Back to Contents
RISK FACTORS
The following describes some of the risks that could affect Rio Tinto. There may be additional risks unknown to Rio Tinto and other risks, currently believed to be immaterial, could turn out to be material. These risks, whether they materialise individually or simultaneously, could significantly affect the Group’s business and financial results. They should also be considered in connection with any forward looking statements in this document and the cautionary statement below.
Economic condition
Commodity prices, and demand for the Group’s products, are influenced strongly by world economic growth, particularly that in the US and Asia. The Group’s normal policy is to sell its products at prevailing market prices. Commodity prices can fluctuate widely and could have a material and adverse impact on the Group’s asset values, revenues, earnings and cash flows. Further discussion can be found on page 14, Business environment and markets, and on page 39, commodity prices.
Exchange rates
The Group’s asset values, earnings and cash flows are influenced by a wide variety of currencies due to the geographic diversity of the Group’s sales and areas of operation. The majority of the Group’s sales are denominated in US dollars. The Australian and US dollars are the most important currencies influencing costs. The relative value of currencies can fluctuate widely and could have a material and adverse impact on the Group’s asset values, costs, earnings and cash flows. Further discussion can be found on page 37, exchange rates, reporting currencies and currency exposure.
Acquisitions
The Group has grown partly through the acquisition of other businesses. Business combinations commonly entail a number of risks and Rio Tinto cannot be sure that management will be able effectively to integrate businesses acquired or generate the cost savings and synergies anticipated. Failure to do so could have a material and adverse impact on the Group’s costs, earnings and cash flows.
Exploration and new projects
The Group seeks to identify new mining properties through an active exploration programme. There is no guarantee, however, that such expenditure will be recouped or that existing mineral reserves will be replaced. Failure to do so could have a material and adverse impact on the Group’s financial results and prospects.
The Group develops new mining properties and expands its existing operations as a means of generating shareholder value. Increasing regulatory, environmental and social approvals are, however, required which can result in significant increases in construction costs and/or significant delays in construction. These increases could materially and adversely affect a project’s economics, the Group’s asset values, costs, earnings and cash flows.
Reserve estimation
There are numerous uncertainties inherent in estimating ore reserves. Reserves that are valid at the time of estimation may change significantly when new information becomes available. Fluctuations in the price of commodities, exchange rates, increased production costs or reduced recovery rates may render lower grade reserves uneconomic and may, ultimately, result in a restatement. A significant restatement could have a material and adverse impact on the Group’s asset values, costs, cash flows and earnings.
Political and community
The Group has operations in jurisdictions having varying degrees of political instability. Political instability can result in civil unrest, expropriation, nationalisation, renegotiation or nullification of existing agreements, mining leases and permits, changes in laws, taxation policies or currency restrictions. Any of these can have a material adverse effect on the profitability or, in extreme cases, the viability of an operation.
Some of the Group’s current and potential operations are located in or near communities that may now, or in the future, regard such an operation as having a detrimental effect on their economic and social circumstances. Should this occur, it might have a material adverse impact on the profitability or, in extreme cases, the viability of an operation. In addition, such an event may adversely affect the Group’s ability to enter into new operations in the country.
Technology
The Group has invested in and implemented information system and operational initiatives. Several technical aspects of these initiatives are still unproven and the eventual operational outcome or viability cannot be assessed with certainty. Accordingly, the costs and benefits from these initiatives and the consequent effects on the Group’s future earnings and financial results may vary widely from present expectations.
Land and resource tenure
The Group operates in several countries where title to land and rights in respect of land and resources (including indigenous title) may be unclear and may lead to disputes over resource development. Such disputes could disrupt relevant mining projects and/or impede the Group’s ability to develop new mining properties.
Health, safety and environment
Rio Tinto operates in an industry that is subject to numerous health, safety and environmental laws and regulations as well as community expectations. Evolving regulatory standards and expectations can result in increased litigation and/or increased costs all of which can have a material and adverse effect on earnings and cash flows.
Mining operations
Mining operations are vulnerable to a number of circumstances beyond the Group’s control, including natural disasters, unexpected geological variations and industrial actions. These can affect costs at particular mines for varying periods. Mining, smelting and refining processes also rely on key inputs, for example fuel and electricity. Appropriate insurance can provide protection from some, but not all, of the costs that may arise from unforeseen events. Disruption to the supply of key inputs, or changes in their pricing, may have a material and adverse impact on the Group’s asset values, costs, earnings and cash flows.
Rio Tinto 2004Form 20-F 9
Back to Contents
Rehabilitation
Costs associated with rehabilitating land disturbed during the mining process and addressing environmental, health and community issues are estimated and provided for based on the most current information available. Estimates may, however, be insufficient and/or further issues may be identified. Any underestimated or unidentified rehabilitation costs will reduce earnings and could materially and adversely affect the Group’s asset values, earnings and cash flows.
Non managed operations
Rio Tinto cannot guarantee that management of mining and processing assets not subject to its management control will comply with the Group’s standards and objectives, nor that effective policies, procedures and controls will be maintained over those assets.
CAUTIONARY STATEMENT ABOUT FORWARD LOOKING STATEMENTS
This document contains certain forward looking statements with respect to the financial condition, results of operations and business of the Rio Tinto Group. The words “intend”, “aim”, “project”, “anticipate”, “estimate”, “plan”, “believes”, “expects”, “may”, “should”, “will”, or similar expressions, commonly identify such forward looking statements. Examples of forward looking statements in this annual report on Form 20-F include those regarding estimated reserves, anticipated production or construction commencement dates, costs, outputs and productive lives of assets or similar factors. Forward looking statements involve known and unknown risks, uncertainties, assumptions and other factors set forth in this document that are beyond the Group’s control. For example, future reserves will be based in part on market prices that may vary significantly from current levels. These may materially affect the timing and feasibility of particular developments. Other factors include the ability to produce and transport products profitably, the effect of foreign currency exchange rates on market prices and operating costs, and activities by governmental authorities, such as changes in taxation or regulation, and political uncertainty.
In light of these risks, uncertainties and assumptions, actual results could be materially different from any future results expressed or implied by these forward looking statements which speak only as at the date of this report. Except as required by applicable regulations or by law, the Group does not undertake any obligation to publicly update or revise any forward looking statements, whether as a result of new information or future events. The Group cannot guarantee that its forward looking statements will not differ materially from actual results.
Item 4. Information on the Company
INTRODUCTION
Rio Tinto Limited and Rio Tinto plc operate as one business organisation, referred to in this report as Rio Tinto, the Rio Tinto Group or, more simply, the Group. These collective expressions are used for convenience only since both Companies, and the individual companies in which they directly or indirectly own investments, are separate and distinct legal entities.
“Limited”, “plc”, “Pty”, “Inc”, “Limitada”, or “SA” has generally been omitted from Group company names, except to distinguish between Rio Tinto plc and Rio Tinto Limited.
Financial data in United States dollars (US$) is derived from, and should be read in conjunction with, the Rio Tinto Group’s consolidated financial statements which are in US$. In general, financial data in pounds sterling (£) and Australian dollars (A$) have been translated from the consolidated financial statements at the rates shown on page 112 and have been provided solely for convenience; exceptions arise where data, such as directors’ remuneration, can be extracted directly from source records.
Rio Tinto Group turnover, profit before tax and net earnings and operating assets for 2003 and 2004 attributable to the Group’s products and geographical areas are shown in Notes 26 and 27 to the consolidated financial statements on pages A-39 to A-43. In the Operational review, operating assets and turnover are consistent with the financial information by business unit on pages A-63 and A-64.
The tables on pages 17 to 20 show production for 2002, 2003 and 2004 and include estimates of proven and probable reserves and mineral resources. The weights and measures used are mainly metric units; conversions into other units are shown on page 112. Words and phrases, often technical, have been used which have particular meanings; definitions of these terms are on pages 109 to 111.
AN OVERVIEW OF RIO TINTO
Rio Tinto is a leading international mining group, combining Rio Tinto plc and Rio Tinto Limited in a dual listed companies (DLC) structure as a single economic entity. Nevertheless, both Companies remain legal entities with separate share listings and registers. Rio Tinto plc is incorporated in England and Wales and Rio Tinto Limited is incorporated in Australia.
Rio Tinto’s international headquarters are in London whilst the Australian representative office in Melbourne provides support for the operations, undertakes external and investor relations and fulfils statutory obligations. The registered office of Rio Tinto plc is at 6 St James’s Square, London, SW1Y 4LD (telephone: +44 20 7930 2399) and the registered office of Rio Tinto Limited is at Level 33, 55 Collins Street, Melbourne, Victoria 3000 (telephone: +61 3 9283 3333).
Rio Tinto 2004Form 20-F 10
Back to Contents
For legal purposes, Rio Tinto’s US agent is Shannon Crompton, Secretary of Rio Tinto’s US holding companies, 8309 West 3595 South, Magna, Utah 84044. Investor relations in the US are provided by Makinson Cowell US Limited, One Penn Plaza, 250 W 34th St, Suite 1935, New York, NY 10119.
| Objective, strategy and management structure |
| Rio Tinto’s fundamental objective is to maximise the overall long term return to its shareholders by operating responsibly and sustainably in areas of proven expertise where the Group has competitive advantage. Its strategy is to maximise the net present value per share by investing in large, long life, cost competitive mines. Investments are driven by the quality of opportunity, not choice of commodity. |
| Rio Tinto’s mining interests are diverse both in geography and product. The Group consists of wholly and partly owned subsidiaries, joint ventures, associated companies and joint arrangements, the principal ones being listed in Notes 31 to 34 of the consolidated financial statements on pages A-52 to A-53. |
| Rio Tinto’s management structure is designed to facilitate a clear focus on business performance and the Group’s objective. The management structure, which is reflected in this report, is based on principal product and global support groups: |
| • | Iron Ore |
| • | Energy |
| • | Industrial Minerals |
| • | Aluminium |
| • | Copper |
| • | Diamonds |
| • | Exploration, and |
| • | Technology |
| The chief executive of each group reports to the chief executive of Rio Tinto. |
2004 financial summary
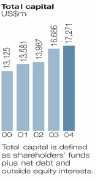
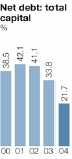
On 31 December 2004, Rio Tinto plc had a market capitalisation of £16.4 billion (US$31.6 billion) and Rio Tinto Limited had a market capitalisation of A$19.5 billion (US$15.2 billion). The combined Group’s market capitalisation in publicly held shares at the end of 2004 was US$41.1 billion.
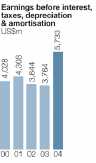
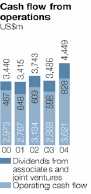
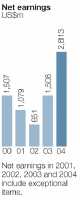
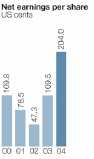
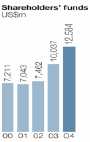
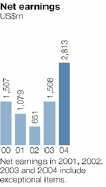
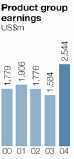
At 31 December 2004, Rio Tinto had consolidated operating assets of US$16.6 billion: 61 per cent were located in Australia and New Zealand and 27 per cent in North America. Group turnover, or sales revenue, in 2004 was US$14.6 billion (or US$11.8 billion excluding Rio Tinto’s share of joint ventures’ and associates’ turnover). Net earnings in 2004 were US$2,813 million.
History
The Rio Tinto Company was formed by investors in 1873 to mine ancient copper workings at Rio Tinto in southern Spain. The Consolidated Zinc Corporation was incorporated in 1905, initially to treat zinc bearing mine waste at Broken Hill, New South Wales, Australia.
The RTZ Corporation (formerly The Rio Tinto-Zinc Corporation) was formed in 1962 by the merger of The Rio Tinto Company and The Consolidated Zinc Corporation. CRA Limited (formerly Conzinc Riotinto of Australia Limited) was formed at the same time by a merger of the Australian interests of The Consolidated Zinc Corporation and The Rio Tinto Company. Between 1962 and 1995, RTZ and CRA discovered important mineral deposits, developed major mining projects and also grew through acquisition.
RTZ and CRA were unified in December 1995 through a DLC structure. Directed by a common board of directors, this is designed to place the shareholders of both companies in substantially the same position as if they held shares in a single enterprise owning all of the assets of both Companies.
In June 1997, The RTZ Corporation became Rio Tinto plc and CRA Limited became Rio Tinto Limited, together known as the Rio Tinto Group. Since the 1995 merger, the Group has continued to invest in developments and acquisitions in keeping with its strategy.
RECENT DEVELOPMENTS
Share buybacks and issues 2004-2005 to date
In April 2004, Rio Tinto plc shareholders renewed approvals for the buyback of up to ten per cent of its own shares and Rio Tinto Limited shareholders renewed approvals to buy back up to 100 per cent of Rio Tinto Limited shares held by Tinto Holdings Australia Pty Limited (a wholly owned subsidiary of Rio Tinto plc) plus, on market, up to ten per cent of the publicly held capital in any 12 month period.
The Group announced on 3 February 2005, its intention to return up to US$1.5 billion of capital to shareholders, therefore, Rio Tinto plc and Rio Tinto Limited obtained renewal of their existing shareholder approvals at their respective annual general meetings in 2005. Both Companies also obtained shareholder approval for Rio Tinto Limited to make off market purchases of its shares within 12 months of the annual general meeting, within the overall limit of ten per cent of publicly held capital described above. This was to be through a tender process at a discount to the market price. The shareholders’ approval obtained would also allow Rio Tinto Limited to buy back its shares from Tinto Holdings Australia, after such an off market tender (at the same price), to maintain the proportional holding of Tinto Holdings Australia following the off market buyback. The number of shares which may eventually be bought back under these authorities will be determined by the directors, based on what they consider to be in the best interests of all shareholders.
Rio Tinto 2004Form 20-F 11
Back to Contents
In the year to 31 December 2004, neither Rio Tinto plc nor Rio Tinto Limited purchased any publicly held shares for cancellation in either Company. However, a further 1,346,874 Rio Tinto plc and 280,332 Rio Tinto Limited shares were issued in respect of the Companies’ employee share plans. During the year, options for a further 1,541,367 Rio Tinto plc and 1,339,834 Rio Tinto Limited shares were granted under Rio Tinto’s share plans.
On 9 May 2005 Rio Tinto Limited announced the successful result of its off market share buy back. A total of approximately 27.3 million shares, representing 8.7 per cent of Rio Tinto Limited’s publicly held issued share capital (2.0 per cent of the Rio Tinto Group), were bought back at A$36.70 per share at a cost of approximately A$1 billion (US$780 million). The buy back price of A$36.70 per share represented a 14 per cent discount to the relevant volume weighted average price of Rio Tinto Limited shares sold on the ASX over the five trading days up to and including the closing date of the buy back. It also represented a discount of 15.6 per cent to the closing price for Rio Tinto Limited shares on 6 May 2005, of A$43.50.
Under a separate buy back, Tinto Holdings Australia accepted the same A$36.70 buy back price for a proportion of its 37.5 per cent holding of Rio Tinto Limited shares so that there was no change in the proportional shareholding in Rio Tinto Limited as a result of the buy back. Rio Tinto Limited therefore bought back a further 16.4 million shares at a cost of approximately A$600 million (US$470 million).
Share buybacks and issues 2002-2003
In 2002, 887,000 Rio Tinto plc and 360,000 Rio Tinto Limited shares were issued under the Companies’ employee share plans and options were granted over 2.6 million Rio Tinto plc shares and 2.2 million Rio Tinto Limited shares. In 2003, 1,193,000 Rio Tinto plc and 240,000 Rio Tinto Limited shares were issued in respect of the Companies’ employee share plans. During 2003, options were granted over 2.7 million Rio Tinto plc and 1.6 million Rio Tinto Limited shares in respect of the Companies’ employee share plans.
In the years 2002 and 2003, neither Rio Tinto plc nor Rio Tinto Limited purchased any publicly held shares for cancellation in either Company.
Operations acquired and divested 2004-2005 to date
In January 2004, Rio Tinto completed the sale of its 100 per cent interest in the nickel mining company Mineração Serra da Fortaleza Ltda to Votorantim Metais, a Brazilian controlled mining company. Including an adjustment for future nickel prices, the total cash consideration was approximately US$80 million.
A 20 per cent interest in the Sepon project in Laos, comprising a gold operation and the Khanong copper project, was sold to Oxiana Limited for a cash consideration of US$85 million.
In March, Rio Tinto completed the sale of its shareholding in Freeport-McMoRan Copper & Gold Inc (FCX). Rio Tinto received net proceeds of US$882 million for its 23,931,100 FCX shares. Rio Tinto retains its 40 per cent joint venture interest in reserves discovered after 1994 at the Grasberg mine which is managed by FCX. The sale of FCX shares does not affect the terms of the joint venture nor the management of the Grasberg mine.
In June, Rio Tinto completed the sale of its 100 per cent interest in Zinkgruvan Mining AB to South Atlantic Ventures. Zinkgruvan was acquired in 2000 as part of North. Rio Tinto received US$101 million in cash plus US$5 million for working capital, and can earn a further US$5 million over the next two years in price participation payments based on zinc, lead and silver prices. Also in June, Rio Tinto’s interest in the Boké bauxite deposit in west Africa was divested for US$12 million.
Rio Tinto and Empresa de Desenvolvimento Mineiro completed the sale of their interests in the Neves Corvo copper mine in Portugal to EuroZinc for a cash consideration and a participation in the average copper price in excess of certain thresholds. Rio Tinto’s share of the consideration for its 49 per cent share of the mine was US$70 million. The remaining price participation rights relating to copper production from Neves Corvo, which was sold in the first half of the year, were themselves sold for US$22 million.
The directors of Rio Tinto Zimbabwe (RioZim) agreed to a restructuring of Rio Tinto’s 56 per cent shareholding in RioZim. The Murowa diamond project in Zimbabwe had been a 50:50 joint venture between Rio Tinto and RioZim. As a result of the restructuring, Rio Tinto owns a direct 78 per cent interest in Murowa and RioZim became an independent Zimbabwean controlled, listed company owning the remaining 22 per cent of Murowa. Rio Tinto ceased to be an ordinary shareholder in RioZim but retains a reduced cash participation in RioZim’s assets other than the Murowa diamond project for a period of ten years. The transaction had no material effect on Rio Tinto.
The sale of the Group’s 51 per cent interest in Rio Paracatu Mineração, the owner of the Morro do Ouro mine in Brazil, was completed on 31 December 2004 for US$250 million, subject to an adjustment for working capital.
The sale to Nippon Steel of an eight per cent interest in the Hail Creek Joint Venture, and the increase in the combined share of the original participants, Marubeni Coal and Sumisho Coal Development, by two per cent was completed in the fourth quarter. Rio Tinto will receive about US$150 million for the sale of these interests in the Hail Creek Joint Venture together with the sale of a 47 per cent interest in the Beasley River iron ore deposit to its joint venture partners in Robe River, which includes Nippon Steel.
In December Kennecott Energy successfully bid for an additional 177 million tonnes of in-situ coal reserves at West Antelope at a cost of US$146 million.
Rio Tinto 2004Form 20-F 12
Back to Contents
In March 2005 the Group announced the sale of its entire holding in the Labrador Iron Ore Royalty Income Fund (LIORIF) for net cash proceeds of US$130 million. LIORIF has an equity interest of 15.1 per cent in, and receives royalties from, the Iron Ore Company of Canada. This transaction has no effect on Rio Tinto’s 59 per cent direct interest in the Iron Ore Company of Canada.
Operations acquired and divested 2002-2003
In January 2002, Kennecott Energy (KEC) purchased the North Jacobs Ranch coal reserves for US$380 million, payable in instalments over a five year period. The reserves are adjacent to KEC’s existing Jacobs Ranch operation and provide a basis for low cost expansion in line with market demand.
Following the purchase of outstanding units in the Western Australian Diamond Trust, Rio Tinto’s interest in Argyle Diamonds increased from 99.8 per cent to 100 per cent.
In August 2002, Comalco completed the acquisition of an additional 9.5 per cent interest in reduction lines 1 and 2 of the Boyne Island Smelter for US$80 million. This increased Comalco’s share in lines 1 and 2 of the smelter to 59.5 per cent from 50 per cent. Comalco’s interest in line 3 remains unchanged at 59.25 per cent.
During the first half of 2002, Coal & Allied Industries completed the sale of its interest in the Moura Joint Venture for US$166 million and in Narama and Ravensworth for US$64 million. These were classified as assets held for resale and consequently their disposal had no effect on net earnings. In September, Rio Tinto acquired for cash in the market a further three per cent in Coal & Allied to bring its shareholding to 75.7 per cent.
As a result of a refinancing in December 2002, in which the Labrador Iron Ore Royalty Income Fund (LIORF) chose not to participate, Rio Tinto’s interest in Iron Ore Company of Canada increased from 56.1 to 58.7 per cent.
The sale of Rio Tinto’s 25 per cent interest in Minera Alumbrera Limited in Argentina, acquired as part of North, together with its wholly owned Peak gold mine in New South Wales, Australia, was completed in March 2003. The cash consideration was US$210 million.
Rio Tinto Zimbabwe sold the Patchway gold mine in 2003. The Framework Agreement signed with the Government of Indonesia in 2002 for divestment of 51 per cent of Kaltim Prima Coal (KPC) to Indonesian interests lapsed in 2003 when no assignment of KPC’s offer was made or accepted within the required timeframe.
On 21 July 2003 Rio Tinto and BP announced that they had agreed to sell their interests in KPC for a cash price of US$500 million, including assumed debt, to PT Bumi Resources, a public company listed on the Jakarta and Surabaya Stock Exchanges. The sale was completed on 10 October and each company received 50 per cent of the net proceeds.
Development projects 2004-2005 to date
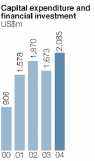
Rio Tinto invested over US$2.2 billion in 2004 on development projects around the world.
In December 2003, Hamersley Iron announced the US$920 million expansion of its port and mine capacity, with further expenditure on the rail network and power infrastructure being evaluated. In April 2005 a further US$290 million was committed to expand the existing iron ore mines. The partners in the Robe River Joint Venture approved US$214 million (Rio Tinto share US$113 million) to dual track a significant part of the Hamersley Iron rail line. Hamersley Iron will spend a further US$46 million to upgrade power infrastructure in the Pilbara. The port and mine expansions are on track for completion by the end of 2005.
In January 2004, Rio Tinto approved the expansion of QIT-Fer et Titane Inc.’s upgraded slag (UGS) plant in Quebec, Canada. Total investment will be US$76 million and capacity will be increased from 250,000 tonnes per year to 325,000 tonnes per year in 2005.
The owners of the Escondida copper mine in Chile approved expenditure of US$870 million (Rio Tinto share US$270 million) on a sulphide leach project to produce 180,000 tonnes (Rio Tinto share 54,000 tonnes) of copper cathode per annum for more than 25 years starting in the second half of 2006.
Construction of the US$100 million second block cave at the underground Northparkes copper and gold mine in New South Wales, Australia was completed and production commenced in 2004.
Development of the 54 per cent owned Eastern Range iron ore mine in Australia with a capacity of ten million tonnes per year was completed. First shipments started in the first half of 2004.
Expansion of the Weipa bauxite mine in Queensland, Australia, was completed, resulting in an increase in production capacity to 16.5 million tonnes per annum. This supports the requirements of the new Comalco Alumina Refinery. A key component of the US$150 million expenditure is a 9.5 million tonne beneficiation plant for ore from the Andoom deposit. In 2005, a new US$42 million power station will be constructed to service the Weipa mining operations and surrounding communities.
Construction of the first stage of Comalco’s new alumina refinery at Gladstone, Queensland commenced in January 2002 and was completed in late 2004, three months early and in line with its budget of US$750 million. Initial shipments from the 1.4 million tonnes per year plant started in early 2005. There is potential for the refinery capacity to increase to over four million tonnes per year in two additional stages when market conditions allow.
Construction began in January 2003 on an expanded US$200 million HIsmelt® plant at Kwinana in Western Australia. Cold commissioning commenced in late 2004 and the first hot metal was produced in the hot commissioning process during the second quarter of 2005. The full production rate of 800,000 tonnes per year is expected to be achieved in 2007.
Rio Tinto 2004 Form 20-F 13
Back to Contents
Approval was given in 2004 for expansion of the Hail Creek coal mine in Australia to eight million tonnes per year at a cost of US$157 million. At the Diavik diamond mine in Canada construction begins in 2005 of a second dike at a cost of US$190 million to enable mining of a third orebody. Also approved was an optimisation study costing US$75 million including construction of an exploration decline to investigate underground mining.
Kennecott Land’s Project Daybreak in Utah, US, a mixed use land development on a 1,800 hectare site, started in 2003, with the first land sales in 2004 that are expected to ramp up over a period of five to six years.
Further detail on these investments and projects is provided in the operational review on pages 44 to 67.
Development projects have been funded using internally generated funds and proceeds of asset disposals.
Development projects 2002-2003
Work on the Robe River Joint Venture’s US$450 million West Angelas iron ore mine and port facilities in Western Australia was completed in mid-2002 and the first shipments were made.
Freeport Indonesia’s Deep Ore Zone (DOZ) underground block cave project was declared fully operational from 1 October 2002. This achieved design capacity of 25,000 tonnes of ore per day in 2002, a year earlier than originally projected. In the first quarter of 2003, Freeport Indonesia completed a further DOZ expansion to 35,000 tonnes per day at a cost of US$34 million.
The Diavik diamond project in the Northwest Territories, Canada was completed in January 2003 three months early and within budget. Initial production commenced from the contact zone above the orebody with the main orebody accessed during the second half of 2003.
Production ramp up at Palabora’s US$465 million underground copper mine in South Africa started in 2003 but was constrained by an inability to clear drawpoints blocked by poorly fragmented, large rocks.
Development of the Escondida Norte satellite deposit at the 30 per cent owned Escondida copper mine in Chile was started in June 2003 to provide mill feed to keep Escondida’s capacity above 1.2 million tonnes of copper per year to the end of 2008. First production is expected by the end of 2005. Commissioning of the new US$1,045 million, 110,000 tonnes of ore per day Laguna Seca concentrator was completed in the second quarter of 2003.
In 2003, Rio Tinto Coal Australia completed development of the US$255 million Hail Creek coking coal project in Queensland, Australia with an initial capacity of 5.5 million tonnes annually.
BUSINESS ENVIRONMENT AND MARKETS
Competitive environment
Rio Tinto is a major producer in all the metals and minerals markets in which it operates. It is generally among the top five global producers by volume. It has market shares for different commodities ranging from five per cent to 40 per cent. The competitive arena is spread across the globe, including eastern Europe, Russia and China.
Most of Rio Tinto’s competitors are private sector companies which are publicly quoted. Several are, like Rio Tinto, diversified in terms of commodity exposure, but others are focused on particular commodity segments. Metal and mineral markets are highly competitive with few barriers to entry. They can be subject to price declines in real terms reflecting large productivity gains, increasing technical sophistication, better management, and advances in information technology.
High quality, long life mineral resources, the basis of good financial returns, are relatively scarce. Rio Tinto’s ownership of or interest in some of the world’s largest deposits enables it to contribute to long term market growth. World production volumes are likely to grow at least in line with global economic activity. The emergence of China and eventually India as economic forces requiring metals and minerals for development could mean even higher market growth.
Economic overview
World economic activity in 2004 grew at the fastest rate since the 1970s, rising to over five per cent from three per cent the year before on a purchasing power parity basis. Trade growth accelerated even faster, to more than eight per cent in real terms, nearly double the rate seen in 2003.
The increase in economic activity was widely based, led by the US and China which grew by 4.3 per cent and nine per cent respectively. Japan benefited from strong exports, which stimulated growth of four per cent. Growth elsewhere in Asia was also stimulated by exports. Latin America grew by five per cent, driven by the boom in demand for metals, oil and some agricultural products. European activity lagged, but higher exports enabled growth to rise to over two per cent.
Inflation remained low by historical standards in spite of the large rise in prices of oil and other commodities. This reflected fierce competition in the manufacturing sector and generally weak labour markets.
The US benefited from very low real interest rates and a loose fiscal policy in the run up to the presidential election. The twin deficits of government finance and trade increased rapidly. The fact that US growth was based on borrowing was underscored by the decline in the value of the US dollar, which fell eight per cent in trade weighted terms, following an 11 per cent fall in 2003. Some currencies are pegged to the US dollar, notably the Chinese renminbi, and the fall against freely traded currencies such as the euro and the Australian dollar was considerably greater.
The other pillar of global growth was China, with GDP rising by nine per cent. This was driven by investment in fixed assets, which rose by more than 25 per cent for the second successive year, and industrial output, which grew more than 16 per cent, also for the second year running.
Rio Tinto 2004 Form 20-F 14
Back to Contents
Growth was strongest in the first half and then slowed. This was most notable in Europe and Japan as their currencies strengthened against the US dollar. The picture in China was less clear. Growth there seems to have slowed from the earlier breakneck pace as the government signalled before the middle of the year that it wanted to reduce growth in investment in fixed assets and introduced curbs. Trade with China in many commodities eased considerably in the second half, but other factors including port congestion also contributed.
Commodity markets had already started to improve in 2003, but the acceleration in economic activity and trade in 2004 tipped many of them into a zone of extreme tightness. Prices soared, aided by a declining US dollar. Fund activity fluctuated through the year, but provided strong support for prices overall. Demand for many products grew considerably faster than the world economy. Chinese growth continued to be very commodity intensive, and there was some rebuilding of stocks in the supply chain. Global steel production grew nine per cent, the fastest since 1973.
Copper benefited more than most non ferrous metals from the acceleration in growth, as it was already in deficit and refined output was held back by a series of disruptions to mine output and by smelter capacity. Demand grew by seven per cent, the deficit in refined copper rose sharply and exchange stocks fell below the levels seen in the mid 1990s. Fund buying intensified pricing in a very tight physical market. The average cash LME price rose to US$1.30 per pound from 80 US cents per pound the year before, only just short of the highest ever price in nominal terms (not adjusted for inflation). In contrast, the copper concentrates market, which had been tight for several years, was well supplied in the second half.
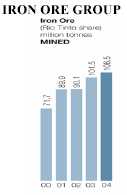
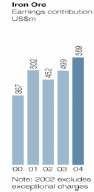
The seaborne iron ore trade continued to grow strongly with China’s iron ore imports nearly 40 per cent above their 2003 level. Price increases of nearly 20 per cent early in the year underlined the tightness of the market. The rapid growth in demand for iron ore caused a shortage of shipping capacity leading to the highest freight rates ever recorded.
Prices for seaborne thermal coal rose by over 60 per cent. Even a rise of this magnitude, however, did not dampen the market and spot prices remained above the contract settlement price throughout the year. World seaborne thermal coal trade is estimated to have grown by about six per cent during 2004. Coking coal prices rose by less than those of thermal coal but significant increases in demand in Asia meant that some spot cargos were trading at very high prices.
The North American aluminium market improved significantly in 2004 with demand growth of around ten per cent. Combined with demand in China, the primary aluminium market moved into deficit for the first time since 2000. The annual average price of aluminium increased accordingly to 78 US cents per pound in 2004 from 65 US cents the previous year. However, the rise was not as strong as for copper because stocks were higher. The spot price for alumina remained very high by historical standards throughout 2004 reflecting general market tightness and strong demand from Chinese aluminium smelters.
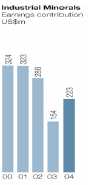
The economic recovery in developed countries, the US in particular, benefited the demand for industrial minerals such as borates and titanium minerals. Demand growth for these products, however, generally continued to fall short of that achieved by metal markets. This was partly due to a lower exposure to the present stage of Chinese growth.
Gold averaged US$409 per ounce, a 16 year nominal high, almost entirely driven by the falling US dollar. Many less widely traded metals also benefited from much higher prices, notably molybdenum, which averaged US$14 per pound for trader oxide, a 25 year nominal high, and silver, which averaged US$6.70 per ounce, up 40 per cent year on year.
A discussion of the financial results for the three years to 31 December 2004 is given in the Financial review on pages 31 to 44.
Comments on the financial performance of the individual product groups for the three years to 31 December 2004 are included in the operational review on pages 44 to 67. Details of production, reserves and information on Group mines are given on pages 17 to 20, A-85 to A-95 and 22 to 26, respectively. Analyses of Rio Tinto’s revenues by product group, geographical origin and geographical destination have been set out in Notes 26 to 27 to the consolidated financial statements on pages A-39 to A-43.
Marketing channels
Each business within each product group is responsible for the marketing and sale of their respective metal and mineral production. Consequently, Rio Tinto has numerous marketing channels, which now include electronic marketplaces, with differing characteristics and pricing mechanisms.
In general, Rio Tinto’s businesses contract their metal and mineral production direct to end users under long term supply contracts and at prevailing market prices. Typically, these contracts specify annual volume commitments and an agreed mechanism for determining prices, for example, businesses producing non ferrous metals and minerals reference their sales prices to the London Metal Exchange (LME) or other metal exchanges such as the Commodity Exchange Inc (Comex) in New York. Fluctuations in these prices, particularly for aluminium, copper and gold, inevitably affect the Group’s financial results.
Businesses producing coal and iron ore would typically reference their sales prices to annually negotiated industry benchmarks. In markets where international reference market prices do not exist or are not transparent, businesses negotiate product prices on an individual customer basis.
Rio Tinto’s marketing channels include a network of regional sales offices worldwide. Some products in certain geographical markets are sold via third party agents or to major trading companies.
Rio Tinto 2004Form 20-F 15
Back to Contents
Governmental regulations
Rio Tinto is subject to extensive governmental regulations affecting all aspects of its operations and consistently seeks to apply best practice in all of its activities. Due to Rio Tinto’s product and geographical spread, there is unlikely to be any single governmental regulation that could have a material effect on the Group’s business.
Rio Tinto’s businesses in Australia, New Zealand, Papua New Guinea and Indonesia are subject to state and federal regulations of general application governing mining and processing, land tenure and use, environmental requirements, workplace health and safety, trade and export, corporations, competition, foreign investment and taxation. Some operations are conducted under specific agreements with the respective governments and associated acts of parliament. In addition, Rio Tinto’s uranium operation in the Northern Territory, Australia is subject to specific regulation in relation to its mining and export of uranium.
US and Canada based operations are subject to local and national regulations governing land use, environmental aspects of operations, product and workplace health and safety and trade and export administration.
The South African Mineral and Petroleum Resources Development Act 2002, as read with the Empowerment Charter for the South African Mining Industry, targets the transfer for fair value of 26 per cent ownership of South African mining assets to historically disadvantaged South Africans (HDSAs) within ten years. Attached to the Empowerment Charter is a “scorecard” by which companies will be judged on their progress towards empowerment and the attainment of the target transfer of 26 per cent ownership. The scorecard also provides that 15 per cent ownership should vest in HDSAs within five years of 1 May 2004. The Mineral and Petroleum Royalty Act, proposed for approval in 2005, will govern state royalties and introduce new royalty payments in respect of mining tenements in South Africa. The royalty will be calculated on a gross sales value basis in relation to any minerals extracted, rather than on the basis of profits generated. The South African government has confirmed that any such royalties would become payable only from 2009.
Rio Tinto 2004Form 20-F 16
Back to Contents
METALS AND MINERALS PRODUCTION
| | | | 2002 | | 2003 | | 2004 | |
| | | | Production (a) | | Production (a) | | Production(a) | |
|
|
|
|
|
|
|
| |
| | Rio Tinto | | Total | | Rio Tinto | | Total | | Rio Tinto | | Total | | Rio Tinto | |
| | % share (b) | | | | share | | | | share | | | | share | |
|
|
|
|
|
|
|
|
|
|
|
|
|
| |
| ALUMINA (’000 tonnes) | | | | | | | | | | | | | | |
| Comalco Alumina Refinery (Australia) (c) | 100.0 | | – | | – | | – | | – | | 175 | | 175 | |
| Eurallumina (Italy) | 56.2 | | 1,010 | | 567 | | 1,021 | | 573 | | 1,064 | | 597 | |
| Queensland Alumina (Australia) | 38.6 | | 3,574 | | 1,380 | | 3,731 | | 1,440 | | 3,778 | | 1,459 | |
|
|
|
|
|
|
|
|
|
|
|
|
|
| |
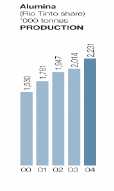
| Rio Tinto total | | | | | 1,947 | | | | 2,014 | | | | 2,231 | |
|
|
|
|
|
|
|
|
|
|
|
|
|
| |
| ALUMINIUM (refined) (’000 tonnes) | | | | | | | | | | | | | | |
| Anglesey (UK) | 51.0 | | 136.8 | | 69.8 | | 141.9 | | 72.4 | | 144.8 | | 73.8 | |
| Bell Bay (Australia) | 100.0 | | 163.9 | | 163.9 | | 166.6 | | 166.6 | | 162.0 | | 162.0 | |
| Boyne Island (Australia) (d) | 59.4 | | 520.2 | | 294.6 | | 520.9 | | 311.1 | | 540.5 | | 321.2 | |
| Tiwai Point (New Zealand) | 79.4 | | 333.9 | | 265.9 | | 334.4 | | 266.5 | | 350.3 | | 279.5 | |
|
|
|
|
|
|
|
|
|
|
|
|
|
| |
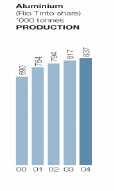
| Rio Tinto total | | | | | 794.1 | | | | 816.6 | | | | 836.5 | |
|
|
|
|
|
|
|
|
|
|
|
|
|
| |
| BAUXITE (’000 tonnes) | | | | | | | | | | | | | | |
| Boké (Guinea) (e) | – | | 12,041 | | 482 | | 12,060 | | 418 | | 5,773 | | 179 | |
| Weipa (Australia) | 100.0 | | 11,241 | | 11,241 | | 11,898 | | 11,898 | | 12,649 | | 12,649 | |
|
|
|
|
|
|
|
|
|
|
|
|
|
| |
| Rio Tinto total | | | | | 11,724 | | | | 12,316 | | | | 12,828 | |
|
|
|
|
|
|
|
|
|
|
|
|
|
| |
| BORATES (’000 tonnes)(f) | | | | | | | | | | | | | | |
| Boron mine (US) | 100.0 | | 514 | | 514 | | 541 | | 541 | | 543 | | 543 | |
| Borax Argentina (Argentina) | 100.0 | | 15 | | 15 | | 17 | | 17 | | 22 | | 22 | |
|
|
|
|
|
|
|
|
|
|
|
|
|
| |
| Rio Tinto total | | | | | 528 | | | | 559 | | | | 565 | |
|
|
|
|
|
|
|
|
|
|
|
|
|
| |
| COAL – HARD COKING (’000 tonnes) | | | | | | | | | | | | | | |
| Rio Tinto Coal Australia(g) | | | | | | | | | | | | | | |
| Hail Creek Coal (Australia) (h) | 82.0 | | – | | – | | 883 | | 812 | | 5,104 | | 4,633 | |
| Kestrel Coal (Australia) | 80.0 | | 2,406 | | 1,925 | | 1,873 | | 1,499 | | 2,659 | | 2,127 | |
|
|
|
|
|
|
|
|
|
|
|
|
|
| |
| Rio Tinto total hard coking coal | | | | | 1,925 | | | | 2,311 | | | | 6,760 | |
|
|
|
|
|
|
|
|
|
|
|
|
|
| |
| COAL – OTHER* (’000 tonnes) | | | | | | | | | | | | | | |
| Coal & Allied Industries(i) | | | | | | | | | | | | | | |
| Bengalla (Australia) | 30.3 | | 5,385 | | 1,587 | | 6,203 | | 1,879 | | 5,312 | | 1,609 | |
| Hunter Valley Operations (Australia) | 75.7 | | 12,625 | | 9,287 | | 12,008 | | 9,091 | | 13,269 | | 10,046 | |
| Mount Thorley Operations (Australia) | 60.6 | | 4,292 | | 2,524 | | 3,153 | | 1,910 | | 3,548 | | 2,149 | |
| Moura (Australia) (j) | – | | 2,399 | | 959 | | – | | – | | – | | – | |
| Narama (Australia) (j) | – | | 370 | | 135 | | – | | – | | – | | – | |
| Ravensworth East (Australia) (j) | – | | 387 | | 281 | | – | | – | | – | | – | |
| Warkworth (Australia) | 42.1 | | 6,882 | | 2,817 | | 5,868 | | 2,469 | | 6,954 | | 2,926 | |
|
|
|
|
|
|
|
|
|
|
|
|
|
| |
| Total Coal & Allied Industries other coal | | | | | 17,590 | | | | 15,348 | | | | 16,729 | |
|
|
|
|
|
|
|
|
|
|
|
|
|
| |
| Rio Tinto Coal Australia(g) | | | | | | | | | | | | | | |
| Blair Athol (Australia) | 71.2 | | 11,809 | | 8,412 | | 12,480 | | 8,890 | | 12,229 | | 8,712 | |
| Kestrel Coal (Australia) | 80.0 | | 1,685 | | 1,348 | | 1,449 | | 1,159 | | 623 | | 499 | |
| Tarong Coal (Australia) | 100.0 | | 5,685 | | 5,685 | | 6,538 | | 6,538 | | 7,004 | | 7,004 | |
|
|
|
|
|
|
|
|
|
|
|
|
|
| |
| Total Rio Tinto Coal Australia other coal | | | | | 15,445 | | | | 16,587 | | | | 16,214 | |
|
|
|
|
|
|
|
|
|
|
|
|
|
| |
| Total Australian other coal | | | | | 33,035 | | | | 31,935 | | | | 32,943 | |
|
|
|
|
|
|
|
|
|
|
|
|
|
| |
| Kaltim Prima Coal(Indonesia) (k) | – | | 17,740 | | 8,870 | | 12,655 | | 6,327 | | – | | – | |
|
|
|
|
|
|
|
|
|
|
|
|
|
| |
| Kennecott Energy | | | | | | | | | | | | | | |
| Antelope (US) | 100.0 | | 24,319 | | 24,319 | | 26,806 | | 26,806 | | 26,928 | | 26,928 | |
| Colowyo (US) | (l) | | 4,889 | | 4,889 | | 4,535 | | 4,535 | | 5,788 | | 5,788 | |
| Cordero Rojo (US) | 100.0 | | 34,724 | | 34,724 | | 32,671 | | 32,671 | | 35,233 | | 35,233 | |
| Decker (US) | 50.0 | | 9,021 | | 4,511 | | 7,358 | | 3,679 | | 7,831 | | 3,916 | |
| Jacobs Ranch (US) | 100.0 | | 28,784 | | 28,784 | | 32,418 | | 32,418 | | 34,979 | | 34,979 | |
| Spring Creek (US) | 100.0 | | 8,093 | | 8,093 | | 8,069 | | 8,069 | | 10,892 | | 10,892 | |
|
|
|
|
|
|
|
|
|
|
|
|
|
| |
| Total US coal | | | | | 105,320 | | | | 108,177 | | | | 117,734 | |
|
|
|
|
|
|
|
|
|
|
|
|
|
| |
| Rio Tinto total other coal | | | | | 147,225 | | | | 146,439 | | | | 150,677 | |
|
|
|
|
|
|
|
|
|
|
|
|
|
| |
* Coal – other includes thermal coal, semi-soft coking coal and semi-hard coking coal.
See notes on page 20
Rio Tinto 2004Form 20-F 17
Back to Contents
| | | | 2002 | | 2003 | | 2004 |
| | | | Production (a) | | Production (a) | | Production(a) |
|
|
|
|
|
|
|
|
| | Rio | | Total | | Rio | | Total | | Rio | | Total | | Rio |
| | Tinto | | | | Tinto | | | | Tinto | | | | Tinto |
| | % share (b) | | | | share | | | | share | | | | share |
|
|
|
|
|
|
|
|
|
|
|
|
|
|
| COPPER (mined) (’000 tonnes) | | | | | | | | | | | | | |
| Alumbrera (Argentina) (m) | – | | 203.7 | | 50.9 | | 34.9 | | 8.7 | | – | | – |
| Bingham Canyon (US) | 100.0 | | 260.2 | | 260.2 | | 281.8 | | 281.8 | | 263.7 | | 263.7 |
| Escondida (Chile) | 30.0 | | 754.5 | | 226.3 | | 992.7 | | 297.8 | | 1,207.1 | | 362.1 |
| Grasberg – FCX (Indonesia) (n) | – | | 494.4 | | 107.5 | | 444.1 | | 84.5 | | 396.4 | | 5.5 |
| Grasberg – Joint Venture (Indonesia) (n) | 40.0 | | 370.0 | | 148.0 | | 271.7 | | 108.7 | | 120.0 | | 48.0 |
| Neves Corvo (Portugal) (o) | – | | 77.2 | | 37.8 | | 77.5 | | 38.0 | | 46.9 | | 23.0 |
| Northparkes (Australia) | 80.0 | | 38.4 | | 30.7 | | 27.1 | | 21.7 | | 30.0 | | 24.0 |
| Palabora (South Africa) | 49.2 | | 52.2 | | 25.7 | | 52.4 | | 25.8 | | 54.4 | | 26.8 |
|
|
|
|
|
|
|
|
|
|
|
|
|
|
| Rio Tinto total | | | | | 887.1 | | | | 867.0 | | | | 753.1 |
|
|
|
|
|
|
|
|
|
|
|
|
|
|
| COPPER (refined) (’000 tonnes) | | | | | | | | | | | | | |
| Atlantic Copper (Spain) (n) | – | | 250.5 | | 41.5 | | 247.1 | | 38.1 | | 58.4 | | 7.0 |
| Escondida (Chile) | 30.0 | | 138.7 | | 41.6 | | 147.6 | | 44.3 | | 152.1 | | 45.6 |
| Kennecott Utah Copper (US) | – | | 293.7 | | 293.7 | | 230.6 | | 230.6 | | 246.7 | | 246.7 |
| Palabora (South Africa) | 49.2 | | 81.6 | | 40.2 | | 73.4 | | 36.1 | | 67.5 | | 33.2 |
|
|
|
|
|
|
|
|
|
|
|
|
|
|
| Rio Tinto total | | | | | 416.9 | | | | 349.1 | | | | 332.6 |
|
|
|
|
|
|
|
|
|
|
|
|
|
|
| DIAMONDS (’000 carats) | | | | | | | | | | | | | |
| Argyle (Australia) (p) | 100.0 | | 33,519 | | 33,503 | | 30,910 | | 30,910 | | 20,620 | | 20,620 |
| Diavik (Canada) | 60.0 | | – | | – | | 3,833 | | 2,300 | | 7,575 | | 4,545 |
| Merlin (Australia) | – | | 117 | | 117 | | 62 | | 62 | | – | | – |
| Murowa (Zimbabwe) (q) | 77.8 | | – | | – | | – | | – | | 47 | | 36 |
|
|
|
|
|
|
|
|
|
|
|
|
|
|
| Rio Tinto total | | | | | 33,620 | | | | 33,272 | | | | 25,202 |
|
|
|
|
|
|
|
|
|
|
|
|
|
|
| GOLD (mined) (’000 ounces) | | | | | | | | | | | | | |
| Alumbrera (Argentina) (m) | – | | 754 | | 188 | | 124 | | 31 | | – | | – |
| Barneys Canyon (US) | 100.0 | | 75 | | 75 | | 35 | | 35 | | 22 | | 22 |
| Bingham Canyon (US) | 100.0 | | 412 | | 412 | | 305 | | 305 | | 308 | | 308 |
| Cortez/Pipeline (US) | 40.0 | | 1,082 | | 433 | | 1,085 | | 434 | | 1,051 | | 421 |
| Escondida (Chile) | 30.0 | | 126 | | 38 | | 184 | | 55 | | 217 | | 65 |
| Grasberg – FCX (Indonesia) (n) | – | | 1,375 | | 355 | | 1,456 | | 354 | | 1,377 | | 14 |
| Grasberg – Joint Venture (Indonesia) (n) | 40.0 | | 1,655 | | 662 | | 1,806 | | 722 | | 207 | | 83 |
| Greens Creek (US) | 70.3 | | 103 | | 72 | | 99 | | 70 | | 86 | | 61 |
| Kelian (Indonesia) | 90.0 | | 539 | | 485 | | 469 | | 422 | | 328 | | 295 |
| Lihir (Papua New Guinea) (r) | 14.5 | | 607 | | 99 | | 551 | | 88 | | 599 | | 87 |
| Morro do Ouro (Brazil) (s) | – | | 225 | | 115 | | 201 | | 103 | | 188 | | 96 |
| Northparkes (Australia) | 80.0 | | 41 | | 33 | | 49 | | 39 | | 79 | | 63 |
| Peak (Australia) (m) | – | | 97 | | 97 | | 20 | | 20 | | – | | – |
| Rawhide (US) | 51.0 | | 82 | | 42 | | 64 | | 32 | | 50 | | 25 |
| Rio Tinto Zimbabwe (Zimbabwe) (t) | – | | 38 | | 21 | | 25 | | 14 | | 11 | | 6 |
| Others | – | | 17 | | 8 | | 14 | | 7 | | 13 | | 7 |
|
|
|
|
|
|
|
|
|
|
|
|
|
|
| Rio Tinto total | | | | | 3,135 | | | | 2,731 | | | | 1,552 |
|
|
|
|
|
|
|
|
|
|
|
|
|
|
| GOLD (refined) (’000 ounces) | | | | | | | | | | | | | |
| Kennecott Utah Copper (US) | 100.0 | | 488 | | 488 | | 308 | | 308 | | 300 | | 300 |
|
|
|
|
|
|
|
|
|
|
|
|
|
|
| IRON ORE (’000 tonnes) | | | | | | | | | | | | | |
| Channar (Australia) | 60.0 | | 10,594 | | 6,356 | | 10,347 | | 6,208 | | 9,759 | | 5,855 |
| Corumbá (Brazil) | 100.0 | | 858 | | 858 | | 1,074 | | 1,074 | | 1,301 | | 1,301 |
| Eastern Range (Australia) (u) | – | | – | | – | | – | | – | | 2,970 | | 2,970 |
| Hamersley Iron (Australia) | 100.0 | | 57,563 | | 57,563 | | 63,056 | | 63,056 | | 65,407 | | 65,407 |
| Iron Ore Company of Canada (Canada) (v) | 58.7 | | 12,758 | | 7,168 | | 14,225 | | 8,353 | | 11,139 | | 6,541 |
| Robe River (Australia) | 53.0 | | 35,860 | | 19,006 | | 45,136 | | 23,922 | | 48,459 | | 25,684 |
|
|
|
|
|
|
|
|
|
|
|
|
|
|
| Rio Tinto total | | | | | 90,951 | | | | 102,613 | | | | 107,757 |
|
|
|
|
|
|
|
|
|
|
|
|
|
|
| | | | | | | | | | | | | | |
| See notes on page 20 | | | | | | | | | | | | | |
Rio Tinto 2004Form 20-F 18
Back to Contents
| | | | 2002 | | 2003 | | 2004 | |
| | | | Production (a) | | Production (a) | | Production(a) | |
|
|
|
|
|
|
|
|
|
|
|
|
|
| |
| | Rio Tinto | | Total | | Rio Tinto | | Total | | Rio Tinto | | Total | | Rio Tinto | |
| | % share (b) | | | | share | | | | share | | | | share | |
|
|
|
|
|
|
|
|
|
|
|
|
|
| |
| LEAD (’000 tonnes) | | | | | | | | | | | | | | |
| Greens Creek (US) | 70.3 | | 22.3 | | 15.7 | | 22.5 | | 15.8 | | 19.8 | | 13.9 | |
| Zinkgruvan (Sweden) (w) | – | | 24.7 | | 24.7 | | 31.8 | | 31.8 | | 11.2 | | 11.2 | |
|
|
|
|
|
|
|
|
|
|
|
|
|
| |
| Rio Tinto total | | | | | 40.4 | | | | 47.6 | | | | 25.1 | |
|
|
|
|
|
|
|
|
|
|
|
|
|
| |
| MOLYBDENUM (’000 tonnes) | | | | | | | | | | | | | | |
| Bingham Canyon (US) | 100.0 | | 6.1 | | 6.1 | | 4.6 | | 4.6 | | 6.8 | | 6.8 | |
|
|
|
|
|
|
|
|
|
|
|
|
|
| |
| NICKEL (mined) (’000 tonnes) | | | | | | | | | | | | | | |
| Fortaleza (Brazil) (x) | – | | 6.3 | | 6.3 | | 6.0 | | 6.0 | | – | | – | |
|
|
|
|
|
|
|
|
|
|
|
|
|
| |
| NICKEL (refined) (’000 tonnes) | | | | | | | | | | | | | | |
| Empress (Zimbabwe) (t) | – | | 6.4 | | 3.6 | | 6.2 | | 3.5 | | 2.9 | | 1.6 | |
|
|
|
|
|
|
|
|
|
|
|
|
|
| |
| SALT (’000 tonnes) | | | | | | | | | | | | | | |
| Dampier Salt (Australia) | 64.9 | | 7,186 | | 4,667 | | 7,135 | | 4,633 | | 7,380 | | 4,792 | |
|
|
|
|
|
|
|
|
|
|
|
|
|
| |
| SILVER (mined) (’000 ounces) | | | | | | | | | | | | | | |
| Bingham Canyon (US) | 100.0 | | 3,663 | | 3,663 | | 3,548 | | 3,548 | | 3,584 | | 3,584 | |
| Escondida (Chile) | 30.0 | | 2,981 | | 894 | | 4,728 | | 1,418 | | 5,747 | | 1,724 | |
| Grasberg – FCX (Indonesia) (n) | – | | 3,795 | | 804 | | 3,659 | | 745 | | 3,077 | | 79 | |
| Grasberg – Joint Venture (Indonesia) (n) | 40.0 | | 2,607 | | 1,043 | | 2,815 | | 1,126 | | 1,961 | | 784 | |
| Greens Creek (US) | 70.3 | | 10,912 | | 7,668 | | 11,707 | | 8,226 | | 9,707 | | 6,821 | |
| Zinkgruvan (Sweden) (w) | – | | 1,554 | | 1,554 | | 1,841 | | 1,841 | | 651 | | 651 | |
| Others | – | | 3,231 | | 1,582 | | 2,511 | | 1,407 | | 2,025 | | 1,187 | |
|
|
|
|
|
|
|
|
|
|
|
|
|
| |
| Rio Tinto total | | | | | 17,207 | | | | 18,311 | | | | 14,830 | |
|
|
|
|
|
|
|
|
|
|
|
|
|
| |
| SILVER (refined) (’000 ounces) | | | | | | | | | | | | | | |
| Kennecott Utah Copper (US) | 100.0 | | 4,037 | | 4,037 | | 2,963 | | 2,963 | | 3,344 | | 3,344 | |
|
|
|
|
|
|
|
|
|
|
|
|
|
| |
| TALC (’000 tonnes) | | | | | | | | | | | | | | |
| Luzenac Group (Australia/Europe/N. America) (y) | 99.9 | | 1,328 | | 1,327 | | 1,358 | | 1,357 | | 1,444 | | 1,443 | |
|
|
|
|
|
|
|
|
|
|
|
|
|
| |
| TIN (tonnes) | | | | | | | | | | | | | | |
| Neves Corvo (Portugal) (o) | – | | 345 | | 169 | | 203 | | 100 | | 120 | | 59 | |
|
|
|
|
|
|
|
|
|
|
|
|
|
| |
| TITANIUM DIOXIDE FEEDSTOCK (‘000 tonnes) | | | | | | | | | | | | | | |
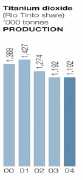
| Rio Tinto Iron & Titanium (Canada/South Africa) (z) | 100.0 | | 1,274 | | 1,274 | | 1,192 | | 1,192 | | 1,192 | | 1,192 | |
|
|
|
|
|
|
|
|
|
|
|
|
|
| |
| URANIUM (tonnes U3O8) | | | | | | | | | | | | | | |
| Energy Resources of Australia (Australia) | 68.4 | | 4,486 | | 3,068 | | 5,134 | | 3,512 | | 5,143 | | 3,517 | |
| Rössing (Namibia) | 68.6 | | 2,751 | | 1,887 | | 2,401 | | 1,647 | | 3,582 | | 2,457 | |
|
|
|
|
|
|
|
|
|
|
|
|
|
| |
| Rio Tinto total | | | | | 4,955 | | | | 5,158 | | | | 5,974 | |
|
|
|
|
|
|
|
|
|
|
|
|
|
| |
| ZINC (mined) (’000 tonnes) | | | | | | | | | | | | | | |
| Greens Creek (US) | 70.3 | | 66.5 | | 46.7 | | 69.1 | | 48.5 | | 62.7 | | 44.1 | |
| Zinkgruvan (Sweden) (w) | – | | 48.0 | | 48.0 | | 64.5 | | 64.5 | | 29.7 | | 29.7 | |
|
|
|
|
|
|
|
|
|
|
|
|
|
| |
| Rio Tinto total | | | | | 94.7 | | | | 113.0 | | | | 73.8 | |
|
|
|
|
|
|
|
|
|
|
|
|
|
| |
| | | | | | | | | | | | | | | |
| See notes on page 20 | | | | | | | | | | | | | | |
Rio Tinto 2004Form 20-F 19
Back to Contents
| Production data notes |
| (a) | Mine production figures for metals refer to the total quantity of metal produced in concentrates or doré bullion irrespective of whether these products are then refined onsite, except for the data for iron ore and bauxite which represent production of saleable quantities of ore. |
| (b) | Rio Tinto percentage share, shown above, is as at the end of 2004 and has applied over the period 2002 – 2004 except for those operations where the share has varied during the year and the weighted average for them is shown below. The Rio Tinto share varies at individual mines and refineries in the “others” category and thus no value is shown. |
| | | | | | | | | |
| | Rio Tinto share % | | | | | | | |
| | Operation | See Note | | 2002 | | 2003 | | 2004 |
| |
|
|
|
|
|
|
|
|
| | Atlantic Copper | (n) | | 16.5 | | 15.4 | | 12.0 |
| | Argyle | (p) | | 99.9 | | 100.0 | | 100.0 |
| | Bengalla | (i) | | 29.4 | | 30.3 | | 30.3 |
| | Boyne Island | (d) | | 56.6 | | 59.4 | | 59.4 |
| | Grasberg | (n) | | 15.0 | | 13.9 | | 10.8 |
| | Hail Creek | (h) | | – | | 92.0 | | 90.8 |
| | Hunter Valley Operations | (i) | | 73.6 | | 75.7 | | 75.7 |
| | Iron Ore Company of Canada | (v) | | 56.2 | | 58.7 | | 58.7 |
| | Lihir | (r) | | 16.3 | | 16.0 | | 14.5 |
| | Mount Thorley Operations | (i) | | 58.9 | | 60.6 | | 60.6 |
| | Moura | (i) (j) | | 40.0 | | – | | – |
| | Narama | (i) (j) | | 36.4 | | – | | – |
| | Ravensworth East | (i) (j) | | 72.7 | | – | | – |
| | Warkworth | (i) | | 41.2 | | 42.1 | | 42.1 |
| |
|
|
|
|
|
|
|
|
| | |
| (c) | Comalco Alumina Refinery started production in October 2004. |
| (d) | Rio Tinto acquired an approximately five per cent additional interest in production from the Boyne Island smelter with effect from August 2002. |
| (e) | Rio Tinto completed the sale of its four per cent interest in the Boké mine on 25 June 2004. Production data are shown up to the date of sale. |
| (f) | Borate quantities are expressed as B2O3 |
| (g) | Rio Tinto Coal Australia was previously known as Pacific Coal. |
| (h) | Hail Creek commenced production in the third quarter of 2003. Rio Tinto reduced its shareholding in Hail Creek from 92.0 per cent to 82.0 per cent on 15 November 2004. |
| (i) | Rio Tinto increased its stake in Coal & Allied Industries from 72.7 per cent to 75.7 per cent during September 2002. |
| (j) | On 14 March 2002, Coal & Allied completed the sale of its interests in Narama and Ravensworth. Coal & Allied sold its interest in the Moura coal mine with effect from 24 May 2002. Production data are shown up to the dates of sale. |
| (k) | Rio Tinto had a 50 per cent share in Kaltim Prima and, under the terms of its Coal Agreement, the Indonesian Government was entitled to a 13.5 per cent share of Kaltim Prima’s production. Rio Tinto’s share of production shown is before deduction of the Government share. Rio Tinto completed the sale of its interest in PT Kaltim Prima Coal on 10 October 2003. Production data are shown up to the date of sale. |
| (l) | Kennecott Energy has a partnership interest in the Colowyo mine but, as it is responsible under a management agreement for the operation of the mine, all of Colowyo’s output is included in Rio Tinto’s share of production. |
| (m) | Rio Tinto completed the sale of its 25 per cent interest in Minera Alumbrera together with its wholly owned Peak gold mine on 17 March 2003. Production data are shown up to the date of sale. |
| (n) | From mid 1995 until 30 March 2004, Rio Tinto held 23.93 million shares of Freeport-McMoRan-Copper & Gold (FCX) common stock from which it derived a share of production. This interest was sold on 30 March 2004. Also, through a joint venture agreement with FCX, Rio Tinto is entitled, as shown separately in the above tables, to 40 per cent of additional material mined as a consequence of expansions and developments of the Grasberg facilities since 1998. |
| (o) | Rio Tinto completed the sale of its 49 per cent interest in Somincor on 18 June 2004. Production data are shown up to the date of sale. |
| (p) | Rio Tinto’s interest in Argyle Diamonds increased from 99.8 per cent to 100 per cent on 29 April 2002, following the purchase of the outstanding units in the Western Australian Diamond Trust. |
| (q) | Ore mining and processing at Murowa commenced during the third quarter of 2004. |
| (r) | Following a placement of shares on 13 November 2003, Rio Tinto’s interest in Lihir moved from 16.3 per cent to 14.5 per cent. |
| (s) | Rio Tinto sold its interest in Morro do Ouro on 31 December 2004. Production data are shown up to the date of sale. |
| (t) | As a result of the corporate restructuring completed on 8 July 2004, Rio Tinto has ceased to be an ordinary shareholder in the renamed RioZim but will retain a reduced cash participation in its gold and nickel assets for a period of ten years. |
| (u) | Rio Tinto’s share of production includes 100 per cent of the production from the Eastern Range mine, which commenced production in March 2004. Under the terms of the joint venture agreement, Hamersley Iron manages the operation and is obliged to purchase all mine production from the joint venture. |
| (v) | Rio Tinto increased its shareholding in Iron Ore Company of Canada from 56.1 per cent to 58.7 per cent on 20 December 2002. |
| (w) | Rio Tinto completed the sale of its 100 per cent interest in the Zinkgruvan mine on 2 June 2004. Production data are shown up to the date of sale. |
| (x) | Rio Tinto completed the sale of its 100 per cent interest in the Fortaleza nickel mine on 16 January 2004. This was effective from 1 January 2004. |
| (y) | Talc production includes some products derived from purchased ores. |
| (z) | Quantities comprise 100 per cent of QIT and 50 per cent of Richards Bay Minerals’ production. |
ORE RESERVES
Ore reserves prepared in accordance with Industry Guide 7 under the Unites States Securities Act of 1933 have been set out on pages A-85 to A-95.
Rio Tinto 2004Form 20-F 20
Back to Contents
GROUP OPERATIONS(wholly owned unless stated otherwise)
 |
| | ALUMINIUM | | COPPER AND GOLD | | IRON ORE | | TALC |
| | Operating sites | | Operating sites | | Operating sites | | Operating sites |
| 1 | Anglesey Aluminium (51%) | 20 | Bougainville (not operating) | 33 | Corumbá | | (only major sites are |
| 2 | Bell Bay | | (54%) | 34 | Hamersley Iron mines: | | shown) |
| 3 | Boyne Island (59%) | 21 | Cortez/Pipeline (40%) | | Brockman | 44 | Ludlow |
| 3 | Comalco Alumina Refinery | 22 | Escondida (30%) | | Marandoo | 45 | Talc de Luzenac (99.9%) |
| 3 | Gladstone Power Station | 23 | Grasberg joint venture (40%) | | Mt Tom Price | 46 | Yellowstone |
| | (42%) | 24 | Kelian (90%) | | Paraburdoo | 47 | Three Springs |
| 3 | Queensland Alumina (39%) | 19 | Kennecott Utah Copper | | Yandicoogina | | |
| 4 | Eurallumina (56%) | 25 | Lihir (14%) | | Channar (60%) | | TITANIUM DIOXIDE |
| 5 | Tiwai Point (79%) | 26 | Northparkes (80%) | | Eastern Range (54%) | | FEEDSTOCK |
| 6 | Weipa | 27 | Palabora (49%) | 35 | Iron Ore Company of | | Operating sites |
| | | 28 | Rawhide (51%) | | Canada (59%) | 48 | QIT-Fer et Titane Lac Allard |
| | BORATES | | | 34 | Robe River mines: (53%) | 49 | QIT-Fer et Titane Sorel |
| | Operating sites | | Projects | | West Angelas | | Plant |
| 7 | Boron | 29 | Resolution (55%) | | Pannawonica | 50 | Richards Bay Minerals (50%) |
| 8 | Coudekerque Plant | | | | | | |
| 9 | Tincalayu | | DIAMONDS | | Projects | | Projects |
| 10 | Wilmington Plant | | Operating sites | 36 | HIsmelt®(60%) | 51 | QIT Madagascar Minerals |
| | | 30 | Argyle | 37 | IOC Pellet Plant (59%) | | (80%) |
| | COAL | 31 | Diavik (60%) | 38 | Simandou | | |
| | Operating sites | 32 | Murowa (78%) | 39 | Orissa (51%) | | URANIUM |
| 11 | Antelope | | | | | | Operating sites |
| 12 | Bengalla (30%) | | | | NICKEL | 52 | ERA (68%) |
| 13 | Blair Athol (71%) | | | | Projects | 53 | Rössing (69%) |
| 14 | Colowyo (20%) | | | 40 | Eagle | | |
| 11 | Cordero Rojo | | | | | | ZINC, LEAD, SILVER |
| 15 | Decker (50%) | | | | POTASH | | Operating sites |
| 13 | Hail Creek (82%) | | | | Projects | 54 | Greens Creek (70%) |
| 16 | Hunter Valley Operations | | | 41 | Rio Colorado Potash | | |
| | (76%) | | | | | | |
| 11 | Jacobs Ranch | | | | SALT | | |
| 17 | Kestrel (80%) | | | | Operating sites | | |
| 16 | Mt Thorley Operations | | | 42 | Dampier (65%) | | |
| | (61%) | | | 43 | Lake MacLeod (65%) | | |
| 15 | Spring Creek | | | 42 | Port Hedland (65%) | | |
| 18 | Tarong | | | | | | |
| 16 | Warkworth (42%) | | | | |  | Mines and mining projects |
| | | | | | | | |
| | Projects | | | | |  | Smelters, refineries and |
| 13 | Clermont (50%) | | | | | | processing plants remote |
| 12 | Mt Pleasant (76%) | | | | | | from mine |
Rio Tinto 2004Form 20-F 21
Back to Contents
INFORMATION ON GROUP MINES(wholly owned unless stated otherwise)
| Mine | | Location | | Access | | Title/lease |
|
| ALUMINIUM | | | | | | |
|
| Comalco | | Weipa, Queensland, Australia | | Road, air, and port | | Queensland Government lease expires in 2041 with 21 year extension, then two years’ notice of termination |
|
| COPPER | | | | | | |
|
| Escondida(30%) | | Atacama Desert, Chile | | Pipeline and road to deep sea port at Coloso | | Rights conferred by Government under Chilean Mining Code |
|
| Grasberg(40% joint venture) | | Papua, Indonesia | | Pipeline, road and port | | Indonesian Government Contracts of Work expire in 2021 with two ten year extensions |
|
| Kennecott Minerals | | Nevada, US | | Road | | Patented and unpatented mining claims |
| Cortez/Pipeline (40%) |
|
| Kennecott Minerals | | Alaska, US | | Port | | Patented and unpatented mining claims |
| Greens Creek (70%) |
|
| Kennecott Utah Copper | | Near Salt Lake City, Utah, US | | Pipeline, road and rail | | Owned |
| Bingham Canyon |
|
| Northparkes(80%) | | Goonumbla, New South | | Road and rail | | State Government mining lease issued in 1991 for 21 years |
| Wales, Australia |
|
| Palabora(49%) | | Phalaborwa, Northern | | Rail and road | | Lease from South African Government until deposits exhausted and base metal claims owned by Palabora |
| Province, South Africa |
|
| DIAMONDS | | | | | | |
|
| Diavik(60%) | | Northwest Territories, Canada | | Air, ice road in winter | | Mining leases from Canadian federal government |
|
| Argyle Diamonds | | Kimberley Ranges, Western Australia | | Road and air | | Mining tenement held under Diamond (Argyle Diamond Mines Joint Venture) Agreement Act 1981-83; lease extended for 21 years from 2004 |
|
| Murowa(78%) | | Zvishavane, Zimbabwe | | Road and air | | Claims and mining leases |
|
| ENERGY | | | | | | |
|
| Coal & Allied Industries | | New South Wales, Australia | | Road, rail and port | | Leases granted by State |
| (76%) |
| Bengalla (30%) |
| Hunter Valley Operations |
| (76%) |
| Mount Thorley (61%) |
| Warkworth (42%) |
|
| Energy Resources of | | Northern Territory, Australia | | Road | | Leases granted by State |
| Australia(68%) |
| Ranger |
|
|
|
|
|
|
|
Rio Tinto 2004Form 20-F 22
Back to Contents
| Mine | | History | | Type of mine | | Power source |
|
| ALUMINIUM | | | | | | |
|
| Comalco | | Bauxite mining commenced in 1961; Major upgrade completed in 1998 to incorporate Alcan’s adjacent Ely reserve in overall mining plan; Rio Tinto interest increased from 72.4% to 100% in 2000; In 2004 a mine expansion was completed to lift annual capacity to16.5 million tonnes | | Open cut | | On site generation; new power station under construction |
|
| COPPER | | | | | | |
|
| Escondida(30%) | | Production started in 1990 and expanded in phases to 2002 when new concentrator was completed; approval in 2003 for Norte project | | Open pit | | Supplied from SING grid under two contracts with Norgener to 2008 |
|
| Grasberg(40% joint venture) | | Joint venture interest acquired 1995; capacity expanded to over 200,000 tonnes of ore per day in 1998 with addition of underground production of more than 35,000 tonnes per day in 2003 | | Open pit and underground | | Long term contract with US-Indonesian consortium operated, |
|
| Kennecott Minerals | | Gold production started at Cortez in 1969; Pipeline in 1997 | | Open pit | | Public utility |
| Cortez/Pipeline (40%) |
|
| Kennecott Minerals | | Redeveloped in 1997 | | Underground/drift and fill | | On site diesel generators |
| Greens Creek (70%) |
|
Kennecott Utah Copper
Bingham Canyon | | Interest acquired in 1989; modernisation includes smelter complex and expanded tailings dam | | Open pit | | On site generation supplemented by long term contracts with Utah Power and Light |
|
| Northparkes(80%) | | Interest acquired in 2000; production | | Open pit and underground | | Supplied from State grid |
| | | started in 1995 | | | | |
|
| Palabora(49%) | | Development of 20 year underground mine commenced 1996 with open pit closure in 2003 | | Open pit and underground | | Supplied by ESKOM via grid |
|
| DIAMONDS | | | | | | |
|
| Diavik(60%) | | Deposits discovered 1994-1995; construction approved 2000; diamond production started 2003 | | Open pit to underground | | On site diesel generators; installed capacity 27MW |
|
| Argyle Diamonds | | Studies into further development options, including underground mining, continue; interest increased from 59.7% following purchase planned of Ashton Mining in 2000 | | Open pit to underground | | Long term contract with Ord Hydro Consortium and on site generation back up |
|
| Murowa(78%) | | Discovered 1997; small scale production started 2004 Open pit | | | | Supplied by ZESA |
|
| ENERGY | | | | | | |
|
| Coal & Allied Industries | | Lemington acquired late 2000 and integrated with Hunter Valley Operations. Peabody Australian interests acquired in 2001. Moura, Narama and Ravensworth interests divested in 2002 | | Open cut | | State owned grid |
| (76%) |
| Bengalla (30%) |
| Hunter Valley Operations |
| (76%) |
| Mount Thorley (61%) |
| Warkworth (42%) |
|
| Energy Resources of | | Mining commenced 1981; interest acquired through North in 2000 | | Open pit | | On site diesel / steam power generation |
| Australia(68%) |
| Ranger |
|
|
|
|
|
|
|
Rio Tinto 2004Form 20-F 23
Back to Contents
| Mine | | Location | | Access | | Title/lease |
|
| ENERGY | | | | | | |
|
| Kennecott Energy | | Wyoming, Montana and Colorado, US | | Rail and road | | Leases from US and State Governments and private parties, with minimum coal production levels, and adherence to permit requirements and statutes |
| Antelope |
| Colowyo (20%) |
| Cordero Rojo |
| Decker (50%) |
| Jacobs Ranch |
| Spring Creek |
|
| Rio Tinto Coal Australia | | Queensland, Australia | | Conveyor, road, rail and port | | Leases granted by State |
| Blair Athol (71%) |
| Kestrel (80%) |
| Hail Creek (82%) |
| Tarong |
|
| Rössing Uranium(69%) | | Namib Desert, Namibia | | Rail, road and port | | Federal lease |
|
| INDUSTRIAL MINERALS | | | | | | |
|
| Boron | | California, US | | Road, rail and port | | Owned |
|
| Dampier Salt(65%) | | Dampier, Lake MacLeod and Port Hedland, Western Australia | | Road and port | | Mining leases expiring in 2013 at Dampier, 2018 at Port Hedland and2021 at Lake MacLeod with options to renew in each case |
|
| Luzenac | | Trimouns, France (other smaller operations in Australia, Europe and North America) | | Road and rail | | Owner of ground (orebody) and long term lease agreement to 2012 |
|
| QIT-Fer et Titane | | Saguenay County, Quebec ,Canada | | Rail and port (St Lawrence River) | | Mining covered by two Concessions granted by State in 1949 and 1951 which, subject to certain Mining Act restrictions, confer rights and obligations of an owner |
|
Richards Bay Minerals
(50%) | | Richards Bay, KwaZulu- Natal, South Africa | | Rail, road and port | | Long term renewable leases; State lease for Reserve 4 initially runs to end 2022; Ingonyama Trust lease for Reserve 10 runs to 2010 |
|
| IRON ORE | | | | | | |
|
| Hamersley Iron | | Hamersley Ranges, Western Australia | | Railway (owned by Hamersley Iron and operated by Pilbara Rail Company) and port (owned by Hamersley Iron and operated by Pilbara Iron) | | Agreements for life of mine with Government of Western Australia |
| Brockman |
| Marandoo |
| Mount Tom Price |
| Paraburdoo |
| Yandicoogina |
| Channar (60%) |
| Eastern Range (54%) |
|
| Iron Ore Company of | | Labrador City, Province of Labrador and Newfoundland | | Railway and port facilities in Sept-Iles, Quebec (owned and operated by IOC) | | Sublease with the Labrador Iron Ore Royalty Income Fund which has lease agreements with the Government of Newfoundland and Labrador that are due to be renewed in 2020 and 2022 |
| Canada(59%) |
| (Rio Tinto also holds a 19% |
| interest in the Labrador Iron |
| Ore Royalty Income Fund |
| which owns 15.1% of IOC) |
|
| Robe River(53%) | | Pilbara region, Western Australia | | Railway (owned by Robe River Iron Associates and operated by Pilbara Rail Company) and port (owned by Robe River Iron Associates and operated by Pilbara Iron) | | Agreements for life of mine with Government of Western Australia |
| Mesa J |
| West Angelas |
|
| Rio Tinto Brasil | | Matto Grosso do Sul, Brazil | | Road, air and river | | Government licence for undetermined period |
| Corumbá |
|
| OTHER | | | | | | |
|
| Kelian(90%) | | Kalimantan, Indonesia | | Road, river and port | | Contract of Work with Indonesian Government for 30 years |
|
| Lihir Gold(14%) | | Lihir Island, Papua New Guinea | | Own road, airstrip and port | | Special Mining Lease with Papua New Guinea Government expires in 2035 |
|
Rio Tinto 2004Form 20-F 24
Back to Contents
| Mine | | History | | Type of mine | | Power source |
|
| ENERGY | | | | | | |
|
| Kennecott Energy | | Antelope, Spring Creek, Decker and Cordero acquired in 1993, Colowyo in 1995, and Jacobs Ranch in 1998; additional North Jacobs Ranch reserves purchased in 2002; West Antelope additional reserves 2004 | | Open cut | | Supplied by IPPs and Cooperatives through national grid service |
| Antelope | | | | |
| Colowyo (20%) | | | | |
| Cordero Rojo | | | | | |
| Decker (50%) | | | | | |
| Jacobs Ranch | | | | | |
| Spring Creek | | | | | |
|
| Rio Tinto Coal Australia | | Production started for export at Blair Athol and adjacent power station at Tarong in 1984. Kestrel acquired and recommissioned in 1999. Hail Creek production commenced 2003 | | Open cut (Blair Athol, Tarong and Hail Creek) and underground (Kestrel) | | State owned grid |
| Blair Athol (71%) | | | | |
| Kestrel (80%) | | | | |
| Hail Creek (82%) | | | | | |
| Tarong | | | | | |
|
| Rössing Uranium(69%) | | Production began in 1978 | | Open pit | | Namibian National Power |
|
| INDUSTRIAL MINERALS | | | | | | |
|
| Boron | | Mine redesign project completed on budget and schedule in 2000 | | Open pit | | On site cogeneration units |
| | | | | | |
|
| Dampier Salt(65%) | | Construction of the Dampier field started in 1969; first shipment in 1972. Lake MacLeod was acquired in 1978 as an operating field | | Solar evaporation of seawater (Dampier and Port Hedland) and underground brine (Lake MacLeod); dredging of gypsum from surface of Lake MacLeod | | Dampier supply from Hamersley Iron Power; Lake MacLeod from Western Power and on site generation units; Port Hedland from Western Power |
| | | | |
| | | | |
|
| Luzenac | | Production started in 1885; acquired in 1988. (Australian mine acquired in 2001) | | Open pit | | Supplied by EdF and on site generation units |
| | | | | |
|
| QIT-Fer et Titane | | Production started 1950; interest acquired in 1989 | | Open pit | | Long term contract with Quebec Hydro |
| | | | | |
|
| Richards Bay Minerals | | Production started 1977; interest acquired 1989; fifth dredge commissioned 2000 | | Beach sand dredging | | Contract with ESCOM |
| (50%) | | | | | |
|
| IRON ORE | | | | | | |
|
| Hamersley Iron | | Annual capacity increased to 68 million tonnes during 1990s; Yandicoogina first ore shipped in 1999 and port capacity increased; Eastern Range mine started 2004 | | Open pits | | Supplied by Hamersley Iron Power |
| Brockman | | | | |
| Marandoo | | | | | |
| Mount Tom Price | | | | | |
| Paraburdoo | | | | | |
| Yandicoogina | | | | | |
| Channar (60%) | | | | | |
| Eastern Range (54%) | | | | | |
|
Iron Ore Company of Canada(59%)
(Rio Tinto also holds a 19% interest in the Labrador Iron Ore Royalty Income Fund which owns 15.1% of IOC) | | Current operation began in 1962 and has processed over one billion tonnes of crude ore since; annual capacity now 17.5 million tonnes of concentrate of which 12.5 million tonnes can be pelletised. Interest acquired in 2000 through North | | Open pit | | Supplied by Newfoundland Hydro under long term contract |
| | | | |
| | | | |
| | | | | |
| | | | | |
|
| Robe River(53%) | | First shipment in 1972; annual sales reached 30 million tonnes in late 1990s; interest acquired in 2000 through North; West Angelas first ore shipped in 2002 and port capacity increased | | Open pit | | Supplied by Robe River Iron Associates; West Angelas supplied by Hamersley Iron Power |
| Mesa J | | | | |
| West Angelas | | | | |
| | | | | |
|
| Rio Tinto Brasil | | Iron ore production started 1978; interest acquired in 1991 | | Open pit | | Supplied by ENERSUL |
| Corumbá | | | | | |
|
| OTHER | | | | | | |
|
| Kelian(90%) | | Gold production started in 1992 and will cease in 2005 | | Open pit | | Kelian’s own 29MW generating station with six identical 4.9MW rated units |
| | | | | |
|
| Lihir Gold(14%) | | Production started in 1997; refinancing in 1999 and merger with Niugini Mining in 2000 | | Open pit | | 12 diesel unit power plant, four steam wells (geothermal power) producing ten per cent of requirements |
| | | | | |
| | | | | |
|
Rio Tinto 2004Form 20-F 25
Back to Contents
INFORMATION ON GROUP SMELTERS, REFINERIES AND PROCESSING PLANTS
(wholly owned unless stated otherwise)
|
| Smelter, refinery or plant | | Location | | Title/lease | | Plant type/product | | Capacity |
|
|
|
|
|
|
|
|
|
| ALUMINIUM GROUP | | | | | | | | |
|
|
|
|
|
|
|
|
|
| Anglesey Aluminium (51%) | | Holyhead, Anglesey, Wales | | 100% Freehold | | Aluminium smelter producing aluminium billet, block, sow | | 145,000 tonnes per year aluminium |
| | | | | |
|
|
|
|
|
|
|
|
|
| Bell Bay | | Bell Bay, Northern Tasmania, Australia | | 100% Freehold | | Aluminium smelter producing aluminium ingot, block, t-bar | | 167,000 tonnes per year aluminium |
| | | | | | |
|
|
|
|
|
|
|
|
|
| Boyne Smelters (59%) | | Boyne Island, Queensland, Australia | | 100% Freehold | | Aluminium smelter producing aluminium ingot, billet, t-bar | | 541,000 tonnes per year aluminium |
| | | | | | |
|
|
|
|
|
|
|
|
|
| Comalco Alumina Refinery | | Gladstone, Queensland, Australia | | 97% Freehold | | Refinery producing alumina | | 1,400,000 tonnes per year alumina |
| | | 3% Leasehold | | |
|
|
|
|
|
|
|
|
|
| Eurallumina(56%) | | Portoscuso, Sardinia, Italy | | 39% Freehold | | Refinery producing alumina | | 1,065,000 tonnes per year alumina |
| | | | 61% Leasehold | | |
|
|
|
|
|
|
|
|
|
| Gladstone Power Station(42%) | | Gladstone, Queensland, Australia | | 100% Freehold | | Thermal power station | | 1,680 megawatts |
| | | | | | | |
|
|
|
|
|
|
|
|
|
| New Zealand | | Tiwai Point, Southland, New Zealand | | 19.6% Freehold | | Aluminium smelter producing aluminium ingot, billet, t-bar | | 350,000 tonnes per year aluminium |
| Aluminium Smelters (NZAS)(79%) | | | 80.4% Leasehold | | |
|
|
|
|
|
|
|
|
|
| Queensland Alumina(39%) | | Gladstone, Queensland, Australia | | 73.3% Freehold | | Refinery producing alumina | | 3,778,000 tonnes per year alumina |
| | | 26.7% Leasehold | | |
|
|
|
|
|
|
|
|
|
| COPPER GROUP | | | | | | | | |
|
|
|
|
|
|
|
|
|
| Kennecott Utah Copper | | Magna, Salt Lake City, Utah, US | | 100% Freehold | | Flash smelting furnace / Flash convertor furnace copper refinery | | 335,000 tonnes per year refined copper |
| | | | | | | | |
|
|
|
|
|
|
|
|
|
| Palabora(49%) | | Phalaborwa, South Africa | | 100% Freehold | | Reverberatory Pierce Smith copper refinery | | 130,000 tonnes per year refined copper |
| | | | | | |
|
|
|
|
|
|
|
|
|
| INDUSTRIAL MINERALS | | | | | | | | |
|
|
|
|
|
|
|
|
|
| Boron | | California, US | | 100% Freehold | | Borates refinery | | 584,000 tonnes per year boric oxide |
| | | | | | | | |
|
|
|
|
|
|
|
|
|
| QIT-Fer et Titane Sorel Plant | | Sorel-Tracy, Quebec, Canada | | 100% Freehold | | Ilmenite smelter | | 1,100,000 tonnes per year titanium dioxide slag, 900,000 tonnes per year iron |
| | | | | | |
| | | | | | | | |
|
|
|
|
|
|
|
|
|
| Richards Bay Minerals(50%) | | Richards Bay, South Africa | | 100% Freehold | | Ilmenite smelter | | 1,060,000 tonnes per year titanium dioxide slag |
| | | | | | |
|
|
|
|
|
|
|
|
|
| IRON ORE GROUP | | | | | | | | |
|
|
|
|
|
|
|
|
|
Hlsmelt®(60%)
Kwinana, Western Australia | | | | 100% Leasehold | | Hlsmelt®ironmakingplant producing pig iron | | 800,000 tonnes per year pig iron |
| | | | | | |
|
|
|
|
|
|
|
|
|
| IOC Pellet Plant(59%) | | Labrador City, Newfoundland, Canada | | 100% Subleased land | | Pellet induration furnaces producing multiple iron ore pellet types | | 12,500,000 tonnes per year pellet |
| | | | | |
| | | | | | |
|
|
|
|
|
|
|
|
|
Rio Tinto 2004Form 20-F 26
Back to Contents
Item 5. Operating and Financial Review and Prospects
CHAIRMAN’S LETTER
Dear shareholder
The recovery in the global economy that gathered momentum in 2003 continued in 2004. As a result of strong demand across our portfolio of metals and minerals, accompanied by increased prices, we achieved a record financial performance.
An important factor has been the strength in metal and minerals demand in the US and Asia, where China has been prominent but markets in Japan and elsewhere have also recovered. Rio Tinto holds a long established position in these markets; 40 years in the case of Japan and 30 years in China. Our strong position today reflects these long term customer relationships.
China’s rapid economic development has led to the adoption by the Government of measures to achieve more balanced growth in the economy. However, we continue to believe that China’s growth trend will remain well above the global average in the years ahead.
In 2004, commodity prices were higher across the board and the US dollar was more stable against our main producing currencies than in 2003. Adjusted earnings* were a record US$2,221 million, US$839 million or 61 per cent above 2003 and exceeding the previous high of US$1,662 million achieved in 2001. Net earnings were US$2,813 million, or 204 US cents per share, including a US$592 million net gain on exceptional items.
Total cash flow from operations including dividends from joint ventures and associates at US$4,449 million was also a record and 28 per cent higher than 2003. An active portfolio management programme, focused on the disposal of non core assets, generated an additional US$1.5 billion in cash. This has further strengthened our balance sheet, allowing us to undertake a major capital investment programme.
While our record financial performance reflects the strong markets for our products, it also underlines the quality of our asset portfolio which has been developed over many years on the basis of a long term commitment to shareholder value.
Investments over recent years have created a platform for earnings growth. This, coupled with a positive view of future growth prospects, has given the board confidence to increase our annual dividend to 77 US cents per share for 2004 an increase of 20 per cent from 2003. This also means that the 2005 interim dividend payable in September can be expected to be 38.5 US cents per share. We intend to maintain our progressive dividend policy from this higher baseline. The board has also decided the current strength of the Group’s cash flow means that in addition to comfortably funding the current and planned investments, capital can be returned to shareholders without reducing our flexibility to pursue other development opportunities. Subject to market conditions, Rio Tinto’s intention, therefore, is to return up to US$1.5 billion of capital to shareholders during the course of 2005 and 2006 through share buyback programmes.
A sustainable business also requires commitment to social and environmental performance alongside delivery of consistently strong financial results. While much remains to be done in this area we are very encouraged by an increasingly productive dialogue with stakeholder organisations. Our sustainable development programmes are responding positively to a range of issues including biodiversity, climate change and HIV/AIDS. The Group’s social and environmental contribution helps to sustain our pipeline of project opportunities in many countries and has a business case which I believe is compelling.
The year 2005 will see the tenth anniversary of the formation of Rio Tinto’s dual listed structure and unified management, which has fully met its objectives and continues to provide great strength to Rio Tinto’s operations and governance.
It is with great sadness I report the sudden death on 27 January 2005 of Bob Adams, our executive director for planning and development. Bob was a major contributor to Rio Tinto’s growth over 35 years, having joined our planning department in 1970. He was a key figure in building Rio Tinto into a leading international mining group. He was respected and liked by all who knew him and his wise counsel and advice will be sorely missed.
At our forthcoming annual meetings we shall see the retirement of Sir Richard Giordano, Leon Davis and John Morschel, all of whom have been outstanding contributors to the board and to our continuing success. I should particularly like to thank Dick and Leon as deputy chairmen for the support they have given me in my initial period as chairman. Their long experience of the Group has been invaluable in a transition period.
We recently welcomed three new colleagues to the board. Richard Goodmanson, executive vice president and chief operating officer of DuPont, was appointed on 1 December 2004.
Ashton Calvert, former secretary of the Department of Foreign Affairs and Trade of the Government of Australia, and Vivienne Cox, executive vice president of BP plc for Integrated Supply and Trading and also for Gas Power and Renewables, were both appointed on 1 February 2005. Each of them will add to the overall skill and experience of the Rio Tinto boards which is a vital underpinning of our high standard of corporate governance.
Looking forward, we expect to see continuing underlying demand growth for metals and minerals despite some economic uncertainties in 2005. We are now beginning to see a supply response to higher prices but this will take some time to impact on the currently tight markets. While prices may ease from current levels in 2005 we expect they will generally remain above the long term trend. The future direction of the US dollar remains a significant uncertainty and, as was the case in 2003, could have a major impact on earnings.
Rio Tinto 2004Form 20-F 27
Back to Contents
In 2004 I had the opportunity to visit many of our operating locations. I have been impressed not only with the scale and complexity of the operations themselves but the depth of management and skill with which they are operated. I would therefore like to acknowledge the hard work and dedication of the Group’s employees throughout the world in 2004. Their commitment to Rio Tinto’s core values underpins the strong results they continue to deliver for shareholders.
Paul Skinner
Chairman
24 February 2005
*Adjusted earnings excludes the effect of exceptional items of such magnitude that their exclusion is necessary in order that adjusted earnings fulfil their purpose of reflecting the Group’s underlying performance. A reconciliation to net earnings can be found on pages A-2.
CHIEF EXECUTIVE’S REPORT
Note: Product group earnings are stated before exceptional items, net interest, exploration and evaluation costs and other central items. A reconciliation is shown on page A-63.
We saw very strong demand across our product range in 2004. This momentum is expected to continue into 2005 though it may be affected by the uncertainties of the US economy and the rate of growth in China. Good market conditions enable us to increase focus on capital management. Our record cash flow gives us considerable options for further organic growth based on our large reserve and resource position.
Operating performance
Product group earnings, excluding exceptional items, were a record US$2,544 million, compared with US$1,584 million in 2003.
Higher metal and mineral prices and greater output from new projects were the main reasons for the strong result. Improved prices, mainly for copper, aluminium, iron ore and coal, combined with additional output from new or expanded projects such as Diavik in Canada (diamonds), Eastern Range, West Angelas and Hail Creek in Australia (iron ore and coking coal), and Escondida in Chile (copper).
The depreciation of the US dollar against most major currencies had an effect on earnings, as did higher operating costs. While the mining industry benefits from higher prices received for the commodities we produce, as a business we also incur higher prices for consumables used in our operations.
To address cost factors more rigorously, we are evolving our business processes to take advantage of Rio Tinto’s scale and to share leading practices around the Group as key levers to creating value. We have been successful in applying these principles in our information technology, procurement and shipping activities. We are working to extend greater capability and sharing of expertise to mining and processing operations, asset management and marketing, to maximise value on several fronts.
Rio Tinto 2004Form 20-F 28
Back to Contents
In 2004 I announced a major reallocation of product group responsibilities. With the retirement of David Klingner as head of Exploration and Chris Renwick as chief executive, Iron Ore, Tom Albanese moved to Copper and Exploration, Sam Walsh to Iron Ore, Oscar Groeneveld to Aluminium, and Andrew Mackenzie was recruited to be chief executive Industrial Minerals. Preston Chiaro and Keith Johnson continue as chief executives of Energy and Diamonds respectively. Both David Klingner and Chris Renwick spent most of their working lives with Rio Tinto, each with 35 years’ service, making very valuable contributions in several areas of the business.
Strategy
Earlier this year the board discussed Rio Tinto’s strategic direction to provide a framework for our medium term decisions. The discussion reaffirmed our focus on mining operations to produce minerals and metals. Furthermore, we recognised that medium term growth will be biased towards growth from within – the development of brownfield and greenfield projects inherent in our existing assets.
The Group has long maintained a commitment to exploration. I believe this is an increasingly important source of competitive advantage. The Group’s diversity and strength, particularly in Australia and North America, enable us to increase our involvement in less familiar territories of the world should opportunities present themselves.
The centre of gravity of our operations has been firmly in the OECD countries where historically we have found the most opportunities. This need not always be the case. The generation of options globally is an important pathway to growth and we possess the technical, community and environmental management capabilities to do so. Also, a key building block will remain our ability to bring well thought out projects to fruition on time without compromising their performance.
A more competitive mining industry is developing and Rio Tinto needs to improve faster to keep ahead. Our fundamental strategy will not change as it has stood the test of time, but we contemplate some changes in emphasis. We will continue to focus on large, long life, low cost operations and run them efficiently. Our growth will largely come from our existing operations and reserves, supplemented by opportunistic mergers, acquisitions, structures and alliances, where these make sense.
While historically the decentralised model of Rio Tinto has delivered enormous benefits, to keep improving we are putting greater emphasis on Rio Tinto’s global scale and specialist skills. We need to continue to improve how we operate, recognising that operational excellence and commercial acumen go hand in hand.
New projects
Over 2005 and 2006, we plan to spend up to US$6 billion on new projects. We have many potential investment options including opportunities in alumina, coal, iron ore, industrial minerals, diamonds and copper. Most of these relate to the large, long life assets we already own. We believe these provide our primary route to value growth and should represent the priority use of shareholders’ funds.
We have recently completed three development projects. Currently we have ten under way, and three more were approved late in 2004. In addition, we have development studies progressing on 15 more projects. Our level of success reflects efforts we have made over a number of years and is a tangible result of our commitment to exploration.
Over the past year we have transferred five projects from exploration to the product groups where the necessary skills can be applied to take them through to the next level of evaluation. These projects – in copper, iron ore, nickel, gold and potash – emphasise the continuity of our growth potential for the medium term.
With a strong market, the outlook for our iron ore businesses remains exciting. The expansion of capacity in Western Australia at a cost of US$1,300 million is the single largest project investment we have made in many years. The major elements of the programme are on track for completion by the end of 2005 with the result that Rio Tinto expects to have a managed capacity of over 170 million tonnes of iron ore per year.
The expansion is part of a major capital expenditure programme in Western Australia that also includes the US$200 million HIsmelt®iron making plant that will be commissioned early in 2005 after more than 20 years of research and development. The Comalco Alumina Refinery in Australia was successfully commissioned in the fourth quarter of 2004 and made its first shipment to China ahead of schedule.
The Hail Creek coking coal mine reached its capacity of 5.5 million tonnes per annum in 2004 well ahead of our original expectations. An expansion of capacity to eight million tonnes is already under way for completion by 2006. This is an excellent example of how our focus on assets with large reserves gives us options to expand in line with demand. It is a large, high quality resource with reserves of nearly 200 million tonnes. Hail Creek also illustrates the value of patience and thoroughness; it was under study on and off for 30 years.
The success of the Diavik diamond project in Canada, where overall performance has comfortably exceeded expectations, prompted us to bring forward development of a second orebody to help sustain the advantages that have been created. Development will necessitate construction of a second dike. Mining of the second orebody is scheduled to begin in early 2008. A study is also under way into the viability of underground mining, including the construction of an exploration decline.
During 2004, we continued to pursue opportunities for asset disposals in a patient and disciplined manner. We sold our shareholding in Freeport-McMoRan Copper & Gold, receiving net proceeds of US$882 million while retaining our joint venture interest in production from the Grasberg mine. We locked in further value with the sale of the Zinkgruvan zinc mine in Sweden, and our interests in the Neves Corvo copper and tin mine in Portugal and the Morro do Ouro gold mine in Brazil. We restructured our interest in Rio Tinto Zimbabwe to focus on the Murowa diamond project in that country.
Rio Tinto 2004Form 20-F 29
Back to Contents
Safety, health, environment and communities
There was a marked improvement in our safety record in 2004 even though there is considerable work still to be done to reach Rio Tinto’s goal of zero injuries and illnesses.
I am sorry to report that there was one fatal accident at a managed operation. While this compares with six deaths at operations in 2003, it remains wholly unacceptable that anyone should be fatally injured at work. There were also a number of near misses. We will redouble our efforts to increase visible leadership from all levels of management and emphasise the role of employees themselves in developing safe work habits. There were 371 lost time incidents during the year, a 21 per cent decrease from 2003. The lost time frequency rate was 0.65 compared with 0.82 in 2003.
The 2004 winners of the Chief Executive’s Safety Award were Rio Tinto Brasil’s Morro do Ouro gold mine for the second consecutive year, Quebec Metal Powders in Canada, and Rio Tinto Exploration Australasia, which was commended for its performance in 2003. The awards improve recognition of good performance based on Rio Tinto's safety targets and programmes.
We continued to improve our understanding of the environmental implications of our activities regarding biodiversity, climate change, water and energy use, waste disposal and use of our products. There was no change in the number of significant environmental incidents (16) compared to 2003. There was, however, a decrease, from eight to four, in the number of significant spills.
At Energy Resources of Australia (ERA) environmental incidents occurred that were unacceptable and which marred an otherwise commendable performance. Numerous changes to systems have been made and increased resources applied so that such shortcomings are not repeated. Three subsequent Australian Government audits were satisfactorily completed.
To improve consistency and to share good practices, we developed standards and guidance to help our businesses to work more closely with people neighbouring our operations. They aim to arrive at an understanding of what we can do for mutual benefit and then to secure implementation of agreed objectives. We support over 2,000 socio-economic programmes covering health care, education, agriculture, and business development.
We responded to the Asian tsunami disaster by committing A$1 million (about US$750,000) to the relief effort in countries where we are active. The funds will be donated through appropriate international agencies in Indonesia and India where we can leverage our local knowledge most effectively.
Outlook
The world economy is slowing to a more sustainable pace after growth accelerated sharply in 2004. If the slowdown is well managed, particularly in the US and China, which have been the key drivers for growth in recent years, it will be a welcome development for commodity markets. These are already severely stretched to meet demand. Developments in the foreign exchange markets remain a key economic uncertainty.
Rio Tinto is benefiting from a very strong business environment as developing countries ramp up their demand for metals and minerals and mature economies enjoy relatively solid economic growth. While this outlook is encouraging for the short and medium term, there remain fundamental uncertainties on the world stage. Among them are the direction the US economy will take, the rate of growth in China and the sustainability of growth in Asia as a whole.
Our record financial performance under strong market conditions in 2004 enabled us to focus on capital management to achieve a balance between future investment and rewards for shareholders. We have many options for investing in our future growth, with a strong suite of opportunities in the project pipeline. As always we will apply our rigorous capital appraisal processes.
The world in which we operate is always changing and we are anticipating and reacting to those changes in order to remain successful. Barring the uncertainties I mentioned, the near term looks encouraging. Whatever the economic conditions, Rio Tinto has the assets and the people to maximise shareholder value in a sustainable way.
In conclusion, I thank my management team and our valued employees all over the world for their continued support during 2004.
Leigh Clifford
Chief executive
24 February 2005
Rio Tinto 2004Form 20-F 30
Back to Contents
FINANCIAL REVIEW
Financial risk management
The Group’s policies with regard to risk management are clearly defined and consistently applied. They are a fundamental tenet of the Group’s long term strategy.
The Group’s business is mining and not trading. The Group only sells commodities it has produced. In the long term, natural hedges operate in a number of ways to help protect and stabilise earnings and cash flow, obviating the need to use derivatives or other forms of synthetic hedging for this purpose. Such hedging is therefore undertaken to a strictly limited degree, as described below.
The Group has a diverse portfolio of commodities and markets, which have varying responses to the economic cycle.
The relationship between commodity prices and the currencies of most of the countries in which the Group operates provides further natural protection. In addition, the Group’s policy of borrowing at floating US dollar interest rates helps to counteract the effect of economic and commodity price cycles.
The Group’s Financial statements and disclosures show the full extent of its financial commitments including debt and similar exposures. The Group’s share of the net debt of joint ventures and associates is also disclosed.
The risk factors to which the Group is subject that are thought to be of particular importance are summarised on pages 8 to 10.
The effectiveness of internal control procedures continues to be a high priority in the Rio Tinto Group. A statement on this is included in Corporate governance on pages 85 to 86.
The Group’s policies with regard to currencies, commodities, interest rates and treasury management are discussed below.
Adjusted earnings
UK Financial Reporting Standard 3 permits the presentation of an adjusted measure of earnings. As presented by Rio Tinto, this excludes the effect of exceptional items of such magnitude that their exclusion is necessary in order that adjusted earnings fulfil their purpose of reflecting the Group’s underlying performance. Except where otherwise indicated, earnings contributions from Group businesses and business segments exclude the effect of these exceptional items. Adjusted earnings is reconciled with net earnings on pages A-2.
Group operating results
2004 compared with 2003
Net earnings of US$2,813 million were US$1,305 million above 2003. Adjusted earnings of US$2,221 million were US$839 million above 2003. The principal factors explaining the changes in earnings are shown in the table below.
| | US$ m | |
|
|
|
| 2003 Net earnings | 1,508 | |
| Exclude: Exceptional gains | 126 | |
|
|
|
| 2003 Adjusted earnings | 1,382 | |
| Prices | 1,638 | |
| Exchange rates | (247 | ) |
| Inflation | (118 | ) |
| Grasberg slippage | (203 | ) |
| Volumes | 270 | |
| Energy costs | (81 | ) |
| Other costs | (173 | ) |
| Other | (247 | ) |
|
|
|
| 2004 Adjusted earnings | 2,221 | |
| Add: exceptional net gains | 592 | |
|
|
|
| 2004 Net earnings | 2,813 | |
|
|
|
Stronger markets resulted in higher prices for most of the Group’s products. Compared with 2003, average copper prices of 130c/lb were over 60 per cent higher, average aluminium prices of 78c/lb were 20 per cent higher and average gold prices of US$409/oz were 13 per cent higher. Average molybdenum prices were over two and a half times those of 2003.
The benchmark iron ore price increased 18.6 per cent. This resulted in increased seaborne iron ore prices, mainly effective from 1 April 2004. The seaborne thermal coal market also strengthened during the year with the benefit of higher prices flowing through progressively in the second half of the year.
The US dollar weakened further against those currencies in which the Group incurs the majority of its costs. Against the Australian dollar it averaged 12 per cent weaker. The effect of this and other currency movements on operating costs reduced earnings by US$326 million. The effect on earnings of the revaluation of monetary items to period end exchange rates was also adverse, although relative to a more substantial charge in 2003 it had a positive effect of US$61 million. Gains on currency hedges initiated by North and Comalco before they became wholly owned subsidiaries in 2000 increased earnings by US$18 million compared with 2003.
Rio Tinto 2004Form 20-F 31
Back to Contents
Production of copper and gold from the Freeport managed Grasberg mine was significantly below 2003 as a consequence of the material slippage in the fourth quarter of 2003. The effect of this on volumes and costs, net of insurance, was to reduce 2004 earnings by US$203 million. Production had returned to normal by the fourth quarter of 2004.
Excluding the effects of the Grasberg slippage, higher volumes, mainly from new projects at Diavik (diamonds), Hail Creek (coking coal), West Angelas (iron ore) and additional output from Escondida (copper) increased earnings by US$270 million. As a result of tropical cyclone Monty the volume growth from the Western Australian iron ore operations was more modest than would otherwise have been the case.
Excluding the effect of inflation, higher energy costs and the Grasberg slippage, the impact on earnings of increased costs was US$173 million. Strong markets create cyclical cost pressures within the industry. Higher prices for skilled labour, steel, rubber, diesel, explosives and freight have all had an effect on operating costs.
At Hamersley, costs were also higher due to increased material movement, including prestripping, and higher maintenance activity. Tropical cyclone Monty had a prolonged effect on the costs as well as volumes at Hamersley and Robe (iron ore). Adverse cost variances at Argyle (diamonds) were attributable largely to lower production and at Palabora (copper) to lower volumes and increased depreciation following the commissioning of the underground project.
Excluding exceptional items, the effective tax rate of 29 per cent was in line with that of 2003.
Other variances included the absence of earnings from divested businesses which reduced earnings by US$122 million.
The East 1 Pushback project at Kennecott Utah Copper was approved in February 2005. This project is a higher value, lower capital intensive, but shorter life option than the previous mine plan which was predicated on development of an underground mine from 2013. Options to extend operations beyond 2017, including further open pit and underground developments, will be fully studied over the coming years but the results for 2004 include a one off, non cash charge of US$36 million due to the increase in the present value of environmental remediation provisions. Pending any extension of the assumed mine life beyond 2017 there will be an increase in annual charges for depreciation and amortisation of discount from 2005 of around US$45 million.
In 2004 there were gains on disposals of undeveloped properties totalling US$38 million. Against this, the 2003 earnings of Rio Tinto Brasil included a benefit of US$32 million resulting from the part reversal of an impairment provision.
The remaining ‘other’ variance includes business interruption insurance claims to the extent that the costs are retained in the Group and reversion to a higher effective tax rate in the US.
The 2004 exceptional items of US$592 million include a net profit on disposals of businesses (US$913 million), a charge of US$160 million relating to Colowyo (coal) and a provision of US$161 million, after tax and outside shareholder interests, for the write down of the carrying value of Palabora’s copper assets.
Gains relating to disposals of businesses include US$518 million profit on sale of the Group’s equity interest in Freeport-McMoRan Copper & Gold Inc. (FCX). Rio Tinto invested in the Grasberg ore body through purchase of an equity interest in FCX and participation in the Grasberg joint venture: these were two components of one investment decision. The investment occurred prior to the introduction of FRS10 and the goodwill arising was therefore eliminated directly against reserves in accordance with Rio Tinto’s then current UK GAAP accounting policy. On disposal of the equity interest in FCX, goodwill of US$228 million attributable to this part of the total investment was written back through reserves and deducted from the profit on disposal.
Against a background of adverse financial results, a review of Palabora’s business was finalised in the third quarter of 2004. Following this review, the workforce was reduced by 13 per cent and the management levels by 20 per cent. These events triggered an assessment of the balance sheet value of Palabora’s copper assets, using forecast long term copper prices, which resulted in the provision for asset impairment.
A detailed review of the mine plan and projected cash flows of the Colowyo coal business was completed in June 2004. This indicated that future operating and development costs are substantially higher than previously estimated. As a consequence, an exceptional charge was recorded in the first half of 2004 for the writedown of Colowyo’s fixed assets and recognition of related onerous contract obligations.
The 2003 exceptional items of US$126 million relate to gains on the disposal of Kaltim Prima Coal and Peak/Alumbrera (gold, copper). No tax was payable on these gains.
2003 compared with 2002
Net earnings of US$1,508 million compared with US$651 million reported for 2002. Adjusted earnings of US$1,382 million were US$148 million below 2002. The principal factors explaining the changes in earnings are shown in the table below.
Rio Tinto 2004Form 20-F 32
Back to Contents
| | US$ m | |
|
|
|
| 2002 Net earnings | 651 | |
| Exclude: Exceptional charges | (879 | ) |
|
|
|
| 2002 Adjusted earnings | 1,530 | |
| Prices | 442 | |
| Exchange rates | (412 | ) |
| Inflation | (106 | ) |
| Volumes | 38 | |
| Energy costs | (54 | ) |
| Other costs | (82 | ) |
| Other | 26 | |
|
|
|
| 2003 Adjusted earnings | 1,382 | |
| Add: exceptional gains | 126 | |
|
|
|
| 2003 Net earnings | 1,508 | |
|
|
|
The weakening of the US dollar against the currencies in which most of the Group’s costs are denominated reduced earnings by US$412 million. The average levels of the Australian dollar, Canadian dollar and South African rand were respectively 20 per cent, 11 per cent and 39 per cent stronger in 2003 than in 2002. The effect of these and other currency movements on operating costs was to reduce earnings by US$352 million. The effect of the shift in exchange rates on balance sheet values expressed in the functional currencies of the relevant units further reduced earnings and this charge was US$100 million more than the corresponding charge in 2002. Gains on currency hedges initiated by North, Ashton and Comalco, before they became wholly owned subsidiaries in 2000, increased earnings by US$40 million relative to 2002.
The prices of many products were stronger, increasing earnings by US$442 million. Copper prices averaged 13 per cent higher; gold 17 per cent and aluminium seven per cent. The copper price was 51 per cent higher at the end of the year than at the beginning and this led to a favourable effect from provisional pricing of US$39 million. Benchmark iron ore prices increased by nine per cent.
Over the full year, seaborne thermal coal prices were on average seven per cent lower and realised uranium prices were lower due to some higher priced contracts expiring at Rössing.
Overall, volume changes increased earnings by US$38 million. Lower gold and molybdenum volumes at Kennecott Utah Copper, as a result of reduced by product grades, partly offset volume growth from new mines at Diavik and West Angelas (iron ore) and capacity expansions at Escondida and Hamersley. The benefit of higher gold grades at Grasberg, particularly in the first half of the year, was negated by lower production following a slippage in the mine in the fourth quarter of the year. Robust demand for diamonds enabled Argyle to reduce inventories. Volumes of titanium dioxide feedstock were affected by weak markets.
Turning to costs, higher oil, power and gas prices reduced earnings by US$54 million. Average oil prices were US$3.50 per barrel or 14 per cent higher than in 2002. Gas prices in the US market were also higher and there were also increases in electricity prices, principally in New Zealand.
Excluding the effects of energy prices and the US$106 million impact of inflation, cost increases reduced earnings by US$82 million. Two significant events adversely affected cost performance in the period. In the first half of the year, there was a three week smelter shut down at Kennecott Utah Copper as a result of an acid plant failure. The slippage at the Grasberg mine in the fourth quarter impacted both production volumes and costs.
Costs at Coal & Allied were affected by higher demurrage caused by a shortage of rail capacity in the Hunter Valley. Lower earnings at Rio Tinto Iron & Titanium included a charge associated with the partial write down of a customer receivable.
Excluding exceptional items, the effective tax rate at 28.8 per cent compared with 31.2 per cent for 2002. The lower charge in 2003 reflected reduced tax payments in the US and a number of one off benefits including a credit of US$8 million resulting from the proposed entry into the Australian tax consolidation regime, with effect from 1 January 2003.
The after tax net interest charge was US$36 million less than in 2002, due both to lower interest paid and higher capitalised interest. The net central cost of the Group’s pension schemes was about US$60 million higher than in 2002.
The net earnings of Rio Tinto Brasil include a credit of US$32 million resulting from the reversal of part of an impairment provision relating to Fortaleza (nickel) recorded in a previous year.
The 2003 exceptional items of US$126 million relate to gains on the disposal of Kaltim Prima Coal, Peak and Alumbrera. No tax was payable on these gains.
Cash flow
2004 compared with 2003
A record total cash flow from operations, including dividends from associates and joint ventures, of US$4,449 million, was 28 per cent above 2003. Working capital levels increased in absolute terms by US$60 million, which is a relatively small amount compared with the increase in sales and production levels.
Investment in the business continued. Capital expenditure and financial investment of US$2,085 million was US$412 million above 2003. Purchases of property, plant and equipment included the major expansion of iron ore capacity in Western Australia, the construction of the Comalco Alumina Refinery, and the purchase of West Antelope coal reserves by Kennecott Energy.
Rio Tinto 2004Form 20-F 33
Back to Contents
Disposals of interests in businesses generated proceeds of over US$1.5 billion. The largest components of this were the sale of shares in FCX and the sale of Rio Tinto’s interest in the Morro do Ouro gold mine in Brazil.
The net cash inflow before management of liquid resources and financing, but after dividends, was US$1,888 million.
2003 compared with 2002
The Group’s operating cash flow remained strong. Total cash flow from operations of US$3,486 million, including dividends from associates and joint ventures, was only seven per cent below 2002 despite ten per cent lower adjusted earnings.
Tax paid included an amount of US$106 million relating to the disputed tax assessments from the Australian Tax Office described in Note 29 of the consolidated financial statements. The amount paid has been recorded as a receivable in these accounts because the directors believe that the relevant tax assessments are not sustainable.
Investment in the business continued at a high level. Capital expenditure and financial investment of US$1,673 million was US$197 million less than 2002. Purchases of plant and equipment included the expansion of iron ore capacity and the construction of the Comalco Alumina Refinery. Purchases less sales of investments in 2002 of US$323 million mainly related to US Treasury bonds held as security for the deferred consideration on the North Jacobs Ranch acquisition, of which US$76 million were sold in 2003.
The sale of assets, principally Peak, Alumbrera and Kaltim Prima Coal, generated a cash inflow of US$405 million.
Balance sheet
Shareholders’ funds increased by US$2,547 million. Profits exceeded dividends declared by US$1,751 million and there was a write back of goodwill of US$228 million relating to the disposal of shares in FCX. Exchange rate translation changes increased shareholders’ funds by US$542 million.
As a result of the strong cash flow, both from operations and from disposals, net debt fell from US$5,646 million to US$3,751 million. The ratio of net debt to total capital fell to 21.7 per cent from 33.8 per cent at 31 December 2003. Interest was covered 20 times (2003: 11 times).
As detailed in Note 18 to the consolidated financial statements, US$806 million (19 per cent) of the Group’s borrowings at the end of 2004 will mature in 2005.
At the year end, medium and long term borrowings totalled US$3,337 million. The amount issued under the US$3 billion European Medium Term Notes Programme was US$1.5 billion of which US$204 million is repayable within one year.
In addition to the above, the Group’s share of the third party net debt of joint ventures and associates totalled US$602 million at 31 December 2004. This debt is set out in Note 14 to the consolidated financial statements, which includes a description of the Group’s responsibilities in relation to Colowyo’s debt. The debt held by other joint ventures and associates is without recourse to the Rio Tinto Group.
Listed Company operating results
The economic interests of Rio Tinto plc and Rio Tinto Limited were merged in December 1995 as a result of the Dual Listed Companies ('DLC') merger. The DLC merger has the effect that shareholders can be regarded as having interests in a single economic enterprise that is under common control and management. Accordingly the Operating and Financial Review and Prospects have been presented on a Group basis with the exception of the separate discussion and analyses relating to Rio Tinto plc and Rio Tinto Limited parts of the Group respectively provided below as a supplement to the discussion of the Rio Tinto Group set out above.
Rio Tinto plc - part of Rio Tinto Group
2004 compared with 2003
Rio Tinto plc's net sales revenue (referred to as consolidated turnover in the financial statements) was US$5,275 million (2003: US$4,092 million). The 29 per cent increase in 2004 is largely due to increases in commodity prices and also the effect of a full year of sales at Diavik.
Profit on ordinary activities before interest and tax was US$2,652 million, an increase of US$1,140 million compared with 2003. During 2004 higher copper prices contributed to increased profits at Kennecott Utah Copper and Escondida, where there were also higher volumes. 2004 profit also benefited from a full year of sales at Diavik. At Freeport the higher copper and gold prices were offset by the effects of lower production and increased costs arising from the material slippage in 2003. The absence of profit from divested operations also had an adverse impact on profit. 2004 profit on ordinary activities before interest and taxation includes net exceptional gains of US$275 million (2003: US$47 million). These comprise exceptional gains on disposal of interests in operations of US$833 million (2003: US$47 million); a charge of US$160 million relating to Colowyo (coal) and a charge of US$398 million (before tax and minority interests) for the write down of the carrying value of Palabora's copper assets.
In 2004, net interest payable decreased to US$69 million (2003: US$138 million), as a result of lower net debt which more than offset the effect of interest rate rises. Interest rates for the majority of Rio Tinto plc's borrowings are based on 3 month LIBOR, which averaged 1.6 per cent in 2004 and 1.2 per cent in 2003.
Rio Tinto 2004Form 20-F 34
Back to Contents
The effective tax rate was 21.3 per cent in 2004. The reduction from the 2003 tax rate of 26.1 per cent was largely due to the effects of exceptional items. Excluding these, the effective tax rate in 2004, at 28.3 per cent was higher than the 27.1 per cent for 2003 as a result of increased taxable profits and withholding tax in locations with higher effective tax rates.
Net earnings of US$2,073 million compare with US$956 million in 2003. The increase of US$1,117 million includes the effect of net exceptional gains totalling US$506 million in 2004 and US$47 million in 2003.
Total cash flow from operations (including dividends from joint ventures and associates) increased from US$1,710 million in 2003 to US$1,951 million in 2004. This is largely the result of dividends received from Rio Tinto Limited (on ordinary shares) and Escondida which offset reduced dividends from the Freeport joint venture, after the material slippage in 2003, and the non recurrence of a special dividend on the Rio Tinto Limited DLC Dividend Share.
Capital expenditure and financial investment rose from US$1,097 million in 2003 to US$1,986 million in 2004 due to an increase of US$1,423 million in funds advanced to Rio Tinto Limited by Rio Tinto plc. In 2003 a subsidiary company of Rio Tinto plc acquired US$500 million of redeemable preference shares in a subsidiary company of Rio Tinto Limited.
The net cash inflow from acquisitions and disposals of US$1,306 million in 2004 includes proceeds from the sales of Rio Tinto plc's interests in operations including: Freeport-McMoRan Copper & Gold Inc, Rio Paracatu Mineracao SA and Mineracao Serra de Fortaleza Limitada. The sale of the investment in Freeport-McMoRan Copper & Gold Inc does not affect the terms of the Grasberg joint venture. In 2003 the net cash inflow from disposals of interests in businesses was US$1,208 million and reflected the deferred payment by Rio Tinto Limited for the buy back in 2000 of some of its shares from Rio Tinto plc. Net debt fell from US$1,842 million to US$1,501 million during 2004.
Shareholders’ funds increased to US$9,139 million at 31 December 2004 (31 December 2003: US$7,343 million), largely due to retained profit and exchange gains.2003 compared with 2002
Rio Tinto plc's net sales revenue (referred to as consolidated turnover in the financial statements) was US$4,092 million (2002: US$3,993 million). The two per cent increase in 2003 is largely due to the commencement of sales at Diavik
Profit on ordinary activities before interest and tax was US$1,512 million. The corresponding figure for 2002 was US$602 million lower, but suffered from exceptional charges of US$755 million. Iron and Titanium profits were lower in 2003 as a result of the weak US dollar, soft market conditions and the write down of a customer receivable. The pretax profit impact of reduced volumes at Kennecott Utah Copper was partly offset by benefits from higher copper prices. A loss at Rossing reflected lower prices and adverse exchange rates. 2003 profits also suffered from increased pension finance costs, resulting from the decrease in fund asset values. However, profits benefited in 2003 from Diavik's first year of operation; and there was an increase in operating profit contributed by joint ventures following expansion of capacity at Escondida.
In 2003, net interest payable decreased to US$138 million (2002: US$156 million), as a result of lower net debt and reduced interest rates. Interest rates for the majority of Rio Tinto plc's borrowings are based on 3 month LIBOR, which averaged 1.2 per cent in 2003 and 1.8 per cent in 2002.
The effective tax rate was 26.1 per cent in 2003. The reduction from the 2002 tax rate of 61.8 per cent is largely due to the effect of exceptional items. Excluding these, the effective tax rate in 2003, at 27.1 per cent, is lower than the 30.7 per cent for 2002 as a result of lower tax payments in the US.
Net earnings of US$956 million compare with US$195 million in 2002. The increase of US$761 million includes the effect of exceptional charges of US$739 million in 2002, in contrast with gains of US$47 million in 2003.
Total cash flow from operations was US$1,710 million (2002: US$1,976 million). Although 2003 operating profit was higher than in 2002, this largely resulted from the absence of exceptional non cash charges. Capital expenditure and financial investment in 2003 was US$1,097 million (2002: US$1,205 million). The decrease was largely due to
| • | an increase in net funds advanced to Rio Tinto plc by Rio Tinto Limited; 2003: US$5 million (2002: US$(87) million) |
| • | a reduction in the purchase of property plant and equipment; as Diavik commenced production. |
| • | the acquisition by a subsidiary company of Rio Tinto plc of US$500 million of redeemable preference shares in a subsidiary company of Rio Tinto Limited. |
| • | the purchase, in 2002, of US$304 million of treasury bonds as security for the deferred consideration on the acquisition of the North Jacobs Ranch reserves. |
The net cash inflow from acquisitions and disposals of US$1,208 million in 2003 reflects deferred payment by Rio Tinto Limited for the buy back in 2000 of some of its shares from Rio Tinto plc. Net debt fell from US$2,625 million in 2002 to US$1,842 million in 2003.
Shareholders funds increased to US$7,343 million at 31 December 2003 (31 December 2002: US$5,899 million), largely due to retained profit and exchange gains.
Rio Tinto Limited - part of Rio Tinto Group
2004 Compared with 2003
Rio Tinto Limited's net sales revenue (referred to as consolidated turnover in the financial statements) was US$6,524 million in 2004 (2003: US$5,476 million). The 19 per cent increase in revenue is largely due to increased volumes and prices at the Iron Ore and Coal operations,and increased prices and smelter output at Comalco. Stronger markets resulted in increased prices for most of the Group’s products. The disposal of Kaltim Prima Coal during 2003 had a negative impact on 2004 revenue.
Rio Tinto 2004Form 20-F 35
Back to Contents
In 2004 profit on ordinary activities before interest and tax was US$1,871 million (2003: US$1,391 million). The US dollar weakened further against the Australian and Canadian dollars, currencies in which the Group incurs a large proportion of its costs, reducing profit. Profit on disposal of interests in operations was US$139 million in 2004, similar to the US$126 million realised in 2003. Disposals in 2004 included Zinkgruvan AB and a 10% interest in Hail Creek.
The effective tax rate in 2004 was 28 per cent, which compares with 28.7 per cent in 2003. However, excluding the effect of exceptional items, the effective tax rate in 2004 was 30.4 per cent (2003: 31.9 per cent) as a result of entry into the Australian consolidated tax regime.
Net earnings increased to US$1,185 million (2003: US$884 million) and total cash flow from operations was US$2,622 million (2003: US$2,053 million) as a result of the factors above. The increase in dividends from joint ventures is largely attributable to Australian coal operations.
Capital expenditure and financial investment increased from US$1,071 million in 2003 to US$1,522 million in 2004 as a result of continued expansion of iron ore capacity in Western Australia and the construction of the Comalco Alumina Refinery. Sales less purchases of other investments of US$110 million in 2004 is US$94 million higher than in 2003. Several investments were disposed of during the year, including the Sepon project in Laos.
Equity dividends paid of US$330 million were US$135 million below 2003 payments despite an increase in the dividend on ordinary shares; in 2004 there was no dividend payment on the DLC dividend share held by Rio Tinto plc; in 2003 a payment of US$164 million was made.
Rio Tinto Limited received US$1,423 million of funding from Rio Tinto plc which, combined with the factors mentioned above, resulted in a US$1,554 million decrease in net debt to US$2,250 million.
Shareholders funds were US$5,515 million at 31 December 2004 (31 December 2003: US$4,324 million). Retained profit and exchange gains have contributed to the increase.
2003 Compared with 2002
Rio Tinto Limited's net sales revenue (referred to as consolidated turnover in the financial statements) was US$5,476 million in 2003 (2002: US$4,722 million). The 16 per cent increase in 2003 is largely due to increased volumes and prices at the Iron Ore operations and increased prices and smelter output at Comalco. The disposals of Kaltim Prima Coal and Alumbrera during the year resulted in a reduction in share of joint ventures' and associates' turnover.
In 2003 profit on ordinary activities before interest and tax was US$1,391 million (2002: US$1,180 million after exceptional asset write downs of US$433 million). The weakening of the US dollar against the Australian dollar and Canadian dollar, in which a large proportion of the Group's costs are denominated reduced profit. However, 2003 profits benefited from exceptional gains on disposal of subsidiary, joint venture and associate, of US$126 million: whereas, 2002 profits were reduced by exceptional net write downs.
In 2003, net interest payable decreased to US$100 million (2002: US$124 million), due largely to lower interest rates.
The effective tax rate in 2003 was 28.7 per cent, which compares with 40.9 per cent in 2002. However, excluding the effect of exceptional items, the tax rate was 31.7 per cent in both years.
Profits attributable to outside interests increased in 2003, primarily because 2002 was impacted by the exceptional asset write downs at IOC.
Net earnings increased to US$884 million (2002: US$736 million) as a result of the factors above. Total cash flow from operations (including dividends from joint ventures and associates) was similar to 2002 at US$2,053 million (2002: US$ 2,043 million). The increase in cash flow from operating activities was offset by a reduction in dividends received from the coal joint ventures in 2003.
Capital expenditure and financial investment increased as a result of continued expansion at Hamersley; and construction of the Comalco Alumina Refinery. During 2003 Rio Tinto Limited remitted US$1,208 million to Rio Tinto plc in respect of shares that were repurchased in 2000. In addition, a subsidiary of Rio Tinto Limited, issued US$500 million of redeemable preference shares to a subsidiary of Rio Tinto plc. The factors mentioned above combined to reduce cash flow and increase the level of net debt in 2003.
Liquidity and capital resources
Rio Tinto plc and Rio Tinto Limited enjoy strong long and short term credit ratings from Moody’s and Standard and Poor’s shown below.
| | Long term | | Short term | | Outlook | |
|
|
|
|
|
| |
| Standard & Poor’s | A+ | | A-1 | | Stable | |
| Moody’s | Aa3 | | P-1 | | Stable | |
|
|
|
|
|
| |
Investors should be aware that a security rating is not a recommendation to buy, sell or hold securities, that it may be subject to revision or withdrawal at any time by the assigning rating organisation, and that each rating should be evaluated independently of the other.
The unified credit status of the Group is maintained through cross guarantees whereby contractual obligations of Rio Tinto plc and Rio Tinto Limited are automatically guaranteed by the other. These ratings continue to provide financial flexibility and consistent access to debt via money or capital markets and enable very competitive terms to be obtained.
Rio Tinto 2004Form 20-F 36
Back to Contents
The Group’s commercial paper programmes are fully backed by bank standby facilities which totalled US$1.45 billion at 31 December 2004, of which US$0.85 billion was on terms exceeding one year. These facilities can be drawn upon at any time.
As at 31 December 2004, the Group had contractual obligations other than bank borrowings repayable on demand arising in the ordinary course of business as follows:
| | | | Less | | Between | | Between | | |
| | than 1 | 1 and 3 | 3 and 5 | After 5 |
| US$ m | Total | year | years | years | years |
|
|
|
|
|
|
|
|
|
|
| Contractual cash obligations | | | | | | | | | |
| Debt (a) | 4,143 | | 806 | | 2,043 | | 813 | | 481 |
| Operating leases | 114 | | 36 | | 37 | | 10 | | 31 |
| Unconditional purchase obligations | 3,232 | | 386 | | 747 | | 611 | | 1,488 |
| Deferred consideration | 250 | | 96 | | 126 | | 28 | | – |
| Other (b) | 700 | | 564 | | 48 | | 88 | | – |
|
|
|
|
|
|
|
|
|
|
| Total | 8,439 | | 1,888 | | 3,001 | | 1,550 | | 2,000 |
|
|
|
|
|
|
|
|
|
|
| | |
| (a) | Debt obligations include commercial paper backed by bank standby facilities. |
| (b) | Other relates to long term obligations including capital commitments. |
| (c) | Other long term liabilities of the Group not shown here include employee benefit obligations for which we expect cash funding to be US$1.4 billion within the next five years and US$1.6 billion between 2010 and 2014. |
On the basis of the levels of obligations described above, the unused capacity under the Group’s commercial paper programmes, the Group’s anticipated ability to access debt and equity capital markets in the future and the level of anticipated internal cash generation, the directors believe that the Group has sufficient short and long term sources of funding available to meet its liquidity requirements.
The Group’s committed bank standby facilities contain a financial undertaking that the Group’s consolidated income before interest and taxes for any annual accounting period shall not be less than three times consolidated interest payable for such period. The ratio for 2004 was 29.6 (2003: 15.2). The Group does not have any financial agreements that would be affected to any material extent by a reduction in the Group’s credit rating.
The Group’s policy is to centralise surplus cash balances whenever possible.
As at 31 December 2004 the Group had current assets amounting to US$874 million which are not expected to be used or converted into cash during the next 12 months, comprising US$836 million relating to accounts receivable and prepayments and US$38 million relating to inventories. Note 16 to the consolidated financial statements provides an analysis of the accounts receivable and prepayments falling due after more than one year. It includes a pension prepayment of US$581 million, representing the cumulative excess of the employer contributions paid to the Group’s deferred benefit pension schemes over the pension charges recognised in respect of those schemes under SSAP 24.
Off-balance sheet arrangements
In the ordinary course of business, to manage the Group’s operations and financing, Rio Tinto enters into certain arrangements, which for the purposes of Item 5 would be considered off-balance sheet arrangements.
The Rio Tinto Group’s off-balance sheet arrangements are comprised principally of performance guarantees, commitments for capital and other expenditure, and certain derivative financial instruments.
The aggregate amount of indemnities and other performance guarantees, on which no material loss is expected, is US$435 million.
The Group has a partnership interest in the Colowyo Coal Company and has undertaken, via a subsidiary company which entered into a management agreement, to cause the partnership to perform its obligations under certain coal supply contracts. The debt owed by the Colowyo Coal Company, which has a book value of US$156 million, is to be serviced and repaid out of the proceeds of these contracts. During 2004, a provision of US$149 million has been recognised in respect of the Group’s obligations under the above management agreement. The debt held by other joint ventures and associates is without recourse to the Rio Tinto Group.
Other commitments include contracted capital expenditure, operating leases and unconditional purchase obligations as set forth in the table of contractual obligations, included in the liquidity and capital resources section above.
The Group holds certain derivative financial instruments for which the initial fair value and/or subsequent changes to fair value are not recorded under UK GAAP until the underlying contracts are settled or the hedged items to which they relate are recognised. For information on these derivative financial instruments, see Note 28 to the consolidated financial statements.
Exchange rates, reporting currencies and currency exposure
Rio Tinto’s assets, earnings and cash flows are influenced by a wide variety of currencies due to the geographic diversity of the Group’s sales and the countries in which it operates. The US dollar, however, is the currency in which the great majority of the Group’s sales are denominated. Operating costs are influenced by the currencies of those countries where the Group’s mines and processing plants are located and also by those currencies in which the costs of imported equipment and services are determined. The Australian and US dollars are the most important currencies influencing costs.
Rio Tinto 2004Form 20-F 37
Back to Contents
In any particular year, currency fluctuations may have a significant impact on Rio Tinto’s financial results. A weakening of the US dollar against the currencies in which the Group’s costs are determined has an adverse effect on Rio Tinto’s net earnings. The approximate effects on the Group’s UK GAAP net earnings of ten per cent movements from the 2004 full year average exchange rates are as follows:
| | | | 2003 | | | | 2004 |
| Average | Effect of | Average | Effect of |
| exchange | 10% change in | exchange | 10% change in |
| rate | full year average | rate | full year average |
| US cents | US$ m | US cents | US$m |
|
|
|
|
|
|
|
|
| Australian dollar | 65 | | 141 ± | | 73 | | 190 ± |
| Canadian dollar | 71 | | 26 ± | | 77 | | 45 ± |
| Chilean peso | 692 | | 6 ± | | 611 | | 6 ± |
| Indonesian rupiah | 0.012 | | 6 ± | | 0.011 | | 3 ± |
| New Zealand dollar | 58 | | 6 ± | | 66 | | 7 ± |
| South African rand | 13 | | 22 ± | | 16 | | 20 ± |
| UK sterling | 163 | | 7 ± | | 183 | | 7 ± |
| Other | n/a | | 10 ± | | n/a | | 10 ± |
|
|
|
|
|
|
|
|
These sensitivities are based on 2004 prices, costs and volumes and assume that all other variables remain constant. They take into account the effect of hedges as disclosed in Note 28 to the consolidated financial statements. These exchange rate sensitivities include the effect on operating costs of movements in exchange rates but exclude the impact through revaluation of foreign currency working capital. They should, therefore, be used with care.
After taking into account the effect of relevant derivative instruments, almost all of the Group’s net debt is either denominated in US dollars or in the functional currency of the entity holding the debt. The table below sets out the currency exposures arising from net monetary assets / (liabilities), other than net debt, which are not denominated in the functional currency of the relevant business unit. Gains and losses resulting from such exposures are recorded in the profit and loss account. The table below reflects the Group’s currency exposure after tax and outside interests:
| | | | | | 2003 | | | | | | 2004 | |
| Currency of exposure | | Currency of exposure | |
| US$m | US dollar | | Other | Total | US dollar | | Other | Total |
|
|
|
|
|
|
|
|
|
|
|
|
|
| Functional currency of business unit: | | | | | | | | | | | | |
| Australian dollar | 251 | | (11 | ) | 240 | | 222 | | 7 | | 229 | |
| Canadian dollar | 19 | | (1 | ) | 18 | | 21 | | - | | 21 | |
| South African rand | 16 | | 2 | | 18 | | 8 | | 3 | | 11 | |
| United States dollar | - | | 20 | | 20 | | - | | 24 | | 24 | |
| Other currencies | 14 | | 9 | | 23 | | 5 | | (16 | ) | (11 | ) |
|
|
|
|
|
|
|
|
|
|
|
|
|
| Total | 300 | | 19 | | 319 | | 256 | | 18 | | 274 | |
|
|
|
|
|
|
|
|
|
|
|
|
|
In the case of the Australian dollar, for example, there is a significant degree of natural protection against cyclical fluctuations, in that the currency tends to be weak, reducing costs in US dollar terms, when commodity prices are low, and vice versa.
Given the dominant role of the US currency in the Group’s affairs, the US dollar is the currency in which financial results are presented both internally and externally. It is also the natural currency for borrowing and holding surplus cash. Modest amounts of cash are held in other currencies for short term operational reasons.
The Group finances its operations primarily in US dollars, either directly or using currency swaps, and a significant proportion of the Group’s US dollar debt is located in subsidiaries having functional currencies other than the US dollar. Exchange gains and losses relating to US dollar debt impact on the profit and loss accounts of such subsidiaries. Under UK GAAP however, such exchange gains and losses are excluded from the Group’s profit and loss account on consolidation with a corresponding adjustment directly to reserves. This means that financing in US dollars impacts in a consistent manner on the Group’s consolidated accounts irrespective of the functional currency of the particular subsidiary where the debt is located.
The Group does not generally believe that active currency hedging would provide long term benefits to shareholders. Currency protection measures may be deemed appropriate in specific commercial circumstances and are subject to strict limits laid down by the Rio Tinto board. As set out in Note 28 to the consolidated financial statements, as at 31 December 2004 there were forward contracts, including synthetic forwards, to purchase A$1,113 million in respect of future trading transactions. From the Group’s perspective, these contracts offset the impact of exchange rate variations on a portion of the local currency costs incurred by various subsidiaries. A significant part of the above hedge book was acquired with North Ltd. North held a substantial hedge book on acquisition which has been retained but is not being renewed as maturities occur.
Rio Tinto 2004Form 20-F 38
Back to Contents
The functional currency of most operations within the Rio Tinto Group is the local currency in the country of operation. Foreign currency gains or losses arising on translation of the net assets of these operations are shown as a movement in reserves. The approximate translation effects on the Group’s net assets of ten per cent movements from the year end exchange rates are as follows:
| | | | 2003 | | | | 2004 |
| Closing | Effect of | Closing | Effect of |
| exchange | 10% change in | exchange | 10% change in |
| rate | closing rate | rate | closing rate |
| US cents | US$m | US cents | US$m |
|
|
|
|
|
|
|
|
| Australian dollar | 75 | | 640 ± | | 78 | | 650 ± |
| Canadian dollar | 77 | | 85 ± | | 83 | | 115 ± |
| South African rand | 15 | | 21 ± | | 18 | | 5 ± |
| UK sterling | 178 | | 11 ± | | 193 | | 14 ± |
| Other | n/a | | 6 ± | | n/a | | 7 ± |
|
|
|
|
|
|
|
|
Interest rates
Rio Tinto’s interest rate management policy is generally to borrow and invest cash at floating rates. Short term US dollar rates are normally lower than long term rates, resulting in lower interest costs to the Group. Furthermore, cyclical movements of interest rates tend to compensate, to an extent, for those of commodity prices. In some circumstances, an element of fixed rate funding may be considered appropriate. At the end of 2004, only 20 per cent of the Group’s net debt was fixed rate. Based on the Group’s net debt at 31 December 2004, and with other variables unchanged, the approximate effect on the Group’s net earnings of a one percentage point increase in US dollar LIBOR interest rates would be a reduction of US$21 million.
Commodity prices
The Group’s normal policy is to sell its products at prevailing market prices. Exceptions to this rule are subject to strict limits laid down by the Rio Tinto board and to rigid internal controls. Rio Tinto’s exposure to commodity prices is diversified by virtue of its broad commodity spread and the Group does not generally believe commodity price hedging would provide long term benefit to shareholders.
Metals such as copper and aluminium are generally sold under contract, often long term, at prices determined by reference to prevailing market prices on terminal markets, such as the London Metal Exchange and COMEX in New York, usually at the time of delivery. Prices fluctuate widely in response to changing levels of supply and demand but, in the long run, prices are related to the marginal cost of supply. Gold is also priced in an active market in which prices respond to daily changes in quantities offered and sought. Newly mined gold is only one source of supply; investment and disinvestment can be important elements of supply and demand. Contract prices for many other natural resource products are generally agreed annually or for longer periods with customers, although volume commitments vary by product.
Approximately 40 per cent of Rio Tinto’s 2004 net earnings from operating businesses came from products whose prices were terminal market related and the remainder came from products priced by direct negotiation.
The approximate effect on the Group’s net earnings of a ten per cent change from the full year average market price in 2004 for the following metals would be:
| | | | | 2003 | | | | 2004 |
| | | | |
| Average | Effect of | Average | Effect of |
| market | 10% change in | market | 10% change in |
| price | full year average | price | full year average |
| | US$m | | US$m |
|
|
|
|
|
|
|
|
|
| Copper | | 80 c/lb | | 109 ± | | 130 c/lb | | 160 ± |
| Aluminium (3 month forward) | | 65 c/lb | | 95 ± | | 78 c/lb | | 110 ± |
| Gold | | US$ 363 oz | | 52 ± | | US$ 409 oz | | 40 ± |
|
|
|
|
|
|
|
|
|
The above sensitivities are based on 2004 volumes and give the estimated impact on net earnings of changes in prices, assuming that all other variables remain constant. These should be used with care. The relationships between currencies and commodity prices is a complex one and movements in exchange rates can cause movements in commodity prices and vice versa. The sensitivities allow for the effect of the commodity hedges maturing in 2005, as disclosed in Note 28 to the consolidated financial statements.
Treasury management and financial instruments
Treasury activities operate as a service to the business of the Rio Tinto Group and not as a profit centre. Strict limits on the size and type of transaction permitted are laid down by the Rio Tinto board and are subject to rigorous internal controls. Corporate funding and overall strategic management of Rio Tinto’s balance sheet is handled by the London based Group Treasury.
Rio Tinto 2004Form 20-F 39
Back to Contents
Rio Tinto does not acquire or issue derivative financial instruments for trading or speculative purposes; nor does it believe that it has exposure to such trading or speculative holdings through its investments in joint ventures and associates. Derivatives are used to separate funding and cash management decisions from currency exposure and interest rate management. The Group uses interest rate swaps in conjunction with longer term funds raised in the capital markets to achieve a floating rate obligation which is consistent with the Group’s interest rate policy. Currency swaps are used to convert debt or investments into currencies, primarily the US dollar, which are consistent with the Group’s policy on currency exposure management. No material exposure is considered to exist by virtue of the possible non performance of the counterparties to financial instruments held by the Group.
The derivative contracts in which the Group is involved are valued for the purposes of the Financial instrument disclosures in the Financial statements by reference to quoted market prices, quotations from independent financial institutions or by discounting expected cash flows.
Dividends
Dividends paid on Rio Tinto plc and Rio Tinto Limited shares are equalised on a net cash basis; that is without taking into account any associated tax credits. Dividends are determined in US dollars.
Rio Tinto’s progressive dividend policy aims to increase the US dollar value of dividends over time, without cutting them in economic downturns. Rio Tinto plc shareholders receive dividends in pounds sterling and Rio Tinto Limited shareholders receive dividends in Australian dollars, which are determined by reference to the exchange rates applicable to the US dollar two days prior to the announcement of dividends. Changes in exchange rates could result in a reduced sterling or Australian dollar dividend in a year in which the US dollar value is maintained or increased. The interim dividend for each year in US dollar terms will be equivalent to 50 per cent of the previous year’s total US dollar dividends.
Critical accounting policies and estimates
Dual listed company reporting
As explained in detail in Outline of dual listed companies’ structure and basis of financial statements, the consolidated financial statements of the Rio Tinto Group on pages A-2.2004 to A-84 deal with the results and assets and liabilities of both of the dual listed companies, Rio Tinto plc and Rio Tinto Limited, and their subsidiaries. They are prepared under UK GAAP and satisfy the obligations of Rio Tinto Limited, as laid down by the Australian Securities and Investments Commission. The consolidated financial statementsalso includes a statement setting out the effect of the adjustments to net earnings and to shareholders’ funds for the Group that would be required under Australian GAAP. The US dollar is the presentation currency used in these financial statements, as it most reliably reflects the Group’s global business performance.
The treatment of gains and losses on US dollar debt is described above in the section dealing with Exchange rates, reporting currencies and currency exposure.
For US reporting purposes separate financial statements are presented for Rio Tinto plc and the companies legally owned by it (‘the Rio Tinto plc part of the Group’); and for Rio Tinto Limited and the companies legally owned by it (‘the Rio Tinto Limited part of the Group’). In these separate financial statements, the consolidated figures for the Rio Tinto plc part of the Group include Rio Tinto plc’s 37.54% share of Rio Tinto Limited accounted for by the equity method.
Ore reserve estimates
The amounts presented under UK GAAP and Australian GAAP are based on the reserves and in some cases resources determined in accordance with the JORC Code.
For the purposes of preparing financial information under US GAAP, estimates of ore reserves are made in accordance with the SEC’s Industry Guide 7.
Asset carrying values
Charges for impairment of the carrying values of certain of the Group’s businesses and related contract obligations, net of tax and outside shareholder interests, amounted to US$321 million in 2004 and US$763 million in 2002. No significant impairment charges occurred in 2003.
The carrying values are assessed by reference to the higher of disposal value and the net present value of forecast future cash flows. The cash flows are particularly sensitive to the change in two particular parameters: exchange rates and commodity selling prices. Management considers, that over the long term, there is a tendency for movements in commodity prices to compensate to some extent for movements in the value of the US dollar (and vice versa). But such compensating changes are not synchronised and do not fully offset each other. The great majority of the Group’s sales are based on prices denominated in US dollars. To the extent that the currencies of countries in which the Group produces commodities strengthen against the US dollar without commodity price offset, cash flows and, therefore, net present values are reduced.
In the three years to 31 December 2004, the Australian dollar strengthened by 53% against the US dollar, the Canadian dollar strengthened by 32% and the South African rand by 121%. Taking these three years together, commodity prices rose substantially: for example, copper prices increased by 124%, aluminium by 47% and gold by 58%.
Rio Tinto’s cash flow forecasts are based on assessments of expected long term commodity prices, which for most commodities are derived from an analysis of the marginal costs of the producers of these commodities. These assessments often differ from current price levels and are updated periodically.
Rio Tinto 2004Form 20-F 40
Back to Contents
In some cases, prices applying to some part of the future sales volumes of an Income Generating Unit are predetermined by existing sales contracts. The effects of such contracts are taken into account in forecasting future cash flows.
The cash flows used in impairment reviews include the effects of derivatives and non-derivative financial instruments designated as hedges of the cash flows of the relevant Income Generating Unit. However, the impact of such instruments on valuations used in measuring impairment is not significant.
For the majority of Rio Tinto’s businesses, by both number and by value, the net present value of the expected cash flows is substantially in excess of the carrying value in the balance sheet. For a minority of the businesses the carrying value is close to the net present value of the cash flows, and these are reviewed for impairment where appropriate. The effects of exchange rate and commodity price changes on the values of these units relative to their book values are monitored closely.
Reviews of carrying values relate to Income Generating Units which, in accordance with FRS 11, are identified by dividing the entity into as many largely independent income streams as is reasonably practicable. In some cases the Business Units within the Product groups consist of several operations with independent income streams, which therefore constitute separate Income Generating Units.
The expected future cash flows of Income Generating Units reflect long term mine plans which are based on detailed research, analysis and iterative modelling to optimise the level of investment and output and sequence of extraction. The plan takes account of all relevant characteristics of the ore body, including waste to ore ratios, ore grades, haul distances, chemical and metallurgical properties of the ore impacting on process recoveries and capacities of processing equipment that can be used. The mine plan is therefore the basis for forecasting production output in each future year and production costs.
The useful lives of the major assets of an Income Generating Unit are usually dependent on the life of the ore body to which they relate. Thus the lives of mining properties, smelters, concentrators and other long-lived processing equipment generally relate to the expected life of the ore body. The life of the ore body, in turn, is estimated on the basis of the long term mine plan.
The cash flow forecasts are based on best estimates of expected future revenues and costs. These may include net cash flows expected to be realised from extraction, processing and sale of mineral resources that do not currently qualify for inclusion in proven or probable ore reserves. Such non-reserve material is included where there is a high degree of confidence in its economic extraction. This expectation is usually based on preliminary drilling and sampling of areas of mineralisation that are contiguous with existing reserves. Typically, the additional evaluation to achieve reserve status for such material has not yet been done because this would involve incurring costs earlier than is required for the efficient planning and operation of the mine.
In the case of undeveloped properties, there may be no proven and probable reserves to form a basis for the impairment review. The carrying values of these assets are reviewed twice per annum by the Audit committee. The review is based on a status report regarding the Group’s intentions for development of the undeveloped property. In some cases, the undeveloped properties are regarded as successors to ore bodies currently in production. It is intended that these will be developed and go into production when the current source of ore is exhausted.
Cost levels incorporated in the cash flow forecasts are based on the current long term mine plan for the Income Generating Unit. Recent cost levels are considered, together with expected changes in costs that are compatible with the current condition of the business and meet the requirements of FRS 11 “Impairment of fixed assets and goodwill”.
Under US GAAP, assumptions used in cash flow forecasts are principally the same as those used under UK GAAP, except that the estimated cash flows related to the liability for asset retirement obligations are excluded under US GAAP. Impairment is only recognised, under US GAAP, when the anticipated undiscounted cash flows are insufficient to recover the carrying value of the asset group. Once impairment is determined, an asset is written down to its fair value, which is normally calculated using discounted cash flows, similar to those under UK GAAP.
Forecast cash flows are discounted to present values using Rio Tinto’s weighted average cost of capital with appropriate adjustment for the risks associated with the relevant unit, to the extent that such risks are not reflected in the forecast cash flows. For final feasibility studies and ore reserve estimation, internal hurdle rates are used which are generally higher than the weighted average cost of capital.
The above rates are applied to net of tax cash flows expressed in real terms. However, where an asset is impaired, the amount of the impairment is determined by discounting the pre-tax cash flows at a pre-tax discount rate derived from the post tax discount rate, having regard to the tax characteristics of the Income Generating Unit.
Final feasibility studies and ore reserve estimation are based on the exchange rates current at the time of the evaluation. For impairment reviews, a forecast of the long term exchange rate is made by reference to historical data.
Forecast cash flows for ore reserve estimation and impairment testing are based on Rio Tinto’s long term price forecasts. For final feasibility studies these prices, and projected costs, are assumed to decline systematically in real terms.
Close down, restoration and environmental obligations
Provision is made for environmental remediation costs when the related environmental disturbance occurs, based on the net present value of estimated future costs. Where the ultimate cost of environmental disturbance is uncertain, there may be variances from these cost estimates which could affect future financial results.
Rio Tinto 2004Form 20-F 41
Back to Contents
Close down and restoration costs are a normal consequence of mining, and the majority of close down and restoration expenditure is incurred at the end of the life of the mine. Although the ultimate cost to be incurred is uncertain, subsidiary companies have estimated their respective costs based on feasibility and engineering studies using current restoration standards and techniques.
Post retirement benefits
UK GAAP post retirement benefits are accounted for in accordance with Statement of Standard Accounting Practice 24, which requires gradual recognition of the surpluses and deficits that emerge as a result of variances from actuarial assumptions.
The most significant assumptions used in accounting for pension plans are the long term rate of return on plan assets and the discount rate. The long term rate of return on plan assets is used to calculate interest income on pension assets, which is credited to the Group’s profit and loss account. The discount rate is used to determine the net present value of future liabilities and each year the unwinding of the discount on those liabilities is charged to the Group’s profit and loss account.
The expected rate of return on pension plan assets is determined as management’s best estimate of the long term return on the major asset classes i.e. equity, debt, real estate and other, weighted by the actual allocation of assets among the categories at the measurement date. The expected rate of return is calculated using geometric averaging.
The sources used to determine management’s best estimate of long term returns are numerous and include country specific bond yields, which may be derived from the market using local bond indices or by analysis of the local bond market, and country specific inflation and investment market expectations derived from market data and analysts’ or governments’ expectations as applicable.
In particular, the Group estimates long term expected real returns on equity i.e. returns in excess of inflation, based on the economic outlook, analysts’ views and those of other market commentators. This is the most subjective of the assumptions used and it is reviewed regularly to ensure that it remains consistent with best practice.
The expected rate of return on pension plan assets is also used as the discount rate for UK GAAP.
Valuations are carried out using the projected unit method.
For 2004 the cost in relation to pensions included in the Group’s net earnings was US$82 million under US GAAP. Under UK GAAP, the net pensions cost was US$88 million. Within these costs the expected return on assets was US$163 million under US GAAP and US$166 million under UK GAAP.
The impact on cash flow in 2004 of the Group’s pension plans, being the employer contributions to defined benefit and defined contribution pension plans, was US$143 million. In addition there were contributions of US$26 million in respect of unfunded healthcare schemes.
In relation to pensions, it is currently expected that there will be no significant regular employer or employee contributions to the UK plan in 2005. Contributions are made to the main Australian plan according to the recommendation of the plan actuary and are primarily to a mixed defined benefit/defined contribution type arrangement. In North America, contributions are agreed annually in nominal terms. Whilst contributions for 2005 will not be determined until later in the year for some Group plans, the currently expected level of contributions by the Group to the plans in Australia, Canada and the US is expected to be similar in aggregate to that made in 2004. Since the Group’s healthcare schemes are unfunded, contributions for future years will be equal to benefit payments and therefore cannot be predetermined.
Under US GAAP post retirement benefits are accounted for in accordance with Financial Accounting Standard No. 87 under which only those surpluses or deficits outside a ten per cent fluctuation corridor are spread.
The discount rate under US GAAP is the implied yield available on AA rated corporate debt at the measurement date.
For US GAAP, the average expected long term rate of return on assets used to determine 2004 pension cost was 6.6%. This will increase to 6.7% in 2005 primarily because of an increase in expected long term nominal equity returns. For 2004, the average future increase in compensation levels was assumed to be 4.2% and this will increase in 2005 to 4.6%; this increase reflects higher anticipated general inflation in the UK and North America. For US GAAP, the average discount rate used for the Group’s plans in 2004 was 5.9% and the average discount rate used in 2005 will be 5.6%. The decrease is attributable to lower corporate bond yields. As noted above, the expected long term rate of return on assets is also used as the discount rate under UK GAAP. The other UK GAAP assumptions vary slightly from those under US GAAP because of the differing measurement dates.
Based on the known changes in assumptions noted above and other known factors such as increasing service cost and amortisation charges, and including the one time curtailment and settlement credit in 2004, the impact of pension costs on the Group’s net earnings in 2005 would be expected to increase by some US$36 million under US GAAP to US$118 million.
Under US GAAP, there are net unrecognised losses in relation to the Group’s pension plans of US$532 million at 31 December 2004 net of tax and minorities. This will be written off to earnings over the average remaining service life of employees in the plans to the extent the losses exceed the 10% corridor on a plan by plan basis. The 2005 impact on the Group’s US GAAP net earnings will be a cost of US$26 million compared to a cost of US$22 million in 2004.
The table below sets out the potential change in the Group’s 2004 UK GAAP and US GAAP net earnings (after tax and outside interests) that would result from hypothetical changes to post retirement assumptions and estimates. The sensitivities are viewed for each assumption in isolation although, under UK GAAP in particular, a change in one assumption is likely to result in a corresponding offset elsewhere.
Rio Tinto 2004Form 20-F 42
Back to Contents
| US$m | UK
GAAP | | US
GAAP | |
|
|
|
| |
| Sensitivity of Group’s 2004 net earnings to changes in: | | | | |
| Expected return on assets | | | | |
| - increase of 1% | 43 | | 20 | |
| - decrease of 1% | (45 | ) | (20 | ) |
| Discount rate | | | | |
| - increase of 0.5% | 20 | | 6 | |
| - decrease of 0.5% | (22 | ) | (6 | ) |
| Salary increases | | | | |
| - increase of 0.5% | (6 | ) | (5 | ) |
| - decrease of 0.5% | 6 | | 5 | |
| Demographic - allowance for additional future mortality improvements | | | | |
| - overall increase of 5% in liability | (23 | ) | (16 | ) |
| - overall decrease of 5% in liability | 20 | | 15 | |
|
|
|
| |
Further information on UK GAAP and US GAAP for pensions is given on pages A-58 to A-59 and A-73 respectively. In addition, information under the UK post retirement accounting standard, FRS 17, is given on pages A-59 to A-62.
Overburden removal costs
In open pit mining operations, it is necessary to remove overburden and other waste materials to access ore from which minerals can economically be extracted. The process of mining overburden and waste materials is referred to as stripping. During the development of a mine, before production commences, it is generally accepted that stripping costs are capitalised as part of the investment in construction of the mine.
Stripping of waste materials continues during the production stage of the mine. Some mining companies expense these production stage stripping costs as incurred, while others defer such stripping costs. Those mining companies that expense stripping costs as incurred will report greater volatility in the results of their operations from period to period.
Rio Tinto defers production stage stripping costs for those operations where this is the most appropriate basis for matching costs with the related economic benefits and the effect is material.
The amount of stripping costs deferred is based on the ratio obtained by dividing the tonnage of waste mined either by the quantity of ore mined or by the quantity of minerals contained in the ore. In some operations, the quantity of ore is used, being a more practical basis for matching costs with the related economic benefits where there are important by products or where the grade of the ore is relatively stable from year to year.
Information about the stripping ratios of the Business Units that account for the majority of the deferred stripping balance at 31 December 2004, and year in which deferred stripping is expected to be fully amortised, is set out in the following table:
| | Actual stripping ratio for year | | Life of mine stripping ratio | |
| | 2002 | | 2003 | | 2004 | | 2002 | | 2003 | | 2004 | |
|
|
|
|
|
|
|
|
|
|
|
| |
| Kennecott Utah Copper (2017) | 2.05 | | 1.86 | | 1.83 | | 1.19 | | 1.24 | | 1.24 | |
| Borax (2034) | 25.00 | | 23.00 | | 20.50 | | 16.00 | | 16.00 | | 18.70 | |
| Argyle Diamonds (2008) | 7.29 | | 6.10 | | 6.70 | | 4.40 | | 4.10 | | 4.91 | |
| Freeport Joint Venture (2014) | 2.35 | | 2.84 | | 3.39 | | 1.77 | | 1.93 | | 2.43 | |
| Diavik (2009) | 24.93 | | 20.31 | | 14.52 | | 8.87 | | 8.54 | | 4.69 | |
|
|
|
|
|
|
|
|
|
|
|
| |
In addition, Escondida, Rio Tinto's 30 per cent owned joint venture, defers stripping costs based on the ratio of waste tonnes to pounds of copper mined. The actual stripping ratio for 2004 was 0.1145 (2003: 0.1024, 2002: 0.1458). The life of mine stripping ratio for 2004 was 0.1129 (2003: 0.1110, 2002: 0.1094). The deferred stripping balance is expected to be fully amortised in 2040.
The life of mine waste-to-ore ratio is a function of an individual mine’s pit design and therefore changes to that design will generally result in changes to the ratio. Changes in other technical or economic parameters that impact on reserves will also have an impact on the life of mine ratio even if they do not affect the mine’s pit design. Changes to the life of mine ratio are accounted for prospectively.
The reduction in the life of mine waste-to-ore ratio at Diavik resulted from the removal from the mine plan of a section of ore which would have required a high level of waste stripping. The increase in the life of mine ratio in 2003 at Utah Copper was caused by the discontinuation of the North concentrator operation. This resulted in certain lower grade material that would have been processed through the concentrator being reclassified as waste. Increases in the ratio for the Grasberg (Freeport Joint Venture) mine primarily relate to changes in the cut off grade at the open pit, caused by a reassessment of the optimal milling rate at the mill facility including a greater proportional contribution of total ore processed from the Deep Ore Zone underground mine.
In operations that experience material fluctuations in the ratio on a year to year basis over the life of the mine, deferral of stripping costs reduces the volatility of the cost of stripping expensed in individual reporting periods, in relation to production of ore or contained minerals, as applicable. Stripping costs incurred in the period are deferred to the extent that the current period ratio exceeds the life of mine ratio. Such deferred costs are then charged against reported profits to the extent that, in subsequent periods, the ratio falls short of the life of mine ratio. The life of mine ratio is based on the proven and probable reserves of the operation.
Rio Tinto 2004Form 20-F 43
Back to Contents
In some operations, there are distinct periods of new development during the production stage of the mine. These may, for example, relate to a discrete section of the orebody. The new development will be characterised by a major departure from the life of mine stripping ratio. Excess stripping costs during such periods are deferred and subsequently amortised on a unit of production basis.
Deferred stripping costs form part of the total investment in the relevant income generating unit, which is reviewed for impairment if events or changes in circumstances indicate that the carrying value may not be recoverable.
During 2004, production stage stripping costs incurred by subsidiaries and equity accounted operations exceeded the amounts charged against pre tax profit by US$135 million. The net book value carried forward in property, plant and equipment and in investments in joint ventures and associated companies at 31 December 2004 was US$784 million.
Amortisation of deferred stripping costs is included in depreciation of property, plant and equipment or in the Group’s share of the results of its equity accounted operations, as appropriate.
Contingencies
Disclosure is made of material contingent liabilities unless the possibility of any loss arising is considered remote. Contingencies are disclosed in Note 29 on page A-49. These include tax assessments of approximately A$500 million which, based on Counsels’ opinion, the Group expects to be successful in challenging.
New US accounting standards
Information on upcoming US accounting standards is provided in Note 42 on page A-71 to the consolidated financial statements.
International financial reporting standards
In 2005 Rio Tinto will be reporting its financial performance in accordance with International Financial Reporting Standards (IFRS) starting with the interim 2005 results. Restatements of full year and half year 2004 financial information under IFRS were included in a media release issued on 5 May 2005 and the differences from the amounts reported under UK GAAP were explained. This media release was filed with the SEC on Form 6-K for the month of May 2005. Restatement of 2004 financial information under IFRS resulted in an increase in net earnings of US$405 million compared to UK GAAP but underlying earnings increased by US$51 million. Shareholders’ equity at31 December 2004 reduced by US$707 million.
Trend information
The Group’s worldwide operations supply essential minerals and metals that help to meet global needs and contribute to improvements in living standards, so changes in the demand for its products are closely aligned with changes in global GDP. Changes in the GDP of developing countries will have a greater impact on materials such as iron ore and coal that can be used to improve infrastructure whereas changes in the GDP of developed countries will have a greater impact on industrial minerals that have many applications in consumer products. Trends in production of the Group’s minerals and metals, consolidated turnover, earnings, total assets and shareholders’ funds are set out in the operational review on pages 27 to 67.
Forward looking statements
Forward looking statements are contained in this financial review and attention is drawn to the Cautionary statement on page 10.
Rio Tinto 2004Form 20-F 44
Back to Contents
Rio Tinto’s Iron Ore group (RTIO) wholly owns Hamersley Iron in Western Australia. Hamersley wholly owns five mines and also operates the 60 per cent owned Channar mine and the 54 per cent owned Eastern Range mine on behalf of joint venture partners. The Channar mine is a joint venture with an Australian subsidiary of the China Iron & Steel Industry & Trade Group Corporation. The Eastern Range mine is owned in joint venture with the Shanghai Baosteel Group Corporation and was commissioned in April 2004.
RTIO also includes Rio Tinto’s effective 53 per cent interest in Robe River Iron Associates’ two mines in Western Australia and Rio Tinto’s 59 per cent interest in Iron Ore Company of Canada. The Iron Ore group operates both enterprises, which were acquired in 2000. From 2005, RTIO also manages Rio Tinto Brasil which owns a 100 per cent interest in Mineração Corumbaense Reunida, known as Corumbá.
In addition, RTIO includes the HIsmelt®direct smelting technology developed in Western Australia and resources held globally, including Orissa (India) and the Simandou (Guinea) deposits.
At 31 December 2004, the group accounted for 28 per cent of Rio Tinto’s operating assets, an increase of three per cent over the year. In 2004, the group contributed approximately 20 per cent of the Group’s turnover and 26 per cent of adjusted earnings.
In 2003, Rio Tinto reached agreement with its joint venture partners in Robe River to allow closer cooperation between the Pilbara operations of Hamersley and Robe. In 2004, a new company, Pilbara Iron, was formed to enable the sharing of rail, port and power infrastructure as well as management of non infrastructure assets, including mobile and other mining equipment, and site and corporate services. Coordination was progressively implemented during 2004. Together with Pilbara Rail Company, which runs the combined rail assets of Hamersley and Robe, the two entities manage RTIO’s iron ore assets in the Pilbara as an optimised and integrated operation. Pilbara Iron, including employees seconded to Pilbara Rail Company, employs 2,880 people.
RTIO Expansion Projects was created in September 2003 to manage the growing portfolio of projects and studies in the Pilbara. The Expansion Projects team operates closely with Pilbara Iron, but is managed independently in order to minimise the impact on operations through project study and implementation phases.
For the contract year commencing April 2005 Hamersley Iron reached agreement with Nippon Steel on price increases of 71.5 per cent for lump, fine and Yandi ore.
RTIO employs almost 6,000 people worldwide. Chris Renwick retired as chief executive Iron Ore in December 2004, and was succeeded by Sam Walsh, who is based in Perth, Western Australia.
Financial performance
2004 compared with 2003
RTIO’s contribution to 2004 earnings was US$569 million, US$70 million higher than in 2003.
Demand for iron ore continued to be extremely strong across the product range throughout 2004. In addition to strong demand from China where iron ore imports rose 40 per cent compared to 2003, the Japanese steel industry operated near capacity and crude steel production in Korea and Taiwan was at record levels. Reflecting the strength of the market, 18.6 per cent price increases were achieved for fiscal year 2004 for both lump and fines following the nine per cent increases agreed to in 2003.
In June, new long term agreements with leading Chinese steel mills for the sale of an incremental 40 million tonnes per annum of iron ore were announced. These agreements, together with supply arrangements reached with Nippon Steel and the Shanghai Baosteel Group earlier in the year, underpin the current phase of Rio Tinto’s expansion of port, rail and mine capacity that is on schedule for completion at the end of 2005.
2003 compared with 2002
RTIO’s contribution to 2003 earnings was US$499 million, US$47 million higher than in 2002.
Demand for iron ore continued to be extremely strong throughout 2003, particularly from China, where imports of iron ore were 30 per cent higher than 2002. Strong demand for iron and steel in China bolstered demand for iron ore in other markets, with Japan, Korea and Taiwan all at record levels.
Price increases reflected the strong market, with a nine per cent increase for 2003 achieved in May.
Hamersley Iron(Rio Tinto: 100 per cent)
Hamersley Iron operates seven mines in Western Australia, including two mines in joint venture, 630 kilometres of dedicated railway, and port and infrastructure facilities located at Dampier. These assets are run as a single operation managed and maintained by Pilbara Iron. Hamersley employs approximately 70 people who work in Sales and Marketing. Hamersley has fewer employees than in 2003 as the majority of employees have been transferred to Pilbara Iron.
In 2003, Hamersley completed option analysis studies to increase its system capacity to ensure its ability to meet the needs of customers and the strong growth in demand for iron ore, particularly in China.
As a consequence, in December 2003, Rio Tinto approved a US$920 million expansion of the Dampier port, Yandicoogina mine, additional rail assets and feasibility study costs.
The port expansion will increase Dampier’s export capacity from 74 million tonnes per annum to 116 million tonnes per annum. The Yandicoogina mine expansion will increase its output to 36 million tonnes per annum; capacity was increased to 24 million tonnes per annum in 2004.
Commissioning of the Yandicoogina expansion will take place in the second half of 2005. Completion of the port expansion is scheduled for late 2005, with progressive commissioning from mid-2005.
Rio Tinto 2004Form 20-F 45
Back to Contents
Expansion work is continuing to provide additional rail, power and other infrastructure to complement the new port and mine requirements. Construction is well advanced to interconnect the power systems of Hamersley and Robe. Plans are at an advanced stage to expand and convert Paraburdoo power generation to being gas fired. Pre-development studies to further increase the capacity of existing mines and develop new mines are being progressed.
Construction of the US$67 million Eastern Range mine was completed in mid-April and its first product was shipped in the second quarter. Located ten kilometres east of Paraburdoo, the mine services an unincorporated joint venture between Hamersley Iron and Shanghai Baosteel Group Corporation, China’s largest iron and steelmaker. The joint venture, in which Hamersley holds a 54 per cent equity share, will supply ten million tonnes of standard Hamersley iron ore products per year over 20 years.
2004 operating performance
Hamersley Iron’s total production in 2004 was 78.1 million tonnes, 4.7 million tonnes more than in 2003. Rio Tinto’s share of this production was 74.2 million tonnes. Production was severely disrupted in early March by tropical cyclone Monty that required port facilities to be closed, and resulted in significant flood damage to the operations. Most operations returned to normal by the end of April, though the Tom Price mine continued to be affected into July, adversely affecting volumes, product mix and costs.
Shipments by Hamersley totalled 76.5 million tonnes, including sales through joint ventures. Hamersley’s shipments to China also reached a record level at 39.5 million tonnes, making China by far the single largest destination for Hamersley Iron ore.
Production from all mines was stretched to achieve these levels, placing cost and other operating stresses on the Hamersley system.
Costs increased in preparation for volume growth, with increased material movement, pre-stripping and higher maintenance activity. Costs of key mining inputs were inflated as a result of the high level of activity across the mining industry. Drilling and exploration programmes and pre-development studies all added significantly to 2004 costs.
The Pilbara Rail Company, formed in 2002, which effectively integrates the rail networks of Hamersley and Robe River into a single operation, continued to deliver operational efficiencies. Additional locomotives and ore cars were commissioned to enhance the overall system capacity.
In the spirit of closer cooperation with Robe, Hamersley shipped four million tonnes of product from its Yandicoogina mine through Robe’s Cape Lambert port facilities, now operated by Pilbara Iron. This has resulted in increased operational flexibility and relieves congestion at Dampier.
Hamersley Iron is currently undertaking an extensive drilling programme that is expected to accelerate conversion of its resource base into reserves. Focused on supporting strategic mine development options, it is one of the largest drilling efforts in Hamersley’s history.
In 2004, the Australian Industrial Relations Commission ratified the Rio Tinto Iron Ore Federal Award agreed between Hamersley Iron, Robe River, Pilbara Iron and the Australian Workers Union.
Hamersley continued to work sustainable development principles into its daily operations throughout the year. The Environmental Management System, certified to ISO 14001, passed the second audit conducted by an external accreditation body. The IronSafe system was launched in 2004, which aligns internal and external health and safety policies, procedures and documentation, throughout Rio Tinto’s Western Australian based iron ore operations.
| | Million tonnes |
|
|
| Hamersley’s total sales of iron ore to major markets in 2004 | |
| China | 39.5 |
| Japan | 19.0 |
| Other Asia | 14.5 |
| Europe | 3.5 |
|
|
| Total | 76.5 |
|
|
NOTE: This table includes 100 per cent of all sales through joint ventures.
Robe River Iron Associates(Rio Tinto: 53 per cent)
Robe River Iron Associates (Robe) is an unincorporated joint venture in which Mitsui (33 per cent), Nippon Steel (10.5 per cent) and Sumitomo Metal Industries (3.5 per cent) also have interests. Robe is the world’s fourth largest seaborne trader in iron ore, employing approximately 570 people, which is fewer than in 2003 as many employees have been transferred to Pilbara Iron.
Robe operates two open pit mining operations in Western Australia. Mesa J is located in the Robe Valley, north of the town of Pannawonica. The mine produces Robe River fines and lump, which are pisolitic iron ore products. The West Angelas mine, opened in 2002, is located approximately 100 kilometres west of the town of Newman. The mine produces West Angelas fines and lump, which are Marra Mamba iron ore products.
West Angelas mine production reached its original design rate of 20 million tonnes per year in the first quarter of 2004, two years earlier than planned. This increased Robe’s production capacity to a nominal 50 million tonnes per year. In 2003, Robe obtained approval to expand West Angelas to 25 million tonnes per year. Work started on the US$105 million expansion in early 2004 and completion is expected by mid 2005.
Rio Tinto 2004Form 20-F 46
Back to Contents
The rail expansion project to duplicate almost 145 kilometres of track and associated interconnection and infrastructure to increase the capacity of the Pilbara Rail main line is progressing. Robe uses a dedicated rail system, operated by Pilbara Rail, to transport ore from its mines to the company’s deepwater port facilities at Cape Lambert.
Robe exports under medium and long term supply contracts with major integrated steel mill customers in Japan, Europe, South Korea and China.
2004 operating performance
Robe’s total production in 2004 was a record 48.5 million tonnes, comprising 30 million tonnes from Mesa J, and 18.5 million tonnes from West Angelas. Production of Mesa J ore was affected in the first quarter by flooding caused by tropical cyclone Monty although production levels returned to normal by the end of April. Product quality was affected for a prolonged period. Robe’s total sales were 50.4 million tonnes, with strong demand in all major markets.
Sales were 31.2 million tonnes of Mesa J and 19.2 million tonnes of West Angelas products. Sales growth was based on increased West Angelas tonnage availability and focused primarily on Japan, where all customers exercised their tonnage options. Further penetration of the Chinese market was also achieved, with sales to China now accounting for one quarter of Robe’s sales. Increased marketing effort in China resulted in the signing of long term agreements with large steel mill customers.
Further studies are under way to improve understanding of the orebody at West Angelas and to determine appropriate mining strategies. In pit stockpiles were introduced in 2004 which has successfully reduced grade variation.
As part of a commitment to sustainable development, Robe updated its long term closure plans for each operation in consultation with community stakeholders.
| | Million tonnes |
|
|
| Robe’s total sales of iron ore to major markets in 2004 | |
| Japan | 26.6 |
| China | 13.0 |
| Europe | 8.2 |
| Other Asia | 2.6 |
|
|
| Total | 50.4 |
|
|
Iron Ore Company of Canada(Rio Tinto: 58.7 per cent)
Rio Tinto’s interest in Iron Ore Company of Canada (IOC) is 58.7 per cent. Mitsubishi (26.2 per cent) and the Labrador Iron Ore Royalty Income Fund (15.1 per cent) are also shareholders in IOC, Canada’s largest iron ore pellet producer. IOC operates an open pit mine, concentrator and pellet plant at Labrador City, Newfoundland, together with a 420 kilometre railway to port facilities and the partially refurbished pellet plant at Sept-Iles, Quebec.
Products are transported on IOC’s railway to Sept-Iles. The port is ice free all year and handles ore carriers of up to 255,000 tonnes. IOC exports its concentrate and pellet products to major North American, European and Asia Pacific steel makers.
The Sept-Iles pellet plant remains closed, following the suspension in September 2001 of the US$240 million refurbishment project.
A five year labour contract expired at the end of February 2004. As part of the change programme at IOC, a new contract was sought which would include more flexible working arrangements. Negotiations for the new contract started in January but despite protracted negotiations the workforce went on strike on 19 July, finally returning to work on 28 September. Mine operations were halted for ten weeks though ship loading from stockpiles continued for part of this period. IOC employs approximately 1,800 people.
2004 operating performance
Net earnings were US$3 million compared with US$7 million in 2003. The reduction in earnings was attributable to the lost production caused by a ten week strike.
Pellet production in the first half of 2004 showed a six per cent improvement over the corresponding period in 2003. Although operations recovered well from the shutdown, second half results were significantly affected and, as a result, full year total production was down 22 per cent on the 2003 level.
During 2004, IOC maintained its focus on the cost reduction programme that commenced in 2002. While progress has been slower than originally anticipated, the new labour agreement provides a further key element in improving the efficiency of the operation. The new agreement, taken together with the further gains made in 2004 in improving the reliability of key production systems, leaves IOC well placed to benefit in 2005. Emphasis remains on improving safety performance.
| | Million tonnes |
|
|
| IOC’s total sales of iron ore to major markets in 2004 | |
| Europe | 5.7 |
| North America | 3.7 |
| Asia Pacific | 2.1 |
|
|
| Total | 11.5 |
|
|
Rio Tinto 2004Form 20-F 47
Back to Contents
Mineração Corumbaense Reunida (Corumbá)(Rio Tinto: 100 per cent)
Corumbá has been transferred to the Iron Ore group in 2005 to accommodate plans to expand production at the mine to 15 million tonnes per year from one million tonnes. In 2004, Corumbá produced 1.3 million tonnes of iron ore which was barged along the Paraguay River to South American and European customers. Logistic options are being considered for expanded export sales, including supplies to a proposed steel making project at Corumbá. Total resources at Corumbá are over 400 million tonnes of lump ore grading 62.7 per cent iron. There are 420 employees.
Iron ore group projects
HIsmelt®(Rio Tinto: 60 per cent)
The HIsmelt®project is a joint venture between Rio Tinto (60 per cent interest through its subsidiary, HIsmelt®Corporation), US steelmaker Nucor Corporation (25 per cent), Mitsubishi Corporation (10 per cent), and Chinese steelmaker Shougang Corporation (5 per cent). The project has received approval for Australian federal government support of A$125 million.
The HIsmelt®process is a direct iron smelting technology developed largely by Rio Tinto that will convert iron ore fines into high quality pig iron (96 per cent iron content) without the use of coke ovens and sinter plants. Notably, the technology allows efficient processing of ore fines with higher levels of impurities.
A pilot plant to demonstrate the technology is being expanded to commercial scale at Kwinana in Western Australia. Construction began in January 2003. The plant will have a production capability of 800,000 tonnes of pig iron per year. Cold commissioning commenced in late 2004 and the first hot metal was produced in the hot commissioning process during the second quarter of 2005 after which it is planned the plant will ramp up to 60 per cent of capacity in the first year, 90 per cent in the second, to reach full capacity in the third. Significant industrial relations issues occurred in the latter half of 2004, resulting in 170,000 lost hours of construction.
In 2003, HIsmelt®signed a process licence agreement with the Laiwu Steel Group Ltd of China to allow for the development of an ironmaking facility using HIsmelt®technology. HIsmelt®has 100 employees.
Orissa, India (Rio Tinto: 51 per cent)
RTIO has a 51 per cent interest in Rio Tinto Orissa Mining, a joint venture with the state owned Orissa Mining Company. The joint venture holds rights to iron ore leases in Orissa, which it is seeking to develop. RTIO has recently appointed a project director to expedite the development of operations in India.
Simandou(Rio Tinto: 100 per cent)
The Simandou deposit in Guinea, west Africa, moved from Rio Tinto Exploration to full project status as part of RTIO in October 2004. Simandou is a greenfields discovery with potential to host significant resources of high grade iron ore. A prefeasibility study, started in fourth quarter 2004, will assess mining and transport options necessary to bring Simandou into production as quickly as possible. The Government of Guinea has an option to take a 20 per cent interest on a commercial basis.
| | |
 | 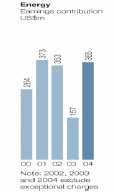 |
Rio Tinto Energy group’s coal interests are in Australia and the US. They supply internationally traded and domestic US and Australian markets. It also includes Rössing Uranium in Namibia and Energy Resources of Australia which supply uranium oxide for electricity generation.
In 2003, Rio Tinto formed a single management organisation for the Energy group’s coal assets in Australia. Rio Tinto and Coal & Allied (Rio Tinto: 75.7 per cent) agreed to combine Coal & Allied corporate and service functions with those of Pacific Coal to increase efficiencies and lower costs. Pacific Coal (Rio Tinto: 100 per cent) was renamed Rio Tinto Coal Australia (RTCA). Effective 1 February 2004, RTCA manages both Pacific Coal’s existing assets and Coal & Allied’s assets in the Hunter Valley in a centralised management structure which provides for shared costs.
At 31 December 2004, the Energy group accounted for 13 per cent of Group operating assets and, in 2004, contributed 20 per cent of Rio Tinto’s turnover and 16 per cent of adjusted earnings.
Preston Chiaro, chief executive Energy, is based in London.
Rio Tinto 2004Form 20-F 48
Back to Contents
Financial performance
2004 compared with 2003
The Energy group’s 2004 contribution to adjusted earnings was US$365 million, US$208 million higher than in 2003.
Results benefited from a strengthening market for thermal coal and the entry of the new Hail Creek mine into a rising market for coking coal.
2003 compared with 2002
The Energy group’s 2003 contribution to adjusted earnings was US$157 million, US$196 million lower than in 2002. A lower export thermal coal price and a stronger Australian dollar were the principal components of the reduced result.
Kennecott Energy(Rio Tinto: 100 per cent)
Kennecott Energy (KEC) wholly owns and operates four open cut coal mines in the Powder River Basin of Montana and Wyoming, US and has a 50 per cent interest in, but does not operate, the Decker mine in Montana. KEC also manages the Group’s interest in Colowyo Coal in Colorado, US. In total it employs some 1,770 people.
One of the largest US producers, KEC sells to electricity generators predominantly in mid western and southern states. Sales are made under multiple year contracts and on a spot basis for one year or less.
The domestic US market for low sulphur coal continues to grow due to its competitive cost per delivered energy unit and restrictions on sulphur emissions by utilities. Continued strong demand for low cost and low sulphur western coal is expected to increase with the announcement of numerous new coal fired generation projects and increased utilisation of existing coal generation capacity in the US.
2004 operating performance
KEC’s attributable production of 118 million tonnes of coal was nine per cent higher than in 2003 as a result of higher demand for low sulphur coal. Earnings of US$119 million were 35 per cent higher than 2003 earnings of US$88 million. This increase represents higher realised prices and sales volumes and a lower tax charge. KEC also made progress in implementing value delivery initiatives that led to cost reductions, productivity improvements, reduced capital requirements and value adding marketing benefits. These benefits were partially offset by higher fuel prices.
A detailed review of the mine plan and projected cash flows of the Colowyo coal business was completed in June 2004. This indicated that future operating and development costs are substantially higher than previously estimated. As a consequence of this, an exceptional charge of US$160 million was recorded in the first half of 2004 for the writedown of Colowyo’s fixed assets and recognition of related contract obligations. This is excluded from adjusted earnings.
Modified mining practices lowered the high wall and waste piles at Cordero Rojo and were successful in alleviating the instability issues that had affected production in 2003.
KEC successfully bid for an additional 177 million tonnes of in-situ coal reserves at West Antelope at a cost of US$146 million.
The improved safety performance of 2003 was sustained into 2004.
Rio Tinto Coal Australia(Rio Tinto: 100 per cent)
Rio Tinto Coal Australia (RTCA), formerly Pacific Coal, manages the Group’s Australian coal interests. These comprise the Blair Athol (Rio Tinto: 71 per cent), Kestrel (Rio Tinto: 80 per cent), Tarong (Rio Tinto: 100 per cent) and Hail Creek (Rio Tinto: 82 per cent) coal mines and the Clermont deposit (Rio Tinto: 50 per cent). RTCA also provides management services to Coal & Allied Industries for day to day operation of its four mines.
About 60 per cent of Blair Athol thermal coal is sold to its two Japanese joint venture partners under contracts extending to 2008 and 2010. The rest is sold by long term and annual agreements to European and southeast Asian customers.
Production from the wholly owned Tarong mine is sold to Tarong Energy Corporation, an adjacent state owned power utility. A ten year contract for up to 7.5 million tonnes annually expires in 2010.
Kestrel, the only underground mine, sells mainly metallurgical coal to customers in Japan, south east Asia, Europe and Central America generally on annual agreements.
After the first commercial shipments in October 2003, the new coking coal mine at Hail Creek ramped up to its production capacity of 5.5 million tonnes per annum during 2004. Acceptance has been strong in all markets, resulting in a decision in mid 2004 to expand production to eight million tonnes per year at a total cost of US$157 million. During 2004, a further two per cent of the asset was sold to existing joint venture partners and eight per cent to Nippon Steel Corporation which entered a 15 year coal purchase contract.
RTCA employs some 904 people.
2004 operating performance
RTCA’s earnings of US$180 million were 157 per cent higher than in 2003 due to new production from Hail Creek, stronger demand and improved prices. Export thermal coal prices increased by 40 per cent, export coking coal prices increased by 20 per cent and domestic prices by 28 per cent.
Blair Athol shipments were constrained during the year by infrastructure: early in the year by failure of loading equipment at the Dalrymple Bay Coal Terminal and late in the year by port congestion.
Rio Tinto 2004Form 20-F 49
Back to Contents
Production decreased from 12.5 million tonnes to 12.2 million tonnes while sales were 11.8 million. Kestrel’s production of 3.3 million tonnes matched 2003 while shipments of 3.2 million tonnes of coking and thermal coal were 13 per cent lower than in 2003. The production sequence in 2004 involved two longwall changes. At Tarong, production increased by seven per cent to seven million tonnes in line with increased demand from Tarong Energy Corporation. Hail Creek production was 5.1 million tonnes of which 4.7 million tonnes were shipped.
Rio Tinto’s share of coal production was 23 million tonnes, an increase of 22 per cent on 2003, principally resulting from production ramp up at Hail Creek.
Although Blair Athol achieved a 75 per cent reduction over 2003 in lost time injury frequency rate, the business overall improved safety performance by only 15 per cent and fell well short of the best ever recorded in 2002.
Coal & Allied Industries(Rio Tinto: 75.7 per cent)
Coal & Allied Industries (Coal & Allied) is publicly listed on the Australian Stock Exchange and had a market capitalisation of A$2.9 billion (US$2.2 billion) at 31 December 2004. In 2003, a committee of independent Coal & Allied directors, negotiated an agreement with Rio Tinto to combine Coal & Allied’s corporate and management functions with those of Rio Tinto Coal Australia. The combined management organisation lowers costs, achieves economies of scale and removes duplicated functions for both Coal & Allied and Rio Tinto.
Coal & Allied’s assets are all located within the Hunter Valley in New South Wales, Australia. It wholly owns Hunter Valley Operations, has an 80 per cent interest in Mount Thorley Operations and a 55.57 per cent interest in the contiguous Warkworth mine, and a 40 per cent interest in the Bengalla mine which abuts its wholly owned Mount Pleasant development project. Coal & Allied also has a 37 per cent interest in Port Waratah Coal Services.
Coal & Allied produces thermal and semi soft coal. Most of its thermal coal is sold under contracts to electrical or industrial customers in Japan, Korea and elsewhere in Asia. The balance is sold in Europe and in Australia. Coal & Allied’s semi soft coal is exported to steel producing customers in Asia and Europe under a combination of long term contracts and spot business.
Coal & Allied employs some 1,095 people.
2004 operating performance
Earnings of US$51 million were achieved compared with a loss of US$24 million in 2003. Export coal prices increased by 37 per cent. Good progress was made in implementing operational cost reductions including the agreement to combine corporate and management functions with those of RTCA, formerly Pacific Coal, and operational integration of the Mount Thorley and Warkworth operations, in order to improve performance in 2004 and beyond.
At all operations, sales were constrained by insufficient rail infrastructure to meet producer demand. The Port Waratah Coal Services Port Allocation System was introduced in April 2004 to limit ship queues and reduce demurrage and will continue at least through 2005.
At Hunter Valley Operations production increased from 12 million tonnes to 13.3 million tonnes while sales were 12.8 million tonnes. The integrated Mount Thorley Warkworth operations increased production from nine million tonnes to 10.5 million tonnes while sales were 10.1 million tonnes. At Bengalla, production decreased from 6.2 million tonnes to 5.3 million tonnes due to mine sequencing issues while sales were 5.8 million tonnes.
Rio Tinto’s share of coal production was 16.7 million tonnes, an increase of nine per cent on 2003, principally resulting from expanded use of seven day rosters, improved productivity and use of contractors to meet strong market demand within the constraints of the Port Allocation System.
Although the lost time injury frequency rate was reduced by 45 per cent from 2003, the result was overshadowed by a fatal injury to an employee of a contractor at Mount Thorley operations in May.
Rössing Uranium (Rio Tinto: 68.6 per cent)
Rössing produces and exports uranium oxide from Namibia to European, US and Asia Pacific electricity producers. Production has been lower than the 4,500 tonnes per year capacity for some years due to market conditions. Rössing employs approximately 830 people.
2004 operating performance
Total production of 3,582 tonnes of uranium oxide was 49 per cent higher than 2003 as a result of higher plant availability and improved market conditions. Expiring long term higher priced sales contracts have been replaced by contracts in line with 2004 market prices. Higher realised prices were more than offset by the strengthening of the Namibian dollar against the US dollar resulting in a loss of US$4 million compared with a loss of US$19 million in 2003. Initiatives to deliver cost savings continued, as did studies on opportunities to extend the mine beyond the life of the existing pit.
In 2004, Rössing’s safety performance continued to improve with a 66 per cent reduction in the lost time injury frequency rate.
Energy Resources of Australia(Rio Tinto: 68.4 per cent)
Energy Resources of Australia Ltd (ERA) is publicly listed and had a market capitalisation of A$1.3 billion (US$1.0 billion) at 31 December 2004. ERA employs approximately 260 people with 13 per cent of the operational workforce represented by Aboriginal people.
Rio Tinto 2004Form 20-F 50
Back to Contents
ERA produces uranium oxide at the Ranger open pit mine, 260 kilometres east of Darwin in the Northern Territory. ERA also has title to the nearby Jabiluka mineral lease, which in 2003 was put on long term care and maintenance. Ranger has a 5,500 tonnes per year capacity and began production in 1981. Estimated ore reserves are sufficient to maintain uranium oxide production for approximately eight years at current rates. ERA’s operations including Jabiluka are surrounded by, but remain separate from, the World Heritage listed Kakadu National Park and especially stringent environmental requirements and governmental oversight apply. Uranium oxide from Ranger is sold to electricity utilities in Japan, Korea, Europe and North America.
2004 operating performance
Uranium oxide production of 5,143 tonnes was above the previous year in response to greater sales commitments. Stronger prices were offset by the strengthening Australian dollar and resulted in earnings of US$19 million, an increase of US$8 million from 2003.
In response to a water contamination incident and a series of equipment radiation clearance breaches that occurred in late 2003 and early 2004, mining and processing operations were suspended for a total of 10 days to ensure that all work necessary to rectify the deficiencies was either complete or under way. In both cases, the government Supervising Scientist's report concluded that it is most unlikely that anyone suffered any long term health effects. ERA has since successfully passed three government audits and has committed to implementing the Australian Health and Safety Standard AS4801 in addition to ISO 14001. On 1 June 2005 ERA was fined A$150,000 in the Darwin Magistrate’s Court after having pleaded guilty to two charges related to these incidents.
Safety performance for 2004 deteriorated against 2003 in terms of lost time injuries.
Energy group projects
Clermont Coal(Rio Tinto: 50.1 per cent)
The Clermont deposit is near RTCA’s Blair Athol mine. It is suited to open cut development. A feasibility study commenced in 2004. Integration options with Blair Athol are available following the signing of a strategic alliance agreement by the Blair Athol and Clermont Joint Ventures. JPower joined the Clermont Joint Venture after acquiring a 15 per cent interest from Rio Tinto and Mitsubishi in 2003.
Mount Pleasant(Rio Tinto: 75.7 per cent)
Development of the Mount Pleasant project continued with further optimisation work in 2004 on the pre-feasibility study undertaken in 2002.
INDUSTRIAL MINERALS GROUP
Rio Tinto’s Industrial Minerals group produces borates, industrial salt, talc and titanium dioxide feedstock. Rio Tinto Borax, Rio Tinto Iron & Titanium, Luzenac and Dampier Salt, its principal businesses, are leading suppliers of their respective products.
The Industrial Minerals group employed approximately 7,000 people in 2004.
Rio Tinto 2004Form 20-F 51
Back to Contents
At 31 December 2004, the Industrial Minerals group accounted for 13 per cent of the Group’s operating assets and contributed approximately 15 per cent of Rio Tinto’s turnover and 10 per cent of adjusted earnings in 2004.
Andrew Mackenzie replaced Tom Albanese as chief executive Industrial Minerals, and is based in London.
Financial performance
2004 compared with 2003
Industrial Minerals’ contribution to 2004 earnings was US$223 million, 45 per cent higher than in 2003, reflecting higher volumes and prices at Borax, increased prices at Rio Tinto Iron & Titanium and the partial reversal of a writedown taken in 2003 relating to a customer receivable. There was also a steady improvement in trading conditions for both the talc and salt businesses in 2004. These factors were partially offset by the strength of the Canadian dollar and South African rand against the US dollar.
Rio Tinto Borax’s earnings were 18 per cent higher at US$94 million. The borates business benefited from continued strength in the US housing market and increasing demand from China.
Rio Tinto Iron & Titanium earnings at US$95 million were 102 per cent higher than in 2003. Although the conventional feedstock market remained in oversupply, earnings benefited from stronger demand for iron, steel, rutile and zircon co-products. Production of conventional slags reflected market conditions, while production of upgraded slag (UGS) continued to run at capacity.
2003 compared with 2002
Industrial Minerals’ contribution to 2003 earnings was US$154 million, 46 per cent lower than in 2002, reflecting the significant weakening of the US dollar against both the Canadian dollar and South African rand and continued weakness across North American and European markets.
Rio Tinto Borax’s earnings were eight per cent lower at US$80 million. The cost base was negatively impacted by higher natural gas and diesel prices, rising employee benefit costs in California and net one off charges.
Rio Tinto Iron & Titanium earnings at US$47 million were 71 per cent lower than in 2002 due to the effect of the weak US dollar, soft market conditions and a charge associated with the writedown of a customer receivable in 2003.
Rio Tinto Borax(Rio Tinto: 100 per cent)
Rio Tinto Borax’s Boron mine in California’s Mojave Desert is the world’s largest borate mine. Borates are used in the US for vitreous applications, such as fibreglass, glass wool, high temperature glasses and enamels. The perborate industry, a major market in Europe, uses borates as bleach in detergents. Other uses include ceramics, fertilisers, flame retardants, wood preservatives and corrosion inhibitors.
Rio Tinto Borax’s US and UK research laboratories provide technical support and participate in collaborative projects with customers.
2004 operating performance
Production volumes were steady at 565,000 tonnes. Sales were nine per cent higher than 2003, due to good trading conditions driven by the US construction sector, growth from newer applications and Chinese demand.
The first phase of an expansion of boric acid capacity, announced in 2003, is scheduled to come on stream in 2005. Approval to commence a second phase expansion has been received, with construction to be completed by 2006.
Rio Tinto Iron & Titanium(Rio Tinto: 100 per cent)
Rio Tinto Iron & Titanium (RIT) comprises the wholly owned QIT-Fer et Titane (QIT) in Quebec, Canada and the 50 per cent interest in Richards Bay Minerals (RBM) in KwaZulu-Natal, South Africa. Both produce titanium dioxide feedstock used by customers to manufacture pigments for paints and surface coatings, plastics and paper, as well as iron and zircon co-products.
QIT’s proprietary process technology enables it to supply both the sulphate and chloride pigment manufacturing methods. Its upgraded slag (UGS) plant supplies the growing chloride sector and is designed for expansion in line with demand up to a capacity of 600,000 tonnes per year from its current level of 250,000 tonnes. During 2003 RIT announced an expansion of its UGS plant to 325,000 tonnes per annum, with new production on schedule to commence in 2005.
RBM’s ilmenite has a low alkali content which makes its feedstock suitable for the chloride pigment process. RBM has the capacity to produce one million tonnes of feedstock annually.
2004 operating performance
Demand for titanium dioxide pigment improved strongly throughout 2004. However, the feedstock side of the industry continued to be affected by the general oversupply of conventional chloride and sulphate slag feedstocks and feedstock inventory levels at some pigment producers. In contrast, demand for very high grade chloride feedstock products, such as UGS, remains strong. Overall, RIT production of titanium dioxide feedstocks was the same as 2003, reflecting both market conditions and the effect of the introduction of new capacity.
Demand for iron and steel coproducts was exceptionally strong during 2004, with prices reaching historic highs. Zircon markets continued to be very tight.
Rio Tinto 2004Form 20-F 52
Back to Contents
Dampier Salt(Rio Tinto: 64.9 per cent)
Dampier Salt (DSL) is now the world’s largest salt exporter. It produces industrial salt by solar evaporation at Dampier, Port Hedland and Lake MacLeod, where it also mines gypsum, in Western Australia.
The chemical industry in Asia is the principal customer for DSL’s salt whilst gypsum’s main use is in wallboard and cement manufacture.
2004 operating performance
Dampier Salt’s earnings in 2004 were unchanged, at US$10 million. While trading conditions were improved through higher volumes, earnings were impacted by the weakness of the US dollar and escalating costs in north western Australia. Salt production was three per cent higher than 2003, at 7.4 million tonnes (Rio Tinto share: 4.8 million tonnes).
Commissioning of a new process plant at Dampier began in December 2004.
Luzenac Group(Rio Tinto: 99.9 per cent)
The Luzenac Group operates talc mines, including the world’s largest, in south west France, and processing facilities in Australia, Austria, Belgium, Canada, France, Italy, Japan, Mexico, Spain, the UK and the US.
Luzenac products are used internationally. Principal uses are in paper, paints, cosmetics, ceramics, agricultural and plastics industries.
2004 operating performance
Earnings in 2004, at US$24 million, were 41 per cent higher than the previous year reflecting recovery in the US paper industry and new product developments. Luzenac’s production in 2004 was six per cent higher than 2003 at 1.44 million tonnes.
Sales volumes were slightly higher than from 2003, while prices showed gradual improvement.
Industrial minerals group projects
QIT Madagascar Minerals(Rio Tinto: 80 per cent)
RIT manages QIT Madagascar Minerals (QMM), in which an agency of the Government of Madagascar has a 20 per cent interest. QMM was formed to evaluate and, if appropriate, develop large mineral sand deposits in the south east of Madagascar.
In November 2001, QMM was granted an environmental permit by the Government for the proposed minerals sands project. The permit requires QMM to comply with a full range of social and environmental obligations throughout the life of the project.
A feasibility study is progressing and RIT is working with the Government, as well as all other interested and affected parties, with a view to making a decision on development in 2005.
Rio Colorado Potash(Rio Tinto: option to acquire 100 per cent)
Rio Tinto entered into an option agreement in 2003 to acquire 100 per cent of Potasio Rio Colorado SA, an Argentine company holding the mineral rights and other assets of the Rio Colorado potash project. The project is located 1,000 kilometres south west of Buenos Aires, in the provinces of Mendoza and Neuquen. The option runs until late 2005, during which time Rio Tinto will evaluate the commercial potential for developing the project. A pilot plant was commissioned in 2004 as part of this evaluation.
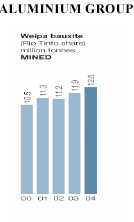
Rio Tinto 2004Form 20-F 53
Back to Contents
Rio Tinto’s Aluminium group encompasses its wholly owned, integrated aluminium subsidiary, Comalco, and its 51 per cent share in Anglesey Aluminium.
At 31 December 2004, the Aluminium group accounted for 23 per cent of Rio Tinto’s operating assets and in 2004 contributed 17 per cent of Group turnover and 15 per cent of adjusted earnings.
Oscar Groeneveld succeeded Sam Walsh as chief executive Aluminium, and is based in Brisbane, Australia.
Financial performance
2004 compared with 2003
Rio Tinto Aluminium’s contribution to 2004 earnings was US$334 million, an increase of 67 per cent.
Stronger aluminium prices increased earnings by US$162 million with the average three months aluminium price in 2004 at 78 US cents per pound compared with 65 US cents per pound in 2003. The effect of the weakening US currency reduced Aluminium’s earnings by US$55 million.
2003 compared with 2002
Aluminium’s contribution to 2003 earnings was US$200 million, a decrease of 22 per cent from 2002.
Stronger aluminium prices increased earning by US$51 million with the average three month aluminium price in 2003 at 65 US cents per pound compared with 61 US cents per pound in 2002. The effect of the weakening US currency reduced Aluminium’s earnings by US$111 million.
Rio Tinto Aluminium
Rio Tinto Aluminium is a major supplier of bauxite, alumina and primary aluminium to world markets. It employs about 3,850 people.
Rio Tinto Aluminium has a large, wholly owned bauxite mine on Cape York Peninsula, Queensland. A US$150 million mine expansion was completed on time to supply the bauxite requirements of the Comalco Alumina Refinery. Approximately 90 per cent of the bauxite from Weipa is shipped to alumina refineries at Gladstone, Queensland and Sardinia, Italy.
Construction of the first stage of the wholly owned Comalco Alumina Refinery at Gladstone in Queensland was completed in late 2004, ahead of schedule and close to the budget of US$750 million. Operations have commenced and first shipments were made in November 2004, three months ahead of schedule. The refinery is expected to produce 1.4 million tonnes of alumina annually, with full capacity due to be reached by the end of 2006. There is potential for capacity to be increased to over four million tonnes per year in two additional stages and a small team is working on a feasibility study for Stage Two. The majority of the refinery’s Stage One output will go into Rio Tinto Aluminium smelters. The balance will be placed in the traded alumina market. The refinery enables Rio Tinto Aluminium to add further value to the Weipa bauxite deposit and strengthen both Rio Tinto Aluminium’s and Australia’s positions in the world alumina market.
In 2004, Comalco sold its four per cent interest in the Boké bauxite deposit in West Africa to other shareholders in the joint venture for US$12 million. The gain of US$4 million has been excluded from adjusted earnings.
In 2003, Comalco signed a long term alumina supply agreement with Norsk Hydro, to supply 300,000 tonnes of alumina in 2005 and then 500,000 tonnes of alumina per year for more than 20 years. This agreement underpins the investment in the Comalco Alumina Refinery.
Rio Tinto Aluminium’s primary aluminium is produced by smelters at Boyne Island at Gladstone (59.4 per cent), Bell Bay (100 per cent) in Tasmania, Tiwai Point (79.4 per cent) in New Zealand and Anglesey Aluminium (51 per cent) in Wales, UK.
2004 operating performance
Overall, Rio Tinto’s share of bauxite production in 2004 increased by four per cent above 2003, despite a first quarter affected by wet weather and the sale of Boké in June 2004.
Bauxite production at Weipa was 12.6 million tonnes, six per cent higher than in 2003. Weipa bauxite shipments increased eight per cent, to 12.3 million tonnes, compared with 2003 levels.
Rio Tinto 2004Form 20-F 54
Back to Contents
QAL production increased by one per cent compared to 2003, despite an interruption to the refinery’s power supply. This interruption reduced production by approximately 85,000 tonnes (33,000 tonnes Rio Tinto share) but otherwise QAL enjoyed strong production for the balance of the year. Eurallumina production increased four per cent over 2003 levels.
Rio Tinto Aluminium’s share of aluminium production from its four smelters at 837,000 tonnes was 20,000 tonnes above 2003 production. Attributable metal shipments for 2004 were 841,000 tonnes, an increase of 21,000 tonnes, and went to similar destinations as in 2003, primarily Japan, Australia, Europe and Korea.
Production at Anglesey increased by two per cent, Boyne Island increased by four per cent, Tiwai Point increased by five per cent. The Bell Bay smelter suffered equipment failure in June in the electrical switchyard, resulting in a three per cent decrease in production. The equipment has been replaced and production returned to normal levels.
Aluminium group projects
Weipa mine expansion(Rio Tinto: 100 per cent)
The US$150 million mine expansion at Weipa in 2004 is expected to increase capacity to 16.5 million tonnes of bauxite per year. The mining upgrade relates to a move to simultaneous mining at Weipa’s Andoom and East Weipa mines and involves a change in ore characteristic (fine ore) to that previously being mined. The majority of the expenditure for the project was on a 9.5 million tonne beneficiation plant to allow mining of lower grade fine ores. The next activity will be the construction of a new US$42 million power station for the Weipa mining operations and surrounding communities.
Rio Tinto’s Copper group comprises Kennecott Utah Copper in the US and interests in the copper mines of Escondida in Chile, Grasberg in Indonesia, Northparkes in Australia, Palabora in South Africa, and the Resolution Copper project in the US. The group also has management responsibility for Kennecott Minerals Company and Kennecott Land in the US.
In March 2004, Rio Tinto sold its holding in Freeport-McMoRan Copper and Gold Inc. (FCX) to FCX for net consideration of US$882 million. Later in the year, it divested its interests in the Zinkgruvan and Neves Corvo mines for a net consideration of US$193 million which included a profit sharing adjustment and the sale of the rights to future price participation on the Neves Corvo sale. Sale of the Fortaleza nickel complex in Brazil was completed in early 2004 for total cash consideration of about US$80 million. The sale of Rio Tinto’s 51 per cent interest in Rio Paracatu Mineração for US$250 million was completed at the end of the year. Responsibility for Rio Tinto Brasil, owner of the Corumbá iron ore mine, was transferred to the Iron Ore group. The gains arising from business disposals by the Copper group have been excluded from adjusted earnings.
At 31 December 2004, the Copper group, which also produces gold as a significant co-product, accounted for 19 per cent of the Group’s operating assets and, in 2004, contributed approximately 22 per cent of Rio Tinto’s turnover, of which 70 per cent was from copper and the remainder mostly from gold. It accounted for 39 per cent of adjusted earnings in 2004.
Tom Albanese, who took over from Oscar Groeneveld as chief executive Copper, is based in London.
Financial performance
2004 compared with 2003
The Copper group’s contribution to earnings was US$856 million, US$416 million higher than in 2003. The average price of copper was 130 US cents per pound compared to 80 US cents in 2003. The average gold price of US$409 per ounce increased by 13 per cent.
Kennecott Utah Copper’s contribution to earnings of US$293 million compared with US$88 million in 2003.
Rio Tinto’s share of earnings from Escondida increased by US$294 million to US$416 million. Mined production of copper was up 22 per cent due to the resumption of full production at the beginning of 2004.
Rio Tinto 2004Form 20-F 55
Back to Contents
The earnings contribution from the Grasberg joint venture decreased by US$66 million to US$38 million chiefly as a result of the material slippage in October 2003. Early in 2004 efforts were directed at accelerating the removal of waste material to restore safe access to the higher grade area of the open pit. Production activities in this area resumed in the second quarter and grades improved during the second half.
Palabora recorded a loss of US$21 million in 2004 due to the negative effect of the stronger rand in relation to the US dollar combined with lower volumes and higher costs due to continued delays in reaching production capacity in the underground mine.
2003 compared with 2002
The Copper group’s contribution to earnings was US$440 million in 2003, US$99 million higher than in 2002. The average price of copper was 80 US cents per pound compared to 71 US cents in 2002. The average gold price of US$363 per ounce increased by 17 per cent.
Kennecott Utah Copper’s 2003 contribution to earnings of US$88 million was broadly in line with 2002.
Rio Tinto’s earnings from Escondida increased to US$122 million despite constrained output in response to weak market demand. Mined production of copper was up 32 per cent (Rio Tinto’s share) due to the commissioning of the new Laguna Seca concentrator.
The Grasberg joint venture’s earnings contribution decreased by US$5 million to US$127 million chiefly as a result of the material slippage in October. This had an adverse effect on both volumes and costs. In the fourth quarter, only lower grade material was mined from the open pit and near term mine sequencing operations were directed to restoration of safe access to the higher grade areas. Despite full production from the underground mine, mill throughput was still significantly below capacity.
Earnings at Palabora decreased to US$1 million in 2003 due to the negative effect of the stronger rand in relation to the US dollar combined with lower volumes and higher costs due to delays in reaching production capacity in the underground mine.
Kennecott Utah Copper(Rio Tinto: 100 per cent)
Kennecott Utah Copper (KUC) operates the Bingham Canyon mine, Copperton concentrator and Garfield smelter complex, near Salt Lake City, US.
KUC supplies more than ten per cent of annual US refined copper requirements and employs approximately 1,500 people. Negotiation of a new labour agreement, to last until September 2009, was concluded in June 2003. The agreement provided for greater flexibility in deployment of personnel and assignment of work.
KUC provides some management services to the wholly owned Barneys Canyon gold mine due to its proximity to Bingham Canyon. Mining and milling at Barneys Canyon ended in 2001 but gold production continues until 2005. The operation employs about 20 people.
KUC, as the owner of 53 per cent of undeveloped land in the Salt Lake Valley of Utah, formed Kennecott Land to develop about 16,000 hectares of the 37,200 hectares owned. The initial 1,800 hectare Daybreak project site lies in the path of expanding residential areas. Kennecott Land has the right to build roads, make utility connections and prepare the land for sale to builders who will construct houses for 30,000 people. Rio Tinto initially invested US$50 million. The first revenues were received in 2004.
2004 operating performance
Net earnings of US$293 million were US$205 million above 2003 assisted by higher metal prices. Byproduct grades, particularly gold and silver, remained at 2003 levels but are anticipated to return to life of mine averages in 2005. Molybdenum production was 48 per cent higher than in 2003 due to higher head grades and recoveries.
Refined copper production was seven per cent higher than in 2003. A project to enlarge the Bingham Canyon open pit was approved in February 2005. The East 1 pushback is expected to extend the life of the open pit to 2017. Capital expenditure on the project is budgeted to be US$100 million for mine facilities, a concentrator upgrade and mobile equipment, and US$70 million after 2008 for the relocation of the in pit crusher and dewatering facilities. The East 1 pushback is a higher value, lower capital intensive option than the previous mine plan which was predicated on development of an underground mine from 2013. Mine development options from 2017 will be reviewed in the context of the decision to proceed with the East 1 pushback, and include various open pit and underground alternatives. A one off non cash charge of US$36 million has been recorded in 2004 to reflect an increase in the present value of provisions for environmental remediation costs, based on the assumption that mining operations cease in 2017. Pending any extension of the assumed mine life beyond 2017, there will be an increase in the annual depreciation charge and amortisation of discount from 2005 of around US$45 million.
Rio Tinto 2004Form 20-F 56
Back to Contents
| | 2002 | | 2003 | | 2004 | |
|
|
|
|
|
| |
| Principal operating statistics at KUC 2002 – 2004 | | | | | | |
| Rock mined (’000 tonnes) | 150,331 | | 135,204 | | 129,196 | |
| Ore milled (’000 tonnes) | 40,720 | | 46,105 | | 45,712 | |
| Head grades: | | | | | | |
| Copper (%) | 0.69 | | 0.67 | | 0.63 | |
| Gold (g/t) | 0.44 | | 0.29 | | 0.29 | |
| Silver (g/t) | 3.42 | | 3.02 | | 3.04 | |
| Molybdenum (%) | 0.034 | | 0.027 | | 0.033 | |
| Copper concentrates produced (’000 tonnes) | 992 | | 1,147 | | 1,106 | |
| Production of metals in copper concentrates | | | | | | |
| Copper (’000 tonnes) | 260.2 | | 281.8 | | 263.7 | |
| Gold (’000 ounces) | 412 | | 305 | | 308 | |
| Silver (’000 ounces) | 3,663 | | 3,548 | | 3,584 | |
| Molybdenum concentrates produced (’000 tonnes) | 11.2 | | 8.8 | | 12.9 | |
| Contained molybdenum (’000 tonnes) | 6.1 | | 4.6 | | 6.8 | |
| Concentrate smelted on site (’000 tonnes) | 1,096 | | 1,060 | | 1,098 | |
| Production of refined metals | | | | | | |
| Copper (’000 tonnes) | 293.7 | | 230.6 | | 246.7 | |
| Gold (’000 ounces) | 488 | | 308 | | 300 | |
| Silver (’000 ounces) | 4,037 | | 2,963 | | 3,344 | |
|
|
|
|
|
| |
Grasberg(Rio Tinto: 40 per cent joint venture)
Grasberg, in Papua, Indonesia, is one of the world’s largest copper and gold mines in terms of reserves and production. It is owned and operated by Freeport Indonesia (PTFI), the principal and 91 per cent owned subsidiary of the US based Freeport-McMoRan Copper & Gold Inc. (FCX).
To meet the mine’s social obligations to local communities, at least one per cent of Grasberg’s net sales revenues are committed to support village based programmes. In addition, two new trust funds were established in 2001 in recognition of the traditional land rights of the local Amungme and Komoro tribes. In 2004, PTFI contributed US$17.8 million (net of Rio Tinto portion) and Rio Tinto US$1.6 million in total to the funds.
As a result of training and educational programmes, Papuans represented more than a quarter of PTFI’s approximately 9,000 workforce by the end of 2004.
2004 operating performance
Grasberg open pit production was affected by two rock slippages in the last quarter of 2003. Consequently, a large part of 2004 was focused on ensuring a safe production environment into the future. This resulted in lower than predicted open pit copper and gold production due to a combination of lower tonnages and grades of ore exacerbated by using low grade ore from the pit to supplement mill production during the first four months of the year. Pit production stabilised during the second half of the year. In December 2004, Rio Tinto and FCX agreed the adjustment to the Participation Agreement and sharing of insurance proceeds attributable to the Grasberg pit slippage incidents. Rio Tinto’s share of insurance proceeds contributed US$20 million to net earnings.
| | 2002 | | 2003 | | 2004 | |
|
|
|
|
|
| |
| Principal operating statistics for PTFI 2002-2004 | | | | | | |
| Ore milled (’000 tonnes) | 86,001 | | 74,103 | | 67,750 | |
| Head grades: | | | | | | |
| Copper (%) | 1.14 | | 1.09 | | 0.87 | |
| Gold (g/t) | 1.24 | | 1.54 | | 0.88 | |
| Silver (g/t) | 3.60 | | 4.03 | | 3.85 | |
| Production of metals in concentrates | | | | | | |
| Copper (’000 tonnes) | 864.4 | | 715.8 | | 516.4 | |
| Gold (’000 ounces) | 3,030 | | 3,262 | | 1,584 | |
| Silver (’000 ounces) | 6,402 | | 6,474 | | 5,037 | |
|
|
|
|
|
| |
Escondida(Rio Tinto: 30 per cent)
The low cost Escondida copper mine in Chile is one of the largest copper mines in the world, with a mine life expected to exceed 30 years at current rates of production. The mine is 57.5 per cent owned and managed by BHP Billiton.
Approval was given in 2003 for the US$400 million Escondida Norte project. The satellite deposit will provide mill feed to maintain capacity at Escondida above 1.2 million tonnes per annum of copper in concentrate and cathode to the end of 2008 as existing Escondida mine grades decline. First production from Norte is expected in the fourth quarter of 2005. Rio Tinto’s share of the project cost is US$120 million.
In 2004 a US$870 million sulphide leach project was approved involving the use of bacteria to leach copper from sulphide ores that would otherwise be discarded as waste. The project will produce 180,000 tonnes (Rio Tinto share 54,000 tonnes) of copper cathode metal per annum for more than 25 years. It is scheduled to start production during the second half of 2006.
Escondida employs approximately 2,800 people directly, together with 2,400 contractor personnel.
Rio Tinto 2004Form 20-F 57
Back to Contents
2004 operating performance
Escondida’s mined copper production was 22 per cent higher than in 2003. In late 2003 high clay content in the ore caused problems in recovering water from tailings that inhibited production from the new Laguna Seca concentrator. These problems were resolved in early 2004 and the concentrator achieved an average throughput of 105,216 tonnes per day during the year compared to the design capacity of 110,000 tonnes per day. Overall, Escondida ore tonnes milled were 17 per cent higher and copper grades six per cent higher than in 2003.
| | 2002 | | 2003 | | 2004 | |
|
|
|
|
|
| |
| Principal operating statistics at Escondida 2002-2004 | | | | | | |
| Rock mined (’000 tonnes) | 306,620 | | 300,386 | | 377,356 | |
| Ore milled (’000 tonnes) | 46,536 | | 70,347 | | 82,378 | |
| Head grade: | | | | | | |
| Copper (%) | 1.58 | | 1.43 | | 1.51 | |
| Production of metals in concentrates | | | | | | |
| Copper (’000 tonnes) | 622.6 | | 847.0 | | 1,045.6 | |
| Gold (’000 ounces) | 126 | | 184 | | 217 | |
| Silver (’000 ounces) | 2,981 | | 4,728 | | 5,747 | |
| Copper cathode (’000 tonnes) | 138.7 | | 147.6 | | 152.1 | |
|
|
|
|
|
| |
Palabora(Rio Tinto: 49.2 per cent)
Palabora Mining Company (Palabora) is a publicly listed company on the Johannesburg Stock Exchange and operates a mine and smelter complex in South Africa.
Palabora has developed a US$465 million underground mine with a planned production rate of 30,000 tonnes per day of ore. Approximately 1.6 million tonnes of copper are expected to be produced over its 20 year life.
Palabora supplies most of South Africa’s copper needs and exports the balance. It employs approximately 1,700 people and labour agreements are negotiated annually.
2004 operating performance
Palabora recorded a net loss of US$21 million compared with earnings of US$1 million in 2003. With closure of the open pit mine in 2002 after 40 years of production, a start was made on commissioning of the underground block cave mining project. During 2003 and 2004 the ramp up to full production of 30,000 tonnes per day was hindered by fragmentation problems and poor performance of remote rock breaking equipment. The average production rate of underground ore mined during the last quarter of 2004 was 26,500 tonnes per day, with 27,250 tonnes per day in December, compared to the target of 30,000 tonnes per day.
The aggregate impact of the limited production from the underground mine, and the strength of the rand against the US dollar, partly offset by cost saving actions, adversely affected earnings, and led to additional borrowing requirements. In addition, this triggered an evaluation of the recoverable amount of Palabora’s copper business which resulted in a provision for asset impairment of US$161 million after tax and outside shareholders’ interests. This is excluded from adjusted earnings.
Palabora is selling its magnetite iron ore stockpile with completion expected in 2005, a by-product of previous and current copper mining, that is stored on site. The stockpile is estimated to contain over 235 million tonnes of material grading more than 55 per cent iron.
| | 2002 | | 2003 | | 2004 | |
|
|
|
|
|
| |
| Principal operating statistics at Palabora 2002-2004 | | | | | | |
| Ore milled (’000 tonnes) | 9,933 | | 11,415 | | 8,657 | |
| Head grade: | | | | | | |
| Copper (%) | 0.63 | | 0.59 | | 0.74 | |
| Copper concentrates produced (’000 tonnes) | 167.9 | | 163.3 | | 187.7 | |
| Contained copper (’000 tonnes) | 52.2 | | 52.4 | | 54.4 | |
| New concentrates smelted on site (’000 tonnes) | 258.6 | | 267.6 | | 253.4 | |
| Refined copper produced (’000 tonnes) | 81.6 | | 73.4 | | 67.5 | |
|
|
|
|
|
| |
Northparkes(Rio Tinto: 80 per cent)
Rio Tinto’s interest in the Northparkes copper-gold mine resulted from the acquisition of North Limited. Northparkes is a joint venture with the Sumitomo Group (20 per cent).
Following an initial open pit operation at Northparkes in central New South Wales, Australia, underground block cave mining has been undertaken since 1997. With present and future developments, the operation has an expected life of 13 years at current production rates.
The copper concentrate produced is shipped under long term contracts that provide for periodic negotiation of certain charges, as well as spot sales, to smelters in Japan (67 per cent), Australia (14 per cent) and other countries (19 per cent).
Northparkes employs approximately 160 people together with 140 permanent contractors.
Rio Tinto 2004Form 20-F 58
Back to Contents
2004 operating performance
Production from the first underground block cave ceased in early 2003 and is being replaced by the Lift 2 block cave which commenced production in 2004. Progress with mine development for Lift 2 was hampered by high rock stresses which adversely affected mine development but assists in the caving of the orebody with good fragmentation. The transition to Lift 2 was completed in 2004.
| | 2002 | | 2003 | | 2004 | |
|
|
|
|
|
| |
| Principal operating statistics at Northparkes 2002-2004 | | | | | | |
| Ore milled (’000 tonnes) | 5,364 | | 5,168 | | 5,008 | |
| Head grade: | | | | | | |
| Copper (%) | 0.86 | | 0.67 | | 0.79 | |
| Gold (g/t) | 0.35 | | 0.44 | | 0.66 | |
| Production of contained metals | | | | | | |
| Copper (’000 tonnes) | 38.4 | | 27.1 | | 30.0 | |
| Gold (’000 ounces) | 40.8 | | 48.6 | | 79.4 | |
|
|
|
|
|
| |
Kennecott Minerals(Rio Tinto: 100 per cent)
Kennecott Minerals in the US manages the Greens Creek mine (Rio Tinto: 70 per cent) in Alaska and the Rawhide mine (Rio Tinto: 51 per cent) in Nevada. It also owns the Group’s interest in the Cortez gold mine (Rio Tinto: 40 per cent), also in Nevada. Ore extraction from Rawhide was completed in October 2002 and reclamation work is well advanced.
Kennecott Minerals employs approximately 300 people, excluding employees of non managed operations.
2004 operating performance
Net earnings of US$79 million were US$19 million above 2003, benefiting from higher gold prices. Gold production decreased by three per cent at the Cortez gold mine.
Greens Creek(Rio Tinto: 70.3 per cent)
In addition to gold, the Kennecott Greens Creek mine on Admiralty Island in Alaska produces silver, zinc and lead.
2004 operating performance
Mill throughput was three per cent higher than in 2003, but due to lower grades, silver and zinc production from Green’s Creek were 17 per cent and nine per cent lower, respectively, than in 2003.
Copper group projects
Resolution(Rio Tinto: 55 per cent)
The Resolution project is situated in Arizona, US, in the area of the depleted Magma (Superior) copper mine. In 2001, an agreement was signed with BHP Billiton Base Metals which allowed Rio Tinto to earn a 55 per cent interest in the project by spending US$25 million over six years. In 2003, five deep exploration drillholes intersected significant copper mineralisation, indicating a large deposit at depth. Rio Tinto completed earning its 55 per cent interest in the project in early 2004. The project is currently in the preliminary stages of a prefeasibility study. It is anticipated that studies will take some considerable time.
Cortez Hills(Rio Tinto: 40 per cent)
Rio Tinto holds a 40 per cent interest in the Cortez gold mine, a joint venture with Placer Dome. The mine is located in northeastern Nevada, US, and the associated area of interest includes the Cortez Hills deposit, discovered in 2003 which contains proven and probable reserves of 7.5 million ounces of gold. A feasibility study is in progress to determine the optimum sequencing for development of the deposits within the Cortez area of interest. It is anticipated that operating permits for Cortez Hills will be obtained in 2006, with initial gold production occurring in mid 2007.
Eagle(Rio Tinto: 100 per cent)
The Eagle project is a small tonnage, high grade nickel deposit located in Michigan, US, for which Kennecott Minerals has commissioned a prefeasibility study.
Rio Tinto 2004Form 20-F 59
Back to Contents
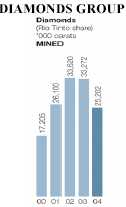
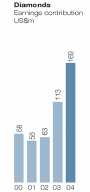
With diamonds becoming a significant earner for Rio Tinto, the Diamonds product group was formed in 2003 from the former Diamonds & Gold group. The group comprises Rio Tinto’s 60 per cent interest in the Diavik Diamonds mine in Canada, the wholly owned Argyle mine in Australia, Rio Tinto’s 78 per cent interest in the Murowa mine in Zimbabwe which started production in 2004 and diamond sales and representative offices in Belgium and India.
Rio Tinto is a leading proponent of the Kimberley Process which seeks to ensure that only legitimately mined and traded rough diamonds are introduced into the world market. Programmes are in place to ensure that firms operating to acceptable standards of social responsibility process diamonds mined by Rio Tinto. Rio Tinto sells its diamonds through its marketing arm, Rio Tinto Diamonds, according to their mine source in order to gain the benefits of origin.
At 31 December 2004, Diamonds accounted for eight per cent of the Group’s operating assets and, in 2004, contributed five per cent of Rio Tinto’s turnover and eight per cent of adjusted earnings.
Keith Johnson, chief executive, Diamonds, is based in London.
Financial performance
2004 compared with 2003
Diamonds contributed US$169 million to adjusted earnings, an increase of US$56 million from 2003, assisted by the continuing operating success of the Diavik Diamonds mine.
The diamond market continued to be strong. There was robust growth in retail jewellery sales in the US and the Japanese market grew for the first time in a number of years. Industry rough prices improved, particularly for large, clean, white rough diamonds for which demand has been consistently in excess of supply. Prices also increased for polished diamonds.
2003 compared with 2002
Diamonds in 2003 contributed US$113 million to adjusted earnings, up US$50 million from 2002, reflecting the startup of the Diavik Diamonds mine.
Demand for rough diamonds was strong throughout 2003 with the rough market outperforming the market for polished stones.
Diavik Diamonds(Rio Tinto: 60 per cent)
Diavik Diamond Mines (DDMI) owns Rio Tinto’s interest in and manages the unincorporated Diavik Diamonds joint venture in the Northwest Territories of Canada.
The project was completed in 2003 well ahead of schedule and within budget. Initial production of gem quality diamonds commenced in January 2003 with commissioning of the process plant. Production will build up over the next two years.
DDMI’s commitment to work with Aboriginal communities was formally concluded in five participation agreements, providing training, employment and business opportunities. Procurement contracts for the operating phase were negotiated with Aboriginal businesses.
2004 operating performance
Net earnings were US$145 million, US$104 million more than in 2003. Sales of diamonds continued to attract a high level of interest with prices being achieved at a significantly higher level than originally projected.
Production continued to ramp up during 2004 and exceeded expectations in nearly all respects. Record volumes were produced as the process plant comfortably exceeded design throughput on a consistent basis. Improving grades continued to reflect the processing of mud rich material that surrounds the kimberlite proper.
A strategic planning team, separate from mine operations, is studying how best to capture the upside of a stronger market and new geological information for both the A154South and A154North kimberlites. After 12 months of study, Rio Tinto approved the construction of the A418 dike at an expected cost of US$190 million. Construction is planned to commence in mid 2005. Rio Tinto also approved studies to investigate the feasibility of underground mining of three of the four kimberlite bodies. The studies will include the construction of an exploratory decline. The project is expected to cost US$75 million. Diavik includes some of the most valuable kimberlites in the world.
Rio Tinto 2004Form 20-F 60
Back to Contents
Argyle(Rio Tinto: 100 per cent)
Rio Tinto owns and operates the Argyle diamond mine in Western Australia.
Production from Argyle’s major resource, the AK1 open pit mine, is expected to continue until 2007 with processing continuing for a short while thereafter. A feasibility study is under way into underground mining by the block caving method beneath the open pit. A decision is expected in 2005 relating to mine closure or further mine development. Development of an exploration decline commenced in 2003 to assist in confirming design criteria. The range of statutory approvals required for underground operation includes environmental and social impact assessments. Argyle employs approximately 780 people.
2004 operating performance
Net earnings of US$23 million were US$49 million lower than in 2003. Diamond production for 2004 was 33 per cent lower with 21 million carats produced. Tight mining conditions prevailed as a result of the deepening open pit which, together with abnormally wet weather, limited mine production. Lower grade ore from stockpiles supplemented ore from the mine.
Reserves decreased following the development of a new resource model and revised mine plan which resulted in some material being transferred to resources.
Murowa(Rio Tinto: 78 per cent)
Early in 2004, Rio Tinto and Rio Tinto Zimbabwe approved expenditure of US$11 million on a small scale plant to start diamond production at Murowa near Zvishavane in southern Zimbabwe.
An updated feasibility study confirmed the existence of three kimberlite pipes representing a mining reserve of 18.7 million tonnes of ore at a grade of 0.9 carats per tonne.
Commercial production commenced in the third quarter. Initial operations are focused on 1.3 million tonnes of weathered material containing 140,000 tonnes of enriched ore. A phased approach reduces the initial investment required and allows confirmation of marketing and regulatory arrangements prior to expansion, which could be considered within three years. Diamonds from Murowa are marketed through Rio Tinto Diamonds in Antwerp. Safeguards are in place regarding the chain of custody of the product. Zimbabwe is a signatory of the Kimberley Process.
Following the decision to proceed with Murowa, the directors of Rio Tinto Zimbabwe (RioZim) agreed to a restructuring of Rio Tinto’s 56 per cent shareholding in RioZim. As a result of the restructure, Rio Tinto owns a direct 78 per cent interest in Murowa and has a residual economic interest in RioZim. RioZim became an independent, Zimbabwean controlled, listed company owning the remaining 22 per cent of Murowa.
2004 operating performance
Net earnings were US$1 million. The construction and commissioning of facilities and infrastructure was the main objective in 2004. While commissioning problems in the process plant delayed full capacity being reached, the fourth quarter saw the first parcel of diamonds successfully mined, processed and sold.
OTHER OPERATIONS
Other operations comprise the Lihir gold mine in Papua New Guinea, the Kelian gold mine in Indonesia and the Sari Gunay gold project in Iran.
Lihir(Rio Tinto: 14.5 per cent)
Lihir Gold is a publicly quoted company formed to finance and develop the Lihir mine in Papua New Guinea. Lihir Gold had a market capitalisation of A$1.49 billion (US$1.16 billion) at 31 December 2004.
Lihir directly employs approximately 1,070 people, of whom 91 per cent are Papua New Guinea nationals, including 36 per cent Lihirians. Some 1,600 contractors are also employed.
2004 operating performance
Lihir’s contribution to Rio Tinto’s earnings for 2004 included US$12 million resulting from the revaluation of ore stockpiles to restore these to the lower of cost and net realisable value taking account of changes in circumstances including higher gold prices.
Gold production at Lihir was 8.9 per cent higher than in 2003 due to higher throughput and higher head grades.
Kelian(Rio Tinto: 90 per cent)
Kelian Equatorial Mining (Kelian) operated an open pit gold mine in East Kalimantan, Indonesia.
Mining ceased in 2003 with production from stockpiled ore completed in February 2005. A mine closure consultative process was completed in 2003 with stakeholders agreeing on the key mine closure directions. Work is continuing on mine closure activities including establishment of post closure institutions, the upgrade of the Namuk tailings dam, and rehabilitation and revegetation. Work is planned for removal of camp and operating facilities and the camp site area prepared for future wetlands development.
Rio Tinto 2004Form 20-F 61
Back to Contents
Kelian has been reducing employee and contractor numbers as it winds down its operations and focuses on mine closure activities. Settlement of compensation claims is continuing under a 2001 agreement and a number of programmes are in place to provide sustainable solutions for local communities and former employees after closure.
2004 operating performance
Rio Tinto’s share of Kelian’s production was 295,000 ounces in 2004, 30 per cent below the previous year, as a result of the processing of low grade stockpiles.
Project
Sari Gunay(Rio Tinto: 70 per cent)
The Sari Gunay (formerly Dashkasan) project in Iran entered the prefeasibility stage during the year. Work continued on the delineation of the sizeable body of gold mineralisation discovered in Kordestan province in western Iran. Drilling continued to outline additional mineralisation and to increase confidence in existing estimates.
Metallurgical test work and community and environmental baseline studies continued.
EXPLORATION GROUP
Rio Tinto Exploration seeks to discover or identify mineral resources that will contribute to the growth of the Rio Tinto Group. The discovery of new resources is essential to replace deposits as they are mined and to help meet the increasing global demand for minerals and metals.
The Exploration group is opportunistic in approach and its resources are deployed on projects that show the best chance of delivering a world class deposit to Rio Tinto. Mineral exploration is a high risk activity. Rio Tinto’s statistics show that an average of only one in 350 mineral prospects that are drill tested result in a mine for the Group. Rio Tinto believes in having a critical mass of projects, selected through a rigorous process of prioritisation.
The Exploration group is organised into four geographically based teams and a fifth team that looks for industrial minerals on a global basis. Additionally, a small focused project generation team covers the world for new opportunities.
At the end of 2004, Rio Tinto was exploring in 30 countries for a broad range of commodities including copper, diamonds, nickel, industrial minerals, gold, bauxite, iron ore and coal. Exploration employs 191 geologists and geophysicists around the world and has a total complement of 880 people.
Tom Albanese succeeded David Klingner as head of Exploration, and is based in London.
2004 operating performance
Exploration in 2004 focused on advancing the most promising targets across the spectrum of grassroots, generative, drill test stage, and near mine programmes. Encouraging results were obtained from a number of locations.
Order of magnitude studies were completed on the Simandou (iron ore, Guinea) and Eagle (nickel-copper, Michigan, US) projects. Both projects have been transferred to relevant product group teams for pre-feasibility assessment. Since 2001 five projects have moved from exploration to the next stage of project evaluation including Resolution (copper, Arizona, US) and Potasio Rio Colorado (potash, Argentina). In addition to these projects, near mine exploration has also been undertaken. Where resources have been supplemented or additional resource discovered this has been has reported by the respective product group.
Several projects are in the process of, or about to initiate, order of magnitude studies to assess their economic potential for advancement to pre-feasibility assessment. An order of magnitude study was commenced at the La Sampala nickel laterite resource in Indonesia, and is nearing completion.
The çöpler and Marcona deposits discovered previously were divested in 2003 and 2004 respectively. In 2004, the Group’s interest in the Sepon project in Laos was sold.
Diamond exploration continued in Canada, southern Africa, Mauritania, Brazil and India. A number of diamond bearing kimberlite pipes were discovered and follow up test work is in progress to gauge economic potential.
Copper exploration continued in Turkey, Peru, Chile, Argentina and the US. Copper mineralisation was encountered in drilling in projects in Turkey and Peru, which warrant further follow up drill testing.
Exploration focus on the bulk commodities iron ore, coal and bauxite has been increasing each year for the last several years and evaluation of several projects is continuing with the intention to progress two projects to product group handover in 2005.
The Exploration group was active in the search for industrial mineral deposits in a number of parts of the world including North and South America, Europe, south east Asia and Turkey.
The Exploration group continued to support brownfield work at a number of Rio Tinto operations. Additional work to develop the Argyle diamond mine continued. In the US and Argentina, active programmes were conducted in the vicinity of the Boron and Tincalayu mines. In Indonesia, exploration in and around the Grasberg mine led to the addition of further copper reserves.
Rio Tinto 2004Form 20-F 62
Back to Contents
Financial performance
2004 compared with 2003
Cash expenditure on exploration in 2004 was US$193 million and the pre-tax charge to earnings was US$187 million, a US$60 million increase over 2003, reflecting increased iron ore exploration in Western Australia and acceleration of evaluation on significant projects by product groups during the year.
2003 compared with 2002
Cash expenditure on exploration in 2003 was US$130 million and the pre-tax charge to earnings was US$127 million, similar to 2002.
TECHNOLOGY GROUP
The Technology group provides technical assistance to Rio Tinto’s product groups and their businesses, and advises executive management. In support of the drive towards operational excellence, a key focus is to identify and implement best practices, to improve safety and environmental performance, maximise operating efficiency and add value across Rio Tinto.
Technology staff include experienced professionals covering all the main industry related disciplines, while the Office of the Chief Technologist manages the Group’s involvement in external and collaborative research.
The total staff in the Technology group at year end was 362 compared with 333 in 2003.
Ian Smith, head of Technology, is based in London. He was formerly managing director, Aluminium Smelting, Comalco and succeeded John O’Reilly who moved to a part time role on 1 May 2005.
2004 operating performance
Technical Services
Technical Services continued to increase its involvement with Rio Tinto operations and also provided significant contributions at non managed operations. Activity over the year was again at record levels, with a strong focus on the enhancement of initiatives to improve performance and implement best practice such as in water management and metallurgical margin improvement. New initiatives recently commenced include Excellence in Mine Planning and Resource Management.
A number of current development projects are linked with external research programmes in order to leverage value for Rio Tinto. Others are focussed on innovation and best practice in key areas to add value in a shorter time frame.
Office of the Chief Technologist
The Office of the Chief Technologist is responsible for the identification and the transfer of technology based opportunities for the Group.
The external research portfolio covers a broad range of industry related initiatives. Some of these link directly with internal development projects. Work on improving efficiency and reducing costs is continuing in areas such as comminution, water usage and materials handling. A number of breakthrough projects are also being pursued.
The Rio Tinto Foundation for a Sustainable Minerals Industry approved a further 14 projects for funding.
Technical Evaluation and Project Management
Technical Evaluation continued in its principal role of providing independent review of all major investment proposals being considered by the Group. Risk assessment and management is an important and integral component of the project review process. The unit also continued with the programme of post investment reviews. It has established a database to consolidate the findings so that lessons learned from completed projects can be shared within the Group.
The Project Management Unit provides ongoing support to major project teams across Rio Tinto, both for projects in execution and those still in the feasibility stage. There was also continued involvement with some major projects at non managed operations. Two project management forums were held during the year focussing on collaboration between projects and lessons learned.
Asset Utilisation
This unit is now well established across the Group and its workload continued to expand. There has been particularly heavy involvement with the iron ore operations in Western Australia which is expected to continue through 2005. The process control group is now well established. The development of tools to improve performance continues, including on asset integrity and remote monitoring.
There is continuing emphasis on ensuring that safety, operability and maintainability issues are fully addressed and incorporated in all the unit’s work.
Financial performance
The charge for the Technology group against net earnings was US$25 million, compared with US$16 million in 2003. The increase was mainly due to the weaker US dollar and the greater level of activity in all Technology group units.
Rio Tinto 2004Form 20-F 63
Back to Contents
GROUP SOCIETY AND ENVIRONMENT

The way we work
Rio Tinto is in business to create value by finding and developing world class mineral deposits and operating and eventually closing operations safely, responsibly and efficiently. To do so, the Group takes a disciplined and integrated approach to the economic, social and environmental aspects of all its activities.
The approach to achieving this is through implementation of the policies described inThe way we work, Rio Tinto’s statement of business practice, at all levels of the business.
The statement, redistributed in 2003 in 19 languages, is the result of many months of wide internal consultation and discussion and represents shared values from around the Group. The document was published initially in January 1998. It was revised in 2002 in the light of experience, following further Group wide review and consultation, external benchmarking of policies against the best practice of other organisations and approval by the Rio Tinto board.
The way we workcommits the Group to transparency consistent with normal commercial confidentiality, corporate accountability and the application of appropriate standards and internal controls. It sets the basis for how Group companies' employees work and also provides guidance for joint venture partners and others. Every employee is responsible for implementing the policies in the document.
Rio Tinto has adopted the Association of British Insurers’ 2003 disclosure guidelines on social responsibility in preparing this report. Details of the Group’s overall and individual businesses’ social and environmental performance continue to be published on the Rio Tinto website: www.riotinto.com/se and in theSustainable development review.
Board responsibilities
The directors of Rio Tinto, and of Group companies, are responsible for monitoring adherence to the Group policies outlined inThe way we work. Assurance for performance in these areas involves checking, reviewing and reporting each business’s implementation of the policies, their compliance with regulations and voluntary commitments, and the effectiveness of management and control systems, while also providing mechanisms for improvement.
As discussed in the section on Corporate governance on pages 82 to 89, the boards established a process for identifying, evaluating and managing the significant risks faced by the Group. Directors meet regularly, have regular scheduled discussions on aspects of the Group’s strategy and full and timely access to the information required to discharge their responsibilities fully and effectively.
Rio Tinto’sCompliance guidancerequires that the identification of risk be systematic and ongoing. It recommends that each Group company undertakes a structured risk profiling exercise to identify, categorise and weigh the risks it faces in the conduct of its business. Each Group company puts systems in place to ensure that risks are reviewed at an appropriate frequency.
Total remuneration is related to performance through the use of annual bonuses, long term incentives and stretching targets for personal, financial and safety performance.
The board’sCommittee on social and environmental accountabilityreviews the effectiveness of policies and procedures. The committee comprises four non executive directors and is chaired by the chairman of the main board. It meets three times annually with the chief executive and heads of Technology, Health, Safety and Environment and Communication and Sustainable Development.
Reports for the committee summarise significant matters identified through Rio Tinto’s assurance activities. These include reviews every four years of each business to identify and manage strategic risks in relation to health, safety, and the environment; audits against Rio Tinto standards; annual risk management audits; risk reviews for specific concerns, such as cyanide management and smelter operations; procedures and systems for reporting critical and significant issues and incidents; completion of annual internal control questionnaires by all Group business leaders covering the full spectrum of business and operational risk; and findings and recommendations of the independent external assurance and data verification programme.
Rio Tinto 2004Form 20-F 64
Back to Contents
Policies, programmes and results
Implementation of the policies inThe way we workis discussed in the following sections named according to each policy area. Known risks arising from social and environmental matters and their management in Group businesses are described in the relevant Group operations section.
Safety
Safety is a core value and a major priority. Rio Tinto believes that all injuries are preventable and its goal is zero injuries. To achieve this, full and consistent implementation of and accountability for Rio Tinto’s comprehensive standards, guidelines, systems and procedures is required across the world. The Group is also building a supportive safety culture that requires visible leadership, ongoing education and training and a high level of participation by everyone in the workplace.
However, there is still some way to go in achieving the goal of zero. In 2004, very regrettably one contractor lost his life at a managed operation. The Group has demonstrated strong improvements in the lost time injury frequency rate (LTIFR) and all injury frequency rate (AIFR) from 2003, with reductions of 21 per cent and 15 per cent respectively. The LTIFR for 2004 was 0.65 per 200,000 hours worked by employees and contractors (2003: 0.82).
Fines for infringement of safety regulations totalled US$19,200 (2003: US$162,000).
Occupational health
Rio Tinto strives to protect physical health and well being in the workplace. This requires clear standards, consistent implementation, transfer of best practice and improvement through Group wide reporting and tracking of remedial actions.
During 2004, Group businesses worked to implement the occupational health standards and 81 per cent of employees now work at an operation where the occupational health standards have been implemented. In 2004, there were 72 new cases of occupational disease per 10,000 employees, (2003: 107).
Operations were temporarily suspended at Energy Resources of Australia’s (ERA) Ranger uranium mine in Australia during March 2004 following an incident of drinking water contamination. The government Office of the Supervising Scientist appointed independent health experts to investigate and advise on the potential for long term harm to workers as a result of the water contamination. They concluded that longer term health effects were most unlikely.
Operations were again temporarily suspended at the end of August 2004 to review safety and health systems following the issue of two reports from the Office of the Supervising Scientist. One report concerned the incident of drinking water contamination and the other concerned radiation clearance procedures for equipment leaving site. Three Australian Government audits arising from the incidents have been satisfactorily completed. On 1 June 2005 ERA was fined A$150,000 in the Darwin Magistrate’s Court after having pleaded guilty to two charges related to these incidents Rio Tinto’s southern African operations are nearing full implementation of the Group HIV/AIDS strategy. This provides access to antiretroviral therapy that is affordable for employees and a partner. Operations in Asia and west Africa are in the process of refining their local strategies to meet Group requirements.
In 2004, Rio Tinto set targets to focus attention on reducing noise induced hearing loss across the Group. The target of zero exposure of employees to a noise dose of more than 82 decibels (averaged over eight hours), after allowing for the use of hearing protection was not met, with 0.5 per cent of employees still exposed to noise greater than this limit.
Fines for infringement of occupational health regulations in 2004 involved four operations, totalling US$257,000 (2003: US$900).
Environment
Wherever possible Rio Tinto prevents, or otherwise minimises, mitigates and remediates, harmful effects of the Group’s operations on the environment.
To do this, the Group seeks to understand the environmental aspects and impacts of what it does, build what is learned into systems to manage and minimise those impacts, and set targets for improvement.
After significant Groupwide consultation, Rio Tinto’s environment standards were finalised and approved in 2003 for implementation by June 2005. During 2004, significant work continued on ways to improve efficiency of greenhouse gas emissions, energy use and water withdrawn from the environment.
By the end of 2004, 84 per cent of operations had implemented ISO 14001 or an equivalent environmental management system (EMS). All Rio Tinto operations are required to have a certified EMS by the end of June 2005: by the end of 2004, 72 per cent of operations had achieved this. There was no change in the number of significant environmental incidents (16) compared to 2003. There was a decrease in the number of significant spills from eight to four. Fines for infringements of environmental regulations involved three operations and totalled US$53,800 (2003: US$126,000).
Land access
Rio Tinto seeks to ensure the widest possible support for its proposals throughout the life cycle of the Group’s activities by coordinating economic, technical, environmental and social factors in an integrated process.
This involves negotiation of mining access agreements with indigenous landowners; responsible land management and rehabilitation; planning for closure; developing and implementing a biodiversity strategy; and forming strategic partnerships with external organisations.
Rio Tinto 2004Form 20-F 65
Back to Contents
Political involvement
Rio Tinto does not directly or indirectly participate in party politics nor make payments to political parties or individual politicians.
ABusiness integrity guidance,addressing bribery, corruption and political involvement, was issued in 2003 to assist managers in implementing this policy. The guidance covers questions relating to compliance and implementation; gifts and entertainment; the use of agents and intermediaries; and “facilitation” payments.
Rio Tinto avoids making facilitation payments anywhere in the world. Bribery in any form is prohibited. Gifts and entertainment are only offered or accepted for conventional social and business purposes and then only at a level appropriate to the circumstances.
Communities
Rio Tinto sets out to build enduring relationships with its neighbours that are characterised by mutual respect, active partnership, and long term commitment.
Every business unit is required to have rolling five year community plans which are updated annually. In 2004, a series of pilot studies were completed aimed at achieving a deeper level of understanding of the linkages between mining activities and the economies in which they take place.
All Group businesses produce their own reports for their local communities and other audiences. Community assurance of the quality and content of these reports is increasing. This provides an opportunity for engagement with the community on their views of programmes sponsored by the operations.
Businesses managed by Rio Tinto contributed US$87.8 million to community programmes in 2004 (2003: US$70 million). Of the total contributions, US$34.2 million was community investment and US$24.1 million in direct payments made under legislation or an agreement with a local community.
Human rights
Rio Tinto supports human rights consistent with the Universal Declaration of Human Rights and Rio Tinto respects those rights in conducting the Group’s operations throughout the world.
Rio Tinto also supports the UN Secretary General’s Global Compact, the US/UK Voluntary Principles on Security and Human Rights and the Global Sullivan Principles.
Rio Tinto’sHuman rights guidanceis designed to assist managers in implementing the Group’s human rights policy in complex local situations. It was revised and republished in 2003. In 2004, a web based training module was developed to instruct managers on what the policy means in practice and how to respond to difficult situations.
Employment
Rio Tinto recognises that business performance is closely linked to effective people development. It has a long term plan to strengthen approaches to the training and development of leaders in the Group.
In 2004, a suite of formal leadership programmes was developed and implemented for both strategic and Group business leaders. In total, ten customised leadership development programmes, involving 225 participants, were successfully run in 2004 in partnership with leading business schools in Europe, North America and Australia. All product groups and businesses were represented. It is planned to run a further ten strategic and business leadership development programmes in 2005 involving about 250 participants.
As well as using the open programmes run by the London Business School and International Institute for Management Development for future leaders, Rio Tinto commissioned the design of a customised, operational leadership programme to be launched in 2005 with eight programmes involving about 240 further participants from across the Group at manager and superintendent level.
These programmes are all focused on ensuring that leaders, at all levels, are well prepared for the wide range of current and future challenges they will face in taking forward a complex and commercially successful organisation. All of these programmes are closely integrated with the core leadership competencies Rio Tinto has identified as necessary for effective leaders wherever they work in the organisation.
Pilot programmes were undertaken in 2004 on the use of career development tools and their application to new and better approaches to coaching and mentoring employees. In 2005, Group wide workshops to improve the capability of all involved in managing careers are being organised.
People development in Rio Tinto is focused on ensuring technical and professional competence. In 2004, five projects were undertaken to define these competencies in Marketing, Finance, Human Resources, Community Relations and Health, Safety and Environment teams. This led to a pilot development programme being successfully designed and delivered for early career Human Resources professionals.
In 2005, all five streams will focus on implementing across the Group common professional development tools, programmes and systems. Competency in these functions will be extended to cover all other disciplines to ensure that the Group builds and strengthens its skills capability at all levels and to facilitate more effective collaboration on areas of common interest in different businesses.
In the past few years, Rio Tinto has focused on strengthening and developing leaders; in 2005 the focus will be on developing talent and potential at all levels and building a stronger alignment between individual and business performance.
Rio Tinto 2004Form 20-F 66
Back to Contents
Rio Tinto requires safe and effective working relationships in all its operations. Whilst respecting different cultures, traditions and employment practices, common goals are shared, in particular the elimination of workplace injuries, and commitment to good corporate values and ethical behaviour.
In 2004, Group companies employed 28,000 people (2003: 29,000) and, together with Rio Tinto’s proportionate share of those employed by joint ventures and associates, the total was 33,000 (2003: 36,000) mainly concentrated in Australia and North America. Wages and salaries paid in 2004 excluding Rio Tinto’s proportionate share of joint ventures and associates totalled US$1.7 billion (2003: US$1.5 billion).
Retirement payments and benefits to dependants are provided in accordance with local conditions and good practice.
Rio Tinto encourages the involvement of its employees in the Group’s performance through their participation in an employee share scheme. As stated inThe way we work, the Group recognises the right of employees to choose whether or not they wish to be represented collectively.
Sustainable development
Rio Tinto believes that its businesses, projects, operations and products should contribute constructively to the global transition to sustainable development.
All businesses are required to assess the sustainable development case for their activities. Rio Tinto has committed itself to integrating the results of the Mining, Minerals and Sustainable Development (MMSD) analysis of 2002 into the Group’s policy and objectives, and developing measures to assess their implementation. As a founding member of the International Council on Mining and Metals, Rio Tinto is participating in dialogue and programmes to advance industry wide progress on key sustainable development priorities.
A Sustainable Development Leadership Panel (SDLP) was formed in 2004 to provide Group leadership and encourage businesses to make sustainable development considerations an integral part of business plans and decision making processes.
Openness and accountability
Rio Tinto conducts the Group’s affairs in an accountable and transparent manner, reflecting the interests of Rio Tinto shareholders, employees, host communities and customers as well as others affected by the Group’s activities.
Policies on transparency, business integrity, corporate governance and internal controls and reporting procedures are outlined inThe way we work. In 2003, aCompliance guidancewas issued to provide a framework to enable each Group business to implement and maintain a best practice compliance programme which should identify and manage risks associated with non compliance with laws, regulations, codes, standards and Rio Tinto policies.
Assurance and verification
To be accountable and transparent, assurance is provided to the Group and others that Rio Tinto policies are being implemented fully and consistently across the Group’s businesses and operations.
The overall objective of the external assurance and data verification programme is to provide assurance that the material in theSustainable development reviewis relevant, complete, accurate and responsive, and, in particular, that Rio Tinto’s policies and programmes are reflected in implementation activities at operations. In 2004, Environmental Resources Management (ERM) undertook the external assurance and data verification programme and the results are available in Rio Tinto’sSustainable development review(previously theSocial and environment review).
Competition
Rio Tinto has adopted a specific antitrust policy requiring all employees to compete fairly and to comply with relevant laws and regulations. Under the policy, guidance is provided on contacts with competitors and benchmarking as well as implementation of the policy in individual businesses. As integral parts of the policy, all relevant employees will receive regular training and will be required to certify annually that they are not aware of any antitrust violations.
Item 6. Directors, Senior Management and Employees
CHAIRMAN
1. Paul Skinner(age 60)
Paul Skinner was appointed chairman in November 2003. He graduated in law from Cambridge University and in business administration from Manchester Business School. A director of Rio Tinto since 2001and chairman of theNominations committee.He was previously a managing director of The “Shell” Transport and Trading Company plc and group managing director of The Royal Dutch/Shell Group of Companies, for whom he had worked since 1966. He is a director of Standard Chartered PLC and the Tetra Laval Group. He is also a member of the board of INSEAD business school. (notes b and d)
Rio Tinto 2004Form 20-F 67
Back to Contents
EXECUTIVE DIRECTORS
2. Leigh Clifford(age 57)
Leigh Clifford became chief executive in 2000, having been a director of Rio Tinto plc since 1994 and Rio Tinto Limited since 1995. A mining engineer he is a bachelor of engineering and a master of engineering science. He has held various roles in the Group’s coal and metalliferous operations since joining in 1970, including managing director of Rio Tinto Limited and chief executive of the Energy group. He is a former director of Freeport-McMoRan Copper & Gold Inc and a non executive director of Barclays Bank plc.
3. Guy Elliott(age 49)
Guy Elliott became finance director of Rio Tinto in 2002. He holds an MA from Oxford and joined the Group in 1980 after gaining an MBA from INSEAD business school. He has subsequently held a variety of management positions, including being president of Rio Tinto Brasil from 1996 to 1999.
NON EXECUTIVE DIRECTORS
4. Ashton Calvert(age 59)
Ashton Calvert was appointed a director of Rio Tinto with effect from 1 February 2005. He recently retired as secretary of the Department of Foreign Affairs and Trade of the Government of Australia. He was educated at the University of Tasmania and, as a Rhodes scholar, also gained a doctorate in mathematics from Oxford University. During his career in the Australian foreign service he held appointments in Washington and, on four occasions, in Tokyo, where he was ambassador between 1993 and 1998 prior to his appointment as secretary. In these and other roles he developed extensive experience of the Asian countries which represent key markets for Rio Tinto. (notes b, d and e)
5. Sir David Clementi(age 56)
Sir David was appointed a director of Rio Tinto in January 2003. He is chairman of Prudential plc, prior to which he was Deputy Governor of the Bank of England. Sir David’s earlier career was with Kleinwort Benson where he spent 22 years, holding various positions including chief executive and vice chairman. A graduate of Oxford University and a qualified chartered accountant, Sir David also holds an MBA from Harvard Business School. (notes a, c and e)
6. Vivienne Cox(age 46)
Vivienne Cox was appointed a director of Rio Tinto with effect from 1 February 2005. She is currently executive vice president of BP p.l.c. for Integrated Supply and Trading and also for Gas Power and Renewables. She is a member of the BP group chief executive’s committee. She holds degrees in chemistry from Oxford University and in business administration from INSEAD. During her career in BP she has worked in chemicals, exploration, finance, and refining and marketing. (notes a and e)
7. Richard Goodmanson(age 57)
Richard Goodmanson was appointed a director of Rio Tinto on 1 December 2004 and is chairman of the
Committee on social and environmental accountability. He is executive vice president and chief operating officer of DuPont and holds degrees in civil engineering, economics, commerce and business administration. During his career he has worked at senior levels for McKinsey & Co, PepsiCo and American West Airlines, where he was president and CEO. He joined DuPont in early 1999 and in his current position has responsibility for the non US operations of DuPont with particular focus on growth in emerging markets. (notes c, d and e)
8. Andrew Gould(age 58)
Andrew Gould was appointed a director of Rio Tinto in 2002 and is chairman of theAudit committee. He holds a degree in economic history and is chairman and chief executive officer of Schlumberger Limited, where he has held a succession of financial and operational management positions, including that of executive vice president of Schlumberger Oilfield Services and president and chief operating officer of Schlumberger Limited. He joined Schlumberger in 1975 from Ernst & Young. (notes a, c and e)
9. Lord Kerr(age 63)
Lord Kerr was appointed a director of Rio Tinto in 2003. He has an MA from Oxford University and was a member of the UK Diplomatic Service for 36 years, heading the service from 1997 to 2002. On a secondment to the UK Treasury he was principal private secretary to two Chancellors of the Exchequer. His service abroad included spells as Ambassador to the European Union from 1990 to 1995, and to the US from 1995 to 1997. He is chairman of the Court and Council of Imperial College, London; a director of The “Shell” Transport and Trading Company plc and The Scottish American Investment Trust plc. Lord Kerr is also a Trustee of the Rhodes Trust. (notes a, d and e)
10. David Mayhew(age 65)
David Mayhew was appointed a director of Rio Tinto in 2000. He is chairman of Cazenove Group plc, which he joined in 1969. Cazenove is a stockbroker to Rio Tinto plc. (notes a and b)
Rio Tinto 2004Form 20-F 68
Back to Contents
11. Sir Richard Sykes(age 62)
Sir Richard was appointed a director of Rio Tinto in 1997. Following Sir Richard Giordano’s retirement, he will become Rio Tinto’s senior independent director. He is chairman of theRemuneration committee. After reading microbiology, he obtained doctorates in microbial chemistry and in science. A former chairman of GlaxoSmithKline plc, Sir Richard is a director of Lonza Group Limited and is rector of Imperial College, London. He is a fellow of the Royal Society and a trustee of the Natural History Museum in London and of the Royal Botanic Gardens, Kew. (notes b, c and e)
Robert Adams died at his home on 27 January 2005. Robert Adams joined the Group in 1970 after reading natural sciences and economics and subsequently gaining an MSc from the London Business School. He had a long distinguished career with Rio Tinto and becoming a director of Rio Tinto plc in 1991 and of Rio Tinto Limited in 1995 with responsibility for planning and development. He was also a non executive director of Foreign & Colonial Investment Trust plc.
Sir Richard Giordanoretired from the boards at the conclusion of the 2005 annual general meetings. He was previously the senior non executive director and a deputy chairman. He was also chairman of the Audit committee. He had been a director of Rio Tinto plc since 1992 and of Rio Tinto Limited since 1995. A lawyer by training, he spent 12 years at BOC Group, first as chief executive, then chairman. In 1993, Sir Richard became a director of British Gas, assuming the role of chairman in 1994. A former chairman of BG Group plc, he is a director of Georgia Pacific Corporation in the US and a trustee of Carnegie Endowment for International Peace.
Leon Davisalso retired from the boards at the conclusion of the 2005 annual general meetings. He was previously the Group’s Australia based non executive deputy chairman. He became a director of Rio Tinto Limited in 1994 and of Rio Tinto plc in 1995. He is a metallurgist and holds a diploma in primary metallurgy and a DSc from Curtin University and the University of Queensland. During nearly 50 years with the Group he has held a number of managerial posts around the world, ultimately as chief executive from 1997 to 2000. A former director of Codan Pty. Limited, he is chairman of Westpac Banking Corporation and a director of Huysmans Pty Limited and Trouin Pty Limited, and is also president of the board of The Walter and Eliza Hall Institute of Medical Research.
Oscar Groeneveld served as a director until 1 October 2004 when he was appointed chief executive of the Aluminium group. See Senior management on page 70 for his full biography.
John Morschelalso retired from the boards at the conclusion of the 2005 annual general meetings. He was appointed to the boards of Rio Tinto in 1998. Educated in Australia and the US, he spent most of his career with Lend Lease Corporation Limited in Australia, culminating as managing director, followed by two years as an executive director of the Westpac Banking Corporation. A former chairman of CSR Limited and Leighton Holdings Limited, he is chairman of Rinker Group Limited and is a director of ANZ Banking Group Limited, Tenix Pty Limited, Gifford Communications Pty Limited and Singapore Telecommunications Limited. He is also a patron of the Property Industry Foundation.
Lord Tugendhatserved as director until 22 April 2004 when he retired by rotation following the 2004 annual general meetings. He holds a BA and MA in history from Cambridge University, and became a director of Rio Tinto in 1997. A former vice president of the Commission of the European Communities, and chairman of the Civil Aviation Authority, he was chairman of Abbey National plc from 1991 until 2002 when he was appointed chairman of Lehman Brothers Europe Limited.
Notes
a)Audit committee
b)Nominations committee
c)Remuneration committee
d)Committee on social and environmental accountability
e) Independent (as defined on pages 82 and 83)
SENIOR MANAGEMENT
1. Tom Albanese(age 47)
Tom Albanese was appointed chief executive of the Copper group and head of Exploration in 2004. He joined Rio Tinto in 1993 on Rio Tinto’s acquisition of Nerco. He holds a BS in mineral economics and an MS in mining engineering. He held a series of management positions before being appointed chief executive of the Industrial Minerals group in 2000.
Rio Tinto 2004Form 20-F 69
Back to Contents
2. Preston Chiaro(age 51)
Preston Chiaro was appointed chief executive of the Energy group in 2003. He holds degrees in environmental engineering. He joined the Group in 1991 at Kennecott Utah Copper’s Bingham Canyon mine as vice president, technical services. In 1995 he became vice president and general manager of Boron operations in California. He was chief executive of Rio Tinto Borax from 1999 to 2003.
3. Oscar Groeneveld(age 51)
Oscar Groeneveld has been with the Group for 29 years and was appointed chief executive of the Aluminium group in October 2004. He has qualifications in engineering, science and management. He has occupied senior roles in coal, aluminium and technology and was Copper group chief executive from 1999 to 2004. Mr Groeneveld was also an executive director of the Group from 1998 to 2004.
4. Keith Johnson(age 44)
Keith Johnson was appointed chief executive, Diamonds in 2003. He holds degrees in mathematics and management and is a Fellow of the Royal Statistical Society. He joined Rio Tinto in 1991 and has held a series of management positions, most recently as managing director of Comalco Mining and Refining.
5. Andrew Mackenzie(age 48)
Andrew Mackenzie joined Rio Tinto in 2004 as chief executive Industrial Minerals. He has a BSc (geology) and a PhD (chemistry) and was previously group vice president, BP Petrochemicals. He spent 22 years with BP primarily in the UK and North America in senior positions including head of Capital Markets in BP Finance, chief reservoir engineer with oversight of oil and gas reserves and production, head of Government and Public Affairs worldwide and group vice president Technology which included responsibility for research and development and engineering.
6. Karen McLeod(age 58)
Karen McLeod was appointed head of Human Resources in 1999. She joined the Group in 1974 at Comalco, working in Aboriginal affairs. She holds a bachelor of social work and a masters in business administration and has held senior positions in human resources, business analysis, marketing and organisation development.
7. Ian Smith(age 47)
Ian Smith joined Rio Tinto in 2002 after more than 20 years in the resource industry which commenced with CRA, a Rio Tinto predecessor company. A mining engineer by profession, Ian also has qualifications in financial administration. He was appointed Head of Technology in May 2005 having previously been managing director, aluminium smelting, with Comalco in Australia.
8. Andrew Vickerman(age 50)
Andrew Vickerman is head of Communication and Sustainable Development. His responsibilities include media, public affairs, internal and external communications, as well as oversight of Rio Tinto’s work on sustainable development and with communities. He has BA (Hons), MA and PhD degrees in economics and, prior to joining Rio Tinto in 1991, worked as a development economist and as a consultant for the World Bank and United Nations agencies. Previous roles with Rio Tinto include finance director of Lihir Gold.
9. Sam Walsh(age 55)
Sam Walsh was appointed chief executive of the Iron Ore group in 2004. He holds a bachelor of commerce degree and joined Rio Tinto in 1991, following 20 years in the automotive industry at General Motors and Nissan Australia. He has held a number of management positions within the Group, including managing director of Comalco Foundry Products, CRA Industrial Products, Hamersley Iron Sales and Marketing, Hamersley Iron Operations, vice president of Rio Tinto Iron Ore (with responsibility for Hamersley Iron and Robe River) and from 2001 chief executive of the Aluminium group.
10. Charles Lenegan(age 54)
Charles Lenegan joined the Group in 1981 and has worked in senior roles in diamonds, coal, salt and gold business units in Australia, Indonesia and Zimbabwe. He was appointed managing director, Rio Tinto Australia in March 2004. He has a BSc in economics and is a chartered accountant.
John O’Reillyjoined Rio Tinto in 1987, following 20 years’ operations experience in Africa and the Middle East. A metallurgical engineer by profession, he has held a series of management positions within the Group, including director of Rio Tinto Technical Services, chief executive officer, Lihir Gold, and head of the former Gold and Other Minerals group, before being appointed head of Technology in 1999. He moved to a part time role at the end of April 2005 and was succeeded by Ian Smith.
Rio Tinto 2004Form 20-F 70
Back to Contents
COMPANY SECRETARIES
11. Anette Lawless(age 48)
Anette Lawless joined Rio Tinto in 1998 and became company secretary of Rio Tinto plc in 2000. Before joining Rio Tinto, she spent 11 years with Pearson plc, five of which as company secretary. She qualified as a chartered secretary in 1989 and became a fellow of the ICSA in 1992. She also holds an MA from the Copenhagen Business School.
12. Stephen Consedine(age 43)
Stephen Consedine joined Rio Tinto in 1983 and has held positions in Accounting, Treasury, and Employee Services before becoming company secretary of Rio Tinto Limited in 2002. He holds a bachelor of business and is a Certified Practising Accountant.
EMPLOYEES
Information on the Group’s employees including their costs, is on pages 66 to 67and in Note 3 to the consolidated financial statements on page A-17, in Note 30 on page A-51 and in Note 41 on page A-64.
REMUNERATION REPORT
Introduction
The boards of Rio Tinto (the board) have pleasure in presenting the Remuneration report to shareholders. The report covers the following information:
| • | a description of theRemuneration committeeand its duties; |
| • | a summary of the Group’s remuneration policy, including a description of the policy on directors’ and senior executive remuneration; |
| • | a résumé of the terms of directors’ service contracts and letters of appointment; |
| • | details of each director’s and certain senior executives’ remuneration and awards under long term incentive plans and the link to corporate performance; |
| • | details of directors’ interests in Rio Tinto shares; and |
| • | graphs illustrating the performance of the Group, including relative to the HSBC Global Mining Companies’ Index. |
Remuneration committee
The following independent, non executive directors were members of theRemuneration committeeduring 200
| • | Sir Richard Sykes (chairman); |
| • | Sir David Clementi; |
| • | Richard Goodmanson (from 1 December 2004); |
| • | Andrew Gould; and |
| • | John Morschel. |
The committee met five times during 2004. Members’ attendance is set out on page 83.
The committee’s responsibilities are set out in its Terms of Reference which can be viewed on Rio Tinto’s website. They include:
| • | recommending any changes to the chairman’s fees; |
| • | recommending remuneration policy relating to executive directors and senior executives to the board; |
| • | reviewing and determining the remuneration of executive directors, product group chief executives and the company secretary of Rio Tinto plc; |
| • | reviewing and agreeing management’s strategy for remuneration and conditions of employment for executives; and |
| • | monitoring the effectiveness and appropriateness of executive remuneration policy and practice. |
Advisors
Jeffery Kortum, Group advisor, remuneration, attends the committee’s meetings in an advisory capacity. The chairman, Paul Skinner, and the chief executive, Leigh Clifford, also participated in meetings of the committee, except where issues relating to their own remuneration were discussed. Anette Lawless, the company secretary of Rio Tinto plc, acts as secretary to the committee but is not present when issues relating to her own remuneration are discussed.
The committee appointed Kepler Associates, an independent consultant with no other links to the Group, to provide advice on executive remuneration matters.
To carry out its duties in accordance with its terms of reference, the committee monitors global remuneration trends and developments and draws on a range of external sources of data, including publications by remuneration consultants Towers Perrin, Hewitt Associates, Hay Group, Watson Wyatt and Monks Partnership.
Rio Tinto 2004Form 20-F 71
Back to Contents
Corporate governance
The committee reviewed its terms of reference in 2004 and concluded that, in the course of its business, it had covered the main duties set out in the Combined Code as attached to the UKLA Listing Rules (the Code) and Principle 9 of the ASX Best Practice Corporate Governance Guidelines, and was constituted in accordance with the requirements of the Code and the ASX Best Practice Corporate Governance Guidelines.
The board considered the performance of the committee and determined that the committee had satisfactorily performed the duties set out in its terms of reference.
The 2004 Remuneration report was approved by shareholders at the 2005 annual general meetings.
Executive remuneration policy
Rio Tinto operates in a global market, where it competes for a limited resource of talented, internationally mobile executives. It recognises that to achieve its business objectives, the Group needs high quality, committed people.
Rio Tinto has, therefore, designed an executive remuneration policy to support its business goals by enabling it to attract, retain and appropriately reward executives of the calibre necessary to produce very high levels of performance.
The main principles of the Group’s executive remuneration policy are:
| • | to provide total remuneration which is competitive in structure and quantum with comparator companies’ practices in the regions and markets within which the Group operates; |
| • | to achieve clear alignment between total remuneration and delivered personal and business performance, with particular emphasis on shareholder value creation; |
| • | to tie variable elements of remuneration to the achievement of challenging performance criteria that are consistent with the best interests of the Group and shareholders over the short, medium and long term; |
| • | to provide an appropriate balance of fixed and variable remuneration; and |
| • | to provide appropriate relativities between executives globally and to support executive placements to meet the needs of the Group. |
Executive remuneration
Total remuneration is a combination of fixed and performance related elements, each of which is described below.
The performance related, or variable, elements are the short and long term incentive plans, which are tied to the achievement of personal and business performance goals and are, therefore, at risk. The rest of the elements of the package are “fixed”, as they are not at risk, although some, such as base salary, are also related to performance.
The composition of the total remuneration package is designed to provide an appropriate balance between the fixed and variable components, in line with Rio Tinto’s stated objective of aligning total remuneration with personal and business performance.
Excluding allowances and pension/superannuation arrangements, the proportion of total direct remuneration provided by way of variable components comprising the Short Term Incentive Plan, the Share Option Plan and the Mining Companies Comparative Plan (STIP, SOP and MCCP) described below, assuming target levels of performance, is currently approximately 68 per cent for the chief executive, 62 per cent for the finance director and between 62 and 68 per cent for the product group heads.
Full details of the directors’ annual remuneration before tax and excluding pension contributions are set out in Table 1 on pages 76 to 78.
Base salary
Base salaries for executive directors and product group chief executives are reviewed annually, taking into account the nature of the individual executive’s role, external market trends and personal and business performance. TheRemuneration committeeuses a range of international companies of a similar size, global reach and complexity to make this comparison.
Short term incentive plan (STIP)
STIP provides an annual cash bonus opportunity for participants and is designed to support overall remuneration policy by:
| • | focusing participants on achieving goals which contribute to sustainable shareholder value; and |
| • | providing significant bonus differential based on performance against challenging personal, business, and other targets, including safety. |
TheRemuneration committeereviews and approves performance targets for executive directors and product group chief executives annually. The executive directors’ STIP payments are linked to three performance criteria: Group financial performance, Group safety performance and personal performance. The product group chief executives’ payments are linked to Group and product group financial performance, product group safety performance and personal performance. These criteria are partly measured on an actual basis and partly on a basis normalised for fluctuations of market prices and exchange rates. The target level of bonus for these participants for 2005 is 60 per cent of salary, the same as 2004. Executives may receive up to twice their target for exceptional performance against all criteria.
STIP awards in respect of 2004, payable in 2005, are included as annual cash bonus in Table 1 on page 76.
Rio Tinto 2004Form 20-F 72
Back to Contents
Long term incentives
Shareholders approved two new long term incentive plans at the annual general meetings in 2004, the Share Option Plan and the Mining Companies Comparative Plan.
The new plans are intended to provide theRemuneration committeewith a means of linking management’s rewards to Group performance. The committee regards total shareholder return (TSR) as the most appropriate measure of a company’s performance for the purpose of share based long term incentive plans and both plans therefore use TSR as a performance measure.
The new plans maintained the expected value of total executive remuneration at approximately the same level as before, but modified the relative proportions in which share options and performance shares may be awarded. For 2004 and 2005, this has meant a shift towards performance shares being the primary long term incentive vehicle.
Details of awards under the long term incentive plans are set out in Table 4 on page 80.
Share Option Plan (SOP)
Each year, theRemuneration committeeconsiders whether a grant of options should be made under the SOP, and if so, at what level. In arriving at a decision, the committee takes into consideration the personal performance of each executive as well as local remuneration practice.
No options will become exercisable unless the Group has met stretching performance conditions. For grants made prior to 2004:
| • | two thirds of options vest when the Group’s adjusted earnings per share growth for a three year performance period is at least nine percentage points higher than US inflation over the same period, as measured by the US Consumer Price Index; |
| • | the balance of the grant vests when growth of at least 12 percentage points above US inflation has been achieved; |
| • | Rio Tinto performance is tested against the performance condition after three years; and |
| • | there is an annual retest on a three year rolling basis until options fully vest or lapse at the end of the option period. |
Under the rules of the new plan, approved by shareholders at the 2004 annual general meetings, vesting will be subject to Rio Tinto’s TSR, measured over three years, equalling or outperforming the HSBC Global Mining Index. Rio Tinto’s TSR is calculated as a weighted average of the TSR of Rio Tinto plc and Rio Tinto Limited. If the TSR performance equals the index, the higher of one third of the original grant or 20,000 options will vest (subject to the actual grant level not being exceeded). The full grant vests if the TSR performance is equal to or greater than the HSBC Global Mining Index plus five per cent per annum. TSR performance at this level is equivalent to the upper quartile of the index. Between these points, options vest on a sliding scale, with no options becoming exercisable for a three year TSR performance below the index.
In addition, theRemuneration committeeretains discretion to satisfy itself before approving any vesting that the TSR performance is a genuine reflection of underlying financial performance.
Options granted under the new plan before 31 December 2006 will be subject to a single fixed base retest five years after grant if they have not vested after the initial three year performance period, with options granted after 31 December 2006 not subject to any retest. These latter options will, therefore, lapse if they do not vest at the conclusion of the three year performance period.
Prior to any options being released to participants for exercise, the Group’s performance against the criteria relevant to the SOP is examined and verified by the external auditors. If there were a change of control or a company restructuring, options would become exercisable subject to the satisfaction of the performance condition measured at the time of the takeover or restructuring.
Where an option holder dies in service, qualifying options vest immediately, regardless of whether the performance conditions have been satisfied. The estate will have 12 months in which to exercise the options.
The maximum grant under the SOP is three times salary, based on the average share price over the previous financial year. Under the SOP no options are granted at a discount. Executive directors may, however, be granted options at a discount under the Rio Tinto Share Savings Plan, described below.
Share options granted to directors are included in Table 4 on page 80.
Mining Companies Comparative Plan (MCCP)
Rio Tinto’s performance share plan, the MCCP, provides participants with a conditional right to receive shares. The conditional awards will only vest if performance conditions approved by the committee are satisfied. Again, were there to be a change of control or a company restructuring, the awards would only vest subject to the satisfaction of the performance condition measured at the time of the takeover or restructuring. These conditional awards are not pensionable.
The performance condition compares Rio Tinto’s TSR with the TSR of a comparator group of 15 other international mining companies over the same four year period. The composition of this comparator group is reviewed regularly by the committee to provide continued relevance in a consolidating industry. The current members of this group are listed at the bottom of the table of comparators on page 74.
The maximum conditional award size under the current MCCP is two times salary (previously 70 per cent), calculated on the average share price over the previous financial year.
Rio Tinto 2004Form 20-F 73
Back to Contents
The following table shows the percentage of each conditional award which will be received by directors and product group chief executives based on Rio Tinto’s four year TSR performance relative to the comparator group for conditional awards made after 1 January 2004:
Ranking in comparator group
| | 1st-2nd | | 3rd | | 4th | | 5th | | 6th | | 7th | | 8th | | 9th-16th | |
|
|
|
|
|
|
|
|
|
|
|
|
|
|
|
| |
| % | 150 | | 125 | | 100 | | 83.75 | | 67.5 | | 51.25 | | 35 | | - | |
|
|
|
|
|
|
|
|
|
|
|
|
|
|
|
| |
The historical ranking of Rio Tinto in relation to the comparator group is shown in the following table:
| Ranking of Rio Tinto versus comparator companies | |
| Period | Ranking out of 16 | |
|
| |
| 1993 – 97 | 4 | |
| 1994 – 98 | 4 | |
| 1995 – 99 | 2 | |
| 1996 – 00 | 2 | |
| 1997 – 01 | 2 | |
| 1998 – 02 | 3 | |
| 1999 – 03 | 7 | |
| 2000 – 04 | 11 | |
|
| |
Current comparator companies:
Alcan, Alcoa, Anglo American, Barrick Gold, BHP Billiton, Freeport, Grupo Mexico, INCO, Newmont, Noranda, Phelps Dodge, Placer Dome, Teck Cominco, WMC and Xstrata
Before awards are released to participants, the external auditors and Kepler Associates independently review the Group’s performance compared to that of the comparator companies.
Awards are released to participants as either Rio Tinto plc or Rio Tinto Limited shares or an equivalent amount in cash. In addition, a cash payment to participants equivalent to the dividends that would have accrued on the vested number of shares over the four year period will be made.
Shares to satisfy the vesting may be acquired by purchase in the market, by subscription, or, in the case of Rio Tinto Limited, by procuring that Tinto Holdings Australia Pty Limited transfers existing shares to participants.
Performance of Rio Tinto
To illustrate the performance of the Companies relative to their markets, graphs showing the performance of Rio Tinto plc compared to the FTSE 100 Index and Rio Tinto Limited compared to the ASX All Ordinaries Index are reproduced in this report. A comparative graph showing Rio Tinto’s performance relative to the HSBC Global Mining Index is also included to illustrate the performance of the Companies relative to other mining companies.
Other share plans
UK executive directors can participate in:
| • | the Rio Tinto plc Share Savings Plan, an Inland Revenue approved savings related plan which is open to all UK employees. Under the Plan directors can save up to £250 per month for a maximum of five years. At the end of the savings period the director may exercise an option over shares granted at a discount of up to 20 per cent to the market value at the time the savings contract is entered into. The number of options the director is entitled to is determined by the option price, the savings amount and the length of the savings contract; and |
| • | the Rio Tinto Share Ownership Plan, also an Inland Revenue approved share incentive plan which was approved by shareholders at the 2001 annual general meeting and introduced in 2002. Under this plan, eligible employees can save up to £125 per month, which the plan administrator invests in Rio Tinto plc shares. Rio Tinto matches these purchases on a one for one basis. In addition, eligible employees may receive an annual award of Rio Tinto shares up to a maximum of five per cent of salary, subject to a cap of £3,000. |
Australian executive directors can participate in the Rio Tinto Limited Share Savings Plan, also introduced in 2001, which is similar to the Rio Tinto plc Share Savings Plan.
Shareholding policy
In 2002, the committee decided that it would be appropriate to encourage executive directors and product group chief executives to build up a substantial shareholding, aiming to reach a holding equal in value to two times salary over five years. Details of directors’ share interests in the Group are set out in Table 3 on page 79.
Pension and superannuation arrangementsUnited Kingdom
UK executive directors and senior management, like all UK staff, participate in the non contributory Rio Tinto Pension Fund, a funded, Inland Revenue approved, final salary occupational pension scheme.
The Fund provides a pension from normal retirement age at 60 of two thirds final pensionable salary, subject to completion of 20 years’ service. Proportionally lower benefits are payable for shorter service or, having attained 20 years’ service, retirement is taken prior to the age of 60. Spouse and dependants’ pensions are also provided.
Rio Tinto 2004Form 20-F 74
Back to Contents
Members retiring early may draw a pension reduced by approximately four per cent a year for each year of early payment from age 50 onwards.
Under the rules of the Rio Tinto Pension Fund, all pensions are guaranteed to increase annually in line with increases in the UK Retail Price Index subject to a maximum of ten per cent per annum. Increases above this level are discretionary.
When pensionable salary is limited by the UK Inland Revenue earnings “cap”, benefits are provided from unfunded supplementary arrangements. The UK Government has made a number of pensions related announcements over the last two years and Rio Tinto continues to review developments in UK pensions legislation.
In February 2005, the defined benefit section of the Rio Tinto pension fund was closed to new participants. Employees joining after that date will join the new defined contributions section of the Plan.
No cash contributions were made in 2004 as the Rio Tinto Pension Fund remains fully funded.
Australia
The Australian executive director and senior management are members of the Rio Tinto Staff Superannuation Fund, a funded superannuation fund regulated by Australian legislation. The fund provides both defined benefit and defined contribution benefits. The executive director is a defined benefit member, accruing lump sums payable on retirement. Retirement benefits are limited to a lump sum multiple of seven times final basic salary at age 62. For retirement after 62, the benefit increases to 7.6 times average salary at age 65.
Death in service and disablement benefits are provided as lump sums and are equal to the prospective age 65 retirement benefit. Proportionate benefits are also payable on termination of employment for ill health or resignation.
Executive directors and senior management are not required to pay contributions. During 2004, Company cash contributions were paid into the Rio Tinto Staff Superannuation Fund to fund members’ defined benefit and defined contribution benefits.
Other pensionable benefits
As the increase in the percentage of total remuneration which is dependent on performance is substantial and has risen over recent years, the committee considers it appropriate that a proportion of this at risk pay should be pensionable. Annual STIP awards are pensionable up to a maximum value of 20 per cent of basic salary.
Details of directors’ pension and superannuation entitlements are set out in Table 2 on page 78.
Service contracts and compensation payments
All executive directors have service contracts with a one year notice period. Rio Tinto has retained the right to pay directors in lieu of notice. Under current pension arrangements, executive directors are normally expected to retire at the age of 60. In 2004, Leigh Clifford’s contractual retirement age was reduced from 62 to 60, with a corresponding change to his retirement arrangements. In the event of early termination, the Group’s policy is to act fairly in all circumstances and the duty to mitigate would be taken into account. Compensation would not reward poor performance.
Neither of the executive directors are proposed for election or re-election at the forthcoming annual general meetings.
| Notice periods: | | | | | Remaining | |
| Name | Date of | | Notice period | | service period | |
| | agreement | | | | if less than | |
| | | | | | 12 months | |
|
|
|
|
|
| |
| Leigh Clifford | 30 March 2004 | | 12 months | | N/A | |
| Guy Elliott | 19 June 2002 | | 12 months | | N/A | |
|
|
|
|
|
| |
External appointments
Executive directors are likely to be invited to become non executive directors of other companies. Rio Tinto believes that such appointments can broaden their experience and knowledge, to the benefit of the Group. It is Group policy to limit executive directors’ external directorships to one FTSE 100 company or equivalent and they are not allowed to take on the chairmanship of another FTSE 100 company. Consequently, where there is no likelihood that such directorships will give rise to conflicts of interests, the board will normally give consent to the appointment, with the director permitted to retain the fees earned. Details of fees earned are set out in the notes to Table 1 on page 76.
Non executive directors’ remuneration Chairman’s fees and letter of appointment
It is Rio Tinto’s policy that the chairman should be remunerated on a competitive basis and at a level which reflects his contribution to the Group, as assessed by the board. He does not participate in the Group’s incentive plans or pension arrangements. Details of his fees can be found in Table 1 on page 76.
Paul Skinner’s letter of appointment summarises his duties as chairman of the Group and was agreed by theRemuneration committee. It stipulates that he is expected to dedicate at least three days per week on average to carry out these duties. The letter envisages that Paul Skinner will continue in the role of chairman until he reaches the age of 65 in 2009, subject to re-election as a director by shareholders.
Rio Tinto 2004Form 20-F 75
Back to Contents
Non executive directors’ fees and letters of appointment
The board as a whole determines non executive directors’ fees, although non executive directors do not vote on any increases of their own fees. Fees are set to reflect the responsibilities and time spent by the directors on the affairs of Rio Tinto. In the light of the increased volume of committee work following regulatory developments in the UK, US and Australia, it was decided in October 2004 to increase the fees for the chairmen of theAudit committeeandRemuneration committeeto £20,000 and £15,000 respectively. It was also agreed to increase the fees forAudit committeemembers to £10,000 and introduce a £5,000 fee forRemuneration committeemembers.
Non executive directors do not participate in the Group’s incentive plans, pension or superannuation arrangements or any other elements of remuneration provided to executive directors.
Non executive directors have a formal letter of appointment setting out their duties and responsibilities which is available for inspection at Rio Tinto plc’s registered office and annual general meeting.
Details of non executive directors’ remuneration is set out in Table 1 on page 76.
Auditable information
Tables 1, 2, 4 and 5 comprise the auditable parts of the Remuneration report, except the information in Table 1 which is required by the Australian Corporations Act (see note 16 to Table 1).
Annual general meetings
Shareholders will be asked to vote on this Remuneration report at the Companies’ forthcoming annual general meetings.
By order of the board
Anette LawlessSecretary
Remuneration committee
24 February 2005
Table 1 – Total remuneration of directors and senior executives
Remuneration comprising salary, bonus and benefits
| | Currency of | Base salary1 | | Annual cash | | Other benefits2 | | | | Subtotal | |
| actual payment | | bonus1 | |
|
| | | | | 2004 | | 2003 |
| Stated in US$’000 | | US$ | US$ | US$ | US$ | | US$ |
|
|
| |
| | | | | | | | | | | | |
| Chairman | | | | | | | | | | | |
| Paul Skinner | £ | 931 | | – | | 32 | | 963 | | 282 | |
| | | | | | | | | | | | |
| Non executive directors | | | | | | | | | | | |
| Sir David Clementi | £ | 110 | | – | | – | | 110 | | 80 | |
| Leon Davis | £ | 275 | | – | | – | | 275 | | 245 | |
| Sir Richard Giordano | £ | 191 | | – | | – | | 191 | | 156 | |
| Richard Goodmanson3 | £ | 8 | | – | | – | | 8 | | – | |
| Andrew Gould | £ | 110 | | – | | – | | 110 | | 91 | |
| Lord Kerr | £ | 115 | | – | | – | | 115 | | 18 | |
| David Mayhew5 | £ | 122 | | – | | – | | 122 | | 91 | |
| John Morschel | A$ | 155 | | – | | – | | 155 | | 123 | |
| Sir Richard Sykes4 | £ | 127 | | – | | – | | 127 | | 92 | |
| Lord Tugendhat7 | £ | 34 | | – | | – | | 34 | | 91 | |
| | | | | | | | | | | | |
| Executive directors | | | | | | | | | | | |
| Robert Adams9 | £ | 911 | | 789 | | 59 | | 1,759 | | 1,334 | |
| Leigh Clifford9 | £ | 1,428 | | 1,288 | | 375 | | 3,091 | | 2,143 | |
| Guy Elliott | £ | 850 | | 855 | | 42 | | 1,747 | | 1,146 | |
| Oscar Groeneveld6, 16 | A$ / £ | 776 | | 649 | | 485 | | 1,910 | | 1,223 | |
| | | | | | | | | | | | |
| Five highest paid senior executives below board level16 | | | | | | | | | | |
| Tom Albanese | US$ | 635 | | 560 | | 1,334 | | 2,529 | | 1,511 | |
| Preston Chiaro | US$ | 492 | | 400 | | 963 | | 1,855 | | 870 | |
| Keith Johnson | £ | 530 | | 517 | | 27 | | 1,074 | | 655 | |
| Christopher Renwick | A$ | 1,000 | | 672 | | 1,447 | | 3,119 | | 1,385 | |
| Sam Walsh | A$ | 709 | | 693 | | 659 | | 2,061 | | 1,108 | |
|
|
|
|
|
|
|
|
|
|
| |
| Remuneration, pension and share scheme fair values16 | |
Rio Tinto 2004Form 20-F 76
Back to Contents
Table 1 – Total remuneration of directors and senior executives (continued)
Remuneration comprising salary, bonus and benefits
| | | | Adjusted for | | | |
| the term of |
| the |
| | | Pension | | Value of long term incentive | performance | Total |
| Subtotal | contrib’s10 | | | schemes11 | period15 | remuneration |
| | |
| |
|
| 2004 | | MCCP12 | | SSP13 | | SOP14 | | 2004 | | 2003 |
| US$ | US$ | US$ | | US$ | | US$ | US$ | US$ | | US$ |
|
|
| | | | | | | | | | | | | | | | | |
| Chairman | | | | | | | | | | | | | | | | |
| Paul Skinner | 963 | | – | | – | | – | | – | | – | | 963 | | 282 | |
| | | | | | | | | | | | | | | | | |
| Non executive directors | | | | | | | | | | | | | | | | |
| Sir David Clementi | 110 | | – | | – | | – | | – | | – | | 110 | | 80 | |
| Leon Davis | 275 | | – | | – | | – | | – | | – | | 275 | | 245 | |
| Sir Richard Giordano | 191 | | – | | – | | – | | – | | – | | 191 | | 156 | |
| Richard Goodmanson3 | 8 | | – | | – | | – | | – | | – | | 8 | | – | |
| Andrew Gould | 110 | | – | | – | | – | | – | | – | | 110 | | 91 | |
| Lord Kerr | 115 | | – | | – | | – | | – | | – | | 115 | | 18 | |
| David Mayhew5 | 122 | | – | | – | | – | | – | | – | | 122 | | 91 | |
| John Morschel | 155 | | – | | – | | – | | – | | – | | 155 | | 123 | |
| Sir Richard Sykes4 | 127 | | – | | – | | – | | – | | – | | 127 | | 92 | |
| Lord Tugendhat7 | 34 | | – | | – | | – | | – | | – | | 34 | | 91 | |
| | | | | | | | | | | | | | | | | |
| Executive directors | | | | | | | | | | | | | | | | |
| Robert Adams9 | 1,759 | | – | | 1,451 | | 2 | | 2,770 | | (3,081 | ) | 2,901 | | 2,204 | |
| Leigh Clifford9 | 3,091 | | 465 | | 2,646 | | 15 | | 2,503 | | (2,733 | ) | 5,987 | | 4,182 | |
| Guy Elliott | 1,747 | | – | | 1,118 | | 12 | | 1,575 | | (1,874 | ) | 2,578 | | 1,591 | |
| Oscar Groeneveld6, 16 | 1,910 | | 249 | | 1,212 | | 8 | | 2,203 | | (2,494 | ) | 3,088 | | 2,077 | |
| | | | | | | | | | | | | | | | | |
| Five highest paid senior executives below board level16 | | | | | | | | | | | | | |
| Tom Albanese | 2,529 | | 48 | | 1,249 | | 3 | | 3,171 | | (3,154 | ) | 3,846 | | 2,379 | |
| Preston Chiaro | 1,855 | | 37 | | 816 | | 4 | | 1,247 | | (1,510 | ) | 2,449 | | 1,178 | |
| Keith Johnson | 1,074 | | – | | 584 | | 6 | | 520 | | (807 | ) | 1,377 | | 655 | |
| Christopher Renwick | 3,119 | | 267 | | 1,193 | | 8 | | 1,981 | | (2,287 | ) | 4,281 | | 2,186 | |
| Sam Walsh | 2,061 | | 228 | | 989 | | 6 | | 1,620 | | (1,868 | ) | 3,036 | | 1,722 | |
|
|
|
|
|
|
|
|
|
|
|
|
|
|
|
| |
| Notes to Table 1 | | | | | | | | | | | | | | | | |
| 1. | The total remuneration is reported in US dollars. The amounts, with the exception of the annual cash bonus, can be converted into sterling at the rate of 1US$ =£0.5463 or alternatively, into Australian dollars at the rate of 1US$ = A$1.3617, each being the average exchange rate for 2004. The annual cash bonus is payable under the STIP and this may be converted at the 2004 year end exchange rate of 1US$ = £0.519 to ascertain the sterling equivalent or alternatively, 1US$ = A$1.2847 to calculate the Australian dollar value. |
| 2. | Other emolument items include healthcare, 401k contributions in the US where appropriate, car and fuel benefits, travel allowances to attend overseas meetings, and professional advice. Housing, relocation payments, tax equalisation adjustments and children’s education assistance are also provided for executive directors and product group executives living outside their home country. UK executive directors are also beneficiaries under the Rio Tinto All Employee Share Ownership Plan up to a maximum value of £3,000 (US$5,492) and may also contribute to the Rio Tinto Share Ownership Plan where the Company will match their personal contributions to a maximum of £1,500 (US$2,746) per annum. A payment in respect of long service leave is paid to Australian executive directors and senior executives on retirement. |
| 3. | Richard Goodmanson was appointed a director on 1 December 2004. |
| 4. | Sir Richard Sykes’ fees were paid direct to him up until 30 April 2004 and thereafter paid to Imperial College London. |
| 5. | David Mayhew’s fees are paid to Cazenove Group plc. |
| 6. | Oscar Groeneveld resigned as a director on 1 October 2004. The figures shown above relate to his total remuneration with the Group for the year. His emoluments for the period when he was a director amounted to US$1,182,341 comprising salary US$552,811, bonus US$465,237 and other benefits US$164,293. |
| 7. | Lord Tugendhat retired on 22 April 2004 and received a gift to the value of US$3,661. |
| 8. | Emoluments of US$53,022 from subsidiary and associated companies were waived by two executive directors (2003: two directors waived US$98,872). Executive directors have agreed to waive any further fees receivable from subsidiary and associated companies. |
| 9. | In the course of the year, Robert Adams received US$45,763 and Leigh Clifford received US$22,881 in respect of non Rio Tinto related directorships. |
| 10. | Includes actual contributions payable to both defined contribution and defined benefit arrangements that are required to secure the pension benefits earned in the year. |
| 11. | The amount of long term share based compensation represents the estimated value of awards granted under the Rio Tinto Share Option Plan (the SOP), the Share Savings Plan (the SSP) and the Mining Companies Comparative Plan (the MCCP) which had not vested at 1 January 2004 or were granted during 2004. The fair value of the SOP and SSP awards have been calculated using an independent binomial model provided by external consultants, Lane Clark and Peacock LLP. The fair value of options granted to executive directors and product group chief executives under the SOP is 17 per cent of face value. The fair value of the MCCP awards has been calculated at the date of grant by external consultants, Kepler Associates based on the share price at that date and the percentage of the conditional awards expected to be paid out. The fair value of conditional awards made to executive directors and product group chief executives under the plan is 52.5 per cent of the face value. The value of long term share based compensation has been valued in accordance with the guidelines issued by the Australian Securities & Investments Commission dated 28 June 2004 (which replaced those of 30 June 2003). The non executive directors do not participate in the long term incentive share schemes. |
| 12. | The number of conditional shares awarded to executive directors under the MCCP for the twelve month period ending 31 December 2004 are shown under Table 4 of this report. The figures in respect of the five highest paid senior executives of the Group are as follows: Tom Albanese 56,015, Keith Johnson 30,387 and Preston Chiaro 46,995 over Rio Tinto plc ordinary shares and Chris Renwick 44,171 and Sam Walsh 38,023 over Rio Tinto Limited shares. The market price of the Rio Tinto plc and Rio Tinto Limited shares were 1,276p and A$33.17 respectively. |
Rio Tinto 2004Form 20-F 77
Back to Contents
| 13. | The award of options to executive directors under the SSP during the 12 month period up to 31 December 2004 are shown in Table 5 of this report. During the same period, of the five highest paid executives, only Preston Chiaro subscribed for 490 Rio Tinto plc ordinary shares at an option price 1,277p. These options must be exercised in January 2006. |
| 14. | The award of options to executive directors under the SOP during the twelve month period up to 31 December 2004 are shown in Table 5 of this report. During the same period options awarded to the five highest paid executives of the Group were as follows; Tom Albanese 84,020, Preston Chiaro 70,490 and Keith Johnson 43,500 over Rio Tinto plc ordinary shares and Chris Renwick 42,223 and Sam Walsh 54,400 over Rio Tinto Limited shares. The options are subject to the performance criteria explained on page 73 and are exercisable between 22 April 2007 and 21 April 2014. The exercise price was set at 1,329p per ordinary Rio Tinto plc share and A$34.406 per ordinary Rio Tinto Limited share. |
| 15. | The fair value of unvested share grants is spread equally over the term of each plan’s performance period. This adjustment spreads the fair value of each grant of long term incentive shares over a three year period in respect of the SOP, a four year period in respect of the MCCP and the length of the relative contract period under the SSP. |
| 16. | The following additional information is provided to meet the requirements of the Australian Corporations Act 2001: details about pension contributions, the value of long term incentive plans and accounting adjustments required to spread the value of long term incentive plans over the performance period; |
| | • | the total remuneration of the five highest paid senior executives below board level; |
| | • | the inclusion of Oscar Groeneveld’s earnings following his resignation from the board on 1 October 2004. |
| | • | The bases for determining the figures presented in respect of pension contributions and long term incentive plans are described in notes 10, 11 and 17 respectively. |
| 17. | Christopher Renwick’s “Other benefits” included a statutory retirement payment of US$1,325,552 relating to his service with the Group. |
Table 2 – Directors’ pension entitlements(as at 31 December 2004)
| | | | | | | | | | Accrued benefits | | | | Transfer values3 | | | |
| | | | | |
|
|
|
|
| |
|
|
| | | |
| | Age | | Years of | | At 31 Dec | | At 31 Dec | | Change in | | Change in | | At 31 Dec | | At 31 Dec | | Change, net | | Transfer | |
| | | | service | | 2003 | | 2004 | | accrued | | accrued | | 2003 | | 2004 | | of personal | | value of | |
| | | | completed | | | | | | benefits | | benefit net | | | | | | contributions | | change in | |
| | | | | | | | | | during the | | of inflation | | | | | | | | accrued | |
| | | | | | | | | | year ended | | | | | | | | | | benefit net | |
| | | | | | �� | | | | 31 Dec | | | | | | | | | | of inflation | |
| | | | | | | | | | 2004 | | | | | | | | | | | |
| UK directors | | | | | £’000 pa | | £’000 pa | | £’000pa | | £’000 pa | | £’000 | | £’000 | | £’000 | | £’000 | |
| | | | | | pension | | pension | | pension | | pension | | | | | | | | | |
|
|
|
|
|
|
|
|
|
|
|
|
|
|
|
|
|
|
|
| |
| | | | | | | | | | | | | | | | | | | | | |
| Robert Adams5 | 59 | | 34 | | 360 | | 389 | | 29 | | 18 | | 6,159 | | 7,465 | | 1,306 | | 353 | |
| Guy Elliott | 49 | | 24 | | 212 | | 256 | | 44 | | 37 | | 2,066 | | 2,915 | | 849 | | 429 | |
|
|
|
|
|
|
|
|
|
|
|
|
|
|
|
|
|
|
|
| |
| | | | | | | | | | | | | | | | | | | | | |
| Australian directors | | | | | A$’000 | | A$’000 | | A$’000 | | A$’000 | | A$’000 | | A$’000 | | A$’000 | | A$’000 | |
| | | | | | Lump sum | | Lump sum | | Lump sum | | Lump sum | | | | | | | | | |
|
|
|
|
|
|
|
|
|
|
|
|
|
|
|
|
|
|
|
| |
| | | | | | | | | | | | | | | | | | | | | |
| Leigh Clifford2, 3 | 57 | | 34 | | 12,099 | | 12,026 | | (73 | ) | (1,881 | ) | 12,099 | | 12,026 | | (73 | ) | (1,881 | ) |
| Oscar Groeneveld2, 6 | 51 | | 29 | | 4,661 | | 5,079 | | 418 | | 21 | | 4,661 | | 5,079 | | 418 | | 21 | |
|
|
|
|
|
|
|
|
|
|
|
|
|
|
|
|
|
|
|
| |
| | | | | | | | | | | | | | | | | | | | | |
| Notes to Table 2 | | | | | | | | | | | | | | | | | | | | |
| 1. | A$76,659 and A$42,384 were credited to the respective accounts belonging to Leigh Clifford and Oscar Groeneveld in the Rio Tinto Staff Superannuation Fund in relation to the superannuable element of their 2004 performance bonus. |
| 2. | The changes in accrued lump sums for Australian directors are before contributions tax and exclude interest. |
| 3. | Transfer values are calculated in a manner consistent with “Retirement Benefit Schemes – Transfer Values (GN 11)” published by the Institute of Actuaries and the Faculty of Actuaries and dated 4 August 2003. |
| 4. | During the period, Leigh Clifford’s Australian superannuable salary was determined by conversion of his sterling pay to A$ through exchange rates. The reduction in his overall accrued benefits reflects the changes in the exchange rate. TheRemuneration committeehas resolved that in respect of 2005 Leigh Clifford’s Australian superannuable salary will be uplifted by the same percentage used to uplift his sterling pay. |
| 5. | Robert Adams died on 27 January 2005. |
| 6. | Oscar Groeneveld resigned as a director on 1 October 2004. The accrued entitlement shown above represents the value at this date. |
Rio Tinto 2004Form 20-F 78
Back to Contents
Table 3 – Directors’ beneficial interests in shares
| | 1 Jan | | 31 Dec | | 10 Jun |
| 20042 | 20047 | 2005 |
|
|
|
|
|
|
| Robert Adams3, 4 | 71,764 | | 72,243 | | n/a |
| Ashton Calvert8 | – | | – | | – |
| Sir David Clementi | – | | – | | – |
| Leigh Clifford | 2,100 | | 2,100 | | 2,100 |
| | 76,428 | | 90,296 | | 91,255 |
| Vivienne Cox8 | – | | – | | – |
| Leon Davis | 6,100 | | 6,100 | | n/a |
| | 187,293 | | 187,293 | | n/a |
| Guy Elliott3 | 40,847 | | 42,888 | | 43,558 |
| Sir Richard Giordano | 1,065 | | 1,065 | | n/a |
| Richard Goodmanson | – | | – | | – |
| Andrew Gould | – | | 1,000 | | 1,000 |
| Oscar Groeneveld4 | 19,010 | | 19,010 | | n/a |
| | 23,515 | | 32,012 | | n/a |
| Lord Kerr | – | | 2,300 | | 2,300 |
| David Mayhew | 2,500 | | 2,500 | | 2,500 |
| John Morschel | – | | 2,000 | | n/a |
| Paul Skinner | 5,140 | | 5,277 | | 5,349 |
| Sir Richard Sykes | 2,359 | | 2,422 | | 2,455 |
| Lord Tugendhat4 | 1,135 | | 1,135 | | n/a |
|
|
|
|
|
|
| | | | | | |
| Notes to Table 3 | | | | | |
| 1. | Rio Tinto plc – ordinary shares of 10p each;Rio Tinto Limited shares stated in italics. |
| 2. | Or date of appointment if later. |
| 3. | These directors also have an interest in a trust fund containing 8,219 Rio Tinto plc shares at 31 December 2004 (1 January 2004: 21,849 Rio Tinto plc shares) as potential beneficiaries of The Rio Tinto Share Ownership Trust. At 10 June 2005 this trust fund contained 825 Rio Tinto plc shares. |
| 4. | Lord Tugendhat and Oscar Groeneveld retired and resigned as directors on 22 April 2004 and 1 October 2004 respectively. Robert Adams died on 27 January 2005. Leon Davis, Sir Richard Giordano and John Morschel resigned as directors on 29 April 2005. |
| 5. | The above includes the beneficial interests obtained through the Rio Tinto Share Ownership Plan, details of which are set out on page 73 under the heading “Other share plans”. |
| 6. | The total beneficial interest of the directors in the Group amounts to less than one per cent. |
| 7. | Or date of retirement or resignation if earlier. |
| 8. | Ashton Calvert and Vivienne Cox were appointed non executive directors on 1 February 2005. |
Rio Tinto 2004Form 20-F 79
Back to Contents
Table 4 – Awards to directors under long term incentive plans
| | | | | | | | | | | | | | | | | | | | Plan terms and conditions |
| |
|
| | | | | | | | | | | | | | Condi- | | Perform- | | | | | | | | Monetary |
| | | | | | | | | | | | | | tional | | ance | | Market | | Date | | Market | | value of |
| | | | | | | | | | | | | | award | | period | | price at | | award | | price at | | vested |
| | Plan | | 1 Jan | | Awarded2 | | Lapsed2 | | Vested2 | | 31 Dec | | granted | | concludes | | award | | vests | | vesting | | award |
| | | | 20042 | | | | | | | | 20048 | | | | | | | | | | | | US$’000 |
| |
|
| | | | | | | | | | | | | | | | | | | | | | | | |
| Leigh | MCCP | | | | | | | | | | | | 6 Mar | | 31 Dec | | A$ | | | | | | |
| Clifford6 | 2001 | | 37,474 | | – | | 37,474 | | – | | – | | 2001 | | 2004 | | 34.406 | | – | | – | | – |
| | MCCP | | | | | | | | | | | | 13 Mar | | 31 Dec | | A$ | | | | | | |
| | 2002 | | 34,435 | | – | | – | | – | | 34,435 | | 2002 | | 2005 | | 39.600 | | – | | – | | – |
| | MCCP | | | | | | | | | | | | 7 Mar | | 31 Dec | | A$ | | | | | | |
| | 2003 | | 36,341 | | – | | – | | – | | 36,341 | | 2003 | | 2006 | | 30.690 | | – | | – | | – |
| | MCCP | | | | | | | | | | | | 22 Apr | | 31 Dec | | A$ | | | | | | |
| | 2004 | | – | | 119,581 | | – | | – | | 119,581 | | 2004 | | 2007 | | 33.170 | | – | | – | | – |
| | | |
|
|
|
|
|
|
|
|
| | | | | | | | | | | |
|
| | | | 108,250 | | 119,581 | | 37,474 | | – | | 190,357 | | | | | | | | | | | | – |
| | | |
|
|
|
|
|
|
|
|
| | | | | | | | | | | |
|
| | | | | | | | | | | | | | | | | | | | | | | | |
| Robert | MCCP | | | | | | | | | | | | 6 Mar | | 31 Dec | | | | | | | | |
| Adams9 | 2001 | | 27,330 | | – | | 27,330 | | – | | – | | 2001 | | 2004 | | 1,310p | | – | | – | | – |
| | MCCP | | | | | | | | | | | | 13 Mar | | 31 Dec | | | | 28 Jan | | | | |
| | 2002 | | 25,064 | | – | | – | | – | | 25,064 | | 2002 | | 2005 | | 1,424p | | 2005 | | 1,651p | | 399 |
| | MCCP | | | | | | | | | | | | 7 Mar | | 31 Dec | | | | 28 Jan | | | | |
| | 2003 | | 26,837 | | – | | – | | – | | 26,837 | | 2003 | | 2006 | | 1,198p | | 2005 | | 1,651p | | 427 |
| | MCCP | | | | | | | | | | | | 22 Apr | | 31 Dec | | | | 28 Jan | | | | |
| | 2004 | | – | | 54,372 | | – | | – | | 54,372 | | 2004 | | 2007 | | 1,276p | | 2005 | | 1,651p | | 606 |
| | | |
|
|
|
|
|
|
|
|
| | | | | | | | | | | |
|
| | | | 79,231 | | 54,372 | | 27,330 | | – | | 106,273 | | | | | | | | | | | | 1,431 |
| | | |
|
|
|
|
|
|
|
|
| | | | | | | | | | | |
|
| | | | | | | | | | | | | | | | | | | | | | | | |
| Guy | MCCP | | | | | | | | | | | | 6 Mar | | 31 Dec | | | | 21 Feb | | | | |
| Elliott1&4 | 2001 | | 7,845 | | – | | 6,865 | | 980 | | – | | 2001 | | 2004 | | 1,310p | | 2005 | | 1,759p | | 33 |
| | MCCP | | | | | | | | | | | | 13 Mar | | 31 Dec | | | | | | | | |
| | 2002 | | 16,935 | | – | | – | | – | | 16,935 | | 2002 | | 2005 | | 1,424p | | – | | – | | – |
| | MCCP | | | | | | | | | | | | 7 Mar | | 31 Dec | | | | | | | | |
| | 2003 | | 22,923 | | – | | – | | – | | 22,923 | | 2003 | | 2006 | | 1,198p | | – | | – | | – |
| | MCCP | | | | | | | | | | | | 22 Apr | | 31 Dec | | | | | | | | |
| | 2004 | | – | | 51,550 | | – | | – | | 51,550 | | 2004 | | 2007 | | 1,276p | | – | | – | | – |
| | | |
|
|
|
|
|
|
|
|
| | | | | | | | | | | |
|
| | | | 47,703 | | 51,550 | | 6,865 | | 980 | | 91,408 | | | | | | | | | | | | 33 |
| | | |
|
|
|
|
|
|
|
|
| | | | | | | | | | | |
|
| | | | | | | | | | | | | | | | | | | | | | | | |
| Oscar | MCCP | | | | | | | | | | | | 6 Mar | | 31 Dec | | A$ | | | | | | |
| Groeneveld6 | 2001 | | 20,934 | | – | | 20,934 | | – | | – | | 2001 | | 2004 | | 34.406 | | – | | – | | – |
| | MCCP | | | | | | | | | | | | 13 Mar | | 31 Dec | | A$ | | | | | | |
| | 2002 | | 20,322 | | – | | – | | – | | 20,322 | | 2002 | | 2005 | | 39.600 | | – | | – | | – |
| | MCCP | | | | | | | | | | | | 7 Mar | | 31 Dec | | A$ | | | | | | |
| | 2003 | | 21,469 | | – | | – | | – | | 21,469 | | 2003 | | 2006 | | 30.690 | | – | | – | | – |
| | MCCP | | | | | | | | | | | | 22 Apr | | 31 Dec | | A$ | | | | | | |
| | 2004 | | – | | 43,785 | | – | | – | | 43,785 | | 2004 | | 2007 | | 33.170 | | – | | – | | – |
| | | |
|
|
|
|
|
|
|
|
| | | | | | | | | | | |
|
| | | | 62,725 | | 43,785 | | 20,934 | | – | | 85,576 | | | | | | | | | | | | – |
| | | |
|
|
|
|
|
|
|
|
| | | | | | | | | | | |
|
| | | | | | | | | | | | | | | | | | | | | | | | |
| Notes to Table 4 |
| 1. | The Rio Tinto Group's 11th place ranking against the comparator group for the MCCP 2001 award will not generate any vesting of the conditional award to any participant who was an executive director at the time of the initial grant. Guy Elliott was not an executive director at that time and along with participating senior executives of the Group, he will qualify for a 12.5 per cent vesting based on the scales applied to conditional awards made prior to 2004. |
| 2. | Rio Tinto plc – ordinary shares of 10p each;Rio Tinto Limited shares stated in italics. |
| 3. | The shares awarded to Guy Elliott under the MCCP 2001 vested on 21 February 2005 but, as the performance cycle ended on 31 December 2004, they have been dealt with in this table as if they had vested on that date. |
| 4. | The value of the award to Guy Elliott has been based on a share price of 1,759p, being the average share price of Rio Tinto plc ordinary shares of 10p each on 21 February 2005, the day the award vested to the beneficiary. The amount in sterling has been translated into US dollars at the year end exchange rate £1.9268. |
| 5. | The shares awarded under the MCCP 2000 last year vested on 27 February 2004 but, as the performance cycle ended 31 December 2003, they were dealt with in the 2003Annual report and financial statementsas if they had vested on that date. The values of the awards in the 2003Annual report and financial statementswere based on share prices of 1,386p and A$35.24, being the closing share prices on 6 February 2004, the latest practicable date prior to the publication of the 2003Annual report and financial statements. The actual share prices on 27 February 2004, when the awards vested were 1,440.5p and A$35.8327 with the result that the values of the awards had been understated in respect of Leigh Clifford by US$3,485, Robert Adams by US$17,335, Guy Elliott by US$2,663 and Oscar Groeneveld by US$1,975. |
| 6. | Leigh Clifford was given a conditional award over 119,581 Rio Tinto Limited shares and Oscar Groeneveld was given a conditional award over 43,785 Rio Tinto Limited shares during the year. These awards were approved by the shareholders under ASX Listing Rule 10.14 at the 2004 annual general meeting. |
| 7. | A full explanation of the MCCP can be found on pages 73 to 74. |
| 8. | Or as at date of resignation or retirement if earlier. |
| 9. | Robert Adams died on 27 January 2005 and the unvested conditional awards will now vest based on the assumption that Rio Tinto achieved median ranking on each of the outstanding performance cycles. This leads to a 50 per cent vesting in respect of the 2002 and 2003 awards and a 35 per cent vesting in respect of the 2004 award. The awards will be made to his estate at the earliest opportunity and, for the purpose of this report, have been valued using the closing price on 10 June 2005 (see also note 4). |
Rio Tinto 2004Form 20-F 80
Back to Contents
Table 5 – Directors’ options to acquire Rio Tinto plc and Rio Tinto Limited shares
| | Option type | | At 1 Jan | | Granted | | Exercised | | At 31 | | Option price | | Market price | | Date from | | Expiry date |
| | | | 2004 | | | | | | Dec 2004 | | | | at date of | | which first | | |
| | | | | | | | | | | | | | exercise | | exercisable | | |
|
|
|
|
|
|
|
|
|
|
|
|
|
|
|
|
|
|
| Robert | | | | | | | | | | | | | | | | | |
| Adams6 | RTPSSP | | 595 | | – | | – | | 595 | | 976p | | – | | 1 Jan 2005 | | 31 Dec 2005 |
| | | | 431 | | – | | – | | 431 | | 876p | | – | | 28 Jan 2005 | | 27 Jan 2006 |
| | RTSOP | | 69,878 | | – | | 69,878 | | – | | 820p | | 1562p | | 27 May 2001 | | – |
| | | | 72,885 | | – | | 72,885 | | – | | 808.8p | | 1562p | | 12 Mar 2002 | | – |
| | | | 42,158 | | – | | 42,158 | | – | | 965.4p | | 1562p | | 7 Mar 2003 | | – |
| | | | 21,080 | | – | | – | | 21,080 | | 965.4p | | – | | 28 Jan 2005 | | 27 Jan 2006 |
| | | | 100,268 | | – | | – | | 100,268 | | 1,265.6p | | – | | 28 Jan 2005 | | 27 Jan 2006 |
| | | | 91,320 | | – | | – | | 91,320 | | 1,458.6p | | – | | 28 Jan 2005 | | 27 Jan 2006 |
| | | | 114,014 | | – | | – | | 114,014 | | 1,263p | | – | | 28 Jan 2005 | | 27 Jan 2006 |
| | | | – | | 77,700 | | – | | 77,700 | | 1,329p | | – | | 28 Jan 2005 | | 27 Jan 2006 |
| | | | | | | | | | | | | | | | | | |
| Leigh | | | | | | | | | | | | | | | | | |
| Clifford | RTLSSP | | 959 | | – | | – | | 959 | | A$27.86 | | – | | 1 Jan 2005 | | 30 Jun 2005 |
| | | | – | | 1,486 | | – | | 1,486 | | A$29.04 | | – | | 1 Jan 2010 | | 30 Jun 2010 |
| | RTSOP | | 52,683 | | – | | – | | 52,683 | | A$23.4382 | | – | | 28 May 2002 | | 28 May 2009 |
| | | | 59,318 | | – | | – | | 59,318 | | A$24.069 | | – | | 7 Mar 2003 | | 7 Mar 2010 |
| | | | 29,660 | | – | | – | | 29,660 | | A$24.069 | | – | | 7 Mar 2005 | | 7 Mar 2010 |
| | | | 241,430 | | – | | – | | 241,430 | | A$33.0106 | | – | | 6 Mar 2005 | | 6 Mar 2011 |
| | | | 208,882 | | – | | – | | 208,882 | | A$39.8708 | | – | | 13 Mar 2005 | | 13 Mar 2012 |
| | | | 254,132 | | – | | – | | 254,132 | | A$33.336 | | – | | 7 Mar 2006 | | 7 Mar 2013 |
| | | | – | | 179,370 | | – | | 179,370 | | A$34.406 | | – | | 22 Apr 2007 | | 22 Apr 2014 |
| | | | | | | | | | | | | | | | | | |
| Leon | | | | | | | | | | | | | | | | | |
| Davis | RTSOP | | 93,978 | | – | | – | | 93,978 | | A$23.4382 | | – | | 28 May 2002 | | 28 May 2009 |
| | | | | | | | | | | | | | | | | | |
| Guy | | | | | | | | | | | | | | | | | |
| Elliott | RTPSSP | | 1,431 | | – | | – | | 1,431 | | 1,107 | p | – | | 1 Jan 2009 | | 30 Jun 2009 |
| | RTSOP | | 3,807 | | – | | – | | 3,807 | | 965.4 | p | – | | 7 Mar 2005 | | 7 Mar 2010 |
| | | | 13,432 | | – | | – | | 13,432 | | 1265.6 | | – | | 6 Mar 2005 | | 6 Mar 2011 |
| | | | 61,703 | | – | | – | | 61,703 | | 1458.6 | | – | | 13 Mar 2005 | | 13 Mar 2012 |
| | | | 97,387 | | – | | – | | 97,387 | | 1263 | | – | | 7 Mar 2006 | | 7 Mar 2013 |
| | | | – | | 73,700 | | – | | 73,700 | | 1329 | | – | | 22 Apr 2007 | | 22 Apr 2014 |
| | | | | | | | | | | | | | | | | | |
| Director leaving the board in 2004 | | | | | | | | | | | | | | |
| | | | | | | | | | | | | | | | | | |
| Oscar | | | | | | | | | | | | | | | | | |
| Groeneveld7 | RTLSSP | | 1,431 | | – | | – | | 1,431 | | A$27.48 | | – | | | | 30 Jun 2009 |
| | RTSOP | | 43,851 | | – | | 43,851 | | – | | A$23.4382 | | A$38.76 | | 28 May 2002 | | – |
| | | | 33,542 | | – | | 33,542 | | – | | A$24.069 | | A$38.76 | | 7 Mar 2003 | | – |
| | | | 16,771 | | – | | – | | 16,771 | | A$24.069 | | – | | 7 Mar 2005 | | 7 Mar 2010 |
| | | | 80,920 | | – | | – | | 80,920 | | A$33.0106 | | – | | 6 Mar 2005 | | 6 Mar 2011 |
| | | | 73,965 | | – | | – | | 73,965 | | A$39.8708 | | – | | 13 Mar 2005 | | 13 Mar 2012 |
| | | | 90,080 | | – | | – | | 90,080 | | A$33.336 | | – | | 7 Mar 2006 | | 7 Mar 2013 |
| | | | – | | 62,600 | | – | | 62,600 | | A$34.406 | | – | | 22 Apr 2007 | | 22 Apr 2014 |
|
|
|
|
|
|
|
|
|
|
|
|
|
|
|
|
|
|
| | | | | | | | | | | | | | | | | | |
| Notes to Table 5 | | | | | | | | | | | | | | | | |
| 1. | Rio Tinto plc ordinary shares of 10p each;Rio Tinto Limited – shares – stated in italics. |
| 2. | Options have been granted under the Rio Tinto Share Option Plan, (“RTSOP”) the Rio Tinto plc Share Savings Plans (“RTPSSP”) and the Rio Tinto Limited Share Savings Plan (“RTLSSP”). |
| 3. | The closing price of Rio Tinto plc ordinary shares at 31 December 2004 was 1,533p (2003: 1,543p) and the closing price of Rio Tinto Limited shares at 31 December 2004 was A$39.12 (2003: A$37.54). The highest and lowest prices during the year were 1,574p and 1,212p respectively for Rio Tinto plc and A$40.20 and A$31.98 for Rio Tinto Limited. |
| 4. | No directors’ options lapsed during the year. |
| 5. | Or at date of retirement or resignation if earlier. |
| 6. | In accordance with the Plan rules, Robert Adams’ outstanding options become exercisable with immediate effect following his death. His award of options under the 2004 grant has been reduced by 17,881 to 59,819 options. |
| 7. | Oscar Groeneveld exercised his options after his resignation as a director. |
Rio Tinto’s register of directors’ interests, which is open to inspection, contains full details of directors’ shareholdings and options to subscribe for Rio Tinto shares.
Rio Tinto 2004Form 20-F 81
Back to Contents
CORPORATE GOVERNANCE
The directors of Rio Tinto believe that high standards of corporate governance are critical to business integrity and performance. The following report describes how this philosophy is applied in practice.
As Rio Tinto’s three main listings are in London, Melbourne and New York, the directors have referred to the Combined Code as attached to the United Kingdom Listing Authority Listing Rules (the Code), the Australian Stock Exchange (ASX) Best Practice Corporate Governance Guidelines and the New York Stock Exchange (NYSE) Corporate Governance Listing Standards, as well as the Sarbanes-Oxley Act of 2002, when formulating this statement.
During 2004, Rio Tinto applied the principles contained in Part 1 of the Code. The detailed provisions of Section 1 of the Code have been complied with as described below. Rio Tinto also complied with the ASX Best Practice Corporate Governance Guidelines and has voluntarily adopted the recommendations of the US Blue Ribbon Committee in respect of disclosures to shareholders, as detailed in theAudit committee’sstatement on page 87. A statement on compliance with the New York Stock Exchange’s Corporate Governance Listing Standards is contained below in this statement.
The board
The Companies have common boards of directors which are collectively responsible for the success of the Group and accountable to shareholders for the performance of the business. Throughout the rest of this report, they will be described as the board.
The board currently consists of 11 directors: the chairman, two executive directors and eight non executive directors. TheNominations committeecontinually assesses the balance of executive and non executive directors and the composition of the board in terms of the skills and diversity required to ensure it remains relevant in the current environment.
The role and responsibilities of the board
The role of the board is to provide the Companies with good governance and strategic direction. The board also reviews the Group’s control and accountability framework. The directors have agreed to a formal schedule of matters specifically reserved for decision by the board, including strategy, major investments and acquisitions. The full list is available on Rio Tinto’s website.
Responsibility for day to day management of the business lies with the executive team, with the board agreeing annual performance targets for management against the Group’s financial plan. The board is ultimately accountable to shareholders for the performance of the business.
To ensure an efficient process, the board meets regularly and in 2004 had eight scheduled and one special meeting. Details of directors’ attendance at board and committee meetings are set out below.
The board has regular scheduled discussions on various aspects of the Group’s strategy and, in line with best practice, a dedicated annual two day meeting at which in depth discussions of Group strategy take place.
Directors receive timely, regular and necessary management and other information to enable them to fulfil their duties. The board has agreed a procedure for the directors to have access to independent professional advice at the Group’s expense and to the advice and services of both company secretaries.
In addition to these formal processes, directors are in regular communication with senior executives from the different product groups, at formal and informal meetings, to ensure regular exchange of knowledge and experience between management and non executive directors. To continue building on the formal induction programmes, which all new non executive directors undertake, they are encouraged to take every opportunity to visit the Group’s operating locations.
The chairman also holds regular meetings with non executive directors without the executive directors present.
Board performance
In 2004, the board conducted a further formal process to evaluate its effectiveness and that of the board committees and individual directors.
Each director’s performance was appraised by the chairman and, in a meeting chaired by the senior non executive director, the non executive directors assessed the chairman’s performance, taking into consideration the views of executive colleagues. This evaluation process takes place annually and aims to cover board dynamics, board capability, board process, board structure, corporate governance, strategic clarity and alignment and the performance of individual directors. Following the evaluation, the directors believe they comply with the requirements of Clause A.6 of the Code and Principle 8 of the ASX Best Practice Corporate Governance Guidelines.
Independence
The board has adopted a policy on directors’ independence. The policy, which contains the materiality thresholds approved by the board, can be viewed on the Rio Tinto website.
Rio Tinto 2004Form 20-F 82
Back to Contents
The tests of director independence in the jurisdictions where Rio Tinto is listed are not wholly consistent. The board has, therefore, adopted the following criteria for independence: independence of management, the absence of any business relationship which could materially interfere with the director’s independence of judgement and ability to provide a strong, valuable contribution to the board’s deliberations or which could interfere with the director’s ability to act in the best interest of the Group. Where contracts in the ordinary course of business exist between Rio Tinto and a company in which a director has declared an interest, these are reviewed for materiality to both Companies.
Applying these criteria, the board is satisfied that the majority of the directors, Ashton Calvert, Sir David Clementi, Vivienne Cox, Richard Goodmanson, Andrew Gould, Lord Kerr and Sir Richard Sykes are independent. John Morschel, who retired at the end of the 2005 annual general meetings, was also independent. Although Sir Richard Giordano, who also retired at the end of the 2005 annual general meetings, had served as a director since 1992, the strength, objectivity and nature of his contribution to board and committee discussions was fully consistent with those of an independent director. Leon Davis, a former chief executive of the Group, and David Mayhew, who is chairman of one of Rio Tinto plc’s stockbrokers, are not independent. Leon Davis also retired by rotation at the end of the 2005 annual general meetings.
Paul Skinner was, until his appointment as chairman in 2003, an independent, non executive director in compliance with the Code. He satisfies the tests for independence under the ASX Best Practice Corporate Governance Guidelines.
The directors’ biographies are set out on pages 67 to 69.
Election and re-election
Directors are elected by shareholders at the first annual general meetings after their appointment and, after that, offer themselves for reelection at least once every three years. Non executive directors are normally expected to serve at least two terms of three years and, except where special circumstances justify it, would not normally serve more than three such terms.
Chairman and chief executive
The roles of the chairman and chief executive are separate and the division of responsibilities has been formally approved by the board.
| Directors’ attendance at board and committee meetings during 2004 | |
| Name of Director | Board | | Audit | | Remuneration | | Committee on | | Nominations |
| | | committee | committee | social and | committee |
| | | | | environmental | |
| | | | | accountability | |
| | A | | B | A | | B | A | | B | A | | B | A | | B |
|
|
|
|
|
|
|
|
|
|
|
|
|
|
|
|
|
|
|
|
|
| Robert Adams | 9 | | 8 | | | | | | | | | | | | | | | | | |
| David Clementi | 9 | | 8 | | 8 | | 8 | | 5 | | 4 | | | | | | | | | |
| Leigh Clifford | 9 | | 9 | | | | | | | | | | | | | | | | | |
| Leon Davis | 9 | | 9 | | | | | | | | | | 3 | | 3 | | | | | |
| Guy Elliott | 9 | | 9 | | | | | | | | | | | | | | | | | |
| Sir Richard Giordano | 9 | | 8 | | 8 | | 7 | | | | | | 3 | | 3 | | 2 | | 2 | |
| Richard Goodmanson1 | – | | – | | | | | | | | | | | | | | | | | |
| Andrew Gould | 9 | | 8 | | 8 | | 8 | | 5 | | 4 | | | | | | | | | |
| Oscar Groeneveld2 | 7 | | 7 | | | | | | | | | | | | | | | | | |
| Lord Kerr3 | 9 | | 8 | | 5 | | 5 | | | | | | 2 | | 2 | | | | | |
| David Mayhew | 9 | | 8 | | 8 | | 7 | | | | | | | | | | 2 | | 2 | |
| John Morschel | 9 | | 9 | | | | | | 5 | | 5 | | 3 | | 3 | | 2 | | 2 | |
| Paul Skinner | 9 | | 9 | | | | | | | | | | 3 | | 3 | | 2 | | 2 | |
| Sir Richard Sykes | 9 | | 8 | | | | | | 5 | | 5 | | | | | | | | | |
| Lord Tugendhat4 | 3 | | 2 | | 3 | | 3 | | | | | | 1 | | 1 | | | | | |
|
|
|
|
|
|
|
|
|
|
|
|
|
|
|
|
|
|
|
|
|
| A = Maximum number of meetings the director could have attended |
| B = Number of meetings attended |
| | |
| 1. | Richard Goodmanson was appointed on 1 December 2004 |
| 2. | Oscar Groeneveld resigned on 1 October 2004 |
| 3. | Lord Kerr became a committee member on 1 June 2004 (Audit and CSEA) |
| 4. | Lord Tugendhat retired on 22 April 2004 |
Board committees
There are four board committees, theNominations committee,Audit committee,Remuneration committeeand the Committee on social and environmental accountability.Each committee plays a vital role in ensuring that good corporate governance is maintained throughout the Group. Committee terms of reference are reviewed annually by the board and the committees themselves to ensure they continue to be at the forefront of best practice and are posted on the Group’s website. Minutes of all committee meetings are circulated to the board, with oral reports at the next board meeting. All committee members are non executive directors.
Rio Tinto 2004Form 20-F 83
Back to Contents
TheAudit committee’smain responsibilities include the review of accounting principles, policies and practices adopted in the preparation of public financial information; review with management of procedures relating to financial and capital expenditure controls, including internal audit plans and reports; review with external auditors of the scope and results of their audit; the nomination of auditors for appointment by shareholders; and the review of and recommendation to the board for approval of Rio Tinto’s risk management policy. Its responsibilities also include the review of corporate governance practices of Group sponsored pension funds. The committee has a number of training sessions which may cover new legislation and other relevant information. The external auditors, the finance director, the Group controller and Group internal auditor attend meetings. A copy of theAudit committeecharter is reproduced on pages 88 to 89 and can be found on the Rio Tinto website.
TheAudit committeeis chaired by Andrew Gould who succeeded Sir Richard Giordano on his retirement at the end of the 2005 annual general meetings. Its other members are Sir David Clementi, Vivienne Cox, Lord Kerr and David Mayhew. To comply with the NYSE’s rules on independence David Mayhew will cease to be a member of the committee with effect from 31 July 2005.
TheRemuneration committeeis responsible for determining the policy for executive remuneration and for the remuneration and benefits of individual executive directors and senior executives. Full disclosure of all elements of directors’ and relevant senior executives’ remuneration can be found in the Remuneration report on pages 71 to 81, together with details of the Group’s remuneration policies. The committee is chaired by Sir Richard Sykes and its other members are Sir David Clementi, Richard Goodmanson and Andrew Gould.
TheNominations committeeis chaired by the chairman of Rio Tinto, Paul Skinner. It is the committee’s responsibility to ensure that there is a clear, appropriate and transparent process in place to source and appoint new directors. Its responsibilities also include evaluating the balance of skills, knowledge and experience on the board and identifying and nominating, for the approval by the board, candidates to fill board vacancies as and when they arise. The committee reviews the structure, size and composition of the board and makes recommendations with regard to any changes it considers appropriate. The committee also reviews the time required to be committed to Group business by non executive directors and assesses whether non executive directors are devoting sufficient time to carry out their duties. In addition to Paul Skinner, the committee consists of Ashton Calvert, Richard Goodmanson, David Mayhew and Sir Richard Sykes. Under the Code, two members of the committee are not considered independent: Paul Skinner, following his appointment as chairman, and David Mayhew. The committee composition is therefore not fully aligned with recommended practice in the UK. The board takes the view, however, that the skills and experience of the members of the committee, combined with the flexibility of a relatively small committee, makes the current composition both efficient and effective.
TheCommittee on social and environmental accountabilityreviews the effectiveness of management policies and procedures in place to deliver those standards inThe way we work, Rio Tinto’s statement of business practice, which are not covered by the other board committees and, in particular, those relating to health, safety, the environment and social issues. The overall objective of the committee is to promote the development of high quality business practices throughout the Group and to develop the necessary clear accountability on these practices. Members of the committee, which is chaired by Richard Goodmanson, are Ashton Calvert, Lord Kerr and Paul Skinner.
Executive directors’ other directorships
Executive directors are likely to be invited to become non executive directors of other companies. For full details of the Group policy and fees, see pages 71 to 81.
Directors’ dealings in shares
Rio Tinto has a Group policy in place to govern the dealing in Rio Tinto securities by directors and employees. The policy, which prohibits dealings when in possession of price sensitive information and shortly before a results announcement, can be viewed on the Rio Tinto website.
Communication
Rio Tinto recognises the importance of effective communication with shareholders and the general investment community. To ensure shareholders are kept informed in a timely manner, the Group has adopted anExternal disclosure guidance, which is posted on the website appended to theCorporate governance guidance.
In addition to statutory documents, Rio Tinto has a comprehensive website featuring in depth information on health, safety and the environment, as well as general investor information and Group policies. Results presentations and other significant events are available as they happen and as an archive on the website.
The Group also produces a range of informative publications, which are available on request. For further details, see the website.
Full advantage is taken of the annual general meetings to inform shareholders of current developments and to give shareholders the opportunity to ask questions. As recommended by the ASX Best Practice Corporate Governance Guidelines, Rio Tinto Limited’s external auditor attends the AGM and is available to answer shareholder questions about the conduct of the audit and the preparation and content of the auditor’s report.
The main channels of communication with the general investment community are through the chairman, chief executive and finance director, who conduct regular meetings with the Companies’ major shareholders. Non executive directors and the senior independent director are also available as appropriate.
The Group also organises regular investor seminars which provide a two way communication with investors and analysts; the valuable feedback is communicated to the board. An annual survey of major shareholders’ opinion and perception of the Group is presented to the board by the Group’s investor relations advisors.
Rio Tinto 2004Form 20-F 84
Back to Contents
Statement of business practice
The way we workprovides the directors and all Group employees with a summary of the principal policies and procedures in place to help ensure that high governance and business standards are communicated and achieved throughout the Group.
Main policies are adopted by the directors after wide consultation, externally and within the Group. Once adopted, they are communicated to business units worldwide, together with guidance and support on implementation. Business units are then required to devote the necessary effort by management to implement and report on these policies.
The following policies are currently in place: health, safety and the environment; communities; human rights; access to land; employees; business integrity; bribery and corruption; corporate governance; compliance; external disclosures, including continuous disclosure, and code of ethics covering the preparation of financial statements and political involvement. These policies apply to all Rio Tinto managed businesses.
There is also a Group wide “whistle blowing” programme calledSpeak-OUT.Employees are encouraged to report any concerns, including any suspicion of a violation of the Group’s financial reporting and environmental procedures, through an independent third party and without fear of recrimination. A process has been established for the investigation of any matters reported with clear lines of reporting and responsibility in each Group business.
Where the Group does not have operating responsibility for a business, Rio Tinto’s policies are communicated to the business partners and they are encouraged to adopt similar policies of their own.
Rio Tinto’s report on social and environmental matters follows the Association of British Insurers’ guidelines. This report can be found on pages 64 to 67. Details of the Group’s overall and individual businesses’ social and environmental performance continue to be published on Rio Tinto’s website and in theSustainable development review.
Responsibilities of the directors
The directors are required by UK and Australian company law to prepare financial statements for each financial period which give a true and fair view of the state of affairs of the Group as at the end of the financial period and of the profit or loss and cash flows for that period. To ensure that this requirement is satisfied, the directors are responsible for establishing and maintaining adequate internal controls and procedures for financial reporting throughout the Group.
The directors consider that the financial statements present a true and fair view and have been prepared in accordance with applicable accounting standards, using the most appropriate accounting policies for Rio Tinto's business and supported by reasonable and prudent judgments. The accounting policies have been consistently applied.
The directors have received a written statement from the chief executive and the finance director to this effect. In accordance with ASX Best Practice Recommendation 7.2, this written statement is founded on a sound system of risk management and internal compliance and control which implements the policies adopted by the board and confirms that the Group’s risk management and internal compliance and control systems are operating efficiently and effectively in all material respects.
The directors, senior executives, senior financial managers and other members of staff who are required to exercise judgement in the course of the preparation of the financial statements are required to conduct themselves with integrity and honesty and in accordance with the ethical standards of their profession and/or business.
The directors are responsible for maintaining proper accounting records, in accordance with the UK Companies Act 1985 and the Australian Corporations Act 2001. They have a general responsibility for taking such steps as are reasonably open to them to safeguard the assets of Group and to prevent and detect fraud and other irregularities.
The directors are also responsible for the maintenance and integrity of the Group’s website. The work carried out by the auditors does not involve consideration of this and, accordingly, the auditors accept no responsibility for any changes that may have occurred to the financial statements since they were initially loaded on the website.
Going concern
The financial statements have been prepared on the going concern basis. The directors report that they have satisfied themselves that the Group is a going concern since it has adequate financial resources to continue in operational existence for the foreseeable future.
Boards’ statement on internal control
Rio Tinto’s overriding corporate objective is to maximise long term shareholder value through responsible and sustainable investment in mining and related assets. The directors recognise that creating shareholder value is the reward for taking and accepting risk.
The directors are responsible for the Group’s system of internal control and for reviewing its effectiveness in providing shareholders with a return on their investments that is consistent with a responsible assessment and mitigation of risks. This includes reviewing financial, operational and compliance controls, and risk management procedures. Because of the limitations inherent in any such system this is designed to manage rather than eliminate risk.Accordingly, it provides reasonable but not absolute assurance against material misstatement or loss.
The directors have established a process for identifying, evaluating and managing the significant risks faced by the Group. This process was in place during 2004 and up to and including the date of approval of the 2004Annual report and financial statements.The process is reviewed annually by the directors and accords with the guidance set out inInternal Control: Guidance for Directors on the Combined Code.
Rio Tinto 2004Form 20-F 85
Back to Contents
The Group’s management committees review information on the Group’s significant risks, with relevant control and monitoring procedures, for completeness and accuracy. This information is presented to the directors to enable them to assess the effectiveness of the internal controls. In addition, the board and their committees monitor the Group’s significant risks on an ongoing basis.
Assurance functions, including internal auditors and health, safety and environmental auditors, perform reviews of control activities and provide regular written and oral reports to directors and management committees. The directors receive and review minutes of the meetings of each board committee, in addition to oral reports from the respective chairmen at the first board meeting following the relevant committee meeting.
Certain risks, for example natural disasters, cannot be mitigated to an acceptable degree using internal controls. Such major risks are transferred to third parties in the international insurance markets, to the extent considered appropriate.
Each year, the leaders of the Group’s businesses and administrative offices complete an internal control questionnaire that seeks to confirm that adequate internal controls are in place and operating effectively. The results of this process are reviewed by the executive committee and it is then presented to the board as a further part of their review of the Group’s internal controls. This process is continually reviewed and strengthened as appropriate.
In 2002, the Group also established aDisclosure and procedures committee,which was tasked with reviewing the adequacy and effectiveness of Group controls and procedures over the public disclosure of financial and related information. The committee has been presenting the results of this process to senior management and directors and will continue to do so.
The Group has material investments in a number of joint ventures and associated companies. Where Rio Tinto does not have managerial control, it cannot guarantee that local management of mining assets will comply with Rio Tinto standards or objectives. Accordingly, the review of their internal controls is less comprehensive than that for the Group’s managed operations.
The New York Stock Exchange
In November 2003, the SEC approved the new corporate governance listing standards of the New York Stock Exchange (NYSE). The Company, as a foreign issuer with American Depositary Shares listed on the NYSE, is obliged to disclose any significant ways in which its corporate governance practices differ from these standards.
The Company has reviewed the NYSE’s listing standards and believes that its corporate governance practices are consistent with them, with two exceptions where the Company does not meet the strict requirements set out in these standards.
The standards state that companies must have a nominating / corporate governance committee composed entirely of independent directors and with written terms of reference which, in addition to identifying individuals qualified to become board members, develops and recommends to the board a set of corporate governance principles applicable to the Company. Rio Tinto has aNominations committee, information about which is set out on page 84. This committee does not develop corporate governance principles for the board’s approval. The board itself performs this task and approves the Group’s overall system of governance and internal controls.
Rio Tinto’sAudit committeeis made up of a majority of independent non executive directors. However, one committee member, David Mayhew, is technically deemed not to be independent and to comply with the NYSE’s rules on independence will cease to be a member of the committee with effect from 31 July 2005. The board, theAudit committeeand theNominations committeeare made up of a majority of independent, non executive directors as defined by the NYSE listing standards.
Principal auditors
The remuneration of the Group’s principal auditors for audit services and other services as well as remuneration payable to other accounting firms has been set out in Note 37 to the consolidated financial statements on page A-56.
Rio Tinto has adopted policies designed to uphold the independence of the Group’s principal auditors by prohibiting their engagement to provide a range of accounting and other professional services that might compromise their appointment as independent auditors. The engagement of the Group’s principal auditors to provide statutory audit services, certain other assurance services, tax services and certain other specific services is pre-approved by theAudit committee. The engagement of the Group’s principal auditors to provide other permitted services are individually subject to the specific approval of theAudit committeeor its chairman.
Prior to the commencement of each financial year, the Group’s finance director and its principal auditors submit to theAudit committeea schedule of the types of services that are expected to be performed during the following year for its approval. TheAudit committeemay impose a US dollar limit on the total value of other permitted services that can be provided. Any non audit service provided by the Group’s principal auditors, where the expected fee exceeds a pre-determined level, must be subject to the Group’s normal tender procedures. However, in exceptional circumstances the finance director is authorised to engage the Group’s principal auditors to provide such services without going to tender, but if the fees are expected to exceed US$250,000 then the chairman of theAudit committeemust approve the engagement.
TheAudit committeeadopted policies for the pre-approval of permitted services provided by the Group’s principal auditors during January 2003 which were further refined and adopted during September 2003. Engagements for services provided by the Group's principal auditors since the adoption of these policies were either within the pre-approval policies or approved by theAudit committee.
Rio Tinto 2004Form 20-F 86
Back to Contents
Audit committee
US Blue Ribbon Compliance statement
TheAudit committeemeets the membership requirements of the Code and the Blue Ribbon Report in the US. The Group also meets the disclosure requirements in respect of audit committees required by the Australian Stock Exchange. TheAudit committeeis governed by a written charter approved by the board, which theAudit committeereviews and reassesses each year for adequacy. A copy of this charter is reproduced on pages 88 to 89. With effect from 31 July 2005, the Group will become subject to the NYSE Rules on Audit Committees. The committee intends to comply with these rules when they come into force.
TheAudit committeecomprised the five members set out below. The members, with the exception of David Mayhew, are independent and are free of any relationship that would interfere with impartial judgement in carrying out their responsibilities. David Mayhew is technically deemed not to be independent by virtue of his professional association with the Group in his capacity as chairman of Cazenove Group PLC, a stockbroker and financial adviser to Rio Tinto plc. However, the board has determined that the relationship does not interfere with David Mayhew’s exercise of independent judgement and believes that his appointment is in the best interests of the Group because of the substantial financial knowledge and expertise he brings to the committee.
Report of the Audit committee
TheAudit committeemet eight times in 2004. It monitors developments in corporate governance in the UK, Australia and the US, to ensure the Group continues to apply high and appropriate standards.
Many of the new US requirements have long been best practice and are incorporated into the committee’s charter, reproduced on pages 88 to 89. The charter is subject to regular discussion and has been reviewed in the light of new requirements and emerging best practice.
There is in place a set of procedures, including budgetary guidelines, for the appointment of the external auditor to undertake non audit work, which aims to provide the best possible services for the Group at the most advantageous price. The committee reviews the independence of the external auditors on an annual basis and a process is also in place to review their effectiveness to ensure that the Group continues to receive an efficient and unbiased service. The committee advised the directors that theAudit committeeis satisfied that the provision of non audit services by the external auditors during 2004 is compatible with the general standard of independence for auditors imposed by the Australian Corporations Act 2001. Furthermore, as part of its responsibility to foster open communication, the committee meets with management, the external auditors and the internal auditor separately.
Financial expert
TheAudit committeereviewed the SEC requirements for audit committees’ financial experts and the Combined Code requirement that at least one committee member should have recent and relevant financial experience. Following an in depth assessment, the committee recommended to the board that Sir Richard Giordano, Sir David Clementi and Andrew Gould be identified as theAudit committee’sfinancial experts in the2004 Annual report and financial statements.The board has concluded that Sir Richard Giordano, Andrew Gould and Sir David Clementi possess the requisite skills, experience and background to qualify for the purpose of C.3.1. of the Code as well as fulfilling the SEC criteria.
2004 financial statements
TheAudit committeehas reviewed and discussed with management the Group’s audited financial statements for the year ended 31 December 2004.
We have discussed with the external auditors the matters described in the American Institute of Certified Public Accountant Auditing Standard No. 90,Audit committee communications, and in the UK Statement of Auditing Standard No 610,Reporting to those charged with Governance (SAS 610),including their judgements regarding the quality of the Group’s accounting principles and underlying estimates.
The committee has discussed with the external auditors their independence, and received and reviewed their written disclosures, as required by the US Independence Standards Board’s Standard No. 1, Independence Discussions with Audit Committees and SAS 610.
Based on the reviews and discussions referred to above, the committee has recommended to the board of directors that the financial statements referred to above be included in thisAnnual report.
Sir Richard Giordano (Chairman)
Sir David Clementi
Andrew F J Gould
Lord Kerr
David L Mayhew
24 February 2005
Rio Tinto 2004Form 20-F 87
Back to Contents
Report of the Nominations committee
TheNominations committeeis pleased to present the report of its activities, which cover a period of considerable change in composition of the board. A number of long standing non executive directors will have retired over the period 2004/5, including Lord Tugendhat, Sir Richard Giordano, Leon Davis and John Morschel. The recruitment, with input from an external search agency, of replacements with appropriate skills and experience has been the main priority of the committee. Richard Goodmanson joined the board on 1 December 2004 and Ashton Calvert and Vivienne Cox on 1 February 2005. Each is an independent director who brings an experience profile which will ensure that the overall quality of the board is maintained. Apart from making a general overview of the composition of the board, the committee members have been directly involved in the assessment of all individuals considered for appointment. As part of his annual performance assessment of individual directors, Paul Skinner, who is chairman of theNominations committee, has reviewed the time committed to Group business and confirmed this to be appropriate in each case.
Paul Skinner(Chairman)
Sir Richard Giordano
David L Mayhew
John Morschel
24 February 2005
Audit committee charter
Scope and authority
The Group is required by the UK Listing Authority (UKLA), the New York Stock Exchange (NYSE), and theAustralian Stock Exchange (ASX) to establish an Audit committee. Each of the UKLA, the NYSE and the ASX also lay down rules and guidelines for the composition of the committee and the work to be undertaken by it. These requirements, where not self evident, have been incorporated into this Charter.
The primary function of theAudit committeeis to assist the boards of directors in fulfilling their responsibilities by reviewing:
| • | the financial information that will be provided to shareholders and the public; |
| • | the systems of internal controls that the boards and management have established; |
| • | the Group’s auditing, accounting and financial reporting processes. |
| In carrying out its responsibilities, the committee has full authority to investigate all matters that fall within the terms of reference of this Charter. Accordingly, the committee may: |
| • | obtain independent professional advice in the satisfaction of its duties at the cost of the Group; |
| • | have such direct access to the resources of the Group as it may reasonably require, including the external and internal auditors. |
Composition
TheAudit committeeshall comprise three or more non executive directors, all of whom shall be independent. The boards will determine each director’s independence having regard to any past and present relationships with the Group which, in the opinion of the boards, could influence the director’s judgment.
All members of the committee shall have a working knowledge of basic finance and accounting practices. At least one member of the committee will have accounting or related financial management expertise, as determined by the boards.
A quorum will comprise any two independent directors.
The committee may invite members of the management team to attend the meetings and to provide information as necessary.
Meetings
The committee shall meet not less than four times a year or more frequently as circumstances require.Audit committeeminutes will be confirmed at the following meeting of the committee and tabled as soon as practicable at a meeting of the boards.
The Group’s senior financial management, external auditors and internal auditor shall be available to attend all meetings.
As part of its responsibility to foster open communication, the committee should meet with management, the external auditors and the internal auditor, at least annually, to discuss any matters that are best dealt with privately.
Responsibilities
The boards and the external auditors are accountable to shareholders. TheAudit committeeis accountable to the boards. The internal auditor is accountable to theAudit committeeand the finance director. To fulfil its responsibilities the committee shall:
| Charter |
| • | Review and, if appropriate, update this Charter at least annually. |
Rio Tinto 2004Form 20-F 88
Back to Contents
| Financial reporting and internal financial controls |
| • | Review with management and the external auditors the Group’s financial statements, Form 20-F, stock exchange and media releases in respect of each half year and full year. |
| • | Review with management and the external auditors the accounting policies and practices adopted by the Group and their compliance with accounting standards, stock exchange listing rules and relevant legislation. |
| • | Discuss with management and the external auditors management’s choice of accounting principles and material judgments, including whether they are aggressive or conservative and whether they are common or minority practices. |
| • | Recommend to the boards that the annual and interim financial statements, and Form 20-F reviewed by the committee (or the chairman representing the committee for this purpose) be included in the Group’s annual report. |
| • | Review the regular reports prepared by the internal auditor including the effectiveness of the Group’s internal financial controls. |
| | |
| External auditors |
| • | Review and recommend to the boards the external auditors to be proposed to shareholders. |
| • | Review with the external auditors the planned scope of their audit and subsequently their audit findings including any internal control recommendations. |
| • | Periodically consult with the external auditors out of the presence of management about the quality of the Group’s accounting principles, material judgments and any other matters that the committee deems appropriate. |
| • | Review the performance of the external auditors and the effectiveness of the audit process, taking into consideration relevant professional and regulatory requirements. |
| • | Review and approve the fees and other compensation to be paid to the external auditors. |
| • | Review and approve any non audit work and related fees to be carried out by the external auditors. |
| • | Ensure that the external auditors submit a written statement outlining all of its professional relationships with the Group including the provision of services that may affect their objectivity or independence. Review and discuss with the external auditors all significant relationships they have with the company to determine their independence. |
| | |
| Internal auditor |
| • | Review the qualifications, organisation, strategic focus and resourcing of internal audit. |
| • | Review and approve the internal audit plans. |
| • | Review internal audit performance. |
| • | Periodically consult privately with the internal auditor about any significant difficulties encountered including restrictions on scope of work, access to required information or any other matters that the committee deems appropriate. |
| | |
| Risk management |
| • | Review and evaluate the internal processes for determining and managing key risk areas. |
| • | Ensure the Group has an effective risk management system and that macro risks are reported at least annually to the board. |
| • | Require periodic reports from nominated senior managers:
- confirming the operation of the risk management system including advice that accountable management have confirmed the proper operation of agreed risk mitigation strategies and controls, and
- detailing material risks. |
| • | Address the effectiveness of the Group’s internal control system with management and the internal and external auditors. |
| • | Evaluate the process the Group has in place for assessing and continuously improving internal controls, particularly those related to areas of material risk. |
| | |
| Other matters |
| The committee shall also perform any other activities consistent with this Charter that the committee or boards deem appropriate. This will include but not be limited to: |
| • | Review of the corporate governance practices of Group sponsored pension funds. |
| • | Review of the Group’s insurance cover. |
| • | Review the Group’s tax planning and compliance. |
| • | Review the Group’s whistle blowing procedures for financial reporting. |
Rio Tinto 2004Form 20-F 89
Back to Contents
Item 7. Major Shareholders and Related Party Transactions
MAJOR SHAREHOLDERS
As far as is known, Rio Tinto plc is not directly or indirectly owned or controlled by another corporation or by any government. The Capital Group of Companies Inc. by way of a notice dated 6 April 2005 informed the Company of its interest in 52,882,175 ordinary shares representing 4.95 per cent of its shares as at the date of notice. Barclays PLC, by way of a notice dated 20 April 2005 informed the Company of its interest in 39,901,471 ordinary shares representing 3.74 per cent of its shares as the date of notice. Rio Tinto plc does not know of any arrangements which may result in a change in its control. As of 10 June 2005, the total amount of the voting securities owned by the directors of Rio Tinto plc as a group was 59,262 ordinary shares of 10p each representing less than one per cent of the number in issue.
As far as is known, Rio Tinto Limited, with the exception of the arrangements for the dual listed companies merger described on pages 95 to 97, is not directly or indirectly owned or controlled by another corporation or by any government. As of 10 June 2005, the only person known to Rio Tinto Limited as owning more than five per cent of its shares was Tinto Holdings Australia Pty Limited, which is an indirect wholly owned subsidiary of Rio Tinto plc, with 171,072,520 shares, representing 37.48 per cent of its issued capital. Rio Tinto Limited does not know of any arrangements which may result in a change in its control. As of 10 June 2005 the total amount of the voting securities owned by the directors of Rio Tinto Limited as a group was 91,255 shares representing less than one per cent of the number in issue.
Directors’ interests in Group voting securities are shown in Table 3 of the Remuneration report on page 79. Their total beneficial interest in the Group amounts to less than one per cent.
Except as provided under the DLC Merger Sharing Agreement as explained on page 97, the Group’s major shareholders have the same voting and other rights as other shareholders.
As at 10 June 2005 there were 247 US registered shareholders holding 140,175 shares in Rio Tinto plc, and 219 US registered shareholders holding 330,380 shares in Rio Tinto Limited.
Rio Tinto share ownership
Twenty largest shareholdersas at 14 February 2005
| RIO TINTO PLC | | | | | RIO TINTO LIMITED | | | |
| | | Number of | | Percentage | | | | Number of | | Percentage |
| shares | of issued | shares | of issued |
| | share | | share |
| capital | capital |
|
|
|
|
| |
|
|
|
|
|
| | | | | | | | | | | |
| 1 | BNY (Nominees) Limited | 128,983,028 | | 12.07 | | 1 | Tinto Holdings Australia Pty | 187,439,520 | | 37.52 |
| | | | | | | | Limited | | | |
| 2 | Chase Nominees Limited | 47,554,868 | | 4.45 | | 2 | National Nominees Limited | 45,071,472 | | 9.02 |
| 3 | HSBC Global Custody | 28,833,545 | | 2.70 | | 3 | JP Morgan Nominees | 44,527,685 | | 8.91 |
| | Nominee (UK) Limited | | | | | | Australia Limited | | | |
| | <357206> | | | | | | | | | |
| 4 | Credit Lyonnais SA | 22,438,646 | | 2.1 | | 4 | Westpac Custodian | 42,274,410 | | 8.46 |
| | | | | | | | Nominees Limited | | | |
| 5 | Prudential Client HSBC GIS | 21,436,365 | | 2.00 | | 5 | Citicorp Nominees Pty | 11,875,963 | | 2.38 |
| | Nominee (UK) Limited | | | | | | Limited | | | |
| | <PAC> | | | | | | | | | |
| 6 | State Street Nominees | 19,457,648 | | 1.82 | | 6 | ANZ Nominees Limited | 11,019,930 | | 2.21 |
| | Limited <OM02> | | | | | | | | | |
| 7 | The Bank of New York | 17,435,234 | | 1.63 | | 7 | Cogent Nominees Pty | 7,203,002 | | 1.44 |
| | (Nominees) Limited | | | | | | Limited | | | |
| 8 | Nortrust Nominees Limited | 16,482,434 | | 1.54 | | 8 | Queensland Investment | 6,484,928 | | 1.30 |
| | <SLEND> | | | | | | Corporation | | | |
| 9 | Nutraco Nominees Limited | 14,215,117 | | 1.33 | | 9 | RBC Global Services | 3,595,894 | | 0.72 |
| | | | | | | | Australia Nominees Pty | | | |
| | | | | | | | Limited | | | |
| 10 | Chase Nominees Limited | 13,423,782 | | 1.26 | | 10 | HSBC Custody Nominees | 3,585,137 | | 0.72 |
| | <LEND> | | | | | | (Australia) Limited | | | |
| 11 | BNY (OCS) Nominees | 11,998,130 | | 1.12 | | 11 | AMP Life Limited | 3,146,536 | | 0.63 |
| | Limited | | | | | | | | | |
| 12 | Chase Nominees Limited | 11,889,623 | | 1.11 | | 12 | Citicorp Nominees Pty | 3,094,846 | | 0.62 |
| | <BGILIFEL> | | | | | | Limited <CFS WSLE | | | |
| | | | | | | | GEARED SHR FND A/C> | | | |
| 13 | Chase (GA Group) | 11,659,302 | | 1.09 | | 13 | Citicorp Nominees Pty | 2,890,455 | | 0.58 |
| | Nominees Limited <GA> | | | | | | Limited<CFS WSLE | | | |
| | | | | | | | IMPUTATION FND A/C> | | | |
| 14 | HSBC Global Custody | 11,256,295 | | 1.05 | | 14 | UBS Nominees Pty | 2,636,088 | | 0.53 |
| | Nominees (UK) Limited | | | | | | Ltd<PRIME BROKING | | | |
| | <899877> | | | | | | A/C> | | | |
| 15 | Nortrust Nominees Limited | 10,693,371 | | 1.00 | | 15 | ANZ Nominees Limited | 2,301,363 | | 0.46 |
Rio Tinto 2004 Form 20-F 90
Back to Contents
| 16 | State Street Nominees Limited <HG18> | 10,350,000 | | 0.97 | | 16 | RBC Global Services Australia Nominees Pty | 2,190,759 | | 0.44 |
| | | | | | | | Limited <PIPOOLED A/C> | | | |
| 17 | State Street Nominees Limited <E802> | 9,373,275 | | 0.88 | | 17 | IAG Nominees Pty Limited | 2,154,975 | | 0.43 |
| 18 | BNP Paribas Arbitrage SNC <2890000> | 9,179,784 | | 0.86 | | 18 | Westpac Financial Services Limited | 2,060,695 | | 0.41 |
| 19 | Chase Nominees Limited <USRESLD> | 8,748,512 | | 0.82 | | 19 | RBC Global Services Australia Nominees Pty Limited | 1,946,255 | | 0.39 |
| 20 | Mellon Nominees (UK) Limited <BSDTGUSD> | 8,492,230 | | 0.79 | | 20 | Citicorp Nominees Pty Limited <CFS | 1,881,535 | | 0.38 |
| | | | | | | | IMPUTATION FUND A/C> | | | |
|
|
|
|
| |
|
|
|
|
|
| | | 433,901,189 | | 40.59 | | | | 387,381,448 | | 77.55 |
|
|
|
|
| |
|
|
|
|
|
| (a) | As far as is known, Rio Tinto is not directly or indirectly owned or controlled by another corporation or by any government. |
| (b) | Rio Tinto is not aware of any arrangement which may result in a change in its control. |
| (c) | Tinto Holdings Australia Pty Limited is a wholly owned subsidiary of Rio Tinto plc. |
| (d) | Other large shareholders are nominees who hold securities on behalf of beneficial shareholders, for example BNY (Nominees) Limited holds Rio Tinto plc shares on behalf of the holders of American Depository Receipts that are traded on the New York Stock Exchange. |
| (e) | Under the listing rules, any shareholder of Rio Tinto plc with a beneficial interest of more than three per cent, or of Rio Tinto Limited with a beneficial interest of more than five per cent, is required to provide the Companies with notice. The only shareholder to have provided such notice is The Capital Group of Companies Inc by way of a notice dated 31 January 2005 which confirmed an interest in 64,021,998 ordinary shares issued by Rio Tinto plc, representing 5.99 per cent of its shares as at the date of notice. |
Analysis of ordinary shareholdersAs at 14 February 2005
| | | | | | Rio Tinto plc | | | | | | Rio Tinto Limited | |
| No of | % | Shares | | % | No of | % | Shares | | % |
| accounts | | | | | accounts | | | | |
|
|
|
|
|
|
|
|
|
|
|
|
|
|
|
| |
| 1 to 1,000 shares | 42,642 | | 67.67 | | 18,272,340 | | 1.71 | | 55,684 | | 76.35 | | 22,327,099 | | 4.47 | |
| 1,001 to 5,000 shares | 16,977 | | 26.94 | | 34,351,886 | | 3.22 | | 15,093 | | 20.69 | | 29,784,565 | | 5.96 | |
| 5,001 to 10,000 shares | 1,472 | | 2.34 | | 10,232,719 | | 0.96 | | 1,315 | | 1.80 | | 9,157,549 | | 1.83 | |
| 10,001 to 25,000 shares | 698 | | 1.11 | | 10,938,289 | | 1.02 | | 551 | | 0.76 | | 8,070,612 | | 1.62 | |
| 25,001 to 125,000 shares | 640 | | 1.01 | | 36,140,355 | | 3.38 | | 197 | | 0.27 | | 9,783,825 | | 1.96 | |
| 125,001 to 250,000 shares | 177 | | 0.28 | | 32,558,472 | | 3.05 | | 33 | | 0.05 | | 6,074,624 | | 1.22 | |
| 250,001 to 1,250,000 shares | 271 | | 0.43 | | 150,765,734 | | 14.11 | | 32 | | 0.04 | | 16,310,955 | | 3.27 | |
| 1,250,001 to 2,500,000 | 70 | | 0.11 | | 120,880,971 | | 11.31 | | 13 | | 0.02 | | 22,268,625 | | 4.46 | |
| 2,500,001 and over | 69 | | 0.11 | | 525,327,145 | | 49.17 | | 14 | | 0.02 | | 374,845,866 | | 75.04 | |
| ADRs | | | | | 128,983,028 | | 12.07 | | | | | | 882,604 | | 0.17 | |
|
|
|
|
|
|
|
|
|
|
|
|
|
|
|
| |
| | 63,016 | | 100 | | 1,068,450,939 | | 100 | | 72,932 | | 100 | | 499,506,324 | | 100 | |
|
|
|
|
|
|
|
|
|
|
|
|
|
|
|
| |
| | | | | | | | | | | | | | | | | |
| Number of holdings less than marketable parcel of A$500. | | | | | | 1,566 | | | | | | | |
RELATED PARTY TRANSACTIONS
Details of the Group’s material related party transactions are set out in Note 38 on page A-57 of the consolidated financial statements.
Except as explained on page 37, the Group’s financial statements show the full extent of the Group’s financial commitments including debt and similar exposures. It has never been the Group’s practice to engineer financial structures as a way of avoiding disclosure. Substance rather than form is a fundamental principle of Rio Tinto’s reporting.
Item 8. Financial Information
LEGAL PROCEEDINGS
Neither Rio Tinto plc nor Rio Tinto Limited nor any of their subsidiaries is a defendant in any proceedings which the directors believe will have a material effect on either Company’s financial position and results of operations.
DIVIDENDS
Both Companies have paid dividends on their shares every year since incorporation in 1962. The rights of Rio Tinto shareholders to receive dividends are explained under the description of the Dual Listed Companies’ Structure on pages 95 to 96.
Dividend policy
The aim of Rio Tinto’s progressive dividend policy is to increase the US dollar value of dividends over time, without cutting them in economic downturns.
Rio Tinto 2004Form 20-F 91
Back to Contents
The rate of the total annual dividend, in US dollars, is determined taking into account the results for the past year and the outlook for the current year. The interim dividend is set at one half of the total dividend for the previous year. Under Rio Tinto’s dividend policy the final dividend for each year is expected to be at least equal to the interim dividend.
Dividend determination
As the majority of the Group’s sales are transacted in US dollars it is the most reliable currency in which to measure the Group’s financial performance and is its main reporting currency. So the US dollar is the natural currency for dividend determination. Dividends determined in US dollars are translated at exchange rates prevailing two days prior to announcement and are then declared payable in sterling by Rio Tinto plc and in Australian dollars by Rio Tinto Limited.
Australian shareholders of Rio Tinto plc can elect to receive dividends in Australian dollars and UK shareholders of Rio Tinto Limited can elect to receive dividends in sterling. If you would like further information contact Computershare.
2004 dividends
The 2004 interim and final dividends were determined at 32 US cents and at 45 US cents per share respectively and the applicable translation rates were US$1.8245 and US$1.8796 to the pound sterling and US$0.7029 and US$0.7720 to the Australian dollar.
Final dividends of 23.94 pence per share and 58.29 Australian cents per share were paid on 8 April 2005. A final dividend of 180 US cents per ADR (each representing four shares) was paid by JP Morgan Chase Bank NA to Rio Tinto plc ADR holders and by The Bank of New York to Rio Tinto Limited ADR holders on 11 April 2005.
The tables below set out the amounts of interim, final and total cash dividends paid on each share or ADS in respect of each financial year, but before deduction of any withholding tax.
| Rio Tinto Group – US cents per share | 2000 | | 2001 | | 2002 | | 2003 | | 2004 | |
|
|
|
|
|
|
|
|
|
| |
| Interim | 19.0 | | 20.0 | | 29.5 | | 30.0 | | 32.0 | |
| Final | 38.5 | | 39.0 | | 30.5 | | 34.0 | | 45.0 | |
| Total | 57.5 | | 59.0 | | 60.0 | | 64.0 | | 77.0 | |
|
|
|
|
|
|
|
|
|
| |
| Rio Tinto plc – UK pence per share | 2000 | | 2001 | | 2002 | | 2003 | | 2004 | |
|
|
|
|
|
|
|
|
|
| |
| Interim | 12.66 | | 14.03 | | 18.87 | | 18.45 | | 17.54 | |
| Final | 26.21 | | 27.65 | | 18.60 | | 18.68 | | 23.94 | |
| Total | 38.87 | | 41.68 | | 37.47 | | 37.13 | | 41.48 | |
|
|
|
|
|
|
|
|
|
| |
| Rio Tinto Limited – Australian cents per share | 2000 | | 2001 | | 2002 | | 2003 | | 2004 | |
|
|
|
|
|
|
|
|
|
| |
| Interim | 32.68 | | 39.42 | | 54.06 | | 45.02 | | 45.53 | |
| Final | 69.76 | | 75.85 | | 51.87 | | 44.68 | | 58.29 | |
| Total | 102.44 | | 115.27 | | 105.93 | | 89.70 | | 103.82 | |
|
|
|
|
|
|
|
|
|
| |
| Rio Tinto plc and Rio Tinto Limited – US cents per ADS | 2000 | | 2001 | | 2002 | | 2003 | | 2004 | |
| Interim | 76 | | 80 | | 118 | | 120 | | 128 | |
| Final | 154 | | 156 | | 122 | | 136 | | 180 | |
| Total | 230 | | 236 | | 240 | | 256 | | 308 | |
|
|
|
|
|
|
|
|
|
| |
Dividend reinvestment plan (DRP)
Rio Tinto offers shareholders a DRP which provides the opportunity to use cash dividends to purchase Rio Tinto shares in the market free of commission. Please see Taxation on page 101 for an explanation of the tax consequences. The DRP is made available only to shareholders whose names are recorded on the respective Company’s register and due to local legislation cannot be extended to shareholders in the US, Canada and certain other countries. Please contact Computershare for further information.
POST BALANCE SHEET EVENTS
On 9 May 2005 Rio Tinto Limited announced the successful result of its off-market share buy-back. A total of approximately 27.3 million shares, representing 8.7 per cent of Rio Tinto Limited’s publicly held issued share capital (2.0 per cent of the Rio Tinto Group), were bought back at A$36.70 per share at a cost of approximately A$1 billion (US$780 million). The buy-back price of A$36.70 per share represented a 14 per cent discount to the relevant volume weighted average price of Rio Tinto Limited shares sold on the ASX over the five trading days up to and including the closing date of the buy-back. It also represented a discount of 15.6 per cent to the closing price for Rio Tinto Limited shares on 6 May 2005, of A$43.50.
Under a separate buy-back, Tinto Holdings Australia accepted the same A$36.70 buy-back price for a proportion of its 37.5 per cent holding of Rio Tinto Limited shares so that there was no change in the proportional shareholding in Rio Tinto Limited as a result of the buy-back. Rio Tinto Limited therefore bought back a further 16.4 million shares at a cost of approximately A$600 million (US$470 million).
Rio Tinto 2004Form 20-F 92
Back to Contents
Item 9. The Offer and Listing
MARKET LISTINGS AND SHARE PRICES
Rio Tinto plc
The principal market for Rio Tinto plc shares is the London Stock Exchange (LSE).
As a constituent of the Financial Times Stock Exchange 100 index (FTSE 100), Rio Tinto plc shares trade through the Stock Exchange Electronic Trading Service (SETS) system.
Central to the SETS system is the electronic order book on which an LSE member firm can post buy and sell orders, either on its own behalf or for its clients. Buy and sell orders are executed against each other automatically in strict price, then size, priority. The order book operates from 8.00 am to 4.30 pm daily. From 7.50 am to 8.00 am orders may be added to, or deleted from the book, but execution does not occur. At 8.00 am the market opens by means of an uncrossing algorithm which calculates the greatest volume of trades on the book which can be executed, then matches the orders, leaving unexecuted orders on the book at the start of trading.
All orders placed on the order book are firm and are for standard three day settlement. While the order book is vital to all market participants, orders are anonymous, with the counterparties being revealed to each other only after execution of the trade.
Use of the order book is not mandatory but all trades, regardless of size, executed over the SETS system are published immediately. The only exception to this is where a Worked Principal Agreement (WPA) is entered into for trades greater than 8 x Normal Market Size (NMS). Rio Tinto plc has an NMS of 100,000 shares. Publication of trades entered under a WPA is delayed until the earlier of 80 per cent of the risk position assumed by the member firm taking on the trade being unwound or the end of the business day.
Closing LSE share prices are published in most UK national newspapers and are also available during the day on the Rio Tinto and other websites. Share prices are also available on CEEFAX and TELETEXT and can be obtained through the Cityline service operated by the Financial Times in the UK: telephone 0906 843 3880; calls are currently charged at 60p per minute.
Rio Tinto plc has a sponsored American Depositary Receipt (ADR) facility with JP Morgan Chase Bank NA under a Deposit Agreement, dated 13 July 1988, as amended on 11 June 1990, as further amended and restated on 15 February 1999 and as further amended and restated on 18 February 2005. JP Morgan Chase Bank NA replaced The Bank of New York following its removal as Depositary. The ADRs evidence Rio Tinto plc American Depositary Shares (ADS), each representing four ordinary shares. The shares are registered with the US Securities and Exchange Commission (SEC), are listed on the New York Stock Exchange (NYSE) and are traded under the symbol ‘RTP’.
Rio Tinto plc shares are also listed on Euronext and on Deutsche Börse.
The following table shows share prices for the period indicated, the reported high and low middle market quotations, which represent an average of bid and asked prices, for Rio Tinto plc’s shares on the LSE based on the LSE Daily Official List, and the highest and lowest sale prices of the Rio Tinto plc ADSs as reported on the NYSE composite tape.
| | Pence per | | US$ per | |
| | Rio Tinto plc share | | Rio Tinto plc ADS | |
| | High | | Low | | High | | Low | |
|
|
|
|
|
|
|
| |
| 2000 | 1,478 | | 900 | | 96.56 | | 55.13 | |
| 2001 | 1,475 | | 930 | | 84.10 | | 55.00 | |
| 2002 | 1,492 | | 981 | | 85.93 | | 62.00 | |
| 2003 | 1,543 | | 1,093 | | 111.35 | | 71.70 | |
| 2004 | 1,574 | | 1,212 | | 119.39 | | 86.42 | |
|
|
|
|
|
|
|
| |
| Aug 2004 | 1,434 | | 1,356 | | 105.77 | | 100.40 | |
| Sept 2004 | 1,496 | | 1,348 | | 108.65 | | 98.05 | |
| Oct 2004 | 1,562 | | 1,421 | | 111.68 | | 103.48 | |
| Nov 2004 | 1,548 | | 1,438 | | 118.47 | | 105.78 | |
| Dec 2004 | 1,540 | | 1,430 | | 119.39 | | 111.59 | |
| Jan 2005 | 1,690 | | 1,472 | | 126.25 | | 111.57 | |
| Feb 2005 | 1,835 | | 1,621 | | 141.57 | | 120.67 | |
| Mar 2005 | 1,851 | | 1,679 | | 142.80 | | 124.41 | |
| Apr 2005 | 1,735 | | 1,557 | | 130.75 | | 118.50 | |
| May 2005 | 1,679 | | 1,570 | | 126.76 | | 115.80 | |
|
|
|
|
|
|
|
| |
| 2003 | | | | | | | | |
| First quarter | 1,298 | | 1,093 | | 83.80 | | 71.70 | |
| Second quarter | 1,272 | | 1,129 | | 85.26 | | 72.30 | |
| Third quarter | 1,420 | | 1,132 | | 93.83 | | 75.31 | |
| Fourth quarter | 1,543 | | 1,290 | | 111.35 | | 86.85 | |
|
|
|
|
|
|
|
| |
| 2004 | | | | | | | | |
| First quarter | 1,574 | | 1,297 | | 111.50 | | 95.95 | |
| Second quarter | 1,409 | | 1,212 | | 105.30 | | 86.42 | |
| Third quarter | 1,496 | | 1,313 | | 108.65 | | 97.03 | |
| Fourth quarter | 1,562 | | 1,421 | | 119.39 | | 103.48 | |
|
|
|
|
|
|
|
| |
| 2005 | | | | | | | | |
| First quarter | 1,851 | | 1,472 | | 142.80 | | 111.57 | |
|
|
|
|
|
|
|
| |
Rio Tinto 2004Form 20-F 93
Back to Contents
As at 10 June 2005, there were 57,585 holders of record of Rio Tinto plc’s shares. Of these holders, 247 had registered addresses in the US and held a total of 140,715 Rio Tinto plc shares, representing 0.01 per cent of the total number of Rio Tinto plc shares issued and outstanding as at such date. In addition, 129 million Rio Tinto plc shares were registered in the name of a custodian account in London. These shares were represented by 32.23 million Rio Tinto plc ADSs held of record by 377 ADR holders. In addition, certain accounts of record with registered addresses other than in the US hold shares, in whole or in part, beneficially for US persons.
Rio Tinto Limited
Rio Tinto Limited shares are listed on the Australian Stock Exchange (ASX) and the New Zealand Stock Exchange. The ASX is the principal trading market for Rio Tinto Limited shares. The ASX is a national stock exchange operating in the capital city of each Australian State with an automated trading system. Although not listed, Rio Tinto Limited shares are also traded in London.
Closing ASX share prices are published in most Australian newspapers and are also available during the day on the Rio Tinto and other websites.
Rio Tinto Limited has an ADR facility with The Bank of New York under a Deposit Agreement, dated 6 June 1989, as amended on 1 August 1989, and as amended and restated on 2 June 1992. The ADRs evidence Rio Tinto Limited’s ADSs, each representing four shares and are traded in the over the counter market under the symbol ‘RTOLY’.
The following tables set out for the periods indicated the high and low closing sale prices of Rio Tinto Limited shares based upon information provided by the ASX and the highest and lowest trading prices of Rio Tinto Limited ADSs, as advised by The Bank of New York. There is no established trading market in the US for Rio Tinto Limited’s shares or ADSs.
| | A$ per | | US$ per | |
| | Rio Tinto Limited share | | Rio Tinto Limited ADS | |
| | High | | Low | | High | | Low | |
|
|
|
|
|
|
|
| |
| 2000 | 33.54 | | 22.65 | | 87.50 | | 50.00 | |
| 2001 | 38.62 | | 28.40 | | 80.55 | | 54.00 | |
| 2002 | 41.35 | | 29.05 | | 85.24 | | 63.62 | |
| 2003 | 37.54 | | 28.17 | | 112.42 | | 73.85 | |
| 2004 | 40.20 | | 31.98 | | 125.00 | | 91.60 | |
|
|
|
|
|
|
|
| |
| Aug 2004 | 38.35 | | 35.88 | | 105.00 | | 103.00 | |
| Sept 2004 | 38.60 | | 35.70 | | 108.20 | | 102.00 | |
| Oct 2004 | 39.63 | | 36.30 | | 111.60 | | 107.00 | |
| Nov 2004 | 39.52 | | 36.59 | | 122.20 | | 110.60 | |
| Dec 2004 | 40.20 | | 37.81 | | 125.00 | | 108.00 | |
| Jan 2005 | 43.80 | | 38.75 | | 135.00 | | 118.80 | |
| Feb 2005 | 47.28 | | 42.36 | | 152.00 | | 129.25 | |
| Mar 2005 | 47.93 | | 44.46 | | 153.00 | | 137.00 | |
| Apr 2005 | 45.90 | | 41.40 | | 142.50 | | 129.45 | |
| May 2005 | 44.91 | | 41.40 | | 139.90 | | 127.50 | |
|
|
|
|
|
|
|
| |
| 2003 | | | | | | | | |
| First quarter | 35.25 | | 30.69 | | 83.22 | | 73.85 | |
| Second quarter | 33.26 | | 29.21 | | 84.00 | | 74.53 | |
| Third quarter | 35.31 | | 28.17 | | 94.00 | | 76.55 | |
| Fourth quarter | 37.54 | | 32.32 | | 112.42 | | 88.22 | |
|
|
|
|
|
|
|
| |
| 2004 | | | | | | | | |
| First quarter | 38.50 | | 33.80 | | 115.00 | | 99.45 | |
| Second quarter | 36.18 | | 31.98 | | 108.00 | | 91.60 | |
| Third quarter | 38.60 | | 35.56 | | 108.20 | | 102.00 | |
| Fourth quarter | 40.20 | | 36.30 | | 125.00 | | 107.00 | |
|
|
|
|
|
|
|
| |
| 2005 | | | | | | | | |
| First quarter | 47.93 | | 38.75 | | 153.00 | | 118.80 | |
|
|
|
|
|
|
|
| |
As at 10 June 2005, a total of 330,380 Rio Tinto Limited shares were held of record by 219 persons with registered addresses in the US, which represented approximately 0.70 per cent of the total number of Rio Tinto Limited shares issued and outstanding as of such date. In addition, an aggregate of 269,413 Rio Tinto Limited ADSs were outstanding, representing 1,077,652 Rio Tinto Limited shares, and were held of record by 28 persons with registered addresses in the US, which represented less than one per cent of the total number of Rio Tinto Limited shares issued and outstanding. In addition, nominee accounts of record with registered addresses other than in the US may hold Rio Tinto Limited shares, in whole or in part, beneficially for US persons.
ADR holders
ADR holders may instruct either JPMorgan Chase Bank NA or The Bank of New York as appropriate as to how the shares represented by their ADRs should be voted.
Rio Tinto 2004Form 20-F 94
Back to Contents
Registered holders of ADRs will have the Annual review and interim reports mailed to them at their record address. Brokers or financial institutions, which hold ADRs for shareholder clients, are responsible for forwarding shareholder information to their clients and will be provided with copies of the Annual review and interim reports for this purpose.
Rio Tinto is subject to the US Securities and Exchange Commission (SEC) reporting requirements for foreign companies. This Form 20-F corresponds with the Form-10K which US public companies are required to file with the SEC. Rio Tinto’s Form 20-F and other filings can be viewed on the SEC web site at www.sec.gov.
Investment warning
Past performance of shares is not necessarily a guide to future performance. The value of investments and any income from them is not guaranteed and can fall as well as rise depending on market movements. You may not get back the original amount invested.
Item 10. Additional Information
DUAL LISTED COMPANIES STRUCTURE
On 20 December 1995, Rio Tinto shareholders approved the terms of the dual listed companies merger (the DLC merger) which was designed to place the shareholders of both Companies in substantially the same position as if they held shares in a single enterprise owning all of the assets of both Companies. As a condition of its approval of the DLC merger, the Australian Government required Rio Tinto plc to reduce its shareholding in Rio Tinto Limited to 39 per cent by the end of 2005. The current holding is approximately 37.6 per cent.
Following the approval of the DLC merger, both Companies entered into a DLC Merger Sharing Agreement (the Sharing Agreement) through which each Company agreed:
| • | to ensure that the businesses of Rio Tinto plc and Rio Tinto Limited are managed on a unified basis, |
| • | to ensure that the boards of directors of each Company is the same, and |
| • | to give effect to certain arrangements designed to provide shareholders of each Company with a common economic interest in the combined enterprise. |
In order to achieve this third objective, the Sharing Agreement provided for the ratio of dividend, voting and capital distribution rights attached to each Rio Tinto plc share and to each Rio Tinto Limited share to be fixed in an Equalisation Ratio which has remained unchanged at 1:1. The Sharing Agreement has provided for this ratio to be revised in special circumstances where, for example, certain modifications are made to the share capital of one Company, such as rights issues, bonus issues, share splits and share consolidations, but not to the share capital of the other. Outside these specified circumstances, the Equalisation Ratio can only be altered with the approval of shareholders under the Class Rights Action approval procedure described under Voting rights. In addition, any adjustments are required to be confirmed by the auditors.
One consequence of the DLC merger is that Rio Tinto is subject to a wide range of laws, rules and regulatory review across multiple jurisdictions. Where these rules differ, in many instances it means that Rio Tinto, as a Group, complies with the strictest applicable level.
Consistent with the creation of a single combined enterprise under the DLC merger, directors of each Company are to act in the best interests of the shareholders of both Companies ie, in the best interests of Rio Tinto as a whole. Identified areas where there may be a conflict of the interests of the shareholders of each Company must be approved under the Class Rights Action approval procedure.
To ensure that directors of each Company are the same, resolutions to appoint or remove directors must be put to shareholders of both Companies as a joint electorate as a Joint Decision as described under Voting rights, and it is a requirement that a person can only be a director of one Company if the person is also a director of the other Company. So, for example, if a person was removed as a director of one Company, he or she would also cease to be a director of the other.Dividend rights
The Sharing Agreement provides for dividends paid on Rio Tinto plc and Rio Tinto Limited shares to be equalised on a net cash basis, that is without taking into account any associated tax credits. Dividends are determined in US dollars and are then, except for ADR holders, translated and paid in sterling and Australian dollars. The Companies are also required to announce and pay their dividends and other distributions as close in time to each other as possible.
In the unlikely event that one Company did not have sufficient distributable reserves to pay the equalised dividend or the equalised capital distribution, it would be entitled to receive a top up payment from the other Company. The top up payment could be made as a dividend on the DLC Dividend Share, on the Equalisation Share if on issue or by way of a contractual payment.
If the payment of an equalised dividend would contravene the law applicable to one of the Companies, then they may depart from the Equalisation Ratio. However, should such a departure occur then the relevant Company will put aside reserves to be held for payment on the relevant shares at a later date.
Rio Tinto shareholders have no direct rights to enforce the dividend equalisation provisions of the Sharing Agreement.
Rio Tinto 2004Form 20-F 95
Back to Contents
The DLC Dividend Share can also be utilised to provide the Group with flexibility for internal funds management by allowing dividends to be paid between the two parts of the Group. Such dividend payments are of no economic significance to the shareholders of either Company, as they will have no effect on the Group's overall resources.
Voting rights
In principle, the Sharing Agreement provides for the public shareholders of Rio Tinto plc and Rio Tinto Limited to vote as a joint electorate on all matters which affect shareholders of both Companies in similar ways. These are referred to as Joint Decisions. Such Joint Decisions include the creation of new classes of share capital, the appointment or removal of directors and auditors and the receiving of annual financial statements. Joint Decisions are voted on a poll.
The Sharing Agreement also provides for the protection of the public shareholders of each Company by treating the shares issued by each Company as if they were separate classes of shares issued by a single company. So decisions that do not affect the shareholders of both Companies equally require the separate approval of the shareholders of both Companies. Matters requiring this approval procedure are referred to as Class Rights Actions and are voted on a poll.
Thus, the interests of the shareholders of each Company are protected against decisions which affect them and the shareholders in the other company differently, by requiring their separate approval. For example, fundamental elements of the DLC merger cannot be changed unless approved by shareholders under the Class Rights Action approval procedure.
Exceptions to these principles can arise in situations such as where legislation requires the separate approval of a decision by the appropriate majority of shareholders in one Company and where approval of the matter by shareholders of the other Company is not required.
Where a matter has been expressly categorised as either a Joint Decision or a Class Rights Action, the directors do not have the power to change that categorisation. If a matter falls within both categories, it is treated as a Class Rights Action. In addition, the directors can determine that matters not expressly listed in either category should be put to shareholders for their approval under either procedure.
To facilitate the joint voting arrangements each Company has entered into shareholder voting agreements. Each Company has issued a Special Voting Share to a special purpose company held in trust by a common Trustee.
Rio Tinto plc has issued its Special Voting Share (RTP Special Voting Share) to RTL Shareholder SVC and Rio Tinto Limited has issued its Special Voting Share (RTL Special Voting Share) to RTP Shareholder SVC. The total number of votes cast on Joint Decisions by the public shareholders of one Company are voted at the parallel meeting of the other Company. The role of these special purpose companies in achieving this is described below.
In exceptional circumstances, certain public shareholders of the Companies can be excluded from voting at the respective Company’s general meetings because they have acquired shares in one Company in excess of a given threshold without making an offer for all the shares in the other Company. If this should occur, the votes cast by these excluded shareholders will be disregarded.
Following the Companies’ general meetings the overall results of the voting on Joint Decisions and the results of voting on separate decisions will be announced to the stock exchanges, published on the Rio Tinto website and advertised in the Financial Times and Australian newspapers.
Rio Tinto plc
At a Rio Tinto plc shareholders’ meeting at which a Joint Decision will be considered, each Rio Tinto plc share will carry one vote and the holder of its Special Voting Share will have one vote for each vote cast by the public shareholders of Rio Tinto Limited. The holder of the Special Voting Share is required to vote strictly and only in accordance with the votes cast by public shareholders for and against the equivalent resolution at the parallel Rio Tinto Limited shareholders’ meeting.
The holders of Rio Tinto Limited ordinary shares do not actually hold any voting shares in Rio Tinto plc by virtue of their holding in Rio Tinto Limited and cannot enforce the voting arrangements relating to the Special Voting Share.
Rio Tinto Limited
At a Rio Tinto Limited shareholders’ meeting at which a Joint Decision will be considered, each Rio Tinto Limited share will carry one vote and, together with the Rio Tinto Limited ordinary shares held by Tinto Holdings Australia, the holder of its Special Voting Share will carry one vote for each vote cast by the public shareholders of Rio Tinto plc in their parallel meeting. Tinto Holdings Australia and the holder of the Special Voting Share are required to vote strictly, and only, in accordance with the votes cast for and against the equivalent resolution at the parallel Rio Tinto plc shareholders’ meeting.
The holders of Rio Tinto plc ordinary shares do not actually hold any voting shares in Rio Tinto Limited by virtue of their holding in Rio Tinto plc and cannot enforce the voting arrangements relating to the Special Voting Share.
Rio Tinto 2004Form 20-F 96
Back to Contents
Capital distribution rights
If either of the Companies goes into liquidation, the Sharing Agreement provides for a valuation to be made of the surplus assets of both Companies. If the surplus assets available for distribution by one Company on each of the shares held by its public shareholders exceed the surplus assets available for distribution by the other Company on each of the shares held by its public shareholders, then an equalising payment between the two Companies shall be made, to the extent permitted by applicable law, such that the amount available for distribution on each share held by public shareholders of each Company conforms to the Equalisation Ratio. The objective is to ensure that the public shareholders of both Companies have equivalent rights to the assets of the combined Group on a per share basis, taking account of the Equalisation Ratio.
The Sharing Agreement does not grant any enforceable rights to the shareholders of either Company upon liquidation of a Company.
Limitations on ownership of shares and merger obligations
The laws and regulations of the UK and Australia impose certain restrictions and obligations on persons who control interests in public quoted companies in excess of certain thresholds that, under certain circumstances, include obligations to make a public offer for all of the outstanding issued shares of the relevant company. The threshold applicable to Rio Tinto plc under UK law and regulations is 30 per cent and to Rio Tinto Limited under Australian laws and regulations is 20 per cent.
As part of the DLC merger, the memorandum and articles of association of Rio Tinto plc and the constitution of Rio Tinto Limited were amended with the intention of extending these laws and regulations to the combined enterprise and, in particular, to ensure that a person cannot exercise control over one Company without having made offers to the public shareholders of both Companies. It is consistent with the creation of the single economic enterprise and the equal treatment of the two sets of shareholders, that these laws and regulations should operate in this way. The articles of association of Rio Tinto plc and the constitution of Rio Tinto Limited impose restrictions on any person who controls, directly or indirectly, 20 per cent or more of the votes on a Joint Decision. If, however, such a person only has an interest in Rio Tinto Limited or Rio Tinto plc, then the restrictions will only apply if they control, directly or indirectly, 30 per cent or more of the votes at that Company’s general meetings.
If one of the thresholds specified above is breached then, subject to certain limited exceptions and notification by the relevant Company, such persons
| • | may not attend or vote at general meetings of the relevant Company; |
| • | may not receive dividends or other distributions from the relevant Company; and |
| • | may be divested of their interest by the directors of the relevant Company. |
These restrictions will continue to apply until such persons have either made a public offer for all of the publicly held shares of the other Company, or have reduced their controlling interest below the thresholds specified, or have acquired through a permitted means at least 50 per cent of the voting rights of all the shares held by the public shareholders of each Company.
These provisions are designed to ensure that offers for the publicly held shares of both Companies would be required to avoid the restrictions set out above, even if the interests which breach the thresholds are only held in one of the Companies. The directors do not have the discretion to exempt a person from the operation of these rules.
Under the Sharing Agreement, the Companies agree to cooperate to enforce the restrictions contained in their articles of association and constitution and also agree that no member of the Rio Tinto Group shall accept a third party offer for Rio Tinto Limited shares unless such acceptance is approved by a Joint Decision of the public shareholders of both Companies.Guarantees
In December 1995, each Company entered into a Deed Poll Guarantee in favour of creditors of the other Company. Pursuant to the Deed Poll Guarantees, each Company guaranteed the contractual obligations of the other Company and the obligations of other persons which are guaranteed by the other Company, subject to certain limited exceptions. Beneficiaries under the Deed Poll Guarantees may make demand upon the guarantor thereunder without first having recourse to the Company or persons whose obligations are being guaranteed. The obligations of the guarantor under each Deed Poll Guarantee expire upon termination of the Sharing Agreement and under other limited circumstances, but only in respect of obligations arising after such termination and, in the case of other limited circumstances, the publication and expiry of due notice. The shareholders of the Companies cannot enforce the provision of the Deed Poll Guarantees.
MEMORANDUM AND ARTICLES OF ASSOCIATION
Rio Tinto plc adopted new Articles of Association by Special Resolution passed on 11 April 2002 and amended on 14 April 2005; and Rio Tinto Limited amended its Constitution by Special Resolution on 18 April 2002 and on 29 April 2005. The resolutions passed during April 2005 were in consequence to a growing market practice in Australia for companies to undertake off market tender buy backs where the buy back price is below the prevailing market prices. Subject to obtaining regulatory relief, such buy backs do not require shareholder approval. The effect of the resolutions was to make it clear that, provided a buy back complied with all applicable laws, it would not require additional shareholder approval for purposes of the dual listed companies (‘DLC’).
Rio Tinto 2004Form 20-F 97
Back to Contents
Introduction
As explained on pages 95 to 97 under the terms of the DLC merger the shareholders of Rio Tinto plc and of Rio Tinto Limited entered into certain contractual arrangements which are designed to place the shareholders of both Companies in substantially the same position as if they held shares in a single enterprise which owned all of the assets of both Companies. Generally and as far as is permitted by the UK Companies Act and the Australian Corporations Law this principle is reflected in the Memorandum and Articles of Association of Rio Tinto plc and in the Constitution of Rio Tinto Limited. The summaries below include descriptions of material rights of the shareholders of both Rio Tinto plc and Rio Tinto Limited. Unless stated otherwise the Memorandum and Articles of Association of and Constitution are identical.
Rio Tinto plc is incorporated under the name “Rio Tinto plc” and is registered in England and Wales with registered number 719885 and Rio Tinto Limited is incorporated under the name “Rio Tinto Limited” and is registered in Australia with ACN Number 004458404.
No holder of shares, which may be held in either certificated or uncertificated form, will be required to make any additional contributions of capital.
Objects
The objects of Rio Tinto plc are set out in the fourth clause of its Memorandum of Association and the objects of Rio Tinto Limited are set out in the second clause of its Constitution. Included in these objects is the right for each Company to enter into, with one another, operate and carry into effect an Agreement known as the DLC Merger Sharing Agreement and a Deed Poll Guarantee.
| Other objects of Rio Tinto plc include provisions: |
| • | to carry on as an Investment Holding Company; |
| • | to subscribe for, sell, exchange or dispose of any type of security or investment; |
| • | to purchase any estate or interest in property or assets; |
| • | to borrow and raise money to secure or discharge any debt or obligation of or binding on the Company; |
| • | to draw, make or deal in negotiable or transferable instruments; |
| • | to amalgamate with and co-operate with or assist or subsidise any company, firm or person and to purchase or otherwise acquire or undertake all or any part of the business property or liabilities of any person, body or company carrying on any business which this Company is authorised to carry on; |
| • | to promote the Company; |
| • | to lend money and guarantee contracts or obligations of the Company and to give all kinds of indemnities; |
| • | to sell, lease, grant licences and other rights over any part of the Company; |
| • | to procure the registration of the Company outside England; |
| • | to subscribe or guarantee money to any national, charitable, benevolent, public, general or exhibition which may further the objects of the Company or the interest of its members; |
| • | to grant pensions or gratuities to employees, ex-employees, officers and ex-officers; |
| • | to establish any scheme or trust which may benefit employees; |
| • | to lend money to employees to purchase Company shares; |
| • | to purchase and maintain insurance for employees and to carry on the objects of the Company in any part of the world either as principals, agents, contractors, trustees or otherwise. |
| |
| Other objects of Rio Tinto Limited include the powers: |
| • | to prospect for, explore, quarry, develop, excavate, dredge for, open, work, win, purchase or otherwise obtain all minerals, metals and substances; |
| • | to carry on business as proprietors of and to purchase, take on, lease or in exchange or otherwise acquire and control mineral and other properties, lands and hereditaments of any tenure, mines and other rights or options thereon; |
| • | to raise, win, get, quarry, crush, smelt, calcine, refine, dress, amalgamate, manipulate and otherwise treat, prepare, sell and deal in ores, metals and other products of mines; |
| • | to carry on business as ship owners, railway proprietors, motor car, lorry and coach proprietors, and garage proprietors, carriers and hauliers, bankers, storekeepers, wharfingers, cartage, storage, building and general contractors and to buy and sell or otherwise deal in real or personal property of any kind; |
| • | to carry on business as manufacturers of and dealers in and exporters and importers of goods and merchandise of all kinds and merchants generally; and |
| • | to guarantee the payment of premiums on any sinking fund or endowment policy or policies taken out by any company having objects similar to the objects of the Company. |
Directors
Under Rio Tinto plc's Articles of Association a director may not vote in respect of any proposal in which he or any other person connected with him, has any material interest other than by virtue of his interests in shares or debentures or other securities of or otherwise in or through the Company, except where resolutions:
| (a) | indemnify him or a third party in respect of obligations incurred by the director on behalf of, or for the benefit of, the Company, or in respect of obligations of the Company, for which the director has assumed responsibility under an indemnity, security or guarantee; |
| (b) | relate to an offer of securities in which he may be interested as a holder of securities or as an underwriter; |
Rio Tinto 2004Form 20-F 98
Back to Contents
| (c) | concern another body corporate in which the director is beneficially interested in less than one per cent of the issued shares of any class of shares of such a body corporate; |
| (d) | relate to an employee benefit in which the director will share equally with other employees; and |
| (e) | relate to liability insurance that the Company is empowered to purchase for the benefit of directors of the Company in respect of actions undertaken as directors (or officers) of the Company. |
Under Rio Tinto Limited's Constitution, except where a director is constrained by Australian law, a director may be present at a meeting of the board while a matter in which the director has a material interest is being considered and may vote in respect of that matter.
The directors are empowered to exercise all the powers of the Companies to borrow money, to charge any property or business of the Companies or all or any of their uncalled capital and to issue debentures or give any other security for a debt, liability or obligation of the Companies or of any other person. The directors shall restrict the borrowings of Rio Tinto plc to the limitation that the aggregate amount of all moneys borrowed by the Company and its subsidiaries shall not exceed an amount equal to one and one half times the Company’s share capital plus aggregate reserves unless sanctioned by an ordinary resolution of the Company.
Directors are not required to hold any shares of either Company by way of qualification, but a director is nevertheless entitled to attend and speak at shareholders' meetings. Nevertheless, as disclosed in the Remuneration report on pages 71 to 81 the Remuneration committee has informed the executive directors that they would be expected to build up a shareholding equal in value to two times salary over five years.
Directors are required to retire in accordance with statutory age limits. Directors who were elected or re-elected a director in the third year before each annual general meeting are required to retire by rotation and such further directors (if any) shall retire by rotation as would bring the number retiring by rotation up to one third of the number of directors in office at the date of the notice of meeting (or, if their number is not a multiple of three, the number nearest to but not greater than one third). These further directors required to retire shall be selected from the other directors subject to retirement by rotation who have been longest in office since their last re-election and where directors were re-elected on the same day then, unless they otherwise agree amongst themselves, they will be selected by the alphabetical order of their names. In addition any director appointed by the directors since the last annual general meeting is also required to retire. A retiring director shall be eligible for re-election.
In the absence of an independent quorum, the directors are not competent to vote compensation to themselves or to any members of their body.Rights attaching to shares
Under English law, dividends on shares may only be paid out of profits available for distribution, as determined in accordance with generally accepted accounting principles and by the relevant law. Shareholders are entitled to receive such dividends as may be declared by the directors. The directors may also pay shareholders such interim dividends as appear to them to be justified by the financial position of the Group.
Any Rio Tinto plc dividend unclaimed after 12 years from the date the dividend was declared, or became due for payment, will be forfeited and returned to the Company. Any Rio Tinto Limited dividend unclaimed may be invested or otherwise made use of by the board for the benefit of the Company until claimed or otherwise disposed of according to Australian law.
Voting rights
Voting at any general meeting of shareholders is by a show of hands unless on a poll, being a written vote, that has been duly demanded. On a show of hands, every shareholder who is present in person or by proxy at a general meeting has one vote regardless of the number of shares held. On a poll, every shareholder who is present in person or by proxy has one vote for every ordinary share or share for which he or she is the holder and, in the case of Joint Decisions, the holder of the Special Voting Share has one vote for each vote cast by the public shareholders at the parallel meeting of shareholders. The voting rights attached to the Special Voting Share have been set out on page 96. A poll may be demanded by any of the following:
| • | the chairman of the meeting; |
| • | at least five shareholders entitled to vote at the meeting; |
| • | any shareholder or shareholders representing in the aggregate not less than one tenth (Rio Tinto plc) or one twentieth (Rio Tinto Limited) of the total voting rights of all shareholders entitled to vote at the meeting; |
| • | any shareholder or shareholders holding shares conferring a right to vote at the meeting on which there have been paid-up sums in the aggregate equal to not less than one tenth of the total sum paid up on all the shares conferring that right; or |
| • | the holder of the Special Voting Share. |
A proxy form will be treated as giving the proxy the authority to demand a poll, or to join others in demanding one.
The necessary quorum for a Rio Tinto plc general meeting is three persons and for a Rio Tinto Limited general meeting is two persons carrying a right to vote upon the business to be transacted, whether present in person or by proxy.
Matters are transacted at general meetings by the proposing and passing of resolutions, of which there are three kinds:Rio Tinto 2004Form 20-F 99
Back to Contents
| • | an ordinary resolution, which includes resolutions for the election of directors, the receiving of financial statements, the cumulative annual payment of dividends, the appointment of auditors, the increase of authorised share capital or the grant of authority to allot shares; |
| • | a special resolution, which includes resolutions amending the Company’s Memorandum and Articles of Association, disapplying statutory pre-emption rights or changing the Company’s name; and |
| • | an extraordinary resolution, which includes resolutions modifying the rights of any class of the Company’s shares at a meeting of the holders of such class or relating to certain matters concerning the Company’s winding up. |
An ordinary resolution requires the affirmative vote of a majority of the votes of those persons voting at a meeting at which there is a quorum. Special and extraordinary resolutions require the affirmative vote of not less than three fourths of the persons voting at a meeting at which there is a quorum. In the case of an equality of votes, whether on a show of hands or on a poll, the chairman of the meeting is entitled to cast the deciding vote in addition to any other vote he may have.
The DLC Merger Sharing Agreement further classifies these three kinds of resolutions into ‘Joint Decisions’ and ‘Class Rights Actions’ as explained on page 96.
Annual general meetings must be convened with 21 days advance written notice for Rio Tinto plc and with 28 days for Rio Tinto Limited. Other meetings must be convened with 21 days advance written notice for the passing of a special resolution and with 14 days for any other resolution, depending on the nature of the business to be transacted. The days of delivery or receipt of the notice are not included. The notice must specify the nature of the business to be transacted. The board of directors may, if they choose, make arrangements for shareholders who are unable to attend the place of the meeting to participate at other places.Variation of Rights
If, at any time, the share capital is divided into different classes of shares, the rights attached to any class may be varied, subject to the provisions of the relevant legislation, with the consent in writing of holders of three fourths in value of the shares of that class or upon the adoption of an extraordinary resolution passed at a separate meeting of the holders of the shares of that class. At every such separate meeting, all of the provision of the Articles of Association and Constitution relating to proceedings at a general meeting apply, except that the quorum is to be the number of persons (which must be two or more) who hold or represent by proxy not less than one third in nominal value of the issued shares of the class.
The DLC Merger Sharing Agreement provides for the protection of the public shareholders of both Companies and so any variations of rights would be dealt with as ‘Class Rights Actions’ that require the separate approval of the shareholders of both Companies.
Rights in a Winding-up
Except as the shareholders have agreed or may otherwise agree, upon a winding up, the balance of assets available for distribution:
| • | after the payment of all creditors including certain preferential creditors, whether statutorily preferred creditors or normal creditors; and |
| • | subject to any special rights attaching to any class of shares; |
is to be distributed among the holders of ordinary shares according to the amounts paid-up on the shares held by them. This distribution is generally to be made in cash. A liquidator may, however, upon the adoption of an extraordinary resolution of the shareholders, divide among the shareholders the whole or any part of the assets in kind.
The DLC Merger Sharing Agreement further sets out the rights of ordinary shareholders in a liquidation as explained on page 96.Limitations on Voting and Shareholding
There are no limitations imposed by either law or Rio Tinto plc's Memorandum or Articles of Association or Rio Tinto Limited's Constitution on the right of non-residents or foreign persons to hold or vote the ordinary shares or ADSs, other than the limitations that would generally apply to all shareholders and those that arise from the DLC merger.
There are no restrictions under Rio Tinto plc’s Memorandum and Articles of Association or under English law that limit the right of non resident or foreign owners to hold or vote its shares. Nor are there any restrictions under Rio Tinto Limited’s constitution or under Australian law that limit the right of non residents to hold or vote its shares, other than under the Foreign Acquisitions and Takeovers Act 1975, see Limitations on ownership of shares and merger obligations on page 97 for details. A description of the change in control provisions triggered by significant share ownership is also set out on page 97.
Rio Tinto 2004Form 20-F 100
Back to Contents
TAXATION
UK resident individuals
Taxation of dividends
Dividends carry a tax credit equal to one ninth of the dividend. Individuals who are not liable to income tax at the higher rate will have no further tax to pay. Higher rate taxpayers are liable to tax on UK dividends at 32.5 per cent which, after taking account of the tax credit, produces a further tax liability of 25 per cent of the dividend received.
Reclaiming income tax on dividends
Tax credits on dividends are no longer recoverable. However, tax credits on dividends paid into Personal Equity Plans or Individual Savings Accounts will be refunded on dividends paid prior to 6 April 2004.
Dividend reinvestment plan (DRP)
The taxation effect of participation in the DRP will depend on individual circumstances. Shareholders will generally be liable for tax on dividends reinvested in the DRP on the same basis as if they had received the cash and arranged the investment. The dividend should, therefore, be included in the annual tax return in the normal way.
The shares acquired should be added to shareholdings at the date and at the net cost shown on the share purchase advice. The actual cost of the shares, for Rio Tinto plc shareholders including the stamp duty/stamp duty reserve tax, will form the base cost for capital gains tax purposes.
Capital gains tax
Shareholders who have any queries on capital gains tax issues are advised to consult their financial adviser.
A leaflet which includes details of relevant events since 31 March 1982 and provides adjusted values for Rio Tinto plc securities as at that date is available from the company secretary.
Australian resident individuals
Taxation of dividends
The basis of the Australian dividend imputation system is that when Australian resident shareholders receive dividends from Rio Tinto Limited, they may be entitled to a credit for the tax paid by the Group in respect of that income, depending on the tax status of the shareholder.
The application of the system results in tax paid by the Group being allocated to shareholders by way of franking credits attaching to the dividends they receive. Such dividends are known as franked dividends. A dividend may be partly or fully franked. The current Rio Tinto Limited dividend is fully franked and the franking credits attached to the dividend are shown in the distribution statement provided to shareholders.
The extent to which a company can frank a dividend depends on the credit balance in its franking account. Credits to this account can arise in a number of ways, including when a company pays company tax or receives a franked dividend from another company. The dividend is required to be included in a resident individual shareholder’s assessable income. In addition, an amount equal to the franking credit attached to the franked dividend is also included in the assessable income of the resident individual, who may then be entitled to a rebate of tax equal to the franking credit amount included in their income. Should the franking credits exceed the tax due, the excess is refunded to the resident individual.
The effect of the dividend imputation system on non resident shareholders is that, to the extent that the dividend is franked, no Australian tax will be payable and there is an exemption from dividend withholding tax.
A withholding tax is normally levied at the rate of 15 per cent when unfranked dividends are paid to residents of countries with which Australia has a taxation treaty. Most Western countries have a taxation treaty with Australia. A rate of 30 per cent applies to countries where there is no taxation treaty.
Since 1988, all dividends paid by Rio Tinto Limited have been fully franked. It is the Group’s policy to pay fully franked dividends whenever possible.
Dividend reinvestment plan (DRP)
Shareholders will generally be liable for tax on dividends reinvested in the DRP on the same basis as if they had received the cash and arranged the investment. The dividend should therefore be included in the annual tax return in the normal way.
The shares acquired should be added to the shareholding at the date of acquisition at the actual cost of the shares, which is the amount of the dividend applied by the shareholder to acquire shares and any incidental costs associated with the acquisition, including stamp duty, will form part of the cost base or reduced cost base of the shares for capital gains tax purposes.
Capital gains tax
The Australian capital gains tax legislation is complex. Shareholders are advised to seek the advice of an independent taxation consultant on any possible capital gains tax exposure.
If shareholders have acquired shares after 19 September 1985 they may be subject to capital gains tax on the disposal of those shares.
Rio Tinto 2004Form 20-F 101
Back to Contents
US resident individuals
The following is a summary of the principal UK tax, Australian tax and US Federal income tax consequences of the ownership of Rio Tinto plc ADSs, Rio Tinto plc shares, Rio Tinto Limited ADSs and Rio Tinto Limited shares (‘the Group’s ADSs and Shares’) by a US holder as defined below. It is not intended to be a comprehensive description of all the tax considerations that are relevant to all classes of taxpayer.
It is based in part on representations by the Group’s depositary banks as Depositaries for the ADRs evidencing the ADSs and assumes that each obligation in the deposit agreements will be performed in accordance with its terms.
You are a US holder if you are a beneficial owner of the Group’s ADSs and Shares and you are:
| • | a citizen or resident of the United States; |
| • | a corporation created or organised under the laws of the United States or any of its political subdivision; |
| • | an estate whose income is subject to United States federal income tax regardless of its source; or |
| • | a trust if a United States court can exercise primary supervision over the trust’s administration and one or more United States persons are authorised to control all substantial decisions of the trust. |
| This section does not apply to you if you are a member of a special class of holders subject to special rules, including: |
| • | a dealer in securities; |
| • | a trader in securities that elects to use a mark-to-market method of accounting for your securities holdings; |
| • | a tax-exempt organisation; |
| • | a life insurance company; |
| • | a person liable for alternative minimum tax; |
| • | a person that actually or constructively owns 10% or more of our voting stock; |
| • | a person that holds the Group’s ADSs and Shares as a part of a straddle or a hedging or conversion transaction; or |
| • | a person whose functional currency is not the US dollar. |
This section is based on the Internal Revenue Code of 1986, as amended, its legislative history, existing and proposed regulations, published rulings and court decisions, and on the convention between the United States of America and United Kingdom, that was ratified and came in force on 31 March 2003, and the convention between the United States of America and Australia (“the Conventions”) which may affect the tax consequences of the ownership of the Group’s ADSs and Shares. These laws are subject to change, possibly on a retroactive basis.
US holders should consult their tax advisers regarding United States federal, state and local and other tax consequences of owning and disposing of the Group’s ADSs and Shares in their particular circumstances.
UK taxation of shareholdings in Rio Tinto plc
Taxation of dividends
US holders do not suffer deductions of UK withholding tax on dividends paid by Rio Tinto plc. Dividends carry a tax credit equal to one ninth of the net dividend, or ten per cent of the net dividend plus the tax credit. The tax credit is not repayable to US holders.
Capital gains
A US holder will not normally be liable to UK tax on capital gains realised on the disposition of Rio Tinto plc ADSs or shares unless the holder carries on a trade, profession or vocation in the UK through a permanent establishment in the UK and the ADSs or shares have been used for the purposes of the trade, profession or vocation or are acquired, held or used for the purposes of such a permanent establishment.
Inheritance tax
Under the UK Estate Tax Treaty, a US holder, who is domiciled in the US and is not a national of the UK, will not be subject to UK inheritance tax upon the holder’s death or on a transfer during the holder’s lifetime unless the ADSs and shares form part of the business property of a permanent establishment in the UK or pertain to a fixed base situated in the UK used in the performance of independent personal services. In the exceptional case where ADSs or shares are subject both to UK inheritance tax and to US Federal gift or estate tax, the UK Estate Tax Treaty generally provides for tax payments to be relieved in accordance with the priority rules set out in the Treaty.
Stamp duty and stamp duty reserve tax
Transfers of Rio Tinto plc ADSs will not be subject to UK stamp duty provided that the transfer instrument is not executed in, and at all times remains outside, the UK.
Purchases of Rio Tinto plc shares are subject either to stamp duty at a rate of 50 pence per £100 or to stamp duty reserve tax (SDRT) at a rate of 0.5 per cent. Conversions of Rio Tinto plc shares into Rio Tinto plc ADSs will be subject to additional SDRT at a rate of 1.5 per cent on all transfers to the Depositary or its nominee.
Australian taxation of shareholdings in Rio Tinto Limited
Taxation of dividends
US holders are not normally liable to Australian withholding tax on dividends paid by Rio Tinto Limited because such dividends are normally fully franked under the Australian dividend imputation system, meaning that they are paid out of income that has borne Australian income tax. Any unfranked dividends would suffer Australian withholding tax which under the Australian income tax convention is limited to 15 per cent of the gross dividend.
Rio Tinto 2004Form 20-F 102
Back to Contents
Capital gains
US holders are not normally subject to any Australian tax on the disposal of Rio Tinto Limited ADSs or shares unless they have been used in carrying on a trade or business wholly or partly through a permanent establishment in Australia, or the gain is in the nature of income sourced in Australia.
Gift, estate and inheritance tax
Australia does not impose any gift, estate or inheritance taxes in relation to gifts of shares or upon the death of a shareholder.
Stamp duty
An issue or transfer of Rio Tinto Limited ADSs or a transfer of Rio Tinto Limited shares does not require the payment of Australian stamp duty.
US Federal income tax
Dividends
Dividends on the Group’s ADSs and shares will generally be treated as dividend income for purposes of US Federal income tax. In the case of Rio Tinto Limited, the income will be the net dividend plus, in the event of a dividend not being fully franked, the withholding tax.
Dividend income will not be eligible for the dividends received deduction allowed to US corporations. Dividends paid by Qualified Foreign Corporations (QFCs) are subject to a maximum rate of income tax of 15 per cent. This maximum rate applies to taxable years beginning after 31 December 2002 and ending before 1 January 2009. Both Rio Tinto plc and Rio Tinto Limited expect to be QFCs throughout this period. To qualify for the 15 per cent maximum income tax rate on dividends the stock of the QFC must be held for more than 60 days during the 121 day period beginning on the date which is 60 days before the ex-dividend date.
EXCHANGE CONTROLS
Rio Tinto plc
At present, there are no UK foreign exchange controls or other restrictions on the export or import of capital or on the payment of dividends to non resident holders of Rio Tinto plc shares or the conduct of Rio Tinto plc’s operations. The Bank of England, however, upholds international law and maintains financial sanctions against specified terrorist organisations and specific targets related to Myanmar, Federal Republic of Yugoslavia and Serbia, Iraq, Liberia and Zimbabwe.
There are no restrictions under Rio Tinto plc’s memorandum and articles of association or under English law that limit the right of non resident or foreign owners to hold or vote Rio Tinto plc’s shares.
Rio Tinto Limited
Under existing Australian legislation, the Reserve Bank of Australia does not restrict the import and export of funds and no permission is required by Rio Tinto Limited for the movement of funds into or out of Australia, except that restrictions apply to certain transactions relating to the following:
| • | supporters of the former government of the Federal Republic of Yugoslavia; and |
| • | ministers and senior officials of the Government of Zimbabwe. |
The Department of Foreign Affairs and Trade upholds international law that prohibits anyone from making assets available to terrorists and their sponsors.
Members of the general public are also required to report the sending of A$10,000 or more in currency out of Australia to the Australian Transaction and Reports Analysis Centre. Rio Tinto Limited must also deduct withholding tax from foreign remittances of dividends, to the extent that they are unfranked, and of interest payments.
There are no limitations, either under the laws of Australia or under the constitution of Rio Tinto Limited, on the right of non residents, other than the Foreign Acquisitions and Takeovers Act 1975 (the Takeovers Act). The Takeovers Act may affect the right of non Australian residents, including US residents, to acquire or hold Rio Tinto Limited shares but does not affect the right to vote, or any other right associated with any Rio Tinto Limited shares held in compliance with its provisions.
Under the Takeovers Act, a foreign person must notify the Treasurer of the Commonwealth of Australia of a proposal to acquire a “substantial shareholding” in an Australian corporation, which involves a person, together with associates, holding 15 per cent or more of the issued shares or voting power of the corporation. In addition, acquisition or issue of shares, including an option to acquire shares, in a corporation that carries on an Australian business, such as Rio Tinto Limited, which would result in foreign persons “controlling” the corporation, or a change in the foreign persons “controlling” it, is also subject to prior notification to, and review and approval by, the Treasurer, who may refuse approval if satisfied that the result would be contrary to the Australian national interest. A foreign person will “control” a corporation if it, together with associates, holds 15 per cent or more of the issued shares or voting power, and the Treasurer is satisfied that it is in a position to determine the policy of the corporation, and a number of foreign persons will “control” a corporation if it, together with associates, holds 40 per cent or more of the issued shares or voting power, and the Treasurer is satisfied that it is in a position to determine the policy of the corporation.Rio Tinto 2004Form 20-F 103
Back to Contents
| | In the context of the Takeovers Act, a foreign person is: |
| • | an individual not ordinarily resident in Australia; and |
| • | any corporation or trust in which there is a substantial foreign interest. |
Unless the Treasurer in the particular circumstances deems otherwise, a “substantial foreign interest” in a corporation is an interest of 15 per cent or more in the ownership of voting power by a single foreign interest either alone or together with associates, or an interest of 40 per cent or more in aggregate in the ownership or voting power by more than one foreign interest and the associates of any of them.
If a single foreign interest, either alone or together with associates, holds a beneficial interest in 15 per cent or more of the capital or income of a trust, or if two or more foreign interests and any associates together hold 40 per cent or more, there will be a substantial foreign interest in the trust. A beneficiary under a discretionary trust is deemed, for this purpose, to hold a beneficial interest in the maximum percentage that could be distributed to the beneficiary.
In addition to the Takeovers Act, there are statutory limitations in Australia on foreign ownership of certain businesses, such as banks and airlines, not relevant to Rio Tinto Limited. There are no other statutory or regulatory provisions of Australian law or ASX requirements that restrict foreign ownership or control of Rio Tinto Limited.DOCUMENTS ON DISPLAY
Rio Tinto plc and Rio Tinto Limited file reports and other information with the SEC. You may read without charge and copy at prescribed rates any document filed at the public reference facilities of the SEC’s principal office at 450 Fifth Street, NW, Washington, D.C. 20549, United States of America. Please call the SEC at 1-800-SEC-0330 for further information on the operation of the public reference facilities.
Item 11. Quantitative and Qualitative Disclosures about Market Risk
The Rio Tinto Group's policies for currency, interest rate and commodity price exposures, and the use of derivative financial instruments are discussed in the financial review on pages 37 to 40. In addition, the Group's quantitive and qualitative disclosures about market risk are set out in Note 28 on pages A-44 to A-49. The discussion regarding market risk contains certain forward looking statements and attention is drawn to the Cautionary statement on page 10.
Item 12. Description of Securities other than Equity Securities
Not applicable.
PART II
Item 13. Defaults, Dividend Arrearages and Delinquencies
There are no defaults, dividend arrearages or delinquencies.
Item 14. Material Modifications to the Rights of Security Holders and Use of Proceeds
There are no material modifications to the rights of security holders.
Item 15. Controls and Procedures
In designing and evaluating the disclosure controls and procedures of each of Rio Tinto plc and Rio Tinto Limited, the common management of each of Rio Tinto plc and Rio Tinto Limited, including their common chief executive and finance director, recognised that any controls and procedures, no matter how well designed and operated, can provide only reasonable assurance of achieving the desired control objectives, and the management of each of Rio Tinto plc and Rio Tinto Limited necessarily was required to apply its judgement in evaluating the cost-benefit relationship of possible controls and procedures. Because of the inherent limitations in all control systems, no evaluation of controls can provide absolute assurance that all control issues and instances of fraud, if any, within each of Rio Tinto plc and Rio Tinto Limited have been detected.
The common management of each of Rio Tinto plc and Rio Tinto Limited with the participation of their common chief executive and finance director have evaluated the effectiveness of the design and operation of its disclosure controls and procedures as of the period covered by theAnnual report. Based on that evaluation, the common chief executive and finance director of each of Rio Tinto plc and Rio Tinto Limited have concluded that these disclosure controls and procedures are effective at the reasonable assurance level.
Rio Tinto 2004Form 20-F 104
Back to Contents
There were no significant changes in the internal controls or in other factors that could significantly affect internal controls of each of Rio Tinto plc and Rio Tinto Limited subsequent to the date of their most recent evaluation.
Item 16A. Audit Committee Financial Expert
See Corporate governance on page 87 for information regarding the identification of theAudit committeefinancial expert.
Item 16B. Code of Ethics
The way we work, Rio Tinto’s statement of business practice, summarises the Group’s principles and policies for all directors and employees.
Since the first edition ofThe way we workin 1998, expectations of corporate responsibilities have increased. Although the Group’s values and objectives are unchanged its responses have evolved and have been further developed and reflected in a revised 2003 edition.
The way we workis supported by supplementary guidance documents and applies to all Rio Tinto managed businesses.
The way we workand the supplementary guidance documents are discussed more fully under Corporate governance on page 85. They can be viewed on Rio Tinto’s website: www.riotinto.com and will be provided to any person without charge upon written request received by one the company secretaries.
Item 16C. Principal Accountant Fees and Services
Auditors’ remuneration including audit fees, audit related fees, further assurance services, taxation services and all other fees have been dealt with in Note 37 to the consolidated financial statements on page A-56.
Rio Tinto has adopted policies designed to uphold the independence of the Group’s principal auditors by prohibiting their engagement to provide a range of accounting and other professional services that might compromise their appointment as independent auditors. The engagement of the Group’s principal auditors to provide statutory audit services, certain other assurance services, tax services and certain limited other services are pre approved. The engagement of the Group’s principal auditors to provide other permitted services are individually subject to the specific approval of the Audit committee or its chairman.
Prior to the commencement of each financial year the Group’s Finance director and its principal auditors submit to the Audit committee a schedule of the types of services that are expected to be performed during the following year for its approval. The Audit committee may impose a US dollar limit on the total value of other permitted services that can be provided. Any non audit service provided by the Group’s principal auditors, where the expected fee exceeds a pre determined level, must be subject to the Group’s normal tender procedures. However, in exceptional circumstances the Finance director is authorised to engage the Group’s principal auditors to provide such services without going to tender, but if the fees are expected to exceed $250,000 then the chairman of the audit committee must approve the engagement.
The Audit committee adopted policies for the pre approval of permitted services provided by the Group’s principal auditors during January 2003 which were further refined and adopted during September 2003. All of the engagements for services provided by the Group's principal auditors since the adoption of these policies were either within the pre approval policies or approved by the Audit committee.
Item 16D. Exemptions from the Listing Standards for Audit Committees
Not applicable.
Item 16E. Purchases of Equity Securities by the Issuer and Affiliated Purchasers
Not applicable.
PART III
Item 17. Financial Statements
Not applicable.
Item 18. Financial Statements
The 2004 financial statements are included as the “A” pages to this annual report.
Rio Tinto 2004Form 20-F 105
Back to Contents
Item 19. Exhibits
Exhibits marked “*” have been filed as exhibits to this annual report on Form 20-F and other exhibits have been incorporated by reference as indicated.
Index
Exhibit
Number Description
| 1.1* | Memorandum and Articles of Association of Rio Tinto plc (adopted by special resolution passed on 11 April 2002 and amended on 14 April 2005) |
| 1.2* | Constitution of Rio Tinto Limited (ACN 004 458 404) (as adopted by special resolution passed on 24 May 2000 and amended by special resolution on 18 April 2002 and 29 April 2005) |
| 3.1 | DLC Merger Implementation Agreement, dated 3 November 1995 between CRA Limited and The RTZ Corporation PLC relating to the implementation of the DLC merger (incorporated by reference to Exhibit 2.1 of Rio Tinto plc's Annual report on Form 20-F for the financial year ended 31 December 1995, File No. 1-10533) |
| 3.2* | DLC Merger Sharing Agreement, dated 21 December 1995 and amended on 29 April 2005 between CRA Limited and The RTZ Corporation PLC relating to the ongoing relationship between CRA and RTZ following the DLC merger |
| 3.3 | RTZ Shareholder Voting Agreement, dated 21 December 1995 between The RTZ Corporation PLC, RTZ Shareholder SVC Pty. Limited, CRA Limited, R.T.Z. Australian Holdings Limited and The Law Debenture Trust Corporation p.l.c. (incorporated by reference to Exhibit 2.3 of Rio Tinto plc's Annual report on Form 20-F for thefinancial year ended 31 December 1995, File No. 1-10533) |
| 3.4 | CRA Shareholder Voting Agreement, dated 21 December 1995 between CRA Limited, CRA Shareholder SVC Limited, The RTZ Corporation PLC and The Law Debenture Trust Corporation p.l.c., relating to the RTZ Special Voting Share (incorporated by reference to Exhibit 2.4 of Rio Tinto plc's Annual report on Form 20-F for the financial year ended 31 December 1995, File No. 1-10533) |
| 4.01 | Letter dated 1 January 1992 to Mr R Adams about supplementary pension arrangements (incorporated by reference to Exhibit 4.23 of Rio Tinto plc's Annual report on Form 20-F for the financial year ended 31 December 2000, File No. 1-10533) |
| 4.02 | Supplementary letter dated 1 January 1992 to Mr R Adams about pension arrangements (incorporated by reference to Exhibit 4.24 of Rio Tinto plc's Annual report on Form 20-F for the financial year ended 31 December 2000, File No. 1-10533) |
| 4.03 | Letter dated 22 November 1994 to Mr R Adams about supplementary pension arrangements (incorporated by reference to Exhibit 4.29 of Rio Tinto plc's Annual report on Form 20-F for the financial year ended 31 December 2000, File No. 1-10533) |
| 4.04 | Letter dated 20 January 1997 to Mr R Adams about directors' pension arrangements (incorporated by reference to Exhibit 4.32 of Rio Tinto plc's Annual report on Form 20-F for the financial year ended 31 December 2001, File No. 1-10533). |
| 4.05 | Service Agreement dated 15 April 2003 between Mr R Adams and Rio Tinto London Limited (incorporated by reference to Exhibit 4.30 of Rio Tinto plc's Annual report on Form 20-F for the financial year ended 31 December 2002, File No. 1-10533) |
| 4.06 | Memorandum effective 1 March 2004 to Service Agreement dated 15 April 2003 between Mr R Adams and Rio Tinto London Limited (incorporated by reference to Exhibit 4.06 of Rio Tinto plc's Annual report on Form 20-F for the financial year ended 31 December 2003, File No. 1-10533) |
| 4.07* | Service Agreement dated 30 March 2004 between Mr R L Clifford and Rio Tinto Limited |
| 4.08* | Supplemental letter dated 30 March 2004 to Service Agreement dated 30 March 2004 between Mr R L Clifford and Rio Tinto Limited |
| 4.09* | Memorandum effective 1 March 2005 to Service Agreement dated 30 March 2004 between Mr R L Clifford and Rio Tinto Limited |
| 4.10 | Service Agreement dated 19 June 2002 between Mr G R Elliott and Rio Tinto London Limited (incorporated by reference to Exhibit 4.31 of Rio Tinto plc's Annual report on Form 20-F for the financial year ended 31 December 2002, File No. 1-10533) |
| 4.11 | Memorandum effective 1 March 2003 to Service Agreement dated 19 June 2002 between Mr G R Elliott and Rio Tinto Limited (incorporated by reference to Exhibit 4.32 of Rio Tinto plc's Annual report on Form 20-F for the financial year ended 31 December 2002, File No. 1-10533) |
| |
| 4.12 | Memorandum effective 1 March 2004 to Service Agreement dated 19 June 2002 between Mr G R Elliott and Rio Tinto London Limited (incorporated by reference to Exhibit 4.32 of Rio Tinto plc's Annual report on Form 20-F for the financial year ended 31 December 2002, File No. 1-10533) |
| 4.13* | Memorandum effective 1 March 2005 to Service Agreement dated 19 June 2002 between Mr G R Elliott and Rio Tinto London Limited |
| 4.14 | Service Agreement dated 19 January 1999 between Mr O L Groeneveld and Rio Tinto Limited (incorporated by reference to Exhibit 4.53 of Rio Tinto plc's Annual report on Form 20-F for the financial year ended 31 December 2000, File No. 1-10533) |
| | |
Rio Tinto 2004Form 20-F 106
Back to Contents
| 4.15 | Memorandum effective 1 April 1999 to Service Agreement dated 19 January 1999 between Mr O L Groeneveld and Rio Tinto Limited (incorporated by reference to Exhibit 4.54 of Rio Tinto plc's Annual report on Form 20-F for the financial year ended 31 December 2000, File No. 1-10533) |
| 4.16 | Memorandum effective 1 April 2000 to Service Agreement dated 19 January 1999 between Mr O L Groeneveld and Rio Tinto Limited (incorporated by reference to Exhibit 4.55 of Rio Tinto plc's Annual report on Form 20-F for the financial year ended 31 December 2000, File No. 1-10533) |
| 4.17 | Memorandum effective 1 April 2001 to Service Agreement dated 19 January 1999 between Mr O L Groeneveld and Rio Tinto Limited (incorporated by reference to Exhibit 4.56 of Rio Tinto plc's Annual report on Form 20-F for the financial year ended 31 December 2000, File No. 1-10533) |
| 4.18 | Memorandum effective 1 March 2002 to Service Agreement dated 19 January 1999 between Mr O L Groeneveld and Rio Tinto Limited (incorporated by reference to Exhibit 4.61 of Rio Tinto plc's Annual report on Form 20-F for the financial year ended 31 December 2001, File No. 1-10533) |
| 4.19 | Memorandum effective 1 March 2003 to Service Agreement dated 19 January 1999 between Mr O L Groeneveld and Rio Tinto Limited (incorporated by reference to Exhibit 4.38 of Rio Tinto plc's Annual report on Form 20-F for the financial year ended 31 December 2002, File No. 1-10533) |
| 4.20 | Service Agreement dated 19 January 2004 between Mr O L Groeneveld and Rio Tinto Limited. Limited (incorporated by reference to Exhibit 4.23 of Rio Tinto plc's Annual report on Form 20-F for the financial year ended 31 December 2003, File No. 1-10533) |
| 4.21 | Memorandum effective 1 March 2004 to Service Agreement dated 19 January 2004 between Mr O L Groeneveld and Rio Tinto Limited. Limited (incorporated by reference to Exhibit 4.24 of Rio Tinto plc's Annual report on Form 20-F for the financial year ended 31 December 2003, File No. 1-10533) |
| 4.22 | Mining Companies Comparative Plan (incorporated by reference to Exhibit 4.65 of Rio Tinto plc's Annual report on Form 20-F for the financial year ended 31 December 2000, File No. 1-10533) |
| 4.23 | Share Option Plan (incorporated by reference to Exhibit 4.66 of Rio Tinto plc's Annual report on Form 20-F for the financial year ended 31 December 2000, File No. 1-10533) |
| 4.24 | Medical expenses plan (incorporated by reference to Exhibit 4.67 of Rio Tinto plc's Annual report on Form 20-F for the financial year ended 31 December 2000, File No. 1-10533) |
| 4.25 | Pension plan (incorporated by reference to Exhibit 4.68 of Rio Tinto plc's Annual report on Form 20-F for the financial year ended 31 December 2000, File No. 1-10533) |
| | |
| 8.1* | List of subsidiary companies. |
| | |
| 12.1* | Certifications pursuant to Rule 13a-14(a) of the Exchange Act. |
| | |
| 13.1* | Certifications furnished pursuant to Rule 13a-14(b) of the Exchange Act (such certificate is not deemed filed for purpose of Section 18 of the Exchange Act and not incorporated by reference with any filing under the Securities Act). |
| | |
| 15.1* | Consent of Independent Accountants. |
Rio Tinto 2004Form 20-F 107
Back to Contents
SIGNATURE
The Registrants hereby certify that they meet all of the requirements for filing on Form 20-F and that they have duly caused and authorised the undersigned to sign this Annual Report on their behalf.
| Rio Tinto plc | Rio Tinto Limited |
| (Registrant) | (Registrant) |
| | |
| | |
| | |
| | |
| /s/ Anette Lawless | /s/ Anette Lawless |
| Name:Anette Lawless | Name:Anette Lawless |
| Title: Secretary | Title: Assistant Secretary |
| | |
| Date: 27 June 2005 | Date: 27 June 2005 |
Rio Tinto 2004Form 20-F 108
Back to Contents
GLOSSARY
NON MINING DEFINITIONS
Throughout this document, the collective expressions Rio Tinto, Rio Tinto Group and Group are used for convenience only. Depending on the context in which they are used, they mean Rio Tinto plc and/or Rio Tinto Limited and/or one or more of the individual companies in which Rio Tinto plc and/or Rio Tinto Limited directly or indirectly own investments, all of which are separate and distinct legal entities.
Unless the context indicates otherwise, the following terms have the meanings shown below:
| ADR | | American Depositary Receipt evidencing American Depositary Shares (ADS). |
| | | |
| Australian dollars | | Australian currency. Abbreviates to A$ |
| | | |
| Australian GAAP | | Generally accepted accounting principles in Australia. |
| | | |
| Billion | | One thousand million. |
| | | |
| Canadian dollars | | Canadian currency. Abbreviates to C$ |
| | | |
| Company/Companies | | Means, as the context so requires, Rio Tinto plc and/or Rio Tinto Limited. |
| | | |
| DLC merger | | Refers to the dual listed companies merger (1995). |
| | | |
| IFRS | | International Financial Reporting Standards. |
| | | |
| LME | | London Metal Exchange. |
| | | |
| New Zealand dollars | | New Zealand currency. Abbreviates to NZ$ |
| | | |
| Pounds sterling | | UK currency. Abbreviates to pence or p. |
| | | |
| Public shareholders | | The holders of Rio Tinto plc shares that are not companies in the Rio Tinto Limited Group and the holders of Rio Tinto Limited shares that are not companies in the Rio Tinto plc Group. |
| | | |
| Rand | | South African currency. Abbreviates to R. |
| | | |
| Rio Tinto Limited | | Refers to Rio Tinto Limited, and, where the context permits, its subsidiaries, joint ventures and associated companies. |
| | | |
| Rio Tinto Limited ADS | | An American Depositary Share representing the right to receive four Rio Tinto Limited shares. |
| | | |
| Rio Tinto Limited Group | | Rio Tinto Limited and its subsidiaries, joint ventures and associated companies. |
| | | |
| Rio Tinto Limited shareholders | | The holders of Rio Tinto Limited shares. |
| | | |
| Rio Tinto Limited shares | | The ordinary shares in Rio Tinto Limited. |
| | | |
| Rio Tinto Limited Shareholder | | The agreement, dated 21 December 1995, between Rio Tinto plc, Rio Tinto Limited, RTL Shareholder |
| | | |
| Voting Agreement | | SVC Limited and the Law Debenture Trust Corporation p.l.c. relating to the voting rights of the Rio Tinto plc Special Voting Share at meetings of shareholders of Rio Tinto plc. |
| | | |
| Rio Tinto Limited/RTL Special Voting Share | | The Special Voting Share in Rio Tinto Limited. |
| | | |
| Rio Tinto plc | | Rio Tinto plc and its subsidiaries, joint ventures and associated companies. |
| | | |
| Rio Tinto plc ADS | | An American Depositary Share representing the right to receive four Rio Tinto plc ordinary shares. |
| | | |
| Rio Tinto plc Group | | Rio Tinto plc and its subsidiaries, joint ventures and associated companies. |
| | | |
| Rio Tinto plc ordinary shares | | The ordinary shares of 10p each in Rio Tinto plc. |
| | | |
| Rio Tinto plc shareholders | | The holders of Rio Tinto plc shares. |
| | | |
| Rio Tinto Shareholder Voting Agreement | | The agreement, dated 21 December 1995, between Rio Tinto plc, Rio Tinto Australian Holdings Limited, RTP Shareholder SVC Pty Limited, Rio Tinto Limited and the Law Debenture Trust Corporation p.l.c. relating to the voting rights of the Rio Tinto Limited shares held by the Rio Tinto plc Group and the Rio Tinto Limited Special Voting Share at meetings of Rio Tinto Limited shareholders. |
| | | |
Rio Tinto 2004Form 20-F 109
Back to Contents
| Rio Tinto plc shares | | Rio Tinto plc ordinary shares. |
| | | |
| Rio Tinto plc/RTP Special Voting | | The Special Voting Share of 10p in Rio Tinto plc. |
| | | |
| Share/shares | | Rio Tinto Limited shares or Rio Tinto plc ordinary shares, as the context requires. |
| | | |
| Sharing Agreement | | The agreement, dated 21 December 1995, as amended between Rio Tinto Limited and Rio Tinto plc relating to the regulation of the relationship between Rio Tinto Limited and Rio Tinto plc following the DLC merger. |
| | | |
| UK GAAP | | Generally accepted accounting principles in the UK. |
| | | |
| US dollars | | United States currency. Abbreviates to dollars, $ or US$ and US cents. |
| | | |
| US GAAP | | Generally accepted accounting principles in the United States. |
| | | |
| MINING AND TECHNICAL DEFINITIONS |
| Alumina | | Aluminium oxide. It is extracted from bauxite in a chemical refining process and is subsequently the principal raw material in the electro-chemical process by which aluminium is produced. |
| | | |
| Anode copper | | At the final stage of the smelting of copper concentrates, molten copper is cast into specially shaped slabs called anodes for subsequent electrolytic refining to produce refined cathode copper. |
| | | |
| Bauxite | | Mainly hydrated aluminium oxides (Al2O3.2H2 O). Principal ore of alumina, the raw material from which aluminium is made. |
| | | |
| Beneficiated bauxite | | Bauxite ore that has been treated to remove waste material to improve its physical or chemical characteristics. |
| | | |
| Bioleaching | | The deliberate use of bacteria to speed the chemical release of metals from ores. |
| | | |
| Block caving | | An underground bulk mining method. It involves undercutting the orebody to induce ore fracture and collapse by gravity. The broken ore is recovered mechanically through draw points below. |
| | | |
| Borates | | A generic term for mineral compounds which contain boron and oxygen. |
| | | |
| Cathode copper | | Refined copper produced by electrolytic refining of impure copper or by electrowinning. |
| | | |
| Classification | | Separating crushed and ground ore into portions of different size particles. |
| | | |
| Coking coal | | Also referred to as metallurgical coal. By virtue of its carbonisation properties, it is used in the manufacture of coke, which is used in the steel making process. |
| | | |
| Concentrate | | The product of a physical concentration process, such as flotation or gravity concentration, which involves separating ore minerals from unwanted waste rock. Concentrates require subsequent processing, such as smelting or leaching, to break down or dissolve the ore minerals and obtain the desired elements, usually metals. |
| | | |
| Cutoff grade | | The lowest grade of mineralised material considered economic to process. It is used in the calculation of the quantity of ore present in a given deposit. |
| | | |
| Doré | | A precious metal alloy which is produced by smelting. refined to produce pure gold and silver. |
| | | |
| DWT | | Dead weight tons is the combined weight in long tons (2,240 pounds weight) of cargo, fuel and fresh water that a ship can carry. |
| | | |
| Flotation | | A method of separating finely ground minerals using a froth created in water by specific reagents. In the flotation process certain mineral particles are induced to float by becoming attached to bubbles of froth whereas others, usually unwanted, sink. |
| | | |
| Grade | | The proportion of metal or mineral present in ore, or any other host material, expressed in this document as per cent, grams per tonne or ounces per tonne. |
| | | |
| Head grade | | The average grade of ore delivered to the mill. |
| | | |
Rio Tinto 2004Form 20-F 110
Back to Contents
| Ilmenite | | Mineral composed of iron, titanium and oxygen. |
| | | |
| Ore | | A rock from which a metal(s) or mineral(s) can be economically extracted. |
| | | |
| Ore milled | | The quantity of ore processed. |
| | | |
| Ore hoisted | | The quantity of ore which is removed from an underground mine for processing. |
| | | |
| Ore reserve | | That part of a mineral deposit which could be economically and legally extracted or produced at the time of the reserve determination. |
| | | |
| Pressure oxidation | | A method of treating sulphide ores. In the case of refractory gold ores, the object is to oxidise the sulphides to sulphates and hence liberate the gold for subsequent cyanide leaching. The technique involves reaction of the ore with sulphuric acid under pressure in the presence of oxygen gas. |
| | | |
| Probable ore reserves | | Reserves for which quantity and grade and/or quality are computed from information similar to that used for proved reserves, but the sites for inspection, sampling and measurement are farther apart or are otherwise less adequately spaced. The degree of assurance, although lower than that for proved reserves, is high enough to assume continuity between points of observation. |
| | | |
| Proved ore reserves | | Reserves for which (a) quantity is computed from dimensions revealed in outcrops, trenches, workings or drill holes; grade and/or quality are computed from the results of detailed sampling and (b) the sites for inspection, sampling and measurement are spaced so closely and the geologic character is so well defined that size, shape, depth and mineral content of reserves are well established. |
| | | |
| Rock mined | | The quantity of ore and waste rock excavated from the mine. In this document, the term is only applied to surface mining operations. |
| | | |
| Rutile | | A mineral composed of titanium and oxygen (TiO2). |
| | | |
| Stripping ratio | | The tonnes of waste material which must be removed to allow the mining of one tonne of ore. |
| | | |
| Solvent extractionand electrowinning (SX-EW) | | Processes for extracting metal from an ore and producing pure metal. First the metal is leached into solution; the resulting solution is then purified in the solvent extraction process; the solution is then treated in an electro-chemical process (electrowinning) to recover cathode copper. |
| | | |
| Tailing | | The rock wastes which are rejected from a concentrating process after the recoverable valuable minerals have been extracted. |
| | | |
| Thermal coal | | Also referred to as steam or energy coal. It is used as a fuel source in electrical power generation, cement manufacture and various industrial applications. |
| | | |
| Titanium dioxide feedstock | | A feedstock rich in titanium dioxide, produced, in Rio Tinto’s case, by smelting ores containing titanium minerals. |
| | | |
| Zircon | | Zirconium mineral (ZrSiO4). |
Rio Tinto 2004Form 20-F 111
Back to Contents
| CONVERSION OF WEIGHTS AND MEASURES |
| | 1 troy ounce = 31.1 grams |
| | 1 kilogram = 32.15 troy ounces |
| | 1 kilogram = 2.2046 pounds |
| | 1 metric tonne = 1,000 kilograms |
| | 1 metric tonne = 2,204.6 pounds |
| | 1 metric tonne = 1.1023 short tons |
| | 1 short ton = 2,000 pounds |
| | 1 long ton = 2,240 pounds |
| | 1 gram per metric tonne = 0.02917 troy ounces per short ton |
| | 1 gram per metric tonne = 0.03215 troy ounces per metric tonne |
| | 1 kilometre = 0.6214 miles |
| | 1 megajoule per kilogram = 430.2 British thermal units (btu) per pound (coal) |
EXCHANGE RATES
The following table shows, for the periods and dates indicated, certain information regarding the exchange rates for the pound sterling and the Australian dollar, based on the Noon Buying Rates for pounds sterling and Australian dollars expressed in US dollars per £1 and per A$1.00.
| Pounds sterling | | | | | | | | | Australian dollars | | | | | | | |
| Year ended 31 December* | Period | | Average | | High | | Low | | Year ended 31 December* | Period | | Average | | High | | Low |
| | end | | rate | | | | | | | end | | rate | | | | |
|
|
|
|
|
|
|
|
|
|
|
|
|
|
|
|
|
| 2004 | 1.93 | | 1.83 | | 1.95 | | 1.76 | | 2004 | 0.783 | | 0.737 | | 0.798 | | 0.686 |
| 2003 | 1.78 | | 1.63 | | 1.79 | | 1.55 | | 2003 | 0.749 | | 0.648 | | 0.752 | | 0.562 |
| 2002 | 1.61 | | 1.50 | | 1.61 | | 1.41 | | 2002 | 0.563 | | 0.544 | | 0.575 | | 0.506 |
| 2001 | 1.45 | | 1.44 | | 1.50 | | 1.37 | | 2001 | 0.512 | | 0.517 | | 0.571 | | 0.483 |
| 2000 | 1.49 | | 1.52 | | 1.65 | | 1.40 | | 2000 | 0.556 | | 0.579 | | 0.672 | | 0.511 |
|
|
|
|
|
|
|
|
|
|
|
|
|
|
|
|
|
* The Noon Buying Rate on such dates differed slightly from the rates used in the preparation of Rio Tinto’s consolidated financial statements as of such date. No representation is made that pound sterling and Australian dollar amounts have been, could have been or could be converted into dollars at the Noon Buying Rate on such dates or at any other dates.
Rio Tinto 2004Form 20-F 112
REPORT OF THE INDEPENDENT ACCOUNTANTS
To the members of Rio Tinto plc and Rio Tinto Limited
We have audited the financial statements of the Rio Tinto Group ("the Group") and of the Rio Tinto plc and Rio Tinto Limited parts of the Group (see "Accounting Presentation" on page A-10) set out on pages A-2.2004 to A-84, which are expressed in US dollars. These consolidated financial statements are the responsibility of the Group's management. Our responsibility is to express an opinion on these consolidated financial statements based on our audits.
We conducted our audits in accordance with Auditing Standards generally accepted in the United Kingdom and Auditing Standards generally accepted in the United States. Those standards require that we plan and perform the audits to obtain reasonable assurance about whether the consolidated financial statements are free of material misstatement. An audit includes examining, on a test basis, evidence supporting the amounts and disclosures in the consolidated financial statements. An audit also includes assessing the accounting principles used and significant estimates made by management, as well as evaluating the overall presentation of the consolidated financial statements. We believe that our audits provide a reasonable basis for our opinion.
In our opinion the consolidated financial statements set out on pages A-2.2004 to A-84 present fairly, in all material respects, the financial position of the Rio Tinto Group and of the Rio Tinto plc and Rio Tinto Limited parts of the Group at 31 December 2004 and 2003 and their results of operations and cash flows for each of the three years in the period ended 31 December 2004, in conformity with accounting principles generally accepted in the United Kingdom.
Accounting principles generally accepted in the United Kingdom vary in certain significant respects from those generally accepted in the United States of America. The application of the latter would have affected the determination of consolidated net income for each of the three years in the period ended 31 December 2004 and the determination of consolidated shareholders' funds at 31 December 2004, 2003 and 2002 to the extent summarised in Note 42 to the consolidated financial statements.
As discussed in Note 42 to the consolidated financial statements, the Group changed its method of accounting for asset retirement obligations, in accordance with US GAAP, with effect from 1 January 2003.
| /s/ PricewaterhouseCoopers LLP | /s/ PricewaterhouseCoopers |
| PricewaterhouseCoopers LLP | PricewaterhouseCoopers |
| Chartered Accountants and Registered Auditors | Chartered Accountants |
| London, England | Perth, Australia |
| 27 June 2005 | 27 June 2005 |
| In respect of the members of Rio Tinto plc | In respect of the members of Rio Tinto Limited |
A-1
Back to Contents
RIO TINTO PLC - RIO TINTO LIMITED
PROFIT AND LOSS ACCOUNTS FOR THE YEAR ENDED 31 DECEMBER 2004
| | | Rio Tinto plc -
part of Rio Tinto Group | | Rio Tinto Limited -
part of Rio Tinto Group | Rio
Tinto Group |
| | |
| |
| |
| |
| | | 2004 | | 2004 | | 2004 | |
| | |
| |
| |
| |
| Note | | US$m | | US$m | | US$m | |
| | Gross turnover (including share of joint | | | | | | |
| | ventures and associates)(c) | 9,606 | | 7,544 | | 14,608 | |
| | Share of joint ventures' turnover (c) | (1,418 | ) | (957 | ) | (2,375 | ) |
| | Share of associates' turnover (c) | (2,913 | ) | (63 | ) | (434 | ) |
| | |
| |
| |
| |
| | Consolidated turnover | 5,275 | | 6,524 | | 11,799 | |
| 2 | Net operating costs (c) | (4,986 | ) | (5,091 | ) | (10,077 | ) |
| | |
| |
| |
| |
| | Group operating profit | 289 | | 1,433 | | 1,722 | |
| | Share of operating profit of joint ventures | 762 | | 290 | | 1,052 | |
| | Share of operating profit of associates | 768 | | 9 | | 156 | |
| | Profit on disposal of interests in operations | 833 | | 139 | | 920 | |
| | |
| |
| |
| |
| | Profit on ordinary activities before interest | 2,652 | | 1,871 | | 3,850 | |
| 5 | Net interest payable | (69 | ) | (121 | ) | (149 | ) |
| 6 | Amortisation of discount | (76 | ) | (46 | ) | (105 | ) |
| | |
| |
| |
| |
| | Profit on ordinary activities before taxation | 2,507 | | 1,704 | | 3,596 | |
| 7 | Taxation | (534 | ) | (477 | ) | (841 | ) |
| | |
| |
| |
| |
| | Profit on ordinary activities after taxation | 1,973 | | 1,227 | | 2,755 | |
| | Attributable to outside shareholders | 100 | | (42 | ) | 58 | |
| | |
| |
| |
| |
| | Profit for the financial year (net earnings) | 2,073 | | 1,185 | | 2,813 | |
| | | | | | | | |
| 4 | Exceptional items | | | | | | |
| | | | | | | | |
| | Profit on disposal of interests in operations | 833 | | 139 | | 920 | |
| | Asset write downs and provision for contract obligation | (558 | ) | - | | (558 | ) |
| | Environmental remediation charge | - | | - | | - | |
| | Taxation | 98 | | (2 | ) | 97 | |
| | Attributable to outside equity shareholders | 133 | | - | | 133 | |
| | |
| |
| |
| |
| | | 506 | | 137 | | 592 | |
| | Adjusted earnings | 1,567 | | 1,048 | | 2,221 | |
| | | | | | | | |
| 8 | Dividends to shareholders | (822 | ) | (385 | ) | (1,062 | ) |
| | |
| |
| |
| |
| | Retained profit/(loss) for the financial year | 1,251 | | 800 | | 1,751 | |
| | |
| |
| |
| |
| 9 | Earnings per ordinary share (US cents) | 194.2c | | 237.4c | | 204.0c | |
| 9 | Adjusted earnings per ordinary share (US cents) | 146.8c | | 210.0c | | 161.0c | |
| 9 | Diluted earnings per ordinary share (US cents) | 193.9c | | 236.9c | | 203.6c | |
| 9 | Diluted adjusted earnings per ordinary share (US cents) | 146.6c | | 209.5c | | 160.8c | |
| | Dividends per share | | | | | | |
| 8 | –– Rio Tinto Group (US cents) | 77.00c | | 77.00c | | 77.00c | |
| 8 | –– Rio Tinto plc (pence) | 41.48p | | | | 41.48p | |
| 8 | –– Rio Tinto Limited (Australian cents) | | | 103.82c | | 103.82c | |
The notes on pages A-10 to A-84 form part of these accounts. Material variations from accounting principles generally
accepted in the United States are set out on pages A-65.2004 to A-84.
A-2.2004
Back to Contents
RIO TINTO PLC - RIO TINTO LIMITED
PROFIT AND LOSS ACCOUNTS FOR THE YEAR ENDED 31 DECEMBER 2003
| | | Rio Tinto plc -
part of Rio Tinto Group | | Rio Tinto Limited -
part of Rio Tinto Group | | Rio Tinto Group | |
| | |
| |
| |
| |
| | | 2003 | | 2003 | | 2003 | |
| | |
| |
| |
| |
| Note | | US$m | | US$m | | US$m | |
| | Gross turnover (including share of joint | | | | | | |
| | ventures and associates)(c) | 7,988 | | 6,253 | | 12,119 | |
| | Share of joint ventures' turnover (c) | (1,128 | ) | (703 | ) | (1,831 | ) |
| | Share of associates' turnover (c) | (2,768 | ) | (74 | ) | (720 | ) |
| | |
| |
| |
| |
| | Consolidated turnover | 4,092 | | 5,476 | | 9,568 | |
| 2 | Net operating costs (c) | (3,724 | ) | (4,348 | ) | (8,072 | ) |
| | |
| |
| |
| |
| | Group operating profit | 368 | | 1,128 | | 1,496 | |
| | Share of operating profit of joint ventures | 419 | | 117 | | 536 | |
| | Share of operating profit of associates | 678 | | 20 | | 234 | |
| | Profit on disposal of interests in operations | 47 | | 126 | | 126 | |
| | |
| |
| |
| |
| | Profit on ordinary activities before interest | 1,512 | | 1,391 | | 2,392 | |
| 5 | Net interest payable | (138 | ) | (100 | ) | (206 | ) |
| 6 | Amortisation of discount | (69 | ) | (36 | ) | (92 | ) |
| | |
| |
| |
| |
| | Profit on ordinary activities before taxation | 1,305 | | 1,255 | | 2,094 | |
| 7 | Taxation | (341 | ) | (360 | ) | (567 | ) |
| | |
| |
| |
| |
| | Profit on ordinary activities after taxation | 964 | | 895 | | 1,527 | |
| | Attributable to outside shareholders | (8 | ) | (11 | ) | (19 | ) |
| | |
| |
| |
| |
| | Profit for the financial year (net earnings) | 956 | | 884 | | 1,508 | |
| | | | | | | | |
| 4 | Exceptional items | | | | | | |
| | | | | | | | |
| | Profit on disposal of interests in operations | 47 | | 126 | | 126 | |
| | Asset write downs and provision for contract obligation | - | | - | | - | |
| | Environmental remediation charge | - | | - | | - | |
| | Taxation | - | | - | | - | |
| | Attributable to outside equity shareholders | - | | - | | - | |
| | |
| |
| |
| |
| | | 47 | | 126 | | 126 | |
| | Adjusted earnings | 909 | | 758 | | 1,382 | |
| | | | | | | | |
| 8 | Dividends to shareholders | (683 | ) | (320 | ) | (882 | ) |
| | |
| |
| |
| |
| | Retained profit/(loss) for the financial year | 273 | | 564 | | 626 | |
| | |
| |
| |
| |
| 9 | Earnings per ordinary share (US cents) | 89.7c | | 177.2c | | 109.5c | |
| 9 | Adjusted earnings per ordinary share (US cents) | 85.3c | | 151.9c | | 100.3c | |
| 9 | Diluted earnings per ordinary share (US cents) | 89.5c | | 176.9c | | 109.3c | |
| 9 | Diluted adjusted earnings per ordinary share (US cents) | 85.1c | | 151.7c | | 100.2c | |
| | Dividends per share | | | | | | |
| 8 | –– Rio Tinto Group (US cents) | 64.00c | | 64.00c | | 64.00c | |
| 8 | –– Rio Tinto plc (pence) | 37.13p | | | | 37.13p | |
| 8 | –– Rio Tinto Limited (Australian cents) | | | 89.70c | | 89.70c | |
The notes on pages A-10 to A-84 form part of these accounts. Material variations from accounting principles generally
accepted in the United States are set out on pages A-65.2004 to A-84.
A-2.2003
Back to Contents
RIO TINTO PLC - RIO TINTO LIMITED
PROFIT AND LOSS ACCOUNTS FOR THE YEAR ENDED 31 DECEMBER 2002
| | | Rio Tinto plc -
part of Rio Tinto Group | | Rio Tinto Limited -
part of Rio Tinto Group | | Rio Tinto Group | |
| | |
| |
| |
| |
| | | 2002 | | 2002 | | 2002 | |
| | |
| |
| |
| |
| Note | | US$m | | US$m | | US$m | |
| | Gross turnover (including share of joint | | | | | | |
| | ventures and associates)(c) | 7,367 | | 5,678 | | 11,119 | |
| | Share of joint ventures' turnover (c) | (859 | ) | (808 | ) | (1,667 | ) |
| | Share of associates' turnover (c) | (2,515 | ) | (148 | ) | (737 | ) |
| | |
| |
| |
| |
| | Consolidated turnover | 3,993 | | 4,722 | | 8,715 | |
| 2 | Net operating costs (c) | (4,012 | ) | (3,867 | ) | (7,884 | ) |
| | |
| |
| |
| |
| | Group operating profit | (19 | ) | 855 | | 831 | |
| | Share of operating profit of joint ventures | 258 | | 274 | | 532 | |
| | Share of operating profit of associates | 671 | | 51 | | 239 | |
| | Profit on disposal of interests in operations | - | | - | | - | |
| | |
| |
| |
| |
| | Profit on ordinary activities before interest | 910 | | 1,180 | | 1,602 | |
| 5 | Net interest payable | (156 | ) | (124 | ) | (237 | ) |
| 6 | Amortisation of discount | (39 | ) | (23 | ) | (54 | ) |
| | |
| |
| |
| |
| | Profit on ordinary activities before taxation | 715 | | 1,033 | | 1,311 | |
| 7 | Taxation | (442 | ) | (423 | ) | (708 | ) |
| | |
| |
| |
| |
| | Profit on ordinary activities after taxation | 273 | | 610 | | 603 | |
| | Attributable to outside shareholders | (78 | ) | 126 | | 48 | |
| | |
| |
| |
| |
| | Profit for the financial year (net earnings) | 195 | | 736 | | 651 | |
| | | | | | | | |
| 4 | Exceptional items | | | | | | |
| | Profit on disposal of interests in operations | - | | - | | - | |
| | Asset write downs and provision for contract obligation | (639 | ) | (433 | ) | (978 | ) |
| | Environmental remediation charge | (116 | ) | - | | (116 | ) |
| | Taxation | 9 | | 42 | | 42 | |
| | Attributable to outside equity shareholders | 7 | | 166 | | 173 | |
| | |
| |
| |
| |
| | | (739 | ) | (225 | ) | (879 | ) |
| | Adjusted earnings | 934 | | 961 | | 1,530 | |
| | | | | | | | |
| 8 | Dividends to shareholders | (639 | ) | (299 | ) | (826 | ) |
| | |
| |
| |
| |
| | Retained profit/(loss) for the financial year | (444 | ) | 437 | | (175 | ) |
| | |
| |
| |
| |
| 9 | Earnings per ordinary share (US cents) | 18.3c | | 147.6c | | 47.3c | |
| 9 | Adjusted earnings per ordinary share (US cents) | 87.7c | | 192.7c | | 111.2c | |
| 9 | Diluted earnings per ordinary share (US cents) | 18.3c | | 147.4c | | 47.2c | |
| 9 | Diluted adjusted earnings per ordinary share (US cents) | 87.5c | | 192.4c | | 110.0c | |
| | Dividends per share | | | | | | |
| 8 | –– Rio Tinto Group (US cents) | 60.00c | | 60.00c | | 60.00c | |
| 8 | –– Rio Tinto plc (pence) | 37.47p | | | | 37.47p | |
| 8 | –– Rio Tinto Limited (Australian cents) | | | 105.93c | | 105.93c | |
The notes on pages A-10 to A-84 form part of these accounts. Material variations from accounting principles generally
accepted in the United States are set out on pages A-65.2004 to A-84.
A-2.2002
Back to Contents
Footnotes to the profit and loss accounts
| (a) | The results for all years relate wholly to continuing operations. |
| (b) | The profit for each year is stated after the exceptional items set out in the box above. 'Adjusted earnings' excludes these items where they are of such magnitude that their exclusion is necessary in order that 'Adjusted earnings' fulfil its purpose of reflecting the underlying performance of the Group. See note 4 for further details. |
| (c) | Turnover and operating costs have been adjusted to reclassify, as turnover, certain amounts charged to customers for freight and handling costs, which previously were deducted from operating costs. The effect was to increase Gross turnover in 2004 by US$473 million (2003: US$364 million, 2002: US$291 million) and increase Net operating costs in 2004 by US$455 million (2003: US$340 million, 2002: US$272 million). |
The separate financial statements for Rio Tinto plc and 100 per cent of Rio Tinto Limited shown above are prepared on the basis of the legal ownership of the various operations within each part of the Group. The distinction between the legal and economic interests represented by Rio Tinto plc and Rio Tinto Limited shareholdings is explained on page A-10. The amounts attributable to the economic interests of Rio Tinto plc shareholders and shareholders of Rio Tinto Limited other than Rio Tinto plc are as follows:
| | Rio Tinto plc
shareholders | | Rio Tinto Limited
shareholders other than
Rio Tinto plc | | Rio Tinto Group | |
| |
| |
| |
| |
| | 2004 | | 2004 | | 2004 | |
| |
| |
| |
| |
| | US$m | | US$m | | US$m | |
| Economic interests in profit for the financial year | 2,177 | | 636 | | 2,813 | |
| Average percentage of Rio Tinto Limited held by | | | | | | |
| shareholders other than Rio Tinto plc | | | 62.5 | % | | |
| | Rio Tinto plc
shareholders | | Rio Tinto Limited
shareholders other than
Rio Tinto plc | | Rio Tinto Group | |
| |
| |
| |
| |
| | 2003 | | 2003 | | 2003 | |
| |
| |
| |
| |
| | US$m | | US$m | | US$m | |
| Economic interests in profit for the financial year | 1,167 | | 341 | | 1,508 | |
| Average percentage of Rio Tinto Limited held by | | | | | | |
| shareholders other than Rio Tinto plc | | | 62.4 | % | | |
| | Rio Tinto plc
shareholders | | Rio Tinto Limited
shareholders other than
Rio Tinto plc | | Rio Tinto Group | |
| |
| |
| |
| |
| | 2002 | | 2002 | | 2002 | |
| |
| |
| |
| |
| | US$m | | US$m | | US$m | |
| Economic interests in profit for the financial year | 504 | | 147 | | 651 | |
| Average percentage of Rio Tinto Limited held by | | | | | | |
| shareholders other than Rio Tinto plc | | | 62.4 | % | | |
The notes on pages A-10 to A-84 form part of these accounts. Material variations from accounting principles generally
accepted in the United States are set out on pages A-65.2004 to A-84.
A-2.Footnotes
Back to Contents
RIO TINTO PLC - RIO TINTO LIMITED
PROFIT AND LOSS ACCOUNTS FOR THE YEAR ENDED 31 DECEMBER 2004 (US GAAP format)
| | | Rio Tinto plc - part of Rio Tinto Group | | Rio Tinto Limited -
part of Rio Tinto Group | | Rio Tinto Group | |
| | |
| |
| |
| |
| | | 2004 | | 2004 | | 2004 | |
| | |
| |
| |
| |
| Note | | US$m | | US$m | | US$m | |
| | | | | | | | |
| | Revenues(b) | 5,275 | | 6,524 | | 11,799 | |
| | | | | | | | |
| | Operating costs and expenses | | | | | | |
| | Costs and expenses applicable to revenues (exclusive of
depreciation and amortisation shown separately below) (b) | (2,957 | ) | (3,497 | ) | (6,454 | ) |
| | Depreciation of fixed assets and amortisation of goodwill | (488 | ) | (716 | ) | (1,204 | ) |
| | Fixed asset write downs and provision for contract obligation | (558 | ) | - | | (558 | ) |
| | Environmental remediation costs | - | | - | | - | |
| | Selling, general and administrative expenses | (552 | ) | (525 | ) | (1,077 | ) |
| | Royalties | (256 | ) | (230 | ) | (486 | ) |
| | Exploration, research & development | (133 | ) | (77 | ) | (210 | ) |
| | Bad and doubtful debts | 16 | | (1 | ) | 15 | |
| | Foreign currency exchange gain/(loss) | (32 | ) | (1 | ) | (33 | ) |
| | Other operating income/(expense) | (26 | ) | (44 | ) | (70 | ) |
| | |
| |
| |
| |
| | | (4,986 | ) | (5,091 | ) | (10,077 | ) |
| | | | | | | | |
| | Non operating income/(expenses) | | | | | | |
| | Gain on sale of fixed asset investments | 781 | | 139 | | 920 | |
| | Interest expense & amortisation of discount on provisions | (49 | ) | (164 | ) | (213 | ) |
| | |
| |
| |
| |
| | Income before income tax, minority | | | | | | |
| | interest and equity income | 1,021 | | 1,408 | | 2,429 | |
| | Income tax expense | (102 | ) | (386 | ) | (488 | ) |
| | Minority interest in income of consolidated subsidiaries | 100 | | (42 | ) | 58 | |
| | Equity income of unconsolidated joint ventures and affiliates | 1,054 | | 205 | | 814 | |
| | |
| |
| |
| |
| | Net income | 2,073 | | 1,185 | | 2,813 | |
| | |
| |
| |
| |
| | | | | | | | |
| | Earnings per ordinary share (US cents) | 194.2 | c | 237.4 | c | 204.0 | c |
| | Diluted earnings per ordinary share (US cents) | 193.9 | c | 236.9 | c | 203.6 | c |
| | | | | | | | |
| | |
| (a) | These Condensed Income Statements are in the format prescribed by the SEC as referred to in note 4 on page A-19. |
| (b) | Revenue and Operating costs and expenses have been adjusted to reclassify, as revenue, certain amounts charged to customers for freight and handling costs, which previously were deducted from Operating costs and expenses. The effect was to increase revenue and to increase Operating costs and expenses in 2004 by US$455 million. |
The notes on pages A-10 to A-84 form part of these accounts. Material variations from accounting principles generally
accepted in the United States are set out on pages A-65.2004 to A-84.
A-3.2004
Back to Contents
RIO TINTO PLC - RIO TINTO LIMITED
PROFIT AND LOSS ACCOUNTS FOR THE YEAR ENDED 31 DECEMBER 2003 (US GAAP format)
| | | Rio Tinto plc -
part of Rio Tinto Group | | Rio Tinto Limited -
part of Rio Tinto Group | | Rio Tinto Group | |
| | |
| |
| |
| |
| | | 2003 | | 2003 | | 2003 | |
| | |
| |
| |
| |
| Note | | US$m | | US$m | | US$m | |
| | | | | | | | |
| | Revenues(b) | 4,092 | | 5,476 | | 9,568 | |
| | | | | | | | |
| | Operating costs and expenses | | | | | | |
| | Costs and expenses applicable to revenues (exclusive of
depreciation and amortisation shown separately below) (b) | (2,460 | ) | (3,030 | ) | (5,490 | ) |
| | Depreciation of fixed assets and amortisation of goodwill | (385 | ) | (621 | ) | (1,006 | ) |
| | Fixed asset write downs and provision for contract obligation | - | | - | | - | |
| | Environmental remediation costs | - | | - | | - | |
| | Selling, general and administrative expenses | (460 | ) | (357 | ) | (817 | ) |
| | Royalties | (220 | ) | (219 | ) | (439 | ) |
| | Exploration, research & development | (107 | ) | (43 | ) | (150 | ) |
| | Bad and doubtful debts | (28 | ) | (3 | ) | (31 | ) |
| | Foreign currency exchange gain/(loss) | (40 | ) | (83 | ) | (123 | ) |
| | Other operating income/(expense) | (24 | ) | 8 | | (16 | ) |
| | |
| |
| |
| |
| | | (3,724 | ) | (4,348 | ) | (8,072 | ) |
| | | | | | | | |
| | Non operating income/(expenses) | | | | | | |
| | Gain on sale of fixed asset investments | - | | 126 | | 126 | |
| | Interest expense & amortisation of discount on provisions | (97 | ) | (131 | ) | (228 | ) |
| | |
| |
| |
| |
| | Income before income tax, minority | | | | | | |
| | interest and equity income | 271 | | 1,123 | | 1,394 | |
| | Income tax expense | (7 | ) | (318 | ) | (325 | ) |
| | Minority interest in income of consolidated subsidiaries | (8 | ) | (11 | ) | (19 | ) |
| | Equity income of unconsolidated joint ventures and affiliates | 700 | | 90 | | 458 | |
| | |
| |
| |
| |
| | Net income | 956 | | 884 | | 1,508 | |
| | |
| |
| |
| |
| | | | | | | | |
| | Earnings per ordinary share (US cents) | 89.7 | c | 177.2 | c | 109.5 | c |
| | Diluted earnings per ordinary share (US cents) | 89.5 | c | 176.9 | c | 109.3 | c |
| | | | | | | | |
| | |
| (a) | These Condensed Income Statements are in the format prescribed by the SEC as referred to in note 4 on page A-19. |
| (b) | Revenue and Operating costs and expenses have been adjusted to reclassify, as revenue, certain amounts charged to customers for freight and handling costs, which previously were deducted from Operating costs and expenses. The effect was to increase revenue and to increase Operating costs and expenses in 2003 by US$340 million. |
The notes on pages A-10 to A-84 form part of these accounts. Material variations from accounting principles generally
accepted in the United States are set out on pages A-65.2004 to A-84.
A-3.2003
Back to Contents
RIO TINTO PLC - RIO TINTO LIMITED
PROFIT AND LOSS ACCOUNTS FOR THE YEAR ENDED 31 DECEMBER 2002 (US GAAP format)
| | | Rio Tinto plc
- -part of Rio Tinto Group | | Rio Tinto Limited -
part of Rio Tinto Group | | Rio Tinto Group | |
| | |
| |
| |
| |
| | | 2002 | | 2002 | | 2002 | |
| | |
| |
| |
| |
| Note | | US$m | | US$m | | US$m | |
| | | | | | | | |
| | Revenues(b) | 3,993 | | 4,722 | | 8,715 | |
| | | | | | | | |
| | Operating costs and expenses | | | | | | |
| | Costs and expenses applicable to revenues (exclusive of
depreciation and amortisation shown separately below) (b) | (2,226 | ) | (2,383 | ) | (4,609 | ) |
| | Depreciation of fixed assets and amortisation of goodwill | (423 | ) | (531 | ) | (954 | ) |
| | Fixed asset write downs and provision for contract obligation | (529 | ) | (433 | ) | (962 | ) |
| | Environmental remediation costs | (116 | ) | - | | (116 | ) |
| | Selling, general and administrative expenses | (380 | ) | (276 | ) | (656 | ) |
| | Royalties | (204 | ) | (186 | ) | (390 | ) |
| | Exploration, research & development | (111 | ) | (44 | ) | (155 | ) |
| | Bad and doubtful debts | (2 | ) | (13 | ) | (15 | ) |
| | Foreign currency exchange gain/(loss) | (28 | ) | (13 | ) | (41 | ) |
| | Other operating income/(expense) | 7 | | 12 | | 14 | |
| | |
| |
| |
| |
| | | (4,012 | ) | (3,867 | ) | (7,884 | ) |
| | | | | | | | |
| | Non operating income/(expenses) | | | | | | |
| | Gain on sale of fixed asset investments | - | | - | | - | |
| | Interest expense & amortisation of discount on provisions | (82 | ) | (131 | ) | (213 | ) |
| | |
| |
| |
| |
| | Income before income tax, minority | | | | | | |
| | interest and equity income | (101 | ) | 724 | | 618 | |
| | Income tax expense | (142 | ) | (341 | ) | (483 | ) |
| | Minority interest in income of consolidated subsidiaries | (78 | ) | 126 | | 48 | |
| | Equity income of unconsolidated joint ventures and affiliates | 516 | | 227 | | 468 | |
| | |
| |
| |
| |
| | Net income | 195 | | 736 | | 651 | |
| | |
| |
| |
| |
| | | | | | | | |
| | Earnings per ordinary share (US cents) | 18.3 | c | 147.6 | c | 47.3 | c |
| | Diluted earnings per ordinary share (US cents) | 18.3 | c | 147.4 | c | 47.2 | c |
| | | | | | | | |
| | |
| (a) | These Condensed Income Statements are in the format prescribed by the SEC as referred to in note 4 on page A-19. |
| (b) | Revenue and Operating costs and expenses have been adjusted to reclassify, as revenue, certain amounts charged to customers for freight and handling costs, which previously were deducted from Operating costs and expenses. The effect was to increase revenue and to increase Operating costs and expenses in 2002 by US$272 million. |
The notes on pages A-10 to A-84 form part of these accounts. Material variations from accounting principles generally
accepted in the United States are set out on pages A-65.2004 to A-84.
A-3.2002
<Back to Contents
RIO TINTO PLC - RIO TINTO LIMITED
CASH FLOW STATEMENTS FOR THE YEAR ENDED 31 DECEMBER 2004
| | | Rio Tinto plc -
part of Rio Tinto Group | | Rio Tinto Limited -
part of Rio Tinto Group | | Rio Tinto Group | |
| | |
| |
| |
| |
| | | 2004 | | 2004 | | 2004 | |
| | |
| |
| |
| |
| Note | | US$m | | US$m | | US$m | |
| | Cash flow from operating activities (see page A-4.2002-2004) | 1,284 | | 2,337 | | 3,621 | |
| | | | | | | | |
| | Dividends from joint ventures | 469 | | 279 | | 748 | |
| | Dividends from associates | 198 | | 6 | | 80 | |
| | |
| |
| |
| |
| | Total cash flow from operations | 1,951 | | 2,622 | | 4,449 | |
| | Interest received | 87 | | 8 | | 23 | |
| | Interest paid | (81 | ) | (159 | ) | (168 | ) |
| | Dividends paid to outside shareholders | (31 | ) | (30 | ) | (61 | ) |
| | |
| |
| |
| |
| | Returns on investment and servicing of finance | (25 | ) | (181 | ) | (206 | ) |
| | Taxation | (205 | ) | (670 | ) | (875 | ) |
| | Purchase of property, plant and equipment | (595 | ) | (1,569 | ) | (2,164 | ) |
| | Funding of Group share of joint ventures' and | | | | | | |
| | associates' capital expenditure | (12 | ) | (21 | ) | (33 | ) |
| | Payments from/(other funding of) joint ventures | | | | | | |
| | and associates | 15 | | - | | 15 | |
| 11 | Exploration and evaluation expenditure | (123 | ) | (70 | ) | (193 | ) |
| | Sale of property, plant and equipment | 12 | | 28 | | 40 | |
| | Sales less purchases of other investments | 140 | | 110 | | 250 | |
| | Loans (to)/repaid by Rio Tinto Limited | (1,423 | ) | - | | - | |
| | Purchase of redeemable preference shares | | | | | | |
| | in a Rio Tinto Limited subsidiary by a Rio Tinto | | | | | | |
| | plc subsidiary | - | | - | | - | |
| | |
| |
| |
| |
| | Capital expenditure and financial investment | (1,986 | ) | (1,522 | ) | (2,085 | ) |
| | Purchase of subsidiaries, joint arrangements, | | | | | | |
| | joint ventures and associates | | | - | | - | |
| 35 | Sale of interests in operations | 1,306 | | 205 | | 1,511 | |
| | Purchases/sales of subsidiaries between | | | | | | |
| | Rio Tinto Limited and Rio Tinto plc | - | | - | | - | |
| | Receipt of share buy back proceeds from Rio | | | | | | |
| | Tinto Limited | - | | - | | - | |
| | |
| |
| |
| |
| | Disposals less acquisitions | 1,306 | | 205 | | 1,511 | |
| | Equity dividends paid - Rio Tinto plc and | | | | | | |
| | Rio Tinto Limited shareholders | (700 | ) | (330 | ) | (906 | ) |
| | Cash inflow/(outflow) before management | | | | | | |
| | of liquid resources and financing | 341 | | 124 | | 1,888 | |
| 23 | Net cash inflow/(outflow) from management of | | | | | | |
| | liquid resources | 96 | | (6 | ) | 90 | |
| | Ordinary shares in Rio Tinto issued for cash | 21 | | 5 | | 26 | |
| | Ordinary shares in subsidiaries issued to | | | | | | |
| | outside shareholders | 1 | | 6 | | 7 | |
| 23 | Loans (repaid) less received | (415 | ) | (1,418 | ) | (1,833 | ) |
| | Payment of share buy back proceeds to Rio Tinto plc | - | | - | | - | |
| | Loans received from/(repaid to) Rio Tinto plc | - | | 1,423 | | - | |
| | Purchase of redeemable preference shares | | | | | | |
| | in a Rio Tinto Limited subsidiary by a Rio Tinto plc | | | | | | |
| | subsidiary | - | | - | | - | |
| | |
| |
| |
| |
| | Management of liquid resources and financing | (297 | ) | 10 | | (1,710 | ) |
| | |
| |
| |
| |
23 | Increase/(decrease) in cash per UK GAAP | 44 | | 134 | | 178 | |
| | |
| |
| |
| |
The notes on pages A-10 to A-84 form part of these accounts. Material variations from accounting principles generally
accepted in the United States are set out on pages A-65.2004 to A-84.
A-4.2004
Back to Contents
RIO TINTO PLC - RIO TINTO LIMITED
CASH FLOW STATEMENTS FOR THE YEAR ENDED 31 DECEMBER 2003
| | | Rio Tinto plc -
part of Rio Tinto Group | | Rio Tinto Limited -
part of Rio Tinto Group | | Rio Tinto Group | |
| | |
| |
| |
| |
| | | 2003 | | 2003 | | 2003 | |
| | |
| |
| |
| |
| Note | | US$m | | US$m | | US$m | |
| | Cash flow from operating activities (see page A-4.2002-2004) | 975 | | 1,913 | | 2,888 | |
| | | | | | | | |
| | Dividends from joint ventures | 338 | | 132 | | 470 | |
| | Dividends from associates | 397 | | 8 | | 128 | |
| | |
| |
| |
| |
| | Total cash flow from operations | 1,710 | | 2,053 | | 3,486 | |
| | Interest received | 48 | | 13 | | 30 | |
| | Interest paid | (121 | ) | (141 | ) | (231 | ) |
| | Dividends paid to outside shareholders | (47 | ) | (29 | ) | (76 | ) |
| | |
| |
| |
| |
| | Returns on investment and servicing of finance | (120 | ) | (157 | ) | (277 | ) |
| | Taxation | (182 | ) | (735 | ) | (917 | ) |
| | Purchase of property, plant and equipment | (559 | ) | (974 | ) | (1,533 | ) |
| | Funding of Group share of joint ventures' and | | | | | | |
| | associates' capital expenditure | (13 | ) | (81 | ) | (94 | ) |
| | Payments from/(other funding of) joint ventures | | | | | | |
| | and associates | (18 | ) | - | | (18 | ) |
| 11 | Exploration and evaluation expenditure | (88 | ) | (42 | ) | (130 | ) |
| | Sale of property, plant and equipment | 9 | | 10 | | 19 | |
| | Sales less purchases of other investments | 67 | | 16 | | 83 | |
| | Loans (to)/repaid by Rio Tinto Limited | 5 | | - | | - | |
| | Purchase of redeemable preference shares | | | | | | |
| | in a Rio Tinto Limited subsidiary by a Rio Tinto | | | | | | |
| | plc subsidiary | (500 | ) | - | | - | |
| | |
| |
| |
| |
| | Capital expenditure and financial investment | (1,097 | ) | (1,071 | ) | (1,673 | ) |
| | Purchase of subsidiaries, joint arrangements, | | | | | | |
| | joint ventures and associates | - | | - | | - | |
| 35 | Sale of interests in operations | - | | 405 | | 405 | |
| | Purchases/sales of subsidiaries between | | | | | | |
| | Rio Tinto Limited and Rio Tinto plc | 1 | | (1 | ) | - | |
| | Receipt of share buy back proceeds from Rio | | | | | | |
| | Tinto Limited | 1,208 | | - | | - | |
| | |
| |
| |
| |
| | Disposals less acquisitions | 1,209 | | 404 | | 405 | |
| | Equity dividends paid - Rio Tinto plc and | | | | | | |
| | Rio Tinto Limited shareholders | (645 | ) | (465 | ) | (833 | ) |
| | Cash inflow/(outflow) before management | | | | | | |
| | of liquid resources and financing | 875 | | 29 | | 191 | |
| 23 | Net cash inflow/(outflow) from management of | | | | | | |
| | liquid resources | (110 | ) | 5 | | (105 | ) |
| | Ordinary shares in Rio Tinto issued for cash | 20 | | 5 | | 25 | |
| | Ordinary shares in subsidiaries issued to | | | | | | |
| | outside shareholders | - | | 8 | | 8 | |
| 23 | Loans (repaid) less received | (794 | ) | 592 | | (202 | ) |
| | Payment of share buy back proceeds to Rio Tinto plc | - | | (1,208 | ) | - | |
| | Loans received from/(repaid to) Rio Tinto plc | - | | (5 | ) | - | |
| | Purchase of redeemable preference shares | | | | | | |
| | in a Rio Tinto Limited subsidiary by a Rio Tinto plc | | | | | | |
| | subsidiary | - | | 500 | | - | |
| | |
| |
| |
| |
| | Management of liquid resources and financing | (884 | ) | (103 | ) | (274 | ) |
| | |
| |
| |
| |
23 | Increase/(decrease) in cash per UK GAAP | (9 | ) | (74 | ) | (83 | ) |
| | |
| |
| |
| |
The notes on pages A-10 to A-84 form part of these accounts. Material variations from accounting principles generally
accepted in the United States are set out on pages A-65.2004 to A-84.
A-4.2003
<
Back to Contents
RIO TINTO PLC - RIO TINTO LIMITED
CASH FLOW STATEMENTS FOR THE YEARS ENDED 31 DECEMBER 2002
| | | Rio Tinto plc -
part of Rio Tinto Group | | Rio Tinto Limited -
part of Rio Tinto Group | | Rio Tinto Group | |
| | |
| |
| |
| |
| | | 2002 | | 2002 | | 2002 | |
| | |
| |
| |
| |
| Note | | US$m | | US$m | | US$m | |
| | Cash flow from operating activities (see page A-4.2002-2004) | 1,380 | | 1,754 | | 3,134 | |
| | | | | | | | |
| | Dividends from joint ventures | 228 | | 285 | | 513 | |
| | Dividends from associates | 368 | | 4 | | 96 | |
| | |
| |
| |
| |
| | Total cash flow from operations | 1,976 | | 2,043 | | 3,743 | |
| | Interest received | 46 | | 52 | | 80 | |
| | Interest paid | (109 | ) | (173 | ) | (264 | ) |
| | Dividends paid to outside shareholders | (78 | ) | (39 | ) | (117 | ) |
| | |
| |
| |
| |
| | Returns on investment and servicing of finance | (141 | ) | (160 | ) | (301 | ) |
| | Taxation | (240 | ) | (482 | ) | (722 | ) |
| | Purchase of property, plant and equipment | (667 | ) | (629 | ) | (1,296 | ) |
| | Funding of Group share of joint ventures' and | | | | | | |
| | associates' capital expenditure | (28 | ) | (109 | ) | (137 | ) |
| | Payments from/(other funding of) joint ventures | | | | | | |
| | and associates | (7 | ) | 1 | | (6 | ) |
| 11 | Exploration and evaluation expenditure | (89 | ) | (35 | ) | (124 | ) |
| | Sale of property, plant and equipment | 3 | | 13 | | 16 | |
| | Sales less purchases of other investments | (330 | ) | 7 | | (323 | ) |
| | Loans (to)/repaid by Rio Tinto Limited | (87 | ) | - | | - | |
| | Purchase of redeemable preference shares | | | | | | |
| | in a Rio Tinto Limited subsidiary by a Rio Tinto | | | | | | |
| | plc subsidiary | - | | - | | - | |
| | |
| |
| |
| |
| | Capital expenditure and financial investment | (1,205 | ) | (752 | ) | (1,870 | ) |
| | Purchase of subsidiaries, joint arrangements, | | | | | | |
| | joint ventures and associates | (1 | ) | (105 | ) | (106 | ) |
| 35 | Sale of interests in operations | 3 | | 230 | | 233 | |
| | Purchases/sales of subsidiaries between | | | | | | |
| | Rio Tinto Limited and Rio Tinto plc | (13 | ) | 13 | | - | |
| | Receipt of share buy back proceeds from Rio | | | | | | |
| | Tinto Limited | 115 | | - | | - | |
| | |
| |
| |
| |
| | Disposals less acquisitions | 104 | | 138 | | 127 | |
| | Equity dividends paid - Rio Tinto plc and | | | | | | |
| | Rio Tinto Limited shareholders | (729 | ) | (495 | ) | (948 | ) |
| | Cash inflow/(outflow) before management | | | | | | |
| | of liquid resources and financing | (235 | ) | 292 | | 29 | |
| 23 | Net cash inflow/(outflow) from management of | | | | | | |
| | liquid resources | 142 | | 71 | | 213 | |
| | Ordinary shares in Rio Tinto issued for cash | 10 | | 5 | | 15 | |
| | Ordinary shares in subsidiaries issued to | | | | | | |
| | outside shareholders | - | | 22 | | 22 | |
| 23 | Loans (repaid) less received | 67 | | (476 | ) | (409 | ) |
| | Payment of share buy back proceeds to Rio Tinto plc | - | | (115 | ) | - | |
| | Loans received from/(repaid to) Rio Tinto plc | - | | 87 | | - | |
| | Purchase of redeemable preference shares | | | | | | |
| | in a Rio Tinto Limited subsidiary by a Rio Tinto plc | | | | | | |
| | subsidiary | - | | - | | - | |
| | |
| |
| |
| |
| | Management of liquid resources and financing | 219 | | (406 | ) | (159 | ) |
| | |
| |
| |
| |
23 | Increase/(decrease) in cash per UK GAAP | (16) | | (114 | ) | (130 | ) |
| | |
| |
| |
| |
The notes on pages A-10 to A-84 form part of these accounts. Material variations from accounting principles generally
accepted in the United States are set out on pages A-65.2004 to A-84.
A-4.2002
Back to Contents
RIO TINTO PLC - RIO TINTO LIMITED
CASH FLOW STATEMENTS FOR THE YEAR ENDED 31 DECEMBER
| | | Rio Tinto plc -
part of Rio Tinto Group | | Rio Tinto Limited -
part of Rio Tinto Group | | Rio Tinto Group | |
| | |
| |
| |
| |
| | | 2004 | | 2004 | | 2004 | |
| | |
| |
| |
| |
| | | US$m | | US$m | | US$m | |
| | Cash flow from operating activities | | | | | | |
| | Group operating profit | 289 | | 1,433 | | 1,722 | |
| | Asset write downs and provision for contract | | | | | | |
| | obligation | 558 | | - | | 558 | |
| 2 | Depreciation and amortisation | 488 | | 716 | | 1,204 | |
| 11 | Exploration & evaluation charged against profit | 116 | | 71 | | 187 | |
| 20 | Provisions (excluding exceptional items) | 109 | | 38 | | 147 | |
| 20 | Utilisation of provisions | (101 | ) | (85 | ) | (186 | ) |
| | Change in inventories | (101 | ) | (78 | ) | (179 | ) |
| | Change in accounts receivable & prepayments | (200 | ) | 43 | | (48 | ) |
| | Change in accounts payable and accruals | 95 | | 182 | | 168 | |
| | Other items | 31 | | 17 | | 48 | |
| | |
| |
| |
| |
| | Cash flow from operating activities | 1,284 | | 2,337 | | 3,621 | |
| | |
| |
| |
| |
| | | | | | | | |
| | | Rio Tinto plc -
part of Rio Tinto Group | | Rio Tinto Limited -
part of Rio Tinto Group | | Rio Tinto Group | |
| | |
| |
| |
| |
| | | 2003 | | 2003 | | 2003 | |
| | |
| |
| |
| |
| | | US$m | | US$m | | US$m | |
| | Cash flow from operating activities | | | | | | |
| | Group operating profit | 368 | | 1,128 | | 1,496 | |
| | Asset write downs and provision for contract | | | | | | |
| | obligation | - | | - | | - | |
| 2 | Depreciation and amortisation | 385 | | 621 | | 1,006 | |
| 11 | Exploration & evaluation charged against profit | 90 | | 37 | | 127 | |
| 20 | Provisions (excluding exceptional items) | 60 | | 94 | | 154 | |
| 20 | Utilisation of provisions | (62 | ) | (97 | ) | (159 | ) |
| | Change in inventories | (85 | ) | 42 | | (43 | ) |
| | Change in accounts receivable & prepayments | (52 | ) | (58 | ) | 154 | |
| | Change in accounts payable and accruals | 180 | | 150 | | 66 | |
| | Other items | 91 | | (4 | ) | 87 | |
| | |
| |
| |
| |
| | Cash flow from operating activities | 975 | | 1,913 | | 2,888 | |
| | |
| |
| |
| |
| | | | | | | | |
| | | Rio Tinto plc -
part of Rio Tinto Group | | Rio Tinto Limited -
part of Rio Tinto Group | | Rio Tinto Group | |
| | |
| |
| |
| |
| | | 2002 | | 2002 | | 2002 | |
| | |
| |
| |
| |
| | | US$m | | US$m | | US$m | |
| | Cash flow from operating activities | | | | | | |
| | Group operating profit | (19 | ) | 855 | | 831 | |
| | Asset write downs and provision for environmental remediation | 645 | | 433 | | 1,078 | |
| 2 | Depreciation and amortisation | 423 | | 531 | | 954 | |
| 11 | Exploration & evaluation charged against profit | 94 | | 36 | | 130 | |
| 20 | Provisions (excluding exceptional items) | 33 | | 25 | | 58 | |
| 20 | Utilisation of provisions | (35 | ) | (83 | ) | (118 | ) |
| | Change in inventories | 42 | | 43 | | 85 | |
| | Change in accounts receivable & prepayments | 113 | | 23 | | 158 | |
| | Change in accounts payable and accruals | 81 | | (116 | ) | (57 | ) |
| | Other items | 3 | | 7 | | 15 | |
| | |
| |
| |
| |
| | Cash flow from operating activities | 1,380 | | 1,754 | | 3,134 | |
| | |
| |
| |
| |
The notes on pages A-10 to A-84 form part of these accounts. Material variations from accounting principles generally
accepted in the United States are set out on pages A-65.2004 to A-84.
A-4.2002-2004
Back to Contents
RIO TINTO PLC - RIO TINTO LIMITED
BALANCE SHEETS FOR THE YEAR ENDED 31 DECEMBER 2004
| | | Rio Tinto plc -
part of Rio Tinto Group | | Rio Tinto Limited -
part of Rio Tinto Group | | Rio Tinto Group | |
| | |
| |
| |
| |
| Note | | 2004 | | 2004 | | 2004 | |
| | |
| |
| |
| |
| | | US$m | | US$m | | US$m | |
| | Intangible fixed assets | | | | | | |
| 10 | Goodwill | 215 | | 924 | | 1,139 | |
| 11 | Exploration and evaluation | 27 | | 70 | | 97 | |
| | |
| |
| |
| |
| | | 242 | | 994 | | 1,236 | |
| | Tangible fixed assets | | | | | | |
| 12 | Property, plant and equipment | 5,972 | | 10,633 | | 16,605 | |
| | Investments | | | | | | |
| 13 | Share of gross assets of joint ventures | 2,027 | | 1,448 | | 3,475 | |
| 13 | Share of gross liabilities of joint ventures | (749 | ) | (294 | ) | (1,043 | ) |
| | |
| |
| |
| |
| | | 1,278 | | 1,154 | | 2,432 | |
| 13 | Investments in associates/other investments | 3,168 | | 72 | | 385 | |
| | |
| |
| |
| |
| | Total investments | 4,446 | | 1,226 | | 2,817 | |
| | |
| |
| |
| |
| | Total fixed assets | 10,660 | | 12,853 | | 20,658 | |
| | |
| |
| |
| |
| | Current assets | | | | | | |
| 15 | Inventories | 1,099 | | 927 | | 2,026 | |
| | Accounts receivable and prepayments | | | | | | |
| 16 | Falling due within one year | 1,083 | | 1,031 | | 1,723 | |
| 16 | Falling due after more than one year | 540 | | 296 | | 836 | |
| | |
| |
| |
| |
| | Total accounts receivable | 1,623 | | 1,327 | | 2,559 | |
| 38 | Loans made to Rio Tinto Limited and its subsidiaries | 1,875 | | - | | - | |
| 17 | Investments | 78 | | - | | 78 | |
| 17 | Cash | 181 | | 209 | | 390 | |
| | |
| |
| |
| |
| | Total current assets | 4,856 | | 2,463 | | 5,053 | |
| | |
| |
| |
| |
| | Current liabilities | | | | | | |
| 18 | Short term borrowings | (232 | ) | (574 | ) | (806 | ) |
| 38 | Loans made by Rio Tinto plc and its subsidiaries | - | | (1,875 | ) | - | |
| 19 | Accounts payable and accruals | (1,529 | ) | (1,736 | ) | (2,589 | ) |
| | |
| |
| |
| |
| | Total current liabilities | (1,761 | ) | (4,185 | ) | (3,395 | ) |
| | |
| |
| |
| |
| | Net current assets/(liabilities) | 3,095 | | (1,722 | ) | 1,658 | |
| | |
| |
| |
| |
| | Total assets less current liabilities | 13,755 | | 11,131 | | 22,316 | |
| | |
| |
| |
| |
| | Liabilities due after one year | | | | | | |
| 22 | Medium and long term borrowings | (1,452 | ) | (1,885 | ) | (3,337 | ) |
| 19 | Accounts payable and accruals | (175 | ) | (226 | ) | (401 | ) |
| 20 | Provisions for liabilities and charges | (2,870 | ) | (2,188 | ) | (5,058 | ) |
| | Outside shareholders' interests | (119 | ) | (1,317 | ) | (936 | ) |
| | |
| |
| |
| |
| | Net assets | 9,139 | | 5,515 | | 12,584 | |
| | |
| |
| |
| |
| | Capital and reserves | | | | | | |
| | Share capital | | | | | | |
| 24 | - Rio Tinto plc | 155 | | - | | 155 | |
| 24 | - Rio Tinto Limited (excl. Rio Tinto plc interest) | - | | 1,336 | | 1,133 | |
| 25 | Share premium account | 1,650 | | - | | 1,650 | |
| 25 | Other reserves | 248 | | 125 | | 326 | |
| 25 | Profit and loss account | 7,086 | | 4,054 | | 9,320 | |
| | |
| |
| |
| |
| | Equity shareholders' funds | 9,139 | | 5,515 | | 12,584 | |
| | |
| |
| |
| |
The separate financial statements for Rio Tinto plc and 100 per cent of Rio Tinto Limited shown above are prepared on the basis of the legal ownership of the various operations within each part of the Group. The distinction between the legal and economic interests represented by Rio Tinto plc and Rio Tinto Limited shareholdings is explained on page A-10. The amounts of the consolidated shareholders' funds attributable to the economic interests of Rio Tinto plc shareholders and the shareholders of RioTinto Limited other than Rio Tinto plc are as follows:
| | | | | Rio Tinto Limited | | | |
| | | Rio Tinto plc | | shareholders other | | | |
| | | shareholders | | than Rio Tinto plc | | Rio Tinto Group | |
| | |
| |
| |
| |
| | | 2004 | | 2004 | | 2004 | |
| | |
| |
| |
| |
| | | US$m | | US$m | | US$m | |
| | Economic interests in consolidated
shareholders' funds | 9,740 | | 2,844 | | 12,584 | |
| | Closing percentage of Rio Tinto Limited held
by shareholders other than Rio Tinto plc | | | 62.5 | % | | |
The notes on pages A-10 to A-84 form part of these accounts. Material variations from accounting principles generally
accepted in the United States are set out on pages A-65.2004 to A-84.
A-5.2004
Back to Contents
RIO TINTO PLC - RIO TINTO LIMITED
BALANCE SHEETS FOR THE YEAR ENDED 31 DECEMBER 2003
| | | Rio Tinto plc -
part of Rio Tinto Group | | Rio Tinto Limited -
part of Rio Tinto Group | | Rio Tinto Group | |
| | |
| |
| |
| |
| Note | | 2003 | | 2003 | | 2003 | |
| | |
| |
| |
| |
| | | US$m | | US$m | | US$m | |
| | Intangible fixed assets | | | | | | |
| 10 | Goodwill | 253 | | 932 | | 1,185 | |
| 11 | Exploration and evaluation | 2 | | 67 | | 69 | |
| | |
| |
| |
| |
| | | 255 | | 999 | | 1,254 | |
| | Tangible fixed assets | | | | | | |
| 12 | Property, plant and equipment | 6,095 | | 9,095 | | 15,196 | |
| | Investments | | | | | | |
| 13 | Share of gross assets of joint ventures | 1,845 | | 1,388 | | 3,233 | |
| 13 | Share of gross liabilities of joint ventures | (731 | ) | (279 | ) | (1,010 | ) |
| | |
| |
| |
| |
| | | 1,114 | | 1,109 | | 2,223 | |
| 13 | Investments in associates/other investments | 2,680 | | 62 | | 517 | |
| | |
| |
| |
| |
| | Total investments | 3,794 | | 1,171 | | 2,740 | |
| | |
| |
| |
| |
| | Total fixed assets | 10,144 | | 11,265 | | 19,190 | |
| | |
| |
| |
| |
| | Current assets | | | | | | |
| 15 | Inventories | 968 | | 815 | | 1,783 | |
| | Accounts receivable and prepayments | | | | | | |
| 16 | Falling due within one year | 991 | | 1,070 | | 1,674 | |
| 16 | Falling due after more than one year | 555 | | 254 | | 809 | |
| | |
| |
| |
| |
| | Total accounts receivable | 1,546 | | 1,324 | | 2,483 | |
| 38 | Loans made to Rio Tinto Limited and its subsidiaries | 563 | | - | | - | |
| 17 | Investments | 230 | | - | | 230 | |
| 17 | Cash | 257 | | 138 | | 395 | |
| | |
| |
| |
| |
| | Total current assets | 3,564 | | 2,277 | | 4,891 | |
| | |
| |
| |
| |
| | Current liabilities | | | | | | |
| 18 | Short term borrowings | (542 | ) | (1,652 | ) | (2,194 | ) |
| 38 | Loans made by Rio Tinto plc and its subsidiaries | - | | (563 | ) | - | |
| 19 | Accounts payable and accruals | (1,325 | ) | (1,291 | ) | (2,140 | ) |
| | |
| |
| |
| |
| | Total current liabilities | (1,867 | ) | (3,506 | ) | (4,334 | ) |
| | |
| |
| |
| |
| | Net current assets/(liabilities) | 1,697 | | (1,229 | ) | 557 | |
| | |
| |
| |
| |
| | Total assets less current liabilities | 11,841 | | 10,036 | | 19,747 | |
| | |
| |
| |
| |
| | Liabilities due after one year | | | | | | |
| 22 | Medium and long term borrowings | (1,559 | ) | (2,290 | ) | (3,849 | ) |
| 19 | Accounts payable and accruals | (156 | ) | (166 | ) | (322 | ) |
| 20 | Provisions for liabilities and charges | (2,543 | ) | (1,993 | ) | (4,536 | ) |
| | Outside shareholders' interests | (240 | ) | (1,263 | ) | (1,003 | ) |
| | |
| |
| |
| |
| | Net assets | 7,343 | | 4,324 | | 10,037 | |
| | |
| |
| |
| |
| | Capital and reserves | | | | | | |
| | Share capital | | | | | | |
| 24 | - Rio Tinto plc | 155 | | - | | 155 | |
| 24 | - Rio Tinto Limited (excl. Rio Tinto plc interest) | - | | 1,280 | | 1,085 | |
| 25 | Share premium account | 1,629 | | - | | 1,629 | |
| 25 | Other reserves | 261 | | 117 | | 334 | |
| 25 | Profit and loss account | 5,298 | | 2,927 | | 6,834 | |
| | |
| |
| |
| |
| | Equity shareholders' funds | 7,343 | | 4,324 | | 10,037 | |
| | |
| |
| |
| |
The separate financial statements for Rio Tinto plc and 100 per cent of Rio Tinto Limited shown above are prepared on the basis of the legal ownership of the various operations within each part of the Group. The distinction between the legal and economic interests represented by Rio Tinto plc and Rio Tinto Limited shareholdings is explained on page A-10. The amounts of the consolidated shareholders' funds attributable to the economic interests of Rio Tinto plc shareholders and the shareholders of RioTinto Limited other than Rio Tinto plc are as follows:
| | | | Rio Tinto Limited | | | |
| | Rio Tinto plc | | shareholders other | | | |
| | shareholders | | than Rio Tinto plc | | Rio Tinto Group | |
| |
| |
| |
| |
| | 2003 | | 2003 | | 2003 | |
| |
| |
| |
| |
| | US$m | | US$m | | US$m | |
Economic interests in consolidated
shareholders' funds | 7,767 | | 2,270 | | 10,037 | |
Closing percentage of Rio Tinto Limited held
by shareholders other than Rio Tinto plc | | | 62.4 | % | | |
The notes on pages A-10 to A-84 form part of these accounts. Material variations from accounting principles generally
accepted in the United States are set out on pages A-65.2004 to A-84.
A-5.2003
Back to Contents
RIO TINTO PLC - RIO TINTO LIMITED
RECONCILIATION WITH AUSTRALIAN GAAP AT 31 DECEMBER
| | Rio Tinto Group | |
| |
|
|
| |
| | 2004 | | 2003 | |
| |
| |
| |
| | US$m | | US$m | |
| Net earnings under UK GAAP | 2,813 | | 1,508 | |
| Increase/(decrease) net of tax in respect of: | | | | |
| Goodwill amortisation | (139 | ) | (164 | ) |
| Profit on sale of operations | 99 | | - | |
| Contributions to fixed asset additions | 99 | | - | |
| Taxation | (23 | ) | (5 | ) |
| Other | - | | 7 | |
| |
| |
| |
| Net earnings attributable to members under Australian GAAP | 2,849 | | 1,346 | |
| |
| |
| |
| Earnings per ordinary share under Australian GAAP | 206.6 | c | 97.7 | c |
| Diluted earnings per share under Australian GAAP | 206.3 | c | 97.5 | c |
| |
| |
| |
| | | | | |
| | Rio Tinto Group | |
| |
|
|
| |
| | 2004 | | 2003 | |
| |
| |
| |
| | US$m | | US$m | |
| Shareholders' funds under UK GAAP | 12,584 | | 10,037 | |
| Increase/(decrease) net of tax in respect of: | | | | |
| Goodwill | 601 | | 872 | |
| Taxation | 46 | | 69 | |
| Dividend | 626 | | 469 | |
| Contributions to fixed asset additions | 105 | | - | |
| Other | (26 | ) | (24 | ) |
| |
| |
| |
| Shareholders' funds under Australian GAAP | 13,936 | | 11,423 | |
| |
| |
| |
The Group’s financial statements have been prepared in accordance with UK GAAP, which differs in certain respects from Australian GAAP. These differences relate principally to the following items, and the effect of each of the adjustments to net earnings and shareholders’ funds that would be required under Australian GAAP is set out above.
Goodwill
For 1997 and prior years, UK GAAP permitted the write off of purchased goodwill on acquisitions directly against reserves. Under Australian GAAP, goodwill is capitalised and amortised by charges against income over the period during which it is expected to be of benefit, subject to a maximum of 20 years. Goodwill previously written off directly to reserves in the UK GAAP accounts has been reinstated and amortised for the purpose of the reconciliation statements. For acquisitions in 1998 and subsequent years, goodwill is capitalised under UK GAAP, in accordance with FRS 10. Adjustments are required for Australian GAAP purposes where such capitalised goodwill is amortised over periods exceeding 20 years in the UK GAAP accounts.
Profit on sale of operations
Under UK GAAP, goodwill previously written off to reserves is reinstated for the purpose of calculating profit on the sale of an operation. Under Australian GAAP, the equivalent goodwill is capitalised and is subject to amortisation. The adjustment to the profit on sale of operations under Australian GAAP reflects the lower book value of goodwill for operations sold under Australian GAAP compared with UK GAAP, which results from the above amortisation.
Contributions to fixed asset additions
Under UK GAAP, contributions made by governments to the cost of acquiring fixed assets are deferred on the balance sheet and credited to the profit and loss account over the expected useful economic life of the fixed assets to which they relate. Under Australian GAAP, such contributions are recognised immediately in the profit and loss account.
Taxation
Under UK GAAP, provision for taxes arising on remittances of earnings can be made only if the dividends have been accrued or if there is a binding agreement for the distribution of the earnings. Under Australian GAAP, provision must be made for tax arising on expected future remittances of past earnings.
Under UK GAAP, tax benefits associated with goodwill charged directly to reserves, in 1997 and previous years, must be accumulated in the deferred tax provision. This means that the tax benefits are not included in earnings until the related goodwill is charged through the profit and loss account, on disposal or closure. For Australian GAAP, no provision is required for such deferred tax because the goodwill that gave rise to these tax benefits was capitalised and gives rise to amortisation charges against profit.
Dividends
Under UK GAAP, ordinary dividends are recognised in the financial year in respect of which they are paid. Under Australian GAAP, such dividends are not recognised until they are declared, determined or publicly recommended by the Board of directors. Prior to 1 January 2003, Australian GAAP was consistent with UK GAAP.
Exceptional items
Earnings under UK GAAP, stated above, include exceptional net gains of US$592 million (2003 US$126 million) relating to profits on disposal of interests in operations less asset write downs and a provision for a contract obligation.
A-6
<Back to Contents
RIO TINTO PLC - RIO TINTO LIMITED
STATEMENTS OF TOTAL RECOGNISED GAINS AND LOSSES
FOR THE YEARS ENDED 31 DECEMBER
| | Rio Tinto plc -
part of Rio Tinto Group | | Rio Tinto Limited -
part of Rio Tinto Group | | Rio Tinto Group | |
| |
| |
| |
| |
| | 2004 | | 2004 | | 2004 | |
| |
| |
| |
| |
| | US$m | | US$m | | US$m | |
| Profit for the financial year | | | | | | |
Parent companies and
subsidiaries | 1,019 | | 980 | | 1,999 | |
| Joint ventures | 510 | | 199 | | 709 | |
| Associates | 544 | | 6 | | 105 | |
| |
| |
| |
| |
| | 2,073 | | 1,185 | | 2,813 | |
| | | | | | | |
Adjustment on currency
translation(a) | | | | | | |
Parent companies and
subsidiaries | 156 | | 383 | | 537 | |
| Joint ventures | - | | 1 | | 1 | |
| Associates | 140 | | 2 | | 4 | |
| |
| |
| |
| |
| | 296 | | 386 | | 542 | |
| | | | | | | |
Total recognised gains and
losses relating to the
financial year | | | | | | |
Parent companies and
subsidiaries | 1,175 | | 1,363 | | 2,536 | |
| Joint ventures | 510 | | 200 | | 710 | |
| Associates | 684 | | 8 | | 109 | |
| |
| |
| |
| |
| | 2,369 | | 1,571 | | 3,355 | |
| |
| |
| |
| |
| | Rio Tinto plc -
part of Rio Tinto Group | | Rio Tinto Limited -
part of Rio Tinto Group | | Rio Tinto Group | |
| | |
| |
| |
| |
| | | 2003 | | 2003 | | 2003 | |
| | |
| |
| |
| |
| | | US$m | | US$m | | US$m | |
| Profit for the financial year | | | | | | | |
Parent companies and
subsidiaries | | 256 | | 794 | | 1,050 | |
| Joint ventures | | 284 | | 76 | | 360 | |
| Associates | | 416 | | 14 | | 98 | |
| | |
| |
| |
| |
| | | 956 | | 884 | | 1,508 | |
| | | | | | | | |
Adjustment on currency
translation(a) | | | | | | | |
Parent companies and
subsidiaries | | 553 | | 1,353 | | 1,864 | |
| Joint ventures | | - | | 53 | | 53 | |
| Associates | | 495 | | 3 | | 7 | |
| | |
| |
| |
| |
| | | 1,048 | | 1,409 | | 1,924 | |
| | | | | | | | |
Total recognised gains and
losses relating to the
financial year | | | | | | | |
Parent companies and
subsidiaries | | 809 | | 2,147 | | 2,914 | |
| Joint ventures | | 284 | | 129 | | 413 | |
| Associates | | 911 | | 17 | | 105 | |
| | |
| |
| |
| |
| | | 2,004 | | 2,293 | | 3,432 | |
| | |
| |
| |
| |
The notes on pages A-10 to A-84 form part of these accounts. Material variations from accounting principles generally
accepted in the United States are set out on pages A-65.2004 to A-84.
A-7
Back to Contents
RIO TINTO PLC - RIO TINTO LIMITED
STATEMENTS OF TOTAL RECOGNISED GAINS AND LOSSES
FOR THE YEARS ENDED 31 DECEMBER
| | Rio Tinto plc -
part of Rio Tinto Group | | Rio Tinto Limited -
part of Rio Tinto Group | | Rio Tinto Group | |
| | |
| |
| |
| |
| | | 2002 | | 2002 | | 2002 | |
| | |
| |
| |
| |
| | | US$m | | US$m | | US$m | |
| Profit for the financial year | | | | | | | |
Parent companies and
subsidiaries | | (321 | ) | 509 | | 183 | |
| Joint ventures | | 159 | | 180 | | 339 | |
| Associates | | 357 | | 47 | | 129 | |
| | |
| |
| |
| |
| | | 195 | | 736 | | 651 | |
| | | | | | | | |
Adjustment on currency
translation(a) | | | | | | | |
Parent companies and
subsidiaries | | 198 | | 374 | | 560 | |
| Joint ventures | | 3 | | 11 | | 13 | |
| Associates | | 137 | | 1 | | 6 | |
| | |
| |
| |
| |
| | | 338 | | 386 | | 579 | |
| | | | | | | | |
Total recognised gains and
losses relating to the
financial year | | | | | | | |
Parent companies and
subsidiaries | | (123 | ) | 883 | | 743 | |
| Joint ventures | | 162 | | 191 | | 352 | |
| Associates | | 494 | | 48 | | 135 | |
| | |
| |
| |
| |
| | | 533 | | 1,122 | | 1,230 | |
| | |
| |
| |
| |
| | |
| (a) | Adjustment on currency translation' is net of current and deferred tax charges (see note 7). |
RECONCILIATION OF MOVEMENTS IN SHAREHOLDERS' FUNDS
FOR YEAR ENDED 31 DECEMBER 2004
| | Rio Tinto plc - | | Rio Tinto Limited - | | | |
| | part of Rio Tinto Group | | part of Rio Tinto Group | | Rio Tinto Group | |
| |
| |
| |
| |
| | 2004 | | 2004 | | 2004 | |
| |
| |
| |
| |
| | US$m | | US$m | | US$m | |
| Profit for the financial year | 2,073 | | 1,185 | | 2,813 | |
| Dividends | (822 | ) | (385 | ) | (1,062 | ) |
| |
| |
| |
| |
| | 1,251 | | 800 | | 1,751 | |
| Adjustment on currency translation | 296 | | 386 | | 542 | |
| Goodwill written back on disposal of interest in operation | 228 | | - | | 228 | |
| Shares issued by Rio Tinto plc and Rio Tinto Limited (b) | 21 | | 5 | | 26 | |
| Dividend on DLC share from Rio Tinto Limited | - | | - | | - | |
| |
| |
| |
| |
| | 1,796 | | 1,191 | | 2,547 | |
| Opening shareholders' funds | 7,343 | | 4,324 | | 10,037 | |
| |
| |
| |
| |
| Closing shareholders' funds | 9,139 | | 5,515 | | 12,584 | |
| |
| |
| |
| |
| (a) | A reconciliation of each individual reserve within shareholders' funds is shown in note 25. |
| (b) | The carrying value of Rio Tinto plc's investment in Rio Tinto Limited increased by US$nil in 2004 (2003: US$1 million) as a result of the Rio Tinto Limited share issues during the year. In 2003, Rio Tinto plc's share of the proceeds received exceeded the dilution of its interest resulting from the share issues. |
The notes on pages A-10 to A-84 form part of these accounts. Material variations from accounting principles generally
accepted in the United States are set out on pages A-65.2004 to A-84.
A-8
Back to Contents
RIO TINTO PLC - RIO TINTO LIMITED
RECONCILIATION OF MOVEMENTS IN SHAREHOLDERS' FUNDS
FOR YEARS ENDED 31 DECEMBER
| | Rio Tinto plc - | | Rio Tinto Limited - | | | |
| | part of Rio Tinto
Group | | part of Rio Tinto Group | | Rio Tinto Group | |
| | |
| |
| |
| |
| | | 2003 | | 2003 | | 2003 | |
| | |
| |
| |
| |
| | | US$m | | US$m | | US$m | |
| Profit for the financial year | | 956 | | 884 | | 1,508 | |
| Dividends | | (683 | ) | (320 | ) | (882 | ) |
| | |
| |
| |
| |
| | | 273 | | 564 | | 626 | |
| Adjustment on currency translation | | 1,048 | | 1,409 | | 1,924 | |
| Goodwill written back on disposal of interest in operation | | - | | - | | - | |
| Shares issued by Rio Tinto plc and Rio Tinto Limited (b) | | 21 | | 5 | | 25 | |
| Dividend on DLC share from Rio Tinto Limited | | 102 | | (164 | ) | - | |
| | |
| |
| |
| |
| | | 1,444 | | 1,814 | | 2,575 | |
| Opening shareholders' funds | | 5,899 | | 2,510 | | 7,462 | |
| | |
| |
| |
| |
| Closing shareholders' funds | | 7,343 | | 4,324 | | 10,037 | |
| | |
| |
| |
| |
| (a) | A reconciliation of each individual reserve within shareholders' funds is shown in note 25. |
| (b) | The carrying value of Rio Tinto plc's investment in Rio Tinto Limited increased by US$nil in 2004 (2003: US$1 million) as a result of the Rio Tinto Limited share issues during the year. In 2003, Rio Tinto plc's share of the proceeds received exceeded the dilution of its interest resulting from the share issues. |
| | |
| | Rio Tinto plc - | | Rio Tinto Limited - | | | |
| | part of Rio Tinto Group | | part of Rio Tinto Group | | Rio Tinto Group | |
| |
| |
| |
| |
| | 2002 | | 2002 | | 2002 | |
| |
| |
| |
| |
| | US$m | | US$m | | US$m | |
| Profit for the financial year | 195 | | 736 | | 651 | |
| Dividends | (639 | ) | (299 | ) | (826 | ) |
| |
| |
| |
| |
| | (444 | ) | 437 | | (175 | ) |
| Adjustment on currency translation | 338 | | 386 | | 579 | |
| Goodwill written back on disposal of interest in operation | - | | - | | - | |
| Shares issued by Rio Tinto plc and Rio Tinto Limited | 12 | | 5 | | 15 | |
| Dividend on DLC share from Rio Tinto Limited | 91 | | (146 | ) | - | |
| |
| |
| |
| |
| | (3 | ) | 682 | | 419 | |
| Opening shareholders' funds | 5,902 | | 1,828 | | 7,043 | |
| |
| |
| |
| |
| Closing shareholders' funds | 5,899 | | 2,510 | | 7,462 | |
| |
| |
| |
| |
The notes on pages A-10 to A-84 form part of these accounts. Material variations from accounting principles generally
accepted in the United States are set out on pages A-65.2004 to A-84.
A-9
Back to Contents
RIO TINTO PLC - RIO TINTO LIMITED
OUTLINE OF DUAL LISTED COMPANIES STRUCTURE
AND BASIS OF FINANCIAL STATEMENTS
The Rio Tinto GroupSet out on pages A-2.2004 to A-84 are the financial statements of the Rio Tinto Group (the 'Group'), formed through the dual listed companies ('DLC') merger of Rio Tinto plc and Rio Tinto Limited that created a single economic enterprise, together with separate financial statements for the Rio Tinto plc and Rio Tinto Limited parts of the Group. The financial statements of the Group have been presented by both Rio Tinto plc and Rio Tinto Limited as their consolidated accounts in accordance with both United Kingdom and Australian legislation and regulations.
Product and geographical analyses of the Group's Operating assets, Turnover, Profit before tax and Net earnings are shown in notes 26 and 27 respectively.
On 21 December 1995, Rio Tinto plc and Rio Tinto Limited, which are listed respectively on Stock Exchanges in the United Kingdom and Australia, entered into a dual listed companies ('DLC') merger. This was effected by contractual arrangements between the Companies and amendments to Rio Tinto plc's Memorandum and Articles of Association and Rio Tinto Limited's constitution.
As a result, Rio Tinto plc and Rio Tinto Limited and their respective groups operate together as a single economic enterprise, with neither assuming a dominant role. In particular, the arrangements:
| - | confer upon the shareholders of Rio Tinto plc and Rio Tinto Limited a common economic interest in both groups; |
| - | provide for common boards of directors and a unified management structure; |
| - | provide for equalised dividends and capital distributions; and |
| - | provide for the shareholders of Rio Tinto plc and Rio Tinto Limited to take key decisions, including the election of directors, through an electoral procedure in which the public shareholders of the two Companies effectively vote on a joint basis. |
The merger involved no change in the legal ownership of any assets of Rio Tinto plc or Rio Tinto Limited, nor any change in the ownership of any existing shares or securities of Rio Tinto plc or Rio Tinto Limited, nor the issue of any shares, securities or payment by way of consideration, save for the issue by each company of one special voting share to a trustee company which provides the joint electoral procedure for public shareholders. During 2002, each of the parent Companies issued a DLC Dividend Share to facilitate the efficient management of funds within the DLC structure.
Under United Kingdom generally accepted accounting principles, the DLC merger is a business combination that has been accounted for as a merger under FRS 6 on the basis that it has created a single economic enterprise for operating and financial reporting purposes.
For the purposes of their filings in the United States under the requirements of the Securities and Exchange Commission, the primary financial statements of the Rio Tinto plc and Rio Tinto Limited parts of the Group are their separate consolidated financial statements prepared on the basis of the legal ownership of the various operations within each part of the Group. Accordingly, the consolidated financial statements for Rio Tinto Limited consolidate Rio Tinto Limited with the Group undertakings under its legal ownership; and the consolidated financial statements for Rio Tinto plc consolidate Rio Tinto plc with the Group undertakings under its legal ownership; Rio Tinto Limited is included on an equity basis that reflects Rio Tinto plc's average 37.5 per cent (2003: 37.6 per cent) ownership of Rio Tinto Limited during the year as shown in the table below.
| | Net earnings | | Shareholders' funds | |
| |
| |
| |
| | 2004 | | 2003 | | 2002 | | 2004 | | 2003 | |
| |
| |
| |
| |
| |
| |
| | US$m | | US$m | | US$m | | US$m | | US$m | |
| Rio Tinto plc - part of Rio Tinto Group (a) | 2,073 | | 956 | | 195 | | 9,139 | | 7,343 | |
| Rio Tinto Limited - part of Rio Tinto Group | 1,185 | | 884 | | 736 | | 5,515 | | 4,324 | |
| Elimination (b) | (445 | ) | (332 | ) | (280 | ) | (2,070 | ) | (1,630 | ) |
| |
| |
| |
| |
| |
| |
| Rio Tinto Group | 2,813 | | 1,508 | | 651 | | 12,584 | | 10,037 | |
| |
| |
| |
| |
| |
| |
| | |
| (a) | Rio Tinto plc Equity shareholders' funds and Net earnings include its share of Rio Tinto Limited. |
| (b) | The Elimination removes Rio Tinto plc's equity interest in Rio Tinto Limited |
The DLC merger between Rio Tinto plc and Rio Tinto Limited has the effect that their shareholders have substantially the same economic interests as if they held shares in a single enterprise which owned all of the assets of both companies. The Directors therefore consider that the combined financial statements of the Rio Tinto Group provide the most meaningful financial representation of the state of affairs, profit and cash flows.
The financial statements are presented in US dollars as most Group revenues are denominated in US dollars, as are many of the Group's costs. In explaining key features and trends of Group financial performance, the US dollar provides a more consistent view which should correspond more closely to underlying business performance.
A-10
Back to Contents
RIO TINTO PLC - RIO TINTO LIMITED
OUTLINE OF DUAL LISTED COMPANIES STRUCTURE
AND BASIS OF FINANCIAL STATEMENTS (continued)
Australian Corporations ActThe financial statements are drawn up in accordance with an order, under section 340 of the Australian Corporations Act 2001, issued by the Australian Securities and Investments Commission ('ASIC') on 21 July 2003. The main provisions of the order are that the financial statements are:
| - | to be made out in accordance with United Kingdom requirements applicable to consolidated accounts; |
| - | to be expressed in United States dollars, but may also be expressed in United Kingdom and Australian currencies; and |
| - | to include a reconciliation from United Kingdom GAAP to Australian GAAP (see page A-65.2004). |
United Kingdom Companies ActIn order to present a true and fair view of the Rio Tinto Group, in accordance with FRS 6, the principles of merger accounting have been adopted. This represents a departure from the provision of the United Kingdom Companies Act 1985 ('the Companies Act 1985'), which sets out the conditions for merger accounting based on the assumption that a merger is effected through the issue of equity shares.
The main consequence of adopting merger rather than acquisition accounting is that the balance sheet of the merged Group includes the assets and liabilities of Rio Tinto plc and Rio Tinto Limited at their carrying values prior to the merger, subject to adjustments to achieve uniformity of accounting policies, rather than at their fair values at the date of the merger.
In the particular circumstances of the merger, the effect of applying acquisition accounting cannot reasonably be quantified.
In order that the financial statements should present a true and fair view, it is necessary to differ from the presentational requirements of the Companies Act 1985 by including amounts attributable to both Rio Tinto plc and Rio Tinto Limited public shareholders in the capital and reserves shown in the balance sheet and in the profit for the financial year. The Companies Act 1985 would require presentation of the capital and reserves and profit for the year attributable to Rio Tinto Limited public shareholders (set out on pages A-2.2004 and A-4.2004) as a minority interest in the financial statements of the Rio Tinto Group. This presentation would not give a true and fair view of the effect of the Sharing Agreement under which the position of all public shareholders is as nearly as possible the same as if they held shares in a single company.
A-11
Back to Contents
RIO TINTO PLC - RIO TINTO LIMITED
NOTES TO FINANCIAL STATEMENTS
1 Principal accounting policies
a Basis of preparation
The Group's accounting policies comply with applicable United Kingdom accounting standards and are consistent with last year. As explained in the section headed 'Outline of dual listed companies structure and basis of financial statements', the accounting policies depart from the requirements of the UK Companies Act 1985 in order to provide a true and fair view of the merger between Rio Tinto plc and Rio Tinto Limited. The financial statements are prepared on the historical cost basis. Turnover has been adjusted to reclassify, as turnover, certain amounts charged to customers for freight and handling costs, which previously were deducted from operating costs.
b Basis of consolidation
The financial statements consist of the consolidation of the accounts of Rio Tinto plc and Rio Tinto Limited and their respective subsidiary undertakings ('subsidiaries'). The financial statements of the Rio Tinto plc part of the Group consist of the consolidation of the accounts of Rio Tinto plc and its subsidiaries. Within these financial statements, Rio Tinto plc 'equity accounts' for its 37.5 per cent interest in Rio Tinto Limited. The financial statements of the Rio Tinto Limited part of the Group consists of the consolidation of the accounts of Rio Tinto Limited and its subsidiaries.
Subsidiaries:A subsidiary is an entity which is controlled by one of the parent companies. Control exists where the parent owns the majority of the voting rights (which does not always equate to percentage ownership) in another entity, except where severe permanent or long-term restrictions substantially hinder the exercise of the parent's rights over the assets or management of the entity (which includes the veto rights held by joint venture partners). Control can also arise in other situations, for example where the parent has the right to control board decisions or otherwise exercise dominant influence over the entity. The consolidated financial statements include all the assets, liabilities, revenues, expenses and cash flows of the parent and its subsidiaries after eliminating intercompany balances and transactions. For partly owned subsidiaries, the net assets and net earnings attributable to other shareholders are presented as 'outside shareholders' interests ' on the consolidated balance sheet and consolidated profit and loss account.
Associated undertakings ('associates'):An associate is an entity in which the Group has a participating interest, and over whose operating and financial policies it exercises significant influence. Significant influence is presumed to exist where an ownership interest of between 20 per cent and 50 per cent is held, but can also arise where the Group holds less than 20 per cent if it is actively involved and influential in policy decisions affecting the entity. The Group's share of the net assets, results and reserves of associates are included in the financial statements using the equity accounting method. This involves recording the investment initially at cost to the Group and then, going forward, adjusting the carrying amount of the investment to reflect the Group's share of the associate's results less any amortisation or impairment of goodwill and any other changes to the associate's net assets such as dividends.
Joint ventures:A joint venture is an entity in which a long-term interest is held and which is jointly controlled by the Group and one or more other venturers under a contractual arrangement (such that significant operating and financial decisions affecting the entity require the consent of all venturers that together jointly control the entity). Joint ventures are accounted for using the gross equity accounting method. This is the same as the equity accounting method, except the Group's share of a joint venture's assets and liabilities are separately disclosed on the balance sheet.
Joint arrangements that are not entities ('joint arrangements'): The Group has certain contractual arrangements under which the participants engage in joint activities that do not create an entity carrying on a trade or business of its own. This includes situations where the participants derive benefit from the joint activity through a share of the production, rather than by receiving a share in the results of trading. The Group's proportionate interest in the assets, liabilities, revenues, expenses and cash flows of joint arrangements are incorporated into the Group's financial statements under the appropriate headings.
Acquisitions and disposals:The results of acquired businesses are brought into the consolidated financial statements from the date of acquisition; the results of businesses sold during the year are included in the consolidated financial statements for the period up to the date of disposal. Gains or losses on disposal are calculated as the difference between the sale proceeds (net of expenses) and the net assets attributable to the interest which has been sold (including any goodwill which has been capitalised but not amortised and any goodwill previously written off through reserves). Where a disposal has a material effect on the nature or focus of the Group's operations, the operating results attributable to the disposal are shown separately in the consolidated profit and loss account under the heading 'discontinued operations'.
A-12
Back to Contents
RIO TINTO PLC - RIO TINTO LIMITED
NOTES TO FINANCIAL STATEMENTS
1 Principal accounting policies (continued)
c Turnover
Turnover comprises sales to third parties at invoiced amounts, with most sales being priced ex-works, free on board (FOB) or cost, insurance and freight (CIF). Turnover excludes any applicable sales taxes. Mining royalties are presented as an operating cost. By-product revenues are included in turnover. |
| | |
| A large proportion of Group production is sold under medium to long term contracts, but turnover is only recognised on individual sales when persuasive evidence exists indicating that all of the following criteria are met: |
| – | there has been a transfer of risks and benefits to the customer and in exchange the Group has received the right to consideration |
| – | the product requires no further work or processing by the Group |
| – | the quantity and quality of the goods has been determined with reasonable accuracy |
| – | the selling price is fixed or determinable |
| – | collection of the sale proceeds is reasonably assured. |
| | |
| These conditions are generally satisfied when title passes to the customer. In most instances turnover is recognised when the product is delivered to the destination specified by the customer, which is typically the vessel on which it will be shipped, the destination port or the customer's premises. |
| | |
| The turnover from sales of many products is subject to adjustment based on a survey of the product by the customer. In such cases, turnover is initially recognised on a provisional basis using the Group's best estimate of the contained metal. Any subsequent adjustments to the initial estimate of metal content are recorded in turnover once they have been determined. |
| Certain products are 'provisionally priced', i.e. the selling price is subject to final adjustment at the end of a period normally ranging from 30 to 180 days after delivery to the customer, based on the market price at the relevant quotation point stipulated in the contract. Turnover is initially recognised when the conditions set out above have been met, using market prices at that date. At each reporting date the provisionally priced metal is marked to market, with adjustments recorded in turnover, based on the forward selling price for the quotational period stipulated in the contract until the quotational period expires. For this purpose, the selling price is considered determinable for those products, such as copper, for which there exists an active and freely traded commodity market such as the London Metals Exchange and the value of the product sold by the Group is directly linked to the form in which it is traded on that market. |
| | |
| Gross turnover shown in the profit and loss account includes the Group's share of the turnover of joint ventures and associates. |
| | |
d Shipping and handling costs
All shipping and handling costs incurred by the Group are recognised as operating costs. Amounts billed to customers in respect of shipping and handling, where the Group is responsible for the carriage, insurance and freight, are classified as turnover. If, however, the Group is acting solely as an agent, amounts billed to customers are credited to operating costs. Turnover has been adjusted to reclassify certain amounts charged to customers for freight and handling costs, which previously were deducted from operating costs. |
| | |
| e Currency translation |
| Transactions in foreign currencies are translated at the exchange rate ruling at the date of transaction or, where foreign currency forward contracts have been arranged, at contractual rates. Monetary assets and liabilities denominated in foreign currencies are retranslated at year-end exchange rates, or at a contractual rate if applicable. |
| | |
| On consolidation, profit and loss account items are translated into US dollars at average rates of exchange. Balance sheet items are translated into US dollars at year end exchange rates. Certain non-United States resident companies, whose functional currency is the US dollar, account in that currency. |
| | |
| The Group finances its operations primarily in US dollars and the majority of the Group's US dollar debt is located in subsidiaries having functional currencies other than the US dollar. Exchange gains and losses relating to US dollar debt impact on the profit and loss accounts of such subsidiaries. However, such exchange gains and losses are excluded from the Group's profit and loss account on consolidation, with a corresponding adjustment to reserves. This means that financing in US dollars impacts in a consistent manner on the Group's consolidated accounts irrespective of the functional currency of the particular subsidiary where the debt is located. Exchange differences on the translation of the net operating assets of companies with functional currencies other than the US dollar, less offsetting exchange differences on net debt in currencies other than the US dollar financing those net assets, are dealt with through reserves. |
| | |
| All other exchange differences are charged or credited to the profit and loss account in the year in which they arise, except as set out below in note (q) relating to derivative contracts. |
| | |
| f Goodwill and intangible assets |
| Goodwill represents the difference between the cost of acquisition and the fair value of the identifiable net assets acquired. Goodwill and intangible assets arising on acquisitions after 31 December 1997 are capitalised in accordance with FRS 10. The goodwill and intangible assets are amortised over their useful economic lives. The amortisation period may exceed 20 years where the lives of the relevant operations are sufficient to justify this, supported by ore reserves (and, for some operations, mineral resources). |
| | |
| In 1997 and previous years, goodwill was eliminated against reserves in the year of acquisition as a matter of accounting policy. Such goodwill was not reinstated on implementation of FRS 10; but on sale or closure of a business, any related goodwill eliminated against reserves is charged to the profit and loss account. |
A-13
Back to Contents
RIO TINTO PLC - RIO TINTO LIMITED
NOTES TO FINANCIAL STATEMENTS
1 Principal accounting policies (continued)
| g Exploration and evaluation |
| Exploration and evaluation expenditure comprises costs which are directly attributable to: researching and analysing existing exploration data; conducting geological studies, exploratory drilling and sampling; examining and testing extraction and treatment methods; and compiling pre-feasibility and feasibility studies. Exploration and evaluation expenditure also includes the costs incurred in acquiring mineral rights, the entry premiums paid to gain access to areas of interest and amounts payable to third parties to acquire interests in existing projects. |
| |
| During the initial stage of a project, full provision is made for the costs thereof by charge against profits for the year. Expenditure on a project after it has reached a stage at which there is a high degree of confidence in its viability is carried forward and transferred to tangible fixed assets if the project proceeds. If a project does not prove viable, all irrecoverable costs associated with the project are written off. If an undeveloped project is sold, any gain or loss is included in operating profit, such transactions being a normal part of the Group's activities. Where expenditure is carried forward in respect of a project which may not proceed to commercial development for some time, provision is made against the possibility of non-development by charge against profits over a period of up to seven years. When it is decided to proceed with development, any provisions made in previous years are reversed to the extent that the relevant costs are recoverable. |
| |
| h Tangible fixed assets |
| The cost of a tangible fixed asset comprises its purchase price and any costs directly attributable to bringing it into working condition for its intended use. Once a mining project has been established as commercially viable, expenditure other than that on land, buildings, plant and equipment is capitalised under mining properties and leases together with any amount transferred from exploration and evaluation. This includes costs incurred in preparing the site for mining operations, including stripping costs (see below). Costs associated with a start up period are capitalised where the asset is available for use but incapable of operating at normal levels without a commissioning period. Development costs incurred after the commencement of production are capitalised to the extent they give rise to a future economic benefit. Pre-tax interest payable on borrowings related to construction or development projects is capitalised until the point when substantially all the activities that are necessary to make the asset ready for use are complete. |
| |
| i Mining properties and leases |
| As noted above, stripping (i.e. overburden and other waste removal) costs incurred in the development of a mine before production commences are capitalised as part of the cost of constructing the mine and subsequently amortised over the life of the operation. |
| |
| The Group defers stripping costs incurred during the production stage of its operations for those operations where this is the most appropriate basis for matching the costs against the related economic benefits because of fluctuations in stripping costs over the life of the mine, and the effect is material. Deferred stripping costs are presented within "mining properties and leases". The amount of stripping costs deferred is based on the ratio ('Ratio') obtained by dividing the tonnage of waste mined either by the quantity of ore mined or by the quantity of minerals contained in the ore. Stripping costs incurred in the period are deferred to the extent that the current period Ratio exceeds the life of mine Ratio. Such deferred costs are then charged against reported profits to the extent that, in subsequent periods, the Ratio falls short of the life of mine Ratio. The life of mine Ratio is based on proven and probable reserves of the operation. |
| |
| In some operations, there are distinct periods of new development during the production stage of the mine. These may, for example, relate to a separate ore body or discrete section of the ore body. The new development will be characterised by a major departure from the life of mine Ratio. Excess stripping costs during such periods are deferred and charged against reported profits in subsequent periods, on a units of production basis. |
| |
| If the Group were to expense stripping costs as incurred, there would be greater volatility in the year-to-year results from operations and excess stripping costs would be expensed at an earlier stage of a mine's operations. |
| |
| Deferred stripping costs form part of the total investment in the relevant income generating unit, which is reviewed for impairment if events or changes in circumstances indicate that the carrying value may not be recoverable. |
| |
| Amortisation of deferred stripping costs is included in depreciation of property, plant and equipment or in the Group's share of the results of its equity accounted operations, as appropriate. Changes to the life of mine stripping ratio are accounted for prospectively. |
A-14
Back to Contents
RIO TINTO PLC - RIO TINTO LIMITED
NOTES TO FINANCIAL STATEMENTS
1 Principal accounting policies (continued)
| j Depreciation and carrying values of fixed assets |
| Assets are fully depreciated over their economic lives, or over the remaining life of the mine if shorter. The major categories of fixed assets are depreciated on a units of production and/or straight-line basis as follows: |
Units of production basis
For mining properties and leases and certain mining equipment, the economic benefits from the asset are consumed in a pattern which is linked to the production level. Except as noted below, such assets are depreciated on a units of production basis.
Straight line basis
Assets within operations for which production is not expected to fluctuate significantly from one year to another or which have a physical life shorter than the related mine are depreciated on a straight line basis as follows:
| Buildings | 10 to 40 years |
| Property, plant and equipment | 3 to 35 years |
| Land | Not depreciated |
Changes to the estimated economic life of fixed assets are accounted for prospectively. In applying the units of production method, depreciation is normally calculated using the quantity of material extracted from the mine in the period as a percentage of the total quantity of material to be extracted in current and future periods based on proven and probable reserves (and, for some mines, mineral resources). Development costs that relate to a discrete section of an ore body and which only provide benefit over the life of those reserves, are depreciated over the estimated life of that discrete section. Development costs incurred which benefit the entire ore body are depreciated over the estimated life of the ore body.
Tangible and intangible fixed assets are reviewed for impairment if events or changes in circumstances indicate that the carrying amount may not be recoverable. This applies to the Group's share of the fixed assets held by associates, joint ventures and joint arrangements as well as the fixed assets held by the Group itself. In addition, goodwill is reviewed for impairment at the end of the first complete financial year after the relevant acquisition and, where the goodwill is being amortised over a period exceeding 20 years, annually thereafter. When a review for impairment is conducted, the recoverable amount is assessed by reference to the net present value of expected future cash flows of the relevant income generating unit, or disposal value if higher. Future cash flows are based on estimates of the quantities of ore reserves and certain mineral resources for which there is a high degree of confidence of economic extraction, future production levels, future commodity prices (assuming that the current market prices will revert to the Group's assessment of the long-term average price, generally over a period of three to five years), future exchange rates (which are assessed using historical average exchange rates as a starting point), and future cash costs of production, capital, close down, restoration and environmental clean up. For operations with a functional currency other than the US dollar, the impairment review is undertaken in the relevant functional currency. These estimates are based on detailed mine plans and operating budgets, modified as appropriate to meet the requirements of FRS 11.
The discount rate applied is based upon the Group’s weighted average cost of capital with appropriate adjustment for the risks associated with the relevant unit, to the extent that such risks are not reflected in the forecast cashflows.
| k Determination of ore reserves |
| The Group estimates its ore reserves and mineral resources based on information compiled by Competent Persons (as defined in accordance with the Australasian Code for Reporting of Mineral Resources and Ore Reserves of December 2004 (the JORC code)). Reserves and, for certain mines, resources determined in this way are used in the calculation of depreciation, amortisation and impairment charges, the assessment of life of mine stripping ratios and for forecasting the timing of the payment of close down and restoration costs. |
In assessing the life of a mine for accounting purposes, mineral resources are only taken into account where there is a high degree of confidence of economic extraction.
| l Provisions for close down and restoration and for environmental clean up costs |
| Close down and restoration costs include the dismantling and demolition of infrastructure and the removal of residual materials and remediation of disturbed areas. Close down and restoration costs are provided for in the accounting period when the obligation arising from the related disturbance occurs, whether this occurs during mine development or during the production phase, based on the net present value of estimated future costs. Provisions for close down and restoration costs do not include any additional obligations which are expected to arise from future disturbance. The costs are estimated on the basis of a closure plan. The cost estimates are updated annually during the life of the operation to reflect known developments and are subject to formal review at regular intervals. |
The amortisation or 'unwinding' of the discount applied in establishing the net present value of provisions is charged to the profit and loss account in each accounting period. The amortisation of the discount is shown as a financing cost rather than as an operating cost. Other movements in the provisions for close down and restoration costs, including those resulting from new disturbance, updated cost estimates, changes to the lives of operations and revisions to discount rates, are capitalised within fixed assets. These costs are then depreciated over the lives of the assets to which they relate.
Where rehabilitiation is conducted systematically over the life of the operation, rather than at the time of closure, provision is made for the outstanding continuous rehabilitation work at each balance sheet date. All other costs of continuous rehabilitation are charged to the profit and loss account as incurred. Provision is made for the estimated present value of the costs of environmental clean up obligations outstanding at the balance sheet date. These costs are charged to the profit and loss account. Movements in the environmental clean up provisions are presented as an operating cost, except for the unwind of the discount which is shown as a financing cost.
A-15
Back to Contents
RIO TINTO PLC - RIO TINTO LIMITED
NOTES TO FINANCIAL STATEMENTS - (continued)
1 Principal accounting policies (continued)
| m Inventories |
| Inventories are valued at the lower of cost and net realisable value on a first in, first out ('FIFO') basis. Cost for raw materials and stores is purchase price and for partly processed and saleable products is generally the cost of production, including the appropriate proportion of depreciation and overheads. For this purpose, the costs of production include labour costs, materials and contractor expenses which are directly attributable to the extraction and processing of ore; the depreciation of mining properties and leases and of fixed assets used in the extraction and processing of ore; and production overheads. |
Stockpiles represent ore that has been extracted and is available for further processing. If there is significant uncertainty as to when the stockpiled ore will be processed the related costs are expensed as incurred. Where the future processing of this ore can be predicted with confidence because it exceeds the mine's cut off grade, it is valued at the lower of cost and net realisable value. If the ore will not be processed within the 12 months after the balance sheet date it is disclosed as 'Inventories not expected to be sold nor used within 12 months'.
Work in progress inventory includes ore stockpiles and other partly processed material. Quantities are assessed primarily through surveys and assays.
| n Costs and expenses applicable to revenues |
| Costs and expenses applicable to revenues include inventory values transferred to the profit and loss account upon sale, together with associated distribution costs. |
| |
| o Deferred tax |
| Full provision is made for deferred taxation on all timing differences that have arisen but have not reversed at the balance sheet date, except in limited circumstances. The main exceptions are as follows: |
| |
| - | Tax payable on the future remittance of the past earnings of subsidiaries, associates and joint ventures is provided only to the extent that dividends have been accrued or there is a binding agreement to distribute such past earnings. |
| | |
| - | Deferred tax is not recognised on revaluations of non-monetary assets arising on acquisitions unless there is a binding agreement to sell the asset and the gain or loss expected to arise from the disposal has been recognised. |
| | |
| - | Deferred tax assets are recognised only to the extent that it is more likely than not that they will be recovered. |
Provisions for deferred tax are made in respect of tax benefits related to goodwill that was charged directly to reserves on acquisitions made prior to 1998. Such provisions are released when the related goodwill is charged through the profit and loss account on disposal or closure. Deferred tax balances are not discounted to their present value.
| p Post retirement benefits |
| In accordance with SSAP 24, the expected costs of post retirement benefits under defined benefit arrangements are charged to the profit and loss account so as to spread the costs over the service lives of employees entitled to those benefits. Variations from the regular cost are spread on a straight line basis over the expected average remaining service lives of relevant current employees. Costs are assessed in accordance with the advice of qualified actuaries. |
| |
| q Financial instruments |
| The Group's policy with regard to 'Treasury management and financial instruments' is set out in the Financial Review. When the Group enters into derivative contracts, these transactions are designed to reduce exposures related to assets and liabilities, firm commitments or anticipated transactions, and are therefore accounted for as hedges. Amounts receivable and payable in respect of interest rate swaps are recognised as an adjustment to net interest over the life of the contract. Gains or losses on foreign currency forward contracts and currency swaps relating to financial assets and liabilities are matched against the losses or gains on the hedged items, either in the profit and loss account or through reserves, as appropriate. Gains and losses on financial instruments relating to firm commitments or anticipated transactions for revenue items are deferred and recognised when the hedged transaction occurs. Gains and losses on financial instruments relating to firm commitments or anticipated transactions for capital expenditure are capitalised and depreciated in line with the underlying asset. The cash flows from these contracts are classified in a manner consistent with the underlying nature of the related transaction. |
A-16
Back to Contents
RIO TINTO PLC - RIO TINTO LIMITED
NOTES TO FINANCIAL STATEMENTS - (continued)
| | | | Rio Tinto plc - | | Rio Tinto Limited - | | | | | | | |
| part of Rio Tinto Group | part of Rio Tinto Group | Rio Tinto Group |
|
|
|
| 2004 | | 2003 | | 2002 | 2004 | | 2003 | | 2002 | 2004 | | 2003 | | 2002 |
| |
| |
|
| |
| |
|
| |
| |
|
| Note | | US$m | | US$m | | US$m | US$m | | US$m | | US$m | US$m | | US$m | | US$m |
| | | Operating costs from continuing operations | | | | | | | | | | | | | | | | | | |
| | | Raw materials and consumables | 1,629 | | 1,455 | | 1,277 | | 1,841 | | 1,520 | | 1,314 | | 3,470 | | 2,975 | | 2,591 | |
| | | Depreciation and amortisation (a) | 488 | | 385 | | 423 | | 716 | | 621 | | 531 | | 1,204 | | 1,006 | | 954 | |
| 3 | | Employment costs | 897 | | 845 | | 687 | | 945 | | 821 | | 650 | | 1,842 | | 1,666 | | 1,337 | |
| | | Royalties and other mining taxes | 256 | | 220 | | 204 | | 230 | | 219 | | 186 | | 486 | | 439 | | 390 | |
| | | Decrease in inventories | 82 | | 4 | | 18 | | 11 | | 51 | | 63 | | 93 | | 55 | | 81 | |
| | | Other external costs (a) (c) | 866 | | 716 | | 622 | | 1,377 | | 1,075 | | 793 | | 2,243 | | 1,791 | | 1,415 | |
| 20 | | Provisions (a) | 109 | | 60 | | 33 | | 38 | | 94 | | 25 | | 147 | | 154 | | 58 | |
| 11 | | Exploration and evaluation | 116 | | 90 | | 94 | | 71 | | 37 | | 36 | | 187 | | 127 | | 130 | |
| | | Research and development | 17 | | 17 | | 17 | | 6 | | 6 | | 8 | | 23 | | 23 | | 25 | |
| | | Net exchange losses on monetary items | 32 | | 40 | | 28 | | 1 | | 83 | | 13 | | 33 | | 123 | | 41 | |
| | | Costs included above qualifying for capitalisation | (51 | ) | (68 | ) | (33 | ) | 1 | | (100 | ) | (80 | ) | (50 | ) | (168 | ) | (113 | ) |
| | | Other operating income | (13 | ) | (40 | ) | (3 | ) | (146 | ) | (79 | ) | (105 | ) | (159 | ) | (119 | ) | (103 | ) |
| | | |
| |
| |
| |
| |
| |
| |
| |
| |
| |
| | | Net operating costs before exceptional | | | | | | | | | | | | | | | | | | |
| | | charges | 4,428 | | 3,724 | | 3,367 | | 5,091 | | 4,348 | | 3,434 | | 9,519 | | 8,072 | | 6,806 | |
| | | Exceptional charges (a) | 558 | | - | | 645 | | - | | - | | 433 | | 558 | | - | | 1,078 | |
| | | |
| |
| |
| |
| |
| |
| |
| |
| |
| |
| | | | 4,986 | | 3,724 | | 4,012 | | 5,091 | | 4,348 | | 3,867 | | 10,077 | | 8,072 | | 7,884 | |
| | | |
| |
| |
| |
| |
| |
| |
| |
| |
| |
| | | | | | | | | | | | | | | | | | | | | |
| (a) | The above detailed analysis of costs is before exceptional charges. Including exceptional charges, the total charge for depreciation and amortisation for the Rio Tinto Group was US$1,612 million in 2004 and US$1,893 million in 2002. The charge for provisions was US$296 million in 2004 and US$174 million in 2002; other external costs were US$1,166 million in 2002. |
| | The total charge for depreciation and amortisation for Rio Tinto plc was US$896 million in 2004 and US$929 million in 2002; the charge for provisions was US$258 million in 2004 and US$149 million in 2002; and other external costs were US$581 million in 2002. |
| | The total charge for depreciation and amortisation for Rio Tinto Limited was US$964 million in 2002 and other external costs were US$585 million in 2002. |
| | |
| (b) | Information on auditor's remuneration is included in note 37. |
| | |
| (c) | Turnover and operating costs have been adjusted to reclassify, as turnover, certain amounts charged to customers for freight and handling costs, which previously were deducted from operating costs. The effect was to increase Net operating costs in 2004 by US$455 million (2003: US$340 million, 2002: US$272 million). |
| | |
| | | | Rio Tinto plc - | | Rio Tinto Limited - | | | |
| part of Rio Tinto Group | part of Rio Tinto Group | Rio Tinto Group |
|
|
|
| 2004 | | 2003 | | 2002 | 2004 | | 2003 | | 2002 | 2004 | | 2003 | | 2002 |
| |
| |
|
| |
| |
|
| |
| |
|
| US$m | | US$m | | US$m | US$m | | US$m | | US$m | US$m | | US$m | | US$m |
| | | | | | | | | | | | | | | | | | | | | |
| | | Employment costs, excluding joint ventures and associates: | | | | | | | | | | | | | | | | | | |
| | | - Wages and salaries | 824 | | 730 | | 647 | | 871 | | 785 | | 615 | | 1,695 | | 1,515 | | 1,262 | |
| | | - Social security costs | 62 | | 59 | | 55 | | 12 | | 13 | | 13 | | 74 | | 72 | | 68 | |
| | | - Net post retirement cost (a) | 68 | | 101 | | 21 | | 105 | | 83 | | 58 | | 173 | | 184 | | 79 | |
| | | |
| |
| |
| |
| |
| |
| |
| |
| |
| |
| | | | 954 | | 890 | | 723 | | 988 | | 881 | | 686 | | 1,942 | | 1,771 | | 1,409 | |
| | | Less: charged within provisions | (57 | ) | (45 | ) | (36 | ) | (43 | ) | (60 | ) | (36 | ) | (100 | ) | (105 | ) | (72 | ) |
| | | |
| |
| |
| |
| |
| |
| |
| |
| |
| |
| | | | 897 | | 845 | | 687 | | 945 | | 821 | | 650 | | 1,842 | | 1,666 | | 1,337 | |
| | | |
| |
| |
| |
| |
| |
| |
| |
| |
| |
| | | | | | | | | | | | | | | | | | | | | |
| (a) | | The net post retirement cost includes the gradual recognition under SSAP 24 of the deficits and surpluses in the Group's defined benefit pension schemes. |
| (b) | | UITF Abstract 17 requires the intrinsic value of share options to be recognised as a cost. However, the Group's SAYE schemes are exempt from this requirement. None of the Group's other share option schemes involve granting new options at a discount to market value. |
A-17
Back to Contents
RIO TINTO PLC - RIO TINTO LIMITED
NOTES TO FINANCIAL STATEMENTS - (continued)
4 Exceptional items
| | | | | | | | 2004 | | 2003 | | 2002 | |
| Outside | Net | Net | Net |
| shareholders' | amount | amount | amount |
| Pre-tax | Taxation | interests | US$m | US$m | US$m |
| |
| |
| |
| |
| |
| |
| |
| Rio Tinto Group | US$m | | US$m | | US$m | | US$m | | US$m | | US$m | |
| Gains/(losses) relating to disposals of: | | | | | | | | | | | | |
| Subsidiaries | 213 | | (9 | ) | 4 | | 208 | | (6 | ) | - | |
| Joint ventures (c) | 67 | | (2 | ) | - | | 65 | | 107 | | - | |
| Associates (d) | 536 | | - | | - | | 536 | | 25 | | - | |
| Other investments | 104 | | - | | - | | 104 | | - | | - | |
| |
| |
| |
| |
| |
| |
| |
| | 920 | | (11 | ) | 4 | | 913 | | 126 | | - | |
| Asset write downs and provision for contract obligation (e) | (558 | ) | 108 | | 129 | | (321 | ) | - | | (879 | ) |
| |
| |
| |
| |
| |
| |
| |
| Net exceptional items | 362 | | 97 | | 133 | | 592 | | 126 | | (879 | ) |
| |
| |
| |
| |
| |
| |
| |
| | | | | | | | | | | | | |
| | | | | | | | 2004 | | 2003 | | 2002 | |
| Outside | Net | Net | Net |
| shareholders' | amount | amount | amount |
| Pre-tax | Taxation | interests | US$m | US$m | US$m |
| |
| |
| |
| |
| |
| |
| |
| Rio Tinto plc | US$m | | US$m | | US$m | | US$m | | US$m | | US$m | |
| Gains/(losses) relating to disposals of: | | | | | | | | | | | | |
| Subsidiaries | 233 | | (9 | ) | 4 | | 228 | | - | | - | |
| Joint ventures (c) | 25 | | (1 | ) | - | | 24 | | 40 | | - | |
| Associates (d) | 536 | | - | | - | | 536 | | 7 | | - | |
| Other investments | 39 | | - | | - | | 39 | | - | | - | |
| |
| |
| |
| |
| |
| |
| |
| | 833 | | (10 | ) | 4 | | 827 | | 47 | | - | |
| Asset write downs and provision for contract obligation (e) | (558 | ) | 108 | | 129 | | (321 | ) | - | | (739 | ) |
| |
| |
| |
| |
| |
| |
| |
| Net exceptional items | 275 | | 98 | | 133 | | 506 | | 47 | | (739 | ) |
| |
| |
| |
| |
| |
| |
| |
| | | | | | | | | | | | | |
| | | | | | | | 2004 | | 2003 | | 2002 | |
| Outside | Net | Net | Net |
| shareholders' | amount | amount | amount |
| Pre-tax | Taxation | interests | US$m | US$m | US$m |
| |
| |
| |
| |
| |
| |
| |
| Rio Tinto Limited | US$m | | US$m | | US$m | | US$m | | US$m | | US$m | |
| Gains/(losses) relating to disposals of: | | | | | | | | | | | | |
| Subsidiaries | (32 | ) | - | | - | | (32 | ) | - | | - | |
| Joint ventures (c) | 67 | | (2 | ) | - | | 65 | | 107 | | - | |
| Associates (d) | - | | - | | - | | - | | 19 | | - | |
| Other investments | 104 | | - | | - | | 104 | | - | | - | |
| |
| |
| |
| |
| |
| |
| |
| | 139 | | (2 | ) | - | | 137 | | 126 | | - | |
| Asset write downs | - | | - | | - | | - | | - | | (225 | ) |
| |
| |
| |
| |
| |
| |
| |
| Net exceptional items | 139 | | (2 | ) | - | | 137 | | 126 | | (225 | ) |
| |
| |
| |
| |
| |
| |
| |
| | | | | | | | | | | | | |
| (a) | The exceptional items analysed above, and within the profit and loss account, are added back in arriving at adjusted earnings and adjusted earnings per share. |
| (b) | Additional information on the disposals of interests in subsidiaries, joint ventures, associates and other investments is included in note 35. |
| (c) | The gain from disposal of a joint venture in 2004 relates to the sale of a 10 per cent interest in Hail Creek. The Group retained joint control after the disposal. |
| (d) | Gains relating to disposals of associates include US$518 million profit on sale of the Group's equity interest in Freeport-McMoRan Copper & Gold Inc. ('FCX'). Rio Tinto invested in the Grasberg ore body through purchase of an equity interest in FCX and participation in the Grasberg joint venture. The investment occurred prior to the introduction of FRS 10 and the goodwill arising was therefore eliminated directly against reserves in accordance with Rio Tinto's UK GAAP accounting policy at the time. On disposal of the equity interest in FCX, the US$228 million of goodwill attributable to this interest was written back through reserves and deducted in arriving at the profit on disposal. |
| (e) | The 2004 asset write down and contract obligation comprises US$160 million (both before and after taxation and minority interests) in respect of Colowyo and US$398 before taxation and minority interests (US$161 million after taxation and minority interests) in respect of Palabora. |
| (f) | The asset write down for Palabora aligns the balance sheet value of the relevant fixed assets with the net present value of the expected future cash flows relating to those assets. The pre-tax discount rate of nine per cent used in calculating the net present value of expected future cash flows was derived from the Group's weighted average cost of capital, with appropriate adjustments for risk. This discount rate has been applied to the relevant pre-tax cash flows stated in real terms. |
| (g) | Future operating and development costs relating to Colowyo are now estimated to be substantially higher than previously expected. This has resulted in the above exceptional charge of US$160 million, which includes assets write downs totalling US$11 million and a provision of US$149 million in respect of the Group's obligations under the management agreement referred to in note 14. These charges are based on the expected further cash flows of the Colowyo operation, having regard to the Group's obligations under the management agreement. In calculating the asset write downs and provision for contract obligations, the cash flows have been estimated in real terms and discounted at a pre-tax discount rate of five per cent. The major area of uncertainty affecting the provision for contract obligations relates to the future operating and development costs of the Colowyo operation, which have been estimated over the next eighteen years. |
| (h) | The gains arising on disposals of subsidiaries, joint ventures and associates in 2003 did not give rise to a tax charge. |
| (i) | The taxation credit for 2004 comprises a deferred tax credit of US$112 million offset by a current tax charge of US$15 million. |
A-18
Back to Contents
RIO TINTO PLC - RIO TINTO LIMITED
NOTES TO FINANCIAL STATEMENTS - (continued)
4 Exceptional items (continued)| | |
| (j) | The exceptional charges of US$879 million recognised in 2002 comprised provisions of US$763 million for the impairment of asset carrying values and a charge of US$116 million related to environmental remediation works at Kennecott Utah Copper ('KUC'). Of the impairment charge, US$480 million related to KUC and US$235 million related to the Iron Ore Company of Canada ('IOC'). Of the total charge, US$16 million before tax related to joint ventures and the remainder to subsidiaries. Most of the 2002 impairment provisions were calculated so as to ensure that the carrying value of the relevant assets were the same as the present value of the expected future cash flows relating to those assets. The discount rates used in calculating the present value of expected future cash flows were derived from the Group's weighted average cost of capital, with appropriate risk adjustments. When adjusted to include inflation and grossed up at the Group's average tax rate for 2 002, before exceptional items, the discount rate applied to the relevant income generating units was equivalent to 10 per cent, except for gold production for which a rate equivalent to 7 per cent was used. The impairment provision against IOC aligned the carrying value with the value negotiated between shareholders during 2002 as part of a financial restructuring exercise. |
| (k) | In preparing financial statements in accordance with the Companies Act and UK GAAP certain information is presented that would be viewed as ‘non-GAAP’ under regulations issued by the United States Securities and Exchange Commission (‘SEC’). The Group has described such items, provided disclosure on the effects and reasons for presentation along with a condensed income statement using the format prescribed by the SEC. The disclosure of asset write downs and contract obligations in 2004 and 2002, as well as the disclosure of the profit on disposal of interests in operations in 2004 and 2003, as exceptional items is expressly permitted under FRS 3. Otherwise, disclosure of these amounts as exceptional items would be prohibited within the Form 20-F. Management consider these asset write downs, contract obligations and profits on disposal to be exceptional in nature because large items of this type do not occur regularly. Their impact on earnings may be positive in some years and negative in others. The environmental remediation charge in 2002 is similarly presented as an exceptional item under FRS 3. Management consider this charge to be exceptional in nature because large items of this type do not occur regularly. Such items do not reflect the performance of the business unit to which they relate in the particular year in which they are recognised. |
5 Net interest payable and similar charges
| | | Rio Tinto plc - | | Rio Tinto Limited - | | | | | | | |
| part of Rio Tinto Group | part of Rio Tinto Group | Rio Tinto Group |
| | |
| |
|
|
|
|
| |
|
|
|
|
| |
| | | 2004 | | 2003 | | 2002 | | 2004 | | 2003 | | 2002 | | 2004 | | 2003 | | 2002 | |
| | |
| |
| |
| |
| |
| |
| |
| |
| |
| |
| | | US$m | | US$m | | US$m | | US$m | | US$m | | US$m | | US$m | | US$m | | US$m | |
| | Interest payable on | | | | | | | | | | | | | | | | | | |
| | Bank borrowings | (26 | ) | (26 | ) | (21 | ) | (27 | ) | (30 | ) | (23 | ) | (53 | ) | (56 | ) | (44 | ) |
| | Other loans | (52 | ) | (64 | ) | (95 | ) | (139 | ) | (100 | ) | (112 | ) | (119 | ) | (143 | ) | (189 | ) |
| | |
| |
| |
| |
| |
| |
| |
| |
| |
| |
| | | (78 | ) | (90 | ) | (116 | ) | (166 | ) | (130 | ) | (135 | ) | (172 | ) | (199 | ) | (233 | ) |
| | Amounts capitalised | 1 | | 12 | | 14 | | 34 | | 27 | | 8 | | 35 | | 39 | | 22 | |
| | |
| |
| |
| |
| |
| |
| |
| |
| |
| |
| | | (77 | ) | (78 | ) | (102 | ) | (132 | ) | (103 | ) | (127 | ) | (137 | ) | (160 | ) | (211 | ) |
| | |
| |
| |
| |
| |
| |
| |
| |
| |
| |
| | Interest receivable and similar income from fixed asset investments | |
| | Joint ventures | 9 | | 8 | | 10 | | 4 | | - | | - | | 13 | | 8 | | 10 | |
| | Associates | 72 | | 31 | | 18 | | - | | 5 | | 1 | | - | | 5 | | 1 | |
| | Other investments | 2 | | 4 | | 9 | | 1 | | - | | - | | 3 | | 4 | | 9 | |
| | |
| |
| |
| |
| |
| |
| |
| |
| |
| |
| | | 83 | | 43 | | 37 | | 5 | | 5 | | 1 | | 16 | | 17 | | 20 | |
| | Other interest receivable | 1 | | (7 | ) | 13 | | 7 | | 1 | | 17 | | 8 | | 4 | | 30 | |
| | |
| |
| |
| |
| |
| |
| |
| |
| |
| |
| | | 84 | | 36 | | 50 | | 12 | | 6 | | 18 | | 24 | | 21 | | 50 | |
| | |
| |
| |
| |
| |
| |
| |
| |
| |
| |
| | Group net interest payable | 7 | | (42 | ) | (52 | ) | (120 | ) | (97 | ) | (109 | ) | (113 | ) | (139 | ) | (161 | ) |
| | | | | | | | | | | | | | | | | | | | |
| | Share of joint ventures' net interest payable (a) | (19 | ) | (11 | ) | (20 | ) | (1 | ) | (2 | ) | (6 | ) | (20 | ) | (13 | ) | (26 | ) |
| | Share of associates' net interest payable (a) | (57 | ) | (85 | ) | (84 | ) | - | | (1 | ) | (9 | ) | (16 | ) | (54 | ) | (50 | ) |
| | |
| |
| |
| |
| |
| |
| |
| |
| |
| |
| | Net interest payable | (69 | ) | (138 | ) | (156 | ) | (121 | ) | (100 | ) | (124 | ) | (149 | ) | (206 | ) | (237 | ) |
| 6 | Amortisation of discount | (76 | ) | (69 | ) | (39 | ) | (46 | ) | (36 | ) | (23 | ) | (105 | ) | (92 | ) | (54 | ) |
| | |
| |
| |
| |
| |
| |
| |
| |
| |
| |
| | Net interest payable and similar charges | (145 | ) | (207 | ) | (195 | ) | (167 | ) | (136 | ) | (147 | ) | (254 | ) | (298 | ) | (291 | ) |
| | |
| |
| |
| |
| |
| |
| |
| |
| |
| |
| | | | | | | | | | | | | | | | | | | | |
| (a) | The Group's share of net interest payable by joint ventures and associates relates to its share of the net debt of joint ventures and associates, which is disclosed in note 14. |
| (b) | Interest of US$72 million payable from Rio Tinto Limited to Rio Tinto plc is included as 'Interest receivable from associates' for Rio Tinto plc and as 'Interest payable on other loans' for Rio Tinto Limited. |
6 Amortisation of discount
| | Rio Tinto plc - | | Rio Tinto Limited - | | | | | | | |
| | part of Rio Tinto Group | | part of Rio Tinto Group | | Rio Tinto Group | |
| |
|
|
|
|
| |
|
|
|
|
| |
|
|
|
|
| |
| | 2004 | | 2003 | | 2002 | | 2004 | | 2003 | | 2002 | | 2004 | | 2003 | | 2002 | |
| |
| |
| |
| |
| |
| |
| |
| |
| |
| |
| | US$m | | US$m | | US$m | | US$m | | US$m | | US$m | | US$m | | US$m | | US$m | |
| Subsidiaries | (56 | ) | (63 | ) | (40 | ) | (44 | ) | (34 | ) | (22 | ) | (100 | ) | (97 | ) | (62 | ) |
| Share of joint ventures | (2 | ) | (1 | ) | (1 | ) | (2 | ) | (2 | ) | (1 | ) | (4 | ) | (3 | ) | (2 | ) |
| Share of associates | (18 | ) | (13 | ) | (8 | ) | - | | - | | - | | (1 | ) | - | | - | |
| |
| |
| |
| |
| |
| |
| |
| |
| |
| |
| | (76 | ) | (77 | ) | (49 | ) | (46 | ) | (36 | ) | (23 | ) | (105 | ) | (100 | ) | (64 | ) |
| Amounts capitalised (b) | - | | 8 | | 10 | | - | | - | | - | | - | | 8 | | 10 | |
| |
| |
| |
| |
| |
| |
| |
| |
| |
| |
| Amortisation of discount | (76 | ) | (69 | ) | (39 | ) | (46 | ) | (36 | ) | (23 | ) | (105 | ) | (92 | ) | (54 | ) |
| |
| |
| |
| |
| |
| |
| |
| |
| |
| |
| (a) | The amortisation of discount relates principally to provisions for close down and restoration and for environmental clean up costs as explained in accounting policy 1(l). It also includes the unwind of the discount on non-interest bearing long term accounts payable. |
| (b) | Amounts capitalised relate to costs on specific projects for which construction or development activities are ongoing. |
| (c) | Under US GAAP 'Amortisation of discount' would be accounted for as an operating cost. |
A-19
Back to Contents
RIO TINTO PLC - RIO TINTO LIMITED
NOTES TO FINANCIAL STATEMENTS - (continued)
7 Taxation charge for the year
| | Rio Tinto plc - | | Rio Tinto Limited - | | | | | | | |
| part of Rio Tinto Group | part of Rio Tinto Group | Rio Tinto Group |
| |
|
|
|
|
| |
|
|
|
|
| |
|
|
|
|
| |
| | 2004 | | 2003 | | 2002 | | 2004 | | 2003 | | 2002 | | 2004 | | 2003 | | 2002 | |
| |
| |
| |
| |
| |
| |
| |
| |
| |
| |
| | US$m | | US$m | | US$m | | US$m | | US$m | | US$m | | US$m | | US$m | | US$m | |
| UK taxation | | | | | | | | | | | | | | | | | | |
| Corporation tax at 30% | | | | | | | | | | | | | | | | | | |
| Current | 22 | | 99 | | 58 | | - | | - | | (4 | ) | 22 | | 99 | | 54 | |
| Deduct: relief for overseas taxes | (15 | ) | (96 | ) | (63 | ) | - | | - | | - | | (15 | ) | (96 | ) | (63 | ) |
| |
| |
| |
| |
| |
| |
| |
| |
| |
| |
| | 7 | | 3 | | (5 | ) | - | | - | | (4 | ) | 7 | | 3 | | (9 | ) |
| Deferred | - | | (7 | ) | 11 | | - | | - | | 1 | | - | | (7 | ) | 12 | |
| |
| |
| |
| |
| |
| |
| |
| |
| |
| |
| | 7 | | (4 | ) | 6 | | - | | - | | (3 | ) | 7 | | (4 | ) | 3 | |
| Australian taxation | | | | | | | | | | | | | | | | | | |
| Corporation tax at 30% | | | | | | | | | | | | | | | | | | |
| Current | 5 | | 3 | | 3 | | 385 | | 297 | | 342 | | 390 | | 300 | | 345 | |
| Deferred | 2 | | (2 | ) | - | | (27 | ) | 11 | | 21 | | (25 | ) | 9 | | 21 | |
| |
| |
| |
| |
| |
| |
| |
| |
| |
| |
| | 7 | | 1 | | 3 | | 358 | | 308 | | 363 | | 365 | | 309 | | 366 | |
| Other countries taxation | | | | | | | | | | | | | | | | | | |
| Current | 162 | | 20 | | 123 | | 42 | | 27 | | 40 | | 204 | | 47 | | 163 | |
| Deferred | (74 | ) | (10 | ) | 10 | | (14 | ) | (17 | ) | (17 | ) | (88 | ) | (27 | ) | (7 | ) |
| |
| |
| |
| |
| |
| |
| |
| |
| |
| |
| | 88 | | 10 | | 133 | | 28 | | 10 | | 23 | | 116 | | 20 | | 156 | |
| Joint ventures - charge for year(b) | 231 | | 123 | | 78 | | 88 | | 37 | | 87 | | 319 | | 160 | | 165 | |
Associates - charge for year (including share of tax relief on exceptional asset write-downs for Rio Tinto plc of: (2002: US$9 million) (b) | 201 | | 211 | | 222 | | 3 | | 5 | | (5 | ) | 34 | | 82 | | 60 | |
Subsidiary companies' deferred tax related to exceptional charges | - | | - | | - | | - | | - | | (42 | ) | - | | - | | (42 | ) |
| |
| |
| |
| |
| |
| |
| |
| |
| |
| |
| | 534 | | 341 | | 442 | | 477 | | 360 | | 423 | | 841 | | 567 | | 708 | |
| |
| |
| |
| |
| |
| |
| |
| |
| |
| |
| (a) | A current tax charge of US$20 million (2003: US$194 million; 2002: US$48 million) and a deferred tax charge of US$13 million (2003: US$162 million; 2002: US$13 million) are dealt with in the Statement of Total Recognised Gains and Losses ('STRGL'). These tax charges relate to exchange gains and losses which are themselves dealt with in the STRGL. |
| (b) | Some tax recognised by subsidiary holding companies is presented in these accounts as part of the tax charge on the profits of the joint ventures and associates to which it relates. |
| (c) | A benefit of US$15 million was recognised in 2004 (2003: US$34 million; 2002: US$20 million) for operating losses that are expected to be recovered in future years. Of this benefit, US$5 million is included within 'UK taxation', US$nil within 'Australian taxation' and US$10 million within 'Other countries'. |
| (d) | Adjustments of prior year accruals and provisions reduced the total tax charge by a net amount of US$8 million (2003: US$28 million; 2002 US$16 million). |
| (e) | The 2004 tax charge was reduced by US$26 million (2003: US$11 million) as a result of the entry into the Australian tax consolidation regime with effect from 1 January 2003. |
| (f) | The Group's effective tax rate for 2004 is 29.0 per cent (2003: 28.8 per cent; 2002: 31.2 per cent) excluding exceptional items and 23.4 per cent (2003: 27.1 per cent; 2002: 54.0 per cent) including exceptional items. |
| (g) | Tax paid during 2003, of US$917 million, included an amount of US$106 million relating to the disputed tax assessment from the Australian Tax Office described in note 29. The amount paid has been recorded as a receivable in these accounts because the Directors believe that the relevant tax assessments are not sustainable. Tax payments also include amounts related to exchange gains and losses on net debt which are recorded directly in the Statement of Total Recognised Gains and Losses. |
| | |
| | Rio Tinto plc - | | Rio Tinto Limited - | | | | | | | |
| part of Rio Tinto Group | part of Rio Tinto Group | Rio Tinto Group |
| |
|
|
|
|
| |
|
|
|
|
| |
|
|
|
|
| |
| | 2004 | | 2003 | | 2002 | | 2004 | | 2003 | | 2002 | | 2004 | | 2003 | | 2002 | |
| |
| |
| |
| |
| |
| |
| |
| |
| |
| |
| | US$m | | US$m | | US$m | | US$m | | US$m | | US$m | | US$m | | US$m | | US$m | |
| Prima facie tax reconciliation | | | | | | | | | | | | | | | | | | |
| Profit on ordinary activities before taxation | 2,507 | | 1,305 | | 715 | | 1,704 | | 1,255 | | 1,033 | | 3,596 | | 2,094 | | 1,311 | |
| |
| |
| |
| |
| |
| |
| |
| |
| |
| |
| Prima facie tax payable at UK and Australian rate of 30% | 752 | | 392 | | 215 | | 511 | | 377 | | 310 | | 1,079 | | 628 | | 393 | |
| Impact of exceptional items | (54 | ) | - | | 227 | | (40 | ) | (38 | ) | 130 | | (94 | ) | (38 | ) | 328 | |
| Other permanent differences | | | | | | | | | | | | | | | | | | |
| Other tax rates applicable outside the UK and Australia | 91 | | 49 | | 55 | | 4 | | 14 | | 1 | | 93 | | 59 | | 56 | |
| Permanently disallowed amortisation/depreciation | 23 | | 22 | | 22 | | 52 | | 48 | | 44 | | 55 | | 53 | | 51 | |
| Research, development and other investment allowances | (6 | ) | (5 | ) | (5 | ) | (2 | ) | - | | (4 | ) | (8 | ) | (5 | ) | (7 | ) |
| Resource depletion allowances | (87 | ) | (54 | ) | (58 | ) | - | | - | | - | | (87 | ) | (54 | ) | (58 | ) |
| Other (h) | (41 | ) | (31 | ) | 25 | | (21 | ) | (8 | ) | 1 | | (30 | ) | (24 | ) | 24 | |
| |
| |
| |
| |
| |
| |
| |
| |
| |
| |
| | (20 | ) | (19 | ) | 39 | | 33 | | 54 | | 42 | | 23 | | 29 | | 66 | |
| Other deferral of taxation | | | | | | | | | | | | | | | | | | |
| Capital allowances in excess of other depreciation charges | (95 | ) | (30 | ) | (82 | ) | 6 | | (27 | ) | (12 | ) | (89 | ) | (48 | ) | (69 | ) |
| Other timing differences | 17 | | 4 | | 19 | | 30 | | 5 | | (4 | ) | 34 | | 14 | | - | |
| |
| |
| |
| |
| |
| |
| |
| |
| |
| |
| Total timing differences related to the current year | (78 | ) | (26 | ) | (63 | ) | 36 | | (22 | ) | (16 | ) | (55 | ) | (34 | ) | (69 | ) |
| |
| |
| |
| |
| |
| |
| |
| |
| |
| |
| Current taxation charge for the year | 600 | | 347 | | 418 | | 540 | | 371 | | 466 | | 953 | | 585 | | 718 | |
| |
|
|
|
|
|
|
|
|
|
|
|
|
|
|
|
|
| |
| Deferred tax recognised on timing differences | 78 | | 26 | | 63 | | (36 | ) | 22 | | (26 | ) | 55 | | 34 | | 27 | |
| Deferred tax impact of changes in tax rates | - | | - | | (15 | ) | - | | - | | 3 | | - | | - | | (14 | ) |
| Deferred tax impact of exceptional charges | (112 | ) | - | | - | | - | | - | | - | | (112 | ) | - | | - | |
| Other deferred tax items (i) | (32 | ) | (32 | ) | (24 | ) | (27 | ) | (33 | ) | (20 | ) | (55 | ) | (52 | ) | (23 | ) |
| |
| |
| |
| |
| |
| |
| |
| |
| |
| |
| Total taxation charge for the year | 534 | | 341 | | 442 | | 477 | | 360 | | 423 | | 841 | | 567 | | 708 | |
| |
| |
| |
| |
| |
| |
| |
| |
| |
| |
| (h) | 'Other' components of the current tax charge include the benefit of reduced Alternative Minimum Tax payable in the United States. |
| (i) | 'Other deferred tax items' include benefits from adjustments of prior year provisions (see (d) above) and from Australian tax consolidation (see (e) above). |
A-20
Back to Contents
RIO TINTO PLC - RIO TINTO LIMITED
NOTES TO FINANCIAL STATEMENTS - (continued)
| 8 Dividends | | | | | | | | |
| | 2004 | | | 2003 | | | 2002 | |
| |
| | |
| | |
| |
| | US$m | | | US$m | | | US$m | |
| Rio Tinto plc Ordinary Interim dividend | 341 | | | 320 | | | 314 | |
| Rio Tinto plc Ordinary Final dividend | 481 | | | 363 | | | 325 | |
| |
| | |
| | |
| |
| | 822 | | | 683 | | | 639 | |
| |
| | |
| | |
| |
| Rio Tinto Limited Ordinary Interim dividend | 160 | | | 150 | | | 146 | |
| Rio Tinto Limited Ordinary Final dividend | 225 | | | 170 | | | 153 | |
| Less dividends payable to Rio Tinto plc (e) | (145 | ) | | (121 | ) | | (112 | ) |
| |
| | |
| | |
| |
| Rio Tinto Limited dividends payable to public shareholders (b) | 240 | | | 199 | | | 187 | |
| |
| | |
| | |
| |
| Total dividends payable to public shareholders | 1,062 | | | 882 | | | 826 | |
| |
| | |
| | |
| |
| | | | | | | | | | | | | |
| | 2004 | | 2003 | | 2002 | | 2004 | | 2003 | | 2002 | |
| |
| |
| |
| |
| |
| |
| |
| | Rates per share | | Number of shares | |
| | | | (millions) | |
| Rio Tinto plc Interim (pence) | 17.54 | p | 18.45 | p | 18.87 | p | 1,067.5 | | 1,066.1 | | 1,065.4 | |
| Rio Tinto plc Final (pence) | 23.94 | p | 18.68 | p | 18.60 | p | 1,068.0 | | 1,066.7 | | 1,065.5 | |
| |
| |
| |
| | | | | | | |
| | 41.48 | p | 37.13 | p | 37.47 | p | | | | | | |
| |
| |
| |
| | | | | | | |
| Rio Tinto Limited Interim - fully franked at 30% (Australian Cents) | 45.53 | c | 45.02 | c | 54.06 | c | 499.1 | | 499.0 | | 498.8 | |
| Less shares held by Rio Tinto plc | | | | | | | (187.4 | ) | (187.4 | ) | (187.4 | ) |
| | | | | | | |
| |
| |
| |
| Shares held by public shareholders (b) | | | | | | | 311.7 | | 311.6 | | 311.4 | |
| | | | | | | |
| |
| |
| |
| Rio Tinto Limited Final – fully franked at 30% (Australian Cents) | 58.29 | c | 44.68 | c | 51.87 | c | 499.3 | | 499.0 | | 498.8 | |
| Less shares held by Rio Tinto plc | | | | | | | (187.4 | ) | (187.4 | ) | (187.4 | ) |
| |
| |
| |
| |
| |
| |
| |
| | 103.82 | c | 89.70 | c | 105.93 | c | | | | | | |
| |
| |
| |
| | | | | | | |
| Shares held by public shareholders (b) | | | | | | | 311.9 | | 311.6 | | 311.4 | |
| | | | | | | |
| |
| |
| |
| | |
| (a) | The 2004 dividends have been based on the following US cents per share amounts: interim – 32.0 cents, final – 45.0 cents. |
| (b) | For the Group accounts, the number of shares on which the Rio Tinto Limited dividends are based excludes those shares held by Rio Tinto plc, in order that the dividends shown represent those paid to public shareholders. |
| (c) | The proposed Rio Tinto Limited dividends will be franked out of existing franking credits or out of franking credits arising from the payment of income tax during 2005. |
| (d) | Rio Tinto Limited formed a tax consolidated group in Australia with effect from 1 January 2003. The approximate amount of the Rio Tinto Limited tax consolidated group's retained profits and reserves that could be distributed as dividends and franked out of the existing franking credits which arose from net payments of income tax in respect of periods up to 31 December 2004 (after deducting franking credits on the proposed final dividend) is US$3,360 million. |
| (e) | In addition, Rio Tinto Limited paid a dividend of US$nil (2003: US$164 million) to Rio Tinto plc on the DLC Dividend Share. |
A-21
<Back to Contents
RIO TINTO PLC - RIO TINTO LIMITED
NOTES TO FINANCIAL STATEMENTS - (continued)
| 9 Earnings per ordinary share | | | | | | |
| | Rio Tinto plc - | | Rio Tinto Limited - | | | |
| | part of Rio Tinto Group | | part of Rio Tinto Group | | Rio Tinto Group | |
| |
| |
| |
| |
| | 2004 | | 2003 | | 2002 | | 2004 | | 2003 | | 2002 | | 2004 | | 2003 | | 2002 | |
| |
| |
| |
| |
| |
| |
| |
| |
| |
| |
| Average number of ordinary shares in issue (million) (b) | 1,067 | | 1,066 | | 1,065 | | 499 | | 499 | | 499 | | 1,379 | | 1,378 | | 1,377 | |
| |
| |
| |
| |
| |
| |
| |
| |
| |
| |
| US$m | | | | | | | | | | | | | | | | | | |
| Profit for the financial year | 2,073 | | 956 | | 195 | | 1,185 | | 884 | | 736 | | 2,813 | | 1,508 | | 651 | |
| Exceptional items (note 4) | (506 | ) | (47 | ) | 739 | | (137 | ) | (126 | ) | 225 | | (592 | ) | (126 | ) | 879 | |
| |
| |
| |
| |
| |
| |
| |
| |
| |
| |
| Adjusted earnings | 1,567 | | 909 | | 934 | | 1,048 | | 758 | | 961 | | 2,221 | | 1,382 | | 1,530 | |
| |
| |
| |
| |
| |
| |
| |
| |
| |
| |
| US cents | | | | | | | | | | | | | | | | | | |
| Earnings per ordinary share | 194.2 | c | 89.7 | c | 18.3 | c | 237.4 | c | 177.2 | c | 147.6 | c | 204.0 | c | 109.5 | c | 47.3 | c |
| |
| |
| |
| |
| |
| |
| |
| |
| |
| |
| Exceptional items per ordinary share | (47.4 | )c | (4.4 | )c | 69.4 | c | (27.4 | )c | (25.3 | )c | 45.1 | c | (43.0 | )c | (9.2 | )c | 63.9 | c |
| |
| |
| |
| |
| |
| |
| |
| |
| |
| |
| Adjusted earnings per ordinary share | 146.8 | c | 85.3 | c | 87.7 | c | 210.0 | c | 151.9 | c | 192.7 | c | 161.0 | c | 100.3 | c | 111.2 | c |
| |
| |
| |
| |
| |
| |
| |
| |
| |
| |
| US cents | | | | | | | | | | | | | | | | | | |
| Diluted earnings per share | 193.9 | c | 89.5 | c | 18.3 | c | 236.9 | c | 176.9 | c | 147.4 | c | 203.6 | c | 109.3 | c | 47.2 | c |
| |
| |
| |
| |
| |
| |
| |
| |
| |
| |
| Exceptional items per share | 47.3 | c | 4.4 | c | (69.2 | )c | 27.4 | c | 25.2 | c | (45.0 | )c | 42.8 | c | 9.1 | c | (62.8 | )c |
| |
| |
| |
| |
| |
| |
| |
| |
| |
| |
| Diluted adjusted earnings per ordinary share | 146.6 | c | 85.1 | c | 87.5 | c | 209.5 | c | 151.7 | c | 192.4 | c | 160.8 | c | 100.2 | c | 110.0 | c |
| |
| |
| |
| |
| |
| |
| |
| |
| |
| |
| | |
| (a) | Adjusted earnings and adjusted earnings per share exclude exceptional items of such magnitude that their exclusion is necessary in order that adjusted earnings fulfil their purpose of reflecting the underlying performance of the Group. |
| (b) | For the Rio Tinto Group, the daily average number of ordinary shares in issue of 1,379 million (2003: 1,378 million, 2002: 1,377 million) excludes the Rio Tinto Limited shares held by Rio Tinto plc. |
| (c) | The daily average number of ordinary shares used for the diluted earnings per share calculation is 1,381 million (2003: 1,379 million, 2002: 1,379 million) and excludes the Rio Tinto Limited shares held by Rio Tinto plc. The extra two million shares included in the calculation relate to unexercised share options. |
| 10 Goodwill | | | | | | |
| | Rio Tinto plc - | | Rio Tinto Limited - | | | |
| | part of Rio Tinto Group | | part of Rio Tinto Group | | Rio Tinto Group | |
| |
| |
| |
| |
| | 2004 | | 2003 | | 2004 | | 2003 | | 2004 | | 2003 | |
| |
| |
| |
| |
| |
| |
| |
| | US$m | | US$m | | US$m | | US$m | | US$m | | US$m | |
| Cost | | | | | | | | | | | | |
| At 1 January | 482 | | 463 | | 1,080 | | 819 | | 1,562 | | 1,282 | |
| Adjustment on currency translation | (1 | ) | (1 | ) | 42 | | 261 | | 41 | | 260 | |
| Additions | – | | 20 | | – | | – | | – | | 20 | |
| |
| |
| |
| |
| |
| |
| |
| At 31 December | 481 | | 482 | | 1,122 | | 1,080 | | 1,603 | | 1,562 | |
| |
| |
| |
| |
| |
| |
| |
| Accumulated amortisation | | | | | | | | | | | | |
| At 1 January | (229 | ) | (191 | ) | (148 | ) | (76 | ) | (377 | ) | (267 | ) |
| Adjustment on currency translation | – | | – | | (10 | ) | (30 | ) | (10 | ) | (30 | ) |
| Amortisation for the year | (37 | ) | (34 | ) | (40 | ) | (42 | ) | (77 | ) | (76 | ) |
| Other movements | – | | (4 | ) | – | | – | | – | | (4 | ) |
| |
| |
| |
| |
| |
| |
| |
| At 31 December | (266 | ) | (229 | ) | (198 | ) | (148 | ) | (464 | ) | (377 | ) |
| |
| |
| |
| |
| |
| |
| |
| Net balance sheet amount | 215 | | 253 | | 924 | | 932 | | 1,139 | | 1,185 | |
| |
| |
| |
| |
| |
| |
| |
| | |
| (a) | Goodwill is being amortised over the economic lives of the relevant operations, which involves periods ranging from nine to 40 years with a weighted average of around 26 years (2003: 26 years). The amortisation period exceeds 20 years where the ore reserves (and, for some mines, mineral resources) are sufficient to justify this. |
A-22
Back to Contents
RIO TINTO PLC - RIO TINTO LIMITED
NOTES TO FINANCIAL STATEMENTS - (continued)
| 11 Exploration and evaluation | | | | | | |
| | Rio Tinto plc - | | Rio Tinto Limited - | | | |
| | part of Rio Tinto Group | | part of Rio Tinto Group | | Rio Tinto Group | |
| |
| |
| |
| |
| | 2004 | | 2003 | | 2004 | | 2003 | | 2004 | | 2003 | |
| |
| |
| |
| |
| |
| |
| |
| | US$m | | US$m | | US$m | | US$m | | US$m | | US$m | |
| At cost less amounts written off | | | | | | | | | | | | |
| At 1 January | 372 | | 355 | | 462 | | 339 | | 834 | | 694 | |
| Adjustment on currency translation | 2 | | 1 | | 21 | | 118 | | 23 | | 119 | |
| Expenditure in year | 123 | | 88 | | 70 | | 42 | | 193 | | 130 | |
| Charged against profit for the year | (45 | ) | (48 | ) | (6 | ) | 1 | | (51 | ) | (47 | ) |
| Disposals, transfers and other movements (a) | (12 | ) | (24 | ) | (27 | ) | (38 | ) | (39 | ) | (62 | ) |
| |
| |
| |
| |
| |
| |
| |
| At 31 December | 440 | | 372 | | 520 | | 462 | | 960 | | 834 | |
| |
| |
| |
| |
| |
| |
| |
| Provision | | | | | | | | | | | | |
| At 1 January | (370 | ) | (350 | ) | (395 | ) | (287 | ) | (765 | ) | (637 | ) |
| Adjustment on currency translation | (2 | ) | - | | (18 | ) | (104 | ) | (20 | ) | (104 | ) |
| Charged against profit for the year | (71 | ) | (42 | ) | (65 | ) | (38 | ) | (136 | ) | (80 | ) |
| Disposals, transfers and other movements | 30 | | 22 | | 28 | | 34 | | 58 | | 56 | |
| |
| |
| |
| |
| |
| |
| |
| At 31 December | (413 | ) | (370 | ) | (450 | ) | (395 | ) | (863 | ) | (765 | ) |
| |
| |
| |
| |
| |
| |
| |
| Net balance sheet amount | 27 | | 2 | | 70 | | 67 | | 97 | | 69 | |
| |
| |
| |
| |
| |
| |
| |
| | |
| (a) | 'Disposals, transfers and other movements' includes the capitalisation of US$17 million of close down and restoration provisions in respect of certain exploration projects. |
| (b) | The total of US$187 million (2003: US$127 million) charged against profit in respect of exploration and evaluation includes US$51 million (2003: US$47 million) written off cost and an increase in the provision of US$136 million (2003: US$80 million). |
| 12 Property, plant and equipment | | | | | | | | | | | | |
| | Mining | | Land | | Plant | | Capital | | | | | |
| | properties | | and | | and | | works in | | 2004 | | 2003 | |
| | and leases | | buildings | | equipment | | progress | | Total | | Total | |
| |
| |
| |
| |
| |
| |
| |
| | | | | | | | | | US$m | | US$m | |
| Rio Tinto Group | | | | | | | | | | | | |
| Cost | | | | | | | | | | | | |
| At 1 January | 5,392 | | 3,523 | | 17,942 | | 1,739 | | 28,596 | | 23,327 | |
| Adjustment on currency translation | 213 | | 101 | | 825 | | 51 | | 1,190 | | 4,273 | |
| Capitalisation of additional closure costs (note 20) | 260 | | - | | - | | - | | 260 | | 167 | |
| Other additions (g) | 199 | | 97 | | 570 | | 1,559 | | 2,425 | | 1,462 | |
| Disposals | (13 | ) | (29 | ) | (208 | ) | (2 | ) | (252 | ) | (449 | ) |
| Subsidiaries acquired/newly consolidated | - | | - | | - | | - | | - | | 3 | |
| Subsidiaries sold | (203 | ) | (12 | ) | (244 | ) | - | | (459 | ) | (185 | ) |
| Transfers and other movements (c) | 160 | | 123 | | 1,356 | | (1,621 | ) | 18 | | (2 | ) |
| |
| |
| |
| |
| |
| |
| |
| At 31 December | 6,008 | | 3,803 | | 20,241 | | 1,726 | | 31,778 | | 28,596 | |
| |
| |
| |
| |
| |
| |
| |
| Accumulated depreciation | | | | | | | | | | | | |
| At 1 January | (1,409 | ) | (1,540 | ) | (10,317 | ) | (134 | ) | (13,400 | ) | (11,144 | ) |
| Adjustment on currency translation | (66 | ) | (49 | ) | (472 | ) | - | | (587 | ) | (1,886 | ) |
| Exceptional asset write downs | (7 | ) | (3 | ) | (398 | ) | - | | (408 | ) | - | |
| Other depreciation for the year | (246 | ) | (119 | ) | (762 | ) | - | | (1,127 | ) | (930 | ) |
| Disposals | 13 | | 9 | | 160 | | 1 | | 183 | | 419 | |
| Subsidiaries sold | 71 | | - | | 110 | | - | | 181 | | 148 | |
| Transfers and other movements (c) | 10 | | (18 | ) | (4 | ) | (3 | ) | (15 | ) | (7 | ) |
| |
| |
| |
| |
| |
| |
| |
| At 31 December | (1,634 | ) | (1,720 | ) | (11,683 | ) | (136 | ) | (15,173 | ) | (13,400 | ) |
| |
| |
| |
| |
| |
| |
| |
| Net balance sheet amount at 31 December 2004 | 4,374 | | 2,083 | | 8,558 | | 1,590 | | 16,605 | | | |
| |
| |
| |
| |
| |
| | | |
| Net balance sheet amount at 31 December 2003 | 3,983 | | 1,983 | | 7,625 | | 1,605 | | | | 15,196 | |
| |
| |
| |
| |
| | | |
| |
A-23
Back to Contents
RIO TINTO PLC - RIO TINTO LIMITED
NOTES TO FINANCIAL STATEMENTS - (continued)
| 12 | Property, plant and equipment (continued) |
| | |
| (a) | The net balance sheet amount at 31 December 2004 includes US$374 million (2003: US$394 million) of pledged assets, in addition to assets held under the finance leases disclosed in note 22. |
| (b) | The net balance sheet amount for land and buildings includes freehold US$2,005 million; long leasehold US$68 million; and short leasehold US$10 million. |
| (c) | 'Transfers and other movements' includes reclassifications between categories. |
| (d) | Accumulated depreciation on 'Capital works in progress' at 1 January 2004 relates to an exceptional charge made in 2002. |
| (e) | Interest is capitalised at a rate based on the Group's cost of borrowing or at the rate on project specific debt where applicable. |
| (f) | During 2002, the Group acquired North Jacob's Ranch for US$380 million. Payments of US$76 million were made in each of 2002, 2003 and 2004. The remainder of the consideration, US$152 million, is payable over the next two years. |
(g)
| During 2004, the Group acquired additional reserves at West Antelope at a cost of US$146 million. |
| (h) | At 31 December 2004, net tangible assets per share amounted to US$8.22 (31 December 2003: US$6.38). |
(i)
| A change in the mine plan at Kennecott Utah Copper was approved in February 2005. Pending any extension of the assumed mine life there will be an increase in the annual depreciation charge and amortisation of the discount relating to provisions, together totalling approximately US$45 million, from 2005. |
| | |
| | Mining | | Land | | Plant | | Capital | | | | | |
| properties | and | and | works in | 2004 | 2003 |
| and leases | buildings | equipment | progress | Total | Total |
| |
| |
| |
| |
| |
| |
| |
| Rio Tinto plc - part of Rio Tinto Group | | | | | | | | | US$m | | US$m | |
| Cost | | | | | | | | | | | | |
| At 1 January | 1,791 | | 1,855 | | 7,481 | | 160 | | 11,287 | | 10,518 | |
| Adjustment on currency translation | 46 | | 29 | | 286 | | 3 | | 364 | | 543 | |
| Capitalisation of additional closure costs (note 20) | 105 | | - | | - | | - | | 105 | | 67 | |
| Other additions | 105 | | 79 | | 168 | | 269 | | 621 | | 485 | |
| Disposals | (13 | ) | (21 | ) | (114 | ) | - | | (148 | ) | (321 | ) |
| Subsidiaries acquired/newly consolidated | - | | - | | - | | - | | - | | 3 | |
| Subsidiaries sold | (18 | ) | (12 | ) | (142 | ) | - | | (172 | ) | - | |
| Transfers and other movements | (92 | ) | 1 | | 180 | | (65 | ) | 24 | | (8 | ) |
| |
| |
| |
| |
| |
| |
| |
| At 31 December | 1,924 | | 1,931 | | 7,859 | | 367 | | 12,081 | | 11,287 | |
| |
| |
| |
| |
| |
| |
| |
| | | | | | | | | | | | | |
| Accumulated depreciation | | | | | | | | | | | | |
| At 1 January | (345 | ) | (685 | ) | (4,162 | ) | - | | (5,192 | ) | (4,955 | ) |
| Adjustment on currency translation | (13 | ) | (5 | ) | (185 | ) | - | | (203 | ) | (183 | ) |
| Exceptional charges | (7 | ) | (3 | ) | (398 | ) | - | | (408 | ) | - | |
| Other depreciation for the year | (73 | ) | (58 | ) | (320 | ) | - | | (451 | ) | (351 | ) |
| Disposals | 13 | | 6 | | 85 | | - | | 104 | | 305 | |
| Subsidiaries sold | - | | - | | 37 | | - | | 37 | | - | |
| Transfers and other movements | 73 | | - | | (69 | ) | - | | 4 | | (8 | ) |
| |
| |
| |
| |
| |
| |
| |
| At 31 December | (352 | ) | (745 | ) | (5,012 | ) | - | | (6,109 | ) | (5,192 | ) |
| |
| |
| |
| |
| |
| |
| |
| Net balance sheet amount at 31 December 2004 | 1,572 | | 1,186 | | 2,847 | | 367 | | 5,972 | | | |
| |
| |
| |
| |
| |
| | | |
| Net balance sheet amount at 31 December 2003 | 1,446 | | 1,170 | | 3,319 | | 160 | | | | 6,095 | |
| |
| |
| |
| |
| | | |
| |
| | |
(a) | The net balance sheet amount at 31 December 2004 includes US$nil (2003: US$25 million) of pledged assets, in addition to assets held under the finance leases disclosed in note 22. |
| | Mining | | Land | | Plant | | Capital | | | | | |
| properties | and | and | works in | 2004 | 2003 |
| and leases | buildings | equipment | progress | Total | Total |
| |
| |
| |
| |
| |
| |
| |
| Rio Tinto Limited - part of Rio Tinto Group | | | | | | | | | US$m | | US$m | |
| Cost | | | | | | | | | | | | |
| At 1 January | 3,601 | | 1,668 | | 10,455 | | 1,579 | | 17,303 | | 12,803 | |
| Adjustment on currency translation | 167 | | 72 | | 539 | | 48 | | 826 | | 3,730 | |
| Capitalisation of additional closure costs (note 20) | 155 | | - | | - | | - | | 155 | | 100 | |
| Other additions | 94 | | 18 | | 402 | | 1,290 | | 1,804 | | 977 | |
| Disposals | - | | (8 | ) | (94 | ) | (2 | ) | (104 | ) | (128 | ) |
| Subsidiaries acquired/newly consolidated | - | | - | | - | | - | | - | | - | |
| Subsidiaries sold | (185 | ) | - | | (102 | ) | - | | (287 | ) | (185 | ) |
| Transfers and other movements | 252 | | 122 | | 1,182 | | (1,556 | ) | - | | 6 | |
| |
| |
| |
| |
| |
| |
| |
| At 31 December | 4,084 | | 1,872 | | 12,382 | | 1,359 | | 19,697 | | 17,303 | |
| |
| |
| |
| |
| |
| |
| |
| | | | | | | | | | | | | |
| Accumulated depreciation | | | | | | | | | | | | |
| At 1 January | (1,064 | ) | (855 | ) | (6,155 | ) | (134 | ) | (8,208 | ) | (6,189 | ) |
| Adjustment on currency translation | (53 | ) | (44 | ) | (287 | ) | - | | (384 | ) | (1,703 | ) |
| Exceptional charges | - | | - | | - | | - | | - | | - | |
| Other depreciation for the year | (173 | ) | (61 | ) | (442 | ) | - | | (676 | ) | (579 | ) |
| Disposals | - | | 3 | | 75 | | 1 | | 79 | | 114 | |
| Subsidiaries sold | 71 | | - | | 73 | | - | | 144 | | 148 | |
| Transfers and other movements | (63 | ) | (18 | ) | 65 | | (3 | ) | (19 | ) | 1 | |
| |
| |
| |
| |
| |
| |
| |
| At 31 December | (1,282 | ) | (975 | ) | (6,671 | ) | (136 | ) | (9,064 | ) | (8,208 | ) |
| |
| |
| |
| |
| |
| |
| |
| Net balance sheet amount at 31 December 2004 | 2,802 | | 897 | | 5,711 | | 1,223 | | 10,633 | | | |
| |
| |
| |
| |
| |
| | | |
| Net balance sheet amount at 31 December 2003 | 2,537 | | 813 | | 4,300 | | 1,445 | | | | 9,095 | |
| |
| |
| |
| |
| | | |
| |
| | |
| (a) | The net balance sheet amount at 31 December 2004 includes US$374 million (2003: US$369 million) of pledged assets in addition to assets held under the finance leases disclosed in note 22. |
A-24
Back to Contents
RIO TINTO PLC - RIO TINTO LIMITED
NOTES TO FINANCIAL STATEMENTS - (continued)
12 Property, plant and equipment (continued)
| | Rio Tinto plc - | | Rio Tinto Limited - | | Rio Tinto | |
| part of Rio Tinto Group | part of Rio Tinto Group | Group |
| |
| |
|
|
|
|
| | US$m | | US$m | | US$m | |
| The 2004 net balance sheet amounts for land and buildings include: | | | | | | |
| Freehold | 1,166 | | 839 | | 2,005 | |
| Long leasehold | 10 | | 58 | | 68 | |
| Short leasehold | 10 | | - | | 10 | |
| |
| |
| |
| |
| | 1,186 | | 897 | | 2,083 | |
| |
| |
| |
| |
Deferred stripping
Deferred stripping costs which are included in 'Mining properties and leases' and 'Investments in Joint Ventures and Associates' (note 13), are analysed below:
| | Rio Tinto Group | |
|
| 2004 | | 2003 | | 2002 |
| |
| |
| |
| |
| | US$m | | US$m | | US$m | |
| At 1 January | | | | | | |
| Subsidiaries | 441 | | 326 | | 292 | |
| Share of equity accounted operations | 230 | | 198 | | 175 | |
| |
| |
| |
| |
| | 671 | | 524 | | 467 | |
| |
| |
| |
| |
| Adjustment on currency translation | | | | | | |
| Subsidiaries | 10 | | 17 | | - | |
| Share of equity accounted operations | 1 | | 3 | | - | |
| |
| |
| |
| |
| | 11 | | 20 | | - | |
| |
| |
| |
| |
| Net deferral of stripping costs during the year | | | | | | |
| Subsidiaries | 116 | | 77 | | 29 | |
| Share of equity accounted operations | 19 | | 32 | | 27 | |
| |
| |
| |
| |
| | 135 | | 109 | | 56 | |
| |
| |
| |
| |
| Other | | | | | | |
| Subsidiaries | 2 | | 21 | | 5 | |
| Share of equity accounted operations | (35 | ) | (3 | ) | (4 | ) |
| |
| |
| |
| |
| | (33 | ) | 18 | | 1 | |
| |
| |
| |
| |
| Deferred stripping balance carried forward at 31 December | | | | | | |
| Subsidiaries | 569 | | 441 | | 326 | |
| Share of equity accounted operations | 215 | | 230 | | 198 | |
| |
| |
| |
| |
| | 784 | | 671 | | 524 | |
| |
| |
| |
| |
| | | | | | | | | | | | | |
| | Rio Tinto plc | | Rio Tinto Limited - | |
| part of Rio Tinto Group | part of Rio Tinto Group |
|
|
| 2004 | | 2003 | | 2002 | 2004 | | 2003 | | 2002 |
| |
| |
| |
|
| |
| |
|
| | US$m | | US$m | | US$m | | US$m | | US$m | | US$m | |
| At 1 January | | | | | | | | | | | | |
| Subsidiaries | 355 | | 260 | | 242 | | 86 | | 66 | | 50 | |
| Equity accounted operations | 250 | | 218 | | 191 | | 20 | | 8 | | 4 | |
| |
| |
| |
| |
| |
| |
| |
| | 605 | | 478 | | 433 | | 106 | | 74 | | 54 | |
| |
| |
| |
| |
| |
| |
| |
| Adjustment on currency translation | | | | | | | | | | | | |
| Subsidiaries | 4 | | 2 | | - | | 6 | | 15 | | - | |
| Equity accounted operations | 3 | | 7 | | - | | 1 | | 3 | | - | |
| |
| |
| |
| |
| |
| |
| |
| | 7 | | 9 | | - | | 7 | | 18 | | - | |
| |
| |
| |
| |
| |
| |
| |
| Net deferral of stripping costs during the year | | | | | | | | | | | | |
| Subsidiaries | 61 | | 66 | | 13 | | 55 | | 11 | | 16 | |
| Equity accounted operations | 40 | | 29 | | 31 | | - | | 12 | | 4 | |
| |
| |
| |
| |
| |
| |
| |
| | 101 | | 95 | | 44 | | 55 | | 23 | | 20 | |
| |
| |
| |
| |
| |
| |
| |
| Other | | | | | | | | | | | | |
| Subsidiaries | 3 | | 27 | | 5 | | (1 | ) | (6 | ) | - | |
| Equity accounted operations | (22 | ) | (3 | ) | (4 | ) | (21 | ) | (3 | ) | - | |
| |
| |
| |
| |
| |
| |
| |
| | (19 | ) | 24 | | 1 | | (22 | ) | (9 | ) | - | |
| |
| |
| |
| |
| |
| |
| |
| Deferred stripping balance carried forward at | | | | | | | | | | | | |
| 31 December | | | | | | | | | | | | |
| Subsidiaries | 423 | | 355 | | 260 | | 146 | | 86 | | 66 | |
| Equity accounted operations | 271 | | 251 | | 218 | | - | | 20 | | 8 | |
| |
| |
| |
| |
| |
| |
| |
| | 694 | | 606 | | 478 | | 146 | | 106 | | 74 | |
| |
| |
| |
| |
| |
| |
| |
A-25
Back to Contents
RIO TINTO PLC - RIO TINTO LIMITED
NOTES TO FINANCIAL STATEMENTS - (continued)
13 Fixed asset investments
| | Investments | | Loans to | | Investments | | Loans | | | | | |
| in joint | joint | in associates/ | to | 2004 | 2003 |
| ventures | ventures | other | associates | Total | Total |
|
|
|
|
|
|
| Rio Tinto Group | | | | | | | | | US$m | | US$m | |
| At 1 January | 2,051 | | 172 | | 515 | | 2 | | 2,740 | | 2,577 | |
| Adjustment on currency translation | 34 | | 2 | | 13 | | - | | 49 | | 283 | |
| Group’s share of earnings net of distributions | 166 | | - | | 47 | | - | | 213 | | 12 | |
| Additions (excluding acquisitions) | 30 | | - | | 14 | | - | | 44 | | 135 | |
| Disposals and repayments of advances | (31 | ) | (10 | ) | (229 | ) | (2 | ) | (272 | ) | (254 | ) |
| Transfers and other movements | 16 | | 2 | | 25 | | - | | 43 | | (13 | ) |
| |
| |
| |
| |
| |
| |
| |
| At 31 December | 2,266 | | 166 | | 385 | | - | | 2,817 | | 2,740 | |
| |
| |
| |
| |
| |
| |
| |
| | | | | | | | | | | | | |
| | Investments | | Loans to | | Investments | | Loans | | | | | |
| in joint | joint | in associates/ | to | 2004 | 2003 |
| ventures | ventures | other | associates | Total | Total |
| |
| |
| |
| |
| |
| |
| |
| Rio Tinto plc - part of Rio Tinto Group | | | | | | | | | US$m | | US$m | |
| At 1 January | 963 | | 151 | | 2,589 | | 91 | | 3,794 | | 2,535 | |
| Adjustment on currency translation | - | | - | | 147 | | - | | 147 | | 546 | |
| Group’s share of earnings net of distributions | 158 | | - | | 344 | | - | | 502 | | 193 | |
| Additions (excluding acquisitions) | 8 | | - | | 14 | | 196 | | 218 | | 852 | |
| Disposals and repayments of advances | - | | (10 | ) | (211 | ) | (2 | ) | (223 | ) | (318 | ) |
| Transfers and other movements | 9 | | (1 | ) | - | | - | | 8 | | (14 | ) |
| |
| |
| |
| |
| |
| |
| |
| At 31 December | 1,138 | | 140 | | 2,883 | | 285 | | 4,446 | | 3,794 | |
| |
| |
| |
| |
| |
| |
| |
| | | | | | | | | | | | | |
| | Investments | | Loans to | | Investments | | Loans | | | | | |
| in joint | joint | in associates/ | to | 2004 | 2003 |
| ventures | ventures | other | associates | Total | Total |
|
|
|
|
|
|
| Rio Tinto Limited - part of Rio Tinto Group | | | | | | | | | US$m | | US$m | |
| At 1 January | 1,088 | | 21 | | 62 | | - | | 1,171 | | 1,072 | |
| Adjustment on currency translation | 34 | | 2 | | 5 | | - | | 41 | | 267 | |
| Group’s share of earnings net of distributions | 8 | | - | | 4 | | - | �� | 12 | | (29 | ) |
| Additions (excluding acquisitions) | 22 | | - | | - | | - | | 22 | | 89 | |
| Disposals and repayments of advances | (31 | ) | - | | (6 | ) | - | | (37 | ) | (233 | ) |
| Transfers and other movements | 7 | | 3 | | 7 | | - | | 17 | | 5 | |
| |
| |
| |
| |
| |
| |
| |
| At 31 December | 1,128 | | 26 | | 72 | | - | | 1,226 | | 1,171 | |
| |
| |
| |
| |
| |
| |
| |
| (a) | The Group’s investments in joint ventures and associates include, where appropriate, entry premiums on acquisition plus interest capitalised by the Group during the development period of the relevant mines. At 31 December 2004, this capitalised interest less accumulated amortisation amounted to US$21 million (2003: US$12 million). |
| (b) | The cash flow statement analyses additions to joint ventures and associates between the following:
- 'Funding of Group share of joint ventures' and associates’ capital expenditure', which reports cash supplied by the Group for the formation of new operating assets whose benefits will be attributable to the Group, and
- 'Repayments from/(other funding of) joint ventures and associates' which includes any financial investment in joint ventures and associates that does not have the above characteristics, and all loan repayments.
- 'Loans (to)/repaid by Rio Tinto Limited'. This includes the change in Rio Tinto plc's loans made to Rio Tinto Limited and its subsidiaries' (which is included in current assets) as well as the increase of US$196 million in loans to associates, which is included in the above table. |
| (c) | Investments in and loans to associates by the Rio Tinto plc part of the Group include amounts relating to Rio Tinto Limited which are eliminated in arriving at the Rio Tinto Group figures. |
| (d) | Further details of investments in joint ventures and associates are set out on page A-27 and in notes 14, 32 and 33. |
A-26
Back to Contents
RIO TINTO PLC - RIO TINTO LIMITED
NOTES TO FINANCIAL STATEMENTS - (continued)
13 Fixed asset investments (continued)
| | Rio Tinto plc - | | Rio Tinto Limited - | | | | | |
| | part of Rio Tinto Group | | part of Rio Tinto Group | | Rio Tinto Group | |
| |
|
| |
|
| |
|
|
| |
| | 2004 | | 2003 | | 2004 | | 2003 | | 2004 | | 2003 | |
| |
| |
| |
| |
| |
| |
| |
| Joint Ventures | US$m | | US$m | | US$m | | US$m | | US$m | | US$m | |
| Rio Tinto's share of assets | | | | | | | | | | | | |
| Fixed assets | 1,591 | | 1,573 | | 1,158 | | 1,195 | | 2,749 | | 2,768 | |
| Current assets | 436 | | 272 | | 290 | | 193 | | 726 | | 465 | |
| |
| |
| |
| |
| |
| |
| |
| | 2,027 | | 1,845 | | 1,448 | | 1,388 | | 3,475 | | 3,233 | |
| Rio Tinto's share of third party liabilities | | | | | | | | | | | | |
| Liabilities due within one year | (316 | ) | (200 | ) | (121 | ) | (112 | ) | (437 | ) | (312 | ) |
| Liabilities due after more than one year (including provisions) | (433 | ) | (531 | ) | (173 | ) | (167 | ) | (606 | ) | (698 | ) |
| |
| |
| |
| |
| |
| |
| |
| | (749 | ) | (731 | ) | (294 | ) | (279 | ) | (1,043 | ) | (1,010 | ) |
| |
| |
| |
| |
| |
| |
| |
| Rio Tinto's share of net assets | 1,278 | | 1,114 | | 1,154 | | 1,109 | | 2,432 | | 2,223 | |
| |
| |
| |
| |
| |
| |
| |
| | | | | | | | | | | | | |
| (a) | The Group's share of joint venture liabilities set out above excludes US$166 million (2003: US$172 million) due to the Group. These excluded liabilities correspond with the loans to joint ventures that are presented earlier in this note as an asset of the Group. Including these loans, the Group's share of the total liabilities of joint ventures was US$1,209 million (2003: US$1,182 million). |
| (b) | Of the US$606 million of liabilities due after more than one year, US$482 million relates to long term debt, which matures as follows: US$111 million between 1-2 years; US$111 million between 2-3 years; US$96 million between 3-4 years; US$63 million between 4-5 years and US$101 million after 5 years. |
| | |
| | Rio Tinto plc - | | Rio Tinto Limited - | | | | | |
| | part of Rio Tinto Group | | part of Rio Tinto Group | | Rio Tinto Group | |
| |
|
| |
|
| |
|
| |
| | 2004 | | 2003 | | 2004 | | 2003 | | 2004 | | 2003 | |
| |
| |
| |
| |
| |
| |
| |
| Associates | US$m | | US$m | | US$m | | US$m | | US$m | | US$m | |
| Rio Tinto's share of assets | | | | | | | | | | | | |
| Fixed assets | 5,127 | | 5,132 | | 177 | | 182 | | 480 | | 1,083 | |
| Current assets/(liabilities) | 1,003 | | 1,197 | | 1 | | 1 | | 79 | | 327 | |
| |
| |
| |
| |
| |
| |
| |
| | 6,130 | | 6,329 | | 178 | | 183 | | 559 | | 1,410 | |
| Rio Tinto's share of third party liabilities | | | | | | | | | | | | |
| Liabilities due within one year | (1,589 | ) | (1,423 | ) | (38 | ) | (36 | ) | (56 | ) | (214 | ) |
| Liabilities due after more than one year (including provisions) | (1,489 | ) | (2,300 | ) | (96 | ) | (104 | ) | (256 | ) | (733 | ) |
| |
| |
| |
| |
| |
| |
| |
| | (3,078 | ) | (3,723 | ) | (134 | ) | (140 | ) | (312 | ) | (947 | ) |
| Non equity capital and outside shareholders' interests | (494 | ) | (515 | ) | - | | - | | - | | (42 | ) |
| |
| |
| |
| |
| |
| |
| |
| Rio Tinto's share of net assets | 2,558 | | 2,091 | | 44 | | 43 | | 247 | | 421 | |
| |
| |
| |
| |
| |
| |
| |
| | | | | | | | | | | | | |
| (a) | Of the US$256 million of liabilities due after more than one year, US$230 million relates to long term debt, which matures as follows: US$58 million between 1-2 years; US$60 million between 2-3 years; US$60 million between 3-4 years; US$15 million between 4-5 years and US$37 million after 5 years. |
| | |
| | Rio Tinto plc - | | Rio Tinto Limited - | | | | | |
| | part of Rio Tinto Group | | part of Rio Tinto Group | | Rio Tinto Group | |
| |
| |
| |
|
| |
| | 2004 | | 2003 | | 2004 | | 2003 | | 2004 | | 2003 | |
| | US$m | | US$m | | US$m | | US$m | | US$m | | US$m | |
| Investments in and loans to associates/other | | | | | | | | | | | | |
| Investments in and loans to associates | 2,558 | | 2,091 | | 44 | | 43 | | 247 | | 421 | |
| Other investments (a) | 610 | | 589 | | 28 | | 19 | | 138 | | 96 | |
| |
| |
| |
| |
| |
| |
| |
| | 3,168 | | 2,680 | | 72 | | 62 | | 385 | | 517 | |
| |
| |
| |
| |
| |
| |
| |
| | | | | | | | | | | | | |
| (a) | Other investments include listed investments of US$46 million with a market value of US$114 million (2003: US$92 million). At 31 December 2004 the Group owned 19 per cent of the Labrador Iron Ore Royalty Income Fund which itself owns 15.1 per cent of Iron Ore Company of Canada Inc. The Group sold its investment in the Labrador Iron ore Royalty Income Fund in March 2005. |
| (b) | Further information on the net debt of joint ventures and associates is shown in note 14. |
A-27
Back to Contents
RIO TINTO PLC - RIO TINTO LIMITED
NOTES TO FINANCIAL STATEMENTS - (continued)
14 Net debt of joint ventures and associates
| | | | Rio Tinto | | | | Rio Tinto | |
| | Rio Tinto | | share of | | Rio Tinto | | share of | |
| | percentage | | net debt | | percentage | | net debt | |
| | 2004 | | 2004 | | 2003 | | 2003 | |
| |
| |
| |
| |
| |
| | % | | US$m | | % | | US$m | |
| Joint ventures | | | | | | | | |
| Minera Escondida Limitada | 30.0 | | 324 | | 30.0 | | 414 | |
| Leichhardt | 44.7 | | 22 | | 44.7 | | 31 | |
| Colowyo | 20.0 | | 31 | | 20.0 | | 32 | |
| Warkworth | 42.1 | | 28 | | 42.1 | | 34 | |
| | | | | | | | | |
| Associates | | | | | | | | |
| Freeport-McMoRan Copper & Gold Inc. | - | | - | | 13.1 | | 236 | |
| Tisand (Pty) Limited | 50.0 | | 137 | | 50.0 | | 121 | |
| Port Waratah Coal Services | 27.6 | | 106 | | 27.6 | | 114 | |
| Sociedade Mineira de Neves-Corvo SA (Somincor) | - | | - | | 49.0 | | 37 | |
| | | | | | | | | |
| Other | | | (46 | ) | | | (15 | ) |
| | | |
| | | |
| |
| Net debt of joint ventures and associates | | | 602 | | | | 1,004 | |
| | | |
| | | |
| |
| | |
| (a) | In accordance with FRS 9, the Group includes its net investment in joint ventures and associates in its consolidated balance sheet. This investment is shown net of the Group's share of the net debt of joint ventures and associates due to third parties, which is set out above. |
| (b) | Some of the debt of joint ventures and associates is subject to financial and general covenants. |
| (c) | The group holds 44.7 per cent of the equity of the Leichhardt joint venture, which has a 31.4 per cent interest in the Blair Athol joint venture. Leichhardt has US$91 million (2003: US$85 million) of shareholders' funds and US$50 million (2003: US$70 million) of debt finance. |
| (d) | The Group has a partnership interest in the Colowyo Coal Company and has undertaken, via a subsidiary company which entered into a management agreement, to cause the partnership to perform its obligations under certain coal supply contracts. The debt of US$156 million owed by the Colowyo Coal Company is to be serviced and repaid out of the proceeds of these contracts. The exceptional charge in 2004, referred to in note 4, includes a provision of US$149 million in respect of the Group's obligations under the above management agreement. |
| (e) | Except for the obligations referred to above, in relation to Colowyo, the debt of joint ventures and associates is without recourse to the Rio Tinto Group. |
| | |
| 15 Inventories | | | | | | | | | | | | |
| | Rio Tinto plc - | | Rio Tinto Limited - | | | | | |
| | part of Rio Tinto Group | | part of Rio Tinto Group | | Rio Tinto Group | |
| |
|
|
| |
|
|
| |
|
|
| |
| | 2004 | | 2003 | | 2004 | | 2003 | | 2004 | | 2003 | |
| |
| |
| |
| |
| |
| |
| |
| | US$m | | US$m | | US$m | | US$m | | US$m | | US$m | |
| Raw material and purchased components | 217 | | 205 | | 120 | | 142 | | 337 | | 347 | |
| Consumable stores | 157 | | 124 | | 210 | | 166 | | 367 | | 290 | |
| Work in progress | 238 | | 219 | | 222 | | 163 | | 460 | | 382 | |
| Finished goods and goods for resale | 487 | | 420 | | 375 | | 344 | | 862 | | 764 | |
| |
| |
| |
| |
| |
| |
| |
| | 1,099 | | 968 | | 927 | | 815 | | 2,026 | | 1,783 | |
| |
| |
| |
| |
| |
| |
| |
| Comprising: | | | | | | | | | | | | |
| Inventories expected to be sold or used within 12 months | 1,099 | | 968 | | 889 | | 778 | | 1,988 | | 1,746 | |
| Inventories not expected to be sold nor used within 12 months | - | | - | | 38 | | 37 | | 38 | | 37 | |
| |
| |
| |
| |
| |
| |
| |
| | 1,099 | | 968 | | 927 | | 815 | | 2,026 | | 1,783 | |
| |
| |
| |
| |
| |
| |
| |
| | | | | | | | | | | | | |
| General and administrative costs | | | | | | | | | | | | |
| - charged to inventory during the year | 129 | | 98 | | 120 | | 112 | | 249 | | 210 | |
| - remaining in inventory at year end | 44 | | 34 | | 17 | | 18 | | 61 | | 52 | |
| |
| |
| |
| |
| |
| |
| |
| | | | | | | | | | | | | |
| (a) | As reported in the Cash flow statement, the increase in inventories during 2004 was US$179 million excluding the effects of subsidiaries sold and changes in exchange rates on translation into US dollars. |
A-28
Back to Contents
RIO TINTO PLC - RIO TINTO LIMITED
NOTES TO FINANCIAL STATEMENTS - (continued)
| 16 | Accounts receivable and prepayments |
| |
| | Rio Tinto plc - | | Rio Tinto Limited - | | | | | |
| part of Rio Tinto Group | part of Rio Tinto Group | Rio Tinto Group |
|
|
|
| 2004 | | 2003 | 2004 | | 2003 | 2004 | | 2003 |
|
|
|
|
|
|
| Falling due within one year | US$m | US$m | US$m | US$m | US$m | US$m |
| Trade debtors | 623 | | 569 | | 716 | | 740 | | 1,339 | | 1,309 | |
| Provision for doubtful debts | (26 | ) | (33 | ) | (8 | ) | (10 | ) | (34 | ) | (43 | ) |
| Bills receivable | 6 | | 3 | | 14 | | 10 | | 20 | | 13 | |
| Amounts owed by joint ventures | 5 | | - | | - | | - | | 5 | | - | |
| Amounts owed by associates (a) | 286 | | 248 | | - | | 1 | | 2 | | 4 | |
| Other debtors (b) | 105 | | 99 | | 270 | | 268 | | 268 | | 225 | |
| Current tax recoverable | 33 | | 93 | | - | | 9 | | 33 | | 102 | |
| Pension prepayments (c) | 35 | | - | | - | | 5 | | 35 | | 5 | |
| Other prepayments | 16 | | 12 | | 39 | | 47 | | 55 | | 59 | |
| |
| |
| |
| |
| |
| |
| |
| | 1,083 | | 991 | | 1,031 | | 1,070 | | 1,723 | | 1,674 | |
| |
| |
| |
| |
| |
| |
| |
| Falling due after more than one year | | | | | | | | | | | | |
| Pension prepayments (c) | 497 | | 530 | | 84 | | 85 | | 581 | | 615 | |
| Other debtors | 12 | | 1 | | 27 | | 35 | | 39 | | 36 | |
| Current tax recoverable | 10 | | - | | 128 | | 130 | | 138 | | 130 | |
| Deferred tax assets | 21 | | 22 | | 21 | | (5 | ) | 42 | | 17 | |
| Bills receivable | - | | 2 | | - | | 4 | | - | | 6 | |
| Other prepayments | - | | - | | 36 | | 5 | | 36 | | 5 | |
| |
| |
| |
| |
| |
| |
| |
| | 540 | | 555 | | 296 | | 254 | | 836 | | 809 | |
| |
| |
| |
| |
| |
| |
| |
| (a) | Amounts owed to Rio Tinto plc by associates includes US$284 million (2003: US$245 million) due from Rio Tinto Limited. |
| (b) | Other debtors for Rio Tinto Limited include US$107 million (2003: US$142 million) due from Rio Tinto plc. |
| (c) | Movements on pension prepayments are included in Other items in the Cash flow statement. |
| 17 | Current asset investments, cash and liquid resources |
| | |
| | Rio Tinto plc - | | Rio Tinto Limited - | | | | | |
| part of Rio Tinto Group | part of Rio Tinto Group | Rio Tinto Group |
|
|
|
| 2004 | | 2003 | 2004 | | 2003 | 2004 | | 2003 |
|
|
|
|
|
|
| US$m | US$m | US$m | US$m | US$m | US$m |
| Liquid resources | | | | | | | | | | | | |
| Time deposits | 48 | | 147 | | 68 | | 59 | | 116 | | 206 | |
| Other | 2 | | 2 | | - | | - | | 2 | | 2 | |
| |
| |
| |
| |
| |
| |
| |
| Total liquid resources | 50 | | 149 | | 68 | | 59 | | 118 | | 208 | |
| Deduct: investments qualifying as cash for balance sheet disclosure | (48 | ) | (147 | ) | (68 | ) | (59 | ) | (116 | ) | (206 | ) |
| |
| |
| |
| |
| |
| |
| |
| | 2 | | 2 | | - | | - | | 2 | | 2 | |
| Other current asset investments | | | | | | | | | | | | |
| US Treasury bonds (a) | 76 | | 228 | | - | | - | | 76 | | 228 | |
| |
| |
| |
| |
| |
| |
| |
| Investments per balance sheet (unlisted) | 78 | | 230 | | - | | - | | 78 | | 230 | |
| |
| |
| |
| |
| |
| |
| |
| | | | | | | | | | | | | |
| Cash | | | | | | | | | | | | |
| Cash as defined in FRS1 Revised ('FRS1 cash') | 67 | | 36 | | 139 | | 5 | | 206 | | 41 | |
| Investments qualifying as cash | 48 | | 147 | | 68 | | 59 | | 116 | | 206 | |
| Add back Bank borrowings repayable on demand included in FRS 1 cash | 66 | | 74 | | 2 | | 74 | | 68 | | 148 | |
| | | | | | | | | | | | | |
| |
| |
| |
| |
| |
| |
| |
| Cash per balance sheet | 181 | | 257 | | 209 | | 138 | | 390 | | 395 | |
| |
| |
| |
| |
| |
| |
| |
| (a) | Current asset investments of Rio Tinto plc and Rio Tinto Group include US$76 million (2003: US$228 million) relating to US treasury bonds that are not regarded as liquid assets because they are held as security for the deferred consideration for certain assets acquired during 2002. |
| (b) | Information on cash and cash equivalents under US GAAP is given in note 42 Reconciliation to US Accounting Principles. |
A-29
Back to Contents
RIO TINTO PLC - RIO TINTO LIMITED
NOTES TO FINANCIAL STATEMENTS - (continued)
| 18 | Short term borrowings | |
| | | |
| | | | | | | | | | | |
| | Rio Tinto plc - | | Rio Tinto Limited - | | | | | |
| | part of Rio Tinto Group | | part of Rio Tinto Group | | Rio Tinto Group | |
| |
| |
| |
| |
| | 2004 | | 2003 | | 2004 | | 2003 | | 2004 | | 2003 | |
| |
| |
| |
| |
| |
| |
| |
| | US$m | | US$m | | US$m | | US$m | | US$m | | US$m | |
| Secured | | | | | | | | | | | | |
| Bank loans repayable within 12 months | 27 | | 36 | | 19 | | 16 | | 46 | | 52 | |
| Other loans repayable within 12 months | 16 | | 21 | | 10 | | 38 | | 26 | | 59 | |
| |
| |
| |
| |
| |
| |
| |
| | 43 | | 57 | | 29 | | 54 | | 72 | | 111 | |
| Unsecured | | | | | | | | | | | | |
| Bank borrowings repayable on demand | 66 | | 74 | | 2 | | 74 | | 68 | | 148 | |
| Bank loans repayable within 12 months | - | | 91 | | 8 | | - | | 8 | | 91 | |
| Other loans repayable within 12 months | 123 | | 44 | | 535 | | 113 | | 658 | | 157 | |
| Commercial paper (a) | - | | 276 | | - | | 1,411 | | - | | 1,687 | |
| |
| |
| |
| |
| |
| |
| |
| | 189 | | 485 | | 545 | | 1,598 | | 734 | | 2,083 | |
| |
| |
| |
| |
| |
| |
| |
| Total short term borrowings per balance sheet | 232 | | 542 | | 574 | | 1,652 | | 806 | | 2,194 | |
| |
| |
| |
| |
| |
| |
| |
| | | | | | | | | | | | | |
| (a) | US$1.1 billion of the commercial paper outstanding at 31 December 2003 was backed by medium term facilities. Under Australian GAAP this amount would be grouped within non-current borrowings. | |
| | | | | | | | | | | | | | |
| 19 | Accounts payable and accruals | | | | | | | | | | | | |
| | | | | | | | | | | | | |
| | Rio Tinto plc - | | Rio Tinto Limited - | | | | | |
| | part of Rio Tinto Group | | part of Rio Tinto Group | | Rio Tinto Group | |
| |
| |
| |
| |
| | 2004 | | 2003 | | 2004 | | 2003 | | 2004 | | 2003 | |
| |
| |
| |
| |
| |
| |
| |
| | US$m | | US$m | | US$m | | US$m | | US$m | | US$m | |
| Due within one year | | | | | | | | | | | | |
| Trade creditors | 398 | | 365 | | 552 | | 372 | | 950 | | 737 | |
| Amounts owed to joint ventures | 5 | | 3 | | - | | 6 | | 5 | | 9 | |
| Amounts owed to associates (a) | 121 | | 185 | | 1 | | 1 | | 15 | | 44 | |
| Other creditors (a) | 222 | | 141 | | 570 | | 355 | | 303 | | 226 | |
| Tax on profits | 63 | | 40 | | 126 | | 210 | | 189 | | 250 | |
| Employee entitlements | 78 | | 83 | | 68 | | 42 | | 146 | | 125 | |
| Royalties and mining taxes | 92 | | 82 | | 59 | | 51 | | 151 | | 133 | |
| Accruals and deferred income | 63 | | 59 | | 135 | | 64 | | 198 | | 123 | |
| Dividends payable to outside shareholders of | | | | | | | | | | | | |
| subsidiaries | - | | - | | - | | 1 | | - | | 1 | |
| Dividends payable to Rio Tinto plc and Rio Tinto | | | | | | | | | | | | |
| Limited shareholders | 487 | | 367 | | 225 | | 189 | | 632 | | 492 | |
| |
| |
| |
| |
| |
| |
| |
| | 1,529 | | 1,325 | | 1,736 | | 1,291 | | 2,589 | | 2,140 | |
| |
| |
| |
| |
| |
| |
| |
| Due in more than one year | | | | | | | | | | | | |
| Other creditors (a) | 154 | | 143 | | 54 | | 51 | | 208 | | 194 | |
| Accruals and deferred income (b) | - | | - | | 130 | | 29 | | 130 | | 29 | |
| Tax on profits | 21 | | 13 | | 42 | | 86 | | 63 | | 99 | |
| |
| |
| |
| |
| |
| |
| |
| | 175 | | 156 | | 226 | | 166 | | 401 | | 322 | |
| |
| |
| |
| |
| |
| |
| |
| | | | | | | | | | | | | |
| (a) | 'Other creditors' for the Rio Tinto Group include deferred consideration of US$250 million (2003: US$219 million) relating to certain assets acquired during 2002 and 2004, of which US$96 million (2003: US$76 million) is due within one year. The deferred consideration is included at its net present value. The amortisation of the discount applied in establishing the net present value is treated as a finance cost. All of the deferred consideration relates to Rio Tinto plc. |
| | Other creditors for Rio Tinto Limited include US$489 million (2003: US$270 million) due to Rio Tinto plc. Dividends payable by Rio Tinto Limited include US$80 million (2003: US$64 million) due to Rio Tinto plc. For Rio Tinto plc US$107 million (2003: US$142 million) of amounts owed to associates relate to balances with Rio Tinto Limited. |
| (b) | 'Accruals and deferred income' include contributions made by governments to the cost of acquiring fixed assets which are to be credited to the profit and loss account over the expected useful economic life of the fixed assets to which they relate. |
A-30
Back to Contents
RIO TINTO PLC - RIO TINTO LIMITED
NOTES TO FINANCIAL STATEMENTS - (continued)
| 20 | Provisions for liabilities and charges |
| | |
| | Post | | Other | | Close down & | | | | | | | |
| | retirement | | employee | | restoration/ | | | | 2004 | | 2003 | |
| | health care | | entitlements | | environmental | | Other | | Total | | Total | |
| |
| |
| |
| |
| |
| |
| |
| | | | | | | | | | US$m | | US$m | |
| Rio Tinto Group | | | | | | | | | | | | |
| At 1 January | 498 | | 337 | | 2,092 | | 211 | | 3,138 | | 2,562 | |
| Adjustment on currency translation | 9 | | 11 | | 71 | | 2 | | 93 | | 335 | |
| Capitalisation of additional closure costs (note 12) | - | | - | | 260 | | - | | 260 | | 167 | |
| Charged/(released) to profit for the year | 43 | | 57 | | 53 | | (6 | ) | 147 | | 154 | |
| Exceptional charge (note 4) | - | | - | | - | | 149 | | 149 | | | |
| Amortisation of discount related to provisions | - | | - | | 95 | | 5 | | 100 | | 89 | |
| Utilised in year: | | | | | | | | | | | | |
| provisions set up on acquisition of businesses | - | | - | | - | | (3 | ) | (3 | ) | (4 | ) |
| other provisions | (26 | ) | (84 | ) | (51 | ) | (22 | ) | (183 | ) | (155 | ) |
| Subsidiaries sold | (1 | ) | (10 | ) | (62 | ) | - | | (73 | ) | (7 | ) |
| Transfers and other movements | - | | (19 | ) | 31 | | 11 | | 23 | | (3 | ) |
| |
| |
| |
| |
| |
| |
| |
| | 523 | | 292 | | 2,489 | | 347 | | 3,651 | | 3,138 | |
| |
| |
| |
| |
| |
| |
| |
| Provision for deferred taxation (note 21) | | | | | | | | | 1,407 | | 1,398 | |
| | | | | | | | | |
| |
| |
| Provisions for liabilities and charges per balance sheet | | | | | | | | | 5,058 | | 4,536 | |
| | | | | | | | | |
| |
| |
| | | | | | | | | | | | | |
| | Post | | Other | | Close down & | | | | | | | |
| | retirement | | employee | | restoration/ | | | | 2004 | | 2003 | |
| | health care | | entitlements | | environmental | | Other | | Total | | Total | |
| |
| |
| |
| |
| |
| |
| |
| | | | | | | | | | US$m | | US$m | |
| Rio Tinto plc - part of Rio Tinto Group | | | | | | | | | | | | |
| At 1 January | 444 | | 84 | | 1,215 | | 60 | | 1,803 | | 1,621 | |
| Adjustment on currency translation | 6 | | 1 | | 23 | | (1 | ) | 29 | | 59 | |
| Capitalisation of additional closure costs (note 12) | - | | - | | 105 | | - | | 105 | | 67 | |
| Charged/(released) to profit for the year | 33 | | 24 | | 53 | | (1 | ) | 109 | | 60 | |
| Exceptional charges | - | | - | | - | | 149 | | 149 | | | |
| Amortisation of discount related to provisions | - | | - | | 51 | | 5 | | 56 | | 55 | |
| Utilised in year: | | | | | | | | | | | | |
| provisions set up on acquisition of businesses | - | | - | | - | | - | | - | | - | |
| other provisions | (24 | ) | (44 | ) | (25 | ) | (8 | ) | (101 | ) | (62 | ) |
| Subsidiaries sold | - | | - | | (52 | ) | - | | (52 | ) | | |
| Transfers and other movements | - | | - | | 13 | | 17 | | 30 | | 3 | |
| |
| |
| |
| |
| |
| |
| |
| | 459 | | 65 | | 1,383 | | 221 | | 2,128 | | 1,803 | |
| |
| |
| |
| |
| |
| |
| |
| Provision for deferred taxation (note 21) | | | | | | | | | 742 | | 740 | |
| | | | | | | | | |
| |
| |
| Provisions for liabilities and charges per balance sheet | | | | | | | | | 2,870 | | 2,543 | |
| | | | | | | | | |
| |
| |
| | | | | | | | | | | | | |
| | Post | | Other | | Close down & | | | | | | | |
| | retirement | | employee | | restoration/ | | | | 2004 | | 2003 | |
| | health care | | entitlements | | environmental | | Other | | Total | | Total | |
| |
| |
| |
| |
| |
| |
| |
| | | | | | | | | | US$m | | US$m | |
| Rio Tinto Limited - part of Rio Tinto Group | | | | | | | | | | | | |
| At 1 January | 54 | | 253 | | 877 | | 151 | | 1,335 | | 941 | |
| Adjustment on currency translation | 3 | | 10 | | 48 | | 3 | | 64 | | 276 | |
| Capitalisation of additional closure costs (note 12) | - | | - | | 155 | | - | | 155 | | 100 | |
| Charged/(released) to profit for the year | 10 | | 33 | | - | | (5 | ) | 38 | | 94 | |
| Exceptional charges | - | | - | | - | | - | | - | | - | |
| Amortisation of discount related to provisions | - | | - | | 44 | | - | | 44 | | 34 | |
| Utilised in year: | | | | | | | | | | | | |
| provisions set up on acquisition of businesses | - | | - | | - | | (3 | ) | (3 | ) | (4 | ) |
| other provisions | (2 | ) | (40 | ) | (26 | ) | (14 | ) | (82 | ) | (93 | ) |
| Subsidiaries sold | (1 | ) | (10 | ) | (10 | ) | - | | (21 | ) | (7 | ) |
| Transfers and other movements | - | | (19 | ) | 18 | | (6 | ) | (7 | ) | (6 | ) |
| |
| |
| |
| |
| |
| |
| |
| | 64 | | 227 | | 1,106 | | 126 | | 1,523 | | 1,335 | |
| |
| |
| |
| |
| |
| |
| |
| Provision for deferred taxation (note 21) | | | | | | | | | 665 | | 658 | |
| | | | | | | | | |
| |
| |
| Provision for liabilities and charges per balance sheet | | | | | | | | | 2,188 | | 1,993 | |
| | | | | | | | | |
| |
| |
A-31
Back to Contents
RIO TINTO PLC - RIO TINTO LIMITED
NOTES TO FINANCIAL STATEMENTS - (continued)
| 20 | Provisions for liabilities and charges (continued) |
| | |
| (a) | The main assumptions used to determine the provision for post retirement healthcare are disclosed in note 40. The provision is expected to be utilised over the next 15 to 20 years. |
| (b) | The provision for other employee entitlements includes pension entitlements of US$53 million and a provision for long service leave, based on the relevant entitlements in certain Group operations. Some US$64 million is expected to be utilised within the next year. |
| (c) | The Group's policy on close down and restoration costs is shown in note 1(l). Close down and restoration costs are a normal consequence of mining, and the majority of close down and restoration expenditure is incurred at the end of the life of the mine. Remaining lives of mines and infrastructure range from 2 to over 50 years with an average, weighted by discounted closure provision, of around 16 years. Although the ultimate cost to be incurred is uncertain, subsidiary companies have estimated their respective costs based on feasibility and engineering studies using current restoration standards and techniques. Provisions of US$2,489 million for close down and restoration costs and for environmental clean up obligations include estimates of the effect of future inflation and have been discounted to their present value at an average of approximately six per cent per annum, being an estimate of the risk free pre-tax cost of borrowing. Excluding the effects of future inflation, but before discounting, the provision is equivalent to some US$4.1 billion. |
| (d) | Some US$142 million of environmental clean up expenditure is expected to take place within the next five years. The remainder includes amounts for the operation and maintenance of remediation facilities in later years. The provision for environmental expenditure includes the issue described in (e) below. |
| (e) | In 1995, Kennecott Utah Copper ('KUC') agreed with the US Environmental Protection Agency (‘EPA’) and the State of Utah to complete certain source control projects and perform specific environmental studies regarding contamination of groundwater in the vicinity of the Bingham Canyon mine. A remedial investigation and feasibility study on the South Zone groundwater contamination, completed in March 1998, identified a range of alternative measures to address this issue pursuant to KUC’s obligation to prevent the further spread of groundwater contamination and to acquire, restore or replace water for the public in the affected area.
Provisions for such environmental obligations had been established in 1989, when KUC was acquired by Rio Tinto and these provisions were updated from time to time taking account of the latest information about future costs. At the start of 2002, a provision of US$273 million had been included in the balance sheet for control and remediation of groundwater contamination, which was based on the expected future cash flows relating to the remediation plan determined at that time, discounted to present value.
Action had been taken, by 2000, to prevent further spread of groundwater contamination. Facilities for filtration of the water and treatment of the contaminants were tested. However, in 2002, following discussions with the EPA a modified plan was developed to accommodate the views expressed by the EPA, which required changes in the methodology for treatment of contaminated groundwater. The provision for the net present value of the expected costs of construction and operation of treatment plants was accordingly increased by US$116 million.
Reviews in 2003 and 2004 of the engineering estimates did not require any modifications to the 2002 estimated cost of remediation. However, in 2004 KUC adopted a new long-term mine plan which would lead to earlier payment of the environmental costs than under the previous mine plan. For that reason the discounted amount of the environmental remediation provision increased in 2004 by US$46 million. The timing of the cash outflows relating to the revised remediation plan is reliably determinable. The plan involves costs that will arise during the operating life of KUC and beyond, including costs of management of groundwater that will continue in perpetuity after the closure of the mine. |
| (f) | At KUC, provisions for close down and restoration costs were increased by US$76 million in 2004 based on the current assumption that the expenditure will occur earlier as a result of the change in the mine plan. |
| (g) | Other provisions deal with a variety of issues and include US$35 million relating to the remaining provision for the market valuation of the hedge books held by companies acquired in 2000 and 2001, which will be utilised over the next seven years (see note 28), and US$40 million relating to payments received from employees for accommodation at some sites which are refundable in certain circumstances. |
A-32
Back to Contents
RIO TINTO PLC - RIO TINTO LIMITED
NOTES TO FINANCIAL STATEMENTS - (continued)
| | | | | | | |
| Rio Tinto plc - | Rio Tinto Limited - | |
| part of Rio Tinto Group | part of Rio Tinto Group | Rio Tinto Group |
|
|
|
| 2004 | | 2003 | 2004 | | 2003 | 2004 | | 2003 |
|
|
|
|
|
|
| US$m | US$m | US$m | US$m | US$m | US$m |
| At 1 January | 718 | | 638 | | 663 | | 368 | | 1,381 | | 1,006 | |
| Adjustment on currency translation | 45 | | 52 | | 29 | | 145 | | 74 | | 197 | |
| Reported in the STRGL (a) | 3 | | - | | 10 | | 162 | | 13 | | 162 | |
| Subsidiaries acquired/sold | (2 | ) | - | | 2 | | 6 | | - | | 6 | |
| (Released)/charged to profit for the year | (72 | ) | (19 | ) | (41 | ) | (6 | ) | (113 | ) | (25 | ) |
| Other movements (b) | 29 | | 47 | | (19 | ) | (12 | ) | 10 | | 35 | |
| |
| |
| |
| |
| |
| |
| |
| | 721 | | 718 | | 644 | | 663 | | 1,365 | | 1,381 | |
| |
| |
| |
| |
| |
| |
| |
| Included in provisions for liabilities and charges | 742 | | 740 | | 665 | | 658 | | 1,407 | | 1,398 | |
| Included in accounts receivable | (21 | ) | (22 | ) | (21 | ) | 5 | | (42 | ) | (17 | ) |
| |
| |
| |
| |
| |
| |
| |
| | 721 | | 718 | | 644 | | 663 | | 1,365 | | 1,381 | |
| |
| |
| |
| |
| |
| |
| |
| (a) | The amounts reported in the Statement of Total Recognised Gains and Losses relate to the provisions for tax relief on exchange differences on net debt recorded directly in reserves. |
| (b) | 'Other movements' include deferred tax recognised by subsidiary holding companies that is presented in these accounts as part of the tax charge on the profits of the joint ventures and associates to which it relates. |
| | | | | | Other | | | | | |
| Rio Tinto Group | UK | Australian | countries' | 2004 | 2003 |
| tax | tax | tax | Total | Total |
| Provided in the accounts |
|
|
|
|
|
| | | | | US$m | US$m |
| Deferred tax assets | 13 | | 315 | | 1,208 | | 1,536 | | 1,369 | |
| Deferred tax liabilities | (130 | ) | (983 | ) | (1,788 | ) | (2,901 | ) | (2,750 | ) |
| |
| |
| |
| |
| |
| |
| Balance as shown above | (117 | ) | (668 | ) | (580 | ) | (1,365 | ) | (1,381 | ) |
| |
| |
| |
| |
| |
| |
| Comprising: | | | | | | | | | | |
| Accelerated capital allowances | (6 | ) | (608 | ) | (1,018 | ) | (1,632 | ) | (1,574 | ) |
| Other timing differences | (124 | ) | (79 | ) | 247 | | 44 | | (89 | ) |
| Tax losses | 13 | | 19 | | 191 | | 223 | | 282 | |
| |
| |
| |
| |
| |
| |
| Balance as shown above | (117 | ) | (668 | ) | (580 | ) | (1,365 | ) | (1,381 | ) |
| |
| |
| |
| |
| |
| |
| | | | | | Other | | | | | |
| Rio Tinto plc - part of Rio Tinto Group | UK | Australian | countries' | 2004 | 2003 |
| tax | tax | tax | Total | Total |
| Provided in the accounts |
|
|
|
|
|
| | | | | US$m | US$m |
| Deferred tax assets | 13 | | 1 | | 1,128 | | 1,142 | | 886 | |
| Deferred tax liabilities | (130 | ) | - | | (1,733 | ) | (1,863 | ) | (1,604 | ) |
| |
| |
| |
| |
| |
| |
| Balance as shown above | (117 | ) | 1 | | (605 | ) | (721 | ) | (718 | ) |
| |
| |
| |
| |
| |
| |
| Comprising: | | | | | | | | | | |
| Accelerated capital allowances | (6 | ) | 1 | | (1,031 | ) | (1,036 | ) | (893 | ) |
| Other timing differences | (124 | ) | - | | 241 | | 117 | | (58 | ) |
| Tax losses | 13 | | - | | 185 | | 198 | | 233 | |
| |
| |
| |
| |
| |
| |
| Balance as shown above | (117 | ) | 1 | | (605 | ) | (721 | ) | (718 | ) |
| |
| |
| |
| |
| |
| |
| | | | | | Other | | | | | |
| Rio Tinto Limited - part of Rio Tinto Group | UK | | Australian | | countries' | | 2004 | | 2003 | |
| tax | | tax | | tax | | Total | | Total | |
| Provided in the accounts |
| |
| |
| |
| |
| |
| | | | | | | | US$m | | US$m | |
| Deferred tax assets | - | | 314 | | 80 | | 394 | | 483 | |
| Deferred tax liabilities | - | | (983 | ) | (55 | ) | (1,038 | ) | (1,146 | ) |
| |
| |
| |
| |
| |
| |
| Balance as shown above | - | | (669 | ) | 25 | | (644 | ) | (663 | ) |
| |
| |
| |
| |
| |
| |
| Comprising: | | | | | | | | | | |
| Accelerated capital allowances | - | | (609 | ) | 13 | | (596 | ) | (681 | ) |
| Other timing differences | - | | (79 | ) | 6 | | (73 | ) | (31 | ) |
| Tax losses | - | | 19 | | 6 | | 25 | | 49 | |
| |
| |
| |
| |
| |
| |
| Balance as shown above | - | | (669 | ) | 25 | | (644 | ) | (663 | ) |
| |
| |
| |
| |
| |
| |
| (c) | US$342 million (2003: US$380 million) of potential deferred tax assets have not been recognised as an asset in these accounts. There is no time limit for the recovery of these potential assets. This total includes US$298 million (2003: US$306 million) of United States Alternative Minimum Tax credits and US tax losses for which recovery is dependent on the level of taxable profits in the US tax group and US$44 million (2003: US$74 million) of tax losses arising in countries other than the US. |
| (d) | There is a limited time period for the recovery of US$6 million (2003: US$26 million) of tax losses which have been recognised as deferred tax assets in the accounts. |
A-33
Back to Contents
RIO TINTO PLC - RIO TINTO LIMITED
NOTES TO FINANCIAL STATEMENTS - (continued)
| 22 | Medium and long term borrowings |
| | |
| | Rio Tinto plc - | | Rio Tinto Limited - | | | | | |
| | part of Rio Tinto Group | | part of Rio Tinto Group | | Rio Tinto Group | |
| |
| |
| |
| |
| | 2004 | | 2003 | | 2004 | | 2003 | | 2004 | | 2003 | |
| |
| |
| |
| |
| |
| |
| |
| | US$m | | US$m | | US$m | | US$m | | US$m | | US$m | |
| At 1 January | 2,027 | | 2,729 | | 3,868 | | 3,184 | | 5,895 | | 5,913 | |
| Adjustment on currency translation | 18 | | 92 | | 7 | | 92 | | 25 | | 184 | |
| Subsidiaries sold | (12 | ) | - | | - | | - | | (12 | ) | - | |
| Loans drawn down | 70 | | 602 | | 135 | | 1,215 | | 205 | | 1,817 | |
| Loan repayments | (485 | ) | (1,396 | ) | (1,553 | ) | (623 | ) | (2,038 | ) | (2,019 | ) |
| |
| |
| |
| |
| |
| |
| |
| At 31 December | 1,618 | | 2,027 | | 2,457 | | 3,868 | | 4,075 | | 5,895 | |
| Deduct: short term | (166 | ) | (468 | ) | (572 | ) | (1,578 | ) | (738 | ) | (2,046 | ) |
| |
| |
| |
| |
| |
| |
| |
| Medium and long term borrowings | 1,452 | | 1,559 | | 1,885 | | 2,290 | | 3,337 | | 3,849 | |
| |
| |
| |
| |
| |
| |
| |
| Borrowings at 31 December | | | | | | | | | | | | |
| Commercial paper | - | | 276 | | - | | 1,411 | | - | | 1,687 | |
| | | | | | | | | | | | | |
| Bank loans | | | | | | | | | | | | |
| Secured | 30 | | 41 | | 251 | | 109 | | 281 | | 296 | |
| Unsecured | 106 | | 173 | | 117 | | 262 | | 223 | | 289 | |
| |
| |
| |
| |
| |
| |
| |
| | 136 | | 214 | | 368 | | 371 | | 504 | | 585 | |
| Other loans | | | | | | | | | | | | |
| Secured | | | | | | | | | | | | |
| Loans | 3 | | 12 | | 30 | | 35 | | 33 | | 47 | |
| Finance leases | 84 | | 99 | | 16 | | 20 | | 100 | | 119 | |
| Unsecured | | | | | | | | | | | | |
| Rio Tinto Finance (USA) Limited Bonds 5.75% 2006 | - | | - | | 500 | | 500 | | 500 | | 500 | |
| Rio Tinto Finance (USA) Limited Bonds 2.625% 2008 | - | | - | | 600 | | 600 | | 600 | | 600 | |
| Rio Tinto Finance (USA) Limited Bonds 7.125% 2013 | - | | - | | 100 | | 100 | | 100 | | 100 | |
| European Medium Term Notes (b) | 1,237 | | 1,237 | | 262 | | 381 | | 1,499 | | 1,618 | |
| North Finance (Bermuda) Limited 7% 2005 | - | | - | | 200 | | 200 | | 200 | | 200 | |
| Other unsecured loans | 158 | | 189 | | 381 | | 250 | | 539 | | 439 | |
| |
| |
| |
| |
| |
| |
| |
| | 1,482 | | 1,537 | | 2,089 | | 2,086 | | 3,571 | | 3,623 | |
| |
| |
| |
| |
| |
| |
| |
| Total borrowings | 1,618 | | 2,027 | | 2,457 | | 3,868 | | 4,075 | | 5,895 | |
| |
| |
| |
| |
| |
| |
| |
| (a) | The majority of the fixed rate borrowings shown above are swapped to floating rates. Details of interest rate and currency swaps and of available standby credit facilities are shown in note 28. |
| (b) | The Group has a US$3 billion European Medium Term Note programme for the issuance of short to medium term debt of which US$1.5 billion was drawn down at 31 December 2004. |
| (c) | Intragroup borrowings between the Rio Tinto plc and Rio Tinto Limited parts of the Group are included in 'Loans made by Rio Tinto plc and its subsidiaries' and 'Accounts payable and accruals'. |
| (d) | Rio Tinto Finance (USA) Limited is a 100 per cent owned finance subsidiary of Rio Tinto Limited. Rio Tinto Limited and Rio Tinto plc have fully and unconditionally guaranteed the securities issued by Rio Tinto Finance (USA) Limited. |
A-34
Back to Contents
RIO TINTO PLC - RIO TINTO LIMITED
NOTES TO FINANCIAL STATEMENTS - (continued)
| 23 Net debt | | | | | | | | | | |
| | | | | | | | | | | |
Analysis of changes in consolidated net debt:
Rio Tinto Group | FRS 1 | | | | Liquid | | 2004 | | 2003 | |
| cash (a) | | Borrowings | | resources (a) | | Net debt | | Net debt | |
| |
| |
| |
| |
| |
| US$m | | US$m | | US$m | | US$m | | US$m | |
| | | | | | | | | | | |
| At 1 January | 41 | | (5,895 | ) | 208 | | (5,646 | ) | (5,747 | ) |
| Adjustment on currency translation | (13 | ) | (25 | ) | 4 | | (34 | ) | (123 | ) |
| Subsidiaries sold | - | | 12 | | (4 | ) | 8 | | - | |
| Per cash flow statement | 178 | | 1,833 | | (90 | ) | 1,921 | | 224 | |
| |
| |
| |
| |
| |
| |
| At 31 December | 206 | | (4,075 | ) | 118 | | (3,751 | ) | (5,646 | ) |
| |
| |
| |
| |
| |
| |
| | | | | | | | | | | |
| | FRS 1 | | | | Liquid | | 2004 | | 2003 | |
| | cash (a) | | Borrowings | | resources (a) | | Net debt | | Net debt | |
| Rio Tinto plc - part of Rio Tinto Group |
| |
| |
| |
| |
| |
| US$m | | US$m | | US$m | | US$m | | US$m | |
| | | | | | | | | | | |
| At 1 January | 36 | | (2,027 | ) | 149 | | (1,842 | ) | (2,625 | ) |
| Adjustment on currency translation | (13 | ) | (18 | ) | 1 | | (30 | ) | (112 | ) |
| Subsidiaries sold | - | | 12 | | (4 | ) | 8 | | - | |
| Per cash flow statement | 44 | | 415 | | (96 | ) | 363 | | 895 | |
| |
| |
| |
| |
| |
| |
| At 31 December | 67 | | (1,618 | ) | 50 | | (1,501 | ) | (1,842 | ) |
| |
| |
| |
| |
| |
| |
| | | | | | | | | | | |
| | FRS 1 | | | | Liquid | | 2004 | | 2003 | |
| | cash (a) | | Borrowings | | resources (a) | | Net debt | | Net debt | |
| |
| |
| |
| |
| |
| |
| Rio Tinto Limited - part of Rio Tinto Group | US$m | | US$m | | US$m | | US$m | | US$m | |
| | | | | | | | | | | |
| At 1 January | 5 | | (3,868 | ) | 59 | | (3,804 | ) | (3,122 | ) |
| Adjustment on currency translation | - | | (7 | ) | 3 | | (4 | ) | (11 | ) |
| Subsidiaries sold | - | | - | | - | | - | | - | |
| Per cash flow statement | 134 | | 1,418 | | 6 | | 1,558 | | (671 | ) |
| |
| |
| |
| |
| |
| |
| At 31 December | 139 | | (2,457 | ) | 68 | | (2,250 | ) | (3,804 | ) |
| |
| |
| |
| |
| |
| |
| (a) | A reconciliation of these figures to their respective balance sheet categories is shown in note 17. |
| | |
| | Rio Tinto plc - | | Rio Tinto Limited - | | | | | |
| | part of Rio Tinto Group | | part of Rio Tinto Group | | Rio Tinto Group | |
| |
| |
| |
| |
| | 2004 | | 2003 | | 2004 | | 2003 | | 2004 | | 2003 | |
| |
| |
| |
| |
| |
| |
| |
| | US$m | | US$m | | US$m | | US$m | | US$m | | US$m | |
| Reconciliation of cash flow to movement in net debt | | | | | | | | | | | | |
| Increase/(decrease) in cash per cash flow statement | 44 | | (9 | ) | 134 | | (74 | ) | 178 | | (83 | ) |
| Decrease/(increase) in borrowings | 415 | | 794 | | 1,418 | | (592 | ) | 1,833 | | 202 | |
| (Decrease)/increase in liquid resources | (96 | ) | 110 | | 6 | | (5 | ) | (90 | ) | 105 | |
| |
| |
| |
| |
| |
| |
| |
| Decrease/(increase) in net debt | 363 | | 895 | | 1,558 | | (671 | ) | 1,921 | | 224 | |
| |
| |
| |
| |
| |
| |
| |
| Net cash flow from movement in liquid resources comprises: | | | | | | | | | | | | |
| (Decrease)/increase in time deposits | (96 | ) | 110 | | 6 | | 3 | | (90 | ) | 113 | |
| Decrease in other liquid investments | - | | - | | - | | (8 | ) | - | | (8 | ) |
| |
| |
| |
| |
| |
| |
| |
| Net cash outflow/(inflow) | (96 | ) | 110 | | 6 | | (5 | ) | (90 | ) | 105 | |
| |
| |
| |
| |
| |
| |
| |
A-35
Back to Contents
RIO TINTO PLC - RIO TINTO LIMITED
NOTES TO FINANCIAL STATEMENTS - (continued)
| 24 | Share capital - Rio Tinto plc |
| | |
| | 2004 | | 2003 | | 2004 | | 2003 | |
| |
| |
| |
| |
| |
| | Number(m) | | Number(m) | | US$m | | US$m | |
| Share capital account | | | | | | | | |
| At 1 January | 1,066.67 | | 1,065.48 | | 155 | | 154 | |
| Ordinary shares issued | 1.35 | | 1.19 | | - | | 1 | |
| |
| |
| |
| |
| |
| At 31 December | 1,068.02 | | 1,066.67 | | 155 | | 155 | |
| |
| |
| |
| |
| |
| Issued and fully paid share capital | | | | | | | | |
| Special voting share of 10p (d) | 1 only | | 1 only | | - | | - | |
| DLC dividend share (d) | 1 only | | 1 only | | - | | - | |
| Ordinary shares of 10p each (equity) | 1,068.02 | | 1,066.67 | | 155 | | 155 | |
| | | | | |
| |
| |
| Total issued share capital | | | | | 155 | | 155 | |
| | | | | |
| |
| |
| Unissued share capital | | | | | | | | |
| Ordinary shares of 10p each | 352.01 | | 353.36 | | 51 | | 51 | |
| Equalisation share of 10p (d) | 1 only | | 1 only | | - | | - | |
| |
| |
| |
| |
| |
| Total authorised share capital | 1,420.03 | | 1,420.03 | | 206 | | 206 | |
| |
| |
| |
| |
| |
| Options outstanding | | | | | | | | |
| Options outstanding at 1 January | 9.61 | | 9.34 | | | | | |
| - granted | 1.54 | | 2.70 | | | | | |
| - exercised | (1.15 | ) | (1.43 | ) | | | | |
| - cancelled | (0.27 | ) | (1.00 | ) | | | | |
| |
| |
| | | | | |
| Options outstanding at 31 December (b) | 9.73 | | 9.61 | | | | | |
| |
| |
| | | | | |
| (a) | 1,346,874 Ordinary shares were issued during the year resulting from the exercise of options under Rio Tinto plc employee share option schemes at prices between 521p and 1,107p (2003: 1,192,702 shares at prices between 521p and 1,061p). |
| (b) | At 31 December 2004, options over the following number of Ordinary shares were outstanding: |
| | -nil under the Rio Tinto plc Executive Share Option Scheme 1985 (31 December 2003: 23,000 shares at price of 861p). |
| | -8,053,292 under the Rio Tinto Share Option Plan 1998 at prices between 808.8p and 1,458.6p (31 December 2003: 7,662,925 shares at prices between 808.8p and 1458.6p). The exercise of share options is subject to the satisfaction of a graduated performance condition set by the Remuneration committee at various dates up to April 2014. |
| | -1,679,702 under the Rio Tinto plc Share Savings Plan at prices between 711p and 1,277p and exercisable at various dates up to June 2010 (31 December 2003: 1,920,430 shares at prices between 521p and 1,150p). |
| (c) | At the 2004 annual general meeting the shareholders resolved to renew the general authority for the company to buy back up to 10 per cent (within any 12 months) of its Ordinary shares of 10p each for a further period of 18 months. This approval was renewed at the annual general meeting in 2005. During the year to 31 December 2004, no shares were bought back (2003: nil). |
| (d) | The 'special voting share' was issued to facilitate the joint voting by shareholders of Rio Tinto plc and Rio Tinto Limited on Joint Decisions, following the DLC merger. Directors have the ability to issue an equalisation share if that is required under the terms of the DLC Merger Sharing Agreement. The 'DLC dividend share' was issued to facilitate the efficient management of funds within the DLC structure. |
| (e) | The aggregate consideration received for shares issued during 2004 was US$21 million (2003: US$20 million). |
Further information on share options is given in note 42 'Reconciliation to US Accounting Principles'.
A-36
Back to Contents
RIO TINTO PLC - RIO TINTO LIMITED
NOTES TO FINANCIAL STATEMENTS - (continued)
| 24 | Share capital - Rio Tinto Limited (100 per cent) |
| | |
| | 2004 | | 2003 | | 2004 | | 2003 | |
| |
| |
| |
| |
| |
| | Number(m) | | Number(m) | | US$m | | US$m | |
| Share capital account | | | | | | | | |
| At 1 January | 499.06 | | 498.82 | | 1,280 | | 964 | |
| Adjustment on currency translation | - | | - | | 51 | | 311 | |
| Share issues | 0.28 | | 0.24 | | 5 | | 5 | |
| |
| |
| |
| |
| |
| At 31 December | 499.34 | | 499.06 | | 1,336 | | 1,280 | |
| |
| |
| |
| |
| |
| Options outstanding | | | | | | | | |
| Options outstanding at 1 January | 6.00 | | 4.69 | | | | | |
| - granted | 1.34 | | 1.63 | | | | | |
| - exercised | (0.22 | ) | (0.07 | ) | | | | |
| - cancelled | (0.38 | ) | (0.25 | ) | | | | |
| |
| |
| | | | | |
| Options outstanding at 31 December (d) | 6.74 | | 6.00 | | | | | |
| |
| |
| | | | | |
| (a) | 280,332 (2003: 240,466) shares were issued during the year, of which 223,617 (2003: 71,563) resulted from the exercise of share options under various Rio Tinto Limited employee share option schemes at prices between A$20.14 and A$27.86 (2003: A$20.37 and A$27.86) and 56,715 (2003: 168,903) from the vesting of shares under the Rio Tinto Mining Companies Comparative Plan. |
| (b) | Rio Tinto Limited is authorised by shareholder approvals obtained in 2004 to buyback up to all the Rio Tinto Limited shares held by Tinto Holdings Australia Pty Limited (a wholly owned subsidiary of Rio Tinto plc) plus, on-market, up to ten per cent of the publicly held shares in any 12 month period. This approval was renewed at the Rio Tinto Limited annual general meeting in 2005. During the year to 31 December 2004 no shares were bought back (2003: nil). |
| (c) | Total share capital in issue at 31 December 2004 was 499.3 million plus one special voting share and one DLC dividend share (31 December 2003: 499.1 million plus one special voting share and one DLC dividend share). The 'special voting share' was issued to facilitate the joint voting by shareholders of Rio Tinto Limited and Rio Tinto plc on Joint Decisions following the DLC merger. Directors have the ability to issue an equalisation share if that is required under the terms of the DLC Merger Sharing Agreement. The 'DLC dividend share' was issued to facilitate the efficient management of funds within the DLC structure. |
| (d) | At 31 December 2004, options over the following number of shares were outstanding: |
| | -4,073,599 shares under the Rio Tinto Share Option Plans 1998 & 2004 at prices between A$20.37 and A$39.87 ('31 December' 2003: 3,602,137 shares at prices between A$20.14 and A$39.87). These share options are exercisable at various dates up to April 2014, subject to the satisfaction of a graduated performance condition set by the Remuneration committee. |
| | -2,651,980 shares under the Rio Tinto Limited Share Savings Plan at prices between A$25.57 and A$29.04 (31 December 2003: 2,385,453 shares at prices between A$25.57 and A$27.86). These share options are exercisable at various dates up to June 2010. |
| (e) | The aggregate consideration received for shares issued during 2004 was US$5 million (2003: US$5 million). |
| | |
| 24(a) | Post Balance Sheet events |
| | In May 2005 Rio Tinto Limited bought back approximately 27.3 million shares from shareholders other than Rio Tinto plc for approximately A$1 billion, through an off market tender. In addition Rio Tinto Limited bought back approximately 16.4 million shares held by a wholly owned subsidiary of Rio Tinto plc. Rio Tinto plc's proportional shareholding in Rio Tinto Limited did not change as a result of the off-market buy-back. |
A-37
Back to Contents
RIO TINTO PLC - RIO TINTO LIMITED
NOTES TO FINANCIAL STATEMENTS - (continued)
25 Share premium and reserves
| | Rio Tinto plc - | | Rio Tinto Limited - | | | | | |
| | part of Rio Tinto Group | | part of Rio Tinto Group | | Rio Tinto Group | |
| |
| |
| |
| |
| | 2004 | | 2003 | | 2004 | | 2003 | | 2004 | | 2003 | |
| |
| |
| |
| |
| |
| |
| |
| | US$m | | US$m | | US$m | | US$m | | US$m | | US$m | |
| | | | | | | | | | | | | |
| Share premium account | | | | | | | | | | | | |
| At 1 January | 1,629 | | 1,610 | | - | | - | | 1,629 | | 1,610 | |
| Premium on issues of ordinary shares | 21 | | 19 | | - | | - | | 21 | | 19 | |
| |
| |
| |
| |
| |
| |
| |
| At 31 December | 1,650 | | 1,629 | | - | | - | | 1,650 | | 1,629 | |
| |
| |
| |
| |
| |
| |
| |
| | | | | | | | | | | | | |
| Parent and subsidiary companies' profit and loss account | | | | | | | | | | | | |
| At 1 January | 3,529 | | 2,800 | | 2,716 | | 1,156 | | 6,266 | | 3,968 | |
| Adjustment on currency translation (b) | 156 | | 553 | | 325 | | 1,009 | | 487 | | 1,569 | |
| Retained profit for the year | 747 | | 80 | | 790 | | 593 | | 1,538 | | 614 | |
| Goodwill written back on disposal of interest in | | | | | | | | | | | | |
| operation (c) | 228 | | - | | - | | - | | 228 | | - | |
| Transfers and other movements (d) | 56 | | 96 | | (8 | ) | (42 | ) | 48 | | 115 | |
| |
| |
| |
| |
| |
| |
| |
| At 31 December | 4,716 | | 3,529 | | 3,823 | | 2,716 | | 8,567 | | 6,266 | |
| |
| |
| |
| |
| |
| |
| |
| | | | | | | | | | | | | |
| Joint ventures' profit and loss account | | | | | | | | | | | | |
| At 1 January | 335 | | 267 | | 193 | | 237 | | 526 | | 504 | |
| Adjustment on currency translation (b) | - | | - | | 1 | | 55 | | 1 | | 53 | |
| Retained profit/(loss) for the year | 158 | | 52 | | 8 | | (37 | ) | 166 | | 15 | |
| Transfers and other movements (d) | 1 | | 16 | | 8 | | (62 | ) | 9 | | (46 | ) |
| |
| |
| |
| |
| |
| |
| |
| At 31 December | 494 | | 335 | | 210 | | 193 | | 702 | | 526 | |
| |
| |
| |
| |
| |
| |
| |
| | | | | | | | | | | | | |
| Associates' profit and loss account | | | | | | | | | | | | |
| At 1 January | 1,434 | | 819 | | 18 | | 67 | | 42 | | 107 | |
| Adjustment on currency translation (b) | 137 | | 483 | | 2 | | 3 | | 4 | | 7 | |
| Retained profit/(loss) for the year | 346 | | 141 | | 2 | | 8 | | 47 | | (3 | ) |
| Transfers and other movements (d) | (41 | ) | (9 | ) | (1 | ) | (60 | ) | (42 | ) | (69 | ) |
| |
| |
| |
| |
| |
| |
| |
| At 31 December | 1,876 | | 1,434 | | 21 | | 18 | | 51 | | 42 | |
| |
| |
| |
| |
| |
| |
| |
| Total profit and loss account | 7,086 | | 5,298 | | 4,054 | | 2,927 | | 9,320 | | 6,834 | |
| |
| |
| |
| |
| |
| |
| |
| | | | | | | | | | | | | |
| Other reserves | | | | | | | | | | | | |
| At 1 January | 261 | | 249 | | 117 | | 86 | | 334 | | 303 | |
| Adjustment on currency translation | 3 | | 12 | | 7 | | 31 | | 7 | | 31 | |
| Transfers and other movements | (16 | ) | - | | 1 | | - | | (15 | ) | - | |
| |
| |
| |
| |
| |
| |
| |
| At 31 December | 248 | | 261 | | 125 | | 117 | | 326 | | 334 | |
| |
| |
| |
| |
| |
| |
| |
| | | | | | | | | | | | | |
| Total reserves | | | | | | | | | | | | |
| - Parent and subsidiary companies | 4,919 | | 3,731 | | 3,948 | | 2,835 | | 8,893 | | 6,585 | |
| - Joint ventures | 492 | | 335 | | 210 | | 191 | | 702 | | 526 | |
| - Associated companies | 1,923 | | 1,493 | | 21 | | 18 | | 51 | | 57 | |
| |
| |
| |
| |
| |
| |
| |
| | 7,334 | | 5,559 | | 4,179 | | 3,044 | | 9,646 | | 7,168 | |
| |
| |
| |
| |
| |
| |
| |
| | | | | | | | | | | | | |
| (a) | A substantial portion of Group reserves are in overseas companies. If these reserves were distributed, there would be a liability to withholding taxes and to corporate tax in the UK and Australia. This would, however, be reduced by double taxation relief. Provision is made in these accounts for such additional tax only to the extent that dividends have been accrued or there is a binding agreement to distribute such past earnings. |
| (b) | Adjustments on currency translation include net of tax exchange gains on net debt of US$139 million (2003: gains of US$715 million), Rio Tinto plc gains of US$59million (2003: gains of US$299 million) and Rio Tinto Limited gains of US$128 million (2003: gains of US$667 million). |
| (c) | The goodwill written back relates to the disposal of the Group's interest in Freeport-McMoRan Copper & Gold Inc. (see note 4). |
| (d) | 'Transfers and other movements' for Rio Tinto plc in 2004 include US$nil (2003: US$102 million) relating to a dividend on the DLC dividend share received from Rio Tinto Limited and US$nil (2003: US$1 million) relating to Rio Tinto Limited share issues (page A-8 note (b)). Other 'Transfers and other movements' relate primarily to the disposal of interests in operations in 2003 and 2004. |
| (e) | At 31 December 2004, cumulative goodwill written off directly to reserves for the Rio Tinto Group amounted to US$2,936 million (2003: US$3,142 million), Rio Tinto plc US$2,518 million (2003: US$2,740 million) and Rio Tinto Limited US$418 million (2003: US$402 million). |
A-38
Back to Contents
RIO TINTO PLC - RIO TINTO LIMITED
NOTES TO FINANCIAL STATEMENTS - (continued)
26 Product analysis - - Rio Tinto Group
| | 2004 | | 2003 | | 2004 | | 2003 | |
| |
| |
| |
| |
| |
| | % | | % | | US$m | | US$m | |
| Operating assets(a) | | | | | | | | |
| Copper, gold and by-products | 16.2 | | 18.2 | | 2,697 | | 2,877 | |
| Iron ore | 28.6 | | 25.0 | | 4,757 | | 3,951 | |
| Coal | 11.5 | | 14.1 | | 1,910 | | 2,234 | |
| Aluminium | 22.2 | | 20.6 | | 3,690 | | 3,261 | |
| Industrial minerals | 12.9 | | 12.9 | | 2,150 | | 2,044 | |
| Diamonds | 7.6 | | 8.0 | | 1,261 | | 1,261 | |
| Other products | 1.0 | | 1.2 | | 144 | | 181 | |
| |
| |
| |
| |
| |
| Total | 100.0 | | 100.0 | | 16,609 | | 15,809 | |
| |
| |
| | | | | |
| Unallocated items | | | | | (274 | ) | (126 | ) |
| Less: net debt | | | | | (3,751 | ) | (5,646 | ) |
| | | | | |
| |
| |
| Net assets | | | | | 12,584 | | 10,037 | |
| | | | | |
| |
| |
| | 2004 | | 2003 | | 2002 | | 2004 | | 2003 | | 2002 | |
| |
| |
| |
| |
| |
| |
| |
| | % | | % | | % | | US$m | | US$m | | US$m | |
| Gross turnover(e) | | | | | | | | | | | | |
| Copper | 15.3 | | 12.4 | | 12.3 | | 2,233 | | 1,507 | | 1,372 | |
| Gold (all sources) | 4.3 | | 8.8 | | 9.4 | | 634 | | 1,068 | | 1,046 | |
| Iron ore | 20.1 | | 18.8 | | 16.6 | | 2,932 | | 2,273 | | 1,843 | |
| Coal | 18.2 | | 17.6 | | 19.9 | | 2,665 | | 2,137 | | 2,211 | |
| Aluminium | 16.7 | | 15.7 | | 15.5 | | 2,441 | | 1,906 | | 1,723 | |
| Industrial minerals | 14.9 | | 16.2 | | 18.0 | | 2,175 | | 1,964 | | 1,997 | |
| Diamonds | 5.1 | | 4.6 | | 3.3 | | 744 | | 556 | | 372 | |
| Other products | 5.4 | | 5.9 | | 5.0 | | 784 | | 708 | | 555 | |
| |
| |
| |
| |
| |
| |
| |
| Total | 100.0 | | 100.0 | | 100.0 | | 14,608 | | 12,119 | | 11,119 | |
| |
| |
| |
| |
| |
| |
| |
| Profit before tax | | | | | | | | | | | | |
| Copper, gold and by-products | 31.5 | | 27.3 | | 19.0 | | 1,186 | | 680 | | 536 | |
| Iron ore | 23.1 | | 30.1 | | 24.2 | | 869 | | 748 | | 680 | |
| Coal | 13.7 | | 10.2 | | 18.5 | | 516 | | 255 | | 520 | |
| Aluminium | 13.3 | | 11.5 | | 13.0 | | 501 | | 287 | | 365 | |
| Industrial minerals | 9.7 | | 11.5 | | 19.9 | | 366 | | 286 | | 559 | |
| Diamonds | 7.6 | | 7.5 | | 3.4 | | 288 | | 187 | | 96 | |
| Other products | 1.1 | | 1.9 | | 2.0 | | 40 | | 46 | | 58 | |
| |
| |
| |
| |
| |
| |
| |
| | 100.0 | | 100.0 | | 100.0 | | 3,766 | | 2,489 | | 2,814 | |
| |
| |
| |
| | | | | | | |
| Exploration and evaluation | | | | | | | (187 | ) | (127 | ) | (130 | ) |
| Net interest (c) | | | | | | | (113 | ) | (139 | ) | (161 | ) |
| Other items | | | | | | | (232 | ) | (255 | ) | (118 | ) |
| | | | | | | |
| |
| |
| |
| | | | | | | | 3,234 | | 1,968 | | 2,405 | |
| Exceptional items (d) | | | | | | | 362 | | 126 | | (1,094 | ) |
| | | | | | | |
| |
| |
| |
| Total | | | | | | | 3,596 | | 2,094 | | 1,311 | |
| | | | | | | |
| |
| |
| |
| Net earnings | | | | | | | | | | | | |
| Copper, gold and by-products | 33.8 | | 27.1 | | 20.8 | | 861 | | 429 | | 369 | |
| Iron ore | 22.4 | | 31.6 | | 25.6 | | 569 | | 500 | | 455 | |
| Coal | 13.8 | | 10.3 | | 17.9 | | 350 | | 163 | | 318 | |
| Aluminium | 13.1 | | 11.9 | | 14.5 | | 334 | | 189 | | 257 | |
| Industrial minerals | 9.3 | | 10.0 | | 16.4 | | 236 | | 159 | | 292 | |
| Diamonds | 6.6 | | 7.0 | | 3.5 | | 169 | | 111 | | 63 | |
| Other products | 1 | | 2.1 | | 1.3 | | 25 | | 33 | | 22 | |
| |
| |
| |
| |
| |
| |
| |
| | 100.0 | | 100.0 | | 100.0 | | 2,544 | | 1,584 | | 1,776 | |
| |
| |
| |
| | | | | | | |
| Exploration and evaluation | | | | | | | (152 | ) | (98 | ) | (109 | ) |
| Net interest (c) | | | | | | | (57 | ) | (59 | ) | (95 | ) |
| Other items | | | | | | | (114 | ) | (45 | ) | (42 | ) |
| | | | | | | |
| |
| |
| |
| | | | | | | | 2,221 | | 1,382 | | 1,530 | |
| Exceptional items (d) | | | | | | | 592 | | 126 | | (879 | ) |
| | | | | | | |
| |
| |
| |
| Total | | | | | | | 2,813 | | 1,508 | | 651 | |
| | | | | | | |
| |
| |
| |
| | | | | | | | | | | | | |
| Note references above are explained on page A-40. | | | | | | | | | | | | |
A-39
Back to Contents
RIO TINTO PLC - RIO TINTO LIMITED
NOTES TO FINANCIAL STATEMENTS - (continued)
26 Product analysis - - Rio Tinto Group (continued)
| Notes |
| (a) | Operating assets of subsidiaries comprise net assets before deducting net debt, less outside shareholders' interests which are calculated by reference to the net assets of the relevant companies (i.e. net of such companies' debt). For joint ventures and associates, Rio Tinto's net investment is shown. |
| (b) | The above analyses include Rio Tinto's shares of the results of joint ventures and associates including interest. |
| (c) | The amortisation of discount is included in the applicable product category. All other financing costs of subsidiaries are shown as Net interest. |
| (d) | Exceptional items are shown separately in the above analysis of 'Profit before tax' and 'Net earnings'. Of the 2004 exceptional items, US$920 million before tax (US$913 million after tax and minority interests) relates to profit on disposal of interests in operations, US$(398) million before tax (US$(161) million after tax and minority interests) relates to Palabora which is part of the 'Copper, gold and by-products' segment and US$160 million before and after tax relates to Colowyo which is part of the 'Coal' segment. |
| (e) | Turnover has been adjusted to reclassify, as turnover, certain amounts charged to customers for freight and handling costs, which previously were deducted from operating costs. The effect was to increase Gross turnover in 2004 by US$473 million (2003: US$364 million, 2002: US$291 million). |
The Group figures on page A-39 include the following amounts for joint ventures:
| | 2004 | | 2003 | |
| |
| |
| |
| | US$m | | US$m | |
| Net investment | | | | |
| Copper, gold and by-products | 1,236 | | 1,072 | |
| Coal | 1,122 | | 1,080 | |
| Other | 74 | | 71 | |
| |
| |
| |
| Total | 2,432 | | 2,223 | |
| |
| |
| |
| | 2004 | | 2003 | | 2002 | |
| |
| |
| |
| |
| | US$m | | US$m | | US$m | |
| Gross turnover(b) | | | | | | |
| Copper | 1,088 | | 625 | | 419 | |
| Gold | 83 | | 283 | | 236 | |
| Coal | 1,123 | | 847 | | 961 | |
| Other | 81 | | 76 | | 51 | |
| |
| |
| |
| |
| Total | 2,375 | | 1,831 | | 1,667 | |
| |
| |
| |
| |
| Profit before tax | | | | | | |
| Copper, gold and by-products | 692 | | 378 | | 232 | |
| Coal | 311 | | 139 | | 285 | |
| Other | 25 | | 3 | | 3 | |
| Exceptional charges | - | | - | | (16 | ) |
| |
| |
| |
| |
| Total | 1,028 | | 520 | | 504 | |
| |
| |
| |
| |
| Net earnings | | | | | | |
| Copper, gold and by-products | 465 | | 256 | | 155 | |
| Coal | 223 | | 102 | | 198 | |
| Other | 21 | | 2 | | 2 | |
| Exceptional charges | - | | - | | (16 | ) |
| |
| |
| |
| |
| | 709 | | 360 | | 339 | |
| |
| |
| |
| |
| The Group figures on page A-39 include the following amounts for associates: | | | | | | |
| | | | 2004 | | 2003 | |
| | | |
| |
| |
| | | | US$m | | US$m | |
| Net investment | | | | | | |
| Copper, gold and by-products | | | 180 | | 362 | |
| Other | | | 67 | | 59 | |
| | | |
| |
| |
| Total | | | 247 | | 421 | |
| | | |
| |
| |
| | | | | | | |
| | 2004 | | 2003 | | 2002 | |
| |
| |
| |
| |
| | US$m | | US$m | | US$m | |
| Gross turnover(b) | | | | | | |
| Copper | 85 | | 185 | | 259 | |
| Gold | 211 | | 411 | | 355 | |
| Other | 138 | | 124 | | 123 | |
| |
| |
| |
| |
| Total | 434 | | 720 | | 737 | |
| |
| |
| |
| |
| Profit before tax | | | | | | |
| Copper, gold and by-products | 120 | | 147 | | 130 | |
| Other | 19 | | 33 | | 59 | |
| |
| |
| |
| |
| Total | 139 | | 180 | | 189 | |
| |
| |
| |
| |
| Net earnings | | | | | | |
| Copper, gold and by-products | 93 | | 77 | | 93 | |
| Other | 12 | | 21 | | 36 | |
| |
| |
| |
| |
| Total | 105 | | 98 | | 129 | |
| |
| |
| |
| |
| (a) | On 30 March 2004 Rio Tinto sold its 13.1 per cent shareholding in Freeport-McMoRan Copper & Gold Inc. which was included in 'Copper,gold and by-products'. |
| (b) | Turnover has been adjusted to reclassify, as turnover, certain amounts charged to customers for freight and handling costs, which previously were deducted from operating costs. The effect was to increase share of joint ventures turnover in 2004 by US$2 million (2003: US$11 million,2002: US$5 million) and to increase share of associates turnover by US$16 million (2003: US$13 million, 2002: US$14 million). |
A-40
Back to Contents
RIO TINTO PLC - RIO TINTO LIMITED
NOTES TO FINANCIAL STATEMENTS - (continued)
| 27 | Geographical analysis - Rio Tinto Group |
| | By country of location |
| | |
| | 2004 | | 2003 | | 2004 | | 2003 | |
| |
| |
| |
| |
| |
| | % | | % | | US$m | | US$m | |
| Operating assets | | | | | | | | |
| North America | 27.4 | | 30.7 | | 4,557 | | 4,846 | |
| Australia and New Zealand | 61.3 | | 55.7 | | 10,176 | | 8,799 | |
| South America | 4.1 | | 4.1 | | 680 | | 652 | |
| Africa | 3.3 | | 3.6 | | 548 | | 577 | |
| Indonesia | 2.4 | | 3.5 | | 398 | | 554 | |
| Europe and other countries | 1.5 | | 2.4 | | 250 | | 381 | |
| |
| |
| |
| |
| |
| Total | 100.0 | | 100.0 | | 16,609 | | 15,809 | |
| |
| |
| | | | | |
| Unallocated items | | | | | (274 | ) | (126 | ) |
| Less: net debt | | | | | (3,751 | ) | (5,646 | ) |
| | | | | |
| |
| |
| Net assets | | | | | 12,584 | | 10,037 | |
| | | | | |
| |
| |
| | | | | | | | | |
| | 2004 | | 2003 | | 2002 | | 2004 | | 2003 | | 2002 | |
| |
| |
| |
| |
| |
| |
| |
| | % | | % | | % | | US$m | | US$m | | US$m | |
| Gross turnover by country of origin(e) | | | | | | | | | | | | |
| North America | 31.2 | | 29.6 | | 30.6 | | 4,553 | | 3,589 | | 3,403 | |
| Australia and New Zealand | 47.9 | | 45.0 | | 42.5 | | 7,000 | | 5,449 | | 4,720 | |
| South America | 7.7 | | 5.7 | | 4.7 | | 1,131 | | 684 | | 527 | |
| Africa | 5.8 | | 5.7 | | 7.2 | | 850 | | 695 | | 804 | |
| Indonesia | 2.2 | | 8.6 | | 9.6 | | 314 | | 1,047 | | 1,061 | |
| Europe and other countries | 5.2 | | 5.4 | | 5.4 | | 760 | | 655 | | 604 | |
| |
| |
| |
| |
| |
| |
| |
| Total | 100.0 | | 100.0 | | 100.0 | | 14,608 | | 12,119 | | 11,119 | |
| |
| |
| |
| |
| |
| |
| |
| | | | | | | | | | | | | |
| | 2004 | | 2003 | | 2002 | | 2004 | | 2003 | | 2002 | |
| |
| |
| |
| |
| |
| |
| |
| | % | | % | | % | | US$m | | US$m | | US$m | |
| Profit before tax | | | | | | | | | | | | |
| North America | 28.3 | | 18.9 | | 17.1 | | 948 | | 399 | | 439 | |
| Australia and New Zealand | 49.8 | | 53.7 | | 57.1 | | 1,666 | | 1,131 | | 1,464 | |
| South America | 18.5 | | 11.1 | | 3.4 | | 619 | | 234 | | 86 | |
| Africa | 1.9 | | 3.1 | | 11.8 | | 65 | | 65 | | 303 | |
| Indonesia | 2.4 | | 16.5 | | 12.2 | | 80 | | 348 | | 312 | |
| Europe and other countries | (0.9 | ) | (3.3 | ) | (1.6 | ) | (31 | ) | (70 | ) | (38 | ) |
| |
| |
| |
| |
| |
| |
| |
| | 100.0 | | 100.0 | | 100.0 | | 3,347 | | 2,107 | | 2,566 | |
| |
| |
| |
| | | | | | | |
| Net interest (c) | | | | | | | (113 | ) | (139 | ) | (161 | ) |
| | | | | | | |
| |
| |
| |
| | | | | | | | 3,234 | | 1,968 | | 2,405 | |
| Exceptional items (d) | | | | | | | 362 | | 126 | | (1,094 | ) |
| | | | | | | |
| |
| |
| |
| Total | | | | | | | 3,596 | | 2,094 | | 1,311 | |
| | | | | | | |
| |
| |
| |
| | | | | | | | | | | | | |
| | 2004 | | 2003 | | 2002 | | 2004 | | 2003 | | 2002 | |
| |
| |
| |
| |
| |
| |
| |
| | % | | % | | % | | US$m | | US$m | | US$m | |
| Net earnings | | | | | | | | | | | | |
| North America | 32.0 | | 25.2 | | 20.1 | | 730 | | 363 | | 326 | |
| Australia and New Zealand | 48.7 | | 52.3 | | 57.8 | | 1,109 | | 754 | | 939 | |
| South America | 16.8 | | 10.8 | | 4.0 | | 382 | | 156 | | 65 | |
| Africa | 0.7 | | 0.8 | | 7.1 | | 15 | | 12 | | 115 | |
| Indonesia | 2.1 | | 12.6 | | 11.4 | | 48 | | 181 | | 185 | |
| Europe and other countries | (0.3 | ) | (1.7 | ) | (0.4 | ) | (6 | ) | (25 | ) | (5 | ) |
| |
| |
| |
| |
| |
| |
| |
| | 100.0 | | 100.0 | | 100.0 | | 2,278 | | 1,441 | | 1,625 | |
| |
| |
| |
| | | | | | | |
| Net interest (c) | | | | | | | (57 | ) | (59 | ) | (95 | ) |
| | | | | | | |
| |
| |
| |
| | | | | | | | 2,221 | | 1,382 | | 1,530 | |
| Exceptional items (d) | | | | | | | 592 | | 126 | | (879 | ) |
| | | | | | | |
| |
| |
| |
| Total | | | | | | | 2,813 | | 1,508 | | 651 | |
| | | | | | | |
| |
| |
| |
| | | | | | | | | | | | | |
| Note references above are explained on page A-42. | | | | | | | | | | | | |
A-41
Back to Contents
RIO TINTO PLC - RIO TINTO LIMITED
NOTES TO FINANCIAL STATEMENTS - (continued)
| 27 | Geographical analysis - Rio Tinto Group (continued) |
| | |
| Notes |
| (a) | Operating assets of subsidiaries comprise net assets before deducting net debt, less outside shareholders' interests which are calculated by reference to the net assets of the relevant companies (i.e. net of such companies' debt). For joint ventures and associates, Rio Tinto's net investment is shown. |
| (b) | The above analyses include the Rio Tinto share of the results of joint ventures and associates including interest. |
| (c) | The amortisation of discount is included in the applicable geographical category. All other financing costs of subsidiaries are shown as Net interest. |
| (d) | Exceptional items are shown separately in the above analysis of 'Profit before tax' and 'Net earnings'. Of the 2004 exceptional items, US$920 million before tax (US$913 million after tax and minority interests) relates to profit on disposal of interests in operations, US$(398) million before tax (US$(161) million after tax and minority interests) relates to Palabora which is included in the 'Africa' segment and US$160 million before and after tax relates to Colowyo which is included in the 'North America' segment. The exceptional items in 2003 relate to the profit on disposal of interests in a subsidiary, joint venture and associate. Of the 2002 exceptional charges, US$596 million before tax relates to Kennecott Utah Copper and US$443 million before tax relates to the Iron Ore Company of Canada, both of which are included in 'North America'. The impact of the exceptional charges on net earnings was US$536 million for Kennecott Utah Copper and US$235 million for the Iron Ore Company of Canada. |
| (e) | Turnover has been adjusted to reclassify, as turnover, certain amounts charged to customers for freight and handling costs, which previously were deducted from operating costs. The effect was to increase Gross turnover in 2004 by US$473 million (2003: US$364 million, 2002: US$291 million). |
The Group figures shown on page A-41 include the following amounts for joint ventures:
| | | | 2004 | | 2003 | |
|
|
| US$m | US$m |
| Net investment by origin | | | | | | |
| Australia and New Zealand | | | 1,154 | | 1,108 | |
| South America | | | 710 | | 552 | |
| Indonesia | | | 529 | | 523 | |
| North America | | | 39 | | 40 | |
| | | |
| |
| |
| Total | | | 2,432 | | 2,223 | |
| | | |
| |
| |
| | | | | | | |
| | 2004 | | 2003 | | 2002 | |
|
|
|
| US$m | US$m | US$m |
| Gross turnover by origin(a) | | | | | | |
| Australia and New Zealand | 957 | | 561 | | 592 | |
| South America | 1,003 | | 502 | | 283 | |
| Indonesia | 153 | | 539 | | 565 | |
| North America | 262 | | 229 | | 227 | |
| |
| |
| |
| |
| Total | 2,375 | | 1,831 | | 1,667 | |
| |
| |
| |
| |
| Profit before tax by origin | | | | | | |
| Australia and New Zealand | 287 | | 57 | | 214 | |
| South America | 632 | | 183 | | 49 | |
| Indonesia | 61 | | 241 | | 231 | |
| North America | 48 | | 39 | | 26 | |
| Exceptional charges | - | | - | | (16 | ) |
| |
| |
| |
| |
| Total | 1,028 | | 520 | | 504 | |
| |
| |
| |
| |
| Net earnings by origin | | | | | | |
| Australia and New Zealand | 199 | | 46 | | 151 | |
| South America | 420 | | 122 | | 32 | |
| Indonesia | 45 | | 155 | | 149 | |
| North America | 45 | | 37 | | 23 | |
| Exceptional charges | - | | - | | (16 | ) |
| |
| |
| |
| |
| Total | 709 | | 360 | | 339 | |
| |
| |
| |
| |
| | | | | | | |
| (a) | Turnover has been adjusted to reclassify, as turonver, certain amounts charged to customers for freight and handling costs, which previously were deducted from operating costs. The effect was to increase share of joint ventures turnover in 2004 by US$2 million (2003: US$11 million, 2002: US$5 million). |
A-42
Back to Contents
RIO TINTO PLC - RIO TINTO LIMITED
NOTES TO FINANCIAL STATEMENTS - (continued)
| 27 | Geographical analysis - Rio Tinto Group (continued) |
The Group figures shown on page A-41 include the following amounts for associates:
| | | | 2004 | | 2003 | |
|
|
| US$m | US$m |
| Net investment by origin | | | | | | |
| North America | | | 66 | | 53 | |
| Indonesia | | | - | | 143 | |
| Other | | | 181 | | 225 | |
| | | |
| |
| |
| Total | | | 247 | | 421 | |
| | | |
| |
| |
| | | | | | | |
| | 2004 | | 2003 | | 2002 | |
|
|
|
| US$m | US$m | US$m |
| Gross turnover by origin(b) | | | | | | |
| North America | 167 | | 155 | | 131 | |
| Indonesia | 43 | | 344 | | 306 | |
| Other | 224 | | 221 | | 300 | |
| |
| |
| |
| |
| Total | 434 | | 720 | | 737 | |
| |
| |
| |
| |
| Profit before tax by origin | | | | | | |
| North America | 79 | | 67 | | 42 | |
| Indonesia | (1 | ) | 72 | | 54 | |
| Other | 61 | | 41 | | 93 | |
| |
| |
| |
| |
| Total | 139 | | 180 | | 189 | |
| |
| |
| |
| |
| Net earnings by origin | | | | | | |
| North America | 58 | | 49 | | 33 | |
| Indonesia | (4 | ) | 23 | | 19 | |
| Other | 51 | | 26 | | 77 | |
| |
| |
| |
| |
| Total | 105 | | 98 | | 129 | |
| |
| |
| |
| |
| | | | | | | |
| (a) | On 30 March 2004 Rio Tinto sold its 13.1 per cent shareholding in Freeport-McMoRan Copper & Gold Inc., which was included in 'Indonesia'. |
| | |
| (b) | Turnover has been adjusted to reclassify, as turnover, certain amounts charged to customers for freight and handling costs, which previously were deducted from operating costs. The effect was to increase share of associates turnover by US$16 million (2003: US$13million, 2002: US$14 million). |
| | |
| By destination | | | | | | | | | | | | |
| | 2004 | | 2003 | | 2002 | | 2004 | | 2003 | | 2002 | |
|
|
|
|
|
|
| % | % | % | US$m | US$m | US$m |
| Turnover by destination(b) | | | | | | | | | | | | |
| North America (c) | 24.4 | | 25.2 | | 28.5 | | 3,569 | | 3,056 | | 3,173 | |
| Europe | 21.3 | | 23.2 | | 21.9 | | 3,109 | | 2,813 | | 2,435 | |
| Japan | 17.1 | | 17.9 | | 17.9 | | 2,504 | | 2,171 | | 1,988 | |
| Other Asia | 23.7 | | 21.9 | | 19.2 | | 3,460 | | 2,655 | | 2,134 | |
| Australia and New Zealand | 8.4 | | 7.6 | | 8.6 | | 1,225 | | 923 | | 956 | |
| Other | 5.1 | | 4.2 | | 3.9 | | 741 | | 501 | | 433 | |
| |
| |
| |
| |
| |
| |
| |
| Total | 100.0 | | 100.0 | | 100.0 | | 14,608 | | 12,119 | | 11,119 | |
| |
| |
| |
| |
| |
| |
| |
| | | | | | | | | | | | | |
The Group figures shown above include the following amounts for joint ventures:
| | 2004 | | 2003 | | 2002 | |
|
|
|
| US$m | US$m | US$m |
| Turnover by destination(b) | | | | | | |
| North America | 210 | | 191 | | 214 | |
| Europe | 355 | | 300 | | 303 | |
| Japan | 766 | | 551 | | 579 | |
| Other | 1,044 | | 789 | | 571 | |
| |
| |
| |
| |
| Total | 2,375 | | 1,831 | | 1,667 | |
| |
| |
| |
| |
| | | | | | | |
| The Group figures shown above include the following amounts for associates: |
| | 2004 | | 2003 | | 2002 | |
|
|
|
| US$m | US$m | US$m |
| Turnover by destination (b) | | | | | | |
| North America | 185 | | 173 | | 159 | |
| Europe | 125 | | 224 | | 252 | |
| Other | 124 | | 323 | | 326 | |
| |
| |
| |
| |
| Total | 434 | | 720 | | 737 | |
| |
| |
| |
| |
| (a) | An analysis of Property, Plant and Equipment by location is included in note 42 'Reconciliation to US Accounting Principles'. |
| |
| (b) | Turnover has been adjusted to reclassify, as turnover, certain amounts charged to customers for freight and handling costs, which previously were deducted from operating costs. The effect was to increase Gross turnover in 2004 by US$473 million (2003: US$364 million, 2002: US$291 million); increase share of joint ventures turnover in 2004 by US$2 million (2003: US$11 million, 2002: US$5 million) and to increase share of associates turnover by US$16 million (2003: US$13 million, 2002: US$14 million). |
| (c) | North America includes US$3,215 million (2003: US$2,764 million, 2002: US$2,893 million) relating to the United States of America. |
A-43
Back to Contents
RIO TINTO PLC - RIO TINTO LIMITED
NOTES TO FINANCIAL STATEMENTS - (continued)
28 Financial Instruments
| The Group's policies with regard to currency, interest rate and commodity price exposures, and the use of derivative financial instruments, are discussed in the following sections on pages 37 to 39 of the Financial review: |
| A | Exchange rates, reporting currencies and currency exposure |
| B | Interest rates |
| C | Commodity prices |
| D | Treasury management and financial instruments |
Except where stated, the information given below relates to the financial instruments of the parent companies and their subsidiaries and excludes joint ventures and associates. The information provided is as at the end of the financial year. Short term debtors and creditors are included only in the currency analysis.
Financial instruments held by companies acquired are marked to market as part of the adjustment of assets and liabilities acquired to fair value. Where appropriate, these fair value adjustments, calculated on a basis consistent with that disclosed in Section E, are shown in the disclosures below.
A) Currency
The Group's currency derivatives are itemised below:
a) Forward contracts hedging trading transactions
| Buy Australian dollar: sell US dollar | Buy | | Sell | | Weighted | | Fair value | | Total fair | |
| average | | value |
| currency | currency | exchange | |
| amount | amount | rate |
| | A$m | | US$m | | A$/US$ | | US$m | | US$m | |
| |
| |
| |
| |
| |
| |
| Less than 1 year | 213 | | 129 | | 0.61 | | 34 | | | |
| 1 to 5 years | 529 | | 321 | | 0.61 | | 64 | | | |
| More than 5 years | 30 | | 18 | | 0.61 | | 2 | | | |
| |
| |
| |
| |
| | | |
| Total | 772 | | 468 | | 0.61 | | | | 100 | |
| |
| |
| |
| | | | | |
| | | | | | | | | | | |
| Of the above, contracts to sell US$439 million were acquired with companies purchased in 2000 and 2001. | | | | | | | |
| | | | | | | | | | | |
| Buy New Zealand dollar: sell US dollar | NZ$m | | US$m | | NZ$/US$ | | US$m | | | |
| |
| |
| |
| |
| | | |
| | | | | | | | | | | |
| Less than 1 year | 95 | | 45 | | 0.47 | | 23 | | | |
| 1 to 5 years | 520 | | 233 | | 0.45 | | 100 | | | |
| More than 5 years | 130 | | 58 | | 0.45 | | 19 | | | |
| |
| |
| |
| |
| | | |
| Total | 745 | | 336 | | 0.45 | | | | 142 | |
| |
| |
| |
| | | | | |
| | | | | | | | | | | |
| Other currency forward contracts | | | | | | | | | (6 | ) |
| | | | | | | | | | | |
| Total fair value | | | | | | | | | 236 | |
| Adjust: Negative fair value recognised in respect of these contracts (of which US$11 million was recognised on acquisition) | | 13 | |
| | | | | | |
| |
| Fair value not recognised | | | | | | | | | 249 | |
| | | | | | | | | |
| |
A-44
Back to Contents
RIO TINTO PLC - RIO TINTO LIMITED
NOTES TO FINANCIAL STATEMENTS - (continued)
28 Financial Instruments (continued)
b) Options hedging trading transactions
The Group acquired a series of bought call options with companies purchased in 2000. The majority of these bought call options are matched at 31 December 2003 by sold puts. The combination of these instruments has a similar effect to forward contracts. During 2004 all of these sold puts totalling US$248 million were knocked-out, ie automatically cancelled, because the Australian dollar strengthened above a predetermined level.
| | | | | | Weighted | | | | | |
| | Buy | | Sell | | average | | | | Total | |
| | currency | | currency | | strike | | Fair | | fair | |
| | amount | | amount | | rate | | value | | value | |
| | A$m | | US$m | | A$/US$ | | US$m | | US$m | |
| |
| |
| |
| |
| |
| |
| Bought A$ call options | | | | | | | | | | |
| | | | | | | | | | | |
| Less than 1 year | 94 | | 66 | | 0.70 | | 7 | | | |
| 1 to 5 years | 247 | | 173 | | 0.70 | | 17 | | | |
| |
| |
| |
| | | | | |
| Total fair value | 341 | | 239 | | 0.70 | | | | 24 | |
| |
| |
| |
| | | | | |
| Adjust: Fair value recognised on acquisition in respect of these contracts | | | | | | | | | 25 | |
| | | | | | | | | |
| |
| Fair value not recognised | | | | | | | | | 49 | |
| | | | | | | | | |
| |
| | | | | | | | | | | |
| c) Currency swaps hedging non US dollar debt | | | | | | | | | | |
| | | | | | Weighted | | | | | |
| | Buy | | Sell | | average | | | | Total | |
| | currency | | currency | | exchange | | Fair | | fair | |
| | amount | | amount | | rate | | value (a) | | value | |
| | | | US$m | | | | | | US$m | |
| |
| |
| |
| |
| |
| |
| Buy Euro: sell US dollars | | | | | | | | | | |
| Less than 1 year | Euro 125m | | 153 | | 0.82 | | 17 | | | |
| 1 to 5 years | Euro 850m | | 781 | | 1.09 | | 377 | | | |
| | | |
| |
| |
| | | |
| | | | 934 | | 1.04 | | 394 | | | |
| | | |
| |
| |
| | | |
| | | | | | | | | | | |
| Buy Japanese yen: sell US dollars | | | | | | | | | | |
| 1 to 5 years | Yen 21 billion | | 177 | | 119 | | 28 | | | |
| | | | | | | | | | | |
| Buy sterling: sell US dollars | | | | | | | | | | |
| Less than 1 year | £10m | | 15 | | 0.67 | | 4 | | | |
| 1 to 5 years | £165m | | 235 | | 0.70 | | 83 | | | |
| | | |
| |
| |
| | | |
| | | | 250 | | 0.70 | | 87 | | | |
| | | |
| |
| |
| | | |
| | | | | | | | | | | |
| Buy Swiss francs: sell US dollars | | | | | | | | | | |
| Less than 1 year | CHF50m | | 36 | | 1.39 | | 9 | | | |
| 1 to 5 years | CHF20m | | 12 | | 1.67 | | 6 | | | |
| | | |
| |
| |
| | | |
| | | | 48 | | 1.46 | | 15 | | | |
| | | |
| |
| |
| | | |
| | | | | | | | | | | |
| Total currency swaps | | | 1,409 | | | | | | 524 | |
| Adjust: Fair value recognised within carrying value of debt | | | | | | | | | (524 | ) |
| | | | | | | | | |
| |
| Fair value not recognised | | | | | | | | | - | |
| | | | | | | | | |
| |
| (a) | These fair values comprise only the 'currency element' of the swaps. The fair value of the 'interest element' is presented in the summary of interest rate swaps. |
A-45
Back to Contents
RIO TINTO PLC - RIO TINTO LIMITED
NOTES TO FINANCIAL STATEMENTS - (continued)
28 Financial Instruments (continued)
d) Currency exposures arising from the Group's net monetary assets/(liabilities)
After taking into account the effect of relevant derivative instruments, almost all the Group's net debt is either denominated in US dollars or in the functional currency of the entity holding the debt. The table below sets out the currency exposures arising from net monetary assets/(liabilities), other than net debt, which are not denominated in the functional currency of the relevant business unit. Gains and losses resulting from such exposures are recorded in the profit and loss account. This table reflects the currency exposures before adjusting for tax and outside interests.
| | Currency of exposure | | Currency of exposure | |
| | US | | Other | | 2004 | | US | | Other | | 2003 | |
| | dollar | | currencies | | Total | | dollar | | currencies | | Total | |
| | US$m | | US$m | | US$m | | US$m | | US$m | | US$m | |
| |
| |
| |
| |
| |
| |
| |
| Functional currency of business unit: | | | | | | | | | | | | |
| United States dollar | - | | 36 | | 36 | | - | | 30 | | 30 | |
| Australian dollar | 345 | | 9 | | 354 | | 385 | | (16 | ) | 369 | |
| Canadian dollar | 57 | | - | | 57 | | 51 | | (1 | ) | 50 | |
| South African rand | 22 | | 12 | | 34 | | 47 | | 6 | | 53 | |
| Other currencies | 12 | | (19 | ) | (7 | ) | 20 | | 15 | | 35 | |
| |
| |
| |
| |
| |
| |
| |
| Total | 436 | | 38 | | 474 | | 503 | | 34 | | 537 | |
| |
| |
| |
| |
| |
| |
| |
The table below shows the Rio Tinto share of the above currency exposures after tax and outside interests:
| | Currency of exposure | | Currency of exposure | |
| | US | | Other | | 2004 | | US | | Other | | 2003 | |
| | dollar | | currencies | | Total | | dollar | | currencies | | Total | |
| | US$m | | US$m | | US$m | | US$m | | US$m | | US$m | |
| |
| |
| |
| |
| |
| |
| |
| Functional currency of business unit: | | | | | | | | | | | | |
| United States dollar | - | | 24 | | 24 | | - | | 20 | | 20 | |
| Australian dollar | 222 | | 7 | | 229 | | 251 | | (11 | ) | 240 | |
| Canadian dollar | 21 | | - | | 21 | | 19 | | (1 | ) | 18 | |
| South African rand | 8 | | 3 | | 11 | | 16 | | 2 | | 18 | |
| Other currencies | 5 | | (16 | ) | (11 | ) | 14 | | 9 | | 23 | |
| |
| |
| |
| |
| |
| |
| |
| Total | 256 | | 18 | | 274 | | 300 | | 19 | | 319 | |
| |
| |
| |
| |
| |
| |
| |
B) Interest rates
(i) Financial liabilities and assets including the effect of interest rate and currency swaps
This table analyses the currency and interest rate composition of the Group's financial assets and liabilities:
| | | | | | | | | | | | 2004 | | 2003 | |
| | United | | | | | | South | | | | Total | | Total | |
| | States | | Australian | | | | African | | Other | | carrying | | carrying | |
| | dollar | | dollar | | Sterling | | rand | | currencies | | value | | value | |
| | US$m | | US$m | | US$m | | US$m | | US$m | | US$m | | US$m | |
| |
| |
| |
| |
| |
| |
| |
| |
| Financial liabilities | | | | | | | | | | | | | | |
| Fixed rate | (758 | ) | - | | - | | - | | - | | (758 | ) | (721 | ) |
| Floating rate | (2,660 | ) | (422 | ) | (12 | ) | (265 | ) | (26 | ) | (3,385 | ) | (5,322 | ) |
| Non interest bearing | (250 | ) | - | | - | | - | | - | | (250 | ) | (219 | ) |
| |
| |
| |
| |
| |
| |
| |
| |
| | (3,668 | ) | (422 | ) | (12 | ) | (265 | ) | (26 | ) | (4,393 | ) | (6,262 | ) |
| Financial assets | | | | | | | | | | | | | | |
| Fixed rate | 87 | | - | | - | | - | | - | | 87 | | 239 | |
| Floating rate (including loans to joint ventures and associates) | 304 | | 132 | | 25 | | 6 | | 91 | | 558 | | 571 | |
| |
| |
| |
| |
| |
| |
| |
| |
| | (3,277 | ) | (290 | ) | 13 | | (259 | ) | 65 | | (3,748 | ) | (5,452 | ) |
| |
| |
| |
| |
| |
| | | | | |
| Adjusted to exclude: | | | | | | | | | | | | | | |
| US Treasury bonds (fixed rate) | | | | | | | | | | | (87 | ) | (239 | ) |
| Deferred consideration payable (non interest bearing) | | | | | | | | | | | 250 | | 219 | |
| Loans to joint ventures and associates (floating rate) | | | | | | | | | | | (166 | ) | (174 | ) |
| | | | | | | | | | | |
| |
| |
| Net debt(note 23) | | | | | | | | | | | (3,751 | ) | (5,646 | ) |
| | | | | | | | | | | |
| |
| |
A-46
Back to Contents
RIO TINTO PLC - - RIO TINTO LIMITED
NOTES TO FINANCIAL STATEMENTS - (continued)
28 Financial Instruments (continued)
(ii) Fixed rate liabilities and assets, presented gross, and interest rate and currency swaps
The US$758 million (2003: US$721 million) of fixed rate liabilities shown in (i) above comprise gross liabilities of US$2,670 million (2003: US$2,716 million) less the interest rate and currency swaps of US$1,912 million (2003: US$1,995 million) shown below:
| | | | | | 2004 | | | | | | 2003 | |
| Gross liabilities | | | | | Excess of | | | | | | Excess of | |
| | | Average | | fair value | | | | Average | | fair value | |
| | | fixed | | over | | | | fixed | | over | |
| Principal | | rate | | principal | | Principal | | rate | | principal | |
| | US$m | | % p.a. | | US$m | | US$m | | % p.a. | | US$m | |
| |
| |
| |
| |
| |
| |
| |
| Maturity | | | | | | | | | | | | |
| Less than 1 year | 200 | | 7.0 | | (6 | ) | - | | - | | - | |
| 1 to 5 years | 1,150 | | 4.1 | | 8 | | 1,350 | | 4.6 | | (33 | ) |
| More than 5 years | 100 | | 7.1 | | (18 | ) | 100 | | 7.2 | | (17 | ) |
| |
| |
| |
| |
| |
| |
| |
| US$ fixed rate liabilities | 1,450 | | 4.7 | | (16 | ) | 1,450 | | 4.8 | | (50 | ) |
| |
| |
| |
| |
| |
| |
| |
| Less than 1 year | 15 | | 5.4 | | - | | 46 | | 2.3 | | - | |
| 1 to 5 years | 1,205 | | 4.5 | | (67 | ) | 1,220 | | 4.5 | | (62 | ) |
| |
| |
| |
| |
| |
| |
| |
| Non US dollar fixed rate liabilities (a) | 1,220 | | 4.5 | | (67 | ) | 1,266 | | 4.4 | | (62 | ) |
| |
| |
| |
| |
| |
| |
| |
| Fixed rate liabilities before interest rate swaps | 2,670 | | | | (83 | ) | 2,716 | | | | (112 | ) |
| |
| | | |
| |
| | | |
| |
| Interest rate swaps | | | | | | | | | | | | |
| | | Average | | | | | | Average | | | |
| Maturity | | | fixed | | 2004 | | | | fixed | | 2003 | |
| Principal | | rate | | Fair value(i) | | Principal | | rate | | Fair value | |
| | US$m | | % p.a. | | US$m | | US$m | | % p.a. | | US$m | |
| |
| |
| |
| |
| |
| |
| |
| Less than 1 year | 200 | | 7.0 | | 5 | | - | | - | | - | |
| 1 to 5 years | 850 | | 4.7 | | 5 | | 1,050 | | 5.1 | | 41 | |
| |
| |
| |
| |
| |
| |
| |
| Interest rate swaps to US$ floating rates | 1,050 | | 5.1 | | 10 | | 1,050 | | 5.1 | | 41 | |
| |
| |
| |
| |
| |
| |
| |
| Less than 1 year | 15 | | 5.4 | | - | | 46 | | 2.3 | | - | |
| 1 to 5 years | 1,205 | | 4.5 | | 59 | | 1,220 | | 4.5 | | 55 | |
| |
| |
| |
| |
| |
| |
| |
| Interest rate swaps from non US$ fixed rates to US$ floating rates (a) | 1,220 | | 4.5 | | 59 | | 1,266 | | 4.4 | | 55 | |
| |
| |
| |
| |
| |
| |
| |
| Less than 1 year | 225 | | 7.0 | | (5 | ) | 20 | | 7.5 | | (1 | ) |
| 1 to 5 years | 133 | | 5.8 | | (11 | ) | 225 | | 7.0 | | (19 | ) |
| More than 5 years | - | | - | | - | | 76 | | 5.6 | | (8 | ) |
| |
| |
| |
| |
| |
| |
| |
| Interest rate swaps to US$ fixed rates (b) | 358 | | 6.6 | | (16 | ) | 321 | | 6.7 | | (28 | ) |
| |
| |
| |
| |
| |
| |
| |
| Interest rate swaps (net impact) | 1,912 | | | | 53 | | 1,995 | | | | 68 | |
| |
| | | |
| |
| | | |
| |
| Total fixed rate financial liabilities after interest rateswaps (b), (d) | 758 | | | | (30 | ) | 721 | | | | (44 | ) |
| |
| | | |
| |
| | | |
| |
| (i) | These fair values include the interest element of the currency swaps described earlier. |
| | | | | | 2004 | | | | | | 2003 | |
| Gross assets | | | | | Excess of | | | | | | Excess of | |
| | | Average | | fair value | | | | Average | | fair value | |
| Maturity | | | fixed | | over | | | | fixed | | over | |
| Principal | | rate | | principal | | Principal | | rate | | principal | |
| | US$m | | % p.a. | | US$m | | US$m | | % p.a. | | US$m | |
| |
| |
| |
| |
| |
| |
| |
| Less than 1 year | 87 | | 2.1 | | - | | 239 | | 1.0 | | (1 | ) |
| |
| |
| |
| |
| |
| |
| |
| Total fixed rate financial assets | 87 | | 2.1 | | - | | 239 | | 1.0 | | (1 | ) |
| |
| |
| |
| |
| |
| |
| |
| | |
| (a) | All of the above non US$ liabilities are swapped to US$. The principal amounts shown above reflect the currency element of the related currency swaps. |
| (b) | As a consequence of acquisitions during 2000, the Group holds a number of interest rate swaps to receive US$ floating rates and pay US$ fixed rates which have been included in the total of fixed rate debt shown above. |
| (c) | The Group has US$100 million of finance leases (2003: US$119 million), the largest of which has a principal of US$74 million, a maturity of 2018 and a floating interest rate. |
| (d) | After taking into account all interest rate swaps, the Group's fixed rate debt totals US$ 758 million and has a weighted average interest rate of 5.1 per cent and a weighted average time to maturity of four years (2003: US$721 million with a weighted average interest rate of 5.1 per cent and a weighted average time to maturity of four years). | |
| (e) | Interest rates on the great majority of the Group's floating rate financial liabilities and assets will have been reset within six months. The interest rates applicable to the Group's US dollar denominated floating rate financial liabilities and assets did not differ materially at the year end from the three month US dollar LIBOR rate of 2.5 per cent (2003: 1.2 per cent). |
| (f) | The above table does not include the remaining US$35 million (2003: US$39 million) net provision for the mark to market valuation of the hedge books held by companies acquired in 2000 and 2001 and other financial assets of US$216 million (2003: US$145 million), all of which are non interest bearing. Further details of the instruments included within the acquisition provision for mark to market valuation of the hedge books held by companies acquired are shown in section A above and section C below. |
| (g) | These non interest bearing financial liabilities have been presented in the financial statements on a discounted basis, using a discount rate of 3.8 per cent. |
A-47
Back to Contents
RIO TINTO PLC - RIO TINTO LIMITED
NOTES TO FINANCIAL STATEMENTS - - (continued)
28 Financial Instruments (continued)
C) Commodities
The Group's material commodity derivatives are summarised below:
| | 2004 | | 2003 | |
| | Fair value | | Fair value | |
| | US$m | | US$m | |
| |
| |
| |
| Commodity derivatives, including options (in 2003) | (10 | ) | (20 | ) |
| Adjust: Fair value recognised on acquisition in respect of these contracts | (1 | ) | (2 | ) |
| |
| |
| |
| Fair value not recognised | (11 | ) | (22 | ) |
| |
| |
| |
D) Liquidity
The maturity profile of the Group's net debt is discussed in the Balance Sheet section of the Financial review.
Financial assets and liabilities are repayable as follows:
| | 2004 | | 2003 | |
| |
| |
| |
| | US$m | | US$m | |
| Financial liabilities | | | | |
| Within 1 year, or on demand | (903 | ) | (2,270 | ) |
| Between 1 and 2 years | (1,168 | ) | (672 | ) |
| Between 2 and 3 years | (1,000 | ) | (1,109 | ) |
| Between 3 and 4 years | (798 | ) | (1,019 | ) |
| Between 4 and 5 years | (43 | ) | (745 | ) |
| After 5 years | (481 | ) | (447 | ) |
| |
| |
| |
| | (4,393 | ) | (6,262 | ) |
| Financial assets | | | | |
| Within 1 year, or on demand | 515 | | 670 | |
| Between 1 and 2 years | 14 | | 10 | |
| Between 2 and 3 years | 15 | | 14 | |
| Between 3 and 4 years | 14 | | 15 | |
| Between 4 and 5 years | 15 | | 14 | |
| After 5 years | 72 | | 87 | |
| |
| |
| |
| Total per currency/interest rate analysis | (3,748 | ) | (5,452 | ) |
| |
| |
| |
| |
| In addition, of the remaining US$35 million net provision for the mark to market of the hedge books held by companies on acquisition in 2000 and 2001, US$10 million matures in 2005, US$24 million in 2006 to 2009 and US$1 million thereafter. There are other financial assets totalling US$216 million, of which US$138 million have no fixed maturity and US$78 million has a maturity greater than one year. |
| As at 31 December 2004, a total of US$1,499 million is outstanding under the US$3 billion European Medium Term Notes facility, of which US$204 million is repayable within one year. |
| In accordance with FRS 4, all commercial paper is classified as short term borrowings. There were no outstandings as at 31 December 2004, (2003: commercial paper of US$1.1 billion all backed by medium term facilities). |
| At 31 December 2004, the Group had unutilised standby credit facilities totalling US$1.45 billion. These facilities, which are summarised below, are for back-up support for the Group’s commercial paper programmes and for general corporate purposes: |
| | | | | |
| | 2004 | | 2003 | |
| |
| |
| |
| | US$m | | US$m | |
| Unutilised standby credit facilities | | | | |
| Within 1 year | 600 | | 1,650 | |
| Between 1 and 2 years | 850 | | - | |
| After 2 years | - | | 1,100 | |
| |
| |
| |
| | 1,450 | | 2,750 | |
| |
| |
| |
A-48
Back to Contents
RIO TINTO PLC - RIO TINTO LIMITED
NOTES TO FINANCIAL STATEMENTS - (continued)
| 28 | Financial Instruments (continued) |
E) Fair values of financial instruments
The carrying values and the fair values of Rio Tinto's financial instruments at 31 December are shown in the following table. Fair value is the amount at which a financial instrument could be exchanged in an arm's length transaction between informed and willing parties. Where available, market values have been used to determine fair values. In other cases, fair values have been calculated using quotations from independent financial institutions, or by discounting expected cash flows at prevailing market rates. The fair value of cash, short term borrowings and loans to joint ventures and associates approximates to the carrying value, as a result of their short maturity, or because they carry floating rates of interest.
If Rio Tinto's financial instruments were realised at the fair values shown, tax of US$84 million would become payable (2003: US$86 million payable). The maturity of the financial instruments is shown in the notes above.
| | | 2004 | | 2003 | |
| | |
|
|
| US$m | Carrying | | Fair | Carrying | | Fair |
| value | value | value | value |
| | |
|
|
|
|
| | | US$m | US$m | US$m | US$m |
| Primary financial instruments held or issued to | | | | | | | | |
| finance the Group's operations: | | | | | | | | |
| | Cash (note 17) | 390 | | 390 | | 395 | | 395 | |
| | Investments (b) | 89 | | 89 | | 230 | | 229 | |
| | Short term borrowings (note 18) (a) | (836 | ) | (836 | ) | (2,199 | ) | (2,199 | ) |
| | Medium and long term borrowings (note 22) (a) | (3,831 | ) | (3,914 | ) | (4,231 | ) | (4,343 | ) |
| | Loans to joint ventures and associates (note 13) | 166 | | 166 | | 174 | | 174 | |
| | Other assets | 216 | | 302 | | 156 | | 156 | |
| | Other liabilities | (250 | ) | (250 | ) | (219 | ) | (219 | ) |
| | |
| |
| |
| |
| |
| | | (4,056 | ) | (4,053 | ) | (5,694 | ) | (5,807 | ) |
| Derivative financial instruments held to manage | | | | | | | | |
| the interest rate and currency profile: | | | | | | | | |
| | Currency forward contracts hedging trading transactions (A) | (13 | ) | 236 | | (22 | ) | 207 | |
| | Currency option contracts hedging trading transactions (A) | (25 | ) | 24 | | (27 | ) | 10 | |
| | Currency forward contracts hedging future capital expenditure (A) | - | | - | | - | | 93 | |
| | Currency swaps hedging non US dollar debt (A) (a) | 524 | | 524 | | 387 | | 387 | |
| | Interest rate swap agreements and options (B) | - | | 53 | | - | | 68 | |
| | Commodity forward/future contracts hedging trading transactions (C) | 1 | | (10 | ) | 2 | | (20 | ) |
| | |
| |
| |
| |
| |
| | | (3,569 | ) | (3,226 | ) | (5,354 | ) | (5,062 | ) |
| |
| |
| |
| |
| |
| Less: mark to market provision at acquisition/other provisions | 37 | | | | 47 | | | |
| 'Other' financial assets | (216 | ) | | | (145 | ) | | |
| |
| | | |
| | | |
| Total per liquidity analysis | (3,748 | ) | | | (5,452 | ) | | |
| |
| | | |
| | | |
| (a) | Of the currency swaps, of US$524 million, US$30 million are netted against short term borrowings in the balance sheet and US$494 million are netted against medium and long term borrowings. |
| (b) | US$11 million of these investments are in fixed assets. |
Gains and losses on hedges
Changes in the fair value of derivatives used as hedges of trading transactions, capital expenditure and interest rate exposures, including changes relating to derivatives held by companies acquired during 2000 and 2001, are not recognised in the financial statements until the hedged position matures.
| | | | | | 2004 | | 2003 | |
| | | | | | Total net | | Total net | |
| US$m | | | | | gains/ | | gains/ | |
| Gains | | Losses | | (losses) | | (losses) | |
| |
| |
| |
| |
| |
| | | | | | | | | |
| Unrecognised gains and losses on hedges at 1 January | 471 | | (66 | ) | 405 | | 25 | |
| Gains and losses arising in previous years recognised in the year | (161 | ) | 18 | | (143 | ) | (35 | ) |
| |
| |
| |
| |
| |
| Gains and losses arising before 1 January that were not recognised in the year | 310 | | (48 | ) | 262 | | (10 | ) |
| Gains and losses arising in the year that were not recognised in the year | 87 | | (9 | ) | 78 | | 415 | |
| |
| |
| |
| |
| |
| Unrecognised gains and losses on hedges at 31 December | 397 | | (57 | ) | 340 | | 405 | |
| |
| |
| |
| |
| |
| Of which: | | | | | | | | |
| Gains and losses expected to be recognised within one year | 105 | | (27 | ) | 78 | | 143 | |
| Gains and losses expected to be recognised in more than one year | 292 | | (30 | ) | 262 | | 262 | |
| |
| |
| |
| |
| |
| | 397 | | (57 | ) | 340 | | 405 | |
| |
| |
| |
| |
| |
A-49
Back to Contents
RIO TINTO PLC - RIO TINTO LIMITED
NOTES TO FINANCIAL STATEMENTS - (continued)
| 29 | Contingent liabilities and commitments |
| | |
| | Rio Tinto plc - | | Rio Tinto Limited - | | | |
| | part of Rio Tinto Group | | part of Rio Tinto Group | | Rio Tinto Group | |
| |
| |
| |
| |
| | 2004 | | 2003 | | 2004 | | 2003 | | 2004 | | 2003 | |
| |
| |
| |
| |
| |
| |
| |
| | US$m | | US$m | | US$m | | US$m | | US$m | | US$m | |
| Commitments | | | | | | | | | | | | |
| Contracted capital expenditure at 31 December (a) | 110 | | 56 | | 590 | | 556 | | 700 | | 612 | |
| Operating lease commitments (b) | 47 | | 35 | | 67 | | 96 | | 114 | | 131 | |
| Other commitments | 30 | | - | | 110 | | 67 | | 140 | | 67 | |
| | |
| (a) | 'Contracted capital expenditure' includes amounts falling due within one year of US$564 million (2003: US$598 million). |
| (b) | 'Operating lease commitments' includes amounts falling due within one year of US$36 million (2003: US$38 million). |
Unconditional purchase obligations
The aggregate amount of future payment commitments under unconditional purchase obligations outstanding at 31 December was:
| | Rio Tinto plc - | | Rio Tinto Limited - | | | |
| | part of Rio Tinto Group | | part of Rio Tinto Group | | Rio Tinto Group | |
| |
| |
| |
| |
| | 2004 | | 2003 | | 2004 | | 2003 | | 2004 | | 2003 | |
| |
| |
| |
| |
| |
| |
| |
| | US$m | | US$m | | US$m | | US$m | | US$m | | US$m | |
| Within 1 year | 38 | | 38 | | 348 | | 230 | | 386 | | 268 | |
| Between 1 and 2 years | 38 | | 38 | | 344 | | 240 | | 382 | | 278 | |
| Between 2 and 3 years | 38 | | 38 | | 327 | | 237 | | 365 | | 275 | |
| Between 3 and 4 years | 8 | | 8 | | 316 | | 235 | | 324 | | 243 | |
| Between 4 and 5 years | 8 | | 8 | | 279 | | 226 | | 287 | | 234 | |
| After 5 years | 48 | | 56 | | 1,440 | | 1,656 | | 1,488 | | 1,712 | |
| |
| |
| |
| |
| |
| |
| |
| | 178 | | 186 | | 3,054 | | 2,824 | | 3,232 | | 3,010 | |
| |
| |
| |
| |
| |
| |
| |
Unconditional purchase obligations relate to commitments to make payments in the future for fixed or minimum quantities of goods or services at fixed or minimum prices. The balance outstanding at 31 December 2004 relates mainly to commitments under 'take or pay' contracts.
| | Rio Tinto plc - | | Rio Tinto Limited - | | | |
| | part of Rio Tinto Group | | part of Rio Tinto Group | | Rio Tinto Group | |
| |
| |
| |
| |
| | 2004 | | 2003 | | 2004 | | 2003 | | 2004 | | 2003 | |
| |
| |
| |
| |
| |
| |
| |
| | US$m | | US$m | | US$m | | US$m | | US$m | | US$m | |
| Contingent liabilities | | | | | | | | | | | | |
| Indemnities and other performance guarantees on | | | | | | | | | | | | |
| which no material loss is expected | 29 | | - | | 406 | | 266 | | 435 | | 266 | |
| | | | | | | | | | | | | |
| (a) | Pursuant to the DLC merger both Rio Tinto plc and Rio Tinto Limited issued deed poll guarantees by which each guaranteed contractual obligations incurred by the other or, to the extent guaranteed by the other, any person. The amounts shown above for Rio Tinto plc and Rio Tinto Limited do not reflect these deed poll guarantees. |
| (b) | In 2002, the Australian Tax Office issued assessments of approximately A$500 million (which amount includes penalties and interest) in relation to certain transactions undertaken in 1997 to acquire franking credits. The transactions were conducted based on the Group’s considered view of the law prevailing at the time. Subsequently, the law was changed. The Group lodged objections to the assessments and on 26 May 2003 the Australian Tax Office (‘ATO’) substantially disallowed those objections. The Group subsequently lodged proceedings in the Federal Court to dispute the assessments. |
| | As required by Australian tax law and practice, part payment of the disputed tax assessments was required pending resolution of the dispute. A payment of A$164 million (US$128 million at the year end exchange rate) was made, which will be subject to recovery with interest if, as it is believed based on Counsels’ opinion, the Group is successful in challenging the assessments. Consequently, the amount paid has been recorded as a receivable on the balance sheet. |
| | As at the year end, the amount of the disputed tax assessments, penalties and interest stood at approximately A$479 million (US$373 million at the year end exchange rate) after tax relief on the general interest charge component. |
| (c) | There are a number of legal claims arising from the normal course of business which are currently outstanding against the Group. No material loss to the Group is expected to result from these claims. |
A-50
Back to Contents
RIO TINTO PLC - RIO TINTO LIMITED
NOTES TO FINANCIAL STATEMENTS - (continued)
| 30 | Average number of employees |
| | |
| | Subsidiaries and joint arrangements(a) | |
| |
| |
| | 2004 | | 2003 | | 2002 | |
| |
| |
| |
| |
| The principal locations of employment were : | | | | | | |
| Australia and New Zealand | 10,002 | | 9,274 | | 8,721 | |
| North America | 8,275 | | 8,478 | | 8,906 | |
| Africa | 4,724 | | 5,661 | | 6,012 | |
| Europe | 2,630 | | 3,059 | | 2,765 | |
| South America | 1,361 | | 1,794 | | 1,708 | |
| Indonesia | 511 | | 569 | | 908 | |
| Other countries | 195 | | 205 | | 150 | |
| |
| |
| |
| |
| | 27,698 | | 29,040 | | 29,170 | |
| |
| |
| |
| |
| | | | | | | |
| | Joint ventures and associates(a) | |
| | (Rio Tinto share) | |
| |
| |
| | 2004 | | 2003 | | 2002 | |
| |
| |
| |
| |
| The principal locations of employment were : | | | | | | |
| Australia and New Zealand | 925 | | 983 | | 995 | |
| North America | 1,055 | | 1,034 | | 873 | |
| Africa | 441 | | 422 | | 450 | |
| Europe | 161 | | 386 | | 433 | |
| South America | 851 | | 773 | | 940 | |
| Indonesia | 1,754 | | 3,234 | | 4,154 | |
| Other countries | 155 | | 144 | | 158 | |
| |
| |
| |
| |
| | 5,342 | | 6,976 | | 8,003 | |
| |
| |
| |
| |
| | | | | | | |
| | Group total | |
| |
| |
| | 2004 | | 2003 | | 2002 | |
| |
| |
| |
| |
| The principal locations of employment were : | | | | | | |
| Australia and New Zealand | 10,927 | | 10,257 | | 9,716 | |
| North America | 9,330 | | 9,512 | | 9,779 | |
| Africa | 5,165 | | 6,083 | | 6,462 | |
| Europe | 2,791 | | 3,445 | | 3,198 | |
| South America | 2,212 | | 2,567 | | 2,648 | |
| Indonesia | 2,265 | | 3,803 | | 5,062 | |
| Other countries | 350 | | 349 | | 308 | |
| |
| |
| |
| |
| | 33,040 | | 36,016 | | 37,173 | |
| |
| |
| |
| |
| (a) | Employee numbers, which represent the average for the year, include 100 per cent of employees of subsidiary companies. Employee numbers for joint arrangements, joint ventures and associates are proportional to the Group's equity interest. |
| (b) | Part-time employees are included on a full time equivalent basis. Temporary employees are included in employee numbers. |
| (c) | People employed by contractors are not included. |
A-51
Back to Contents
RIO TINTO PLC - RIO TINTO LIMITED
NOTES TO FINANCIAL STATEMENTS - (continued)
31 Principal subsidiaries at 31 December 2004
| | | | Class of | | Proportion | | Group | | Ultimate |
| Company and country | | | shares | | of class | | interest | | parent |
| of incorporation/operation | Principal activities | | held | | held % | | % | | company |
|
|
|
|
|
|
|
|
|
|
| Australia | | | | | | | | | |
| Argyle Diamond Mines | Mining and processing of diamonds | | (a) | | | | 100 | | Rio Tinto Limited |
| Coal & Allied Industries Limited | Coal mining | | Ordinary | | 75.71 | | 75.71 | | Rio Tinto Limited |
| Comalco Limited | Bauxite mining; alumina production; | | Ordinary | | 100 | | 100 | | Rio Tinto Limited |
| | primary aluminium smelting | | | | | | | | |
| Dampier Salt Limited | Salt production | | Ordinary | | 64.94 | | 64.94 | | Rio Tinto Limited |
| Energy Resources of Australia Ltd | Uranium mining | | Class A | | 68.39 | | 68.39 | | Rio Tinto Limited |
| Hamersley Iron Pty Limited | Iron ore mining | | Ordinary | | 100 | | 100 | | Rio Tinto Limited |
| Rio Tinto Coal Australia Pty Limited | Coal mining | | Ordinary | | 100 | | 100 | | Rio Tinto Limited |
|
|
|
|
|
|
|
|
|
|
| Canada | | | | | | | | | |
| Iron Ore Company of Canada Inc (b) | Iron ore mining; iron ore pellets | | Series A & E | | 58.72 | | 58.72 | | Rio Tinto Limited |
| QIT-Fer et Titane Inc | Titanium dioxide feedstock; high | | Common shares | | 100 | | 100 | | Rio Tinto plc |
| | purity iron and steel | | Preferred shares | | 100 | | 100 | | |
|
|
|
|
|
|
|
|
|
|
| France | | | | | | | | | |
| Talc de Luzenac S.A. | Mining, refining and marketing of talc | | E15.25 | | 99.94 | | 99.94 | | Rio Tinto plc |
|
|
|
|
|
|
|
|
|
|
| Indonesia | | | | | | | | | |
| P.T. Kelian Equatorial Mining | Gold mining | | Ordinary US$1 | | 90 | | 90 | | Rio Tinto Limited |
|
|
|
|
|
|
|
|
|
|
| Namibia | | | | | | | | | |
| Rossing Uranium Limited (c) | Uranium mining | | 'B'N$1 | | 71.16 | } | 68.58 | | Rio Tinto plc |
| | | | 'C'N10c | | 70.59 | | | |
|
|
|
|
|
|
|
|
|
|
| Papua New Guinea | | | | | | | | | |
| Bougainville Copper Limited (d) | Copper and gold mining | | Ordinary 1 Kina | | 53.58 | | 53.58 | | Rio Tinto Limited |
|
|
|
|
|
|
|
|
|
|
| South Africa | | | | | | | | | |
| Palabora Mining Company Limited | Copper mining, smelting and refining | | R1 | | 75.2 | | 49.2 | | Rio Tinto plc |
| Richards Bay Iron and Titanium | Titanium dioxide feedstock; | | R1 | | 50.5 | | 50 | | Rio Tinto plc |
| (Pty) Limited | high purity iron | | | | | | | | |
|
|
|
|
|
|
|
|
|
|
| United Kingdom | | | | | | | | | |
| Anglesey Aluminium Metal Limited | Aluminium smelting | | Ordinary £1 | | 51 | | 51 | | Rio Tinto plc |
|
|
|
|
|
|
|
|
|
|
| United States of America | | | | | | | | | |
| Kennecott Holdings Corporation | Copper and gold mining, smelting | | Common US$0.01 | | 100 | | 100 | | Rio Tinto plc |
| (including Kennecott Utah Copper, | and refining, land development | | | | | | | | |
| Kennecott Minerals and Kennecott | | | | | | | | | |
| Land Company) | | | | | | | | | |
| Kennecott Energy & Coal Company | Coal mining | | Common US$1 | | 100 | | 100 | | Rio Tinto plc |
| U.S. Borax Inc. | Mining, refining and marketing of borates | | Common US$1 | | 100 | | 100 | | Rio Tinto plc |
|
|
|
|
|
|
|
|
|
|
| (a) | The entity marked (a) is unincorporated. |
| (b) | In addition, at 31 December 2004 the Group held 19.0 per cent of the Labrador Iron Ore Royalty Income Fund which has a 15.1 per cent interest in the Iron Ore Company of Canada. The Group sold its investment in the Labrador Iron Ore Royalty Income Fund in March 2005. |
| (c) | The Group's shareholding in Rossing Uranium Limited carries 35.54 per cent of the total voting rights. Rossing is consolidated by virtue of Board control. |
| (d) | The results of Bougainville Copper Limited are not consolidated (see note 39). |
| (e) | The Group comprises a large number of companies and it is not practical to include all of them in this list. The list therefore only includes those companies that have a more significant impact on the profit or assets of the Group. |
| (f) | The Group's principal subsidiaries are held by intermediate holding companies and not directly by Rio Tinto plc or Rio Tinto Limited. |
| (g) | All entities operate mainly in the countries in which they are incorporated. |
A-52
Back to Contents
RIO TINTO PLC - RIO TINTO LIMITED
NOTES TO FINANCIAL STATEMENTS - (continued)
32 Principal joint venture interests at 31 December 2004
| | | | Class of | | | | Group | | Ultimate |
| Name and country | | | shares | | | interest | | parent |
| of incorporation/operation | Principal activities | | held | | | % | | company |
|
|
|
|
|
|
|
|
|
|
| Australia | | | | | | | | | |
| Blair Athol Coal | Coal mining | | (b) | | | | 71.2 | | Rio Tinto Limited |
| Kestrel | Coal mining | | (b) | | | | 80.0 | | Rio Tinto Limited |
| Hail Creek | Coal mining | | (b) | | | | 82.0 | | Rio Tinto Limited |
| Mount Thorley | Coal mining | | (b) | | | | 60.6 | | Rio Tinto Limited |
| Bengalla | Coal mining | | (b) | | | | 30.3 | | Rio Tinto Limited |
| Warkworth | Coal mining | | (b) | | | | 42.1 | | Rio Tinto Limited |
|
|
|
|
|
|
|
|
|
|
| Chile | | | | | | | | | |
| Minera Escondida Limitada (f) | Copper mining and refining | | (b) | | | | 30 | | Rio Tinto plc |
|
|
|
|
|
|
|
|
|
|
| Indonesia | | | | | | | | | |
| Grasberg expansion | Copper and gold mining | | (b) | | | | 40 | | Rio Tinto plc |
|
|
|
|
|
|
|
|
|
|
| United States of America | | | | | | | | | |
| Decker | Coal mining | | (b) | | | | 50.0 | | Rio Tinto plc |
| Greens Creek | Silver, gold, zinc and lead mining | | (b) | | | | 70.3 | | Rio Tinto plc |
| Rawhide | Gold mining | | (b) | | | | 51.0 | | Rio Tinto plc |
|
|
|
|
|
|
|
|
|
|
| (a) | The Group has joint control of the above ventures and therefore includes them in its accounts using the gross equity accounting technique. |
| (b) | These entities are unincorporated. |
| (c) | The Group comprises a large number of entities and it is not practical to include all of them in this list. The list therefore only includes those entities that have a more significant impact on the profit or assets of the Group. |
| (d) | The Group's principal joint ventures are held by intermediate holding companies and not directly by Rio Tinto plc or Rio Tinto Limited. |
| (e) | All entities operate mainly in the countries in which they are incorporated. |
| (f) | The year end of Minera Escondida Limitada is 30 June. |
33 Principal associates at 31 December 2004
| | | | | | Class of | | Proportion | | Group | | Ultimate |
| Name and country | | | Number of shares | | shares | | of class | | interest | | parent |
| of incorporation/operation | Principal activities | | held by the Group | | held | | held % | | % | | company |
|
|
|
|
|
|
|
|
|
|
|
|
| Papua New Guinea | | | | | | | | | | | |
| Lihir Gold Limited (a) | Gold mining | | 185,758,126 | | Ordinary Kina 0.1 | | 14.46 | | 14.46 | | Rio Tinto plc |
|
|
|
|
|
|
|
|
|
|
|
|
| South Africa | | | | | | | | | | | |
| Tisand (Pty) Limited | Rutile and zircon mining | | 7,353,675 | | R1 | | 49.5 | | 50 | | Rio Tinto plc |
|
|
|
|
|
|
|
|
|
|
|
|
| United States of America | | | | | | | | | | | |
| Cortez | Gold mining | | | | (b) | | | | 40.0 | | Rio Tinto plc |
|
|
|
|
|
|
|
|
|
|
|
|
| (a) | The Group continues to have significant influence over the activities of Lihir Gold Limited, including Board representation; consequently the Group equity accounts for its interest in this company. |
| (b) | This entity is unincorporated. |
| (c) | The Group comprises a large number of entities and it is not practical to include all of them in this list. The list therefore only includes those entities that have a more significant impact on the profit or assets of the Group. |
| (d) | The Group's principal associates are held by intermediate holding companies and not directly by Rio Tinto plc or Rio Tinto Limited. |
| (e) | All entities operate mainly in the countries in which they are incorporated. |
34 Principal joint arrangements at 31 December 2004
| | | | | | Class of | | Proportion | | Group | | Ultimate |
| Name and country | | | Number of shares | | shares | | of class | | interest | | parent |
| of incorporation/operation | Principal activities | | held by the Group | | held | | held % | | % | | company |
|
|
|
|
|
|
|
|
|
|
|
|
| Australia | | | | | | | | | | | |
| Boyne Smelters Limited | Aluminium smelting | | 153,679,560 | | Ordinary | | 59.4 | | 59.4 | | Rio Tinto Limited |
| Gladstone Power Station | Power generation | | | | (b) | | | | 42.1 | | Rio Tinto Limited |
| Northparkes Mine | Copper/gold mining and processing | | (b) | | | | 80 | | Rio Tinto Limited |
| Queensland Alumina Limited | Alumina production | | 854,078 | | Ordinary | | 38.6 | | 38.6 | | Rio Tinto Limited |
| Robe River Iron Associates | Iron ore mining | | | | (b) | | | | 53 | | Rio Tinto Limited |
| Hlsmelt® Kwinana Joint Venture | Iron technology | | | | (b) | | | | 60 | | Rio Tinto Limited |
| Bao-HI Ranges Joint Venture | Iron ore mining | | | | (b) | | | | 54 | | Rio Tinto Limited |
|
|
|
|
|
|
|
|
|
|
|
|
| Canada | | | | | | | | | | | |
| Diavik | Mining and processing of diamonds | | (b) | | | | 60 | | Rio Tinto plc |
|
|
|
|
|
|
|
|
|
|
|
|
| New Zealand | | | | | | | | | | | |
| New Zealand Aluminium Smelters Limited | Aluminium smelting | | 24,998,400 | | Ordinary | | 79.36 | | 79.36 | | Rio Tinto Limited |
|
|
|
|
|
|
|
|
|
|
|
|
| (a) | The Group comprises a large number of entities and it is not practical to include all of them in this list. The list therefore only includes those entities that have a more significant impact on the profit or assets of the Group. |
| (b) | These entities are unincorporated. |
| (c) | All entities operate mainly in the countries in which they are incorporated. |
| (d) | The Group's principal joint arrangements are held by intermediate holding companies and not directly by Rio Tinto plc or Rio Tinto Limited. |
A-53
Back to Contents
RIO TINTO PLC - RIO TINTO LIMITED
NOTES TO FINANCIAL STATEMENTS - (continued)
35 Sales and purchases of subsidiaries, joint ventures, associates and other interests in operations
| 2004 Disposals | | | | | | | | |
| Name of operation | Location | Principal activities | Ownership | Date of |
| | | | disposed | disposal |
| | | | % | |
|
|
|
|
|
|
|
| |
| Rio Tinto plc - part of Rio Tinto Group | | | | | | | | |
| | | | | | | | | |
| Subsidiaries | | | | | | | | |
| Mineracao Serra de Fortaleza Limitada | Brazil | | Nickel mining | | 99.9 | | 1 January 2004 | |
| Rio Paracatu Mineracao S.A. | Brazil | | Gold mining | | 51.0 | | 31 December 2004 | |
|
|
|
|
|
|
|
| |
| Associates | | | | | | | | |
| Freeport-McMoRan Copper & Gold Inc. (b) | USA | | Copper and gold mining in Indonesia | | 13.1 | | 30 March 2004 | |
| Sociedade Mineira de Neves-Corvo S.A. | Portugal | | Copper mining | | 49.0 | | 18 June 2004 | |
| (Somincor) | | | | | | | | |
|
|
|
|
|
|
|
| |
| Rio Tinto Limited - part of Rio Tinto Group | | | | | | | | |
| Subsidiaries | | | | | | | | |
| Zinkgruvan AB | Sweden | | Zinc, lead and silver mining | | 100.0 | | 2 June 2004 | |
|
|
|
|
|
|
|
| |
| Joint ventures | | | | | | | | |
| Hail Creek | Australia | | Coal mining | | 10.0 | | 15 November 2004 | |
|
|
|
|
|
|
|
| |
| Other investments | | | | | | | | |
| Lake Cowal | Australia | | Gold mining | | (c | ) | 9 July 2001 | |
| Sepon | Laos | | Gold mining | | 20.0 | | 1 January 2004 | |
| Boke | Guinea | | Bauxite mining | | 4.0 | | 25 June 2004 | |
|
|
|
|
|
|
|
| |
| (a) | The aggregate profit on disposal of interests in operations in 2004 was US$920 million, which is analysed in note 4. These gains have been classified as exceptional items and consequently excluded from adjusted earnings at the foot of the profit and loss account. |
| (b) | The sale of investment in Freeport-McMoRan Copper & Gold Inc. does not affect the terms of the Grasberg joint venture referred to in note 32 above. |
| (c) | The Group disposed of the Lake Cowal gold project in July 2001. In accordance with the sale agreement, a US$15 million payment on commencement of mining activity was made to the Group on 5 March 2004. |
| (d) | In accordance with FRS 2 and FRS 9, the Group consolidates the results of subsidiary operations, and recognises its share of the results of joint ventures and associates, up to the date of disposal. In addition to the amount recorded as 'Profit on disposal of interests in operations' on the face of the profit and loss account, the subsidiaries which were disposed of during the year contributed US$16 million to Group profit. |
| (e) | The Cash flow statement includes proceeds from disposals of interests in operations as follows: |
| | –US$1,511 million included in 'Disposals less acquisitions' which, in accordance with FRS1, is stated net of US $16 million cash and overdrafts transferred on sale of subsidiaries. This comprises US$431 million in respect of subsidiaries and US$1,080 in respect of joint ventures and associates. |
| | –US$110 million included in 'Sales less purchases of other investments'. |
| | | | | | | | | |
| 2003 Disposals | | | | | | | | |
| Name of operation | Location | | Principal activities | | Ownership | | Date of | |
| | | | | disposed | | disposal | |
| | | | | % | | | |
|
|
|
|
|
|
|
| |
| Rio Tinto Limited - part of Rio Tinto Group | | | | | | | | |
| | | | | | | | | |
| Subsidiaries | | | | | | | | |
| Peak Gold Mines Pty Limited | Australia | | Gold mining | | 100 | | 17 March 2003 | |
|
|
|
|
|
|
|
| |
| Joint ventures | | | | | | | | |
| P.T. Kaltim Prima Coal | Indonesia | | Coal mining | | 50 | | 10 October 2003 | |
|
|
|
|
|
|
|
| |
| Associates | | | | | | | | |
| Minera Alumbrera Limited | Argentina | | Copper and gold mining | | 25 | | 17 March 2003 | |
|
|
|
|
|
|
|
| |
| | |
| (f) | The profit on disposal of interests in operations in 2003 was US$126 million. This was classified as an exceptional items and consequently excluded from adjusted earnings at the foot of the profit and loss account. |
| (g) | The sale proceeds of US$403 million relating to these disposals were included in the Cash flow statement within 'Disposals less acquisitions'. |
| | |
2003 Acquisitions
During 2003 Kennecott Energy, an indirect subsidiary of Rio Tinto plc, increased its holding in Pegasus Technologies Inc. from 20 per cent to 86 per cent. The transaction gave rise to goodwill of US$20 million. The transaction did not involve any cash consideration.
A-54
Back to Contents
RIO TINTO PLC - - RIO TINTO LIMITED
NOTES TO FINANCIAL STATEMENTS - (continued)
| 36 | Directors' remuneration |
Aggregate remuneration of the directors of the parent Companies was as follows:
| | | Rio Tinto Group | |
|
| 2004 | | 2003 | | 2002 |
|
|
|
| | | US$'000 | | US$'000 | | US$'000 | |
| Emoluments | | 9,992 | | 9,571 | | 9,541 | |
| Long term incentive plans | | 57 | | 3,278 | | 8,443 | |
| | |
| |
| |
| |
| | | 10,049 | | 12,849 | | 17,984 | |
| | |
| |
| |
| |
| Pension contributions | | 669 | | 424 | | 65 | |
| Gains made on exercise of share options | | 2,414 | | 2,029 | | 2,992 | |
For 2004, a total of US$4,190,900 (2003: US$4,048,800) was attributable to the highest paid director in respect of the aggregate amounts disclosed in the above table, including gains made on exercise of share options. The accrued pension entitlement for the highest paid director was US$712,400 (2003: US$1,158,700).
The aggregate remuneration incurred by Rio Tinto plc in respect of its directors was US$7,756,000 (2003: US$9,794,000).
There were no pension contributions.
The aggregate remuneration, including pension contributions and other retirement benefits, incurred by Rio Tinto Limited in respect of its directors was US$5,376,000 (2003: US$5,508,000). The aggregate pension contribution was US$668,982 (2003: US$423,938).
During 2004, four directors (2003: six) accrued retirement benefits under defined benefit arrangements.
Shares awarded last year in respect of the MCCP 2000 performance periods vested after the publication of the 2003 Annual Report and financial statements and the value of awards provided therein were estimated based on share prices of 1,386p and A$35.24. The actual share prices on 27 February 2004 when the awards vested were 1,440.5p and A$35.83 and the above 2004 figures for long term incentive plans have included this adjustment. Further details are given in the Remuneration report.
Emoluments included in the table above have been translated from local currency at the average rate for the year with the exception of bonus payments which, together with amounts payable under long term incentive plans, have been translated at the year end rate.
More detailed information concerning directors’ remuneration, shareholdings and options is shown in the Remuneration report, including Tables 1 to 5, on pages 76 to 81.
A-55
Back to Contents
RIO TINTO PLC - RIO TINTO LIMITED
NOTES TO FINANCIAL STATEMENTS - (continued)
| | Rio Tinto plc - | | Rio Tinto Limited - | | | |
| part of Rio Tinto Group | part of Rio Tinto Group | Rio Tinto Group |
|
|
|
| 2004 | | 2003 | | 2002 | 2004 | | 2003 | | 2002 | 2004 | | 2003 | | 2002 |
|
|
|
|
|
|
|
|
|
| US$m | US$m | US$m | US$m | US$m | US$m | US$m | US$m | US$m |
| Auditors' remuneration - Group Auditors | | | | | | | | | | | | | | | | | | |
| Audit services | | | | | | | | | | | | | | | | | | |
| - Statutory audit | 3.4 | | 3.1 | | 2.6 | | 2.6 | | 2.1 | | 1.5 | | 6.0 | | 5.2 | | 4.1 | |
| - Audit-related regulatory reporting | 1.7 | | 0.9 | | 0.7 | | 1.7 | | 0.4 | | 0.4 | | 3.4 | | 1.3 | | 1.1 | |
| Further assurance services | 0.1 | | 0.1 | | 0.2 | | 0.1 | | 0.2 | | 0.2 | | 0.2 | | 0.3 | | 0.4 | |
| Tax services | | | | | | | | | | | | | | | | | | |
| - Compliance | 0.5 | | 0.4 | | 0.4 | | 0.5 | | 1.3 | | 1.1 | | 1.0 | | 1.7 | | 1.5 | |
| - Advisory | 0.4 | | 0.4 | | 0.2 | | 0.4 | | 0.7 | | 0.7 | | 0.8 | | 1.1 | | 0.9 | |
| Other services | | | | | | | | | | | | | | | | | | |
| - Financial information technology | - | | 0.1 | | - | | - | | - | | - | | - | | 0.1 | | - | |
| - Internal audit | - | | 0.1 | | 0.3 | | - | | - | | - | | - | | 0.1 | | 0.3 | |
| - Other services not covered above | - | | 0.1 | | 0.2 | | 0.1 | | 0.2 | | 0.2 | | 0.1 | | 0.3 | | 0.4 | |
| |
| |
| |
| |
| |
| |
| |
| |
| |
| |
| | 6.1 | | 5.2 | | 4.6 | | 5.4 | | 4.9 | | 4.1 | | 11.5 | | 10.1 | | 8.7 | |
| |
| |
| |
| |
| |
| |
| |
| |
| |
| |
| | | | | | | | | | | | | | | | | | | |
| Remuneration payable to other accounting firms | | | | | | | | | | | | | | | | | | |
| Statutory audit | 0.4 | | 0.3 | | 0.2 | | - | | 0.1 | | 0.1 | | 0.4 | | 0.4 | | 0.3 | |
| Tax services | 0.7 | | 0.3 | | 0.2 | | 2.3 | | 2.2 | | 0.6 | | 3.0 | | 2.5 | | 0.8 | |
| Internal audit | 1.0 | | 1.2 | | 0.3 | | 0.8 | | 1.1 | | 0.7 | | 1.8 | | 2.3 | | 1.0 | |
| Other services | 2.0 | | 2.0 | | 1.1 | | 3.9 | | 4.9 | | 2.6 | | 5.9 | | 6.9 | | 3.7 | |
| |
| |
| |
| |
| |
| |
| |
| |
| |
| |
| | 4.1 | | 3.8 | | 1.8 | | 7.0 | | 8.3 | | 4.0 | | 11.1 | | 12.1 | | 5.8 | |
| |
| |
| |
| |
| |
| |
| |
| |
| |
| |
| | 10.2 | | 9.0 | | 6.4 | | 12.4 | | 13.2 | | 8.1 | | 22.6 | | 22.2 | | 14.5 | |
| |
| |
| |
| |
| |
| |
| |
| |
| |
| |
| (a) | The audit fees payable to PricewaterhouseCoopers, the Group Auditors, are reviewed by the Audit committee. The committee sets the policy for the award of non-audit work to the auditors and reviews the nature and extent of such work, and the amount of the related fees, to ensure that independence is maintained. The fees disclosed above consolidate all payments made to PricewaterhouseCoopers by the companies and their subsidiaries. |
| (b) | 'Audit-related regulatory reporting' includes the audit of employee benefit plans, consultation regarding the application of accounting principles (including IFRS) and work performed in connection with Section 404 of the Sarbanes-Oxley Act. |
| (c) | 'Further assurance services' includes financial due diligence for potential business acquisitions and disposals. |
| (d) | 'Tax services' includes tax compliance, involving the preparation or review of returns for corporation, income, sales and excise taxes; acquisitions advice on transfer pricing and dealing with tax returns for expatriates. |
| (e) | 'Other services' includes reviews of risk management policies and procedures, forensic investigations and provision of training services. |
| (f) | Internal audit fees payable to Group Auditors in 2003 relate to projects which were carried forward from 2002. There were no internal audit services provided by the Group auditors in 2004. |
| (g) | 'Remuneration payable to other accounting firms' does not include fees for similar services payable to suppliers of consultancy services other than accountancy firms. |
| (h) | Amounts payable to PricewaterhouseCoopers for non-audit work for the Group's UK companies were US$1.7 million (2003: US$1.3 million 2002: US$0.9 million) and for the Group's Australian companies were US$2.1 million (2003: US$2.3 million 2002: US$1.7 million). |
A-56
Back to Contents
RIO TINTO PLC - RIO TINTO LIMITED
NOTES TO FINANCIAL STATEMENTS - (continued)
38 Related party transactions
Information about material related party transactions of the Rio Tinto Group is set out below:
Subsidiary companies:Details of investments in principal subsidiary companies are disclosed in note 31.
Joint ventures and associates: Information relating to joint ventures and associates can be found in the following notes:
| Note 4 - | Exceptional items |
| Note 5 - | Net interest payable and similar charges |
| Note 6 - | Amortisation of discount |
| Note 7 - | Taxation charge |
| Note 12 - | Property, plant and equipment |
| Note 13 - | Fixed asset investments |
| Note 14 - | Net debt of joint ventures and associates |
| Note 16 - | Accounts receivable and prepayments |
| Note 19 - | Accounts payable and accruals |
| Note 25 - | Share premium and reserves |
| Note 26 - | Product analysis |
| Note 27 - | Geographical analysis |
| Note 30 - | Average number of employees |
| Note 32 - | Principal joint venture interests |
| Note 33 - | Principal associates |
| Note 35 - | Purchases and sales of subsidiaries, joint arrangements, joint ventures and associates |
Information relating to joint arrangements can be found in note 34 - Principal joint arrangements.
Pension funds:Information relating to pension fund arrangements is disclosed in note 40.
Directors:Details of directors' remuneration are set out in note 36 and in the Remuneration report.
Transactions between the Rio Tinto plc part of the Group and the Rio Tinto Limited part of the Group
These are eliminated on the consolidation of the Rio Tinto Group. Transactions during 2004 and 2003 included the following:
| - | During 2004, Rio Tinto plc made loans of US$1.4 billion to Rio Tinto Limited. |
| | |
| - | During 2003, a subsidiary of the Rio Tinto plc part of the Group acquired US$500 million of redeemable preference shares in a subsidiary of the Rio Tinto Limited part of the Group. |
| | |
| - | During 2003, a payment of US$1,208 million was made by the Rio Tinto Limited part of the Group to the Rio Tinto plc part of the Group in respect of a number of shares which were bought back during 2000. |
| | |
| - | During 2003 a dividend of US$164 million was paid by Rio Tinto Limited on the DLC Dividend Share, which was issued to facilitate the efficient management of funds within the DLC structure. Of this, US$62 million was paid out of Rio Tinto plc's 37.6% share of the reserves of Rio Tinto Limited and, therefore, had no impact on the shareholders' funds of Rio Tinto plc. The remaining US$102 million of this dividend gave rise to an increase in the shareholders' funds of the Rio Tinto plc part of the Group.This dividend, however, had no impact on the shareholders' funds of the Rio Tinto Group as the economic interests of shareholders both of Rio Tinto plc and Rio Tinto Limited are in the combined net assets of the two dual listed companies. There was no such dividend in 2004. |
Leighton Holdings Limited (Leighton)
In 2001, John Morschel became a director and, subsequently, the chairman of Leighton, Australia's largest project development and contracting group. A number of Rio Tinto companies in Australia and Indonesia have, in the ordinary course of their businesses, awarded commercial contracts to subsidiaries of Leighton. The Board does not consider the value of these contracts to be material to the business of either Leighton or the Rio Tinto Group. John Morschel resigned from the board of Leighton on 25 March 2004.
Barclays Bank plc and ANZ Banking Group Limited
On 1 October 2004, Leigh Clifford became a director of Barclays Bank plc and John Morschel became a director of ANZ Banking Group Limited. Rio Tinto is a client of both these banks.
Dupont
Richard Goodmanson's employer, The DuPont Company, has commercial buy and sell arrangements with Rio Tinto. These are not material to either company and, in the normal course of his duties, he does not play a role in nor exert influence over these transactions.
39 Bougainville Copper Limited ('BCL')
The Panguna mine remains shut down. Access to the mine site has not been possible and an accurate assessment of the condition of the assets cannot be determined. Considerable funding would be required to recommence operations to the level which applied at the time of the mine's closure in 1989 and these funding requirements cannot be forecast accurately. The directors do not have access to reliable, verifiable or objective information on BCL and the directors have therefore decided to exclude BCL information from the financial statements. BCL reported a net profit of US$2 million for the financial year (2003: profit of US$4 million, 2002: profit of US$2 million). This is based upon actual transactions for the financial year. The aggregate amount of capital and reserves reported by BCL as at 31 December 2004 was US$106 million (2003: US$97 million). The Group owns 214,887,966 shares in BCL, representing 53.6 per cent of the issued share capital. The investment of US$195 million was fully provided against in 1991. At 31 December 2004, the market value of the shareholding in BCL was US$40 million.
A-57
Back to Contents
RIO TINTO PLC - RIO TINTO LIMITED
NOTES TO FINANCIAL STATEMENTS - (continued)
40 Post retirement benefits
(a) SSAP 24 accounting and disclosure
Pensions
The Group operates a number of pension plans around the world. Whilst some of these plans are defined contribution, the majority are of the funded defined benefit type, with assets held in separate trustee administered funds. Valuations of these plans are updated annually to 31 December by independent qualified actuaries. Further details regarding the plans are provided in the FRS 17 disclosures in section (b) of this note.
| Summary of independent actuarial reviews | UK | | Australia | | US | | Canada | | Other (e) | |
| |
| |
| |
| |
| |
| |
| | | | | | | | | | | |
| At 31 December 2004 | | | | | | | | | | |
| | | | | | | | | | | |
| Assumptions | | | | | | | | | | |
| Rate of return on investments (a) | 6.8 | % | 6.4 | % | 6.8 | % | 6.8 | % | 8.2 | % |
| Rate of earnings growth, where appropriate (b) | 4.9 | % | 4.7 | % | 4.2 | % | 4.4 | % | 6.0 | % |
| Rate of increase in pensions | 2.9 | % | 2.7 | % | - | | - | | 4.0 | % |
| | | | | | | | | | | |
| Results | | | | | | | | | | |
| Smoothed market value of assets ($m) (c) | 1,738 | | 1,273 | | 682 | | 815 | | 208 | |
| Percentage of coverage of liabilities by assets (d) | 121 | % | 101 | % | 91 | % | 82 | % | 112 | % |
| Amount of deficit for individual plans with net deficits ($m) | 15 | | - | | 97 | | 186 | | 12 | |
| | | | | | | | | | | |
| At 31 December 2003 | | | | | | | | | | |
| | | | | | | | | | | |
| Assumptions | | | | | | | | | | |
| Rate of return on investments (a) | 6.9 | % | 6.4 | % | 6.7 | % | 6.5 | % | 9.2 | % |
| Rate of earnings growth, where appropriate (b) | 4.8 | % | 4.0 | % | 4.0 | % | 4.0 | % | 6.5 | % |
| Rate of increase in pensions | 2.8 | % | 2.5 | % | - | | - | | 4.5 | % |
| | | | | | | | | | | |
| Results | | | | | | | | | | |
| Smoothed market value of assets ($m) (c) | 1,506 | | 962 | | 573 | | 673 | | 194 | |
| Percentage of coverage of liabilities by assets (d) | 124 | % | 100 | % | 81 | % | 80 | % | 91 | % |
| Amount of deficit for individual plans with net deficits ($m) | 13 | | 7 | | 145 | | 174 | | 19 | |
| | |
| (a) | The rate of return on investments assumed for Australia is after taking into account the tax applicable to Australian pension schemes. |
| (b) | The rate of earnings growth assumed includes a promotional salary scale where appropriate. |
| (c) | Assets were measured at market value smoothed over a one year period. |
| (d) | Asset coverage of the liability is quoted after allowing for expected increases in earnings. |
| (e) | The assumptions vary by location for the 'Other ' plans. Assumptions shown are for Africa. |
Other information
A triennial actuarial valuation of the Group's UK plan was made at 31 March 2003 using the projected unit method. In Australia, whilst Group companies sponsor or subscribe to a number of pension plans, the Rio Tinto Staff Superannuation Fund is the only significant plan. This plan principally contains defined contribution liabilities but also has defined benefit liabilities. Valuations are made at least every three years using the projected unit method, with the latest valuation being as at 30 June 2004. A number of defined benefit pension plans are sponsored by the US entities, typically with separate provision for salaried and hourly paid staff. Valuations are made annually at 1 January using the projected unit method. A number of defined benefit pension plans are sponsored by entities in Canada. Valuations are updated annually using the projected unit method. Other defined benefit plans sponsored by the Group around the world were assessed at various dates during 2002, 2003 and 2004. Th e above summary is based on the most recent valuation in each case, updated to the appropriate balance sheet date. The expected average remaining service life in the plans relating to the Group's major entities ranges from eight to 17 years, with an overall average of 12 years. The main pension plans, providing purely defined contribution benefits, held assets equal to their liabilities, of US$180 million as at 31 December 2004 (US$186 million at 31 December 2003). The Group's contributions to these plans of US$6 million (2003:US$9 million) are charged against profits and are included in the 'Regular cost' shown below. The Group also operates a number of unfunded plans, which are included within the deficit and percentage coverage statistics above, measured on a basis consistent with both SSAP 24 and FRS 17.
Profit and loss account - effect of pension costs, before tax and outside shareholders' interests
| | 2004 | | 2003 | |
| US$m | US$m |
| |
| |
| |
| Regular cost | (118 | ) | (102 | ) |
| Variation cost | (92 | ) | (90 | ) |
| Interest on prepayment under SSAP 24 | 39 | | 42 | |
| Settlement | 41 | | - | |
| |
| |
| |
| Net post retirement cost | (130 | ) | (150 | ) |
| |
| |
| |
The variation cost reflects the amortisation of the excess of the pension asset carried in the balance sheet at the beginning of the year over the surplus/(deficit) in the relevant plans calculated on a SSAP 24 valuation basis. The settlement represents a pension surplus allocated to the Group in South Africa, which is reflected as a credit.
A-58
Back to Contents
RIO TINTO PLC - - RIO TINTO LIMITED
NOTES TO FINANCIAL STATEMENTS - (continued)
40 Post retirement benefits (continued)
Balance sheet - effect of pension assets and liabilities, before tax and outside shareholders' interests
| | 2004 | | 2003 | |
| US$m | US$m |
| |
| |
| |
| Prepayment under SSAP 24 | 616 | | 620 | |
| Provisions | (53 | ) | (77 | ) |
| |
| |
| |
| Net post retirement asset | 563 | | 543 | |
| |
| |
| |
Post retirement healthcare
Certain subsidiaries of the Group, mainly in the US, provide health and life insurance benefits to retired employees and in some cases their beneficiaries and covered dependants. Eligibility for cover is dependent upon certain age and service criteria. These arrangements are unfunded.
On 30 September 2004, the unfunded accumulated post retirement benefit obligation and annual cost of accrual of benefits were determined by independent actuaries using the projected unit method. The main financial assumptions were: discount rate 5.7 per cent (at 30 September 2003: 6.1 per cent), Medical Trend Rate 10.5 per cent reducing to 5.0 per cent by the year 2011 (at 30 September 2003 initially 11.2 per cent reducing to 4.7 per cent by the year 2011), claims cost based on individual company experience. The assumptions were consistent with those adopted for determining pension costs. At 30 September 2004, which is the measurement date, the unfunded accumulated post retirement benefits obligation (excluding associates and joint ventures) was US$523 million (at 30 September 2003: US$563 million).
Profit and loss account - effect of post retirement healthcare costs, before tax and outside shareholders' interests
| | 2004 | | 2003 | |
| US$m | US$m |
| |
| |
| |
| Regular cost | (10 | ) | (9 | ) |
| Amortisation | (4 | ) | 4 | |
| Interest | (32 | ) | (29 | ) |
| Curtailment | 3 | | - | |
| |
| |
| |
| Net post retirement cost | (43 | ) | (34 | ) |
| |
| |
| |
| | | | | |
| Balance sheet - effect of post retirement healthcare liabilities, before tax and outside shareholders' interests | | | | |
| | 2004 | | 2003 | |
| | US$m | | US$m | |
| |
| |
| |
| Provisions | (523 | ) | (498 | ) |
| | | | | |
b) FRS 17 Transitional disclosures
FRS 17 - 'Retirement Benefits', which deals with accounting for post retirement benefits, has not been adopted, but the additional disclosures which are required are shown below. The standard requires pension deficits, and surpluses to the extent that they are considered recoverable, to be recognised in full. Annual service cost and net financial income on the assets and liabilities of the plans are recognised through earnings. Other fluctuations in the value of the surpluses/(deficits) are recognised in the Statement of Total Recognised Gains and Losses ('STRGL'). Details of post retirement benefit plan assets and liabilities at 31 December 2004, 2003 and 2002, valued on a projected unit basis in accordance with FRS 17, are set out below:
| Main assumptions for FRS 17 purposes | UK | | Australia | | US | | Canada | | Other (mainly Africa) | |
| |
| |
| |
| |
| |
| |
| | | | | | | | | | | |
| At 31 December 2004 | | | | | | | | | | |
| Rate of increase in salaries | 4.9 | % | 4.7 | % | 4.2 | % | 4.4 | % | 6.0 | % |
| Rate of increase in pensions | 2.9 | % | 2.7 | % | - | | - | | 4.0 | % |
| Discount rate | 5.3 | % | 5.1 | % | 5.6 | % | 5.6 | % | 8.5 | % |
| Inflation | 2.9 | % | 2.7 | % | 2.7 | % | 2.7 | % | 4.0 | % |
| | | | | | | | | | | |
| At 31 December 2003 | | | | | | | | | | |
| Rate of increase in salaries | 4.8 | % | 4.0 | % | 4.0 | % | 4.0 | % | 6.5 | % |
| Rate of increase in pensions | 2.8 | % | 2.5 | % | - | | - | | 4.5 | % |
| Discount rate | 5.4 | % | 6.0 | % | 5.9 | % | 6.1 | % | 9.0 | % |
| Inflation | 2.8 | % | 2.5 | % | 2.5 | % | 2.3 | % | 4.5 | % |
| | | | | | | | | | | |
| At 31 December 2002 | | | | | | | | | | |
| Rate of increase in salaries | 4.8 | % | 4.0 | % | 3.2 | % | 3.7 | % | 10.5 | % |
| Rate of increase in pensions | 2.3 | % | 2.5 | % | - | | - | | 7.0 | % |
| Discount rate | 5.6 | % | 6.2 | % | 6.2 | % | 6.5 | % | 11.5 | % |
| Inflation | 2.3 | % | 2.5 | % | 2.2 | % | 2.2 | % | 7.0 | % |
The main financial assumptions used for the health care schemes, which are predominantly in the US, were: discount rate: 5.6% (2003: 5.9%, 2002: 6.2%), Medical Trend Rate: 10.7% reducing to 5.2% by the year 2011 (2003: Medical Trend Rate: 11.5% reducing to 5.0% by the year 2011, 2002: Medical Trend Rate 8.0% reducing to 5.0% by the year 2009), claims cost based on individual company experience. For the pension and healthcare arrangements the post retirement mortality assumptions allow for expected increases in longevity. The mortality table used for the main arrangements implies that a 60 year old male has an expected future lifetime of 24 years.
A-59
Back to Contents
RIO TINTO PLC - - RIO TINTO LIMITED
NOTES TO FINANCIAL STATEMENTS - (continued)
40 Post retirement benefits (continued)
| | UK | | Australia | | US | | Canada | | Other (mainly Africa) | |
| |
| |
| |
| |
| |
| |
| Long term rate of return expected at 31 December 2004 | | | | | | | | | | |
| Equities | 7.9 | % | 7.2 | % | 7.7 | % | 7.7 | % | 9.0 | % |
| Fixed interest bonds | 4.8 | % | 4.7 | % | 5.1 | % | 5.1 | % | 8.5 | % |
| Index linked bonds | 4.8 | % | 4.7 | % | 5.1 | % | 5.1 | % | 8.5 | % |
| Other | 4.5 | % | 4.9 | % | 5.2 | % | 4.0 | % | 5.0 | % |
| | | | | | | | | | | |
| Long term rate of return expected at 31 December 2003 | | | | | | | | | | |
| Equities | 7.8 | % | 7.0 | % | 7.5 | % | 7.3 | % | 9.5 | % |
| Fixed interest bonds | 5.0 | % | 5.1 | % | 5.4 | % | 5.2 | % | 8.5 | % |
| Index linked bonds | 5.0 | % | 5.1 | % | 5.4 | % | 5.2 | % | 8.5 | % |
| Other | 4.6 | % | 5.1 | % | 5.1 | % | 3.3 | % | 5.6 | % |
| | | | | | | | | | | |
| Long term rate of return expected at 31 December 2002 | | | | | | | | | | |
| Equities | 7.3 | % | 7.0 | % | 7.2 | % | 7.2 | % | 12.5 | % |
| Fixed interest bonds | 5.0 | % | 5.5 | % | 5.6 | % | 6.0 | % | 11.0 | % |
| Index linked bonds | 5.0 | % | 5.5 | % | 5.6 | % | 6.0 | % | 11.0 | % |
| Other | 4.6 | % | 5.9 | % | 6.4 | % | 5.0 | % | 10.2 | % |
Scheme assets
The assets in the pension plans and the contributions made were:
| | UK | | Australia | | US | | Canada | | Other (mainly Africa) | | Total | |
| |
| |
| |
| |
| |
| |
| |
| | US$m | | US$m | | US$m | | US$m | | US$m | | US$m | |
| Value at 31 December 2004 | | | | | | | | | | | | |
| Equities | 1,211 | | 852 | | 460 | | 534 | | 114 | | 3,171 | |
| Fixed interest bonds | 318 | | 299 | | 154 | | 228 | | 14 | | 1,013 | |
| Index linked bonds | 162 | | - | | - | | 54 | | - | | 216 | |
| Other | 84 | | 132 | | 79 | | 11 | | 80 | | 386 | |
| |
| |
| |
| |
| |
| |
| |
| | 1,775 | | 1,283 | | 693 | | 827 | | 208 | | 4,786 | |
| |
| |
| |
| |
| |
| |
| |
| Value at 31 December 2003 | | | | | | | | | | | | |
| Equities | 1,094 | | 646 | | 401 | | 451 | | 82 | | 2,674 | |
| Fixed interest bonds | 300 | | 229 | | 126 | | 193 | | 15 | | 863 | |
| Index linked bonds | 127 | | 7 | | 12 | | 44 | | - | | 190 | |
| Other | 54 | | 88 | | 74 | | 21 | | 97 | | 334 | |
| |
| |
| |
| |
| |
| |
| |
| | 1,575 | | 970 | | 613 | | 709 | | 194 | | 4,061 | |
| |
| |
| |
| |
| |
| |
| |
| Value at 31 December 2002 | | | | | | | | | | | | |
| Equities | 823 | | 377 | | 342 | | 271 | | 93 | | 1,906 | |
| Fixed interest bonds | 294 | | 160 | | 139 | | 148 | | 18 | | 759 | |
| Index linked bonds | 95 | | 5 | | 11 | | 32 | | - | | 143 | |
| Other | 60 | | 65 | | 39 | | 64 | | 190 | | 418 | |
| |
| |
| |
| |
| |
| |
| |
| | 1,272 | | 607 | | 531 | | 515 | | 301 | | 3,226 | |
| |
| |
| |
| |
| |
| |
| |
| Employer contributions made during 2004 * | - | | 56 | | 41 | | 37 | | 9 | | 143 | |
| |
| |
| |
| |
| |
| |
| |
| Employer contributions made during 2003 * | 6 | | 45 | | 4 | | 43 | | 5 | | 103 | |
| |
| |
| |
| |
| |
| |
| |
| Employer contributions made during 2002 * | - | | 10 | | 4 | | 15 | | 4 | | 33 | |
| |
| |
| |
| |
| |
| |
| |
| *The contributions shown include US$6 million (2003:US$9 million; 2002: US$13 million) for defined contribution plans. | |
In addition, there were contributions of US$26 million (2003: US$18 million; 2002: US$16 million) in respect of unfunded health care schemes in the year. Since these schemes are unfunded, contributions for future years will be equal to benefit payments and therefore cannot be pre-determined. In relation to pensions, it is currently expected that there will be no significant regular employer or employee contributions to the UK plan in 2005. Contributions are made to the main Australian plan according to the recommendation of the plan actuary and are primarily to a mixed defined benefit/defined contribution type arrangement (included in the above figures). In North America, contributions are agreed annually in nominal terms. Whilst contributions for 2005 are yet to be determined, the currently expected level of contributions by the Group to the plans in Australia, Canada and the US is expected to be higher similar in aggregate to that made in 2004.
The most recent full valuation of the UK plans was at 31 March 2003. The most recent full valuation of the Australian plans was at 30 June 2004. For both the US and Canadian major plans, the most recent full valuation was at 1 January 2004.
A-60
Back to Contents
RIO TINTO PLC - RIO TINTO LIMITED
NOTES TO FINANCIAL STATEMENTS - (continued)
40 Post retirement benefits (continued)
Surpluses/(deficits) in the plans
The following amounts were measured in accordance with FRS 17:
| At 31 December 2004 | | | | | | | | | | | Total | | | | | |
| UK | | Australia | | US | | Canada | | Other | | Pensions | | Healthcare | | Total | |
| | US$m | | US$m | | US$m | | US$m | | US$m | | US$m | | US$m | | US$m | |
| |
| |
| |
| |
| |
| |
| |
| |
| |
| Total market value of plan assets | 1,775 | | 1,283 | | 693 | | 827 | | 208 | | 4,786 | | - | | 4,786 | |
| Present value of plan liabilities | (1,760 | ) | (1,275 | ) | (868 | ) | (1,129 | ) | (185 | ) | (5,217 | ) | (544 | ) | (5,761 | ) |
| |
| |
| |
| |
| |
| |
| |
| |
| |
| Surplus/(deficit) in the plans | 15 | | 8 | | (175 | ) | (302 | ) | 23 | | (431 | ) | (544 | ) | (975 | ) |
| |
| |
| |
| |
| |
| |
| |
| | | |
| Related deferred tax | | | | | | | | | | | | | | | 168 | |
| Related outside shareholders' interest | | | | | | | | | | | | | | | 108 | |
| | | | | | | | | | | | | | | |
| |
| Net post retirement liability | | | | | | | | | | | | | | | (699 | ) |
| | | | | | | | | | | | | | | |
| |
| | | | | | | | | | | | | | | | | |
| Surplus/(deficit) in the plans comprises: | | | | | | | | | | | | | | | | |
| Surplus | 36 | | 8 | | 6 | | 6 | | 35 | | 91 | | - | | 91 | |
| Deficit | (21 | ) | - | | (181 | ) | (308 | ) | (12 | ) | (522 | ) | (544 | ) | (1,066 | ) |
| |
| |
| |
| |
| |
| |
| |
| |
| |
| | 15 | | 8 | | (175 | ) | (302 | ) | 23 | | (431 | ) | (544 | ) | (975 | ) |
| |
| |
| |
| |
| |
| |
| |
| |
| |
| | | | | | | | | | | | | | | | | |
| | | | | | | | | | | | Total | | | | | |
| At 31 December 2003 | UK | | Australia | | US | | Canada | | Other | | Pensions | | Healthcare | | Total | |
| | US$m | | US$m | | US$m | | US$m | | US$m | | US$m | | US$m | | US$m | |
| |
| |
| |
| |
| |
| |
| |
| |
| |
| Total market value of plan assets | 1,575 | | 970 | | 613 | | 709 | | 194 | | 4,061 | | - | | 4,061 | |
| Present value of plan liabilities | (1,477 | ) | (963 | ) | (768 | ) | (877 | ) | (213 | ) | (4,298 | ) | (561 | ) | (4,859 | ) |
| |
| |
| |
| |
| |
| |
| |
| |
| |
| Surplus/(deficit) in the plans | 98 | | 7 | | (155 | ) | (168 | ) | (19 | ) | (237 | ) | (561 | ) | (798 | ) |
| |
| |
| |
| |
| |
| |
| |
| | | |
| Related deferred tax | | | | | | | | | | | | | | | 123 | |
| Related outside shareholders' interest | | | | | | | | | | | | | | | 92 | |
| | | | | | | | | | | | | | | |
| |
| Net post retirement liability | | | | | | | | | | | | | | | (583 | ) |
| | | | | | | | | | | | | | | |
| |
| | | | | | | | | | | | | | | | | |
| Surplus/(deficit) in the plans comprises: | | | | | | | | | | | | | | | | |
| Surplus | 121 | | 7 | | 12 | | 2 | | - | | 142 | | - | | 142 | |
| Deficit | (23 | ) | - | | (167 | ) | (170 | ) | (19 | ) | (379 | ) | (561 | ) | (940 | ) |
| |
| |
| |
| |
| |
| |
| |
| |
| |
| | 98 | | 7 | | (155 | ) | (168 | ) | (19 | ) | (237 | ) | (561 | ) | (798 | ) |
| |
| |
| |
| |
| |
| |
| |
| |
| |
If the above amounts had been recognised in the financial statements, the Group's shareholders' funds at 31 December would have been as follows:
| | 2004 | | 2003 | |
| | US$m | | US$m | |
| |
| |
| |
| Shareholders' funds including SSAP 24 post retirement net asset | 12,584 | | 10,037 | |
| Deduct: SSAP 24 post retirement net asset | 362 | | 357 | |
| Deduct: SSAP 24 post retirement healthcare liability | (305 | ) | (290 | ) |
| |
| |
| |
| Shareholders' funds excluding SSAP 24 post retirement pension net asset | 12,527 | | 9,970 | |
| Include: FRS 17 post retirement net liability | (382 | ) | (242 | ) |
| Include: FRS 17 post retirement healthcare liability | (317 | ) | (341 | ) |
| |
| |
| |
| Shareholders' funds including FRS 17 post retirement net liability | 11,828 | | 9,387 | |
| |
| |
| |
| | | | | |
| The post retirement assets and liablities shown above are net of tax and outside shareholders' interests. | | | | |
| | | | | |
| Movements in deficit during the year | | | | |
The net post retirement deficit under FRS 17 before deferred tax and outside shareholders interests would have moved as follows during 2004:
| | Pension | | Other | | 2004 | | 2003 | |
| | benefits | | benefits | | Total | | Total | |
| | | | | | US$m | | US$m | |
| |
| |
| |
| |
| |
| Net post retirement deficit at 1 January | (237 | ) | (561 | ) | (798 | ) | (666 | ) |
| Movement in year: | | | | | | | | |
| Currency translation adjustment | (12 | ) | (14 | ) | (26 | ) | (45 | ) |
| Total current service cost (employer and employee) | (164 | ) | (10 | ) | (174 | ) | (149 | ) |
| Past service cost | (15 | ) | (4 | ) | (19 | ) | (7 | ) |
| Curtailment and settlement gains | 31 | | 4 | | 35 | | 3 | |
| Subsidiaries sold | 7 | | - | | 7 | | - | |
| Plan amendments | - | | - | | - | | (10 | ) |
| Other net finance (expense)/income | 19 | | (33 | ) | (14 | ) | (30 | ) |
| Contributions (including employee contributions) | 185 | | 26 | | 211 | | 156 | |
| Actuarial (loss)/gain recognised in STRGL | (245 | ) | 48 | | (197 | ) | (50 | ) |
| |
| |
| |
| |
| |
| Net post retirement deficit at 31 December | (431 | ) | (544 | ) | (975 | ) | (798 | ) |
| |
| |
| |
| |
| |
The curtailment and settlement gain primarily reflects the allocation of a surplus to the employer in a South African plan.
A-61
Back to Contents
RIO TINTO PLC - RIO TINTO LIMITED
NOTES TO FINANCIAL STATEMENTS - (continued)
40 Post retirement benefits (continued)
Amounts which would have been recognised in the profit and loss account and in the STRGL under FRS 17
The following amounts would have been included within operating profit under FRS 17:
| | Pension | | Other | | 2004 | | 2003 | |
| | benefits | | benefits | | Total | | Total | |
| | | | | | US$m | | US$m | |
| |
| |
| |
| |
| |
| Employer current service cost | (125 | ) | (10 | ) | (135 | ) | (122 | ) |
| Past service cost | (15 | ) | (4 | ) | (19 | ) | (7 | ) |
| Curtailment and settlement gains | 31 | | 4 | | 35 | | 3 | |
| |
| |
| |
| |
| |
| Total operating charge | (109 | ) | (10 | ) | (119 | ) | (126 | ) |
| |
| |
| |
| |
| |
Employer contributions of US$6 million (2003: US$9 million) for defined contribution arrangements have been included in the above operating charge.
The following amounts would have been included as other net finance (expense)/income under FRS 17:
| | Pension | | Other | | 2004 | | 2003 | |
| | benefits | | benefits | | Total | | Total | |
| | | | | | US$m | | US$m | |
| |
| |
| |
| |
| |
| Expected return on pension scheme assets | 272 | | - | | 272 | | 213 | |
| Interest on post retirement liabilities | (253 | ) | (33 | ) | (286 | ) | (243 | ) |
| |
| |
| |
| |
| |
| Net return | 19 | | (33 | ) | (14 | ) | (30 | ) |
| |
| |
| |
| |
| |
If the above amounts had been recognised in the financial statements instead of the SSAP24 charges, the Group's reported net earnings for 2004 would have increased by US$27 million (2003: increased by US$17 million).
The following amounts would have been recognised within the STRGL under FRS 17:
| | 2004 | | 2003 | | 2002 | |
| | US$m | | US$m | | US$m | |
| |
| |
| |
| |
| Excess actual returns on plan assets compared with the expected return | | | | | | |
| Amount (US$m) | 226 | | 354 | | (599 | ) |
| As a percentage of plan assets | 5% | | 9% | | -19% | |
| |
| |
| |
| |
| | | | | | | |
| Experience (losses)/gains on plan liabilities: | | | | | | |
| (i.e. variances between the actual estimate of liabilities and the subsequent outcome) | | | | | | |
| Amount (US$m) | (7 | ) | (118 | ) | 28 | |
| As a percentage of the present value of the plan liabilities | - | | -2% | | 1% | |
| |
| |
| |
| |
| | | | | | | |
| Change in assumptions: | | | | | | |
| Amount (US$m) | (416 | ) | (286 | ) | (148 | ) |
| |
| |
| |
| |
| | | | | | | |
| Total amount recognised in STRGL | | | | | | |
| Amount (US$m) | (197 | ) | (50 | ) | (719 | ) |
| As a percentage of the present value of the plan liabilities | -3% | | -1% | | -18% | |
| |
| |
| |
| |
A-62
Back to Contents
RIO TINTO PLC - RIO TINTO LIMITED
NOTES TO FINANCIAL STATEMENTS - (continued)
41 Rio Tinto financial information by business unit
| | Rio Tinto | | Gross turnover (a) | | EBITDA (b) | | Net earnings (c) | |
| | interest | | | | | | | |
| | % | | 2004 | | 2003 | | 2002 | | 2004 | | 2003 | | 2002 | | 2004 | | 2003 | | 2002 | |
| |
| |
| |
| |
| |
| |
| |
| |
| |
| |
| |
| | | | US$m | | US$m | | US$m | | US$m | | US$m | | US$m | | US$m | | US$m | | US$m | |
| Iron Ore | | | | | | | | | | | | | | | | | | | | |
| Hamersley (inc. HIsmelt®) | 100.0 | | 1,858 | | 1,409 | | 1,173 | | 800 | | 711 | | 676 | | 447 | | 424 | | 401 | |
| Robe River | 53.0 | | 614 | | 400 | | 253 | | 325 | | 213 | | 160 | | 119 | | 68 | | 54 | |
| Iron Ore Company of Canada | 58.7 | | 428 | | 442 | | 400 | | 55 | | 47 | | 25 | | 3 | | 7 | | (3 | ) |
| | | |
| |
| |
| |
| |
| |
| |
| |
| |
| |
| | | | 2,900 | | 2,251 | | 1,826 | | 1,180 | | 971 | | 861 | | 569 | | 499 | | 452 | |
| | | |
| |
| |
| |
| |
| |
| |
| |
| |
| |
| Energy | | | | | | | | | | | | | | | | | | | | |
| Kennecott Energy | 100.0 | | 1,107 | | 955 | | 949 | | 277 | | 236 | | 267 | | 119 | | 88 | | 90 | |
| Rio Tinto Coal Australia | 100.0 | | 780 | | 443 | | 421 | | 336 | | 157 | | 233 | | 180 | | 70 | | 134 | |
| Kaltim Prima Coal | (d | ) | - | | 142 | | 216 | | - | | 74 | | 79 | | - | | 31 | | 26 | |
| Coal & Allied | 75.7 | | 779 | | 599 | | 627 | | 204 | | 52 | | 207 | | 51 | | (24 | ) | 68 | |
| Rössing | 68.6 | | 124 | | 86 | | 112 | | 8 | | (33 | ) | 50 | | (4 | ) | (19 | ) | 23 | |
| Energy Resources of Australia | 68.4 | | 174 | | 131 | | 113 | | 70 | | 58 | | 50 | | 19 | | 11 | | 12 | |
| | | |
| |
| |
| |
| |
| |
| |
| |
| |
| |
| | | | 2,964 | | 2,356 | | 2,438 | | 895 | | 544 | | 886 | | 365 | | 157 | | 353 | |
| | | |
| |
| |
| |
| |
| |
| |
| |
| |
| |
| Industrial Minerals | | | 2,126 | | 1,916 | | 1,946 | | 538 | | 465 | | 717 | | 223 | | 154 | | 286 | |
| | | |
| |
| |
| |
| |
| |
| |
| |
| |
| |
| Aluminium | (e | ) | 2,478 | | 1,995 | | 1,722 | | 720 | | 488 | | 510 | | 334 | | 200 | | 256 | |
| | | |
| |
| |
| |
| |
| |
| |
| |
| |
| |
| Copper | | | | | | | | | | | | | | | | | | | | |
| Kennecott Utah Copper | 100.0 | | 1,113 | | 722 | | 755 | | 496 | | 230 | | 236 | | 293 | | 88 | | 86 | |
| Escondida | 30.0 | | 1,003 | | 502 | | 283 | | 699 | | 284 | | 121 | | 416 | | 122 | | 32 | |
| Freeport | (f | ) | 43 | | 344 | | 306 | | 7 | | 169 | | 139 | | (4 | ) | 23 | | 19 | |
| Grasberg joint venture | (g | ) | 159 | | 407 | | 371 | | 102 | | 225 | | 215 | | 38 | | 104 | | 113 | |
| Palabora | 49.2 | | 305 | | 206 | | 201 | | (20 | ) | 20 | | 53 | | (21 | ) | 1 | | 12 | |
| Kennecott Minerals | 100.0 | | 263 | | 239 | | 205 | | 129 | | 122 | | 93 | | 79 | | 60 | | 38 | |
| Rio Tinto Brasil | (h | ) | 109 | | 141 | | 117 | | 31 | | 48 | | 40 | | 1 | | 48 | | 16 | |
| Other Copper | (d | ) | 169 | | 178 | | 256 | | 91 | | 51 | | 100 | | 54 | | (6 | ) | 25 | |
| | | |
| |
| |
| |
| |
| |
| |
| |
| |
| |
| | | | 3,164 | | 2,739 | | 2,494 | | 1,535 | | 1,149 | | 997 | | 856 | | 440 | | 341 | |
| | | |
| |
| |
| |
| |
| |
| |
| |
| |
| |
| Diamonds | | | | | | | | | | | | | | | | | | | | |
| Argyle | 100.0 | | 322 | | 434 | | 372 | | 102 | | 198 | | 175 | | 23 | | 72 | | 63 | |
| Diavik | 60.0 | | 420 | | 122 | | - | | 316 | | 106 | | - | | 145 | | 41 | | - | |
| Murowa | 78.0 | | 2 | | - | | - | | 1 | | - | | - | | 1 | | - | | - | |
| | | |
| |
| |
| |
| |
| |
| |
| |
| |
| |
| | | | 744 | | 556 | | 372 | | 419 | | 304 | | 175 | | 169 | | 113 | | 63 | |
| | | |
| |
| |
| |
| |
| |
| |
| |
| |
| |
| Other Operations | | | 145 | | 184 | | 208 | | 83 | | 77 | | 81 | | 28 | | 21 | | 25 | |
| | | |
| |
| |
| |
| |
| |
| |
| |
| |
| |
| Product Group Total | | | 14,521 | | 11,997 | | 11,006 | | 5,370 | | 3,998 | | 4,227 | | 2,544 | | 1,584 | | 1,776 | |
| | | |
| |
| |
| |
| |
| |
| |
| |
| |
| |
| Other items | | | 87 | | 122 | | 113 | | (221 | ) | (233 | ) | (137 | ) | (114 | ) | (45 | ) | (42 | ) |
| Exploration and evaluation | | | | | | | | | (187 | ) | (127 | ) | (130 | ) | (152 | ) | (98 | ) | (109 | ) |
| Net interest | | | | | | | | | | | | | | | (57 | ) | (59 | ) | (95 | ) |
| | | | | | | | | | | | | | | |
| |
| |
| |
| Adjusted earnings | | | | | | | | | | | | | | | 2,221 | | 1,382 | | 1,530 | |
| Exceptional items | | | | | | | | | 771 | | 126 | | (116 | ) | 592 | | 126 | | (879 | ) |
| | | |
| |
| |
| |
| |
| |
| |
| |
| |
| |
| Total | | | 14,608 | | 12,119 | | 11,119 | | 5,733 | | 3,764 | | 3,844 | | 2,813 | | 1,508 | | 651 | |
| | | |
| |
| |
| |
| |
| |
| |
| |
| |
| |
| Depreciation & amortisation in subsidiaries | | | | | | | | | (1,204 | ) | (1,006 | ) | (954 | ) | | | | | | |
| Asset write-downs relating to subsidiaries & joint ventures | | | | | | | (408 | ) | - | | (955 | ) | | | | | | |
| Depreciation & amortisation in joint ventures and associates | | | | | | | (271 | ) | (366 | ) | (333 | ) | | | | | | |
| | | | | | | | |
| |
| |
| | | | | | | |
| Profit on ordinary activities before interest and tax | | | | | | | | 3,850 | | 2,392 | | 1,602 | | | | | | | |
| | | | | | | | |
| |
| |
| | | | | | | |
| | |
| (a) | Gross turnover includes 100 per cent of subsidiaries' turnover and the Group's share of the turnover of joint ventures and associates. |
| | Turnover has been adjusted to reclassify, as turnover, certain amounts charged to customers for freight and handling, which previously were deducted from operating costs. |
| (b) | EBITDA of subsidiaries, joint ventures and associates represents profit before: exceptional items, tax, net interest payable, depreciation and amortisation, that is attributable to the Rio Tinto Group. |
| (c) | Net earnings represent after tax earnings attributable to the Rio Tinto Group. Earnings of subsidiaries are stated before interest charges but after the amortisation of the discount related to provisions. Earnings attributable to joint ventures and associates include interest charges. |
| (d) | During June 2004, Rio Tinto sold its interests in Somincor and Zinkgruvan. During 2003 Rio Tinto sold its interests in Kaltim Prima Coal, Alumbrera and Peak. |
| (e) | Includes Rio Tinto's interest in Anglesey Aluminium (51 per cent) and Comalco (100 per cent). |
| (f) | On 30 March 2004 Rio Tinto sold its 13.1 per cent shareholding in Freeport-McMoRan Copper & Gold Inc. The sale of the shares does not affect the terms of the joint venture referred to below. |
| (g) | Under the terms of a joint venture agreement, Rio Tinto is entitled to 40 per cent of additional material mined as a consequence of expansions and developments of the Grasberg facilities since 1998. |
| (h) | Rio Tinto sold its 99.9 per cent interest in Fortaleza on 1 January 2004, and its 51 per cent interest in Morro do Ouro on 31 December 2004. |
| (i) | Business units have been classified above according to the Group’s management structure at 31 December 2004. Generally, this structure has regard to the primary product of each business unit but there are exceptions. For example, the Copper group includes certain gold operations. This summary differs, therefore, from the Product Analysis, in which the contributions of individual business units are attributed to several products as appropriate. |
| | |
| | |
A-63
Back to Contents
RIO TINTO PLC - - RIO TINTO LIMITED
NOTES TO FINANCIAL STATEMENTS - (continued)
41 Rio Tinto financial information by business unit(continued)
| | Capital expenditure (j) | | Depreciation & amortisation (k) | | Operating assets (l) | | Employees (m) | |
| | | | | | | | | |
| | 2004 | | 2003 | | 2002 | | 2004 | | 2003 | | 2002 | | 2004 | | 2003 | | 2002 | | 2004 | | 2003 | | 2002 | |
| |
| |
| |
| |
| |
| |
| |
| |
| |
| |
| |
| |
| |
| | US$m | | US$m | | US$m | | US$m | | US$m | | US$m | | US$m | | US$m | | US$m | | US$m | | US$m | | US$m | |
| Iron Ore | | | | | | | | | | | | | | | | | | | | | | | | |
| Hamersley (inc. HIsmelt®) | 745 | | 298 | | 79 | | 161 | | 110 | | 94 | | 2,211 | | 1,543 | | 923 | | 2,581 | | 2,169 | | 2,006 | |
| Robe River | 109 | | 75 | | 81 | | 93 | | 74 | | 50 | | 1,910 | | 1,852 | | 1,409 | | 527 | | 478 | | 496 | |
| Iron Ore Company of Canada | 51 | | 37 | | 39 | | 41 | | 29 | | 35 | | 530 | | 489 | | 416 | | 1,528 | | 1,884 | | 1,936 | |
| |
| |
| |
| |
| |
| |
| |
| |
| |
| |
| |
| |
| |
| | 905 | | 410 | | 199 | | 295 | | 213 | | 179 | | 4,651 | | 3,884 | | 2,748 | | 4,636 | | 4,531 | | 4,438 | |
| |
| |
| |
| |
| |
| |
| |
| |
| |
| |
| |
| |
| |
| Energy | | | | | | | | | | | | | | | | | | | | | | | | |
| Kennecott Energy | 169 | | 168 | | 152 | | 118 | | 105 | | 128 | | 447 | | 561 | | 486 | | 1,771 | | 1,776 | | 1,710 | |
| Rio Tinto Coal Australia | 50 | | 92 | | 126 | | 73 | | 52 | | 37 | | 661 | | 649 | | 406 | | 904 | | 755 | | 679 | |
| Kaltim Prima Coal | - | | 2 | | 5 | | - | | 16 | | 21 | | - | | - | | 46 | | - | | 2,108 | | 2,760 | |
| Coal & Allied | 15 | | 34 | | 58 | | 94 | | 91 | | 69 | | 717 | | 787 | | 626 | | 1,095 | | 1,338 | | 1,375 | |
| Rössing | 2 | | 4 | | 5 | | 15 | | 7 | | 5 | | 40 | | 46 | | 48 | | 814 | | 810 | | 786 | |
| Energy Resources of Australia | 7 | | 5 | | 4 | | 35 | | 30 | | 23 | | 179 | | 178 | | 140 | | 273 | | 238 | | 262 | |
| |
| |
| |
| |
| |
| |
| |
| |
| |
| |
| |
| |
| |
| | 243 | | 305 | | 350 | | 335 | | 301 | | 283 | | 2,044 | | 2,221 | | 1,752 | | 4,857 | | 7,025 | | 7,572 | |
| |
| |
| |
| |
| |
| |
| |
| |
| |
| |
| |
| |
| |
| Industrial Minerals | 248 | | 139 | | 133 | | 176 | | 172 | | 158 | | 2,170 | | 2,038 | | 2,063 | | 6,575 | | 6,581 | | 6,723 | |
| |
| |
| |
| |
| |
| |
| |
| |
| |
| |
| |
| |
| |
| Aluminium | 449 | | 436 | | 269 | | 202 | | 169 | | 137 | | 3,683 | | 3,258 | | 2,365 | | 4,349 | | 4,223 | | 3,929 | |
| |
| |
| |
| |
| |
| |
| |
| |
| |
| |
| |
| |
| |
| Copper | | | | | | | | | | | | | | | | | | | | | | | | |
| Kennecott Utah Copper | 105 | | 83 | | 97 | | 90 | | 92 | | 129 | | 1,243 | | 1,277 | | 1,378 | | 1,449 | | 1,406 | | 1,596 | |
| Escondida | 113 | | 45 | | 117 | | 54 | | 79 | | 52 | | 624 | | 492 | | 449 | | 851 | | 722 | | 704 | |
| Freeport | - | | 33 | | 23 | | 3 | | 54 | | 50 | | - | | 144 | | 128 | | | | | | | |
| Grasberg joint venture | 35 | | 60 | | 55 | | 43 | | 43 | | 40 | | 428 | | 417 | | 412 | | 1,783 | | 1,165 | | 1,445 | |
| Palabora | 30 | | 66 | | 64 | | 41 | | 17 | | 13 | | 358 | | 426 | | 287 | | 1,734 | | 2,043 | | 2,176 | |
| Kennecott Minerals | 36 | | 9 | | 21 | | 27 | | 42 | | 43 | | 166 | | 136 | | 155 | | 714 | | 672 | | 763 | |
| Rio Tinto Brasil | 18 | | 19 | | 14 | | 6 | | (18 | ) | 11 | | 50 | | 138 | | 91 | | 975 | | 1,393 | | 1,320 | |
| Other Copper | 42 | | 63 | | 60 | | 23 | | 52 | | 73 | | 190 | | 335 | | 443 | | 467 | | 931 | | 1,266 | |
| |
| |
| |
| |
| |
| |
| |
| |
| |
| |
| |
| |
| |
| | 379 | | 378 | | 451 | | 287 | | 361 | | 411 | | 3,059 | | 3,365 | | 3,343 | | 7,973 | | 8,332 | | 9,270 | |
| |
| |
| |
| |
| |
| |
| |
| |
| |
| |
| |
| |
| |
| Diamonds | | | | | | | | | | | | | | | | | | | | | | | | |
| Argyle | 89 | | 22 | | 31 | | 58 | | 76 | | 76 | | 666 | | 600 | | 488 | | 809 | | 750 | | 751 | |
| Diavik | 49 | | 78 | | 206 | | 67 | | 34 | | - | | 599 | | 674 | | 484 | | 377 | | 298 | | 250 | |
| Murowa | 14 | | - | | - | | - | | - | | - | | 16 | | - | | - | | 76 | | - | | - | |
| |
| |
| |
| |
| |
| |
| |
| |
| |
| |
| |
| |
| |
| | 152 | | 100 | | 237 | | 125 | | 110 | | 76 | | 1,281 | | 1,274 | | 972 | | 1,262 | | 1,048 | | 1,001 | |
| |
| |
| |
| |
| |
| |
| |
| |
| |
| |
| |
| |
| |
| Other Operations | 10 | | 4 | | 6 | | 45 | | 37 | | 36 | | 89 | | 98 | | 114 | | 1,432 | | 2,228 | | 2,789 | |
| |
| |
| |
| |
| |
| |
| |
| |
| |
| |
| |
| |
| |
| Product Group Total | 2,386 | | 1,772 | | 1,645 | | 1,465 | | 1,363 | | 1,280 | | 16,977 | | 16,138 | | 13,357 | | 31,084 | | 33,968 | | 35,722 | |
| |
| |
| |
| |
| |
| |
| |
| |
| |
| |
| |
| |
| |
| Other items | 5 | | 17 | | 13 | | 418 | | 9 | | 7 | | (642 | ) | (455 | ) | (148 | ) | 1,956 | | 2,048 | | 1,451 | |
| Less: Joint ventures and associates (j) (k) | (234 | ) | (181 | ) | (241 | ) | (271 | ) | (366 | ) | (333 | ) | | | | | | | | | | | | |
| |
| |
| |
| |
| |
| |
| |
| |
| |
| |
| |
| |
| |
| Total | 2,157 | | 1,608 | | 1,417 | | 1,612 | | 1,006 | | 954 | | 16,335 | | 15,683 | | 13,209 | | 33,040 | | 36,016 | | 37,173 | |
| |
| |
| |
| |
| |
| |
| |
| |
| |
| |
| |
| |
| |
| Less: net debt | | | | | | | | | | | | | (3,751 | ) | (5,646 | ) | (5,747 | ) | | | | | | |
| | | | | | | | | | | | | |
| |
| |
| | | | | | | |
| Net Assets | | | | | | | | | | | | | 12,584 | | 10,037 | | 7,462 | | | | | | | |
| | | | | | | | | | | | | |
| |
| |
| | | | | | | |
| | |
| (j) | Capital expenditure comprises the net cash outflow on purchases less disposals of property, plant and equipment. The details provided include 100 per cent of subsidiaries' capital expenditure and Rio Tinto's share of the capital expenditure of joint ventures and associates. Amounts relating to joint ventures and associates not specifically funded by Rio Tinto are deducted before arriving at total capital expenditure for the Group. |
| (k) | Depreciation figures include 100 per cent of subsidiaries' depreciation and amortisation of goodwill and include Rio Tinto's share of the depreciation and goodwill amortisation of joint ventures and associates. Amounts relating to joint ventures and associates are deducted before arriving at the total depreciation charge. |
| (l) | Operating assets of subsidiaries comprise net assets before deducting net debt, less outside shareholders' interests which are calculated by reference to the net assets of the relevant companies (ie net of such companies' debt). For joint ventures and associates, Rio Tinto's net investment is shown. For joint ventures and associates shown above, Rio Tinto's shares of operating assets, defined as for subsidiaries, are as follows: Escondida US$948 million (2003: US$905 million; 2002: US$913 million), Grasberg joint venture US$428 million (2003: US$417 million; 2002: US$412 million). |
| (m) | Employee numbers, which represent the average for the year, include 100 per cent of employees of subsidiary companies. Employee numbers for joint arrangements, joint ventures and associates are proportional to the Group's equity interest. Part time employees are included on a full time equivalent basis and people employed by contractors are not included. Temporary employees are included in employee numbers. |
A-64
Back to Contents
RIO TINTO PLC - RIO TINTO LIMITED
NOTES TO FINANCIAL STATEMENTS - (continued)
42 Reconciliation to US Accounting Principles
Reconciliation with US GAAP
| | | | Rio Tinto plc -
part of Rio Tinto Group | | Rio Tinto Limited -
part of Rio Tinto Group | | Rio Tinto Group | |
| | | |
| |
| |
| |
| | | | 2004 | | 2004 | | 2004 | |
| | | |
| |
| |
| |
| | | | US$m | | US$m | | US$m | |
| Net earnings under UK GAAP | 2,073 | | 1,185 | | 2,813 | |
| | Increase/(decrease) before tax in respect of: | | | | | | |
| | Amortisation of goodwill - subsidiaries and joint arrangements | 37 | | 40 | | 77 | |
| | Amortisation of intangibles - subsidiaries and joint arrangements | (44 | ) | - | | (44 | ) |
| | Amortisation of intangibles - equity accounted companies (excluding Rio Tinto Limited) | (6 | ) | - | | (6 | ) |
| | Exchange differences included in earnings under US GAAP | 18 | | 209 | | 227 | |
| | Mark to market of derivative contracts | 4 | | 23 | | 27 | |
| | Profit on sale of operations | 114 | | - | | 114 | |
| | Adjustments to asset carrying values - subsidiaries and joint arrangements | (5 | ) | - | | (5 | ) |
| | Adjustments to asset carrying values - equity accounted companies (excluding Rio Tinto Limited) | - | | - | | - | |
| | Pensions/post retirement benefits | 12 | | 3 | | 15 | |
| | Exploration and evaluation | (6 | ) | (65 | ) | (71 | ) |
| | Depreciation of mining assets | (1 | ) | (67 | ) | (68 | ) |
| | Share options | (14 | ) | (9 | ) | (23 | ) |
| | Effect of historical average commodity prices and other items in ore reserve determination | (94 | ) | (2 | ) | (96 | ) |
| | Other | (12 | ) | (53 | ) | (65 | ) |
| | Taxation: | | | | | | |
| | | Tax effect of the above adjustments | 24 | | 38 | | 62 | |
| | | Other tax adjustments | (137 | ) | - | | (137 | ) |
| | Outside shareholders' interests in the above adjustments | 4 | | (1 | ) | 3 | |
| | Share of US GAAP adjustments of Rio Tinto Limited | 43 | | - | | - | |
| | | |
| |
| |
| |
Net income/(loss) under US GAAP before cumulative effect of change in accounting principle | 2,010 | | 1,301 | | 2,823 | |
| | | |
| |
| |
| |
| | Cumulative effect of change in accounting principle for close down and restoration costs | - | | - | | - | |
| | Share of US GAAP adjustment of Rio Tinto Limited | - | | - | | - | |
| | | |
| |
| |
| |
| Net income/(loss) under US GAAP | 2,010 | | 1,301 | | 2,823 | |
| | | |
| |
| |
| |
| Basic earnings per ordinary share under US GAAP | | | | | | |
| | Before cumulative effect of change in accounting principle | 188.3 | c | 260.6 | c | 204.7 | c |
| | | |
| |
| |
| |
| | Cumulative effect of change in accounting principle | - | | - | | - | |
| | | |
| |
| |
| |
| | After cumulative effect of change in accounting principle | 188.3 | c | 260.6 | c | 204.7 | c |
| | | |
| |
| |
| |
| Diluted earnings per ordinary share under US GAAP | | | | | | |
| | Before cumulative effect of change in accounting principle | 188.0 | c | 260.1 | c | 204.4 | c |
| | | |
| |
| |
| |
| | Cumulative effect of change in accounting principle | - | | - | | - | |
| | | |
| |
| |
| |
| | After cumulative effect of change in accounting principle | 188.0 | c | 260.1 | c | 204.4 | c |
| | | |
| |
| |
| |
A-65.2004
Back to Contents
RIO TINTO PLC - RIO TINTO LIMITED
NOTES TO FINANCIAL STATEMENTS - (continued)
42 Reconciliation to US Accounting Principles
Reconciliation with US GAAP
| | | | Rio Tinto plc -
part of Rio Tinto Group | | Rio Tinto Limited -
part of Rio Tinto Group | | Rio Tinto Group | |
| | | |
| |
| |
| |
| | | | 2003 | | 2003 | | 2003 | |
| | | |
| |
| |
| |
| | | | US$m | | US$m | | US$m | |
| Net earnings under UK GAAP | 956 | | 884 | | 1,508 | |
| | Increase/(decrease) before tax in respect of: | | | | | | |
| | Amortisation of goodwill - subsidiaries and joint arrangements | 34 | | 42 | | 76 | |
| | Amortisation of intangibles - subsidiaries and joint arrangements | (40 | ) | - | | (40 | ) |
| | Amortisation of intangibles - equity accounted companies (excluding Rio Tinto Limited) | (7 | ) | - | | (7 | ) |
| | Exchange differences included in earnings under US GAAP | 52 | | 967 | | 1,019 | |
| | Mark to market of derivative contracts | (24 | ) | 311 | | 287 | |
| | Profit on sale of operations | - | | - | | - | |
| | Adjustments to asset carrying values - subsidiaries and joint arrangements | (32 | ) | - | | (32 | ) |
| | Adjustments to asset carrying values - equity accounted companies (excluding Rio Tinto Limited) | - | | - | | - | |
| | Pensions/post retirement benefits | 55 | | 4 | | 59 | |
| | Exploration and evaluation | (8 | ) | (16 | ) | (24 | ) |
| | Depreciation of mining assets | 16 | | (75 | ) | (59 | ) |
| | Share options | (12 | ) | (9 | ) | (21 | ) |
| | Effect of historical average commodity prices and other items in ore reserve determination | (82 | ) | - | | (82 | ) |
| | Other | (60 | ) | (37 | ) | (97 | ) |
| | Taxation: | | | | | | |
| | | Tax effect of the above adjustments | 16 | | (412 | ) | (396 | ) |
| | | Other tax adjustments | (12 | ) | 7 | | (5 | ) |
| | Outside shareholders' interests in the above adjustments | 8 | | (39 | ) | (31 | ) |
| | Share of US GAAP adjustments of Rio Tinto Limited | 279 | | - | | - | |
| | | |
| |
| |
| |
Net income/(loss) under US GAAP before cumulative effect of change in accounting principle | 1,139 | | 1,627 | | 2,155 | |
| | | |
| |
| |
| |
| | Cumulative effect of change in accounting principle for close down and restoration costs | (198 | ) | 20 | | (178 | ) |
| | Share of US GAAP adjustment of Rio Tinto Limited | 8 | | - | | - | |
| | | |
| |
| |
| |
| Net income/(loss) under US GAAP | 949 | | 1,647 | | 1,977 | |
| | | |
| |
| |
| |
| Basic earnings per ordinary share under US GAAP | | | | | | |
| | Before cumulative effect of change in accounting principle | 106.8 | c | 326.1 | c | 156.4 | c |
| | | |
| |
| |
| |
| | Cumulative effect of change in accounting principle | (17.8 | )c | 4.0 | c | (12.9 | )c |
| | | |
| |
| |
| |
| | After cumulative effect of change in accounting principle | 89.0 | c | 330.1 | c | 143.5 | c |
| | | |
| |
| |
| |
| Diluted earnings per ordinary share under US GAAP | | | | | | |
| | Before cumulative effect of change in accounting principle | 106.7 | c | 326.0 | c | 156.2 | c |
| | | |
| |
| |
| |
| | Cumulative effect of change in accounting principle | (17.8 | )c | 4.0 | c | (12.9 | )c |
| | | |
| |
| |
| |
| | After cumulative effect of change in accounting principle | 88.9 | c | 330.0 | c | 143.3 | c |
| | | |
| |
| |
| |
A-65.2003
Back to Contents
RIO TINTO PLC - RIO TINTO LIMITED
NOTES TO FINANCIAL STATEMENTS - (continued)
42 Reconciliation to US Accounting Principles
Reconciliation with US GAAP
| | | | Rio Tinto plc -
part of Rio Tinto Group | | Rio Tinto Limited -
part of Rio Tinto Group | | Rio Tinto Group | |
| | | |
| |
| |
| |
| | | | 2002 | | 2002 | | 2002 | |
| | | |
| |
| |
| |
| | | | US$m | | US$m | | US$m | |
| Net earnings under UK GAAP | 195 | | 736 | | 651 | |
| | Increase/(decrease) before tax in respect of: | | | | | | |
| | Amortisation of goodwill - subsidiaries and joint arrangements | 52 | | 38 | | 90 | |
| | Amortisation of intangibles - subsidiaries and joint arrangements | (59 | ) | - | | (59 | ) |
| | Amortisation of intangibles - equity accounted companies (excluding Rio Tinto Limited) | (9 | ) | - | | (9 | ) |
| | Exchange differences included in earnings under US GAAP | (53 | ) | 293 | | 240 | |
| | Mark to market of derivative contracts | 6 | | 151 | | 157 | |
| | Profit on sale of operations | - | | - | | - | |
| | Adjustments to asset carrying values - subsidiaries and joint arrangements | (422 | ) | 420 | | (2 | ) |
| | Adjustments to asset carrying values - equity accounted companies (excluding Rio Tinto Limited) | (87 | ) | - | | (87 | ) |
| | Pensions/post retirement benefits | 8 | | (7 | ) | 1 | |
| | Exploration and evaluation | - | | (17 | ) | (17 | ) |
| | Depreciation of mining assets | 10 | | (20 | ) | (10 | ) |
| | Share options | (12 | ) | (5 | ) | (17 | ) |
| | Effect of historical average commodity prices and other items in ore reserve determination | - | | - | | - | |
| | Other | (39 | ) | (32 | ) | (71 | ) |
| | Taxation: | | | | | | |
| | | Tax effect of the above adjustments | 11 | | (125 | ) | (114 | ) |
| | | Other tax adjustments | (13 | ) | - | | (13 | ) |
| | Outside shareholders' interests in the above adjustments | 6 | | (165 | ) | (159 | ) |
| | Share of US GAAP adjustments of Rio Tinto Limited | 200 | | - | | - | |
| | | |
| |
| |
| |
Net income/(loss) under US GAAP before cumulative effect of change in accounting principle | (206 | ) | 1,267 | | 581 | |
| | | |
| |
| |
| |
| | Cumulative effect of change in accounting principle for close down and restoration costs | - | | - | | - | |
| | Share of US GAAP adjustment of Rio Tinto Limited | - | | - | | - | |
| | | |
| |
| |
| |
| Net income/(loss) under US GAAP | (206 | ) | 1,267 | | 581 | |
| | | |
| |
| |
| |
| Basic earnings per ordinary share under US GAAP | | | | | | |
| | Before cumulative effect of change in accounting principle | (19.3 | )c | 254.0 | c | 42.2 | c |
| | | |
| |
| |
| |
| | Cumulative effect of change in accounting principle | - | | - | | - | |
| | | |
| |
| |
| |
| | After cumulative effect of change in accounting principle | (19.3 | )c | 254.0 | c | 42.2 | c |
| | | |
| |
| |
| |
| Diluted earnings per ordinary share under US GAAP | | | | | | |
| | Before cumulative effect of change in accounting principle | (19.3 | )c | 253.7 | c | 42.1 | c |
| | | |
| |
| |
| |
| | Cumulative effect of change in accounting principle | - | | - | | - | |
| | | |
| |
| |
| |
| | After cumulative effect of change in accounting principle | (19.3 | )c | 253.7 | c | 42.1 | c |
| | | |
| |
| |
| |
A-65.2002
Back to Contents
RIO TINTO PLC - RIO TINTO LIMITED
NOTES TO FINANCIAL STATEMENTS - (continued)
42 Reconciliation to US Accounting Principles (continued)
Reconciliation with US GAAP
| | | | Rio Tinto plc -
part of Rio Tinto Group | | Rio Tinto Limited -
part of Rio Tinto Group | | Rio Tinto Group | |
| | | |
| |
| |
| |
| | | | 2004 | | 2004 | | 2004 | |
| | | |
| |
| |
| |
| | | | US$m | | US$m | | US$m | |
| Shareholders' funds under UK GAAP | 9,139 | | 5,515 | | 12,584 | |
| | Increase/(decrease) before tax in respect of: | | | | | | |
| | Goodwill - subsidiaries and joint arrangements | 938 | | 351 | | 1,289 | |
| | Goodwill - equity accounted companies (excluding Rio Tinto Limited) | 206 | | - | | 206 | |
| | Intangibles - subsidiaries and joint arrangements | 196 | | - | | 196 | |
| | Intangibles - equity accounted companies (excluding Rio Tinto Limited) | 36 | | - | | 36 | |
| | Mark to market of derivative contracts | (66 | ) | 454 | | 388 | |
| | Adjustments to asset carrying values - subsidiaries and joint arrangements | 117 | | 399 | | 516 | |
| | Pensions/post retirement benefits | (389 | ) | (26 | ) | (415 | ) |
| | Exploration and evaluation | (14 | ) | (241 | ) | (255 | ) |
| | Depreciation of mining assets | 34 | | (219 | ) | (185 | ) |
| | Effect of historical average commodity prices and other items in ore reserve determination | (176 | ) | (2 | ) | (178 | ) |
| | Provision for close down and restoration costs | (63 | ) | 70 | | 7 | |
| | Start up costs | (128 | ) | (30 | ) | (158 | ) |
| | Proposed dividends | 401 | | 225 | | 626 | |
| | Other | 55 | | (70 | ) | (15 | ) |
| | Tax effect of the above adjustments | 48 | | (98 | ) | (50 | ) |
| | Deferred tax on acquisitions: | | | | | | |
| | | Impact on mining property | - | | 789 | | 789 | |
| | | Impact on tax provisions | - | | (789 | ) | (789 | ) |
| | Other tax adjustments | (69 | ) | 1 | | (68 | ) |
| | Outside shareholders' interests in the above adjustments | 20 | | (82 | ) | (62 | ) |
| | Share of US GAAP adjustments of Rio Tinto Limited | 275 | | - | | - | |
| | | |
| |
| |
| |
| Shareholders' funds under US GAAP | 10,560 | | 6,247 | | 14,462 | |
| | | |
| |
| |
| |
A-66.2004
Back to Contents
RIO TINTO PLC - RIO TINTO LIMITED
NOTES TO FINANCIAL STATEMENTS - (continued)
42 Reconciliation to US Accounting Principles (continued)
Reconciliation with US GAAP
| | | | Rio Tinto plc -
part of Rio Tinto Group | | Rio Tinto Limited -
part of Rio Tinto Group | | Rio Tinto Group | |
| | | |
| |
| |
| |
| | | | 2003 | | 2003 | | 2003 | |
| | | |
| |
| |
| |
| | | | US$m | | US$m | | US$m | |
| Shareholders' funds under UK GAAP | 7,343 | | 4,324 | | 10,037 | |
| | Increase/(decrease) before tax in respect of: | | | | | | |
| | Goodwill - subsidiaries and joint arrangements | 896 | | 302 | | 1,198 | |
| | Goodwill - equity accounted companies (excluding Rio Tinto Limited) | 352 | | - | | 352 | |
| | Intangibles - subsidiaries and joint arrangements | 240 | | - | | 240 | |
| | Intangibles - equity accounted companies (excluding Rio Tinto Limited) | 42 | | - | | 42 | |
| | Mark to market of derivative contracts | (65 | ) | 446 | | 381 | |
| | Adjustments to asset carrying values - subsidiaries and joint arrangements | 96 | | 409 | | 505 | |
| | Pensions/post retirement benefits | (410 | ) | (59 | ) | (469 | ) |
| | Exploration and evaluation | (8 | ) | (172 | ) | (180 | ) |
| | Depreciation of mining assets | 35 | | (142 | ) | (107 | ) |
| | Effect of historical average commodity prices and other items in ore reserve determination | (82 | ) | - | | (82 | ) |
| | Provision for close down and restoration costs | (29 | ) | 82 | | 53 | |
| | Start up costs | (122 | ) | (34 | ) | (156 | ) |
| | Proposed dividends | 299 | | 170 | | 469 | |
| | Other | (44 | ) | (84 | ) | (128 | ) |
| | Tax effect of the above adjustments | 55 | | (157 | ) | (102 | ) |
| | Deferred tax on acquisitions: | | | | | | |
| | | Impact on mining property | - | | 831 | | 831 | |
| | | Impact on tax provisions | - | | (831 | ) | (831 | ) |
| | Other tax adjustments | 68 | | 1 | | 69 | |
| | Outside shareholders' interests in the above adjustments | 12 | | (90 | ) | (78 | ) |
| | Share of US GAAP adjustments of Rio Tinto Limited | 253 | | - | | - | |
| | | |
| |
| |
| |
| Shareholders' funds under US GAAP | 8,931 | | 4,996 | | 12,044 | |
| | | |
| |
| |
| |
A-66.2003
Back to Contents
RIO TINTO PLC - RIO TINTO LIMITED
NOTES TO FINANCIAL STATEMENTS - (continued)
42 Reconciliation to US Accounting Principles (continued)
Reconciliation with US GAAP
| | | | Rio Tinto plc -
part of Rio Tinto Group | | Rio Tinto Limited -
part of Rio Tinto Group | | Rio Tinto Group | |
| | | |
| |
| |
| |
| | | | 2002 | | 2002 | | 2002 | |
| | | |
| |
| |
| |
| | | | US$m | | US$m | | US$m | |
| Shareholders' funds under UK GAAP | 5,899 | | 2,510 | | 7,462 | |
| | Increase/(decrease) before tax in respect of: | | | | | | |
| | Goodwill - subsidiaries and joint arrangements | 862 | | 203 | | 1,065 | |
| | Goodwill - equity accounted companies (excluding Rio Tinto Limited) | 352 | | - | | 352 | |
| | Intangibles - subsidiaries and joint arrangements | 271 | | - | | 271 | |
| | Intangibles - equity accounted companies (excluding Rio Tinto Limited) | 49 | | - | | 49 | |
| | Mark to market of derivative contracts | (10 | ) | (44 | ) | (54 | ) |
| | Adjustments to asset carrying values - subsidiaries and joint arrangements | 133 | | 420 | | 553 | |
| | Pensions/post retirement benefits | (454 | ) | (18 | ) | (472 | ) |
| | Exploration and evaluation | - | | (124 | ) | (124 | ) |
| | Depreciation of mining assets | 19 | | (37 | ) | (18 | ) |
| | Effect of historical average commodity prices and other items in ore reserve determination | - | | - | | - | |
| | Provision for close down and restoration costs | 216 | | 71 | | 287 | |
| | Start up costs | (81 | ) | (29 | ) | (110 | ) |
| | Proposed dividends | 272 | | 158 | | 430 | |
| | Other | (33 | ) | (54 | ) | (87 | ) |
| | Tax effect of the above adjustments | (32 | ) | (28 | ) | (60 | ) |
| | Deferred tax on acquisitions: | | | | | | |
| | | Impact on mining property | - | | 825 | | 825 | |
| | | Impact on tax provisions | - | | (825 | ) | (825 | ) |
| | Other tax adjustments | 80 | | (6 | ) | 74 | |
| | Outside shareholders' interests in the above adjustments | (1 | ) | (100 | ) | (101 | ) |
| | Share of US GAAP adjustments of Rio Tinto Limited | 155 | | - | | - | |
| | | |
| |
| |
| |
| Shareholders' funds under US GAAP | 7,697 | | 2,922 | | 9,517 | |
| | | |
| |
| |
| |
A-66.2002
Back to Contents
RIO TINTO PLC - RIO TINTO LIMITED
NOTES TO FINANCIAL STATEMENTS - (continued)
42 Reconciliation to US Accounting Principles (continued)
The Group’s financial statements have been prepared in accordance with generally accepted accounting principles in the United Kingdom ('UK GAAP'), which differ in certain respects from those in the United States ('US GAAP'). These differences relate principally to the following items, and the effect of each of the adjustments to net earnings and shareholders' funds that would be required under US GAAP is set out on the preceding pages.
Goodwill
For 1997 and prior years, UK GAAP permitted the write off of purchased goodwill on acquisition, directly against reserves. For acquisitions in 1998 and subsequent years, goodwill is capitalised and amortised over its expected useful life under UK GAAP. Under US GAAP, goodwill is capitalised and, until 2001, was amortised by charges against income over the period during which it was expected to be of benefit, subject to a maximum of 40 years. Goodwill previously written off directly to reserves in the UK GAAP financial statements was therefore reinstated and amortised under US GAAP. From 1 January 2002, goodwill and indefinite lived intangible assets are no longer amortised under US GAAP but are reviewed annually for impairment under SFAS 142 'Goodwill and Other Intangible Assets'. Goodwill amortisation of US$77 million charged against UK GAAP earnings for 2004 (2003: US$76 million, 2002: US$90 million) is added back in the US GAAP reconciliation. No impairment write-downs were required on the initial transition to SFAS 142.
Intangible assets under US GAAP
The implementation of SFAS 141 'Business Combinations' resulted in the reclassification of US$340 million from goodwill to finite lived intangible assets at 1 January 2002. The accumulated cost relating to these intangible assets at 31 December 2004 was US$714 million and accumulated amortisation was US$482 million. The total amortisation expense for 2004 was US$50 million of which US$18 million is related to the amortisation of goodwill previously written off to reserves under UK GAAP now reclassified as finite lived intangible assets under US GAAP. The remaining US$32 million relates to the amortisation of an asset classified as goodwill on the UK GAAP balance sheet but now reclassified as finite lived intangible assets under US GAAP. The estimated amortisation charge relating to intangible assets for each of the next five years is US$50 million.
Exchange differences included in earnings under US GAAP
The Group finances its operations primarily in US dollars, and a significant proportion of the Group's US dollar debt is located in its Australian operations. Under UK GAAP, this debt is dealt with in the context of the currency status of the Group as a whole and exchange differences reported by the Australian operations are adjusted through reserves. US GAAP permits such exchange gains and losses to be taken to reserves only to the extent that the US dollar debt hedges US dollar assets in the Australian Group. Exchange gains of the Group of US$227 million pre-tax (2003: gains of US$1,019 million, 2002: gains of US$240 million), US$183 million net of tax and minorities (2003: US$623 million net of tax and minorities, 2002: US$177 million loss net of tax and minorities), on US dollar debt that does not qualify for hedge accounting under US GAAP have therefore been recorded in US GAAP earnings.
Mark to market of derivative contracts
The Group is party to derivative contracts in respect of some of its future transactions in order to hedge its exposure to fluctuations in exchange rates against the US dollar. Under UK GAAP, these contracts are accounted for as hedges: gains and losses are deferred and subsequently recognised when the hedged transaction occurs. Under SFAS 133 ' Accounting for Derivative Instruments and Hedging Activities', all derivative instruments are included in the balance sheet as assets or liabilities measured at fair value. Certain of the Group's derivative contracts do not qualify for hedge accounting under SFAS 133, principally because the hedge is not located in the entity with the relevant exposure. Unrealised pre-tax losses for the Group of US$87 million (2003: unrealised pre-tax gains of US$182 million, 2002: unrealised pre-tax gains of US$148 million), US$57 million after tax and minorities (2003: US$115 million after tax and minorities, 2002: US$104 million after tax and minorities), on such derivatives have therefore been recorded in US GAAP earnings. Realised gains of US$114 million pre tax (2003: US$105 million pre tax, 2002: US$9 million pre tax), US$79 million after tax and minorities, (2003: US$75 million after tax and minorities, 2002: US$6 million after tax and minorities), which have been capitalised under UK GAAP have also been recorded in earnings under US GAAP.
Accounting treatment for the derivatives disclosed in the Financial instruments note 28
Forward exchange contracts and currency options hedging trading transactions
Under UK GAAP, gains and losses on these contracts are taken to the profit and loss account in the same accounting period as the hedged item to which they relate. Under US GAAP, certain of these contracts qualify as cash flow hedges under SFAS 133. Unrealised gains and losses on these qualifying contracts are reflected in other comprehensive income until the maturity of the hedged item when they are reclassified to earnings. The remainder of these contracts do not qualify for hedge accounting under SFAS 133. Gains and losses on these contracts are recorded in earnings as they arise.
Forward exchange contracts hedging capital expenditure
Under UK GAAP, gains and losses on the contracts are credited or debited to the cost of the asset in the same accounting period as the hedged expenditure and are depreciated over the economic life of the asset. Under US GAAP, these contracts do not qualify for hedge accounting under SFAS 133. Gains and losses on contracts not qualifying for hedge accounting are recorded in earnings as they arise.
Currency swaps hedging non US dollar debt
Under UK GAAP, unrealised exchange gains and losses on the currency swaps hedging non US dollar debt are taken to reserves offsetting unrealised exchange gains and losses on the underlying hedged debt. Under US GAAP, both unrealised gains and losses on the currency swaps and unrealised gains and losses on the underlying debt are recorded in earnings.
A-67
Back to Contents
RIO TINTO PLC - RIO TINTO LIMITED
NOTES TO FINANCIAL STATEMENTS - (continued)
42 Reconciliation to US Accounting Principles (continued)
Interest rate swaps
Under UK GAAP, the interest differential arising from interest rate swaps is taken to the profit and loss account on an accruals basis, and matched against the interest charge on the hedged loan. Under US GAAP, for those interest rate swaps that qualify for fair value hedge accounting under SFAS 133, the fair value gain or loss on the interest rate swap and the offsetting gain or loss on the hedged loan are recorded to earnings. For those interest rate swaps that do not qualify for hedge accounting under SFAS 133 the fair value gain or loss is recorded in earnings.
Commodity derivatives
Under UK GAAP, gains and losses on these contracts are taken to the profit and loss account in the same accounting period as the hedged item to which they relate. Under US GAAP, unrealised gains and losses on the derivatives and the offsetting gains and losses on the underlying hedged item are recorded in earnings for those commodity derivatives that qualify as fair value hedges under SFAS 133. For those commodity derivatives that qualify as cash flow hedges under SFAS 133, unrealised gains and losses are reflected in other comprehensive income until the maturity of the hedged item when they are reclassified to earnings. For those commodity derivatives that do not qualify for either fair value or cash flow hedge accounting under SFAS 133, the unrealised gains and losses are immediately recorded in earnings.
Profit on sale of operations
Under UK GAAP, goodwill previously written off to reserves is reinstated for the purpose of calculating profit on the sale of an operation. Under US GAAP, the equivalent goodwill is capitalised and was subject to amortisation in the period from acquisition until 2001. The profit on sale of operations balance under US GAAP reflects the lower book values of operations sold under US GAAP compared to UK GAAP, principally as a result of such amortisation.
Adjustments to asset carrying values
Impairment of fixed assets under UK GAAP is recognised and measured by reference to the discounted cash flows expected to be generated by an Income Generating Unit or disposal value if higher. Under US GAAP, impairment, other than that relating to equity accounted investments, is recognised only when the anticipated undiscounted cash flows are insufficient to recover the carrying value of the asset group.
However, where an asset group is found to be impaired under US GAAP, its carrying value is written down to fair value. Fair value is normally assessed by reference to the discounted cash flows expected to be generated from the asset group, generally using the same assumptions and bases to those applicable under UK GAAP. For example, the evaluation is on a pre-tax and pre-debt basis. The amount of such impairment is, therefore, generally similar under US GAAP to that computed under UK GAAP, except where the US GAAP carrying value includes goodwill on acquisitions prior to 31 December 1997, which was written off to reserves on acquisition under UK GAAP. Furthermore under US GAAP, SFAS 143 'Accounting for Asset Retirement Obligations' requires that estimated cash flows related to a liability for an asset retirement obligation that has been recognised in the financial statements are excluded from the undiscounted cash flows used to test the asset for recoverability, the discounted cash flows used to measure the asset's fair value and the book value of the asset.
Under UK GAAP, impairment provisions may be written back in a future year if the expected recoverable amount of the Income Generating Unit increases. Any credits to UK GAAP earnings resulting from such write backs are reversed in the reconciliation to US GAAP because reversal of impairment provisions is not permitted under US GAAP.
Under US GAAP, APB 18 'The Equity Method of Accounting for Investments in Common Stock' provides that impairment of an equity accounted investment is recognised and measured by comparing the fair value of the investment with its carrying value. Any differences in impairment charges from UK GAAP would generally relate to differences in the carrying value. These differences may arise where the US GAAP carrying value includes goodwill that was written off to reserves on acquisition under UK GAAP.
In 2004 the impact of applying the guidance in SFAS 143 resulted in an additional impairment recognised under US GAAP of US$5 million pre-tax (US$nil million net of tax and minorities).
The adjustment to asset carrying values for the Group in 2003 under US GAAP, of US$32 million, relates to the reversal of a credit made to UK GAAP earnings on the write back of an impairment provision.
The asset write downs for the Group in 2002, under US GAAP, include amounts recognised in 2001 under UK GAAP of US$445 million and exclude asset write downs recognised in 2002 under UK GAAP of US$235 million. The 2002 Group US GAAP asset write downs also include an adjustment for goodwill. The 2002 US GAAP impairment write-down for the Group was US$1,067 million pre-tax (US$1,060 million net of tax and minorities). This is US$89 million pre-tax (US$297 million net of tax and minorities) above the charge of US$978 million pre-tax (US$763 million net of tax and minorities) included under UK GAAP. The asset write downs for Rio Tinto plc in 2002, under US GAAP, include amounts recognised in 2001 under UK GAAP, of US$445 million. The 2002 Rio Tinto plc asset write downs also include an adjustment for goodwill. The 2002 US GAAP impairment write-down for Rio Tinto plc was US$1,059 million pre-tax (US$1,052 million net of tax and minorities). This is US$420 million pre-tax (US$429 million net of tax and minorities) above the charge of US$639 million pre-tax (US$623 million net of tax and minorities) included under UK GAAP. The asset write downs for Rio Tinto Limited in 2002, under US GAAP, exclude asset write downs recognised in 2002 under UK GAAP of US$212 million. The 2002 US GAAP impairment write-down for Rio Tinto Limited was US$13 million pre-tax (US$13 million net of tax and minorities). This is US$420 million pre-tax (US$212 million net of tax and minorities) below the charge of US$433 million pre-tax (US$225 million net of tax and minorities) included under UK GAAP.
A-68
Back to Contents
RIO TINTO PLC - RIO TINTO LIMITED
NOTES TO FINANCIAL STATEMENTS - (continued)
42 Reconciliation to US Accounting Principles (continued)
Pensions/post retirement benefits
Under UK GAAP, post retirement benefits are accounted for in accordance with Statement of Standard Accounting Practice 24. The expected costs under defined benefit arrangements are spread over the service lives of employees entitled to those benefits. Variations from the regular cost are spread on a straight line basis over the expected average remaining service lives of relevant current employees. Under US GAAP, the annual pension cost comprises the estimated cost of benefits accruing in the period adjusted for the amortisation of the surplus arising when SFAS 87, 'Employers' Accounting for Pensions' was adopted. The charge is further adjusted to reflect the cost of benefit improvements and any surpluses/deficits that emerge as a result of variances from actuarial assumptions. For US purposes, only those surpluses/deficits outside a ten per cent fluctuation 'corridor' are spread. The reductions in shareholders' funds at 31 December 2004, 2003 and 2002 also include the effect of the US GAAP requirement to make immediate provision for pension fund deficits through other comprehensive income. The provision reflects the reduction in equity values over recent years. The additional disclosures required under FRS 17, 'Retirement Benefits', are included in note 40 to the consolidated financial statements.
Exploration and evaluation
Under UK GAAP, expenditure on a project can be carried forward after it has reached a stage where there is a high degree of confidence in its viability. US GAAP does not allow expenditure to be carried forward unless the viability of the project is supported by a final feasibility study. In addition, under UK GAAP, provisions made against exploration and evaluation in prior years can be reversed when the project proceeds to development, to the extent that the relevant costs are recoverable. US GAAP does not allow such provisions to be reversed.
Depreciation of mining assets
Under UK GAAP, mining assets are fully depreciated over their economic lives or the remaining life of the mine if shorter. In some cases, mineral resources that do not yet have the status of reserves are taken into account in determining depreciation charges, where there is a high degree of confidence that they will be mined economically. For US GAAP, only 'proven and probable reserves' are taken into account in the calculation of depreciation, depletion and amortisation charges. As a result, adjustments have been made to depreciation reducing Group US GAAP earnings.
Share option plans
Under UK GAAP, no cost is accrued where the option scheme applies to all relevant employees and the intention is to satisfy the share options by the issuance of new shares. Under the fair value recognition provisions of SFAS 123, ' Accounting for Stock-Based Compensation', the fair value of the plans is determined using an option pricing model.
Effect of historical average commodity prices and other items in ore reserve determination
For UK and Australian reporting, the Group’s ore reserve estimates are determined in accordance with the JORC code and are based on forecasts of future commodity prices. During 2003, the SEC formally indicated that, for US reporting, historical price data should be used. The application of historical prices has led to reduced ore reserve quantities for US reporting purposes for certain of the Group’s operations, which results in lower earnings for US reporting, largely as a result of higher depreciation charges. The reduced ore reserves also had the effect of increasing the present value of provisions for closure obligations for certain of the Group's operations. Details of the ore reserves used for US reporting are set out on pages A-85 to A-95.
Provisions for close down and restoration costs
SFAS 143 'Accounting for Asset Retirement Obligations' was implemented with effect from 1 January 2003. Under this US standard, provision is made in the accounting period when the related environmental disturbance occurs, based on the net present value of estimated future costs. The costs so recognised are capitalised and depreciated over the estimated useful life of the related asset. In each subsequent year, the discount applied to the provision 'unwinds', resulting in a charge to the profit and loss account for the year and an increase in the present value of the provision. This accounting treatment is broadly similar to Rio Tinto's established policy under UK GAAP.
Start up costs
Under US GAAP, Statement of Position 98-5, 'Reporting on the Costs of Start-up Activities', requires that the costs of start up activities are expensed as incurred. Under UK GAAP, some of these start up costs qualify for capitalisation and are amortised over the economic lives of the relevant assets.
Proposed dividends
Under UK GAAP, ordinary dividends are recognised in the financial year in respect of which they are paid. Under US GAAP, such dividends are recognised when they are formally declared by the board of directors or approved by the shareholders.
A-69
Back to Contents
RIO TINTO PLC - RIO TINTO LIMITED
NOTES TO FINANCIAL STATEMENTS - (continued)
42 Reconciliation to US Accounting Principles (continued)
Other
Other adjustments include amounts relating to differences between UK and US accounting principles in respect of revenue recognition, unrealised holding gains and losses and higher cost of sales resulting from acquisition accounting.
| | Revenue recognition -Staff Accounting Bulletin No. 104 ('SAB 104') 'Revenue Recognition in Financial Statements' has the result that, in some cases, sales recorded as revenue under UK GAAP are deferred and are not recognised as revenue under US GAAP until a future accounting period. Occasionally, sales of goods recorded as revenue for UK GAAP purposes may be kept in store by Rio Tinto at the request of the buyer.
Under US GAAP, such transactions cannot be recognised as revenue unless the goods are physically segregated from the supplier's other inventory and certain additional criteria are met. In 2004, such timing differences resulted in an increase in Rio Tinto Group US GAAP pre tax earnings of US$24 million (2003: US$17 million reduction, 2002: US$4 million increase). The timing differences increased Rio Tinto plc pre tax earnings by US$23 million (2003: US$20 million reduction, 2002: nil); and increased Rio Tinto Limited's pre tax earnings by US$1 million (2003: US$3 million increase, 2002: US$4 million increase).
All of the turnover attributable to Rio Tinto's share of joint ventures and associates presented under UK GAAP would also be attributed to equity accounted units under US GAAP. |
| | |
| | Unrealised holding gains and losses - -UK GAAP permits current asset investments to be valued at the lower of cost and net realisable value. Under US GAAP, SFAS 115 'Accounting for Certain Investments in Debt and Equity Securities' requires that unrealised holding gains and losses on investments classified as 'available for sale' are reported within a separate component of shareholders' funds and excluded from earnings until realised. |
| | |
| | Higher cost of sales resulting from acquisition accounting -Under UK GAAP, the inventories of acquired companies are valued at the lower of replacement cost and net realisable value. Under US GAAP, such inventories are recognised at the time of acquisition on the basis of expected net sales proceeds. |
Taxation
Under UK GAAP, provision for taxes arising on remittances of earnings can only be made if the dividends have been accrued or if there is a binding agreement for the distribution of the earnings. Under US GAAP, provision must be made for tax arising on expected future remittances of past earnings.
Under UK GAAP, deferred tax is not provided in respect of upward fair value adjustments to tangible fixed assets and inventories made on acquisitions. Under US GAAP, deferred tax must be provided on all fair value adjustments to non-monetary assets recorded on acquisition with a consequential increase in the amount allocated to mining properties or goodwill as appropriate.
A valuation allowance of US$114 million has been recorded against a deferred tax asset that existed in the opening balance sheet, resulting in a non-recurring charge against earnings. Under UK GAAP, this deferred tax asset is offset against deferred tax liabilities relating to goodwill.
Profit contribution from equity accounted operations
Under US GAAP, investments in affiliates are accounted for using the equity method, and the reporting entity's share of the after tax profits and losses of its affiliates is included in the profit and loss account as a single line item. Under UK GAAP, the reporting entity's share of the trading results of its associates and joint ventures is split in the profit and loss account between its share of their operating profits/losses, interest receivable/payable and taxation.
The Group's share of the after tax profits and losses of associates and joint ventures is shown in its 'Statement of Total Recognised Gains and Losses'.
Consolidated statement of cash flows
The consolidated statement of cash flows prepared in accordance with FRS 1 (revised) presents substantially the same information as that required under US GAAP. Under US GAAP, however, there are certain differences from UK GAAP with regard to the classification of items within the cash flow statement and with regard to the definition of cash and cash equivalents. Under US GAAP, tax paid and interest would form part of operating cash flow. Similarly, deferred stripping costs which are shown as capital expenditure under UK GAAP would be included in operating cash flow for the purposes of the US GAAP cash flow disclosure. Under UK GAAP, cash for the purposes of the cash flow statement is defined as cash in hand and deposits repayable on demand with any qualifying financial institution, less bank borrowings from any qualifying financial institution repayable on demand. Deposits are repayable on demand if they can be withdrawn at any time without notice and without penalty or if a maturity or period of notice of not more than 24 hours or one working day has been agreed. Under US GAAP, cash equivalents comprise cash balances and current asset investments with an original maturity of less than three months and exclude bank borrowings repayable on demand. Under US GAAP, funding of the Group’s share of joint ventures’ and associates' capital and other expenditure would be included on one line within the investing section of the statement of cash flows.
Balance sheet classification
Under UK GAAP, Accounts receivable and prepayments falling due after more than one year and Inventories expected to be neither sold nor used within 12 months are included within Current assets. Under US GAAP, they would be classified as non-current assets.
A-70
Back to Contents
RIO TINTO PLC - RIO TINTO LIMITED
NOTES TO FINANCIAL STATEMENTS - (continued)
42 Reconciliation to US Accounting Principles (continued)
Income statement classification
Certain sales are made on the basis that the selling price will be determind at the end of a period ranging from 30 to 180 days after delivery to the customer. Such sales are recorded provisionally on the basis of the prices quoted in the market when the revenue is first recognised. Under UK GAAP, subsequent adjustments to such provisional prices are recorded in turnover. Under US GAAP such subsequent adjustments would be classified as derivative gains and losses. As a consequence, under US GAAP, revenues for 2004 would have been US$9 million lower than that reported under UK GAAP (2003: US$6 million lower, 2002: no difference).
Adjusted earnings
As permitted under UK GAAP, adjusted earnings and adjusted earnings per share have been presented excluding the impact of exceptional items to provide a measure that reflects the underlying performance of the Group. This is in addition to the presentation of net earnings and basic earnings per share, which include the exceptional items. Under US GAAP, earnings and earnings per share have been presented based on US GAAP earnings, without adjustment for the impact of exceptional items. Such additional measures of underlying performance are not permitted under US GAAP.
Guarantor's accounting
Under US GAAP there is a requirement for entities to recognise, upon issue of a guarantee, an initial liability for the fair value, or market value, of the associated obligation with disclosure of that information in its interim and annual financial statements. FIN 45 is effective, on a prospective basis, to guarantees issued or modified after 31 December 2002. The disclosure requirements of FIN 45 apply to these accounts and the following information is given in response to these.
Note 29 to the financial statements discloses indemnities and other performance guarantees totalling US$435 million on which no material loss is expected. This includes US$21 million relating to the Group's commitment to pay deferred consideration in relation to acquisitions of mining properties in 2002 and previous years. This does not include guarantees of payment of US$97 million entered into by the Group relating to deferred consideration arising from such acquisitions because the deferred consideration has been recognised as a liability within the Group's balance sheet. The disclosure in note 29 to the consolidated financial statements also includes guarantees for up to US$197 million relating to the costs of infrastructure financed by certain government authorities, which would be subject to reimbursement by the Group if the facilities are not completed or certain tests relating to the related project are not met. There are a further US$84 million of liabilities relating to the outstanding portion of a loan relating to a joint venture arrangement. Of the remaining US$133 million disclosed in note 29, US$40 million would be subject to reimbursement by a third party in the event that the Group was required to make payment under the guarantees.
In addition to the above, the Group has issued guarantees and indemnities totalling US$816 million relating to its close down, restoration and environmental remediation obligations. These are not disclosed as contingent liabilities because the obligations are included in the amounts recognised in the balance sheet as provisions for liabilities and charges.
A Group company has guaranteed that the quality of product from a joint venture in which it participates will be in accordance with agreed specifications. It has also undertaken to make up any shortfalls from minimum ore reserve quantities over the life of the joint venture. Currently, no shortfalls are anticipated.
As explained in Note 14 to the consolidated financial statements, the Group has a partnership interest in the Colowyo Coal Company and has undertaken, via a subsidiary company which entered into a management agreement, to cause the partnership to perform its obligations under certain coal supply contracts. The debt of US$156 million owed by the Colowyo Coal Company is to be serviced and repaid out of the proceeds of these contracts.
Variable Interest Entities
In January 2003, the FASB issued interpretation No. 46, 'Consolidation of Variable Interest Entities' (FIN 46). Under FIN 46, certain entities labelled “Variable Interest Entities” (VIE) must be consolidated by the “primary beneficiary” of the entity. The primary beneficiary is generally defined as the party exposed to the majority of the risks and rewards arising from the VIE. For VIE’s in which a significant variable interest is held that is not a majority interest, certain disclosures are required.
The Group has a 20% general partnership interest in the Colowyo limited partnership, which was acquired for US$25 million in December 1994. It is included in the UK GAAP Group accounts on the equity accounting basis. This joint venture falls within the definition of a Variable Interest Entity set out in FIN 46. The Colowyo joint venture produces coal, which is sold under long-term contracts. Colowyo’s total sales revenues for 2004 were US$119 million and its total assets as at 31 December 2004 were US$(150) million. A provision of US$160 million was recognised in 2004 for asset write-downs and contract obligations at Colowyo.
Colowyo has bonds in issue with outstanding capital of US$156 million at 31 December 2004. These are repayable by instalments up to 2016 with interest at rates between 9.56% and 10.19% per annum. The bonds are to be serviced and repaid exclusively out of the net revenues from certain specified sales contracts relating to coal supplies by Colowyo. The bondholders bear the risks of loss that might arise if the revenues are interrupted due to failure of the purchasers or force majeure. The Rio Tinto Group is responsible under a management contract in which it agreed, for the sole and exclusive benefit of the bondholders, to cause Colowyo to perform its obligations under the specified coal sales contracts.
A-71
Back to Contents
RIO TINTO PLC - RIO TINTO LIMITED
NOTES TO FINANCIAL STATEMENTS - (continued)
42 Reconciliation to US Accounting Principles (continued)
New US Accounting Standards
In May 2005, the FASB issued SFAS No. 154, “Accounting Changes and Error Corrections” (“SFAS 154”), which replaced APB No. 20, “Accounting Changes” and SFAS No. 3, “Reporting Accounting Changes in Interim Financial Statements”. SFAS 154 changes the requirements for the accounting for and reporting of a change in accounting principle by requiring voluntary changes in accounting principles to be reported using retrospective application, unless impracticable to do so. SFAS 154 is effective for accounting changes and corrections of errors made in fiscal years beginning after December 15, 2005.
In March 2005, the EITF reached consensus on Issue No. 04-06, “Accounting for Stripping Costs Incurred during Production in the Mining Industry” (“EITF 04-06”). EITF 04-06 sets out guidance that stripping costs incurred during the production phase of a mine are variable production costs that should be included in the cost of the inventory produced during the period that the stripping costs are incurred (the “inventory cost model”). EITF 04-06 is effective for the first reporting period in fiscal years beginning after December 15, 2005, with early adoption permitted. Details of deferred stripping balances and costs deferred during each of the three years to 31 December 2004 are set out in Note 12 to the consolidated financial statements. On implementation of EITF 04-06, deferred post production stripping balances brought forward will be written off through the cumulative effect of a change in accounting policy; and deferred stripping costs incurred in each year will be charged against earnings.
In December 2004, the FASB issued SFAS No. 123 (revised 2004), “Share-Based Payment” (“SFAS 123R”), which replaces SFAS No. 123, “Accounting for Stock-Based Compensation,” (“SFAS 123”) and supersedes APB Opinion No. 25, “Accounting for Stock Issued to Employees.” SFAS 123R requires all share-based payments to employees, including grants of employee stock options, to be recognized in the financial statements based on their fair values beginning with the first annual period after June 15, 2005. Since the Group currently applies the provisions of SFAS 123, it does not expect the adoption of SFAS 123(R) to have a material impact on its financial position, results of operations or cash flows.
In December 2004, the FASB issued SFAS No. 153, “Exchanges of Nonmonetary Assets”-An Amendment of APB Opinion No. 29. SFAS 153 eliminates the exception from fair value measurement for nonmonetary exchanges of similar productive assets and replaces it with an exception for exchanges that do not have commercial substance. The standard specifies that a nonmonetary exchange has commercial substance if the future cash flows of the entity are expected to change significantly as a result of the exchange. SFAS 153 is effective for the fiscal periods beginning after June 15, 2005. The Group does not expect the adoption of SFAS 153 to have a material impact on its financial position, results of operations or cash flows.
In November 2004, the FASB issued SFAS No. 151, “Inventory Costs, an amendment of ARB No. 43, Chapter 4”, clarifying the existing requirements in ARB No. 43 that abnormal amounts of idle facility expense, freight, handling costs and wasted materials (spoilage) should be recognized as current-period charges and requires the allocation of fixed production overheads to inventory based on normal capacity of the production facilities. The guidance is effective for inventory costs incurred during fiscal years beginning after June 15, 2005. The Group does not expect the adoption of SFAS 151 to have a material impact on its financial position, results of operations or cash flows.
In March 2004, the EITF reached consensus on Issue No. 03-01, “The Meaning of Other-Than-Temporary Impairment and its Application to Certain Investments” (“EITF 03-01”). EITF 03-01 was intended to address the meaning of “other-than-temporary” impairment and its application to certain investments in debt and equity securities. A consensus was reached regarding disclosure requirements concerning unrealized losses on available-for-sale debt and equity securities accounted for under Financial Accounting Standard No. 115, Accounting for Certain Investments in Debt and Equity Securities (FAS 115). The guidance for evaluating whether an investment is other-than-temporarily impaired has been applied beginning January 1, 2005. The Group does not expect application of this guidance to have a material impact on its results of operations. The disclosure requirements of EITF 03-01 have been included in the consolidated financial statements for the year ended December 31, 2004, for available-for-sale and cost method investments. For all other investments within the scope of EITF 03-01, the disclosures will be effective for the year ending December 31, 2005.
In March 2004, the EITF reached a consensus on Issue No. 04-03, “Mineral Assets: Impairment and Business Combinations” (“EITF 04-03”). EITF 04-03 provides guidance that the value attributable to the value beyond proven and probable reserves (VBPP) and the effects of anticipated fluctuations in future market prices of minerals should be considered in a manner that is consistent with the expectations of marketplace participants when an entity tests its mining assets for impairment, and also when an entity allocates the purchase price to assets acquired in a business combination. The consensus applies prospectively to business combinations completed and impairment tests performed in reporting periods beginning after March 31, 2004. Adoption of this EITF did not have a material impact upon the Group.
A-72
Back to Contents
RIO TINTO PLC - RIO TINTO LIMITED
NOTES TO FINANCIAL STATEMENTS - (continued)
42 Reconciliation to US Accounting Principles (continued)
Post Retirement benefits
Information in respect of the net periodic benefit cost and related obligation determined in accordance with US Statements of Financial Accounting Standards 87, 106 and 132 is given below. The measurement date used to establish year end asset values and benefit obligations was 30 September 2004. The previous measurement date, used to determine 2004 costs, was 30 September 2003.
Benefits under the major pension plans are principally determined by years of service and employee remuneration. The Group’s largest defined benefit pension plans are in the UK, Australia, the US and Canada and a description of the investment policies and strategies followed is set out below
In the UK and the US, the investment strategy is determined by the pension plan trustee and investment committee respectively, after consulting the company. Agreed investment policies aim to ensure that the objectives are met in a prudent manner, consistent with established guidelines. The investment objectives include generating a return that exceeds consumer price and wage inflation over the long term. Ranges for the proportions to be held in each asset class have been agreed; a substantial proportion of the assets is invested in a spread of domestic and overseas equities, with a smaller proportion in fixed and variable income bonds, cash and, in the US, real estate. Risk is managed in various ways, including identifying investments considered to be unsuitable and placing limits on some types of investment. In particular, the funds are not allowed to invest directly in any Rio Tinto Group company.
In Australia, the investments reflect the various defined benefit and defined contribution liabilities and are primarily in Australian and overseas equities and fixed interest stocks.
At 30 September 2004, funded pension plans held assets invested in the following proportions:
| | UK target | | US target* | | Group actual | |
| | 2004 | | 2003 | | 2004 | | 2003 | | 2004 | | 2003 | |
| Equities | 45%-85% | | 45%-85% | | 65% | | 65% | | 66% | | 65% | |
| Debt securities | 15%-45% | | 15%-45% | | 30% | | 30% | | 26% | | 27% | |
| Real estate | – | | – | | 5% | | 5% | | 3% | | 3% | |
| Other | 0%-10% | | 0%-10% | | - | | - | | 5% | | 5% | |
| | | | | | | | | | | | | |
| *plus or minus 5% | | | | | | | | | | | | |
The expected rate of return on pension plan assets is determined as management’s best estimate of the long term return of the major asset classes – equity, debt, real estate and other – weighted by the actual allocation of assets among the categories at the measurement date.
Pension plan funding policy is based on annual contributions at a rate that is intended to fund benefits as a level percentage of pay over the working lifetime of a plan’s participants, subject to local statutory minimum contribution requirements. Details of anticipated contributions in 2005 are set out in the FRS17 transitional disclosures on page A-56.
Assumptions used to determine the net periodic benefit cost and the end of year benefit obligation for the major pension plans varied between the limits shown below. The average rate for each assumption has been weighted by benefit obligation. The assumptions used to determine the end of year benefit obligation are also used to calculate the following year’s cost.
| | 2004 Cost** | | Year end benefit obligation |
| |
| |
|
| Discount rate | 5.4% to 9.5% (Average: 5.9%) | | 5.2% to 9.5% (Average: 5.6%) |
| Long term rate of return on plan assets | 6.3% to 11.0% (Average: 6.6%) | | 6.3% to 7.9% (Average: 6.7%) |
| Increase in compensation levels | 3.7% to 6.5% (Average: 4.2%) | | 4.0% to 6.5% (Average: 4.6%) |
| | | | |
| ** 31st December 2003 year end benefit obligations were measured on the same assumptions as the 2004 cost. |
The actuarial calculations in respect of the UK plans assume a rate of increase of pensions in payment of 2.9 per cent per annum at the year end. This assumption is consistent with the expected rates of return and salary increase assumptions in the respective valuations. Appropriate assumptions were made for plans in other countries.
Other post retirement benefits are provided to employees who meet the eligibility requirements, and their beneficiaries and dependants, through unfunded self-insurance arrangements. The majority of these plans are for employees in the United States. The plans are non-contributory, although some contain an element of cost sharing such as deductibles and co-insurance.
In the US, the Medicare Prescription Drug, Improvement and Modernization Act of 2003 provides an employer subsidy beginning in 2006. The Group's post retirement medical plans are expected to be eligible for this employer subsidy. Therefore, in accordance with FASB Staff Position 106-2, the change in Accumulated Post Retirement Benefit Obligation (APBO) due to the estimated impact of the employer subsidy has been treated as a one-off gain that offsets any net accumulated unrecognised loss. This reduction in APBO in turn reduces the net periodic post retirement benefit cost due to corresponding reductions in the service cost, interest cost, and the amortisation of the net accumulated loss.
The weighted average assumptions used in determining the costs and year end benefit obligation for the major post retirement benefit plans other than pension plans were as shown below:
| | 2004 Cost** | | Year end benefit obligation |
|
| |
|
| Discount rate | 5.4% to 9.5% (average 6.4%) | | 5.2% to 9.5% (average 6.1%) |
| Average healthcare cost trend rate | | | |
| - trend in first year | 6.1% to 11.2% (average 10.6%) | | 6.4% to 10.5% (average 10.1%) |
| - reducing to long term rate by 2011 | 4.6% to 9.5% (average 5.5%) | | 5.0% to 7.5% (average 5.3%) |
| | | | |
| ** 31st December 2003 year end benefit obligations were measured on the same assumptions as the 2004 cost. |
A-73
Back to Contents
RIO TINTO PLC - RIO TINTO LIMITED
NOTES TO FINANCIAL STATEMENTS - (continued)
| 42 | Reconciliation to US Accounting Principles (continued) |
The components of net benefit expense under US GAAP are detailed in the table below.
| | Rio Tinto plc - | | Rio Tinto Limited - | | | |
| | part of Rio Tinto Group | | part of Rio Tinto Group | | Rio Tinto Group | |
| |
| |
| |
| |
| | 2004 | | 2003 | | 2002 | | 2004 | | 2003 | | 2002 | | 2004 | | 2003 | | 2002 | |
| |
| |
| |
| |
| |
| |
| |
| |
| |
| |
| Pension benefits | US$m | | US$m | | US$m | | US$m | | US$m | | US$m | | US$m | | US$m | | US$m | |
| Service cost | (58 | ) | (50 | ) | (42 | ) | (66 | ) | (53 | ) | (55 | ) | (124 | ) | (103 | ) | (97 | ) |
| Interest cost on benefit obligation | (148 | ) | (140 | ) | (147 | ) | (90 | ) | (70 | ) | (60 | ) | (238 | ) | (210 | ) | (207 | ) |
| Expected return on plan assets | 173 | | 182 | | 197 | | 87 | | 70 | | 61 | | 260 | | 252 | | 258 | |
| Net amortisation and deferral: | | | | | | | | | | | | | | | | | | |
| - transitional obligation | 5 | | 10 | | 10 | | - | | - | | - | | 5 | | 10 | | 10 | |
| - recognised (gains) and losses | (13 | ) | 3 | | 18 | | (19 | ) | (9 | ) | (8 | ) | (32 | ) | (6 | ) | 10 | |
| - prior service cost recognised | (20 | ) | (21 | ) | (21 | ) | (2 | ) | (2 | ) | (1 | ) | (22 | ) | (23 | ) | (22 | ) |
| |
| |
| |
| |
| |
| |
| |
| |
| |
| |
| Total net amortisation and deferral | (28 | ) | (8 | ) | 7 | | (21 | ) | (11 | ) | (9 | ) | (49 | ) | (19 | ) | (2 | ) |
| |
| |
| |
| |
| |
| |
| |
| |
| |
| |
| Net periodic benefit (cost)/credit | (61 | ) | (16 | ) | 15 | | (90 | ) | (64 | ) | (63 | ) | (151 | ) | (80 | ) | (48 | ) |
| Curtailment and settlement credit/(charge) | 37 | | - | | (8 | ) | - | | - | | - | | 37 | | - | | (8 | ) |
| |
| |
| |
| |
| |
| |
| |
| |
| |
| |
| Net benefit (expense)/credit | (24 | ) | (16 | ) | 7 | | (90 | ) | (64 | ) | (63 | ) | (114 | ) | (80 | ) | (56 | ) |
| |
| |
| |
| |
| |
| |
| |
| |
| |
| |
| | Rio Tinto plc - | | Rio Tinto Limited - | | | |
| | part of Rio Tinto Group | | part of Rio Tinto Group | | Rio Tinto Group | |
| |
| |
| |
| |
| | 2004 | | 2003 | | 2002 | | 2004 | | 2003 | | 2002 | | 2004 | | 2003 | | 2002 | |
| |
| |
| |
| |
| |
| |
| |
| |
| |
| |
| Other benefits | US$m | | US$m | | US$m | | US$m | | US$m | | US$m | | US$m | | US$m | | US$m | |
| Service cost | (9 | ) | (8 | ) | (6 | ) | (1 | ) | (1 | ) | (1 | ) | (10 | ) | (9 | ) | (7 | ) |
| Interest cost on benefit obligation | (28 | ) | (25 | ) | (23 | ) | (4 | ) | (3 | ) | (2 | ) | (32 | ) | (28 | ) | (25 | ) |
| Net amortisation and deferral: | | | | | | | | | | | | | | | | | | |
| - recognised (gains) and losses | 1 | | 5 | | 8 | | - | | - | | - | | 1 | | 5 | | 8 | |
| - prior service cost recognised | 1 | | 1 | | 1 | | (4 | ) | - | | - | | (3 | ) | 1 | �� | 1 | |
| |
| |
| |
| |
| |
| |
| |
| |
| |
| |
| Total net amortisation and deferral | 2 | | 6 | | 9 | | (4 | ) | - | | - | | (2 | ) | 6 | | 9 | |
| |
| |
| |
| |
| |
| |
| |
| |
| |
| |
| Net periodic benefit cost | (35 | ) | (27 | ) | (20 | ) | (9 | ) | (4 | ) | (3 | ) | (44 | ) | (31 | ) | (23 | ) |
| Curtailment and settlement gain/(charge) | 3 | | 3 | | (2 | ) | - | | - | | - | | 3 | | 3 | | (2 | ) |
| |
| |
| |
| |
| |
| |
| |
| |
| |
| |
| Net benefit expense | (32 | ) | (24 | ) | (22 | ) | (9 | ) | (4 | ) | (3 | ) | (41 | ) | (28 | ) | (25 | ) |
| |
| |
| |
| |
| |
| |
| |
| |
| |
| |
The 2004 pension cost recognised for defined contribution plans, of US$6 million (2003: US$9 million), is included in the above. The curtailment and settlement gain primarily reflects the allocation of a surplus to the employer in a South African plan.
The funded status of the Group's principal schemes is summarised in the table below.
| | Rio Tinto plc - | | Rio Tinto Limited - | | | |
| | part of Rio Tinto Group | | part of Rio Tinto Group | | Rio Tinto Group | |
| |
| |
| |
| |
| | 2004 | | 2003 | | 2002 | | 2004 | | 2003 | | 2002 | | 2004 | | 2003 | | 2002 | |
| |
| |
| |
| |
| |
| |
| |
| |
| |
| |
| Pension benefits | US$m | | US$m | | US$m | | US$m | | US$m | | US$m | | US$m | | US$m | | US$m | |
| Benefit obligation at end of year | (3,000 | ) | (2,680 | ) | (2,377 | ) | (1,817 | ) | (1,481 | ) | (989 | ) | (4,817 | ) | (4,161 | ) | (3,366 | ) |
| Fair value of plan assets | 2,840 | | 2,488 | | 2,256 | | 1,675 | | 1,347 | | 910 | | 4,515 | | 3,835 | | 3,166 | |
| |
| |
| |
| |
| |
| |
| |
| |
| |
| |
| Benefit obligations in excess of plan assets | (160 | ) | (192 | ) | (121 | ) | (142 | ) | (134 | ) | (79 | ) | (302 | ) | (326 | ) | (200 | ) |
| Unrecognised prior service cost | 124 | | 140 | | 155 | | 3 | | 4 | | 4 | | 127 | | 144 | | 159 | |
| Unrecognised net loss | 325 | | 305 | | 239 | | 331 | | 317 | | 225 | | 656 | | 622 | | 464 | |
| Unrecognised transitional asset | (5 | ) | (9 | ) | (27 | ) | (2 | ) | (2 | ) | (2 | ) | (7 | ) | (11 | ) | (29 | ) |
| Company contributions in fourth quarter | 12 | | 4 | | 2 | | 27 | | 25 | | 5 | | 39 | | 29 | | 7 | |
| |
| |
| |
| |
| |
| |
| |
| |
| |
| |
| Net amount recognised at end of year | 296 | | 248 | | 248 | | 217 | | 210 | | 153 | | 513 | | 458 | | 401 | |
| |
| |
| |
| |
| |
| |
| |
| |
| |
| |
| Comprising: | | | | | | | | | | | | | | | | | | |
| - benefit prepayment | 281 | | 243 | | 212 | | 171 | | 171 | | 134 | | 452 | | 414 | | 346 | |
| - benefit provision | (230 | ) | (293 | ) | (236 | ) | (120 | ) | (116 | ) | (83 | ) | (350 | ) | (409 | ) | (319 | ) |
| - intangible asset | 46 | | 52 | | 53 | | 2 | | 1 | | - | | 48 | | 53 | | 53 | |
| - amount recognised through accumulated | | | | | | | | | | | | | | | | | | |
| othercomprehensive income | 199 | | 246 | | 219 | | 164 | | 154 | | 102 | | 363 | | 400 | | 321 | |
| |
| |
| |
| |
| |
| |
| |
| |
| |
| |
| Net amount recognised | 296 | | 248 | | 248 | | 217 | | 210 | | 153 | | 513 | | 458 | | 401 | |
| |
| |
| |
| |
| |
| |
| |
| |
| |
| |
| | Rio Tinto plc - | | Rio Tinto Limited - | | | |
| part of Rio Tinto Group | part of Rio Tinto Group | Rio Tinto Group |
| |
| |
| |
| | 2004 | | 2003 | | 2002 | | 2004 | | 2003 | | 2002 | | 2004 | | 2003 | | 2002 | |
|
|
|
|
|
|
| |
| |
|
| Other benefits | US$m | | US$m | | US$m | | US$m | | US$m | | US$m | | US$m | | US$m | | US$m | |
| Benefit obligation at end of year | (458 | ) | (501 | ) | (396 | ) | (80 | ) | (62 | ) | (41 | ) | (538 | ) | (563 | ) | (437 | ) |
| Unrecognised prior service cost | (2 | ) | (2 | ) | (2 | ) | - | | - | | - | | (2 | ) | (2 | ) | (2 | ) |
| Unrecognised net loss/(gain) | (16 | ) | 45 | | (40 | ) | 16 | | 9 | | - | | - | | 54 | | (40 | ) |
| Company contributions in fourth quarter | 4 | | 4 | | - | | 1 | | 1 | | - | | 5 | | 5 | | - | |
| |
| |
| |
| |
| |
| |
| |
| |
| |
| |
| Net amount recognised at end of year | (472 | ) | (454 | ) | (438 | ) | (63 | ) | (52 | ) | (41 | ) | (535 | ) | (506 | ) | (479 | ) |
| |
| |
| |
| |
| |
| |
| |
| |
| |
| |
| Comprising: | | | | | | | | | | | | | | | | | | |
| - benefit provision | (472 | ) | (454 | ) | (438 | ) | (63 | ) | (52 | ) | (41 | ) | (535 | ) | (506 | ) | (479 | ) |
| |
| |
| |
| |
| |
| |
| |
| |
| |
| |
| Net amount recognised | (472 | ) | (454 | ) | (438 | ) | (63 | ) | (52 | ) | (41 | ) | (535 | ) | (506 | ) | (479 | ) |
| |
| |
| |
| |
| |
| |
| |
| |
| |
| |
A-74
Back to Contents
RIO TINTO PLC - RIO TINTO LIMITED
NOTES TO FINANCIAL STATEMENTS - (continued)
| 42 | Reconciliation to US Accounting Principles (continued) |
Change in benefit obligation
| | Rio Tinto plc - | | Rio Tinto Limited - | | | |
| | part of Rio Tinto Group | | part of Rio Tinto Group | | Rio Tinto Group | |
| |
| |
| |
| |
| | 2004 | | 2003 | | 2002 | | 2004 | | 2003 | | 2002 | | 2004 | | 2003 | | 2002 | |
| |
| |
| |
| |
| |
| |
| |
| |
| |
| |
| Pension benefits | US$m | | US$m | | US$m | | US$m | | US$m | | US$m | | US$m | | US$m | | US$m | |
| Benefit obligation at start of year | (2,680 | ) | (2,377 | ) | (1,903 | ) | (1,481 | ) | (989 | ) | (900 | ) | (4,161 | ) | (3,366 | ) | (2,803 | ) |
| Service cost | (57 | ) | (50 | ) | (42 | ) | (81 | ) | (62 | ) | (55 | ) | (138 | ) | (112 | ) | (97 | ) |
| Interest cost | (148 | ) | (140 | ) | (147 | ) | (90 | ) | (70 | ) | (60 | ) | (238 | ) | (210 | ) | (207 | ) |
| Contributions by plan participants | (2 | ) | (3 | ) | (3 | ) | (25 | ) | (23 | ) | (6 | ) | (27 | ) | (26 | ) | (9 | ) |
| Actuarial gains and (losses) | (322 | ) | (381 | ) | (246 | ) | (140 | ) | (172 | ) | 42 | | (462 | ) | (553 | ) | (204 | ) |
| Benefits paid | 190 | | 151 | | 141 | | 137 | | 109 | | 54 | | 327 | | 260 | | 195 | |
| Benefits bought out | - | | 191 | | - | | (40 | ) | - | | - | | (40 | ) | 191 | | - | |
| Plan amendments | 4 | | (6 | ) | (16 | ) | (9 | ) | (1 | ) | - | | (5 | ) | (7 | ) | (16 | ) |
| Settlement, curtailment and other gain/(loss) | 40 | | (13 | ) | - | | - | | 23 | | - | | 40 | | 10 | | - | |
| Plans relating to companies sold | - | | - | | - | | 8 | | - | | - | | 8 | | - | | - | |
| Currency and other adjustments | (25 | ) | (52 | ) | (161 | ) | (96 | ) | (296 | ) | (64 | ) | (121 | ) | (348 | ) | (225 | ) |
| |
| |
| |
| |
| |
| |
| |
| |
| |
| |
| Benefit obligation at end of year | (3,000 | ) | (2,680 | ) | (2,377 | ) | (1,817 | ) | (1,481 | ) | (989 | ) | (4,817 | ) | (4,161 | ) | (3,366 | ) |
| |
| |
| |
| |
| |
| |
| |
| |
| |
| |
| | Rio Tinto plc - | | Rio Tinto Limited - | | | |
| | part of Rio Tinto Group | | part of Rio Tinto Group | | Rio Tinto Group | |
| |
| |
| |
| |
| | 2004 | | 2003 | | 2002 | | 2004 | | 2003 | | 2002 | | 2004 | | 2003 | | 2002 | |
| |
| |
| |
| |
| |
| |
| |
| |
| |
| |
| Other benefits | US$m | | US$m | | US$m | | US$m | | US$m | | US$m | | US$m | | US$m | | US$m | |
| Benefit obligation at start of year | (501 | ) | (396 | ) | (323 | ) | (62 | ) | (41 | ) | (39 | ) | (563 | ) | (437 | ) | (362 | ) |
| Service cost | (9 | ) | (8 | ) | (6 | ) | (1 | ) | (1 | ) | (1 | ) | (10 | ) | (9 | ) | (7 | ) |
| Interest cost | (28 | ) | (25 | ) | (23 | ) | (4 | ) | (3 | ) | (2 | ) | (32 | ) | (28 | ) | (25 | ) |
| Actuarial gains and (losses) | 64 | | (83 | ) | (48 | ) | (7 | ) | (10 | ) | - | | 57 | | (93 | ) | (48 | ) |
| Benefits paid | 21 | | 16 | | 14 | | 3 | | 2 | | 2 | | 24 | | 18 | | 16 | |
| Plan amendments | - | | 5 | | (2 | ) | (4 | ) | - | | - | | (4 | ) | 5 | | (2 | ) |
| Settlement, curtailment and other gains | 3 | | 3 | | - | | - | | - | | - | | 3 | | 3 | | - | |
| Currency and other adjustments | (8 | ) | (13 | ) | (8 | ) | (5 | ) | (9 | ) | (1 | ) | (13 | ) | (22 | ) | (9 | ) |
| |
| |
| |
| |
| |
| |
| |
| |
| |
| |
| Benefit obligation at end of year | (458 | ) | (501 | ) | (396 | ) | (80 | ) | (62 | ) | (41 | ) | (538 | ) | (563 | ) | (437 | ) |
| |
| |
| |
| |
| |
| |
| |
| |
| |
| |
The benefit obligation shown above includes an allowance for future salary increases, where applicable; the accumulated benefit obligation does not include this allowance. The accumulated benefit obligations for pension plans at 30 September 2004 amounted to US$4,610 million. At 30 September 2003, the corresponding total of accumulated benefit obligations was US$3,973 million. For each plan, where the accumulated benefit obligation exceeds the fair value of the assets and this deficit is greater than the amount provided, an increase in the provision is charged to other comprehensive income. To the extent that the deficit relates to previous benefit improvements an intangible asset is created which reduces the charge to other comprehensive income.
In Australia there has been a merger of plans, leading to an increase in both the benefit obligation and the plan assets of $40m in the Group's main Australian plan.
Change in plan assets
| | Rio Tinto plc - | | Rio Tinto Limited - | | | |
| | part of Rio Tinto Group | | part of Rio Tinto Group | | Rio Tinto Group | |
| |
| |
| |
| |
| | 2004 | | 2003 | | 2002 | | 2004 | | 2003 | | 2002 | | 2004 | | 2003 | | 2002 | |
| |
| |
| |
| |
| |
| |
| |
| |
| |
| |
| Pension benefits | US$m | | US$m | | US$m | | US$m | | US$m | | US$m | | US$m | | US$m | | US$m | |
| Fair value of plan assets at start of year | 2,488 | | 2,256 | | 2,271 | | 1,347 | | 910 | | 917 | | 3,835 | | 3,166 | | 3,188 | |
| Actual return/(loss) on plan assets | 456 | | 486 | | (108 | ) | 212 | | 203 | | (42 | ) | 668 | | 689 | | (150 | ) |
| Contributions by plan participants | 2 | | 3 | | 3 | | 25 | | 23 | | 6 | | 27 | | 26 | | 9 | |
| Contributions by employer | 50 | | 25 | | 13 | | 102 | | 67 | | 17 | | 152 | | 92 | | 30 | |
| Benefits paid | (190 | ) | (151 | ) | (141 | ) | (137 | ) | (109 | ) | (54 | ) | (327 | ) | (260 | ) | (195 | ) |
| Benefits bought out | - | | (191 | ) | - | | 40 | | - | | - | | 40 | | (191 | ) | - | |
| Settlement, curtailment and other gain/(loss) | (3 | ) | 4 | | - | | - | | (23 | ) | - | | (3 | ) | (19 | ) | - | |
| Currency and other adjustments | 37 | | 56 | | 218 | | 86 | | 276 | | 66 | | 123 | | 332 | | 284 | |
| |
| |
| |
| |
| |
| |
| |
| |
| |
| |
| Fair value of plan assets at end of year | 2,840 | | 2,488 | | 2,256 | | 1,675 | | 1,347 | | 910 | | 4,515 | | 3,835 | | 3,166 | |
| |
| |
| |
| |
| |
| |
| |
| |
| |
| |
| | Rio Tinto plc - | | Rio Tinto Limited - | | | |
| | part of Rio Tinto Group | | part of Rio Tinto Group | | Rio Tinto Group | |
| |
| |
| |
| |
| | 2004 | | 2003 | | 2002 | | 2004 | | 2003 | | 2002 | | 2004 | | 2003 | | 2002 | |
| |
| |
| |
| |
| |
| |
| |
| |
| |
| |
| Other benefits | US$m | | US$m | | US$m | | US$m | | US$m | | US$m | | US$m | | US$m | | US$m | |
| Fair value of plan assets at start of year | - | | - | | - | | | | - | | - | | | | - | | - | |
| Contributions by employer | 21 | | 16 | | 14 | | 3 | | 2 | | 2 | | 24 | | 18 | | 16 | |
| Benefits paid | (21 | ) | (16 | ) | (14 | ) | (3 | ) | (2 | ) | (2 | ) | (24 | ) | (18 | ) | (16 | ) |
| |
| |
| |
| |
| |
| |
| |
| |
| |
| |
| Fair value of plan assets at end of year | - | | - | | - | | - | | - | | - | | - | | - | | - | |
| |
| |
| |
| |
| |
| |
| |
| |
| |
| |
A-75
Back to Contents
RIO TINTO PLC - RIO TINTO LIMITED
NOTES TO FINANCIAL STATEMENTS - (continued)
| 42 | Reconciliation to US Accounting Principles (continued) |
Change in additional minimum liability before tax
| | Rio Tinto plc - | | Rio Tinto Limited - | | | |
| | part of Rio Tinto Group | | part of Rio Tinto Group | | Rio Tinto Group | |
| |
| |
| |
| |
| | 2004 | | 2003 | | 2002 | | 2004 | | 2003 | | 2002 | | 2004 | | 2003 | | 2002 | |
| |
| |
| |
| |
| |
| |
| |
| |
| |
| |
| Pension benefits | US$m | | US$m | | US$m | | US$m | | US$m | | US$m | | US$m | | US$m | | US$m | |
| Accrued pension benefit expense | (53 | ) | 26 | | 187 | | 11 | | 53 | | 34 | | (42 | ) | 79 | | 221 | |
| Decrease/(increase) in intangible asset | 6 | | 1 | | (21 | ) | (1 | ) | (1 | ) | - | | 5 | | - | | (21 | ) |
| |
| |
| |
| |
| |
| |
| |
| |
| |
| |
| Other comprehensive income before tax | (47 | ) | 27 | | 166 | | 10 | | 52 | | 34 | | (37 | ) | 79 | | 200 | |
| |
| |
| |
| |
| |
| |
| |
| |
| |
| |
Sensitivity to change in healthcare trend
Changing the healthcare cost trend rates by 1% would result in the following effects:
| | Rio Tinto plc - | | Rio Tinto Limited - | | | |
| | part of Rio Tinto | | part of Rio Tinto | | | |
| | Group | | Group | | Rio Tinto Group | |
| |
| |
| |
| |
| | 1% Increase | | 1% Decrease | | 1% Increase | | 1% Decrease | | 1% Increase | | 1% Decrease | |
| |
| |
| |
| |
| |
| |
| |
| 2004 | US$m | | US$m | | US$m | | US$m | | US$m | | US$m | |
| | | | | | | | | | | | | |
| (Increase)/decrease in service cost plus interest cost | (5 | ) | 4 | | (1 | ) | 1 | | (6 | ) | 5 | |
| (Increase)/decrease in benefit obligation at 30 September | (55 | ) | 44 | | (9 | ) | 8 | | (64 | ) | 52 | |
| | | | | | | | | | | | | |
| 2003 | | | | | | | | | | | | |
| | | | | | | | | | | | | |
| (Increase)/decrease in service cost plus interest cost | (5 | ) | 4 | | - | | - | | (5 | ) | 4 | |
| (Increase)/decrease in benefit obligation at 30 September | (61 | ) | 54 | | (7 | ) | 6 | | (68 | ) | 60 | |
| | | | | | | | | | | | | |
| 2002 | | | | | | | | | | | | |
| | | | | | | | | | | | | |
| (Increase)/decrease in service cost plus interest cost | (5 | ) | 4 | | - | | - | | (5 | ) | 4 | |
| (Increase)/decrease in benefit obligation at 30 September | (43 | ) | 35 | | (5 | ) | 5 | | (48 | ) | 40 | |
Expected benefit payments
| | Rio Tinto plc - | | Rio Tinto Limited - | | | |
| | part of Rio Tinto | | part of Rio Tinto | | | |
| | Group | | Group | | Rio Tinto Group | |
| |
| |
| |
| |
| | US$m | | US$m | | US$m | |
| Pension benefits | | | | | | |
| Expected benefit payments in 2005 | (183 | ) | (63 | ) | (246 | ) |
| Expected benefit payments in 2006 | (179 | ) | (61 | ) | (240 | ) |
| Expected benefit payments in 2007 | (184 | ) | (70 | ) | (254 | ) |
| Expected benefit payments in 2008 | (188 | ) | (68 | ) | (256 | ) |
| Expected benefit payments in 2009 | (194 | ) | (64 | ) | (258 | ) |
| Expected benefit payments from 2010 to 2014 | (1,078 | ) | (330 | ) | (1,408 | ) |
| | | | | | | |
| Other benefits | | | | | | |
| Expected benefit payments in 2005 | (20 | ) | (4 | ) | (24 | ) |
| Expected benefit payments in 2006 | (21 | ) | (4 | ) | (25 | ) |
| Expected benefit payments in 2007 | (23 | ) | (4 | ) | (27 | ) |
| Expected benefit payments in 2008 | (24 | ) | (4 | ) | (28 | ) |
| Expected benefit payments in 2009 | (24 | ) | (5 | ) | (29 | ) |
| Expected benefit payments from 2010 to 2014 | (128 | ) | (27 | ) | (155 | ) |
A-76
Back to Contents
RIO TINTO PLC - RIO TINTO LIMITED
NOTES TO FINANCIAL STATEMENTS - (continued)
42 Reconciliation to US Accounting Principles (continued)
Accumulated foreign currency translation gains and (losses) recorded directly in shareholders' funds under US GAAP
| | Rio Tinto plc - | | Rio Tinto Limited - | | | |
| | part of Rio Tinto Group | | part of Rio Tinto Group | | Rio Tinto Group | |
| |
| |
| |
| |
| | US$m | | US$m | | US$m | |
| |
| |
| |
| |
| At 1 January 2004 | (87 | ) | 568 | | 287 | |
| Current period change | 388 | | 255 | | 551 | |
| |
| |
| |
| |
| At 31 December 2004 | 301 | | 823 | | 838 | |
| |
| |
| |
| |
| | | | | | | |
| At 1 January 2003 | (871 | ) | (261 | ) | (1,014 | ) |
| Current period change | 784 | | 829 | | 1,301 | |
| |
| |
| |
| |
| At 31 December 2003 | (87 | ) | 568 | | 287 | |
| |
| |
| |
| |
| | | | | | | |
| At 1 January 2002 | (1,189 | ) | (428 | ) | (1,436 | ) |
| Current period change | 318 | | 167 | | 422 | |
| |
| |
| |
| |
| At 31 December 2002 | (871 | ) | (261 | ) | (1,014 | ) |
| |
| |
| |
| |
Additional US GAAP cash flow information
A summary of Rio Tinto's operating, investing and financing cash flows classified in accordance with US GAAP is presented below:
| | | Rio Tinto plc - | | Rio Tinto Limited - | | | |
| | | part of Rio Tinto Group | | part of Rio Tinto Group | | Rio Tinto Group | |
| | |
| |
| |
| |
| | | 2004 | | 2003 | | 2002 | | 2004 | | 2003 | | 2002 | | 2004 | | 2003 | | 2002 | |
| | |
| |
| |
| |
| |
| |
| |
| |
| |
| |
| | | US$m | | US$m | | US$m | | US$m | | US$m | | US$m | | US$m | | US$m | | US$m | |
| Net cash flow from operating activities | | 1,721 | | 1,413 | | 1,536 | | 1,771 | | 1,156 | | 1,379 | | 3,368 | | 2,292 | | 2,640 | |
| Net cash flow from investing activities | | (680 | ) | 112 | | (1,042 | ) | (1,317 | ) | (667 | ) | (592 | ) | (574 | ) | (1,268 | ) | (1,663 | ) |
| Net cash flow from financing activities | | (1,124 | ) | (1,439 | ) | (507 | ) | (387 | ) | (505 | ) | (948 | ) | (2,810 | ) | (954 | ) | (1,151 | ) |
| | |
| |
| |
| |
| |
| |
| |
| |
| |
| |
| Increase/(decrease) in cash and cash equivalents per US GAAP | | (83 | ) | 86 | | (13 | ) | 67 | | (16 | ) | (161 | ) | (16 | ) | 70 | | (174 | ) |
| | |
| |
| |
| |
| |
| |
| |
| |
| |
| |
| Increase/(decrease) in cash under UK GAAP | | 44 | | (9 | ) | (16 | ) | 134 | | (74 | ) | (114 | ) | 178 | | (83 | ) | (130 | ) |
| (Decrease)/increase in additional liquid resources qualifying for inclusion under US GAAP | | (110 | ) | 110 | | (2 | ) | 8 | | 10 | | (25 | ) | (102 | ) | 120 | | (27 | ) |
| (Decrease)/increase in bank borrowings repayable on demand included in cash under UK GAAP | | (17 | ) | (15 | ) | 5 | | (75 | ) | 48 | | (22 | ) | (92 | ) | 33 | | (17 | ) |
| | |
| |
| |
| |
| |
| |
| |
| |
| |
| |
| (Decrease)/increase in cash and cash equivalents under US GAAP | | (83 | ) | 86 | | (13 | ) | 67 | | (16 | ) | (161 | ) | (16 | ) | 70 | | (174 | ) |
| | |
| |
| |
| |
| |
| |
| |
| |
| |
| |
| Cash per balance sheet under UK GAAP | | 181 | | 257 | | 174 | | 209 | | 138 | | 151 | | 390 | | 395 | | 325 | |
| Qualifying liquid resources less non qualifying deposits | | (12 | ) | - | | (1 | ) | (1 | ) | (36 | ) | (44 | ) | (13 | ) | (36 | ) | (45 | ) |
| | |
| |
| |
| |
| |
| |
| |
| |
| |
| |
| Cash and cash equivalents under US GAAP | | 169 | | 257 | | 173 | | 208 | | 102 | | 107 | | 377 | | 359 | | 280 | |
| | |
| |
| |
| |
| |
| |
| |
| |
| |
| |
The year end cash and cash equivalents position under US GAAP included in the above table reflects both the movement in cash and cash equivalents in the year and the impact of exchange gains and losses in the year.
Deferred tax credit/(charge)
| | | Rio Tinto plc - | | Rio Tinto Limited - | | | |
| | | part of Rio Tinto Group | | part of Rio Tinto Group | | Rio Tinto Group | |
| | |
| |
| |
| |
| | | 2004 | | 2003 | | 2002 | | 2004 | | 2003 | | 2002 | | 2004 | | 2003 | | 2002 | |
| | |
| |
| |
| |
| |
| |
| |
| |
| |
| |
| | | US$m | | US$m | | US$m | | US$m | | US$m | | US$m | | US$m | | US$m | | US$m | |
| The credit/(charge) under UK GAAP for deferred taxation arises as follows: | | | | | | | | | | | | | | | | | | | |
| - accelerated capital allowances | | (58 | ) | (80 | ) | 158 | | 36 | | (3 | ) | 28 | | (22 | ) | (83 | ) | 186 | |
| - pension prepayments | | 120 | | 47 | | (1 | ) | 4 | | 1 | | 12 | | 124 | | 48 | | 11 | |
| - provisions | | (48 | ) | (26 | ) | 20 | | 12 | | 2 | | (14 | ) | (36 | ) | (24 | ) | 6 | |
| - provision against AMT credits and US tax losses | | (7 | ) | 50 | | (228 | ) | - | | - | | - | | (7 | ) | 50 | | (228 | ) |
| - other timing differences | | 65 | | 28 | | 30 | | (11 | ) | 6 | | 11 | | 54 | | 34 | | 41 | |
| | |
| |
| |
| |
| |
|
| |
| |
| |
| |
| | | 72 | | 19 | | (21 | ) | 41 | | 6 | | 37 | | 113 | | 25 | | 16 | |
| | |
| |
| |
| |
| |
|
| |
| |
| |
| |
A-77
Back to Contents
RIO TINTO PLC - RIO TINTO LIMITED
NOTES TO FINANCIAL STATEMENTS - (continued)
42 Reconciliation to US Accounting Principles (continued)
Fixed asset investments
The aggregated profit and loss accounts and balance sheets of equity and gross equity accounted companies on a 100 per cent basis are set out below:
| | | Rio Tinto plc - | | Rio Tinto Limited - | | | |
| | | part of Rio Tinto Group | | part of Rio Tinto Group | | Rio Tinto Group | |
| | |
| |
| |
| |
| | | 2004 | | 2003 | | 2002 | | 2004 | | 2003 | | 2002 | | 2004 | | 2003 | | 2002 | |
| | |
| |
| |
| |
| |
| |
| |
| |
| |
| |
| | | US$m | | US$m | | US$m | | US$m | | US$m | | US$m | | US$m | | US$m | | US$m | |
| Profit and loss account: | | | | | | | | | | | | | | | | | | | |
| Sales revenue | | 11,913 | | 11,541 | | 9,529 | | 1,566 | | 1,085 | | 1,871 | | 6,945 | | 7,133 | | 6,666 | |
| Cost of sales | | (7,561 | ) | (8,171 | ) | (7,060 | ) | (1,042 | ) | (901 | ) | (1,247 | ) | (3,502 | ) | (4,707 | ) | (4,428 | ) |
| | |
| |
| |
| |
| |
| |
| |
| |
| |
| |
| Operating profit | | 4,352 | | 3,370 | | 2,469 | | 524 | | 184 | | 624 | | 3,443 | | 2,426 | | 2,238 | |
| Profit of equity accounted companies | | 300 | | 137 | | 325 | | - | | - | | - | | 1 | | - | | - | |
| Profit on sale of fixed asset investments | | 139 | | 126 | | - | | - | | - | | - | | - | | - | | - | |
| Net interest | | (315 | ) | (445 | ) | (475 | ) | (7 | ) | (8 | ) | (49 | ) | (155 | ) | (317 | ) | (377 | ) |
| | |
| |
| |
| |
| |
| |
| |
| |
| |
| |
| Profit before tax | | 4,476 | | 3,188 | | 2,319 | | 517 | | 176 | | 575 | | 3,289 | | 2,109 | | 1,861 | |
| Taxation | | (970 | ) | (1,070 | ) | (911 | ) | (155 | ) | (4 | ) | (91 | ) | (648 | ) | (714 | ) | (579 | ) |
| Profit attributable to outside shareholders | | (42 | ) | (59 | ) | 90 | | - | | - | | - | | - | | (48 | ) | (36 | ) |
| | |
| |
| |
| |
| |
| |
| |
| |
| |
| |
| Net profit on ordinary activities (100 per cent basis) | | 3,464 | | 2,059 | | 1,498 | | 362 | | 172 | | 484 | | 2,641 | | 1,347 | | 1,246 | |
| | |
| |
| |
| |
| |
| |
| |
| |
| |
| |
| | | Rio Tinto plc - | | Rio Tinto Limited - | | | |
| | | part of Rio Tinto Group | | part of Rio Tinto Group | | Rio Tinto Group | |
| | |
| |
| |
| |
| | | 2004 | | 2003 | | 2002 | | 2004 | | 2003 | | 2002 | | 2004 | | 2003 | | 2002 | |
| | |
| |
| |
| |
| |
| |
| |
| |
| |
| |
| | | US$m | | US$m | | US$m | | US$m | | US$m | | US$m | | US$m | | US$m | | US$m | |
| Balance sheet: | | | | | | | | | | | | | | | | | | | |
| Intangible fixed assets | | 994 | | 1,062 | | 988 | | 2 | | 1 | | 1 | | 2 | | 64 | | 194 | |
| Tangible fixed assets | | 16,355 | | 18,499 | | 15,942 | | 1,989 | | 2,002 | | 2,758 | | 7,711 | | 11,406 | | 12,086 | |
| Investments | | 1,277 | | 1,247 | | 1,235 | | 2 | | 2 | | 3 | | 53 | | 78 | | 166 | |
| Working capital | | (814 | ) | 1,040 | | (434 | ) | 73 | | 17 | | 86 | | 616 | | 775 | | 593 | |
| Net cash less current debt | | (429 | ) | (1,182 | ) | (2,658 | ) | 16 | | (13 | ) | (33 | ) | (48 | ) | 319 | | (835 | ) |
| Long term debt | | (3,540 | ) | (6,954 | ) | (5,667 | ) | (361 | ) | (402 | ) | (1,005 | ) | (2,016 | ) | (5,066 | ) | (5,406 | ) |
| Provisions | | (2,952 | ) | (3,457 | ) | (2,648 | ) | (204 | ) | (164 | ) | (361 | ) | (742 | ) | (1,462 | ) | (1,658 | ) |
| Outside shareholders' interests | | (1,317 | ) | (1,580 | ) | (847 | ) | (1 | ) | (1 | ) | - | | (1 | ) | (321 | ) | (290 | ) |
| | |
| |
| |
| |
| |
| |
| |
| |
| |
| |
| Aggregate shareholders' funds (100 per cent basis) | | 9,574 | | 8,675 | | 5,911 | | 1,516 | | 1,442 | | 1,449 | | 5,575 | | 5,793 | | 4,850 | |
| | |
| |
| |
| |
| |
| |
| |
| |
| |
| |
For Rio Tinto plc the above disclosures include 100 per cent of the profit and loss account and balance sheet of Rio Tinto Limited.
The historical data for 2003 and 2002 has been reclassified for the impact of reporting reimbursement of certain shipping and handling costs incurred by the Group that are more appropriately classified as “turnover” rather than a reduction of “net operating costs”.
Joint arrangements equity accounted for under US GAAP
The Group accounts for nine joint arrangements using proportional consolidation under UK GAAP for which the equity method of accounting would be applied under US GAAP. The difference in treatment between proportional consolidation and the equity method of accounting has no impact on shareholders’ funds or net income. Condensed financial information relating to the Group’s proportionate interest in the joint arrangements that would be equity accounted under US GAAP is as follows:
| | | Rio Tinto plc - | | Rio Tinto Limited - | | | |
| | | part of Rio Tinto Group | | part of Rio Tinto Group | | Rio Tinto Group | |
| | |
| |
| |
| |
| | | 2004 | | 2003 | | 2002 | | 2004 | | 2003 | | 2002 | | 2004 | | 2003 | | 2002 | |
| | |
| |
| |
| |
| |
| |
| |
| |
| |
| |
| | | US$m | | US$m | | US$m | | US$m | | US$m | | US$m | | US$m | | US$m | | US$m | |
| Profit and loss account: | | | | | | | | | | | | | | | | | | | |
| Operating (loss)/profit | | - | | - | | - | | (34 | ) | (75 | ) | (4 | ) | (34 | ) | (75 | ) | (4 | ) |
| (Loss)/profit after interest, tax and outside interests | | - | | - | | - | | (56 | ) | (74 | ) | (22 | ) | (56 | ) | (74 | ) | (22 | ) |
| | | | | | | | | | | | | | | | | | | | |
| Cash flow statement | | | | | | | | | | | | | | | | | | | |
| Net cash flow from operating activities | | - | | - | | - | | 49 | | 50 | | 15 | | 49 | | 50 | | 15 | |
| Net cash flow from investing activities | | - | | - | | - | | (40 | ) | (63 | ) | (74 | ) | (40 | ) | (63 | ) | (74 | ) |
| Net cash flow from financing activities | | - | | - | | - | | (8 | ) | (6 | ) | (6 | ) | (8 | ) | (6 | ) | (6 | ) |
| | | | | | | | | | | | | | | | | | | | |
| Balance sheet: | | | | | | | | | | | | | | | | | | | |
| Current assets | | - | | - | | - | | 675 | | 599 | | 525 | | 675 | | 599 | | 525 | |
| Non-current assets | | - | | - | | - | | 1,732 | | 1,724 | | 1,484 | | 1,732 | | 1,724 | | 1,484 | |
| Current liabilities | | - | | - | | - | | (318 | ) | (537 | ) | (672 | ) | (318 | ) | (537 | ) | (672 | ) |
| Non-current liabilities | | - | | - | | - | | (1,376 | ) | (1,036 | ) | (699 | ) | (1,376 | ) | (1,036 | ) | (699 | ) |
| Outside interests | | - | | - | | - | | (4 | ) | (5 | ) | (4 | ) | (4 | ) | (5 | ) | (4 | ) |
A-78
< Back to Contents
RIO TINTO PLC - RIO TINTO LIMITED
NOTES TO FINANCIAL STATEMENTS - (continued)
42 Reconciliation to US Accounting Principles (continued)
Deferred Stripping
Information about the stripping ratios of the Business Units that account for the majority of the deferred stripping balance at 31 December 2004, and the year in which deferred stripping is expected to be fully amortised (as shown in brackets), is set out in the following table:
| | Actual stripping ratio | | Life of mine stripping | |
| | for year | | ratio | |
| | 2004 | | 2003 | | 2002 | | 2004 | | 2003 | | 2002 | |
| |
| |
| |
| |
| |
| |
| |
| Kennecott Utah Copper (2017) | 1.83 | | 1.86 | | 2.05 | | 1.24 | | 1.24 | | 1.19 | |
| Borax (2034) | 20.50 | | 23.00 | | 25.00 | | 18.70 | | 16.00 | | 16.00 | |
| Argyle Diamonds (2008) | 6.70 | | 6.10 | | 7.29 | | 4.91 | | 4.10 | | 4.40 | |
| Freeport Joint Venture (2014) | 3.39 | | 2.84 | | 2.35 | | 2.43 | | 1.93 | | 1.77 | |
| Diavik (2009) | 14.52 | | 20.31 | | 24.93 | | 4.69 | | 8.54 | | 8.87 | |
In addition, Escondida, Rio Tinto's 30 per cent owned joint venture, defers stripping costs based on the ratio of waste tonnes to pounds of copper mined. The actual stripping ratio for 2004 was 0.1145 (2003: 0.1024, 2002: 0.1458). The life of mine stripping ratio for 2004 was 0.1129 (2003: 0.1110, 2002: 0.1094). The deferred stripping balance is expected to be fully amortised in 2040.
Unrealised holding gains and losses
Under SFAS 115, unrealised holding gains and losses on investments classified as 'available for sale' are excluded from earnings and reported within a separate component of shareholders' funds until realised.
The following tables show the investments in debt and equity securities which are held as 'available for sale' in accordance with SFAS 115, for the Rio Tinto Group, Rio Tinto plc part of the Group and Rio Tinto Limited part of the Group.
| | | | | Unrealised | | Unrealised | | | | Net unrealised | |
| Rio Tinto Group | | Net book | | holding | | holding | | Market | | holding | |
| | | value | | gains | | losses | | value | | gains/(losses) | |
| | |
| |
| |
| |
| |
| |
| | | US$m | | US$m | | US$m | | US$m | | US$m | |
| At 1 January 2004 | | 79 | | 19 | | (6 | ) | 92 | | 13 | |
| Change | | 16 | | 35 | | 1 | | 52 | | 36 | |
| | |
| |
| |
| |
| |
| |
| At 31 December 2004 | | 95 | | 54 | | (5 | ) | 144 | | 49 | |
| | |
| |
| |
| |
| |
| |
| | | | | | | | | | | | |
| | | | | Unrealised | | Unrealised | | | | Net unrealised | |
| Rio Tinto plc - part of the Group | | Net book | | holding | | holding | | Market | | holding | |
| | | value | | gains | | losses | | value | | gains/(losses) | |
| | |
| |
| |
| |
| |
| |
| | | US$m | | US$m | | US$m | | US$m | | US$m | |
| At 1 January 2004 | | 69 | | 19 | | - | | 88 | | 19 | |
| Change | | 16 | | 34 | | - | | 50 | | 34 | |
| | |
| |
| |
| |
| |
| |
| At 31 December 2004 | | 85 | | 53 | | - | | 138 | | 53 | |
| | |
| |
| |
| |
| |
| |
| | | | | | | | | | | | |
| | | | | Unrealised | | Unrealised | | | | Net unrealised | |
| Rio Tinto Limited - part of the Group | | Net book | | holding | | holding | | Market | | holding | |
| | | value | | gains | | losses | | value | | gains/(losses) | |
| | |
| |
| |
| |
| |
| |
| | | US$m | | US$m | | US$m | | US$m | | US$m | |
| At 1 January 2004 | | 10 | | - | | (6 | ) | 4 | | (6 | ) |
| Change | | - | | 1 | | 1 | | 2 | | 2 | |
| | |
| |
| |
| |
| |
| |
| At 31 December 2004 | | 10 | | 1 | | (5 | ) | 6 | | (4 | ) |
| | |
| |
| |
| |
| |
| |
Employee share-based payment plans
At 31 December 2004, Rio Tinto plc and Rio Tinto Limited have a number of share-based payment plans, which are described below. Prior to 2002 the Group accounted for share-based payment plans under the recognition and measurement provisions of APB Opinion No. 25, 'Accounting for Stock Issued to Employees', and related interpretations. In 2002, the Group adopted the fair value recognition provisions of SFAS 123, 'Accounting for Stock-Based Compensation', which is considered by the SEC to be a preferable accounting method for share based employee compensation. As permitted by SFAS 148, 'Accounting for Stock-Based Compensation - Transition and Disclosure', all prior periods presented have been restated to reflect the compensation cost that would have been recognised had the recognition provisions of SFAS 123 been applied to all awards granted to employees after 1 January 1995.
The compensation cost that has been recognised in income for Rio Tinto's share-based option plans is set out in the table below.
| | Compensation cost | |
| | recognised (US $m) | |
| |
| |
| | 2004 | | 2003 | | 2002 | |
| |
| |
| |
| |
| Fixed Share Option Plan | | | | | | |
| Rio Tinto plc | 2.0 | | 2.5 | | 2.3 | |
| Rio Tinto Limited | 2.3 | | 3.0 | | 1.8 | |
| Performance Based Share Option Plan | | | | | | |
| Rio Tinto plc | 11.9 | | 9.1 | | 9.6 | |
| Rio Tinto Limited | 6.9 | | 5.9 | | 3.7 | |
| |
| |
| |
| |
| Totals (US$ million) | 23.1 | | 20.5 | | 17.4 | |
| |
| |
| |
| |
A-79
<Back to Contents
RIO TINTO PLC - RIO TINTO LIMITED
NOTES TO FINANCIAL STATEMENTS - (continued)
42 Reconciliation to US Accounting Principles (continued)
Lattice-based option valuation model
The fair value of share options is estimated on the date of grant using a lattice-based option valuation model. The significant assumptions used in the valuation model are disclosed below. Expected volatilities are based on the historical volatility of Rio Tinto's stock returns under the UK and Australian listings and other factors. Historical data was used to estimate option exercise and employee termination rates within the valuation model. Under the Fixed Share Option Plan and the Performance Based Share Option Plan it is assumed that after options have vested, 20% of participants will exercise their options each year when the market price is at least 20% above the exercise price of the option. The expected term of options granted is derived from the output of the option valuation model and represents the period of time that options granted are expected to be outstanding. The risk-free rate used in the valuation model is equal to the yield available on UK and Australian government bonds at the date of grant with a term equal to the expected term of the options.
Fixed Share Option Plans
The Rio Tinto Share Savings Plan is open to all employees. Employees who participate agree to save a fixed amount from monthly pay to a savings account for a term of between 2 and 5 years (depending on their location of employment). At the end of the savings term, the employees have a choice of using the money to buy shares in the relevant company, withdrawing the money, or a combination of both. The option to buy shares is based on a fixed exercise price which is equal to the market price of the relevant company's shares on the date of grant less a 20% discount.
The fair value of each award was estimated on the date of grant using a lattice-based option valuation model, including allowance for the exercise price being at a 20% discount to market price. The key assumptions used in the valuation are noted in the following table.
| | 2004 | | | | | | | | | |
| |
| | | | | | | | | |
| | Risk-free | | Expected | | Dividend | | Turnover | | Implied | | | | | | | | | |
| | interest rate | | volatility | | yield | | Rates | | Lifetime | | | | | | | | | |
| |
| |
| |
| |
| |
| | | | | | | | | |
| | % | | % | | % | | % | | years | | | | | | | | | |
| Rio Tinto plc | 4.7-4.8 | | 32.0 | | 2.3 | | 10.0 | | 2.2-5.4 | | | | | | | | | |
| Rio Tinto Limited | 5.3-5.4 | | 26.0 | | 2.3 | | 10.0 | | 3.4-5.4 | | | | | | | | | |
| | | | | | | | | | | | | | | | | | |
| | 2003 | | 2002 |
| |
| |
| |
| | Risk-free | | Expected | | Dividend | | Turnover | | Implied | | Risk-free | | Expected | | Dividend | | Implied | |
| | interest rate | | volatility | | yield | | Rates | | Lifetime | | interest rate | | volatility | | yield | | Lifetime | |
| |
| |
| |
| |
| |
| |
| |
| |
| |
| |
| | % | | % | | % | | % | | years | | % | | % | | % | | years | |
| Rio Tinto plc | 4.3-4.6 | | 30.0 | | 2.6 | | 10.0 | | 2.2-5.6 | | 4.4-4.5 | | 31.8 | | 4.5 | | 2.2-5.6 | |
| Rio Tinto Limited | 5.2-5.4 | | 25.0 | | 2.6 | | 10.0 | | 3.6-5.6 | | 5.4 | | 26.1 | | 2.6 | | 3.6-5.6 | |
| | | | | | | | | | | | | | | | | | |
A summary of the status of the companies’ fixed share option plans as at 31 December 2004, 2003 and 2002, and changes during the years ending on those dates is presented below:
| | | | | | Rio Tinto plc - Share Savings Plan | | | | | |
| |
| |
| | 2004 | | 2003 | | 2002 | |
| |
| |
| |
| |
| | | | Weighted | | | | Weighted | | | | Weighted | |
| | | | average | | | | average | | | | average | |
| | Number | | exercise price | | Number | | exercise price | | Number | | exercise price | |
| |
| |
| |
| |
| |
| |
| |
| | | | £ | | | | £ | | | | £ | |
| Options outstanding at 1 January (a) | 1,995,504 | | 8.63 | | 2,079,845 | | 8.14 | | 2,010,403 | | 7.74 | |
| Granted | 412,785 | | 11.40 | | 390,518 | | 11.21 | | 509,954 | | 8.76 | |
| Forfeited | (121,112 | ) | 9.64 | | - | | - | | - | | - | |
| Exercised | (527,641 | ) | 5.74 | | (367,866 | ) | 8.47 | | (278,134 | ) | 5.96 | |
| Cancellations (b) | (15,773 | ) | 10.09 | | (182,067 | ) | 9.06 | | (162,378 | ) | 8.85 | |
| Expired | (34,694 | ) | 8.41 | | - | | - | | - | | - | |
| |
| |
| |
| |
| |
| |
| |
| Options outstanding at 31 December | 1,709,069 | | 10.11 | | 1,920,430 | | 8.61 | | 2,079,845 | | 8.14 | |
| |
| |
| |
| |
| |
| |
| |
| | | | | | | | | | | | | |
| Weighted-average grant-date fair value of options granted during the year (£): | | 5.48 | | | | 4.20 | | | | 2.78 | |
| | | | | | | | | | | | |
| (a) | The number of options outstanding as at 1st January 2004 includes the International SAR plan; prior disclosure figures excluded this plan. |
| (b) | Prior to 2004, expiries and forfeitures were included in cancellations. |
| | |
| | Rio Tinto Limited - Share Savings Plan | |
| |
| |
| | 2004 | | 2003 | | 2002 | |
| |
| |
| |
| |
| | | | Weighted | | | | Weighted | | | | Weighted | |
| | | | average | | | | average | | | | average | |
| | Number | | exercise price | | Number | | exercise price | | Number | | exercise price | |
| |
| |
| |
| |
| |
| |
| |
| | | | A$ | | | | A$ | | | | A$ | |
| Options outstanding at 1 January (a) | 2,415,421 | | 26.71 | | 2,246,174 | | 26.59 | | 1,380,826 | | 27.86 | |
| Granted | 547,052 | | 29.04 | | 384,180 | | 27.48 | | 1,245,639 | | 25.57 | |
| Forfeited | (254,478 | ) | 26.72 | | - | | - | | - | | - | |
| Exercised | (27,009 | ) | 27.13 | | (12,588 | ) | 27.67 | | (2,130 | ) | 27.86 | |
| Cancellations (b) | - | | - | | (232,313 | ) | 26.76 | | (378,161 | ) | 27.86 | |
| Expired | - | | - | | - | | - | | - | | - | |
| |
| |
| |
| |
| |
| |
| |
| Options outstanding at 31 December | 2,680,986 | | 27.18 | | 2,385,453 | | 26.71 | | 2,246,174 | | 26.59 | |
| |
| |
| |
| |
| |
| |
| |
| | | | | | | | | | | | | |
| Weighted-average grant date fair value of options granted during the year (A$): | 14.10 | | | | 10.90 | | | | 7.59 | |
| | | | | | | | | | | |
| (a) | The number of options outstanding as at 1st January 2004 includes the International SAR plan; previously this plan was excluded from the disclosure. |
| (b) | Prior to 2004, expiries and forfeitures were included in cancellations. |
A-80
Back to Contents
RIO TINTO PLC - RIO TINTO LIMITED
NOTES TO FINANCIAL STATEMENTS - - (continued)
42 Reconciliation to US Accounting Principles (continued)
| | Rio Tinto plc - Share Savings Plan | |
| As at 31 December 2004: |
| |
| Options outstanding | | Options exercisable | |
| |
| |
| |
| | | | Weighted | | Weighted | | | | Weighted | | Weighted | |
| Range of exercise prices | | | average | | average | | | | average | | average | |
| Number | | exercise price | | contractual life | | Number | | exercise price | | contractual life | |
| |
| |
| |
| |
| |
| |
| |
| | | | £ | | years | | | | £ | | years | |
| £7.11 - £10.00 | 917,888 | | 9.09 | | 1.5 | | 2,133 | | 7.11 | | 0.1 | |
| £10.00 - £12.77 | 791,181 | | 11.30 | | 3.2 | | 455 | | 10.61 | | 0.1 | |
| |
| |
| |
| |
| |
| |
| |
| £7.11 - £12.77 | 1,709,069 | | 10.11 | | 2.3 | | 2,588 | | 7.73 | | 0.1 | |
| |
| |
| |
| |
| |
| |
| |
At 31 December 2003 there were 5,263 (2002: 3,554) options exercisable with a weighted average exercise price of £7.97 (2002: £7.44).
| | Rio Tinto Limited - Share Savings Plan | |
| |
| |
| As at 31 December 2004: | | | | | | | | | | | | |
| Options outstanding | | Options exercisable | |
| |
| |
| |
| | | | Weighted | | Weighted | | | | Weighted | | Weighted | |
| Range of exercise prices | | | average | | average | | | | average | | average | |
| Number | | exercise price | | contractual life | | Number | | exercise price | | contractual life | |
| |
| |
| |
| |
| |
| |
| |
| | | | A$ | | years | | | | A$ | | years | |
| A$25 - A$30 | 2,680,986 | | 27.18 | | 2.6 | | - | | - | | - | |
| |
| |
| |
| |
| |
| |
| |
At 31 December 2003 and 31 December 2002 there were no options exercisable.
Performance Based Share Option Plan
Under its 1998 Executive Share Option Scheme and Share Option Plan, the Company grants selected executives and other key employees share option awards. For pre-2004 awards, vesting is contingent upon achieving increases in the Group's earnings per share above certain predetermined target levels over a three year performance period. There is an annual retest on a three year rolling basis until options fully vest or lapse at the end of the option period. This is a non-market condition under SFAS 123. As such, a best estimate of the service period (over which compensation cost is recognised) is made at the grant date and revised to reflect changes in the Group's earnings per share and market expectations for future earnings per share growth. For awards granted prior to 2004, the fair value is calculated assuming the performance conditions will be achieved. If such conditions are not met, no compensation cost is recognised and previously recognised compensation cost is then reversed.
For awards granted in 2004, vesting is contingent on the Group's Total Shareholder Return equalling or outperforming that of the HSBC Global Mining Index over a three year period. Vesting is based on a sliding scale with zero vesting for performance below the index up to full vesting for performance of 5%pa above the index. A single fixed base retest will be made five years after the date of grant. This "market condition" has been incorporated in the measurement of fair value for 2004 awards by modelling the correlation between Rio Tinto's TSR and that of the index. The relationship between Rio Tinto's TSR and the index was simulated many thousands of times to derive a distribution which, in conjunction with the lattice-based option valuation model, was used to determine the fair value of the options.
The Group has a policy of settling these awards by the issue of equity, although the directors at their discretion can offer a cash alternative.
The exercise price of each option, which has a 10-year life, is equal to the average market price of the Company's shares over a 5 working-day period prior to the date of grant. The fair value of each option grant was estimated on the date of grant using a lattice-based option valuation model. The key assumptions are noted in the following table.
| | 2004 | | | | | | | | | |
| |
| | | | | | | | | |
| | Risk-free | | Expected | | Dividend | | Turnover | | Implied | | | | | | | | | |
| | interest rate | | volatility | | yield | | Rates | | Lifetime | | | | | | | | | |
| |
| |
| |
| |
| |
| | | | | | | | | |
| | % | | % | | % | | % | | years | | | | | | | | | |
| Rio Tinto plc | 4.9 | | 32.0 | | 3.0 | | 5.0 | | 4.7 | | | | | | | | | |
| Rio Tinto Limited | 5.7 | | 26.0 | | 2.8 | | 5.0 | | 5.0 | | | | | | | | | |
| | | | | | | | | | | | | | | | | | | |
| | | 2003 | | 2002 | |
| | |
| |
| |
| | | Risk-free | | Expected | | Dividend | | Turnover | | Implied | | Risk-free | | Expected | | Dividend | | Implied | |
| | | interest rate | | volatility | | yield | | Rates | | Lifetime | | interest rate | | volatility | | yield | | Lifetime | |
| | |
| |
| |
| |
| |
| |
| |
| |
| |
| |
| | | % | | % | | % | | % | | years | | % | | % | | % | | years | |
| Rio Tinto plc | | 4.3 | | 30.0 | | 3.1 | | 5.0 | | 5.3 | | 5.2 | | 30.8 | | 2.8 | | 10 | |
| Rio Tinto Limited | | 5.3 | | 25.0 | | 3.1 | | 5.0 | | 5.8 | | 6.5 | | 25.9 | | 2.8 | | 10 | |
| | | | | | | | | | | | | | | | | | | | |
A-81
Back to Contents
RIO TINTO PLC - RIO TINTO LIMITED
NOTES TO FINANCIAL STATEMENTS - (continued)
42 Reconciliation to US Accounting Principles (continued)
A summary of the status of each company's performance-based share option plan as of 31 December 2004, 2003 and 2002, and changes during the years ending on those dates, is presented below:
| | | | | | Rio Tinto plc - Share Option Plan | | | | | |
| |
| |
| | 2004 | | 2003 | | 2002 | |
| |
| |
| |
| |
| | | | Weighted | | | | Weighted | | | | Weighted | |
| | | | average | | | | average | | | | average | |
| | Number | | exercise price | | Number | | exercise price | | Number | | exercise price | |
| |
| |
| |
| |
| |
| |
| |
| | | | £ | | | | £ | | | | £ | |
| Options outstanding at 1 January | 7,662,925 | | 11.93 | | 7,186,254 | | 11.35 | | 5,785,625 | | 9.97 | |
| Granted | 1,134,053 | | 13.29 | | 2,305,406 | | 12.63 | | 2,095,314 | | 14.59 | |
| Exercised | (584,263 | ) | 8.69 | | (1,009,307 | ) | 8.50 | | (540,568 | ) | 8.16 | |
| Forfeited | (159,423 | ) | 13.09 | | (797,927 | ) | 13.05 | | (154,117 | ) | 14.72 | |
| Expired | - | | - | | (21,501 | ) | 12.98 | | - | | - | |
| |
| |
| |
| |
| |
| |
| |
| Options outstanding at 31 December | 8,053,292 | | 12.33 | | 7,662,925 | | 11.93 | | 7,186,254 | | 11.35 | |
| |
| |
| |
| |
| |
| |
| |
| | | | | | | | | | | | | |
| Weighted-average fair value of options granted during the year (£): | | 2.81 | | | | 2.97 | | | | 4.99 | |
| | | | | | | | | | | | |
| | | | | | Rio Tinto Limited - Share Option Plan | | | | | |
| |
| |
| | 2004 | | 2003 | | 2002 | |
| |
| |
| |
| |
| | | | Weighted | | | | Weighted | | | | Weighted | |
| | | | average | | | | average | | | | average | |
| | Number | | exercise price | | Number | | exercise price | | Number | | exercise price | |
| |
| |
| |
| |
| |
| |
| |
| | | | A$ | | | | A$ | | | | A$ | |
| Options outstanding at 1 January | 3,602,137 | | 33.58 | | 2,439,330 | | 33.42 | | 1,694,730 | | 28.09 | |
| Granted | 796,683 | | 34.41 | | 1,242,475 | | 33.34 | | 1,003,849 | | 39.87 | |
| Exercised | (196,608 | ) | 22.25 | | (58,975 | ) | 22.04 | | (208,528 | ) | 20.15 | |
| Forfeited | (128,613 | ) | 34.91 | | (18,197 | ) | 33.76 | | (50,721 | ) | 37.65 | |
| Expired | - | | - | | (2,496 | ) | 33.01 | | - | | - | |
| |
| |
| |
| |
| |
| |
| |
| Options outstanding at 31 December | 4,073,599 | | 34.24 | | 3,602,137 | | 33.58 | | 2,439,330 | | 33.42 | |
| |
| |
| |
| |
| |
| |
| |
| | | | | | | | | | | | | |
| Weighted-average fair value of options granted during the year A$ | | 6.17 | | | | 6.68 | | | | 13.71 | |
| | | | | | | | | | | | |
| | | | | | Rio Tinto plc - Share Option Plan | | | | | |
| As at 31 December 2004: |
| |
| Options outstanding | | Options exercisable | |
| |
| |
| |
| | | | Weighted | | Weighted | | | | Weighted | | Weighted | |
| Range of exercise prices | | | average | | average | | | | average | | average | |
| Number | | exercise price | | contractual life | | Number | | exercise price | | contractual life | |
| |
| |
| |
| |
| |
| |
| |
| | | | £ | | years | | | | £ | | years | |
| £8 - £10 | 1,742,875 | | 8.95 | | 4.6 | | 1,308,908 | | 8.72 | | 4.4 | |
| £12 - £15 | 6,310,417 | | 13.27 | | 7.6 | | 1,626,166 | | 12.66 | | 6.2 | |
| |
| |
| |
| |
| |
| |
| |
| £8 - £15 | 8,053,292 | | 12.33 | | 6.9 | | 2,935,074 | | 10.90 | | 5.4 | |
| |
| |
| |
| |
| |
| |
| |
At 31 December 2003 there were 2.3 million (2002: 1.9 million) options exercisable with a weighted average exercise price of £8.89 (2002: £8.13)
| | | | | | Rio Tinto Limited - Share Option Plan | | | | | |
| As at 31 December 2004: |
| |
| | | Options outstanding | | | | Options exercisable | |
| |
| |
| |
| | | | Weighted | | Weighted | | | | Weighted | | Weighted | |
| Range of exercise prices | | | average | | average | | | | average | | average | |
| Number | | exercise price | | contractual life | | Number | | exercise price | | contractual life | |
| |
| |
| |
| |
| |
| |
| |
| | | | A$ | | years | | | | A$ | | years | |
| A$20 - A$25 | 309,660 | | 23.67 | | 4.8 | | 227,337 | | 23.52 | | 4.6 | |
| A$30 - A$40 | 3,763,939 | | 35.11 | | 7.7 | | 890,338 | | 33.01 | | 6.2 | |
| |
| |
| |
| |
| |
| |
| |
| A$20 - A$40 | 4,073,599 | | 34.24 | | 7.4 | | 1,117,675 | | 31.08 | | 5.9 | |
| |
| |
| |
| |
| |
| |
| |
At 31 December 2003 there were 0.5 million (2002: 0.3 million) options exercisable with a weighted average exercise price of A$23.12 (2002: A$22.18)
A-82
Back to Contents
RIO TINTO PLC - RIO TINTO LIMITED
NOTES TO FINANCIAL STATEMENTS - (continued)
| 42 | Reconciliation to US Accounting Principles (continued) |
| | |
| | Rio Tinto plc - 1985 Executive Share Option Scheme | |
| |
| |
| | 2004 | | 2003 | | 2002 | |
| |
| |
| |
| |
| | | | Weighted | | | | Weighted | | | | Weighted | |
| | | | average | | | | average | | | | average | |
| | Number | | exercise price | | Number | | exercise price | | Number | | exercise price | |
| |
| |
| |
| |
| |
| |
| |
| | | | £ | | | | £ | | | | £ | |
| Options outstanding at 1 January | 23,000 | | 8.61 | | 62,000 | | 8.49 | | 130,786 | | 8.09 | |
| Exercised | (23,000 | ) | 8.61 | | (39,000 | ) | 8.41 | | (68,786 | ) | 7.73 | |
| |
| |
| |
| |
| |
| |
| |
| Options outstanding at 31 December | - | | - | | 23,000 | | 8.61 | | 62,000 | | 8.49 | |
| |
| |
| |
| |
| |
| |
| |
| Number of options exercisable at year end | - | | | | 23,000 | | | | 62,000 | | | |
| Weighted-average exercise price of options exercisable at year end | | | | | | | 8.61 | | | | 8.49 | |
As at 31 December 2004, Rio Tinto plc has no options outstanding under the 1985 Executive Share Option Scheme.
Employee Stock Purchase Plan
The Rio Tinto Share Ownership Plan is a UK Inland Revenue approved share incentive plan which was approved by shareholders at the 2001 annual general meeting for Rio Tinto plc and introduced in 2002. Under this plan, eligible employees may save up to £125 per month, which the plan administrator invests in Rio Tinto plc shares ("Partnership" shares). Rio Tinto matches these purchases on a one for one basis ("Matching" shares). In addition, eligible employees can receive an annual award of Rio Tinto shares up to a maximum of five per cent of salary, subject to a cap of £3,000 ("Free" Shares).
The fair values of awards of Matching and Free Shares made by Rio Tinto are taken to be the market value of the shares on the date of purchase. The minimum service requirement for employees to benefit from the Matching Shares is one year after they are awarded; there is no minimum service requirement to be able to benefit from the award of Free Shares. For accounting purposes, both Matching and Free Shares are assumed to vest immediately. These awards are settled in equity.
The compensation costs for stocks granted during 2002, 2003 and 2004 were US$0.3 million, US$1.4 million and US$1.6 million respectively.
A summary of the shares awarded under the Company's employee stock purchase plan during the years 2004, 2003 and 2002 is presented below:
| | Rio Tinto Share Ownership Plan | |
| |
| |
| | 2004 | | 2003 | | 2002 | |
| |
| |
| |
| |
| | Number of
shares
awarded | | Weighted
average
share price | | Number of
shares
awarded | | Weighted
average
share price | | Number of
shares
awarded | | Weighted
average
share price | |
| |
|
| |
| |
| |
| |
| |
| | | | £ | | | | £ | | | | £ | |
| Matching Shares | 18,452 | | 13.93 | | 19,385 | | 12.81 | | 16,937 | | 12.30 | |
| Free Shares | 49,182 | | 12.53 | | 50,942 | | 11.96 | | - | | - | |
| |
| |
| |
| |
| |
| |
| |
| Total | 67,634 | | 12.91 | | 70,327 | | 12.19 | | 16,937 | | 12.30 | |
| |
| |
| |
| |
| |
| |
| |
Performance Based Stock Plan
The Mining Companies Comparative Plan is a long-term performance share incentive plan which was approved by shareholders at the 1998 annual general meeting. Under this plan, eligible senior executives are annually awarded a conditional right to receive shares. These rights only vest if the performance conditions approved by the committee are satisfied. The current performance condition compares Rio Tinto's total shareholder return against a comparator group of 15 other international mining companies over a four year period. Vesting is based on a sliding scale from zero vesting for TSR performance below that of the company ranked 11th in the comparator group, up to 100% vesting for TSR performance above that of the company ranked 5th. (A different scale applies to Directors and Product Group Chief Executives.) Awards are released to participants in the form of shares all an equivalent amount in cash.
A summary of the status of each company's performance-based stock plan as of 31 December 2004, 2003 and 2002, and changes during the years ending on those dates is presented below:
| | Rio Tinto plc - Mining Companies Comparative Plan | |
| |
| |
| | 2004 | | 2003 | | 2002 | |
| |
| |
| |
| |
| | | | Weighted | | | | Weighted | | | | Weighted | |
| | | | average | | | | average | | | | average | |
| | Number | | price at award | | Number | | price at award | | Number | | price at award | |
| |
| |
| |
| |
| |
| |
| |
| | | | £ | | | | £ | | | | £ | |
| Options outstanding at 1 January | 1,198,273 | | 11.55 | | 1,312,121 | | 10.21 | | 1,220,500 | | 9.40 | |
| Awarded | 910,170 | | 12.90 | | 349,258 | | 12.52 | | 378,122 | | 12.40 | |
| Forfeited | (41,805 | ) | 12.55 | | (113,985 | ) | 11.86 | | (22,326 | ) | 12.40 | |
| Vested | (170,184 | ) | 10.26 | | (349,121 | ) | 7.39 | | (264,175 | ) | 9.39 | |
| Lapsed | (102,140 | ) | 10.26 | | - | | - | | - | | - | |
| |
| |
| |
| |
| |
| |
| |
| Options outstanding at 31 December | 1,794,314 | | 12.41 | | 1,198,273 | | 11.55 | | 1,312,121 | | 10.21 | |
| |
| |
| |
| |
| |
| |
| |
The compensation costs for stocks granted during 2004, 2003 and 2002 were £11.7 million, £4.4 million and £4.7 million respectively.
A-83
Back to Contents
RIO TINTO PLC - RIO TINTO LIMITED
NOTES TO FINANCIAL STATEMENTS - (continued)
| 42 | Reconciliation to US Accounting Principles (continued) |
| | |
| | Rio Tinto Limited - Mining Companies Comparative Plan | |
| |
| |
| | 2004 | | 2003 | | 2002 | |
| |
| |
| |
| |
| | | | Weighted | | | | Weighted | | | | Weighted | |
| | | | average | | | | average | | | | average | |
| | Number | | price at award | | Number | | price at award | | Number | | price at award | |
| |
| |
| |
| |
| |
| |
| |
| | | | A$ | | | | A$ | | | | A$ | |
| Options outstanding at 1 January | 711,683 | | 30.07 | | 774,606 | | 25.56 | | 804,920 | | 22.22 | |
| Awarded | 603,686 | | 32.88 | | 183,997 | | 34.95 | | 182,060 | | 33.68 | |
| Forfeited | (25,270 | ) | 32.88 | | (3,612 | ) | 34.95 | | (5,002 | ) | 33.38 | |
| Vested | (103,448 | ) | 25.10 | | (243,308 | ) | 19.32 | | (207,372 | ) | 19.55 | |
| Lapsed | (62,094 | ) | 25.10 | | - | | - | | - | | - | |
| |
| |
| |
| |
| |
| |
| |
| Options outstanding at 31 December | 1,124,557 | | 32.25 | | 711,683 | | 30.07 | | 774,606 | | 25.56 | |
| |
| |
| |
| |
| |
| |
| |
The compensation costs for stocks granted during 2004, 2003 and 2002 were A$19.8 million, A$6.4 million and A$6.1 million respectively.
The following supplements segmental information provided elsewhere in this report to provide additional information required under US GAAP.
Property, plant and equipment by location
| | Rio Tinto Group | |
| |
| |
| | 2004 | | 2003 | | 2002 | | 2004 | | 2003 | | 2002 | |
| |
| |
| |
| |
| |
| |
| |
| | % | | % | | % | | US$m | | US$m | | US$m | |
| North America (a) | 35.1 | | 36.2 | | 42.7 | | 5,825 | | 5,504 | | 5,204 | |
| Australia and New Zealand | 59.7 | | 54.6 | | 48.5 | | 9,905 | | 8,290 | | 5,912 | |
| South America | 0.3 | | 1.1 | | 0.9 | | 53 | | 168 | | 112 | |
| Africa | 3.4 | | 5.6 | | 5.0 | | 565 | | 851 | | 608 | |
| Indonesia | 0.1 | | 0.2 | | 0.4 | | 18 | | 28 | | 50 | |
| Europe and other countries | 1.4 | | 2.3 | | 2.5 | | 239 | | 355 | | 297 | |
| |
| |
| |
| |
| |
| |
| |
| | 100.0 | | 100.0 | | 100.0 | | 16,605 | | 15,196 | | 12,183 | |
| |
| |
| |
| |
| |
| |
| |
| | |
| (a) | North America includes US$3,512 million (2003: US$3,335 million, 2002: US$3,287 million) relating to the United States of America. |
Tax charge by product group (UK GAAP)
| | Rio Tinto Group | |
| |
| |
| | 2004 | | 2003 | | 2002 | |
| |
| |
| |
| |
| | US$m | | US$m | | US$m | |
| Iron Ore | (267 | ) | (226 | ) | (215 | ) |
| Energy | (151 | ) | (96 | ) | (197 | ) |
| Industrial Minerals | (88 | ) | (93 | ) | (200 | ) |
| Aluminium | (164 | ) | (106 | ) | (107 | ) |
| Copper | (334 | ) | (223 | ) | (126 | ) |
| Diamonds | (119 | ) | (76 | ) | (33 | ) |
| Other operations | (7 | ) | (13 | ) | (16 | ) |
| Tax on exploration | 14 | | 17 | | 18 | |
| Other items, including tax relief on asset write downs | 275 | | 249 | | 168 | |
| |
| |
| |
| |
| | (841 | ) | (567 | ) | (708 | ) |
| |
| |
| |
| |
Covenants
Of the Rio Tinto Group's medium and long term borrowings of US$3.3 billion, some US$0.7 billion relates to the Group's share of non-recourse borrowings which are the subject of various financial and general covenants with which the respective borrowers are in compliance.
Accounting for derivative instruments and hedging activities
During 2004, the following movements, before tax and minorities, took place in Other Comprehensive Income ('OCI') and earnings under US GAAP in relation to derivatives:
| | Derivative | | | | Recorded in | |
| | assets less | | Recorded in | | retained | |
| | liabilities | | OCI | | earnings | |
| |
| |
| |
| |
| | US$m | | US$m | | US$m | |
| Net derivative assets on balance sheet at 31 December 2003 | 267 | | 88 | | 179 | |
| Less: net derivative assets marked to market through OCI at 1 January 2004 relating to contracts maturing in 2004 (a) | (38 | ) | (38 | ) | - | |
| Less: net derivative assets marked to market through retained earnings at 1 January 2004 relating to contracts maturing in 2004 (b) | (95 | ) | - | | (95 | ) |
| Add: mark to market of net derivative assets designated as SFAS 133 cash flow hedges at 31 December 2004 (c) | 18 | | 18 | | - | |
| Add: mark to market of net derivative assets not designated as hedges under SFAS 133 at 31 December 2004 (d) | 8 | | - | | 8 | |
| |
| |
| |
| |
| On balance sheet at 31 December 2004 | 160 | | 68 | | 92 | |
| |
| |
| |
| |
| | | | | | | |
| (a) | During 2004, net gains of US$38 million relating to derivatives designated as cash flow hedges under SFAS 133 were transferred from accumulated OCI to US GAAP earnings on maturity of the contracts. |
| (b) | During 2004, accrued gains of US$95 million relating to derivatives that were not designated as hedges under SFAS 133 were realised on maturity of the contracts. |
| (c) | The fair value of net derivative assets designated as cash flow hedges under SFAS 133 increased by US$18 million during 2004 resulting in a closing asset balance related to cash flow hedging activities of US$68 million in OCI. These cash flow hedges hedge the Group's exposure to the US dollar in relation to future trading transactions. The Group expects to reclassify US$13 million of this amount as increases in earnings over the next twelve months as these contracts and the transactions which they hedge mature. As at 31 December 2004, the Group had US$144 million of cash flow hedge derivative assets and US$76 million of cash flow hedge derivative liabilities. The cash flow hedges extend to 2010. |
| (d) | Certain of the Group's derivative contracts do not qualify for hedge accounting under SFAS 133, principally because the hedge is not located in the entity with the exposure. The fair value of these net derivative assets increased by US$8 million during 2004. As at 31 December 2004, the Group had US$152 million of assets relating to derivatives which do not qualify for hedge accounting under SFAS 133, and US$60 million of liabilities. |
A-84
Back to Contents
RIO TINTO PLC - RIO TINTO LIMITED
ORE RESERVES UNDER INDUSTRY GUIDE 7
Reserves have been prepared in accordance with Industry Guide 7 under the United States Securities Act of 1933 and the following definitions:
An ‘Ore Reserve’ means that part of a mineral deposit that can be economically and legally extracted or produced at the time of the reserves determination. To establish this, studies appropriate to the type of mineral deposit involved have been carried out to estimate the quantity, grade and value of the ore mineral(s) present. In addition, technical studies have been completed to determine realistic assumptions for the extraction of the minerals including estimates of mining, processing, economic, marketing, legal, environmental, social and governmental factors. The degree of these studies is sufficient to demonstrate the technical and economic feasibility of the project and depends on whether or not the project is an extension of an existing project or operation. The estimates of minerals to be produced include allowances for ore losses and the treatment of unmineralised materials which may occur as part of the mining and processing activities. Ore Reserves are sub-divided in order of increasing confidence into Probable Ore Reserves and Proven Ore Reserves as defined below.
The term "economically", as used in the definition of reserves, implies that profitable extraction or production under defined investment assumptions has been established through the creation of a mining plan, processing plan and cash flow model. The assumptions made must be reasonable, including costs and operating conditions that will prevail during the life of the project.
Reserves are determined using current prices in accordance with Industry Guide 7. For commodities for which the price is determined on public exchanges, current prices have been determined by using the average spot price for the three years before the date of the reserve estimate. For commodities for which the price is not determined on public exchanges, the average realised price for the previous three years has been used. To the extent that commodities are traded under contract, the contract prices in existence at the date of reserve determination have been used, for the contracted amounts.
The term "legally", as used in the definition of reserves, does not imply that all permits needed for mining and processing have been obtained or that other legal issues have been completely resolved. However, for reserves to exist, there is reasonable assurance of the issuance of these permits or resolution of legal issues. Reasonable assurance means that, based on applicable laws and regulations, the issuance of permits or resolution of legal issues necessary for mining and processing at a particular deposit will be accomplished in the ordinary course and in a timeframe consistent with the Company’s current mine plans.
The term "proven reserves" means reserves for which (a) quantity is computed from dimensions revealed in outcrops, trenches, workings or drill holes; grade and/or quality are computed from the results of detailed sampling; and (b) the sites for inspection, sampling and measurement are spaced so closely and the geologic character is so well defined that size, shape, depth and mineral content of reserves are well established. Proven reserves represent that part of an orebody for which there exists the highest level of confidence in data regarding its geology, physical characteristics, chemical composition and probable processing requirements.
The term "probable reserves" means reserves for which quantity and grade and/or quality are computed from information similar to that used for proven reserves, but the sites for inspection, sampling and measurement are farther apart or are otherwise less adequately spaced. The degree of assurance, although lower than that for proven reserves, is high enough to assume continuity between points of observation. This means that probable reserves generally have a wider drill hole spacing than for proven reserves.
The amount of proven and probable reserves shown below does not necessarily represent the amount of material currently scheduled for extraction, because the amount scheduled for extraction may be derived from a life of mine plan predicated on prices and other assumptions which are different to those used in the life of mine plan prepared in accordance with Industry Guide 7.
The estimated ore reserve figures in the following tables are as of 31 December 2004. Metric units are used throughout. The figures used to calculate Rio Tinto's share of reserves are often more precise than the rounded numbers shown in the tables, hence small differences might result if the calculations are repeated using the tabulated figures. Commodity price information is given in footnote (a).
A-85
Back to Contents
RIO TINTO PLC - RIO TINTO LIMITED
ORE RESERVES UNDER INDUSTRY GUIDE 7 CONTINUED
| | Type of
mine
(b) | | | | Total ore reserves at end 2004 | | | | | | Rio Tinto share | |
| | | | | |
|
|
|
| |
| | | | | | Tonnage | | Grade | | | | Interest | | Recoverable | |
| | | | | | | | | | | | % | | mineral | |
|
|
|
|
|
|
|
|
|
|
|
|
|
| |
| BAUXITE (d) | | | | | millions | | | | | | | | millions | |
| Reserves at operating mine | | | | | of tonnes | | %Al2O3 | | | | | | of tonnes | |
| Weipa (Australia) | O/P | | | | 1,259 | | 53.7 | | | | 100.0 | | 1,259 | |
|
|
|
|
|
|
|
|
|
|
|
|
|
| |
| | | | | | | | | | | | | | Marketable | |
| | | | | | | | | | | | | | product | |
|
|
|
|
|
|
|
|
|
|
|
|
|
| |
| BORATES (e) | | | | | millions | | | | | | | | millions | |
| Reserves at operating mines | | | | | of tonnes | | | | | | | | of tonnes | |
| Boron (US) | | | | | | | | | | | | | | |
| - open pit | O/P | | | | 23.1 | | | | | | 100.0 | | 23.1 | |
| - stockpiles (q) | S/P | | | | 2.1 | | | | | | 100.0 | | 2.1 | |
|
|
|
|
|
|
|
|
|
|
|
|
|
| |
| Total | | | | | | | | | | | | | 25.2 | |
|
|
|
|
|
|
|
|
|
|
|
|
|
| |
| | | | | Marketable | | | | | | | | | |
| COAL (f) | | | Coal type | | reserves | | Marketable coal quality | | | | | |
| | | | | |
|
|
|
|
| | | | | |
| | | (g) | | Total | | | | | | | | | |
| | | | | | | (h) | | (h) | | | | Marketable | |
| | | | | | | | | | | | | reserves | |
|
|
|
|
|
|
|
|
|
|
|
|
|
| |
| Reserves at operating mines | | | | | millions | | Calorific | | Sulphur | | | | millions | |
| | | | | of tonnes | | value | | content | | | | of tonnes | |
| | | | | | | MJ/kg | | % | | | | | |
| Coal & Allied Industries | | | | | | | | | | | | | | |
| Bengalla (Australia) | O/C | | SC | | 161 | | 28.30 | | 0.50 | | 30.3 | | 49 | |
| Hunter Valley Operations (Australia) | O/C | | SC + MC | | 336 | | 28.94 | | 0.57 | | 75.7 | | 254 | |
| Mount Thorley Operations (Australia) | O/C | | SC + MC | | 24 | | 28.20 | | 0.53 | | 60.6 | | 14 | |
| Warkworth (Australia) | O/C | | SC + MC | | 246 | | 29.35 | | 0.53 | | 42.1 | | 104 | |
|
|
|
|
|
|
|
|
|
|
|
|
|
| |
| Sub-total | | | | | | | | | | | | | 421 | |
|
|
|
|
|
|
|
|
|
|
|
|
|
| |
| Kennecott Energy | | | | | | | | | | | | | | |
| Antelope (US) | O/C | | SC | | 249 | | 20.59 | | 0.22 | | 100.0 | | 249 | |
| Colowyo (US) (i) | O/C | | SC | | 24 | | 24.31 | | 0.40 | | 100.0 | | 24 | |
| Cordero Rojo (US) | O/C | | SC | | 365 | | 19.59 | | 0.30 | | 100.0 | | 365 | |
| Decker (US) (j) | O/C | | SC | | 25 | | 22.10 | | 0.37 | | 50.0 | | 13 | |
| Jacobs Ranch (US) | O/C | | SC | | 500 | | 20.35 | | 0.44 | | 100.0 | | 500 | |
| Spring Creek (US) | O/C | | SC | | 225 | | 21.75 | | 0.33 | | 100.0 | | 225 | |
|
|
|
|
|
|
|
|
|
|
|
|
|
| |
| Sub-total | | | | | | | | | | | | | 1,375 | |
|
|
|
|
|
|
|
|
|
|
|
|
|
| |
| Rio Tinto Coal Australia | | | | | | | | | | | | | | |
| Blair Athol (Australia) | O/C | | SC | | 61 | | 27.95 | | 0.32 | | 71.2 | | 43 | |
| Hail Creek (Australia) (k) | O/C | | MC | | 190 | | 32.20 | | 0.35 | | 82.0 | | 156 | |
| Kestrel (Australia) | U/G | | SC + MC | | 120 | | 32.20 | | 0.65 | | 80.0 | | 96 | |
| Tarong-Meandu (Australia) | O/C | | SC | | 93 | | 21.05 | | 0.30 | | 100.0 | | 93 | |
|
|
|
|
|
|
|
|
|
|
|
|
|
| |
| Sub-total | | | | | | | | | | | | | 388 | |
|
|
|
|
|
|
|
|
|
|
|
|
|
| |
| Total reserves at operating mines | | | | | | | | | | | | | 2,184 | |
|
|
|
|
|
|
|
|
|
|
|
|
|
| |
| Undeveloped reserves (l) | | | | | | | | | | | | | | |
| | | | | | | | | | | | | | |
| Coal & Allied Industries | | | | | | | | | | | | | | |
| Mount Pleasant (Australia) | O/C | | SC | | 350 | | 26.73 | | 0.51 | | 75.7 | | 265 | |
|
|
|
|
|
|
|
|
|
|
|
|
|
| |
| Rio Tinto Coal Australia | | | | | | | | | | | | | | |
| Clermont (Australia) | O/C | | SC | | 189 | | 27.90 | | 0.33 | | 50.1 | | 95 | |
| SW Yarraman (Australia) | O/C | | SC | | 41 | | 21.05 | | 0.30 | | 100.0 | | 41 | |
| Tarong-Kunioon (Australia) | O/C | | SC | | 163 | | 21.05 | | 0.30 | | 100.0 | | 163 | |
|
|
|
|
|
|
|
|
|
|
|
|
|
| |
| Sub-total | | | | | | | | | | | | | 299 | |
|
|
|
|
|
|
|
|
|
|
|
|
|
| |
| Total undeveloped reserves | | | | | | | | | | | | | 564 | |
|
|
|
|
|
|
|
|
|
|
|
|
|
| |
| See Notes on page A-94 and A-95 | | | | | | | | | | | | | | |
A-86
Back to Contents
RIO TINTO PLC - RIO TINTO LIMITED
ORE RESERVES UNDER INDUSTRY GUIDE 7 CONTINUED
| | Type of
mine
(b) | | | | Total ore reserves at end 2004 | | Average | | Rio Tinto share | |
| | | | | |
|
|
| | mill | |
|
|
| |
| | | | | | Tonnage | | Grade | | recovery | | Interest | | Recoverable | |
| | | | | | | | | | % | | % | | metal | |
|
|
|
|
|
|
|
|
|
|
|
|
|
| |
| COPPER | | | | | millions | | | | | | | | millions | |
| Reserves at operating mines | | | | | of tonnes | | %Cu | | | | | | of tonnes | |
| Bingham Canyon (US) (m) | | | | | | | | | | | | | | |
| - open pit | O/P | | | | 631 | | 0.58 | | 87 | | 100.0 | | 3.171 | |
| - stockpiles (p) | S/P | | | | 27 | | 0.39 | | 87 | | 100.0 | | 0.090 | |
| Escondida (Chile) (n) | | | | | | | | | | | | | | |
| - sulphide (open pit) | O/P | | | | 1,163 | | 1.23 | | 84 | | 30.0 | | 3.590 | |
| - sulphide leach (open pit) | O/P | | | | 630 | | 0.54 | | 36 | | 30.0 | | 0.369 | |
| - oxide (open pit) | O/P | | | | 39.1 | | 0.69 | | 81 | | 30.0 | | 0.065 | |
| - sulphide (stockpiles (p)) | S/P | | | | 20.1 | | 1.18 | | 84 | | 30.0 | | 0.059 | |
| - sulphide leach (stockpiles (p)) | S/P | | | | 161 | | 0.68 | | 36 | | 30.0 | | 0.118 | |
| - oxide (stockpiles (p)) | S/P | | | | 118 | | 0.70 | | 81 | | 30.0 | | 0.198 | |
| Escondida Norte (Chile) (n) | | | | | | | | | | | | | | |
| - sulphide | O/P | | | | 535 | | 1.41 | | 88 | | 30.0 | | 1.994 | |
| - sulphide leach | O/P | | | | 159 | | 0.63 | | 29 | | 30.0 | | 0.087 | |
| - oxide | O/P | | | | 123 | | 0.78 | | 54 | | 30.0 | | 0.156 | |
| Grasberg (Indonesia) | O/P + U/G | | | | 2,769 | | 1.09 | | 88 | | (o) | | 7.432 | |
| Northparkes (Australia) | | | | | | | | | | | | | | |
| - open pit | O/P | | | | 1.8 | | 0.60 | | 78 | | 80.0 | | 0.007 | |
| - stockpiles (p) | S/P | | | | 2.8 | | 0.65 | | 71 | | 80.0 | | 0.010 | |
| - underground | U/G | | | | 47.2 | | 1.17 | | 89 | | 80.0 | | 0.392 | |
| Palabora (South Africa) | | | | | | | | | | | | | | |
| - underground block cave | U/G | | | | 201 | | 0.68 | | 88 | | 49.2 | | 0.589 | |
|
|
|
|
|
|
|
|
|
|
|
|
|
| |
| Total | | | | | | | | | | | | | 18.327 | |
|
|
|
|
|
|
|
|
|
|
|
|
|
| |
| | | | | | | | | | | | | | Recoverable | |
| | | | | | | | | | | | | | diamonds | |
|
|
|
|
|
|
|
|
|
|
|
|
|
| |
| DIAMONDS (d) | | | | | millions | | carats | | | | | | millions | |
| Reserves at operating mines | | | | | of tonnes | | per tonne | | | | | | of carats | |
| Argyle (Australia) (q) | | | | | | | | | | | | | | |
| - AK1 pipe (open pit) | O/P + U/G | | | | 35.0 | | 2.9 | | | | 100.0 | | 100.4 | |
| - AK1 pipe (stockpiles (p)) | S/P | | | | 1.5 | | 2.7 | | | | 100.0 | | 4.1 | |
| Diavik (Canada) (r) | O/P + U/G | | | | 29.8 | | 3.2 | | | | 60.0 | | 57.7 | |
| Murowa (Zimbabwe) | O/P | | | | 23.0 | | 0.7 | | | | 77.8 | | 12.3 | |
|
|
|
|
|
|
|
|
|
|
|
|
|
| |
| Total | | | | | | | | | | | | | 174.5 | |
|
|
|
|
|
|
|
|
|
|
|
|
|
| |
| | | | | | | | | | | | | | Recoverable | |
| | | | | | | | | | | | | | metal | |
|
|
|
|
|
|
|
|
|
|
|
|
|
| |
| GOLD | | | | | millions | | grammes | | | | | | millions of | |
| Reserves at operating mines | | | | | of tonnes | | per tonne | | | | | | ounces | |
| Bingham Canyon (US) (m) | | | | | | | | | | | | | | |
| - open pit | O/P | | | | 631 | | 0.32 | | 64 | | 100.0 | | 4.224 | |
| - stockpiles (p) | S/P | | | | 27 | | 0.22 | | 64 | | 100.0 | | 0.121 | |
| Cortez/Pipeline (US) (s) | | | | | | | | | | | | | | |
| - open pit | O/P | | | | 291 | | 1.55 | | 79 | | 40.0 | | 4.555 | |
| - stockpiles (p) | S/P | | | | 2 | | 5.04 | | 78 | | 40.0 | | 0.077 | |
| Grasberg (Indonesia) | O/P + U/G | | | | 2,769 | | 0.97 | | 72 | | (o) | | 15.208 | |
| Greens Creek (US) | U/G | | | | 6.0 | | 3.89 | | 68 | | 70.3 | | 0.359 | |
| Kelian (Indonesia) (t) | O/P | | | | - | | - | | | | | | - | |
| Lihir (PNG) (u) | | | | | | | | | | | | | | |
| - open pit | O/P | | | | 149 | | 3.69 | | 90 | | 14.5 | | 2.305 | |
| - stockpiles (p) | S/P | | | | 39 | | 2.66 | | 90 | | 14.5 | | 0.430 | |
| Northparkes (Australia) | | | | | | | | | | | | | | |
| - open pit | O/P | | | | 1.8 | | 0.60 | | 57 | | 80.0 | | 0.016 | |
| - stockpiles (p) | S/P | | | | 2.8 | | 0.48 | | 58 | | 80.0 | | 0.020 | |
| - underground | U/G | | | | 47.2 | | 0.46 | | 74 | | 80.0 | | 0.416 | |
|
|
|
|
|
|
|
|
|
|
|
|
|
| |
| Total | | | | | | | | | | | | | 27.731 | |
|
|
|
|
|
|
|
|
|
|
|
|
|
| |
| See Notes on page A-94 and A-95 | | | | | | | | | | | | | | |
A-87
Back to Contents
RIO TINTO PLC - RIO TINTO LIMITED
ORE RESERVES UNDER INDUSTRY GUIDE 7 CONTINUED
| | Type of
mine
(b) | | | | Total ore reserves at end 2004 | | | | Rio Tinto share | |
| | | | | |
|
|
| | Average | |
|
|
| |
| | | | | | | | | | mill | | | | | |
| | | | | | Tonnage | | Grade | | recovery | | Interest | | Marketable | |
| | | | | | | | | | % | | % | | product | |
|
|
|
|
|
|
|
|
|
|
|
|
|
| |
| IRON ORE (d) | | | | | | | | | | | | | | |
| Reserves at operating mines | | | | | millions | | | | | | | | | |
| and mines under construction | | | | | of tonnes | | % Fe | | | | | | | |
| Channar (Australia) | | | | | | | | | | | | | | |
| - Brockman Ore | O/P | | | | 120 | | 63.5 | | | | 60.0 | | 72 | |
| Corumbá (Brazil) | O/P | | | | 217 | | 67.2 | | | | 100.0 | | 217 | |
| Eastern Range (Australia) | | | | | | | | | | | | | | |
| - Brockman Ore | O/P | | | | 113 | | 62.9 | | | | 54.0 | | 61 | |
| Hamersley (Australia) | | | | | | | | | | | | | | |
| - Brockman 2 (Brockman Ore) | O/P | | | | 24 | | 62.5 | | | | 100.0 | | 24 | |
| - Marandoo (Marra Mamba Ore) | O/P | | | | 76 | | 62.4 | | | | 100.0 | | 76 | |
| - Mt Tom Price (Brockman Ore) | | | | | | | | | | | | | | |
| - open pit | O/P | | | | 154 | | 64.6 | | | | 100.0 | | 154 | |
| - stockpiles (p) | S/P | | | | 14 | | 64.5 | | | | 100.0 | | 14 | |
| - Paraburdoo (Brockman Ore) | O/P | | | | 23 | | 63.8 | | | | 100.0 | | 23 | |
| - Paraburdoo (Marra Mamba Ore) | O/P | | | | 1 | | 63.1 | | | | 100.0 | | 1 | |
| - Nammuldi (Marra Mamba Ore) (v) | O/P | | | | 39 | | 61.4 | | | | 100.0 | | 39 | |
| - Yandicoogina (w) | | | | | | | | | | | | | | |
| - open pit | O/P | | | | 244 | | 59.7 | | | | 100.0 | | 244 | |
| - stockpiles (p) | S/P | | | | 4 | | 58.5 | | | | 100.0 | | 4 | |
| Iron Ore Company of Canada | | | | | | | | | | | | | | |
| (Canada) (x) | O/P | | | | 443 | | 65.0 | | | | 58.7 | | 260 | |
| Robe River (Australia) | | | | | | | | | | | | | | |
| - Pannawonica (Pisolite Ore) | | | | | | | | | | | | | | |
| - open pit | O/P | | | | 158 | | 57.1 | | | | 53.0 | | 84 | |
| - stockpiles (p) | S/P | | | | 14 | | 57.0 | | | | 53.0 | | 7 | |
| - West Angelas (Marra Mamba Ore) | | | | | | | | | | | | | | |
| - open pit | O/P | | | | 417 | | 62.2 | | | | 53.0 | | 221 | |
| - stockpiles (p) | S/P | | | | 1 | | 59.7 | | | | 53.0 | | 1 | |
|
|
|
|
|
|
|
|
|
|
|
|
|
| |
| Total | | | | | | | | | | | | | 1,503 | |
|
|
|
|
|
|
|
|
|
|
|
|
|
| |
| | | | | | | | | | | | | | Recoverable | |
| | | | | | | | | | | | | | metal | |
|
|
|
|
|
|
|
|
|
|
|
|
|
| |
| LEAD | | | | | millions | | | | | | | | millions | |
| Reserves at operating mines | | | | | of tonnes | | %Pb | | | | | | of tonnes | |
| Greens Creek (US) | U/G | | | | 6.0 | | 4.04 | | 66 | | 70.3 | | 0.113 | |
|
|
|
|
|
|
|
|
|
|
|
|
|
| |
| MOLYBDENUM | | | | | millions | | | | | | | | millions | |
| Reserves at operating mine | | | | | of tonnes | | %Mo | | | | | | of tonnes | |
| Bingham Canyon (US) (m) | | | | | | | | | | | | | | |
| - open pit | O/P | | | | 631 | | 0.039 | | 66 | | 100.0 | | 0.163 | |
| - stockpiles (p) | S/P | | | | 27 | | 0.034 | | 66 | | 100.0 | | 0.006 | |
|
|
|
|
|
|
|
|
|
|
|
|
|
| |
| Total | | | | | | | | | | | | | 0.169 | |
|
|
|
|
|
|
|
|
|
|
|
|
|
| |
| SILVER | | | | | millions | | grammes | | | | | | millions | |
| Reserves at operating mines | | | | | of tonnes | | per tonne | | | | | | of ounces | |
| Bingham Canyon (US) (m) | | | | | | | | | | | | | | |
| - open pit | O/P | | | | 631 | | 2.68 | | 78 | | 100.0 | | 42.190 | |
| - stockpiles (p) | S/P | | | | 27 | | 1.92 | | 78 | | 100.0 | | 1.272 | |
| Grasberg (Indonesia) | O/P + U/G | | | | 2,769 | | 3.84 | | 66 | | (o) | | 64.080 | |
| Greens Creek (US) | U/G | | | | 6.0 | | 528 | | 74 | | 70.3 | | 53.019 | |
|
|
|
|
|
|
|
|
|
|
|
|
|
| |
| Total | | | | | | | | | | | | | 160.562 | |
|
|
|
|
|
|
|
|
|
|
|
|
|
| |
| | | | | | | | | | | | | | Marketable | |
| | | | | | | | | | | | | | product | |
|
|
|
|
|
|
|
|
|
|
|
|
|
| |
| TALC (e) | | | | | millions | | | | | | | | millions | |
| Reserves at operating mines | | | | | of tonnes | | | | | | | | of tonnes | |
| Luzenac Group | O/P + U/G | | | | 50.3 | | | | | | 99.9 | | 50.2 | |
| (Europe/North America/Australia) | | | | | | | | | | | | | | |
|
|
|
|
|
|
|
|
|
|
|
|
|
| |
| See Notes on page A-94 and A-95 | | | | | | | | | | | | | | |
A-88
Back to Contents
RIO TINTO PLC – RIO TINTO LIMITED
ORE RESERVES UNDER INDUSTRY GUIDE 7 CONTINUED
| | Type of | | Total ore reserves at | | | | | Rio Tinto share | |
| | mine | | end 2004 | | | Average | | | | | |
| | (b) | |
|
| | mill | |
| |
| | | | Tonnage | | Grade | | | recovery | | Interest | | Marketable | |
| | | | | | | | | % | | % | | product | |
|
|
|
|
|
|
|
|
|
|
|
|
| |
| TITANIUM DIOXIDE FEEDSTOCK (e) | | | millions | | | | | | | | | millions | |
| Reserves at operating mines | | | of tonnes | | | | | | | | | of tonnes | |
| Rio Tinto Iron & Titanium (y) | O/P + D/O | | 75.3 | | | | | | | | | 75.3 | |
| (Canada/South Africa) | | | | | | | | | | | | | |
|
|
|
|
|
|
|
|
|
|
|
|
| |
| | | | | | | | | | | | | Recoverable | |
| | | | | | | | | | | | | metal | |
|
|
|
|
|
|
|
|
|
|
|
|
| |
| | | | | | | | | | | | | | |
| URANIUM | | | millions | | | | | | | | | millions | |
| Reserves at operating mines | | | of tonnes | | %U308 | | | | | | | of tonnes | |
| Energy Resources of Australia (Australia) | | | | | | | | | | | | | |
| - Ranger #3 open pit | O/P | | 11.7 | | 0.26 | | | 90 | | 68.4 | | 0.019 | |
| - Ranger #3 stockpiled ore | S/P | | 6.3 | | 0.20 | | | 88 | | 68.4 | | 0.008 | |
| Rössing (Namibia) | | | | | | | | | | | | | |
| - open pit | O/P | | 21.2 | | 0.039 | | | 85 | | 68.6 | | 0.005 | |
| - stockpiles (p) | | | 2.6 | | 0.042 | | | 85 | | 68.6 | | 0.001 | |
|
|
|
|
|
|
|
|
|
|
|
|
| |
| Total | | | | | | | | | | | | 0.032 | |
|
|
|
|
|
|
|
|
|
|
|
|
| |
| | | | | | | | | | | | | | |
| | | | millions | | | | | | | | | millions | |
| Undeveloped reserves (l) | | | of tonnes | | %U308 | | | | | | | of tonnes | |
| Energy Resources of Australia (Australia) | | | | | | | | | | | | | |
| - Jabiluka | U/G | | 13.8 | | 0.51 | | | 94 | | 68.4 | | 0.045 | |
|
|
|
|
|
|
|
|
|
|
|
|
| |
| | | | | | | | | | | | | | |
| ZINC | | | millions | | | | | | | | | millions | |
| Reserves at operating mines | | | of tonnes | | %Zn | | | | | | | of tonnes | |
| Greens Creek (US) | U/G | | 6.0 | | 10.2 | | | 78 | | 70.3 | | 0.333 | |
|
|
|
|
|
|
|
|
|
|
|
|
| |
| See Notes on page A-94 and A-95 | | | | | | | | | | | | | |
A-89
Back to Contents
RIO TINTO PLC – RIO TINTO LIMITED
ORE RESERVES UNDER INDUSTRY GUIDE 7 CONTINUED
| | Type of | | Proved ore reserves at end 2004 | | Probable ore reserves at end 2004 | |
| | mine | |
| |
| |
| | (b) | | | | | | Drill hole | | | | | | Drill hole | |
| | | | Tonnage | | Grade | | spacing (c) | | Tonnage | | Grade | | spacing (c) | |
|
|
|
|
|
|
|
|
|
|
|
|
|
| |
| BAUXITE (d) | | | millions | | | | | | millions | | | | | |
| Reserves at operating mine | | | of tonnes | | %Al2O3 | | | | of tonnes | | %Al2O3 | | | |
| | | | | | | | | | | | | | |
| Weipa (Australia) | O/P | | 144 | | 54.3 | | 76 | m | 1,115 | | 53.6 | | Max 800m x 400m | |
|
|
|
|
|
|
|
|
|
|
|
|
|
| |
|
|
|
|
|
|
|
|
|
|
|
|
|
| |
| BORATES (e) | | | millions | | | | | | millions | | | | | |
| Reserves at operating mines | | | of tonnes | | | | | | of tonnes | | | | | |
| Boron (US) | | | | | | | | | | | | | | |
| - open pit | O/P | | 22.2 | | | | 61 | m | 0.9 | | | | 61m | |
| - stockpiles (q) | S/P | | 0.1 | | | | | | 1.9 | | | | | |
|
|
|
|
|
|
|
|
|
|
|
|
|
| |
| COAL (f) | | | Recoverable | | % Yield to | |
|
|
|
|
|
|
| |
| | | | reserves | | give | | Proved | | | | Probable | | | |
| | | | total | | marketable | | | | Drill hole | | | | Drill hole | |
| | | | | | reserves | | | | spacing (c) | | | | spacing (c) | |
|
|
|
|
|
|
|
|
|
|
|
|
|
| |
| Reserves at operating mines | | | millions | | | | millions | | | | millions | | | |
| | | of tonnes | | | | of tonnes | | | | of tonnes | | | |
| | | | | | | | | | | | | | |
| Coal & Allied Industries | | | | | | | | | | | | | | |
| Bengalla (Australia) | O/C | | 197 | | 81 | | 98 | | 50m to 350m | | 62 | | Four holes/km2 | |
| Hunter Valley Operations (Australia) | O/C | | 491 | | 68 | | 262 | | 300m | | 74 | | 500m | |
| Mount Thorley Operations (Australia) | O/C | | 37 | | 65 | | 24 | | 125m | | | | | |
| Warkworth (Australia) | O/C | | 386 | | 64 | | 149 | | 450m | | 97 | | Max 1000m | |
|
|
|
|
|
|
|
|
|
|
|
|
|
| |
| Kennecott Energy | | | | | | | | | | | | | | |
| Antelope (US) | O/C | | 249 | | 100 | | 249 | | Max 457m | | | | | |
| Colowyo (US) (i) | O/C | | 24 | | 100 | | 24 | | Max 229m | | | | | |
| Cordero Rojo (US) | O/C | | 365 | | 100 | | 365 | | Max 457m | | | | | |
| Decker (US) (j) | O/C | | 25 | | 100 | | 25 | | Max 457m | | | | | |
| Jacobs Ranch (US) | O/C | | 500 | | 100 | | 496 | | Max 457m | | 4 | | Max 760m | |
| Spring Creek (US) | O/C | | 225 | | 100 | | 225 | | Max 457m | | | | | |
|
|
|
|
|
|
|
|
|
|
|
|
|
| |
| Rio Tinto Coal Australia | | | | | | | | | | | | | | |
| Blair Athol (Australia) | O/C | | 62 | | 98 | | 60 | | 150m | | 1 | | 150m | |
| Hail Creek (Australia) (k) | O/C | | 301 | | 63 | | 111 | | 300m | | 80 | | 400m | |
| Kestrel (Australia) | U/G | | 149 | | 80 | | 57 | | 500m | | 63 | | 1000m | |
| Tarong-Meandu (Australia) | O/C | | 136 | | 68 | | 86 | | 200m | | 7 | | 400m | |
|
|
|
|
|
|
|
|
|
|
|
|
|
| |
| Undeveloped reserves (l) | | | | | | | | | | | | | | |
| | | | | | | | | | | | | | |
| Coal & Allied Industries | | | | | | | | | | | | | | |
| Mount Pleasant (Australia) | O/C | | 459 | | 76 | | | | | | 350 | | 125m to 500m | |
|
|
|
|
|
|
|
|
|
|
|
|
|
| |
| Rio Tinto Coal Australia | | | | | | | | | | | | | | |
| Clermont (Australia) | O/C | | 197 | | 96 | | 163 | | 220m | | 26 | | 150m to 300m | |
| SW Yarraman (Australia) | O/C | | 54 | | 76 | | | | | | 41 | | 450m | |
| Tarong-Kunioon (Australia) | O/C | | 257 | | 63 | | | | | | 163 | | 400m | |
|
|
|
|
|
|
|
|
|
|
|
|
|
| |
| See Notes on page A-94 and A-95 | | | | | | | | | | | | | | |
A-90
Back to Contents
RIO TINTO PLC – RIO TINTO LIMITED
ORE RESERVES UNDER INDUSTRY GUIDE 7 CONTINUED
| | Type of | | Proved ore reserves at end 2004 | | Probable ore reserves at end 2004 | |
| | mine | |
| |
| |
| | (b) | | | | | | Drill hole | | | | | | Drill hole | |
| | | | Tonnage | | Grade | | spacing (c) | | Tonnage | | Grade | | spacing (c) | |
|
|
|
|
|
|
|
|
|
|
|
|
|
| |
| COPPER | | | millions | | | | | | millions | | | | | |
| Reserves at operating mines | | | of tonnes | | %Cu | | | | of tonnes | | %Cu | | | |
| Bingham Canyon (US) (m) | | | | | | | | | | | | | | |
| - open pit | O/P | | 34.8 | | 0.63 | | Max 25m | | 596 | | 0.57 | | Max 215m | |
| - stockpiles (p) | S/P | | 1.4 | | 0.40 | | | | 25 | | 0.39 | | | |
| Escondida (Chile) (n) | | | | | | | | | | | | | | |
| - sulphide (open pit) | O/P | | 594 | | 1.40 | } | | | 569 | | 1.05 | } | | |
| - sulphide leach (open pit) | O/P | | 251 | | 0.53 | 55m to 60m | | 379 | | 0.54 | 60m to 110m | |
| - oxide (open pit) | O/P | | 19.6 | | 0.72 | | | 19.5 | | 0.66 | | |
| - sulphide (stockpiles (p)) | S/P | | 20.1 | | 1.18 | | | | | | | | | |
| - sulphide leach (stockpiles (p)) | S/P | | 161 | | 0.68 | | | | | | | | | |
| - oxide (stockpiles (p)) | S/P | | 118 | | 0.70 | | | | | | | | | |
| Escondida Norte (Chile) (n) | | | | | | | | | | | | | | |
| - sulphide | O/P | | 187 | | 1.65 | } | 48m to 60m | | 348 | | 1.28 | } | 60m to 125m | |
| - sulphide leach | O/P | | 28.7 | | 0.57 | | 130 | | 0.65 | |
| - oxide | O/P | | | | | | | | 123 | | 0.78 | |
| Grasberg (Indonesia) | O/P + U/G | | 772 | | 1.12 | | 25m to 75m | | 1,997 | | 1.07 | | 50m to 150m | |
| Northparkes (Australia) | | | | | | | | | | | | | | |
| - open pit | O/P | | 1.8 | | 0.60 | | 20m x 40m | | | | | | | |
| - stockpiles (p) | S/P | | 2.8 | | 0.65 | | | | | | | | | |
| - underground | U/G | | | | | | | | 47.2 | | 1.17 | | 20m x 40m | |
| Palabora (South Africa) | | | | | | | | | | | | | | |
| - underground block cave | U/G | | 185 | | 0.69 | | 75m | | 16.0 | | 0.49 | | 75m | |
|
|
|
|
|
|
|
|
|
|
|
|
|
| |
| DIAMONDS (d) | | | millions | | carats | | | | millions | | carats | | | |
| Reserves at operating mines | | | of tonnes | | per tonne | | | | of tonnes | | per tonne | | | |
| Argyle (Australia) (q) | | | | | | | | | | | | | | |
| - AK1 pipe (open pit) | O/P + U/G | | 25.9 | | 2.9 | | 25m x 50m | | 9.1 | | 2.9 | | 25m x 50m | |
| - AK1 pipe (stockpiles (p)) | S/P | | 1.5 | | 2.7 | | | | | | | | | |
| Diavik (Canada) (r) | O/P + U/G | | 16.2 | | 3.5 | | 25m to 30m | | 13.6 | | 2.9 | | 25m to 30m | |
| Murowa (Zimbabwe) | O/P | | | | | | | | 23.0 | | 0.7 | | 50m | |
|
|
|
|
|
|
|
|
|
|
|
|
|
| |
| GOLD | | | millions | | grammes | | | | millions | | grammes | | | |
| Reserves at operating mines | | | of tonnes | | per tonne | | | | of tonnes | | per tonne | | | |
| Bingham Canyon (US) (m) | | | | | | | | | | | | | | |
| - open pit | O/P | | 34.8 | | 0.35 | | Max 25m | | 596 | | 0.32 | | Max 215m | |
| - stockpiles (p) | S/P | | 1.4 | | 0.23 | | | | 25 | | 0.22 | | | |
| Cortez/Pipeline (US) (s) | | | | | | | | | | | | | | |
| - open pit | O/P | | 192 | | 1.74 | | 30.5m to 43m | | 99.4 | | 1.18 | | 30.5m to 43m | |
| - stockpiles (p) | S/P | | 2 | | 5.04 | | | | | | | | | |
| Grasberg (Indonesia) | O/P + U/G | | 772 | | 1.10 | | 25m to 75m | | 1,997 | | 0.93 | | 50m to 150m | |
| Greens Creek (US) | U/G | | | | | | | | 6.0 | | 3.89 | | 15m to 30.5m | |
| Kelian (Indonesia) (t) | O/P | | | | | | - | | | | | | - | |
| Lihir (PNG) (u) | | | | | | | | | | | | | | |
| - open pit | O/P | | 2.2 | | 3.42 | | 35m | | 147 | | 3.69 | | 35m to 70m | |
| - stockpiles (p) | S/P | | 38.7 | | 2.66 | | | | | | | | | |
| Northparkes (Australia) | | | | | | | | | | | | | | |
| - open pit | O/P | | 1.8 | | 0.60 | | 20m x 40m | | | | | | | |
| - stockpiles (p) | S/P | | 2.8 | | 0.48 | | | | | | | | | |
| - underground | U/G | | | | | | | | 47.2 | | 0.46 | | 20m x 40m | |
|
|
|
|
|
|
|
|
|
|
|
|
|
| |
| See Notes on page A-94 and A-95 | | | | | | | | | | | | | | |
A-91
Back to Contents
RIO TINTO PLC - RIO TINTO LIMITED
ORE RESERVES UNDER INDUSTRY GUIDE 7 CONTINUED
| | | | | | % Yield to | | | | | | | | | |
| | | | Recoverable | | give | |
|
|
|
|
|
|
| |
| | Type of | | reserves | | marketable | | | | Drill hole | | | | Drill hole | |
| | mine (b) | | total | | reserves | | Proved | | spacing (c) | | Probable | | spacing (c) | |
|
|
|
|
|
|
|
|
|
|
|
|
|
| |
| IRON ORE (d) | | | millions | | | | | | millions | | | | | |
| | of tonnes | %Fe | of tonnes | %Fe |
| Reserves at operating mines | | | | | | | | | | | | | | |
| and mines under construction | | | | | | | | | | | | | | |
| Channar (Australia) | | | | | | | | | | | | | | |
| – Brockman Ore | O/P | | 107 | | 63.5 | | 60m | | 13 | | 63.6 | | Max 120m | |
| Corumbá (Brazil) | O/P | | 111 | | 67.2 | | 100m to 400m | | 106 | | 67.2 | | 200m x 400m | |
| Eastern Range (Australia) | | | | | | | | | | | | | | |
| – Brockman Ore | O/P | | 90 | | 63.0 | | 60m | | 23 | | 62.8 | | Max 120m | |
| Hamersley (Australia) | | | | | | | | | | | | | | |
| – Brockman 2 (Brockman Ore) | O/P | | 17 | | 62.5 | | 50m | | 7 | | 62.7 | | Max 100m | |
| – Marandoo (Marra Mamba Ore) | O/P | | 73 | | 62.4 | | 75m | | 3 | | 62.6 | | Max 150m | |
| – Mt Tom Price (Brockman Ore) | | | | | | | | | | | | | | |
| – open pit | O/P | | 112 | | 64.5 | | 30m | | 42 | | 64.8 | | 60m x 30m | |
| – stockpiles (p) | S/P | | | | | | | | 14 | | 64.5 | | | |
| – Paraburdoo (Brockman Ore) | O/P | | 17 | | 63.8 | | 30m | | 6 | | 63.6 | | 60m x 30m | |
| – Paraburdoo (Marra Mamba Ore) | O/P | | | | | | | | 1 | | 63.1 | | 60m | |
| – Nammuldi (Marra Mamba Ore) (v) | O/P | | 11 | | 61.4 | | 50m | | 28 | | 61.4 | | 100m x 50m | |
| – Yandicoogina (w) | | | | | | | | | | | | | | |
| – open pit | O/P | | 191 | | 58.9 | | 50m | | 53 | | 62.7 | | 100m x 50m | |
| – stockpiles (p) | S/P | | | | | | | | 4 | | 58.5 | | 100m x 50m | |
| Iron Ore Company of Canada (Canada) (x) | O/P | | 361 | | 65.0 | | 122m x 61m | | 82 | | 65.0 | | 122m | |
| Robe River (Australia) | | | | | | | | | | | | | | |
| – Pannawonica (Pisolite Ore) | | | | | | | | | | | | | | |
| – open pit | O/P | | 112 | | 57.0 | | Max 50m | | 46 | | 57.1 | | 50m | |
| – stockpiles (p) | S/P | | 2 | | 57.0 | | | | 12 | | 57.0 | | | |
| – West Angelas (Marra Mamba Ore) | | | | | | | | | | | | | | |
| – open pit | O/P | | 141 | | 62.8 | | Max 50m | | 276 | | 61.9 | | 200m x 100m | |
| – stockpiles (p) | S/P | | 1 | | 59.7 | | | | | | | | | |
|
|
|
|
|
|
|
|
|
|
|
|
|
| |
| LEAD | | | millions | | | | | | millions | | | | | |
| | | | of tonnes | | %Pb | | | | of tonnes | | %Pb | | | |
| Reserves at operating mines | | | | | | | | | | | | | | |
| Greens Creek (US) | U/G | | | | | | | | 6.0 | | 4.04 | | 15m to 30.5m | |
|
|
|
|
|
|
|
|
|
|
|
|
|
| |
| MOLYBDENUM | | | millions | | | | | | millions | | | | | |
| | | | of tonnes | | %Mo | | | | of tonnes | | %Mo | | | |
| Reserves at operating mine | | | | | | | | | | | | | | |
| Bingham Canyon (US) (m) | | | | | | | | | | | | | | |
| – open pit | O/P | | 34.8 | | 0.037 | | Max 25m | | 596 | | 0.039 | | Max 215m | |
| – stockpiles (p) | S/P | | 1.4 | | 0.031 | | | | 25 | | 0.034 | | | |
|
|
|
|
|
|
|
|
|
|
|
|
|
| |
| | | | | | | | | | | | | | |
| SILVER | | | millions | | grammes | | | | millions | | grammes | | | |
| | | | of tonnes | | per tonne | | | | of tonnes | | per tonne | | | |
| Reserves at operating mines | | | | | | | | | | | | | | |
| Bingham Canyon (US) (m) | | | | | | | | | | | | | | |
| – open pit | O/P | | 34.8 | | 3.10 | | Max 25m | | 596 | | 2.66 | | Max 215m | |
| – stockpiles (p) | S/P | | 1.4 | | 2.33 | | | | 25 | | 1.90 | | | |
| Grasberg (Indonesia) | O/P + U/G | | 772 | | 3.80 | | 25m to 75m | | 1,997 | | 3.86 | | 50m to 150m | |
| Greens Creek (US) | U/G | | | | | | | | 6.0 | | 528 | | 15m to 30.5m | |
|
|
|
|
|
|
|
|
|
|
|
|
|
| |
| | | | | | | | | | | | | | |
| See Notes on page A-94 and A-95 | | | | | | | | | | | | | | |
A-92
Back to Contents
RIO TINTO PLC - RIO TINTO LIMITED
ORE RESERVES UNDER INDUSTRY GUIDE 7 CONTINUED
| | | | | | % Yield to | | | | | | | | | |
| | | | Recoverable | | give | |
|
|
|
|
|
|
| |
| | Type of | | reserves | | marketable | | | | Drill hole | | | | Drill hole | |
| | mine (b) | | total | | reserves | | Proved | | spacing (c) | | Probable | | spacing (c) | |
|
|
|
|
|
|
|
|
|
|
|
|
|
| |
| TALC (e) | | | millions | | | | | | millions | | | | | |
| | | | of tonnes | | | | | | of tonnes | | | | | |
| Reserves at operating mines | | | | | | | | | | | | | | |
| Luzenac Group | O/P + U/G | | 32.4 | | | | 15m to 100m | | 17.9 | | | | 15m to 100m | |
| (Europe/North America/Australia) | | | | | | | | | | | | | | |
|
|
|
|
|
|
|
|
|
|
|
|
|
| |
| TITANIUM DIOXIDE FEEDSTOCK (e) | | | millions | | | | | | millions | | | | | |
| Reserves at operating mines | | | of tonnes | | | | | | of tonnes | | | | | |
| Rio Tinto Iron & Titanium (y) | O/P + D/O | | 42.5 | | | | Max 60m | | 32.8 | | | | 100m x 100m-800m | |
| (Canada/South Africa) | | | | | | | | | | | | | | |
|
|
|
|
|
|
|
|
|
|
|
|
|
| |
| URANIUM | | | millions | | | | | | millions | | | | | |
| | | | of tonnes | | %U308 | | | | of tonnes | | %U308 | | | |
| Reserves at operating mines | | | | | | | | | | | | | | |
| Energy Resources of Australia (Australia) | | | | | | | | | | | | | | |
| – Ranger #3 open pit | O/P | | 4.2 | | 0.29 | | Max 25m grid | | 7.5 | | 0.25 | | Max 50m grid | |
| – Ranger #3 stockpiled ore | S/P | | 6.3 | | 0.20 | | | | | | | | | |
| Rössing (Namibia) | | | | | | | | | | | | | | |
| – open pit | O/P | | 4.8 | | 0.051 | | 15m to 20m | | 16.4 | | 0.035 | | 60m to 120m | |
| – stockpiles (p) | | | 2.6 | | 0.042 | | | | | | | | | |
|
|
|
|
|
|
|
|
|
|
|
|
|
| |
| | | | millions | | | | | | millions | | | | | |
| | | | of tonnes | | %U308 | | | | of tonnes | | %U308 | | | |
| Undeveloped reserves (l) | | | | | | | | | | | | | | |
| Energy Resources of Australia (Australia) | | | | | | | | | | | | | | |
| – Jabiluka | U/G | | 6.8 | | 0.57 | | Max 30m | | 7.0 | | 0.45 | | Max 30m x 60m | |
|
|
|
|
|
|
|
|
|
|
|
|
|
| |
| ZINC | | | millions | | | | | | millions | | | | | |
| | | | of tonnes | | %Zn | | | | of tonnes | | %Zn | | | |
| Reserves at operating mines | | | | | | | | | | | | | | |
| Greens Creek (US) | U/G | | | | | | | | 6.0 | | 10.2 | | 15m to 30.5m | |
|
|
|
|
|
|
|
|
|
|
|
|
|
| |
| | | | | | | | | | | | | | |
| See Notes on page A-94 and A-95 | | | | | | | | | | | | | | |
A-93
Back to Contents
RIO TINTO PLC - RIO TINTO LIMITED
ORE RESERVES UNDER INDUSTRY GUIDE 7 CONTINUED
Notes
(a) Commodity prices (based on a three year average historical price) used in these reserve estimates include the following exchange quoted prices :
| ALUMINIUM | | | LEAD | |
| Weipa (Australia) | US$ 0.65/lb | | Greens Creek (US) | US$ 0.24/lb |
| | | | | |
| COPPER | | | MOLYBDENUM | |
| Bingham Canyon (US) | US$ 0.82/lb | | Bingham Canyon (US) | US$ 5.17/lb |
| Escondida (Chile)* | US$ 0.82/lb | | | |
| Escondida Norte (Chile)* | US$ 0.74/lb | | SILVER | |
| Grasberg (Indonesia)* | US$ 0.85/lb | | Bingham Canyon (US) | US$ 4.95/oz |
| Northparkes (Australia) | US$ 0.82/lb | | Grasberg (Indonesia)* | US$ 5.00/oz |
| Palabora (South Africa) | US$ 0.82/lb | | Greens Creek (US) | US$ 4.95/oz |
| | | | | |
| GOLD | | | ZINC | |
| Bingham Canyon (US) | US$ 338/oz | | Greens Creek (US) | US$ 0.38/lb |
| Cortez/Pipeline (US)* | US$ 338/oz | | | |
| Grasberg (Indonesia)* | US$ 270/oz | | (Note * = Non-managed operations) | |
| Greens Creek (US) | US$ 338/oz | | | |
| Lihir (PNG)* | US$ 380/oz | | | |
| Northparkes (Australia) | US$ 338/oz | | | |
| | | | | |
| | | | | |
| (b) | Type of mine: O/P = open pit, O/C = open cut, U/G = underground, D/O = dredging operation, S/P = stockpile. |
| | |
| (c) | Drill hole spacings are either average distances, a specified grid distance (a regular pattern of drill holes - the distance between the drill holes along the two axes of the grid will be aligned to test the size, shape and continuity of the mineral deposit; as such there may be different distances between the drill holes along the two axes of a grid) or the maximum drill hole spacing that is sufficient to determine the reserve category for a particular deposit. As the continuity of mineralisation varies from deposit to deposit, the drill hole spacing required to categorise a reserve varies between and within deposit types. |
| | |
| (d) | Reserves of iron ore, bauxite and diamonds are shown as recoverable reserves of saleable product after accounting for all mining and processing losses. Mill recoveries are therefore not shown. |
| | |
| (e) | Reserves of industrial minerals are expressed in terms of marketable product, i.e. after all mining and processing losses. In the case of borates, the saleable product is B2O3. |
| | |
| (f) | Coal reserves are shown as both recoverable and marketable. The yield factors shown reflect the impact of further processing, where necessary, to provide marketable coal. All reserves at operating mines are assigned, all undeveloped reserves are unassigned. By “assigned” and “unassigned,” we mean the following: Assigned reserves means coal which has been committed by the coal company to operating mine shafts, mining equipment, and plant facilities, and all coal which has been leased by the company to others. Unassigned reserves represent coal which has not been committed, and which would require new mineshafts, mining equipment, or plant facilities before operations could begin in the property. |
| | |
| (g) | Coal type: SC = steam/thermal coal; MC = metallurgical/coking coal. |
| | |
| (h) | Analyses of coal from the US were undertaken according to "American Standard Testing Methods" (ASTM) on an "As Received" moisture basis whereas the coals from Australia have been analysed on an "Air Dried" moisture basis according to Australian Standards (AS). MJ/kg = megajoules per kilogramme. 1 MJ/kg = 430.2 Btu/lb. |
| | |
| (i) | Kennecott Energy has a partnership interest in the Colowyo mine, but, as it is responsible under a management agreement for the operation of the mine, all of Colowyo's reserves are included in Rio Tinto's share shown above. |
| | |
| (j) | Reserves at Decker have decreased following a reduction of tonnage commitments under a sales contract. |
| | |
| (k) | Rio Tinto reduced its shareholding in Hail Creek from 92.0 per cent to 82.0 per cent on 15 November 2004. |
A-94
Back to Contents
RIO TINTO PLC - RIO TINTO LIMITED
ORE RESERVES UNDER INDUSTRY GUIDE 7 CONTINUED
| Notes (Continued) |
| | |
| (l) | The term 'undeveloped reserves' is used here to describe material that is economically viable on the basis of technical and economic studies but for which construction and commissioning have yet to be commenced. |
| | |
| (m) | Open pit reserves at Bingham Canyon have increased following revisions to the geological model and development of a revised mine plan. |
| | |
| (n) | Reserves at Escondida have changed following the development of a new geological model that includes additional drilling and revised cut-off grades. Approval of the Sulphide Leach Project has resulted in a new reserve category, 'Sulphide Leach', that includes material in the previously named 'Low Grade Float' and 'Mixed' categories. The significant increase in the reserve tonnages of this material are a consequence of low grade primary mineralisation now being considered to be processable by the sulphide leach process. |
| | |
| (o) | Rio Tinto completed the sale of its interest in Freeport-McMoRan-Copper & Gold (FCX) on 30 March 2004. Under the terms of a joint venture agreement between Rio Tinto and FCX, Rio Tinto is entitled to a direct 40 per cent share in reserves discovered after 31 December 1994 and it is this entitlement that is shown. |
| | |
| (p) | Stockpile components of reserves are shown for all operations, where relevant. |
| | |
| (q) | Reserves at Argyle have decreased following the development of a new geological model and revised mine plan which has resulted in the reclassification of some reserves as mineralised material. |
| | |
| (r) | Reserves at Diavik have increased following the development of a new geological model that incorporates additional drilling and a revised diamond valuation. |
| | |
| (s) | Reserves at Cortez increased as a result of the transfer of mineralised material to reserves at the Cortez Hills and Pediment deposits. |
| | |
| (t) | At 2004 year end, Kelian was in the process of closing and only minor amounts of stockpiled material remain. |
| | |
| (u) | Reserves at Lihir increased as a result of additional drilling which has led to significant re-modelling of the Minifie deposit and re-modelling of the Kapit, Coastal and Lienitz deposits and the subsequent development of a new geological model. |
| | |
| (v) | Reserves of Marra Mamba ore at Nammuldi are included following the completion of a feasibility study. |
| | |
| (w) | Reserves at Yandicoogina have decreased mainly as a result of production, cut-off grade and recovery factor adjustments. |
| | |
| (x) | Reserves at IOC have decreased as a result of revisions to the geological model and the pit design. |
| | |
| (y) | Comprises reserves at QIT Fer et Titane (Rio Tinto 100 per cent) and Richards Bay Minerals (Rio Tinto 50 per cent). |
| | |
| (z) | The following operations were sold during 2004: Neves Corvo (Portugal), Morro do Ouro (Brazil), Rio Tinto Zimbabwe, Fortaleza (Brazil) and Zinkgruvan (Sweden). |
| | |
| (aa) | Reserves at the following mines were reclassified as mineralised material during 2004: Maules Creek (Australia), Oaklands (Australia) and Mt Tom Price - Marra Mamba ore (Australia). |
A-95