UNITED STATES
SECURITIES AND EXCHANGE COMMISSION
Washington, D.C. 20549
FORM N-CSR
CERTIFIED SHAREHOLDER REPORT OF REGISTERED
MANAGEMENT INVESTMENT COMPANIES
Investment Company Act file number | 811-06017 |
|
Julius Baer Global Equity Fund Inc. |
(Exact name of registrant as specified in charter) |
|
330 Madison Avenue, New York, NY | | 10017 |
(Address of principal executive offices) | | (Zip code) |
|
Tony Williams |
330 Madison Avenue, New York, NY 10017 |
(Name and address of agent for service) |
|
Registrant’s telephone number, including area code: | 212-297-3600 | |
|
Date of fiscal year end: | 10/31 | |
|
Date of reporting period: | 11/01/04 – 10/31/05 | |
| | | | | | | | |
Item 1. Reports to Stockholders.
Dear Fellow Shareholder:
I am pleased to present the Annual Report for the Julius Baer Funds (the "Funds") for the fiscal year ended October 31, 2005 (the "Reporting Period"). In the wake of a bitter battle with Mother Nature that included a crippling tsunami in Southeast Asia as well as Hurricanes Katrina, Rita, and Wilma, which collectively changed the face of the U.S. Gulf Coast, energy prices soared to record levels during the Reporting Period. Consumers were faced with $3+ per gallon gasoline prices and many feared that this coupled with a forecast drop in the housing markets would lead to a significant drag on worldwide equity prices. Although periods of volatility arose from such events and the victims of such catastrophes are still reeling from their lingering effects, global markets have enjoyed positive returns. The Dow Jones Industrial Average and the S&P 500 posted moderate gains; whereas major European indices (such as the FTSE Index, CAC 40, and DA X) and Japan's Nikkei index garnered double digit increases. The Funds also achieved stellar performance, which is further outlined in each portfolio manager's commentary.
Not only was performance good, but the Funds also experienced sizeable growth in net assets during the Reporting Period. The net assets of our flagship product, the Julius Baer International Equity Fund ("IEF"), grew by 101.3%, crossing the $15 billion level and Management's overall assets under management rose by 84.7%, topping $31 billion. While we were pleased that IEF attracted so much interest, continued large inflows could have eventually impaired the portfolio managers' ability to maintain performance integrity and abide by its stated investment objectives. As a result of such rapid growth, Management, as well as the Board of Directors (the "Board") believed the responsible action was to close this specific fund to new investors while making the same basic investment strategy and the talents of the same management team available to investors through the launch of the Julius Baer International Equity Fund II ("IE2").
On May 4, 2005, we launched IE2. The product was structured to maintain a similar strategy as IEF, but limited its investment to shares of mid to large capitalization companies. The Fund offers both Class A and Class I shares and is available directly through its transfer agent (US Bancorp LLC) and through a broad array of distribution channels, such as Schwab, Fidelity, and TD Waterhouse.
Bearing in mind the Funds' growth as well as a desire to remain competitive in the marketplace, the Board and Management reassessed each Fund's current expense structure. As a result of such analysis, we introduced breakpoints to the IEF advisory fee schedule, which effectively reduced advisory fees from a flat 90 basis points to
Julius Baer Funds 2005 Annual Report
1
an annual rate of 0.90% for the first $7.5 billion dollars of average daily net assets, 0.88% for the next $2.5 billion dollars of average daily net assets and 0.85% for average daily net assets over $10.0 billion dollars, which translated into a full 2 basis point savings for shareholders during the Reporting Period. In addition, we opted to lower the advisory fee of the Julius Baer Total Return Bond Fund from 65 basis points to 45 basis points and capped the total net expense ratio at 69 basis points on Class A shares and 44 basis points on Class I, respectively. Finally, we decided to further lower the expense cap on the Julius Baer Global Equity Fund ("GEF") to 140 basis points on Class A shares and 115 basis points on Class I shares.
During the Reporting Period, we also initiated a 10:1 reverse stock split on GEF. Prior to engaging in such a split, the low absolute price of the Fund created a situation in which small movements in share price may not have completely captured the underlying Fund performance. While these differences would be expected to "average out" over time, near term variations could have adversely effected existing shareholders/new investors and could cause slight tracking issues with respect to competitors. We believe that this coupled with a general investor belief that low priced funds are inferior investments warranted the action taken.
To make all of the Funds more attractive to registered investment advisors as well as broker wrap platforms, we have also decided to lower the investment minimum on the Class I shares from $2 million to $1 million. The primary difference between the two share classes is that the Class A shares have a 12b-1 and Shareholder Servicing Fee of 25 basis points while this does not exist on the Class I shares. If current shareholders believe they qualify to transfer their assets to the Class I shares given these lower minimum investment thresholds, they should contact the Funds' transfer agent at 1-800-387-6977 or their intermediary. For more information on the Funds, please visit their website at www.us-funds.juliusbaer.com.
In closing, on behalf of Management, I would like to extend our appreciation to all shareholders for their continued support of the Funds. We look forward to continuing to provide clients with the best professional management in the forthcoming year.
Sincerely,

Tony Williams
President
Julius Baer Funds 2005 Annual Report
2
The Dow Jones Industrial Average is a price-weighted average of 30 blue-chip stocks that are generally the leaders in their industry. The FTSE 100 Index is a capitalization-weighted index of the 100 most highly capitalized companies traded on the London Stock Exchange. The CAC 40 Index is a narrow based, modified capitalization-weighted index of 40 companies listed on the Paris Bourse. The German Stock Index (DAX) is a total return index of 30 selected German blue chip stocks traded on the Frankfurt Stock Exchange. The Nikkei-225 Stock Average is a price-weighted average of 225 top-rated Japanese companies listed in the First Section of the Tokyo Stock Exchange. It is not possible to invest directly in an index or average.
This material is provided for informational purposes only and does not in any sense constitute a solicitation or offer of the purchase or sale of securities unless preceded or accompanied by a prospectus.
Mutual funding investing involves risk; principle loss is possible.
Distributor: Quasar Distributors, LLC (12/05)
Julius Baer Funds 2005 Annual Report
3
MANAGEMENT'S COMMENTARY
JULIUS BAER GLOBAL EQUITY FUND INC.
Annual Report
Period Ending October 31, 2005.
The Julius Baer Global Equity Fund Inc. ("Global Equity Fund") enjoyed its first full fiscal year in the current form. The Global Equity Fund, which had previously been known as the closed-end European Warrant Fund, became an open-ended fund on July 1, 2004 and changed its name to reflect the change in strategy and management team. This is the second annual report since the change and the first that covers a full 12-month period.
The Global Equity Fund Class A shares returned 17.00% over the Reporting Period (10/31/04 - 10/31/05), which compares favorably to its benchmark, the MSCI World Index (net dividends), which returned 13.27%.
Our ability to outperform the benchmark during this Reporting Period was due to a number of factors, including our decision to invest significantly in the emerging markets of Central and Eastern Europe while underweighting holdings based in North America. In addition, our overweight exposure to energy stocks for much of the period and underweighting companies exposed to the US consumer also provided benefit. Specifically, our best performance came from our decisions to invest in Turkey, Russia, Romania, Hungary and Poland; to underweight the United States; and to overweight Continental Europe. Individual names that contributed most to these results included OTP Bank (Hungary), Sberbank (Russia), Lukoil ADR (Russia), Prudential Financial (United States), Bank Pekao (Poland) and Macquarie Infrastructure Company Trust (United States).
Over the past year, we were concerned about the global economy and the imbalances in the Anglo-Saxon countries, especially the United States. This presented us with a tough balancing act as the global markets generally performed better than we expected and our cash holdings were a drag on performance. Consumers in the Anglo region were buffered by extraordinarily strong housing markets, which they were then able to translate into increased purchasing power, spending at levels well above what income growth alone would have allowed and driving economic growth forward. The US consumer's ability to continue to spend is now challenged by a central bank that was busily raising interest rates for much of the period. In the US, the Fed Funds rate was raised eight times from 1.75% to 3.75%, during the fiscal year and longer-term interest rates moved higher by roughly 50 basis points (the ten-year government note rose from 4.03% to 4.55%). Earlier, ce ntral bankers in the UK and Australia moved to raise interest rates keeping yield curves in these countries flat over the entire period. In addition, higher energy prices would also logically seem to take away from other discretionary spending.
Julius Baer Funds 2005 Annual Report
4
The US consumer defied all expectations and continued with unbridled spending. While disposable incomes only rose by 5.2%, personal consumption rose almost twice as much to 11% over the 12 months ending October 31 2005. Lower taxes and reduced savings rates helped, but the biggest boost was provided by that ATM machine otherwise known as the home. By virtue of rising prices and the ease of refinancing one's mortgage, the consumer was able to turn the growing equity in his home into cash. Going forward, we feel that the tailwinds described above will disappear as the new year progresses. Certainly with deficits catching the attention of lawmakers, tax cuts are off the table despite this being an election year. Second, with a savings rate already at zero, we should not count on any more stimulus from this source and may even see a reversal should the consumer opt to save more if interest rates move higher. More importantly, consumers who took out adjustable rate mortgages in 2004 will face higher rates when their reset period arrives. In 2004, approximately 37% of all borrowers opted for the adjustable rate mortgage. This percentage was even higher among lower end borrowers as 88% of all such mortgages were of the adjustable variety. Most importantly, 65% of total sub-prime mortgages had a two year reset, meaning they will come due during 2006 at interest rates at least 150 basis points higher. Such an increase amounts to approximately $90/month for each $100,000 borrowed. This will certainly detract from discretionary consumer spending that otherwise would have gone to MP3 players, flat-screen televisions and the like.
Contrary to the risks building in the United States, we remain excited about the prospects for the emerging markets of Central and Eastern Europe. As we noted in last year's annual report, "Central Europe possesses risks similar to those of a developed market, but with the potential for rewards and growth of an emerging one." We were not disappointed and while the strong gains over the past few years have left these markets pricier than in the past, strong economic growth has delivered great profit performance. Unlike previous emerging market booms that went bust, this one appears to be better balanced and less susceptible to outside influences. In May 2004, ten predominantly Eastern European countries joined the European Union. By reforming their legal, political and economic systems, these countries have become a favored destination for global investment capital, increasing standards of living across the region and spawning the beginning o f a consumer market. Likewise, they are not dependent on external growth as was the emerging market model in the past. Other countries that have not yet joined the union, such as Turkey, have also attracted our interest as they have implemented tough reforms to bring down deficits and inflation rates to ultimately join the EU. While Turkey's entry into the EU may not be for another ten years, we believe the process is more important than the final destination. Underpenetration of the consumer sectors of these countries has allowed banks to grow assets well in excess of already robust
Julius Baer Funds 2005 Annual Report
5
GDP growth rates. While some bumps are possible, if not probable, we believe the long-term attractiveness of the region remains.
Although somewhat more risky, Russia may ultimately be even more profitable. The immaturity of the Russian markets along with a government that hasn't always been investor friendly has created interesting valuation opportunities in this country. In particular, the energy sector looks attractive when compared to western country competitors with the ability to buy reserves in the public market at about one third the cost. Like Central Europe, an underpenetrated Russian consumer sector allows for significant growth opportunities.
One can't properly review the state of the world today without commenting on the two giants of the emerging world, China and India. Economic growth continues apace in both countries and in a complementary fashion. India has done a better job growing its service-oriented industries (benefiting from its educational levels and the widespread use of English), while China has become the world's "factory". The emergence of these two giants has already impacted the world as their increased demand for commodities to stoke their growth engines has led to higher prices for almost everything tangible. Previous underinvestment in global commodity production capacity has prevented supply from keeping pace and prices have subsequently moved higher. While direct investment in these countries might seem a simple decision given the rapid growth rates, this is not the case. In China, the quality of the listed companies, their transparency and their valuation has left us to largely skirt the market. India, on the other hand, may ultimately be the more interesting destination, and we continue to evaluate opportunities as they arise. Due to a potential whimsical judiciary and governmental red-tape, India has lagged other emerging countries in attracting investment capital and thus been less successful in developing its manufacturing base. The country has attracted only $3.4 billion of foreign investment in the 12 months ending June 30, 2005, compared with almost $55.3 billion for China and over $30 billion for Brazil. India has, however, succeeded in developing a strong domestic economy where consumption as a share of GDP has reached 64% compared with 58% in Europe, 55% in Japan and just 42% in China (of course, the US remains the undisputed champ of spending with the consumer at over 70% of GDP).
In Continental Europe, three major themes guided our investments over much of the Reporting Period. First, the opportunity for consolidation across the Italian banking sector prompted our investment in many of the country's banks. The investment was not without drama as Italy's head central banker, Antonio Fazio, became ensnared in controversy as he was caught interfering in the acquisition process of Banca Antonveneta by ABN Amro. The historic inefficiencies of the Italian banks leave further room for more internal or external consolidation. Second, our
Julius Baer Funds 2005 Annual Report
6
distaste for the heavily indebted Anglo-Saxon consumer led us to the more frugal consumers of Scandinavia. Whereas debt/income ratios in the US and the UK are closing in on 25%, ratios in the Nordic countries are closer to 5%, leaving the banks more opportunity for growth and less susceptible to bad credits in a slowing economy. Finally, we continued to invest in infrastructure-related companies around the world. In Europe, we purchased airport and seaport operators who should benefit from the physical movement of people and goods as the global economies grew. We also invested in cement companies that benefit from industry consolidation and the many public infrastructure projects taking place in Europe and the United States.
Japan has made significant strides in stoking its domestic economy and has benefited from its close proximity to China's booming economy. Recent elections reinforced Prime Minister Koizumi's reform agenda, which should help keep momentum moving forward. Japanese banks have (finally) taken the needed steps to clean their balance sheets and resume lending. Robust corporate profits and strengthened balance sheets have fed through into increased hiring (the year on year growth in total employment is the strongest since the 1996-1997 upswing). The key to Japan's story going forward will be maintenance and development of domestic growth drivers. Reform of the postal system may potentially stimulate increased capital markets activity as currently misallocated deposits are put to more productive use in the private sector. Still, we must remember that Japan has previously seen at least three false starts and talk of higher taxes could also cause this recovery to stumble prematurely.
In the period ahead, we plan to invest around the following key global themes:
• the increasing wealth of the Eastern and Central European countries,
• whether Japan can continue and accelerate its domestic demand,
• whether the US consumer finally throws in the towel and, of course,
• the direction of economic growth in China and its impact on commodity prices.
We lean favorably to the first theme and will proceed cautiously on the last three.
 | |  | |
|
Brett Gallagher
Global Equity Fund Inc.
Portfolio Manager | | Rudolph-Riad Younes, CFA
Global Equity Fund Inc.
Portfolio Manager | |
|
Julius Baer Funds 2005 Annual Report
7
Performance quoted represents past performance which does not guarantee future results. Investment performance reflects fee waivers that may or may not be currently in effect. In the absence of such waivers, total return would be reduced.
Investing internationally involves additional risks, such as currency fluctuations, social and economic instability, differing securities regulations and accounting standards, limited public information, possible changes in taxation, and periods of illiquidity.
The views expressed are subject to change based on market and other conditions. Furthermore, the opinions expressed do not constitute investment advice or recommendation by the individuals, Julius Baer Investment Management LLC ("JBIM"), the Funds, or any affiliated company.
The MSCI World Index is a market capitalization weighted index composed of companies representative of the market structure of developed and emerging market countries in the Americas, Europe/Middle East, and Asia/Pacific Regions. It is not possible to invest directly in an index.
Please see the Portfolio of Investments in this report for complete fund holdings. Fund holdings and/or sector weightings are subject to change at any time and are not recommendations to buy or sell any security mentioned.
Julius Baer Funds 2005 Annual Report
8
MANAGEMENT'S COMMENTARY
JULIUS BAER INTERNATIONAL EQUITY FUND
JULIUS BAER INTERNATIONAL EQUITY FUND II
Annual Report
Period Ending October 31, 2005
DIAGNOSIS:
Both the Julius Baer International Equity Fund ("IEF") and the Julius Baer International Equity Fund II ("IE II") outperformed their benchmark, the MSCI EAFE Index ("the Index"), for the period under review. For the twelve months ending October 31, 2005, IEF Class A shares returned 22.19% versus 18.09% for the Index. For the period from inception on May 4, 2005 to October 31, 2005, IE II Class A shares rose 9.30% compared to an Index return of 7.23% for the same timeframe. While IE II only invests in companies with a market capitalization greater than US$2.5 billion at the time of purchase (and IEF invests in securities of all market capitalizations), whenever feasible, the geographic and sector exposure for the two funds are similar.
Maintaining our strong performance proved to be a difficult balancing act of remaining defensively positioned yet still participating in the market's strong rally. We remain concerned about structural imbalances in the US economy and believe that the country's recent economic rebound was overly reliant on house-price inflation, which was the result of excessive monetary and fiscal stimuli.
Our strong performance was the result of a number of factors, primary among them was our exposure to emerging markets, specifically Russia and Turkey. In Russia, we focused on oil and gas companies that are rich in reserves and trade at a fraction of the valuation of their major Western counterparts. In Turkey, we emphasized the banking sector and conglomerates both of which we feel are well positioned to benefit from Turkey's quest to join the European Union.
In Japan, our focus on the banking sector and some of the country's dominant exporters proved beneficial. We believe that the banking sector stands to benefit the most from an end to deflation and continued structural reforms. Japanese auto manufacturers remain our favorite among the nation's exporters given their increasing global market share (including the US, Europe and China) based on popular, high quality car models at attractive prices. Their focus on fuel-efficient cars during this rising oil price environment puts them in a strategically well-placed position.
In Continental Europe, oil, construction, and airport holdings were strong contributors to performance. The valuation of these oil companies reflected a price of
Julius Baer Funds 2005 Annual Report
9
US$30-40 per barrel, which is way below prevailing and, we believe, normalized market prices. Airports and seaports are under-appreciated, unique assets that are natural monopolies able to leverage increases in travel and global trade. Those construction companies we invested in got rewarded for diversifying their business into higher margin and lower volatility public infrastructure projects.
Exposure to the Australian and Canadian mining and energy industries was also a positive factor in our performance. These basic resource companies are benefiting from overall global monetary policies and increased demand from China and India. We reduced our exposure towards the end of the fiscal-year over concerns of a cyclical downturn in commodity prices within a structural bull market.
The strength of the US dollar against most major currencies caught many market participants by surprise. The dollar benefited from rising US interest rates and covering of many short positions. Industry specific issues have prevented defensive sectors such as food, pharmaceuticals, and telecommunication carriers from offering a safe haven during times of market turbulence. The food sector is suffering from a combination of higher prices caused by commodities, and pricing pressure caused by private labels and discounters. Pharmaceutical companies continue to suffer from a weak pipeline of new products, assault from generic drug brands, and threats of pricing pressure from lawmakers. Telecommunications carriers are facing a tougher regulatory environment, aggressive new entrants, and price deflation caused by technological innovation.
Finally, this year was a very active year for mergers and acquisitions as cash rich corporations, private equity firms and hedge funds went on a spending binge. Twenty-two companies in IEF and ten in IE II were the targets of such activity.
PROGNOSIS
Looking ahead to next year, many challenges remain. The debate is no longer whether structural imbalances exist, but whether the adjustment will be painless. Some expect the US corporate sector, along with the stagnant Japanese and European economies, will take the baton from the US consumer while others expect a significant slowdown once the US consumer tires and asset prices deflate.
Adding complexity to the situation, early next year Ben Bernanke will replace Alan Greenspan as the Chairman of the US Federal Reserve ("the Fed")—arguably the world's most important financial position. How the new Chairman acts and reacts will significantly impact the ultimate trajectory of the global economy.
Julius Baer Funds 2005 Annual Report
10
BIG PICTURE
Our investment process is driven by both the big picture as well as the close-up details. Looking at the big picture, we continue to believe that the adjustment to such imbalances will not be smooth. The question also remains as to when such an adjustment will take place. Long-bond yield rates have barely budged, despite the fact that short-term rates have moved from 1.75% to 3.75%, between July 2004 to November 2005. Housing prices continue to rise and the current account deficit has fallen deeper in the red. The economy has not been stress-tested since the imbalances keep getting larger despite the increase in the short rates—and long rates may not rise at all.
We shall attempt to address three issues: the adjustment of the imbalances, the current pace of globalization, and the US dollar.
The Coming Adjustment: Where is the Baton?
As the US Fed tightens and the consumer grows tired, financial markets appear preoccupied with the question: will the consumer drop the baton or, will it be smoothly handed-off to the corporate sector? Thus far, the suspense continues. The consumer is running with the same energy and showing no sign of fatigue, while the corporate sector remains largely idle. What will happen to the baton?
The economy is driven by business and consumer dynamics. Businesses create jobs and pay wages to consumers who in turn consume their wages paying them back to the corporations who in turn re-invest the proceeds in more investments and job creation. Hence, a virtual circle is created. Whenever this circle is broken, macroeconomic policies intercede. In the US, these policies tend to be biased towards "trickle-down" economics—i.e., focus on the business sector. If the business sector is in good shape then the economy is in good shape, because a healthy business sector leads to a healthy job market, which leads to healthy demand and a healthy economy.
By late 2000, the balance sheet of corporate America was a total mess. Companies believed in their inflated market capitalization and over-borrowed, over-hired, over-expanded, over-paid for acquisitions, and over-cooked their books. The financial health of the consumer was also deteriorating due to job losses and balance sheet shrinkage caused by the meltdown of the equity market. To spare the US economy a severe recession, the monetary and fiscal authorities showered the corporate sector with tax breaks and lower borrowing costs, and put money in consumer's pockets through tax rebates and house price inflation. As a result of these policies, the current balance sheet of corporate America is in very solid shape.
Julius Baer Funds 2005 Annual Report
11
However, given that consumers are the ones who replenished the corporate coffers, they are now buried even further in debt. The consumers and the policy makers are still waiting for reciprocity from corporate America: to start expanding, investing, hiring, and raising wages.
So far, the business sector has invested little in the domestic economy. Managers remain cautious in the aftermath of the bubble. They continue to off-shore and outsource, suffer from excess capacity or do not believe in the sustainability of the recovery.
As a result, most of the action has been "trapped-up" instead of "trickle-down". Companies are using excess cash for share buy-backs or dividend hikes. While such actions tend to increase the wealth of shareholders, they do little to improve the prospects of the job market or the economy. More worrisome of late, private equity investors are undoing the macro-economic policies of the past five years. They are raiding cash-rich companies, taking out the excess cash, and re-leveraging them to the hilt. Again, excess cash is ending up in the pockets of wealthy investors instead of corporate investment that expands employment.
We believe the performance of the corporate sector in this relay will be disappointing. They will remain stingy in their contribution to the domestic economy for two main reasons: businesses continue to expand overseas to meet domestic demand and financial activities by CFOs and private equity firms siphoning liquidity away from the coffer of corporations into the pockets of wealthy investors. There is a possibility that the baton may have to be picked by the authorities again.
US policy makers will soon have to realize that "trickle-down" is an ineffective and misplaced policy. The business sector is no longer "domestic"; it is global while the consumers remain domestic. Hence the policies should focus on the consumer and not on the business sector. "Trickle up" policies would be much more effective in managing the domestic economy in this globalized world.
Globalization: It is the Anglo-Saxons Model—For Now
In the late 80's, short-sighted corporate America was the laughing stock of the business world. As the saying went, Japanese managers think in decades; Europeans think in years; while their American counterparts think in quarters. Today, we are at the other extreme and anything that is not done the Anglo-Saxon way is scorned both at the macro- and micro-economic levels. The economic prosperity and low unemployment that Anglo-Saxon countries have enjoyed over the past 15 years has been the envy of the rest of the developed world. Japan has been in deflation for years and Continental Europe has been stuck with low economic growth and double digit unemployment. In Japan's case, one might argue that some of its stagnation is
Julius Baer Funds 2005 Annual Report
12
a legacy of the bubble era and that it is currently benefiting from China's expansion. But it is also true that the globalization process has brought about the rise of Asian tigers such as Korea and Taiwan, which has had severe deflationary effects on many Japanese industries.
Citizens are protesting by voting against the establishment: the old guard in the Japanese ruling party LDP was voted out of office, the Social Democrats lost power in Germany, and the popularity of President Chirac in France and Prime Minister Berlusconi in Italy is at a low point. In turn, politicians are quarreling with their "independent" central bankers: Japan's Prime Minister Koizumi has threatened and ordered the Bank of Japan not to end its quantitative easing policies and European finance ministers have been very vocal and confrontational about their displeasure with European Central Bank (ECB) monetary policy. Governments under pressure from voters are now desperately seeking growth. Accommodative monetary and expansive fiscal policies are the easy remedies normally used to counter the deflationary effects of globalization but thus far, they have met with little success. While globalization is causing low inflation in tradable good s, and wage stagnation both in the manufacturing sector and a small part of the service sector where wage labor can be arbitraged, the remedies (the easy monetary policies) are mainly causing inflation in asset prices such as real-estate and bonds.
Why are the Anglo-Saxons prospering from global trade while the rest of the developed world, especially Continental Europe, is suffering from it? Should the rest of the developed world emulate the Anglo-Saxon model? If not, how do they get out of their miserable trap?
Common wisdom attributes the success of the US and its Anglo-Saxon brethren to their high productivity, the flexibility of their labor laws, their strong embrace of free market principles, and positive demographic trends. However, it is difficult to ignore that strong economic performance has been accompanied by a plethora of severe structural imbalances: the vast current account and fiscal deficits, the exceptionally low saving rates, the record high household debt as a percentage of income, and the overheated housing market.
Two factors may better explain the Anglo-Saxons' recent fortunes. First, their economies are less dependent on manufacturing and second, the development of their financial markets has enabled the consumers to easily extract equity from sky-rocketing home prices thereby compensating for stagnant wages. Meanwhile, Continental Europe is more dependent on manufacturing, and has experienced modest home price appreciation with limited means for extracting equity. Therefore, the Anglo-Saxons' recent fortunes may be transient in nature and merely
Julius Baer Funds 2005 Annual Report
13
reflect their ability to postpone a painful adjustment while Continental Europe, lacking this flexibility, is in the midst of such adjustments.
Beyond liberalizing its labor laws, Europe can do little but await the ultimate conclusion of this vendor-financing scheme. The current pace and nature of this globalization is hazardous to long-term U.S. vitality. Trade is a win-win game as long as it is a balanced one. Warren Buffett has publicly warned against the current trade imbalance and provided a possible solution, but his advice and warnings fell on deaf ears. Unless the United States wakes up, foreign central bank financing of our trade deficit may end up being the United States's Trojan horse: seemingly useful on the surface but deadly in the long run.
Workers are also voters. They may have lost their bargaining power with management but not with government. So far, the ability of consumers to transform houses into ATMs has softened the impact of stagnant wages and delayed a grass-root revolt in the US. However, malcontent was apparent in our recent November elections where the Democratic Party had big wins. It remains to be seen whether 2006 elections prove even more unsettling for incumbent politicians.
Finally, American corporations' rush to embrace outsourcing may resurrect the old label of shortsightedness. To save a few pennies today, they may have incubated future competitors who will cost them dollars tomorrow.
The US Dollar: What Next?
Despite the well publicized imbalances of the US economy, especially the current account deficit, the US dollar had a surprisingly strong year against most major currencies. What's happening here? Don't current account deficits on the scale of 6% of Gross Domestic Product ("GDP") matter? And what should we expect next year?
In hindsight, there are plausible explanations for the US dollar's strength. First, it rallied because by late 2004 it became a crowded trade—technically, it was oversold. Second, the dollar does not appear overvalued against major currencies based on purchasing power parity. Third, the US Federal Reserve is the only central bank that has been raising rates aggressively. Rates in the US are expected to hover between 4.5% and 5% from next year until the end of the decade. Japanese, Eurozone and Swiss rates are expected to stay below US rates for the foreseeable future. You may have to wait years before earning 1% on the yen, 2% on the Swiss franc, or 3% on the Euro. Only the British pound is forecast to provide interest rates commensurate
Julius Baer Funds 2005 Annual Report
14
to the US dollar. Finally, the yen and, to a lesser extent the Euro, have become the hedge funds' "borrow currency" of choice.
Short term interest rates
futures (90 days) | | December 2005 | | Long-dated future | |
| US dollar | | | 4.49 | % | | 4.97% (June '09) | |
|
| Euro | | | 2.52 | % | | 3.095% (Sept. '07) | |
|
| British pound | | | 4.61 | % | | 4.69% (June '09) | |
|
| Japanese yen | | | 0.09 | % | | 1.54% (Sept. '10) | |
|
| Swiss franc | | | 1.08 | % | | 2.14% (Sept. '07) | |
|
Source: Bloomberg
Though highest of the group, even US dollar rates are hardly enticing when for the last three years nominal GDP grew at a pace of 6% to 7%. Central bankers fooled many financial market participants into accepting core inflation as the reference point. They argue that interest rates somewhat above core inflation should be considered adequate if not generous. Over the past 12 months inflation has averaged about 3.4%—so one should be grateful for earning 4%.
For the past five years Consumer Price Inflation (CPI) has averaged 2.55% while Core CPI (which is ex-food and energy) was about 2.09%. It is hard to imagine that inflation was this low during a period where real estate prices more than doubled in many parts of the world and many commodities prices performed similarly. Many (ourselves included) suspect that conventional inflation measures understate the true cost of living.
Ricardo Reis, an economist at Princeton University, attempted to address that very issue in a recent paper (The Economist, October 15, 2005, page 76). He argued that CPI measures only the prices of goods and services consumed today; it does not include the prices of what we will consume tomorrow. If share or housing prices rise sharply, future consumption becomes more costly, as well as the cost of living. So, he designed a new inflation index—dynamic price index (DPI)—that included asset prices such as equities and real estate. For the four years ending in 2004, the annual rate of inflation according to DPI was 7.4%, compared with an average increase of only 2.3% in the CPI. No wonder there is a rush to buy real assets all over the world.
Investors are finally realizing that all major central banks, irrespective of their charter, are being forced 'de facto' either by politicians or by globalization to follow monetary policies that give more weight to growth than price stability. This is
Julius Baer Funds 2005 Annual Report
15
evidenced by the public quarrels between the Bank of Japan and the European Central Bank on the one hand and the politicians on the other.
The real issue is not the debate on the merit of holding yen versus US dollars or Euros; it is about holding any of these sanctioned currencies versus real assets, which were again major winners this year. It is apparent that holding paper currency today is akin to a hemorrhage of one's purchasing power. That's why people are grabbing real assets: real estate, commodities, and precious metals. Also, it is no surprise that gold has risen and many expect substantial gains are still to come while the Fed is raising interest rates.
The dilemma with real assets is that some of them have become expensive places to hide from the malfeasance of central bankers. The trick is to find those real assets whose values remain supported by fundamentals. For example, an investor should look for real estate opportunities in remote areas where prices have barely budged rather than overpaying for something similar in crowded metropolitan areas.
CLOSE-UP
Our analysis continues to guide us towards emerging Europe, including Russia and Turkey. In the short-term, there is a possibility of a correction in these markets, which we view as a buying opportunity. While we are not big believers in the current Japanese market rally, we are not yet fighting it. We have also returned to neutral positions in commodities until more clarity on the macroeconomics front is received. Lastly, we have identified positive dynamics in several sectors that may create attractive investment opportunities.
Emerging Markets
Our view on emerging markets is divided into two camps: one whose fortune is tied to global trade and the other whose is tied to the expansion of the European Union. The first relies on the current imbalance in global trade while the second relies on the goodwill of European politics.
Most markets in Asia and Latin America are benefiting from the boom in Anglo-Saxon consumption along with Chinese capital spending and infrastructure projects. Asia is gaining through exports and Latin America through the rise in commodity prices. The fortune of both is joined at the hip. There is no denying that the fundamentals have improved in both regions as evidenced by the record current account surpluses. However, we are not convinced that their fundamentals will remain positive once global imbalances start to adjust.
Central and Eastern Europe, in particular Turkey and Russia, are big beneficiaries of the drive to reunite Europe. This process is rooted in a sound political foundation,
Julius Baer Funds 2005 Annual Report
16
unlike the current imbalance in global trade. This year, both Turkey and Russia enjoyed outsized returns, but we believe the two countries will decouple once the pace of globalization slows or adjustment of the imbalances begins.
The biggest risk in Central and Eastern Europe is the complacency of the governments towards reform. The time table to join the European Monetary Union (EMU) is being continually pushed further into the future. In some countries, like Hungary, budget deficits are worsening as a result of populist policies aimed at appeasing voters. However, we believe that sooner rather than later, either market forces or fear of forfeiting their chance to join the EMU will force the violating countries into sound policies.
Japan
Japan's economic prospects have improved. Prime Minister Koizumi won decisively in the recent elections and earned a mandate to continue structural reform. Privatizing the postal office is likely to be at the top of the agenda. China, Japan's neighbor and its second most important trading partner, grew at a 9-10% pace. Corporate profits are strong, the result of restructuring, an improving domestic economy, a weaker yen, and strong global growth—especially in China and the US.
But are these improvements already discounted? As of late, the Japanese stock market has been on a tear: "Turnover reaches five times bubble average; concerns grow that new one is forming... Behind the records is active stock trading by foreigners and individual investors encouraged by the economic recovery and brighter corporate earnings... The high turnover is driven in large part by churning on the part of individuals trading online." (The Nikkei Weekly, November 14, 2005, Page 1)
Domestic retail investors have been active in low priced stocks—i.e. penny stocks. Foreign investors were active in the reflation trade, indiscriminately purchasing mainly domestic sector stocks perceived to be leveraged to the end of deflation in sectors such as real estate, insurance, banking, and retail. Foreign private equity funds have been aggressively bidding up real estate prices in Tokyo and now few prime properties there yield more than 3%.
On many valuation metrics Japan is looking very expensive compared to Europe. Japan's Topix Index trades on 23x earnings and yield 0.93% while European averages trade around 13x earnings and yield about 3%. The market is partially correct to ignore current financial multiples on the premise that earnings are depressed after more than ten years of deflation, but does Japan deserve a 100% premium to Europe?
Julius Baer Funds 2005 Annual Report
17
One way to measure operational leverage is to value companies based on assets and operational metrics instead of earnings related ones. Aside from banks, whose market capitalization to deposit ratio is still at a large discount to their European counterparts, we have failed to find fundamental justification to chase this rally in the other domestic sectors.
In our opinion, Japan's real leverage is not from reflation but from its unique exposure to its neighbor, China—and that can be huge. The potential benefit from this relationship could surpass the combined benefits that Mexico and the US enjoy from their trade relationship. Japan is doing the near-shoring that America did but at the same time they are, like the Mexicans, exposed to a super-jumbo economy next door. Whereas the US population is about three times that of Mexico, the Chinese population is about ten times that of Japan. As previously mentioned, Japan is a country with the worst demographics but the most improving geographics. Instead of chasing a reflation trade, we continue to focus on companies that are highly leveraged to the emergence of China as a major economy. We are also looking at companies that are transplanting the China-Japan model to India. In the long run, India may prove to be a more stable partner given the l ack of political sensitivity that exists with the Chinese. India is already a democracy and has a much younger demographic than China.
Sectors and Themes
We continue to attempt to find attractive industries that are consolidating, not reliant on global imbalances, with high entry barriers, and set to experience above average growth.
The global cement industry has been slowly consolidating into an oligopoly where the top eleven cement companies now own about 56% of global capacity today compared with less than 17% in 1988. The consolidation has led to more pricing discipline and additional capacity. The high transportation cost of the product, especially by land, provides an added protection from cheap imports—less than 5% of global cement is exported. The entry barriers are also very high with tough permission and environmental demands and intense capital expenditure. Cement also possesses some defensive characteristics since it benefits from large government spending when the economy slows. The industry is, for the first time, focused on cost cutting and efficiency programs. We feel the sector's valuations remain attractive; cement still trades in line with its long-term average while a re-rating is well deserved. Some of our holdings in the period include Lafarge , Holcim, and Cemex.
We anticipate the luxury goods industry will enjoy strong growth over the next decade. Currently, the industry is benefiting from several big drivers. First, as consumers are dividing their purchases between a "trade-up" to a luxury good or a
Julius Baer Funds 2005 Annual Report
18
"trade-down" to a discounter, the market share of luxury goods manufacturers is increasing. Second, the expected increase in purchasing power of consumers from emerging economies could be a boon for the industry. The Chinese consumer could account for as much as 29% of all luxury purchases by 2015 (Japanese make right now around 40% of all purchases). The Indian consumer demographic is also very attractive with 44% of population below 19 years of age, and lastly, the Russian consumer whose appetite is second to none. In addition, the increase in global travel should accelerate luxury good purchases through duty free shops. Two luxury goods companies we held during the reporting period were LVMH and Swatch, and we like their prospects based on their strong position in emerging markets.
Consolidation has brought the global spirits industry down to four players: Diageo, Pernod Ricard, Fortune Brands and Bacardi. The industry's barriers to entry are extremely high due to brand loyalty, expensive distribution networks, and high marketing spend. Additional features that make this an attractive segment include the world's aging demographics and the growth in wealth in emerging markets. As consumers get older, they drink more spirits and less beer, and as consumers in emerging economies grow in wealth they will increase their consumption of top spirits brands as a show of status. Our holdings over the fiscal year include the top two players in terms of sales, Pernod Ricard and Diageo.
The construction sector is benefiting from the budgetary problems that face national and local governments. Given the public sector's funding problems and inefficient operations, public authorities are now engaging private companies. The construction sector diversified its cash flows out of a business that traditionally had low margins and negative working capital requirements, into one that includes concessions like toll roads, airport services, and waste collection. Certain firms entered into build-operate-transfer (BOT) agreements for projects like hospitals, schools and prisons, which are projects that have double the margins of regular construction business. Construction deserved a strong re-rating as its business mix migrated towards higher margin and lower volatility projects. Companies that profited from these changes include Ferrovial, Vinci, and Skanska. Our exposure to the sector was reduced during the period due to strong perform ance and the rising risk from higher interest rates.
The European electric utility sector has also been experiencing a favorable pricing environment. We correctly anticipated that electricity prices would rise significantly in response to the increase in input (oil, gas, and coal) and emission costs. Given that the market equilibrium price is set by the producers who have the highest variable cost (coal and gas), we favored utilities that had high exposure to nuclear and hydro power. Strong performers in this category during the reporting period were
Julius Baer Funds 2005 Annual Report
19
Fortum, RWE, Suez and Eon and a smaller company, BKW. Later in the period, our exposure was reduced as the undervaluation has substantially narrowed.
Privately-owned hospitals in Europe are experiencing both growth and consolidation: governments are struggling to cope with the burden of healthcare costs while privately-owned hospitals are providing the best and most efficient hospital care. As a result, public hospitals are being privatized and long-term contracts for hospital care are being awarded to the private entities.
Private hospitals are also expected to benefit from an increase in medical procedures due to an aging population as well as from market share gains coming at the expense of poorly run public hospitals. There are ample opportunities for acquiring public hospitals and smaller private clinics as the market is still very fragmented. Profitability can be improved as leading hospitals gain economies of scale through consolidation and by reducing the length of hospital stays for the same procedure (most reimbursements are based on procedures rather than hospital days). Two such companies held in IEF during the reporting period were Generale De Sante, the largest private hospital in France and Capio, the largest private hospital in Europe. (Since both stocks have a capitalization of under US$2.5 billion, they were not in IE II.)
The Italian banking industry is one of the most fragmented in Europe but is expected to experience a wave of consolidations over the next two to three years. In the past, unfriendly shareholder rules and a hostile central banker made mergers and acquisitions difficult for both domestic and foreign banks. This has begun to change rather dramatically since the beginning of the year when two foreign banks, BBVA and ABN Amro, tested the resolve of the Bank of Italy with one of them succeeding in acquiring a local bank.
In addition to the prospects of consolidation, Italian banks have many attractive attributes. Italy is one of the most immature credit markets in Europe and penetration remains very low. Italians have been slow to increase borrowing given their cultural distaste for credit due to historically high interest rates, but that is changing and the potential for growth is high as Italy converges to European averages.
Italian banks still have ample opportunity for efficiency gains as their cost is one of the highest in Europe. The potential from restructuring is equally high based on cleaning the loan portfolios and liquidating non-core holdings. In summary, the leverage to higher profits is significant and originates from cost cutting, faster credit growth, lower structural provisions and, at some point, stronger economic growth. In spite of better long-term growth prospects and M&A speculation, the Italian banks trade in line to a discount to the European averages. During the period, our holdings in the area include Banca Intesa, Capitalia, and Banca Popolare di Milano, all of which are undergoing restructuring and are potential takeover targets.
Julius Baer Funds 2005 Annual Report
20
German real estate has been stagnant for more than a decade as a result of the huge overbuilds during the early '90's and unfriendly legislation that heavily favored tenants over landlords. However, the sector seems to be turning the corner driven by several strong fundamentals: household formation is growing as the number of persons per household declines. Home ownership in Germany (43%) is the lowest in Europe while in Spain, the UK, and France it is 82%, 69%, and 53%, respectively. The supply side is vastly improving as completions are at half the peak level of 1994 and vacancy rates are coming down. Despite the oversupply, rent grew by 2.4% annually over the past ten years. Finally, the anticipation of REIT legislation in 2006/2007 should attract additional private equity investors who would most likely cause upward pressure on market prices. We mainly gained exposure to the sector through real estate companies and banks.
Along with our attempts on getting the big picture right and identifying positive sector developments, we continue to focus on unearthing individual investment opportunities around the globe.

Rudolph-Riad Younes, CFA
International Equity Fund and International Equity Fund II Portfolio Manager
Performance quoted represents past performance, which does not guarantee future results. Investment performance reflects fee waivers that may or may not be currently in effect. In the absence of such waivers, total return would be reduced.
Investing internationally involves additional risks, such as currency fluctuations, social and economic instability, differing securities regulations and accounting standards, limited public information, possible changes in taxation, and periods of illiquidity.
The views expressed are subject to change based on market and other conditions. Furthermore, the opinions expressed do not constitute investment advice or recommendation by the individuals, JBIM, the funds, or any affiliated company.
The MSCI EAFE Index is an unmanaged list of equity securities from Europe, Australasia, and the Far East with all values expressed in U.S. dollars. It is not possible to invest directly in an index or average.
Please see the Portfolio of Investments in this report for complete fund holdings. Fund holdings and/or sector weightings are subject to change at any time and are not recommendations to buy or sell any security mentioned.
The Price to Earnings (P/E) Ratio reflects the multiple of earnings at which a stock sells.
Julius Baer Funds 2005 Annual Report
21
MANAGEMENT'S COMMENTARY
JULIUS BAER TOTAL RETURN BOND FUND
Annual Report
Period Ended October 31, 2005
The Julius Baer Total Return Bond Fund (the "Fund"), Class A shares returned 3.93% for the fiscal year ending October 31, 2005. Over the same time period the benchmark, Lehman Brothers Aggregate Bond Index, had a return of 1.13%.
One of the major contributors to the Fund's outperformance over the last year was our positioning within the US yield curve. We expected the Federal Reserve to continue to raise the Federal Funds rate at least into the second half of 2005. We, therefore, were confident that rates would go up in the short end of the US yield curve. We were less sure about the direction of rates in the long end of the curve. Usually, when the Fed starts a tightening program, it is due to an increase in inflation or at least that inflationary expectations are moving higher. This results in higher interest rates all along the yield curve.
In our opinion, when the Fed started this tightening program, it was more driven by the desire to eliminate the 'insurance' of a historically low rate. This all-time low was in effect to ward off the threat of deflation that was a feared result of the bursting of the equity bubble in the beginning of the decade. When the members of the Federal Open Market Committee made the decision to begin to raise rates in June 2004, they made it clear that they were looking to reach a 'neutral' rate and not to prevent a pick-up in inflation.
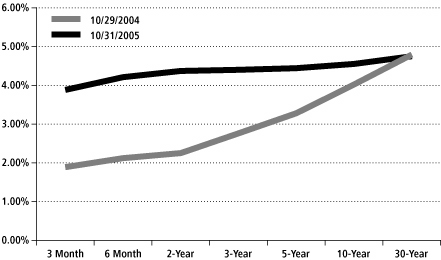
Bonds in the long end of the yield curve did not increase in yield simply because there was scant sign of inflationary pressure, and the Fed was tightening, meaning there was little chance of inflation getting ahead of the Fed. An environment with benign inflation and a central bank that is tightening is usually very good for longer-term bonds. Remember, the Federal Reserve can strongly influence rates in the short end of the yield curve. The longer end of the curve, on the other hand, is more influenced by inflation and inflationary expectations. Our yield curve strategy in October 2004 was to be positioned for a flattening. We had this position well into the second half of 2005 and it paid off. The following graph shows the
Julius Baer Funds 2005 Annual Report
22
change in the shape of the curve from the beginning to the end of the funds fiscal year.
U.S. Yield Curve
Source: Bloomberg
Another position that significantly added to the Fund's higher return versus the index was our positioning in Mexican bonos and the peso. In January 2005, Mexican bonos had a yield of 9.8%. At the same time, the Mexican peso was close to its all-time low versus the US dollar, trading as low as 11.38 and the US dollar was near the end of its two year depreciation versus the major world currencies. This meant that the Mexican peso had a large decreased in value versus many currencies, including a 61% drop value versus the Canadian dollar between early 2002 and December 31 of 2004. The central bank of Mexico, Banco De Mexico, meanwhile was quietly going about bringing inflation down and hence raising its own credibility. We believed that this was a very attractive combination for a fixed income investment. This, combined with the fact that Mexico has significant oil reserves, led us to our decision to take a large position in longer-term bonos and a corresponding weight in the currency. From January 1 to October 31, 2005, bonos have rallied 110 basis points while the peso rose over 3.3% versus the US dollar. A similar maturity US treasury actually lost almost 40 basis points over the same time period.
Over the full fiscal year, our currency stance had mix results. In the last two months of 2004 the Euro rallied from 1.2752 to 1.3554, an increase of 6.3%. During the same time period the Japanese yen rallied 3.6%. We feel the Fund was well positioned for this move, with our currency position very close to the maximum allowed by our guidelines.
Julius Baer Funds 2005 Annual Report
23
January to October 2005 was a much harder environment for non-dollar assets, as the US dollar rallied for most of the year. The Euro was down 11.5% versus the dollar, closing at 1.1992 on October 31, 2005. The Japanese yen lost 13.4% over the same time period. We substantially reduced our non-dollar position in the beginning of January. This allowed us to avoid much of the poor performance that would have resulted had we left our currency positioning static.
Outlook
The US fixed income market has two countervailing expectations. The first forecasts a pickup in inflation and higher interest rates. The second anticipates a drop in demand from the consumer and an inverted yield curve.
Those who believe in the first opinion, which appears to include the Fed, are fearful that inflation is on the rise and, probably more importantly, that there may be an increase in inflationary expectations. The Fed has expressed their reluctance to allow an increase in inflation expectations given the assumption that a wage/price spiral could develop. In addition, concerns over government-induced inflation from the hurricane rebuilding efforts along the Gulf Coast could contribute to inflation during 2006. Against this backdrop, high energy prices should flow through into both the current headline CPI and the more widely watched core CPI in the near future.
The second opinion is based on concerns that the housing market will correct or slow-down and that high heating costs may diminish consumer spending starting in early 2006. Both of these issues imply a shift in consumer spending behavior. In addition, a legislated increase from 2% to 4% in the minimum payments on credit cards balances may cause some consumers to rethink the use of credit as a spending vehicle or at least impair near-term purchases. The conclusion drawn from these factors is a growth slowdown, a limiting effect on inflation and, therefore, a desire by investors to extend duration.
We expect some combination of higher prices limited by slowing growth to emerge over the next several quarters but predict a "muddle through" economy rather than one with volatile characteristics. In the near-term, fixed income markets should continue to be dominated by tighter Fed policy. On February 1, 2006, Ben Bernanke will replace Alan Greenspan as the new Federal Reserve Chairman. Past changes in Fed chairmen have increased market volatility. The economic scenario and global imbalances Greenspan will leave behind suggest that concern is warranted.
From our perspective, the major item of concern is the housing market. Greenspan went so far as to co-author (only the second time in his role as Chairman) a long and technical piece on the subject. We believe the Fed is concerned that the housing market presents a substantial risk to the economy as many consumers have
Julius Baer Funds 2005 Annual Report
24
"cashed out" the equity in their homes to fund a lifestyle they could otherwise not afford. Also, savings rates have dropped dramatically, eroding many consumers' downside cushion. The Fed's concern is that a substantial number of consumers have no more equity in their house than they did five years ago, even though prices are dramatically higher and, at the same time, have very little traditional savings. ING Group recently released a study estimating that GDP would be reduced by 1.5% if housing price growth is flat for one year.
In a perfect world, we believe the Fed would prefer to have ten year Treasury rates rise just enough to slow housing price growth to a low, but positive, rate for several years allowing other portions of the economy to rebalance to the housing market gains. Therefore, we believe that the Fed would like to see long-term rates higher now but their ability to influence the long end of the yield curve is tenuous at best. Hence, Greenspan's conundrum. In short, we expect the Fed will continue to raise the Fed Funds rate to the point where long rates slow the growth rate of house prices.
In this environment, it can be difficult to manage fixed income assets. As the Fed tightens, we expect long rates to move higher. Yet, a rising interest rate environment is tough on fixed income performance. The classic response in a domestic fixed income account is to lower the portfolio's duration, hence, potentially reducing interest rate risk.
We are able to employ a different strategy. Instead of trying to bet if and when an increase or decrease in longer-term rates in the US will occur, we are inclined to use our global knowledge to position the Total Return Bond Fund in "friendlier" interest rate environments. An example is Europe, where we are invested in longer-term bonds, thereby capturing a substantial amount of duration versus a central bank handcuffed with a soft economy. Over the last year, we held a substantial position in European government debt having expected that this region's economy would struggle, which it has. We continue to hold this position based on our forecast that the European Central Bank (ECB) is unlikely to tighten more than one or two times because the regions economy is struggling to grow. Another positive aspect of this particular investment is the "positive carry" that is generated by hedging the Euro back to the US dollar. Due to the steeper yield curve in Europe versus the US, holding long European debt while hedging out the currency risk can result in a higher implied interest rate on the total investment than would be generated by buying a similar US Treasury bond. This allows us to invest in a bond with what we feel is substantially less risk of price erosion due to an increase in interest rates and have virtually no currency risk with a higher total yield than a comparable US Treasury.
Julius Baer Funds 2005 Annual Report
25
Another foreign market where we are currently positioned is the United Kingdom gilt market. Their ten year bonds currently yield approximately the same as ten year Treasuries, yet the UK central bank has already successfully slowed the country's growth rate. Therefore, we believe that their rates are less likely to rise than US interest rates. Finally, we have positions in Mexico and Iceland. Bonds in these countries offer higher yields (8.50% and 7.60%, respectively) making them attractive markets with the potential to make a meaningful contribution to performance while diversifying US interest rate risks.
We believe our defensive strategy should produce higher returns relative to the benchmark. While absolute returns are likely to be meager in the near-term, the expected adjustment in the fixed income market should provide a more favorable backdrop for investment returns in 2006.

Donald Quigley
Total Return Bond Fund Portfolio Manager
Performance quoted represents past performance which does not guarantee future results. Investment performance reflects fee waivers that may or may not be currently in effect. In the absence of such waivers, total return would be reduced.
Investments in debt securities typically decrease in value when interest rates rise. This risk is usually greater for longer term debt securities. Investing internationally involves additional risks, such as currency fluctuations, social and economic instability, differing securities regulations and accounting standards, limited public information, possible changes in taxation, and periods of illiquidity.
The views expressed are subject to change based on market and other conditions. Furthermore, the opinions expressed do not constitute investment advice or recommendation by the individuals, JBIM, the funds, or any affiliated company.
The Lehman Brothers US Aggregate Bond Index is a benchmark index composed of US securities in Treasury, Government-Related, Corporate, and Securitized sectors. It includes securities that are of investment-grade quality or better, have at least one year to maturity, and have an outstanding par value of at least $250 million. It is not possible to invest directly in an index or average.
Please see the Portfolio of Investments in this report for complete fund holdings. Fund holdings and/or sector weightings are subject to change at any time and are not recommendations to buy or sell any security mentioned.
Julius Baer Funds 2005 Annual Report
26
MANAGEMENT'S COMMENTARY
JULIUS BAER GLOBAL HIGH YIELD BOND FUND
Annual Report
Period Ended October 31, 2005
The Julius Baer Global High Yield Bond Fund (the "High Yield Fund"), Class A shares enjoyed a good fiscal year in the twelve months ending October 31, 2005, returning of 6.15%, net of all fees and expenses. This performance outpaced our benchmark, the Merrill Lynch Constrained Global High Yield Index by 2.53%.
The overall macro-economic environment continued to be support of high yield bonds during the review period. Global economies expanded, inflation remained muted, and corporate profits grew. However, imbalances in the global economy also grew, namely the US current account and budget deficits, structural rigidities in the European economy, highly export-oriented trade surpluses in some emerging market economies, and rising commodity prices, particularly energy. All of these imbalances are interconnected making it hard to see how they will be resolved without policy coordination on the part of governments throughout the world. In the US, there is a need to dampen excessive consumer spending and real estate speculation. Europe needs to address pension and employment reform. Some of the larger emerging economies need to introduce more flexible currency regimes and stimulate domestic consumption.
The most substantive movement during the review period was the steady rise of the US Federal Funds rate—steady rise a necessary evil given the circumstances. However, future hikes will likely be detrimental if there is not further progress on other economic problems both in the US and abroad.
As we manage the High Yield Fund, we keep a macro economic eye on two potential outcomes to this dilemma. The first and more pessimistic outcome is that US Fed Funds rate increases will continue without equivalent progress on other policy fronts. In this case, investment caution is warranted. Bonds, including high yield, should provide a better haven than equities, but within the bond asset class, high grade securities should outperform lower grade issues. If markets perceive policy responses as being asymmetric, risk aversion will likely take hold and high yield spreads (the difference in yield between high yield securities and government bonds) will presumably widen. The second potential outcome is that policy progress will in fact be balanced enough to engineer a "global soft landing". In this case, broad measures of economic progress will be positive, but there will, inevitably, be winners and losers.
Julius Baer Funds 2005 Annual Report
27
We remain optimistic and have managed the High Yield Fund with an emphasis on attempting to identify the potential winners and losers of economic rebalancing on a global scale. In doing so, we are also attentive to the risks of the first, more pessimistic, prognosis. One such potential winner we identified is the energy sector and therefore have maintained an overweight position for much of the fiscal year. On the flip-side, auto bonds are an area we are less enthusiastic about and hold a very low weighting in the industry. Those auto bonds we chose to invest in were primarily European-based companies denominated in their local currency because we believe they will endure the market turmoil better than their US-based counterparts. We also invested in the local currency bonds of a number of emerging economics, on the belief that they will benefit from global growth far more than corporations or whole industries rooted in the developed world.
At the same time, recognizing the possibility of the more pessimistic outcome to our current situation, we have steadily reduced our holdings of riskier developed economy corporates, including those rated below B-/B3 by S&P/Moody's, as we believe they have the potential to be more vulnerable in the event of a hard landing. For much of the year, we also carried an overweight position in healthcare bonds, given our feelings that they will perform relatively well regardless of the market or economic environment.
This dual approach has helped us navigate a somewhat turbulent fiscal year. While we were not perfect and made occasional mistakes in specific issues, we have moved quickly to assess each situation and cut our exposure at the point we felt our initial investment premise was no longer supportable.
As we enter a new fiscal year we remain optimists, but also retain our cautious approach. As optimists, we believe there will be many attractive opportunities to invest in areas of the world, in industries, and in companies that could be thriving in what is becoming a more global, more interconnected, and, hopefully, more balanced world. There will also be areas to avoid, and we will be careful to do so. And, along the way, there will always be uncertainty and volatility, for there is no free lunch in investing, but we will seek to dampen these bumps by respecting the more pessimistic possibilities and carefully considering any investments that do not live up to expectations.

Greg Hopper
Global High Yield Bond Portfolio Manager
Julius Baer Funds 2005 Annual Report
28
Performance quoted represents past performance, which does not guarantee future results. Investment performance reflects fee waivers that may or may not be currently in effect. In the absence of such waivers, total return would be reduced.
The securities in which the Fund will invest may be considered more speculative in nature and are sometimes known as "junk bonds." These securities tend to offer higher yields than higher rated securities fixed income securities can present a greater risk of loss of income and principal than higher rated securities. Investing internationally involves additional risks, such as currency fluctuations, social and economic instability, differing securities regulations and accounting standards, limited public information, possible changes in taxation, and periods of illiquidity.
The views expressed are subject to change based on market and other conditions. Furthermore, the opinions expressed do not constitute investment advice or recommendation by the individuals, JBIM, the funds, or any affiliated company.
The Merrill Lynch Global High Yield Constrained Index tracks the performance of below investment grade bonds of corporate issuers domiciled in countries having an investment grade foreign currency long term debt rating (based on a composite of Moody's and S&P). The index is weighted by outstanding issuance, but constrained such that the percentage that any one issuer may not represent more than 3% of the index. It is not possible to invest in an index.
Please see the Portfolio of Investments in this report for complete fund holdings. Fund holdings and/or sector weightings are subject to change at any time and are not recommendations to buy or sell any security mentioned.
Julius Baer Funds 2005 Annual Report
29
SHAREHOLDER EXPENSES (Unaudited)
As a shareholder of the Julius Baer Global Equity Fund Inc., Julius Baer International Equity Fund, Julius Baer International Equity Fund II, Julius Baer Total Return Bond Fund, or Julius Baer Global High Yield Bond Fund, you incur ongoing expenses, such as management fees, shareholder service fees, distribution fees and other fund expenses. The following table is intended to help you understand your ongoing expenses (in dollars and cents) of investing in Julius Baer Global Equity Fund Inc., Julius Baer International Equity Fund, Julius Baer International Equity Fund II, Julius Baer Total Return Bond Fund, or Julius Baer Global High Yield Bond Fund and to compare these expenses with the ongoing expenses of investing in other funds.
The table is based on an investment of $1,000 invested at the beginning of the period and held for the entire period from May 1, 2005 to October 31, 2005.
Actual Expenses
The first line in the table below provides information about the actual account values and actual expenses. You may use the information in this line, together with the amount you invested, to estimate the expenses that you paid over the period. Simply divide your account value by $1,000 (for example, an $8,600 account value divided by $1,000 = 8.6), then multiply the result by the number in the first line for the Fund under the heading entitled "Expenses Paid During Period" to estimate the expenses you paid on your account during this period.
Hypothetical Example for Comparison Purposes
The second line in the table below provides information about the hypothetical account values and hypothetical expenses based on the Fund's actual expense ratio and an assumed rate of return of 5% per year before expenses, which is not the Fund's actual return. The hypothetical account value and expenses may not be used to estimate the actual ending account balance or expenses you paid for the period. You may use this information to compare the ongoing costs of investing in your Fund and other funds. To do so, compare this 5% hypothetical example with the 5% hypothetical examples that appear in the shareholder reports of the other funds.
Global Equity Fund Class A
| | | Beginning Account
Value 5/1/05 | | Ending Account
Value 10/31/05 | | Annualized
Expense Ratio | | Expense Paid
during Period | |
| Actual | | $ | 1,000.00 | | | $ | 1,099.70 | | | | 1.41 | % | | $ | 7.46 | | |
| Hypothetical | | $ | 1,000.00 | | | $ | 1,018.10 | | | | 1.41 | % | | $ | 7.17 | | |
Julius Baer Funds 2005 Annual Report
30
Global Equity Fund Class I
| | | Beginning Account
Value 5/1/05 | | Ending Account
Value 10/31/05 | | Annualized
Expense Ratio | | Expense Paid
during Period | |
| Actual | | $ | 1,000.00 | | | $ | 1,100.60 | | | | 1.15 | % | | $ | 6.09 | | |
| Hypothetical | | $ | 1,000.00 | | | $ | 1,019.40 | | | | 1.15 | % | | $ | 5.85 | | |
International Equity Fund Class A
| | | Beginning Account
Value 5/1/05 | | Ending Account
Value 10/31/05 | | Annualized
Expense Ratio | | Expense Paid
during Period | |
| Actual | | $ | 1,000.00 | | | $ | 1,113.30 | | | | 1.30 | % | | $ | 6.92 | | |
| Hypothetical | | $ | 1,000.00 | | | $ | 1,018.70 | | | | 1.30 | % | | $ | 6.61 | | |
International Equity Fund Class I
| | | Beginning Account
Value 5/1/05 | | Ending Account
Value 10/31/05 | | Annualized
Expense Ratio | | Expense Paid
during Period | |
| Actual | | $ | 1,000.00 | | | $ | 1,115.50 | | | | 1.04 | % | | $ | 5.55 | | |
| Hypothetical | | $ | 1,000.00 | | | $ | 1,020.00 | | | | 1.04 | % | | $ | 5.30 | | |
International Equity Fund II Class A
| | | Beginning Account
Value 5/1/05 | | Ending Account
Value 10/31/05 | | Annualized
Expense Ratio | | Expense Paid
during Period | |
| Actual* | | $ | 1,000.00 | | | $ | 1,093.00 | | | | 1.35 | % | | $ | 6.97 | | |
| Hypothetical | | $ | 1,000.00 | | | $ | 1,018.00 | | | | 1.35 | % | | $ | 6.72 | | |
International Equity Fund II Class I
| | | Beginning Account
Value 5/1/05 | | Ending Account
Value 10/31/05 | | Annualized
Expense Ratio | | Expense Paid
during Period | |
| Actual* | | $ | 1,000.00 | | | $ | 1,096.00 | | | | 1.08 | % | | $ | 5.58 | | |
| Hypothetical | | $ | 1,000.00 | | | $ | 1,019.30 | | | | 1.08 | % | | $ | 5.38 | | |
Total Return Bond Fund Class A
| | | Beginning Account
Value 5/1/05 | | Ending Account
Value 10/31/05 | | Annualized
Expense Ratio | | Expense Paid
during Period | |
| Actual | | $ | 1,000.00 | | | $ | 1,004.30 | | | | 0.69 | % | | $ | 3.49 | | |
| Hypothetical | | $ | 1,000.00 | | | $ | 1,021.70 | | | | 0.69 | % | | $ | 3.52 | | |
Total Return Bond Fund Class I
| | | Beginning Account
Value 5/1/05 | | Ending Account
Value 10/31/05 | | Annualized
Expense Ratio | | Expense Paid
during Period | |
| Actual | | $ | 1,000.00 | | | $ | 1,004.90 | | | | 0.44 | % | | $ | 2.22 | | |
| Hypothetical | | $ | 1,000.00 | | | $ | 1,023.00 | | | | 0.44 | % | | $ | 2.24 | | |
* Actual returns for period from May 4, 2005 (commencement of operations) to October 31, 2005.
Julius Baer Funds 2005 Annual Report
31
High Yield Bond Class A
| | | Beginning Account
Value 5/1/05 | | Ending Account
Value 10/31/05 | | Annualized
Expense Ratio | | Expense Paid
during Period | |
| Actual | | $ | 1,000.00 | | | $ | 1,048.90 | | | | 1.25 | % | | $ | 6.46 | | |
| Hypothetical | | $ | 1,000.00 | | | $ | 1,018.90 | | | | 1.25 | % | | $ | 6.36 | | |
High Yield Bond Class I
| | | Beginning Account
Value 5/1/05 | | Ending Account
Value 10/31/05 | | Annualized
Expense Ratio | | Expense Paid
during Period | |
| Actual | | $ | 1,000.00 | | | $ | 1,049.90 | | | | 1.00 | % | | $ | 5.17 | | |
| Hypothetical | | $ | 1,000.00 | | | $ | 1,020.20 | | | | 1.00 | % | | $ | 5.09 | | |
Julius Baer Funds 2005 Annual Report
32
Julius Baer Global Equity Fund Inc.(1)
It is the Julius Baer Global Equity Fund Inc.'s, policy to declare and pay annual dividends from its net investment income and distribute net realized capital gains, if any, annually.
Average Annual Total Return*—Class A
| Year Ended October 31, 2005 | | | 17.00 | % | |
| Five years ended 10/31/05 | | | (26.55 | )% | |
| Ten years ended 10/31/05 | | | (1.23 | )% | |
| Inception (7/17/90) through 10/31/05 | | | 0.20 | % | |
* All average annual total return figures shown reflect the reinvestment of dividends and capital gains distributions. The Julius Baer Global Equity Fund Inc., commenced operations on July 17, 1990. Total returns for the Fund reflect expenses, waived and reimbursed, if applicable, by the Adviser and/or Administrator. Without such waivers and reimbursements, total returns would have been lower.
Growth of $10,000 invested in shares of Julius Baer Global Equity Fund
Inc. vs. MSCI World Index (in US dollars) October 31, 1995-October 31, 2005†
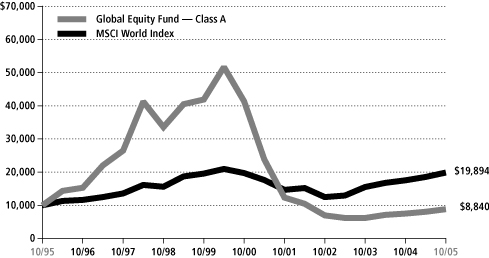
† Hypothetical illustration of $10,000 invested on October 31, 1995 assuming reinvestment of dividends and capital gains distributions through October 31, 2005. No adjustment has been made for shareholder tax liability on dividends or cap gains distributions. The MSCI World Index is a market capitalization weighted index composed of companies representative of the market structure of developed and emerging market countries in the Americas, Europe/Middle East and Asia/Pacific regions.
(1) On July 1, 2004 the Fund converted from a closed-end, non diversified investment company ("closed-end Fund") to an open-end diversified investment company with a different investment objective, different investment strategies and a new investment adviser (an affiliate of the closed-end Fund's adviser). Until the close of business on June 30, 2004, the Fund operated as a closed-end investment company and its common stock (which then comprised of a single share class) was listed on the NYSE. After the close of business on June 30, 2004, all of the common stock was converted into Class A shares of the Fund. For periods prior thereto, all historical performance information for Class A shares reflects the NAV performance of the Fund's common stock while it was a closed-end Fund.
Note: All figures cited here and on the following pages represent past performance of the Global Equity Fund, Inc., and do not guarantee future results. Investment return and principal value of an investment will fluctuate so that an investor's shares upon redemption may be worth more or less than their original cost.
Julius Baer Funds 2005 Annual Report
33
Julius Baer International Equity Fund
It is the Julius Baer International Equity Fund's policy to declare and pay annual dividends from its net investment income and distribute net realized capital gains, if any, annually.
Average Annual Total Return*—Class A
| Year Ended 10/31/05 | | | 22.19 | % | |
| Five Years Ended 10/31/05 | | | 7.75 | % | |
| Ten Years Ended 10/31/05 | | | 14.98 | % | |
| Inception (10/4/93) through 10/31/05 | | | 10.71 | % | |
The performance quoted represents past performance, which does not guarantee future results. The investment return and principal value of an investment will fluctuate and will fluctuate so that an investor's shares, when redeemed, may be worth more or less than their original cost. Current performance of the Fund may be lower or higher than the performance quoted. For up to date month-end performance information, please call 800-387-6977.
* All average annual total return figures shown reflect the reinvestment of dividends and capital gains distributions. The International Equity Fund Class A commenced operations on October 4, 1993. Total returns for the Fund reflect expenses, waived and reimbursed, if applicable, by the Adviser and/or Administrator. Without such waivers and reimbursements, total returns would have been lower.
Growth of $10,000 invested in Class A shares of Julius Baer International Equity Fund vs. Morgan Stanley EAFE Index October 31, 1995-October 31, 2005†
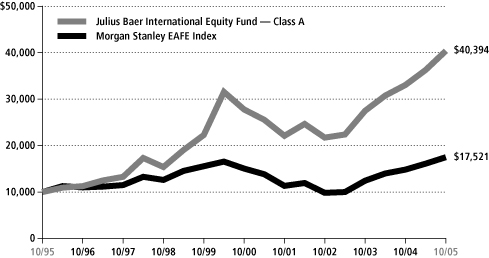
† Hypothetical illustration of $10,000 invested on October 31, 1995 assuming reinvestment of dividends and capital gains distributions through October 31, 2005. This period was one in which stock and bond prices fluctuated and the results should not be considered as a representation of dividend income or capital gain or loss which may be realized from an investment in the Interational Equity Fund today. No adjustment has been made for shareholder tax liability on dividends or capital gains distributions. The Morgan Stanley EAFE Index is a composite portfolio consisting of equity total returns for the countries of Europe, Australia, New Zealand and countries in the Far East, weighted based on each country's gross domestic product. Indexes do not incur expenses and are not available for investment.
Julius Baer Funds 2005 Annual Report
34
Julius Baer Total Return Bond Fund
It is the Julius Baer Total Return Bond Fund's policy to declare and pay monthly dividends from its net investment income and distribute net realized capital gains, if any, annually.
Average Annual Total Return*—Class A
| Year Ended 10/31/05 | | | 3.93 | % | |
| Five Years Ended 10/31/05 | | | 8.13 | % | |
| Ten Years Ended 10/31/05 | | | 5.96 | % | |
| Inception (7/1/92) through 10/31/05 | | | 6.17 | % | |
The performance quoted represents past performance, which does not guarantee future results. The investment return and principal value of an investment will fluctuate so that an investor's shares, when redeemed, may be worth more or less than their original cost. Current performance of the Fund may be lower or higher than the performance quoted. For up to date month-end performance information, please call 800-387-6977.
* All average annual total return figures shown reflect the reinvestment of dividends and capital gains distributions. The Julius Baer Total Return Bond Fund commenced operations on July 1, 1992 and the service providers waived their advisory, sub-advisory and administration fees from 7/1/92 to 10/31/92 and from 9/1/98 to 10/31/03; without such waivers and reimbursements, total returns would have been lower.
Growth of $10,000 invested in Class A shares of Julius Baer Total Return Bond Fund vs. a Blended Merrill Lynch and JP Morgan Index and Lehman Brothers US Aggregate Bond Index October 31, 1995-October 31, 2005†
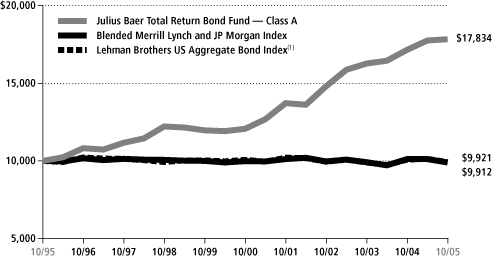
† Hypothetical illustration of $10,000 invested on October 31, 1995 assuming reinvestment of dividends and capital gains distributions and application of fee waivers through October 31, 2005. This period was one in which stock and bond prices fluctuated and the results should not be considered a representation of the income or capital gain or loss which may be realized from an investment in the Income Fund today. No adjustment has been made for shareholder tax liability on dividends or capital gains distributions. The Merrill Lynch and JP Morgan combined benchmark index for performance comparison consists of 80% of the Merrill Lynch 1-10 year U.S. Government/Corporate Index and 20% of the JP Morgan Global Government Bond (non-U.S.) Index. The Lehman Brothers US Aggregate Bond Index, an unmanaged index used as a general measure of U.S. fixed income securities, tracks the performance of debt instruments issued by corporations a nd the US Government and its agencies. Indexes do not incur expenses and are not available for investment.
(1) Effective July 1, 2005 the benchmark for comparison changed to the Lehman Brothers US Aggregate Bond Index.
Julius Baer Funds 2005 Annual Report
35
Julius Baer Global High Yield Bond Fund
It is the Julius Baer Global High Yield Bond Fund's policy to declare and pay monthly dividends from its net investment income and distribute net realized capital gains, if any, annually.
Total Return*—Class A
| Year Ended 10/31/05 | | | 6.15 | % | |
| Inception (12/17/02) through 10/31/05 | | | 13.65 | % | |
The performance quoted represents past performance, which does not guarantee future results. The investment return and principal value of an investment will fluctuate so that an investor's shares, when redeemed, may be worth more or less than their original cost. Current performance of the Fund may be lower or higher than the performance quoted. For up to date month-end performance information, please call 800-387-6977.
* Total return figures shown reflect the reinvestment of dividends and capital gains distributions. The Global High Yield Bond Fund commenced operations on December 17, 2002 and the Adviser had contractually agreed to reimburse certain expenses of the Fund through 2/28/2006; without such reimbursements total returns woiuld have been lower.
Growth of $10,000 invested in Class A shares of Julius Baer Global High Yield Bond Fund vs. Merrill Lynch Global High Yield Constrained Index December 17, 2002-October 31, 2005†
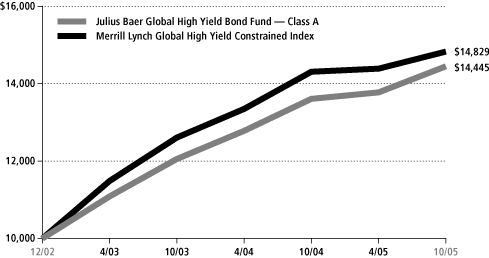
† Hypothetical illustration of $10,000 invested on December 17, 2002 assuming reinvestment of dividends and capital gains distributions and application of fee waivers through 2/28/2006. This period was one in which stock and bond prices fluctuated and the results should not be considered a representation of the income or capital gain or loss which may be realized from an investment in the Income Fund today. No adjustment has been made for shareholder tax liability on dividends or capital gains distributions. The Merrill Lynch Global High Yield Constrained Index tracks the performance of below investment grade bonds of corporate issuers domiciled in countries having an investment grade of foreign currency long-term debt rating (based on a composite of Moody's Investors Service, Inc. and Standard & Poor's Rating Service). Indexes do not incur expenses and are not available for investment.
Julius Baer Funds 2005 Annual Report
36
PORTFOLIO OF INVESTMENTS October 31, 2005
Julius Baer Global Equity Fund Inc. (Percentage of Net Assets)
Share
Amount | | Description | | Market
Value (Note 1) | |
| COMMON STOCKS—84.6% | | | |
| | | United States—33.7% | |
| | 11,027 | | | 3COM Corp* | | $ | 42,455 | | |
| | 1,320 | | | 3M Co | | | 100,290 | | |
| | 4,330 | | | Abbott Laboratories | | | 186,406 | | |
| | 4,490 | | | Albertson's Inc | | | 112,744 | | |
| | 3,650 | | | Altria Group | | | 273,932 | | |
| | 8,050 | | | American International Group | | | 521,643 | | |
| | 5,180 | | | AmerisourceBergen | | | 395,079 | | |
| | 3,510 | | | Amgen* | | | 265,918 | | |
| | 13,130 | | | Applied Materials | | | 215,069 | | |
| | 10,270 | | | Archer-Daniels-Midland | | | 250,280 | | |
| | 2,215 | | | Automatic Data Processing | | | 103,352 | | |
| | 5,130 | | | Bank of America | | | 224,386 | | |
| | 3,350 | | | Becton Dickinson & Co | | | 170,012 | | |
| | 2,870 | | | Boeing Co | | | 185,517 | | |
| | 6,793 | | | Bristol-Myers Squibb | | | 143,808 | | |
| | 4,070 | | | Cardinal Health | | | 254,416 | | |
| | 9,787 | | | Citigroup Inc | | | 448,049 | | |
| | 3,174 | | | Clear Channel Communications | | | 96,553 | | |
| | 6,170 | | | Comcast Corp* (3) | | | 171,711 | | |
| | 11,470 | | | Compuware Corp* | | | 92,792 | | |
| | 3,480 | | | Duke Energy | | | 92,150 | | |
| | 4,540 | | | Eli Lilly & Co | | | 226,047 | | |
| | 18,413 | | | EMC Corp* | | | 257,045 | | |
| | 1,450 | | | Emerson Electric | | | 100,847 | | |
| | 2,524 | | | Express Scripts* (3) | | | 190,335 | | |
| | 15,200 | | | Exxon Mobil | | | 853,328 | | |
| | 2,040 | | | FedEx Corp | | | 187,537 | | |
| | 26,920 | | | General Electric | | | 912,857 | | |
| | 13,530 | | | Genworth Financial-Class A | | | 428,766 | | |
| | 2,350 | | | Grant Prideco* | | | 91,392 | | |
| | 7,620 | | | Home Depot | | | 312,725 | | |
| | 2,800 | | | IBM Corp | | | 229,264 | | |
| | 9,820 | | | Intel Corp | | | 230,770 | | |
| | 5,585 | | | Johnson & Johnson | | | 349,733 | | |
| | 5,181 | | | JP Morgan Chase | | | 189,728 | | |
| | 4,780 | | | Kellogg Co | | | 211,133 | | |
| | 4,620 | | | KLA-Tencor Corp | | | 213,860 | | |
| | 2,800 | | | Linear Technology | | | 92,988 | | |
| | 19,400 | | | Macquarie Infrastructure | | | 582,000 | | |
See Notes to Financial Statements.
Julius Baer Funds 2005 Annual Report
37
PORTFOLIO OF INVESTMENTS (Continued) October 31, 2005
Julius Baer Global Equity Fund Inc. (Percentage of Net Assets)
Share
Amount | | Description | | Market
Value (Note 1) | |
| COMMON STOCKS—Continued | | | |
| | | United States—Continued | |
| | 7,336 | | | McDonald's Corp | | $ | 231,818 | | |
| | 4,070 | | | Merck & Co | | | 114,855 | | |
| | 8,266 | | | Merrill Lynch | | | 535,141 | | |
| | 33,604 | | | Microsoft Corp | | | 863,623 | | |
| | 1,270 | | | Molson Coors Brewing-Class B | | | 78,359 | | |
| | 8,177 | | | Morgan Stanley | | | 444,911 | | |
| | 4,620 | | | Motorola Inc | | | 102,379 | | |
| | 1,678 | | | National Oilwell Varco* | | | 104,825 | | |
| | 2,058 | | | Noble Corp | | | 132,494 | | |
| | 1,540 | | | Paccar Inc | | | 107,831 | | |
| | 4,626 | | | Parker Hannifin | | | 289,958 | | |
| | 1,320 | | | Peabody Energy | | | 103,171 | | |
| | 5,804 | | | Pepsico Inc | | | 342,900 | | |
| | 6,900 | | | Pfizer Inc | | | 150,006 | | |
| | 7,980 | | | Procter & Gamble | | | 446,800 | | |
| | 8,234 | | | Prudential Financial | | | 599,353 | | |
| | 5,520 | | | Raytheon Co | | | 203,964 | | |
| | 8,130 | | | Safeway Inc (3) | | | 189,104 | | |
| | 2,510 | | | Sempra Energy | | | 111,193 | | |
| | 10,110 | | | Smurfit-Stone Container* | | | 106,762 | | |
| | 547 | | | Southern Copper | | | 30,162 | | |
| | 4,440 | | | Sprint Nextel | | | 103,496 | | |
| | 6,520 | | | Sysco Corp | | | 208,053 | | |
| | 2,042 | | | Target Corp | | | 113,719 | | |
| | 11,360 | | | Time Warner | | | 202,549 | | |
| | 6,750 | | | Tyco International | | | 178,133 | | |
| | 2,682 | | | United Parcel Service-Class B | | | 195,625 | | |
| | 4,350 | | | Verizon Communications | | | 137,069 | | |
| | 3,620 | | | W.W. Grainger | | | 242,468 | | |
| | 2,160 | | | Wal-Mart Stores | | | 102,190 | | |
| | 3,022 | | | Weyerhaeuser Co | | | 191,413 | | |
| | 8,327 | | | Wyeth | | | 371,051 | | |
| | | | 17,342,292 | | |
| | | Japan—6.4% | |
| | 600 | | | Aeon Credit Service (1) | | | 47,146 | | |
| | 7,000 | | | Bank of Yokohama (1) | | | 56,976 | | |
| | 9,000 | | | Bosch Corp (1) | | | 47,599 | | |
| | 1,800 | | | Canon Inc (1) | | | 95,257 | | |
| | 4,400 | | | Credit Saison (1) | | | 199,895 | | |
See Notes to Financial Statements.
Julius Baer Funds 2005 Annual Report
38
PORTFOLIO OF INVESTMENTS (Continued) October 31, 2005
Julius Baer Global Equity Fund Inc. (Percentage of Net Assets)
Share
Amount | | Description | | Market
Value (Note 1) | |
| COMMON STOCKS—Continued | | | |
| | | Japan—Continued | |
| | 2,200 | | | Denso Corp (1) | | $ | 62,784 | | |
| | 800 | | | Fuji Photo Film (1) | | | 25,547 | | |
| | 34 | | | Fuji Television Network (1) | | | 75,699 | | |
| | 3,156 | | | Honda Motor (1) | | | 175,291 | | |
| | 1,300 | | | Ibiden Co (1) | | | 52,929 | | |
| | 10 | | | Japan Tobacco (1) | | | 158,300 | | |
| | 14,000 | | | Matsushita Electric Industrial (1) | | | 256,989 | | |
| | 42 | | | Mitsubishi Tokyo Financial (1) | | | 529,620 | | |
| | 49 | | | Mizuho Financial (1) | | | 329,134 | | |
| | 2,000 | | | NGK Spark Plug (1) | | | 32,210 | | |
| | 200 | | | Nidec Corp* | | | 11,082 | | |
| | 2,527 | | | Nikko Securities (1) | | | 30,899 | | |
| | 5,959 | | | Nissan Motor (1) | | | 62,281 | | |
| | 1,100 | | | Nitto Denko (1) | | | 66,597 | | |
| | 9,716 | | | Nomura Holdings (1) | | | 149,618 | | |
| | 17,000 | | | Seiyu Ltd* (1) | | | 34,638 | | |
| | 2,248 | | | Sony Corp (1) | | | 73,312 | | |
| | 33 | | | Sumitomo Mitsui Financial (1) | | | 307,326 | | |
| | 700 | | | Takeda Chemical Industries (1) | | | 38,493 | | |
| | 1,080 | | | Takefuji Corp (1) | | | 75,900 | | |
| | 5,800 | | | Toyota Motor (1) | | | 269,285 | | |
| | 1,300 | | | Yamaha Motor (1) | | | 27,979 | | |
| | | | 3,292,786 | | |
| | | United Kingdom—6.4% | |
| | 12,041 | | | Aegis Group (1) | | | 26,539 | | |
| | 7,307 | | | BAA PLC (1) | | | 79,365 | | |
| | 5,159 | | | BAE Systems (1) | | | 30,169 | | |
| | 7,932 | | | Balfour Beatty (1) | | | 42,763 | | |
| | 9,939 | | | Barclays (1) | | | 98,485 | | |
| | 1,826 | | | BG Group (1) | | | 16,025 | | |
| | 3,640 | | | BP PLC ADR | | | 241,696 | | |
| | 3,462 | | | British Sky Broadcasting (1) | | | 31,260 | | |
| | 9,485 | | | Burberry Group (1) | | | 64,403 | | |
| | 16,938 | | | Compass Group (1) | | | 56,980 | | |
| | 24,024 | | | Diageo PLC (1) | | | 355,152 | | |
| | 3,299 | | | Exel PLC (1) | | | 70,441 | | |
| | 17,754 | | | GlaxoSmithkline PLC (1) | | | 461,947 | | |
| | 28,073 | | | Hilton Group (1) | | | 168,500 | | |
| | 3,397 | | | Imperial Tobacco (1) | | | 97,431 | | |
See Notes to Financial Statements.
Julius Baer Funds 2005 Annual Report
39
PORTFOLIO OF INVESTMENTS (Continued) October 31, 2005
Julius Baer Global Equity Fund Inc. (Percentage of Net Assets)
Share
Amount | | Description | | Market
Value (Note 1) | |
| COMMON STOCKS—Continued | | | |
| | | United Kingdom—Continued | |
| | 3,445 | | | National Grid (1) | | $ | 31,504 | | |
| | 2,121 | | | Pearson PLC (1) | | | 23,583 | | |
| | 8,940 | | | Peninsular and Oriental Steam Navigation (1) | | | 63,903 | | |
| | 1,273 | | | Peter Hambro Mining* (1) | | | 17,580 | | |
| | 6,027 | | | Prudential PLC (1) | | | 50,580 | | |
| | 3,688 | | | Reckitt Benckiser (1) | | | 111,463 | | |
| | 498 | | | Rhoen Klinikum (1) | | | 18,056 | | |
| | 7,940 | | | Rolls-Royce Group* (1) | | | 51,311 | | |
| | 2,837 | | | Royal Bank of Scotland (1) | | | 78,557 | | |
| | 4,717 | | | Scottish & Newcastle (1) | | | 39,020 | | |
| | 6,280 | | | Scottish Power (1) | | | 61,484 | | |
| | 11,079 | | | Smith & Nephew (1) | | | 93,758 | | |
| | 1,703 | | | Smiths Group (1) | | | 27,500 | | |
| | 561 | | | South African Breweries (1) | | | 10,581 | | |
| | 40,059 | | | Tesco PLC (1) | | | 213,296 | | |
| | 149,280 | | | Vodafone Group (1) | | | 391,834 | | |
| | 1,404 | | | Whitbread PLC (1) | | | 23,348 | | |
| | 4,878 | | | William Hill (1) | | | 46,128 | | |
| | 1,024 | | | Wolseley PLC (1) | | | 20,832 | | |
| | 7,775 | | | WPP Group (1) | | | 76,469 | | |
| | | | 3,291,943 | | |
| | | France—5.6% | |
| | 7,866 | | | Alcatel Alsthom* (1) | | | 92,263 | | |
| | 617 | | | Alstom* (1) | | | 29,539 | | |
| | 436 | | | Atos Origin* (1) | | | 29,965 | | |
| | 903 | | | Autoroutes du Sud de la France (1) | | | 50,345 | | |
| | 1,315 | | | BNP Paribas (1) | | | 99,638 | | |
| | 2,514 | | | Bouygues SA (1) | | | 123,983 | | |
| | 627 | | | Carrefour SA (1) | | | 27,851 | | |
| | 975 | | | Compagnie de Saint-Gobain (1) | | | 53,375 | | |
| | 731 | | | Compagnie Generale des Etablissements Michelin-Class B (1) | | | 39,423 | | |
| | 7,452 | | | France Telecom (1) | | | 193,598 | | |
| | 2,191 | | | Generale de Sante (1) | | | 75,832 | | |
| | 1,263 | | | JC Decaux* (1) | | | 25,799 | | |
| | 3,258 | | | Lafarge SA (1) | | | 267,776 | | |
| | 592 | | | L'Air Liquide (1) | | | 107,593 | | |
| | 3,132 | | | LVMH SA (1) | | | 253,445 | | |
| | 1,192 | | | Pernod-Ricard (1) | | | 208,227 | | |
| | 746 | | | Pinault-Printemps-Redoute (1) | | | 78,325 | | |
See Notes to Financial Statements.
Julius Baer Funds 2005 Annual Report
40
PORTFOLIO OF INVESTMENTS (Continued) October 31, 2005
Julius Baer Global Equity Fund Inc. (Percentage of Net Assets)
Share
Amount | | Description | | Market
Value (Note 1) | |
| COMMON STOCKS—Continued | | | |
| | | France—Continued | |
| | 1,396 | | | Publicis Groupe (1) | | $ | 46,155 | | |
| | 348 | | | Renault SA (1) | | | 30,099 | | |
| | 4,296 | | | Sanofi-Synthelabo (1) | | | 343,777 | | |
| | 704 | | | Schneider Electric (1) | | | 57,772 | | |
| | 2,010 | | | Societe Television Francaise (1) | | | 51,502 | | |
| | 4,311 | | | Suez SA (1) | | | 116,647 | | |
| | 1,203 | | | Total Fina-Class B (1) | | | 302,751 | | |
| | 975 | | | Vinci SA (1) | | | 76,110 | | |
| | 2,111 | | | Vivendi Universal (1) | | | 66,294 | | |
| | | | 2,848,084 | | |
| | | Germany—4.7% | |
| | 834 | | | Aareal Bank* (1) | | | 25,454 | | |
| | 447 | | | Adidas-Salomon (1) | | | 74,924 | | |
| | 406 | | | Allianz AG (1) | | | 57,309 | | |
| | 1,022 | | | BASF AG (1) | | | 73,632 | | |
| | 2,217 | | | Bayerische Hypo-und Vereinsbank* (1) | | | 61,742 | | |
| | 1,232 | | | Bilfinger and Berger Bau (1) | | | 53,250 | | |
| | 3,317 | | | Commerzbank AG (1) | | | 86,743 | | |
| | 676 | | | Continental AG (1) | | | 51,639 | | |
| | 1,181 | | | DaimlerChrysler AG-Registered (1) | | | 59,089 | | |
| | 1,185 | | | Deutsche Bank (1) | | | 110,920 | | |
| | 528 | | | Deutsche Boerse (1) | | | 49,650 | | |
| | 4,404 | | | Deutsche Post (1) | | | 98,101 | | |
| | 654 | | | Deutsche Postbank (1) | | | 36,028 | | |
| | 8,294 | | | Deutsche Telekom (1) | | | 146,542 | | |
| | 213 | | | Deutsche Wohnen (1) | | | 48,087 | | |
| | 1,871 | | | E.ON AG (1) | | | 169,445 | | |
| | 8,386 | | | Fraport AG (1) | | | 424,420 | | |
| | 464 | | | Freenet.de AG (1) | | | 10,672 | | |
| | 500 | | | Fresenius AG (1) | | | 64,437 | | |
| | 1,153 | | | Fresenius Medical Care (1) | | | 103,666 | | |
| | 721 | | | Henkel KGAA (1) | | | 57,354 | | |
| | 663 | | | Hypo Real Estate Holding (1) | | | 32,024 | | |
| | 3,002 | | | IVG Immobilien (1) | | | 57,703 | | |
| | 783 | | | Linde AG (1) | | | 55,748 | | |
| | 1,583 | | | Metro AG (1) | | | 71,954 | | |
| | 49 | | | Q-Cells AG* (1) | | | 2,688 | | |
| | 1,437 | | | RWE AG (1) | | | 91,724 | | |
| | 500 | | | Schering AG (1) | | | 30,874 | | |
See Notes to Financial Statements.
Julius Baer Funds 2005 Annual Report
41
PORTFOLIO OF INVESTMENTS (Continued) October 31, 2005
Julius Baer Global Equity Fund Inc. (Percentage of Net Assets)
Share
Amount | | Description | | Market
Value (Note 1) | |
| COMMON STOCKS—Continued | | | |
| | | Germany—Continued | |
| | 2,576 | | | Siemens AG (1) | | $ | 191,460 | | |
| | 202 | | | Solarworld AG (1) | | | 27,372 | | |
| | | | 2,424,651 | | |
| | | Switzerland—4.0% | |
| | 250 | | | BKW FMB Energie (1) | | | 16,788 | | |
| | 2,580 | | | Compagnie Financiere Richemont (1) | | | 98,050 | | |
| | 3,294 | | | Holcim Ltd (1) | | | 204,664 | | |
| | 1,749 | | | Nestle SA-Registered (1) | | | 519,890 | | |
| | 10,361 | | | Novartis AG-Registered (1) | | | 556,580 | | |
| | 2,982 | | | Roche Holding (1) | | | 444,901 | | |
| | 49 | | | SGS SA (1) | | | 36,058 | | |
| | 1,260 | | | The Swatch Group-Class B (1) | | | 174,413 | | |
| | | | 2,051,344 | | |
| | | Russia—2.3% | |
| | 400 | | | Avtovaz Sponsored GDR | | | 9,582 | | |
| | 1,300 | | | JSC MMC Norilsk Nickel ADR (3) | | | 94,770 | | |
| | 4,700 | | | LUKOIL ADR | | | 259,205 | | |
| | 25 | | | NovaTek OAO | | | 55,000 | | |
| | 882 | | | NovaTek OAO Sponsored GDR*† | | | 19,404 | | |
| | 4,100 | | | OAO Gazprom ADR (3) | | | 237,390 | | |
| | 438 | | | Sberbank RF | | | 389,820 | | |
| | 4,474 | | | Tyumen Oil* | | | 27,739 | | |
| | 598 | | | Unified Energy System GDR | | | 21,169 | | |
| | 5,300 | | | Uralsvyazinform ADR | | | 36,994 | | |
| | 6,400 | | | VolgaTelecom ADR | | | 46,464 | | |
| | | | 1,197,537 | | |
| | | Poland—2.0% | |
| | 421 | | | Agora SA (1) | | | 7,977 | | |
| | 6,877 | | | Bank PEKAO (1) | | | 325,560 | | |
| | 496 | | | Bank Prezemyslowo-Handlowy (1) | | | 94,347 | | |
| | 2,533 | | | Budimex* (1) | | | 29,455 | | |
| | 2,837 | | | CCC SA* (1) | | | 20,058 | | |
| | 1,428 | | | Opoczno SA* (1) | | | 18,109 | | |
| | 44,999 | | | Pko Bank Polski (1) | | | 377,568 | | |
| | 14,460 | | | Polski Koncern Miesy Duda* (1) | | | 44,308 | | |
| | 15,756 | | | Telekomunikacja Polska (1) | | | 112,996 | | |
| | | | 1,030,378 | | |
See Notes to Financial Statements.
Julius Baer Funds 2005 Annual Report
42
PORTFOLIO OF INVESTMENTS (Continued) October 31, 2005
Julius Baer Global Equity Fund Inc. (Percentage of Net Assets)
Share
Amount | | Description | | Market
Value (Note 1) | |
| COMMON STOCKS—Continued | | | |
| | | Sweden—2.0% | |
| | 3,100 | | | Capio AB* (1) | | $ | 53,512 | | |
| | 4,900 | | | ForeningsSparbanken AB (1) | | | 120,866 | | |
| | 4,400 | | | Getinge AB-Class B (1) | | | 54,955 | | |
| | 1,900 | | | Modern Times Group-Class B* (1) | | | 72,656 | | |
| | 24,000 | | | Nordea AB (1) | | | 235,087 | | |
| | 11,800 | | | Skandinaviska Enskilda Banken (1) | | | 220,057 | | |
| | 7,500 | | | Skanska AB-Class B (1) | | | 105,018 | | |
| | 5,495 | | | Svenska Handelsbanken-Class A (1) | | | 125,248 | | |
| | 5,500 | | | TeliaSonera AB (1) | | | 26,856 | | |
| | | | 1,014,255 | | |
| | | Italy—1.8% | |
| | 3,949 | | | Assicurazioni Generali (1) | | | 117,400 | | |
| | 1,478 | | | Autostrada Torino-Milano (1) | | | 28,063 | | |
| | 19,916 | | | Banca Intesa (1) | | | 92,901 | | |
| | 20,391 | | | Banca Intesa-RNC (1) | | | 88,275 | | |
| | 11,723 | | | Banca Popolare di Milano (1) | | | 111,607 | | |
| | 788 | | | Banca Popolare Emilia Romagna (1) | | | 41,559 | | |
| | 3,284 | | | Banche Popolari Unite (1) | | | 69,456 | | |
| | 2,728 | | | Banco Popolare di Verona (1) | | | 50,314 | | |
| | 37,444 | | | Beni Stabili (1) | | | 35,859 | | |
| | 3,556 | | | Buzzi Unicem (1) | | | 49,904 | | |
| | 9,901 | | | Capitalia SpA (1) | | | 51,606 | | |
| | 25,125 | | | Cassa di Risparmio Di Firenze (1) | | | 74,881 | | |
| | 5,802 | | | Credito Emiliano (1) | | | 61,172 | | |
| | 402 | | | Geox SpA (1) | | | 3,815 | | |
| | 1,286 | | | Luxottica Group (1) | | | 31,078 | | |
| | 9,009 | | | Parmalat SpA* (1) | | | 26,297 | | |
| | | | 934,187 | | |
| | | Turkey—1.8% | |
| | 24,929 | | | Akbank TAS (1) | | | 155,013 | | |
| | 124 | | | Alarko Gayrimenkul Yatirum Ortakligi* (1) | | | 5,691 | | |
| | 1,207 | | | Bim Birlesik Magazalar* | | | 29,238 | | |
| | 55,420 | | | Dogan Sirketler Grubu* (1) | | | 138,793 | | |
| | 12,229 | | | Eczacibasi Ilac Sanayi ve Ticaret (1) | | | 34,811 | | |
| | 32,525 | | | Haci Omer Sabanci (1) | | | 151,861 | | |
| | 24,940 | | | Koc Holding (1) | | | 93,195 | | |
| | 51,520 | | | Turkiye Garanti Bankasi* (1) | | | 153,222 | | |
| | 22,750 | | | Turkiye Is Bankasi (1) | | | 157,653 | | |
| | | | 919,477 | | |
See Notes to Financial Statements.
Julius Baer Funds 2005 Annual Report
43
PORTFOLIO OF INVESTMENTS (Continued) October 31, 2005
Julius Baer Global Equity Fund Inc. (Percentage of Net Assets)
Share
Amount | | Description | | Market
Value (Note 1) | |
| COMMON STOCKS—Continued | | | |
| | | Austria—1.7% | |
| | 2,626 | | | Bank Austria Creditanstalt (1) | | $ | 288,322 | | |
| | 457 | | | Flughafen Wien (1) | | | 29,563 | | |
| | 7,889 | | | Immoeast Immobilien Anlagen* (1) | | | 77,485 | | |
| | 3,655 | | | OMV AG (1) | | | 197,133 | | |
| | 2,419 | | | Raiffeisen International Bank Holding* (1) | | | 152,174 | | |
| | 4,484 | | | Telekom Austria (1) | | | 92,548 | | |
| | 1,049 | | | Wienerberger AG (1) | | | 40,530 | | |
| | | | 877,755 | | |
| | | Australia—1.3% | |
| | 11,479 | | | BHP Billiton (1) | | | 177,994 | | |
| | 6,319 | | | Brambles Industries (1) | | | 40,019 | | |
| | 2,028 | | | CSL Ltd (1) | | | 56,984 | | |
| | 22,947 | | | Macquarie Airports (1) | | | 51,638 | | |
| | 12,701 | | | Newcrest Mining (1) | | | 173,389 | | |
| | 4,408 | | | News Corp (1) | | | 65,834 | | |
| | 8,303 | | | Patrick Corp (1) | | | 42,510 | | |
| | 808 | | | Rio Tinto (1) | | | 34,101 | | |
| | 4,955 | | | Transurban Group (1) | | | 23,757 | | |
| | | | 666,226 | | |
| | | Netherlands—1.2% | |
| | 1,775 | | | ABN Amro Holding (1) | | | 41,937 | | |
| | 3,068 | | | Aegon NV (1)(3) | | | 46,141 | | |
| | 200 | | | Efes Breweries International GDR*† | | | 6,326 | | |
| | 676 | | | Euronext NV (1) | | | 28,705 | | |
| | 1,537 | | | European Aeronautic Defense and Space (1) | | | 53,184 | | |
| | 2,296 | | | Heineken NV (1) | | | 72,673 | | |
| | 4,424 | | | Philips Electronics (1) | | | 115,597 | | |
| | 4,128 | | | Royal KPN (1) | | | 39,258 | | |
| | 936 | | | Royal Numico* (1) | | | 37,864 | | |
| | 3,631 | | | TNT NV (1) | | | 85,661 | | |
| | 1,125 | | | Unilever NV (1) | | | 79,130 | | |
| | 805 | | | VNU NV (1) | | | 25,576 | | |
| | | | 632,052 | | |
| | | Norway—1.1% | |
| | 14,500 | | | Acta Holding (1) | | | 34,156 | | |
| | 1,200 | | | Cermaq ASA* (1) | | | 9,119 | | |
See Notes to Financial Statements.
Julius Baer Funds 2005 Annual Report
44
PORTFOLIO OF INVESTMENTS (Continued) October 31, 2005
Julius Baer Global Equity Fund Inc. (Percentage of Net Assets)
Share
Amount | | Description | | Market
Value (Note 1) | |
| COMMON STOCKS—Continued | | | |
| | | Norway—Continued | |
| | 2,440 | | | Norsk Hydro (1) | | $ | 242,286 | | |
| | 11,050 | | | Statoil ASA (1) | | | 245,615 | | |
| | 6,000 | | | Tomra Systems (1) | | | 41,147 | | |
| | | | 572,323 | | |
| | | Czech Republic—1.0% | |
| | 641 | | | CEZ (1) | | | 16,817 | | |
| | 3,313 | | | Komercni Banka (1) | | | 465,055 | | |
| | | | 481,872 | | |
| | | Denmark—0.9% | |
| | 390 | | | Chr Hansen Holding-Class B (1) | | | 36,548 | | |
| | 3,214 | | | Danske Bank (1) | | | 100,730 | | |
| | 750 | | | Kobenhavns Lufthavne (1) | | | 237,525 | | |
| | 600 | | | Novo Nordisk-Class B (1) | | | 30,795 | | |
| | 550 | | | Royal UNIBREW (1) | | | 42,658 | | |
| | 1,067 | | | Vestas Wind Systems* (1) | | | 23,089 | | |
| | | | 471,345 | | |
| | | Hungary—0.9% | |
| | 17,751 | | | Magyar Telekom RT (1) | | | 84,359 | | |
| | 10,402 | | | OTP Bank (1) | | | 376,149 | | |
| | | | 460,508 | | |
| | | Belgium—0.8% | |
| | 427 | | | Almancora (1) | | | 41,385 | | |
| | 2,769 | | | Fortis (1) | | | 78,777 | | |
| | 1,602 | | | InBev (1) | | | 63,975 | | |
| | 2,938 | | | KBC Groupe (1) | | | 239,203 | | |
| | | | 423,340 | | |
| | | Spain—0.7% | |
| | 543 | | | Cintra Concesiones De Infrae (1) | | | 6,433 | | |
| | 1,459 | | | Corporacion Mapfre (1) | | | 25,535 | | |
| | 3,210 | | | Endesa SA (1) | | | 79,790 | | |
| | 958 | | | Fadesa Inmobiliaria (1) | | | 32,191 | | |
| | 1,112 | | | Grupo Ferrovial (1) | | | 82,068 | | |
| | 1,792 | | | Inditex SA (1) | | | 52,996 | | |
| | 2,144 | | | Promotora de Informaciones (1) | | | 39,294 | | |
| | 1,893 | | | Telefonica SA | | | 30,178 | | |
| | | | 348,485 | | |
See Notes to Financial Statements.
Julius Baer Funds 2005 Annual Report
45
PORTFOLIO OF INVESTMENTS (Continued) October 31, 2005
Julius Baer Global Equity Fund Inc. (Percentage of Net Assets)
Share
Amount | | Description | | Market
Value (Note 1) | |
| COMMON STOCKS—Continued | | | |
| | | South Korea—0.5% | |
| | 511 | | | Samsung Electronics (1) | | $ | 273,443 | | |
| | | Finland—0.5% | |
| | 4,000 | | | Fortum Oyj (1) | | | 70,771 | | |
| | 9,550 | | | Nokia Oyj (1) | | | 160,156 | | |
| | 1,000 | | | Nokia Oyj ADR | | | 16,820 | | |
| | 650 | | | Stockman Oyj-Class B (1) | | | 23,162 | | |
| | | | 270,909 | | |
| | | Romania—0.4% | |
| | 72,428 | | | Impact SA | | | 10,051 | | |
| | 11,750 | | | Romanian Bank for Development | | | 49,611 | | |
| | 1,168,539 | | | SNP Petrom* | | | 152,985 | | |
| | | | 212,647 | | |
| | | Netherland Antilles—0.3% | |
| | 1,868 | | | Schlumberger Ltd | | | 169,558 | | |
| | | Mexico—0.3% | |
| | 7,066 | | | Fomento Economico Mexicano | | | 47,914 | | |
| | 400 | | | Fomento Economico Mexicano ADR | | | 27,196 | | |
| | 9,875 | | | Grupo Financiero Banorte | | | 84,114 | | |
| | | | 159,224 | | |
| | | Greece—0.3% | |
| | 950 | | | Alpha Bank (1) | | | 27,257 | | |
| | 3,200 | | | Hellenic Telecommunication* (1) | | | 66,112 | | |
| | 1,326 | | | National Bank of Greece (1) | | | 51,780 | | |
| | | | 145,149 | | |
| | | Canada—0.3% | |
| | 7,641 | | | Bema Gold* | | | 19,239 | | |
| | 170 | | | Centerra Gold* | | | 3,264 | | |
| | 3,929 | | | Eldorado Gold* | | | 12,025 | | |
| | 400 | | | Ivanhoe Mines* | | | 3,005 | | |
| | 2,790 | | | Nova Chemicals | | | 99,910 | | |
| | | | 137,443 | | |
| | | Cayman Islands—0.3% | |
| | 2,390 | | | ACE Ltd | | | 124,519 | | |
See Notes to Financial Statements.
Julius Baer Funds 2005 Annual Report
46
PORTFOLIO OF INVESTMENTS (Continued) October 31, 2005
Julius Baer Global Equity Fund Inc. (Percentage of Net Assets)
Share
Amount | | Description | | Market
Value (Note 1) | |
| COMMON STOCKS—Continued | | | |
| | | Ireland—0.2% | |
| | 44,231 | | | Dragon Oil* (1) | | $ | 118,885 | | |
| | | Indonesia—0.2% | |
| | 430,500 | | | Bank Mandiri Persero (1) | | | 56,295 | | |
| | 116,500 | | | Telekomunikasi Indonesia (1) | | | 58,393 | | |
| | | | 114,688 | | |
| | | Croatia—0.2% | |
| | 102 | | | Atlantska Plovidba* | | | 15,437 | | |
| | 528 | | | Dom Holding* | | | 12,055 | | |
| | 84 | | | Ericsson Nikola Tesla | | | 27,189 | | |
| | 18 | | | Institut Gradevinarstva* | | | 7,991 | | |
| | 492 | | | Podravka Prehrambena Industija* | | | 25,301 | | |
| | 347 | | | Proficio Dd* | | | 4,800 | | |
| | 205 | | | Validus Dd* (2) | | | 3,002 | | |
| | 32 | | | Viadukt Dd* | | | 3,223 | | |
| | | | 98,998 | | |
| | | China—0.2% | |
| | 60,000 | | | Beijing Capital International Airport-Class H (1) | | | 24,213 | | |
| | 26,500 | | | Weiqiao Textile (1) | | | 32,149 | | |
| | 16,000 | | | Wumart Stores-Class H (1) | | | 33,084 | | |
| | | | 89,446 | | |
| | | Hong Kong—0.1% | |
| | 16,000 | | | China Merchants Holdings International (1) | | | 31,131 | | |
| | 16,000 | | | Clear Media* (1) | | | 13,441 | | |
| | 34,000 | | | Texwinca Holdings (1) | | | 22,954 | | |
| | | | 67,526 | | |
| | | Portugal—0.1% | |
| | 20,432 | | | Banco Comercial Portugues (1) | | | 51,643 | | |
| | | Cyprus—0.1% | |
| | 9,950 | | | Bank of Cyprus (1) | | | 50,389 | | |
| | | Luxembourg—0.1% | |
| | 800 | | | TVSL SA* | | | 44,077 | | |
| | | New Zealand—0.1% | |
| | 27,755 | | | Auckland International Airport (1) | | | 38,155 | | |
See Notes to Financial Statements.
Julius Baer Funds 2005 Annual Report
47
PORTFOLIO OF INVESTMENTS (Continued) October 31, 2005
Julius Baer Global Equity Fund Inc. (Percentage of Net Assets)
Share
Amount | | Description | | Market
Value (Note 1) | |
| COMMON STOCKS—Continued | | | |
| | | Bermuda—0.1% | |
| | 500 | | | Central European Media-Class A* | | $ | 23,245 | | |
| | | Brazil—0.0% | |
| | 1,000 | | | Diagnosticos da America* | | | 16,206 | | |
| | | India—0.0% | |
| | 2,600 | | | India Cements GDR*† (3) | | | 10,174 | | |
| | | Kazkhstan—0.0% | |
| | 318 | | | Kazakhmys PLC* (1) | | | 3,040 | | |
| | | | | TOTAL COMMON STOCKS (Cost $41,569,729) | | | 43,500,204 | | |
| PREFERRED STOCKS—0.1% | | | |
| | | Germany—0.1% | |
| | 2,326 | | | ProsiebenSat.1 Media (1) | | | 40,061 | | |
| | 315 | | | Volkswagen AG (1) | | | 12,792 | | |
| | | | 52,853 | | |
| | | Croatia—0.0% | |
| | 32 | | | Adris Grupa | | | 17,836 | | |
| | | | | TOTAL PREFERRED STOCKS (Cost $80,119) | | | 70,689 | | |
| INVESTMENT FUNDS—2.8% | | | |
| | | United States—2.6% | |
| | 20,200 | | | Financial Select Sector SPDR Fund | | | 614,484 | | |
| | 6,059 | | | SPDR Trust Series 1 (3) | | | 727,868 | | |
| | | | 1,342,352 | | |
| | | Romania—0.1% | |
| | 19,500 | | | SIF 1 Banat Crisana Arad | | | 11,552 | | |
| | 21,000 | | | SIF 2 Moldova Bacau | | | 12,716 | | |
| | 16,000 | | | SIF 3 Transilvania Brasov | | | 9,269 | | |
| | 29,000 | | | SIF 4 Muntenia Bucuresti | | | 12,055 | | |
| | 18,500 | | | SIF 5 Oltenia Craiova | | | 13,018 | | |
| | | | 58,610 | | |
| | | Australia—0.1% | |
| | 11,505 | | | Australian Infrastructure Fund (1) | | | 20,670 | | |
| | | | | TOTAL INVESTMENT FUNDS (Cost $1,405,045) | | | 1,421,632 | | |
See Notes to Financial Statements.
Julius Baer Funds 2005 Annual Report
48
PORTFOLIO OF INVESTMENTS (Continued) October 31, 2005
Julius Baer Global Equity Fund Inc. (Percentage of Net Assets)
Share
Amount | | Description | | Market
Value (Note 1) | |
| RIGHTS—0.0% | | | |
| | | Cyprus—0.0% | |
| | 9,950 | | | Bank of Cyprus Public Rights, Expires 12/19/2005 (Cost $0) | | $ | 3,575 | | |
| WARRANTS—0.4% | | | |
| | | India—0.4% | |
| | 19,908 | | | Bharti Televentures-Class A Warrants, Expires 05/31/2010*† | | | 142,509 | | |
| | 8,485 | | | Bharti Televentures Warrants, Expires 04/03/2006*† | | | 67,155 | | |
| | | | | TOTAL WARRANTS (Cost $193,443) | | | 209,664 | | |
| STRUCTURED NOTES—0.1% | | | |
Face
Value | |
Currency | |
| |
| |
| | | | | | | Philippines—0.1% | | | | | |
| | 5 | | | USD | | Phillippines Notes, due 10/17/2006 (Cost $74,246)*† | | | 76,011 | | |
| U.S. GOVERNMENT AND AGENCY OBLIGATIONS—0.3% | | | |
| | | | | | | United States—0.3% | | | | | |
| | 100,000 | | | USD | | U.S. Treasury Bill 3.340%, due 11/17/2005 (4) | | | 99,852 | | |
| | 40,000 | | | USD | | U.S. Treasury Bill 3.450%, due 11/25/2005 (4) | | | 39,908 | | |
| | | | | | | TOTAL U.S. GOVERNMENT AND AGENCY OBLIGATIONS
(Cost $139,759) | | | 139,760 | | |
SHORT-TERM INVESTMENTS PURCHASED WITH CASH COLLATERAL
FROM SECURITY LENDING—3.3% | | | |
| | | | | United States—2.2% | |
| | 18,580 | | | USD | | American Beacon Funds 3.806%, due 11/01/2005 (5) | | | 18,580 | | |
| | 46,443 | | | USD | | Bank of America 3.770%, due 01/17/2006 (5) | | | 46,443 | | |
| | 37,155 | | | USD | | Bear Stearns & Co 4.198%, due 12/06/2005 (5) | | | 37,155 | | |
| | 24,082 | | | USD | | BGI Institional 3.923%, due 11/01/2005 (5) | | | 24,082 | | |
| | 92,887 | | | USD | | Branch Banker & Trust 3.835%, due 11/22/2005 (5) | | | 92,887 | | |
| | 130,984
| | | USD
| | Credit Suisse First Boston, with rates ranging from
3.880%-4.105% and maturity dates ranging from
11/01/2005-03/10/2006 (5) | | |
130,984 | | |
| | 21,859
| | | USD
| | Goldman Sachs Financial Square Prime Obligations Fund
3.788%, due 11/01/2005 (5) | | |
21,859 | | |
| | 302,513
| | | USD
| | Goldman Sachs Group, with rates ranging from
4.020%-4.103% and maturity dates ranging from
11/01/2005-11/07/2005 (5) | | |
302,513 | | |
| | 18,577 | | | USD | | Harris Trust & Savings Bank 3.795%, due 11/04/2005 (5) | | | 18,577 | | |
See Notes to Financial Statements.
Julius Baer Funds 2005 Annual Report
49
PORTFOLIO OF INVESTMENTS (Continued) October 31, 2005
Julius Baer Global Equity Fund Inc. (Percentage of Net Assets)
Face
Value | |
Currency | |
Description | | Market
Value (Note 1) | |
SHORT-TERM INVESTMENTS PURCHASED WITH CASH COLLATERAL
FROM SECURITY LENDING—Continued | | | |
| | | | | United States—Continued | |
| | 4,273 | | | USD | | Lehman Brothers Repo/Triparty 4.103%, due 11/01/2005 (5) | | $ | 4,273 | | |
| | 222,533 | | | USD | | Merrill Lynch & Co 4.103%, due 11/01/2005 (5) | | | 222,533 | | |
| | 126,796 | | | USD | | Merrimac Cash Fund-Premium Class 3.700%, due 11/01/2005 (5) | | | 126,796 | | |
| | 19,817 | | | USD | | Morgan Stanley Dean Witter & Co 4.168%, due 11/01/2005 (5) | | | 19,817 | | |
| | 27,866 | | | USD | | Ranger Funding 3.989%, due 11/15/2005 (5) | | | 27,866 | | |
| | 37,155 | | | USD | | Wells Fargo 4.010%, due 12/12/2005 (5) | | | 37,155 | | |
| | | | 1,131,520 | | |
| | | | | United Kingdom—0.5% | |
| | 278,660
| | | USD
| | Royal Bank of Scotland, with rates ranging from
3.760%-4.000% and maturity dates ranging from
11/01/2005-12/12/2005. (5) | | |
278,660 | | |
| | | | | Canada—0.4% | |
| | 92,887
| | | USD
| | Canadian Imperial Bank of Commerce
4.075%, due 05/18/2006 (5) | | |
92,887 | | |
| | 92,887 | | | USD | | Royal Bank of Canada 3.825%, due 11/22/2005 (5) | | | 92,887 | | |
| | | | 185,774 | | |
| | | | | Belgium—0.2% | |
| | 111,464 | | | USD | | Fortis Bank, with rates ranging from 3.850%-4.010% and
maturity dates ranging from 11/03/2005-11/28/2005. (5) | | |
111,464 | | |
| | | | | | | TOTAL SHORT-TERM INVESTMENTS PURCHASED
WITH CASH COLLATERAL FROM SECURITY LENDING
(Cost $1,707,418) | | |
1,707,418 | | |
| REPURCHASE AGREEMENTS—1.4% | | | |
| | | | | United States—1.4% | |
| | 713,328 | | | USD | | Investors Bank & Trust Company Repurchase Agreement, | | |
| | |
| | | | | | | dated 10/31/2005, due 11/01/2005, with a maturity value | | |
| | |
| | | | | | | of $713,382 and an effective yield of 2.75%, collaterallized | | |
| | |
| | | | | | | by a U.S. Government and Agency Obligation, with a rate | | |
| | |
| | | | | | | of 6.50%, a maturity of 07/01/2021, and an aggregate | | |
| | |
| | | | | | | market value of $748,994. (Cost $713,328) | | | 713,328 | | |
| | | | | | | TOTAL INVESTMENTS—93.0% (Cost $45,883,087) | | | 47,842,281 | | |
| | | | | | | OTHER ASSETS AND LIABILITIES (Net)—7.0% | | | 3,575,996 | | |
| | | | | | | TOTAL NET ASSETS—100.0% | | $ | 51,418,277 | | |
See Notes to Financial Statements.
Julius Baer Funds 2005 Annual Report
50
PORTFOLIO OF INVESTMENTS (Continued) October 31, 2005
Julius Baer Global Equity Fund Inc. (Percentage of Net Assets)
Notes to the Portfolio of Investments:
ADR American Depositary Receipt
GDR Global Depositary Receipt
(1) Security valued at fair value utilizing the fair value model in accordance with valuation policies approved by the board of directors.
(2) Illiquid security
(3) All or a portion of this security was on loan to brokers at October 31, 2005.
(4) Security has been pledged for futures collateral.
(5) Represents investments of security lending collateral.
* Non-income producing security.
† Securities exempt from registration under Rule 144A of the Securities Act of 1933. These securities may be resold in transactions exempt from registrations, normally to qualified institutional buyers.
Aggregate cost for federal income tax purposes was $46,003,653.
Glossary of Currencies
USD — United States Dollar
See Notes to Financial Statements.
Julius Baer Funds 2005 Annual Report
51
SCHEDULE OF FORWARD FOREIGN EXCHANGE CONTRACTS
October 31, 2005
Julius Baer Global Equity Fund Inc.
FORWARD FOREIGN EXCHANGE CONTRACTS TO BUY
| | | Contracts to Receive | | | |
Expiration
Date | | Local | | Value in
Currency | | In Exchange
USDfor USD | | Net Unrealized
Depreciation | |
| 11/01/2005 | | CHF | 5,469 | | | | 4,236 | | | | 4,284 | | | $ | (48 | ) | |
| 11/02/2005 | | CHF | 8,064 | | | | 6,246 | | | | 6,246 | | | | 0 | | |
| 11/02/2005 | | CZK | 795,959 | | | | 32,154 | | | | 32,426 | | | | (272 | ) | |
| 11/02/2005 | | DKK | 187,123 | | | | 30,033 | | | | 30,033 | | | | 0 | | |
| 11/02/2005 | | EUR | 21,755 | | | | 26,056 | | | | 26,056 | | | | 0 | | |
| 11/01/2005 | | GBP | 27,038 | | | | 47,863 | | | | 48,043 | | | | (180 | ) | |
| 12/09/2005 | | JPY | 195,663,314 | | | | 1,688,022 | | | | 1,772,698 | | | | (84,676 | ) | |
| Net unrealized depreciation on forward foreign exchange contracts to buy | | | | | | | | | | | | | | $ | (85,176 | ) | |
FORWARD FOREIGN EXCHANGE CONTRACTS TO SELL
| | | Contracts to Deliver | | | |
Expiration
Date | | Local | | Value in
Currency | | In Exchange
USDfor USD | | Net Unrealized
Appreciation
(Depreciation) | |
| 12/27/2005 | | CZK | 2,146,234 | | | | 86,971 | | | | 88,279 | | | $ | 1,308 | | |
| 12/29/2005 | | CZK | 3,319,470 | | | | 134,528 | | | | 135,870 | | | | 1,342 | | |
| 01/23/2006 | | CZK | 2,345,286 | | | | 95,173 | | | | 94,721 | | | | (452 | ) | |
| 11/01/2005 | | EUR | 43,346 | | | | 51,917 | | | | 52,328 | | | | 411 | | |
| 11/02/2005 | | EUR | 57,133 | | | | 68,431 | | | | 68,704 | | | | 273 | | |
| 11/02/2005 | | GBP | 14,771 | | | | 26,148 | | | | 26,056 | | | | (92 | ) | |
| 12/29/2005 | | HUF | 20,971,008 | | | | 100,138 | | | | 100,953 | | | | 815 | | |
| 12/27/2005 | | PLN | 577,920 | | | | 174,420 | | | | 178,740 | | | | 4,320 | | |
| 12/27/2005 TRY | | | 207,110 | | | | 150,892 | | | | 148,679 | | | | (2,213 | ) | |
| Net unrealized appreciation on forward foreign exchange contracts to sell | | | | | | | | | | | | | | $ | 5,712 | | |
Glossary of Currencies
CHF — Swiss Franc
CZK — Czech Koruna
DKK — Danish Krone
EUR — Euro
GBP — British Pound Sterling
HUF — Hungarian Forint
JPY — Japanese Yen
PLN — Polish Zloty
TRY — Turkish Lira
See Notes to Financial Statements.
Julius Baer Funds 2005 Annual Report
52
PORTFOLIO OF INVESTMENTS–Industry Sector (Unaudited) October 31, 2005
Julius Baer Global Equity Fund Inc. (Percentage of Net Assets)
At October 31, 2005, sector diversification of the Fund's investments were as follows:
| % of Net | | Market
Assets | | Value (Note 1) | |
| INDUSTRY SECTOR | |
| Financials | | | 26.6 | % | | $ | 13,662,717 | | |
| Industrials | | | 12.1 | | | | 6,242,393 | | |
| Healthcare | | | 9.4 | | | | 4,830,213 | | |
| Consumer Discretionary | | | 9.3 | | | | 4,784,965 | | |
| Consumer Staples | | | 9.1 | | | | 4,674,861 | | |
| Energy | | | 5.9 | | | | 3,037,437 | | |
| Information Technology | | | 5.3 | | | | 2,753,014 | | |
| Materials | | | 4.3 | | | | 2,216,009 | | |
| Telecommunications | | | 3.4 | | | | 1,740,167 | | |
| Utilities | | | 2.6 | | | | 1,339,998 | | |
| US Treasury Bills | | | 0.3 | | | | 139,760 | | |
| Cash & Cash Equivalents | | | 4.7 | | | | 2,420,747 | * | |
| Total Investments | | | 93.0 | | | | 47,842,281 | | |
| Other Assets and Liabilities (Net) | | | 7.0 | | | | 3,575,996 | * | |
| Net Assets | | | 100.0 | % | | $ | 51,418,277 | | |
* Cash and Cash Equivalents and Other Assets and Liabilities (Net) include the margin requirements for $2,551,664 and notional market value for futures, which is 5% of net assets.
See Notes to Financial Statements.
Julius Baer Funds 2005 Annual Report
53
PORTFOLIO OF INVESTMENTS October 31, 2005
Julius Baer International Equity Fund (Percentage of Net Assets)
Share
Amount | | Description | | Market
Value (Note 1) | |
| COMMON STOCKS—85.7% | | | |
| | | Japan—11.3% | |
| | 126,700 | | | Acom Co (2) | | $ | 8,251,135 | | |
| | 261,366 | | | Aeon Credit Service (2) | | | 20,537,463 | | |
| | 196,050 | | | Aiful Corp (2) | | | 14,653,538 | | |
| | 354,400 | | | Aisin Seiki (2) | | | 10,689,506 | | |
| | 345,100 | | | Astellas Pharma (2) | | | 12,340,500 | | |
| | 696,000 | | | Bank of Fukuoka (1)(2) | | | 5,439,394 | | |
| | 4,289,000 | | | Bank of Yokohama (2) | | | 34,909,764 | | |
| | 2,432,556 | | | Bosch Corp (1)(2) | | | 12,865,219 | | |
| | 480,000 | | | Bridgestone Corp (2) | | | 9,824,701 | | |
| | 1,119,759 | | | Canon Inc (2) | | | 59,258,571 | | |
| | 645,000 | | | Chiba Bank (2) | | | 5,767,870 | | |
| | 1,211,995 | | | Credit Saison (2) | | | 55,061,738 | | |
| | 422,000 | | | Dai Nippon Printing (2) | | | 6,893,379 | | |
| | 386,000 | | | Daihatsu Motor (2) | | | 3,682,039 | | |
| | 1,182,957 | | | Denso Corp (2) | | | 33,759,191 | | |
| | 2,738 | | | East Japan Railway (2) | | | 16,321,738 | | |
| | 171,600 | | | Exedy Corp (2) | | | 4,008,042 | | |
| | 72,800 | | | Fanuc Ltd (2) | | | 5,754,200 | | |
| | 393,956 | | | Fuji Photo Film (2) | | | 12,580,627 | | |
| | 12,356 | | | Fuji Television Network (2) | | | 27,510,083 | | |
| | 1,093,000 | | | Gunma Bank (2) | | | 7,813,050 | | |
| | 531,900 | | | Hitachi Credit (1)(2) | | | 11,286,280 | | |
| | 1,233,949 | | | Honda Motor (2) | | | 68,536,338 | | |
| | 522,900 | | | Ibiden Co (1)(2) | | | 21,289,860 | | |
| | 5,484 | | | Japan Tobacco (2) | | | 86,811,583 | | |
| | 912,000 | | | Joyo Bank (2) | | | 6,116,536 | | |
| | 2,072 | | | Jupiter Telecommunications* (2) | | | 1,671,825 | | |
| | 1,224,148 | | | Koito Manufacturing (2) | | | 16,409,909 | | |
| | 6,343,687 | | | Matsushita Electric Industrial (2) | | | 116,446,987 | | |
| | 20,806 | | | Mitsubishi Tokyo Financial (2) | | | 262,363,633 | | |
| | 24,737 | | | Mizuho Financial (2) | | | 166,158,926 | | |
| | 308,000 | | | Neomax Co Ltd (2) | | | 9,344,599 | | |
| | 566,000 | | | NGK Spark Plug (2) | | | 9,115,504 | | |
| | 88,100 | | | Nidec Corp* | | | 4,881,620 | | |
| | 757,172 | | | Nikko Securities (2) | | | 9,260,063 | | |
| | 2,425,490 | | | Nissan Motor (2) | | | 25,350,339 | | |
| | 546,100 | | | Nitto Denko (2) | | | 33,062,314 | | |
| | 3,059,699 | | | Nomura Holdings (2) | | | 47,116,661 | | |
| | 33,600 | | | Orix Corp (2) | | | 6,298,937 | | |
See Notes to Financial Statements.
Julius Baer Funds 2005 Annual Report
54
PORTFOLIO OF INVESTMENTS (Continued) October 31, 2005
Julius Baer International Equity Fund (Percentage of Net Assets)
Share
Amount | | Description | | Market
Value (Note 1) | |
| COMMON STOCKS—Continued | | | |
| | | Japan—Continued | |
| | 306,000 | | | Ricoh Co (2) | | $ | 4,848,171 | | |
| | 148,500 | | | Secom Co (2) | | | 7,443,448 | | |
| | 4,172,625 | | | Seiyu Ltd* (1)(2) | | | 8,501,790 | | |
| | 447,260 | | | Seven & I Holdings* (2) | | | 14,600,644 | | |
| | 44,495 | | | SMC Corp (2) | | | 5,943,049 | | |
| | 1,158,483 | | | Sony Corp (2) | | | 37,780,649 | | |
| | 16,811 | | | Sumitomo Mitsui Financial (2) | | | 156,559,196 | | |
| | 1,870,653 | | | Sumitomo Trust & Banking (2) | | | 15,893,557 | | |
| | 318,800 | | | Takeda Chemical Industries (2) | | | 17,530,847 | | |
| | 304,770 | | | Takefuji Corp (2) | | | 21,418,585 | | |
| | 597,000 | | | Toppan Printing (2) | | | 5,769,239 | | |
| | 1,732,000 | | | Toshiba Corp (2) | | | 8,060,844 | | |
| | 2,834,695 | | | Toyota Motor (2) | | | 131,610,326 | | |
| | 755,400 | | | Yamaha Motor (2) | | | 16,257,924 | | |
| | | | 1,721,661,931 | | |
| | | United Kingdom—10.2% | |
| | 3,567,180 | | | Aegis Group (2) | | | 7,862,233 | | |
| | 2,603,980 | | | Associated British Ports (2) | | | 25,235,544 | | |
| | 2,835,154 | | | BAE Systems (2) | | | 16,579,573 | | |
| | 2,276,601 | | | Balfour Beatty (2) | | | 12,273,539 | | |
| | 3,908,012 | | | Barclays (2) | | | 38,724,097 | | |
| | 917,616 | | | BG Group (2) | | | 8,053,140 | | |
| | 1,787,435 | | | BAA PLC (2) | | | 19,414,117 | | |
| | 423,085 | | | British Land (2) | | | 6,666,833 | | |
| | 1,461,100 | | | British Sky Broadcasting (2) | | | 13,192,835 | | |
| | 5,017,455 | | | Burberry Group (2) | | | 34,068,562 | | |
| | 1,302,335 | | | Cadbury Schweppes (2) | | | 12,819,862 | | |
| | 9,746,284 | | | Compass Group (2) | | | 32,786,660 | | |
| | 11,419,880 | | | Diageo PLC (2) | | | 168,822,355 | | |
| | 736,467 | | | Exel PLC (2) | | | 15,725,256 | | |
| | 9,093,976 | | | GlaxoSmithkline PLC (2) | | | 236,618,901 | | |
| | 3,480,260 | | | Highland Gold Mining (2) | | | 13,832,146 | | |
| | 14,096,189 | | | Hilton Group (2) | | | 84,608,456 | | |
| | 1,683,311 | | | Imperial Tobacco (2) | | | 48,279,677 | | |
| | 491,640 | | | London Stock Exchange (2) | | | 4,928,216 | | |
| | 1,100,960 | | | National Grid (2) | | | 10,068,144 | | |
| | 1,374,691 | | | Pearson PLC (2) | | | 15,285,149 | | |
| | 4,720,553 | | | Peninsular and Oriental Steam Navigation (2) | | | 33,742,436 | | |
| | 1,471,772 | | | Peter Hambro Mining* (2) | | | 20,325,385 | | |
See Notes to Financial Statements.
Julius Baer Funds 2005 Annual Report
55
PORTFOLIO OF INVESTMENTS (Continued) October 31, 2005
Julius Baer International Equity Fund (Percentage of Net Assets)
Share
Amount | | Description | | Market
Value (Note 1) | |
| COMMON STOCKS—Continued | | | |
| | | United Kingdom—Continued | |
| | 3,849,425 | | | Prudential PLC (2) | | $ | 32,305,377 | | |
| | 2,034,233 | | | Reckitt Benckiser (2) | | | 61,480,690 | | |
| | 2,412,260 | | | Rolls-Royce Group* (2) | | | 15,588,711 | | |
| | 994,632 | | | Royal Bank of Scotland (2) | | | 27,541,365 | | |
| | 1,414,550 | | | Scottish & Newcastle (2) | | | 11,701,328 | | |
| | 3,180,360 | | | Scottish Power (2) | | | 31,137,379 | | |
| | 2,717,429 | | | Smith & Nephew (2) | | | 22,996,788 | | |
| | 810,869 | | | Smiths Group (2) | | | 13,093,879 | | |
| | 154,778 | | | South African Breweries (2) | | | 2,919,150 | | |
| | 22,658,103 | | | Tesco PLC (2) | | | 120,643,930 | | |
| | 92,745,393 | | | Vodafone Group (2) | | | 243,440,279 | | |
| | 704,229 | | | Whitbread PLC (2) | | | 11,711,012 | | |
| | 2,601,159 | | | William Hill (2) | | | 24,597,339 | | |
| | 802,415 | | | Wolseley PLC (2) | | | 16,324,001 | | |
| | 4,025,023 | | | WPP Group (2) | | | 39,587,316 | | |
| | | | 1,554,981,660 | | |
| | | France—9.0% | |
| | 125,691 | | | Accor SA (2) | | | 6,269,122 | | |
| | 4,223,976 | | | Alcatel Alsthom* (2) | | | 49,544,408 | | |
| | 182,825 | | | Alstom* (1)(2) | | | 8,752,700 | | |
| | 176,906 | | | Atos Origin* (2) | | | 12,158,150 | | |
| | 147,240 | | | Autoroutes du Sud de la France (2) | | | 8,209,027 | | |
| | 670,770 | | | BNP Paribas (2) | | | 50,824,521 | | |
| | 1,155,580 | | | Bouygues SA (2) | | | 56,989,726 | | |
| | 315,229 | | | Carrefour SA (2) | | | 14,002,246 | | |
| | 488,634 | | | Compagnie de Saint-Gobain (2) | | | 26,749,708 | | |
| | 205,992 | | | Compagnie Generale des Etablissements Michelin-Class B (2) | | | 11,109,313 | | |
| | 72,813 | | | Eurazeo (2) | | | 7,070,519 | | |
| | 3,794,630 | | | France Telecom (2) | | | 98,581,910 | | |
| | 1,183,162 | | | Generale de Sante (2) | | | 40,950,286 | | |
| | 1,190,439 | | | Havas SA (2) | | | 5,772,792 | | |
| | 530,862 | | | JC Decaux* (2) | | | 10,843,915 | | |
| | 1,600,981 | | | Lafarge SA (2) | | | 131,585,108 | | |
| | 302,034 | | | L'Air Liquide (2) | | | 54,893,062 | | |
| | 1,580,147 | | | LVMH SA (2) | | | 127,867,137 | | |
| | 228,551 | | | Nexity (2) | | | 10,425,718 | | |
| | 625,892 | | | Pernod-Ricard (1)(2) | | | 109,335,238 | | |
| | 404,409 | | | Pinault-Printemps-Redoute (1)(2) | | | 42,460,272 | | |
See Notes to Financial Statements.
Julius Baer Funds 2005 Annual Report
56
PORTFOLIO OF INVESTMENTS (Continued) October 31, 2005
Julius Baer International Equity Fund (Percentage of Net Assets)
Share
Amount | | Description | | Market
Value (Note 1) | |
| COMMON STOCKS—Continued | | | |
| | | France—Continued | |
| | 420,387 | | | Publicis Groupe (1)(2) | | $ | 13,898,890 | | |
| | 167,250 | | | Renault SA (2) | | | 14,465,513 | | |
| | 2,119,918 | | | Sanofi-Synthelabo (2) | | | 169,641,311 | | |
| | 307,038 | | | Schneider Electric (2) | | | 25,196,304 | | |
| | 1,357,335 | | | Societe Television Francaise (1)(2) | | | 34,778,761 | | |
| | 1,962,629 | | | Suez SA (1)(2) | | | 53,104,651 | | |
| | 528,002 | | | Total Fina-Class B (2) | | | 132,878,755 | | |
| | 292,693 | | | Veolia Environnement (2) | | | 12,196,149 | | |
| | 441,619 | | | Vinci SA (1)(2) | | | 34,473,276 | | |
| | | | 1,375,028,488 | | |
| | | Germany—7.0% | |
| | 308,495 | | | Aareal Bank* (1)(2) | | | 9,415,394 | | |
| | 223,901 | | | Adidas-Salomon (1)(2) | | | 37,529,280 | | |
| | 174,055 | | | Allianz AG (2) | | | 24,568,687 | | |
| | 414,006 | | | BASF AG (2) | | | 29,828,056 | | |
| | 1,087,369 | | | Bayerische Hypo-und Vereinsbank* (2) | | | 30,282,468 | | |
| | 515,998 | | | Bilfinger and Berger Bau (2) | | | 22,302,799 | | |
| | 1,680,556 | | | Commerzbank AG (1)(2) | | | 43,948,153 | | |
| | 164,643 | | | Continental AG (2) | | | 12,576,929 | | |
| | 603,001 | | | DaimlerChrysler AG-Registered (2) | | | 30,169,858 | | |
| | 528,491 | | | Deutsche Bank (2) | | | 49,468,414 | | |
| | 220,842 | | | Deutsche Boerse (2) | | | 20,766,532 | | |
| | 2,341,417 | | | Deutsche Post (1)(2) | | | 52,156,127 | | |
| | 225,851 | | | Deutsche Postbank (1)(2) | | | 12,441,795 | | |
| | 4,110,734 | | | Deutsche Telekom (2) | | | 72,630,248 | | |
| | 122,032 | | | Deutsche Wohnen (2) | | | 27,550,036 | | |
| | 953,904 | | | E.ON AG (2) | | | 86,389,041 | | |
| | 1,978,587 | | | Fraport AG (1)(2) | | | 100,137,351 | | |
| | 209,275 | | | Freenet.de AG (2) | | | 4,813,117 | | |
| | 151,254 | | | Fresenius AG (1)(2) | | | 19,492,831 | | |
| | 315,605 | | | Fresenius Medical Care (1)(2) | | | 28,375,993 | | |
| | 391,289 | | | Henkel KGAA (2) | | | 31,126,283 | | |
| | 340,306 | | | Hypo Real Estate Holding (2) | | | 16,437,400 | | |
| | 1,133,655 | | | IVG Immobilien (2) | | | 21,790,685 | | |
| | 1,172,949 | | | Karstadt AG* (1)(2) | | | 13,820,632 | | |
| | 434,591 | | | Linde AG (2) | | | 30,941,994 | | |
| | 168,615 | | | Man AG (2) | | | 7,823,570 | | |
| | 810,223 | | | Metro AG (2) | | | 36,827,946 | | |
| | 126,200 | | | Muenchener Rueckversicherungs-Gesellschaft (2) | | | 14,815,026 | | |
See Notes to Financial Statements.
Julius Baer Funds 2005 Annual Report
57
PORTFOLIO OF INVESTMENTS (Continued) October 31, 2005
Julius Baer International Equity Fund (Percentage of Net Assets)
Share
Amount | | Description | | Market
Value (Note 1) | |
| COMMON STOCKS—Continued | | | |
| | | Germany—Continued | |
| | 15,114 | | | Q-Cells AG* (2) | | $ | 829,108 | | |
| | 523,388 | | | Rhoen Klinikum (1)(2) | | | 18,976,354 | | |
| | 695,385 | | | RWE AG (1)(2) | | | 44,386,358 | | |
| | 255,006 | | | Schering AG (2) | | | 15,745,875 | | |
| | 1,308,652 | | | Siemens AG (2) | | | 97,264,984 | | |
| | 87,142 | | | Solarworld AG (1)(2) | | | 11,808,380 | | |
| | | | 1,077,437,704 | | |
| | | Switzerland—6.2% | |
| | 77,890 | | | BKW FMB Energie (2) | | | 5,230,582 | | |
| | 1,062,584 | | | Compagnie Financiere Richemont (2) | | | 40,382,488 | | |
| | 1,689,759 | | | Holcim Ltd (2) | | | 104,988,816 | | |
| | 909,802 | | | Nestle SA-Registered (2) | | | 270,438,721 | | |
| | 3,772,978 | | | Novartis AG-Registered (2) | | | 202,679,555 | | |
| | 1,464,799 | | | Roche Holding (2) | | | 218,541,506 | | |
| | 10,473 | | | SGS SA (2) | | | 7,706,812 | | |
| | 611,738 | | | The Swatch Group-Class B (2) | | | 84,678,692 | | |
| | 12,629 | | | Unique Zurich Airport* (2) | | | 2,093,432 | | |
| | | | 936,740,604 | | |
| | | Poland—4.3% | |
| | 839,126 | | | Agora SA (2) | | | 15,900,063 | | |
| | 684,562 | | | Bank Handlowy w Warszawie (2) | | | 12,154,792 | | |
| | 6,628,172 | | | Bank Millenium (2) | | | 9,251,432 | | |
| | 3,435,931 | | | Bank PEKAO (2) | | | 162,658,413 | | |
| | 264,828 | | | Bank Prezemyslowo-Handlowy (2) | | | 50,374,335 | | |
| | 1,804,874 | | | Bank Zachodni WBK (2) | | | 60,751,821 | | |
| | 340,453 | | | BRE Bank* (2) | | | 15,112,967 | | |
| | 1,089,193 | | | Budimex* (2) | | | 12,665,769 | | |
| | 725,544 | | | CCC SA* (2) | | | 5,129,628 | | |
| | 285,873 | | | Cersanit-Krasnystaw SA* (2) | | | 10,445,744 | | |
| | 292,752 | | | Grupa Kety (2) | | | 11,619,597 | | |
| | 613,971 | | | Inter Cars (2)(5) | | | 4,598,154 | | |
| | 123,410 | | | Inter Groclin Auto* (2) | | | 3,312,084 | | |
| | 217,022 | | | JC Auto (2) | | | 2,307,005 | | |
| | 598,502 | | | Opoczno SA* (2) | | | 7,589,638 | | |
| | 621,954 | | | Orbis SA (2) | | | 5,635,737 | | |
| | 21,482,772 | | | Pko Bank Polski (2) | | | 180,253,273 | | |
| | 540,697 | | | Polska Grupa Farmaceutyczna (2) | | | 8,489,297 | | |
| | 2,404,170 | | | Polski Koncern Miesy Duda* (2) | | | 7,366,864 | | |
| | 709,930 | | | Sniezka (2) | | | 4,929,103 | | |
See Notes to Financial Statements.
Julius Baer Funds 2005 Annual Report
58
PORTFOLIO OF INVESTMENTS (Continued) October 31, 2005
Julius Baer International Equity Fund (Percentage of Net Assets)
Share
Amount | | Description | | Market
Value (Note 1) | |
| COMMON STOCKS—Continued | | | |
| | | Poland—Continued | |
| | 82,385 | | | Stomil Sanok* (2) | | $ | 2,786,783 | | |
| | 9,122,242 | | | Telekomunikacja Polska (2) | | | 65,420,954 | | |
| | | | 658,753,453 | | |
| | | Russia—4.3% | |
| | 82,100 | | | Avtovaz Sponsored GDR | | | 1,966,706 | | |
| | 39,360 | | | Baltika Brewery | | | 1,102,080 | | |
| | 18,120,773 | | | Central Telecommunication | | | 7,212,068 | | |
| | 1,051,267 | | | JSC MMC Norilsk Nickel ADR (1) | | | 76,637,364 | | |
| | 2,322,636 | | | LUKOIL ADR | | | 128,093,375 | | |
| | 225,000 | | | Moscow City Telephone | | | 3,903,750 | | |
| | 137,946 | | | Moscow City Telephone ADR | | | 2,276,109 | | |
| | 212,600 | | | North-West Telecom ADR (1) | | | 7,254,975 | | |
| | 7,535 | | | NovaTek OAO | | | 16,577,000 | | |
| | 37,000 | | | NovaTek OAO Sponsored GDR*† | | | 814,000 | | |
| | 2,234,287 | | | OAO Gazprom ADR (1) | | | 129,365,217 | | |
| | 170,000 | | | Onaco* (3) | | | 701,250 | | |
| | 547,586 | | | RBC Information Systems* | | | 2,973,392 | | |
| | 172,081 | | | Sberbank RF | | | 153,152,090 | | |
| | 492,671 | | | Sibirtelecom ADR (1) | | | 24,554,723 | | |
| | 657,432 | | | TNK-BP Ltd (3) | | | 1,446,350 | | |
| | 3,683,966 | | | Tyumen Oil* | | | 22,840,589 | | |
| | 314,616 | | | Unified Energy System GDR | | | 11,137,406 | | |
| | 3,189,153 | | | Uralsvyazinform ADR (1) | | | 22,260,288 | | |
| | 3,385,843 | | | VolgaTelecom | | | 12,290,610 | | |
| | 1,685,925 | | | VolgaTelecom ADR | | | 12,239,816 | | |
| | 900,418 | | | Wimm-Bill-Dann Foods ADR* (1) | | | 16,261,549 | | |
| | | | 655,060,707 | | |
| | | Turkey—3.9% | |
| | 2,133,594 | | | Acibadem Saglik Hizmetleri Ve Ticaret (2) | | | 14,217,420 | | |
| | 16,709,255 | | | Akbank TAS (2) | | | 103,901,168 | | |
| | 44,138 | | | Alarko Gayrimenkul Yatirum Ortakligi* (2) | | | 2,025,817 | | |
| | 1,606,647 | | | Aygaz AS (2) | | | 4,658,218 | | |
| | 528,658 | | | Bim Birlesik Magazalar* | | | 12,805,880 | | |
| | 1,965,222 | | | Cimsa Cimento Sanayi Ve Ticar (2) | | | 11,410,680 | | |
| | 31,886,630 | | | Dogan Sirketler Grubu* (2) | | | 79,856,637 | | |
| | 7,134,030 | | | Eczacibasi Ilac Sanayi ve Ticaret (2) | | | 20,307,863 | | |
| | 1 | | | Enka Insaat ve Sanayi (2) | | | 11 | | |
| | 18,345,106 | | | Haci Omer Sabanci (2) | | | 85,654,050 | | |
See Notes to Financial Statements.
Julius Baer Funds 2005 Annual Report
59
PORTFOLIO OF INVESTMENTS (Continued) October 31, 2005
Julius Baer International Equity Fund (Percentage of Net Assets)
Share
Amount | | Description | | Market
Value (Note 1) | |
| COMMON STOCKS—Continued | | | |
| | | Turkey—Continued | |
| | 2,040,444 | | | Hurriyet Gazetecilik ve Matbaacilik (2) | | $ | 5,739,489 | | |
| | 13,736,639 | | | Koc Holding (2) | | | 51,330,846 | | |
| | 881,141 | | | Migros Turk (2) | | | 7,698,876 | | |
| | 21,883,822 | | | Turkiye Garanti Bankasi* (2) | | | 65,083,271 | | |
| | 18,422,962 | | | Turkiye Is Bankasi (2) | | | 127,667,612 | | |
| | | | 592,357,838 | | |
| | | Sweden—3.4% | |
| | 419,315 | | | Autoliv Inc (1)(2) | | | 18,010,041 | | |
| | 1,373,847 | | | Capio AB* (1)(2) | | | 23,715,107 | | |
| | 692,724 | | | Elekta AB-Class B (1)(2) | | | 10,566,347 | | |
| | 2,427,522 | | | Ericsson AB-Class B (2) | | | 7,963,381 | | |
| | 2,494,900 | | | ForeningsSparbanken AB (2) | | | 61,540,506 | | |
| | 2,097,928 | | | Getinge AB-Class B (1)(2) | | | 26,202,697 | | |
| | 237,650 | | | Hennes & Mauritz-Class B (2) | | | 7,711,934 | | |
| | 886,300 | | | Modern Times Group-Class B* (1)(2) | | | 33,892,165 | | |
| | 11,444,000 | | | Nordea AB (2) | | | 112,097,268 | | |
| | 5,484,800 | | | Skandinaviska Enskilda Banken (2) | | | 102,285,421 | | |
| | 3,887,927 | | | Skanska AB-Class B (2) | | | 54,440,549 | | |
| | 2,589,953 | | | Svenska Handelsbanken-Class A (2) | | | 59,033,079 | | |
| | 816,500 | | | Telia AB (2) | | | 3,986,914 | | |
| | | | 521,445,409 | | |
| | | Italy—3.3% | |
| | 1,985,943 | | | Assicurazioni Generali (1)(2) | | | 59,040,365 | | |
| | 585,894 | | | Autostrada Torino-Milano (1)(2) | | | 11,124,321 | | |
| | 10,155,932 | | | Banca Intesa (2) | | | 47,373,583 | | |
| | 10,367,677 | | | Banca Intesa-RNC (2) | | | 44,882,823 | | |
| | 391,498 | | | Banca Popolare dell'Etruria e del Lazio (1)(2) | | | 6,739,073 | | |
| | 490,278 | | | Banca Popolare di Intra (1)(2) | | | 6,226,548 | | |
| | 5,152,286 | | | Banca Popolare di Milano (1)(2) | | | 49,051,325 | | |
| | 1,217,726 | | | Banca Popolare di Sondrio (1)(2) | | | 17,866,937 | | |
| | 239,725 | | | Banca Popolare Emilia Romagna (1)(2) | | | 12,643,196 | | |
| | 1,393,507 | | | Banche Popolari Unite (2) | | | 29,472,322 | | |
| | 1,577,765 | | | Banco Popolare di Verona (2) | | | 29,099,343 | | |
| | 6,696,801 | | | Beni Stabili (2) | | | 6,413,384 | | |
| | 1,814,947 | | | Buzzi Unicem (1)(2) | | | 25,470,725 | | |
| | 4,680,978 | | | Capitalia SpA (2) | | | 24,398,353 | | |
| | 14,351,361 | | | Cassa di Risparmio Di Firenze (2) | | | 42,772,174 | | |
| | 3,316,504 | | | Credito Emiliano (2) | | | 34,966,753 | | |
See Notes to Financial Statements.
Julius Baer Funds 2005 Annual Report
60
PORTFOLIO OF INVESTMENTS (Continued) October 31, 2005
Julius Baer International Equity Fund (Percentage of Net Assets)
Share
Amount | | Description | | Market
Value (Note 1) | |
| COMMON STOCKS—Continued | | | |
| | | Italy—Continued | |
| | 170,593 | | | Geox SpA (2) | | $ | 1,618,763 | | |
| | 612,268 | | | Luxottica Group (2) | | | 14,796,499 | | |
| | 4,575,771 | | | Parmalat SpA* (2) | | | 13,356,295 | | |
| | 1,372,320 | | | Piccolo Credito Valtellinese Scarl (2) | | | 18,002,710 | | |
| | 568,480 | | | Societa Iniziative Autostradali e Servizi (2) | | | 6,581,632 | | |
| | | | 501,897,124 | | |
| | | Austria—2.8% | |
| | 1,117,734 | | | Bank Austria Creditanstalt (1)(2) | | | 122,721,835 | | |
| | 185,000 | | | Erste Bank der Oesterreichischen Sparkassen (2) | | | 9,613,196 | | |
| | 352,992 | | | Flughafen Wien (2) | | | 22,834,760 | | |
| | 3,085,042 | | | Immoeast Immobilien Anlagen* (2) | | | 30,301,137 | | |
| | 417,076 | | | Meinl European Land* (2) | | | 7,388,445 | | |
| | 1,887,526 | | | OMV AG (2) | | | 101,804,167 | | |
| | 1,110,679 | | | Raiffeisen International Bank Holding* (1)(2) | | | 69,870,213 | | |
| | 2,012,050 | | | Telekom Austria (2) | | | 41,528,111 | | |
| | 609,849 | | | Wienerberger AG (2) | | | 23,562,440 | | |
| | | | 429,624,304 | | |
| | | Norway—2.2% | |
| | 6,598,262 | | | Acta Holding (2) | | | 15,542,953 | | |
| | 332,800 | | | Cermaq ASA* (2) | | | 2,529,105 | | |
| | 738,537 | | | DNB Holding (2) | | | 7,560,016 | | |
| | 1,240,060 | | | Norsk Hydro (2) | | | 123,135,065 | | |
| | 473,100 | | | Orkla ASA (2) | | | 16,579,274 | | |
| | 5,626,805 | | | Statoil ASA (2) | | | 125,070,332 | | |
| | 1,675,977 | | | Telenor ASA (2) | | | 16,387,197 | | |
| | 3,016,152 | | | Tomra Systems (1)(2) | | | 20,684,137 | | |
| | | | 327,488,079 | | |
| | | Australia—2.0% | |
| | 5,217,324 | | | BHP Billiton (2) | | | 80,899,897 | | |
| | 1,863,506 | | | Brambles Industries (1)(2) | | | 11,801,787 | | |
| | 813,577 | | | CSL Ltd (2) | | | 22,860,301 | | |
| | 13,668,135 | | | Macquarie Airports (2) | | | 30,757,761 | | |
| | 2,986,760 | | | Macquarie Infrastructure (2) | | | 7,679,219 | | |
| | 5,697,651 | | | Newcrest Mining (2) | | | 77,782,040 | | |
| | 2,276,078 | | | News Corp (1)(2) | | | 33,993,375 | | |
| | 3,233,788 | | | Patrick Corp (2) | | | 16,556,292 | | |
See Notes to Financial Statements.
Julius Baer Funds 2005 Annual Report
61
PORTFOLIO OF INVESTMENTS (Continued) October 31, 2005
Julius Baer International Equity Fund (Percentage of Net Assets)
Share
Amount | | Description | | Market
Value (Note 1) | |
| COMMON STOCKS—Continued | | | |
| | | Australia—Continued | |
| | 370,371 | | | Rio Tinto (1)(2) | | $ | 15,631,012 | | |
| | 740,447 | | | Transurban Group (2) | | | 3,550,182 | | |
| | | | 301,511,866 | | |
| | | Netherlands—1.9% | |
| | 684,405 | | | ABN Amro Holding (2) | | | 16,170,081 | | |
| | 1,014,208 | | | Aegon NV (2) | | | 15,253,109 | | |
| | 67,250 | | | Efes Breweries International GDR*† | | | 2,127,118 | | |
| | 310,549 | | | Euronext NV (2) | | | 13,186,973 | | |
| | 450,229 | | | European Aeronautic Defense and Space (1)(2) | | | 15,578,946 | | |
| | 925,363 | | | Heineken NV (1)(2) | | | 29,289,712 | | |
| | 2,320,982 | | | Philips Electronics (2) | | | 60,645,952 | | |
| | 2,071,588 | | | Royal KPN (2) | | | 19,701,082 | | |
| | 440,677 | | | Royal Numico* (1)(2) | | | 17,826,901 | | |
| | 1,782,632 | | | TNT NV (2) | | | 42,054,927 | | |
| | 572,159 | | | Unilever NV (1)(2) | | | 40,244,489 | | |
| | 344,797 | | | VNU NV (2) | | | 10,954,699 | | |
| | | | 283,033,989 | | |
| | | Czech Republic—1.6% | |
| | 762,479 | | | Cesky Telecom* (2) | | | 15,672,213 | | |
| | 328,981 | | | CEZ (2) | | | 8,631,076 | | |
| | 1,584,688 | | | Komercni Banka (2) | | | 222,447,231 | | |
| | | | 246,750,520 | | |
| | | Spain—1.3% | |
| | 410,244 | | | ACS Actividades de Construccion y Servicios (2) | | | 11,720,048 | | |
| | 368,312 | | | Cintra Concesiones De Infrae (2) | | | 4,363,694 | | |
| | 856,869 | | | Corporacion Mapfre (2) | | | 14,996,814 | | |
| | 1,575,642 | | | Endesa SA (2) | | | 39,165,288 | | |
| | 482,924 | | | Fadesa Inmobiliaria (2) | | | 16,227,566 | | |
| | 511,811 | | | Grupo Empresarial Chapultec (1)(2) | | | 16,203,895 | | |
| | 558,627 | | | Grupo Ferrovial (2) | | | 41,227,946 | | |
| | 667,533 | | | Inditex SA (2) | | | 19,741,473 | | |
| | 881,455 | | | Promotora de Informaciones (2) | | | 16,154,833 | | |
| | 949,577 | | | Telefonica SA (2) | | | 15,138,206 | | |
| | | | 194,939,763 | | |
See Notes to Financial Statements.
Julius Baer Funds 2005 Annual Report
62
PORTFOLIO OF INVESTMENTS (Continued) October 31, 2005
Julius Baer International Equity Fund (Percentage of Net Assets)
Share
Amount | | Description | | Market
Value (Note 1) | |
| COMMON STOCKS—Continued | | | |
| | | Denmark—1.2% | |
| | 127,300 | | | Chr Hansen Holding-Class B (1)(2) | | $ | 11,929,789 | | |
| | 1,542,967 | | | Danske Bank (2) | | | 48,358,178 | | |
| | 259,709 | | | Kobenhavns Lufthavne (2) | | | 82,249,904 | | |
| | 150,850 | | | Novo Nordisk-Class B (2) | | | 7,742,488 | | |
| | 335,340 | | | Royal UNIBREW (2) | | | 26,008,843 | | |
| | 565,902 | | | Vestas Wind Systems* (1)(2) | | | 12,245,789 | | |
| | | | 188,534,991 | | |
| | | Belgium—1.2% | |
| | 262,782 | | | Almancora (2) | | | 25,468,875 | | |
| | 1,090,411 | | | Fortis (2) | | | 31,021,733 | | |
| | 368,759 | | | InBev (2) | | | 14,726,087 | | |
| | 1,418,038 | | | KBC Groupe (2) | | | 115,452,092 | | |
| | | | 186,668,787 | | |
| | | Hungary—1.2% | |
| | 187,510 | | | Egis Rt (2) | | | 16,193,652 | | |
| | 9,025,465 | | | Magyar Telekom RT (2) | | | 42,892,388 | | |
| | 3,417,425 | | | OTP Bank (2) | | | 123,578,375 | | |
| | | | 182,664,415 | | |
| | | South Korea—1.0% | |
| | 281,183 | | | Samsung Electronics (2) | | | 150,464,709 | | |
| | | Mexico—0.9% | |
| | 862,366 | | | Consorcio Ara | | | 3,180,249 | | |
| | 5,075,309 | | | Fomento Economico Mexicano | | | 34,415,250 | | |
| | 553,144 | | | Fomento Economico Mexicano ADR | | | 37,608,261 | | |
| | 356,300 | | | Grupo Aeroportuario del Sureste ADR | | | 11,579,750 | | |
| | 5,104,749 | | | Grupo Financiero Banorte | | | 43,481,396 | | |
| | 966,393 | | | Urbi Desarrollos Urbanos* | | | 6,092,886 | | |
| | | | 136,357,792 | | |
| | | Romania—0.9% | |
| | 16,921,274 | | | Biofarm Bucuresti | | | 2,769,167 | | |
| | 2,610,000 | | | Compa-Sibi | | | 1,324,093 | | |
| | 30,164,828 | | | Impact SA | | | 4,186,131 | | |
| | 2,164,000 | | | Rolast AG* | | | 53,121 | | |
| | 9,808,600 | | | Romanian Bank for Development | | | 41,413,590 | | |
| | 59,500 | | | Santierul Naval Braila* (3) | | | 132,426 | | |
| | 8,152,018 | | | Sicomed SA* | | | 3,441,922 | | |
See Notes to Financial Statements.
Julius Baer Funds 2005 Annual Report
63
PORTFOLIO OF INVESTMENTS (Continued) October 31, 2005
Julius Baer International Equity Fund (Percentage of Net Assets)
Share
Amount | | Description | | Market
Value (Note 1) | |
| COMMON STOCKS—Continued | | | |
| | | Romania—Continued | |
| | 590,761,228 | | | SNP Petrom* | | $ | 77,342,484 | | |
| | 7,627,000 | | | Socep Constanta* | | | 686,487 | | |
| | | | 131,349,421 | | |
| | | Finland—0.7% | |
| | 2,108,902 | | | Fortum Oyj (2) | | | 37,312,385 | | |
| | 3,641,597 | | | Nokia Oyj (1)(2) | | | 61,070,686 | | |
| | 281,480 | | | Stockman Oyj-Class B (2) | | | 10,030,265 | | |
| | | | 108,413,336 | | |
| | | Greece—0.6% | |
| | 738,430 | | | Alpha Bank (2) | | | 21,186,469 | | |
| | 1,755,231 | | | Hellenic Telecommunication* (2) | | | 36,263,269 | | |
| | 849,222 | | | National Bank of Greece (2) | | | 33,162,224 | | |
| | | | 90,611,962 | | |
| | | Bulgaria—0.4% | |
| | 7,602,910 | | | Bulgarian Telecommunication | | | 50,748,144 | | |
| | 192,919 | | | DZI* | | | 9,451,023 | | |
| | | | 60,199,167 | | |
| | | Ireland—0.4% | |
| | 876,543 | | | Celtic Resources* (2) | | | 3,304,814 | | |
| | 219,934 | | | DePfa Bank (2) | | | 3,424,130 | | |
| | 18,098,658 | | | Dragon Oil* (2) | | | 48,645,955 | | |
| | | | 55,374,899 | | |
| | | China—0.3% | |
| | 29,145,847 | | | Beijing Capital International Airport-Class H (2) | | | 11,761,660 | | |
| | 4,360,387 | | | Shenzhen Chiwan Wharf (2) | | | 6,165,250 | | |
| | 14,352,455 | | | Weiqiao Textile (2) | | | 17,411,877 | | |
| | 6,002,210 | | | Wumart Stores-Class H (2) | | | 12,411,031 | | |
| | | | 47,749,818 | | |
| | | Hong Kong—0.3% | |
| | 4,848,000 | | | China Merchants Holdings International (2) | | | 9,432,844 | | |
| | 22,494,000 | | | Clear Media* (2) | | | 18,897,051 | | |
| | 19,070,264 | | | Texwinca Holdings (2) | | | 12,874,472 | | |
| | | | 41,204,367 | | |
See Notes to Financial Statements.
Julius Baer Funds 2005 Annual Report
64
PORTFOLIO OF INVESTMENTS (Continued) October 31, 2005
Julius Baer International Equity Fund (Percentage of Net Assets)
Share
Amount | | Description | | Market
Value (Note 1) | |
| COMMON STOCKS—Continued | | | |
| | | Indonesia—0.3% | |
| | 56,478,090 | | | Bank Mandiri Persero (2) | | $ | 7,385,436 | | |
| | 35,835,820 | | | Indofood Sukses Makmur (2) | | | 2,905,826 | | |
| | 5,595,740 | | | Semen Gresik (2) | | | 10,333,222 | | |
| | 39,535,932 | | | Telekomunikasi Indonesia (2) | | | 19,816,551 | | |
| | | | 40,441,035 | | |
| | | Luxembourg—0.2% | |
| | 690,277 | | | Millicom International Cellular* (1) | | | 13,135,971 | | |
| | 348,273 | | | TVSL SA* | | | 19,188,623 | | |
| | | | 32,324,594 | | |
| | | United States—0.2% | |
| | 260 | | | News Corp-Class B (1) | | | 3,916 | | |
| | 148,082 | | | Southern Copper (1) | | | 8,165,241 | | |
| | 617,718 | | | Telewest Global* | | | 14,090,148 | | |
| | | | 22,259,305 | | |
| | | Brazil—0.1% | |
| | 340,212 | | | Aracruz Celulose ADR | | | 13,030,120 | | |
| | 501,662 | | | Diagnosticos da America* | | | 8,129,943 | | |
| | | | 21,160,063 | | |
| | | Portugal—0.1% | |
| | 5,988,128 | | | Banco Comercial Portugues (2) | | | 15,135,282 | | |
| | 363,062 | | | Jeronimo Martins (2) | | | 5,227,212 | | |
| | | | 20,362,494 | | |
| | | Canada—0.1% | |
| | 3,555,964 | | | Bema Gold* | | | 8,953,595 | | |
| | 53,152 | | | Centerra Gold* | | | 1,020,637 | | |
| | 2,387,649 | | | Eldorado Gold* | | | 7,307,374 | | |
| | 243,177 | | | Ivanhoe Mines* | | | 1,826,585 | | |
| | | | 19,108,191 | | |
| | | New Zealand—0.1% | |
| | 13,794,215 | | | Auckland International Airport (2) | | | 18,962,876 | | |
See Notes to Financial Statements.
Julius Baer Funds 2005 Annual Report
65
PORTFOLIO OF INVESTMENTS (Continued) October 31, 2005
Julius Baer International Equity Fund (Percentage of Net Assets)
Share
Amount | | Description | | Market
Value (Note 1) | |
| COMMON STOCKS—Continued | | | |
| | | Ukraine—0.1% | |
| | 37,000,000 | | | Bank Aval* (3) | | $ | 2,647,322 | | |
| | 2,053,250 | | | Centrenergo* (3) | | | 1,224,237 | | |
| | 165,000 | | | Centrenergo ADR (3) | | | 1,051,385 | | |
| | 2,040,000 | | | Slavutich Pivzavod* (3) | | | 2,602,887 | | |
| | 24,898 | | | Ukrnafta Oil ADR* (3) | | | 5,233,687 | | |
| | 19,600,000 | | | UkrTelecom* | | | 2,921,594 | | |
| | 334,455 | | | Ukrtelecom GDR (2) | | | 2,203,264 | | |
| | | | 17,884,376 | | |
| | | Cyprus—0.1% | |
| | 3,446,357 | | | Bank of Cyprus (2) | | | 17,453,196 | | |
| | | Philippines—0.1% | |
| | 504,288 | | | Ayala Corp (2) | | | 2,656,426 | | |
| | 22,221,000 | | | Ayala Land (2) | | | 3,612,056 | | |
| | 3,066,000 | | | Bank of the Philippine Islands (2) | | | 2,906,316 | | |
| | 153,320 | | | Globe Telecom (2) | | | 1,966,506 | | |
| | 152,993 | | | Philippine Long Distance Telephone (2) | | | 4,651,516 | | |
| | | | 15,792,820 | | |
| | | Bermuda—0.1% | |
| | 268,600 | | | Central European Media-Class A* (1) | | | 12,487,214 | | |
| | | Singapore—0.1% | |
| | 8,532,000 | | | Singapore Telecommunications (2) | | | 11,799,703 | | |
| | | Venezuela—0.1% | |
| | 697,410 | | | CANTV ADR | | | 8,996,589 | | |
| | | Croatia—0.1% | |
| | 8,149 | | | Atlantska Plovidba* | | | 1,233,311 | | |
| | 20,979 | | | Dom Holding* | | | 478,991 | | |
| | 11,424 | | | Ericsson Nikola Tesla | | | 3,697,755 | | |
| | 779 | | | Institut Gradevinarstva* | | | 345,833 | | |
| | 27,137 | | | Podravka Prehrambena Industija* | | | 1,395,514 | | |
| | 3,957 | | | Proficio Dd* | | | 54,736 | | |
| | 12,811 | | | Validus Dd* (3) | | | 187,634 | | |
| | | | 7,393,774 | | |
| | | Latvia—0.1% | |
| | 1,424,182 | | | Parex Bank* (3)(4) | | | 7,349,985 | | |
See Notes to Financial Statements.
Julius Baer Funds 2005 Annual Report
66
PORTFOLIO OF INVESTMENTS (Continued) October 31, 2005
Julius Baer International Equity Fund (Percentage of Net Assets)
Share
Amount | | Description | | Market
Value (Note 1) | |
| COMMON STOCKS—Continued | | | |
| | | Kazkhstan—0.0% | |
| | 557,311 | | | Kazakhmys PLC* (2) | | $ | 5,327,531 | | |
| | | India—0.0% | |
| | 1,334,100 | | | India Cements GDR*† (1) | | | 5,220,469 | | |
| | | Argentina—0.0% | |
| | 676,203 | | | Grupo Financiero Galicia ADR* (1) | | | 5,220,287 | | |
| | | Lithuania—0.0% | |
| | 144,733 | | | Rokiskio Suris | | | 3,614,999 | | |
| | | Thailand—0.0% | |
| | 746,800 | | | Airports of Thailand (2) | | | 924,461 | | |
| | | | | TOTAL COMMON STOCKS (Cost $10,683,221,248) | | | 13,052,391,065 | | |
| PREFERRED STOCKS—0.3% | | | |
| | | Germany—0.3% | |
| | 70,840 | | | Henkel KGAA-Vorzug (2) | | | 6,101,280 | | |
| | 1,566,498 | | | ProsiebenSat.1 Media (1)(2) | | | 26,980,050 | | |
| | 199,583 | | | Volkswagen AG (2) | | | 8,104,818 | | |
| | | | 41,186,148 | | |
| | | Croatia—0.0% | |
| | 4,541 | | | Adris Grupa | | | 2,531,030 | | |
| | | | | TOTAL PREFERRED STOCKS (Cost $37,952,692) | | | 43,717,178 | | |
| INVESTMENT FUNDS—0.1% | | | |
| | | Romania—0.1% | |
| | 5,488,000 | | | SIF 1 Banat Crisana Arad | | | 3,251,164 | | |
| | 5,190,500 | | | SIF 2 Moldova Bacau | | | 3,142,875 | | |
| | 5,460,500 | | | SIF 3 Transilvania Brasov | | | 3,163,383 | | |
| | 8,070,000 | | | SIF 4 Muntenia Bucuresti | | | 3,354,466 | | |
| | 5,801,500 | | | SIF 5 Oltenia Craiova | | | 4,082,488 | | |
| | | | 16,994,376 | | |
| | | Australia—0.0% | |
| | 3,474,543 | | | Australian Infrastructure Fund (2) | | | 6,242,461 | | |
| | | | | TOTAL INVESTMENT FUNDS (Cost $23,321,891) | | | 23,236,837 | | |
See Notes to Financial Statements.
Julius Baer Funds 2005 Annual Report
67
PORTFOLIO OF INVESTMENTS (Continued) October 31, 2005
Julius Baer International Equity Fund (Percentage of Net Assets)
Share
Amount | | Description | | Market
Value (Note 1) | |
| RIGHTS—0.0% | | | |
| | | Cyprus—0.0% | |
| | 3,446,357 | | | Bank of Cyprus Public Rights, Expires 12/19/2005 (Cost $0) | | $ | 1,238,362 | | |
| WARRANTS—0.7% | | | |
| | | India—0.7% | |
| | 9,492,878 | | | Bharti Televentures-Class A Warrants, Expires 05/31/2010*† | | | 67,953,818 | | |
| | 1,374,128 | | | Bharti Televentures Warrants, Expires 04/03/2006*† | | | 10,875,536 | | |
| | 844,816 | | | CLSA State Bank of India Warrants, Expires 05/13/2010*† | | | 17,953,488 | | |
| | | | 96,782,842 | | |
| | | Austria—0.0% | |
| | 1,961,673 | | | DZI AD Warrants, Expires 03/01/2006* | | | 4,628,700 | | |
| | | Luxembourg—0.0% | |
| | 177,472 | | | Bharti Televentures Warrants, Expires 1/19/2009*† | | | 1,384,636 | | |
| | | | | TOTAL WARRANTS (Cost $87,137,912) | | | 102,796,178 | | |
Face
Value | |
Currency | |
| |
| |
| FOREIGN GOVERNMENT BONDS—0.0% | | | |
| | | | | Bulgaria—0.0% | |
| | 4,812,631 | | | BGN | | Bulgaria Compensation Notes* (3) | | | 2,042,347 | | |
| | 1,678,768 | | | BGN | | Bulgaria Housing Compensation Notes* (3) | | | 709,339 | | |
| | 12,894,688 | | | BGN | | Bulgaria Registered Compensation Vouchers* (3) | | | 5,468,201 | | |
| | | | | | | TOTAL FOREIGN GOVERNMENT BONDS
(Cost $8,970,697) | | | 8,219,887 | | |
| STRUCTURED NOTES—0.2% | | | |
| | | | | Philippines—0.2% | |
| | 1,679 | | | USD | | Phillippines Notes, due 10/17/2006
(Cost $24,931,891)*† | | | 25,524,625 | | |
| U.S. GOVERNMENT AND AGENCY OBLIGATIONS—0.4% | | | |
| | | | | United States—0.4% | |
| | 49,000,000 | | | USD | | U.S. Treasury Bill 3.340%, due 11/17/2005 (6) | | | 48,927,262 | | |
| | 10,000,000 | | | USD | | U.S. Treasury Bill 3.450%, due 11/25/2005 (6) | | | 9,977,000 | | |
| | | | | | | TOTAL U.S. GOVERNMENT AND AGENCY
OBLIGATIONS (Cost $58,904,262) | | | 58,904,262 | | |
See Notes to Financial Statements.
Julius Baer Funds 2005 Annual Report
68
PORTFOLIO OF INVESTMENTS (Continued) October 31, 2005
Julius Baer International Equity Fund (Percentage of Net Assets)
Face
Value | |
Currency | |
Description | | Market
Value (Note 1) | |
SHORT-TERM INVESTMENTS PURCHASED WITH CASH
COLLATERAL FROM SECURITY LENDING—6.0% | | | |
| | | | | United States—4.0% | |
| | 9,926,200 | | | USD | | American Beacon Funds 3.806%, due 11/01/2005 (7) | | $ | 9,926,200 | | |
| | 24,815,501 | | | USD | | Bank of America 3.770%, due 01/17/2006 (7) | | | 24,815,501 | | |
| | 19,852,401 | | | USD | | Bear Stearns & Co 4.198%, due 12/06/2005 (7) | | | 19,852,401 | | |
| | 12,867,296 | | | USD | | BGI Institional 3.923%, due 11/01/2005 (7) | | | 12,867,296 | | |
| | 49,631,002 | | | USD | | Branch Banker & Trust 3.835%, due 11/22/2005 (7) | | | 49,631,002 | | |
| | 69,987,732
| | | USD
| | Credit Suisse First Boston, with rates ranging from
3.880%-4.105% and maturity dates ranging
from 11/01/2005-03/10/2006. (7) | | |
69,987,732 | | |
| | 11,679,811
| | | USD
| | Goldman Sachs Financial Square Prime Obligations
Fund 3.788%, due 11/01/2005 (7) | | |
11,679,811 | | |
| | 161,637,931 | | | USD | | Goldman Sachs Group, with rates ranging from | | | | | |
| | | | | | | 4.020%-4.103% and maturity dates ranging from | | | | | |
| | | | | | | 11/01/2005-11/07/2005. (7) | | | 161,637,931 | | |
| | 9,926,200 | | | USD | | Harris Trust & Savings Bank 3.795%,
due 11/04/2005 (7) | | | 9,926,200 | | |
| | 2,283,026 | | | USD | | Lehman Brothers Repo/Triparty 4.103%,
due 11/01/2005 (7) | | | 2,283,026 | | |
| | 118,902,897 | | | USD | | Merrill Lynch & Co 4.103%, due 11/01/2005 (7) | | | 118,902,897 | | |
| | 67,748,985 | | | USD | | Merrimac Cash Fund-Premium Class 3.700%,
due 11/01/2005 (7) | | | 67,748,985 | | |
| | 10,588,685 | | | USD | | Morgan Stanley Dean Witter & Co 4.168%,
due 11/01/2005 (7) | | | 10,588,685 | | |
| | 14,889,300 | | | USD | | Ranger Funding 3.989%, due 11/15/2005 (7) | | | 14,889,300 | | |
| | 19,852,401 | | | USD | | Wells Fargo 4.010%, due 12/12/2005 (7) | | | 19,852,401 | | |
| | | | 604,589,368 | | |
| | | | | United Kingdom—1.0% | |
| | 148,893,004
| | | USD
| | Royal Bank of Scotland, with rates ranging from
3.760%-4.000% and maturity dates ranging
from 11/01/2005-12/12/2005. (7) | | |
148,893,004 | | |
| | | | | Canada—0.6% | |
| | 49,631,002
| | | USD
| | Canadian Imperial Bank of Commerce 4.075%,
due 05/18/2006 (7) | | |
49,631,002 | | |
| | 49,631,002 | | | USD | | Royal Bank of Canada 3.825%, due 11/22/2005 (7) | | | 49,631,002 | | |
| | | | 99,262,004 | | |
See Notes to Financial Statements.
Julius Baer Funds 2005 Annual Report
69
PORTFOLIO OF INVESTMENTS (Continued) October 31, 2005
Julius Baer International Equity Fund (Percentage of Net Assets)
Face
Value | |
Currency | |
Description | | Market
Value (Note 1) | |
SHORT-TERM INVESTMENTS PURCHASED WITH CASH
COLLATERAL FROM SECURITY LENDING—Continued | |
| | | | | Belgium—0.4% | |
| | 59,557,202 | | | USD | | Fortis Bank, with rates ranging from 3.850%-4.010 | | |
| | |
| | | | and maturity dates ranging from | | |
| | |
| | | | 11/03/2005-11/28/2005. (7) | | $ | 59,557,202 | | |
| | | | | TOTAL SHORT-TERM INVESTMENTS
PURCHASED WITH CASH COLLATERAL
FROM SECURITY LENDING
(Cost $912,301,578) | | |
912,301,578 | | |
| REPURCHASE AGREEMENTS—5.3% | |
| | | | | United States—5.3% | |
| | 812,534,475 | | | USD | | Investors Bank & Trust Company Repurchase | | |
| | |
| | | | | Agreement, dated 10/31/2005, due 11/01/2005, | | |
| | |
| | | | | with a maturity value of $812,596,544 and an | | |
| | |
| | | | | effective yield of 2.75%, collaterallized by | | |
| | |
| | | | | U.S. Government and Agency Obligations, with | | |
| | |
| | | | | rates ranging from 4.130-7.375%, maturities | | |
| | |
| | | | | from 1/25/2015-12/15/2034, and an aggregate | | |
| | |
| | | | | market value of $853,161,199 | | |
| | |
| | | | | (Cost $812,534,475) | | | 812,534,475 | | |
| | | | | TOTAL INVESTMENTS—98.7%
(Cost $12,649,276,646) | | | 15,040,864,447 | | |
| | | | | OTHER ASSETS AND LIABILITIES (Net)—1.3% | | | 197,522,088 | | |
| | | | | TOTAL NET ASSETS—100.0% | | $ | 15,238,386,535 | | |
Notes to the Portfolio of Investments:
ADR American Depositary Receipt
GDR Global Depositary Receipt
(1) All or a portion of this security was on loan to brokers at October 31, 2005.
(2) Security valued at fair value utilizing the fair value model in accordance with valuation policies approved by the board of directors.
(3) Illiquid security
(4) Security valued at fair value as determined by the policies approved by the board of directors.
(5) See footnote number five in the Notes to the Financial Statements regarding investments in affiliated
issuers.
(6) Security has been pledged for futures collateral.
(7) Represents investments of security lending collateral.
* Non-income producing security.
† Securities exempt from registration under Rule 144A of the Securities Act of 1933. These securities may be resold in transactions exempt from registrations, normally to qualified institutional buyers.
Aggregate cost for federal income tax purposes was $12,741,937,562.
Glossary of Currencies
BGN — Bulgarian Lev
USD — United States Dollar
See Notes to Financial Statements.
Julius Baer Funds 2005 Annual Report
70
SCHEDULE OF FORWARD FOREIGN EXCHANGE CONTRACTS
October 31, 2005
Julius Baer International Equity Fund
FORWARD FOREIGN EXCHANGE CONTRACTS TO BUY
| | | Contracts to Receive | | | |
Expiration
Date | | Local | | Value in
Currency | | In Exchange
USDfor USD | | Net Unrealized
Appreciation
(Depreciation) | |
| 11/02/2005 | | CZK | 32,160,927 | | | | 1,299,182 | | | | 1,304,703 | | | $ | (5,521 | ) | |
| 11/30/2005 | | CZK | 758,251,620 | | | | 30,678,089 | | | | 31,323,004 | | | | (644,915 | ) | |
| 11/03/2005 | | EUR | 92,533,331 | | | | 110,837,782 | | | | 113,388,493 | | | | (2,550,711 | ) | |
| 11/30/2005 | | GBP | 59,136,140 | | | | 104,651,527 | | | | 106,627,942 | | | | (1,976,415 | ) | |
| 11/08/2005 | | JPY | 24,985,679,996 | | | | 214,789,605 | | | | 226,114,751 | | | | (11,325,146 | ) | |
| 12/01/2005 | | JPY | 17,983,800,000 | | | | 154,999,865 | | | | 180,126,290 | | | | (25,126,425 | ) | |
| 12/09/2005 | | JPY | 11,065,400,000 | | | | 95,460,730 | | | | 110,897,976 | | | | (15,437,246 | ) | |
| 12/19/2005 | | JPY | 27,695,000,000 | | | | 239,205,916 | | | | 257,819,773 | | | | (18,613,857 | ) | |
| 12/27/2005 | | JPY | 26,618,423,700 | | | | 230,124,918 | | | | 235,020,517 | | | | (4,895,599 | ) | |
| 01/23/2006 | | JPY | 13,106,000,000 | | | | 113,671,893 | | | | 114,643,107 | | | | (971,214 | ) | |
| 04/20/2006 | | JPY | 26,477,720,001 | | | | 232,156,752 | | | | 233,561,681 | | | | (1,404,929 | ) | |
| 11/28/2005 TRY | | | 61,848,760 | | | | 45,407,883 | | | | 44,008,579 | | | | 1,399,304 | | |
| Net unrealized depreciation on forward foreign exchange contracts to buy | | | | | | | | | | | | | | $ | (81,552,674 | ) | |
FORWARD FOREIGN EXCHANGE CONTRACTS TO SELL
| | | Contracts to Deliver | | | |
Expiration
Date | | Local | | Value in
Currency | | In Exchange
USDfor USD | | Net Unrealized
Appreciation
(Depreciation) | |
| 11/01/2005 | | CAD | 224,384,664 | | | | 190,229,040 | | | | 189,610,162 | | | $ | (618,878 | ) | |
| 11/30/2005 | | CZK | 1,487,400,420 | | | | 60,178,708 | | | | 61,572,900 | | | | 1,394,192 | | |
| 12/27/2005 | | CZK | 764,190,814 | | | | 30,966,842 | | | | 31,432,659 | | | | 465,817 | | |
| 12/29/2005 | | CZK | 2,154,218,701 | | | | 87,304,271 | | | | 88,305,489 | | | | 1,001,218 | | |
| 01/23/2006 | | CZK | 992,091,216 | | | | 40,259,548 | | | | 40,068,304 | | | | (191,244 | ) | |
| 11/03/2005 | | HUF | 2,258,940,473 | | | | 10,820,419 | | | | 10,816,090 | | | | (4,329 | ) | |
| 12/29/2005 | | HUF | 6,413,325,474 | | | | 30,624,771 | | | | 30,873,372 | | | | 248,601 | | |
| 12/29/2005 | | PLN | 69,765,310 | | | | 21,055,505 | | | | 21,465,457 | | | | 409,952 | | |
| 01/23/2006 | | PLN | 202,489,234 | | | | 61,106,807 | | | | 61,974,485 | | | | 867,678 | | |
| 11/28/2005 TRY | | | 84,943,921 | | | | 62,363,798 | | | | 57,872,900 | | | | (4,490,898 | ) | |
| 12/29/2005 TRY | | | 55,908,389 | | | | 40,699,165 | | | | 40,308,860 | | | | (390,305 | ) | |
| Net unrealized depreciation on forward foreign exchange contracts to sell | | | | | | | | | | | | | | $ | (1,308,196 | ) | |
Glossary of Currencies
CAD — Canadian Dollar
CZK — Czech Koruna
EUR — Euro
GBP — British Pound Sterling
HUF — Hungarian Forint
JPY — Japanese Yen
PLN — Polish Zloty
TRY — Turkish Lira
See Notes to Financial Statements.
Julius Baer Funds 2005 Annual Report
71
PORTFOLIO OF INVESTMENTS–Industry Sector (Unaudited) October 31, 2005
Julius Baer International Equity Fund (Percentage of Net Assets)
At October 31, 2005, sector diversification of the Fund's investments were as follows:
| | | % of Net
Assets | | Market
Value (Note 1) | |
| INDUSTRY SECTOR | |
| Financials | | | 30.9 | % | | $ | 4,706,601,647 | | |
| Consumer Discretionary | | | 10.4 | | | | 1,581,953,960 | | |
| Consumer Staples | | | 8.7 | | | | 1,320,490,614 | | |
| Industrials | | | 8.1 | | | | 1,233,428,496 | | |
| Healthcare | | | 7.2 | | | | 1,098,491,438 | | |
| Telecommunications | | | 5.8 | | | | 894,270,448 | | |
| Energy | | | 5.0 | | | | 767,705,184 | | |
| Materials | | | 5.0 | | | | 759,022,898 | | |
| Utilities | | | 3.8 | | | | 574,195,606 | | |
| Information Technology | | | 2.1 | | | | 320,963,841 | | |
| US Treasury Bills | | | 0.4 | | | | 58,904,262 | | |
| Cash & Cash Equivalents | | | 11.3 | | | | 1,724,836,053 | * | |
| Total Investments | | | 98.7 | | | | 15,040,864,447 | | |
| Other Assets and Liabilities (Net) | | | 1.3 | | | | 197,522,088 | * | |
| Net Assets | | | 100.0 | % | | $ | 15,238,386,535 | | |
* Cash and Cash Equivalents and Other Assets and Liabilities (Net) include the margin requirements for $984,437,544 and notional market value for futures, which is 6.5% of net assets, and $38,347,670 in market value for swaps, which is 0.3% of net assets.
See Notes to Financial Statements.
Julius Baer Funds 2005 Annual Report
72
PORTFOLIO OF INVESTMENTS October 31, 2005
Julius Baer International Equity Fund II (Percentage of Net Assets)
Share
Amount | | Description | | Market
Value (Note 1) | |
| COMMON STOCKS—79.4% | | | |
| | | Japan—11.2% | |
| | 5,333 | | | Acom Co (1) | | $ | 347,303 | | |
| | 8,556 | | | Aeon Credit Service (1) | | | 672,308 | | |
| | 6,050 | | | Aiful Corp (1) | | | 452,201 | | |
| | 22,645 | | | Aisin Seiki (1) | | | 683,024 | | |
| | 13,472 | | | Astellas Pharma (1) | | | 481,748 | | |
| | 42,000 | | | Bank of Fukuoka (1) | | | 328,239 | | |
| | 116,633 | | | Bank of Yokohama (1) | | | 949,319 | | |
| | 11,490 | | | Bridgestone Corp (1) | | | 235,179 | | |
| | 28,344 | | | Canon Inc (1) | | | 1,499,988 | | |
| | 34,000 | | | Chiba Bank (1) | | | 304,043 | | |
| | 30,472 | | | Credit Saison (1) | | | 1,384,363 | | |
| | 12,000 | | | Dai Nippon Printing (1) | | | 196,020 | | |
| | 6,000 | | | Daihatsu Motor (1) | | | 57,234 | | |
| | 37,626 | | | Denso Corp (1) | | | 1,073,770 | | |
| | 101 | | | East Japan Railway (1) | | | 602,080 | | |
| | 2,600 | | | Fanuc Ltd (1) | | | 205,507 | | |
| | 14,432 | | | Fuji Photo Film (1) | | | 460,873 | | |
| | 333 | | | Fuji Television Network (1) | | | 741,410 | | |
| | 48,000 | | | Gunma Bank (1) | | | 343,117 | | |
| | 28,460 | | | Honda Motor (1) | | | 1,580,733 | | |
| | 14,500 | | | Ibiden Co (1) | | | 590,367 | | |
| | 141 | | | Japan Tobacco (1) | | | 2,232,027 | | |
| | 50,000 | | | Joyo Bank (1) | | | 335,336 | | |
| | 182,306 | | | Matsushita Electric Industrial (1) | | | 3,346,474 | | |
| | 510 | | | Mitsubishi Tokyo Financial (1) | | | 6,431,099 | | |
| | 652 | | | Mizuho Financial (1) | | | 4,379,497 | | |
| | 30,000 | | | NGK Spark Plug (1) | | | 483,154 | | |
| | 1,687 | | | Nidec Corp* | | | 93,477 | | |
| | 26,500 | | | Nikko Securities (1) | | | 324,090 | | |
| | 6,180 | | | Nippon Television Network (1) | | | 999,758 | | |
| | 68,167 | | | Nissan Motor (1) | | | 712,457 | | |
| | 16,569 | | | Nitto Denko (1) | | | 1,003,130 | | |
| | 80,207 | | | Nomura Holdings (1) | | | 1,235,117 | | |
| | 900 | | | Orix Corp (1) | | | 168,722 | | |
| | 13,000 | | | Ricoh Co (1) | | | 205,968 | | |
| | 4,500 | | | Secom Co (1) | | | 225,559 | | |
| | 21,040 | | | Seven & I Holdings* (1) | | | 686,843 | | |
| | 2,300 | | | SMC Corp (1) | | | 307,203 | | |
| | 32,530 | | | Sony Corp (1) | | | 1,060,874 | | |
See Notes to Financial Statements.
Julius Baer Funds 2005 Annual Report
73
PORTFOLIO OF INVESTMENTS (Continued) October 31, 2005
Julius Baer International Equity Fund II (Percentage of Net Assets)
Share
Amount | | Description | | Market
Value (Note 1) | |
| COMMON STOCKS—Continued | | | |
| | | Japan—Continued | |
| | 435 | | | Sumitomo Mitsui Financial (1) | | $ | 4,051,112 | | |
| | 65,633 | | | Sumitomo Trust & Banking (1) | | | 557,635 | | |
| | 10,396 | | | Takeda Chemical Industries (1) | | | 571,677 | | |
| | 8,143 | | | Takefuji Corp (1) | | | 572,273 | | |
| | 38,000 | | | Toppan Printing (1) | | | 367,221 | | |
| | 72,000 | | | Toshiba Corp (1) | | | 335,093 | | |
| | 66,924 | | | Toyota Motor (1) | | | 3,107,174 | | |
| | 22,944 | | | Yamaha Motor (1) | | | 493,807 | | |
| | | | 47,475,603 | | |
| | | United Kingdom—10.6% | |
| | 103,835 | | | Aegis Group (1) | | | 228,857 | | |
| | 72,375 | | | Associated British Ports (1) | | | 701,397 | | |
| | 103,981 | | | BAE Systems (1) | | | 608,066 | | |
| | 37,067 | | | Balfour Beatty (1) | | | 199,834 | | |
| | 111,974 | | | Barclays (1) | | | 1,109,539 | | |
| | 32,932 | | | BG Group (1) | | | 289,016 | | |
| | 160,069 | | | BAA PLC (1) | | | 1,738,580 | | |
| | 10,762 | | | British Land (1) | | | 169,584 | | |
| | 34,088 | | | British Sky Broadcasting (1) | | | 307,794 | | |
| | 160,170 | | | Burberry Group (1) | | | 1,087,556 | | |
| | 54,314 | | | Cadbury Schweppes (1) | | | 534,654 | | |
| | 304,013 | | | Compass Group (1) | | | 1,022,705 | | |
| | 314,403 | | | Diageo PLC (1) | | | 4,647,882 | | |
| | 18,133 | | | Exel PLC (1) | | | 387,181 | | |
| | 247,327 | | | GlaxoSmithkline PLC (1) | | | 6,435,276 | | |
| | 398,997 | | | Hilton Group (1) | | | 2,394,869 | | |
| | 46,553 | | | Imperial Tobacco (1) | | | 1,335,204 | | |
| | 18,543 | | | London Stock Exchange (1) | | | 185,876 | | |
| | 31,412 | | | National Grid (1) | | | 287,259 | | |
| | 57,927 | | | Pearson PLC (1) | | | 644,089 | | |
| | 131,511 | | | Peninsular and Oriental Steam Navigation (1) | | | 940,039 | | |
| | 89,728 | | | Prudential PLC (1) | | | 753,021 | | |
| | 65,005 | | | Reckitt Benckiser (1) | | | 1,964,648 | | |
| | 88,787 | | | Rolls-Royce Group* (1) | | | 573,767 | | |
| | 31,740 | | | Royal Bank of Scotland (1) | | | 878,881 | | |
| | 38,917 | | | Scottish & Newcastle (1) | | | 321,926 | | |
| | 83,674 | | | Scottish Power (1) | | | 819,212 | | |
| | 119,646 | | | Smith & Nephew (1) | | | 1,012,528 | | |
See Notes to Financial Statements.
Julius Baer Funds 2005 Annual Report
74
PORTFOLIO OF INVESTMENTS (Continued) October 31, 2005
Julius Baer International Equity Fund II (Percentage of Net Assets)
Share
Amount | | Description | | Market
Value (Note 1) | |
| COMMON STOCKS—Continued | | | |
| | | United Kingdom—Continued | |
| | 25,278 | | | Smiths Group (1) | | $ | 408,188 | | |
| | 8,439 | | | South African Breweries (1) | | | 159,162 | | |
| | 672,211 | | | Tesco PLC (1) | | | 3,579,213 | | |
| | 2,419,748 | | | Vodafone Group (1) | | | 6,351,411 | | |
| | 22,399 | | | Whitbread PLC (1) | | | 372,485 | | |
| | 81,053 | | | William Hill (1) | | | 766,461 | | |
| | 19,569 | | | Wolseley PLC (1) | | | 398,104 | | |
| | 131,924 | | | WPP Group (1) | | | 1,297,512 | | |
| | | | 44,911,776 | | |
| | | France—9.2% | |
| | 4,247 | | | Accor SA (1) | | | 211,829 | | |
| | 106,687 | | | Alcatel Alsthom* (1) | | | 1,251,367 | | |
| | 4,848 | | | Alstom* (1) | | | 232,097 | | |
| | 4,482 | | | Atos Origin* (1) | | | 308,033 | | |
| | 12,280 | | | Autoroutes du Sud de la France (1) | | | 684,643 | | |
| | 18,062 | | | BNP Paribas (1) | | | 1,368,565 | | |
| | 34,572 | | | Bouygues SA (1) | | | 1,704,987 | | |
| | 14,580 | | | Carrefour SA (1) | | | 647,633 | | |
| | 15,228 | | | Compagnie de Saint-Gobain (1) | | | 833,639 | | |
| | 5,446 | | | Compagnie Generale des Etablissements Michelin-Class B (1) | | | 293,707 | | |
| | 3,150 | | | Eurazeo (1) | | | 305,881 | | |
| | 103,687 | | | France Telecom (1) | | | 2,693,718 | | |
| | 7,356 | | | Havas SA (1) | | | 35,671 | | |
| | 21,731 | | | JC Decaux* (1) | | | 443,899 | | |
| | 44,541 | | | Lafarge SA (1) | | | 3,660,838 | | |
| | 8,122 | | | L'Air Liquide (1) | | | 1,476,130 | | |
| | 43,091 | | | LVMH SA (1) | | | 3,486,969 | | |
| | 16,590 | | | Pernod-Ricard (1) | | | 2,898,058 | | |
| | 13,202 | | | Pinault-Printemps-Redoute (1) | | | 1,386,123 | | |
| | 19,965 | | | Publicis Groupe (1) | | | 660,085 | | |
| | 4,412 | | | Renault SA (1) | | | 381,596 | | |
| | 56,791 | | | Sanofi-Synthelabo (1) | | | 4,544,562 | | |
| | 7,431 | | | Schneider Electric (1) | | | 609,806 | | |
| | 36,702 | | | Societe Television Francaise (1) | | | 940,409 | | |
| | 52,374 | | | Suez SA (1) | | | 1,417,131 | | |
| | 15,679 | | | Total Fina-Class B (1) | | | 3,945,830 | | |
| | 3,451 | | | Unibail (1) | | | 455,559 | | |
| | 16,129 | | | Veolia Environnement (1) | | | 672,075 | | |
| | 18,650 | | | Vinci SA (1) | | | 1,455,840 | | |
| | | | 39,006,680 | | |
See Notes to Financial Statements.
Julius Baer Funds 2005 Annual Report
75
PORTFOLIO OF INVESTMENTS (Continued) October 31, 2005
Julius Baer International Equity Fund II (Percentage of Net Assets)
Share
Amount | | Description | | Market
Value (Note 1) | |
| COMMON STOCKS—Continued | | | |
| | | Germany—6.5% | |
| | 8,098 | | | Adidas-Salomon (1) | | $ | 1,357,350 | | |
| | 4,352 | | | Allianz AG (1) | | | 614,305 | | |
| | 14,471 | | | BASF AG (1) | | | 1,042,598 | | |
| | 25,211 | | | Bayerische Hypo-und Vereinsbank* (1) | | | 702,109 | | |
| | 4,115 | | | Bayerische Hypo-und Vereinsbank* (1) | | | 114,901 | | |
| | 41,960 | | | Commerzbank AG (1) | | | 1,097,294 | | |
| | 3,751 | | | Continental AG (1) | | | 286,536 | | |
| | 16,171 | | | DaimlerChrysler AG-Registered (1) | | | 809,081 | | |
| | 12,953 | | | Deutsche Bank (1) | | | 1,212,441 | | |
| | 5,159 | | | Deutsche Boerse (1) | | | 485,119 | | |
| | 59,260 | | | Deutsche Post (1) | | | 1,320,043 | | |
| | 9,242 | | | Deutsche Postbank (1) | | | 509,128 | | |
| | 119,607 | | | Deutsche Telekom (1) | | | 2,113,269 | | |
| | 24,385 | | | E.ON AG (1) | | | 2,208,395 | | |
| | 68,877 | | | Fraport AG (1) | | | 3,485,902 | | |
| | 6,053 | | | Fresenius AG (1) | | | 780,079 | | |
| | 11,143 | | | Fresenius Medical Care (1) | | | 1,001,865 | | |
| | 11,987 | | | Henkel KGAA (1) | | | 953,543 | | |
| | 11,240 | | | Hypo Real Estate Holding (1) | | | 542,913 | | |
| | 24,950 | | | Karstadt AG* (1) | | | 293,981 | | |
| | 11,905 | | | Linde AG (1) | | | 847,612 | | |
| | 6,364 | | | Man AG (1) | | | 295,283 | | |
| | 19,682 | | | Metro AG (1) | | | 894,627 | | |
| | 2,705 | | | Muenchener Rueckversicherungs-Gesellschaft (1) | | | 317,549 | | |
| | 18,564 | | | RWE AG (1) | | | 1,184,938 | | |
| | 8,583 | | | Schering AG (1) | | | 529,975 | | |
| | 33,736 | | | Siemens AG (1) | | | 2,507,413 | | |
| | | | 27,508,249 | | |
| | | Switzerland—6.1% | |
| | 1,223 | | | BKW FMB Energie (1) | | | 82,129 | | |
| | 27,250 | | | Compagnie Financiere Richemont (1) | | | 1,035,610 | | |
| | 46,075 | | | Holcim Ltd (1) | | | 2,862,751 | | |
| | 23,654 | | | Nestle SA-Registered (1) | | | 7,031,153 | | |
| | 3,321 | | | Nobel Biocare Holding (1) | | | 764,594 | | |
| | 96,514 | | | Novartis AG-Registered (1) | | | 5,184,609 | | |
| | 36,784 | | | Roche Holding (1) | | | 5,488,009 | | |
| | 619 | | | SGS SA (1) | | | 455,506 | | |
| | 3,718 | | | Synthes Inc (1) | | | 392,973 | | |
| | 18,834 | | | The Swatch Group-Class B (1) | | | 2,607,061 | | |
| | | | 25,904,395 | | |
See Notes to Financial Statements.
Julius Baer Funds 2005 Annual Report
76
PORTFOLIO OF INVESTMENTS (Continued) October 31, 2005
Julius Baer International Equity Fund II (Percentage of Net Assets)
Share
Amount | | Description | | Market
Value (Note 1) | |
| COMMON STOCKS—Continued | | | |
| | | Russia—3.9% | |
| | 24,958 | | | AFK Sistema Sponsored GDR (1) | | $ | 558,616 | | |
| | 29,903 | | | JSC MMC Norilsk Nickel ADR (2) | | | 2,179,929 | | |
| | 67,491 | | | LUKOIL ADR | | | 3,722,129 | | |
| | 125 | | | NovaTek OAO | | | 275,000 | | |
| | 8,737 | | | NovaTek OAO Sponsored GDR*† | | | 192,214 | | |
| | 68,734 | | | OAO Gazprom ADR (2) | | | 3,979,699 | | |
| | 5,195 | | | Sberbank RF | | | 4,623,550 | | |
| | 114,145 | | | Tyumen Oil* | | | 707,699 | | |
| | 14,174 | | | Unified Energy System GDR | | | 501,760 | | |
| | | | 16,740,596 | | |
| | | Poland—3.7% | |
| | 3,754 | | | Bank Handlowy w Warszawie (1) | | | 66,654 | | |
| | 101,674 | | | Bank PEKAO (1) | | | 4,813,290 | | |
| | 6,984 | | | Bank Prezemyslowo-Handlowy (1) | | | 1,328,464 | | |
| | 59,728 | | | Bank Zachodni WBK (1) | | | 2,010,437 | | |
| | 623,576 | | | Pko Bank Polski (1) | | | 5,232,175 | | |
| | 333,903 | | | Telekomunikacja Polska (1) | | | 2,394,615 | | |
| | | | 15,845,635 | | |
| | | Turkey—3.6% | |
| | 635,750 | | | Akbank TAS (1) | | | 3,953,208 | | |
| | 558,692 | | | Haci Omer Sabanci (1) | | | 2,608,556 | | |
| | 401,142 | | | Koc Holding (1) | | | 1,498,981 | | |
| | 888,270 | | | Turkiye Garanti Bankasi* (1) | | | 2,641,747 | | |
| | 650,916 | | | Turkiye Is Bankasi (1) | | | 4,510,724 | | |
| | | | 15,213,216 | | |
| | | Sweden—3.1% | |
| | 11,246 | | | Autoliv Inc (1) | | | 483,028 | | |
| | 58,959 | | | Ericsson AB-Class B (1) | | | 193,412 | | |
| | 71,796 | | | ForeningsSparbanken AB (1) | | | 1,770,958 | | |
| | 67,619 | | | Getinge AB-Class B (1) | | | 844,548 | | |
| | 13,380 | | | Hennes & Mauritz-Class B (1) | | | 434,192 | | |
| | 21,850 | | | Modern Times Group-Class B* (1) | | | 835,545 | | |
| | 292,483 | | | Nordea AB (1) | | | 2,864,955 | | |
| | 142,075 | | | Skandinaviska Enskilda Banken (1) | | | 2,649,541 | | |
| | 97,310 | | | Skanska AB-Class B (1) | | | 1,362,580 | | |
| | 68,145 | | | Svenska Handelsbanken-Class A (1) | | | 1,553,236 | | |
| | 9,000 | | | Telia Sonera AB (1) | | | 43,946 | | |
| | | | 13,035,941 | | |
See Notes to Financial Statements.
Julius Baer Funds 2005 Annual Report
77
PORTFOLIO OF INVESTMENTS (Continued) October 31, 2005
Julius Baer International Equity Fund II (Percentage of Net Assets)
Share
Amount | | Description | | Market
Value (Note 1) | |
| COMMON STOCKS—Continued | | | |
| | | Italy—2.9% | |
| | 58,112 | | | Assicurazioni Generali (1) | | $ | 1,727,619 | | |
| | 288,666 | | | Banca Intesa (1) | | | 1,346,518 | | |
| | 261,164 | | | Banca Intesa-RNC (1) | | | 1,130,608 | | |
| | 140,775 | | | Banca Popolare di Milano (1) | | | 1,340,221 | | |
| | 36,994 | | | Banca Popolare di Sondrio (1) | | | 542,790 | | |
| | 6,251 | | | Banca Popolare Emilia Romagna (1) | | | 329,680 | | |
| | 43,189 | | | Banche Popolari Unite (1) | | | 913,436 | | |
| | 38,417 | | | Banco Popolare di Verona (1) | | | 708,540 | | |
| | 47,223 | | | Buzzi Unicem (1) | | | 662,721 | | |
| | 129,116 | | | Capitalia SpA (1) | | | 672,983 | | |
| | 383,062 | | | Cassa di Risparmio Di Firenze (1) | | | 1,141,661 | | |
| | 90,130 | | | Credito Emiliano (1) | | | 950,264 | | |
| | 17,652 | | | Geox SpA (1) | | | 167,500 | | |
| | 16,757 | | | Luxottica Group (1) | | | 404,961 | | |
| | 149,307 | | | Parmalat SpA* (1) | | | 435,815 | | |
| | | | 12,475,317 | | |
| | | Austria—2.5% | |
| | 28,823 | | | Bank Austria Creditanstalt (1) | | | 3,164,627 | | |
| | 100,126 | | | Immofinanz Immobilien Anlagen* (1) | | | 967,828 | | |
| | 52,720 | | | OMV AG (1) | | | 2,843,466 | | |
| | 27,148 | | | Raiffeisen International Bank Holding* (1) | | | 1,707,817 | | |
| | 57,223 | | | Telekom Austria (1) | | | 1,181,066 | | |
| | 18,241 | | | Wienerberger AG (1) | | | 704,769 | | |
| | | | 10,569,573 | | |
| | | Australia—2.1% | |
| | 134,870 | | | BHP Billiton (1) | | | 2,091,296 | | |
| | 57,996 | | | Brambles Industries (1) | | | 367,295 | | |
| | 24,451 | | | CSL Ltd (1) | | | 687,037 | | |
| | 768,840 | | | Macquarie Airports (1) | | | 1,730,141 | | |
| | 95,716 | | | Macquarie Infrastructure (1) | | | 246,094 | | |
| | 151,643 | | | Newcrest Mining (1) | | | 2,070,169 | | |
| | 48,128 | | | News Corp (1) | | | 718,795 | | |
| | 108,547 | | | Patrick Corp (1) | | | 555,737 | | |
| | 11,082 | | | Rio Tinto (1) | | | 467,701 | | |
| | 38,576 | | | Transurban Group (1) | | | 184,958 | | |
| | | | 9,119,223 | | |
See Notes to Financial Statements.
Julius Baer Funds 2005 Annual Report
78
PORTFOLIO OF INVESTMENTS (Continued) October 31, 2005
Julius Baer International Equity Fund II (Percentage of Net Assets)
Share
Amount | | Description | | Market
Value (Note 1) | |
| COMMON STOCKS—Continued | | | |
| | | Netherlands—1.9% | |
| | 23,200 | | | ABN Amro Holding (1) | | $ | 548,134 | | |
| | 24,404 | | | Aegon NV (1)(2) | | | 367,022 | | |
| | 9,189 | | | Euronext NV (1) | | | 390,196 | | |
| | 12,010 | | | European Aeronautic Defense and Space (1) | | | 415,573 | | |
| | 27,271 | | | Heineken NV (1) | | | 863,185 | | |
| | 66,474 | | | Philips Electronics (1) | | | 1,736,928 | | |
| | 71,037 | | | Royal KPN (1) | | | 675,571 | | |
| | 14,606 | | | Royal Numico* (1) | | | 590,863 | | |
| | 45,233 | | | TNT NV (1) | | | 1,067,113 | | |
| | 17,634 | | | Unilever NV (1) | | | 1,240,339 | | |
| | 11,526 | | | VNU NV (1) | | | 366,198 | | |
| | | | 8,261,122 | | |
| | | Norway—1.8% | |
| | 13,980 | | | DNB Holding (1) | | | 143,106 | | |
| | 32,383 | | | Norsk Hydro (1) | | | 3,215,556 | | |
| | 10,150 | | | Orkla ASA (1) | | | 355,696 | | |
| | 145,049 | | | Statoil ASA (1) | | | 3,224,090 | | |
| | 58,780 | | | Telenor ASA (1) | | | 574,733 | | |
| | | | 7,513,181 | | |
| | | Czech Republic—1.7% | |
| | 19,516 | | | Cesky Telecom* (1) | | | 401,138 | | |
| | 13,855 | | | CEZ (1) | | | 363,497 | | |
| | 44,519 | | | Komercni Banka (1) | | | 6,249,261 | | |
| | | | 7,013,896 | | |
| | | Spain—1.3% | |
| | 16,145 | | | ACS Actividades de Construccion y Servicios (1) | | | 461,238 | | |
| | 23,050 | | | Cintra Concesiones De Infrae (1) | | | 273,092 | | |
| | 22,533 | | | Corporacion Mapfre (1) | | | 394,370 | | |
| | 45,790 | | | Endesa SA (1) | | | 1,138,189 | | |
| | 14,810 | | | Fadesa Inmobiliaria (1) | | | 497,657 | | |
| | 17,333 | | | Grupo Ferrovial (1) | | | 1,279,215 | | |
| | 18,190 | | | Inditex SA (1) | | | 537,947 | | |
| | 20,961 | | | Promotora de Informaciones (1) | | | 384,162 | | |
| | 39,389 | | | Telefonica SA (1) | | | 627,942 | | |
| | | | 5,593,812 | | |
See Notes to Financial Statements.
Julius Baer Funds 2005 Annual Report
79
PORTFOLIO OF INVESTMENTS (Continued) October 31, 2005
Julius Baer International Equity Fund II (Percentage of Net Assets)
Share
Amount | | Description | | Market
Value (Note 1) | |
| COMMON STOCKS—Continued | | | |
| | | Belgium—1.3% | |
| | 8,418 | | | Almancora (1) | | $ | 815,874 | | |
| | 30,803 | | | Fortis (1) | | | 876,332 | | |
| | 12,152 | | | InBev (1) | | | 485,280 | | |
| | 40,431 | | | KBC Groupe (1) | | | 3,291,762 | | |
| | | | 5,469,248 | | |
| | | Hungary—1.2% | |
| | 400,918 | | | Magyar Telekom RT (1) | | | 1,905,312 | | |
| | 84,904 | | | OTP Bank (1) | | | 3,070,235 | | |
| | | | 4,975,547 | | |
| | | South Korea—1.1% | |
| | 5,553 | | | Samsung Electronics (1) | | | 2,971,483 | | |
| | 5,626 | | | Samsung Electronics GDR (1) | | | 1,502,485 | | |
| | | | 4,473,968 | | |
| | | Mexico—0.8% | |
| | 215,207 | | | Fomento Economico Mexicano | | | 1,459,301 | | |
| | 8,900 | | | Fomento Economico Mexicano ADR | | | 605,111 | | |
| | 152,782 | | | Grupo Financiero Banorte | | | 1,301,371 | | |
| | | | 3,365,783 | | |
| | | Finland—0.6% | |
| | 58,453 | | | Fortum Oyj (1) | | | 1,034,197 | | |
| | 100,329 | | | Nokia Oyj (1) | | | 1,682,548 | | |
| | | | 2,716,745 | | |
| | | Greece—0.6% | |
| | 20,180 | | | Alpha Bank (1) | | | 578,989 | | |
| | 54,954 | | | Hellenic Telecommunication* (1) | | | 1,135,356 | | |
| | 23,333 | | | National Bank of Greece (1) | | | 911,157 | | |
| | | | 2,625,502 | | |
| | | Denmark—0.4% | |
| | 37,105 | | | Danske Bank (1) | | | 1,162,909 | | |
| | 26,804 | | | Vestas Wind Systems* (1) | | | 580,023 | | |
| | | | 1,742,932 | | |
See Notes to Financial Statements.
Julius Baer Funds 2005 Annual Report
80
PORTFOLIO OF INVESTMENTS (Continued) October 31, 2005
Julius Baer International Equity Fund II (Percentage of Net Assets)
Share
Amount | | Description | | Market
Value (Note 1) | |
| COMMON STOCKS—Continued | | | |
| | | Indonesia—0.3% | |
| | 1,789,000 | | | Bank Mandiri Persero (1) | | $ | 233,941 | | |
| | 1,769,000 | | | Telekomunikasi Indonesia (1) | | | 886,674 | | |
| | | | 1,120,615 | | |
| | | Philippines—0.2% | |
| | 25,577 | | | Philippine Long Distance Telephone (1) | | | 777,629 | | |
| | | Romania—0.2% | |
| | 4,933,500 | | | SNP Petrom* | | | 645,894 | | |
| | | Hong Kong—0.1% | |
| | 224,000 | | | China Merchants Holdings International (1) | | | 435,841 | | |
| | 74,500 | | | Yue Yuen Industrial Holdings (1) | | | 188,099 | | |
| | | | 623,940 | | |
| | | Brazil—0.1% | |
| | 16,059 | | | Aracruz Celulose ADR | | | 615,062 | | |
| | | United States—0.1% | |
| | 3,442 | | | Southern Copper | | | 189,792 | | |
| | 14,223 | | | Telewest Global* | | | 324,427 | | |
| | | | 514,219 | | |
| | | Canada—0.1% | |
| | 18,482 | | | Barrick Gold | | | 464,577 | | |
| | | Portugal—0.1% | |
| | 182,981 | | | Banco Comercial Portugues (1) | | | 462,493 | | |
| | | Singapore—0.1% | |
| | 256,000 | | | Singapore Telecommunications (1) | | | 354,046 | | |
| | | Kazkhstan—0.0% | |
| | 16,924 | | | Kazakhmys PLC* (1) | | | 161,782 | | |
| | | Ireland—0.0% | |
| | 1,942 | | | DePfa Bank (1) | | | 30,235 | | |
| | | | | TOTAL COMMON STOCKS (Cost $330,449,738) | | | 337,328,432 | | |
| PREFERRED STOCKS—0.2% | | | |
| | | Germany—0.2% | |
| | 3,451 | | | Henkel KGAA-Vorzug (1) | | | 297,227 | | |
| | 39,828 | | | ProsiebenSat.1 Media (1) | | | 685,964 | | |
| | 385 | | | Volkswagen AG (1) | | | 15,634 | | |
| | | | | TOTAL PREFERRED STOCKS (Cost $1,023,995) | | | 998,825 | | |
See Notes to Financial Statements.
Julius Baer Funds 2005 Annual Report
81
PORTFOLIO OF INVESTMENTS (Continued) October 31, 2005
Julius Baer International Equity Fund II (Percentage of Net Assets)
Share
Amount | | Description | | Market
Value (Note 1) | |
| WARRANTS—0.8% | |
| | | India—0.8% | |
| | 296,727 | | | Bharti Televentures-Class A Warrants, Expires 05/31/2010*† | | $ | 2,124,090 | | |
| | 51,595 | | | CLSA State Bank of India Warrants, Expires 05/13/2010*† | | | 1,096,464 | | |
| | | TOTAL WARRANTS (Cost $3,316,460) | | | 3,220,554 | | |
Face
Value | |
Currency | |
| |
| |
| U.S. GOVERNMENT AND AGENCY OBLIGATIONS—8.1% | | | |
| | | | | United States—8.1% | |
| | 20,000 | | | USD | | U.S. Treasury Bill 3.470%, due 11/25/2005 (3) | | | 19,954 | | |
| | 2,000,000 | | | USD | | U.S. Treasury Bill 3.660%, due 11/25/2005 (3) | | | 1,995,120 | | |
| | 2,600,000 | | | USD | | U.S. Treasury Bill 3.300%, due 12/01/2005 (3) | | | 2,592,850 | | |
| | 30,000,000 | | | USD | | U.S. Treasury Bill 3.555%, due 12/15/2005 (3) | | | 29,869,650 | | |
| | | | | | | TOTAL U.S. GOVERNMENT AND AGENCY OBLIGATIONS
(Cost $34,477,574) | | | 34,477,574 | | |
SHORT-TERM INVESTMENTS PURCHASED WITH CASH COLLATERAL
FROM SECURITY LENDING—1.2% | | | |
| | | | | United States—0.8% | |
| | 55,222 | | | USD | | American Beacon Funds 3.806%, due 11/01/2005 (4) | | | 55,222 | | |
| | 138,056 | | | USD | | Bank of America 3.770%, due 01/17/2006 (4) | | | 138,056 | | |
| | 110,445 | | | USD | | Bear Stearns & Co 4.198%, due 12/06/2005 (4) | | | 110,445 | | |
| | 71,584 | | | USD | | BGI Institional 3.923%, due 11/01/2005 (4) | | | 71,584 | | |
| | 276,111 | | | USD | | Branch Banker & Trust 3.835%, due 11/22/2005 (4) | | | 276,111 | | |
| | 389,362 | | | USD | | Credit Suisse First Boston, with rates ranging from
3.880%-4.105% and maturity dates ranging from
11/01/2005-03/10/2006 (4) | | |
389,362 | | |
| | 64,978 | | | USD | | Goldman Sachs Financial Square Prime Obligations Fund
3.788%, due 11/01/2005 (4) | | | 64,978 | | |
| | 899,238 | | | USD | | Goldman Sachs Group, with rates ranging from
4.020%-4.103% and maturity dates ranging from
11/01/2005-11/07/2005. (4) | | |
899,238 | | |
| | 55,222 | | | USD | | Harris Trust & Savings Bank 3.795%, due 11/04/2005 (4) | | | 55,222 | | |
| | 12,701 | | | USD | | Lehman Brothers Repo/Triparty 4.103%, due 11/01/2005 (4) | | | 12,701 | | |
| | 661,491 | | | USD | | Merrill Lynch & Co 4.103%, due 11/01/2005 (4) | | | 661,491 | | |
| | 376,907 | | | USD | | Merrimac Cash Fund-Premium Class 3.700%,
due 11/01/2005 (4) | | | 376,907 | | |
| | 58,908 | | | USD | | Morgan Stanley Dean Witter & Co 4.168%, due 11/01/2005 (4) | | | 58,908 | | |
See Notes to Financial Statements.
Julius Baer Funds 2005 Annual Report
82
PORTFOLIO OF INVESTMENTS (Continued) October 31, 2005
Julius Baer International Equity Fund II (Percentage of Net Assets)
Face
Value | |
Currency | |
Description | | Market
Value (Note 1) | |
SHORT-TERM INVESTMENTS PURCHASED WITH CASH COLLATERAL
FROM SECURITY LENDING—Continued | | | |
| | | | | United States—Continued | |
| | 82,833 | | | USD | | Ranger Funding 3.989%, due 11/15/2005 (4) | | $ | 82,833 | | |
| | 110,445 | | | USD | | Wells Fargo 4.010%, due 12/12/2005 (4) | | | 110,445 | | |
| | | | 3,363,503 | | |
| | | | | United Kingdom—0.2% | |
| | 828,334
| | | USD
| | Royal Bank of Scotland, with rates ranging from
3.760%-4.000% and maturity dates ranging from
11/01/2005-12/12/2005 (4) | | |
828,334 | | |
| | | | | Canada—0.1% | |
| | 276,111 | | | USD | | Canadian Imperial Bank of Commerce 4.075%,
due 05/18/2006 (4) | | | 276,111 | | |
| | 276,111 | | | USD | | Royal Bank of Canada 3.825%, due 11/22/2005 (4) | | | 276,111 | | |
| | | | 552,222 | | |
| | | | | Belgium—0.1% | |
| | 331,334 | | | USD | | Fortis Bank, with rates ranging from 3.850%-4.010% and
maturity dates ranging from 11/03/2005-11/28/2005. (4) | | | 331,334 | | |
| | | | | | | TOTAL SHORT-TERM INVESTMENTS PURCHASED
WITH CASH COLLATERAL FROM SECURITY LENDING
(Cost $5,075,393) | | |
5,075,393 | | |
| REPURCHASE AGREEMENTS—9.7% | | | |
| | | | | United States—9.7% | |
| | 41,307,395 | | | USD | | Investors Bank & Trust Company Repurchase Agreement, | | |
| | |
| | | | | | | dated 10/31/2005, due 11/01/2005, with a maturity | | |
| | |
| | | | | | | value of $41,310,550 and an effective yield of 2.75%, | | |
| | |
| | | | | | | collaterallized by U.S. Government and Agency Obligations, | | |
| | |
| | | | | | | with rates ranging from 5.875-7.125%, maturities from | | |
| | |
| | | | | | | 1/25/2022-09/25/2027, and an aggregate market value | | |
| | |
| | | | | | | of $43,372,764 (Cost $41,307,395) | | | 41,307,395 | | |
| | | | | | | TOTAL INVESTMENTS—99.4% (Cost $415,650,555) | | | 422,408,173 | | |
| | | | | | | OTHER ASSETS AND LIABILITIES (Net)—0.6% | | | 2,644,042 | | |
| | | | | | | TOTAL NET ASSETS—100.0% | | $ | 425,052,215 | | |
See Notes to Financial Statements.
Julius Baer Funds 2005 Annual Report
83
PORTFOLIO OF INVESTMENTS (Continued) October 31, 2005
Julius Baer International Equity Fund II (Percentage of Net Assets)
Notes to the Portfolio of Investments:
ADR American Depositary Receipt
GDR Global Depositary Receipt
(1) Security valued at fair value utilizing the fair value model in accordance with valuation policies approved by the board of directors.
(2) All or a portion of this security was on loan to brokers at October 31, 2005.
(3) Security has been pledged for futures collateral.
(4) Represents investments of security lending collateral.
* Non-income producing security.
† Securities exempt from registration under Rule 144A of the Securities Act of 1933. These securities may be resold in transactions exempt from registrations, normally to qualified institutional buyers.
Aggregate cost for federal income tax purposes was $416,583,192.
Glossary of Currencies
USD — United States Dollar
See Notes to Financial Statements.
Julius Baer Funds 2005 Annual Report
84
SCHEDULE OF FORWARD FOREIGN EXCHANGE CONTRACTS
October 31, 2005
Julius Baer International Equity Fund II
FORWARD FOREIGN EXCHANGE CONTRACTS TO BUY
| | | Contracts to Receive | | | | | |
Expiration
Date | | Local | | Value in
Currency | | In Exchange
USDfor USD | | Net Unrealized
Appreciation
(Depreciation) | |
| 11/01/2005 | | CHF | 199,183 | | | | 154,274 | | | | 156,210 | | | $ | (1,936 | ) | |
| 11/02/2005 | | CHF | 512,134 | | | | 396,665 | | | | 396,972 | | | | (307 | ) | |
| 11/03/2005 | | CHF | 1,366,092 | | | | 1,058,181 | | | | 1,080,000 | | | | (21,819 | ) | |
| 11/02/2005 | | CZK | 642,639 | | | | 25,960 | | | | 26,288 | | | | (328 | ) | |
| 11/03/2005 | | DKK | 5,249,318 | | | | 842,557 | | | | 864,000 | | | | (21,443 | ) | |
| 11/01/2005 | | EUR | 1,058,444 | | | | 1,267,751 | | | | 1,282,535 | | | | (14,784 | ) | |
| 11/03/2005 | | EUR | 5,703,112 | | | | 6,831,272 | | | | 7,000,000 | | | | (168,728 | ) | |
| 11/14/2005 | | EUR | 905,058 | | | | 1,084,735 | | | | 1,124,000 | | | | (39,265 | ) | |
| 12/02/2005 | | EUR | 1,438,384 | | | | 1,725,615 | | | | 1,782,000 | | | | (56,385 | ) | |
| 12/09/2005 | | EUR | 10,339,521 | | | | 12,408,970 | | | | 12,900,000 | | | | (491,030 | ) | |
| 12/14/2005 | | EUR | 7,690,626 | | | | 9,232,424 | | | | 9,500,000 | | | | (267,576 | ) | |
| 01/05/2006 | | EUR | 1,352,864 | | | | 1,626,041 | | | | 1,620,000 | | | | 6,041 | | |
| 01/17/2006 | | EUR | 180,510 | | | | 217,106 | | | | 218,173 | | | | (1,067 | ) | |
| 11/01/2005 | | GBP | 554,586 | | | | 981,756 | | | | 974,806 | | | | 6,950 | | |
| 11/02/2005 | | GBP | 42,499 | | | | 75,234 | | | | 75,249 | | | | (15 | ) | |
| 11/03/2005 | | GBP | 1,039,432 | | | | 1,840,032 | | | | 1,836,000 | | | | 4,032 | | |
| 12/09/2005 | | GBP | 1,758,634 | | | | 3,112,004 | | | | 3,225,000 | | | | (112,996 | ) | |
| 12/14/2005 | | GBP | 2,059,789 | | | | 3,644,810 | | | | 3,752,400 | | | | (107,590 | ) | |
| 02/01/2006 | | GBP | 401,427 | | | | 710,172 | | | | 711,450 | | | | (1,278 | ) | |
| 11/01/2005 | | JPY | 78,068,718 | | | | 670,665 | | | | 702,000 | | | | (31,335 | ) | |
| 11/02/2005 | | JPY | 11,159,080 | | | | 95,864 | | | | 95,901 | | | | (37 | ) | |
| 11/04/2005 | | JPY | 442,812,744 | | | | 3,804,927 | | | | 3,996,000 | | | | (191,073 | ) | |
| 11/14/2005 | | JPY | 99,776,700 | | | | 858,312 | | | | 900,000 | | | | (41,688 | ) | |
| 11/18/2005 | | JPY | 501,289,000 | | | | 4,314,200 | | | | 4,616,984 | | | | (302,784 | ) | |
| 12/02/2005 | | JPY | 195,262,650 | | | | 1,683,132 | | | | 1,782,000 | | | | (98,868 | ) | |
| 12/09/2005 | | JPY | 872,840,533 | | | | 7,529,958 | | | | 8,102,400 | | | | (572,442 | ) | |
| 12/14/2005 | | JPY | 543,750,000 | | | | 4,693,678 | | | | 5,000,000 | | | | (306,322 | ) | |
| 12/27/2005 | | JPY | 309,644,000 | | | | 2,676,973 | | | | 2,810,219 | | | | (133,246 | ) | |
| 12/29/2005 | | JPY | 160,220,900 | | | | 1,385,489 | | | | 1,421,658 | | | | (36,169 | ) | |
| 01/05/2006 | | JPY | 182,982,240 | | | | 1,583,629 | | | | 1,620,000 | | | | (36,371 | ) | |
| 01/17/2006 | | JPY | 741,250,000 | | | | 6,424,430 | | | | 6,548,434 | | | | (124,004 | ) | |
| 01/24/2006 | | JPY | 490,630,000 | | | | 4,255,878 | | | | 4,300,000 | | | | (44,122 | ) | |
| 04/20/2006 | | JPY | 117,544,845 | | | | 1,030,634 | | | | 1,036,871 | | | | (6,237 | ) | |
| 11/03/2005 NOK | | | 4,832,201 | | | | 743,400 | | | | 756,000 | | | | (12,600 | ) | |
| 11/03/2005 | | SEK | 8,262,864 | | | | 1,037,644 | | | | 1,080,000 | | | | (42,356 | ) | |
| 11/28/2005 TRY | | | 82,339 | | | | 60,451 | | | | 59,188 | | | | 1,263 | | |
| Net unrealized depreciation on forward foreign exchange contracts to buy | | | | | | | | | | | | | | $ | (3,267,915 | ) | |
See Notes to Financial Statements.
Julius Baer Funds 2005 Annual Report
85
SCHEDULE OF FORWARD FOREIGN EXCHANGE CONTRACTS (Continued)
October 31, 2005
Julius Baer International Equity Fund II
FORWARD FOREIGN EXCHANGE CONTRACTS TO SELL
| | | Contracts to Deliver | | | | | |
Expiration
Date | | Local | | Value in
Currency | | In Exchange
USDfor USD | | Net Unrealized
Appreciation
(Depreciation) | |
| 11/02/2005 | | CAD | 4,118,824 | | | | 3,491,961 | | | | 3,481,677 | | | $ | (10,284 | ) | |
| 11/03/2005 | | CHF | 1,366,092 | | | | 1,058,181 | | | | 1,077,742 | | | | 19,561 | | |
| 11/09/2005 | | CZK | 13,720,037 | | | | 554,453 | | | | 571,335 | | | | 16,882 | | |
| 11/18/2005 | | CZK | 32,582,000 | | | | 1,317,358 | | | | 1,378,141 | | | | 60,783 | | |
| 11/30/2005 | | CZK | 7,686,099 | | | | 310,973 | | | | 312,878 | | | | 1,905 | | |
| 01/23/2006 | | CZK | 4,873,555 | | | | 197,771 | | | | 196,832 | | | | (939 | ) | |
| 11/01/2005 | | EUR | 866,974 | | | | 1,038,418 | | | | 1,060,915 | | | | 22,497 | | |
| 11/03/2005 | | EUR | 5,703,112 | | | | 6,831,272 | | | | 6,977,631 | | | | 146,359 | | |
| 12/02/2005 | | EUR | 1,438,384 | | | | 1,725,614 | | | | 1,731,887 | | | | 6,273 | | |
| 12/09/2005 | | EUR | 10,339,521 | | | | 12,408,970 | | | | 12,773,183 | | | | 364,213 | | |
| 12/14/2005 | | EUR | 7,690,626 | | | | 9,232,424 | | | | 9,408,412 | | | | 175,988 | | |
| 11/01/2005 | | GBP | 401,427 | | | | 710,627 | | | | 711,931 | | | | 1,304 | | |
| 11/03/2005 | | GBP | 1,039,432 | | | | 1,840,032 | | | | 1,836,561 | | | | (3,471 | ) | |
| 12/09/2005 | | GBP | 1,200,000 | | | | 2,123,469 | | | | 2,205,384 | | | | 81,915 | | |
| 12/14/2005 | | GBP | 1,900,000 | | | | 3,362,062 | | | | 3,425,453 | | | | 63,391 | | |
| 11/02/2005 | | HUF | 24,768,975 | | | | 118,645 | | | | 119,397 | | | | 752 | | |
| 11/03/2005 | | HUF | 12,923,013 | | | | 61,902 | | | | 62,400 | | | | 498 | | |
| 12/29/2005 | | HUF | 6,153,102 | | | | 29,382 | | | | 29,621 | | | | 239 | | |
| 01/23/2006 | | HUF | 20,769,360 | | | | 99,046 | | | | 97,486 | | | | (1,560 | ) | |
| 11/01/2005 | | JPY | 78,068,718 | | | | 670,665 | | | | 706,728 | | | | 36,063 | | |
| 12/09/2005 | | JPY | 132,860,291 | | | | 1,146,180 | | | | 1,208,419 | | | | 62,239 | | |
| 12/14/2005 | | JPY | 376,414,000 | | | | 3,249,225 | | | | 3,430,491 | | | | 181,266 | | |
| 11/03/2005 NOK | | | 4,832,201 | | | | 743,400 | | | | 752,914 | | | | 9,514 | | |
| 12/29/2005 | | PLN | 355,940 | | | | 107,425 | | | | 109,516 | | | | 2,091 | | |
| 01/23/2006 | | PLN | 958,004 | | | | 289,105 | | | | 293,210 | | | | 4,105 | | |
| 11/28/2005 TRY | | | 82,339 | | | | 60,451 | | | | 56,100 | | | | (4,351 | ) | |
| 01/23/2006 TRY | | | 403,460 | | | | 291,916 | | | | 286,345 | | | | (5,571 | ) | |
| Net unrealized appreciation on forward foreign exchange contracts to sell | | | | | | | | | | | | | | $ | 1,231,662 | | |
Glossary of Currencies
CAD — Canadian Dollar
CHF — Swiss Franc
CZK — Czech Koruna
DKK — Danish Krone
EUR — Euro
GBP — British Pound Sterling
HUF — Hungarian Forint
JPY — Japanese Yen
NOK — Norwegian Krone
PLN — Polish Zloty
SEK — Swedish Krona
TRY — Turkish Lira
See Notes to Financial Statements.
Julius Baer Funds 2005 Annual Report
86
PORTFOLIO OF INVESTMENTS–Industry Sector (Unaudited) October 31, 2005
Julius Baer International Equity Fund II (Percentage of Net Assets)
At October 31, 2005, sector diversification of the Fund's investments were as follows:
| | | % of Net
Assets | | Market
Value (Note 1) | |
| INDUSTRY SECTOR | |
| Financials | | | 28.5 | % | | $ | 120,947,688 | | |
| Consumer Discretionary | | | 9.6 | | | | 40,514,164 | | |
| Industrials | | | 8.0 | | | | 33,882,038 | | |
| Consumer Staples | | | 7.9 | | | | 33,562,198 | | |
| Healthcare | | | 6.4 | | | | 27,174,808 | | |
| Telecommunications | | | 5.5 | | | | 23,288,717 | | |
| Materials | | | 4.3 | | | | 18,423,342 | | |
| Energy | | | 4.3 | | | | 18,355,665 | | |
| Utilities | | | 3.7 | | | | 15,869,840 | | |
| Information Technology | | | 2.2 | | | | 9,529,351 | | |
| US Treasury Bills | | | 8.1 | | | | 34,477,574 | | |
| Cash & Cash Equivalents | | | 10.9 | | | | 46,382,788 | * | |
| Total Investments | | | 99.4 | | | | 422,408,173 | | |
| Other Assets and Liabilities (Net) | | | 0.6 | | | | 2,644,042 | * | |
| Net Assets | | | 100.0 | % | | $ | 425,052,215 | | |
* Cash and Cash Equivalents and Other Assets and Liabilities (Net) include the margin requirements for $30,559,240 and notional market value for futures, which is 7.2% of net assets.
See Notes to Financial Statements.
Julius Baer Funds 2005 Annual Report
87
PORTFOLIO OF INVESTMENTS October 31, 2005
Julius Baer Total Return Bond Fund (Percentage of Net Assets)
Face
Value | |
Currency | | | | Market
Value (Note 1) | |
| U.S. GOVERNMENT AND AGENCY OBLIGATIONS—46.2% | | | |
| | | | | | | | | Federal Agricultural Mortgage | | | | | |
| | 4,000,000 | | | USD | | | | 4.250% due 07/29/2008 | | $ | 3,955,964 | | |
| | | | | | | | | Federal Home Loan Bank | | | | | |
| | 7,000,000 | | | USD | | | | 3.920% due 11/25/2005 | | | 6,981,707 | | |
| | 2,000,000 | | | USD | | | | 3.720% due 02/22/2007 (1) | | | 1,999,162 | | |
| | 4,928,491 | | | USD | | | | 4.720% due 09/20/2012 (1) | | | 4,922,330 | | |
| | | | 13,903,199 | | |
| | | | | | | | | Federal Home Loan Mortgage | | | | | |
| | 4,000,000 | | | USD | | | | 2.810% due 02/02/2006 | | | 3,985,248 | | |
| | 3,800,000 | | | USD | | | | 3.750% due 11/15/2006 | | | 3,768,555 | | |
| | 3,600,000 | | | USD | | | | 4.050% due 06/28/2007 | | | 3,569,479 | | |
| | | | 11,323,282 | | |
| | | | | | | | | Federal National Mortgage Association | | | | | |
| | 4,300,000 | | | USD | | | | 4.250% due 09/15/2007 | | | 4,271,212 | | |
| | 1,510,000 | | | USD | | | | 3.250% due 11/15/2007 | | | 1,470,216 | | |
| | 4,300,000 | | | USD | | | | 4.400% due 07/28/2008 | | | 4,246,168 | | |
| | 12,000,000 | | | USD | | | | 4.500% due 11/01/2020* | | | 11,606,256 | | |
| | | | 21,593,852 | | |
| | | | | | | | | Government National Mortgage Association | | | | | |
| | 92,235 | | | USD | | | | 7.000% due 04/15/2032 | | | 96,988 | | |
| | 8,500,000 | | | USD | | | | 6.000% due 12/01/2034* | | | 8,646,098 | | |
| | | | 8,743,086 | | |
| | | | | | | | | | | | U.S. Treasury Bond | | |
| | 5,035,000 | | | USD | | | | 6.875% due 08/15/2025 | | | 6,332,303 | | |
| | | | | | | | | U.S. Treasury Inflation Indexed Bond | | | | | |
| | 2,280,388 | | | USD | | | | 0.875% due 04/15/2010 | | | 2,192,203 | | |
| | | | | | | | | U.S. Treasury Inflation Indexed Notes | | | | | |
| | 4,375,764 | | | USD | | | | 3.625% due 01/15/2008 | | | 4,579,854 | | |
| | 4,167,040 | | | USD | | | | 2.375% due 01/15/2025 | | | 4,337,468 | | |
| | | | 8,917,322 | | |
| | | | | | | | | U.S. Treasury Notes | | | | | |
| | 16,580,000 | | | USD | | | | 1.875% due 01/31/2006 | | | 16,499,056 | | |
| | 3,350,000 | | | USD | | | | 4.250% due 08/15/2015 | | | 3,269,915 | | |
| | | | 19,768,971 | | |
| | | | | | | | | TOTAL U.S. GOVERNMENT AND AGENCY OBLIGATIONS
(Cost $97,278,175) | | | 96,730,182 | | |
See Notes to Financial Statements.
Julius Baer Funds 2005 Annual Report
88
PORTFOLIO OF INVESTMENTS (Continued) October 31, 2005
Julius Baer Total Return Bond Fund (Percentage of Net Assets)
Face
Value | |
Currency | | | | Market
Value (Note 1) | |
| CORPORATE BONDS—29.5% | | | |
| | | | | United States—23.7% | |
| | | | | | | | | Alliance Capital Management | | | | | |
| | 2,300,000 | | | USD | | | | 5.625% due 08/15/2006 | | $ | 2,314,359 | | |
| | | | | | | | | AXA Equitable Life Insurance | | | | | |
| | 1,500,000 | | | USD | | | | 6.950% due 12/01/2005† | | | 1,503,009 | | |
| | | | | | | | | Barrick Gold | | | | | |
| | 1,500,000 | | | USD | | | | 5.800% due 11/15/2034 | | | 1,413,865 | | |
| | | | | | | | | BHP Finance USA | | | | | |
| | 4,300,000 | | | USD | | | | 6.690% due 03/01/2006 | | | 4,333,338 | | |
| | | | | | | | | Cargill Inc | | | | | |
| | 1,710,000 | | | USD | | | | 3.625% due 03/04/2009† | | | 1,642,735 | | |
| | 1,000,000 | | | USD | | | | 6.300% due 04/15/2009† | | | 1,041,436 | | |
| | | | 2,684,171 | | |
| | | | | | | | | Citigroup | | | | | |
| | 2,500,000 | | | USD | | | | 5.000% due 09/15/2014 | | | 2,452,549 | | |
| | | | | | | | | Comcast Corp | | | | | |
| | 1,300,000 | | | USD | | | | 7.050% due 03/15/2033 | | | 1,394,243 | | |
| | | | | | | | | ConocoPhillips | | | | | |
| | 2,000,000 | | | USD | | | | 8.750% due 05/25/2010 | | | 2,312,548 | | |
| | | | | | | | | Credit Suisse First Boston USA | | | | | |
| | 2,150,000 | | | USD | | | | 4.875% due 08/15/2010 | | | 2,126,230 | | |
| | | | | | | | | General Electric Capital | | | | | |
| | 2,700,000 | | | USD | | | | 5.350% due 03/30/2006 | | | 2,709,947 | | |
| | | | | | | | | Home Depot | | | | | |
| | 2,800,000 | | | USD | | | | 4.625% due 08/15/2010 | | | 2,772,594 | | |
| | | | | | | | | International Lease Finance | | | | | |
| | 595,000 | | | USD | | | | 5.625% due 06/01/2007 | | | 601,190 | | |
| | | | | | | | | MassMutual Global Funding II | | | | | |
| | 815,000 | | | USD | | | | 4.040% due 12/13/2005 (1)† | | | 814,870 | | |
| | | | | | | | | Nestle Holdings | | | | | |
| | 4,000,000 | | | USD | | | | 4.375% due 10/27/2009 | | | 3,954,440 | | |
See Notes to Financial Statements.
Julius Baer Funds 2005 Annual Report
89
PORTFOLIO OF INVESTMENTS (Continued) October 31, 2005
Julius Baer Total Return Bond Fund (Percentage of Net Assets)
Face
Value | |
Currency | | | | Market
Value (Note 1) | |
| CORPORATE BONDS—Continued | | | |
| | | | | United States—Continued | |
| | | | | | | | | Ocean Energy | | | | | |
| | 2,475,000 | | | USD | | | | 7.250% due 10/01/2011 | | $ | 2,717,817 | | |
| | | | | | | | | Oglethorpe Power | | | | | |
| | 2,400,000 | | | USD | | | | 6.974% due 06/30/2011 | | | 2,483,642 | | |
| | | | | | | | | Reed Elsevier Capital | | | | | |
| | 1,000,000 | | | USD | | | | 6.125% due 08/01/2006 | | | 1,007,116 | | |
| | | | | | | | | Selkirk Cogen Funding, Series A | | | | | |
| | 2,431,180 | | | USD | | | | 8.650% due 12/26/2007 | | | 2,514,769 | | |
| | | | | | | | | Time Warner Entertainment | | | | | |
| | 1,500,000 | | | USD | | | | 8.375% due 03/15/2023 | | | 1,767,412 | | |
| | | | | | | | | UnitedHealth Group | | | | | |
| | 2,525,000 | | | USD | | | | 7.500% due 11/15/2005 | | | 2,527,209 | | |
| | | | | | | | | Valero Energy | | | | | |
| | 1,100,000 | | | USD | | | | 6.875% due 04/15/2012 | | | 1,194,212 | | |
| | | | | | | | | Viacom | | | | | |
| | 1,400,000 | | | USD | | | | 6.400% due 01/30/2006 | | | 1,406,094 | | |
| | | | | | | | | Wachovia Bank | | | | | |
| | 1,700,000 | | | USD | | | | 4.375% due 08/15/2008 | | | 1,681,292 | | |
| | | | | | | | | Wyeth | | | | | |
| | 900,000 | | | USD | | | | 5.500% due 02/01/2014 | | | 907,928 | | |
| | | | 49,594,844 | | |
| | | | | Supra National—2.6% | |
| | | | | | | | | European Investment Bank | | | | | |
| | 3,800,000 | | | USD | | | | 3.000% due 08/15/2006 | | | 3,760,298 | | |
| | | | | | | | | International Bank for Reconstruction & Development | | | | | |
| | 2,000,000 | | | USD | | | | due 01/15/2008 | | | 1,798,114 | | |
| | | | 5,558,412 | | |
| | | | | Singapore—1.1% | |
| | | | | | | | | Temasek Financial I | | | | | |
| | 2,500,000 | | | USD | | | | 4.500% due 09/21/2015† | | | 2,386,610 | | |
See Notes to Financial Statements.
Julius Baer Funds 2005 Annual Report
90
PORTFOLIO OF INVESTMENTS (Continued) October 31, 2005
Julius Baer Total Return Bond Fund (Percentage of Net Assets)
Face
Value | |
Currency | | | | Market
Value (Note 1) | |
| CORPORATE BONDS—Continued | | | |
| | | | | Germany—1.1% | |
| | | | | | | | | Kreditanstalt fuer Wiederaufbau | | | | | |
| | 2,300,000 | | | USD | | | | 3.875% due 06/30/2009 | | $ | 2,248,011 | | |
| | | | | Qatar—1.0% | |
| | | | | | | | | Ras Laffan Liquefied Natural Gas II | | | | | |
| | 2,100,000 | | | USD | | | | 5.298% due 09/30/2020† | | | 2,058,099 | | |
| | | | | | | | | TOTAL CORPORATE BONDS (Cost $62,783,964) | | | 61,845,976 | | |
| FOREIGN GOVERNMENT BONDS—19.0% | | | |
| | | | | France—4.7% | |
| | | | | | | | | Government of France | | | | | |
| | 3,780,000 | | | EUR | | | | 4.000% due 10/25/2014 | | | 4,754,603 | | |
| | 3,230,000 | | | EUR | | | | 5.750% due 10/25/2032 | | | 5,145,372 | | |
| | | | 9,899,975 | | |
| | | | | New Zealand—3.0% | |
| | | | | | | | | New Zealand Government | | | | | |
| | 9,000,000 | | | NZD | | | | 6.000% due 04/15/2015 | | | 6,318,692 | | |
| | | | | United Kingdom—2.7% | |
| | | | | | | | | United Kingdom | | | | | |
| | 3,130,000 | | | GBP | | | | 4.750% due 09/07/2015 | | | 5,722,651 | | |
| | | | | Canada—2.4% | |
| | | | | | | | | Canada Government | | | | | |
| | 3,600,000 | | | CAD | | | | 5.000% due 06/01/2014 | | | 3,245,143 | | |
| | | | | | | | | Ontario Province | | | | | |
| | 1,900,000 | | | CAD | | | | 4.500% due 02/03/2015 | | | 1,843,335 | | |
| | | | 5,088,478 | | |
| | | | | Iceland—2.1% | |
| | | | | | | | | Housing Finance Fund | | | | | |
| | 269,411,993 | | | | ISK | | | 3.750% due 06/15/2044 | | | 4,312,183 | | |
| | | | | Mexico—2.1% | |
| | | | | | | | | United Mexican States | | | | | |
| | 48,765,000 | | | MXN | | | | 8.000% due 12/19/2013 | | | 4,286,983 | | |
See Notes to Financial Statements.
Julius Baer Funds 2005 Annual Report
91
PORTFOLIO OF INVESTMENTS (Continued) October 31, 2005
Julius Baer Total Return Bond Fund (Percentage of Net Assets)
Face
Value | |
Currency | | | | Market
Value (Note 1) | |
| FOREIGN GOVERNMENT BONDS—Continued | | | |
| | | | | Israel—2.0% | |
| | | | | | | | | Israel Trust | | | | | |
| | 4,275,000 | | | USD | | | | due 11/15/2006 | | $ | 4,082,689 | | |
| | | | | | | | | TOTAL FOREIGN GOVERNMENT BONDS
(Cost $39,623,371) | | | 39,711,651 | | |
| ASSET BACKED SECURITIES—15.3% | | | |
| | | | | | | | | Bank One Issuance Trust, , Series 2003-A5, Class A-5 | | | | | |
| | 4,000,000 | | | USD | | | | 4.020% due 10/15/2008 (1) | | | 4,003,107 | | |
| | | | | | | | | Bank One Issuance Trust, Series 2003-A2, Class A-2 | | | | | |
| | 1,600,000 | | | USD | | | | 4.020% due 02/17/2009 (1) | | | 1,601,602 | | |
| | | | | | | | | Chase Credit Card Master Trust, Series 2001-2, Class A | | | | | |
| | 2,000,000 | | | USD | | | | 4.090% due 09/15/2008 (1) | | | 2,002,640 | | |
| | | | | | | | | Citibank Credit Card Issuance Trust, Series 2003-A2, Class A | | | | | |
| | 4,000,000 | | | USD | | | | 2.700% due 01/15/2008 | | | 3,988,505 | | |
| | | | | | | | | Discover Card Master Trust I, Series 2000-9, Class A | | | | | |
| | 2,500,000 | | | USD | | | | 6.350% due 07/15/2008 | | | 2,511,112 | | |
| | | | | | | | | Discover Card Master Trust I, Series 2001-2, Class A | | | | | |
| | 7,000,000 | | | USD | | | | 4.130% due 07/15/2008 (1) | | | 7,006,711 | | |
| | | | | | | | | Harley-Davidson Motorcycle Trust, Series 2003-2, Class A | | | | | |
| | 2,414,411 | | | USD | | | | 2.070% due 02/15/2011 | | | 2,345,721 | | |
| | | | | | | | | MBNA Master Credit Card Trust, Series 2001-A, Class A | | | | | |
| | 3,000,000 | | | USD | | | | 4.120% due 07/15/2008 (1) | | | 3,003,215 | | |
| | | | | | | | | Nissan Auto Lease Trust, Series 2005-A, Class A1 | | | | | |
| | 3,000,000 | | | USD | | | | 4.271% due 11/15/2006 | | | 3,000,000 | | |
| | | | | | | | | Small Business Administration, Series 2005-P10B, Class 1 | | | | | |
| | 2,656,000 | | | USD | | | | 4.940% due 08/10/2015 | | | 2,636,200 | | |
| | | | | | | | | TOTAL ASSET BACKED SECURITIES (Cost $32,109,564) | | | 32,098,813 | | |
See Notes to Financial Statements.
Julius Baer Funds 2005 Annual Report
92
PORTFOLIO OF INVESTMENTS (Continued) October 31, 2005
Julius Baer Total Return Bond Fund (Percentage of Net Assets)
Face
Value | |
Currency | | | | Market
Value (Note 1) | |
| REPURCHASE AGREEMENTS—4.1% | |
| | | | | United States—4.1% | |
| | 8,601,466 | | | USD | | Investors Bank & Trust Company Repurchase Agreement, | | |
| | |
| | | | | dated 10/31/2005, due 11/01/2005, with a maturity | | |
| | |
| | | | | value of $8,602,123 and an effective yield of 2.75%, | | |
| | |
| | | | | collaterallized by U.S. Government and Agency | | |
| | |
| | | | | Obligations, with rates ranging from 4.000-4.908%, | | |
| | |
| | | | | maturities from 02/20/2033-07/01/2034, | | |
| | |
| | | | | and an aggregate market value of $9,031,539. | | |
| | |
| | | | | (Cost $8,601,466) | | $ | 8,601,466 | | |
| | | | | TOTAL INVESTMENTS—114.1% (Cost $240,396,540) | | | 238,988,088 | | |
| | | | | OTHER ASSETS AND LIABILITIES (Net)—(14.1%) | | | (29,620,693 | ) | |
| | | | | TOTAL NET ASSETS—100.0% | | $ | 209,367,395 | | |
Portfolio Footnotes:
(1) Variable rate security.
† Securities exempt from registration under Rule 144A of the Securities Act of 1933. These securities may be resold in transactions exempt from registrations, normally to qualified institutional buyers.
* TBA — To Be Announced: Securities purchased on a forward commitment basis with an approximate principal amount and maturity date. The actual principal amount and maturity date will be determined upon settlement.
Aggregate cost for federal income tax purposes was $240,482,246.
Glossary of Currencies
CAD — Canadian Dollar
EUR — Euro
GBP — British Pound Sterling
ISK — Icelandic Krona
MXN — Mexican Nuevo Peso
NZD — New Zealand Dollar
USD — United States Dollar
See Notes to Financial Statements.
Julius Baer Funds 2005 Annual Report
93
SCHEDULE OF FORWARD FOREIGN EXCHANGE CONTRACTS
October 31, 2005
Julius Baer Total Return Bond Fund
FORWARD FOREIGN EXCHANGE CONTRACTS TO BUY
| | | Contracts to Receive | | | | | |
Expiration
Date | | Local
Currency | | Value in
USD | | In Exchange
for USD | | Net Unrealized
Depreciation | |
| 12/16/2005 | | AUD | 8,300,000 | | | | 6,190,908 | | | | 6,349,002 | | | $ | (158,094 | ) | |
| 12/16/2005 | | CAD | 3,280,206 | | | | 2,784,539 | | | | 2,786,128 | | | | (1,589 | ) | |
| 11/18/2005 | | CLP | 2,300,000,000 | | | | 4,225,172 | | | | 4,295,854 | | | | (70,682 | ) | |
| 12/16/2005 | | EUR | 13,250,000 | | | | 15,908,067 | | | | 16,159,896 | | | | (251,829 | ) | |
| 11/10/2005 | | JPY | 866,087,000 | | | | 7,447,003 | | | | 7,795,563 | | | | (348,560 | ) | |
| 12/16/2005 | | SEK | 16,800,000 | | | | 2,116,125 | | | | 2,153,846 | | | | (37,721 | ) | |
| 12/22/2005 TWD | | | 69,600,000 | | | | 2,087,019 | | | | 2,115,502 | | | | (28,483 | ) | |
| Net unrealized depreciation on forward foreign exchange contracts to buy | | | | | | | | | | | | | | $ | (896,958 | ) | |
FORWARD FOREIGN EXCHANGE CONTRACTS TO SELL
| | | Contracts to Deliver | | | | | |
Expiration
Date | | Local
Currency | | Value in
USD | | In Exchange
for USD | | Net Unrealized
Appreciation
(Depreciation) | |
| 11/18/2005 | | CLP | 2,300,000,000 | | | | 4,225,171 | | | | 4,243,542 | | | $ | 18,371 | | |
| 11/02/2005 | | EUR | 8,040,060 | | | | 9,629,982 | | | | 9,757,096 | | | | 127,114 | | |
| 12/16/2005 | | EUR | 21,645,901 | | | | 25,988,261 | | | | 26,519,192 | | | | 530,931 | | |
| 12/16/2005 | | GBP | 3,265,000 | | | | 5,777,371 | | | | 5,719,039 | | | | (58,332 | ) | |
| 11/10/2005 | | JPY | 870,948,250 | | | | 7,488,803 | | | | 7,569,567 | | | | 80,764 | | |
| Net unrealized appreciation on forward foreign exchange contracts to sell | | | | | | | | | | | | | | $ | 698,848 | | |
Glossary of Currencies
AUD — Australian Dollar
CAD — Canadian Dollar
CLP — Chilean Peso
EUR — Euro
GBP — British Pound Sterling
JPY — Japanese Yen
SEK — Swedish Krona
TWD — New Taiwan Dollar
See Notes to Financial Statements.
Julius Baer Funds 2005 Annual Report
94
PORTFOLIO OF INVESTMENTS–Industry Sector (Unaudited) October 31, 2005
Julius Baer Total Return Bond Fund (Percentage of Net Assets)
At October 31, 2005, sector diversification of the Fund's investments were as follows:
| | | % of Net
Assets | | Market
Value (Note 1) | |
| INDUSTRY SECTOR | |
| U.S. Government and Agency Obligations | | | 46.2 | % | | $ | 96,730,182 | | |
| Corporate Bonds | | | 29.5 | | | | 61,845,977 | | |
| Foreign Government Bonds | | | 19.0 | | | | 39,711,651 | | |
| Asset Backed Securities | | | 15.3 | | | | 32,098,813 | | |
| Cash & Cash Equivalents | | | 4.1 | | | | 8,601,466 | | |
| Total Investments | | | 114.1 | | | | 238,988,089 | | |
| Other Assets and Liabilities (Net) | | | (14.1 | ) | | | (29,620,694 | ) | |
| Net Assets | | | 100.0 | % | | $ | 209,367,395 | | |
See Notes to Financial Statements.
Julius Baer Investment Funds 2005 Annual Report
95
PORTFOLIO OF INVESTMENTS October 31, 2005
Julius Baer Global High Yield Bond Fund (Percentage of Net Assets)
Face
Value | |
Currency | | | | Market
Value (Note 1) | |
| CORPORATE BONDS—68.0% | | | |
| | | | | United States—53.5% | |
| | | | | | | | | ACCO Brands | | | | | |
| | 630,000 | | | USD | | | | 7.625% due 08/15/2015† | | $ | 601,650 | | |
| | | | | | | | | Airgas Inc | | | | | |
| | 820,000 | | | USD | | | | 6.250% due 07/15/2014 | | | 820,000 | | |
| | | | | | | | | Allied Waste North America, Series B | | | | | |
| | 630,000 | | | USD | | | | 7.375% due 04/15/2014 | | | 593,775 | | |
| | | | | | | | | American Towers | | | | | |
| | 400,000 | | | USD | | | | 7.250% due 12/01/2011 | | | 420,000 | | |
| | | | | | | | | Buckeye Technologies | | | | | |
| | 515,000 | | | USD | | | | 8.000% due 10/15/2010 | | | 489,250 | | |
| | | | | | | | | Callon Petroleum | | | | | |
| | 380,000 | | | USD | | | | 9.750% due 12/08/2010 | | | 399,000 | | |
| | | | | | | | | Cincinnati Bell | | | | | |
| | 180,000 | | | USD | | | | 7.250% due 07/15/2013 | | | 188,550 | | |
| | | | | | | | | CMS Energy | | | | | |
| | 800,000 | | | USD | | | | 8.500% due 04/15/2011 | | | 878,000 | | |
| | | | | | | | | Cooper-Standard Automotive | | | | | |
| | 120,000 | | | USD | | | | 8.375% due 12/15/2014 | | | 90,600 | | |
| | | | | | | | | Crown Cork & Seal Company | | | | | |
| | 580,000 | | | USD | | | | 7.375% due 12/15/2026 | | | 551,000 | | |
| | | | | | | | | Crystal US Holdings | | | | | |
| | 820,000 | | | USD | | | | 10.500% due 10/01/2014 (1) | | | 571,950 | | |
| | | | | | | | | Dex Media | | | | | |
| | 300,000 | | | USD | | | | 8.000% due 11/15/2013 | | | 306,750 | | |
| | | | | | | | | Dex Media West | | | | | |
| | 138,000 | | | USD | | | | 9.875% due 08/15/2013 | | | 152,835 | | |
| | | | | | | | | Dresser-Rand Group | | | | | |
| | 821,000 | | | USD | | | | 7.375% due 11/01/2014† | | | 845,630 | | |
| | | | | | | | | Exco Resources | | | | | |
| | 580,000 | | | USD | | | | 7.250% due 01/15/2011 | | | 588,700 | | |
| | | | | | | | | Fisher Scientific International | | | | | |
| | 400,000 | | | USD | | | | 6.750% due 08/15/2014 | | | 415,000 | | |
See Notes to Financial Statements.
Julius Baer Funds 2005 Annual Report
96
PORTFOLIO OF INVESTMENTS (Continued) October 31, 2005
Julius Baer Global High Yield Bond Fund (Percentage of Net Assets)
Face
Value | |
Currency | | | | Market
Value (Note 1) | |
| CORPORATE BONDS—Continued | | | |
| | | | | United States—Continued | |
| | | | | | | | | Ford Motor | | | | | |
| | 750,000 | | | USD | | | | 7.450% due 07/16/2031 | | $ | 555,000 | | |
| | | | | | | | | Foundation PA Coal | | | | | |
| | 830,000 | | | USD | | | | 7.250% due 08/01/2014 | | | 852,825 | | |
| | | | | | | | | IASIS Healthcare Capital | | | | | |
| | 645,000 | | | USD | | | | 8.750% due 06/15/2014 | | | 664,350 | | |
| | | | | | | | | Intcomex Inc | | | | | |
| | 285,000 | | | USD | | | | 11.750% due 01/15/2011† | | | 285,000 | | |
| | | | | | | | | INVISTA | | | | | |
| | 790,000 | | | USD | | | | 9.250% due 05/01/2012† | | | 852,212 | | |
| | | | | | | | | LaBranche & Co | | | | | |
| | 900,000 | | | USD | | | | 9.500% due 05/15/2009 | | | 951,750 | | |
| | | | | | | | | MedCath Holdings | | | | | |
| | 600,000 | | | USD | | | | 9.875% due 07/15/2012 | | | 639,000 | | |
| | | | | | | | | MSW Energy Holdings | | | | | |
| | 400,000 | | | USD | | | | 7.375% due 09/01/2010 | | | 416,000 | | |
| | 300,000 | | | USD | | | | 8.500% due 09/01/2010 | | | 321,000 | | |
| | | | 737,000 | | |
| | | | | | | | | Neff Rental/Neff Finance | | | | | |
| | 200,000 | | | USD | | | | 11.250% due 06/15/2012† | | | 209,500 | | |
| | | | | | | | | Nortek Inc | | | | | |
| | 220,000 | | | USD | | | | 8.500% due 09/01/2014 | | | 211,200 | | |
| | | | | | | | | NRG Energy | | | | | |
| | 250,000 | | | USD | | | | 8.000% due 12/15/2013 | | | 273,750 | | |
| | | | | | | | | OM Group | | | | | |
| | 975,000 | | | USD | | | | 9.250% due 12/15/2011 | | | 943,312 | | |
| | | | | | | | | Owens Brockway Glass Container | | | | | |
| | 390,000 | | | EUR | | | | 6.750% due 12/01/2014 | | | 460,116 | | |
| | | | | | | | | Premcor Refining Group | | | | | |
| | 100,000 | | | USD | | | | 9.250% due 02/01/2010 | | | 108,375 | | |
| | 575,000 | | | USD | | | | 7.500% due 06/15/2015 | | | 615,250 | | |
| | | | 723,625 | | |
See Notes to Financial Statements.
Julius Baer Funds 2005 Annual Report
97
PORTFOLIO OF INVESTMENTS (Continued) October 31, 2005
Julius Baer Global High Yield Bond Fund (Percentage of Net Assets)
Face
Value | |
Currency | | | | Market
Value (Note 1) | |
| CORPORATE BONDS—Continued | | | |
| | | | | United States—Continued | |
| | | | | | | | | Qwest Communications International | | | | | |
| | 250,000 | | | USD | | | | 7.500% due 02/15/2014† | | $ | 240,625 | | |
| | | | | | | | | Range Resources | | | | | |
| | 895,000 | | | USD | | | | 6.375% due 03/15/2015 | | | 890,525 | | |
| | | | | | | | | Royal Caribbean Cruises | | | | | |
| | 550,000 | | | USD | | | | 7.500% due 10/15/2027 | | | 570,625 | | |
| | | | | | | | | SBA Communication | | | | | |
| | 400,000 | | | USD | | | | 8.500% due 12/01/2012 | | | 438,000 | | |
| | | | | | | | | Station Casinos | | | | | |
| | 430,000 | | | USD | | | | 6.875% due 03/01/2016 | | | 435,375 | | |
| | | | | | | | | Stone Energy | | | | | |
| | 850,000 | | | USD | | | | 8.250% due 12/15/2011 | | | 888,250 | | |
| | | | | | | | | Sun Guard Data Systems | | | | | |
| | 715,000 | | | USD | | | | 10.250% due 08/15/2015† | | | 712,319 | | |
| | | | | | | | | Terex Corp | | | | | |
| | 340,000 | | | USD | | | | 7.375% due 01/15/2014 | | | 340,000 | | |
| | | | | | | | | UGS Corp | | | | | |
| | 715,000 | | | USD | | | | 10.000% due 06/01/2012 | | | 784,713 | | |
| | | | | | | | | United Air Lines, Series 00-1 | | | | | |
| | 399,694 | | | USD | | | | 7.730% due 07/01/2010* (2) | | | 386,025 | | |
| | | | | | | | | Wesco Distribution | | | | | |
| | 500,000 | | | USD | | | | 7.500% due 10/15/2017† | | | 501,875 | | |
| | | | | | | | | Williams Cos | | | | | |
| | 730,000 | | | USD | | | | 7.750% due 06/15/2031 | | | 774,713 | | |
| | | | | | | | | XM Satellite Radio | | | | | |
| | 140,000 | | | USD | | | | 12.000% due 06/15/2010 | | | 157,150 | | |
| | | | 23,391,525 | | |
| | | | | United Kingdom—4.0% | |
| | | | | | | | | British Airways | | | | | |
| | 140,000 | | | GBP | | | | 7.250% due 08/23/2016 | | | 274,477 | | |
See Notes to Financial Statements.
Julius Baer Funds 2005 Annual Report
98
PORTFOLIO OF INVESTMENTS (Continued) October 31, 2005
Julius Baer Global High Yield Bond Fund (Percentage of Net Assets)
Face
Value | |
Currency | | | | Market
Value (Note 1) | |
| CORPORATE BONDS—Continued | | | |
| | | | | United Kingdom—Continued | |
| | | | | | | | | Lucasvarity PLC | | | | | |
| | 350,000 | | | GBP | | | | 10.875% due 07/10/2020 | | $ | 802,366 | | |
| | | | | | | | | WRG Finance | | | | | |
| | 375,000 | | | GBP | | | | 9.000% due 12/15/2014† | | | 693,717 | | |
| | | | 1,770,560 | | |
| | | | | Canada—3.5% | |
| | | | | | | | | Rogers Wireless Communications | | | | | |
| | 670,000 | | | CAD | | | | 7.625% due 12/15/2011 | | | 609,194 | | |
| | | | | | | | | Shaw Communications | | | | | |
| | 1,000,000 | | | CAD | | | | 7.500% due 11/20/2013 | | | 907,617 | | |
| | | | 1,516,811 | | |
| | | | | Luxembourg—1.9% | |
| | | | | | | | | Nell AF SARL | | | | | |
| | 540,000 | | | EUR | | | | 8.375% due 08/15/2015† | | | 650,019 | | |
| | | | | | | | | Teksid Aluminum Luxembourg | | | | | |
| | 200,000 | | | EUR | | | | 11.375% due 07/15/2011 | | | 207,810 | | |
| | | | 857,829 | | |
| | | | | Belgium—1.9% | |
| | | | | | | | | Telenet Group Holding, Step Note | | | | | |
| | 1,025,000 | | | EUR | | | | due 06/15/2014 (1)† | | | 820,000 | | |
| | | | | Germany—1.4% | |
| | | | | | | | | Tele Columbus | | | | | |
| | 500,000 | | | EUR | | | | 9.375% due 04/15/2012† | | | 625,824 | | |
| | | | | Brazil—1.3% | |
| | | | | | | | | Petrobras International Finance | | | | | |
| | 500,000 | | | USD | | | | 8.375% due 12/10/2018 | | | 552,500 | | |
| | | | | Netherlands—0.5% | |
| | | | | | | | | Kazkommerts International | | | | | |
| | 210,000 | | | EUR | | | | 8.000% due 11/03/2015† | | | 210,000 | | |
| | | | | | | | | TOTAL CORPORATE BONDS (Cost $29,498,072) | | | 29,745,049 | | |
See Notes to Financial Statements.
Julius Baer Funds 2005 Annual Report
99
PORTFOLIO OF INVESTMENTS (Continued) October 31, 2005
Julius Baer Global High Yield Bond Fund (Percentage of Net Assets)
Face
Value | |
Currency | | | | Market
Value (Note 1) | |
| U.S. GOVERNMENT AND AGENCY OBLIGATIONS—15.9% | | | |
| | | | | | | | | U.S. Treasury Bill | | | | | |
| | 7,000,000 | | | USD | | | | 3.555% due 12/15/2005 (Cost $6,969,585) | | $ | 6,969,585 | | |
| FOREIGN GOVERNMENT BONDS—6.4% | | | |
| | | | | Colombia—2.4% | |
| | | | | | | | | Republic of Colombia | | | | | |
| | 2,000,000,000 | | | COP | | | | 12.000% due 10/22/2015 | | | 1,020,371 | | |
| | | | | Uruguay—1.8% | |
| | | | | | | | | Republica of Uruguay | | | | | |
| | 15,000,000 | | | | UYU | | | 10.500% due 10/20/2006 | | | 789,302 | | |
| | | | | Argentina—1.7% | |
| | | | | | | | | Argentine Republic | | | | | |
| | 2,200,000 | | | ARS | | | | 2.000% due 09/30/2014 | | | 743,088 | | |
| | | | | Bulgaria—0.5% | |
| | 540,000 | | | | BGN | | | Bulgaria Registered Compensation Vouchers* (3) | | | 228,996 | | |
| | | | | | | | | TOTAL FOREIGN GOVERNMENT BONDS
(Cost $2,367,789) | | | 2,781,757 | | |
| COMMON STOCKS—2.9% | | | |
| | | | | United States—2.1% | |
| | 16,000 | | | | USD | | | Coinmach Service | | | 220,960 | | |
| | 73,500 | | | | USD | | | Oakmont Acquisition* | | | 438,795 | | |
| | 40,000 | | | | USD | | | Royster-Clark* | | | 254,334 | | |
| | | | 914,089 | | |
| | | | | Canada—0.8% | |
| | 21,000 | | | | CAD | | | Fort Chicago Energy Partners | | | 204,739 | | |
| | 5,000 | | | | CAD | | | Harvest Energy Trust | | | 142,088 | | |
| | | | 346,827 | | |
| | | | | | | | | TOTAL COMMON STOCKS (Cost $1,354,960) | | | 1,260,916 | | |
| OPEN-ENDED TRUST—0.5% | | | |
| | | | | Canada—0.5% | |
| | 20,000 | | | | CAD | | | Yellow Pages Income Fund (Cost $225,193) | | | 228,901 | | |
See Notes to Financial Statements.
Julius Baer Funds 2005 Annual Report
100
PORTFOLIO OF INVESTMENTS (Continued) October 31, 2005
Julius Baer Global High Yield Bond Fund (Percentage of Net Assets)
Face
Value | |
Currency | | | | Market
Value (Note 1) | |
| PREFERRED STOCKS—0.4% | |
| | | | | United States—0.4% | |
| | 1,850 | | | USD | | Chesapeake Energy Convertible, 4.500%
due 12/31/2049 (Cost $185,951) | | $ | 190,550 | | |
| REPURCHASE AGREEMENTS—2.2% | |
| | | | | United States—2.2% | |
| | 955,409 | | | USD | | Investors Bank & Trust Company Repurchase Agreement, | | |
| | |
| | | | | dated 10/31/2005, due 11/01/2005, with a maturity value | | |
| | |
| | | | | of $955,482 and an effective yield of 2.75%, collaterallized | | |
| | |
| | | | | by a U.S. Government Agency Obligation, with a rate of | | |
| | |
| | | | | 6.625%, a maturity from 3/25/2022, and an aggregate | | |
| | |
| | | | | market value of $1,003,180 (Cost $955,409) | | | 955,409 | | |
| | | | | TOTAL INVESTMENTS—96.3% (Cost $41,556,959) | | | 42,132,167 | | |
| | | | | OTHER ASSETS AND LIABILITIES (Net)—3.7% | | | 1,619,799 | | |
| | | | | TOTAL NET ASSETS—100.0% | | $ | 43,751,966 | | |
Portfolio Footnotes:
(1) Variable rate security.
(2) Defaulted Security.
(3) Illiquid security
* Non-income producing security.
† Securities exempt from registration under Rule 144A of the Securities Act of 1933. These securities may be resold in transactions exempt from registrations, normally to qualified institutional buyers.
Aggregate cost for federal income tax purposes was $41,554,189.
Glossary of Currencies
ARS — Argentinian Peso
BGN — Bulgarian Lev
CAD — Canadian Dollar
COP — Colombian Peso
EUR — Euro
GBP — British Pound Sterling
USD — United States Dollar
UYU — Uruguayuan Peso
See Notes to Financial Statements.
Julius Baer Funds 2005 Annual Report
101
SCHEDULE OF FORWARD FOREIGN EXCHANGE CONTRACTS
October 31, 2005
Julius Baer Global High Yield Bond Fund
FORWARD FOREIGN EXCHANGE CONTRACTS TO BUY
| | | Contracts to Receive | | | | | |
Expiration
Date | | Local | | Value in
Currency | | In Exchange
USDfor USD | | Net Unrealized
Appreciation
(Depreciation) | |
| 01/04/2006 | | BRL | 1,246,000 | | | | 541,052 | | | | 500,000 | | | $ | 41,052 | | |
| 01/31/2006 | | CAD | 1,642,540 | | | | 1,396,214 | | | | 1,404,915 | | | | (8,701 | ) | |
| 12/01/2005 | | EUR | 2,167,000 | | | | 2,599,587 | | | | 2,669,007 | | | | (69,420 | ) | |
| 01/31/2006 | | EUR | 2,139,000 | | | | 2,574,682 | | | | 2,610,072 | | | | (35,390 | ) | |
| 11/02/2005 | | GBP | 135,000 | | | | 238,984 | | | | 239,104 | | | | (120 | ) | |
| 12/01/2005 | | GBP | 976,000 | | | | 1,727,179 | | | | 1,776,320 | | | | (49,141 | ) | |
| 01/31/2006 | | GBP | 906,899 | | | | 1,604,416 | | | | 1,595,507 | | | | 8,909 | | |
| 01/05/2006 | | IDR | 4,208,000,000 | | | | 415,317 | | | | 400,000 | | | | 15,317 | | |
| Net unrealized depreciation on forward foreign exchange contracts to buy | | | | | | | | | | | | | | $ | (97,494 | ) | |
FORWARD FOREIGN EXCHANGE CONTRACTS TO SELL
| | | Contracts to Deliver | | | | | |
Expiration
Date | | Local | | Value in
Currency | | In Exchange
USDfor USD | | Net Unrealized
Appreciation
(Depreciation) | |
| 01/04/2006 | | BRL | 1,246,000 | | | | 541,051 | | | | 531,230 | | | $ | (9,821 | ) | |
| 12/01/2005 | | CAD | 742,000 | | | | 629,598 | | | | 630,202 | | | | 604 | | |
| 01/31/2006 | | CAD | 2,600,000 | | | | 2,210,087 | | | | 2,208,068 | | | | (2,019 | ) | |
| 12/01/2005 | | EUR | 2,077,151 | | | | 2,491,803 | | | | 2,500,000 | | | | 8,197 | | |
| 01/31/2006 | | EUR | 4,593,961 | | | | 5,529,680 | | | | 5,551,998 | | | | 22,318 | | |
| 01/31/2006 | | GBP | 2,115,000 | | | | 3,741,695 | | | | 3,739,135 | | | | (2,560 | ) | |
| Net unrealized appreciation on forward foreign exchange contracts to sell | | | | | | | | | | | | | | $ | 16,719 | | |
Glossary of Currencies
BRL — Brazilian Real
CAD — Canadian Dollar
EUR — Euro
GBP — British Pound Sterling
IDR — Indonesian Rupiah
See Notes to Financial Statements.
Julius Baer Funds 2005 Annual Report
102
PORTFOLIO OF INVESTMENTS–Industry Sector (Unaudited) October 31, 2005
Julius Baer Global High Yield Bond Fund (Percentage of Net Assets)
At October 31, 2005, sector diversification of the Fund's investments were as follows:
| | | % of Net
Assets | | Market
Value (Note 1) | |
| INDUSTRY SECTOR | |
| Corporate Bonds | | | 68.0 | % | | $ | 29,745,049 | | |
| U.S. Government and Agency Obligations | | | 15.9 | | | | 6,969,585 | | |
| Foreign Government Bonds | | | 6.4 | | | | 2,781,757 | | |
| Common Stocks | | | 3.4 | | | | 1,489,817 | | |
| Preferred Stocks | | | 0.4 | | | | 190,550 | | |
| Cash & Cash Equivalents | | | 2.2 | | | | 955,409 | | |
| Total Investments | | | 96.3 | | | | 42,132,167 | | |
| Other Assets and Liabilities (Net) | | | 3.7 | | | | 1,619,799 | | |
| Net Assets | | | 100.0 | % | | $ | 43,751,966 | | |
See Notes to Financial Statements.
Julius Baer Investment Funds 2005 Annual Report
103
STATEMENTS OF ASSETS AND LIABILITIES October 31, 2005
| | | Julius Baer
Global Equity | | Julius Baer
International Equity | |
| ASSETS: | |
Investments in securities, at market value
(Cost $45,883,087 and $12,649,276,646, respectively) | | $ | 47,842,281 | | | $ | 15,040,864,447 | | |
| Cash | | | 4,500 | | | | — | | |
Foreign currency, at market value
(Cost $4,625,709 and $1,152,678,171, respectively) | | | 4,615,258 | | | | 1,144,843,344 | | |
| Receivables: | |
| Investments sold | | | 5,919,001 | | | | 134,621,463 | | |
| Fund shares sold | | | 13,207 | | | | 20,145,601 | | |
| Interest and dividends | | | 64,508 | | | | 12,219,551 | | |
| Daily variation margin on open financial futures contracts | | | 43,823 | | | | 17,239,219 | | |
| Unrealized appreciation on open swap contracts | | | — | | | | 38,347,670 | | |
| Tax reclaim | | | 9,920 | | | | 680,426 | | |
| Miscellaneous | | | — | | | | 31,665 | | |
| Unrealized appreciation on forward foreign exchange contracts | | | 8,469 | | | | 5,786,762 | | |
| Receivable from advisor—net (Note 3) | | | 836,280 | | | | — | | |
| Prepaid insurance | | | 57,606 | | | | 183,806 | | |
| Total Assets | | | 59,414,853 | | | | 16,414,963,954 | | |
| LIABILITIES: | |
| Payables: | |
| Investments purchased | | | 6,007,421 | | | | 151,675,614 | | |
| Fund shares repurchased | | | 1,920 | | | | 7,145,205 | | |
| Dividends | | | 1,091 | | | | — | | |
| Collateral for securities loaned (Note 9) | | | 1,707,418 | | | | 912,301,578 | | |
| Investment advisory fee (Note 2) | | | 39,359 | | | | 11,435,923 | | |
| Unrealized depreciation on forward foreign exchange contracts | | | 87,933 | | | | 88,647,632 | | |
| Accrued expenses and other payables | | | 151,434 | | | | 5,371,467 | | |
| Total Liabilities | | | 7,996,576 | | | | 1,176,577,419 | | |
| NET ASSETS | | $ | 51,418,277 | | | $ | 15,238,386,535 | | |
| NET ASSETS Consist of: | |
| Par value | | $ | 1,633 | | | $ | 439,793 | | |
| Paid in capital in excess of par value | | | 181,656,211 | | | | 12,155,859,499 | | |
| Undistributed net investment income | | | 72,371 | | | | 15,823,649 | | |
Accumulated net realized gain (loss) on investments sold, forward foreign
exchange contracts, foreign currency transactions, options,
and swap contracts | | | (132,253,030 | ) | | | 695,254,768 | | |
Net unrealized appreciation on investments, forward foreign exchange
contracts, foreign currency related transactions, options, and swap contracts | | | 1,941,092 | | | | 2,371,008,826 | | |
| NET ASSETS | | $ | 51,418,277 | | | $ | 15,238,386,535 | | |
| Class A | | $ | 34,608,326 | | | $ | 7,018,030,273 | | |
| Class I | | $ | 16,809,951 | | | $ | 8,220,356,262 | | |
| SHARES OUTSTANDING (Note 6) | |
| Class A | | | 1,100,472 | (1) | | | 204,655,118 | | |
| Class I | | | 532,311 | (1) | | | 235,137,467 | | |
| NET ASSET VALUE AND REDEMPTION PRICE PER SHARE | |
| Class A | | $ | 31.45 | (1) | | $ | 34.29 | | |
| Class I | | $ | 31.58 | (1) | | $ | 34.96 | | |
(1) Shares outstanding and net asset value were adjusted to reflect a 10 for 1 reverse stock split effective September 15, 2005.
See Notes to Financial Statements.
Julius Baer Funds 2005 Annual Report
104
STATEMENTS OF ASSETS AND LIABILITIES October 31, 2005
| | | Julius Baer
International Equity II | | Julius Baer
Total Return Bond | |
| ASSETS: | |
Investments in securities, at market value
(Cost $415,650,555 and $240,396,540, respectively) | | $ | 422,408,173 | | | $ | 238,988,088 | | |
Foreign currency, at market value
(Cost $7,670,267 and $1,398,476, respectively) | | | 7,655,559 | | | | 1,405,891 | | |
| Receivables: | |
| Investments sold | | | 3,028,639 | | | | 9,629,982 | | |
| Fund shares sold | | | 7,262,744 | | | | 1,004,936 | | |
| Interest and dividends | | | 176,966 | | | | 1,769,283 | | |
| Daily variation margin on open financial futures contracts | | | 698,140 | | | | — | | |
| Miscellaneous receivable | | | 3,792 | | | | — | | |
| Tax reclaim | | | 5,639 | | | | — | | |
| Unrealized appreciation on forward foreign exchange contracts | | | 1,276,124 | | | | 757,180 | | |
| Receivable from advisor—net (Note 3) | | | 403,870 | | | | 292,108 | | |
| Prepaid expenses | | | 31,753 | | | | 2,603 | | |
| Total Assets | | | 442,951,399 | | | | 253,850,071 | | |
| LIABILITIES: | |
| Payables: | |
| Investments purchased | | | 8,992,619 | | | | 37,258,212 | | |
| Fund shares repurchased | | | 44,605 | | | | 6,101,160 | | |
| Dividends | | | — | | | | 46 | | |
| Collateral for securities loaned (Note 9) | | | 5,075,393 | | | | — | | |
| Investment advisory fee (Note 2) | | | 267,490 | | | | 81,836 | | |
| Unrealized depreciation on forward foreign exchange contracts | | | 3,312,377 | | | | 955,290 | | |
| Accrued expenses and other payables | | | 206,700 | | | | 86,132 | | |
| Total Liabilities | | | 17,899,184 | | | | 44,482,676 | | |
| NET ASSETS | | $ | 425,052,215 | | | $ | 209,367,395 | | |
| NET ASSETS Consist of: | |
| Par value | | $ | 38,797 | | | $ | 15,664 | | |
| Paid in capital in excess of par value | | | 418,625,783 | | | | 205,086,454 | | |
| Undistributed net investment income | | | 1,879,635 | | | | 4,329,021 | | |
Accumulated net realized gain (loss) on investments sold, forward foreign
exchange contracts, foreign currency transactions, options,
and swap contracts | | | (1,462,400 | ) | | | 1,626,047 | | |
Net unrealized appreciation on investments, forward foreign
exchange contracts, foreign currency related transactions,
options, and swap contracts | | | 5,970,400 | | | | (1,689,791 | ) | |
| NET ASSETS | | $ | 425,052,215 | | | $ | 209,367,395 | | |
| Class A | | $ | 127,434,880 | | | $ | 68,222,845 | | |
| Class I | | $ | 297,617,335 | | | $ | 141,144,550 | | |
| SHARES OUTSTANDING (Note 6) | |
| Class A | | | 11,650,445 | | | | 5,118,995 | | |
| Class I | | | 27,146,331 | | | | 10,545,091 | | |
| NET ASSET VALUE AND REDEMPTION PRICE PER SHARE | |
| Class A | | $ | 10.94 | | | $ | 13.33 | | |
| Class I | | $ | 10.96 | | | $ | 13.38 | | |
See Notes to Financial Statements.
Julius Baer Funds 2005 Annual Report
105
STATEMENTS OF ASSETS AND LIABILITIES October 31, 2005
| | | Julius Baer
Global High Yield | |
| ASSETS: | |
Investments in securities, at market value
(Cost $41,556,959) | | $ | 42,132,167 | | |
Foreign currency, at market value
(Cost $868,501) | | | 872,865 | | |
| Receivables: | |
| Investments sold | | | 1,554,690 | | |
| Fund shares sold | | | 20,130 | | |
| Interest and dividends | | | 704,580 | | |
| Unrealized appreciation on forward foreign exchange contracts | | | 96,397 | | |
| Receivable from advisor—net (Note 3) | | | 32,594 | | |
| Prepaid insurance | | | 345 | | |
| Total Assets | | | 45,413,768 | | |
| LIABILITIES: | |
| Payables: | |
| Investments purchased | | | 1,408,131 | | |
| Fund shares repurchased | | | 2,840 | | |
| Investment advisory fee (Note 2) | | | 28,083 | | |
| Unrealized depreciation on forward foreign exchange contracts | | | 177,172 | | |
| Accrued expenses and other payables | | | 45,576 | | |
| Total Liabilities | | | 1,661,802 | | |
| NET ASSETS | | $ | 43,751,966 | | |
| NET ASSETS Consist of: | |
| Par value | | $ | 3,684 | | |
| Paid in capital in excess of par value | | | 38,642,267 | | |
| Undistributed net investment income | | | 1,745,535 | | |
Accumulated net realized gain on investments sold, forward foreign exchange contracts,
foreign currency transactions, options, and swap contracts | | | 2,861,602 | | |
Net unrealized appreciation on investments, forward foreign exchange contracts, foreign currency
related transactions, options, and swap contracts | | | 498,878 | | |
| NET ASSETS | | $ | 43,751,966 | | |
| Class A | | $ | 36,165,942 | | |
| Class I | | $ | 7,586,024 | | |
| SHARES OUTSTANDING (Note 6) | |
| Class A | | | 3,030,676 | | |
| Class I | | | 653,314 | | |
| NET ASSET VALUE AND REDEMPTION PRICE PER SHARE | |
| Class A | | $ | 11.93 | | |
| Class I | | $ | 11.61 | | |
See Notes to Financial Statements.
Julius Baer Funds 2005 Annual Report
106
STATEMENTS OF OPERATIONS
For the Year Ended October 31, 2005
| | | Julius Baer
Global Equity | | Julius Baer
International Equity | |
| INVESTMENT INCOME: | |
| Interest† | | $ | 12,915 | | | $ | 27,879,813 | | |
| Dividends†† | | | 888,123 | | | | 267,099,635 | | |
| | | | 901,038 | | | | 294,979,448 | | |
| EXPENSES: | |
| Investment advisory fee (Note 2) | | | 362,662 | | | | 109,831,650 | | |
| Custody fees | | | 92,435 | | | | 6,094,694 | | |
| Administration fees | | | 188,473 | | | | 8,862,996 | | |
| Professional fees | | | 180,239 | | | | 617,156 | | |
| Trustees' fees and expenses (Note 2) | | | 43,041 | | | | 392,865 | | |
| Registration and filing fees | | | 33,442 | | | | 836,719 | | |
| Shareholder reports | | | 59,078 | | | | 2,988,109 | | |
| Insurance premium expense | | | 89,114 | | | | 211,464 | | |
| Compliance expense | | | 594 | | | | 190,987 | | |
| Miscellaneous fees | | | 4,140 | | | | 118,196 | | |
| Total expenses common to all classes | | | 1,053,218 | | | | 130,144,836 | | |
| Transfer agent fees | |
| Class A | | | 25,891 | | | | 1,179,178 | | |
| Classs I | | | 4,401 | | | | 249,049 | | |
| Distribution and shareholder servicing fees (Class A) (Note 3) | | | 78,075 | | | | 14,577,882 | | |
| Total gross expenses | | | 1,161,585 | | | | 146,150,945 | | |
| Less: Custody Offset Arrangement (Note 2) | | | (4,935 | ) | | | (1,760,590 | ) | |
| Expenses Reimbursed by Investment Advisor (Note 2) | | | (582,696 | ) | | | — | | |
| Net expenses | | | 573,954 | | | | 144,390,355 | | |
| NET INVESTMENT INCOME | | | 327,084 | | | | 150,589,093 | | |
NET REALIZED AND UNREALIZED GAIN
(LOSS) ON INVESTMENTS (Notes 1 and 4): | |
| Realized gain (loss) on: | |
| Investments | | | 4,717,304 | | | | 719,248,153 | | |
| Financial futures contracts | | | 60,920 | | | | 54,102,740 | | |
| Interest rate swap contracts | | | — | | | | 85,297 | | |
| Forward foreign exchange contracts | | | (14,183 | ) | | | (14,749,604 | ) | |
| Foreign currency transactions | | | (241,049 | ) | | | (83,031,807 | ) | |
| Net realized gain on investments | | | 4,522,992 | | | | 675,654,779 | | |
| Net change in unrealized appreciation (depreciation) on: | |
| Investments | | | 752,509 | | | | 1,460,735,016 | | |
| Financial futures contracts | | | 72,833 | | | | 35,079,335 | | |
| Interest rate swap contracts | | | — | | | | 17,791,606 | | |
| Forward foreign exchange contracts | | | (89,645 | ) | | | (128,064,956 | ) | |
| Currencies and net other assets | | | (1,296 | ) | | | (909,723 | ) | |
| Net change in unrealized appreciation of investments | | | 734,401 | | | | 1,384,631,278 | | |
| NET REALIZED AND UNREALIZED GAIN ON INVESTMENTS | | | 5,257,393 | | | | 2,060,286,057 | | |
| NET INCREASE IN NET ASSETS RESULTING FROM OPERATIONS | | $ | 5,584,477 | | | $ | 2,210,875,150 | | |
† Interest Income includes security lending income of $1,799 and $13,409,560 for the Global Equity and the International Equity Fund, respectively.
†† Net of foreign wthholdings taxes of $72,818 and $34,434,894 for the Global Equity Fund and the International Equity Fund, repectively.
See Notes to Financial Statements.
Julius Baer Funds 2005 Annual Report
107
STATEMENTS OF OPERATIONS
For the Year Ended October 31, 2005
| | | Julius Baer
International Equity II (1) | | Julius Baer
Total Return Bond | |
| INVESTMENT INCOME: | |
| Interest† | | $ | 187,992 | | | $ | 6,508,298 | | |
| Dividends†† | | | 600,053 | | | | — | | |
| Miscellaneous income | | | 181 | | | | — | | |
| Total investment income | | | 788,226 | | | | 6,508,298 | | |
| EXPENSES: | |
| Investment advisory fee (Note 2) | | | 631,662 | | | | 777,219 | | |
| Custody fees | | | 38,327 | | | | 76,219 | | |
| Administration fees | | | 382,780 | | | | 48,080 | | |
| Professional fees | | | 23,167 | | | | 38,038 | | |
| Trustees' fees and expenses (Note 2) | | | 1,124 | | | | 4,900 | | |
| Registration and filing fees | | | 52,905 | | | | 104,029 | | |
| Shareholder reports | | | 3,717 | | | | 35,189 | | |
| Organization expenses | | | 29,326 | | | | — | | |
| Insurance premium expense | | | 366 | | | | 2,752 | | |
| Compliance expense | | | 1,050 | | | | 2,627 | | |
| Miscellaneous fees | | | 715 | | | | 5,027 | | |
| Total expenses common to all classes | | | 1,165,139 | | | | 1,094,080 | | |
| Transfer agent fees | |
| Class A | | | 6,186 | | | | 9,267 | | |
| Class I | | | 2,818 | | | | 7,170 | | |
| Distribution and shareholder servicing fees (Class A) (Note 3) | | | 51,244 | | | | 165,974 | | |
| Total gross expenses | | | 1,225,387 | | | | 1,276,491 | | |
| Less: Custody Offset Arrangement (Note 2) | | | (8,455 | ) | | | (11,090 | ) | |
| Expenses Reimbursed by Investment Advisor (Note 2) | | | (403,870 | ) | | | (292,108 | ) | |
| Net expenses | | | 813,062 | | | | 973,293 | | |
| NET INVESTMENT INCOME (LOSS) | | | (24,836 | ) | | | 5,535,005 | | |
NET REALIZED AND UNREALIZED GAIN
(LOSS) ON INVESTMENTS (Notes 1 and 4): | |
| Realized gain (loss) on: | |
| Investments | | | (1,434,787 | ) | | | 5,127,755 | | |
| Financial futures contracts | | | (26,759 | ) | | | — | | |
| Forward foreign exchange contracts | | | 720,265 | | | | (77,809 | ) | |
| Foreign currency transactions | | | (994,333 | ) | | | 622,835 | | |
| Net realized gain (loss) on investments | | | (1,735,614 | ) | | | 5,672,781 | | |
| Net change in unrealized appreciation (depreciation) on: | |
| Investments | | | 6,757,618 | | | | (6,070,865 | ) | |
| Financial futures contracts | | | 1,254,187 | | | | — | | |
| Forward foreign exchange contracts | | | (2,050,961 | ) | | | (322,097 | ) | |
| Currencies and net other assets | | | 9,556 | | | | (123,882 | ) | |
| Net change in unrealized appreciation (depreciation) of investments | | | 5,970,400 | | | | (6,516,844 | ) | |
| NET REALIZED AND UNREALIZED GAIN (LOSS) ON INVESTMENTS | | | 4,234,786 | | | | (844,063 | ) | |
| NET INCREASE IN NET ASSETS RESULTING FROM OPERATIONS | | $ | 4,209,950 | | | $ | 4,690,942 | | |
† Interest Income includes security lending income of $4,030 for the International Equity Fund II.
†† Net of withholding taxes of $49,674 for the International Equity Fund II.
(1) Commenced operations on May 4, 2005.
See Notes to Financial Statements.
Julius Baer Funds 2005 Annual Report
108
STATEMENTS OF OPERATIONS
For the Year Ended October 31, 2005
| | | Julius Baer
Global High Yield | |
| INVESTMENT INCOME: | |
| Interest | | $ | 4,870,925 | | |
| Dividends | | | 61,741 | | |
| Total investment income | | | 4,932,666 | | |
| EXPENSES: | |
| Investment advisory fee (Note 2) | | | 503,404 | | |
| Custody fees | | | 52,102 | | |
| Administration fees | | | 32,920 | | |
| Professional fees | | | 32,647 | | |
| Trustees' fees and expenses (Note 2) | | | 2,767 | | |
| Registration and filing fees | | | 53,451 | | |
| Shareholder reports | | | 12,311 | | |
| Insurance premium expense | | | 2,106 | | |
| Compliance expense | | | 803 | | |
| Miscellaneous fees | | | 9,250 | | |
| Total expenses common to all classes | | | 701,761 | | |
| Transfer agent fees | |
| Class A | | | 12,993 | | |
| Class I | | | 5,854 | | |
| Distribution and shareholder servicing fees (Class A) (Note 3) | | | 96,045 | | |
| Total gross expenses | | | 816,653 | | |
| Less: Custody Offset Arrangement (Note 2) | | | (20,762 | ) | |
| Expense Reimbursed by Investment Advisor (Note2) | | | (28,038 | ) | |
| Net expenses | | | 767,853 | | |
| NET INVESTMENT INCOME | | | 4,164,813 | | |
NET REALIZED AND UNREALIZED GAIN
(LOSS) ON INVESTMENTS (Notes 1 and 4): | |
| Realized gain (loss) on: | |
| Investments | | | 4,149,401 | | |
| Written options | | | (156,490 | ) | |
| Interest rate swap contracts | | | 287,590 | | |
| Forward foreign exchange contracts | | | (22,273 | ) | |
| Foreign currency transactions | | | (224,496 | ) | |
| Net realized gain on investments | | | 4,033,732 | | |
| Net change in unrealized appreciation (depreciation) on: | |
| Investments | | | (5,114,005 | ) | |
| Interest rate swap contracts | | | (90,625 | ) | |
| Forward foreign exchange contracts | | | 320,731 | | |
| Currencies and net other assets | | | (20,012 | ) | |
| Net change in unrealized depreciation of investments | | | (4,903,911 | ) | |
| NET REALIZED AND UNREALIZED GAIN (LOSS) ON INVESTMENTS | | | (870,179 | ) | |
| NET INCREASE IN NET ASSETS RESULTING FROM OPERATIONS | | $ | 3,294,634 | | |
See Notes to Financial Statements.
Julius Baer Funds 2005 Annual Report
109
STATEMENTS OF CHANGES IN NET ASSETS
Julius Baer Global Equity Fund
| | |
For the Year
Ended
October 31, 2005 | | For the period
April 1, 2004
Through
October 31, 2004 | | For the Year
Ended
March 31, 2004 | |
| INCREASE IN NET ASSETS FROM OPERATIONS: | |
| Net investment income | | $ | 327,084 | | | $ | (318,920 | ) | | $ | (1,104,733 | ) | |
| Net realized gain on investments | | | 4,522,992 | | | | 6,718,340 | | | | (5,977,618 | ) | |
Net change in unrealized appreciation
of investments | | | 734,401 | | | | (4,976,829 | ) | | | 8,889,756 | | |
Net increase in net assets
resulting from operations | | | 5,584,477 | | | | 1,422,591 | | | | 1,807,405 | | |
| DISTRIBUTIONS TO SHAREHOLDERS (Note 1): | |
| Distributions from net investment income | | | (26,244 | ) | | | — | | | | — | | |
| FUND SHARE TRANSACTIONS (Note 6): | |
| Proceeds from sale of shares | |
| Class A | | | 14,982,802 | | | | 5,162,223 | | | | — | | |
| Class I | | | 16,623,735 | | | | — | | | | — | | |
Net Asset Value of shares issued to shareholders
in payment of distributions declared | |
| Class A | | | 17,724 | | | | — | | | | — | | |
| Class I | | | 3,411 | | | | — | | | | — | | |
| Cost of shares redeemed | |
| Class A | | | (9,572,684 | ) | | | (18,827,878 | ) | | | — | | |
| Class I | | | (884,078 | ) | | | — | | | | — | | |
| Fees from redemptions | | | 1,116 | | | | 1,548 | | | | — | | |
Net (decrease) increase from
Fund share transactions | | | 21,172,026 | | | | (13,664,107 | ) | | | — | | |
| Net (decrease) increase in net assets | | | 26,730,259 | | | | (12,241,516 | ) | | | 1,807,405 | | |
| NET ASSETS: | |
| Beginning of year | | | 24,688,018 | | | | 36,929,534 | | | | 35,122,129 | | |
End of year (including undistributed net
investment income of $72,371, and
$20,483 and $0 respectively) | | $ | 51,418,277 | | | $ | 24,688,018 | | | $ | 36,929,534 | | |
See Notes to Financial Statements.
Julius Baer Funds 2005 Annual Report
110
STATEMENTS OF CHANGES IN NET ASSETS
Julius Baer International Equity Fund
| | | For the Year
Ended
October 31, 2005 | | For the Year
Ended
October 31, 2004 | |
| INCREASE IN NET ASSETS FROM OPERATIONS: | |
| Net investment income | | $ | 150,589,093 | | | $ | 38,106,504 | | |
| Net realized gain on investments | | | 675,654,779 | | | | 255,205,590 | | |
| Net change in unrealized appreciation (depreciation) of investments | | | 1,384,631,278 | | | | 616,940,326 | | |
| Net increase in net assets resulting from operations | | | 2,210,875,150 | | | | 910,252,420 | | |
| DISTRIBUTIONS TO SHAREHOLDERS (Note 1): | |
| Distributions from net investment income | |
| Class A | | | (65,706,866 | ) | | | (26,677,968 | ) | |
| Class I | | | (71,893,528 | ) | | | (23,046,877 | ) | |
| Distributions from realized gain | |
| Class A | | | (84,704,257 | ) | | | — | | |
| Class I | | | (90,327,774 | ) | | | — | | |
| FUND SHARE TRANSACTIONS (Note 6): | |
| Proceeds from sale of shares | |
| Class A | | | 3,301,554,085 | | | | 1,958,704,970 | | |
| Class I | | | 3,854,830,556 | | | | 2,552,562,180 | | |
Net Asset Value of shares issued to shareholders
in payment of distributions declared | |
| Class A | | | 140,295,305 | | | | 25,098,025 | | |
| Class I | | | 139,663,385 | | | | 18,989,268 | | |
| Cost of shares redeemed | |
| Class A | | | (1,026,587,778 | ) | | | (408,277,032 | ) | |
| Class I | | | (636,445,754 | ) | | | (261,009,432 | ) | |
| Fees from redemptions | | | 711,284 | | | | 443,634 | | |
| Net increase (decrease) from Fund share transactions | | | 5,774,021,083 | | | | 3,886,511,613 | | |
| Net increase (decrease) in net assets | | | 7,672,263,808 | | | | 4,747,039,188 | | |
| NET ASSETS: | |
| Beginning of year | | | 7,566,122,727 | | | | 2,819,083,539 | | |
End of year (including undistributed net investment income
(loss) of $15,823,649 and $33,773,256, respectively) | | $ | 15,238,386,535 | | | $ | 7,566,122,727 | | |
See Notes to Financial Statements.
Julius Baer Funds 2005 Annual Report
111
STATEMENTS OF CHANGES IN NET ASSETS
Julius Baer International Equity Fund II
| | | For the period
Ended
October 31, 2005 (1) | |
| INCREASE IN NET ASSETS FROM OPERATIONS: | |
| Net investment loss | | $ | (24,836 | ) | |
| Net realized loss on investments | | | (1,735,614 | ) | |
| Net change in unrealized appreciation of investments | | | 5,970,400 | | |
| Net increase in net assets resulting from operations | | | 4,209,950 | | |
| FUND SHARE TRANSACTIONS (Note 6): | |
| Proceeds from sale of shares | |
| Class A | | | 136,031,555 | | |
| Class I | | | 302,232,671 | | |
| Cost of shares redeemed | |
| Class A | | | (10,286,728 | ) | |
| Class I | | | (7,148,213 | ) | |
| Fees from redemptions | | | 12,980 | | |
| Net increase from Fund share transactions | | | 420,842,265 | | |
| Net increase in net assets | | | 425,052,215 | | |
| NET ASSETS: | |
| Beginning of year | | | — | | |
| End of year (including undistributed net investment income of $1,879,635) | | $ | 425,052,215 | | |
(1) Commenced operations on May 4, 2005.
See Notes to Financial Statements.
Julius Baer Funds 2005 Annual Report
112
STATEMENTS OF CHANGES IN NET ASSETS
Julius Baer Total Return Bond Fund
| | | For the Year
Ended
October 31, 2005 | | For the Year
Ended
October 31, 2004 | |
| INCREASE IN NET ASSETS FROM OPERATIONS: | |
| Net investment income | | $ | 5,535,005 | | | $ | 2,256,670 | | |
| Net realized gain on investments | | | 5,672,781 | | | | 938,709 | | |
| Net change in unrealized appreciation (depreciation) of investments | | | (6,516,844 | ) | | | 1,384,030 | | |
| Net increase in net assets resulting from operations | | | 4,690,942 | | | | 4,579,409 | | |
| DISTRIBUTIONS TO SHAREHOLDERS (Note 1): | |
| Distributions from net investment income | |
| Class A | | | (2,241,952 | ) | | | (2,111,903 | ) | |
| Class I | | | (3,494,839 | ) | | | (635,180 | ) | |
| Distributions from realized gain | |
| Class A | | | (434,145 | ) | | | (1,092,659 | ) | |
| Class I | | | (253,638 | ) | | | (271,240 | ) | |
| FUND SHARE TRANSACTIONS (Note 6): | |
| Proceeds from sale of shares | |
| Class A | | | 29,288,075 | | | | 12,634,277 | | |
| Class I | | | 124,690,812 | | | | 22,165,219 | | |
Net Asset Value of shares issued to shareholders
in payment of distributions declared | |
| Class A | | | 2,338,413 | | | | 2,854,008 | | |
| Class I | | | 3,491,042 | | | | 678,428 | | |
| Cost of shares redeemed | |
| Class A | | | (21,978,139 | ) | | | (20,205,546 | ) | |
| Class I | | | (17,419,639 | ) | | | (5,549,155 | ) | |
| Fees from redemptions | | | 5,764 | | | | 2,715 | | |
| Net increase from Fund share transactions | | | 120,416,328 | | | | 12,579,946 | | |
| Net increase in net assets | | | 118,682,696 | | | | 13,048,373 | | |
| NET ASSETS: | |
| Beginning of year | | | 90,684,699 | | | | 77,636,326 | | |
End of year (including undistributed net investment income
of $4,329,021 and $478,284, respectively) | | $ | 209,367,395 | | | $ | 90,684,699 | | |
See Notes to Financial Statements.
Julius Baer Funds 2005 Annual Report
113
STATEMENTS OF CHANGES IN NET ASSETS
Julius Baer Global High Yield Bond Fund
| | | For the Year
Ended
October 31, 2005 | | For the Year
Ended
October 31, 2004 | |
| INCREASE IN NET ASSETS FROM OPERATIONS: | |
| Net investment income | | $ | 4,164,813 | | | $ | 4,812,359 | | |
| Net realized gain on investments | | | 4,033,732 | | | | 1,648,116 | | |
| Net change in unrealized appreciation of investments | | | (4,903,911 | ) | | | 3,238,869 | | |
| Net increase in net assets resulting from operations | | | 3,294,634 | | | | 9,699,344 | | |
| DISTRIBUTIONS TO SHAREHOLDERS (Note 1): | |
| Distributions from net investment income | |
| Class A | | | (2,246,194 | ) | | | (1,996,919 | ) | |
| Class I | | | (1,813,691 | ) | | | (2,891,591 | ) | |
| Distributions from realized gain | |
| Class A | | | (523,278 | ) | | | (186,858 | ) | |
| Class I | | | (569,420 | ) | | | (312,616 | ) | |
| FUND SHARE TRANSACTIONS (Note 6): | |
| Proceeds from sale of shares | |
| Class A | | | 12,481,178 | | | | 25,429,644 | | |
| Class I | | | 2,897,931 | | | | 33,964,975 | | |
Net Asset Value of shares issued to shareholders
in payment of distributions declared | |
| Class A | | | 2,221,011 | | | | 1,543,575 | | |
| Class I | | | 535,898 | | | | 382,217 | | |
| Cost of shares redeemed | |
| Class A | | | (23,353,353 | ) | | | (11,789,689 | ) | |
| Class I | | | (39,975,454 | ) | | | (12,084,606 | ) | |
| Fees from redemptions | | | 2,836 | | | | 8,771 | | |
| Net increase (decrease) from Fund share transactions | | | (45,189,953 | ) | | | 37,454,887 | | |
| Net increase in net assets | | | (47,047,902 | ) | | | 41,766,247 | | |
| NET ASSETS: | |
| Beginning of year | | | 90,799,868 | | | | 49,033,621 | | |
End of year (including undistributed net investment income
of $1,745,535 and $499,401, respectively) | | $ | 43,751,966 | | | $ | 90,799,868 | | |
See Notes to Financial Statements.
Julius Baer Funds 2005 Annual Report
114
FINANCIAL HIGHLIGHTS
Julius Baer Global Equity Fund Inc. (8)
For a share outstanding throughout each period
| | | Class A | |
| | | Year Ended
October 31, | | April 1, 2004
through
October 31, | | Year Ended March 31, | |
| | | 2005(7) | | 2004(7) | | 2004(7) | | 2003(7) | | 2002(7) | | 2001(7) | |
| Net Asset Value, beginning of year | | $ | 26.90 | | | $ | 25.30 | | | $ | 24.10 | | | $ | 42.50 | | | $ | 76.60 | | | $ | 230.00 | | |
| Net investment income (loss) (1)(2) | | | 0.21 | | | | (0.30 | ) | | | (0.80 | ) | | | (0.60 | ) | | | (0.70 | ) | | | (1.40 | ) | |
Net realized and unrealized
gain (loss) on investments (2) | | | 4.36 | | | | 1.90 | | | | 2.00 | | | | (17.50 | ) | | | (33.40 | ) | | | (133.30 | ) | |
Total income (loss)
from investment operations | | | 4.57 | | | | 1.60 | | | | 1.20 | | | | (18.10 | ) | | | (34.10 | ) | | | (134.70 | ) | |
| Capital effect of dividend reinvestment | | | — | | | | — | | | | — | | | | — | | | | — | | | | (2.70 | ) | |
| Less distributions: | |
| From net realized gains on investments | | | — | | | | — | | | | — | | | | — | | | | — | | | | (16.00 | ) | |
| From net investment income | | | (0.02 | ) | | | — | | | | — | | | | (0.03 | ) | | | — | | | | — | | |
| Total Distributions | | | (0.02 | ) | | | — | | | | — | | | | (0.30 | ) | | | — | | | | (16.00 | ) | |
| Net Asset Value, end of year | | $ | 31.45 | | | $ | 26.90 | | | $ | 25.30 | | | $ | 24.10 | | | $ | 42.50 | | | $ | 76.60 | | |
| Market Value, end of year | | $ | — | | | $ | — | | | $ | 23.600 | | | $ | 19.700 | | | $ | 39.700 | | | $ | 67.500 | | |
| Total Return | | | 17.00 | % | | | 6.32 | %(5) | | | 19.80 | % | | | (49.75 | )% | | | (41.19 | )% | | | (54.60 | )% | |
| Ratios/Supplemental Data: | |
| Net Assets, end of year (in 000's) | | $ | 34,608 | | | $ | 24,688 | | | $ | 36,930 | | | $ | 35,122 | | | $ | 62,042 | | | $ | 111,737 | | |
Ratio of net investment income
to average net assets | | | 0.71 | % | | | (1.80 | )%(4) | | | (3.25 | )% | | | (2.21 | )% | | | (1.11 | )% | | | (0.84 | )% | |
Ratio of expenses
to average net assets (1) | | | 1.51 | % | | | 2.37 | %(4)(6) | | | 3.31 | % | | | 2.93 | % | | | 2.13 | % | | | 1.61 | % | |
Ratio of expenses
to average net assets (1)(3) | | | 1.50 | % | | | 2.30 | %(4)(6) | | | 3.25 | % | | | 2.82 | % | | | 1.85 | % | | | 1.48 | % | |
| Portfolio turnover rate | | | 118 | % | | | 204 | %(5) | | | 605 | % | | | 1024 | % | | | 778 | % | | | 216 | % | |
| (1) The net expenses of the Fund reflect a waiver of fees by an affiliate of the investment advisor . Had such an action not been taken, the operating expenses ratios would have been: | |
Ratio of expenses to
average net assets (3) | | | 2.98 | % | | | 3.73 | % | | | 3.50 | % | | | 3.07 | % | | | 2.10 | % | | | 1.86 | % | |
Ratio of expenses to
average net assets | | | 2.99 | % | | | 3.80 | % | | | 3.56 | % | | | 3.18 | % | | | 2.38 | % | | | 1.99 | % | |
(2) Based on average shares outstanding during the period.
(3) Ratio of expenses including the effect of expense offset arrangement.
(4) Annualized.
(5) Not Annualized.
(6) The current expenses for the period April 1, 2004 to October 31, 2004 exceed the expense cap of 1.75% due to the expense reimbursement not starting until July 1, 2004.
(7) Per share amounts were adjusted to reflect a 10 for 1 reverse stock split effective September 15, 2005.
(8) On July 1, 2004 the Fund converted from a closed-end, non diversified investment company ("closed-end Fund") to an open-end diversified investment company with a different investment objective, different investment strategies and a new investment adviser (an affiliate of the closed-end Fund's adviser). Until the close of business on June 30, 2004, the Fund operated as a closed-end Fund and its common stock (which then comprised of a single share class) was listed on the NYSE. After the close of business on June 30, 2004, all of the common stock was converted into Class A shares of the Fund. For periods prior thereto, all historical performance information for Class A shares reflects the NAV performance of the Fund's common stock while it was a closed-end Fund.
See Notes to Financial Statements
Julius Baer Funds 2005 Annual Report
115
FINANCIAL HIGHLIGHTS
Julius Baer Global Equity Fund Inc.
For a share outstanding throughout each period
| | | Class I | |
| | | Period Ended
October 31,
2005(6)(7) | |
| Net Asset Value, beginning of period | | $ | 30.80 | | |
| Net investment income (2) | | | 0.23 | | |
| Net realized and unrealized gain on investments (3) | | | 0.56 | | |
| Total income from investment operations | | | 0.79 | | |
| Less distributions: | |
| From net investment income | | | (0.01 | ) | |
| Total Distributions | | | (0.01 | ) | |
| Net Asset Value, end of period | | $ | 31.58 | | |
| Total Return | | | 2.56 | %(5) | |
| Ratios/Supplemental Data: | |
| Net Assets, end of period (in 000's) | | $ | 16,810 | | |
| Ratio of net investment income to average net assets | | | 1.15 | %(4) | |
| Ratio of expenses to average net assets (1) | | | 1.17 | %(4) | |
| Ratio of expenses to average net assets (1)(3) | | | 1.15 | %(4) | |
| Portfolio turnover rate | | | 118 | %(8) | |
| (1) The net expenses of the Fund reflect a waiver of fees by an affiliate of the investment advisor . Had such an action not been taken, the operating expenses ratios would have been: | |
| Ratio of expenses to average net assets(3) | | | 2.49 | %(4) | |
| Ratio of expenses to average net assets | | | 2.51 | %(4) | |
(2) Based on average shares outstanding during the period.
(3) Ratio of expenses including the effect of the expense offeset arrangement.
(4) Annualized
(5) Not Annualized
(6) Class I commenced operations on March 14, 2005.
(7) Per share amounts were adjusted to reflect a 10 for 1 reverse stock split effective September 15, 2005.
(8) Portfolio turnover is for the year ended October 31, 2005.
See Notes to Financial Statements
Julius Baer Funds 2005 Annual Report
116
FINANCIAL HIGHLIGHTS
Julius Baer International Equity Fund
For a share outstanding throughout each year
| | | Class A | |
| | | Year Ended October 31, | |
| | | 2005 | | 2004 | | 2003 | | 2002 | | 2001 | |
| Net Asset Value, beginning of year | | $ | 28.99 | | | $ | 24.45 | | | $ | 19.60 | | | $ | 19.95 | | | $ | 25.06 | | |
| Income (loss) from investment operations: | |
| Net investment income | | | 0.35 | | | | 0.16 | | | | 0.24 | | | | 0.11 | | | | 0.07 | | |
| Net realized and unrealized gain (loss) on investments | | | 5.98 | | | | 4.71 | | | | 4.93 | | | | (0.46 | ) | | | (5.18 | ) | |
| Total income (loss) from investment operations | | | 6.33 | | | | 4.87 | | | | 5.17 | | | | (0.35 | ) | | | (5.11 | ) | |
| Less distributions: | |
| From net realized gains on investments | | | (0.58 | ) | | | — | | | | — | | | | — | | | | — | | |
| From net investment income | | | (0.45 | ) | | | (0.33 | ) | | | (0.32 | ) | | | — | | | | — | | |
| Total Distributions | | | (1.03 | ) | | | (0.33 | ) | | | (0.32 | ) | | | — | | | | — | | |
| Net Asset Value, end of year | | $ | 34.29 | | | $ | 28.99 | | | $ | 24.45 | | | $ | 19.60 | | | $ | 19.95 | | |
| Total Return | | | 22.19 | % | | | 20.05 | % | | | 26.78 | % | | | (1.75 | )% | | | (20.49 | )% | |
| Ratios/Supplemental Data: | |
| Net Assets, end of year (in 000's) | | $ | 7,018,030 | | | $ | 3,721,409 | | | $ | 1,705,074 | | | $ | 615,897 | | | $ | 287,174 | | |
| Ratio of net investment income to average net assets | | | 1.09 | % | | | 0.58 | % | | | 0.83 | % | | | 0.49 | % | | | 0.36 | % | |
| Ratio of expenses to average net assets (1) | | | 1.32 | % | | | 1.35 | % | | | 1.37 | % | | | 1.51 | % | | | 1.53 | % | |
| Ratio of expenses to average net assets | | | 1.31 | % | | | 1.32 | % | | | 1.31 | % | | | 1.43 | % | | | 1.40 | % | |
| Portfolio turnover rate | | | 57 | % | | | 100 | % | | | 114 | % | | | 93 | % | | | 89 | % | |
(1) Expense ratio without taking into consideration any expense reductions related to custody offset arrangement.
See Notes to Financial Statements
Julius Baer Funds 2005 Annual Report
117
FINANCIAL HIGHLIGHTS
Julius Baer International Equity Fund
For a share outstanding throughout each year
| | | Class I | |
| | | Year Ended October 31, | |
| | | 2005 | | 2004 | | 2003 | | 2002 | | 2001 | |
| Net Asset Value, beginning of year | | $ | 29.47 | | | $ | 24.79 | | | $ | 19.79 | | | $ | 20.08 | | | $ | 25.16 | | |
| Income (loss) from investment operations: | |
| Net investment income | | | 0.44 | | | | 0.23 | | | | 0.28 | | | | 0.21 | | | | 0.14 | | |
| Net realized and unrealized gain (loss) on investments | | | 6.09 | | | | 4.79 | | | | 5.05 | | | | (0.45 | ) | | | (5.16 | ) | |
| Total income (loss) from investment operations | | | 6.53 | | | | 5.02 | | | | 5.33 | | | | (0.24 | ) | | | (5.02 | ) | |
| Less distributions: | |
| From net realized gains on investments | | | (0.58 | ) | | | — | | | | — | | | | — | | | | — | | |
| From net investment income | | | (0.46 | ) | | | (0.34 | ) | | | (0.33 | ) | | | (0.05 | ) | | | (0.06 | ) | |
| Total Distributions | | | (1.04 | ) | | | (0.34 | ) | | | (0.33 | ) | | | (0.05 | ) | | | (0.06 | ) | |
| Net Asset Value, end of year | | $ | 34.96 | | | $ | 29.47 | | | $ | 24.79 | | | $ | 19.79 | | | $ | 20.08 | | |
| Total Return | | | 22.52 | % | | | 20.39 | % | | | 27.39 | % | | | (1.21 | )% | | | (20.10 | )% | |
| Ratios/Supplemental Data: | |
| Net Assets, end of year (in 000's) | | $ | 8,220,356 | | | $ | 3,844,713 | | | $ | 1,114,010 | | | $ | 415,159 | | | $ | 219,614 | | |
| Ratio of net investment income to average net assets | | | 1.33 | % | | | 0.87 | % | | | 1.16 | % | | | 0.99 | % | | | 0.86 | % | |
| Ratio of expenses to average net assets (1) | | | 1.05 | % | | | 1.08 | % | | | 1.08 | % | | | 1.00 | % | | | 1.02 | % | |
| Ratio of expenses to average net assets | | | 1.04 | % | | | 1.05 | % | | | 1.02 | % | | | 0.92 | % | | | 0.89 | % | |
| Portfolio turnover rate | | | 57 | % | | | 100 | % | | | 114 | % | | | 93 | % | | | 89 | % | |
(1) Expense ratio without taking into consideration any expense reductions related to custody offset arrangement.
See Notes to Financial Statements
Julius Baer Funds 2005 Annual Report
118
FINANCIAL HIGHLIGHTS
Julius Baer Internationl Equity Fund II
For a share outstanding throughout the period
| | | Class A | |
| | | Period Ended
October 31,
2005(5) | |
| Net Asset Value, beginning of period | | $ | 10.00 | | |
| Income from investment operations: | |
| Net investment loss | | | (0.01 | ) | |
| Net realized and unrealized gain on investments | | | 0.95 | | |
| Total income from investment operations | | | 0.94 | | |
| Net Asset Value, end of period | | $ | 10.94 | | |
| Total Return | | | 9.30 | %(2) | |
| Ratios/Supplemental Data: | |
| Net Assets, end of period (in 000's) | | $ | 127,435 | | |
| Ratio of net investment income to average net assets | | | (0.11 | )%(3) | |
| Ratio of expenses to average net assets (1) | | | 1.36 | %(3)(4) | |
| Ratio of expenses to average net assets | | | 1.35 | %(3) | |
| Portfolio turnover rate | | | 38 | %(2) | |
(1) Expense ratio without taking into consideration any expense reductions related to custody offset arrangement.
(2) Not annualized.
(3) Annualized.
(4) The net expenses of the Fund reflect a waiver of fees by the Fund's investment advisor. Had such action not been taken, the annualized operating expense ratios would have been 2.06% for the period ended October 31, 2005.
(5) Commenced operations on May 4, 2005.
See Notes to Financial Statements
Julius Baer Funds 2005 Annual Report
119
FINANCIAL HIGHLIGHTS
Julius Baer Internationl Equity Fund II
For a share outstanding throughout the period
| | | Class I | |
| | | Period Ended
October 31,
2005(5) | |
| Net Asset Value, beginning of period | | $ | 10.00 | | |
| Income from investment operations: | |
| Net realized and unrealized gain on investments | | | 0.96 | | |
| Total income from investment operations | | | 0.96 | | |
| Net Asset Value, end of period | | $ | 10.96 | | |
| Total Return | | | 9.60 | %(2) | |
| Ratios/Supplemental Data: | |
| Net Assets, end of period (in 000's) | | $ | 297,617 | | |
| Ratio of net investment income to average net assets | | | (0.01 | )%(3) | |
| Ratio of expenses to average net assets (1) | | | 1.09 | %(3)(4) | |
| Ratio of expenses to average net assets | | | 1.08 | %(3) | |
| Portfolio turnover rate | | | 38 | %(2) | |
(1) Expense ratio without taking into consideration any expense reductions related to custody offset arrangement.
(2) Not annualized.
(3) Annualized.
(4) The net expenses of the fund reflect a waiver of fees by the Fund's investment advisor. Had such action not been taken, the annualized operating expense ratio would have been 1.60% for the period ended October 31, 2005.
(5) Commenced operations on May 4, 2005.
See Notes to Financial Statements
Julius Baer Funds 2005 Annual Report
120
FINANCIAL HIGHLIGHTS
Julius Baer Total Return Bond Fund
For a share outstanding throughout each year
| | | Class A | |
| | | Year Ended October 31, | |
| | | 2005 | | 2004 | | 2003 | | 2002(1) | | 2001 | |
| Net Asset Value, beginning of year | | $ | 13.37 | | | $ | 13.34 | | | $ | 12.55 | | | $ | 12.10 | | | $ | 11.09 | | |
| Income from investment operations: | |
| Net investment income | | | 0.42 | | | | 0.37 | | | | 0.30 | | | | 0.44 | | | | 0.54 | | |
| Net realized and unrealized gain on investments | | | 0.10 | | | | 0.35 | | | | 0.92 | | | | 0.49 | | | | 0.95 | | |
| Total income from investment operations | | | 0.52 | | | | 0.72 | | | | 1.22 | | | | 0.93 | | | | 1.49 | | |
| Less distributions: | |
| From net realized gains on investments | | | (0.10 | ) | | | (0.23 | ) | | | (0.11 | ) | | | — | | | | — | | |
| From net investment income | | | (0.46 | ) | | | (0.46 | ) | | | (0.32 | ) | | | (0.47 | ) | | | (0.36 | ) | |
| From capital (Note 1) | | | — | | | | — | | | | — | | | | (0.01 | ) | | | (0.12 | ) | |
| Total Distributions | | | (0.56 | ) | | | (0.69 | ) | | | (0.43 | ) | | | (0.48 | ) | | | (0.48 | ) | |
| Net Asset Value, end of year | | $ | 13.33 | | | $ | 13.37 | | | $ | 13.34 | | | $ | 12.55 | | | $ | 12.10 | | |
| Total Return | | | 3.93 | % | | | 5.50 | % | | | 9.83 | % | | | 7.86 | % | | | 13.73 | % | |
| Ratios/Supplemental Data: | |
| Net Assets, end of year (in 000's) | | $ | 68,223 | | | $ | 58,823 | | | $ | 63,449 | | | $ | 33,858 | | | $ | 24,119 | | |
| Ratio of net investment income to average net assets | | | 3.11 | % | | | 2.79 | % | | | 2.24 | % | | | 3.65 | % | | | 4.70 | % | |
| Ratio of expenses to average net assets (2) | | | 0.78 | % | | | 1.17 | % | | | 1.16 | % | | | 1.28 | % | | | 1.16 | % | |
| Ratio of expenses to average net assets | | | 0.77 | %(3) | | | 1.17 | % | | | 1.16 | % | | | 1.28 | %(3) | | | 1.16 | %(3) | |
| Portfolio turnover rate | | | 202 | % | | | 69 | % | | | 160 | % | | | 156 | % | | | 96 | % | |
(1) The Fund has adopted the provisions of the revised AICPA Audit and Accounting Guide for Investment Companies and began using the interest method to amortize premiums on fixed-income securities. The effect of this change for the year ended October 31, 2002 was to increase net investment income per share by $0.002, decrease net realized and unrealized gains per share by $0.002 and increase the ratio of net investment income to average net assets from 3.63% to 3.65%. Per share data and ratios for the periods prior to November 1, 2002 have not been restated to reflect this change in presentation.
(2) Expense ratio without taking into consideration any reductions related to custody offset arrangement.
(3) The net expenses of the Fund reflect a waiver of fees by the Fund's investment advisor. Had such action not been taken, the operating expense ratios would have been 0.93%,1.38% and 1.49%, for the periods ended October 31, 2005, 2002 and 2001, respectively.
See Notes to Financial Statements
Julius Baer Funds 2005 Annual Report
121
FINANCIAL HIGHLIGHTS
Julius Baer Total Return Bond Fund
For a share outstanding throughout each year
| | | Class I | |
| | | Year Ended October 31, | |
| | | 2005 | | 2004 | | 2003 | | 2002(1) | | 2001 | |
| Net Asset Value, beginning of year | | $ | 13.41 | | | $ | 13.37 | | | $ | 12.56 | | | $ | 12.07 | | | $ | 11.03 | | |
| Income (loss) from investment operations: | |
| Net investment income | | | 0.47 | | | | 0.41 | | | | 0.37 | | | | 0.48 | | | | 0.59 | | |
| Net realized and unrealized gain on investments | | | 0.08 | | | | 0.34 | | | | 0.89 | | | | 0.50 | | | | 0.94 | | |
| Total income (loss) from investment operations | | | 0.55 | | | | 0.75 | | | | 1.26 | | | | 0.98 | | | | 1.53 | | |
| Less distributions: | |
| From net realized gains on investments | | | (0.10 | ) | | | (0.23 | ) | | | (0.11 | ) | | | — | | | | — | | |
| From net investment income | | | (0.48 | ) | | | (0.48 | ) | | | (0.34 | ) | | | (0.48 | ) | | | (0.39 | ) | |
| From capital (Note 1) | | | — | | | | — | | | | — | | | | (0.01 | ) | | | (0.10 | ) | |
| Total Distributions | | | (0.58 | ) | | | (0.71 | ) | | | (0.45 | ) | | | (0.49 | ) | | | (0.49 | ) | |
| Net Asset Value, end of year | | $ | 13.38 | | | $ | 13.41 | | | $ | 13.37 | | | $ | 12.56 | | | $ | 12.07 | | |
| Total Return | | | 4.10 | % | | | 5.82 | % | | | 10.19 | % | | | 8.41 | % | | | 14.20 | % | |
| Ratios/Supplemental Data: | |
| Net Assets, end of year (in 000's) | | $ | 141,145 | | | $ | 31,862 | | | $ | 14,188 | | | $ | 1,167 | | | $ | 538 | | |
| Ratio of net investment income to average net assets | | | 3.50 | % | | | 3.08 | % | | | 2.50 | % | | | 4.00 | % | | | 5.13 | % | |
| Ratio of expenses to average net assets (2) | | | 0.47 | % | | | 0.88 | % | | | 0.90 | % | | | 0.85 | % | | | 0.74 | % | |
| Ratio of expenses to average net assets | | | 0.47 | %(3) | | | 0.88 | % | | | 0.89 | % | | | 0.85 | %(3) | | | 0.74 | %(3) | |
| Portfolio turnover rate | | | 202 | % | | | 69 | % | | | 160 | % | | | 156 | % | | | 96 | % | |
(1) The Fund has adopted the provisions of the revised AICPA Audit and Accounting Guide for Investment Companies and began using the interest method to amortize premiums on fixed-income securities. The effect of this change for the year ended October 31, 2002 was to increase net investment income per share by $0.002, decrease net realized and unrealized gains per share by $0.002 and increase the ratio of net investment income to average net assets from 3.98% to 4.00%. Per share data and ratios for the periods prior to November 1, 2002 have not been restated to reflect this change in presentation.
(2) Expense ratio without taking into consideration any reductions related to custody offset arrangement.
(3) The net expenses of the Fund reflect a waiver of fees by the Fund's investment adviser. Had such action not been taken, the operating expense ratios would have been 0.65%, 0.95% and 1.07% for years ended October 31, 2005, 2002 and 2001, respectively.
See Notes to Financial Statements
Julius Baer Funds 2005 Annual Report
122
FINANCIAL HIGHLIGHTS
Julius Baer Global High Yield Bond Fund
For a share outstanding throughout each period
| | | Class A | |
| | | Year Ended October 31, | | Period Ended
October 31, | |
| | | 2005 | | 2004 | | 2003(1) | |
| Net Asset Value, beginning of year | | $ | 12.07 | | | $ | 11.43 | | | $ | 10.00 | | |
| Income from investment operations: | |
| Net investment income (2) | | | 0.73 | | | | 0.70 | | | | 0.64 | | |
| Net realized and unrealized gain (loss) on investments | | | (0.01 | ) | | | 0.72 | | | | 1.37 | | |
| Total income from investment operations | | | 0.72 | | | | 1.42 | | | | 2.01 | | |
| Less distributions: | |
| From net realized gains on investments | | | (0.15 | ) | | | (0.07 | ) | | | — | | |
| From net investment income | | | (0.71 | ) | | | (0.71 | ) | | | (0.58 | ) | |
| Total Distributions | | | (0.86 | ) | | | (0.78 | ) | | | (0.58 | ) | |
| Net Asset Value, end of year | | $ | 11.93 | | | $ | 12.07 | | | $ | 11.43 | | |
| Total Return | | | 6.15 | % | | | 12.87 | % | | | 20.57 | %(6) | |
| Ratios/Supplemental Data: | |
| Net Assets, end of year (in 000's) | | $ | 36,166 | | | $ | 45,164 | | | $ | 28,195 | | |
| Ratio of net investment income to average net assets | | | 6.01 | % | | | 5.97 | % | | | 6.71 | %(3) | |
| Ratio of expenses to average net assets (4) | | | 1.28 | % | | | 1.24 | % | | | 1.26 | %(3) | |
| Ratio of expenses to average net assets | | | 1.25 | %(5) | | | 1.25 | % | | | 1.25 | %(3)(5) | |
| Portfolio turnover rate | | | 99 | % | | | 93 | % | | | 83 | % | |
(1) Class A shares commenced operations on December 17, 2002.
(2) Based on average shares outstanding during the period.
(3) Annualized.
(4) Expense ratio without taking into consideration any expense reductions related to custody offset arrangement and reimbursement of expense previously assumed by the advisor.
(5) The net expenses of the fund reflect a waiver by the Fund's investment advisor. Had such action not been taken, the operating expenses ratios would have been 1.30% and 1.95% for the years ended October 31, 2005 and October 31, 2003.
(6) Not annualized.
See Notes to Financial Statements
Julius Baer Funds 2005 Annual Report
123
FINANCIAL HIGHLIGHTS
Julius Baer Global High Yield Bond Fund
For a share outstanding throughout each period
| | | Class I | |
| | | Year Ended October 31, | | Period Ended
October 31, | |
| | | 2005 | | 2004 | | 2003(1) | |
| Net Asset Value, beginning of year | | $ | 12.01 | | | $ | 11.36 | | | $ | 10.00 | | |
| Income from investment operations: | |
| Net investment income (2) | | | 0.78 | | | | 0.73 | | | | 0.57 | | |
| Net realized and unrealized gain (loss) on investments | | | (0.05 | ) | | | 0.72 | | | | 1.35 | | |
| Total income from investment operations | | | 0.73 | | | | 1.45 | | | | 1.92 | | |
| Less distributions: | |
| From net realized gains on investments | | | (0.15 | ) | | | (0.07 | ) | | | — | | |
| From net investment income | | | (0.98 | ) | | | (0.73 | ) | | | (0.56 | ) | |
| Total Distributions | | | (1.13 | ) | | | (0.80 | ) | | | (0.56 | ) | |
| Net Asset Value, end of year | | $ | 11.61 | | | $ | 12.01 | | | $ | 11.36 | | |
| Total Return | | | 6.37 | % | | | 13.28 | % | | | 19.66 | %(6) | |
| Ratios/Supplemental Data: | |
| Net Assets, end of year (in 000's) | | $ | 7,586 | | | $ | 45,636 | | | $ | 20,839 | | |
| Ratio of net investment income to average net assets | | | 6.47 | % | | | 6.24 | % | | | 6.91 | %(3) | |
| Ratio of expenses to average net assets (4) | | | 1.03 | % | | | 0.97 | % | | | 1.02 | %(3) | |
| Ratio of expenses to average net assets | | | 1.00 | %(5) | | | 1.00 | % | | | 1.00 | %(3)(5) | |
| Portfolio turnover rate | | | 99 | % | | | 93 | % | | | 83 | % | |
(1) Class I shares commenced operations on January 30, 2003.
(2) Based on average shares outstanding during the period.
(3) Annualized.
(4) Expense ratio without taking into consideration any expense reductions related to custody offset arrangement and reimbursement of expense previously assumed by the Fund's investment advisor.
(5) The net expenses of the Fund reflect a waiver of fees by the Fund's investment advisor. Had such an action not been taken, the operating expense ratios would have been 1.04% and 1.41% for the periods October 31, 2005 and October 31, 2003.
(6) Not annualized.
See Notes to Financial Statements
Julius Baer Funds 2005 Annual Report
124
NOTES TO FINANCIAL STATEMENTS
1. Significant Accounting Policies
The Julius Baer Funds consist of the Julius Baer Global Equity Fund Inc. ( "Global Equity Fund") and the Julius Baer Investment Funds (the "Trust"). As of October 31, 2005, the Julius Baer Funds consisted of five funds (each a "Fund" and together, the "Funds").
The Global Equity Fund was incorporated under the laws of the State of Maryland on May 23, 1990 and is registered with the Securities and Exchange Commission ('SEC") under the Investment Company Act of 1940, as amended (the "1940 Act").
The Trust is registered with the SEC under the 1940 Act, as an open-end management investment company. As of October 31, 2005, the Trust offered four investment funds: Julius Baer International Equity Fund (the "International Equity Fund"), Julius Baer International Equity Fund II (the "International Equity Fund II"), Julius Baer Total Return Bond Fund (the "Total Return Bond Fund") and Julius Baer Global High Yield Bond Fund (the "High Yield Bond Fund"). The International Equity Fund II commenced operations on May 4, 2005.
The International Equity Fund is closed to new shareholders (at the account level). This excludes 401(k) plans that have existing investments in the Fund through related 401(k) plans and new plan participants within 401(k) plans that hold positions in the Fund. In addition, existing shareholders, may continue to invest.
Each Fund offers two share classes, Class A and Class I. The two classes of shares are offered to different types of investors and have different expense structures, as outlined in the Funds' Prospectus. Each class of shares has exclusive voting rights with respect to matters that affect that class. Income, realized gains and losses, unrealized appreciation and depreciation, and expenses that are not attributable to a specific class are allocated daily to each class based on its relative net assets. Expenses directly attributable to a Fund are charged to that Fund. Other expenses are allocated to the respective Fund based on average daily net assets. Class I shares commenced operations on March 14, 2005 for the Global Equity Fund.
The Global Equity Fund's investment objective is to maximize total return through capital appreciation. The International Equity Fund's investment objective is long-term growth of capital from primarily investing in a diversified portfolio of common stocks of foreign issuers of all sizes. The International Equity Fund II investment objective is long term growth of capital primarily investing in a diversified portfolio
Julius Baer Funds 2005 Annual Report
125
NOTES TO FINANCIAL STATEMENTS (Continued)
of common stocks, convertible securities and preferred stocks of foreign issuers focusing on mid to large capitalization companies. The Total Return Bond Fund's investment objective is to maximize current income consistent with the protection of principal by investing in a non-diversified portfolio of high quality fixed income securities of governmental, supranational and corporate issuers denominated in various currencies, including United States (U.S.) dollars. The High Yield Bond Fund's investment objective is to maximize total return, principally through a high level of current income, and secondarily through capital appreciation by investing in a diversified portfolio of below investment grade, fixed income securities (commonly known as "junk bonds") of issues located throughout the world.
The following is a summary of significant accounting policies consistently followed by the Funds in the preparation of their financial statements. The presentation of financial statements in conformity with accounting principles generally accepted in the United States of America requires management to make estimates and assumptions that affect the reported amounts of assets and liabilities and disclosure of contingent assets and liabilities at the date of the financial statements and the reported amounts of revenue and expenses during the reporting period. Actual results could differ from these estimates.
a) Portfolio valuation: Each Fund's investments are valued at market. Equity securities, which are traded primarily on a U.S. or foreign stock exchange are valued at the last sale price on that exchange or, if there were no sales during the day, at the mean of the current quoted bid and asked prices. Portfolio securities which are traded primarily on foreign securities exchanges are generally valued at the preceding closing values of such securities on their respective exchanges, except that when a significant event subsequent to that time is likely to have changed such value, including substantial changes in the values of U.S. markets subsequent to the close of a foreign market. In these circumstances, the fair value of those securities will be determined by consideration of other factors by or under the direction of the Global Equity Fund's Board of Directors, t he Trust's Board of Trustees (each "Board" and collectively, the "Boards") or their respective delegates. Debt securities (other than government securities and short-term obligations) are valued by independent pricing services approved by the respective Board. Investments in government securities (other than short-term securities) are valued at the mean of the quoted bid and asked prices in the over-the-counter market. Short-term investments that mature in 60 days or less are valued at amortized cost. Any securities for which
Julius Baer Funds 2005 Annual Report
126
NOTES TO FINANCIAL STATEMENTS (Continued)
market quotations are not readily available, or for which a significant event has occurred since the time of the most recent market quotations, are valued in accordance with fair value pricing approved by the respective Board.
The Boards have identified certain circumstances in which the use of fair value pricing method is necessary. In such circumstances, the Boards have also approved an independent fair value service for foreign equities, which may provide the fair value price. For options and warrants, a fair value price may be determined using an industry accepted modeling tool. In addition, the Funds' Pricing Committees may determine the fair value price based upon factors that include the type of the security, the initial cost of the security and price quotations from dealers and/or pricing services in similar securities or in similar markets. At October 31, 2005, the Global Equity Fund, the International Equity Fund and the International Equity Fund II held $23,721,597, $11,951,692,354 and $316,446,089 of fair-valued securities utilizing the fair value model in accordance with valuations policies approved by the board of directors, respectively.
b) Repurchase agreements: The Funds may engage in repurchase agreement transactions. Under the terms of a typical repurchase agreement, a Fund takes possession of an underlying debt obligation in return for the use of the Fund's available cash, subject to an obligation of the seller to repurchase and the Fund to resell the obligation, at an agreed-upon price and time. Thus, the yield during the Fund's holding period is determinable. This arrangement results in a fixed rate of return that is not subject to market fluctuations during a Fund's holding period. The value of the collateral at all times is equal to at least 100% of the total amount of the repurchase obligations, including accrued interest. In the event of counterparty default, the Fund has the right to use the collateral to offset losses incurred. There is potential loss to a Fund in the event the Fund i s delayed or prevented from exercising its rights to dispose of the collateral securities, including the risk of a possible decline in the value of the underlying securities during the period in which the Fund seeks to assert its rights. The Funds' investment adviser reviews the value of the collateral and the creditworthiness of those banks and dealers with whom the Funds enter into repurchase agreements to evaluate potential risks.
c) Foreign currency: The books and records of the Funds are maintained in U.S. dollars. Foreign currencies and investments and other assets and liabilities denominated in foreign currencies are translated into U.S. dollars at the exchange rates prevailing at the
Julius Baer Funds 2005 Annual Report
127
NOTES TO FINANCIAL STATEMENTS (Continued)
end of the period, purchases and sales of investment securities and income and expenses are translated on the respective dates of such transactions. Unrealized gains or losses on investments which result from changes in foreign currencies have been included in the net unrealized appreciation (depreciation) of investments. Net realized currency gains and losses include foreign currency gains and losses between trade date and settlement date on investment securities transactions, gains and losses from foreign currency transactions and the gains and losses from differences between the amounts of interest and dividends recorded on the books of the Funds and the amounts actually received. The portion of foreign currency gains and losses related to fluctuations in exchange rates between the purchase trade date and sale trade date is included in realized gains and losses on security transactions.
d) Forward foreign currency contracts: Forward foreign currency contracts are valued at the forward rate and are marked-to-market at each valuation date. The change in market value is recorded by the Funds as an unrealized gain or loss. When the contract is closed, a Fund records a realized gain or loss equal to the difference between the value of the contract at the time it was opened and the value at the time it was closed.
As part of its investment strategy, a Fund may enter into forward foreign currency contracts to manage the Fund's portfolio holdings against currency risks. A Fund may also utilize forward foreign currency contracts to reduce or eliminate an underweighted position in a currency relative to its benchmark when purchasing underlying equities denominated in that currency is not advisable by the advisor. With respect to a Fund's obligations to purchase or sell currencies under forward foreign currency contracts, a Fund will either deposit with its custodian in a segregated account cash or other liquid securities having a value at least equal to its obligations, or continue to own or have the right to sell or acquire respectively, the currency subject to the forward foreign currency contract.
The use of forward foreign currency contracts does not eliminate fluctuations in the underlying prices of a Fund's portfolio securities, but it does establish a rate of exchange that can be achieved in the future. Although forward foreign currency contracts limit the risk of loss due to a decline in the value of the currency holdings, they also limit any potential gain that might result should the value of the currency increase. In addition, a Fund could be exposed to risks if the counterparties to the contracts are unable to meet the terms of the contracts.
Julius Baer Funds 2005 Annual Report
128
NOTES TO FINANCIAL STATEMENTS (Continued)
e) Financial Futures Contracts: In order to gain exposure to or protect against changes in security values, the Funds may buy and sell futures contracts. The primary risks associated with the use of futures contracts are the imperfect correlation between changes in market values of securities held by the Funds and the prices of future contracts, and the possibility of an illiquid market.
Futures contracts are valued based upon their quoted daily settlement prices. The aggregate principal amounts of the contracts are not recorded in the financial statements. The Funds' agree to receive from or pay to the broker an amount of cash equal to the daily flucation in the value of the contract. Such receipts or payments are know as "variation margin" and are recorded by a Fund as unrealized gains or losses. Fluctuations in the value of the contracts are recorded in the Statement of Assets and Liabilities as an asset or liability and in the Statement of Operations as unrealized gains or losses until the contracts are closed, at which point they are recorded as net realized gains or losses on futures contracts (see Note 11 for outstanding futures contracts at October 31, 2005).
f) Options: The Funds may write options to generate current income to manage investment risk. Each Fund may write put and call options on up to 25% of the net asset value of the securities in its portfolio and will realize fees (referred to as "premiums") for granting the rights evidenced by the options. When a Fund writes a call option or a put option, an amount equal to the premium received by that Fund is recorded as a liability, the value of which is marked-to-market at each valuation date. When a written option expires, that Fund realizes a gain equal to the amount of the premium originally received. When a Fund enters into a closing purchase transaction, the Fund realizes a gain (or loss if the cost of the closing purchase transaction exceeds the premium originally received when the option was sold/written) without regard to any unrealized gain or loss on th e underlying security, and the liability related to such option is eliminated. When a call option is exercised, a Fund realizes a gain or loss from the sale of the underlying security and the proceeds from such sale are increased by the amount of the premium originally received. When a put option is exercised, the amount of the premium originally received will reduce the cost of the security which that Fund purchased upon exercise. The Funds will write only covered options.
The Funds may purchase put and call options that are traded on foreign as well as U.S. exchanges and in the over-the-counter market. Each Fund may utilize up to
Julius Baer Funds 2005 Annual Report
129
NOTES TO FINANCIAL STATEMENTS (Continued)
2% of its assets to purchase both put and call options on portfolio securities. Purchases of put and call options are recorded as an investment, the value of which is marked-to-market at each valuation date. When a purchased option expires, no proceeds will be expected and a Fund will realize a loss. When a fund exercises a put option, it will realize a gain or loss from the sale of the underlying security and the proceeds from such sale will be decreased by the premium originally paid. When a Fund exercises a call option, the cost of the security which the Fund purchases upon exercise will be increased by the premium originally paid.
The International Equity Fund, the International Equity Fund II, the High Yield Bond Fund and the Global Equity Fund may purchase and sell call and put options on stock indices. A Fund's possible loss, in either, case will be limited to the premium paid for the option, plus related transaction costs. In contrast to an option on a security, an option on a stock index provides the holder with the right but not the obligation to make or receive a cash settlement upon exercise of the option, rather than the right to purchase or sell a security. The amount of this settlement is equal to (i) the amount, if any, by which the fixed exercise price of the option exceeds (in the case of a call) or is below (in the case of a put) the closing value of the underlying index on the date of exercise, multiplied by (ii) a fixed "index multiplier."
The risk associated with purchasing options is limited to the premium originally paid. The risk in writing a call option is that a Fund may forego the opportunity for profit if the market price of the underlying security increases and the option is exercised. The risk in writing a put option is that a Fund may incur a loss if the market price of the underlying security decreases and the option is exercised. There is also the risk a Fund may not be able to enter into a closing transaction because of an illiquid secondary market. In addition, a Fund could be exposed to risks if the counterparties to the transaction are unable to meet the terms of the contracts.
g) Swaps: The Funds may enter into interest rate, currency, index, total return and credit default swaps. The Funds expect to enter into these transactions primarily to preserve a return or spread on a particular investment or portion of its portfolio, to protect against currency fluctuations, as a duration management technique or to protect against any increase in the price of securities the Funds anticipate purchasing at a later date. Interest rate swaps involve the exchange with another party of their respective commitments to pay or receive interest, for example, an exchange of floating rate payments for fixed rate payments with respect to a notional amount
Julius Baer Funds 2005 Annual Report
130
NOTES TO FINANCIAL STATEMENTS (Continued)
of principal. A currency swap is an agreement to exchange cash flows on a notional amount of two or more currencies based on the relative value differential among them and an index swap is an agreement to swap cash flows on a notional amount based on changes in the values of the reference indices. A total return swap is an agreement to exchange the return on a stock, bond or index for a fixed or variable financing charge. A credit default swap is an agreement between two counterparties that allows one counterparty to be "long" a third-party credit risk, and the other counterparty to be "short" the credit risk. Credit default swaps are designed to transfer the credit exposure of fixed income products between parties.
The Funds will usually enter into swaps on a net basis, that is, the two payment streams are netted out in a cash settlement on the payment date or dates specified in the instrument, with a Fund receiving or paying, as the case may be, only the net amount of the two payments. Inasmuch as these swaps are entered into for good faith hedging purposes, the investment adviser believes such obligations do not constitute senior securities under the 1940 Act, and, accordingly, will not treat them as being subject to its borrowing restrictions. The Funds will not enter into any swap transaction unless, at the time of entering into such transaction, the unsecured long-term debt of the counterparty, combined with any credit enhancements, is rated at least A by S&P or Moody's or has an equivalent rating from a NRSRO or is determined to be of equivalent credit quality by the investment adviser. If there is a default by the counterparty, the Funds may have contractual remedies pursuant to the agreements related to the transaction.
h) Securities Lending: The Global Equity Fund, the International Equity Fund and the International Equity Fund II have established a securities lending agreement with Investors Bank & Trust Company in which the Funds lend portfolio securities to a broker in exchange for collateral consisting of either cash or U.S. government securities in an amount at least equal to 102% of the market value of the securities on loan. These Funds may loan securities to brokers, dealers, and financial institutions determined by the Adviser to be creditworthy, subject to certain limitations. Under the agreement, these Funds continue to earn income on the securities loaned. Collateral received is generally cash, and such Funds invest the cash and receive any interest on the amount invested, but it must also pay the broker a loan rebate fee computed as a varying percentage of the c ollateral received. In the event of counterparty default, these Funds are subject to potential loss if any such Fund is delayed or prevented from exercising its right to dispose of the collateral. These Funds each
Julius Baer Funds 2005 Annual Report
131
NOTES TO FINANCIAL STATEMENTS (Continued)
bear risk in the event that invested collateral is not sufficient to meet obligations due on the loans.
i) Securities transactions and investment income: Securities transactions are recorded as of the trade date. Realized gains and losses from securities transactions are recorded on the identified cost basis. Interest income is recorded on an accrual basis and includes amortization and accretion of bond premiums and discounts, respectively, using effective interest method. Dividend income is recorded in the statement of operations on the ex-dividend date or when the Fund becomes aware of dividend distributions. It is expected that certain capital gains earned by the Funds and certain dividends and interest received by the Funds will be subject to foreign withholding taxes.
j) Dividends and distributions to shareholders: Distributions to shareholders are recorded on the ex-dividend date. Each Fund intends to distribute annually to its shareholders substantially all of its taxable income. The Total Return Bond Fund and the High Yield Bond Fund declare and pay monthly dividends. The International Equity Fund, the International Equity Fund II and the Global Equity Fund declare and pay dividends from its net investment income, if any, annually. The Funds will distribute net realized capital gains, if any, annually. Additional distributions of net investment income and capital gains may be made at the discretion of the Board of the Funds to avoid the application of the excise tax imposed under Section 4982 of the Internal Revenue Code of 1986, as amended, for certain undistributed amounts. Income distributions and capital gain distributio ns are determined in accordance with income tax regulations which may differ from generally accepted accounting principles. These differences are primarily due to differing treatments of income and gains on various investment securities held by the Funds, timing differences and differing characterization of distributions made by the Funds as a whole.
k) Federal income taxes: The Global Equity Fund and the Trust intends that each Fund separately qualify as a regulated investment company for U.S. federal income tax purposes. Accordingly, the Funds do not anticipate that any income taxes will be paid.
2. Investment Advisory Fee and Other Transactions
Julius Baer Investment Management LLC ("JBIM" or "Adviser") serves as the investment adviser. The Global Equity Fund pays JBIM a fee at an annual rate of 0.90%
Julius Baer Funds 2005 Annual Report
132
NOTES TO FINANCIAL STATEMENTS (Continued)
of average daily net assets. Effective April 1, 2005, the International Equity Fund pays JBIM a fee at an annual rate of 0.90% for the first $7.5 billion dollars of average daily next assets, 0.88% for the next $2.5 billion dollars of average daily net assets and 0.85% for average daily net assets over $10.0 billion dollars. Prior to April 1, 2005, the International Equity Fund paid JBIM a fee at an annual rate of 0.90% of daily average net assets. The Total Return Bond Fund, the High Yield Bond Fund and the International Equity Fund II pay JBIM a fee at an annual rate of 0.45%, 0.75% and 0.90% of average daily net assets, respectively.
From July 1, 2004 until March 1, 2005 the adviser contractually agreed to reimburse certain expenses of the Global Equity Fund so that the net annual expenses of the Global Equity Fund based on average net assets were limited to 1.75% and 1.50% of the Class A and Class I shares, respectviely. Commencing on March 1, 2005, the adviser contractually agreed to reimburse certain expenses of the Global Equity Fund so that the net annual expenses of the Global Equity Fund based on average net assets were limited to 1.40% and 1.15% of the Class A and Class I shares, respectviely.
Commencing May 4, 2005, January 1, 2005 and December 17, 2002, the Adviser has contractually agreed to reimburse certain expenses of the the International Equity Fund II, the Total Return Bond Fund and the High Yield Bond Fund, respectively, through February 28, 2006, so that the net operating expenses of each Fund (excluding interest, taxes, brokerage commissions, and extraordinary expenses) based on average net assets are limited (the "Expense Limit") as specified in the table below. In addition, in connection with the commencement of these reimbursement plans, the Global Equity Fund, the Total Return Bond Fund, the High Yield Bond Fund and the International Equity Fund II have agreed to allow the Adviser to recoup expenses reimbursed to each Fund provided that repayment does not cause each of the Funds' annual operating expenses to exceed the Expense Limit. Any such recoupment must be made within three years after the year in which the Ad viser incurred the expense. The table below specifies the reimbursement made to each Fund by the Adviser for the year ended October 31, 2005 and the Adviser's potential recoupment as of October 31, 2005.
| | | Expense Limit | | | | Potential | |
| Fund | | Class A | | Class I | | Reimbursement | | Recoupment | |
| Global Equity Fund | | | 1.40 | % | | | 1.15 | % | | $ | 582,696 | | | $ | 836,280 | | |
| International Equity Fund II | | | 1.35 | | | | 1.08 | | | | 403,870 | | | | 403,870 | | |
| Total Return Bond Fund | | | 0.69 | | | | 0.44 | | | | 292,108 | | | | 292,108 | | |
| High Yield Bond Fund | | | 1.25 | | | | 1.00 | | | | 28,038 | | | | 109,461 | | |
Julius Baer Funds 2005 Annual Report
133
NOTES TO FINANCIAL STATEMENTS (Continued)
For the year ended October 31, 2005, the Global Equity Fund incurred total brokerage commissions of $127,021 of which $2,692 was paid to UBS Securities LLC, an affiliated broker dealer of the Adviser.
For the year ended October 31, 2005, the International Equity Fund incurred total brokerage commissions of $30,038,715 of which $1,489,333 and $1,274,234 was paid to UBS Securities LLC and Kepler Equities, respectively, affiliated broker dealers of the Adviser.
For the year ended October 31, 2005, the International Equity Fund II incurred total brokerage commissions of $442,713 of which $6,861 was paid to UBS Securities LLC, an affiliated broker dealer of the Adviser.
During the year ended October 31, 2005, the Adviser reimbursed the International Equity Fund II, the Total Return Bond Fund and the Global High Yield Bond Fund, for losses incurred on certain security transactions in the amount of $123, $9,355 and $14,538, respectively. These dollar amounts are recorded by the fund as realized gains on the Statement of Operations. The percentage of net assets for these realized gains were less than 0.05% for all three Funds. Additionally, the International Equity Fund II was reimbursed $3,792 by Investors Bank and Trust for a loss incurred by the Fund.
The Funds entered into expense offset arrangements as part of their custody agreement with Investors Bank and Trust Company. Under this agreement, each Fund's custody fees were reduced by $4,935, $1,760,590, $8,455, $11,090 and $20,762 respectively for the Global Equity Fund, International Equity Fund, International Equity Fund II, Total Return Bond Fund and the Global High Yield Bond Fund.
In June 2005, the Funds adopted a commission recapture program. Under the program, a percentage of commissions generated by the portfolio transactions of a Fund is rebated to that Fund by the broker-dealers and are recorded as to short-term security gain. The commission recapture amounts for the Funds during the year ended 10/31/05 were as follows:
| Fund | | Broker Commission
Recaptured
during the
year ended
10/31/05 | |
| Global Equity Fund | | $ | 26,893 | | |
| International Equity Fund | | $ | 194 | | |
| International Equity Fund II | | $ | 14,160 | | |
Julius Baer Funds 2005 Annual Report
134
NOTES TO FINANCIAL STATEMENTS (Continued)
3. Distribution and Shareholder Servicing Plan
The Funds have adopted a Shareholder Services Plan and a Distribution Plan (the "Plans") for the Class A shares pursuant to Rule 12b-1 under the 1940 Act. Under the Plans, the Funds may compensate certain financial institutions, including the distributor, for certain distribution, shareholder servicing, administrative and accounting services for their clients and customers who are beneficial owners of each of the Funds' Class A shares. A Fund may expend an aggregate amount, on an annual basis, not to exceed 0.25% of the value of the average daily net assets of a Fund attributable to Class A Shares. The Adviser may pay additional marketing and other distribution costs out of their profits.
Quasar Distributors, LLC ("Quasar" or "Distributor") is the Distributor of the Funds' shares.
Under their terms, the Funds' Plans shall remain in effect from year to year, provided such continuance is approved annually by a vote of a majority of the Directors/Trustees and a majority of those Directors/Trustees who are not "interested persons" of the Funds and who have no direct or indirect financial interest in the operation of the Plans or in any agreement related to the Plans.
4. Purchases and Sales of Securities
Cost of purchases and proceeds from sales (including paydowns) of securities, excluding short-term investments, during the year ended October 31, 2005 were as follows:
| Fund | | Cost of
Purchases | | Proceeds
from Sales | |
| Global Equity Fund | | $ | 61,463,738 | | | $ | 45,300,213 | | |
| International Equity Fund | | | 10,858,609,497 | | | | 6,586,842,964 | | |
| International Equity Fund II | | | 396,169,138 | | | | 59,926,175 | | |
| Total Return Bond Fund | | | 497,806,405 | | | | 314,264,131 | | |
| High Yield Bond Fund | | | 58,296,882 | | | | 103,345,840 | | |
Cost of purchases and proceeds from sales of long-term U.S. Government securities during the year ended October 31, 2005 were $270,419,232 and $206,324,190, respectively for the Total Return Bond Fund.
At October 31, 2005, net unrealized appreciation/depreciation for federal income tax purposes is comprised of the following components:
| Fund | |
Federal
Income Tax
Cost | |
Gross
Unrealized
Appreciation | |
Gross
Unrealized
Depreciation | | Tax Basis
Net Unrealized
Appreciation/
(Depreciation) | |
| Global Equity Fund | | $ | 46,003,653 | | | $ | 2,916,798 | | | $ | (1,078,170 | ) | | $ | 1,838,628 | | |
| International Equity Fund | | | 12,741,937,562 | | | | 2,467,877,681 | | | | (168,950,796 | ) | | | 2,298,926,885 | | |
| International Equity Fund II | | | 416,583,192 | | | | 12,672,329 | | | | (6,847,348 | ) | | | 5,824,981 | | |
| Total Return Bond Fund | | | 240,482,246 | | | | 519,395 | | | | (2,013,553 | ) | | | (1,494,158 | ) | |
| High Yield Bond Fund | | | 41,554,189 | | | | 1,101,347 | | | | (523,369 | ) | | | 577,978 | | |
Julius Baer Funds 2005 Annual Report
135
NOTES TO FINANCIAL STATEMENTS (Continued)
5. Investments in Affiliated Issuers
An affiliated issuer, as defined under 1940 Act is one in which a Fund's holdings of an issuer represents 5% or more of the outstanding voting securities of the issuer. A summary of each Fund's investments in securities of these issuers for the year ended October 31, 2005, is set forth below:
Summary of Transactions with Affiliated Companies
Julius Baer International Equity Fund
| Affiliate | | Shares Held
October 31,
2005 | |
Purchases
(Cost) | |
Proceeds
Sales | |
Dividend
Income | | Market Value
October 31,
2005 | |
| Inter Cars | | | 613,971 | | | $ | 1,270,152 | | | $ | — | | | $ | 24,557 | | | $ | 4,598,154 | | |
| TOTALS | | | | | | $ | 1,270,152 | | | $ | — | | | $ | 24,557 | | | $ | 4,598,154 | | |
Thacher Proffitt & Wood are the legal counsel for the Funds and certain individuals of this firm serve as principal officers of the Funds. The following fees were paid by the Funds during the year ended 10/31/05:
| Fund | | Fees paid to
Thacher Proffitt
during the year ended
10/31/05 | |
| Global Equity Fund | | $ | 34,802 | | |
| International Equity Fund | | | 341,451 | | |
| International Equity Fund II | | | 290 | | |
| Total Return Bond Fund | | | 4,780 | | |
| High Yield Bond Fund | | | 1,976 | | |
6. Shares of Beneficial Interest
The Funds may issue an unlimited number of shares of beneficial interest of each Fund, with a par value of $.001 per share. Changes in outstanding shares of beneficial interest on the Global Equity Fund, the International Equity Fund, the International Equity Fund II, the Total Return Bond Fund and the High Yield Bond Fund were as follows:
| | | Year Ended
October 31, 2005 | | Year Ended
October 31, 2004 | |
| | | Shares | | Amount | | Shares | | Amount | |
| Global Equity Fund: | |
| Class A† | |
| Sold | | | 504,221 | | | $ | 14,982,802 | | | | 1,988,927 | | | $ | 5,162,223 | | |
| Issued as reinvestment of dividends | | | 595 | | | | 17,724 | | | | — | | | | — | | |
| Redeemed | | | (321,159 | ) | | | (9,572,684 | ) | | | (7,406,141 | ) | | | (18,827,878 | ) | |
| Net increase (decrease) | | | 183,657 | | | $ | 5,427,842 | | | | (5,417,214 | ) | | $ | (13,665,655 | ) | |
Julius Baer Funds 2005 Annual Report
136
NOTES TO FINANCIAL STATEMENTS (Continued)
| | | Year Ended
October 31, 2005 | | Year Ended
October 31, 2004 | |
| | | Shares | | Amount | | Shares | | Amount | |
| Class I†* | |
| Sold | | | 562,288 | | | $ | 16,623,735 | | | | — | | | $ | — | | |
| Issued as reinvestment of dividends | | | 108 | | | | 3,411 | | | | — | | | | — | | |
| Redeemed | | | (30,084 | ) | | | (884,078 | ) | | | — | | | | — | | |
| Net increase | | | 532,312 | | | $ | 15,743,068 | | | | — | | | $ | — | | |
| International Equity Fund: | |
| Class A | |
| Sold | | | 103,621,498 | | | $ | 3,301,554,085 | | | | 1,988,927 | | | $ | 5,162,223 | | |
| Issued as reinvestment of dividends | | | 4,473,703 | | | | 140,295,305 | | | | — | | | | — | | |
| Redeemed | | | (31,794,210 | ) | | | (1,026,587,778 | ) | | | (7,406,141 | ) | | | (18,827,878 | ) | |
| Net increase (decrease) | | | 76,300,991 | | | $ | 2,415,261,612 | | | | (5,417,214 | ) | | $ | (13,665,655 | ) | |
| Class I | |
| Sold | | | 119,507,433 | | | $ | 3,854,830,556 | | | | — | | | $ | — | | |
| Issued as reinvestment of dividends | | | 4,379,535 | | | | 139,663,385 | | | | — | | | | — | | |
| Redeemed | | | (19,229,479 | ) | | | (636,445,754 | ) | | | — | | | | — | | |
| Net increase | | | 104,657,489 | | | $ | 3,358,048,187 | | | | — | | | $ | — | | |
| International Equity Fund II: | |
| Class A** | |
| Sold | | | 12,611,282 | | | $ | 136,031,555 | | | | — | | | $ | — | | |
| Issued as reinvestment of dividends | | | — | | | | — | | | | — | | | | — | | |
| Redeemed | | | (960,837 | ) | | | (10,286,728 | ) | | | — | | | | — | | |
| Net increase | | | 11,650,445 | | | $ | 125,744,827 | | | | — | | | $ | — | | |
| Class I** | |
| Sold | | | 27,800,516 | | | $ | 302,232,671 | | | | — | | | $ | — | | |
| Issued as reinvestment of dividends | | | — | | | | — | | | | — | | | | — | | |
| Redeemed | | | (654,185 | ) | | | (7,148,213 | ) | | | — | | | | — | | |
| Net increase | | | 27,146,331 | | | $ | 295,084,458 | | | | — | | | $ | — | | |
| Total Return Bond Fund: | |
| Class A | |
| Sold | | | 2,168,655 | | | $ | 29,288,075 | | | | 953,045 | | | $ | 12,634,277 | | |
| Issued as reinvestment of dividends | | | 173,411 | | | | 2,338,413 | | | | 216,337 | | | | 2,854,008 | | |
| Redeemed | | | (1,624,188 | ) | | | (21,978,139 | ) | | | (1,523,290 | ) | | | (20,205,546 | ) | |
| Net increase (decrease) | | | 717,878 | | | $ | 9,648,349 | | | | (353,908 | ) | | $ | (4,717,261 | ) | |
| Class I | |
| Sold | | | 9,201,128 | | | $ | 124,690,812 | | | | 1,677,042 | | | $ | 22,165,219 | | |
| Issued as reinvestment of dividends | | | 258,094 | | | | 3,491,042 | | | | 51,336 | | | | 678,428 | | |
| Redeemed | | | (1,290,448 | ) | | | (17,419,639 | ) | | | (413,348 | ) | | | (5,549,155 | ) | |
| Net increase | | | 8,168,774 | | | $ | 110,762,215 | | | | 1,315,030 | | | $ | 17,294,492 | | |
Julius Baer Funds 2005 Annual Report
137
NOTES TO FINANCIAL STATEMENTS (Continued)
| | | Year Ended
October 31, 2005 | | Year Ended
October 31, 2004 | |
| | | Shares | | Amount | | Shares | | Amount | |
| High Yield Bond Fund: | |
| Class A | |
| Sold | | | 1,027,360 | | | $ | 12,481,178 | | | | 2,141,901 | | | $ | 25,429,644 | | |
| Issued as reinvestment of dividends | | | 184,133 | | | | 2,221,011 | | | | 131,481 | | | | 1,543,575 | | |
| Redeemed | | | (1,922,780 | ) | | | (23,353,353 | ) | | | (999,041 | ) | | | (11,789,689 | ) | |
| Net increase (decrease) | | | (711,287 | ) | | $ | (8,651,164 | ) | | | 1,274,341 | | | $ | 15,183,530 | | |
| Class I | |
| Sold | | | 243,650 | | | $ | 2,897,931 | | | | 2,970,016 | | | $ | 33,964,975 | | |
| Issued as reinvestment of dividends | | | 45,502 | | | | 535,898 | | | | 32,591 | | | | 382,217 | | |
| Redeemed | | | (3,436,553 | ) | | | (39,975,454 | ) | | | (1,035,636 | ) | | | (12,084,606 | ) | |
| Net increase (decrease) | | | (3,147,401 | ) | | $ | (36,541,625 | ) | | | 1,966,971 | | | $ | 22,262,586 | | |
† Share transactions were adjusted to reflect a 10 for 1 reverse split effective September 15, 2005.
* Commenced operations on March 14, 2005.
** Commenced operations on May 4, 2005.
The Funds assess a redemption fee of 2% for shares redeemed within 90 days of purchase. For the year ended October 31, 2005, the Global Equity Fund, the International Equity Fund, the International Equity Fund II, the Total Return Bond Fund and HighYield Bond Fund received redemption fees of $1,116, $711,284, $12,980, $5,764 and $2,836, respectively, which are disclosed in the statement of changes in net assets.
7. Foreign Securities
Investing in securities of foreign companies and foreign governments involves special risks and considerations not typically associated with investing in U.S. companies and the U.S. government. These risks include the loss of value in investments of foreign securities because of currency exchange rate fluctuations, price volatility that may exceed the volatility of U.S. securities, uncertain political conditions, lack of timely and reliable financial information and other factors. These risks are increased for investment in emerging markets. Emerging market securities involve unique risks, such as exposure to economies less diverse and mature than that of the U.S. or more established foreign markets. Economic or political instability may cause larger price changes in emerging market securities than other foreign securities. Moreover, securities of many foreign companies and foreign governments and their markets may be less liquid and their p rices more volatile than those of securities of comparable U.S. companies and the U.S. government.
Julius Baer Funds 2005 Annual Report
138
NOTES TO FINANCIAL STATEMENTS (Continued)
8. Federal Tax Information
The tax character of distributions paid for the year ended October 31, 2005 were as follows:
| | | Global
Equity
Fund | | International
Equity
Fund | | International
Equity
Fund II | | Total Return
Bond
Fund | | High
Yield Bond
Fund | |
| Ordinary Income | | $ | 26,244 | | | $ | 239,978,606 | | | $ | — | | | $ | 5,736,791 | | | $ | 5,121,653 | | |
| Long Term Capital Gains | | | — | | | | 72,653,819 | | | | — | | | | 687,783 | | | | 30,930 | | |
The tax character of distributions paid for the year ended October 31, 2004 were as follows:
| | | Total Return
Bond Fund | | International
Equity Fund | | High Yield
Bond Fund | |
| Ordinary Income | | $ | 3,192,805 | | | $ | 49,724,845 | | | $ | 5,379,480 | | |
| Long Term Capital Gains | | | 918,177 | | | | — | | | | 8,504 | | |
The Global Equity Fund did not have any distributions for the period ended October 31, 2004 and for the year ended March 31, 2004.
At October 31, 2005, the Global Equity Fund had $3,303,809, $92,632,637, $28,922,938 and $7,288,718 available as capital loss carryforwards which expire in 2008, 2009, 2010 and 2011, respectively.
As of October 31, 2005, the components of Distributable Earnings on a tax basis for the Global Equity Fund were as follows:
| Undistributed Ordinary Income | | $ | 230 | | |
| Unrealized Appreciation | | $ | 1,908,305 | | |
| Undistributed Long Term Capital Gains | | $ | 0 | | |
The difference between the components of Distributable Earnings on a tax basis and the amounts reflected in the statements of assets and liabilities of the Global Equity Fund are primarily due to mark-to-market of forwards.
As of October 31, 2005, the components of Distributable Earnings on a tax basis for the International Equity Fund were as follows:
| Undistributed Ordinary Income | | $ | 219,792,699 | | |
| Unrealized Appreciation | | $ | 2,364,937,310 | | |
| Undistributed Long Term Capital Gains | | $ | 497,357,234 | | |
The differences between components of Distributable Earnings on a tax basis and the amounts reflected in the statements of assets and liabilities of the International Equity Fund are primarily due to wash sales, mark-to-market of passive foreign investment companies, futures and forwards.
Julius Baer Funds 2005 Annual Report
139
NOTES TO FINANCIAL STATEMENTS (Continued)
At October 31, 2005, the International Equity Fund II had $585,104 available as capital loss carryforwards which expire in 2013.
As of October 31, 2005, the components of Distributable Earnings on a tax basis for the International Equity Fund II were as follows:
| Undistributed Ordinary Income | | $ | — | | |
| Unrealized Appreciation | | $ | 6,972,739 | | |
| Undistributed Long Term Capital Gains | | $ | — | | |
The differences between components of Distributable Earnings on a tax basis and the amounts reflected in the statements of assets and liabilities of the International Equity Fund II are primarily due to wash sales, mark-to-market of passive foreign investment companies, futures and forwards.
As of October 31, 2005, the components of Distributable Earnings on a tax basis for the Total Return Bond Fund were as follows:
| Undistributed Ordinary Income | | $ | 4,433,698 | | |
| Unrealized Depreciation | | $ | (1,658,182 | ) | |
| Undistributed Long Term Capital Gains | | $ | 1,489,761 | | |
The difference between the components of Distributable Earnings on a tax basis and the amounts reflected in the statements of assets and liabilities of the Total Return Bond Fund are primarily due to wash sales and forwards. In addition, short-term capital gains are considered ordinary income for income tax purposes.
As of October 31, 2005, the components of Distributable Earnings on a tax basis for the High Yield Bond Fund were as follows:
| Undistributed Ordinary Income | | $ | 2,047,593 | | |
| Unrealized Appreciation | | $ | 597,741 | | |
| Undistributed Long Term Capital Gains | | $ | 2,460,681 | | |
The differences between components of Distributable Earnings on a tax basis and the amounts reflected in the statements of assets and liabilities of the High Yield Bond Fund are primarily due to wash sales and forwards. In addition, short-term capital gains are considered ordinary income for income tax purposes.
9. Security Lending Agreement
The security lending income net of the loan rebate fee for the Global Equity Fund, the International Equity and the International Equity Fund II amounted to $1,799, $13,409,560 and $4,030, respectively, for the year ended October 31, 2005 and is included in interest income in the statement of operations. The Global Equity Fund and the International Equity Fund II started security lending on October 14, 2005.
Julius Baer Funds 2005 Annual Report
140
NOTES TO FINANCIAL STATEMENTS (Continued)
As of October 31, 2005 the value of the securities loaned and the value of the collateral amounted to approximately the following amounts:
| | | Market Value of
Securities Loaned | | Value of
Collateral | |
| Global Equity Fund | | $ | 1,652,383 | | | $ | 1,707,418 | | |
| International Equity Fund | | | 868,853,797 | | | | 912,301,578 | | |
| International Equity Fund II | | | 4,912,232 | | | | 5,075,393 | | |
10. Line of Credit
On March 21, 2005, the High Yield Bond Fund ( the "Borrower") entered into a Credit Agreement (the "Agreement") with Investors Bank & Trust Company (the "Bank"). The Agreement is a $10.0 million revolving credit facility to be utilized for temporary or emergency purposes to fund shareholder redemptions or for other short-term liquidity purposes. The Borrower will pay interest on the principal amount of the Loans outstanding at a floating rate per annum equal to the Federal Funds Rate plus 0.75%. In addition, the Borrower shall pay to the Bank an annual commitment fee, in connection with the establishment and maintenance of the Credit Facility, at the rate of 0.10% per annum on the difference between $10.0 million and the average daily amount of Loans outstanding. During the year ended October 31, 2005, there were not borrowings on this line of credit.
11.Financial Futures Contracts
The following financial futures contracts were outstanding on the Fund as of October 31, 2005:
| | | Expiration
Date | | Contracts | | Description | | Position | | Net Unrealized
Appreciation
(Depreciation) | |
| Global Equity Fund: | | 12/05 | | | 4 | | | DAX Index | | Long | | $ | (1,527 | ) | |
| | 12/05 | | | 5 | | | NIKKEI 225 Index | | Long | | | 32,987 | | |
| | 12/05 | | | 4 | | | TOPIX Index | | Long | | | 40,024 | | |
| | 12/05 | | | 15 | | | DJ EURO STOXX | | Long | | | (3,401 | ) | |
| | 12/05 | | | 3 | | | FTSE 100 Index | | Long | | | 4,750 | | |
| | | $ | 72,833 | | |
| | | Expiration
Date | | Contracts | | Description | | Position | | Net Unrealized
Appreciation
(Depreciation) | |
| International Equity Fund: | | 12/05 | | | 1663 | | | DAX Index | | Long | | $ | (634,867 | ) | |
| | 12/05 | | | 2382 | | | NIKKEI 225 Index | | Long | | | 15,715,177 | | |
| | 12/05 | | | 1447 | | | TOPIX Index | | Long | | | 16,570,715 | | |
| | 12/05 | | | 4574 | | | DJ Euro Stoxx | | Long | | | (1,037,177 | ) | |
| | 12/05 | | | 982 | | | FTSE 100 Index | | Long | | | 1,555,016 | | |
| | | | | $ | 32,168,864 | | |
Julius Baer Funds 2005 Annual Report
141
NOTES TO FINANCIAL STATEMENTS (Continued)
| | | Expiration
Date | | Contracts | | Description | | Position | | Net Unrealized
Appreciation
(Depreciation) | |
| International Equity Fund II: | | 12/05 | | | 232 | | | Euro 10 Index | | Long | | $ | 122,520 | | |
| | 12/05 | | | 138 | | | DAX Index | | Long | | | 35,595 | | |
| | 12/05 | | | 56 | | | NIKKEI 225 Index | | Long | | | 349,823 | | |
| | 12/05 | | | 14 | | | TOPIX Index | | Long | | | 671,116 | | |
| | 12/05 | | | 57 | | | DJ Euro STOXX | | Long | | | (16,099 | ) | |
| | 12/05 | | | 71 | | | FTSE 100 Index | | Long | | | 91,232 | | |
| | | | | $ | 1,254,187 | | |
12. Written Options
Activity in written options for the High Yield Bond Fund for the year ended October 31, 2005 was as follows:
| | | Premium | | Number of
Contracts | |
| Options outstanding at October 31, 2004 | | $ | — | | | | — | | |
| Options written | | | 78,956 | | | | 7,000,250 | | |
| Options closed | | | (78,956 | ) | | | (7,000,250 | ) | |
| Options outstanding at October 31, 2005 | | $ | — | | | | — | | |
13. Swaps
The International Equity Fund has entered into the following swap agreements:
A Relative Return Swap Agreement with UBS AG (London) whereby this Fund will receive the dividend yield based on the Nikkei 225 Index net of any relevant withholding tax. In exchange, this Fund will make semi-annual payments equal to 1.10% on the 1,961,000,000 JPY face value plus the repo spread (0.30% for the first reset period) on 1,800,000,000 JPY plus a spread of 0.25% on the same notional amount. The value of the contract, which terminates on September 17, 2008, is recorded as a receivable for open swap contracts of $9,374,550 at October 31, 2005.
A Relative Return Swap Agreement with UBS AG (London) whereby this Fund will receive the dividend yield based on the Nikkei 225 Index net of any relevant withholding tax. In exchange, this Fund will make semi-annual payments equal to 0.80% on the 1,958,000,000 JPY face value plus the repo spread (0.32% for the first reset period) on 1,800,000,000 JPY plus a spread of 0.25% on the same notional amount. The value of the contract, which terminates on June 17, 2008, is recorded as a receivable for open swap contracts of $8,104,572 at October 31, 2005.
Julius Baer Funds 2005 Annual Report
142
NOTES TO FINANCIAL STATEMENTS (Continued)
A Relative Return Swap Agreement with UBS AG (London) whereby this Fund will receive the dividend yield based on the TOPIX Index net of any relevant withholding tax. In exchange, this Fund will make semi-annual payments equal to 1.10% on the 1,961,000,000 JPY face value plus the repo spread (0.37% for the first reset period) on 1,800,000,000 JPY plus a spread of 0.25% on the same notional amount. The value of the contract, which terminates on September 17, 2008, is recorded as a receivable for open swap contracts of $11,012,174 at October 31, 2005.
A Relative Return Swap Agreement with UBS AG (London) whereby this Fund will receive the dividend yield based on the TOPIX Index net of any relevant withholding tax. In exchange, this Fund will make semi-annual payments equal to 0.80% on the 1,958,000,000 JPY face value plus the repo spread (0.32% for the first reset period) on 1,800,000,000 JPY plus a spread of 0.25% on the same notional amount. The value of the contract, which terminates on June 17, 2008, is recorded as a receivable for open swap contracts of $9,743,678 at October 31, 2005.
A Total Return Swap Agreement with ING Bank N.V. whereby this fund will receive the notional amount multiplied by the return on SC Impact Bucuresti, variable rate, 6 month Euribor + 6.5%, due 01/31/2009. In exchange, this Fund will pay the net coupon amounts on the notional amount converted into EUR at a specified FX rate. The value of the contract, which expires on March 1, 2009 is recorded as receivable for open swap contracts of $112,696 at October 31, 2005.
Additional Information (unaudited)
Investment Advisory Agreement
At a meeting held on December 8, 2004, the Board of the Trust approved the renewals of the Investment Advisory Agreements (each an "Agreement" and collectively, the "Agreements") with the Adviser for the Total Return Bond Fund, International Equity Fund and High Yield Bond Fund (each a "JBIF Fund" and collectively, the "JBIF Funds"). The Adviser also contractually agreed to reimburse certain expenses of the Total Return Bond Fund, commencing January 1, 2005 through February 28, 2006. The Board noted that the Advisor also had agreed previously to reimburse certain expenses of the High Yield Bond Fund through February 28, 2006.
At a meeting held on March 16, 2005, the Board of the Trust, approved the investment advisor agreement for the International Equity Fund II ("IEF II Agreement").
Julius Baer Funds 2005 Annual Report
143
NOTES TO FINANCIAL STATEMENTS (Continued)
The Advisor also contractually agreed to reimburse certain expenses of International Equity Fund II through February 28, 2006.
In determining whether to approve the approval of the IEF II Agreement and the renewals to the Agreements, the Board of the Trust, including all of the Trustees who are not interested persons under the 1940 Act, as amended (the "Independent Trustees"), reviewed and considered, among other items: (1) a guide from independent counsel setting forth the Board's fiduciary duties, responsibilities and the factors the Board should consider in its evaluation of the renewals of the Agreements; (2) comparative information, comparing each JBIF Fund's proposed advisory fees, expenses and returns to those of its relevant peer group; (3) the Adviser's complete Form ADV; (4) the Adviser's Financial Statements for December 31, 2004, 2003 and 2002; and (5) reports of and presentations by representatives of the adviser that described: (i) the nature, extent and quality of the Adviser's services provided to their respective JBIF Funds; (ii) the experience and qualifications of the personnel providing those services, (iii) their investment advice and performance; (iv) their assets under management and client descriptions; (v) their soft dollar commission and trade allocation policies, including information on the types of research and services obtained in connection with soft dollar commissions; (vi) the current and proposed advisory fee arrangements with the JBIF Funds and other similarly managed clients: (vii) compliance program information; (viii) the Adviser's financial information and profitability analysis related to providing service to the JBIF Funds; (ix) fees and other benefits; (x) methodologies to allocate securities among the JBIF Funds; (xi) outstanding lawsuits; (xii) breakpoints; and (xiii) the extent to which economies of scale are relevant to the JBIF Funds.
At a meeting held on March 16, 2005, the Board of Trustees of the Trust approved an amendment to the International Equity Fund's Agreement to include breakpoints reducing the investment advisory fees on the International Equity Fund's net assets over $7.5 Billion. In determining whether to amend the International Equity Fund's Agreement to include breakpoints, the Board, including all of the Independent Trustees, reviewed and considered the materials presented at the December 8, 2004 and a forecast for the fiscal year ended 2005. The Trustees discussed the written materials and the Adviser's presentations and deliberation on the renewal of the Agreements in light of this information. In the deliberations, the Trustees did not identify any single piece of information that was all important or controlling but gave significant weight to the relative investment performance of the JBIF Funds along with consideration of the other relevant factors.
Julius Baer Funds 2005 Annual Report
144
NOTES TO FINANCIAL STATEMENTS (Continued)
The Board including, all of the Independent Trustees of the Trust, reached conclusions, among others, regarding the Adviser and the respective renewals: the Adviser has the capabilities, resources and personnel necessary to manage the JBIF Funds; the Board is satisfied with the quality of service provided by the Adviser in advising the JBIF Funds; the proposed management/advisory fees for the JBIF Funds are reasonable as compared to the median and the average fees paid by comparable funds in their respective peer groups; the proposed total annual portfolio operating expenses to be paid by the JBIF Funds are reasonable as compared to the median and average expenses paid comparable funds in the respective peer group: the performance of the JBIF Funds are reasonable in comparison with their benchmark indices and other mutual funds in their peer groups; the expected profit of the Adviser for advisory services, based on the proposed fees, seems r easonable based on the data provided; and the benefits derived by the Adviser from managing the JBIF Funds, including how each uses soft dollars, the ways in which they conduct portfolio transactions and select brokers are reasonable.
Based upon the Board's deliberations and its evaluation of the information described above, the Trustees, including all of the Independent Trustees, determined that the terms of the renewals to the Agreements were fair to, and in the best interests of the JBIF Funds and their shareholders.
The Board of the Global Equity Fund is not scheduled to consider the approval of the renewal of its Investment Advisory Agreement with the Adviser until the March 2006 meeting of the Board.
Julius Baer Funds 2005 Annual Report
145
REPORT OF INDEPENDENT REGISTERED PUBLIC ACCOUNTING FIRM
To the Shareholders and Board of Directors
Julius Baer Global Equity Fund Inc.
To the Shareholders and Board of Trustees
Julius Baer Investment Funds
We have audited the accompanying statements of assets and liabilities of the Julius Baer Global Equity Fund Inc. and Julius Baer International Equity Fund, Julius Baer International Equity Fund II, Julius Baer Total Return Bond Fund and Julius Baer Global High Yield Bond Fund, each a series of Julius Baer Investment Funds, including the schedules of investments, as of October 31, 2005, and the related statements of operations for the year or period then ended, the statements of changes in net assets for each of the years or periods in the two-year period then ended and the financial highlights for each of the years or periods in the five-year period then ended. These financial statements and financial highlights are the responsibility of the Funds' management. Our responsibility is to express an opinion on these financial statements and financial highlights based on our audits.
We conducted our audits in accordance with the standards of the Public Company Accounting Oversight Board (United States). Those standards require that we plan and perform the audit to obtain reasonable assurance about whether the financial statements and financial highlights are free of material misstatement. An audit includes examining, on a test basis, evidence supporting the amounts and disclosures in the financial statements. Our procedures included confirmation of securities owned as of October 31, 2005, by correspondence with the custodian and brokers, or by other appropriate auditing procedures where replies from brokers were not received. An audit also includes assessing the accounting principles used and significant estimates made by management, as well as evaluating the overall financial statement presentation. We believe that our audits provide a reasonable basis for our opinion.
In our opinion, the financial statements and financial highlights referred to above present fairly, in all material respects, the financial position of the Julius Baer Global Equity Fund Inc., Julius Baer International Equity Fund, Julius Baer International Equity Fund II, Julius Baer Total Return Bond Fund and Julius Baer Global High Yield Bond Fund, as of October 31, 2005, the results of their operations, the changes in their net assets and financial highlights for each of the years or periods described above in conformity with accounting principles generally accepted in the United States of America.

Boston, Massachusetts
December 16, 2005
Julius Baer Funds 2005 Annual Report
146
ADDITIONAL INFORMATION PAGE
1. Proxy Voting Policies
A description of the Funds' proxy voting policies and procedures is available without charge, upon request, (1) on the Fund's website [www.us-funds.juliusbaer.com] and by calling the Funds at 1-800-387-6977 (2) on the SEC's (Securities and Exchange Commission) website [www.sec.gov].
Information regarding how the Fund voted proxies relating to portfolio securities during the most recent 12-month period ended June 30 is available via the methods noted above.
2. Quarterly Filing Requirements
Beginning July 2004, the Fund will be filing its complete schedule of investments with the Securities and Exchange Commission for the first and third quarter of each fiscal year on Form N-Q, which when filed, will be available on the Commission's web-site at www.sec.gov or on the Funds' website at www.us-funds.juliusbaer.com.
Julius Baer Funds 2005 Annual Report
147
STOCK HOLDER MEETING RESULTS
JULIUS BAER GLOBAL EQUITY FUND INC.
| Annual Meeting of Shareholders | |
|
The Fund held its annual meeting of Shareholders on July 25, 2005. 15,429,865.00 (94.808% of the record date common shares) were represented at the meeting. The matters below were voted by the Shareholders.
Proposal I: The election of Robert S. Matthews and Thomas J. Gibbons as Class II Directors of the Fund.
| Elected by All Shareholders | | Affirmative | | Withheld | |
| Robert S. Matthews | | | 15,382,826.507 | | | | 47,038.493 | | |
| Thomas J. Gibbons | | | 15,385,549.283 | | | | 44,315.717 | | |
Messrs. Gerard J.M. Vlak, Antoine Bernheim, Harvey B. Kaplan, Peter Wolfram and Michael K. Quain continue in office as directors.
Julius Baer Funds 2005 Annual Report
148
JULIUS BAER FUNDS as of October 31, 2005
| Julius Baer Funds (Unaudited) | |
|
| Disinterested Trustees of the Trust and Directors of Julius Baer Global Equity Fund Inc. (Global Equity Fund): | |
|
Name, Date of
Birth, and Address | | Position(s)
Held
with Fund | | Term of
Office and
Length of
Time
Served (1) | | Principal Occupation(s)
During the Past 5 Years | | Number of
Portfolios
in Fund
Complex
Overseen
by
Trustee/
Director* | | Other
Directorships
Held by
Trustee/
Director (2) | |
| Antoine Bernheim (May 30, 1953) 330 Madison Avenue, New York, NY 10017 | | Trustee and Director | | Trustee since 2004; Director since 1990 | | President, Dome Capital Management, Inc.; Chairman, Dome Securities Corp. | | | 5 | | | None | |
|
| Thomas Gibbons (June 1, 1947) 330 Madison Avenue, New York, NY 10017 | | Trustee and Director | | Trustee since 2004; Director since 1993 | | President, Cornerstone Associates Management (Consulting Firm) | | | 5 | | | None | |
|
| Harvey B. Kaplan, (Sept 22, 1937) 330 Madison Avenue, New York, NY 10017 | | Trustee and Director | | Trustee since 1995; Director since 1990 | | Controller (Chief Financial Officer), Easter Unlimited, Inc. (toy company). | | | 5 | | | None | |
|
| Robert S. Matthews, (October 16, 1947) 330 Madison Avenue, New York, NY 10017 | | Trustee and Director | | Trustee since 1992; Director since 2002 | | Partner, Matthews & Co. (certified public accountants). | | | 5 | | | None | |
|
| Gerard J.M. Vlak, (September 28, 1933) 330 Madison Avenue, New York, NY 10017 | | Trustee and Director | | Trustee since 1992; Director since 2004 | | Retired. | | | 5 | | | The Rouse Company (1996-present). | |
|
| Peter Wolfram, (April 2, 1953) 330 Madison Avenue, New York, NY 10017 | | Trustee and Director | | Trustee since 1992; Director since 2004 | | Partner, Kelley Drye & Warren (law firm). | | | 5 | | | None | |
|
Julius Baer Funds 2005 Annual Report
149
JULIUS BAER FUNDS as of October 31, 2005 (Continued)
| Julius Baer Funds (Unaudited) | |
|
| Interested Trustees: | |
|
Name, Date of
Birth, and Address | | Position(s)
Held
with Fund | | Term of
Office and
Length of
Time
Served | | Principal Occupation(s)
During the Past 5 Years | | Number of
Portfolios
in Fund
Complex
Overseen
by
Trustee* | | Other
Directorships
Held by
Trustee | |
| Glen Wisher(3) (October 10, 1963) 330 Madison Avenue, New York, NY 10017 | | Trustee | | Since 2005 | | CEO of Julius Baer Americas (since May 2004); Managing Director & Head of Institutional Asset Management Americas of Julius Baer Americas (October 2001-June 2004). Director of Fixed Income (London) (January 2001-October 2001; Senior Portfolio Manager (New York) (January 1999-December 2000). | | | 4 | | | None | |
|
* The Fund Complex, referred to in the charts above, is comprised of the four current series of the Trust and Global Equity Fund.
Principal Officers Who are Not Trustees:
The business address for each officer to the Trust, except Ms. Sanders, Ms. McFarlane Mr. McVoy, Mr. Howard and Mr. Majewski, is Julius Baer Investment Management LLC, 330 Madison Avenue, New York, New York, 10177. The business address for Ms. Sanders, and Ms. McFarlane is Investors Bank & Trust Company, 200 Clarendon Street, Boston, Massachusetts 02116. The business address for Mr. McVoy is US Bancorp Fund Services, LLC, 615 E. Michigan Street, Milwaukee, WI 53202. The business address for Mr. Howard and Mr. Majewski is Thatcher Proffitt and Wood, Two World Financial Center, New York, New York 10281.
Name, Age,
and Address | | Position(s)
Held
with Fund | | Term of Office
and Length of
Time Served (4) | | Principal Occupation(s)
During the Past 5 Years | |
| Anthony Williams, (March 15, 1964) | | President, Chief Executive Officer and Principal Executive Officer | | Since 2004 | | Chief Executive Officer of Julius Baer Investment Management LLC (formerly, Julius Baer Investment Management, Inc.) and Asset Management Americas (since 2004); Head of Asset Management Americas and Chief Operating Officer, Julius Baer Investment Management LLC (since 2003); Director and Head of Cross Border Strategies, JP Morgan Fleming Asset Management (1989-2002); Chief Operating Officer, JP Morgan Fleming Asset Management (1998-2001). | |
|
Julius Baer Funds 2005 Annual Report
150
JULIUS BAER FUNDS as of October 31, 2005 (Continued)
| Julius Baer Funds (Unaudited) | |
|
| Principal Officers Who are Not Trustees—(Continued): | |
|
Name, Age,
and Address | | Position(s)
Held
with Fund | | Term of Office
and Length of
Time Served (4) | | Principal Occupation(s)
During the Past 5 Years | |
| Denise Downey, (September 1, 1961) | | Vice President | | Since 2004 | | First Vice President, Director, Institutional Investments (2002 to present); First Vice President, Head of Product Development, Bank Julius Baer (2001-2002); Vice President, Deputy Chief Investment Officer, Bank Julius Baer (1995-2001); Vice President, Senior Portfolio Manager, Bankers Trust Company (1986-1995). | |
|
| Brett Gallagher (August 28, 1961) | | Vice President | | Since 1999 for the Trust; since 2004 for Global Equity Fund | | First Vice President and Deputy Chief Investment Officer of Julius Baer Investment Management LLC (formerly, Bank Julius Baer Investment Management LLC.) (1999-present). | |
|
| Greg Hopper, (March 24, 1957) | | Vice President of the Trust | | Since 2002 | | First Vice President of Julius Baer Investment Management LLC (formerly, Bank Julius Baer Investment Management LLC) (2002-present); Senior Vice President and High Yield Bond Portfolio Manager, Zurich Scudder Investments (2000-2002); High Yield Bond Portfolio Manager, Harris Investment Management (1999-2000). | |
|
| Richard C. Pell, (September 21, 1954) | | Vice President | | Since 1995 for Trust; since 2004 for Global Equity Fund | | Senior Vice President and Chief Investment Officer of Julius Baer Investment Management LLC (formerly, Bank Julius Baer & Co., Ltd., New York Branch ) (1995-present). | |
|
| Donald Quigley, (January 13, 1965) | | Vice President | | Since 2001 | | Vice President and Head of Global Fixed-Income Management for Julius Baer Investment Management LLC (2001-present); Fixed Income Trader for Chase Asset Management (1993-2001). | |
|
| Rudolph-Riad Younes, (September 25, 1961) | | Vice President | | Since 1997 for Trust; Since 2004 for Global Equity Fund | | Senior Vice President and Head of International Equity Management of Julius Baer Investment Management LLC (formerly, Bank Julius Baer & Co., Ltd., New York Branch ) (1993-present). | |
|
| Craig M. Giunta, (December 20, 1971) | | Secretary and Chief Financial Officer | | Since 2001 (Secretary) Since 2003 (Chief Financial Officer) | | Vice President, Julius Baer Investment Management LLC (2002-present); Assistant Vice President, Bank Julius Baer & Co., Ltd. New York Branch (2001-2002); Supervisor of Fund Accounting, Neuberger Berman LLC (1994-2001). | |
|
Julius Baer Funds 2005 Annual Report
151
JULIUS BAER FUNDS as of October 31, 2005 (Continued)
| Julius Baer Funds (Unaudited) | |
|
| Principal Officers Who are Not Trustees—(Continued): | |
|
Name, Age,
and Address | | Position(s)
Held
with Fund | | Term of Office
and Length of
Time Served (4) | | Principal Occupation(s)
During the Past 5 Years | |
| Alex Bogaenko (April 13, 1963) | | Treasurer | | Since 2005 | | Vice President, Julius Baer Investment Management LLC (2005-present); Manager of Accounting and Director of Portfolio Administration of Van Eck Global (1995-2005). | |
|
| Michael K. Quain (July 6, 1957) | | Chief Compliance Officer | | Since 2004 | | First Vice President of Julius Baer Investment Management LLC (since August 2002); First Vice President of Julius Baer Securities Inc. (1998-2002); First Vice President, Bank Julius Baer & Co., Ltd. New York Branch, (1998-2002); President and Chief Executive Officer of Julius Baer Global Equity Fund (formerly, The European Warrant Fund, Inc)(1997-2004); President and Chief Executive Officer of Julius Baer Investment Funds LLC (1998-2004). | |
|
| Michael McVoy (August 8, 1957) | | Anti-Money Laundering Officer | | Since 2004 | | Legal Counsel for U.S. Bancorp (formerly, Firstar Corp.) (1986-present); Senior Vice President and Risk Manager for U.S. Bancorp (1999-Present). | |
|
| Dorothy Sanders (May 18, 1955) | | Assistant Secretary | | Since 2005 | | Director, Mutual Fund Administration, Investors Bank & Trust Company (2004-present); Chief Legal Officer of Fred Algers (2000-2004). | |
|
| Steve R. Howard (January 16, 1953) | | Assistant Secretary | | Since 2005 (5) | | Partner, Thatcher Proffitt and Wood (2005-present); Partner, Paul, Weiss, Rifkind, Wharton & Garrison LLP (1998-2005). | |
|
| Thomas M. Majewski (February 22, 1963) | | Assistant Secretary | | Since 2005 (5) | | Counsel, Thatcher Proffitt and Wood (2005-present); Associate, Paul, Weiss, Rifkind, Wharton & Garrison LLP (1998-2005). | |
|
| Victoria McFarlane (October 2, 1966) | | Assistant Treasurer | | Since 2003 | | Director, Mutual Fund Administration, Investors Bank & Trust Company (2001-present); Manager/Assistant Vice President of Fund Treasury for MFS Investment Services (1997-2002). | |
|
(1) Each Trustee serves during the lifetime of the Trust until he or she dies, resigns, is declared bankrupt or incompetent, or is removed or, if sooner, until the next meeting of the Trust's shareholders and until the election and qualification of his or her successor. Each Director serves for a period of 3 years and until his successor is elected and qualified.
(2) Directorships include public companies and any company registered as an investment company.
(3) Mr. Wisher is an interested trustee because he is an employee of the Julius Baer Americas.
(4) Pursuant to the Trust's By-laws, officers of the Trust are elected by the Board of Trustees to hold such office until their successor is chosen and qualified, or until they resign or are removed from office. Each officer of the Global Equity Fund is elected for a term of 1 year until his or her successor is duly elected and qualified.
(5) Resigned effective November 11, 2005.
Julius Baer Funds 2005 Annual Report
152
SUPPLEMENTAL TAX INFORMATION (Unaudited)
The Global Equity Fund and International Equity Fund paid foreign taxes of $67,705 and $31,360,539 and earned $662,495 and $328,744,929 of foreign income during the year ended October 31, 2005. Pursuant to Section 853 of the Internal Revenue Code, $0.04147 and $.07131 per share were designated as foreign taxes paid for the Global Equity Fund and International Equity Fund and $0.40575 and $0.74750 per share were designated as income earned from foreign sources for the Global Equity Fund and International Equity Fund for the year ended October 31, 2005.
The Global Equity Fund and International Equity Fund designate $26,244 and $239,978,606 of distributions paid from investment company taxable income earned in 10/31/05, or the maximum amount allowable under the tax law, as Qualified Dividend Income in accordance with the Internal Revenue Code. Complete 2005 year end information will be reported to you on your 2005 Form 1099-DIV, which shall be provided to you in early 2006
For corporate shareholders, a portion of the ordinary dividends paid during the Funds' year ended October 31, 2005 qualified dividends received deductions for the Global Equity Fund was 100%.
Pursuant to Sector 852 of the Internal Revenue Code, the Funds designated the following capital gain dividends for the year ended October 31, 2005:
| | | Long Term
Capital Gain
Dividend | |
| International Equity Fund | | | 72,653,819 | | |
| Total Return Bond Fund | | | 687,783 | | |
| High Yield Bond Fund | | | 30,930 | | |
Julius Baer Funds 2005 Annual Report
153
Item 2. Code of Ethics.
As of October 31, 2005, the Registrant has adopted a code of ethics that applies to the Registrant’s President/Chief Executive Officer and Treasurer/Chief Financial Officer. During the year ended October 31, 2005, the Registrant amended its code of ethics in response to new Securities and Exchange Commission Final Rule IA-2256, dated 07/22/04, requiring registered advisers to adopt codes of ethics setting forth standards of conduct expected of advisory personnel and addressing conflicts that arise from personal trading by advisory personnel. During the year ended October 31, 2005, the Registrant did not grant any waivers from a provision of the code of ethics. A copy of its code of ethics is filed with this Form N-CSR under Item 11(a)(1).
Item 3. Audit Committee Financial Expert.
The Registrant’s Board of Directors has determined that the Registrant has one audit committee financial expert serving on its audit committee. The audit committee financial expert serving on the Registrant’s audit committee is Mr. Harvey B. Kaplan, who is an independent director.
Item 4. Principal Accountant Fees and Services.
(a) AUDIT FEES: The aggregate fees billed for professional services rendered by its principal accountants, KPMG LLP, for the audit of the Registrant’s annual financial statements for the year ended October 31, 2005, for the year ended March 31, 2004 and for the seven months October 31, 2004 were $32,500, $30,000 and $30,000 respectively. Effective July 1, 2004, the Fund changed its fiscal end from March 31 to October 31.
(b) AUDIT RELATED FEES: No such fees were billed to the Registrant by KPMG LLP for the year ended October 31, 2005, for the year ended March 31, 2004 and for the seven months October 31, 2004. Effective July 1, 2004, the Fund changed its fiscal end from March 31 to October 31.
(c) TAX FEES: The aggregate fees billed for professional services rendered by KPMG LLP for the review of Form 1120-RIC, Form 8613, and review of excise tax distribution for the year ended October 31, 2005, for the year ended March 31, 2004 and for the seven months October 31, 2004 were $7,500, $4,500 and $4,500, respectively. Effective July 1, 2004, the Fund changed its fiscal end from March 31 to October 31
(d) ALL OTHER FEES: : No such fees were billed to the Registrant by KPMG for the year ended October 31, 2005, for the year ended March 31, 2004 and for the seven months October 31, 2004. Effective July 1, 2004, the Fund changed its fiscal end from March 31 to October 31.
(e) (1)The Registrant’s audit committee pre-approves all audit and non-audit services to be performed by the Registrant’s accountant before the accountant is engaged by the Registrant to perform such services.
(e) (2)The percentage of services described in each of paragraphs (b) through (d) of this Item that were approved by the audit committee pursuant to paragraph (c)(7)(i)(C) of Rule 2-01 of Regulation S-X are as follows:
(b) Not applicable
(c) 100%
(d) Not applicable
(f) Not Applicable.
(g) The aggregate non-audit fees billed by KPMG to the Trust for the fiscal years ending October 31, 2005, for the year ended March 31, 2004 and for the seven months October 31, 2004 were $7,500, $4,500 and $4,500, respectively. The aggregate non-audit fees billed by KPMG to the Trust, the Adviser and all entities controlling, controlled by, or under common control with the Adviser that provide services to the Trust for the fiscal years ended October 31, 2005 and October 31, 2004 were $71,000 and $54,500, respectively.
(h) Not applicable.
Items 5. Audit Committee of Listed Registrants
Not applicable to this filing.
Item 6. Schedule of Investments
Not applicable to this filing.
Item 7. Disclosure of Proxy Voting Policies and Procedures for Closed-End Management Investment Companies.
Not applicable to this filing.
Item 8. Portfolio Managers of Closed-End Management Investment Companies
Not applicable to this filing.
Items 9. Purchase of Equity Securities by Closed-End Management Investment Company and Affiliated Purchasers.
Not applicable to this filing
Items 10. Submission of Matters to a Vote of Security Holders.
There have been no material changes to the procedures by which the shareholders may recommend nominees to the Registrant’s Board of Directors, where those changes were implemented after the Registrant last provided disclosure in response to the requirements of Item 7(d)(2)(ii)(G) of Schedule 14A (17 CFR 240.14a-101), or this Item.
Item 11. Controls and Procedures.
(a) The Registrant’s Principal Executive Officer and Principal Financial Officer concluded that the Registrant’s disclosure controls and procedures (as defined in Rule 30a-3(c) under the Investment Company Act of 1940) were effective as of a date within 90 days prior to the filing date of this report (the “Evaluation Date”), based on their evaluation of the effectiveness of the Registrant’s disclosure controls and procedures as of the Evaluation Date.
(b) There were no changes in the Registrant’s internal control over financial reporting (as defined in Rule 30a-3(d) under the 1940 Act (17 CFR 270.30a-3(d)) that occurred during the Registrant’s last fiscal half-year (the Registrant’s second fiscal half-year in the case of an annual report) that has materially affected, or is reasonably likely to materially affect, the Registrant’s internal control over financial reporting.
Item 12. Exhibits.
(a)(1) Code of Ethics is attached.
(a)(2) Separate certifications for the Registrant’s of Principal Executive Officer and Principal Financial Officer, as required by Rule 30a-2(a) under the Investment Company Act of 1940 (17 CFR 270.30a-2(a)) are attached hereto as Exhibit 99CERT.
(b) Certifications for the Registrant’s Principal Executive Officer and Principal Financial Officer, as required by Rule 30a-2(b), under the Investment Company Act of 1940 are attached here to as Exhibit 99.906CERT. These certifications are being furnished to the Securities and Exchange Commission solely pursuant to 18 U.S.C. section 1350 and are not being filed as part of the Form N-CSR with the Commission.
SIGNATURES
Pursuant to the requirements of the Securities Exchange Act of 1934 and the Investment Company Act of 1940, the registrant has duly caused this report to be signed on its behalf by the undersigned, thereunto duly authorized.
(Registrant) | Julius Baer Global Equity Fund Inc. |
| |
By (Signature and Title) | /s/ Tony Williams |
| Tony Williams President (Principal Executive Officer) |
| |
Date | 01/06/06 | |
| | | | | |
Pursuant to the requirements of the Securities Exchange Act of 1934 and the Investment Company Act of 1940, this report has been signed below by the following persons on behalf of the registrant and in the capacities and on the dates indicated.
By (Signature and Title) | /s/ Craig Giunta |
| Craig Giunta Chief Financial Officer (Principal Financial Officer) |
| |
Date | 01/06/06 | |
| |
By (Signature and Title) | /s/ Tony Williams |
| Tony Williams President (Principal Executive Officer) |
Date | 01/06/06 | |
| | | | | | |