UNITED STATES
SECURITIES AND EXCHANGE COMMISSION
Washington, D.C. 20549
FORM N-CSR
CERTIFIED SHAREHOLDER REPORT OF REGISTERED
MANAGEMENT INVESTMENT COMPANIES
Investment Company Act file number | 811-06017 |
|
Julius Baer Global Equity Fund Inc. |
(Exact name of registrant as specified in charter) |
|
330 Madison Avenue, New York, NY | | 10017 |
(Address of principal executive offices) | | (Zip code) |
|
Tony Williams
330 Madison Avenue, New York, NY 10017 |
(Name and address of agent for service) |
|
Registrant’s telephone number, including area code: | 212-297-3600 | |
|
Date of fiscal year end: | 10/31 | |
|
Date of reporting period: | 10/31/07 | |
| | | | | | | | |
Item 1. Reports to Stockholders.
The annual report is attached.

Annual Report
Julius Baer Funds
Julius Baer Global Equity Fund Inc.
Julius Baer International Equity Fund
Julius Baer International Equity Fund II
Julius Baer Total Return Bond Fund
Julius Baer Global High Income Fund
Julius Baer U.S. Microcap Fund
Julius Baer U.S. Smallcap Fund
Julius Baer U.S. Midcap Fund
Julius Baer U.S. Multicap Fund
October 31, 2007
SHAREHOLDERS LETTER October 31, 2007
December 7, 2007
Dear Shareholder
I am pleased to present the Annual Report for the Julius Baer Funds (the "Funds") for the fiscal year ending October 31, 2007 (the "Reporting Period").
While the Reporting Period ended with many major world indices advancing significantly, financial markets faced several major hurdles. The most notable was the subprime mortgage crisis. For the last several years, economists warned that the "housing bubble" was due to burst. Despite these admonishments, homeowners qualified for loans which they ordinarily would not have been granted and in turn, refinanced their properties to fuel further consumer spending. When housing prices began to tumble, many homeowners could not meet the necessary payments. The sharp rise in foreclosures led to a chain reaction of corporate write-offs and bankruptcies. Not surprisingly, the major lending institutions' stock prices were severely punished. As investors attempted to reassess their risk exposure, the fixed income, equity and derivative markets became increasingly volatile.
Fortunately, the Funds did not have any material exposure to subprime investments and weathered the market meltdown. During the Reporting Period, most of our Funds had solid performance results (see each fund's commentary) and all experienced positive cash flows. Investors continued to be attracted to our International Equity Strategy, with strong growth in the Julius Baer International Equity Fund II ("International Equity Fund II") over the Reporting Period. Additionally, our fixed income products gained more traction. The Julius Baer Global High Income Fund ("Global High Income Fund") will soon reach its 5-year track record. For the twelve month period ending October 31, 2007, the Global High Income Fund Class A shares again received a 5-star overall rating from Morningstar out of 454 US domiciled high yield bond funds. The Julius Baer International Equity Fund Class A shares ("International Equity Fund") and Julius Baer Total Return Bond Fund Class A shares ("Total Return Bond Fund") were also rated with a 5-star overall from Morningstar for the same period, out of 571 funds in the foreign large blend funds and 972 funds in the intermediate-term bond funds, respectively. The Morningstar Overall RatingTM for a fund is derived from a weighted average of the performance figures associated with its three-, five- and ten-year (if applicable) Morningstar Ratings metrics, which are based on risk-adjusted performance. Such visibility combined with solid performance helped each fund increase assets significantly over the Reporting Period.
The Funds continue to expand their distribution capacities. In the past, they were available through packaged product platforms such as broker-dealer wrap fee
Julius Baer Funds 2007 Annual Report
1
programs and research models, primarily limiting them to the fee-based financial advisors that use these products. Effective November 1, 2007, we launched a Consultant share class for our global, US equity, and fixed income funds with a higher 12b-1 fee to provide a mechanism for commission-based advisors to create their own asset allocation program for more sophisticated clients. To accommodate some of the small to midsize retirement plans, we also launched an R-share class for the Julius Baer Global Equity Fund Inc. ("Global Equity Fund") and Total Return Bond Fund. The higher 12b-1 fee on this share class is used by plan sponsors to cover administration costs. With the passage of the Pension Protection Act of 2006, there is a significant opportunity to garner assets in the growing defined contribution marketplace. Corporations continue to freeze and close their defined benefit plans, offering employees a 401(k) plan. The provision also al lows employers to automatically enroll their employees and thus dramatically boost plan participation.
Our fund managers reacted to the changing investment landscape by positioning our Funds to be able to invest in both new products and new markets. For example, the Global High Income Fund began investing in bank loans late last year. Over the last several years, the bank loan market has evolved considerably. Bank loans are the most senior element of a firm's capital structure typically secured by the assets of the issuing firm. The use of loans was primarily a defensive tactic that seeks to protect the fund from bankruptcies in a down market; however, the loan market also gives us the ability to gain credit exposure to companies that do not have high yield bonds outstanding. As of the end of the Reporting Period, these instruments represented 19.1% of the Global High Income Fund's net assets.
As I stated in my letter last year, the International Equity Fund, International Equity Fund II and Global Equity Fund increased their potential exposure to emerging markets to 35%. Consequently, we changed each Fund's benchmark to make it more representative of the underlying holdings. The International Equity Fund and the International Equity Fund II now benchmark to MSCI (Morgan Stanley Capital International) ACWI (All Country World Index) ex-US and the Global Equity Fund benchmarks to MSCI ACWI.
In conclusion, I'd like to express our appreciation to you as shareholders for your continued support during these changing times and to wish you and your family a happy and healthy holiday season.
Sincerely,

Tony Williams
President
Julius Baer Funds 2007 Annual Report
2
This material is provided for informational purposes only and does not in any sense constitute a solicitation or offer of the purchase or sale of securities unless preceded or accompanied by a prospectus.
The Julius Baer International Equity Fund Class A shares received 5 stars among 571 foreign large blend funds for the three-year period, 5 stars among 470 funds for the five-year period, 5 stars among 225 funds for the ten-year period and 5 stars among 571 funds for the overall period.
The Julius Baer Total Return Bond Fund Class A shares received 5 stars among 972 intermediate-term bond funds for the three-year period, 5 stars among 828 funds for the five-year period, 4 stars among 409 funds for the ten-year period, and 5 stars among 972 funds for the overall period.
The Julius Baer Global High Income Fund Class A shares received 5 stars among 454 U.S.-domiciled high yield bond funds for the three-year period and 5 stars among 454 U.S.-domiciled high yield bond funds for the overall period.
For each fund with at least a three-year history, Morningstar calculates a Morningstar RatingTM (based on a Morningstar Risk-Adjusted Return measure that accounts for variation in a fund's monthly performance, including the effects of sales charges, loads, and redemption fees), placing more emphasis on downward variations and rewarding consistent performance. The top 10% of funds in each category receive 5 stars, the next 22.5% receive 4 stars, the next 35% receive 3 stars, the next 22.5% receive 2 stars, and the bottom 10% receive 1 star. (Each share class is counted as a fraction of one fund within this scale and rated separately, which may cause slight variations in the distribution percentages.)
© 2007 Morningstar, Inc. All Rights Reserved. The information contained herein: (1) is proprietary to Morningstar; (2) may not be copied or distributed; and (3) is not warranted to be accurate, complete or timely. Neither Morningstar nor its content providers are responsible for any damages or losses arising from any use of this information. Past performance is no guarantee of future results.
Mutual funding investing involves risk; principle loss is possible.
Distributor: Quasar Distributors, LLC (12/07)
Julius Baer Funds 2007 Annual Report
3
MANAGEMENT'S COMMENTARY
JULIUS BAER GLOBAL EQUITY FUND INC.
2007 Annual Report
On many levels, the fiscal year 2007 was one of extremes. Commodities, led by oil, gold and grain saw some of their largest gains in years, supported by China's continued demand (and no foreseeable cessation) for raw materials. The euro surged against the US dollar and investors flocked to US Treasury issues amid subprime concerns.
Extremes were also apparent across global equities with emerging markets far outpacing returns for developed markets. Asia, led by China, outperformed all other regions and in Latin America, Brazil was notably strong given its commodity orientation. Finally, of the larger developed markets, Japan and the United States underperformed.
During this twelve month period ending October 31, 2007, the Julius Baer Global Equity Fund Inc. Class A Shares returned 23.02%, versus 24.19% for the MSCI All Country World Index. Effective March 1, 2007, the MSCI All Country World Index replaced the MSCI World Index as the Fund's benchmark. This change coincided with our ability to invest up to 35% of the portfolio in emerging markets.
From a geographic perspective, the Fund benefited from an underweight position to Japanese and US equities. Within Japan, lack of reforms, poor corporate governance and extended valuations leave little incentive to increase exposure. With regard to our stance in the US, we prefer opportunities within Continental Europe and those emerging markets we believe offer more compelling growth potential.
Our underweight to Asia, specifically South Korea, China and Hong Kong detracted from results as did our underweight to commodity-oriented countries such as Canada and Brazil. For some time, we have referred to the global imbalances, including current account and fiscal deficits, which exist today. Overconsumption within Anglo-Saxon countries, mainly the US, was one of the major imbalance concerns and subprime worries provided the global economy's first real stress-test. As these Anglo-Saxon imbalances began to unfold, Asian markets were the primary beneficiaries.
Our positioning in Central and Eastern Europe, including Russia, benefited returns. Economic growth within the region has been driven more by domestic demand than US consumption growth, providing diversification benefits. Our overweight to India also had a positive impact. While economic growth there was equally impressive as China, India offers an industry mix more focused on services than manufacturing, which we believe leaves the country less susceptible to a global slowdown.
Julius Baer Funds 2007 Annual Report
4
Financial services had a positive effect on performance. Several positions held in emerging market banks were particularly strong, including PKO Bank Polski and Bank Polska Kasa Opieki (Poland), Komercni Banka (Czech Republic), State Bank of India warrants and OTP Bank (Hungary). Our decision to underweight major banks in the United States, the United Kingdom and to a lesser degree Japan proved beneficial given fears of the impact of the subprime debacle. This positioning more than made up for poor performance from E*Trade Financial Group (United States) which was caught up in write-downs related to its mortgage-backed securities. Our defensive allocation to cash equivalents during a strong equity environment detracted. Within the energy sector, our underweight in China had a negative effect as did stock selection in Russia and Romania.
Stock selection was positive in the US healthcare sector. We have been particularly interested in companies benefiting from demographic shifts or capitalizing on baby boomers entering retirement age who want to maintain their active lifestyle. Companies involved in orthopedics is one way to tap into this trend; demand for knee and hip replacements, spinal surgeries and other procedures has been growing. ArthroCare Corp., whose medical devices are used to perform closed joint and cosmetic surgeries, was a positive contributor to results. Additionally, Medco Health Solutions Inc., the country's largest prescription benefits manager, was also a strong performer. These positions offset the underperformance of C.R. Bard Inc., the maker of hernia mesh and heart stents.
Weak performance from NII Holdings Inc. (United States), a vendor of mobile-phone service throughout Latin America, led returns from the telecommunications sector to detract. On a positive note, stock selection as well as our overweight to industrials supported performance. Shares of Stericycle Inc. (United States) which provides regulated medical waste management services had solid results. Additionally as part of our interest in transportation infrastructure, Beijing Capital International Airport Co. Ltd. (China) performed well. Finally, our overweight to and stock selection within consumer discretionary stocks detracted. Specifically, shares of Cheesecake Factory and Nordstrom (United States) as well as Melco PBL Entertainment (Macau) Ltd. ADR exhibited negative performance.
Looking ahead, we continue to find compelling opportunities across emerging markets. Specifically, Central and Eastern Europe including Russia remain an important component of the strategy. In addition, we established positions in South Korea and Taiwan which have become more like developed markets, although they are classified as emerging by MSCI.
Strong demand drove commodity-oriented markets such as Brazil, South Africa, Canada and Australia and during the period we increased our exposure. The UK is also underrepresented, especially given our avoidance to the UK banking sector. We still find transportation infrastructure companies, such as airports, compelling
Julius Baer Funds 2007 Annual Report
5
businesses with attractive franchises (restaurants, duty free shops, etc.) amid an increase in global travel and trade. Construction and cement companies are also well positioned given the increase in infrastructure projects. Luxury goods and spirits companies are expected to continue benefiting from emerging market consumer demand.
As we move into the next fiscal year, we remain focused on uncovering opportunities worldwide and managing the unique risks presented by the global equity markets on behalf of our valued shareholders.

Richard Pell
Chief Investment Officer
Past performance does not guarantee future results.
Investing internationally involves additional risks, such as currency fluctuations, social and economic instability, differing securities regulations and accounting standards, limited public information, possible changes in taxation, and periods of illiquidity.
The views expressed solely reflect those of Julius Baer Investment Management LLC ("JBIM") and the managers of the fund, and do not necessarily reflect the views of any affiliated companies. The material contains forward-looking statements regarding the intent, beliefs, or current expectations. Readers are cautioned that such forward-looking statements are not a guarantee of future performance, involve risks and uncertainties, and actual results may differ materially from those statements as a result of various factors. The views expressed are subject to change based on market and other conditions. Furthermore, the opinions expressed do not constitute investment advice or recommendation by the managers, JBIM, the fund, or any affiliated company.
The Morgan Stanley Capital International (MSCI) All Country World Index (ACWI) is a free float adjusted market capitalization index that is designed to measure equity market performance in the global developed and emerging markets.
The MSCI World Index is a market capitalization weighted index composed of companies representative of the market structure of developed market countries in the Americas, Europe/Middle East, and Asia/Pacific Regions.
It is not possible to invest directly in an index.
Please see the Schedule of Investments in this report for complete fund holdings. Fund holdings and/or sector weightings are subject to change at any time and are not recommendations to buy or sell any security mentioned.
Julius Baer Funds 2007 Annual Report
6
MANAGEMENT'S COMMENTARY
JULIUS BAER INTERNATIONAL EQUITY FUND
JULIUS BAER INTERNATIONAL EQUITY FUND II
2007 Annual Report
In the middle of this fiscal year, we made a decision to change our benchmark from MSCI (Morgan Stanley Capital International) EAFE (Europe, Australasia, Far East) Index to MSCI ACWI (All Country World Index) (ex-US). Although the difference in the ten-year performance between the two indices is less than 1%, we felt the difference in geographical composition would start to become relevant and the performance would start to diverge in a pronounced manner. The rationale for our move is that MSCI ACWI (ex-US) has substantial exposure to emerging markets (about 18%) and Canada (about 6%) while MSCI EAFE has no exposure to these markets. We believe that these geographic areas can greatly benefit from current US trade policies and the trend in globalization.
Since our benchmark transitioned mid-year, for this report, we will compare our performance to both indices.
The Julius Baer International Equity Fund (Class A Shares) and Julius Baer International Equity Fund II (Class A Shares) had another strong year, up 33.33% and 30.89% respectively for the one year period ending October 31, 2007. During the same period MSCI EAFE gained 24.91%, MSCI ACWI (ex-US) rose 32.43%.
The current subprime debacle seems another pyrrhic victory for sanity in this age of decadence. It is pyrrhic because, like the tech bubble, it lasted longer than a skeptic could remain sane or solvent; decadence because greed apparently continues to blind many of the essential economic agents in our society.
For several years, we have warned about global imbalances driven mainly by excessive US consumption and Asian over-investment. The Anglo Saxons' voracious appetite to consume and their addiction to spend and borrow against asset prices has disproportionately benefited Asia through increased trade and other countries and regions such as Canada, Australia, Brazil, Russia, Africa, and the Middle East from the resulting increase in commodity prices. China has been winning on two fronts: record trade surplus and strong foreign direct investment. These two engines have caused investment in China to grow at an alarming rate (almost 50% of GDP), planting the seeds for a potential investment bubble whose dimension can only be scaled once the global economy slows down or the Anglo Saxons wake up from their malaise and start mending their errant ways of borrow and spend.
Julius Baer Funds 2007 Annual Report
7
While the first shoe of the global imbalance was being dropped, the second one was feverishly bid up by the decoupling and reflation crowd. On one hand we were rewarded for being underweight domestic Anglo Saxon sectors such as UK retailers and banks. On the other hand, we were punished for being underweight the beneficiaries of that boom: Canadian and Australian currencies dramatically shot up in a very short period; many Asian markets, including Hong Kong, rallied more than 40% between mid-August and the end of October. During that time, the rallying cry was that China's growth would not be impeded by the US slowdown. In addition, the Hong Kong market was overwrought on the prospect of a newly suggested law that may allow Chinese mainlanders to invest in Hong Kong.
In response, a precautionary move, we selectively increased our exposure to Canada, Australia, Hong Kong, South Korea, and Taiwan. This move did not mean we were advocating that Asian economies could decouple. However, in the short-term, given the huge foreign reserves these countries possess and China's continued spending for the summer 2008 Olympics, we acknowledge the region's capability to engineer a delayed coupling, one that could last long enough to make 2007 and even 2008 pyrrhic years for disbelievers.
In Europe, the decoupling theme also dominated. Sectors and companies with high exposure to Asia were strong and resilient. Those with US or even domestic exposure fared poorly. Given our aversion to global trade we did not benefit from that rally.
It was disheartening to witness many European financial companies prove once again that they are the dumping ground for America's toxic waste. While the insurers were caught during the tech bubble (holding debt from the likes of Enron and WorldCom), this time around it was the banks that seemed to rapaciously amass large sums of subprime collateralized debt obligations (CDOs), both on- and off-balance sheet. French and German banks—that we favored for their domestic exposure—negated that advantage by making investments that were not core to their activities. By doing so, they exposed us to an area we sought to avoid, depriving us of what we believed to be a safe-haven status.
In the aftermath of the subprime crisis, Asia became the darling of the hot money looking for a new home. The region's attractiveness seemed to be the positive short-term visibility it provides: record trade surpluses and the potential decoupling from a US slowdown driven by high spending on infrastructure and uninterrupted demand from China. There are also those who expect the recent interest rate cuts in the US to ignite asset reflation in the region. Finally, additional currency gains are possible as pressure for currency revaluation mounts from the US and Europe.
Three major factors contributed to Western Europe's poor performance during the crisis. First, a strong euro hindered the competitiveness and the margins of the export sector. With Asian central banks staunchly defending their currencies from
Julius Baer Funds 2007 Annual Report
8
significant appreciation, the only voting booth open for those who dislike the US dollar is the "euro booth". Second, as mentioned above, many European financial companies were caught in the US subprime mess. Finally, many investors sold European positions to fund their increasing exposure to Asia.
Latin America, Africa, and the Middle East continued to prosper as prices of commodities and oil stayed on an upward trajectory. In addition, trade surpluses, record foreign reserves, and hot money flows put upward pressure on many currencies in these regions.
For similar reasons, the Australian and Canadian dollars staged a rally against the US dollar. Surprisingly, they appreciated approximately 20% against the US dollar this fiscal year. What was also unusual was the drubbing that the US dollar received against third world currencies.
Our underweight in Japan was a positive contributor to performance. During the year, the country's domestic sectors such as banks and consumer related stocks underperformed the exporters, particularly those with significant exposure to Asia and China.
In most global markets, post the subprime crisis, the rally was narrowly focused on Asian decoupling and commodities, while the sell-off centered on the financial sector and the US dollar versus most currencies.
Again this year, actions by corporations, private equity funds, and sovereign wealth funds continued to drive prices of many stocks and sectors: ports, airports and stock exchanges continued to experience interest and bidding from a wide spectrum of investors due to the monopolistic nature of these businesses. Euronext was acquired by the New York Stock Exchange (NYSE) and OMX, the Swedish stock exchange, is scheduled to be taken over by a consortium led by NASDAQ and Bourse Dubai. The consolidation in the Italian banking sector continued as UniCredito Italiano acquired Capitalia and Banca Intesa Sanpaolo bid for Banca Carifirenze. With the recent approach of BHP Billiton to acquire Rio Tinto, the consolidation in the mining sector began to worry the Chinese government. Such a consolidation could mean pricing power for the mines and higher prices for the commodity hungry Chinese economy.
At the company level, we continue to focus on companies that we believe are: exhibiting strong leadership in a growing sector such as FLSmidth, a Danish company that is a global leader in cement plants and a consolidator in the mineral equipment space; undertaking a genuine restructuring such as Siemens in Germany; following a credible growth and expansion strategy such as OTP Bank (Hungary); or a conservative and consistent management sticking to their competence and competitive advantage such as Banca Credem in Italy.
Julius Baer Funds 2007 Annual Report
9
We continue to favor industries that are monopolistic or oligopolistic in nature such as airports, seaports and stock exchanges. We also prefer industries leveraged to infrastructure spending such as mining and cement and are attracted to the positive dynamic in the agriculture industry with exposure to producers of agriculture chemicals such Potash Corp. of Saskatchewan in Canada. In addition, we like the Indian banking sector due to its low relative valuations and high growth opportunities. Russia is expected to be our favorite country next year as it has lagged many emerging markets despite the cheap valuation and the $90 per barrel oil environment.
At the regional level, we feel strongly about Central and Eastern Europe based on our belief that it offers the best risk and reward tradeoff. We believe that if there is a genuine decoupling investment immune to the expected global imbalance adjustment, it is Central and Eastern Europe, whose fortune is mainly driven by its integration into the European Union. However, the region is currently confronted by its own imbalances. Strong, appreciating currencies accompanied by new money flow ignited consumption for imported goods, spiked inflation and eroded competitiveness. In particular, Romania and the three Baltic states need to rein in inflation and trade imbalances. An adjustment is needed and welcome. Although the current imbalances prevented the region from being what we consider a safe-haven this time, we expect it to be resilient when the second shoe of the global imbalance drops, especially if today's local excesses are largely addres sed.
Looking at the big picture, we believe that the process of correcting the imbalances has begun. As a result, we believe that both the Anglo Saxons and the Asian economies will share the pain of adjustment. Hence, unlike consensus thinking, we remain cautious on China and Asia. The most crucial issue is to understand how this global imbalance will end. We coined this period of imbalance the "Age of Decadence", and now make an attempt to share our thoughts and beliefs about its origin, its unfolding, and its implication on investment.
The Age of Decadence
Alan Greenspan, former chairman of the US Federal Reserve Bank (the "Fed"), predicted in a recently authored book that we are about to enter a new world: "The Age of Turbulence". That might very well be true. To survive and succeed in such a world it helps to understand the world we are about to exit. Upon reflection it doesn't take long to realize that we were living for more than two decades in the Age of Decadence. This decadence was so prevalent that everyone from the government down to the regular citizen was an accomplice.
During this period we saw America continually make the wrong decisions, lose its industrial might, damage its national balance sheet, and erode the reserve status of its
Julius Baer Funds 2007 Annual Report
10
currency. We also created structural imbalances and excesses in our economy that led to one bubble then another—the least painful way to contain one bubble is to create another; hence postponing the day of reckoning. In this period, we made useless financiers fly-by-night billionaires, destroyed most American's living standards by depressing their wages and sinking the dollar against most currencies known to man—with few exceptions such as the Zimbabwe dollar. How did we do it?
Decadence started at the top, with the government, and has gone on for more than two decades. The government has, since the early 1980s, rigged the inflation index to artificially depress the cost of living. It has used the flawed method of cash accounting instead of accrual accounting in order to "hide" the albatross of unfunded liabilities and entitlements such as Social Security; spent irresponsibly and accumulated record budget deficits; espoused trade policies responsible for the record deficits; and, damaged to the long-term prospects of the economy—all in an effort to appease the corporate lobby.
The Fed has shirked many of its responsibilities: by allowing asset bubbles to form unfettered; by maintaining ultra-lax monetary policies; by neglecting its regulatory oversight authority; and, by succumbing easily to the faintest political pressure.
The rampant decadence at the top trickled, as expected, all the way to the bottom resulting in two major bubbles while laying the foundation for future ones.
The tech bubble of the 1990's was the first major one. What enabled that bubble to form and fester was the contribution from the referees, the intermediaries and the players to the fertile background laid in by the government. The Financial Accounting Standards Board (FASB), under pressure from the US Congress, allowed firms to omit the cost of stock options in their earnings, thereby encouraging manipulation of earnings. Its abuse was a major enabler for the first bubble. Research analysts invented heretic valuation metrics to justify buying those stocks at any price and later some were accused of fraud. Accounting firms let conflicts of interest cloud their judgment, provided suspect audits and in some cases aided the fraud. Corporations were accused of malfeasance, aggressive accounting, abuse of tax loopholes and fraud. Financial entities were found guilty of market timing and predatory pricing. Even the regular citizen was guilty as his internet day-trading fad, leverage, and momentum investing took the mania to extreme.
The second bubble in real estate (especially in the subprime segment) started as soon as the tech bubble began to deflate. Again it was aided by top to bottom decadence, but through different agents. One agent included the Fed, which pursued an ultra-easy monetary policy. Rating agencies are also being accused of conflicts of interest and rendering suspect opinion on many of the structured products created. Appraisers are being sued by state attorneys for inflating home values. Loan originators
Julius Baer Funds 2007 Annual Report
11
are being accused of setting weak standards and for pressuring appraisers. Financial innovation was found to be nothing but a mix of concoction, hallucination, and heresy. Banks shocked the market with their lack of risk management, especially in the way the CDO exposure sneaked off balance sheet. Unregulated funds through their opacity and leverage also added to the confusion and the damage. Finally, the individual was a main agent by willingly filling these "liar loans".
Unfortunately, there is no Mother Theresa among us. We were decadent from top to bottom.
The Cardinal Sin: Believing in Santa Claus
If there were one cardinal sin to point to as the main enabler of the Age of Decadence, it would be the overhauling of the inflation index. The high inflation environment from the late 1970s to early 1980s created a vicious cycle for the Federal government because entitlement benefits were indexed to the inflation rate. High inflation led to higher entitlement costs and bigger government deficits.
One way to lower the entitlements was to bring inflation rates down, translating into lower cost of living adjustments (COLA). Instead of inflicting the pain to bring down the inflation rate, the government chose to alter the way it measured inflation, bringing the index artificially down. It replaced house prices with owners' equivalent rent (OER), introduced the concept of product substitution; and reduced prices of goods for quality improvements. Under these rules, the new inflation index was consistently below the old one. For example, under the old method, inflation during the past ten years would have ranged between 8% and 10% while under the new method it ranged between 2% and 4%.
While the artificially low inflation reading aided our fiscal situation, it inflicted fatal blows to our economic policies. With the new index understating inflation by approximately 4%-6% during the past decade, the Fed set interest rates too low and helped create the mirage of high real growth and low inflation which led credence to the theories of "the productivity miracle" and "paradigm shift".
However, history has taught us that the only miracle that comes from easy monetary policies is a bubble in asset prices. Had the inflation methodology been kept intact, inflation readings would have been 4%-6% higher and interest rates would have been correspondingly higher. In such an environment, we would have grown slower during the boom but we would have avoided the bubbles and the ensuing bust. Like the tortoise, we would have beaten the hare through the full economic (boom/bust) cycle.
Julius Baer Funds 2007 Annual Report
12
Directly targeting asset prices has always been political suicide for the Fed. The old inflation index—since it included asset prices—would have allowed the Fed to fight asset bubbles while only targeting inflation.
In short, the government (the parents) invented Santa Claus in order to cheer up pensioners and laborers (the children) who were worried about their parent's ability to pay for their entitlements (gifts). The whole family was happy with Santa Claus. The children were happy with the yearly gifts and parents were satisfied that their children were buying the fairly tale and able to rein in spending. But as in real life, it is a blessing only when children believe in Santa Claus and a tragedy when parents do!
The Fed now conducts its policies based on the new method, ignoring many obvious signs: the 8%-10% reading from the old method, the tech bubble, record trade deficits, record budget deficits, free falling US dollars, skyrocketing commodities, subprime bubble, housing bubble, etc... What a tragedy indeed!
"Turbulence" Ahead But Is It with More Decadence or Do We Experience Renaissance?
The case for renaissance would be based on the assumptions of the government adopting accrual accounting, balance the budget, releasing honest inflation figures, espousing sound trade policies, and curtailing lobbies' influence. It also entails having an independent and proactive Fed that fights inflation and asset bubbles, punishes risky behavior, and resists political pressure.
The probability, therefore, of renaissance is almost zero.
Hence, we anticipate more decadence emboldened by the following rationales:
1. We can't turn back the clock on innovation and globalization. The status quo seems to equate excessive leverage with innovation, trade deficits with globalization, and trade balance with protectionism.
2. We are better off being third in a fast growing world than being first in a slow growing one. Wealth is relative not an absolute. If I have one million dollars but everyone else has one billion then I must be a poor man. In our "fast growing world" the only ones who are better off are Wall Street and multinationals who are "the opium pushers" into the US economy.
3. Our policies are eradicating poverty around the world. This is akin to a surgeon boasting to a dead patient's parents that the surgery was extremely successful, because the donated organs will save many lives.
Julius Baer Funds 2007 Annual Report
13
4. Blame it on foreign exchange. The proponents of the status quo should continue to divert attention towards foreign exchange (FX) levels as the main culprit to our imbalance. It is the perfect decoy. By the time we figure out that the FX rate is no panacea to our ills, it might be too late to reverse course.
Hence, one should expect more turbulence and bubbles in the new age. We expect the ultimate winners to be real assets, commodities, emerging markets, and equities in general, and the big losers to be fiat currencies: money and bonds.

Rudolph-Riad Younes, CFA
International Equity Fund and International Equity Fund II Portfolio Manager
Past performance does not guarantee future results.
Investing internationally involves additional risks, such as currency fluctuations, social and economic instability, differing securities regulations and accounting standards, limited public information, possible changes in taxation, and periods of illiquidity.
The views expressed solely reflect those of Julius Baer Investment Management LLC ("JBIM") and the managers of the fund, and do not necessarily reflect the views of any affiliated companies. The material contains forward-looking statements regarding the intent, beliefs, or current expectations. Readers are cautioned that such forward-looking statements are not a guarantee of future performance, involve risks and uncertainties, and actual results may differ materially from those statements as a result of various factors. The views expressed are subject to change based on market and other conditions. Furthermore, the opinions expressed do not constitute investment advice or recommendation by the managers, JBIM, the fund, or any affiliated company.
The MSCI ACWI (ex-US) is a free float-adjusted market capitalization index that is designed to measure equity market performance in the global developed and emerging markets excluding the US.
The MSCI EAFE Index is an unmanaged list of equity securities from Europe, Australasia, and the Far East with all values expressed in U.S. dollars.
It is not possible to invest directly in an index or average.
Please see the Schedule of Investments in this report for complete fund holdings. Fund holdings and/or sector weightings are subject to change at any time and are not recommendations to buy or sell any security mentioned.
Julius Baer Funds 2007 Annual Report
14
MANAGEMENT'S COMMENTARY
JULIUS BAER TOTAL RETURN BOND FUND
2007 Annual Report
The Julius Baer Total Return Bond Fund Class A Shares (the "Fund") returned 6.75% for the 12 months ending October 31, 2007, outperforming its benchmark, the Lehman Brothers Aggregate Bond Index, which returned 5.38%.
A major source of the Fund's outperformance was our currency positioning. Our belief for most of the period was that the US dollar was in a long-term bear market. In the first few weeks of January 2007, the US dollar experienced a strong rally and it took until the end of March for the Fund's performance to overtake the index. All but one month since that time saw currency positioning contribute to outperformance. August was the exception, when the subprime mortgage driven credit crunch hit financial markets hard. Though we reduced risk before the liquidity crises emerged, it was not enough. Currencies that worked well over the twelve months included the Australian dollar, the euro and the Brazilian real while the Mexican peso was the largest detractor (especially in January).
For much of the fiscal year, the Fund was positioned to spend its duration budget in the US and away from most international markets. Our belief was that many international economies were in better condition than the US. While that is usually a good reason to like a country's currency, it's also likely to result in rates moving higher, which is bad for bondholders.
Of the few international bonds the Fund held during the period, a position in Mexican Bonos was the best performer. In the second calendar quarter of 2007, as rates around the world were rising, Mexican Bonos yields were moving down. One driver of this reduction in yield was a surge in investor optimism due to political cooperation after a contentious election and poor governmental relations between parties during the previous administration. Another contributing factor was a drop in inflation and inflationary expectations. The gain that resulted from this drop in yield was more than enough to offset the currency loss and led to Mexico's overall positive contribution. The Fund's position in a Romanian treasury bill also contributed to performance.
Within the US market, our interest rate positioning detracted from performance, particularly in July and August. When financial markets started to struggle with the liquidity crises, the Fund was positioned for interest rates to continue to increase. However, as yields dropped and markets began to freeze up, our repositioning did not occur fast enough.
Julius Baer Funds 2007 Annual Report
15
Within the spread sectors, our strategy to underweight US corporate bonds contributed most to outperformance. This positioning was based on the belief that corporate spreads were too tight and given the active leveraged buyout (LBO) market, we could achieve better risk-adjusted returns in other sectors. That stance paid off after the credit crunch unfolded in August and corporate bonds significantly underperformed. We used this spread widening to increase our positioning in the sector and anticipate we will continue to do so in an opportunistic manner.
Outlook
Looking forward, we anticipate the US dollar (USD) will remain in a long-term bear market. Our rationale includes the nation's huge current account deficit, considerable foreign participation in US financial markets, and a dampening in the economic growth advantage that the US enjoyed over the last two decades. It may take several years for such headwinds to USD performance to be resolved. Nonetheless, it is also possible for the USD to undergo a bear market rally that could last two or three quarters. Ultimately, we believe that the USD needs to fall more for the imbalances in the US economy to correct.
One currency that we like is the euro. Even though it is sitting close to its all-time high versus the USD, its importance as a credible replacement to the USD—as the reserve currency of the world—should encourage bidding by market participants as long as the economy of the eurozone keeps growing.
We also favor emerging market currencies because: a majority of them now float freely; fiscal and monetary policies in most emerging market countries are now more credible; and economic growth is likely to be markedly higher than in the developed world. However, we will continue to monitor changes in the political environment and market sentiment for emerging economies, as these countries and their currencies can pose more challenging risks than developed nations.
At the same time, we do not consider international sovereign bonds to be compelling investments. With most of the global economy growing at a decent pace, we think that foreign interest rates are more likely to increase than those in the US or that rates in the US will fall more than those abroad. Hence, our exposure to foreign government bonds is mild.
We do not have a strong opinion on the direction of US interest rates over the near-term. A reasonable case can be made for rates moving higher as well as lower. Given that level of uncertainty, we do not believe it is constructive to have a large duration position versus the benchmark. The yield curve is another matter. We believe that over the next several months the curve will steepen. With the Fed likely to ease interest rates a few more times over the next year, we think that short-term rates
Julius Baer Funds 2007 Annual Report
16
will trend lower. At the long end of the yield curve, inflation and inflationary expectations exert greater influence. With global growth likely to remain strong, we expect some inflationary pressure in the US over the next year, mostly due to higher commodity prices leading to higher prices throughout the economy. Therefore, it is more probable for interest rates at the short end of the yield curve to go down more or up less than rates at the long end of the curve.
In the domestic spread sectors, after being underweight corporate bonds for almost the entire fiscal year, we built-up our position after the increase in yield spreads that took place during the August and September credit crunch. At this time, we believe there is still value in corporate bonds. However, we continue to be cautious amid investor concern that many financial institutions have not fully disclosed their participation in the various beleaguered housing-related markets. One encouraging facet in the leveraged loan market is the lack of liquidity, because it is less likely that a corporate bond's value will implode due to a leveraged buyout.
Of the structured products in fixed income markets, we favor mortgage-backed securities (MBS) that have either a high coupon or a low one. A MBS with a high coupon—a premium bond—trades at a higher price than a current coupon bond. The price for a high coupon MBS will not rise as much as it would if it were a corporate or treasury bond, given that the prospect of the homeowner prepaying early by refinancing is high. Yet in the current housing market, we do not think premium bonds will experience prepayments at the same level that might have transpired a few years ago. Consequently, we expect these higher coupon bonds to pay higher yields than what the market presumes. At the same time, we also favor lower coupon bonds, as they should perform well if interest rates drop over the next few quarters.
Within the commercial mortgage-backed securities (CMBS) market, we continue to prefer the super senior structures. Despite a widening in spreads over the last few months, we believe that investors are still not correctly pricing these bonds versus the poorly structured bonds that are also available in the market. As such, we expect to continue choosing these securities until the market addresses the pricing discrepancy.

Donald Quigley
Total Return Bond Fund Portfolio Manager
Past performance does not guarantee future results.
Investments in debt securities typically decrease in value when interest rates rise. This risk is usually greater for longer term debt securities. Investing
Julius Baer Funds 2007 Annual Report
17
internationally involves additional risks, such as currency fluctuations, social and economic instability, differing securities regulations and accounting standards, limited public information, possible changes in taxation, and periods of illiquidity.
Investments in Asset Backed and Mortgage Backed Securities include additional risks that investors should be aware of such as credit risk, prepayment risk, possible illiquidity and default, as well as increased susceptibility to adverse economic developments.
The views expressed solely reflect those of Julius Baer Investment Management LLC ("JBIM") and the managers of the fund, and do not necessarily reflect the views of any affiliated companies. The material contains forward-looking statements regarding the intent, beliefs, or current expectations. Readers are cautioned that such forward-looking statements are not a guarantee of future performance, involve risks and uncertainties, and actual results may differ materially from those statements as a result of various factors. The views expressed are subject to change based on market and other conditions. Furthermore, the opinions expressed do not constitute investment advice or recommendation by the managers, JBIM, the fund, or any affiliated company.
The Lehman Brothers US Aggregate Bond Index is a benchmark index composed of US securities in Treasury, Government-Related, Corporate, and Securitized sectors. It includes securities that are of investment-grade quality or better, have at least one year to maturity, and have an outstanding par value of at least $250 million. It is not possible to invest directly in an index or average.
A basis point is a unit of measure equal to 1/100th of 1%.
Please see the Schedule of Investments in this report for complete fund holdings. Fund holdings and/or sector weightings are subject to change at any time and are not recommendations to buy or sell any security mentioned.
Julius Baer Funds 2007 Annual Report
18
MANAGEMENT'S COMMENTARY
JULIUS BAER GLOBAL HIGH INCOME FUND
2007 Annual Report
For the twelve months ending October 31, 2007, the Julius Baer Global High Income Fund (Class A Shares) rose 8.58%, beating its benchmark, the Merrill Lynch Global High Yield Constrained Index (in US dollars [USD]) which returned 8.33%.
These returns masked two divergent periods within the fiscal year. During the first eight months (through June 2007), global markets experienced robust performance, capping five years of generally improving prices. This was driven by a healthy global economy centered on GDP (Gross Domestic Product) growth in some of the largest emerging markets, strength in US consumer demand, rising corporate earnings, and ample liquidity. In addition, yield spreads over comparable treasuries for our benchmark declined from 3.17% to 2.87% in a generally benign interest rate environment, leading to total returns in USD terms of 6.36%.
However, beginning in the early summer, the persistent declines in US residential real estate prices and sales activity began manifesting itself in rising delinquency rates among subprime mortgage borrowers. Falling housing prices and rising subprime mortgage delinquencies caused several concerns among investors. First, there were (and still are) fears that weakness in this sector would spread to the rest of the US economy via its impact on the consumers' ability to continue spending. Second, there were concerns that the subprime mortgage market excesses would repeat in related markets, including high yield corporate securities which comprise the bulk of the Fund's investments. Finally, beginning in late summer and early fall, the rapidly accelerating decline in the value of subprime debt and related collateralized debt obligations (CDOs) forced many financial institutions to announce substantial write-downs. Banks became less willing to len d to each other in the money markets out of concern over what the actual subprime debt exposure of their counterparties might be as well as a desire to guard their own liquidity.
Beginning in August, the major developed country central banks repeatedly injected reserves into the financial system, including the US Federal Reserve which also cut their benchmark interest rate by fifty basis points on September 18. These actions on the part of policy makers helped stabilize the markets in late September and October, but, by the end of October there was still a great deal of uncertainty and volatility persisted.
During the final four months of the fiscal year, this economic and market backdrop was exacerbated within the high yield bond market by an historically unprecedented surge in the new issuance pipeline. In the highly confident period leading
Julius Baer Funds 2007 Annual Report
19
up to the summer, many investment banks made large, multi-billion dollar commitments to finance increasingly bigger transactions, most of which were leveraged buy-outs of public and private companies by private equity firms. In our opinion, this over-extension on the part of underwriters is one of the few attributes the subprime and high yield markets share. However, in terms of market structure, diversification, research and pricing practices, we believe the two have far more differences than similarities.
During these final four more challenging months, the US treasury yield curve declined substantially in yield, from 4.92% to 4.17% on the a five year bond, as investors sought the comparative safety of government bonds. In the opposite reaction, yields on high yield bonds expanded from 7.81% to 8.49%. Thus, the spread of high yield bonds to the benchmark treasury widened from the end of June's 2.89% to 4.32% at the end of October. The price depreciation implied by these moves was partially offset by coupon income such that the index total return for these final four months was still a positive, though meager, 1.84%.
Most credit markets followed similar patterns during the twelve month period, exhibiting tightening yield margins over riskless benchmarks and good total returns until June then widening for the final four months and showing considerably lower, though still positive, total returns. Leveraged loan markets moved along with the high yield bond market but turned in better returns for the latter four months of the period. Leveraged loans share some similarities to high yield bonds but differ in several respects, most importantly, they generally carry a more senior claim on assets.
Many non-US markets, whether dollar denominated or not, exhibited less volatility than the US market and turned in significantly better total returns. Emerging market sovereign bonds issued in hard currencies were especially strong, reflecting the issuers improved credit quality since the markets last went through a serious downturn. The local currency markets of emerging countries also performed considerably better than US high yield, both on a local currency and USD basis. The European high yield market, though less volatile, turned in lower returns in local currency terms, as benchmark European government interest rates were rising for much of the period, causing an underlying price erosion. For unhedged dollar investors, however, European high yield still outperformed its US counterpart as the effect of appreciating European currencies against the US dollar offset interest rate and credit related local price declines.
The Fund's performance was aided by several factors, all of which we believe are grounded in our more diversified, global approach to this asset class. First, beginning early in the period, we migrated the portfolio from close to 0% loans to 14% at the end of June. These securities were more defensive in nature and aided
Julius Baer Funds 2007 Annual Report
20
performance during the more difficult final four months. We executed this change out of relative value considerations, not because we necessarily predicted the turbulence of the June through October period. Second, our continued positioning in local emerging market sovereign debt, which performed better than US high yield debt, helped relative returns, even though our holdings in these markets never exceeded 9% of the portfolio. Finally, and again for relative value reasons, we gradually improved the credit quality of the portfolio between late 2006 and the summer of 2007. We accomplished this by selling out of some bonds whose issuers were particularly highly leveraged or vulnerable from an industry standpoint.
These positive contributions were somewhat offset by other factors. First, partly because of our loan position, the portfolio carried a significantly lower duration for much of the period. As investors sought the safety of government bonds beginning in July and interest rates declined precipitously, this lower duration hurt relative performance. Secondly, although issue selection was positive, there were some specific issues that detracted.
As the Fund enters its sixth fiscal year, high yield securities are generally at the highest yield and exhibit the highest premium over treasuries since late 2003. There are many uncertainties in the global economy and financial markets. However, we believe that current levels on high yield securities discount all but the direst scenarios. For the first time in many years the "premium" is back into the risk premia and investors are being paid to take risks, provided they take a longer-term view, greater than the next month or the next few quarters. There is no guarantee that these yields will ultimately prove high enough to compensate for what the future may bring, but we believe our more diversified approach, combined with our investment discipline, should continue to help us navigate these markets successfully.

Greg Hopper
Global High Income Fund Portfolio Manager
Past performance does not guarantee future results.
The securities in which the Fund will invest may be considered more speculative in nature and are sometimes known as "junk bonds." These securities tend to offer higher yields than higher rated securities fixed income securities can present a greater risk of loss of income and principal than higher rated securities. Investing internationally involves additional risks, such as currency fluctuations, social and economic instability, differing securities
Julius Baer Funds 2007 Annual Report
21
regulations and accounting standards, limited public information, possible changes in taxation, and periods of illiquidity.
Investments in Asset Backed Securities include additional risks that investors should be aware of such as credit risk, prepayment risk, possible illiquidity and default, as well as increased susceptibility to adverse economic developments.
The views expressed solely reflect those of Julius Baer Investment Management LLC ("JBIM") and the managers of the fund, and do not necessarily reflect the views of any affiliated companies. The material contains forward-looking statements regarding the intent, beliefs, or current expectations. Readers are cautioned that such forward-looking statements are not a guarantee of future performance, involve risks and uncertainties, and actual results may differ materially from those statements as a result of various factors. The views expressed are subject to change based on market and other conditions. Furthermore, the opinions expressed do not constitute investment advice or recommendation by the managers, JBIM, the fund, or any affiliated company.
The Merrill Lynch Global High Yield Constrained Index tracks the performance of below investment grade bonds of corporate issuers domiciled in countries having an investment grade foreign currency long term debt rating (based on a composite of Moody's and S&P). The index is weighted by outstanding issuance, but constrained such that the percentage that any one issuer may not represent more than 3% of the index. It is not possible to invest in an index.
A basis point is a unit of measure equal to 1/100th of 1%.
Please see the Schedule of Investments in this report for complete fund holdings. Fund holdings and/or sector weightings are subject to change at any time and are not recommendations to buy or sell any security mentioned.
Julius Baer Funds 2007 Annual Report
22
MANAGEMENT'S COMMENTARY
JULIUS BAER U.S. MICROCAP FUND
JULIUS BAER U.S. SMALLCAP FUND
JULIUS BAER U.S. MIDCAP FUND
JULIUS BAER U.S. MULTICAP FUND
2007 Annual Report
Equity Market Commentary
The twelve months ended October 31, 2007 was characterized by the return of share price volatility. It's difficult to recall a period with so many twists and turns led by repeating bouts of optimism and pessimism. Investors had many challenges to overcome throughout the year including the ongoing military effort in and around Iraq; a significant deterioration in the U.S. housing market in terms of oversupply and reduced purchases; the falling U.S. dollar; subprime credit concerns that paralyzed credit markets resulting in a sharp slowdown in merger and acquisition activity as well as surprisingly large financial sector write-downs; and, lower consumer spending growth rates toward the end of the year.
Despite these challenges, the U.S equity market saw a favorable environment in terms of capital formation underscored by a vibrant initial public offering market, decent job growth and manageable inflation levels. Performance leaders were dominated by the energy and materials sectors, which benefited from positive global demand. These two sectors led across the market capitalization spectrum, topping the Russell 2000 Index as well as the S&P 500 Index.
The past fiscal year saw small cap stocks cede leadership to their large counterparts for the first time since 2000 with the S&P 500 posting a gain of 14.56%, outpacing the Russell 2000's return of 9.29%. Earnings growth rates fell across the board during the period, but the rate of decline was greater for smaller companies. Sectors that lagged were financial services, the only sector that posted an absolute decline during the year, and consumer discretionary.
Portfolio Strategy and Investment Focus Areas
We manage concentrated portfolios and diversify our investment positions across multiple sectors. We believe our value added is from thoroughly researching and selecting stocks that seek to outperform the broader market. Our goal is to identify emerging growth companies and turn-around situations early on. Our dedicated analyst team has unique sector responsibilities which allow them to become experts of their respective sector's industries and individual companies.
Julius Baer Funds 2007 Annual Report
23
In terms of strategy, we are not interested in constructing portfolios that satisfy a certain style box category, i.e. smallcap growth—our goal is for each fund to outperform the U.S. market and all the various style boxes over a complete market cycle. We believe style investing limits a portfolio team to a narrower investment universe and prohibits any significant participation in anticipatory shifts in the markets' proclivity for certain types of risks or exposure. Our sector weights incorporate macroeconomic as well as fundamental, company-specific analysis. While we normally have fairly even representation across all sectors, from time-to-time we consciously overweight or underweight sectors. Nevertheless, sector allocation is generally a smaller, secondary factor with regard to our r elative returns—stock selection is the most important.
As the year progressed, we increased exposure to the technology sector, reflecting a favorable corporate spending environment and solid purchasing power based on many companies' record cash levels as a percentage of assets. As credit markets came under pressure during the summer, we reduced our weighting in the financial services sector and added to our industrials exposure. We felt it was difficult to assess the potential risks and exposure by many financial companies and the market would re-price the risk to reflect this uncertainty in the form of lower price-to-earnings and price-to-book multiple valuations. A second and more obvious indicator was falling loan demand due to a weakening housing market—diminished demand for mortgages was due to buyers not stepping up to purchase because home prices were declining. In summary, most banks were writing fewer loans, while at the same time, a small but increasing number of loans on their bo oks were becoming delinquent—both factors adversely impacting earnings prospects. As we ended the fiscal year, we had overweight positions in the consumer discretionary sector and small underweight positions in the energy and materials sectors. We also were overweight the healthcare sector based on the fact that we like the long-term demographic theme of aging and the demand it will create for healthcare and financial services such as aesthetics and asset management. Late in the period, we began to selectively add to our financial services exposure.
Julius Baer U.S. Microcap Fund
For the period of November 1, 2006 through October 31, 2007 the Julius Baer U.S. Microcap Fund (Class A Shares) returned 12.43%, ahead of its benchmark, the Russell 2000 Index, return of 9.29% as well as the Russell Microcap Index gain of 5.05%.
Outperformance versus the Russell 2000 and Russell Microcap Indexes was driven by our stock selection. In particular, consumer staples and healthcare holdings did well, more than offsetting unfavorable relative stock results in the technology and financial services sectors. Our best contributors to returns included Green
Julius Baer Funds 2007 Annual Report
24
Mountain Coffee Roasters, Abaxis Inc. and Measurement Specialties, Inc.; the largest detractors included Jones Soda Co., Evercore Partners, Inc. and Seacoast Banking Corp. of Florida. Our sector positioning had a modest negative impact. The Fund finished the fiscal year overweight in the consumer discretionary and healthcare sectors and underweight in the financial services and industrials sectors.
Julius Baer U.S. Smallcap Fund
For the fiscal year ended October 31, 2007, the Julius Baer U.S. Smallcap Fund (Class A Shares) returned 29.44%, surpassing the Russell 2000 Index return of 9.29%.
The Fund's relative outperformance can be attributed to strong results within the consumer discretionary and technology sectors, which more than offset weak performance within the materials and financial services sectors. Our best contributors to returns included Chipotle Mexican Grill, Inc., Morningstar, Inc. and Ventana Medical Systems Inc.; the largest detractors included Palomar Medical Technologies Inc., Privatebancorp Inc. and Evercore Partners Inc. Our sector positioning had a modest negative impact. The Fund ended the period under review overweight in the technology, consumer discretionary and consumer staples sectors and underweight in the industrials and financial services sectors.
Julius Baer U.S. Midcap Fund
The Julius Baer U.S. Midcap Fund (Class A Shares) returned 17.16%, above the Russell Midcap Index return of 15.37%, for the twelve months ending October 31, 2007.
Outperformance versus the Russell Midcap benchmark was driven by stock selection, particularly our technology, consumer discretionary and healthcare holdings. This more than offset unfavorable results in the materials, energy and financial services sectors. Our largest contributors included VMware Inc., Express Scripts, Inc. and Wynn Resorts Ltd. while the largest detractors included E*TRADE Financial Corp., Qlogic Inc. and Melco PBL Entertainment Ltd. Our sector positioning had a relatively large negative effect, mainly due to low representation of materials, energy and utilities holdings in the portfolio. At the end of the fiscal year, the Fund was overweight the technology and healthcare sectors and underweight the financial services and utilities sectors.
Julius Baer U.S. Multicap Fund
For the period of November 1, 2007 to October 31, 2007 the Julius Baer U.S. Multicap Fund (Class A Shares) returned 17.47%, ahead of the Russell 3000 Index's return of 14.59%.
Julius Baer Funds 2007 Annual Report
25
Relative outperformance versus the Russell 3000 benchmark was driven by stock selection, an overweight technology sector position and an underweight financial services sector position. In particular, our technology and healthcare sector holdings did well, more than offsetting unfavorable stock performance in the materials and consumer discretionary sectors. Our best contributors to returns included Apple Inc., VMware Inc. and ArthroCare Inc. while the largest detractors included E*TRADE Financial Corp., Qlogic, Inc. and Akamai Technologies Inc. Overall sector positioning had a positive impact to annual performance and the Fund finished the fiscal year overweight the technology and healthcare sectors and underweight the energy and consumer staples sectors.
Outlook
Shortly after the end of the fiscal year, fears of a potential U.S. recession intensified. Questions about how the continued soft housing market and hard-to-quantify exposure financial institutions had to subprime loans via lending or investments and SIVs (structured investment vehicles) may spill over and impact "Main Street" were a concern. The falling value of U.S. dollar versus other major world currencies was also on people's mind because it erodes purchasing power. However, the tradeoff is that U.S. exports are competitively priced in the market place, satisfying strong demand from Europe, China and India. While much was written about investment opportunities in China, I offer one simple thought: it is estimated that the number of middle class Chinese will soon be six-to-eight times larger than the U.S. While a Western influence on their economy is readily apparent by the success of some largecap, multinational companies that invested early there, the long-term opportunity is probably much greater.
From a short-term perspective, we believe that U.S. economic growth will slow in the coming year due to the leverage effect that consumer spending has on U.S. gross domestic product. Since the end of World War II, consumer spending remained fairly steady, between 60% and 65% of gross domestic product (GDP). The combination of low interest rates and easy credit likely caused consumer spending to peak at over 70% of GDP in the last few years. However, housing price declines slowed the rate of housing turnover and associated spending. In addition, rising default rates and greater credit losses should result in higher lending standards, ultimately reducing the pool of potential borrowers and the aggregate demand for mortgages. One of our major concerns is the health of the job market. Any protracted economic slowdown may slow job creation and increase the unemployment rate, both of which could negatively impact consumer confidence and hurt consu mer spending. If consumer spending slows for several quarters, investment or capital spending by businesses will likely decline in the future, resulting in a one-two punch to domestic economic
Julius Baer Funds 2007 Annual Report
26
growth. While we feel the strong housing and related industries helped our economy in terms of incremental growth during the early part of this decade, we believe the pendulum is swinging back and they will be a drag on our economy until 2009.
For 2008, a potentially slower economy and uncertainty regarding the outcome of the presidential election should create an interesting investment backdrop. Presidential elections generally create questions around the potential for change to tax and healthcare policies, so our goal is to be prepared to capitalize on any opportunities that surface. Our mantra is to be early in uncovering and investing in companies that we believe will improve their operating results and/or grow their sales and earnings in good or bad economic times. While a slowing economy will almost certainly reduce investor confidence, we do our best to capitalize where and when we see opportunities. Over the years, we learned that investors overreact with both optimism and pessimism, especially around inflection and/or turning points that have some substantive impact to the economy. A relevant, current example may be housing, financial services and consumer discretionary s tocks. All three benefited greatly during the favorable upswing in the housing market in the early part of this decade but struggled this year. We feel the pessimism may be close to a climax, so we are investigating these and other opportunities as we write this.
We take some solace in knowing that historically, the economy grows approximately 85% of the time and is in recession the remaining 15%. There have been twelve recessions since the Great Depression, with an average duration of 10.4 months. The average expansion period since World War II, including the current one, has lasted 58.3 months. As we construct our portfolios, we strongly believe that the most successful businesses are ones that create products and services that change the habits of consumers and business spenders, irrespective of the economy. Many of these companies will be smaller in size with the ability to prosper and outperform irrespective of the headwinds that develop in every economic cycle.
It is our duty to shareholders to capitalize on the opportunities that will undoubtedly present themselves as we reconcile the U.S. and global economic crosscurrents and we consider it a privilege to act as your Fund manager.

Samuel Dedio
U.S. Microcap Fund, U.S. Smallcap Fund, U.S. Midcap Fund and U.S. Multicap Fund Portfolio Manager
Julius Baer Funds 2007 Annual Report
27
Past performance does not guarantee future results.
Please refer to the prospectus for more complete information on the special risks associated with investing in the Julius Baer U.S. Equity Funds, including, but not limited to: stock market risk, smaller companies risk, liquidity risk, foreign investment risk, derivatives risk.
The views expressed solely reflect those of Julius Baer Investment Management LLC ("JBIM") and the managers of the fund, and do not necessarily reflect the views of any affiliated companies. The material contains forward-looking statements regarding the intent, beliefs, or current expectations. Readers are cautioned that such forward-looking statements are not a guarantee of future performance, involve risks and uncertainties, and actual results may differ materially from those statements as a result of various factors. The views expressed are subject to change based on market and other conditions. Furthermore, the opinions expressed do not constitute investment advice or recommendation by the managers, JBIM, the fund, or any affiliated company.
Please see the Schedule of Investments in this report for complete fund holdings. Fund holdings and/or sector weightings are subject to change at any time and are not recommendations to buy or sell any security mentioned.
The Russell 3000 Index measures the performance of the 3,000 largest U.S. companies based on total market capitalization, which represents approximately 98% of the investable U.S. equity market, with all values expressed in U.S. dollars.
The Russell Midcap Index measures the performance of the 800 smallest companies in the Russell 1000 Index, which represent approximately 25% of the total market capitalization of the Russell 1000 Index, with all values expressed in U.S. dollars.
The Russell 2000 Index measures the performance of the 2,000 smallest companies in the Russell 3000 Index, which represents approximately 8% of the total market capitalization of the Russell 3000 Index, with all values expressed in U.S. dollars.
The Russell Microcap Index measures the performance of the smallest 1,000 securities in the small-cap Russell 2000 Index along with the next smallest 1,000 companies, based on a ranking of all U.S. equities by market capitalization.
It is not possible to invest directly in an index.
Julius Baer Funds 2007 Annual Report
28
SHAREHOLDER EXPENSES
As a stockholder of the Julius Baer Global Equity Fund or a shareholder of Julius Baer Investment Funds, you incur ongoing expenses, such as management fees, shareholder service fees, distribution fees and other fund expenses. The following table is intended to help you understand your ongoing expenses (in dollars and cents) of investing in the Funds and to compare these expenses with the ongoing expenses of investing in other funds.
The table is based on an investment of $1,000 invested at the beginning of the period and held for the entire period from May 1, 2007 to October 31, 2007.
Actual Expenses
The first line in the table below provides information about the actual account values and actual expenses. You may use the information in this line, together with the amount you invested, to estimate the expenses that you paid over the period. Simply divide your account value by $1,000 (for example, an $8,600 account value divided by $1,000 = 8.6), then multiply the result by the number in the first line for the Fund under the heading entitled "Expenses Paid During Period" to estimate the expenses you paid on your account during this period.
Hypothetical Example for Comparison Purposes
The second line in the table below provides information about the hypothetical account values and hypothetical expenses based on the Fund's actual expense ratio and an assumed rate of return of 5% per year before expenses, which is not the Fund's actual return. The hypothetical account value and expenses may not be used to estimate the actual ending account balance or expenses you paid for the period. You may use this information to compare the ongoing costs of investing in your Fund and other funds. To do so, compare this 5% hypothetical example with the 5% hypothetical examples that appear in the shareholder reports of the other funds.
Global Equity Fund Class A
| | | Beginning Account
Value 05/01/07 | | Ending Account
Value 10/31/07 | | Annualized
Expense Ratio | | Expense Paid
During Period | |
| Actual | | $ | 1,000.00 | | | $ | 1,088.70 | | | | 1.42 | % | | $ | 7.48 | | |
| Hypothetical | | | 1,000.00 | | | | 1,018.00 | | | | 1.42 | | | | 7.22 | | |
Global Equity Fund Class I
| | | Beginning Account
Value 05/01/07 | | Ending Account
Value 10/31/07 | | Annualized
Expense Ratio | | Expense Paid
During Period | |
| Actual | | $ | 1,000.00 | | | $ | 1,090.00 | | | | 1.17 | % | | $ | 6.16 | | |
| Hypothetical | | | 1,000.00 | | | | 1,019.30 | | | | 1.17 | | | | 5.95 | | |
Julius Baer Funds 2007 Annual Report
29
International Equity Fund Class A
| | | Beginning Account
Value 05/01/07 | | Ending Account
Value 10/31/07 | | Annualized
Expense Ratio | | Expense Paid
During Period | |
| Actual | | $ | 1,000.00 | | | $ | 1,116.00 | | | | 1.24 | % | | $ | 6.61 | | |
| Hypothetical | | | 1,000.00 | | | | 1,019.00 | | | | 1.24 | | | | 6.31 | | |
International Equity Fund Class I
| | | Beginning Account
Value 05/01/07 | | Ending Account
Value 10/31/07 | | Annualized
Expense Ratio | | Expense Paid
During Period | |
| Actual | | $ | 1,000.00 | | | $ | 1,117.30 | | | | 0.99 | % | | $ | 5.28 | | |
| Hypothetical | | | 1,000.00 | | | | 1,020.20 | | | | 0.99 | | | | 5.04 | | |
International Equity Fund II Class A
| | | Beginning Account
Value 05/01/07 | | Ending Account
Value 10/31/07 | | Annualized
Expense Ratio | | Expense Paid
During Period | |
| Actual | | $ | 1,000.00 | | | $ | 1,115.10 | | | | 1.30 | % | | $ | 6.93 | | |
| Hypothetical | | | 1,000.00 | | | | 1,018.70 | | | | 1.30 | | | | 6.61 | | |
International Equity Fund II Class I
| | | Beginning Account
Value 05/01/07 | | Ending Account
Value 10/31/07 | | Annualized
Expense Ratio | | Expense Paid
During Period | |
| Actual | | $ | 1,000.00 | | | $ | 1,116.40 | | | | 1.02 | % | | $ | 5.44 | | |
| Hypothetical | | | 1,000.00 | | | | 1,020.10 | | | | 1.02 | | | | 5.19 | | |
Total Return Bond Fund Class A
| | | Beginning Account
Value 05/01/07 | | Ending Account
Value 10/31/07 | | Annualized
Expense Ratio | | Expense Paid
During Period | |
| Actual | | $ | 1,000.00 | | | $ | 1,037.50 | | | | 0.69 | % | | $ | 3.54 | | |
| Hypothetical | | | 1,000.00 | | | | 1,021.70 | | | | 0.69 | | | | 3.52 | | |
Total Return Bond Fund Class I
| | | Beginning Account
Value 05/01/07 | | Ending Account
Value 10/31/07 | | Annualized
Expense Ratio | | Expense Paid
During Period | |
| Actual | | $ | 1,000.00 | | | $ | 1,039.50 | | | | 0.44 | % | | $ | 2.26 | | |
| Hypothetical | | | 1,000.00 | | | | 1,023.00 | | | | 0.44 | | | | 2.24 | | |
Global High Income Fund Class A
| | | Beginning Account
Value 05/01/07 | | Ending Account
Value 10/31/07 | | Annualized
Expense Ratio | | Expense Paid
During Period | |
| Actual | | $ | 1,000.00 | | | $ | 1,016.10 | | | | 1.00 | % | | $ | 5.08 | | |
| Hypothetical | | | 1,000.00 | | | | 1,020.20 | | | | 1.00 | | | | 5.09 | | |
Julius Baer Funds 2007 Annual Report
30
Global High Income Fund Class I
| | | Beginning Account
Value 05/01/07 | | Ending Account
Value 10/31/07 | | Annualized
Expense Ratio | | Expense Paid
During Period | |
| Actual | | $ | 1,000.00 | | | $ | 1,017.20 | | | | 0.75 | % | | $ | 3.81 | | |
| Hypothetical | | | 1,000.00 | | | | 1,021.40 | | | | 0.75 | | | | 3.82 | | |
U.S. Microcap Fund Class A
| | | Beginning Account
Value 05/01/07 | | Ending Account
Value 10/31/07 | | Annualized
Expense Ratio | | Expense Paid
During Period | |
| Actual | | $ | 1,000.00 | | | $ | 1,039.40 | | | | 1.80 | % | | $ | 9.25 | | |
| Hypothetical | | | 1,000.00 | | | | 1,016.10 | | | | 1.80 | | | | 9.15 | | |
U.S. Microcap Fund Class I
| | | Beginning Account
Value 05/01/07 | | Ending Account
Value 10/31/07 | | Annualized
Expense Ratio | | Expense Paid
During Period | |
| Actual | | $ | 1,000.00 | | | $ | 1,041.00 | | | | 1.50 | % | | $ | 7.72 | | |
| Hypothetical | | | 1,000.00 | | | | 1,017.60 | | | | 1.50 | | | | 7.63 | | |
U.S. Smallcap Fund Class A
| | | Beginning Account
Value 05/01/07 | | Ending Account
Value 10/31/07 | | Annualized
Expense Ratio | | Expense Paid
During Period | |
| Actual | | $ | 1,000.00 | | | $ | 1,171.40 | | | | 1.50 | % | | $ | 8.21 | | |
| Hypothetical | | | 1,000.00 | | | | 1,017.60 | | | | 1.50 | | | | 7.63 | | |
U.S. Smallcap Fund Class I
| | | Beginning Account
Value 05/01/07 | | Ending Account
Value 10/31/07 | | Annualized
Expense Ratio | | Expense Paid
During Period | |
| Actual | | $ | 1,000.00 | | | $ | 1,171.80 | | | | 1.20 | % | | $ | 6.57 | | |
| Hypothetical | | | 1,000.00 | | | | 1,019.20 | | | | 1.20 | | | | 6.11 | | |
U.S. Midcap Fund Class A
| | | Beginning Account
Value 05/01/07 | | Ending Account
Value 10/31/07 | | Annualized
Expense Ratio | | Expense Paid
During Period | |
| Actual | | $ | 1,000.00 | | | $ | 1,029.90 | | | | 1.35 | % | | $ | 6.91 | | |
| Hypothetical | | | 1,000.00 | | | | 1,018.40 | | | | 1.35 | | | | 6.87 | | |
U.S. Midcap Fund Class I
| | | Beginning Account
Value 05/01/07 | | Ending Account
Value 10/31/07 | | Annualized
Expense Ratio | | Expense Paid
During Period | |
| Actual | | $ | 1,000.00 | | | $ | 1,031.50 | | | | 1.05 | % | | $ | 5.38 | | |
| Hypothetical | | | 1,000.00 | | | | 1,019.90 | | | | 1.05 | | | | 5.35 | | |
Julius Baer Funds 2007 Annual Report
31
U.S. Multicap Fund Class A
| | | Beginning Account
Value 05/01/07 | | Ending Account
Value 10/31/07 | | Annualized
Expense Ratio | | Expense Paid
During Period | |
| Actual | | $ | 1,000.00 | | | $ | 1,064.70 | | | | 1.30 | % | | $ | 6.77 | | |
| Hypothetical | | | 1,000.00 | | | | 1,018.70 | | | | 1.30 | | | | 6.61 | | |
U.S. Multicap Fund Class I
| | | Beginning Account
Value 05/01/07 | | Ending Account
Value 10/31/07 | | Annualized
Expense Ratio | | Expense Paid
During Period | |
| Actual | | $ | 1,000.00 | | | $ | 1,066.30 | | | | 1.00 | % | | $ | 5.21 | | |
| Hypothetical | | | 1,000.00 | | | | 1,020.20 | | | | 1.00 | | | | 5.09 | | |
Julius Baer Funds 2007 Annual Report
32
Julius Baer Global Equity Fund Inc.(1)
It is the Julius Baer Global Equity Fund Inc.'s, policy to declare and pay annual dividends from its net investment income and distribute net realized capital gains, if any, annually.
Average Annual Total Return*—Class A
| Year Ended October 31, 2007 | | | 23.02 | % | |
| Five years ended 10/31/07 | | | 13.62 | % | |
| Ten years ended 10/31/07 | | | (6.72 | )% | |
| 7/1/04 - 10/31/07(1) | | | 20.02 | % | |
* All average annual total return figures shown reflect the reinvestment of dividends and capital gains distributions. Total returns for the Fund reflect expenses, waived and reimbursed, if applicable, by the Adviser and/or Administrator. Without such waivers and reimbursements, total returns would have been lower.
Growth of $10,000 invested in shares of Julius Baer Global Equity Fund
Inc. vs. MSCI All Country World Index and MSCI World Index (in U.S. dollars)
July 1, 2004-October 31, 2007†
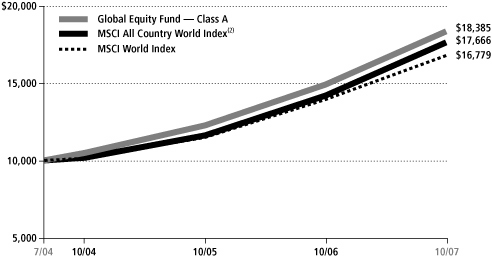
† Hypothetical illustration of $10,000 invested on July 1, 2004 assuming reinvestment of dividends and capital gains distributions through October 31, 2007. No adjustment has been made for shareholder tax liability on dividends or cap gains distributions. The MSCI All Country World Index ("MSCI ACWI") is a free float-adjusted market capitalization index that is designed to measure equity market performance in the global developed and emerging markets. As of June 2006, the MSCI ACWI consisted of 48 developed and emerging market country indices. The MSCI ACWI contemplates emerging market securities, which have become a significant part of the Fund's holdings. The MSCI World Index is a market capitalization weighted index composed of companies representative of the market structure of developed and emerging market countries in the Americas, Europe/Middle East and Asia/Pacific regions.
(1) On July 1, 2004, the Fund changed its name from The European Warrant Fund, Inc. and converted from a close-end, non diversified investment company ("closed-end fund") to an open-end diversified investment company with a different investment objective, different investment strategies, different management team and a new investment adviser (an affiliate of the closed-end Fund's adviser). Until the close of business on June 30, 2004, the Fund operated as a closed-end Fund and its common stock (which then comprised of a single share class) was listed on the NYSE. After the close of business on June 30, 2004, all of the common stock was converted into Class A shares of the Fund, and the Fund began seeking to maximize total return principally through capital appreciation by investing in a diversified portfolio of equity securities of issuers located throughout the world. For periods prior thereto, all historical performance informat ion for Class A shares reflects the Net Asset Value (NAV) performance of the Fund's common stock while it was a closed-end fund.
(2) Effective March 1, 2007, the index was changed to the MSCI All Country World Index.
Note: All figures cited here and on the following pages represent past performance of the Global Equity Fund, Inc., and do not guarantee future results. Investment return and principal value of an investment will fluctuate so that an investor's shares upon redemption may be worth more or less than their original cost.
Julius Baer Funds 2007 Annual Report
33
Julius Baer International Equity Fund
It is the Julius Baer International Equity Fund's policy to declare and pay annual dividends from its net investment income and distribute net realized capital gains, if any, annually.
Average Annual Total Return*—Class A
| Year Ended 10/31/07 | | | 33.33 | % | |
| Five Years Ended 10/31/07 | | | 26.61 | % | |
| Ten Years Ended 10/31/07 | | | 18.20 | % | |
| Inception (10/4/93) through 10/31/07 | | | 13.55 | % | |
The performance quoted represents past performance, which does not guarantee future results. The investment return and principal value of an investment will fluctuate and will fluctuate so that an investor's shares, when redeemed, may be worth more or less than their original cost. Current performance of the Fund may be lower or higher than the performance quoted. For up to date month-end performance information, please call 800-387-6977.
* All average annual total return figures shown reflect the reinvestment of dividends and capital gains distributions. The International Equity Fund Class A commenced operations on October 4, 1993. Total returns for the Fund reflect expenses, waived and reimbursed, if applicable, by the Adviser and/or Administrator. Without such waivers and reimbursements, total returns would have been lower.
Growth of $10,000 invested in Class A shares of Julius Baer International Equity Fund vs. MSCI All Country World ex-U.S. Index and Morgan Stanley EAFE Index October 31, 1997-October 31, 2007†
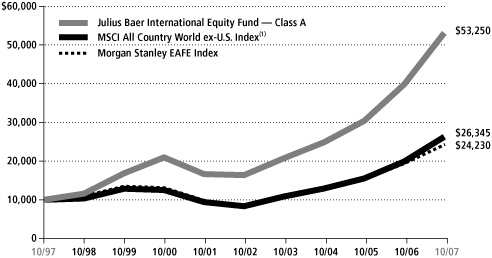
† Hypothetical illustration of $10,000 invested on October 31, 1997 assuming reinvestment of dividends and capital gains distributions through October 31, 2007. This period was one in which stock and bond prices fluctuated and the results should not be considered as a representation of dividend income or capital gain or loss which may be realized from an investment in the Interational Equity Fund today. No adjustment has been made for shareholder tax liability on dividends or capital gains distributions. The MSCI All Country World ex-US Index(1) is a composite portfolio consisting of equity total returns for the countries of Europe, Australia, New Zealand and countries in the Far East, weighted based on each country's gross domestic product. Indexes do not incur expenses and are not available for investment.
(1) Effective March 1, 2007 the benchmark for comparison changed to the MSCI All Country ex-U.S. Index.
Julius Baer Funds 2007 Annual Report
34
Julius Baer International Equity Fund II
It is the Julius Baer International Equity Fund II's policy to declare and pay annual dividends from its net investment income and distribute net realized capital gains, if any, annually.
Average Annual Total Return*—Class A
| Year Ended 10/31/07 | | | 30.89 | % | |
| Inception (5/4/2005) through 10/31/07 | | | 27.72 | % | |
The performance quoted represents past performance, which does not guarantee future results. The investment return and principal value of an investment will fluctuate and will fluctuate so that an investor's shares, when redeemed, may be worth more or less than their original cost. Current performance of the Fund may be lower or higher than the performance quoted. For up to date month-end performance information, please call 800-387-6977.
* All average annual total return figures shown reflect the reinvestment of dividends and capital gains distributions. The International Equity Fund II Class A commenced operations on May 4, 2005. Total returns for the Fund reflect expenses, waived and reimbursed, if applicable, by the Adviser and/or Administrator. Without such waivers and reimbursements, total returns would have been lower.
Growth of $10,000 invested in Class A shares of Julius Baer International Equity Fund II vs. MSCI All Country World ex-U.S. Index(1) and Morgan Stanley EAFE Index May 4, 2005-October 31, 2007†

† Hypothetical illustration of $10,000 invested on May 4, 2005 assuming reinvestment of dividends and capital gains distributions through October 31, 2007. This period was one in which stock and bond prices fluctuated and the results should not be considered as a representation of dividend income or capital gain or loss which may be realized from an investment in the Interational Equity Fund II today. No adjustment has been made for shareholder tax liability on dividends or capital gains distributions. The MSCI All Country World ex-U.S. Index(1) is a composite portfolio consisting of equity total returns for the countries of Europe, Australia, New Zealand and countries in the Far East, weighted based on each country's gross domestic product. Indexes do not incur expenses and are not available for investment.
(1) Effective March 1, 2007 the benchmark for comparison changed to the MSCI All Country World ex-U.S. Index.
Julius Baer Funds 2007 Annual Report
35
Julius Baer Total Return Bond Fund
It is the Julius Baer Total Return Bond Fund's policy to declare and pay monthly dividends from its net investment income and distribute net realized capital gains, if any, annually.
Average Annual Total Return*—Class A
| Year Ended 10/31/07 | | | 6.75 | % | |
| Five Years Ended 10/31/07 | | | 6.19 | % | |
| Ten Years Ended 10/31/07 | | | 5.98 | % | |
| Inception (7/1/92) through 10/31/07 | | | 6.13 | % | |
The performance quoted represents past performance, which does not guarantee future results. The investment return and principal value of an investment will fluctuate so that an investor's shares, when redeemed, may be worth more or less than their original cost. Current performance of the Fund may be lower or higher than the performance quoted. For up to date month-end performance information, please call 800-387-6977.
* All average annual total return figures shown reflect the reinvestment of dividends and capital gains distributions. The Julius Baer Total Return Bond Fund commenced operations on July 1, 1992 and the service providers waived their advisory, sub-advisory and administration fees from 7/1/92 to 10/31/92 and from 9/1/98 to 10/31/03; without such waivers and reimbursements, total returns would have been lower.
Growth of $10,000 invested in Class A shares of Julius Baer Total Return Bond Fund vs. Lehman Brothers U.S. Aggregate Bond Index October 31, 1997-October 31, 2007†
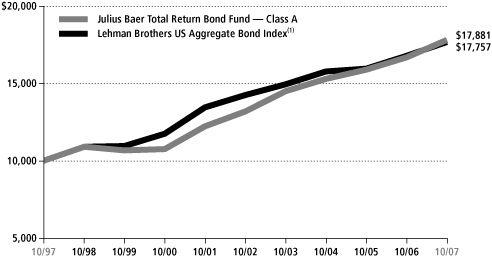
† Hypothetical illustration of $10,000 invested on October 31, 1996 assuming reinvestment of dividends and capital gains distributions and application of fee waivers through October 31, 2007. This period was one in which stock and bond prices fluctuated and the results should not be considered a representation of the income or capital gain or loss which may be realized from an investment in the Total Return Bond Fund today. No adjustment has been made for shareholder tax liability on dividends or capital gains distributions. The Lehman Brothers U.S. Aggregate Bond Index, an unmanaged index used as a general measure of U.S. fixed income securities, tracks the performance of debt instruments issued by corporations and the U.S. Government and its agencies. Indexes do not incur expenses and are not available for investment.
(1) Effective July 1, 2005 the benchmark for comparison changed to the Lehman Brothers U.S. Aggregate Bond Index.
Julius Baer Funds 2007 Annual Report
36
Julius Baer Global High Income Fund
It is the Julius Baer Global High Income Fund's policy to declare and pay monthly dividends from its net investment income and distribute net realized capital gains, if any, annually.
Total Return*—Class A
| Year Ended 10/31/07 | | | 8.58 | % | |
| Inception (12/17/02) through 10/31/07 | | | 11.94 | % | |
The performance quoted represents past performance, which does not guarantee future results. The investment return and principal value of an investment will fluctuate so that an investor's shares, when redeemed, may be worth more or less than their original cost. Current performance of the Fund may be lower or higher than the performance quoted. For up to date month-end performance information, please call 800-387-6977.
* Total return figures shown reflect the reinvestment of dividends and capital gains distributions. The Global High Income Fund commenced operations on December 17, 2002 and the Adviser had contractually agreed to reimburse certain expenses of the Fund through 2/28/2006; without such reimbursements total returns woiuld have been lower.
Growth of $10,000 invested in Class A shares of Julius Baer Global High Income Fund vs. Merrill Lynch Global High Yield Constrained Index December 17, 2002-October 31, 2007†
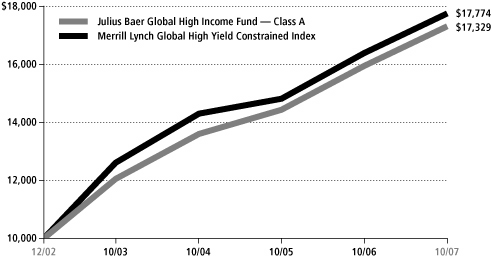
† Hypothetical illustration of $10,000 invested on December 17, 2002 assuming reinvestment of dividends and capital gains distributions and application of fee waivers through 2/28/2006. This period was one in which stock and bond prices fluctuated and the results should not be considered a representation of the income or capital gain or loss which may be realized from an investment in the Global High Income Fund today. No adjustment has been made for shareholder tax liability on dividends or capital gains distributions. The Merrill Lynch Global High Yield Constrained Index tracks the performance of below investment grade bonds of corporate issuers domiciled in countries having an investment grade of foreign currency long-term debt rating (based on a composite of Moody's Investors Service, Inc. and Standard & Poor's Rating Service). Indexes do not incur expenses and are not available for investment.
Julius Baer Funds 2007 Annual Report
37
Julius Baer U.S. Microcap Fund
It is the Julius Baer U.S. Microcap Fund's policy to declare and pay annual dividends from its net investment income and distribute net realized capital gains, if any, annually.
Average Annual Total Return*—Class A
| Year Ended 10/31/07 | | | 12.43 | % | |
| Inception (7/24/06) through 10/31/07 | | | 20.39 | % | |
The performance quoted represents past performance, which does not guarantee future results. The investment return and principal value of an investment will fluctuate and will fluctuate so that an investor's shares, when redeemed, may be worth more or less than their original cost. Current performance of the Fund may be lower or higher than the performance quoted. For up to date month-end performance information, please call 800-387-6977.
* All average annual total return figures shown reflect the reinvestment of dividends and capital gains distributions. The U.S. Microcap Fund Class A commenced operations on July 24, 2006. Total returns for the Fund reflect expenses, waived and reimbursed, if applicable, by the Adviser and/or Administrator. Without such waivers and reimbursements, total returns would have been lower.
Growth of $10,000 invested in Class A shares of Julius Baer U.S. Microcap Fund vs. Russell 2000 Index July 24, 2006-October 31, 2007†

† Hypothetical illustration of $10,000 invested on July 24, 2006 assuming reinvestment of dividends and capital gains distributions through October 31, 2007. This period was one in which stock and bond prices fluctuated and the results should not be considered as a representation of dividend income or capital gain or loss which may be realized from an investment in the U.S. Microcap Fund today. No adjustment has been made for shareholder tax liability on dividends or capital gains distributions.
Julius Baer Funds 2007 Annual Report
38
Julius Baer U.S. Smallcap Fund
It is the Julius Baer U.S. Smallcap Fund's policy to declare and pay annual dividends from its net investment income and distribute net realized capital gains, if any, annually.
Average Annual Total Return*—Class A
| Year Ended 10/31/07 | | | 29.44 | % | |
| Inception (7/24/06) through 10/31/07 | | | 32.99 | % | |
The performance quoted represents past performance, which does not guarantee future results. The investment return and principal value of an investment will fluctuate and will fluctuate so that an investor's shares, when redeemed, may be worth more or less than their original cost. Current performance of the Fund may be lower or higher than the performance quoted. For up to date month-end performance information, please call 800-387-6977.
* All average annual total return figures shown reflect the reinvestment of dividends and capital gains distributions. The U.S. Smallcap Fund Class A commenced operations on July 24, 2006. Total returns for the Fund reflect expenses, waived and reimbursed, if applicable, by the Adviser and/or Administrator. Without such waivers and reimbursements, total returns would have been lower.
Growth of $10,000 invested in Class A shares of Julius Baer U.S. Smallcap Fund vs. Russell 2000 Index July 24, 2006-October 31, 2007†
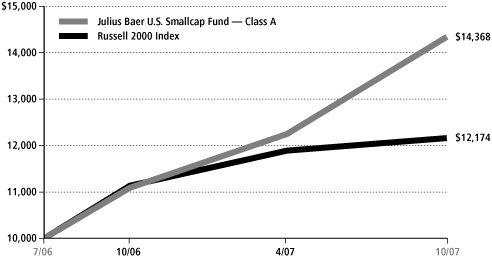
† Hypothetical illustration of $10,000 invested on July 24, 2006 assuming reinvestment of dividends and capital gains distributions through October 31, 2007. This period was one in which stock and bond prices fluctuated and the results should not be considered as a representation of dividend income or capital gain or loss which may be realized from an investment in the U.S. Smallcap Fund today. No adjustment has been made for shareholder tax liability on dividends or capital gains distributions.
Julius Baer Funds 2007 Annual Report
39
Julius Baer U.S. Midcap Fund
It is the Julius Baer U.S. Midcap Fund's policy to declare and pay annual dividends from its net investment income and distribute net realized capital gains, if any, annually.
Average Annual Total Return*—Class A
| Year Ended 10/31/07 | | | 17.16 | % | |
| Inception (7/24/06) through 10/31/07 | | | 22.52 | % | |
The performance quoted represents past performance, which does not guarantee future results. The investment return and principal value of an investment will fluctuate and will fluctuate so that an investor's shares, when redeemed, may be worth more or less than their original cost. Current performance of the Fund may be lower or higher than the performance quoted. For up to date month-end performance information, please call 800-387-6977.
* All average annual total return figures shown reflect the reinvestment of dividends and capital gains distributions. The U.S. Midcap Fund Class A commenced operations on July 24, 2006. Total returns for the Fund reflect expenses, waived and reimbursed, if applicable, by the Adviser and/or Administrator. Without such waivers and reimbursements, total returns would have been lower.
Growth of $10,000 invested in Class A shares of Julius Baer U.S. Midcap Fund vs. Russell Midcap Index July 24, 2006-October 31, 2007†
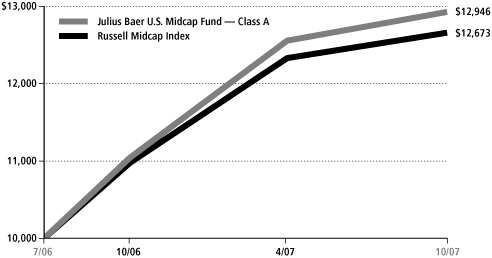
† Hypothetical illustration of $10,000 invested on July 24, 2006 assuming reinvestment of dividends and capital gains distributions through October 31, 2007. This period was one in which stock and bond prices fluctuated and the results should not be considered as a representation of dividend income or capital gain or loss which may be realized from an investment in the U.S. Midcap Fund today. No adjustment has been made for shareholder tax liability on dividends or capital gains distributions.
Julius Baer Funds 2007 Annual Report
40
Julius Baer U.S. Multicap Fund
It is the Julius Baer U.S. Multicap Fund's policy to declare and pay annual dividends from its net investment income and distribute net realized capital gains, if any, annually.
Average Annual Total Return*—Class A
| Year Ended 10/31/07 | | | 17.47 | % | |
| Inception (7/24/06) through 10/31/07 | | | 23.21 | % | |
The performance quoted represents past performance, which does not guarantee future results. The investment return and principal value of an investment will fluctuate and will fluctuate so that an investor's shares, when redeemed, may be worth more or less than their original cost. Current performance of the Fund may be lower or higher than the performance quoted. For up to date month-end performance information, please call 800-387-6977.
* All average annual total return figures shown reflect the reinvestment of dividends and capital gains distributions. The U.S. Multicap Fund Class A commenced operations on July 24, 2006. Total returns for the Fund reflect expenses, waived and reimbursed, if applicable, by the Adviser and/or Administrator. Without such waivers and reimbursements, total returns would have been lower.
Growth of $10,000 invested in Class A shares of Julius Baer U.S. Multicap Fund vs. Morgan Stanley EAFE Index July 24, 2006-October 31, 2007†
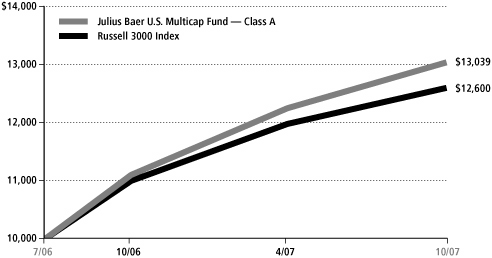
† Hypothetical illustration of $10,000 invested on July 24, 2006 assuming reinvestment of dividends and capital gains distributions through October 31, 2007. This period was one in which stock and bond prices fluctuated and the results should not be considered as a representation of dividend income or capital gain or loss which may be realized from an investment in the U.S. Multicap Fund today. No adjustment has been made for shareholder tax liability on dividends or capital gains distributions.
Julius Baer Funds 2007 Annual Report
41
PORTFOLIO OF INVESTMENTS October 31, 2007
Julius Baer Global Equity Fund Inc.
Share
Amount | | (Percentage of
Net Assets) | | Description | | Market
Value (Note 2) | |
| | COMMON STOCKS—87.7% | |
| | | United States—33.6% | |
| | 1,950 | | | | | 3M Co | | $ | 168,402 | | |
| | 24,374 | | | | | Activision Inc* | | | 576,445 | | |
| | 9,080 | | | | | Adobe Systems* | | | 434,932 | | |
| | 5,710 | | | | | Air Products & Chemicals | | | 558,724 | | |
| | 3,070 | | | | | Altria Group | | | 223,895 | | |
| | 16,770 | | | | | American Express | | | 1,022,132 | | |
| | 3,293 | | | | | Apple Inc* | | | 625,505 | | |
| | 14,420 | | | | | Aqua America | | | 335,409 | | |
| | 8,863 | | | | | ArthroCare Corp* (2) | | | 574,677 | | |
| | 12,770 | | | | | AT&T Inc | | | 533,658 | | |
| | 8,220 | | | | | Boeing Co | | | 810,410 | | |
| | 6,800 | | | | | Burlington Northern Santa Fe | | | 592,620 | | |
| | 11,525 | | | | | Carrizo Oil & Gas* (2) | | | 592,270 | | |
| | 8,518 | | | | | Celgene Corp* | | | 562,188 | | |
| | 64,467 | | | | | Century Casinos* | | | 460,939 | | |
| | 34,308 | | | | | Cheesecake Factory* (2) | | | 769,528 | | |
| | 26,340 | | | | | Cisco Systems* | | | 870,800 | | |
| | 2,350 | | | | | Colonial BancGroup | | | 45,073 | | |
| | 6,883 | | | | | CR Bard | | | 575,488 | | |
| | 3,720 | | | | | Crown Holdings* | | | 92,256 | | |
| | 22,181 | | | | | Daktronics Inc (2) | | | 661,437 | | |
| | 4,800 | | | | | Exelon Corp | | | 397,344 | | |
| | 9,890 | | | | | Freeport-McMoRan Copper & Gold | | | 1,163,855 | | |
| | 9,863 | | | | | Genentech Inc* | | | 731,144 | | |
| | 25,970 | | | | | General Electric | | | 1,068,925 | | |
| | 1,324 | | | | | Google Inc-Class A* | | | 936,068 | | |
| | 11,670 | | | | | Guess? Inc | | | 599,721 | | |
| | 17,048 | | | | | Hewlett-Packard | | | 881,041 | | |
| | 17,611 | | | | | Hexcel Corp* (2) | | | 440,803 | | |
| | 4,310 | | | | | Johnson & Johnson | | | 280,883 | | |
| | 15,023 | | | | | JPMorgan Chase | | | 706,081 | | |
| | 8,200 | | | | | Lehman Brothers | | | 519,388 | | |
| | 18,866 | | | | | Macqarie Infrastructure | | | 787,844 | | |
| | 25,310 | | | | | Marvell Technology* | | | 456,339 | | |
| | 3,770 | | | | | McDonald's Corp | | | 225,257 | | |
| | 6,184 | | | | | Medco Health Solutions* | | | 583,646 | | |
| | 27,160 | | | | | Mentor Graphics* | | | 435,103 | | |
| | 6,750 | | | | | Merrill Lynch | | | 445,635 | | |
| | 14,390 | | | | | Microsoft Corp | | | 529,696 | | |
See Notes to Financial Statements.
Julius Baer Funds 2007 Annual Report
42
PORTFOLIO OF INVESTMENTS (Continued) October 31, 2007
Julius Baer Global Equity Fund Inc.
Share
Amount | | (Percentage of
Net Assets) | | Description | | Market
Value (Note 2) | |
| | COMMON STOCKS—Continued | |
| | | United States—Continued | |
| | 22,614 | | | | | Network Appliance* | | $ | 712,115 | | |
| | 12,060 | | | | | Newmont Mining | | | 613,854 | | |
| | 13,482 | | | | | NII Holdings* | | | 781,956 | | |
| | 14,630 | | | | | Noble Corp | | | 774,659 | | |
| | 16,817 | | | | | Nordstrom Inc | | | 663,262 | | |
| | 5,210 | | | | | Nymex Holdings | | | 669,589 | | |
| | 11,340 | | | | | Polo Ralph Lauren (2) | | | 780,192 | | |
| | 14,048 | | | | | Procter & Gamble (2) | | | 976,617 | | |
| | 10,487 | | | | | RTI International Metals* (2) | | | 819,874 | | |
| | 10,750 | | | | | Southern Co | | | 394,095 | | |
| | 14,196 | | | | | Stericycle Inc* | | | 828,053 | | |
| | 11,810 | | | | | T Rowe Price | | | 758,674 | | |
| | 9,060 | | | | | Terex Corp* | | | 671,800 | | |
| | 8,835 | | | | | United Technologies | | | 676,673 | | |
| | 6,460 | | | | | Vulcan Materials | | | 552,395 | | |
| | 16,590 | | | | | WABCO Holdings | | | 843,10 4 | | |
| | 8,466 | | | | | Weight Watchers International | | | 433,798 | | |
| | 19,730 | | | | | Wells Fargo | | | 671,017 | | |
| | 16,570 | | | | | Western Refining | | | 607,788 | | |
| | 19,375 | | | | | Whole Foods Market (2) | | | 959,838 | | |
| | 2,830 | | | | | Wynn Resorts (2) | | | 456,847 | | |
| | 8,600 | | | | | Yum! Brands | | | 346,322 | | |
| | 10,690 | | | | | Zimmer Holdings* | | | 742,848 | | |
| | | | 38,010,931 | | |
| | | France—5.6% | |
| | 163 | | | | | Accor SA (1) | | | 15,590 | | |
| | 1,573 | | | | | Aeroports de Paris (1) | | | 180,571 | | |
| | 2,146 | | | | | Air Liquide (1) | | | 295,942 | | |
| | 871 | | | | | Alstom (1) | | | 207,200 | | |
| | 1,660 | | | | | BNP Paribas (1) | | | 183,650 | | |
| | 2,878 | | | | | Bouygues SA (1) | | | 277,098 | | |
| | 830 | | | | | Bureau Veritas* (1) | | | 48,008 | | |
| | 1,612 | | | | | Compagnie de Saint-Gobain (1) | | | 173,945 | | |
| | 2,160 | | | | | Credit Agricole (1) | | | 85,587 | | |
| | 209 | | | | | EDF Energies Nouvelles (1) | | | 16,777 | | |
| | 3,844 | | | | | Electricite de France (1) | | | 461,797 | | |
| | 302 | | | | | Eurazeo (1) | | | 45,073 | | |
| | 4,962 | | | | | France Telecom (1) | | | 183,309 | | |
See Notes to Financial Statements.
Julius Baer Funds 2007 Annual Report
43
PORTFOLIO OF INVESTMENTS (Continued) October 31, 2007
Julius Baer Global Equity Fund Inc.
Share
Amount | | (Percentage of
Net Assets) | | Description | | Market
Value (Note 2) | |
| | COMMON STOCKS—Continued | |
| | | France—Continued | |
| | 139 | | | | | Hermes International (1) | | $ | 18,305 | | |
| | 2,092 | | | | | JC Decaux (1) | | | 77,084 | | |
| | 4,077 | | | | | Lafarge SA (1) | | | 664,912 | | |
| | 5,331 | | | | | LVMH Moet Hennessy Louis Vuitton (1) | | | 687,537 | | |
| | 1,020 | | | | | M6-Metropole Television (1) | | | 30,215 | | |
| | 876 | | | | | Neuf Cegetel (1) | | | 44,352 | | |
| | 847 | | | | | Nexity (1) | | | 56,394 | | |
| | 982 | | | | | Pernod-Ricard (1) | | | 226,994 | | |
| | 1,126 | | | | | PPR (1) | | | 223,525 | | |
| | 320 | | | | | Remy Cointreau (1) | | | 24,609 | | |
| | 1,086 | | | | | Renault SA (1) | | | 182,952 | | |
| | 4,080 | | | | | Societe Television Francaise (1) | | | 113,102 | | |
| | 420 | | | | | Sodexho Alliance (1) | | | 30,456 | | |
| | 6,846 | | | | | Suez SA (1) | | | 446,178 | | |
| | 570 | | | | | Technip SA (1) | | | 51,220 | | |
| | 9,944 | | | | | Total SA (1) | | | 801,531 | | |
| | 1,411 | | | | | Veolia Environnement (1) | | | 126,121 | | |
| | 3,144 | | | | | Vinci SA (1) | | | 258,527 | | |
| | 780 | | | | | Vivendi (1) | | | 35,172 | | |
| | 250 | | | | | Wendel (1) | | | 42,921 | | |
| | | | 6,316,654 | | |
| | | United Kingdom—4.5% | |
| | 8,504 | | | | | Amec PLC (1) | | | 148,654 | | |
| | 7,981 | | | | | Anglo American (1) | | | 550,470 | | |
| | 2,530 | | | | | BAE Systems (1) | | | 26,262 | | |
| | 12,534 | | | | | BHP Billiton (1) | | | 477,708 | | |
| | 66,187 | | | | | BP PLC (1) | | | 859,810 | | |
| | 6,423 | | | | | Burberry Group (1) | | | 82,312 | | |
| | 19,421 | | | | | Compass Group (1) | | | 140,095 | | |
| | 27,847 | | | | | Diageo PLC (1) | | | 637,808 | | |
| | 8,065 | | | | | GlaxoSmithKline PLC (1) | | | 207,818 | | |
| | 3,701 | | | | | Intertek Group (1) | | | 79,175 | | |
| | 5,241 | | | | | Kingfisher PLC (1) | | | 21,540 | | |
| | 1,000 | | | | | Persimmon PLC (1) | | | 21,883 | | |
| | 1,073 | | | | | Peter Hambro Mining* (1) | | | 31,383 | | |
| | 4,410 | | | | | Reckitt Benckiser (1) | | | 256,024 | | |
See Notes to Financial Statements.
Julius Baer Funds 2007 Annual Report
44
PORTFOLIO OF INVESTMENTS (Continued) October 31, 2007
Julius Baer Global Equity Fund Inc.
Share
Amount | | (Percentage of
Net Assets) | | Description | | Market
Value (Note 2) | |
| | COMMON STOCKS—Continued | |
| | | United Kingdom—Continued | |
| | 17,050 | | | | | Rolls-Royce Group* (1) | | $ | 191,180 | | |
| | 688,820 | | | | | Rolls-Royce Group-Class B-Entitlement Shares* | | | 1,431 | | |
| | 4,646 | | | | | Scottish & Newcastle (1) | | | 75,801 | | |
| | 8,188 | | | | | Smith & Nephew (1) | | | 110,751 | | |
| | 7,080 | | | | | Taylor Wimpey (1) | | | 36,607 | | |
| | 29,087 | | | | | Tesco PLC (1) | | | 295,614 | | |
| | 186,729 | | | | | Vodafone Group (1) | | | 735,840 | | |
| | 4,833 | | | | | William Hill (1) | | | 62,368 | | |
| | 2,417 | | | | | WPP Group (1) | | | 33,062 | | |
| | | | 5,083,596 | | |
| | | Germany—4.3% | |
| | 303 | | | | | Adidas AG (1) | | | 20,244 | | |
| | 3,534 | | | | | Arcandor AG* (1)(2) | | | 113,571 | | |
| | 690 | | | | | BASF AG (1) | | | 95,409 | | |
| | 1,600 | | | | | Bayer AG (1) | | | 133,797 | | |
| | 506 | | | | | Bilfinger Berger (1) | | | 45,257 | | |
| | 580 | | | | | Celesio AG (1) | | | 32,867 | | |
| | 15,213 | | | | | Commerzbank AG (1) | | | 647,554 | | |
| | 240 | | | | | Continental AG (1) | | | 36,315 | | |
| | 4,627 | | | | | Daimler AG (1) | | | 510,942 | | |
| | 1,336 | | | | | Deutsche Boerse (1) | | | 211,729 | | |
| | 2,569 | | | | | Deutsche Post-Registered (1) | | | 77,890 | | |
| | 1,520 | | | | | Deutsche Postbank (1) | | | 111,267 | | |
| | 2,942 | | | | | E.ON AG (1) | | | 574,525 | | |
| | 9,948 | | | | | Fraport AG (1) | | | 778,949 | | |
| | 1,753 | | | | | Fresenius Medical Care (1) | | | 92,621 | | |
| | 2,996 | | | | | Fresenius SE (1) | | | 233,262 | | |
| | 2,257 | | | | | Henkel KGaA (1) | | | 104,773 | | |
| | 2,631 | | | | | Hypo Real Estate (1) | | | 156,949 | | |
| | 1,655 | | | | | IKB Deutsche Industriebank* (1) | | | 34,656 | | |
| | 183 | | | | | Merck KGaA (1) | | | 22,931 | | |
| | 897 | | | | | Rheinmetall AG (1) | | | 80,233 | | |
| | 5,184 | | | | | Rhoen-Klinikum AG (1) | | | 165,584 | | |
| | 1,000 | | | | | RWE AG (1) | | | 136,607 | | |
| | 2,784 | | | | | Siemens AG-Registered (1) | | | 378,849 | | |
| | 1,060 | | | | | Tognum AG* (1) | | | 38,347 | | |
| | | | 4,835,128 | | |
See Notes to Financial Statements.
Julius Baer Funds 2007 Annual Report
45
PORTFOLIO OF INVESTMENTS (Continued) October 31, 2007
Julius Baer Global Equity Fund Inc.
Share
Amount | | (Percentage of
Net Assets) | | Description | | Market
Value (Note 2) | |
| | COMMON STOCKS—Continued | |
| | | Russia—4.2% | |
| | 8,000 | | | | | AvtoVAZ GDR (3) | | $ | 65,972 | | |
| | 2,330 | | | | | Cherepovets MK Severstal Sponsored GDR† | | | 55,221 | | |
| | 1,524 | | | | | CTC Media* (2) | | | 38,237 | | |
| | 2,450 | | | | | Evraz Group GDR† | | | 183,819 | | |
| | 11 | | | | | Evrocement Group* (3) | | | 133,897 | | |
| | 19,687 | | | | | Gazprom Sponsored ADR (2) | | | 977,656 | | |
| | 3,173 | | | | | LUKOIL Sponsored ADR | | | 286,839 | | |
| | 530 | | | | | Mechel OAO ADR | | | 44,600 | | |
| | 148 | | | | | MMC Norilsk Nickel | | | 43,438 | | |
| | 1,690 | | | | | MMC Norilsk Nickel ADR (2) | | | 535,730 | | |
| | 21,156 | | | | | NovaTek OAO | | | 121,435 | | |
| | 50 | | | | | NovaTek OAO Sponsored GDR† | | | 2,870 | | |
| | 1,070 | | | | | NovaTek OAO Sponsored GDR-Registered Shares (1) | | | 61,621 | | |
| | 270 | | | | | Open Investments* (3) | | | 74,520 | | |
| | 4,683 | | | | | Pharmstandard GDR*† (3) | | | 102,136 | | |
| | 3,392 | | | | | Polyus Gold Sponsored ADR | | | 155,184 | | |
| | 841 | | | | | Rosneft Oil | | | 7,376 | | |
| | 44,852 | | | | | Rosneft Oil GDR (1) | | | 398,297 | | |
| | 66,300 | | | | | Sayano-Shushenskaya (3) | | | 116,191 | | |
| | 101,356 | | | | | Sberbank | | | 435,831 | | |
| | 6,961 | | | | | Sistema Hals GDR*† (3) | | | 67,870 | | |
| | 3,445 | | | | | Unified Energy System GDR* | | | 423,735 | | |
| | 3,720 | | | | | Uralkali | | | 18,600 | | |
| | 780 | | | | | Uralkali Sponsored GDR*† | | | 19,500 | | |
| | 1,700 | | | | | Uralsvyazinform ADR | | | 21,590 | | |
| | 1 | | | | | VolgaTelecom ADR | | | 11 | | |
| | 34,510 | | | | | Volzhskaya Hydroelectric Power Station (3) | | | 32,612 | | |
| | 9,589 | | | | | VTB Bank Sponsored GDR*† | | | 92,054 | | |
| | 1,880 | | | | | Wimm-Bill-Dann Foods ADR | | | 225,130 | | |
| | | | 4,741,972 | | |
| | | Japan—3.3% | |
| | 340 | | | | | Acom Co (1) | | | 8,126 | | |
| | 576 | | | | | Aeon Credit Service (1) | | | 8,861 | | |
| | 330 | | | | | Aiful Corp (1) | | | 7,792 | | |
| | 1,099 | | | | | Aisin Seiki (1) | | | 44,999 | | |
| | 820 | | | | | Bank of Kyoto (1) | | | 10,458 | | |
| | 9,520 | | | | | Bank of Yokohama (1) | | | 67,241 | | |
| | 2,567 | | | | | Canon Inc (1) | | | 129,795 | | |
See Notes to Financial Statements.
Julius Baer Funds 2007 Annual Report
46
PORTFOLIO OF INVESTMENTS (Continued) October 31, 2007
Julius Baer Global Equity Fund Inc.
Share
Amount | | (Percentage of
Net Assets) | | Description | | Market
Value (Note 2) | |
| | COMMON STOCKS—Continued | |
| | | Japan—Continued | |
| | 2,625 | | | | | Chiba Bank (1) | | $ | 21,030 | | |
| | 445 | | | | | Credit Saison (1) | | | 14,126 | | |
| | 1,593 | | | | | Daihatsu Motor (1) | | | 16,950 | | |
| | 682 | | | | | Daikin Industries (1) | | | 34,268 | | |
| | 2,097 | | | | | Daiwa Securities (1) | | | 20,212 | | |
| | 2,591 | | | | | Denso Corp (1) | | | 104,779 | | |
| | 4 | | | | | Dentsu Inc (1) | | | 10,490 | | |
| | 7 | | | | | East Japan Railway (1) | | | 57,664 | | |
| | 668 | | | | | Eisai Co (1) | | | 28,040 | | |
| | 660 | | | | | Fanuc Ltd (1) | | | 72,290 | | |
| | 16 | | | | | Fuji Television Network (1) | | | 32,282 | | |
| | 1,430 | | | | | Gunma Bank (1) | | | 10,161 | | |
| | 3,780 | | | | | Honda Motor (1) | | | 141,748 | | |
| | 486 | | | | | HOYA Corp (1) | | | 17,676 | | |
| | 1,082 | | | | | Ibiden Co (1) | | | 92,010 | | |
| | 2,439 | | | | | ITOCHU Corp (1) | | | 31,073 | | |
| | 16 | | | | | Japan Tobacco (1) | | | 93,188 | | |
| | 480 | | | | | JFE Holdings (1) | | | 28,060 | | |
| | 679 | | | | | JS Group (1) | | | 10,978 | | |
| | 640 | | | | | JSR Corp (1) | | | 16,575 | | |
| | 9 | | | | | KDDI Corp (1) | | | 68,178 | | |
| | 1,760 | | | | | Komatsu Ltd (1) | | | 59,001 | | |
| | 2,079 | | | | | Kubota Corp (1) | | | 17,494 | | |
| | 261 | | | | | Kyocera Corp (1) | | | 22,117 | | |
| | 805 | | | | | Makita Corp (1) | | | 38,943 | | |
| | 3,751 | | | | | Matsushita Electric Industrial (1) | | | 71,740 | | |
| | 2,150 | | | | | Mitsubishi Corp (1) | | | 66,887 | | |
| | 3,425 | | | | | Mitsubishi Electric (1) | | | 41,572 | | |
| | 16,308 | | | | | Mitsubishi UFJ Financial (1) | | | 162,565 | | |
| | 2,680 | | | | | Mitsui & Co (1) | | | 69,720 | | |
| | 874 | | | | | Mitsui Fudosan (1) | | | 24,147 | | |
| | 21 | | | | | Mizuho Financial (1) | | | 118,103 | | |
| | 554 | | | | | Nintendo Co (1) | | | 349,353 | | |
| | 2,974 | | | | | Nippon Electric Glass (1) | | | 50,428 | | |
| | 7 | | | | | Nippon Telegraph & Telephone (1) | | | 32,098 | | |
| | 1,620 | | | | | Nissan Motor (1) | | | 18,678 | | |
| | 1,080 | | | | | Nitto Denko (1) | | | 52,716 | | |
| | 1,948 | | | | | Nomura Holdings (1) | | | 34,731 | | |
| | 2,655 | | | | | NSK Ltd (1) | | | 23,623 | | |
See Notes to Financial Statements.
Julius Baer Funds 2007 Annual Report
47
PORTFOLIO OF INVESTMENTS (Continued) October 31, 2007
Julius Baer Global Equity Fund Inc.
Share
Amount | | (Percentage of
Net Assets) | | Description | | Market
Value (Note 2) | |
| | COMMON STOCKS—Continued | |
| | | Japan—Continued | |
| | 36 | | | | | NTT DoCoMo (1) | | $ | 52,209 | | |
| | 490 | | | | | Olympus Corp (1) | | | 20,505 | | |
| | 437 | | | | | Promise Co (1) | | | 13,127 | | |
| | 1,199 | | | | | Ricoh Co (1) | | | 23,654 | | |
| | 2 | | | | | Sapporo Hokuyo (1) | | | 20,577 | | |
| | 570 | | | | | Seven & I (1) | | | 14,685 | | |
| | 1,386 | | | | | Sharp Corp (1) | | | 21,836 | | |
| | 980 | | | | | Shizuoka Bank (1) | | | 10,258 | | |
| | 1,960 | | | | | Sony Corp (1) | | | 96,903 | | |
| | 1,270 | | | | | Stanley Electric (1) | | | 28,209 | | |
| | 4,870 | | | | | Sumitomo Chemical (1) | | | 43,222 | | |
| | 1,898 | | | | | Sumitomo Corp (1) | | | 33,092 | | |
| | 1,075 | | | | | Sumitomo Electric Industries (1) | | | 17,322 | | |
| | 3,749 | | | | | Sumitomo Heavy Industries (1) | | | 49,605 | | |
| | 6,563 | | | | | Sumitomo Metal Industries (1) | | | 32,362 | | |
| | 12 | | | | | Sumitomo Mitsui Financial (1) | | | 97,986 | | |
| | 1,936 | | | | | Sumitomo Trust & Banking (1) | | | 14,387 | | |
| | 1,570 | | | | | Suruga Bank (1) | | | 20,651 | | |
| | 5,533 | | | | | Suzuki Motor (1) | | | 180,932 | | |
| | 560 | | | | | Takata Corp (1) | | | 19,949 | | |
| | 476 | | | | | Takeda Pharmaceutical (1) | | | 29,731 | | |
| | 713 | | | | | Takefuji Corp (1) | | | 18,233 | | |
| | 1,785 | | | | | Toray Industries (1) | | | 13,766 | | |
| | 5,298 | | | | | Toyota Motor (1) | | | 302,871 | | |
| | 535 | | | | | Yamada Denki (1) | | | 55,105 | | |
| | 2,092 | | | | | Yamaha Motor (1) | | | 59,589 | | |
| | 1,203 | | | | | Yamato Holdings (1) | | | 17,668 | | |
| | 1,163 | | | | | Yokogawa Electric (1) | | | 14,683 | | |
| | | | 3,776,083 | | |
| | | Australia—3.0% | |
| | 25,455 | | | | | BHP Billiton (1) | | | 1,102,434 | | |
| | 428 | | | | | BHP Billiton Sponsored ADR (2) | | | 37,347 | | |
| | 4,611 | | | | | Brambles Ltd (1) | | | 61,106 | | |
| | 6,130 | | | | | Fairfax Media (1) | | | 27,093 | | |
| | 108,192 | | | | | Macquarie Airports (1) | | | 442,035 | | |
| | 19,137 | | | | | Newcrest Mining | | | 574,621 | | |
| | 980 | | | | | Publishing & Broadcasting (1) | | | 19,053 | | |
| | 220 | | | | | Rio Tinto Sponsored ADR (2) | | | 82,500 | | |
See Notes to Financial Statements.
Julius Baer Funds 2007 Annual Report
48
PORTFOLIO OF INVESTMENTS (Continued) October 31, 2007
Julius Baer Global Equity Fund Inc.
Share
Amount | | (Percentage of
Net Assets) | | Description | | Market
Value (Note 2) | |
| | COMMON STOCKS—Continued | |
| | | Australia—Continued | |
| | 10,168 | | | | | Rio Tinto (1) | | $ | 999,951 | | |
| | | | 3,346,140 | | |
| | | Switzerland—2.7% | |
| | 9,410 | | | | | ABB Ltd (1) | | | 284,365 | | |
| | 1,372 | | | | | BKW FMB Energie (1) | | | 164,973 | | |
| | 5,565 | | | | | Compagnie Financiere Richemont (1) | | | 397,830 | | |
| | 2,012 | | | | | Credit Suisse-Registered (1) | | | 135,758 | | |
| | 383 | | | | | Dufry Group (1) | | | 42,346 | | |
| | 330 | | | | | Flughafen Wien-Registered (1) | | | 133,467 | | |
| | 3,125 | | | | | Holcim Ltd (1) | | | 357,270 | | |
| | 809 | | | | | Nestle SA-Registered (1) | | | 373,756 | | |
| | 120 | | | | | Nobel Biocare Holding* (1) | | | 35,031 | | |
| | 898 | | | | | Roche Holding (1) | | | 153,420 | | |
| | 95 | | | | | SGS SA (1) | | | 125,139 | | |
| | 1,020 | | | | | Swatch Group (1) | | | 326,798 | | |
| | 580 | | | | | Synthes Inc (1) | | | 72,490 | | |
| | 2,100 | | | | | UBS AG-Registered (1) | | | 112,645 | | |
| | 4,930 | | | | | Xstrata PLC (1) | | | 353,671 | | |
| | | | 3,068,959 | | |
| | | Poland—2.6% | |
| | 694 | | | | | Bank BPH (1) | | | 272,587 | | |
| | 5,850 | | | | | Bank Handlowy w Warszawie (1) | | | 273,745 | | |
| | 14,591 | | | | | Bank Millenium (1) | | | 79,260 | | |
| | 5,876 | | | | | Bank Pekao (1) | | | 627,176 | | |
| | 2,410 | | | | | Bank Zachodni WBK (1) | | | 267,566 | | |
| | 150 | | | | | BRE Bank* (1) | | | 34,274 | | |
| | 1,943 | | | | | Budimex SA* (1) | | | 57,669 | | |
| | 210 | | | | | ING Bank Slaski (1) | | | 74,580 | | |
| | 508 | | | | | Opoczno SA* (1) | | | 8,741 | | |
| | 27,001 | | | | | PKO Bank Polski (1) | | | 600,468 | | |
| | 57,630 | | | | | Polskie Gornictwo Naftowe I (1) | | | 131,396 | | |
| | 20,837 | | | | | Polski Koncern Miesny Duda* (1) | | | 80,487 | | |
| | 45,275 | | | | | Telekomunikacja Polska (1) | | | 428,808 | | |
| | | | 2,936,757 | | |
See Notes to Financial Statements.
Julius Baer Funds 2007 Annual Report
49
PORTFOLIO OF INVESTMENTS (Continued) October 31, 2007
Julius Baer Global Equity Fund Inc.
Share
Amount | | (Percentage of
Net Assets) | | Description | | Market
Value (Note 2) | |
| | COMMON STOCKS—Continued | |
| | | Hungary—2.4% | |
| | 98,487 | | | | | Magyar Telekom Telecommunications (1) | | $ | 529,662 | | |
| | 447 | | | | | MOL Hungarian Oil and Gas (1) | | | 68,792 | | |
| | 36,086 | | | | | OTP Bank (1) | | | 1,956,800 | | |
| | 868 | | | | | Richter Gedeon (1) | | | 188,466 | | |
| | | | 2,743,720 | | |
| | | Canada—2.2% | |
| | 3,830 | | | | | Cameco Corp | | | 187,710 | | |
| | 570 | | | | | Canadian Natural Resources | | | 47,146 | | |
| | 2,760 | | | | | Eldorado Gold* | | | 19,150 | | |
| | 1,930 | | | | | Imperial Oil | | | 104,547 | | |
| | 24,147 | | | | | Ivanhoe Mines* | | | 330,248 | | |
| | 2,510 | | | | | OPTI Canada* | | | 50,343 | | |
| | 3,496 | | | | | Potash Corp of Saskatchewan | | | 432,859 | | |
| | 770 | | | | | Research in Motion* | | | 95,873 | | |
| | 2,680 | | | | | Suncor Energy | | | 291,899 | | |
| | 3,910 | | | | | Talisman Energy | | | 84,721 | | |
| | 11,113 | | | | | Ultra Petroleum* | | | 787,467 | | |
| | 7,350 | | | | | UTS Energy* | | | 47,282 | | |
| | | | 2,479,245 | | |
| | | Austria—1.7% | |
| | 578 | | | | | CA Immobilien Anlagen* (1) | | | 15,606 | | |
| | 4,842 | | | | | Erste Bank der Oesterreichischen Sparkassen (1) | | | 394,710 | | |
| | 626 | | | | | Flughafen Wien (1) | | | 74,208 | | |
| | 14,164 | | | | | Immoeast AG* (1) | | | 172,907 | | |
| | 1,530 | | | | | Oesterreichische Elektrizitaetswirtschafts-Class A (1) | | | 101,162 | | |
| | 5,283 | | | | | OMV AG (1) | | | 395,921 | | |
| | 2,705 | | | | | Raiffeisen International Bank (1) | | | 449,086 | | |
| | 1,622 | | | | | Telekom Austria (1) | | | 46,576 | | |
| | 2,253 | | | | | Wiener Staedtische Versicherung (1) | | | 166,339 | | |
| | 2,570 | | | | | Wienerberger AG (1) | | | 160,666 | | |
| | | | 1,977,181 | | |
| | | Finland—1.5% | |
| | 619 | | | | | Elisa Oyj (1)(2) | | | 18,394 | | |
| | 9,094 | | | | | Fortum Oyj (1) | | | 394,767 | | |
| | 4,112 | | | | | Kemira Oyj (1) | | | 97,534 | | |
| | 1,297 | | | | | Kesko Oyj-Class B (1) | | | 77,768 | | |
| | 620 | | | | | Metso Oyj (1) | | | 37,959 | | |
See Notes to Financial Statements.
Julius Baer Funds 2007 Annual Report
50
PORTFOLIO OF INVESTMENTS (Continued) October 31, 2007
Julius Baer Global Equity Fund Inc.
Share
Amount | | (Percentage of
Net Assets) | | Description | | Market
Value (Note 2) | |
| | COMMON STOCKS—Continued | |
| | | Finland—Continued | |
| | 12,928 | | | | | Nokia Oyj (1) | | $ | 512,831 | | |
| | 389 | | | | | Nokian Renkaat (1) | | | 14,677 | | |
| | 1,660 | | | | | OKO Bank-Class A (1) | | | 35,626 | | |
| | 5,467 | | | | | Orion Oyj-Class B (1) | | | 140,437 | | |
| | 1,600 | | | | | Outotec Oyj (1) | | | 122,934 | | |
| | 4,754 | | | | | Ramirent Oyj (1) | | | 106,529 | | |
| | 1,305 | | | | | Sanoma-WSOY Oyj (1) | | | 37,691 | | |
| | 3,505 | | | | | YIT Oyj (1) | | | 108,721 | | |
| | | | 1,705,868 | | |
| | | Belgium—1.5% | |
| | 5,350 | | | | | Fortis (1) | | | 171,469 | | |
| | 357 | | | | | Groupe Bruxelles Lambert (1) | | | 45,788 | | |
| | 9,260 | | | | | KBC Ancora (1) | | | 1,045,731 | | |
| | 2,777 | | | | | KBC Groep (1) | | | 389,747 | | |
| | | | 1,652,735 | | |
| | | Hong Kong—1.4% | |
| | 2,850 | | | | | Alibaba.com Ltd*† | | | 4,964 | | |
| | 46,797 | | | | | China Merchants Holdings International (1) | | | 331,772 | | |
| | 12,960 | | | | | China Mobile (1) | | | 270,499 | | |
| | 16,000 | | | | | Clear Media* (1) | | | 17,003 | | |
| | 64,630 | | | | | Emperor Entertainment Hotel (1) | | | 14,907 | | |
| | 27,978 | | | | | Galaxy Entertainment* (1) | | | 30,533 | | |
| | 130,240 | | | | | GOME Electrical Appliances (1) | | | 298,022 | | |
| | 10,929 | | | | | Hutchison Telecommunications International (1) | | | 15,597 | | |
| | 50,200 | | | | | Melco International Development (1) | | | 95,806 | | |
| | 6,970 | | | | | Melco PBL Entertainment ADR* (2) | | | 110,823 | | |
| | 209,769 | | | | | Shun Tak (1) | | | 329,449 | | |
| | 48,540 | | | | | Texwinca Holdings (1) | | | 42,744 | | |
| | | | 1,562,119 | | |
| | | Italy—1.4% | |
| | 560 | | | | | Autogrill SpA (1) | | | 11,187 | | |
| | 12,830 | | | | | Banca Popolare di Milano (1) | | | 200,130 | | |
| | 2,752 | | | | | Banco Popolare Scarl* (1) | | | 65,945 | | |
| | 1,939 | | | | | Bulgari SpA (1) | | | 30,192 | | |
| | 9,391 | | | | | Buzzi Unicem (1) | | | 265,813 | | |
| | 4,716 | | | | | Credito Emiliano (1) | | | 63,722 | | |
| | 1,030 | | | | | Finmeccanica SpA (1) | | | 30,487 | | |
See Notes to Financial Statements.
Julius Baer Funds 2007 Annual Report
51
PORTFOLIO OF INVESTMENTS (Continued) October 31, 2007
Julius Baer Global Equity Fund Inc.
Share
Amount | | (Percentage of
Net Assets) | | Description | | Market
Value (Note 2) | |
| | COMMON STOCKS—Continued | |
| | | Italy—Continued | |
| | 4,398 | | | | | Geox SpA (1) | | $ | 105,201 | | |
| | 27,050 | | | | | Intesa Sanpaolo* (1) | | | 205,595 | | |
| | 3,642 | | | | | Italcementi SpA (1) | | | 83,571 | | |
| | 300 | | | | | Lottomatica SpA (1) | | | 10,691 | | |
| | 3,970 | | | | | Mediobanca SpA (1) | | | 94,150 | | |
| | 10,327 | | | | | Telecom Italia (1) | | | 32,390 | | |
| | 31,121 | | | | | UniCredito Italiano (1) | | | 266,366 | | |
| | 2,360 | | | | | Unione di Banche Italiane (1) | | | 65,492 | | |
| | | | 1,530,932 | | |
| | | Norway—1.3% | |
| | 3,670 | | | | | Aker Kvaerner (1) | | | 128,122 | | |
| | 690 | | | | | Cermaq ASA (1) | | | 10,544 | | |
| | 12,113 | | | | | DnB NOR (1) | | | 199,522 | | |
| | 23,580 | | | | | Marine Harvest* (1) | | | 23,901 | | |
| | 18,472 | | | | | Norsk Hydro (1) | | | 270,422 | | |
| | 14,743 | | | | | StatoiHydro ASA (1) | | | 496,900 | | |
| | 4,465 | | | | | Telenor ASA* (1) | | | 104,853 | | |
| | 5,700 | | | | | Yara International (1) | | | 220,898 | | |
| | | | 1,455,162 | | |
| | | Czech Republic—1.3% | |
| | 6,242 | | | | | Komercni Banka (1) | | | 1,434,104 | | |
| | | Mexico—1.2% | |
| | 25,277 | | | | | America Movil SAB de CV-Class L | | | 79,823 | | |
| | 5,870 | | | | | America Movil SAB de CV ADR-Class L | | | 383,839 | | |
| | 4,705 | | | | | Controladora Comercial Mexicana | | | 14,599 | | |
| | 28,730 | | | | | Corporacion Moctezuma | | | 91,264 | | |
| | 650 | | | | | Desarrolladora Homex ADR* (2) | | | 36,731 | | |
| | 4,817 | | | | | Fomento Economico Mexicano Sponsored ADR | | | 171,533 | | |
| | 854 | | | | | Grupo Aeroportuario del Sureste ADR (2) | | | 50,933 | | |
| | 49,166 | | | | | Grupo Financiero Banorte | | | 221,870 | | |
| | 7,090 | | | | | Grupo Televisa Sponsored ADR | | | 176,186 | | |
| | 20,427 | | | | | Urbi Desarrollos Urbanos* | | | 79,012 | | |
| | | | 1,305,790 | | |
| | | Sweden—1.1% | |
| | 1,642 | | | | | Getinge AB-Class B (1) | | | 43,571 | | |
| | 1,499 | | | | | Hennes & Mauritz-Class B (1) | | | 99,893 | | |
See Notes to Financial Statements.
Julius Baer Funds 2007 Annual Report
52
PORTFOLIO OF INVESTMENTS (Continued) October 31, 2007
Julius Baer Global Equity Fund Inc.
Share
Amount | | (Percentage of
Net Assets) | | Description | | Market
Value (Note 2) | |
| | COMMON STOCKS—Continued | |
| | | Sweden—Continued | |
| | 897 | | | | | Modern Times-Class B (1) | | $ | 63,134 | | |
| | 22,366 | | | | | Nordea Bank AB (1) | | | 400,871 | | |
| | 2,097 | | | | | OMX AB (1) | | | 88,185 | | |
| | 820 | | | | | Securitas AB-Class B (1) | | | 10,358 | | |
| | 5,682 | | | | | Skandinaviska Enskilda Banken (1) | | | 174,588 | | |
| | 9,989 | | | | | Swedbank AB (1) | | | 313,353 | | |
| | 11,168 | | | | | Telefonaktiebolaget LM Ericsson-Class B (1) | | | 33,503 | | |
| | 3,299 | | | | | TeliaSonera AB (1) | | | 32,497 | | |
| | | | 1,259,953 | | |
| | | Netherlands—1.0% | |
| | 2,167 | | | | | ING Groep (1) | | | 97,685 | | |
| | 18,885 | | | | | KKR Private Equity Investors | | | 370,146 | | |
| | 2,270 | | | | | Koninklijke Ahold* (1) | | | 34,140 | | |
| | 916 | | | | | Koninklijke Vopak (1) | | | 52,582 | | |
| | 8,268 | | | | | Royal KPN (1) | | | 156,122 | | |
| | 1,628 | | | | | TNT NV (1) | | | 66,850 | | |
| | 6,307 | | | | | Unilever NV (1) | | | 205,166 | | |
| | 3,260 | | | | | X 5 Retail GDR-Registered* (1) | | | 117,779 | | |
| | | | 1,100,470 | | |
| | | Cyprus—0.6% | |
| | 1,911 | | | | | AFI Development GDR*† | | | 19,874 | | |
| | 19,334 | | | | | Bank of Cyprus (1) | | | 378,481 | | |
| | 18,430 | | | | | Marfin Popular Bank Public (1) | | | 300,696 | | |
| | | | 699,051 | | |
| | | China—0.5% | |
| | 265,262 | | | | | Beijing Capital International Airport-Class H (1) | | | 532,640 | | |
| | 700 | | | | | China Communications Construction-Class H (1) | | | 2,221 | | |
| | 15,280 | | | | | Weiqiao Textile-Class H (1) | | | 28,705 | | |
| | 49,040 | | | | | Wumart Stores-Class H | | | 44,606 | | |
| | | | 608,172 | | |
| | | Spain—0.5% | |
| | 953 | | | | | Gamesa Corporacion Tecnologica (1) | | | 48,644 | | |
| | 4,970 | | | | | Iberdrola SA (1) | | | 79,985 | | |
| | 589 | | | | | Inditex SA (1) | | | 43,962 | | |
| | 10,998 | | | | | Telefonica SA (1) | | | 363,695 | | |
| | | | 536,286 | | |
See Notes to Financial Statements.
Julius Baer Funds 2007 Annual Report
53
PORTFOLIO OF INVESTMENTS (Continued) October 31, 2007
Julius Baer Global Equity Fund Inc.
Share
Amount | | (Percentage of
Net Assets) | | Description | | Market
Value (Note 2) | |
| | COMMON STOCKS—Continued | |
| | | Greece—0.5% | |
| | 40,300 | | | | | Alapis Holding Industrial and Commercial* (1) | | $ | 148,151 | | |
| | 5,071 | | | | | Hellenic Telecommunication Organization (1) | | | 185,586 | | |
| | 19,020 | | | | | Marfin Investment (1) | | | 180,503 | | |
| | | | 514,240 | | |
| | | Ukraine—0.4% | |
| | 2,526 | | | | | Ukrnafta Oil* (1) | | | 201,301 | | |
| | 1,096,759 | | | | | UkrTelecom* | | | 243,989 | | |
| | | | 445,290 | | |
| | | Romania—0.4% | |
| | 9,401 | | | | | BRD-Groupe Societe Generale | | | 106,630 | | |
| | 112,299 | | | | | Impact Developer and Contractor* | | | 50,266 | | |
| | 1,207,713 | | | | | SNP Petrom | | | 275,542 | | |
| | | | 432,438 | | |
| | | India—0.4% | |
| | 3,388 | | | | | State Bank of India GDR (1) | | | 422,482 | | |
| | | Ireland—0.3% | |
| | 4,300 | | | | | CRH PLC (1) | | | 165,137 | | |
| | 32,342 | | | | | Dragon Oil* (1) | | | 210,090 | | |
| | | | 375,227 | | |
| | | Denmark—0.3% | |
| | 60 | | | | | ALK-Abello (1) | | | 12,987 | | |
| | 579 | | | | | Carlsberg A/S-Class B (1) | | | 78,114 | | |
| | 430 | | | | | FLSmidth & Co (1) | | | 46,835 | | |
| | 1,150 | | | | | Novo-Nordisk-Class B (1) | | | 143,039 | | |
| | 104 | | | | | Rockwool International-Class B (1) | | | 33,369 | | |
| | 386 | | | | | Vestas Wind Systems* (1) | | | 34,725 | | |
| | | | 349,069 | | |
| | | South Africa—0.3% | |
| | 3,670 | | | | | Impala Platinum (1) | | | 134,704 | | |
| | 5,420 | | | | | MTN Group (1) | | | 105,483 | | |
| | 3,990 | | | | | Standard Bank (1) | | | 71,683 | | |
| | | | 311,870 | | |
See Notes to Financial Statements.
Julius Baer Funds 2007 Annual Report
54
PORTFOLIO OF INVESTMENTS (Continued) October 31, 2007
Julius Baer Global Equity Fund Inc.
Share
Amount | | (Percentage of
Net Assets) | | Description | | Market
Value (Note 2) | |
| | COMMON STOCKS—Continued | |
| | | Multinational—0.3% | |
| | 1,508 | | | | | Central European Media Enterprises-Class A* (2) | | $ | 173,043 | | |
| | 1,180 | | | | | Millicom International Cellular* | | | 138,626 | | |
| | | | 311,669 | | |
| | | South Korea—0.2% | |
| | 610 | | | | | Hyundai Motor (1) | | | 48,508 | | |
| | 530 | | | | | Kookmin Bank (1) | | | 43,766 | | |
| | 146 | | | | | NHN Corp* (1) | | | 47,385 | | |
| | 234 | | | | | Samsung Electronics (1) | | | 145,283 | | |
| | | | 284,942 | | |
| | | Croatia—0.2% | |
| | 102 | | | | | Atlantska Plovidba | | | 69,975 | | |
| | 528 | | | | | Dom Holding* | | | 19,420 | | |
| | 84 | | | | | Ericsson Nikola Tesla | | | 53,695 | | |
| | 205 | | | | | FIMA Validus* | | | 6,330 | | |
| | 18 | | | | | Institut Gradevinarstva Hrvatske | | | 49,331 | | |
| | 492 | | | | | Podravka prehrambena industija | | | 49,545 | | |
| | 347 | | | | | Proficio DD* | | | 4,300 | | |
| | 32 | | | | | Viadukt DD* | | | 25,169 | | |
| | | | 277,765 | | |
| | | Brazil—0.2% | |
| | 9,690 | | | | | Bovespa Holding* (1) | | | 181,023 | | |
| | 791 | | | | | Diagnosticos da America (1) | | | 18,496 | | |
| | 2,600 | | | | | Unibanco-Units | | | 40,950 | | |
| | 140 | | | | | Unibanco GDR (1) | | | 22,126 | | |
| | | | 262,595 | | |
| | | Portugal—0.2% | |
| | 12,756 | | | | | Energias de Portugal (1) | | | 82,111 | | |
| | 23,100 | | | | | Jeronimo Martins (1) | | | 171,311 | | |
| | | | 253,422 | | |
| | | Turkey—0.2% | |
| | 5,174 | | | | | Acibadem Saglik Hizmetleri ve Ticaret (1) | | | 38,315 | | |
| | 1 | | | | | Anadolu Anonim Turk Sigorta Sirketi (1) | | | 3 | | |
| | 5,022 | | | | | Haci Omer Sabanci (1) | | | 34,368 | | |
| | 11,382 | | | | | Turkiye Garanti Bankasi (1) | | | 104,953 | | |
| | 9,011 | | | | | Turkiye Is Bankasi (1) | | | 61,757 | | |
| | | | 239,396 | | |
See Notes to Financial Statements.
Julius Baer Funds 2007 Annual Report
55
PORTFOLIO OF INVESTMENTS (Continued) October 31, 2007
Julius Baer Global Equity Fund Inc.
Share
Amount | | (Percentage of
Net Assets) | | Description | | Market
Value (Note 2) | |
| | COMMON STOCKS—Continued | |
| | | New Zealand—0.1% | |
| | 71,050 | | | | | Auckland International Airport (1) | | $ | 157,500 | | |
| | | Chile—0.1% | |
| | 530 | | | | | Sociedad Quimica y Minera de Chile Sponsored ADR | | | 101,760 | | |
| | | Thailand—0.1% | |
| | 80,380 | | | | | Bank of Ayudhya-NVDR (1) | | | 70,519 | | |
| | | Indonesia—0.1% | |
| | 88,770 | | | | | Semen Gresik Persero (1) | | | 61,014 | | |
| | | Lebanon—0.0% | |
| | 2,540 | | | | | SOLIDERE-Class A | | | 46,253 | | |
| | | Philippines—0.0% | |
| | 1,798 | | | | | Ayala Corp (1) | | | 25,930 | | |
| | 46,092 | | | | | Ayala Land (1) | | | 16,045 | | |
| | | | 41,975 | | |
| | | Taiwan—0.0% | |
| | 1,850 | | | | | Taiwan Semiconductor Manufacturing Sponsored ADR | | | 19,703 | | |
| | | TOTAL COMMON STOCKS (Cost $91,927,176) | | | 99,146,137 | | |
| | WARRANTS—1.9% | |
| | | India—1.6% | |
| | 6,565 | | | | | Bharti Airtel-Class A, Issued by CLSA, Expires 05/31/2010*† | | | 168,151 | | |
| | 17,698 | | | | | Canara Bank, Issued by Citigroup, Expires 10/24/2012 | | | 132,043 | | |
| | 2,458 | | | | | Oil and Natural Gas, Issued by CLSA, Expires 05/13/2010† | | | 77,943 | | |
| | 831 | | | | | Reliance Industrial, Issued by CLSA, Expires 05/17/2010† | | | 58,860 | | |
| | 3,484 | | | | | ICICI Bank, Issued by CLSA, Expires 05/10/2010† | | | 111,173 | | |
| | 1,874 | | | | | ICICI Bank, Issued by ABN Amro Bank, Expires 06/30/2009 | | | 59,904 | | |
| | 6,553 | | | | | ICICI Bank, Issued by Citigroup, Expires 10/24/2012† | | | 210,089 | | |
| | 3,869 | | | | | India Cements, Issued by ABN Amro Bank, Expires 06/30/2009 | | | 27,818 | | |
| | 3,205 | | | | | Mahindra & Mehindra, Issued by CLSA, Expires 06/28/2010† | | | 61,536 | | |
| | 4,314 | | | | | State Bank of India, Issued by Citigroup, Expires 10/24/2012† | | | 269,617 | | |
| | 7,899 | | | | | State Bank of India, Issued by CLSA, Expires 05/13/2010† | | | 492,596 | | |
| | 1,629 | | | | | State Bank of India, Issued by Deutsche Bank AG, Expires 08/18/2017† | | | 102,740 | | |
| | 473 | | | | | Suzlon Energy, Issued by Citigroup, Expires 10/24/2012 | | | 23,592 | | |
| | 116 | | | | | Suzlon Energy, Issued by CLSA, Expires 06/22/2011† | | | 5,825 | | |
| | | | 1,801,887 | | |
See Notes to Financial Statements.
Julius Baer Funds 2007 Annual Report
56
PORTFOLIO OF INVESTMENTS (Continued) October 31, 2007
Julius Baer Global Equity Fund Inc.
Share
Amount | | (Percentage of
Net Assets) | | Description | | Market
Value (Note 2) | |
| | WARRANTS—Continued | |
| | | Taiwan—0.3% | |
| | 29,520 | | |
| | Formosa Plastics, Issued by Deutsche Bank,
AG London, Expires 01/24/2017† | | $ | 90,922 | | |
| | 21,628 | | |
| | Hon Hai Precision Industry, Issued by Deutsche Bank,
AG London, Expires 08/19/2008† | | | 164,221 | | |
| | 31,743 | | |
| | Taiwan Semiconductor Manufacturing, Issued by Deutsche Bank,
AG London, Expires 01/19/2017 | | | 62,502 | | |
| | | | 317,645 | | |
| | | TOTAL WARRANTS (Cost $1,543,338) | | | 2,119,532 | | |
| | INVESTMENT FUNDS—1.7% | |
| | | India—0.6% | |
| | 28,256 | | |
| | Banking Index Benchmark Exchange Traded Scheme-Bank BeES,
Issued by Citigroup, Expires 10/24/2012† | | | 650,934 | | |
| | 4,636 | | |
| | Banking Index Benchmark Exchange Traded Scheme-Bank BeES,
Issued by CLSA, Expires 03/22/2012† | | | 107,694 | | |
| | | | 758,628 | | |
| | | France—0.6% | |
| | 15,265 | | | | | Lyxor ETF Eastern Europe (1) | | | 671,807 | | |
| | | United States—0.3% | |
| | 3,790 | | | | | IShares MSCI Brazil (2) | | | 324,424 | | |
| | | Romania—0.2% | |
| | 23,500 | | | | | SIF 1 Banat Crisana Arad | | | 36,459 | | |
| | 25,400 | | | | | SIF 2 Moldova Bacau | | | 39,627 | | |
| | 38,700 | | | | | SIF 3 Transilvania Brasov* | | | 40,195 | | |
| | 35,000 | | | | | SIF 4 Muntenia Bucuresti | | | 38,025 | | |
| | 22,300 | | | | | SIF 5 Oltenia Craiova | | | 41,962 | | |
| | | | 196,268 | | |
| | | TOTAL INVESTMENT FUNDS (Cost $1,471,913) | | | 1,951,127 | | |
| | PREFERRED STOCKS—1.2% | |
| | | Brazil—0.8% | |
| | 19,690 | | | | | Cia Vale do Rio Doce (1) | | | 618,531 | | |
| | 7,780 | | | | | Petroleo Brasileiro (1) | | | 322,076 | | |
| | | | 940,607 | | |
See Notes to Financial Statements.
Julius Baer Funds 2007 Annual Report
57
PORTFOLIO OF INVESTMENTS (Continued) October 31, 2007
Julius Baer Global Equity Fund Inc.
Share
Amount | | (Percentage of
Net Assets) | | Description | | Market
Value (Note 2) | |
| | PREFERRED STOCKS—Continued | |
| | | Russia—0.2% | |
| | 348 | | | | | Silvinit (3) | | $ | 138,330 | | |
| | 24,975 | | | | | URSA Bank (3) | | | 47,452 | | |
| | | | 185,782 | | |
| | | Germany—0.2% | |
| | 163 | | | | | Fresenius SE (1) | | | 12,923 | | |
| | 740 | | | | | Volkswagen AG | | | 140,434 | | |
| | | | 153,357 | | |
| | | Croatia—0.0% | |
| | 390 | | | | | Adris Grupa | | | 39,887 | | |
| | | TOTAL PREFERRED STOCKS (Cost $1,073,390) | | | 1,319,633 | | |
Face
Value | | Currency | | | | | |
| | U.S. GOVERNMENT AND AGENCY OBLIGATIONS—1.0% | |
| | | United States—1.0% | |
| | | | | | | U.S. Treasury Bills | | | | | |
| | 1,000,000 | | | USD | | 3.790% due 12/06/2007 (4) | | | 996,315 | | |
| | 100,000 | | | USD | | 3.800% due 12/06/2007 (4) | | | 99,631 | | |
| | | | 1,095,946 | | |
| | | | | TOTAL U.S. GOVERNMENT AND AGENCY OBLIGATIONS | | (Cost $1,095,946) | | | 1,095,946 | | |
| | STRUCTURED NOTES—0.2% | |
| | | Philippines—0.2% | |
| | 8
| | | USD
| | Phillippines Notes, due 10/17/2008 Zero Coupon
(Cost $182,308)*† | | | 301,563 | | |
Share
Amount | | | | | | | |
| | RIGHTS—0.0% | |
| | | Philippines—0.0% | |
| | 56,604 | | | | | Ayala Land Rights, Expires TBD (Cost $121) | | | 130 | | |
See Notes to Financial Statements.
Julius Baer Funds 2007 Annual Report
58
PORTFOLIO OF INVESTMENTS (Continued) October 31, 2007
Julius Baer Global Equity Fund Inc.
Face
Value | |
Currency | |
Description | | Market
Value (Note 2) | |
| | SHORT-TERM INVESTMENTS PURCHASED WITH CASH COLLATERAL
FROM SECURITY LENDING—9.5% | |
| | | United States—9.5% | |
| | 10,713,067 | | | USD
| | State Street Navigator Securities Lending Prime Portfolio
(Cost $10,713,067) | | $ | 10,713,067 | | |
| | REPURCHASE AGREEMENT—4.4% | |
| | | United States—4.4% | |
| | 4,958,667 | | | USD | | | | State Street Bank and Trust Repurchase Agreement,
dated 10/31/2007, due 11/01/2007, with a maturity
value $4,959,082 and an effective yield of 3.01%,
collateralized by a U.S. Government and Agency Obligation,
with a rate of 4.760%, a maturity date of 09/01/2034,
and an aggregate market value of $5,059,068.
(Cost $4,958,667) | | $ | 4,958,667 | | |
| | | | | TOTAL INVESTMENTS—107.6% (Cost $112,965,926) | | | 121,605,802 | | |
| | | | | OTHER ASSETS AND LIABILITIES (Net)—(7.6%) | | | (8,577,152 | ) | |
| | | | | TOTAL NET ASSETS—100.0% | | $ | 113,028,650 | | |
Notes to the Portfolio of Investments:
ADR American Depositary Receipt
ETF Exchange-Traded Funds
GDR Global Depositary Receipt
NVDR Non Voting Depositary Receipt
(1) Security valued at fair value utilizing fair value model in accordance with valuation policies approved by the board of Trustees.
(2) All or a portion of this security was on loan to brokers at October 31, 2007.
(3) Illiquid security
(4) Security has been pledged for futures collateral.
* Non-income producing security.
† Securities exempt from registration under Rule 144A of the Securities Act of 1933, as amended. These securities may be resold in transactions exempt from registrations, normally to qualified institutional buyers.
Aggregate cost for federal income tax purposes was $113,289,325.
Glossary of Currencies
USD — United States Dollar
See Notes to Financial Statements.
Julius Baer Funds 2007 Annual Report
59
SCHEDULE OF FORWARD FOREIGN EXCHANGE CONTRACTS
October 31, 2007
Julius Baer Global Equity Fund Inc.
FORWARD FOREIGN EXCHANGE CONTRACTS TO BUY
| | | Contracts to Receive | | | | | |
Expiration
Date | |
Local
Currency | |
Value in
USD | |
In Exchange
for USD | | Net Unrealized
Appreciation
(Depreciation) | |
| 11/02/07 | | AUD | 2,403 | | | | 2,227 | | | | 2,218 | | | $ | 9 | | |
| 11/20/07 | | AUD | 1,196,141 | | | | 1,107,433 | | | | 1,027,944 | | | | 79,489 | | |
| 12/12/07 | | AUD | 463,720 | | | | 428,807 | | | | 404,366 | | | | 24,441 | | |
| 01/24/08 | | BRL | 363,738 | | | | 206,924 | | | | 197,531 | | | | 9,393 | | |
| 11/01/07 | | CAD | 10,706 | | | | 11,272 | | | | 11,221 | | | | 51 | | |
| 11/02/07 | | CAD | 14,273 | | | | 15,027 | | | | 14,994 | | | | 33 | | |
| 11/19/07 | | CAD | 834,756 | | | | 878,917 | | | | 823,182 | | | | 55,735 | | |
| 12/27/07 | | CAD | 615,433 | | | | 648,130 | | | | 614,278 | | | | 33,852 | | |
| 01/24/08 | | CAD | 128,543 | | | | 135,390 | | | | 131,261 | | | | 4,129 | | |
| 11/08/07 | | HKD | 9,471,733 | | | | 1,222,111 | | | | 1,220,733 | | | | 1,378 | | |
| 12/17/07 | | HKD | 1,268,800 | | | | 163,787 | | | | 163,579 | | | | 208 | | |
| 01/24/08 | | HKD | 1,544,834 | | | | 199,527 | | | | 199,346 | | | | 181 | | |
| 11/19/07 | | HUF | 180,235,617 | | | | 1,036,588 | | | | 1,008,412 | | | | 28,176 | | |
| 12/27/07 | | HUF | 14,730,036 | | | | 84,494 | | | | 82,387 | | | | 2,107 | | |
| 11/27/07 | | INR | 10,304,951 | | | | 261,734 | | | | 258,903 | | | | 2,831 | | |
| 11/01/07 | | JPY | 9,367,357 | | | | 81,254 | | | | 81,711 | | | | (457 | ) | |
| 11/02/07 | | JPY | 3,101,534 | | | | 26,903 | | | | 26,874 | | | | 29 | | |
| 11/20/07 | | JPY | 121,084,361 | | | | 1,052,475 | | | | 1,085,292 | | | | (32,817 | ) | |
| 11/30/07 | | JPY | 119,012,588 | | | | 1,035,655 | | | | 1,050,421 | | | | (14,766 | ) | |
| 12/03/07 | | KRW | 198,145,536 | | | | 220,296 | | | | 217,337 | | | | 2,959 | | |
| 11/20/07 | | MXN | 2,261,045 | | | | 210,964 | | | | 205,061 | | | | 5,903 | | |
| 11/01/07 | | NOK | 400,990 | | | | 74,377 | | | | 75,049 | | | | (672 | ) | |
| 11/02/07 | | NOK | 1,921 | | | | 356 | | | | 356 | | | | 0 | | |
| 11/19/07 | | PLN | 1,728,941 | | | | 689,497 | | | | 646,177 | | | | 43,320 | | |
| 12/24/07 | | PLN | 405,931 | | | | 161,865 | | | | 151,909 | | | | 9,956 | | |
| 11/19/07 | | TRY | 293,735 | | | | 249,322 | | | | 240,569 | | | | 8,753 | | |
| 12/24/07 | | TRY | 145,474 | | | | 122,141 | | | | 117,861 | | | | 4,280 | | |
| 12/03/07 | | TWD | 15,015,025 | | | | 464,934 | | | | 464,135 | | | | 799 | | |
| 01/04/08 | | ZAR | 3,777,686 | | | | 571,931 | | | | 540,701 | | | | 31,230 | | |
| Net unrealized appreciation on forward foreign exchange contracts to buy | | | | | | | | | | | | | | $ | 300,530 | | |
See Notes to Financial Statements.
Julius Baer Funds 2007 Annual Report
60
SCHEDULE OF FORWARD FOREIGN EXCHANGE CONTRACTS (Continued)
October 31, 2007
Julius Baer Global Equity Fund Inc.
FORWARD FOREIGN EXCHANGE CONTRACTS TO SELL
| | | Contracts to Deliver | | | | | |
Expiration
Date | | Local
Currency | | Value in
USD | | In Exchange
for USD | | Net Unrealized
Depreciation | |
| 11/20/07 | | AUD | 1,196,141 | | | | 1,107,433 | | | | 931,777 | | | $ | (175,656 | ) | |
| 11/19/07 | | CAD | 834,756 | | | | 878,917 | | | | 776,481 | | | | (102,436 | ) | |
| 12/27/07 | | CZK | 4,628,149 | | | | 249,440 | | | | 237,441 | | | | (11,999 | ) | |
| 01/24/08 | | EUR | 370,950 | | | | 537,180 | | | | 528,138 | | | | (9,042 | ) | |
| 01/31/08 | | EUR | 884,961 | | | | 1,281,603 | | | | 1,275,017 | | | | (6,586 | ) | |
| 11/19/07 | | HUF | 271,608,204 | | | | 1,562,099 | | | | 1,397,898 | | | | (164,201 | ) | |
| 12/27/07 | | HUF | 14,730,036 | | | | 84,494 | | | | 81,920 | | | | (2,574 | ) | |
| 11/20/07 | | MXN | 5,284,013 | | | | 493,018 | | | | 465,889 | | | | (27,129 | ) | |
| 11/19/07 | | PLN | 3,097,513 | | | | 1,235,280 | | | | 1,087,960 | | | | (147,320 | ) | |
| 12/24/07 | | PLN | 405,931 | | | | 161,865 | | | | 151,207 | | | | (10,658 | ) | |
| 11/19/07 | | TRY | 504,886 | | | | 428,546 | | | | 349,416 | | | | (79,130 | ) | |
| 12/24/07 | | TRY | 145,474 | | | | 122,141 | | | | 114,447 | | | | (7,694 | ) | |
| Net unrealized depreciation on forward foreign exchange contracts to sell | | | | | | | | | | | | | | $ | (744,425 | ) | |
Glossary of Currencies
AUD — Australian Dollar
BRL — Brazilian Real
CAD — Canadian Dollar
CZK — Czech Koruna
EUR — Euro
HKD — Hong Kong Dollar
HUF — Hungarian Forint
INR — Indian Rupee
JPY — Japanese Yen
KRW — South Korean Won
MXN — Mexican Nuevo Peso
NOK — Norwegian Krone
PLN — Polish Zloty
TRY — Turkish Lira
TWD — New Taiwan Dollar
ZAR — South African Rand
See Notes to Financial Statements.
Julius Baer Funds 2007 Annual Report
61
PORTFOLIO OF INVESTMENTS–Industry Sector (Unaudited) October 31, 2007
Julius Baer Global Equity Fund Inc.
At October 31, 2007, sector diversification of the Fund's investments were as follows:
| | | % of Net
Assets | | Market
Value (Note 2) | |
| INDUSTRY SECTOR | |
| Financials | | | 23.9 | % | | $ | 27,078,283 | | |
| Materials | | | 12.3 | | | | 13,925,240 | | |
| Industrials | | | 11.5 | | | | 13,038,431 | | |
| Consumer Discretionary | | | 10.2 | | | | 11,591,050 | | |
| Energy | | | 7.8 | | | | 8,791,737 | | |
| Information Technology | | | 7.7 | | | | 8,699,954 | | |
| Healthcare | | | 5.3 | | | | 5,956,296 | | |
| Telecommunications | | | 4.9 | | | | 5,486,908 | | |
| Consumer Staples | | | 4.8 | | | | 5,402,945 | | |
| Utilities | | | 4.3 | | | | 4,867,278 | | |
| Cash & Cash Equivalents | | | 14.9 | | | | 16,767,680 | * | |
| Total Investments | | | 107.6 | | | | 121,605,802 | | |
| Other Assets and Liabilities (Net) | | | (7.6 | ) | | | (8,577,152 | )* | |
| Net Assets | | | 100.0 | % | | $ | 113,028,650 | | |
* Cash and Cash Equivalents and Other Assets and Liabilities (Net) include the margin requirements for futures with a notional market value of $5,524,118, which is 4.89% of net assets.
See Notes to Financial Statements.
Julius Baer Funds 2007 Annual Report
62
PORTFOLIO OF INVESTMENTS October 31, 2007
Julius Baer International Equity Fund
Share
Amount | | (Percentage of
Net Assets) | | Description | | Market
Value (Note 2) | |
| | COMMON STOCKS—85.6% | |
| | | France—8.4% | |
| | 101,564 | | | | | Accor SA (1) | | $ | 9,713,738 | | |
| | 497,143 | | | | | Aeroports de Paris (1)(2) | | | 57,069,133 | | |
| | 766,906 | | | | | Air Liquide (1) | | | 105,759,245 | | |
| | 241,822 | | | | | Alstom (1) | | | 57,526,290 | | |
| | 712,708 | | | | | BNP Paribas (1) | | | 78,848,762 | | |
| | 1,032,289 | | | | | Bouygues SA (1) | | | 99,390,264 | | |
| | 226,707 | | | | | Bureau Veritas* (1) | | | 13,112,974 | | |
| | 598,228 | | | | | Compagnie de Saint-Gobain (1) | | | 64,552,580 | | |
| | 955,991 | | | | | Credit Agricole (1) | | | 37,879,792 | | |
| | 81,434 | | | | | EDF Energies Nouvelles (1)(2) | | | 6,537,083 | | |
| | 1,611,991 | | | | | Electricite de France (1) | | | 193,655,643 | | |
| | 133,390 | | | | | Eurazeo (1) | | | 19,908,276 | | |
| | 1,873,901 | | | | | France Telecom (1) | | | 69,226,608 | | |
| | 94,793 | | | | | Hermes International (1)(2) | | | 12,483,581 | | |
| | 776,232 | | | | | JC Decaux (1)(2) | | | 28,601,703 | | |
| | 1,372,925 | | | | | Lafarge SA (1) | | | 223,908,316 | | |
| | 1,804,033 | | | | | LVMH Moet Hennessy Louis Vuitton (1) | | | 232,665,571 | | |
| | 399,388 | | | | | M6-Metropole Television (1) | | | 11,831,010 | | |
| | 479,412 | | | | | Neuf Cegetel (1) | | | 24,272,641 | | |
| | 238,058 | | | | | Nexity (1) | | | 15,850,180 | | |
| | 344,965 | | | | | Pernod-Ricard (1) | | | 79,740,433 | | |
| | 255,995 | | | | | PPR (1) | | | 50,818,140 | | |
| | 158,704 | | | | | Remy Cointreau (1) | | | 12,204,846 | | |
| | 265,494 | | | | | Renault SA (1) | | | 44,726,288 | | |
| | 1,301,439 | | | | | Societe Television Francaise 1 (1) | | | 36,077,233 | | |
| | 161,857 | | | | | Sodexho Alliance (1) | | | 11,736,928 | | |
| | 2,485,318 | | | | | Suez SA (1) | | | 161,977,046 | | |
| | 241,760 | | | | | Technip SA (1) | | | 21,724,522 | | |
| | 3,914,870 | | | | | Total SA (1) | | | 315,556,011 | | |
| | 536,028 | | | | | Veolia Environnement (1) | | | 47,912,226 | | |
| | 1,117,741 | | | | | Vinci SA (1) | | | 91,910,503 | | |
| | 302,337 | | | | | Vivendi (1) | | | 13,633,121 | | |
| | 78,860 | | | | | Wendel (1)(2) | | | 13,539,073 | | |
| | | | 2,264,349,760 | | |
| | | United Kingdom—7.3% | |
| | 2,178,091 | | | | | Amec PLC (1) | | | 38,074,113 | | |
| | 2,776,711 | | | | | Anglo American (1) | | | 191,516,780 | | |
| | 1,628,031 | | | | | BAE Systems (1) | | | 16,899,036 | | |
See Notes to Financial Statements.
Julius Baer Funds 2007 Annual Report
63
PORTFOLIO OF INVESTMENTS (Continued) October 31, 2007
Julius Baer International Equity Fund
Share
Amount | | (Percentage of
Net Assets) | | Description | | Market
Value (Note 2) | |
| | COMMON STOCKS—Continued | |
| | | United Kingdom—Continued | |
| | 4,662,632 | | | | | BHP Billiton (1) | | $ | 177,706,883 | | |
| | 24,901,505 | | | | | BP PLC (1) | | | 323,485,923 | | |
| | 2,679,507 | | | | | Burberry Group (1) | | | 34,338,329 | | |
| | 2,281,335 | | | | | Ceres Power* (1) | | | 16,010,588 | | |
| | 6,910,185 | | | | | Compass Group (1) | | | 49,847,260 | | |
| | 9,750,347 | | | | | Diageo PLC (1) | | | 223,321,958 | | |
| | 53,674 | | | | | Equest Investments Balkans* | | | 1,369,774 | | |
| | 2,832,791 | | | | | GlaxoSmithKline PLC (1) | | | 72,995,066 | | |
| | 4,424,974 | | | | | Highland Gold Mining* (1) | | | 11,412,224 | | |
| | 1,178,029 | | | | | Intertek Group (1) | | | 25,201,486 | | |
| | 1,531,230 | | | | | Kingfisher PLC (1) | | | 6,293,245 | | |
| | 235,679 | | | | | Persimmon PLC (1) | | | 5,157,346 | | |
| | 660,020 | | | | | Peter Hambro Mining* (1) | | | 19,304,285 | | |
| | 6,163,648 | | | | | QinetiQ PLC (1) | | | 24,316,491 | | |
| | 1,396,159 | | | | | Reckitt Benckiser (1) | | | 81,054,524 | | |
| | 5,992,092 | | | | | Rolls-Royce Group* (1) | | | 67,188,870 | | |
| | 242,080,516 | | | | | Rolls-Royce Group-Class B-Entitlement Shares* | | | 502,886 | | |
| | 1,025,555 | | | | | Scottish & Newcastle (1) | | | 16,732,181 | | |
| | 8,374,603 | | | | | Smith & Nephew (1) | | | 113,275,427 | | |
| | 1,670,778 | | | | | Taylor Wimpey (1) | | | 8,638,690 | | |
| | 11,543,422 | | | | | Tesco PLC (1) | | | 117,316,783 | | |
| | 72,750,579 | | | | | Vodafone Group (1) | | | 286,686,975 | | |
| | 1,797,488 | | | | | William Hill (1) | | | 23,195,840 | | |
| | 942,323 | | | | | WPP Group (1) | | | 12,889,846 | | |
| | 835,295 | | | | | Xchanging Ltd* (1) | | | 4,738,779 | | |
| | | | 1,969,471,588 | | |
| | | Germany—6.8% | |
| | 263,947 | | | | | Aareal Bank (1)(2) | | | 13,727,797 | | |
| | 123,006 | | | | | Adidas AG (1) | | | 8,218,283 | | |
| | 881,773 | | | | | Arcandor AG* (1)(2) | | | 28,337,192 | | |
| | 205,207 | | | | | BASF AG (1) | | | 28,374,832 | | |
| | 479,499 | | | | | Bayer AG (1) | | | 40,097,113 | | |
| | 207,755 | | | | | Bilfinger Berger (1) | | | 18,581,705 | | |
| | 135,990 | | | | | Celesio AG (1) | | | 7,706,214 | | |
| | 5,552,825 | | | | | Commerzbank AG (1) | | | 236,360,572 | | |
| | 90,063 | | | | | Continental AG (1) | | | 13,627,583 | | |
| | 1,386,693 | | | | | Curanum AG (1) | | | 18,148,853 | | |
See Notes to Financial Statements.
Julius Baer Funds 2007 Annual Report
64
PORTFOLIO OF INVESTMENTS (Continued) October 31, 2007
Julius Baer International Equity Fund
Share
Amount | | (Percentage of
Net Assets) | | Description | | Market
Value (Note 2) | |
| | COMMON STOCKS—Continued | |
| | | Germany—Continued | |
| | 1,700,644 | | | | | Daimler AG (1) | | $ | 187,795,688 | | |
| | 236,572 | | | | | Demag Cranes (1) | | | 13,669,452 | | |
| | 297,625 | | | | | Deutsche Beteiligungs (1) | | | 10,392,781 | | |
| | 489,175 | | | | | Deutsche Boerse (1) | | | 77,524,375 | | |
| | 1,041,248 | | | | | Deutsche Post-Registered (1) | | | 31,569,696 | | |
| | 535,303 | | | | | Deutsche Postbank (1) | | | 39,185,061 | | |
| | 526,317 | | | | | Deutsche Wohnen (1) | | | 23,295,869 | | |
| | 1,064,142 | | | | | E.ON AG (1) | | | 207,809,768 | | |
| | 3,212,832 | | | | | Fraport AG (1)(2) | | | 251,571,359 | | |
| | 841,095 | | | | | Fresenius Medical Care (1) | | | 44,439,664 | | |
| | 794,018 | | | | | Fresenius SE (1) | | | 61,820,568 | | |
| | 850,340 | | | | | Henkel KGaA (1) | | | 39,473,869 | | |
| | 1,015,879 | | | | | Hypo Real Estate (1)(2) | | | 60,601,165 | | |
| | 802,708 | | | | | IKB Deutsche Industriebank* (1)(2) | | | 16,808,740 | | |
| | 67,520 | | | | | Interhyp AG (1)(2) | | | 5,816,879 | | |
| | 379,393 | | | | | Marseille-Kliniken AG (1) | | | 9,170,035 | | |
| | 1,832,860 | | | | | Mediclin AG* (1)(4) | | | 9,311,705 | | |
| | 145,299 | | | | | Merck KGaA (1) | | | 18,206,784 | | |
| | 165,892 | | | | | MLP AG (2) | | | 2,202,010 | | |
| | 150,364 | | | | | MVV Energie (1) | | | 6,524,294 | | |
| | 335,062 | | | | | Prakitker Bau-und Heimwerkermaerkte (1) | | | 12,164,406 | | |
| | 277,619 | | | | | Rheinmetall AG (1) | | | 24,831,949 | | |
| | 1,111,625 | | | | | Rhoen-Klinikum AG (1) | | | 35,506,869 | | |
| | 382,812 | | | | | RWE AG (1) | | | 52,294,762 | | |
| | 1,081,590 | | | | | Siemens AG-Registered (1) | | | 147,183,764 | | |
| | 409,004 | | | | | Tognum AG* (1) | | | 14,796,391 | | |
| | 266,561 | | | | | Wacker Construction Equipment* (1) | | | 6,377,106 | | |
| | | | 1,823,525,153 | | |
| | | Russia—6.1% | |
| | 457,611 | | | | | Alfa Cement* (3) | | | 70,700,900 | | |
| | 5,624,640 | | | | | AvtoVAZ GDR (3) | | | 46,383,453 | | |
| | 34,722,025 | | | | | Central Telecommunication (3) | | | 31,770,653 | | |
| | 53,536,950 | | | | | Chelindbank (3) | | | 15,258,031 | | |
| | 326,584 | | | | | Cherepovets MK Severstal Sponsored GDR† | | | 7,740,041 | | |
| | 231,825 | | | | | CTC Media* | | | 5,816,489 | | |
| | 15,070,348 | | | | | Dagestan Regional Generation | | | 2,637,311 | | |
| | 772,406 | | | | | Evraz Group GDR† | | | 57,952,077 | | |
| | 440 | | | | | Evrocement Group* (3) | | | 5,355,900 | | |
See Notes to Financial Statements.
Julius Baer Funds 2007 Annual Report
65
PORTFOLIO OF INVESTMENTS (Continued) October 31, 2007
Julius Baer International Equity Fund
Share
Amount | | (Percentage of
Net Assets) | | Description | | Market
Value (Note 2) | |
| | COMMON STOCKS—Continued | |
| | | Russia—Continued | |
| | 6,016,784 | | | | | Gazprom Sponsored ADR | | $ | 298,793,493 | | |
| | 547,651 | | | | | Kuban Energy Retail* (3) | | | 1,807,248 | | |
| | 547,651 | | | | | Kuban Main Network* (1)(3) | | | 0 | | |
| | 547,651 | | | | | Kubanenergo OJSC (3) | | | 15,886,307 | | |
| | 11,287,332 | | | | | Lenenergo* (3) | | | 20,542,944 | | |
| | 632,127 | | | | | LUKOIL Sponsored ADR | | | 57,144,281 | | |
| | 124,979 | | | | | Mechel OAO ADR | | | 10,516,983 | | |
| | 640,995 | | | | | MMC Norilsk Nickel ADR (2) | | | 203,195,415 | | |
| | 50,181,127 | | | | | Moscow Energy Network | | | 3,487,588 | | |
| | 281,975 | | | | | North-West Telecom ADR | | | 25,307,256 | | |
| | 4,578,826 | | | | | NovaTek OAO | | | 26,282,461 | | |
| | 152,124 | | | | | NovaTek OAO Sponsored GDR† | | | 8,731,918 | | |
| | 376,326 | | | | | NovaTek OAO Sponsored GDR-Registered Shares (1) | | | 21,672,655 | | |
| | 66,772,886 | | | | | Novorossiysk Sea Trade Port (3) | | | 16,860,154 | | |
| | 77,528 | | | | | Open Investments* (3) | | | 21,397,728 | | |
| | 166,537 | | | | | Pharmstandard* (3) | | | 14,528,688 | | |
| | 93,713 | | | | | Polyus Gold | | | 4,254,570 | | |
| | 1,074,505 | | | | | Polyus Gold Sponsored ADR | | | 49,158,604 | | |
| | 646,001 | | | | | RBC Information Systems* | | | 6,040,109 | | |
| | 3,952,052 | | | | | Rosneft Oil | | | 34,659,496 | | |
| | 9,653,647 | | | | | Rosneft Oil GDR (1)(2) | | | 85,726,835 | | |
| | 32,146,187 | | | | | Rostovenergo* (3) | | | 3,061,603 | | |
| | 21,446,429 | | | | | Sberbank | | | 92,219,645 | | |
| | 333,982 | | | | | Sibirskiy Cement (3) | | | 31,895,281 | | |
| | 56,811 | | | | | Sibirtelecom ADR | | | 5,135,714 | | |
| | 21,446 | | | | | Sistema Hals*† | | | 4,181,970 | | |
| | 1,483,076 | | | | | Sistema Hals GDR* (3) | | | 14,459,991 | | |
| | 787,702 | | | | | Southern Telecommunication ADR | | | 7,581,632 | | |
| | 13,669,823,591 | | | | | TGK-8 | | | 18,226,796 | | |
| | 738,555 | | | | | Unified Energy System GDR* (2) | | | 90,842,265 | | |
| | 6,347,868 | | | | | Uralkali | | | 31,739,340 | | |
| | 184,983 | | | | | Uralkali Sponsored GDR*† | | | 4,624,575 | | |
| | 645,906 | | | | | Veropharm* (4) | | | 30,519,059 | | |
| | 1,600,473 | | | | | VolgaTelecom | | | 9,122,696 | | |
| | 205,040 | | | | | VolgaTelecom ADR (2) | | | 2,337,456 | | |
| | 64,840 | | | | | Volskcement-Class BRD (3) | | | 23,342,400 | | |
| | 4,126,097 | | | | | Volzhskaya Hydroelectric Power Station (3) | | | 3,899,162 | | |
| | 2,502,584 | | | | | VTB Bank Sponsored GDR*† | | | 24,024,806 | | |
| | 428,130 | | | | | Wimm-Bill-Dann Foods ADR (2) | | | 51,268,568 | | |
See Notes to Financial Statements.
Julius Baer Funds 2007 Annual Report
66
PORTFOLIO OF INVESTMENTS (Continued) October 31, 2007
Julius Baer International Equity Fund
Share
Amount | | (Percentage of
Net Assets) | | Description | | Market
Value (Note 2) | |
| | COMMON STOCKS—Continued | |
| | | Russia—Continued | |
| | 207,398,357 | | | | | Zagorskaya Gaes (3) | | $ | 8,347,784 | | |
| | 26,482,383 | | | | | Zhigulyovskaya Hydro (3) | | | 13,671,530 | | |
| | | | 1,640,111,861 | | |
| | | Japan—5.7% | |
| | 261,890 | | | | | Acom Co (1)(2) | | | 6,259,481 | | |
| | 465,349 | | | | | Aeon Credit Service (1) | | | 7,158,595 | | |
| | 291,700 | | | | | Aiful Corp (1)(2) | | | 6,888,037 | | |
| | 421,927 | | | | | Aisin Seiki (1) | | | 17,275,911 | | |
| | 361,726 | | | | | Bank of Kyoto (1)(2) | | | 4,613,180 | | |
| | 3,028,686 | | | | | Bank of Yokohama (1) | | | 21,391,999 | | |
| | 1,172,688 | | | | | Canon Inc (1) | | | 59,294,672 | | |
| | 1,230,000 | | | | | Chiba Bank (1) | | | 9,854,148 | | |
| | 262,147 | | | | | Credit Saison (1) | | | 8,321,644 | | |
| | 631,000 | | | | | Daihatsu Motor (1) | | | 6,713,981 | | |
| | 199,300 | | | | | Daikin Industries (1) | | | 10,014,001 | | |
| | 795,458 | | | | | Daiwa Securities (1) | | | 7,667,199 | | |
| | 869,406 | | | | | Denso Corp (1) | | | 35,158,336 | | |
| | 1,347 | | | | | Dentsu Inc (1) | | | 3,532,511 | | |
| | 3,148 | | | | | East Japan Railway (1) | | | 25,932,502 | | |
| | 282,500 | | | | | Eisai Co (1) | | | 11,858,042 | | |
| | 171,600 | | | | | Exedy Corp (1) | | | 5,629,209 | | |
| | 255,400 | | | | | Fanuc Ltd (1) | | | 27,973,933 | | |
| | 4,086 | | | | | Fuji Television Network (1) | | | 8,243,906 | | |
| | 1,093,000 | | | | | Gunma Bank (1) | | | 7,766,155 | | |
| | 1,409,652 | | | | | Honda Motor (1) | | | 52,861,296 | | |
| | 558,132 | | | | | HOYA Corp (1) | | | 20,299,032 | | |
| | 263,260 | | | | | Ibiden Co (1) | | | 22,386,819 | | |
| | 1,259,297 | | | | | ITOCHU Corp (1) | | | 16,043,740 | | |
| | 7,661 | | | | | Japan Tobacco (1) | | | 44,619,571 | | |
| | 187,301 | | | | | JFE Holdings (1) | | | 10,949,114 | | |
| | 331,931 | | | | | JS Group (1) | | | 5,366,801 | | |
| | 297,728 | | | | | JSR Corp (1) | | | 7,710,831 | | |
| | 3,345 | | | | | KDDI Corp (1) | | | 25,339,461 | | |
| | 1,224,148 | | | | | Koito Manufacturing (1) | | | 17,042,044 | | |
| | 641,700 | | | | | Komatsu Ltd (1) | | | 21,511,885 | | |
| | 581,269 | | | | | Kubota Corp (1) | | | 4,891,153 | | |
| | 100,900 | | | | | Kyocera Corp (1) | | | 8,550,286 | | |
| | 419,932 | | | | | Makita Corp (1) | | | 20,314,758 | | |
See Notes to Financial Statements.
Julius Baer Funds 2007 Annual Report
67
PORTFOLIO OF INVESTMENTS (Continued) October 31, 2007
Julius Baer International Equity Fund
Share
Amount | | (Percentage of
Net Assets) | | Description | | Market
Value (Note 2) | |
| | COMMON STOCKS—Continued | |
| | | Japan—Continued | |
| | 1,469,132 | | | | | Matsushita Electric Industrial (1) | | $ | 28,098,023 | | |
| | 841,397 | | | | | Mitsubishi Corp (1) | | | 26,175,983 | | |
| | 1,369,000 | | | | | Mitsubishi Electric (1) | | | 16,616,509 | | |
| | 6,404,522 | | | | | Mitsubishi UFJ Financial (1) | | | 63,842,814 | | |
| | 1,058,000 | | | | | Mitsui & Co (1) | | | 27,523,778 | | |
| | 307,022 | | | | | Mitsui Fudosan (1) | | | 8,482,563 | | |
| | 5,658 | | | | | Mizuho Financial (1) | | | 31,820,266 | | |
| | 496,000 | | | | | Nabtesco Corp | | | 8,463,936 | | |
| | 171,926 | | | | | Nintendo Co (1) | | | 108,416,667 | | |
| | 1,159,314 | | | | | Nippon Electric Glass (1) | | | 19,657,509 | | |
| | 1,729 | | | | | Nippon Telegraph & Telephone (1) | | | 7,928,235 | | |
| | 400,226 | | | | | Nissan Motor (1) | | | 4,614,567 | | |
| | 516,131 | | | | | Nitto Denko (1) | | | 25,193,084 | | |
| | 697,049 | | | | | Nomura Holdings (1) | | | 12,427,748 | | |
| | 935,000 | | | | | NSK Ltd (1) | | | 8,319,156 | | |
| | 15,923 | | | | | NTT DoCoMo (1) | | | 23,092,511 | | |
| | 522,000 | | | | | OKUMA Corp | | | 7,382,470 | | |
| | 119,279 | | | | | Olympus Corp (1) | | | 4,991,494 | | |
| | 278,580 | | | | | Promise Co (1)(2) | | | 8,368,461 | | |
| | 761,000 | | | | | Ricoh Co (1) | | | 15,013,044 | | |
| | 485 | | | | | Sapporo Hokuyo (1) | | | 4,989,864 | | |
| | 169,841 | | | | | Seven & I (1) | | | 4,375,784 | | |
| | 479,000 | | | | | Sharp Corp (1) | | | 7,546,452 | | |
| | 454,603 | | | | | Shizuoka Bank (1) | | | 4,758,507 | | |
| | 740,708 | | | | | Sony Corp (1) | | | 36,620,951 | | |
| | 443,688 | | | | | Stanley Electric (1) | | | 9,855,050 | | |
| | 2,103,000 | | | | | Sumitomo Chemical (1) | | | 18,664,405 | | |
| | 769,652 | | | | | Sumitomo Corp (1) | | | 13,418,873 | | |
| | 713,700 | | | | | Sumitomo Electric Industries (1) | | | 11,499,922 | | |
| | 1,502,696 | | | | | Sumitomo Heavy Industries (1) | | | 19,882,913 | | |
| | 2,877,175 | | | | | Sumitomo Metal Industries (1) | | | 14,187,415 | | |
| | 5,091 | | | | | Sumitomo Mitsui Financial (1)(2) | | | 41,570,695 | | |
| | 1,777,653 | | | | | Sumitomo Trust & Banking (1) | | | 13,210,581 | | |
| | 425,000 | | | | | Suruga Bank (1) | | | 5,590,304 | | |
| | 1,918,700 | | | | | Suzuki Motor (1) | | | 62,742,330 | | |
| | 231,279 | | | | | Takata Corp (1) | | | 8,238,827 | | |
| | 318,800 | | | | | Takeda Pharmaceutical (1) | | | 19,912,198 | | |
| | 277,950 | | | | | Takefuji Corp (1)(2) | | | 7,107,977 | | |
| | 1,135,431 | | | | | Toray Industries (1)(2) | | | 8,756,389 | | |
See Notes to Financial Statements.
Julius Baer Funds 2007 Annual Report
68
PORTFOLIO OF INVESTMENTS (Continued) October 31, 2007
Julius Baer International Equity Fund
Share
Amount | | (Percentage of
Net Assets) | | Description | | Market
Value (Note 2) | |
| | COMMON STOCKS—Continued | |
| | | Japan—Continued | |
| | 2,065,689 | | | | | Toyota Motor (1) | | $ | 118,089,493 | | |
| | 146,900 | | | | | Ulvac Inc (1)(2) | | | 5,748,857 | | |
| | 348,680 | | | | | Yamada Denki (1) | | | 35,913,745 | | |
| | 503,500 | | | | | Yamaha Motor (1) | | | 14,341,810 | | |
| | 333,587 | | | | | Yamato Holdings (1) | | | 4,899,233 | | |
| | 724,895 | | | | | Yokogawa Electric (1) | | | 9,151,646 | | |
| | | | 1,526,937,272 | | |
| | | Australia—4.3% | |
| | 1,190,950 | | | | | Austereo Group (1) | | | 2,857,085 | | |
| | 8,994,236 | | | | | BHP Billiton (1) | | | 389,532,476 | | |
| | 130,749 | | | | | BHP Billiton Sponsored ADR (2) | | | 11,409,158 | | |
| | 2,550,440 | | | | | Brambles Ltd (1) | | | 33,799,269 | | |
| | 530,382 | | | | | Fairfax Media (1) | | | 2,344,172 | | |
| | 31,440,390 | | | | | Macquarie Airports (1) | | | 128,454,590 | | |
| | 6,663,269 | | | | | Newcrest Mining | | | 200,075,979 | | |
| | 709,992 | | | | | Prime Television (1) | | | 2,558,244 | | |
| | 134,226 | | | | | Publishing & Broadcasting (1) | | | 2,609,638 | | |
| | 2,048,563 | | | | | Rio Tinto (1) | | | 191,598,239 | | |
| | 1,941,406 | | | | | Rio Tinto (1)(2) | | | 200,630,693 | | |
| | 178,845 | | | | | Southern Cross Broadcasting (1) | | | 2,888,424 | | |
| | 786,814 | | | | | Ten Network (1)(2) | | | 2,017,936 | | |
| | | | 1,170,775,903 | | |
| | | Switzerland—4.2% | |
| | 3,015,377 | | | | | ABB Ltd (1) | | | 91,123,172 | | |
| | 292,446 | | | | | BKW FMB Energie (1) | | | 35,164,457 | | |
| | 1,953,511 | | | | | Compagnie Financiere Richemont (1) | | | 139,652,504 | | |
| | 787,983 | | | | | Credit Suisse-Registered (1) | | | 53,168,589 | | |
| | 573,760 | | | | | Dufry Group (1) | | | 63,437,349 | | |
| | 136,505 | | | | | Flughafen Wien-Registered (1) | | | 55,208,956 | | |
| | 1,272,183 | | | | | Holcim Ltd (1) | | | 145,444,140 | | |
| | 303,380 | | | | | Nestle SA-Registered (1) | | | 140,160,784 | | |
| | 28,226 | | | | | Nobel Biocare Holding* (1) | | | 8,239,934 | | |
| | 432,797 | | | | | Roche Holding (1) | | | 73,941,804 | | |
| | 32,367 | | | | | SGS SA (1) | | | 42,635,607 | | |
See Notes to Financial Statements.
Julius Baer Funds 2007 Annual Report
69
PORTFOLIO OF INVESTMENTS (Continued) October 31, 2007
Julius Baer International Equity Fund
Share
Amount | | (Percentage of
Net Assets) | | Description | | Market
Value (Note 2) | |
| | COMMON STOCKS—Continued | |
| | | Switzerland—Continued | |
| | 384,991 | | | | | Swatch Group (1) | | $ | 123,347,227 | | |
| | 114,499 | | | | | Synthes Inc (1) | | | 14,310,489 | | |
| | 847,116 | | | | | UBS AG-Registered (1) | | | 45,439,731 | | |
| | 1,576,605 | | | | | Xstrata PLC (1) | | | 113,103,408 | | |
| | | | 1,144,378,151 | | |
| | | Poland—3.8% | |
| | 4,394,619 | | | | | Agora SA (1)(4) | | | 98,026,219 | | |
| | 185,249 | | | | | Bank BPH (1) | | | 72,761,582 | | |
| | 892,087 | | | | | Bank Handlowy w Warszawie (1) | | | 41,744,339 | | |
| | 2,858,170 | | | | | Bank Millenium (1) | | | 15,525,904 | | |
| | 1,784,509 | | | | | Bank Pekao (1) | | | 190,470,034 | | |
| | 932,930 | | | | | Bank Zachodni WBK (1) | | | 103,576,740 | | |
| | 24,257 | | | | | BRE Bank* (1) | | | 5,542,575 | | |
| | 542,832 | | | | | Budimex SA* (1) | | | 16,111,547 | | |
| | 103,866 | | | | | Dom Development (1) | | | 5,521,713 | | |
| | 347,671 | | | | | Grupa Kety (1) | | | 26,348,709 | | |
| | 436,617 | | | | | Inter Cars (1) | | | 24,081,143 | | |
| | 87,826 | | | | | Inter Groclin Auto* (1) | | | 1,547,562 | | |
| | 588,065 | | | | | NFI Empik Media & Fashion* (1) | | | 5,637,724 | | |
| | 378,963 | | | | | Opoczno SA* (1) | | | 6,520,490 | | |
| | 23,352 | | | | | PBG SA* (1) | | | 3,177,452 | | |
| | 9,159,649 | | | | | PKO Bank Polski (1) | | | 203,699,010 | | |
| | 557,625 | | | | | Polish Energy Partners* (1) | | | 9,063,191 | | |
| | 4,910,883 | | | | | Polskie Gornictwo Naftowe I (1) | | | 11,196,802 | | |
| | 117,363 | | | | | Polnord SA* (1) | | | 7,766,692 | | |
| | 788,945 | | | | | Polska Grupa Farmaceutyczna (1)(4) | | | 32,440,947 | | |
| | 4,783,965 | | | | | Polski Koncern Miesny Duda* (1) | | | 18,479,004 | | |
| | 320,892 | | | | | Sniezka SA (1) | | | 7,043,400 | | |
| | 9,876,593 | | | | | Stalexport SA* (1) | | | 15,974,005 | | |
| | 82,385 | | | | | Stomil Sanok (1) | | | 6,691,415 | | |
| | 24,508 | | | | | Techmex SA* (1) | | | 406,376 | | |
| | 9,911,197 | | | | | Telekomunikacja Polska (1) | | | 93,870,760 | | |
| | | | 1,023,225,335 | | |
| | | Hungary—3.1% | |
| | 980,663 | | | | | Ablon Group* (1) | | | 5,000,754 | | |
| | 101,460 | | | | | Egis Gyogyszergyar (1) | | | 12,933,007 | | |
| | 24,778,286 | | | | | Magyar Telekom Telecommunications (1) | | | 133,257,467 | | |
See Notes to Financial Statements.
Julius Baer Funds 2007 Annual Report
70
PORTFOLIO OF INVESTMENTS (Continued) October 31, 2007
Julius Baer International Equity Fund
Share
Amount | | (Percentage of
Net Assets) | | Description | | Market
Value (Note 2) | |
| | COMMON STOCKS—Continued | |
| | | Hungary—Continued | |
| | 127,969 | | | | | MOL Hungarian Oil and Gas (1) | | $ | 19,694,072 | | |
| | 11,464,773 | | | | | OTP Bank (1) | | | 621,689,113 | | |
| | 179,059 | | | | | Richter Gedeon (1) | | | 38,878,590 | | |
| | | | 831,453,003 | | |
| | | Finland—3.1% | |
| | 970,228 | | | | | Atria Group (1) | | | 28,857,338 | | |
| | 833,620 | | | | | Citycon Oyj (1) | | | 5,426,403 | | |
| | 626,506 | | | | | Cramo Oyj (1)(2) | | | 23,636,610 | | |
| | 401,687 | | | | | Elisa Oyj (1)(2) | | | 11,936,669 | | |
| | 3,901,076 | | | | | Fortum Oyj (1) | | | 169,344,358 | | |
| | 2,138,569 | | | | | HKScan Oyj (1) | | | 50,382,721 | | |
| | 704,368 | | | | | Kemira Oyj (1) | | | 16,707,095 | | |
| | 227,496 | | | | | Kesko Oyj-Class B (1) | | | 13,640,608 | | |
| | 184,946 | | | | | Metso Oyj (1) | | | 11,323,167 | | |
| | 6,088,640 | | | | | Nokia Oyj (1) | | | 241,525,430 | | |
| | 227,741 | | | | | Nokian Renkaat (1)(2) | | | 8,592,874 | | |
| | 677,976 | | | | | OKO Bank-Class A (1) | | | 14,550,201 | | |
| | 789,582 | | | | | Olvi Oyj (1) | | | 30,660,183 | | |
| | 340,800 | | | | | Oriola-KD Oyj-Class A (1) | | | 1,589,120 | | |
| | 2,522,169 | | | | | Oriola-KD Oyj-Class B (1) | | | 11,788,046 | | |
| | 980,081 | | | | | Orion Oyj-Class B (1)(2) | | | 25,176,437 | | |
| | 569,191 | | | | | Outotec Oyj (1) | | | 43,733,007 | | |
| | 2,187,983 | | | | | Ramirent Oyj (1) | | | 49,028,941 | | |
| | 388,931 | | | | | Sanoma-WSOY Oyj (1) | | | 11,233,014 | | |
| | 1,849,765 | | | | | YIT Oyj (1)(2) | | | 57,377,503 | | |
| | | | 826,509,725 | | |
| | | Austria—2.6% | |
| | 333,794 | | | | | CA Immobilien Anlagen* (1) | | | 9,012,211 | | |
| | 1,328,162 | | | | | CA Immo International* (1) | | | 23,231,157 | | |
| | 1,300,623 | | | | | Erste Bank der Oesterreichischen Sparkassen (1) | | | 106,024,242 | | |
| | 806,641 | | | | | Flughafen Wien (1) | | | 95,621,523 | | |
| | 2,884,917 | | | | | Immoeast AG* (1) | | | 35,217,614 | | |
| | 380,083 | | | | | Oesterreichische Elektrizitaetswirtschafts-Class A (1) | | | 25,130,670 | | |
| | 1,717,600 | | | | | OMV AG (1) | | | 128,721,258 | | |
| | 897,852 | | | | | Raiffeisen International Bank (1)(2) | | | 149,062,027 | | |
| | 573,101 | | | | | Telekom Austria (1) | | | 16,456,530 | | |
See Notes to Financial Statements.
Julius Baer Funds 2007 Annual Report
71
PORTFOLIO OF INVESTMENTS (Continued) October 31, 2007
Julius Baer International Equity Fund
Share
Amount | | (Percentage of
Net Assets) | | Description | | Market
Value (Note 2) | |
| | COMMON STOCKS—Continued | |
| | | Austria—Continued | |
| | 607,871 | | | | | Wiener Staedtische Versicherung (1) | | $ | 44,879,165 | | |
| | 918,868 | | | | | Wienerberger AG (1) | | | 57,443,850 | | |
| | | | 690,800,247 | | |
| | | Norway—2.2% | |
| | 1,742,454 | | | | | Acta Holding (1)(2) | | | 6,925,854 | | |
| | 965,759 | | | | | Aker Kvaerner (1) | | | 33,715,235 | | |
| | 2,564,094 | | | | | Austevoll Seafood* (1) | | | 20,667,132 | | |
| | 722,307 | | | | | Cermaq ASA (1) | | | 11,037,650 | | |
| | 3,292,006 | | | | | Copeinca ASA* (1) | | | 33,259,313 | | |
| | 4,331,384 | | | | | DnB NOR (1) | | | 71,345,262 | | |
| | 1,966,882 | | | | | Marine Farms* (1)(4) | | | 10,649,204 | | |
| | 7,706,646 | | | | | Marine Harvest* (1)(2) | | | 7,811,422 | | |
| | 5,399,624 | | | | | Norsk Hydro (1) | | | 79,048,232 | | |
| | 731,971 | | | | | Norske Skogindustrier ASA Class A | | | 8,044,056 | | |
| | 865,827 | | | | | RomReal Ltd* | | | 3,677,639 | | |
| | 2,783,755 | | | | | Scandanavian Property Development* (1) | | | 20,008,070 | | |
| | 5,438,825 | | | | | StatoiHydro ASA (1) | | | 183,310,880 | | |
| | 1,713,940 | | | | | Telenor ASA* (1) | | | 40,248,807 | | |
| | 1,693,260 | | | | | Yara International (1) | | | 65,620,754 | | |
| | | | 595,369,510 | | |
| | | Italy—2.2% | |
| | 2,215,356 | | | | | Aeffe SpA* (1) | | | 11,853,175 | | |
| | 1,323,930 | | | | | Aicon SpA* (1) | | | 7,141,649 | | |
| | 132,215 | | | | | Autogrill SpA (1) | | | 2,641,165 | | |
| | 341,041 | | | | | Banca Popolare dell' Emilia Romagna (1) | | | 8,083,693 | | |
| | 391,498 | | | | | Banca Popolare dell'Etruria e del Lazio (1)(2) | | | 7,197,661 | | |
| | 4,405,764 | | | | | Banca Popolare di Milano (1) | | | 68,723,605 | | |
| | 1,202,461 | | | | | Banca Popolare di Sondrio (1)(2) | | | 19,154,751 | | |
| | 1,078,766 | | | | | Banco Popolare Scarl* (1) | | | 25,850,076 | | |
| | 657,922 | | | | | Bulgari SpA (1) | | | 10,244,537 | | |
| | 2,482,727 | | | | | Buzzi Unicem (1) | | | 70,273,743 | | |
| | 1,486,418 | | | | | Credito Emiliano (1) | | | 20,084,342 | | |
| | 354,175 | | | | | Finmeccanica SpA (1) | | | 10,483,212 | | |
| | 753,641 | | | | | Geox SpA (1) | | | 18,027,156 | | |
| | 11,364,278 | | | | | Intesa Sanpaolo* (1) | | | 86,374,836 | | |
| | 859,140 | | | | | Italcementi SpA (1)(2) | | | 19,714,254 | | |
| | 70,800 | | | | | Lottomatica SpA (1) | | | 2,523,170 | | |
| | 1,172,831 | | | | | Mediobanca SpA (1) | | | 27,814,141 | | |
See Notes to Financial Statements.
Julius Baer Funds 2007 Annual Report
72
PORTFOLIO OF INVESTMENTS (Continued) October 31, 2007
Julius Baer International Equity Fund
Share
Amount | | (Percentage of
Net Assets) | | Description | | Market
Value (Note 2) | |
| | COMMON STOCKS—Continued | |
| | | Italy—Continued | |
| | 1,292,320 | | | | | Piccolo Credito Valtellinese (1)(2) | | $ | 17,986,139 | | |
| | 299,825 | | | | | Poltrona Frau (1) | | | 1,173,174 | | |
| | 257,374 | | | | | SAVE SpA (1) | | | 8,932,254 | | |
| | 6,718,143 | | | | | Telecom Italia (1) | | | 21,071,172 | | |
| | 12,181,195 | | | | | UniCredito Italiano (1) | | | 104,259,426 | | |
| | 758,327 | | | | | Unione di Banche Italiane (1)(2) | | | 21,044,105 | | |
| | | | 590,651,436 | | |
| | | Sweden—2.2% | |
| | 893,711 | | | | | Elekta AB-Class B (1)(2) | | | 17,287,471 | | |
| | 739,658 | | | | | Getinge AB-Class B (1)(2) | | | 19,627,039 | | |
| | 462,506 | | | | | Hemtex AB (1) | | | 6,740,177 | | |
| | 806,174 | | | | | Hennes & Mauritz-Class B (1) | | | 53,723,359 | | |
| | 479,959 | | | | | Modern Times-Class B (1) | | | 33,781,077 | | |
| | 266,132 | | | | | Nobia AB | | | 2,335,293 | | |
| | 8,721,610 | | | | | Nordea Bank AB (1) | | | 156,319,267 | | |
| | 806,572 | | | | | OMX AB (1)(2) | | | 33,918,665 | | |
| | 7,816 | | | | | RaySearch Laboratories* (1) | | | 243,456 | | |
| | 2,630,451 | | | | | Rezidor Hotel (1) | | | 21,035,214 | | |
| | 193,254 | | | | | Securitas AB-Class B (1) | | | 2,441,061 | | |
| | 2,174,457 | | | | | Skandinaviska Enskilda Banken (1) | | | 66,813,411 | | |
| | 3,839,075 | | | | | Swedbank AB (1)(2) | | | 120,431,169 | | |
| | 7,103,522 | | | | | Telefonaktiebolaget LM Ericsson-Class B (1) | | | 21,309,840 | | |
| | 1,883,670 | | | | | TeliaSonera AB (1) | | | 18,554,994 | | |
| | 105,162 | | | | | Trelleborg AB -B Shares | | | 2,690,487 | | |
| | 823,770 | | | | | Vostok Nafta Investment* (1) | | | 12,378,383 | | |
| | | | 589,630,363 | | |
| | | Canada—2.1% | |
| | 1,334,672 | | | | | Cameco Corp | | | 65,412,699 | | |
| | 167,194 | | | | | Canadian Natural Resources | | | 13,828,975 | | |
| | 3,030,263 | | | | | Eldorado Gold* | | | 21,024,882 | | |
| | 617,286 | | | | | Imperial Oil | | | 33,437,950 | | |
| | 7,464,735 | | | | | Ivanhoe Mines* | | | 102,091,922 | | |
| | 735,635 | | | | | OPTI Canada* | | | 14,754,524 | | |
| | 1,197,661 | | | | | Potash Corp of Saskatchewan | | | 148,289,044 | | |
| | 221,094 | | | | | Research in Motion* | | | 27,528,414 | | |
| | 978,042 | | | | | Suncor Energy | | | 106,526,053 | | |
See Notes to Financial Statements.
Julius Baer Funds 2007 Annual Report
73
PORTFOLIO OF INVESTMENTS (Continued) October 31, 2007
Julius Baer International Equity Fund
Share
Amount | | (Percentage of
Net Assets) | | Description | | Market
Value (Note 2) | |
| | COMMON STOCKS—Continued | |
| | | Canada—Continued | |
| | 1,330,638 | | | | | Talisman Energy | | $ | 28,831,891 | | |
| | 2,158,874 | | | | | UTS Energy* | | | 13,887,892 | | |
| | | | 575,614,246 | | |
| | | Hong Kong—1.9% | |
| | 674,150 | | | | | Alibaba.com Ltd*† | | | 1,174,205 | | |
| | 9,985,758 | | | | | China Merchants Holdings International (1) | | | 70,794,962 | | |
| | 3,434,766 | | | | | China Mobile (1) | | | 71,689,943 | | |
| | 34,129,602 | | | | | Clear Media* (1)(4) | | | 36,268,597 | | |
| | 40,296,244 | | | | | Emperor Entertainment Hotel (1) | | | 9,294,095 | | |
| | 14,816,208 | | | | | Galaxy Entertainment* (1) | | | 16,169,326 | | |
| | 35,007,354 | | | | | GOME Electrical Appliances (1) | | | 80,105,741 | | |
| | 5,823,459 | | | | | Hutchison Telecommunications International (1) | | | 8,310,612 | | |
| | 34,260,718 | | | | | Melco International Development (1) | | | 65,385,834 | | |
| | 7,648 | | | | | Melco PBL Entertainment ADR* (2) | | | 121,603 | | |
| | 68,752,661 | | | | | Shun Tak (1) | | | 107,978,256 | | |
| | 20,230,339 | | | | | Texwinca Holdings (1) | | | 17,814,844 | | |
| | 18,639,053 | | | | | Tianjin Port Development (1) | | | 19,512,377 | | |
| | | | 504,620,395 | | |
| | | Czech Republic—1.8% | |
| | 2,126,273 | | | | | Komercni Banka (1)(4) | | | 488,512,803 | | |
| | | Netherlands—1.8% | |
| | 627,209 | | | | | Draka Holding (1)(2) | | | 27,474,619 | | |
| | 863,421 | | | | | ING Groep (1) | | | 38,921,827 | | |
| | 7,327,894 | | | | | KKR Private Equity Investors | | | 143,626,722 | | |
| | 897,698 | | | | | Koninklijke Ahold* (1) | | | 13,501,091 | | |
| | 327,092 | | | | | Koninklijke Vopak (1)(2) | | | 18,776,275 | | |
| | 4,034,049 | | | | | Plaza Centers* (1) | | | 18,894,443 | | |
| | 2,986,868 | | | | | Royal KPN (1) | | | 56,400,085 | | |
| | 1,208,182 | | | | | Spazio Investment (1) | | | 21,001,152 | | |
| | 578,221 | | | | | TNT NV (1) | | | 23,743,391 | | |
| | 2,486,315 | | | | | Unilever NV (1) | | | 80,879,698 | | |
| | 212,040 | | | | | Vedior NV (1) | | | 4,841,952 | | |
| | 1,369,339 | | | | | Wavin NV (1) | | | 23,702,672 | | |
| | 451,920 | | | | | X 5 Retail GDR-Registered* (1) | | | 16,327,250 | | |
| | | | 488,091,177 | | |
See Notes to Financial Statements.
Julius Baer Funds 2007 Annual Report
74
PORTFOLIO OF INVESTMENTS (Continued) October 31, 2007
Julius Baer International Equity Fund
Share
Amount | | (Percentage of
Net Assets) | | Description | | Market
Value (Note 2) | |
| | COMMON STOCKS—Continued | |
| | | Ukraine—1.6% | |
| | 214,485 | | | | | Anthousa Ltd Sponsored GDR† (3) | | $ | 8,750,634 | | |
| | 6,188,223 | | | | | Bank Forum* | | | 55,433,360 | | |
| | 2,343,250 | | | | | Centrenergo* | | | 12,047,558 | | |
| | 178,305 | | | | | Centrenergo Sponsored ADR* (3) | | | 9,167,352 | | |
| | 20,500 | | | | | Dniproenergo* (1) | | | 10,458,770 | | |
| | 10,201,398 | | | | | Dragon-Ukrainian Properties & Development* (4) | | | 27,473,006 | | |
| | 12,260 | | | | | Farmak* (3) | | | 593,787 | | |
| | 7,562,990 | | | | | Harkivoblenergo* (3) | | | 18,806,525 | | |
| | 902,412 | | | | | Hmelnitskoblenergo* (3) | | | 2,052,153 | | |
| | 10,700 | | | | | Ivano-Frankivskcement* (3) | | | 2,010,085 | | |
| | 116,601,842 | | | | | JSCB Ukrsotsbank* (3) | | | 31,312,102 | | |
| | 2,750,000 | | | | | Kirovogradoblenergo* (3) | | | 4,078,505 | | |
| | 240,262 | | | | | Korukivskas Technical Papers* (3) | | | 3,254,488 | | |
| | 3,228,131 | | | | | Krymenergo* (3) | | | 9,575,235 | | |
| | 115,161 | | | | | Kyivmedpreparat* (3)(4) | | | 9,906,078 | | |
| | 76,611,005 | | | | | Lutsk Automobile Plant* | | | 22,080,391 | | |
| | 189,156 | | | | | Lvivoblenergo* (3) | | | 455,403 | | |
| | 488,244 | | | | | Poltavaoblenergo* (3) | | | 1,158,578 | | |
| | 183,743,363 | | | | | Raiffeisen Bank Aval | | | 40,403,920 | | |
| | 65,228 | | | | | Retail Group* (3) | | | 32,614,000 | | |
| | 21,206 | | | | | Rodovid Bank* (3) | | | 37,740,558 | | |
| | 6,895,337 | | | | | Slavutich Brewery* (3) | | | 7,022,145 | | |
| | 2,636,403 | | | | | Tsukrovyy Soyz Ukrros* (3) | | | 5,930,212 | | |
| | 1,153,346,022 | | | | | Ukrinbank* (3)(4) | | | 6,842,075 | | |
| | 17,577 | | | | | Ukrnafta Oil ADR* | | | 8,803,956 | | |
| | 116,751,392 | | | | | UkrTelecom* | | | 25,972,971 | | |
| | 573,260 | | | | | UkrTelecom GDR* (1) | | | 6,236,817 | | |
| | 18,621,729 | | | | | VK Development* (3) | | | 6,536,201 | | |
| | 3,553,786 | | | | | Zakarpattyaoblenergo* (3) | | | 7,378,832 | | |
| | 15,000 | | | | | Zakhidenergo* | | | 1,812,488 | | |
| | 595,792 | | | | | Zakhidenergo GDR* (3) | | | 17,997,761 | | |
| | 400,000 | | | | | Zhytomyroblenergo* (3) | | | 779,118 | | |
| | | | 434,685,064 | | |
| | | Romania—1.3% | |
| | 18,586,112 | | | | | Albalact SA* | | | 6,703,956 | | |
| | 1,312,300 | | | | | Antibiotice | | | 1,072,150 | | |
| | 57,310,400 | | | | | ARDAF-Societatea de Asigurare Reasigurare* (3) | | | 3,636,226 | | |
| | 4,814,944 | | | | | Banca Transilvania* | | | 1,893,670 | | |
See Notes to Financial Statements.
Julius Baer Funds 2007 Annual Report
75
PORTFOLIO OF INVESTMENTS (Continued) October 31, 2007
Julius Baer International Equity Fund
Share
Amount | | (Percentage of
Net Assets) | | Description | | Market
Value (Note 2) | |
| | COMMON STOCKS—Continued | |
| | | Romania—Continued | |
| | 50,060,712 | | | | | Biofarm Bucuresti* (4) | | $ | 13,705,727 | | |
| | 4,415,699 | | | | | BRD-Groupe Societe Generale | | | 50,084,631 | | |
| | 425,284 | | | | | Cemacon SA* (4) | | | 3,308,239 | | |
| | 62,668,800 | | | | | Compania Hoteliera Intercontinental* (4) | | | 7,625,598 | | |
| | 8,672,500 | | | | | Compa-Sibiu* | | | 5,804,028 | | |
| | 1,487,326 | | | | | Concefa SA* | | | 2,662,980 | | |
| | 11,250,200 | | | | | Condmag* (4) | | | 7,822,485 | | |
| | 66,191,800 | | | | | Dafora SA* (4) | | | 15,820,907 | | |
| | 175,968 | | | | | Farmaceutica Remedia SA Deva* | | | 562,064 | | |
| | 97,126,031 | | | | | Impact Developer and Contractor* (4) | | | 43,474,778 | | |
| | 693,300 | | | | | Policolor* | | | 1,295,550 | | |
| | 648,444,600 | | | | | Rompetrol Rafinare* | | | 32,970,328 | | |
| | 113,050 | | | | | Santierul Naval Braila* (3) | | | 171,950 | | |
| | 139,400 | | | | | Simcor Oradea* | | | 1,090,435 | | |
| | 555,587,557 | | | | | SNP Petrom | | | 126,758,273 | | |
| | 16,413,875 | | | | | Socep Constanta* | | | 2,139,917 | | |
| | 3,654,000 | | | | | Spicul Buzau* | | | 2,143,714 | | |
| | 90,000 | | | | | Transelectrica SA | | | 1,517,535 | | |
| | 18,317,818 | | | | | Zentiva SA* | | | 10,826,228 | | |
| | | | 343,091,369 | | |
| | | Belgium—1.2% | |
| | 1,679,951 | | | | | Fortis (1) | | | 53,842,998 | | |
| | 104,348 | | | | | Groupe Bruxelles Lambert (1) | | | 13,383,327 | | |
| | 233,923 | | | | | Ion Beam Applications* (1) | | | 6,544,504 | | |
| | 841,547 | | | | | KBC Ancora (1) | | | 95,035,785 | | |
| | 1,120,678 | | | | | KBC Groep (1)(2) | | | 157,285,059 | | |
| | | | 326,091,673 | | |
| | | Mexico—1.2% | |
| | 8,526,894 | | | | | America Movil SAB de CV-Class L | | | 26,927,369 | | |
| | 443,203 | | | | | America Movil SAB de CV ADR-Class L | | | 28,981,044 | | |
| | 1,276,253 | | | | | Banco Compartamos* | | | 6,677,458 | | |
| | 6,668,348 | | | | | Consorcio ARA | | | 7,351,680 | | |
| | 2,319,255 | | | | | Controladora Comercial Mexicana | | | 7,196,208 | | |
| | 9,613,131 | | | | | Corporacion Moctezuma | | | 30,537,265 | | |
| | 125,329 | | | | | Desarrolladora Homex ADR* (2) | | | 7,082,342 | | |
| | 1,190,997 | | | | | Fomento Economico Mexicano Sponsored ADR | | | 42,411,403 | | |
| | 704,852 | | | | | Grupo Aeroportuario del Centro Norte ADR | | | 21,519,132 | | |
See Notes to Financial Statements.
Julius Baer Funds 2007 Annual Report
76
PORTFOLIO OF INVESTMENTS (Continued) October 31, 2007
Julius Baer International Equity Fund
Share
Amount | | (Percentage of
Net Assets) | | Description | | Market
Value (Note 2) | |
| | COMMON STOCKS—Continued | |
| | | Mexico—Continued | |
| | 96,852 | | | | | Grupo Aeroportuario del Pacifico ADR | | $ | 5,079,887 | | |
| | 376,921 | | | | | Grupo Aeroportuario del Sureste ADR (2) | | | 22,479,568 | | |
| | 2,084,100 | | | | | Grupo Cementos de Chihuahua | | | 11,622,686 | | |
| | 10,991,661 | | | | | Grupo Financiero Banorte | | | 49,601,729 | | |
| | 1,625,699 | | | | | Grupo Televisa Sponsored ADR | | | 40,398,620 | | |
| | 2,150,507 | | | | | Urbi Desarrollos Urbanos* | | | 8,318,166 | | |
| | | | 316,184,557 | | |
| | | Bulgaria—1.2% | |
| | 301,290 | | | | | Bulgarian American Credit Bank | | | 18,495,670 | | |
| | 11,641,174 | | | | | Bulgarian Telecommunication | | | 94,710,191 | | |
| | 1,408,255 | | | | | Central Cooperative Bank* | | | 12,498,842 | | |
| | 10,049,867 | | | | | Chimimport AD* | | | 124,749,024 | | |
| | 138,554 | | | | | Devin AD* (3) | | | 809,568 | | |
| | 212,919 | | | | | DZI Insurance & Reinsurance* (3) | | | 29,309,925 | | |
| | 138,320 | | | | | Kaolin AD* | | | 2,015,387 | | |
| | 1,224,550 | | | | | LEV INS* (3) | | | 23,874,219 | | |
| | 826,010 | | | | | Sopharma AD | | | 5,651,117 | | |
| | | | 312,113,943 | | |
| | | Denmark—0.9% | |
| | 131,379 | | | | | ALK-Abello (1)(2) | | | 28,436,162 | | |
| | 150,146 | | | | | Almindelig Brand* (1)(2) | | | 9,961,004 | | |
| | 108,113 | | | | | Carlsberg A/S-Class B (1)(2) | | | 14,585,771 | | |
| | 176,717 | | | | | FLSmidth & Co (1) | | | 19,247,722 | | |
| | 747,425 | | | | | GN Store Nord* | | | 7,978,380 | | |
| | 345,732 | | | | | Harboes Bryggeri-Class B (1) | | | 10,552,010 | | |
| | 434,604 | | | | | Novo-Nordisk-Class B (1) | | | 54,056,772 | | |
| | 42,413 | | | | | Rockwool International-Class B (1)(2) | | | 13,608,292 | | |
| | 376,560 | | | | | Royal UNIBREW (1)(4) | | | 48,151,749 | | |
| | 726,577 | | | | | TK Development* (1)(2) | | | 13,821,213 | | |
| | 273,463 | | | | | Vestas Wind Systems* (1) | | | 24,601,055 | | |
| | | | 245,000,130 | | |
| | | Cyprus—0.9% | |
| | 731,292 | | | | | AFI Development GDR*† | | | 7,605,437 | | |
| | 4,339,425 | | | | | Bank of Cyprus (1) | | | 84,948,210 | | |
| | 5,117,681 | | | | | Hellenic Bank | | | 41,018,188 | | |
| | 6,007,254 | | | | | Marfin Popular Bank Public (1) | | | 98,011,837 | | |
| | | | 231,583,672 | | |
See Notes to Financial Statements.
Julius Baer Funds 2007 Annual Report
77
PORTFOLIO OF INVESTMENTS (Continued) October 31, 2007
Julius Baer International Equity Fund
Share
Amount | | (Percentage of
Net Assets) | | Description | | Market
Value (Note 2) | |
| | COMMON STOCKS—Continued | |
| | | China—0.8% | |
| | 73,813,492 | | | | | Beijing Capital International Airport-Class H (1) | | $ | 148,215,893 | | |
| | 265,265 | | | | | Guangzhou Pharmaceutical-Class H (1) | | | 292,014 | | |
| | 8,839,558 | | | | | Lianhua Supermarket Holdings-H | | | 14,143,243 | | |
| | 11,294,724 | | | | | Shenzhen Chiwan Wharf-Class B (1) | | | 26,968,602 | | |
| | 5,526,552 | | | | | Weiqiao Textile-Class H (1) | | | 10,382,028 | | |
| | 27,342,132 | | | | | Wumart Stores-Class H | | �� | 24,869,953 | | |
| | | | 224,871,733 | | |
| | | Spain—0.8% | |
| | 240,227 | | | | | Gamesa Corporacion Tecnologica (1) | | | 12,261,885 | | |
| | 2,234,060 | | | | | Grupo Empresarial Ence (1) | | | 28,478,151 | | |
| | 1,668,490 | | | | | Iberdrola SA (1) | | | 26,851,818 | | |
| | 266,198 | | | | | Inditex SA (1) | | | 19,868,802 | | |
| | 4,116,169 | | | | | Telefonica SA (1) | | | 136,118,522 | | |
| | | | 223,579,178 | | |
| | | Serbia—0.8% | |
| | 18,481 | | | | | Agrobanka AD* | | | 9,135,284 | | |
| | 412,158 | | | | | AIK Banka (3)(4) | | | 77,592,202 | | |
| | 146,409 | | | | | Energoprojekt Holding | | | 7,864,505 | | |
| | 83,273 | | | | | Imlek AD* | | | 3,965,529 | | |
| | 42,159 | | | | | Komercijalna Banka* (3) | | | 90,647,565 | | |
| | 7,116 | | | | | Metals Banka* | | | 6,179,485 | | |
| | 90,600 | | | | | Privredna Banka* | | | 7,283,911 | | |
| | 130,820 | | | | | Tigar AD* (4) | | | 4,647,247 | | |
| | 78,160 | | | | | Toza Markovic* (3)(4) | | | 4,822,436 | | |
| | 13,809 | | | | | Univerzal Banka* | | | 10,348,811 | | |
| | | | 222,486,975 | | |
| | | Greece—0.8% | |
| | 11,780,453 | | | | | Alapis Holding Industrial and Commercial* (1) | | | 43,307,384 | | |
| | 1,099,641 | | | | | Athens Medical Center (1) | | | 8,156,759 | | |
| | 128,599 | | | | | Fourlis Holding (1) | | | 5,182,437 | | |
| | 1,832,621 | | | | | Hellenic Telecommunication Organization (1) | | | 67,069,201 | | |
| | 503,701 | | | | | Heracles General Cement (1) | | | 12,933,010 | | |
| | 6,403,979 | | | | | Marfin Investment Group (1) | | | 60,774,712 | | |
| | 828,796 | | | | | ireus Aquaculture (1) | | | 4,761,879 | | |
| | 596,170 | | | | | Sprider Stores SA (1) | | | 13,131,968 | | |
| | | | 215,317,350 | | |
See Notes to Financial Statements.
Julius Baer Funds 2007 Annual Report
78
PORTFOLIO OF INVESTMENTS (Continued) October 31, 2007
Julius Baer International Equity Fund
Share
Amount | | (Percentage of
Net Assets) | | Description | | Market
Value (Note 2) | |
| | COMMON STOCKS—Continued | |
| | | Ireland—0.6% | |
| | 1,075,586 | | | | | CRH PLC (1) | | $ | 41,306,686 | | |
| | 18,239,543 | | | | | Dragon Oil* (1) | | | 118,481,982 | | |
| | 213,317 | | | | | Kingspan Group (1) | | | 5,097,645 | | |
| | | | 164,886,313 | | |
| | | Brazil—0.5% | |
| | 2,267,795 | | | | | Bovespa Holding* (1) | | | 42,365,544 | | |
| | 706,740 | | | | | Diagnosticos da America (1) | | | 16,525,943 | | |
| | 610,100 | | | | | Drogasil SA (1) | | | 5,604,069 | | |
| | 684,513 | | | | | Dufry South America BDR* (1) | | | 20,342,198 | | |
| | 209,357 | | | | | Medial Saude ADR*† | | | 2,719,704 | | |
| | 1,552,612 | | | | | Santos-Brasil SA (1) | | | 22,356,113 | | |
| | 779,163 | | | | | Unibanco | | | 12,271,694 | | |
| | 36,327 | | | | | Unibanco GDR (1) | | | 5,741,119 | | |
| | | | 127,926,384 | | |
| | | Multinational—0.4% | |
| | 222,192 | | | | | Central European Media Enterprises-Class A* | | | 25,496,532 | | |
| | 736,174 | | | | | Millicom International Cellular* (2) | | | 86,485,722 | | |
| | | | 111,982,254 | | |
| | | South Korea—0.4% | |
| | 143,990 | | | | | Hyundai Motor (1) | | | 11,450,391 | | |
| | 156,099 | | | | | Kookmin Bank (1) | | | 12,890,280 | | |
| | 40,612 | | | | | NHN Corp* (1) | | | 13,180,811 | | |
| | 94,816 | | | | | Samsung Electronics (1) | | | 58,868,219 | | |
| | | | 96,389,701 | | |
| | | South Africa—0.3% | |
| | 1,082,662 | | | | | Impala Platinum (1) | | | 39,737,984 | | |
| | 1,662,842 | | | | | MTN Group (1) | | | 32,361,858 | | |
| | 1,148,401 | | | | | Standard Bank Group (1) | | | 20,631,664 | | |
| | | | 92,731,506 | | |
| | | Venezuela—0.3% | |
| | 3,652,895 | | | | | Banco Provincial (3) | | | 467,818 | | |
| | 156,169 | | | | | Banco Venezolano de Credito (3) | | | 191,820 | | |
| | 15,843,815 | | | | | Cemex Venezuela SACA-1 (3) | | | 7,378,482 | | |
| | 27,956,747 | | | | | Mercantil Servicios Financieros-Class B (3) | | | 43,602,266 | | |
| | 262,677,795 | | | | | Siderurgica Venezolana Sivensa SACA (3) | | | 27,524,102 | | |
| | | | 79,164,488 | | |
See Notes to Financial Statements.
Julius Baer Funds 2007 Annual Report
79
PORTFOLIO OF INVESTMENTS (Continued) October 31, 2007
Julius Baer International Equity Fund
Share
Amount | | (Percentage of
Net Assets) | | Description | | Market
Value (Note 2) | |
| | COMMON STOCKS—Continued | |
| | | Turkey—0.3% | |
| | 1,737,033 | | | | | Acibadem Saglik Hizmetleri ve Ticaret (1) | | $ | 12,863,113 | | |
| | 158,846 | | | | | BIM Birlesik Magazalar | | | 13,019,608 | | |
| | 793,019 | | | | | Haci Omer Sabanci (1) | | | 5,426,947 | | |
| | 2,526,850 | | | | | Selcuk Ecza Deposu Ticaret ve Sanayi* (1) | | | 5,227,172 | | |
| | 912,828 | | | | | TAV Havalimanlari* (1) | | | 8,419,482 | | |
| | 118,940 | | | | | Turk Sise ve Cam Fabrikalari (1) | | | 261,869 | | |
| | 1,684,020 | | | | | Turkiye Garanti Bankasi (1) | | | 15,528,336 | | |
| | 2,126,268 | | | | | Turkiye Is Bankasi (1) | | | 14,572,379 | | |
| | 369,693 | | | | | Yapi Kredi Sigorta (1) | | | 3,561,944 | | |
| | | | 78,880,850 | | |
| | | India—0.3% | |
| | 622,040 | | | | | State Bank of India GDR (1) | | | 77,568,144 | | |
| | | Portugal—0.2% | |
| | 4,278,637 | | | | | Energias de Portugal (1) | | | 27,541,896 | | |
| | 5,089,133 | | | | | Jeronimo Martins (1) | | | 37,741,297 | | |
| | | | 65,283,193 | | |
| | | New Zealand—0.2% | |
| | 18,940,995 | | | | | Auckland International Airport (1) | | | 41,987,483 | | |
| | | Chile—0.1% | |
| | 147,376 | | | | | Sociedad Quimica y Minera de Chile Sponsored ADR | | | 28,296,192 | | |
| | | Malaysia—0.1% | |
| | 5,146,082 | | | | | Steppe Cement* (1) | | | 27,280,489 | | |
| | | Indonesia—0.1% | |
| | 16,891,866 | | | | | Indofood Sukses Makmur (1) | | | 4,126,276 | | |
| | 30,701,260 | | | | | Semen Gresik Persero (1) | | | 21,101,782 | | |
| | | | 25,228,058 | | |
| | | Estonia—0.1% | |
| | 1,994,329 | | | | | Arco Vara* | | | 4,183,678 | | |
| | 1,247,952 | | | | | Olympic Entertainment | | | 9,532,906 | | |
| | 6,012,166 | | | | | Tallink Group* | | | 8,959,044 | | |
| | | | 22,675,628 | | |
See Notes to Financial Statements.
Julius Baer Funds 2007 Annual Report
80
PORTFOLIO OF INVESTMENTS (Continued) October 31, 2007
Julius Baer International Equity Fund
Share
Amount | | (Percentage of
Net Assets) | | Description | | Market
Value (Note 2) | |
| | COMMON STOCKS—Continued | |
| | | Croatia—0.1% | |
| | 8,149 | | | | | Atlantska Plovidba | | $ | 5,590,487 | | |
| | 20,979 | | | | | Dom Holding* | | | 771,605 | | |
| | 11,424 | | | | | Ericsson Nikola Tesla | | | 7,302,480 | | |
| | 12,811 | | | | | FIMA Validus* | | | 395,596 | | |
| | 779 | | | | | Institut Gradevinarstva Hrvatske | | | 2,134,938 | | |
| | 27,137 | | | | | Podravka prehrambena industija | | | 2,732,755 | | |
| | 3,957 | | | | | Proficio DD* | | | 49,039 | | |
| | 2,053 | | | | | Viadukt DD* | | | 1,614,760 | | |
| | | | 20,591,660 | | |
| | | Kazakhstan—0.1% | |
| | 1,608,996 | | | | | BMB Munai* (2) | | | 9,396,537 | | |
| | 475,595 | | | | | KazakhGold GDR* (1)(2) | | | 10,664,844 | | |
| | | | 20,061,381 | | |
| | | Thailand—0.1% | |
| | 22,158,400 | | | | | Bank of Ayudhya NVDR (1) | | | 19,077,306 | | |
| | | United States—0.1% | |
| | 483,784 | | | | | News Corp (1) | | | 11,046,713 | | |
| | 348,957 | | | | | News Corp-Class B (2) | | | 8,001,584 | | |
| | | | 19,048,297 | | |
| | | Georgia—0.1% | |
| | 571,956 | | | | | Bank of Georgia GDR-Registered Shares* | | | 18,874,548 | | |
| | | Lebanon—0.1% | |
| | 741,983 | | | | | SOLIDERE-Class A | | | 13,511,510 | | |
| | | Latvia—0.0% | |
| | 1,424,182 | | | | | Parex Bank* (1)(3) | | | 13,200,451 | | |
| | | Zambia—0.0% | |
| | 8,072,405 | | | | | Zambeef Products (3) | | | 11,943,320 | | |
| | | Philippines—0.0% | |
| | 519,218 | | | | | Ayala Corp (1) | | | 7,487,909 | | |
| | 7,519,733 | | | | | Ayala Land (1) | | | 2,617,660 | | |
| | | | 10,105,569 | | |
See Notes to Financial Statements.
Julius Baer Funds 2007 Annual Report
81
PORTFOLIO OF INVESTMENTS (Continued) October 31, 2007
Julius Baer International Equity Fund
Share
Amount | | (Percentage of
Net Assets) | | Description | | Market
Value (Note 2) | |
| | COMMON STOCKS—Continued | |
| | | Taiwan—0.0% | |
| | 744,339 | | | | | Taiwan Semiconductor Manufacturing Sponsored ADR | | $ | 7,927,210 | | |
| | | Morocco—0.0% | |
| | 21,439 | | | | | Ciments Du Maroc (1) | | | 7,662,748 | | |
| | | Lithuania—0.0% | |
| | 179,733 | | | | | Rokiskio Suris* | | | 5,874,366 | | |
| | | Israel—0.0% | |
| | 145,642 | | | | | Queenco Leisure International GDR*† (3) | | | 2,528,491 | | |
| | | TOTAL COMMON STOCKS (Cost $14,768,381,375) | | | 23,049,721,112 | | |
| | WARRANTS—2.9% | |
| | | India—2.6% | |
| | 1,284,846 | | | | | Bharti Airtel-Class A, Issued by CLSA, Expires 05/31/2010*† | | | 32,909,018 | | |
| | 4,278,617 | | | | | Canara Bank, Issued by Citigroup, Expires 10/24/2012 | | | 31,922,299 | | |
| | 1,096,677 | | | | | ICIC Bank, Issued by CLSA, Expires 05/10/2010† | | | 34,994,634 | | |
| | 1,218,388 | | | | | ICICI Bank, Issued by Citigroup, Expires 10/24/2012† | | | 39,061,519 | | |
| | 1,757,432 | | | | | India Cements, Issued by ABN Amro Bank, Expires 06/30/2009 | | | 12,635,936 | | |
| | 76,404 | | | | | Indian Bank, Issued by Citigroup, Expires 01/17/2012† | | | 299,045 | | |
| | 630,454 | | | | | Mahindra & Mehindra, Issued by CLSA, Expires 06/28/2010† | | | 12,104,717 | | |
| | 483,733 | | | | | Oil & Natural Gas, Issued by CLSA, Expires 05/13/2010† | | | 15,339,173 | | |
| | 194,244 | | | | | Reliance Industries, Issued by CLSA, Expires 05/17/2010† | | | 13,758,303 | | |
| | 1,431,418 | | | | | State Bank of India, Issued by Citigroup, Expires 10/24/2012† | | | 89,460,884 | | |
| | 6,355,228 | | | | | State Bank of India, Issued by CLSA, Expires 05/13/2010† | | | 396,323,521 | | |
| | 232,678 | | | | | Suzlon Energy, Issued by Citigroup, Expires 10/24/2012 | | | 11,605,281 | | |
| | | | 690,414,330 | | |
| | | Taiwan—0.3% | |
| | 6,857,371
| | |
| | Formosa Plastics, Issued by Deutsche Bank AG London,
Expires 01/24/2017† | | | 21,120,703 | | |
| | 6,826,828
| | |
| | Hon Hai Precision Industry, Issued by Deutsche Bank AG
London, Expires 08/19/2008† | | | 51,836,105 | | |
| | 9,027,285
| | |
| | Taiwan Semiconductor Manufacturing, Issued by
Deutsche Bank AG London, Expires 01/19/2017 | | | 17,774,724 | | |
| | | | 90,731,532 | | |
| | | Ukraine—0.0% | |
| | 1,013
| | |
| | Laona Investments, Issued by Bank Austria Creditanatalt,
Expires 11/16/2007* | | | 10,991,683 | | |
See Notes to Financial Statements.
Julius Baer Funds 2007 Annual Report
82
PORTFOLIO OF INVESTMENTS (Continued) October 31, 2007
Julius Baer International Equity Fund
Share
Amount | | (Percentage of
Net Assets) | | Description | | Market
Value (Note 2) | |
| | WARRANTS—Continued | |
| | | Russia—0.0% | |
| | | | | 117
| | Russian Domestic Small-Cap Basket, Issued by UBS,
Expires 12/22/2007*† | | $ | 2,141,100 | | |
| | | TOTAL WARRANTS (Cost $425,621,001) | | | 794,278,645 | | |
| | INVESTMENT FUNDS—1.8% | |
| | | India—1.1% | |
| | 12,686,170 | | | | | Banking Index Benchmark Exchange Traded Scheme-
Bank BeES, Issued by Citigroup, Expires 10/24/2012† | | | 292,251,298 | | |
| | | United States—0.4% | |
| | 1,107,933 | | | | | IShares MSCI Brazil (2) | | | 94,839,065 | | |
| | | Romania—0.1% | |
| | 4,035,500 | | | | | SIF 1 Banat Crisana Arad | | | 6,260,804 | | |
| | 3,406,316 | | | | | SIF 2 Moldova Bacau | | | 5,314,273 | | |
| | 9,533,500 | | | | | SIF 3 Transilvania Brasov* | | | 9,901,815 | | |
| | 4,871,855 | | | | | SIF 4 Muntenia Bucuresti | | | 5,292,963 | | |
| | 4,143,975 | | | | | SIF 5 Oltenia Craiova | | | 7,797,754 | | |
| | | | 34,567,609 | | |
| | | Australia—0.1% | |
| | 10,919,015 | | | | | Australian Infrastructure Fund (1) | | | 34,214,410 | | |
| | | Russia—0.1% | |
| | 92,634 | | | | | Renaissance Pre-IPO Fund* (3) | | | 9,494,985 | | |
| | 99,000 | | | | | Renfin Ltd-Class A* (3) | | | 11,360,250 | | |
| | 3,277,081 | | | | | RenShares Utilites* | | | 10,978,221 | | |
| | | | 31,833,456 | | |
| | | Sweden—0.0% | |
| | 1,485,000 | | | | | NAXS Nordic Access Buyout* (1) | | | 7,759,103 | | |
| | | TOTAL INVESTMENT FUNDS (Cost $314,097,685) | | | 495,464,941 | | |
| | PREFERRED STOCKS—1.7% | |
| | | Brazil—1.2% | |
| | 7,335,675 | | | | | Cia Vale do Rio Doce (1) | | | 230,438,948 | | |
| | 2,360,659 | | | | | Petroleo Brasileiro (1) | | | 97,726,425 | | |
| | | | 328,165,373 | | |
See Notes to Financial Statements.
Julius Baer Funds 2007 Annual Report
83
PORTFOLIO OF INVESTMENTS (Continued) October 31, 2007
Julius Baer International Equity Fund
Share
Amount | | (Percentage of
Net Assets) | | Description | | Market
Value (Note 2) | |
| | PREFERRED STOCKS—Continued | |
| | | Russia—0.3% | |
| | 121,092 | | | | | Silvinit (3) | | $ | 48,134,070 | | |
| | 7,791,100 | | | | | URSA Bank (3) | | | 14,803,090 | | |
| | | | 62,937,160 | | |
| | | Germany—0.2% | |
| | 89,379 | | | | | Fresenius SE (1) | | | 7,086,328 | | |
| | 259,214 | | | | | Volkswagen AG | | | 49,192,433 | | |
| | | | 56,278,761 | | |
| | | Croatia—0.0% | |
| | 45,410 | | | | | Adris Grupa | | | 4,644,247 | | |
| | | TOTAL PREFERRED STOCKS (Cost $345,610,514) | | | 452,025,541 | | |
Face
Value | | Currency | | | | | |
| | STRUCTURED NOTES—0.2% | |
| | | Philippines—0.2% | |
| | 1,679 | | | USD | | Phillippines Notes, due 10/17/2008 Zero Coupon
(Cost $38,261,791)*† | | | 63,290,528 | | |
Share
Amount | | | | | | | |
| | FOREIGN GOVERNMENT COMPENSATION NOTES—0.1% | |
| | | Bulgaria—0.1% | |
| | 12,071,674 | | | BGN | | Bulgaria Compensation Notes* | | | 4,082,968 | | |
| | 3,842,865 | | | BGN | | Bulgaria Housing Compensation Notes* | | | 1,335,858 | | |
| | 29,663,486 | | | BGN | | Bulgaria Registered Compensation Vouchers* | | | 9,670,992 | | |
| | | TOTAL FOREIGN GOVERNMENT
COMPENSATION NOTES (Cost $19,710,351) | | | | | 15,089,818 | | |
See Notes to Financial Statements.
Julius Baer Funds 2007 Annual Report
84
PORTFOLIO OF INVESTMENTS (Continued) October 31, 2007
Julius Baer International Equity Fund
Face
Value | | Currency | | Description | | Market
Value (Note 2) | |
| | U.S. GOVERNMENT AND AGENCY OBLIGATIONS—0.1% | |
| | | United States—0.1% | |
| | | | | | | U.S. Treasury Bills | | | | | |
| | 8,000,000 | | | USD | | 3.790% due 12/06/2007 (5) | | $ | 7,970,520 | | |
| | 5,500,000 | | | USD | | 3.800% due 12/06/2007 (5) | | | 5,479,680 | | |
| | | | 13,450,200 | | |
| | | | | TOTAL U.S. GOVERNMENT AND
AGENCY OBLIGATIONS (Cost $13,450,200) | | | | | 13,450,200 | | |
Share
Amount | | (Percentage of
Net Assets) | | | | | |
| | CONVERTIBLE BOND—0.0% | |
| | | Greece—0.0% | |
| | 591,950 | | | | | Nirefs SA (Cost $782,184) (1) | | | 836,706 | | |
| | RIGHTS—0.0% | |
| | | Bulgaria—0.0% | |
| | 1,408,255 | | | | | Central Cooperative Bank Rights, Expires 12/05/2007 | | | 781,178 | | |
| | | Philippines—0.0% | |
| | 11,528,247 | | | | | Ayala Land Rights, Expires TBD | | | 26,392 | | |
| | | TOTAL RIGHTS (Cost $24,683) | | | 807,570 | | |
Face
Value | | Currency | | | | | |
| | SHORT-TERM INVESTMENTS PURCHASED WITH CASH COLLATERAL
FROM SECURITY LENDING—3.6% | |
| | | United States—3.6% | |
| | 970,162,722 | | | USD
| | State Street Navigator Securities Lending Prime Portfolio
(Cost $970,162,722) | | | 970,162,722 | | |
See Notes to Financial Statements.
Julius Baer Funds 2007 Annual Report
85
PORTFOLIO OF INVESTMENTS (Continued) October 31, 2007
Julius Baer International Equity Fund
Face
Value | | Currency | | Description | | Market
Value (Note 2) | |
| | REPURCHASE AGREEMENT—0.1% | |
| | | United States—0.1% | |
| | 22,464,979 | | | USD | | State Street Bank and Trust Repurchase Agreement, | | |
| | |
| | | | dated 10/31/2007, due 11/01/2007, with a | | |
| | |
| | | | maturity value of $22,466,858 and an effective | | |
| | |
| | | | yield of 3.01%, collateralized by a U.S. Government | | |
| | |
| | | | and Agency Obligation, with a rate of 5.375%, | | |
| | |
| | | | a maturity of 09/25/2031, and an aggregate | | |
| | |
| | | | market value of $22,917,340. (Cost $22,464,979) | | $ | 22,464,979 | | |
| | | TOTAL INVESTMENTS—96.1%
(Cost $16,918,567,485) | | | | | 25,877,592,762 | | |
| | | | | OTHER ASSETS AND LIABILITIES (Net)—3.9% | | | 1,052,581,537 | | |
| | | | | TOTAL NET ASSETS—100.0% | | $ | 26,930,174,299 | | |
Notes to the Portfolio of Investments:
ADR American Depositary Receipt
BDR Brazilian Depositary Receipt
GDR Global Depositary Receipt
NVDR Non-Voting Depositary Receipt
(1) Security valued at fair value utilizing fair value model in accordance with valuation policies approved by the board of Trustees.
(2) All or a portion of this security was on loan to brokers at October 31, 2007.
(3) Illiquid security
(4) Affiliated Security
(5) Security has been pledged for futures collateral.
* Non-income producing security.
† Securities exempt from registration under Rule 144A of the Securities Act of 1933, as amended. These
securities may be resold in transactions exempt from registrations, normally to qualified institutional buyers.
Aggregate cost for federal income tax purposes was $17,179,351,851.
Glossary of Currencies
BGN — Bulgarien Lev
USD — United States Dollar
See Notes to Financial Statements.
Julius Baer Funds 2007 Annual Report
86
SCHEDULE OF FORWARD FOREIGN EXCHANGE CONTRACTS
October 31, 2007
Julius Baer International Equity Fund
FORWARD FOREIGN EXCHANGE CONTRACTS TO BUY
| | | Contracts to Receive | | | | | |
Expiration
Date | | Local
Currency | | Value in
USD | | In Exchange
for USD | | Net Unrealized
Appreciation
(Depreciation) | |
| 11/20/07 | | AUD | 601,245,004 | | | | 556,655,652 | | | | 516,769,669 | | | $ | 39,885,983 | | |
| 12/12/07 | | AUD | 191,457,668 | | | | 177,043,204 | | | | 166,216,202 | | | | 10,827,002 | | |
| 11/01/07 | | CAD | 10,000,000 | | | | 10,528,532 | | | | 10,471,770 | | | | 56,762 | | |
| 11/19/07 | | CAD | 251,756,313 | | | | 265,075,006 | | | | 248,265,697 | | | | 16,809,309 | | |
| 12/27/07 | | CAD | 410,001,357 | | | | 431,783,996 | | | | 409,790,907 | | | | 21,993,089 | | |
| 12/24/07 | | GBP | 59,136,140 | | | | 122,642,260 | | | | 118,510,572 | | | | 4,131,688 | | |
| 11/08/07 | | HKD | 3,849,092,841 | | | | 496,637,503 | | | | 496,077,783 | | | | 559,720 | | |
| 12/17/07 | | HKD | 678,835,925 | | | | 87,629,724 | | | | 87,518,304 | | | | 111,420 | | |
| 11/19/07 | | HUF | 47,320,515,799 | | | | 272,154,273 | | | | 264,702,548 | | | | 7,451,725 | | |
| 12/27/07 | | HUF | 6,413,325,474 | | | | 36,787,871 | | | | 35,870,717 | | | | 917,154 | | |
| 11/27/07 | | INR | 4,977,107,487 | | | | 126,412,724 | | | | 125,045,412 | | | | 1,367,312 | | |
| 11/20/07 | | JPY | 52,924,897,211 | | | | 460,027,235 | | | | 474,371,498 | | | | (14,344,263 | ) | |
| 12/26/07 | | JPY | 43,589,880,789 | | | | 380,436,167 | | | | 382,532,015 | | | | (2,095,848 | ) | |
| 01/23/08 | | JPY | 26,477,720,000 | | | | 231,792,997 | | | | 231,957,536 | | | | (164,539 | ) | |
| 01/31/08 | | JPY | 70,609,000,000 | | | | 618,660,079 | | | | 621,421,336 | | | | (2,761,257 | ) | |
| 12/03/07 | | KRW | 95,603,810,146 | | | | 106,291,411 | | | | 104,868,475 | | | | 1,422,936 | | |
| 11/20/07 | | MXN | 1,318,424,321 | | | | 123,013,792 | | | | 119,572,625 | | | | 3,441,167 | | |
| 11/01/07 | | NOK | 142,152,501 | | | | 26,366,773 | | | | 26,530,888 | | | | (164,115 | ) | |
| 11/19/07 | | PLN | 665,779,268 | | | | 265,510,926 | | | | 248,829,355 | | | | 16,681,571 | | |
| 12/24/07 | | PLN | 272,254,543 | | | | 108,561,697 | | | | 101,884,044 | | | | 6,677,653 | | |
| 11/01/07 | | RON | 2,121,265 | | | | 921,848 | | | | 920,289 | | | | 1,559 | | |
| 11/19/07 | | TRY | 137,880,606 | | | | 117,032,942 | | | | 112,932,652 | | | | 4,100,290 | | |
| 12/03/07 | | TWD | 5,022,188,565 | | | | 155,509,787 | | | | 155,228,164 | | | | 281,623 | | |
| 11/01/07 | | UAH | 14,090,640 | | | | 2,786,364 | | | | 2,788,293 | | | | (1,929 | ) | |
| 11/07/07 | | UAH | 22,582,474 | | | | 4,465,861 | | | | 4,468,680 | | | | (2,819 | ) | |
| 11/13/07 | | UAH | 10,042,779 | | | | 1,986,184 | | | | 1,987,292 | | | | (1,108 | ) | |
| 01/04/08 | | ZAR | 1,272,490,551 | | | | 192,651,272 | | | | 182,103,236 | | | | 10,548,036 | | |
| Net unrealized appreciation on forward foreign exchange contracts to buy | | | | | | | | | | | | | | $ | 127,730,121 | | |
See Notes to Financial Statements.
Julius Baer Funds 2007 Annual Report
87
SCHEDULE OF FORWARD FOREIGN EXCHANGE CONTRACTS (Continued)
October 31, 2007
Julius Baer International Equity Fund
FORWARD FOREIGN EXCHANGE CONTRACTS TO SELL
| | | Contracts to Deliver | |
| Expiration | | Local
Date | | Value in
Currency | | In Exchange
USDfor USD | | Net Unrealized
Depreciation | |
| 11/20/07 | | AUD | 601,245,004 | | | | 556,655,652 | | | | 468,361,280 | | | $ | (88,294,372 | ) | |
| 11/19/07 | | CAD | 251,756,313 | | | | 265,075,006 | | | | 234,181,027 | | | | (30,893,979 | ) | |
| 12/27/07 | | CZK | 4,596,912,098 | | | | 247,756,143 | | | | 235,891,540 | | | | (11,864,603 | ) | |
| 11/01/07 | | EUR | 22,916,667 | | | | 33,154,688 | | | | 33,000,000 | | | | (154,688 | ) | |
| 01/31/08 | | EUR | 238,933,193 | | | | 346,023,714 | | | | 344,245,384 | | | | (1,778,330 | ) | |
| 11/19/07 | | HUF | 90,995,443,002 | | | | 523,341,689 | | | | 468,330,319 | | | | (55,011,370 | ) | |
| 12/27/07 | | HUF | 6,413,325,474 | | | | 36,787,871 | | | | 35,667,235 | | | | (1,120,636 | ) | |
| 11/20/07 | | MXN | 2,656,030,015 | | | | 247,817,277 | | | | 234,180,643 | | | | (13,636,634 | ) | |
| 11/19/07 | | PLN | 1,319,938,888 | | | | 526,387,969 | | | | 463,610,992 | | | | (62,776,977 | ) | |
| 12/24/07 | | PLN | 272,254,543 | | | | 108,561,697 | | | | 101,413,448 | | | | (7,148,249 | ) | |
| 11/01/07 | | RON | 440,103 | | | | 191,258 | | | | 188,837 | | | | (2,421 | ) | |
| 11/02/07 | | RON | 886,499 | | | | 385,250 | | | | 383,185 | | | | (2,065 | ) | |
| 11/01/07 | | TRY | 4,282,410 | | | | 3,656,273 | | | | 3,632,855 | | | | (23,418 | ) | |
| 11/19/07 | | TRY | 169,188,489 | | | | 143,607,048 | | | | 117,090,321 | | | | (26,516,727 | ) | |
| 12/24/07 | | TRY | 79,003,549 | | | | 66,332,179 | | | | 62,012,205 | | | | (4,319,974 | ) | |
| Net unrealized depreciation on forward foreign exchange contracts to sell | | | | | | | | | | | | | | $ | (303,544,443 | ) | |
Glossary of Currencies
AUD — Australian Dollar
CAD — Canadian Dollar
CZK — Czech Koruna
EUR — Euro
GBP — British Pound Sterling
HKD — Hong Kong Dollar
HUF — Hungarian Forint
INR — Indian Rupee
JPY — Japanese Yen
KRW — South Korean Won
MXN — Mexican Nuevo Peso
NOK — Norwegian Krone
PLN — Polish Zloty
RON — Romanian Leu
TRY — Turkish Lira
TWD — New Taiwan Dollar
UAH — Ukraine Hryvnia
ZAR — South African Rand
See Notes to Financial Statements.
Julius Baer Funds 2007 Annual Report
88
PORTFOLIO OF INVESTMENTS–Industry Sector (Unaudited) October 31, 2007
Julius Baer International Equity Fund
At October 31, 2007, sector diversification of the Fund's non-cash equivalents investments were as follows:
| | | % of Net
Assets | | Market
Value (Note 2) | |
| INDUSTRY SECTOR | |
| Financials | | | 29.0 | % | | $ | 7,847,560,653 | | |
| Materials | | | 13.4 | | | | 3,612,584,927 | | |
| Consumer Discretionary | | | 9.8 | | | | 2,639,848,953 | | |
| Industrials | | | 9.8 | | | | 2,627,159,721 | | |
| Energy | | | 9.7 | | | | 2,602,076,576 | | |
| Consumer Staples | | | 5.7 | | | | 1,528,791,413 | | |
| Telecommunications | | | 5.4 | | | | 1,443,658,163 | | |
| Utilities | | | 4.0 | | | | 1,069,556,406 | | |
| Healthcare | | | 3.1 | | | | 839,505,195 | | |
| Information Technology | | | 2.5 | | | | 660,772,853 | | |
| Cash & Cash Equivalents | | | 3.7 | | | | 1,006,077,902 | * | |
| Total Investments | | | 96.1 | | | | 25,877,592,762 | | |
| Other Assets and Liabilities (Net) | | | 3.9 | | | | 1,052,581,537 | * | |
| Net Assets | | | 100.0 | % | | $ | 26,930,174,299 | | |
* Cash and Cash Equivalents and Other Assets and Liabilities (Net) include the margin requirements for futures with a notional market value of $1,721,043,488, which is 6.39% of net assets, and market value for swaps of $54,611,024, which is 0.20% of net assets.
See Notes to Financial Statements.
Julius Baer Funds 2007 Annual Report
89
PORTFOLIO OF INVESTMENTS October 31, 2007
Julius Baer International Equity Fund II
Share
Amount | | (Percentage of
Net Assets) | | Description | | Market
Value (Note 2) | |
| | COMMON STOCKS—84.5% | |
| | | France—9.0% | |
| | 27,905 | | | | | Accor SA (1) | | $ | 2,668,877 | | |
| | 204,248 | | | | | Aeroports de Paris (1)(2) | | | 23,446,486 | | |
| | 296,350 | | | | | Air Liquide (1)(2) | | | 40,867,788 | | |
| | 101,770 | | | | | Alstom (1) | | | 24,209,752 | | |
| | 229,187 | | | | | BNP Paribas (1) | | | 25,355,561 | | |
| | 390,029 | | | | | Bouygues SA (1) | | | 37,552,551 | | |
| | 91,840 | | | | | Bureau Veritas* (1) | | | 5,312,123 | | |
| | 219,375 | | | | | Compagnie de Saint-Gobain (1) | | | 23,671,948 | | |
| | 288,317 | | | | | Credit Agricole (1) | | | 11,424,154 | | |
| | 25,382 | | | | | EDF Energies Nouvelles (1)(2) | | | 2,037,530 | | |
| | 580,842 | | | | | Electricite de France (1) | | | 69,779,131 | | |
| | 39,972 | | | | | Eurazeo (1) | | | 5,965,767 | | |
| | 679,420 | | | | | France Telecom (1) | | | 25,099,481 | | |
| | 41,746 | | | | | Hermes International (1) | | | 5,497,659 | | |
| | 328,872 | | | | | JC Decaux (1)(2) | | | 12,117,897 | | |
| | 581,244 | | | | | Lafarge SA (1) | | | 94,794,228 | | |
| | 716,647 | | | | | LVMH Moet Hennessy Louis Vuitton (1) | | | 92,425,739 | | |
| | 195,111 | | | | | M6-Metropole Television (1) | | | 5,779,743 | | |
| | 166,855 | | | | | Neuf Cegetel (1)(2) | | | 8,447,872 | | |
| | 115,466 | | | | | Nexity (1) | | | 7,687,861 | | |
| | 138,160 | | | | | Pernod-Ricard (1) | | | 31,936,394 | | |
| | 144,678 | | | | | PPR (1) | | | 28,720,353 | | |
| | 77,679 | | | | | Remy Cointreau (1) | | | 5,973,764 | | |
| | 115,503 | | | | | Renault SA (1) | | | 19,458,144 | | |
| | 544,904 | | | | | Societe Television Francaise 1 (1) | | | 15,105,301 | | |
| | 66,129 | | | | | Sodexho Alliance (1) | | | 4,795,290 | | |
| | 886,079 | | | | | Suez SA (1) | | | 57,748,932 | | |
| | 85,754 | | | | | Technip SA (1) | | | 7,705,843 | | |
| | 1,429,576 | | | | | Total SA (1) | | | 115,230,212 | | |
| | 206,292 | | | | | Veolia Environnement (1) | | | 18,439,165 | | |
| | 450,365 | | | | | Vinci SA (1) | | | 37,032,974 | | |
| | 147,699 | | | | | Vivendi (1) | | | 6,660,112 | | |
| | 29,220 | | | | | Wendel (1)(2) | | | 5,016,634 | | |
| | | | 877,965,266 | | |
| | | United Kingdom—7.5% | |
| | 1,128,541 | | | | | Amec PLC (1) | | | 19,727,458 | | |
| | 1,051,635 | | | | | Anglo American (1) | | | 72,533,926 | | |
| | 405,574 | | | | | BAE Systems (1) | | | 4,209,877 | | |
See Notes to Financial Statements.
90
PORTFOLIO OF INVESTMENTS (Continued) October 31, 2007
Julius Baer International Equity Fund II
Share
Amount | | (Percentage of
Net Assets) | | Description | | Market
Value (Note 2) | |
| | COMMON STOCKS—Continued | |
| | | United Kingdom—Continued | |
| | 1,680,237 | | | | | BHP Billiton (1) | | $ | 64,038,869 | | |
| | 9,123,989 | | | | | BP PLC (1) | | | 118,526,250 | | |
| | 1,147,019 | | | | | Burberry Group (1) | | | 14,699,240 | | |
| | 2,640,525 | | | | | Compass Group (1) | | | 19,047,672 | | |
| | 3,738,487 | | | | | Diageo PLC (1) | | | 85,626,310 | | |
| | 1,090,450 | | | | | GlaxoSmithKline PLC (1) | | | 28,098,603 | | |
| | 420,772 | | | | | Intertek Group (1) | | | 9,001,544 | | |
| | 432,422 | | | | | Kingfisher PLC (1) | | | 1,777,223 | | |
| | 164,027 | | | | | Persimmon PLC (1) | | | 3,589,391 | | |
| | 69,944 | | | | | Peter Hambro Mining* (1) | | | 2,045,724 | | |
| | 2,214,715 | | | | | QinetiQ PLC (1) | | | 8,737,374 | | |
| | 580,584 | | | | | Reckitt Benckiser (1) | | | 33,706,018 | | |
| | 2,357,206 | | | | | Rolls-Royce Group* (1) | | | 26,431,171 | | |
| | 95,231,122 | | | | | Rolls-Royce Group-Class B-Entitlement Shares* | | | 197,828 | | |
| | 562,553 | | | | | Scottish & Newcastle (1) | | | 9,178,190 | | |
| | 3,625,267 | | | | | Smith & Nephew (1) | | | 49,035,598 | | |
| | 1,017,096 | | | | | Taylor Wimpey (1) | | | 5,258,854 | | |
| | 3,998,012 | | | | | Tesco PLC (1) | | | 40,632,137 | | |
| | 26,181,155 | | | | | Vodafone Group (1) | | | 103,171,634 | | |
| | 660,056 | | | | | William Hill (1) | | | 8,517,750 | | |
| | 324,950 | | | | | WPP Group (1) | | | 4,444,925 | | |
| | | | 732,233,566 | | |
| | | Germany—7.1% | |
| | 39,051 | | | | | Adidas AG (1) | | | 2,609,077 | | |
| | 360,161 | | | | | Arcandor AG* (1)(2) | | | 11,574,352 | | |
| | 90,412 | | | | | BASF AG (1) | | | 12,501,646 | | |
| | 216,678 | | | | | Bayer AG (1) | | | 18,119,250 | | |
| | 73,576 | | | | | Bilfinger Berger (1) | | | 6,580,672 | | |
| | 78,871 | | | | | Celesio AG (1) | | | 4,469,423 | | |
| | 2,105,376 | | | | | Commerzbank AG (1) | | | 89,617,064 | | |
| | 38,042 | | | | | Continental AG (1) | | | 5,756,199 | | |
| | 615,344 | | | | | Daimler AG (1) | | | 67,950,112 | | |
| | 171,450 | | | | | Deutsche Boerse (1) | | | 27,171,368 | | |
| | 372,147 | | | | | Deutsche Post-Registered (1) | | | 11,283,160 | | |
| | 215,640 | | | | | Deutsche Postbank (1) | | | 15,785,203 | | |
| | 402,033 | | | | | E.ON AG (1) | | | 78,510,560 | | |
| | 1,419,108 | | | | | Fraport AG (1)(2) | | | 111,119,077 | | |
See Notes to Financial Statements.
91
PORTFOLIO OF INVESTMENTS (Continued) October 31, 2007
Julius Baer International Equity Fund II
Share
Amount | | (Percentage of
Net Assets) | | Description | | Market
Value (Note 2) | |
| | COMMON STOCKS—Continued | |
| | | Germany—Continued | |
| | 394,849 | | | | | Fresenius Medical Care (1) | | $ | 20,862,039 | | |
| | 402,595 | | | | | Fresenius SE (1) | | | 31,345,198 | | |
| | 342,773 | | | | | Henkel KGaA (1) | | | 15,911,960 | | |
| | 361,178 | | | | | Hypo Real Estate (1)(2) | | | 21,545,684 | | |
| | 331,500 | | | | | IKB Deutsche Industriebank* (1)(2) | | | 6,941,624 | | |
| | 46,593 | | | | | Merck KGaA (1) | | | 5,838,366 | | |
| | 318,382 | | | | | Praktiker Bau-und Heimwerkermaerkte (1) | | | 11,558,839 | | |
| | 126,954 | | | | | Rheinmetall AG (1) | | | 11,355,546 | | |
| | 719,250 | | | | | Rhoen-Klinikum AG (1) | | | 22,973,858 | | |
| | 134,617 | | | | | RWE AG (1) | | | 18,389,612 | | |
| | 381,729 | | | | | Siemens AG-Registered (1) | | | 51,946,034 | | |
| | 247,841 | | | | | Tognum AG* (1) | | | 8,966,055 | | |
| | | | 690,681,978 | | |
| | | Russia—6.4% | |
| | 2,827,000 | | | | | AvtoVAZ (3) | | | 4,509,065 | | |
| | 160,000 | | | | | AvtoVAZ GDR (3) | | | 1,319,436 | | |
| | 355,039 | | | | | Cherepovets MK Severstal Sponsored GDR† | | | 8,414,424 | | |
| | 199,997 | | | | | CTC Media* (2) | | | 5,017,925 | | |
| | 339,223 | | | | | Evraz Group GDR† | | | 25,451,223 | | |
| | 106 | | | | | Evrocement Group* (3) | | | 1,290,285 | | |
| | 2,789,709 | | | | | Gazprom Sponsored ADR (2) | | | 138,536,949 | | |
| | 417,857 | | | | | LUKOIL Sponsored ADR | | | 37,774,273 | | |
| | 90,679 | | | | | Mechel OAO ADR | | | 7,630,638 | | |
| | 11,113 | | | | | MMC Norilsk Nickel | | | 3,261,666 | | |
| | 238,507 | | | | | MMC Norilsk Nickel ADR (2) | | | 75,606,719 | | |
| | 1,169,091 | | | | | NovaTek OAO | | | 6,710,582 | | |
| | 191,731 | | | | | NovaTek OAO Sponsored GDR† | | | 11,005,359 | | |
| | 130,375 | | | | | NovaTek OAO Sponsored GDR-Registered Shares (1) | | | 7,508,310 | | |
| | 31,488 | | | | | Open Investments* (3) | | | 8,690,688 | | |
| | 652,224 | | | | | Pharmstandard GDR*† (3) | | | 14,225,005 | | |
| | 427,422 | | | | | Polyus Gold | | | 19,404,959 | | |
| | 155,249 | | | | | Polyus Gold Sponsored ADR | | | 7,102,642 | | |
| | 1,124,453 | | | | | Rosneft Oil | | | 9,861,453 | | |
| | 5,381,186 | | | | | Rosneft Oil GDR (1)(2) | | | 47,786,297 | | |
| | 14,222,282 | | | | | Sberbank | | | 61,155,813 | | |
| | 1,128,331 | | | | | Sistema Hals GDR*† (3) | | | 11,001,227 | | |
| | 448,571 | | | | | Unified Energy System GDR* (2) | | | 55,174,233 | | |
| | 1,916,811 | | | | | Uralkali | | | 9,584,055 | | |
See Notes to Financial Statements.
92
PORTFOLIO OF INVESTMENTS (Continued) October 31, 2007
Julius Baer International Equity Fund II
Share
Amount | | (Percentage of
Net Assets) | | Description | | Market
Value (Note 2) | |
| | COMMON STOCKS—Continued | |
| | | Russia—Continued | |
| | 64,997 | | | | | Uralkali Sponsored GDR*† | | $ | 1,624,925 | | |
| | 193,659 | | | | | Uralsvyazinform ADR | | | 2,459,469 | | |
| | 465,490 | | | | | Volzhskaya Hydroelectric Power Station (3) | | | 439,888 | | |
| | 1,520,728 | | | | | VTB Bank Sponsored GDR*† | | | 14,598,989 | | |
| | 115,096 | | | | | Wimm-Bill-Dann Foods | | | 9,426,362 | | |
| | 139,090 | | | | | Wimm-Bill-Dann Foods ADR (2) | | | 16,656,028 | | |
| | | | 623,228,887 | | |
| | | Japan—5.7% | |
| | 68,780 | | | | | Acom Co (1)(2) | | | 1,643,923 | | |
| | 110,316 | | | | | Aeon Credit Service (1) | | | 1,697,022 | | |
| | 76,550 | | | | | Aiful Corp (1)(2) | | | 1,807,608 | | |
| | 200,448 | | | | | Aisin Seiki (1) | | | 8,207,396 | | |
| | 183,396 | | | | | Bank of Kyoto (1)(2) | | | 2,338,894 | | |
| | 1,170,773 | | | | | Bank of Yokohama (1) | | | 8,269,320 | | |
| | 446,316 | | | | | Canon Inc (1) | | | 22,567,094 | | |
| | 465,000 | | | | | Chiba Bank (1) | | | 3,725,349 | | |
| | 73,723 | | | | | Credit Saison (1) | | | 2,340,277 | | |
| | 168,000 | | | | | Daihatsu Motor (1) | | | 1,787,558 | | |
| | 107,500 | | | | | Daikin Industries (1) | | | 5,401,431 | | |
| | 288,928 | | | | | Daiwa Securities (1) | | | 2,784,897 | | |
| | 365,249 | | | | | Denso Corp (1) | | | 14,770,484 | | |
| | 648 | | | | | Dentsu Inc (1) | | | 1,699,382 | | |
| | 1,014 | | | | | East Japan Railway (1) | | | 8,353,099 | | |
| | 101,100 | | | | | Eisai Co (1) | | | 4,243,710 | | |
| | 128,440 | | | | | Fanuc Ltd (1) | | | 14,068,019 | | |
| | 1,025 | | | | | Fuji Television Network (1) | | | 2,068,038 | | |
| | 298,000 | | | | | Gunma Bank (1) | | | 2,117,396 | | |
| | 532,632 | | | | | Honda Motor (1) | | | 19,973,453 | | |
| | 155,038 | | | | | HOYA Corp (1)(2) | | | 5,638,669 | | |
| | 152,010 | | | | | Ibiden Co (1) | | | 12,926,462 | | |
| | 452,000 | | | | | ITOCHU Corp (1) | | | 5,758,586 | | |
| | 2,708 | | | | | Japan Tobacco (1) | | | 15,772,066 | | |
| | 62,779 | | | | | JFE Holdings (1) | | | 3,669,892 | | |
| | 118,991 | | | | | JS Group (1) | | | 1,923,897 | | |
| | 93,417 | | | | | JSR Corp (1) | | | 2,419,399 | | |
| | 1,176 | | | | | KDDI Corp (1) | | | 8,908,582 | | |
| | 259,630 | | | | | Komatsu Ltd (1) | | | 8,703,648 | | |
| | 271,484 | | | | | Kubota Corp (1) | | | 2,284,432 | | |
See Notes to Financial Statements.
93
PORTFOLIO OF INVESTMENTS (Continued) October 31, 2007
Julius Baer International Equity Fund II
Share
Amount | | (Percentage of
Net Assets) | | Description | | Market
Value (Note 2) | |
| | COMMON STOCKS—Continued | |
| | | Japan—Continued | |
| | 30,100 | | | | | Kyocera Corp (1) | | $ | 2,550,680 | | |
| | 112,996 | | | | | Makita Corp (1) | | | 5,466,329 | | |
| | 516,551 | | | | | Matsushita Electric Industrial (1) | | | 9,879,345 | | |
| | 384,273 | | | | | Mitsubishi Corp (1) | | | 11,954,789 | | |
| | 464,000 | | | | | Mitsubishi Electric (1) | | | 5,631,892 | | |
| | 2,104,647 | | | | | Mitsubishi UFJ Financial (1) | | | 20,979,956 | | |
| | 408,800 | | | | | Mitsui & Co (1) | | | 10,634,897 | | |
| | 98,793 | | | | | Mitsui Fudosan (1) | | | 2,729,504 | | |
| | 1,791 | | | | | Mizuho Financial (1) | | | 10,072,481 | | |
| | 75,941 | | | | | Nintendo Co (1) | | | 47,888,453 | | |
| | 414,500 | | | | | Nippon Electric Glass (1) | | | 7,028,327 | | |
| | 621 | | | | | Nippon Telegraph & Telephone (1) | | | 2,847,562 | | |
| | 169,243 | | | | | Nissan Motor (1) | | | 1,951,355 | | |
| | 151,478 | | | | | Nitto Denko (1) | | | 7,393,855 | | |
| | 272,154 | | | | | Nomura Holdings (1) | | | 4,852,257 | | |
| | 362,000 | | | | | NSK Ltd (1) | | | 3,220,892 | | |
| | 4,612 | | | | | NTT DoCoMo (1) | | | 6,688,605 | | |
| | 56,493 | | | | | Olympus Corp (1) | | | 2,364,075 | | |
| | 73,220 | | | | | Promise Co (1)(2) | | | 2,199,507 | | |
| | 254,000 | | | | | Ricoh Co (1) | | | 5,010,924 | | |
| | 141 | | | | | Sapporo Hokuyo (1) | | | 1,450,662 | | |
| | 99,254 | | | | | Seven & I (1) | | | 2,557,180 | | |
| | 209,000 | | | | | Sharp Corp (1) | | | 3,292,711 | | |
| | 217,119 | | | | | Shizuoka Bank (1) | | | 2,272,669 | | |
| | 289,898 | | | | | Sony Corp (1) | | | 14,332,693 | | |
| | 229,061 | | | | | Stanley Electric (1) | | | 5,087,827 | | |
| | 724,000 | | | | | Sumitomo Chemical (1) | | | 6,425,597 | | |
| | 239,611 | | | | | Sumitomo Corp (1) | | | 4,177,615 | | |
| | 228,500 | | | | | Sumitomo Electric Industries (1) | | | 3,681,844 | | |
| | 944,642 | | | | | Sumitomo Heavy Industries (1) | | | 12,499,025 | | |
| | 1,026,318 | | | | | Sumitomo Metal Industries (1) | | | 5,060,797 | | |
| | 1,419 | | | | | Sumitomo Mitsui Financial (1)(2) | | | 11,586,882 | | |
| | 548,633 | | | | | Sumitomo Trust & Banking (1) | | | 4,077,152 | | |
| | 175,000 | | | | | Suruga Bank (1) | | | 2,301,890 | | |
| | 755,200 | | | | | Suzuki Motor (1) | | | 24,695,371 | | |
| | 105,482 | | | | | Takata Corp (1) | | | 3,757,574 | | |
| | 101,596 | | | | | Takeda Pharmaceutical (1) | | | 6,345,670 | | |
| | 91,200 | | | | | Takefuji Corp (1)(2) | | | 2,332,245 | | |
| | 329,286 | | | | | Toray Industries (1)(2) | | | 2,539,438 | | |
See Notes to Financial Statements.
94
PORTFOLIO OF INVESTMENTS (Continued) October 31, 2007
Julius Baer International Equity Fund II
Share
Amount | | (Percentage of
Net Assets) | | Description | | Market
Value (Note 2) | |
| | COMMON STOCKS—Continued | |
| | | Japan—Continued | |
| | 758,794 | | | | | Toyota Motor (1) | | $ | 43,378,068 | | |
| | 117,830 | | | | | Yamada Denki (1) | | | 12,136,390 | | |
| | 278,977 | | | | | Yamaha Motor (1) | | | 7,946,445 | | |
| | 127,505 | | | | | Yamato Holdings (1) | | | 1,872,605 | | |
| | 188,965 | | | | | Yokogawa Electric (1) | | | 2,385,643 | | |
| | | | 555,409,661 | | |
| | | Australia—4.6% | |
| | 3,230,239 | | | | | BHP Billiton (1) | | | 139,898,819 | | |
| | 65,399 | | | | | BHP Billiton Sponsored ADR (2) | | | 5,706,717 | | |
| | 750,768 | | | | | Brambles Ltd (1) | | | 9,949,424 | | |
| | 690,724 | | | | | Fairfax Media (1) | | | 3,052,848 | | |
| | 14,106,625 | | | | | Macquarie Airports (1) | | | 57,634,805 | | |
| | 2,675,449 | | | | | Newcrest Mining | | | 80,334,905 | | |
| | 108,147 | | | | | Publishing & Broadcasting (1) | | | 2,102,607 | | |
| | 774,436 | | | | | Rio Tinto (1) | | | 72,431,541 | | |
| | 713,414 | | | | | Rio Tinto (1)(2) | | | 73,726,333 | | |
| | | | 444,837,999 | | |
| | | Switzerland—4.4% | |
| | 1,249,548 | | | | | ABB Ltd (1) | | | 37,760,709 | | |
| | 123,253 | | | | | BKW FMB Energie (1) | | | 14,820,257 | | |
| | 838,826 | | | | | Compagnie Financiere Richemont (1) | | | 59,965,954 | | |
| | 280,341 | | | | | Credit Suisse-Registered (1) | | | 18,915,808 | | |
| | 57,851 | | | | | Flughafen Wien-Registered (1) | | | 23,397,629 | | |
| | 487,481 | | | | | Holcim Ltd (1) | | | 55,731,962 | | |
| | 114,452 | | | | | Nestle SA-Registered (1) | | | 52,876,531 | | |
| | 16,371 | | | | | Nobel Biocare Holding* (1) | | | 4,779,139 | | |
| | 153,550 | | | | | Roche Holding (1) | | | 26,233,463 | | |
| | 12,492 | | | | | SGS SA (1) | | | 16,455,155 | | |
| | 147,119 | | | | | Swatch Group (1) | | | 47,135,441 | | |
| | 75,037 | | | | | Synthes Inc (1) | | | 9,378,389 | | |
| | 304,554 | | | | | UBS AG-Registered (1) | | | 16,336,431 | | |
| | 648,294 | | | | | Xstrata PLC (1) | | | 46,507,693 | | |
| | | | 430,294,561 | | |
| | | Poland—3.9% | |
| | 102,244 | | | | | Bank BPH (1) | | | 40,159,111 | | |
| | 615,418 | | | | | Bank Handlowy w Warszawie (1) | | | 28,797,884 | | |
| | 1,986,795 | | | | | Bank Millenium (1) | | | 10,792,496 | | |
See Notes to Financial Statements.
95
PORTFOLIO OF INVESTMENTS (Continued) October 31, 2007
Julius Baer International Equity Fund II
Share
Amount | | (Percentage of
Net Assets) | | Description | | Market
Value (Note 2) | |
| | COMMON STOCKS—Continued | |
| | | Poland—Continued | |
| | 819,117 | | | | | Bank Pekao (1) | | $ | 87,428,667 | | |
| | 386,131 | | | | | Bank Zachodni WBK (1) | | | 42,869,444 | | |
| | 16,489 | | | | | BRE Bank* (1) | | | 3,767,635 | | |
| | 28,986 | | | | | ING Bank Slaski (1) | | | 10,294,222 | | |
| | 3,763,616 | | | | | PKO Bank Polski (1) | | | 83,698,060 | | |
| | 5,034,913 | | | | | Polskie Gornictwo Naftowe I (1) | | | 11,479,590 | | |
| | 6,240,866 | | | | | Telekomunikacja Polska (1) | | | 59,108,383 | | |
| | | | 378,395,492 | | |
| | | Hungary—3.8% | |
| | 12,945,423 | | | | | Magyar Telekom Telecommunications (1) | | | 69,620,404 | | |
| | 60,360 | | | | | MOL Hungarian Oil and Gas (1) | | | 9,289,236 | | |
| | 4,845,747 | | | | | OTP Bank (1) | | | 262,765,617 | | |
| | 131,883 | | | | | Richter Gedeon (1) | | | 28,635,394 | | |
| | | | 370,310,651 | | |
| | | Finland—3.1% | |
| | 148,859 | | | | | Elisa Oyj (1)(2) | | | 4,423,545 | | |
| | 1,556,906 | | | | | Fortum Oyj (1) | | | 67,584,750 | | |
| | 371,080 | | | | | Kemira Oyj (1) | | | 8,801,747 | | |
| | 203,230 | | | | | Kesko Oyj-Class B (1)(2) | | | 12,185,624 | | |
| | 99,697 | | | | | Metso Oyj (1) | | | 6,103,867 | | |
| | 2,278,646 | | | | | Nokia Oyj (1) | | | 90,389,801 | | |
| | 68,855 | | | | | Nokian Renkaat (1) | | | 2,597,961 | | |
| | 343,952 | | | | | OKO Bank-Class A (1) | | | 7,381,634 | | |
| | 723,966 | | | | | Orion Oyj-Class B (1)(2) | | | 18,597,325 | | |
| | 255,499 | | | | | Outotec Oyj (1) | | | 19,630,914 | | |
| | 869,702 | | | | | Ramirent Oyj (1)(2) | | | 19,488,528 | | |
| | 382,814 | | | | | Sanoma-WSOY Oyj (1)(2) | | | 11,056,344 | | |
| | 996,213 | | | | | YIT Oyj (1) | | | 30,901,338 | | |
| | | | 299,143,378 | | |
| | | Austria—2.8% | |
| | 161,785 | | | | | CA Immobilien Anlagen* (1) | | | 4,368,085 | | |
| | 636,523 | | | | | Erste Bank der Oesterreichischen Sparkassen (1) | | | 51,888,109 | | |
| | 2,019,738 | | | | | Immoeast AG* (1) | | | 24,655,945 | | |
| | 160,231 | | | | | Oesterreichische Elektrizitaetswirtschafts-Class A (1) | | | 10,594,297 | | |
| | 725,952 | | | | | OMV AG (1) | | | 54,404,666 | | |
| | 377,237 | | | | | Raiffeisen International Bank (1)(2) | | | 62,629,113 | | |
| | 243,391 | | | | | Telekom Austria (1) | | | 6,988,945 | | |
See Notes to Financial Statements.
96
PORTFOLIO OF INVESTMENTS (Continued) October 31, 2007
Julius Baer International Equity Fund II
Share
Amount | | (Percentage of
Net Assets) | | Description | | Market
Value (Note 2) | |
| | COMMON STOCKS—Continued | |
| | | Austria—Continued | |
| | 334,813 | | | | | Wiener Staedtische Versicherung (1) | | $ | 24,719,271 | | |
| | 509,515 | | | | | Wienerberger AG (1) | | | 31,852,783 | | |
| | | | 272,101,214 | | |
| | | Canada—2.3% | |
| | 533,347 | | | | | Cameco Corp | | | 26,139,506 | | |
| | 71,189 | | | | | Canadian Natural Resources | | | 5,888,195 | | |
| | 264,094 | | | | | Imperial Oil | | | 14,305,787 | | |
| | 3,281,760 | | | | | Ivanhoe Mines* | | | 44,883,199 | | |
| | 365,427 | | | | | OPTI Canada* | | | 7,329,316 | | |
| | 478,845 | | | | | Potash Corp of Saskatchewan | | | 59,288,452 | | |
| | 85,460 | | | | | Research in Motion* | | | 10,640,625 | | |
| | 375,025 | | | | | Suncor Energy | | | 40,846,848 | | |
| | 541,166 | | | | | Talisman Energy | | | 11,725,833 | | |
| | 1,072,420 | | | | | UTS Energy* | | | 6,898,806 | | |
| | | | 227,946,567 | | |
| | | Italy—2.2% | |
| | 92,018 | | | | | Autogrill SpA (1) | | | 1,838,178 | | |
| | 93,202 | | | | | Banca Popolare dell' Emilia Romagna (1) | | | 2,209,167 | | |
| | 1,619,525 | | | | | Banca Popolare di Milano (1) | | | 25,262,269 | | |
| | 309,222 | | | | | Banca Popolare di Sondrio (1) | | | 4,925,790 | | |
| | 379,389 | | | | | Banco Popolare Scarl* (1) | | | 9,091,160 | | |
| | 285,223 | | | | | Bulgari SpA (1) | | | 4,441,222 | | |
| | 1,305,586 | | | | | Buzzi Unicem (1)(2) | | | 36,954,693 | | |
| | 578,063 | | | | | Credito Emiliano (1) | | | 7,810,734 | | |
| | 120,427 | | | | | Finmeccanica SpA (1) | | | 3,564,514 | | |
| | 273,764 | | | | | Geox SpA (1) | | | 6,548,458 | | |
| | 3,867,934 | | | | | Intesa Sanpaolo* (1) | | | 29,398,451 | | |
| | 496,902 | | | | | Italcementi SpA (1) | | | 11,402,161 | | |
| | 49,275 | | | | | Lottomatica SpA (1) | | | 1,756,062 | | |
| | 530,570 | | | | | Mediobanca SpA (1)(2) | | | 12,582,673 | | |
| | 2,267,806 | | | | | Telecom Italia (1) | | | 7,112,878 | | |
| | 4,321,445 | | | | | UniCredito Italiano (1) | | | 36,987,453 | | |
| | 327,910 | | | | | Unione di Banche Italiane (1)(2) | | | 9,099,732 | | |
| | | | 210,985,595 | | |
See Notes to Financial Statements.
97
PORTFOLIO OF INVESTMENTS (Continued) October 31, 2007
Julius Baer International Equity Fund II
Share
Amount | | (Percentage of
Net Assets) | | Description | | Market
Value (Note 2) | |
| | COMMON STOCKS—Continued | |
| | | Hong Kong—2.2% | |
| | 240,909 | | | | | Alibaba.com Ltd*† | | $ | 419,605 | | |
| | 6,743,779 | | | | | China Merchants Holdings International (1) | | | 47,810,650 | | |
| | 1,749,012 | | | | | China Mobile (1) | | | 36,505,127 | | |
| | 4,806,909 | | | | | Galaxy Entertainment* (1) | | | 5,245,909 | | |
| | 17,588,525 | | | | | GOME Electrical Appliances (1) | | | 40,247,024 | | |
| | 1,843,323 | | | | | Hutchison Telecommunications International (1) | | | 2,630,592 | | |
| | 8,573,505 | | | | | Melco International Development (1) | | | 16,362,348 | | |
| | 904,740 | | | | | Melco PBL Entertainment ADR* (2) | | | 14,385,366 | | |
| | 29,397,676 | | | | | Shun Tak (1) | | | 46,169,991 | | |
| | | | 209,776,612 | | |
| | | Sweden—2.0% | |
| | 315,452 | | | | | Getinge AB-Class B (1)(2) | | | 8,370,610 | | |
| | 269,956 | | | | | Hennes & Mauritz-Class B (1) | | | 17,989,842 | | |
| | 197,752 | | | | | Modern Times-Class B (1) | | | 13,918,430 | | |
| | 3,480,907 | | | | | Nordea Bank AB (1) | | | 62,389,035 | | |
| | 274,320 | | | | | OMX AB (1)(2) | | | 11,535,943 | | |
| | 134,500 | | | | | Securitas AB-Class B (1) | | | 1,698,918 | | |
| | 802,717 | | | | | Skandinaviska Enskilda Banken (1) | | | 24,664,668 | | |
| | 1,392,631 | | | | | Swedbank AB (1) | | | 43,686,612 | | |
| | 2,579,736 | | | | | Telefonaktiebolaget LM Ericsson-Class B (1) | | | 7,738,944 | | |
| | 663,675 | | | | | TeliaSonera AB (1) | | | 6,537,496 | | |
| | | | 198,530,498 | | |
| | | Norway—2.0% | |
| | 494,764 | | | | | Aker Kvaerner (1)(2) | | | 17,272,513 | | |
| | 1,748,439 | | | | | DnB NOR (1) | | | 28,799,765 | | |
| | 3,643,118 | | | | | Marine Harvest* (1)(2) | | | 3,692,648 | | |
| | 2,119,528 | | | | | Norsk Hydro (1) | | | 31,029,002 | | |
| | 2,078,863 | | | | | StatoiHydro ASA (1) | | | 70,066,274 | | |
| | 642,043 | | | | | Telenor ASA* (1) | | | 15,077,228 | | |
| | 787,275 | | | | | Yara International (1) | | | 30,510,128 | | |
| | | | 196,447,558 | | |
| | | Czech Republic—2.0% | |
| | 841,449 | | | | | Komercni Banka (1) | | | 193,323,533 | | |
| | | Netherlands—1.5% | |
| | 297,857 | | | | | ING Groep (1) | | | 13,426,983 | | |
| | 2,476,619 | | | | | KKR Private Equity Investors (2) | | | 48,541,732 | | |
See Notes to Financial Statements.
98
PORTFOLIO OF INVESTMENTS (Continued) October 31, 2007
Julius Baer International Equity Fund II
Share
Amount | | (Percentage of
Net Assets) | | Description | | Market
Value (Note 2) | |
| | COMMON STOCKS—Continued | |
| | | Netherlands—Continued | |
| | 322,216 | | | | | Koninklijke Ahold* (1) | | $ | 4,846,026 | | |
| | 120,206 | | | | | Koninklijke Vopak (1)(2) | | | 6,900,263 | | |
| | 1,141,648 | | | | | Royal KPN (1) | | | 21,557,379 | | |
| | 206,515 | | | | | TNT NV (1) | | | 8,480,090 | | |
| | 860,910 | | | | | Unilever NV (1) | | | 28,005,358 | | |
| | 154,402 | | | | | Vedior NV (1) | | | 3,525,783 | | |
| | 396,350 | | | | | X 5 Retail GDR-Registered* (1) | | | 14,319,582 | | |
| | | | 149,603,196 | | |
| | | Mexico—1.5% | |
| | 5,295,782 | | | | | America Movil SAB de CV-Class L | | | 16,723,730 | | |
| | 181,337 | | | | | America Movil SAB de CV ADR-Class L | | | 11,857,626 | | |
| | 1,936,259 | | | | | Controladora Comercial Mexicana | | | 6,007,845 | | |
| | 5,222,028 | | | | | Corporacion Moctezuma | | | 16,588,399 | | |
| | 91,126 | | | | | Desarrolladora Homex ADR* (2) | | | 5,149,530 | | |
| | 7,425,291 | | | | | Fomento Economico Mexicano Sponsored ADR | | | 25,959,936 | | |
| | 1,112,550 | | | | | Grupo Cementos de Chihuahua | | | 6,204,510 | | |
| | 6,024,418 | | | | | Grupo Financiero Banorte | | | 27,186,205 | | |
| | 932,888 | | | | | Grupo Televisa Sponsored ADR | | | 23,182,267 | | |
| | 1,908,777 | | | | | Urbi Desarrollos Urbanos* | | | 7,383,153 | | |
| | | | 146,243,201 | | |
| | | Belgium—1.2% | |
| | 754,647 | | | | | Fortis (1) | | | 24,186,692 | | |
| | 42,614 | | | | | Groupe Bruxelles Lambert (1) | | | 5,465,530 | | |
| | 798,532 | | | | | KBC Ancora (1) | | | 90,178,107 | | |
| | | | 119,830,329 | | |
| | | Cyprus—1.0% | |
| | 364,349 | | | | | AFI Development GDR*† | | | 3,789,230 | | |
| | 2,784,847 | | | | | Bank of Cyprus (1) | | | 54,515,925 | | |
| | 2,488,927 | | | | | Marfin Popular Bank Public (1) | | | 40,608,289 | | |
| | | | 98,913,444 | | |
| | | China—0.8% | |
| | 33,128,735 | | | | | Beijing Capital International Airport-Class H (1) | | | 66,521,782 | | |
| | 4,583,518 | | | | | Shenzhen Chiwan Wharf-Class B (1) | | | 10,944,143 | | |
| | 1,824,882 | | | | | Weiqiao Textile-Class H (1) | | | 3,428,173 | | |
| | | | 80,894,098 | | |
See Notes to Financial Statements.
99
PORTFOLIO OF INVESTMENTS (Continued) October 31, 2007
Julius Baer International Equity Fund II
Share
Amount | | (Percentage of
Net Assets) | | Description | | Market
Value (Note 2) | |
| | COMMON STOCKS—Continued | |
| | | Romania—0.8% | |
| | 1,922,691 | | | | | BRD-Groupe Societe Generale | | $ | 21,807,933 | | |
| | 229,613,399 | | | | | SNP Petrom | | | 52,386,699 | | |
| | | | 74,194,632 | | |
| | | Spain—0.7% | |
| | 67,395 | | | | | Gamesa Corporacion Tecnologica (1) | | | 3,440,037 | | |
| | 710,393 | | | | | Iberdrola SA (1) | | | 11,432,699 | | |
| | 101,859 | | | | | Inditex SA (1) | | | 7,602,673 | | |
| | 1,509,270 | | | | | Telefonica SA (1) | | | 49,910,390 | | |
| | | | 72,385,799 | | |
| | | Greece—0.7% | |
| | 4,611,870 | | | | | Alapis Holding Industrial and Commercial* (1) | | | 16,954,189 | | |
| | 686,817 | | | | | Hellenic Telecommunication Organization (1) | | | 25,135,730 | | |
| | 2,583,144 | | | | | Marfin Investment Group (1) | | | 24,514,420 | | |
| | | | 66,604,339 | | |
| | | Denmark—0.6% | |
| | 5,202 | | | | | ALK-Abello (1) | | | 1,125,940 | | |
| | 81,865 | | | | | Carlsberg A/S-Class B (1)(2) | | | 11,044,594 | | |
| | 101,985 | | | | | FLSmidth & Co (1) | | | 11,108,037 | | |
| | 165,754 | | | | | Novo-Nordisk-Class B (1) | | | 20,616,760 | | |
| | 16,347 | | | | | Rockwool International-Class B (1)(2) | | | 5,244,966 | | |
| | 88,887 | | | | | Vestas Wind Systems* (1) | | | 7,996,380 | | |
| | | | 57,136,677 | | |
| | | Multinational—0.5% | |
| | 201,453 | | | | | Central European Media Enterprises-Class A* (2) | | | 23,116,732 | | |
| | 229,760 | | | | | Millicom International Cellular* (2) | | | 26,992,205 | | |
| | | | 50,108,937 | | |
| | | Ukraine—0.5% | |
| | 2,809,196 | | | | | Raiffeisen Bank Aval | | | 617,723 | | |
| | 39,541 | | | | | Ukrnafta Oil* (1) | | | 3,151,082 | | |
| | 33,398 | | | | | Ukrnafta Oil ADR* | | | 16,728,367 | | |
| | 92,477,349 | | | | | UkrTelecom* | | | 20,572,873 | | |
| | 627,195 | | | | | UkrTelecom GDR* (1) | | | 6,823,606 | | |
| | | | 47,893,651 | | |
See Notes to Financial Statements.
100
PORTFOLIO OF INVESTMENTS (Continued) October 31, 2007
Julius Baer International Equity Fund II
Share
Amount | | (Percentage of
Net Assets) | | Description | | Market
Value (Note 2) | |
| | COMMON STOCKS—Continued | |
| | | Ireland—0.5% | |
| | 582,334 | | | | | CRH PLC (1) | | $ | 22,363,891 | | |
| | 2,878,829 | | | | | Dragon Oil* (1) | | | 18,700,543 | | |
| | 148,464 | | | | | Kingspan Group (1) | | | 3,547,850 | | |
| | | | 44,612,284 | | |
| | | India—0.5% | |
| | 33,840 | | | | | ICICI Bank ADR | | | 2,349,850 | | |
| | 336,749 | | | | | State Bank of India GDR (1) | | | 41,992,468 | | |
| | | | 44,342,318 | | |
| | | South Africa—0.5% | |
| | 503,844 | | | | | Impala Platinum (1) | | | 18,493,071 | | |
| | 745,369 | | | | | MTN Group (1) | | | 14,506,204 | | |
| | 578,734 | | | | | Standard Bank Group (1) | | | 10,397,279 | | |
| | | | 43,396,554 | | |
| | | South Korea—0.4% | |
| | 50,645 | | | | | Hyundai Motor (1) | | | 4,027,398 | | |
| | 67,294 | | | | | Kookmin Bank (1) | | | 5,556,977 | | |
| | 20,396 | | | | | NHN Corp* (1) | | | 6,619,615 | | |
| | 33,360 | | | | | Samsung Electronics (1) | | | 20,712,156 | | |
| | | | 36,916,146 | | |
| | | Portugal—0.4% | |
| | 1,822,302 | | �� | | | Energias de Portugal (1) | | | 11,730,290 | | |
| | 3,065,373 | | | | | Jeronimo Martins (1) | | | 22,732,979 | | |
| | | | 34,463,269 | | |
| | | Brazil—0.3% | |
| | 1,220,329 | | | | | Bovespa Holding* (1) | | | 22,797,432 | | |
| | 312,538 | | | | | Unibanco | | | 4,922,424 | | |
| | 26,755 | | | | | Unibanco GDR (1) | | | 4,228,360 | | |
| | | | 31,948,216 | | |
| | | Turkey—0.3% | |
| | 686,787 | | | | | Haci Omer Sabanci (1) | | | 4,699,959 | | |
| | 1,514,981 | | | | | Turkiye Garanti Bankasi (1) | | | 13,969,629 | | |
| | 1,775,611 | | | | | Turkiye Is Bankasi (1) | | | 12,169,151 | | |
| | | | 30,838,739 | | |
See Notes to Financial Statements.
101
PORTFOLIO OF INVESTMENTS (Continued) October 31, 2007
Julius Baer International Equity Fund II
Share
Amount | | (Percentage of
Net Assets) | | Description | | Market
Value (Note 2) | |
| | COMMON STOCKS—Continued | |
| | | New Zealand—0.2% | |
| | 10,069,150 | | | | | Auckland International Airport (1) | | $ | 22,320,805 | | |
| | | Indonesia—0.2% | |
| | 24,162,170 | | | | | Semen Gresik Persero (1) | | | 16,607,294 | | |
| | | Chile—0.2% | |
| | 74,316 | | | | | Sociedad Quimica y Minera de Chile Sponsored ADR (2) | | | 14,268,672 | | |
| | | Thailand—0.1% | |
| | 8,944,800 | | | | | Bank of Ayudhya NVDR* (1) | | | 7,701,038 | | |
| | | Philippines—0.1% | |
| | 231,822 | | | | | Ayala Corp (1) | | | 3,343,215 | | |
| | 5,911,338 | | | | | Ayala Land (1) | | | 2,057,769 | | |
| | | | 5,400,984 | | |
| | | United States—0.0% | |
| | 163,464 | | | | | News Corp (1)(2) | | | 3,732,533 | | |
| | 31,492 | | | | | News Corp-Class B (2) | | | 722,112 | | |
| | | | 4,454,645 | | |
| | | Taiwan—0.0% | |
| | 376,367 | | | | | Taiwan Semiconductor Manufacturing Sponsored ADR | | | 4,008,309 | | |
| | | Morocco—0.0% | |
| | 9,208 | | | | | Ciments Du Maroc (1) | | | 3,291,132 | | |
| | | Croatia—0.0% | |
| | 41,502 | | | | | Hrvatske Telekomunikacije Sponsored GDR*† (3) | | | 3,003,901 | | |
| | | Lebanon—0.0% | |
| | 101,972 | | | | | SOLIDERE-Class A | | | 1,856,910 | | |
| | | TOTAL COMMON STOCKS (Cost $6,629,448,438) | | | 8,224,852,535 | | |
| | WARRANTS—3.2% | |
| | | India—2.7% | |
| | 732,053 | | | | | Bharti Airtel-Class A, Issued by CLSA, Expires 05/31/2010*† | | | 18,750,220 | | |
| | 2,297,183 | | | | | Canara Bank, Issued by Citigroup, Expires 10/24/2012 | | | 17,139,034 | | |
| | 417,259 | | | | | ICIC Bank, Issued by CLSA, Expires 05/10/2010† | | | 13,314,609 | | |
| | 322,516 | | | | | ICICI Bank, Issued by ABN Amro Bank, Expires 06/30/2009 | | | 10,309,423 | | |
| | 646,950 | | | | | ICICI Bank, Issued by Citigroup, Expires 10/24/2012† | | | 20,741,217 | | |
| | 443,063 | | | | | Mahindra & Mehindra, Issued by CLSA, Expires 06/28/2010† | | | 8,506,810 | | |
See Notes to Financial Statements.
102
PORTFOLIO OF INVESTMENTS (Continued) October 31, 2007
Julius Baer International Equity Fund II
Share
Amount | | (Percentage of
Net Assets) | | Description | | Market
Value (Note 2) | |
| | WARRANTS—Continued | |
| | | India—Continued | |
| | 339,977 | | | | | Oil & Natural Gas, Issued by CLSA, Expires 05/13/2010† | | $ | 10,780,671 | | |
| | 122,298 | | | | | Reliance Industries, Issued by CLSA, Expires 05/17/2010† | | | 8,662,367 | | |
| | 1,027,723 | | | | | State Bank of India, Issued by Citigroup, Expires 10/24/2012† | | | 64,230,719 | | |
| | 1,130,142 | | | | | State Bank of India, Issued by CLSA, Expires 05/13/2010† | | | 70,477,701 | | |
| | 310,709 | | |
| | State Bank of India, Issued by Deutsche Bank AG,
Expires 08/18/2017† | | | 19,596,292 | | |
| | 69,051 | | | | | Suzlon Energy, Issued by Citigroup, Expires 10/24/2012 | | | 3,444,057 | | |
| | 2,900 | | | | | Suzlon Energy, Issued by CLSA, Expires 06/22/2011† | | | 145,638 | | |
| | | | 266,098,758 | | |
| | | Taiwan—0.5% | |
| | 4,204,838 | | |
| | Formosa Plastics, Issued by Deutsche Bank AG London,
Expires 01/24/2017† | | | 12,950,901 | | |
| | 2,954,740 | | |
| | Hon Hai Precision Industry, Issued by Deutsche
Bank AG London, Expires 08/19/2008† | | | 22,435,341 | | |
| | 3,943,432 | | |
| | Taiwan Semiconductor Manufacturing, Issued by Deutsche
Bank AG London, Expires 01/19/2017 | | | 7,764,618 | | |
| | | | 43,150,860 | | |
| | | TOTAL WARRANTS (Cost $202,651,900) | | | 309,249,618 | | |
| | PREFERRED STOCKS—2.0% | |
| | | Brazil—1.4% | |
| | 2,720,206 | | | | | Cia Vale do Rio Doce (1) | | | 85,451,088 | | |
| | 1,093,698 | | | | | Petroleo Brasileiro (1) | | | 45,276,846 | | |
| | | | 130,727,934 | | |
| | | Russia—0.4% | |
| | 1,274,840 | | | | | Sberbank | | | 3,748,030 | | |
| | 47,697 | | | | | Silvinit (3) | | | 18,959,557 | | |
| | 7,015,479 | | | | | URSA Bank (3) | | | 13,329,410 | | |
| | | | 36,036,997 | | |
| | | Germany—0.2% | |
| | 39,085 | | | | | Fresenius SE (1) | | | 3,098,817 | | |
| | 107,087 | | | | | Volkswagen AG | | | 20,322,475 | | |
| | | | 23,421,292 | | |
| | | TOTAL PREFERRED STOCKS (Cost $151,117,376) | | | 190,186,223 | | |
See Notes to Financial Statements.
103
PORTFOLIO OF INVESTMENTS (Continued) October 31, 2007
Julius Baer International Equity Fund II
Share
Amount | | (Percentage of
Net Assets) | | Description | | Market
Value (Note 2) | |
| | INVESTMENT FUNDS—1.5% | |
| | | India—1.0% | |
| | 4,158,537 | | |
| | Banking Index Benchmark Exchange Traded Scheme-Bank
BeES, Issued by Citigroup, Expires 10/24/2012† | | $ | 95,800,217 | | |
| | 170,000 | | |
| | Banking Index Benchmark Exchange Traded Scheme-Bank
BeES, Issued by CLSA, Expires 03/22/2012† | | | 3,949,100 | | |
| | | | 99,749,317 | | |
| | | United States—0.5% | |
| | 509,815 | | | | | IShares MSCI Brazil (2) | | | 43,640,164 | | |
| | | TOTAL INVESTMENT FUNDS (Cost $96,340,713) | | | 143,389,481 | | |
Face
Value | | Currency | | | | | |
| | U.S. GOVERNMENT AND AGENCY OBLIGATIONS—0.2% | |
| | | United States—0.2% | |
| | | | | | | U.S. Treasury Bills | | | | | |
| | 15,000,000 | | | USD | | 3.780% due 12/06/2007 (4) | | | 14,943,300 | | |
| | 3,000,000 | | | USD | | 3.790% due 12/06/2007 (4) | | | 2,988,629 | | |
| | 2,400,000 | | | USD | | 3.800% due 12/06/2007 (4) | | | 2,390,880 | | |
| | | | 20,322,809 | | |
| | | | | | | TOTAL U.S. GOVERNMENT AND AGENCY OBLIGATIONS
(Cost $20,322,809) | | | 20,322,809 | | |
Share
Amount | | | | | | | |
| | RIGHTS—0.0% | |
| | | Philippines—0.0% | |
| | 8,687,023 | | | | | Ayala Land Rights, Expires TBD (Cost $18,600) | | | 19,888 | | |
Face
Value | | | | | | | |
| | SHORT-TERM INVESTMENTS PURCHASED WITH CASH COLLATERAL
FROM SECURITY LENDING—4.2% | |
| | | United States—4.2% | |
| | 410,296,503 | | | USD
| | State Street Navigator Securities
Lending Prime Portfolio (Cost $410,296,503) | |
410,296,503 | |
See Notes to Financial Statements.
104
PORTFOLIO OF INVESTMENTS (Continued) October 31, 2007
Julius Baer International Equity Fund II
Face
Value | | Currency | | Description | | Market
Value (Note 2) | |
| | REPURCHASE AGREEMENT—1.6% | |
| | | United States—1.6% | |
| | 159,431,189 | | | USD | | | | State Street Bank and Trust Company Repurchase
Agreement, dated 10/31/2007, due 11/1/2007,
with a maturity value of $159,444,519 and an
effective yield of 3.01%, collateralized by U.S.
Government and Agency Obligations, with rates
ranging from 4.768%-5.810%, maturities ranging
from 9/25/2031-7/15/2036, and an aggregate
market value of $162,620,704.
(Cost $159,431,189) | | $ | 159,431,189 | | |
| | | TOTAL INVESTMENTS—97.2% (Cost $7,669,627,528) | | | 9,457,748,246 | | |
| | | OTHER ASSETS AND LIABILITIES (Net)—2.8% | | 275,716,335 | |
| | | TOTAL NET ASSETS—100.0% | | $ | 9,733,464,581 | | |
Notes to the Portfolio of Investments:
ADR American Depositary Receipt
GDR Global Depositary Receipt
NVDR Non-Voting Depositary Receipt
(1) Security valued at fair value utilizing fair value model in accordance with valuation policies approved by the board of Trustees.
(2) All or a portion of this security was on loan to brokers at October 31, 2007.
(3) Illiquid security
(4) Security has been pledged for futures collateral.
* Non-income producing security.
† Securities exempt from registration under Rule 144A of the Securities Act of 1933, as amended. These securities may be resold in transactions exempt from registrations, normally to qualified institutional buyers.
Aggregate cost for federal income tax purposes was $7,741,065,901.
Glossary of Currencies
USD — United States Dollar
See Notes to Financial Statements.
105
SCHEDULE OF FORWARD FOREIGN EXCHANGE CONTRACTS
October 31, 2007
Julius Baer International Equity Fund II
FORWARD FOREIGN EXCHANGE CONTRACTS TO BUY
| | | Contracts to Receive | | | |
Expiration
Date | |
Local | |
Value in
Currency | |
In Exchange
USDfor USD | | Net Unrealized
Appreciation
(Depreciation) | |
| 11/20/07 | | AUD | 183,154,401 | | | | 169,571,359 | | | | 157,384,487 | | | $ | 12,186,872 | | |
| 12/12/07 | | AUD | 68,392,688 | | | | 63,243,539 | | | | 59,392,683 | | | | 3,850,856 | | |
| 01/24/08 | | BRL | 50,708,097 | | | | 28,846,930 | | | | 27,537,497 | | | | 1,309,433 | | |
| 11/01/07 | | CAD | 1,577,493 | | | | 1,660,868 | | | | 1,653,383 | | | | 7,485 | | |
| 11/02/07 | | CAD | 2,105,925 | | | | 2,217,236 | | | | 2,212,339 | | | | 4,897 | | |
| 11/19/07 | | CAD | 76,695,840 | | | | 80,753,289 | | | | 75,632,448 | | | | 5,120,841 | | |
| 12/27/07 | | CAD | 140,026,864 | | | | 147,466,241 | | | | 139,953,883 | | | | 7,512,358 | | |
| 01/24/08 | | CAD | 17,942,134 | | | | 18,897,955 | | | | 18,321,574 | | | | 576,381 | | |
| 11/14/07 | | CHF | 22,708,000 | | | | 19,608,083 | | | | 19,149,134 | | | | 458,949 | | |
| 11/07/07 | | DKK | 5,249,318 | | | | 1,018,986 | | | | 973,177 | | | | 45,809 | | |
| 11/30/07 | | GBP | 5,055,000 | | | | 10,491,919 | | | | 10,138,308 | | | | 353,611 | | |
| 12/06/07 | | GBP | 29,499,900 | | | | 61,216,747 | | | | 59,278,526 | | | | 1,938,221 | | |
| 12/24/07 | | GBP | 25,129,200 | | | | 52,115,371 | | | | 50,484,927 | | | | 1,630,444 | | |
| 11/06/07 | | HKD | 3,285,087 | | | | 423,856 | | | | 423,854 | | | | 2 | | |
| 11/08/07 | | HKD | 1,339,999,596 | | | | 172,896,337 | | | | 172,701,480 | | | | 194,857 | | |
| 12/17/07 | | HKD | 238,544,350 | | | | 30,793,267 | | | | 30,754,113 | | | | 39,154 | | |
| 01/24/08 | | HKD | 215,362,565 | | | | 27,815,756 | | | | 27,790,511 | | | | 25,245 | | |
| 11/19/07 | | HUF | 29,641,538,712 | | | | 170,477,250 | | | | 166,008,471 | | | | 4,468,779 | | |
| 12/20/07 | | HUF | 1,782,641,000 | | | | 10,229,945 | | | | 9,971,701 | | | | 258,244 | | |
| 11/27/07 | | INR | 1,689,229,812 | | | | 42,904,467 | | | | 42,440,396 | | | | 464,071 | | |
| 11/01/07 | | JPY | 1,834,894,512 | | | | 15,916,160 | | | | 16,005,709 | | | | (89,549 | ) | |
| 11/02/07 | | JPY | 363,149,285 | | | | 3,150,013 | | | | 3,146,602 | | | | 3,411 | | |
| 11/08/07 | | JPY | 4,034,737,744 | | | | 35,022,011 | | | | 34,603,242 | | | | 418,769 | | |
| 11/14/07 | | JPY | 2,222,000,000 | | | | 19,300,502 | | | | 19,105,756 | | | | 194,746 | | |
| 11/16/07 | | JPY | 1,169,000,000 | | | | 10,156,374 | | | | 9,989,315 | | | | 167,059 | | |
| 11/20/07 | | JPY | 18,541,689,363 | | | | 161,165,775 | | | | 166,191,163 | | | | (5,025,388 | ) | |
| 11/26/07 | | JPY | 2,154,286,400 | | | | 18,738,126 | | | | 18,998,242 | | | | (260,116 | ) | |
| 11/30/07 | | JPY | 4,300,000,000 | | | | 37,418,876 | | | | 37,952,359 | | | | (533,483 | ) | |
| 12/06/07 | | JPY | 8,261,096,700 | | | | 71,937,639 | | | | 72,333,357 | | | | (395,718 | ) | |
| 12/19/07 | | JPY | 6,392,971,000 | | | | 55,751,483 | | | | 55,833,937 | | | | (82,454 | ) | |
| 12/26/07 | | JPY | 13,094,832,320 | | | | 114,286,796 | | | | 114,155,904 | | | | 130,892 | | |
| 01/23/08 | | JPY | 10,411,860,846 | | | | 91,148,197 | | | | 91,212,899 | | | | (64,702 | ) | |
| 01/31/08 | | JPY | 8,455,100,000 | | | | 74,081,673 | | | | 74,412,321 | | | | (330,648 | ) | |
| 12/03/07 | | KRW | 37,186,784,318 | | | | 41,343,915 | | | | 40,793,215 | | | | 550,700 | | |
| 11/20/07 | | MXN | 886,785,190 | | | | 82,740,289 | | | | 80,425,500 | | | | 2,314,789 | | |
| 11/01/07 | | NOK | 65,967,817 | | | | 12,235,862 | | | | 12,346,588 | | | | (110,726 | ) | |
| 11/30/07 | | NOK | 216,500,000 | | | | 40,138,426 | | | | 37,003,171 | | | | 3,135,255 | | |
| 11/19/07 | | PLN | 322,496,691 | | | | 128,610,786 | | | | 120,530,403 | | | | 8,080,383 | | |
| 12/24/07 | | PLN | 1,313,945 | | | | 523,936 | | | | 491,709 | | | | 32,227 | | |
| 11/19/07 | | TRY | 45,072,565 | | | | 38,257,555 | | | | 36,917,474 | | | | 1,340,081 | | |
| 12/24/07 | | TRY | 403,460 | | | | 338,749 | | | | 326,794 | | | | 11,955 | | |
| 12/03/07 | | TWD | 1,994,807,810 | | | | 61,768,317 | | | | 61,668,094 | | | | 100,223 | | |
| 01/04/08 | | ZAR | 544,018,762 | | | | 82,362,817 | | | | 77,858,153 | | | | 4,504,664 | | |
| Net unrealized appreciation on forward foreign exchange contracts to buy | | | | | | | | | | | | | | $ | 54,538,879 | | |
See Notes to Financial Statements.
106
SCHEDULE OF FORWARD FOREIGN EXCHANGE CONTRACTS (Continued)
October 31, 2007
Julius Baer International Equity Fund II
FORWARD FOREIGN EXCHANGE CONTRACTS TO SELL
| | | Contracts to Deliver | | | | | |
Expiration
Date | | Local | | Value in
Currency | | In Exchange
USDfor USD | | Net Unrealized
Depreciation | |
| 11/20/07 | | AUD | 183,154,401 | | | | 169,571,359 | | | | 142,674,665 | | | $ | (26,896,694 | ) | |
| 11/19/07 | | CAD | 76,695,840 | | | | 80,753,289 | | | | 71,341,649 | | | | (9,411,640 | ) | |
| 11/23/07 | | CZK | 32,582,000 | | | | 1,753,852 | | | | 1,594,968 | | | | (158,884 | ) | |
| 12/19/07 | | CZK | 389,697,000 | | | | 20,997,186 | | | | 19,793,631 | | | | (1,203,555 | ) | |
| 12/27/07 | | CZK | 26,279,692 | | | | 1,416,376 | | | | 1,348,160 | | | | (68,216 | ) | |
| 01/24/08 | | EUR | 12,932,200 | | | | 18,727,378 | | | | 18,321,574 | | | | (405,804 | ) | |
| 01/24/08 | | EUR | 38,797,320 | | | | 56,183,177 | | | | 55,328,008 | | | | (855,169 | ) | |
| 01/31/08 | | EUR | 66,823,410 | | | | 96,773,848 | | | | 96,276,495 | | | | (497,353 | ) | |
| 11/19/07 | | HUF | 44,351,213,263 | | | | 255,076,937 | | | | 228,264,374 | | | | (26,812,563 | ) | |
| 12/20/07 | | HUF | 1,782,641,000 | | | | 10,229,945 | | | | 9,694,062 | | | | (535,883 | ) | |
| 12/27/07 | | HUF | 26,922,463 | | | | 154,432 | | | | 149,727 | | | | (4,705 | ) | |
| 11/20/07 | | MXN | 1,375,459,409 | | | | 128,335,374 | | | | 121,273,467 | | | | (7,061,907 | ) | |
| 11/19/07 | | PLN | 542,817,038 | | | | 216,473,930 | | | | 190,657,271 | | | | (25,816,659 | ) | |
| 12/24/07 | | PLN | 1,313,945 | | | | 523,936 | | | | 489,438 | | | | (34,498 | ) | |
| 11/19/07 | | TRY | 77,308,625 | | | | 65,619,496 | | | | 53,503,000 | | | | (12,116,496 | ) | |
| 12/24/07 | | TRY | 403,460 | | | | 338,749 | | | | 316,687 | | | | (22,062 | ) | |
| Net unrealized depreciation on forward foreign exchange contracts to sell | | | | | | | | | | | | | | $ | (111,902,088 | ) | |
Glossary of Currencies
AUD — Australian Dollar
BRL — Brazilian Real
CAD — Canadian Dollar
CHF — Swiss Franc
CZK — Czech Koruna
DKK — Danish Krone
EUR — Euro
GBP — British Pound Sterling
HKD — Hong Kong Dollar
HUF — Hungarian Forint
INR — Indian Rupee
JPY — Japanese Yen
KRW — Republic of Korea Won
MXN — Mexican Nuevo Peso
NOK — Norwegian Krone
PLN — Polish Zloty
TRY — Turkish Lira
TWD — New Taiwan Dollar
ZAR — South African Rand
See Notes to Financial Statements.
107
PORTFOLIO OF INVESTMENTS–Industry Sector (Unaudited) October 31, 2007
Julius Baer International Equity Fund II
At October 31, 2007, sector diversification of the Fund's non-cash equivalents investments were as follows:
| | | % of Net
Assets | | Market
Value (Note 2) | |
| INDUSTRY SECTOR | |
| Financials | | | 28.7 | % | | $ | 2,800,544,021 | | |
| Materials | | | 13.4 | | | | 1,303,589,337 | | |
| Consumer Discretionary | | | 9.8 | | | | 952,439,775 | | |
| Energy | | | 9.4 | | | | 913,480,229 | | |
| Industrials | | | 9.1 | | | | 894,000,680 | | |
| Telecommunications | | | 5.6 | | | | 548,345,123 | | |
| Utilities | | | 5.0 | | | | 487,633,542 | | |
| Consumer Staples | | | 4.9 | | | | 473,455,593 | | |
| Healthcare | | | 3.0 | | | | 287,663,524 | | |
| Information Technology | | | 2.1 | | | | 206,545,921 | | |
| Cash & Cash Equivalents | | | 6.1 | | | | 590,050,501 | * | |
| Total Investments | | | 97.1 | | | | 9,457,748,246 | | |
| Other Assets and Liabilities (Net) | | | 2.9 | | | | 275,716,335 | * | |
| Net Assets | | | 100.0 | % | | $ | 9,733,464,581 | | |
* Cash and Cash Equivalents and Other Assets and Liabilities (Net) include the margin requirements for futures with a notional market value of $722,161,097, which is 7.42% of net assets.
See Notes to Financial Statements.
Julius Baer Funds 2007 Annual Report
108
PORTFOLIO OF INVESTMENTS October 31, 2007
Julius Baer Total Return Bond Fund
Face
Value | |
Currency | | (Percentage of
Net Assets) | | Market
Value (Note 2) | |
| | | | U.S. GOVERNMENT AND AGENCY OBLIGATIONS—57.7% | |
| | | | | | | | | Federal Home Loan Bank | | | | | |
| | 9,000,000 | | | USD | | | | 4.500% due 09/16/2013 | | $ | 8,898,264 | | |
| | 13,645,000 | | | USD | | | | 5.500% due 08/13/2014 | | | 14,207,474 | | |
| | | | 23,105,738 | | |
| | | | | | | | | Federal Home Loan Mortgage Corporation | | | | | |
| | 25,600,000 | | | USD | | | | 4.875% due 02/09/2010 | | | 25,901,184 | | |
| | 15,754,000 | | | USD | | | | 5.500% due 08/20/2012 | | | 16,346,177 | | |
| | 2,822,919 | | | USD | | | | 4.655% due 09/01/2035 (1) | | | 2,851,628 | | |
| | 2,512,462 | | | USD | | | | 4.917% due 04/01/2036 (1) | | | 2,509,762 | | |
| | 4,350,974 | | | USD | | | | 5.640% due 12/01/2036 (1) | | | 4,390,455 | | |
| | 1,181,024 | | | USD | | | | 5.502% due 01/01/2037 (1) | | | 1,187,467 | | |
| | 5,465,321 | | | USD | | | | 5.177% due 02/01/2037 (1) | | | 5,445,558 | | |
| | 3,264,123 | | | USD | | | | 5.504% due 03/01/2037 (1) | | | 3,283,186 | | |
| | 1,434,875 | | | USD | | | | 5.630% due 04/01/2037 (1) | | | 1,448,634 | | |
| | 4,024,222 | | | USD | | | | 5.620% due 07/01/2037 (1) | | | 4,058,086 | | |
| | 58,880,000 | | | USD | | | | 5.000% due 11/01/2037* | | | 56,515,615 | | |
| | 23,300,000 | | | USD | | | | 5.500% due 11/01/2037* | | | 22,961,428 | | |
| | 26,300,000 | | | USD | | | | 6.500% due 11/01/2037* | | | 26,936,960 | | |
| | | | 173,836,140 | | |
| | | | | | | | | Federal National Mortgage Association Corporation | | | | | |
| | 53,700,000 | | | USD | | | | 6.000% due 11/01/2021* | | | 54,631,373 | | |
| | 1,621,406 | | | USD | | | | 4.332% due 01/01/2034 (1) | | | 1,647,829 | | |
| | 4,305,590 | | | USD | | | | 4.247% due 10/01/2034 (1) | | | 4,275,939 | | |
| | 3,273,979 | | | USD | | | | 4.670% due 11/01/2035 (1) | | | 3,291,659 | | |
| | 2,607,173 | | | USD | | | | 5.539% due 02/01/2036 (1) | | | 2,623,001 | | |
| | 856,557 | | | USD | | | | 6.000% due 06/01/2036 | | | 863,162 | | |
| | 167,654 | | | USD | | | | 6.000% due 11/01/2036 | | | 168,947 | | |
| | 995,596 | | | USD | | | | 6.000% due 12/01/2036 | | | 1,003,272 | | |
| | 2,969,989 | | | USD | | | | 5.387% due 03/01/2037 (1) | | | 2,970,110 | | |
| | 876,225 | | | USD | | | | 6.000% due 03/01/2037 | | | 882,978 | | |
| | 1,684,488 | | | USD | | | | 5.000% due 05/01/2037 | | | 1,617,053 | | |
| | 26,941 | | | USD | | | | 6.000% due 05/01/2037 | | | 27,145 | | |
| | 1,584,928 | | | USD | | | | 6.000% due 06/01/2037 | | | 1,596,958 | | |
| | 492,113 | | | USD | | | | 6.000% due 07/01/2037 | | | 495,848 | | |
| | 6,651,715 | | | USD | | | | 5.960% due 08/01/2037 (1) | | | 6,713,090 | | |
| | 19,744,127 | | | USD | | | | 6.000% due 08/01/2037 | | | 19,893,990 | | |
| | 17,100,000 | | | USD | | | | 5.000% due 11/01/2037* | | | 16,413,332 | | |
| | 22,620,000 | | | USD | | | | 6.000% due 11/01/2037* | | | 22,786,121 | | |
| | 3,779,039 | | | USD | | | | 5.643% due 01/01/2047 | | | 3,817,921 | | |
| | | | 145,719,728 | | |
See Notes to Financial Statements.
109
PORTFOLIO OF INVESTMENTS (Continued) October 31, 2007
Julius Baer Total Return Bond Fund
Face
Value | |
Currency | | (Percentage of
Net Assets) | | Market
Value (Note 2) | |
| | | | U.S. GOVERNMENT AND AGENCY OBLIGATIONS—Continued | |
| | | | | | | | | Government National Mortgage Association | | | | | |
| | 56,256 | | | USD | | | | 7.000% due 04/15/2032 | | $ | 59,235 | | |
| | 4,282,650 | | | USD | | | | 6.000% due 03/15/2037 | | | 4,337,664 | | |
| | 3,166,592 | | | USD | | | | 6.000% due 04/15/2037 | | | 3,207,270 | | |
| | 499,184 | | | USD | | | | 6.000% due 05/15/2037 | | | 505,597 | | |
| | 4,885,604 | | | USD | | | | 6.000% due 06/15/2037 | | | 4,948,363 | | |
| | 2,078,702 | | | USD | | | | 6.000% due 07/15/2037 | | | 2,105,405 | | |
| | 1,598,317 | | | USD | | | | 6.000% due 09/15/2037 | | | 1,618,848 | | |
| | 43,500,000 | | | USD | | | | 6.000% due 11/01/2037* | | | 44,050,537 | | |
| | | | 60,832,919 | | |
| | | | | | | | | U.S. Treasury Bonds | | | | | |
| | 900,000 | | | USD | | | | 5.000% due 05/15/2037 | | | 936,071 | | |
| | | | | | | | | U.S. Treasury Inflation Indexed Bonds | | | | | |
| | 10,999,485 | | | USD | | | | 2.375% due 04/15/2011 | | | 11,173,937 | | |
| | 18,642,824 | | | USD | | | | 1.625% due 01/15/2015 | | | 18,101,026 | | |
| | | | 29,274,963 | | |
| | | | | | | | | U.S. Treasury Inflation Indexed Note | | | | | |
| | 20,864,947 | | | USD | | | | 2.375% due 01/15/2025 | | | 21,311,603 | | |
| | | | | | | | | U.S. Treasury Notes | | | | | |
| | 6,550,000 | | | USD | | | | 4.000% due 09/30/2009 | | | 6,561,259 | | |
| | 9,400,000 | | | USD | | | | 3.625% due 10/31/2009 | | | 9,349,334 | | |
| | 4,800,000 | | | USD | | | | 4.500% due 05/15/2010 | | | 4,869,379 | | |
| | 916,000 | | | USD | | | | 4.125% due 08/31/2012 | | | 915,356 | | |
| | 16,140,000 | | | USD | | | | 3.875% due 10/31/2012 | | | 15,938,266 | | |
| | 24,000,000 | | | USD | | | | 3.875% due 02/15/2013 | | | 23,688,768 | | |
| | 20,740,000 | | | USD | | | | 3.625% due 05/15/2013 | | | 20,193,957 | | |
| | | | 81,516,319 | | |
| | | | | | | | | TOTAL U.S. GOVERNMENT AND AGENCY OBLIGATIONS
(Cost $530,713,651) | | | 536,533,481 | | |
| | | | ASSET BACKED SECURITIES—25.8% | |
| | | | | | | | | American Express Credit Account Master Trust | | | | | |
| | 4,600,000 | | | USD | | | | 5.430% due 09/15/2010 (1) | | | 4,601,662 | | |
| | 8,050,000 | | | USD | | | | 5.721% due 10/15/2010 (1) | | | 8,053,388 | | |
| | | | 12,655,050 | | |
See Notes to Financial Statements.
110
PORTFOLIO OF INVESTMENTS (Continued) October 31, 2007
Julius Baer Total Return Bond Fund
Face
Value | |
Currency | | (Percentage of
Net Assets) | | Market
Value (Note 2) | |
| | | | ASSET BACKED SECURITIES—Continued | |
| | | | | | | | | Banc of America Commercial Mortgage | | | | | |
| | 2,000,000 | | | USD | | | | 5.118% due 07/11/2043 | | $ | 1,990,512 | | |
| | 10,270,000 | | | USD | | | | 5.929% due 05/10/2045 (1) | | | 10,422,913 | | |
| | 8,500,000 | | | USD | | | | 5.414% due 09/10/2047 | | | 8,390,473 | | |
| | | | 20,803,898 | | |
| | | | | | | | | Bank One Issuance Trust | | | | | |
| �� | 3,400,000 | | | USD | | | | 5.440% due 09/15/2010 (1) | | | 3,401,160 | | |
| | | | | | | | | Bear Stearns Commercial Mortgage Securities | | | | | |
| | 3,205,000 | | | USD | | | | 5.201% due 12/11/2038 | | | 3,112,384 | | |
| | 12,400,000 | | | USD | | | | 4.674% due 06/11/2041 | | | 11,731,616 | | |
| | | | 14,844,000 | | |
| | | | | | | | | Capital Auto Receivables Asset Trust | | | | | |
| | 5,145,857 | | | USD | | | | 3.580% due 01/15/2009 | | | 5,132,863 | | |
| | 5,000,000 | | | USD | | | | 5.030% due 10/15/2009 | | | 4,998,792 | | |
| | | | 10,131,655 | | |
| | | | | | | | | Capital One Prime Auto Receivables Trust,
Series 2006-1, Class A3 | | | | | |
| | 6,517,803 | | | USD | | | | 4.990% due 09/15/2010 | | | 6,520,307 | | |
| | | | | | | | | Citibank Credit Card Issuance Trust | | | | | |
| | 9,100,000 | | | USD | | | | 5.460% due 01/15/2010 (1) | | | 9,107,827 | | |
| | 6,100,000 | | | USD | | | | 3.100% due 03/10/2010 | | | 6,059,464 | | |
| | 8,500,000 | | | USD | | | | 5.846% due 08/20/2014 (1) | | | 8,550,394 | | |
| | | | 23,717,685 | | |
| | | | | | | | | City Mortgage MBS Finance BV,
Series 2006-1A, Class AFL | | | | | |
| | 1,887,317 | | | USD | | | | 6.920% due 09/10/2033† (1) | | | 1,859,007 | | |
| | | | | | | | | CNH Equipment Trust,
Series 2007-A, Class A2 | | | | | |
| | 2,700,000 | | | USD | | | | 5.130% due 10/15/2009 | | | 2,705,210 | | |
| | | | | | | | | Commercial Mortgage Pass Through Certificates,
Series 2006-C7, Class A4 | | | | | |
| | 7,500,000 | | | USD | | | | 5.769% due 06/10/2046 (1) | | | 7,628,130 | | |
See Notes to Financial Statements.
111
PORTFOLIO OF INVESTMENTS (Continued) October 31, 2007
Julius Baer Total Return Bond Fund
Face
Value | |
Currency | | (Percentage of
Net Assets) | | Market
Value (Note 2) | |
| | | | ASSET BACKED SECURITIES—Continued | |
| | | | | | | | | Credit Suisse Mortgage Capital Certificates | | | | | |
| | 9,100,000 | | | USD | | | | 5.467% due 09/15/2039 | | $ | 8,999,895 | | |
| | 6,600,000 | | | USD | | | | 5.311% due 12/15/2039 | | | 6,452,708 | | |
| | | | 15,452,603 | | |
| | | | | | | | | Discover Card Master Trust I | | | | | |
| | 2,800,000 | | | USD | | | | 5.540% due 01/15/2008 (1) | | | 2,801,543 | | |
| | | | | | | | | Ford Credit Auto Owner Trust | | | | | |
| | 1,387,857 | | | USD | | | | 3.540% due 11/15/2008 | | | 1,385,698 | | |
| | 3,285,686 | | | USD | | | | 4.300% due 08/15/2009 | | | 3,277,446 | | |
| | | | 4,663,144 | | |
| | | | | | | | | GE Capital Commercial Mortgage Corporation,
Series 2002-1A, Class A3 | | | | | |
| | 3,700,000 | | | USD | | | | 6.269% due 12/10/2035 | | | 3,839,295 | | |
| | | | | | | | | Harley-Davidson Motorcycle Trust | | | | | |
| | 1,717,091 | | | USD | | | | 2.070% due 02/15/2011 (2) | | | 1,711,145 | | |
| | | | | | | | | Honda Auto Receivables Owner Trust | | | | | |
| | 143,966 | | | USD | | | | 5.322% due 03/18/2008 | | | 143,991 | | |
| | 3,583,754 | | | USD | | | | 5.326% due 06/23/2008 (3) | | | 3,585,195 | | |
| | 2,533,867 | | | USD | | | | 3.870% due 04/20/2009 | | | 2,524,654 | | |
| | 2,771,611 | | | USD | | | | 4.610% due 08/17/2009 | | | 2,767,085 | | |
| | 6,739,104 | | | USD | | | | 4.850% due 10/19/2009 | | | 6,734,214 | | |
| | | | 15,755,139 | | |
| | | | | | | | | John Deere Owner Trust | | | | | |
| | 2,864,621 | | | USD | | | | 3.980% due 06/15/2009 | | | 2,859,059 | | |
| | | | | | | | | JPMorgan Chase Commercial Mortgage Securities Corp,
Series 2002-CIB4, Class A3 | | | | | |
| | 1,920,000 | | | USD | | | | 6.162% due 05/12/2034 | | | 1,985,646 | | |
| | | | | | | | | Lehman Brothers-UBS Commercial Mortgage Trust,
Series 2001-C3, Class A2 | | | | | |
| | 5,620,000 | | | USD | | | | 6.365% due 12/15/2028 | | | 5,843,976 | | |
See Notes to Financial Statements.
112
PORTFOLIO OF INVESTMENTS (Continued) October 31, 2007
Julius Baer Total Return Bond Fund
Face
Value | |
Currency | | (Percentage of
Net Assets) | | Market
Value (Note 2) | |
| | | | ASSET BACKED SECURITIES—Continued | |
| | | | | | | | | MBNA Credit Card Master Note Trust,
Series 2000-L, Class A | | | | | |
| | 10,000,000 | | | USD | | | | 6.500% due 04/15/2010 | | $ | 10,005,151 | | |
| | | | | | | | | Morgan Stanley Capital I | | | | | |
| | 2,600,000 | | | USD | | | | 5.810% due 08/12/2041 (1) | | | 2,657,255 | | |
| | 8,650,000 | | | USD | | | | 5.332% due 12/15/2043 | | | 8,474,273 | | |
| | | | 11,131,528 | | |
| | | | | | | | | Morgan Stanley Dean Witter Capital I | | | | | |
| | 500,000 | | | USD | | | | 6.390% due 07/15/2033 | | | 518,826 | | |
| | 5,200,000 | | | USD | | | | 6.390% due 10/15/2035 | | | 5,406,761 | | |
| | 7,500,000 | | | USD | | | | 5.980% due 01/15/2039 | | | 7,699,822 | | |
| | | | 13,625,409 | | |
| | | | | | | | | Nelnet Student Loan Trust, Series 2006-3, Class A1 | | | | | |
| | 3,974,732 | | | USD | | | | 5.183% due 09/25/2012 (1) | | | 3,972,213 | | |
| | | | | | | | | Nissan Auto Receivables Owner Trust | | | | | |
| | 416,183 | | | USD | | | | 5.321% due 03/17/2008 | | | 416,243 | | |
| | 4,750,269 | | | USD | | | | 4.000% due 12/15/2009 | | | 4,729,688 | | |
| | | | 5,145,931 | | |
| | | | | | | | | SLM Student Loan Trust | | | | | |
| | 3,221,505 | | | USD | | | | 5.340% due 04/25/2014 (1) | | | 3,215,906 | | |
| | 3,415,557 | | | USD | | | | 5.410% due 04/25/2018 (1) | | | 3,412,191 | | |
| | | | 6,628,097 | | |
| | | | | | | | | Small Business Administration | | | | | |
| | 2,387,402 | | | USD | | | | 4.940% due 08/10/2015 | | | 2,360,623 | | |
| | 4,016,683 | | | USD | | | | 5.408% due 02/10/2016 | | | 4,018,602 | | |
| | 6,309,667 | | | USD | | | | 5.459% due 02/10/2017 | | | 6,332,619 | | |
| | | | 12,711,844 | | |
| | | | | | | | | Taganka Car Loan Finance PLC, Series 2006-1A, Class A | | | | | |
| | 1,005,218 | | | USD | | | | 6.320% due 11/14/2013† (1) | | | 1,006,224 | | |
| | | | | | | | | TIAA Retail Commercial Trust, Series 2007-C4, Class A3 | | | | | |
| | 4,500,000 | | | USD | | | | 6.104% due 08/15/2039 (1) | | | 4,593,402 | | |
See Notes to Financial Statements.
113
PORTFOLIO OF INVESTMENTS (Continued) October 31, 2007
Julius Baer Total Return Bond Fund
Face
Value | |
Currency | | (Percentage of
Net Assets) | | Market
Value (Note 2) | |
| | | | ASSET BACKED SECURITIES—Continued | |
| | | | | | | | | U-Haul S Fleet LLC,
Series 2007-BT1, Class BT | | | | | |
| | 3,776,971 | | | USD | | | | 5.559% due 02/25/2020† | | $ | 3,815,429 | | |
| | | | | | | | | Volkswagen Auto Lease Trust,
Series 2006-A, Class A2 | | | | | |
| | 4,534,101 | | | USD | | | | 5.550% due 11/20/2008 | | | 4,537,878 | | |
| | | | | | | | | Volkswagen Auto Loan Enhanced Trust,
Series 2007-1, Class A2 | | | | | |
| | 3,303,848 | | | USD | | | | 5.290% due 05/20/2009 | | | 3,306,627 | | |
| | | | | | | | | TOTAL ASSET BACKED SECURITIES (Cost $239,206,554) | | | 239,657,385 | | |
| | | | CORPORATE BONDS—20.5% | |
| | | | | United States—12.1% | |
| | | | | | | | | Alabama Power | | | | | |
| | 1,280,000 | | | USD | | | | Series CC, 3.500% due 11/15/2007 | | | 1,279,384 | | |
| | | | | | | | | American Express Bank | | | | | |
| | 4,500,000 | | | USD | | | | 5.550% due 10/17/2012 | | | 4,546,413 | | |
| | | | | | | | | American General | | | | | |
| | 4,900,000 | | | USD | | | | 7.500% due 08/11/2010 | | | 5,199,130 | | |
| | | | | | | | | Anheuser-Busch Co | | | | | |
| | 1,000,000 | | | USD | | | | 6.450% due 09/01/2037 | | | 1,084,808 | | |
| | | | | | | | | Bottling Group | | | | | |
| | 2,400,000 | | | USD | | | | 5.500% due 04/01/2016 | | | 2,416,716 | | |
| | | | | | | | | Burlington Northern Santa Fe | | | | | |
| | 3,000,000 | | | USD | | | | 6.150% due 05/01/2037 | | | 2,973,756 | | |
| | | | | | | | | Cargill Inc | | | | | |
| | 4,400,000 | | | USD | | | | 4.375% due 06/01/2013† | | | 4,213,343 | | |
| | | | | | | | | Chubb Corp | | | | | |
| | 6,300,000 | | | USD | | | | 4.934% due 11/16/2007 | | | 6,300,063 | | |
| | | | | | | | | CIT Group | | | | | |
| | 2,500,000 | | | USD | | | | 5.400% due 01/30/2016 | | | 2,292,858 | | |
| | | | | | | | | Citigroup Inc, Global Senior Note | | | | | |
| | 4,300,000 | | | USD | | | | 6.000% due 08/15/2017 | | | 4,390,691 | | |
See Notes to Financial Statements.
114
PORTFOLIO OF INVESTMENTS (Continued) October 31, 2007
Julius Baer Total Return Bond Fund
Face
Value | |
Currency | | (Percentage of
Net Assets) | | Market
Value (Note 2) | |
| | | | CORPORATE BONDS—Continued | |
| | | | | United States—Continued | |
| | | | | | | | | Coca-Cola Co | | | | | |
| | 3,750,000 | | | USD | | | | 5.350% due 11/15/2017 | | $ | 3,731,190 | | |
| | | | | | | | | Comcast Corp | | | | | |
| | 690,000 | | | USD | | | | 6.300% due 11/15/2017 | | | 713,078 | | |
| | 2,700,000 | | | USD | | | | 6.950% due 08/15/2037 | | | 2,898,763 | | |
| | | | 3,611,841 | | |
| | | | | | | | | ConocoPhillips | | | | | |
| | 3,300,000 | | | USD | | | | 8.750% due 05/25/2010 | | | 3,605,098 | | |
| | | | | | | | | Consolidated Edison | | | | | |
| | 2,050,000 | | | USD | | | | 5.500% due 09/15/2016 | | | 2,043,598 | | |
| | | | | | | | | Credit Suisse, Senior Note | | | | | |
| | 3,000,000 | | | USD | | | | 4.875% due 01/15/2015 | | | 2,886,852 | | |
| | | | | | | | | CVS Caremark | | | | | |
| | 2,700,000 | | | USD | | | | 5.750% due 06/01/2017 | | | 2,691,020 | | |
| | | | | | | | | Eli Lilly | | | | | |
| | 3,900,000 | | | USD | | | | 5.550% due 03/15/2037 | | | 3,737,159 | | |
| | | | | | | | | Estee Lauder | | | | | |
| | 3,500,000 | | | USD | | | | 5.550% due 05/15/2017 | | | 3,475,682 | | |
| | | | | | | | | Genentech Inc, Senior Note | | | | | |
| | 1,200,000 | | | USD | | | | 4.750% due 07/15/2015 | | | 1,151,927 | | |
| | | | | | | | | General Electric Capital | | | | | |
| | 3,600,000 | | | USD | | | | 5.400% due 02/15/2017 | | | 3,579,772 | | |
| | | | | | | | | GlaxoSmithKline Capital | | | | | |
| | 2,300,000 | | | USD | | | | 4.375% due 04/15/2014 | | | 2,180,179 | | |
| | | | | | | | | Grand Metropolitan Investment,
Guaranteed Senior Note | | | | | |
| | 800,000 | | | USD | | | | 7.450% due 04/15/2035 | | | 930,702 | | |
| | | | | | | | | Hewlett-Packard Co | | | | | |
| | 2,100,000 | | | USD | | | | 5.250% due 03/01/2012 | | | 2,125,313 | | |
| | | | | | | | | HSBC Bank, Global Note | | | | | |
| | 3,100,000 | | | USD | | | | 5.875% due 11/01/2034 | | | 2,875,290 | | |
See Notes to Financial Statements.
115
PORTFOLIO OF INVESTMENTS (Continued) October 31, 2007
Julius Baer Total Return Bond Fund
Face
Value | |
Currency | | (Percentage of
Net Assets) | | Market
Value (Note 2) | |
| | | | CORPORATE BONDS—Continued | |
| | | | | United States—Continued | |
| | | | | | | | | IBM International Group Capital | | | | | |
| | 2,500,000 | | | USD | | | | 5.050% due 10/22/2012 | | $ | 2,501,578 | | |
| | | | | | | | | International Lease Finance | | | | | |
| | 4,400,000 | | | USD | | | | 5.320% due 12/09/2007 | | | 4,399,512 | | |
| | | | | | | | | Jefferies Group | | | | | |
| | 1,200,000 | | | USD | | | | 6.450% due 06/08/2027 | | | 1,131,932 | | |
| | | | | | | | | JPMorgan Chase | | | | | |
| | 2,000,000 | | | USD | | | | 5.875% due 06/13/2016 | | | 2,026,800 | | |
| | | | | | | | | JPMorgan Chase, Subordinated Note | | | | | |
| | 2,500,000 | | | USD | | | | 6.000% due 07/05/2017 | | | 2,545,260 | | |
| | | | | | | | | Kohls Corp | | | | | |
| | 1,180,000 | | | USD | | | | 6.250% due 12/15/2017 | | | 1,183,518 | | |
| | | | | | | | | Merna Reinsurance | | | | | |
| | 2,700,000 | | | USD | | | | 7.110% due 07/07/2010† (1) | | | 2,699,595 | | |
| | | | | | | | | Private Export Funding, Series D | | | | | |
| | 3,040,000 | | | USD | | | | 5.870% due 07/31/2008 | | | 3,069,911 | | |
| | | | | | | | | SC Johnson & Son | | | | | |
| | 2,700,000 | | | USD | | | | 5.750% due 02/15/2033† | | | 2,537,430 | | |
| | | | | | | | | Selkirk Cogen Funding, Series A | | | | | |
| | 402,308 | | | USD | | | | 8.650% due 12/26/2007 | | | 402,889 | | |
| | | | | | | | | Southern Co, Series A, Senior Note | | | | | |
| | 3,900,000 | | | USD | | | | 5.300% due 01/15/2012 | | | 3,923,404 | | |
| | | | | | | | | SunTrust Banks, Senior Note | | | | | |
| | 3,300,000 | | | USD | | | | 6.000% due 09/11/2017 | | | 3,356,516 | | |
| | | | | | | | | Wachovia Corp | | | | | |
| | 3,800,000 | | | USD | | | | 5.750% due 06/15/2017 | | | 3,821,652 | | |
| | | | | | | | | Wyeth | | | | | |
| | 3,600,000 | | | USD | | | | 5.450% due 04/01/2017 | | | 3,554,262 | | |
| | | | | | | | | Zeneca Wilmington, Guaranteed Note | | | | | |
| | 1,900,000 | | | USD | | | | 7.000% due 11/15/2023 | | | 2,128,399 | | |
| | | | 112,605,443 | | |
See Notes to Financial Statements.
116
PORTFOLIO OF INVESTMENTS (Continued) October 31, 2007
Julius Baer Total Return Bond Fund
Face
Value | |
Currency | | (Percentage of
Net Assets) | | Market
Value (Note 2) | |
| | | | CORPORATE BONDS—Continued | |
| | | | | Supra National—1.7% | |
| | | | | | | | | European Investment Bank | | | | | |
| | 16,000,000 | | | USD | | | | 4.625% due 03/21/2012 | | $ | 16,062,400 | | |
| | | | | United Kingdom—1.6% | |
| | | | | | | | | Astrazeneca PLC | | | | | |
| | 1,500,000 | | | USD | | | | 5.400% due 06/01/2014 | | | 1,504,538 | | |
| | | | | | | | | Diageo Capital | | | | | |
| | 3,900,000 | | | USD | | | | 5.125% due 01/30/2012 | | | 3,883,207 | | |
| | | | | | | | | Lloyds TSB | | | | | |
| | 3,500,000 | | | USD | | | | 6.267% due 05/14/2049† (1)(2) | | | 3,243,335 | | |
| | | | | | | | | Royal Bank of Scotland | | | | | |
| | 2,000,000 | | | USD | | | | 7.640% due 03/31/2049 (1) | | | 2,076,622 | | |
| | | | | | | | | Standard Chartered Bank,
Subordinated Note | | | | | |
| | 3,200,000 | | | USD | | | | 6.400% due 09/26/2017† | | | 3,276,464 | | |
| | | | | | | | | Vodafone Group | | | | | |
| | 470,000 | | | USD | | | | 6.150% due 02/27/2037 | | | 462,859 | | |
| | | | 14,447,025 | | |
| | | | | Norway—0.9% | |
| | | | | | | | | Eksportfinans A/S | | | | | |
| | 8,100,000 | | | USD | | | | 5.000% due 02/14/2012 | | | 8,215,409 | | |
| | | | | Chile—0.8% | |
| | | | | | | | | Celulosa Arauco y Constitucion | | | | | |
| | 3,600,000 | | | USD | | | | 7.750% due 09/13/2011 | | | 3,871,534 | | |
| | | | | | | | | Transelec SA | | | | | |
| | 3,000,000 | | | USD | | | | 7.875% due 04/15/2011 | | | 3,200,637 | | |
| | | | 7,072,171 | | |
| | | | | France—0.7% | |
| | | | | | | | | AXA SA | | | | | |
| | 3,800,000 | | | USD | | | | 8.600% due 12/15/2030 | | | 4,767,142 | | |
| | | | | | | | | Lafarge SA | | | | | |
| | 2,000,000 | | | USD | | | | 7.125% due 07/15/2036 | | | 2,059,944 | | |
| | | | 6,827,086 | | |
See Notes to Financial Statements.
117
PORTFOLIO OF INVESTMENTS (Continued) October 31, 2007
Julius Baer Total Return Bond Fund
Face
Value | |
Currency | | (Percentage of
Net Assets) | | Market
Value (Note 2) | |
| | | | CORPORATE BONDS—Continued | |
| | | | | Canada—0.7% | |
| | | | | | | | | Alcan Inc | | | | | |
| | 2,700,000 | | | USD | | | | 7.250% due 03/15/2031 | | $ | 3,013,024 | | |
| | | | | | | | | Thomson Corp | | | | | |
| | 3,800,000 | | | USD | | | | 5.700% due 10/01/2014 | | | 3,801,056 | | |
| | | | 6,814,080 | | |
| | | | | Mexico—0.5% | |
| | | | | | | | | Monterrey Power | | | | | |
| | 4,181,348 | | | USD | | | | 9.625% due 11/15/2009† | | | 4,547,215 | | |
| | | | | Russia—0.4% | |
| | | | | | | | | Norilsk Nickel | | | | | |
| | 3,500,000 | | | USD | | | | 7.125% due 09/30/2009 | | | 3,605,805 | | |
| | | | | Brazil—0.4% | |
| | | | | | | | | Embraer Overseas | | | | | |
| | 2,350,000 | | | USD | | | | 6.375% due 01/24/2017 | | | 2,303,000 | | |
| | | | | | | | | Petrobras International Finance, Global Note | | | | | |
| | 1,250,000 | | | USD | | | | 5.875% due 03/01/2018 | | | 1,234,375 | | |
| | | | 3,537,375 | | |
| | | | | Luxembourg—0.4% | |
| | | | | | | | | VTB Capital (Vneshtorgbank) | | | | | |
| | 3,300,000 | | | USD | | | | 5.955% due 08/01/2008† (1) | | | 3,271,125 | | |
| | | | | Australia—0.3% | |
| | | | | | | | | BHP Billiton Finance | | | | | |
| | 3,100,000 | | | USD | | | | 5.400% due 03/29/2017 | | | 3,051,535 | | |
| | | | | | | | | TOTAL CORPORATE BONDS (Cost $188,653,292) | | | 190,056,669 | | |
| | | | FOREIGN GOVERNMENT BONDS—3.8% | |
| | | | | United Kingdom—1.7% | |
| | | | | | | | | United Kingdom | | | | | |
| | 7,790,000 | | | GBP | | | | 4.000% due 03/07/2009 | | | 15,938,912 | | |
| | | | | Sweden—0.9% | |
| | | | | | | | | Kingdom of Sweden | | | | | |
| | 8,000,000 | | | USD | | | | 4.875% due 01/19/2010 | | | 8,096,320 | | |
See Notes to Financial Statements.
118
PORTFOLIO OF INVESTMENTS (Continued) October 31, 2007
Julius Baer Total Return Bond Fund
Face
Value | |
Currency | | (Percentage of
Net Assets) | | Market
Value (Note 2) | |
| | | | FOREIGN GOVERNMENT BONDS—Continued | |
| | | | | Australia—0.8% | |
| | | | | | | | | New South Wales Treasury | | | | | |
| | 8,352,000 | | | AUD | | | | 5.500% due 08/01/2014 | | $ | 7,207,627 | | |
| | | | | Turkey—0.3% | |
| | | | | | | | | Turkey Trust | | | | | |
| | 3,000,000 | | | USD | | | | Zero Coupon due 11/15/2007 | | | 2,995,212 | | |
| | | | | France—0.1% | |
| | | | | | | | | CCCE-Principal Certificate | | | | | |
| | 1,400,000 | | | USD | | | | Zero Coupon due 05/01/2009 | | | 1,308,601 | | |
| | | | | | | | | TOTAL FOREIGN GOVERNMENT BONDS
(Cost $33,742,632) | | | 35,546,672 | | |
| | | | SHORT-TERM INVESTMENTS—2.3% | |
| | | | | United States—1.5% | |
| | | | | | | | | Capital One Prime Auto Receivables Trust,
Series 2007-1, Class A1 | | | | | |
| | 4,715,416 | | | USD | | | | 5.344% due 06/15/2008 | | | 4,715,416 | | |
| | | | | | | | | Ford Credit Auto Owner Trust,
Series 2007-A, Class A1 | | | | | |
| | 4,229,782 | | | USD | | | | 5.349% due 07/15/2008† | | | 4,229,782 | | |
| | | | | | | | | Nissan Auto Lease Trust,
Series 2007-A, Class A1 | | | | | |
| | 1,654,854 | | | USD | | | | 5.330% due 08/15/2008 | | | 1,654,854 | | |
| | | | | | | | | Wachovia Auto Owner Trust,
Series 2007-A, Class A1 | | | | | |
| | 3,933,105 | | | USD | | | | 5.340% due 07/18/2008 | | | 3,933,105 | | |
| | | | 14,533,157 | | |
| | | | | Romania—0.8% | |
| | | | | | | | | Romania Government | | | | | |
| | 17,000,000 | | | RON | | | | Zero Coupon due 03/12/2008 | | | 7,189,889 | | |
| | | | | | | | | TOTAL SHORT-TERM INVESTMENTS (Cost $21,028,511) | | | 21,723,046 | | |
See Notes to Financial Statements.
119
PORTFOLIO OF INVESTMENTS (Continued) October 31, 2007
Julius Baer Total Return Bond Fund
Face
Value | |
Currency | | (Percentage of
Net Assets) | | Market
Value (Note 2) | |
| | | | MUNICIPAL OBLIGATIONS—0.3% | |
| | | | | United States—0.3% | |
| | | | | Duke University | | | | | |
| | 2,700,000 | | | USD | | 5.850% due 04/01/2037 (Cost $2,700,000) | | $ | 2,764,638 | | |
| | | | REPURCHASE AGREEMENT—15.3% | |
| | | | | United States—15.3% | |
| | 142,560,577 | | | USD | | State Street Bank and Trust Repurchase Agreement, | | |
| | |
| | | | | dated 10/31/2007, due 11/01/2007, with a maturity | | |
| | |
| | | | | value of $142,572,496 and an effective yield of 3.01%, | | |
| | |
| | | | | collateralized by a U.S. Government and Agency | | |
| | |
| | | | | Obligation, with rates ranging from 5.233%-5.441%, | | |
| | |
| | | | | maturities from 12/15/2034-08/15/2036, and | | |
| | |
| | | | | an aggregate market value of $145,414,410 | | |
| | |
| | | | | (Cost $142,560,577) | | $ | 142,560,577 | | |
| | | | | TOTAL INVESTMENTS—125.7%
(Cost $1,158,605,217) | | | 1,168,842,468 | | |
| | | | | OTHER ASSETS AND LIABILITIES (Net)—(25.7%) | | | (239,233,734 | ) | |
| | | | | TOTAL NET ASSETS—100.0% | | $ | 929,608,734 | | |
Portfolio Footnotes:
(1) Variable rate security.
(2) Callable
* TBA - To Be Announced: Securities purchased on a forward commitment basis with an approximate principal amount and maturity date. The actual principal amount and maturity date will be determined upon settlement.
† Securities exempt from registration under Rule 144A of the Securities Act of 1933, as amended. These securities may be resold in transactions exempt from registrations, normally to qualified institutional buyers.
Aggregate cost for federal income tax purposes was $1,159,116,876.
Glossary of Currencies
AUD — Australian Dollar
GBP — British Pound Sterling
RON — Romanian Leu
USD — United States Dollar
See Notes to Financial Statements.
120
SCHEDULE OF FORWARD FOREIGN EXCHANGE CONTRACTS
October 31, 2007
Julius Baer Total Return Bond Fund
FORWARD FOREIGN EXCHANGE CONTRACTS TO BUY
| | | Contracts to Receive | | | | | |
Expiration
Date | |
Local | |
Value in
Currency | | In Exchange
USDfor USD | | Net Unrealized
Appreciation
(Depreciation) | |
| 11/02/07 | | AUD | 42,814,861 | | | | 39,678,672 | | | | 35,978,465 | | | $ | 3,700,207 | | |
| 12/11/07 | | AUD | 5,179,902 | | | | 4,790,186 | | | | 4,270,000 | | | | 520,186 | | |
| 01/10/08 | | AUD | 21,125,650 | | | | 19,502,342 | | | | 18,740,000 | | | | 762,342 | | |
| 02/04/08 | | AUD | 10,500,000 | | | | 9,678,060 | | | | 9,653,700 | | | | 24,360 | | |
| 12/24/07 | | BRL | 24,362,000 | | | | 13,918,516 | | | | 12,917,285 | | | | 1,001,231 | | |
| 01/02/08 | | BRL | 24,918,500 | | | | 14,220,945 | | | | 13,520,066 | | | | 700,879 | | |
| 02/06/08 | | BRL | 35,000,000 | | | | 19,871,686 | | | | 19,841,270 | | | | 30,416 | | |
| 11/27/07 | | EUR | 66,858,007 | | | | 96,766,184 | | | | 92,323,806 | | | | 4,442,378 | | |
| 11/08/07 | | GBP | 7,912,023 | | | | 16,432,993 | | | | 16,377,589 | | | | 55,404 | | |
| 02/06/08 | | HUF | 1,624,000,000 | | | | 9,290,288 | | | | 9,277,344 | | | | 12,944 | | |
| 01/02/08 | | INR | 521,900,000 | | | | 13,232,423 | | | | 13,136,171 | | | | 96,252 | | |
| 02/04/08 | | INR | 475,000,000 | | | | 12,028,057 | | | | 12,057,369 | | | | (29,312 | ) | |
| 11/13/07 | | JPY | 1,968,694,520 | | | | 17,098,305 | | | | 16,919,995 | | | | 178,310 | | |
| 11/19/07 | | JPY | 1,869,642,000 | | | | 16,249,206 | | | | 16,159,995 | | | | 89,211 | | |
| 12/11/07 | | JPY | 962,546,175 | | | | 8,386,568 | | | | 8,549,999 | | | | (163,431 | ) | |
| 01/02/08 | | MYR | 44,838,000 | | | | 13,470,933 | | | | 13,198,646 | | | | 272,287 | | |
| 02/04/08 | | NOK | 52,170,965 | | | | 9,659,716 | | | | 9,700,000 | | | | (40,284 | ) | |
| 11/13/07 | | NZD | 11,204,707 | | | | 8,608,399 | | | | 7,976,854 | | | | 631,545 | | |
| 01/09/08 | | NZD | 36,420,965 | | | | 27,820,495 | | | | 27,260,000 | | | | 560,495 | | |
| 01/02/08 | | PEN | 27,084,000 | | | | 9,047,581 | | | | 8,804,429 | | | | 243,152 | | |
| 01/03/08 | | RON | 20,705,000 | | | | 8,969,066 | | | | 8,791,745 | | | | 177,321 | | |
| 11/27/07 | | SEK | 89,500,000 | | | | 14,075,604 | | | | 13,076,097 | | | | 999,507 | | |
| Net unrealized appreciation on forward foreign exchange contracts to buy | | | | | | | | | | | | | | $ | 14,265,400 | | |
See Notes to Financial Statements.
121
SCHEDULE OF FORWARD FOREIGN EXCHANGE CONTRACTS (Continued)
October 31, 2007
Julius Baer Total Return Bond Fund
FORWARD FOREIGN EXCHANGE CONTRACTS TO SELL
| | | Contracts to Deliver | | | | | |
Expiration
Date | |
Local | |
Value in
Currency | | In Exchange
USDfor USD | | Net Unrealized
Appreciation
(Depreciation) | |
| 11/02/07 | | AUD | 42,814,861 | | | | 39,678,672 | | | | 36,356,308 | | | $ | (3,322,364 | ) | |
| 11/27/07 | | EUR | 40,700,000 | | | | 58,906,687 | | | | 57,162,625 | | | | (1,744,062 | ) | |
| 11/01/07 | | GBP | 7,719,843 | | | | 16,036,816 | | | | 15,990,883 | | | | (45,933 | ) | |
| 11/08/07 | | GBP | 15,521,050 | | | | 32,236,675 | | | | 31,304,373 | | | | (932,302 | ) | |
| 01/02/08 | | INR | 260,950,000 | | | | 6,616,212 | | | | 6,502,616 | | | | (113,596 | ) | |
| 11/13/07 | | JPY | 1,968,694,520 | | | | 17,098,305 | | | | 17,163,532 | | | | 65,227 | | |
| 11/19/07 | | JPY | 1,869,642,000 | | | | 16,249,205 | | | | 16,229,037 | | | | (20,168 | ) | |
| 12/11/07 | | JPY | 962,546,175 | | | | 8,386,568 | | | | 8,447,017 | | | | 60,449 | | |
| 11/13/07 | | NZD | 11,204,707 | | | | 8,608,399 | | | | 8,380,000 | | | | (228,399 | ) | |
| 11/27/07 | | SEK | 89,500,000 | | | | 14,075,604 | | | | 13,686,382 | | | | (389,222 | ) | |
| Net unrealized depreciation on forward foreign exchange contracts to sell | | | | | | | | | | | | | | $ | (6,670,370 | ) | |
Glossary of Currencies
AUD — Australian Dollar
BRL — Brazilian Real
EUR — Euro
GBP — British Pound Sterling
HUF — Hungarian Forint
INR — Polish Zloty
JPY — Japanese Yen
MYR — Malaysian Ringgit
NOK — Norwegian Krone
NZD — New Zealand Dollar
PEN — Nuevo Sol (Peruvian)
RON — Romanian Leu
SEK — Swedish Krona
See Notes to Financial Statements.
122
PORTFOLIO OF INVESTMENTS–Industry Sector (Unaudited) October 31, 2007
Julius Baer Total Return Bond Fund
At October 31, 2007, sector diversification of the Fund's non-cash equivalents investments were as follows:
| | | % of Net
Assets | | Market
Value (Note 2) | |
| INDUSTRY SECTOR | |
| U.S. Government and Agency Obligations | | | 57.7 | % | | $ | 536,533,481 | | |
| Asset Backed Securities | | | 25.8 | | | | 239,657,385 | | |
| Corporate Bonds | | | 20.5 | | | | 190,056,669 | | |
| Foreign Government Bonds | | | 3.8 | | | | 35,546,672 | | |
| Short Term Investments | | | 2.3 | | | | 21,723,046 | | |
| Municipal Obligations | | | 0.3 | | | | 2,764,638 | | |
| Cash & Cash Equivalents | | | 15.3 | | | | 142,560,577 | | |
| Total Investments | | | 125.7 | | | | 1,168,842,468 | | |
| Other Assets and Liabilities (Net) | | | (25.7 | ) | | | (239,233,734 | ) | |
| Net Assets | | | 100.0 | % | | $ | 929,608,734 | | |
See Notes to Financial Statements.
Julius Baer Funds 2007 Annual Report
123
PORTFOLIO OF INVESTMENTS October 31, 2007
Julius Baer Global High Income Fund
Face
Value | |
Currency | | (Percentage of
Net Assets) | | Market
Value (Note 2) | |
| | | | CORPORATE BONDS—65.6% | |
| | | | | United States—41.4% | |
| | 2,215,000 | | | USD | | | | Advanced Medical Optics
7.500% due 05/01/2017 (2) | | $ | 2,098,710 | | |
| | 1,070,000 | | | USD | | | | Airgas Inc
6.250% due 07/15/2014 (2) | | | 1,051,275 | | |
| | 530,000 | | | USD | | | | Alliance Imaging
7.250% due 12/15/2012 (2) | | | 508,800 | | |
| | 2,600,000 | | | USD | | | | Alliant Techsystems
6.750% due 04/01/2016 (2) | | | 2,600,000 | | |
| | 1,694,000 | | | USD | | | | Allison Transmission
11.250% due 11/01/2015† | | | 1,679,177 | | |
| | 2,615,000 | | | USD | | | | Alpha Natural Resources
10.000% due 06/01/2012 (2) | | | 2,798,050 | | |
| | 1,600,000 | | | USD | | | | American Airlines Series 1999-1
7.324% due 10/15/2009 | | | 1,580,000 | | |
| | 850,000 | | | USD | | | | Atlantic & Western, Series B
11.610% due 01/09/2009† (1) | | | 860,480 | | |
| | 250,000 | | | USD | | | | Calabash Re
13.760% due 01/08/2010† (1) | | | 259,887 | | |
| | 1,675,000 | | | USD | | | | Calpine Generating
11.070% due 04/01/2010 (3)(1)(2) | | | 452,250 | | |
| | 330,000 | | | USD | | | | Carillon Ltd
15.355% due 01/08/2010† (1) | | | 345,510 | | |
| | 640,000 | | | USD | | | | Cascadia Ltd
8.485% due 06/13/2008† (1) | | | 640,992 | | |
| | 2,910,000 | | | USD | | | | Case New Holland
6.000% due 06/01/2009 | | | 2,924,550 | | |
| | 2,610,000 | | | USD | | | | Choctaw Resort Development Enterprise
7.250% due 11/15/2019† (2) | | | 2,557,800 | | |
| | 1,090,000 | | | USD | | | | Church & Dwight
6.000% due 12/15/2012 (2) | | | 1,066,837 | | |
| | 2,300,000 | | | USD | | | | CMS Energy
8.500% due 04/15/2011 | | | 2,477,666 | | |
See Notes to Financial Statements.
124
PORTFOLIO OF INVESTMENTS (Continued) October 31, 2007
Julius Baer Global High Income Fund
Face
Value | |
Currency | | (Percentage of
Net Assets) | | Market
Value (Note 2) | |
| | | | CORPORATE BONDS—Continued | |
| | | | | United States—Continued | |
| | 2,245,000 | | | USD | | | | Community Health Systems
8.875% due 07/15/2015† (2) | | $ | 2,284,287 | | |
| | 2,100,000 | | | USD | | | | Cooper-Standard Automotive
7.000% due 12/15/2012 (2) | | | 1,921,500 | | |
| | 1,500,000 | | | USD | | | | Delphi Corp
Zero Coupon due 06/15/2008 | | | 1,380,000 | | |
| | 300,000 | | | USD | | | | Dex Media
8.000% due 11/15/2013 (2) | | | 302,250 | | |
| | 338,000 | | | USD | | | | Dex Media West
9.875% due 08/15/2013 (2) | | | 362,082 | | |
| | 1,431,000 | | | USD | | | | Dresser-Rand
7.375% due 11/01/2014 (2) | | | 1,447,099 | | |
| | 645,000 | | | USD | | | | Eurus Ltd
11.610% due 04/08/2009† (1) | | | 656,739 | | |
| | 1,232,000 | | | USD | | | | Federal-Mogul
7.875% due 07/01/2010 | | | 1,084,160 | | |
| | 1,580,000 | | | USD | | | | Fisher Scientific International
6.750% due 08/15/2014 (2) | | | 1,612,635 | | |
| | 1,540,000 | | | USD | | | | Ford Motor
7.125% due 11/15/2025 | | | 1,155,000 | | |
| | 1,500,000 | | | USD | | | | 7.450% due 07/16/2031 | | | 1,192,500 | | |
| | | | 2,347,500 | | |
| | 1,000,000 | | | USD | | | | Ford Motor Credit
7.375% due 02/01/2011 | | | 943,853 | | |
| | 1,100,000 | | | USD | | | | Foundation Re
7.310% due 01/06/2009† (1) | | | 1,086,250 | | |
| | 270,000 | | | USD | | | | Freeport-McMoran Copper & Gold
8.250% due 04/01/2015 (2) | | | 292,275 | | |
| | 805,000 | | | USD | | | | 8.375% due 04/01/2017 (2) | | | 883,487 | | |
| | | | 1,175,762 | | |
| | 3,550,000 | | | USD | | | | General Motors
8.375% due 07/15/2033 | | | 3,248,250 | | |
See Notes to Financial Statements.
125
PORTFOLIO OF INVESTMENTS (Continued) October 31, 2007
Julius Baer Global High Income Fund
Face
Value | |
Currency | | (Percentage of
Net Assets) | | Market
Value (Note 2) | |
| | | | CORPORATE BONDS—Continued | |
| | | | | United States—Continued | |
| | 790,000 | | | USD | | | | Helix 04
10.749% due 06/30/2009† (1) | | $ | 799,654 | | |
| | 2,425,000 | | | USD | | | | Hertz Corp
10.500% due 01/01/2016† (2) | | | 2,619,000 | | |
| | 2,125,000 | | | USD | | | | Hexcel Corp
6.750% due 02/01/2015 (2) | | | 2,098,437 | | |
| | 2,470,000 | | | USD | | | | IASIS Healthcare Capital
8.750% due 06/15/2014 (2) | | | 2,507,050 | | |
| | 2,115,000 | | | USD | | | | Intcomex Inc
11.750% due 01/15/2011† (2) | | | 2,167,875 | | |
| | 1,150,000 | | | USD | | | | Invacare Corp
9.750% due 02/15/2015 (2) | | | 1,175,875 | | |
| | 1,620,000 | | | USD | | | | KAR Holdings
8.750% due 05/01/2014† | | | 1,571,400 | | |
| | 1,275,000 | | | USD | | | | KB Home
6.250% due 06/15/2015 | | | 1,153,875 | | |
| | 1,491,000 | | | USD | | | | Koppers Holdings Multi-Coupon
9.875% due 11/15/2014 (1)(2) | | | 1,285,987 | | |
| | 3,445,000 | | | USD | | | | Level 3 Financing
9.250% due 11/01/2014 (2) | | | 3,264,138 | | |
| | 1,600,000 | | | USD | | | | LVB Acquisition Merger, Senior Note
10.000% due 10/15/2017† | | | 1,652,000 | | |
| | 2,215,000 | | | USD | | | | MacDermid Inc
9.500% due 04/15/2017† (2) | | | 2,126,400 | | |
| | 1,885,000 | | | USD | | | | Meritage Homes
7.000% due 05/01/2014 (2) | | | 1,545,700 | | |
| | 2,105,000 | | | USD | | | | Mohegan Tribal Gaming Authority
6.125% due 02/15/2013 (2) | | | 2,015,538 | | |
| | 1,390,000 | | | USD | | | | Mosaic Co
7.625% due 12/01/2016† (2) | | | 1,504,675 | | |
See Notes to Financial Statements.
126
PORTFOLIO OF INVESTMENTS (Continued) October 31, 2007
Julius Baer Global High Income Fund
Face
Value | |
Currency | | (Percentage of
Net Assets) | | Market
Value (Note 2) | |
| | | | CORPORATE BONDS—Continued | |
| | | | | United States—Continued | |
| | 550,000 | | | USD | | | | Mystic Re
11.660% due 12/05/2008† (1) | | $ | 559,983 | | |
| | 2,335,000 | | | USD | | | | Newmarket Corp
7.125% due 12/15/2016 (2) | | | 2,352,513 | | |
| | 3,151,000 | | | USD | | | | NRG Energy
7.375% due 02/01/2016 (2) | | | 3,151,000 | | |
| | 250,000 | | | USD | | | | Redwood Capital VII
10.610% due 01/09/2008† (1) | | | 250,688 | | |
| | 2,760,000 | | | USD | | | | RH Donnelly, Senior Note
8.875% due 10/15/2017† | | | 2,773,800 | | |
| | 2,060,000 | | | USD | | | | Serena Software
10.375% due 03/15/2016† (2) | | | 2,142,400 | | |
| | 1,900,000 | | | USD | | | | Service Corp International
7.000% due 06/15/2017† | | | 1,866,750 | | |
| | 800,000 | | | USD | | | | Stanadyne Corp
10.000% due 08/15/2014 (2) | | | 816,000 | | |
| | 2,980,000 | | | USD | | | | Sunguard Data Systems
10.250% due 08/15/2015 (2) | | | 3,121,550 | | |
| | 675,000 | | | USD | | | | Tartan Capital
8.360% due 01/07/2009*† (1) | | | 674,055 | | |
| | 1,390,000 | | | USD | | | | Terex Corp
7.375% due 01/15/2014 (2) | | | 1,403,900 | | |
| | 1,965,000 | | | USD | | | | Verso Paper
9.125% due 08/01/2014 | | | 2,038,688 | | |
| | 3,590,000 | | | USD | | | | Vought Aircraft Industries
8.000% due 07/15/2011 | | | 3,585,513 | | |
| | 1,450,000 | | | USD | | | | WCA Waste
9.250% due 06/15/2014† (2) | | | 1,508,000 | | |
| | 500,000 | | | USD | | | | Wesco Distribution
7.500% due 10/15/2017 (2) | | | 470,000 | | |
See Notes to Financial Statements.
127
PORTFOLIO OF INVESTMENTS (Continued) October 31, 2007
Julius Baer Global High Income Fund
Face
Value | |
Currency | | (Percentage of
Net Assets) | | Market
Value (Note 2) | |
| | | | CORPORATE BONDS—Continued | |
| | | | | United States—Continued | |
| | 4,350,000 | | | USD | | | | Wynn Las Vegas
6.625% due 12/01/2014 (2) | | $ | 4,295,625 | | |
| | | | 102,252,420 | | |
| | | | | Brazil—4.4% | |
| | 350,000 | | | USD | | | | Cia Energetica de Sao Paulo
9.250% due 08/11/2013† | | | 384,125 | | |
| | 7,320,000 | | | BRL | | | | 9.750% due 01/15/2015† (1) | | | 4,553,040 | | |
| | | | 4,937,165 | | |
| | 2,155,000 | | | USD | | | | Cosan Finance
7.000% due 02/01/2017† | | | 2,084,962 | | |
| | 350,000 | | | USD | | | | CSN Islands IX, Multi-Coupon
10.500% due 01/15/2015 | | | 414,295 | | |
| | 1,250,000 | | | USD | | | | ISA Capital do Brasil
8.800% due 01/30/2017† | | | 1,303,125 | | |
| | 1,065,000 | | | USD | | | | Petrobras International Finance
5.875% due 03/01/2018 | | | 1,051,687 | | |
| | 1,000,000 | | | USD | | | | 8.375% due 12/10/2018 | | | 1,180,000 | | |
| | | | 2,231,687 | | |
| | | | 10,971,234 | | |
| | | | | Norway—3.6% | |
| | 2,900,000 | | | USD | | | | Biofuel Energy
10.000% due 06/07/2012 (2) | | | 2,784,000 | | |
| | 2,700,000 | | | USD | | | | Ocean RIG
9.24% due 04/04/2011† (1)(2) | | | 2,700,000 | | |
| | 3,400,000 | | | USD | | | | Sea Production
9.825% due 02/14/2012† (1)(2) | | | 3,327,750 | | |
| | | | 8,811,750 | | |
| | | | | Russia—3.2% | |
| | 2,480,000 | | | USD | | | | ALROSA Finance
8.875% due 11/17/2014† | | | 2,730,872 | | |
See Notes to Financial Statements.
128
PORTFOLIO OF INVESTMENTS (Continued) October 31, 2007
Julius Baer Global High Income Fund
Face
Value | |
Currency | | (Percentage of
Net Assets) | | Market
Value (Note 2) | |
| | | | CORPORATE BONDS—Continued | |
| | | | | Russia—Continued | |
| | 560,000 | | | USD | | | | Norilsk Nickel
7.125% due 09/30/2009 | | $ | 576,929 | | |
| | 1,400,000 | | | USD | | | | SibacademFinance (Ursabk)
12.000% due 12/30/2011 | | | 1,408,158 | | |
| | 1,400,000 | | | USD | | | | TMK Capital (OAO TMK)
8.500% due 09/29/2009 | | | 1,409,897 | | |
| | 1,025,000 | | | USD | | | | TNK-BP Finance
7.500% due 07/18/2016† | | | 1,001,937 | | |
| | 890,000 | | | USD | | | | 6.625% due 03/20/2017† | | | 815,462 | | |
| | | | 1,817,399 | | |
| | | | 7,943,255 | | |
| | | | | Canada—2.2% | |
| | 970,000 | | | USD | | | | Aquila Inc
7.750% due 06/15/2011 | | | 1,024,587 | | |
| | 1,000,000 | | | USD | | | | Gerdau Ameristeel
10.375% due 07/15/2011 (2) | | | 1,062,500 | | |
| | 1,300,000 | | | USD | | | | Rogers Wireless
7.500% due 03/15/2015 | | | 1,410,991 | | |
| | 1,000,000 | | | CAD | | | | Shaw Communications
7.500% due 11/20/2013 | | | 1,134,407 | | |
| | 860,000 | | | CAD | | | | 5.700% due 03/02/2017 | | | 861,422 | | |
| | | | 1,995,829 | | |
| | | | 5,493,907 | | |
| | | | | Netherlands—1.5% | |
| | 3,655,000 | | | USD | | | | Sensata Technologies
8.000% due 05/01/2014 (2) | | | 3,604,744 | | |
| | | | | Spain—1.3% | |
| | 2,155,000 | | | EUR | | | | Ono Finance
10.500% due 05/15/2014 (2) | | | 3,316,503 | | |
See Notes to Financial Statements.
129
PORTFOLIO OF INVESTMENTS (Continued) October 31, 2007
Julius Baer Global High Income Fund
Face
Value | |
Currency | | (Percentage of
Net Assets) | | Market
Value (Note 2) | |
| | | | CORPORATE BONDS—Continued | |
| | | | | Denmark—1.2% | |
| | 1,900,000 | | | EUR | | | | Nordic Telephone
8.250% due 05/01/2016 (2) | | $ | 2,941,243 | | |
| | | | | Greece—1.0% | |
| | 1,615,000 | | | EUR | | | | Hellas Telecommunications
8.232% due 10/15/2012 (1) | | | 2,339,422 | | |
| | | | | France—0.9% | |
| | 1,600,000 | | | EUR | | | | Europcar Groupe
8.125% due 05/15/2014† (2) | | | 2,285,865 | | |
| | | | | Supra National—0.8% | |
| | 2,550,000 | | | NZD | | | | European Investment Bank
6.000% due 07/15/2009 | | | 1,884,982 | | |
| | | | | United Kingdom—0.7% | |
| | 800,000 | | | GBP | | | | Global Crossing UK Finance
11.750% due 12/15/2014 (2) | | | 1,778,212 | | |
| | | | | New Zealand—0.7% | |
| | 2,200,000 | | | NZD | | | | International Bank Reconciliation & Development
6.375% due 07/15/2009 | | | 1,634,567 | | |
| | | | | Kazakhstan—0.6% | |
| | 1,605,000 | | | USD | | | | Kazakhgold
9.375% due 11/06/2013 (2) | | | 1,544,986 | | |
| | | | | Mexico—0.5% | |
| | 1,170,000 | | | USD | | | | Axtel SAB
7.625% due 02/01/2017† (2) | | | 1,184,625 | | |
| | | | | Ireland—0.4% | |
| | 1,000,000 | | | USD | | | | Osiris Capital
10.243% due 01/15/2010† (1) | | | 1,012,900 | | |
| | | | | Hungary—0.4% | |
| | 617,739 | | | EUR | | | | Invitel Holdings
12.982% due 04/15/2013† (1)(2) | | | 907,120 | | |
| | | | | Germany—0.3% | |
| | 600,000 | | | EUR | | | | Grohe Holding
8.625% due 10/01/2014 (2) | | | 802,946 | | |
See Notes to Financial Statements.
130
PORTFOLIO OF INVESTMENTS (Continued) October 31, 2007
Julius Baer Global High Income Fund
Face
Value | |
Currency | | (Percentage of
Net Assets) | | Market
Value (Note 2) | |
| | | | CORPORATE BONDS—Continued | |
| | | | | Australia—0.2% | |
| | 495,000 | | | USD | | | | Australis Ltd
9.005% due 03/24/2009† (1) | | $ | 495,619 | | |
| | | | | Japan—0.2% | |
| | 485,000 | | | USD | | | | Akibare Ltd
8.445% due 05/22/2012† (1) | | | 493,027 | | |
| | | | | Ukraine—0.1% | |
| | 1,500,000 | | | UAH | | | | Rodovid Bank
11.250% due 09/22/2009 (1) | | | 296,826 | | |
| | | | | | | | | TOTAL CORPORATE BONDS (Cost $160,247,723) | | | 161,996,153 | | |
| | | | BANK LOANS—19.1% | |
| | | | | United States—15.5% | |
| | 2,493,707 | | | USD | | | | ATP Oil & Gas
8.863% due 04/14/2010 | | | 2,499,164 | | |
| | 2,493,655 | | | USD | | | | 9.948% due 10/14/2010 | | | 2,552,879 | | |
| | | | 5,052,043 | | |
| | 432,721 | | | USD | | | | Boston Generating
5.073% due 12/20/2013 | | | 425,208 | | |
| | 2,062,390 | | | USD | | | | 7.448% due 12/20/2013 | | | 2,026,584 | | |
| | | | 2,451,792 | | |
| | 1,090,764 | | | USD | | | | Covanta Energy
5.098% due 02/10/2014 | | | 1,062,587 | | |
| | 2,204,537 | | | USD | | | | 6.876% due 02/10/2014 | | | 2,147,587 | | |
| | | | 3,210,174 | | |
| | 1,000,000 | | | USD | | | | Delphi Corporation
Zero Coupon due 12/31/2007 | | | 997,750 | | |
| | 2,750,000 | | | USD | | | | Delta Air Lines
Zero Coupon due 04/30/2014 | | | 2,729,867 | | |
| | 273,410 | | | USD | | | | Hawker Beechcraft
5.198% due 03/28/2014 | | | 267,963 | | |
| | 4,974,284 | | | USD | | | | 7.169% due 03/28/2014 | | | 4,875,187 | | |
| | | | 5,143,150 | | |
See Notes to Financial Statements.
131
PORTFOLIO OF INVESTMENTS (Continued) October 31, 2007
Julius Baer Global High Income Fund
Face
Value | |
Currency | | (Percentage of
Net Assets) | | Market
Value (Note 2) | |
| | | | BANK LOANS—Continued | |
| | | | | United States—Continued | |
| | 2,480,000 | | | USD | | | | HBI Branded Apparel
8.815% due 03/05/2014 | | $ | 2,497,050 | | |
| | 2,938,002 | | | USD | | | | HCA Inc
7.198% due 11/16/2012 | | | 2,845,402 | | |
| | 2,150,000 | | | USD | | | | Helicon Cable Holdings
8.360% due 07/05/2014 | | | 2,088,188 | | |
| | 2,089,231 | | | USD | | | | Progressive Moulded
10.460% due 08/16/2011 | | | 1,901,200 | | |
| | 2,235,169 | | | USD | | | | Spectrum Brands
Zero Coupon due 03/30/2013 | | | 2,204,994 | | |
| | 2,000,000 | | | USD | | | | TXU Corporation
Zero Coupon due 10/10/2014 | | | 2,000,622 | | |
| | 4,175,034 | | | USD | | | | Univision Communications
7.204% due 09/29/2014 | | | 3,963,673 | | |
| | 1,395,000 | | | USD | | | | W&T Offshore
7.450% due 05/26/2010 | | | 1,389,769 | | |
| | | | 38,475,674 | | |
| | | | | Netherlands—1.9% | |
| | 4,817,678 | | | EUR | | | | UPC Broadband Holding
Zero Coupon due 12/31/2014 | | | 4,656,724 | | |
| | | | | Canada—1.7% | |
| | 4,225,723 | | | CAD | | | | Great Canadian Gaming
7.000% due 02/13/2014 | | | 4,196,671 | | |
| | | | | | | | | TOTAL BANK LOANS (Cost $47,634,517) | | | 47,329,069 | | |
| | | | FOREIGN GOVERNMENT BONDS—4.5% | |
| | | | | Brazil—1.7% | |
| | 4,980,000 | | | BRL | | | | Federative Republic of Brazil
10.000% due 01/01/2010 | | | 2,779,358 | | |
| | 2,600,000 | | | BRL | | | | 10.000% due 01/01/2012 | | | 1,415,165 | | |
| | | | 4,194,523 | | |
| | | | | Colombia—1.0% | |
| | 4,400,000,000 | | | COP | | | | Republic of Colombia
12.000% due 10/22/2015 | | | 2,494,785 | | |
See Notes to Financial Statements.
132
PORTFOLIO OF INVESTMENTS (Continued) October 31, 2007
Julius Baer Global High Income Fund
Face
Value | |
Currency | | (Percentage of
Net Assets) | | Market
Value (Note 2) | |
| | | | FOREIGN GOVERNMENT BONDS—Continued | |
| | | | | Turkey—0.6% | |
| | 1,700,000 | | | TRY | | | | Republic of Turkey
10.000% due 02/15/2012 | | $ | 1,553,837 | | |
| | | | | Hungary—0.6% | |
| | 250,000,000 | | | HUF | | | | Republic of Hungary
6.500% due 08/12/2009 | | | 1,425,087 | | |
| | | | | Vietnam—0.6% | |
| | 1,260,000 | | | USD | | | | Socialist Republic of Vietnam
6.875% due 01/15/2016† | | | 1,344,970 | | |
| | | | | | | | | TOTAL FOREIGN GOVERNMENT BONDS
(Cost $9,654,528) | | | 11,013,202 | | |
| | | | INVESTMENT FUNDS—2.5% | |
| | | | | Canada—2.5% | |
| | 32,660 | | | CAD | | | | ARC Energy Trust | | | 734,833 | | |
| | 31,860 | | | CAD | | | | Crescent Point Energy Trust | | | 778,218 | | |
| | 19,800 | | | CAD | | | | Labrador Iron ORE Royalty, Income Fund | | | 910,992 | | |
| | 26,570 | | | CAD | | | | NAL Oil & Gas Trust | | | 355,274 | | |
| | 21,690 | | | CAD | | | | Newalta Income Fund | | | 429,096 | | |
| | 22,600 | | | CAD | | | | Penn West Energy Trust | | | 716,690 | | |
| | 60,450 | | | CAD | | | | Progress Energy Trust | | | 752,920 | | |
| | 18,990 | | | CAD | | | | Vermilion Energy Trust | | | 787,751 | | |
| | 27,320 | | | CAD | | | | Zargon Energy Trust | | | 779,790 | | |
| | | | 6,245,564 | | |
| | | | | | | | | TOTAL INVESTMENT FUNDS (Cost $5,467,294) | | | 6,245,564 | | |
| | | | COMMERCIAL PAPER—2.4% | |
| | | | | United States—2.4% | |
| | 3,000,000 | | | USD | | | | United Healthcare
5.150% due 12/17/2007 | | | 2,980,258 | | |
| | 3,000,000 | | | USD | | | | Walt Disney
5.100% due 11/16/2007 | | | 2,993,625 | | |
| | | | 5,973,883 | | |
| | | | | | | | | TOTAL COMMERCIAL PAPER (Cost $5,973,883) | | | 5,973,883 | | |
See Notes to Financial Statements.
133
PORTFOLIO OF INVESTMENTS (Continued) October 31, 2007
Julius Baer Global High Income Fund
Face
Value | |
Currency | | (Percentage of
Net Assets) | | Market
Value (Note 2) | |
| | | | SHORT-TERM INVESTMENTS—1.6% | |
| | | | | Mexico—1.3% | |
| | | | | | | | | Mexican Cetes | | | | | |
| | 19,200,000 | | | MXN | | | | Zero Coupon due 11/22/2007 | | $ | 1,785,730 | | |
| | 532,300 | | | USD | | | | 15.187% due 11/22/2007 | | | 527,584 | | |
| | 880,000 | | | USD | | | | 21.217% due 11/22/2007 | | | 869,627 | | |
| | | | 3,182,941 | | |
| | | | | United States—0.3% | |
| | 730,000 | | | USD | | | | Javelin Re
8.159% due 07/25/2008† (1) | | | 730,000 | | |
| | | | | | | | | TOTAL SHORT-TERM INVESTMENTS (Cost $3,880,929) | | | 3,912,941 | | |
| | | | MUNICIPAL OBLIGATIONS—0.9% | |
| | | | | United States—0.9% | |
| | 2,250,000 | | | USD | | | | Buckeye, OH, Tobacco Settlement Financing Authority
5.875% due 06/01/2047 (Cost $2,184,348) | | | 2,184,368 | | |
| | | | STRUCTURED NOTES—0.5% | |
| | | | | Dominican Republic—0.3% | |
| | 813,632 | | | USD | | | | 16.000% due 07/20/2009 (1) | | | Dominican Republic, Issued by Standard Bank,
827,449 | | |
| | | | | Ukraine—0.2% | |
| | 1,800,000 | | | UAH | | | | 12.420% due 02/01/2008 | | | Nadra Bank, Issued by ING Bank,
357,302 | | |
| | | | | | | | | TOTAL STRUCTURED NOTES (Cost $1,169,763) | | | 1,184,751 | | |
| | | | FOREIGN GOVERNMENT COMPENSATION NOTES—0.1% | |
| | | | | Bulgaria—0.1% | |
| | 923,000 | | | BGN | | | | Bulgaria Registered Compensation Vouchers
(Cost $365,634)* | | | 300,920 | | |
See Notes to Financial Statements.
134
PORTFOLIO OF INVESTMENTS (Continued) October 31, 2007
Julius Baer Global High Income Fund
Face
Value | |
Currency | | (Percentage of
Net Assets) | | Market
Value (Note 2) | |
| | | | REPURCHASE AGREEMENT—4.7% | |
| | | | | United States—4.7% | |
| | 11,622,909 | | | USD | | State Street Bank and Trust Company Repurchase Agreement, | | |
| | |
| | | | | dated 10/31/2007, due 11/01/2007, with a maturity | | |
| | |
| | | | | value of $11,623,881 and an effective yield of 3.01%, | | |
| | |
| | | | | collateralized by U.S. Government and Agency | | |
| | |
| | | | | Obligations, with rates ranging from 4.146%-4.452%, | | |
| | |
| | | | | a maturity of 05/01/2033, and an aggregate market | | |
| | |
| | | | | value of $11,856,548. (Cost $11,622,909) | | $ | 11,622,909 | | |
| | | | | TOTAL INVESTMENTS—101.9% (Cost $248,201,528) | | | 251,763,760 | | |
| | | | | OTHER ASSETS AND LIABILITIES (Net)—(1.9%) | | | (4,646,023 | ) | |
| | | | | TOTAL NET ASSETS—100.0% | | $ | 247,117,737 | | |
Portfolio Footnotes:
(1) Variable rate security.
(2) Callable
(3) Defaulted Security.
(4) Illiquid security
* Non-income producing security.
† Securities exempt from registration under Rule 144A of the Securities Act of 1933, as amended. These securities may be resold in transactions exempt from registrations, normally to qualified institutional buyers.
Aggregate cost for federal income tax purposes was $248,218,594.
Glossary of Currencies
BGN — Bulgarien Lev
BRL — Brazilian Real
CAD — Canadian Dollar
COP — Colombian Peso
EUR — Euro
GBP — British Pound Sterling
HUF — Hungarian Forint
MXN — Mexican Nuevo Peso
NZD — New Zealand Dollar
TRY — Turkish Lira
UAH — Ukraine Hryvnia
USD — United States Dollar
See Notes to Financial Statements.
135
SCHEDULE OF FORWARD FOREIGN EXCHANGE CONTRACTS
October 31, 2007
Julius Baer Global High Income Fund
FORWARD FOREIGN EXCHANGE CONTRACTS TO BUY
| | | Contracts to Receive | | | | | |
Expiration
Date | | Local | | Value in
Currency | | In Exchange
USDfor USD | | Net Unrealized
Appreciation | |
| 12/14/07 | | AUD | 623,885 | | | | 576,849 | | | | 563,263 | | | $ | 13,586 | | |
| 12/14/07 | | AUD | 3,238,700 | | | | 2,994,528 | | | | 2,824,308 | | | | 170,220 | | |
| 12/14/07 | | EUR | 4,225,441 | | | | 6,116,831 | | | | 6,000,000 | | | | 116,831 | | |
| 12/14/07 | | GBP | 117,000 | | | | 242,728 | | | | 235,293 | | | | 7,435 | | |
| 11/06/07 | | ZAR | 6,173,440 | | | | 943,443 | | | | 800,000 | | | | 143,443 | | |
| Net unrealized appreciation on forward foreign exchange contracts to buy | | | | | | | | | | | | | | $ | 451,515 | | |
FORWARD FOREIGN EXCHANGE CONTRACTS TO SELL
| | | Contracts to Deliver | | | | | |
Expiration
Date | | Local | | Value in
Currency | | In Exchange
USDfor USD | | Net Unrealized
Depreciation | |
| 12/14/07 | | CAD | 4,525,157 | | | | 4,765,114 | | | | 4,555,876 | | | $ | (209,238 | ) | |
| 12/14/07 | | EUR | 6,301,420 | | | | 9,122,058 | | | | 8,880,676 | | | | (241,382 | ) | |
| 12/14/07 | | HUF | 248,300,000 | | | | 1,425,435 | | | | 1,408,395 | | | | (17,040 | ) | |
| 12/14/07 | | NZD | 736,310 | | | | 563,914 | | | | 563,263 | | | | (651 | ) | |
| 12/14/07 | | NZD | 3,800,000 | | | | 2,910,289 | | | | 2,802,880 | | | | (107,409 | ) | |
| 11/06/07 | | ZAR | 6,173,440 | | | | 943,443 | | | | 814,073 | | | | (129,370 | ) | |
| Net unrealized depreciation on forward foreign exchange contracts to sell | | | | | | | | | | | | | | $ | (705,090 | ) | |
Glossary of Currencies
AUD — Australian Dollar
CAD — Canadian Dollar
EUR — Euro
GBP — British Pound Sterling
HUF — Hungarian Forint
NZD — New Zealand Dollar
ZAR — South African Rand
UAH — Ukraine Hryvnia
See Notes to Financial Statements.
136
PORTFOLIO OF INVESTMENTS–Industry Sector (Unaudited) October 31, 2007
Julius Baer Global High Income Fund
At October 31, 2007, sector diversification of the Fund's investments were as follows:
| | | % of Net
Assets | | Market
Value (Note 2) | |
| INDUSTRY SECTOR | |
| Corporate Bonds | | | 65.6 | % | | $ | 161,996,153 | | |
| Bank Loans | | | 19.1 | | | | 47,329,069 | | |
| Foreign Government Bonds | | | 4.5 | | | | 11,013,202 | | |
| Investment Funds | | | 2.5 | | | | 6,245,564 | | |
| Commercial Paper | | | 2.4 | | | | 5,973,883 | | |
| Short Term Investments | | | 1.6 | | | | 3,912,941 | | |
| Municipal Obligations | | | 0.9 | | | | 2,184,368 | | |
| Structured Notes | | | 0.5 | | | | 1,184,751 | | |
| Foreign Government Compensation Notes | | | 0.1 | | | | 300,920 | | |
| Cash & Cash Equivalents | | | 4.7 | | | | 11,622,909 | * | |
| Total Investments | | | 101.9 | | | | 251,763,760 | | |
| Other Assets and Liabilities (Net) | | | (1.9 | ) | | | (4,646,023 | )* | |
| Net Assets | | | 100.0 | % | | $ | 247,117,737 | | |
* Cash and Cash Equivalents and Other Assets and Liabilities (Net) includes market value for swaps of $(117,872) which is (0.05)% of net assets.
See Notes to Financial Statements.
Julius Baer Funds 2007 Annual Report
137
PORTFOLIO OF INVESTMENTS October 31, 2007
Julius Baer U.S. Microcap Fund
Share
Amount | | (Percentage of
Net Assets) | | Description | | Market
Value (Note 2) | |
| | COMMON STOCKS—97.2% | |
| | | Health Care Equipment & Services—18.1% | |
| | 8,310 | | | | | Abaxis Inc* | | $ | 243,649 | | |
| | 19,010 | | | | | ADAM Inc* | | | 152,650 | | |
| | 6,770 | | | | | Cutera Inc* | | | 166,000 | | |
| | 2,240 | | | | | Genoptix Inc* | | | 55,328 | | |
| | 9,750 | | | | | Gentiva Health Services* | | | 185,055 | | |
| | 7,410 | | | | | Kensey Nash* | | | 202,738 | | |
| | 6,090 | | | | | Micrus Endovascular* | | | 119,668 | | |
| | 4,450 | | | | | SonoSite Inc* | | | 156,596 | | |
| | 3,950 | | | | | Volcano Corp* | | | 67,506 | | |
| | | | 1,349,190 | | |
| | | Technology Hardware & Equipment—10.3% | |
| | 5,700 | | | | | Cyberoptics Corp* | | | 71,307 | | |
| | 7,257 | | | | | Daktronics Inc | | | 216,404 | | |
| | 8,184 | | | | | Measurement Specialties* | | | 227,024 | | |
| | 18,510 | | | | | Netezza Corp* | | | 254,513 | | |
| | | | 769,248 | | |
| | | Diversified Financials—9.6% | |
| | 16,675 | | | | | Epoch Holding | | | 234,117 | | |
| | 10,100 | | | | | optionsXpress Holdings | | | 300,576 | | |
| | 14,860 | | | | | TradeStation Group* | | | 181,292 | | |
| | | | 715,985 | | |
| | | Software & Services—8.0% | |
| | 37,110 | | | | | Broadcaster Inc* | | | 53,810 | | |
| | 9,880 | | | | | Mentor Graphics* | | | 158,278 | | |
| | 6,980 | | | | | Perficient Inc* | | | 131,573 | | |
| | 6,630 | | | | | SPSS Inc* | | | 251,940 | | |
| | | | 595,601 | | |
| | | Consumer Services—7.3% | |
| | 7,500 | | | | | BJ's Restaurants* | | | 148,425 | | |
| | 32,314 | | | | | Century Casinos* | | | 231,045 | | |
| | 12,190 | | | | | Morton's Restaurant Group* | | | 168,953 | | |
| | | | 548,423 | | |
See Notes to Financial Statements.
Julius Baer Funds 2007 Annual Report
138
PORTFOLIO OF INVESTMENTS (Continued) October 31, 2007
Julius Baer U.S. Microcap Fund
Share
Amount | | (Percentage of
Net Assets) | | Description | | Market
Value (Note 2) | |
| | COMMON STOCKS—Continued | |
| | | Semiconductors & Semiconductor Equipment—6.1% | |
| | 6,180 | | | | | ATMI Inc* | | $ | 198,625 | | |
| | 8,230 | | | | | Rudolph Technologies* | | | 107,237 | | |
| | 3,870 | | | | | Standard Microsystems* | | | 150,930 | | |
| | | | 456,792 | | |
| | | Energy—5.1% | |
| | 2,170 | | | | | Carrizo Oil & Gas* | | | 111,516 | | |
| | 20,770 | | | | | Newpark Resources* | | | 130,228 | | |
| | 15,480 | | | | | Quest Resource* | | | 135,605 | | |
| | | | 377,349 | | |
| | | Household & Personal Products—4.6% | |
| | 8,650 | | | | | WD-40 Co | | | 342,540 | | |
| | | Media—4.1% | |
| | 4,610 | | | | | Dolan Media* | | | 124,470 | | |
| | 13,100 | | | | | Martha Stewart Living Omnimedia-Class A* | | | 180,649 | | |
| | | | 305,119 | | |
| | | Consumer Durables & Apparel—3.8% | |
| | 5,180 | | | | | Movado Group | | | 155,866 | | |
| | 4,280 | | | | | Volcom Inc* | | | 125,190 | | |
| | | | 281,056 | | |
| | | Commercial Services and Supplies—3.2% | |
| | 37,600 | | | | | GlobalOptions Group* | | | 169,200 | | |
| | 5,924 | | | | | HireRight Inc* | | | 70,970 | | |
| | | | 240,170 | | |
| | | Retailing—3.2% | |
| | 12,740 | | | | | Coldwater Creek* | | | 114,023 | | |
| | 7,940 | | | | | hhgregg Inc* | | | 125,134 | | |
| | | | 239,157 | | |
| | | Capital Goods—3.1% | |
| | 4,050 | | | | | Babcock & Brown Air Limited ADR* | | | 90,153 | | |
| | 1,370 | | | | | Harbin Electric* | | | 26,331 | | |
| | 2,920 | | | | | RBC Bearings* | | | 117,355 | | |
| | | | 233,839 | | |
See Notes to Financial Statements.
Julius Baer Funds 2007 Annual Report
139
PORTFOLIO OF INVESTMENTS (Continued) October 31, 2007
Julius Baer U.S. Microcap Fund
Share
Amount | | (Percentage of
Net Assets) | | Description | | Market
Value (Note 2) | |
| | COMMON STOCKS—Continued | |
| | | Materials—2.6% | |
| | 5,570 | | | | | Schweitzer-Mauduit International | | $ | 156,071 | | |
| | 1,116 | | | | | Universal Stainless & Alloy* | | | 41,571 | | |
| | | | 197,642 | | |
| | | Pharmaceuticals & Biotechnology—2.4% | |
| | 5,920 | | | | | Martek Biosciences* | | | 180,856 | | |
| | | Food, Beverage & Tobacco—2.4% | |
| | 4,740 | | | | | Green Mountain Coffee Roasters* | | | 176,802 | | |
| | | Transportation—2.2% | |
| | 3,900 | | | | | Macquarie Infrastructure | | | 162,864 | | |
| | | Telecommunication Services—1.1% | |
| | 2,070 | | | | | Cbeyond Inc* | | | 80,978 | | |
| | | TOTAL COMMON STOCKS (Cost $6,617,292) | | | 7,253,611 | | |
Face
Value | |
Currency | |
| |
| |
| | REPURCHASE AGREEMENT—5.0% | |
| | 370,562 | | | USD | | | | State Street Bank and Trust Company Repurchase Agreement,
dated 10/31/2007, due 11/01/2007 with a maturity value
of $370,593 and an effective yield of 3.01%, collateralized
by a U.S. Government and Agency Obligation, with a rate
of 5.441%, a maturity of 01/15/2035 and an aggregate
market value of $380,987. (Cost $370,562) | | $ | 370,562 | | |
| | | | | TOTAL INVESTMENTS—102.2% (Cost $6,987,854) | | | 7,624,173 | | |
| | | | | OTHER ASSETS AND LIABILITIES (Net)—(2.2%) | | | (165,851 | ) | |
| | | | | TOTAL NET ASSETS—100.0% | | $ | 7,458,322 | | |
Notes to the Portfolio of Investments:
ADR American Depositary Receipt
* Non-income producing security.
Aggregate cost for federal income tax purposes was $6,988,430.
Glossary of Currencies
USD — United States Dollar
See Notes to Financial Statements.
Julius Baer Funds 2007 Annual Report
140
PORTFOLIO OF INVESTMENTS–Industry Sector (Unaudited) October 31, 2007
Julius Baer U.S. Microcap Fund
At October 31, 2007, sector diversification of the Fund's non-cash equivalents investments were as follows:
| | | % of Net
Assets | | Market
Value (Note 2) | |
| INDUSTRY SECTOR | |
| Information Technology | | | 24.4 | % | | $ | 1,821,641 | | |
| Healthcare | | | 20.5 | | | | 1,530,046 | | |
| Consumer Discretionary | | | 18.4 | | | | 1,373,755 | | |
| Financials | | | 9.6 | | | | 715,985 | | |
| Industrials | | | 8.5 | | | | 636,873 | | |
| Consumer Staples | | | 7.0 | | | | 519,342 | | |
| Energy | | | 5.1 | | | | 377,349 | | |
| Materials | | | 2.6 | | | | 197,642 | | |
| Telecommunications | | | 1.1 | | | | 80,978 | | |
| Cash & Cash equivalents | | | 5.0 | | | | 370,562 | | |
| Total Investments | | | 102.2 | | | | 7,624,173 | | |
| Other Assets and Liabilities (Net) | | | (2.2 | ) | | | (165,851 | ) | |
| Net Assets | | | 100.0 | % | | $ | 7,458,322 | | |
See Notes to Financial Statements.
Julius Baer Funds 2007 Annual Report
141
PORTFOLIO OF INVESTMENTS October 31, 2007
Julius Baer U.S. Smallcap Fund
Share
Amount | | (Percentage of
Net Assets) | | Description | | Market
Value (Note 2) | |
| | COMMON STOCKS—92.8% | |
| | | Software & Services—15.4% | |
| | 4,600 | | | | | Cognos Inc* | | $ | 231,518 | | |
| | 1,230 | | | | | Equinix Inc* | | | 143,492 | | |
| | 4,500 | | | | | Factset Research Systems | | | 317,340 | | |
| | 21,160 | | | | | Mentor Graphics* | | | 338,983 | | |
| | 9,820 | | | | | THQ Inc* | | | 266,024 | | |
| | | | 1,297,357 | | |
| | | Technology Hardware & Equipment—11.1% | |
| | 3,330 | | | | | Ciena Corp* | | | 159,374 | | |
| | 6,830 | | | | | Daktronics Inc | | | 203,671 | | |
| | 4,890 | | | | | F5 Networks* | | | 176,187 | | |
| | 5,690 | | | | | Foundry Networks* | | | 120,287 | | |
| | 20,100 | | | | | Netezza Corp* | | | 276,375 | | |
| | | | 935,894 | | |
| | | Health Care Equipment & Services—10.6% | |
| | 8,250 | | | | | Angiodynamics Inc* | | | 165,000 | | |
| | 3,130 | | | | | ArthroCare Corp* | | | 202,949 | | |
| | 4,380 | | | | | Cynosure Inc-Class A* | | | 166,484 | | |
| | 2,400 | | | | | Genoptix Inc* | | | 59,280 | | |
| | 2,750 | | | | | Healthways Inc* | | | 166,925 | | |
| | 3,260 | | | | | Psychiatric Solutions* | | | 129,096 | | |
| | | | 889,734 | | |
| | | Consumer Services—7.9% | |
| | 5,650 | | | | | Bright Horizons Family Solutions* | | | 219,220 | | |
| | 1,280 | | | | | Chipotle Mexican Grill-Class A* | | | 177,920 | | |
| | 4,110 | | | | | Orient-Express Hotels | | | 266,328 | | |
| | | | 663,468 | | |
| | | Capital Goods—7.4% | |
| | 5,440 | | | | | Aecom Technology* | | | 183,709 | | |
| | 6,400 | | | | | Babcock & Brown Air Limited ADR* | | | 142,464 | | |
| | 3,950 | | | | | Baldor Electric | | | 159,264 | | |
| | 5,320 | | | | | Hexcel Corp* | | | 133,159 | | |
| | | | 618,596 | | |
See Notes to Financial Statements.
Julius Baer Funds 2007 Annual Report
142
PORTFOLIO OF INVESTMENTS (Continued) October 31, 2007
Julius Baer U.S. Smallcap Fund
Share
Amount | | (Percentage of
Net Assets) | | Description | | Market
Value (Note 2) | |
| | COMMON STOCKS—Continued | |
| | | Diversified Financials—6.5% | |
| | 9,310 | | | | | optionsXpress Holdings | | $ | 277,065 | | |
| | 13,760 | | | | | Pzena Investment Management* | | | 266,669 | | |
| | | | 543,734 | | |
| | | Energy—6.0% | |
| | 2,260 | | | | | Carrizo Oil & Gas* | | | 116,141 | | |
| | 5,160 | | | | | CVR Energy* | | | 117,648 | | |
| | 13,930 | | | | | Parker Drilling* | | | 117,569 | | |
| | 2,820 | | | | | USEC Inc* | | | 24,816 | | |
| | 8,740 | | | | | Warren Resources* | | | 132,673 | | |
| | | | 508,847 | | |
| | | Consumer Durables & Apparel—5.5% | |
| | 7,490 | | | | | Jarden Corp* | | | 266,045 | | |
| | 3,730 | | | | | Lululemon Athletica-W/I* | | | 198,510 | | |
| | | | 464,555 | | |
| | | Household & Personal Products—4.4% | |
| | 3,630 | | | | | Herbalife Ltd | | | 160,047 | | |
| | 5,300 | | | | | WD-40 Co | | | 209,880 | | |
| | | | 369,927 | | |
| | | Media—3.3% | |
| | 11,400 | | | | | Lions Gate Entertainment* | | | 121,980 | | |
| | 2,140 | | | | | Morningstar Inc* | | | 159,259 | | |
| | | | 281,239 | | |
| | | Pharmaceuticals & Biotechnology—3.3% | |
| | 3,830 | | | | | Martek Biosciences* | | | 117,006 | | |
| | 1,790 | | | | | Ventana Medical Systems* | | | 157,520 | | |
| | | | 274,526 | | |
| | | Automobiles & Components—3.1% | |
| | 5,140 | | | | | WABCO Holdings | | | 261,215 | | |
| | | Banks—1.9% | |
| | 5,520 | | | | | Boston Private Financial | | | 158,755 | | |
| | | Food & Staples Retailing—1.8% | |
| | 5,170 | | | | | United Natural Foods* | | | 149,620 | | |
See Notes to Financial Statements.
Julius Baer Funds 2007 Annual Report
143
PORTFOLIO OF INVESTMENTS (Continued) October 31, 2007
Julius Baer U.S. Smallcap Fund
Share
Amount | | (Percentage of
Net Assets) | | Description | | Market
Value (Note 2) | |
| | COMMON STOCKS—Continued | |
| | | Semiconductors & Semiconductor Equipment—1.6% | |
| | 2,700 | | | | | Hittite Microwave* | | $ | 135,675 | | |
| | | Materials—1.4% | |
| | 1,530 | | | | | RTI International Metals* | | | 119,615 | | |
| | | Telecommunication Services—0.9% | |
| | 5,740 | | | | | PAETEC Holding* | | | 77,203 | | |
| | | Commercial Services and Supplies—0.7% | |
| | 4,611 | | | | | HireRight Inc* | | | 55,240 | | |
| | | TOTAL COMMON STOCKS (Cost $6,886,594) | | | 7,805,200 | | |
Face
Value | |
Currency | |
| |
| |
| | REPURCHASE AGREEMENT—0.7% | |
| | 62,812 | | | USD | | | | State Street Bank and Trust Company Repurchase Agreement,
dated 10/31/2007, due 11/01/2007, with a maturity value
of $62,817 and an effective yield of 3.01%, collateralized
by a U.S. Government and Agency Obligation, with a rate
of 5.441%, a maturity of 12/15/2034 and an aggregate
market value of $66,557. (Cost $62,812) | | $ | 62,812 | | |
| | | | | | | TOTAL INVESTMENTS—93.5% (Cost $6,949,406) | | | 7,868,012 | | |
| | | | | | | OTHER ASSETS AND LIABILITIES (Net)—6.5% | | | 544,290 | | |
| | | | | | | TOTAL NET ASSETS—100.0% | | $ | 8,412,302 | | |
Notes to the Portfolio of Investments:
ADR American Depositary Receipt
* Non-income producing security.
Aggregate cost for federal income tax purposes was $6,956,964.
Glossary of Currencies
USD — United States Dollar
See Notes to Financial Statements.
Julius Baer Funds 2007 Annual Report
144
PORTFOLIO OF INVESTMENTS–Industry Sector (Unaudited) October 31, 2007
Julius Baer U.S. Smallcap Fund
At October 31, 2007, sector diversification of the Fund's non-cash equivalents investments were as follows:
| | | % of Net
Assets | | Market
Value (Note 2) | |
| INDUSTRY SECTOR | |
| Information Technology | | | 28.1 | % | | $ | 2,368,926 | | |
| Consumer Discretionary | | | 20.0 | | | | 1,670,477 | | |
| Healthcare | | | 13.8 | | | | 1,164,260 | | |
| Financials | | | 8.4 | | | | 702,489 | | |
| Industrials | | | 8.0 | | | | 673,836 | | |
| Consumer Staples | | | 6.2 | | | | 519,547 | | |
| Energy | | | 6.0 | | | | 508,847 | | |
| Materials | | | 1.4 | | | | 119,615 | | |
| Telcommunications | | | 0.9 | | | | 77,203 | | |
| Cash & Cash Equivalents | | | 0.7 | | | | 62,812 | | |
| Total Investments | | | 93.5 | | | | 7,868,012 | | |
| Other Assets and Liabilities (Net) | | | 6.5 | | | | 544,290 | | |
| Net Assets | | | 100.0 | % | | $ | 8,412,302 | | |
See Notes to Financial Statements.
Julius Baer Funds 2007 Annual Report
145
PORTFOLIO OF INVESTMENTS October 31, 2007
Julius Baer U.S. Midcap Fund
Share
Amount | | (Percentage of
Net Assets) | | Description | | Market
Value (Note 2) | |
| | COMMON STOCKS—94.3% | |
| | | Software & Services—12.0% | |
| | 9,960 | | | | | Activision Inc* | | $ | 235,554 | | |
| | 2,690 | | | | | Adobe Systems* | | | 128,851 | | |
| | 3,040 | | | | | Cognos Inc* | | | 153,003 | | |
| | 1,830 | | | | | Factset Research Systems | | | 129,052 | | |
| | 15,810 | | | | | Mentor Graphics* | | | 253,276 | | |
| | | | 899,736 | | |
| | | Health Care Equipment & Services—11.1% | |
| | 3,960 | | | | | CR Bard | | | 331,096 | | |
| | 3,110 | | | | | Express Scripts* | | | 196,241 | | |
| | 1,640 | | | | | Gen-Probe Inc* | | | 114,833 | | |
| | 2,700 | | | | | Zimmer Holdings* | | | 187,623 | | |
| | | | 829,793 | | |
| | | Capital Goods—7.7% | |
| | 2,730 | | | | | BE Aerospace* | | | 135,708 | | |
| | 790 | | | | | Precision Castparts | | | 118,350 | | |
| | 4,360 | | | | | Spirit AeroSystems-Class A* | | | 151,379 | | |
| | 2,360 | | | | | Terex Corp* | | | 174,994 | | |
| | | | 580,431 | | |
| | | Consumer Services—7.3% | |
| | 6,220 | | | | | Cheesecake Factory* | | | 139,515 | | |
| | 3,070 | | | | | Weight Watchers International | | | 157,307 | | |
| | 1,540 | | | | | Wynn Resorts | | | 248,602 | | |
| | | | 545,424 | | |
| | | Retailing—6.0% | |
| | 3,000 | | | | | Guess? Inc | | | 154,170 | | |
| | 3,410 | | | | | Nordstrom Inc | | | 134,490 | | |
| | 6,420 | | | | | Urban Outfitters* | | | 162,233 | | |
| | | | 450,893 | | |
| | | Technology Hardware & Equipment—5.8% | |
| | 4,860 | | | | | Foundry Networks* | | | 102,740 | | |
| | 2,850 | | | | | NCR Corp* | | | 78,632 | | |
| | 4,420 | | | | | Network Appliance* | | | 139,186 | | |
| | 3,920 | | | | | Teradata Corp* | | | 111,838 | | |
| | | | 432,396 | | |
See Notes to Financial Statements.
Julius Baer Funds 2007 Annual Report
146
PORTFOLIO OF INVESTMENTS (Continued) October 31, 2007
Julius Baer U.S. Midcap Fund
Share
Amount | | (Percentage of
Net Assets) | | Description | | Market
Value (Note 2) | |
| | COMMON STOCKS—Continued | |
| | | Energy—5.7% | |
| | 2,920 | | | | | Noble Corp | | $ | 154,614 | | |
| | 2,170 | | | | | Ultra Petroleum* | | | 153,766 | | |
| | 3,140 | | | | | Western Refining | | | 115,175 | | |
| | | | 423,555 | | |
| | | Materials—4.7% | |
| | 7,930 | | | | | Crown Holdings* | | | 196,664 | | |
| | 2,020 | | | | | RTI International Metals* | | | 157,924 | | |
| | | | 354,588 | | |
| | | Consumer Durables & Apparel—4.3% | |
| | 4,780 | | | | | Jarden Corp* | | | 169,786 | | |
| | 2,190 | | | | | Polo Ralph Lauren | | | 150,672 | | |
| | | | 320,458 | | |
| | | Commercial Services and Supplies—4.3% | |
| | 5,670 | | | | | Corrections Corp of America* | | | 160,404 | | |
| | 2,730 | | | | | Stericycle Inc* | | | 159,241 | | |
| | | | 319,645 | | |
| | | Pharmaceuticals & Biotechnology—4.0% | |
| | 1,980 | | | | | Allergan Inc | | | 133,808 | | |
| | 2,560 | | | | | Celgene Corp* | | | 168,960 | | |
| | | | 302,768 | | |
| | | Diversified Financials—3.9% | |
| | 1,150 | | | | | Nymex Holdings | | | 147,798 | | |
| | 2,300 | | | | | T Rowe Price | | | 147,752 | | |
| | | | 295,550 | | |
| | | Semiconductors & Semiconductor Equipment—3.9% | |
| | 7,150 | | | | | Marvell Technology* | | | 128,914 | | |
| | 2,220 | | | | | MEMC Electronic Materials* | | | 162,548 | | |
| | | | 291,462 | | |
| | | Automobiles & Components—2.9% | |
| | 4,250 | | | | | WABCO Holdings | | | 215,985 | | |
| | | Food & Staples Retailing—2.5% | |
| | 3,720 | | | | | Whole Foods Market | | | 184,289 | | |
See Notes to Financial Statements.
Julius Baer Funds 2007 Annual Report
147
PORTFOLIO OF INVESTMENTS (Continued) October 31, 2007
Julius Baer U.S. Midcap Fund
Share
Amount | | (Percentage of
Net Assets) | | Description | | Market
Value (Note 2) | |
| | COMMON STOCKS—Continued | |
| | | Household & Personal Products—2.2% | |
| | 3,710 | | | | | Herbalife Ltd | | $ | 163,574 | | |
| | | Real Estate—2.1% | |
| | 1,470 | | | | | Boston Properties REIT | | | 159,260 | | |
| | | Banks—2.0% | |
| | 8,070 | | | | | New York Community Bancorp | | | 150,183 | | |
| | | Telecommunication Services—1.9% | |
| | 2,430 | | | | | NII Holdings-Class B* | | | 140,940 | | |
| | | TOTAL COMMON STOCKS (Cost $6,127,514) | | | 7,060,930 | | |
Face
Value | |
Currency | |
| |
| |
| | REPURCHASE AGREEMENT—5.3% | |
| | 396,149 | | | USD | | | | State Street Bank and Trust Company Repurchase Agreement,
dated 10/31/2007, due 11/01/2007, with a maturity value
of $396,182 and an effective yield of 3.01%, collateralized
by U.S. Government and Agency Obligations, with rates
ranging from 4.760% to 4.912%, a maturity of 09/01/2034
and an aggregate market value of $406,360. (Cost $396,149) | | $ | 396,149 | | |
| | | | | TOTAL INVESTMENTS—99.6% (Cost $6,523,663) | | | 7,457,079 | | |
| | | | | OTHER ASSETS AND LIABILITIES (Net)—0.4% | | | 30,344 | | |
| | | | | TOTAL NET ASSETS—100.0% | | $ | 7,487,423 | | |
Notes to the Portfolio of Investments:
REIT Real Estate Investment Trust
* Non-income producing security.
Aggregate cost for federal income tax purposes was $6,525,646.
Glossary of Currencies
USD — United States Dollar
See Notes to Financial Statements.
Julius Baer Funds 2007 Annual Report
148
PORTFOLIO OF INVESTMENTS–Industry Sector (Unaudited) October 31, 2007
Julius Baer U.S. Midcap Fund
At October 31, 2007, sector diversification of the Fund's non-cash equivalents investments were as follows:
| | | % of Net
Assets | | Market
Value (Note 2) | |
| INDUSTRY SECTOR | |
| Information Technology | | | 21.7 | % | | $ | 1,623,594 | | |
| Consumer Discretionary | | | 20.5 | | | | 1,532,760 | | |
| Healthcare | | | 15.1 | | | | 1,132,561 | | |
| Industrials | | | 12.0 | | | | 900,076 | | |
| Financials | | | 8.1 | | | | 604,993 | | |
| Energy | | | 5.7 | | | | 423,555 | | |
| Materials | | | 4.7 | | | | 354,588 | | |
| Consumer Staples | | | 4.6 | | | | 347,863 | | |
| Telecommunications | | | 1.9 | | | | 140,940 | | |
| Cash & Cash Equivalents | | | 5.3 | | | | 396,149 | | |
| Total Investments | | | 99.6 | | | | 7,457,079 | | |
| Other Assets and Liabilities (Net) | | | 0.4 | | | | 30,344 | | |
| Net Assets | | | 100.0 | % | | $ | 7,487,423 | | |
See Notes to Financial Statements.
Julius Baer Funds 2007 Annual Report
149
PORTFOLIO OF INVESTMENTS October 31, 2007
Julius Baer U.S. Multicap Fund
Share
Amount | | (Percentage of
Net Assets) | | Description | | Market
Value (Note 2) | |
| | COMMON STOCKS—99.8% | |
| | | Health Care Equipment & Services—12.7% | |
| | 3,820 | | | | | ArthroCare Corp* | | $ | 247,689 | | |
| | 3,650 | | | | | CR Bard | | | 305,177 | | |
| | 2,330 | | | | | Medco Health Solutions* | | | 219,905 | | |
| | 2,740 | | | | | Zimmer Holdings* | | | 190,403 | | |
| | | | 963,174 | | |
| | | Technology Hardware & Equipment—12.2% | |
| | 640 | | | | | Apple Inc* | | | 121,568 | | |
| | 7,120 | | | | | Cisco Systems* | | | 235,387 | | |
| | 4,150 | | | | | Daktronics Inc | | | 123,753 | | |
| | 5,760 | | | | | Hewlett-Packard | | | 297,677 | | |
| | 4,450 | | | | | Network Appliance* | | | 140,131 | | |
| | | | 918,516 | | |
| | | Diversified Financials—11.8% | |
| | 3,200 | | | | | American Express | | | 195,040 | | |
| | 4,030 | | | | | JPMorgan Chase | | | 189,410 | | |
| | 1,830 | | | | | Lehman Brothers | | | 115,912 | | |
| | 1,510 | | | | | Merrill Lynch | | | 99,690 | | |
| | 1,160 | | | | | Nymex Holdings | | | 149,083 | | |
| | 2,280 | | | | | T Rowe Price | | | 146,467 | | |
| | | | 895,602 | | |
| | | Software & Services—10.6% | |
| | 9,500 | | | | | Activision Inc* | | | 224,675 | | |
| | 2,920 | | | | | Adobe Systems* | | | 139,868 | | |
| | 250 | | | | | Google Inc-Class A* | | | 176,750 | | |
| | 6,980 | | | | | Mentor Graphics* | | | 111,820 | | |
| | 1,950 | | | | | Nintendo Co-ADR | | | 150,833 | | |
| | | | 803,946 | | |
| | | Capital Goods—9.3% | |
| | 1,600 | | | | | Boeing Co | | | 157,744 | | |
| | 3,700 | | | | | General Electric | | | 152,292 | | |
| | 1,770 | | | | | Terex Corp* | | | 131,246 | | |
| | 3,380 | | | | | United Technologies | | | 258,874 | | |
| | | | 700,156 | | |
See Notes to Financial Statements.
Julius Baer Funds 2007 Annual Report
150
PORTFOLIO OF INVESTMENTS (Continued) October 31, 2007
Julius Baer U.S. Multicap Fund
Share
Amount | | (Percentage of
Net Assets) | | Description | | Market
Value (Note 2) | |
| | COMMON STOCKS—Continued | |
| | | Energy—7.1% | |
| | 2,280 | | | | | Carrizo Oil & Gas* | | $ | 117,169 | | |
| | 2,810 | | | | | Noble Corp | | | 148,790 | | |
| | 2,190 | | | | | Ultra Petroleum* | | | 155,183 | | |
| | 3,180 | | | | | Western Refining | | | 116,642 | | |
| | | | 537,784 | | |
| | | Pharmaceuticals & Biotechnology—4.2% | |
| | 2,730 | | | | | Celgene Corp* | | | 180,180 | | |
| | 1,860 | | | | | Genentech Inc* | | | 137,882 | | |
| | | | 318,062 | | |
| | | Consumer Services—4.2% | |
| | 6,730 | | | | | Cheesecake Factory* | | | 150,954 | | |
| | 3,190 | | | | | Weight Watchers International | | | 163,456 | | |
| | | | 314,410 | | |
| | | Telecommunication Services—4.1% | |
| | 1,220 | | | | | America Movil SAB de CV ADR-Class L | | | 79,776 | | |
| | 1,980 | | | | | AT&T Inc | | | 82,744 | | |
| | 2,530 | | | | | NII Holdings-Class B* | | | 146,740 | | |
| | | | 309,260 | | |
| | | Retailing—3.6% | |
| | 2,570 | | | | | Guess? Inc | | | 132,072 | | |
| | 3,530 | | | | | Nordstrom Inc | | | 139,223 | | |
| | | | 271,295 | | |
| | | Automobiles & Components—2.9% | |
| | 4,300 | | | | | WABCO Holdings | | | 218,526 | | |
| | | Semiconductors & Semiconductor Equipment—2.6% | |
| | 11,040 | | | | | Marvell Technology* | | | 199,051 | | |
| | | Food & Staples Retailing—2.5% | |
| | 3,830 | | | | | Whole Foods Market | | | 189,738 | | |
| | | Household & Personal Products—2.3% | |
| | 2,520 | | | | | Procter & Gamble | | | 175,190 | | |
| | | Commercial Services and Supplies—2.1% | |
| | 2,750 | | | | | Stericycle Inc* | | | 160,407 | | |
See Notes to Financial Statements.
Julius Baer Funds 2007 Annual Report
151
PORTFOLIO OF INVESTMENTS (Continued) October 31, 2007
Julius Baer U.S. Multicap Fund
Share
Amount | | (Percentage of
Net Assets) | | Description | | Market
Value (Note 2) | |
| | COMMON STOCKS—Continued | |
| | | Materials—2.1% | |
| | 2,010 | | | | | RTI International Metals* | | $ | 157,142 | | |
| | | Consumer Durables & Apparel—2.0% | |
| | 2,220 | | | | | Polo Ralph Lauren | | | 152,736 | | |
| | | Banks—2.0% | |
| | 4,410 | | | | | Wells Fargo | | | 149,984 | | |
| | | Transportation—1.5% | |
| | 1,320 | | | | | Burlington Northern Santa Fe | | | 115,038 | | |
| | | TOTAL COMMON STOCKS (Cost $6,687,608) | | | 7,550,017 | | |
Face
Value | |
Currency | |
| |
| |
| | REPURCHASE AGREEMENT—1.0% | |
| | 75,416 | | | USD | | | | State Street Bank and Trust Company Repurchase Agreement,
dated 10/31/2007, due 11/01/2007, with maturity value
of $75,422 and an effective yield of 3.01%, collateralized
by a U.S. Government and Agency Obligation, with a rate
of 5.441%, a maturity of 01/15/2035 and an aggregate
market value of $79,073 (Cost $75,416) | | $ | 75,416 | | |
| | | | | TOTAL INVESTMENTS—100.8% (Cost $6,763,024) | | | 7,625,433 | | |
| | | | | OTHER ASSETS AND LIABILITIES (Net)—(0.8%) | | | (57,936 | ) | |
| | | | | TOTAL NET ASSETS—100.0% | | $ | 7,567,497 | | |
Notes to the Portfolio of Investments:
ADR American Depositary Receipt
* Non-income producing security.
Aggregate cost for federal income tax purposes was $6,766,859.
Glossary of Currencies
USD — United States Dollar
See Notes to Financial Statements.
Julius Baer Funds 2007 Annual Report
152
PORTFOLIO OF INVESTMENTS–Industry Sector (Unaudited) October 31, 2007
Julius Baer U.S. Multicap Fund
At October 31, 2007, sector diversification of the Fund's non-cash equivalents investments were as follows:
| | | % of Net
Assets | | Market
Value (Note 2) | |
| INDUSTRY SECTOR | |
| Information Technology | | | 25.5 | % | | $ | 1,921,511 | | |
| Healthcare | | | 16.9 | | | | 1,281,235 | | |
| Financials | | | 13.8 | | | | 1,045,587 | | |
| Industrials | | | 12.9 | | | | 975,601 | | |
| Consumer Discretionary | | | 12.6 | | | | 956,967 | | |
| Energy | | | 7.1 | | | | 537,785 | | |
| Consumer Staples | | | 4.8 | | | | 364,929 | | |
| Telecommunications | | | 4.1 | | | | 309,260 | | |
| Materials | | | 2.1 | | | | 157,142 | | |
| Cash & Cash Equivalents | | | 1.0 | | | | 75,416 | | |
| Total Investments | | | 100.8 | | | | 7,625,433 | | |
| Other Assets and Liabilities (Net) | | | (0.8 | ) | | | (57,936 | ) | |
| Net Assets | | | 100.0 | % | | $ | 7,567,497 | | |
See Notes to Financial Statements.
Julius Baer Funds 2007 Annual Report
153
STATEMENT OF ASSETS AND LIABILITIES October 31, 2007
| | | Julius Baer
Global Equity | | Julius Baer
International Equity | |
| ASSETS: | |
Investments in securities, at market value
including market value of securities on loan of $10,408,426
and $926,438,950 respectively (Cost $112,965,926 and
$16,391,781,615 respectively) | | $ | 121,605,802 | | | $ | 24,900,671,700 | | |
| Affiliated securities (Cost $— and $526,785,870) | | | — | | | | 976,921,062 | | |
| Cash on deposit for broker (Note 2) | | | 272,008 | | | | 106,607,687 | | |
Foreign currency, at market value
(Cost $1,901,475 and $1,955,162,615 respectively) | | | 1,924,958 | | | | 1,985,929,393 | | |
| Receivables: | |
| Investments sold | | | 34,822,197 | | | | 208,225,973 | | |
| Fund shares sold | | | 43,257 | | | | 13,053,793 | | |
| Interest and dividends | | | 71,933 | | | | 26,283,093 | | |
| Tax reclaim | | | 24,409 | | | | 3,600,310 | | |
| Miscellaneous | | | 48,643 | | | | 139,707 | | |
| Daily variation margin on open financial futures contracts | | | 29,904 | | | | 14,553,103 | | |
| Unrealized appreciation on open swap contracts | | | 29,954 | | | | 54,611,024 | | |
| Unrealized appreciation on forward foreign exchange contracts | | | 349,242 | | | | 147,265,999 | | |
| Prepaid expense | | | 56,019 | | | | 143,316 | | |
| Total Assets | | | 159,278,326 | | | | 28,438,006,160 | | |
| LIABILITIES: | |
| Payables: | |
| Investments purchased | | | 34,566,774 | | | | 176,338,160 | | |
| Fund shares repurchased | | | 13,327 | | | | 9,647,294 | | |
| Payable for closed swap contracts | | | — | | | | 2,761,327 | | |
| Collateral for securities loaned (Note 2) | | | 10,713,067 | | | | 970,162,722 | | |
| Investment advisory fee (Note 3) | | | 58,762 | | | | 20,349,884 | | |
| Unrealized depreciation on forward foreign exchange contracts | | | 793,137 | | | | 323,080,321 | | |
| Accrued expenses and other payables | | | 104,609 | | | | 5,492,153 | | |
| Total Liabilities | | | 46,249,676 | | | | 1,507,831,861 | | |
| NET ASSETS | | $ | 113,028,650 | | | $ | 26,930,174,299 | | |
| NET ASSETS Consist of: | |
| Par value | | $ | 2,390 | | | $ | 511,726 | | |
| Paid in capital in excess of par value | | | 218,886,426 | | | | 15,100,755,651 | | |
| Undistributed net investment income | | | 526,656 | | | | 263,404,052 | | |
Accumulated net realized gain (loss) on investments sold, forward foreign
exchange contracts, foreign currency related transactions,
and swap contracts | | | (114,761,973 | ) | | | 2,643,425,478 | | |
Net unrealized appreciation on investments, forward foreign exchange
contracts, foreign currency related transactions, and swap contracts | | | 8,375,151 | | | | 8,922,077,392 | | |
| NET ASSETS | | $ | 113,028,650 | | | $ | 26,930,174,299 | | |
| Class A | | $ | 38,995,328 | | | $ | 11,619,663,335 | | |
| Class I | | $ | 74,033,322 | | | $ | 15,310,510,964 | | |
| SHARES OUTSTANDING (Note 7) | |
| Class A | | | 829,328 | | | | 223,648,970 | | |
| Class I | | | 1,560,213 | | | | 288,077,240 | | |
| NET ASSET VALUE AND REDEMPTION PRICE PER SHARE | |
| Class A | | $ | 47.02 | | | $ | 51.95 | | |
| Class I | | $ | 47.45 | | | $ | 53.15 | | |
See Notes to Financial Statements.
Julius Baer Funds 2007 Annual Report
154
STATEMENT OF ASSETS AND LIABILITIES October 31, 2007
| | | Julius Baer
International Equity II | | Julius Baer
Total Return Bond | |
| ASSETS: | |
Investments in securities, at market value
including market value of securities on loan of $392,912,596
and $0 respectively (Cost $7,510,196,339 and
$1,016,044,640 respectively) | | $ | 9,298,317,057 | | | $ | 1,026,281,891 | | |
| Repurchase agreements (Cost $159,431,189 and $142,560,577) | | | 159,431,189 | | | | 142,560,577 | | |
| Cash on deposit for broker (Note 2) | | | 37,427,637 | | | | — | | |
Foreign currency, at market value
(Cost $664,216,507 and $783,566 respectively) | | | 674,278,096 | | | | 423,000 | | |
| Receivables: | |
| Investments sold | | | 71,363,560 | | | | 34,673,891 | | |
| Fund shares sold | | | 67,873,110 | | | | 2,898,109 | | |
| Interest and dividends | | | 9,924,594 | | | | 6,680,122 | | |
| Tax reclaim | | | 1,208,676 | | | | — | | |
| Miscellaneous | | | 39,314 | | | | 4,242 | | |
| Daily variation margin on open financial futures contracts | | | 5,243,404 | | | | — | | |
| Receivable for closed swap contracts | | | 691,664 | | | | — | | |
| Receivable from advisor—net (Note 3) | | | — | | | | 90,207 | | |
| Unrealized appreciation on forward foreign exchange contracts | | | 61,431,663 | | | | 14,624,103 | | |
| Prepaid expense | | | 51,719 | | | | 5,300 | | |
| Total Assets | | | 10,387,281,683 | | | | 1,228,241,442 | | |
| LIABILITIES: | |
| Payables: | |
| Investments purchased | | | 112,705,699 | | | | 290,734,481 | | |
| Fund shares repurchased | | | 2,622,968 | | | | 279,671 | | |
| Collateral for securities loaned (Note 2) | | | 410,296,503 | | | | — | | |
| Investment advisory fee (Note 3) | | | 7,422,032 | | | | 367,322 | | |
| Unrealized depreciation on forward foreign exchange contracts | | | 118,794,872 | | | | 7,029,073 | | |
| Accrued expenses and other payables | | | 1,975,028 | | | | 222,161 | | |
| Total Liabilities | | | 653,817,102 | | | | 298,632,708 | | |
| NET ASSETS | | $ | 9,733,464,581 | | | $ | 929,608,734 | | |
| NET ASSETS Consist of: | |
| Par value | | $ | 529,101 | | | $ | 69,216 | | |
| Paid in capital in excess of par value | | | 7,750,840,670 | | | | 906,371,592 | | |
| Undistributed net investment income | | | 110,928,766 | | | | 7,891,905 | | |
Accumulated net realized gain (loss) on investments
sold, forward foreign exchange contracts, and foreign
currency related transactions | | | 109,412,896 | | | | (2,222,088 | ) | |
Net unrealized appreciation on investments, forward foreign
exchange contracts, and foreign currency related transactions | | | 1,761,753,148 | | | | 17,498,109 | | |
| NET ASSETS | | $ | 9,733,464,581 | | | $ | 929,608,734 | | |
| Class A | | $ | 1,980,188,324 | | | $ | 148,602,767 | | |
| Class I | | $ | 7,753,276,257 | | | $ | 781,005,967 | | |
| SHARES OUTSTANDING (Note 7) | |
| Class A | | | 108,161,190 | | | | 11,079,640 | | |
| Class I | | | 420,939,804 | | | | 58,135,891 | | |
| NET ASSET VALUE AND REDEMPTION PRICE PER SHARE | |
| Class A | | $ | 18.31 | | | $ | 13.41 | | |
| Class I | | $ | 18.42 | | | $ | 13.43 | | |
See Notes to Financial Statements.
Julius Baer Funds 2007 Annual Report
155
STATEMENT OF ASSETS AND LIABILITIES October 31, 2007
| | | Julius Baer
Global High Income | | Julius Baer
U.S. Microcap | |
| ASSETS: | |
Investments in securities, at market value
(Cost $248,201,528 and $6,987,854 respectively) | | $ | 251,763,760 | | | $ | 7,624,173 | | |
Foreign currency, at market value
(Cost $5,325,300 and $0 respectively) | | | 5,447,671 | | | | — | | |
| Receivables: | |
| Investments sold | | | 2,077,660 | | | | 109,385 | | |
| Fund shares sold | | | 1,265,847 | | | | — | | |
| Interest and dividends | | | 4,439,146 | | | | 3,011 | | |
| Miscellaneous | | | 1,116 | | | | 41 | | |
| Receivable from advisor—net (Note 3) | | | — | | | | 4,983 | | |
| Unrealized appreciation on forward foreign exchange contracts | | | 451,515 | | | | — | | |
| Unrealized appreciation on open swap contracts | | | 31,460 | | | | — | | |
| Prepaid expense | | | 1,322 | | | | 39 | | |
| Total Assets | | | 265,479,497 | | | | 7,741,632 | | |
| LIABILITIES: | |
| Payables: | |
| Investments purchased | | | 17,029,777 | | | | 248,781 | | |
| Fund shares repurchased | | | 255,817 | | | | — | | |
| Investment advisory fee (Note 3) | | | 117,759 | | | | — | | |
| Unrealized depreciation on forward foreign exchange contracts | | | 705,090 | | | | — | | |
| Unrealized depreciation on open swap contracts | | | 149,332 | | | | — | | |
| Unfunded loan commitments (Note 2) | | | 7,339 | | | | — | | |
| Accrued expenses and other payables | | | 96,646 | | | | 34,529 | | |
| Total Liabilities | | | 18,361,760 | | | | 283,310 | | |
| NET ASSETS | | $ | 247,117,737 | | | $ | 7,458,322 | | |
| NET ASSETS Consist of: | |
| Par value | | $ | 22,801 | | | $ | 588 | | |
| Paid in capital in excess of par value | | | 243,471,798 | | | | 6,018,484 | | |
| Undistributed net investment income (loss) | | | 241,430 | | | | (33,916 | ) | |
Accumulated net realized gain (loss) on investments sold,
forward foreign exchange contracts, foreign currency related
transactions, and swap contracts | | | 113 | | | | 836,847 | | |
Net unrealized appreciation on investments, forward foreign exchange
contracts, foreign currency related transactions, swap contracts and
unfunded loan commitments | | | 3,381,595 | | | | 636,319 | | |
| NET ASSETS | | $ | 247,117,737 | | | $ | 7,458,322 | | |
| Class A | | $ | 94,348,348 | | | $ | 3,780,984 | | |
| Class I | | $ | 152,769,389 | | | $ | 3,677,338 | | |
| SHARES OUTSTANDING (Note 7) | |
| Class A | | | 8,538,365 | | | | 298,547 | | |
| Class I | | | 14,262,839 | | | | 289,263 | | |
| NET ASSET VALUE AND REDEMPTION PRICE PER SHARE | |
| Class A | | $ | 11.05 | | | $ | 12.66 | | |
| Class I | | $ | 10.71 | | | $ | 12.71 | | |
See Notes to Financial Statements.
Julius Baer Funds 2007 Annual Report
156
STATEMENT OF ASSETS AND LIABILITIES October 31, 2007
| | | Julius Baer
U.S. Smallcap | | Julius Baer
U.S. Midcap | |
| ASSETS: | |
Investments in securities, at market value
(Cost $6,949,406 and $6,523,663 respectively) | | $ | 7,868,012 | | | $ | 7,457,079 | | |
| Receivables: | |
| Investments sold | | | 1,249,194 | | | | 651,236 | | |
| Fund shares sold | | | 42,414 | | | | — | | |
| Interest and dividends | | | 2,690 | | | | 1,613 | | |
| Miscellaneous | | | 39 | | | | 41 | | |
| Receivable from advisor—net (Note 3) | | | 5,409 | | | | 6,455 | | |
| Prepaid expense | | | 64 | | | | 41 | | |
| Total Assets | | | 9,167,822 | | | | 8,116,465 | | |
| LIABILITIES: | |
| Payables: | |
| Investments purchased | | | 720,859 | | | | 595,254 | | |
| Accrued expenses and other payables | | | 34,661 | | | | 33,788 | | |
| Total Liabilities | | | 755,520 | | | | 629,042 | | |
| NET ASSETS | | $ | 8,412,302 | | | $ | 7,487,423 | | |
| NET ASSETS Consist of: | |
| Par value | | $ | 594 | | | $ | 587 | | |
| Paid in capital in excess of par value | | | 5,749,879 | | | | 6,012,863 | | |
| Accumulated net investment loss | | | (33,916 | ) | | | (30,534 | ) | |
| Accumulated net realized gain on investments sold | | | 1,777,139 | | | | 571,091 | | |
| Net unrealized appreciation on investments | | | 918,606 | | | | 933,416 | | |
| NET ASSETS | | $ | 8,412,302 | | | $ | 7,487,423 | | |
| Class A | | $ | 4,339,410 | | | $ | 3,645,760 | | |
| Class I | | $ | 4,072,892 | | | $ | 3,841,663 | | |
| SHARES OUTSTANDING (Note 7) | |
| Class A | | | 307,004 | | | | 286,151 | | |
| Class I | | | 287,200 | | | | 300,988 | | |
| NET ASSET VALUE AND REDEMPTION PRICE PER SHARE | |
| Class A | | $ | 14.13 | | | $ | 12.74 | | |
| Class I | | $ | 14.18 | | | $ | 12.76 | | |
See Notes to Financial Statements.
Julius Baer Funds 2007 Annual Report
157
STATEMENT OF ASSETS AND LIABILITIES October 31, 2007
| | | Julius Baer
U.S. Multicap | |
| ASSETS: | |
| Investments in securities, at market value (Cost $6,763,024) | | $ | 7,625,433 | | |
| Receivables: | |
| Investments sold | | | 628,484 | | |
| Fund shares sold | | | 1,000 | | |
| Interest and dividends | | | 4,589 | | |
| Miscellaneous | | | 42 | | |
| Receivable from advisor—net (Note 3) | | | 6,471 | | |
| Prepaid expense | | | 41 | | |
| Total Assets | | | 8,266,060 | | |
| LIABILITIES: | |
| Payables: | |
| Investments purchased | | | 665,356 | | |
| Accrued expenses and other payables | | | 33,207 | | |
| Total Liabilities | | | 698,563 | | |
| NET ASSETS | | $ | 7,567,497 | | |
| NET ASSETS Consist of: | |
| Par value | | $ | 589 | | |
| Paid in capital in excess of par value | | | 6,058,682 | | |
| Overdistributed net investment income | | | (19,438 | ) | |
| Accumulated net realized gain on investments sold | | | 665,255 | | |
| Net unrealized appreciation on investments | | | 862,409 | | |
| NET ASSETS | | $ | 7,567,497 | | |
| Class A | | $ | 3,620,116 | | |
| Class I | | $ | 3,947,381 | | |
| SHARES OUTSTANDING (Note 7) | |
| Class A | | | 282,047 | | |
| Class I | | | 307,011 | | |
| NET ASSET VALUE AND REDEMPTION PRICE PER SHARE | |
| Class A | | $ | 12.84 | | |
| Class I | | $ | 12.86 | | |
See Notes to Financial Statements.
Julius Baer Funds 2007 Annual Report
158
STATEMENT OF OPERATIONS
For the Year Ended October 31, 2007
| | | Julius Baer
Global Equity | | Julius Baer
International Equity | |
| INVESTMENT INCOME: | |
| Interest† | | $ | 188,546 | | | $ | 29,233,438 | | |
| Dividends, from unaffiliated issuers†† | | | 1,400,017 | | | | 595,848,436 | | |
| Dividends, from affiliated issuers††† | | | — | | | | 19,189,084 | | |
| Total investment income | | | 1,588,563 | | | | 644,270,958 | | |
| EXPENSES: | |
| Investment advisory fee (Note 3) | | | 647,059 | | | | 204,020,950 | | |
| Custody fees | | | 34,816 | | | | 17,661,106 | | |
| Administration fees | | | 257,129 | | | | 4,027,931 | | |
| Professional fees | | | 30,300 | | | | 1,184,231 | | |
| Trustees' fees and expenses | | | 5,463 | | | | 692,876 | | |
| Registration and filing fees | | | 62,988 | | | | 353,516 | | |
| Shareholder reports | | | 60,528 | | | | 4,266,604 | | |
| Insurance premium expense | | | 76,763 | | | | 233,871 | | |
| Interest expense | | | 5,009 | | | | — | | |
| Compliance expense | | | 620 | | | | 205,815 | | |
| Miscellaneous fees | | | 11,879 | | | | 120,265 | | |
| Total expenses common to all classes | | | 1,192,554 | | | | 232,767,165 | | |
| Transfer agent fees | |
| Class A | | | 20,515 | | | | 1,113,432 | | |
| Class I | | | 5,824 | | | | 293,318 | | |
| Distribution and shareholder servicing fees (Class A) (Note 4) | | | 84,485 | | | | 24,746,716 | | |
| Total gross expenses | | | 1,303,378 | | | | 258,920,631 | | |
| Custody offset arrangement (Note 3) | | | (14,844 | ) | | | (12,363,639 | ) | |
| Expenses waived by investment advisor (Note 3) | | | (377,251 | ) | | | — | | |
| Net expenses | | | 911,283 | | | | 246,556,992 | | |
| NET INVESTMENT INCOME | | | 677,280 | | | | 397,713,966 | | |
| NET REALIZED AND UNREALIZED GAIN (LOSS) ON INVESTMENTS: | |
| Realized gain (loss) on: | |
| Investments†††† | | | 10,306,057 | | | | 2,660,841,355 | | |
| Investments from affiliates | | | — | | | | (5,218,266 | ) | |
| Financial futures contracts | | | 228,223 | | | | 49,678,572 | | |
| Interest rate swap contracts | | | 29,954 | | | | (1,836,465 | ) | |
| Forward foreign exchange contracts | | | (48,026 | ) | | | (5,909,917 | ) | |
| Foreign currency transactions | | | (244,315 | ) | | | (57,607,490 | ) | |
| Net realized gain on investments | | | 10,271,893 | | | | 2,639,947,789 | | |
| Net change in unrealized appreciation (depreciation) on: | |
| Investments | | | 5,145,295 | | | | 3,821,963,635 | | |
| Financial futures contracts | | | 133,646 | | | | 36,352,109 | | |
| Interest rate swap contracts | | | — | | | | 661,693 | | |
| Forward foreign exchange contracts | | | (409,111 | ) | | | (134,117,826 | ) | |
| Foreign currency transactions | | | 156 | | | | 551,302 | | |
| Net change in unrealized appreciation of investments | | | 4,869,986 | | | | 3,725,410,913 | | |
| NET REALIZED AND UNREALIZED GAIN ON INVESTMENTS | | | 15,141,879 | | | | 6,365,358,702 | | |
| NET INCREASE IN NET ASSETS RESULTING FROM OPERATIONS | | $ | 15,819,159 | | | $ | 6,763,072,668 | | |
† Interest income includes security lending income (net of rebate and agent fees) of $24,852 and $21,520,253 for the Global Equity Fund and International Equity Fund, respectively.
†† Net of foreign withholdings taxes of $85,414 and $46,532,732 for the Global Equity Fund and International Equity Fund, respectively.
††† Net of foreign withholding taxes of $2,971,498 for the International Equity Fund.
†††† Net of Thai capital gains taxes of $42 and $191,661 for the Global Equity Fund and International Equity Fund, respectively.
See Notes to Financial Statements.
Julius Baer Funds 2007 Annual Report
159
STATEMENT OF OPERATIONS
For the Year Ended October 31, 2007
| | | Julius Baer
International Equity II | | Julius Baer
Total Return Bond | |
| INVESTMENT INCOME: | |
| Interest† | | $ | 15,099,137 | | | $ | 35,262,212 | | |
| Dividends†† | | | 179,146,279 | | | | — | | |
| Total investment income | | | 194,245,416 | | | | 35,262,212 | | |
| EXPENSES: | |
| Investment advisory fee (Note 3) | | | 53,422,713 | | | | 3,144,621 | | |
| Custody fees | | | 2,585,512 | | | | 208,230 | | |
| Administration fees | | | 2,463,999 | | | | 111,909 | | |
| Professional fees | | | 273,271 | | | | 55,738 | | |
| Trustees' fees and expenses | | | 190,010 | | | | 20,986 | | |
| Registration and filing fees | | | 485,802 | | | | 50,506 | | |
| Shareholder reports | | | 941,808 | | | | 133,915 | | |
| Insurance premium expense | | | 40,271 | | | | 5,413 | | |
| Interest expense | | | — | | | | 10,139 | | |
| Compliance expense | | | 50,252 | | | | 6,040 | | |
| Miscellaneous fees | | | 21,204 | | | | 4,298 | | |
| Total expenses common to all classes | | | 60,474,842 | | | | 3,751,795 | | |
| Transfer agent fees | |
| Class A | | | 407,547 | | | | 33,499 | | |
| Class I | | | 215,102 | | | | 12,396 | | |
| Distribution and shareholder servicing fees (Class A) (Note 4) | | | 3,157,498 | | | | 288,976 | | |
| Total gross expenses | | | 64,254,989 | | | | 4,086,666 | | |
| Custody offset arrangement (Note 3) | | | (1,073,479 | ) | | | (24,464 | ) | |
Recoupment of expenses previously assumed by
Investment advisor (Note 3) | | | 196,954 | | | | — | | |
| Expenses waived by investment advisor (Note 3) | | | — | | | | (698,492 | ) | |
| Net expenses | | | 63,378,464 | | | | 3,363,710 | | |
| NET INVESTMENT INCOME | | | 130,866,952 | | | | 31,898,502 | | |
| NET REALIZED AND UNREALIZED GAIN (LOSS) ON INVESTMENTS: | |
| Realized gain (loss) on: | |
| Investments††† | | | 101,743,187 | | | | 3,442,612 | | |
| Financial futures contracts | | | 24,498,880 | | | | (110 | ) | |
| Interest rate swap contracts | | | 691,664 | | | | — | | |
| Forward foreign exchange contracts | | | (9,515,033 | ) | | | 450,068 | | |
| Foreign currency transactions | | | (8,231,246 | ) | | | 2,305,828 | | |
| Net realized gain on investments | | | 109,187,452 | | | | 6,198,398 | | |
| Net change in unrealized appreciation (depreciation) on: | |
| Investments | | | 1,441,947,822 | | | | 5,250,168 | | |
| Financial futures contracts | | | 18,714,680 | | | | — | | |
| Forward foreign exchange contracts | | | (46,223,225 | ) | | | 7,894,907 | | |
| Foreign currency transactions | | | 207,068 | | | | 2,785 | | |
| Net change in unrealized appreciation of investments | | | 1,414,646,345 | | | | 13,147,860 | | |
| NET REALIZED AND UNREALIZED GAIN ON INVESTMENTS | | | 1,523,833,797 | | | | 19,346,258 | | |
| NET INCREASE IN NET ASSETS RESULTING FROM OPERATIONS | | $ | 1,654,700,749 | | | $ | 51,244,760 | | |
† Interest income includes security lending income (net of rebate and agent fees) of $6,010,802 for the International Equity Fund II.
†† Net of withholding taxes of $13,794,448 for the International Equity Fund II.
††† Net of Thai capital gains tax of $54,672 for the International Equity Fund II.
See Notes to Financial Statements.
Julius Baer Funds 2007 Annual Report
160
STATEMENT OF OPERATIONS
For the Year Ended October 31, 2007
| | | Julius Baer
Global High Income | | Julius Baer
U.S. Microcap | |
| INVESTMENT INCOME: | |
| Interest | | $ | 12,844,090 | | | $ | 8,206 | | |
| Dividends† | | | 253,145 | | | | 55,209 | | |
| Total investment income | | | 13,097,235 | | | | 63,415 | | |
| EXPENSES: | |
| Investment advisory fee (Note 3) | | | 1,244,480 | | | | 87,762 | | |
| Custody fees | | | 53,721 | | | | 4,202 | | |
| Administration fees | | | 80,086 | | | | 20,796 | | |
| Professional fees | | | 44,410 | | | | 27,219 | | |
| Trustees' fees and expenses | | | 5,070 | | | | 176 | | |
| Registration and filing fees | | | 56,196 | | | | 33,774 | | |
| Shareholder reports | | | 26,838 | | | | — | | |
| Amortization of offering expenses | | | — | | | | 30,534 | | |
| Insurance premium expense | | | 1,059 | | | | 19 | | |
| Interest expense | | | 10,139 | | | | — | | |
| Compliance expense | | | 1,426 | | | | — | | |
| Miscellaneous fees | | | 1,454 | | | | 932 | | |
| Total expenses common to all classes | | | 1,524,879 | | | | 205,414 | | |
| Transfer agent fees | |
| Class A | | | 24,113 | | | | 12,419 | | |
| Class I | | | 6,527 | | | | 5,200 | | |
| Distribution and shareholder servicing fees (Class A) (Note 4) | | | 162,823 | | | | 8,963 | | |
| Total gross expenses | | | 1,718,342 | | | | 231,996 | | |
| Custody offset arrangement (Note 3) | | | (9,253 | ) | | | — | | |
| Expenses waived by investment advisor (Note 3) | | | (301,788 | ) | | | (115,922 | ) | |
| Net expenses | | | 1,407,301 | | | | 116,074 | | |
| NET INVESTMENT INCOME (LOSS) | | | 11,689,934 | | | | (52,659 | ) | |
| NET REALIZED AND UNREALIZED GAIN (LOSS) ON INVESTMENTS: | |
| Realized gain (loss) on: | |
| Investments | | | 612,223 | | | | 859,303 | | |
| Interest rate swap contracts | | | 17,080 | | | | — | | |
| Forward foreign exchange contracts | | | 58,745 | | | | — | | |
| Foreign currency transactions | | | (1,661,155 | ) | | | — | | |
| Net realized gain (loss) on investments | | | (973,107 | ) | | | 859,303 | | |
| Net change in unrealized appreciation (depreciation) on: | |
| Investments | | | 1,832,768 | | | | 2,200 | | |
| Interest rate swap contracts | | | (198,322 | ) | | | — | | |
| Forward foreign exchange contracts | | | (84,727 | ) | | | — | | |
| Foreign currency transactions | | | 90,003 | | | | — | | |
| Net change in unrealized appreciation of investments | | | 1,639,722 | | | | 2,200 | | |
| NET REALIZED AND UNREALIZED GAIN (LOSS) ON INVESTMENTS | | | 666,615 | | | | 861,503 | | |
| NET INCREASE IN NET ASSETS RESULTING FROM OPERATIONS | | $ | 12,356,549 | | | $ | 808,844 | | |
† Net of withholding taxes of $51,460 for the Global High Income Fund.
See Notes to Financial Statements.
Julius Baer Funds 2007 Annual Report
161
STATEMENT OF OPERATIONS
For the Year Ended October 31, 2007
| | | Julius Baer
U.S. Smallcap | | Julius Baer
U.S. Midcap | |
| INVESTMENT INCOME: | |
| Interest | | $ | 6,917 | | | $ | 5,968 | | |
| Dividends | | | 42,955 | | | | 120,314 | | |
| Total investment income | | | 49,872 | | | | 126,282 | | |
| EXPENSES: | |
| Investment advisory fee (Note 3) | | | 71,635 | | | | 56,068 | | |
| Custody fees | | | 4,149 | | | | 4,194 | | |
| Administration fees | | | 19,087 | | | | 15,536 | | |
| Professional fees | | | 27,231 | | | | 27,243 | | |
| Trustees' fees and expenses | | | 190 | | | | 190 | | |
| Registration and filing fees | | | 35,866 | | | | 33,779 | | |
| Amortization of offering expenses | | | 30,534 | | | | 27,983 | | |
| Insurance premium expense | | | 20 | | | | 19 | | |
| Compliance expense | | | 1 | | | | 3 | | |
| Miscellaneous fees | | | 929 | | | | 918 | | |
| Total expenses common to all classes | | | 189,642 | | | | 165,933 | | |
| Transfer agent fees | |
| Class A | | | 12,420 | | | | 12,419 | | |
| Class I | | | 5,199 | | | | 5,203 | | |
| Distribution and shareholder servicing fees (Class A) (Note 4) | | | 10,469 | | | | 8,663 | | |
| Total gross expenses | | | 217,730 | | | | 192,218 | | |
| Expenses waived by investment advisor (Note 3) | | | (114,682 | ) | | | (108,233 | ) | |
| Net expenses | | | 103,048 | | | | 83,985 | | |
| NET INVESTMENT INCOME (LOSS) | | | (53,176 | ) | | | 42,297 | | |
| NET REALIZED AND UNREALIZED GAIN ON INVESTMENTS: | |
| Realized gain on: | |
| Investments | | | 1,800,207 | | | | 579,568 | | |
| Net realized gain on investments | | | 1,800,207 | | | | 579,568 | | |
| Net change in unrealized appreciation on: | |
| Investments | | | 457,173 | | | | 422,673 | | |
| Net change in unrealized appreciation of investments | | | 457,173 | | | | 422,673 | | |
| NET REALIZED AND UNREALIZED GAIN ON INVESTMENTS | | | 2,257,380 | | | | 1,002,241 | | |
| NET INCREASE IN NET ASSETS RESULTING FROM OPERATIONS | | $ | 2,204,204 | | | $ | 1,044,538 | | |
See Notes to Financial Statements.
Julius Baer Funds 2007 Annual Report
162
STATEMENT OF OPERATIONS
For the Year Ended October 31, 2007
| | | Julius Baer
U.S. Multicap | |
| INVESTMENT INCOME: | |
| Interest | | $ | 5,714 | | |
| Dividends | | | 130,726 | | |
| Total investment income | | | 136,440 | | |
| EXPENSES: | |
| Investment advisory fee (Note 3) | | | 52,947 | | |
| Custody fees | | | 4,214 | | |
| Administration fees | | | 17,154 | | |
| Professional fees | | | 27,264 | | |
| Trustees' fees and expenses | | | 201 | | |
| Registration and filing fees | | | 33,767 | | |
| Amortization of offering expenses | | | 26,388 | | |
| Insurance premium expense | | | 20 | | |
| Compliance expense | | | 33 | | |
| Miscellaneous fees | | | 766 | | |
| Total expenses common to all classes | | | 162,754 | | |
| Transfer agent fees | |
| Class A | | | 12,424 | | |
| Class I | | | 5,204 | | |
| Distribution and shareholder servicing fees (Class A) (Note 4) | | | 9,235 | | |
| Total gross expenses | | | 189,617 | | |
| Expenses waived by investment advisor (Note 3) | | | (107,939 | ) | |
| Net expenses | | | 81,678 | | |
| NET INVESTMENT INCOME | | | 54,762 | | |
| NET REALIZED AND UNREALIZED GAIN ON INVESTMENTS: | |
| Realized gain on: | |
| Investments | | | 665,255 | | |
| Net realized gain on investments | | | 665,255 | | |
| Net change in unrealized appreciation on: | |
| Investments | | | 333,356 | | |
| Net change in unrealized appreciation of investments | | | 333,356 | | |
| NET REALIZED AND UNREALIZED GAIN ON INVESTMENTS | | | 998,611 | | |
| NET INCREASE IN NET ASSETS RESULTING FROM OPERATIONS | | $ | 1,053,373 | | |
See Notes to Financial Statements.
Julius Baer Funds 2007 Annual Report
163
STATEMENT OF CHANGES IN NET ASSETS
Julius Baer Global Equity Fund Inc.
| | | For the
Year Ended
October 31,
2007 | | For the
Year Ended
October 31,
2006 | |
| INCREASE IN NET ASSETS FROM OPERATIONS: | |
| Net investment income | | $ | 677,280 | | | $ | 438,419 | | |
| Net realized gain on investments | | | 10,271,893 | | | | 7,905,567 | | |
| Net change in unrealized appreciation of investments | | | 4,869,986 | | | | 1,564,073 | | |
| Net increase in net assets resulting from operations | | | 15,819,159 | | | | 9,908,059 | | |
| DISTRIBUTIONS TO SHAREHOLDERS (Note 2): | |
| Distributions from net investment income | |
| Class I | | | — | | | | (989 | ) | |
| Total distributions to shareholders | | | — | | | | (989 | ) | |
| FUND SHARE TRANSACTIONS (Note 7): | |
| Proceeds from sale of shares | |
| Class A | | | 9,518,604 | | | | 10,921,299 | | |
| Class I | | | 59,719,862 | | | | 18,354,968 | | |
Net Asset Value of shares issued to shareholders in payment of
distributions declared | |
| Class I | | | — | | | | 637 | | |
| Cost of shares redeemed | |
| Class A | | | (7,378,540 | ) | | | (22,181,768 | ) | |
| Class I | | | (24,100,668 | ) | | | (8,973,789 | ) | |
| Fees from redemptions | | | — | | | | 3,539 | | |
| Net increase (decrease) from Fund share transactions | | | 37,759,258 | | | | (1,875,114 | ) | |
| Net increase in net assets | | | 53,578,417 | | | | 8,031,956 | | |
| NET ASSETS: | |
| Beginning of year | | | 59,450,233 | | | | 51,418,277 | | |
End of period (including undistributed net investment income of
$526,656 and ($60,212), respectively) | | $ | 113,028,650 | | | $ | 59,450,233 | | |
See Notes to Financial Statements.
Julius Baer Funds 2007 Annual Report
164
STATEMENT OF CHANGES IN NET ASSETS
Julius Baer International Equity Fund
| | | For the
Year Ended
October 31,
2007 | | For the
Year Ended
October 31,
2006 | |
| INCREASE IN NET ASSETS FROM OPERATIONS: | |
| Net investment income | | $ | 397,713,966 | | | $ | 235,638,205 | | |
| Net realized gain on investments | | | 2,639,947,789 | | | | 1,735,683,740 | | |
| Net change in unrealized appreciation of investments | | | 3,725,410,913 | | | | 2,825,657,653 | | |
| Net increase in net assets resulting from operations | | | 6,763,072,668 | | | | 4,796,979,598 | | |
| DISTRIBUTIONS TO SHAREHOLDERS (Note 2): | |
| Distributions from net investment income | |
| Class A | | | (59,400,112 | ) | | | — | | |
| Class I | | | (97,389,687 | ) | | | — | | |
| Distributions from realized gain | |
| Class A | | | (880,815,538 | ) | | | (323,074,339 | ) | |
| Class I | | | (1,057,761,836 | ) | | | (394,079,789 | ) | |
| Total distributions to shareholders | | | (2,095,367,173 | ) | | | (717,154,128 | ) | |
| FUND SHARE TRANSACTIONS (Note 7): | |
| Proceeds from sale of shares | |
| Class A | | | 1,611,747,637 | | | | 1,516,430,147 | | |
| Class I | | | 2,352,325,275 | | | | 1,762,515,023 | | |
Net Asset Value of shares issued to shareholders in payment of
distributions declared | |
| Class A | | | 885,050,416 | | | | 303,135,073 | | |
| Class I | | | 1,012,198,966 | | | | 352,634,605 | | |
| Cost of shares redeemed | |
| Class A | | | (1,990,356,059 | ) | | | (1,596,363,910 | ) | |
| Class I | | | (1,778,609,637 | ) | | | (1,487,008,935 | ) | |
| Fees from redemptions | | | — | | | | 558,198 | | |
| Net increase from Fund share transactions | | | 2,092,356,598 | | | | 851,900,201 | | |
| Net increase in net assets | | | 6,760,062,093 | | | | 4,931,725,671 | | |
| NET ASSETS: | |
| Beginning of year | | | 20,170,112,206 | | | | 15,238,386,535 | | |
End of year (including undistributed net investment income of
$263,404,052 and $51,753,799, respectively) | | $ | 26,930,174,299 | | | $ | 20,170,112,206 | | |
See Notes to Financial Statements.
Julius Baer Funds 2007 Annual Report
165
STATEMENT OF CHANGES IN NET ASSETS
Julius Baer International Equity Fund II
| | | For the
Year Ended
October 31,
2007 | | For the
Year Ended
October 31,
2006 | |
| INCREASE IN NET ASSETS FROM OPERATIONS: | |
| Net investment income | | $ | 130,866,952 | | | $ | 25,470,795 | | |
| Net realized gain (loss) on investments | | | 109,187,452 | | | | (19,126,250 | ) | |
| Net change in unrealized appreciation of investments | | | 1,414,646,345 | | | | 341,136,403 | | |
| Net increase in net assets resulting from operations | | | 1,654,700,749 | | | | 347,480,948 | | |
| DISTRIBUTIONS TO SHAREHOLDERS (Note 2): | |
| Distributions from net investment income | |
| Class A | | | (1,953,851 | ) | | | — | | |
| Class I | | | (11,447,304 | ) | | | — | | |
| Distributions from realized gain | |
| Class A | | | (2,983,592 | ) | | | — | | |
| Class I | | | (10,064,024 | ) | | | — | | |
| Total distributions to shareholders | | | (26,448,771 | ) | | | — | | |
| FUND SHARE TRANSACTIONS (Note 7): | |
| Proceeds from sale of shares | |
| Class A | | | 1,254,778,148 | | | | 611,006,976 | | |
| Class I | | | 4,517,095,068 | | | | 1,992,799,751 | | |
Net Asset Value of shares issued to shareholders in payment of
distributions declared | |
| Class A | | | 4,509,126 | | | | — | | |
| Class I | | | 16,754,682 | | | | — | | |
| Cost of shares redeemed | |
| Class A | | | (335,414,636 | ) | | | (100,844,079 | ) | |
| Class I | | | (514,794,780 | ) | | | (113,397,417 | ) | |
| Fees from redemptions | | | — | | | | 186,601 | | |
| Net increase from Fund share transactions | | | 4,942,927,608 | | | | 2,389,751,832 | | |
| Net increase in net assets | | | 6,571,179,586 | | | | 2,737,232,780 | | |
| NET ASSETS: | |
| Beginning of year | | | 3,162,284,995 | | | | 425,052,215 | | |
End of year (including undistributed net investment income of
$110,928,766 and $10,991,811, respectively) | | $ | 9,733,464,581 | | | $ | 3,162,284,995 | | |
See Notes to Financial Statements.
Julius Baer Funds 2007 Annual Report
166
STATEMENT OF CHANGES IN NET ASSETS
Julius Baer Total Return Bond Fund
| | | For the
Year Ended
October 31,
2007 | | For the
Year Ended
October 31,
2006 | |
| INCREASE IN NET ASSETS FROM OPERATIONS: | |
| Net investment income | | $ | 31,898,502 | | | $ | 14,432,716 | | |
| Net realized gain (loss) on investments | | | 6,198,398 | | | | (1,532,288 | ) | |
| Net change in unrealized appreciation of investments | | | 13,147,860 | | | | 6,040,040 | | |
| Net increase in net assets resulting from operations | | | 51,244,760 | | | | 18,940,468 | | |
| DISTRIBUTIONS TO SHAREHOLDERS (Note 2): | |
| Distributions from net investment income | |
| Class A | | | (4,751,855 | ) | | | (4,633,879 | ) | |
| Class I | | | (26,752,826 | ) | | | (13,426,375 | ) | |
| Distributions from realized gain | |
| Class A | | | — | | | | (517,211 | ) | |
| Class I | | | — | | | | (1,194,669 | ) | |
| Total distributions to shareholders | | | (31,504,681 | ) | | | (19,772,134 | ) | |
| FUND SHARE TRANSACTIONS (Note 7): | |
| Proceeds from sale of shares | |
| Class A | | | 79,050,470 | | | | 72,384,334 | | |
| Class I | | | 487,023,641 | | | | 290,781,223 | | |
Net Asset Value of shares issued to shareholders in payment of
distributions declared | |
| Class A | | | 4,318,464 | | | | 4,578,373 | | |
| Class I | | | 17,281,842 | | | | 12,496,422 | | |
| Cost of shares redeemed | |
| Class A | | | (41,786,343 | ) | | | (40,748,651 | ) | |
| Class I | | | (138,938,609 | ) | | | (45,130,436 | ) | |
| Fees from redemptions | | | — | | | | 22,196 | | |
| Net increase from Fund share transactions | | | 406,949,465 | | | | 294,383,461 | | |
| Net increase in net assets | | | 426,689,544 | | | | 293,551,795 | | |
| NET ASSETS: | |
| Beginning of year | | | 502,919,190 | | | | 209,367,395 | | |
End of year (including undistributed net investment income of
$7,891,905 and $1,172,581, respectively) | | $ | 929,608,734 | | | $ | 502,919,190 | | |
See Notes to Financial Statements.
Julius Baer Funds 2007 Annual Report
167
STATEMENT OF CHANGES IN NET ASSETS
Julius Baer Global High Income Fund
| | | For the
Year Ended
October 31,
2007 | | For the
Year Ended
October 31,
2006 | |
| INCREASE IN NET ASSETS FROM OPERATIONS: | |
| Net investment income | | $ | 11,689,934 | | | $ | 3,265,164 | | |
| Net realized gain (loss) on investments | | | (973,107 | ) | | | 879,451 | | |
| Net change in unrealized appreciation of investments | | | 1,639,722 | | | | 1,242,995 | | |
| Net increase in net assets resulting from operations | | | 12,356,549 | | | | 5,387,610 | | |
| DISTRIBUTIONS TO SHAREHOLDERS (Note 2): | |
| Distributions from net investment income | |
| Class A | | | (4,072,440 | ) | | | (3,603,396 | ) | |
| Class I | | | (6,532,304 | ) | | | (1,282,103 | ) | |
| Distributions from realized gain | |
| Class A | | | (420,733 | ) | | | (2,359,814 | ) | |
| Class I | | | (457,444 | ) | | | (499,032 | ) | |
| Return of capital | |
| Class A | | | (448,526 | ) | | | | | |
| | | | Class I | | | | (719,449 | ) | |
| Total distributions to shareholders | | | (12,650,896 | ) | | | (7,744,345 | ) | |
| FUND SHARE TRANSACTIONS (Note 7): | |
| Proceeds from sale of shares | |
| Class A | | | 79,811,932 | | | | 33,421,918 | | |
| Class I | | | 133,818,463 | | | | 31,257,017 | | |
Net Asset Value of shares issued to shareholders in payment of
distributions declared | |
| Class A | | | 4,232,194 | | | | 5,028,917 | | |
| Class I | | | 3,403,772 | | | | 1,537,266 | | |
| Cost of shares redeemed | |
| Class A | | | (35,767,124 | ) | | | (26,442,289 | ) | |
| Class I | | | (19,116,348 | ) | | | (5,182,090 | ) | |
| Fees from redemptions | | | — | | | | 13,225 | | |
| Net increase from Fund share transactions | | | 166,382,889 | | | | 39,633,964 | | |
| Net increase in net assets | | | 166,088,542 | | | | 37,277,229 | | |
| NET ASSETS: | |
| Beginning of year | | | 81,029,195 | | | | 43,751,966 | | |
End of year (including undistributed net investment income of
$241,430 and $140,449, respectively) | | $ | 247,117,737 | | | $ | 81,029,195 | | |
See Notes to Financial Statements.
Julius Baer Funds 2007 Annual Report
168
STATEMENT OF CHANGES IN NET ASSETS
Julius Baer U.S. Microcap Fund
| | | For the
Year Ended
October 31,
2007 | | For the Period from
July 24, 2006*
to
October 31, 2006 | |
| INCREASE IN NET ASSETS FROM OPERATIONS: | |
| Net investment loss | | $ | (52,659 | ) | | $ | (11,957 | ) | |
| Net realized gain on investments | | | 859,303 | | | | 8,004 | | |
| Net change in unrealized appreciation of investments | | | 2,200 | | | | 634,119 | | |
| Net increase in net assets resulting from operations | | | 808,844 | | | | 630,166 | | |
| FUND SHARE TRANSACTIONS (Note 7): | |
| Proceeds from sale of shares | |
| Class A | | | 1,033,965 | | | | 2,661,894 | | |
| Class I | | | 528,215 | | | | 2,500,000 | | |
| Cost of shares redeemed | |
| Class A | | | (605,058 | ) | | | (20,311 | ) | |
| Class I | | | (79,393 | ) | | | — | | |
| Net increase from Fund share transactions | | | 877,729 | | | | 5,141,583 | | |
| Net increase in net assets | | | 1,686,573 | | | | 5,771,749 | | |
| NET ASSETS: | |
| Beginning of period | | | 5,771,749 | | | | — | | |
End of period (including accumulated net investment loss of
$(33,916) and $5,852, respectively) | | $ | 7,458,322 | | | $ | 5,771,749 | | |
* Commencement of operations.
See Notes to Financial Statements.
Julius Baer Funds 2007 Annual Report
169
STATEMENT OF CHANGES IN NET ASSETS
Julius Baer U.S. Smallcap Fund
| | | For the
Year Ended
October 31,
2007 | | For the Period from
July 24, 2006*
to
October 31, 2006 | |
| INCREASE IN NET ASSETS FROM OPERATIONS: | |
| Net investment loss | | $ | (53,176 | ) | | $ | (2,036 | ) | |
| Net realized gain on investments | | | 1,800,207 | | | | 93,131 | | |
| Net change in unrealized appreciation of investments | | | 457,173 | | | | 461,433 | | |
| Net increase in net assets resulting from operations | | | 2,204,204 | | | | 552,528 | | |
| DISTRIBUTIONS TO SHAREHOLDERS (Note 2): | |
| Distributions from net investment income | |
| Class I | | | (1,456 | ) | | | — | | |
| Distributions from realized gain | |
| Class A | | | (47,337 | ) | | | — | | |
| Class I | | | (46,110 | ) | | | — | | |
| Total distributions to shareholders | | | (94,903 | ) | | | — | | |
| FUND SHARE TRANSACTIONS (Note 7): | |
| Proceeds from sale of shares | |
| Class A | | | 5,152,744 | | | | 2,535,318 | | |
| Class I | | | 421,237 | | | | 2,500,000 | | |
Net Asset Value of shares issued to shareholders in payment of
distributions declared | |
| Class A | | | 47,337 | | | | — | | |
| Class I | | | 47,144 | | | | — | | |
| Cost of shares redeemed | |
| Class A | | | (4,914,765 | ) | | | (3,063 | ) | |
| Class I | | | (35,479 | ) | | | — | | |
| Net increase from Fund share transactions | | | 718,218 | | | | 5,032,255 | | |
| Net increase in net assets | | | 2,827,519 | | | | 5,584,783 | | |
| NET ASSETS: | |
| Beginning of period | | | 5,584,783 | | | | — | | |
End of period (including accumulated net investment loss of
$(33,916) and $4,396, respectively) | | $ | 8,412,302 | | | $ | 5,584,783 | | |
* Commencement of operations.
See Notes to Financial Statements.
Julius Baer Funds 2007 Annual Report
170
STATEMENT OF CHANGES IN NET ASSETS
Julius Baer U.S. Midcap Fund
| | | For the
Year Ended
October 31,
2007 | | For the Period from
July 24, 2006*
to
October 31, 2006 | |
| INCREASE IN NET ASSETS FROM OPERATIONS: | |
| Net investment income(loss) | | $ | 42,297 | | | $ | (5,295 | ) | |
| Net realized gain on investments | | | 579,568 | | | | 24,072 | | |
| Net change in unrealized appreciation of investments | | | 422,673 | | | | 510,743 | | |
| Net increase in net assets resulting from operations | | | 1,044,538 | | | | 529,520 | | |
| DISTRIBUTIONS TO SHAREHOLDERS (Note 2): | |
| Distributions from net investment income | |
| Class A | | | (34,293 | ) | | | — | | |
| Class I | | | (42,422 | ) | | | — | | |
| Distributions from realized gain | |
| Class A | | | (11,538 | ) | | | — | | |
| Class I | | | (12,014 | ) | | | — | | |
| Total distributions to shareholders | | | (100,267 | ) | | | — | | |
| FUND SHARE TRANSACTIONS (Note 7): | |
| Proceeds from sale of shares | |
| Class A | | | 497,510 | | | | 2,625,610 | | |
| Class I | | | 627,149 | | | | 2,500,000 | | |
Net Asset Value of shares issued to shareholders in payment of
distributions declared | |
| Class A | | | 36,212 | | | | — | | |
| Class I | | | 43,010 | | | | — | | |
| Cost of shares redeemed | |
| Class A | | | (230,323 | ) | | | (3,069 | ) | |
| Class I | | | (82,467 | ) | | | — | | |
| Net increase from Fund share transactions | | | 891,091 | | | | 5,122,541 | | |
| Net increase in net assets | | | 1,835,362 | | | | 5,652,061 | | |
| NET ASSETS: | |
| Beginning of period | | | 5,652,061 | | | | — | | |
End of period (including overdistributed net investment income of
$(30,534) and $4,952, respectively) | | $ | 7,487,423 | | | $ | 5,652,061 | | |
* Commencement of operations.
See Notes to Financial Statements.
Julius Baer Funds 2007 Annual Report
171
STATEMENT OF CHANGES IN NET ASSETS
Julius Baer U.S. Multicap Fund
| | | For the
Year Ended
October 31,
2007 | | For the Period from
July 24, 2006*
to
October 31, 2006 | |
| INCREASE IN NET ASSETS FROM OPERATIONS: | |
| Net investment income | | $ | 54,762 | | | $ | 1,721 | | |
| Net realized gain on investments | | | 665,255 | | | | 23,143 | | |
| Net change in unrealized appreciation of investments | | | 333,356 | | | | 529,053 | | |
| Net increase in net assets resulting from operations | | | 1,053,373 | | | | 553,917 | | |
| DISTRIBUTIONS TO SHAREHOLDERS (Note 2): | |
| Distributions from net investment income | |
| Class A | | | (34,572 | ) | | | — | | |
| Class I | | | (41,349 | ) | | | — | | |
| Distributions from realized gain | |
| Class A | | | (11,507 | ) | | | — | | |
| Class I | | | (11,636 | ) | | | — | | |
| Total distributions to shareholders | | | (99,064 | ) | | | — | | |
| FUND SHARE TRANSACTIONS (Note 7): | |
| Proceeds from sale of shares | |
| Class A | | | 1,319,599 | | | | 2,515,010 | | |
| Class I | | | 660,159 | | | | 2,500,000 | | |
Net Asset Value of shares issued to shareholders in payment of
distributions declared | |
| Class A | | | 35,926 | | | | — | | |
| Class I | | | 40,976 | | | | — | | |
| Cost of shares redeemed | |
| Class A | | | (965,928 | ) | | | (11,270 | ) | |
| Class I | | | (35,201 | ) | | | — | | |
| Net increase from Fund share transactions | | | 1,055,531 | | | | 5,003,740 | | |
| Net increase in net assets | | | 2,009,840 | | | | 5,557,657 | | |
| NET ASSETS: | |
| Beginning of period | | | 5,557,657 | | | | — | | |
End of period (including undistributed (overdistributed) net investment
income of ($19,438) and $1,721, respectively) | | $ | 7,567,497 | | | $ | 5,557,657 | | |
* Commencement of operations.
See Notes to Financial Statements.
Julius Baer Funds 2007 Annual Report
172
FINANCIAL HIGHLIGHTS
Julius Baer Global Equity Fund Inc.(8)
For a share outstanding throughout each period
| | | Class A | |
| | | Year Ended October 31, | | April 01, 2004
through
October 31, | | Year Ended
March 31, | |
| | | 2007 | | 2006 | | 2005(7) | | 2004(7) | | 2004(7) | | 2003(7) | |
| Net Asset Value, beginning of period | | $ | 38.23 | | | $ | 31.45 | | | $ | 26.90 | | | $ | 25.30 | | | $ | 24.10 | | | $ | 42.50 | | |
| Income (loss) from investment operations: | |
| Net investment income (loss) (2) | | | 0.33 | | | | 0.23 | | | | 0.21 | | | | (0.30 | ) | | | (0.80 | ) | | | (0.60 | ) | |
Net realized and unrealized gain (loss)
on investments | | | 8.46 | | | | 6.55 | | | | 4.36 | | | | 1.90 | | | | 2.00 | | | | (17.50 | ) | |
Total income (loss)
from investment operations | | | 8.79 | | | | 6.78 | | | | 4.57 | | | | 1.60 | | | | 1.20 | | | | (18.10 | ) | |
| Less distributions: | |
| From net investment income | | | — | | | | — | | | | (0.02 | ) | | | — | | | | — | | | | (0.30 | ) | |
| Total Distributions | | | — | | | | — | | | | (0.02 | ) | | | — | | | | — | | | | (0.30 | ) | |
| Net Asset Value, end of period | | $ | 47.02 | | | $ | 38.23 | | | $ | 31.45 | | | $ | 26.90 | | | $ | 25.30 | | | $ | 24.10 | | |
| Market Value, end of period (8) | | $ | — | | | $ | — | | | $ | — | | | $ | — | | | $ | 23.600 | | | $ | 19.700 | | |
| Total Return | | | 23.02 | % | | | 21.56 | % | | | 17.00 | % | | | 6.32 | %(5) | | | 19.80 | % | | | (49.75 | )% | |
| Ratios/Supplemental Data: | |
| Net Assets, end of period (in 000's) | | $ | 38,995 | | | $ | 29,852 | | | $ | 34,608 | | | $ | 24,688 | | | $ | 36,930 | | | $ | 35,122 | | |
Ratio of net investment income
to average net assets | | | 0.78 | % | | | 0.65 | % | | | 0.71 | % | | | (1.80 | )%(4) | | | (3.25 | )% | | | (2.21 | )% | |
Ratio of expenses
to average net assets (1) | | | 1.42 | % | | | 1.42 | % | | | 1.51 | % | | | 2.37 | %(4)(6) | | | 3.31 | % | | | 2.93 | % | |
Ratio of expenses
to average net assets (1)(3) | | | 1.40 | % | | | 1.40 | % | | | 1.50 | % | | | 2.30 | %(4)(6) | | | 3.25 | % | | | 2.82 | % | |
| Portfolio turnover rate | | | 185 | % | | | 162 | % | | | 118 | % | | | 204 | %(5) | | | 605 | % | | | 1024 | % | |
(1) The net expenses of the Fund reflect a waiver of fees by the Fund's investment advisor. Had such an action not been taken, the operating expenses ratios would have been:
Ratio of expenses to
average net assets (3) | | | 1.97 | % | | | 2.24 | % | | | 2.98 | % | | | 3.73 | % | | | 3.50 | % | | | 3.07 | % | |
Ratio of expenses to
average net assets | | | 1.99 | % | | | 2.26 | % | | | 2.99 | % | | | 3.80 | % | | | 3.56 | % | | | 3.18 | % | |
(2) Based on average shares outstanding during the period.
(3) Ratio of expenses including the effect of the expense offset arrangement.
(4) Annualized
(5) Not Annualized
(6) The current expenses for the period April 1, 2004 to October 31, 2004 exceed the expense cap of 1.75% due to the expense reimbursement not starting until July 1, 2004.
(7) Per share amounts were adjusted to reflect a 10 for 1 reverse stock split effective September 15, 2005
(8) On July 1, 2004 the Fund changed its name from The European Warrant Fund, Inc. and converted from a closed-end, non diversified investment company ("closed-end fund") to an open-end diversified investment company with a different investment objective, different investment strategies, different management team and a new investment adviser (an affiliate of the closed-end fund's adviser). Until the close of business on June 30, 2004, the Fund operated as a closed-end Fund and its common stock (which then comprised of a single share class) was listed on the NYSE. After the close of business on June 30, 2004, all of the common stock was converted into Class A shares of the Fund, and the Fund began seeking to maximize total return principally through capital appreciation by investing in a diversified portfolio of equit y securities of issuers located throughout the world. For periods prior thereto, all historical performance information for Class A shares reflects the Net Asset Value (NAV) performance of the Fund's common stock while it was a closed-end fund.
See Notes to Financial Statements.
Julius Baer Funds 2007 Annual Report
173
FINANCIAL HIGHLIGHTS
Julius Baer Global Equity Fund Inc.
For a share outstanding throughout each period
| | | Class I | |
| | | Year Ended
October 31, | | Period
Ended
October 31, | |
| | | 2007 | | 2006 | | 2005(6)(7) | |
| Net Asset Value, beginning of period | | $ | 38.48 | | | $ | 31.58 | | | $ | 30.80 | | |
| Income from investment operations: | |
| Net investment income (2) | | | 0.46 | | | | 0.38 | | | | 0.23 | | |
| Net realized and unrealized gain on investments | | | 8.51 | | | | 6.52 | | | | 0.56 | | |
| Total income from investment operations | | | 8.97 | | | | 6.90 | | | | 0.79 | | |
| Less distributions: | |
| From net investment income | | | — | | | | — | (8) | | | (0.01 | ) | |
| Total Distributions | | | — | | | | — | | | | (0.01 | ) | |
| Net Asset Value, end of period | | $ | 47.45 | | | $ | 38.48 | | | $ | 31.58 | | |
| Total Return | | | 23.31 | % | | | 21.89 | % | | | 2.56 | %(5) | |
| Ratios/Supplemental Data: | |
| Net Assets, end of period (in 000's) | | $ | 74,033 | | | $ | 29,598 | | | $ | 16,810 | | |
| Ratio of net investment income to average net assets | | | 1.08 | % | | | 1.06 | % | | | 1.15 | %(4) | |
| Ratio of expenses to average net assets (1) | | | 1.17 | % | | | 1.17 | % | | | 1.17 | %(4) | |
| Ratio of expenses to average net assets (1)(3) | | | 1.15 | % | | | 1.15 | % | | | 1.15 | %(4) | |
| Portfolio turnover rate | | | 185 | % | | | 162 | % | | | 118 | %(5) | |
(1) The net expenses of the Fund reflect a waiver of fees by the Fund's investment advisor. Had such an action not been taken, the operating expenses ratios would have been:
| Ratio of expenses to average net assets (3) | | | 1.63 | % | | | 1.86 | % | | | 2.49 | % | |
| Ratio of expenses to average net assets | | | 1.65 | % | | | 1.88 | % | | | 2.51 | % | |
(2) Based on average shares outstanding during the period.
(3) Ratio of expenses including the effect of the expense offset arrangement.
(4) Annualized.
(5) Not Annualized.
(6) Class I commenced operations on March 14, 2005.
(7) Per share amounts were adjusted to reflect a 10 for 1 reverse stock split effective September 15, 2005.
(8) Rounds to less than $0.01.
See Notes to Financial Statements.
Julius Baer Funds 2007 Annual Report
174
FINANCIAL HIGHLIGHTS
Julius Baer International Equity Fund
For a share outstanding throughout each period
| | | Class A | |
| | | Year Ended October 31, | |
| | | 2007 | | 2006 | | 2005 | | 2004 | | 2003 | |
| Net Asset Value, beginning of year | | $ | 43.09 | | | $ | 34.29 | | | $ | 28.99 | | | $ | 24.45 | | | $ | 19.60 | | |
| Income from investment operations: | |
| Net investment income (2) | | | 0.71 | | | | 0.50 | | | | 0.35 | | | | 0.16 | | | | 0.24 | | |
| Net realized and unrealized gain on investments | | | 12.60 | | | | 9.87 | | | | 5.98 | | | | 4.71 | | | | 4.93 | | |
Total income from
investment operations | | | 13.31 | | | | 10.37 | | | | 6.33 | | | | 4.87 | | | | 5.17 | | |
| Less distributions: | |
| From net investment income | | | (0.28 | ) | | | — | | | | (0.45 | ) | | | (0.33 | ) | | | (0.32 | ) | |
| From net realized gains on investments | | | (4.17 | ) | | | (1.57 | ) | | | (0.58 | ) | | | — | | | | — | | |
| Total Distributions | | | (4.45 | ) | | | (1.57 | ) | | | (1.03 | ) | | | (0.33 | ) | | | (0.32 | ) | |
| Net Asset Value, end of year | | $ | 51.95 | | | $ | 43.09 | | | $ | 34.29 | | | $ | 28.99 | | | $ | 24.45 | | |
| Total Return | | | 33.33 | % | | | 31.20 | % | | | 22.19 | % | | | 20.05 | % | | | 26.78 | % | |
| Ratios/Supplemental Data: | |
| Net Assets, end of year (in 000's) | | $ | 11,619,663 | | | $ | 9,092,359 | | | $ | 7,018,030 | | | $ | 3,721,409 | | | $ | 1,705,074 | | |
Ratio of net investment income
to average net assets | | | 1.54 | % | | | 1.28 | % | | | 1.09 | % | | | 0.58 | % | | | 0.83 | % | |
| Ratio of expenses to average net assets (1) | | | 1.24 | % | | | 1.24 | % | | | 1.32 | % | | | 1.35 | % | | | 1.37 | % | |
| Ratio of expenses to average net assets | | | 1.19 | % | | | 1.19 | % | | | 1.31 | % | | | 1.32 | % | | | 1.31 | % | |
| Portfolio turnover rate | | | 51 | % | | | 62 | % | | | 57 | % | | | 100 | % | | | 114 | % | |
(1) Expense ratio without taking into consideration any expense reductions related to custody offset arrangement.
(2) Based on average shares outstanding during the period.
See Notes to Financial Statements.
Julius Baer Funds 2007 Annual Report
175
FINANCIAL HIGHLIGHTS
Julius Baer International Equity Fund
For a share outstanding throughout each period
| | | Class I | |
| | | Year Ended October 31, | |
| | | 2007 | | 2006 | | 2005 | | 2004 | | 2003 | |
| Net Asset Value, beginning of year | | $ | 43.97 | | | $ | 34.96 | | | $ | 29.47 | | | $ | 24.79 | | | $ | 19.79 | | |
| Income from investment operations: | |
| Net investment income (2) | | | 0.85 | | | | 0.52 | | | | 0.44 | | | | 0.23 | | | | 0.28 | | |
| Net realized and unrealized gain on investments | | | 12.88 | | | | 10.15 | | | | 6.09 | | | | 4.79 | | | | 5.05 | | |
| Total income from investment operations | | | 13.73 | | | | 10.67 | | | | 6.53 | | | | 5.02 | | | | 5.33 | | |
| Less distributions: | |
| From net investment income | | | (0.38 | ) | | | — | | | | (0.46 | ) | | | (0.34 | ) | | | (0.33 | ) | |
| From net realized gains on investments | | | (4.17 | ) | | | (1.66 | ) | | | (0.58 | ) | | | — | | | | — | | |
| Total Distributions | | | (4.55 | ) | | | (1.66 | ) | | | (1.04 | ) | | | (0.34 | ) | | | (0.33 | ) | |
| Net Asset Value, end of year | | $ | 53.15 | | | $ | 43.97 | | | $ | 34.96 | | | $ | 29.47 | | | $ | 24.79 | | |
| Total Return | | | 33.65 | % | | | 31.53 | % | | | 22.52 | % | | | 20.39 | % | | | 27.39 | % | |
| Ratios/Supplemental Data: | |
| Net Assets, end of year (in 000's) | | $ | 15,310,511 | | | $ | 11,077,753 | | | $ | 8,220,356 | | | $ | 3,844,713 | | | $ | 1,114,010 | | |
Ratio of net investment income
to average net assets | | | 1.81 | % | | | 1.29 | % | | | 1.33 | % | | | 0.87 | % | | | 1.16 | % | |
| Ratio of expenses to average net assets (1) | | | 0.99 | % | | | 0.99 | % | | | 1.05 | % | | | 1.08 | % | | | 1.08 | % | |
| Ratio of expenses to average net assets | | | 0.94 | % | | | 0.94 | % | | | 1.04 | % | | | 1.05 | % | | | 1.02 | % | |
| Portfolio turnover rate | | | 51 | % | | | 62 | % | | | 57 | % | | | 100 | % | | | 114 | % | |
(1) Expense ratio without taking into consideration any expense reductions related to custody offset arrangement.
(2) Based on average shares outstanding during the period.
See Notes to Financial Statements.
Julius Baer Funds 2007 Annual Report
176
FINANCIAL HIGHLIGHTS
Julius Baer International Equity Fund II
For a share outstanding throughout each period
| | | Class A | |
| | | Year Ended October 31, | | Period
Ended
October 31, | |
| | | 2007 | | 2006 | | 2005(5) | |
| Net Asset Value, beginning of period | | $ | 14.07 | | | $ | 10.94 | | | $ | 10.00 | | |
| Income from investment operations: | |
| Net investment income (loss) (7) | | | 0.31 | | | | 0.16 | | | | (0.01 | ) | |
| Net realized and unrealized gain on investments | | | 4.01 | | | | 2.97 | | | | 0.95 | | |
| Total income from investment operations | | | 4.32 | | | | 3.13 | | | | 0.94 | | |
| Less distributions: | |
| From net investment income | | | (0.03 | ) | | | — | | | | — | | |
| From net realized gains on investments | | | (0.05 | ) | | | — | | | | — | | |
| Total Distributions | | | (0.08 | ) | | | — | | | | — | | |
| Net Asset Value, end of period | | $ | 18.31 | | | $ | 14.07 | | | $ | 10.94 | | |
| Total Return | | | 30.89 | % | | | 28.73 | % | | | 9.30 | %(2) | |
| Ratios/Supplemental Data: | |
| Net Assets, end of period (in 000's) | | $ | 1,980,188 | | | $ | 722,531 | | | $ | 127,435 | | |
| Ratio of net investment income to average net assets | | | 1.93 | % | | | 1.25 | % | | | (0.11 | )%(3) | |
| Ratio of expenses to average net assets (1)(4)(6) | | | 1.31 | % | | | 1.33 | % | | | 1.36 | %(3) | |
| Ratio of expenses to average net assets | | | 1.29 | % | | | 1.32 | % | | | 1.35 | %(3) | |
| Portfolio turnover rate | | | 64 | % | | | 61 | % | | | 38 | %(2) | |
(1) Expense ratio without taking into consideration any expense reductions related to custody offset arrangement.
(2) Not annualized.
(3) Annualized.
(4) The net expenses of the Fund reflect a recoupment or waiver of fees by the Fund's investment advisor. Had such action not been taken, the annualized operating expense ratios would have been 1.28%, 1.32% and 2.06% for the periods ended October 31, 2007, October 31, 2006 and October 31, 2005.
(5) Commenced operations on May 4, 2005.
(6) On March 1, 2006, the expense cap changed from 1.35% to 1.32%.
(7) Based on average shares outstanding during the period.
See Notes to Financial Statements.
Julius Baer Funds 2007 Annual Report
177
FINANCIAL HIGHLIGHTS
Julius Baer International Equity Fund II
For a share outstanding throughout each period
| | | Class I | |
| | | Year Ended October 31, | | Period
Ended
October 31, | |
| | | 2007 | | 2006 | | 2005(5) | |
| Net Asset Value, beginning of period | | $ | 14.14 | | | $ | 10.96 | | | $ | 10.00 | | |
| Income from investment operations: | |
| Net investment income (7) | | | 0.37 | | | | 0.20 | | | | — | | |
| Net realized and unrealized gain on investments | | | 4.02 | | | | 2.98 | | | | 0.96 | | |
| Total income from investment operations | | | 4.39 | | | | 3.18 | | | | 0.96 | | |
| Less distributions: | |
| From net investment income | | | (0.06 | ) | | | — | | | | — | | |
| From net realized gains on investments | | | (0.05 | ) | | | — | | | | — | | |
| Total Distributions | | | (0.11 | ) | | | — | | | | — | | |
| Net Asset Value, end of period | | $ | 18.42 | | | $ | 14.14 | | | $ | 10.96 | | |
| Total Return | | | 31.15 | % | | | 29.11 | % | | | 9.60 | %(2) | |
| Ratios/Supplemental Data: | |
| Net Assets, end of year (in 000's) | | $ | 7,753,276 | | | $ | 2,439,754 | | | $ | 297,617 | | |
| Ratio of net investment income to average net assets | | | 2.28 | % | | | 1.54 | % | | | (0.01 | )%(3) | |
| Ratio of expenses to average net assets (1)(4)(6) | | | 1.03 | % | | | 1.06 | % | | | 1.09 | %(3) | |
| Ratio of expenses to average net assets | | | 1.01 | % | | | 1.05 | % | | | 1.08 | %(3) | |
| Portfolio turnover rate | | | 64 | % | | | 61 | % | | | 38 | %(2) | |
(1) Expense ratio without taking into consideration any expense reductions related to custody offset arrangement.
(2) Not annualized.
(3) Annualized.
(4) The net expenses of the Fund reflect a recoupment or waiver of fees by the Fund's investment advisor. Had such action not been taken, the annualized operating expense ratio would have been 1.01%, 1.05%, and 1.60% for the periods ended October 31, 2007, October 31, 2006 and October 31, 2005.
(5) Commenced operations on May 4, 2005.
(6) On March 1, 2006, the expense cap changed from 1.08% to 1.05%.
(7) Based on average shares outstanding during the period.
See Notes to Financial Statements.
Julius Baer Funds 2007 Annual Report
178
FINANCIAL HIGHLIGHTS
Julius Baer Total Return Bond Fund
For a share outstanding throughout each period
| | | Class A | |
| | | Year Ended October 31, | |
| | | 2007 | | 2006 | | 2005 | | 2004 | | 2003 | |
| Net Asset Value, beginning of year | | $ | 13.08 | | | $ | 13.33 | | | $ | 13.37 | | | $ | 13.34 | | | $ | 12.55 | | |
| Income from investment operations: | |
| Net investment income (3) | | | 0.57 | | | | 0.56 | | | | 0.42 | | | | 0.37 | | | | 0.30 | | |
| Net realized and unrealized gain on investments | | | 0.29 | | | | 0.07 | | | | 0.10 | | | | 0.35 | | | | 0.92 | | |
| Total income from investment operations | | | 0.86 | | | | 0.63 | | | | 0.52 | | | | 0.72 | | | | 1.22 | | |
| Less distributions: | |
| From net investment income | | | (0.53 | ) | | | (0.77 | ) | | | (0.46 | ) | | | (0.46 | ) | | | (0.32 | ) | |
| From net realized gains on investments | | | — | | | | (0.11 | ) | | | (0.10 | ) | | | (0.23 | ) | | | (0.11 | ) | |
| Total Distributions | | | (0.53 | ) | | | (0.88 | ) | | | (0.56 | ) | | | (0.69 | ) | | | (0.43 | ) | |
| Net Asset Value, end of year | | $ | 13.41 | | | $ | 13.08 | | | $ | 13.33 | | | $ | 13.37 | | | $ | 13.34 | | |
| Total Return | | | 6.75 | % | | | 4.98 | % | | | 3.93 | % | | | 5.50 | % | | | 9.83 | % | |
| Ratios/Supplemental Data: | |
| Net Assets, end of year (in 000's) | | $ | 148,603 | | | $ | 103,732 | | | $ | 68,223 | | | $ | 58,823 | | | $ | 63,449 | | |
| Ratio of net investment income to average net assets | | | 4.34 | % | | | 4.32 | % | | | 3.11 | % | | | 2.79 | % | | | 2.24 | % | |
| Ratio of expenses to average net assets (1) | | | 0.69 | % | | | 0.69 | % | | | 0.78 | % | | | 1.17 | % | | | 1.16 | % | |
| Ratio of expenses to average net assets | | | 0.69 | %(2) | | | 0.69 | %(2) | | | 0.77 | %(2) | | | 1.17 | % | | | 1.16 | % | |
| Portfolio turnover rate | | | 433 | %(4) | | | 411 | % | | | 202 | % | | | 69 | % | | | 160 | % | |
(1) Expense ratio without taking into consideration any reductions related to custody offset arrangement.
(2) The net expenses of the Fund reflect a waiver of fees by the Fund's investment advisor. Had such action not been taken, the operating expense ratios would have been 0.81%, 0.83%, and 0.93% for the periods ended October 31, 2007, 2006, and 2005, respectively.
(3) Based on average shares outstanding during the period.
(4) The portfolio turnover rate not including TBA transactions was 238%, 220%, 174%, 67% and 155% for the years ended October 31, 2007, October 31, 2006, October 31, 2005, October 31, 2004 and October 31, 2003.
See Notes to Financial Statements.
Julius Baer Funds 2007 Annual Report
179
FINANCIAL HIGHLIGHTS
Julius Baer Total Return Bond Fund
For a share outstanding throughout each period
| | | Class I | |
| | | Year Ended October 31, | |
| | | 2007 | | 2006 | | 2005 | | 2004 | | 2003 | |
| Net Asset Value, beginning of year | | $ | 13.12 | | | $ | 13.38 | | | $ | 13.41 | | | $ | 13.37 | | | $ | 12.56 | | |
| Income from investment operations: | |
| Net investment income (3) | | | 0.61 | | | | 0.60 | | | | 0.47 | | | | 0.41 | | | | 0.37 | | |
| Net realized and unrealized gain on investments | | | 0.29 | | | | 0.07 | | | | 0.08 | | | | 0.34 | | | | 0.89 | | |
| Total income from investment operations | | | 0.90 | | | | 0.67 | | | | 0.55 | | | | 0.75 | | | | 1.26 | | |
| Less distributions: | |
| From net investment income | | | (0.59 | ) | | | (0.82 | ) | | | (0.48 | ) | | | (0.48 | ) | | | (0.34 | ) | |
| From net realized gains on investments | | | — | | | | (0.11 | ) | | | (0.10 | ) | | | (0.23 | ) | | | (0.11 | ) | |
| Total Distributions | | | (0.59 | ) | | | (0.93 | ) | | | (0.58 | ) | | | (0.71 | ) | | | (0.45 | ) | |
| Net Asset Value, end of year | | $ | 13.43 | | | $ | 13.12 | | | $ | 13.38 | | | $ | 13.41 | | | $ | 13.37 | | |
| Total Return | | | 7.13 | % | | | 5.25 | % | | | 4.10 | % | | | 5.82 | % | | | 10.19 | % | |
| Ratios/Supplemental Data: | |
| Net Assets, end of year (in 000's) | | $ | 781,006 | | | $ | 399,187 | | | $ | 141,145 | | | $ | 31,862 | | | $ | 14,188 | | |
| Ratio of net investment income to average net assets | | | 4.61 | % | | | 4.64 | % | | | 3.50 | % | | | 3.08 | % | | | 2.50 | % | |
| Ratio of expenses to average net assets (1) | | | 0.44 | % | | | 0.44 | % | | | 0.47 | % | | | 0.88 | % | | | 0.90 | % | |
| Ratio of expenses to average net assets | | | 0.44 | %(2) | | | 0.44 | %(2) | | | 0.47 | %(2) | | | 0.88 | % | | | 0.89 | % | |
| Portfolio turnover rate | | | 433 | %(4) | | | 411 | % | | | 202 | % | | | 69 | % | | | 160 | % | |
(1) Expense ratio without taking into consideration any reductions related to custody offset arrangement.
(2) The net expenses of the Fund reflect a waiver of fees by the Fund's investment advisor. Had such action not been taken, the operating expense ratios would have been 0.54%, 0.56%, and 0.65% for periods ended October 31, 2007, 2006, and 2005, respectively.
(3) Based on average shares outstanding during the period.
(4) The portfolio turnover rate not including TBA transactions was 238%, 220%, 174%, 67% and 155% for the years ended October 31, 2007, October 31, 2006, October 31, 2005, October 31, 2004 and October 31, 2003.
See Notes to Financial Statements.
Julius Baer Funds 2007 Annual Report
180
FINANCIAL HIGHLIGHTS
Julius Baer Global High Income Fund
For a share outstanding throughout each period
| | | Class A | |
| | | Year Ended October 31, | | Period
Ended
October 31, | |
| | | 2007 | | 2006 | | 2005 | | 2004 | | 2003(1) | |
| Net Asset Value, beginning of period | | $ | 10.99 | | | $ | 11.93 | | | $ | 12.07 | | | $ | 11.43 | | | $ | 10.00 | | |
| Income from investment operations: | |
| Net investment income (2) | | | 0.76 | | | | 0.68 | | | | 0.73 | | | | 0.70 | | | | 0.64 | | |
| Net realized and unrealized gain (loss) on investments | | | 0.15 | | | | 0.43 | | | | (0.01 | ) | | | 0.72 | | | | 1.37 | | |
| Total income from investment operations | | | 0.91 | | | | 1.11 | | | | 0.72 | | | | 1.42 | | | | 2.01 | | |
| Less distributions: | |
| From net investment income | | | (0.68 | ) | | | (1.17 | ) | | | (0.71 | ) | | | (0.71 | ) | | | (0.58 | ) | |
| From net realized gains on investments | | | (0.10 | ) | | | (0.88 | ) | | | (0.15 | ) | | | (0.07 | ) | | | — | | |
| | | | Return of capital | | | | (0.07 | ) | | | | | | | | | | | | | |
| Total Distributions | | | (0.85 | ) | | | (2.05 | ) | | | (0.86 | ) | | | (0.78 | ) | | | (0.58 | ) | |
| Net Asset Value, end of period | | $ | 11.05 | | | $ | 10.99 | | | $ | 11.93 | | | $ | 12.07 | | | $ | 11.43 | | |
| Total Return | | | 8.58 | % | | | 10.49 | % | | | 6.15 | % | | | 12.87 | % | | | 20.57 | %(6) | |
| Ratios/Supplemental Data: | |
| Net Assets, end of period (in 000's) | | $ | 94,348 | | | $ | 45,930 | | | $ | 36,166 | | | $ | 45,164 | | | $ | 28,195 | | |
| Ratio of net investment income to average net assets | | | 6.89 | % | | | 6.16 | % | | | 6.01 | % | | | 5.97 | % | | | 6.71 | %(3) | |
| Ratio of expenses to average net assets (4)(7) | | | 1.01 | % | | | 1.10 | % | | | 1.28 | % | | | 1.24 | % | | | 1.26 | %(3) | |
| Ratio of expenses to average net assets (7) | | | 1.00 | %(5) | | | 1.08 | %(5) | | | 1.25 | %(5) | | | 1.25 | % | | | 1.25 | %(3)(5) | |
| Portfolio turnover rate | | | 63 | % | | | 96 | % | | | 99 | % | | | 93 | % | | | 83 | %(6) | |
(1) Class A shares commenced operations on December 17, 2002.
(2) Based on average shares outstanding during the period.
(3) Annualized.
(4) Expense ratio without taking into consideration any expense reductions related to custody offset arrangement and reimbursement of expense previously assumed by the Fund's investment advisor.
(5) The net expenses of the Fund reflect a waiver of fees by the Fund's investment advisor. Had such action not been taken, the operating expenses ratios would have been 1.20%, 1.35%, 1.30% and 1.95% for the periods ended October 31, 2007, October 31, 2006, October 31, 2005 and October 31, 2003.
(6) Not annualized.
(7) On March 1, 2006, the expense cap changed from 1.25% to 1.00%.
See Notes to Financial Statements.
Julius Baer Funds 2007 Annual Report
181
FINANCIAL HIGHLIGHTS
Julius Baer Global High Income Fund
For a share outstanding throughout each period
| | | Class I | |
| | | Year Ended October 31, | | Period
Ended
October 31, | |
| | | 2007 | | 2006 | | 2005 | | 2004 | | 2003(1) | |
| Net Asset Value, beginning of period | | $ | 10.66 | | | $ | 11.61 | | | $ | 12.01 | | | $ | 11.36 | | | $ | 10.00 | | |
| Income from investment operations: | |
| Net investment income (2) | | | 0.77 | | | | 0.70 | | | | 0.78 | | | | 0.73 | | | | 0.57 | | |
Net realized and unrealized gain (loss)
on investments | | | 0.14 | | | | 0.40 | | | | (0.05 | ) | | | 0.72 | | | | 1.35 | | |
| Total income from investment operations | | | 0.91 | | | | 1.10 | | | | 0.73 | | | | 1.45 | | | | 1.92 | | |
| Less distributions: | |
| From net investment income | | | (0.68 | ) | | | (1.17 | ) | | | (0.98 | ) | | | (0.73 | ) | | | (0.56 | ) | |
| From net realized gains on investments | | | (0.10 | ) | | | (0.88 | ) | | | (0.15 | ) | | | (0.07 | ) | | | — | | |
| Return of capital | | | (0.08 | ) | | | | | | | | | | | | | | | | | |
| Total Distributions | | | (0.86 | ) | | | (2.05 | ) | | | (1.13 | ) | | | (0.80 | ) | | | (0.56 | ) | |
| Net Asset Value, end of period | | $ | 10.71 | | | $ | 10.66 | | | $ | 11.61 | | | $ | 12.01 | | | $ | 11.36 | | |
| Total Return | | | 8.82 | % | | | 10.76 | % | | | 6.37 | % | | | 13.28 | % | | | 19.66 | %(6) | |
| Ratios/Supplemental Data: | | | | | | | | | | | | | | | | | | | | | |
| Net Assets, end of period (in 000's) | | $ | 152,769 | | | $ | 35,100 | | | $ | 7,586 | | | $ | 45,636 | | | $ | 20,839 | | |
Ratio of net investment income
to average net assets | | | 7.15 | % | | | 6.61 | % | | | 6.47 | % | | | 6.24 | % | | | 6.91 | %(3) | |
| Ratio of expenses to average net assets (4)(7) | | | 0.76 | % | | | 0.81 | % | | | 1.03 | % | | | 0.97 | % | | | 1.02 | %(3) | |
| Ratio of expenses to average net assets (7) | | | 0.75 | %(5) | | | 0.79 | %(5) | | | 1.00 | %(5) | | | 1.00 | % | | | 1.00 | %(3)(5) | |
| Portfolio turnover rate | | | 63 | % | | | 96 | % | | | 99 | % | | | 93 | % | | | 83 | %(6) | |
(1) Class I shares commenced operations on January 30, 2003.
(2) Based on average shares outstanding during the period.
(3) Annualized.
(4) Expense ratio without taking into consideration any expense reductions related to custody offset arrangement and reimbursement of expense previously assumed by the Fund's investment advisor.
(5) The net expenses of the Fund reflect a waiver of fees by the Fund's investment advisor. Had such an action not been taken, the operating expense ratios would have been 0.92%, 1.08%, 1.04% and 1.41% for the periods October 31, 2007, October 31, 2006, October 31, 2005 and October 31, 2003.
(6) Not annualized.
(7) On March 1, 2006, the expense cap changed from 1.00% to 0.75%.
See Notes to Financial Statements.
Julius Baer Funds 2007 Annual Report
182
FINANCIAL HIGHLIGHTS
Julius Baer U.S. Microcap Fund
For a share outstanding throughout each period
| | | Class A | |
| | | Year
Ended
October 31,
2007 | | Period
Ended
October 31,
2006(1) | |
| Net Asset Value, beginning of period | | $ | 11.26 | | | $ | 10.00 | | |
| Income from investment operations: | |
| Net investment loss (5) | | | (0.11 | ) | | | (0.03 | ) | |
| Net realized and unrealized gain on investments | | | 1.51 | | | | 1.29 | | |
| Total income from investment operations | | | 1.40 | | | | 1.26 | | |
| Net Asset Value, end of period | | $ | 12.66 | | | $ | 11.26 | | |
| Total Return | | | 12.43 | % | | | 12.60 | %(2) | |
| Ratios/Supplemental Data: | |
| Net Assets, end of period (in 000's) | | $ | 3,781 | | | $ | 2,955 | | |
| Ratio of net investment income to average net assets | | | (0.90 | )% | | | (0.99 | )%(3) | |
| Ratio of expenses to average net assets (4) | | | 1.80 | % | | | 1.80 | %(3) | |
| Portfolio turnover rate | | | 172 | % | | | 19 | %(2) | |
(1) Commenced operations on July 24, 2006.
(2) Not annualized.
(3) Annualized.
(4) The net expenses of the Fund reflect a waiver of fees by the Fund's investment advisor. Had such action not been taken, the operating expense ratio would have been 3.52% for the period ended October 31, 2007 and 4.52% for the period ended October 31, 2006.
(5) Based on average shares outstanding during the period.
See Notes to Financial Statements.
Julius Baer Funds 2007 Annual Report
183
FINANCIAL HIGHLIGHTS
Julius Baer U.S. Microcap Fund
For a share outstanding throughout each period
| | | Class I | |
| | | Year
Ended
October 31,
2007 | | Period
Ended
October 31,
2006(1) | |
| Net Asset Value, beginning of period | | $ | 11.27 | | | $ | 10.00 | | |
| Income from investment operations: | |
| Net investment loss (5) | | | (0.07 | ) | | | (0.02 | ) | |
| Net realized and unrealized gain on investments | | | 1.51 | | | | 1.29 | | |
| Total income from investment operations | | | 1.44 | | | | 1.27 | | |
| Net Asset Value, end of period | | $ | 12.71 | | | $ | 11.27 | | |
| Total Return | | | 12.88 | % | | | 12.60 | %(2) | |
| Ratios/Supplemental Data: | |
| Net Assets, end of period (in 000's) | | $ | 3,677 | | | $ | 2,816 | | |
| Ratio of net investment income to average net assets | | | (0.60 | )% | | | (0.69 | )%(3) | |
| Ratio of expenses to average net assets (4) | | | 1.50 | % | | | 1.50 | %(3) | |
| Portfolio turnover rate | | | 172 | % | | | 19 | %(2) | |
(1) Commenced operations on July 24, 2006.
(2) Not annualized.
(3) Annualized.
(4) The net expenses of the Fund reflect a waiver of fees by the Fund's investment advisor. Had such action not been taken, the operating expense ratio would have been 3.08% for the period ended October 31, 2007 and 4.03% for the period ended October 31, 2006.
(5) Based on average shares outstanding during the period.
See Notes to Financial Statements.
Julius Baer Funds 2007 Annual Report
184
FINANCIAL HIGHLIGHTS
Julius Baer U.S. Smallcap Fund
For a share outstanding throughout each period
| | | Class A | |
| | | Year
Ended
October 31,
2007 | | Period
Ended
October 31,
2006(1) | |
| Net Asset Value, beginning of period | | $ | 11.10 | | | $ | 10.00 | | |
| Income from investment operations: | |
| Net investment loss (5) | | | (0.10 | ) | | | (0.01 | ) | |
| Net realized and unrealized gain on investments | | | 3.31 | | | | 1.11 | | |
| Total income from investment operations | | | 3.21 | | | | 1.10 | | |
| Less distributions: | |
| From net realized gains on investments | | | (0.18 | ) | | | — | | |
| Total Distributions | | | (0.18 | ) | | | — | | |
| Net Asset Value, end of period | | $ | 14.13 | | | $ | 11.10 | | |
| Total Return | | | 29.44 | % | | | 11.00 | %(2) | |
| Ratios/Supplemental Data: | |
| Net Assets, end of period (in 000's) | | $ | 4,339 | | | $ | 2,807 | | |
| Ratio of net investment income to average net assets | | | (0.85 | )% | | | (0.29 | )%(3) | |
| Ratio of expenses to average net assets (4) | | | 1.50 | % | | | 1.50 | %(3) | |
| Portfolio turnover rate | | | 238 | % | | | 13 | %(2) | |
(1) Commenced operations on July 24, 2006.
(2) Not annualized.
(3) Annualized.
(4) The net expenses of the Fund reflect a waiver of fees by the Fund's investment advisor. Had such action not been taken, the operating expense ratio would have been 2.97% and 4.22% for the periods ending October 31, 2007 and October 31, 2006.
(5) Based on average shares outstanding during the period.
See Notes to Financial Statements.
Julius Baer Funds 2007 Annual Report
185
FINANCIAL HIGHLIGHTS
Julius Baer U.S. Smallcap Fund
For a share outstanding throughout each period
| | | Class I | |
| | | Year
Ended
October 31,
2007 | | Period
Ended
October 31,
2006(1) | |
| Net Asset Value, beginning of period | | $ | 11.11 | | | $ | 10.00 | | |
| Income from investment operations: | |
| Net investment loss (5) | | | (0.06 | ) | | | — | | |
| Net realized and unrealized gain on investments | | | 3.32 | | | | 1.11 | | |
| Total income from investment operations | | | 3.26 | | | | 1.11 | | |
| Less distributions: | |
| From net investment income | | | (0.01 | ) | | | — | | |
| From net realized gains on investments | | | (0.18 | ) | | | — | | |
| Total Distributions | | | (0.19 | ) | | | — | | |
| Net Asset Value, end of period | | $ | 14.18 | | | $ | 11.11 | | |
| Total Return | | | 29.75 | % | | | 11.10 | %(2) | |
| Ratios/Supplemental Data: | |
| Net Assets, end of period (in 000's) | | $ | 4,073 | | | $ | 2,777 | | |
| Ratio of net investment income to average net assets | | | (0.52 | )% | | | 0.01 | %(3) | |
| Ratio of expenses to average net assets (4) | | | 1.20 | % | | | 1.20 | %(3) | |
| Portfolio turnover rate | | | 238 | % | | | 13 | %(2) | |
(1) Commenced operations on July 24, 2006.
(2) Not annualized.
(3) Annualized.
(4) The net expenses of the Fund reflect a waiver of fees by the Fund's investment advisor. Had such action not been taken, the operating expense ratio would have been 2.79% and 3.68% for the periods ending October 31, 2007 and October 31, 2006.
(5) Based on average shares outstanding during the period.
See Notes to Financial Statements.
Julius Baer Funds 2007 Annual Report
186
FINANCIAL HIGHLIGHTS
Julius Baer U.S. Midcap Fund
For a share outstanding throughout each period
| | | Class A | |
| | | Year
Ended
October 31,
2007 | | Period
Ended
October 31,
2006(1) | |
| Net Asset Value, beginning of period | | $ | 11.05 | | | $ | 10.00 | | |
| Income from investment operations: | |
| Net investment income (5) | | | 0.05 | | | | 0.01 | | |
| Net realized and unrealized gain on investments | | | 1.81 | | | | 1.04 | | |
| Total income from investment operations | | | 1.86 | | | | 1.05 | | |
| Less distributions: | |
| From net investment income | | | (0.13 | ) | | | — | | |
| From net realized gains on investments | | | (0.04 | ) | | | — | | |
| Total Distributions | | | (0.17 | ) | | | — | | |
| Net Asset Value, end of period | | $ | 12.74 | | | $ | 11.05 | | |
| Total Return | | | 17.16 | % | | | 10.50 | %(2) | |
| Ratios/Supplemental Data: | |
| Net Assets, end of period (in 000's) | | $ | 3,646 | | | $ | 2,887 | | |
| Ratio of net investment income to average net assets | | | 0.43 | % | | | 0.52 | %(3) | |
| Ratio of expenses to average net assets (4) | | | 1.35 | % | | | 1.35 | %(3) | |
| Portfolio turnover rate | | | 155 | % | | | 11 | %(2) | |
(1) Commenced operations on July 24, 2006.
(2) Not annualized.
(3) Annualized.
(4) The net expenses of the Fund reflect a waiver of fees by the Fund's investment advisor. Had such action not been taken, the operating expense ratio would have been 2.98% and 3.94% for the periods ended October 31, 2007 and October 31, 2006.
(5) Based on average shares outstanding during the period.
See Notes to Financial Statements.
Julius Baer Funds 2007 Annual Report
187
FINANCIAL HIGHLIGHTS
Julius Baer U.S. Midcap Fund
For a share outstanding throughout each period
| | | Class I | |
| | | Year
Ended
October 31,
2007 | | Period
Ended
October 31,
2006(1) | |
| Net Asset Value, beginning of period | | $ | 11.06 | | | $ | 10.00 | | |
| Income from investment operations: | |
| Net investment income (5) | | | 0.09 | | | | 0.01 | | |
| Net realized and unrealized gain on investments | | | 1.80 | | | | 1.05 | | |
| Total income from investment operations | | | 1.89 | | | | 1.06 | | |
| Less distributions: | |
| From net investment income | | | (0.15 | ) | | | — | | |
| From net realized gains on investments | | | (0.04 | ) | | | — | | |
| Total Distributions | | | (0.19 | ) | | | — | | |
| Net Asset Value, end of period | | $ | 12.76 | | | $ | 11.06 | | |
| Total Return | | | 17.47 | % | | | 10.60 | %(2) | |
| Ratios/Supplemental Data: | |
| Net Assets, end of period (in 000's) | | $ | 3,842 | | | $ | 2,765 | | |
| Ratio of net investment income to average net assets | | | 0.77 | % | | | 0.22 | %(3) | |
| Ratio of expenses to average net assets (4) | | | 1.05 | % | | | 1.05 | %(3) | |
| Portfolio turnover rate | | | 155 | % | | | 11 | %(2) | |
(1) Commenced operations on July 24, 2006.
(2) Not annualized.
(3) Annualized.
(4) The net expenses of the Fund reflect a waiver of fees by the Fund's investment advisor. Had such action not been taken, the operating expense ratio would have been 2.51% and 3.46% for the periods ended October 31, 2007 and October 31, 2006.
(5) Based on average shares outstanding during the period.
See Notes to Financial Statements.
Julius Baer Funds 2007 Annual Report
188
FINANCIAL HIGHLIGHTS
Julius Baer U.S. Multicap Fund
For a share outstanding throughout each period
| | | Class A | |
| | | Year
Ended
October 31,
2007 | | Period
Ended
October 31,
2006(1) | |
| Net Asset Value, beginning of period | | $ | 11.10 | | | $ | 10.00 | | |
| Income from investment operations: | |
| Net investment income (6) | | | 0.07 | | | | — | (5) | |
| Net realized and unrealized gain on investments | | | 1.85 | | | | 1.10 | | |
| Total income from investment operations | | | 1.92 | | | | 1.10 | | |
| Less distributions: | |
| From net investment income | | | (0.13 | ) | | | — | | |
| From net realized gains on investments | | | (0.05 | ) | | | — | | |
| Total Distributions | | | (0.18 | ) | | | — | | |
| Net Asset Value, end of period | | $ | 12.84 | | | $ | 11.10 | | |
| Total Return | | | 17.47 | % | | | 11.00 | %(2) | |
| Ratios/Supplemental Data: | |
| Net Assets, end of period (in 000's) | | $ | 3,620 | | | $ | 2,780 | | |
| Ratio of net investment income to average net assets | | | 0.58 | % | | | (0.03 | )%(3) | |
| Ratio of expenses to average net assets (4) | | | 1.30 | % | | | 1.30 | %(3) | |
| Portfolio turnover rate | | | 152 | % | | | 15 | %(2) | |
(1) Commenced operations on July 24, 2006.
(2) Not Annualized.
(3) Annualized.
(4) The net expenses of the Fund reflect a waiver of fees by the Fund's investment advisor. Had such action been taken, the operating expenses ratio would have been 2.93% and 3.87% for the periods ended October 31, 2007 and October 31, 2006.
(5) Amount was less than $0.01 per share.
(6) Based on average shares outstanding during the period.
See Notes to Financial Statements.
Julius Baer Funds 2007 Annual Report
189
FINANCIAL HIGHLIGHTS
Julius Baer U.S. Multicap Fund
For a share outstanding throughout each period
| | | Class I | |
| | | Year
Ended
October 31,
2007 | | Period
Ended
October 31,
2006(1) | |
| Net Asset Value, beginning of period | | $ | 11.11 | | | $ | 10.00 | | |
| Income from investment operations: | |
| Net investment income (5) | | | 0.12 | | | | 0.01 | | |
| Net realized and unrealized gain on investments | | | 1.84 | | | | 1.10 | | |
| Total income from investment operations | | | 1.96 | | | | 1.11 | | |
| Less distributions: | |
| From net investment income | | | (0.16 | ) | | | — | | |
| From net realized gains on investments | | | (0.05 | ) | | | — | | |
| Total Distributions | | | (0.21 | ) | | | — | | |
| Net Asset Value, end of period | | $ | 12.86 | | | $ | 11.11 | | |
| Total Return | | | 17.79 | % | | | 11.10 | %(2) | |
| Ratios/Supplemental Data: | |
| Net Assets, end of period (in 000's) | | $ | 3,947 | | | $ | 2,778 | | |
| Ratio of net investment income to average net assets | | | 0.99 | % | | | 0.27 | %(3) | |
| Ratio of expenses to average net assets (4) | | | 1.00 | % | | | 1.00 | %(3) | |
| Portfolio turnover rate | | | 152 | % | | | 15 | %(2) | |
(1) Commenced operations on July 24, 2006.
(2) Not Annualized.
(3) Annualized.
(4) The net expenses of the Fund reflect a waiver of fees by the Fund's investment advisor. Had such action not been taken, the operating expenses ratio would have been 2.42% and 3.33% for the periods ended October 31, 2007 and October 31, 2006.
(5) Based on average shares outstanding during the period.
See Notes to Financial Statements.
Julius Baer Funds 2007 Annual Report
190
NOTES TO FINANCIAL STATEMENTS
1. Organization
The Julius Baer Funds consist of the Julius Baer Global Equity Fund Inc. ("Global Equity Fund") and the Julius Baer Investment Funds (the "Trust"). As of October 31, 2007, the Julius Baer Funds comprised nine funds (each a "Fund" and together, the "Funds").
The Global Equity Fund was incorporated under the laws of the State of Maryland on May 23, 1990 and is registered with the Securities and Exchange Commission ("SEC") under the Investment Company Act of 1940, as amended (the "1940 Act").
On July 1, 2004, the Fund changed its name from The European Warrant Fund, Inc. and converted from a closed-end, non-diversified investment company ("closed-end fund") to an open-end diversified investment company with a different investment objective, different investment strategies, different management team and a new investment advisor (an affiliate of the closed-end Fund's advisor). Until the close of business on June 30, 2004, the Fund operated as a closed-end Fund and its common stock (which then comprised a single share class) was listed on the NYSE. After the close of business on June 30, 2004, all of the common stock was converted into Class A shares of the Fund, and the Fund began seeking to maximize total return principally through capital appreciation by investing in a diversified portfolio of equity securities of issuers located throughout the world. For periods prior thereto, all historical performance information for Class A s hares reflects the Net Asset Value (NAV) performance of the Fund's common stock while it was a closed-end fund.
The Trust is registered with the SEC under the 1940 Act, as an open-end management investment company. As of October 31, 2007, the Trust offered eight investment funds: Julius Baer International Equity Fund (the "International Equity Fund"), Julius Baer International Equity Fund II (the "International Equity Fund II"), Julius Baer Total Return Bond Fund (the "Total Return Bond Fund"), Julius Baer Global High Income Fund (the "Global High Income Fund"), Julius Baer U.S. Microcap Fund (the "U.S. Microcap Fund"), Julius Baer U.S. Smallcap Fund (the "U.S. Smallcap Fund"), Julius Baer U.S. Midcap Fund (the "U.S. Midcap Fund") and Julius Baer U.S. Multicap Fund (the "U.S. Multicap Fund"). On July 24, 2006 Julius Baer U.S. Microcap Fund, Julius Baer U.S. Smallcap Fund, Julius Baer U.S. Midcap Fund and the Julius Baer U.S. Multicap Fund commenced operations.
Julius Baer Funds 2007 Annual Report
191
NOTES TO FINANCIAL STATEMENTS (Continued)
The International Equity Fund is closed to new shareholders (at the account level). This excludes 401(k) plans that have existing investments in the Fund through related 401(k) plans and new plan participants within 401(k) plans that hold positions in the Fund. In addition, existing shareholders may continue to invest.
As of October 31, 2007, each Fund offered two share classes, Class A and Class I. The two classes of shares are offered to different types of investors and have different expense structures, as outlined in the Funds' Prospectus. Each class of shares has exclusive voting rights with respect to matters that affect that class. Income, realized gains and losses, unrealized appreciation and depreciation, and expenses that are not attributable to a specific class are allocated daily to each class based on its relative net assets. Expenses directly attributable to a Fund are charged to that Fund. Other expenses are allocated to the respective Fund based on average daily net assets.
Commencing November 1, 2007, some of the Funds will offer Retirement and Consultant Share Classes. (See Subsequent Events in Note 13).
Each Fund has distinct investment objectives. The following are the objectives for the Funds that are covered in this report:
| Fund Name | | Investment Objective | |
| Global Equity Fund | | Seeks to maximize total return, primarily through capital appreciation. | |
|
| International Equity Fund | | Seeks long term growth of capital. | |
|
| International Equity Fund II | | Seeks long term growth of capital. | |
|
| Total Return Bond Fund | | Seeks to provide total return, which consists of two components: (1) changes in the market value of the Fund's portfolio securities (both realized and unrealized appreciation/depreciation) and (2) income received from its portfolio securities. | |
|
| Global High Income Fund | | Seeks to maximize total return, principally through a high level of current income, and secondarily through capital appreciation. | |
|
| U.S. Microcap Fund | | Seeks to achieve long term growth of capital. | |
|
| U.S. Smallcap Fund | | Seeks to achieve long term growth of capital. | |
|
| U.S. Midcap Fund | | Seeks to achieve long term growth of capital. | |
|
| U.S. Multicap Fund | | Seeks to achieve long term growth of capital. | |
|
Julius Baer Funds 2007 Annual Report
192
NOTES TO FINANCIAL STATEMENTS (Continued)
2. Significant Accounting Policies
The following is a summary of significant accounting policies consistently followed by the Funds in the preparation of their financial statements. The presentation of financial statements in conformity with U.S. generally accepted accounting principles requires management to make estimates and assumptions that affect the reported amounts of assets and liabilities and disclosure of contingent assets and liabilities at the date of the financial statements and the reported amounts of revenue and expenses during the reporting period. Actual results could differ from these estimates.
a) Portfolio valuation: Each Fund's investments are valued at market. Equity securities, which are traded primarily on a U.S. or foreign stock exchange are valued at the last sale price on that exchange or, if there were no sales during the day, at the mean of the current quoted bid and asked prices. Portfolio securities which are traded primarily on foreign securities exchanges are generally valued at the preceding closing values of such securities on their respective exchanges, except when a significant event subsequent to the closing of a foreign exchange is likely to have changed such value, including substantial changes in the values of U.S. markets subsequent to the close of a foreign market. In these circumstances, the fair value of those securities will be determined by consideration of other factors by or under the direction of the Global Equity Fund's Bo ard of Directors, the Trust's Board of Trustees (each a "Board" and collectively, the "Boards") or their respective delegates. Debt securities, including bank loans (other than government securities and short-term obligations) are valued by independent pricing services approved by the Board of each respective Fund. Investments in government securities (other than short-term securities) are valued at the mean of the quoted bid and asked prices in the over-the-counter market. Short-term investments that mature in 60 days or less are valued at amortized cost. Any securities for which market quotations are not readily available, or for which a significant event has occurred since the time of the most recent market quotations, are valued in accordance with fair value pricing approved by the respective Board. To the extent each Fund invests in other open-end funds, the Fund will calculate its NAV based upon the NAV of the underlying funds in which it invests. The prospectuses of these underlying funds explain the circumstances under which they will use fair value pricing and the effects of such fair value pricing.
The Boards have identified certain circumstances in which the use of a fair value pricing method is necessary. In such circumstances, the Boards have also approved
Julius Baer Funds 2007 Annual Report
193
NOTES TO FINANCIAL STATEMENTS (Continued)
an independent fair value service for foreign equities, which may provide the fair value price. For options, swaps, and warrants, a fair value price may be determined using an industry accepted modeling tool. In addition, the Funds' Pricing Committees may determine a fair value price, subject to the approval of the respective Board, based upon factors that include the type of the security, the initial cost of the security and price quotations from dealers and/or pricing services in similar securities or in similar markets.
b) Repurchase agreements: The Funds may engage in repurchase agreement transactions. Under the terms of a typical repurchase agreement, a Fund takes possession of an underlying debt obligation in return for the use of the Fund's available cash, subject to an agreement by the seller to repurchase and the Fund to resell the obligation, at an agreed-upon price and time. Thus, the yield during the Fund's holding period is determinable. This arrangement results in a fixed rate of return that is not subject to market fluctuations during a Fund's holding period. The value of the collateral at all times is equal to at least 100% of the total amount of the repurchase obligations, including accrued interest. In the event of counterparty default, the Fund has the right to use the collateral to offset losses incurred. There is potential loss to a Fund in the event the Fund is delayed or prevented from exercising its rights to dispose of the collateral securities, including the risk of a possible decline in the value of the underlying securities during the period in which the Fund seeks to assert its rights. The Funds' investment advisor reviews the value of the collateral and the creditworthiness of those banks and dealers with whom the Funds enter into repurchase agreements to evaluate potential risks. The funds primarily engage in repurchase agreements with their custodian to accommodate cash sweeps of any residual U.S. dollars held in a particular portfolio.
c) Foreign currency: The books and records of the Funds are maintained in U.S. dollars. Foreign currencies and investments and other assets and liabilities denominated in foreign currencies are translated into U.S. dollars at the exchange rates prevailing at the end of the period. Purchases and sales of investment securities and income and expenses are translated on the respective dates of such transactions. Unrealized gains or losses on investments which result from changes in foreign currencies have been included in the net unrealized appreciation (depreciation) of investments. Net realized currency gains and losses include foreign currency gains and losses between trade date and settlement date on investment securities transactions, gains and losses from foreign currency transactions and the gains and losses from differences between the amounts of interest
Julius Baer Funds 2007 Annual Report
194
NOTES TO FINANCIAL STATEMENTS (Continued)
and dividends recorded on the books of the Funds and the amounts actually received. The portion of foreign currency gains and losses related to fluctuations in exchange rates between the purchase settlement date and sale trade date is included in realized gains and losses on security transactions.
d) Forward foreign currency contracts: Forward foreign currency contracts are valued at the forward rate and are marked-to-market at each valuation date. The change in market value is recorded by a Fund as an unrealized gain or loss. When the contract is closed, a Fund records a realized gain or loss equal to the difference between the value of the contract at the time it was opened and the value at the time it was closed.
As part of its investment strategy, a Fund may enter into forward foreign currency contracts to manage a Fund's portfolio holdings against currency risks. A Fund may also utilize forward foreign currency contracts to reduce or eliminate an underweighted position in a currency relative to its benchmark when purchasing underlying equities denominated in that currency is not advisable by the advisor. With respect to a Fund's obligations to purchase or sell currencies under forward foreign currency contracts, a Fund will earmark liquid securities having a value at least equal to its obligations, or continue to own or have the right to sell or acquire respectively, the currency subject to the forward foreign currency contract.
The use of forward foreign currency contracts does not eliminate fluctuations in the underlying prices of a Fund's portfolio securities, but it does establish a rate of exchange that can be achieved in the future. Although forward foreign currency contracts limit the risk of loss due to a decline in the value of the currency holdings, they also limit any potential gain that might result should the value of the currency increase. In addition, a Fund could be exposed to risks if the counterparties to the contracts are unable to meet the terms of the contracts.
Some of the forward foreign currency contracts entered into by the Funds are classified as non-deliverable forwards ("NDF"). NDFs are cash-settled, short-term forward contracts that trade thinly or are denominated in non-convertible foreign currency, where the profit or loss at the time at the settlement date is calculated by taking the difference between the agreed upon exchange rate and the spot rate at the time of settlement, for an agreed upon notional amount of funds. All NDFs have a fixing date and a settlement date. The fixing date is the date at which the difference between the prevailing market exchange rate and the agreed upon exchange rate is calculated. The settlement date is the date by which the payment of the difference is
Julius Baer Funds 2007 Annual Report
195
NOTES TO FINANCIAL STATEMENTS (Continued)
due to the party receiving payment. NDFs are commonly quoted for time periods of one month up to one year, and are normally quoted and settled in U.S. dollars. They are often used to gain exposure to and/or to hedge exposure to foreign currencies that are not internationally traded.
e) Financial Futures Contracts: In order to gain exposure to or protect against changes in security values, the Funds may buy and sell futures contracts. The primary risks associated with the use of futures contracts are the imperfect correlation between changes in market values of securities held by the Funds and the prices of future contracts, and the possibility of an illiquid market. To the extent fluctuations in value are not settled with the counterparty on a daily basis, the Fund is also subject to the credit risk of the counterparty. Cash collateral for futures contracts outstanding may be held by the broker on certain contracts. These amounts are listed on the Statement of Assets and Liabilities as Cash on deposit for broker.
Futures contracts are valued based upon their quoted daily settlement prices. The aggregate principal amounts of the contracts are not recorded in the financial statements. The Funds generally agree to receive from or pay to the broker an amount of cash equal to the daily fluctuations in the value of the contract. Such receipts or payments are known as "variation margin" and are recorded by a fund as unrealized gains or losses. Fluctuations in the value of the contracts are recorded in the Statement of Operations as unrealized gains or losses until the contracts are closed, at which point they are recorded as net realized gains or losses on futures contracts (see Note 11 for outstanding futures contracts at October 31, 2007).
The Funds may also enter into swap contracts that function similar to futures contracts (synthetic futures) to gain exposure to or protect against changes in security values. Generally these contracts are counterparty agreements, do not require daily variation margin payments, and, as such, the Funds are exposed to the credit risk of the counterparty in addition to the risks described above. The accounting treatment of such contracts is similar to that described above for standard futures contracts. The Funds disclose synthetic futures with other futures contracts.
f) Options: The Funds may write options to generate current income and to manage investment risk. Each Fund may write put and call options on up to 25% of the net asset value of the securities in its portfolio and will realize fees (referred to as "premiums") for granting the rights evidenced by the options. When a Fund writes a call option or a put option, an amount equal to the premium received by that Fund
Julius Baer Funds 2007 Annual Report
196
NOTES TO FINANCIAL STATEMENTS (Continued)
is recorded as a liability, the value of which is marked-to-market at each valuation date. When a written option expires, that Fund realizes a gain equal to the amount of the premium originally received. When a Fund enters into a closing purchase transaction, the Fund realizes a gain (or loss if the cost of the closing purchase transaction exceeds the premium originally received when the option was sold/written) without regard to any unrealized gain or loss on the underlying security, and the liability related to such option is eliminated. When a call option is exercised, a Fund realizes a gain or loss from the sale of the underlying security and the proceeds from such sale are increased by the amount of the premium originally received. When a put option is exercised, the amount of the premium originally received will reduce the cost of the security which that Fund purchased upon exercise. The Funds will write only covered options. There wer e no written options at year ended, October 31, 2007.
The Funds may purchase put and call options that are traded on foreign as well as U.S. exchanges and in the over-the-counter market. Each Fund may utilize up to 2% of its assets to purchase both put and call options on portfolio securities. Purchases of put and call options are recorded as an investment, the value of which is marked-to-market at each valuation date. When a purchased option expires, no proceeds will be expected and a Fund will realize a loss. When a Fund exercises a put option, it will realize a gain or loss from the sale of the underlying security and the proceeds from such sale will be decreased by the premium originally paid. When a Fund exercises a call option, the cost of the security which the Fund purchases upon exercise will be increased by the premium originally paid. There were no purchased options for the year ended October 31, 2007.
All the funds except the Total Return Bond Fund may purchase and sell call and put options on stock indices. In contrast to an option on a security, an option on a stock index provides the holder with the right but not the obligation to make or receive a cash settlement upon exercise of the option, rather than the right to purchase or sell a security. The amount of this settlement is equal to (i) the amount, if any, by which the fixed exercise price of the option exceeds (in the case of a call) or is below (in the case of a put) the closing value of the underlying index on the date of exercise, multiplied by (ii) a fixed "index multiplier."
A Fund's risks in using these contracts include changes in the value of the underlying instruments, non-performance of the counterparties under the contracts' terms and changes in the liquidity of the secondary market for the contracts. When a Fund
Julius Baer Funds 2007 Annual Report
197
NOTES TO FINANCIAL STATEMENTS (Continued)
writes an option, the amount of the premium received is recorded as a liability and is subsequently adjusted to the current fair value of the option written. Premiums received from writing options that expire unexercised are treated by the Funds on the expiration date as realized gains from investments. The difference between the premium and the amount paid on effecting a closing purchase transaction, including brokerage commissions, is also treated as a realized gain, or if the premium is less than the amount paid for the closing purchase, as a realized loss. When an option is exercised, the proceeds from the sale of the underlying security or the cost basis of the securities purchased is adjusted by the original premium received or paid.
g) Swaps: The Funds may enter into interest rate, currency, index, total return and credit default swaps. These Funds expect to enter into these transactions primarily to preserve a return or spread on a particular investment or portion of their portfolio, to protect against currency fluctuations, as a duration management technique or to protect against any increase in the price of securities the Funds anticipate purchasing at a later date. Interest rate swaps involve the exchange with another party of their respective commitments to pay or receive interest, for example, an exchange of floating rate payments for fixed rate payments with respect to a notional amount of principal. A currency swap is an agreement to exchange cash flows on a notional amount of two or more currencies based on the relative value differential among them and an index swap is an agreement to swap cash flows on a notional amount based on changes in the values of the reference indices. A total return swap is an agreement to exchange the return on a stock, bond or index for a fixed or variable financing charge. A credit default swap is an agreement between two counterparties that allows one counterparty to be "long" a third-party credit risk, and the other counterparty to be "short" the credit risk. Credit default swaps are designed to transfer the credit exposure of fixed income products between parties.
The Funds will usually enter into swaps on a net basis, that is, the two payment streams are netted out in a cash settlement on the payment date or dates specified in the instrument, with a Fund receiving or paying, as the case may be, only the net amount of the two payments. In as much as these swaps are entered into for good faith hedging purposes, the investment advisor believes such obligations do not constitute senior securities under the 1940 Act, and, accordingly, will not treat them as being subject to its borrowing restrictions. The Funds will not enter into any swap transaction unless, at the time of entering into such transaction, the unsecured long-term debt of the counterparty, combined with any credit enhancements, is rated at
Julius Baer Funds 2007 Annual Report
198
NOTES TO FINANCIAL STATEMENTS (Continued)
least A by Standard & Poor's (S&P) or Moody's or has an equivalent rating from a NRSRO or is determined to be of equivalent credit quality by the investment advisor. If there is a default by the counterparty, the Funds may have contractual remedies pursuant to the agreements related to the transaction.
Entering into swap agreements involves, to varying degrees, elements of credit and market risk in excess of the amounts recognized on the Statement of Asset and Liabilities. Such risk involve the possibility that there will be no liquid market for these agreements, that the counterparty to the agreements may default on its obligation to perform and that there may be unfavorable changes in the value of the index or securities underlying the agreement.
The International Equity Fund and Global High Income Fund engaged in swap transactions during the year ending October 31, 2007.
The International Equity Fund has entered into the following swap agreements:
A Total Return Swap Agreement with UBS AG (London) whereby this Fund will receive the dividend yield based on the Nikkei 225 Index net of any relevant withholding tax. In exchange, this Fund will make semi-annual payments equal to 1.10% on the 1,961,000,000 JPY face value plus the repo spread of 0.37% on 1,800,000,000 JPY plus a spread of 0.25% on the same notional amount. The value of the contract, which terminates on September 17, 2008, is recorded as unrealized appreciation of $14,567,706 at October 31, 2007.
A Total Return Swap Agreement with UBS AG (London) whereby this Fund will receive the dividend yield based on the Nikkei 225 Index net of any relevant withholding tax. In exchange, this Fund will make semi-annual payments equal to 0.80% on the 1,958,000,000 JPY face value plus the repo spread of 0.32% on the same notional amount. The value of the contract, which terminates on June 17, 2008, is recorded as unrealized appreciation of $13,254,831 at October 31, 2007.
A Total Return Swap Agreement with UBS AG (London) whereby this Fund will receive the dividend yield based on the TOPIX Index net of any relevant withholding tax. In exchange, this Fund will make semi-annual payments equal to 1.10% on the 1,961,000,000 JPY face value plus the repo spread of 0.37% on 1,800,000,000 JPY plus a spread of 0.25% on the same notional amount. The value of the contract, which terminates on September 17, 2008, is recorded as unrealized appreciation of $13,993,779 at October 31, 2007.
Julius Baer Funds 2007 Annual Report
199
NOTES TO FINANCIAL STATEMENTS (Continued)
A Total Return Swap Agreement with UBS AG (London) whereby this Fund will receive the dividend yield based on the TOPIX Index net of any relevant withholding tax. In exchange, this Fund will make semi-annual payments equal to 0.80% on the 1,958,000,000 JPY face value plus the repo spread of 0.32% on 1,800,000,000 JPY plus a spread of 0.25% on the same notional amount. The value of the contract, which terminates on June 17, 2008, is recorded as unrealized appreciation of $12,680,617 at October 31, 2007.
A Total Return Swap Agreement with ING Bank N.V. whereby this fund will receive the notional amount multiplied by the return on SC Impact Bucuresti, variable rate 0.10%, 6 month Euribor + 6.5%, due 01/31/2009. In exchange, this Fund will pay the net coupon amounts on the notional amount converted into euro at a specified foreign exchange rate. The value of the contract, which expires on February 1, 2009 is recorded as unrealized appreciation of $114,091 at October 31, 2007.
The Global High Income Fund has entered into the following swap agreements:
A Credit Default Swap Agreement with Credit Suisse International whereby this Fund will receive the notional $1,660,000 amount multiplied by 0.50% per year. In exchange this Fund will pay the notional amount upon a default of Allied Waste North America, Inc., 7.375% due April 15, 2014. The value of the contract, which expires June 20, 2012 is unrealized depreciation for open swap contracts of $65,442 at October 31, 2007.
A Credit Default Swap Agreement with JPMorgan Chase Bank, N.A. whereby this Fund will receive the notional $1,000,000 amount multiplied by 0.50% per year. In exchange this Fund will pay the notional amount upon a default of Allied Waste North America, Inc., 7.375% due April 15, 2014. The value of the contract, which expires June 20, 2012 is unrealized depreciation for open swap contracts of $38,268 at October 31, 2007.
A Credit Default Swap Agreement with Merrill Lynch whereby this Fund will receive the notional amount of $600,000 multiplied by 0.50% per year. In exchange this Fund will pay the notional amount upon a default of Grohe Holding, 8.625% due October 1, 2014. The value of the contract, which expires December 20, 2011 is unrealized appreciation for open swap contracts of $5,586 at October 31, 2007.
A Credit Default Swap Agreement with JPMorgan Chase Bank, N.A. whereby this Fund will receive the notional amount of $2,000,000 multiplied by 0.50% per year.
Julius Baer Funds 2007 Annual Report
200
NOTES TO FINANCIAL STATEMENTS (Continued)
In exchange this Fund will pay the notional amount upon a default of K. Hovnanian Enterprises, Inc., 6.500% due January 15, 2014. The value of the contract, which expires September 20, 2012 is unrealized depreciation for open swap contracts of $19,748 at October 31, 2007.
h) Securities Lending: The Global Equity Fund, the International Equity Fund, the International Equity Fund II, the U.S. Microcap Fund, the U.S. Smallcap Fund, the U.S. Midcap Fund and the U.S. Multicap Fund have established securities lending agreements with State Street Bank and Trust Company under which the Funds lend portfolio securities to a broker in exchange for collateral consisting of either cash or U.S. government securities in an amount at least equal to 100% of the market value of the securities on loan. These Funds may loan securities to brokers, dealers, and financial institutions determined by the Julius Baer Investment Management LLC ("JBIM" or "Advisor") to be creditworthy, subject to certain limitations. Under these agreements, these Funds continue to earn income on the securities loaned. Collateral received is generally cash, and such Funds inve st the cash in the State Street Navigator Securities Lending Prime Portfolio and receive any interest on the amount invested, but they must also pay the broker a loan rebate fee computed as a varying percentage of the collateral received. In the event of counterparty default, these Funds are subject to potential loss if any such Fund is delayed or prevented from exercising its right to dispose of the collateral. These Funds each bear risk in the event that invested collateral is not sufficient to meet obligations due on the loans.
In the State Street Navigator Securities Lending Prime Portfolio, the security lending income net of the loan rebate fee for the Global Equity Fund, the International Equity Fund and the International Equity Fund II amounted to $24,852, $21,520,253, and $6,010,802, respectively, for the year ended October 31, 2007 and is included in interest income in the statement of operations. The U.S. Microcap Fund, the U.S. Smallcap Fund, the U.S. Midcap Fund and the U.S. Multicap Fund did not participate in securities lending during the year ended October 31, 2007.
As of October 31, 2007, the value of the securities loaned and the value of the collateral amounted to approximately the following amounts:
| | | Market Value of
Securities Loaned | | Value of
Collateral | |
| Global Equity Fund | | $ | 10,408,426 | | | $ | 10,713,067 | | |
| International Equity Fund | | | 926,438,950 | | | | 970,162,722 | | |
| International Equity Fund II | | | 392,912,596 | | | | 410,296,502 | | |
Julius Baer Funds 2007 Annual Report
201
NOTES TO FINANCIAL STATEMENTS (Continued)
i) Securities transactions and investment income: Securities transactions are recorded as of the trade date. Realized gains and losses from securities transactions are recorded on the identified cost basis. Interest income is recorded on an accrual basis and includes amortization and accretion of bond premiums and discounts, respectively, using the effective interest method. Dividend income is recorded in the statement of operations on the ex-dividend date or when the Fund becomes aware of dividend distribution. It is expected that certain capital gains earned by the Funds and certain dividends and interest received by the Funds will be subject to foreign withholding taxes.
j) Dividends and distributions to shareholders: Distributions to shareholders are recorded on the ex-dividend date. Each Fund intends to distribute annually to its shareholders substantially all of its taxable income. The Total Return Bond Fund and the Global High Income Fund declare and pay monthly dividends. The International Equity Fund, the International Equity Fund II, the Global Equity Fund, the U.S. Microcap Fund, the U.S. Smallcap Fund, the U.S. Midcap Fund and the U.S. Multicap Fund declare and pay dividends from net investment income, if any, annually. The Funds will distribute net realized capital gains, if any, annually. Additional distributions of net investment income and capital gains may be made at the discretion of the Board of the Funds to avoid the application of the excise tax imposed under Section 4982 of the Internal Revenue Code of 1986, as amended, for certain undistributed amounts. Income distributions and capital gain distributions are determined in accordance with income tax regulations which may differ from generally accepted accounting principles. These differences are primarily due to differing treatments of income and gains on various investment securities held by the Funds, timing differences and differing characterization of distributions made by the Funds as a whole.
k) Federal income taxes: The Global Equity Fund and the Trust intend that each Fund separately qualify as a regulated investment company for U.S. federal income tax purposes. Accordingly, the Funds do not anticipate that any income taxes will be paid.
l) Bank Loans: The Global High Income Fund may invest in Bank Loans. Bank Loans include institutionally traded floating and fixed-rate debt securities generally acquired as a participation interest in or assignment of a loan originated by a lender or financial institution. Assignments and participations involve credit, interest rate, and liquidity risk. Interest rates on floating rate securities adjust with interest rate changes and/or issuer credit quality. Many such loans are secured, although some may be unsecured. Loans that are fully secured offer a fund more protection than an unsecured loan in the event of non-payment of scheduled interest or principal. There is no assurance that any collateral securing a loan could be liquidated or, if liquidated, that such collateral would
Julius Baer Funds 2007 Annual Report
202
NOTES TO FINANCIAL STATEMENTS (Continued)
be of sufficient value to repay the loans taken against it. There may be limited secondary market liquidity for these instruments which could result in volatile pricing for the securities which in turn may affect this Fund's NAV.
The Global High Income Fund may enter into certain credit agreements all or a portion of which may be unfunded. The Fund is obligated to fund these commitments at the borrower's discretion. There was one unfunded commitment which amounted to $144,966 and had a market value of $7,339 at October 31, 2007.
3. Investment Advisory Fee and Other Transactions
JBIM serves as the Funds' investment advisor. The Global Equity Fund pays JBIM a fee at an annual rate of 0.90% of average daily net assets. The International Equity Fund pays JBIM a fee at an annual rate of 0.90% of the first $7.5 billion of average daily net assets, 0.88% of the next $2.5 billion of average daily net assets and 0.85% of average daily net assets over $10 billion. The International Equity II Fund paid JBIM a fee at an annual rate of 0.90% of the average daily net assets for the period November 1, 2006 through August 31, 2007. Effective September 1, 2007, the International Equity II Fund pays JBIM a fee at an annual rate of 0.90% of the first $7.5 billion of average daily net assets, 0.88% of the next $2.5 billion of average daily net assets and 0.85% of average daily net assets over $10 billion. The Total Return Bond Fund and the Global High Income Fund pay JBIM a fee at an annual rate of 0.45% and 0.75% of average daily net assets, respectively. The U.S. Microcap Fund, the U.S. Smallcap Fund, the U.S. Midcap Fund and the U.S. Multicap Fund pay JBIM a fee at an annual rate of 1.25%, 0.95%, 0.80% and 0.75% of average daily net assets, respectively.
The Advisor has contractually agreed to reimburse certain expenses of the Funds listed in the table below, through February 28, 2008, so that the net operating expenses of each Fund (excluding interest, taxes, brokerage commissions, and extraordinary expenses) based on average net assets are limited (the "Expense Limit") as specified in the table below. Any Fund with a reimbursement plan has agreed to allow the Advisor to recoup expenses reimbursed to each Fund provided that repayment does not cause each of the Fund's annual operating expenses to exceed the Expense Limit. Any such recoupment must be made within three years after the year in which the Advisor incurred the expense. The table below specifies the reimbursement made to each Fund by the Advisor for the year ended October 31, 2007 and the Advisor's potential recoupment as of October 31, 2007.
Julius Baer Funds 2007 Annual Report
203
NOTES TO FINANCIAL STATEMENTS (Continued)
| | | Expense
Limitations | | Reimbursement
made by
Advisor
Beginning | | Expenses
Waived-
Current | | Expenses
Recouped
or Expired-
Current | | Total
Expenses
Eligible for
Recoupment-
October 31, | |
| Fund | | Class A | | Class I | | of Year | | Year | | Year | | 2007 | |
Global Equity
Fund | | | 1.40 | % | | | 1.15 | % | | $ | 1,259,126 | | | $ | 377,251 | | | $ | (253,584 | ) | | $ | 1,382,793 | | |
International
Equity Fund II* | | | 1.32 | % | | | 1.05 | % | | | 196,954 | | | | — | | | | (196,954 | ) | | | — | | |
Total Return
Bond Fund | | | 0.69 | % | | | 0.44 | % | | | 678,849 | | | | 698,492 | | | | — | | | | 1,377,341 | | |
Global High
Income Fund | | | 1.00 | % | | | 0.75 | % | | | 171,885 | | | | 301,788 | | | | — | | | | 473,673 | | |
U.S. Microcap
Fund | | | 1.80 | % | | | 1.50 | % | | | 37,233 | | | | 115,922 | | | | — | | | | 153,155 | | |
| U.S. Smallcap Fund | | | 1.50 | % | | | 1.20 | % | | | 37,032 | | | | 114,682 | | | | — | | | | 151,714 | | |
| U.S. Midcap Fund | | | 1.35 | % | | | 1.05 | % | | | 35,848 | | | | 108,233 | | | | — | | | | 144,081 | | |
| U.S. Multicap Fund | | | 1.30 | % | | | 1.00 | % | | | 35,018 | | | | 107,939 | | | | — | | | | 142,957 | | |
* The Expense Limitations for Class A and Class I of International Equity Fund II expired as of Feburary 28, 2007.
The expenses eligible for recoupment at October 31, 2007 are set to expire as follows:
| Fund | | Amount | | Expires
October 31, | |
| Global Equity Fund | | $ | 582,696 | | | | 2008 | | |
| | | | 422,846 | | | | 2009 | | |
| | | | 377,251 | | | | 2010 | | |
| Total Return Bond Fund | | $ | 292,108 | | | | 2008 | | |
| | | | 386,741 | | | | 2009 | | |
| | | | 698,492 | | | | 2010 | | |
| Global High Income Fund | | $ | 28,038 | | | | 2008 | | |
| | | | 143,847 | | | | 2009 | | |
| | | | 301,788 | | | | 2010 | | |
| U.S. Microcap Fund | | $ | 37,233 | | | | 2009 | | |
| | | | 115,922 | | | | 2010 | | |
| U.S. Smallcap Fund | | $ | 37,032 | | | | 2009 | | |
| | | | 114,682 | | | | 2010 | | |
| U.S. Midcap Fund | | $ | 35,848 | | | | 2009 | | |
| | | | 108,233 | | | | 2010 | | |
| U.S. Multicap Fund | | $ | 35,018 | | | | 2009 | | |
| | | | 107,939 | | | | 2010 | | |
The Funds entered into expense offset arrangements as part of their custody agreement with State Street Bank and Trust Company (the "Bank"). Under this agreement, the custody fees for the Global Equity Fund, International Equity Fund, International Equity Fund II, Total Return Bond Fund and the Global High Income Fund were reduced by $14,844, $12,363,639, $1,073,479, $24,464, and $9,253 respectively, for the year ended October 31, 2007. These amounts may vary significantly over time,
Julius Baer Funds 2007 Annual Report
204
NOTES TO FINANCIAL STATEMENTS (Continued)
based on the Advisor's decisions and current interest rates from market to market regarding cash positions held in the Funds.
4. Distribution and Shareholder Servicing Plan
The Funds have adopted certain Distribution and Shareholder Services Plans (collectively the "Plans"), pursuant to Rule 12b-1 under the 1940 Act. Under the Plans each Fund's Class A may compensate certain financial institutions, including the distributor, for certain distribution, shareholder servicing, administrative and accounting services. The Funds Class A shares may expend an aggregate amount, on an annual basis, not to exceed 0.25% of the value of the average daily net assets of a Fund attributable to Class A shares. The Advisor may pay additional marketing and other distribution costs out of its profits.
Quasar Distributors, LLC ("Quasar" or "Distributor") is the Distributor of the Funds' shares.
Under their terms, the Funds' Plans shall remain in effect from year to year, provided such continuance is approved annually by a vote of a majority of the Directors/Trustees and a majority of those Directors/Trustees who are not "interested persons" of the Funds and who have no direct or indirect financial interest in the operation of the Plans or in any agreement related to the Plans.
On August 1, 2005, the International Equity Fund closed to new shareholders (at the account level). As a result, all of the 12b-1 payments made by the Fund are only to compensate certain financial institutions for shareholder servicing, administration and accounting and not for additional distributions. As a result, 12b-1 expenses incurred by the Fund may be lower than the 0.25% defined in the Plan.
5. Purchases and Sales of Securities
Cost of purchases and proceeds from sales of securities, excluding short-term investments and paydowns, during the year ended October 31, 2007 were as follows:
| | | Cost of
Purchases | | Proceeds
from Sales | |
| Global Equity Fund | | $ | 157,635,575 | | | $ | 123,561,850 | | |
| International Equity Fund | | | 11,426,968,460 | | | | 11,967,546,540 | | |
| International Equity Fund II | | | 7,890,950,200 | | | | 3,589,276,310 | | |
| Total Return Bond Fund | | | 3,903,668,844 | | | | 3,517,133,273 | | |
| Global High Income Fund | | | 186,843,506 | | | | 80,420,973 | | |
| U.S. Microcap Fund | | | 12,260,139 | | | | 11,620,214 | | |
| U.S. Smallcap Fund | | | 17,130,998 | | | | 17,193,770 | | |
| U.S. Midcap Fund | | | 10,997,834 | | | | 10,539,099 | | |
| U.S. Multicap Fund | | | 11,415,424 | | | | 10,431,053 | | |
Julius Baer Funds 2007 Annual Report
205
NOTES TO FINANCIAL STATEMENTS (Continued)
Cost of purchases and proceeds from sales of long-term U.S. Government securities during the year ended October 31, 2007 were $3,079,319,934 and $2,841,686,874, respectively for the Total Return Bond Fund.
At October 31, 2007, net unrealized appreciation/depreciation for federal income tax purposes is comprised of the following components:
| |
Federal
Income Tax
Cost | |
Gross
Unrealized
Appreciation | |
Gross
Unrealized
Depreciation | | Tax Basis
Net Unrealized
Appreciation/
(Depreciation) | |
| Global Equity Fund | | $ | 113,289,325 | | | $ | 10,379,717 | | | $ | (2,063,240 | ) | | $ | 8,316,477 | | |
| International Equity Fund | | | 17,179,351,851 | | | | 8,981,306,907 | | | | (283,065,996 | ) | | | 8,698,240,911 | | |
| International Equity Fund II | | | 7,741,065,901 | | | | 1,830,544,097 | | | | (113,861,752 | ) | | | 1,716,682,345 | | |
| Total Return Bond Fund | | | 1,159,116,876 | | | | 11,064,981 | | | | (1,339,389 | ) | | | 9,725,592 | | |
| Global High Income Fund | | | 248,218,594 | | | | 6,281,131 | | | | (2,735,965 | ) | | | 3,545,166 | | |
| U.S. Microcap Fund | | | 6,988,430 | | | | 870,441 | | | | (234,698 | ) | | | 635,743 | | |
| U.S. Smallcap Fund | | | 6,956,964 | | | | 995,365 | | | | (84,317 | ) | | | 911,048 | | |
| U.S. Midcap Fund | | | 6,525,646 | | | | 997,070 | | | | (65,637 | ) | | | 931,433 | | |
| U.S. Multicap Fund | | | 6,766,859 | | | | 1,000,352 | | | | (141,778 | ) | | | 858,574 | | |
6. Investments in Affiliated Issuers
An affiliated issuer, as defined under 1940 Act, is one in which a Fund's holdings of an issuer represents 5% or more of the outstanding voting securities of the issuer. A summary of International Equity Fund's investments in securities of these issuers for the year ended October 31, 2007, is set forth below:
| Affiliate | | Shares Held
October 31,
2007 | |
Purchases
(Cost) | |
Proceeds
(Sales) | |
Dividend
Income | | Market Value
October 31,
2007 | |
| Agora SA | | | 4,394,619 | | | $ | 19,799,153 | | | $ | — | | | $ | 2,418,923 | | | $ | 98,026,219 | | |
| AIK Banka | | | 412,158 | | | | 6,827,905 | | | | — | | | | 208,070 | | | | 77,592,202 | | |
| Biofarm Bucuresti | | | 50,060,712 | | | | 1,387,023 | | | | 488,798 | | | | — | | | | 13,705,727 | | |
| Cemacon SA | | | 425,284 | | | | 2,547,545 | | | | — | | | | — | | | | 3,308,239 | | |
| Clear Media | | | 34,129,602 | | | | 3,746,127 | | | | — | | | | — | | | | 36,268,597 | | |
| Compania Hoteliera | | | | | | | | | | | | | | | | | | | — | | |
| Intercontinental | | | 62,668,800 | | | | 6,988,428 | | | | — | | | | — | | | | 7,625,598 | | |
| Condmag | | | 11,250,200 | | | | — | | | | 4,087,039 | | | | — | | | | 7,822,485 | | |
| Dafora | | | 66,191,800 | | | | 8,148,435 | | | | 227,323 | | | | — | | | | 15,820,907 | | |
Dragon Ukrainian
Properties & Development | | | 10,201,398 | | | | 20,402,796 | | | | — | | | | — | | | | 27,473,006 | | |
| Impact SA | | | 97,126,031 | | | | 16,547,948 | | | | — | | | | — | | | | 43,474,778 | | |
| Komercni Banka | | | 2,126,273 | | | | 72,577,130 | | | | 4,984,781 | | | | 15,126,869 | | | | 488,512,803 | | |
| Kyivmedpreparat | | | 115,161 | | | | 9,154,020 | | | | — | | | | — | | | | 9,906,078 | | |
| Marine Farms | | | 1,966,882 | | | | 8,726,198 | | | | — | | | | — | | | | 10,649,204 | | |
| Mediclin AG | | | 1,832,860 | | | | 4,444,803 | | | | — | | | | — | | | | 9,311,705 | | |
Polska Grupa
Farmaceutyczna | | | 788,945 | | | | 8,564,508 | | | | 3,622,141 | | | | 759,509 | | | | 32,440,947 | | |
| Royal UNIBREW | | | 376,560 | | | | 5,066,689 | | | | — | | | | 611,862 | | | | 48,151,749 | | |
Julius Baer Funds 2007 Annual Report
206
NOTES TO FINANCIAL STATEMENTS (Continued)
| Affiliate | | Shares Held
October 31,
2007 | |
Purchases
(Cost) | |
Proceeds
(Sales) | |
Dividend
Income | | Market Value
October 31,
2007 | |
| Tigar AD | | | 130,820 | | | $ | — | | | $ | — | | | $ | 63,851 | | | $ | 4,647,247 | | |
| Toza Markovic | | | 78,160 | | | | 4,264,296 | | | | — | | | | — | | | | 4,822,436 | | |
| Ukrinbank | | | 1,153,346,022 | | | | — | | | | 1,384,496 | | | | — | | | | 6,842,075 | | |
| Veropharm | | | 645,906 | | | | 13,424,903 | | | | 3,659,977 | | | | — | | | | 30,519,059 | | |
7. Shares of Beneficial Interest
The Global Equity Fund may issue 50,000,000,000 shares of beneficial interest with a par value of $.001 per share. The Funds of the Trust may issue an unlimited number of shares of beneficial interest of each Fund, with a par value of $.001 per share. Changes in outstanding shares of beneficial interest of the Funds were as follows:
| | | Year Ended
October 31, 2007 | | Year Ended
October 31, 2006 | |
| | | Shares | | Amount | | Shares | | Amount | |
| Global Equity Fund: | |
| Class A | |
| Sold | | | 224,437 | | | $ | 9,518,604 | | | | 307,742 | | | $ | 10,921,299 | | |
| Issued as reinvestment of dividends | | | — | | | | — | | | | — | | | | — | | |
| Redeemed | | | (175,984 | ) | | | (7,378,540 | ) | | | (627,339 | ) | | | (22,181,768 | ) | |
| Net increase (decrease) | | | 48,453 | | | $ | 2,140,064 | | | | (319,597 | ) | | $ | (11,260,469 | ) | |
| Class I | |
| Sold | | | 1,341,996 | | | $ | 59,719,862 | | | | 503,222 | | | $ | 18,354,968 | | |
| Issued as reinvestment of dividends | | | — | | | | — | | | | 19 | | | | 637 | | |
| Redeemed | | | (550,889 | ) | | | (24,100,668 | ) | | | (266,446 | ) | | | (8,973,789 | ) | |
| Net increase | | | 791,107 | | | $ | 35,619,194 | | | | 236,795 | | | $ | 9,381,816 | | |
| International Equity Fund: | |
| Class A | |
| Sold | | | 35,314,625 | | | $ | 1,611,747,637 | | | | 38,738,115 | | | $ | 1,516,430,147 | | |
| Issued as reinvestment of dividends | | | 21,032,806 | | | | 885,050,416 | | | | 8,479,351 | | | | 303,135,073 | | |
| Redeemed | | | (43,728,020 | ) | | | (1,990,356,059 | ) | | | (40,843,025 | ) | | | (1,596,363,910 | ) | |
| Net increase | | | 12,619,411 | | | $ | 506,441,994 | | | | 6,374,441 | | | $ | 223,201,310 | | |
| Class I | |
| Sold | | | 50,750,676 | | | $ | 2,352,325,275 | | | | 44,263,719 | | | $ | 1,762,515,023 | | |
| Issued as reinvestment of dividends | | | 23,561,651 | | | | 1,012,198,966 | | | | 9,685,161 | | | | 352,634,605 | | |
| Redeemed | | | (38,151,630 | ) | | | (1,778,609,637 | ) | | | (37,169,804 | ) | | | (1,487,008,935 | ) | |
| Net increase | | | 36,160,697 | | | $ | 1,585,914,604 | | | | 16,779,076 | | | $ | 628,140,693 | | |
Julius Baer Funds 2007 Annual Report
207
NOTES TO FINANCIAL STATEMENTS (Continued)
| | | Year Ended
October 31, 2007 | | Year Ended
October 31, 2006 | |
| | | Shares | | Amount | | Shares | | Amount | |
| International Equity Fund II: | |
| Class A | |
| Sold | | | 77,431,947 | | | $ | 1,254,778,148 | | | | 47,435,232 | | | $ | 611,006,976 | | |
| Issued as reinvestment of dividends | | | 299,821 | | | | 4,509,126 | | | | — | | | | — | | |
| Redeemed | | | (20,909,689 | ) | | | (335,414,636 | ) | | | (7,746,566 | ) | | | (100,844,079 | ) | |
| Net increase | | | 56,822,079 | | | $ | 923,872,638 | | | | 39,688,666 | | | $ | 510,162,897 | | |
| Class I | |
| Sold | | | 278,971,033 | | | $ | 4,517,095,068 | | | | 153,977,557 | | | $ | 1,992,799,751 | | |
| Issued as reinvestment of dividends | | | 1,110,317 | | | | 16,754,682 | | | | — | | | | — | | |
| Redeemed | | | (31,626,725 | ) | | | (514,794,780 | ) | | | (8,638,709 | ) | | | (113,397,417 | ) | |
| Net increase | | | 248,454,625 | | | $ | 4,019,054,970 | | | | 145,338,848 | | | $ | 1,879,402,334 | | |
| Total Return Bond Fund: | |
| Class A | |
| Sold | | | 5,995,550 | | | $ | 79,050,470 | | | | 5,583,049 | | | $ | 72,384,334 | | |
| Issued as reinvestment of dividends | | | 328,097 | | | | 4,318,464 | | | | 352,886 | | | | 4,578,373 | | |
| Redeemed | | | (3,177,588 | ) | | | (41,786,343 | ) | | | (3,121,349 | ) | | | (40,748,651 | ) | |
| Net increase | | | 3,146,059 | | | $ | 41,582,591 | | | | 2,814,586 | | | $ | 36,214,056 | | |
| Class I | |
| Sold | | | 36,931,702 | | | $ | 487,023,641 | | | | 22,370,233 | | | $ | 290,781,223 | | |
| Issued as reinvestment of dividends | | | 1,310,510 | | | | 17,281,842 | | | | 960,754 | | | | 12,496,422 | | |
| Redeemed | | | (10,528,758 | ) | | | (138,938,609 | ) | | | (3,453,641 | ) | | | (45,130,436 | ) | |
| Net increase | | | 27,713,454 | | | $ | 365,366,874 | | | | 19,877,346 | | | $ | 258,147,209 | | |
| Global High Income Fund: | |
| Class A | |
| Sold | | | 7,205,415 | | | $ | 79,811,932 | | | | 3,073,565 | | | $ | 33,421,918 | | |
| Issued as reinvestment of dividends | | | 383,180 | | | | 4,232,194 | | | | 468,401 | | | | 5,028,917 | | |
| Redeemed | | | (3,228,413 | ) | | | (35,767,124 | ) | | | (2,394,459 | ) | | | (26,442,289 | ) | |
| Net increase | | | 4,360,182 | | | $ | 48,277,002 | | | | 1,147,507 | | | $ | 12,008,546 | | |
| Class I | |
| Sold | | | 12,438,303 | | | $ | 133,818,463 | | | | 2,972,452 | | | $ | 31,257,017 | | |
| Issued as reinvestment of dividends | | | 318,292 | | | | 3,403,772 | | | | 147,688 | | | | 1,537,266 | | |
| Redeemed | | | (1,786,034 | ) | | | (19,116,348 | ) | | | (481,176 | ) | | | (5,182,090 | ) | |
| Net increase | | | 10,970,561 | | | $ | 118,105,887 | | | | 2,638,964 | | | $ | 27,612,193 | | |
| U.S. Microcap Fund: | |
| Class A* | |
| Sold | | | 86,388 | | | $ | 1,033,965 | | | | 264,561 | | | $ | 2,661,874 | | |
| Issued as reinvestment of dividends | | | — | | | | — | | | | — | | | | — | | |
| Redeemed | | | (50,414 | ) | | | (605,058 | ) | | | (1,988 | ) | | | (20,311 | ) | |
| Net increase | | | 35,974 | | | $ | 428,907 | | | | 262,573 | | | $ | 2,641,563 | | |
| Class I* | |
| Sold | | | 45,643 | | | $ | 528,215 | | | | 250,000 | | | $ | 2,500,000 | | |
| Issued as reinvestment of dividends | | | — | | | | — | | | | — | | | | — | | |
| Redeemed | | | (6,380 | ) | | | (79,393 | ) | | | — | | | | — | | |
| Net increase | | | 39,263 | | | $ | 448,822 | | | | 250,000 | | | $ | 2,500,000 | | |
Julius Baer Funds 2007 Annual Report
208
NOTES TO FINANCIAL STATEMENTS (Continued)
| | | Year Ended
October 31, 2007 | | Year Ended
October 31, 2006 | |
| | | Shares | | Amount | | Shares | | Amount | |
| U.S. Smallcap Fund: | |
| Class A* | |
| Sold | | | 411,140 | | | $ | 5,152,744 | | | | 253,225 | | | $ | 2,535,318 | | |
| Issued as reinvestment of dividends | | | 4,088 | | | | 47,337 | | | | — | | | | — | | |
| Redeemed | | | (361,149 | ) | | | (4,914,765 | ) | | | (300 | ) | | | (3,063 | ) | |
| Net increase | | | 54,079 | | | $ | 285,316 | | | | 252,925 | | | $ | 2,532,255 | | |
| Class I* | |
| Sold | | | 35,970 | | | $ | 421,237 | | | | 250,000 | | | $ | 2,500,000 | | |
| Issued as reinvestment of dividends | | | 4,067 | | | | 47,144 | | | | — | | | | — | | |
| Redeemed | | | (2,837 | ) | | | (35,479 | ) | | | — | | | | — | | |
| Net increase | | | 37,200 | | | $ | 432,902 | | | | 250,000 | | | $ | 2,500,000 | | |
| U.S. Midcap Fund: | |
| Class A* | |
| Sold | | | 41,116 | | | $ | 497,510 | | | | 261,475 | | | $ | 2,625,610 | | |
| Issued as reinvestment of dividends | | | 3,079 | | | | 36,212 | | | | — | | | | — | | |
| Redeemed | | | (19,219 | ) | | | (230,323 | ) | | | (300 | ) | | | (3,069 | ) | |
| Net increase | | | 24,976 | | | $ | 303,399 | | | | 261,175 | | | $ | 2,622,541 | | |
| Class I* | |
| Sold | | | 53,857 | | | $ | 627,149 | | | | 250,000 | | | $ | 2,500,000 | | |
| Issued as reinvestment of dividends | | | 3,661 | | | | 43,010 | | | | — | | | | — | | |
| Redeemed | | | (6,530 | ) | | | (82,467 | ) | | | — | | | | — | | |
| Net increase | | | 50,988 | | | $ | 587,692 | | | | 250,000 | | | $ | 2,500,000 | | |
| U.S. Multicap Fund: | |
| Class A* | |
| Sold | | | 110,908 | | | $ | 1,319,599 | | | | 251,404 | | | $ | 2,515,010 | | |
| Issued as reinvestment of dividends | | | 3,084 | | | | 35,926 | | | | — | | | | — | | |
| Redeemed | | | (82,321 | ) | | | (965,928 | ) | | | (1,028 | ) | | | (11,270 | ) | |
| Net increase | | | 31,671 | | | $ | 389,597 | | | | 250,376 | | | $ | 2,503,740 | | |
| Class I* | |
| Sold | | | 56,331 | | | $ | 660,159 | | | | 250,000 | | | $ | 2,500,000 | | |
| Issued as reinvestment of dividends | | | 3,521 | | | | 40,976 | | | | — | | | | — | | |
| Redeemed | | | (2,841 | ) | | | (35,201 | ) | | | — | | | | — | | |
| Net increase | | | 57,011 | | | $ | 665,934 | | | | 250,000 | | | $ | 2,500,000 | | |
* Commenced operations on July 24, 2006.
Julius Baer Funds 2007 Annual Report
209
NOTES TO FINANCIAL STATEMENTS (Continued)
Through seed capital contributions by Julius Baer Group, an affiliate of the Advisor, ownership of beneficial shares outstanding at October 31, 2007 were:
| Fund | | % Ownership | |
| U.S. Microcap Fund – Class A shares | | | 83.7 | % | |
| U.S. Microcap Fund – Class I shares | | | 86.4 | % | |
| U.S. Smallcap Fund – Class A shares | | | 82.7 | % | |
| U.S. Smallcap Fund – Class I shares | | | 88.4 | % | |
| U.S. Midcap Fund – Class A shares | | | 88.3 | % | |
| U.S. Midcap Fund – Class I shares | | | 84.1 | % | |
| U.S. Multicap Fund – Class A shares | | | 89.7 | % | |
| U.S. Multicap Fund – Class I shares | | | 82.5 | % | |
8. Foreign Securities
Investing in securities of foreign companies and foreign governments involves special risks and considerations not typically associated with investing in U.S. companies and the U.S. government. These risks include the loss of value in investments of foreign securities because of currency exchange rate fluctuations, price volatility that may exceed the volatility of U.S. securities, uncertain political conditions, lack of timely and reliable financial information and other factors. These risks are increased for investment in emerging markets. Emerging market securities involve unique risks, such as exposure to economies less diverse and mature than that of the U.S. or more established foreign markets. Economic or political instability may cause larger price changes in emerging market securities than other foreign securities. Moreover, securities of many foreign companies and foreign governments and their markets may be less liquid and their p rices more volatile than those of securities of comparable U.S. companies and the U.S. government.
9. Federal Tax Information
Permanent book and tax differences, if any, relating to shareholder distributions will result in reclassifications to paid-in capital, undistributed net investment income or accumulated net realized gains/losses. These include net operating losses not utilized during the current year, commission adjustments, paydown gains and losses, bond premium amortization, foreign currency gains and losses, recharacterized distributions, and adjustments relating to the dispositions of Real Estate Investment Trust and Passive Foreign Investment Company securities. These reclassifications have no effect on net assets or net asset values per share. Any taxable gain remaining at fiscal year end is distributed in the following year.
Julius Baer Funds 2007 Annual Report
210
NOTES TO FINANCIAL STATEMENTS (Continued)
| Fund | | Paid-In
Capital
Increase/
(Decrease) | | Undistributed
Net Investment
Income
Increase/
(Decrease) | | Accumulated
Net Realized
Gain/(Loss)
Increase/
(Decrease) | |
| Global Equity Fund | | $ | 1,530,056 | | | $ | (90,412 | ) | | $ | (1,439,644 | ) | |
| International Equity Fund | | | — | | | | (29,273,914 | ) | | | 29,273,914 | | |
| International Equity Fund II | | | (1,582 | ) | | | (17,528,842 | ) | | | 17,530,424 | | |
| Total Return Bond Fund | | | — | | | | 6,325,503 | | | | (6,325,503 | ) | |
| Global High Income Fund | | | (3,092 | ) | | | (984,209 | ) | | | 987,301 | | |
| U.S. Microcap Fund | | | — | | | | 24,595 | | | | (24,595 | ) | |
| U.S. Smallcap Fund | | | — | | | | 25,112 | | | | (25,112 | ) | |
| U.S. Midcap Fund | | | (182 | ) | | | 8,836 | | | | (8,654 | ) | |
| U.S. Multicap Fund | | | — | | | | — | | | | — | | |
The tax character of distributions paid for the year ended October 31, 2007 were as follows:
| | | Global
Equity
Fund | | International
Equity
Fund | | International
Equity
Fund II | | Total Return
Bond
Fund | | Global High
Income
Fund | |
| Ordinary Income | | $ | — | | | $ | 777,618,293 | | | $ | 24,766,562 | | | $ | 31,504,681 | | | $ | 10,906,412 | | |
| Long Term Capital Gains | | | — | | | | 1,317,748,880 | | | | 1,682,209 | | | | — | | | | 576,509 | | |
| Return of Capital | | | — | | | | — | | | | — | | | | — | | | | 1,167,975 | | |
| | | U.S. Microcap
Fund | | U.S. Smallcap
Fund | | U.S. Midcap
Fund | | U.S. Multicap
Fund | |
| Ordinary Income | | $ | — | | | $ | 94,903 | | | $ | 99,705 | | | $ | 99,064 | | |
| Long Term Capital Gains | | | — | | | | — | | | | 562 | | | | — | | |
The tax character of distributions paid for the year ended October 31, 2006 were as follows:
| | | Global
Equity
Fund | | International
Equity
Fund | | International
Equity
Fund II | | Total Return
Bond
Fund | | Global High
Income
Fund | |
| Ordinary Income | | $ | 989 | | | $ | 219,796,418 | | | $ | — | | | $ | 18,265,856 | | | $ | 5,283,652 | | |
| Long Term Capital Gains | | | — | | | | 497,357,710 | | | | — | | | | 1,506,278 | | | | 2,460,693 | | |
| | | U.S. Microcap
Fund | | U.S. Smallcap
Fund | | U.S. Midcap
Fund | | U.S. Multicap
Fund | |
| Ordinary Income | | $ | — | | | $ | — | | | $ | — | | | $ | — | | |
| Long Term Capital Gains | | | — | | | | — | | | | — | | | | — | | |
The International Equity Fund II, U.S. Microcap Fund, U.S. Smallcap Fund, U.S. Midcap Fund and U.S. Multicap Fund did not have any distributions for the year ended October 31, 2006.
Julius Baer Funds 2007 Annual Report
211
NOTES TO FINANCIAL STATEMENTS (Continued)
As of October 31, 2007, the components of Distributable Earnings on a tax basis for the Global Equity Fund were as follows:
| Undistributed Ordinary Income | | $ | 369,516 | | |
| Unrealized Appreciation | | $ | 8,051,752 | | |
| Undistributed Long Term Capital Gains | | $ | — | | |
The difference between the components of Distributable Earnings on a tax basis and the amounts reflected in the statements of assets and liabilities of the Global Equity Fund are primarily due to mark-to-market of forwards.
At October 31, 2007, the Global Equity Fund had $78,444,271, $28,922,938 and $7,288,718 available as capital loss carryforwards which expire in 2009, 2010, and 2011, respectively.
As of October 31, 2007, the components of Distributable Earnings on a tax basis for the International Equity Fund were as follows:
| Undistributed Ordinary Income | | $ | 806,060,530 | | |
| Unrealized Appreciation | | $ | 8,661,293,026 | | |
| Undistributed Long Term Capital Gains | | $ | 2,270,529,464 | | |
The differences between components of Distributable Earnings on a tax basis and the amounts reflected in the statements of assets and liabilities of the International Equity Fund are primarily due to wash sales, mark-to-market of passive foreign investment companies, futures and forwards. In addition, short-term capital gains are considered ordinary income for income tax purposes.
As of October 31, 2007, the components of Distributable Earnings on a tax basis for the International Equity Fund II were as follows:
| Undistributed Ordinary Income | | $ | 172,771,568 | | |
| Unrealized Appreciation | | $ | 1,670,314,775 | | |
| Undistributed Long Term Capital Gains | | $ | 67,792,317 | | |
The differences between components of Distributable Earnings on a tax basis and the amounts reflected in the statements of assets and liabilities of the International Equity Fund II are primarily due to wash sales, mark-to-market of passive foreign investment companies, futures and forwards. In addition, short-term capital gains are considered ordinary income for income tax purposes.
Julius Baer Funds 2007 Annual Report
212
NOTES TO FINANCIAL STATEMENTS (Continued)
As of October 31, 2007, the components of Distributable Earnings on a tax basis for the Total Return Bond Fund were as follows:
| Undistributed Ordinary Income | | $ | 14,524,845 | | |
| Unrealized Appreciation | | $ | 10,353,510 | | |
| Undistributed Long Term Capital Gains | | $ | — | | |
The difference between the components of Distributable Earnings on a tax basis and the amounts reflected in the statements of assets and liabilities of the Total Return Bond Fund are primarily due to wash sales and forwards. In addition, short-term capital gains are considered ordinary income for income tax purposes.
At October 31, 2007, the Total Return Bond Fund had $1,695,163 and 15,266 available as capital loss carryforwards which expire in 2014 and 2015 respectively.
As of October 31, 2007, the components of Distributable Earnings on a tax basis for the Global High Income Fund were as follows:
| Undistributed Ordinary Income | | $ | — | | |
| Unrealized Appreciation | | $ | 3,364,529 | | |
| Undistributed Long Term Capital Gains | | $ | — | | |
The differences between components of Distributable Earnings on a tax basis and the amounts reflected in the statements of assets and liabilities of the Global High Income Fund are primarily due to wash sales and forwards. In addition, short-term capital gains are considered ordinary income for income tax purposes.
As of October 31, 2007, the components of Distributable Earnings on a tax basis for the U.S. Microcap Fund were as follows:
| Undistributed Ordinary Income | | $ | 738,567 | | |
| Unrealized Appreciation | | $ | 635,743 | | |
| Undistributed Long Term Capital Gains | | $ | 98,856 | | |
The differences between components of Distributable Earnings on a tax basis and the amounts reflected in the statements of assets and liabilities of the U.S. Microcap Fund are primarily due to organization cost adjustments. In addition, the short-term capital gains are considered ordinary income for income tax purposes.
As of October 31, 2007, the components of Distributable Earnings on a tax basis for the U.S. Smallcap Fund were as follows:
| Undistributed Ordinary Income | | $ | 1,170,429 | | |
| Unrealized Appreciation | | $ | 911,048 | | |
| Undistributed Long Term Capital Gains | | $ | 614,268 | | |
Julius Baer Funds 2007 Annual Report
213
NOTES TO FINANCIAL STATEMENTS (Continued)
The differences between the compoents of Distributable Earnings on a tax basis and the amounts reflected in the statements of assets and liabilities of the U.S. Smallcap Fund are primarily due to organization cost adjustments. In addition, short term capital gains are considered ordinary income for income tax purposes.
As of October 31, 2007, the components of Distributable Earnings on a tax basis for the U.S. Midcap Fund were as follows:
| Undistributed Ordinary Income | | $ | 373,789 | | |
| Unrealized Appreciation | | $ | 931,433 | | |
| Undistributed Long Term Capital Gains | | $ | 199,450 | | |
The differences between components of Distributable Earnings on a tax basis and the amounts reflected in the statements of assets and liabilities of the U.S. Midcap Fund are primarily due to organization cost adjustments. In addition, short-term capital gains are considered ordinary income for income tax purposes.
As of October 31, 2007, the components of Distributable Earnings on a tax basis for the U.S. Multicap Fund were as follows:
| Undistributed Ordinary Income | | $ | 550,950 | | |
| Unrealized Appreciation | | $ | 858,574 | | |
| Undistributed Long Term Capital Gains | | $ | 127,392 | | |
The differences between the components of Distributable Earnings on a tax basis and the amounts reflected in the statements of assets and liabilities of the U.S. Multicap Fund are primarily due to organization cost adjustments. In addition, short-term capital gains are considered ordinary income for income tax purposes.
10. Line of Credit
On September 28, 2005, Global Equity Fund, Total Return Bond Fund and Global High Income Fund (the "Borrowers") entered into a Credit Agreement (the "Agreement") with State Street Bank and Trust Company (the "Bank"). The Agreement is a $25,000,000 revolving credit facility to be utilized for temporary or emergency purposes to fund shareholder redemptions or for other short-term liquidity purposes. Total Return Bond Fund and Global High Income Fund may draw up to $10,000,000 and the Global Equity Fund may draw up to $5,000,000. The Borrowers will pay interest on the principal amount of the Loans outstanding at a floating rate per annum equal to the Federal Funds Rate plus 0.75%. In addition, the Borrowers shall pay to the Bank an annual commitment fee, in
Julius Baer Funds 2007 Annual Report
214
NOTES TO FINANCIAL STATEMENTS (Continued)
connection with the establishment and maintenance of the Credit Facility, at the rate of 0.10% per annum on the difference between $10.0 million and the average daily amount of Loans outstanding. Under the Agreement, the average daily outstanding balance utilized by the Global Equity Fund during the year ended October 31, 2007 was $2,083, at an average weighted interest rate of 6.00%. The Total Return Bond Fund and Global High Income Fund did not utilize the Agreement during the year ended October 31, 2007. As of October 31, 2007, Global Equity Fund, Total Return Bond Fund and Global High Income Fund had unused available balances of $5,000,000, $10,000,000 and $10,000,000 pursuant to the line of credit.
11. Financial Futures Contracts
The following financial futures contracts were outstanding as of October 31, 2007:
| | | Expiration
Date | | Contracts | | Description | | Position | | Notional
Current
Market
Value | | Net
Unrealized
Appreciation
(Depreciation) | |
Global
Equity Fund: | | 12/07 | | | 14 | | | FTSE/ JSE | | Long | | $ | 618,235 | | | $ | 9,542 | | |
| | | 11/07 | | | 8 | | | H-SHARES Index | | Long | | | 1,031,893 | | | | 20,310 | | |
| | | 11/07 | | | 4 | | | HANG SENG Index | | Long | | | 806,859 | | | | 25,447 | | |
| | | 12/07 | | | 2 | | | NIKKEI 225 | | Long | | | 168,550 | | | | 10,383 | | |
| | | 12/07 | | | 3 | | | S&P/ TSE 60 Index | | Long | | | 538,534 | | | | 22,265 | | |
| | | 12/07 | | | 1 | | | TOPIX Index | | Long | | | 140,218 | | | | (3,875 | ) | |
| | | 12/07 | | | 3 | | | SPI 200 | | Long | | | 472,225 | | | | 13,574 | | |
| | | 12/07 | | | 3 | | | FTSE 100 Index | | Long | | | 420,570 | | | | 15,108 | | |
| | | *11/07 | | | 8 | | | TAIEX | | Long | | | 482,815 | | | | 9,861 | | |
| | | *12/07 | | | 4 | | | KOSPI2 Index | | Long | | | 581,325 | | | | 8,884 | | |
| | | *11/07 | | | 35 | | | S&P CNX NIFTY Index | | Long | | | 262,893 | | | | 22,577 | | |
| | | $ | 154,076 | | |
| | | Expiration
Date | | Contracts | | Description | | Position | | Notional
Current
Market
Value | | Net
Unrealized
Appreciation
(Depreciation) | |
International
Equity Fund: | | 12/07 | | | 4,537 | | | FTSE/ JSE | | Long | | $ | 200,352,455 | | | $ | 3,103,287 | | |
| | | 11/07 | | | 2,695 | | | H-SHARES Index | | Long | | | 347,619,117 | | | | 6,839,211 | | |
| | | 11/07 | | | 1,355 | | | HANG SENG Index | | Long | | | 273,323,367 | | | | 8,615,010 | | |
| | | 12/07 | | | 2,275 | | | S&P/ TSE 60 Index | | Long | | | 408,388,608 | | | | 15,373,980 | | |
| | | 12/07 | | | 259 | | | TOPIX Index | | Long | | | 36,316,390 | | | | 1,527,623 | | |
| | | 12/07 | | | 882 | | | SPI 200 | | Long | | | 138,834,286 | | | | 5,088,751 | | |
| | | *11/07 | | | 2641 | | | TAIEX | | Long | | | 159,389,241 | | | | 3,255,414 | | |
| | | *12/07 | | | 1332 | | | KOSPI2 Index | | Long | | | 193,581,437 | | | | 3,068,963 | | |
| | | *11/07 | | | 15230 | | | S&P CNX NIFTY Index | | Long | | | 114,395,896 | | | | 9,823,992 | | |
| | | 12/07 | | | (48 | ) | | DAX Index | | Short | | | 13,992,098 | | | | (450,633 | ) | |
| | | 12/07 | | | (2105 | ) | | EUR STOXX | | Short | | | 137,165,210 | | | | (3,458,369 | ) | |
| | | $ | 52,787,229 | | |
Julius Baer Funds 2007 Annual Report
215
NOTES TO FINANCIAL STATEMENTS (Continued)
| | | Expiration
Date | | Contracts | | Description | | Position | | Notional
Current
Market
Value | | Net
Unrealized
Appreciation
(Depreciation) | |
International
Equity Fund II: | | 12/07 | | | 1,942 | | | FTSE/ JSE | | Long | | $ | 85,758,093 | | | $ | 1,320,596 | | |
| | | 11/07 | | | 970 | | | H-SHARES Index | | Long | | | 125,117,085 | | | | 2,462,609 | | |
| | | 11/07 | | | 562 | | | HANG SENG Index | | Long | | | 113,363,640 | | | | 3,238,259 | | |
| | | 12/07 | | | 850 | | | S&P/ TSE 60 Index | | Long | | | 152,584,754 | | | | 5,821,221 | | |
| | | 12/07 | | | 40 | | | TOPIX Index | | Long | | | 5,608,709 | | | | 389,030 | | |
| | | 12/07 | | | 380 | | | SPI 200 | | Long | | | 59,815,225 | | | | 1,893,632 | | |
| | | *11/07 | | | 1067 | | | TAIEX | | Long | | | 64,395,426 | | | | 1,315,232 | | |
| | | *12/07 | | | 552 | | | KOSPI2 Index | | Long | | | 80,222,938 | | | | 1,146,446 | | |
| | | *11/07 | | | 4699 | | | S&P CNX NIFTY Index | | Long | | | 35,295,227 | | | | 3,031,053 | | |
| | | $ | 20,618,078 | | |
* Swap transaction on futures indexes for each of the respective funds' with a counterparty of Merrill Lynch. The unrealized appreciation for the swap transactions on futures indexes are reflected in the unrealized financial futures amount in the Statement of Operations.
12. Recent Accounting Pronouncements
In July 2006, FASB issued FASB Interpretation No. 48, (FIN 48) "Accounting for Uncertainty in Income Taxes – an interpretation of FASB Statement No. 109". FIN 48 clarifies the accounting for uncertainty in income taxes recognized in accordance with FASB Statement No. 109, "Accounting for Income Taxes." This interpretation prescribes a recognition threshold and measurement attribute for the financial statement recognition and measurement of a tax position taken or expected to be taken in a tax return. It also provides guidance on de-recognition, classification, interest and penalties, accounting in interim periods, disclosure and transition. FIN 48 is effective for fiscal years beginning after December 15, 2006. Management is currently evaluating the impact, if any, the adoption of FIN 48 will have on the Fund's net assets, results of operations and financial statement disclosures.
In September 2006, FASB issued Statement of Financial Accounting Standards No. 157, Fair Value Measurements ("FAS 157"). FAS 157 establishes a single authoritative definition of fair value, establishes a framework for measuring fair value and expands disclosures about fair value measurements. FAS 157 applies to fair value measurements already required or permitted by existing standards. The change to current generally accepted accounting principles from the application of FAS 157 relate to the definition of fair value, the methods used to measure fair value, and the expanded disclosures about fair value measurements. Management of the Funds does not believe the adoption of FAS 157 will materially impact the financial statement amounts, however, additional disclosures may be required about the inputs used to develop the measurements and the
Julius Baer Funds 2007 Annual Report
216
NOTES TO FINANCIAL STATEMENTS (Continued)
effect of certain of the measurements on changes in net assets for the period. FAS 157 is effective for financial statements issued for fiscal years beginning after November 15, 2007 and interim periods within those fiscal years.
In February 2007, the FASB issued Statement of Financial Accounting Standard No. 159,("FAS 159") "The Fair Value Option for Financial Assets and Financial Liabilities - including an amendment of FASB Statement No. 115." FAS 159 permits entities to elect to measure certain financial assets and liabilities at fair value. Unrealized gains and losses on items for which the fair value option has been elected will be reported in earnings at each subsequent reporting date. FAS 159 is effective as of the beginning of the first fiscal year that begins after November 15, 2007. Management is currently evaluating the impact the adoption of FAS 159 will have on the Fund's financial statements.
13. Subsequent Events
New Share Classes
Effective November 1, 2007, additional classes of shares became available for sale for certain Julius Baer Funds. Class R shares became available for Global Equity Fund and Total Return Bond Fund. Consultant Class shares became available for Global Equity Fund, Total Return Bond Fund, Global High Income Fund, U.S. Microcap Fund, U.S. Smallcap Fund, U.S. Midcap Fund and U.S. Multicap Fund. Class R shares are offered exclusively through certain tax-exempt retirement plans. Consultant Class shares are offered primarily through financial advisers, including brokers, and other entities that have a dealer agreement with the Fund's distributor.
Investment Advisory Fee Rate Change
On December 19, 2007, the Board of Trustees approved JBIM's investment advisor fee reduction proposal for the Total Return Bond Fund and the Global High Income Fund. The fee for total Return Bond Fund will change from an annual rate of 0.45% to 0.35% on the average daily net assets. The Global High Income Fund fee will change from an annual rate of 0.75% to 0.65% on the average daily net assets. The fee changes will be effective February 28, 2008.
Julius Baer Funds 2007 Annual Report
217
REPORT OF INDEPENDENT AND REGISTERED PUBLIC ACCOUNTING FIRM
To the Shareholders and Board of Directors
Julius Baer Global Equity Fund Inc.
and
To the Shareholders and Board of Trustees
Julius Baer Investment Funds:
We have audited the accompanying statements of assets and liabilities, including the portfolios of investments, of Julius Baer Global Equity Fund Inc. and Julius Baer International Equity Fund, Julius Baer International Equity Fund II, Julius BaerTotal Return Bond Fund, Julius Baer Global High Income Fund (formerly Julius Baer Global High Yield Bond Fund), Julius Baer U.S. Microcap Fund, Julius Baer U.S. Smallcap Fund, Julius Baer U.S. Midcap Fund, and Julius Baer U.S. Multicap Fund, each a series of Julius Baer Investment Funds, as of October 31, 2007, and the related statements of operations for the year then ended, the statements of changes in net assets for each of the years or periods in the two-year period then ended and the financial highlights for each of the years or periods in the five-year period then ended. These financial statements and financial highlights are the responsibility of the Funds' management. Our responsibility is t o express an opinion on these financial statements and financial highlights based on our audits.
We conducted our audits in accordance with the standards of the Public Company Accounting Oversight Board (United States). Those standards require that we plan and perform the audit to obtain reasonable assurance about whether the financial statements and financial highlights are free of material misstatement. An audit includes examining, on a test basis, evidence supporting the amounts and disclosures in the financial statements. Our procedures included confirmation of securities owned as of October 31, 2007 by correspondence with the custodian and brokers, or by other appropriate auditing procedures. An audit also includes assessing the accounting principles used and significant estimates made by management, as well as evaluating the overall financial statement presentation. We believe that our audits provide a reasonable basis for our opinion.
In our opinion, the financial statements and financial highlights referred to above present fairly, in all material respects, the financial position of Julius Baer Global Equity Fund Inc., Julius Baer International Equity Fund, Julius Baer International Equity Fund II, Julius Baer Total Return Bond Fund, Julius Baer Global High Income Fund, Julius Baer U.S. Microcap Fund, Julius Baer U.S. Smallcap Fund, Julius Baer U.S. Midcap Fund, and Julius Baer U.S. Multicap Fund as of October 31, 2007, and the results of their operations, the changes in their net assets, and the financial highlights for each of the years or periods described above, in conformity with U.S. generally accepted accounting principles.

Boston, Massachusetts
December 28, 2007
Julius Baer Funds 2007 Annual Report
218
ADDITIONAL INFORMATION PAGE (Unaudited)
1. Proxy Voting Policies
A description of the Fund's proxy voting policies and procedures is available without charge, upon request, (1) on the Fund's website www.us-funds.juliusbaer.com and (2) on the SEC's Securities and Exchange Commission website www.sec.gov.
Information regarding how the Fund voted proxies relating to portfolio securities during the most recent 12-month period ended June 30 is available via the methods noted above.
2. Quarterly Filing Requirements
A Fund files its complete schedule of portfolio holdings with the Securities and Exchange Commission for the first and third quarters of each fiscal year on Form N-Q, which when filed, will be available on the Commission's web-site at www.sec.gov or on the Fund's website at.
A Fund's forms N-Q may be reviewed and copied at the Commissions's Public Reference Room in Washington, DC. Information regarding the operation of the Public reference Room may be obtained by calling 1-800-SEC-0330.
Julius Baer Funds 2007 Annual Report
219
RESULTS OF MEETINGS OF SHAREHOLDERS (Unaudited)
JULIUS BAER INVESTMENT FUNDS
Special Meetings of Shareholders
The continuation of a special meeting of Shareholders of the Julius Baer International Equity Fund (the "Fund"), a series of Julius Baer Investment Funds, was held on June 1, 2007. At the meeting, 268,987,153.21 shares (52.62% of the record date shares) were represented. Shareholders of the Fund voted the following proposals:
Proposal I: The modification of the fundamental investment restriction of the Fund related to the purchase or sale of real estate, real estate investment trust securities, commodities or commodity contracts, or investment in real estate limited partnerships, oil, gas or mineral exploration or development programs or oil, gas or mineral leases.
| Affirmative | | Against | | Abstain | |
| | 248,913,767.56 | | | | 16,262,711.07 | | | | 3,810,674.58 | | |
Proposal II: The modification of the fundamental investment restriction of the Fund related to the purchase, writing or sale of puts, calls, straddles, spreads or combinations thereof.
| Affirmative | | Against | | Abstain | |
| | 246,516,125.46 | | | | 18,393,729.08 | | | | 4,077,298.67 | | |
Julius Baer Funds 2007 Annual Report
220
JULIUS BAER FUNDS as of October 31, 2007
Julius Baer Funds (Unaudited)
Disinterested Trustees of the Trust and Directors of Julius Baer Global Equity Fund Inc. (Global Equity Fund):
Name, Date of
Birth, and Address | | Position(s)
Held
with Fund | | Term of
Office and
Length of
Time
Served (1) | | Principal Occupation(s)
During the Past 5 Years | | Number of
Portfolios
in Fund
Complex
Overseen
by
Trustee/
Director* | | Other
Directorships
Held by
Trustee/
Director (2) | |
| Antoine Bernheim (May 30, 1953) 330 Madison Avenue New York, New York 10017 | | Trustee and Director | | Trustee since 2004; Director since 1990 | | President, Dome Capital Management, Inc.; Chairman, Dome Securities Corp.; President, The U.S. Offshore Funds Directory, 1990-present (Publishing) | | | 9 | | | None | |
|
| Thomas Gibbons (June 1, 1947) 330 Madison Avenue New York, New York 10017 | | Trustee and Director | | Trustee since 2004; Director since 1993 | | President, Cornerstone Associates Management (Consulting Firm). | | | 9 | | | None | |
|
| Harvey B. Kaplan (September 22, 1937) 330 Madison Avenue New York, New York 10017 | | Trustee and Director | | Trustee since 1995; Director since 1990 | | Retired since 2006; Controller (Chief Financial Officer), Easter Unlimited, Inc. (toy company). | | | 9 | | | None | |
|
| Robert S. Matthews (October 16, 1943) 330 Madison Avenue New York, New York 10017 | | Trustee and Director | | Trustee since 1992; Director since 2002 | | Partner, Matthews & Co. (certified public accountants). | | | 9 | | | None | |
|
| Gerard J.M. Vlak (September 28, 1933) 330 Madison Avenue New York, New York 10017 | | Trustee and Director | | Trustee of the Trust since 1992.; Director since 2004; Chairman of the Fund Complex since 2005 | | Retired. | | | 9 | | | The Rouse Company (1996-present).
Océ North America, 1992-present. | |
|
| Peter Wolfram (April 2, 1953) 330 Madison Avenue New York, New York 10017 | | Trustee and Director | | Trustee since 1992; Director since 2004 | | Partner, Kelley Drye & Warren (law firm). | | | 9 | | | None | |
|
Julius Baer Funds 2007 Annual Report
221
JULIUS BAER FUNDS as of October 31, 2007 (Continued)
Julius Baer Funds (Unaudited)
Disinterested Trustees of the Trust and Directors of Julius Baer Global Equity Fund Inc. (Global Equity Fund)—(Continued):
Name, Date of
Birth, and Address | | Position(s)
Held
with Fund | | Term of
Office and
Length of
Time
Served (1) | | Principal Occupation(s)
During the Past 5 Years | | Number of
Portfolios
in Fund
Complex
Overseen
by
Trustee/
Director* | | Other
Directorships
Held by
Trustee/
Director (2) | |
| Robert J. McGuire (December 8, 1936) 330 Madison Avenue New York, New York 10017 | | Trustee and Director | | Trustee since 2006; Director since 2006 | | Self-employed since 1998; Counsel, Morvillo, Abramowitz, Grand, Iasaon & Silberberg, P.C., (1998-2005). | | | 9 | | | Mutual of America Investment Corp.; Six Flags, Inc. (entertainment); Protection One, Inc. (Security Systems); GAM Funds, Inc.; GAM Avalon Funds, Inc.; Police Athletic League. | |
|
Interested Trustees:
Name, Date of
Birth, and Address | | Position(s)
Held
with Fund | | Term of
Office and
Length of
Time
Served | | Principal Occupation(s)
During the Past 5 Years | | Number of
Portfolios
in Fund
Complex
Overseen
by
Trustee/
Director* | | Other
Directorships
Held by
Trustee/
Director (2) | |
| Glen Wisher (3) (October 10, 1963) 330 Madison Avenue New York, NY 10017 | | Trustee and Director | | Trustee since 2005; Director since 2005 | | Managing Director (since 1995) and Chairman of the Board (since 2004) of Julius Baer Investment Management LLC; Chairman of the Board of Julius Baer Americas (since 2005). | | | 9 | | | None | |
|
* The Fund Complex, referred to in the charts above, is comprised of the eight current series of the Trust and Global Equity Fund.
(1) Each Trustee and Director serves during the lifetime of the Trust or Global Equity Fund until he or she dies, resigns, retires, is declared bankrupt or incompetent, or is removed or, if sooner, until the next meeting of the shareholders/stockholders and until the election and qualification of his or her successor.
(2) Directorships include public companies and any company registered as an investment company.
(3) Mr. Wisher is an interested Trustee/Director because he is an employee of Julius Baer Americas.
Julius Baer Funds 2007 Annual Report
222
JULIUS BAER FUNDS as of October 31, 2007 (Continued)
Officers of Funds:
The business address for each officer to the funds, except Mr. Frost, Ms. McFarlane, Mr. Smith and Mr. McVoy, is Julius Baer Investment Management LLC,330 Madison Avenue, New York, New York, 10177. The business address for Mr. Frost, Ms. McFarlane and Mr. Smith is State Street Bank and Trust Company, 200 Clarendon Street, Boston, Massachusetts 02116. The business address for Mr. McVoy is US Bancorp Fund Services, LLC, 615 E. Michigan Street, Milwaukee, WI 53202.
Name, Date of Birth,
and Address | | Position(s)
Held
with Fund | | Term of Office
and Length of
Time Served | | Principal Occupation(s)
During the Past 5 Years | |
| Anthony Williams, (March 15, 1964) | | President | | Since 2004 | | Chief Executive Officer of Julius Baer Investment Management LLC (formerly, Julius Baer Investment Management, Inc.) and Asset Management Americas (since 2004); Head of Asset Management Americas and Chief Operating Officer, Julius Baer Investment Management LLC (since 2003). | |
|
| Denise Downey, (September 1, 1961) | | Vice President | | Since 1995 | | First Vice President, Director, Institutional Investments, Julius Baer Investment Management LLC (formerly Julius Baer Investment Management, Inc.) (2002-present). | |
|
| Greg Hopper, (March 24, 1957) | | Vice President | | Since 2002 | | First Vice President of Julius Baer Investment Management LLC (formerly, Bank Julius Baer Investment Management, Inc.) (2002-present). | |
|
| Samuel Dedio, (June 4, 1966) | | Vice President | | Since 2006 | | Senior Portfolio Manager and First Vice President of the Adviser of Julius Baer Investment Management LLC (2006-present); Managing Director, Co-Lead Portfolio Manager and Co-Head, Deutsche Asset Management (1999-2006). | |
|
| Richard C. Pell, (September 21, 1954) | | Vice President | | Since 1995 for Trust; since 2004 for Global Equity Fund | | Senior Vice President and Chief Investment Officer of Julius Baer Investment Management LLC (formerly, Bank Julius Baer & Co., Ltd., New York Branch ) (1995-present). | |
|
| Donald Quigley, (January 13, 1965) | | Vice President | | Since 2001 | | First Vice President and Head of Global Fixed-Income Management for Julius Baer Investment Management LLC (2001-present). | |
|
Julius Baer Funds 2007 Annual Report
223
JULIUS BAER FUNDS as of October 31, 2007 (Continued)
Julius Baer Funds (Unaudited)
Officers of Funds—(Continued):
Name, Date of Birth,
and Address | | Position(s)
Held
with Fund | | Term of Office
and Length of
Time Served | | Principal Occupation(s)
During the Past 5 Years | |
| Rudolph-Riad Younes, (September 25, 1961) | | Vice President | | Since 1997 for Trust; since 2004 for Global Equity Fund | | Senior Vice President and Head of International Equity Management of Julius Baer Investment Management LLC (formerly, Bank Julius Baer & Co., Ltd., New York Branch ) (1993-present). | |
|
| Keith Walter, (June 17, 1968) | | Vice President | | Since 2006 | | First Vice President, Julius Baer Investment Management LLC (2000-present). | |
|
| Craig M. Giunta, (December 20, 1971) | | Chief Financial Officer | | Since 2003 | | First Vice President, Julius Baer Investment Management LLC (formerly Julius Baer Investment Management, Inc.) (2002-present). | |
|
| Alex Bogaenko, (April 13, 1963) | | Treasurer | | Since 2005 | | Vice President, Julius Baer Investment Management LLC (formerly Julius Baer Investment Management, Inc.) (2005-present); Manager of Accounting and Director of Portfolio Administration of Van Eck Global (1995-2005). | |
|
| John Whilesmith, (March 8, 1967) | | Secretary | | Since 2005 | | Vice President for Julius Baer Investment Management LLC (formerly Julius Baer Investment Management, Inc.) (2005-present); Compliance Officer, Morgan Stanley Investment Management (2002-2005). | |
|
| Michael K. Quain, (July 6, 1957) | | Chief Compliance Officer | | Since 2004 | | First Vice President of Julius Baer Investment Management LLC (formerly Julius Baer Investment Management, Inc.) (2002-present); First Vice President of Julius Baer Securities Inc. (1998-2002); First Vice President, Bank Julius Baer & Co., Ltd. New York Branch, (1998-2002); President and Chief Executive Officer of Julius Baer Global Equity Fund (formerly, The European Warrant Fund, Inc) (1997-2004); President and Chief Executive Officer of Julius Baer Investment Funds LLC (1998-2004). | |
|
| Michael McVoy, (August 8, 1957) | | Anti-Money Laundering Officer | | Since 2004 | | Chief Compliance Officer for U.S. Bancorp (2002-present); Legal Counsel for U.S. Bancorp (formerly, Firstar Corp.) (1986-2006); Senior Vice President and Risk Manager for U.S. Bancorp (1999-Present). | |
|
Julius Baer Funds 2007 Annual Report
224
JULIUS BAER FUNDS as of October 31, 2007 (Continued)
| Julius Baer Funds (Unaudited) | |
|
Officers of Funds—(Continued):
Name, Date of Birth,
and Address | | Position(s)
Held
with Fund | | Term of Office
and Length of
Time Served | | Principal Occupation(s)
During the Past 5 Years | |
| Rainer L.C. Frost, (March 5, 1957) | | Assistant Secretary | | Since 2005 | | Director and Counsel, State Street Bank and Trust Company (2005-present); Principal and General Counsel, Clarity Group (2000-2005). | |
|
| Victoria McFarlane, (October 2, 1966) | | Assistant Treasurer | | Since 2003 | | Senior Director, Mutual Fund Administration, State Street Bank and Trust Company (2005-present); Director, Mutual Fund Administration, State Street Bank and Trust Company (2001-2005). | |
|
| Brian Smith, (March 15, 1967) | | Assistant Treasurer | | Since 2007 | | Director, Mutual Fund Administration, State Street Bank and Trust Company (2005-present); Senior Manager, Mutual Fund Administration, State Street Bank and Trust Company (2003-2005); Manager/Assistant Vice President of Fund Treasury for MFS Investment Services (2001-2003). | |
|
Julius Baer Funds 2007 Annual Report
225
SUPPLEMENTAL TAX INFORMATION (Unaudited)
The International Equity Fund and International Equity Fund II paid foreign taxes of $47,219,504 and $11,739,684 and earned $591,685,090 and $173,337,924 of foreign income during the year ended October 31, 2007. Pursuant to Section 853 of the Internal Revenue Code, $0.09 and $0.02 per share were designated as foreign taxes paid for International Equity Fund and International Equity Fund II and $1.16 and $0.33 per share were designated as income earned from foreign sources for the International Equity Fund and International Equity Fund II for the year ended October 31, 2007.
The table below shows distributions paid from investment company taxable income earned in October 31, 2007, or the maximum amount allowable under the tax law, as Qualified Dividend Income in accordance with the Internal Revenue Code. Complete 2007 year end information will be reported to you on your 2007 Form 1099-DIV, which shall be provided to you in early 2008.
| Fund | | QDI | |
| International Equity Fund | | $ | 356,454,747 | | |
| International Equity Fund II | | | 24,766,562 | | |
| Global High Income Fund | | | 304,336 | | |
| U.S. Smallcap Fund | | | 22,193 | | |
| U.S. Multicap Fund | | | 56,473 | | |
| U.S. Midcap Fund | | | 99,705 | | |
For corporate shareholders, a portion of the ordinary dividends paid during the Funds' year ended October 31, 2007 qualified dividends received deductions were the following:
| Fund | | DRD | |
| International Equity Fund | | | 0.09 | % | |
| International Equity Fund II | | | 0.86 | % | |
| U.S. Smallcap Fund | | | 23.16 | % | |
| U.S. Multicap Fund | | | 55.95 | % | |
| U.S. Midcap Fund | | | 32.76 | % | |
Pursuant to Sector 852 of the Internal Revenue Code, the Funds designated the following capital gain dividends for the year ended October 31, 2007:
| Fund | | Long Term
Capital Gain
Dividend | |
| International Equity Fund | | $ | 1,317,748,880 | | |
| International Equity Fund II | | | 1,682,209 | | |
| Global High Income Fund | | | 576,509 | | |
| U.S. Midcap Fund | | | 562 | | |
Julius Baer Funds 2007 Annual Report
226
JULIUS BAER FUNDS
330 Madison Avenue
New York, New York 10017
This report is sent to shareholders of the Julius Baer Global Equity Fund Inc. and the Julius Baer Investment Funds for their information. It is not a Prospectus, circular or representation intended for use in the purchase or sale of shares of the funds or of any securities mentioned in the report.
www.us-funds.juliusbaer.com
Zurich (head office), Buenos Aires, Dubai, Frankfurt, Geneva, Hong Kong, London, Lugano, New York, Singapore, Tokyo and 21 other cities around the globe.
Item 2. Code of Ethics.
As of October 31, 2007, the Registrant has adopted a Code of Ethics that applies to the Registrant’s President/Chief Executive Officer and Chief Financial Officer pursuant to the Sarbanes-Oxley Act of 2002. During the year ended October 31, 2007, there were no amendments to a provision of the Code of Ethics nor were there any waivers granted from a provision of the Code of Ethics. A copy of its code of ethics is filed with this Form N-CSR under Item 12(a)(1).
Item 3. Audit Committee Financial Expert.
The Registrant’s Board of Directors has determined that the Registrant has one audit committee financial expert serving on its audit committee. The audit committee financial expert serving on the Registrant’s audit committee is Mr. Harvey B. Kaplan, who is an independent director.
Item 4. Principal Accountant Fees and Services.
(a) AUDIT FEES: The aggregate fees billed for professional services rendered by its principal “Independent Registered Accounting Firm”, KPMG LLP, for the audit of the Registrant’s annual financial statements for the years ended October 31, 2007 and 2006 were $18,900 and $18,000, respectively.
(b) AUDIT RELATED FEES: No such fees were billed to the Registrant by KPMG LLP for the fiscal years ending October 31, 2007 and 2006 were $3000 and $0, respectively.
(c) TAX FEES: The aggregate fees billed for professional services rendered by KPMG LLP for the review of Form 1120-RIC, Form 8613, and review of excise tax distribution calculations for the fiscal years ending October 31, 2007 and 2006 were $8,400 and $8,000, respectively.
(d) ALL OTHER FEES: No such fees were billed to the Registrant by KPMG LLP for the fiscal years ending October 31, 2007 and 2006.
(e) (1)The Registrant’s audit committee pre-approves all audit and non-audit services to be performed by the Registrant’s accountant before the accountant is engaged by the Registrant to perform such services.
(e) (2)The percentage of services described in each of paragraphs (b) through (d) of this Item that were approved by the audit committee pursuant to paragraph (c)(7)(i)(C) of Rule 2-01 of Regulation S-X are as follows:
(b) Not applicable
(c) 100%
(d) Not applicable
(f) Not applicable.
(g) The aggregate non-audit fees billed by KPMG LLP to the Registrant for the fiscal years ending October 31, 2007 and October 31, 2006 were $8,400 and $8,000, respectively. The aggregate non-audit fees billed by KPMG to the Registrant, the Adviser and all entities controlling, controlled by, or under common control with the Adviser that provide services to the Registrant for the fiscal years ended October 31, 2007 and October 31, 2006 were $334,388 and $168,725, respectively.
(h) The Audit Committee has authorized the Chairman of the Audit Committee to pre-approve audit and non-audit services. For the fiscal years ended October 31, 2007 and October 31, 2006, the Audit Committee pre-approved all such services.
2
Items 5. Audit Committee of Listed Registrants
Not applicable.
Item 6. Schedule of Investments
Included as part of the annual report provided in Item 1.
Item 7. Disclosure of Proxy Voting Policies and Procedures for Closed-End Management Investment Companies.
Not applicable.
Item 8. Portfolio Managers of Closed-End Management Investment Companies
Not applicable.
Items 9. Purchase of Equity Securities by Closed-End Management Investment Company and Affiliated Purchasers.
Not applicable.
Items 10. Submission of Matters to a Vote of Security Holders.
There have been no material changes to the procedures by which the shareholders may recommend nominees to the Registrant’s Board of Directors, where those changes were implemented after the Registrant last provided disclosure in response to the requirements of Item 7(d)(2)(ii)(G) of Schedule 14A (17 CFR 240.14a-101), or this Item.
Item 11. Controls and Procedures.
(a) The Registrant’s Principal Executive Officer and Principal Financial Officer concluded that the Registrant’s disclosure controls and procedures (as defined in Rule 30a-3(c) under the Investment Company Act of 1940) were effective as of a date within 90 days prior to the filing date of this report (the “Evaluation Date”), based on their evaluation of the effectiveness of the Registrant’s disclosure controls and procedures as of the Evaluation Date.
(b) There were no changes in the Registrant’s internal control over financial reporting (as defined in Rule 30a-3(d) under the Investment Company Act of 1940 (17 CFR 270.30a-3(d)) that occurred during the Registrant’s second fiscal quarter of the period covered by this report that has materially affected, or is reasonably likely to materially affect, the Registrant’s internal control over financial reporting.
3
Item 12. Exhibits.
(a)(1) Code of Ethics is attached.
(a)(2) Separate certifications for the Registrant’s Principal Executive Officer and Principal Financial Officer, as required by Rule 30a-2(a) under the Investment Company Act of 1940 (17 CFR 270.30a-2(a)) are attached hereto as Exhibit 99CERT.
(b) Certifications for the Registrant’s Principal Executive Officer and Principal Financial Officer, as required by Rule 30a-2(b) under the Investment Company Act of 1940, are attached here to as Exhibit 99.906CERT. These certifications are being furnished to the Securities and Exchange Commission solely pursuant to 18 U.S.C. section 1350 and are not being filed as part of the Form N-CSR with the Commission.
4
SIGNATURES
Pursuant to the requirements of the Securities Exchange Act of 1934 and the Investment Company Act of 1940, the registrant has duly caused this report to be signed on its behalf by the undersigned, thereunto duly authorized.
(Registrant) | Julius Baer Global Equity Fund Inc. | |
By (Signature and Title) | /s/ Tony Williams | |
| Tony Williams | President (Principal Executive Officer) |
| | | |
Pursuant to the requirements of the Securities Exchange Act of 1934 and the Investment Company Act of 1940, this report has been signed below by the following persons on behalf of the registrant and in the capacities and on the dates indicated.
By (Signature and Title) | /s/ Craig Giunta | |
| Craig Giunta | Chief Financial Officer (Principal Financial Officer) |
| | | |
By (Signature and Title) | /s/ Tony Williams | |
| Tony Williams | President (Principal Executive Officer) |
| | | |
5