UNITED STATES
SECURITIES AND EXCHANGE COMMISSION
Washington, D.C. 20549
FORM N-CSR
CERTIFIED SHAREHOLDER REPORT OF REGISTERED
MANAGEMENT INVESTMENT COMPANIES
Investment Company Act file number 811-06017
Artio Global Equity Fund Inc.
(Exact name of registrant as specified in charter)
| | | |
|
| 330 Madison Avenue, New York, New York | | 10017 |
| |
| (Address of principal executive offices) | | (Zip code) |
Anthony Williams, President, 330 Madison Avenue, New York, NY 10017
(Name and address of agent for service)
Registrant’s telephone number, including area code: (212) 297-3600
Date of fiscal year end: 10/31/2010
Date of reporting period: 10/31/2010
TABLE OF CONTENTS
Item 1. Reports to Stockholders.
Annual Report
Artio Global Funds
Artio Global Equity Fund Inc.
Artio International Equity Fund
Artio International Equity Fund II
Artio Total Return Bond Fund
Artio Global High Income Fund
Artio U.S. Microcap Fund
Artio U.S. Smallcap Fund
Artio U.S. Midcap Fund
Artio U.S. Multicap Fund
October 31, 2010
ARTIO GLOBAL FUNDS
330 Madison Avenue
New York, New York 10017
This report is sent to shareholders of the Artio Global Equity Fund Inc. and the Artio Global Investment Funds for their information. It is not a Prospectus, circular or representation intended for use in the purchase or sale of shares of the funds or of any securities mentioned in the report.
www.artiofunds.com
November 23, 2010
Dear Shareholder,
I am pleased to present the Annual Report for the Artio Global Funds (the “Funds”) for the fiscal year ending October 31, 2010 (the “reporting period”).
The reporting period proved positive for financial markets as nascent signs of global economic recovery became somewhat more apparent, although still sluggish, and investors took some comfort that the US Federal Reserve was set to embark upon a second round of bond purchases (affectionately known as “quantitative easing II”, or “QE II”) to safeguard the world’s largest economy. However, joblessness is stubbornly high in the US and the housing market remains weak, serving as a constant reminder that we are not out of the woods just yet.
The reporting period was not without drama, as the sovereign debt crisis and concerns over bank stress tests in Europe took hold of global equity markets during the first half of 2010. Declines in European bourses were further exacerbated by a decline in the euro as investors began to question the long-term viability of the common currency. Gold, long held as an asset of choice during periods of market stress, surged throughout this period and remains well supported amid a climate of burgeoning government deficits in the developed world. The final four months of the reporting period led to a turnaround in global equity markets as well as for the euro after positive euro zone stress test results were announced. The same period saw concerns over the sovereign debt crisis begin to ease and the prospects for QE II take center stage, although subsequent to the period’s end concerns have been raised once again, in particular with respect to Ireland.
As you will read in the commentaries which follow, assessing the dynamics between the developed and emerging markets is an increasing necessity across the asset classes we manage. The growing importance of the emerging world is likely to have profound and long-term implications for investors and we remain confident that the global expertise across our equity and fixed income investment teams is particularly well suited to meet these challenges on behalf of our shareholders going forward.
As we continue to ensure that we maintain a strong system of checks and balances on behalf of the Artio Global Funds, I am pleased to welcome Ms. Cynthia Hostetler as a director for the Global Equity Fund Inc. and an adviser and consultant for the Artio Global Investment Funds. Ms. Hostetler started her professional career as an attorney in the corporate/banking department of the law firm Simpson Thacher & Bartlett. She later became President and member of the Board of Directors of First Manhattan Bancorporation and more recently served as a Vice President for
| | |
| ARTIO GLOBAL FUNDS ï 2010 ANNUAL REPORT | 1 |
Investment Funds at the Overseas Private Investment Corporation. She is currently a Trustee of the Eisenhower Presidential Foundation and Library. Additionally, she is Vice Chairman of the Thunderbird Private Equity Center Board of Directors. We believe Ms. Hostetler’s considerable experience and knowledge within the financial industry will be a valuable asset for shareholders.
I would like to express my sincere appreciation to you as shareholders for your continued confidence and wish all of you much happiness and success in the New Year.
Sincerely,
Tony Williams
President
This material is provided for informational purposes only and does not in any sense constitute a solicitation or offer of the purchase or sale of securities unless preceded or accompanied by a prospectus.
Mutual funding investing involves risk; principle loss is possible.
Distributor: Quasar Distributors, LLC (12/10)
| | |
| 2 | ARTIO GLOBAL FUNDS ï 2010 ANNUAL REPORT | |
MANAGEMENT’S COMMENTARY
Artio Global Equity Fund Inc.
2010 Annual Report
Introduction
The Artio Global Equity Fund Inc. (the “Fund”) Class A Shares posted a return of 15.65% for the fiscal year ended October 31, 2010, exceeding the Fund’s benchmark, the MSCI All Country World Index (MSCI ACWI) which was up 14.10% over the same period. We are pleased with the results in light of the volatile market conditions prevailing during the twelve months. Diverging macroeconomic views arguing strongly for either inflationary or deflationary pressures, combined with capricious economic data and sovereign debt default fears, whipsawed stocks and investors. Correlations between assets classes were high, emphasizing the need for a robust investment process and strategy to navigate the choppy waters. In this annual letter we would like to highlight, at first, certain aspects of our macroeconomic framework that have led to the current portfolio positioning and then discuss our performance for the year as well as some of our favorite investment ideas.
A Few Great Nations
“To achieve greatness, start where you are, use what you have, do what you can.”
Arthur Ashe
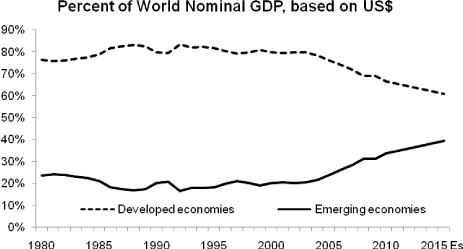
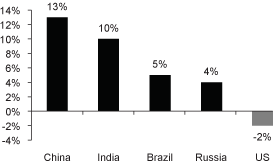
All nations aspire to achieve greatness. Greatness measured not necessarily by military or ideological dominance, although history has its share of such precedents, but rather by a nation’s standard of living and the promise for a brighter future. It has been and will continue to be a driver of human evolution. This process, despite its existence for thousands of years, is not a smoothly balanced one, but a competitive one, and therefore has, on occasions, led to tensions. The last decade has seen a giant improvement in the standard of living in a number of developing nations across Asia, Europe, Africa and Latin America. These countries have made use of their natural resources, low-cost abundant labor, strong educational traditions, and strategic geography, thus garnering a rapidly growing share of world gross domestic product (GDP). In 2010, emerging economies’ contribution to world GDP rose to 34%, up from 20% in 20001. This was a very important driver of the last decade’s global economic expansion. A recent study by Goldman Sachs suggests that by 2030, emerging markets’ share of global GDP will be 55%2. Therefore, we believe it is likely that the emerging world’s growth trends will continue for a while.
1 Source: IMF, WEO Aggregate Data, October 2010.
2 Source: Goldman Sachs, Global Economics Paper No. 204, September 8, 2010, p.2.
| | |
| ARTIO GLOBAL FUNDS ï 2010 ANNUAL REPORT | 3 |
This worldwide economic transformation experienced over the last decade has not been cost-free for all participants. While the size of the global pie has increased, the faster growth of the emerging world, along with other macroeconomic and geopolitical factors, has left some of the mature developed nations with relatively smaller pieces. In other words, the “new great nations” have started to crowd out some of the “old great nations” (see Exhibit 1).
Exhibit 1
Global GDP Historical Attribution
Source: IMF, WEO Aggregate Data, October 2010
Faced with the prospects of shrinking global share, a few of these “old great nations” have borrowed, incurring in some cases debts substantially above their means of repayment, in order to sustain their “greatness”, i.e. current standard of living. This combination of eroding competitiveness and rising leverage has led to a number of structural economic problems in parts of the developed world — soaring deficits, indebted consumers, rising unemployment, and declining asset values. Of course, to blame these issues solely on the advance of the emerging world would be too trivial. A number of geopolitical and macroeconomic factors have been contributors, including but not limited to, political and corporate ’short-termism’, huge entitlement obligations, poor demographics, consumption favoritism, low savings rates, rigid labor laws and lack of regulatory oversight.
One Simple Equation — Three Difficult Solutions
To illustrate the dilemma faced by some “old great nations” governments, we will draw on some basic macroeconomic terminology. A nation’s GDP represents all the goods and services produced in an economy. The end-use of this aggregate output
| | |
| 4 | ARTIO GLOBAL FUNDS ï 2010 ANNUAL REPORT | |
includes private consumption, private investment, government spending, with the balance exported abroad. In other words:
GDP = Consumption + Investment + Government Spending + Net Exports
Another way to define GDP is to think of it as a nation’s income, i.e. the total value of the goods and services a country produces is effectively its gross income3. Such income, in turn, is spent on consumption, saving or paying taxes. Put into an equation form:
GDP = Consumption + Savings + Taxation
Both equations are a different form of deriving national GDP. Equating the two rights sides and simplifying the results leads to:
Net Exports = (Savings — Investments) + (Taxation — Government Spending)
Since (Savings — Investments) is effectively Net Private Savings and (Taxation — Government Spending) is Net Government Savings, we can simplify the equation further to:
Net Exports4 = Net Private Savings + Net Government Savings
When a country’s share of the global market pie starts contracting, it typically experiences a decline in net exports as consumers purchase more foreign-produced goods. Over time, this imbalance of higher imports and lower exports leads to Net Export deficit (i.e. trade deficit). The equation above tells us that when the left side, Net Exports, is deep into the negative (i.e. a large trade deficit), then the right side would be deep into the negative as well, implying negative Net Private Savings (i.e. over-leveraged, under-saved individuals) or negative Net Government Savings (i.e. over-leveraged government balance sheets). To put it in simple terms, a country that runs large trade deficits usually has indebted citizens and/or governments. No country can achieve prosperity through infinite borrowing. Just like a company that continuously generates negative cash flow cannot survive indefinitely by borrowing from the capital markets, a nation that spends more that it earns cannot thrive and maintain its “greatness” forever.
There are three parts to this equation and hence three possible solutions. To turn things from negative to positive territory, effective policies can choose to boost Net Exports, Net Private Savings, Net Government Savings or a combination thereof. Despite
3 This analysis ignores other sources of income that a nation has, such as foreign dividends and interest and/or external government aid, the sum of which is also known as Net Factor Income. Such Net Factor Income is usually relatively small compared to the other components in the equation. In addition, it is somewhat difficult to control directly through policy as it is derived externally. Therefore it has been left out for simplicity.
4 As explained in the prior footnote, for simplicity we have excluded Net Factor Income out of the analysis. If the term were to be included, the equation would have been Current Account = Net Exports + Net Factor Income = Net Private Savings + Net Government Savings.
| | |
| ARTIO GLOBAL FUNDS ï 2010 ANNUAL REPORT | 5 |
the simplicity of this theoretical framework, the solutions are not easy as the cost in some cases could outweigh the benefits. The “right” long-term solution should aim to broadly constrain a nation’s consumption within its means. However, such policies could lead to significant economic contraction in the near term. For instance, if policies target higher Net Private Savings, encouraging greater savings and less consumption, the resulting impact on an economy driven largely by a consuming domestic population could lead to a recession. Similarly, aiming towards greater Net Government Savings through various austerity packages, combining higher taxes and lower expenditures, would also have a belt-tightening effect on the economy. The third alternative is to boost Net Exports directly through weakening the currency thus making a country’s exports more competitive and imports more expensive for domestic consumers. While the immediate impact of the third solution is undoubtedly positive, a weakened currency in the long-term spurs inflation.
The Rise of the Bond Vigilantes
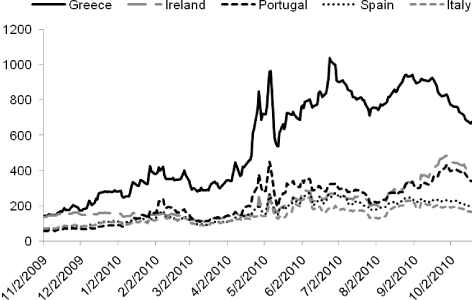
Few nations take preemptive measures to stop yawning deficits — why stop the dance while the music is still playing, as a former CEO once quipped. Actions are typically taken when governments are forced to react to external pressures. Such pressures came in early 2010 when bond vigilantes refused to continue funding the profligate spending of the worst sovereign offenders. Historical evidence5suggests that government debt crises are usually preceded by a banking system collapse. A little over a year after the fall of Lehman Brothers in late 2008, the periphery of developed Europe (Greece, Spain, Portugal, Italy and Ireland) was engulfed by a full-blown sovereign debt crisis. The day of reckoning for lost competitiveness had arrived.
Exhibit 2
Annual Current Account Deficits6
| | | | | | | | | | | | | | | | | | | | | | | | | | | | | | | | | | | | | | | | | |
| | | | | | Pre-Crisis
| |
| | | Annual Current Account Deficit in US$ Millions (Seasonally Adjusted) | | | CAGR1 | |
| | | 2001 | | | 2002 | | | 2003 | | | 2004 | | | 2005 | | | 2006 | | | 2007 | | | 2008 | | | 2009 | | | 2001-2008 | |
| |
Italy | | $ | (663 | ) | | $ | (9,438 | ) | | $ | (19,603 | ) | | $ | (16,248 | ) | | $ | (29,389 | ) | | $ | (48,131 | ) | | $ | (51,628 | ) | | $ | (83,095 | ) | | $ | (68,576 | ) | | | 99.4 | % |
Ireland | | | (692 | ) | | | (1,106 | ) | | | 74 | | | | (1,079 | ) | | | (7,134 | ) | | | (7,865 | ) | | | (13,837 | ) | | | (15,286 | ) | | | (6,485 | ) | | | 55.6 | % |
Spain | | | (24,021 | ) | | | (22,396 | ) | | | (31,041 | ) | | | (54,871 | ) | | | (83,094 | ) | | | (110,848 | ) | | | (144,103 | ) | | | (154,937 | ) | | | (80,992 | ) | | | 30.5 | % |
Greece | | | (9,520 | ) | | | (10,051 | ) | | | (12,829 | ) | | | (13,543 | ) | | | (18,377 | ) | | | (29,719 | ) | | | (44,928 | ) | | | (50,914 | ) | | | (37,060 | ) | | | 27.1 | % |
Hungary | | | (3,214 | ) | | | (4,623 | ) | | | (6,705 | ) | | | (8,808 | ) | | | (8,337 | ) | | | (8,556 | ) | | | (9,531 | ) | | | (11,311 | ) | | | (593 | ) | | | 19.7 | % |
Portugal | | | (12,429 | ) | | | (10,908 | ) | | | (10,428 | ) | | | (15,447 | ) | | | (19,791 | ) | | | (21,573 | ) | | | (23,374 | ) | | | (31,725 | ) | | | (23,981 | ) | | | 14.3 | % |
US | | | (397,159 | ) | | | (458,074 | ) | | | (520,667 | ) | | | (630,487 | ) | | | (747,590 | ) | | | (802,636 | ) | | | (718,094 | ) | | | (668,853 | ) | | | (378,431 | ) | | | 7.7 | % |
UK | | | (30,394 | ) | | | (27,990 | ) | | | (29,900 | ) | | | (45,656 | ) | | | (59,698 | ) | | | (82,692 | ) | | | (73,002 | ) | | | (43,538 | ) | | | (27,458 | ) | | | 5.3 | % |
| |
| 1. | CAGR = Compound Annual Growth Rate |
Source: OECD
5 Carmen M. Reinhart, Kenneth Rogoff – This Time is Different: Eight Centuries of Financial Folly.
6 Current Account Deficit used as a proxy for Trade Deficit.
| | |
| 6 | ARTIO GLOBAL FUNDS ï 2010 ANNUAL REPORT | |
Exhibit 2 highlights some of the countries with the largest current account deficits. These nations borrowed heavily at the public and/or private level to maintain their consumption of foreign goods and services. Not surprisingly the countries that had a fast ascent in their deficits, and hence soaring aggregate debt levels, saw a huge rise in their funding costs (see Exhibit 3).
Exhibit 3
5-Year Sovereign Debt Default Swaps — One-Year Historical Chart to 10/31/10
Source: Bloomberg
This bond vigilantes’ revolt forced these highly-leveraged nations to seek non-market based alternatives for rolling over their large upcoming maturities. In May 2010, the members of the European Union (EU), some begrudgingly, agreed to a $962 billion package to fund Europe’s most indebted countries. Unfortunately, this was not enough to put investors’ minds at ease and markets fell shortly after the announcements. The bond vigilantes saw through this temporary liquidity injection, focusing instead on the need for structural reforms leading to stronger national balance sheets.
As we discussed in the previous section, there are no easy solutions to soaring deficits. The countries of the European periphery, as members of the EU, have very limited individual control over their currency. Therefore, direct interventions to lower foreign exchange rates and boost exports, and hence competitiveness, are not easily available as a solution. Furthermore, the major EU nations (Germany, France and the Netherlands) have quite clearly stated their unwillingness for additional liquidity “bail-outs” which would add to their citizens’ tax burden. The countries under attack from the bond vigilantes had no choice but to institute harsh austerity
| | |
| ARTIO GLOBAL FUNDS ï 2010 ANNUAL REPORT | 7 |
programs to lower their deficits. Some market strategists foresee the need for debt restructuring in addition to the proposed measures to bring down the overall leverage levels. While in the long-term, bringing debt and consumption within a nation’s means may be the right solution, the short-term economic impact, as highlighted earlier, would most likely be contractionary. Belt-tightening is typically not accompanied by economic booms.
The US and the UK, with their full currency control, have more options to address their deficits. The UK chose a combination of solutions. They embarked on further monetary easing, leading to some currency devaluation, combined with a sizable portion of austerity programs. The US on the other hand, has so far eschewed any belt-tightening efforts in favor of heavier doses of monetary stimuli in the form of quantitative easing. It remains to be seen how long US policymakers can postpone the inevitable austerity programs. It is hard to make unpopular fiscal decisions and maintain political longevity. Perhaps the rise of the Tea Party in the US is an indication that government spending and involvement has gone a bit too far and part of the citizenry is looking for alternatives. For now, the re-initiated printing of US dollars is expected to lead to a lower currency thus stimulating exports. Furthermore, the combined effect of lower interest rates, brought down by the US Federal Reserve’s bond purchases and massive liquidity injections should reflate asset values, thus boosting wealth and Net Savings.
While the near-term net effect should be positive with respect to deficit reduction, long-term, easy monetary policy usually leads to high inflation. Few will benefit if, in anticipation of that, oil prices quickly jump back to $145 per barrel and wheat starts marching in the teens. Therefore, it remains to be seen what impact the second round of quantitative easing will have on the real economy, particularly unemployment. Skeptics abound. Business confidence in the US was undermined not by high rates and lack of liquidity but by the increased regulatory, tax and political unpredictability as well as the general feeling that not all problems plaguing the economy during the last credit crisis have been permanently resolved. On the other hand, reflationary pressures could bring back the “animal” in “animal spirits” which might boost confidence and bring back some investment and rehiring initiatives. Ultimately, the limited historical precedents have not been favorable. Heavy and prolonged monetary printing did not lead to prosperity during the Weimar Republic but to increased economic difficulties.
Our Three Hats, the Fund’s Current Positioning and the 2010 Scorecard
In order to generate strong performance and best shield Fund shareholders’ capital from stormy market winds, we like to say that we put on three hats. The first is our strategist’s hat, the second, our analyst’s hat and the third is our risk manager’s hat.
| | |
| 8 | ARTIO GLOBAL FUNDS ï 2010 ANNUAL REPORT | |
This approach allows us to maintain an intense focus on macro strategy, bottom-up fundamental analysis and risk management at all times. We monitor closely all major global markets to find the best opportunities. The Fund’s modus operandi is based on practicing both investment dogmatism, i.e. proactive involvement in high-conviction, fundamentally-researched opportunities, and investment pragmatism, i.e. reactive adjustment of the portfolio based on market feedback.
Our macroeconomic framework outlined in the previous sections has led to our current positioning. We are underweight developed world equities, in particular, industries dependent on domestic consumption or government spending and regulations such as utilities, telecommunications, financials and pharmaceuticals. Our current relative positioning in these regions is dictated by the heavy burden of upcoming government austerity programs, the ongoing consumer and corporate deleveraging, high unemployment, increased regulations and depressed home values. Within the developed world we are focused on corporations that (i) benefit from strong commodity prices as well as related equipment and services, (ii) have a strong and growing presence in emerging markets including auto makers, luxury products, media content providers and truck manufacturers, or (iii) take advantage of strong secular industry tailwinds such as mobile communications, biotechnological companies, and generic/bio-similar drug manufacturers. We are overweight regions and sectors where we see strong liquidity flows, high real returns on capital, expanding global market share and still reasonable valuations that are creating a virtuous investment cycle. We are witnessing this today in many emerging market equities where we are attracted to domestic consumer-oriented, infrastructure-related and industrial export-targeting companies given our view on their solid growth potential.
During the fiscal year, the top sectors that contributed to performance were materials, technology, consumer staples and consumer discretionary due to both an overweight positioning and favorable stock selection. The bottom performing sectors were telecommunications and financials where our underweight positioning and unfavorable stock selection detracted. Financial sector underperformance was further augmented by regulatory uncertainties (e.g. Basel III, US regulations) that caused violent market whipsaws. The countries where the Fund generated the most attractive returns were the US, Russia, Korea, Japan and Germany primarily due to favorable stock selection, while allocation early in the year to certain countries in East Asia, namely China and Indonesia, detracted.
Looking Into the Future — Where Are We Finding Love in Global Markets?
We run a core, well-diversified global equity portfolio which helps to better control risks while striving to achieve consistent outperformance against our benchmark.
| | |
| ARTIO GLOBAL FUNDS ï 2010 ANNUAL REPORT | 9 |
We are proud of our long-term track record and look forward to continuing to find rewarding global investment opportunities for shareholders. In this annual letter we will briefly outline three ideas that we are quite excited about and currently occupy a good portion of the Fund’s capital.
| |
| I. | The Universal Language Of Louis Vuitton — The Rise Of The Emerging Markets Consumer |
Rising emerging market consumption is well covered both in the popular press and investment media. Valuations, while not excessively exuberant, are not cheap in relation to developed world consumer stocks. However, the potential for emerging nations to increase consumption is far more abundant compared to the developed world. Many countries in emerging Asia, Latin America and Africa are feeling both internal and external pressures to raise wages and boost domestic consumption. Fortunately, they have ample room to gradually accommodate such pressures. Diversification away from sole dependence on the overleveraged Western consumer could go a long way in rebalancing global trade deficits. The charts in Exhibit 4 highlight some of the key growth underpinnings of these trends: (i) relative under penetration of consumption as a percentage of GDP, (ii) rising incomes, (iii) retail industry in an infancy stage, and (iv) nascent consumer credit available to support future consumption — all of which constitute strong positive growth drivers.
| | |
| 10 | ARTIO GLOBAL FUNDS ï 2010 ANNUAL REPORT | |
Exhibit. 4 — Growth Underpinnings for Emerging Market Consumption
| | | |
Consumption Still a Small % of BRIC1 Economies | | Emerging Market Retail Industry in its Infancy |
| | | |
Consumption % of GDP | | Retail Workers per 1,000 People |
| | | |
 | |  |
Emerging Market Wages Rising Rapidly | | Consumer Credit Still at a Nascent Stage |
| | | |
Real Wage Growth (2008) | | Credit Cards per Capita |
| | | |
 | |  |
1. Brazil, Russia, India and China
Source: Credit Suisse estimates, Factset, Reuters, company estimates
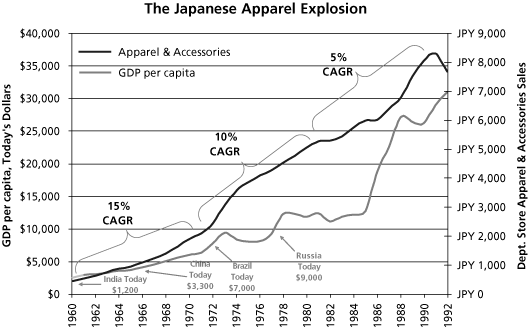
Interestingly, despite cultural and socio-economic differences, the new emerging consumers’ tastes are largely similar to those of their Western counterparts. We all want a luxury car (preferably of German origin), a fancy leather handbag (ideally with a French logo) and sneakers that make us airborne (like the famous basketball players wear). In our office, we have hosted management teams from a number of the world’s largest luxury goods companies and they have all excitedly talked about the rapid growth in both sales and profitability they are experiencing in places like China, India, Russia and Brazil and their plans for future expansion. Clearly, the sustainability of these companies’ growth will depend on the degree of their market penetration, as well the continuing rise of GDP per capita. Comparable historical precedents show that periods of sustained rise in income levels lead to significant increase in consumption. Exhibit 5 provides such an example, showing the Japanese economic boom of 1960-1990 and the impact rising domestic income per capita had on apparel consumption and department store sales.
| | |
| ARTIO GLOBAL FUNDS ï 2010 ANNUAL REPORT | 11 |
Exhibit 5
The Japanese Historical Perspective — 1960-1990
Source: Factset, IBES, CS HOLT, Company data, Credit Suisse estimates
The Fund has investments that we believe will be direct beneficiaries of these secular trends. One holding we feel is well positioned to capture future consumption growth in the largest emerging market, China, is Hang Lung Properties (“Hang Lung”). Hang Lung is one of the leading shopping mall and office real estate owners and operators in China and Hong Kong. Its roots date back to 1960 when the company started establishing itself as a solid player in Hong Kong’s commercial and residential real estate markets. Members of the founding family are still actively involved with the company from a leadership and ownership perspective. Over the last two decades, Hang Lung’s astute management team has had the vision to start monetizing its mature Hong Kong assets and swapping the proceeds for land stakes in premier locations in key Chinese cities’ central areas.
We view the company’s disciplined approach, combined with its early entry, as giving it a competitive advantage from a cost perspective. Hang Lung has accumulated an attractive portfolio of key commercial and retail real estate assets with significant growth potential both organically and through acquisitions. It currently has a presence in six Chinese cities and has identified potentially 75 additional cities that could provide fertile ground for expansion. In our estimation, a fraction of this potential growth is currently priced in the stock which we feel affords the opportunity for further upside.
The company’s rental contracts are partly tied to its tenants’ revenues and we believe therefore, that investors can benefit from increased Chinese consumer spending while offering the potential downside protection of premier hard assets’ ownership
| | |
| 12 | ARTIO GLOBAL FUNDS ï 2010 ANNUAL REPORT | |
as well as a hedge to a potentially rising renminbi. Our level of comfort with this investment is further boosted by the strength of the company’s balance sheet. It is net cash positive, a unique feature for an owner of a large real estate portfolio. Its strong cash-flow and inventory of assets for sale provide it with the ability to fund future growth almost entirely through internal sources. Lastly, Hang Lung’s key locations, combined with its strong execution in design and property management, has led to full occupancy and above market rents for its established shopping malls and strong historical shareholder returns. Last year in Shanghai, the company achieved gross yields on unleveraged investment costs in excess of 30%.
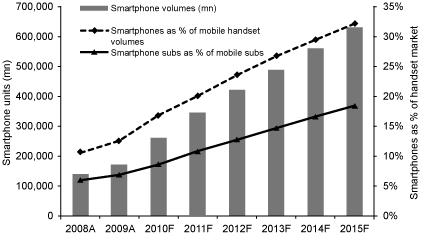
II. 50 Billion Fingers On The Go — The Triumph Of The Smartphone
By the end of 2010, aggregate global mobile subscriptions are estimated to exceed 5 billion and global telecom equipment manufacturers will have produced and shipped over 1.5 billion mobile handsets worldwide. While these figures are less than the world’s population, they do not necessarily suggest an underpenetrated market. On the other hand, the smartphone and the tablet, the fancier, more capable cousins in the mobile device family, are in their nascent stages of development. As Exhibit 6 implies, smartphones are still a small fraction of mobile handsets and subscriptions, suggesting an opportunity for strong expansion. Estimates over the next five years suggest that smartphone subscriptions will grow at a rate in excess of 25% driven by rising incomes, lower prices and greater acceptance.
Exhibit 6
Smartphone Penetration as % of Mobile Handset Devices
Source: Credit Suisse estimates
| | |
| ARTIO GLOBAL FUNDS ï 2010 ANNUAL REPORT | 13 |
Tablets are in even more embryonic stages of their growth trajectory. Technology users have clearly voted for mobility, convenience, ubiquitous web access, smart design and seemingly omnipotent customized apps rather than super-powerful devices with huge storage availability that can do all things possible. This secular shift strongly favors smartphones and tablets over other consumer electronics devices such as mobile phones (not powerful and capable enough) and personal computers /notebooks (too powerful and not convenient enough). With the emergence of ubiquitous broadband and cloud computing services, reducing the need for local, on-device storage, as well as new generations of wireless network technology, so called “4G”, these trends are likely to be further reinforced.
However, most of those who lived through the technology boom and bust of 1998-2001 know that this sector is fickle and long-term visibility is often a rarity. Therefore, we have strategically chosen a somewhat more diversified investment approach for this industry, which we believe reduces the risk of “being in the right race but betting on the wrong horse.” Furthermore, as we have observed in the past, quite often the “winner takes most” within its technological niche and therefore our preference is for companies that are clear market leaders and share gainers.
There are currently two smartphone platforms that command a large and growing share of the market — Apple’s iOS and Google’s Android. We feel the Fund holds a balanced mix of investments associated with each including a leading equipment manufacturer from each platform, Apple Inc. and HTC Corp, respectively. Both of these companies have a strong and diverse product line-up as well as an early-mover advantage, allowing them to establish a firm foothold on this expanding market. We also have positions in component makers Qualcomm Inc. and Arm Holdings PLC. Qualcomm is a semiconductor company at the center of both the smartphone and the emerging tablet sector. They have a strong suite of intellectual property used in most 3G and 4G wireless technology devices. ARM is a leading developer of application processor technology. Chips based on ARM’s technology are found in 95% of mobile phones and in an increasing number of consumer devices. Lastly, the Fund owns Sandisk Corp., a flash memory supplier whose lightweight and efficient storage products have a large customer base among mobile equipment manufacturers. When we selected our investments, not only did we look for market leadership, but also balance sheet strength, visionary management teams, untapped markets, valuations below our estimates of fair value, and robust intellectual property, providing not only a competitive advantage but a stream of recurring, high-margin revenues in the form of royalties. Given the technology industry’s dynamism, we regularly monitor smartphone market statistics related to both adoption and pricing and when necessary, make adjustments to the Fund with a goal of achieving the best risk-adjusted returns.
| | |
| 14 | ARTIO GLOBAL FUNDS ï 2010 ANNUAL REPORT | |
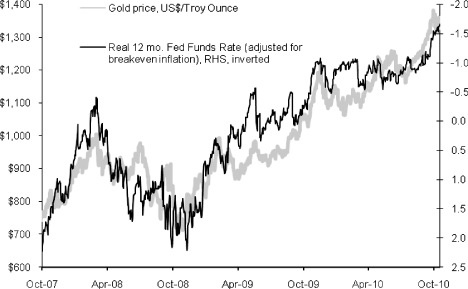
III. Gold And The Fed — Opposites Attract
Metals and mining companies have been an important part of the portfolio over the last few years. Strong commodity pricing driven by voracious Chinese and Indian demand, combined with oligopolistic industry structure, stagnant supply and attractive valuations have all contributed to the sector’s strong performance. For the immediate future, we expect to maintain an overweight position to commodity producers as we see current trends as sustainable.
During the fiscal year, we increased the relative weight of gold and other precious metals. We added a selection of North American and Australian domiciled gold producers that were characterized by what we deemed as a growing reserve base, low-cost structure, sound management teams with solid track records and operations in politically-safe jurisdictions. This shift represented a risk management move on our behalf to hedge against increased market uncertainty.
Gold has very limited practical utility and offers no yield; however it is a well-proven preserver of value. The US Federal Reserve recently started a second round of printing money which generally has led to inflation and currency debasement. In such an environment, capital has traditionally flowed into precious metals and other hard assets that can offer protection against real wealth destruction caused by a weaker US dollar. Exhibit 7 shows that gold prices are closely correlated to real Fed Funds Rate. In a period of zero nominal rates and positive inflation, real rates of return are negative. Over the last few years, such occurrences have led to strong rallies in gold prices as the chart below suggests. With the Fed’s intention to keep nominal rates low for an extended period while attempting to spur inflation, we believe the impact on precious metals prices should be solidly positive.
| | |
| ARTIO GLOBAL FUNDS ï 2010 ANNUAL REPORT | 15 |
Exhibit 7
Historical Inverse Relationship Between Gold Prices and Fed Funds Rate
Source: Bloomberg, Factset, Credit Suisse
There has been a lot of talk in the financial media whether or not gold is treading into bubble territory. Clearly there are no commonly accepted metrics to value it accurately. Some analysts attempting to establish its worth have done so by comparing its historical performance to that of other asset classes and advocating a reversion to the mean. Others have looked at the rapidly rising costs of extracting the marginal ounce of gold and have used this metric as a valuation floor for prices. A third camp of analysts have measured the value of available gold supplies as a percentage of the money supply, arguing that, at equilibrium, this metric should stay constant. In theory we see validity in these arguments because an asset that is viewed as a store of value should indeed preserve its worth against other assets and should be valued at least as highly as its cost of replication. However, we know from experience, that betting on market equilibrium or mean reversion could take longer than most investors’ time horizon. Therefore, we are closely monitoring factors that could impact precious metals and if necessary, will make appropriate adjustments to the portfolio. For illustrative purposes, and not necessarily to predict the future trajectory of gold, we have included the following chart in Exhibit 8 that attempts to establish valuation parameters for gold pricing.
| | |
| 16 | ARTIO GLOBAL FUNDS ï 2010 ANNUAL REPORT | |
Exhibit 8
Gold as Percentage of the US Monetary Base
Source: Societe General
Conclusion
The past fiscal year was characterized by high market volatility and increased political, regulatory and financial uncertainty. It also marked the end of a decade that saw the bursting of two bubbles, two recessions and an enormous shift in world economic order. The actions currently taken by governments around the world to deal with the structural problems that have followed these transformations will be paramount in determining market direction in the coming decade. We fully intend to monitor, analyze and act upon these events as they play out adhering to our proven investment process and philosophy. We will continue to look for attractive global market opportunities to create value for our shareholders.
Dimitre Genov
Co-Portfolio Manager
Artio Global Equity Fund Inc.
Past performance does not guarantee future results.
| | |
| ARTIO GLOBAL FUNDS ï 2010 ANNUAL REPORT | 17 |
Investing internationally involves additional risks such as currency fluctuations, currency devaluations, price volatility, social and economic instability, differing securities regulation and accounting standards, limited publicly available information, changes in taxation, periods of illiquidity and other factors. These risks are greater in the emerging markets. Stocks of mid-capitalization companies are slightly less volatile than those of small-capitalization companies but both still involve substantial risk and they will be subject to more abrupt or erratic movements than large-capitalization companies. In order to achieve its investment goals and objectives, the Fund may invest in derivatives such as futures, options, and swaps to a very substantial extent. Derivatives involve special risks including correlation, counterparty, liquidity, operational, accounting and tax risks. These risks, in certain cases, may be greater than the risks presented by more traditional investments and are fully disclosed in the prospectus. As of 10/31/10, the Fund invested approximately 0.0% of its net assets in derivatives (excludes forward foreign exchange contracts).
The Fund may also invest in precious metal-related instruments (such as gold, silver, platinum and palladium), including (i) the equity securities of companies that explore for, extract, process or deal in precious metals, and related options or warrants thereof, (ii) asset-based securities indexed to the value of such metals, such as ETFs, and related options thereof (iii) precious metal related structured notes, futures and options on futures, swaps, and (iv) commodity pools and other indirect investments in precious metals (collectively “precious metal-related instruments”).
The views expressed solely reflect those of Artio Global Management LLC (“Artio Global”) and the managers of the Fund, and do not necessarily reflect the views of any affiliated companies. The material contains forward-looking statements regarding the intent, beliefs, or current expectations. Readers are cautioned that such forward-looking statements are not a guarantee of future performance, involve risks and uncertainties, and actual results may differ materially from those statements as a result of various factors. The views expressed are subject to change based on market and other conditions. Furthermore, the opinions expressed do not constitute investment advice or recommendation by the managers, Artio Global, the fund, or any affiliated company.
The Morgan Stanley Capital International (MSCI) All Country World Index (ACWI) is a free float adjusted market capitalization index that is designed to measure equity market performance in the global developed and emerging markets.
Cash flow measures the cash generating capability of a company by adding non-cash charges (e.g. depreciation) and interest expense to pretax income.
| | |
| 18 | ARTIO GLOBAL FUNDS ï 2010 ANNUAL REPORT | |
Correlation is a relationship between two variables.
It is not possible to invest directly in an index.
Please see the Schedule of Investments in this report for complete fund holdings. Fund holdings and/or sector weightings are subject to change at any time and are not recommendations to buy or sell any security mentioned.
| | |
| ARTIO GLOBAL FUNDS ï 2010 ANNUAL REPORT | 19 |
MANAGEMENT’S COMMENTARY
Artio International Equity Fund
Artio International Equity Fund II
2010 Annual Report
Increasing political noise, but growing market clarity. During the fiscal year ended October 31, 2010 (the Reporting Period), the direction of market trends became increasingly apparent, enabling us to reposition with greater confidence.
For the twelve months ended October 31, 2010 the Artio International Equity Fund and the Artio International Equity Fund II (both Class A Shares) returned 10.06% and 9.75% respectively, while the MSCI ACWI (ex-US) rose by 12.62% and the MSCI EAFE Index was up 8.36%. For the same period the average fund in Morningstar’s Foreign Large Blend category returned 12.65%.
Within developed markets, our underweight to the energy and information technology sectors were the top positive contributors throughout the year, while our overweight to the defensively-oriented consumer staples and healthcare sectors, detracted. In addition, the Funds’ underweight to the euro zone banks had a negative impact on performance, particularly in July, when the results of the region’s stress tests and release of new Basel III capital requirements had been seen as victories for the banking industry. Our underweight to the Japanese market contributed positively to performance. Within emerging markets, our overweight positions in Russia and Taiwan contributed positively throughout the year, while our overweight to the financial sector throughout the region detracted.
From an investment perspective, the global picture has grown clearer even as the noise has become louder. In the midst of the financial crisis, policy makers around the globe followed large-scale monetary and fiscal stimuli to avert a feared global depression. With their finances in shambles and their economies too reliant on stimuli, governments had no clear exit strategy. We approached this binary situation with caution, aware that unacceptably high risks would accompany any aggressive positioning of the portfolio. However, midway through the reporting period, exit strategies became clear in most key economies.
US policy makers’ exit strategy is to continue providing additional fiscal and monetary stimuli until a self-sustaining economic growth has been reached — escape velocity; ignore the imbalance for now; focus on creating jobs; and weaken the dollar to stimulate exports. The UK entered into a more fiscally prudent direction after elections in May 2010 put Conservatives at the helm of government. In the euro zone, the euro and sovereign debt crisis have forced many members into harsh austerity programs.
| | |
| 20 | ARTIO GLOBAL FUNDS ï 2010 ANNUAL REPORT | |
The US expansionary policy is extremely beneficial to gold, commodities, and emerging economies. The austerity policies being followed by many governments in Europe should depress earnings prospects of companies focused on European demand.
Adding to the clarity is the change from a G7 to a G20 platform for solving global economic problems. This shift reduces the risk for dramatic change in policies or rising conflicts — the increased number of voices at the table makes it more difficult and time consuming to arrive at a consensus for change.
In response, we increased exposure to emerging market consumer-related holdings and the mining sector; and reduced exposure to domestically-oriented stocks in Western and Central Europe, repositioning the Funds with the understanding that the US would take no effective action to reduce its trade deficit at least until the next election.
Global Picture
United States
US policy makers face two key challenges: reducing the stubbornly high unemployment rate while tackling the twin-deficits (current account and government budget). The policy priority is very clear: first focus on bringing down unemployment via additional fiscal and monetary stimuli until a strong and self-sustaining economic growth has been reached, i.e. “escape velocity.” Only then can the twin deficits be addressed through the inevitable spending cuts and tax hikes.
Current policy may succeed in creating short-term economic growth. However, we believe it will fail to create a sufficient number of jobs and worsen the balance sheet of the government. In the end, we think the US will be in worse shape than it is today. Escaping reality does not lead to escape velocity. Complacency and denial are turning the American dream into a day-dream.
For years, the minority criticizing “free trade” or warning about trade deficits was shunned, scorned, and ridiculed. Critics were labeled protectionists, isolationists, or just plain ignorant. Complacency was rampant. In 2004, former US Federal Reserve Chairman Alan Greenspan wondered whether “something fundamental happened to the US economy and, by extension US banking, that enables us to disregard all the time-tested criteria of imbalance and economic danger?” We became complacent because for 25 years we had consistent current account deficits and no harm befell us. Empires do not fall easily. It takes a heavy dose of complacency, self destruction, and reprehensible ignorance — legal definition for malpractice — to bring one down.
| | |
| ARTIO GLOBAL FUNDS ï 2010 ANNUAL REPORT | 21 |
Now that everyone realizes we are in economic danger because we disregarded all the time tested criteria of imbalance, a new and equally divisive debate has come to the fore: how to rebalance? Economists, Nobel laureates, finance ministers, central bankers, and financial gurus passionately argue and disagree on the merit of additional fiscal stimuli versus austerity. Europe is steering towards austerity while the US is sticking with additional doses of fiscal and monetary stimuli. In part, Europe has little choice, but it is also Germany’s preferred route to recovery for the euro zone. However the US has the luxury to choose — for now. Is it choosing wisely or are we being exposed to reprehensible ignorance once more?
Fixing the current account imbalance
Structural current account deficits occur when nations live beyond their means. When a person spends beyond one’s income, one of two actions is needed to avoid bankruptcy: reduce spending or find a higher paying job. The first choice is painful and unpleasant but it is under one’s control. The second choice is painless but may not be feasible. The rational person would cut spending until a better job is found.
To appreciate the options facing our government, one only needs to be aware of the following reality:
Current account = private savings surplus — government budget deficits
When our imports of goods and services are larger than our exports we incur a current account deficit; when our government deficit is larger than our private savings we incur a current account deficit. To bring the deficit into balance one could focus either on the left-side of the equation (reducing imports and increasing exports) or on the right side of the equation (increasing private savings and reducing government deficits).
Focusing on the left side of the equation is the least painful choice: increasing exports is a pleasant prospect. But the drawbacks are numerous: it may not be feasible; it can lead to unorthodox and administrative measures such as currency manipulation and tariffs by our trading partners; and, it deals with the symptom and not the disease. The reason we have a deficit is because we are spending too much, not because we have chosen not to export.
Focusing on the right side of the equation is the most dreaded option. It is painful. Less government spending, higher taxation, and increased saving may lead to economic contraction. It is a step usually only taken when the vigilantes and the International Monetary Fund are knocking on the door. But there are benefits. One is dealing with the disease and not the symptoms, the traditional tools of fiscal and monetary policies are available, the treatment is within one’s control, and the actions do not lead to trade frictions.
| | |
| 22 | ARTIO GLOBAL FUNDS ï 2010 ANNUAL REPORT | |
US policy makers are pinning their hope that a weaker dollar and strong demand from emerging market consumers will bail us out. The current administration’s goal of doubling US exports in five years is a blatant proof of that fixation. The private sector does not believe in the feasibility of that strategy and is evidenced in the words of David Speer, chief executive of Illinois Tool Works, “we’re not going to be any better off by saying: ‘we are going to ship our product to China from the US. We can’t do it. It won’t work. We won’t be able to compete...”
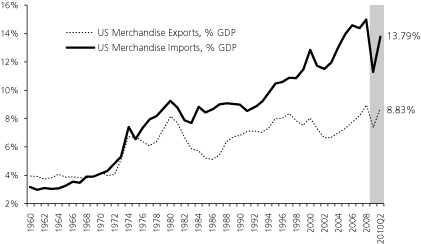
Since the mid-1970s, US imports have risen steadily to about 15% of GDP (gross domestic product) before the crisis and are now roughly 14% of GDP while exports have stagnated around 8%. A doubling of exports over five years is exactly what is needed if we were to close the gap through exports alone. We very much doubt that exports will rise meaningfully above the current level. Most of the adjustment would likely have to come from fewer imports as we will ultimately be forced to spend less and save more.
US Merchandise Imports & Exports
(1960-6/30/10)
Source: World Trade Organization, World Bank, IMF
Jobs
It is all about those elusive jobs. Policy makers’ hope is pinned on a weaker US dollar and a stronger Chinese yuan, expansion by large multinationals, the dynamism and creativity of our entrepreneurs and start-ups, and gaining a lead in “green technology.” We are likely to be disappointed until the roots of our structural unemployment are addressed.
| | |
| ARTIO GLOBAL FUNDS ï 2010 ANNUAL REPORT | 23 |
A weaker dollar and a stronger yuan would do little to slow migration of jobs from West to East. Multinational’s attraction to China is as much about its cheap labor as it is about its vast domestic market. Hence the focus on the yuan’s valuation alone would do little to shift trade and jobs in favor of the developed economies.
Initially, the main attraction was China’s cheap labor. Multinationals feasted on outsourcing, off-shoring, or any kind of labor arbitrage thereby catapulting China into the low-added value leader of the “global food-chain.” But now, it is the lure of the country’s huge domestic market that is enabling China to leapfrog into the mid- and high-added value.
Intense competition among multinationals seeking access to the Chinese domestic market has allowed China to masterfully use the “stick and carrot approach.” The Chinese government has insisted on technology transfer as the price of entry into China. Foreign operators must operate through local joint ventures and must allow their Chinese partners to “digest” their technology. Digestion is China’s process of acquiring foreign technology, then innovating, imitating, or slightly modifying it and finally branding and selling it. China’s focus on acquiring patents remains relentless. It is now accused of resorting to trickery. A new patent law requires foreign companies to file key patents in China as a pre-requisite to qualify for government procurement. Such a requirement is likened to handing over key technologies to Chinese bureaucrats. While some foreign companies complain about forced technology transfer and infringement on intellectual property, others have even transferred much more advanced and valuable technology than they admit or realize.
Some multinationals are now complaining about deception. The Chinese stick is getting bigger and the carrot is getting smaller. More and more state policies are favoring local companies and as a result, multinational’s domestic market share is shrinking. In China, it’s commonplace to find government procurement programs favoring local firms and strict standards designed to give advantage to local companies such as tax breaks and subsidies to Chinese companies, preference in state contracts, raising “local content” requirements and anti-monopoly regulations intended to limit foreign access to key sectors in the economy.
This grand scale squandering of know-how and trade secrets has allowed Chinese backed companies to become global competitors almost overnight. Multinationals are finding themselves competing for export contracts all over the world with Chinese companies selling digested technology at discounted prices while providing cheap vendor financing — a key competitive edge in a leveraged world.
| | |
| 24 | ARTIO GLOBAL FUNDS ï 2010 ANNUAL REPORT | |
As for startups and innovation as a dynamo for job creation, Andy Grove a co-founder of Intel provided a prescient and insightful analysis of its dynamic and influence on job-creation in America:
Startups are a wonderful thing, but they cannot by themselves increase tech employment. Equally important is what comes after that mythical moment of creation in the garage, as technology goes from prototype to mass production. This is the phase where companies scale up. Scaling is hard work but necessary to make innovation matter.
The scaling process is no longer happening in the US. And as long as that’s the case, plowing capital into young companies that build their factories elsewhere will continue to yield a bad return in terms of American jobs.
But what kind of society are we going to have if it consists of highly paid people doing high-value-added-work — and masses of unemployed?
Simply put, the US has become widely inefficient at creating American tech jobs.
There’s more at stake than exported jobs.
A new industry needs an effective ecosystem in which technology knowhow accumulates, experience builds on experience, and close relationships develop between supplier and customer.
...we broke the chain of experience that is so important in technological evolution.
...abandoning today’s “commodity” manufacturing can lock you out of tomorrow’s emerging industry.
However, our pursuit of our individual businesses, which often involves transferring manufacturing and a great deal of engineering out of the country, has hindered our ability to bring innovations to scale at home. Without scaling, we don’t just lose jobs — we lose our hold on new technologies. Losing the ability to scale will ultimately damage our capacity to innovate.
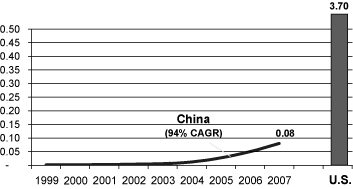
As for becoming the undisputed leader in green-technology and creating green-collar jobs, China is already the world’s largest maker of wind turbines and the world’s largest manufacturer of solar panels. The race to invest has begun. China is now spending about 1.5% of GDP on research and development (R&D); the country will soon surpass the European Union (EU) average of 2.2% and is expected to match the US level of about 2.5% by the end of this decade. China will continue moving up the R&D value chain and its firms will become archrivals to current dominant multinationals.
The “Sputnik crisis” has become the administration’s new rallying cry. That crisis was precipitated in 1957 when the US found itself behind in the space race after the Soviet Union successfully launched “Sputnik 1”, the first earth orbiting satellite. An ensuing space race took off within the Cold War, a race in which the US played catch-up and ended up dominating.
| | |
| ARTIO GLOBAL FUNDS ï 2010 ANNUAL REPORT | 25 |
The Sputnik crisis had a happy ending, but this is no Sputnik. Yes, we are behind again but this time, the damage is self-inflicted and the enemy is within. “Free-trade” is our Trojan horse and has been allowed to prosper and roam within our walls for too long. The power of big business prevented the relationship between the US and China from going sour years ago. American businesses have acted as the biggest barrier to an anti-Chinese backlash in the US. We were vigilant then, we are complacent now.
Not all corporations are so short-sighted. Yoshiyuki Kasai, the chairman of Central Japan Railway did not allow his company to bid on contracts in China for fear its technology would be taken and warned other Japanese rail groups that they would end up creating a low-cost competitor should they bid. He said, “They didn’t take our advice. I think it’s been a bitter experience for them.” But many are either blinded by short-term greed or face a prisoner’s dilemma: my competitor is giving away intellectual property, we both are going to end up with a low-cost competitor, but at least he is getting paid something for it. I may be better off giving it away as well — at least I get paid. This propagate a race to the bottom.
“Public companies are like stray dogs; they both need an owner” a wise entrepreneur once stated — very true indeed. Many of today’s major companies are stray dogs with no real owners. Their managers are focused on short-term financial results or their own exit strategy rather than the longer-term issues of generational succession or community well-being. These stray dog millionaires move critical operations into emerging markets with little thought for the trade secrets that may be inadvertently transferred to future competitors or the opportunities for innovation surrendered on foreign factory floors.
As China is successfully expanding into higher value industries and competing both domestically and globally, the task of improving job prospects in the developed world becomes even more challenging. China is winning by carrot, by stick, and maybe by trick. China is playing smart, but the rest are playing dumb. The success of China is less driven by its central planners (“the nine guys in the room”) and more by our “nine guys in the boardroom.”
The euro’s existential crisis
The fate of the euro, not Chinese demand nor pace of US recovery, is the most critical question for 2011-12. The euro is in crisis and to survive, the status quo cannot be maintained. Band-aid solution attempts have failed so far. What was once inconceivable has become possible. Either there is a drastic change or it is the end of the euro.
In its most simplified form, the euro is a pegged currency — the member countries of the euro zone have pegged their currency to the old deutsche mark. To convince the market about their dedication and their will to maintain the peg, a political union was formed and national currencies were replaced by the euro.
| | |
| 26 | ARTIO GLOBAL FUNDS ï 2010 ANNUAL REPORT | |
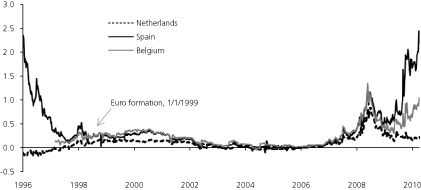
The major benefit of a successful pegged regime is to enjoy the low cost of capital (interest rates) of the currency being pegged to. It is a surrogate currency after all. Once interest rates diverge, the raison d’être (reason for existence) for the peg disappears and that is the challenge facing the euro zone today.
Spreads over German 10 Year Bonds
(10/31/97-12/10/10)
Source: Bloomberg
Before this economic crisis, the peg worked wonderfully. Borrowing costs were almost uniform among euro zone members despite diverging economic fundamentals. One key reason was “moral hazard” — investors assumed that Germany, the main anchor of the euro project, would be a de facto guarantor of euro zone debt in a financial crisis.
In the good times, an implicit guarantee is good enough. In times of crisis, moral hazard appears. The bond markets are pressuring the German government to make the “implicit” explicit. But so far, Frau Angela Merkel (Chancellor of Germany) has countered with an explicit non-guarantee and self indemnification — a new German proposal explicitly asks holders of sovereign debt to expect hair-cuts in any future crisis.
Without some kind of a German guarantee there would be no euro in its current form. In response to the hard German position, the ability to borrow at reasonable spreads to that of Germany has become a rare privilege to fewer and fewer members. The difficulty to borrow is no longer limited to Portugal, Ireland, Greece, and Spain; it has recently spread to Italy, Belgium and even France.
Another challenge to the euro’s survival is how to address and correct the lack of competitiveness of the weaker members. On the one hand, Germany has fully recovered from being “the sick man of Europe”. Its business confidence is at a 20-year high and its unemployment dipped below 3 million — an 18-year low. Reforms of the labor market and restructuring in the private sector have led to wage restraint and increased competitiveness. On the other hand, weaker members,
| | |
| ARTIO GLOBAL FUNDS ï 2010 ANNUAL REPORT | 27 |
especially the so-called PIIGS (Portugal, Italy, Ireland, Greece and Spain), have lost competitiveness as a result of sharp increases in labor costs and low productivity gains.
Given weaker members’ high level of debt, high interest cost, low economic growth and lost competitiveness, the needed adjustment process is expected to be painful and long. In such an environment, the countries’ resolve to take pain will be tested and they may be tempted to leave the euro. The fate of the euro is dependent on Germany’s largess, PIIGS tolerance for pain and the market’s moral hazard.
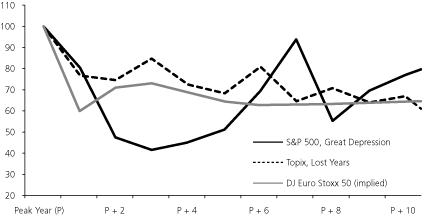
Peak to Trough Dividends
S&P 500 Peak Yr. = 1930; Topix Peak Yr. = 1992, DJ Euro Stoxx Peak Yr. = 2008
Source: Standard & Poors, Nomura, Bloomberg
By a number of measures, it appears that the prospect of a lost decade is being priced into the market. The futures contracts on dividends for the Dow Jones Euro Stoxx 50 Index suggest that by 2019 the dividend will be 30% lower than it was in 2008. The situation recalls Japan’s lost decade and the US Great Depression, periods during which average dividends experienced similar declines. Not surprisingly, given this grim outlook, valuations on many leading domestic European franchises have dropped to historic lows. But in the absence of any near-term growth prospects or other catalyst, we do not see the likelihood for this value to be realized in the near term.
| | |
| 28 | ARTIO GLOBAL FUNDS ï 2010 ANNUAL REPORT | |
Geographic Positioning
Emerging Markets
As a result of governments’ exit strategies; we expect emerging markets to continue expanding much more rapidly than the G7. Capitalizing on emerging market consumption growth has become an important part of our current strategy.
China’s centrally planned government may incur a degree of political risk, but its political continuity and five-year economic plans offer advantages in today’s global environment over the electoral discontinuity and short-term vision encountered in the US.
Several thematic areas seem particularly well positioned to benefit from China’s ongoing economic expansion and the government’s current five-year plan. These include the increase in consumer spending, a push for lower industrial pollution and greater energy efficiency, a focus on higher value-added manufacturing, government support for rural development and enhancement of the social safety net. We are focusing on opportunities in the domestically oriented consumer discretionary space, where we look for companies with defensible competitive advantages, a strong balance sheet, good visibility and a trustworthy management team. Within this group, we are emphasizing companies that derive a significant percentage of their growth from rural regions and second or third tier cities, where the country has made rapid development a priority.
Indian infrastructure is another area of interest. We believe strong economic growth coupled with government support for such initiatives are expected to lead to significant activity over the next several years. The current government has taken steps to speed project awards to ease execution and improve the general financing environment. With this in mind, we are investing in engineering and construction companies as well as those involved in electric power generation. India’s per capita consumption of electricity is significantly below the global average and the government expects this to increase in the coming years. Rounding out our Indian infrastructure theme, we have exposure to some of the country’s seaports. Given that 95% of India’s trade by volume is seaborne, we believe ports will be a prime beneficiary of increased trade.
While China and India are expected to offer some of the greatest opportunities in this area, we see similar trends unfolding in Russia, Brazil and sub-Saharan Africa. We are currently focused on investing in developed and emerging market companies we feel are best poised to exploit these long-term growth prospects.
Across emerging markets, we hold positions in a wide range of companies involved in food retailing, food and beverage production, personal care products, pharmaceuticals and other consumption-related industries. South Africa and many others in
| | |
| ARTIO GLOBAL FUNDS ï 2010 ANNUAL REPORT | 29 |
sub-Saharan Africa are experiencing a surge in domestic consumption, driven in part by changing trade flows, notably increases in Chinese demand.
Another example of this strategy is our exposure to Russia’s pharmaceutical sector. The Russian market has a strong long-term outlook with a large population and low drug spend per capita. In addition, it is a fragmented market and the government is supporting local manufacturers. We also have exposure to Russian food retailers we believe are well positioned to benefit from a stronger domestic consumer.
Developed Economies
In contrast with major emerging nations, where growth is forecast in the upper single digits, Europe may face a decade or more of near-flat economic activity due to austerity measures being forced on the PIIGS, and by the UK’s voluntary tax increases and spending cuts.
In addition to the macro-issues affecting the region, some European sectors are expected to be subject to negative industry developments. European utilities, for example, are likely to suffer from low power prices and oversupply in the market at least for the next year or two.
On the other hand, we believe certain segments of the European market show promise. Again, we see similarities to the experience of Japan in the early 1990’s. At that time, while retailers and other domestic companies underperformed their global counterparts, Japanese exporters exposed to growing US and European markets performed as well as most of their US and European competitors. Similarly, we see a situation in Europe today in which utilities, telecommunications providers, banks and other companies that derive revenues primarily from European and American operations are likely to experience little, if any, growth, while those with significant exposure to emerging markets, such as mining and luxury goods makers, could continue to generate attractive increases in earnings, revenue and share price.
While we remain concerned about the financial system in Europe, there are some special situations in banks which we think offer attractive investment opportunities. We prefer banks which operate in the UK over Europe, as the Bank of England has the independence to choose its optimal monetary policy, while avoiding the dramatic issues that the EU has to face in addressing the problems in Europe’s peripheral countries.
Japan itself remains a slow growth story plagued by an aging population and very high levels of government debt. Japan’s national debt is already more than twice its GDP, with far more debt issuance expected in the coming year. Japanese banks, which hold the lion’s share of this debt in the form of Japanese Government Bonds,
| | |
| 30 | ARTIO GLOBAL FUNDS ï 2010 ANNUAL REPORT | |
could face daunting financial challenges if the quality of those bonds should come into question.
Sectors and Stocks of Special Interest
Metals and Mining
The fast pace of urbanization and industrialization in emerging markets, especially China, is driving robust demand for all types of commodities. Demand is so strong that we are beginning to see supply straining to satisfy the global hunger for energy, materials and agricultural products despite dramatically subdued economic activity in the developed world. We focus on strategically important metals with what we deem to be the best demand characteristics and on companies we feel have low product costs and extensive reserves. Ivanhoe is one of these names. They are in the process of building one of the largest copper/gold mines in the world in partnership with Rio Tinto. This is one of the newest high grade, large deposits in the world. Initial production is slated for 2013 but we believe the project will further expand into subsequent phases, providing additional growth potential.
Gold is an area of particular interest in the current environment of competitive currency devaluations and large-scale US quantitative easing. As investors have grown increasingly uneasy with the perceived value of paper money, the demand for gold, the historical alternate to paper currencies, has accelerated. Newcrest is one of our preferred gold mining stocks. We view them as having world class assets and strong management. Their production is unhedged, which gives them positive gearing to higher gold prices. In addition, we feel they operate low cost mines and are rapidly rising production output, yet the stock trades at a discount to its growth and to other slower growing majors.
Healthcare
Although healthcare names in general are negatively exposed to pricing pressures, patent expiry and limited pipelines, there are a few names that we favor given their expertise in the treatment of certain diseases, their focus on innovation and delivery of services.
The rise in global wealth has been accompanied by a corresponding increase in chronic disease burdens, particularly in the developing world. One such disease of affluence now reaching pandemic proportions is diabetes, afflicting nearly 6.4% of the global adult population. Novo Nordisk, one of the global leaders in diabetes care, is at the forefront of delivering breakthrough medications for this disease and is also the partner of choice for governments in the developing world to provide affordable care. Two diabetes-related medical conditions are renal failure and vision impairment, both of which are also rising at a startling rate. Fresenius has taken an integrated approach in providing renal care, from dialysis products and infusion technology to hospital services. We
| | |
| ARTIO GLOBAL FUNDS ï 2010 ANNUAL REPORT | 31 |
believe that this integrated approach provides significant and sustainable competitive barriers to entry. Similarly, in vision care, Essilor sets the ‘operating system’ standard for the ophthalmic lens industry through its progressive lenses. Innovations in anti-glare, anti-fogging and photochromics will further strengthen their global leadership position.
Smartphones
The smartphone market grew 96% from the third quarter of 2009 to the third quarter of 2010 and we expect that strong growth to continue as consumers opt for more convenient, and personal, mobile connectivity. HTC is a cellular phone manufacturer that specializes in devices running Google’s Android operating system. Surpassing Apple’s market share, Android currently enjoys a 16% share of the smartphone market, and is expected to grow to 25% by 2014. HTC has transformed itself from being an anonymous manufacturer for other companies, to building their own global brand awareness. With approximately 30% share of the Android smartphone sales, we view HTC as positioned to benefit from Android’s growing share of a growing market. We expect HTC’s expertise in mobile phones to translate to strong products in the nascent tablet market in 2011, providing them another source of growth.
Emerging Market Consumer
Between 1998 and 2008, consumer spending in developing nations rose two times faster than developed nations. At this pace, the additional demand from emerging economies could represent the equivalent of consumer spending in the entire euro zone by 2015, or even that of the US economy by 2020. China offers some of the greatest opportunities given their forecasted GDP growth and biggest emerging middle class.
We believe Hang Lung Properties is directly geared to increased Chinese consumer spending. They are one of the leading shopping mall and office real estate owners and operators in both China and Hong Kong. They are currently present in six key Chinese cities’ central areas and have identified 35 additional cities that could provide fertile ground for expansion. The company’s rental contracts are partly tied to its tenants’ revenues and therefore stand to benefit from an expansion in Chinese consumer spending. The company’s key locations, combined with its superb execution in design and property management, has led to its current full occupancy and above market rents for its established shopping malls.
Belle International is the largest footwear retailer and one of the top two sportswear distributors in China. It pursues a vertically integrated business model in footwear with what we view as efficient supply chain management and quick response to market trends. Belle, operating over 11,000 stores in China, has adopted a multi-brand strategy, positioning at the mid to high-market segment. Its core Belle brand commands the largest share in China’s ladies footwear market, while five of its other
| | |
| 32 | ARTIO GLOBAL FUNDS ï 2010 ANNUAL REPORT | |
self-owned brands rank among the top ten. Despite exceptionally strong footwear consumption growth over the past five years, footwear consumption per capita in China is still far below that of developed countries and thus we believe it presents significant growth potential. Belle, as the largest footwear retailer in the country, is likely to be a primary beneficiary of this growth.
Indian Infrastructure
India currently lacks adequate infrastructure, but strong economic growth coupled with government focus is expected to lead to significant activity over the next several years. We view Adani Enterprises as uniquely exposed to the positive infrastructure developments through its portfolio of investments in coal, ports and power. Several captive coal mine development contracts should open up for bidding in the near term and Adani’s experience in coal mining and the groups logistics support should give them an edge over peers to win future contracts. In addition, the company’s Mundra Port provides a proxy to participate in the Indian growth story, as 95% of India’s trade by volume is seaborne. Capacity constraints at the major ports, coupled with the scalability of Mundra port, have enabled it to win market share and enjoy pricing power as well. Lastly, Adani’s power business is expected to expand nearly eightfold in the coming three years. In its totality, we believe Adani Enterprises will be a primary beneficiary of India’s infrastructure expansion in the coming years.
Conclusion
The clarity of the current global economic situation enables us to see risks as well as opportunities. We believe US unemployment will remain stubbornly high and monetary and fiscal stimuli will be maintained for a prolonged period leading to a boom in emerging markets and commodities. However the resulting jump in government debt is expected to continue to support gold prices on fear of debt-monetization.
While we believe that emerging market expansion centered in China is likely to fuel global investment growth in the coming two to three years, we also recognize the risks implicit in that conclusion. Activity in China could be affected by any number of factors, from rising interest rates triggered by stubborn inflation figures to increasing global trade frictions that escalate to protectionism. We continually monitor such risks, ready to implement a proactive exit strategy if our investment themes shift.
We view the fate of the euro as the most important question of 2011-12, not Chinese demand nor pace of US recovery. Given the euro zone weaker members’ high level of debt, high interest cost, low economic growth, and lost competitiveness, the needed adjustment process is expected to be painful and long. In such an environment, the countries’ resolve to take pain will be tested. The fate of the euro is dependent on Germany’s largess, PIIGS tolerance for pain, and the market’s moral
| | |
| ARTIO GLOBAL FUNDS ï 2010 ANNUAL REPORT | 33 |
hazard. Valuations on many leading domestic European franchises have dropped to historic lows. But in the absence of any near-term growth prospects or other catalyst, we do not see likelihood for this value to be realized in the near term.
Geographic diversification may prove illusory if a portfolio is correlated to a single investment concept. We have attempted to balance our thematic investments with non-correlated investments where we identify company-specific catalysts for growth.
Rudolph-Riad Younes, CFA
Co-Portfolio Manager
Artio International Equity Fund
Artio International Equity Fund II
Past performance does not guarantee future results.
Investing internationally involves additional risks such as currency fluctuations, currency devaluations, price volatility, social and economic instability, differing securities regulations and accounting standards, limited publically available information, changes in taxation, periods of illiquidity and other factors. These risks are greater in the emerging markets. Stocks of mid-capitalization companies are slightly less volatile than those of small-capitalization companies but both still involve substantial risk and they will be subject to more abrupt or erratic movements than large-capitalization companies. In order to achieve its investment goals and objectives, the Fund may invest in derivatives such as futures, options, and swaps to a very substantial extent. Derivatives involve special risks including correlation, counterparty, liquidity, operational, accounting and tax risks. These risks, in certain cases, may be greater than the risks presented by more traditional investments and are fully disclosed in the prospectus.
The Funds may also invest in precious metal-related instruments (such as gold, silver, platinum and palladium), including (i) the equity securities of companies that explore for, extract, process or deal in precious metals, and related options or warrants thereof, (ii) asset-based securities indexed to the value of such metals, such as ETFs, and related options thereof (iii) precious metal related structured notes, futures and options on futures, swaps,
| | |
| 34 | ARTIO GLOBAL FUNDS ï 2010 ANNUAL REPORT | |
and (iv) commodity pools and other indirect investments in precious metals (collectively “precious metal-related instruments”).
The views expressed solely reflect those of Artio Global Management LLC (“Artio Global”) and the managers of the funds, and do not necessarily reflect the views of any affiliated companies. The material contains forward-looking statements regarding the intent, beliefs, or current expectations. Readers are cautioned that such forward-looking statements are not a guarantee of future performance, involve risks and uncertainties, and actual results may differ materially from those statements as a result of various factors. The views expressed are subject to change based on market and other conditions. Furthermore, the opinions expressed do not constitute investment advice or recommendation by the managers, Artio Global, the funds, or any affiliated company.
Diversification does not assure a profit or protect against a loss in a declining market.
Correlation is a relationship between two variables.
Each Morningstar category average represents a universe of funds with similar objectives.
The Morgan Stanley Capital International All Country World Index (ex-US) (MSCI ACWI (ex-US)) is a free float-adjusted market capitalization index that is designed to measure equity market performance in the global developed and emerging markets excluding the US.
The MSCI EAFE Index is a market capitalization weighted index composed of companies representative of the market structure of developed market countries in Europe, Australia and the Far East. The Index excludes the US and Canada.
The S&P 500 Index is a capitalization-weighted index of 500 widely held equity securities, designed to measure broad US equity performance.
The Tokyo Stock Price Index (Topix) is a stock market index for the Tokyo Stock Exchange in Japan, tracking all domestic companies of the exchange’s First Section.
The Dow Jones (DJ) Euro Stoxx 50 Index provides a blue-chip representation of supersector leaders in the euro zone. The index covers 50 stocks from 12 euro zone countries: Austria, Belgium, Finland, France, Germany, Greece, Ireland, Italy, Luxembourg, the Netherlands, Portugal and Spain.
You cannot invest directly in an index.
Please see the Schedule of Investments in this report for complete fund holdings. Fund holdings and/or sector weightings are subject to change at any time and are not recommendations to buy or sell any security mentioned.
Current and future holdings are subject to risk.
| | |
| ARTIO GLOBAL FUNDS ï 2010 ANNUAL REPORT | 35 |
MANAGEMENT’S COMMENTARY
Artio Total Return Bond Fund
2010 Annual Report
With the close of the Artio Total Return Bond Fund’s (the Fund) fiscal year on October 31, 2010 a quick look back on the highlights of the last twelve months is appropriate. During the period, the Fund’s Class A Shares returned 9.16%, outperforming its benchmark, the Barclays Capital US Aggregate Bond Index, which returned 8.01%. At the start of the period, market sentiment was more back-to-normal after the devastation of 2008. Towards the end of 2009 there were many Wall Street pundits saying the US Federal Reserve (the ’Fed’) would start to tighten by the middle of 2010 as the economy improved. The fourth quarter of 2009 and the first quarter of 2010 both saw strong US GDP (gross domestic product) figures and the investment community started to believe that the great recession was now in the rear view mirror. Unfortunately, there were other things to be concerned about which came to the fore.
European sovereign risk emerged in 2010 when Greece’s newly-elected Prime Minister announced that the budget deficit was about 12% of GDP instead of the previous government’s estimate (fabrication) of 5% to 6%. With this, research analysts and the press began to look more closely at the country and what they found was not pretty. A few of the problems (by no means exhaustive) were:
| | |
| | • | Anemic tax collection |
| |
| | • | Widespread corruption |
| |
| | • | Bloated and inefficient government |
| |
| | • | Inadequate (if any) method of tracking government expenditures |
| |
| | • | Laughably early retirement ages with robust pensions |
By May 2010 the euro zone was in crisis. Greek government bonds were trading at higher yields than most emerging market countries, the acronym PIIGS was created to describe the peripheral European countries (Portugal, Ireland, Italy, Greece and Spain), and the investment community began to worry that the European Union (EU) would break up due to market stresses.
At the end of May, the International Monetary Fund (IMF) and healthier euro zone countries put together a three year bailout of Greece. They also created the European Financial Stability Facility (EFSF) to have a system to bailout other EU member states that ran into difficulty. These programs worked — in the short term. Over the summer, interest rates in the PIIGS dropped significantly, especially in the hardest hit countries of Greece, Ireland and Portugal. In September and October these countries’ bonds began to deteriorate again, especially Ireland where
| | |
| 36 | ARTIO GLOBAL FUNDS ï 2010 ANNUAL REPORT | |
the banking sector is like a horror show. With the Irish government agreeing to cover the obligations of the country’s banks, the risk is that Ireland itself fails to pay its obligations as bailout costs have caused the 2010 deficit to skyrocket. Portuguese bonds have also deteriorated as investors grow dubious on the government’s ability to execute a meaningful austerity program that would bring the country’s fiscal metrics to a more reasonable position while increasing their competitiveness. As of this writing, both Ireland and Portugal are expected to have to borrow from the EFSF and give up a certain amount of federal independence.
Our opinion is that Greece will eventually be forced to restructure its debt, most likely due to default. If Greece fails to meet the stipulations imposed by the IMF and the other euro zone countries, it’s unlikely Greece will see any more loans. Ireland also has high odds of default, though it is not guaranteed. Thus far, their banking system problems have been focused on the commercial real estate sector, but a wave of residential mortgage defaults is possible. The odds of a Portuguese default are lower still. If the government can get some austerity plans implemented and take advantage of the cheaper funding via the EFSF, they could make it through this crisis, but this is by no means a sure thing. Spain is in much better condition than Greece, Ireland and Portugal and Italy is better still. It is almost unfair to lump these two in with the others but we caution that if market confidence is hurt by contagion from the little PIGs, all bets are off as the EFSF would not be able to support these two larger economies.
Major moves also took place in the US. Interest rates along the US yield curve moved lower to disturbingly low levels. The benchmark 10-year rate dropped 78 basis points (bps) to 2.6%. Not to be outdone, the 5-year rate fell 114 bps to 1.17%. Two-year Treasury rates ‘only’ dropped by 55 bps but since they closed the year at 0.34%, there is only so much farther they can go. The 30-year bond was the laggard, dropping 24 bps to close at 3.98%.
US spread sectors had good performance over the fiscal year. The commercial mortgage backed securities (CMBS) sector was the star performer over the period with an excess return over Treasuries of 14.79%. The Fund had a substantial overweight in this sector throughout the fiscal year. This was followed by the corporate sector with an excess return of 3.39%, asset backed securities (ABS) at 2.60%, agency backed mortgage backed securities (MBS) at 1.47% and government-related entities at 1.33%.
The securitized sectors of the market began the year on sound footing after the Treasury’s and Fed’s targeted liquidity programs in 2009. The TALF (Term Asset Backed Securities Loan Facility) program accomplished its goal of restarting the market for consumer ABS. Another TALF program had failed to restart commercial real estate lending, but nevertheless stabilized the secondary market for CMBS. The
| | |
| ARTIO GLOBAL FUNDS ï 2010 ANNUAL REPORT | 37 |
first round of quantitative easing bought up one trillion dollars worth of agency backed MBS, supporting spreads and triggering a refinancing wave that would ease the stress of legacy securities on the financial system. The Treasury’s public and private cooperative investment vehicles (PPIP), had $24 billion of capital ready to deploy into the distressed areas of the securitized markets providing relief to legacy holders and backstopping the market to the relief and comfort of other participants.
It was an open question as to how the market would respond with the winding down of these programs. The results exceeded expectations. Many questioned the agency MBS market’s ability to stand on its own feet after the expiration of the Fed’s $1 trillion purchase program, but that market has posted positive excess returns throughout most of 2010. The greatest concerns in this space were related to prepayments, as the market trades at a very high premium due to the nearly year long rally in Treasury rates making nearly the entire market refinancable.
Credit-sensitive assets in the securitized space outperformed this year because of their high yields, improving fundamentals, and stronger markets. The PPIP backstop was instrumental, as was the decision by the National Association of Insurance Commissioners to abandon traditional credit ratings when determining capital requirements. This substantially increased the market’s holding power, even as waves of downgrades swept through. When the European sovereign debt crisis surfaced in May, securitized markets had some down months but outperformed all other risk assets in the fixed income market in the second quarter.
There were headlines throughout the year related to the servicing practices of the main banks, but were viewed as either positive or shrugged off. Even when the mortgage foreclosure “robo-signing” scandal struck in October, precipitating an investigation by all 50 state attorneys general, bank shares sold off, but the market for RMBS without government-sponsored enterprise backing continued to rally. By contrast, noise around bankruptcy cramdowns sent the market into a panic in early 2009, but this shock was absorbed by a healthier market this year. The market for commercial real estate debt has managed to return to life, with several dealers pricing approximately $5 billion of new securities through September 2010. These are secured by higher-quality collateral with properties being financed with much more equity than they were in the previous incarnation of the CMBS market.
Within the credit markets, corporate bonds returned 11.6% during the fiscal year, providing a 3.4% excess return over Treasuries. This performance moved cumulative corporate excess returns into positive territory for the first time since the start of the 2008 recession.
Throughout the year, the Fund had an overweight position in credit, which contributed to overall outperformance.
| | |
| 38 | ARTIO GLOBAL FUNDS ï 2010 ANNUAL REPORT | |
While returns were comparable across industry sectors, financials and materials were the best performers and we were positioned correctly in both. However, the steepening of the Treasury 5-30 year curve translated to underperformance of credit in longer maturities and our exposure in long corporate bonds detracted.
In 2010, emerging markets experienced their second highest year of inflows (only bested by 2007). This led to price appreciation and interest rates compression worldwide. The Fund benefited from selective positions in emerging markets that were boosted by a combination of a healthy fundamental outlook and a good mix of monetary and fiscal policies as well as benign inflation expectations. We felt that political and economic priorities were becoming particularly challenging and conflicting, forcing a number of countries to intervene on their capital account and indeed, it has materialized. Thus far, Brazil has taken the most aggressive steps. While Asian central banks have continued their long-standing policy to stem currency appreciation via reserve build-up, they have begun to introduce tighter measures as well.
Outlook
We began the Outlook portion of last year’s annual report with the following paragraph:
The Federal Reserve Bank will likely be a major determinant of how financial markets perform over the medium-term. Market expectations are that the Fed will leave the Fed Funds rate close to zero until the middle of 2010. We agree. The Fed has signalled that they do not want the economy to slip into a deflationary spiral and appear willing to risk a surge in inflation and a decline in the value of the US dollar to ensure this is the case.
This statement still applies today. All we need to update is our expectation that the Fed Funds rate will remain close to zero throughout 2011.
We remain concerned that over the next several years the US rate of growth will not be able to reach what was considered acceptable over the last 20 years. A few of the reasons for this concern include a higher unemployment rate that may be due to a structural shift as opposed to a cyclical one, the loss of access for most homeowners to their home equity as an ATM and the damage to individuals’ confidence due to both these factors.
We see the continuing deleveraging of the American consumer as another growth retardant. On an individual basis, if a person increases their savings rate, especially if they are in debt, it is a good thing. If most everyone in a society increases their savings rate at the same time that can lead to trouble for an economy. For the US, a structural shift to more savings by individuals is a good thing — over the extremely long term. The problem is getting to that point in time will, most likely, be painful.
| | |
| ARTIO GLOBAL FUNDS ï 2010 ANNUAL REPORT | 39 |
As individuals save more, spending is reduced. For a consumption-driven economy such as the US, that is a structural change and an adjustment needs to take place. The most obvious one is an increase in unemployment as jobs that were designed to meet consumption are shut down or put at risk. The concern is that if the American consumer is becoming the American saver than many jobs that were appropriate in the old economy will be unnecessary in the new one. This phenomenon is known in economic circles as the paradox of thrift.
The Fed has signalled that they are now actively targeting the inflation rate, which has been trending down since the financial crises began. They have become concerned that deflation is a threat to the economy and its effects on consumer spending habits. Hence, their focus on inflation. The Fed’s new asset purchase program, referred to as quantitative easing II (QE II, by Wall Street) is projected to start in early November 2010 and run through June 2011. The Fed projects that they will purchase about $110 billion per month (approximately $75 billion in new purchases and $35 billion in cash proceeds that are generated from the first asset purchase program, now called QE I) in US Treasuries. Their hope with this program is that 10-year and shorter interest rates will drop due to these purchases. Several projected benefits are expected if this takes place. First, it would allow more mortgage refinancings with the anticipated drop in mortgage rates. This would not only put some money back into consumer’s pockets on a monthly basis but also strengthen the housing market. Another benefit would be a projected reduction in the borrowing rate for corporations who would hopefully use this lower cost of funds to expand their capital expenditures and increase hiring. An increase in prices throughout the financial markets is another potential benefit. The thinking here is that all the added liquidity, basically newly printed dollars, must go somewhere in the financial markets to have some kind of return. Whether it goes to stocks, bonds, commodities or some other asset, it should drive up the price to a level higher than where it would have been without the stimulus. This has the potential to increase the ‘wealth effect‘ for the consumer, who should feel wealthier because their investments are worth more. QE II is also widely perceived as a program that will bring down the value of the US dollar. One advantage of a declining currency is the assistance it gives to domestic manufacturers. Exports can be sold more cheaply and imports are more expensive to US consumers, making them less competitive. As a heavily indebted society, devaluation is beneficial as the debt burden becomes less heavy, relatively.
Many market participants do not object to a central bank looking to bring down rates as a boost to the housing markets or to ignite the animal spirits in the corporate sector. However, the objective of driving up prices throughout financial markets is seen as a very dangerous move for the Fed and perceived by many investors as encouraging financial asset bubbles. The Fed risks losing credibility with the
| | |
| 40 | ARTIO GLOBAL FUNDS ï 2010 ANNUAL REPORT | |
investment community due to the implementation of this type of policy. Former Fed Chairman Alan Greenspan had a stellar reputation in the late 1990’s and early 2000’s. With the rupturing of the housing bubble after a protracted period of low rates, the Fed encouraged deregulation and inexcusably poor regulatory enforcement, Chairman Greenspan’s legacy is somewhere between blemished and ruined, depending on who you talk to. The Fed needs to be very careful not to allow its institutional reputation to become more damaged than what it sustained in the last five years.
Encouraging a drop in the value of the US dollar also has significant risks including the behavior of foreign investors. They have little incentive to buy US debt at current low yields if the value of the dollar is expected to drop versus the value of their own currency. Currency devaluation can also lead to an increase in inflation or inflationary expectations. Either of these two potential outcomes could bring higher interest rates, posing a problem for the economic recovery.
Within this investing environment, it is likely that the ‘risk on’ trade will remain a force to contend with as the Fed pumps the markets up with ‘sugar’. It is not clear whether financial markets will continue to rise steadily over the next year because many sectors are already trading through what many would consider fair value, especially when the poor health of the economy is taken into account. We will try to participate in this high risk tolerance trade but with a healthy degree of scepticism. Our strategy is to buy fundamentally sound positions and pay a premium for more liquid securities. We will also be paying close attention to the comments and actions of foreign central banks, especially from Asia.
With this in mind, our outlook for spread sectors follows. Within the corporate bond sector, we believe there is still value to be had, but opportunities are not overly abundant. Compared to historic levels, credit spreads to Treasuries remain wide, but this is largely due to lofty spreads in financials, which represent 35% of the US corporate portion of the Barclays Capital US Aggregate Bond Index. Most banks still face elevated loan losses as well as potential for mortgage “put-backs” due to reps and warrants breaches, which should limit spread compression in the sector for the foreseeable future. We believe credit offers only limited value at current levels, but as spreads represent a substantial percentage of the absolute yield, we prefer to enter the New Year weighted close to the index rather than underweight.
A trend that we have been monitoring closely is the pick-up in bondholder unfriendly activity in corporate America over the last few quarters. As we anticipated last year, shareholder-friendly activities such as leveraged buy-outs, mergers and acquisitions and stock buy-backs have picked up. We believe that this trend will
| | |
| ARTIO GLOBAL FUNDS ï 2010 ANNUAL REPORT | 41 |
intensify going forward and have positioned the Fund to minimize exposure to sectors that appear most vulnerable. This view is based on the following factors:
| | |
| | • | Cash balances at non-financial corporations as a percent of total assets continued to grow (from 4.5% in 2008 to 6.5% currently) while short yields were anchored close to zero percent |
| |
| | • | Corporate balance sheets appear strong with overall leverage declining |
| |
| | • | Most investment grade issuers continued to have easy access to extremely cheap funding (e.g. a number of companies were able to borrow below 1% for 3 years and below 3% for 10 years) |
| |
| | • | Investors’ appetite for corporate bonds remained strong which is supported by healthy fund flows into the asset class |
| |
| | • | Shareholders became more vocal and pressured Chief Executive Officers for enhancing returns |
The outlook for emerging markets in 2011 is clouded due to QE II. Besides the uncertain effect on the US economy and inflation pressures, the un-orthodox measures pose a risk by way of greater investment flows to emerging markets and a more aggressive response by governmental or monetary authorities to prevent these flows from damaging the economy. Moreover, monetary policy globally will likely be more complicated. On one hand, authorities will need to manage potential inflationary pressures rising from supply and demand imbalances. On the other hand, they will be constrained due to the risk of attracting ever more capital which would result in greater currency appreciation than is justified by the fundamentals of that economy. These unwanted flows also complicate productive capital allocation decisions. As a result, we expect both interest rate and currency investments in 2011 to be more volatile than 2010. Another uncertainty worthy of investors’ attention for the emerging market space is developments in the euro zone due to the potential delay in resolving the leverage and fiscal trap for a number of sovereigns. This will prolong stress and uncertainty in the financial system and real economy of many countries, not least the emerging countries of this region.
Within the securitized markets we favor CMBS and non-agency MBS. The CMBS market often gets negative attention from the media but we see several positive trends including:
| | |
| | • | Stabilizing delinquency rates for seasoned paper |
| |
| | • | Less levered capital structure in new deals |
| |
| | • | Significantly lower loan-to-value ratio (i.e. increased percentage of equity in the deal) |
| |
| | • | Smaller deals — averaging 20 properties compared to hundreds in older deals |
| | |
| 42 | ARTIO GLOBAL FUNDS ï 2010 ANNUAL REPORT | |
We also favor non-agency MBS as implied breakeven default rates remain substantially higher than actual rates. We expect the default rates to remain lower than what is expected by the market due to moderating losses in this area. With the highest yields in the investment grade universe and better expectations than what appears to be priced into the market, we expect to have substantial positions in this sector for the foreseeable future.
Donald Quigley, CFA
Co-Portfolio Manager
Artio Total Return Bond Fund
Past performance does not guarantee future results.
Investments in debt securities typically decrease in value when interest rates rise. This risk is usually greater for longer term debt securities. Investing internationally involves additional risks, such as currency fluctuations, social and economic instability, differing securities regulations and accounting standards, limited public information, possible changes in taxation, and periods of illiquidity.
Investments in asset backed and mortgage backed securities include additional risks that investors should be aware of such as credit risk, prepayment risk, possible illiquidity and default, as well as increased susceptibility to adverse economic developments.
The views expressed solely reflect those of Artio Global Management LLC (“Artio Global”) and the managers of the Fund, and do not necessarily reflect the views of any affiliated companies. The material contains forward-looking statements regarding the intent, beliefs, or current expectations. Readers are cautioned that such forward-looking statements are not a guarantee of future performance, involve risks and uncertainties, and actual results may differ materially from those statements as a result of various factors. The views expressed are subject to change based on market and other conditions. Furthermore, the opinions expressed do not constitute investment advice or recommendation by the managers, Artio Global, the Fund, or any affiliated company.
The Barclays Capital US Aggregate Bond Index is a benchmark index composed of US securities in Treasury, Government-Related, Corporate, and Securitized sectors. It includes securities that are of investment-grade quality or better, have at least
| | |
| ARTIO GLOBAL FUNDS ï 2010 ANNUAL REPORT | 43 |
one year to maturity, and have an outstanding par value of at least $250 million. It is not possible to invest directly in an index or average.
A basis point is a unit of measure equal to 1/100th of 1%.
Please see the Schedule of Investments in this report for complete Fund holdings. Fund holdings and/or sector weightings are subject to change at any time and are not recommendations to buy or sell any security mentioned.
Current and future portfolio holdings are subject to risk.
| | |
| 44 | ARTIO GLOBAL FUNDS ï 2010 ANNUAL REPORT | |
MANAGEMENT’S COMMENTARY
Artio Global High Income Fund
2010 Annual Report
Performance (% as of 10/31/10)
| | | | | | | | | | | | | | | | | | | | | | | | | | | | | |
| | | | | | | | | | | | | | | | | | Gross
| | | Net
| |
| | | Inception
| | | | | | | | | | | | Since
| | | Exp.
| | | Exp.
| |
| | | Date | | | 1 Year | | | 3 Years2 | | | 5 Years2 | | | Inception2 | | | Ratio3 | | | Ratio3 | |
| |
| Class A | | | 12/17/02 | | | | 16.08 | | | | 8.86 | | | | 9.13 | | | | 10.76 | | | | 1.01 | | | | 1.00 | 4 |
| Class I | | | 1/30/03 | | | | 16.39 | | | | 9.16 | | | | 9.41 | | | | 11.09 | | | | 0.75 | | | | 0.75 | 4 |
Benchmark(1) | | | N/A | | | | 18.29 | | | | 9.72 | | | | 9.63 | | | | A: 11.44
I: 11.04 | | | | N/A | | | | N/A | |
| | | |
| 1. | | BofA Merrill Lynch Global High Yield Constrained Index |
| 2. | | Annualized |
| 3. | | As stated in the prospectus dated 3/1/10 |
| 4. | | The Investment Adviser has contractually agreed to reimburse certain expenses of the Fund through 2/27/11. The Investment Adviser has also agreed to waive a portion of its management fees; this waiver may be discontinued at any time by the Fund’s board. Additional expenses are net of reductions related to custody offset arrangements. |
The performance quoted represents past performance, which does not guarantee future results. The investment return and principal value of an investment will fluctuate so that an investor’s shares may be worth more or less than their original cost. Current performance of the Fund may be lower or higher than the performance quoted. Performance data current to the most recent month-end may be obtained by calling 800 387 6977 or visiting www.artiofunds.com.
Investment performance reflects fee waivers. In the absence of such waivers, total return would be reduced.
During the fiscal year ending October 31, 2010, an economic recovery unfolded in North America and Europe that encouraged markets with its arrival but periodically shook them with evidence that its roots were not yet firmly planted. US gross domestic product (GDP) growth was barely positive at the beginning of the period, but at the end was growing at an annual rate of over 3%. European growth was decidedly negative at the beginning of the period, but by the end was running at about 2%. Other key measures of economic health such as industrial production and consumer spending also turned strongly positive over the period. Moreover, corporations reported much better profitability, including many in industries that until recently were very challenged. In the wake of a second round of quantitative easing, the US Treasury bond yield exactly halved from 2.34% to 1.17% and corporate borrowing costs reached historic lows. These positive strides helped both consumer and market sentiment, and sent markets higher. Unfortunately, progress was punctuated by numerous doubts and uncertainties. In Europe, the fiscal situation of Greece and other “peripheral” European Union members sparked concerns of
| | |
| ARTIO GLOBAL FUNDS ï 2010 ANNUAL REPORT | 45 |
renewed financial crises at several junctures. In the US, unemployment rates stayed stubbornly high, the housing market remained moribund, and local and state governments faced mounting deficits. Consensus opinion seemed to be that the US could not fully recover without a renewal of the type of stimulus used in early 2009. The form of this stimulus, whether fiscal or monetary, was a matter of heated debate. Meanwhile, most emerging markets enjoyed an unqualified recovery — so much so that by the end of the Fund’s fiscal year many of them were beginning to engage in policies directed at slowing, rather than accelerating, growth. The lack of balance between the high, often export-led GDP growth in the emerging world and the low growth and high unemployment rates in the developed world was, and still is, perhaps the largest fissure in the underlying support for US recovery. As the fiscal year closed, world leaders were increasingly at odds over how to address these continued imbalances.
Despite the uncertainties, which are present to some degree in every recovery, the fact that US GDP growth was once again positive and that profits had returned were two of the most salient facts for investors. As a result, markets rallied, including global high yield. Our benchmark, the BofA Merrill Lynch Global High Yield Constrained Index returned 18.29% for the period. Part of this return reflected the underlying decline in interest rates, which tends to pull all yields down. When yields of fixed income instruments decline, prices rise. The underlying gravitational pull of lower interest rates was given further weight by the increased willingness of investors to take on credit risk in an environment of improving growth and profitability. This effect is quantified by the “spread” of high yield corporate yields over underlying “risk-free” rates, which declined from approximately 790 basis points at the beginning of the period to 575 basis points at the end. The decline in risk premiums did not unfold without interruption. The Greek debt crisis awoke concerns that widened spreads in February and, in a more pronounced fashion, during May and June. Despite such hiccups, investors’ willingness to take on more credit risk grew dramatically and engendered something of a virtuous circle as the year progressed. Money entered the high yield market as investors of all stripes increased their exposure. Corporate issuers, in turn, took advantage of these inflows to issue record amounts of new debt. Importantly, most of this borrowing activity was used to repair balance sheets rather than re-lever them. The new issuance was largely used to extend maturities and lower borrowing costs, thereby further improving underlying fundamentals. However, this process left many balance sheets still to be addressed in future periods.
Within the global high yield markets, some segments enjoyed better returns than others. The lowest rated, CCC securities, fared the best as issuers who did not default during the recession became increasingly likely to survive and rallied from especially low levels. BB rated securities also did well, as these relatively higher
| | |
| 46 | ARTIO GLOBAL FUNDS ï 2010 ANNUAL REPORT | |
quality securities move more closely with declining interest rates in general. B rated securities fared the worst. European high yield outperformed US high yield on a local currency basis. The European market, like CCCs, was recovering from lower price levels and did not have the same level of new issuance to digest as did the US market. Bond debt fared better than loan debt. Bonds are usually fixed rate instruments, while loans are floating rate. Thus, similar to the behavior of higher rated BB securities, bonds gained from falling interest rates. As less senior, generally unsecured and more risky instruments, bonds also benefited more than loans from the increased risk appetite. Emerging market sovereigns and corporates also performed well, especially considering the generally higher rating of these securities in an environment that tended to reward riskier securities.
The Artio Global High Income Fund’s (the “Fund”) Class A Shares returned 16.08% for the twelve months ending October 31, 2010, bringing the three and five year annualized returns to 8.86% and 9.13%, respectively. These one year returns lagged the Morningstar High Yield Bond peer group, placing us in the bottom quartile (as of 10/31/10 Class A Shares ranked 454 out of 571 funds based on total returns). However, since we have historically outperformed our Morningstar category to a far greater extent during more volatile periods, the Fund’s longer run three and five year returns remain in the top decile of our Morningstar universe (as of 10/31/10 Class A Shares ranked 41 out of 504 and 17 out of 428 funds respectively based on total returns). Versus our benchmark, our returns lagged by 2.21% over the past year, and a narrower 0.86% and 0.50% over the trailing three and five years.
We wish that our performance had been better over this past year, but we are gratified that our longer-run performance remains perched near the top of our peer group. The dichotomy between short-term and long-term rankings stems from the fact that our underperformance over the past year was, in absolute terms, lower than our outperformance in prior, more volatile periods. The dispersion among manager performance was also tighter during this less volatile period than in prior periods, meaning that smaller absolute differences this past year led to wider ranking differences than would have been the case in prior years. In our opinion, outperformance when it counted is what led to our top decile rankings over longer periods. Moreover, we believe that our results are rooted in our more diversified and risk aware approach to the asset class, which we realize may not work in every possible environment.
Nonetheless, we need to review the pitfalls we encountered during the past twelve months. Chief among the tactical miscues was our weighting in loans, which ranged between 16% and 23%. Floating rate, more senior loans lagged during this period of declining rates and increased risk tolerance. However, in any reversal, we believe that loans would provide far more protection than they surrendered in upside during
| | |
| ARTIO GLOBAL FUNDS ï 2010 ANNUAL REPORT | 47 |
this year’s rally. This is the kind of asymmetric return we seek for the Fund. Our rating distribution also hurt, as we were overweight, on average by 19%, in B securities. Our bottom-up approach led us to this positioning, and it was the sector least exposed to interest rate and default risk, both of which we believe are longer-run threats, but neither of which increased over the past year.
Several positive contributors partially offset these miscues. First, within a number of sub-sectors, we continued to demonstrate a solid ability to choose individual credits. Chief among these was our selection of individual loan issuers, which helped offset the drag of the overall sector. Within emerging markets, we were able to pick outperformers among corporates and issuers of local currency denominated debt. Away from individual issue selection, our shifting between an emphasis on US high yield bonds in the early parts of the period to a European emphasis toward the end of the period also proved beneficial. On average, our weighting in US bonds and loans was 70% during the period and 14% in European bonds and loans. Finally, relative to the BofA Merrill Lynch Global High Yield Constrained Index, which carries approximately a 17% weighting in euro denominated bonds, our management of currency exposure helped.
The new fiscal year will doubtless contain its own set of risks and opportunities. The recovery seems to be taking hold and it is especially strong in some emerging markets. But many challenges persist. The European currency union requires a better fiscal policy framework. The US needs to place its recovery on firmer footing. Globally, all the world’s economies need to obtain a more balanced growth trajectory which will require more cooperative leadership on the part of all countries than has been exhibited thus far. Within the high yield market, there are a number of issuers who still must find a way to address substantial maturities in the 2012 to 2015 period. As the responses to these challenges unfold, the pricing of various credit risks should shift, both up and down, and we expect this will create opportunities for us to add value for shareholders. We believe that our globally diversified approach to this asset class, our ability to buy an array of different debt instruments, our more equity-like approach to credit analysis, and our risk awareness position us well for these upcoming challenges and opportunities.
Greg Hopper
Portfolio Manager
Artio Global High Income Fund
Past performance does not guarantee future results.
| | |
| 48 | ARTIO GLOBAL FUNDS ï 2010 ANNUAL REPORT | |
The securities in which the Fund will invest may be considered more speculative in nature and are sometimes known as “junk bonds.” These securities tend to offer higher yields than higher rated securities of comparable maturities because the historic financial condition of the issuers of these securities is usually not as strong as that of other issuers. High yield fixed income securities can present a greater risk of loss of income and principal than higher rated securities. Investing internationally involves additional risks, such as currency fluctuations, social and economic instability, differing securities regulations and accounting standards, limited public information, possible changes in taxation, and periods of illiquidity. These risks are greater for emerging markets. In order to achieve its investment objectives, the Fund may use certain types of exchange traded funds or investment derivatives such as futures, forwards, and swaps. Derivatives involve risks different from, and in certain cases, greater than the risks presented by more traditional investments. These risks are fully disclosed in the prospectus.
Investments in asset backed and mortgage backed securities include additional risks that investors should be aware of such as credit risk, prepayment risk, possible illiquidity and default, as well as increased susceptibility to adverse economic developments.
Morningstar Rankings represent a fund’s total return rank relative to all funds that have the same Morningstar Category. The highest rank is 1 and the lowest is based on the total number of funds ranked in the category. It is based on Morningstar total return, which includes both income and capital gains or losses and is not adjusted for sales charges or redemption fees.
The views expressed solely reflect those of Artio Global Management LLC (“Artio Global”) and the managers of the fund, and do not necessarily reflect the views of any affiliated companies. The material contains forward-looking statements regarding the intent, beliefs, or current expectations. Readers are cautioned that such forward-looking statements are not a guarantee of future performance, involve risks and uncertainties, and actual results may differ materially from those statements as a result of various factors. The views expressed are subject to change based on market and other conditions. Furthermore, the opinions expressed do not constitute investment advice or recommendation by the managers, Artio Global, the fund, or any affiliated company.
The BofA Merrill Lynch Global High Yield Constrained Index tracks the performance of below investment grade bonds of corporate issuers domiciled in countries having an investment grade foreign currency long term debt rating (based on a composite of Moody’s and S&P). The index is weighted by outstanding issuance,
| | |
| ARTIO GLOBAL FUNDS ï 2010 ANNUAL REPORT | 49 |
but constrained such that the percentage that any one issuer may not represent more than 3% of the index. It is not possible to invest in an index.
A basis point is a unit of measure equal to 1/100th of 1%.
Please see the Schedule of Investments in this report for complete fund holdings. Fund holdings and/or sector weightings are subject to change at any time and are not recommendations to buy or sell any security mentioned.
| | |
| 50 | ARTIO GLOBAL FUNDS ï 2010 ANNUAL REPORT | |
MANAGEMENT’S COMMENTARY
Artio US Microcap Fund
Artio US Smallcap Fund
Artio US Midcap Fund
Artio US Multicap Fund
2010 Annual Report
Performance (% as of 10/31/10)
Artio US Microcap Fund
| | | | | | | | | | | | | | | | | | | | | | | | | |
| | | Inception
| | | | | | | | | Since
| | | Gross Exp.
| | | Net Exp.
| |
| | | Date | | | 1 Year | | | 3 Years1 | | | Inception1 | | | Ratio2 | | | Ratio2 | |
| |
| Class A | | | 7/24/06 | | | | 26.88 | | | | -4.32 | | | | 2.45 | | | | 4.26 | | | | 1.81 | 3 |
| Class I | | | 7/24/06 | | | | 27.23 | | | | -4.00 | | | | 2.78 | | | | 3.61 | | | | 1.51 | 3 |
| Russell 2000 Index | | | N/A | | | | 26.58 | | | | -3.91 | | | | 1.81 | | | | N/A | | | | N/A | |
| Russell Microcap Index | | | N/A | | | | 25.07 | | | | -7.26 | | | | -1.71 | | | | N/A | | | | N/A | |
Artio US Smallcap Fund
| | | | | | | | | | | | | | | | | | | | | | | | | |
| | | Inception
| | | | | | | | | Since
| | | Gross Exp.
| | | Net Exp.
| |
| | | Date | | | 1 Year | | | 3 Years1 | | | Inception1 | | | Ratio2 | | | Ratio2 | |
| |
| Class A | | | 7/24/06 | | | | 18.87 | | | | -2.50 | | | | 6.93 | | | | 2.89 | | | | 1.51 | 3 |
| Class I | | | 7/24/06 | | | | 19.25 | | | | -2.19 | | | | 7.25 | | | | 2.60 | | | | 1.21 | 3 |
| Russell 2000 Index | | | N/A | | | | 26.58 | | | | -3.91 | | | | 1.81 | | | | N/A | | | | N/A | |
Artio US Midcap Fund
| | | | | | | | | | | | | | | | | | | | | | | | | |
| | | Inception
| | | | | | | | | Since
| | | Gross Exp.
| | | Net Exp.
| |
| | | Date | | | 1 Year | | | 3 Years1 | | | Inception1 | | | Ratio2 | | | Ratio2 | |
| |
| Class A | | | 7/24/06 | | | | 25.13 | | | | -4.54 | | | | 2.82 | | | | 3.73 | | | | 1.37 | 3 |
| Class I | | | 7/24/06 | | | | 25.68 | | | | -4.22 | | | | 3.14 | | | | 3.03 | | | | 1.07 | 3 |
| Russell Midcap Index | | | N/A | | | | 27.71 | | | | -3.46 | | | | 3.08 | | | | N/A | | | | N/A | |
Artio US Multicap Fund
| | | | | | | | | | | | | | | | | | | | | | | | | |
| | | Inception
| | | | | | | | | Since
| | | Gross Exp.
| | | Net Exp.
| |
| | | Date | | | 1 Year | | | 3 Years1 | | | Inception1 | | | Ratio2 | | | Ratio2 | |
| |
| Class A | | | 7/24/06 | | | | 19.43 | | | | -4.65 | | | | 2.91 | | | | 3.65 | | | | 1.32 | 3 |
| Class I | | | 7/24/06 | | | | 19.85 | | | | -4.34 | | | | 3.23 | | | | 2.99 | | | | 1.02 | 3 |
| Russell 3000 Index | | | N/A | | | | 18.34 | | | | -5.96 | | | | 1.08 | | | | N/A | | | | N/A | |
| | | |
| 1. | | Annualized |
| 2. | | As stated in the prospectus dated 3/1/10 |
| 3. | | Due to the start-up costs associated with launching a new fund and the time it takes to obtain sufficient scale, the Investment Adviser has contractually agreed to reimburse certain expenses of the funds through 2/27/11. The Investment Adviser has also agreed to waive a portion of its management fees; this waiver may be discontinued at any time by the Fund’s board. Additional expenses are net of reductions related to fee waivers. |
The performance quoted represents past performance, which does not guarantee future results. The investment return and principal value of an investment will fluctuate so that an investor’s shares may be worth more or less than their original cost. Current performance of the Fund may be lower or higher than the performance quoted. Performance data current to the most recent month-end may be obtained by calling 800 387 6977 or visiting www.artiofunds.com.
Investment performance reflects fee waivers. In the absence of such waivers, total return would be reduced.
| | |
| ARTIO GLOBAL FUNDS ï 2010 ANNUAL REPORT | 51 |
For the fiscal year ended October 31, 2010 (the Reporting Period), US equity markets overcame mid-period adversity to finish higher for a second consecutive year. Besides a continuation of the macro issues that have plagued equity markets for some time now, such as sovereign debt, lackluster confidence in US and European financial systems and concerns of what had been an aggressive democratic political agenda, there was nothing particularly remarkable about the Reporting Period.
There were bouts of optimism and pessimism regarding broad economic conditions in the US and around the world that resulted in some periods of heightened volatility. Of note, correlation levels among stocks reached record levels during the year, attributable to a combination of a lower demand for actively managed funds (to the benefit of passively managed index funds) and heightened risk aversion levels. Indeed, compared to fiscal years 2008 and 2009, we view this year’s equity markets as tranquil. The bond market remained resilient and precious metals and most commodities soared.
Sector and Size Performance
Stock market returns during the Reporting Period followed the traditional “playbook” of smallcaps leading largecaps out of a recession with midcaps strong as well. The Russell 2000 Index returned 26.58%, modestly behind the 27.71% return of the Russell Midcap Index. The largecap Russell 1000 and S&P 500 Indexes returned 17.67% and 16.52% respectively. Growth outperformed value across all size segments of the market as investors bid up those companies that they perceived would continue to grow faster than the broader market and/or overall economy. We mentioned in last year’s annual letter that the lagging returns of smaller companies surprised us somewhat. We surmise that the severity of the recent recession has resulted in a slower and longer recovery period that is now going on two years, as conviction in the sustainability of the recovery has been questioned since the recession officially ended in June 2009.
| | |
| 52 | ARTIO GLOBAL FUNDS ï 2010 ANNUAL REPORT | |
Source: FactSet, Russell Investments, Bloomberg
In reviewing the performance of the US equity market for the fiscal year, we observed the financials sector continued to struggle as a combination of loan losses and equity issuance (actual and perceived) kept investors on the sidelines. This is the primary reason why value indices lagged their growth counterparts, with larger capitalization financials particularly weak. In addition, smaller capitalization technology companies outperformed their larger brethren, due to greater sales and profit recoveries (operating leverage) and growth rates that resulted in larger swings in smaller company valuations. Energy stocks were weak across the board, reflecting the negative effects of the BP oil spill and poor domestic natural gas market conditions. Healthcare stocks saw another tough year as the healthcare reform bill passed Congress in March and was signed by President Obama shortly thereafter. The legislation is quite lengthy at over 2,000 pages and will take years to be fully implemented, leaving investors uncertain about how smoothly the implementation will be and whether or not more changes may be in the cards. Investors clearly took a wait and see attitude toward the sector in 2010.
Lessons Learned
The calendar years 2008 and 2009 will be remembered by most investors as very challenging. In last year’s letter, we went into great detail about some lessons we
| | |
| ARTIO GLOBAL FUNDS ï 2010 ANNUAL REPORT | 53 |
learned during this time period that humbled us but also made us better investors. Investing in stocks has often been called “a game of mistakes.” We know this to be true, as not every one of our stock investments has worked out as planned and we have indeed sold some of our mistakes. We make a point to learn from these mistakes in the quest to improve our stock level batting average or hit rate.
Some noteworthy lessons for this fiscal year included reexamining our thinking and positioning in healthcare and industrials. We felt confident that healthcare reform would pass and the market would be excited to have the uncertainty behind us — the expected result being broad outperformance by the sector. What we learned was that the complexity and lead time, along with the implementation of such far-reaching and complicated legislation, resulted in lackluster enthusiasm for the sector. We needed to look beyond the actual passing of the law to see how investors would rationalize the implementation, which in hindsight is clearly viewed as an opportunity cost we absorbed.
In industrials, we could have been better diversified among industries and sub-industries. If investors begin to believe a recovery is underway, exposure to the economically sensitive industries and companies within the sector (included in our benchmarks) is needed to outperform within industrials. While our approach is to identify companies we think will outperform employing a bottom-up investment process, sometimes not having sufficient, consistent diversification and/or exposure in some industries of a diverse sector like industrials are meaningful risk factors, which negatively impacted our performance. The lesson learned is that we have to challenge ourselves to look for how we may be (without intention) imposing a top-down view, even if isolated to one industry or sub-industry within a sector of a bottom-up investment process, understanding fully the risk-reward tradeoffs.
US Equity Portfolio Strategy
During the year, we were pleased that Lipper reclassified our smallcap, midcap and multicap funds as core style. Now, all four of our US equity mutual funds are considered core in terms of style, which is gratifying to us because we intentionally consider and purchase both growth and value securities in an effort to maximize our opportunity set. Similar to last year and throughout the Reporting Period, we maintained modest sector bets, purposely placing the performance burden on our team of analysts to rely on stock picking to add value.
In early 2010, we increased our healthcare sector weighting on the belief that lawmakers would pass a sweeping healthcare reform bill and healthcare stocks would broadly see at least a relief rally. While this did not materialize, we still believe valuations are quite reasonable and expect better relative performance from the
| | |
| 54 | ARTIO GLOBAL FUNDS ï 2010 ANNUAL REPORT | |
sector as investors get more comfortable with the implementation of the plan and focus on how and which companies can capitalize on the changes.
The financial sector struggled across the market capitalization spectrum during the twelve month period as investors remained concerned about banks and their problematic books of loans and reduced loan underwriting levels — both of which serve to reduce earnings and/or earnings growth. We ended the year broadly underweight the sector, but as we discussed in last year’s letter, increased our exposure throughout the year. We believe that for many banks, the worst part of the credit cycle is upon or behind them and that better-positioned banks will begin to grow over our minimum investment horizon of one to two years.
Looking at the technology sector, we reduced our weighting during the earlier part of the fiscal year from an overweight position then increased it as technology stocks fell during the summer.
For our four US equity funds, sector allocations remain a secondary determinant of long-term relative performance — we will continue to measure our success by our ability to pick individual stocks that outperform the market.
Performance Review
Our goal remains to develop returns that demonstrate outperformance relative to each fund’s stated benchmark over an extended period of time. Because we manage concentrated portfolios with sizeable, idiosyncratic, stock-specific risks, we will undoubtedly encounter calendar and/or fiscal years where we will report negative relative performance. It is important to emphasize that our primary performance focus is on delivering long-term outperformance over a market cycle, which we view as consistent with an economic cycle of four-to-six years. As we look ahead to 2011, all of our US equity funds will reach the important five year performance milestone. We are optimistic that all four funds can maintain their records of outperformance since inception and we look forward to reporting to you our progress on this front next year. As for this year, two of our four funds outperformed their benchmarks as noted below.
Artio US Microcap Fund
For the Reporting Period, the Artio US Microcap Fund (Class A Shares) returned 26.88%, outperforming the 25.07% return of the Russell Microcap Index and the 26.58% return of Russell 2000 Index. Outperformance was primarily attributable to favorable stock selection within the financial, consumer discretionary and healthcare sectors. This offset unfavorable relative stock results in the industrials, technology and consumer staples sectors. The best contributors to returns over the course of the twelve month period were Viropharma Inc., Gold Resources Corp. and LTX Corp.
| | |
| ARTIO GLOBAL FUNDS ï 2010 ANNUAL REPORT | 55 |
Among the largest detractors were Genoptix Inc., Duoyuan Global Water Inc. and Duoyuan Printing Inc. The Fund’s sector positioning had a positive impact. At the end of the Reporting Period, the Fund was overweight the consumer discretionary and industrials sectors and underweight the financial and healthcare sectors.
Artio US Smallcap Fund
For the Reporting Period, the Artio US Smallcap Fund (Class A Shares) returned 18.87%, underperforming the 26.58% return of Russell 2000 Index. Underperformance was attributable to unfavorable stock selection. The Fund’s industrials, healthcare and consumer discretionary holdings underperformed and more than outweighed positive stock performance within the technology and financial sectors. The largest detractors during the fiscal year were Duoyaun Global Water Inc., Skechers USA Inc. and Penson Worldwide Inc. Positive contributors included ViroPharma Inc., National Financial Partners Corp. and Saks Inc. Sector positioning also had a modest negative impact. The Fund ended the Reporting Period overweight the technology and consumer discretionary sectors and underweight the financial and utilities sectors.
Artio US Midcap Fund
For the Reporting Period, the Artio US Midcap Fund (Class A Shares) returned 25.13% versus the 27.71% return of the Russell Midcap Index. The underperformance was attributable to unfavorable stock selection within the healthcare, financial and consumer discretionary sectors, which overshadowed strong relative performance within the technology, materials and energy sectors. During the fiscal year, 3Par Inc., Sybase Inc. and Smith International were the leading contributors to results while Skechers USA Inc., Myriad Genetics Inc. and Petrohawk Corp. were the largest detractors. The Fund closed the Reporting Period overweight the technology and healthcare sectors and underweight the utilities and telecommunications sectors.
Artio US Multicap Fund
For the Reporting Period, the Artio US Multicap Fund (Class A Shares) rose 19.43%, outpacing the 18.34% rise of the Russell 3000 Index. Outperformance was attributable to favorable stock selection within the energy and materials sectors and more than offset unfavorable stock selection with the healthcare and consumer staples sectors. Sector allocation was also a positive contributor. The largest performance contributors included Apple Inc., Las Vegas Sands Corp. and Mosaic Co., while the biggest detractors were Myriad Genetics Inc., Petrohawk Corp. and WellPoint Inc. The Fund finished the Reporting Period overweight the technology,
| | |
| 56 | ARTIO GLOBAL FUNDS ï 2010 ANNUAL REPORT | |
materials and healthcare sectors and underweight the energy, telecommunications and utilities sectors.
Outlook
As we exit 2010, it appears the US stock market is attempting to end on a high note. Recently, economic data has improved on many fronts, albeit modestly. We believe housing and employment continue to be the critical factors determining the path of any US economic recovery. In the real world, away from the creativity, greed and problems of Wall Street, most people have one significant asset: their home. In most parts of this country, the value of this asset has become impaired, reducing citizens’ overall confidence, their appetite for investing and risk and their desire to spend on non-essential items. This has been the story for the last couple of years, especially in 2008 and 2009.
This year has seen consumer spending on goods and services recover with four straight quarters of positive growth in consumption (according to the Bureau of Economic Analysis) and the stock market has also risen, although it’s hard to point to the foundation of the recovery. Has it been the added liquidity of the US Federal Reserve’s quantitative easings (QE I and II)? Was it fundamentally driven by substantial profit recoveries posted by the majority of US companies the last two years and the revaluation of extrapolated future earnings power? Maybe it was the stimulus plan implemented in 2008-2009. Our opinion is that it doesn’t really matter because at the end of the day, the market is right. A key part of our approach in investing in US equities is to emphasize individual companies and not let meaningful sector overweights and underweights determine relative, long-term investment performance. Looking back at the last year or so, we feel this key attribute to our investment process was a determining factor in our performance. It was very difficult to make sector calls because of so many variants of economic uncertainty and we were reminded again of how important it was to stay disciplined to the process of looking at companies one at a time, maintaining diversification in terms of sector representation, company size (revenues and/or equity market capitalization) and capital structure (a willingness to invest in companies with or without debt).
As growth in emerging market economies continues at high levels, our outlook for robust improvement here in the US remains cautiously optimistic. Comparisons to prior recessions and recoveries may not add much value in handicapping future GDP (gross domestic product) growth amid this recovery. We believe a few items will continue to constrain growth going forward:
| |
| 1. | Lackluster demand for business and consumer credit combined with a lower propensity to lend by the nation’s banks should serve to retard small business formation and corporate expansion. |
| | |
| ARTIO GLOBAL FUNDS ï 2010 ANNUAL REPORT | 57 |
| |
| 2. | Conservative corporate capital investment spending (annual cap-ex spending of the S&P 500 Index companies in 2010 has been less than annual depreciation) — part of the reason the unemployment rate continues to be over 9%. |
| |
| 3. | Confidence continues to be fragile for investors, consumers and corporate managers, reducing their propensity to transact. |
In our view, housing data and unemployment claims are showing signs of basing and improving. As bottom-up investors, we do not pretend to spend hours and hours each week pouring over macroeconomic data, but we view housing and employment data as the most important variables that influence confidence. Confidence in the employment situation of the average person should in turn influence spending levels on discretionary and big-ticket items. Any aggregate spending uptick normally causes a domino effect of economic activity and begins to influence corporations to expand output, which often includes an expansion of the work force and incremental capital spending. This is where we think the economy is currently positioned — the early stages of forming a constructive environment for better consumer spending and growth in capital expenditures. No doubt economic conditions remain fragile, but we haven’t felt this moderate amount of confidence in our forward looking outlook in over three years.
If all goes well, consumer and corporate capital spending could both see meaningful recoveries and growth in 2011, however, some of this has likely been discounted by the stock market in 2010. We believe that the combination of reasonable valuations, ample liquidity thanks to the Federal Reserve, the prospect for future sales and earnings growth and improvements, along with a reversal of negative asset allocation decisions (fund flows returning back to equities), should all serve to increase the demand for equities, driving stock indices higher in 2011. Our high level outlook does influence our sector positioning, however, our ultimate success hinges upon our stocks in the portfolios outperforming. We can be wrong with our “outlook” and still deliver good results — this will always be our proposition to investors. We remain committed to our goal of delivering strong long-term results in all the funds we manage through a rigorous, disciplined, yet free-thinking investment culture.

Samuel Dedio
Portfolio Manager
Artio US Microcap Fund, Artio US Smallcap Fund, Artio US Midcap Fund, Artio US Multicap Fund
| | |
| 58 | ARTIO GLOBAL FUNDS ï 2010 ANNUAL REPORT | |
Past performance does not guarantee future results.
Please refer to the prospectus for more complete information on the special risks associated with investing in the Artio US Equity Funds, including, but not limited to stock market risk, smaller companies risk, liquidity risk, foreign investment risk and derivatives risk. Stocks of micro, small and mid capitalization companies are more volatile, less liquid, involve substantial risks, and are subject to more abrupt or erratic movements than large capitalization companies. In order to achieve its investment objective, each fund may use derivatives such as futures, forwards and swaps. Derivatives involve risks different from, and in certain cases, greater than the risks presented by more traditional investments.
The views expressed solely reflect those of Artio Global Management LLC (“Artio Global”) and the manager of the funds, and do not necessarily reflect the views of any affiliated companies. The material contains forward-looking statements regarding the intent, beliefs, or current expectations. Readers are cautioned that such forward-looking statements are not a guarantee of future performance, involve risks and uncertainties, and actual results may differ materially from those statements as a result of various factors. The views expressed are subject to change based on market and other conditions. Furthermore, the opinions expressed do not constitute investment advice or recommendation by the manager, Artio Global, the funds, or any affiliated company.
Please see the Schedule of Investments in this report for complete fund holdings. Fund holdings and/or sector weightings are subject to change at any time and are not recommendations to buy or sell any security mentioned. Contributing and detracting stocks held by each portfolio may or may not be held at the end of the Reporting Period.
Current and future portfolio holdings are subject to risk.
The S&P 500 Index is a capitalization-weighted index of 500 widely held equity securities, designed to measure broad US equity performance.
The Russell 1000 Index measures the performance of the 1,000 largest US companies based on total market capitalization, which represents approximately 92% of the investable US equity market, with all values expressed in US dollars.
The Russell 2000 Index measures the performance of the 2,000 smallest companies in the Russell 3000 Index, which represents approximately 8% of the total market capitalization of the Russell 3000 Index, with all values expressed in US dollars.
| | |
| ARTIO GLOBAL FUNDS ï 2010 ANNUAL REPORT | 59 |
The Russell 3000 Index measures the performance of the 3,000 largest US companies based on total market capitalization, which represents approximately 98% of the investable US equity market, with all values expressed in US dollars.
The Russell Microcap Index measures the performance of the smallest 1,000 securities in the small-cap Russell 2000 Index along with the next smallest 1,000 companies, based on a ranking of all US equities by market capitalization.
The Russell Midcap Index measures the performance of the 800 smallest companies in the Russell 1000 Index, which represent approximately 25% of the total market capitalization of the Russell 1000 Index, with all values expressed in US dollars.
It is not possible to invest directly in an index.
Correlation is a relationship between two variables.
Batting average (hit rate) is the number of stocks that outperform vs. those that underperform.
| | |
| 60 | ARTIO GLOBAL FUNDS ï 2010 ANNUAL REPORT | |
SHAREHOLDER EXPENSES (Unaudited)
As a stockholder of the Artio Global Equity Fund Inc. or a shareholder of Artio Global Investment Funds, you incur ongoing expenses, such as management fees, shareholder service fees, distribution fees and other fund expenses. The following table is intended to help you understand your ongoing expenses (in dollars and cents) of investing in the Funds and to compare these expenses with the ongoing expenses of investing in other funds.
The table is based on an investment of $1,000 invested at the beginning of the period and held for the entire period from May 1, 2010 to October 31, 2010.
Actual Expenses
The first line in the table below provides information about the actual account values and actual expenses. You may use the information in this line, together with the amount you invested, to estimate the expenses that you paid over the period. Simply divide your account value by $1,000 (for example, an $8,600 account value divided by $1,000 = 8.6), then multiply the result by the number in the first line for the Fund under the heading entitled “Expenses Paid During Period” to estimate the expenses you paid on your account during this period.
Hypothetical Example for Comparison Purposes
The second line in the table below provides information about the hypothetical account values and hypothetical expenses based on the Fund’s actual expense ratio and an assumed rate of return of 5% per year before expenses, which is not the Fund’s actual return. The hypothetical account value and expenses may not be used to estimate the actual ending account balance or expenses you paid for the period. You may use this information to compare the ongoing costs of investing in your Fund and other funds. To do so, compare this 5% hypothetical example with the 5% hypothetical examples that appear in the shareholder reports of the other funds.
Global Equity Fund Class A
| | | | | | | | | | | | | | | | | |
| | | Beginning Account
| | Ending Account
| | Annualized
| | Expense Paid
|
| | | Value 05/01/10 | | Value 10/31/10 | | Expense Ratio | | during Period |
| Actual | | $ | 1,000.00 | | | $ | 1,030.30 | | | | 1.41 | % | | $ | 7.22 | |
| Hypothetical | | | 1,000.00 | | | | 1,018.10 | | | | 1.41 | | | | 7.17 | |
| | |
| Artio Global Funds ï 2010 Annual Report | 61 |
Global Equity Fund Class I
| | | | | | | | | | | | | | | | | |
| | | Beginning Account
| | Ending Account
| | Annualized
| | Expense Paid
|
| | | Value 05/01/10 | | Value 10/31/10 | | Expense Ratio | | during Period |
| Actual | | $ | 1,000.00 | | | $ | 1,031.80 | | | | 1.16 | % | | $ | 5.94 | |
| Hypothetical | | | 1,000.00 | | | | 1,019.40 | | | | 1.16 | | | | 5.90 | |
International Equity Fund Class A
| | | | | | | | | | | | | | | | | |
| | | Beginning Account
| | Ending Account
| | Annualized
| | Expense Paid
|
| | | Value 05/01/10 | | Value 10/31/10 | | Expense Ratio | | during Period |
| Actual | | $ | 1,000.00 | | | $ | 1,039.60 | | | | 1.29 | % | | $ | 6.63 | |
| Hypothetical | | | 1,000.00 | | | | 1,018.70 | | | | 1.29 | | | | 6.56 | |
International Equity Fund Class I
| | | | | | | | | | | | | | | | | |
| | | Beginning Account
| | Ending Account
| | Annualized
| | Expense Paid
|
| | | Value 05/01/10 | | Value 10/31/10 | | Expense Ratio | | during Period |
| Actual | | $ | 1,000.00 | | | $ | 1,041.10 | | | | 1.04 | % | | $ | 5.35 | |
| Hypothetical | | | 1,000.00 | | | | 1,020.00 | | | | 1.04 | | | | 5.30 | |
International Equity Fund II Class A
| | | | | | | | | | | | | | | | | |
| | | Beginning Account
| | Ending Account
| | Annualized
| | Expense Paid
|
| | | Value 05/01/10 | | Value 10/31/10 | | Expense Ratio | | during Period |
| Actual | | $ | 1,000.00 | | | $ | 1,045.50 | | | | 1.29 | % | | $ | 6.65 | |
| Hypothetical | | | 1,000.00 | | | | 1,018.70 | | | | 1.29 | | | | 6.56 | |
International Equity Fund II Class I
| | | | | | | | | | | | | | | | | |
| | | Beginning Account
| | Ending Account
| | Annualized
| | Expense Paid
|
| | | Value 05/01/10 | | Value 10/31/10 | | Expense Ratio | | during Period |
| Actual | | $ | 1,000.00 | | | $ | 1,046.00 | | | | 1.05 | % | | $ | 5.41 | |
| Hypothetical | | | 1,000.00 | | | | 1,019.90 | | | | 1.05 | | | | 5.35 | |
Total Return Bond Fund Class A
| | | | | | | | | | | | | | | | | |
| | | Beginning Account
| | Ending Account
| | Annualized
| | Expense Paid
|
| | | Value 05/01/10 | | Value 10/31/10 | | Expense Ratio | | during Period |
| Actual | | $ | 1,000.00 | | | $ | 1,054.70 | | | | 0.69 | % | | $ | 3.57 | |
| Hypothetical | | | 1,000.00 | | | | 1,021.70 | | | | 0.69 | | | | 3.52 | |
Total Return Bond Fund Class I
| | | | | | | | | | | | | | | | | |
| | | Beginning Account
| | Ending Account
| | Annualized
| | Expense Paid
|
| | | Value 05/01/10 | | Value 10/31/10 | | Expense Ratio | | during Period |
| Actual | | $ | 1,000.00 | | | $ | 1,055.70 | | | | 0.44 | % | | $ | 2.28 | |
| Hypothetical | | | 1,000.00 | | | | 1,023.00 | | | | 0.44 | | | | 2.24 | |
| | |
| 62 | Artio Global Funds ï 2010 Annual Report | |
Global High Income Fund Class A
| | | | | | | | | | | | | | | | | |
| | | Beginning Account
| | Ending Account
| | Annualized
| | Expense Paid
|
| | | Value 05/01/10 | | Value 10/31/10 | | Expense Ratio | | during Period |
| Actual | | $ | 1,000.00 | | | $ | 1,050.20 | | | | 1.00 | % | | $ | 5.17 | |
| Hypothetical | | | 1,000.00 | | | | 1,020.20 | | | | 1.00 | | | | 5.09 | |
Global High Income Fund Class I
| | | | | | | | | | | | | | | | | |
| | | Beginning Account
| | Ending Account
| | Annualized
| | Expense Paid
|
| | | Value 05/01/10 | | Value 10/31/10 | | Expense Ratio | | during Period |
| Actual | | $ | 1,000.00 | | | $ | 1,051.30 | | | | 0.75 | % | | $ | 3.88 | |
| Hypothetical | | | 1,000.00 | | | | 1,021.40 | | | | 0.75 | | | | 3.82 | |
U.S. Microcap Fund Class A
| | | | | | | | | | | �� | | | | | | |
| | | Beginning Account
| | Ending Account
| | Annualized
| | Expense Paid
|
| | | Value 05/01/10 | | Value 10/31/10 | | Expense Ratio | | during Period |
| Actual | | $ | 1,000.00 | | | $ | 938.50 | | | | 1.80 | % | | $ | 8.79 | |
| Hypothetical | | | 1,000.00 | | | | 1,016.10 | | | | 1.80 | | | | 9.15 | |
U.S. Microcap Fund Class I
| | | | | | | | | | | | | | | | | |
| | | Beginning Account
| | Ending Account
| | Annualized
| | Expense Paid
|
| | | Value 05/01/10 | | Value 10/31/10 | | Expense Ratio | | during Period |
| Actual | | $ | 1,000.00 | | | $ | 940.80 | | | | 1.50 | % | | $ | 7.34 | |
| Hypothetical | | | 1,000.00 | | | | 1,017.60 | | | | 1.50 | | | | 7.63 | |
U.S. Smallcap Fund Class A
| | | | | | | | | | | | | | | | | |
| | | Beginning Account
| | Ending Account
| | Annualized
| | Expense Paid
|
| | | Value 05/01/10 | | Value 10/31/10 | | Expense Ratio | | during Period |
| Actual | | $ | 1,000.00 | | | $ | 941.20 | | | | 1.51 | % | | $ | 7.39 | |
| Hypothetical | | | 1,000.00 | | | | 1,017.60 | | | | 1.51 | | | | 7.68 | |
U.S. Smallcap Fund Class I
| | | | | | | | | | | | | | | | | |
| | | Beginning Account
| | Ending Account
| | Annualized
| | Expense Paid
|
| | | Value 05/01/10 | | Value 10/31/10 | | Expense Ratio | | during Period |
| Actual | | $ | 1,000.00 | | | $ | 942.50 | | | | 1.21 | % | | $ | 5.92 | |
| Hypothetical | | | 1,000.00 | | | | 1,019.10 | | | | 1.21 | | | | 6.16 | |
U.S. Midcap Fund Class A
| | | | | | | | | | | | | | | | | |
| | | Beginning Account
| | Ending Account
| | Annualized
| | Expense Paid
|
| | | Value 05/01/10 | | Value 10/31/10 | | Expense Ratio | | during Period |
| Actual | | $ | 1,000.00 | | | $ | 1,032.40 | | | | 1.35 | % | | $ | 6.92 | |
| Hypothetical | | | 1,000.00 | | | | 1,018.40 | | | | 1.35 | | | | 6.87 | |
| | |
| Artio Global Funds ï 2010 Annual Report | 63 |
U.S. Midcap Fund Class I
| | | | | | | | | | | | | | | | | |
| | | Beginning Account
| | Ending Account
| | Annualized
| | Expense Paid
|
| | | Value 05/01/10 | | Value 10/31/10 | | Expense Ratio | | during Period |
| Actual | | $ | 1,000.00 | | | $ | 1,034.30 | | | | 1.05 | % | | $ | 5.38 | |
| Hypothetical | | | 1,000.00 | | | | 1,019.90 | | | | 1.05 | | | | 5.35 | |
U.S. Multicap Fund Class A
| | | | | | | | | | | | | | | | | |
| | | Beginning Account
| | Ending Account
| | Annualized
| | Expense Paid
|
| | | Value 05/01/10 | | Value 10/31/10 | | Expense Ratio | | during Period |
| Actual | | $ | 1,000.00 | | | $ | 1,010.10 | | | | 1.30 | % | | $ | 6.59 | |
| Hypothetical | | | 1,000.00 | | | | 1,018.70 | | | | 1.30 | | | | 6.61 | |
U.S. Multicap Fund Class I
| | | | | | | | | | | | | | | | | |
| | | Beginning Account
| | Ending Account
| | Annualized
| | Expense Paid
|
| | | Value 05/01/10 | | Value 10/31/10 | | Expense Ratio | | during Period |
| Actual | | $ | 1,000.00 | | | $ | 1,012.00 | | | | 1.00 | % | | $ | 5.07 | |
| Hypothetical | | | 1,000.00 | | | | 1,020.20 | | | | 1.00 | | | | 5.09 | |
| | |
| 64 | Artio Global Funds ï 2010 Annual Report | |
FUND PERFORMANCE
Artio Global Equity Fund Inc.(1)
It is the Artio Global Equity Fund Inc.’s, policy to declare and pay annual dividends from its net investment income and distribute net realized capital gains, if any, annually.
Average Annual Total Return*—Class A
| | | | | |
Year Ended 10/31/10 | | | 15.65 | % |
|
Five Years Ended 10/31/10 | | | 3.77 | % |
|
Ten Years Ended 10/31/10 | | | (12.70 | )% |
|
| 7/1/04 - 10/31/10(1) | | | 6.37 | % |
|
| | |
| * | | All average annual total return figures shown reflect the reinvestment of dividends and capital gains distributions. Total returns for the Fund reflect expenses, waived and reimbursed, if applicable, by the Adviser and/or Administrator. Without such waivers and reimbursements, total returns would have been lower. |
Growth of $10,000 invested in Class A shares of Artio Global Equity Fund Inc. vs. MSCI All Country World Index (in U.S. dollars) July 1, 2004-October 31, 2010†
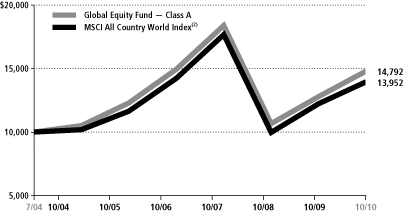
| | |
| † | | Hypothetical illustration of $10,000 invested on July 1, 2004 assuming reinvestment of dividends and capital gains distributions through October 31, 2010. No adjustment has been made for shareholder tax liability on dividends or cap gains distributions. The MSCI All Country World Index (“MSCI ACWI”) is a free float-adjusted market capitalization index that is designed to measure equity market performance in the global developed and emerging markets. As of June 2006, the MSCI ACWI consisted of 48 developed and emerging market country indices. The MSCI ACWI contemplates emerging market securities, which have become a significant part of the Fund’s holdings. |
| (1) | | On July 1, 2004, the Fund changed its name from The European Warrant Fund, Inc. and converted from a close-end, non diversified investment company (“closed-end fund”) to an open-end diversified investment company with a different investment objective, different investment strategies, different management team and a new investment adviser (an affiliate of the closed-end Fund’s adviser). Until the close of business on June 30, 2004, the Fund operated as a closed-end Fund and its common stock (which then comprised of a single share class) was listed on the NYSE. After the close of business on June 30, 2004, all of the common stock was converted into Class A shares of the Fund, and the Fund began seeking to maximize total return principally through capital appreciation by investing in a diversified portfolio of equity securities of issuers located throughout the world. For periods prior thereto, all historical performance information for Class A shares reflects the Net Asset Value (NAV) performance of the Fund’s common stock while it was a closed-end fund. |
| (2) | | Effective March 1, 2007, the index was changed to the MSCI All Country World Index. |
| | Note: All figures cited here and on the following pages represent past performance of the Global Equity Fund, Inc., and do not guarantee future results. Investment return and principal value of an investment will fluctuate so that an investor’s shares upon redemption may be worth more or less than their original cost. |
| | |
| ARTIO GLOBAL FUNDS ï 2010 ANNUAL REPORT | 65 |
FUND PERFORMANCE
Artio International Equity Fund
It is the Artio International Equity Fund’s policy to declare and pay annual dividends from its net investment income and distribute net realized capital gains, if any, annually.
Average Annual Total Return*—Class A
| | | | | |
Year Ended 10/31/10 | | | 10.06 | % |
|
Five Years Ended 10/31/10 | | | 3.91 | % |
|
Ten Years Ended 10/31/10 | | | 5.82 | % |
|
Inception (10/4/93) through 10/31/10 | | | 8.68 | % |
|
The performance quoted represents past performance, which does not guarantee future results. The investment return and principal value of an investment will fluctuate and will fluctuate so that an investor’s shares, when redeemed, may be worth more or less than their original cost. Current performance of the Fund may be lower or higher than the performance quoted. For up to date month-end performance information, please call 800-387-6977.
| | |
| * | | All average annual total return figures shown reflect the reinvestment of dividends and capital gains distributions. The International Equity Fund Class A commenced operations on October 4, 1993. Total returns for the Fund reflect expenses, waived and reimbursed, if applicable, by the Adviser and/or Administrator. Without such waivers and reimbursements, total returns would have been lower. |
Growth of $10,000 invested in Class A shares of Artio International Equity Fund vs. MSCI All Country World ex-U.S. Index October 31, 2000-October 31, 2010†
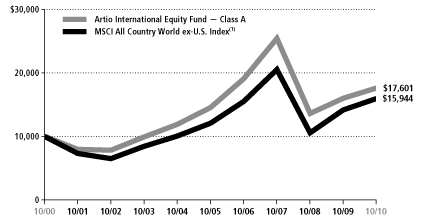
| | |
| † | | Hypothetical illustration of $10,000 invested on October 31, 2000 assuming reinvestment of dividends and capital gains distributions through October 31, 2010. This period was one in which stock and bond prices fluctuated and the results should not be considered as a representation of dividend income or capital gain or loss which may be realized from an investment in the International Equity Fund today. No adjustment has been made for shareholder tax liability on dividends or capital gains distributions. The MSCI All Country World ex-US Index(1) is a composite portfolio consisting of equity total returns for the countries of Europe, Australia, New Zealand and countries in the Far East, weighted based on each country’s gross domestic product. Indexes do not incur expenses and are not available for investment. |
| |
| (1) | | Effective March 1, 2007 the benchmark for comparison changed to the MSCI All Country ex-U.S. Index. |
| | |
| 66 | ARTIO GLOBAL FUNDS ï 2010 ANNUAL REPORT | |
FUND PERFORMANCE
Artio International Equity Fund II
It is the Artio International Equity Fund II’s policy to declare and pay annual dividends from its net investment income and distribute net realized capital gains, if any, annually.
Average Annual Total Return*—Class A
| | | | | |
Year Ended 10/31/10 | | | 9.75 | % |
|
Five Years Ended 10/31/10 | | | 4.43 | % |
|
Inception (5/4/05) through 10/31/10 | | | 5.72 | % |
|
The performance quoted represents past performance, which does not guarantee future results. The investment return and principal value of an investment will fluctuate and will fluctuate so that an investor’s shares, when redeemed, may be worth more or less than their original cost. Current performance of the Fund may be lower or higher than the performance quoted. For up to date month-end performance information, please call 800-387-6977.
| | |
| * | | All average annual total return figures shown reflect the reinvestment of dividends and capital gains distributions. The International Equity Fund II Class A commenced operations on May 4, 2005. Total returns for the Fund reflect expenses, waived and reimbursed, if applicable, by the Adviser and/or Administrator. Without such waivers and reimbursements, total returns would have been lower. |
Growth of $10,000 invested in Class A shares of Artio International Equity Fund II vs. MSCI All Country World ex-U.S. Index(1) May 4, 2005-October 31, 2010†
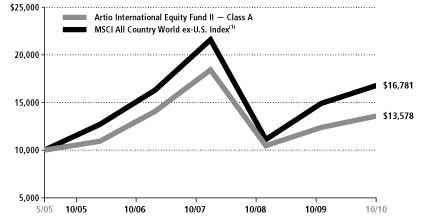
| | |
| † | | Hypothetical illustration of $10,000 invested on May 4, 2005 assuming reinvestment of dividends and capital gains distributions through October 31, 2010. This period was one in which stock and bond prices fluctuated and the results should not be considered as a representation of dividend income or capital gain or loss which may be realized from an investment in the International Equity Fund II today. No adjustment has been made for shareholder tax liability on dividends or capital gains distributions. The MSCI All Country World ex-U.S. Index(1) is a composite portfolio consisting of equity total returns for the countries of Europe, Australia, New Zealand and countries in the Far East, weighted based on each country’s gross domestic product. Indexes do not incur expenses and are not available for investment. |
| |
| (1) | | Effective March 1, 2007 the benchmark for comparison changed to the MSCI All Country World ex-U.S. Index. |
| | |
| ARTIO GLOBAL FUNDS ï 2010 ANNUAL REPORT | 67 |
FUND PERFORMANCE
Artio Total Return Bond Fund
It is the Artio Total Return Bond Fund’s policy to declare and pay monthly dividends from its net investment income and distribute net realized capital gains, if any, annually.
Average Annual Total Return*—Class A
| | | | | |
Year Ended 10/31/10 | | | 9.16 | % |
|
Five Years Ended 10/31/10 | | | 6.61 | % |
|
Ten Years Ended 10/31/10 | | | 7.37 | % |
|
Inception (7/1/92) through 10/31/10 | | | 6.29 | % |
|
The performance quoted represents past performance, which does not guarantee future results. The investment return and principal value of an investment will fluctuate so that an investor’s shares, when redeemed, may be worth more or less than their original cost. Current performance of the Fund may be lower or higher than the performance quoted. For up to date month-end performance information, please call 800-387-6977.
| | |
| * | | All average annual total return figures shown reflect the reinvestment of dividends and capital gains distributions. The Artio Total Return Bond Fund commenced operations on July 1, 1992 and the service providers waived their advisory, sub-advisory and administration fees from 7/1/92 to 10/31/92 and from 9/1/98 to 10/31/03; without such waivers and reimbursements, total returns would have been lower. |
Growth of $10,000 invested in Class A shares of Artio Total Return Bond Fund vs. Barclays Capital U.S. Aggregate Bond Index October 31, 2000-October 31, 2010†
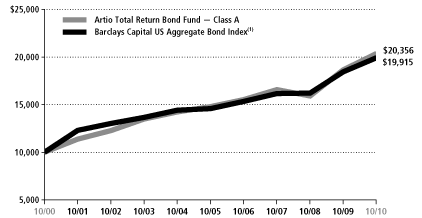
| | |
| † | | Hypothetical illustration of $10,000 invested on October 31, 2000 assuming reinvestment of dividends and capital gains distributions and application of fee waivers through October 31, 2010. This period was one in which stock and bond prices fluctuated and the results should not be considered a representation of the income or capital gain or loss which may be realized from an investment in the Total Return Bond Fund today. No adjustment has been made for shareholder tax liability on dividends or capital gains distributions. The Lehman Brothers U.S. Aggregate Bond Index, an unmanaged index used as a general measure of U.S. fixed income securities, tracks the performance of debt instruments issued by corporations and the U.S. Government and its agencies. Indexes do not incur expenses and are not available for investment. |
| |
| (1) | | Effective September 22, 2008 the benchmark for comparison changed from the Lehman Brothers U.S. Aggregate Bond Index to the Barclays Capital U.S. Aggregate Bond Index. |
| | |
| 68 | ARTIO GLOBAL FUNDS ï 2010 ANNUAL REPORT | |
FUND PERFORMANCE
Artio Global High Income Fund
It is the Artio Global High Income Fund’s policy to declare and pay monthly dividends from its net investment income and distribute net realized capital gains, if any, annually.
Total Return*—Class A
| | | | | |
Year Ended 10/31/10 | | | 16.08 | % |
|
Five Years Ended 10/31/10 | | | 9.13 | % |
|
Inception (12/17/02) through 10/31/10 | | | 10.76 | % |
|
The performance quoted represents past performance, which does not guarantee future results. The investment return and principal value of an investment will fluctuate so that an investor’s shares, when redeemed, may be worth more or less than their original cost. Current performance of the Fund may be lower or higher than the performance quoted. For up to date month-end performance information, please call 800-387-6977.
| | |
| * | | Total return figures shown reflect the reinvestment of dividends and capital gains distributions. The Global High Income Fund commenced operations on December 17, 2002 and the Adviser had contractually agreed to reimburse certain expenses of the Fund through 2/28/2006; without such reimbursements total returns would have been lower. |
Growth of $10,000 invested in Class A shares of Artio Global High Income Fund vs. BofA Merrill Lynch Global High Yield Constrained Index December 17, 2002-October 31, 2010†
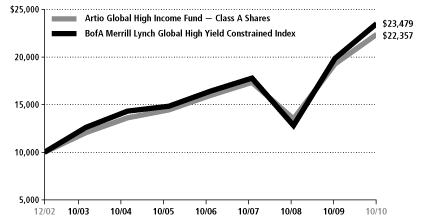
| | |
| † | | Hypothetical illustration of $10,000 invested on December 17, 2002 assuming reinvestment of dividends and capital gains distributions and application of fee waivers through 2/28/2006. This period was one in which stock and bond prices fluctuated and the results should not be considered a representation of the income or capital gain or loss which may be realized from an investment in the Global High Income Fund today. No adjustment has been made for shareholder tax liability on dividends or capital gains distributions. The Merrill Lynch Global High Yield Constrained Index tracks the performance of below investment grade bonds of corporate issuers domiciled in countries having an investment grade of foreign currency long-term debt rating (based on a composite of Moody’s Investors Service, Inc. and Standard & Poor’s Rating Service). Indexes do not incur expenses and are not available for investment. |
| | |
| ARTIO GLOBAL FUNDS ï 2010 ANNUAL REPORT | 69 |
FUND PERFORMANCE
Artio U.S. Microcap Fund
It is the Artio U.S. Microcap Fund’s policy to declare and pay annual dividends from its net investment income and distribute net realized capital gains, if any, annually.
Average Annual Total Return*—Class A
| | | | | |
Year Ended 10/31/10 | | | 26.88 | % |
|
Inception (7/24/06) through 10/31/10 | | | 2.45 | % |
|
The performance quoted represents past performance, which does not guarantee future results. The investment return and principal value of an investment will fluctuate and will fluctuate so that an investor’s shares, when redeemed, may be worth more or less than their original cost. Current performance of the Fund may be lower or higher than the performance quoted. For up to date month-end performance information, please call 800-387-6977.
| | |
| * | | All average annual total return figures shown reflect the reinvestment of dividends and capital gains distributions. The U.S. Microcap Fund Class A commenced operations on July 24, 2006. Total returns for the Fund reflect expenses, waived and reimbursed, if applicable, by the Adviser and/or Administrator. Without such waivers and reimbursements, total returns would have been lower. |
Growth of $10,000 invested in Class A shares of Artio U.S. Microcap Fund vs. Russell 2000 Index July 24, 2006-October 31, 2010†
| | |
| † | | Hypothetical illustration of $10,000 invested on July 24, 2006 assuming reinvestment of dividends and capital gains distributions through October 31, 2010. This period was one in which stock and bond prices fluctuated and the results should not be considered as a representation of dividend income or capital gain or loss which may be realized from an investment in the U.S. Microcap Fund today. No adjustment has been made for shareholder tax liability on dividends or capital gains distributions. |
| | |
| 70 | ARTIO GLOBAL FUNDS ï 2010 ANNUAL REPORT | |
FUND PERFORMANCE
Artio U.S. Smallcap Fund
It is the Artio U.S. Smallcap Fund’s policy to declare and pay annual dividends from its net investment income and distribute net realized capital gains, if any, annually.
Average Annual Total Return*—Class A
| | | | | |
Year Ended 10/31/10 | | | 18.87 | % |
|
Inception (7/24/06) through 10/31/10 | | | 6.93 | % |
|
The performance quoted represents past performance, which does not guarantee future results. The investment return and principal value of an investment will fluctuate and will fluctuate so that an investor’s shares, when redeemed, may be worth more or less than their original cost. Current performance of the Fund may be lower or higher than the performance quoted. For up to date month-end performance information, please call 800-387-6977.
| | |
| * | | All average annual total return figures shown reflect the reinvestment of dividends and capital gains distributions. The U.S. Smallcap Fund Class A commenced operations on July 24, 2006. Total returns for the Fund reflect expenses, waived and reimbursed, if applicable, by the Adviser and/or Administrator. Without such waivers and reimbursements, total returns would have been lower. |
Growth of $10,000 invested in Class A shares of Artio U.S. Smallcap Fund vs. Russell 2000 Index July 24, 2006-October 31, 2010†
| | |
| † | | Hypothetical illustration of $10,000 invested on July 24, 2006 assuming reinvestment of dividends and capital gains distributions through October 31, 2010. This period was one in which stock and bond prices fluctuated and the results should not be considered as a representation of dividend income or capital gain or loss which may be realized from an investment in the U.S. Smallcap Fund today. No adjustment has been made for shareholder tax liability on dividends or capital gains distributions. |
| | |
| ARTIO GLOBAL FUNDS ï 2010 ANNUAL REPORT | 71 |
FUND PERFORMANCE
Artio U.S. Midcap Fund
It is the Artio U.S. Midcap Fund’s policy to declare and pay annual dividends from its net investment income and distribute net realized capital gains, if any, annually.
Average Annual Total Return*—Class A
| | | | | |
Year Year Ended 10/31/10 | | | 25.13 | % |
|
Inception (7/24/06) through 10/31/10 | | | 2.82 | % |
|
The performance quoted represents past performance, which does not guarantee future results. The investment return and principal value of an investment will fluctuate and will fluctuate so that an investor’s shares, when redeemed, may be worth more or less than their original cost. Current performance of the Fund may be lower or higher than the performance quoted. For up to date month-end performance information, please call 800-387-6977.
| | |
| * | | All average annual total return figures shown reflect the reinvestment of dividends and capital gains distributions. The U.S. Midcap Fund Class A commenced operations on July 24, 2006. Total returns for the Fund reflect expenses, waived and reimbursed, if applicable, by the Adviser and/or Administrator. Without such waivers and reimbursements, total returns would have been lower. |
Growth of $10,000 invested in Class A shares of Artio U.S. Midcap Fund vs. Russell Midcap Index July 24, 2006-October 31, 2010†
| | |
| † | | Hypothetical illustration of $10,000 invested on July 24, 2006 assuming reinvestment of dividends and capital gains distributions through October 31, 2010. This period was one in which stock and bond prices fluctuated and the results should not be considered as a representation of dividend income or capital gain or loss which may be realized from an investment in the U.S. Midcap Fund today. No adjustment has been made for shareholder tax liability on dividends or capital gains distributions. |
| | |
| 72 | ARTIO GLOBAL FUNDS ï 2010 ANNUAL REPORT | |
FUND PERFORMANCE
Artio U.S. Multicap Fund
It is the Artio U.S. Multicap Fund’s policy to declare and pay annual dividends from its net investment income and distribute net realized capital gains, if any, annually.
Average Annual Total Return*—Class A
| | | | | |
Year Ended 10/31/10 | | | 19.43 | % |
|
Inception (7/24/06) through 10/31/10 | | | 2.91 | % |
|
The performance quoted represents past performance, which does not guarantee future results. The investment return and principal value of an investment will fluctuate and will fluctuate so that an investor’s shares, when redeemed, may be worth more or less than their original cost. Current performance of the Fund may be lower or higher than the performance quoted. For up to date month-end performance information, please call 800-387-6977.
| | |
| * | | All average annual total return figures shown reflect the reinvestment of dividends and capital gains distributions. The U.S. Multicap Fund Class A commenced operations on July 24, 2006. Total returns for the Fund reflect expenses, waived and reimbursed, if applicable, by the Adviser and/or Administrator. Without such waivers and reimbursements, total returns would have been lower. |
Growth of $10,000 invested in Class A shares of Artio U.S. Multicap Fund vs. Russell 3000 Index July 24, 2006-October 31, 2010†
| | |
| † | | Hypothetical illustration of $10,000 invested on July 24, 2006 assuming reinvestment of dividends and capital gains distributions through October 31, 2010. This period was one in which stock and bond prices fluctuated and the results should not be considered as a representation of dividend income or capital gain or loss which may be realized from an investment in the U.S. Multicap Fund today. No adjustment has been made for shareholder tax liability on dividends or capital gains distributions. |
| | |
| ARTIO GLOBAL FUNDS ï 2010 ANNUAL REPORT | 73 |
| |
| PORTFOLIO OF INVESTMENTS | October 31, 2010 |
Artio Global Equity Fund Inc.
| | | | | | | | | | | | | |
Share
| | | | | | | Fair
| | | |
| Amount | | | Description | | | | Value (Note 2) | | | |
COMMON STOCKS—93.0%† |
| | | | | United States—37.2% | | | | | | |
| | 3,952 | | | 3M Co | | $ | 332,837 | | | |
| | 9,454 | | | Adobe Systems (1) | | | 266,130 | | | |
| | 9,993 | | | Aecom Technology (1) | | | 264,715 | | | |
| | 9,874 | | | Alpha Natural Resources (1) | | | 446,009 | | | |
| | 1,484 | | | Amazon.com Inc (1) | | | 245,068 | | | |
| | 1,805 | | | Apache Corp | | | 182,341 | | | |
| | 4,719 | | | Apple Inc (1) | | | 1,419,805 | | | |
| | 8,999 | | | Archer-Daniels-Midland Co | | | 299,847 | | | |
| | 11,460 | | | AutoNation Inc (1) | | | 266,101 | | | |
| | 5,652 | | | Baxter International | | | 287,687 | | | |
| | 15,154 | | | CareFusion Corp (1) | | | 365,818 | | | |
| | 3,625 | | | Celgene Corp (1) | | | 225,004 | | | |
| | 4,628 | | | CF Industries Holdings | | | 567,069 | | | |
| | 6,037 | | | Chevron Corp | | | 498,717 | | | |
| | 376,491 | | | Citigroup Inc (1) | | | 1,569,967 | | | |
| | 5,667 | | | Cliffs Natural Resources | | | 369,488 | | | |
| | 5,547 | | | Coach Inc | | | 277,350 | | | |
| | 10,600 | | | Coca-Cola Enterprises | | | 254,506 | | | |
| | 6,882 | | | Coinstar Inc (1) | | | 396,266 | | | |
| | 20,155 | | | Corning Inc | | | 368,433 | | | |
| | 2,392 | | | Cummins Inc | | | 210,735 | | | |
| | 9,700 | | | CVS Caremark | | | 292,164 | | | |
| | 11,412 | | | DreamWorks Animation-Class A (1) | | | 402,844 | | | |
| | 18,190 | | | EMC Corp (1) | | | 382,172 | | | |
| | 4,993 | | | Emerson Electric | | | 274,116 | | | |
| | 4,734 | | | Freeport-McMoRan Copper & Gold | | | 448,215 | | | |
| | 16,692 | | | General Growth Properties REIT | | | 280,426 | | | |
| | 8,634 | | | Gilead Sciences (1) | | | 342,511 | | | |
| | 2,494 | | | Google Inc-Class A (1) | | | 1,528,797 | | | |
| | 7,816 | | | Hasbro Inc | | | 361,490 | | | |
| | 2,924 | | | Herbalife Ltd | | | 186,727 | | | |
| | 5,537 | | | Hess Corp | | | 348,997 | | | |
| | 5,621 | | | Hospira Inc (1) | | | 334,337 | | | |
| | 4,586 | | | Itron Inc (1) | | | 278,691 | | | |
| | 3,813 | | | Joy Global | | | 270,532 | | | |
| | 13,365 | | | JPMorgan Chase | | | 502,925 | | | |
| | 11,920 | | | Juniper Networks (1) | | | 386,089 | | | |
| | 10,410 | | | Las Vegas Sands (1) | | | 477,611 | | | |
| | 9,604 | | | Liberty Global (1) | | | 362,935 | | | |
See Notes to Financial Statements
| | |
| 74 | Artio Global Funds ï 2010 Annual Report | |
| |
| PORTFOLIO OF INVESTMENTS (Continued) | October 31, 2010 |
Artio Global Equity Fund Inc.
| | | | | | | | | | | | | |
Share
| | | | | | | Fair
| | | |
| Amount | | | Description | | | | Value (Note 2) | | | |
COMMON STOCKS—Continued |
| | | | | United States—Continued | | | | | | |
| | | | | | | | | | | | | |
| | 41,716 | | | Lions Gate Entertainment (1) | | $ | 301,607 | | | |
| | 1,340 | | | MasterCard Inc-Class A | | | 321,680 | | | |
| | 19,755 | | | McDermott International (1) | | | 304,820 | | | |
| | 5,626 | | | Mosaic Co | | | 411,598 | | | |
| | 4,900 | | | Murphy Oil | | | 319,284 | | | |
| | 8,367 | | | National-Oilwell Varco | | | 449,810 | | | |
| | 27,585 | | | NCR Corp (1) | | | 378,466 | | | |
| | 7,968 | | | Newmont Mining | | | 485,012 | | | |
| | 4,605 | | | NIKE Inc-Class B | | | 375,031 | | | |
| | 6,938 | | | Nordstrom Inc | | | 267,182 | | | |
| | 7,360 | | | Norfolk Southern | | | 452,566 | | | |
| | 3,152 | | | Northern Trust | | | 156,434 | | | |
| | 4,800 | | | Occidental Petroleum | | | 377,424 | | | |
| | 31,732 | | | Office Depot (1) | | | 142,477 | | | |
| | 3,310 | | | Polo Ralph Lauren | | | 320,673 | | | |
| | 26,872 | | | QUALCOMM Inc | | | 1,212,733 | | | |
| | 15,587 | | | Quanta Services (1) | | | 306,440 | | | |
| | 10,513 | | | SanDisk Corp (1) | | | 395,078 | | | |
| | 8,147 | | | Schlumberger Ltd | | | 569,394 | | | |
| | 3,205 | | | T Rowe Price | | | 177,140 | | | |
| | 54,847 | | | Tenet Healthcare (1) | | | 239,133 | | | |
| | 6,850 | | | Thermo Fisher Scientific (1) | | | 352,227 | | | |
| | 4,304 | | | Transocean Ltd (1) | | | 272,701 | | | |
| | 6,414 | | | Union Pacific | | | 562,379 | | | |
| | 6,461 | | | UnitedHealth Group | | | 232,919 | | | |
| | 11,970 | | | Urban Outfitters (1) | | | 368,317 | | | |
| | 5,514 | | | Visteon Corp (1) | | | 346,831 | | | |
| | 4,120 | | | Walter Energy | | | 362,395 | | | |
| | 2,931 | | | Whiting Petroleum (1) | | | 294,390 | | | |
| | 13,350 | | | Williams Cos | | | 287,292 | | | |
| | 15,035 | | | Yahoo! Inc (1) | | | 248,228 | | | |
| | 5,455 | | | Yum! Brands Inc | | | 270,350 | | | |
| | | | | | | | | | | | | |
| | | | | | | | | | 28,137,483 | | | |
| | | | | | | | | | | | | |
| | | | | | | | | | | | | |
| | | | | China—8.2% | | | | | | |
| | 3,105 | | | Baidu Inc Sponsored ADR (1) | | | 341,581 | | | |
| | 182,000 | | | Belle International | | | 326,798 | | | |
| | 511,000 | | | China Construction Bank-Class H | | | 487,119 | | | |
| | 47,827 | | | China Merchants Holdings International | | | 167,499 | | | |
| | 158,000 | | | China National Building Material-Class H | | | 385,609 | | | |
See Notes to Financial Statements
| | |
| Artio Global Funds ï 2010 Annual Report | 75 |
| |
| PORTFOLIO OF INVESTMENTS (Continued) | October 31, 2010 |
Artio Global Equity Fund Inc.
| | | | | | | | | | | | | |
Share
| | | | | | | Fair
| | | |
| Amount | | | Description | | | | Value (Note 2) | | | |
COMMON STOCKS—Continued |
| | | | | China—Continued | | | | | | |
| | | | | | | | | | | | | |
| | 104,000 | | | China Overseas Land & Investment | | $ | 218,402 | | | |
| | 256,360 | | | China Resources Enterprise | | | 1,076,393 | | | |
| | 190,260 | | | China Yurun Food | | | 736,272 | | | |
| | 6,236 | | | Ctrip.com International Sponsored ADR (1) | | | 324,709 | | | |
| | 156,000 | | | Dongfeng Motor Group-Class H | | | 337,665 | | | |
| | 84,000 | | | Golden Eagle Retail | | | 222,128 | | | |
| | 25,660 | | | Hengan International | | | 242,953 | | | |
| | 142,000 | | | Sany Heavy Equipment International Holdings | | | 203,320 | | | |
| | 79,050 | | | Sinopharm Group-Class H | | | 309,478 | | | |
| | 180,500 | | | Sinotruk Hong Kong | | | 207,921 | | | |
| | 126,000 | | | Tingyi (Cayman Islands) Holding | | | 342,943 | | | |
| | 17,000 | | | Weichai Power-Class H | | | 222,141 | | | |
| | 29,000 | | | Wumart Stores-Class H | | | 68,008 | | | |
| | | | | | | | | | | | | |
| | | | | | | | | | 6,220,939 | | | |
| | | | | | | | | | | | | |
| | | | | | | | | | | | | |
| | | | | United Kingdom—7.2% | | | | | | |
| | 42,290 | | | ARM Holdings | | | 245,639 | | | |
| | 73,880 | | | Barclays PLC | | | 324,356 | | | |
| | 11,190 | | | BG Group | | | 217,460 | | | |
| | 24,020 | | | BHP Billiton | | | 850,054 | | | |
| | 65,560 | | | Cairn Energy (1) | | | 404,490 | | | |
| | 486,260 | | | Lloyds Banking (1) | | | 535,962 | | | |
| | 20,752 | | | Rio Tinto | | | 1,339,076 | | | |
| | 40,050 | | | Rolls-Royce Group (1) | | | 414,607 | | | |
| | 2,563,200 | | | Rolls-Royce Group-Class C (1)(4) | | | 4,098 | | | |
| | 199,067 | | | Royal Bank of Scotland (1) | | | 141,980 | | | |
| | 49,190 | | | Xstrata PLC | | | 951,211 | | | |
| | | | | | | | | | | | | |
| | | | | | | | | | 5,428,933 | | | |
| | | | | | | | | | | | | |
| | | | | | | | | | | | | |
| | | | | France—4.7% | | | | | | |
| | 4,353 | | | BNP Paribas | | | 317,940 | | | |
| | 5,540 | | | Carrefour SA | | | 298,608 | | | |
| | 8,463 | | | CFAO SA | | | 375,584 | | | |
| | 5,104 | | | Danone SA | | | 322,602 | | | |
| | 8,463 | | | Essilor International | | | 564,376 | | | |
| | 73,250 | | | L’ Occitane International (1) | | | 217,323 | | | |
| | 3,761 | | | LVMH | | | 588,607 | | | |
| | 1,530 | | | PPR | | | 250,507 | | | |
| | 2,358 | | | Schneider Electric | | | 334,293 | | | |
See Notes to Financial Statements
| | |
| 76 | Artio Global Funds ï 2010 Annual Report | |
| |
| PORTFOLIO OF INVESTMENTS (Continued) | October 31, 2010 |
Artio Global Equity Fund Inc.
| | | | | | | | | | | | | |
Share
| | | | | | | Fair
| | | |
| Amount | | | Description | | | | Value (Note 2) | | | |
COMMON STOCKS—Continued |
| | | | | France—Continued | | | | | | |
| | | | | | | | | | | | | |
| | 3,380 | | | Technip SA | | $ | 283,704 | | | |
| | | | | | | | | | | | | |
| | | | | | | | | | 3,553,544 | | | |
| | | | | | | | | | | | | |
| | | | | | | | | | | | | |
| | | | | Japan—4.1% | | | | | | |
| | 5,600 | | | Canon Inc | | | 258,622 | | | |
| | 2,750 | | | Fanuc Ltd | | | 397,735 | | | |
| | 12,490 | | | Honda Motor | | | 455,408 | | | |
| | 20,690 | | | Komatsu Ltd | | | 506,526 | | | |
| | 2,630 | | | Nidec Corp | | | 259,898 | | | |
| | 7,700 | | | Shiseido Co | | | 160,787 | | | |
| | 1,500 | | | SMC Corp | | | 229,050 | | | |
| | 11,940 | | | Suzuki Motor | | | 290,977 | | | |
| | 13,710 | | | Unicharm Corp | | | 523,380 | | | |
| | | | | | | | | | | | | |
| | | | | | | | | | 3,082,383 | | | |
| | | | | | | | | | | | | |
| | | | | | | | | | | | | |
| | | | | Canada—3.8% | | | | | | |
| | 3,410 | | | Agnico-Eagle Mines | | | 265,066 | | | |
| | 13,742 | | | Barrick Gold | | | 663,332 | | | |
| | 2,846 | | | Canadian Pacific Railway | | | 185,930 | | | |
| | 2,805 | | | First Quantum Minerals | | | 246,182 | | | |
| | 7,710 | | | Goldcorp Inc | | | 343,789 | | | |
| | 12,322 | | | Ivanhoe Mines (1) | | | 295,699 | | | |
| | 1,120 | | | Potash Corp of Saskatchewan | | | 162,343 | | | |
| | 13,503 | | | Silver Wheaton (1) | | | 388,477 | | | |
| | 8,000 | | | Teck Resources-Class B | | | 358,490 | | | |
| | | | | | | | | | | | | |
| | | | | | | | | | 2,909,308 | | | |
| | | | | | | | | | | | | |
| | | | | | | | | | | | | |
| | | | | Russia—3.8% | | | | | | |
| | 1,914,370 | | | IDGC Holding (1) | | | 340,758 | | | |
| | 13,382 | | | Magnit OJSC Sponsored GDR | | | 357,835 | | | |
| | 2,540 | | | NovaTek OAO Sponsored GDR | | | 242,951 | | | |
| | 15,905 | | | Pharmstandard Sponsored GDR (1) | | | 413,530 | | | |
| | 271,307 | | | Sberbank of Russian Federation | | | 899,111 | | | |
| | 57,391 | | | VTB Bank Sponsored GDR | | | 379,928 | | | |
| | 5,650 | | | X 5 Retail Sponsored GDR (1) | | | 236,735 | | | |
| | | | | | | | | | | | | |
| | | | | | | | | | 2,870,848 | | | |
| | | | | | | | | | | | | |
| | | | | | | | | | | | | |
| | | | | Hong Kong—3.4% | | | | | | |
| | 380,000 | | | Hang Lung Properties | | | 1,852,870 | | | |
| | 17,300 | | | Hong Kong Exchanges & Clearing | | | 380,710 | | | |
See Notes to Financial Statements
| | |
| Artio Global Funds ï 2010 Annual Report | 77 |
| |
| PORTFOLIO OF INVESTMENTS (Continued) | October 31, 2010 |
Artio Global Equity Fund Inc.
| | | | | | | | | | | | | |
Share
| | | | | | | Fair
| | | |
| Amount | | | Description | | | | Value (Note 2) | | | |
COMMON STOCKS—Continued |
| | | | | Hong Kong—Continued | | | | | | |
| | | | | | | | | | | | | |
| | 68,000 | | | Li & Fung | | $ | 358,319 | | | |
| | | | | | | | | | | | | |
| | | | | | | | | | 2,591,899 | | | |
| | | | | | | | | | | | | |
| | | | | | | | | | | | | |
| | | | | Switzerland—3.2% | | | | | | |
| | 10,560 | | | ABB Ltd (1) | | | 218,823 | | | |
| | 3,633 | | | Dufry Group (1) | | | 422,219 | | | |
| | 9,778 | | | Nestle SA | | | 535,876 | | | |
| | 9,610 | | | Nobel Biocare | | | 158,978 | | | |
| | 5,360 | | | Novartis AG | | | 310,918 | | | |
| | 1,120 | | | Swatch Group | | | 428,299 | | | |
| | 18,710 | | | UBS AG (1) | | | 316,938 | | | |
| | | | | | | | | | | | | |
| | | | | | | | | | 2,392,051 | | | |
| | | | | | | | | | | | | |
| | | | | | | | | | | | | |
| | | | | Germany—3.1% | | | | | | |
| | 2,698 | | | BMW AG | | | 193,160 | | | |
| | 5,747 | | | Daimler AG (1) | | | 378,859 | | | |
| | 8,922 | | | Fraport AG | | | 565,224 | | | |
| | 3,280 | | | Fresenius SE | | | 289,078 | | | |
| | 3,701 | | | MAN SE | | | 406,378 | | | |
| | 4,828 | | | Siemens AG | | | 550,793 | | | |
| | | | | | | | | | | | | |
| | | | | | | | | | 2,383,492 | | | |
| | | | | | | | | | | | | |
| | | | | | | | | | | | | |
| | | | | South Africa—2.1% | | | | | | |
| | 24,240 | | | Aspen Pharmacare (1) | | | 325,776 | | | |
| | 36,100 | | | Shoprite Holdings | | | 513,813 | | | |
| | 36,965 | | | Standard Bank | | | 548,866 | | | |
| | 8,740 | | | Tiger Brands | | | 235,954 | | | |
| | | | | | | | | | | | | |
| | | | | | | | | | 1,624,409 | | | |
| | | | | | | | | | | | | |
| | | | | | | | | | | | | |
| | | | | Brazil—2.1% | | | | | | |
| | 35,049 | | | All America Latina Logistica (Unit) | | | 334,243 | | | |
| | 31,845 | | | Diagnosticos da America (1) | | | 394,156 | | | |
| | 27,500 | | | Hypermarcas SA (1) | | | 453,835 | | | |
| | 7,334 | | | Souza Cruz | | | 377,842 | | | |
| | | | | | | | | | | | | |
| | | | | | | | | | 1,560,076 | | | |
| | | | | | | | | | | | | |
| | | | | | | | | | | | | |
| | | | | Denmark—1.7% | | | | | | |
| | 3,407 | | | Carlsberg AS-Class B | | | 372,152 | | | |
| | 6,536 | | | Novo Nordisk-Class B | | | 687,134 | | | |
See Notes to Financial Statements
| | |
| 78 | Artio Global Funds ï 2010 Annual Report | |
| |
| PORTFOLIO OF INVESTMENTS (Continued) | October 31, 2010 |
Artio Global Equity Fund Inc.
| | | | | | | | | | | | | |
Share
| | | | | | | Fair
| | | |
| Amount | | | Description | | | | Value (Note 2) | | | |
COMMON STOCKS—Continued |
| | | | | Denmark—Continued | | | | | | |
| | | | | | | | | | | | | |
| | 4,422 | | | Pandora AS (1) | | $ | 214,310 | | | |
| | | | | | | | | | | | | |
| | | | | | | | | | 1,273,596 | | | |
| | | | | | | | | | | | | |
| | | | | | | | | | | | | |
| | | | | Australia—1.7% | | | | | | |
| | 38,557 | | | Aquarius Platinum | | | 221,849 | | | |
| | 26,312 | | | Newcrest Mining | | | 1,030,609 | | | |
| | | | | | | | | | | | | |
| | | | | | | | | | 1,252,458 | | | |
| | | | | | | | | | | | | |
| | | | | | | | | | | | | |
| | | | | Netherlands—1.3% | | | | | | |
| | 22,102 | | | ING Groep Dutch Certificate (1) | | | 235,619 | | | |
| | 18,434 | | | LyondellBasell Industries NV-Class A (1) | | | 495,137 | | | |
| | 9,441 | | | Unilever NV Dutch Certificate | | | 279,566 | | | |
| | | | | | | | | | | | | |
| | | | | | | | | | 1,010,322 | | | |
| | | | | | | | | | | | | |
| | | | | | | | | | | | | |
| | | | | South Korea—1.0% | | | | | | |
| | 5,060 | | | Hyundai Motor | | | 764,452 | | | |
| | | | | | | | | | | | | |
| | | | | | | | | | | | | |
| | | | | India—0.8% | | | | | | |
| | 1,660 | | | HDFC Bank Sponsored ADR | | | 287,114 | | | |
| | 4,860 | | | Reliance Capital Sponsored GDR | | | 89,035 | | | |
| | 12,190 | | | United Spirits Sponsored GDR | | | 204,792 | | | |
| | | | | | | | | | | | | |
| | | | | | | | | | 580,941 | | | |
| | | | | | | | | | | | | |
| | | | | | | | | | | | | |
| | | | | Sweden—0.8% | | | | | | |
| | 5,598 | | | Hennes & Mauritz-Class B | | | 196,544 | | | |
| | 27,688 | | | Volvo AB-Class B (1) | | | 373,526 | | | |
| | | | | | | | | | | | | |
| | | | | | | | | | 570,070 | | | |
| | | | | | | | | | | | | |
| | | | | | | | | | | | | |
| | | | | Israel—0.7% | | | | | | |
| | 10,250 | | | Teva Pharmaceutical Industries Sponsored ADR | | | 531,975 | | | |
| | | | | | | | | | | | | |
| | | | | | | | | | | | | |
| | | | | Austria—0.5% | | | | | | |
| | 8,570 | | | Erste Group Bank | | | 386,288 | | | |
| | | | | | | | | | | | | |
| | | | | | | | | | | | | |
| | | | | Singapore—0.4% | | | | | | |
| | 103,000 | | | CapitaLand Ltd | | | 309,577 | | | |
| | | | | | | | | | | | | |
| | | | | | | | | | | | | |
| | | | | Mexico—0.3% | | | | | | |
| | 46,470 | | | Fomento Economico Mexicano (Unit) | | | 255,741 | | | |
| | | | | | | | | | | | | |
| | | | | | | | | | | | | |
| | | | | Indonesia—0.3% | | | | | | |
| | 379,500 | | | Indofood CBP Sukses Makmur (1) | | | 242,031 | | | |
| | | | | | | | | | | | | |
| | | | | | | | | | | | | |
See Notes to Financial Statements
| | |
| Artio Global Funds ï 2010 Annual Report | 79 |
| |
| PORTFOLIO OF INVESTMENTS (Continued) | October 31, 2010 |
Artio Global Equity Fund Inc.
| | | | | | | | | | | | | |
Share
| | | | | | | Fair
| | | |
| Amount | | | Description | | | | Value (Note 2) | | | |
COMMON STOCKS—Continued |
| | | | | | | | | | | | | |
| | | | | Greece—0.3% | | | | | | |
| | 8,580 | | | Coca-Cola Hellenic Bottling | | $ | 221,811 | | | |
| | | | | | | | | | | | | |
| | | | | | | | | | | | | |
| | | | | Czech Republic—0.3% | | | | | | |
| | 924 | | | Komercni Banka | | | 209,211 | | | |
| | | | | | | | | | | | | |
| | | | | TOTAL COMMON STOCKS (Cost $63,518,738) | | | 70,363,838 | | | |
| | | | | | | | | | | | | |
| | | | | | | | | | | | | |
| | | | | | | | | | | | | |
EQUITY LINKED NOTES—5.2% |
| | | | | India—4.0% | | | | | | |
| | 43,345 | | | Adani Enterprises, Issued by CLSA, Expires 12/29/2014 | | | 687,326 | | | |
| | 6,394 | | | Axis Bank, Issued by Merrill Lynch International, Expires 03/16/2015 (1)(9) | | | 211,092 | | | |
| | 107,950 | | | Dabur India, Issued by Deutsche Bank AG London, Expires 09/13/2012 (1)(9) | | | 242,369 | | | |
| | 25,368 | | | Housing Development Finance, Issued by Deutsche Bank AG London, Expires 01/30/2017 (1)(9) | | | 392,676 | | | |
| | 62,474 | | | ITC Ltd, Issued by CLSA, Expires 05/05/2015 (1) | | | 240,756 | | | |
| | 13,034 | | | JSW Steel, Issued by Citigroup Global Markets, Expires 10/24/2012 (1) | | | 391,620 | | | |
| | 16,836 | | | Larsen & Toubro, Issued by CLSA, Expires 04/11/2011 (9) | | | 768,488 | | | |
| | 7,517 | | | Reliance Capital, Issued by Citigroup, Expires 10/24/2012 (1)(9) | | | 137,042 | | | |
| | | | | | | | | | | | | |
| | | | | | | | | | 3,071,369 | | | |
| | | | | | | | | | | | | |
| | | | | | | | | | | | | |
| | | | | Taiwan—1.2% | | | | | | |
| | 1,171 | | | Hon Hai Precision Industry, Issued by Deutsche Bank AG London, Expires 08/06/2018 (1)(9) | | | 4,436 | | | |
| | 39,948 | | | HTC Corp, Issued by Citigroup, Expires 01/20/2015 (9) | | | 898,670 | | | |
| | | | | | | | | | | | | |
| | | | | | | | | | 903,106 | | | |
| | | | | | | | | | | | | |
| | | | | | | | | | | | | |
| | | | | TOTAL EQUITY LINKED NOTES (Cost $3,416,540) | | | 3,974,475 | | | |
| | | | | | | | | | | | | |
| | | | | | | | | | | | | |
| | | | | | | | | | | | | |
PREFERRED STOCKS—0.0% |
| | | | | Philippines—0.0% | | | | | | |
| | 56,604 | | | Ayala Land
0.000% (Cost $121) (4)(12) | | | 132 | | | |
| | | | | | | | | | | | | |
| | | | | | | | | | | | | |
| | | | | | | | | | | | | |
See Notes to Financial Statements
| | |
| 80 | Artio Global Funds ï 2010 Annual Report | |
| |
| PORTFOLIO OF INVESTMENTS (Continued) | October 31, 2010 |
Artio Global Equity Fund Inc.
| | | | | | | | | | | | | | | | | |
Face
| | | | | | | | | | Fair
| | | |
| Value | | | Currency | | | Description | | | | Value (Note 2) | | | |
REPURCHASE AGREEMENT—1.0% |
| | | | | United States—1.0% | | | | | | | | |
| | 748,296 | | | | USD | | | State Street Bank and Trust Company Repurchase Agreement, dated 10/29/2010 due 11/01/2010, with a maturity value of $748,297 and an effective yield of 0.02%, collateralized by a U.S. Government and Agency Obligation, with a rate of 4.375%, a maturity of 09/15/2012 and an aggregate fair value of $765,913. (Cost $748,296) | | $ | 748,296 | | | |
| | | | | | | | | | | | | | | | | |
| | | | | | | | | TOTAL INVESTMENTS—99.2% (Cost $67,683,695) | | | 75,086,741 | | | |
| | | | | | | | | OTHER ASSETS AND LIABILITIES—0.8% | | | 569,592 | | | |
| | | | | | | | | | | | | | | | | |
| | | | | | | | | TOTAL NET ASSETS—100.0% | | $ | 75,656,333 | | | |
| | | | | | | | | | | | | | | | | |
Notes to the Portfolio of Investments.
| | | |
Aggregate cost for federal income tax purposes was $68,075,077. | | |
See Notes to Financial Statements
| | |
| Artio Global Funds ï 2010 Annual Report | 81 |
| |
| SCHEDULE OF FORWARD FOREIGN EXCHANGE CONTRACTS | October 31, 2010 |
Artio Global Equity Fund Inc.
FORWARD FOREIGN EXCHANGE CONTRACTS TO BUY
| | | | | | | | | | | | | | | | | | | | | |
| | | | | Contracts to Receive | | | | Net Unrealized
|
Expiration
| | | | Local
| | Value in
| | In Exchange
| | Appreciation
|
| Date | | Counterparty | | Currency | | USD | | for USD | | (Depreciation) |
| 12/15/10 | | Credit Suisse | | EUR | | | 825,226 | | | | 1,146,357 | | | | 1,087,833 | | | $ | 58,524 | |
| 12/15/10 | | Deutsche Bank AG London | | EUR | | | 1,086,963 | | | | 1,509,947 | | | | 1,513,737 | | | | (3,790 | ) |
| 12/16/10 | | Credit Suisse | | EUR | | | 345,003 | | | | 479,251 | | | | 422,970 | | | | 56,281 | |
| 12/16/10 | | UBS AG | | EUR | | | 324,220 | | | | 450,382 | | | | 404,899 | | | | 45,483 | |
| 12/15/10 | | Deutsche Bank AG London | | JPY | | | 57,643,121 | | | | 715,895 | | | | 682,959 | | | | 32,936 | |
| | | | | | | | | | | | | | | | | | | | | |
| Net unrealized appreciation on forward foreign exchange contracts to buy | | $ | 189,434 | |
| | | | | | | | | | | | | | | | | | | | | |
FORWARD FOREIGN EXCHANGE CONTRACTS TO SELL
| | | | | | | | | | | | | | | | | | | | | |
| | | | | Contracts to Deliver | | | | |
Expiration
| | | | Local
| | Value in
| | In Exchange
| | Net Unrealized
|
| Date | | Counterparty | | Currency | | USD | | for USD | | Depreciation |
| 12/15/10 | | Credit Suisse | | EUR | | | 825,226 | | | | 1,146,357 | | | | 1,077,214 | | | $ | (69,143 | ) |
| 12/15/10 | | Deutsche Bank AG London | | EUR | | | 1,086,963 | | | | 1,509,947 | | | | 1,499,640 | | | | (10,307 | ) |
| 12/16/10 | | Credit Suisse | | EUR | | | 345,003 | | | | 479,252 | | | | 414,402 | | | | (64,850 | ) |
| 12/16/10 | | UBS AG | | EUR | | | 324,220 | | | | 450,382 | | | | 392,955 | | | | (57,427 | ) |
| 12/15/10 | | Deutsche Bank AG London | | JPY | | | 57,643,121 | | | | 715,895 | | | | 676,280 | | | | (39,615 | ) |
| | | | | | | | | | | | | | | | | | | | | |
| Net unrealized depreciation on forward foreign exchange contracts to sell | | $ | (241,342 | ) |
| | | | | | | | | | | | | | | | | | | | | |
Glossary of Currencies
| | | |
JPY | | — Japanese Yen |
EUR | | — Euro |
USD | | — United States Dollar |
See Notes to Financial Statements
| | |
| 82 | Artio Global Funds ï 2010 Annual Report | |
| |
| PORTFOLIO OF INVESTMENTS-Industry Sector (Unaudited) | October 31, 2010 |
Artio Global Equity Fund Inc.
At October 31, 2010, sector diversification of the Fund’s investments was as follows:
| | | | | | | | | |
| | | % of Net
| | Fair
|
| | | Assets | | Value (Note 2) |
INDUSTRY SECTOR | | | | | | | | |
| Consumer Discretionary | | | 15.2 | % | | $ | 11,528,001 | |
| Financials | | | 15.0 | | | | 11,348,860 | |
| Materials | | | 14.6 | | | | 11,032,320 | |
| Industrials | | | 12.8 | | | | 9,712,139 | |
| Consumer Staples | | | 12.7 | | | | 9,576,298 | |
| Information Technology | | | 11.8 | | | | 8,935,250 | |
| Health Care | | | 8.4 | | | | 6,365,035 | |
| Energy | | | 7.3 | | | | 5,499,784 | |
| Utilities | | | 0.4 | | | | 340,758 | |
| Short-term Investment | | | 1.0 | | | | 748,296 | |
| | | | | | | | | |
Total Investments | | | 99.2 | | | | 75,086,741 | |
Other Assets and Liabilities (Net) | | | 0.8 | | | | 569,592 | |
| | | | | | | | | |
Net Assets | | | 100.0 | % | | $ | 75,656,333 | |
| | | | | | | | | |
See Notes to Financial Statements
| | |
| Artio Global Funds ï 2010 Annual Report | 83 |
| |
| PORTFOLIO OF INVESTMENTS | October 31, 2010 |
Artio International Equity Fund
| | | | | | | | | | | | | |
Share
| | | | | | | Fair
| | | |
| Amount | | | Description | | | | Value (Note 2) | | | |
COMMON STOCKS—94.2%† |
| | | | | United Kingdom—16.5% | | | | | | |
| | 653,670 | | | Anglo American | | $ | 30,391,152 | | | |
| | 6,133,209 | | | ARM Holdings | | | 35,624,385 | | | |
| | 17,090,114 | | | Barclays PLC | | | 75,030,822 | | | |
| | 265,321 | | | Betfair Group (1) | | | 6,087,202 | | | |
| | 3,087,398 | | | BG Group | | | 59,998,693 | | | |
| | 3,243,258 | | | BHP Billiton | | | 114,777,097 | | | |
| | 593,838 | | | Burberry Group | | | 9,674,675 | | | |
| | 2,495,104 | | | Cairn Energy (1) | | | 15,394,218 | | | |
| | 4,889,063 | | | Compass Group | | | 39,982,089 | | | |
| | 1,396,007 | | | Diageo PLC | | | 25,711,907 | | | |
| | 2,899,972 | | | GlaxoSmithKline PLC | | | 56,611,372 | | | |
| | 2,162,191 | | | Hikma Pharmaceuticals | | | 27,171,325 | | | |
| | 5,498,738 | | | HSBC Holdings | | | 57,064,872 | | | |
| | 1,586,605 | | | Imperial Tobacco | | | 50,707,923 | | | |
| | 103,869,728 | | | Lloyds Banking (1) | | | 114,486,554 | | | |
| | 356,418 | | | Lonmin PLC (1) | | | 9,966,522 | | | |
| | 1,434,607 | | | Reckitt Benckiser | | | 80,071,323 | | | |
| | 3,925,352 | | | Rio Tinto | | | 253,293,459 | | | |
| | 3,612,270 | | | Rolls-Royce Group (1) | | | 37,395,056 | | | |
| | 231,185,280 | | | Rolls-Royce Group-Class C (1)(4) | | | 369,619 | | | |
| | 53,013,257 | | | Royal Bank of Scotland (1) | | | 37,810,369 | | | |
| | 2,175,103 | | | Royal Dutch Shell-Class A | | | 70,455,269 | | | |
| | 822,343 | | | SABMiller PLC | | | 26,604,213 | | | |
| | 37,851,648 | | | Vodafone Group | | | 102,788,506 | | | |
| | 3,843,134 | | | William Morrison Supermarkets | | | 18,052,258 | | | |
| | 3,890,344 | | | WPP PLC | | | 45,156,351 | | | |
| | 8,546,860 | | | Xstrata PLC | | | 165,274,813 | | | |
| | | | | | | | | | | | | |
| | | | | | | | | | 1,565,952,044 | | | |
| | | | | | | | | | | | | |
| | | | | | | | | | | | | |
| | | | | China—8.5% | | | | | | |
| | 3,264,000 | | | Anhui Conch Cement-Class H | | | 13,683,681 | | | |
| | 537,843 | | | Baidu Inc Sponsored ADR (1) | | | 59,168,108 | | | |
| | 25,134,325 | | | Belle International | | | 45,131,097 | | | |
| | 19,441,000 | | | Boshiwa International Holding (1) | | | 17,830,258 | | | |
| | 56,502,000 | | | China Construction Bank-Class H | | | 53,861,406 | | | |
| | 8,729,204 | | | China Merchants Holdings International (3) | | | 30,571,300 | | | |
| | 6,192,000 | | | China National Building Material-Class H | | | 15,111,985 | | | |
| | 28,592,000 | | | China Overseas Land & Investment (3) | | | 60,043,827 | | | |
| | 23,784,000 | | | China Resources Enterprise | | | 99,863,163 | | | |
| | 15,740,000 | | | China Yurun Food | | | 60,910,956 | | | |
See Notes to Financial Statements
| | |
| 84 | Artio Global Funds ï 2010 Annual Report | |
| |
| PORTFOLIO OF INVESTMENTS (Continued) | October 31, 2010 |
Artio International Equity Fund
| | | | | | | | | | | | | |
Share
| | | | | | | Fair
| | | |
| Amount | | | Description | | | | Value (Note 2) | | | |
COMMON STOCKS—Continued |
| | | | | China—Continued | | | | | | |
| | | | | | | | | | | | | |
| | 16,026,602 | | | Clear Media (1) | | $ | 9,571,762 | | | |
| | 728,747 | | | Ctrip.com International Sponsored ADR (1) | | | 37,945,856 | | | |
| | 1,219,600 | | | Dongfang Electric-Class H (3) | | | 5,923,138 | | | |
| | 15,674,000 | | | Dongfeng Motor Group-Class H | | | 33,926,670 | | | |
| | 43,720,000 | | | Geely Automobile | | | 24,701,521 | | | |
| | 11,002,012 | | | Golden Eagle Retail | | | 29,093,462 | | | |
| | 2,197,500 | | | Hengan International | | | 20,806,277 | | | |
| | 22,115,000 | | | Intime Department Store (3) | | | 33,947,151 | | | |
| | 7,023,558 | | | Lianhua Supermarket-Class H | | | 29,897,890 | | | |
| | 15,678,000 | | | Lonking Holdings (3) | | | 8,433,273 | | | |
| | 3,518,000 | | | Sany Heavy Equipment International Holdings (3) | | | 5,037,189 | | | |
| | 3,330,000 | | | Shandong Weigao Group Medical Polymer-Class H (3) | | | 8,719,864 | | | |
| | 4,228,600 | | | Sinopharm Group-Class H | | | 16,554,830 | | | |
| | 5,357,500 | | | Sinotruk Hong Kong | | | 6,171,391 | | | |
| | 16,303,856 | | | Tingyi (Cayman Islands) Holding (3) | | | 44,375,393 | | | |
| | 505,000 | | | Weichai Power-Class H | | | 6,598,880 | | | |
| | 9,722,000 | | | Wumart Stores-Class H (3) | | | 22,799,164 | | | |
| | | | | | | | | | | | | |
| | | | | | | | | | 800,679,492 | | | |
| | | | | | | | | | | | | |
| | | | | | | | | | | | | |
| | | | | Japan—8.4% | | | | | | |
| | 468,827 | | | Aisin Seiki | | | 14,707,956 | | | |
| | 2,088,000 | | | Asahi Glass | | | 20,037,542 | | | |
| | 958,973 | | | Canon Inc | | | 44,287,766 | | | |
| | 510,000 | | | Daikin Industries | | | 17,734,451 | | | |
| | 435,106 | | | Denso Corp | | | 13,531,229 | | | |
| | 370,200 | | | Fanuc Ltd | | | 53,542,272 | | | |
| | 2,710,752 | | | Honda Motor | | | 98,838,965 | | | |
| | 7,725,000 | | | Isuzu Motors | | | 29,729,981 | | | |
| | 3,366,397 | | | ITOCHU Corp | | | 29,505,602 | | | |
| | 2,137,000 | | | Komatsu Ltd | | | 52,317,368 | | | |
| | 1,778,897 | | | Mitsubishi Corp | | | 42,733,280 | | | |
| | 2,567,000 | | | Mitsubishi Electric | | | 24,060,645 | | | |
| | 696,116 | | | Nidec Corp (3) | | | 68,790,607 | | | |
| | 3,620,800 | | | Nissan Motor | | | 31,915,183 | | | |
| | 8,410 | | | NTT DoCoMo | | | 14,147,176 | | | |
| | 737,000 | | | Ricoh Co | | | 10,302,446 | | | |
| | 188,100 | | | Sawai Pharmaceutical (3) | | | 16,416,425 | | | |
| | 812,600 | | | Shiseido Co | | | 16,968,258 | | | |
| | 160,600 | | | SMC Corp | | | 24,523,650 | | | |
| | 1,091,800 | | | Softbank Corp | | | 35,105,673 | | | |
See Notes to Financial Statements
| | |
| Artio Global Funds ï 2010 Annual Report | 85 |
| |
| PORTFOLIO OF INVESTMENTS (Continued) | October 31, 2010 |
Artio International Equity Fund
| | | | | | | | | | | | | |
Share
| | | | | | | Fair
| | | |
| Amount | | | Description | | | | Value (Note 2) | | | |
COMMON STOCKS—Continued |
| | | | | Japan—Continued | | | | | | |
| | | | | | | | | | | | | |
| | 1,909,600 | | | Suzuki Motor | | $ | 46,536,869 | | | |
| | 212,950 | | | Towa Pharmaceutical (3) | | | 11,566,186 | | | |
| | 733,289 | | | Toyota Motor | | | 26,026,980 | | | |
| | 1,437,400 | | | Unicharm Corp (3) | | | 54,872,812 | | | |
| | | | | | | | | | | | | |
| | | | | | | | | | 798,199,322 | | | |
| | | | | | | | | | | | | |
| | | | | | | | | | | | | |
| | | | | Germany—6.3% | | | | | | |
| | 215,962 | | | Bayer AG | | | 16,094,884 | | | |
| | 241,395 | | | Beiersdorf AG | | | 15,705,458 | | | |
| | 223,906 | | | Bilfinger Berger | | | 16,285,465 | | | |
| | 431,963 | | | BMW AG | | | 30,925,860 | | | |
| | 146,661 | | | Continental AG (1) | | | 12,723,954 | | | |
| | 1,532,906 | | | Daimler AG (1) | | | 101,053,727 | | | |
| | 334,917 | | | Deutsche Boerse | | | 23,535,745 | | | |
| | 2,683,058 | | | Fraport AG | | | 169,976,182 | | | |
| | 788,692 | | | Fresenius SE | | | 69,510,254 | | | |
| | 337,774 | | | HeidelbergCement AG | | | 17,645,114 | | | |
| | 124,603 | | | Henkel AG | | | 6,180,134 | | | |
| | 687,159 | | | MAN SE (3) | | | 75,451,524 | | | |
| | 684,962 | | | Marseille-Kliniken AG (1)(10) | | | 2,303,910 | | | |
| | 128,320 | | | Metro AG | | | 8,981,808 | | | |
| | 225,309 | | | Siemens AG | | | 25,703,933 | | | |
| | | | | | | | | | | | | |
| | | | | | | | | | 592,077,952 | | | |
| | | | | | | | | | | | | |
| | | | | | | | | | | | | |
| | | | | Russia—6.2% | | | | | | |
| | 656,887 | | | Alfa Cement (1)(4)(10)(12) | | | 51,966,291 | | | |
| | 53,536,950 | | | Chelindbank OJSC (1)(4)(10) | | | 3,881,429 | | | |
| | 337,701 | | | Cherkizovo Group (1) | | | 10,279,146 | | | |
| | 204,155 | | | Cherkizovo Group Sponsored GDR (1) | | | 4,287,255 | | | |
| | 473,800 | | | Globaltrans Investment Sponsored GDR | | | 6,964,860 | | | |
| | 115,688,469 | | | IDGC Holding (1) | | | 20,592,547 | | | |
| | 205,522,262 | | | IDGC of Center and Volga (1) | | | 1,890,805 | | | |
| | 494,494,096 | | | IDGC of North-West (1) | | | 3,594,478 | | | |
| | 166,480,998 | | | IDGC of South (1) | | | 998,886 | | | |
| | 12,477 | | | Inter Rao UES Sponsored GDR (1)(9) | | | 185,907 | | | |
| | 547,651 | | | Kuban Trunk Grid (1)(4) | | | 86,392 | | | |
| | 538,651 | | | Kubanenergo OAO (1) | | | 3,131,302 | | | |
| | 137,713 | | | Magnit OJSC | | | 15,940,280 | | | |
| | 796,672 | | | Magnit OJSC Sponsored GDR | | | 21,303,009 | | | |
| | 41,256,470 | | | MRSK Centra (1) | | | 2,042,195 | | | |
See Notes to Financial Statements
| | |
| 86 | Artio Global Funds ï 2010 Annual Report | |
| |
| PORTFOLIO OF INVESTMENTS (Continued) | October 31, 2010 |
Artio International Equity Fund
| | | | | | | | | | | | | |
Share
| | | | | | | Fair
| | | |
| Amount | | | Description | | | | Value (Note 2) | | | |
COMMON STOCKS—Continued |
| | | | | Russia—Continued | | | | | | |
| | | | | | | | | | | | | |
| | 236,718,165 | | | MRSK Urala (1) | | $ | 2,538,566 | | | |
| | 768,373 | | | NovaTek OAO | | | 6,177,921 | | | |
| | 72,150 | | | NovaTek OAO Sponsored GDR | | | 6,901,148 | | | |
| | 280,917 | | | Novorossiysk Sea Trade Port Sponsored GDR | | | 2,514,207 | | | |
| | 366,444 | | | OAO Dalsvyaz (4) | | | 1,315,534 | | | |
| | 2,799 | | | OGK2 OAO Sponsored GDR (9) | | | 14,831 | | | |
| | 267,858 | | | OGK5 OJSC Sponsored GDR (1) | | | 1,107,641 | | | |
| | 670,892 | | | Pharmstandard (1) | | | 59,038,496 | | | |
| | 520,397 | | | Pharmstandard Sponsored GDR (1) | | | 13,530,322 | | | |
| | 2,439,084 | | | Protek (1) | | | 4,695,237 | | | |
| | 270,401 | | | Quadra Power Generation Sponsored GDR (9) | | | 701,038 | | | |
| | 46,993,909 | | | RAO Energy System of East (1)(4) | | | 589,821 | | | |
| | 3,277,698 | | | Rosneft Oil Sponsored GDR (1)(3) | | | 22,845,555 | | | |
| | 78,061 | | | RTS Stock Exchange-BRD (1)(4) | | | 30,053,485 | | | |
| | 48,519,199 | | | Sberbank of Russian Federation | | | 160,792,625 | | | |
| | 817,203 | | | Sibirskiy Cement (1)(4) | | | 16,139,759 | | | |
| | 25,272 | | | TGK14 JSC Sponsored GDR (9) | | | 103,194 | | | |
| | 472,896 | | | Veropharm (1)(4) | | | 19,064,066 | | | |
| | 8,583,275 | | | VTB Bank Sponsored GDR | | | 56,821,280 | | | |
| | 916,550 | | | X 5 Retail Sponsored GDR (1) | | | 38,403,445 | | | |
| | | | | | | | | | | | | |
| | | | | | | | | | 590,492,953 | | | |
| | | | | | | | | | | | | |
| | | | | | | | | | | | | |
| | | | | France—5.4% | | | | | | |
| | 248,805 | | | Aeroports de Paris | | | 21,105,039 | | | |
| | 965,668 | | | BNP Paribas | | | 70,531,683 | | | |
| | 618,890 | | | Carrefour SA | | | 33,358,381 | | | |
| | 685,764 | | | CFAO SA | | | 30,433,878 | | | |
| | 889,603 | | | Danone SA | | | 56,228,000 | | | |
| | 580,786 | | | Essilor International | | | 38,731,121 | | | |
| | 770,257 | | | European Aeronautic Defence & Space (1)(3) | | | 20,217,913 | | | |
| | 661,226 | | | Eutelsat Communications | | | 24,800,249 | | | |
| | 109,545 | | | Iliad SA (3) | | | 12,317,562 | | | |
| | 4,942,002 | | | L’ Occitane International (1)(3) | | | 14,662,235 | | | |
| | 479,901 | | | LVMH | | | 75,105,844 | | | |
| | 169,748 | | | PPR | | | 27,792,886 | | | |
| | 208,334 | | | Schneider Electric | | | 29,535,479 | | | |
| | 1,023,513 | | | SES SA FDR | | | 26,196,832 | | | |
| | 210,881 | | | Sodexo | | | 13,705,524 | | | |
See Notes to Financial Statements
| | |
| Artio Global Funds ï 2010 Annual Report | 87 |
| |
| PORTFOLIO OF INVESTMENTS (Continued) | October 31, 2010 |
Artio International Equity Fund
| | | | | | | | | | | | | |
Share
| | | | | | | Fair
| | | |
| Amount | | | Description | | | | Value (Note 2) | | | |
COMMON STOCKS—Continued |
| | | | | France—Continued | | | | | | |
| | | | | | | | | | | | | |
| | 189,341 | | | Technip SA | | $ | 15,892,543 | | | |
| | | | | | | | | | | | | |
| | | | | | | | | | 510,615,169 | | | |
| | | | | | | | | | | | | |
| | | | | | | | | | | | | |
| | | | | Switzerland—4.8% | | | | | | |
| | 1,677,857 | | | ABB Ltd (1) | | | 34,768,404 | | | |
| | 512,322 | | | Dufry Group (1) | | | 59,540,828 | | | |
| | 136,505 | | | Flughafen Zuerich | | | 50,347,930 | | | |
| | 1,844,655 | | | Nestle SA | | | 101,094,972 | | | |
| | 1,155,917 | | | Nobel Biocare | | | 19,122,287 | | | |
| | 1,080,123 | | | Novartis AG | | | 62,654,822 | | | |
| | 64,433 | | | Swatch Group | | | 24,639,808 | | | |
| | 630,061 | | | Swiss Reinsurance | | | 30,301,866 | | | |
| | 114,851 | | | Syngenta AG | | | 31,786,926 | | | |
| | 2,204,743 | | | UBS AG (1) | | | 37,347,248 | | | |
| | | | | | | | | | | | | |
| | | | | | | | | | 451,605,091 | | | |
| | | | | | | | | | | | | |
| | | | | | | | | | | | | |
| | | | | India—4.6% | | | | | | |
| | 4,778,752 | | | Adani Enterprises | | | 76,320,192 | | | |
| | 173,841 | | | Asian Paints | | | 10,477,418 | | | |
| | 5,959,348 | | | Dabur India | | | 13,347,330 | | | |
| | 176,225 | | | Future Mall Management (1)(4) | | | — | | | |
| | 590,178 | | | HDFC Bank | | | 30,133,287 | | | |
| | 1,624,003 | | | Housing Development Finance | | | 25,103,047 | | | |
| | 9,514,948 | | | ITC Ltd | | | 36,410,606 | | | |
| | 3,476,950 | | | Jain Irrigation Systems | | | 18,149,796 | | | |
| | 1,547,029 | | | JSW Steel | | | 46,732,986 | | | |
| | 617,307 | | | Larsen & Toubro | | | 28,068,883 | | | |
| | 7,648,955 | | | Mundra Port & Special Economic Zone | | | 26,205,311 | | | |
| | 3,524,512 | | | Pantaloon Retail India | | | 37,327,696 | | | |
| | 1,363,603 | | | Reliance Capital | | | 24,957,695 | | | |
| | 638,376 | | | State Bank of India | | | 45,365,291 | | | |
| | 386,906 | | | United Spirits | | | 12,994,119 | | | |
| | | | | | | | | | | | | |
| | | | | | | | | | 431,593,657 | | | |
| | | | | | | | | | | | | |
| | | | | | | | | | | | | |
| | | | | Canada—4.5% | | | | | | |
| | 167,302 | | | Agnico-Eagle Mines (3) | | | 13,004,705 | | | |
| | 3,066,356 | | | Barrick Gold | | | 148,014,354 | | | |
| | 148,420 | | | Canadian Pacific Railway | | | 9,696,307 | | | |
| | 323,390 | | | First Quantum Minerals | | | 28,382,430 | | | |
| | 1,097,992 | | | Goldcorp Inc | | | 49,137,732 | | | |
See Notes to Financial Statements
| | |
| 88 | Artio Global Funds ï 2010 Annual Report | |
| |
| PORTFOLIO OF INVESTMENTS (Continued) | October 31, 2010 |
Artio International Equity Fund
| | | | | | | | | | | | | |
Share
| | | | | | | Fair
| | | |
| Amount | | | Description | | | | Value (Note 2) | | | |
COMMON STOCKS—Continued |
| | | | | Canada—Continued | | | | | | |
| | | | | | | | | | | | | |
| | 386,322 | | | IAMGOLD Corp | | $ | 7,065,107 | | | |
| | 1,538,575 | | | Ivanhoe Mines (1) | | | 36,922,171 | | | |
| | 552,608 | | | Kinross Gold (3) | | | 9,964,973 | | | |
| | 153,395 | | | Potash Corp of Saskatchewan (3) | | | 22,234,436 | | | |
| | 2,270,715 | | | Silver Wheaton (1) | | | 65,425,869 | | | |
| | 807,530 | | | Teck Resources-Class B | | | 36,186,486 | | | |
| | | | | | | | | | | | | |
| | | | | | | | | | 426,034,570 | | | |
| | | | | | | | | | | | | |
| | | | | | | | | | | | | |
| | | | | Hong Kong—3.1% | | | | | | |
| | 520,000 | | | Galaxy Entertainment (1) | | | 488,320 | | | |
| | 33,879,000 | | | Hang Lung Properties | | | 165,193,065 | | | |
| | 1,314,800 | | | Hong Kong Exchanges & Clearing | | | 28,933,978 | | | |
| | 12,730,000 | | | Li & Fung (3) | | | 67,079,512 | | | |
| | 9,491,200 | | | Sands China (1)(3) | | | 20,617,341 | | | |
| | 2,578,000 | | | SJM Holdings | | | 3,830,935 | | | |
| | 4,552,800 | | | Wynn Macau (1)(3) | | | 10,066,044 | | | |
| | | | | | | | | | | | | |
| | | | | | | | | | 296,209,195 | | | |
| | | | | | | | | | | | | |
| | | | | | | | | | | | | |
| | | | | Netherlands—2.8% | | | | | | |
| | 160,281 | | | ASML Holding | | | 5,281,986 | | | |
| | 480,049 | | | Heineken NV | | | 24,300,164 | | | |
| | 5,653,568 | | | ING Groep Dutch Certificate (1) | | | 60,270,067 | | | |
| | 2,780,464 | | | Koninklijke (Royal) KPN | | | 46,374,817 | | | |
| | 748,920 | | | Koninklijke Philips Electronics (3) | | | 22,619,283 | | | |
| | 3,699,859 | | | Unilever NV Dutch Certificate | | | 109,559,591 | | | |
| | | | | | | | | | | | | |
| | | | | | | | | | 268,405,908 | | | |
| | | | | | | | | | | | | |
| | | | | | | | | | | | | |
| | | | | South Africa—1.9% | | | | | | |
| | 2,755,328 | | | Aspen Pharmacare (1) | | | 37,030,518 | | | |
| | 4,754,678 | | | Shoprite Holdings | | | 67,673,542 | | | |
| | 3,610,521 | | | Standard Bank | | | 53,609,909 | | | |
| | 950,517 | | | Tiger Brands | | | 25,661,179 | | | |
| | | | | | | | | | | | | |
| | | | | | | | | | 183,975,148 | | | |
| | | | | | | | | | | | | |
| | | | | | | | | | | | | |
| | | | | Brazil—1.8% | | | | | | |
| | 2,768,742 | | | All America Latina Logistica (Unit) | | | 26,403,940 | | | |
| | 444,632 | | | Amil Participacoes | | | 4,533,719 | | | |
| | 2,495,388 | | | Diagnosticos da America (1) | | | 30,886,245 | | | |
| | 649,284 | | | Drogasil SA | | | 16,466,973 | | | |
| | 4,261,020 | | | Hypermarcas SA (1) | | | 70,320,078 | | | |
See Notes to Financial Statements
| | |
| Artio Global Funds ï 2010 Annual Report | 89 |
| |
| PORTFOLIO OF INVESTMENTS (Continued) | October 31, 2010 |
Artio International Equity Fund
| | | | | | | | | | | | | |
Share
| | | | | | | Fair
| | | |
| Amount | | | Description | | | | Value (Note 2) | | | |
COMMON STOCKS—Continued |
| | | | | Brazil—Continued | | | | | | |
| | | | | | | | | | | | | |
| | 491,189 | | | Souza Cruz | | $ | 25,305,650 | | | |
| | | | | | | | | | | | | |
| | | | | | | | | | 173,916,605 | | | |
| | | | | | | | | | | | | |
| | | | | | | | | | | | | |
| | | | | Australia—1.7% | | | | | | |
| | 1,646,080 | | | Aquarius Platinum | | | 9,471,172 | | | |
| | 7,782,270 | | | Asciano Group (1) | | | 11,938,103 | | | |
| | 24,978,488 | | | MAp Group | | | 74,675,934 | | | |
| | 1,761,380 | | | Newcrest Mining | | | 68,991,124 | | | |
| | | | | | | | | | | | | |
| | | | | | | | | | 165,076,333 | | | |
| | | | | | | | | | | | | |
| | | | | | | | | | | | | |
| | | | | Denmark—1.5% | | | | | | |
| | 456,011 | | | Carlsberg AS-Class B | | | 49,810,792 | | | |
| | 745,539 | | | Novo Nordisk-Class B | | | 78,379,048 | | | |
| | 292,117 | | | Pandora AS (1) | | | 14,157,308 | | | |
| | 726,577 | | | TK Development (1) | | | 3,372,341 | | | |
| | | | | | | | | | | | | |
| | | | | | | | | | 145,719,489 | | | |
| | | | | | | | | | | | | |
| | | | | | | | | | | | | |
| | | | | Austria—1.5% | | | | | | |
| | 117,501 | | | bwin Interactive Entertainment | | | 5,611,493 | | | |
| | 1,939,793 | | | Erste Group Bank | | | 87,435,143 | | | |
| | 798,709 | | | Flughafen Wien | | | 49,478,315 | | | |
| | 143,322 | | | Wienerberger AG (1)(3) | | | 2,410,360 | | | |
| | | | | | | | | | | | | |
| | | | | | | | | | 144,935,311 | | | |
| | | | | | | | | | | | | |
| | | | | | | | | | | | | |
| | | | | Finland—1.5% | | | | | | |
| | 819,738 | | | Fortum Oyj | | | 23,208,645 | | | |
| | 300,521 | | | Kesko Oyj-Class B | | | 14,878,270 | | | |
| | 337,527 | | | Olvi Oyj-Class A | | | 14,435,097 | | | |
| | 273,030 | | | Outotec Oyj (3) | | | 12,727,911 | | | |
| | 3,647,812 | | | Stora Enso-Class R (3) | | | 36,200,481 | | | |
| | 2,323,874 | | | UPM-Kymmene Oyj | | | 38,597,944 | | | |
| | | | | | | | | | | | | |
| | | | | | | | | | 140,048,348 | | | |
| | | | | | | | | | | | | |
| | | | | | | | | | | | | |
| | | | | Sweden—1.3% | | | | | | |
| | 1,057,456 | | | Atlas Copco-Class A | | | 22,017,519 | | | |
| | 272,612 | | | Elekta AB-Class B (3) | | | 10,278,806 | | | |
| | 883,922 | | | Hennes & Mauritz-Class B | | | 31,034,236 | | | |
| | 215,427 | | | Swedish Match | | | 5,998,810 | | | |
| | 4,101,294 | | | Volvo AB-Class B (1) | | | 55,328,656 | | | |
| | | | | | | | | | | | | |
| | | | | | | | | | 124,658,027 | | | |
| | | | | | | | | | | | | |
| | | | | | | | | | | | | |
See Notes to Financial Statements
| | |
| 90 | Artio Global Funds ï 2010 Annual Report | |
| |
| PORTFOLIO OF INVESTMENTS (Continued) | October 31, 2010 |
Artio International Equity Fund
| | | | | | | | | | | | | |
Share
| | | | | | | Fair
| | | |
| Amount | | | Description | | | | Value (Note 2) | | | |
COMMON STOCKS—Continued |
| | | | | | | | | | | | | |
| | | | | Czech Republic—1.2% | | | | | | |
| | 487,270 | | | Komercni Banka | | $ | 110,327,253 | | | |
| | | | | | | | | | | | | |
| | | | | | | | | | | | | |
| | | | | Ukraine—1.0% | | | | | | |
| | 214,485 | | | Anthousa Ltd Sponsored GDR (4)(9) | | | 2,251,646 | | | |
| | 8,916,599 | | | Bank Forum (1) | | | 6,987,473 | | | |
| | 76,611,005 | | | Bohdan Automobile Plant (1) | | | 1,638,223 | | | |
| | 2,852,650 | | | Centrenergo (1) | | | 4,569,622 | | | |
| | 178,305 | | | Centrenergo Sponsored ADR (1) | | | 2,856,244 | | | |
| | 1,237,519 | | | Chernivtsioblenergo (1)(4) | | | 582,179 | | | |
| | 5,006,914 | | | Davento PLC GDR (1)(4)(9)(10) | | | 3,409,965 | | | |
| | 22,500 | | | Dniproenergo | | | 2,928,962 | | | |
| | 11,770,906 | | | Dragon-Ukrainian Properties & Development (1)(10) | | | 13,549,916 | | | |
| | 7,562,990 | | | Harkivoblenergo (1)(4) | | | 2,497,214 | | | |
| | 10,700 | | | Ivano Frankivskcement (1)(4) | | | 201,887 | | | |
| | 902,412 | | | Khmelnitskoblenergo JSC (1)(4) | | | 280,940 | | | |
| | 2,750,000 | | | Kirovogradoblenergo (1)(4) | | | 686,635 | | | |
| | 240,262 | | | Korukivskas Technical Papers Factory (1)(4) | | | 1,344,863 | | | |
| | 3,228,131 | | | Krymenergo (4) | | | 1,228,314 | | | |
| | 115,161 | | | Kyivmedpreparat (1)(4) | | | 796,711 | | | |
| | 189,156 | | | Lvivoblenergo (1)(4) | | | 68,405 | | | |
| | 267,596 | | | Odessaoblenergo (1)(4) | | | 84,150 | | | |
| | 5,542,248 | | | Oranta (1)(4) | | | 3,485,691 | | | |
| | 488,244 | | | Poltavaoblenergo (1)(4) | | | 150,772 | | | |
| | 115,793,980 | | | Raiffeisen Bank Aval (1) | | | 5,999,439 | | | |
| | 65,228 | | | Retail Group (1)(4)(12) | | | 6,257,950 | | | |
| | 21,017 | | | Rodovid Bank (1)(4)(12) | | | 182 | | | |
| | 8,375,303 | | | Slavutich Brewery (1)(4) | | | 2,602,138 | | | |
| | 641,180 | | | Ternopiloblenergo (1)(4) | | | 194,774 | | | |
| | 2,636,403 | | | Tsukrovyy soyz Ukrros (1)(4) | | | 994,869 | | | |
| | 1,153,346,022 | | | Ukrinbank (1)(4)(10) | | | 1,450,750 | | | |
| | 12,880 | | | Ukrnafta | | | 474,656 | | | |
| | 8,685 | | | Ukrnafta Sponsored ADR | | | 1,946,685 | | | |
| | 84,835,914 | | | Ukrsotsbank JSCB (1) | | | 4,571,535 | | | |
| | 116,751,392 | | | UkrTelecom (1) | | | 7,564,609 | | | |
| | 653,260 | | | UkrTelecom Sponsored GDR (1) | | | 2,115,905 | | | |
| | 65,728 | | | Vinnitsaoblenergo (1)(4) | | | 897,043 | | | |
| | 4,114,636 | | | Volynoblenergo (1)(4) | | | 186,323 | | | |
| | 4,799,516 | | | Zakarpattyaoblenergo (4) | | | 1,871,509 | | | |
| | 20,071 | | | Zakhidenergo (1)(4) | | | 1,370,887 | | | |
| | 595,792 | | | Zakhidenergo GDR (1)(4) | | | 10,173,430 | | | |
See Notes to Financial Statements
| | |
| Artio Global Funds ï 2010 Annual Report | 91 |
| |
| PORTFOLIO OF INVESTMENTS (Continued) | October 31, 2010 |
Artio International Equity Fund
| | | | | | | | | | | | | |
Share
| | | | | | | Fair
| | | |
| Amount | | | Description | | | | Value (Note 2) | | | |
COMMON STOCKS—Continued |
| | | | | Ukraine—Continued | | | | | | |
| | | | | | | | | | | | | |
| | 400,000 | | | Zhytomyroblenergo (1)(4) | | $ | 88,050 | | | |
| | | | | | | | | | | | | |
| | | | | | | | | | 98,360,546 | | | |
| | | | | | | | | | | | | |
| | | | | | | | | | | | | |
| | | | | Mexico—1.0% | | | | | | |
| | 1,139,884 | | | Fomento Economico Mexicano Sponsored ADR | | | 62,591,030 | | | |
| | 7,038,418 | | | Genomma Lab Internacional-Class B (1)(3) | | | 15,180,180 | | | |
| | 4,675,149 | | | Grupo Financiero Banorte (3) | | | 20,018,571 | | | |
| | | | | | | | | | | | | |
| | | | | | | | | | 97,789,781 | | | |
| | | | | | | | | | | | | |
| | | | | | | | | | | | | |
| | | | | Romania—0.9% | | | | | | |
| | 731,600 | | | Antibiotice | | | 141,785 | | | |
| | 208,660 | | | Banca Transilvania (1) | | | 93,111 | | | |
| | 4,586,344 | | | Biofarm Bucuresti (1) | | | 288,313 | | | |
| | 4,182,214 | | | BRD-Groupe Societe Generale | | | 16,891,505 | | | |
| | 14,619,597 | | | Cemacon SA (1)(10) | | | 619,041 | | | |
| | 7,691,800 | | | Compa Sibiu (1) | | | 1,099,849 | | | |
| | 15,345,894 | | | Concefa SA (1) | | | 799,747 | | | |
| | 4,950,133 | | | Condmag SA (1) | | | 1,177,010 | | | |
| | 40,338,000 | | | Dafora SA (1) | | | 1,813,150 | | | |
| | 16,912,495 | | | Impact Developer & Contractor (1)(4)(10) | | | 2,293,558 | | | |
| | 504,039,057 | | | OMV Petrom (1) | | | 54,669,969 | | | |
| | 6,887,600 | | | Spicul Buzau | | | 639,371 | | | |
| | 11,918,318 | | | Zentiva SA (1) | | | 2,989,139 | | | |
| | | | | | | | | | | | | |
| | | | | | | | | | 83,515,548 | | | |
| | | | | | | | | | | | | |
| | | | | | | | | | | | | |
| | | | | Bulgaria—0.8% | | | | | | |
| | 301,290 | | | Bulgarian American Credit Bank (1) | | | 2,132,911 | | | |
| | 1,276,434 | | | Central Cooperative Bank (1) | | | 925,116 | | | |
| | 10,693,367 | | | Chimimport AD (1)(10) | | | 17,475,926 | | | |
| | 354,861 | | | DZI Insurance (4)(10)(12) | | | 21,911,693 | | | |
| | 4,078,860 | | | LEV INS (1)(4)(10)(12) | | | 5,303,808 | | | |
| | 806,010 | | | Sopharma AD (1) | | | 2,254,778 | | | |
| | 1,425,011 | | | Sparki Eltos Lovetch (1)(4)(10) | | | 1,467,184 | | | |
| | 11,652,801 | | | Vivacom (1)(4)(12) | | | 27,489,465 | | | |
| | | | | | | | | | | | | |
| | | | | | | | | | 78,960,881 | | | |
| | | | | | | | | | | | | |
| | | | | | | | | | | | | |
| | | | | Singapore—0.7% | | | | | | |
| | 20,000,000 | | | CapitaLand Ltd (3) | | | 60,112,034 | | | |
| | 2,714,000 | | | Genting Singapore (1) | | | 4,550,419 | | | |
| | | | | | | | | | | | | |
| | | | | | | | | | 64,662,453 | | | |
| | | | | | | | | | | | | |
| | | | | | | | | | | | | |
See Notes to Financial Statements
| | |
| 92 | Artio Global Funds ï 2010 Annual Report | |
| |
| PORTFOLIO OF INVESTMENTS (Continued) | October 31, 2010 |
Artio International Equity Fund
| | | | | | | | | | | | | |
Share
| | | | | | | Fair
| | | |
| Amount | | | Description | | | | Value (Note 2) | | | |
COMMON STOCKS—Continued |
| | | | | | | | | | | | | |
| | | | | South Korea—0.7% | | | | | | |
| | 1,308,333 | | | Celltrion Inc (1) | | $ | 28,951,337 | | | |
| | 220,740 | | | Hyundai Motor | | | 33,348,856 | | | |
| | | | | | | | | | | | | |
| | | | | | | | | | 62,300,193 | | | |
| | | | | | | | | | | | | |
| | | | | | | | | | | | | |
| | | | | Taiwan—0.6% | | | | | | |
| | 1,801 | | | Acer Inc | | | 5,229 | | | |
| | 2,665,000 | | | HTC Corp | | | 60,137,975 | | | |
| | | | | | | | | | | | | |
| | | | | | | | | | 60,143,204 | | | |
| | | | | | | | | | | | | |
| | | | | | | | | | | | | |
| | | | | Ireland—0.6% | | | | | | |
| | 5,943,968 | | | Dragon Oil (1) | | | 42,004,222 | | | |
| | 2,950,960 | | | Ryanair Holdings | | | 16,947,565 | | | |
| | | | | | | | | | | | | |
| | | | | | | | | | 58,951,787 | | | |
| | | | | | | | | | | | | |
| | | | | | | | | | | | | |
| | | | | Poland—0.6% | | | | | | |
| | 660,666 | | | Dom Development | | | 10,855,443 | | | |
| | 129,747 | | | PBG SA | | | 9,863,927 | | | |
| | 9,185,808 | | | Polimex Mostostal | | | 13,355,441 | | | |
| | 1,071,000 | | | Polska Grupa Farmaceutyczna (1)(10) | | | 17,897,840 | | | |
| | 231,934 | | | Sniezka SA | | | 3,323,384 | | | |
| | | | | | | | | | | | | |
| | | | | | | | | | 55,296,035 | | | |
| | | | | | | | | | | | | |
| | | | | | | | | | | | | |
| | | | | Israel—0.5% | | | | | | |
| | 857,015 | | | Teva Pharmaceutical Industries Sponsored ADR | | | 44,479,078 | | | |
| | | | | | | | | | | | | |
| | | | | | | | | | | | | |
| | | | | Norway—0.5% | | | | | | |
| | 966,179 | | | Austevoll Seafood (3) | | | 7,021,864 | | | |
| | 720,458 | | | Copeinca ASA (3) | | | 6,606,227 | | | |
| | 1,356,551 | | | DnB NOR | | | 18,520,097 | | | |
| | 10,388,353 | | | Marine Harvest (3) | | | 10,266,461 | | | |
| | | | | | | | | | | | | |
| | | | | | | | | | 42,414,649 | | | |
| | | | | | | | | | | | | |
| | | | | | | | | | | | | |
| | | | | Greece—0.5% | | | | | | |
| | 1,623,821 | | | Coca-Cola Hellenic Bottling | | | 41,979,261 | | | |
| | | | | | | | | | | | | |
| | | | | | | | | | | | | |
| | | | | Georgia—0.4% | | | | | | |
| | 2,466,387 | | | Bank of Georgia Sponsored GDR (1)(10) | | | 40,670,722 | | | |
| | | | | | | | | | | | | |
| | | | | | | | | | | | | |
| | | | | Nigeria—0.4% | | | | | | |
| | 4,183,878 | | | Guinness Nigeria | | | 4,994,019 | | | |
| | 2,322,675 | | | Nestle Foods Nigeria | | | 5,929,906 | | | |
| | 24,818,709 | | | Nigerian Breweries | | | 12,590,393 | | | |
| | 6,834,708 | | | PZ Cussons Nigeria | | | 1,518,321 | | | |
See Notes to Financial Statements
| | |
| Artio Global Funds ï 2010 Annual Report | 93 |
| |
| PORTFOLIO OF INVESTMENTS (Continued) | October 31, 2010 |
Artio International Equity Fund
| | | | | | | | | | | | | |
Share
| | | | | | | Fair
| | | |
| Amount | | | Description | | | | Value (Note 2) | | | |
COMMON STOCKS—Continued |
| | | | | Nigeria—Continued | | | | | | |
| | | | | | | | | | | | | |
| | 61,252,360 | | | Unilever Nigeria | | $ | 11,373,117 | | | |
| | | | | | | | | | | | | |
| | | | | | | | | | 36,405,756 | | | |
| | | | | | | | | | | | | |
| | | | | | | | | | | �� | | |
| | | | | Italy—0.3% | | | | | | |
| | 707,383 | | | Buzzi Unicem (3) | | | 8,111,334 | | | |
| | 409,926 | | | Saipem SpA | | | 18,192,319 | | | |
| | | | | | | | | | | | | |
| | | | | | | | | | 26,303,653 | | | |
| | | | | | | | | | | | | |
| | | | | | | | | | | | | |
| | | | | Portugal—0.2% | | | | | | |
| | 1,470,261 | | | Jeronimo Martins | | | 22,029,107 | | | |
| | | | | | | | | | | | | |
| | | | | | | | | | | | | |
| | | | | Serbia—0.2% | | | | | | |
| | 48,500 | | | Energoprojekt Holding (1) | | | 587,879 | | | |
| | 78,573 | | | Imlek ad (4) | | | 1,978,061 | | | |
| | 41,505 | | | Komercijalna Banka (4) | | | 13,438,332 | | | |
| | 93,520 | | | Privredna Banka (1)(4) | | | 811,427 | | | |
| | 6,149 | | | Razvojna Banka Vojvodine (1)(4) | | | 255,412 | | | |
| | 123,132 | | | Tigar ad Pirot (1)(4)(10) | | | 999,790 | | | |
| | 78,160 | | | Toza Markovic ad Kikinda (1)(4)(10)(12) | | | 2,151,880 | | | |
| | 16,667 | | | Univerzal Banka (1)(4) | | | 1,024,151 | | | |
| | | | | | | | | | | | | |
| | | | | | | | | | 21,246,932 | | | |
| | | | | | | | | | | | | |
| | | | | | | | | | | | | |
| | | | | Lebanon—0.2% | | | | | | |
| | 278,581 | | | SOLIDERE-Class A | | | 5,181,607 | | | |
| | 752,109 | | | SOLIDERE Sponsored GDR (9) | | | 13,989,227 | | | |
| | | | | | | | | | | | | |
| | | | | | | | | | 19,170,834 | | | |
| | | | | | | | | | | | | |
| | | | | | | | | | | | | |
| | | | | Venezuela—0.2% | | | | | | |
| | 38,451 | | | Banco Provincial (4) | | | 113,747 | | | |
| | 156 | | | Banco Venezolano de Credito (4) | | | 60,228 | | | |
| | 15,843,815 | | | Cemex Venezuela SACA-I (1)(4) | | | 1,423,938 | | | |
| | 2,797,674 | | | Mercantil Servicios Financieros-Class B (4) | | | 10,978,214 | | | |
| | 2,847,910 | | | Siderurgica Venezolana Sivensa (4)(10) | | | 3,136,306 | | | |
| | | | | | | | | | | | | |
| | | | | | | | | | 15,712,433 | | | |
| | | | | | | | | | | | | |
| | | | | | | | | | | | | |
| | | | | Indonesia—0.1% | | | | | | |
| | 20,739,500 | | | Indofood CBP Sukses Makmur (1) | | | 13,226,870 | | | |
| | | | | | | | | | | | | |
| | | | | | | | | | | | | |
| | | | | Spain—0.1% | | | | | | |
| | 476,958 | | | Amadeus IT-Class A (1) | | | 9,701,895 | | | |
| | | | | | | | | | | | | |
| | | | | | | | | | | | | |
See Notes to Financial Statements
| | |
| 94 | Artio Global Funds ï 2010 Annual Report | |
| |
| PORTFOLIO OF INVESTMENTS (Continued) | October 31, 2010 |
Artio International Equity Fund
| | | | | | | | | | | | | |
Share
| | | | | | | Fair
| | | |
| Amount | | | Description | | | | Value (Note 2) | | | |
COMMON STOCKS—Continued |
| | | | | | | | | | | | | |
| | | | | Kenya—0.1% | | | | | | |
| | 130,837,686 | | | Safaricom Ltd | | $ | 7,858,362 | | | |
| | | | | | | | | | | | | |
| | | | | | | | | | | | | |
| | | | | Zambia—0.1% | | | | | | |
| | 9,363,990 | | | Zambeef Products (1)(10) | | | 7,450,917 | | | |
| | | | | | | | | | | | | |
| | | | | | | | | | | | | |
| | | | | Latvia—0.0% | | | | | | |
| | 1,424,182 | | | AS Parex Banka (1)(4)(12) | | | 2,789,232 | | | |
| | | | | | | | | | | | | |
| | | | | | | | | | | | | |
| | | | | Croatia—0.0% | | | | | | |
| | 10,188 | | | FIMA Validus (1) | | | 19,291 | | | |
| | | | | | | | | | | | | |
| | | | | TOTAL COMMON STOCKS (Cost $7,827,187,519) | | | 8,931,961,287 | | | |
| | | | | | | | | | | | | |
| | | | | | | | | | | | | |
| | | | | | | | | | | | | |
EXCHANGE-TRADED FUNDS—2.6% |
| | | | | Multinational—2.3% | | | | | | |
| | 3,823,717 | | | Market Vectors Gold Miners ETF (3) | | | 218,907,798 | | | |
| | | | | | | | | | | | | |
| | | | | | | | | | | | | |
| | | | | Australia—0.1% | | | | | | |
| | 6,527,159 | | | Australian Infrastructure Fund (3) | | | 12,635,894 | | | |
| | | | | | | | | | | | | |
| | | | | | | | | | | | | |
| | | | | Romania—0.1% | | | | | | |
| | 4,035,500 | | | SIF 1 Banat Crisana Arad | | | 1,511,596 | | | |
| | 3,406,316 | | | SIF 2 Moldova Bacau | | | 1,386,869 | | | |
| | 9,533,500 | | | SIF 3 Transilvania Brasov | | | 1,816,555 | | | |
| | 4,871,855 | | | SIF 4 Muntenia Bucuresti | | | 1,079,055 | | | |
| | 4,143,975 | | | SIF 5 Oltenia Craiova | | | 1,984,152 | | | |
| | | | | | | | | | | | | |
| | | | | | | | | | 7,778,227 | | | |
| | | | | | | | | | | | | |
| | | | | | | | | | | | | |
| | | | | Sweden—0.1% | | | | | | |
| | 1,485,000 | | | NAXS Nordic Access Buyout Fund (1)(10) | | | 7,109,714 | | | |
| | | | | | | | | | | | | |
| | | | | | | | | | | | | |
| | | | | Russia—0.0% | | | | | | |
| | 92,634 | | | Renaissance Pre-IPO Fund (1)(4) | | | 1,389,510 | | | |
| | | | | | | | | | | | | |
| | | | | TOTAL EXCHANGE-TRADED FUNDS (Cost $226,349,008) | | | 247,821,143 | | | |
| | | | | | | | | | | | | |
| | | | | | | | | | | | | |
| | | | | | | | | | | | | |
EQUITY LINKED NOTES—2.1% |
| | | | | Taiwan—1.2% | | | | | | |
| | 6,550 | | | ACER Inc, Issued by CLSA, Expires 01/04/2011 (9) | | | 18,995 | | | |
| | 122,044 | | | Hon Hai Precision Industry, Issued by Deutsche Bank AG London, Expires 08/06/2018 (9) | | | 462,290 | | | |
| | 5,119,332 | | | HTC Corp, Issued by Citigroup, Expires 01/20/2015 (9) | | | 115,164,493 | | | |
| | | | | | | | | | | | | |
| | | | | | | | | | 115,645,778 | | | |
| | | | | | | | | | | | | |
| | | | | | | | | | | | | |
See Notes to Financial Statements
| | |
| Artio Global Funds ï 2010 Annual Report | 95 |
| |
| PORTFOLIO OF INVESTMENTS (Continued) | October 31, 2010 |
Artio International Equity Fund
| | | | | | | | | | | | | |
Share
| | | | | | | Fair
| | | |
| Amount | | | Description | | | | Value (Note 2) | | | |
EQUITY LINKED NOTES—Continued |
| | | | | | | | | | | | | |
| | | | | India—0.7% | | | | | | |
| | 758,256 | | | Axis Bank, Issued by Merrill Lynch International, Expires 03/16/2015 (9) | | $ | 25,033,139 | | | |
| | 11,142 | | | Future Mall Management, Issued by Merrill Lynch International, Expires 09/17/2015 (1)(9) | | | — | | | |
| | 927,665 | | | Larsen & Toubro, Issued by CLSA, Expires 04/11/2011 (9) | | | 42,343,733 | | | |
| | 222,850 | | | Pantaloon Retail, Issued by Merrill Lynch International, Expires 01/29/2015 (9) | | | 2,355,658 | | | |
| | | | | | | | | | | | | |
| | | | | | | | | | 69,732,530 | | | |
| | | | | | | | | | | | | |
| | | | | | | | | | | | | |
| | | | | Serbia—0.2% | | | | | | |
| | 1 | | | AIK Banka, Issued by KBC Financial Products, Expires 12/31/2040 (1) | | | 5,045,854 | | | |
| | 1 | | | AIK Banka, KomerciJalna Banka, Univerzal Banka, Issued by UnicreditoSerbian Banking, Expires 12/31/2040 (1) | | | 11,751,501 | | | |
| | | | | | | | | | | | | |
| | | | | | | | | | 16,797,355 | | | |
| | | | | | | | | | | | | |
| | | | | | | | | | | | | |
| | | | | Ukraine—0.0% | | | | | | |
| | 1,016 | | | Laona Investments, Issued by UniCredit Bank Austria, Expires 11/16/2010 (1)(4)(12) | | | 529,552 | | | |
| | | | | | | | | | | | | |
| | | | | TOTAL EQUITY LINKED NOTES (Cost $133,023,160) | | | 202,705,215 | | | |
| | | | | | | | | | | | | |
| | | | | | | | | | | | | |
| | | | | | | | | | | | | |
PREFERRED STOCKS—1.1% |
| | | | | Germany—0.8% | | | | | | |
| | 323,760 | | | Henkel AG
1.240% | | | 19,070,753 | | | |
| | 70,637 | | | Porsche Automobil Holding
0.140% | | | 3,614,438 | | | |
| | 375,101 | | | Volkswagen AG
1.570% | | | 56,306,128 | | | |
| | | | | | | | | | | | | |
| | | | | | | | | | 78,991,319 | | | |
| | | | | | | | | | | | | |
| | | | | | | | | | | | | |
| | | | | Russia—0.2% | | | | | | |
| | 20,525 | | | Silvinit
6.170% (4) | | | 6,957,975 | | | |
| | 3,611,690 | | | TNK-BP Holding
18.550% | | | 6,591,334 | | | |
| | | | | | | | | | | | | |
| | | | | | | | | | 13,549,309 | | | |
| | | | | | | | | | | | | |
| | | | | | | | | | | | | |
See Notes to Financial Statements
| | |
| 96 | Artio Global Funds ï 2010 Annual Report | |
| |
| PORTFOLIO OF INVESTMENTS (Continued) | October 31, 2010 |
Artio International Equity Fund
| | | | | | | | | | | | | |
Share
| | | | | | | Fair
| | | |
| Amount | | | Description | | | | Value (Note 2) | | | |
PREFERRED STOCKS—Continued |
| | | | | | | | | | | | | |
| | | | | Bulgaria—0.1% | | | | | | |
| | 6,416,021 | | | Chimimport AD
9.000% (10) | | $ | 10,984,761 | | | |
| | | | | | | | | | | | | |
| | | | | | | | | | | | | |
| | | | | Philippines—0.0% | | | | | | |
| | 11,528,247 | | | Ayala Land
0.000% (4)(12) | | | 26,797 | | | |
| | | | | | | | | | | | | |
| | | | | TOTAL PREFERRED STOCKS (Cost $76,533,172) | | | 103,552,186 | | | |
| | | | | | | | | | | | | |
| | | | | | | | | | | | | |
| | | | | | | | | | | | | |
FOREIGN GOVERNMENT COMPENSATION NOTES—0.1% |
| | | | | Bulgaria—0.1% | | | | | | |
| | 12,071,674 | | | Bulgaria Compensation Notes (1) | | | 1,389,570 | | | |
| | 29,663,486 | | | Bulgaria Compensation Vouchers (1) | | | 4,721,370 | | | |
| | 3,842,865 | | | Bulgaria Housing Compensation Notes (1)(4) | | | 423,238 | | | |
| | | | | | | | | | | | | |
| | | | | TOTAL FOREIGN GOVERNMENT COMPENSATION NOTES (Cost $19,710,351) | | | 6,534,178 | | | |
| | | | | | | | | | | | | |
| | | | | | | | | | | | | |
| | | | | | | | | | | | | |
| | | | | | | | | | | | | | | | | |
Share
| | | | | | | | | | | | | |
| Amount | | | Currency | | | | | | | | | | |
INVESTMENT COLLATERAL FROM SECURITY LENDING—3.4% |
| | | | | | | | | United States—3.4% | | | | | | |
| | 323,390,282 | | | | USD | | | State Street Navigator Securities Lending Prime Portfolio (Cost $323,390,282) | | | 323,390,282 | | | |
| | | | | | | | | | | | | | | | | |
| | | | | | | | | TOTAL INVESTMENTS—103.5% (Cost $8,606,193,492) | | | 9,815,964,291 | | | |
| | | | | | | | | OTHER ASSETS AND LIABILITIES—(3.5)% | | | (333,019,466 | ) | | |
| | | | | | | | | | | | | | | | | |
| | | | | | | | | TOTAL NET ASSETS—100.0% | | $ | 9,482,944,825 | | | |
| | | | | | | | | | | | | | | | | |
Notes to the Portfolio of Investments.
| | | |
Aggregate cost for federal income tax purposes was $8,841,913,140. | | |
See Notes to Financial Statements
| | |
| Artio Global Funds ï 2010 Annual Report | 97 |
| |
| SCHEDULE OF FORWARD FOREIGN EXCHANGE CONTRACTS | October 31, 2010 |
Artio International Equity Fund
FORWARD FOREIGN EXCHANGE CONTRACTS TO BUY
| | | | | | | | | | | | | | | | | | | | | |
| | | | | Contracts to Receive | | | | Net Unrealized
|
Expiration
| | | | Local
| | Value in
| | In Exchange
| | Appreciation
|
| Date | | Counterparty | | Currency | | USD | | for USD | | (Depreciation) |
| 12/08/10 | | Credit Suisse | | CZK | | | 1,399,464,006 | | | | 78,884,732 | | | | 73,145,139 | | | $ | 5,739,593 | |
| 12/08/10 | | Deutsche Bank | | CZK | | | 283,637,744 | | | | 15,988,040 | | | | 14,720,453 | | | | 1,267,587 | |
| 12/15/10 | | Credit Suisse | | CZK | | | 938,275,256 | | | | 52,884,531 | | | | 48,630,114 | | | | 4,254,417 | |
| 12/15/10 | | JPMorgan Chase Bank N.A. | | CZK | | | 380,896,782 | | | | 21,468,697 | | | | 19,720,768 | | | | 1,747,929 | |
| 12/16/10 | | Credit Suisse | | CZK | | | 1,526,167,310 | | | | 86,019,290 | | | | 79,100,125 | | | | 6,919,165 | |
| 12/16/10 | | Deutsche Bank | | CZK | | | 1,503,348,848 | | | | 84,733,174 | | | | 77,917,461 | | | | 6,815,713 | |
| 12/15/10 | | Credit Suise | | EUR | | | 140,773,026 | | | | 195,553,800 | | | | 191,495,048 | | | | 4,058,752 | |
| 12/16/10 | | Credit Suisse | | EUR | | | 86,962,880 | | | | 120,802,179 | | | | 105,316,224 | | | | 15,485,955 | |
| 12/16/10 | | Morgan Stanley | | EUR | | | 314,702,833 | | | | 437,161,096 | | | | 392,918,480 | | | | 44,242,616 | |
| 12/16/10 | | Credit Suisse | | GBP | | | 9,777,906 | | | | 15,627,629 | | | | 14,862,417 | | | | 765,212 | |
| 12/16/10 | | State Street Bank & Trust | | GBP | | | 32,183,537 | | | | 51,437,638 | | | | 49,532,565 | | | | 1,905,073 | |
| 12/15/10 | | Deutsche Bank | | JPY | | | 7,263,461,801 | | | | 90,208,067 | | | | 86,057,935 | | | | 4,150,132 | |
| 12/15/10 | | JPMorgan Chase Bank N.A. | | JPY | | | 15,685,533,796 | | | | 194,805,413 | | | | 187,631,332 | | | | 7,174,081 | |
| 12/15/10 | | JPMorgan Chase Bank N.A. | | ZAR | | | 8,257,094 | | | | 1,179,062 | | | | 1,192,016 | | | | (12,954 | ) |
| | | | | | | | | | | | | | | | | | | | | |
| Net unrealized appreciation on forward foreign exchange contracts to buy | | $ | 104,513,271 | |
| | | | | | | | | | | | | | | | | | | | | |
FORWARD FOREIGN EXCHANGE CONTRACTS TO SELL
| | | | | | | | | | | | | | | | | | | | | |
| | | | | Contracts to Deliver | | | | |
Expiration
| | | | Local
| | Value in
| | In Exchange
| | Net Unrealized
|
| Date | | Counterparty | | Currency | | USD | | for USD | | Depreciation |
| 12/08/10 | | Credit Suisse | | CZK | | | 1,399,464,006 | | | | 78,884,732 | | | | 65,106,793 | | | $ | (13,777,939 | ) |
| 12/08/10 | | Deutsche Bank | | CZK | | | 283,637,744 | | | | 15,988,041 | | | | 13,021,598 | | | | (2,966,443 | ) |
| 12/15/10 | | Credit Suisse | | CZK | | | 938,275,256 | | | | 52,884,531 | | | | 44,882,815 | | | | (8,001,716 | ) |
| 12/15/10 | | JPMorgan Chase Bank N.A. | | CZK | | | 380,896,782 | | | | 21,468,698 | | | | 18,229,087 | | | | (3,239,611 | ) |
| 12/16/10 | | Credit Suisse | | CZK | | | 1,526,167,310 | | | | 86,019,291 | | | | 72,653,788 | | | | (13,365,503 | ) |
| 12/16/10 | | Deutsche Bank | | CZK | | | 1,503,348,849 | | | | 84,733,174 | | | | 69,020,432 | | | | (15,712,742 | ) |
| 12/15/10 | | Credit Suisse | | EUR | | | 140,773,025 | | | | 195,553,799 | | | | 183,758,913 | | | | (11,794,886 | ) |
| 12/16/10 | | Credit Suisse | | EUR | | | 86,962,880 | | | | 120,802,179 | | | | 104,455,827 | | | | (16,346,352 | ) |
| 12/16/10 | | Morgan Stanley | | EUR | | | 314,702,832 | | | | 437,161,096 | | | | 376,795,275 | | | | (60,365,821 | ) |
See Notes to Financial Statements
| | |
| 98 | Artio Global Funds ï 2010 Annual Report | |
| |
| SCHEDULE OF FORWARD FOREIGN EXCHANGE CONTRACTS (Continued) | October 31, 2010 |
Artio International Equity Fund
| | | | | | | | | | | | | | | | | | | | | |
| | | | | Contracts to Deliver | | | | |
Expiration
| | | | Local
| | Value in
| | In Exchange
| | Net Unrealized
|
| Date | | Counterparty | | Currency | | USD | | for USD | | Depreciation |
| 12/16/10 | | Credit Suisse | | GBP | | | 9,777,906 | | | | 15,627,629 | | | | 14,089,669 | | | $ | (1,537,960 | ) |
| 12/16/10 | | State Street Bank & Trust | | GBP | | | 32,183,537 | | | | 51,437,638 | | | | 46,276,708 | | | | (5,160,930 | ) |
| 12/15/10 | | Deutsche Bank | | JPY | | | 7,263,461,801 | | | | 90,208,066 | | | | 85,216,292 | | | | (4,991,774 | ) |
| 12/15/10 | | JPMorgan Chase Bank N.A. | | JPY | | | 7,952,820,297 | | | | 98,769,507 | | | | 97,210,264 | | | | (1,559,243 | ) |
| | | | | | | | | | | | | | | | | | | | | |
| Net unrealized depreciation on forward foreign exchange contracts to sell | | $ | (158,820,920 | ) |
| | | | | | | | | | | | | | | | | | | | | |
Glossary of Currencies
| | | |
CZK | | — Czech Koruna |
EUR | | — Euro |
GBP | | — Great British Pound |
JPY | | — Japanese Yen |
USD | | — United States Dollar |
ZAR | | — South African Rand |
See Notes to Financial Statements
| | |
| Artio Global Funds ï 2010 Annual Report | 99 |
| |
| PORTFOLIO OF INVESTMENTS-Industry Sector (Unaudited) | October 31, 2010 |
Artio International Equity Fund
At October 31, 2010, sector diversification of the Fund’s investments was as follows:
| | | | | | | | | |
| | | % of Net
| | Fair
|
| | | Assets | | Value (Note 2) |
INDUSTRY SECTOR | | | | | | | | |
| Financials | | | 18.9 | % | | $ | 1,792,455,871 | |
| Consumer Staples | | | 16.7 | | | | 1,585,679,957 | |
| Materials | | | 16.1 | | | | 1,522,564,776 | |
| Industrials | | | 16.0 | | | | 1,520,755,593 | |
| Consumer Discretionary | | | 14.2 | | | | 1,347,156,521 | |
| Health Care | | | 7.5 | | | | 711,868,731 | |
| Information Technology | | | 3.6 | | | | 340,155,568 | |
| Energy | | | 3.4 | | | | 323,357,682 | |
| Telecommunication Services | | | 2.7 | | | | 257,077,609 | |
| Utilities | | | 1.0 | | | | 91,501,701 | |
| Short-term Investment | | | 3.4 | | | | 323,390,282 | |
| | | | | | | | | |
Total Investments | | | 103.5 | | | | 9,815,964,291 | |
Other Assets and Liabilities (Net) | | | (3.5 | ) | | | (333,019,466 | ) |
| | | | | | | | | |
Net Assets | | | 100.0 | % | | $ | 9,482,944,825 | |
| | | | | | | | | |
See Notes to Financial Statements
| | |
| 100 | Artio Global Funds ï 2010 Annual Report | |
| |
| PORTFOLIO OF INVESTMENTS | October 31, 2010 |
Artio International Equity Fund II
| | | | | | | | | | | | | |
Share
| | | | | | | Fair
| | | |
| Amount | | | Description | | | | Value (Note 2) | | | |
COMMON STOCKS—94.3%† |
| | | | | United Kingdom—16.8% | | | | | | |
| | 592,455 | | | Anglo American | | $ | 27,545,077 | | | |
| | 6,501,181 | | | ARM Holdings | | | 37,761,729 | | | |
| | 14,949,760 | | | Barclays PLC | | | 65,634,014 | | | |
| | 2,917,123 | | | BG Group | | | 56,689,668 | | | |
| | 2,917,746 | | | BHP Billiton | | | 103,257,408 | | | |
| | 802,980 | | | Burberry Group | | | 13,081,969 | | | |
| | 2,223,446 | | | Cairn Energy (1) | | | 13,718,151 | | | |
| | 4,659,824 | | | Compass Group | | | 38,107,404 | | | |
| | 1,230,591 | | | Diageo PLC | | | 22,665,245 | | | |
| | 2,666,540 | | | GlaxoSmithKline PLC | | | 52,054,464 | | | |
| | 4,855,699 | | | HSBC Holdings | | | 50,391,534 | | | |
| | 1,593,054 | | | Imperial Tobacco | | | 50,914,033 | | | |
| | 92,317,167 | | | Lloyds Banking (1) | | | 101,753,172 | | | |
| | 349,827 | | | Lonmin PLC (1) | | | 9,782,218 | | | |
| | 1,297,966 | | | Reckitt Benckiser | | | 72,444,826 | | | |
| | 3,735,856 | | | Rio Tinto | | | 241,065,741 | | | |
| | 3,778,097 | | | Rolls-Royce Group (1) | | | 39,111,735 | | | |
| | 241,798,208 | | | Rolls-Royce Group-Class C (1)(4) | | | 386,587 | | | |
| | 48,419,155 | | | Royal Bank of Scotland (1) | | | 34,533,742 | | | |
| | 1,926,359 | | | Royal Dutch Shell-Class A | | | 62,398,030 | | | |
| | 718,187 | | | SABMiller PLC | | | 23,234,587 | | | |
| | 34,985,934 | | | Vodafone Group | | | 95,006,481 | | | |
| | 3,680,226 | | | William Morrison Supermarkets | | | 17,287,034 | | | |
| | 3,478,050 | | | WPP PLC | | | 40,370,735 | | | |
| | 8,125,033 | | | Xstrata PLC | | | 157,117,738 | | | |
| | | | | | | | | | | | | |
| | | | | | | | | | 1,426,313,322 | | | |
| | | | | | | | | | | | | |
| | | | | | | | | | | | | |
| | | | | Japan—8.4% | | | | | | |
| | 425,148 | | | Aisin Seiki | | | 13,337,666 | | | |
| | 2,010,000 | | | Asahi Glass | | | 19,289,013 | | | |
| | 882,164 | | | Canon Inc | | | 40,740,535 | | | |
| | 451,900 | | | Daikin Industries | | | 15,714,114 | | | |
| | 384,349 | | | Denso Corp | | | 11,952,753 | | | |
| | 333,040 | | | Fanuc Ltd | | | 48,167,796 | | | |
| | 2,419,932 | | | Honda Motor | | | 88,235,137 | | | |
| | 7,639,000 | | | Isuzu Motors | | | 29,399,007 | | | |
| | 3,042,888 | | | ITOCHU Corp | | | 26,670,129 | | | |
| | 1,913,830 | | | Komatsu Ltd | | | 46,853,790 | | | |
| | 1,637,638 | | | Mitsubishi Corp | | | 39,339,907 | | | |
| | 2,404,000 | | | Mitsubishi Electric | | | 22,532,837 | | | |
See Notes to Financial Statements
| | |
| Artio Global Funds ï 2010 Annual Report | 101 |
| |
| PORTFOLIO OF INVESTMENTS (Continued) | October 31, 2010 |
Artio International Equity Fund II
| | | | | | | | | | | | | |
Share
| | | | | | | Fair
| | | |
| Amount | | | Description | | | | Value (Note 2) | | | |
COMMON STOCKS—Continued |
| | | | | Japan—Continued | | | | | | |
| | | | | | | | | | | | | |
| | 695,814 | | | Nidec Corp (3) | | $ | 68,760,763 | | | |
| | 3,321,600 | | | Nissan Motor | | | 29,277,914 | | | |
| | 5,550 | | | NTT DoCoMo | | | 9,336,127 | | | |
| | 659,000 | | | Ricoh Co | | | 9,212,092 | | | |
| | 1,077,100 | | | Shiseido Co | | | 22,491,399 | | | |
| | 161,700 | | | SMC Corp | | | 24,691,620 | | | |
| | 973,800 | | | Softbank Corp | | | 31,311,508 | | | |
| | 1,734,200 | | | Suzuki Motor | | | 42,262,379 | | | |
| | 603,094 | | | Toyota Motor | | | 21,405,906 | | | |
| | 1,511,100 | | | Unicharm Corp (3) | | | 57,686,313 | | | |
| | | | | | | | | | | | | |
| | | | | | | | | | 718,668,705 | | | |
| | | | | | | | | | | | | |
| | | | | | | | | | | | | |
| | | | | China—7.9% | | | | | | |
| | 2,942,000 | | | Anhui Conch Cement-Class H | | | 12,333,759 | | | |
| | 483,979 | | | Baidu Inc Sponsored ADR (1) | | | 53,242,530 | | | |
| | 22,261,675 | | | Belle International | | | 39,972,978 | | | |
| | 50,834,000 | | | China Construction Bank-Class H | | | 48,458,297 | | | |
| | 8,055,912 | | | China Merchants Holdings International | | | 28,213,306 | | | |
| | 5,584,000 | | | China National Building Material-Class H | | | 13,628,121 | | | |
| | 25,204,000 | | | China Overseas Land & Investment (3) | | | 52,928,953 | | | |
| | 24,030,000 | | | China Resources Enterprise | | | 100,896,057 | | | |
| | 14,163,000 | | | China Yurun Food | | | 54,808,250 | | | |
| | 655,512 | | | Ctrip.com International Sponsored ADR (1) | | | 34,132,510 | | | |
| | 1,097,400 | | | Dongfang Electric-Class H | | | 5,329,658 | | | |
| | 14,106,000 | | | Dongfeng Motor Group-Class H | | | 30,532,704 | | | |
| | 39,215,000 | | | Geely Automobile | | | 22,156,225 | | | |
| | 10,005,534 | | | Golden Eagle Retail | | | 26,458,399 | | | |
| | 2,828,000 | | | Hengan International | | | 26,775,950 | | | |
| | 11,109,000 | | | Intime Department Store | | | 17,052,629 | | | |
| | 2,048,000 | | | Lianhua Supermarket-Class H | | | 8,717,929 | | | |
| | 3,166,000 | | | Sany Heavy Equipment International Holdings | | | 4,533,184 | | | |
| | 3,004,000 | | | Shandong Weigao Group Medical Polymer-Class H (3) | | | 7,866,207 | | | |
| | 3,754,000 | | | Sinopharm Group-Class H (3) | | | 14,696,787 | | | |
| | 4,817,500 | | | Sinotruk Hong Kong | | | 5,549,356 | | | |
| | 14,802,801 | | | Tingyi (Cayman Islands) Holding (3) | | | 40,289,862 | | | |
| | 455,000 | | | Weichai Power-Class H | | | 5,945,526 | | | |
| | 6,335,000 | | | Wumart Stores-Class H (3) | | | 14,856,275 | | | |
| | | | | | | | | | | | | |
| | | | | | | | | | 669,375,452 | | | |
| | | | | | | | | | | | | |
| | | | | | | | | | | | | |
See Notes to Financial Statements
| | |
| 102 | Artio Global Funds ï 2010 Annual Report | |
| |
| PORTFOLIO OF INVESTMENTS (Continued) | October 31, 2010 |
Artio International Equity Fund II
| | | | | | | | | | | | | |
Share
| | | | | | | Fair
| | | |
| Amount | | | Description | | | | Value (Note 2) | | | |
COMMON STOCKS—Continued |
| | | | | | | | | | | | | |
| | | | | Germany—6.7% | | | | | | |
| | 193,642 | | | Bayer AG | | $ | 14,431,453 | | | |
| | 217,610 | | | Beiersdorf AG | | | 14,157,976 | | | |
| | 220,110 | | | Bilfinger Berger | | | 16,009,368 | | | |
| | 514,758 | | | BMW AG | | | 36,853,466 | | | |
| | 154,559 | | | Continental AG (1) | | | 13,409,166 | | | |
| | 1,440,103 | | | Daimler AG (1) | | | 94,935,877 | | | |
| | 309,106 | | | Deutsche Boerse | | | 21,721,919 | | | |
| | 2,423,702 | | | Fraport AG | | | 153,545,549 | | | |
| | 861,399 | | | Fresenius SE | | | 75,918,183 | | | |
| | 313,364 | | | HeidelbergCement AG | | | 16,369,950 | | | |
| | 107,337 | | | Henkel AG | | | 5,323,765 | | | |
| | 648,633 | | | MAN SE | | | 71,221,287 | | | |
| | 162,167 | | | Metro AG | | | 11,350,942 | | | |
| | 201,553 | | | Siemens AG | | | 22,993,776 | | | |
| | | | | | | | | | | | | |
| | | | | | | | | | 568,242,677 | | | |
| | | | | | | | | | | | | |
| | | | | | | | | | | | | |
| | | | | Russia—6.4% | | | | | | |
| | 217,083,846 | | | IDGC Holding (1) | | | 38,640,925 | | | |
| | 16,023 | | | Inter Rao UES Sponsored GDR (1)(9) | | | 238,743 | | | |
| | 166,249 | | | Magnit OJSC | | | 19,243,322 | | | |
| | 1,457,910 | | | Magnit OJSC Sponsored GDR | | | 38,984,513 | | | |
| | 455,000 | | | NovaTek OAO | | | 3,658,320 | | | |
| | 115,150 | | | NovaTek OAO Sponsored GDR | | | 11,014,097 | | | |
| | 790,558 | | | Novorossiysk Sea Trade Port Sponsored GDR | | | 7,075,494 | | | |
| | 847 | | | OGK2 OAO Sponsored GDR (1)(9) | | | 4,488 | | | |
| | 1,926,855 | | | OGK5 OJSC Sponsored GDR (1) | | | 2,273,775 | | | |
| | 490,008 | | | Pharmstandard (1) | | | 43,120,704 | | | |
| | 2,365,054 | | | Pharmstandard Sponsored GDR (1) | | | 61,491,404 | | | |
| | 174,984 | | | Quadra Power Generation Sponsored GDR (9) | | | 453,661 | | | |
| | 28,443,591 | | | RAO Energy System of East (1)(4) | | | 356,996 | | | |
| | 3,030,368 | | | Rosneft Oil Sponsored GDR (1)(3) | | | 21,121,665 | | | |
| | 51,232,713 | | | Sberbank of Russian Federation | | | 169,785,211 | | | |
| | 16,355 | | | TGK14 JSC Sponsored GDR (1)(9) | | | 66,783 | | | |
| | 11,522,828 | | | VTB Bank Sponsored GDR | | | 76,281,121 | | | |
| | 1,205,688 | | | X 5 Retail Sponsored GDR (1) | | | 50,518,327 | | | |
| | | | | | | | | | | | | |
| | | | | | | | | | 544,329,549 | | | |
| | | | | | | | | | | | | |
| | | | | | | | | | | | | |
| | | | | France—5.9% | | | | | | |
| | 247,767 | | | Aeroports de Paris | | | 21,016,990 | | | |
| | 857,155 | | | BNP Paribas | | | 62,605,973 | | | |
See Notes to Financial Statements
| | |
| Artio Global Funds ï 2010 Annual Report | 103 |
| |
| PORTFOLIO OF INVESTMENTS (Continued) | October 31, 2010 |
Artio International Equity Fund II
| | | | | | | | | | | | | |
Share
| | | | | | | Fair
| | | |
| Amount | | | Description | | | | Value (Note 2) | | | |
COMMON STOCKS—Continued |
| | | | | France—Continued | | | | | | |
| | | | | | | | | | | | | |
| | 565,836 | | | Carrefour SA | | $ | 30,498,752 | | | |
| | 637,597 | | | CFAO SA | | | 28,296,249 | | | |
| | 904,192 | | | Danone SA | | | 57,150,108 | | | |
| | 649,659 | | | Essilor International | | | 43,324,084 | | | |
| | 649,364 | | | European Aeronautic Defence & Space (1)(3) | | | 17,044,681 | | | |
| | 600,641 | | | Eutelsat Communications | | | 22,527,920 | | | |
| | 96,306 | | | Iliad SA (3) | | | 10,828,930 | | | |
| | 7,636,729 | | | L’ Occitane International (1) | | | 22,657,117 | | | |
| | 484,378 | | | LVMH | | | 75,806,508 | | | |
| | 167,638 | | | PPR | | | 27,447,415 | | | |
| | 182,044 | | | Schneider Electric | | | 25,808,349 | | | |
| | 913,588 | | | SES SA FDR | | | 23,383,300 | | | |
| | 222,635 | | | Sodexo | | | 14,469,437 | | | |
| | 180,920 | | | Technip SA | | | 15,185,717 | | | |
| | | | | | | | | | | | | |
| | | | | | | | | | 498,051,530 | | | |
| | | | | | | | | | | | | |
| | | | | | | | | | | | | |
| | | | | India—5.0% | | | | | | |
| | 4,877,899 | | | Adani Enterprises | | | 77,903,643 | | | |
| | 229,596 | | | Asian Paints | | | 13,837,778 | | | |
| | 10,601,572 | | | Dabur India | | | 23,744,658 | | | |
| | 865,899 | | | HDFC Bank | | | 44,211,039 | | | |
| | 1,436,719 | | | Housing Development Finance | | | 22,208,102 | | | |
| | 9,486,877 | | | ITC Ltd | | | 36,303,187 | | | |
| | 1,389,066 | | | JSW Steel | | | 41,961,206 | | | |
| | 1,159,354 | | | Larsen & Toubro | | | 52,715,703 | | | |
| | 7,377,325 | | | Mundra Port & Special Economic Zone | | | 25,274,707 | | | |
| | 1,200,625 | | | Reliance Capital | | | 21,974,748 | | | |
| | 708,535 | | | State Bank of India | | | 50,351,041 | | | |
| | 471,309 | | | United Spirits | | | 15,828,768 | | | |
| | | | | | | | | | | | | |
| | | | | | | | | | 426,314,580 | | | |
| | | | | | | | | | | | | |
| | | | | | | | | | | | | |
| | | | | Canada—4.9% | | | | | | |
| | 177,602 | | | Agnico-Eagle Mines (3) | | | 13,805,344 | | | |
| | 3,059,621 | | | Barrick Gold (3) | | | 147,689,253 | | | |
| | 119,684 | | | Canadian Pacific Railway | | | 7,818,978 | | | |
| | 291,197 | | | First Quantum Minerals | | | 25,557,001 | | | |
| | 1,016,686 | | | Goldcorp Inc | | | 45,499,096 | | | |
| | 339,989 | | | IAMGOLD Corp | | | 6,217,763 | | | |
| | 1,495,498 | | | Ivanhoe Mines (1) | | | 35,888,425 | | | |
| | 573,090 | | | Kinross Gold (3) | | | 10,334,317 | | | |
See Notes to Financial Statements
| | |
| 104 | Artio Global Funds ï 2010 Annual Report | |
| |
| PORTFOLIO OF INVESTMENTS (Continued) | October 31, 2010 |
Artio International Equity Fund II
| | | | | | | | | | | | | |
Share
| | | | | | | Fair
| | | |
| Amount | | | Description | | | | Value (Note 2) | | | |
COMMON STOCKS—Continued |
| | | | | Canada—Continued | | | | | | |
| | | | | | | | | | | | | |
| | 166,301 | | | Potash Corp of Saskatchewan | | $ | 24,105,147 | | | |
| | 2,148,506 | | | Silver Wheaton (1) | | | 61,904,674 | | | |
| | 912,974 | | | Teck Resources-Class B | | | 40,911,571 | | | |
| | | | | | | | | | | | | |
| | | | | | | | | | 419,731,569 | | | |
| | | | | | | | | | | | | |
| | | | | | | | | | | | | |
| | | | | Switzerland—4.8% | | | | | | |
| | 1,554,658 | | | ABB Ltd (1) | | | 32,215,486 | | | |
| | 495,891 | | | Dufry Group (1) | | | 57,631,257 | | | |
| | 74,643 | | | Flughafen Zuerich | | | 27,531,010 | | | |
| | 1,683,777 | | | Nestle SA | | | 92,278,170 | | | |
| | 1,293,375 | | | Nobel Biocare | | | 21,396,249 | | | |
| | 988,066 | | | Novartis AG | | | 57,314,861 | | | |
| | 79,584 | | | Swatch Group | | | 30,433,698 | | | |
| | 596,888 | | | Swiss Reinsurance | | | 28,706,459 | | | |
| | 100,355 | | | Syngenta AG | | | 27,774,917 | | | |
| | 2,002,087 | | | UBS AG (1) | | | 33,914,356 | | | |
| | | | | | | | | | | | | |
| | | | | | | | | | 409,196,463 | | | |
| | | | | | | | | | | | | |
| | | | | | | | | | | | | |
| | | | | Hong Kong—3.3% | | | | | | |
| | 467,000 | | | Galaxy Entertainment (1) | | | 438,548 | | | |
| | 30,815,000 | | | Hang Lung Properties (3) | | | 150,253,086 | | | |
| | 1,182,900 | | | Hong Kong Exchanges & Clearing | | | 26,031,338 | | | |
| | 11,384,000 | | | Li & Fung (3) | | | 59,986,894 | | | |
| | 15,114,800 | | | Sands China (1)(3) | | | 32,833,254 | | | |
| | 2,321,000 | | | SJM Holdings | | | 3,449,031 | | | |
| | 4,096,400 | | | Wynn Macau (1)(3) | | | 9,056,963 | | | |
| | | | | | | | | | | | | |
| | | | | | | | | | 282,049,114 | | | |
| | | | | | | | | | | | | |
| | | | | | | | | | | | | |
| | | | | Netherlands—3.0% | | | | | | |
| | 141,056 | | | ASML Holding | | | 4,648,436 | | | |
| | 606,169 | | | Heineken NV | | | 30,684,380 | | | |
| | 5,056,086 | | | ING Groep Dutch Certificate (1) | | | 53,900,588 | | | |
| | 2,361,162 | | | Koninklijke (Royal) KPN | | | 39,381,361 | | | |
| | 706,097 | | | Koninklijke Philips Electronics | | | 21,325,920 | | | |
| | 3,505,492 | | | Unilever NV Dutch Certificate | | | 103,804,028 | | | |
| | | | | | | | | | | | | |
| | | | | | | | | | 253,744,713 | | | |
| | | | | | | | | | | | | |
| | | | | | | | | | | | | |
| | | | | South Africa—2.7% | | | | | | |
| | 4,083,457 | | | Aspen Pharmacare (1) | | | 54,880,047 | | | |
| | 5,713,880 | | | Shoprite Holdings (3) | | | 81,325,906 | | | |
| | 4,365,836 | | | Standard Bank | | | 64,825,013 | | | |
See Notes to Financial Statements
| | |
| Artio Global Funds ï 2010 Annual Report | 105 |
| |
| PORTFOLIO OF INVESTMENTS (Continued) | October 31, 2010 |
Artio International Equity Fund II
| | | | | | | | | | | | | |
Share
| | | | | | | Fair
| | | |
| Amount | | | Description | | | | Value (Note 2) | | | |
COMMON STOCKS—Continued |
| | | | | South Africa—Continued | | | | | | |
| | | | | | | | | | | | | |
| | 1,199,072 | | | Tiger Brands | | $ | 32,371,437 | | | |
| | | | | | | | | | | | | |
| | | | | | | | | | 233,402,403 | | | |
| | | | | | | | | | | | | |
| | | | | | | | | | | | | |
| | | | | Brazil—2.2% | | | | | | |
| | 3,470,461 | | | All America Latina Logistica | | | 33,095,841 | | | |
| | 1,069,309 | | | Amil Participacoes | | | 10,903,277 | | | |
| | 2,849,254 | | | Diagnosticos da America (1) | | | 35,266,162 | | | |
| | 4,910,155 | | | Hypermarcas SA (1) | | | 81,032,824 | | | |
| | 565,246 | | | Souza Cruz | | | 29,121,005 | | | |
| | | | | | | | | | | | | |
| | | | | | | | | | 189,419,109 | | | |
| | | | | | | | | | | | | |
| | | | | | | | | | | | | |
| | | | | Australia—1.9% | | | | | | |
| | 1,092,820 | | | Aquarius Platinum (3) | | | 6,287,839 | | | |
| | 7,205,315 | | | Asciano Group (1) | | | 11,053,046 | | | |
| | 22,833,082 | | | MAp Group | | | 68,262,008 | | | |
| | 1,977,698 | | | Newcrest Mining | | | 77,464,039 | | | |
| | | | | | | | | | | | | |
| | | | | | | | | | 163,066,932 | | | |
| | | | | | | | | | | | | |
| | | | | | | | | | | | | |
| | | | | Denmark—1.7% | | | | | | |
| | 467,973 | | | Carlsberg AS-Class B | | | 51,117,420 | | | |
| | 746,160 | | | Novo Nordisk-Class B | | | 78,444,334 | | | |
| | 263,306 | | | Pandora AS (1) | | | 12,760,997 | | | |
| | | | | | | | | | | | | |
| | | | | | | | | | 142,322,751 | | | |
| | | | | | | | | | | | | |
| | | | | | | | | | | | | |
| | | | | Sweden—1.5% | | | | | | |
| | 923,808 | | | Atlas Copco-Class A | | | 19,234,805 | | | |
| | 474,691 | | | Elekta AB-Class B | | | 17,898,174 | | | |
| | 822,549 | | | Hennes & Mauritz-Class B | | | 28,879,448 | | | |
| | 202,341 | | | Swedish Match | | | 5,634,415 | | | |
| | 4,055,937 | | | Volvo AB-Class B (1) | | | 54,716,766 | | | |
| | | | | | | | | | | | | |
| | | | | | | | | | 126,363,608 | | | |
| | | | | | | | | | | | | |
| | | | | | | | | | | | | |
| | | | | Finland—1.3% | | | | | | |
| | 830,258 | | | Fortum Oyj | | | 23,506,490 | | | |
| | 370,334 | | | Kesko Oyj-Class B | | | 18,334,589 | | | |
| | 3,275,421 | | | Stora Enso-Class R (3) | | | 32,504,915 | | | |
| | 2,108,536 | | | UPM-Kymmene Oyj | | | 35,021,328 | | | |
| | | | | | | | | | | | | |
| | | | | | | | | | 109,367,322 | | | |
| | | | | | | | | | | | | |
| | | | | | | | | | | | | |
| | | | | Czech Republic—1.2% | | | | | | |
| | 456,746 | | | Komercni Banka | | | 103,416,035 | | | |
| | | | | | | | | | | | | |
| | | | | | | | | | | | | |
See Notes to Financial Statements
| | |
| 106 | Artio Global Funds ï 2010 Annual Report | |
| |
| PORTFOLIO OF INVESTMENTS (Continued) | October 31, 2010 |
Artio International Equity Fund II
| | | | | | | | | | | | | |
Share
| | | | | | | Fair
| | | |
| Amount | | | Description | | | | Value (Note 2) | | | |
COMMON STOCKS—Continued |
| | | | | | | | | | | | | |
| | | | | Mexico—1.1% | | | | | | |
| | 1,220,152 | | | Fomento Economico Mexicano Sponsored ADR | | $ | 66,998,547 | | | |
| | 993,390 | | | Fomento Economico Mexicano (Unit) (3) | | | 5,466,968 | | | |
| | 5,750,970 | | | Grupo Financiero Banorte (3) | | | 24,625,140 | | | |
| | | | | | | | | | | | | |
| | | | | | | | | | 97,090,655 | | | |
| | | | | | | | | | | | | |
| | | | | | | | | | | | | |
| | | | | Austria—1.1% | | | | | | |
| | 2,010,587 | | | Erste Group Bank (3) | | | 90,626,145 | | | |
| | 1,400 | | | Flughafen Wien | | | 86,727 | | | |
| | 239,286 | | | Wienerberger AG (1)(3) | | | 4,024,263 | | | |
| | | | | | | | | | | | | |
| | | | | | | | | | 94,737,135 | | | |
| | | | | | | | | | | | | |
| | | | | | | | | | | | | |
| | | | | South Korea—0.9% | | | | | | |
| | 345,732 | | | Celltrion Inc (1) | | | 7,650,501 | | | |
| | 481,747 | | | Hyundai Motor | | | 72,781,151 | | | |
| | | | | | | | | | | | | |
| | | | | | | | | | 80,431,652 | | | |
| | | | | | | | | | | | | |
| | | | | | | | | | | | | |
| | | | | Ireland—0.7% | | | | | | |
| | 6,049,203 | | | Dragon Oil (1) | | | 42,747,885 | | | |
| | 2,667,674 | | | Ryanair Holdings | | | 15,320,635 | | | |
| | | | | | | | | | | | | |
| | | | | | | | | | 58,068,520 | | | |
| | | | | | | | | | | | | |
| | | | | | | | | | | | | |
| | | | | Singapore—0.7% | | | | | | |
| | 17,312,000 | | | CapitaLand Ltd (3) | | | 52,032,977 | | | |
| | 2,441,000 | | | Genting Singapore (1) | | | 4,092,694 | | | |
| | | | | | | | | | | | | |
| | | | | | | | | | 56,125,671 | | | |
| | | | | | | | | | | | | |
| | | | | | | | | | | | | |
| | | | | Taiwan—0.6% | | | | | | |
| | 1,650 | | | Acer Inc | | | 4,790 | | | |
| | 2,373,000 | | | HTC Corp | | | 53,548,749 | | | |
| | | | | | | | | | | | | |
| | | | | | | | | | 53,553,539 | | | |
| | | | | | | | | | | | | |
| | | | | | | | | | | | | |
| | | | | Israel—0.5% | | | | | | |
| | 813,834 | | | Teva Pharmaceutical Industries Sponsored ADR | | | 42,237,985 | | | |
| | | | | | | | | | | | | |
| | | | | | | | | | | | | |
| | | | | Greece—0.5% | | | | | | |
| | 1,602,715 | | | Coca-Cola Hellenic Bottling | | | 41,433,625 | | | |
| | | | | | | | | | | | | |
| | | | | | | | | | | | | |
| | | | | Romania—0.5% | | | | | | |
| | 1,663,581 | | | BRD-Groupe Societe Generale | | | 6,719,022 | | | |
| | 305,148,699 | | | OMV Petrom (1) | | | 33,097,574 | | | |
| | | | | | | | | | | | | |
| | | | | | | | | | 39,816,596 | | | |
| | | | | | | | | | | | | |
| | | | | | | | | | | | | |
See Notes to Financial Statements
| | |
| Artio Global Funds ï 2010 Annual Report | 107 |
| |
| PORTFOLIO OF INVESTMENTS (Continued) | October 31, 2010 |
Artio International Equity Fund II
| | | | | | | | | | | | | |
Share
| | | | | | | Fair
| | | |
| Amount | | | Description | | | | Value (Note 2) | | | |
COMMON STOCKS—Continued |
| | | | | | | | | | | | | |
| | | | | Norway—0.5% | | | | | | |
| | 1,302,490 | | | DnB NOR | | $ | 17,782,037 | | | |
| | 21,107,643 | | | Marine Harvest (3) | | | 20,859,976 | | | |
| | | | | | | | | | | | | |
| | | | | | | | | | 38,642,013 | | | |
| | | | | | | | | | | | | |
| | | | | | | | | | | | | |
| | | | | Nigeria—0.3% | | | | | | |
| | 53,635,434 | | | Nigerian Breweries | | | 27,208,957 | | | |
| | | | | | | | | | | | | |
| | | | | | | | | | | | | |
| | | | | Italy—0.3% | | | | | | |
| | 615,193 | | | Buzzi Unicem (3) | | | 7,054,220 | | | |
| | 391,456 | | | Saipem SpA | | | 17,372,630 | | | |
| | | | | | | | | | | | | |
| | | | | | | | | | 24,426,850 | | | |
| | | | | | | | | | | | | |
| | | | | | | | | | | | | |
| | | | | Ukraine—0.3% | | | | | | |
| | 110,904,020 | | | Raiffeisen Bank Aval (1) | | | 5,746,084 | | | |
| | 39,541 | | | Ukrnafta | | | 1,457,172 | | | |
| | 26,941 | | | Ukrnafta Sponsored ADR | | | 6,038,647 | | | |
| | 13,114,606 | | | Ukrsotsbank JSCB (1) | | | 706,704 | | | |
| | 92,477,349 | | | UkrTelecom (1) | | | 5,991,834 | | | |
| | 627,195 | | | UkrTelecom Sponsored GDR (1) | | | 2,031,481 | | | |
| | | | | | | | | | | | | |
| | | | | | | | | | 21,971,922 | | | |
| | | | | | | | | | | | | |
| | | | | | | | | | | | | |
| | | | | Portugal—0.2% | | | | | | |
| | 1,325,134 | | | Jeronimo Martins | | | 19,854,651 | | | |
| | | | | | | | | | | | | |
| | | | | | | | | | | | | |
| | | | | Lebanon—0.2% | | | | | | |
| | 897,219 | | | SOLIDERE Sponsored GDR (9) | | | 16,688,273 | | | |
| | | | | | | | | | | | | |
| | | | | | | | | | | | | |
| | | | | Indonesia—0.1% | | | | | | |
| | 18,638,500 | | | Indofood CBP Sukses Makmur (1) | | | 11,886,931 | | | |
| | | | | | | | | | | | | |
| | | | | | | | | | | | | |
| | | | | Spain—0.1% | | | | | | |
| | 430,855 | | | Amadeus IT-Class A (1) | | | 8,764,105 | | | |
| | | | | | | | | | | | | |
| | | | | | | | | | | | | |
| | | | | Kenya—0.1% | | | | | | |
| | 141,439,984 | | | Safaricom Ltd | | | 8,495,157 | | | |
| | | | | | | | | | | | | |
| | | | | TOTAL COMMON STOCKS (Cost $6,784,526,108) | | | 8,024,810,071 | | | |
| | | | | | | | | | | | | |
| | | | | | | | | | | | | |
| | | | | | | | | | | | | |
EXCHANGE-TRADED FUND—2.4% |
| | | | | Multinational—2.4% | | | | | | |
| | 3,609,210 | | | Market Vectors Gold Miners ETF (3)(Cost $174,522,533) | | | 206,627,273 | | | |
| | | | | | | | | | | | | |
| | | | | | | | | | | | | |
| | | | | | | | | | | | | |
See Notes to Financial Statements
| | |
| 108 | Artio Global Funds ï 2010 Annual Report | |
| |
| PORTFOLIO OF INVESTMENTS (Continued) | October 31, 2010 |
Artio International Equity Fund II
| | | | | | | | | | | | | |
Share
| | | | | | | Fair
| | | |
| Amount | | | Description | | | | Value (Note 2) | | | |
EQUITY LINKED NOTES—2.3% |
| | | | | Taiwan—1.4% | | | | | | |
| | 6,296 | | | ACER Inc, Issued by CLSA, Expires 01/04/2011 (9) | | $ | 18,258 | | | |
| | 106,786 | | | Hon Hai Precision Industry, Issued by Deutsche Bank AG London, Expires 08/06/2018 (9) | | | 404,495 | | | |
| | 5,048,988 | | | HTC Corp, Issued by Citigroup, Expires 01/20/2015 (9) | | | 113,582,034 | | | |
| | | | | | | | | | | | | |
| | | | | | | | | | 114,004,787 | | | |
| | | | | | | | | | | | | |
| | | | | | | | | | | | | |
| | | | | India—0.9% | | | | | | |
| | 998,165 | | | Axis Bank, Issued by Merrill Lynch International, Expires 03/16/2015 (9) | | | 32,953,519 | | | |
| | 978,745 | | | Larsen & Toubro, Issued by CLSA, Expires 04/11/2011 (9) | | | 44,675,305 | | | |
| | | | | | | | | | | | | |
| | | | | | | | | | 77,628,824 | | | |
| | | | | | | | | | | | | |
| | | | | | | | | | | | | |
| | | | | TOTAL EQUITY LINKED NOTES (Cost $117,163,505) | | | 191,633,611 | | | |
| | | | | | | | | | | | | |
| | | | | | | | | | | | | |
| | | | | | | | | | | | | |
PREFERRED STOCKS—0.9% |
| | | | | Germany—0.8% | | | | | | |
| | 336,893 | | | Henkel AG
1.240% | | | 19,844,339 | | | |
| | 63,558 | | | Porsche Automobil Holding
0.140% | | | 3,252,211 | | | |
| | 339,736 | | | Volkswagen AG
1.570% | | | 50,997,515 | | | |
| | | | | | | | | | | | | |
| | | | | | | | | | 74,094,065 | | | |
| | | | | | | | | | | | | |
| | | | | | | | | | | | | |
| | | | | Russia—0.1% | | | | | | |
| | 1,885 | | | Silvinit
6.170% (4) | | | 639,015 | | | |
| | 2,521,889 | | | TNK-BP Holding
18.550% | | | 4,602,447 | | | |
| | | | | | | | | | | | | |
| | | | | | | | | | 5,241,462 | | | |
| | | | | | | | | | | | | |
| | | | | | | | | | | | | |
| | | | | Philippines—0.0% | | | | | | |
| | 8,687,023 | | | Ayala Land
0.000% (4)(12) | | | 20,193 | | | |
| | | | | | | | | | | | | |
| | | | | TOTAL PREFERRED STOCKS (Cost $58,717,824) | | | 79,355,720 | | | |
| | | | | | | | | | | | | |
| | | | | | | | | | | | | |
| | | | | | | | | | | | | |
See Notes to Financial Statements
| | |
| Artio Global Funds ï 2010 Annual Report | 109 |
| |
| PORTFOLIO OF INVESTMENTS (Continued) | October 31, 2010 |
Artio International Equity Fund II
| | | | | | | | | | | | | | | | | |
Share
| | | | | | | | | | Fair
| | | |
| Amount | | | Currency | | | Description | | | | Value (Note 2) | | | |
INVESTMENT COLLATERAL FROM SECURITY LENDING—2.9% |
| | | | | | | | | United States—2.9% | | | | | | |
| | 244,252,923 | | | | USD | | | State Street Navigator Securities Lending Prime Portfolio (Cost $244,252,923) | | $ | 244,252,923 | | | |
| | | | | | | | | | | | | | | | | |
| | | | | | | | | TOTAL INVESTMENTS—102.8% (Cost $7,379,182,893) | | | 8,746,679,598 | | | |
| | | | | | | | | OTHER ASSETS AND LIABILITIES—(2.8)% | | | (235,402,381 | ) | | |
| | | | | | | | | | | | | | | | | |
| | | | | | | | | TOTAL NET ASSETS—100.0% | | $ | 8,511,277,217 | | | |
| | | | | | | | | | | | | | | | | |
Notes to the Portfolio of Investments.
| | | |
Aggregate cost for federal income tax purposes was $7,558,383,953. | | |
See Notes to Financial Statements
| | |
| 110 | Artio Global Funds ï 2010 Annual Report | |
| |
| SCHEDULE OF FORWARD FOREIGN EXCHANGE CONTRACTS | October 31, 2010 |
Artio International Equity Fund II
FORWARD FOREIGN EXCHANGE CONTRACTS TO BUY
| | | | | | | | | | | | | | | | | | | | | |
| | | | | Contracts to Receive | | | | Net Unrealized
|
Expiration
| | | | Local
| | Value in
| | In Exchange
| | Appreciation
|
| Date | | Counterparty | | Currency | | USD | | for USD | | (Depreciation) |
| 12/08/10 | | Credit Suisse | | CZK | | | 1,138,154,892 | | | | 64,155,307 | | | | 59,487,416 | | | $ | 4,667,891 | |
| 12/08/10 | | Deutsche Bank AG | | CZK | | | 230,676,662 | | | | 13,002,740 | | | | 11,971,838 | | | | 1,030,902 | |
| 12/15/10 | | Credit Suisse | | CZK | | | 808,174,744 | | | | 45,551,604 | | | | 41,887,101 | | | | 3,664,503 | |
| 12/16/10 | | Credit Suisse | | CZK | | | 1,179,322,556 | | | | 66,470,097 | | | | 61,123,418 | | | | 5,346,679 | |
| 12/16/10 | | Deutsche Bank AG | | CZK | | | 1,183,559,894 | | | | 66,708,926 | | | | 61,343,036 | | | | 5,365,890 | |
| 12/15/10 | | Credit Suisse | | EUR | | | 157,671,664 | | | | 219,028,417 | | | | 215,569,630 | | | | 3,458,787 | |
| 12/16/10 | | Credit Suisse | | EUR | | | 70,482,786 | | | | 97,909,294 | | | | 85,457,192 | | | | 12,452,102 | |
| 12/16/10 | | Morgan Stanley | | EUR | | | 302,307,603 | | | | 419,942,591 | | | | 379,671,452 | | | | 40,271,139 | |
| 12/16/10 | | Credit Suisse | | GBP | | | 11,160,164 | | | | 17,836,836 | | | | 16,840,018 | | | | 996,818 | |
| 12/16/10 | | State Street Bank & Trust | | GBP | | | 30,380,683 | | | | 48,556,209 | | | | 46,565,020 | | | | 1,991,189 | |
| 12/15/10 | | Deutsche Bank AG | | JPY | | | 6,422,769,613 | | | | 79,767,148 | | | | 76,097,363 | | | | 3,669,785 | |
| 12/15/10 | | JPMorgan Chase Bank N.A. | | JPY | | | 14,147,746,994 | | | | 175,706,975 | | | | 169,236,521 | | | | 6,470,454 | |
| 12/15/10 | | JPMorgan Chase Bank N.A. | | ZAR | | | 9,506,463 | | | | 1,357,463 | | | | 1,372,378 | | | | (14,915 | ) |
| | | | | | | | | | | | | | | | | | | | | |
| Net unrealized appreciation on forward foreign exchange contracts to buy | | $ | 89,371,224 | |
| | | | | | | | | | | | | | | | | | | | | |
FORWARD FOREIGN EXCHANGE CONTRACTS TO SELL
| | | | | | | | | | | | | | | | | | | | | |
| | | | | Contracts to Deliver | | | | |
Expiration
| | | | Local
| | Value in
| | In Exchange
| | Net Unrealized
|
| Date | | Counterparty | | Currency | | USD | | for USD | | Depreciation |
| 12/08/10 | | Credit Suisse | | CZK | | | 1,138,154,892 | | | | 64,155,307 | | | | 52,949,997 | | | $ | (11,205,310 | ) |
| 12/08/10 | | Deutsche Bank AG | | CZK | | | 230,676,662 | | | | 13,002,740 | | | | 10,590,194 | | | | (2,412,546 | ) |
| 12/15/10 | | Credit Suisse | | CZK | | | 808,174,744 | | | | 45,551,604 | | | | 38,659,400 | | | | (6,892,204 | ) |
| 12/16/10 | | Credit Suisse | | CZK | | | 1,179,322,555 | | | | 66,470,097 | | | | 56,142,693 | | | | (10,327,404 | ) |
| 12/16/10 | | Deutsche Bank AG | | CZK | | | 1,183,559,895 | | | | 66,708,926 | | | | 54,333,837 | | | | (12,375,089 | ) |
| 12/15/10 | | Credit Suisse | | EUR | | | 125,805,992 | | | | 174,762,457 | | | | 164,221,607 | | | | (10,540,850 | ) |
| 12/16/10 | | Credit Suisse | | EUR | | | 70,482,786 | | | | 97,909,293 | | | | 84,660,693 | | | | (13,248,600 | ) |
| 12/16/10 | | Morgan Stanley | | EUR | | | 302,307,603 | | | | 419,942,591 | | | | 361,954,404 | | | | (57,988,187 | ) |
| 12/16/10 | | Credit Suisse | | GBP | | | 11,160,164 | | | | 17,836,836 | | | | 16,081,461 | | | | (1,755,375 | ) |
| 12/16/10 | | State Street Bank & Trust | | GBP | | | 30,380,683 | | | | 48,556,210 | | | | 43,684,384 | | | | (4,871,826 | ) |
| 12/15/10 | | Deutsche Bank AG | | JPY | | | 6,422,769,613 | | | | 79,767,147 | | | | 75,353,134 | | | | (4,414,013 | ) |
See Notes to Financial Statements
| | |
| Artio Global Funds ï 2010 Annual Report | 111 |
| |
| SCHEDULE OF FORWARD FOREIGN EXCHANGE CONTRACTS (Continued) | October 31, 2010 |
Artio International Equity Fund II
| | | | | | | | | | | | | | | | | | | | | |
| | | | | Contracts to Deliver | | | | |
Expiration
| | | | Local
| | Value in
| | In Exchange
| | Net Unrealized
|
| Date | | Counterparty | | Currency | | USD | | for USD | | Depreciation |
| 12/15/10 | | JPMorgan Chase Bank N.A. | | JPY | | | 7,194,289,212 | | | | 89,348,982 | | | | 87,938,458 | | | $ | (1,410,524 | ) |
| 12/15/10 | | JPMorgan Chase Bank N.A. | | ZAR | | | 9,506,463 | | | | 1,357,463 | | | | 1,334,521 | | | | (22,942 | ) |
| | | | | | | | | | | | | | | | | | | | | |
| Net unrealized depreciation on forward foreign exchange contracts to sell | | $ | (137,464,870 | ) |
| | | | | | | | | | | | | | | | | | | | | |
Glossary of Currencies
| | | |
CZK | | — Czech Koruna |
EUR | | — Euro |
GBP | | — British Pound Sterling |
JPY | | — Japanese Yen |
USD | | — United States Dollar |
ZAR | | — South African Rand |
See Notes to Financial Statements
| | |
| 112 | Artio Global Funds ï 2010 Annual Report | |
| |
| PORTFOLIO OF INVESTMENTS-Industry Sector (Unaudited) | October 31, 2010 |
Artio International Equity Fund II
At October 31, 2010, sector diversification of the Fund’s investments was as follows:
| | | | | | | | | |
| | | % of Net
| | Fair
|
| | | Assets | | Value (Note 2) |
INDUSTRY SECTOR | | | | | | | | |
| Consumer Staples | | | 18.3 | % | | $ | 1,555,430,246 | |
| Financials | | | 18.1 | | | | 1,542,689,112 | |
| Materials | | | 16.9 | | | | 1,442,185,133 | |
| Industrials | | | 14.4 | | | | 1,231,059,658 | |
| Consumer Discretionary | | | 14.4 | | | | 1,224,116,431 | |
| Health Care | | | 7.4 | | | | 627,991,599 | |
| Information Technology | | | 3.8 | | | | 321,927,753 | |
| Energy | | | 3.4 | | | | 289,102,003 | |
| Telecommunication Services | | | 2.4 | | | | 202,382,879 | |
| Utilities | | | 0.8 | | | | 65,541,861 | |
| Short-term Investment | | | 2.9 | | | | 244,252,923 | |
| | | | | | | | | |
Total Investments | | | 102.8 | | | | 8,746,679,598 | |
Other Assets and Liabilities (Net) | | | (2.8 | ) | | | (235,402,381 | ) |
| | | | | | | | | |
Net Assets | | | 100.0 | % | | $ | 8,511,277,217 | |
| | | | | | | | | |
See Notes to Financial Statements
| | |
| Artio Global Funds ï 2010 Annual Report | 113 |
| |
| PORTFOLIO OF INVESTMENTS | October 31, 2010 |
Artio Total Return Bond Fund
| | | | | | | | | | | | | | | | | |
Face
| | | | | | | | | | | | | |
| Value | | | Currency | | | | | | | | | | |
ASSET BACKED SECURITIES—33.1%† |
| | | | | | | | | United States—33.1% | | | | | | |
| | | | | | | | | Banc of America Alternative Loan Trust
Series 2004-10, Class 2CB1 | | | | | | |
| | 1,365,249 | | | | USD | | | 6.000% due 11/25/2034 (5) | | $ | 1,400,480 | | | |
| | | | | | | | | | | | | | | | | |
| | | | | | | | | | | | | | | | | |
| | | | | | | | | Banc of America Commercial Mortgage | | | | | | |
| | | | | | | | | Series 2006-3, Class A4 | | | | | | |
| | 8,064,000 | | | | USD | | | 5.889% due 07/10/2044 (5)(6) | | | 8,844,031 | | | |
| | | | | | | | | Series 2006-2, Class A4 | | | | | | |
| | 7,885,000 | | | | USD | | | 5.740% due 05/10/2045 (5)(6) | | | 8,800,813 | | | |
| | | | | | | | | Series 2006-5, Class A4 | | | | | | |
| | 6,340,000 | | | | USD | | | 5.414% due 09/10/2047 (5) | | | 6,785,053 | | | |
| | | | | | | | | | | | | | | | | |
| | | | | | | | | | | | | | 24,429,897 | | | |
| | | | | | | | | | | | | | | | | |
| | | | | | | | | | | | | | | | | |
| | | | | | | | | Banc of America Mortgage Securities
Series 2004-7, Class 2A3 | | | | | | |
| | 1,568,402 | | | | USD | | | 5.750% due 08/25/2034 (5) | | | 1,571,000 | | | |
| | | | | | | | | | | | | | | | | |
| | | | | | | | | | | | | | | | | |
| | | | | | | | | Bank of America Credit Card Trust | | | | | | |
| | | | | | | | | Series 2008-A1, Class A1 | | | | | | |
| | 1,818,000 | | | | USD | | | 0.836% due 04/15/2013 (5)(6) | | | 1,818,386 | | | |
| | | | | | | | | Series 2007-A2, Class A2 | | | | | | |
| | 1,890,000 | | | | USD | | | 0.276% due 06/17/2013 (5)(6) | | | 1,889,525 | | | |
| | | | | | | | | | | | | | | | | |
| | | | | | | | | | | | | | 3,707,911 | | | |
| | | | | | | | | | | | | | | | | |
| | | | | | | | | | | | | | | | | |
| | | | | | | | | Bear Stearns Adjustable Rate Mortgage Trust
Series 2004-3, Class 4A | | | | | | |
| | 3,655,575 | | | | USD | | | 4.866% due 07/25/2034 (5)(6) | | | 3,547,155 | | | |
| | | | | | | | | | | | | | | | | |
| | | | | | | | | | | | | | | | | |
| | | | | | | | | Bear Stearns Commercial Mortgage Securities | | | | | | |
| | | | | | | | | Series 2001-TOP4, Class A3 | | | | | | |
| | 3,600,000 | | | | USD | | | 5.610% due 11/15/2033 (5) | | | 3,685,527 | | | |
| | | | | | | | | Series 2006-PW12, Class A4 | | | | | | |
| | 2,755,000 | | | | USD | | | 5.723% due 09/11/2038 (5)(6) | | | 3,086,010 | | | |
| | | | | | | | | Series 2006-PW14, Class A4 | | | | | | |
| | 3,205,000 | | | | USD | | | 5.201% due 12/11/2038 (5) | | | 3,481,297 | | | |
| | | | | | | | | Series 2006-PW11, Class A4 | | | | | | |
| | 11,140,000 | | | | USD | | | 5.623% due 03/11/2039 (5)(6) | | | 12,291,222 | | | |
| | | | | | | | | Series 2005-PWR8, Class A4 | | | | | | |
| | 8,210,000 | | | | USD | | | 4.674% due 06/11/2041 (5) | | | 8,774,936 | | | |
See Notes to Financial Statements
| | |
| 114 | Artio Global Funds ï 2010 Annual Report | |
| |
| PORTFOLIO OF INVESTMENTS (Continued) | October 31, 2010 |
Artio Total Return Bond Fund
| | | | | | | | | | | | | | | | | |
Face
| | | | | | | | | | Fair
| | | |
| Value | | | Currency | | | Description | | | | Value (Note 2) | | | |
ASSET BACKED SECURITIES—Continued |
| | | | | | | | | United States—Continued | | | | | | |
| | | | | | | | | Bear Stearns Commercial Mortgage Securities—Continued | | | | | | |
| | | | | | | | | | | | | | | | | |
| | | | | | | | | Series 2006-T24, Class A4 | | | | | | |
| | 2,990,000 | | | | USD | | | 5.537% due 10/12/2041 (5) | | $ | 3,312,997 | | | |
| | | | | | | | | | | | | | | | | |
| | | | | | | | | | | | | | 34,631,989 | | | |
| | | | | | | | | | | | | | | | | |
| | | | | | | | | | | | | | | | | |
| | | | | | | | | Chrysler Financial Auto Securitization Trust
Series 2009-B, Class A2 | | | | | | |
| | 2,293,610 | | | | USD | | | 1.150% due 11/08/2011 (5) | | | 2,297,820 | | | |
| | | | | | | | | | | | | | | | | |
| | | | | | | | | | | | | | | | | |
| | | | | | | | | Chrysler Financial Lease Trust
Series 2010-A, Class A2 | | | | | | |
| | 4,400,426 | | | | USD | | | 1.780% due 06/15/2011 (5)(9) | | | 4,411,043 | | | |
| | | | | | | | | | | | | | | | | |
| | | | | | | | | | | | | | | | | |
| | | | | | | | | Citicorp Mortgage Securities | | | | | | |
| | | | | | | | | Series 2005-1, Class 1A1 | | | | | | |
| | 1,835,919 | | | | USD | | | 5.000% due 02/25/2035 (5) | | | 1,851,507 | | | |
| | | | | | | | | Series 2006-5, Class 1A2 | | | | | | |
| | 3,928,369 | | | | USD | | | 6.000% due 10/25/2036 (5) | | | 4,012,779 | | | |
| | | | | | | | | Series 2006-6, Class A12 | | | | | | |
| | 4,646,662 | | | | USD | | | 0.556% due 11/25/2036 (5)(6) | | | 4,341,334 | | | |
| | | | | | | | | | | | | | | | | |
| | | | | | | | | | | | | | 10,205,620 | | | |
| | | | | | | | | | | | | | | | | |
| | | | | | | | | | | | | | | | | |
| | | | | | | | | Citigroup Commercial Mortgage Trust | | | | | | |
| | | | | | | | | Series 2007-C6, Class AM | | | | | | |
| | 5,080,000 | | | | USD | | | 5.699% due 12/10/2049 (5)(6) | | | 5,024,440 | | | |
| | | | | | | | | Series 2008-C7, Class A4 | | | | | | |
| | 7,275,000 | | | | USD | | | 6.293% due 12/10/2049 (5)(6) | | | 7,903,606 | | | |
| | | | | | | | | | | | | | | | | |
| | | | | | | | | | | | | | 12,928,046 | | | |
| | | | | | | | | | | | | | | | | |
| | | | | | | | | | | | | | | | | |
| | | | | | | | | Citigroup Mortgage Loan Trust
Series 2005-4, Class A | | | | | | |
| | 6,517,479 | | | | USD | | | 5.339% due 08/25/2035 (5)(6) | | | 6,296,334 | | | |
| | | | | | | | | | | | | | | | | |
| | | | | | | | | | | | | | | | | |
| | | | | | | | | Citigroup/Deutsche Bank Commercial Mortgage Trust
Series 2007-CD4, Class A4 | | | | | | |
| | 6,660,000 | | | | USD | | | 5.322% due 12/11/2049 (5) | | | 6,959,732 | | | |
| | | | | | | | | | | | | | | | | |
| | | | | | | | | | | | | | | | | |
| | | | | | | | | CNH Equipment Trust | | | | | | |
| | | | | | | | | Series 2010-B, Class A2 | | | | | | |
| | 3,750,000 | | | | USD | | | 0.670% due 01/15/2013 | | | 3,754,298 | | | |
See Notes to Financial Statements
| | |
| Artio Global Funds ï 2010 Annual Report | 115 |
| |
| PORTFOLIO OF INVESTMENTS (Continued) | October 31, 2010 |
Artio Total Return Bond Fund
| | | | | | | | | | | | | | | | | |
Face
| | | | | | | | | | Fair
| | | |
| Value | | | Currency | | | Description | | | | Value (Note 2) | | | |
ASSET BACKED SECURITIES—Continued |
| | | | | | | | | United States—Continued | | | | | | |
| | | | | | | | | CNH Equipment Trust—Continued | | | | | | |
| | | | | | | | | | | | | | | | | |
| | | | | | | | | Series 2009-B, Class A4 | | | | | | |
| | 13,390,000 | | | | USD | | | 5.170% due 10/15/2014 (5) | | $ | 14,145,550 | | | |
| | | | | | | | | | | | | | | | | |
| | | | | | | | | | | | | | 17,899,848 | | | |
| | | | | | | | | | | | | | | | | |
| | | | | | | | | | | | | | | | | |
| | | | | | | | | Commercial Mortgage Pass Through Certificates | | | | | | |
| | | | | | | | | Series 2010-C1, Class A1 | | | | | | |
| | 2,430,000 | | | | USD | | | 1.000% due 11/10/2015 (9) | | | 2,496,066 | | | |
| | | | | | | | | Series 2007-C9, Class A4 | | | | | | |
| | 3,890,000 | | | | USD | | | 5.815% due 12/10/2049 (5)(6) | | | 4,217,853 | | | |
| | | | | | | | | | | | | | | | | |
| | | | | | | | | | | | | | 6,713,919 | | | |
| | | | | | | | | | | | | | | | | |
| | | | | | | | | | | | | | | | | |
| | | | | | | | | Countrywide Alternative Loan Trust | | | | | | |
| | | | | | | | | Series 2004-24CB, Class 2A1 | | | | | | |
| | 3,477,400 | | | | USD | | | 5.000% due 11/25/2019 (5) | | | 3,613,890 | | | |
| | | | | | | | | Series 2004-2CB, Class 1A2 | | | | | | |
| | 5,160,000 | | | | USD | | | 5.125% due 03/25/2034 (5) | | | 5,305,017 | | | |
| | | | | | | | | Series 2004-24CB, Class 1A1 | | | | | | |
| | 1,469,995 | | | | USD | | | 6.000% due 11/25/2034 (5) | | | 1,486,171 | | | |
| | | | | | | | | Series 2004-28CB, Class 3A1 | | | | | | |
| | 10,257,200 | | | | USD | | | 6.000% due 01/25/2035 (5) | | | 9,852,574 | | | |
| | | | | | | | | Series 2005-10CB, Class 1A6 | | | | | | |
| | 9,360,675 | | | | USD | | | 5.500% due 05/25/2035 | | | 9,243,110 | | | |
| | | | | | | | | Series 2005-21CB, Class A9 | | | | | | |
| | 2,939,175 | | | | USD | | | 5.500% due 06/25/2035 (5) | | | 2,913,013 | | | |
| | | | | | | | | Series 2005-86CB, Class A8 | | | | | | |
| | 5,119,099 | | | | USD | | | 5.500% due 02/25/2036 | | | 4,694,117 | | | |
| | | | | | | | | | | | | | | | | |
| | | | | | | | | | | | | | 37,107,892 | | | |
| | | | | | | | | | | | | | | | | |
| | | | | | | | | | | | | | | | | |
| | | | | | | | | Credit Suisse First Boston Mortgage Securities | | | | | | |
| | | | | | | | | Series 2004-8, Class 5A1 | | | | | | |
| | 5,110,367 | | | | USD | | | 6.000% due 11/25/2034 (5) | | | 4,905,479 | | | |
| | | | | | | | | Series 2005-9, Class 1A3 | | | | | | |
| | 1,868,883 | | | | USD | | | 5.250% due 10/25/2035 (5) | | | 1,729,685 | | | |
| | | | | | | | | | | | | | | | | |
| | | | | | | | | | | | | | 6,635,164 | | | |
| | | | | | | | | | | | | | | | | |
| | | | | | | | | | | | | | | | | |
| | | | | | | | | Credit Suisse Mortgage Capital Certificates | | | | | | |
| | | | | | | | | Series 2006-C4, Class A3 | | | | | | |
| | 7,110,000 | | | | USD | | | 5.467% due 09/15/2039 (5) | | | 7,603,253 | | | |
See Notes to Financial Statements
| | |
| 116 | Artio Global Funds ï 2010 Annual Report | |
| |
| PORTFOLIO OF INVESTMENTS (Continued) | October 31, 2010 |
Artio Total Return Bond Fund
| | | | | | | | | | | | | | | | | |
Face
| | | | | | | | | | Fair
| | | |
| Value | | | Currency | | | Description | | | | Value (Note 2) | | | |
ASSET BACKED SECURITIES—Continued |
| | | | | | | | | United States—Continued | | | | | | |
| | | | | | | | | Credit Suisse Mortgage Capital Certificates—Continued | | | | | | |
| | | | | | | | | | | | | | | | | |
| | | | | | | | | Series 2006-C5, Class A3 | | | | | | |
| | 4,640,000 | | | | USD | | | 5.311% due 12/15/2039 (5) | | $ | 4,893,429 | | | |
| | | | | | | | | | | | | | | | | |
| | | | | | | | | | | | | | 12,496,682 | | | |
| | | | | | | | | | | | | | | | | |
| | | | | | | | | | | | | | | | | |
| | | | | | | | | Daimler Chrysler Auto Trust
Series 2007-A, Class A3B | | | | | | |
| | 184,614 | | | | USD | | | 0.937% due 02/08/2012 (5)(6) | | | 184,636 | | | |
| | | | | | | | | | | | | | | | | |
| | | | | | | | | | | | | | | | | |
| | | | | | | | | FDIC Structured Sale Guaranteed Notes | | | | | | |
| | | | | | | | | Series 2010-L2A, Class A | | | | | | |
| | 4,593,424 | | | | USD | | | 3.000% due 09/30/2019 (9) | | | 4,775,029 | | | |
| | | | | | | | | Series 2010-S1, Class 2A | | | | | | |
| | 2,703,299 | | | | USD | | | 3.250% due 04/25/2038 (5)(9) | | | 2,755,549 | | | |
| | | | | | | | | Series 2010-S1, Class 2A | | | | | | |
| | 5,880,000 | | | | USD | | | 2.570% due 07/29/2047 | | | 5,880,000 | | | |
| | | | | | | | | Series 2010-S1, Class 1A | | | | | | |
| | 5,826,144 | | | | USD | | | 0.806% due 02/25/2048 (5)(6)(9) | | | 5,842,224 | | | |
| | | | | | | | | | | | | | | | | |
| | | | | | | | | | | | | | 19,252,802 | | | |
| | | | | | | | | | | | | | | | | |
| | | | | | | | | | | | | | | | | |
| | | | | | | | | FDIC Trust
Series 2010-R1, Class A | | | | | | |
| | 5,478,167 | | | | USD | | | 2.184% due 05/25/2050 (5)(9) | | | 5,515,069 | | | |
| | | | | | | | | | | | | | | | | |
| | | | | | | | | | | | | | | | | |
| | | | | | | | | First Horizon Asset Securities
Series 2006-3, Class 1A8 | | | | | | |
| | 1,249,502 | | | | USD | | | 6.250% due 11/25/2036 (5) | | | 1,241,149 | | | |
| | | | | | | | | | | | | | | | | |
| | | | | | | | | | | | | | | | | |
| | | | | | | | | Ford Credit Floorplan Master Owner Trust | | | | | | |
| | | | | | | | | Series 2006-4, Class A | | | | | | |
| | 5,560,000 | | | | USD | | | 0.506% due 06/15/2013 (5)(6) | | | 5,534,571 | | | |
| | | | | | | | | Series 2009-2, Class A | | | | | | |
| | 7,470,000 | | | | USD | | | 1.806% due 09/15/2014 (6) | | | 7,593,980 | | | |
| | | | | | | | | | | | | | | | | |
| | | | | | | | | | | | | | 13,128,551 | | | |
| | | | | | | | | | | | | | | | | |
| | | | | | | | | | | | | | | | | |
| | | | | | | | | GE Capital Commercial Mortgage | | | | | | |
| | | | | | | | | Series 2002-1A, Class A3 | | | | | | |
| | 6,025,055 | | | | USD | | | 6.269% due 12/10/2035 (5) | | | 6,348,939 | | | |
See Notes to Financial Statements
| | |
| Artio Global Funds ï 2010 Annual Report | 117 |
| |
| PORTFOLIO OF INVESTMENTS (Continued) | October 31, 2010 |
Artio Total Return Bond Fund
| | | | | | | | | | | | | | | | | |
Face
| | | | | | | | | | Fair
| | | |
| Value | | | Currency | | | Description | | | | Value (Note 2) | | | |
ASSET BACKED SECURITIES—Continued |
| | | | | | | | | United States—Continued | | | | | | |
| | | | | | | | | GE Capital Commercial Mortgage—Continued | | | | | | |
| | | | | | | | | | | | | | | | | |
| | | | | | | | | Series 2004-C3, Class A3 | | | | | | |
| | 6,910,000 | | | | USD | | | 4.865% due 07/10/2039 (5)(6) | | $ | 7,095,207 | | | |
| | | | | | | | | | | | | | | | | |
| | | | | | | | | | | | | | 13,444,146 | | | |
| | | | | | | | | | | | | | | | | |
| | | | | | | | | | | | | | | | | |
| | | | | | | | | GMAC Mortgage Corp Loan Trust
Series 2005-AR5, Class 4A1 | | | | | | |
| | 5,599,926 | | | | USD | | | 4.999% due 09/19/2035 (5)(6) | | | 5,234,623 | | | |
| | | | | | | | | | | | | | | | | |
| | | | | | | | | | | | | | | | | |
| | | | | | | | | GMAC Mortgage Servicer Advance Funding
Series 2010-1A, Class A | | | | | | |
| | 8,380,000 | | | | USD | | | 4.250% due 01/15/2022 (5)(9) | | | 8,439,100 | | | |
| | | | | | | | | | | | | | | | | |
| | | | | | | | | | | | | | | | | |
| | | | | | | | | Greenwich Capital Commercial Funding
Series 2007-GG9, Class A4 | | | | | | |
| | 4,830,000 | | | | USD | | | 5.444% due 03/10/2039 (5) | | | 5,171,744 | | | |
| | | | | | | | | | | | | | | | | |
| | | | | | | | | | | | | | | | | |
| | | | | | | | | GS Mortgage Securities | | | | | | |
| | | | | | | | | Series 2006-GG8, Class A4 | | | | | | |
| | 6,397,000 | | | | USD | | | 5.560% due 11/10/2039 (5) | | | 6,921,974 | | | |
| | | | | | | | | Series 2010-C1, Class A2 | | | | | | |
| | 5,940,000 | | | | USD | | | 4.592% due 08/10/2043 (5)(9) | | | 6,323,644 | | | |
| | | | | | | | | | | | | | | | | |
| | | | | | | | | | | | | | 13,245,618 | | | |
| | | | | | | | | | | | | | | | | |
| | | | | | | | �� | | | | | | | | | |
| | | | | | | | | GSR Mortgage Loan Trust
Series 2006-AR1, Class 3A1 | | | | | | |
| | 1,516,535 | | | | USD | | | 5.157% due 01/25/2036 (5)(6) | | | 1,344,765 | | | |
| | | | | | | | | | | | | | | | | |
| | | | | | | | | | | | | | | | | |
| | | | | | | | | Harley-Davidson Motorcycle Trust | | | | | | |
| | | | | | | | | Series 2009-2, Class A2 | | | | | | |
| | 1,679,967 | | | | USD | | | 2.000% due 07/15/2012 (5) | | | 1,682,167 | | | |
| | | | | | | | | Series 2009-4, Class A2 | | | | | | |
| | 2,909,823 | | | | USD | | | 1.160% due 10/15/2012 (5) | | | 2,914,432 | | | |
| | | | | | | | | Series 2006-2, Class A2 | | | | | | |
| | 616,704 | | | | USD | | | 5.350% due 03/15/2013 (5) | | | 625,303 | | | |
| | | | | | | | | | | | | | | | | |
| | | | | | | | | | | | | | 5,221,902 | | | |
| | | | | | | | | | | | | | | | | |
| | | | | | | | | | | | | | | | | |
| | | | | | | | | Homebanc Mortgage Trust
Series 2006-2, Class A1 | | | | | | |
| | 3,087,825 | | | | USD | | | 0.436% due 12/25/2036 (5)(6) | | | 2,272,759 | | | |
| | | | | | | | | | | | | | | | | |
| | | | | | | | | | | | | | | | | |
See Notes to Financial Statements
| | |
| 118 | Artio Global Funds ï 2010 Annual Report | |
| |
| PORTFOLIO OF INVESTMENTS (Continued) | October 31, 2010 |
Artio Total Return Bond Fund
| | | | | | | | | | | | | | | | | |
Face
| | | | | | | | | | Fair
| | | |
| Value | | | Currency | | | Description | | | | Value (Note 2) | | | |
ASSET BACKED SECURITIES—Continued |
| | | | | | | | | United States—Continued | | | | | | |
| | | | | | | | | | | | | | | | | |
| | | | | | | | | Hyundai Floorplan Master Owner Trust
Series 2009-1A, Class A | | | | | | |
| | 7,200,000 | | | | USD | | | 1.506% due 11/17/2014 (5)(6)(9) | | $ | 7,258,620 | | | |
| | | | | | | | | | | | | | | | | |
| | | | | | | | | | | | | | | | | |
| | | | | | | | | Indymac INDA Mortgage Loan Trust | | | | | | |
| | | | | | | | | Series 2005-AR2, Class 3A1 | | | | | | |
| | 6,556,734 | | | | USD | | | 4.996% due 01/25/2036 (5)(6) | | | 6,136,693 | | | |
| | | | | | | | | Series 2006-AR1, Class A1 | | | | | | |
| | 955,740 | | | | USD | | | 5.686% due 08/25/2036 (5)(6) | | | 930,198 | | | |
| | | | | | | | | | | | | | | | | |
| | | | | | | | | | | | | | 7,066,891 | | | |
| | | | | | | | | | | | | | | | | |
| | | | | | | | | | | | | | | | | |
| | | | | | | | | JP Morgan Mortgage Trust | | | | | | |
| | | | | | | | | Series 2005-A2, Class 3A2 | | | | | | |
| | 4,280,740 | | | | USD | | | 4.816% due 04/25/2035 (5)(6) | | | 4,077,430 | | | |
| | | | | | | | | Series 2007-A1, Class 2A2 | | | | | | |
| | 3,600,633 | | | | USD | | | 3.251% due 07/25/2035 (5)(6) | | | 3,422,877 | | | |
| | | | | | | | | Series 2005-A5, Class 2A2 | | | | | | |
| | 1,925,000 | | | | USD | | | 3.002% due 08/25/2035 (5)(6) | | | 1,648,471 | | | |
| | | | | | | | | Series 2005-A6, Class 4A1 | | | | | | |
| | 5,446,756 | | | | USD | | | 5.419% due 09/25/2035 (5)(6) | | | 5,250,398 | | | |
| | | | | | | | | Series 2005-A8, Class 1A1 | | | | | | |
| | 5,541,876 | | | | USD | | | 5.410% due 11/25/2035 (5)(6) | | | 5,365,542 | | | |
| | | | | | | | | Series 2006-S1, Class 2A6 | | | | | | |
| | 5,970,682 | | | | USD | | | 6.000% due 04/25/2036 (5) | | | 5,584,555 | | | |
| | | | | | | | | | | | | | | | | |
| | | | | | | | | | | | | | 25,349,273 | | | |
| | | | | | | | | | | | | | | | | |
| | | | | | | | | | | | | | | | | |
| | | | | | | | | JPMorgan Chase Commercial Mortgage Securities | | | | | | |
| | | | | | | | | Series 2002-CIB4, Class A3 | | | | | | |
| | 1,920,000 | | | | USD | | | 6.162% due 05/12/2034 (5) | | | 2,013,541 | | | |
| | | | | | | | | Series 2006-LDP9, Class A3 | | | | | | |
| | 7,110,000 | | | | USD | | | 5.336% due 05/15/2047 (5) | | | 7,494,151 | | | |
| | | | | | | | | | | | | | | | | |
| | | | | | | | | | | | | | 9,507,692 | | | |
| | | | | | | | | | | | | | | | | |
| | | | | | | | | | | | | | | | | |
| | | | | | | | | LB-UBS Commercial Mortgage Trust | | | | | | |
| | | | | | | | | Series 2002-C2, Class A4 | | | | | | |
| | 8,247,000 | | | | USD | | | 5.594% due 06/15/2031 (5) | | | 8,737,838 | | | |
| | | | | | | | | Series 2006-C7, Class A3 | | | | | | |
| | 10,640,000 | | | | USD | | | 5.347% due 11/15/2038 (5) | | | 11,422,509 | | | |
See Notes to Financial Statements
| | |
| Artio Global Funds ï 2010 Annual Report | 119 |
| |
| PORTFOLIO OF INVESTMENTS (Continued) | October 31, 2010 |
Artio Total Return Bond Fund
| | | | | | | | | | | | | | | | | |
Face
| | | | | | | | | | Fair
| | | |
| Value | | | Currency | | | Description | | | | Value (Note 2) | | | |
ASSET BACKED SECURITIES—Continued |
| | | | | | | | | United States—Continued | | | | | | |
| | | | | | | | | LB-UBS Commercial Mortgage Trust—Continued | | | | | | |
| | | | | | | | | | | | | | | | | |
| | | | | | | | | Series 2007-C1, Class A4 | | | | | | |
| | 6,720,000 | | | | USD | | | 5.424% due 02/15/2040 (5) | | $ | 7,209,881 | | | |
| | | | | | | | | | | | | | | | | |
| | | | | | | | | | | | | | 27,370,228 | | | |
| | | | | | | | | | | | | | | | | |
| | | | | | | | | | | | | | | | | |
| | | | | | | | | MASTR Adjustable Rate Mortgages Trust
Series 2006-2, Class 4A1 | | | | | | |
| | 3,127,460 | | | | USD | | | 4.968% due 02/25/2036 (5)(6) | | | 2,985,869 | | | |
| | | | | | | | | | | | | | | | | |
| | | | | | | | | | | | | | | | | |
| | | | | | | | | MASTR Alternative Loans Trust
Series 2004-10, Class 4A1 | | | | | | |
| | 2,064,785 | | | | USD | | | 6.000% due 09/25/2019 (5) | | | 2,101,060 | | | |
| | | | | | | | | | | | | | | | | |
| | | | | | | | | | | | | | | | | |
| | | | | | | | | MBNA Master Credit Card Trust
Series 2001-B, Class A | | | | | | |
| | 2,810,000 | | | | USD | | | 0.516% due 08/15/2013 (5)(6) | | | 2,811,165 | | | |
| | | | | | | | | | | | | | | | | |
| | | | | | | | | | | | | | | | | |
| | | | | | | | | Merrill Lynch/Countrywide Commercial Mortgage Trust
Series 2006-3, Class A4 | | | | | | |
| | 5,078,000 | | | | USD | | | 5.414% due 07/12/2046 (5)(6) | | | 5,432,111 | | | |
| | | | | | | | | | | | | | | | | |
| | | | | | | | | | | | | | | | | |
| | | | | | | | | MLCC Mortgage Investors | | | | | | |
| | | | | | | | | Series 2006-1, Class 2A1 | | | | | | |
| | 4,417,520 | | | | USD | | | 4.830% due 02/25/2036 (5)(6) | | | 4,090,656 | | | |
| | | | | | | | | Series 2007-2, Class 2A1 | | | | | | |
| | 3,995,923 | | | | USD | | | 5.937% due 06/25/2037 (5)(6) | | | 3,742,264 | | | |
| | | | | | | | | Series 2007-3, Class 2A2 | | | | | | |
| | 3,183,886 | | | | USD | | | 5.853% due 09/25/2037 (5)(6) | | | 2,832,605 | | | |
| | | | | | | | | | | | | | | | | |
| | | | | | | | | | | | | | 10,665,525 | | | |
| | | | | | | | | | | | | | | | | |
| | | | | | | | | | | | | | | | | |
| | | | | | | | | MMAF Equipment Finance
Series 2009-AA, Class A2 | | | | | | |
| | 3,860,872 | | | | USD | | | 1.730% due 04/16/2012 (5)(9) | | | 3,862,889 | | | |
| | | | | | | | | | | | | | | | | |
| | | | | | | | | | | | | | | | | |
| | | | | | | | | Morgan Stanley Capital I
Series 2006-T23, Class A4 | | | | | | |
| | 2,600,000 | | | | USD | | | 5.808% due 08/12/2041 (5)(6) | | | 2,933,209 | | | |
| | | | | | | | | | | | | | | | | |
| | | | | | | | | | | | | | | | | |
| | | | | | | | | Morgan Stanley Dean Witter Capital I
Series 2001-TOP3, Class A4 | | | | | | |
| | 2,753,549 | | | | USD | | | 6.390% due 07/15/2033 (5) | | | 2,819,730 | | | |
| | | | | | | | | | | | | | | | | |
| | | | | | | | | | | | | | | | | |
See Notes to Financial Statements
| | |
| 120 | Artio Global Funds ï 2010 Annual Report | |
| |
| PORTFOLIO OF INVESTMENTS (Continued) | October 31, 2010 |
Artio Total Return Bond Fund
| | | | | | | | | | | | | | | | | |
Face
| | | | | | | | | | Fair
| | | |
| Value | | | Currency | | | Description | | | | Value (Note 2) | | | |
ASSET BACKED SECURITIES—Continued |
| | | | | | | | | United States—Continued | | | | | | |
| | | | | | | | | | | | | | | | | |
| | | | | | | | | Morgan Stanley Mortgage Loan Trust
Series 2004-9, Class 1A | | | | | | |
| | 2,605,123 | | | | USD | | | 6.008% due 11/25/2034 (5)(6) | | $ | 2,636,367 | | | |
| | | | | | | | | | | | | | | | | |
| | | | | | | | | | | | | | | | | |
| | | | | | | | | Navistar Financial Dealer Note Master Trust
Series 2009-1, Class A | | | | | | |
| | 4,070,000 | | | | USD | | | 1.706% due 10/26/2015 (6)(9) | | | 4,120,895 | | | |
| | | | | | | | | | | | | | | | | |
| | | | | | | | | | | | | | | | | |
| | | | | | | | | OBP Depositor Trust
Series 2010-OBP, Class A | | | | | | |
| | 3,580,000 | | | | USD | | | 4.646% due 07/15/2045 (9) | | | 3,849,705 | | | |
| | | | | | | | | | | | | | | | | |
| | | | | | | | | | | | | | | | | |
| | | | | | | | | Residential Funding Mortgage Securities I | | | | | | |
| | | | | | | | | Series 2006-S12, Class 3A4 | | | | | | |
| | 1,843,203 | | | | USD | | | 5.750% due 12/25/2036 (5) | | | 1,825,076 | | | |
| | | | | | | | | Series 2007-S2, Class A3 | | | | | | |
| | 1,234,985 | | | | USD | | | 6.000% due 02/25/2037 (5) | | | 1,228,350 | | | |
| | | | | | | | | | | | | | | | | |
| | | | | | | | | | | | | | 3,053,426 | | | |
| | | | | | | | | | | | | | | | | |
| | | | | | | | | | | | | | | | | |
| | | | | | | | | Small Business Administration | | | | | | |
| | | | | | | | | Series 2005-P10B, Class 1 | | | | | | |
| | 6,345,553 | | | | USD | | | 4.940% due 08/10/2015 (5) | | | 6,782,537 | | | |
| | | | | | | | | Series 2006-P10A, Class 1 | | | | | | |
| | 457,434 | | | | USD | | | 5.408% due 02/10/2016 (5) | | | 499,557 | | | |
| | | | | | | | | Series 2007-P10A, Class 1 | | | | | | |
| | 4,108,406 | | | | USD | | | 5.459% due 02/10/2017 (5) | | | 4,506,151 | | | |
| | | | | | | | | | | | | | | | | |
| | | | | | | | | | | | | | 11,788,245 | | | |
| | | | | | | | | | | | | | | | | |
| | | | | | | | | | | | | | | | | |
| | | | | | | | | Structured Asset Securities
Series 2004-18H, Class A5 | | | | | | |
| | 5,320,000 | | | | USD | | | 4.750% due 10/25/2034 (5) | | | 5,135,425 | | | |
| | | | | | | | | | | | | | | | | |
| | | | | | | | | | | | | | | | | |
| | | | | | | | | Thornburg Mortgage Securities Trust
Series 2007-4, Class 3A1 | | | | | | |
| | 5,803,946 | | | | USD | | | 6.196% due 09/25/2037 (5)(6) | | | 5,707,688 | | | |
| | | | | | | | | | | | | | | | | |
| | | | | | | | | | | | | | | | | |
| | | | | | | | | Thornburg Mortgage Securities Trust Series 2
Series 2007-4, Class 2A1 | | | | | | |
| | 8,781,943 | | | | USD | | | 6.193% due 09/25/2037 (5)(6) | | | 8,434,990 | | | |
| | | | | | | | | | | | | | | | | |
| | | | | | | | | | | | | | | | | |
| | | | | | | | | TIAA Seasoned Commercial Mortgage Trust
Series 2007-C4, Class A3 | | | | | | |
| | 6,955,000 | | | | USD | | | 6.049% due 08/15/2039 (5)(6) | | | 7,762,266 | | | |
| | | | | | | | | | | | | | | | | |
| | | | | | | | | | | | | | | | | |
See Notes to Financial Statements
| | |
| Artio Global Funds ï 2010 Annual Report | 121 |
| |
| PORTFOLIO OF INVESTMENTS (Continued) | October 31, 2010 |
Artio Total Return Bond Fund
| | | | | | | | | | | | | | | | | |
Face
| | | | | | | | | | Fair
| | | |
| Value | | | Currency | | | Description | | | | Value (Note 2) | | | |
ASSET BACKED SECURITIES—Continued |
| | | | | | | | | United States—Continued | | | | | | |
| | | | | | | | | | | | | | | | | |
| | | | | | | | | Vornado DP
Series 2010-FX, Class A2 | | | | | | |
| | 2,450,000 | | | | USD | | | 4.004% due 09/13/2020 (9) | | $ | 2,485,150 | | | |
| | | | | | | | | | | | | | | | | |
| | | | | | | | | | | | | | | | | |
| | | | | | | | | Wachovia Mortgage Loan Trust
Series 2005-B, Class 3A1 | | | | | | |
| | 4,558,471 | | | | USD | | | 5.126% due 10/20/2035 (5)(6) | | | 4,381,094 | | | |
| | | | | | | | | | | | | | | | | |
| | | | | | | | | | | | | | | | | |
| | | | | | | | | WaMu Mortgage Pass Through Certificates | | | | | | |
| | | | | | | | | Series 2005-AR3, Class A1 | | | | | | |
| | 4,166,607 | | | | USD | | | 2.724% due 03/25/2035 (5)(6) | | | 3,767,882 | | | |
| | | | | | | | | Series 2005-AR5, Class A5 | | | | | | |
| | 7,430,000 | | | | USD | | | 2.705% due 05/25/2035 (5)(6) | | | 6,635,113 | | | |
| | | | | | | | | Series 2005-AR7, Class A2 | | | | | | |
| | 7,160,000 | | | | USD | | | 2.786% due 08/25/2035 (5)(6) | | | 6,664,546 | | | |
| | | | | | | | | Series 2005-AR10, Class 1A2 | | | | | | |
| | 5,595,000 | | | | USD | | | 2.772% due 09/25/2035 (5)(6) | | | 5,053,379 | | | |
| | | | | | | | | Series 2005-AR14, Class 1A1 | | | | | | |
| | 3,514,261 | | | | USD | | | 4.070% due 12/25/2035 (5)(6) | | | 3,440,441 | | | |
| | | | | | | | | | | | | | | | | |
| | | | | | | | | | | | | | 25,561,361 | | | |
| | | | | | | | | | | | | | | | | |
| | | | | | | | | | | | | | | | | |
| | | | | | | | | Wells Fargo Commercial Mortgage Trust
Series 2010-C1, Class A2 | | | | | | |
| | 4,010,000 | | | | USD | | | 4.393% due 10/15/2057 (9) | | | 4,130,067 | | | |
| | | | | | | | | | | | | | | | | |
| | | | | | | | | | | | | | | | | |
| | | | | | | | | Wells Fargo Mortgage Backed Securities
Series 2005-AR15, Class 1A1 | | | | | | |
| | 9,300,560 | | | | USD | | | 5.074% due 09/25/2035 (5)(6) | | | 8,643,191 | | | |
| | | | | | | | | | | | | | | | | |
| | | | | | | | | | | | | | | | | |
| | | | | | | | | Wells Fargo Mortgage Backed Securities Trust | | | | | | |
| | | | | | | | | Series 2005-AR13, Class 4A1 | | | | | | |
| | 5,726,901 | | | | USD | | | 5.381% due 05/25/2035 (5)(6) | | | 5,509,336 | | | |
| | | | | | | | | Series 2005-17, Class 1A1 | | | | | | |
| | 2,508,973 | | | | USD | | | 5.500% due 01/25/2036 (5) | | | 2,449,764 | | | |
| | | | | | | | | Series 2006-AR6, Class 5A1 | | | | | | |
| | 6,697,238 | | | | USD | | | 4.976% due 03/25/2036 (5)(6) | | | 6,332,540 | | | |
| | | | | | | | | Series 2006-AR6, Class 7A1 | | | | | | |
| | 7,718,298 | | | | USD | | | 5.076% due 03/25/2036 (5)(6) | | | 7,504,053 | | | |
| | | | | | | | | Series 2006-13, Class A8 | | | | | | |
| | 3,720,000 | | | | USD | | | 6.000% due 10/25/2036 (5) | | | 3,728,005 | | | |
| | | | | | | | | Series 2006-19, Class A4 | | | | | | |
| | 2,905,000 | | | | USD | | | 5.250% due 12/26/2036 (5) | | | 2,343,954 | | | |
See Notes to Financial Statements
| | |
| 122 | Artio Global Funds ï 2010 Annual Report | |
| |
| PORTFOLIO OF INVESTMENTS (Continued) | October 31, 2010 |
Artio Total Return Bond Fund
| | | | | | | | | | | | | | | | | |
Face
| | | | | | | | | | Fair
| | | |
| Value | | | Currency | | | Description | | | | Value (Note 2) | | | |
ASSET BACKED SECURITIES—Continued |
| | | | | | | | | United States—Continued | | | | | | |
| | | | | | | | | Wells Fargo Mortgage Backed Securities Trust—Continued | | | | | | |
| | | | | | | | | | | | | | | | | |
| | | | | | | | | Series 2007-13, Class A1 | | | | | | |
| | 9,234,781 | | | | USD | | | 6.000% due 09/25/2037 (5) | | $ | 9,362,669 | | | |
| | | | | | | | | Series 2007-14, Class 1A1 | | | | | | |
| | 6,629,235 | | | | USD | | | 6.000% due 10/25/2037 (5) | | | 6,146,544 | | | |
| | | | | | | | | | | | | | | | | |
| | | | | | | | | | | | | | 43,376,865 | | | |
| | | | | | | | | | | | | | | | | |
| | | | | | | | | | | | | | | | | |
| | | | | | | | | | | | | | 538,168,393 | | | |
| | | | | | | | | | | | | | | | | |
| | | | | | | | | | | | | | | | | |
| | | | | | | | | Russia—0.0% | | | | | | |
| | | | | | | | | CityMortgage MBS Finance
Series 2006-1A, Class AFL | | | | | | |
| | 628,662 | | | | USD | | | 1.856% due 09/10/2033 (5)(6)(9) | | | 474,640 | | | |
| | | | | | | | | | | | | | | | | |
| | | | | | | | | TOTAL ASSET BACKED SECURITIES (Cost $513,709,381) | | | 538,643,033 | | | |
| | | | | | | | | | | | | | | | | |
| | | | | | | | | | | | | | | | | |
| | | | | | | | | | | | | | | | | |
CORPORATE BONDS—26.5% |
| | | | | | | | | United States—14.2% | | | | | | |
| | | | | | | | | Abbott Laboratories | | | | | | |
| | 4,350,000 | | | | USD | | | 5.600% due 11/30/2017 (5) | | | 5,183,625 | | | |
| | | | | | | | | | | | | | | | | |
| | | | | | | | | | | | | | | | | |
| | | | | | | | | American Express Credit | | | | | | |
| | 3,810,000 | | | | USD | | | 2.750% due 09/15/2015 | | | 3,846,896 | | | |
| | | | | | | | | | | | | | | | | |
| | | | | | | | | | | | | | | | | |
| | | | | | | | | American Water Capital | | | | | | |
| | 5,110,000 | | | | USD | | | 6.085% due 10/15/2017 | | | 5,917,942 | | | |
| | | | | | | | | | | | | | | | | |
| | | | | | | | | | | | | | | | | |
| | | | | | | | | Anheuser-Busch Co | | | | | | |
| | 3,930,000 | | | | USD | | | 5.500% due 01/15/2018 (5) | | | 4,466,193 | | | |
| | 2,210,000 | | | | USD | | | 6.800% due 08/20/2032 (5) | | | 2,611,298 | | | |
| | | | | | | | | | | | | | | | | |
| | | | | | | | | | | | | | 7,077,491 | | | |
| | | | | | | | | | | | | | | | | |
| | | | | | | | | | | | | | | | | |
| | | | | | | | | Anheuser-Busch InBev Worldwide | | | | | | |
| | 2,180,000 | | | | USD | | | 8.000% due 11/15/2039 (9) | | | 3,045,214 | | | |
| | | | | | | | | | | | | | | | | |
| | | | | | | | | | | | | | | | | |
| | | | | | | | | Axis Specialty Finance | | | | | | |
| | 3,500,000 | | | | USD | | | 5.875% due 06/01/2020 (5) | | | 3,588,679 | | | |
| | | | | | | | | | | | | | | | | |
| | | | | | | | | | | | | | | | | |
| | | | | | | | | Berkshire Hathaway Finance | | | | | | |
| | 4,710,000 | | | | USD | | | 5.750% due 01/15/2040 (5) | | | 4,950,959 | | | |
| | | | | | | | | | | | | | | | | |
| | | | | | | | | | | | | | | | | |
| | | | | | | | | Celgene Corp | | | | | | |
| | 2,310,000 | | | | USD | | | 3.950% due 10/15/2020 | | | 2,308,981 | | | |
| | | | | | | | | | | | | | | | | |
| | | | | | | | | | | | | | | | | |
See Notes to Financial Statements
| | |
| Artio Global Funds ï 2010 Annual Report | 123 |
| |
| PORTFOLIO OF INVESTMENTS (Continued) | October 31, 2010 |
Artio Total Return Bond Fund
| | | | | | | | | | | | | | | | | |
Face
| | | | | | | | | | Fair
| | | |
| Value | | | Currency | | | Description | | | | Value (Note 2) | | | |
CORPORATE BONDS—Continued |
| | | | | | | | | United States—Continued | | | | | | |
| | | | | | | | | | | | | | | | | |
| | | | | | | | | Charles Schwab | | | | | | |
| | 3,640,000 | | | | USD | | | 4.950% due 06/01/2014 | | $ | 4,066,033 | | | |
| | | | | | | | | | | | | | | | | |
| | | | | | | | | | | | | | | | | |
| | | | | | | | | Cisco Systems | | | | | | |
| | 5,165,000 | | | | USD | | | 5.500% due 01/15/2040 (5) | | | 5,538,192 | | | |
| | | | | | | | | | | | | | | | | |
| | | | | | | | | | | | | | | | | |
| | | | | | | | | Citigroup Inc | | | | | | |
| | 6,680,000 | | | | USD | | | 6.010% due 01/15/2015 | | | 7,409,910 | | | |
| | | | | | | | | | | | | | | | | |
| | | | | | | | | | | | | | | | | |
| | | | | | | | | Coca-Cola Co | | | | | | |
| | 7,830,000 | | | | USD | | | 5.350% due 11/15/2017 (5) | | | 9,207,422 | | | |
| | | | | | | | | | | | | | | | | |
| | | | | | | | | | | | | | | | | |
| | | | | | | | | Comcast Corp | | | | | | |
| | 5,330,000 | | | | USD | | | 6.950% due 08/15/2037 (5) | | | 6,220,798 | | | |
| | | | | | | | | | | | | | | | | |
| | | | | | | | | | | | | | | | | |
| | | | | | | | | Consolidated Edison | | | | | | |
| | 6,140,000 | | | | USD | | | 5.850% due 04/01/2018 (5) | | | 7,232,834 | | | |
| | | | | | | | | | | | | | | | | |
| | | | | | | | | | | | | | | | | |
| | | | | | | | | Covidien International Finance | | | | | | |
| | 3,915,000 | | | | USD | | | 4.200% due 06/15/2020 (5) | | | 4,153,780 | | | |
| | | | | | | | | | | | | | | | | |
| | | | | | | | | | | | | | | | | |
| | | | | | | | | CSX Corp | | | | | | |
| | 10,390,000 | | | | USD | | | 5.500% due 04/15/2041 (5) | | | 10,306,402 | | | |
| | | | | | | | | | | | | | | | | |
| | | | | | | | | | | | | | | | | |
| | | | | | | | | Delmarva Power & Light | | | | | | |
| | 2,550,000 | | | | USD | | | 6.400% due 12/01/2013 (5) | | | 2,942,924 | | | |
| | | | | | | | | | | | | | | | | |
| | | | | | | | | | | | | | | | | |
| | | | | | | | | Diageo Investment | | | | | | |
| | 3,500,000 | | | | USD | | | 7.450% due 04/15/2035 | | | 4,511,850 | | | |
| | | | | | | | | | | | | | | | | |
| | | | | | | | | | | | | | | | | |
| | | | | | | | | Edison International | | | | | | |
| | 1,700,000 | | | | USD | | | 3.750% due 09/15/2017 | | | 1,757,712 | | | |
| | | | | | | | | | | | | | | | | |
| | | | | | | | | | | | | | | | | |
| | | | | | | | | General Electric Capital | | | | | | |
| | 3,440,000 | | | | USD | | | 6.000% due 08/07/2019 | | | 3,892,938 | | | |
| | | | | | | | | | | | | | | | | |
| | | | | | | | | | | | | | | | | |
| | | | | | | | | Goldman Sachs | | | | | | |
| | 6,750,000 | | | | USD | | | 5.375% due 03/15/2020 | | | 7,155,175 | | | |
| | | | | | | | | | | | | | | | | |
| | | | | | | | | | | | | | | | | |
| | | | | | | | | Goodrich Corp | | | | | | |
| | 2,220,000 | | | | USD | | | 3.600% due 02/01/2021 (5) | | | 2,209,637 | | | |
| | | | | | | | | | | | | | | | | |
| | | | | | | | | | | | | | | | | |
| | | | | | | | | Harley-Davidson Funding | | | | | | |
| | 3,600,000 | | | | USD | | | 5.750% due 12/15/2014 (9) | | | 3,882,528 | | | |
| | | | | | | | | | | | | | | | | |
| | | | | | | | | | | | | | | | | |
| | | | | | | | | Hasbro Inc | | | | | | |
| | 1,640,000 | | | | USD | | | 6.350% due 03/15/2040 (5) | | | 1,656,251 | | | |
| | | | | | | | | | | | | | | | | |
| | | | | | | | | | | | | | | | | |
See Notes to Financial Statements
| | |
| 124 | Artio Global Funds ï 2010 Annual Report | |
| |
| PORTFOLIO OF INVESTMENTS (Continued) | October 31, 2010 |
Artio Total Return Bond Fund
| | | | | | | | | | | | | | | | | |
Face
| | | | | | | | | | Fair
| | | |
| Value | | | Currency | | | Description | | | | Value (Note 2) | | | |
CORPORATE BONDS—Continued |
| | | | | | | | | United States—Continued | | | | | | |
| | | | | | | | | | | | | | | | | |
| | | | | | | | | Heinz (H.J.) Co | | | | | | |
| | 4,675,000 | | | | USD | | | 5.350% due 07/15/2013 (5) | | $ | 5,173,397 | | | |
| | | | | | | | | | | | | | | | | |
| | | | | | | | | | | | | | | | | |
| | | | | | | | | JPMorgan Chase | | | | | | |
| | 2,390,000 | | | | USD | | | 3.400% due 06/24/2015 | | | 2,501,682 | | | |
| | 6,800,000 | | | | USD | | | 4.950% due 03/25/2020 | | | 7,225,333 | | | |
| | | | | | | | | | | | | | | | | |
| | | | | | | | | | | | | | 9,727,015 | | | |
| | | | | | | | | | | | | | | | | |
| | | | | | | | | | | | | | | | | |
| | | | | | | | | Metropolitan Life Global Funding I | | | | | | |
| | 3,500,000 | | | | USD | | | 2.500% due 09/29/2015 (9) | | | 3,529,277 | | | |
| | | | | | | | | | | | | | | | | |
| | | | | | | | | | | | | | | | | |
| | | | | | | | | Morgan Stanley | | | | | | |
| | 6,450,000 | | | | USD | | | 6.000% due 05/13/2014 | | | 7,101,702 | | | |
| | 3,230,000 | | | | USD | | | 5.500% due 01/26/2020 (5) | | | 3,368,147 | | | |
| | | | | | | | | | | | | | | | | |
| | | | | | | | | | | | | | 10,469,849 | | | |
| | | | | | | | | | | | | | | | | |
| | | | | | | | | | | | | | | | | |
| | | | | | | | | National Rural Utilities Cooperative Finance | | | | | | |
| | 3,290,000 | | | | USD | | | 1.900% due 11/01/2015 | | | 3,299,847 | | | |
| | | | | | | | | | | | | | | | | |
| | | | | | | | | | | | | | | | | |
| | | | | | | | | NBC Universal | | | | | | |
| | 5,070,000 | | | | USD | | | 5.150% due 04/30/2020 (5)(9) | | | 5,512,099 | | | |
| | | | | | | | | | | | | | | | | |
| | | | | | | | | | | | | | | | | |
| | | | | | | | | Omnicom Group | | | | | | |
| | 4,965,000 | | | | USD | | | 4.450% due 08/15/2020 | | | 5,109,606 | | | |
| | | | | | | | | | | | | | | | | |
| | | | | | | | | | | | | | | | | |
| | | | | | | | | Pfizer Inc | | | | | | |
| | 3,530,000 | | | | USD | | | 5.350% due 03/15/2015 (5) | | | 4,098,235 | | | |
| | | | | | | | | | | | | | | | | |
| | | | | | | | | | | | | | | | | |
| | | | | | | | | PNC Funding | | | | | | |
| | 3,400,000 | | | | USD | | | 5.125% due 02/08/2020 | | | 3,696,820 | | | |
| | | | | | | | | | | | | | | | | |
| | | | | | | | | | | | | | | | | |
| | | | | | | | | Procter & Gamble | | | | | | |
| | 4,100,000 | | | | USD | | | 4.700% due 02/15/2019 (5) | | | 4,640,454 | | | |
| | | | | | | | | | | | | | | | | |
| | | | | | | | | | | | | | | | | |
| | | | | | | | | Renre North America Holdings | | | | | | |
| | 3,330,000 | | | | USD | | | 5.750% due 03/15/2020 (5) | | | 3,466,970 | | | |
| | | | | | | | | | | | | | | | | |
| | | | | | | | | | | | | | | | | |
| | | | | | | | | Roche Holdings | | | | | | |
| | 4,320,000 | | | | USD | | | 5.000% due 03/01/2014 (5)(9) | | | 4,848,915 | | | |
| | | | | | | | | | | | | | | | | |
| | | | | | | | | | | | | | | | | |
| | | | | | | | | SC Johnson & Son | | | | | | |
| | 8,790,000 | | | | USD | | | 4.800% due 09/01/2040 (5)(9) | | | 8,291,176 | | | |
| | | | | | | | | | | | | | | | | |
| | | | | | | | | | | | | | | | | |
| | | | | | | | | Sempra Energy | | | | | | |
| | 6,830,000 | | | | USD | | | 6.500% due 06/01/2016 (5) | | | 8,249,110 | | | |
| | | | | | | | | | | | | | | | | |
| | | | | | | | | | | | | | | | | |
See Notes to Financial Statements
| | |
| Artio Global Funds ï 2010 Annual Report | 125 |
| |
| PORTFOLIO OF INVESTMENTS (Continued) | October 31, 2010 |
Artio Total Return Bond Fund
| | | | | | | | | | | | | | | | | |
Face
| | | | | | | | | | Fair
| | | |
| Value | | | Currency | | | Description | | | | Value (Note 2) | | | |
CORPORATE BONDS—Continued |
| | | | | | | | | United States—Continued | | | | | | |
| | | | | | | | | | | | | | | | | |
| | | | | | | | | Time Warner Cable | | | | | | |
| | 8,030,000 | | | | USD | | | 6.750% due 07/01/2018 (5) | | $ | 9,650,952 | | | |
| | | | | | | | | | | | | | | | | |
| | | | | | | | | | | | | | | | | |
| | | | | | | | | UnitedHealth Group | | | | | | |
| | 3,620,000 | | | | USD | | | 6.875% due 02/15/2038 (5) | | | 4,213,148 | | | |
| | | | | | | | | | | | | | | | | |
| | | | | | | | | | | | | | | | | |
| | | | | | | | | University of Notre Dame | | | | | | |
| | 1,750,000 | | | | USD | | | 4.900% due 03/01/2041 | | | 1,759,552 | | | |
| | | | | | | | | | | | | | | | | |
| | | | | | | | | | | | | | | | | |
| | | | | | | | | Valero Energy | | | | | | |
| | 3,460,000 | | | | USD | | | 7.500% due 04/15/2032 (5) | | | 3,749,630 | | | |
| | | | | | | | | | | | | | | | | |
| | | | | | | | | | | | | | | | | |
| | | | | | | | | Validus Holdings | | | | | | |
| | 5,850,000 | | | | USD | | | 8.875% due 01/26/2040 (5) | | | 6,317,345 | | | |
| | | | | | | | | | | | | | | | | |
| | | | | | | | | | | | | | | | | |
| | | | | | | | | Wal-Mart Stores | | | | | | |
| | 6,260,000 | | | | USD | | | 4.875% due 07/08/2040 | | | 6,163,001 | | | |
| | | | | | | | | | | | | | | | | |
| | | | | | | | | | | | | | | | | |
| | | | | | | | | | | | | | 230,030,571 | | | |
| | | | | | | | | | | | | | | | | |
| | | | | | | | | | | | | | | | | |
| | | | | | | | | United Kingdom—2.2% | | | | | | |
| | | | | | | | | Anglo American Capital | | | | | | |
| | 4,769,000 | | | | USD | | | 9.375% due 04/08/2014 (5)(9) | | | 5,862,079 | | | |
| | | | | | | | | | | | | | | | | |
| | | | | | | | | | | | | | | | | |
| | | | | | | | | AstraZeneca PLC | | | | | | |
| | 1,650,000 | | | | USD | | | 5.900% due 09/15/2017 (5) | | | 1,970,300 | | | |
| | | | | | | | | | | | | | | | | |
| | | | | | | | | | | | | | | | | |
| | | | | | | | | Barclays Bank | | | | | | |
| | 6,730,000 | | | | USD | | | 2.500% due 09/21/2015 (9) | | | 6,786,586 | | | |
| | 2,930,000 | | | | USD | | | 5.125% due 01/08/2020 | | | 3,179,929 | | | |
| | | | | | | | | | | | | | | | | |
| | | | | | | | | | | | | | 9,966,515 | | | |
| | | | | | | | | | | | | | | | | |
| | | | | | | | | | | | | | | | | |
| | | | | | | | | Diageo Capital | | | | | | |
| | 1,680,000 | | | | USD | | | 5.750% due 10/23/2017 | | | 1,988,545 | | | |
| | | | | | | | | | | | | | | | | |
| | | | | | | | | | | | | | | | | |
| | | | | | | | | HSBC Bank | | | | | | |
| | 1,660,000 | | | | USD | | | 3.500% due 06/28/2015 (9) | | | 1,759,631 | | | |
| | | | | | | | | | | | | | | | | |
| | | | | | | | | | | | | | | | | |
| | | | | | | | | Royal Bank Of Scotland | | | | | | |
| | 7,410,000 | | | | USD | | | 3.950% due 09/21/2015 | | | 7,643,289 | | | |
| | | | | | | | | | | | | | | | | |
| | | | | | | | | | | | | | | | | |
| | | | | | | | | Vodafone Group | | | | | | |
| | 6,110,000 | | | | USD | | | 5.000% due 09/15/2015 (5) | | | 6,932,473 | | | |
| | | | | | | | | | | | | | | | | |
| | | | | | | | | | | | | | | | | |
| | | | | | | | | | | | | | 36,122,832 | | | |
| | | | | | | | | | | | | | | | | |
| | | | | | | | | | | | | | | | | |
See Notes to Financial Statements
| | |
| 126 | Artio Global Funds ï 2010 Annual Report | |
| |
| PORTFOLIO OF INVESTMENTS (Continued) | October 31, 2010 |
Artio Total Return Bond Fund
| | | | | | | | | | | | | | | | | |
Face
| | | | | | | | | | Fair
| | | |
| Value | | | Currency | | | Description | | | | Value (Note 2) | | | |
CORPORATE BONDS—Continued |
| | | | | | | | | | | | | | | | | |
| | | | | | | | | France—2.1% | | | | | | |
| | | | | | | | | BNP Paribas Home Loan Covered Bonds | | | | | | |
| | 12,130,000 | | | | USD | | | 2.200% due 11/02/2015 (9) | | $ | 12,211,975 | | | |
| | | | | | | | | | | | | | | | | |
| | | | | | | | | | | | | | | | | |
| | | | | | | | | Cie de Financement Foncier | | | | | | |
| | 5,400,000 | | | | USD | | | 2.125% due 04/22/2013 (9) | | | 5,517,455 | | | |
| | 4,300,000 | | | | USD | | | 2.500% due 09/16/2015 (9) | | | 4,363,786 | | | |
| | | | | | | | | | | | | | | | | |
| | | | | | | | | | | | | | 9,881,241 | | | |
| | | | | | | | | | | | | | | | | |
| | | | | | | | | | | | | | | | | |
| | | | | | | | | Dexia Credit Local | | | | | | |
| | 8,450,000 | | | | USD | | | 2.000% due 03/05/2013 (9) | | | 8,559,951 | | | |
| | | | | | | | | | | | | | | | | |
| | | | | | | | | | | | | | | | | |
| | | | | | | | | Lafarge SA | | | | | | |
| | 4,265,000 | | | | USD | | | 7.125% due 07/15/2036 (5) | | | 4,265,862 | | | |
| | | | | | | | | | | | | | | | | |
| | | | | | | | | | | | | | | | | |
| | | | | | | | | | | | | | 34,919,029 | | | |
| | | | | | | | | | | | | | | | | |
| | | | | | | | | | | | | | | | | |
| | | | | | | | | Supranational—2.0% | | | | | | |
| | | | | | | | | Asian Development Bank | | | | | | |
| | 9,090,000 | | | | AUD | | | 6.000% due 01/20/2015 | | | 9,049,006 | | | |
| | | | | | | | | | | | | | | | | |
| | | | | | | | | | | | | | | | | |
| | | | | | | | | International Bank for Reconstruction & Development | | | | | | |
| | 15,750,000 | | | | AUD | | | 5.500% due 10/21/2014 | | | 15,446,209 | | | |
| | 8,860,000 | | | | AUD | | | 5.750% due 10/21/2019 | | | 8,642,995 | | | |
| | | | | | | | | | | | | | | | | |
| | | | | | | | | | | | | | 24,089,204 | | | |
| | | | | | | | | | | | | | | | | |
| | | | | | | | | | | | | | | | | |
| | | | | | | | | | | | | | 33,138,210 | | | |
| | | | | | | | | | | | | | | | | |
| | | | | | | | | | | | | | | | | |
| | | | | | | | | Netherlands—1.6% | | | | | | |
| | | | | | | | | Koninklijke Philips Electronics | | | | | | |
| | 3,120,000 | | | | USD | | | 6.875% due 03/11/2038 (5) | | | 3,871,568 | | | |
| | | | | | | | | | | | | | | | | |
| | | | | | | | | | | | | | | | | |
| | | | | | | | | Rabobank Nederland | | | | | | |
| | 12,060,000 | | | | USD | | | 2.125% due 10/13/2015 | | | 12,171,290 | | | |
| | | | | | | | | | | | | | | | | |
| | | | | | | | | | | | | | | | | |
| | | | | | | | | Shell International Finance | | | �� | | | |
| | 4,730,000 | | | | USD | | | 3.100% due 06/28/2015 (5) | | | 5,021,259 | | | |
| | 3,645,000 | | | | USD | | | 6.375% due 12/15/2038 (5) | | | 4,465,810 | | | |
| | | | | | | | | | | | | | | | | |
| | | | | | | | | | | | | | 9,487,069 | | | |
| | | | | | | | | | | | | | | | | |
| | | | | | | | | | | | | | | | | |
| | | | | | | | | | | | | | 25,529,927 | | | |
| | | | | | | | | | | | | | | | | |
| | | | | | | | | | | | | | | | | |
| | | | | | | | | Canada—1.3% | | | | | | |
| | | | | | | | | Bank of Nova Scotia | | | | | | |
| | 12,150,000 | | | | USD | | | 1.650% due 10/29/2015 (9) | | | 12,118,379 | | | |
| | | | | | | | | | | | | | | | | |
| | | | | | | | | | | | | | | | | |
See Notes to Financial Statements
| | |
| Artio Global Funds ï 2010 Annual Report | 127 |
| |
| PORTFOLIO OF INVESTMENTS (Continued) | October 31, 2010 |
Artio Total Return Bond Fund
| | | | | | | | | | | | | | | | | |
Face
| | | | | | | | | | Fair
| | | |
| Value | | | Currency | | | Description | | | | Value (Note 2) | | | |
CORPORATE BONDS—Continued |
| | | | | | | | | Canada—Continued | | | | | | |
| | | | | | | | | | | | | | | | | |
| | | | | | | | | CDP Financial | | | | | | |
| | 5,840,000 | | | | USD | | | 4.400% due 11/25/2019 (5)(9) | | $ | 6,236,110 | | | |
| | | | | | | | | | | | | | | | | |
| | | | | | | | | | | | | | | | | |
| | | | | | | | | Potash Corp of Saskatchewan | | | | | | |
| | 2,650,000 | | | | USD | | | 5.875% due 12/01/2036 | | | 2,808,727 | | | |
| | | | | | | | | | | | | | | | | |
| | | | | | | | | | | | | | | | | |
| | | | | | | | | | | | | | 21,163,216 | | | |
| | | | | | | | | | | | | | | | | |
| | | | | | | | | | | | | | | | | |
| | | | | | | | | Australia—1.2% | | | | | | |
| | | | | | | | | BHP Billiton Finance | | | | | | |
| | 4,280,000 | | | | USD | | | 5.400% due 03/29/2017 | | | 4,915,636 | | | |
| | | | | | | | | | | | | | | | | |
| | | | | | | | | | | | | | | | | |
| | | | | | | | | Rio Tinto Finance | | | | | | |
| | 6,685,000 | | | | USD | | | 5.875% due 07/15/2013 (5) | | | 7,566,611 | | | |
| | | | | | | | | | | | | | | | | |
| | | | | | | | | | | | | | | | | |
| | | | | | | | | Westpac Banking | | | | | | |
| | 6,420,000 | | | | USD | | | 3.000% due 08/04/2015 | | | 6,642,504 | | | |
| | | | | | | | | | | | | | | | | |
| | | | | | | | | | | | | | | | | |
| | | | | | | | | | | | | | 19,124,751 | | | |
| | | | | | | | | | | | | | | | | |
| | | | | | | | | | | | | | | | | |
| | | | | | | | | Hong Kong—0.6% | | | | | | |
| | | | | | | | | Hutchison Whampoa International | | | | | | |
| | 8,300,000 | | | | USD | | | 5.750% due 09/11/2019 (9) | | | 9,214,220 | | | |
| | | | | | | | | | | | | | | | | |
| | | | | | | | | | | | | | | | | |
| | | | | | | | | | | | | | | | | |
| | | | | | | | | Brazil—0.4% | | | | | | |
| | | | | | | | | Petrobras International Finance | | | | | | |
| | 4,300,000 | | | | USD | | | 5.875% due 03/01/2018 (5) | | | 4,830,689 | | | |
| | 1,630,000 | | | | USD | | | 6.875% due 01/20/2040 (5) | | | 1,894,197 | | | |
| | | | | | | | | | | | | | | | | |
| | | | | | | | | | | | | | 6,724,886 | | | |
| | | | | | | | | | | | | | | | | |
| | | | | | | | | | | | | | | | | |
| | | | | | | | | Germany—0.4% | | | | | | |
| | | | | | | | | Deutsche Telekom International Finance | | | | | | |
| | 5,820,000 | | | | USD | | | 4.875% due 07/08/2014 (5) | | | 6,459,490 | | | |
| | | | | | | | | | | | | | | | | |
| | | | | | | | | | | | | | | | | |
| | | | | | | | | | | | | | | | | |
| | | | | | | | | Norway—0.3% | | | | | | |
| | | | | | | | | Statoil ASA | | | | | | |
| | 5,120,000 | | | | USD | | | 3.125% due 08/17/2017 (5) | | | 5,268,465 | | | |
| | | | | | | | | | | | | | | | | |
| | | | | | | | | | | | | | | | | |
| | | | | | | | | | | | | | | | | |
| | | | | | | | | Switzerland—0.2% | | | | | | |
| | | | | | | | | Credit Suisse New York | | | | | | |
| | 2,840,000 | | | | USD | | | 4.375% due 08/05/2020 | | | 2,927,767 | | | |
| | | | | | | | | | | | | | | | | |
| | | | | | | | | | | | | | | | | |
| | | | | | | | | TOTAL CORPORATE BONDS (Cost $405,741,528) | | | 430,623,364 | | | |
| | | | | | | | | | | | | | | | | |
| | | | | | | | | | | | | | | | | |
| | | | | | | | | | | | | | | | | |
See Notes to Financial Statements
| | |
| 128 | Artio Global Funds ï 2010 Annual Report | |
| |
| PORTFOLIO OF INVESTMENTS (Continued) | October 31, 2010 |
Artio Total Return Bond Fund
| | | | | | | | | | | | | | | | | |
Face
| | | | | | | | | | Fair
| | | |
| Value | | | Currency | | | Description | | | | Value (Note 2) | | | |
U.S. GOVERNMENT AND AGENCY OBLIGATIONS—20.0% |
| | | | | | | | | Federal Home Loan Mortgage Corporation | | | | | | |
| | 38,703,116 | | | | USD | | | 6.500% due 05/01/2022-12/01/2038 | | $ | 42,759,867 | | | |
| | 824,716 | | | | USD | | | 2.826% due 09/01/2035 (6) | | | 861,935 | | | |
| | 1,169,921 | | | | USD | | | 3.152% due 04/01/2036 (6) | | | 1,224,632 | | | |
| | | | | | | | | | | | | | | | | |
| | | | | | | | | | | | | | 44,846,434 | | | |
| | | | | | | | | | | | | | | | | |
| | | | | | | | | | | | | | | | | |
| | | | | | | | | Federal National Mortgage Association Corporation | | | | | | |
| | 16,600,000 | | | | USD | | | 0.750% due 12/18/2013 | | | 16,638,761 | | | |
| | 1,719,717 | | | | USD | | | 2.746% due 11/01/2035 (6) | | | 1,802,177 | | | |
| | 4,060,218 | | | | USD | | | 5.475% due 02/01/2036-06/01/2037 (6) | | | 4,309,311 | | | |
| | 22,628,658 | | | | USD | | | 6.000% due 06/01/2036-02/01/2038 | | | 24,618,598 | | | |
| | 5,464,444 | | | | USD | | | 5.709% due 12/01/2037 (6) | | | 5,814,373 | | | |
| | | | | | | | | | | | | | | | | |
| | | | | | | | | | | | | | 53,183,220 | | | |
| | | | | | | | | | | | | | | | | |
| | | | | | | | | | | | | | | | | |
| | | | | | | | | Federal National Mortgage Association Corporation TBA | | | | | | |
| | 12,460,000 | | | | USD | | | 4.500% due 11/01/2025 | | | 13,180,337 | | | |
| | | | | | | | | | | | | | | | | |
| | | | | | | | | | | | | | | | | |
| | | | | | | | | Government National Mortgage Association | | | | | | |
| | 14,046,596 | | | | USD | | | 6.000% due 07/15/2034-09/15/2038 | | | 15,491,177 | | | |
| | | | | | | | | | | | | | | | | |
| | | | | | | | | | | | | | | | | |
| | | | | | | | | U.S. Treasury Bonds | | | | | | |
| | 11,620,000 | | | | USD | | | 5.250% due 02/15/2029 | | | 14,232,687 | | | |
| | 4,280,000 | | | | USD | | | 3.500% due 02/15/2039 | | | 3,919,543 | | | |
| | 4,120,000 | | | | USD | | | 4.250% due 05/15/2039 | | | 4,300,893 | | | |
| | 6,085,000 | | | | USD | | | 4.500% due 08/15/2039 | | | 6,618,387 | | | |
| | 48,720,100 | | | | USD | | | 4.375% due 11/15/2039-05/15/2040 | | | 51,898,499 | | | |
| | | | | | | | | | | | | | | | | |
| | | | | | | | | | | | | | 80,970,009 | | | |
| | | | | | | | | | | | | | | | | |
| | | | | | | | | | | | | | | | | |
| | | | | | | | | U.S. Treasury Notes | | | | | | |
| | 7,310,000 | | | | USD | | | 1.000% due 04/30/2012 | | | 7,387,976 | | | |
| | 3,500,000 | | | | USD | | | 0.625% due 07/31/2012 | | | 3,518,466 | | | |
| | 8,310,000 | | | | USD | | | 1.750% due 04/15/2013 | | | 8,582,036 | | | |
| | 4,770,000 | | | | USD | | | 1.375% due 05/15/2013 | | | 4,885,129 | | | |
| | 9,868,300 | | | | USD | | | 1.125% due 06/15/2013 | | | 10,046,393 | | | |
| | 2,924,800 | | | | USD | | | 1.250% due 08/31/2015-09/30/2015 | | | 2,939,419 | | | |
| | 16,920,000 | | | | USD | | | 3.625% due 02/15/2020 | | | 18,475,845 | | | |
| | 42,274,000 | | | | USD | | | 3.500% due 05/15/2020 | | | 45,599,991 | | | |
See Notes to Financial Statements
| | |
| Artio Global Funds ï 2010 Annual Report | 129 |
| |
| PORTFOLIO OF INVESTMENTS (Continued) | October 31, 2010 |
Artio Total Return Bond Fund
| | | | | | | | | | | | | | | | | |
Face
| | | | | | | | | | Fair
| | | |
| Value | | | Currency | | | Description | | | | Value (Note 2) | | | |
U.S. GOVERNMENT AND AGENCY OBLIGATIONS—Continued |
| | | | | | | | | U.S. Treasury Notes—Continued | | | | | | |
| | | | | | | | | | | | | | | | | |
| | 15,857,100 | | | | USD | | | 2.625% due 08/15/2020 | | $ | 15,874,448 | | | |
| | | | | | | | | | | | | | | | | |
| | | | | | | | | | | | | | 117,309,703 | | | |
| | | | | | | | | | | | | | | | | |
| | | | | | | | | | | | | | | | | |
| | | | | | | | | TOTAL U.S. GOVERNMENT AND AGENCY OBLIGATIONS (Cost $312,984,943) | | | 324,980,880 | | | |
| | | | | | | | | | | | | | | | | |
| | | | | | | | | | | | | | | | | |
| | | | | | | | | | | | | | | | | |
FOREIGN GOVERNMENT AND AGENCY BONDS—16.9% |
| | | | | | | | | Brazil—5.4% | | | | | | |
| | | | | | | | | Brazil Notas do Tesouro Nacional, Series F | | | | | | |
| | 151,110,000 | | | | BRL | | | 10.000% due 01/01/2012 | | | 87,386,722 | | | |
| | | | | | | | | | | | | | | | | |
| | | | | | | | | | | | | | | | | |
| | | | | | | | | Canada—4.2% | | | | | | |
| | | | | | | | | Canadian Government Bond | | | | | | |
| | 6,790,000 | | | | CAD | | | 1.750% due 03/01/2013 | | | 6,699,058 | | | |
| | 61,650,000 | | | | CAD | | | 2.500% due 06/01/2015 | | | 62,131,159 | | | |
| | | | | | | | | | | | | | | | | |
| | | | | | | | | | | | | | 68,830,217 | | | |
| | | | | | | | | | | | | | | | | |
| | | | | | | | | | | | | | | | | |
| | | | | | | | | Poland—2.5% | | | | | | |
| | | | | | | | | Poland Government Bond | | | | | | |
| | 109,153,000 | | | | PLN | | | 6.250% due 10/24/2015 | | | 39,938,796 | | | |
| | | | | | | | | | | | | | | | | |
| | | | | | | | | | | | | | | | | |
| | | | | | | | | Mexico—2.4% | | | | | | |
| | | | | | | | | Mexican Bonos | | | | | | |
| | 361,500,000 | | | | MXN | | | 10.000% due 12/05/2024 | | | 39,420,129 | | | |
| | | | | | | | | | | | | | | | | |
| | | | | | | | | | | | | | | | | |
| | | | | | | | | Australia—1.6% | | | | | | |
| | | | | | | | | Australian Government Bond | | | | | | |
| | 10,399,000 | | | | AUD | | | 6.250% due 04/15/2015 | | | 10,705,914 | | | |
| | 17,340,000 | | | | AUD | | | 4.500% due 04/15/2020 | | | 16,087,293 | | | |
| | | | | | | | | | | | | | | | | |
| | | | | | | | | | | | | | 26,793,207 | | | |
| | | | | | | | | | | | | | | | | |
| | | | | | | | | | | | | | | | | |
| | | | | | | | | Qatar—0.5% | | | | | | |
| | | | | | | | | State of Qatar | | | | | | |
| | 7,570,000 | | | | USD | | | 4.000% due 01/20/2015 (5)(9) | | | 8,014,738 | | | |
| | | | | | | | | | | | | | | | | |
| | | | | | | | | | | | | | | | | |
| | | | | | | | | Norway—0.3% | | | | | | |
| | | | | | | | | Kommunalbanken AS | | | | | | |
| | 3,920,000 | | | | USD | | | 2.750% due 05/05/2015 (9) | | | 4,140,257 | | | |
| | | | | | | | | | | | | | | | | |
| | | | | | | | | TOTAL FOREIGN GOVERNMENT AND AGENCY BONDS (Cost $261,024,857) | | | 274,524,066 | | | |
| | | | | | | | | | | | | | | | | |
| | | | | | | | | | | | | | | | | |
| | | | | | | | | | | | | | | | | |
See Notes to Financial Statements
| | |
| 130 | Artio Global Funds ï 2010 Annual Report | |
| |
| PORTFOLIO OF INVESTMENTS (Continued) | October 31, 2010 |
Artio Total Return Bond Fund
| | | | | | | | | | | | | | | | | |
Face
| | | | | | | | | | Fair
| | | |
| Value | | | Currency | | | Description | | | | Value (Note 2) | | | |
MUNICIPAL OBLIGATION—0.1% |
| | | | | | | | | United States—0.1% | | | | | | |
| | | | | | | | | State of Illinois, General Obligation Unlimited | | | | | | |
| | 1,720,000 | | | | USD | | | 4.071% due 01/01/2014 (Cost $1,720,000) | | $ | 1,775,573 | | | |
| | | | | | | | | | | | | | | | | |
| | | | | | | | | | | | | | | | | |
| | | | | | | | | | | | | | | | | |
REPURCHASE AGREEMENT—4.9% |
| | | | | | | | | United States—4.9% | | | | | | |
| | 79,015,798 | | | | USD | | | State Street Bank and Trust Company Repurchase Agreement, dated 10/29/2010, due 11/01/2010, with maturity value of $79,015,930 and an effective yield of 0.02%, collateralized by U.S. Government and Agency Obligations, with rates ranging from 4.375%-4.625%, maturities ranging from 09/15/2012-10/25/2012, and an aggregate fair market value of $80,596,806. (Cost $79,015,798) | | | 79,015,798 | | | |
| | | | | | | | | | | | | | | | | |
| | | | | | | | | TOTAL INVESTMENTS—101.5% (Cost $1,574,196,507) | | | 1,649,562,714 | | | |
| | | | | | | | | OTHER ASSETS AND LIABILITIES—(1.5)% | | | (23,941,986 | ) | | |
| | | | | | | | | | | | | | | | | |
| | | | | | | | | TOTAL NET ASSETS—100.0% | | $ | 1,625,620,728 | | | |
| | | | | | | | | | | | | | | | | |
Notes to the Portfolio of Investments.
| | | |
Aggregate cost for federal income tax purposes was $1,575,501,480. | | |
See Notes to Financial Statements
| | |
| Artio Global Funds ï 2010 Annual Report | 131 |
| |
| SCHEDULE OF FORWARD FOREIGN EXCHANGE CONTRACTS | October 31, 2010 |
Artio Total Return Bond Fund
FORWARD FOREIGN EXCHANGE CONTRACTS TO BUY
| | | | | | | | | | | | | | | | | | | | | |
| | | | | Contracts to Receive | | | | Net Unrealized
|
Expiration
| | | | Local
| | Value in
| | In Exchange
| | Appreciation
|
| Date | | Counterparty | | Currency | | USD | | for USD | | (Depreciation) |
| 12/07/10 | | Westpac Banking | | AUD | | | 23,563,310 | | | | 22,984,996 | | | | 22,916,328 | | | $ | 68,668 | |
| 12/13/10 | | Deutsche Bank AG London | | CAD | | | 16,450,000 | | | | 16,113,289 | | | | 16,119,491 | | | | (6,202 | ) |
| 12/23/10 | | JPMorgan Chase Bank N.A. | | EUR | | | 38,200,000 | | | | 53,132,750 | | | | 50,947,722 | | | | 2,185,028 | |
| 11/29/10 | | Standard Chartered Bank | | TWD | | | 450,370,000 | | | | 14,714,560 | | | | 14,822,116 | | | | (107,556 | ) |
| | | | | | | | | | | | | | | | | | | | | |
| Net unrealized appreciation on forward foreign exchange contracts to buy | | $ | 2,139,938 | |
| | | | | | | | | | | | | | | | | | | | | |
FORWARD FOREIGN EXCHANGE CONTRACTS TO SELL
| | | | | | | | | | | | | | | | | | | | | |
| | | | | Contracts to Deliver | | | | Net Unrealized
|
Expiration
| | | | Local
| | Value in
| | In Exchange
| | Appreciation
|
| Date | | Counterparty | | Currency | | USD | | for USD | | (Depreciation) |
| 12/07/10 | | Westpac Banking | | AUD | | | 21,269,175 | | | | 20,747,165 | | | | 20,554,866 | | | $ | (192,299 | ) |
| 12/02/10 | | Credit Suisse | | BRL | | | 56,540,000 | | | | 33,049,092 | | | | 31,477,564 | | | | (1,571,528 | ) |
| 12/02/10 | | Deutsche Bank AG London | | BRL | | | 91,289,799 | | | | 53,361,248 | | | | 50,835,171 | | | | (2,526,077 | ) |
| 12/13/10 | | Deutsche Bank AG London | | CAD | | | 45,757,957 | | | | 44,821,349 | | | | 45,134,130 | | | | 312,781 | |
| 12/23/10 | | JPMorgan Chase Bank N.A. | | EUR | | | 38,200,000 | | | | 53,132,750 | | | | 52,712,753 | | | | (419,997 | ) |
| 11/15/10 | | Credit Suisse | | PLN | | | 119,225,669 | | | | 41,794,120 | | | | 41,952,064 | | | | 157,944 | |
| | | | | | | | | | | | | | | | | | | | | |
| Net unrealized depreciation on forward foreign exchange contracts to sell | | $ | (4,239,176 | ) |
| | | | | | | | | | | | | | | | | | | | | |
Glossary of Currencies
| | | |
AUD | | — Australian Dollar |
BRL | | — Brazilian Real |
CAD | | — Canadian Dollar |
EUR | | — Euro |
MXN | | — Mexican Peso |
PLN | | — Polish Zloty |
TWD | | — New Taiwan Dollar |
USD | | — United States Dollar |
See Notes to Financial Statements
| | |
| 132 | Artio Global Funds ï 2010 Annual Report | |
| |
| PORTFOLIO OF INVESTMENTS-Industry Sector (Unaudited) | October 31, 2010 |
Artio Total Return Bond Fund
At October 31, 2010, security type diversification of the Fund’s investments was as follows:
| | | | | | | | | |
| | | % of Net
| | Fair
|
| | | Assets | | Value (Note 2) |
SECURITY TYPE | | | | | | | | |
| Asset Backed Securities | | | 33.1 | % | | $ | 538,643,033 | |
| Corporate Bonds | | | 26.5 | | | | 430,623,364 | |
| U.S. Government and Agency Obligations | | | 20.0 | | | | 324,980,880 | |
| Foreign Government and Agency Bonds | | | 16.9 | | | | 274,524,066 | |
| Municipal Obligation | | | 0.1 | | | | 1,775,573 | |
| Short-term Investment | | | 4.9 | | | | 79,015,798 | |
| | | | | | | | | |
Total Investments | | | 101.5 | | | | 1,649,562,714 | |
Other Assets and Liabilities (Net) | | | (1.5 | ) | | | (23,941,986 | ) |
| | | | | | | | | |
Net Assets | | | 100.0 | % | | $ | 1,625,620,728 | |
| | | | | | | | | |
See Notes to Financial Statements
| | |
| Artio Global Funds ï 2010 Annual Report | 133 |
| |
| PORTFOLIO OF INVESTMENTS | October 31, 2010 |
Artio Global High Income Fund
| | | | | | | | | | | | | | | | | |
Face
| | | | | | | | | | Fair
| | | |
| Value | | | Currency | | | Description | | | | Value (Note 2) | | | |
CORPORATE BONDS—73.0%† |
| | | | | | | | | United States—51.5% | | | | | | |
| | | | | | | | | ABN Amro NA | | | | | | |
| | 15,045,000 | | | | USD | | | 6.523% due 12/29/2049 (5)(6)(9) | | $ | 13,239,600 | | | |
| | | | | | | | | | | | | | | | | |
| | | | | | | | | | | | | | | | | |
| | | | | | | | | Activant Solutions | | | | | | |
| | 13,368,000 | | | | USD | | | 9.500% due 05/01/2016 (5) | | | 12,916,830 | | | |
| | | | | | | | | | | | | | | | | |
| | | | | | | | | | | | | | | | | |
| | | | | | | | | AES Corp | | | | | | |
| | 3,635,000 | | | | USD | | | 9.750% due 04/15/2016 (5) | | | 4,243,863 | | | |
| | 21,750,000 | | | | USD | | | 8.000% due 06/01/2020 (5) | | | 24,523,125 | | | |
| | | | | | | | | | | | | | | | | |
| | | | | | | | | | | | | | 28,766,988 | | | |
| | | | | | | | | | | | | | | | | |
| | | | | | | | | | | | | | | | | |
| | | | | | | | | Alere Inc | | | | | | |
| | 5,530,000 | | | | USD | | | 9.000% due 05/15/2016 (5) | | | 5,930,925 | | | |
| | | | | | | | | | | | | | | | | |
| | | | | | | | | | | | | | | | | |
| | | | | | | | | Alliant Techsystems | | | | | | |
| | 11,725,000 | | | | USD | | | 6.750% due 04/01/2016 (5) | | | 12,223,312 | | | |
| | | | | | | | | | | | | | | | | |
| | | | | | | | | | | | | | | | | |
| | | | | | | | | Allison Transmission | | | | | | |
| | 16,830,000 | | | | USD | | | 11.000% due 11/01/2015 (5)(9) | | | 18,344,700 | | | |
| | 6,849,720 | | | | USD | | | 11.250% due 11/01/2015 (5)(9) | | | 7,457,633 | | | |
| | | | | | | | | | | | | | | | | |
| | | | | | | | | | | | | | 25,802,333 | | | |
| | | | | | | | | | | | | | | | | |
| | | | | | | | | | | | | | | | | |
| | | | | | | | | Aramark Corp | | | | | | |
| | 20,605,000 | | | | USD | | | 3.966% due 02/01/2015 (5)(6) | | | 19,317,187 | | | |
| | | | | | | | | | | | | | | | | |
| | | | | | | | | | | | | | | | | |
| | | | | | | | | Arch Coal | | | | | | |
| | 17,474,000 | | | | USD | | | 8.750% due 08/01/2016 (5)(9) | | | 19,701,935 | | | |
| | 2,520,000 | | | | USD | | | 7.250% due 10/01/2020 (5) | | | 2,772,000 | | | |
| | | | | | | | | | | | | | | | | |
| | | | | | | | | | | | | | 22,473,935 | | | |
| | | | | | | | | | | | | | | | | |
| | | | | | | | | | | | | | | | | |
| | | | | | | | | Asbury Automotive | | | | | | |
| | 6,980,000 | | | | USD | | | 8.000% due 03/15/2014 (5) | | | 7,119,600 | | | |
| | 6,190,000 | | | | USD | | | 7.625% due 03/15/2017 (5) | | | 6,097,150 | | | |
| | | | | | | | | | | | | | | | | |
| | | | | | | | | | | | | | 13,216,750 | | | |
| | | | | | | | | | | | | | | | | |
| | | | | | | | | | | | | | | | | |
| | | | | | | | | ATP Oil & Gas | | | | | | |
| | 40,240,000 | | | | USD | | | 11.875% due 05/01/2015 (5)(9) | | | 36,920,200 | | | |
| | | | | | | | | | | | | | | | | |
| | | | | | | | | | | | | | | | | |
| | | | | | | | | Avis Budget Car Rental | | | | | | |
| | 5,955,000 | | | | USD | | | 8.250% due 01/15/2019 (5)(9) | | | 6,044,325 | | | |
| | | | | | | | | | | | | | | | | |
| | | | | | | | | | | | | | | | | |
| | | | | | | | | Boise Paper Holdings | | | | | | |
| | 1,140,000 | | | | USD | | | 9.000% due 11/01/2017 (5) | | | 1,248,300 | | | |
| | | | | | | | | | | | | | | | | |
| | | | | | | | | | | | | | | | | |
| | | | | | | | | Calpine Corp | | | | | | |
| | 3,775,000 | | | | USD | | | 7.250% due 10/15/2017 (5)(9) | | | 3,944,875 | | | |
See Notes to Financial Statements
| | |
| 134 | Artio Global Funds ï 2010 Annual Report | |
| |
| PORTFOLIO OF INVESTMENTS (Continued) | October 31, 2010 |
Artio Global High Income Fund
| | | | | | | | | | | | | | | | | |
Face
| | | | | | | | | | Fair
| | | |
| Value | | | Currency | | | Description | | | | Value (Note 2) | | | |
CORPORATE BONDS—Continued |
| | | | | | | | | United States—Continued | | | | | | |
| | | | | | | | | Calpine Corp—Continued | | | | | | |
| | | | | | | | | | | | | | | | | |
| | 8,910,000 | | | | USD | | | 7.875% due 07/31/2020 (5)(9) | | $ | 9,377,775 | | | |
| | 15,340,000 | | | | USD | | | 7.500% due 02/15/2021 (5)(9) | | | 15,781,025 | | | |
| | | | | | | | | | | | | | | | | |
| | | | | | | | | | | | | | 29,103,675 | | | |
| | | | | | | | | | | | | | | | | |
| | | | | | | | | | | | | | | | | |
| | | | | | | | | Capital One Capital III | | | | | | |
| | 5,091,000 | | | | USD | | | 7.686% due 08/15/2036 | | | 5,218,275 | | | |
| | | | | | | | | | | | | | | | | |
| | | | | | | | | | | | | | | | | |
| | | | | | | | | Carrizo Oil & Gas | | | | | | |
| | 17,540,000 | | | | USD | | | 8.625% due 10/15/2018 (5)(9) | | | 17,846,950 | | | |
| | | | | | | | | | | | | | | | | |
| | | | | | | | | | | | | | | | | |
| | | | | | | | | Casella Waste Systems | | | | | | |
| | 18,405,000 | | | | USD | | | 9.750% due 02/01/2013 (5) | | | 18,612,056 | | | |
| | 5,780,000 | | | | USD | | | 11.000% due 07/15/2014 (5) | | | 6,423,025 | | | |
| | | | | | | | | | | | | | | | | |
| | | | | | | | | | | | | | 25,035,081 | | | |
| | | | | | | | | | | | | | | | | |
| | | | | | | | | | | | | | | | | |
| | | | | | | | | Chesapeake Energy | | | | | | |
| | 1,215,000 | | | | USD | | | 6.875% due 08/15/2018 (5) | | | 1,290,938 | | | |
| | 3,645,000 | | | | USD | | | 6.625% due 08/15/2020 | | | 3,877,369 | | | |
| | | | | | | | | | | | | | | | | |
| | | | | | | | | | | | | | 5,168,307 | | | |
| | | | | | | | | | | | | | | | | |
| | | | | | | | | | | | | | | | | |
| | | | | | | | | Citigroup Capital XXI, Multi-Coupon | | | | | | |
| | 7,505,000 | | | | USD | | | 8.300% due 12/21/2057 (5)(6) | | | 7,889,631 | | | |
| | | | | | | | | | | | | | | | | |
| | | | | | | | | | | | | | | | | |
| | | | | | | | | Clear Channel Worldwide, Series A | | | | | | |
| | 9,015,000 | | | | USD | | | 9.250% due 12/15/2017 (5) | | | 9,781,275 | | | |
| | | | | | | | | | | | | | | | | |
| | | | | | | | | | | | | | | | | |
| | | | | | | | | Clear Channel Worldwide, Series B | | | | | | |
| | 29,567,000 | | | | USD | | | 9.250% due 12/15/2017 (5) | | | 32,449,782 | | | |
| | | | | | | | | | | | | | | | | |
| | | | | | | | | | | | | | | | | |
| | | | | | | | | Cloud Peak Energy Resources | | | | | | |
| | 21,195,000 | | | | USD | | | 8.250% due 12/15/2017 (5) | | | 23,155,537 | | | |
| | 10,845,000 | | | | USD | | | 8.500% due 12/15/2019 (5) | | | 11,983,725 | | | |
| | | | | | | | | | | | | | | | | |
| | | | | | | | | | | | | | 35,139,262 | | | |
| | | | | | | | | | | | | | | | | |
| | | | | | | | | | | | | | | | | |
| | | | | | | | | Delta Air Lines | | | | | | |
| | 8,916,000 | | | | USD | | | 9.500% due 09/15/2014 (5)(9) | | | 9,852,180 | | | |
| | | | | | | | | | | | | | | | | |
| | | | | | | | | | | | | | | | | |
| | | | | | | | | DineEquity Inc | | | | | | |
| | 21,990,000 | | | | USD | | | 9.500% due 10/30/2018 (5)(9) | | | 23,529,300 | | | |
| | | | | | | | | | | | | | | | | |
| | | | | | | | | | | | | | | | | |
| | | | | | | | | DPH Holdings | | | | | | |
| | 1,500,000 | | | | USD | | | 6.550% due 06/15/2006 (4)(5)(7) | | | 52,969 | | | |
| | | | | | | | | | | | | | | | | |
| | | | | | | | | | | | | | | | | |
See Notes to Financial Statements
| | |
| Artio Global Funds ï 2010 Annual Report | 135 |
| |
| PORTFOLIO OF INVESTMENTS (Continued) | October 31, 2010 |
Artio Global High Income Fund
| | | | | | | | | | | | | | | | | |
Face
| | | | | | | | | | Fair
| | | |
| Value | | | Currency | | | Description | | | | Value (Note 2) | | | |
CORPORATE BONDS—Continued |
| | | | | | | | | United States—Continued | | | | | | |
| | | | | | | | | | | | | | | | | |
| | | | | | | | | Dresdner Funding Trust I | | | | | | |
| | 6,255,000 | | | | USD | | | 8.151% due 06/30/2031 (5)(9) | | $ | 5,926,613 | | | |
| | | | | | | | | | | | | | | | | |
| | | | | | | | | | | | | | | | | |
| | | | | | | | | E*Trade Financial | | | | | | |
| | 6,685,000 | | | | USD | | | 12.500% due 11/30/2017 (5) | | | 7,771,313 | | | |
| | | | | | | | | | | | | | | | | |
| | | | | | | | | | | | | | | | | |
| | | | | | | | | El Paso | | | | | | |
| | 4,000,000 | | | | USD | | | 8.050% due 10/15/2030 | | | 4,311,748 | | | |
| | 19,119,000 | | | | USD | | | 7.800% due 08/01/2031 (5) | | | 20,551,166 | | | |
| | | | | | | | | | | | | | | | | |
| | | | | | | | | | | | | | 24,862,914 | | | |
| | | | | | | | | | | | | | | | | |
| | | | | | | | | | | | | | | | | |
| | | | | | | | | Energy Future Holdings | | | | | | |
| | 14,355,000 | | | | USD | | | 10.000% due 01/15/2020 (5)(9) | | | 15,107,231 | | | |
| | | | | | | | | | | | | | | | | |
| | | | | | | | | | | | | | | | | |
| | | | | | | | | Entravision Communications | | | | | | |
| | 11,365,000 | | | | USD | | | 8.750% due 08/01/2017 (5)(9) | | | 12,231,581 | | | |
| | | | | | | | | | | | | | | | | |
| | | | | | | | | | | | | | | | | |
| | | | | | | | | Exide Technologies, Series B | | | | | | |
| | 27,410,000 | | | | USD | | | 10.500% due 03/15/2013 (5) | | | 28,129,512 | | | |
| | | | | | | | | | | | | | | | | |
| | | | | | | | | | | | | | | | | |
| | | | | | | | | Ford Motor Credit | | | | | | |
| | 6,870,000 | | | | USD | | | 7.000% due 04/15/2015 | | | 7,599,814 | | | |
| | 3,200,000 | | | | USD | | | 8.000% due 12/15/2016 | | | 3,750,307 | | | |
| | 17,145,000 | | | | USD | | | 8.125% due 01/15/2020 | | | 21,001,528 | | | |
| | | | | | | | | | | | | | | | | |
| | | | | | | | | | | | | | 32,351,649 | | | |
| | | | | | | | | | | | | | | | | |
| | | | | | | | | | | | | | | | | |
| | | | | | | | | Frontier Communications | | | | | | |
| | 14,400,000 | | | | USD | | | 8.750% due 04/15/2022 | | | 16,812,000 | | | |
| | 16,715,000 | | | | USD | | | 9.000% due 08/15/2031 (5) | | | 18,720,800 | | | |
| | | | | | | | | | | | | | | | | |
| | | | | | | | | | | | | | 35,532,800 | | | |
| | | | | | | | | | | | | | | | | |
| | | | | | | | | | | | | | | | | |
| | | | | | | | | General Motors | | | | | | |
| | 2,240,000 | | | | USD | | | 7.125% due 07/15/2013 (5)(7) | | | 795,200 | | | |
| | 7,200,000 | | | | USD | | | 8.800% due 03/01/2021 (7) | | | 2,502,000 | | | |
| | 35,495,000 | | | | USD | | | 8.250% due 07/15/2023 (5)(7) | | | 12,600,725 | | | |
| | 2,485,000 | | | | USD | | | 8.100% due 06/15/2024 (5)(7) | | | 857,325 | | | |
| | 2,415,000 | | | | EUR | | | 8.375% due 07/05/2033 (7) | | | 1,092,389 | | | |
| | 3,550,000 | | | | USD | | | 8.375% due 07/15/2033 (7) | | | 1,295,750 | | | |
| | 3,460,000 | | | | USD | | | 7.375% due 05/23/2048 (5)(7) | | | 1,176,400 | | | |
| | | | | | | | | | | | | | | | | |
| | | | | | | | | | | | | | 20,319,789 | | | |
| | | | | | | | | | | | | | | | | |
| | | | | | | | | | | | | | | | | |
| | | | | | | | | GMAC Inc | | | | | | |
| | 12,195,000 | | | | USD | | | 8.000% due 03/15/2020 (9) | | | 13,505,962 | | | |
| | | | | | | | | | | | | | | | | |
| | | | | | | | | | | | | | | | | |
See Notes to Financial Statements
| | |
| 136 | Artio Global Funds ï 2010 Annual Report | |
| |
| PORTFOLIO OF INVESTMENTS (Continued) | October 31, 2010 |
Artio Global High Income Fund
| | | | | | | | | | | | | | | | | |
Face
| | | | | | | | | | Fair
| | | |
| Value | | | Currency | | | Description | | | | Value (Note 2) | | | |
CORPORATE BONDS—Continued |
| | | | | | | | | United States—Continued | | | | | | |
| | | | | | | | | | | | | | | | | |
| | | | | | | | | HCA Inc | | | | | | |
| | 2,864,000 | | | | USD | | | 7.190% due 11/15/2015 (5) | | $ | 2,828,200 | | | |
| | 3,859,000 | | | | USD | | | 7.250% due 09/15/2020 (5) | | | 4,240,076 | | | |
| | | | | | | | | | | | | | | | | |
| | | | | | | | | | | | | | 7,068,276 | | | |
| | | | | | | | | | | | | | | | | |
| | | | | | | | | | | | | | | | | |
| | | | | | | | | Headwaters Inc | | | | | | |
| | 25,056,000 | | | | USD | | | 11.375% due 11/01/2014 (5) | | | 27,279,720 | | | |
| | | | | | | | | | | | | | | | | |
| | | | | | | | | | | | | | | | | |
| | | | | | | | | Hertz Corp | | | | | | |
| | 10,870,000 | | | | EUR | | | 7.875% due 01/01/2014 (5) | | | 15,469,266 | | | |
| | 6,695,000 | | | | USD | | | 7.500% due 10/15/2018 (5)(9) | | | 6,929,325 | | | |
| | | | | | | | | | | | | | | | | |
| | | | | | | | | | | | | | 22,398,591 | | | |
| | | | | | | | | | | | | | | | | |
| | | | | | | | | | | | | | | | | |
| | | | | | | | | IASIS Healthcare Capital | | | | | | |
| | 11,449,000 | | | | USD | | | 8.750% due 06/15/2014 (5) | | | 11,778,159 | | | |
| | | | | | | | | | | | | | | | | |
| | | | | | | | | | | | | | | | | |
| | | | | | | | | IMS Health | | | | | | |
| | 23,890,000 | | | | USD | | | 12.500% due 03/01/2018 (5)(9) | | | 28,130,475 | | | |
| | | | | | | | | | | | | | | | | |
| | | | | | | | | | | | | | | | | |
| | | | | | | | | ING Capital | | | | | | |
| | 14,215,000 | | | | USD | | | 8.439% due 12/29/2049 (5)(6) | | | 13,717,475 | | | |
| | | | | | | | | | | | | | | | | |
| | | | | | | | | | | | | | | | | |
| | | | | | | | | Interactive Data | | | | | | |
| | 14,230,000 | | | | USD | | | 10.250% due 08/01/2018 (5)(9) | | | 15,635,212 | | | |
| | | | | | | | | | | | | | | | | |
| | | | | | | | | | | | | | | | | |
| | | | | | | | | International Lease Finance | | | | | | |
| | 9,250,000 | | | | USD | | | 8.625% due 09/15/2015 (9) | | | 10,429,375 | | | |
| | 10,330,000 | | | | USD | | | 8.750% due 03/15/2017 (9) | | | 11,776,200 | | | |
| | 4,245,000 | | | | USD | | | 8.875% due 09/01/2017 | | | 4,871,138 | | | |
| | | | | | | | | | | | | | | | | |
| | | | | | | | | | | | | | 27,076,713 | | | |
| | | | | | | | | | | | | | | | | |
| | | | | | | | | | | | | | | | | |
| | | | | | | | | Inverness Medical Innovations | | | | | | |
| | 5,715,000 | | | | USD | | | 7.875% due 02/01/2016 (5) | | | 6,015,038 | | | |
| | | | | | | | | | | | | | | | | |
| | | | | | | | | | | | | | | | | |
| | | | | | | | | JP Morgan Chase Capital XX, Series T | | | | | | |
| | 2,460,000 | | | | USD | | | 6.550% due 09/29/2036 (5) | | | 2,393,477 | | | |
| | | | | | | | | | | | | | | | | |
| | | | | | | | | | | | | | | | | |
| | | | | | | | | K Hovnanian Enterprises | | | | | | |
| | 7,740,000 | | | | USD | | | 6.250% due 01/15/2016 (5) | | | 5,301,900 | | | |
| | 2,985,000 | | | | USD | | | 10.625% due 10/15/2016 (5) | | | 3,052,163 | | | |
| | 13,730,000 | | | | USD | | | 8.625% due 01/15/2017 (5) | | | 9,508,025 | | | |
| | | | | | | | | | | | | | | | | |
| | | | | | | | | | | | | | 17,862,088 | | | |
| | | | | | | | | | | | | | | | | |
| | | | | | | | | | | | | | | | | |
| | | | | | | | | KB Home | | | | | | |
| | 3,910,000 | | | | USD | | | 5.875% due 01/15/2015 (5) | | | 3,807,363 | | | |
See Notes to Financial Statements
| | |
| Artio Global Funds ï 2010 Annual Report | 137 |
| |
| PORTFOLIO OF INVESTMENTS (Continued) | October 31, 2010 |
Artio Global High Income Fund
| | | | | | | | | | | | | | | | | |
Face
| | | | | | | | | | Fair
| | | |
| Value | | | Currency | | | Description | | | | Value (Note 2) | | | |
CORPORATE BONDS—Continued |
| | | | | | | | | United States—Continued | | | | | | |
| | | | | | | | | KB Home—Continued | | | | | | |
| | | | | | | | | | | | | | | | | |
| | 9,420,000 | | | | USD | | | 9.100% due 09/15/2017 (5) | | $ | 9,843,900 | | | |
| | | | | | | | | | | | | | | | | |
| | | | | | | | | | | | | | 13,651,263 | | | |
| | | | | | | | | | | | | | | | | |
| | | | | | | | | | | | | | | | | |
| | | | | | | | | Knight Ridder | | | | | | |
| | 5,530,000 | | | | USD | | | 7.150% due 11/01/2027 (5) | | | 3,152,100 | | | |
| | | | | | | | | | | | | | | | | |
| | | | | | | | | | | | | | | | | |
| | | | | | | | | Landry’s Restaurant | | | | | | |
| | 14,320,000 | | | | USD | | | 11.625% due 12/01/2015 (5) | | | 15,429,800 | | | |
| | | | | | | | | | | | | | | | | |
| | | | | | | | | | | | | | | | | |
| | | | | | | | | Level 3 Financing | | | | | | |
| | 8,782,000 | | | | USD | | | 4.344% due 02/15/2015 (5)(6) | | | 7,420,790 | | | |
| | 28,500,000 | | | | USD | | | 10.000% due 02/01/2018 (5) | | | 27,431,250 | | | |
| | | | | | | | | | | | | | | | | |
| | | | | | | | | | | | | | 34,852,040 | | | |
| | | | | | | | | | | | | | | | | |
| | | | | | | | | | | | | | | | | |
| | | | | | | | | MacDermid Inc | | | | | | |
| | 25,265,000 | | | | USD | | | 9.500% due 04/15/2017 (5)(9) | | | 27,096,712 | | | |
| | | | | | | | | | | | | | | | | |
| | | | | | | | | | | | | | | | | |
| | | | | | | | | Marquette Transportation | | | | | | |
| | 24,700,000 | | | | USD | | | 10.875% due 01/15/2017 (5)(9) | | | 26,058,500 | | | |
| | | | | | | | | | | | | | | | | |
| | | | | | | | | | | | | | | | | |
| | | | | | | | | Merge Healthcare | | | | | | |
| | 15,145,000 | | | | USD | | | 11.750% due 05/01/2015 (5)(9) | | | 15,940,112 | | | |
| | | | | | | | | | | | | | | | | |
| | | | | | | | | | | | | | | | | |
| | | | | | | | | Meritage Homes | | | | | | |
| | 9,855,000 | | | | USD | | | 7.731% due 04/30/2017 (5)(9) | | | 9,041,963 | | | |
| | | | | | | | | | | | | | | | | |
| | | | | | | | | | | | | | | | | |
| | | | | | | | | MetroPCS Wireless | | | | | | |
| | 2,390,000 | | | | USD | | | 7.875% due 09/01/2018 (5) | | | 2,575,225 | | | |
| | | | | | | | | | | | | | | | | |
| | | | | | | | | | | | | | | | | |
| | | | | | | | | Mirant Americas Generation | | | | | | |
| | 3,555,000 | | | | USD | | | 8.500% due 10/01/2021 (5) | | | 3,501,675 | | | |
| | 35,242,650 | | | | USD | | | 9.125% due 05/01/2031 (5) | | | 33,656,731 | | | |
| | | | | | | | | | | | | | | | | |
| | | | | | | | | | | | | | 37,158,406 | | | |
| | | | | | | | | | | | | | | | | |
| | | | | | | | | | | | | | | | | |
| | | | | | | | | Momentive Performance Materials | | | | | | |
| | 8,715,000 | | | | USD | | | 9.000% due 01/15/2021 (5)(9) | | | 9,063,600 | | | |
| | 15,585,000 | | | | EUR | | | 9.500% due 01/15/2021 (5)(9) | | | 22,197,332 | | | |
| | | | | | | | | | | | | | | | | |
| | | | | | | | | | | | | | 31,260,932 | | | |
| | | | | | | | | | | | | | | | | |
| | | | | | | | | | | | | | | | | |
| | | | | | | | | Montana Re | | | | | | |
| | 3,025,000 | | | | USD | | | 10.043% due 12/07/2012 (4)(6)(9) | | | 3,072,190 | | | |
| | | | | | | | | | | | | | | | | |
| | | | | | | | | | | | | | | | | |
| | | | | | | | | NES Rentals Holdings | | | | | | |
| | 6,115,000 | | | | USD | | | 12.250% due 04/15/2015 (5)(9) | | | 4,876,713 | | | |
| | | | | | | | | | | | | | | | | |
| | | | | | | | | | | | | | | | | |
See Notes to Financial Statements
| | |
| 138 | Artio Global Funds ï 2010 Annual Report | |
| |
| PORTFOLIO OF INVESTMENTS (Continued) | October 31, 2010 |
Artio Global High Income Fund
| | | | | | | | | | | | | | | | | |
Face
| | | | | | | | | | Fair
| | | |
| Value | | | Currency | | | Description | | | | Value (Note 2) | | | |
CORPORATE BONDS—Continued |
| | | | | | | | | United States—Continued | | | | | | |
| | | | | | | | | | | | | | | | | |
| | | | | | | | | New Albertsons | | | | | | |
| | 5,942,000 | | | | USD | | | 7.750% due 06/15/2026 | | $ | 4,961,570 | | | |
| | 4,420,000 | | | | USD | | | 6.625% due 06/01/2028 | | | 3,303,950 | | | |
| | 10,825,000 | | | | USD | | | 7.450% due 08/01/2029 (5) | | | 8,822,375 | | | |
| | 9,290,000 | | | | USD | | | 8.700% due 05/01/2030 (5) | | | 8,244,875 | | | |
| | | | | | | | | | | | | | | | | |
| | | | | | | | | | | | | | 25,332,770 | | | |
| | | | | | | | | | | | | | | | | |
| | | | | | | | | | | | | | | | | |
| | | | | | | | | NewMarket Corp | | | | | | |
| | 7,675,000 | | | | USD | | | 7.125% due 12/15/2016 (5) | | | 7,866,875 | | | |
| | | | | | | | | | | | | | | | | |
| | | | | | | | | | | | | | | | | |
| | | | | | | | | NRG Energy | | | | | | |
| | 9,515,000 | | | | USD | | | 7.375% due 01/15/2017 (5) | | | 9,943,175 | | | |
| | | | | | | | | | | | | | | | | |
| | | | | | | | | | | | | | | | | |
| | | | | | | | | Plains Exploration & Production | | | | | | |
| | 9,025,000 | | | | USD | | | 10.000% due 03/01/2016 (5) | | | 10,344,906 | | | |
| | 22,885,000 | | | | USD | | | 8.625% due 10/15/2019 (5) | | | 25,516,775 | | | |
| | 8,150,000 | | | | USD | | | 7.625% due 04/01/2020 (5) | | | 8,822,375 | | | |
| | | | | | | | | | | | | | | | | |
| | | | | | | | | | | | | | 44,684,056 | | | |
| | | | | | | | | | | | | | | | | |
| | | | | | | | | | | | | | | | | |
| | | | | | | | | PNC Preferred Funding Trust I | | | | | | |
| | 8,980,000 | | | | USD | | | 6.517% due 12/31/2049 (5)(6)(9) | | | 6,984,366 | | | |
| | | | | | | | | | | | | | | | | |
| | | | | | | | | | | | | | | | | |
| | | | | | | | | Reynolds Group Issuer | | | | | | |
| | 1,230,000 | | | | USD | | | 7.125% due 04/15/2019 (5)(9) | | | 1,288,425 | | | |
| | 13,155,000 | | | | USD | | | 9.000% due 04/15/2019 (5)(9) | | | 13,730,531 | | | |
| | | | | | | | | | | | | | | | | |
| | | | | | | | | | | | | | 15,018,956 | | | |
| | | | | | | | | | | | | | | | | |
| | | | | | | | | | | | | | | | | |
| | | | | | | | | Rite Aid | | | | | | |
| | 7,310,000 | | | | USD | | | 10.375% due 07/15/2016 (5) | | | 7,812,563 | | | |
| | 22,535,000 | | | | USD | | | 10.250% due 10/15/2019 (5) | | | 24,112,450 | | | |
| | | | | | | | | | | | | | | | | |
| | | | | | | | | | | | | | 31,925,013 | | | |
| | | | | | | | | | | | | | | | | |
| | | | | | | | | | | | | | | | | |
| | | | | | | | | SandRidge Energy | | | | | | |
| | 11,210,000 | | | | USD | | | 8.625% due 04/01/2015 (5) | | | 11,518,275 | | | |
| | 6,735,000 | | | | USD | | | 8.000% due 06/01/2018 (5)(9) | | | 6,768,675 | | | |
| | 14,122,000 | | | | USD | | | 8.750% due 01/15/2020 (5)(9) | | | 14,757,490 | | | |
| | | | | | | | | | | | | | | | | |
| | | | | | | | | | | | | | 33,044,440 | | | |
| | | | | | | | | | | | | | | | | |
| | | | | | | | | | | | | | | | | |
| | | | | | | | | Sanmina-SCI Corp | | | | | | |
| | 23,364,000 | | | | USD | | | 3.042% due 06/15/2014 (5)(6)(9) | | | 22,312,620 | | | |
| | | | | | | | | | | | | | | | | |
| | | | | | | | | | | | | | | | | |
| | | | | | | | | Sears Holdings | | | | | | |
| | 1,225,000 | | | | USD | | | 6.625% due 10/15/2018 (5)(9) | | | 1,228,063 | | | |
| | | | | | | | | | | | | | | | | |
| | | | | | | | | | | | | | | | | |
See Notes to Financial Statements
| | |
| Artio Global Funds ï 2010 Annual Report | 139 |
| |
| PORTFOLIO OF INVESTMENTS (Continued) | October 31, 2010 |
Artio Global High Income Fund
| | | | | | | | | | | | | | | | | |
Face
| | | | | | | | | | Fair
| | | |
| Value | | | Currency | | | Description | | | | Value (Note 2) | | | |
CORPORATE BONDS—Continued |
| | | | | | | | | United States—Continued | | | | | | |
| | | | | | | | | | | | | | | | | |
| | | | | | | | | Spectrum Brands | | | | | | |
| | 2,515,000 | | | | USD | | | 9.500% due 06/15/2018 (5)(9) | | $ | 2,796,366 | | | |
| | | | | | | | | | | | | | | | | |
| | | | | | | | | | | | | | | | | |
| | | | | | | | | Stanadyne Corp | | | | | | |
| | 9,605,000 | | | | USD | | | 12.000% due 02/15/2015 (5)(8) | | | 8,740,550 | | | |
| | | | | | | | | | | | | | | | | |
| | | | | | | | | | | | | | | | | |
| | | | | | | | | Stanadyne Corp, Series 1 | | | | | | |
| | 8,135,000 | | | | USD | | | 10.000% due 08/15/2014 (4)(5) | | | 8,094,325 | | | |
| | | | | | | | | | | | | | | | | |
| | | | | | | | | | | | | | | | | |
| | | | | | | | | Standard Pacific | | | | | | |
| | 3,595,000 | | | | USD | | | 7.000% due 08/15/2015 (5) | | | 3,541,075 | | | |
| | 31,080,000 | | | | USD | | | 10.750% due 09/15/2016 (5) | | | 35,120,400 | | | |
| | | | | | | | | | | | | | | | | |
| | | | | | | | | | | | | | 38,661,475 | | | |
| | | | | | | | | | | | | | | | | |
| | | | | | | | | | | | | | | | | |
| | | | | | | | | Successor X | | | | | | |
| | 5,850,000 | | | | USD | | | 0.019% due 12/09/2010 (4)(6)(9) | | | 5,733,910 | | | |
| | | | | | | | | | | | | | | | | |
| | | | | | | | | | | | | | | | | |
| | | | | | | | | SunGard Data Systems | | | | | | |
| | 1,605,000 | | | | USD | | | 9.125% due 08/15/2013 (5) | | | 1,651,144 | | | |
| | 20,255,000 | | | | USD | | | 10.625% due 05/15/2015 (5) | | | 22,736,237 | | | |
| | | | | | | | | | | | | | | | | |
| | | | | | | | | | | | | | 24,387,381 | | | |
| | | | | | | | | | | | | | | | | |
| | | | | | | | | | | | | | | | | |
| | | | | | | | | Toys R Us | | | | | | |
| | 1,650,000 | | | | USD | | | 7.375% due 10/15/2018 (5) | | | 1,608,750 | | | |
| | | | | | | | | | | | | | | | | |
| | | | | | | | | | | | | | | | | |
| | | | | | | | | Toys R Us Property | | | | | | |
| | 23,535,000 | | | | USD | | | 10.750% due 07/15/2017 (5) | | | 27,006,412 | | | |
| | | | | | | | | | | | | | | | | |
| | | | | | | | | | | | | | | | | |
| | | | | | | | | Travelport LLC | | | | | | |
| | 24,800,000 | | | | USD | | | 4.921% due 09/01/2014 (5)(6) | | | 23,560,000 | | | |
| | 9,500,000 | | | | EUR | | | 5.513% due 09/01/2014 (5)(6) | | | 12,362,664 | | | |
| | | | | | | | | | | | | | | | | |
| | | | | | | | | | | | | | 35,922,664 | | | |
| | | | | | | | | | | | | | | | | |
| | | | | | | | | | | | | | �� | | | |
| | | | | | | | | Tutor Perini | | | | | | |
| | 3,370,000 | | | | USD | | | 7.625% due 11/01/2018 (5)(9) | | | 3,437,400 | | | |
| | | | | | | | | | | | | | | | | |
| | | | | | | | | | | | | | | | | |
| | | | | | | | | United Air Lines | | | | | | |
| | 25,050,000 | | | | USD | | | 9.875% due 08/01/2013 (5)(9) | | | 27,680,250 | | | |
| | | | | | | | | | | | | | | | | |
| | | | | | | | | | | | | | | | | |
| | | | | | | | | United Rentals North America | | | | | | |
| | 30,194,000 | | | | USD | | | 9.250% due 12/15/2019 (5) | | | 33,666,310 | | | |
| | 11,090,000 | | | | USD | | | 8.375% due 09/15/2020 (5) | | | 11,311,800 | | | |
| | | | | | | | | | | | | | | | | |
| | | | | | | | | | | | | | 44,978,110 | | | |
| | | | | | | | | | | | | | | | | |
| | | | | | | | | | | | | | | | | |
| | | | | | | | | Universal Hospital Services | | | | | | |
| | 22,418,000 | | | | USD | | | 4.134% due 06/01/2015 (5)(6) | | | 20,288,290 | | | |
See Notes to Financial Statements
| | |
| 140 | Artio Global Funds ï 2010 Annual Report | |
| |
| PORTFOLIO OF INVESTMENTS (Continued) | October 31, 2010 |
Artio Global High Income Fund
| | | | | | | | | | | | | | | | | |
Face
| | | | | | | | | | Fair
| | | |
| Value | | | Currency | | | Description | | | | Value (Note 2) | | | |
CORPORATE BONDS—Continued |
| | | | | | | | | United States—Continued | | | | | | |
| | | | | | | | | Universal Hospital Services—Continued | | | | | | |
| | | | | | | | | | | | | | | | | |
| | 860,000 | | | | USD | | | 8.500% due 06/01/2015 (5) | | $ | 900,850 | | | |
| | | | | | | | | | | | | | | | | |
| | | | | | | | | | | | | | 21,189,140 | | | |
| | | | | | | | | | | | | | | | | |
| | | | | | | | | | | | | | | | | |
| | | | | | | | | Vanguard Health | | | | | | |
| | 28,430,000 | | | | USD | | | 8.000% due 02/01/2018 (5) | | | 30,100,262 | | | |
| | | | | | | | | | | | | | | | | |
| | | | | | | | | | | | | | | | | |
| | | | | | | | | Verso Paper, Series B | | | | | | |
| | 5,500,000 | | | | USD | | | 4.216% due 08/01/2014 (5)(6) | | | 4,963,750 | | | |
| | 8,415,000 | | | | USD | | | 9.125% due 08/01/2014 (5) | | | 8,709,525 | | | |
| | 24,415,000 | | | | USD | | | 11.375% due 08/01/2016 (5) | | | 23,621,512 | | | |
| | | | | | | | | | | | | | | | | |
| | | | | | | | | | | | | | 37,294,787 | | | |
| | | | | | | | | | | | | | | | | |
| | | | | | | | | | | | | | | | | |
| | | | | | | | | Visant Corp | | | | | | |
| | 12,970,000 | | | | USD | | | 10.000% due 10/01/2017 (5)(9) | | | 13,845,475 | | | |
| | | | | | | | | | | | | | | | | |
| | | | | | | | | | | | | | | | | |
| | | | | | | | | WCA Waste | | | | | | |
| | 7,325,000 | | | | USD | | | 9.250% due 06/15/2014 (5) | | | 7,618,000 | | | |
| | | | | | | | | | | | | | | | | |
| | | | | | | | | | | | | | | | | |
| | | | | | | | | Wells Fargo Capital XIII, Multi-Coupon | | | | | | |
| | 4,650,000 | | | | USD | | | 7.700% due 12/29/2049 (5)(6) | | | 4,847,625 | | | |
| | | | | | | | | | | | | | | | | |
| | | | | | | | | | | | | | | | | |
| | | | | | | | | Windstream Corp | | | | | | |
| | 21,470,000 | | | | USD | | | 7.875% due 11/01/2017 (5) | | | 23,563,325 | | | |
| | 2,400,000 | | | | USD | | | 8.125% due 09/01/2018 (5)(9) | | | 2,598,000 | | | |
| | 3,100,000 | | | | USD | | | 7.750% due 10/15/2020 (5)(9) | | | 3,301,500 | | | |
| | | | | | | | | | | | | | | | | |
| | | | | | | | | | | | | | 29,462,825 | | | |
| | | | | | | | | | | | | | | | | |
| | | | | | | | | | | | | | | | | |
| | | | | | | | | Wyle Services | | | | | | |
| | 25,835,000 | | | | USD | | | 10.500% due 04/01/2018 (5)(9) | | | 25,770,412 | | | |
| | | | | | | | | | | | | | | | | |
| | | | | | | | | | | | | | | | | |
| | | | | | | | | | | | | | 1,595,944,369 | | | |
| | | | | | | | | | | | | | | | | |
| | | | | | | | | | | | | | | | | |
| | | | | | | | | Canada—4.2% | | | | | | |
| | | | | | | | | Air Canada | | | | | | |
| | 19,355,088 | | | | USD | | | 9.250% due 08/01/2015 (5)(9) | | | 20,274,455 | | | |
| | 10,042,642 | | | | USD | | | 12.000% due 02/01/2016 (5)(9) | | | 10,519,667 | | | |
| | | | | | | | | | | | | | | | | |
| | | | | | | | | | | | | | 30,794,122 | | | |
| | | | | | | | | | | | | | | | | |
| | | | | | | | | | | | | | | | | |
| | | | | | | | | Garda World Security | | | | | | |
| | 13,975,000 | | | | USD | | | 9.750% due 03/15/2017 (5)(9) | | | 14,953,250 | | | |
| | | | | | | | | | | | | | | | | |
| | | | | | | | | | | | | | | | | |
| | | | | | | | | Great Canadian Gaming | | | | | | |
| | 13,880,000 | | | | USD | | | 7.250% due 02/15/2015 (5)(9) | | | 14,227,000 | | | |
| | | | | | | | | | | | | | | | | |
| | | | | | | | | | | | | | | | | |
See Notes to Financial Statements
| | |
| Artio Global Funds ï 2010 Annual Report | 141 |
| |
| PORTFOLIO OF INVESTMENTS (Continued) | October 31, 2010 |
Artio Global High Income Fund
| | | | | | | | | | | | | | | | | |
Face
| | | | | | | | | | Fair
| | | |
| Value | | | Currency | | | Description | | | | Value (Note 2) | | | |
CORPORATE BONDS—Continued |
| | | | | | | | | Canada—Continued | | | | | | |
| | | | | | | | | | | | | | | | | |
| | | | | | | | | Patheon Inc | | | | | | |
| | 23,242,000 | | | | USD | | | 8.625% due 04/15/2017 (5)(9) | | $ | 24,229,785 | | | |
| | | | | | | | | | | | | | | | | |
| | | | | | | | | | | | | | | | | |
| | | | | | | | | Postmedia Network | | | | | | |
| | 1,830,000 | | | | USD | | | 12.500% due 07/15/2018 (5)(9) | | | 2,058,750 | | | |
| | | | | | | | | | | | | | | | | |
| | | | | | | | | | | | | | | | | |
| | | | | | | | | Reliance Intermediate | | | | | | |
| | 12,950,000 | | | | USD | | | 9.500% due 12/15/2019 (5)(9) | | | 13,824,125 | | | |
| | | | | | | | | | | | | | | | | |
| | | | | | | | | | | | | | | | | |
| | | | | | | | | Telesat Canada | | | | | | |
| | 9,430,000 | | | | USD | | | 11.000% due 11/01/2015 (5) | | | 10,632,325 | | | |
| | 16,347,000 | | | | USD | | | 12.500% due 11/01/2017 (5) | | | 19,371,195 | | | |
| | | | | | | | | | | | | | | | | |
| | | | | | | | | | | | | | 30,003,520 | | | |
| | | | | | | | | | | | | | | | | |
| | | | | | | | | | | | | | | | | |
| | | | | | | | | | | | | | 130,090,552 | | | |
| | | | | | | | | | | | | | | | | |
| | | | | | | | | | | | | | | | | |
| | | | | | | | | United Kingdom—4.2% | | | | | | |
| | | | | | | | | Barclays Bank | | | | | | |
| | 4,126,000 | | | | USD | | | 5.926% due 09/29/2049 (5)(6)(9) | | | 3,919,700 | | | |
| | | | | | | | | | | | | | | | | |
| | | | | | | | | | | | | | | | | |
| | | | | | | | | Barclays Bank, Series 1 | | | | | | |
| | 6,870,000 | | | | USD | | | 6.278% due 12/29/2049 (4)(5)(6) | | | 6,328,987 | | | |
| | | | | | | | | | | | | | | | | |
| | | | | | | | | | | | | | | | | |
| | | | | | | | | Channel Link Enterprises | | | | | | |
| | 33,345,000 | | | | EUR | | | 2.261% due 06/30/2012 (6) | | | 37,359,707 | | | |
| | | | | | | | | | | | | | | | | |
| | | | | | | | | | | | | | | | | |
| | | | | | | | | EC Finance | | | | | | |
| | 7,390,000 | | | | EUR | | | 9.750% due 08/01/2017 (5)(9) | | | 11,159,662 | | | |
| | | | | | | | | | | | | | | | | |
| | | | | | | | | | | | | | | | | |
| | | | | | | | | HBOS Capital Funding | | | | | | |
| | 14,650,000 | | | | USD | | | 6.071% due 06/29/2049 (5)(6)(9) | | | 13,331,500 | | | |
| | | | | | | | | | | | | | | | | |
| | | | | | | | | | | | | | | | | |
| | | | | | | | | Intelsat Bermuda | | | | | | |
| | 390 | | | | USD | | | 11.500% due 02/04/2017 (5) | | | 424 | | | |
| | | | | | | | | | | | | | | | | |
| | | | | | | | | | | | | | | | | |
| | | | | | | | | Intelsat Intermediate | | | | | | |
| | 15,419,000 | | | | USD | | | 9.500% due 02/01/2015 (5)(6)(8) | | | 16,112,855 | | | |
| | | | | | | | | | | | | | | | | |
| | | | | | | | | | | | | | | | | |
| | | | | | | | | Intelsat Jackson Holdings | | | | | | |
| | 17,485,000 | | | | USD | | | 8.500% due 11/01/2019 (5)(9) | | | 19,189,787 | | | |
| | | | | | | | | | | | | | | | | |
| | | | | | | | | | | | | | | | | |
| | | | | | | | | Intelsat Luxembourg | | | | | | |
| | 7,250,000 | | | | USD | | | 11.250% due 02/04/2017 (5) | | | 7,802,812 | | | |
| | | | | | | | | | | | | | | | | |
| | | | | | | | | | | | | | | | | |
| | | | | | | | | LBG Capital No. 1 | | | | | | |
| | 1,520,000 | | | | EUR | | | 6.439% due 05/23/2020 | | | 1,893,405 | | | |
| | | | | | | | | | | | | | | | | |
| | | | | | | | | | | | | | | | | |
See Notes to Financial Statements
| | |
| 142 | Artio Global Funds ï 2010 Annual Report | |
| |
| PORTFOLIO OF INVESTMENTS (Continued) | October 31, 2010 |
Artio Global High Income Fund
| | | | | | | | | | | | | | | | | |
Face
| | | | | | | | | | Fair
| | | |
| Value | | | Currency | | | Description | | | | Value (Note 2) | | | |
CORPORATE BONDS—Continued |
| | | | | | | | | United Kingdom—Continued | | | | | | |
| | | | | | | | | | | | | | | | | |
| | | | | | | | | LBG Capital No. 2 | | | | | | |
| | 9,255,000 | | | | EUR | | | 6.385% due 05/12/2020 | | $ | 11,528,593 | | | |
| | | | | | | | | | | | | | | | | |
| | | | | | | | | | | | | | | | | |
| | | | | | | | | | | | | | 128,627,432 | | | |
| | | | | | | | | | | | | | | | | |
| | | | | | | | | | | | | | | | | |
| | | | | | | | | Netherlands—2.6% | | | | | | |
| | | | | | | | | BLT Finance | | | | | | |
| | 7,432,000 | | | | USD | | | 7.500% due 05/15/2014 (5) | | | 5,834,596 | | | |
| | | | | | | | | | | | | | | | | |
| | | | | | | | | | | | | | | | | |
| | | | | | | | | DTEK Finance | | | | | | |
| | 10,985,000 | | | | USD | | | 9.500% due 04/28/2015 (9) | | | 11,465,594 | | | |
| | | | | | | | | | | | | | | | | |
| | | | | | | | | | | | | | | | | |
| | | | | | | | | Hertz Holdings | | | | | | |
| | 9,510,000 | | | | EUR | | | 8.500% due 07/31/2015 (5)(9) | | | 14,096,360 | | | |
| | | | | | | | | | | | | | | | | |
| | | | | | | | | | | | | | | | | |
| | | | | | | | | Impress Holdings | | | | | | |
| | 1,320,000 | | | | USD | | | 3.414% due 09/15/2013 (5)(6)(9) | | | 1,320,000 | | | |
| | 1,670,000 | | | | EUR | | | 4.110% due 09/15/2013 (5)(6) | | | 2,327,211 | | | |
| | | | | | | | | | | | | | | | | |
| | | | | | | | | | | | | | 3,647,211 | | | |
| | | | | | | | | | | | | | | | | |
| | | | | | | | | | | | | | | | | |
| | | | | | | | | Sensata Technologies | | | | | | |
| | 2,574,000 | | | | USD | | | 8.000% due 05/01/2014 (5) | | | 2,670,525 | | | |
| | 19,835,000 | | | | EUR | | | 9.000% due 05/01/2016 (5) | | | 29,124,704 | | | |
| | | | | | | | | | | | | | | | | |
| | | | | | | | | | | | | | 31,795,229 | | | |
| | | | | | | | | | | | | | | | | |
| | | | | | | | | | | | | | | | | |
| | | | | | | | | Ziggo Bond | | | | | | |
| | 8,456,000 | | | | EUR | | | 8.000% due 05/15/2018 (5)(9) | | | 12,210,401 | | | |
| | | | | | | | | | | | | | | | | |
| | | | | | | | | | | | | | | | | |
| | | | | | | | | | | | | | 79,049,391 | | | |
| | | | | | | | | | | | | | | | | |
| | | | | | | | | | | | | | | | | |
| | | | | | | | | Germany—2.0% | | | | | | |
| | | | | | | | | OXEA Finance | | | | | | |
| | 715,000 | | | | EUR | | | 9.625% due 07/15/2017 (5) | | | 1,092,163 | | | |
| | 9,740,000 | | | | EUR | | | 9.625% due 07/15/2017 (5)(9) | | | 14,877,855 | | | |
| | | | | | | | | | | | | | | | | |
| | | | | | | | | | | | | | 15,970,018 | | | |
| | | | | | | | | | | | | | | | | |
| | | | | | | | | | | | | | | | | |
| | | | | | | | | UPC Germany GmbH | | | | | | |
| | 30,845,000 | | | | EUR | | | 8.125% due 12/01/2017 (5)(9) | | | 45,076,577 | | | |
| | | | | | | | | | | | | | | | | |
| | | | | | | | | | | | | | | | | |
| | | | | | | | | | | | | | 61,046,595 | | | |
| | | | | | | | | | | | | | | | | |
| | | | | | | | | | | | | | | | | |
| | | | | | | | | Italy—1.4% | | | | | | |
| | | | | | | | | Wind Acquisition Finance | | | | | | |
| | 2,650,000 | | | | EUR | | | 11.750% due 07/15/2017 (5)(9) | | | 4,149,304 | | | |
| | 6,300,000 | | | | USD | | | 11.750% due 07/15/2017 (5)(9) | | | 7,213,500 | | | |
See Notes to Financial Statements
| | |
| Artio Global Funds ï 2010 Annual Report | 143 |
| |
| PORTFOLIO OF INVESTMENTS (Continued) | October 31, 2010 |
Artio Global High Income Fund
| | | | | | | | | | | | | | | | | |
Face
| | | | | | | | | | Fair
| | | |
| Value | | | Currency | | | Description | | | | Value (Note 2) | | | |
CORPORATE BONDS—Continued |
| | | | | | | | | Italy—Continued | | | | | | |
| | | | | | | | | Wind Acquisition Finance—Continued | | | | | | |
| | | | | | | | | | | | | | | | | |
| | 4,635,000 | | | | EUR | | | 11.750% due 07/15/2017 (5) | | $ | 7,257,367 | | | |
| | | | | | | | | | | | | | | | | |
| | | | | | | | | | | | | | 18,620,171 | | | |
| | | | | | | | | | | | | | | | | |
| | | | | | | | | | | | | | | | | |
| | | | | | | | | Wind Acquisition Holdings Finance | | | | | | |
| | 5,911,000 | | | | EUR | | | 12.250% due 07/15/2017 (5) | | | 9,304,323 | | | |
| | 10,725,297 | | | | EUR | | | 12.250% due 07/15/2017 (5)(9) | | | 16,878,343 | | | |
| | | | | | | | | | | | | | | | | |
| | | | | | | | | | | | | | 26,182,666 | | | |
| | | | | | | | | | | | | | | | | |
| | | | | | | | | | | | | | | | | |
| | | | | | | | | | | | | | 44,802,837 | | | |
| | | | | | | | | | | | | | | | | |
| | | | | | | | | | | | | | | | | |
| | | | | | | | | Ireland—1.4% | | | | | | |
| | | | | | | | | Allied Irish Banks | | | | | | |
| | 7,318,000 | | | | EUR | | | 12.500% due 06/25/2019 | | | 8,964,019 | | | |
| | | | | | | | | | | | | | | | | |
| | | | | | | | | | | | | | | | | |
| | | | | | | | | Ardagh Glass Finance | | | | | | |
| | 16,195,000 | | | | EUR | | | 7.125% due 06/15/2017 (5) | | | 21,131,439 | | | |
| | 855,000 | | | | EUR | | | 8.750% due 02/01/2020 (5)(9) | | | 1,189,989 | | | |
| | | | | | | | | | | | | | | | | |
| | | | | | | | | | | | | | 22,321,428 | | | |
| | | | | | | | | | | | | | | | | |
| | | | | | | | | | | | | | | | | |
| | | | | | | | | Ardagh Packaging Finance | | | | | | |
| | 735,000 | | | | USD | | | 7.375% due 10/15/2017 (5)(9) | | | 782,775 | | | |
| | | | | | | | | | | | | | | | | |
| | | | | | | | | | | | | | | | | |
| | | | | | | | | ATLAS VI Capital | | | | | | |
| | 2,715,000 | | | | EUR | | | 10.386% due 04/06/2013 (4)(6)(9) | | | 3,889,643 | | | |
| | | | | | | | | | | | | | | | | |
| | | | | | | | | | | | | | | | | |
| | | | | | | | | Bank of Ireland | | | | | | |
| | 5,820,000 | | | | GBP | | | 9.250% due 09/07/2020 (5)(6) | | | 8,314,928 | | | |
| | | | | | | | | | | | | | | | | |
| | | | | | | | | | | | | | | | | |
| | | | | | | | | | | | | | 44,272,793 | | | |
| | | | | | | | | | | | | | | | | |
| | | | | | | | | | | | | | | | | |
| | | | | | | | | Brazil—1.3% | | | | | | |
| | | | | | | | | CESP Companhia Energetica Sao Paulo | | | | | | |
| | 10,270,000 | | | | BRL | | | 9.750% due 01/15/2015 (4)(9) | | | 7,732,034 | | | |
| | 17,281,000 | | | | BRL | | | 9.750% due 01/15/2015 (4) | | | 13,010,445 | | | |
| | | | | | | | | | | | | | | | | |
| | | | | | | | | | | | | | 20,742,479 | | | |
| | | | | | | | | | | | | | | | | |
| | | | | | | | | | | | | | | | | |
| | | | | | | | | Fibria Overseas Finance | | | | | | |
| | 1,578,000 | | | | USD | | | 7.500% due 05/04/2020 (5) | | | 1,708,185 | | | |
| | 7,700,000 | | | | USD | | | 7.500% due 05/04/2020 (5)(9) | | | 8,335,250 | | | |
| | | | | | | | | | | | | | | | | |
| | | | | | | | | | | | | | 10,043,435 | | | |
| | | | | | | | | | | | | | | | | |
| | | | | | | | | | | | | | | | | |
See Notes to Financial Statements
| | |
| 144 | Artio Global Funds ï 2010 Annual Report | |
| |
| PORTFOLIO OF INVESTMENTS (Continued) | October 31, 2010 |
Artio Global High Income Fund
| | | | | | | | | | | | | | | | | |
Face
| | | | | | | | | | Fair
| | | |
| Value | | | Currency | | | Description | | | | Value (Note 2) | | | |
CORPORATE BONDS—Continued |
| | | | | | | | | Brazil—Continued | | | | | | |
| | | | | | | | | | | | | | | | | |
| | | | | | | | | Suzano Trading | | | | | | |
| | 8,540,000 | | | | USD | | | 5.875% due 01/23/2021 (9) | | $ | 8,625,400 | | | |
| | | | | | | | | | | | | | | | | |
| | | | | | | | | | | | | | | | | |
| | | | | | | | | | | | | | 39,411,314 | | | |
| | | | | | | | | | | | | | | | | |
| | | | | | | | | | | | | | | | | |
| | | | | | | | | Indonesia—1.1% | | | | | | |
| | | | | | | | | Berau Capital Resources, Series 1 | | | | | | |
| | 14,155,000 | | | | USD | | | 12.500% due 07/08/2015 (5)(9) | | | 16,366,719 | | | |
| | | | | | | | | | | | | | | | | |
| | | | | | | | | | | | | | | | | |
| | | | | | | | | GT 2005 Bonds, Multi-Coupon | | | | | | |
| | 18,645,000 | | | | USD | | | 5.000% due 07/21/2014 (5)(8) | | | 17,269,931 | | | |
| | | | | | | | | | | | | | | | | |
| | | | | | | | | | | | | | | | | |
| | | | | | | | | | | | | | 33,636,650 | | | |
| | | | | | | | | | | | | | | | | |
| | | | | | | | | | | | | | | | | |
| | | | | | | | | Czech Republic—1.0% | | | | | | |
| | | | | | | | | CET 21 SPOL | | | | | | |
| | 21,130,000 | | | | EUR | | | 9.000% due 11/01/2017 (5)(9) | | | 30,217,476 | | | |
| | | | | | | | | | | | | | | | | |
| | | | | | | | | | | | | | | | | |
| | | | | | | | | | | | | | | | | |
| | | | | | | | | Norway—0.8% | | | | | | |
| | | | | | | | | Trico Shipping | | | | | | |
| | 31,239,065 | | | | USD | | | 13.875% due 11/01/2014 (5)(6)(9) | | | 26,084,619 | | | |
| | | | | | | | | | | | | | | | | |
| | | | | | | | | | | | | | | | | |
| | | | | | | | | | | | | | | | | |
| | | | | | | | | Russia—0.5% | | | | | | |
| | | | | | | | | Evraz Group | | | | | | |
| | 550,000 | | | | USD | | | 8.875% due 04/24/2013 (5) | | | 588,500 | | | |
| | 2,295,000 | | | | USD | | | 8.250% due 11/10/2015 (5)(9) | | | 2,458,519 | | | |
| | 4,455,000 | | | | USD | | | 8.250% due 11/10/2015 (5) | | | 4,789,125 | | | |
| | 7,905,000 | | | | USD | | | 9.500% due 04/24/2018 (5) | | | 8,962,294 | | | |
| | | | | | | | | | | | | | | | | |
| | | | | | | | | | | | | | 16,798,438 | | | |
| | | | | | | | | | | | | | | | | |
| | | | | | | | | | | | | | | | | |
| | | | | | | | | France—0.5% | | | | | | |
| | | | | | | | | Europcar Group | | | | | | |
| | 1,115,000 | | | | EUR | | | 4.399% due 05/15/2013 (5)(6) | | | 1,482,024 | | | |
| | 4,835,000 | | | | EUR | | | 4.399% due 05/15/2013 (5)(6)(9) | | | 6,426,532 | | | |
| | 1,200,000 | | | | EUR | | | 8.125% due 05/15/2014 (5)(9) | | | 1,699,388 | | | |
| | 3,385,000 | | | | EUR | | | 8.125% due 05/15/2014 (5) | | | 4,793,690 | | | |
| | | | | | | | | | | | | | | | | |
| | | | | | | | | | | | | | 14,401,634 | | | |
| | | | | | | | | | | | | | | | | |
| | | | | | | | | | | | | | | | | |
| | | | | | | | | Switzerland—0.3% | | | | | | |
| | | | | | | | | Sunrise Communications International | | | | | | |
| | 2,960,000 | | | | CHF | | | 7.000% due 12/31/2017 (5)(9) | | | 3,143,336 | | | |
| | 1,760,000 | | | | EUR | | | 7.000% due 12/31/2017 (5)(9) | | | 2,535,303 | | | |
| | | | | | | | | | | | | | | | | |
| | | | | | | | | | | | | | 5,678,639 | | | |
| | | | | | | | | | | | | | | | | |
| | | | | | | | | | | | | | | | | |
See Notes to Financial Statements
| | |
| Artio Global Funds ï 2010 Annual Report | 145 |
| |
| PORTFOLIO OF INVESTMENTS (Continued) | October 31, 2010 |
Artio Global High Income Fund
| | | | | | | | | | | | | | | | | |
Face
| | | | | | | | | | Fair
| | | |
| Value | | | Currency | | | Description | | | | Value (Note 2) | | | |
CORPORATE BONDS—Continued |
| | | | | | | | | Switzerland—Continued | | | | | | |
| | | | | | | | | | | | | | | | | |
| | | | | | | | | UBS AG | | | | | | |
| | 2,785,000 | | | | EUR | | | 4.280% due 04/29/2049 (5)(6) | | $ | 3,585,451 | | | |
| | | | | | | | | | | | | | | | | |
| | | | | | | | | | | | | | | | | |
| | | | | | | | | | | | | | 9,264,090 | | | |
| | | | | | | | | | | | | | | | | |
| | | | | | | | | | | | | | | | | |
| | | | | | | | | Mexico—0.1% | | | | | | |
| | | | | | | | | MultiCat Mexico 2009, Series B | | | | | | |
| | 1,965,000 | | | | USD | | | 10.250% due 10/19/2012 (4)(6)(9) | | | 2,096,851 | | | |
| | | | | | | | | | | | | | | | | |
| | | | | | | | | | | | | | | | | |
| | | | | | | | | MultiCat Mexico 2009, Series C | | | | | | |
| | 1,965,000 | | | | USD | | | 10.250% due 10/19/2012 (4)(6)(9) | | | 2,096,852 | | | |
| | | | | | | | | | | | | | | | | |
| | | | | | | | | | | | | | | | | |
| | | | | | | | | | | | | | 4,193,703 | | | |
| | | | | | | | | | | | | | | | | |
| | | | | | | | | | | | | | | | | |
| | | | | | | | | Greece—0.1% | | | | | | |
| | | | | | | | | Hellas Telecommunications | | | | | | |
| | 7,029,340 | | | | EUR | | | 4.835% due 10/15/2012 (5)(6)(7) | | | 2,421,400 | | | |
| | | | | | | | | | | | | | | | | |
| | | | | | | | | | | | | | | | | |
| | | | | | | | | | | | | | | | | |
| | | | | | | | | Sweden—0.0% | | | | | | |
| | | | | | | | | TVN Finance | | | | | | |
| | 115,000 | | | | EUR | | | 10.750% due 11/15/2017 (5) | | | 181,665 | | | |
| | | | | | | | | | | | | | | | | |
| | | | | | | | | | | | | | | | | |
| | | | | | | | | TOTAL CORPORATE BONDS (Cost $2,099,973,123) | | | 2,260,444,958 | | | |
| | | | | | | | | | | | | | | | | |
| | | | | | | | | | | | | | | | | |
| | | | | | | | | | | | | | | | | |
BANK LOANS—16.6% |
| | | | | | | | | United States—13.4% | | | | | | |
| | | | | | | | | Allison Transmission | | | | | | |
| | 2,251,394 | | | | USD | | | 3.028% due 08/07/2014 (6) | | | 2,165,359 | | | |
| | | | | | | | | | | | | | | | | |
| | | | | | | | | | | | | | | | | |
| | | | | | | | | Astoria Generating | | | | | | |
| | 19,525,578 | | | | USD | | | 4.040% due 08/23/2013 (6) | | | 19,297,773 | | | |
| | | | | | | | | | | | | | | | | |
| | | | | | | | | | | | | | | | | |
| | | | | | | | | CIT Group | | | | | | |
| | 14,856,201 | | | | USD | | | 6.250% due 08/11/2015 (6) | | | 15,133,210 | | | |
| | | | | | | | | | | | | | | | | |
| | | | | | | | | | | | | | | | | |
| | | | | | | | | Coinmach Corp | | | | | | |
| | 4,937,186 | | | | USD | | | 3.305% due 11/14/2014 (6) | | | 4,313,866 | | | |
| | 21,092,468 | | | | USD | | | 3.350% due 11/20/2014 (6) | | | 18,455,909 | | | |
| | | | | | | | | | | | | | | | | |
| | | | | | | | | | | | | | 22,769,775 | | | |
| | | | | | | | | | | | | | | | | |
| | | | | | | | | | | | | | | | | |
| | | | | | | | | Ford Motor | | | | | | |
| | 1,115,434 | | | | USD | | | 1.328% due 11/30/2013 (6)(13) | | | 1,079,957 | | | |
| | 1,954,383 | | | | USD | | | 3.028% due 12/16/2013 (6) | | | 1,932,091 | | | |
See Notes to Financial Statements
| | |
| 146 | Artio Global Funds ï 2010 Annual Report | |
| |
| PORTFOLIO OF INVESTMENTS (Continued) | October 31, 2010 |
Artio Global High Income Fund
| | | | | | | | | | | | | | | | | |
Face
| | | | | | | | | | Fair
| | | |
| Value | | | Currency | | | Description | | | | Value (Note 2) | | | |
BANK LOANS—Continued |
| | | | | | | | | United States—Continued | | | | | | |
| | | | | | | | | Ford Motor—Continued | | | | | | |
| | | | | | | | | | | | | | | | | |
| | 20,575,311 | | | | USD | | | 3.038% due 12/16/2013 (6) | | $ | 20,402,355 | | | |
| | | | | | | | | | | | | | | | | |
| | | | | | | | | | | | | | 23,414,403 | | | |
| | | | | | | | | | | | | | | | | |
| | | | | | | | | | | | | | | | | |
| | | | | | | | | Gate Gourmet Borrower | | | | | | |
| | 10,813,770 | | | | USD | | | 2.789% due 05/22/2013 (6) | | | 10,191,979 | | | |
| | 3,149,080 | | | | EUR | | | 3.380% due 05/22/2013 (6) | | | 4,156,439 | | | |
| | 8,715,092 | | | | USD | | | 2.789% due 05/31/2013 (6) | | | 8,213,974 | | | |
| | | | | | | | | | | | | | | | | |
| | | | | | | | | | | | | | 22,562,392 | | | |
| | | | | | | | | | | | | | | | | |
| | | | | | | | | | | | | | | | | |
| | | | | | | | | Global Brass & Copper | | | | | | |
| | 29,585,000 | | | | USD | | | 10.250% due 07/29/2015 (6) | | | 29,511,038 | | | |
| | | | | | | | | | | | | | | | | |
| | | | | | | | | | | | | | | | | |
| | | | | | | | | Hawker Beechcraft Acquisition | | | | | | |
| | 11,937,841 | | | | USD | | | 2.264% due 03/26/2014 (6) | | | 10,029,649 | | | |
| | 748,276 | | | | USD | | | 2.289% due 03/26/2014 (6) | | | 628,669 | | | |
| | | | | | | | | | | | | | | | | |
| | | | | | | | | | | | | | 10,658,318 | | | |
| | | | | | | | | | | | | | | | | |
| | | | | | | | | | | | | | | | | |
| | | | | | | | | HCA Inc | | | | | | |
| | 4,867,136 | | | | USD | | | 2.539% due 11/18/2013 (6) | | | 4,768,762 | | | |
| | | | | | | | | | | | | | | | | |
| | | | | | | | | | | | | | | | | |
| | | | | | | | | HHI Holding | | | | | | |
| | 24,027,500 | | | | USD | | | 9.750% due 03/30/2015 (6) | | | 24,387,913 | | | |
| | | | | | | | | | | | | | | | | |
| | | | | | | | | | | | | | | | | |
| | | | | | | | | High Plains Broadcasting | | | | | | |
| | 4,077,412 | | | | USD | | | 9.000% due 09/14/2016 (6) | | | 4,072,282 | | | |
| | | | | | | | | | | | | | | | | |
| | | | | | | | | | | | | | | | | |
| | | | | | | | | Inverness Medical | | | | | | |
| | 6,714,216 | | | | USD | | | 4.505% due 06/26/2015 (6) | | | 6,519,087 | | | |
| | | | | | | | | | | | | | | | | |
| | | | | | | | | | | | | | | | | |
| | | | | | | | | Landry’s Restaurant | | | | | | |
| | 4,145,995 | | | | USD | | | 8.256% due 11/30/2013 (6) | | | 4,164,133 | | | |
| | | | | | | | | | | | | | | | | |
| | | | | | | | | | | | | | | | | |
| | | | | | | | | N.E.W. Holdings I LLC | | | | | | |
| | 29,355,000 | | | | USD | | | 9.500% due 03/22/2017 (6) | | | 29,036,997 | | | |
| | | | | | | | | | | | | | | | | |
| | | | | | | | | | | | | | | | | |
| | | | | | | | | Newport Television | | | | | | |
| | 14,870,107 | | | | USD | | | 9.000% due 09/14/2016 (6) | | | 14,851,400 | | | |
| | | | | | | | | | | | | | | | | |
| | | | | | | | | | | | | | | | | |
| | | | | | | | | Six Flags Theme Parks | | | | | | |
| | 33,155,000 | | | | USD | | | 9.500% due 10/08/2016 (6) | | | 34,370,694 | | | |
| | | | | | | | | | | | | | | | | |
| | | | | | | | | | | | | | | | | |
| | | | | | | | | Spectrum Brands | | | | | | |
| | 23,892,537 | | | | USD | | | 8.000% due 06/16/2016 (6) | | | 24,407,731 | | | |
| | | | | | | | | | | | | | | | | |
| | | | | | | | | | | | | | | | | |
See Notes to Financial Statements
| | |
| Artio Global Funds ï 2010 Annual Report | 147 |
| |
| PORTFOLIO OF INVESTMENTS (Continued) | October 31, 2010 |
Artio Global High Income Fund
| | | | | | | | | | | | | | | | | |
Face
| | | | | | | | | | Fair
| | | |
| Value | | | Currency | | | Description | | | | Value (Note 2) | | | |
BANK LOANS—Continued |
| | | | | | | | | United States—Continued | | | | | | |
| | | | | | | | | | | | | | | | | |
| | | | | | | | | Swift Transportation | | | | | | |
| | 40,897,605 | | | | USD | | | 8.250% due 05/10/2014 (6) | | $ | 40,284,141 | | | |
| | | | | | | | | | | | | | | | | |
| | | | | | | | | | | | | | | | | |
| | | | | | | | | Texas Competitive Electric | | | | | | |
| | 29,265,801 | | | | USD | | | 3.756% due 10/10/2014 (6) | | | 23,024,869 | | | |
| | 8,180,885 | | | | USD | | | 3.923% due 10/10/2014 (6) | | | 6,436,311 | | | |
| | | | | | | | | | | | | | | | | |
| | | | | | | | | | | | | | 29,461,180 | | | |
| | | | | | | | | | | | | | | | | |
| | | | | | | | | | | | | | | | | |
| | | | | | | | | Univision Communications | | | | | | |
| | 25,148,078 | | | | USD | | | 4.505% due 03/31/2017 (6) | | | 23,762,897 | | | |
| | | | | | | | | | | | | | | | | |
| | | | | | | | | | | | | | | | | |
| | | | | | | | | Visteon Corp | | | | | | |
| | 28,785,000 | | | | USD | | | 8.500% due 09/01/2017 (6) | | | 29,054,859 | | | |
| | | | | | | | | | | | | | | | | |
| | | | | | | | | | | | | | | | | |
| | | | | | | | | | | | | | 414,654,344 | | | |
| | | | | | | | | | | | | | | | | |
| | | | | | | | | | | | | | | | | |
| | | | | | | | | United Kingdom—1.5% | | | | | | |
| | | | | | | | | Ineos Holdings | | | | | | |
| | 33,405,192 | | | | EUR | | | 9.001% due 12/16/2015 (6) | | | 46,714,191 | | | |
| | | | | | | | | | | | | | | | | |
| | | | | | | | | | | | | | | | | |
| | | | | | | | | | | | | | | | | |
| | | | | | | | | Germany—1.0% | | | | | | |
| | | | | | | | | Kabel Deutschland | | | | | | |
| | 21,555,342 | | | | EUR | | | 7.983% due 11/18/2014 (6) | | | 30,425,747 | | | |
| | | | | | | | | | | | | | | | | |
| | | | | | | | | | | | | | | | | |
| | | | | | | | | | | | | | | | | |
| | | | | | | | | Netherlands—0.5% | | | | | | |
| | | | | | | | | Sensata Technologies | | | | | | |
| | 3,347,447 | | | | EUR | | | 3.043% due 04/26/2013 (6) | | | 4,509,890 | | | |
| | | | | | | | | | | | | | | | | |
| | | | | | | | | | | | | | | | | |
| | | | | | | | | UPC Broadband | | | | | | |
| | 9,369,000 | | | | EUR | | | 2.623% due 10/16/2011 (6) | | | 12,356,008 | | | |
| | | | | | | | | | | | | | | | | |
| | | | | | | | | | | | | | | | | |
| | | | | | | | | | | | | | 16,865,898 | | | |
| | | | | | | | | | | | | | | | | |
| | | | | | | | | | | | | | | | | |
| | | | | | | | | Canada—0.1% | | | | | | |
| | | | | | | | | Postmedia Network | | | | | | |
| | 3,400,000 | | | | USD | | | Zero Coupon due 07/13/2016 (6) | | | 3,459,500 | | | |
| | | | | | | | | | | | | | | | | |
| | | | | | | | | | | | | | | | | |
| | | | | | | | | Progressive Moulded Products | | | | | | |
| | 1,396,007 | | | | USD | | | Zero Coupon due 08/16/2011 (4)(6)(7) | | | 6,987 | | | |
| | | | | | | | | | | | | | | | | |
| | | | | | | | | | | | | | | | | |
| | | | | | | | | | | | | | 3,466,487 | | | |
| | | | | | | | | | | | | | | | | |
| | | | | | | | | | | | | | | | | |
| | | | | | | | | Norway—0.1% | | | | | | |
| | | | | | | | | Trico Shipping | | | | | | |
| | 1,469,000 | | | | USD | | | 13.500% due 09/21/2017 (6) | | | 1,469,000 | | | |
| | | | | | | | | | | | | | | | | |
| | | | | | | | | | | | | | | | | |
| | | | | | | | | TOTAL BANK LOANS (Cost $490,855,682) | | | 513,595,667 | | | |
| | | | | | | | | | | | | | | | | |
| | | | | | | | | | | | | | | | | |
| | | | | | | | | | | | | | | | | |
See Notes to Financial Statements
| | |
| 148 | Artio Global Funds ï 2010 Annual Report | |
| |
| PORTFOLIO OF INVESTMENTS (Continued) | October 31, 2010 |
Artio Global High Income Fund
| | | | | | | | | | | | | | | | | |
Face
| | | | | | | | | | Fair
| | | |
| Value | | | Currency | | | Description | | | | Value (Note 2) | | | |
FOREIGN GOVERNMENT BONDS—3.1% |
| | | | | | | | | Brazil—1.5% | | | | | | |
| | | | | | | | | Brazil Notas do Tesouro Nacional, Series F | | | | | | |
| | 35,615,000 | | | | BRL | | | 10.000% due 01/01/2012 | | $ | 20,596,109 | | | |
| | 46,435,000 | | | | BRL | | | 10.000% due 01/01/2013 | | | 26,325,757 | | | |
| | | | | | | | | | | | | | | | | |
| | | | | | | | | | | | | | 46,921,866 | | | |
| | | | | | | | | | | | | | | | | |
| | | | | | | | | | | | | | | | | |
| | | | | | | | | Indonesia—1.0% | | | | | | |
| | | | | | | | | Indonesia Treasury Bond | | | | | | |
| | 72,117,000,000 | | | | IDR | | | 9.000% due 09/15/2013 | | | 8,659,043 | | | |
| | 41,600,000,000 | | | | IDR | | | 9.000% due 09/15/2018 | | | 5,161,826 | | | |
| | 117,200,000,000 | | | | IDR | | | 10.000% due 09/15/2024 | | | 15,413,711 | | | |
| | | | | | | | | | | | | | | | | |
| | | | | | | | | | | | | | 29,234,580 | | | |
| | | | | | | | | | | | | | | | | |
| | | | | | | | | | | | | | | | | |
| | | | | | | | | Ghana—0.4% | | | | | | |
| | | | | | | | | Ghana Government Bond | | | | | | |
| | 4,400,000 | | | | GHS | | | 14.470% due 12/15/2011 (4) | | | 3,136,457 | | | |
| | 6,500,000 | | | | GHS | | | 15.000% due 12/10/2012 (4) | | | 4,746,496 | | | |
| | 2,800,000 | | | | GHS | | | 19.000% due 01/14/2013 (4) | | | 2,184,873 | | | |
| | 4,570,000 | | | | GHS | | | 14.250% due 07/29/2013 (4) | | | 3,302,461 | | | |
| | | | | | | | | | | | | | | | | |
| | | | | | | | | | | | | | 13,370,287 | | | |
| | | | | | | | | | | | | | | | | |
| | | | | | | | | | | | | | | | | |
| | | | | | | | | Venezuela—0.2% | | | | | | |
| | | | | | | | | Venezuela Government International Bond | | | | | | |
| | 10,405,000 | | | | USD | | | 7.750% due 10/13/2019 | | | 7,111,817 | | | |
| | | | | | | | | | | | | | | | | |
| | | | | | | | | TOTAL FOREIGN GOVERNMENT BONDS (Cost $88,493,489) | | | 96,638,550 | | | |
| | | | | | | | | | | | | | | | | |
| | | | | | | | | | | | | | | | | |
| | | | | | | | | | | | | | | | | |
CONVERTIBLE BOND—0.7% |
| | | | | | | | | United States—0.7% | | | | | | |
| | | | | | | | | Carrizo Oil & Gas | | | | | | |
| | 20,655,000 | | | | USD | | | 4.375% due 06/01/2028 (Cost $12,180,284)(5) | | | 20,629,181 | | | |
| | | | | | | | | | | | | | | | | |
| | | | | | | | | | | | | | | | | |
| | | | | | | | | | | | | | | | | |
Share
| | | | | | | | | | | | | |
| Amount | | | | | | | | | | | | | |
PREFERRED STOCKS—0.5% |
| | | | | | | | | United States—0.5% | | | | | | |
| | | | | | | | | Ally Financial | | | | | | |
| | 16,062 | | | | USD | | | 7.000% (9) | | | 14,275,103 | | | |
| | | | | | | | | | | | | | | | | |
| | | | | | | | | | | | | | | | | |
See Notes to Financial Statements
| | |
| Artio Global Funds ï 2010 Annual Report | 149 |
| |
| PORTFOLIO OF INVESTMENTS (Continued) | October 31, 2010 |
Artio Global High Income Fund
| | | | | | | | | | | | | | | | | |
Share
| | | | | | | | (Percentage of
| | Market
| | | |
| Amount | | | Currency | | | Description | | Net Assets) | | Value (Note 2) | | | |
PREFERRED STOCKS—Continued |
| | | | | | | | | United States—Continued | | | | | | |
| | | | | | | | | | | | | | | | | |
| | | | | | | | | Merrill Lynch Capital Trust II | | | | | | |
| | 1,600 | | | | USD | | | 6.450% (5)(6) | | $ | 36,720 | | | |
| | | | | | | | | | | | | | | | | |
| | | | | | | | | | | | | | | | | |
| | | | | | | | | TOTAL PREFERRED STOCKS (Cost $13,376,141) | | | 14,311,823 | | | |
| | | | | | | | | | | | | | | | | |
| | | | | | | | | | | | | | | | | |
| | | | | | | | | | | | | | | | | |
Face
| | | | | | | | | | | | | |
| Value | | | | | | | | | | | | | |
CREDIT LINKED NOTE—0.2% |
| | | | | | | | | Ukraine—0.2% | | | | | | |
| | | | | | | | | ING Americas Issuance | | | | | | |
| | 50,000,000 | | | | UAH | | | 20.000% due 10/31/2012 (Cost $5,888,717)(4) | | | 7,234,591 | | | |
| | | | | | | | | | | | | | | | | |
| | | | | | | | | | | | | | | | | |
| | | | | | | | | | | | | | | | | |
Share
| | | | | | | | | | | | | |
| Amount | | | | | | | | | | | | | |
COMMON STOCK—0.0% |
| | | | | | | | | United States—0.0% | | | | | | |
| | 28,233 | | | | USD | | | Federal Mogul (1) (Cost $1,040,431) | | | 559,860 | | | |
| | | | | | | | | | | | | | | | | |
| | | | | | | | | | | | | | | | | |
| | | | | | | | | | | | | | | | | |
Face
| | | | | | | | | | | | | |
| Value | | | | | | | | | | | | | |
REPURCHASE AGREEMENT—5.6% |
| | | | | | | | | United States—5.6% | | | | | | |
| | 173,262,426 | | | | USD | | | State Street Bank and Trust Company Repurchase Agreement, dated 10/29/2010, due 11/01/2010, with maturity value of $173,262,715 and an effective yield of 0.02%, collateralized by U.S. Government and Agency Obligations, with a rate of 1.375%, maturities ranging from 10/15/2012-11/15/2012, and an aggregate fair value of $176,727,781. (Cost $173,262,426) | | | 173,262,426 | | | |
| | | | | | | | | | | | | | | | | |
| | | | | | | | | | | | | | | | | |
| | | | | | | | | | | | | | | | | |
See Notes to Financial Statements
| | |
| 150 | Artio Global Funds ï 2010 Annual Report | |
| |
| PORTFOLIO OF INVESTMENTS (Continued) | October 31, 2010 |
Artio Global High Income Fund
| | | | | | | | | | | | | | | | | |
Face
| | | | | | | | (Percentage of
| | Fair
| | | |
| Value | | | Currency | | | Description | | Net Assets) | | Value (Note 2) | | | |
TIME DEPOSIT—0.3% |
| | | | | | | | | United States—0.3% | | | | | | |
| | | | | | | | | State Street Euro Dollar Time Deposit | | | | | | |
| | 8,550,000 | | | | USD | | | 0.010% due 11/01/2010 (Cost $8,550,000)(11) | | $ | 8,550,000 | | | |
| | | | | | | | | | | | | | | | | |
| | | | | | | | | | | | | | | | | |
| | | | | | | | | TOTAL INVESTMENTS—100.0% (Cost $2,893,620,293) | | | 3,095,227,056 | | | |
| | | | | | | | | OTHER ASSETS AND LIABILITIES——% | | | 1,245,335 | | | |
| | | | | | | | | | | | | | | | | |
| | | | | | | | | TOTAL NET ASSETS—100.0% | | $ | 3,096,472,391 | | | |
| | | | | | | | | | | | | | | | | |
Notes to the Portfolio of Investments.
| | | |
Aggregate cost for federal income tax purposes was $2,901,168,062. | | |
See Notes to Financial Statements
| | |
| Artio Global Funds ï 2010 Annual Report | 151 |
| |
| SCHEDULE OF FORWARD FOREIGN EXCHANGE CONTRACTS | October 31, 2010 |
Artio Global High Income Fund
FORWARD FOREIGN EXCHANGE CONTRACTS TO BUY
| | | | | | | | | | | | | | | | | | | | | |
| | | | | Contracts to Receive | | | | |
Expiration
| | | | Local
| | Value in
| | In Exchange
| | Net Unrealized
|
| Date | | Counterparty | | Currency | | USD | | for USD | | Appreciation |
| 12/20/10 | | JPMorgan Chase Bank N.A. | | MXN | | | 511,802,080 | | | | 41,315,741 | | | | 39,427,926 | | | $ | 1,887,815 | |
| | | | | | | | | | | | | | | | | | | | | |
| | | | | | | | | | | | | | | | | | | | | |
| | | | | | | | | | | | | | | | | | | | | |
FORWARD FOREIGN EXCHANGE CONTRACTS TO SELL
| | | | | | | | | | | | | | | | | | | | | |
| | | | | Contracts to Deliver | | | | Net Unrealized
|
Expiration
| | | | Local
| | Value in
| | In Exchange
| | Appreciation
|
| Date | | Counterparty | | Currency | | USD | | for USD | | (Depreciation) |
| 11/12/10 | | Brown Brothers Harriman & Co | | EUR | | | 145,901,000 | | | | 203,041,186 | | | | 185,693,372 | | | $ | (17,347,814 | ) |
| 01/12/11 | | JPMorgan Chase Bank N.A. | | EUR | | | 78,608,000 | | | | 109,305,526 | | | | 109,509,943 | | | | 204,417 | |
| 11/12/10 | | Brown Brothers Harriman & Co | | GBP | | | 6,100,000 | | | | 9,773,629 | | | | 9,388,632 | | | | (384,997 | ) |
| | | | | | | | | | | | | | | | | | | | | |
| Net unrealized depreciation on forward foreign exchange contracts to sell | | $ | (17,528,394 | ) |
| | | | | | | | | | | | | | | | | | | | | |
Glossary of Currencies
| | | |
BRL | | — Brazilian Real |
CHF | | — Swiss Franc |
EUR | | — Euro |
GBP | | — British Pound Sterling |
GHS | | — Ghanaian Cedi |
IDR | | — Indonesian Rupiah |
MXN | | — Mexican Peso |
UAH | | — Ukraine Hryvnia |
USD | | — United States Dollar |
See Notes to Financial Statements
| | |
| 152 | Artio Global Funds ï 2010 Annual Report | |
| |
| PORTFOLIO OF INVESTMENTS-Industry Sector (Unaudited) | October 31, 2010 |
Artio Global High Income Fund
At October 31, 2010, security type diversification of the Fund’s investments was as follows:
| | | | | | | | | |
| | | % of Net
| | Fair
|
| | | Assets | | Value (Note 2) |
SECURITY TYPE | | | | | | | | |
| Corporate Bonds | | | 73.0 | % | | $ | 2,260,444,958 | |
| Bank Loans | | | 16.6 | | | | 513,595,667 | |
| Foreign Government Bonds | | | 3.1 | | | | 96,638,550 | |
| Convertible Bond | | | 0.7 | | | | 20,629,181 | |
| Preferred Stocks | | | 0.5 | | | | 14,311,823 | |
| Credit Linked Note | | | 0.2 | | | | 7,234,591 | |
| Common Stock | | | 0.0 | | | | 559,860 | |
| Short-term Investments | | | 5.9 | | | | 181,812,426 | * |
| | | | | | | | | |
Total Investments | | | 100.0 | | | | 3,095,227,056 | |
Other Assets and Liabilities (Net) | | | — | | | | 1,245,335 | * |
| | | | | | | | | |
Net Assets | | | 100.0 | % | | $ | 3,096,472,391 | |
| | | | | | | | | |
| | | |
* | | Short-term investments includes securities that have been voluntarily segregated by the advisor as collateral for swaps with a notional value of $162,450,000, which is 5.25% of net assets. Other assets and liabilities includes swaps with a net fair value of $8,747,193, which is 0.28% of net assets. |
See Notes to Financial Statements
| | |
| Artio Global Funds ï 2010 Annual Report | 153 |
| |
| PORTFOLIO OF INVESTMENTS | October 31, 2010 |
Artio U.S. Microcap Fund
| | | | | | | | | | | | | |
Share
| | | | | | | Fair
| | | |
| Amount | | | Description | | | | Value (Note 2) | | | |
COMMON STOCKS—99.6%† |
| | | | | Banks—12.3% | | | | | | |
| | 10,446 | | | Danvers Bancorp | | $ | 157,003 | | | |
| | 13,240 | | | First Community Bancshares | | | 178,211 | | | |
| | 21,652 | | | First Defiance Financial (1) | | | 241,203 | | | |
| | 6,510 | | | First of Long Island | | | 161,969 | | | |
| | 18,505 | | | Lakeland Bancorp | | | 171,541 | | | |
| | 8,534 | | | Washington Banking | | | 107,443 | | | |
| | 8,669 | | | WSFS Financial | | | 338,438 | | | |
| | | | | | | | | | | | | |
| | | | | | | | | | 1,355,808 | | | |
| | | | | | | | | | | | | |
| | | | | | | | | | | | | |
| | | | | Semiconductors & Semiconductor Equipment—11.9% | | | | | | |
| | 9,770 | | | Advanced Energy Industries (1) | | | 140,297 | | | |
| | 33,120 | | | Exar Corp (1) | | | 220,248 | | | |
| | 45,390 | | | Integrated Device Technology (1) | | | 267,347 | | | |
| | 8,365 | | | Mellanox Technologies (1) | | | 192,562 | | | |
| | 18,770 | | | Rudolph Technologies (1) | | | 139,274 | | | |
| | 6,420 | | | Ultratech Inc (1) | | | 117,550 | | | |
| | 33,650 | | | Zoran Corp (1) | | | 238,242 | | | |
| | | | | | | | | | | | | |
| | | | | | | | | | 1,315,520 | | | |
| | | | | | | | | | | | | |
| | | | | | | | | | | | | |
| | | | | Capital Goods—9.0% | | | | | | |
| | 3,680 | | | Ameron International | | | 253,037 | | | |
| | 18,090 | | | Douglas Dynamics | | | 260,858 | | | |
| | 23,020 | | | Keyw Holding (1) | | | 292,354 | | | |
| | 15,783 | | | SeaCube Container Leasing (1) | | | 183,872 | | | |
| | | | | | | | | | | | | |
| | | | | | | | | | 990,121 | | | |
| | | | | | | | | | | | | |
| | | | | | | | | | | | | |
| | | | | Pharmaceuticals & Biotechnology—8.0% | | | | | | |
| | 38,562 | | | ISTA Pharmaceuticals (1) | | | 166,588 | | | |
| | 12,055 | | | Obagi Medical Products (1) | | | 137,548 | | | |
| | 14,660 | | | Pain Therapeutics (1) | | | 112,589 | | | |
| | 4,965 | | | Par Pharmaceutical (1) | | | 161,412 | | | |
| | 16,330 | | | Questcor Pharmaceuticals (1) | | | 200,369 | | | |
| | 6,465 | | | Viropharma Inc (1) | | | 105,767 | | | |
| | | | | | | | | | | | | |
| | | | | | | | | | 884,273 | | | |
| | | | | | | | | | | | | |
| | | | | | | | | | | | | |
| | | | | Diversified Financials—7.0% | | | | | | |
| | 21,580 | | | Calamos Asset Management-Class A | | | 258,744 | | | |
| | 51,035 | | | Cowen Group-Class A (1) | | | 178,622 | | | |
| | 20,840 | | | optionsXpress Holdings (1) | | | 332,815 | | | |
| | | | | | | | | | | | | |
| | | | | | | | | | 770,181 | | | |
| | | | | | | | | | | | | |
| | | | | | | | | | | | | |
See Notes to Financial Statements
| | |
| 154 | Artio Global Funds ï 2010 Annual Report | |
| |
| PORTFOLIO OF INVESTMENTS (Continued) | October 31, 2010 |
Artio U.S. Microcap Fund
| | | | | | | | | | | | | |
Share
| | | | | | | Fair
| | | |
| Amount | | | Description | | | | Value (Note 2) | | | |
COMMON STOCKS—Continued |
| | | | | | | | | | | | | |
| | | | | Commercial & Professional Services—5.8% | | | | | | |
| | 31,600 | | | CBIZ Inc (1) | | $ | 187,072 | | | |
| | 40,940 | | | Cenveo Inc (1) | | | 225,170 | | | |
| | 23,850 | | | Intersections Inc | | | 231,822 | | | |
| | | | | | | | | | | | | |
| | | | | | | | | | 644,064 | | | |
| | | | | | | | | | | | | |
| | | | | | | | | | | | | |
| | | | | Materials—5.2% | | | | | | |
| | 27,085 | | | American Vanguard | | | 199,616 | | | |
| | 10,820 | | | Gold Resource | | | 228,302 | | | |
| | 10,585 | | | Quadra Mining (1) | | | 149,566 | | | |
| | | | | | | | | | | | | |
| | | | | | | | | | 577,484 | | | |
| | | | | | | | | | | | | |
| | | | | | | | | | | | | |
| | | | | Retailing—5.0% | | | | | | |
| | 9,060 | | | hhgregg Inc (1) | | | 208,742 | | | |
| | 54,530 | | | New York & Co (1) | | | 170,134 | | | |
| | 47,935 | | | Wet Seal-Class A (1) | | | 167,773 | | | |
| | | | | | | | | | | | | |
| | | | | | | | | | 546,649 | | | |
| | | | | | | | | | | | | |
| | | | | | | | | | | | | |
| | | | | Media—4.9% | | | | | | |
| | 5,155 | | | Imax Corp (1) | | | 111,606 | | | |
| | 25,185 | | | Lions Gate Entertainment (1) | | | 182,087 | | | |
| | 95,200 | | | LodgeNet Interactive (1) | | | 242,760 | | | |
| | | | | | | | | | | | | |
| | | | | | | | | | 536,453 | | | |
| | | | | | | | | | | | | |
| | | | | | | | | | | | | |
| | | | | Energy—4.8% | | | | | | |
| | 6,560 | | | Carrizo Oil & Gas (1) | | | 154,947 | | | |
| | 10,899 | | | Gulfport Energy (1) | | | 181,577 | | | |
| | 43,510 | | | Union Drilling (1) | | | 198,841 | | | |
| | | | | | | | | | | | | |
| | | | | | | | | | 535,365 | | | |
| | | | | | | | | | | | | |
| | | | | | | | | | | | | |
| | | | | Technology Hardware & Equipment—4.7% | | | | | | |
| | 17,906 | | | Super Micro Computer (1) | | | 199,115 | | | |
| | 32,074 | | | Technitrol Inc | | | 147,540 | | | |
| | 42,080 | | | X-Rite Inc (1) | | | 170,424 | | | |
| | | | | | | | | | | | | |
| | | | | | | | | | 517,079 | | | |
| | | | | | | | | | | | | |
| | | | | | | | | | | | | |
| | | | | Software & Services—4.3% | | | | | | |
| | 44,745 | | | Art Technology (1) | | | 187,482 | | | |
| | 12,849 | | | Envestnet Inc (1) | | | 169,735 | | | |
| | 3,000 | | | Progress Software (1) | | | 112,110 | | | |
| | | | | | | | | | | | | |
| | | | | | | | | | 469,327 | | | |
| | | | | | | | | | | | | |
| | | | | | | | | | | | | |
See Notes to Financial Statements
| | |
| Artio Global Funds ï 2010 Annual Report | 155 |
| |
| PORTFOLIO OF INVESTMENTS (Continued) | October 31, 2010 |
Artio U.S. Microcap Fund
| | | | | | | | | | | | | |
Share
| | | | | | | Fair
| | | |
| Amount | | | Description | | | | Value (Note 2) | | | |
COMMON STOCKS—Continued |
| | | | | | | | | | | | | |
| | | | | Transportation—4.2% | | | | | | |
| | 5,330 | | | Allegiant Travel | | $ | 250,990 | | | |
| | 16,200 | | | Celadon Group (1) | | | 210,114 | | | |
| | | | | | | | | | | | | |
| | | | | | | | | | 461,104 | | | |
| | | | | | | | | | | | | |
| | | | | | | | | | | | | |
| | | | | Health Care Equipment & Services—4.0% | | | | | | |
| | 8,980 | | | America Service | | | 137,394 | | | |
| | 16,985 | | | Natus Medical (1) | | | 222,504 | | | |
| | 2,955 | | | NuVasive Inc (1) | | | 77,421 | | | |
| | | | | | | | | | | | | |
| | | | | | | | | | 437,319 | | | |
| | | | | | | | | | | | | |
| | | | | | | | | | | | | |
| | | | | Consumer Services—3.7% | | | | | | |
| | 21,485 | | | Morgans Hotel (1) | | | 173,384 | | | |
| | 42,840 | | | Morton’s Restaurant (1) | | | 239,904 | | | |
| | | | | | | | | | | | | |
| | | | | | | | | | 413,288 | | | |
| | | | | | | | | | | | | |
| | | | | | | | | | | | | |
| | | | | Household & Personal Products—1.8% | | | | | | |
| | 22,525 | | | GLG Life Tech (1) | | | 195,742 | | | |
| | | | | | | | | | | | | |
| | | | | | | | | | | | | |
| | | | | Automobiles & Components—1.5% | | | | | | |
| | 13,010 | | | Tower International (1) | | | 167,179 | | | |
| | | | | | | | | | | | | |
| | | | | | | | | | | | | |
| | | | | Consumer Durables & Apparel—1.5% | | | | | | |
| | 26,410 | | | Liz Claiborne (1) | | | 161,629 | | | |
| | | | | | | | | | | | | |
| | | | | TOTAL COMMON STOCKS (Cost $9,820,726) | | | 10,978,585 | | | |
| | | | | | | | | | | | | |
| | | | | TOTAL INVESTMENTS—99.6% (Cost $9,820,726) | | | 10,978,585 | | | |
| | | | | OTHER ASSETS AND LIABILITIES—0.4% | | | 48,030 | | | |
| | | | | | | | | | | | | |
| | | | | TOTAL NET ASSETS—100.0% | | $ | 11,026,615 | | | |
| | | | | | | | | | | | | |
Notes to the Portfolio of Investments.
| | | |
Aggregate cost for federal income tax purposes was $9,942,485. | | |
See Notes to Financial Statements
| | |
| 156 | Artio Global Funds ï 2010 Annual Report | |
| |
| PORTFOLIO OF INVESTMENTS-Industry Sector (Unaudited) | October 31, 2010 |
Artio U.S. Microcap Fund
At October 31, 2010, industry diversification of the Fund’s investments was as follows:
| | | | | | | | | |
| | | % of Net
| | Fair
|
| | | Assets | | Value (Note 2) |
INDUSTRY SECTOR | | | | | | | | |
| Information Technology | | | 20.9 | % | | $ | 2,301,926 | |
| Financials | | | 19.3 | | | | 2,125,989 | |
| Industrials | | | 19.0 | | | | 2,095,289 | |
| Consumer Discretionary | | | 16.6 | | | | 1,825,198 | |
| Health Care | | | 12.0 | | | | 1,321,592 | |
| Materials | | | 5.2 | | | | 577,484 | |
| Energy | | | 4.8 | | | | 535,365 | |
| Consumer Staples | | | 1.8 | | | | 195,742 | |
| | | | | | | | | |
Total Investments | | | 99.6 | | | | 10,978,585 | |
Other Assets and Liabilities (Net) | | | 0.4 | | | | 48,030 | |
| | | | | | | | | |
Net Assets | | | 100.0 | % | | $ | 11,026,615 | |
| | | | | | | | | |
See Notes to Financial Statements
| | |
| Artio Global Funds ï 2010 Annual Report | 157 |
| |
| PORTFOLIO OF INVESTMENTS | October 31, 2010 |
Artio U.S. Smallcap Fund
| | | | | | | | | | | | | | | | | |
Share
| | | | | | | | | | Fair
| | | |
| Amount | | | | | | Description | | | | Value (Note 2) | | | |
COMMON STOCKS—99.2%† |
| | | | | | | | | Semiconductors & Semiconductor Equipment—12.1% | | | | | | |
| | 88,530 | | | | | | | Advanced Energy Industries (1) | | $ | 1,271,291 | | | |
| | 57,555 | | | | | | | Atheros Communications (1) | | | 1,786,507 | | | |
| | 510,490 | | | | | | | Integrated Device Technology (1) | | | 3,006,786 | | | |
| | 73,360 | | | | | | | Intersil Corp-Class A | | | 960,283 | | | |
| | 67,820 | | | | | | | Ultratech Inc (1) | | | 1,241,784 | | | |
| | 258,840 | | | | | | | Zoran Corp (1) | | | 1,832,587 | | | |
| | | | | | | | | | | | | | | | | |
| | | | | | | | | | | | | | 10,099,238 | | | |
| | | | | | | | | | | | | | | | | |
| | | | | | | | | | | | | | | | | |
| | | | | | | | | Retailing—9.1% | | | | | | |
| | 163,720 | | | | | | | Chico’s FAS | | | 1,591,358 | | | |
| | 76,070 | | | | | | | hhgregg Inc (1) | | | 1,752,653 | | | |
| | 256,800 | | | | | | | Office Depot (1) | | | 1,153,032 | | | |
| | 154,390 | | | | | | | Saks Inc (1) | | | 1,719,905 | | | |
| | 391,060 | | | | | | | Wet Seal-Class A (1) | | | 1,368,710 | | | |
| | | | | | | | | | | | | | | | | |
| | | | | | | | | | | | | | 7,585,658 | | | |
| | | | | | | | | | | | | | | | | |
| | �� | | | | | | | | | | | | | | | |
| | | | | | | | | Pharmaceuticals & Biotechnology—8.9% | | | | | | |
| | 75,000 | | | | | | | Cepheid Inc (1) | | | 1,578,000 | | | |
| | 90,450 | | | | | | | Myriad Genetics (1) | | | 1,802,669 | | | |
| | 32,600 | | | | | | | Par Pharmaceutical (1) | | | 1,059,826 | | | |
| | 32,770 | | | | | | | Salix Pharmaceuticals (1) | | | 1,239,689 | | | |
| | 107,140 | | | | | | | Viropharma Inc (1) | | | 1,752,810 | | | |
| | | | | | | | | | | | | | | | | |
| | | | | | | | | | | | | | 7,432,994 | | | |
| | | | | | | | | | | | | | | | | |
| | | | | | | | | | | | | | | | | |
| | | | | | | | | Diversified Financials—8.5% | | | | | | |
| | 164,685 | | | | | | | Calamos Asset Management-Class A | | | 1,974,573 | | | |
| | 22,580 | | | | | | | Greenhill & Co | | | 1,753,788 | | | |
| | 105,140 | | | | | | | optionsXpress Holdings (1) | | | 1,679,086 | | | |
| | 329,500 | | | | | | | Penson Worldwide (1) | | | 1,696,925 | | | |
| | | | | | | | | | | | | | | | | |
| | | | | | | | | | | | | | 7,104,372 | | | |
| | | | | | | | | | | | | | | | | |
| | | | | | | | | | | | | | | | | |
| | | | | | | | | Capital Goods—8.5% | | | | | | |
| | 24,420 | | | | | | | Ameron International | | | 1,679,119 | | | |
| | 53,680 | | | | | | | Carlisle Cos | | | 1,882,558 | | | |
| | 75,470 | | | | | | | GrafTech International (1) | | | 1,242,991 | | | |
| | 180,950 | | | | | | | Keyw Holding (1) | | | 2,298,065 | | | |
| | | | | | | | | | | | | | | | | |
| | | | | | | | | | | | | | 7,102,733 | | | |
| | | | | | | | | | | | | | | | | |
| | | | | | | | | | | | | | | | | |
| | | | | | | | | Banks—7.7% | | | | | | |
| | 95,050 | | | | | | | First Community Bancshares | | | 1,279,373 | | | |
See Notes to Financial Statements
| | |
| 158 | Artio Global Funds ï 2010 Annual Report | |
| |
| PORTFOLIO OF INVESTMENTS (Continued) | October 31, 2010 |
Artio U.S. Smallcap Fund
| | | | | | | | | | | | | | | | | |
Share
| | | | | | | | | | Fair
| | | |
| Amount | | | | | | Description | | | | Value (Note 2) | | | |
COMMON STOCKS—Continued |
| | | | | | | | | Banks—Continued | | | | | | |
| | | | | | | | | | | | | | | | | |
| | 673,320 | | | | | | | Popular Inc (1) | | $ | 1,838,164 | | | |
| | 61,125 | | | | | | | Washington Banking | | | 769,564 | | | |
| | 64,340 | | | | | | | WSFS Financial | | | 2,511,833 | | | |
| | | | | | | | | | | | | | | | | |
| | | | | | | | | | | | | | 6,398,934 | | | |
| | | | | | | | | | | | | | | | | |
| | | | | | | | | | | | | | | | | |
| | | | | | | | | Energy—6.5% | | | | | | |
| | 36,850 | | | | | | | Alpha Natural Resources (1) | | | 1,664,514 | | | |
| | 115,260 | | | | | | | Basic Energy Services (1) | | | 1,274,776 | | | |
| | 67,380 | | | | | | | Carrizo Oil & Gas (1) | | | 1,591,515 | | | |
| | 190,070 | | | | | | | Union Drilling (1) | | | 868,620 | | | |
| | | | | | | | | | | | | | | | | |
| | | | | | | | | | | | | | 5,399,425 | | | |
| | | | | | | | | | | | | | | | | |
| | | | | | | | | | | | | | | | | |
| | | | | | | | | Materials—5.8% | | | | | | |
| | 130,335 | | | | | | | American Vanguard | | | 960,569 | | | |
| | 92,020 | | | | | | | Coeur d’Alene Mines (1) | | | 1,896,532 | | | |
| | 58,120 | | | | | | | Intrepid Potash (1) | | | 1,995,260 | | | |
| | | | | | | | | | | | | | | | | |
| | | | | | | | | | | | | | 4,852,361 | | | |
| | | | | | | | | | | | | | | | | |
| | | | | | | | | | | | | | | | | |
| | | | | | | | | Technology Hardware & Equipment—5.2% | | | | | | |
| | 274,860 | | | | | | | Brocade Communications Systems (1) | | | 1,737,115 | | | |
| | 154,101 | | | | | | | Super Micro Computer (1) | | | 1,713,603 | | | |
| | 183,489 | | | | | | | Technitrol Inc | | | 844,050 | | | |
| | | | | | | | | | | | | | | | | |
| | | | | | | | | | | | | | 4,294,768 | | | |
| | | | | | | | | | | | | | | | | |
| | | | | | | | | | | | | | | | | |
| | | | | | | | | Health Care Equipment & Services—4.9% | | | | | | |
| | 44,360 | | | | | | | ArthroCare Corp (1) | | | 1,210,141 | | | |
| | 128,540 | | | | | | | Natus Medical (1) | | | 1,683,874 | | | |
| | 45,885 | | | | | | | NuVasive Inc (1) | | | 1,202,187 | | | |
| | | | | | | | | | | | | | | | | |
| | | | | | | | | | | | | | 4,096,202 | | | |
| | | | | | | | | | | | | | | | | |
| | | | | | | | | | | | | | | | | |
| | | | | | | | | Software & Services—4.1% | | | | | | |
| | 51,260 | | | | | | | Nice Systems Sponsored ADR (1) | | | 1,716,697 | | | |
| | 45,940 | | | | | | | Progress Software (1) | | | 1,716,778 | | | |
| | | | | | | | | | | | | | | | | |
| | | | | | | | | | | | | | 3,433,475 | | | |
| | | | | | | | | | | | | | | | | |
| | | | | | | | | | | | | | | | | |
| | | | | | | | | Commercial & Professional Services—3.6% | | | | | | |
| | 238,750 | | | | | | | Cenveo Inc (1) | | | 1,313,125 | | | |
| | 46,600 | | | | | | | FTI Consulting (1) | | | 1,652,436 | | | |
| | | | | | | | | | | | | | | | | |
| | | | | | | | | | | | | | 2,965,561 | | | |
| | | | | | | | | | | | | | | | | |
| | | | | | | | | | | | | | | | | |
See Notes to Financial Statements
| | |
| Artio Global Funds ï 2010 Annual Report | 159 |
| |
| PORTFOLIO OF INVESTMENTS (Continued) | October 31, 2010 |
Artio U.S. Smallcap Fund
| | | | | | | | | | | | | | | | | |
Share
| | | | | | | | | | Fair
| | | |
| Amount | | | | | | Description | | | | Value (Note 2) | | | |
COMMON STOCKS—Continued |
| | | | | | | | | | | | | | | | | |
| | | | | | | | | Consumer Services—3.5% | | | | | | |
| | 213,434 | | | | | | | Morton’s Restaurant (1) | | $ | 1,195,230 | | | |
| | 50,250 | | | | | | | Weight Watchers International | | | 1,682,873 | | | |
| | | | | | | | | | | | | | | | | |
| | | | | | | | | | | | | | 2,878,103 | | | |
| | | | | | | | | | | | | | | | | |
| | | | | | | | | | | | | | | | | |
| | | | | | | | | Media—2.3% | | | | | | |
| | 264,266 | | | | | | | Lions Gate Entertainment (1) | | | 1,910,643 | | | |
| | | | | | | | | | | | | | | | | |
| | | | | | | | | | | | | | | | | |
| | | | | | | | | Insurance—2.1% | | | | | | |
| | 126,080 | | | | | | | National Financial Partners (1) | | | 1,739,904 | | | |
| | | | | | | | | | | | | | | | | |
| | | | | | | | | | | | | | | | | |
| | | | | | | | | Transportation—2.0% | | | | | | |
| | 35,470 | | | | | | | Allegiant Travel | | | 1,670,282 | | | |
| | | | | | | | | | | | | | | | | |
| | | | | | | | | | | | | | | | | |
| | | | | | | | | Consumer Durables & Apparel—1.7% | | | | | | |
| | 72,440 | | | | | | | Skechers Inc-Class A (1) | | | 1,408,234 | | | |
| | | | | | | | | | | | | | | | | |
| | | | | | | | | | | | | | | | | |
| | | | | | | | | Household & Personal Products—1.4% | | | | | | |
| | 133,045 | | | | | | | GLG Life Tech (1) | | | 1,156,161 | | | |
| | | | | | | | | | | | | | | | | |
| | | | | | | | | | | | | | | | | |
| | | | | | | | | Food, Beverage & Tobacco—1.3% | | | | | | |
| | 24,170 | | | | | | | Diamond Foods | | | 1,068,314 | | | |
| | | | | | | | | | | | | | | | | |
| | | | | | | | | TOTAL COMMON STOCKS (Cost $76,307,044) | | | 82,597,362 | | | |
| | | | | | | | | | | | | | | | | |
| | | | | | | | | | | | | | | | | |
| | | | | | | | | | | | | | | | | |
Face
| | | | | | | | | | | | | |
| Value | | | Currency | | | | | | | | | | |
REPURCHASE AGREEMENT—0.5% |
| | 379,762 | | | | USD | | | State Street Bank and Trust Company Repurchase Agreement, dated 10/29/2010 due 11/01/2010, with a maturity value of $379,762 and an effective yield of 0.02%, collateralized by a U.S. Government and Agency Obligation, with a rate of 1.000%, a maturity of 09/30/2011 and an aggregate fair value of $388,369. (Cost $379,762) | | | 379,762 | | | |
| | | | | | | | | | | | | | | | | |
| | | | | | | | | TOTAL INVESTMENTS—99.7% (Cost $76,686,806) | | | 82,977,124 | | | |
| | | | | | | | | OTHER ASSETS AND LIABILITIES—0.3% | | | 247,381 | | | |
| | | | | | | | | | | | | | | | | |
| | | | | | | | | TOTAL NET ASSETS—100.0% | | $ | 83,224,505 | | | |
| | | | | | | | | | | | | | | | | |
Notes to the Portfolio of Investments.
| | | |
Aggregate cost for federal income tax purposes was $79,340,652. | | |
See Notes to Financial Statements
| | |
| 160 | Artio Global Funds ï 2010 Annual Report | |
| |
| PORTFOLIO OF INVESTMENTS-Industry Sector (Unaudited) | October 31, 2010 |
Artio U.S. Smallcap Fund
At October 31, 2010, sector diversification of the Fund’s investments was as follows:
| | | | | | | | | |
| | | % of Net
| | Fair
|
| | | Assets | | Value (Note 2) |
INDUSTRY SECTOR | | | | | | | | |
| Information Technology | | | 21.4 | % | | $ | 17,827,481 | |
| Financials | | | 18.3 | | | | 15,243,210 | |
| Consumer Discretionary | | | 16.6 | | | | 13,782,638 | |
| Industrials | | | 14.1 | | | | 11,738,576 | |
| Health Care | | | 13.8 | | | | 11,529,196 | |
| Energy | | | 6.5 | | | | 5,399,425 | |
| Materials | | | 5.8 | | | | 4,852,361 | |
| Consumer Staples | | | 2.7 | | | | 2,224,475 | |
| Short-term Investment | | | 0.5 | | | | 379,762 | |
| | | | | | | | | |
Total Investments | | | 99.7 | | | | 82,977,124 | |
Other Assets and Liabilities (Net) | | | 0.3 | | | | 247,381 | |
| | | | | | | | | |
Net Assets | | | 100.0 | % | | $ | 83,224,505 | |
| | | | | | | | | |
See Notes to Financial Statements
| | |
| Artio Global Funds ï 2010 Annual Report | 161 |
| |
| PORTFOLIO OF INVESTMENTS | October 31, 2010 |
Artio U.S. Midcap Fund
| | | | | | | | | | | | | |
Share
| | | | | | | Fair
| | | |
| Amount | | | Description | | | | Value (Note 2) | | | |
COMMON STOCKS—99.4%† |
| | | | | Pharmaceuticals & Biotechnology—9.4% | | | | | | |
| | 2,030 | | | Alexion Pharmaceuticals (1) | | $ | 138,649 | | | |
| | 820 | | | Genzyme Corp (1) | | | 59,147 | | | |
| | 3,830 | | | Human Genome Sciences (1) | | | 102,950 | | | |
| | 5,880 | | | Mylan Inc (1) | | | 119,482 | | | |
| | 8,870 | | | Myriad Genetics (1) | | | 176,779 | | | |
| | | | | | | | | | | | | |
| | | | | | | | | | 597,007 | | | |
| | | | | | | | | | | | | |
| | | | | | | | | | | | | |
| | | | | Software & Services—9.2% | | | | | | |
| | 3,300 | | | Adobe Systems (1) | | | 92,895 | | | |
| | 1,380 | | | Alliance Data Systems (1) | | | 83,794 | | | |
| | 2,700 | | | ANSYS Inc (1) | | | 122,175 | | | |
| | 2,500 | | | eBay Inc (1) | | | 74,525 | | | |
| | 7,110 | | | Electronic Arts (1) | | | 112,693 | | | |
| | 3,420 | | | Paychex Inc | | | 94,734 | | | |
| | | | | | | | | | | | | |
| | | | | | | | | | 580,816 | | | |
| | | | | | | | | | | | | |
| | | | | | | | | | | | | |
| | | | | Diversified Financials—8.6% | | | | | | |
| | 1,070 | | | IntercontinentalExchange Inc (1) | | | 122,911 | | | |
| | 3,520 | | | Lazard Ltd-Class A | | | 129,888 | | | |
| | 2,370 | | | T Rowe Price | | | 130,990 | | | |
| | 9,450 | | | TD Ameritrade Holding (1) | | | 161,500 | | | |
| | | | | | | | | | | | | |
| | | | | | | | | | 545,289 | | | |
| | | | | | | | | | | | | |
| | | | | | | | | | | | | |
| | | | | Semiconductors & Semiconductor Equipment—7.9% | | | | | | |
| | 2,480 | | | Cree Inc (1) | | | 127,199 | | | |
| | 22,220 | | | Integrated Device Technology (1) | | | 130,876 | | | |
| | 8,310 | | | Intersil Corp-Class A | | | 108,778 | | | |
| | 4,560 | | | Netlogic Microsystems (1) | | | 137,073 | | | |
| | | | | | | | | | | | | |
| | | | | | | | | | 503,926 | | | |
| | | | | | | | | | | | | |
| | | | | | | | | | | | | |
| | | | | Energy—7.9% | | | | | | |
| | 3,040 | | | Alpha Natural Resources (1) | | | 137,317 | | | |
| | 1,900 | | | Oceaneering International (1) | | | 117,553 | | | |
| | 8,350 | | | PetroHawk Energy (1) | | | 142,033 | | | |
| | 1,040 | | | Whiting Petroleum (1) | | | 104,458 | | | |
| | | | | | | | | | | | | |
| | | | | | | | | | 501,361 | | | |
| | | | | | | | | | | | | |
| | | | | | | | | | | | | |
| | | | | Retailing—7.7% | | | | | | |
| | 12,970 | | | Chico’s FAS | | | 126,068 | | | |
| | 4,000 | | | Expedia Inc | | | 115,800 | | | |
| | 5,190 | | | hhgregg Inc (1) | | | 119,578 | | | |
See Notes to Financial Statements
| | |
| 162 | Artio Global Funds ï 2010 Annual Report | |
| |
| PORTFOLIO OF INVESTMENTS (Continued) | October 31, 2010 |
Artio U.S. Midcap Fund
| | | | | | | | | | | | | |
Share
| | | | | | | Fair
| | | |
| Amount | | | Description | | | | Value (Note 2) | | | |
COMMON STOCKS—Continued |
| | | | | Retailing—Continued | | | | | | |
| | | | | | | | | | | | | |
| | 2,350 | | | Tiffany & Co | | $ | 124,550 | | | |
| | | | | | | | | | | | | |
| | | | | | | | | | 485,996 | | | |
| | | | | | | | | | | | | |
| | | | | | | | | | | | | |
| | | | | Materials—7.3% | | | | | | |
| | 2,590 | | | Agnico-Eagle Mines | | | 200,958 | | | |
| | 4,940 | | | Intrepid Potash (1) | | | 169,590 | | | |
| | 3,720 | | | MeadWestvaco Corp | | | 95,716 | | | |
| | | | | | | | | | | | | |
| | | | | | | | | | 466,264 | | | |
| | | | | | | | | | | | | |
| | | | | | | | | | | | | |
| | | | | Capital Goods—7.1% | | | | | | |
| | 4,050 | | | Carlisle Cos | | | 142,033 | | | |
| | 5,460 | | | GrafTech International (1) | | | 89,926 | | | |
| | 1,640 | | | Parker Hannifin | | | 125,542 | | | |
| | 2,850 | | | Pentair Inc | | | 93,281 | | | |
| | | | | | | | | | | | | |
| | | | | | | | | | 450,782 | | | |
| | | | | | | | | | | | | |
| | | | | | | | | | | | | |
| | | | | Commercial & Professional Services—5.3% | | | | | | |
| | 2,500 | | | Copart Inc (1) | | | 84,650 | | | |
| | 4,190 | | | FTI Consulting (1) | | | 148,577 | | | |
| | 1,470 | | | Stericycle Inc (1) | | | 105,458 | | | |
| | | | | | | | | | | | | |
| | | | | | | | | | 338,685 | | | |
| | | | | | | | | | | | | |
| | | | | | | | | | | | | |
| | | | | Banks—4.6% | | | | | | |
| | 7,440 | | | BB&T Corp | | | 174,170 | | | |
| | 42,160 | | | Popular Inc (1) | | | 115,097 | | | |
| | | | | | | | | | | | | |
| | | | | | | | | | 289,267 | | | |
| | | | | | | | | | | | | |
| | | | | | | | | | | | | |
| | | | | Health Care Equipment & Services—4.1% | | | | | | |
| | 3,270 | | | Allscripts Healthcare Solutions (1) | | | 62,425 | | | |
| | 6,260 | | | Hologic Inc (1) | | | 100,285 | | | |
| | 360 | | | Intuitive Surgical (1) | | | 94,662 | | | |
| | | | | | | | | | | | | |
| | | | | | | | | | 257,372 | | | |
| | | | | | | | | | | | | |
| | | | | | | | | | | | | |
| | | | | Consumer Services—3.4% | | | | | | |
| | 2,080 | | | Darden Restaurants | | | 95,077 | | | |
| | 3,610 | | | Weight Watchers International | | | 120,899 | | | |
| | | | | | | | | | | | | |
| | | | | | | | | | 215,976 | | | |
| | | | | | | | | | | | | |
| | | | | | | | | | | | | |
| | | | | Food, Beverage & Tobacco—2.9% | | | | | | |
| | 2,690 | | | Dr. Pepper Snapple | | | 98,320 | | | |
See Notes to Financial Statements
| | |
| Artio Global Funds ï 2010 Annual Report | 163 |
| |
| PORTFOLIO OF INVESTMENTS (Continued) | October 31, 2010 |
Artio U.S. Midcap Fund
| | | | | | | | | | | | | |
Share
| | | | | | | Fair
| | | |
| Amount | | | Description | | | | Value (Note 2) | | | |
COMMON STOCKS—Continued |
| | | | | Food, Beverage & Tobacco—Continued | | | | | | |
| | | | | | | | | | | | | |
| | 1,330 | | | J.M. Smucker | | $ | 85,492 | | | |
| | | | | | | | | | | | | |
| | | | | | | | | | 183,812 | | | |
| | | | | | | | | | | | | |
| | | | | | | | | | | | | |
| | | | | Technology Hardware & Equipment—2.4% | | | | | | |
| | 1,990 | | | Juniper Networks (1) | | | 64,456 | | | |
| | 10,550 | | | Motorola Inc (1) | | | 85,983 | | | |
| | | | | | | | | | | | | |
| | | | | | | | | | 150,439 | | | |
| | | | | | | | | | | | | |
| | | | | | | | | | | | | |
| | | | | Transportation—2.3% | | | | | | |
| | 3,160 | | | Allegiant Travel | | | 148,804 | | | |
| | | | | | | | | | | | | |
| | | | | | | | | | | | | |
| | | | | Insurance—1.9% | | | | | | |
| | 4,540 | | | Delphi Financial Group-Class A | | | 122,898 | | | |
| | | | | | | | | | | | | |
| | | | | | | | | | | | | |
| | | | | Real Estate—1.9% | | | | | | |
| | 3,250 | | | Plum Creek Timber REIT | | | 119,730 | | | |
| | | | | | | | | | | | | |
| | | | | | | | | | | | | |
| | | | | Consumer Durables & Apparel—1.7% | | | | | | |
| | 5,680 | | | Skechers Inc-Class A (1) | | | 110,419 | | | |
| | | | | | | | | | | | | |
| | | | | | | | | | | | | |
| | | | | Media—1.5% | | | | | | |
| | 5,640 | | | CBS Corp-Class B | | | 95,485 | | | |
| | | | | | | | | | | | | |
| | | | | | | | | | | | | |
| | | | | Household & Personal Products—1.3% | | | | | | |
| | 1,270 | | | Clorox Co | | | 84,519 | | | |
| | | | | | | | | | | | | |
| | | | | | | | | | | | | |
| | | | | Food & Staples Retailing—1.0% | | | | | | |
| | 1,600 | | | Whole Foods Market (1) | | | 63,600 | | | |
| | | | | | | | | | | | | |
| | | | | TOTAL COMMON STOCKS (Cost $5,707,179) | | | 6,312,447 | | | |
| | | | | | | | | | | | | |
| | | | | TOTAL INVESTMENTS—99.4% (Cost $5,707,179) | | | 6,312,447 | | | |
| | | | | OTHER ASSETS AND LIABILITIES—0.6% | | | 37,875 | | | |
| | | | | | | | | | | | | |
| | | | | TOTAL NET ASSETS—100.0% | | $ | 6,350,322 | | | |
| | | | | | | | | | | | | |
Notes to the Portfolio of Investments.
| | | |
Aggregate cost for federal income tax purposes was $5,715,151. | | |
See Notes to Financial Statements
| | |
| 164 | Artio Global Funds ï 2010 Annual Report | |
| |
| PORTFOLIO OF INVESTMENTS-Industry Sector (Unaudited) | October 31, 2010 |
Artio U.S. Midcap Fund
At October 31, 2010, sector diversification of the Fund’s investments was as follows:
| | | | | | | | | |
| | | % of Net
| | Fair
|
| | | Assets | | Value (Note 2) |
INDUSTRY SECTOR | | | | | | | | |
| Information Technology | | | 19.4 | % | | $ | 1,235,181 | |
| Financials | | | 17.0 | | | | 1,077,184 | |
| Industrials | | | 14.8 | | | | 938,271 | |
| Consumer Discretionary | | | 14.3 | | | | 907,876 | |
| Health Care | | | 13.5 | | | | 854,379 | |
| Energy | | | 7.9 | | | | 501,361 | |
| Materials | | | 7.3 | | | | 466,264 | |
| Consumer Staples | | | 5.2 | | | | 331,931 | |
| | | | | | | | | |
Total Investments | | | 99.4 | | | | 6,312,447 | |
Other Assets and Liabilities (Net) | | | 0.6 | | | | 37,875 | |
| | | | | | | | | |
Net Assets | | | 100.0 | % | | $ | 6,350,322 | |
| | | | | | | | | |
See Notes to Financial Statements
| | |
| Artio Global Funds ï 2010 Annual Report | 165 |
| |
| PORTFOLIO OF INVESTMENTS | October 31, 2010 |
Artio U.S. Multicap Fund
| | | | | | | | | | | | | |
Share
| | | | | | | Fair
| | | |
| Amount | | | Description | | | | Value (Note 2) | | | |
COMMON STOCKS—99.2%† |
| | | | | Diversified Financials—12.7% | | | | | | |
| | 2,740 | | | American Express | | $ | 113,600 | | | |
| | 36,270 | | | Citigroup Inc (1) | | | 151,246 | | | |
| | 1,160 | | | Franklin Resources | | | 133,052 | | | |
| | 1,370 | | | Goldman Sachs | | | 220,501 | | | |
| | 1,140 | | | IntercontinentalExchange Inc (1) | | | 130,952 | | | |
| | 10,690 | | | optionsXpress Holdings (1) | | | 170,719 | | | |
| | 3,310 | | | State Street | | | 138,226 | | | |
| | | | | | | | | | | | | |
| | | | | | | | | | 1,058,296 | | | |
| | | | | | | | | | | | | |
| | | | | | | | | | | | | |
| | | | | Technology Hardware & Equipment—10.7% | | | | | | |
| | 1,340 | | | Apple Inc (1) | | | 403,166 | | | |
| | 5,830 | | | EMC Corp (1) | | | 122,488 | | | |
| | 3,320 | | | Hewlett-Packard Co | | | 139,639 | | | |
| | 3,610 | | | Juniper Networks (1) | | | 116,928 | | | |
| | 14,070 | | | Motorola Inc (1) | | | 114,671 | | | |
| | | | | | | | | | | | | |
| | | | | | | | | | 896,892 | | | |
| | | | | | | | | | | | | |
| | | | | | | | | | | | | |
| | | | | Pharmaceuticals & Biotechnology—10.0% | | | | | | |
| | 2,010 | | | Amgen Inc (1) | | | 114,952 | | | |
| | 2,660 | | | Celgene Corp (1) | | | 165,106 | | | |
| | 3,900 | | | Cepheid Inc (1) | | | 82,056 | | | |
| | 1,120 | | | Genzyme Corp (1) | | | 80,786 | | | |
| | 13,210 | | | Myriad Genetics (1) | | | 263,275 | | | |
| | 2,530 | | | Teva Pharmaceutical Industries Sponsored ADR | | | 131,307 | | | |
| | | | | | | | | | | | | |
| | | | | | | | | | 837,482 | | | |
| | | | | | | | | | | | | |
| | | | | | | | | | | | | |
| | | | | Capital Goods—9.9% | | | | | | |
| | 5,340 | | | Carlisle Cos | | | 187,274 | | | |
| | 3,990 | | | Danaher Corp | | | 173,006 | | | |
| | 2,200 | | | Parker Hannifin | | | 168,410 | | | |
| | 3,510 | | | Raytheon Co | | | 161,741 | | | |
| | 1,840 | | | United Technologies | | | 137,577 | | | |
| | | | | | | | | | | | | |
| | | | | | | | | | 828,008 | | | |
| | | | | | | | | | | | | |
| | | | | | | | | | | | | |
| | | | | Software & Services—8.8% | | | | | | |
| | 4,410 | | | Adobe Systems (1) | | | 124,142 | | | |
| | 2,810 | | | eBay Inc (1) | | | 83,766 | | | |
| | 8,080 | | | Electronic Arts (1) | | | 128,068 | | | |
| | 970 | | | MasterCard Inc-Class A | | | 232,858 | | | |
See Notes to Financial Statements
| | |
| 166 | Artio Global Funds ï 2010 Annual Report | |
| |
| PORTFOLIO OF INVESTMENTS (Continued) | October 31, 2010 |
Artio U.S. Multicap Fund
| | | | | | | | | | | | | |
Share
| | | | | | | Fair
| | | |
| Amount | | | Description | | | | Value (Note 2) | | | |
COMMON STOCKS—Continued |
| | | | | Software & Services—Continued | | | | | | |
| | | | | | | | | | | | | |
| | 5,980 | | | Paychex Inc | | $ | 165,646 | | | |
| | | | | | | | | | | | | |
| | | | | | | | | | 734,480 | | | |
| | | | | | | | | | | | | |
| | | | | | | | | | | | | |
| | | | | Energy—7.6% | | | | | | |
| | 3,530 | | | Alpha Natural Resources (1) | | | 159,450 | | | |
| | 4,935 | | | Carrizo Oil & Gas (1) | | | 116,565 | | | |
| | 2,230 | | | Oceaneering International (1) | | | 137,970 | | | |
| | 12,850 | | | PetroHawk Energy (1) | | | 218,578 | | | |
| | | | | | | | | | | | | |
| | | | | | | | | | 632,563 | | | |
| | | | | | | | | | | | | |
| | | | | | | | | | | | | |
| | | | | Materials—7.5% | | | | | | |
| | 3,420 | | | Agnico-Eagle Mines | | | 265,358 | | | |
| | 2,510 | | | Mosaic Co | | | 183,632 | | | |
| | 1,930 | | | Praxair Inc | | | 176,286 | | | |
| | | | | | | | | | | | | |
| | | | | | | | | | 625,276 | | | |
| | | | | | | | | | | | | |
| | | | | | | | | | | | | |
| | | | | Food, Beverage & Tobacco—5.1% | | | | | | |
| | 1,990 | | | J.M. Smucker | | | 127,917 | | | |
| | 4,610 | | | PepsiCo Inc | | | 301,033 | | | |
| | | | | | | | | | | | | |
| | | | | | | | | | 428,950 | | | |
| | | | | | | | | | | | | |
| | | | | | | | | | | | | |
| | | | | Health Care Equipment & Services—5.0% | | | | | | |
| | 1,590 | | | CR Bard | | | 132,161 | | | |
| | 3,430 | | | Express Scripts (1) | | | 166,423 | | | |
| | 3,100 | | | St Jude Medical (1) | | | 118,730 | | | |
| | | | | | | | | | | | | |
| | | | | | | | | | 417,314 | | | |
| | | | | | | | | | | | | |
| | | | | | | | | | | | | |
| | | | | Consumer Services—3.8% | | | | | | |
| | 3,160 | | | Las Vegas Sands (1) | | | 144,981 | | | |
| | 5,030 | | | Weight Watchers International | | | 168,454 | | | |
| | | | | | | | | | | | | |
| | | | | | | | | | 313,435 | | | |
| | | | | | | | | | | | | |
| | | | | | | | | | | | | |
| | | | | Retailing—3.5% | | | | | | |
| | 6,380 | | | hhgregg Inc (1) | | | 146,995 | | | |
| | 6,990 | | | Lowe’s Cos | | | 149,097 | | | |
| | | | | | | | | | | | | |
| | | | | | | | | | 296,092 | | | |
| | | | | | | | | | | | | |
| | | | | | | | | | | | | |
| | | | | Banks—3.1% | | | | | | |
| | 9,960 | | | Wells Fargo | | | 259,757 | | | |
| | | | | | | | | | | | | |
| | | | | | | | | | | | | |
| | | | | Transportation—2.3% | | | | | | |
| | 4,040 | | | Allegiant Travel | | | 190,244 | | | |
| | | | | | | | | | | | | |
| | | | | | | | | | | | | |
See Notes to Financial Statements
| | |
| Artio Global Funds ï 2010 Annual Report | 167 |
| |
| PORTFOLIO OF INVESTMENTS (Continued) | October 31, 2010 |
Artio U.S. Multicap Fund
| | | | | | | | | | | | | |
Share
| | | | | | | Fair
| | | |
| Amount | | | Description | | | | Value (Note 2) | | | |
COMMON STOCKS—Continued |
| | | | | | | | | | | | | |
| | | | | Semiconductors & Semiconductor Equipment—2.2% | | | | | | |
| | 31,770 | | | Integrated Device Technology (1) | | $ | 187,125 | | | |
| | | | | | | | | | | | | |
| | | | | | | | | | | | | |
| | | | | Media—2.0% | | | | | | |
| | 9,650 | | | CBS Corp-Class B | | | 163,374 | | | |
| | | | | | | | | | | | | |
| | | | | | | | | | | | | |
| | | | | Commercial & Professional Services—1.9% | | | | | | |
| | 2,255 | | | Stericycle Inc (1) | | | 161,774 | | | |
| | | | | | | | | | | | | |
| | | | | | | | | | | | | |
| | | | | Household & Personal Products—1.7% | | | | | | |
| | 2,130 | | | Clorox Co | | | 141,752 | | | |
| | | | | | | | | | | | | |
| | | | | | | | | | | | | |
| | | | | Consumer Durables & Apparel—1.4% | | | | | | |
| | 5,890 | | | Skechers Inc-Class A (1) | | | 114,502 | | | |
| | | | | | | | | | | | | |
| | | | | TOTAL COMMON STOCKS (Cost $7,139,644) | | | 8,287,316 | | | |
| | | | | | | | | | | | | |
| | | | | TOTAL INVESTMENTS—99.2% (Cost $7,139,644) | | | 8,287,316 | | | |
| | | | | OTHER ASSETS AND LIABILITIES—0.8% | | | 67,461 | | | |
| | | | | | | | | | | | | |
| | | | | TOTAL NET ASSETS—100.0% | | $ | 8,354,777 | | | |
| | | | | | | | | | | | | |
See Notes to Financial Statements
| | |
| 168 | Artio Global Funds ï 2010 Annual Report | |
| |
| PORTFOLIO OF INVESTMENTS (Continued) | October 31, 2010 |
Artio U.S. Multicap Fund
Notes to the Portfolio of Investments.
| | | |
Aggregate cost for federal income tax purposes was $7,183,110. | | |
Master Notes to the Portfolio of Investments.
| | | |
† | | Percentages indicated are based on Fund net assets. |
ADR | | American Depositary Receipt |
ETF | | Exchange-Traded Funds |
ETN | | Exchange-Traded Notes |
FDR | | Fiduciary Depositary Receipt |
GDR | | Global Depositary Receipt |
REIT | | Real Estate Investment Trust |
TBA | | To Be Announced: Securities purchased on a forward commitment basis with an approximate principal amount and maturity date. The actual principal amount and maturity date will be determined upon settlement. |
(1) | | Non-income producing security. |
(3) | | All or portion of this security was on loan to brokers at October 31, 2010. |
(4) | | Security determined to be illiquid by management. |
(5) | | Callable security. |
(6) | | Variable rate security. |
(7) | | Defaulted security. |
(8) | | Step-Coupon. |
(9) | | Securities exempt from registration under Rule 144A of the Securities Act of 1933, as amended. These securities may be resold in transactions exempt from registrations, normally to qualified institutional buyers. |
(10) | | Affiliated security. |
(11) | | Security has been pledged for collateral of swaps. |
(12) | | Security valued at fair value in good faith as determined by the policies approved by the Board of Trustees/Directors. |
(13) | | This security has additional commitments and contingencies. Principal amount and value exclude unfunded commitment. |
See Notes to Financial Statements
| | |
| Artio Global Funds ï 2010 Annual Report | 169 |
| |
| PORTFOLIO OF INVESTMENTS-Industry Sector (Unaudited) | October 31, 2010 |
Artio U.S. Multicap Fund
At October 31, 2010, sector diversification of the Fund’s investments was as follows:
| | | | | | | | | |
| | | % of Net
| | Fair
|
| | | Assets | | Value (Note 2) |
INDUSTRY SECTOR | | | | | | | | |
| Information Technology | | | 21.8 | % | | $ | 1,818,497 | |
| Financials | | | 15.8 | | | | 1,318,053 | |
| Health Care | | | 15.0 | | | | 1,254,796 | |
| Industrials | | | 14.1 | | | | 1,180,026 | |
| Consumer Discretionary | | | 10.6 | | | | 887,403 | |
| Energy | | | 7.6 | | | | 632,563 | |
| Materials | | | 7.5 | | | | 625,276 | |
| Consumer Staples | | | 6.8 | | | | 570,702 | |
| | | | | | | | | |
Total Investments | | | 99.2 | | | | 8,287,316 | |
Other Assets and Liabilities (Net) | | | 0.8 | | | | 67,461 | |
| | | | | | | | | |
Net Assets | | | 100.0 | % | | $ | 8,354,777 | |
| | | | | | | | | |
See Notes to Financial Statements
| | |
| 170 | Artio Global Funds ï 2010 Annual Report | |
| |
| STATEMENT OF ASSETS AND LIABILITIES | October 31, 2010 |
| | | | | | | | | |
| | | Artio
| | Artio
|
| | | Global Equity | | International Equity |
| ASSETS: | | | | | | | | |
Investments in securities, at fair value including fair value of securities on loan of $0 and $314,517,357, respectively
(Cost $66,935,399 and $8,148,358,694, respectively) | | $ | 74,338,445 | | | $ | 9,599,928,890 | |
Affiliated securities, at fair value
(Cost $0 and $457,834,798, respectively) | | | — | | | | 216,035,401 | |
Repurchase agreements
(Cost $748,296 and $0, respectively) | | | 748,296 | | | | — | |
| Cash | | | 262,201 | | | | — | |
| Cash on deposit for broker (Note 2) | | | — | | | | 11,008 | |
Foreign currency, at fair value
(Cost $10,022 and $51,861,891, respectively) | | | 10,010 | | | | 34,430,613 | |
| Receivables: | | | | | | | | |
| Investments sold | | | 1,492,107 | | | | 130,965,091 | |
| Fund shares sold | | | 6,874 | | | | 3,002,813 | |
| Interest and dividends | | | 53,463 | | | | 17,553,936 | |
| Tax reclaims | | | 54,896 | | | | 8,606,179 | |
| Unrealized appreciation on forward foreign exchange contracts | | | 193,224 | | | | 104,526,225 | |
| Prepaid expense | | | 319 | | | | 44,450 | |
| | | | | | | | | |
Total Assets | | | 77,159,835 | | | | 10,115,104,606 | |
| | | | | | | | | |
| | | | | | | | | |
| LIABILITIES: | | | | | | | | |
| Payables: | | | | | | | | |
| Investments purchased | | | 991,355 | | | | 56,500,609 | |
| Fund shares repurchased | | | 25,817 | | | | 12,101,630 | |
| Collateral for securities loaned (Note 2) | | | — | | | | 323,390,282 | |
| Investment advisory fee (Note 3) | | | 77,036 | | | | 7,194,941 | |
| Unrealized depreciation on forward foreign exchange contracts | | | 245,132 | | | | 158,833,874 | |
| Note payable (Note 10) | | | — | | | | 70,349,358 | |
| Accrued expenses and other payables | | | 164,162 | | | | 3,789,087 | |
| | | | | | | | | |
Total Liabilities | | | 1,503,502 | | | | 632,159,781 | |
| | | | | | | | | |
NET ASSETS | | $ | 75,656,333 | | | $ | 9,482,944,825 | |
| | | | | | | | | |
| | | | | | | | | |
| NET ASSETS Consist of: | | | | | | | | |
| Par value | | $ | 2,047 | | | $ | 323,244 | |
| Paid in capital in excess of par value | | | 105,472,560 | | | | 10,653,373,496 | |
| Undistributed net investment income | | | 97,508 | | | | 72,549,800 | |
| Accumulated net realized loss on investments sold, forward foreign exchange contracts, foreign currency related transactions, and swap contracts | | | (37,271,890 | ) | | | (2,382,629,329 | ) |
| Net unrealized appreciation on investments, forward foreign exchange contracts, foreign currency related transactions, and swap contracts | | | 7,356,108 | | | | 1,139,327,614 | |
| | | | | | | | | |
NET ASSETS | | $ | 75,656,333 | | | $ | 9,482,944,825 | |
| | | | | | | | | |
| Class A | | $ | 12,302,077 | | | $ | 3,692,637,509 | |
| | | | | | | | | |
| Class I | | $ | 63,354,256 | | | $ | 5,790,307,316 | |
| | | | | | | | | |
| | | | | | | | | |
| SHARES OUTSTANDING (Note 8) | | | | | | | | |
| Class A | | | 335,166 | | | | 127,886,511 | |
| | | | | | | | | |
| Class I | | | 1,711,716 | | | | 195,357,679 | |
| | | | | | | | | |
| | | | | | | | | |
| NET ASSET VALUE AND REDEMPTION PRICE PER SHARE | | | | | | | | |
| Class A | | $ | 36.70 | | | $ | 28.87 | |
| | | | | | | | | |
| Class I | | $ | 37.01 | | | $ | 29.64 | |
| | | | | | | | | |
See Notes to Financial Statements
| | |
| Artio Global Funds ï 2010 Annual Report | 171 |
| |
| STATEMENT OF ASSETS AND LIABILITIES (Continued) | October 31, 2010 |
| | | | | | | | | |
| | | Artio
| | Artio
|
| | | International Equity II | | Total Return Bond |
| ASSETS: | | | | | | | | |
Investments in securities, at fair value including fair value of securities on loan of $236,855,549 and $0, respectively
(Cost $7,379,182,893 and $1,495,180,709, respectively) | | $ | 8,746,679,598 | | | $ | 1,570,546,916 | |
Repurchase agreements
(Cost $0 and $79,015,798, respectively) | | | — | | | | 79,015,798 | |
| Cash on deposit for broker (Note 2) | | | 5,717 | | | | — | |
Foreign currency, at fair value
(Cost $17,975,374 and $7,786,547, respectively) | | | 17,737,779 | | | | 7,913,328 | |
| Receivables: | | | | | | | | |
| Investments sold | | | 157,781,637 | | | | 33,638,493 | |
| Fund shares sold | | | 7,820,907 | | | | 1,425,993 | |
| Interest and dividends | | | 16,469,413 | | | | 14,008,519 | |
| Tax reclaims | | | 6,908,369 | | | | — | |
| Unrealized appreciation on forward foreign exchange contracts | | | 89,386,139 | | | | 2,724,421 | |
| Prepaid expense | | | 36,752 | | | | 6,060 | |
| | | | | | | | | |
Total Assets | | | 9,042,826,311 | | | | 1,709,279,528 | |
| | | | | | | | | |
| | | | | | | | | |
| LIABILITIES: | | | | | | | | |
| Payables: | | | | | | | | |
| Investments purchased | | | 66,755,022 | | | | 76,309,816 | |
| Fund shares repurchased | | | 20,591,743 | | | | 1,596,768 | |
| Collateral for securities loaned (Note 2) | | | 244,252,923 | | | | — | |
| Investment advisory fee (Note 3) | | | 6,485,524 | | | | 471,728 | |
| Unrealized depreciation on forward foreign exchange contracts | | | 137,479,785 | | | | 4,823,659 | |
| Note payable (Note 10) | | | 51,388,924 | | | | — | |
| Accrued expenses and other payables | | | 4,595,173 | | | | 456,829 | |
| | | | | | | | | |
Total Liabilities | | | 531,549,094 | | | | 83,658,800 | |
| | | | | | | | | |
NET ASSETS | | $ | 8,511,277,217 | | | $ | 1,625,620,728 | |
| | | | | | | | | |
| | | | | | | | | |
| NET ASSETS Consist of: | | | | | | | | |
| Par value | | $ | 694,975 | | | $ | 114,669 | |
| Paid in capital in excess of par value | | | 10,198,726,724 | | | | 1,500,925,571 | |
| Undistributed net investment income | | | 151,547,495 | | | | 1,991,682 | |
| Accumulated net realized gain (loss) on investments sold, forward foreign exchange contracts, foreign currency related transactions, and swap contracts | | | (3,159,106,074 | ) | | | 49,138,273 | |
| Net unrealized appreciation on investments, forward foreign exchange contracts, foreign currency related transactions, and swap contracts | | | 1,319,414,097 | | | | 73,450,533 | |
| | | | | | | | | |
NET ASSETS | | $ | 8,511,277,217 | | | $ | 1,625,620,728 | |
| | | | | | | | | |
| Class A | | $ | 2,156,072,033 | | | $ | 319,781,570 | |
| | | | | | | | | |
| Class I | | $ | 6,355,205,184 | | | $ | 1,305,839,158 | |
| | | | | | | | | |
| | | | | | | | | |
| SHARES OUTSTANDING (Note 8) | | | | | | | | |
| Class A | | | 177,058,373 | | | | 22,464,196 | |
| | | | | | | | | |
| Class I | | | 517,916,134 | | | | 92,204,347 | |
| | | | | | | | | |
| | | | | | | | | |
| NET ASSET VALUE AND REDEMPTION PRICE PER SHARE | | | | | | | | |
| Class A | | $ | 12.18 | | | $ | 14.24 | |
| | | | | | | | | |
| Class I | | $ | 12.27 | | | $ | 14.16 | |
| | | | | | | | | |
See Notes to Financial Statements
| | |
| 172 | Artio Global Funds ï 2010 Annual Report | |
| |
| STATEMENT OF ASSETS AND LIABILITIES (Continued) | October 31, 2010 |
| | | | | | | | | |
| | | Artio
| | Artio
|
| | | Global High Income | | U.S. Microcap |
| ASSETS: | | | | | | | | |
Investments in securities, at fair value
(Cost $2,720,357,867 and $9,820,726, respectively) | | $ | 2,921,964,630 | | | $ | 10,978,585 | |
Repurchase agreements
(Cost $173,262,426 and $0, respectively) | | | 173,262,426 | | | | — | |
| Cash | | | 10,566,410 | | | | 67,314 | |
| Cash on deposit for broker (Note 2) | | | 1,020,000 | | | | — | |
Foreign currency, at fair value
(Cost $13,897,968 and $0, respectively) | | | 13,924,768 | | | | — | |
| Receivables: | | | | | | | | |
| Investments sold | | | 19,491,509 | | | | 636,154 | |
| Fund shares sold | | | 14,182,765 | | | | 8,840 | |
| Interest and dividends | | | 61,083,153 | | | | 2,264 | |
| Unfunded loan commitments (Note 2) | | | 2,964,010 | | | | — | |
| Receivable on closed swap contracts | | | 73,067,403 | | | | — | |
| Unrealized appreciation on forward foreign exchange contracts | | | 2,092,232 | | | | — | |
| Open swaps agreements, at fair value (upfront payments paid $1,903,375 and $0, respectively) | | | 9,544,321 | | | | — | |
| Prepaid expense | | | 6,086 | | | | 26 | |
| | | | | | | | | |
Total Assets | | | 3,303,169,713 | | | | 11,693,183 | |
| | | | | | | | | |
| | | | | | | | | |
| LIABILITIES: | | | | | | | | |
| Payables: | | | | | | | | |
| Investments purchased | | | 101,676,357 | | | | 413,866 | |
| Fund shares repurchased | | | 2,396,712 | | | | 7,135 | |
| Dividends payable | | | 160 | | | | — | |
| Collateral from broker | | | 8,550,000 | | | | — | |
| Investment advisory fee (Note 3) | | | 1,767,702 | | | | 10,943 | |
| Unrealized depreciation on forward foreign exchange contracts | | | 17,732,811 | | | | — | |
| Open swaps agreements, at fair value (upfront payments received $1,553,632 and $0, respectively) | | | 797,128 | | | | — | |
| Payable on closed swap contracts | | | 72,525,903 | | | | — | |
| Note payable (Note 10) | | | — | | | | 183,288 | |
| Accrued expenses and other payables | | | 1,250,549 | | | | 51,336 | |
| | | | | | | | | |
Total Liabilities | | | 206,697,322 | | | | 666,568 | |
| | | | | | | | | |
NET ASSETS | | $ | 3,096,472,391 | | | $ | 11,026,615 | |
| | | | | | | | | |
| | | | | | | | | |
| NET ASSETS Consist of: | | | | | | | | |
| Par value | | $ | 286,725 | | | $ | 1,123 | |
| Paid in capital in excess of par value | | | 2,792,107,487 | | | | 10,927,943 | |
| Undistributed net investment income (loss) | | | 25,784,200 | | | | (26,506 | ) |
| Accumulated net realized gain (loss) on investments sold, forward foreign exchange contracts, foreign currency related transactions, and swap contracts | | | 81,217,718 | | | | (1,033,804 | ) |
| Net unrealized appreciation on investments, forward foreign exchange contracts, foreign currency related transactions, and swap contracts | | | 197,076,261 | | | | 1,157,859 | |
| | | | | | | | | |
NET ASSETS | | $ | 3,096,472,391 | | | $ | 11,026,615 | |
| | | | | | | | | |
| Class A | | $ | 1,222,933,287 | | | $ | 4,840,226 | |
| | | | | | | | | |
| Class I | | $ | 1,873,539,104 | | | $ | 6,186,389 | |
| | | | | | | | | |
| | | | | | | | | |
| SHARES OUTSTANDING (Note 8) | | | | | | | | |
| Class A | | | 110,570,509 | | | | 495,317 | |
| | | | | | | | | |
| Class I | | | 176,154,394 | | | | 627,778 | |
| | | | | | | | | |
| | | | | | | | | |
| NET ASSET VALUE AND REDEMPTION PRICE PER SHARE | | | | | | | | |
| Class A | | $ | 11.06 | | | $ | 9.77 | |
| | | | | | | | | |
| Class I | | $ | 10.64 | | | $ | 9.85 | |
| | | | | | | | | |
See Notes to Financial Statements
| | |
| Artio Global Funds ï 2010 Annual Report | 173 |
| |
| STATEMENT OF ASSETS AND LIABILITIES (Continued) | October 31, 2010 |
| | | | | | | | | |
| | | Artio
| | Artio
|
| | | U.S. Smallcap | | U.S. Midcap |
| ASSETS: | | | | | | | | |
Investments in securities, at fair value
(Cost $76,307,044 and $5,707,179, respectively) | | $ | 82,597,362 | | | $ | 6,312,447 | |
Repurchase agreements
(Cost $379,762 and $0, respectively) | | | 379,762 | | | | — | |
| Cash | | | 102,343 | | | | 93,715 | |
| Receivables: | | | | | | | | |
| Investments sold | | | 3,205,730 | | | | — | |
| Fund shares sold | | | 163,410 | | | | 3,943 | |
| Dividends receivable | | | 8,187 | | | | 3,863 | |
| Prepaid expense | | | 48 | | | | 20 | |
| | | | | | | | | |
Total Assets | | | 86,456,842 | | | | 6,413,988 | |
| | | | | | | | | |
| | | | | | | | | |
| LIABILITIES: | | | | | | | | |
| Payables: | | | | | | | | |
| Investments purchased | | | 2,321,275 | | | | 12,545 | |
| Fund shares repurchased | | | 98,966 | | | | — | |
| Investment advisory fee (Note 3) | | | 55,806 | | | | 488 | |
| Note payable (Note 10) | | | 691,083 | | | | — | |
| Accrued expenses and other payables | | | 65,207 | | | | 50,633 | |
| | | | | | | | | |
Total Liabilities | | | 3,232,337 | | | | 63,666 | |
| | | | | | | | | |
NET ASSETS | | $ | 83,224,505 | | | $ | 6,350,322 | |
| | | | | | | | | |
| | | | | | | | | |
| NET ASSETS Consist of: | | | | | | | | |
| Par value | | $ | 8,218 | | | $ | 621 | |
| Paid in capital in excess of par value | | | 79,841,861 | | | | 6,529,637 | |
| Undistributed net investment loss | | | (26,504 | ) | | | (23,991 | ) |
| Accumulated net realized loss on investments sold | | | (2,889,388 | ) | | | (761,213 | ) |
| Net unrealized appreciation on investments | | | 6,290,318 | | | | 605,268 | |
| | | | | | | | | |
NET ASSETS | | $ | 83,224,505 | | �� | $ | 6,350,322 | |
| | | | | | | | | |
| Class A | | $ | 27,023,774 | | | $ | 3,208,525 | |
| | | | | | | | | |
| Class I | | $ | 56,200,731 | | | $ | 3,141,797 | |
| | | | | | | | | |
| | | | | | | | | |
| SHARES OUTSTANDING (Note 8) | | | | | | | | |
| Class A | | | 2,683,026 | | | | 314,797 | |
| | | | | | | | | |
| Class I | | | 5,534,782 | | | | 306,649 | |
| | | | | | | | | |
| | | | | | | | | |
| NET ASSET VALUE AND REDEMPTION PRICE PER SHARE | | | | | | | | |
| Class A | | $ | 10.07 | | | $ | 10.19 | |
| | | | | | | | | |
| Class I | | $ | 10.15 | | | $ | 10.25 | |
| | | | | | | | | |
See Notes to Financial Statements
| | |
| 174 | Artio Global Funds ï 2010 Annual Report | |
| |
| STATEMENT OF ASSETS AND LIABILITIES (Continued) | October 31, 2010 |
| | | | | |
| | | Artio
|
| | | U.S. Multicap |
| ASSETS: | | | | |
Investments in securities, at fair value
(Cost $7,139,644) | | $ | 8,287,316 | |
| Cash | | | 65,499 | |
| Receivables: | | | | |
| Investments sold | | | 46,879 | |
| Fund shares sold | | | 789 | |
| Dividends receivable | | | 5,672 | |
| Prepaid expense | | | 20 | |
| | | | | |
Total Assets | | | 8,406,175 | |
| | | | | |
| | | | | |
| LIABILITIES: | | | | |
| Payables: | | | | |
| Investment advisory fee (Note 3) | | | 685 | |
| Accrued expenses and other payables | | | 50,713 | |
| | | | | |
Total Liabilities | | | 51,398 | |
| | | | | |
NET ASSETS | | $ | 8,354,777 | |
| | | | | |
| | | | | |
| NET ASSETS Consist of: | | | | |
| Par value | | $ | 828 | |
| Paid in capital in excess of par value | | | 8,497,690 | |
| Undistributed net investment loss | | | (22,420 | ) |
| Accumulated net realized loss on investments sold | | | (1,268,993 | ) |
| Net unrealized appreciation on investments | | | 1,147,672 | |
| | | | | |
NET ASSETS | | $ | 8,354,777 | |
| | | | | |
| Class A | | $ | 3,001,166 | |
| | | | | |
| Class I | | $ | 5,353,611 | |
| | | | | |
| | | | | |
| SHARES OUTSTANDING (Note 8) | | | | |
| Class A | | | 298,496 | |
| | | | | |
| Class I | | | 529,337 | |
| | | | | |
| | | | | |
| NET ASSET VALUE AND REDEMPTION PRICE PER SHARE | | | | |
| Class A | | $ | 10.05 | |
| | | | | |
| Class I | | $ | 10.11 | |
| | | | | |
See Notes to Financial Statements
| | |
| Artio Global Funds ï 2010 Annual Report | 175 |
STATEMENT OF OPERATIONS
For the Year Ended October 31, 2010
| | | | | | | | | |
| | | Artio
| | Artio
|
| | | Global Equity | | International Equity |
| INVESTMENT INCOME: | | | | | | | | |
| Interest | | $ | 283 | | | $ | 41,556 | |
| Securities lending income | | | 243 | | | | 7,261,120 | |
| Dividends, from unaffiliated issuers†† | | | 1,021,054 | | | | 212,966,719 | |
| Dividends, from affiliated issuers††† | | | — | | | | 6,086,928 | |
| | | | | | | | | |
Total investment income | | | 1,021,580 | | | | 226,356,323 | |
| | | | | | | | | |
| | | | | | | | | |
| EXPENSES: | | | | | | | | |
| Investment advisory fee (Note 3) | | | 673,820 | | | | 88,789,480 | |
| Custody fees | | | 204,464 | | | | 9,120,884 | |
| Administration fees | | | 24,391 | | | | 718,338 | |
| Professional fees | | | 78,875 | | | | 971,541 | |
| Trustees’ fees and expenses | | | 2,955 | | | | 390,341 | |
| Registration and filing fees | | | 40,192 | | | | 67,254 | |
| Shareholder reports | | | 16,250 | | | | 1,051,569 | |
| Insurance premium expense | | | 4,395 | | | | 333,401 | |
| Interest expense | | | 3,807 | | | | 307,586 | |
| Commitment fee | | | 6,303 | | | | 103,210 | |
| Compliance expense | | | 2,719 | | | | 47,653 | |
| Miscellaneous fees | | | 17,968 | | | | 220,038 | |
| | | | | | | | | |
Total expenses common to all classes | | | 1,076,139 | | | | 102,121,295 | |
| | | | | | | | | |
| Transfer agent fees | | | | | | | | |
| Class A | | | 18,519 | | | | 291,134 | |
| Class I | | | 891 | | | | 120,875 | |
| Distribution and shareholder servicing fees (Note 4) | | | | | | | | |
| Class A | | | 38,665 | | | | 9,917,223 | |
| | | | | | | | | |
Total gross expenses | | | 1,134,214 | | | | 112,450,527 | |
| | | | | | | | | |
| Custody offset arrangement (Note 3) | | | — | | | | (248,856 | ) |
| Expenses reimbursed by investment advisor (Note 3)(1) | | | (226,359 | ) | | | — | |
| Expenses waived by investment advisor (Note 3) | | | (3,744 | ) | | | (496,575 | ) |
| | | | | | | | | |
Net expenses | | | 904,111 | | | | 111,705,096 | |
| | | | | | | | | |
NET INVESTMENT INCOME | | | 117,469 | | | | 114,651,227 | |
| | | | | | | | | |
| | | | | | | | | |
| NET REALIZED AND UNREALIZED GAIN ON INVESTMENTS: | | | | | | | | |
| Realized gain (loss) on: | | | | | | | | |
| Investments | | | 7,677,054 | | | | 505,553,690 | |
| Financial futures contracts and synthetic futures | | | (6,009 | ) | | | (21,748,933 | ) |
| Swap contracts | | | 3 | | | | (5,961,906 | ) |
| Forward foreign exchange contracts | | | 319,242 | | | | 155,010,075 | |
| Foreign currency transactions†††† | | | (81,059 | ) | | | (22,022,990 | ) |
| | | | | | | | | |
Net realized gain on investments | | | 7,909,231 | | | | 610,829,936 | |
| | | | | | | | | |
| Net change in unrealized appreciation (depreciation) on: | | | | | | | | |
| Investments | | | 2,437,140 | | | | 274,020,972 | |
| Forward foreign exchange contracts | | | (91,378 | ) | | | (59,465,501 | ) |
| Foreign currency transactions | | | 3,225 | | | | (6,446,044 | ) |
| | | | | | | | | |
Net change in unrealized appreciation of investments | | | 2,348,987 | | | | 208,109,427 | |
| | | | | | | | | |
NET REALIZED AND UNREALIZED GAIN ON INVESTMENTS | | | 10,258,218 | | | | 818,939,363 | |
| | | | | | | | | |
NET INCREASE IN NET ASSETS RESULTING FROM OPERATIONS | | $ | 10,375,687 | | | $ | 933,590,590 | |
| | | | | | | | | |
| | | |
†† | | Net of foreign withholding taxes of $77,237 and $22,838,936 for the Artio Global Equity Fund Inc. and Artio International Equity Fund, respectively. |
††† | | Net of foreign withholding taxes of $0 and $59,556 for the Artio Global Equity Fund Inc. and Artio International Equity Fund, respectively. |
†††† | | Net of Brazilian IOF tax of $42,946 and $3,272,302 for the Artio Global Equity Fund Inc. and Artio International Equity Fund, respectively. |
(1) | | The expenses reimbursed on Artio Global Equity Fund Inc. for Class A and Class I were $(58,133) and $(168,226), respectively. |
See Notes to Financial Statements
| | |
| 176 | Artio Global Funds ï 2010 Annual Report | |
STATEMENT OF OPERATIONS (Continued)
For the Year Ended October 31, 2010
| | | | | | | | | |
| | | Artio
| | Artio
|
| | | International Equity II | | Total Return Bond |
| INVESTMENT INCOME: | | | | | | | | |
| Interest† | | $ | 46,876 | | | $ | 74,302,033 | |
| Securities lending income | | | 6,505,334 | | | | — | |
| Dividends†† | | | 192,379,754 | | | | — | |
| | | | | | | | | |
Total investment income | | | 198,931,964 | | | | 74,302,033 | |
| | | | | | | | | |
| | | | | | | | | |
| EXPENSES: | | | | | | | | |
| Investment advisory fee (Note 3) | | | 78,754,270 | | | | 5,838,876 | |
| Custody fees | | | 7,027,774 | | | | 762,555 | |
| Administration fees | | | 685,253 | | | | 59,294 | |
| Professional fees | | | 873,783 | | | | 168,334 | |
| Trustees’ fees and expenses | | | 347,653 | | | | 71,754 | |
| Registration and filing fees | | | 90,656 | | | | 58,636 | |
| Shareholder reports | | | 1,491,041 | | | | 194,927 | |
| Insurance premium expense | | | 271,501 | | | | 44,870 | |
| Interest expense | | | 207,801 | | | | — | |
| Commitment fee | | | 113,006 | | | | 66,515 | |
| Compliance expense | | | 41,930 | | | | 9,954 | |
| Miscellaneous fees | | | 128,276 | | | | 24,280 | |
| | | | | | | | | |
Total expenses common to all classes | | | 90,032,944 | | | | 7,299,995 | |
| | | | | | | | | |
| Transfer agent fees | | | | | | | | |
| Class A | | | 229,356 | | | | 36,392 | |
| Class I | | | 1,441,494 | | | | 30,750 | |
| Distribution and shareholder servicing fees (Note 4) | | | | | | | | |
| Class A | | | 5,295,771 | | | | 796,007 | |
| | | | | | | | | |
Total gross expenses | | | 96,999,565 | | | | 8,163,144 | |
| | | | | | | | | |
| Custody offset arrangement (Note 3) | | | (306,353 | ) | | | (5,753 | ) |
| Recoupment of expenses previously assumed by investment advisor (Note 3) | | | — | | | | 72,825 | |
| Expenses reimbursed by investment advisor (Note 3)(1) | | | — | | | | (10,609 | ) |
| Expenses waived by investment advisor (Note 3) | | | (438,945 | ) | | | (83,412 | ) |
| | | | | | | | | |
Net expenses | | | 96,254,267 | | | | 8,136,195 | |
| | | | | | | | | |
NET INVESTMENT INCOME | | | 102,677,697 | | | | 66,165,838 | |
| | | | | | | | | |
| | | | | | | | | |
| NET REALIZED AND UNREALIZED GAIN ON INVESTMENTS: | | | | | | | | |
| Realized gain (loss) on: | | | | | | | | |
| Investments | | | 165,879,505 | | | | 80,635,437 | |
| Financial futures contracts and synthetic futures | | | (16,755,916 | ) | | | 182,721 | |
| Swap contracts | | | (5,464,948 | ) | | | — | |
| Forward foreign exchange contracts | | | 153,723,182 | | | | (604,304 | ) |
| Foreign currency transactions†††† | | | (16,451,266 | ) | | | (315,524 | ) |
| | | | | | | | | |
Net realized gain on investments | | | 280,930,557 | | | | 79,898,330 | |
| | | | | | | | | |
| Net change in unrealized appreciation (depreciation) on: | | | | | | | | |
| Investments††††† | | | 430,795,665 | | | | 13,798,586 | |
| Financial futures contracts and synthetic futures | | | — | | | | 192,209 | |
| Forward foreign exchange contracts | | | (58,925,247 | ) | | | (8,776,388 | ) |
| Foreign currency transactions | | | 768,020 | | | | (159,693 | ) |
| | | | | | | | | |
Net change in unrealized appreciation of investments | | | 372,638,438 | | | | 5,054,714 | |
| | | | | | | | | |
NET REALIZED AND UNREALIZED GAIN ON INVESTMENTS | | | 653,568,995 | | | | 84,953,044 | |
| | | | | | | | | |
NET INCREASE IN NET ASSETS RESULTING FROM OPERATIONS | | $ | 756,246,692 | | | $ | 151,118,882 | |
| | | | | | | | | |
| | | |
† | | Net of foreign withholding taxes of $0 and $116,085 for the Artio International Equity Fund II and Artio Total Return Bond Fund, respectively. |
†† | | Net of foreign withholding taxes of $20,349,586 and $0 for the Artio International Equity Fund II and Artio Total Return Bond Fund, respectively. |
†††† | | Net of Brazilian IOF tax of $3,094,419 and $736,592 for the Artio International Equity Fund II and Artio Total Return Bond Fund, respectively. |
††††† | | Net of foreign capital gains taxes of $903,712 and $0 for the Artio International Equity II Fund and Artio Total Return Bond Fund, respectively. |
(1) | | The expenses reimbursed on Artio Total Return Bond Fund for Class A and Class I were $(10,609) and $0, respectively. |
See Notes to Financial Statements
| | |
| Artio Global Funds ï 2010 Annual Report | 177 |
STATEMENT OF OPERATIONS (Continued)
For the Year Ended October 31, 2010
| | | | | | | | | |
| | | Artio
| | Artio
|
| | | Global High Income | | U.S. Microcap |
| INVESTMENT INCOME: | | | | | | | | |
| Interest† | | $ | 220,338,615 | | | $ | 72 | |
| Dividends | | | 220,578 | | | | 61,831 | |
| | | | | | | | | |
Total investment income | | | 220,559,193 | | | | 61,903 | |
| | | | | | | | | |
| | | | | | | | | |
| EXPENSES: | | | | | | | | |
| Investment advisory fee (Note 3) | | | 16,466,441 | | | | 119,445 | |
| Custody fees | | | 999,294 | | | | 23,383 | |
| Administration fees | | | 68,562 | | | | 40 | |
| Professional fees | | | 246,051 | | | | 27,591 | |
| Trustees’ fees and expenses | | | 110,980 | | | | 420 | |
| Registration and filing fees | | | 176,838 | | | | 45,153 | |
| Shareholder reports | | | 382,175 | | | | 1,342 | |
| Insurance premium expense | | | 44,155 | | | | 192 | |
| Interest expense | | | — | | | | 212 | |
| Commitment fee | | | 101,986 | | | | 3,331 | |
| Compliance expense | | | 13,844 | | | | 1,804 | |
| Miscellaneous fees | | | 78,009 | | | | 5,168 | |
| | | | | | | | | |
Total expenses common to all classes | | | 18,688,335 | | | | 228,081 | |
| | | | | | | | | |
| Transfer agent fees | | | | | | | | |
| Class A | | | 168,679 | | | | 5,409 | |
| Class I | | | 96,086 | | | | 31 | |
| Distribution and shareholder servicing fees (Note 4) | | | | | | | | |
| Class A | | | 2,489,852 | | | | 10,778 | |
| | | | | | | | | |
Total gross expenses | | | 21,442,952 | | | | 244,299 | |
| | | | | | | | | |
| Custody offset arrangement (Note 3) | | | (47,772 | ) | | | — | |
| Recoupment of expenses previously assumed by investment advisor (Note 3) | | | 220,853 | | | | — | |
| Expenses reimbursed by investment advisor (Note 3)(1) | | | — | | | | (87,348 | ) |
| Expenses waived by investment advisor (Note 3) | | | (126,665 | ) | | | (478 | ) |
| | | | | | | | | |
Net expenses | | | 21,489,368 | | | | 156,473 | |
| | | | | | | | | |
NET INVESTMENT INCOME (LOSS) | | | 199,069,825 | | | | (94,570 | ) |
| | | | | | | | | |
| | | | | | | | | |
| NET REALIZED AND UNREALIZED GAIN ON INVESTMENTS: | | | | | | | | |
| Realized gain on: | | | | | | | | |
| Investments | | | 86,793,178 | | | | 705,479 | |
| Swap contracts | | | 12,009,558 | | | | — | |
| Forward foreign exchange contracts | | | 21,884,138 | | | | — | |
| Foreign currency transactions†††† | | | 2,628,529 | | | | — | |
| | | | | | | | | |
Net realized gain on investments | | | 123,315,403 | | | | 705,479 | |
| | | | | | | | | |
| Net change in unrealized appreciation (depreciation) on: | | | | | | | | |
| Investments††††† | | | 45,316,045 | | | | 1,065,882 | |
| Swap contracts | | | 4,067,844 | | | | — | |
| Forward foreign exchange contracts | | | (12,365,257 | ) | | | — | |
| Foreign currency transactions | | | 92,929 | | | | — | |
| | | | | | | | | |
Net change in unrealized appreciation of investments | | | 37,111,561 | | | | 1,065,882 | |
| | | | | | | | | |
NET REALIZED AND UNREALIZED GAIN ON INVESTMENTS | | | 160,426,964 | | | | 1,771,361 | |
| | | | | | | | | |
NET INCREASE IN NET ASSETS RESULTING FROM OPERATIONS | | $ | 359,496,789 | | | $ | 1,676,791 | |
| | | | | | | | | |
| | | |
† | | Net of foreign withholding taxes of $417,110 and $0 for the Artio Global High Income Fund and Artio U.S. Microcap Fund, respectively. |
†††† | | Net of Brazilian IOF tax of $346,371 and $0 for the Artio Global High Income Fund and Artio U.S. Microcap Fund, respectively. |
††††† | | Net of foreign capital gains tax of $390,269 and $0 for the Artio Global High Income Fund and Artio U.S. Microcap Fund, respectively. |
(1) | | The expenses reimbursed on Artio U.S. Microcap for Class A and Class I were $(41,118) and $(46,230), respectively. |
See Notes to Financial Statements
| | |
| 178 | Artio Global Funds ï 2010 Annual Report | |
STATEMENT OF OPERATIONS (Continued)
For the Year Ended October 31, 2010
| | | | | | | | | |
| | | Artio
| | Artio
|
| | | U.S. Smallcap | | U.S. Midcap |
| INVESTMENT INCOME: | | | | | | | | |
| Interest | | $ | 189 | | | $ | 9 | |
| Dividends†† | | | 254,805 | | | | 64,031 | |
| | | | | | | | | |
Total investment income | | | 254,994 | | | | 64,040 | |
| | | | | | | | | |
| | | | | | | | | |
| EXPENSES: | | | | | | | | |
| Investment advisory fee (Note 3) | | | 479,288 | | | | 44,656 | |
| Custody fees | | | 54,832 | | | | 14,923 | |
| Administration fees | | | 46 | | | | 1,582 | |
| Professional fees | | | 30,902 | | | | 27,245 | |
| Trustees’ fees and expenses | | | 2,507 | | | | 229 | |
| Registration and filing fees | | | 55,196 | | | | 45,024 | |
| Shareholder reports | | | 14,177 | | | | 428 | |
| Insurance premium expense | | | 350 | | | | 148 | |
| Interest expense | | | 1,687 | | | | 5 | |
| Commitment fee | | | 3,216 | | | | 3,343 | |
| Compliance expense | | | 1,959 | | | | 1,789 | |
| Miscellaneous fees | | | 5,370 | | | | 5,144 | |
| | | | | | | | | |
Total expenses common to all classes | | | 649,530 | | | | 144,516 | |
| | | | | | | | | |
| Transfer agent fees | | | | | | | | |
| Class A | | | 9,680 | | | | 5,184 | |
| Class I | | | 313 | | | | 6 | |
| Distribution and shareholder servicing fees (Note 4) | | | | | | | | |
| Class A | | | 66,087 | | | | 6,907 | |
| | | | | | | | | |
Total gross expenses | | | 725,610 | | | | 156,613 | |
| | | | | | | | | |
| Expenses reimbursed by investment advisor (Note 3)(1) | | | (36,593 | ) | | | (89,426 | ) |
| Expenses waived by investment advisor (Note 3) | | | (2,523 | ) | | | (279 | ) |
| | | | | | | | | |
Net expenses | | | 686,494 | | | | 66,908 | |
| | | | | | | | | |
NET INVESTMENT LOSS | | | (431,500 | ) | | | (2,868 | ) |
| | | | | | | | | |
| | | | | | | | | |
| NET REALIZED AND UNREALIZED GAIN (LOSS) ON INVESTMENTS: | | | | | | | | |
| Realized gain (loss) on: | | | | | | | | |
| Investments | | | (1,530,579 | ) | | | 1,188,107 | |
| | | | | | | | | |
Net realized gain (loss) on investments | | | (1,530,579 | ) | | | 1,188,107 | |
| | | | | | | | | |
| Net change in unrealized appreciation on: | | | | | | | | |
| Investments | | | 6,040,784 | | | | 79,382 | |
| | | | | | | | | |
Net change in unrealized appreciation of investments | | | 6,040,784 | | | | 79,382 | |
| | | | | | | | | |
NET REALIZED AND UNREALIZED GAIN ON INVESTMENTS | | | 4,510,205 | | | | 1,267,489 | |
| | | | | | | | | |
NET INCREASE IN NET ASSETS RESULTING FROM OPERATIONS | | $ | 4,078,705 | | | $ | 1,264,621 | |
| | | | | | | | | |
| | | |
†† | | Net of foreign withholding taxes of $0 and $28 for the Artio U.S. Smallcap Fund and Artio U.S. Midcap Fund, respectively. |
(1) | | The expenses reimbursed on Artio U.S. Smallcap Fund for Class A and Class I were $(20,231) and $(16,362), respectively. The expenses reimbursed on Artio U.S. Midcap for Class A and Class I were $(46,138) and $(43,288), respectively. |
See Notes to Financial Statements
| | |
| Artio Global Funds ï 2010 Annual Report | 179 |
STATEMENT OF OPERATIONS (Continued)
For the Year Ended October 31, 2010
| | | | | |
| | | Artio
|
| | | U.S. Multicap |
| INVESTMENT INCOME: | | | | |
| Interest | | $ | 14 | |
| Dividends(1) | | | 81,729 | |
| | | | | |
Total investment income | | | 81,743 | |
| | | | | |
| | | | | |
| EXPENSES: | | | | |
| Investment advisory fee (Note 3) | | | 54,296 | |
| Custody fees | | | 15,333 | |
| Administration fees | | | 675 | |
| Professional fees | | | 27,381 | |
| Trustees’ fees and expenses | | | 310 | |
| Registration and filing fees | | | 45,024 | |
| Shareholder reports | | | 490 | |
| Insurance premium expense | | | 149 | |
| Commitment fee | | | 3,344 | |
| Compliance expense | | | 1,795 | |
| Miscellaneous fees | | | 5,158 | |
| | | | | |
Total expenses common to all classes | | | 153,955 | |
| | | | | |
| Transfer agent fees | | | | |
| Class A | | | 5,265 | |
| Class I | | | 6 | |
| Distribution and shareholder servicing fees (Note 4) | | | | |
| Class A | | | 6,886 | |
| | | | | |
Total gross expenses | | | 166,112 | |
| | | | | |
| Expenses reimbursed by investment advisor (Note 3)(2) | | | (85,087 | ) |
| Expenses waived by investment advisor (Note 3) | | | (362 | ) |
| | | | | |
Net expenses | | | 80,663 | |
| | | | | |
NET INVESTMENT INCOME | | | 1,080 | |
| | | | | |
| | | | | |
| NET REALIZED AND UNREALIZED GAIN ON INVESTMENTS: | | | | |
| Realized gain on: | | | | |
| Investments | | | 584,975 | |
| | | | | |
Net realized gain on investments | | | 584,975 | |
| | | | | |
| Net change in unrealized appreciation on: | | | | |
| Investments | | | 546,945 | |
| | | | | |
Net change in unrealized appreciation of investments | | | 546,945 | |
| | | | | |
NET REALIZED AND UNREALIZED GAIN ON INVESTMENTS | | | 1,131,920 | |
| | | | | |
NET INCREASE IN NET ASSETS RESULTING FROM OPERATIONS | | $ | 1,133,000 | |
| | | | | |
| | | |
(1) | | Net of withholding taxes of $5 for the Artio U.S. Multicap Fund. |
(2) | | The expenses reimbursed on Artio U.S. Multicap for Class A and Class I were $(35,825) and $(49,262), respectively. |
See Notes to Financial Statements
| | |
| 180 | Artio Global Funds ï 2010 Annual Report | |
STATEMENT OF CHANGES IN NET ASSETS
Artio Global Equity Fund Inc.
| | | | | | | | | |
| | | For the Year
| | For the Year
|
| | | Ended
| | Ended
|
| | | October 31, 2010 | | October 31, 2009 |
| INCREASE IN NET ASSETS FROM OPERATIONS: | | | | | | | | |
| Net investment income | | $ | 117,469 | | | $ | 770,816 | |
| Net realized gain (loss) on investments | | | 7,909,231 | | | | (6,539,251 | ) |
| Net change in unrealized appreciation of investments | | | 2,348,987 | | | | 19,112,591 | |
| | | | | | | | | |
Net increase in net assets resulting from operations | | | 10,375,687 | | | | 13,344,156 | |
| | | | | | | | | |
| | | | | | | | | |
| DISTRIBUTIONS TO SHAREHOLDERS (NOTE 2): | | | | | | | | |
| Distributions from net investment income | | | | | | | | |
| Class A | | | (466,218 | ) | | | (51,820 | ) |
| Class I | | | (1,502,089 | ) | | | (442,421 | ) |
| | | | | | | | | |
Total distributions to shareholders | | | (1,968,307 | ) | | | (494,241 | ) |
| | | | | | | | | |
| | | | | | | | | |
| FUND SHARE TRANSACTIONS (NOTE 8): | | | | | | | | |
| Proceeds from sale of shares | | | | | | | | |
| Class A | | | 1,555,984 | | | | 4,260,109 | |
| Class I | | | 21,457,884 | | | | 21,461,260 | |
| Net Asset Value of shares issued to shareholders in payment of distributions declared | | | | | | | | |
| Class A | | | 427,401 | | | | 45,354 | |
| Class I | | | 1,354,987 | | | | 385,162 | |
| Cost of shares redeemed | | | | | | | | |
| Class A | | | (8,991,108 | ) | | | (5,616,212 | ) |
| Class I | | | (16,280,465 | ) | | | (29,225,075 | ) |
| | | | | | | | | |
Net decrease from Fund share transactions | | | (475,317 | ) | | | (8,689,402 | ) |
| | | | | | | | | |
Net increase in net assets | | | 7,932,063 | | | | 4,160,513 | |
| | | | | | | | | |
| | | | | | | | | |
| NET ASSETS | | | | | | | | |
| Beginning of year | | | 67,724,270 | | | | 63,563,757 | |
| | | | | | | | | |
End of year (including undistributed net investment income of $97,508 and $1,928,053, respectively) | | $ | 75,656,333 | | | $ | 67,724,270 | |
| | | | | | | | | |
See Notes to Financial Statements
| | |
| Artio Global Funds ï 2010 Annual Report | 181 |
STATEMENT OF CHANGES IN NET ASSETS (Continued)
Artio International Equity Fund
| | | | | | | | | |
| | | For the Year
| | For the Year
|
| | | Ended
| | Ended
|
| | | October 31, 2010 | | October 31, 2009 |
| INCREASE IN NET ASSETS FROM OPERATIONS: | | | | | | | | |
| Net investment income | | $ | 114,651,227 | | | $ | 126,684,185 | |
| Net realized gain (loss) on investments | | | 610,829,936 | | | | (882,321,355 | ) |
| Net change in unrealized appreciation of investments | | | 208,109,427 | | | | 2,307,256,713 | |
| | | | | | | | | |
Net increase in net assets resulting from operations | | | 933,590,590 | | | | 1,551,619,543 | |
| | | | | | | | | |
| | | | | | | | | |
| DISTRIBUTIONS TO SHAREHOLDERS (NOTE 2): | | | | | | | | |
| Distributions from net investment income | | | | | | | | |
| Class A | | | (312,693,549 | ) | | | (85,664,078 | ) |
| Class I | | | (464,863,718 | ) | | | (140,445,131 | ) |
| | | | | | | | | |
Total distributions to shareholders | | | (777,557,267 | ) | | | (226,109,209 | ) |
| | | | | | | | | |
| | | | | | | | | |
| FUND SHARE TRANSACTIONS (NOTE 8): | | | | | | | | |
| Proceeds from sale of shares | | | | | | | | |
| Class A | | | 284,001,164 | | | | 404,301,509 | |
| Class I | | | 685,401,750 | | | | 932,167,894 | |
| Net Asset Value of shares issued to shareholders in payment of distributions declared | | | | | | | | |
| Class A | | | 304,130,078 | | | | 82,972,280 | |
| Class I | | | 407,783,876 | | | | 123,510,037 | |
| Cost of shares redeemed | | | | | | | | |
| Class A | | | (1,318,136,727 | ) | | | (1,536,672,807 | ) |
| Class I | | | (1,794,595,216 | ) | | | (2,336,722,790 | ) |
| | | | | | | | | |
Net decrease from Fund share transactions | | | (1,431,415,075 | ) | | | (2,330,443,877 | ) |
| | | | | | | | | |
Net decrease in net assets | | | (1,275,381,752 | ) | | | (1,004,933,543 | ) |
| | | | | | | | | |
| | | | | | | | | |
| NET ASSETS | | | | | | | | |
| Beginning of year | | | 10,758,326,577 | | | | 11,763,260,120 | |
| | | | | | | | | |
End of year (including undistributed net investment income of $72,549,800 and $623,935,988, respectively) | | $ | 9,482,944,825 | | | $ | 10,758,326,577 | |
| | | | | | | | | |
See Notes to Financial Statements
| | |
| 182 | Artio Global Funds ï 2010 Annual Report | |
STATEMENT OF CHANGES IN NET ASSETS (Continued)
Artio International Equity Fund II
| | | | | | | | | |
| | | For the Year
| | For the Year
|
| | | Ended
| | Ended
|
| | | October 31, 2010 | | October 31, 2009 |
| INCREASE IN NET ASSETS FROM OPERATIONS: | | | | | | | | |
| Net investment income | | $ | 102,677,697 | | | $ | 80,213,609 | |
| Net realized gain (loss) on investments | | | 280,930,557 | | | | (834,693,721 | ) |
| Net change in unrealized appreciation of investments | | | 372,638,438 | | | | 2,215,572,057 | |
| | | | | | | | | |
Net increase in net assets resulting from operations | | | 756,246,692 | | | | 1,461,091,945 | |
| | | | | | | | | |
| | | | | | | | | |
| DISTRIBUTIONS TO SHAREHOLDERS (NOTE 2): | | | | | | | | |
| Distributions from net investment income | | | | | | | | |
| Class A | | | (103,530,863 | ) | | | (53,302,535 | ) |
| Class I | | | (341,289,827 | ) | | | (173,674,445 | ) |
| | | | | | | | | |
Total distributions to shareholders | | | (444,820,690 | ) | | | (226,976,980 | ) |
| | | | | | | | | |
| | | | | | | | | |
| FUND SHARE TRANSACTIONS (NOTE 8): | | | | | | | | |
| Proceeds from sale of shares | | | | | | | | |
| Class A | | | 626,381,765 | | | | 1,339,361,355 | |
| Class I | | | 1,779,295,234 | | | | 2,951,347,838 | |
| Net Asset Value of shares issued to shareholders in payment of distributions declared | | | | | | | | |
| Class A | | | 99,920,171 | | | | 51,235,076 | |
| Class I | | | 213,807,193 | | | | 124,414,774 | |
| Cost of shares redeemed | | | | | | | | |
| Class A | | | (802,773,219 | ) | | | (796,724,175 | ) |
| Class I | | | (2,848,274,565 | ) | | | (2,299,984,847 | ) |
| | | | | | | | | |
Net increase (decrease) from Fund share transactions | | | (931,643,421 | ) | | | 1,369,650,021 | |
| | | | | | | | | |
Net increase (decrease) in net assets | | | (620,217,419 | ) | | | 2,603,764,986 | |
| | | | | | | | | |
| | | | | | | | | |
| NET ASSETS | | | | | | | | |
| Beginning of year | | | 9,131,494,636 | | | | 6,527,729,650 | |
| | | | | | | | | |
End of year (including undistributed net investment income of $151,547,495 and $411,290,022, respectively) | | $ | 8,511,277,217 | | | $ | 9,131,494,636 | |
| | | | | | | | | |
See Notes to Financial Statements
| | |
| Artio Global Funds ï 2010 Annual Report | 183 |
STATEMENT OF CHANGES IN NET ASSETS (Continued)
Artio Total Return Bond Fund
| | | | | | | | | |
| | | For the Year
| | For the Year
|
| | | Ended
| | Ended
|
| | | October 31, 2010 | | October 31, 2009 |
| INCREASE IN NET ASSETS FROM OPERATIONS: | | | | | | | | |
| Net investment income | | $ | 66,165,838 | | | $ | 58,862,088 | |
| Net realized gain (loss) on investments | | | 79,898,330 | | | | (16,111,380 | ) |
| Net change in unrealized appreciation of investments | | | 5,054,714 | | | | 184,840,308 | |
| | | | | | | | | |
Net increase in net assets resulting from operations | | | 151,118,882 | | | | 227,591,016 | |
| | | | | | | | | |
| | | | | | | | | |
| DISTRIBUTIONS TO SHAREHOLDERS (NOTE 2): | | | | | | | | |
| Distributions from net investment income | | | | | | | | |
| Class A | | | (11,120,626 | ) | | | (15,140,174 | ) |
| Class I | | | (53,469,238 | ) | | | (56,438,166 | ) |
| Distributions from realized gain | | | | | | | | |
| Class A | | | — | | | | (3,273,465 | ) |
| Class I | | | — | | | | (10,279,203 | ) |
| | | | | | | | | |
Total distributions to shareholders | | | (64,589,864 | ) | | | (85,131,008 | ) |
| | | | | | | | | |
| | | | | | | | | |
| FUND SHARE TRANSACTIONS (NOTE 8): | | | | | | | | |
| Proceeds from sale of shares | | | | | | | | |
| Class A | | | 136,248,652 | | | | 147,840,856 | |
| Class I | | | 438,140,936 | | | | 530,039,756 | |
| Net Asset Value of shares issued to shareholders in payment of distributions declared | | | | | | | | |
| Class A | | | 10,470,356 | | | | 17,725,866 | |
| Class I | | | 34,785,128 | | | | 39,412,940 | |
| Cost of shares redeemed | | | | | | | | |
| Class A | | | (174,736,709 | ) | | | (168,566,731 | ) |
| Class I | | | (475,552,050 | ) | | | (405,092,093 | ) |
| | | | | | | | | |
Net increase (decrease) from Fund share transactions | | | (30,643,687 | ) | | | 161,360,594 | |
| | | | | | | | | |
Net increase in net assets | | | 55,885,331 | | | | 303,820,602 | |
| | | | | | | | | |
| | | | | | | | | |
| NET ASSETS | | | | | | | | |
| Beginning of year | | | 1,569,735,397 | | | | 1,265,914,795 | |
| | | | | | | | | |
End of year (including undistributed net investment income (loss) of $1,991,682 and $(6,316,396), respectively) | | $ | 1,625,620,728 | | | $ | 1,569,735,397 | |
| | | | | | | | | |
See Notes to Financial Statements
| | |
| 184 | Artio Global Funds ï 2010 Annual Report | |
STATEMENT OF CHANGES IN NET ASSETS (Continued)
Artio Global High Income Fund
| | | | | | | | | |
| | | For the Year
| | For the Year
|
| | | Ended
| | Ended
|
| | | October 31, 2010 | | October 31, 2009 |
| INCREASE IN NET ASSETS FROM OPERATIONS: | | | | | | | | |
| Net investment income | | $ | 199,069,825 | | | $ | 64,215,393 | |
| Net realized gain (loss) on investments | | | 123,315,403 | | | | (11,398,781 | ) |
| Net change in unrealized appreciation of investments | | | 37,111,561 | | | | 274,614,152 | |
| | | | | | | | | |
Net increase in net assets resulting from operations | | | 359,496,789 | | | | 327,430,764 | |
| | | | | | | | | |
| | | | | | | | | |
| DISTRIBUTIONS TO SHAREHOLDERS (NOTE 2): | | | | | | | | |
| Distributions from net investment income | | | | | | | | |
| Class A | | | (77,291,651 | ) | | | (26,042,197 | ) |
| Class I | | | (125,168,810 | ) | | | (39,483,744 | ) |
| Return of capital | | | | | | | | |
| Class A | | | — | | | | (5,125,386 | ) |
| Class I | | | — | | | | (7,770,829 | ) |
| | | | | | | | | |
Total distributions to shareholders | | | (202,460,461 | ) | | | (78,422,156 | ) |
| | | | | | | | | |
| | | | | | | | | |
| FUND SHARE TRANSACTIONS (NOTE 8): | | | | | | | | |
| Proceeds from sale of shares | | | | | | | | |
| Class A | | | 1,000,594,646 | | | | 679,159,672 | |
| Class I | | | 1,499,770,538 | | | | 787,876,363 | |
| Net Asset Value of shares issued to shareholders in payment of distributions declared | | | | | | | | |
| Class A | | | 68,400,882 | | | | 29,332,975 | |
| Class I | | | 99,259,758 | | | | 36,506,876 | |
| Cost of shares redeemed | | | | | | | | |
| Class A | | | (628,711,516 | ) | | | (233,104,717 | ) |
| Class I | | | (749,472,836 | ) | | | (260,336,225 | ) |
| | | | | | | | | |
Net increase from Fund share transactions | | | 1,289,841,472 | | | | 1,039,434,944 | |
| | | | | | | | | |
Net increase in net assets | | | 1,446,877,800 | | | | 1,288,443,552 | |
| | | | | | | | | |
| | | | | | | | | |
| NET ASSETS | | | | | | | | |
| Beginning of year | | | 1,649,594,591 | | | | 361,151,039 | |
| | | | | | | | | |
End of year (including undistributed net investment income of $25,784,200 and $1,209,850, respectively) | | $ | 3,096,472,391 | | | $ | 1,649,594,591 | |
| | | | | | | | | |
See Notes to Financial Statements
| | |
| Artio Global Funds ï 2010 Annual Report | 185 |
STATEMENT OF CHANGES IN NET ASSETS (Continued)
Artio U.S. Microcap Fund
| | | | | | | | | |
| | | For the Year
| | For the Year
|
| | | Ended
| | Ended
|
| | | October 31, 2010 | | October 31, 2009 |
| INCREASE IN NET ASSETS FROM OPERATIONS: | | | | | | | | |
| Net investment loss | | $ | (94,570 | ) | | $ | (31,881 | ) |
| Net realized gain (loss) on investments | | | 705,479 | | | | (254,236 | ) |
| Net change in unrealized appreciation of investments | | | 1,065,882 | | | | 1,341,679 | |
| | | | | | | | | |
Net increase in net assets resulting from operations | | | 1,676,791 | | | | 1,055,562 | |
| | | | | | | | | |
| | | | | | | | | |
| FUND SHARE TRANSACTIONS (NOTE 8): | | | | | | | | |
| Proceeds from sale of shares | | | | | | | | |
| Class A | | | 4,561,517 | | | | 1,295,639 | |
| Class I | | | 2,888,373 | | | | 392,317 | |
| Cost of shares redeemed | | | | | | | | |
| Class A | | | (3,641,369 | ) | | | (586,054 | ) |
| Class I | | | (519,518 | ) | | | (164,113 | ) |
| | | | | | | | | |
Net increase from Fund share transactions | | | 3,289,003 | | | | 937,789 | |
| | | | | | | | | |
Net increase in net assets | | | 4,965,794 | | | | 1,993,351 | |
| | | | | | | | | |
| | | | | | | | | |
| NET ASSETS | | | | | | | | |
| Beginning of year | | | 6,060,821 | | | | 4,067,470 | |
| | | | | | | | | |
End of year (including undistributed net investment loss of $(26,506) and $(28,976), respectively) | | $ | 11,026,615 | | | $ | 6,060,821 | |
| | | | | | | | | |
See Notes to Financial Statements
| | |
| 186 | Artio Global Funds ï 2010 Annual Report | |
STATEMENT OF CHANGES IN NET ASSETS (Continued)
Artio U.S. Smallcap Fund
| | | | | | | | | |
| | | For the Year
| | For the Year
|
| | | Ended
| | Ended
|
| | | October 31, 2010 | | October 31, 2009 |
| INCREASE IN NET ASSETS FROM OPERATIONS: | | | | | | | | |
| Net investment loss | | $ | (431,500 | ) | | $ | (23,505 | ) |
| Net realized gain (loss) on investments | | | (1,530,579 | ) | | | 372,747 | |
| Net change in unrealized appreciation of investments | | | 6,040,784 | | | | 1,230,793 | |
| | | | | | | | | |
Net increase in net assets resulting from operations | | | 4,078,705 | | | | 1,580,035 | |
| | | | | | | | | |
| | | | | | | | | |
| FUND SHARE TRANSACTIONS (NOTE 8): | | | | | | | | |
| Proceeds from sale of shares | | | | | | | | |
| Class A | | | 42,487,000 | | | | 8,479,268 | |
| Class I | | | 52,213,686 | | | | 427,454 | |
| Cost of shares redeemed | | | | | | | | |
| Class A | | | (26,932,106 | ) | | | (743,583 | ) |
| Class I | | | (3,389,647 | ) | | | (170,096 | ) |
| | | | | | | | | |
Net increase from Fund share transactions | | | 64,378,933 | | | | 7,993,043 | |
| | | | | | | | | |
Net increase in net assets | | | 68,457,638 | | | | 9,573,078 | |
| | | | | | | | | |
| | | | | | | | | |
| NET ASSETS | | | | | | | | |
| Beginning of year | | | 14,766,867 | | | | 5,193,789 | |
| | | | | | | | | |
End of year (including undistributed net investment loss of $(26,504) and $(28,976), respectively) | | $ | 83,224,505 | | | $ | 14,766,867 | |
| | | | | | | | | |
See Notes to Financial Statements
| | |
| Artio Global Funds ï 2010 Annual Report | 187 |
STATEMENT OF CHANGES IN NET ASSETS (Continued)
Artio U.S. Midcap Fund
| | | | | | | | | |
| | | For the Year
| | For the Year
|
| | | Ended
| | Ended
|
| | | October 31, 2010 | | October 31, 2009 |
| INCREASE IN NET ASSETS FROM OPERATIONS: | | | | | | | | |
| Net investment income (loss) | | $ | (2,868 | ) | | $ | 14,128 | |
| Net realized gain (loss) on investments | | | 1,188,107 | | | | (605,528 | ) |
| Net change in unrealized appreciation of investments | | | 79,382 | | | | 1,372,735 | |
| | | | | | | | | |
Net increase in net assets resulting from operations | | | 1,264,621 | | | | 781,335 | |
| | | | | | | | | |
| | | | | | | | | |
| DISTRIBUTIONS TO SHAREHOLDERS (NOTE 2): | | | | | | | | |
| Distributions from net investment income | | | | | | | | |
| Class A | | | (2,214 | ) | | | — | |
| Class I | | | (8,251 | ) | | | — | |
| | | | | | | | | |
Total distributions to shareholders | | | (10,465 | ) | | | — | |
| | | | | | | | | |
| | | | | | | | | |
| FUND SHARE TRANSACTIONS (NOTE 8): | | | | | | | | |
| Proceeds from sale of shares | | | | | | | | |
| Class A | | | 220,226 | | | | 103,437 | |
| Class I | | | 148,513 | | | | 60,785 | |
| Net Asset Value of shares issued to shareholders in payment of distributions declared | | | | | | | | |
| Class A | | | 186 | | | | — | |
| Class I | | | 784 | | | | — | |
| Cost of shares redeemed | | | | | | | | |
| Class A | | | (77,042 | ) | | | (139,466 | ) |
| Class I | | | (133,358 | ) | | | (190,574 | ) |
| | | | | | | | | |
Net increase (decrease) from Fund share transactions | | | 159,309 | | | | (165,818 | ) |
| | | | | | | | | |
Net increase in net assets | | | 1,413,465 | | | | 615,517 | |
| | | | | | | | | |
| | | | | | | | | |
| NET ASSETS | | | | | | | | |
| Beginning of year | | | 4,936,857 | | | | 4,321,340 | |
| | | | | | | | | |
End of year (including undistributed net investment loss of $(23,991) and $(15,766), respectively) | | $ | 6,350,322 | | | $ | 4,936,857 | |
| | | | | | | | | |
See Notes to Financial Statements
| | |
| 188 | Artio Global Funds ï 2010 Annual Report | |
STATEMENT OF CHANGES IN NET ASSETS (Continued)
Artio U.S. Multicap Fund
| | | | | | | | | |
| | | For the Year
| | For the Year
|
| | | Ended
| | Ended
|
| | | October 31, 2010 | | October 31, 2009 |
| INCREASE IN NET ASSETS FROM OPERATIONS: | | | | | | | | |
| Net investment income | | $ | 1,080 | | | $ | 25,830 | |
| Net realized gain (loss) on investments | | | 584,975 | | | | (367,589 | ) |
| Net change in unrealized appreciation of investments | | | 546,945 | | | | 1,247,045 | |
| | | | | | | | | |
Net increase in net assets resulting from operations | | | 1,133,000 | | | | 905,286 | |
| | | | | | | | | |
| | | | | | | | | |
| DISTRIBUTIONS TO SHAREHOLDERS (NOTE 2): | | | | | | | | |
| Distributions from net investment income | | | | | | | | |
| Class A | | | (8,327 | ) | | | — | |
| Class I | | | (14,635 | ) | | | (797 | ) |
| | | | | | | | | |
Total distributions to shareholders | | | (22,962 | ) | | | (797 | ) |
| | | | | | | | | |
| | | | | | | | | |
| FUND SHARE TRANSACTIONS (NOTE 8): | | | | | | | | |
| Proceeds from sale of shares | | | | | | | | |
| Class A | | | 76,842 | | | | 118,712 | |
| Class I | | | 2,366,268 | | | | 72,052 | |
| Net Asset Value of shares issued to shareholders in payment of distributions declared | | | | | | | | |
| Class A | | | 508 | | | | — | |
| Class I | | | 817 | | | | 576 | |
| Cost of shares redeemed | | | | | | | | |
| Class A | | | (80,526 | ) | | | (126,590 | ) |
| Class I | | | (156,949 | ) | | | (307,842 | ) |
| | | | | | | | | |
Net increase (decrease) from Fund share transactions | | | 2,206,960 | | | | (243,092 | ) |
| | | | | | | | | |
Net increase in net assets | | | 3,316,998 | | | | 661,397 | |
| | | | | | | | | |
| | | | | | | | | |
| NET ASSETS | | | | | | | | |
| Beginning of year | | | 5,037,779 | | | | 4,376,382 | |
| | | | | | | | | |
End of year (including undistributed net investment loss of $(22,420) and $(1,550), respectively) | | $ | 8,354,777 | | | $ | 5,037,779 | |
| | | | | | | | | |
See Notes to Financial Statements
| | |
| Artio Global Funds ï 2010 Annual Report | 189 |
FINANCIAL HIGHLIGHTS
Artio Global Equity Fund Inc.
For a share outstanding throughout each period
| | | | | | | | | | | | | | | | | | | | | | | |
| | | Class A |
| | | Year Ended October 31, |
| | | 2010 | | 2009 | | 2008 | | 2007 | | 2006 | | |
Net Asset Value, beginning of year | | | $32.55 | | | | $27.23 | | | | $47.02 | | | | $38.23 | | | | $31.45 | | | |
| | | | | | | | | | | | | | | | | | | | | | | |
Income (loss) from investment operations: | | | | | | | | | | | | | | | | | | | | | | |
| Net investment income (loss) (2) | | | (0.01 | ) | | | 0.27 | | | | 0.32 | | | | 0.33 | | | | 0.23 | | | |
| Net realized and unrealized gain (loss) on investments | | | 5.05 | | | | 5.15 | | | | (20.03 | ) | | | 8.46 | | | | 6.55 | | | |
| | | | | | | | | | | | | | | | | | | | | | | |
Total income (loss) from investment operations | | | 5.04 | | | | 5.42 | | | | (19.71 | ) | | | 8.79 | | | | 6.78 | | | |
| | | | | | | | | | | | | | | | | | | | | | | |
Less distributions: | | | | | | | | | | | | | | | | | | | | | | |
| From net investment income | | | (0.89 | ) | | | (0.10 | ) | | | (0.08 | ) | | | — | | | | — | | | |
| | | | | | | | | | | | | | | | | | | | | | | |
Total Distributions | | | (0.89 | ) | | | (0.10 | ) | | | (0.08 | ) | | | — | | | | — | | | |
| | | | | | | | | | | | | | | | | | | | | | | |
Net Asset Value, end of year | | | $36.70 | | | | $32.55 | | | | $27.23 | | | | $47.02 | | | | $38.23 | | | |
| | | | | | | | | | | | | | | | | | | | | | | |
Total Return | | | 15.65 | % | | | 19.94 | % | | | (42.00 | )% | | | 23.02 | % | | | 21.56 | % | | |
| | | | | | | | | | | | | | | | | | | | | | | |
Ratios/Supplemental Data: | | | | | | | | | | | | | | | | | | | | | | |
Net Assets, end of year (in 000’s) | | | $12,302 | | | | $17,703 | | | | $16,045 | | | | $38,995 | | | | $29,852 | | | |
| | | | | | | | | | | | | | | | | | | | | | | |
| Ratio of net investment income (loss) to average net assets | | | (0.04 | )% | | | 0.99 | % | | | 0.79 | % | | | 0.78 | % | | | 0.65 | % | | |
| Ratio of net expenses to average net assets (1)(3) | | | 1.40 | %(4) | | | 1.40 | % | | | 1.45 | % | | | 1.42 | % | | | 1.42 | % | | |
| Ratio of net expenses to average net assets (1) | | | 1.40 | %(4) | | | 1.40 | % | | | 1.40 | % | | | 1.40 | % | | | 1.40 | % | | |
| | | | | | | | | | | | | | | | | | | | | | | |
Portfolio turnover rate | | | 195 | % | | | 320 | % | | | 200 | % | | | 185 | % | | | 162 | % | | |
| | | | | | | | | | | | | | | | | | | | | | | |
(1) The net expenses of the Fund reflect a waiver of fees by the Fund’s investment advisor. Had such an action not been taken, the operating expenses ratios would have been: |
Ratio of gross expenses to average net assets (3) | | | 1.78 | %(4) | | | 1.89 | % | | | 1.75 | % | | | 1.99 | % | | | 2.26 | % | | |
Ratio of gross expenses to average net assets | | | 1.78 | %(4) | | | 1.89 | % | | | 1.70 | % | | | 1.97 | % | | | 2.24 | % | | |
| | | |
(2) | | Based on average shares outstanding during the period. |
(3) | | Expense ratio without taking into consideration any expense reductions related to custody offset arrangement. |
(4) | | Includes interest expense that amounts to less than 0.01%. |
See Notes to Financial Statements
| | |
| 190 | Artio Global Funds ï 2010 Annual Report | |
FINANCIAL HIGHLIGHTS
Artio Global Equity Fund Inc.
For a share outstanding throughout each period
| | | | | | | | | | | | | | | | | | | | | | | |
| | | Class I |
| | | Year Ended October 31, |
| | | 2010 | | 2009 | | 2008 | | 2007 | | 2006 | | |
Net Asset Value, beginning of period | | | $32.80 | | | | $27.55 | | | | $47.45 | | | | $38.48 | | | | $31.58 | | | |
| | | | | | | | | | | | | | | | | | | | | | | |
Income (loss) from investment operations: | | | | | | | | | | | | | | | | | | | | | | |
| Net investment income (2) | | | 0.07 | | | | 0.35 | | | | 0.39 | | | | 0.46 | | | | 0.38 | | | |
| Net realized and unrealized gain (loss) on investments | | | 5.09 | | | | 5.17 | | | | (20.10 | ) | | | 8.51 | | | | 6.52 | | | |
| | | | | | | | | | | | | | | | | | | | | | | |
Total income (loss) from investment operations | | | 5.16 | | | | 5.52 | | | | (19.71 | ) | | | 8.97 | | | | 6.90 | | | |
| | | | | | | | | | | | | | | | | | | | | | | |
Less distributions: | | | | | | | | | | | | | | | | | | | | | | |
| From net investment income | | | (0.95 | ) | | | (0.27 | ) | | | (0.19 | ) | | | — | | | | — | (3) | | |
| | | | | | | | | | | | | | | | | | | | | | | |
Total Distributions | | | (0.95 | ) | | | (0.27 | ) | | | (0.19 | ) | | | — | | | | — | (3) | | |
| | | | | | | | | | | | | | | | | | | | | | | |
Net Asset Value, end of period | | | $37.01 | | | | $32.80 | | | | $27.55 | | | | $47.45 | | | | $38.48 | | | |
| | | | | | | | | | | | | | | | | | | | | | | |
Total Return | | | 15.94 | % | | | 20.23 | % | | | (41.68 | )% | | | 23.31 | % | | | 21.89 | % | | |
| | | | | | | | | | | | | | | | | | | | | | | |
Ratios/Supplemental Data: | | | | | | | | | | | | | | | | | | | | | | |
Net Assets, end of period (in 000’s) | | | $63,354 | | | | $50,021 | | | | $47,518 | | | | $74,033 | | | | $29,598 | | | |
| | | | | | | | | | | | | | | | | | | | | | | |
| Ratio of investment income to average net assets | | | 0.21 | % | | | 1.27 | % | | | 0.98 | % | | | 1.08 | % | | | 1.06 | % | | |
| Ratio of net expenses to average net assets (1)(4) | | | 1.15 | %(5) | | | 1.15 | % | | | 1.20 | % | | | 1.17 | % | | | 1.17 | % | | |
| Ratio of net expenses to average net assets (1) | | | 1.15 | %(5) | | | 1.15 | % | | | 1.15 | % | | | 1.15 | % | | | 1.15 | % | | |
| | | | | | | | | | | | | | | | | | | | | | | |
Portfolio turnover rate | | | 195 | % | | | 320 | % | | | 200 | % | | | 185 | % | | | 162 | % | | |
| | | | | | | | | | | | | | | | | | | | | | | |
(1) The net expenses of the Fund reflect a waiver of fees by the Fund’s investment advisor. Had such an action not been taken, the operating expenses ratios would have been: |
Ratio of gross expenses to average net assets (4) | | | 1.44 | %(5) | | | 1.50 | % | | | 1.45 | % | | | 1.65 | % | | | 1.88 | % | | |
Ratio of gross expenses to average net assets | | | 1.44 | %(5) | | | 1.50 | % | | | 1.40 | % | | | 1.63 | % | | | 1.86 | % | | |
| | | |
(2) | | Based on average shares outstanding during the period. |
(3) | | Rounds to less than $0.01. |
(4) | | Expense ratio without taking into consideration any expense reductions related to custody offset arrangement. |
(5) | | Includes interest expense that amounts to less than 0.01%. |
See Notes to Financial Statements
| | |
| Artio Global Funds ï 2010 Annual Report | 191 |
FINANCIAL HIGHLIGHTS
Artio International Equity Fund
For a share outstanding throughout each period
| | | | | | | | | | | | | | | | | | | | | | | |
| | | Class A |
| | | Year Ended October 31, |
| | | 2010 | | 2009 | | 2008 | | 2007 | | 2006 | | |
Net Asset Value, beginning of year | | | $28.20 | | | | $24.46 | † | | | $51.95 | | | | $43.09 | | | | $34.29 | | | |
| | | | | | | | | | | | | | | | | | | | | | | |
Income (loss) from investment operations: | | | | | | | | | | | | | | | | | | | | | | |
| Net investment income (1) | | | 0.27 | | | | 0.26 | | | | 0.52 | | | | 0.71 | | | | 0.50 | | | |
| Net realized and unrealized gain (loss) on investments | | | 2.48 | | | | 3.94 | | | | (22.03 | ) | | | 12.60 | | | | 9.87 | | | |
| | | | | | | | | | | | | | | | | | | | | | | |
Total income (loss) from investment operations | | | 2.75 | | | | 4.20 | | | | (21.51 | ) | | | 13.31 | | | | 10.37 | | | |
| | | | | | | | | | | | | | | | | | | | | | | |
Less distributions: | | | | | | | | | | | | | | | | | | | | | | |
| From net investment income | | | (2.08 | ) | | | (0.46 | ) | | | (0.72 | ) | | | (0.28 | ) | | | — | | | |
| From net realized gains on investments | | | — | | | | — | | | | (5.26 | ) | | | (4.17 | ) | | | (1.57 | ) | | |
| | | | | | | | | | | | | | | | | | | | | | | |
Total Distributions | | | (2.08 | ) | | | (0.46 | ) | | | (5.98 | ) | | | (4.45 | ) | | | (1.57 | ) | | |
| | | | | | | | | | | | | | | | | | | | | | | |
Net Asset Value, end of year | | | $28.87 | | | | $28.20 | | | | $24.46 | † | | | $51.95 | | | | $43.09 | | | |
| | | | | | | | | | | | | | | | | | | | | | | |
Total Return | | | 10.06 | % | | | 17.62 | % | | | (46.49 | )% | | | 33.33 | % | | | 31.20 | % | | |
| | | | | | | | | | | | | | | | | | | | | | | |
Ratios/Supplemental Data: | | | | | | | | | | | | | | | | | | | | | | |
Net Assets, end of year (in 000’s) | | | $3,692,638 | | | | $4,368,400 | | | | $4,884,851 | | | | $11,619,663 | | | | $9,092,359 | | | |
| | | | | | | | | | | | | | | | | | | | | | | |
| Ratio of net investment income to average net assets | | | 1.00 | % | | | 1.09 | % | | | 1.31 | % | | | 1.54 | % | | | 1.28 | % | | |
| Ratio of net expenses to average net assets (2) | | | 1.28 | %(3) | | | 1.26 | % | | | 1.22 | % | | | 1.24 | % | | | 1.24 | % | | |
| Ratio of net expenses to average net assets | | | 1.28 | %(3)(4) | | | 1.21 | %(4) | | | 1.13 | %(4) | | | 1.19 | % | | | 1.19 | % | | |
| | | | | | | | | | | | | | | | | | | | | | | |
Portfolio turnover rate | | | 105 | % | | | 201 | % | | | 55 | % | | | 51 | % | | | 62 | % | | |
| | | | | | | | | | | | | | | | | | | | | | | |
| | | |
(1) | | Based on average shares outstanding during the period. |
(2) | | Expense ratio without taking into consideration any expense reductions related to custody offset arrangement. |
(3) | | Includes interest expense that amounts to less than 0.01%. |
(4) | | The net expenses of the Fund reflect a waiver of fees by the Fund’s investment advisor. Had such action not been taken, the annualized operating expense ratios would have been 1.28%, 1.21% and 1.13% for the years ended October 31, 2010, 2009 and 2008, respectively. |
† | | The financial statements are prepared to conform to U.S. generally accepted accounting principles. As a result, the NAVs for certain funds reported in the financial statements may differ from the NAV used to process shareholder transactions. The reported NAV for shareholder transaction activity for International Equity Fund Class A shares was $24.44. The NAV above has been restated to correct an error which was identified subsequent to the close of the fiscal year. |
See Notes to Financial Statements
| | |
| 192 | Artio Global Funds ï 2010 Annual Report | |
FINANCIAL HIGHLIGHTS
Artio International Equity Fund
For a share outstanding throughout each period
| | | | | | | | | | | | | | | | | | | | | | | |
| | | Class I |
| | | Year Ended October 31, |
| | | 2010 | | 2009 | | 2008 | | 2007 | | 2006 | | |
Net Asset Value, beginning of year | | | $28.89 | | | | $25.09 | † | | | $53.15 | | | | $43.97 | | | | $34.96 | | | |
| | | | | | | | | | | | | | | | | | | | | | | |
Income (loss) from investment operations: | | | | | | | | | | | | | | | | | | | | | | |
| Net investment income (1) | | | 0.35 | | | | 0.33 | | | | 0.63 | | | | 0.85 | | | | 0.52 | | | |
| Net realized and unrealized gain (loss) on investments | | | 2.55 | | | | 4.03 | | | | (22.60 | ) | | | 12.88 | | | | 10.15 | | | |
| | | | | | | | | | | | | | | | | | | | | | | |
Total income (loss) from investment operations | | | 2.90 | | | | 4.36 | | | | (21.97 | ) | | | 13.73 | | | | 10.67 | | | |
| | | | | | | | | | | | | | | | | | | | | | | |
Less distributions: | | | | | | | | | | | | | | | | | | | | | | |
| From net investment income | | | (2.15 | ) | | | (0.56 | ) | | | (0.83 | ) | | | (0.38 | ) | | | — | | | |
| From net realized gains on investments | | | — | | | | — | | | | (5.26 | ) | | | (4.17 | ) | | | (1.66 | ) | | |
| | | | | | | | | | | | | | | | | | | | | | | |
Total Distributions | | | (2.15 | ) | | | (0.56 | ) | | | (6.09 | ) | | | (4.55 | ) | | | (1.66 | ) | | |
| | | | | | | | | | | | | | | | | | | | | | | |
Net Asset Value, end of year | | | $29.64 | | | | $28.89 | | | | $25.09 | † | | | $53.15 | | | | $43.97 | | | |
| | | | | | | | | | | | | | | | | | | | | | | |
Total Return | | | 10.37 | % | | | 17.91 | % | | | (46.37 | )% | | | 33.65 | % | | | 31.53 | % | | |
| | | | | | | | | | | | | | | | | | | | | | | |
Ratios/Supplemental Data: | | | | | | | | | | | | | | | | | | | | | | |
Net Assets, end of year (in 000’s) | | | $5,790,307 | | | | $6,389,926 | | | | $6,878,409 | | | | $15,310,511 | | | | $11,077,753 | | | |
| | | | | | | | | | | | | | | | | | | | | | | |
| Ratio of investment income to average net assets | | | 1.26 | % | | | 1.36 | % | | | 1.56 | % | | | 1.81 | % | | | 1.29 | % | | |
| Ratio of net expenses to average net assets (2) | | | 1.02 | %(3) | | | 1.01 | % | | | 0.98 | % | | | 0.99 | % | | | 0.99 | % | | |
| Ratio of net expenses to average net assets | | | 1.02 | %(3)(4) | | | 0.95 | %(4) | | | 0.89 | %(4) | | | 0.94 | % | | | 0.94 | % | | |
| | | | | | | | | | | | | | | | | | | | | | | |
Portfolio turnover rate | | | 105 | % | | | 201 | % | | | 55 | % | | | 51 | % | | | 62 | % | | |
| | | | | | | | | | | | | | | | | | | | | | | |
| | | |
(1) | | Based on average shares outstanding during the period. |
(2) | | Expense ratio without taking into consideration any expense reductions related to custody offset arrangement. |
(3) | | Includes interest expense that amounts to less than 0.01%. |
(4) | | The net expenses of the Fund reflect a waiver of fees by the Fund’s investment advisor. Had such action not been taken, the annualized operating expense ratios would have been 1.02%, 0.95% and 0.89% for the years ended October 31, 2010, 2009 and 2008, respectively. |
† | | The financial statements are prepared to conform to U.S. generally accepted accounting principles. As a result, the NAVs for certain funds reported in the financial statements may differ from the NAV used to process shareholder transactions. The reported NAV for shareholder transaction activity for International Equity Fund Class I shares was $25.07. The NAV above was restated to correct an error which was identified subsequent to the close of the fiscal year end. |
See Notes to Financial Statements
| | |
| Artio Global Funds ï 2010 Annual Report | 193 |
FINANCIAL HIGHLIGHTS
Artio International Equity Fund II
For a share outstanding throughout each period
| | | | | | | | | | | | | | | | | | | | | | | |
| | | Class A |
| | | Year Ended October 31, |
| | | 2010 | | 2009 | | 2008 | | 2007 | | 2006 | | |
Net Asset Value, beginning of period | | | $11.62 | | | | $10.15 | † | | | $18.31 | | | | $14.07 | | | | $10.94 | | | |
| | | | | | | | | | | | | | | | | | | | | | | |
Income (loss) from investment operations: | | | | | | | | | | | | | | | | | | | | | | |
| Net investment income (1) | | | 0.11 | | | | 0.09 | | | | 0.19 | | | | 0.31 | | | | 0.16 | | | |
| Net realized and unrealized gain (loss) on investments | | | 1.00 | | | | 1.71 | | | | (7.94 | ) | | | 4.01 | | | | 2.97 | | | |
| | | | | | | | | | | | | | | | | | | | | | | |
Total income (loss) from investment operations | | | 1.11 | | | | 1.80 | | | | (7.75 | ) | | | 4.32 | | | | 3.13 | | | |
| | | | | | | | | | | | | | | | | | | | | | | |
Less distributions: | | | | | | | | | | | | | | | | | | | | | | |
| From net investment income | | | (0.55 | ) | | | (0.33 | ) | | | (0.14 | ) | | | (0.03 | ) | | | — | | | |
| From net realized gains on investments | | | — | | | | — | | | | (0.27 | ) | | | (0.05 | ) | | | — | | | |
| | | | | | | | | | | | | | | | | | | | | | | |
Total Distributions | | | (0.55 | ) | | | (0.33 | ) | | | (0.41 | ) | | | (0.08 | ) | | | — | | | |
| | | | | | | | | | | | | | | | | | | | | | | |
Net Asset Value, end of period | | | $12.18 | | | | $11.62 | | | | $10.15 | † | | | $18.31 | | | | $14.07 | | | |
| | | | | | | | | | | | | | | | | | | | | | | |
Total Return | | | 9.75 | % | | | 18.23 | % | | | (43.18 | )% | | | 30.89 | % | | | 28.73 | % | | |
| | | | | | | | | | | | | | | | | | | | | | | |
Ratios/Supplemental Data: | | | | | | | | | | | | | | | | | | | | | | |
Net Assets, end of period (in 000’s) | | | $2,156,072 | | | | $2,146,222 | | | | $1,309,002 | | | | $1,980,188 | | | | $722,531 | | | |
| | | | | | | | | | | | | | | | | | | | | | | |
| Ratio of net investment income to average net assets | | | 0.98 | % | | | 0.87 | % | | | 1.25 | % | | | 1.93 | % | | | 1.25 | % | | |
| Ratio of net expenses to average net assets (2)(3) | | | 1.29 | %(4) | | | 1.27 | % | | | 1.28 | % | | | 1.31 | % | | | 1.33 | % | | |
| Ratio of net expenses to average net assets (5) | | | 1.28 | %(4) | | | 1.24 | % | | | 1.21 | % | | | 1.29 | % | | | 1.32 | % | | |
| | | | | | | | | | | | | | | | | | | | | | | |
Portfolio turnover rate | | | 123 | % | | | 205 | % | | | 89 | % | | | 64 | % | | | 61 | % | | |
| | | | | | | | | | | | | | | | | | | | | | | |
| | | |
(1) | | Based on average shares outstanding during the period. |
(2) | | Expense ratio without taking into consideration any expense reductions related to custody offset arrangement. |
(3) | | On March 1, 2006, the expense cap changed from 1.35% to 1.32%. |
(4) | | Includes interest expense that amounts to less than 0.01%. |
(5) | | The net expenses of the Fund reflect a recoupment or waiver of fees by the Fund’s investment advisor. Had such action not been taken, the annualized operating expense ratios would have been 1.28%,1.25%, 1.21%, 1.28% and 1.32% for the periods ended October 31, 2010, 2009, 2008, 2007 and 2006, respectively. |
† | | The financial statements are prepared to conform to U.S. generally accepted accounting principles. As a result, the NAVs for certain funds reported in the financial statements may differ from the NAV used to process shareholder transactions. The reported NAV for shareholder transaction activity for International Equity Fund II Class A shares was $10.16. |
See Notes to Financial Statements
| | |
| 194 | Artio Global Funds ï 2010 Annual Report | |
FINANCIAL HIGHLIGHTS
Artio International Equity Fund II
For a share outstanding throughout each period
| | | | | | | | | | | | | | | | | | | | | | | |
| | | Class I |
| | | Year Ended October 31, |
| | | 2010 | | 2009 | | 2008 | | 2007 | | 2006 | | |
Net Asset Value, beginning of period | | | $11.70 | | | | $10.22 | † | | | $18.42 | | | | $14.14 | | | | $10.96 | | | |
| | | | | | | | | | | | | | | | | | | | | | | |
Income (loss) from investment operations: | | | | | | | | | | | | | | | | | | | | | | |
| Net investment income (1) | | | 0.14 | | | | 0.12 | | | | 0.23 | | | | 0.37 | | | | 0.20 | | | |
| Net realized and unrealized gain (loss) on investments | | | 1.01 | | | | 1.72 | | | | (7.99 | ) | | | 4.02 | | | | 2.98 | | | |
| | | | | | | | | | | | | | | | | | | | | | | |
Total income (loss) from investment operations | | | 1.15 | | | | 1.84 | | | | (7.76 | ) | | | 4.39 | | | | 3.18 | | | |
| | | | | | | | | | | | | | | | | | | | | | | |
Less distributions: | | | | | | | | | | | | | | | | | | | | | | |
| From net investment income | | | (0.58 | ) | | | (0.36 | ) | | | (0.17 | ) | | | (0.06 | ) | | | — | | | |
| From net realized gains on investments | | | — | | | | — | | | | (0.27 | ) | | | (0.05 | ) | | | — | | | |
| | | | | | | | | | | | | | | | | | | | | | | |
Total Distributions | | | (0.58 | ) | | | (0.36 | ) | | | (0.44 | ) | | | (0.11 | ) | | | — | | | |
| | | | | | | | | | | | | | | | | | | | | | | |
Net Asset Value, end of period | | | $12.27 | | | | $11.70 | | | | $10.22 | † | | | $18.42 | | | | $14.14 | | | |
| | | | | | | | | | | | | | | | | | | | | | | |
Total Return | | | 9.99 | % | | | 18.59 | % | | | (43.03 | )% | | | 31.15 | % | | | 29.11 | % | | |
| | | | | | | | | | | | | | | | | | | | | | | |
Ratios/Supplemental Data: | | | | | | | | | | | | | | | | | | | | | | |
Net Assets, end of period (in 000’s) | | | $6,355,205 | | | | $6,985,273 | | | | $5,218,728 | | | | $7,753,276 | | | | $2,439,754 | | | |
| | | | | | | | | | | | | | | | | | | | | | | |
| Ratio of investment income to average net assets | | | 1.23 | % | | | 1.18 | % | | | 1.48 | % | | | 2.28 | % | | | 1.54 | % | | |
| Ratio of net expenses to average net assets (2)(3) | | | 1.05 | %(4) | | | 1.02 | % | | | 1.00 | % | | | 1.03 | % | | | 1.06 | % | | |
| Ratio of net expenses to average net assets (5) | | | 1.04 | %(4) | | | 0.98 | % | | | 0.93 | % | | | 1.01 | % | | | 1.05 | % | | |
| | | | | | | | | | | | | | | | | | | | | | | |
Portfolio turnover rate | | | 123 | % | | | 205 | % | | | 89 | % | | | 64 | % | | | 61 | % | | |
| | | | | | | | | | | | | | | | | | | | | | | |
| | | |
(1) | | Based on average shares outstanding during the period. |
(2) | | Expense ratio without taking into consideration any expense reductions related to custody offset arrangement. |
(3) | | On March 1, 2006, the expense cap changed from 1.08% to 1.05%. |
(4) | | Includes interest expense that amounts to less than 0.01%. |
(5) | | The net expenses of the Fund reflect a recoupment or waiver of fees by the Fund’s investment advisor. Had such action not been taken, the annualized operating expense ratio would have been 1.04%, 0.99%, 0.93%, 1.01% and 1.05% for the periods October 31, 2010, 2009, 2008, 2007 and 2006, respectively. |
† | | The financial statements are prepared to conform to U.S. generally accepted accounting principles. As a result, the NAVs for certain funds reported in the financial statements may differ from the NAV used to process shareholder transactions. The reported NAV for shareholder transaction activity for International Equity Fund II Class I shares was $10.23. |
See Notes to Financial Statements
| | |
| Artio Global Funds ï 2010 Annual Report | 195 |
FINANCIAL HIGHLIGHTS
Artio Total Return Bond Fund
For a share outstanding throughout each period
| | | | | | | | | | | | | | | | | | | | | | | |
| | | Class A |
| | | Year Ended October 31, |
| | | 2010 | | 2009 | | 2008 | | 2007 | | 2006 | | |
Net Asset Value, beginning of year | | | $13.51 | | | | $12.21 | | | | $13.41 | | | | $13.08 | | | | $13.33 | | | |
| | | | | | | | | | | | | | | | | | | | | | | |
Income (loss) from investment operations: | | | | | | | | | | | | | | | | | | | | | | |
| Net investment income (1) | | | 0.52 | | | | 0.51 | | | | 0.57 | | | | 0.57 | | | | 0.56 | | | |
| Net realized and unrealized gain (loss) on investments | | | 0.69 | | | | 1.54 | | | | (1.07 | ) | | | 0.29 | | | | 0.07 | | | |
| | | | | | | | | | | | | | | | | | | | | | | |
Total income (loss) from investment operations | | | 1.21 | | | | 2.05 | | | | (0.50 | ) | | | 0.86 | | | | 0.63 | | | |
| | | | | | | | | | | | | | | | | | | | | | | |
Less distributions: | | | | | | | | | | | | | | | | | | | | | | |
| From net investment income | | | (0.48 | ) | | | (0.62 | ) | | | (0.70 | ) | | | (0.53 | ) | | | (0.77 | ) | | |
| From net realized gains on investments | | | — | | | | (0.13 | ) | | | — | | | | — | | | | (0.11 | ) | | |
| | | | | | | | | | | | | | | | | | | | | | | |
Total Distributions | | | (0.48 | ) | | | (0.75 | ) | | | (0.70 | ) | | | (0.53 | ) | | | (0.88 | ) | | |
| | | | | | | | | | | | | | | | | | | | | | | |
Net Asset Value, end of year | | | $14.24 | | | | $13.51 | | | | $12.21 | | | | $13.41 | | | | $13.08 | | | |
| | | | | | | | | | | | | | | | | | | | | | | |
Total Return | | | 9.16 | % | | | 17.27 | % | | | (4.01 | )% | | | 6.75 | % | | | 4.98 | % | | |
| | | | | | | | | | | | | | | | | | | | | | | |
Ratios/Supplemental Data: | | | | | | | | | | | | | | | | | | | | | | |
Net Assets, end of year (in 000’s) | | | $319,782 | | | | $331,224 | | | | $302,869 | | | | $148,603 | | | | $103,732 | | | |
| | | | | | | | | | | | | | | | | | | | | | | |
| Ratio of net investment income to average net assets | | | 3.77 | % | | | 3.98 | % | | | 4.27 | % | | | 4.34 | % | | | 4.32 | % | | |
| Ratio of net expenses to average net assets (2) | | | 0.69 | % | | | 0.69 | % | | | 0.69 | % | | | 0.69 | % | | | 0.69 | % | | |
| Ratio of net expenses to average net assets (3) | | | 0.69 | % | | | 0.69 | % | | | 0.69 | % | | | 0.69 | % | | | 0.69 | % | | |
| | | | | | | | | | | | | | | | | | | | | | | |
Portfolio turnover rate(4) | | | 193 | % | | | 289 | % | | | 341 | % | | | 433 | % | | | 411 | % | | |
| | | | | | | | | | | | | | | | | | | | | | | |
| | | |
(1) | | Based on average shares outstanding during the period. |
(2) | | Expense ratio without taking into consideration any expense reductions related to custody offset arrangement. |
(3) | | The net expenses of the Fund reflect a recoupment or waiver of fees by the Fund’s investment advisor. Had such action not been taken, the operating expense ratios would have been 0.70%, 0.69%, 0.72%, 0.81% and 0.83% for the years ended October 31, 2010, 2009, 2008, 2007 and 2006, respectively. |
(4) | | The portfolio turnover rate not including TBA transactions was 164%, 159%, 238%, 220% and 174% for the periods ended October 31, 2010, 2009, 2008, 2007 and 2006, respectively. |
See Notes to Financial Statements
| | |
| 196 | Artio Global Funds ï 2010 Annual Report | |
FINANCIAL HIGHLIGHTS
Artio Total Return Bond Fund
For a share outstanding throughout each period
| | | | | | | | | | | | | | | | | | | | | | | |
| | | Class I |
| | | Year Ended October 31, |
| | | 2010 | | 2009 | | 2008 | | 2007 | | 2006 | | |
Net Asset Value, beginning of year | | | $13.47 | | | | $12.20 | | | | $13.43 | | | | $13.12 | | | | $13.38 | | | |
| | | | | | | | | | | | | | | | | | | | | | | |
Income (loss) from investment operations: | | | | | | | | | | | | | | | | | | | | | | |
| Net investment income (1) | | | 0.55 | | | | 0.54 | | | | 0.57 | | | | 0.61 | | | | 0.60 | | | |
| Net realized and unrealized gain (loss) on investments | | | 0.69 | | | | 1.53 | | | | (1.04 | ) | | | 0.29 | | | | 0.07 | | | |
| | | | | | | | | | | | | | | | | | | | | | | |
Total income (loss) from investment operations | | | 1.24 | | | | 2.07 | | | | (0.47 | ) | | | 0.90 | | | | 0.67 | | | |
| | | | | | | | | | | | | | | | | | | | | | | |
Less distributions: | | | | | | | | | | | | | | | | | | | | | | |
| From net investment income | | | (0.55 | ) | | | (0.67 | ) | | | (0.76 | ) | | | (0.59 | ) | | | (0.82 | ) | | |
| From net realized gains on investments | | | — | | | | (0.13 | ) | | | — | | | | — | | | | (0.11 | ) | | |
| | | | | | | | | | | | | | | | | | | | | | | |
Total Distributions | | | (0.55 | ) | | | (0.80 | ) | | | (0.76 | ) | | | (0.59 | ) | | | (0.93 | ) | | |
| | | | | | | | | | | | | | | | | | | | | | | |
Net Asset Value, end of year | | | $14.16 | | | | $13.47 | | | | $12.20 | | | | $13.43 | | | | $13.12 | | | |
| | | | | | | | | | | | | | | | | | | | | | | |
Total Return | | | 9.39 | % | | | 17.56 | % | | | (3.84 | )% | | | 7.13 | % | | | 5.25 | % | | |
| | | | | | | | | | | | | | | | | | | | | | | |
Ratios/Supplemental Data: | | | | | | | | | | | | | | | | | | | | | | |
Net Assets, end of year (in 000’s) | | | $1,305,839 | | | | $1,238,512 | | | | $963,045 | | | | $781,006 | | | | $399,187 | | | |
| | | | | | | | | | | | | | | | | | | | | | | |
| Ratio of investment income to average net assets | | | 4.01 | % | | | 4.26 | % | | | 4.27 | % | | | 4.61 | % | | | 4.64 | % | | |
| Ratio of net expenses to average net assets (2) | | | 0.44 | % | | | 0.43 | % | | | 0.44 | % | | | 0.44 | % | | | 0.44 | % | | |
| Ratio of net expenses to average net assets (3) | | | 0.44 | % | | | 0.44 | % | | | 0.44 | % | | | 0.44 | % | | | 0.44 | % | | |
| | | | | | | | | | | | | | | | | | | | | | | |
Portfolio turnover rate(4) | | | 193 | % | | | 289 | % | | | 341 | % | | | 433 | % | | | 411 | % | | |
| | | | | | | | | | | | | | | | | | | | | | | |
| | | |
(1) | | Based on average shares outstanding during the period. |
(2) | | Expense ratio without taking into consideration any expense reductions related to custody offset arrangement. |
(3) | | The net expenses of the Fund reflect a recoupment or waiver of fees by the Fund’s investment advisor. Had such action not been taken, the operating expense ratios would have been 0.44%, 0.43%, 0.46%, 0.54% and 0.56% for the years October 31, 2010, 2009, 2008, 2007 and 2006, respectively. |
(4) | | The portfolio turnover rate not including TBA transactions was 164%, 159%, 238%, 220% and 174% for the periods ended October 31, 2010, 2009, 2008, 2007 and 2006, respectively. |
See Notes to Financial Statements
| | |
| Artio Global Funds ï 2010 Annual Report | 197 |
FINANCIAL HIGHLIGHTS
Artio Global High Income Fund
For a share outstanding throughout each period
| | | | | | | | | | | | | | | | | | | | | | | |
| | | Class A |
| | | Year Ended October 31, |
| | | 2010 | | 2009 | | 2008 | | 2007 | | 2006 | | |
Net Asset Value, beginning of year | | | $10.28 | | | | $8.08 | | | | $11.05 | | | | $10.99 | | | | $11.93 | | | |
| | | | | | | | | | | | | | | | | | | | | | | |
Income (loss) from investment operations: | | | | | | | | | | | | | | | | | | | | | | |
| Net investment income (1) | | | 0.82 | | | | 0.71 | | | | 0.68 | | | | 0.76 | | | | 0.68 | | | |
| Net realized and unrealized gain (loss) on investments | | | 0.77 | | | | 2.42 | | | | (3.00 | ) | | | 0.15 | | | | 0.43 | | | |
| | | | | | | | | | | | | | | | | | | | | | | |
Total income (loss) from investment operations | | | 1.59 | | | | 3.13 | | | | (2.32 | ) | | | 0.91 | | | | 1.11 | | | |
| | | | | | | | | | | | | | | | | | | | | | | |
Less distributions: | | | | | | | | | | | | | | | | | | | | | | |
| From net investment income | | | (0.81 | ) | | | (0.78 | ) | | | (0.65 | ) | | | (0.68 | ) | | | (1.17 | ) | | |
| From net realized gains on investments | | | — | | | | — | | | | — | | | | (0.10 | ) | | | (0.88 | ) | | |
| Return of capital | | | — | | | | (0.15 | ) | | | — | | | | (0.07 | ) | | | — | | | |
| | | | | | | | | | | | | | | | | | | | | | | |
Total Distributions | | | (0.81 | ) | | | (0.93 | ) | | | (0.65 | ) | | | (0.85 | ) | | | (2.05 | ) | | |
| | | | | | | | | | | | | | | | | | | | | | | |
Net Asset Value, end of year | | | $11.06 | | | | $10.28 | | | | $8.08 | | | | $11.05 | | | | $10.99 | | | |
| | | | | | | | | | | | | | | | | | | | | | | |
Total Return | | | 16.08 | % | | | 42.71 | % | | | (22.12 | )% | | | 8.58 | % | | | 10.49 | % | | |
| | | | | | | | | | | | | | | | | | | | | | | |
Ratios/Supplemental Data: | | | | | | | | | | | | | | | | | | | | | | |
Net Assets, end of year (in 000’s) | | | $1,222,933 | | | | $715,541 | | | | $139,340 | | | | $94,348 | | | | $45,930 | | | |
| | | | | | | | | | | | | | | | | | | | | | | |
| Ratio of net investment income to average net assets | | | 7.70 | % | | | 7.83 | % | | | 6.67 | % | | | 6.89 | % | | | 6.16 | % | | |
| Ratio of net expenses to average net assets (2)(3) | | | 1.00 | % | | | 1.01 | % | | | 1.02 | % | | | 1.01 | % | | | 1.10 | % | | |
| Ratio of net expenses to average net assets (2)(4) | | | 1.00 | % | | | 1.00 | % | | | 1.00 | % | | | 1.00 | % | | | 1.08 | % | | |
| | | | | | | | | | | | | | | | | | | | | | | |
Portfolio turnover rate | | | 57 | % | | | 43 | % | | | 28 | % | | | 63 | % | | | 96 | % | | |
| | | | | | | | | | | | | | | | | | | | | | | |
| | | |
(1) | | Based on average shares outstanding during the period. |
(2) | | On March 1, 2006, the expense cap changed from 1.25% to 1.00%. |
(3) | | Expense ratio without taking into consideration any expense reductions related to custody offset arrangements and reimbursement of expense previously assumed by the Fund’s investment advisor. |
(4) | | The net expenses of the Fund reflect a recoupment or waiver of fees by the Fund’s investment advisor. Had such action not been taken, the operating expenses ratios would have been 1.00%, 1.01%, 1.08%, 1.20%, and 1.35% for the years ended October 31, 2010, 2009, 2008, 2007 and 2006, respectively. |
See Notes to Financial Statements
| | |
| 198 | Artio Global Funds ï 2010 Annual Report | |
FINANCIAL HIGHLIGHTS
Artio Global High Income Fund
For a share outstanding throughout each period
| | | | | | | | | | | | | | | | | | | | | | | |
| | | Class I |
| | | Year Ended October 31, |
| | | 2010 | | 2009 | | 2008 | | 2007 | | 2006 | | |
Net Asset Value, beginning of year | | | $9.90 | | | | $7.82 | | | | $10.71 | | | | $10.66 | | | | $11.61 | | | |
| | | | | | | | | | | | | | | | | | | | | | | |
Income (loss) from investment operations: | | | | | | | | | | | | | | | | | | | | | | |
| Net investment income (1) | | | 0.82 | | | | 0.70 | | | | 0.69 | | | | 0.77 | | | | 0.70 | | | |
| Net realized and unrealized gain (loss) on investments | | | 0.74 | | | | 2.33 | | | | (2.90 | ) | | | 0.14 | | | | 0.40 | | | |
| | | | | | | | | | | | | | | | | | | | | | | |
Total income (loss) from investment operations | | | 1.56 | | | | 3.03 | | | | (2.21 | ) | | | 0.91 | | | | 1.10 | | | |
| | | | | | | | | | | | | | | | | | | | | | | |
Less distributions: | | | | | | | | | | | | | | | | | | | | | | |
| From net investment income | | | (0.82 | ) | | | (0.79 | ) | | | (0.68 | ) | | | (0.68 | ) | | | (1.17 | ) | | |
| From net realized gains on investments | | | — | | | | — | | | | — | | | | (0.10 | ) | | | (0.88 | ) | | |
| Return of capital | | | — | | | | (0.16 | ) | | | — | | | | (0.08 | ) | | | — | | | |
| | | | | | | | | | | | | | | | | | | | | | | |
Total Distributions | | | (0.82 | ) | | | (0.95 | ) | | | (0.68 | ) | | | (0.86 | ) | | | (2.05 | ) | | |
| | | | | | | | | | | | | | | | | | | | | | | |
Net Asset Value, end of year | | | $10.64 | | | | $9.90 | | | | $7.82 | | | | $10.71 | | | | $10.66 | | | |
| | | | | | | | | | | | | | | | | | | | | | | |
Total Return | | | 16.39 | % | | | 42.99 | % | | | (21.84 | )% | | | 8.82 | % | | | 10.76 | % | | |
| | | | | | | | | | | | | | | | | | | | | | | |
Ratios/Supplemental Data: | | | | | | | | | | | | | | | | | | | | | | |
Net Assets, end of year (in 000’s) | | | $1,873,539 | | | | $934,054 | | | | $221,811 | | | | $152,769 | | | | $35,100 | | | |
| | | | | | | | | | | | | | | | | | | | | | | |
| Ratio of investment income to average net assets | | | 7.96 | % | | | 8.10 | % | | | 6.93 | % | | | 7.15 | % | | | 6.61 | % | | |
| Ratio of net expenses to average net assets (2)(3) | | | 0.75 | % | | | 0.76 | % | | | 0.77 | % | | | 0.76 | % | | | 0.81 | % | | |
| Ratio of net expenses to average net assets (2)(4) | | | 0.75 | % | | | 0.75 | % | | | 0.75 | % | | | 0.75 | % | | | 0.79 | % | | |
| | | | | | | | | | | | | | | | | | | | | | | |
Portfolio turnover rate | | | 57 | % | | | 43 | % | | | 28 | % | | | 63 | % | | | 96 | % | | |
| | | | | | | | | | | | | | | | | | | | | | | |
| | | |
(1) | | Based on average shares outstanding during the period. |
(2) | | On March 1, 2006, the expense cap changed from 1.00% to 0.75%. |
(3) | | Expense ratio without taking into consideration any expense reductions related to custody offset arrangements and reimbursement of expense previously assumed by the Fund’s investment advisor. |
(4) | | The net expenses of the Fund reflect a recoupment or waiver of fees by the Fund’s investment advisor. Had such an action not been taken, the operating expense ratios would have been 0.74%, 0.74%, 0.79%, 0.92% and 1.08% for the years ended October 31, 2010, 2009, 2008, 2007 and 2006, respectively. |
See Notes to Financial Statements
| | |
| Artio Global Funds ï 2010 Annual Report | 199 |
FINANCIAL HIGHLIGHTS
Artio U.S. Microcap Fund
For a share outstanding throughout each period
| | | | | | | | | | | | | | | | | | | | | | | |
| | | Class A |
| | | | | | | | | | | Period Ended
| | |
| | | Year Ended October 31, | | October 31,
| | |
| | | 2010 | | 2009 | | 2008 | | 2007 | | 2006 (1) | | |
Net Asset Value, beginning of period | | | $7.70 | | | | $6.04 | | | | $12.66 | | | | $11.26 | | | | $10.00 | | | |
| | | | | | | | | | | | | | | | | | | | | | | |
Income (loss) from investment operations: | | | | | | | | | | | | | | | | | | | | | | |
| Net investment loss (2) | | | (0.10 | ) | | | (0.06 | ) | | | (0.11 | ) | | | (0.11 | ) | | | (0.03 | ) | | |
| Net realized and unrealized gain (loss) on investments | | | 2.17 | | | | 1.72 | | | | (5.11 | ) | | | 1.51 | | | | 1.29 | | | |
| | | | | | | | | | | | | | | | | | | | | | | |
Total income (loss) from investment operations | | | 2.07 | | | | 1.66 | | | | (5.22 | ) | | | 1.40 | | | | 1.26 | | | |
| | | | | | | | | | | | | | | | | | | | | | | |
Less distributions: | | | | | | | | | | | | | | | | | | | | | | |
| From net realized gains on investments | | | — | | | | — | | | | (1.40 | ) | | | — | | | | — | | | |
| | | | | | | | | | | | | | | | | | | | | | | |
Total Distributions | | | — | | | | — | | | | (1.40 | ) | | | — | | | | — | | | |
| | | | | | | | | | | | | | | | | | | | | | | |
Net Asset Value, end of period | | | $9.77 | | | | $7.70 | | | | $6.04 | | | | $12.66 | | | | $11.26 | | | |
| | | | | | | | | | | | | | | | | | | | | | | |
Total Return | | | 26.88 | % | | | 27.48 | % | | | (45.85 | )%(4) | | | 12.43 | % | | | 12.60 | %(3) | | |
| | | | | | | | | | | | | | | | | | | | | | | |
Ratios/Supplemental Data: | | | | | | | | | | | | | | | | | | | | | | |
Net Assets, end of period (in 000’s) | | | $4,840 | | | | $3,236 | | | | $2,021 | | | | $3,781 | | | | $2,955 | | | |
| | | | | | | | | | | | | | | | | | | | | | | |
| Ratio of net investment loss to average net assets | | | (1.12 | )% | | | (0.92 | )% | | | (1.19 | )% | | | (0.90 | )% | | | (0.99 | )%(5) | | |
| Ratio of net expenses to average net assets (6) | | | 1.80 | %(7) | | | 1.80 | % | | | 1.80 | % | | | 1.80 | % | | | 1.80 | %(5) | | |
| | | | | | | | | | | | | | | | | | | | | | | |
Portfolio turnover rate | | | 137 | % | | | 276 | % | | | 215 | % | | | 172 | % | | | 19 | %(3) | | |
| | | | | | | | | | | | | | | | | | | | | | | |
| | | |
(1) | | Commenced operations on July 24, 2006. |
(2) | | Based on average shares outstanding during the period. |
(3) | | Not annualized. |
(4) | | The net effect to total return, for a reimbursement made by the investment adviser due to a transaction in error is 0.24%. |
(5) | | Annualized. |
(6) | | The net expenses of the Fund reflect a waiver of fees by the Fund’s investment advisor. Had such action not been taken, the operating expense ratio would have been 2.61%, 4.25%, 3.80%, 3.52% and 4.52% for the periods ended October 31, 2010, 2009, 2008, 2007 and 2006, respectively. |
(7) | | Includes interest expense that amounts to less than 0.01%. |
See Notes to Financial Statements
| | |
| 200 | Artio Global Funds ï 2010 Annual Report | |
FINANCIAL HIGHLIGHTS
Artio U.S. Microcap Fund
For a share outstanding throughout each period
| | | | | | | | | | | | | | | | | | | | | | | |
| | | Class I |
| | | | | | | | | | | Period Ended
| | |
| | | Year Ended October 31, | | October 31,
| | |
| | | 2010 | | 2009 | | 2008 | | 2007 | | 2006 (1) | | |
Net Asset Value, beginning of period | | | $7.75 | | | | $6.05 | | | | $12.71 | | | | $11.27 | | | | $10.00 | | | |
| | | | | | | | | | | | | | | | | | | | | | | |
Income (loss) from investment operations: | | | | | | | | | | | | | | | | | | | | | | |
| Net investment loss (2) | | | (0.08 | ) | | | (0.04 | ) | | | (0.08 | ) | | | (0.07 | ) | | | (0.02 | ) | | |
| Net realized and unrealized gain (loss) on investments | | | 2.18 | | | | 1.74 | | | | (5.12 | ) | | | 1.51 | | | | 1.29 | | | |
| | | | | | | | | | | | | | | | | | | | | | | |
Total income (loss) from investment operations | | | 2.10 | | | | 1.70 | | | | (5.20 | ) | | | 1.44 | | | | 1.27 | | | |
| | | | | | | | | | | | | | | | | | | | | | | |
Less distributions: | | | | | | | | | | | | | | | | | | | | | | |
| From net realized gains on investments | | | — | | | | — | | | | (1.46 | ) | | | — | | | | — | | | |
| | | | | | | | | | | | | | | | | | | | | | | |
Total Distributions | | | — | | | | — | | | | (1.46 | ) | | | — | | | | — | | | |
| | | | | | | | | | | | | | | | | | | | | | | |
Net Asset Value, end of period | | | $9.85 | | | | $7.75 | | | | $6.05 | | | | $12.71 | | | | $11.27 | | | |
| | | | | | | | | | | | | | | | | | | | | | | |
Total Return | | | 27.23 | % | | | 27.89 | % | | | (45.63 | )%(4) | | | 12.88 | % | | | 12.60 | %(3) | | |
| | | | | | | | | | | | | | | | | | | | | | | |
Ratios/Supplemental Data: | | | | | | | | | | | | | | | | | | | | | | |
Net Assets, end of period (in 000’s) | | | $6,186 | | | | $2,825 | | | | $2,046 | | | | $3,677 | | | | $2,816 | | | |
| | | | | | | | | | | | | | | | | | | | | | | |
| Ratio of net investment loss to average net assets | | | (0.88 | )% | | | (0.60 | )% | | | (0.89 | )% | | | (0.60 | )% | | | (0.69 | )%(5) | | |
| Ratio of net expenses to average net assets (6) | | | 1.50 | %(7) | | | 1.50 | % | | | 1.50 | % | | | 1.50 | % | | | 1.50 | %(5) | | |
| | | | | | | | | | | | | | | | | | | | | | | |
Portfolio turnover rate | | | 137 | % | | | 276 | % | | | 215 | % | | | 172 | % | | | 19 | %(3) | | |
| | | | | | | | | | | | | | | | | | | | | | | |
| | | |
(1) | | Commenced operations on July 24, 2006. |
(2) | | Based on average shares outstanding during the period. |
(3) | | Not annualized. |
(4) | | The net effect to total return, for a reimbursement made by the investment adviser due to a transaction in error is 0.24%. |
(5) | | Annualized. |
(6) | | The net expenses of the Fund reflect a waiver of fees by the Fund’s investment advisor. Had such action not been taken, the operating expense ratio would have been 2.39%, 3.60%, 3.32%, 3.08% and 4.03% for the periods ended October 31, 2010, 2009, 2008, 2007 and 2006, respectively. |
(7) | | Includes interest expense that amounts to less than 0.01%. |
See Notes to Financial Statements
| | |
| Artio Global Funds ï 2010 Annual Report | 201 |
FINANCIAL HIGHLIGHTS
Artio U.S. Smallcap Fund
For a share outstanding throughout each period
| | | | | | | | | | | | | | | | | | | | | | | |
| | | Class A |
| | | | | | | | | | | Period Ended
| | |
| | | Year Ended October 31, | | October 31,
| | |
| | | 2010 | | 2009 | | 2008 | | 2007 | | 2006 (1) | | |
Net Asset Value, beginning of period | | | $8.48 | | | | $6.32 | | | | $14.13 | | | | $11.10 | | | | $10.00 | | | |
| | | | | | | | | | | | | | | | | | | | | | | |
Income (loss) from investment operations: | | | | | | | | | | | | | | | | | | | | | | |
| Net investment loss (2) | | | (0.09 | ) | | | (0.04 | ) | | | (0.03 | ) | | | (0.10 | ) | | | (0.01 | ) | | |
| Net realized and unrealized gain (loss) on investments | | | 1.68 | | | | 2.20 | | | | (4.82 | ) | | | 3.31 | | | | 1.11 | | | |
| | | | | | | | | | | | | | | | | | | | | | | |
Total income (loss) from investment operations | | | 1.59 | | | | 2.16 | | | | (4.85 | ) | | | 3.21 | | | | 1.10 | | | |
| | | | | | | | | | | | | | | | | | | | | | | |
Less distributions: | | | | | | | | | | | | | | | | | | | | | | |
| From net realized gains on investments | | | — | | | | — | | | | (2.96 | ) | | | (0.18 | ) | | | — | | | |
| | | | | | | | | | | | | | | | | | | | | | | |
Total Distributions | | | — | | | | — | | | | (2.96 | ) | | | (0.18 | ) | | | — | | | |
| | | | | | | | | | | | | | | | | | | | | | | |
Net Asset Value, end of period | | | $10.07 | | | | $8.48 | | | | $6.32 | | | | $14.13 | | | | $11.10 | | | |
| | | | | | | | | | | | | | | | | | | | | | | |
Total Return | | | 18.87 | % | | | 34.18 | % | | | (41.89 | )% | | | 29.44 | % | | | 11.00 | %(3) | | |
| | | | | | | | | | | | | | | | | | | | | | | |
Ratios/Supplemental Data: | | | | | | | | | | | | | | | | | | | | | | |
Net Assets, end of period (in 000’s) | | | $27,024 | | | | $11,277 | | | | $2,743 | | | | $4,339 | | | | $2,807 | | | |
| | | | | | | | | | | | | | | | | | | | | | | |
| Ratio of net investment loss to average net assets | | | (0.94 | )% | | | (0.52 | )% | | | (0.31 | )% | | | (0.85 | )% | | | (0.29 | )%(4) | | |
| Ratio of net expenses to average net assets (5) | | | 1.50 | %(6) | | | 1.50 | % | | | 1.50 | % | | | 1.50 | % | | | 1.50 | %(4) | | |
| | | | | | | | | | | | | | | | | | | | | | | |
Portfolio turnover rate | | | 145 | % | | | 281 | % | | | 253 | % | | | 238 | % | | | 13 | %(3) | | |
| | | | | | | | | | | | | | | | | | | | | | | |
| | | |
(1) | | Commenced operations on July 24, 2006. |
(2) | | Based on average shares outstanding during the period. |
(3) | | Not annualized. |
(4) | | Annualized. |
(5) | | The net expenses of the Fund reflect a waiver of fees by the Fund’s investment advisor. Had such action not been taken, the annualized operating expense ratio would have been 1.54%, 2.88%, 3.21%, 2.97% and 4.22% for the periods ended October 31, 2010, 2009, 2008, 2007 and 2006, respectively. |
(6) | | Includes interest expense that amounts to less than 0.01%. |
See Notes to Financial Statements
| | |
| 202 | Artio Global Funds ï 2010 Annual Report | |
FINANCIAL HIGHLIGHTS
Artio U.S. Smallcap Fund
For a share outstanding throughout each period
| | | | | | | | | | | | | | | | | | | | | | | |
| | | Class I |
| | | | | | | | | | | Period Ended
| | |
| | | Year Ended October 31, | | October 31,
| | |
| | | 2010 | | 2009 | | 2008 | | 2007 | | 2006 (1) | | |
Net Asset Value, beginning of period | | | $8.52 | | | | $6.33 | | | | $14.18 | | | | $11.11 | | | | $10.00 | | | |
| | | | | | | | | | | | | | | | | | | | | | | |
Income (loss) from investment operations: | | | | | | | | | | | | | | | | | | | | | | |
| Net investment income (loss) (2) | | | (0.07 | ) | | | (0.01 | ) | | | — | (3) | | | (0.06 | ) | | | — | | | |
| Net realized and unrealized gain (loss) on investments | | | 1.70 | | | | 2.20 | | | | (4.84 | ) | | | 3.32 | | | | 1.11 | | | |
| | | | | | | | | | | | | | | | | | | | | | | |
Total income (loss) from investment operations | | | 1.63 | | | | 2.19 | | | | (4.84 | ) | | | 3.26 | | | | 1.11 | | | |
| | | | | | | | | | | | | | | | | | | | | | | |
Less distributions: | | | | | | | | | | | | | | | | | | | | | | |
| From net investment income | | | — | | | | — | | | | — | | | | (0.01 | ) | | | — | | | |
| From net realized gains on investments | | | — | | | | — | | | | (3.01 | ) | | | (0.18 | ) | | | — | | | |
| | | | | | | | | | | | | | | | | | | | | | | |
Total Distributions | | | — | | | | — | | | | (3.01 | ) | | | (0.19 | ) | | | — | | | |
| | | | | | | | | | | | | | | | | | | | | | | |
Net Asset Value, end of period | | | $10.15 | | | | $8.52 | | | | $6.33 | | | | $14.18 | | | | $11.11 | | | |
| | | | | | | | | | | | | | | | | | | | | | | |
Total Return | | | 19.25 | % | | | 34.60 | % | | | (41.70 | )% | | | 29.75 | % | | | 11.10 | %(4) | | |
| | | | | | | | | | | | | | | | | | | | | | | |
Ratios/Supplemental Data: | | | | | | | | | | | | | | | | | | | | | | |
Net Assets, end of period (in 000’s) | | | $56,201 | | | | $3,490 | | | | $2,450 | | | | $4,073 | | | | $2,777 | | | |
| | | | | | | | | | | | | | | | | | | | | | | |
| Ratio of net investment income (loss) to average net assets | | | (0.76 | )% | | | (0.12 | )% | | | (0.02 | )% | | | (0.52 | )% | | | 0.01 | %(5) | | |
| Ratio of net expenses to average net assets (6) | | | 1.20 | %(7) | | | 1.20 | % | | | 1.20 | % | | | 1.20 | % | | | 1.20 | %(5) | | |
| | | | | | | | | | | | | | | | | | | | | | | |
Portfolio turnover rate | | | 145 | % | | | 281 | % | | | 253 | % | | | 238 | % | | | 13 | %(4) | | |
| | | | | | | | | | | | | | | | | | | | | | | |
| | | |
(1) | | Commenced operations on July 24, 2006. |
(2) | | Based on average shares outstanding during the period. |
(3) | | Rounds to less than $0.01. |
(4) | | Not annualized. |
(5) | | Annualized. |
(6) | | The net expenses of the Fund reflect a waiver of fees by the Fund’s investment advisor. Had such action not been taken, the annualized operating expense ratio would have been 1.27%, 2.59%, 2.78%, 2.79% and 3.68% for the periods ended October 31, 2010, 2009, 2008, 2007 and 2006, respectively. |
(7) | | Includes interest expense that amounts to less than 0.01%. |
See Notes to Financial Statements
| | |
| Artio Global Funds ï 2010 Annual Report | 203 |
FINANCIAL HIGHLIGHTS
Artio U.S. Midcap Fund
For a share outstanding throughout each period
| | | | | | | | | �� | | | | | | | | | | | | | | |
| | | Class A |
| | | | | | | | | | | Period Ended
| | |
| | | Year Ended October 31, | | October 31,
| | |
| | | 2010 | | 2009 | | 2008 | | 2007 | | 2006 (1) | | |
Net Asset Value, beginning of period | | | $8.15 | | | | $6.81 | | | | $12.74 | | | | $11.05 | | | | $10.00 | | | |
| | | | | | | | | | | | | | | | | | | | | | | |
Income (loss) from investment operations: | | | | | | | | | | | | | | | | | | | | | | |
| Net investment income (loss) (2) | | | (0.02 | ) | | | 0.01 | | | | (0.01 | ) | | | 0.05 | | | | 0.01 | | | |
| Net realized and unrealized gain (loss) on investments | | | 2.07 | | | | 1.33 | | | | (4.94 | ) | | | 1.81 | | | | 1.04 | | | |
| | | | | | | | | | | | | | | | | | | | | | | |
Total income (loss) from investment operations | | | 2.05 | | | | 1.34 | | | | (4.95 | ) | | | 1.86 | | | | 1.05 | | | |
| | | | | | | | | | | | | | | | | | | | | | | |
Less distributions: | | | | | | | | | | | | | | | | | | | | | | |
| From net investment income | | | (0.01 | ) | | | — | | | | — | | | | (0.13 | ) | | | — | | | |
| From net realized gains on investments | | | — | | | | — | | | | (0.98 | ) | | | (0.04 | ) | | | — | | | |
| | | | | | | | | | | | | | | | | | | | | | | |
Total Distributions | | | (0.01 | ) | | | — | | | | (0.98 | ) | | | (0.17 | ) | | | — | | | |
| | | | | | | | | | | | | | | | | | | | | | | |
Net Asset Value, end of period | | | $10.19 | | | | $8.15 | | | | $6.81 | | | | $12.74 | | | | $11.05 | | | |
| | | | | | | | | | | | | | | | | | | | | | | |
Total Return | | | 25.13 | % | | | 19.68 | % | | | (41.91 | )% | | | 17.16 | % | | | 10.50 | %(3) | | |
| | | | | | | | | | | | | | | | | | | | | | | |
Ratios/Supplemental Data: | | | | | | | | | | | | | | | | | | | | | | |
Net Assets, end of period (in 000’s) | | | $3,209 | | | | $2,442 | | | | $2,096 | | | | $3,646 | | | | $2,887 | | | |
| | | | | | | | | | | | | | | | | | | | | | | |
| Ratio of net investment income (loss) to average net assets | | | (0.20 | )% | | | 0.19 | % | | | (0.08 | )% | | | 0.43 | % | | | 0.52 | %(4) | | |
| Ratio of net expenses to average net assets (5) | | | 1.35 | %(6) | | | 1.35 | % | | | 1.35 | % | | | 1.35 | % | | | 1.35 | %(4) | | |
| | | | | | | | | | | | | | | | | | | | | | | |
Portfolio turnover rate | | | 141 | % | | | 232 | % | | | 209 | % | | | 155 | % | | | 11 | %(3) | | |
| | | | | | | | | | | | | | | | | | | | | | | |
| | | |
(1) | | Commenced operations on July 24, 2006. |
(2) | | Based on average shares outstanding during the period. |
(3) | | Not annualized. |
(4) | | Annualized. |
(5) | | The net expenses of the Fund reflect a waiver of fees by the Fund’s investment advisor. Had such action not been taken, the annualized operating expense ratio would have been 2.74%, 3.71%, 3.10%, 2.98% and 3.94% for the periods ended October 31, 2010, 2009, 2008, 2007 and 2006, respectively. |
(6) | | Includes interest expense that amounts to less than 0.01%. |
See Notes to Financial Statements
| | |
| 204 | Artio Global Funds ï 2010 Annual Report | |
FINANCIAL HIGHLIGHTS
Artio U.S. Midcap Fund
For a share outstanding throughout each period
| | | | | | | | | | | | | | | | | | | | | | | |
| | | Class I |
| | | | | | | | | | | Period Ended
| | |
| | | Year Ended October 31, | | October 31,
| | |
| | | 2010 | | 2009 | | 2008 | | 2007 | | 2006 (1) | | |
Net Asset Value, beginning of period | | | $8.18 | | | | $6.82 | | | | $12.76 | | | | $11.06 | | | | $10.00 | | | |
| | | | | | | | | | | | | | | | | | | | | | | |
Income (loss) from investment operations: | | | | | | | | | | | | | | | | | | | | | | |
| Net investment income (2) | | | 0.01 | | | | 0.03 | | | | 0.02 | | | | 0.09 | | | | 0.01 | | | |
| Net realized and unrealized gain (loss) on investments | | | 2.09 | | | | 1.33 | | | | (4.94 | ) | | | 1.80 | | | | 1.05 | | | |
| | | | | | | | | | | | | | | | | | | | | | | |
Total income (loss) from investment operations | | | 2.10 | | | | 1.36 | | | | (4.92 | ) | | | 1.89 | | | | 1.06 | | | |
| | | | | | | | | | | | | | | | | | | | | | | |
Less distributions: | | | | | | | | | | | | | | | | | | | | | | |
| From net investment income | | | (0.03 | ) | | | — | | | | — | | | | (0.15 | ) | | | — | | | |
| From net realized gains on investments | | | — | | | | — | | | | (0.98 | ) | | | (0.04 | ) | | | — | | | |
| Return of capital | | | — | | | | — | | | | (0.04 | ) | | | — | | | | — | | | |
| | | | | | | | | | | | | | | | | | | | | | | |
Total Distributions | | | (0.03 | ) | | | — | | | | (1.02 | ) | | | (0.19 | ) | | | — | | | |
| | | | | | | | | | | | | | | | | | | | | | | |
Net Asset Value, end of period | | | $10.25 | | | | $8.18 | | | | $6.82 | | | | $12.76 | | | | $11.06 | | | |
| | | | | | | | | | | | | | | | | | | | | | | |
Total Return | | | 25.68 | % | | | 19.94 | % | | | (41.72 | )% | | | 17.47 | % | | | 10.60 | %(3) | | |
| | | | | | | | | | | | | | | | | | | | | | | |
Ratios/Supplemental Data: | | | | | | | | | | | | | | | | | | | | | | |
Net Assets, end of period (in 000’s) | | | $3,142 | | | | $2,495 | | | | $2,226 | | | | $3,842 | | | | $2,765 | | | |
| | | | | | | | | | | | | | | | | | | | | | | |
| Ratio of investment income to average net assets | | | 0.10 | % | | | 0.49 | % | | | 0.22 | % | | | 0.77 | % | | | 0.22 | %(4) | | |
| Ratio of net expenses to average net assets (5) | | | 1.05 | %(6) | | | 1.05 | % | | | 1.05 | % | | | 1.05 | % | | | 1.05 | %(4) | | |
| | | | | | | | | | | | | | | | | | | | | | | |
Portfolio turnover rate | | | 141 | % | | | 232 | % | | | 209 | % | | | 155 | % | | | 11 | %(3) | | |
| | | | | | | | | | | | | | | | | | | | | | | |
| | | |
(1) | | Commenced operations on July 24, 2006. |
(2) | | Based on average shares outstanding during the period. |
(3) | | Not annualized. |
(4) | | Annualized. |
(5) | | The net expenses of the Fund reflect a waiver of fees by the Fund’s investment advisor. Had such action not been taken, the annualized operating expense ratio would have been 2.59%, 3.01%, 2.62%, 2.51% and 3.46% for the periods ended October 31, 2010, 2009, 2008, 2007 and 2006, respectively. |
(6) | | Includes interest expense that amounts to less than 0.01%. |
See Notes to Financial Statements
| | |
| Artio Global Funds ï 2010 Annual Report | 205 |
FINANCIAL HIGHLIGHTS
Artio U.S. Multicap Fund
For a share outstanding throughout each period
| | | | | | | | | | | | | | | | | | | | | | | |
| | | Class A |
| | | | | | | | | | | Period Ended
| | |
| | | Year Ended October 31, | | October 31,
| | |
| | | 2010 | | 2009 | | 2008 | | 2007 | | 2006 (1) | | |
Net Asset Value, beginning of period | | | $8.44 | | | | $6.93 | | | | $12.84 | | | | $11.10 | | | | $10.00 | | | |
| | | | | | | | | | | | | | | | | | | | | | | |
Income (loss) from investment operations: | | | | | | | | | | | | | | | | | | | | | | |
| Net investment income (loss) (2) | | | (0.01 | ) | | | 0.03 | | | | (0.02 | ) | | | 0.07 | | | | — | (3) | | |
| Net realized and unrealized gain (loss) on investments | | | 1.65 | | | | 1.48 | | | | (4.75 | ) | | | 1.85 | | | | 1.10 | | | |
| | | | | | | | | | | | | | | | | | | | | | | |
Total income (loss) from investment operations | | | 1.64 | | | | 1.51 | | | | (4.77 | ) | | | 1.92 | | | | 1.10 | | | |
| | | | | | | | | | | | | | | | | | | | | | | |
Less distributions: | | | | | | | | | | | | | | | | | | | | | | |
| From net investment income | | | (0.03 | ) | | | — | | | | — | | | | (0.13 | ) | | | — | | | |
| From net realized gains on investments | | | — | | | | — | | | | (1.14 | ) | | | (0.05 | ) | | | — | | | |
| | | | | | | | | | | | | | | | | | | | | | | |
Total Distributions | | | (0.03 | ) | | | — | | | | (1.14 | ) | | | (0.18 | ) | | | — | | | |
| | | | | | | | | | | | | | | | | | | | | | | |
Net Asset Value, end of period | | | $10.05 | | | | $8.44 | | | | $6.93 | | | | $12.84 | | | | $11.10 | | | |
| | | | | | | | | | | | | | | | | | | | | | | |
Total Return | | | 19.43 | % | | | 21.79 | % | | | (40.40 | )% | | | 17.47 | % | | | 11.00 | %(4) | | |
| | | | | | | | | | | | | | | | | | | | | | | |
Ratios/Supplemental Data: | | | | | | | | | | | | | | | | | | | | | | |
Net Assets, end of period (in 000’s) | | | $3,001 | | | | $2,525 | | | | $2,048 | | | | $3,620 | | | | $2,780 | | | |
| | | | | | | | | | | | | | | | | | | | | | | |
| Ratio of net investment income (loss) to average net assets | | | (0.15 | )% | | | 0.46 | % | | | (0.21 | )% | | | 0.58 | % | | | (0.03 | )%(5) | | |
| Ratio of net expenses to average net assets (6) | | | 1.30 | % | | | 1.30 | % | | | 1.30 | % | | | 1.30 | % | | | 1.30 | %(5) | | |
| | | | | | | | | | | | | | | | | | | | | | | |
Portfolio turnover rate | | | 93 | % | | | 240 | % | | | 214 | % | | | 152 | % | | | 15 | %(4) | | |
| | | | | | | | | | | | | | | | | | | | | | | |
| | | |
(1) | | Commenced operations on July 24, 2006. |
(2) | | Based on average shares outstanding during the period. |
(3) | | Amount was less than $0.01 per share. |
(4) | | Not annualized. |
(5) | | Annualized. |
(6) | | The net expenses of the Fund reflect a waiver of fees by the Fund’s investment advisor. Had such action not been taken, the annualized operating expense ratio would have been 2.31%, 3.63%, 3.14%, 2.93% and 3.87% for the periods ended October 31, 2010, 2009, 2008, 2007 and 2006, respectively. |
See Notes to Financial Statements
| | |
| 206 | Artio Global Funds ï 2010 Annual Report | |
FINANCIAL HIGHLIGHTS
Artio U.S. Multicap Fund
For a share outstanding throughout each period
| | | | | | | | | | | | | | | | | | | | | | | |
| | | Class I |
| | | | | | | | | | | Period Ended
| | |
| | | Year Ended October 31, | | October 31,
| | |
| | | 2010 | | 2009 | | 2008 | | 2007 | | 2006 (1) | | |
Net Asset Value, beginning of period | | | $8.48 | | | | $6.94 | | | | $12.86 | | | | $11.11 | | | | $10.00 | | | |
| | | | | | | | | | | | | | | | | | | | | | | |
Income (loss) from investment operations: | | | | | | | | | | | | | | | | | | | | | | |
| Net investment income (2) | | | 0.01 | | | | 0.05 | | | | 0.01 | | | | 0.12 | | | | 0.01 | | | |
| Net realized and unrealized gain (loss) on investments | | | 1.67 | | | | 1.49 | | | | (4.76 | ) | | | 1.84 | | | | 1.10 | | | |
| | | | | | | | | | | | | | | | | | | | | | | |
Total income (loss) from investment operations | | | 1.68 | | | | 1.54 | | | | (4.75 | ) | | | 1.96 | | | | 1.11 | | | |
| | | | | | | | | | | | | | | | | | | | | | | |
Less distributions: | | | | | | | | | | | | | | | | | | | | | | |
| From net investment income | | | (0.05 | ) | | | — | (3) | | | (0.03 | ) | | | (0.16 | ) | | | — | | | |
| From net realized gains on investments | | | — | | | | — | | | | (1.14 | ) | | | (0.05 | ) | | | — | | | |
| | | | | | | | | | | | | | | | | | | | | | | |
Total Distributions | | | (0.05 | ) | | | — | (3) | | | (1.17 | ) | | | (0.21 | ) | | | — | | | |
| | | | | | | | | | | | | | | | | | | | | | | |
Net Asset Value, end of period | | | $10.11 | | | | $8.48 | | | | $6.94 | | | | $12.86 | | | | $11.11 | | | |
| | | | | | | | | | | | | | | | | | | | | | | |
Total Return | | | 19.85 | % | | | 22.24 | % | | | (40.26 | )% | | | 17.79 | % | | | 11.10 | %(4) | | |
| | | | | | | | | | | | | | | | | | | | | | | |
Ratios/Supplemental Data: | | | | | | | | | | | | | | | | | | | | | | |
Net Assets, end of period (in 000’s) | | | $5,354 | | | | $2,513 | | | | $2,328 | | | | $3,947 | | | | $2,778 | | | |
| | | | | | | | | | | | | | | | | | | | | | | |
| Ratio of investment income to average net assets | | | 0.12 | % | | | 0.76 | % | | | 0.09 | % | | | 0.99 | % | | | 0.27 | %(5) | | |
| Ratio of net expenses to average net assets (6) | | | 1.00 | % | | | 1.00 | % | | | 1.00 | % | | | 1.00 | % | | | 1.00 | %(5) | | |
| | | | | | | | | | | | | | | | | | | | | | | |
Portfolio turnover rate | | | 93 | % | | | 240 | % | | | 214 | % | | | 152 | % | | | 15 | %(4) | | |
| | | | | | | | | | | | | | | | | | | | | | | |
| | | |
(1) | | Commenced operations on July 24, 2006. |
(2) | | Based on average shares outstanding during the period. |
(3) | | Amount was less than $0.01 per share. |
(4) | | Not annualized. |
(5) | | Annualized. |
(6) | | The net expenses of the Fund reflect a waiver of fees by the Fund’s investment advisor. Had such action not been taken, the annualized operating expense ratio would have been 2.10%, 2.97%, 2.63%, 2.42% and 3.33% for the periods ended October 31, 2010, 2009, 2008, 2007 and 2006, respectively. |
See Notes to Financial Statements
| | |
| Artio Global Funds ï 2010 Annual Report | 207 |
NOTES TO FINANCIAL STATEMENTS
The Artio Global Funds consist of the Artio Global Equity Fund Inc. (“Global Equity Fund”) and the Artio Global Investment Funds (the “Trust”). As of October 31, 2010, the Artio Global Funds are comprised of nine funds (each a “Fund” and together, the “Funds”).
The Global Equity Fund was incorporated under the laws of the State of Maryland on May 23, 1990 and is registered with the Securities and Exchange Commission (“SEC”) under the Investment Company Act of 1940, as amended (the “1940 Act”) as a diversified, open-end management investment company.
The Trust is organized as a Massachusetts business trust and is registered with the SEC under the 1940 Act, as an open-end management investment company. As of October 31, 2010, the Trust offered eight diversified investment funds: Artio International Equity Fund (the “International Equity Fund”), Artio International Equity Fund II (the “International Equity Fund II”), Artio Total Return Bond Fund (the “Total Return Bond Fund”), Artio Global High Income Fund (the “Global High Income Fund”), Artio U.S. Microcap Fund (the “U.S. Microcap Fund”), Artio U.S. Smallcap Fund (the “U.S. Smallcap Fund”), Artio U.S. Midcap Fund (the “U.S. Midcap Fund”) and Artio U.S. Multicap Fund (the “U.S. Multicap Fund”).
The International Equity Fund is closed to new shareholders (at the account level). This excludes 401(k) plans that have existing investments in the Fund through related 401(k) plans and new plan participants within 401(k) plans that hold positions in the Fund. In addition, existing shareholders may continue to invest.
Each of the Artio Global Funds offers multiple share classes. As of October 31, 2010, all of the Funds offered Class A and Class I shares. The classes of shares are offered to different types of investors and have different expense structures, as outlined in the Funds’ Prospectuses. Each class of shares has exclusive voting rights with respect to matters that affect that class. Income, realized gains and losses, unrealized appreciation and depreciation, and expenses that are not attributable to a specific class are allocated daily to each class based on its relative net assets. Expenses directly attributable to a Fund are charged to that Fund. Other expenses are allocated to the respective Fund based on average daily net assets.
| | |
| 208 | Artio Global Funds ï 2010 Annual Report | |
NOTES TO FINANCIAL STATEMENTS (Continued)
Each Fund has distinct investment objectives. Following are the objectives for the Funds:
| | | | | |
| Fund | | Investment Objective | | |
| Global Equity Fund | | Seeks to maximize total return, principally through capital appreciation. | | |
| International Equity Fund | | Seeks long term growth of capital. | | |
| International Equity Fund II | | Seeks long term growth of capital. | | |
| Total Return Bond Fund | | Seeks to provide total return, which consists of two components: (1) changes in the market value of the Fund’s portfolio securities (both realized and unrealized appreciation/depreciation) and (2) income received from its portfolio securities. | | |
| Global High Income Fund | | Seeks to maximize total return, principally through a high level of current income, and secondarily through capital appreciation. | | |
| U.S. Microcap Fund | | Seeks long term growth of capital. | | |
| U.S. Smallcap Fund | | Seeks long term growth of capital. | | |
| U.S. Midcap Fund | | Seeks long term growth of capital. | | |
| U.S. Multicap Fund | | Seeks long term growth of capital. | | |
| | | | | |
| |
| 2. | Significant Accounting Policies |
The following is a summary of significant accounting policies consistently followed by the Funds in the preparation of their financial statements. The presentation of financial statements in conformity with U.S. generally accepted accounting principles requires management to make estimates and assumptions that affect the reported amounts of assets and liabilities and disclosure of contingent assets and liabilities at the date of the financial statements and the reported amounts of revenue and expenses during the reporting period. Actual results could differ from these estimates.
a) Portfolio valuation: Each Fund’s assets for which market quotations are readily available are valued at fair value on the basis of quotations furnished by a pricing service or provided by securities dealers. Equity investments are generally valued using the last sale price or official closing price taken from the primary market in which each security trades, or if no sales occurred during the day, at the mean of the current quoted bid and asked prices. Fixed income securities are generally valued using prices provided directly by independent third party services or provided directly from one or more broker dealers or market makers, each in accordance with valuation procedures (“Valuation Procedures”) approved by the Global Equity Fund Board of Director’s, and the Trusts’ Board of Trustees (each a “Board” and collectively, “the Boards”), as applicable.
| | |
| Artio Global Funds ï 2010 Annual Report | 209 |
NOTES TO FINANCIAL STATEMENTS (Continued)
The pricing services may use valuation models or matrix pricing, which considers yield or prices with respect to comparable bond quotations from bond dealers or by reference to other securities that are considered comparable in such characteristics as rating, interest rate and maturity date, to determine current value. Assets and liabilities initially expressed in foreign currency will be converted into U.S. dollar values. Short-term dollar-denominated investments of appropriate credit quality that mature in 60 days or less are valued on the basis of amortized cost. To the extent each Fund invests in other open-end funds, the Fund will calculate its NAV based upon the NAV of the underlying funds in which it invests. The prospectues of these underlying funds explain the circumstances under which they will use fair value pricing and the effects of such fair value pricing.
When market quotations or exchange rates are not readily available, or if the Adviser believes that such market quotations do not accurately reflect fair value, the fair value of a Fund’s assets are determined in good faith in accordance with the Valuation Procedures. For options, swaps and warrants, a fair value price may be detemined using an industry accepted modeling tool using inputs, which may include yield data, risk free rate, volatility, contract terms, and others, as applicable. In addition, the Adviser, through its pricing committee may determine the fair value price based upon multiple factors as set forth in the Valuation Procedures approved by the Boards. These inputs may include prices of similar securities, yield data, the financial condition of the issuer, and other factors, as applicable. The adviser will use both a market and income approach. The closing prices of domestic or foreign securities may not reflect their market values at the time the Funds calculate their respective NAVs if an event that materially affects the value of those securities has occurred since the closing prices were established on the domestic or foreign exchange market, but before the Funds’ NAV calculations. Under certain conditions, the Boards have approved an independent pricing service to fair value foreign securities. This is generally accomplished by adjusting the closing price for movements in correlated indices, securities or derivatives. Fair value pricing may cause the value of the security on the books of the Funds to be different from the closing value on the non-U.S. exchange and may affect the calculation of a Funds’ NAV. Certain Funds may fair value securities in other situations, for example, when a particular foreign market is closed but the Funds are open.
Fair value is defined as the price that the Funds would receive upon selling an investment in a timely transaction to an independent buyer in the principal or most advantageous market for the investment. Fair value measurements are determined within a framework that has established a three-tier hierarchy to maximize the use of observable market data and minimize the use of unobservable inputs and to establish
| | |
| 210 | Artio Global Funds ï 2010 Annual Report | |
NOTES TO FINANCIAL STATEMENTS (Continued)
classification of fair value measurements for disclosure purposes. Inputs refer broadly to the assumptions that market participants would use in pricing the asset or liability, including assumptions about risk, for example, the risk inherent in a particular valuation technique used to measure fair value including such a pricing model and/or the risk inherent in the inputs to the valuation technique. Inputs may be observable or unobservable. Observable inputs are inputs that reflect the assumptions market participants would use in pricing the assets or liabilities developed based on market data obtained from sources independent of the reporting entity. Unobservable inputs are inputs that reflect the reporting entity’s own assumptions about the assumptions participants would use in pricing the asset or liability developed based on the best information available in the circumstances. The three-tier hierarchy of inputs is summarized in the three broad levels listed below.
Level 1 — Quoted prices in active markets for identical investments
Level 2 — Other significant observable inputs (including quoted prices for similar investments, interest rates, prepayment speeds, credit risk, etc.)
Level 3 — Significant unobservable inputs (including the Funds’ own assumptions in determining the fair value of investments)
The Funds will fair value foreign securities when the advisor does not believe that the closing prices are reflective of fair value due to significant events that occurred subsequent to the close of the foreign markets but before the Funds’ NAV calculations. When securities are fair valued under this method, they will be classified as Level 2 resulting in significant transfers between Level 1 and Level 2. The number of days on which fair value prices will be used depends on market activity. It is possible that fair value prices will be used by the Funds to a significant extent. Foreign securities in the Global Equity Fund, International Equity Fund and International Equity Fund II were fair valued under this method at October 31, 2009. Securities were not fair valued using this method at October 31, 2010, resulting in significant transfers from Level 2 to Level 1 in the fair value hierarchies.
The following is a summary of the inputs used as of October 31, 2010 in valuing the Funds’ investments:
| | |
| Artio Global Funds ï 2010 Annual Report | 211 |
NOTES TO FINANCIAL STATEMENTS (Continued)
Global Equity Fund Inc.
Assets Valuation Input
| | | | | | | | | | | | | | | | | | | | | | | |
| | | Quoted Prices
| | | | | | | | | | |
| | | in Active
| | Significant
| | | | | | | | |
| | | Markets for
| | Other
| | Significant
| | | | | | |
| | | Identical
| | Observable
| | Unobservable
| | | | | | |
| | | Assets
| | Inputs
| | Inputs
| | | | | | |
| Description | | (Level 1) | | (Level 2) | | (Level 3) | | Total | | | | |
| COMMON STOCKS | | | | | | | | | | | | | | | | | | | | | | |
| United States | | $ | 28,137,483 | | | $ | — | | | $ | — | | | $ | 28,137,483 | | | | | | | |
| China | | | 6,220,939 | | | | — | | | | — | | | | 6,220,939 | | | | | | | |
| United Kingdom | | | 5,424,835 | | | | 4,098 | | | | — | | | | 5,428,933 | | | | | | | |
| France | | | 3,553,544 | | | | — | | | | — | | | | 3,553,544 | | | | | | | |
| Japan | | | 3,082,383 | | | | — | | | | — | | | | 3,082,383 | | | | | | | |
| Canada | | | 2,909,308 | | | | — | | | | — | | | | 2,909,308 | | | | | | | |
| Russia | | | 2,870,848 | | | | — | | | | — | | | | 2,870,848 | | | | | | | |
| Hong Kong | | | 2,591,899 | | | | — | | | | — | | | | 2,591,899 | | | | | | | |
| Switzerland | | | 2,392,051 | | | | — | | | | — | | | | 2,392,051 | | | | | | | |
| Germany | | | 2,383,492 | | | | — | | | | — | | | | 2,383,492 | | | | | | | |
| South Africa | | | 1,624,409 | | | | — | | | | — | | | | 1,624,409 | | | | | | | |
| Brazil | | | 1,560,076 | | | | — | | | | — | | | | 1,560,076 | | | | | | | |
| Denmark | | | 1,273,596 | | | | — | | | | — | | | | 1,273,596 | | | | | | | |
| Australia | | | 1,252,458 | | | | — | | | | — | | | | 1,252,458 | | | | | | | |
| Netherlands | | | 1,010,322 | | | | — | | | | — | | | | 1,010,322 | | | | | | | |
| South Korea | | | 764,452 | | | | — | | | | — | | | | 764,452 | | | | | | | |
| India | | | 580,941 | | | | — | | | | — | | | | 580,941 | | | | | | | |
| Sweden | | | 570,070 | | | | — | | | | — | | | | 570,070 | | | | | | | |
| Israel | | | 531,975 | | | | — | | | | — | | | | 531,975 | | | | | | | |
| Austria | | | 386,288 | | | | — | | | | — | | | | 386,288 | | | | | | | |
| Singapore | | | 309,577 | | | | — | | | | — | | | | 309,577 | | | | | | | |
| Mexico | | | 255,741 | | | | — | | | | — | | | | 255,741 | | | | | | | |
| Indonesia | | | 242,031 | | | | — | | | | — | | | | 242,031 | | | | | | | |
| Greece | | | 221,811 | | | | — | | | | — | | | | 221,811 | | | | | | | |
| Czech Republic | | | 209,211 | | | | — | | | | — | | | | 209,211 | | | | | | | |
| | | | | | | | | | | | | | | | | | | | | | | |
| TOTAL COMMON STOCKS | | | 70,359,740 | | | | 4,098 | | | | — | | | | 70,363,838 | | | | | | | |
| | | | | | | | | | | | | | | | | | | | | | | |
| EQUITY LINKED NOTES | | | | | | | | | | | | | | | | | | | | | | |
| India | | | — | | | | 3,071,369 | | | | — | | | | 3,071,369 | | | | | | | |
| Taiwan | | | — | | | | 903,106 | | | | — | | | | 903,106 | | | | | | | |
| | | | | | | | | | | | | | | | | | | | | | | |
| TOTAL EQUITY LINKED NOTES | | | — | | | | 3,974,475 | | | | — | | | | 3,974,475 | | | | | | | |
| | | | | | | | | | | | | | | | | | | | | | | |
| PREFERRED STOCKS | | | | | | | | | | | | | | | | | | | | | | |
| Philippines | | | — | | | | — | | | | 132 | | | | 132 | | | | | | | |
| | | | | | | | | | | | | | | | | | | | | | | |
| REPURCHASE AGREEMENT | | | | | | | | | | | | | | | | | | | | | | |
| United States | | | — | | | | 748,296 | | | | — | | | | 748,296 | | | | | | | |
| | | | | | | | | | | | | | | | | | | | | | | |
| TOTAL INVESTMENTS | | | 70,359,740 | | | | 4,726,869 | | | | 132 | | | | 75,086,741 | | | | | | | |
| | | | | | | | | | | | | | | | | | | | | | | |
| | |
| 212 | Artio Global Funds ï 2010 Annual Report | |
NOTES TO FINANCIAL STATEMENTS (Continued)
| | | | | | | | | | | | | | | | | | | | | | | |
| | | Quoted Prices
| | | | | | | | | | |
| | | in Active
| | Significant
| | | | | | | | |
| | | Markets for
| | Other
| | Significant
| | | | | | |
| | | Identical
| | Observable
| | Unobservable
| | | | | | |
| | | Assets
| | Inputs
| | Inputs
| | | | | | |
| Description | | (Level 1) | | (Level 2) | | (Level 3) | | Total | | | | |
| FORWARD FOREIGN EXCHANGE CONTRACTS | | $ | — | | | $ | 193,224 | | | $ | — | | | $ | 193,224 | | | | | | | |
| | | | | | | | | | | | | | | | | | | | | | | |
| TOTAL | | $ | 70,359,740 | | | $ | 4,920,093 | | | $ | 132 | | | $ | 75,279,965 | | | | | | | |
| | | | | | | | | | | | | | | | | | | | | | | |
Liabilities Valuation Input
| | | | | | | | | | | | | | | | | | | | | | | |
| | | Quoted Prices
| | | | | | | | | | |
| | | in Active
| | Significant
| | | | | | | | |
| | | Markets for
| | Other
| | Significant
| | | | | | |
| | | Identical
| | Observable
| | Unobservable
| | | | | | |
| | | Assets
| | Inputs
| | Inputs
| | | | | | |
| Description | | (Level 1) | | (Level 2) | | (Level 3) | | Total | | | | |
| FORWARD FOREIGN EXCHANGE CONTRACTS | | $ | — | | | $ | (245,132 | ) | | $ | — | | | $ | (245,132 | ) | | | | | | |
| | | | | | | | | | | | | | | | | | | | | | | |
| TOTAL | | $ | — | | | $ | (245,132 | ) | | $ | — | | | $ | (245,132 | ) | | | | | | |
| | | | | | | | | | | | | | | | | | | | | | | |
| | |
| Artio Global Funds ï 2010 Annual Report | 213 |
NOTES TO FINANCIAL STATEMENTS (Continued)
Global Equity Fund
Summary Fair Value Level 3 Rollforward Report
Reporting Period: 10/31/2009—10/31/2010
Transfer In—Beginning of Period / Transfer Out—End of Period
Asset Valuation Inputs
| | | | | | | | | | | | | | | | | | | | | | | | | | | | | | | | | | | | | | | | | | | | | | | |
| | | | | | | | | | | | | | | | | | | | | Change in
| | | | |
| | | | | | | | | | | | | | | | | | | | | Unrealized
| | | | |
| | | | | | | | | | | | | | | | | | | | | Appreciation
| | | | |
| | | | | | | | | Change in
| | | | | | | | | | | | (Depreciation)
| | | | |
| | | Balance as of
| | Accrued
| | | | Unrealized
| | | | | | | | | | | | from Investments
| | | | |
Investments in
| | October 31,
| | Discounts
| | Realized Gain
| | Appreciation
| | | | | | Net Transfers
| | Net Transfers
| | Balance as of
| | Held at
| | | | |
| Securities | | 2009 | | (Premiums) | | (Loss) | | (Depreciation) | | Net Purchases | | Net Sales | | into Level 3 | | out of Level 3 | | October 31, 2010 | | October 31, 2010 | | | | |
PREFERRED STOCKS | | | | | | | | | | | | | | | | | | | | | | | | | | | | | | | | | | | | | | | | | | | | | | |
Philippines | | $ | 119 | | | $ | — | | | $ | — | | | $ | 13 | | | $ | — | | | $ | — | | | $ | — | | | $ | — | | | $ | 132 | | | $ | 13 | | | | | | | |
| | | | | | | | | | | | | | | | | | | | | | | | | | | | | | | | | | | | | | | | | | | | | | | |
TOTAL | | $ | 119 | | | $ | — | | | $ | — | | | $ | 13 | | | $ | — | | | $ | — | | | $ | — | | | $ | — | | | $ | 132 | | | $ | 13 | | | | | | | |
| | | | | | | | | | | | | | | | | | | | | | | | | | | | | | | | | | | | | | | | | | | | | | | |
| | |
| 214 | Artio Global Funds ï 2010 Annual Report | |
NOTES TO FINANCIAL STATEMENTS (Continued)
International Equity Fund
Assets Valuation Input
| | | | | | | | | | | | | | | | | | | | | | | |
| | | Quoted Prices
| | | | | | | | | | |
| | | in Active
| | Significant
| | | | | | | | |
| | | Markets for
| | Other
| | Significant
| | | | | | |
| | | Identical
| | Observable
| | Unobservable
| | | | | | |
| | | Assets
| | Inputs
| | Inputs
| | | | | | |
| Description | | (Level 1) | | (Level 2) | | (Level 3) | | Total | | | | |
| COMMON STOCKS | | | | | | | | | | | | | | | | | | | | | | |
| United Kingdom | | $ | 1,565,582,425 | | | $ | 369,619 | | | $ | — | | | $ | 1,565,952,044 | | | | | | | |
| China | | | 800,679,492 | | | | — | | | | — | | | | 800,679,492 | | | | | | | |
| Japan | | | 798,199,322 | | | | — | | | | — | | | | 798,199,322 | | | | | | | |
| Germany | | | 592,077,952 | | | | — | | | | — | | | | 592,077,952 | | | | | | | |
| Russia | | | 375,591,770 | | | | 146,795,133 | | | | 68,106,050 | | | | 590,492,953 | | | | | | | |
| France | | | 510,615,169 | | | | — | | | | — | | | | 510,615,169 | | | | | | | |
| Switzerland | | | 451,605,091 | | | | — | | | | — | | | | 451,605,091 | | | | | | | |
| India | | | 431,593,657 | | | | — | | | | — | | | | 431,593,657 | | | | | | | |
| Canada | | | 426,034,570 | | | | — | | | | — | | | | 426,034,570 | | | | | | | |
| Hong Kong | | | 296,209,195 | | | | — | | | | — | | | | 296,209,195 | | | | | | | |
| Netherlands | | | 268,405,908 | | | | — | | | | — | | | | 268,405,908 | | | | | | | |
| South Africa | | | 183,975,148 | | | | — | | | | — | | | | 183,975,148 | | | | | | | |
| Brazil | | | 173,916,605 | | | | — | | | | — | | | | 173,916,605 | | | | | | | |
| Australia | | | 165,076,333 | | | | — | | | | — | | | | 165,076,333 | | | | | | | |
| Denmark | | | 145,719,489 | | | | — | | | | — | | | | 145,719,489 | | | | | | | |
| Austria | | | 144,935,311 | | | | — | | | | — | | | | 144,935,311 | | | | | | | |
| Finland | | | 140,048,348 | | | | — | | | | — | | | | 140,048,348 | | | | | | | |
| Sweden | | | 124,658,027 | | | | — | | | | — | | | | 124,658,027 | | | | | | | |
| Czech Republic | | | 110,327,253 | | | | — | | | | — | | | | 110,327,253 | | | | | | | |
| Ukraine | | | 49,743,372 | | | | 35,407,912 | | | | 13,209,262 | | | | 98,360,546 | | | | | | | |
| Mexico | | | 97,789,781 | | | | — | | | | — | | | | 97,789,781 | | | | | | | |
| Romania | | | 81,221,990 | | | | — | | | | 2,293,558 | | | | 83,515,548 | | | | | | | |
| Bulgaria | | | 24,255,915 | | | | — | | | | 54,704,966 | | | | 78,960,881 | | | | | | | |
| Singapore | | | 64,662,453 | | | | — | | | | — | | | | 64,662,453 | | | | | | | |
| South Korea | | | 62,300,193 | | | | — | | | | — | | | | 62,300,193 | | | | | | | |
| Taiwan | | | 60,143,204 | | | | — | | | | — | | | | 60,143,204 | | | | | | | |
| Ireland | | | 58,951,787 | | | | — | | | | — | | | | 58,951,787 | | | | | | | |
| Poland | | | 55,296,035 | | | | — | | | | — | | | | 55,296,035 | | | | | | | |
| Israel | | | 44,479,078 | | | | — | | | | — | | | | 44,479,078 | | | | | | | |
| Norway | | | 42,414,649 | | | | — | | | | — | | | | 42,414,649 | | | | | | | |
| Greece | | | 41,979,261 | | | | — | | | | — | | | | 41,979,261 | | | | | | | |
| Georgia | | | 40,670,722 | | | | — | | | | — | | | | 40,670,722 | | | | | | | |
| Nigeria | | | 36,405,756 | | | | — | | | | — | | | | 36,405,756 | | | | | | | |
| Italy | | | 26,303,653 | | | | — | | | | — | | | | 26,303,653 | | | | | | | |
| Portugal | | | 22,029,107 | | | | — | | | | — | | | | 22,029,107 | | | | | | | |
| Serbia | | | 19,095,052 | | | | — | | | | 2,151,880 | | | | 21,246,932 | | | | | | | |
| Lebanon | | | 5,181,607 | | | | 13,989,227 | | | | — | | | | 19,170,834 | | | | | | | |
| Venezuela | | | — | | | | — | | | | 15,712,433 | | | | 15,712,433 | | | | | | | |
| Indonesia | | | 13,226,870 | | | | — | | | | — | | | | 13,226,870 | | | | | | | |
| Spain | | | 9,701,895 | | | | — | | | | — | | | | 9,701,895 | | | | | | | |
| | |
| Artio Global Funds ï 2010 Annual Report | 215 |
NOTES TO FINANCIAL STATEMENTS (Continued)
| | | | | | | | | | | | | | | | | | | | | | | |
| | | Quoted Prices
| | | | | | | | | | |
| | | in Active
| | Significant
| | | | | | | | |
| | | Markets for
| | Other
| | Significant
| | | | | | |
| | | Identical
| | Observable
| | Unobservable
| | | | | | |
| | | Assets
| | Inputs
| | Inputs
| | | | | | |
| Description | | (Level 1) | | (Level 2) | | (Level 3) | | Total | | | | |
| Kenya | | $ | 7,858,362 | | | $ | — | | | $ | — | | | $ | 7,858,362 | | | | | | | |
| Zambia | | | — | | | | — | | | | 7,450,917 | | | | 7,450,917 | | | | | | | |
| Latvia | | | — | | | | — | | | | 2,789,232 | | | | 2,789,232 | | | | | | | |
| Croatia | | | 19,291 | | | | — | | | | — | | | | 19,291 | | | | | | | |
| | | | | | | | | | | | | | | | | | | | | | | |
| TOTAL COMMON STOCKS | | | 8,568,981,098 | | | | 196,561,891 | | | | 166,418,298 | | | | 8,931,961,287 | | | | | | | |
| | | | | | | | | | | | | | | | | | | | | | | |
| EXCHANGE-TRADED FUNDS | | | | | | | | | | | | | | | | | | | | | | |
| Multinational | | | 218,907,798 | | | | — | | | | — | | | | 218,907,798 | | | | | | | |
| Australia | | | 12,635,894 | | | | — | | | | — | | | | 12,635,894 | | | | | | | |
| Romania | | | 7,778,227 | | | | — | | | | — | | | | 7,778,227 | | | | | | | |
| Sweden | | | 7,109,714 | | | | — | | | | — | | | | 7,109,714 | | | | | | | |
| Russia | | | — | | | | — | | | | 1,389,510 | | | | 1,389,510 | | | | | | | |
| | | | | | | | | | | | | | | | | | | | | | | |
| TOTAL EXCHANGE-TRADED FUNDS | | | 246,431,633 | | | | — | | | | 1,389,510 | | | | 247,821,143 | | | | | | | |
| | | | | | | | | | | | | | | | | | | | | | | |
| EQUITY LINKED NOTES | | | | | | | | | | | | | | | | | | | | | | |
| Taiwan | | | — | | | | 115,645,778 | | | | — | | | | 115,645,778 | | | | | | | |
| India | | | — | | | | 69,732,530 | | | | — | | | | 69,732,530 | | | | | | | |
| Serbia | | | — | | | | 16,797,355 | | | | — | | | | 16,797,355 | | | | | | | |
| Ukraine | | | — | | | | — | | | | 529,552 | | | | 529,552 | | | | | | | |
| | | | | | | | | | | | | | | | | | | | | | | |
| TOTAL EQUITY LINKED NOTES | | | — | | | | 202,175,663 | | | | 529,552 | | | | 202,705,215 | | | | | | | |
| | | | | | | | | | | | | | | | | | | | | | | |
| PREFERRED STOCKS | | | | | | | | | | | | | | | | | | | | | | |
| Germany | | | 78,991,319 | | | | — | | | | — | | | | 78,991,319 | | | | | | | |
| Russia | | | 13,549,309 | | | | — | | | | — | | | | 13,549,309 | | | | | | | |
| Bulgaria | | | — | | | | 10,984,761 | | | | — | | | | 10,984,761 | | | | | | | |
| Philippines | | | — | | | | — | | | | 26,797 | | | | 26,797 | | | | | | | |
| | | | | | | | | | | | | | | | | | | | | | | |
| TOTAL PREFERRED STOCKS | | | 92,540,628 | | | | 10,984,761 | | | | 26,797 | | | | 103,552,186 | | | | | | | |
| | | | | | | | | | | | | | | | | | | | | | | |
| FOREIGN GOVERNMENT COMPENSATION NOTES | | | | | | | | | | | | | | | | | | | | | | |
| Bulgaria | | | 6,110,940 | | | | 423,238 | | | | — | | | | 6,534,178 | | | | | | | |
| | | | | | | | | | | | | | | | | | | | | | | |
| INVESTMENT COLLATERAL FROM SECURITY LENDING | | | | | | | | | | | | | | | | | | | | | | |
| United States | | | 323,390,282 | | | | — | | | | — | | | | 323,390,282 | | | | | | | |
| | | | | | | | | | | | | | | | | | | | | | | |
| TOTAL INVESTMENTS | | | 9,237,454,581 | | | | 410,145,553 | | | | 168,364,157 | | | | 9,815,964,291 | | | | | | | |
| | | | | | | | | | | | | | | | | | | | | | | |
| FORWARD FOREIGN EXCHANGE CONTRACTS | | | — | | | | 104,526,225 | | | | — | | | | 104,526,225 | | | | | | | |
| | | | | | | | | | | | | | | | | | | | | | | |
| TOTAL | | $ | 9,237,454,581 | | | $ | 514,671,778 | | | $ | 168,364,157 | | | $ | 9,920,490,516 | | | | | | | |
| | | | | | | | | | | | | | | | | | | | | | | |
| | |
| 216 | Artio Global Funds ï 2010 Annual Report | |
NOTES TO FINANCIAL STATEMENTS (Continued)
Liabilities Valuation Input
| | | | | | | | | | | | | | | | | | | | | | | |
| | | Quoted Prices
| | | | | | | | | | |
| | | in Active
| | Significant
| | | | | | | | |
| | | Markets for
| | Other
| | Significant
| | | | | | |
| | | Identical
| | Observable
| | Unobservable
| | | | | | |
| | | Assets
| | Inputs
| | Inputs
| | | | | | |
| Description | | (Level 1) | | (Level 2) | | (Level 3) | | Total | | | | |
| FORWARD FOREIGN EXCHANGE CONTRACTS | | $ | — | | | $ | (158,833,874 | ) | | $ | — | | | $ | (158,833,874 | ) | | | | | | |
| | | | | | | | | | | | | | | | | | | | | | | |
| TOTAL | | $ | — | | | $ | (158,833,874 | ) | | $ | — | | | $ | (158,833,874 | ) | | | | | | |
| | | | | | | | | | | | | | | | | | | | | | | |
| | |
| Artio Global Funds ï 2010 Annual Report | 217 |
NOTES TO FINANCIAL STATEMENTS (Continued)
International Equity Fund
Summary Fair Value Level 3 Rollforward Report
Reporting Period: 10/31/2009—10/31/2010
Transfer In—Beginning of Period / Transfer Out—End of Period
Asset Valuation Inputs
| | | | | | | | | | | | | | | | | | | | | | | | | | | | | | | | | | | | | | | | | | | | | | | | | | | |
| | | | | | | | | | | | | | | | | | | | | Change in
| | | | | | |
| | | | | | | | | | | | | | | | | | | | | Unrealized
| | | | | | |
| | | | | | | | | | | | | | | | | | | | | Appreciation
| | | | | | |
| | | | | | | | | | | | | | | | | | | | | (Depreciation)
| | | | | | |
| | | | | | | | | Change in
| | | | | | | | | | | | from
| | | | | | |
| | | Balance as of
| | Accrued
| | | | Unrealized
| | | | | | | | | | | | Investments
| | | | | | |
Investments in
| | October 31,
| | Discounts
| | Realized Gain
| | Appreciation
| | | | | | Net Transfers
| | Net Transfers
| | Balance as of
| | Held at
| | | | | | |
| Securities | | 2009 | | (Premiums) | | (Loss) | | (Depreciation) | | Net Purchases | | Net Sales | | into Level 3 | | out of Level 3 | | October 31, 2010 | | October 31, 2010 | | | | | | |
| COMMON STOCKS | | | | | | | | | | | | | | | | | | | | | | | | | | | | | | | | | | | | | | | | | | | | | | | | | | |
| Bulgaria | | $ | 10,480,179 | | | $ | — | | | $ | (358 | ) | | $ | 17,191,379 | | | $ | 10,137,154 | | | $ | (10,136,796 | ) | | $ | 27,033,408 | | | $ | — | | | $ | 54,704,966 | | | $ | 17,191,379 | | | | �� | | | | | | | |
| Latvia | | | 2,963,033 | | | | — | | | | — | | | | (173,801 | ) | | | — | | | | — | | | | — | | | | — | | | | 2,789,232 | | | | (173,801 | ) | | | | | | | | | | |
| Romania | | | — | | | | — | | | | — | | | | (890,434 | ) | | | — | | | | — | | | | 3,183,992 | | | | — | | | | 2,293,558 | | | | (890,433 | ) | | | | | | | | | | |
| Russia | | | 12,364,077 | | | | — | | | | — | | | | 21,180,514 | | | | 15,204,986 | | | | — | | | | 21,247,278 | | | | (1,890,805 | ) | | | 68,106,050 | | | | 20,533,119 | | | | | | | | | | | |
| Serbia | | | 32,215,204 | | | | — | | | | (1,114,952 | ) | | | (11,787,511 | ) | | | — | | | | (464,904 | ) | | | — | | | | (16,695,957 | ) | | | 2,151,880 | | | | (1,231,643 | ) | | | | | | | | | | |
| Ukraine | | | 32,461,138 | | | | — | | | | — | | | | (722,297 | ) | | | — | | | | — | | | | 4,034,020 | | | | (22,563,599 | ) | | | 13,209,262 | | | | 1,017,988 | | | | | | | | | | | |
| Venezuela | | | 20,797,915 | | | | — | | | | — | | | | (5,085,482 | ) | | | — | | | | — | | | | — | | | | — | | | | 15,712,433 | | | | (5,085,482 | ) | | | | | | | | | | |
| Zambia | | | 8,081,113 | | | | — | | | | — | | | | (630,196 | ) | | | — | | | | — | | | | — | | | | — | | | | 7,450,917 | | | | (630,196 | ) | | | | | | | | | | |
| EQUITY LINKED NOTES | | | | | | | | | | | | | | | | | | | | | | | | | | | | | | | | | | | | | | | | | | | | | | | | | | |
| Ukraine | | | — | | | | — | | | | — | | | | (32,595 | ) | | | — | | | | — | | | | 562,147 | | | | — | | | | 529,552 | | | | (32,595 | ) | | | | | | | | | | |
| EXCHANGE-TRADED FUNDS | | | | | | | | | | | | | | | | | | | | | | | | | | | | | | | | | | | | | | | | | | | | | | | | | | |
| Russia | | | 1,157,925 | | | | — | | | | — | | | | 231,585 | | | | — | | | | — | | | | — | | | | — | | | | 1,389,510 | | | | 231,585 | | | | | | | | | | | |
| PREFERRED STOCKS | | | | | | | | | | | | | | | | | | | | | | | | | | | | | | | | | | | | | | | | | | | | | | | | | | |
| Philippines | | | 24,212 | | | | — | | | | — | | | | 2,585 | | | | — | | | | — | | | | — | | | | — | | | | 26,797 | | | | 2,585 | | | | | | | | | | | |
| Russia | | | 7,101,650 | | | | — | | | | — | | | | (143,675 | ) | | | — | | | | — | | | | — | | | | (6,957,975 | ) | | | — | | | | — | | | | | | | | | | | |
| | | | | | | | | | | | | | | | | | | | | | | | | | | | | | | | | | | | | | | | | | | | | | | | | | | |
| TOTAL | | $ | 127,646,446 | | | $ | — | | | $ | (1,115,310 | ) | | $ | 19,140,072 | | | $ | 25,342,140 | | | $ | (10,601,700 | ) | | $ | 56,060,845 | | | $ | (48,108,336 | ) | | $ | 168,364,157 | | | $ | 30,932,506 | | | | | | | | | | | |
| | | | | | | | | | | | | | | | | | | | | | | | | | | | | | | | | | | | | | | | | | | | | | | | | | | |
| | |
| 218 | Artio Global Funds ï 2010 Annual Report | |
NOTES TO FINANCIAL STATEMENTS (Continued)
International Equity Fund II
Assets Valuation Input
| | | | | | | | | | | | | | | | | | | | | | | |
| | | Quoted Prices
| | | | | | | | | | |
| | | in Active
| | Significant
| | | | | | | | |
| | | Markets for
| | Other
| | Significant
| | | | | | |
| | | Identical
| | Observable
| | Unobservable
| | | | | | |
| | | Assets
| | Inputs
| | Inputs
| | | | | | |
| Description | | (Level 1) | | (Level 2) | | (Level 3) | | Total | | | | |
| COMMON STOCKS | | | | | | | | | | | | | | | | | | | | | | |
| United Kingdom | | $ | 1,425,926,735 | | | $ | 386,587 | | | $ | — | | | $ | 1,426,313,322 | | | | | | | |
| Japan | | | 718,668,705 | | | | — | | | | — | | | | 718,668,705 | | | | | | | |
| China | | | 669,375,452 | | | | — | | | | — | | | | 669,375,452 | | | | | | | |
| Germany | | | 568,242,677 | | | | — | | | | — | | | | 568,242,677 | | | | | | | |
| Russia | | | 496,429,854 | | | | 47,899,695 | | | | — | | | | 544,329,549 | | | | | | | |
| France | | | 498,051,530 | | | | — | | | | — | | | | 498,051,530 | | | | | | | |
| India | | | 426,314,580 | | | | — | | | | — | | | | 426,314,580 | | | | | | | |
| Canada | | | 419,731,569 | | | | — | | | | — | | | | 419,731,569 | | | | | | | |
| Switzerland | | | 409,196,463 | | | | — | | | | — | | | | 409,196,463 | | | | | | | |
| Hong Kong | | | 282,049,114 | | | | — | | | | — | | | | 282,049,114 | | | | | | | |
| Netherlands | | | 253,744,713 | | | | — | | | | — | | | | 253,744,713 | | | | | | | |
| South Africa | | | 233,402,403 | | | | — | | | | — | | | | 233,402,403 | | | | | | | |
| Brazil | | | 189,419,109 | | | | — | | | | — | | | | 189,419,109 | | | | | | | |
| Australia | | | 163,066,932 | | | | — | | | | — | | | | 163,066,932 | | | | | | | |
| Denmark | | | 142,322,751 | | | | — | | | | — | | | | 142,322,751 | | | | | | | |
| Sweden | | | 126,363,608 | | | | — | | | | — | | | | 126,363,608 | | | | | | | |
| Finland | | | 109,367,322 | | | | — | | | | — | | | | 109,367,322 | | | | | | | |
| Czech Republic | | | 103,416,035 | | | | — | | | | — | | | | 103,416,035 | | | | | | | |
| Mexico | | | 97,090,655 | | | | — | | | | — | | | | 97,090,655 | | | | | | | |
| Austria | | | 94,737,135 | | | | — | | | | — | | | | 94,737,135 | | | | | | | |
| South Korea | | | 80,431,652 | | | | — | | | | — | | | | 80,431,652 | | | | | | | |
| Ireland | | | 58,068,520 | | | | — | | | | — | | | | 58,068,520 | | | | | | | |
| Singapore | | | 56,125,671 | | | | — | | | | — | | | | 56,125,671 | | | | | | | |
| Taiwan | | | 53,553,539 | | | | — | | | | — | | | | 53,553,539 | | | | | | | |
| Israel | | | 42,237,985 | | | | — | | | | — | | | | 42,237,985 | | | | | | | |
| Greece | | | 41,433,625 | | | | — | | | | — | | | | 41,433,625 | | | | | | | |
| Romania | | | 39,816,596 | | | | — | | | | — | | | | 39,816,596 | | | | | | | |
| Norway | | | 38,642,013 | | | | — | | | | — | | | | 38,642,013 | | | | | | | |
| Nigeria | | | 27,208,957 | | | | — | | | | — | | | | 27,208,957 | | | | | | | |
| Italy | | | 24,426,850 | | | | — | | | | — | | | | 24,426,850 | | | | | | | |
| Ukraine | | | 13,901,794 | | | | 8,070,128 | | | | — | | | | 21,971,922 | | | | | | | |
| Portugal | | | 19,854,651 | | | | — | | | | — | | | | 19,854,651 | | | | | | | |
| Lebanon | | | — | | | | 16,688,273 | | | | — | | | | 16,688,273 | | | | | | | |
| Indonesia | | | 11,886,931 | | | | — | | | | — | | | | 11,886,931 | | | | | | | |
| Spain | | | 8,764,105 | | | | — | | | | — | | | | 8,764,105 | | | | | | | |
| Kenya | | | 8,495,157 | | | | — | | | | — | | | | 8,495,157 | | | | | | | |
| | | | | | | | | | | | | | | | | | | | | | | |
| TOTAL COMMON STOCKS | | | 7,951,765,388 | | | | 73,044,683 | | | | — | | | | 8,024,810,071 | | | | | | | |
| | | | | | | | | | | | | | | | | | | | | | | |
| EXCHANGE-TRADED FUND | | | | | | | | | | | | | | | | | | | | | | |
| Multinational | | | 206,627,273 | | | | — | | | | — | | | | 206,627,273 | | | | | | | |
| | | | | | | | | | | | | | | | | | | | | | | |
| | |
| Artio Global Funds ï 2010 Annual Report | 219 |
NOTES TO FINANCIAL STATEMENTS (Continued)
| | | | | | | | | | | | | | | | | | | | | | | |
| | | Quoted Prices
| | | | | | | | | | |
| | | in Active
| | Significant
| | | | | | | | |
| | | Markets for
| | Other
| | Significant
| | | | | | |
| | | Identical
| | Observable
| | Unobservable
| | | | | | |
| | | Assets
| | Inputs
| | Inputs
| | | | | | |
| Description | | (Level 1) | | (Level 2) | | (Level 3) | | Total | | | | |
| EQUITY LINKED NOTES | | | | | | | | | | | | | | | | | | | | | | |
| Taiwan | | $ | — | | | $ | 114,004,787 | | | $ | — | | | $ | 114,004,787 | | | | | | | |
| India | | | — | | | | 77,628,824 | | | | — | | | | 77,628,824 | | | | | | | |
| | | | | | | | | | | | | | | | | | | | | | | |
| TOTAL EQUITY LINKED NOTES | | | — | | | | 191,633,611 | | | | — | | | | 191,633,611 | | | | | | | |
| | | | | | | | | | | | | | | | | | | | | | | |
| PREFERRED STOCKS | | | | | | | | | | | | | | | | | | | | | | |
| Germany | | | 74,094,065 | | | | — | | | | — | | | | 74,094,065 | | | | | | | |
| Russia | | | 5,241,462 | | | | — | | | | — | | | | 5,241,462 | | | | | | | |
| Philippines | | | — | | | | — | | | | 20,193 | | | | 20,193 | | | | | | | |
| | | | | | | | | | | | | | | | | | | | | | | |
| TOTAL PREFERRED STOCKS | | | 79,335,527 | | | | — | | | | 20,193 | | | | 79,355,720 | | | | | | | |
| | | | | | | | | | | | | | | | | | | | | | | |
| INVESTMENT COLLATERAL FROM SECURITY LENDING | | | | | | | | | | | | | | | | | | | | | | |
| United States | | | 244,252,923 | | | | — | | | | — | | | | 244,252,923 | | | | | | | |
| | | | | | | | | | | | | | | | | | | | | | | |
| TOTAL INVESTMENTS | | | 8,481,981,111 | | | | 264,678,294 | | | | 20,193 | | | | 8,746,679,598 | | | | | | | |
| | | | | | | | | | | | | | | | | | | | | | | |
| FORWARD FOREIGN EXCHANGE CONTRACTS | | | — | | | | 89,386,139 | | | | — | | | | 89,386,139 | | | | | | | |
| | | | | | | | | | | | | | | | | | | | | | | |
| TOTAL | | $ | 8,481,981,111 | | | $ | 354,064,433 | | | $ | 20,193 | | | $ | 8,836,065,737 | | | | | | | |
| | | | | | | | | | | | | | | | | | | | | | | |
Liabilities Valuation Input
| | | | | | | | | | | | | | | | | | | | | | | |
| | | Quoted Prices
| | | | | | | | | | |
| | | in Active
| | Significant
| | | | | | | | |
| | | Markets for
| | Other
| | Significant
| | | | | | |
| | | Identical
| | Observable
| | Unobservable
| | | | | | |
| | | Assets
| | Inputs
| | Inputs
| | | | | | |
| Description | | (Level 1) | | (Level 2) | | (Level 3) | | Total | | | | |
| FORWARD FOREIGN EXCHANGE CONTRACTS | | $ | — | | | $ | (137,479,785 | ) | | $ | — | | | $ | (137,479,785 | ) | | | | | | |
| | | | | | | | | | | | | | | | | | | | | | | |
| TOTAL | | $ | — | | | $ | (137,479,785 | ) | | $ | — | | | $ | (137,479,785 | ) | | | | | | |
| | | | | | | | | | | | | | | | | | | | | | | |
| | |
| 220 | Artio Global Funds ï 2010 Annual Report | |
NOTES TO FINANCIAL STATEMENTS (Continued)
International Equity Fund II
Summary Fair Value Level 3 Rollforward Report
Reporting Period: 10/31/2009—10/31/2010
Transfer In—Beginning of Period / Transfer Out—End of Period
Asset Valuation Inputs
| | | | | | | | | | | | | | | | | | | | | | | | | | | | | | | | | | | | | | | | | | | | | | | | | | | |
| | | | | | | | | | | | | | | | | | | | | Change in
| | | | | | |
| | | | | | | | | | | | | | | | | | | | | Unrealized
| | | | | | |
| | | | | | | | | | | | | | | | | | | | | Appreciation
| | | | | | |
| | | | | | | | | Change in
| | | | | | | | | | | | (Depreciation)
| | | | | | |
| | | Balance as of
| | Accrued
| | | | Unrealized
| | | | | | | | | | | | from Investments
| | | | | | |
Investments in
| | October 31,
| | Discounts
| | Realized Gain
| | Appreciation
| | | | | | Net Transfers
| | Net Transfers
| | Balance as of
| | Held at
| | | | | | |
| Securities | | 2009 | | (Premiums) | | (Loss) | | (Depreciation) | | Net Purchases | | Net Sales | | into Level 3 | | out of Level 3 | | October 31, 2010 | | October 31, 2010 | | | | | | |
| PREFERRED STOCKS | | | | | | | | | | | | | | | | | | | | | | | | | | | | | | | | | | | | | | | | | | | | | | | | | | |
| Philippines | | $ | 18,244 | | | $ | — | | | $ | — | | | $ | 1,949 | | | $ | — | | | $ | — | | | $ | — | | | $ | — | | | $ | 20,193 | | | $ | 1,949 | | | | | | | | | | | |
| Russia | | | 652,210 | | | | — | | | | — | | | | (13,195 | ) | | | — | | | | — | | | | — | | | | (639,015 | ) | | | — | | | | — | | | | | | | | | | | |
| | | | | | | | | | | | | | | | | | | | | | | | | | | | | | | | | | | | | | | | | | | | | | | | | | | |
| TOTAL | | $ | 670,454 | | | $ | — | | | $ | — | | | $ | (11,246 | ) | | $ | — | | | $ | — | | | $ | — | | | $ | (639,015 | ) | | $ | 20,193 | | | $ | 1,949 | | | | | | | | | | | |
| | | | | | | | | | | | | | | | | | | | | | | | | | | | | | | | | | | | | | | | | | | | | | | | | | | |
| | |
| Artio Global Funds ï 2010 Annual Report | 221 |
NOTES TO FINANCIAL STATEMENTS (Continued)
Total Return Bond Fund
Assets Valuation Input
| | | | | | | | | | | | | | | | | | | | | | | |
| | | Quoted Prices
| | | | | | | | | | |
| | | in Active
| | Significant
| | | | | | | | |
| | | Markets for
| | Other
| | Significant
| | | | | | |
| | | Identical
| | Observable
| | Unobservable
| | | | | | |
| | | Assets
| | Inputs
| | Inputs
| | | | | | |
| Description | | (Level 1) | | (Level 2) | | (Level 3) | | Total | | | | |
| ASSET BACKED SECURITIES | | | | | | | | | | | | | | | | | | | | | | |
| United States | | $ | — | | | $ | 538,168,393 | | | $ | — | | | $ | 538,168,393 | | | | | | | |
| Russia | | | — | | | | — | | | | 474,640 | | | | 474,640 | | | | | | | |
| | | | | | | | | | | | | | | | | | | | | | | |
| TOTAL ASSET BACKED SECURITIES | | | — | | | | 538,168,393 | | | | 474,640 | | | | 538,643,033 | | | | | | | |
| | | | | | | | | | | | | | | | | | | | | | | |
| CORPORATE BONDS | | | | | | | | | | | | | | | | | | | | | | |
| United States | | | — | | | | 230,030,571 | | | | — | | | | 230,030,571 | | | | | | | |
| United Kingdom | | | — | | | | 36,122,832 | | | | — | | | | 36,122,832 | | | | | | | |
| France | | | — | | | | 34,919,029 | | | | — | | | | 34,919,029 | | | | | | | |
| Supranational | | | — | | | | 33,138,210 | | | | — | | | | 33,138,210 | | | | | | | |
| Netherlands | | | — | | | | 25,529,927 | | | | — | | | | 25,529,927 | | | | | | | |
| Canada | | | — | | | | 21,163,216 | | | | — | | | | 21,163,216 | | | | | | | |
| Australia | | | — | | | | 19,124,751 | | | | — | | | | 19,124,751 | | | | | | | |
| Hong Kong | | | — | | | | 9,214,220 | | | | — | | | | 9,214,220 | | | | | | | |
| Brazil | | | — | | | | 6,724,886 | | | | — | | | | 6,724,886 | | | | | | | |
| Germany | | | — | | | | 6,459,490 | | | | — | | | | 6,459,490 | | | | | | | |
| Norway | | | — | | | | 5,268,465 | | | | — | | | | 5,268,465 | | | | | | | |
| Switzerland | | | — | | | | 2,927,767 | | | | — | | | | 2,927,767 | | | | | | | |
| | | | | | | | | | | | | | | | | | | | | | | |
| TOTAL CORPORATE BONDS | | | — | | | | 430,623,364 | | | | — | | | | 430,623,364 | | | | | | | |
| | | | | | | | | | | | | | | | | | | | | | | |
| U.S. GOVERNMENT AND AGENCY OBLIGATIONS | | | | | | | | | | | | | | | | | | | | | | |
| United States | | | — | | | | 324,980,880 | | | | — | | | | 324,980,880 | | | | | | | |
| | | | | | | | | | | | | | | | | | | | | | | |
| FOREIGN GOVERNMENT AND AGENCY BONDS | | | | | | | | | | | | | | | | | | | | | | |
| Brazil | | | — | | | | 87,386,722 | | | | — | | | | 87,386,722 | | | | | | | |
| Canada | | | — | | | | 68,830,217 | | | | — | | | | 68,830,217 | | | | | | | |
| Poland | | | — | | | | 39,938,796 | | | | — | | | | 39,938,796 | | | | | | | |
| Mexico | | | — | | | | 39,420,129 | | | | — | | | | 39,420,129 | | | | | | | |
| Australia | | | — | | | | 26,793,207 | | | | — | | | | 26,793,207 | | | | | | | |
| Qatar | | | — | | | | 8,014,738 | | | | — | | | | 8,014,738 | | | | | | | |
| Norway | | | — | | | | 4,140,257 | | | | — | | | | 4,140,257 | | | | | | | |
| | | | | | | | | | | | | | | | | | | | | | | |
| TOTAL FOREIGN GOVERNMENT AND AGENCY BONDS | | | — | | | | 274,524,066 | | | | — | | | | 274,524,066 | | | | | | | |
| | | | | | | | | | | | | | | | | | | | | | | |
| MUNICIPAL OBLIGATION | | | | | | | | | | | | | | | | | | | | | | |
| United States | | | — | | | | 1,775,573 | | | | — | | | | 1,775,573 | | | | | | | |
| | | | | | | | | | | | | | | | | | | | | | | |
| REPURCHASE AGREEMENT | | | | | | | | | | | | | | | | | | | | | | |
| United States | | | — | | | | 79,015,798 | | | | — | | | | 79,015,798 | | | | | | | |
| | | | | | | | | | | | | | | | | | | | | | | |
| TOTAL INVESTMENTS | | | — | | | | 1,649,088,074 | | | | 474,640 | | | | 1,649,562,714 | | | | | | | |
| | | | | | | | | | | | | | | | | | | | | | | |
| | |
| 222 | Artio Global Funds ï 2010 Annual Report | |
NOTES TO FINANCIAL STATEMENTS (Continued)
| | | | | | | | | | | | | | | | | | | | | | | |
| | | Quoted Prices
| | | | | | | | | | |
| | | in Active
| | Significant
| | | | | | | | |
| | | Markets for
| | Other
| | Significant
| | | | | | |
| | | Identical
| | Observable
| | Unobservable
| | | | | | |
| | | Assets
| | Inputs
| | Inputs
| | | | | | |
| Description | | (Level 1) | | (Level 2) | | (Level 3) | | Total | | | | |
| FORWARD FOREIGN EXCHANGE CONTRACTS | | $ | — | | | $ | 2,724,421 | | | $ | — | | | $ | 2,724,421 | | | | | | | |
| | | | | | | | | | | | | | | | | | | | | | | |
| TOTAL | | $ | — | | | $ | 1,651,812,495 | | | $ | 474,640 | | | $ | 1,652,287,135 | | | | | | | |
| | | | | | | | | | | | | | | | | | | | | | | |
Liabilities Valuation Input
| | | | | | | | | | | | | | | | | | | | | | | |
| | | Quoted Prices
| | | | | | | | | | |
| | | in Active
| | Significant
| | | | | | | | |
| | | Markets for
| | Other
| | Significant
| | | | | | |
| | | Identical
| | Observable
| | Unobservable
| | | | | | |
| | | Assets
| | Inputs
| | Inputs
| | | | | | |
| Description | | (Level 1) | | (Level 2) | | (Level 3) | | Total | | | | |
| FORWARD FOREIGN EXCHANGE CONTRACTS | | $ | — | | | $ | (4,823,659 | ) | | $ | — | | | $ | (4,823,659 | ) | | | | | | |
| | | | | | | | | | | | | | | | | | | | | | | |
| TOTAL | | $ | — | | | $ | (4,823,659 | ) | | $ | — | | | $ | (4,823,659 | ) | | | | | | |
| | | | | | | | | | | | | | | | | | | | | | | |
| | |
| Artio Global Funds ï 2010 Annual Report | 223 |
NOTES TO FINANCIAL STATEMENTS (Continued)
Total Return Bond Fund
Summary Fair Value Level 3 Rollforward Report
Reporting Period: 10/31/2009—10/31/2010
Transfer In—Beginning of Period / Transfer Out—End of Period
Asset Valuation Inputs
| | | | | | | | | | | | | | | | | | | | | | | | | | | | | | | | | | | | | | | | | | | | | | | |
| | | | | | | | | | | | | | | | | | | | | Change in
| | | | |
| | | | | | | | | | | | | | | | | | | | | Unrealized
| | | | |
| | | | | | | | | | | | | | | | | | | | | Appreciation
| | | | |
| | | | | | | | | Change in
| | | | | | | | | | | | (Depreciation)
| | | | |
| | | Balance as of
| | Accrued
| | | | Unrealized
| | | | | | | | | | | | from Investments
| | | | |
Investments in
| | October 31,
| | Discounts
| | Realized Gain
| | Appreciation
| | | | | | Net Transfers
| | Net Transfers
| | Balance as of
| | Held at
| | | | |
| Securities | | 2009 | | (Premiums) | | (Loss) | | (Depreciation) | | Net Purchases | | Net Sales | | into Level 3 | | out of Level 3 | | October 31, 2010 | | October 31, 2010 | | | | |
| ASSET BACKED SECURITIES | | | | | | | | | | | | | | | | | | | | | | | | | | | | | | | | | | | | | | | | | | | | | | |
| Russia | | $ | 556,183 | | | $ | — | | | $ | 6,069 | | | $ | 210,698 | | | $ | — | | | $ | (298,310 | ) | | $ | — | | | $ | — | | | $ | 474,640 | | | $ | 210,698 | | | | | | | |
| | | | | | | | | | | | | | | | | | | | | | | | | | | | | | | | | | | | | | | | | | | | | | | |
| TOTAL | | $ | 556,183 | | | $ | — | | | $ | 6,069 | | | $ | 210,698 | | | $ | — | | | $ | (298,310 | ) | | $ | — | | | $ | — | | | $ | 474,640 | | | $ | 210,698 | | | | | | | |
| | | | | | | | | | | | | | | | | | | | | | | | | | | | | | | | | | | | | | | | | | | | | | | |
| | |
| 224 | Artio Global Funds ï 2010 Annual Report | |
NOTES TO FINANCIAL STATEMENTS (Continued)
Global High Income Fund
Assets Valuation Input
| | | | | | | | | | | | | | | | | | | | | | | |
| | | Quoted Prices
| | | | | | | | | | |
| | | in Active
| | Significant
| | | | | | | | |
| | | Markets for
| | Other
| | Significant
| | | | | | |
| | | Identical
| | Observable
| | Unobservable
| | | | | | |
| | | Assets
| | Inputs
| | Inputs
| | | | | | |
| Description | | (Level 1) | | (Level 2) | | (Level 3) | | Total | | | | |
| CORPORATE BONDS | | | | | | | | | | | | | | | | | | | | | | |
| United States | | $ | — | | | $ | 1,595,944,369 | | | $ | — | | | $ | 1,595,944,369 | | | | | | | |
| Canada | | | — | | | | 130,090,552 | | | | — | | | | 130,090,552 | | | | | | | |
| United Kingdom | | | — | | | | 91,267,725 | | | | 37,359,707 | | | | 128,627,432 | | | | | | | |
| Netherlands | | | — | | | | 79,049,391 | | | | — | | | | 79,049,391 | | | | | | | |
| Germany | | | — | | | | 61,046,595 | | | | — | | | | 61,046,595 | | | | | | | |
| Italy | | | — | | | | 44,802,837 | | | | — | | | | 44,802,837 | | | | | | | |
| Ireland | | | — | | | | 40,383,150 | | | | 3,889,643 | | | | 44,272,793 | | | | | | | |
| Brazil | | | — | | | | 39,411,314 | | | | — | | | | 39,411,314 | | | | | | | |
| Indonesia | | | — | | | | 33,636,650 | | | | — | | | | 33,636,650 | | | | | | | |
| Czech Republic | | | — | | | | 30,217,476 | | | | — | | | | 30,217,476 | | | | | | | |
| Norway | | | — | | | | 26,084,619 | | | | — | | | | 26,084,619 | | | | | | | |
| Russia | | | — | | | | 16,798,438 | | | | — | | | | 16,798,438 | | | | | | | |
| France | | | — | | | | 14,401,634 | | | | — | | | | 14,401,634 | | | | | | | |
| Switzerland | | | — | | | | 9,264,090 | | | | — | | | | 9,264,090 | | | | | | | |
| Mexico | | | — | | | | 4,193,703 | | | | — | | | | 4,193,703 | | | | | | | |
| Greece | | | — | | | | 2,421,400 | | | | — | | | | 2,421,400 | | | | | | | |
| Sweden | | | — | | | | 181,665 | | | | — | | | | 181,665 | | | | | | | |
| | | | | | | | | | | | | | | | | | | | | | | |
| TOTAL CORPORATE BONDS | | | — | | | | 2,219,195,608 | | | | 41,249,350 | | | | 2,260,444,958 | | | | | | | |
| | | | | | | | | | | | | | | | | | | | | | | |
| BANK LOANS | | | | | | | | | | | | | | | | | | | | | | |
| United States | | | — | | | | 360,755,393 | | | | 53,898,951 | | | | 414,654,344 | | | | | | | |
| United Kingdom | | | — | | | | 46,714,191 | | | | — | | | | 46,714,191 | | | | | | | |
| Germany | | | — | | | | 30,425,747 | | | | — | | | | 30,425,747 | | | | | | | |
| Netherlands | | | — | | | | 16,865,898 | | | | — | | | | 16,865,898 | | | | | | | |
| Canada | | | — | | | | — | | | | 3,466,487 | | | | 3,466,487 | | | | | | | |
| Norway | | | — | | | | 1,469,000 | | | | — | | | | 1,469,000 | | | | | | | |
| | | | | | | | | | | | | | | | | | | | | | | |
| TOTAL BANK LOANS | | | — | | | | 456,230,229 | | | | 57,365,438 | | | | 513,595,667 | | | | | | | |
| | | | | | | | | | | | | | | | | | | | | | | |
| FOREIGN GOVERNMENT BONDS | | | | | | | | | | | | | | | | | | | | | | |
| Brazil | | | — | | | | 46,921,866 | | | | — | | | | 46,921,866 | | | | | | | |
| Indonesia | | | — | | | | 29,234,580 | | | | — | | | | 29,234,580 | | | | | | | |
| Ghana | | | — | | | | — | | | | 13,370,287 | | | | 13,370,287 | | | | | | | |
| Venezuela | | | — | | | | 7,111,817 | | | | — | | | | 7,111,817 | | | | | | | |
| | | | | | | | | | | | | | | | | | | | | | | |
| TOTAL FOREIGN GOVERNMENT BONDS | | | — | | | | 83,268,263 | | | | 13,370,287 | | | | 96,638,550 | | | | | | | |
| | | | | | | | | | | | | | | | | | | | | | | |
| CONVERTIBLE BOND | | | | | | | | | | | | | | | | | | | | | | |
| United States | | | — | | | | 20,629,181 | | | | — | | | | 20,629,181 | | | | | | | |
| | | | | | | | | | | | | | | | | | | | | | | |
| PREFERRED STOCKS | | | | | | | | | | | | | | | | | | | | | | |
| United States | | | 36,720 | | | | 14,275,103 | | | | — | | | | 14,311,823 | | | | | | | |
| | | | | | | | | | | | | | | | | | | | | | | |
| | |
| Artio Global Funds ï 2010 Annual Report | 225 |
NOTES TO FINANCIAL STATEMENTS (Continued)
| | | | | | | | | | | | | | | | | | | | | | | |
| | | Quoted Prices
| | | | | | | | | | |
| | | in Active
| | Significant
| | | | | | | | |
| | | Markets for
| | Other
| | Significant
| | | | | | |
| | | Identical
| | Observable
| | Unobservable
| | | | | | |
| | | Assets
| | Inputs
| | Inputs
| | | | | | |
| Description | | (Level 1) | | (Level 2) | | (Level 3) | | Total | | | | |
| CREDIT LINKED NOTE | | | | | | | | | | | | | | | | | | | | | | |
| Ukraine | | $ | — | | | $ | — | | | $ | 7,234,591 | | | $ | 7,234,591 | | | | | | | |
| | | | | | | | | | | | | | | | | | | | | | | |
| COMMON STOCK | | | | | | | | | | | | | | | | | | | | | | |
| United States | | | 559,860 | | | | — | | | | — | | | | 559,860 | | | | | | | |
| | | | | | | | | | | | | | | | | | | | | | | |
| REPURCHASE AGREEMENT | | | | | | | | | | | | | | | | | | | | | | |
| United States | | | — | | | | 173,262,426 | | | | — | | | | 173,262,426 | | | | | | | |
| | | | | | | | | | | | | | | | | | | | | | | |
| TIME DEPOSIT | | | | | | | | | | | | | | | | | | | | | | |
| United States | | | — | | | | 8,550,000 | | | | — | | | | 8,550,000 | | | | | | | |
| | | | | | | | | | | | | | | | | | | | | | | |
| TOTAL INVESTMENTS | | | 596,580 | | | | 2,975,410,810 | | | | 119,219,666 | | | | 3,095,227,056 | | | | | | | |
| | | | | | | | | | | | | | | | | | | | | | | |
| FORWARD FOREIGN EXCHANGE CONTRACTS | | | — | | | | 2,092,232 | | | | — | | | | 2,092,232 | | | | | | | |
| | | | | | | | | | | | | | | | | | | | | | | |
| SWAPS | | | — | | | | 9,544,321 | | | | — | | | | 9,544,321 | | | | | | | |
| | | | | | | | | | | | | | | | | | | | | | | |
| TOTAL | | $ | 596,580 | | | $ | 2,987,047,363 | | | $ | 119,219,666 | | | $ | 3,106,863,609 | | | | | | | |
| | | | | | | | | | | | | | | | | | | | | | | |
Liabilities Valuation Input
| | | | | | | | | | | | | | | | | | | | | | | |
| | | Quoted Prices
| | | | | | | | | | |
| | | in Active
| | Significant
| | | | | | | | |
| | | Markets for
| | Other
| | Significant
| | | | | | |
| | | Identical
| | Observable
| | Unobservable
| | | | | | |
| | | Assets
| | Inputs
| | Inputs
| | | | | | |
| Description | | (Level 1) | | (Level 2) | | (Level 3) | | Total | | | | |
| FORWARD FOREIGN EXCHANGE CONTRACTS | | $ | — | | | $ | (17,732,811 | ) | | $ | — | | | $ | (17,732,811 | ) | | | | | | |
| | | | | | | | | | | | | | | | | | | | | | | |
| SWAPS | | | — | | | | (797,128 | ) | | | — | | | | (797,128 | ) | | | | | | |
| | | | | | | | | | | | | | | | | | | | | | | |
| TOTAL | | $ | — | | | $ | (18,529,939 | ) | | $ | — | | | $ | (18,529,939 | ) | | | | | | |
| | | | | | | | | | | | | | | | | | | | | | | |
| | |
| 226 | Artio Global Funds ï 2010 Annual Report | |
NOTES TO FINANCIAL STATEMENTS (Continued)
Global High Income Fund
Summary Fair Value Level 3 Rollforward Report
Reporting Period: 10/31/2009—10/31/2010
Transfer In—Beginning of Period / Transfer Out—End of Period
Asset Valuation Inputs
| | | | | | | | | | | | | | | | | | | | | | | | | | | | | | | | | | | | | | | | | | | |
| | | | | | | | | | | | | | | | | | | | | Change in
| | |
| | | | | | | | | | | | | | | | | | | | | Unrealized
| | |
| | | | | | | | | | | | | | | | | | | | | Appreciation
| | |
| | | | | | | | | Change in
| | | | | | | | | | | | (Depreciation)
| | |
| | | Balance as of
| | Accrued
| | | | Unrealized
| | | | | | | | | | | | from Investments
| | |
Investments in
| | October 31,
| | Discounts
| | Realized Gain
| | Appreciation
| | Net
| | | | Net Transfers
| | Net Transfers
| | Balance as of
| | Held at
| | |
| Securities | | 2009 | | (Premiums) | | (Loss) | | (Depreciation) | | Purchases | | Net Sales | | into Level 3 | | out of Level 3 | | October 31, 2010 | | October 31, 2010 | | |
| BANK LOANS | | | | | | | | | | | | | | | | | | | | | | | | | | | | | | | | | | | | | | | | | | |
| Canada | | $ | 2,793,523 | | | $ | 13,528 | | | $ | 22,383 | | | $ | (1,351,830 | ) | | $ | 4,830,144 | | | $ | (2,841,261 | ) | | $ | — | | | $ | — | | | $ | 3,466,487 | | | $ | (1,353,187 | ) | | |
| United States | | | 26,618,055 | | | | 1,371,085 | | | | (174,377 | ) | | | 246,608 | | | | 73,811,302 | | | | (18,859,495 | ) | | | — | | | | (29,114,227 | ) | | | 53,898,951 | | | | 1,027,412 | | | |
| CORPORATE BONDS | | | | | | | | | | | | | | | | | | | | | | | | | | | | | | | | | | | | | | | | | | |
| Brazil | | | 12,660,155 | | | | (297,554 | ) | | | — | | | | 2,658,584 | | | | 5,721,293 | | | | — | | | | — | | | | (20,742,478 | ) | | | — | | | | — | | | |
| Ghana | | | 7,202,638 | | | | — | | | | 51,812 | | | | (134,031 | ) | | | — | | | | (7,120,419 | ) | | | — | | | | — | | | | — | | | | — | | | |
| Hungary | | | 612,548 | | | | (17 | ) | | | (437,641 | ) | | | 507,272 | | | | — | | | | (682,162 | ) | | | — | | | | — | | | | — | | | | — | | | |
| Ireland | | | 998,650 | | | | (1,337 | ) | | | — | | | | (150,032 | ) | | | 4,042,362 | | | | (1,000,000 | ) | | | — | | | | — | | | | 3,889,643 | | | | (152,719 | ) | | |
| Japan | | | 473,554 | | | | — | | | | (12,125 | ) | | | 11,446 | | | | — | | | | (472,875 | ) | | | — | | | | — | | | | — | | | | — | | | |
| Mexico | | | 3,984,038 | | | | — | | | | — | | | | 209,666 | | | | — | | | | — | | | | — | | | | (4,193,704 | ) | | | — | | | | — | | | |
| Netherlands | | | 11,422,048 | | | | 333,382 | | | | 18,997 | | | | 2,506,144 | | | | 16,644,527 | | | | (480,394 | ) | | | — | | | | (30,444,704 | ) | | | — | | | | — | | | |
| United Kingdom | | | — | | | | 15,483 | | | | — | | | | 2,640,507 | | | | 34,703,717 | | | | — | | | | — | | | | — | | | | 37,359,707 | | | | 2,640,507 | | | |
| United States | | | 6,709,532 | | | | 124,751 | | | | 318,540 | | | | 1,557,390 | | | | 4,605,650 | | | | (5,221,538 | ) | | | — | | | | (8,094,325 | ) | | | — | | | | — | | | |
| CREDIT LINKED NOTES | | | | | | | | | | | | | | | | | | | | | | | | | | | | | | | | | | | | | | | | | | |
| Ukraine | | | — | | | | 83,660 | | | | — | | | | 1,345,874 | | | | 5,805,057 | | | | — | | | | — | | | | — | | | | 7,234,591 | | | | 1,345,874 | | | |
| FOREIGN GOVERNMENT BONDS | | | | | | | | | | | | | | | | | | | | | | | | | | | | | | | | | | | | | | | | | | |
| Ghana | | | — | | | | 215,190 | | | | — | | | | 935,833 | | | | 12,219,264 | | | | — | | | | — | | | | — | | | | 13,370,287 | | | | 935,833 | | | |
| | | | | | | | | | | | | | | | | | | | | | | | | | | | | | | | | | | | | | | | | | | |
| TOTAL | | $ | 73,474,741 | | | $ | 1,858,171 | | | $ | (212,411 | ) | | $ | 10,983,431 | | | $ | 162,383,316 | | | $ | (36,678,144 | ) | | $ | — | | | $ | (92,589,438 | ) | | $ | 119,219,666 | | | $ | 4,443,720 | | | |
| | | | | | | | | | | | | | | | | | | | | | | | | | | | | | | | | | | | | | | | | | | |
| | |
| Artio Global Funds ï 2010 Annual Report | 227 |
NOTES TO FINANCIAL STATEMENTS (Continued)
U.S. Microcap Fund
Assets Valuation Input
| | | | | | | | | | | | | | | | | | | | | | | |
| | | Quoted Prices
| | | | | | | | | | |
| | | in Active
| | Significant
| | | | | | | | |
| | | Markets for
| | Other
| | Significant
| | | | | | |
| | | Identical
| | Observable
| | Unobservable
| | | | | | |
| | | Assets
| | Inputs
| | Inputs
| | | | | | |
| Description | | (Level 1) | | (Level 2) | | (Level 3) | | Total | | | | |
| COMMON STOCKS | | | | | | | | | | | | | | | | | | | | | | |
| Banks | | $ | 1,355,808 | | | $ | — | | | $ | — | | | $ | 1,355,808 | | | | | | | |
| Semiconductors & Semiconductor Equipment | | | 1,315,520 | | | | — | | | | — | | | | 1,315,520 | | | | | | | |
| Capital Goods | | | 990,121 | | | | — | | | | — | | | | 990,121 | | | | | | | |
| Pharmaceuticals & Biotechnology | | | 884,273 | | | | — | | | | — | | | | 884,273 | | | | | | | |
| Diversified Financials | | | 770,181 | | | | — | | | | — | | | | 770,181 | | | | | | | |
| Commercial & Professional Services | | | 644,064 | | | | — | | | | — | | | | 644,064 | | | | | | | |
| Materials | | | 577,484 | | | | — | | | | — | | | | 577,484 | | | | | | | |
| Retailing | | | 546,649 | | | | — | | | | — | | | | 546,649 | | | | | | | |
| Media | | | 536,453 | | | | — | | | | — | | | | 536,453 | | | | | | | |
| Energy | | | 535,365 | | | | — | | | | — | | | | 535,365 | | | | | | | |
| Technology Hardware & Equipment | | | 517,079 | | | | — | | | | — | | | | 517,079 | | | | | | | |
| Software & Services | | | 469,327 | | | | — | | | | — | | | | 469,327 | | | | | | | |
| Transportation | | | 461,104 | | | | — | | | | — | | | | 461,104 | | | | | | | |
| Health Care Equipment & Services | | | 437,319 | | | | — | | | | — | | | | 437,319 | | | | | | | |
| Consumer Services | | | 413,288 | | | | — | | | | — | | | | 413,288 | | | | | | | |
| Household & Personal Products | | | 195,742 | | | | — | | | | — | | | | 195,742 | | | | | | | |
| Automobiles & Components | | | 167,179 | | | | — | | | | — | | | | 167,179 | | | | | | | |
| Consumer Durables & Apparel | | | 161,629 | | | | — | | | | — | | | | 161,629 | | | | | | | |
| | | | | | | | | | | | | | | | | | | | | | | |
| TOTAL COMMON STOCKS | | | 10,978,585 | | | | — | | | | — | | | | 10,978,585 | | | | | | | |
| | | | | | | | | | | | | | | | | | | | | | | |
| TOTAL INVESTMENTS | | | 10,978,585 | | | | — | | | | — | | | | 10,978,585 | | | | | | | |
| | | | | | | | | | | | | | | | | | | | | | | |
| TOTAL | | $ | 10,978,585 | | | $ | — | | | $ | — | | | $ | 10,978,585 | | | | | | | |
| | | | | | | | | | | | | | | | | | | | | | | |
| | |
| 228 | Artio Global Funds ï 2010 Annual Report | |
NOTES TO FINANCIAL STATEMENTS (Continued)
U.S. Smallcap Fund
Assets Valuation Input
| | | | | | | | | | | | | | | | | | | | | | | |
| | | Quoted Prices
| | | | | | | | | | |
| | | in Active
| | Significant
| | | | | | | | |
| | | Markets for
| | Other
| | Significant
| | | | | | |
| | | Identical
| | Observable
| | Unobservable
| | | | | | |
| | | Assets
| | Inputs
| | Inputs
| | | | | | |
| Description | | (Level 1) | | (Level 2) | | (Level 3) | | Total | | | | |
| COMMON STOCKS | | | | | | | | | | | | | | | | | | | | | | |
| Semiconductors & Semiconductor Equipment | | $ | 10,099,238 | | | $ | — | | | $ | — | | | $ | 10,099,238 | | | | | | | |
| Retailing | | | 7,585,658 | | | | — | | | | — | | | | 7,585,658 | | | | | | | |
| Pharmaceuticals & Biotechnology | | | 7,432,994 | | | | — | | | | — | | | | 7,432,994 | | | | | | | |
| Diversified Financials | | | 7,104,372 | | | | — | | | | — | | | | 7,104,372 | | | | | | | |
| Capital Goods | | | 7,102,733 | | | | — | | | | — | | | | 7,102,733 | | | | | | | |
| Banks | | | 6,398,934 | | | | — | | | | — | | | | 6,398,934 | | | | | | | |
| Energy | | | 5,399,425 | | | | — | | | | — | | | | 5,399,425 | | | | | | | |
| Materials | | | 4,852,361 | | | | — | | | | — | | | | 4,852,361 | | | | | | | |
| Technology Hardware & Equipment | | | 4,294,768 | | | | — | | | | — | | | | 4,294,768 | | | | | | | |
| Health Care Equipment & Services | | | 4,096,202 | | | | — | | | | — | | | | 4,096,202 | | | | | | | |
| Software & Services | | | 3,433,475 | | | | — | | | | — | | | | 3,433,475 | | | | | | | |
| Commercial & Professional Services | | | 2,965,561 | | | | — | | | | — | | | | 2,965,561 | | | | | | | |
| Consumer Services | | | 2,878,103 | | | | — | | | | — | | | | 2,878,103 | | | | | | | |
| Media | | | 1,910,643 | | | | — | | | | — | | | | 1,910,643 | | | | | | | |
| Insurance | | | 1,739,904 | | | | — | | | | — | | | | 1,739,904 | | | | | | | |
| Transportation | | | 1,670,282 | | | | — | | | | — | | | | 1,670,282 | | | | | | | |
| Consumer Durables & Apparel | | | 1,408,234 | | | | — | | | | — | | | | 1,408,234 | | | | | | | |
| Household & Personal Products | | | 1,156,161 | | | | — | | | | — | | | | 1,156,161 | | | | | | | |
| Food, Beverage & Tobacco | | | 1,068,314 | | | | — | | | | — | | | | 1,068,314 | | | | | | | |
| | | | | | | | | | | | | | | | | | | | | | | |
| TOTAL COMMON STOCKS | | | 82,597,362 | | | | — | | | | — | | | | 82,597,362 | | | | | | | |
| | | | | | | | | | | | | | | | | | | | | | | |
| REPURCHASE AGREEMENT | | | — | | | | 379,762 | | | | — | | | | 379,762 | | | | | | | |
| | | | | | | | | | | | | | | | | | | | | | | |
| TOTAL INVESTMENTS | | | 82,597,362 | | | | 379,762 | | | | — | | | | 82,977,124 | | | | | | | |
| | | | | | | | | | | | | | | | | | | | | | | |
| TOTAL | | $ | 82,597,362 | | | $ | 379,762 | | | $ | — | | | $ | 82,977,124 | | | | | | | |
| | | | | | | | | | | | | | | | | | | | | | | |
| | |
| Artio Global Funds ï 2010 Annual Report | 229 |
NOTES TO FINANCIAL STATEMENTS (Continued)
U.S. Midcap Fund
Assets Valuation Input
| | | | | | | | | | | | | | | | | | | | | | | |
| | | Quoted Prices
| | | | | | | | | | |
| | | in Active
| | Significant
| | | | | | | | |
| | | Markets for
| | Other
| | Significant
| | | | | | |
| | | Identical
| | Observable
| | Unobservable
| | | | | | |
| | | Assets
| | Inputs
| | Inputs
| | | | | | |
| Description | | (Level 1) | | (Level 2) | | (Level 3) | | Total | | | | |
| COMMON STOCKS | | | | | | | | | | | | | | | | | | | | | | |
| Pharmaceuticals & Biotechnology | | $ | 597,007 | | | $ | — | | | $ | — | | | $ | 597,007 | | | | | | | |
| Software & Services | | | 580,816 | | | | — | | | | — | | | | 580,816 | | | | | | | |
| Diversified Financials | | | 545,289 | | | | — | | | | — | | | | 545,289 | | | | | | | |
| Semiconductors & Semiconductor Equipment | | | 503,926 | | | | — | | | | — | | | | 503,926 | | | | | | | |
| Energy | | | 501,361 | | | | — | | | | — | | | | 501,361 | | | | | | | |
| Retailing | | | 485,996 | | | | — | | | | — | | | | 485,996 | | | | | | | |
| Materials | | | 466,264 | | | | — | | | | — | | | | 466,264 | | | | | | | |
| Capital Goods | | | 450,782 | | | | — | | | | — | | | | 450,782 | | | | | | | |
| Commercial & Professional Services | | | 338,685 | | | | — | | | | — | | | | 338,685 | | | | | | | |
| Banks | | | 289,267 | | | | — | | | | — | | | | 289,267 | | | | | | | |
| Health Care Equipment & Services | | | 257,372 | | | | — | | | | — | | | | 257,372 | | | | | | | |
| Consumer Services | | | 215,976 | | | | — | | | | — | | | | 215,976 | | | | | | | |
| Food, Beverage & Tobacco | | | 183,812 | | | | — | | | | — | | | | 183,812 | | | | | | | |
| Technology Hardware & Equipment | | | 150,439 | | | | — | | | | — | | | | 150,439 | | | | | | | |
| Transportation | | | 148,804 | | | | — | | | | — | | | | 148,804 | | | | | | | |
| Insurance | | | 122,898 | | | | — | | | | — | | | | 122,898 | | | | | | | |
| Real Estate | | | 119,730 | | | | — | | | | — | | | | 119,730 | | | | | | | |
| Consumer Durables & Apparel | | | 110,419 | | | | — | | | | — | | | | 110,419 | | | | | | | |
| Media | | | 95,485 | | | | — | | | | — | | | | 95,485 | | | | | | | |
| Household & Personal Products | | | 84,519 | | | | — | | | | — | | | | 84,519 | | | | | | | |
| Food & Staples Retailing | | | 63,600 | | | | — | | | | — | | | | 63,600 | | | | | | | |
| | | | | | | | | | | | | | | | | | | | | | | |
| TOTAL COMMON STOCKS | | | 6,312,447 | | | | — | | | | — | | | | 6,312,447 | | | | | | | |
| | | | | | | | | | | | | | | | | | | | | | | |
| TOTAL INVESTMENTS | | | 6,312,447 | | | | — | | | | — | | | | 6,312,447 | | | | | | | |
| | | | | | | | | | | | | | | | | | | | | | | |
| TOTAL | | $ | 6,312,447 | | | $ | — | | | $ | — | | | $ | 6,312,447 | | | | | | | |
| | | | | | | | | | | | | | | | | | | | | | | |
| | |
| 230 | Artio Global Funds ï 2010 Annual Report | |
NOTES TO FINANCIAL STATEMENTS (Continued)
U.S. Multicap Fund
Assets Valuation Input
| | | | | | | | | | | | | | | | | | | | | | | |
| | | Quoted Prices
| | | | | | | | | | |
| | | in Active
| | Significant
| | | | | | | | |
| | | Markets for
| | Other
| | Significant
| | | | | | |
| | | Identical
| | Observable
| | Unobservable
| | | | | | |
| | | Assets
| | Inputs
| | Inputs
| | | | | | |
| Description | | (Level 1) | | (Level 2) | | (Level 3) | | Total | | | | |
| COMMON STOCKS | | | | | | | | | | | | | | | | | | | | | | |
| Diversified Financials | | $ | 1,058,296 | | | $ | — | | | $ | — | | | $ | 1,058,296 | | | | | | | |
| Technology Hardware & Equipment | | | 896,892 | | | | — | | | | — | | | | 896,892 | | | | | | | |
| Pharmaceuticals & Biotechnology | | | 837,482 | | | | — | | | | — | | | | 837,482 | | | | | | | |
| Capital Goods | | | 828,008 | | | | — | | | | — | | | | 828,008 | | | | | | | |
| Software & Services | | | 734,480 | | | | — | | | | — | | | | 734,480 | | | | | | | |
| Energy | | | 632,563 | | | | — | | | | — | | | | 632,563 | | | | | | | |
| Materials | | | 625,276 | | | | — | | | | — | | | | 625,276 | | | | | | | |
| Food, Beverage & Tobacco | | | 428,950 | | | | — | | | | — | | | | 428,950 | | | | | | | |
| Health Care Equipment & Services | | | 417,314 | | | | — | | | | — | | | | 417,314 | | | | | | | |
| Consumer Services | | | 313,435 | | | | — | | | | — | | | | 313,435 | | | | | | | |
| Retailing | | | 296,092 | | | | — | | | | — | | | | 296,092 | | | | | | | |
| Banks | | | 259,757 | | | | — | | | | — | | | | 259,757 | | | | | | | |
| Transportation | | | 190,244 | | | | — | | | | — | | | | 190,244 | | | | | | | |
| Semiconductors & Semiconductor Equipment | | | 187,125 | | | | — | | | | — | | | | 187,125 | | | | | | | |
| Media | | | 163,374 | | | | — | | | | — | | | | 163,374 | | | | | | | |
| Commercial & Professional Services | | | 161,774 | | | | — | | | | — | | | | 161,774 | | | | | | | |
| Household & Personal Products | | | 141,752 | | | | — | | | | — | | | | 141,752 | | | | | | | |
| Consumer Durables & Apparel | | | 114,502 | | | | — | | | | — | | | | 114,502 | | | | | | | |
| | | | | | | | | | | | | | | | | | | | | | | |
| TOTAL COMMON STOCKS | | | 8,287,316 | | | | — | | | | — | | | | 8,287,316 | | | | | | | |
| | | | | | | | | | | | | | | | | | | | | | | |
| TOTAL INVESTMENTS | | | 8,287,316 | | | | — | | | | — | | | | 8,287,316 | | | | | | | |
| | | | | | | | | | | | | | | | | | | | | | | |
| TOTAL | | $ | 8,287,316 | | | $ | — | | | $ | — | | | $ | 8,287,316 | | | | | | | |
| | | | | | | | | | | | | | | | | | | | | | | |
| | |
| Artio Global Funds ï 2010 Annual Report | 231 |
NOTES TO FINANCIAL STATEMENTS (Continued)
b) Repurchase agreements: The Funds may engage in repurchase agreement transactions. Under the terms of a typical repurchase agreement, a Fund takes possession of an underlying debt obligation in return for the use of the Fund’s available cash, subject to an agreement by the seller to repurchase and the Fund to resell the obligation, at an agreed-upon price and time. Thus, the yield during the Fund’s holding period is determinable. This arrangement results in a fixed rate of return that is not subject to market fluctuations during a Fund’s holding period. The value of the collateral at all times is equal to at least 102% of the total amount of the repurchase obligations, including accrued interest. In the event of counterparty default, the Fund has the right to use the collateral to offset losses incurred. There is potential loss to a Fund in the event a Fund is delayed or prevented from exercising its rights to dispose of the collateral securities, including the risk of a possible decline in the value of the underlying securities during the period in which the Fund seeks to assert its rights. The Funds’ investment adviser reviews the value of the collateral and the creditworthiness of those banks and dealers with whom the Funds enter into repurchase agreements to evaluate potential risks. The Funds primarily engage in repurchase agreements with Fixed Income Clearing Corporation (FICC) through their custodian to accommodate cash sweeps of any residual U.S. dollars held in a particular portfolio.
c) Foreign currency: The books and records of the Funds are maintained in U.S. dollars. Foreign currencies and investments and other assets and liabilities denominated in foreign currencies are translated into U.S. dollars at the exchange rates prevailing at the end of the period as defined by the Funds’ Valuation Procedures. Purchases and sales of investment securities and income and expenses are translated on the respective dates of such transactions. Unrealized gains or losses on investments denominated in foreign currencies which result from changes in foreign currencies have been included in the net unrealized appreciation or depreciation of investments. Net realized currency gains and losses include foreign currency gains and losses occurring between trade date and settlement date on investment securities transactions, gains and losses from foreign currency transactions and the gains and losses from differences between the amounts of interest and dividends recorded on the books of the Funds and the amounts actually received. The portion of foreign currency gains and losses related to fluctuations in exchange rates between the purchase settlement date and sale trade date is included in realized gains and losses on security transactions.
d) Forward foreign currency contracts: As part of their investment strategy, Funds entered into forward foreign currency contracts to manage the portfolio holdings against currency risks. Funds also utilized forward foreign currency contracts to
| | |
| 232 | Artio Global Funds ï 2010 Annual Report | |
NOTES TO FINANCIAL STATEMENTS (Continued)
reduce or eliminate underweighted positions in a currency relative to its benchmark when purchasing underlying investments denominated in that currency is not advisable by the adviser. Forward foreign currency contracts are valued at the forward rate and are marked-to-market at each valuation date in the manner set forth by the Funds’ Valuation Procedures. The change in fair value is recorded by a Fund as an unrealized gain or loss. When the contract is closed, a Fund records a realized gain or loss equal to the difference between the value of the contract at the time it was opened and the value at the time it was closed. Such imperfect correlation may prevent the Fund from achieving the intended hedge or expose the Fund to the risk of currency exchange loss.
The use of forward foreign currency contracts does not eliminate fluctuations in the underlying prices of a Fund’s portfolio securities, but it does establish a rate of exchange that can be achieved in the future. Although forward foreign currency contracts to sell foreign currency limit the risk of loss due to a decline in the value of the currency holdings, they also limit any potential gain that might result should the value of the currency increase. In addition, a Fund could be exposed to risks if the counterparties to the contracts are unable to meet the terms of the contracts.
Some of the forward foreign currency contracts entered into by the Funds are classified as non-deliverable forwards (“NDF”). NDFs are cash-settled, short-term forward contracts that have limited trading or are denominated in non-convertible foreign currency, where the profit or loss at the time of the settlement date is calculated by taking the difference between the agreed upon exchange rate and the spot rate at the time of settlement, for an agreed upon notional amount of funds. All NDFs have a fixing date and a settlement date. The fixing date is the date at which the difference between the prevailing market exchange rate and the agreed upon exchange rate is calculated. The settlement date is the date by which the payment of the difference is due to the party receiving payment. NDFs are commonly quoted for time periods of one month up to one year, and are normally quoted and settled in U.S. dollars. They are often used to gain exposure to and/or to hedge exposure to foreign currencies that are not internationally traded. With respect to a Fund’s obligations to purchase or sell currencies under forward foreign currency contracts, a Fund will earmark liquid securities having a value at least equal to its obligations, or continue to own or have the right to sell or acquire respectively, the currency subject to the forward foreign currency contract. The Funds’ maximum risk of loss from counterparty credit risk is the unrealized appreciation of forward foreign exchange contracts recorded on the Statement of Asset and Liabilities.
| | |
| Artio Global Funds ï 2010 Annual Report | 233 |
NOTES TO FINANCIAL STATEMENTS (Continued)
e) Bank loans: The Global High Income Fund may invest in bank loans. Bank loans include institutionally traded floating and fixed-rate debt obligations generally acquired as a participation interest in or assignment of a loan originated by a lender or financial institution. Assignments and participations involve credit, interest rate, and liquidity risk. Interest rates on floating rate securities adjust with interest rate changes and/or issuer credit quality. Many such loans are secured, although some may be unsecured. Loans that are fully secured offer a fund more protection than an unsecured loan in the event of non-payment of scheduled interest or principal. There is no assurance that any collateral securing a loan could be liquidated or, if liquidated, that such collateral would be of sufficient value to repay the loans taken against it. There may be limited secondary market liquidity for these instruments which could result in volatile pricing for the securities which in turn may affect this Fund’s NAV.
The Fund may enter into, or acquire participation in, delayed funding loans and revolving credit facilities. Delayed funding loans and revolving credit facilities are borrowings in which the Fund agrees to make loans up to a maximum amount upon demand by the borrowing issuer for a specified term. A revolving credit facility differs from a delayed funding loan in that as the borrowing issuer repays the loan, an amount equal to the repayment is again made available to the borrowing issuer under the facility. The borrowing issuer may at any time borrow and repay amounts so long as, in the aggregate, at any given time the amount borrowed does not exceed the maximum amount. Delayed funding loans and revolving credit facilities usually provide for floating or variable rates of interest.
There are a number of risks associated with an investment in delayed funding loans and revolving credit facilities including credit, interest rate and liquidity risk and the risks of being a lender. There may be circumstances under which the borrowing issuer’s credit risk may be deteriorating and yet the Fund may be obligated to make loans to the borrowing issuer as the borrowing issuer’s credit continues to deteriorate, including at a time when the borrowing issuer’s financial condition makes it unlikely that such amounts will be repaid. Delayed funding loans and revolving credit facilities may be subject to restrictions on transfer, and only limited opportunities may exist to resell such instruments. As a result, the Fund may be unable to sell such investments at an opportune time or may have to resell them at less than fair market value. These risks could cause the Fund to lose money on its investment, which in turn could affect the Fund’s returns. The Fund currently intends to treat delayed funding loans and revolving credit facilities for which there is no readily available market as illiquid for purposes of the Fund’s limitation on illiquid investments. Delayed funding loans and revolving credit facilities are considered
| | |
| 234 | Artio Global Funds ï 2010 Annual Report | |
NOTES TO FINANCIAL STATEMENTS (Continued)
to be debt obligations for purposes of the Trust’s investment restriction relating to the lending of funds or assets by the Fund.
At October 31, 2010, there were three unfunded commitments which amounted to $23,305,533 of par and and had cost and fair value of $19,278,187 and $22,242,197, respectively.
f) Foreign securities: Investing in securities of foreign companies and foreign governments involves special risks and considerations not typically associated with investing in U.S. companies and the U.S. government. These risks include the loss of value in investments of foreign securities because of currency exchange rate fluctuations, price volatility that may exceed the volatility of U.S. securities, uncertain political conditions, lack of timely and reliable financial information and other factors. These risks are increased for investment in emerging markets. Emerging market securities involve unique risks, such as exposure to economies less diverse and mature than that of the U.S. or more established foreign markets. Economic or political instability may cause larger price changes in emerging market securities than other foreign securities. Moreover, securities of many foreign companies and foreign governments and their markets may be less liquid and their prices more volatile than those of securities of comparable U.S. companies and the U.S. government.
g) Financial futures contracts: In order to gain exposure to or protect against changes in security values, the Funds bought and sold futures contracts. The primary risks associated with the use of futures contracts are the imperfect correlation between changes in fair values of securities held by the Funds and the prices of future contracts, and the possibility of an illiquid market. To the extent fluctuations in value are not settled with the counterparty on a daily basis, the Funds are also subject to the credit risk of the counterparty. Cash collateral for futures contracts outstanding may be held by the broker on certain contracts. These amounts are included on the Statement of Assets and Liabilities as cash on deposit with broker. The Funds entered into futures contracts for hedging purposes, managing the duration and yield curve profile, market exposure or to enhance income.
Futures contracts are valued based upon their quoted daily settlement prices. The aggregate principal amounts of the contracts are not recorded in the financial statements. The Funds generally agree to receive from or pay to the broker an amount of cash equal to the daily fluctuations in the value of the contract. Such receipts or payments are known as “variation margin” and are recorded by a Fund as unrealized gains or losses. Fluctuations in the value of the contracts are recorded in the Statement of Operations as unrealized gains or losses until the contracts are
| | |
| Artio Global Funds ï 2010 Annual Report | 235 |
NOTES TO FINANCIAL STATEMENTS (Continued)
closed, at which point they are recorded as net realized gains or losses on futures contracts.
The Funds entered into swap contracts that function similar to futures contracts (synthetic futures) to gain exposure and to protect against changes in security values. Generally these contracts are counterparty agreements and do not require daily variation margin payments to be directly paid to the counterparty, however they do require hard segregation of cash. These amounts are included on the Statement of Assets and Liabilities as cash on deposit with broker. The Funds are exposed to the credit risk of the counterparty in addition to the risks described above. The accounting treatment of such contracts is similar to that described above for standard futures contracts. The Funds disclose synthetic futures with other futures contracts. The Funds’ maximum risk of loss associated with futures contracts is minimal since futures contracts are exchange traded and the exchange’s clearinghouse, as counterparty to all exchange traded futures contracts, guarantee the futures contracts against default. The Fund’s maximum risk of loss due to counterparty credit risk for synthetic futures contracts is the unrealized appreciation for synthetic futures contracts.
h) Options: The Funds may write options to generate current income and to manage investment risk. Each Fund may write any call option or put option that is covered and immediately thereafter the aggregate market value of all portfolio securities or currencies required to cover such options written by a Fund would not exceed 25% of its net assets. A Fund will realize fees (referred to as “premiums”) for granting the rights evidenced by the call options it has written. When a Fund writes a call option or a put option, an amount equal to the premium received by that Fund is recorded as a liability, the value of which is marked-to-market at each valuation date. When a written option expires, that Fund realizes a gain equal to the amount of the premium originally received. When a Fund enters into a closing purchase transaction, the Fund realizes a gain (or loss if the cost of the closing purchase transaction exceeds the premium originally received when the option was sold/written) without regard to any unrealized gain or loss on the underlying security, and the liability related to such option is eliminated. When a call option is exercised, a Fund realizes a gain or loss from the sale of the underlying security and the proceeds from such sale are increased by the amount of the premium originally received. When a put option is exercised, the amount of the premium originally received will reduce the cost of the security the Fund purchased upon exercise. The Funds will only write covered options.
| | |
| 236 | Artio Global Funds ï 2010 Annual Report | |
NOTES TO FINANCIAL STATEMENTS (Continued)
The Funds may purchase put and call options that are traded on foreign as well as U.S. exchanges and in the over-the-counter market. Each Fund may utilize up to 5% of its total assets to purchase both put options on portfolio securities and instruments in which it may invest and an additional 5% of its total assets to purchase call options on securities and instruments in which it may invest. Purchases of put and call options are recorded as an investment, the value of which is marked-to-market at each valuation date. When a purchased option expires, no proceeds will be expected and a Fund will realize a loss. When a Fund exercises a put option, it will realize a gain or loss from the sale of the underlying security and the proceeds from such sale will be decreased by the premium originally paid. When a Fund exercises a call option, the cost of the security which the Fund purchases upon exercise will be increased by the premium originally paid.
Each Fund, except the Total Return Bond Fund, may purchase and sell call and put options on stock indices. In contrast to an option on a security, an option on a stock index provides the holder with the right but not the obligation to make or receive a cash settlement upon exercise of the option, rather than the right to purchase or sell a security. The amount of this settlement is equal to (i) the amount, if any, by which the fixed exercise price of the option exceeds (in the case of a call) or is below (in the case of a put) the closing value of the underlying index on the date of exercise, multiplied by (ii) a fixed “index multiplier.”
A Fund’s risks in using these contracts include changes in the value of the underlying instruments, non-performance of the counterparties under the contracts’ terms and changes in the liquidity of the secondary market for the contracts. The Fund’s maximum risk of loss from counterparty risk related to non-exchange traded purchased options is the fair value of the investment. The Funds’ maximum risk of loss from counterparty risk related to written non-exchange traded options is minimal as the Funds’ receive the premium when the options are sold. This risk is mitigated by having a master netting arrangement between the Funds and the counterparty and by the posting of collateral by the counterparty to the Funds to cover the Funds’ exposure to the counterparty.
i) Swaps: The Funds entered into interest rate, total return and credit default swaps primarily to preserve a return or spread on a particular investment or portion of their portfolio. The Funds may also enter into currency and index swaps to protect against currency fluctuations, as a duration management technique or to protect against any increase in the price of securities the Funds anticipate purchasing at a later date. Interest rate swaps involve the exchange with another party of their respective commitments to pay or receive interest, for example, an exchange of
| | |
| Artio Global Funds ï 2010 Annual Report | 237 |
NOTES TO FINANCIAL STATEMENTS (Continued)
floating rate payments for fixed rate payments with respect to a notional amount of principal. A currency swap is an agreement to exchange cash flows on a notional amount of two or more currencies based on the relative value differential among them and an index swap is an agreement to swap cash flows on a notional amount based on changes in the values of the reference indices. A total return swap is an agreement to exchange the return on a stock, bond or index for a fixed or variable financing charge. A credit default swap is an agreement between two counterparties that allows one party to be “long” a third-party credit risk, and the other party to be “short” the credit risk. Credit default swaps are designed to transfer the credit exposure of fixed income products between parties.
The Funds will usually enter into swaps on a net basis, that is, the two payment streams are netted out in a cash settlement on the payment date or dates specified in the instrument, with a Fund receiving or paying, as the case may be, only the net amount of the two payments. In as much as these swaps are entered into for good faith hedging purposes, the investment adviser believes such obligations do not constitute senior securities under the 1940 Act, and, accordingly, will not treat them as being subject to its borrowing restrictions. The Funds will not enter into any swap transaction unless, at the time of entering into such transaction, the unsecured long-term debt of the counterparty, combined with any credit enhancements on the swap contracts, is rated at least A by Standard & Poor’s (S&P) or Moody’s or has an equivalent rating from a Nationally Recognized Statistical Rating Organization (“NRSRO”) or is determined to be of equivalent credit quality by the investment adviser. If there is a default by the counterparty, the Funds may have contractual remedies pursuant to the agreements related to the transaction.
Entering into swap agreements involves, to varying degrees, elements of credit and market risk in excess of the amounts recognized on the Statements of Assets and Liabilities. Such risks involve the possibility that there will be no liquid market for these agreements, that the counterparty to the agreements may default on its obligation to perform and that there may be unfavorable changes in the value of the index or securities underlying the agreement. The Funds’ maximum risk of loss from couterparty risk related to swaps is the fair value of the contract. This risk is mitigated by having a master netting agreement between the Funds and the counterparties and by the posting of collateral by the counterparties to the Funds to cover the Funds’ exposure to the counterparty.
Certain Funds hold derivative instruments which contain credit-risk-related contingent provisions. If the Fund’s net assets were to fall below certain thresholds from the prior fiscal year net assets, it would be in violation of these provisions, and the
| | |
| 238 | Artio Global Funds ï 2010 Annual Report | |
NOTES TO FINANCIAL STATEMENTS (Continued)
counterparties to the derivative instruments could request immediate payment or demand immediate and ongoing full overnight collateralization on derivative instruments in net liability positions. The aggregate fair value of all derivative instruments with credit-risk-related contingent features that are in a liability position on October 31, 2010, is $797,128 for which the Global High Income Fund has pledged collateral of $1,020,000 in the normal course of business.
j) Securities lending: Global Equity Fund, International Equity Fund, International Equity Fund II, U.S. Microcap Fund, U.S. Smallcap Fund, U.S. Midcap Fund and U.S. Multicap Fund have established securities lending agreements with State Street Bank and Trust Company (“State Street”) in which the Funds lend portfolio securities to a broker. In exchange, collateral consisting of either cash or U.S. government securities in an amount of at least 102% of the value of the U.S. securities loaned and 105% of the value of the foreign securities loaned will be maintained at all times. These Funds may loan securities to brokers, dealers, and financial institutions determined by Artio Global Management LLC, (“Artio Global” or “Adviser”) to be creditworthy, subject to certain limitations. Under these agreements, these Funds continue to earn income on the securities loaned. Collateral received is generally cash, and such Funds invest the cash in the State Street Navigator Securities Lending Prime Portfolio. These Funds receive any interest on the amount invested, but they must also pay the broker a loan rebate fee computed as a varying percentage of the collateral received. In the event of counterparty default, these Funds are subject to potential loss if any such Fund is delayed or prevented from exercising its right to dispose of the collateral. These Funds each bear risk in the event that invested collateral is not sufficient to meet obligations due on the loans.
The security lending income net of the loan rebate fee for the Global Equity Fund, International Equity Fund and the International Equity Fund II, amounted to $243, $7,261,120 and $6,505,334, respectively, for the year ended October 31, 2010 and is included in securities lending income in the Statement of Operations.
As of October 31, 2010, the value of the securities on loan and the value of the collateral was as follows:
| | | | | | | | | | | |
| | | Fair Value of
| | | | |
| | | Securities on Loan | | Value of Collateral | | |
| International Equity Fund | | $ | 314,517,357 | | | $ | 323,390,282 | | | |
| International Equity Fund II | | | 236,855,549 | | | | 244,252,923 | | | |
| | | | | | | | | | | |
| | |
| Artio Global Funds ï 2010 Annual Report | 239 |
NOTES TO FINANCIAL STATEMENTS (Continued)
k) Securities transactions and investment income: Securities transactions are recorded as of the trade date. Realized gains and losses from securities transactions are recorded on the identified cost basis. Interest income is recorded on an accrual basis and includes amortization and accretion of bond premiums and discounts, respectively, using the effective interest method. Dividend income is recorded in the Statement of Operations on the ex-dividend date or when the Funds become aware of the dividend distribution in the case of certain foreign securities. It is expected that certain capital gains earned by the Funds and certain dividends and interest received by the Funds will be subject to foreign withholding taxes.
The Funds are subject to an Imposto sobre Operacoes Financeiras (IOF) transaction tax levied by the Brazilian government on certain foreign exchange transactions related to security transactions executed across Brazilian exchanges. The IOF tax has been included in net realized gain (loss) from foreign currency transactions in the Statement of Operations.
l) Dividends and distributions to shareholders: Distributions to shareholders are recorded on the ex-dividend date. Each Fund intends to distribute annually to its shareholders substantially all of its taxable income. Total Return Bond Fund and Global High Income Fund declare and pay dividends monthly. International Equity Fund, International Equity Fund II, Global Equity Fund, U.S. Microcap Fund, U.S. Smallcap Fund, U.S. Midcap Fund and U.S. Multicap Fund declare and pay dividends from net investment income, if any, annually. The Funds will distribute net realized capital gains, if any, annually. Additional distributions of net investment income and capital gains may be made at the discretion of the Boards of the Funds to avoid the application of the excise tax imposed under Section 4982 of the Internal Revenue Code of 1986, as amended, for certain undistributed amounts. Income distributions and capital gain distributions are determined in accordance with income tax regulations which may differ from generally accepted accounting principles. These differences are primarily due to differing treatments of income and gains on various investment securities held by the Funds, timing differences and differing characterization of distributions made by the Funds as a whole.
m) Federal income taxes: The Global Equity Fund and the Trust intend that each Fund separately qualify as a regulated investment company for U.S. federal income tax purposes. Accordingly, the Funds do not anticipate that any income taxes will be paid.
The Adviser has performed an analysis of each Fund’s tax positions for the open tax years as of October 31, 2010 and has concluded that no provisions for income tax are required. The Adviser is not aware of any events that are reasonably possible to
| | |
| 240 | Artio Global Funds ï 2010 Annual Report | |
NOTES TO FINANCIAL STATEMENTS (Continued)
occur in the next twelve months that would result in the amounts of any unrecognized tax benefits significantly increasing or decreasing for the Funds. However, management’s conclusions regarding tax positions taken may be subject to review and adjustment at a later date based on factors including, but not limited to, new tax laws and accounting regulations and interpretations thereof. The Funds’ income and excise tax returns and all financial records supporting those returns for the prior three fiscal years are subject to examination by the federal, Massachusetts and Delaware revenue authorities.
| |
| 3. | Investment Advisory Fee and Other Transactions |
Artio Global serves as the Funds’ investment adviser. Artio Global receives advisory fees, based on average net assets, at the following rates:
| | | | | |
| Global Equity Fund | | 0.90% | | |
| International Equity Fund | | 0.90% of the first 7.5 billion | | |
| | | 0.88% of the next 2.5 billion | | |
| | | 0.85% of any in excess of 10 billion | | |
| International Equity Fund II | | 0.90% of the first 7.5 billion | | |
| | | 0.88% of the next 2.5 billion | | |
| | | 0.85% of any in excess of 10 billion | | |
| Total Return Bond Fund | | 0.35% | | |
| Global High Income Fund | | 0.65% | | |
| U.S. Microcap Fund | | 1.25% | | |
| U.S. Smallcap Fund | | 0.95% | | |
| U.S. Midcap Fund | | 0.80% | | |
| U.S. Multicap Fund | | 0.75% | | |
| | | | | |
Effective May 1, 2008, the Adviser agreed to waive a portion of its management fee for each of the Funds at the annual rate of 0.005% of the respective Funds’ average daily net assets. This waiver may be terminated at any time by the Funds’ Boards.
The Adviser has contractually agreed to reimburse certain expenses of the Funds listed in the table below, through February 28, 2011, so that the net operating expenses of each Fund (excluding interest, taxes, brokerage commissions, and extraordinary expenses) based on average daily net assets are limited (the “Expense Limit”) as specified in the table below. Any Fund with a reimbursement plan has agreed to allow the Adviser to recoup expenses reimbursed to each Fund provided that repayment does not cause each of the Fund’s annual operating expenses to exceed the Expense Limit in place at the time of the reimbursement. Any such recoupment must be made within three years after the year in which the Adviser incurred the expense. The table below specifies the reimbursement made to each Fund by the Adviser for the year ended October 31, 2010 and the Adviser’s potential recoupment as of October 31, 2010.
| | |
| Artio Global Funds ï 2010 Annual Report | 241 |
NOTES TO FINANCIAL STATEMENTS (Continued)
| | | | | | | | | | | | | | | | | | | | | | | | | | | |
| | | | | | | Total
| | | | | | | | |
| | | | | | | Expenses
| | | | Expenses
| | Total
| | |
| | | | | | | Eligible for
| | Expenses
| | Recouped
| | Expenses
| | |
| | | | | | | Recoupment -
| | Waived -
| | or Expired -
| | Eligible for
| | |
| | | Expense Limitations | | Beginning
| | Current
| | Current
| | Recoupment -
| | |
| | | Class A | | Class I | | of Period | | Period | | Period | | October 31, 2010 | | |
| Global Equity Fund | | | 1.40 | % | | | 1.15 | % | | $ | 872,631 | | | $ | 226,359 | | | $ | (377,251 | ) | | $ | 721,739 | | | |
| Total Return Bond Fund | | | 0.69 | % | | | 0.44 | % | | | 904,797 | | | | 10,609 | | | | (698,492 | ) | | | 216,914 | | | |
| Global High Income Fund | | | 1.00 | % | | | 0.75 | % | | | 441,049 | | | | — | | | | (326,160 | ) | | | 114,889 | | | |
| U.S. Microcap Fund | | | 1.80 | % | | | 1.50 | % | | | 324,603 | | | | 87,348 | | | | (115,922 | ) | | | 296,029 | | | |
| U.S. Smallcap Fund | | | 1.50 | % | | | 1.20 | % | | | 319,905 | | | | 36,593 | | | | (114,682 | ) | | | 241,816 | | | |
| U.S. Midcap Fund | | | 1.35 | % | | | 1.05 | % | | | 301,328 | | | | 89,426 | | | | (108,233 | ) | | | 282,521 | | | |
| U.S. Multicap Fund | | | 1.30 | % | | | 1.00 | % | | | 306,861 | | | | 85,087 | | | | (107,939 | ) | | | 284,009 | | | |
| | | | | | | | | | | | | | | | | | | | | | | | | | | |
The expenses eligible for recoupment at October 31, 2010 are set to expire as follows:
| | | | | | | | | | | |
| | | | | Expire
| | |
| | | Amount | | October 31, | | |
| Global Equity Fund | | $ | 255,173 | | | | 2011 | | | |
| | | | 240,207 | | | | 2012 | | | |
| | | | 226,359 | | | | 2013 | | | |
| Total Return Bond Fund | | $ | 206,305 | | | | 2011 | | | |
| | | | — | | | | 2012 | | | |
| | | | 10,609 | | | | 2013 | | | |
| Global High Income Fund | | $ | 108,448 | | | | 2011 | | | |
| | | | 6,441 | | | | 2012 | | | |
| | | | — | | | | 2013 | | | |
| U.S. Microcap Fund | | $ | 113,400 | | | | 2011 | | | |
| | | | 95,281 | | | | 2012 | | | |
| | | | 80,640 | | | | 2013 | | | |
| U.S. Smallcap Fund | | $ | 115,741 | | | | 2011 | | | |
| | | | 89,482 | | | | 2012 | | | |
| | | | 28,052 | | | | 2013 | | | |
| U.S. Midcap Fund | | $ | 105,181 | | | | 2011 | | | |
| | | | 87,914 | | | | 2012 | | | |
| | | | 81,503 | | | | 2013 | | | |
| U.S. Multicap Fund | | $ | 107,874 | | | | 2011 | | | |
| | | | 91,048 | | | | 2012 | | | |
| | | | 76,998 | | | | 2013 | | | |
| | | | | | | | | | | |
The Funds listed below have entered into agreements with certain brokers whereby the brokers will rebate, in cash, a portion of brokerage commissions. Rebated commission are amounts earned by the Funds and are included with income on
| | |
| 242 | Artio Global Funds ï 2010 Annual Report | |
NOTES TO FINANCIAL STATEMENTS (Continued)
investments presented in the Statement of Operations. For the year ended October 31, 2010, brokerage commissions rebated under these agreements were as follows:
| | | | | | | |
| | | Rebated
| | |
| | | Commissions | | |
| Global Equity Fund | | $ | 132 | | | |
| International Equity Fund | | | 38,214 | | | |
| International Equity Fund II | | | 37,257 | | | |
| Total Return Bond Fund | | | — | | | |
| Global High Income Fund | | | — | | | |
| U.S. Microcap Fund | | | — | | | |
| U.S. Smallcap Fund | | | — | | | |
| U.S. Midcap Fund | | | — | | | |
| U.S. Multicap Fund | | | — | | | |
| | | | | | | |
The Funds entered into expense offset arrangements as part of their custody agreement with State Street. Under this agreement, the custody fees for the International Equity Fund, International Equity Fund II, Total Return Bond Fund, and Global High Income Fund were reduced by $248,856, $306,353, $5,753, and $47,772 respectively, for the year ended October 31, 2010 due to earnings credits on cash balances maintained by the Funds in foreign sub-custodial accounts. These amounts may vary significantly over time based on the Adviser’s decisions regarding cash positions held in the Funds and current interest rates.
| |
| 4. | Distribution and Shareholder Services Plans |
The Funds have adopted a Distribution and Shareholder Services Plan (the “Plan”), pursuant to Rule 12b-1 under the 1940 Act. Under the Plan each Fund’s Class A shares may compensate certain financial institutions, including the Distributor, for certain distribution, shareholder servicing, administrative and accounting services. The Funds’ Class A shares may expend an aggregate amount, on an annual basis, not to exceed 0.25% of the value of the average daily net assets of a Fund attributable to Class A shares. The Funds will adjust accruals accordingly for any unused or surplus balances on an annual basis. The Adviser may pay additional marketing and other distribution costs out of its profits.
Quasar Distributors, LLC (“Quasar” or “Distributor”) is the Distributor of the Funds’ shares.
Under their terms, the Funds’ Plan shall remain in effect from year to year, provided such continuance is approved annually by a vote of a majority of the Boards’
| | |
| Artio Global Funds ï 2010 Annual Report | 243 |
NOTES TO FINANCIAL STATEMENTS (Continued)
members and a majority of those Boards’ members who are not “interested persons” of the Funds and who have no direct or indirect financial interest in the operation of the Plan or in any agreement related to the Plan.
The International Equity Fund is closed to new shareholders (at the account level). As a result, all 12b-1 payments made by the International Equity Fund are only to compensate certain financial intermediaries for shareholder servicing and/or asset retention.
| |
| 5. | Derivative Instruments |
a) Financial futures contracts:
At October 31, 2010, the Funds did not have any outstanding futures contracts.
b) Written Options:
The Funds did not invest in written options during the year ended October 31, 2010.
c) Swaps:
The Global High Income Fund entered into the following swap transactions as of October 31, 2010:
Global High Income Fund
Interest Rate Swaps
| | | | | | | | | | | | | | | | | | | |
Notional
| | | | Expiration
| | | | | | Fixed
| | Variable
| | Fair
| | |
| Amount | | Currency | | Date | | Counterparty | | Receive (Pay)# | | Rate | | Rate | | Value | | |
| 109,800,000 | | USD | | 06/07/2015 | | Deutsche Bank | | Receive | | 2.490% | | 3-month LIBOR | | $ | 7,013,483 | | | |
| | | | | | | | | | | | | | | | | | | |
| | | | | | | | | | | | | | | $ | 7,013,483 | | | |
| | | | | | | | | | | | | | | | | | | |
| | | |
# | | Receive–Fund receives fixed rate and pays variable rate. |
| | | (Pay)–Fund pays fixed rate and receives variable rate. |
Credit Default Swaps
| | | | | | | | | | | | | | | | | | | |
Notional
| | | | Expiration
| | | | | | Annual
| | Deliverable
| | Fair
| | |
| Amount | | Currency | | Date | | Counterparty | | Receive (Pay)ˆ | | Premium | | on Default | | Value | | |
| 6,800,000 | | USD | | 09/20/2015 | | JPMorgan Chase | | (Pay) | | 5.000% | | K. Hovanian Enterprises | | $ | 2,192,481 | | | |
| | | | | | | | | | | | | | | | | | | |
| | | | | | | | | | | | | | | $ | 2,192,481 | | | |
| | | | | | | | | | | | | | | | | | | |
| | | | | | | | | | | | | Premiums to (Pay) | | $ | 1,768,000 | | | |
| | | |
| ˆ | | Receive–Fund receives premium and sells credit protection. |
| | | (Pay)–Fund pays premium and buys credit protection. |
| | |
| 244 | Artio Global Funds ï 2010 Annual Report | |
NOTES TO FINANCIAL STATEMENTS (Continued)
Credit Default Swaps on Credit Indices-Sell Protection (1)
| | | | | | | | | | | | | | | | | | | | | | | | | | | | | | | | | |
| | | | | | | | | | | | | Upfront
| | | | Net
| | |
| | | Fixed-Deal
| | | | | | Original
| | Current
| | Premiums
| | | | Unrealized
| | |
Reference
| | Received
| | Maturity
| | | | Notional
| | Notional
| | Paid/
| | Fair
| | Appreciation/
| | |
| Obligation | | Rate | | Date | | Counterparty | | Amount | | Amount (2) | | (Received) | | Value (3) | | (Depreciation) | | |
| Grohe Holding Gmbh(T) | | | 5.00% | | | | 09/20/2015 | | | UBS AG | | $ | 9,750,000 | | | $ | 9,750,000 | | | $ | (1,553,632 | ) | | $ | (797,128 | ) | | $ | 756,504 | | | |
| CDX.NA.HY-15(T) | | | 5.00% | | | | 12/20/2015 | | | Deutsche Bank | | | 36,100,000 | | | | 36,100,000 | | | | 135,375 | | | | 338,357 | | | | 202,982 | | | |
| | | | | | | | | | | | | | | | | | | | | | | | | | | | | | | | | |
| | | | | | | | | | | | | $ | 45,850,000 | | | | | | | $ | (1,418,257 | ) | | $ | (458,771 | ) | | $ | 959,486 | | | |
| | | | | | | | | | | | | | | | | | | | | | | | | | | | | | | | | |
| | | |
(T) | | The Fund entered into this contract for speculative purposes. |
(1) | | If the Fund is a seller of protection and a credit event occurs, as defined under the terms of that particular swap agreement, the Fund will either (i) pay to the buyer of protection an amount equal to the notional amount of the swap and take delivery of the referenced obligation or underlying securities comprising the referenced index or (ii) pay a net settlement amount in the form of cash or securities equal to the notional amount of the swap less the recovery value of the referenced obligation or underlying securities comprising the referenced index. |
(2) | | The maximum potential amount the Portfolio could be required to make as a seller of credit protection or receive as a buyer of credit event as defined under the terms of that particular swap agreement. |
(3) | | The quoted market prices and resulting values for credit default swap agreements on asset-backed securities and credit indices serve as an indicator of the current status of the payment/performance risk and represent the expected amount paid or received for the credit derivative if the amount of the swap agreement was closed/sold as of the period end. Increasing market values, in absolute terms when compared to the notional amount of the swap, represent a deterioration of the referenced entity’s credit soundness and a greater likelihood or risk of default or other credit event occurring as defined under the terms of the agreements. |
d) Quantitative Disclosure of Derivative Holdings:
Funds use derivatives, which are financial contracts whose value depends on, or is derived from, the value of underlying assets, reference rates, or indices, to increase, decrease or adjust elements of the investment exposure of the Funds’ portfolios. Derivatives relate to securities, interest rates, exchange rates, inflation rates, commodities and indices, and include swaps and exchange traded and over-the-counter contracts. As of and for the year ended October 31, 2010, derivative summary tables for each Fund are as follows:
Global Equity Fund
Asset Derivatives
| | | | | | | | | | | | | | | | | | | | | | | | | | | | | | | | | |
| | | | | | | Foreign
| | | | | | | | | | | | |
| | | Statement of
| | Interest Rate
| | Exchange
| | Credit
| | Equity
| | Commodity
| | Other
| | | | |
| | | Assets and Liabilities
| | Contracts
| | Contracts
| | Contracts
| | Contracts
| | Contracts
| | Contracts
| | | | |
| | | Location | | Risk | | Risk | | Risk | | Risk | | Risk | | Risk | | Total | | |
| Forward Contracts | | Unrealized appreciation on forward foreign exchange contracts | | $ | — | | | $ | 193,244 | | | $ | — | | | $ | — | | | $ | — | | | $ | — | | | $ | 193,244 | | | |
| | | | | | | | | | | | | | | | | | | | | | | | | | | | | | | | | |
| Total Value | | | | $ | — | | | $ | 193,244 | | | $ | — | | | $ | — | | | $ | — | | | $ | — | | | $ | 193,244 | | | |
| | | | | | | | | | | | | | | | | | | | | | | | | | | | | | | | | |
| | |
| Artio Global Funds ï 2010 Annual Report | 245 |
NOTES TO FINANCIAL STATEMENTS (Continued)
Liability Derivatives
| | | | | | | | | | | | | | | | | | | | | | | | | | | | | | | | | |
| | | | | | | Foreign
| | | | | | | | | | | | |
| | | Statement of
| | Interest Rate
| | Exchange
| | Credit
| | Equity
| | Commodity
| | Other
| | | | |
| | | Assets and Liabilities
| | Contracts
| | Contracts
| | Contracts
| | Contracts
| | Contracts
| | Contracts
| | | | |
| | | Location | | Risk | | Risk | | Risk | | Risk | | Risk | | Risk | | Total | | |
| Forward Contracts | | Unrealized depreciation on forward foreign exchange contracts | | $ | — | | | $ | 245,132 | | | $ | — | | | $ | — | | | $ | — | | | $ | — | | | $ | 245,132 | | | |
| | | | | | | | | | | | | | | | | | | | | | | | | | | | | | | | | |
| Total Value | | | | $ | — | | | $ | 245,132 | | | $ | — | | | $ | — | | | $ | — | | | $ | — | | | $ | 245,132 | | | |
| | | | | | | | | | | | | | | | | | | | | | | | | | | | | | | | | |
Realized Gain (Loss)
| | | | | | | | | | | | | | | | | | | | | | | | | | | | | | | | | |
| | | | | | | Foreign
| | | | | | | | | | | | |
| | | Statement of
| | Interest Rate
| | Exchange
| | Credit
| | Equity
| | Commodity
| | Other
| | | | |
| | | Operations
| | Contracts
| | Contracts
| | Contracts
| | Contracts
| | Contracts
| | Contracts
| | | | |
| | | Location | | Risk | | Risk | | Risk | | Risk | | Risk | | Risk | | Total | | |
| Rights | | Investments | | $ | — | | | $ | — | | | $ | — | | | $ | (2,718 | ) | | $ | — | | | $ | — | | | $ | (2,718 | ) | | |
| Swaps Contracts | | Swap contracts | | | — | | | | — | | | | — | | | | 3 | | | | — | | | | — | | | | 3 | | | |
| Futures Contracts | | Financial futures contracts and synthetic futures | | | — | | | | — | | | | — | | | | (6,009 | ) | | | — | | | | — | | | | (6,009 | ) | | |
| Forward Contracts | | Forward foreign exchange contracts | | | — | | | | 319,242 | | | | — | | | | — | | | | — | | | | — | | | | 319,242 | | | |
| | | | | | | | | | | | | | | | | | | | | | | | | | | | | | | | | |
| Total Realized Gain (Loss) | | | | $ | — | | | $ | 319,242 | | | $ | — | | | $ | (8,724 | ) | | $ | — | | | $ | — | | | $ | 310,518 | | | |
| | | | | | | | | | | | | | | | | | | | | | | | | | | | | | | | | |
Change in Appreciation (Depreciation)
| | | | | | | | | | | | | | | | | | | | | | | | | | | | | | | | | |
| | | | | | | Foreign
| | | | | | | | | | | | |
| | | Statement of
| | Interest Rate
| | Exchange
| | Credit
| | Equity
| | Commodity
| | Other
| | | | |
| | | Operations
| | Contracts
| | Contracts
| | Contracts
| | Contracts
| | Contracts
| | Contracts
| | | | |
| | | Location | | Risk | | Risk | | Risk | | Risk | | Risk | | Risk | | Total | | |
| Forward Contracts | | Forward foreign exchange contracts | | $ | — | | | $ | (91,378 | ) | | $ | — | | | $ | — | | | $ | — | | | $ | — | | | $ | (91,378 | ) | | |
| | | | | | | | | | | | | | | | | | | | | | | | | | | | | | | | | |
| Total Change in Appreciation (Depreciation) | | | | $ | — | | | $ | (91,378 | ) | | $ | — | | | $ | — | | | $ | — | | | $ | — | | | $ | (91,378 | ) | | |
| | | | | | | | | | | | | | | | | | | | | | | | | | | | | | | | | |
Number of Contracts, Notional Amounts, Fair Value or Shares/Units (1)
| | | | | | | | | | | | | | | | | | | | | | | | | | | | | | | |
| | | | | Foreign
| | | | | | | | | | | | |
| | | Interest Rate
| | Exchange
| | Credit
| | Equity
| | Commodity
| | Other
| | | | |
| | | Contracts
| | Contracts
| | Contracts
| | Contracts
| | Contracts
| | Contracts
| | | | |
| | | Risk | | Risk | | Risk | | Risk | | Risk | | Risk | | Total | | |
| Rights | | | — | | | | — | | | | — | | | | 17,520 | | | | — | | | | — | | | | 17,520 | | | |
| Swaps Contracts | | | — | | | | — | | | | — | | | | — | | | | — | | | | — | | | | — | | | |
| Futures Contracts — Long | | | — | | | | — | | | | — | | | | — | | | | — | | | | — | | | | — | | | |
| | |
| 246 | Artio Global Funds ï 2010 Annual Report | |
NOTES TO FINANCIAL STATEMENTS (Continued)
| | | | | | | | | | | | | | | | | | | | | | | | | | | | | | | |
| | | | | Foreign
| | | | | | | | | | | | |
| | | Interest Rate
| | Exchange
| | Credit
| | Equity
| | Commodity
| | Other
| | | | |
| | | Contracts
| | Contracts
| | Contracts
| | Contracts
| | Contracts
| | Contracts
| | | | |
| | | Risk | | Risk | | Risk | | Risk | | Risk | | Risk | | Total | | |
| Forward Contracts | | | — | | | | 9,332,589 | | | | — | | | | — | | | | — | | | | — | | | | 9,332,589 | | | |
| | | | | | | | | | | | | | | | | | | | | | | | | | | | | | | |
| | | |
(1) | | Volume of derivative activity is based on an average of month-end shares, fair value, contracts or notional amounts outstanding during the period. |
International Equity Fund
Asset Derivatives
| | | | | | | | | | | | | | | | | | | | | | | | | | | | | | | | | |
| | | | | | | Foreign
| | | | | | | | | | | | |
| | | Statement of
| | Interest Rate
| | Exchange
| | Credit
| | Equity
| | Commodity
| | Other
| | | | |
| | | Assets and Liabilities
| | Contracts
| | Contracts
| | Contracts
| | Contracts
| | Contracts
| | Contracts
| | | | |
| | | Location | | Risk | | Risk | | Risk | | Risk | | Risk | | Risk | | Total | | |
| Forward Contracts | | Unrealized appreciation on forward foreign exchange contracts | | $ | — | | | $ | 104,526,225 | | | $ | — | | | $ | — | | | $ | — | | | $ | — | | | $ | 104,526,225 | | | |
| | | | | | | | | | | | | | | | | | | | | | | | | | | | | | | | | |
| Total Value | | | | $ | — | | | $ | 104,526,225 | | | $ | — | | | $ | — | | | $ | — | | | $ | — | | | $ | 104,526,225 | | | |
| | | | | | | | | | | | | | | | | | | | | | | | | | | | | | | | | |
Liability Derivatives
| | | | | | | | | | | | | | | | | | | | | | | | | | | | | | | | | |
| | | | | | | Foreign
| | | | | | | | | | | | |
| | | Statement of
| | Interest Rate
| | Exchange
| | Credit
| | Equity
| | Commodity
| | Other
| | | | |
| | | Assets and Liabilities
| | Contracts
| | Contracts
| | Contracts
| | Contracts
| | Contracts
| | Contracts
| | | | |
| | | Location | | Risk | | Risk | | Risk | | Risk | | Risk | | Risk | | Total | | |
| Forward Contracts | | Unrealized depreciation on forward foreign exchange contracts | | $ | — | | | $ | 158,833,874 | | | $ | — | | | $ | — | | | $ | — | | | $ | — | | | $ | 158,833,874 | | | |
| | | | | | | | | | | | | | | | | | | | | | | | | | | | | | | | | |
| Total Value | | | | $ | — | | | $ | 158,833,874 | | | $ | — | | | $ | — | | | $ | — | | | $ | — | | | $ | 158,833,874 | | | |
| | | | | | | | | | | | | | | | | | | | | | | | | | | | | | | | | |
Realized Gain (Loss)
| | | | | | | | | | | | | | | | | | | | | | | | | | | | | | | | | |
| | | | | | | Foreign
| | | | | | | | | | | | |
| | | Statement of
| | Interest Rate
| | Exchange
| | Credit
| | Equity
| | Commodity
| | Other
| | | | |
| | | Operations
| | Contracts
| | Contracts
| | Contracts
| | Contracts
| | Contracts
| | Contracts
| | | | |
| | | Location | | Risk | | Risk | | Risk | | Risk | | Risk | | Risk | | Total | | |
| Rights | | Investments | | $ | — | | | $ | — | | | $ | — | | | $ | 2,629,150 | | | $ | — | | | $ | — | | | $ | 2,629,150 | | | |
| Swaps Contracts | | Swap contracts | | | — | | | | — | | | | — | | | | (5,961,906 | ) | | | — | | | | — | | | | (5,961,906 | ) | | |
| Futures Contracts | | Financial futures contracts and synthetic futures | | | — | | | | — | | | | — | | | | (21,748,933 | ) | | | — | | | | — | | | | (21,748,933 | ) | | |
| Forward Contracts | | Forward foreign exchange contracts | | | — | | | | 155,010,075 | | | | — | | | | — | | | | — | | | | — | | | | 155,010,075 | | | |
| | | | | | | | | | | | | | | | | | | | | | | | | | | | | | | | | |
| Total Realized Gain (Loss) | | | | $ | — | | | $ | 155,010,075 | | | $ | — | | | $ | (25,081,689 | ) | | $ | — | | | $ | — | | | $ | 129,928,386 | | | |
| | | | | | | | | | | | | | | | | | | | | | | | | | | | | | | | | |
| | |
| Artio Global Funds ï 2010 Annual Report | 247 |
NOTES TO FINANCIAL STATEMENTS (Continued)
Change in Appreciation (Depreciation)
| | | | | | | | | | | | | | | | | | | | | | | | | | | | | | | | | |
| | | | | | | Foreign
| | | | | | | | | | | | |
| | | Statement of
| | Interest Rate
| | Exchange
| | Credit
| | Equity
| | Commodity
| | Other
| | | | |
| | | Operations
| | Contracts
| | Contracts
| | Contracts
| | Contracts
| | Contracts
| | Contracts
| | | | |
| | | Location | | Risk | | Risk | | Risk | | Risk | | Risk | | Risk | | Total | | |
| Forward Contracts | | Forward foreign exchange contracts | | $ | — | | | $ | (59,465,501 | ) | | $ | — | | | $ | — | | | $ | — | | | $ | — | | | $ | (59,465,501 | ) | | |
| | | | | | | | | | | | | | | | | | | | | | | | | | | | | | | | | |
| Total Change in Appreciation (Depreciation) | | | | $ | — | | | $ | (59,465,501 | ) | | $ | — | | | $ | — | | | $ | — | | | $ | — | | | $ | (59,465,501 | ) | | |
| | | | | | | | | | | | | | | | | | | | | | | | | | | | | | | | | |
Number of Contracts, Notional Amounts, Fair Value or Shares/Units (1)
| | | | | | | | | | | | | | | | | | | | | | | | | | | | | | | |
| | | | | Foreign
| | | | | | | | | | | | |
| | | Interest Rate
| | Exchange
| | Credit
| | Equity
| | Commodity
| | Other
| | | | |
| | | Contracts
| | Contracts
| | Contracts
| | Contracts
| | Contracts
| | Contracts
| | | | |
| | | Risk | | Risk | | Risk | | Risk | | Risk | | Risk | | Total | | |
| Rights | | | — | | | | — | | | | — | | | | 2,537,299 | | | | — | | | | — | | | | 2,537,299 | | | |
| Swaps Contracts | | | — | | | | — | | | | — | | | | 8,416,645 | | | | — | | | | — | | | | 8,416,645 | | | |
| Futures Contracts — Long | | | — | | | | — | | | | — | | | | 23,247,922 | | | | — | | | | — | | | | 23,247,922 | | | |
| Futures Contracts — Short | | | — | | | | — | | | | — | | | | (33,055,188 | ) | | | — | | | | — | | | | (33,055,188 | ) | | |
| Forward Contracts | | | — | | | | 3,056,960,427 | | | | — | | | | — | | | | — | | | | — | | | | 3,056,960,427 | | | |
| | | | | | | | | | | | | | | | | | | | | | | | | | | | | | | |
| | | |
(1) | | Volume of derivative activity is based on an average of month-end shares, fair value, contracts or notional amounts outstanding during the period. |
International Equity Fund II
Asset Derivatives
| | | | | | | | | | | | | | | | | | | | | | | | | | | | | | | | | |
| | | | | | | Foreign
| | | | | | | | | | | | |
| | | Statement of
| | Interest Rate
| | Exchange
| | Credit
| | Equity
| | Commodity
| | Other
| | | | |
| | | Assets and Liabilities
| | Contracts
| | Contracts
| | Contracts
| | Contracts
| | Contracts
| | Contracts
| | | | |
| | | Location | | Risk | | Risk | | Risk | | Risk | | Risk | | Risk | | Total | | |
| Forward Contracts | | Unrealized appreciation on forward foreign exchange contracts | | $ | — | | | $ | 89,386,139 | | | $ | — | | | $ | — | | | $ | — | | | $ | — | | | $ | 89,386,139 | | | |
| | | | | | | | | | | | | | | | | | | | | | | | | | | | | | | | | |
| Total Value | | | | $ | — | | | $ | 89,386,139 | | | $ | — | | | $ | — | | | $ | — | | | $ | — | | | $ | 89,386,139 | | | |
| | | | | | | | | | | | | | | | | | | | | | | | | | | | | | | | | |
| | |
| 248 | Artio Global Funds ï 2010 Annual Report | |
NOTES TO FINANCIAL STATEMENTS (Continued)
Liability Derivatives
| | | | | | | | | | | | | | | | | | | | | | | | | | | | | | | | | |
| | | | | | | Foreign
| | | | | | | | | | | | |
| | | Statement of
| | Interest Rate
| | Exchange
| | Credit
| | Equity
| | Commodity
| | Other
| | | | |
| | | Assets and Liabilities
| | Contracts
| | Contracts
| | Contracts
| | Contracts
| | Contracts
| | Contracts
| | | | |
| | | Location | | Risk | | Risk | | Risk | | Risk | | Risk | | Risk | | Total | | |
| Forward Contracts | | Unrealized depreciation on forward foreign exchange contracts | | $ | — | | | $ | 137,479,785 | | | $ | — | | | $ | — | | | $ | — | | | $ | — | | | $ | 137,479,785 | | | |
| | | | | | | | | | | | | | | | | | | | | | | | | | | | | | | | | |
| Total Value | | | | $ | — | | | $ | 137,479,785 | | | $ | — | | | $ | — | | | $ | — | | | $ | — | | | $ | 137,479,785 | | | |
| | | | | | | | | | | | | | | | | | | | | | | | | | | | | | | | | |
Realized Gain (Loss)
| | | | | | | | | | | | | | | | | | | | | | | | | | | | | | | | | |
| | | | | | | Foreign
| | | | | | | | | | | | |
| | | Statement of
| | Interest Rate
| | Exchange
| | Credit
| | Equity
| | Commodity
| | Other
| | | | |
| | | Operations
| | Contracts
| | Contracts
| | Contracts
| | Contracts
| | Contracts
| | Contracts
| | | | |
| | | Location | | Risk | | Risk | | Risk | | Risk | | Risk | | Risk | | Total | | |
| Rights | | Investments | | $ | — | | | $ | — | | | $ | — | | | $ | 2,006,570 | | | $ | — | | | $ | — | | | $ | 2,006,570 | | | |
| Swaps Contracts | | Swap contracts | | | — | | | | — | | | | — | | | | (5,464,948 | ) | | | — | | | | — | | | | (5,464,948 | ) | | |
| Futures Contracts | | Financial futures contracts and synthetic futures | | | — | | | | — | | | | — | | | | (16,755,916 | ) | | | — | | | | — | | | | (16,755,916 | ) | | |
| Forward Contracts | | Forward foreign exchange contracts | | | — | | | | 153,723,182 | | | | — | | | | — | | | | — | | | | — | | | | 153,723,182 | | | |
| | | | | | | | | | | | | | | | | | | | | | | | | | | | | | | | | |
| Total Realized Gain (Loss) | | | | $ | — | | | $ | 153,723,182 | | | $ | — | | | $ | (20,214,294 | ) | | $ | — | | | $ | — | | | $ | 133,508,888 | | | |
| | | | | | | | | | | | | | | | | | | | | | | | | | | | | | | | | |
Change in Appreciation (Depreciation)
| | | | | | | | | | | | | | | | | | | | | | | | | | | | | | | | | |
| | | | | | | Foreign
| | | | | | | | | | | | |
| | | Statement of
| | Interest Rate
| | Exchange
| | Credit
| | Equity
| | Commodity
| | Other
| | | | |
| | | Operations
| | Contracts
| | Contracts
| | Contracts
| | Contracts
| | Contracts
| | Contracts
| | | | |
| | | Location | | Risk | | Risk | | Risk | | Risk | | Risk | | Risk | | Total | | |
| Forward Contracts | | Forward foreign exchange contracts | | $ | — | | | $ | (58,925,247 | ) | | $ | — | | | $ | — | | | $ | — | | | $ | — | | | $ | (58,925,247 | ) | | |
| | | | | | | | | | | | | | | | | | | | | | | | | | | | | | | | | |
| Total Change in Appreciation (Depreciation) | | | | $ | — | | | $ | (58,925,247 | ) | | $ | — | | | $ | — | | | $ | — | | | $ | — | | | $ | (58,925,247 | ) | | |
| | | | | | | | | | | | | | | | | | | | | | | | | | | | | | | | | |
Number of Contracts, Notional Amounts, Fair Value or Shares/Units (1)
| | | | | | | | | | | | | | | | | | | | | | | | | | | | | | | |
| | | | | Foreign
| | | | | | | | | | | | |
| | | Interest Rate
| | Exchange
| | Credit
| | Equity
| | Commodity
| | Other
| | | | |
| | | Contracts
| | Contracts
| | Contracts
| | Contracts
| | Contracts
| | Contracts
| | | | |
| | | Risk | | Risk | | Risk | | Risk | | Risk | | Risk | | Total | | |
| Rights | | | — | | | | — | | | | — | | | | 1,800,367 | | | | — | | | | — | | | | 1,800,367 | | | |
| Swaps Contracts | | | — | | | | — | | | | — | | | | 7,632,505 | | | | — | | | | — | | | | 7,632,505 | | | |
| Futures Contracts — Long | | | — | | | | — | | | | — | | | | 21,561,087 | | | | — | | | | — | | | | 21,561,087 | | | |
| Futures Contracts — Short | | | — | | | | — | | | | — | | | | (30,016,091 | ) | | | — | | | | — | | | | (30,016,091 | ) | | |
| | |
| Artio Global Funds ï 2010 Annual Report | 249 |
NOTES TO FINANCIAL STATEMENTS (Continued)
| | | | | | | | | | | | | | | | | | | | | | | | | | | | | | | |
| | | | | Foreign
| | | | | | | | | | | | |
| | | Interest Rate
| | Exchange
| | Credit
| | Equity
| | Commodity
| | Other
| | | | |
| | | Contracts
| | Contracts
| | Contracts
| | Contracts
| | Contracts
| | Contracts
| | | | |
| | | Risk | | Risk | | Risk | | Risk | | Risk | | Risk | | Total | | |
| Forward Contracts | | | — | | | | 2,946,928,346 | | | | — | | | | — | | | | — | | | | — | | | | 2,946,928,346 | | | |
| | | | | | | | | | | | | | | | | | | | | | | | | | | | | | | |
| | | |
(1) | | Volume of derivative activity is based on an average of month-end shares, fair value, contracts or notional amounts outstanding during the period. |
Total Return Bond Fund
Asset Derivatives
| | | | | | | | | | | | | | | | | | | | | | | | | | | | | | | | | |
| | | | | | | Foreign
| | | | | | | | | | | | |
| | | Statement of
| | Interest Rate
| | Exchange
| | Credit
| | Equity
| | Commodity
| | Other
| | | | |
| | | Assets and Liabilities
| | Contracts
| | Contracts
| | Contracts
| | Contracts
| | Contracts
| | Contracts
| | | | |
| | | Location | | Risk | | Risk | | Risk | | Risk | | Risk | | Risk | | Total | | |
| Forward Contracts | | Unrealized appreciation on forward foreign exchange contracts | | $ | — | | | $ | 2,724,421 | | | $ | — | | | $ | — | | | $ | — | | | $ | — | | | $ | 2,724,421 | | | |
| | | | | | | | | | | | | | | | | | | | | | | | | | | | | | | | | |
| Total Value | | | | $ | — | | | $ | 2,724,421 | | | $ | — | | | $ | — | | | $ | — | | | $ | — | | | $ | 2,724,421 | | | |
| | | | | | | | | | | | | | | | | | | | | | | | | | | | | | | | | |
Liability Derivatives
| | | | | | | | | | | | | | | | | | | | | | | | | | | | | | | | | |
| | | | | | | Foreign
| | | | | | | | | | | | |
| | | Statement of
| | Interest Rate
| | Exchange
| | Credit
| | Equity
| | Commodity
| | Other
| | | | |
| | | Assets and Liabilities
| | Contracts
| | Contracts
| | Contracts
| | Contracts
| | Contracts
| | Contracts
| | | | |
| | | Location | | Risk | | Risk | | Risk | | Risk | | Risk | | Risk | | Total | | |
| Forward Contracts | | Unrealized depreciation on forward foreign exchange contracts | | $ | — | | | $ | 4,823,659 | | | $ | — | | | $ | — | | | $ | — | | | $ | — | | | $ | 4,823,659 | | | |
| | | | | | | | | | | | | | | | | | | | | | | | | | | | | | | | | |
| Total Value | | | | $ | — | | | $ | 4,823,659 | | | $ | — | | | $ | — | | | $ | — | | | $ | — | | | $ | 4,823,659 | | | |
| | | | | | | | | | | | | | | | | | | | | | | | | | | | | | | | | |
Realized Gain (Loss)
| | | | | | | | | | | | | | | | | | | | | | | | | | | | | | | | | |
| | | | | | | Foreign
| | | | | | | | | | | | |
| | | Statement of
| | Interest Rate
| | Exchange
| | Credit
| | Equity
| | Commodity
| | Other
| | | | |
| | | Operations
| | Contracts
| | Contracts
| | Contracts
| | Contracts
| | Contracts
| | Contracts
| | | | |
| | | Location | | Risk | | Risk | | Risk | | Risk | | Risk | | Risk | | Total | | |
| Futures Contracts | | Financial futures contracts and synthetic futures | | $ | 182,721 | | | $ | — | | | $ | — | | | $ | — | | | $ | — | | | $ | — | | | $ | 182,721 | | | |
| Forward Contracts | | Forward foreign exchange contracts | | | — | | | | (604,304 | ) | | | — | | | | — | | | | — | | | | — | | | | (604,304 | ) | | |
| | | | | | | | | | | | | | | | | | | | | | | | | | | | | | | | | |
| Total Realized Gain (Loss) | | | | $ | 182,721 | | | $ | (604,304 | ) | | $ | — | | | $ | — | | | $ | — | | | $ | — | | | $ | (421,583 | ) | | |
| | | | | | | | | | | | | | | | | | | | | | | | | | | | | | | | | |
| | |
| 250 | Artio Global Funds ï 2010 Annual Report | |
NOTES TO FINANCIAL STATEMENTS (Continued)
Change in Appreciation (Depreciation)
| | | | | | | | | | | | | | | | | | | | | | | | | | | | | | | | | |
| | | | | | | Foreign
| | | | | | | | | | | | |
| | | Statement of
| | Interest Rate
| | Exchange
| | Credit
| | Equity
| | Commodity
| | Other
| | | | |
| | | Operations
| | Contracts
| | Contracts
| | Contracts
| | Contracts
| | Contracts
| | Contracts
| | | | |
| | | Location | | Risk | | Risk | | Risk | | Risk | | Risk | | Risk | | Total | | |
| Futures Contracts | | Financial futures contracts and synthetic futures | | $ | 192,209 | | | $ | — | | | $ | — | | | $ | — | | | $ | — | | | $ | — | | | $ | 192,209 | | | |
| Forward Contracts | | Forward foreign exchange contracts | | | — | | | | (8,776,388 | ) | | | — | | | | — | | | | — | | | | — | | | | (8,776,388 | ) | | |
| | | | | | | | | | | | | | | | | | | | | | | | | | | | | | | | | |
| Total Change in Appreciation (Depreciation) | | | | $ | 192,209 | | | $ | (8,776,388 | ) | | $ | — | | | $ | — | | | $ | — | | | $ | — | | | $ | (8,584,179 | ) | | |
| | | | | | | | | | | | | | | | | | | | | | | | | | | | | | | | | |
Number of Contracts, Notional Amounts, Fair Value or Shares/Units (1)
| | | | | | | | | | | | | | | | | | | | | | | | | | | | | | | |
| | | | | Foreign
| | | | | | | | | | | | |
| | | Interest Rate
| | Exchange
| | Credit
| | Equity
| | Commodity
| | Other
| | | | |
| | | Contracts
| | Contracts
| | Contracts
| | Contracts
| | Contracts
| | Contracts
| | | | |
| | | Risk | | Risk | | Risk | | Risk | | Risk | | Risk | | Total | | |
| Futures Contracts — Long | | | 2,014,453 | | | | — | | | | — | | | | — | | | | — | | | | — | | | | 2,014,453 | | | |
| Forward Contracts | | | — | | | | 448,648,387 | | | | — | | | | — | | | | — | | | | — | | | | 448,648,387 | | | |
| | | | | | | | | | | | | | | | | | | | | | | | | | | | | | | |
| | | |
(1) | | Volume of derivative activity is based on an average of month-end shares, fair value, contracts or notional amounts outstanding during the period. |
Global High Income Fund
Asset Derivatives
| | | | | | | | | | | | | | | | | | | | | | | | | | | | | | | | | |
| | | | | | | Foreign
| | | | | | | | | | | | |
| | | Statement of
| | Interest Rate
| | Exchange
| | Credit
| | Equity
| | Commodity
| | Other
| | | | |
| | | Assets and Liabilities
| | Contracts
| | Contracts
| | Contracts
| | Contracts
| | Contracts
| | Contracts
| | | | |
| | | Location | | Risk | | Risk | | Risk | | Risk | | Risk | | Risk | | Total | | |
| Swaps Contracts | | Open swap agreements, at fair value | | $ | 7,013,483 | | | $ | — | | | $ | 2,530,838 | | | $ | — | | | $ | — | | | $ | — | | | $ | 9,544,321 | | | |
| Forward Contracts | | Unrealized appreciation on forward foreign exchange contracts | | | — | | | | 2,092,232 | | | | — | | | | — | | | | — | | | | — | | | | 2,092,232 | | | |
| | | | | | | | | | | | | | | | | | | | | | | | | | | | | | | | | |
| Total Value | | | | $ | 7,013,483 | | | $ | 2,092,232 | | | $ | 2,530,838 | | | $ | — | | | $ | — | | | $ | — | | | $ | 11,636,553 | | | |
| | | | | | | | | | | | | | | | | | | | | | | | | | | | | | | | | |
| | |
| Artio Global Funds ï 2010 Annual Report | 251 |
NOTES TO FINANCIAL STATEMENTS (Continued)
Liability Derivatives
| | | | | | | | | | | | | | | | | | | | | | | | | | | | | | | | | |
| | | | | | | Foreign
| | | | | | | | | | | | |
| | | Statement of
| | Interest Rate
| | Exchange
| | Credit
| | Equity
| | Commodity
| | Other
| | | | |
| | | Assets and Liabilities
| | Contracts
| | Contracts
| | Contracts
| | Contracts
| | Contracts
| | Contracts
| | | | |
| | | Location | | Risk | | Risk | | Risk | | Risk | | Risk | | Risk | | Total | | |
| Swaps Contracts | | Open swap agreements, at fair value | | $ | — | | | $ | — | | | $ | 797,128 | | | $ | — | | | $ | — | | | $ | — | | | $ | 797,128 | | | |
| Forward Contracts | | Unrealized depreciation on forward foreign exchange contracts | | | — | | | | 17,732,811 | | | | — | | | | — | | | | — | | | | — | | | | 17,732,811 | | | |
| | | | | | | | | | | | | | | | | | | | | | | | | | | | | | | | | |
| Total Value | | | | $ | — | | | $ | 17,732,811 | | | $ | 797,128 | | | $ | — | | | $ | — | | | $ | — | | | $ | 18,529,939 | | | |
| | | | | | | | | | | | | | | | | | | | | | | | | | | | | | | | | |
Realized Gain (Loss)
| | | | | | | | | | | | | | | | | | | | | | | | | | | | | | | | | |
| | | | | | | Foreign
| | | | | | | | | | | | |
| | | Statement of
| | Interest Rate
| | Exchange
| | Credit
| | Equity
| | Commodity
| | Other
| | | | |
| | | Operations
| | Contracts
| | Contracts
| | Contracts
| | Contracts
| | Contracts
| | Contracts
| | | | |
| | | Location | | Risk | | Risk | | Risk | | Risk | | Risk | | Risk | | Total | | |
| Swaps Contracts | | Swap contracts | | $ | 3,431,872 | | | $ | — | | | $ | 8,577,686 | | | $ | — | | | $ | — | | | $ | — | | | $ | 12,009,558 | | | |
| Forward Contracts | | Forward foreign exchange contracts | | | — | | | | 21,884,138 | | | | — | | | | — | | | | — | | | | — | | | | 21,884,138 | | | |
| | | | | | | | | | | | | | | | | | | | | | | | | | | | | | | | | |
| Total Realized Gain (Loss) | | | | $ | 3,431,872 | | | $ | 21,884,138 | | | $ | 8,577,686 | | | $ | — | | | $ | — | | | $ | — | | | $ | 33,893,696 | | | |
| | | | | | | | | | | | | | | | | | | | | | | | | | | | | | | | | |
Change in Appreciation (Depreciation)
| | | | | | | | | | | | | | | | | | | | | | | | | | | | | | | | | |
| | | | | | | Foreign
| | | | | | | | | | | | |
| | | Statement of
| | Interest Rate
| | Exchange
| | Credit
| | Equity
| | Commodity
| | Other
| | | | |
| | | Operations
| | Contracts
| | Contracts
| | Contracts
| | Contracts
| | Contracts
| | Contracts
| | | | |
| | | Location | | Risk | | Risk | | Risk | | Risk | | Risk | | Risk | | Total | | |
| Swaps Contracts | | Swap contracts | | $ | 7,013,483 | | | $ | — | | | $ | (2,945,639 | ) | | $ | — | | | $ | — | | | $ | — | | | $ | 4,067,844 | | | |
| Forward Contracts | | Forward foreign exchange contracts | | | — | | | | (12,365,257 | ) | | | — | | | | — | | | | — | | | | — | | | | (12,365,257 | ) | | |
| | | | | | | | | | | | | | | | | | | | | | | | | | | | | | | | | |
| Total Change in Appreciation (Depreciation) | | | | $ | 7,013,483 | | | $ | (12,365,257 | ) | | $ | (2,945,639 | ) | | $ | — | | | $ | — | | | $ | — | | | $ | (8,297,413 | ) | | |
| | | | | | | | | | | | | | | | | | | | | | | | | | | | | | | | | |
Number of Contracts, Notional Amounts, Fair Value or Shares/Units (1)
| | | | | | | | | | | | | | | | | | | | | | | | | | | | | | | |
| | | | | Foreign
| | | | | | | | | | | | |
| | | Interest Rate
| | Exchange
| | Credit
| | Equity
| | Commodity
| | Other
| | | | |
| | | Contracts
| | Contracts
| | Contracts
| | Contracts
| | Contracts
| | Contracts
| | | | |
| | | Risk | | Risk | | Risk | | Risk | | Risk | | Risk | | Total | | |
| Warrants | | | — | | | | — | | | | — | | | | 6,468 | | | | — | | | | — | | | | 6,468 | | | |
| Swaps Contracts | | | 61,640,833 | | | | — | | | | 75,250,125 | | | | — | | | | — | | | | — | | | | 136,890,958 | | | |
| | |
| 252 | Artio Global Funds ï 2010 Annual Report | |
NOTES TO FINANCIAL STATEMENTS (Continued)
| | | | | | | | | | | | | | | | | | | | | | | | | | | | | | | |
| | | | | Foreign
| | | | | | | | | | | | |
| | | Interest Rate
| | Exchange
| | Credit
| | Equity
| | Commodity
| | Other
| | | | |
| | | Contracts
| | Contracts
| | Contracts
| | Contracts
| | Contracts
| | Contracts
| | | | |
| | | Risk | | Risk | | Risk | | Risk | | Risk | | Risk | | Total | | |
| Forward Contracts | | | — | | | | 406,738,126 | | | | — | | | | — | | | | — | | | | — | | | | 406,738,126 | | | |
| | | | | | | | | | | | | | | | | | | | | | | | | | | | | | | |
| | | |
(1) | | Volume of derivative activity is based on an average of month-end shares, fair value, contracts or notional amounts outstanding during the period. |
| |
| 6. | Purchases and Sales of Securities |
Cost of purchases and proceeds from sales of securities, excluding short-term investments, during the year ended October 31, 2010 were as follows:
| | | | | | | | | | | |
| | | Cost of
| | Proceeds
| | |
| | | Purchases | | From Sales | | |
| Global Equity Fund | | $ | 141,561,114 | | | $ | 144,749,140 | | | |
| International Equity Fund | | | 10,157,781,048 | | | | 11,800,167,069 | | | |
| International Equity Fund II | | | 10,470,478,253 | | | | 11,321,481,077 | | | |
| Total Return Bond Fund | | | 3,028,421,050 | | | | 3,037,055,946 | | | |
| Global High Income Fund | | | 2,726,596,523 | | | | 1,328,964,513 | | | |
| U.S. Microcap Fund | | | 15,918,630 | | | | 12,749,979 | | | |
| U.S. Smallcap Fund | | | 134,977,809 | | | | 71,438,295 | | | |
| U.S. Midcap Fund | | | 7,890,205 | | | | 7,727,632 | | | |
| U.S. Multicap Fund | | | 8,678,585 | | | | 6,524,029 | | | |
| | | | | | | | | | | |
Cost of purchases and proceeds from sales of long-term U.S. Government securities during the year ended October 31, 2010 were $1,555,561,987 and $1,665,456,661 for the Total Return Bond Fund.
At October 31, 2010, net unrealized appreciation/depreciation for federal income tax purposes is comprised of the following components:
| | | | | | | | | | | | | | | | | | | |
| | | | | | | | | Tax Basis
| | |
| | | Federal
| | Gross
| | Gross
| | Net Unrealized
| | |
| | | Income Tax
| | Unrealized
| | Unrealized
| | Appreciation
| | |
| | | Cost | | Appreciation | | Depreciation | | (Depreciation) | | |
| Global Equity Fund | | $ | 68,075,077 | | | $ | 7,990,501 | | | $ | (978,837 | ) | | $ | 7,011,664 | | | |
| International Equity Fund | | | 8,841,913,140 | | | | 1,637,192,939 | | | | (663,141,788 | ) | | | 974,051,151 | | | |
| International Equity Fund II | | | 7,558,383,953 | | | | 1,313,815,929 | | | | (125,520,284 | ) | | | 1,188,295,645 | | | |
| Total Return Bond Fund | | | 1,575,501,480 | | | | 76,251,655 | | | | (2,190,421 | ) | | | 74,061,234 | | | |
| Global High Income Fund | | | 2,901,168,062 | | | | 223,568,575 | | | | (29,509,581 | ) | | | 194,058,994 | | | |
| U.S. Microcap Fund | | | 9,942,485 | | | | 1,442,815 | | | | (406,715 | ) | | | 1,036,100 | | | |
| U.S. Smallcap Fund | | | 79,340,652 | | | | 7,035,946 | | | | (3,399,474 | ) | | | 3,636,472 | | | |
| U.S. Midcap Fund | | | 5,715,151 | | | | 785,014 | | | | (187,718 | ) | | | 597,296 | | | |
| U.S. Multicap Fund | | | 7,183,110 | | | | 1,270,356 | | | | (166,150 | ) | | | 1,104,206 | | | |
| | | | | | | | | | | | | | | | | | | |
| | |
| Artio Global Funds ï 2010 Annual Report | 253 |
NOTES TO FINANCIAL STATEMENTS (Continued)
| |
| 7. | Investments in Affiliated Issuers |
An affiliated issuer, as defined under 1940 Act, is one in which a Fund’s holdings of an issuer represents 5% or more of the outstanding voting securities of the issuer. A summary of Funds’ investments in securities of these issuers for the year ended October 31, 2010, is set forth below:
| | | | | | | | | | | | | | | | | | | | | | | |
| | | Shares Held
| | Purchases
| | Sales
| | Dividend
| | Fair Value
| | |
| Affiliate | | October 31, 2010 | | (Cost) | | (Proceeds) | | Income | | October 31, 2010 | | |
International Equity Fund | | | | | | | | | | | | | | | | | | | | | | |
| Alfa Cement | | | 656,887 | | | $ | 15,204,986 | | | $ | — | | | $ | — | | | $ | 51,966,291 | | | |
| Bank of Georgia Sponsored GDR | | | 2,466,387 | | | | — | | | | — | | | | — | | | | 40,670,722 | | | |
| Cemacon SA | | | 14,619,597 | | | | — | | | | — | | | | — | | | | 619,041 | | | |
| Chelindbank OJSC | | | 53,536,950 | | | | — | | | | — | | | | 62,730 | | | | 3,881,429 | | | |
| Chimimport AD | | | 10,693,367 | | | | — | | | | — | | | | — | | | | 17,475,926 | | | |
| Chimimport AD Preferred | | | 6,416,021 | | | | — | | | | — | | | | 434,681 | | | | 10,984,761 | | | |
| Davento PLC GDR | | | 5,006,914 | | | | — | | | | — | | | | — | | | | 3,409,965 | | | |
| Dragon-Ukrainian Properties & Development | | | 11,770,906 | | | | — | | | | — | | | | — | | | | 13,549,916 | | | |
| DZI Insurance | | | 354,861 | | | | — | | | | — | | | | 420,521 | | | | 21,911,693 | | | |
| Impact Developer & Contractor | | | 16,912,495 | | | | — | | | | — | | | | — | | | | 2,293,558 | | | |
| LEV INS | | | 4,078,860 | | | | — | | | | — | | | | — | | | | 5,303,808 | | | |
| Marseille-Kliniken AG | | | 684,962 | | | | — | | | | 234,546 | | | | — | | | | 2,303,910 | | | |
| NAXS Nordic Access Buyout Fund | | | 1,485,000 | | | | — | | | | — | | | | — | | | | 7,109,714 | | | |
| Polska Grupa Farmaceutyczna | | | 1,071,000 | | | | — | | | | — | | | | — | | | | 17,897,840 | | | |
| Siderurgica Venezolana Sivensa | | | 2,847,910 | | | | — | | | | — | | | | 5,168,996 | | | | 3,136,306 | | | |
| Sparki Eltos Lovetch | | | 1,425,011 | | | | — | | | | — | | | | — | | | | 1,467,184 | | | |
| Tigar ad Pirot | | | 123,132 | | | | — | | | | — | | | | — | | | | 999,790 | | | |
| Toza Markovic ad Kikinda | | | 78,160 | | | | — | | | | — | | | | — | | | | 2,151,880 | | | |
| Ukrinbank | | | 1,153,346,022 | | | | — | | | | — | | | | — | | | | 1,450,750 | | | |
| | |
| 254 | Artio Global Funds ï 2010 Annual Report | |
NOTES TO FINANCIAL STATEMENTS (Continued)
| | | | | | | | | | | | | | | | | | | | | | | |
| | | Shares Held
| | Purchases
| | Sales
| | Dividend
| | Fair Value
| | |
| Affiliate | | October 31, 2010 | | (Cost) | | (Proceeds) | | Income | | October 31, 2010 | | |
| Zambeef Products | | | 9,363,990 | | | $ | — | | | $ | — | | | $ | — | | | $ | 7,450,917 | | | |
| | | | | | | | | | | | | | | | | | | | | | | |
| | | | | | | | | | | | | | | | | | | $ | 216,035,401 | | | |
| | | | | | | | | | | | | | | | | | | | | | | |
| |
| 8. | Shares of Beneficial Interest |
The Global Equity Fund may issue 50,000,000,000 shares of beneficial interest with a par value of $.001 per share. The Trust may issue an unlimited number of shares of beneficial interest of each Fund, with a par value of $.001 per share. Changes in outstanding shares of beneficial interest of the Funds were as follows:
| | | | | | | | | | | | | | | | | | | |
| | | Year Ended
| | Year Ended
| | |
| | | October 31, 2010 | | October 31, 2009 | | |
| | | |
| | | Shares | | Amount | | Shares | | Amount | | |
Global Equity Fund | | | | | | | | | | | | | | | | | | |
Class A | | | | | | | | | | | | | | | | | | |
| Sold | | | 44,527 | | | $ | 1,555,984 | | | | 156,177 | | | $ | 4,260,109 | | | |
| Issued as reinvestment of dividends | | | 12,289 | | | | 427,401 | | | | 1,750 | | | | 45,354 | | | |
| Redeemed | | | (265,536 | ) | | | (8,991,108 | ) | | | (203,337 | ) | | | (5,616,212 | ) | | |
| | | | | | | | | | | | | | | | | | | |
| Net increase (decrease) | | | (208,720 | ) | | $ | (7,007,723 | ) | | | (45,410 | ) | | $ | (1,310,749 | ) | | |
| | | | | | | | | | | | | | | | | | | |
Class I | | | | | | | | | | | | | | | | | | |
| Sold | | | 626,379 | | | $ | 21,457,884 | | | | 752,616 | | | $ | 21,461,260 | | | |
| Issued as reinvestment of dividends | | | 38,714 | | | | 1,354,987 | | | | 14,786 | | | | 385,162 | | | |
| Redeemed | | | (478,550 | ) | | | (16,280,465 | ) | | | (966,746 | ) | | | (29,225,075 | ) | | |
| | | | | | | | | | | | | | | | | | | |
| Net increase (decrease) | | | 186,543 | | | $ | 6,532,406 | | | | (199,344 | ) | | $ | (7,378,653 | ) | | |
| | | | | | | | | | | | | | | | | | | |
| | |
| Artio Global Funds ï 2010 Annual Report | 255 |
NOTES TO FINANCIAL STATEMENTS (Continued)
| | | | | | | | | | | | | | | | | | | |
| | | Year Ended
| | Year Ended
| | |
| | | October 31, 2010 | | October 31, 2009 | | |
| | | |
| | | Shares | | Amount | | Shares | | Amount | | |
International Equity Fund | | | | | | | | | | | | | | | | | | |
Class A | | | | | | | | | | | | | | | | | | |
| Sold | | | 10,426,670 | | | $ | 284,001,164 | | | | 17,174,521 | | | $ | 404,301,509 | | | |
| Issued as reinvestment of dividends | | | 10,959,643 | | | | 304,130,078 | | | | 3,490,630 | | | | 82,972,280 | | | |
| Redeemed | | | (48,416,598 | ) | | | (1,318,136,727 | ) | | | (65,445,343 | ) | | | (1,536,672,807 | ) | | |
| | | | | | | | | | | | | | | | | | | |
| Net increase (decrease) | | | (27,030,285 | ) | | $ | (730,005,485 | ) | | | (44,780,192 | ) | | $ | (1,049,399,018 | ) | | |
| | | | | | | | | | | | | | | | | | | |
Class I | | | | | | | | | | | | | | | | | | |
| Sold | | | 24,606,930 | | | $ | 685,401,750 | | | | 38,410,073 | | | $ | 932,167,894 | | | |
| Issued as reinvestment of dividends | | | 14,348,483 | | | | 407,783,876 | | | | 5,082,713 | | | | 123,510,037 | | | |
| Redeemed | | | (64,771,008 | ) | | | (1,794,595,216 | ) | | | (96,435,823 | ) | | | (2,336,722,790 | ) | | |
| | | | | | | | | | | | | | | | | | | |
| Net increase (decrease) | | | (25,815,595 | ) | | $ | (701,409,590 | ) | | | (52,943,037 | ) | | $ | (1,281,044,859 | ) | | |
| | | | | | | | | | | | | | | | | | | |
| | | | | | | | | | | | | | | | | | | |
| | | Year Ended
| | Year Ended
| | |
| | | October 31, 2010 | | October 31, 2009 | | |
| | | |
| | | Shares | | Amount | | Shares | | Amount | | |
International Equity Fund II | | | | | | | | | | | | | | | | | | |
Class A | | | | | | | | | | | | | | | | | | |
| Sold | | | 54,835,585 | | | $ | 626,381,765 | | | | 135,355,324 | | | $ | 1,339,361,355 | | | |
| Issued as reinvestment of dividends | | | 8,474,993 | | | | 99,920,171 | | | | 5,260,275 | | | | 51,235,076 | | | |
| Redeemed | | | (70,921,596 | ) | | | (802,773,219 | ) | | | (84,879,674 | ) | | | (796,724,175 | ) | | |
| | | | | | | | | | | | | | | | | | | |
| Net increase (decrease) | | | (7,611,018 | ) | | $ | (76,471,283 | ) | | | 55,735,925 | | | $ | 593,872,256 | | | |
| | | | | | | | | | | | | | | | | | | |
Class I | | | | | | | | | | | | | | | | | | |
| Sold | | | 154,175,322 | | | $ | 1,779,295,234 | | | | 307,506,805 | | | $ | 2,951,347,838 | | | |
| Issued as reinvestment of dividends | | | 18,027,588 | | | | 213,807,193 | | | | 12,721,347 | | | | 124,414,774 | | | |
| Redeemed | | | (251,172,862 | ) | | | (2,848,274,565 | ) | | | (233,823,492 | ) | | | (2,299,984,847 | ) | | |
| | | | | | | | | | | | | | | | | | | |
| Net increase (decrease) | | | (78,969,952 | ) | | $ | (855,172,138 | ) | | | 86,404,660 | | | $ | 775,777,765 | | | |
| | | | | | | | | | | | | | | | | | | |
| | |
| 256 | Artio Global Funds ï 2010 Annual Report | |
NOTES TO FINANCIAL STATEMENTS (Continued)
| | | | | | | | | | | | | | | | | | | |
| | | Year Ended
| | Year Ended
| | |
| | | October 31, 2010 | | October 31, 2009 | | |
| | | |
| | | Shares | | Amount | | Shares | | Amount | | |
Total Return Bond Fund | | | | | | | | | | | | | | | | | | |
Class A | | | | | | | | | | | | | | | | | | |
| Sold | | | 9,884,031 | | | $ | 136,248,652 | | | | 11,596,714 | | | $ | 147,840,856 | | | |
| Issued as reinvestment of dividends | | | 759,080 | | | | 10,470,356 | | | | 1,387,891 | | | | 17,725,866 | | | |
| Redeemed | | | (12,693,395 | ) | | | (174,736,709 | ) | | | (13,285,104 | ) | | | (168,566,731 | ) | | |
| | | | | | | | | | | | | | | | | | | |
| Net increase (decrease) | | | (2,050,284 | ) | | $ | (28,017,701 | ) | | | (300,499 | ) | | $ | (3,000,009 | ) | | |
| | | | | | | | | | | | | | | | | | | |
Class I | | | | | | | | | | | | | | | | | | |
| Sold | | | 32,022,992 | | | $ | 438,140,936 | | | | 41,724,285 | | | $ | 530,039,756 | | | |
| Issued as reinvestment of dividends | | | 2,537,082 | | | | 34,785,128 | | | | 3,086,244 | | | | 39,412,940 | | | |
| Redeemed | | | (34,282,273 | ) | | | (475,552,050 | ) | | | (31,848,476 | ) | | | (405,092,093 | ) | | |
| | | | | | | | | | | | | | | | | | | |
| Net increase (decrease) | | | 277,801 | | | $ | (2,625,986 | ) | | | 12,962,053 | | | $ | 164,360,603 | | | |
| | | | | | | | | | | | | | | | | | | |
| | | | | | | | | | | | | | | | | | | |
| | | Year Ended
| | Year Ended
| | |
| | | October 31, 2010 | | October 31, 2009 | | |
| | | |
| | | Shares | | Amount | | Shares | | Amount | | |
Global High Income Fund | | | | | | | | | | | | | | | | | | |
Class A | | | | | | | | | | | | | | | | | | |
| Sold | | | 93,811,966 | | | $ | 1,000,594,646 | | | | 75,714,992 | | | $ | 679,159,672 | | | |
| Issued as reinvestment of dividends | | | 6,418,911 | | | | 68,400,882 | | | | 3,415,802 | | | | 29,332,975 | | | |
| Redeemed | | | (59,276,905 | ) | | | (628,711,516 | ) | | | (26,751,066 | ) | | | (233,104,717 | ) | | |
| | | | | | | | | | | | | | | | | | | |
| Net increase (decrease) | | | 40,953,972 | | | $ | 440,284,012 | | | | 52,379,728 | | | $ | 475,387,930 | | | |
| | | | | | | | | | | | | | | | | | | |
Class I | | | | | | | | | | | | | | | | | | |
| Sold | | | 146,139,699 | | | $ | 1,499,770,538 | | | | 91,490,942 | | | $ | 787,876,363 | | | |
| Issued as reinvestment of dividends | | | 9,690,549 | | | | 99,259,758 | | | | 4,382,093 | | | | 36,506,876 | | | |
| Redeemed | | | (74,064,002 | ) | | | (749,472,836 | ) | | | (29,858,820 | ) | | | (260,336,225 | ) | | |
| | | | | | | | | | | | | | | | | | | |
| Net increase (decrease) | | | 81,766,246 | | | $ | 849,557,460 | | | | 66,014,215 | | | $ | 564,047,014 | | | |
| | | | | | | | | | | | | | | | | | | |
| | |
| Artio Global Funds ï 2010 Annual Report | 257 |
NOTES TO FINANCIAL STATEMENTS (Continued)
| | | | | | | | | | | | | | | | | | | |
| | | Year Ended
| | Year Ended
| | |
| | | October 31, 2010 | | October 31, 2009 | | |
| | | |
| | | Shares | | Amount | | Shares | | Amount | | |
U.S. Microcap Fund | | | | | | | | | | | | | | | | | | |
Class A | | | | | | | | | | | | | | | | | | |
| Sold | | | 467,248 | | | $ | 4,561,517 | | | | 174,735 | | | $ | 1,295,639 | | | |
| Issued as reinvestment of dividends | | | — | | | | — | | | | — | | | | — | | | |
| Redeemed | | | (392,076 | ) | | | (3,641,369 | ) | | | (89,172 | ) | | | (586,054 | ) | | |
| | | | | | | | | | | | | | | | | | | |
| Net increase (decrease) | | | 75,172 | | | $ | 920,148 | | | | 85,563 | | | $ | 709,585 | | | |
| | | | | | | | | | | | | | | | | | | |
Class I | | | | | | | | | | | | | | | | | | |
| Sold | | | 320,017 | | | $ | 2,888,373 | | | | 56,906 | | | $ | 392,317 | | | |
| Issued as reinvestment of dividends | | | — | | | | — | | | | — | | | | — | | | |
| Redeemed | | | (56,938 | ) | | | (519,518 | ) | | | (30,237 | ) | | | (164,113 | ) | | |
| | | | | | | | | | | | | | | | | | | |
| Net increase (decrease) | | | 263,079 | | | $ | 2,368,855 | | | | 26,669 | | | $ | 228,204 | | | |
| | | | | | | | | | | | | | | | | | | |
| | | | | | | | | | | | | | | | | | | |
| | | Year Ended
| | Year Ended
| | |
| | | October 31, 2010 | | October 31, 2009 | | |
| | | |
| | | Shares | | Amount | | Shares | | Amount | | |
U.S. Smallcap Fund | | | | | | | | | | | | | | | | | | |
Class A | | | | | | | | | | | | | | | | | | |
| Sold | | | 4,281,539 | | | $ | 42,487,000 | | | | 1,001,008 | | | $ | 8,479,268 | | | |
| Issued as reinvestment of dividends | | | — | | | | — | | | | — | | | | — | | | |
| Redeemed | | | (2,928,920 | ) | | | (26,932,106 | ) | | | (104,826 | ) | | | (743,583 | ) | | |
| | | | | | | | | | | | | | | | | | | |
| Net increase (decrease) | | | 1,352,619 | | | $ | 15,554,894 | | | | 896,182 | | | $ | 7,735,685 | | | |
| | | | | | | | | | | | | | | | | | | |
Class I | | | | | | | | | | | | | | | | | | |
| Sold | | | 5,486,040 | | | $ | 52,213,686 | | | | 53,068 | | | $ | 427,454 | | | |
| Issued as reinvestment of dividends | | | — | | | | — | | | | — | | | | — | | | |
| Redeemed | | | (360,995 | ) | | | (3,389,647 | ) | | | (30,426 | ) | | | (170,096 | ) | | |
| | | | | | | | | | | | | | | | | | | |
| Net increase (decrease) | | | 5,125,045 | | | $ | 48,824,039 | | | | 22,642 | | | $ | 257,358 | | | |
| | | | | | | | | | | | | | | | | | | |
| | |
| 258 | Artio Global Funds ï 2010 Annual Report | |
NOTES TO FINANCIAL STATEMENTS (Continued)
| | | | | | | | | | | | | | | | | | | |
| | | Year Ended
| | Year Ended
| | |
| | | October 31, 2010 | | October 31, 2009 | | |
| | | |
| | | Shares | | Amount | | Shares | | Amount | | |
U.S. Midcap Fund | | | | | | | | | | | | | | | | | | |
Class A | | | | | | | | | | | | | | | | | | |
| Sold | | | 23,235 | | | $ | 220,226 | | | | 14,082 | | | $ | 103,437 | | | |
| Issued as reinvestment of dividends | | | 21 | | | | 186 | | | | — | | | | — | | | |
| Redeemed | | | (8,255 | ) | | | (77,042 | ) | | | (22,085 | ) | | | (139,466 | ) | | |
| | | | | | | | | | | | | | | | | | | |
| Net increase (decrease) | | | 15,001 | | | $ | 143,370 | | | | (8,003 | ) | | $ | (36,029 | ) | | |
| | | | | | | | | | | | | | | | | | | |
Class I | | | | | | | | | | | | | | | | | | |
| Sold | | | 16,358 | | | $ | 148,513 | | | | 10,014 | | | $ | 60,785 | | | |
| Issued as reinvestment of dividends | | | 87 | | | | 784 | | | | — | | | | — | | | |
| Redeemed | | | (14,749 | ) | | | (133,358 | ) | | | (31,523 | ) | | | (190,574 | ) | | |
| | | | | | | | | | | | | | | | | | | |
| Net increase (decrease) | | | 1,696 | | | $ | 15,939 | | | | (21,509 | ) | | $ | (129,789 | ) | | |
| | | | | | | | | | | | | | | | | | | |
| | | | | | | | | | | | | | | | | | | |
| | | Year Ended
| | Year Ended
| | |
| | | October 31, 2010 | | October 31, 2009 | | |
| | | |
| | | Shares | | Amount | | Shares | | Amount | | |
U.S. Multicap Fund | | | | | | | | | | | | | | | | | | |
Class A | | | | | | | | | | | | | | | | | | |
| Sold | | | 7,938 | | | $ | 76,842 | | | | 20,239 | | | $ | 118,712 | | | |
| Issued as reinvestment of dividends | | | 55 | | | | 508 | | | | — | | | | — | | | |
| Redeemed | | | (8,635 | ) | | | (80,526 | ) | | | (16,744 | ) | | | (126,590 | ) | | |
| | | | | | | | | | | | | | | | | | | |
| Net increase (decrease) | | | (642 | ) | | $ | (3,176 | ) | | | 3,495 | | | $ | (7,878 | ) | | |
| | | | | | | | | | | | | | | | | | | |
Class I | | | | | | | | | | | | | | | | | | |
| Sold | | | 250,241 | | | $ | 2,366,268 | | | | 10,557 | | | $ | 72,052 | | | |
| Issued as reinvestment of dividends | | | 88 | | | | 817 | | | | 96 | | | | 576 | | | |
| Redeemed | | | (17,166 | ) | | | (156,949 | ) | | | (49,887 | ) | | | (307,842 | ) | | |
| | | | | | | | | | | | | | | | | | | |
| Net increase (decrease) | | | 233,163 | | | $ | 2,210,136 | | | | (39,234 | ) | | $ | (235,214 | ) | | |
| | | | | | | | | | | | | | | | | | | |
| | |
| Artio Global Funds ï 2010 Annual Report | 259 |
NOTES TO FINANCIAL STATEMENTS (Continued)
Through seed capital contributions by Julius Baer Group, an affiliate of the Adviser, ownership of beneficial shares outstanding at October 31, 2010 were:
| | | | | | | |
| Fund | | % Ownership | | |
| U.S. Microcap Fund — Class A shares | | | 57.29 | % | | |
| U.S. Microcap Fund — Class I shares | | | 45.42 | % | | |
| U.S. Smallcap Fund — Class A shares | | | 12.31 | % | | |
| U.S. Smallcap Fund — Class I shares | | | 6.00 | % | | |
| U.S. Midcap Fund — Class A shares | | | 87.41 | % | | |
| U.S. Midcap Fund — Class I shares | | | 90.08 | % | | |
| U.S. Multicap Fund — Class A shares | | | 93.59 | % | | |
| U.S. Multicap Fund — Class I shares | | | 52.97 | % | | |
| | | | | | | |
| |
| 9. | Federal Tax Information |
Permanent differences between book and tax income and loss amounts, if any, relating to shareholder distributions will result in reclassifications to paid-in capital, undistributed net investment income or accumulated net realized gains/losses. These include net operating losses not utilized during the current year, recharacterized swap income and expense, amortization of upfront payments, partnership adjustments, expiration of capital loss carryforwards, paydown gains and losses, bond premium amortization, foreign currency gains and losses, recharacterized distributions, and adjustments relating to the dispositions of Real Estate Investment Trust and Passive Foreign Investment Company securities. These reclassifications have no effect on net assets or net asset values per share. Any taxable gain remaining at fiscal year end is distributed in the following year.
| | | | | | | | | | | | | | | |
| | | | | Undistributed
| | Accumulated
| | |
| | | | | Net Investment
| | Net Realized
| | |
| | | Paid-in Capital
| | Income
| | Gain/(loss)
| | |
| | | Increase/(decrease) | | Increase/(decrease) | | Increase/(decrease) | | |
| Global Equity Fund | | $ | (21,458,113 | ) | | $ | 20,293 | | | $ | 21,437,820 | | | |
| International Equity Fund | | | 15,843,761 | | | | 111,519,852 | | | | (127,363,613 | ) | | |
| International Equity Fund II | | | (5 | ) | | | 82,400,466 | | | | (82,400,461 | ) | | |
| Total Return Bond Fund | | | — | | | | 6,732,104 | | | | (6,732,104 | ) | | |
| Global High Income Fund | | | — | | | | 27,964,986 | | | | (27,964,986 | ) | | |
| U.S. Microcap Fund | | | (96,627 | ) | | | 97,040 | | | | (413 | ) | | |
| U.S. Smallcap Fund | | | (433,971 | ) | | | 433,972 | | | | (1 | ) | | |
| U.S. Midcap Fund | | | (10,219 | ) | | | 5,108 | | | | 5,111 | | | |
| U.S. Multicap Fund | | | (1,012 | ) | | | 1,012 | | | | — | | | |
| | | | | | | | | | | | | | | |
| | |
| 260 | Artio Global Funds ï 2010 Annual Report | |
NOTES TO FINANCIAL STATEMENTS (Continued)
The tax character of distributions paid for the year ended October 31, 2010 was as follows:
| | | | | | | | | | | | | | | |
| | | Ordinary
| | Long Term
| | Return of
| | |
| | | Income | | Capital Gains | | Capital | | |
| Global Equity Fund | | $ | 1,968,307 | | | $ | — | | | $ | — | | | |
| International Equity Fund | | | 777,557,267 | | | | — | | | | — | | | |
| International Equity Fund II | | | 444,820,690 | | | | — | | | | — | | | |
| Total Return Bond Fund | | | 64,589,864 | | | | — | | | | — | | | |
| Global High Income Fund | | | 202,460,461 | | | | — | | | | — | | | |
| U.S. Microcap Fund | | | — | | | | — | | | | — | | | |
| U.S. Smallcap Fund | | | — | | | | — | | | | — | | | |
| U.S. Midcap Fund | | | 10,465 | | | | — | | | | — | | | |
| U.S. Multicap Fund | | | 22,962 | | | | — | | | | — | | | |
| | | | | | | | | | | | | | | |
The tax character of distributions paid for the year ended October 31, 2009 was as follows:
| | | | | | | | | | | | | | | |
| | | Ordinary
| | Long Term
| | Return of
| | |
| | | Income | | Capital Gains | | Capital | | |
| Global Equity Fund | | $ | 494,241 | | | $ | — | | | $ | — | | | |
| International Equity Fund | | | 226,109,209 | | | | — | | | | — | | | |
| International Equity Fund II | | | 226,976,980 | | | | — | | | | — | | | |
| Total Return Bond Fund | | | 84,574,852 | | | | 556,156 | | | | — | | | |
| Global High Income Fund | | | 65,525,941 | | | | — | | | | 12,896,215 | | | |
| U.S. Microcap Fund | | | — | | | | — | | | | — | | | |
| U.S. Smallcap Fund | | | — | | | | — | | | | — | | | |
| U.S. Midcap Fund | | | — | | | | — | | | | — | | | |
| U.S. Multicap Fund | | | 797 | | | | — | | | | — | | | |
| | | | | | | | | | | | | | | |
| | |
| Artio Global Funds ï 2010 Annual Report | 261 |
NOTES TO FINANCIAL STATEMENTS (Continued)
As of October 31, 2010, the components of distributable earnings on a tax basis was as follows:
| | | | | | | | | | | | | | | | | | | |
| | | | | | | Undistributed
| | | | |
| | | | | | | Long Term
| | | | |
| | | Undistributed
| | Unrealized
| | Capital Gains
| | Other
| | |
| | | Ordinary
| | Appreciation/
| | (Capital Loss
| | Temporary
| | |
| | | Income | | (Depreciation) | | Carryforwards) | | Differences | | |
| Global Equity Fund | | $ | 97,508 | | | $ | 7,016,635 | | | $ | (36,932,417 | ) | | $ | — | | | |
| International Equity Fund | | | 173,960,632 | | | | 957,915,616 | | | | (2,302,628,163 | ) | | | — | | | |
| International Equity Fund II | | | 170,645,928 | | | | 1,188,306,683 | | | | (3,047,059,219 | ) | | | (37,874 | ) | | |
| Total Return Bond Fund | | | 19,543,969 | | | | 74,137,242 | | | | 30,899,277 | | | | — | | | |
| Global High Income Fund | | | 65,694,483 | | | | 205,186,249 | | | | 33,119,397 | | | | 78,049 | | | |
| U.S. Microcap Fund | | | — | | | | 1,036,100 | | | | (912,045 | ) | | | (26,506 | ) | | |
| U.S. Smallcap Fund | | | — | | | | 3,636,472 | | | | (235,542 | ) | | | (26,504 | ) | | |
| U.S. Midcap Fund | | | — | | | | 597,296 | | | | (753,241 | ) | | | (23,991 | ) | | |
| U.S. Multicap Fund | | | — | | | | 1,104,206 | | | | (1,225,526 | ) | | | (22,420 | ) | | |
| | | | | | | | | | | | | | | | | | | |
The differences between components of distributable earnings on a tax basis and the amounts reflected in the Statements of Assets and Liabilities are primarily due to wash sales, mark-to market of passive foreign investment companies, futures and forwards. In addition, short-term capital gains are considered ordinary income for income tax purposes.
At October 31, 2010, the following Funds had net realized loss carryforwards for federal income tax purposes:
| | | | | | | | | | | | | | | | | | | |
| | | Expires in
| | Expires in
| | Expires in
| | Expires in
| | |
| | | 2011 | | 2016 | | 2017 | | 2018 | | |
| Global Equity Fund | | $ | 7,288,718 | | | $ | 19,631,562 | | | $ | 10,012,137 | | | $ | — | | | |
| International Equity Fund | | | — | | | | 658,934,984 | | | | 1,643,693,179 | | | | — | | | |
| International Equity Fund II | | | — | | | | 1,714,515,520 | | | | 1,211,390,775 | | | | 121,152,924 | | | |
| Total Return Bond Fund | | | — | | | | — | | | | — | | | | — | | | |
| Global High Income Fund | | | — | | | | — | | | | — | | | | — | | | |
| U.S. Microcap Fund | | | — | | | | 500,228 | | | | 411,817 | | | | — | | | |
| U.S. Smallcap Fund | | | — | | | | 235,542 | | | | — | | | | — | | | |
| U.S. Midcap Fund | | | — | | | | — | | | | 753,241 | | | | — | | | |
| U.S. Multicap Fund | | | — | | | | 781,560 | | | | 443,966 | | | | — | | | |
| | | | | | | | | | | | | | | | | | | |
Artio Global Equity Fund Inc. and Artio Global Investment Funds (the “Borrowers”) entered into a new Credit Agreement (the “Agreement”) with State Street Bank and Trust Company (the “Bank”). The Agreement provides for a
| | |
| 262 | Artio Global Funds ï 2010 Annual Report | |
NOTES TO FINANCIAL STATEMENTS (Continued)
$250,000,000 (the “Facility Amount”) revolving credit facility to be utilized for temporary or emergency purposes to fund shareholder redemptions or for other short-term liquidity purposes. On December 1, 2009, the Agreement was amended to increase the sublimit that the Artio Global High Income Fund may draw from $40,000,000 to $100,000,000. On September 17, 2010, the Borrowers executed a Third Amendment to the Agreement extending the facility amount until September 27, 2011. The Funds may draw up to their stated sublimit (subject to certain other limitations therein):
| | | | | | | |
| | | Sublimit
| | |
| | | Amount | | |
| Global Equity Fund | | $ | 10,000,000 | | | |
| International Equity Fund | | | 200,000,000 | | | |
| International Equity Fund II | | | 200,000,000 | | | |
| Total Return Bond Fund | | | 50,000,000 | | | |
| Global High Income Fund | | | 100,000,000 | | | |
| U.S. Microcap Fund | | | 1,000,000 | | | |
| U.S. Smallcap Fund | | | 5,000,000 | | | |
| U.S. Midcap Fund | | | 1,000,000 | | | |
| U.S. Multicap Fund | | | 1,000,000 | | | |
| | | | | | | |
Under the Agreement, the average outstanding daily balance utilized by the Global Equity Fund, International Equity Fund, International Equity Fund II, U.S. Microcap Fund, U.S. Smallcap Fund and the U.S. Midcap Fund during the period ended October 31, 2010 was $326,642, $21,109,215, $13,855,343, $14,073, $108,824 and $334, respectively, at an average weighted interest rate of 1.50%, 1.48%, 1.51%, 1.50%, 1.50% and 1.54%, respectively. The Total Return Bond Fund, Global High Income Fund and the U.S. Multicap Fund did not utilize the Agreement during the year ended October 31, 2010.
On April 26, 2010, the Agreement was amended to remove the Global High Income Fund and the Global High Income Fund entered into a separate Credit Agreement (the “Global High Income Fund Credit Agreement”) with the Bank. The Global High Income Fund Credit Agreement provides for a $100,000,000 revolving credit facility to be utilized for temporary or emergency purposes to fund shareholder redemptions or for other short-term liquidity purposes.
On September 29, 2010, the Agreement for the Global Equity Fund and the Artio Investment Funds, excluding the Global High Income Fund, was amended. The significant changes include a reduction of the commitment fee from 0.15% to 0.125% per annum of the daily-unused portion and reductions of available sublimit
| | |
| Artio Global Funds ï 2010 Annual Report | 263 |
NOTES TO FINANCIAL STATEMENTS (Continued)
amounts for the Total Return Bond Fund, U.S. Microcap Fund, U.S. Midcap Fund and U.S. Multicap Fund. The current sublimits are reflected in the table above.
Principal on each outstanding loan made under the Agreement shall bear interest at a variable rate per annum equal to the higher of (a) the Federal Funds Rate as in effect on that day plus 1.25% and (b) the Overnight LIBOR Rate as in effect on that day plus 1.25%. In addition, the Borrowers shall pay to the Bank a commitment fee at the rate of 0.15% per annum on the daily unused portion of the Facility Amount. The Global High Income Fund did not utilize the Global High Income Fund Credit Agreement during the year ended October 31, 2010.
| |
| 11. | Recent Accounting Pronouncements |
In January 2010, the Financial Accounting Standards Board issued Accounting Standards Update No. 2010-06, “Improving Disclosures About Fair Value Measurements” (“ASU”). The ASU requires enhanced disclosures about purchases, sales, issuances, and settlements on a gross basis relating to Level 3 measurements. The disclosure will be effective for fiscal years beginning after December 15, 2010, and for interim periods within those fiscal years. Management is currently evaluating the impact the adoption of this ASU will have on the Funds’ financial statement disclosures.
Management has considered the circumstances under which the Funds should recognize or make disclosures regarding events or transactions occurring subsequent to October 31, 2010 through the date the financial statements were issued. Adjustments or additional disclosures, if any, have been included in these financial statements.
| | |
| 264 | Artio Global Funds ï 2010 Annual Report | |
REPORT OF INDEPENDENT REGISTERED PUBLIC ACCOUNTING FIRM
The Shareholders and Board of Directors
Artio Global Equity Fund Inc.
and
The Shareholders and Board of Trustees
Artio Global Investment Funds
We have audited the accompanying statements of assets and liabilities, including the portfolios of investments, of Artio Global Equity Fund Inc. and Artio International Equity Fund, Artio International Equity Fund II, Artio Total Return Bond Fund, Artio Global High Income Fund, Artio U.S. Microcap Fund, Artio U.S. Smallcap Fund, Artio U.S. Midcap Fund, and Artio U.S. Multicap Fund, each a series of Artio Global Investment Funds, (collectively, the “Funds”) as of October 31, 2010, and the related statements of operations for the year then ended, the statements of changes in net assets for each of the years in the two-year period then ended, and the financial highlights for each of the years or periods in the five-year period then ended. These financial statements and financial highlights are the responsibility of the Funds’ management. Our responsibility is to express an opinion on these financial statements and financial highlights based on our audits.
We conducted our audits in accordance with the standards of the Public Company Accounting Oversight Board (United States). Those standards require that we plan and perform the audits to obtain reasonable assurance about whether the financial statements and financial highlights are free of material misstatement. An audit includes examining, on a test basis, evidence supporting the amounts and disclosures in the financial statements. Our procedures included confirmation of securities owned as of October 31, 2010 by correspondence with the custodian and brokers, or by other appropriate auditing procedures where replies from brokers were not received. An audit also includes assessing the accounting principles used and significant estimates made by management, as well as evaluating the overall financial statement presentation. We believe that our audits provide a reasonable basis for our opinion.
In our opinion, the financial statements and financial highlights referred to above present fairly, in all material respects, the financial position of Artio Global Equity Fund, Inc., Artio International Equity Fund, Artio International Equity Fund II, Artio Total Return Bond Fund, Artio Global High Income Fund, Artio U.S. Microcap Fund, Artio U.S. Smallcap Fund, Artio U.S. Midcap Fund, and Artio U.S. Multicap Fund as of October 31, 2010, and the results of their operations, the changes in
| | |
| ARTIO GLOBAL FUNDS ï 2010 ANNUAL REPORT | 265 |
their net assets and the financial highlights for each of the years or periods described above, in conformity with U.S. generally accepted accounting principles.
Boston, Massachusetts
December 27, 2010
| | |
| 266 | ARTIO GLOBAL FUNDS ï 2010 ANNUAL REPORT | |
ADDITIONAL INFORMATION PAGE (Unaudited)
1. Proxy Voting Policies
A description of the Fund’s proxy voting policies and procedures is available without charge, upon request, (1) on the Fund’s website www.artiofunds.com and (2) on the SEC’s Securities and Exchange Commission website www.sec.gov.
Information regarding how the Fund voted proxies relating to portfolio securities during the most recent 12-month period ended June 30 is available via the methods noted above.
2. Quarterly Filing Requirements
A Fund files its complete schedule of portfolio holdings with the Securities and Exchange Commission for the first and third quarters of each fiscal year on Form N-Q, which when filed, will be available on the Commission’s web-site at www.sec.gov or on the Funds’ website at www.artiofunds.com.
A Fund’s forms N-Q may be reviewed and copied at the Commissions’s Public Reference Room in Washington, DC. Information regarding the operation of the Public reference Room may be obtained by calling 1-800-SEC-0330.
ARTIO GLOBAL FUNDS
Independent Trustees of Artio Global Investment Funds (the “Trust”) and Independent Directors of Artio Global Equity Fund Inc. (the “Global Equity Fund” or “GEF”):
| | | | | | | | | |
| | | Positions,
| | | | Number of
| | |
| | | Term of
| | | | Portfolios
| | |
| | | Office (1)
| | | | in Fund
| | |
| | | and Length
| | | | Family
| | |
| | | of Time
| | | | Overseen
| | Other
|
| | | Served with
| | Principal Occupation(s)
| | by Trustee
| | Directorships (2)
|
| Name, Age (3) and Address | | the Funds | | During Past Five Years | | or Director* | | Held |
| |
| | | | | | | | | |
Antoine Bernheim
57
330 Madison Avenue
New York, New York 10017 | | Trustee of the Trust since November 2004; Director of GEF since July 1990; Chairman of the Fund complex since December 2008. | | President, Dome Capital Management, Inc., 1984–present (investment advisory firm); Chairman, Dome Securities Corp., 1995–present (broker/dealer); President, The U.S. Offshore Funds Directory, 1990–present (publishing) | | 9 | | None |
| | | | | | | | | |
Thomas Gibbons
63
330 Madison Avenue
New York, New York 10017 | | Trustee of the Trust since November 2004; Director of GEF since December 1993. | | President, Cornerstone Associates Management, 1987–present (consulting firm) | | 9 | | None |
| | | | | | | | | |
Harvey B. Kaplan
73
330 Madison Avenue
New York, New York 10017 | | Trustee of the Trust since December 1995; Director of GEF since July 1990. | | Retired since 2006; Controller (Chief Financial Officer), Easter Unlimited, Inc., 1990–2006 (toy and novelty company) | | 9 | | None |
| | | | | | | | | |
Robert S.Matthews
67
330 Madison Avenue
New York, New York 10017 | | Trustee of the Trust since June 1992; Director of GEF since June 2002. | | Managing Partner, Matthews & Co., 1990–present (certified public accounting firm) | | 9 | | Trustee, Allstate Financial Investment Trust, 2008–2009 (investment company) |
| | |
| 268 | Artio Global Funds ï 2010 Annual Report | |
ARTIO GLOBAL FUNDS (Continued)
Independent Trustees of Artio Global Investment Funds (the “Trust”) and Independent Directors of Artio Global Equity Fund Inc. (the “Global Equity Fund” or “GEF”)—(Continued):
| | | | | | | | | |
| | | Positions,
| | | | Number of
| | |
| | | Term of
| | | | Portfolios
| | |
| | | Office (1)
| | | | in Fund
| | |
| | | and Length
| | | | Family
| | |
| | | of Time
| | | | Overseen
| | Other
|
| | | Served with
| | Principal Occupation(s)
| | by Trustee
| | Directorships (2)
|
| Name, Age (3) and Address | | the Funds | | During Past Five Years | | or Director* | | Held |
| |
| | | | | | | | | |
Robert J. McGuire
73
330 Madison Avenue
New York, New York 10017 | | Trustee of the Trust since June 2006; Director of GEF since 2006. | | Self-employed Attorney/Consultant, 1998–present; Counsel, Morvillo, Abramowitz, Grand, Iason & Silberberg, P.C., 1998–2005. | | 9 | | Director, Mutual of America Life Insurance Co., 2008–present (financial services and insurance); Director, Six Flags, Inc., 2003–2010 (entertainment); Director, Protection One, Inc., 2005–2010 (security systems); Director, Mutual of America Investment Corp., 2000–2008 (investment management); Director, GAM Avalon Funds, Inc., 2000–2007 (investment management); Director, GAM Funds, Inc., 1998–2007 (investment management) |
| | | | | | | | | |
Peter Wolfram
57
330 Madison Avenue
New York, New York 10017 | | Trustee of the Trust since June 1992; Director of GEF since November 2004. | | Partner, Kelley Drye & Warren, 1983–present (law firm) | | 9 | | None |
| | |
| Artio Global Funds ï 2010 Annual Report | 269 |
ARTIO GLOBAL FUNDS (Continued)
Interested Trustees of Artio Global Investment Funds (the “Trust”) and Interested Directors of Artio Global Equity Fund Inc. (the “Global Equity Fund“ or ”GEF ”):
| | | | | | | | | |
| | | | | | | Number of
| | |
| | | | | | | Portfolios
| | |
| | | | | | | in Fund
| | |
| | | | | | | Family
| | |
| | | Position
| | | | Overseen
| | Other
|
| | | and Term
| | Principal Occupation(s)
| | by Trustee
| | Directorships (2)
|
| Name, Age (3) and Address | | of Office (1) | | During Past Five Years | | or Director | | Held |
| |
| | | | | | | | | |
Glen Wisher (4)
47
330 Madison Avenue
New York, NY 10017 | | Trustee of the Trust since September 2005; Director of GEF since December 2005. | | President and Member of the Board of Artio Global Investors, Inc., 2007–present; Member of the Board of Artio Global Investment Management LLC, 2004–present; Member of the Board of Artio Global Holdings LLC, 2004–present;
Member of the Board of Artio Capital Management LLC, 2007–present; Chief Executive Officer of Artio Global Investors Inc., 2004–2007 | | 9 | | None |
| | | |
| * | | The Fund Complex refers to the eight series of the Trust and the Global Equity Fund. |
| (1) | | Each Trustee and Director serves during the lifetime of the Trust or Global Equity Fund or until he or she dies, resigns, retires, is declared bankrupt or incompetent, or is removed or, if sooner, until the next special meeting of the Funds’ shareholders and until the election and qualification of his or her successor. |
| (2) | | Directorships include public companies and any company registered as an investment company. |
| (3) | | Age calculated as of October 31, 2010. |
| (4) | | Mr. Wisher is an interested trustee because he is an employee of Artio Global Investors Inc. |
| | |
| 270 | Artio Global Funds ï 2010 Annual Report | |
ARTIO GLOBAL FUNDS (Continued)
Officers of Funds:
The business address for each officer of the Funds, except Mr. James, Ms. Coop, Ms. McGowan, Mr. Smith, Mr. McVoy and Mr. Kapner is Artio Global Management LLC, 330 Madison Avenue, New York, New York 10017. The business address for Mr. James, Ms. Coop, Ms. McGowan and Mr. Smith is State Street Bank and Trust Company, 4 Copley Place, 5th Floor, Boston, Massachusetts, 02116. The business address for Mr. McVoy is U.S. Bancorp Fund Services, LLC, 615 E. Michigan Street, Milwaukee, WI 53202. The business address for Mr. Kapner is Global Financial Markets Institute, P.O. Box 388, Jericho, NY 17753-0388.
| | | | | |
| | | Length of Time
| | |
| | | Served As Fund
| | Principal Occupation(s)
|
| Name, Age (3) and Position(s) Held | | Officer (1),(2) | | During Past Five Years |
| |
| | | | | |
Anthony Williams
46
President, Chief Executive Officer and Principal Executive Officer | | Officer for the Funds since 2004. | | • Chief Operating Officer and member of Board of Directors of Artio Global Management LLC (2004–present)
• Board of Directors of Artio Global Investors Inc. (2007–present)
• Chief Executive Officer, Artio Global Investment Management (2004–2007) |
| | | | | |
Denise Downey
49
Vice President | | Officer for the Funds since 1995. | | • First Vice President and Head of Marketing, Artio Global Management LLC (2002–present) |
| | | | | |
Greg Hopper
53
Vice President | | Officer for the Funds since 2002. | | • Senior Vice President, Artio Global Management LLC (2009–present)
• First Vice President of Artio Global Management LLC (2002–2009) |
| | | | | |
Samuel Dedio
44
Vice President | | Officer for the Trust
since 2006. | | • Senior Portfolio Manager and First Vice President of Artio Global Management LLC (2006–present)
• Managing Director, Deutsche Asset Management (1999–2006). |
| | | | | |
Richard C. Pell
56
Vice President | | Officer for the Trust since 1995; for GEF, since 2004. | | • Chief Executive Officer and Chairman of the Board of Directors, Artio Global Investments, Inc. (2007–present)
• Chief Executive Officer and Chief Investment Officer of Artio Global Management LLC (1995–present) |
| | | | | |
Donald Quigley
45
Vice President | | Officer for the Trust since 2001. | | • Senior Vice President and Head of Global Fixed-Income, Artio Global Management LLC (2001–present) |
| | | | | |
Rudolph-Riad Younes
49
Vice President | | Officer for the Trust since 1997; for GEF, since 2004. | | • Managing Director and Head of International Equity, Artio Global Management LLC (2002–present) |
| | | | | |
Victor J. Simon
41
Vice President | | Officer for the Funds
since 2010. | | • Vice President, Artio Global (2006–present)
• Vice President, Deutsche Bank (1994–2006) |
| | |
| Artio Global Funds ï 2010 Annual Report | 271 |
ARTIO GLOBAL FUNDS (Continued)
Officers of Funds—(Continued):
| | | | | |
| | | Length of Time
| | |
| | | Served As Fund
| | Principal Occupation(s)
|
| Name, Age (3) and Position(s) Held | | Officer (1),(2) | | During Past Five Years |
| |
| | | | | |
Timothy J. Clemens
34
Chief Financial Officer | | Officer for the Funds since 2009. | | • Vice President, Artio Global Management LLC (2009–present)
• Vice President, The Bank of New York Mellon (2006–2009)
• Vice President, Gemini Fund Services LLC (2001–2006) |
| | | | | |
Alex Bogaenko
47
Treasurer | | Officer for the Funds since 2005. | | • Vice President, Artio Global Management LLC (2005–present)
• Manager of Accounting and Director of Portfolio Administration of Van Eck Global (1995–2005) |
| | | | | |
John Whilesmith
43
Secretary | | Officer for the Funds since 2005. | | • Vice President and Operations Compliance Officer, Artio Global Management LLC (2005–present)
• Compliance Officer, Morgan Stanley Investment Management (2002–2005) |
| | | | | |
Michael K. Quain
53
Chief Compliance Officer | | Officer for the Funds since 2004. | | • First Vice President of Artio Global Management LLC (2002–present) |
| | | | | |
Prasad Nanisetty
53
Chief Risk Officer | | Officer for the Funds since 2008. | | • Head of Risk Management, Artio Global Management LLC (2004–present) |
| | | | | |
Kenneth Kapner
53
Vice President of Risk Management | | Officer for the Funds since 2009. | | • President, CEO, Financial Trainer and Consultant, Global Financial Markets Institute (1997–present) |
| | | | | |
Michael McVoy
53
Anti-Money Laundering Officer | | Officer for the Funds since 2004. | | • Chief Compliance Officer for U.S. Bancorp (2002–present)
• Legal Counsel for U.S. Bancorp (formerly, Firstar Corp.) (1986–2006)
• Senior Vice President and Risk Manager for U.S. Bancorp (1999–present) |
| | | | | |
David James
39
Assistant Secretary | | Officer for the Funds
since 2010. | | • Vice President and Managing Counsel, State Street Bank and Trust Company (2009–present)
• Vice President and Counsel, PNC Global Investment Servicing (US), Inc. (2006–2009)
• Retired (2005) |
| | | | | |
Tracie A. Coop
33
Assistant Secretary | | Officer for the Funds
since 2008. | | • Vice President and Senior Counsel, State Street Bank and Trust Company (2007–present)
• Associate Counsel and Manager, Natixis Asset Management Advisors, L.P. (2006–2007)
• Associate Counsel, Natixis Asset Management Advisors, L.P. (2005–2006) |
| | |
| 272 | Artio Global Funds ï 2010 Annual Report | |
ARTIO GLOBAL FUNDS (Continued)
Officers of Funds—(Continued):
| | | | | |
| | | Length of Time
| | |
| | | Served As Fund
| | Principal Occupation(s)
|
| Name, Age (3) and Position(s) Held | | Officer (1),(2) | | During Past Five Years |
| |
| | | | | |
Victoria McGowan
44
Assistant Treasurer | | Officer for the Funds since 2003. | | • Senior Vice President, State Street Bank and Trust Company (2007–present)
• Senior Director, State Street Bank and Trust Company (formerly Investors Bank and Trust Company) (2002–2007) |
| | | | | |
Brian Smith
43
Assistant Treasurer | | Officer for the Funds since 2007. | | • Vice President, State Street Bank and Trust Company (2007–present)
• Director, Mutual Fund Administration, State Street Bank and Trust Company (2005–2007)
• Senior Manager, Mutual Fund Administration, State Street Bank and Trust Company (formerly Investors Bank and Trust Company) (2003–2005) |
| | | |
| (1) | | Each officer of the Global Equity Fund is elected for a term of 1 year and until his or her successor is duly elected and qualified. |
| (2) | | Pursuant to the Trust’s By-laws, officers of the Trust are elected by the Board of Trustees to hold such office until his or her successor is chosen and qualified, or until they resign or are removed from office. |
| (3) | | Age calculated as of October 31, 2010. |
| | |
| Artio Global Funds ï 2010 Annual Report | 273 |
SUPPLEMENTAL TAX INFORMATION (Unaudited)
The Global Equity Fund, International Equity Fund and International Equity Fund II paid foreign taxes of $75,355, $13,186,285 and $11,093,435 and earned $755,550, $237,654,206 and $208,437,077 of foreign income during the year ended October 31, 2010. Pursuant to Section 853 of the Internal Revenue Code, $0.04, $0.04 and $0.02 per share were designated as foreign taxes paid for Global Equity Fund, International Equity Fund and International Equity Fund II and $0.37, $0.74 and $0.30 per share were designated as income earned from foreign sources for the Global Equity Fund, International Equity Fund and International Equity Fund II for the year ended October 31, 2010.
The table below shows distributions paid from investment company taxable income earned in the year ended October 31, 2010, or the maximum amount allowable under the tax law, as Qualified Dividend Income in accordance with the Internal Revenue Code. Complete 2010 year end information will be reported to you on your 2010 Form 1099-DIV, which shall be provided to you in early 2011.
| | | | | | | |
| | | QDI | | |
| Global Equity Fund | | $ | 946,577 | | | |
| International Equity Fund | | | 137,994,858 | | | |
| International Equity Fund II | | | 112,303,182 | | | |
| Global High Income Fund | | | 37,260 | | | |
| | | | | | | |
For corporate shareholders, a portion of the ordinary dividends paid during the Funds’ year ended October 31, 2010 qualified dividends received deductions were the following:
| | | | | | | |
| | | DRD | | |
| Global Equity Fund | | | 27.04 | % | | |
| | | | | | | |
| | |
| 274 | Artio Global Funds ï 2010 Annual Report | |
SUPPLEMENTAL TAX INFORMATION (Unaudited) (Continued)
Pursuant to Sector 852 of the Internal Revenue Code, the Funds designated the following capital gain dividends for the year ended October 31, 2010:
| | | | | | | |
| | | Long Term
| | |
| | | Capital Gain
| | |
| | | Dividend | | |
| Global Equity Fund | | $ | — | | | |
| International Equity Fund | | | — | | | |
| International Equity Fund II | | | — | | | |
| Total Return Bond Fund | | | — | | | |
| Global High Income Fund | | | — | | | |
| U.S. Microcap Fund | | | — | | | |
| U.S. Smallcap Fund | | | — | | | |
| U.S. Midcap Fund | | | — | | | |
| U.S. Multicap Fund | | | — | | | |
| | | | | | | |
| | |
| Artio Global Funds ï 2010 Annual Report | 275 |
ARTIO GLOBAL FUNDS
330 Madison Avenue
New York, New York 10017
This report is sent to shareholders of the Artio Global Equity Fund Inc. and the Artio Global Investment Funds for their information. It is not a Prospectus, circular or representation intended for use in the purchase or sale of shares of the funds or of any securities mentioned in the report.
www.artiofunds.com
Item 2. Code of Ethics.
As of the end of the period covered by this report, the registrant has adopted a code of ethics that applies to the registrant’s President/Chief Executive Officer and Chief Financial Officer pursuant to the Sarbanes-Oxley Act of 2002. During the period covered by this report, no substantive amendments were made to the Code of Ethics. During the period covered by this report, the registrant did not grant any waivers, including any implicit waivers, from any provision of the Code of Ethics.
The Code of Ethics is incorporated by reference to Form N-CSR as filed with the SEC via EDGAR on January 8, 2010 (SEC Accession No. 0000950123-10-001305).
Item 3. Audit Committee Financial Expert.
| (a)(1) | | The Board of Directors of the registrant has determined that the registrant has one Board member serving on the Audit Committee that possesses the attributes identified in Instructions 2(b) of Item 3 to Form N-CSR to qualify as an “audit committee financial expert.” |
| (2) | Mr. Harvey B. Kaplan is the registrant’s audit committee financial expert. The Board also determined that Mr. Kaplan is not an “interested person” of the registrant as that term is defined in Section 2(a)(19) of the Investment Company Act of 1940, as amended. |
Item 4. Principal Accountant Fees and Services.
| (a) | | Audit Fees. |
| |
| | | For the fiscal years ended October 31, 2010 and October 31, 2009, the aggregate audit fees billed for professional services rendered by the principal independent registered public accounting firm, KPMG LLP, for the audit of the Registrant’s annual financial statements were $24,000 and $20,500, respectively. |
| |
| (b) | | Audit-Related Fees. |
| |
| | | For the fiscal years ended October 31, 2010 and October 31, 2009, the aggregate audit fees billed by KPMG LLP for assurances and related services that are reasonably related to the performance of the audit of the registrant’s financial statements and are not reported under paragraph (a) of this Item were $4,000 and $3,250, respectively. |
| |
| (c) | | Tax Fees. |
| |
| | | The aggregate fees billed for professional services rendered by KPMG LLP for the review of Form 1120-RIC, Form 8613, and review of excise tax distribution calculations for the fiscal years ended October 31, 2010 and October 31, 2009 were $9,524 and $9,070, respectively. |
| |
| (d) | | All Other Fees. |
| |
| | | There were no other fees billed by KPMG LLP for the fiscal year ended October 31, 2009. For the fiscal year ended October 31, 2010, KPMG LLP charged $10,000 for services related to the establishment of an offshore subsidiary. |
| |
| (e)(1) | | Audit Committee Pre-Approval Policies and Procedures. |
| |
| | | The Registrant’s audit committee pre-approves all audit and non-audit services to be performed by the Registrant’s accountant before the accountant is engaged by the Registrant to perform such services. |
| |
| (e)(2) | | The percentage of services described in each of paragraphs (b) through (d) of this Item that were approved by the audit committee pursuant to paragraph (c)(7)(i)(C) of Rule 2-01 of Regulation S-X are as follows: |
| | (b) | | Not applicable |
| |
| | (c) | | 100% |
| |
| | (d) | | Not applicable |
| (g) | | The aggregate non-audit fees billed by KPMG LLP to the Registrant for the fiscal years ended October 31, 2010 and October 31, 2009 were $9,524 and $9,070, respectively. The aggregate non-audit fees billed by KPMG to the Registrant, the Adviser and all entities controlling, controlled by, or under common control with the Adviser that provide services to |
the Registrant for the fiscal years ended October 31, 2010 and October 31, 2009 were $1,496,185 and $1,371,745, respectively.
Item 5. Audit Committee of Listed Registrants.
Not applicable to this registrant.
Item 6. Schedule of Investments
Schedule of Investments is included as a part of the report to shareholders filed under Item 1 of this Form N-CSR.
Item 7. Disclosure of Proxy Voting Policies and Procedures for Closed-End Management Investment Companies.
Not applicable to this registrant.
Item 8. Portfolio Managers of Closed-end Management Investment Companies.
Not applicable to this registrant.
Item 9. Purchases of Equity Securities by Closed-End Management Investment Company and Affiliated Purchasers.
Not applicable to this registrant.
Item 10. Submission of Matters to a Vote of Security Holders.
There have been no material changes to the procedures by which the shareholders may recommend nominees to the registrant’s Board of Directors, where those changes were implemented after the registrant last provided disclosure in response to the requirements of Item 7(d)(2)(ii)(G) of Schedule 14A (17 CFR 240.14a-101), or this Item.
Item 11. Controls and Procedures.
(a) The registrant’s Principal Executive Officer and Principal Financial Officer concluded that the Registrant’s disclosure controls and procedures (as defined in Rule 30a-3(c) under the Investment Company Act of 1940) were effective as of a date within 90 days prior to the filing date of this report (the “Evaluation Date”), based on their evaluation of the effectiveness of the Registrant’s disclosure controls and procedures as of the Evaluation Date.
(b) There were no significant changes in the Registrant’s internal control over financial reporting (as defined in Rule 30a-3(d) under the 1940 Act) that occurred during the period covered by this report that has materially affected, or is reasonably likely to materially affect, the Registrant’s internal control over financial reporting.
Item 12. Exhibits.
| | (a)(1) Code of Ethics is incorporated by reference to Form N-CSR as filed with the SEC via EDGAR on January 8, 2010 (SEC Accession No. 0000950123-10-001305). |
| | (a)(2) The certifications required by Rule 30a-2(a) under the Investment Company Act of 1940 are attached hereto. |
| | (b) | | Certifications of the Registrant’s Principal Executive Officer and Principal Financial Officer as required by Rule 30a-2(b) under the Investment Company Act of 1940 are attached hereto. These certifications are being furnished to the Securities and Exchange Commission solely pursuant to 18 U.S.C. section 1350 and are not being filed as part of the Form N-CSR with the Commission. |
SIGNATURES
Pursuant to the requirements of the Securities Exchange Act of 1934 and the Investment Company Act of 1940, the Registrant has duly caused this report to be signed on its behalf by the undersigned, thereunto duly authorized.
| | | | | |
|
| Artio Global Equity Fund Inc. | | |
| | | | | |
| By: | | /s/ Anthony Williams | | |
| | | Anthony Williams | | |
| | | President | | |
| | | | | |
| Date: December 30, 2010 | | |
Pursuant to the requirements of the Securities Exchange Act of 1934 and the Investment Company Act of 1940, this report has been signed below by the following persons on behalf of the registrant and in the capacities and on the dates indicated.
| | | | | |
|
| By: | | /s/ Anthony Williams | | |
| | | Anthony Williams | | |
| | | President | | |
| | | | | |
| Date: December 30, 2010 | | |
| | | | | |
| By: | | /s/ Timothy J. Clemens | | |
| | | Timothy J. Clemens | | |
| | | Chief Financial Officer | | |
| | | | | |
| Date: December 30, 2010 | | |