UNITED STATES
SECURITIES AND EXCHANGE COMMISSION
Washington, D.C. 20549
FORM N-CSR
CERTIFIED SHAREHOLDER REPORT OF
REGISTERED MANAGEMENT INVESTMENT COMPANIES
Investment Company Act file number: 811-06017
Aberdeen Global Select Opportunities Fund Inc.
(Exact name of registrant as specified in charter)
1735 Market Street, 32nd Floor
Philadelphia, PA 19103
(Address of principal executive offices) (Zip code)
Ms. Andrea Melia
c/o Aberdeen Asset Management Inc.
1735 Market Street, 32nd Floor
Philadelphia, PA 19103
(Name and address of agent for service)
Registrant’s telephone number, including area code: (800) 387-6977
Date of fiscal year end: October 31st
Date of reporting period: October 31, 2013
Item 1. Reports to Shareholders.

Aberdeen Investment Funds
Aberdeen Global Select Opportunities Fund Inc.
Annual Report
October 31, 2013
Aberdeen Global Select Opportunities Fund Inc.
Aberdeen Select International Equity Fund
Aberdeen Select International Equity Fund II
Aberdeen Total Return Bond Fund
Aberdeen Global High Income Fund

Table of Contents
Investors should carefully consider a fund’s investment objectives, risks, fees, and expenses before investing any money. To obtain this and other fund information, please call 1-800-387-6977 to request a prospectus, or download a prospectus at www.aberdeen-asset.us. Please read it carefully before investing any money.
Investing in mutual funds involves risk, including possible loss of principal.
Aberdeen Investment Funds and Aberdeen Global Select Opportunities Fund Inc. are distributed by Aberdeen Fund Distributors, LLC, Member FINRA, 1735 Market Street, 32nd Floor, Philadelphia, PA 19103.
Aberdeen Asset Management Inc. (AAMI) has been registered as an investment adviser under the Investment Advisers Act of 1940 since August 23,1995.
Statement Regarding Availability of Quarterly Portfolio Schedule.
Aberdeen Investment Funds and Aberdeen Global Select Opportunities Fund Inc. file complete schedules of portfolio holdings for each Fund with the Securities and Exchange Commission (the “Commission”) for the first and third quarters of each fiscal year on Form N-Q. The Funds’ Forms N-Q are available on the Commission’s website at http://www.sec.gov. The Funds’ Forms N-Q may be reviewed and copied at the Commission’s Public Reference Room in Washington, DC, and information on the operation of the Public Reference Room may be obtained by calling 800-SEC-0330; and the Funds make their most recent Forms N-Q available to shareholders on www.aberdeen-asset.us or upon request without charge.
Statement Regarding Availability of Proxy Voting Record.
Information regarding the policies and procedures that the Funds use to determine how to vote proxies relating to portfolio securities is available without charge, upon request, by calling 1-800-387-6977. The information is also included in the Funds’ Statement of Additional Information, which is available on the Funds’ website at www.aberdeen-asset.us and on the Commission’s website at www.sec.gov.
Information relating to how each Fund voted proxies relating to portfolio securities held during the most recent twelve months ended June 30 is available by August 30 of the relevant year: (i) upon request and without charge by calling 1-800-387-6977; and (ii) on the Commission’s website at www.sec.gov.
Letter to Shareholders
October 31, 2013
Dear Shareholder:
Welcome to the Aberdeen Investment Funds and Aberdeen Global Select Opportunities Fund Inc. Annual Report covering the activities for the twelve-month period ended October 31, 2013.
Market overview
During the reporting period, global equity markets continued their bull run amid widespread dovish monetary policy by central banks and growing optimism toward the end of the summer that the U.S. Federal Reserve’s (Fed) quantitative easing policy would continue at least through the first quarter of 2014. On the other hand, global investment-grade fixed income markets posted mostly negative returns as U.S. Treasury yields spiked and markets experienced a sharp sell-off in risk assets amid confused rhetoric from the Fed in early summer.
Going forward, we believe the overall global economic recovery remains fragile and any action in the form of tapering by the Fed needs to be carefully calculated. We believe that central banks around the world continue to walk the fine line between the fiscal conservatism necessary to tighten up balance sheets in heavily indebted Western nations and the continued stimulus that is necessary to support growth. Given President Obama’s recent nomination of Janet Yellen as the next Fed Chief, we expect policy to likely remain fairly dovish for the short-to-medium term, allowing equity markets to continue their strong run and investment-grade fixed income markets to correct. Therefore, we believe that now is the time for investors to consider diversifying their portfolios globally to gain access to the growth potential of Asia and emerging markets as well as securities that are less interest rate sensitive than U.S. dollar-denominated securities.*
Anne Richards, Aberdeen Group’s Chief Investment Officer, provides you with a detailed insight on the investment marketplace in the Global Market Review and Outlook on the following page.
Aberdeen Developments
In May 2013, Aberdeen Group completed the acquisition of Artio Global Investors Inc., a U.S. publicly-listed asset manager. This acquisition expands Aberdeen’s U.S. business, deepens our distribution network in the U.S., and adds to our existing fixed income capabilities. Artio’s Global High Yield and Total Return Bond teams, including lead portfolio managers Greg Hopper and Don Quigley, have comfortably migrated their teams to Aberdeen’s New York City office.
In June 2013, Aberdeen hosted the second annual U.S. Investment Conference at the TimeWarner Center in New York City. Approximately 200 financial advisors gathered to observe panels of Aberdeen fund managers and guest speakers, including keynote speaker Todd Buchholz, discuss the main theme, “Navigating a New Investment Reality.” Toward the end of the reporting period in October 2013, Aberdeen held its Annual Investment Conference in London, where institutional investors and financial advisors from around the world gathered to observe panel discussions from different Aberdeen investment teams and guest speakers on the outlook for central bank monetary policy and other key economic issues against the backdrop of “Investing in Different Tomorrows.”
During the reporting period, Aberdeen’s global marketing team won a total of 11 STAR Awards from the Mutual Fund Education Association for our mutual fund client and marketing communications. We are pleased and proud to be so recognized.
Additionally, Aberdeen has launched a global campaign to educate investors about how fixed income should be viewed in the current global economic context and to promote Aberdeen’s wide range of fixed income capabilities. This campaign largely promotes the Aberdeen Global High Income Fund and the Aberdeen Total Return Bond Fund as well as our other strategies and funds. To learn more about the campaign and Aberdeen’s fixed income capabilities, visit www.aberdeen-asset.us/fixedincome.
Thank you for choosing Aberdeen Investment Funds and Aberdeen Global Select Opportunities Fund Inc. We value your investment with us.
Yours sincerely,

Gary Marshall
President
Aberdeen Investment Funds
Aberdeen Global Select Opportunities Fund, Inc.
| * | | Diversification does not ensure a profit or eliminate the risk of loss. |
2013 Annual Report
1
Market Review
Major global equity market indices rose sharply during the 12-month period ended October 31, 2013, buoyed mainly by coordinated global central bank monetary policy. The developed markets significantly outperformed their emerging markets counterparts for the period. The U.S. broader-market S&P 500 Index and the MSCI All Country World ex-U.S. Index gained 27.2% and 20.3%, respectively, versus the 6.9% return of the MSCI Emerging Markets Index over the annual period. Investors appeared to be preoccupied initially by the U.S. presidential election in November 2012, and then focused on a succession of impending crises fueled by the ongoing political wrangling in Washington, DC over federal spending and debt management – including a partial shutdown of the U.S. government in October 2013. Elsewhere, there were signs of economic recovery in Europe, albeit a modest upturn, and China rebounded from a comparative slowdown earlier in the annual period, buoyed mainly by loose monetary policy.
Shares of U.S. companies posted healthy gains during the annual period amid the release of modestly improving U.S. economic data and with the support of continued accommodative monetary policy. At first, the uncertain fiscal situation across Europe and the upcoming U.S. presidential election dominated the news, swiftly followed by the impending fiscal cliff and the eventual reality of across-the-board U.S. federal spending cuts. The Federal Reserve (Fed) then assumed the spotlight, as global financial markets clamored for a sign from the central bank as to when it would begin to slow the pace of its monetary easing. Major market indices moved higher after the Fed announced at its September 2013 meeting that it would keep policy unchanged. Late in the period, markets appeared to be preoccupied with the 15-day U.S. government shutdown which began on October 1 after politicians failed to agree on a budget for the 2014 fiscal year. By the end of the reporting period, Congress had reached an accord on temporary funding of government operations and suspending the nation’s debt ceiling until early 2014.
Japan was the strongest performer among the major developed equity markets for the annual period attributable largely to the Bank of Japan’s aggressive monetary easing policy, as well as a notable decline in the yen versus most major global currencies – which was a boon to exports. Europe emerged from recession in the third quarter of 2013 after six consecutive quarters of contraction, while UK gross domestic product (GDP) growth accelerated. The European Central Bank (ECB) lowered its benchmark interest rate in May 2013 and asserted that it could implement negative deposit rates in an effort to encourage banks to lend. However, as of the end of the reporting period, the ECB had not taken additional actions, although ECB President Mario Draghi indicated that all policy options remained on the table.
Emerging market equities provided only modest returns for much of the period until rallying in September and October 2013. Performance initially was dampened by concerns about slowing economic growth in the developing markets, along with the ongoing monetary policy tightening in China. Emerging markets suffered a significant correction in June after the Fed began communicating a timeline for the withdrawal of its quantitative easing program, which has supplied copious amounts of liquidity to emerging economies. The upturn late in the annual period was spurred mainly by an increase in investor risk appetite, as well as improvement in Chinese economic growth. China’s GDP grew 7.8% year over year in the third quarter, up from the 7.5% rate for the previous three-month period, bolstered by the manufacturing sector. Nonetheless, there was a slowdown in infrastructure investment, which we believe may signal that the momentum of the economic rebound is fading, particularly if credit growth continues to decline. In Latin America, economic data over the reporting period generally did not meet expectations. The governments of Brazil, Chile, Colombia and Mexico all downgraded their full-year GDP forecasts. Additionally, the Brazilian central bank embarked on a rate-tightening cycle in an effort to stem inflation.
There was quite a different performance story in the global investment-grade fixed income markets. The Barclays Capital Global Aggregate Bond Index, the broad investment-grade fixed income market benchmark, returned -1.5% for the annual period. The markets were well-supported through May 2013 by central bank asset purchases in Japan and the West, signs of a stalling global economic recovery, and receding inflation. Subsequently, however, U.S. monetary policy dynamics came to the fore in driving market sentiment. Fears that the Fed was about to reduce its stimulus program led to a spike in U.S. Treasury yields, and consequently, a sharp sell-off across other markets. Income investors were not completely “left out in the cold,” however, as positive returns could be found further down on the credit quality ladder, with both the U.S. and global high yield markets posting gains for the annual period. High yield bonds historically have outperformed versus their investment-grade counterparts in rising interest-rate environments.
Outlook
The Fed’s recent deferral of monetary policy tapering has provided some relief for bond markets; however, we think that this is merely a short term reprieve. We maintain our expectation of bond yields gradually rising from their current, historic lows once monetary tightening begins, most likely in the first half of 2014. Due to the vast scale and reach of the U.S. quantitative easing program (dubbed “QE3”), we see the likely impact being felt across global bond markets. In our view, global equities are well-positioned to gain from improving economic activity in the developed world, particularly given the current healthy balance sheets and margins of many companies. We are, however, conscious of the significant rise in company valuations that has occurred, particularly in developed equity markets, and we note the need for an improvement in earnings growth to substantiate further re-rating. Looking ahead, we believe the markets will remain highly sensitive to Fed policy-induced capital outflows, and growth in emerging economies generally should exceed that of the developed world, yet with more volatility. We believe that both demographics and the scope for productivity growth remain positive in emerging markets, and that the fundamentals remain attractive over a longer time horizon.
Anne Richards
Chief Investment Officer
Aberdeen Asset Management
Annual Report 2013
2
Aberdeen Global Select Opportunities Fund Inc. (Unaudited)
Aberdeen Global Select Opportunities Fund Inc. (Class A shares at net asset value net of fees) returned 15.02% for the 12-month period ended October 31, 2013, versus 23.29% for its benchmark, the MSCI All Country World Index, during the same period. For broader comparison, the average return of the Fund’s Lipper peer category of Global Multi-Cap Growth Funds (consisting of 232 funds) was 25.89% for the period.
Market review
Global equities rallied significantly during the reporting period. Following investors’ risk aversion in the second quarter of 2013, equity markets climbed higher, supported by coordinated monetary policy. Sentiment was further boosted as Japanese policymakers explicitly targeted an inflation rate of 2%. The U.S. presidential election and China’s leadership change proceeded smoothly, supporting risk appetite as well. However, the warning in May 2013 from Federal Reserve (Fed) Chairman Ben Bernanke that U.S. monetary policy would be tightened in the near future unsettled markets. Core government bond yields rose sharply, while equity markets, especially in developing countries, corrected. After the initial volatility, Bernanke calmed markets by emphasizing the link of the reduction in quantitative easing (QE) to employment data, thereby suggesting that the degree of future tapering would be measured. Subsequently, he surprised investors by announcing that the Fed was keeping stimulus unchanged following the Federal Open Market Committee meeting in September, which caused markets to rally. Towards the end of the review period, U.S. politicians failed to agree on the federal budget. Consequently, the U.S. government began its first partial shutdown in 17 years. A temporary solution was found by mid-October, but this simply deferred the problems of the budget and federal debt ceiling to early 2014.
Aberdeen’s equity investment process
Aberdeen’s investment approach is based on bottom-up company analysis. We believe that, given the inefficiency of markets, strong long-term returns are achieved by identifying good-quality stocks, buying them at reasonable prices and holding them for the long run. In our view, sound fundamentals drive stock prices over time. As a consequence of our rigorous selection criteria, we introduce new stocks infrequently, the result of which is reflected in our portfolios’ typically low annual turnover rates. Our research process relies primarily on gathering information from meetings with company management and public filings. We prepare a written analysis after each management meeting in a standard Aberdeen format used by our regional teams worldwide. Investment in a new company is made only after our investment managers have met with management, prepared written detailed research reports and thoroughly discussed the merits of the company in a team-based setting. We do not actively seek to overweight or underweight companies in a benchmark index. Instead, we focus on each investment on its own merit. We will not own a stock due solely to its sizeable position in an index.
After Aberdeen Asset Management Inc. was appointed as investment adviser of the Fund effective May 22, 2013, the Aberdeen Global Equity team began to position the Fund in accordance with Aberdeen’s investment process.
Fund positioning and outlook
As bottom-up stock pickers, our country and sector allocations are driven by where we believe that we can find quality companies with attractive valuations. This approach may lead to significant deviations from the MSCI All Country World Index benchmark.
At the end of the reporting period, the Fund was most overweight relative to the benchmark in Switzerland and the UK.
Switzerland – In our view, the Swiss market is home to some of Europe’s best-run companies. The Fund holds substantial positions in food conglomerate Nestle, pharmaceutical companies Roche and Novartis, as well as insurer Zurich Insurance.
UK – We believe that this market has a broad array of diverse companies that benefit from a range of growth drivers that underpins their prospects and earnings. The Fund has positions in Vodafone, Standard Chartered, HSBC, Royal Dutch Shell, BHP Billiton and British American Tobacco, which generate significant portions of their revenue from overseas. We also hold utility Centrica, which is more directly exposed to UK gas consumption.
The Fund’s largest underweight positions were in the U.S., Japan and Germany.
U.S. – We believe that excessive risk and leverage in the banking sector have hobbled the U.S. economy. Recovery is likely to be tenuous, in our opinion, as the country works through its massive imbalances. However, we hold several firms that we think are well-managed, including energy company Schlumberger.
Japan – Although Japan is Asia’s biggest market, we feel that quite a few domestically-oriented corporations remain unattractive due to an inherent lack of competitiveness amid a sluggish domestic economy. The recent stock market rally has been fuelled by hope and expectation surrounding political rhetoric, in our view, rather than evidence of improving fundamentals at the company level.
Germany – The Fund is underweight in this market as we believe that there are better opportunities elsewhere.
The Fund’s most notable sector overweights versus the benchmark were energy and consumer staples.
Energy –The Fund holds a broad range of exposures within this sector covering energy and energy service companies with operations spread around the world. Holdings include Eni and Royal Dutch Shell.
Consumer Staples – The Fund is overweight in this sector as a result of our bottom-up, stock-driven investment process. Holdings in this sector include British American Tobacco, Philip Morris International, and Nestle. We are attracted to the strong characteristics and sound cash flows of the underlying businesses and, in many cases, the exposure these companies have to domestic demand growth in emerging markets.
Conversely, the Fund was most underweight relative to the benchmark in the consumer discretionary and financials sectors.
2013 Annual Report
3
Aberdeen Global Select Opportunities Fund Inc. (Unaudited) (concluded)
Consumer Discretionary – The Fund has only a small position in this sector, which is dominated by developed-market companies exposed to the over-indebted western consumer, in our view.
Financials – Although the Fund holds a diverse range of stocks both in the context of geography and end-market exposure, the position is underweight in comparison to the benchmark.
While the Fund used derivatives during the reporting period, they had minimal impact on performance. The Fund had no derivative positions open as of October 31, 2013.
In our view, investors realize that financial markets are approaching a period of transition, from unconventional U.S. monetary policy towards a more normalized environment. While the initial reaction to the Fed announcement on the likely delay of quantitative easing (QE) tapering was significant, we see indications of growing Fed confidence in U.S. economic growth. In our opinion, it would seem premature for Fed officials to begin managing investor expectations if they still believed that the economic upturn was in doubt. While global economic data continue to improve, the recovery remains uneven. With a lot of positive news already discounted, equity markets require healthy earnings growth to progress meaningfully from these levels. We therefore believe that there will be higher levels of volatility in the medium term.
Portfolio Management:
Aberdeen Global Equity Team
PAST PERFORMANCE DOES NOT GUARANTEE FUTURE RESULTS.
The performance quoted represents past performance, which does not guarantee future results. Class A shares have up to a 0.25% 12b-1 fee. The investment return and principal value of an investment will fluctuate so that an investor’s shares, when redeemed, may be worth more or less than their original cost. Current performance of the Fund may be lower or higher than the performance quoted. Performance data current to the most recent month-end may be obtained by calling 800-387-6977 or visiting www.aberdeen-asset.us.
Total returns assume the reinvestment of all distributions. Investment performance reflects fee waivers and, in the absence of such waivers, returns would have been lower. Indexes are unmanaged and have been provided for comparison purposes only. No fees or expenses are reflected. You cannot invest directly in an index.
Lipper is a leading global provider of mutual fund information and analysis to fund companies, financial intermediaries and media organizations.
Risk Considerations
Investing in mutual funds involves risk, including the possible loss of principal. There is no assurance that the investment objective of any fund will be achieved.
Foreign securities are more volatile, harder to price and less liquid than U.S. securities. They are subject to different accounting and regulatory standards, and political and economic risks. These risks are enhanced in emerging markets countries.
Equity stocks of small and mid-cap companies carry greater risk, and more volatility than equity stocks of larger, more established companies.
Please read the prospectus for more detailed information regarding these and other risks.
Annual Report 2013
4
Aberdeen Global Select Opportunities Fund Inc. (Unaudited)
| | | | | | | | | | | | |
Average Annual Total Return (For periods ended October 31, 2013) | | 1 Yr. | | | 5 Yr. | | | Inception | |
Class A1 | | | 15.02% | | | | 8.83% | | | | 5.36% | |
Class I2 | | | 15.23% | | | | 9.08% | | | | 3.87% | |
| 1 | | Class commenced operations on July 01, 2004. |
| 2 | | Class commenced operations on March 14, 2005. |
2013 Annual Report
5
Aberdeen Global Select Opportunities Fund Inc. (Unaudited)
Performance of a $10,000 Investment (as of October 31, 2013)
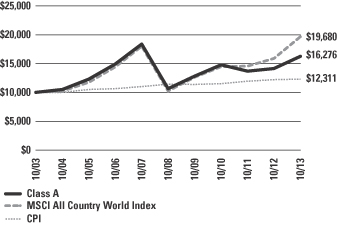
Comparative performance of $10,000 invested in Class A shares of the Aberdeen Global Select Opportunities Fund Inc., Morgan Stanley Capital International (MSCI) All Country World Index and the Consumer Price Index (CPI) over a 10-year period ended October 31, 2013. Unlike the Fund, the returns for these unmanaged indexes do not reflect any fees or expenses. Investors cannot invest directly in market indexes.
The MSCI All Country World Index is a free float-adjusted, market capitalization-weighted index that captures large and mid cap representation across 24 developed markets countries including: Australia, Austria, Belgium, Canada, Denmark, Finland, France, Germany, Greece, Hong Kong, Ireland, Israel, Italy, Japan, Netherlands, New Zealand, Norway, Portugal, Singapore, Spain, Sweden, Switzerland, the UK and the US.
The CPI represents changes in prices of a basket of goods and services purchased for consumption by urban households.
Investment return and principal value will fluctuate, and when redeemed, shares may be worth more or less than original cost. Past performance is no guarantee of future results and does not reflect the deduction of taxes that a shareholder would pay on fund distributions or the redemption of fund shares. Investing in mutual funds involves market risk, including loss of principal. Performance returns assume the reinvestment of all distributions.
Portfolio Summary (as a percentage of net assets)
October 31, 2013 (Unaudited)
| | | | |
| Asset Allocation | | | |
Common Stocks | | | 88.9% | |
Preferred Stocks | | | 9.4% | |
Repurchase Agreement | | | 2.1% | |
Liabilities in excess of other assets | | | (0.4% | ) |
| | | | 100.0% | |
The following chart summarizes the composition of the Fund’s portfolio, in industry classification standard sectors, expressed as a percentage of net assets. An industry classification standard sector can include more than one industry. As of October 31, 2013, the Fund did not have more than 25% of its assets invested in any industry group. The sectors, as classified by Morgan Stanley Capital International’s and Standard & Poor’s Global Industry Classification Standard Sectors, are comprised of several industry groups.
| | | | |
| Top Sectors | | | |
Financials | | | 18.4% | |
Energy | | | 17.6% | |
Consumer Staples | | | 16.6% | |
Health Care | | | 12.9% | |
Information Technology | | | 8.8% | |
Materials | | | 8.5% | |
Industrials | | | 8.0% | |
Telecommunication Services | | | 4.5% | |
Utilities | | | 1.9% | |
Consumer Discretionary | | | 1.1% | |
Other | | | 1.7% | |
| | | | 100.0% | |
| | | | |
| Top Holdings* | | | |
Roche Holding AG | | | 4.0% | |
British American Tobacco PLC | | | 3.7% | |
Philip Morris International, Inc. | | | 3.6% | |
Vodafone Group PLC | | | 3.5% | |
Taiwan Semiconductor Manufacturing Co. Ltd., ADR | | | 3.1% | |
Johnson & Johnson | | | 3.0% | |
CVS Caremark Corp. | | | 3.0% | |
Novartis AG | | | 3.0% | |
Royal Dutch Shell PLC, B Shares | | | 3.0% | |
Standard Chartered PLC | | | 2.9% | |
Other | | | 67.2% | |
| | | | 100.0% | |
| | | | |
| Top Countries | | | |
United States | | | 29.1% | |
United Kingdom | | | 18.6% | |
Switzerland | | | 11.8% | |
Brazil | | | 6.5% | |
Italy | | | 5.6% | |
Japan | | | 4.4% | |
Sweden | | | 4.2% | |
Canada | | | 4.0% | |
Taiwan | | | 3.1% | |
Republic of South Korea | | | 2.9% | |
Other | | | 9.8% | |
| | | | 100.0% | |
| * | | For the purpose of listing top holdings, repurchase agreements included as part of Other. |
Annual Report 2013
6
Statement of Investments
October 31, 2013
Aberdeen Global Select Opportunities Fund Inc.
| | | | | | | | |
| | | Shares or
Principal
Amount | | | Value | |
COMMON STOCKS (88.9%) | | | | | | | | |
AUSTRALIA (1.4%) | | | | | | | | |
Financials (1.4%) | | | | | | | | |
QBE Insurance Group Ltd. | | | 8,300 | | | $ | 116,323 | |
CANADA (4.0%) | | | | | | | | |
Industrials (2.1%) | | | | | | | | |
Canadian National Railway Co. | | | 1,600 | | | | 175,749 | |
Materials (1.9%) | | | | | | | | |
Potash Corp. of Saskatchewan, Inc. | | | 5,000 | | | | 155,344 | |
| | | | | | | | 331,093 | |
CHINA (1.5%) | | | | | | | | |
Energy (1.5%) | | | | | | | | |
PetroChina Co. Ltd., H Shares | | | 106,000 | | | | 121,408 | |
FRANCE (1.0%) | | | | | | | | |
Industrials (1.0%) | | | | | | | | |
Schneider Electric SA | | | 1,000 | | | | 84,357 | |
HONG KONG (2.5%) | | | | | | | | |
Financials (2.5%) | | | | | | | | |
AIA Group Ltd. | | | 25,500 | | | | 129,423 | |
Swire Pacific Ltd., Class A | | | 7,000 | | | | 80,942 | |
| | | | | | | | 210,365 | |
ITALY (5.6%) | | | | | | | | |
Energy (5.6%) | | | | | | | | |
Eni SpA | | | 8,800 | | | | 223,121 | |
Tenaris SA, ADR | | | 5,100 | | | | 238,731 | |
| | | | | | | | 461,852 | |
JAPAN (4.4%) | | | | | | | | |
Financials (1.0%) | | | | | | | | |
Daito Trust Construction Co. Ltd. | | | 800 | | | | 81,623 | |
Industrials (1.5%) | | | | | | | | |
FANUC Corp. | | | 800 | | | | 128,182 | |
Materials (1.9%) | | | | | | | | |
Shin-Etsu Chemical Co. Ltd. | | | 2,800 | | | | 157,823 | |
| | | | | | | | 367,628 | |
MEXICO (1.8%) | | | | | | | | |
Consumer Staples (1.8%) | | | | | | | | |
Fomento Economico Mexicano SAB de CV, ADR | | | 1,600 | | | | 149,280 | |
SINGAPORE (1.0%) | | | | | | | | |
Financials (1.0%) | | | | | | | | |
City Developments Ltd. | | | 10,000 | | | | 83,041 | |
SOUTH AFRICA (1.0%) | | | | | | | | |
Telecommunication Services (1.0%) | | | | | | | | |
MTN Group Ltd. | | | 4,200 | | | | 83,761 | |
SWEDEN (4.2%) | | | | | | | | |
Financials (2.0%) | | | | | | | | |
Nordea Bank AB | | | 13,000 | | | | 166,743 | |
Industrials (1.4%) | | | | | | | | |
Atlas Copco AB, A Shares | | | 4,100 | | | | 113,920 | |
Information Technology (0.8%) | | | | | | | | |
Telefonaktiebolaget LM Ericsson, B Shares | | | 6,000 | | | | 71,719 | |
| | | | | | | | 352,382 | |
SWITZERLAND (11.8%) | | | | | | | | |
Consumer Staples (2.1%) | | | | | | | | |
Nestle SA | | | 2,400 | | | | 173,596 | |
Financials (2.7%) | | | | | | | | |
Zurich Insurance Group AG * | | | 800 | | | | 221,656 | |
Health Care (7.0%) | | | | | | | | |
Novartis AG | | | 3,200 | | | | 248,954 | |
Roche Holding AG | | | 1,200 | | | | 332,880 | |
| | | | | | | | 581,834 | |
| | | | | | | | 977,086 | |
TAIWAN (3.1%) | | | | | | | | |
Information Technology (3.1%) | | | | | | | | |
Taiwan Semiconductor Manufacturing Co. Ltd., ADR | | | 13,800 | | | | 254,058 | |
UNITED KINGDOM (18.6%) | | | | | | | | |
Consumer Staples (3.7%) | | | | | | | | |
British American Tobacco PLC | | | 5,600 | | | | 309,136 | |
Energy (3.0%) | | | | | | | | |
Royal Dutch Shell PLC, B Shares | | | 7,100 | | | | 246,331 | |
Financials (4.9%) | | | | | | | | |
HSBC Holdings PLC | | | 14,900 | | | | 163,284 | |
Standard Chartered PLC | | | 10,100 | | | | 243,319 | |
| | | | | | | | 406,603 | |
Materials (1.6%) | | | | | | | | |
BHP Billiton PLC | | | 4,300 | | | | 133,366 | |
Telecommunication Services (3.5%) | | | | | | | | |
Vodafone Group PLC | | | 79,600 | | | | 287,103 | |
Utilities (1.9%) | | | | | | | | |
Centrica PLC | | | 27,600 | | | | 156,705 | |
| | | | | | | | 1,539,244 | |
UNITED STATES (27.0%) | | | | | | | | |
Consumer Discretionary (1.1%) | | | | | | | | |
Comcast Corp., Class A | | | 1,900 | | | | 90,402 | |
Consumer Staples (9.0%) | | | | | | | | |
CVS Caremark Corp. | | | 4,000 | | | | 249,040 | |
PepsiCo, Inc. | | | 2,400 | | | | 201,816 | |
Philip Morris International, Inc. | | | 3,300 | | | | 294,096 | |
| | | | | | | | 744,952 | |
See accompanying notes to financial statements.
2013 Annual Report
7
Statement of Investments (concluded)
October 31, 2013
Aberdeen Global Select Opportunities Fund Inc.
| | | | | | | | |
| | | Shares or
Principal
Amount | | | Value | |
Energy (5.9%) | | | | | | | | |
Chevron Corp. | | | 1,000 | | | $ | 119,960 | |
EOG Resources, Inc. | | | 1,100 | | | | 196,240 | |
Schlumberger Ltd. | | | 1,800 | | | | 168,696 | |
| | | | | | | | 484,896 | |
Health Care (5.9%) | | | | | | | | |
Baxter International, Inc. | | | 1,800 | | | | 118,566 | |
Johnson & Johnson | | | 2,700 | | | | 250,047 | |
Quest Diagnostics, Inc. | | | 2,000 | | | | 119,820 | |
| | | | | | | | 488,433 | |
Industrials (2.0%) | | | | | | | | |
United Technologies Corp. | | | 1,600 | | | | 170,000 | |
Information Technology (2.0%) | | | | | | | | |
Oracle Corp. | | | 5,000 | | | | 167,500 | |
Materials (1.1%) | | | | | | | | |
Praxair, Inc. | | | 700 | | | | 87,297 | |
| | | | | | | | 2,233,480 | |
Total Common Stocks | | | | | | | 7,365,358 | |
PREFERRED STOCKS (9.4%) | | | | | | | | |
BRAZIL (6.5%) | | | | | | | | |
Energy (1.6%) | | | | | | | | |
Petroleo Brasileiro SA, ADR, Preferred Shares | | | 7,200 | | | | 130,752 | |
Financials (2.9%) | | | | | | | | |
Banco Bradesco SA, ADR, Preferred Shares | | | 16,500 | | | | 237,930 | |
Materials (2.0%) | | | | | | | | |
Vale SA, ADR, Preferred Shares | | | 11,500 | | | | 168,360 | |
| | | | | | | | 537,042 | |
REPUBLIC OF SOUTH KOREA (2.9%) | | | | | | | | |
Information Technology (2.9%) | | | | | | | | |
Samsung Electronics Co. Ltd., GDR, Preferred Shares (a) | | | 500 | | | | 239,550 | |
Total Preferred Stocks | | | | | | | 776,592 | |
REPURCHASE AGREEMENT (2.1%) | | | | | | | | |
UNITED STATES (2.1%) | | | | | | | | |
State Street Bank, 0.00%, dated 10/31/2013, due 11/01/2013, repurchase price $171,625 collateralized by Federal Home Loan Mortgage Corp., maturity 09/10/2015; total market value of $180,031 | | $ | 171,625 | | | | 171,625 | |
Total Repurchase Agreement | | | | | | | 171,625 | |
Total Investments
(Cost $8,056,448) (b)—100.4% | | | | | | | 8,313,575 | |
| | |
Liabilities in excess of other assets—(0.4)% | | | | | | | (35,350 | ) |
Net Assets—100.0% | | | $ | 8,278,225 | |
| * | | Non-income producing security. |
| (a) | | Denotes a security issued under Regulation S or Rule 144A. |
| (b) | | See notes to financial statements for tax unrealized appreciation/depreciation of securities. |
| ADR | | American Depositary Receipt |
| GDR | | Global Depositary Receipt |
See accompanying notes to financial statements.
Annual Report 2013
8
Aberdeen Select International Equity Fund (Unaudited)
Aberdeen Select International Equity Fund (Class A shares at net asset value net of fees) returned 20.70% for the 12-month period ended October 31, 2013, versus 20.29% for its benchmark, the MSCI All Country World ex-U.S. Index, during the same period. For broader comparison, the average return of the Fund’s Lipper peer category of International Multi-Cap Growth Funds (consisting of 335 funds) was 21.94% for the period.
Market review
Global equities rallied significantly during the reporting period. Following investors’ risk aversion in the second quarter of 2013, equity markets climbed higher, supported by coordinated monetary policy. Sentiment was further boosted as Japanese policymakers explicitly targeted an inflation rate of 2%. The U.S. presidential election and China’s leadership change proceeded smoothly, supporting risk appetite as well. However, the warning in May 2013 from Federal Reserve (Fed) Chairman Ben Bernanke that U.S. monetary policy would be tightened in the near future unsettled markets. Core government bond yields rose sharply, while equity markets, especially in developing countries, corrected. After the initial volatility, Bernanke calmed markets by emphasizing the link of the reduction in quantitative easing (QE) to employment data, thereby suggesting that the degree of future tapering would be measured. Subsequently, he surprised investors by announcing that the Fed was keeping stimulus unchanged following the Federal Open Market Committee meeting in September, which caused markets to rally. Towards the end of the review period, U.S. politicians failed to agree on the federal budget. Consequently, the U.S. government began its first partial shutdown in 17 years. A temporary solution was found by mid-October, but this simply deferred the problems of the budget and federal debt ceiling to early 2014.
Aberdeen’s equity investment process
Aberdeen’s investment approach is based on bottom-up company analysis. We believe that, given the inefficiency of markets, strong long-term returns are achieved by identifying good-quality stocks, buying them at reasonable prices and holding them for the long run. In our view, sound fundamentals drive stock prices over time. As a consequence of our rigorous selection criteria, we introduce new stocks infrequently, the result of which is reflected in our portfolios’ typically low annual turnover rates. Our research process relies primarily on gathering information from meetings with company management and public filings. We prepare a written analysis after each management meeting in a standard Aberdeen format used by our regional teams worldwide. Investment in a new company is made only after our investment managers have met with management, prepared written detailed research reports and thoroughly discussed the merits of the company in a team-based setting. We do not actively seek to overweight or underweight companies in a benchmark index. Instead, we focus on each investment on its own merit. We will not own a stock due solely to its sizeable position in an index.
After Aberdeen Asset Management Inc. was appointed as investment adviser of the Fund effective May 22, 2013, the Aberdeen Global Equity team began to position the Fund in accordance with Aberdeen’s investment process.
Fund positioning and Outlook
As bottom-up stock pickers, our country and sector allocations are driven by where we believe that we can find quality companies with attractive valuations. This approach may lead to significant deviations from the benchmark MSCI All Country World ex-U.S. Index.
At the end of the reporting period, the Fund was most overweight relative to the benchmark in Switzerland and the UK.
Switzerland – In our view, the Swiss market is home to some of Europe’s best-run companies. The Fund holds substantial positions in food conglomerate Nestle, pharmaceutical companies Roche and Novartis, as well as insurer Zurich Insurance.
UK – We believe that this market has a broad array of diverse companies that benefit from a range of growth drivers that underpins their prospects and earnings. The Fund has positions in Vodafone, Standard Chartered, HSBC, Royal Dutch Shell, BHP Billiton and British American Tobacco, which generate significant portions of their revenue from overseas. We also hold utility Centrica, which is more directly exposed to UK gas consumption.
The Fund’s largest underweight positions were in Japan and Germany.
Japan – Although Japan is Asia’s biggest market, we feel that quite a few domestically-oriented corporations remain unattractive due to an inherent lack of competitiveness amid a sluggish domestic economy. The recent stock market rally has been fuelled by hope and expectation surrounding political rhetoric, in our view, rather than evidence of improving fundamentals at the company level.
Germany – The Fund is underweight in this market as we believe that there are better opportunities elsewhere.
The Fund’s most notable sector overweights versus the benchmark were energy and consumer staples.
Energy – The Fund holds a broad range of exposures within this sector covering energy and energy service companies with operations spread around the world. Holdings include Eni and Royal Dutch Shell.
Consumer Staples – The Fund is overweight in this sector as a result of our bottom-up, stock-driven investment process. Holdings in this sector include British American Tobacco, Philip Morris International, and Nestle. We are attracted to the strong characteristics and sound cash flows of the underlying businesses and, in many cases, the exposure these companies have to domestic demand growth in emerging markets.
Conversely, the Fund was most underweight relative to the benchmark in the consumer discretionary and financials sectors.
Consumer Discretionary – The Fund has only a small position in this sector, which is dominated by developed-market companies exposed to the over-indebted western consumer, in our view.
2013 Annual Report
9
Aberdeen Select International Equity Fund (Unaudited) (concluded)
Financials – Although the Fund holds a diverse range of stocks both in the context of geography and end-market exposure, the position is underweight in comparison to the benchmark.
The Fund’s use of total return swaps, forward foreign exchange contracts and futures contracts positively contributed to the performance of the Fund during the year. The Fund had no derivative positions open as of October 31, 2013.
In our view, investors realize that financial markets are approaching a period of transition, from unconventional U.S. monetary policy towards a more normalized environment. While the initial reaction to the Fed announcement on the likely delay of quantitative easing (QE) tapering was significant, we see indications of growing Fed confidence in U.S. economic growth. In our opinion, it would seem premature for Fed officials to begin managing investor expectations if they still believed that the economic upturn was in doubt. While global economic data continue to improve, the recovery remains uneven. With a lot of positive news already discounted, equity markets require healthy earnings growth to progress meaningfully from these levels. We therefore believe that there will be higher levels of volatility in the medium term.
Portfolio Management:
Aberdeen Global Equity Team
PAST PERFORMANCE DOES NOT GUARANTEE FUTURE RESULTS.
The performance quoted represents past performance, which does not guarantee future results. Class A shares have up to a 0.25% 12b-1 fee. The investment return and principal value of an investment will fluctuate so that an investor's shares, when redeemed, may be worth more or less than their original cost. Current performance of the Fund may be lower or higher than the performance quoted. Performance data current to the most recent month-end may be obtained by calling 800-387-6977 or visiting www.aberdeen-asset.us.
Total returns assume the reinvestment of all distributions. Investment performance reflects fee waivers and, in the absence of such waivers, returns would have been lower. Indexes are unmanaged and have been provided for comparison purposes only. No fees or expenses are reflected. You cannot invest directly in an index.
Lipper is a leading global provider of mutual fund information and analysis to fund companies, financial intermediaries and media organizations.
Risk Considerations
Investing in mutual funds involves risk, including the possible loss of principal. There is no assurance that the investment objective of any fund will be achieved.
Foreign securities are more volatile, harder to price and less liquid than U.S. securities. They are subject to different accounting and regulatory standards, and political and economic risks. These risks are enhanced in emerging markets countries.
Equity stocks of small and mid-cap companies carry greater risk, and more volatility than equity stocks of larger, more established companies.
Please read the prospectus for more detailed information regarding these and other risks.
Annual Report 2013
10
Aberdeen Select International Equity Fund (Unaudited)
| | | | | | | | | | | | |
Average Annual Total Return (For periods ended October 31, 2013) | | 1 Yr. | | | 5 Yr. | | | 10 Yr. | |
Class A | | | 20.70% | | | | 5.97% | | | | 6.26% | |
Class I | | | 21.04% | | | | 6.23% | | | | 6.52% | |
2013 Annual Report
11
Aberdeen Select International Equity Fund (Unaudited)
Performance of a $10,000 Investment (as of October 31, 2013)
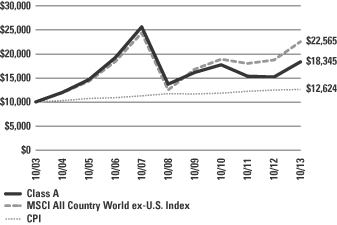
Comparative performance of $10,000 invested in Class A shares of the Aberdeen Select International Equity Fund, Morgan Stanley Capital International All Country World ex-U.S. Index (MSCI ACWI ex-US), and the Consumer Price Index (CPI) over a 10-year period ended October 31, 2013. Unlike the Fund, the returns for these unmanaged indexes do not reflect any fees or expenses. Investors cannot invest directly in market indexes.
The MSCI ACWI ex-US is a free float-adjusted market capitalization index that is designed to measure equity market performance in the global developed and emerging markets excluding the US.
The CPI represents changes in prices of a basket of goods and services purchased for consumption by urban households.
Investment return and principal value will fluctuate, and when redeemed, shares may be worth more or less than original cost. Past performance is no guarantee of future results and does not reflect the deduction of taxes that a shareholder would pay on fund distributions or the redemption of fund shares. Investing in mutual funds involves market risk, including loss of principal. Performance returns assume the reinvestment of all distributions.
Portfolio Summary (as a percentage of net assets)
October 31, 2013 (Unaudited)
| | | | |
| Asset Allocation | | | |
Common Stocks | | | 87.3% | |
Preferred Stocks | | | 11.6% | |
Government Bonds | | | 0.3% | |
Exchange Traded Funds | | | 0.2% | |
Repurchase Agreement | | | 0.1% | |
Other assets in excess of liabilities | | | 0.5% | |
| | | | 100.0% | |
The following chart summarizes the composition of the Fund’s portfolio, in industry classification standard sectors, expressed as a percentage of net assets. An industry classification standard sector can include more than one industry. As of October 31, 2013, the Fund did not have more than 25% of its assets invested in any industry group. The sectors, as classified by Morgan Stanley Capital International’s and Standard & Poor’s Global Industry Classification Standard Sectors, are comprised of several industry groups.
| | | | |
| Top Sectors | | | |
Financials | | | 20.6% | |
Energy | | | 14.2% | |
Consumer Staples | | | 14.0% | |
Materials | | | 10.8% | |
Industrials | | | 9.9% | |
Information Technology | | | 9.4% | |
Health Care | | | 9.2% | |
Telecommunication Services | | | 7.9% | |
Utilities | | | 2.9% | |
Other | | | 1.1% | |
| | | | 100.0% | |
| | | | |
| Top Holdings* | | | |
Roche Holding AG | | | 4.9% | |
Samsung Electronics Co. Ltd., Preferred Shares | | | 4.6% | |
British American Tobacco PLC | | | 4.3% | |
Novartis AG | | | 4.3% | |
Taiwan Semiconductor Manufacturing Co. Ltd. | | | 3.9% | |
Nestle SA | | | 3.9% | |
Vodafone Group PLC | | | 3.6% | |
Eni SpA | | | 3.3% | |
Royal Dutch Shell PLC, B Shares | | | 3.2% | |
Standard Chartered PLC | | | 3.0% | |
Other | | | 61.0% | |
| | | | 100.0% | |
| | | | |
| Top Countries | | | |
United Kingdom | | | 24.3% | |
Switzerland | | | 16.9% | |
Brazil | | | 7.0% | |
Japan | | | 6.6% | |
Italy | | | 6.3% | |
Canada | | | 5.4% | |
Republic of South Korea | | | 4.6% | |
Sweden | | | 4.5% | |
France | | | 4.3% | |
Taiwan | | | 3.9% | |
Other | | | 16.2% | |
| | | | 100.0% | |
| * | | For the purpose of listing top holdings, repurchase agreements included as part of Other. |
Annual Report 2013
12
Statement of Investments
October 31, 2013
Aberdeen Select International Equity Fund
| | | | | | | | |
| | | Shares or
Principal
Amount | | | Value | |
COMMON STOCKS (87.3%) | | | | | | | | |
AUSTRALIA (1.5%) | | | | | | | | |
Financials (1.5%) | | | | | | | | |
QBE Insurance Group Ltd. | | | 705,600 | | | $ | 9,888,885 | |
BULGARIA (0.3%) | | | | | | | | |
Financials (0.2%) | | | | | | | | |
LEV Insurance (a)(b)(c) | | | 4,078,860 | | | | 1,933,107 | |
Industrials (0.1%) | | | | | | | | |
Sparki Eltos AD-Lovech (a)(b)(c) | | | 1,321,370 | | | | 358,219 | |
| | | | | | | | 2,291,326 | |
CANADA (5.4%) | | | | | | | | |
Industrials (2.3%) | | | | | | | | |
Canadian National Railway Co. | | | 138,300 | | | | 15,191,317 | |
Materials (2.0%) | | | | | | | | |
Potash Corp. of Saskatchewan, Inc. | | | 434,100 | | | | 13,486,925 | |
Telecommunication Services (1.1%) | | | | | | | | |
TELUS Corp. | | | 208,100 | | | | 7,267,586 | |
| | | | | | | | 35,945,828 | |
CHINA (1.5%) | | | | | | | | |
Energy (1.5%) | | | | | | | | |
PetroChina Co. Ltd., H Shares | | | 8,943,200 | | | | 10,243,145 | |
FRANCE (4.3%) | | | | | | | | |
Consumer Staples (2.3%) | | | | | | | | |
Casino Guichard-Perrachon SA | | | 133,200 | | | | 15,013,781 | |
Industrials (1.0%) | | | | | | | | |
Schneider Electric SA | | | 80,200 | | | | 6,765,425 | |
Utilities (1.0%) | | | | | | | | |
GDF Suez | | | 281,000 | | | | 7,006,234 | |
| | | | | | | | 28,785,440 | |
GERMANY (1.0%) | | | | | | | | |
Materials (1.0%) | | | | | | | | |
Linde AG | | | 34,700 | | | | 6,602,088 | |
HONG KONG (3.3%) | | | | | | | | |
Financials (3.3%) | | | | | | | | |
AIA Group Ltd. | | | 2,924,400 | | | | 14,842,564 | |
Swire Pacific Ltd., Class A | | | 588,900 | | | | 6,809,563 | |
| | | | | | | | 21,652,127 | |
ITALY (6.3%) | | | | | | | | |
Energy (6.3%) | | | | | | | | |
Eni SpA | | | 865,600 | | | $ | 21,946,993 | |
Tenaris SA, ADR | | | 433,100 | | | | 20,273,411 | |
| | | | | | | | 42,220,404 | |
JAPAN (6.6%) | | | | | | | | |
Consumer Staples (1.0%) | | | | | | | | |
Japan Tobacco, Inc. | | | 194,700 | | | | 7,045,001 | |
Financials (1.1%) | | | | | | | | |
Daito Trust Construction Co. Ltd. | | | 69,600 | | | | 7,101,172 | |
Industrials (2.0%) | | | | | | | | |
FANUC Corp. | | | 82,500 | | | | 13,218,836 | |
Materials (2.5%) | | | | | | | | |
Shin-Etsu Chemical Co. Ltd. | | | 291,800 | | | | 16,447,396 | |
| | | | | | | | 43,812,405 | |
LATVIA (0.0%) | | | | | | | | |
Financials (0.0%) | | | | | | | | |
AS Parex Banka* (c) | | | 1,424,182 | | | | – | |
MEXICO (2.5%) | | | | | | | | |
Consumer Staples (2.5%) | | | | | | | | |
Fomento Economico Mexicano SAB de CV, ADR | | | 176,100 | | | | 16,430,130 | |
SERBIA (0.2%) | | | | | | | | |
Financials (0.2%) | | | | | | | | |
Komercijalna Banka ad Beograd* | | | 95,073 | | | | 1,382,962 | |
Industrials (0.0%) | | | | | | | | |
Toza Markovic ad Kikinda* (a)(b)(c) | | | 78,160 | | | | 80,145 | |
| | | | | | | | 1,463,107 | |
SINGAPORE (3.7%) | | | | | | | | |
Financials (1.6%) | | | | | | | | |
City Developments Ltd. | | | 1,253,000 | | | | 10,405,047 | |
Telecommunication Services (2.1%) | | | | | | | | |
Singapore Telecommunications Ltd. | | | 4,570,600 | | | | 13,929,027 | |
| | | | | | | | 24,334,074 | |
SOUTH AFRICA (1.1%) | | | | | | | | |
Telecommunication Services (1.1%) | | | | | | | | |
MTN Group Ltd. | | | 362,600 | | | | 7,231,343 | |
SWEDEN (4.5%) | | | | | | | | |
Financials (2.1%) | | | | | | | | |
Nordea Bank AB | | | 1,107,500 | | | | 14,205,191 | |
Industrials (1.5%) | | | | | | | | |
Atlas Copco AB, A Shares | | | 350,700 | | | | 9,744,301 | |
Information Technology (0.9%) | | | | | | | | |
Telefonaktiebolaget LM Ericsson, B Shares | | | 505,500 | | | | 6,042,362 | |
| | | | | | | | 29,991,854 | |
SWITZERLAND (16.9%) | | | | | | | | |
Consumer Staples (3.9%) | | | | | | | | |
Nestle SA | | | 355,500 | | | | 25,713,931 | |
Financials (2.8%) | | | | | | | | |
Zurich Insurance Group AG* | | | 68,000 | | | | 18,840,704 | |
Health Care (9.2%) | | | | | | | | |
Novartis AG | | | 365,600 | | | | 28,442,957 | |
Roche Holding AG | | | 118,600 | | | | 32,899,697 | |
| | | | | | | | 61,342,654 | |
See accompanying notes to financial statements.
2013 Annual Report
13
Statement of Investments (concluded)
October 31, 2013
Aberdeen Select International Equity Fund
| | | | | | | | |
| | | Shares or
Principal
Amount | | | Value | |
Industrials (1.0%) | | | | | | | | |
Schindler Holding AG | | | 46,800 | | | $ | 6,651,383 | |
| | | | | | | | 112,548,672 | |
TAIWAN (3.9%) | | | | | | | | |
Information Technology (3.9%) | | | | | | | | |
Taiwan Semiconductor Manufacturing Co. Ltd. | | | 6,932,000 | | | | 25,836,178 | |
UNITED KINGDOM (24.3%) | | | | | | | | |
Consumer Staples (4.3%) | | | | | | | | |
British American Tobacco PLC | | | 521,300 | | | | 28,777,229 | |
Energy (4.7%) | | | | | | | | |
John Wood Group PLC | | | 779,600 | | | | 10,170,351 | |
Royal Dutch Shell PLC, B Shares | | | 600,800 | | | | 20,844,487 | |
| | | | | | | | 31,014,838 | |
Financials (5.1%) | | | | | | | | |
HSBC Holdings PLC | | | 1,263,700 | | | | 13,848,417 | |
Standard Chartered PLC | | | 841,900 | | | | 20,282,200 | |
| | | | | | | | 34,130,617 | |
Industrials (2.0%) | | | | | | | | |
Weir Group PLC (The) | | | 366,500 | | | | 13,277,876 | |
Materials (2.7%) | | | | | | | | |
BHP Billiton PLC | | | 572,400 | | | | 17,753,236 | |
Telecommunication Services (3.6%) | | | | | | | | |
Vodafone Group PLC | | | 6,702,500 | | | | 24,174,709 | |
Utilities (1.9%) | | | | | | | | |
Centrica PLC | | | 2,174,500 | | | | 12,346,221 | |
| | | | | | | | 161,474,726 | |
VENEZUELA (0.0%) | | | | | | | | |
Financials (0.0%) | | | | | | | | |
Banco Provincial SA-Banco Universal (a)(c) | | | 18,422 | | | | 281,236 | |
Banco Venezolano de Credito SA* (a)(c) | | | 156 | | | | – | |
| | | | | | | | 281,236 | |
Industrials (0.0%) | | | | | | | | |
Cemex Venezuela SACA-I* (a)(c) | | | 15,843,815 | | | | – | |
Materials (0.0%) | | | | | | | | |
Siderurgica Venezolana Sivensa SACA, ADR (c) | | | 2,847,910 | | | | – | |
| | | | | | | | 281,236 | |
Total Common Stocks | | | | | | | 581,032,968 | |
EXCHANGE TRADED FUNDS (0.2%) | | | | | | | | |
RUSSIA (0.2%) | | | | | | | | |
Renaissance Pre-IPO Fund* (a)(c) | | | 92,634 | | | | 1,389,510 | |
Total Exchange Traded Funds | | | | | | | 1,389,510 | |
GOVERNMENT BONDS (0.3%) | | | | | | | | |
VENEZUELA (0.3%) | | | | | | | | |
Bonos de la Deuda Publica Nacional (VEF), 17.25%, 12/31/2015 (a)(c) | | $ | 10,000,000 | | | | 232,811 | |
Bonos de la Deuda Publica Nacional (VEF), 16.00%, 08/23/2018 (a)(c) | | | 49,500,000 | | | | 1,142,969 | |
Bonos de la Deuda Publica Nacional (VEF), 18.00%, 04/12/2018 (a)(c) | | | 20,000,000 | | | | 473,255 | |
| | | | | | | | 1,849,035 | |
Total Government Bonds | | | | | | | 1,849,035 | |
PREFERRED STOCKS (11.6%) | | | | | | | | |
BRAZIL (7.0%) | | | | | | | | |
Energy (1.7%) | | | | | | | | |
Petroleo Brasileiro SA, ADR, Preferred Shares | | | 611,600 | | | | 11,106,656 | |
Financials (2.7%) | | | | | | | | |
Banco Bradesco SA, ADR, Preferred Shares | | | 1,237,800 | | | | 17,849,076 | |
Materials (2.6%) | | | | | | | | |
Vale SA, ADR, Preferred Shares | | | 1,198,100 | | | | 17,540,184 | |
| | | | | | | | 46,495,916 | |
REPUBLIC OF SOUTH KOREA (4.6%) | | | | | | | | |
Information Technology (4.6%) | | | | | | | | |
Samsung Electronics Co. Ltd., Preferred Shares | | | 32,100 | | | | 30,987,886 | |
Total Preferred Stocks | | | | | | | 77,483,802 | |
REPURCHASE AGREEMENT (0.1%) | | | | | | | | |
UNITED STATES (0.1%) | | | | | | | | |
State Street Bank, 0.00%, dated 10/31/2013, due 11/01/2013, repurchase price $1,007,688 collateralized by Federal Home Loan Bank, maturity 01/08/2016; total market value of $1,031,288 | | $ | 1,007,687 | | | | 1,007,687 | |
Total Repurchase Agreement | | | | | | | 1,007,687 | |
Total Investments
(Cost $724,940,260) (d)—99.5% | | | | | | | 662,763,002 | |
| | |
Other assets in excess of liabilities—0.5% | | | | | | | 3,051,990 | |
Net Assets—100.0% | | | | | | $ | 665,814,992 | |
| * | | Non-income producing security. |
| (a) | | The Fund’s adviser has deemed this security to be illiquid based upon procedures approved by the Board of Trustees. Illiquid securities held by the Fund represent 0.88% of net assets as of October 31, 2013. (unaudited) |
| (b) | | Investment in affiliate. |
| (c) | | Fair Valued Security. Fair Values are determined pursuant to procedures approved by the Board of Trustees. See Note 2(a) of the accompanying notes to financial statements. |
| (d) | | See notes to financial statements for tax unrealized appreciation/depreciation of securities. |
| ADR | | American Depositary Receipt |
See accompanying notes to financial statements.
Annual Report 2013
14
Aberdeen Select International Equity Fund II (Unaudited)
Aberdeen Select International Equity Fund II (Class A shares at net asset value net of fees) returned 20.00% for the 12-month period ended October 31, 2013, versus 20.29% for its benchmark, the MSCI All Country World ex-U.S. Index, during the same period. For broader comparison, the average return of the Fund’s Lipper peer category of International Large-Cap Growth Funds (consisting of 142 funds) was 20.76% for the period.
Market review
Global equities rallied significantly during the reporting period. Following investors’ risk aversion in the second quarter of 2013, equity markets climbed higher, supported by coordinated monetary policy. Sentiment was further boosted as Japanese policymakers explicitly targeted an inflation rate of 2%. The U.S. presidential election and China’s leadership change proceeded smoothly, supporting risk appetite as well. However, the warning in May 2013 from Federal Reserve (Fed) Chairman Ben Bernanke that U.S. monetary policy would be tightened in the near future unsettled markets. Core government bond yields rose sharply, while equity markets, especially in developing countries, corrected. After the initial volatility, Bernanke calmed markets by emphasizing the link of the reduction in quantitative easing (QE) to employment data, thereby suggesting that the degree of future tapering would be measured. Subsequently, he surprised investors by announcing that the Fed was keeping stimulus unchanged following the Federal Open Market Committee meeting in September, which caused markets to rally. Towards the end of the review period, U.S. politicians failed to agree on the federal budget. Consequently, the U.S. government began its first partial shutdown in 17 years. A temporary solution was found by mid-October, but this simply deferred the problems of the budget and federal debt ceiling to early 2014.
Aberdeen’s equity investment process
Aberdeen’s investment approach is based on bottom-up company analysis. We believe that, given the inefficiency of markets, strong long-term returns are achieved by identifying good-quality stocks, buying them at reasonable prices and holding them for the long run. In our view, sound fundamentals drive stock prices over time. As a consequence of our rigorous selection criteria, we introduce new stocks infrequently, the result of which is reflected in our portfolios’ typically low annual turnover rates. Our research process relies primarily on gathering information from meetings with company management and public filings. We prepare a written analysis after each management meeting in a standard Aberdeen format used by our regional teams worldwide. Investment in a new company is made only after our investment managers have met with management, prepared written detailed research reports and thoroughly discussed the merits of the company in a team-based setting. We do not actively seek to overweight or underweight companies in a benchmark index. Instead, we focus on each investment on its own merit. We will not own a stock due solely to its sizeable position in an index.
After Aberdeen Asset Management Inc. was appointed as investment adviser of the Fund effective May 22, 2013, the Aberdeen Global Equity team began to position the Fund in accordance with Aberdeen’s investment process.
Fund positioning and Outlook
As bottom-up stock pickers, our country and sector allocations are driven by where we believe that we can find quality companies with attractive valuations. This approach may lead to significant deviations from the benchmark MSCI All Country World ex-U.S. Index.
At the end of the reporting period, the Fund was most overweight relative to the benchmark in Switzerland and the UK.
Switzerland – In our view, the Swiss market is home to some of Europe’s best-run companies. The Fund holds substantial positions in food conglomerate Nestle, pharmaceutical companies Roche and Novartis, as well as insurer Zurich Insurance.
UK – We believe that this market has a broad array of diverse companies that benefit from a range of growth drivers that underpins their prospects and earnings. The Fund has positions in Vodafone, Standard Chartered, HSBC, Royal Dutch Shell, BHP Billiton and British American Tobacco, which generate significant portions of their revenue from overseas. We also hold utility Centrica, which is more directly exposed to UK gas consumption.
The Fund’s largest underweight positions were in Japan and Germany.
Japan – Although Japan is Asia’s biggest market, we feel that quite a few domestically-oriented corporations remain unattractive due to an inherent lack of competitiveness amid a sluggish domestic economy. The recent stock market rally has been fuelled by hope and expectation surrounding political rhetoric, in our view, rather than evidence of improving fundamentals at the company level.
Germany – The Fund is underweight this market as we believe that there are better opportunities elsewhere.
The Fund’s most notable sector overweights versus the benchmark were energy and consumer staples.
Energy – The Fund holds a broad range of exposures within this sector covering energy and energy service companies with operations spread around the world. Holdings include Eni and Royal Dutch Shell.
Consumer Staples – The Fund is overweight in this sector as a result of our bottom-up, stock-driven investment process. Holdings in this sector include British American Tobacco, Philip Morris International, and Nestle. We are attracted to the strong characteristics and sound cash flows of the underlying businesses and, in many cases, the exposure these companies have to domestic demand growth in emerging markets.
Conversely, the Fund was most underweight relative to the benchmark in the consumer discretionary and financials sectors.
Consumer Discretionary – The Fund has only a small position in this sector, which is dominated by developed-market companies exposed to the over-indebted western consumer, in our view.
2013 Annual Report
15
Aberdeen Select International Equity Fund II (Unaudited) (concluded)
Financials – Although the Fund holds a diverse range of stocks both in the context of geography and end-market exposure, the position is underweight in comparison to the benchmark.
The Fund’s use of total return swaps, forward foreign exchange contracts and futures contracts positively contributed to the performance of the Fund during the year. The Fund had no derivative positions open as of October 31, 2013.
In our view, investors realize that financial markets are approaching a period of transition, from unconventional U.S. monetary policy towards a more normalized environment. While the initial reaction to the Fed announcement on the likely delay of quantitative easing (QE) tapering was significant, we see indications of growing Fed confidence in U.S. economic growth. In our opinion, it would seem premature for Fed officials to begin managing investor expectations if they still believed that the economic upturn was in doubt. While global economic data continue to improve, the recovery remains uneven. With a lot of positive news already discounted, equity markets require healthy earnings growth to progress meaningfully from these levels. We therefore believe that there will be higher levels of volatility in the medium term.
Portfolio Management:
Aberdeen Global Equity Team
PAST PERFORMANCE DOES NOT GUARANTEE FUTURE RESULTS.
The performance quoted represents past performance, which does not guarantee future results. Class A shares have up to a 0.25% 12b-1 fee. The investment return and principal value of an investment will fluctuate so that an investor’s shares, when redeemed, may be worth more or less than their original cost. Current performance of the Fund may be lower or higher than the performance quoted. Performance data current to the most recent month-end may be obtained by calling 800-387-6977 or visiting www.aberdeen-asset.us.
Total returns assume the reinvestment of all distributions. Investment performance reflects fee waivers and, in the absence of such waivers, returns would have been lower. Indexes are unmanaged and have been provided for comparison purposes only. No fees or expenses are reflected. You cannot invest directly in an index.
Lipper is a leading global provider of mutual fund information and analysis to fund companies, financial intermediaries and media organizations.
Risk Considerations
Investing in mutual funds involves risk, including the possible loss of principal. There is no assurance that the investment objective of any fund will be achieved.
Foreign securities are more volatile, harder to price and less liquid than U.S. securities. They are subject to different accounting and regulatory standards, and political and economic risks. These risks are enhanced in emerging markets countries.
Equity stocks of small and mid-cap companies carry greater risk, and more volatility than equity stocks of larger, more established companies.
Please read the prospectus for more detailed information regarding these and other risks.
Annual Report 2013
16
Aberdeen Select International Equity Fund II (Unaudited)
| | | | | | | | | | | | |
Average Annual Total Return (For periods ended October 31, 2013) | | 1 Yr. | | | 5 Yr. | | | Inception1 | |
Class A | | | 20.00% | | | | 6.55% | | | | 4.36% | |
Class I | | | 20.36% | | | | 6.84% | | | | 4.65% | |
| 1 | | Fund commenced operations on May 04, 2005. |
2013 Annual Report
17
Aberdeen Select International Equity Fund II (Unaudited)
Performance of a $10,000 Investment (as of October 31, 2013)
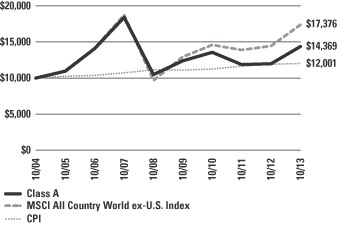
Comparative performance of $10,000 invested in Class A shares of the Aberdeen Select International Equity Fund II, Morgan Stanley Capital International All Country World ex-U.S. Index (MSCI ACWI ex-US), and the Consumer Price Index (CPI) over a 10-year period ended October 31, 2013. Unlike the Fund, the returns for these unmanaged indexes do not reflect any fees or expenses. Investors cannot invest directly in market indexes.
The MSCI ACWI ex-US is a free float-adjusted market capitalization index that is designed to measure equity market performance in the global developed and emerging markets excluding the US.
The CPI represents changes in prices of a basket of goods and services purchased for consumption by urban households.
Investment return and principal value will fluctuate, and when redeemed, shares may be worth more or less than original cost. Past performance is no guarantee of future results and does not reflect the deduction of taxes that a shareholder would pay on fund distributions or the redemption of fund shares. Investing in mutual funds involves market risk, including loss of principal. Performance returns assume the reinvestment of all distributions.
Portfolio Summary (as a percentage of net assets)
October 31, 2013 (Unaudited)
| | | | |
| Asset Allocation | | | |
Common Stocks | | | 86.5% | |
Preferred Stocks | | | 11.9% | |
Other assets in excess of liabilities | | | 1.6% | |
| | | | 100.0% | |
The following chart summarizes the composition of the Fund’s portfolio, in industry classification standard sectors, expressed as a percentage of net assets. An industry classification standard sector can include more than one industry. As of October 31, 2013, the Fund did not have more than 25% of its assets invested in any industry group. The sectors, as classified by Morgan Stanley Capital International’s and Standard & Poor’s Global Industry Classification Standard Sectors, are comprised of several industry groups.
| | | | |
| Top Sectors | | | |
Financials | | | 20.2% | |
Energy | | | 14.3% | |
Consumer Staples | | | 14.3% | |
Materials | | | 10.8% | |
Industrials | | | 9.8% | |
Information Technology | | | 9.2% | |
Health Care | | | 9.1% | |
Telecommunication Services | | | 7.7% | |
Utilities | | | 3.0% | |
Other | | | 1.6% | |
| | | | 100.0% | |
| | | | |
| Top Holdings | | | |
Roche Holding AG | | | 4.9% | |
Samsung Electronics Co. Ltd., Preferred Shares | | | 4.6% | |
British American Tobacco PLC | | | 4.4% | |
Novartis AG | | | 4.2% | |
Nestle SA | | | 3.7% | |
Taiwan Semiconductor Manufacturing Co. Ltd. | | | 3.6% | |
Vodafone Group PLC | | | 3.5% | |
Eni SpA | | | 3.3% | |
Royal Dutch Shell PLC, B Shares | | | 3.1% | |
Tenaris SA, ADR | | | 3.1% | |
Other | | | 61.6% | |
| | | | 100.0% | |
| | | | |
| Top Countries | | | |
United Kingdom | | | 24.4% | |
Switzerland | | | 16.6% | |
Brazil | | | 7.3% | |
Japan | | | 6.8% | |
Italy | | | 6.4% | |
Canada | | | 5.4% | |
Republic of South Korea | | | 4.6% | |
Sweden | | | 4.5% | |
France | | | 4.3% | |
Taiwan | | | 3.6% | |
Other | | | 16.1% | |
| | | | 100.0% | |
Annual Report 2013
18
Statement of Investments
October 31, 2013
Aberdeen Select International Equity Fund II
| | | | | | | | |
| | | Shares or
Principal
Amount | | | Value | |
COMMON STOCKS (86.5%) | | | | | | | | |
AUSTRALIA (1.6%) | | | | | | | | |
Financials (1.6%) | | | | | | | | |
QBE Insurance Group Ltd. | | | 371,100 | | | $ | 5,200,914 | |
CANADA (5.4%) | | | | | | | | |
Industrials (2.3%) | | | | | | | | |
Canadian National Railway Co. | | | 69,100 | | | | 7,590,166 | |
Materials (1.9%) | | | | | | | | |
Potash Corp. of Saskatchewan, Inc. | | | 199,700 | | | | 6,204,421 | |
Telecommunication Services (1.2%) | | | | | | | | |
TELUS Corp. | | | 112,100 | | | | 3,914,927 | |
| | | | | | | | 17,709,514 | |
CHINA (1.7%) | | | | | | | | |
Energy (1.7%) | | | | | | | | |
PetroChina Co. Ltd., H Shares | | | 4,796,000 | | | | 5,493,126 | |
FRANCE (4.3%) | | | | | | | | |
Consumer Staples (2.3%) | | | | | | | | |
Casino Guichard-Perrachon SA | | | 66,200 | | | | 7,461,804 | |
Industrials (1.0%) | | | | | | | | |
Schneider Electric SA | | | 39,500 | | | | 3,332,099 | |
Utilities (1.0%) | | | | | | | | |
GDF Suez | | | 130,000 | | | | 3,241,318 | |
| | | | | | | | 14,035,221 | |
GERMANY (1.0%) | | | | | | | | |
Materials (1.0%) | | | | | | | | |
Linde AG | | | 16,837 | | | | 3,203,440 | |
HONG KONG (3.1%) | | | | | | | | |
Financials (3.1%) | | | | | | | | |
AIA Group Ltd. | | | 1,361,600 | | | | 6,910,694 | |
Swire Pacific Ltd., Class A | | | 272,500 | | | | 3,150,970 | |
| | | | | | | | 10,061,664 | |
ITALY (6.4%) | | | | | | | | |
Energy (6.4%) | | | | | | | | |
Eni SpA | | | 428,700 | | | | 10,869,542 | |
Tenaris SA, ADR | | | 213,600 | | | | 9,998,616 | |
| | | | | | | | 20,868,158 | |
JAPAN (6.8%) | | | | | | | | |
Consumer Staples (1.3%) | | | | | | | | |
Japan Tobacco, Inc. | | | 112,200 | | | | 4,059,831 | |
Financials (1.0%) | | | | | | | | |
Daito Trust Construction Co. Ltd. | | | 33,400 | | | | 3,407,746 | |
Industrials (2.0%) | | | | | | | | |
FANUC Corp. | | | 40,900 | | | | 6,553,338 | |
Materials (2.5%) | | | | | | | | |
Shin-Etsu Chemical Co. Ltd. | | | 142,800 | | | | 8,048,966 | |
| | | | | | | | 22,069,881 | |
MEXICO (2.6%) | | | | | | | | |
Consumer Staples (2.6%) | | | | | | | | |
Fomento Economico Mexicano SAB de CV, ADR | | | 89,100 | | | | 8,313,030 | |
SINGAPORE (3.5%) | | | | | | | | |
Financials (1.5%) | | | | | | | | |
City Developments Ltd. | | | 596,000 | | | | 4,949,248 | |
Telecommunication Services (2.0%) | | | | | | | | |
Singapore Telecommunications Ltd. | | | 2,162,000 | | | | 6,588,753 | |
| | | | | | | | 11,538,001 | |
SOUTH AFRICA (1.0%) | | | | | | | | |
Telecommunication Services (1.0%) | | | | | | | | |
MTN Group Ltd. | | | 165,900 | | | | 3,308,549 | |
SWEDEN (4.5%) | | | | | | | | |
Financials (2.1%) | | | | | | | | |
Nordea Bank AB | | | 543,300 | | | | 6,968,560 | |
Industrials (1.4%) | | | | | | | | |
Atlas Copco AB, A Shares | | | 165,100 | | | | 4,587,351 | |
Information Technology (1.0%) | | | | | | | | |
Telefonaktiebolaget LM Ericsson, B Shares | | | 263,100 | | | | 3,144,897 | |
| | | | | | | | 14,700,808 | |
SWITZERLAND (16.6%) | | | | | | | | |
Consumer Staples (3.7%) | | | | | | | | |
Nestle SA | | | 168,200 | | | | 12,166,197 | |
Financials (2.8%) | | | | | | | | |
Zurich Insurance Group AG* | | | 33,200 | | | | 9,198,697 | |
Health Care (9.1%) | | | | | | | | |
Novartis AG | | | 176,000 | | | | 13,692,452 | |
Roche Holding AG | | | 57,000 | | | | 15,811,828 | |
| | | | | | | | 29,504,280 | |
Industrials (1.0%) | | | | | | | | |
Schindler Holding AG | | | 22,500 | | | | 3,197,781 | |
| | | | | | | | 54,066,955 | |
TAIWAN (3.6%) | | | | | | | | |
Information Technology (3.6%) | | | | | | | | |
Taiwan Semiconductor Manufacturing Co. Ltd. | | | 3,192,000 | | | | 11,896,867 | |
UNITED KINGDOM (24.4%) | | | | | | | | |
Consumer Staples (4.4%) | | | | | | | | |
British American Tobacco PLC | | | 258,100 | | | | 14,247,847 | |
Energy (4.6%) | | | | | | | | |
John Wood Group PLC | | | 381,500 | | | | 4,976,897 | |
Royal Dutch Shell PLC, B Shares | | | 294,300 | | | | 10,210,607 | |
| | | | | | | | 15,187,504 | |
See accompanying notes to financial statements.
2013 Annual Report
19
Statement of Investments (concluded)
October 31, 2013
Aberdeen Select International Equity Fund II
| | | | | | | | |
| | | Shares or
Principal
Amount | | | Value | |
Financials (5.1%) | | | | | | | | |
HSBC Holdings PLC | | | 608,600 | | | $ | 6,669,420 | |
Standard Chartered PLC | | | 412,302 | | | | 9,932,762 | |
| | | | | | | | 16,602,182 | |
Industrials (2.1%) | | | | | | | | |
Weir Group PLC (The) | | | 188,800 | | | | 6,840,008 | |
Materials (2.7%) | | | | | | | | |
BHP Billiton PLC | | | 279,800 | | | | 8,678,119 | |
Telecommunication Services (3.5%) | | | | | | | | |
Vodafone Group PLC | | | 3,180,100 | | | | 11,470,048 | |
Utilities (2.0%) | | | | | | | | |
Centrica PLC | | | 1,164,000 | | | | 6,608,876 | |
| | | | | | | | 79,634,584 | |
Total Common Stocks | | | | | | | 282,100,712 | |
PREFERRED STOCKS (11.9%) | | | | | | | | |
BRAZIL (7.3%) | | | | | | | | |
Energy (1.6%) | | | | | | | | |
Petroleo Brasileiro SA, ADR, Preferred Shares | | | 288,300 | | | | 5,235,528 | |
Financials (3.0%) | | | | | | | | |
Banco Bradesco SA, ADR, Preferred Shares | | | 676,400 | | | | 9,753,688 | |
Materials (2.7%) | | | | | | | | |
Vale SA, ADR, Preferred Shares | | | 593,100 | | | | 8,682,984 | |
| | | | | | | | 23,672,200 | |
REPUBLIC OF SOUTH KOREA (4.6%) | | | | | | | | |
Information Technology (4.6%) | | | | | | | | |
Samsung Electronics Co. Ltd., Preferred Shares | | | 15,600 | | | | 15,059,533 | |
Total Preferred Stocks | | | | | | | 38,731,733 | |
Total Investments
(Cost $308,013,257) (a)—98.4% | | | | | | | 320,832,445 | |
| | |
Other assets in excess of liabilities—1.6% | | | | | | | 5,071,923 | |
Net Assets—100.0% | | | $ | 325,904,368 | |
| * | | Non-income producing security. |
| (a) | | See notes to financial statements for tax unrealized appreciation/depreciation of securities. |
| ADR | | American Depositary Receipt |
See accompanying notes to financial statements.
Annual Report 2013
20
Aberdeen Total Return Bond Fund (Unaudited)
Aberdeen Total Return Bond Fund (Class A shares at net asset value net of fees) returned -1.81% for the 12-month period ended October 31, 2013, versus the –1.08% return of its benchmark, the Barclays U.S. Aggregate Bond Index, for the same period. For broader comparison, the average return of the Fund’s Lipper peer category of Core Bond Funds (consisting of 497 funds) was -0.95% for the period.
During the first six months of the reporting period, the Federal Reserve’s (Fed) easy monetary policies and ample liquidity across global central banks caused investors to continue their quest to build yield into their portfolios. Fixed income assets and in particular spread sectors continued to benefit from this liquidity as government bond yields moved lower and quality spreads tightened versus comparable-duration1 U.S. Treasuries. In our view, it was apparent that the Fed had been far too optimistic about its forecast for economic growth in the U.S. In fact, between 2010 and 2013, the Fed came into each year with the view that real gross domestic product (GDP) would be somewhere between 3.5%-4.0%; however, as each year has progressed, the central bank had to adjust to reality. In our opinion, the U.S economy was stuck in a deleveraging phase, mired in sub-2% growth with very anemic inflation.
As we entered the second half of the annual period, the U.S. fixed income market was dominated by several separate and highly significant factors related to U.S. government policies and actions (or inactions). The biggest impact on the market, in our view, was the potential for the central bank to commence tapering its quantitative easing (QE) program. This announcement caused the U.S yield curve to significantly steepen and we saw a volatility storm within emerging markets (EM) as the capital inflows from easy liquidity from central banks quickly reversed course. Countries with large current account deficits, less credible central banks and high fiscal imbalances took the brunt of the reversal. Consequently, there was a severe unwinding of the carry trade2 which contributed to the sell-off in the emerging markets.
Both security selection and an overweight position relative to the Barclays U.S. Aggregate Bond Index in corporate bonds were the primary contributors to the Fund’s relative underperformance for the reporting period. U.S. corporate bonds, as measured by the Barclays Capital U.S. Credit Index, posted negative total returns for the 12-month period ended October 31, 2013, but still delivered positive excess returns versus comparable-duration U.S. Treasuries. The Fund’s positions in insurance, European utilities and Verizon (following the deal to acquire Vodafone’s minority interest in Verizon Wireless) were major contributors. The Fund’s holdings in the securitized sector, most notably commercial mortgage-backed securities (CMBS) and non-U.S. agency mortgages, also had a positive impact on performance for the annual period. After price action driven by increased risk tolerance in 2012, 2013 saw consolidation of those gains playing out against a backdrop of increased attention to Fed monetary policy. Credit risk continued to benefit from strong demand, with non-U.S. agency mortgages delivering strong returns for the period.
Fund performance was hindered mainly by holdings in EM. Investments based on our focus in seeking what we believe are high-quality risk assets witnessed a significant correction in the second half of the reporting period, particularly in Latin America. For example, 10-year Mexican government bond yields climbed close to 100 basis points (bps) over the annual period, while the intermediate segment of the Brazil yield curve rose 150 bps, significantly underperforming versus comparable-duration U.S. Treasuries.
During the reporting period, we reduced the Fund’s exposure to foreign bond and currency markets before the sell-off in foreign markets; unfortunately, our risk reduction efforts were not enough to mitigate all of the negative impact of these exposures on Fund performance. We seek to enhance the Fund’s total return by finding value in overseas markets. We accomplish this by investing in countries offering higher yields or where we believe there are better return prospects and by diversifying3 the Fund’s duration across multiple global yield curves. We believe this allows us to find some region of the world that is essentially at a different stage of its credit/interest rate cycle.
The Fund’s use of forward foreign exchange contracts positively contributed to the performance of the Fund during the year.
We believe that 2014 will be a year in which both the Fed and governmental policy will not be of paramount importance to the financial markets. Instead, we think that fundamental economic growth will be the key determinant to how the markets perform. In fact, the diminished influence of official policy may be accelerated by economic growth, in our view.
This is not to say that changes in government policy will not be important. The Fed’s decision on when and how to start reducing its monthly government bond purchases through quantitative easing will be watched closely by the bond markets. In our opinion, the federal government may not be able to get any new legislation passed and the risk of debt ceiling fiascos and/or governmental shutdowns remain high. We think that the Affordable Care Act (ACA), dubbed “Obamacare,” is also a concern due to its effect on small business, a very important engine for economic growth. We believe that government and Fed policy will need to be watched closely to successfully manage a portfolio this coming year.
Over the past several years, we have been saying that U.S. GDP will be around 2%. The main reason for this opinion was the work of Carmen M. Reinhart and Kenneth Rogoff in This Time is Different.4
| 1 | | Duration is an estimate of bond price sensitivity to changes in interest rates. The higher the duration, the greater the change (i.e., high risk) in relation to interest-rate movements. |
| 2 | | A carry trade is a strategy in which an investor sells a certain currency with a relatively low interest rate and uses the funds to purchase a different currency yielding a higher interest rate. |
| 3 | | Diversification does not ensure a profit or eliminate the risk of loss. |
| 4 | | This Time is Different, by Carmen M. Reinhart and Kenneth Rogoff, Princeton University Press (2009) |
2013 Annual Report
21
Aberdeen Total Return Bond Fund (Unaudited) (continued)
They theorized that, after a financial crisis, a country either has a dramatic economic collapse or is consigned to slow or no economic growth for a long period of time, usually between seven and 10 years. We think the time frame may be somewhat shorter, because the corporate and consumer de-leveraging phase is fading. However, this time, we believe, we could be set up for a bit of irony with regard to restraint from some of these headwinds, along with a tailwind from massive amounts of liquidity still awash in the system. Here are some reasons to consider:
| | • | | The Fed’s extraordinary measures have allowed the financial markets to remain liquid when the worst of the crisis was taking place |
| | • | | There has been a great deal of corporate – especially banks – and household deleveraging; and |
| | • | | The U.S. had a huge advantage, compared to situations in the past, of the U.S. dollar being the global reserve currency with no practical substitutes in sight. |
In our view, these factors have allowed the U.S. economy to heal much faster than many had anticipated in 2008 – not to say that five years was fast, however.
We think that 10-year U.S. Treasury rates may rise modestly over the next year, but we anticipate that yields likely will be capped at around 3.50-3.75% as higher rates can cause the U.S. economy to stall quickly.5 We do not think that inflation will be a problem, but inflationary expectations may start to rise in the second half of the year. We will continue to avoid the U.S. Treasury sector in favor of the yield advantage supplied by spread product.6
In our view, investment-grade corporate bonds still offer an attractive risk/reward profile. At the end of the reporting period on October 31, 2013, the spread of the Barclays Capital U.S. Credit Index over U.S. Treasuries stood at 131 bps. This is the index’s tightest level since 2007, but is well off its trough level of 80 bps during the mid-2000s. We believe that investment-grade spreads will continue to tighten versus comparable-duration Treasuries over the next year, given the low level of nominal yields. We envision this scenario even if Treasury yields continue their upward trajectory as corporate spreads still account for nearly half of all-in yields.7 Our view is that non-financial firms may maintain the pace of re-leveraging and our focus is to seek to immunize the Fund against that risk. Consequently, we prefer exposure to financial companies, which continue to repair their balance sheets and boost their capital ratios, as well as what we believe are high-quality industrials that have already announced major debt-financed deals (e.g., Verizon).
In our view, the residential credit sector may see continued strong performance in 2014, as ongoing normalization in the property market should more than offset negative effects from a potential rise in interest rates associated with a tapering of the Fed’s bond-buying program. We think that the agency mortgage-backed securities (MBS) market will be much more tied to official policy as investors may be forced to digest a large amount of duration in that sector, with the Fed’s withdrawing its easy policy as well as through maturity extension resulting from the MBS universe becoming less attractive for refinancing. The CMBS market may potentially see high levels of issuance, in our opinion, as the legacy universe will experience more refinancing activity and increased scheduled maturities from the 2004 vintage, as well as seven-year loans issued in 2007. We believe that this activity will be a net positive for credit in legacy CMBS, as the deals de-leverage. The credit quality of the new issue space will bear watching, in our opinion. The tight spread conditions that occurred in 2011 and 2012 made for high quality CMBS deals, but, in our view, are also unsustainable. Whether the market will provide discipline to lenders in an era of looser credit remains to be seen.
Looking past the domestic fixed income market, we believe that one of our biggest advantages is the ability to invest effectively overseas. Just because U.S. interest rates are at risk of increasing does not mean other global fixed income markets will perform poorly. If a different county is expected to have weak growth or economic contraction and relatively tame inflation, we would not look for U.S. rates to increase; and we think that they may actually decline. We would probably look to hedge out8 the foreign exchange risk presented by the country’s currency in this scenario. We think that this would be a good place for a U.S. fixed income investor to “hide” while U.S. rates are increasing. Another advantageous scenario, in our opinion, is to look at countries where rates are already high. If we believe a country has high rates and a growing economy, we can buy lower-maturity bonds and continue to hold the currency risk. In this scenario, we anticipate that the currency likely would appreciate versus the U.S. dollar while the extra yield would enhance the Fund’s return. We would look to hold low-duration bonds in this scenario so the Fund would have relatively low sensitivity to a continuing rising-rate environment.
We believe that we may be able to find opportunities in Australia, Canada, and some countries in the Eurozone.9 We maintain a cautious view of Europe. We believe there are several questions that need to be answered before we can invest in the region without credit concern. However, we think that we will see some tactical opportunities present themselves in 2014.
Regarding the emerging markets, we feel that retail fund outflows will continue to exist in a rising-rate environment despite recent positive performance by EM fixed income assets. Foreign investment within the EM space is less saturated than what it was in May 2013 and the delay in Fed tapering of easy monetary policy has given central banks more time to adjust their fiscal imbalances.
| 5 | | Forecasts and estimates are offered as opinion and are not reflective of potential performance, are not guaranteed and actual events or results may differ materially. |
| 6 | | Spread product is any taxable bond other than U.S. Treasury securities. |
| 7 | | The all-in yields include cash interest, origination fees, and extension fees assuming full extension of loan maturities and no defaults. |
| 8 | | A hedge is an investment intended to reduce the risk of adverse price movements in an asset. |
| 9 | | The Eurozone includes the 17 European Union countries which have adopted the euro as their currency: Austria, Belgium, Cyprus, Estonia, Finland, France, Germany, Greece, Ireland, Italy, Luxembourg, Malta, the Netherlands, Portugal, Slovakia, Slovenia, and Spain. |
Annual Report 2013
22
Aberdeen Total Return Bond Fund (Unaudited) (concluded)
In our view, the Fed’s reluctance to validate substantially tighter monetary conditions suggests that the sell-off in EM rates would be more contained should the central bank surprise with tighter monetary conditions. Global economic growth, which is the single most important driver for EM assets, appears to have bottomed out and fears of a hard landing for China seem to have abated, in our opinion. Re-pricing and repositioning in the EM world historically has been sudden and volatile. We believe that this enables us to find value in countries which have strong fundamentals and are in a better position to benefit from a global recovery. With this in mind, we would be inclined to add exposure to countries such as South Korea, Mexico and Poland when we believe that valuations are attractive. Mexico remains our favorite market in the EM world with the increased likelihood of the enactment of energy reform that can have a significant positive impact on foreign direct investment and, in turn, the Mexican peso. Additionally, we think that depreciation in the EM currencies such as the Brazilian real (BRL) over the past six months should help in putting that nation’s current accounts in better shape. Brazil also remains one of the few countries with high real interest rates (after inflation) and has the potential for most spread compression against comparable-duration Treasuries, in our view. Since most emerging markets are greatly affected by U.S. monetary policy, we believe that the key for 2014 is to avoid those countries which have low or falling saving rates, use portfolio inflows to finance their current account deficits, and have done little on the policy front (e.g., Turkey, South Africa and Indonesia).
Portfolio Management:
Donald Quigley, CFA
PAST PERFORMANCE DOES NOT GUARANTEE FUTURE RESULTS.
The performance quoted represents past performance, which does not guarantee future results. Class A shares have up to a 0.25% 12b-1 fee. The investment return and principal value of an investment will fluctuate so that an investor’s shares, when redeemed, may be worth more or less than their original cost. Current performance of the Fund may be lower or higher than the performance quoted. Performance data current to the most recent month-end may be obtained by calling 800-387-6977 or visiting www.aberdeen-asset.us.
Total returns assume the reinvestment of all distributions. Investment performance reflects fee waivers and, in the absence of such waivers, returns would have been lower. Indexes are unmanaged and have been provided for comparison purposes only. No fees or expenses are reflected. You cannot invest directly in an index.
Lipper is a leading global provider of mutual fund information and analysis to fund companies, financial intermediaries and media organizations.
Risk Considerations
Investing in mutual funds involves risk, including possible loss of principal. There is no assurance that the investment objective of any fund will be achieved.
Fixed income securities are subject to certain risks including, but not limited to: interest rate (changes in interest rates may cause a decline in the market value of an investment), credit (changes in the financial condition of the issuer, borrower, counterparty, or underlying collateral), prepayment (debt issuers may repay or refinance their loans or obligations earlier than anticipated), and extension (principal repayments may not occur as quickly as anticipated, causing the expected maturity of a security to increase). Additionally, high yield securities may face additional risks, including economic growth; inflation; liquidity; supply; and externally generated shocks.
Investments in asset-backed and mortgage-backed securities include additional risks that investors should be aware which include those associated with fixed income securities, as well as increased susceptibility to adverse economic developments.
Derivatives are speculative and may hurt the Fund’s performance. They present the risk of disproportionately increased losses and/or reduced gains when the financial asset or measure to which the derivative is linked changes in unexpected ways.
Foreign securities are more volatile, harder to price and less liquid than U.S. securities; and are subject to different accounting and regulatory standards, and political and economic risks. These risks are enhanced in emerging markets countries.
Please read the prospectus for more detailed information regarding these and other risks.
2013 Annual Report
23
Aberdeen Total Return Bond Fund (Unaudited)
| | | | | | | | | | | | |
Average Annual Total Return (For periods ended October 31, 2013) | | 1 Yr. | | | 5 Yr. | | | 10 Yr. | |
Class A | | | (1.81% | ) | | | 7.17% | | | | 5.25% | |
Class I | | | (1.59% | ) | | | 7.45% | | | | 5.52% | |
Annual Report 2013
24
Aberdeen Total Return Bond Fund (Unaudited)
Performance of a $10,000 Investment (as of October 31, 2013)
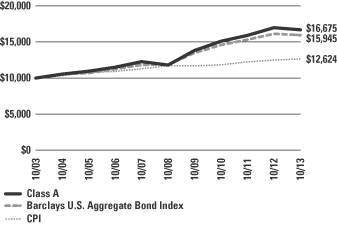
Comparative performance of $10,000 invested in Class A shares of the Aberdeen Total Return Bond Fund, Barclays U.S. Aggregate Bond Index and the Consumer Price Index (CPI) over a 10-year period ended October 31, 2013. Unlike the Fund, the returns for these unmanaged indexes do not reflect any fees or expenses. Investors cannot invest directly in market indexes.
The Barclays U.S. Aggregate Bond Index is a benchmark index composed of U.S. securities in Treasury, Government-Related, Corporate, and Securitized sectors. It includes securities that are of investment-grade quality or better, have at least one year to maturity, and have an outstanding par value of at least $250 million.
The CPI represents changes in prices of a basket of goods and services purchased for consumption by urban households.
Investment return and principal value will fluctuate, and when redeemed, shares may be worth more or less than original cost. Past performance is no guarantee of future results and does not reflect the deduction of taxes that a shareholder would pay on fund distributions or the redemption of fund shares. Investing in mutual funds involves market risk, including loss of principal. Performance returns assume the reinvestment of all distributions.
Portfolio Summary (as a percentage of net assets)
October 31, 2013 (Unaudited)
| | | | |
| Asset Allocation | | | |
Corporate Bonds | | | 29.4% | |
Commercial Mortgage-Backed Securities | | | 19.6% | |
Government Bonds | | | 18.1% | |
U.S. Agencies | | | 14.8% | |
Asset-Backed Securities | | | 10.3% | |
U.S. Treasuries | | | 6.5% | |
Repurchase Agreement | | | 4.9% | |
Municipal Bonds | | | 4.1% | |
Liabilities in excess of other assets | | | (7.7% | ) |
| | | | 100.0% | |
The following chart summarizes the composition of the Fund’s portfolio, expressed as a percentage of net assets. The industries listed below may include more than one industry group. As of October 31, 2013, the Fund did not have more than 25% of its assets invested in any industry group.
| | | | |
| Top Industries | | | |
Commercial Banks | | | 8.5% | |
Oil, Gas & Consumable Fuels | | | 1.8% | |
Diversified Financial Services | | | 1.5% | |
Electric Utilities | | | 1.6% | |
Supranational | | | 1.5% | |
Aerospace & Defense | | | 1.3% | |
Pharmaceutical | | | 1.3% | |
Insurance | | | 1.2% | |
Advertising | | | 1.1% | |
Diversified Telecommunication Services | | | 1.1% | |
Other | | | 79.1% | |
| | | | 100.0% | |
| | | | |
| Top Holdings* | | | |
Mexico Fixed Rate Bonds, Series M20 12/05/2024 | | | 3.6% | |
Brazil Notas do Tesouro Nacional Series F, Series NTNF 01/01/2017 | | | 3.0% | |
Federal National Mortgage Association, TBA 11/01/2043 | | | 2.5% | |
Federal National Mortgage Association, TBA 11/01/2043 | | | 1.7% | |
Mexican Bonos 05/29/2031 | | | 1.4% | |
Australia Government Bond 03/15/2019 | | | 1.1% | |
U.S. Treasury Notes 09/30/2018 | | | 1.1% | |
International Bank for Reconstruction & Development, Series GDIF 10/21/2019 | | | 1.0% | |
Canada Housing Trust No 1 12/15/2018 | | | 1.0% | |
Federal National Mortgage Association 10/01/2023 | | | 1.0% | |
Other | | | 82.6% | |
| | | | 100.0% | |
| | | | |
| Top Countries | | | |
United States | | | 74.9% | |
Brazil | | | 5.3% | |
Mexico | | | 5.0% | |
Canada | | | 4.5% | |
Australia | | | 2.8% | |
Germany | | | 2.4% | |
United Kingdom | | | 1.8% | |
Netherlands | | | 1.8% | |
Sweden | | | 1.7% | |
Supranational | | | 1.5% | |
Other | | | (1.7% | ) |
| | | | 100.0% | |
| * | | For the purpose of listing top holdings, repurchase agreements included as part of Other. |
2013 Annual Report
25
Statement of Investments
October 31, 2013
Aberdeen Total Return Bond Fund
| | | | | | | | |
| | | Shares or
Principal
Amount | | | Value | |
ASSET-BACKED SECURITIES (10.3%) | | | | | | | | |
CANADA (0.9%) | | | | | | | | |
Golden Credit Card Trust, Series 2012-5A, Class A (USD), 0.79%, 09/15/2017 (a) | | $ | 9,030,000 | | | $ | 9,047,712 | |
Master Credit Card Trust II, Series 2012-2A, Class A (USD), 0.78%, 04/21/2017 (a) | | | 5,690,000 | | | | 5,687,437 | |
| | | | | 14,735,149 | |
UNITED STATES (9.4%) | | | | | | | | |
Ally Auto Receivables Trust, Series 2011-4, Class A3 (USD), 0.79%, 09/15/2015 | | | 1,219,879 | | | | 1,220,907 | |
Ally Master Owner Trust | | | | | | | | |
Series 2011-3, Class A1 (USD),
0.80%, 05/15/2016 (b) | | | 3,830,000 | | | | 3,836,285 | |
Series 2012-1, Class A2 (USD),
1.44%, 02/15/2017 | | | 5,720,000 | | | | 5,771,065 | |
Series 2012-5, Class A (USD),
1.54%, 09/15/2019 | | | 5,820,000 | | | | 5,787,510 | |
BA Credit Card Trust, Series 2006-A14, Class A14 (USD),
0.23%, 04/15/2016 (b) | | | 4,837,000 | | | | 4,836,557 | |
BMW Floorplan Master Owner Trust,
Series 2012-1A, Class A (USD),
0.57%, 09/15/2017 (a)(b) | | | 6,170,000 | | | | 6,179,270 | |
Chesapeake Funding LLC, Series 2013-1A, Class A (USD), 0.62%, 01/07/2025 (a)(b) | | | 3,510,000 | | | | 3,502,210 | |
Citibank Credit Card Issuance Trust,
Series 2005-A2, Class A2 (USD),
4.85%, 03/10/2017 | | | 2,800,000 | | | | 2,964,842 | |
CNH Equipment Trust | | | | | | | | |
Series 2012-A, Class A3 (USD),
0.94%, 05/15/2017 | | | 2,702,733 | | | | 2,710,146 | |
Series 2013-A, Class A2 (USD),
0.44%, 07/15/2016 | | | 4,620,000 | | | | 4,618,609 | |
Series 2013-A, Class A3 (USD),
0.69%, 06/15/2018 | | | 2,595,000 | | | | 2,595,154 | |
Discover Card Master Trust,
Series 2012-A6, Class A6 (USD),
1.67%, 01/18/2022 | | | 7,400,000 | | | | 7,267,270 | |
Dryrock Issuance Trust,
Series 2012-2, Class A (USD),
0.64%, 08/15/2018 | | | 4,890,000 | | | | 4,881,039 | |
Ford Credit Auto Owner Trust,
Series 2013-C, Class A2 (USD),
0.55%, 04/15/2016 | | | 3,670,000 | | | | 3,674,000 | |
Ford Credit Floorplan Master Owner Trust, Series 2012-2, Class A (USD),
1.92%, 01/15/2019 | | | 4,350,000 | | | | 4,441,367 | |
GE Capital Credit Card Master Note Trust, Series 2012-1, Class A (USD),
1.03%, 01/15/2018 | | | 4,765,000 | | | | 4,781,408 | |
GE Dealer Floorplan Master Note Trust | | | | | | | | |
Series 2012-4, Class A (USD),
0.61%, 10/20/2017 (b) | | | 3,810,000 | | | | 3,812,517 | |
Series 2013-1, Class A (USD),
0.57%, 04/20/2018 (b) | | | 6,830,000 | | | | 6,819,775 | |
GE Equipment Transportation LLC | | | | | | | | |
Series 2012-1, Class A3 (USD),
0.99%, 11/23/2015 | | | 1,606,180 | | | | 1,610,405 | |
Series 2012-2, Class A2 (USD),
0.47%, 04/24/2015 | | | 1,752,005 | | | | 1,752,475 | |
Honda Auto Receivables Owner Trust, Series 2012-4, Class A2 (USD),
0.40%, 04/20/2015 | | | 5,694,775 | | | | 5,697,699 | |
Mercedes-Benz Master Owner Trust,
Series 2012-BA, Class A (USD),
0.44%, 11/15/2016 (a)(b) | | | 4,620,000 | | | | 4,620,584 | |
Navistar Financial Dealer Note Master Trust | | | | | | | | |
Series 2013-1, Class A (USD),
0.84%, 01/25/2018 (a)(b) | | | 3,910,000 | | | | 3,912,194 | |
Series 2013-2, Class A (USD),
0.86%, 09/25/2018 (a)(b) | | | 4,170,000 | | | | 4,170,100 | |
Nissan Auto Lease Trust,
Series 2012-A, Class A3 (USD),
0.98%, 05/15/2015 | | | 7,110,000 | | | | 7,123,896 | |
Nissan Auto Receivables Owner Trust | | | | | | | | |
Series 2013-B, Class A2 (USD),
0.52%, 04/15/2016 | | | 3,280,000 | | | | 3,282,872 | |
Series 2013-B, Class A3 (USD),
0.84%, 11/15/2017 | | | 2,400,000 | | | | 2,408,416 | |
SLM Student Loan Trust | | | | | | | | |
Series 2011-1, Class A1 (USD),
0.69%, 03/25/2026 (b) | | | 4,208,626 | | | | 4,214,826 | |
Series 2011-2, Class A1 (USD),
0.77%, 11/25/2027 (b) | | | 8,048,117 | | | | 8,060,837 | |
Series 2013-1, Class A1 (USD),
0.32%, 02/27/2017 (b) | | | 2,292,013 | | | | 2,289,992 | |
Series 2013-2, Class A (USD),
0.62%, 09/25/2026 (b) | | | 4,033,812 | | | | 4,032,602 | |
United States Small Business Administration | | | | | | | | |
Series 2005-P10B, Class 1 (USD),
4.94%, 08/10/2015 | | | 1,389,252 | | | | 1,452,361 | |
Series 2006-P10A, Class 1 (USD),
5.41%, 02/10/2016 | | | 105,379 | | | | 111,168 | |
Series 2007-P10A, Class 1 (USD),
5.46%, 02/10/2017 | | | 1,556,450 | | | | 1,693,336 | |
Volkswagen Auto Lease Trust,
Series 2013-A, Class A3 (USD),
0.84%, 07/20/2016 | | | 3,620,000 | | | | 3,627,300 | |
Volkswagen Auto Loan Enhanced Trust, Series 2012-2, Class A2 (USD),
0.33%, 07/20/2015 | | | 2,463,519 | | | | 2,462,733 | |
Volvo Financial Equipment LLC, Series 2013-1A, Class A3 (USD),
0.74%, 03/15/2017 (a) | | | 7,405,000 | | | | 7,402,808 | |
| | | | | | | | 149,626,535 | |
Total Asset-Backed Securities | | | | | | | 164,361,684 | |
See accompanying notes to financial statements.
Annual Report 2013
26
Statement of Investments (continued)
October 31, 2013
Aberdeen Total Return Bond Fund
| | | | | | | | |
| | | Shares or
Principal
Amount | | | Value | |
COMMERCIAL MORTGAGE-BACKED SECURITIES (19.6%) | | | | | | | | |
UNITED STATES (19.6%) | | | | | | | | |
Alternative Loan Trust | | | | | | | | |
Series 2004-2CB, Class 1A2 (USD),
5.13%, 03/25/2034 | | $ | 1,265,112 | | | $ | 1,276,270 | |
Series 2004-28CB, Class 3A1 (USD),
6.00%, 01/25/2035 | | | 4,211,751 | | | | 4,091,838 | |
Series 2005-10CB, Class 1A6 (USD),
5.50%, 05/25/2035 | | | 190,741 | | | | 190,622 | |
Series 2005-86CB, Class A8 (USD),
5.50%, 02/25/2036 | | | 3,544,269 | | | | 3,325,942 | |
Banc of America Commercial Mortgage Trust, Series 2006-5, Class AM (USD),
5.45%, 09/10/2047 | | | 4,000,000 | | | | 4,290,408 | |
Banc of America Mortgage Trust,
Series 2004-7, Class 2A3 (USD),
5.75%, 08/25/2034 | | | 784,894 | | | | 801,883 | |
Bear Stearns Adjustable Rate Mortgage Trust, Series 2004-3, Class 4A (USD),
4.61%, 07/25/2034 (b) | | | 1,473,115 | | | | 1,479,036 | |
Bear Stearns Commercial Mortgage Securities Trust, Series 2005-PW10, Class AM (USD),
5.45%, 12/11/2040 (b) | | | 4,412,000 | | | | 4,741,188 | |
CD Commercial Mortgage Trust,
Series 2007-CD4, Class A4 (USD),
5.32%, 12/11/2049 | | | 5,715,000 | | | | 6,341,264 | |
CHL Mortgage Pass-Through Trust,
Series 2005-21, Class A2 (USD),
5.50%, 10/25/2035 | | | 1,274,485 | | | | 1,251,010 | |
Citigroup Commercial Mortgage Trust | | | | | | | | |
(USD), 2.11%, 01/12/2018 | | | 2,534,946 | | | | 2,563,375 | |
(USD), 3.63%, 05/10/2035 | | | 5,653,000 | | | | 5,337,000 | |
Series 2007-C6, Class AM (USD),
5.71%, 12/10/2049 (b) | | | 4,730,000 | | | | 5,259,599 | |
Citigroup Mortgage Loan Trust,
Series 2005-11, Class A3 (USD),
2.50%, 11/25/2035 (b) | | | 2,319,984 | | | | 2,272,973 | |
COMM 2013-300P Mortgage Trust,
Series 2013-300P, Class A1, (USD),
4.35%, 08/10/2030 (a) | | | 5,770,000 | | | | 6,040,079 | |
Commercial Mortgage Pass Through Certificates | | | | | | | | |
Series 2012-9W57, Class A (USD),
2.36%, 02/10/2029 (a) | | | 4,070,000 | | | | 4,183,156 | |
Series 2012-LTRT, Class A2 (USD),
3.40%, 10/05/2030 (a) | | | 2,870,000 | | | | 2,734,675 | |
Series 2013-WWP, Class A2 (USD),
3.42%, 03/10/2031 (a) | | | 4,910,000 | | | | 4,815,222 | |
Series 2006-C4, Class A3 (USD),
5.47%, 09/15/2039 | | | 5,162,997 | | | | 5,657,023 | |
Series 2013-CR9, Class A1 (USD),
1.34%, 07/10/2045 | | | 3,002,029 | | | | 3,016,389 | |
Commercial Mortgage Trust, Series 2007-GG11, Class A4 (USD), 5.74%, 12/10/2049 | | | 4,535,000 | | | | 5,120,947 | |
Credit Suisse First Boston Mortgage Securities Corp., Series 2004-8, Class 5A1 (USD),
6.00%, 12/25/2034 | | | 3,943,017 | | | | 4,000,644 | |
Credit Suisse Mortgage Capital Trust | | | | | | | | |
Series 2013-TH1, Class A1 (USD),
2.13%, 02/25/2043 (a)(b) | | | 7,569,499 | | | | 6,899,091 | |
Series 2013-IVR1, Class A1 (USD),
2.50%, 03/25/2043 (a)(b) | | | 6,015,975 | | | | 5,593,695 | |
Series 2013-IVR2, Class A1 (USD),
2.50%, 04/25/2043 (a)(b) | | | 7,961,605 | | | | 7,368,195 | |
Series 2013-IVR3, ClassA1 (USD),
2.50%, 05/25/2043 (a)(b) | | | 6,035,440 | | | | 5,583,313 | |
Series 2013-6, Class2A1 (USD),
3.50%, 08/25/2043 (a)(b) | | | 5,799,574 | | | | 5,558,648 | |
DBUBS Mortgage Trust, Series 2011-LC2A, Class A4 (USD), 4.54%, 07/10/2044 (a) | | | 7,470,000 | | | | 8,167,310 | |
EverBank Mortgage Loan Trust,
Series 2013-2, Class A (USD),
3.00%, 06/25/2043 (a)(b) | | | 5,753,198 | | | | 5,720,727 | |
FDIC Guaranteed Notes Trust | | | | | | | | |
Series 2010-C1, Class A (USD),
2.98%, 12/06/2020 (a) | | | 3,581,107 | | | | 3,710,117 | |
Series 2010-S2, Class 2A (USD),
2.57%, 07/29/2047 (a) | | | 3,467,245 | | | | 3,371,895 | |
FDIC Trust, Series 2010-R1, Class A (USD), 2.18%, 05/25/2050 (a) | | | 2,996,083 | | | | 3,024,601 | |
Federal National Mortgage Association, TBA (USD), 1.00%, 11/01/2043 | | | 6,509,706 | | | | 6,509,706 | |
Greenwich Capital Commercial Funding Corp., Series 2007-GG9, Class A4 (USD), 5.44%, 03/10/2039 | | | 3,980,000 | | | | 4,415,422 | |
GS Mortgage Securites Corp. Trust | | | | | | | | |
Series 2013-NYC5, Class A (USD),
2.32%, 01/10/2030 (a) | | | 4,740,000 | | | | 4,790,628 | |
Series 2012-SHOP, Class A (USD),
2.93%, 06/05/2031 (a) | | | 6,950,000 | | | | 7,046,893 | |
Series 2012-ALOH, Class A (USD),
3.55%, 04/10/2034 (a) | | | 2,980,000 | | | | 2,999,708 | |
GS Mortgage Securities Corp. II,
Series 2013-KYO, Class A (USD),
1.02%, 11/08/2029 (a)(b) | | | 7,250,000 | | | | 7,183,293 | |
GSR Mortgage Loan Trust,
Series 2005-6F, Class 1A6 (USD), 5.25%, 07/25/2035 | | | 3,234,137 | | | | 3,245,146 | |
IndyMac INDA Mortgage Loan Trust | | | | | | | | |
Series 2005-AR2, Class 3A1 (USD), 2.76%, 01/25/2036 (b) | | | 3,647,703 | | | | 3,194,604 | |
Series 2006-AR1, Class A1 (USD), 5.28%, 08/25/2036 (b) | | | 541,782 | | | | 533,400 | |
JP Morgan Chase Commercial Mortgage Securities Corp., Series 2013-C13, Class A1 (USD), 1.30%, 01/15/2046 | | | 2,791,053 | | | | 2,806,833 | |
JP Morgan Mortgage Trust | | | | | | | | |
Series 2005-A2, Class 3A2 (USD),
2.55%, 04/25/2035 (b) | | | 2,267,741 | | | | 2,248,548 | |
Series 2005-A5, Class 2A2 (USD),
2.74%, 08/25/2035 (b) | | | 1,925,000 | | | | 1,878,429 | |
Series 2006-S1, Class 2A6 (USD),
6.00%, 04/25/2036 | | | 3,107,210 | | | | 3,165,601 | |
Series 2013-1, Class 1A2 (USD),
3.00%, 03/25/2043 (a) | | | 8,127,734 | | | | 7,964,497 | |
See accompanying notes to financial statements.
2013 Annual Report
27
Statement of Investments (continued)
October 31, 2013
Aberdeen Total Return Bond Fund
| | | | | | | | |
| | | Shares or
Principal
Amount | | | Value | |
Series 2013-1, Class B1 (USD),
3.56%, 03/25/2043 (a)(b) | | $ | 3,231,890 | | | $ | 3,278,924 | |
Series 2013-2, Class A2 (USD),
3.50%, 05/25/2043 (a)(b) | | | 4,848,481 | | | | 4,815,763 | |
Series 2013-3, Class A3 (USD),
3.50%, 07/25/2043 (a)(b) | | | 5,262,435 | | | | 5,201,360 | |
LB-UBS Commercial Mortgage Trust | | | | | | | | |
Series 2006-C4, Class AM (USD),
5.88%, 06/15/2038 (b) | | | 3,180,000 | | | | 3,498,382 | |
Series 2006-C7, Class A3 (USD),
5.35%, 11/15/2038 | | | 5,560,000 | | | | 6,155,373 | |
Madison Avenue Trust, Series 2013-650M, Class A (USD), 3.75%, 10/12/2032 (b) | | | 2,610,000 | | | | 2,737,535 | |
MASTR Adjustable Rate Mortgages Trust,
Series 2006-2, Class 4A1 (USD),
2.63%, 02/25/2036 (b) | | | 1,587,791 | | | | 1,537,522 | |
Merrill Lynch Mortgage Investors Trust | | | | | | | | |
Series 2006-1, Class 2A1 (USD),
2.17%, 02/25/2036 (b) | | | 2,671,254 | | | | 2,555,071 | |
Series 2007-2, Class 2A1 (USD),
2.91%, 06/25/2037 (b) | | | 1,901,385 | | | | 1,800,163 | |
Series 2007-3, Class 2A2 (USD),
2.76%, 09/25/2037 (b) | | | 1,744,286 | | | | 1,617,194 | |
Morgan Stanley Capital I Trust | | | | | | | | |
Series 2013-WLSR, Class A (USD),
2.70%, 01/11/2032 (a) | | | 5,220,000 | | | | 5,218,097 | |
Series 2006-IQ12, Class AM (USD),
5.37%, 12/15/2043 | | | 4,150,000 | | | | 4,556,893 | |
Series 2007-IQ16, Class A4 (USD),
5.81%, 12/12/2049 | | | 7,180,000 | | | | 8,127,850 | |
NCUA Guaranteed Notes Trust | | | | | | | | |
Series 2010-R2, Class 1A (USD),
0.54%, 11/06/2017 (b) | | | 3,944,257 | | | | 3,950,568 | |
Series 2010-R3, Class 1A (USD),
0.73%, 12/08/2020 (b) | | | 5,314,736 | | | | 5,341,310 | |
Sequoia Mortgage Trust | | | | | | | | |
Series 2013-4, Class A2 (USD),
2.50%, 04/25/2043 (b) | | | 5,339,215 | | | | 4,931,566 | |
Series 2013-5, Class A1 (USD),
2.50%, 05/25/2043 (a)(b) | | | 6,054,906 | | | | 5,593,346 | |
Series 2013-6, Class A1 (USD),
2.50%, 05/25/2043 (b) | | | 5,422,454 | | | | 4,948,429 | |
Series 2013-7, Class A1 (USD),
2.50%, 06/25/2043 (b) | | | 6,149,329 | | | | 5,519,582 | |
Structured Asset Securities Corp.,
Series 2004-18H, Class A5 (USD),
4.75%, 10/25/2034 | | | 4,868,677 | | | | 4,890,022 | |
Thornburg Mortgage Securities Trust | | | | | | | | |
Series 2007-4, Class 2A1 (USD),
6.08%, 09/25/2037 (b) | | | 4,293,055 | | | | 4,251,410 | |
Series 2007-4, Class 3A1 (USD),
6.09%, 09/25/2037 (b) | | | 309,417 | | | | 323,437 | |
Wachovia Bank Commercial Mortgage Trust | | | | | | | | |
Series 2007-C34, Class A3 (USD),
5.68%, 05/15/2046 | | | 2,789,000 | | | | 3,143,920 | |
Series 2006-C28, Class AM (USD),
5.60%, 10/15/2048 (b) | | | 6,045,000 | | | | 6,588,863 | |
WaMu Mortgage Pass Through Certificates | | | | | | | | |
Series 2005-AR5, Class A5 (USD),
2.40%, 05/25/2035 (b) | | | 2,966,284 | | | | 2,960,799 | |
Series 2005-AR7, Class A3 (USD),
2.42%, 08/25/2035 (b) | | | 4,680,000 | | | | 4,527,909 | |
Wells Fargo Commercial Mortgage Trust,
Series 2010-C1, Class A2 (USD),
4.39%, 11/15/2043 (a) | | | 3,100,000 | | | | 3,351,184 | |
Wells Fargo Mortgage Backed Securities Trust | | | | | | | | |
Series 2005-AR13, Class 4A1 (USD),
5.33%, 05/25/2035 (b) | | | 3,583,752 | | | | 3,578,470 | |
Series 2006-5, Class 1A5 (USD),
5.25%, 04/25/2036 | | | 4,228,054 | | | | 4,244,700 | |
Series 2006-10, Class A4 (USD),
6.00%, 08/25/2036 | | | 1,950,459 | | | | 2,000,122 | |
Series 2006-19, Class A4 (USD),
5.25%, 12/26/2036 | | | 1,276,342 | | | | 1,253,062 | |
Series 2007-12, Class A13 (USD),
5.50%, 09/25/2037 | | | 211,282 | | | | 211,453 | |
| | | | | | | | 314,481,122 | |
Total Commercial Mortgage-Backed Securities | | | | | | | 314,481,122 | |
CORPORATE BONDS (29.4%) | | | | | | | | |
BRAZIL (0.5%) | | | | | | | | |
Embraer SA (USD),
5.15%, 06/15/2022 | | | 740,000 | | | | 754,800 | |
Petrobras International Finance Co. (USD), 5.88%, 03/01/2018 | | | 7,373,000 | | | | 8,007,535 | |
| | | | | | | | 8,762,335 | |
CANADA (0.2%) | | | | | | | | |
National Bank of Canada (USD), GMTN,
1.45%, 11/07/2017 | | | 3,860,000 | | | | 3,815,988 | |
FRANCE (1.3%) | | | | | | | | |
LVMH Moet Hennessy Louis Vuitton SA (USD), 1.63%, 06/29/2017 (a) | | | 6,650,000 | | | | 6,687,612 | |
Pernod-Ricard SA (USD),
4.25%, 07/15/2022 (a) | | | 9,670,000 | | | | 9,868,177 | |
Sanofi (USD), 4.00%, 03/29/2021 | | | 3,530,000 | | | | 3,792,138 | |
| | | | | | | | 20,347,927 | |
GERMANY (2.4%) | | | | | | | | |
KFW | | | | | | | | |
(USD), 1.38%, 01/13/2014 (c) | | | 7,997,000 | | | | 8,016,976 | |
(AUD), MTN, 6.00%, 08/20/2020 (c) | | | 15,580,000 | | | | 16,020,011 | |
Landwirtschaftliche Rentenbank (USD), EMTN, 4.88%, 01/10/2014 (c) | | | 10,000,000 | | | | 10,083,330 | |
Norddeutsche Landesbank Girozentrale (USD), 0.88%, 10/16/2015 (a) | | | 3,780,000 | | | | 3,796,194 | |
| | | | | | | | 37,916,511 | |
HONG KONG (0.4%) | | | | | | | | |
Hutchison Whampoa International 11 Ltd. (USD), 3.50%, 01/13/2017 (a) | | | 6,420,000 | | | | 6,746,008 | |
See accompanying notes to financial statements.
Annual Report 2013
28
Statement of Investments (continued)
October 31, 2013
Aberdeen Total Return Bond Fund
| | | | | | | | |
| | | Shares or
Principal
Amount | | | Value | |
ITALY (0.6%) | | | | | | | | |
Intesa Sanpaolo SpA (USD),
3.13%, 01/15/2016 | | $ | 9,920,000 | | | $ | 10,121,495 | |
NETHERLANDS (1.8%) | | | | | | | | |
ABN AMRO Bank (USD),
2.50%, 10/30/2018 (a) | | | 5,550,000 | | | | 5,540,276 | |
Cooperatieve Centrale Raiffeisen-Boerenleenbank BA (USD), GMTN,
3.88%, 02/08/2022 | | | 7,240,000 | | | | 7,381,716 | |
Enel Finance International (USD),
6.00%, 10/07/2039 (a) | | | 5,080,000 | | | | 4,898,014 | |
Shell International Finance BV (USD),
3.40%, 08/12/2023 | | | 10,372,000 | | | | 10,416,009 | |
| | | | | | | | 28,236,015 | |
NORWAY (0.8%) | | | | | | | | |
DNB Bank ASA (USD), 3.20%, 04/03/2017 (a) | | | 9,060,000 | | | | 9,522,513 | |
Statoil ASA (USD), 3.95%, 05/15/2043 | | | 3,490,000 | | | | 3,172,075 | |
| | | | | | | | 12,694,588 | |
PANAMA (0.2%) | | | | | | | | |
Carnival Corp. (USD), 3.95%, 10/15/2020 | | | 3,510,000 | | | | 3,565,763 | |
REPUBLIC OF IRELAND (0.5%) | | | | | | | | |
Iberdrola Finance Ltd. (USD), 5.00%, 09/11/2019 (a) | | | 6,810,000 | | | | 7,426,353 | |
REPUBLIC OF SOUTH KOREA (0.3%) | | | | | | | | |
Export-Import Bank of Korea (USD),
2.88%, 09/17/2018 | | | 4,200,000 | | | | 4,283,924 | |
SUPRANATIONAL (1.5%) | | | | | | | | |
International Bank for Reconstruction & Development, Series GDIF (AUD), MTN, 5.75%, 10/21/2019 | | | 16,370,000 | | | | 16,745,570 | |
International Finance Corp. (AUD), MTN, 3.25%, 07/26/2017 | | | 8,170,000 | | | | 7,642,117 | |
| | | | | | | | 24,387,687 | |
SWEDEN (0.9%) | | | | | | | | |
Nordea Bank AB (USD), 3.13%, 03/20/2017 (a) | | | 7,760,000 | | | | 8,166,965 | |
Svenska Handelsbanken AB (USD),
2.50%, 01/25/2019 | | | 6,250,000 | | | | 6,334,019 | |
| | | | | | | | 14,500,984 | |
SWITZERLAND (0.6%) | | | | | | | | |
Credit Suisse AG (USD), 1.63%, 03/06/2015 (a) | | | 10,270,000 | | | | 10,426,844 | |
UNITED KINGDOM (1.8%) | | | | | | | | |
Abbey National Treasury Services PLC (USD), 3.05%, 08/23/2018 | | | 3,010,000 | | | | 3,119,483 | |
Anglo American Capital PLC (USD),
2.63%, 09/27/2017 (a) | | | 2,030,000 | | | | 2,036,634 | |
BAE Systems PLC (USD),
4.75%, 10/11/2021 (a) | | | 6,852,000 | | | | 7,256,371 | |
Vodafone Group PLC (USD), 2.95%, 02/19/2023 | | | 9,000,000 | | | | 8,393,373 | |
WPP Finance 2010 (USD), 4.75%, 11/21/2021 | | | 8,190,000 | | | | 8,581,080 | |
| | | | | | | | 29,386,941 | |
UNITED STATES (15.6%) | | | | | | | | |
AbbVie, Inc. (USD), 4.40%, 11/06/2042 | | | 1,980,000 | | | | 1,874,102 | |
American International Group, Inc. (USD), 4.13%, 02/15/2024 | | | 3,230,000 | | | | 3,327,456 | |
Anheuser-Busch InBev Worldwide, Inc. (USD), 2.50%, 07/15/2022 | | | 7,760,000 | | | | 7,323,034 | |
Bank of America Corp. (USD), 2.60%, 01/15/2019 | | | 4,400,000 | | | | 4,435,081 | |
Berkshire Hathaway, Inc. (USD), 4.50%, 02/11/2043 | | | 5,620,000 | | | | 5,440,812 | |
Boeing Co. (The) (USD), 7.95%, 08/15/2024 | | | 8,819,000 | | | | 12,221,802 | |
Bristol-Myers Squibb Co. (USD), 4.50%, 03/01/2044 | | | 5,230,000 | | | | 5,177,920 | |
Burlington Northern Santa Fe LLC (USD), 4.40%, 03/15/2042 | | | 4,760,000 | | | | 4,409,978 | |
Celgene Corp. (USD), 3.95%, 10/15/2020 | | | 7,402,000 | | | | 7,713,113 | |
Citigroup, Inc. (USD), 2.50%, 09/26/2018 | | | 11,670,000 | | | | 11,784,844 | |
CME Group, Inc. (USD), 3.00%, 09/15/2022 | | | 2,170,000 | | | | 2,097,824 | |
CVS Caremark Corp. (USD), 5.75%, 05/15/2041 | | | 4,885,000 | | | | 5,436,370 | |
DIRECTV Holdings LLC / DIRECTV Financing Co., Inc. (USD), 2.40%, 03/15/2017 | | | 5,890,000 | | | | 5,995,814 | |
Dominion Gas Holdings LLC (USD),
4.80%, 11/01/2043 (a) | | | 1,300,000 | | | | 1,312,116 | |
Dow Chemical Co. (The) (USD), 4.38%, 11/15/2042 | | | 4,070,000 | | | | 3,687,567 | |
Duke Energy Corp. (USD), 3.95%, 10/15/2023 | | | 2,460,000 | | | | 2,513,126 | |
Edison International (USD), 3.75%, 09/15/2017 | | | 6,715,000 | | | | 7,137,609 | |
Energy Transfer Partners LP (USD),
4.15%, 10/01/2020 | | | 7,090,000 | | | | 7,369,474 | |
Freeport-McMoRan Copper & Gold, Inc. (USD), 3.55%, 03/01/2022 | | | 3,360,000 | | | | 3,171,974 | |
General Electric Capital Corp. (USD), GMTN, 3.10%, 01/09/2023 | | | 7,900,000 | | | | 7,630,412 | |
George Washington University (The),
Series 2013 (USD), 4.36%, 09/15/2043 | | | 1,120,000 | | | | 963,523 | |
Goldman Sachs Group, Inc. (The) (USD), 2.90%, 07/19/2018 | | | 5,400,000 | | | | 5,520,328 | |
Harley-Davidson Financial Services, Inc. (USD), MTN, 3.88%, 03/15/2016 (a) | | | 5,260,000 | | | | 5,587,645 | |
Ingersoll-Rand Global Holding Co. Ltd. (USD), 5.75%, 06/15/2043 (a) | | | 2,870,000 | | | | 3,021,283 | |
International Business Machines Corp. (USD), 7.00%, 10/30/2025 | | | 3,130,000 | | | | 4,105,452 | |
JPMorgan Chase & Co. | | | | | | | | |
(USD), 2.00%, 08/15/2017 | | | 7,370,000 | | | | 7,470,534 | |
(USD), 4.35%, 08/15/2021 | | | 4,990,000 | | | | 5,301,446 | |
Lowe’s Cos., Inc. (USD), 5.00%, 09/15/2043 | | | 4,470,000 | | | | 4,666,564 | |
Merck Sharp & Dohme Corp. (USD),
6.30%, 01/01/2026 | | | 650,000 | | | | 809,260 | |
Metropolitan Life Global Funding I (USD), 2.50%, 09/29/2015 (a) | | | 4,600,000 | | | | 4,749,606 | |
Morgan Stanley (USD), GMTN, 5.55%, 04/27/2017 | | | 6,050,000 | | | | 6,803,655 | |
Mylan, Inc. (USD), 3.13%, 01/15/2023 (a) | | | 4,350,000 | | | | 3,996,728 | |
See accompanying notes to financial statements.
2013 Annual Report
29
Statement of Investments (continued)
October 31, 2013
Aberdeen Total Return Bond Fund
| | | | | | | | |
| | | Shares or
Principal
Amount | | | Value | |
Newmont Mining Corp. (USD), 4.88%, 03/15/2042 | | $ | 4,820,000 | | | $ | 3,625,402 | |
News America, Inc. | | | | | | | | |
(USD), 8.88%, 04/26/2023 | | | 680,000 | | | | 895,785 | |
(USD), 7.75%, 01/20/2024 | | | 530,000 | | | | 641,657 | |
(USD), 7.43%, 10/01/2026 | | | 3,630,000 | | | | 4,411,401 | |
Noble Holding International Ltd. (USD), 3.95%, 03/15/2022 | | | 5,020,000 | | | | 4,985,091 | |
Omnicom Group, Inc. | | | | | | | | |
(USD), 6.25%, 07/15/2019 | | | 6,752,000 | | | | 7,886,336 | |
(USD), 3.63%, 05/01/2022 | | | 2,410,000 | | | | 2,357,657 | |
Packaging Corp. of America (USD),
4.50%, 11/01/2023 | | | 940,000 | | | | 968,558 | |
Pentair Finance SA (USD), 1.88%, 09/15/2017 | | | 4,260,000 | | | | 4,234,623 | |
San Diego Gas & Electric Co. (USD),
6.00%, 06/01/2026 | | | 1,225,000 | | | | 1,517,584 | |
Sempra Energy (USD), 9.80%, 02/15/2019 | | | 6,077,000 | | | | 8,179,988 | |
Time Warner Cos., Inc. (USD), 7.57%, 02/01/2024 | | | 1,770,000 | | | | 2,216,978 | |
United Parcel Service, Inc. (USD),
3.88%, 04/01/2014 | | | 2,380,000 | | | | 2,414,236 | |
United Technologies Corp. (USD),
8.75%, 03/01/2021 | | | 2,700,000 | | | | 3,671,433 | |
Valero Energy Corp. (USD), 8.75%, 06/15/2030 | | | 1,325,000 | | | | 1,726,078 | |
Validus Holdings Ltd. (USD), 8.88%, 01/26/2040 | | | 4,370,000 | | | | 5,707,259 | |
Verizon Communications, Inc. | | | | | | | | |
(USD), 4.50%, 09/15/2020 | | | 4,450,000 | | | | 4,823,755 | |
(USD), 6.40%, 09/15/2033 | | | 3,550,000 | | | | 4,029,971 | |
Wal-Mart Stores, Inc. (USD), 4.25%, 04/15/2021 | | | 3,640,000 | | | | 3,987,715 | |
WellPoint, Inc. | | | | | | | | |
(USD), 4.65%, 01/15/2043 | | | 2,140,000 | | | | 2,012,593 | |
(USD), 5.10%, 01/15/2044 | | | 2,500,000 | | | | 2,522,543 | |
Williams Partners LP (USD), 4.13%, 11/15/2020 | | | 4,053,000 | | | | 4,184,479 | |
Wyeth LLC (USD), 6.45%, 02/01/2024 | | | 3,332,000 | | | | 4,165,536 | |
Zimmer Holdings, Inc. | | | | | | | | |
(USD), 4.63%, 11/30/2019 | | | 2,570,000 | | | | 2,844,301 | |
(USD), 3.38%, 11/30/2021 | | | 2,250,000 | | | | 2,230,603 | |
| | | | | | | | 249,298,014 | |
Total Corporate Bonds | | | | | | | 471,917,377 | |
MUNICIPAL BONDS (4.1%) | | | | | | | | |
CALIFORNIA (1.0%) | | | | | | | | |
Los Angeles Unified School District General Obligation Unlimited Bonds | | | | | | | | |
(USD), 5.76%, 07/01/2029 | | | 2,810,000 | | | | 3,129,413 | |
(USD), 6.76%, 07/01/2034 | | | 590,000 | | | | 737,293 | |
San Francisco City & County Public Utilities Commission Water, Revenue Bonds (USD), 6.00%, 11/01/2040 | | | 3,370,000 | | | | 3,831,387 | |
State of California General Obligation Unlimited Bonds | | | | | | | | |
(USD), 7.55%, 04/01/2039 | | | 4,000,000 | | | | 5,414,080 | |
(USD), 7.35%, 11/01/2039 | | | 2,195,000 | | | | 2,878,874 | |
| | | | | | | | 15,991,047 | |
CONNECTICUT (0.3%) | | | | | | | | |
State of Connecticut General Obligation Unlimited Bonds, Series A (USD), 5.85%, 03/15/2032 | | | 4,420,000 | | | | 4,941,162 | |
FLORIDA (0.1%) | | | | | | | | |
Florida Hurricane Catastrophe Fund Finance Corp., Revenue Bonds, Series A (USD), 1.30%, 07/01/2016 | | | 2,370,000 | | | | 2,369,005 | |
MASSACHUSETTS (0.6%) | | | | | | | | |
Commonwealth of Massachusetts General Obligation Limited Bonds | | | | | | | | |
Series E (USD),
4.20%, 12/01/2021 | | | 4,975,000 | | | | 5,393,795 | |
(USD), 4.91%, 05/01/2029 | | | 1,810,000 | | | | 1,960,809 | |
(USD), 5.46%, 12/01/2039 | | | 2,760,000 | | | | 3,077,014 | |
| | | | | | | | 10,431,618 | |
NEW YORK (1.3%) | | | | | | | | |
New York City Municipal Water Finance Authority Revenue Bonds (Build America Bonds) (USD), 5.44%, 06/15/2043 | | | 5,355,000 | | | | 5,902,495 | |
New York City Transitional Finance Authority Revenue Bonds (Qualified School Construction BD) | | | | | | | | |
(USD), 5.27%, 05/01/2027 | | | 3,655,000 | | | | 4,051,933 | |
(USD), 5.01%, 08/01/2027 | | | 3,780,000 | | | | 3,992,549 | |
New York City Water & Sewer System (USD), 5.75%, 06/15/2041 | | | 1,460,000 | | | | 1,673,335 | |
New York State Dormitory Authority Revenue Bonds (USD), 5.60%, 03/15/2040 | | | 4,710,000 | | | | 5,323,431 | |
| | | | | | | | 20,943,743 | |
OREGON (0.3%) | | | | | | | | |
State of Oregon General Obligation Unlimited Bonds (USD),
5.89%, 06/01/2027 | | | 3,380,000 | | | | 4,028,757 | |
TEXAS (0.5%) | | | | | | | | |
State of Texas General Obligation Unlimited Bonds (USD), 5.52%, 04/01/2039 | | | 5,070,000 | | | | 5,847,434 | |
Series A (USD), 4.68%, 04/01/2040 | | | 1,620,000 | | | | 1,652,789 | |
| | | | | | | | 7,500,223 | |
Total Municipal Bonds | | | | | | | 66,205,555 | |
GOVERNMENT BONDS (18.1%) | | | | | | | | |
AUSTRALIA (2.8%) | | | | | | | | |
Australia Government Bond (AUD), 5.25%, 03/15/2019 | | | 17,240,000 | | | | 17,771,996 | |
See accompanying notes to financial statements.
Annual Report 2013
30
Statement of Investments (continued)
October 31, 2013
Aberdeen Total Return Bond Fund
| | | | | | | | |
| | | Shares or
Principal
Amount | | | Value | |
New South Wales Treasury Corp. (AUD), 6.00%, 04/01/2019 | | $ | 15,580,000 | | | $ | 16,342,719 | |
Queensland Treasury Corp. | | | | | | | | |
(AUD), 6.00%, 09/14/2017 | | | 3,040,000 | | | | 3,140,555 | |
(AUD), 6.00%, 06/14/2021 | | | 6,610,000 | | | | 6,985,184 | |
| | | | | | | | 44,240,454 | |
BRAZIL (4.8%) | | | | | | | | |
Brazil Letras do Tesouro Nacional,
Series LTN (BRL), 0.00%, 01/01/2017 (d) | | | 51,874,000 | | | | 16,475,749 | |
Brazil Notas do Tesouro Nacional Series F | | | | | | | | |
Series NTNF (BRL),
10.00%, 01/01/2014 | | | 30,209,000 | | | | 13,497,858 | |
Series NTNF (BRL),
10.00%, 01/01/2017 | | | 110,052,000 | | | | 47,416,226 | |
| | | | | | | | 77,389,833 | |
CANADA (3.4%) | | | | | | | | |
Canada Housing Trust No 1 | | | | | | | | |
(CAD), 2.05%, 06/15/2018(a)(c) | | | 7,950,000 | | | | 7,668,950 | |
(CAD), 2.35%, 12/15/2018(a)(c) | | | 17,110,000 | | | | 16,642,476 | |
Canadian Government Bond (CAD), 1.25%, 09/01/2018 | | | 16,800,000 | | | | 15,766,364 | |
Export Development Canada (USD), 3.13%, 04/24/2014 | | | 3,640,000 | | | | 3,690,374 | |
Province of British Columbia (USD), 2.85%, 06/15/2015 | | | 2,080,000 | | | | 2,164,598 | |
Province of Ontario (USD), 4.10%, 06/16/2014 | | | 9,180,000 | | | | 9,400,201 | |
| | | | | | | | 55,332,963 | |
MEXICO (5.0%) | | | | | | | | |
Mexican Bonos (MXN), 7.75%, 05/29/2031 | | | 281,330,000 | | | | 23,112,778 | |
Mexico Fixed Rate Bonds,
Series M20 (MXN), 10.00%, 12/05/2024 | | | 564,028,400 | | | | 57,054,570 | |
| | | | | | | | 80,167,348 | |
NORWAY (0.5%) | | | | | | | | |
Norway Government Bond (NOK),
2.00%, 05/24/2023 | | | 51,520,000 | | | | 8,090,718 | |
QATAR (0.6%) | | | | | | | | |
Qatar Government International Bond (USD), 4.00%, 01/20/2015 (a) | | | 9,310,000 | | | | 9,647,487 | |
REPUBLIC OF SOUTH KOREA (0.2%) | | | | | | | | |
Korea Housing Finance Corp. (USD), 1.63%, 09/15/2018 (a) | | | 3,230,000 | | | | 3,096,394 | |
SWEDEN (0.8%) | | | | | | | | |
Sweden Government International Bond (USD), 1.00%, 06/03/2014 (a) | | | 12,070,000 | | | | 12,135,806 | |
Total Government Bonds | | | | | | | 290,101,003 | |
U.S. AGENCIES (14.8%) | | | | | | | | |
UNITED STATES (14.8%) | | | | | | | | |
Federal Home Loan Mortgage Corp. | | | | | | | | |
(USD), 6.50%, 05/01/2022 | | | 2,103 | | | | 2,345 | |
(USD), 6.50%, 08/01/2036 | | | 900,036 | | | | 994,870 | |
(USD), 6.50%, 09/01/2037 | | | 148,672 | | | | 173,752 | |
(USD), 6.50%, 12/01/2037 | | | 137,766 | | | | 152,315 | |
(USD), 6.50%, 05/01/2038 | | | 2,946,567 | | | | 3,269,161 | |
(USD), 6.50%, 09/01/2038 | | | 237,173 | | | | 261,756 | |
(USD), 6.50%, 10/01/2038 | | | 2,364,377 | | | | 2,664,270 | |
(USD), 6.50%, 10/01/2038 | | | 21,121 | | | | 23,363 | |
(USD), 6.50%, 11/01/2038 | | | 1,286,058 | | | | 1,500,107 | |
(USD), 6.50%, 12/01/2038 | | | 1,505,112 | | | | 1,759,753 | |
(USD), 4.50%, 06/01/2039 | | | 490,331 | | | | 525,246 | |
(USD), 4.50%, 11/01/2039 | | | 2,887,294 | | | | 3,084,133 | |
(USD), 4.50%, 09/01/2040 | | | 15,210 | | | | 16,262 | |
(USD), 4.50%, 04/01/2041 | | | 12,239 | | | | 13,101 | |
(USD), 4.50%, 05/01/2041 | | | 764,663 | | | | 818,343 | |
(USD), 4.50%, 06/01/2041 | | | 1,483,459 | | | | 1,588,159 | |
(USD), 4.50%, 11/01/2041 | | | 2,777,796 | | | | 2,970,565 | |
(USD), 3.00%, 02/01/2043 | | | 7,978,994 | | | | 7,847,926 | |
(USD), 3.00%, 04/01/2043 | | | 8,636,939 | | | | 8,508,559 | |
TBA (USD), 3.50%, 11/01/2043 | | | 8,770,000 | | | | 8,911,142 | |
TBA (USD), 3.50%, 11/01/2043 | | | 8,320,000 | | | | 8,505,900 | |
Federal National Mortgage Association | | | | | | | | |
(USD), 4.50%, 10/01/2019 | | | 3,873,808 | | | | 4,122,927 | |
(USD), 3.50%, 10/01/2023 | | | 15,558,930 | | | | 16,488,568 | |
(USD), 3.50%, 10/01/2023 | | | 5,744,843 | | | | 6,088,105 | |
TBA (USD), 3.50%, 11/01/2028 | | | 7,700,000 | | | | 8,112,071 | |
(USD), 5.50%, 01/01/2029 | | | 329,660 | | | | 359,498 | |
(USD), 5.50%, 02/01/2033 | | | 775,134 | | | | 848,526 | |
(USD), 5.00%, 05/01/2035 | | | 4,682,070 | | | | 5,095,267 | |
(USD), 2.75%, 02/01/2036(b) | | | 355,663 | | | | 383,075 | |
(USD), 5.50%, 11/01/2036 | | | 477,530 | | | | 521,653 | |
(USD), 5.50%, 01/01/2037 | | | 295,713 | | | | 322,758 | |
(USD), 5.50%, 05/01/2037 | | | 14,577,410 | | | | 16,001,804 | |
(USD), 5.50%, 11/01/2037 | | | 894,139 | | | | 975,270 | |
(USD), 5.50%, 02/01/2038 | | | 2,755,625 | | | | 3,005,659 | |
(USD), 5.50%, 06/01/2038 | | | 312,213 | | | | 340,542 | |
(USD), 5.50%, 11/01/2038 | | | 5,894,688 | | | | 6,429,546 | |
(USD), 5.50%, 08/01/2039 | | | 2,013,459 | | | | 2,201,721 | |
(USD), 5.50%, 02/01/2041 | | | 923,158 | | | | 1,030,894 | |
(USD), 3.00%, 02/01/2043 | | | 16,554,495 | | | | 16,361,825 | |
(USD), 3.00%, 03/01/2043 | | | 2,298,676 | | | | 2,242,456 | |
(USD), 3.00%, 06/01/2043 | | | 2,540,661 | | | | 2,478,650 | |
(USD), 3.00%, 07/01/2043 | | | 2,066,901 | | | | 2,016,419 | |
TBA (USD), 4.00%, 11/01/2043 | | | 25,880,000 | | | | 27,194,219 | |
TBA (USD), 4.50%, 11/01/2043 | | | 37,760,000 | | | | 40,432,702 | |
Government National Mortgage Association | | | | | |
(USD), 6.00%, 04/15/2037 | | | 248,765 | | | | 275,048 | |
(USD), 6.00%, 06/15/2037 | | | 177,376 | | | | 195,900 | |
(USD), 6.00%, 09/15/2037 | | | 441,293 | | | | 487,240 | |
(USD), 6.00%, 11/15/2037 | | | 869,487 | | | | 960,432 | |
(USD), 6.00%, 11/15/2037 | | | 303,435 | | | | 335,234 | |
(USD), 6.00%, 12/15/2037 | | | 286,279 | | | | 316,358 | |
(USD), 6.00%, 12/15/2037 | | | 102,045 | | | | 112,737 | |
(USD), 6.00%, 01/15/2038 | | | 214,160 | | | | 236,388 | |
(USD), 6.00%, 04/15/2038 | | | 409,717 | | | | 452,454 | |
See accompanying notes to financial statements.
2013 Annual Report
31
Statement of Investments (continued)
October 31, 2013
Aberdeen Total Return Bond Fund
| | | | | | | | |
| | | Shares or
Principal
Amount | | | Value | |
(USD), 5.00%, 06/15/2038 | | $ | 128,389 | | | $ | 140,229 | |
(USD), 6.00%, 07/15/2038 | | | 183,742 | | | | 203,329 | |
(USD), 6.00%, 08/15/2038 | | | 86,181 | | | | 95,294 | |
(USD), 6.00%, 09/15/2038 | | | 466,663 | | | | 520,482 | |
(USD), 6.00%, 09/15/2038 | | | 309,680 | | | | 342,429 | |
(USD), 4.50%, 02/15/2039 | | | 354,334 | | | | 383,126 | |
(USD), 5.00%, 03/15/2039 | | | 971,004 | | | | 1,060,450 | |
(USD), 5.00%, 04/15/2039 | | | 369,609 | | | | 403,159 | |
(USD), 5.00%, 06/15/2039 | | | 303,155 | | | | 338,039 | |
(USD), 4.50%, 04/15/2040 | | | 2,316,953 | | | | 2,511,983 | |
(USD), 4.50%, 07/15/2040 | | | 4,245,139 | | | | 4,600,555 | |
(USD), 4.50%, 04/15/2041 | | | 4,583,631 | | | | 4,982,966 | |
(USD), 5.00%, 05/15/2041 | | | 495,739 | | | | 545,360 | |
(USD), 5.00%, 06/15/2041 | | | 572,480 | | | | 629,602 | |
(USD), 5.00%, 10/15/2041 | | | 16,958 | | | | 18,545 | |
| | | | | | | | 236,792,522 | |
Total U.S. Agencies | | | | | | | 236,792,522 | |
U.S. TREASURIES (6.5%) | | | | | | | | |
UNITED STATES (6.5%) | | | | | | | | |
U.S. Treasury Bond (USD),
2.88%, 05/15/2043 | | | 6,880,000 | | | | 5,903,900 | |
U.S. Treasury Bonds (USD), 4.75%, 02/15/2041 | | | 6,530,000 | | | | 7,912,525 | |
U.S. Treasury Inflation Index Bonds (USD), 0.63%, 02/15/2043 | | | 8,770,000 | | | | 7,409,253 | |
U.S. Treasury Notes | | | | | | | | |
(USD), 0.38%, 08/31/2015 | | | 4,370,000 | | | | 4,377,853 | |
(USD), 0.63%, 08/15/2016 | | | 3,530,000 | | | | 3,539,789 | |
(USD), 0.88%, 09/15/2016 | | | 2,490,000 | | | | 2,513,441 | |
(USD), 0.63%, 10/15/2016 | | | 10,020,000 | | | | 10,037,615 | |
(USD), 0.63%, 04/30/2018 | | | 8,910,000 | | | | 8,705,346 | |
(USD), 1.00%, 05/31/2018 | | | 4,810,000 | | | | 4,771,857 | |
(USD), 1.38%, 06/30/2018 | | | 7,560,000 | | | | 7,615,815 | |
(USD), 1.38%, 07/31/2018 | | | 11,630,000 | | | | 11,706,781 | |
(USD), 1.38%, 09/30/2018 | | | 16,910,000 | | | | 16,978,029 | |
(USD), 1.25%, 10/31/2018 | | | 3,680,000 | | | | 3,668,644 | |
(USD), 2.00%, 07/31/2020 | | | 2,640,000 | | | | 2,662,482 | |
(USD), 2.50%, 08/15/2023 | | | 6,640,000 | | | | 6,616,136 | |
| | | | | | | | 104,419,466 | |
Total U.S. Treasuries | | | | | | | 104,419,466 | |
REPURCHASE AGREEMENT (4.9%) | | | | | | | | |
UNITED STATES (4.9%) | | | | | | | | |
State Street Bank, 0.00%, dated 10/31/2013, due 11/01/2013, repurchase price $78,162,894, collateralized by Federal Home Loan Banks, maturing 01/08/2016; total market value of $2,998,744 and U.S. Treasury Note, maturing 11/15/2015; total market value of $76,729,512 | | | 78,162,894 | | | | 78,162,894 | |
Total Repurchase Agreement | | | | | | | 78,162,894 | |
Total Investments (Cost $1,728,643,961) (e)—107.7% | | | | | | | 1,726,441,623 | |
| |
Liabilities in excess of other assets—(7.7)% | | | | (123,295,890 | ) |
Net Assets—100.0% | | | | | | $ | 1,603,145,733 | |
| (a) | | Denotes a security issued under Regulation S or Rule 144A. |
| (b) | | Variable or Floating Rate Security. Rate disclosed is as of October 31, 2013. |
| (c) | | This security is government guaranteed. |
| (d) | | Issued with a zero coupon. |
| (e) | | See notes to financial statements for tax unrealized appreciation/depreciation of securities. |
| EMTN | | Euro Medium Term Note |
| GMTN | | Global Medium Term Note |
| TBA | | Securities purchased on a forward commitment basis with an appropriate principal amount and no definitive maturity date. The actual principal and maturity date will be determined upon settlement date. |
See accompanying notes to financial statements.
Annual Report 2013
32
Statement of Investments (concluded)
October 31, 2013
Aberdeen Total Return Bond Fund
At October 31, 2013, the Fund’s open forward foreign currency exchange contracts were as follows:
| | | | | | | | | | | | | | | | | | | | | | | | | | |
| Purchase Contracts Settlement Date* | | Counterparty | | Amount
Purchased | | | Amount Sold | | | Fair Value | | | Unrealized
Appreciation/
(Depreciation) | |
| Australian Dollar/United States Dollar | | | | | | | | | | | | | | | | | | | | | | | | | | |
12/31/2013 | | Westpac Banking Corp. | | | AUD | | | | 830,317 | | | | USD | | | | 770,375 | | | $ | 781,844 | | | $ | 11,469 | |
| | | | | | | |
| Brazilian Real/United States Dollar | | | | | | | | | | | | | | | | | | | | | | | | | | |
11/04/2013 | | Credit Suisse | | | BRL | | | | 79,386,223 | | | | USD | | | | 36,349,003 | | | | 35,437,114 | | | | (911,889 | ) |
11/04/2013 | | JPMorgan Chase | | | BRL | | | | 91,345,827 | | | | USD | | | | 41,834,589 | | | | 40,775,746 | | | | (1,058,843 | ) |
| | | | | | | |
| Mexican Peso/United States Dollar | | | | | | | | | | | | | | | | | | | | | | | | | | |
12/20/2013 | | Credit Suisse | | | MXN | | | | 1,558,436 | | | | USD | | | | 120,983 | | | | 119,016 | | | | (1,967 | ) |
| 12/20/2013 | | Deutsche Bank | | | MXN | | | | 104,304,462 | | | | USD | | | | 8,011,588 | | | | 7,965,624 | | | | (45,964 | ) |
| | | | | | | | | | | | | | | | | | | | | $ | 85,079,344 | | | $ | (2,007,194 | ) |
| | | | | | | | | | | | | | | | | | | | | | | | | | |
| Sale Contracts Settlement Date* | | Counterparty | | Amount Purchased | | | Amount Sold | | | Fair Value | | | Unrealized
Appreciation/
(Depreciation) | |
| | | | | | | |
| United States Dollar/Australian Dollar | | | | | | | | | | | | | | | | | | | | | | | | | | |
12/31/2013 | | Westpac Banking Corp. | | | USD | | | | 85,091,094 | | | | AUD | | | | 89,032,118 | | | $ | 83,834,616 | | | $ | 1,256,478 | |
| | | | | | | |
| United States Dollar/Brazilian Real | | | | | | | | | | | | | | | | | | | | | | | | | | |
11/04/2013 | | Credit Suisse | | | USD | | | | 35,273,751 | | | | BRL | | | | 79,386,223 | | | | 35,437,114 | | | | (163,363 | ) |
11/04/2013 | | JPMorgan Chase | | | USD | | | | 40,613,488 | | | | BRL | | | | 91,345,827 | | | | 40,775,746 | | | | (162,258 | ) |
12/02/2013 | | Credit Suisse | | | USD | | | | 36,109,267 | | | | BRL | | | | 79,386,223 | | �� | | 35,198,082 | | | | 911,185 | |
12/02/2013 | | JPMorgan Chase | | | USD | | | | 41,554,830 | | | | BRL | | | | 91,345,827 | | | | 40,500,704 | | | | 1,054,126 | |
| | | | | | | |
| United States Dollar/Canadian Dollar | | | | | | | | | | | | | | | | | | | | | | | | | | |
11/21/2013 | | Deutsche Bank | | | USD | | | | 39,599,653 | | | | CAD | | | | 41,053,296 | | | | 39,354,271 | | | | 245,382 | |
| | | | | | | |
| United States Dollar/Mexican Peso | | | | | | | | | | | | | | | | | | | | | | | | | | |
12/20/2013 | | Credit Suisse | | | USD | | | | 24,751,388 | | | | MXN | | | | 317,828,534 | | | | 24,272,236 | | | | 479,152 | |
12/20/2013 | | Deutsche Bank | | | USD | | | | 7,973,214 | | | | MXN | | | | 102,846,488 | | | | 7,854,280 | | | | 118,934 | |
| | | | | | | |
| United States Dollar/Norwegian Krone | | | | | | | | | | | | | | | | | | | | | | | | | | |
| 11/29/2013 | | JPMorgan Chase | | | USD | | | | 8,197,392 | | | | NOK | | | | 48,369,940 | | | | 8,117,828 | | | | 79,564 | |
| | | | | | | | | | | | | | | | | | | | | $ | 315,344,877 | | | $ | 3,819,200 | |
| * | | Certain contracts with different trade dates and like characteristics have been shown net. |
2013 Annual Report
33
Aberdeen Global High Income Fund (Unaudited)
Aberdeen Global High Income Fund (Class A shares at NAV net of fees) returned 10.20% for the 12-month period ended October 31, 2013, versus the 9.98% return of its benchmark, the Bank of America Merrill Lynch Global High Yield Constrained Index, during the same period. For broader comparison, the average return of the Fund’s Lipper peer category of High Current Yield Funds (consisting of 545 funds) was 8.19% for the period.
For roughly the first half of the reporting period, credit trends continued to show modest improvement against a backdrop of benign global central bank policy. In late May 2013, however, the bond and credit markets reacted negatively to signals from the U.S. Federal Reserve (Fed) that the pace of quantitative easing (QE) might be slowed as early as the fourth quarter of 2013. U.S. Treasury rates rose by almost one full percentage point and the credit premium exhibited by high yield bonds (as measured by the benchmark Bank of America Merrill Lynch Global High Yield Constrained Index) rose by approximately 80 basis points (bps) through the end of June 2013. However, high yield issuers continued to report earnings that supported tighter credit spreads, and the high yield market recovered some of its lost ground in July and August. This recovery gained further momentum in late September when the Fed chose not to begin reducing its stimulus, thus driving the benchmark U.S. Treasury yield curve lower. European high yield rates and credit spreads etched out much the same pattern, but European credit spreads generally tended to tighten more than U.S. spreads through the period, beginning the reporting period over 100 bps wider than the U.S. and ending the year within 10 bps of U.S. credit spreads. This outperformance on the part of European high yield bonds reflected growing confidence that peripheral Europe (Greece, Italy, Spain, Portugal, and Ireland) was less vulnerable to fiscal and debt destabilization. In contrast to Europe, yields on emerging market bonds steadily widened relative to U.S. high yield during the period, having begun with roughly a 150-bps credit spread advantage and ending with an approximate 220-bps advantage. In our view, this widening reflected growing concerns that the eventual removal of unconventional monetary stimulus in the developed economies would negatively affect emerging market economies, particularly those which had enjoyed large increases in fund inflows along with deteriorating fiscal and current account balances over the past several years.
Security selection in both the U.S. and Europe significantly bolstered Fund performance during the annual period. Of particular note were the loans of a reorganized European telecommunications provider which benefited from a reduction in interest costs under a new liability structure; the securities of a U.S. trucking company that was also benefiting from a recent restructuring; and the bonds of a specialty chemical company. Additionally, the Fund’s underweight exposure versus the benchmark index to emerging market bonds contributed to performance as that sector increasingly lagged U.S. and European bonds in the summer and early autumn.
These positive contributors to Fund performance were partially offset by the underweight to European high yield during the period, as well as the hedge of European currency exposures. Although European currencies lagged the U.S. dollar for much of the annual period, they performed well during the last several months of the period.
While the Fund used derivatives during the reporting period, they had minimal impact on performance.
Changes to the Fund during the reporting period were driven primarily through our bottom-up security selection process and resulted in relatively modest changes to the broader characteristics of the Fund. The largest change occurred along the credit rating spectrum, where we increased both BB and B rated bonds by over 2% of net assets while reducing the exposure to bonds rated CCC and below and, to a lesser extent, BBB bonds.1 This change is the net effect of our judgments on the changes in credit quality and structure of the lowest-rated category of bonds, which, as is typical when credit recoveries gather momentum, are declining in quality even as their spreads tighten. Regarding geographic allocations, we reduced the Fund’s positions in Canada and in developing Asian countries in favor of U.S., Latin American, and Eastern European-based issuers. With reference to security types, the Fund’s loan positions, after peaking in April 2013 at about 13% of the Fund’s net assets, declined by about 3% into the end of the reporting period in favor of bonds, cash, and a small position in index swaps that we used to manage the Fund’s overall risk exposure. While loans continue to enjoy very strong technical support, we increasingly believe that pricing fundamentals are being ignored by the market. The Fund’s currency exposures remained heavily weighted to the U.S. dollar throughout the annual period, although we did begin modestly increasing the European currency exposures towards the end of the period. Within Latin America, we hedged out2 the Brazilian real exposure for much of the period, but increased the exposure to Mexican pesos as we added Mexican local currency government bonds. By industry, we increased the Fund’s exposures to energy-related issuers and reduced holdings in the media and healthcare sectors. There also was an increase in financial services issues, primarily among insurance companies and several banks.
In what we believe is likely to be a mild acceleration of the slow economic growth environment of the past several years, we think that tightening credit spreads may at least absorb what are likely to be small increases in benchmark global government yield curves over the next year. In our opinion, the offsetting effects of rising rates and declining credit spreads may result in another year where the total return of the benchmark Bank of America Merrill Lynch Global High Yield Constrained Index closely mimics its current yield. It should be
| 1 | | Standard & Poor’s credit ratings express the agency’s opinion about the ability and willingness of an issuer, such as a corporation or state or city government, to meet its financial obligations in full and on time. Typically, ratings are expressed as letter grades that range, for example, from “AAA” to “D” to communicate the agency’s opinion of relative level of credit risk. |
| 2 | | A hedge is an investment intended to reduce the risk of adverse price movements in an asset. |
Annual Report 2013
34
Aberdeen Global High Income Fund (Unaudited) (concluded)
noted that the spread tightening required to offset the kind of interest rate increases that we think are likely to occur in a slow growth environment would still leave credit spreads well above their historic tight levels relative to benchmark government yield curves. We believe there will be a similar scenario in Europe, where lower growth may limit interest rate moves but where, as indicated by a substantial amount of credit tightening, investors have already anticipated what credit improvement might be expected. We believe that below-investment-grade emerging market corporate bonds will benefit the most from the improving global economy and a continued search for yield in what likely will remain a painfully low yield environment. This sector of the global high yield market reached historically wide levels in 2013 versus U.S. sub-investment-grade corporates on what we believe are exaggerated fears about the impact of Fed monetary policy tapering on emerging market economies. Therefore, we think that the sector has the most room to improve if the markets’ worst fears are left unfulfilled.
Along the credit rating curve, we believe that this environment will continue to favor CCC rated securities over single B, and single B over higher-quality BB bonds. While longer-duration3 bonds of all stripes probably will be most vulnerable, in our view, the unusually steep slope of both the global government yield curves and credit curves may already discount a substantial part of their vulnerability going forward. Within the loan market, we believe that there is value among European issuers and in special situations globally.
We believe that the largest risk to our outlook rests in the possibility of a renewal of declining growth. In our opinion, this type of negative scenario could be caused by overly stringent and coincident fiscal restraint on the part of the major economies, the failure of consumer or capital spending to react positively in any way to continued accommodative monetary policy, or a major geopolitical event. In light of the recent tightening of credit spreads, we think that this scenario would be especially damaging to high-yielding, lower-rated corporate bonds worldwide. We believe that CCC rated securities, in particular, would be vulnerable, as would below-investment-grade emerging market corporates.
Regardless of the environment, we intend to maintain our efforts to generate returns for the Fund’s shareholders exceeding those of the benchmark Bank of America Merrill Lynch Global High Yield Constrained Index over a full market cycle4 through our emphasis on flexibility within a global context, bottom-up analysis, and business economics-based research, with careful attention to downside risks.
Portfolio Management:
Greg Hopper
PAST PERFORMANCE DOES NOT GUARANTEE FUTURE RESULTS.
The performance quoted represents past performance, which does not guarantee future results. Class A shares have up to a 0.25% 12b-1 fee. The investment return and principal value of an investment will fluctuate so that an investor’s shares, when redeemed, may be worth more or less than their original cost. Current performance of the Fund may be lower or higher than the performance quoted. Performance data current to the most recent month-end may be obtained by calling 800-387-6977 or visiting www.aberdeen-asset.us.
Total returns assume the reinvestment of all distributions. Investment performance reflects fee waivers and, in the absence of such waivers, returns would have been lower. Indexes are unmanaged and have been provided for comparison purposes only. No fees or expenses are reflected. You cannot invest directly in an index.
Lipper is a leading global provider of mutual fund information and analysis to fund companies, financial intermediaries and media organizations.
Risk Considerations
Investing in mutual funds involves risk, including the possible loss of principal. There is no assurance that the investment objective of any fund will be achieved.
Fixed income securities are subject to certain risks including, but not limited to: interest rate (changes in interest rates may cause a decline in the market value of an investment), credit (changes in the financial condition of the issuer, borrower, counterparty, or underlying collateral), prepayment (debt issuers may repay or refinance their loans or obligations earlier than anticipated), and extension (principal repayments may not occur as quickly as anticipated, causing the expected maturity of a security to increase). Additionally, high yield securities may face additional risks, including economic growth; inflation; liquidity; supply; and externally generated shocks.
Derivatives are speculative and may hurt the Fund’s performance. They present the risk of disproportionately increased losses and/or reduced gains when the financial asset or measure to which the derivative is linked changes in unexpected ways.
Foreign securities are more volatile, harder to price and less liquid than U.S. securities; and are subject to different accounting and regulatory standards, and political and economic risks. These risks are enhanced in emerging markets countries.
Please read the prospectus for more detailed information regarding these and other risks.
Standard & Poor’s credit ratings express the agency’s opinion about the ability and willingness of an issuer, such as a corporation or state or city government, to meet its financial obligations in full and on time. Typically, ratings are expressed as letter grades that range, for example, from “AAA” to “D” to communicate the agency’s opinion of relative level of credit risk.
| 3 | | Duration is an estimate of bond price sensitivity to changes in interest rates. The higher the duration, the greater the change (i.e., high risk) in relation to interest-rate movements. |
| 4 | | A market cycle comprises the longer-term price movements in a broader market index, including one complete upturn and one complete downturn. |
2013 Annual Report
35
Aberdeen Global High Income Fund (Unaudited)
| | | | | | | | | | | | |
Average Annual Total Return (For periods ended October 31, 2013) | | 1 Yr. | | | 5 Yr. | | | 10 Yr. | |
Class A | | | 10.20% | | | | 15.52% | | | | 8.70% | |
Class I | | | 10.53% | | | | 15.80% | | | | 8.98% | |
Annual Report 2013
36
Aberdeen Global High Income Fund (Unaudited)
Performance of a $10,000 Investment (as of October 31, 2013)
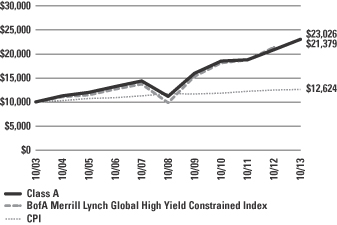
Comparative performance of $10,000 invested in Class A shares of the Aberdeen Global High Income Fund, BofA Merrill Lynch Global High Yield Constrained Index and the Consumer Price Index (CPI) over a 10-year period ended October 31, 2013. Unlike the Fund, the returns for these unmanaged indexes do not reflect any fees or expenses. Investors cannot invest directly in market indexes.
The BofA Merrill Lynch Global High Yield Constrained Index tracks the performance of below investment grade bonds of corporate issuers domiciled in countries having an investment grade foreign currency long term debt rating (based on a composite of Moody’s and S&P). The index is weighted by outstanding issuance, but constrained such that the percentage that any one issuer may not represent more than 2% of the index.
The CPI represents changes in prices of a basket of goods and services purchased for consumption by urban households.
Investment return and principal value will fluctuate, and when redeemed, shares may be worth more or less than original cost. Past performance is no guarantee of future results and does not reflect the deduction of taxes that a shareholder would pay on fund distributions or the redemption of fund shares. Investing in mutual funds involves market risk, including loss of principal. Performance returns assume the reinvestment of all distributions.
Portfolio Summary (as a percentage of net assets)
October 31, 2013 (Unaudited)
| | | | |
| Asset Allocation | | | |
Corporate Bonds | | | 73.9% | |
Term Loans | | | 9.6% | |
Repurchase Agreement | | | 8.5% | |
Government Bonds | | | 2.5% | |
Common Stocks | | | 1.7% | |
Preferred Stocks | | | 1.6% | |
Warrants | | | 0.4% | |
Other assets in excess of liabilities | | | 1.8% | |
| | | | 100.0% | |
The following chart summarizes the composition of the Fund’s portfolio, expressed as a percentage of net assets. The industries listed below may include more than one industry group. As of October 31, 2013, the Fund did not have more than 25% of its assets invested in any industry group.
| | | | |
| Top Industries | | | |
Oil, Gas & Consumable Fuels | | | 8.5% | |
Diversified Telecommunication Services | | | 7.7% | |
Commercial Services & Supplies | | | 5.4% | |
Diversified Financial Services | | | 4.2% | |
Media | | | 4.4% | |
Commercial Banks | | | 4.2% | |
Software | | | 3.7% | |
Metals & Mining | | | 3.2% | |
Transportation | | | 2.8% | |
Retail | | | 2.4% | |
Other | | | 53.5% | |
| | | | 100.0% | |
| | | | |
| Top Holdings* | | | |
Deep Ocean | | | 1.3% | |
Postmedia Network, Inc. 08/16/2017 | | | 1.3% | |
Palace Entertainment Holdings LLC / Palace Entertainment Holdings Corp. 04/15/2017 | | | 1.2% | |
Mexico Fixed Rate Bonds, Series M10 12/17/2015 | | | 1.2% | |
Infor US, Inc. 04/01/2019 | | | 1.1% | |
Midstates Petroleum Co., Inc. / Midstates Petroleum Co. LLC 06/01/2021 | | | 1.1% | |
Laureate Education, Inc. 09/01/2019 | | | 1.1% | |
WPX Energy, Inc. 01/15/2022 | | | 1.1% | |
Global Brass & Copper, Inc. 06/01/2019 | | | 1.1% | |
Marquette Transportation Co LLC / Marquette Transportation Finance Corp. 01/15/2017 | | | 1.1% | |
Other | | | 88.4% | |
| | | | 100.0% | |
| | | | |
| Top Countries | | | |
United States | | | 67.8% | |
Canada | | | 4.8% | |
United Kingdom | | | 4.7% | |
Luxembourg | | | 2.3% | |
Mexico | | | 1.9% | |
Australia | | | 1.6% | |
Brazil | | | 1.3% | |
Republic of Ireland | | | 1.3% | |
Norway | | | 1.3% | |
Russia | | | 1.2% | |
Other | | | 11.8% | |
| | | | 100.0% | |
| * | | For the purpose of listing top holdings, repurchase agreements included as part of Other. |
2013 Annual Report
37
Statement of Investments
October 31, 2013
Aberdeen Global High Income Fund
| | | | | | | | |
| | | Shares or
Principal
Amount | | | Value | |
CORPORATE BONDS (73.9%) | | | | | | | | |
AUSTRALIA (1.6%) | | | | | | | | |
FMG Resources August 2006 Pty Ltd. (USD), 8.25%, 11/01/2019 (a) | | $ | 17,795,000 | | | $ | 19,841,425 | |
(USD), 6.88%, 04/01/2022 (a) | | | 8,610,000 | | | | 9,191,175 | |
Paladin Energy Ltd. (USD),
6.00%, 04/30/2017 (a) | | | 16,580,000 | | | | 11,730,350 | |
| | | | | | | | 40,762,950 | |
BRAZIL (0.4%) | | | | | | | | |
Tonon Bioenergia SA (USD),
9.25%, 01/24/2020 (a) | | | 11,375,000 | | | | 10,493,438 | |
CANADA (4.8%) | | | | | | | | |
Air Canada | | | | | | | | |
(CAD), 7.63%, 10/01/2019 (a) | | | 12,530,000 | | | | 12,317,892 | |
(USD), 8.75%, 04/01/2020 (a) | | | 2,080,000 | | | | 2,129,234 | |
Bombardier, Inc. | | | | | | | | |
(USD), 6.13%, 01/15/2023 (a) | | | 8,080,000 | | | | 8,221,400 | |
(USD), 7.45%, 05/01/2034 (a) | | | 4,170,000 | | | | 4,149,150 | |
First Quantum Minerals Ltd. (USD),
7.25%, 10/15/2019 (a) | | | 12,320,000 | | | | 11,611,600 | |
FQM Akubra, Inc. (USD),
7.50%, 06/01/2021 (a) | | | 2,240,000 | | | | 2,385,600 | |
Garda World Security Corp. | | | | | | | | |
(USD), 9.75%, 03/15/2017 (a) | | | 15,910,000 | | | | 17,220,984 | |
(CAD), 9.75%, 03/15/2017 | | | 1,175,000 | | | | 1,219,908 | |
Nortel Networks Ltd. (USD),
0.00%, 07/15/2011 (b) | | | 8,535,000 | | | | 9,025,763 | |
Postmedia Network, Inc. (CAD),
8.25%, 08/16/2017 (a) | | | 32,788,900 | | | | 32,076,610 | |
Trinidad Drilling Ltd. (USD),
7.88%, 01/15/2019 (a) | | | 21,575,000 | | | | 23,193,125 | |
| | | | | | | | 123,551,266 | |
CAYMAN ISLANDS (0.3%) | | | | | | | | |
Cementos Progreso Trust (USD),
7.13%, 11/06/2023 (a) | | | 7,385,000 | | | | 7,442,695 | |
CHINA (0.9%) | | | | | | | | |
MIE Holdings Corp. (USD),
9.75%, 05/12/2016 (a) | | | 15,290,000 | | | | 16,207,400 | |
Residential Reinsurance 2013 Ltd. (USD), 8.04%, 06/06/2019 (a)(c) | | | 5,380,000 | | | | 5,594,124 | |
| | | | | | | | 21,801,524 | |
CZECH REPUBLIC (1.0%) | | | | | | | | |
CET 21 spol sro (EUR),
9.00%, 11/01/2017 (a) | | | 17,545,000 | | | | 24,476,808 | |
FRANCE (0.9%) | | | | | | | | |
Labco SAS (EUR), 8.50%, 01/15/2018 (a) | | | 15,999,000 | | | | 23,244,953 | |
GERMANY (1.0%) | | | | | | | | |
Commerzbank AG (USD),
8.13%, 09/19/2023 (a) | | | 9,665,000 | | | | 10,365,713 | |
KP Germany Erste GmbH (EUR),
11.63%, 07/15/2017 (a) | | | 8,125,000 | | | | 12,882,283 | |
Unitymedia Hessen GmbH & Co. KG / Unitymedia NRW GmbH (EUR),
5.13%, 01/21/2023 (a) | | | 770,000 | | | | 1,030,736 | |
| | | | | | | | 24,278,732 | |
INDONESIA (0.7%) | | | | | | | | |
Gajah Tunggal Tbk PT (USD),
7.75%, 02/06/2018 (a) | | | 18,005,000 | | | | 17,959,987 | |
ITALY (0.2%) | | | | | | | | |
Wind Acquisition Finance SA (USD),
7.25%, 02/15/2018 (a) | | | 4,810,000 | | | | 5,086,575 | |
JERSEY (1.0%) | | | | | | | | |
Galaxy Bidco Ltd. | | | | | | | | |
(GBP), 5.52%, 11/15/2019 (a)(c) | | | 2,025,000 | | | | 3,246,883 | |
(GBP), 6.38%, 11/15/2020 (a) | | | 1,410,000 | | | | 2,266,445 | |
Galaxy Finco Ltd. (GBP),
7.88%, 11/15/2021 (a) | | | 1,600,000 | | | | 2,571,852 | |
Hastings Insurance Group Finance PLC | | | | | | | | |
(GBP), 6.58%, 10/21/2019 (a)(c) | | | 3,680,000 | | | | 5,900,509 | |
(GBP), 8.00%, 10/21/2020 (a) | | | 4,375,000 | | | | 7,225,318 | |
HBOS Euro Finance Jersey LP (EUR), EMTN, 3.10%, 12/29/2049 (c) | | | 3,530,000 | | | | 4,107,477 | |
| | | | | | | | 25,318,484 | |
LUXEMBOURG (2.3%) | | | | | | | | |
Exopack Holdings SA (USD),
7.88%, 11/01/2019 (a) | | | 1,525,000 | | | | 1,528,813 | |
Far East Capital Ltd. SA (USD),
8.00%, 05/02/2018 | | | 2,335,000 | | | | 2,119,012 | |
INEOS Group Holdings SA | | | | | | | | |
(USD), 6.13%, 08/15/2018 (a) | | | 1,935,000 | | | | 1,959,187 | |
(EUR), 6.50%, 08/15/2018 (a) | | | 13,715,000 | | | | 18,684,286 | |
Magnolia BC SA (EUR),
9.00%, 08/01/2020 (a) | | | 9,405,000 | | | | 13,290,633 | |
Mobile Challenger Intermediate Group SA | | | | | | | | |
(CHF), 8.75%, 03/15/2019 (a) | | | 5,450,000 | | | | 6,126,632 | |
(EUR), 8.75%, 03/15/2019 (a) | | | 4,390,000 | | | | 6,079,730 | |
Xella Holdco Finance SA (EUR),
9.13%, 09/15/2018 (a) | | | 5,375,000 | | | | 7,662,798 | |
| | | | | | | | 57,451,091 | |
MARSHALL ISLAND (0.2%) | | | | | | | | |
Navios Maritime Acquisition Corp. / Navios Acquisition Finance US, Inc. (USD),
8.13%, 11/15/2021 (a) | | | 6,240,000 | | | | 6,333,600 | |
MEXICO (0.7%) | | | | | | | | |
Satelites Mexicanos SA de CV (USD),
9.50%, 05/15/2017 | | | 15,209,000 | | | | 16,615,832 | |
NETHERLANDS (0.6%) | | | | | | | | |
DTEK Finance BV (USD),
9.50%, 04/28/2015 (a) | | | 2,123,000 | | | | 2,136,800 | |
Metinvest BV (USD),
8.75%, 02/14/2018 (a) | | | 15,315,000 | | | | 13,898,362 | |
| | | | | | | | 16,035,162 | |
See accompanying notes to financial statements.
Annual Report 2013
38
Statement of Investments (continued)
October 31, 2013
Aberdeen Global High Income Fund
| | | | | | | | |
| | | Shares or
Principal
Amount | | | Value | |
PERU (0.5%) | | | | | | | | |
Corp. Lindley SA (USD), 4.63%, 04/12/2023 (a) | | $ | 13,810,000 | | | $ | 13,223,075 | |
REPUBLIC OF IRELAND (0.3%) | | | | | | | | |
Argon Capital PLC for Royal Bank of Scotland (GBP), MTN, 2.85%, 10/29/2049 (c) | | | 3,203,000 | | | | 3,330,103 | |
Nomos Bank Via Nomos Capital PLC (USD), 10.00%, 04/26/2019 | | | 3,855,000 | | | | 4,071,651 | |
| | | | | | | | 7,401,754 | |
RUSSIA (1.2%) | | | | | | | | |
Evraz Group SA (USD), 9.50%, 04/24/2018 (a) | | | 14,745,000 | | | | 16,256,362 | |
Far Eastern Shipping Co. (USD),
8.00%, 05/02/2018 (a) | | | 10,485,000 | | | | 9,515,138 | |
VTB Bank OJSC via VTB Eurasia Ltd. (USD), 9.50%, 12/29/2049 (a)(c) | | | 4,930,000 | | | | 5,404,759 | |
| | | | | | | | 31,176,259 | |
SWEDEN (1.0%) | | | | | | | | |
Verisure Holding AB | | | | | | | | |
(EUR), 8.75%, 09/01/2018 (a) | | | 2,079,000 | | | | 3,105,037 | |
(EUR), MTN, 8.75%, 09/01/2018 (a) | | | 1,650,000 | | | | 2,464,315 | |
(EUR), 8.75%, 12/01/2018 (a) | | | 2,070,000 | | | | 3,007,279 | |
(EUR), MTN, 8.75%, 12/01/2018 (a) | | | 10,855,000 | | | | 15,770,054 | |
| | | | | | | | 24,346,685 | |
SWITZERLAND (0.3%) | | | | | | | | |
Credit Suisse AG (USD), 6.50%, 08/08/2023 (a) | | | 3,315,000 | | | | 3,546,719 | |
Credit Suisse Group Guernsey I Ltd. (USD), 7.88%, 02/24/2041 (a)(c) | | | 4,315,000 | | | | 4,740,243 | |
| | | | | | | | 8,286,962 | |
UKRAINE (0.6%) | | | | | | | | |
Mriya Agro Holding PLC (USD),
9.45%, 04/19/2018 (a) | | | 18,125,000 | | | | 15,723,438 | |
UNITED KINGDOM (4.7%) | | | | | | | | |
Avanti Communications Group PLC (USD), 10.00%, 10/01/2019 (a) | | | 24,975,000 | | | | 26,223,750 | |
Barclays Bank PLC (GBP),
6.13%, 04/29/2049 (c) | | | 6,586,000 | | | | 10,266,947 | |
DTEK Finance PLC (USD),
7.88%, 04/04/2018 (a) | | | 7,030,000 | | | | 6,344,575 | |
INEOS Group Holdings SA (EUR),
7.88%, 02/15/2016 (a) | | | 2,250,014 | | | | 3,103,987 | |
Intelsat Jackson Holdings SA (USD),
7.25%, 04/01/2019 | | | 4,130,000 | | | | 4,470,725 | |
Lloyds Bank PLC | | | | | | | | |
(GBP), EMTN, 13.00%, 01/29/2049 (c) | | | 8,010,000 | | | | 19,874,895 | |
(EUR), 2.73%, 10/29/2049 (c) | | | 3,769,000 | | | | 5,015,010 | |
National Westminster Bank PLC (GBP), MTN, 5.98%, 01/29/2049 (c) | | | 2,815,000 | | | | 4,084,780 | |
Pearl Group Holdings No 1 Ltd. (GBP),
6.59%, 11/29/2049 (c) | | | 7,127,250 | | | | 10,227,905 | |
Royal Bank of Scotland Group PLC (EUR), 5.50%, 11/29/2049 | | | 4,353,000 | | | | 4,709,018 | |
Santander UK PLC (USD),
5.00%, 11/07/2023 | | | 1,600,000 | | | | 1,594,896 | |
Unique Pub Finance Co. PLC | | | | | | | | |
Series M (GBP), 7.40%, 03/28/2024 | | | 4,110,000 | | | | 6,408,747 | |
Series A4 (GBP), 5.66%, 06/30/2027 | | | 10,624,993 | | | | 16,652,793 | |
Virgin Media Secured Finance PLC (USD),
5.38%, 04/15/2021 (a) | | | 2,070,000 | | | | 2,090,700 | |
| | | | | | | | 121,068,728 | |
UNITED STATES (48.3%) | | | | | | | | |
AES Corp. (USD), 8.00%, 06/01/2020 | | | 20,670,000 | | | | 24,235,575 | |
Alpha Natural Resources, Inc. | | | | | | | | |
(USD), 6.00%, 06/01/2019 | | | 9,290,000 | | | | 8,035,850 | |
(USD), 6.25%, 06/01/2021 | | | 3,485,000 | | | | 2,970,963 | |
American Achievement Corp. (USD), 10.88%, 04/15/2016 (a) | | | 12,510,000 | | | | 13,135,500 | |
American International Group, Inc.,
Series A2 (GBP), 5.75%, 03/15/2067 (c) | | | 4,000,000 | | | | 6,304,566 | |
APX Group, Inc. | | | | | | | | |
(USD), 6.38%, 12/01/2019 | | | 6,265,000 | | | | 6,272,831 | |
(USD), 8.75%, 12/01/2020 | | | 9,375,000 | | | | 9,656,250 | |
Arch Coal, Inc. | | | | | | | | |
(USD), 7.00%, 06/15/2019 | | | 5,415,000 | | | | 4,250,775 | |
(USD), 7.25%, 06/15/2021 | | | 25,130,000 | | | | 19,350,100 | |
Blackboard, Inc. (USD), 7.75%, 11/15/2019 (a) | | | 7,460,000 | | | | 7,534,600 | |
Blue Danube Ltd. (USD),
10.80%, 04/10/2015 (a)(c) | | | 9,355,000 | | | | 10,026,689 | |
Cenveo Corp. (USD), 8.88%, 02/01/2018 | | | 7,665,000 | | | | 7,760,813 | |
Chaparral Energy, Inc. (USD),
7.63%, 11/15/2022 | | | 7,545,000 | | | | 8,186,325 | |
Chesapeake Energy Corp. | | | | | | | | |
(USD), 5.38%, 06/15/2021 | | | 4,150,000 | | | | 4,336,750 | |
(USD), 2.50%, 05/15/2037 | | | 1,370,000 | | | | 1,397,400 | |
Clayton Williams Energy, Inc. (USD),
7.75%, 04/01/2019 | | | 24,450,000 | | | | 25,122,375 | |
Clear Channel Worldwide Holdings, Inc. (USD), 6.50%, 11/15/2022 | | | 11,665,000 | | | | 12,275,075 | |
Clearwire Communications LLC | | | | | | | | |
(USD), 12.00%, 12/01/2015 (a) | | | 11,155,000 | | | | 11,584,467 | |
(USD), 14.75%, 12/01/2016 (a) | | | 710,000 | | | | 976,250 | |
Compass Re Ltd., Series CL3 (USD),
11.29%, 01/08/2015 (a)(c) | | | 7,245,000 | | | | 7,650,720 | |
DPH Holdings Corp. (USD),
6.55%, 06/15/2006 (b)(d)(f) | | | 1,500,000 | | | | 43,875 | |
Dresdner Funding Trust I (USD),
8.15%, 06/30/2031 (a) | | | 2,078,000 | | | | 2,114,365 | |
Drill Rigs Holdings, Inc. (USD),
6.50%, 10/01/2017 (a) | | | 15,595,000 | | | | 16,491,712 | |
El Paso LLC | | | | | | | | |
(USD), MTN, 8.05%, 10/15/2030 | | | 1,330,000 | | | | 1,390,953 | |
(USD), MTN, 7.80%, 08/01/2031 | | | 23,249,000 | | | | 24,117,234 | |
Energy Future Intermediate Holding Co. LLC / EFIH Finance, Inc. (USD),
10.00%, 12/01/2020 | | | 6,880,000 | | | | 7,258,400 | |
Epicor Software Corp. (USD),
8.63%, 05/01/2019 | | | 8,630,000 | | | | 9,406,700 | |
Everglades Re Ltd. (USD),
10.04%, 03/28/2018 (a)(c) | | | 2,452,000 | | | | 2,598,875 | |
First Data Corp. (USD), 8.25%, 01/15/2021 (a) | | | 23,345,000 | | | | 24,979,150 | |
Florida East Coast Holdings Corp. (USD),
10.50%, 08/01/2017 | | | 21,342,925 | | | | 22,303,357 | |
See accompanying notes to financial statements.
2013 Annual Report
39
Statement of Investments (continued)
October 31, 2013
Aberdeen Global High Income Fund
| | | | | | | | |
| | | Shares or
Principal
Amount | | | Value | |
Frontier Communications Corp. | | | | | | | | |
(USD), 8.75%, 04/15/2022 | | $ | 13,533,000 | | | $ | 15,529,117 | |
(USD), 7.63%, 04/15/2024 | | | 1,840,000 | | | | 1,950,400 | |
(USD), 9.00%, 08/15/2031 | | | 13,510,000 | | | | 14,050,400 | |
GenCorp, Inc. (USD), 7.13%, 03/15/2021 (a) | | | 13,115,000 | | | | 14,098,625 | |
General Motors (Escrow Shares) | | | | | | | | |
(USD), 7.13%, 07/15/2013 | | | 2,240,000 | | | | — | |
(USD), 8.25%, 07/15/2023 | | | 35,495,000 | | | | — | |
(USD), 8.10%, 06/15/2024 | | | 2,485,000 | | | | — | |
(USD), 7.38%, 05/23/2048 | | | 3,460,000 | | | | — | |
(USD), 8.80%, 03/01/2049 | | | 7,200,000 | | | | — | |
(USD), 8.38%, 07/15/2049 | | | 3,550,000 | | | | — | |
General Motors Co. (USD),
6.25%, 10/02/2043 (a) | | | 16,410,000 | | | | 17,148,450 | |
GenOn Americas Generation LLC | | | | | | | | |
(USD), 8.50%, 10/01/2021 | | | 295,000 | | | | 323,763 | |
(USD), 9.13%, 05/01/2031 | | | 20,327,650 | | | | 21,852,224 | |
Global Brass & Copper, Inc. (USD),
9.50%, 06/01/2019 | | | 23,975,000 | | | | 26,971,875 | |
Halcon Resources Corp. (USD),
8.88%, 05/15/2021 | | | 23,875,000 | | | | 24,979,219 | |
HCA Holdings, Inc. (USD), 7.75%, 05/15/2021 | | | 14,920,000 | | | | 16,374,700 | |
HCA, Inc. | | | | | | | | |
(USD), 7.19%, 11/15/2015 | | | 2,364,000 | | | | 2,600,400 | |
(USD), 7.50%, 02/15/2022 | | | 7,000,000 | | | | 7,883,750 | |
Hercules Offshore, Inc. | | | | | | | | |
(USD), 10.25%, 04/01/2019 (a) | | | 7,720,000 | | | | 8,762,200 | |
(USD), 8.75%, 07/15/2021 (a) | | | 7,870,000 | | | | 8,696,350 | |
(USD), 7.50%, 10/01/2021 (a) | | | 6,955,000 | | | | 7,302,750 | |
Immucor, Inc. (USD), 11.13%, 08/15/2019 | | | 9,385,000 | | | | 10,581,587 | |
IMS Health, Inc. (USD),
12.50%, 03/01/2018 (a) | | | 18,465,000 | | | | 22,065,675 | |
Infor US, Inc. (EUR), 10.00%, 04/01/2019 | | | 18,785,000 | | | | 28,565,959 | |
Jefferies Finance LLC / JFIN Co-Issuer Corp. (USD), 7.38%, 04/01/2020 (a) | | | 6,260,000 | | | | 6,463,450 | |
KB Home (USD), 1.38%, 02/01/2019 | | | 180,000 | | | | 178,875 | |
KCG Holdings, Inc. (USD),
8.25%, 06/15/2018 (a) | | | 6,790,000 | | | | 6,942,775 | |
Landry's Holdings II, Inc. (USD),
10.25%, 01/01/2018 (a) | | | 10,515,000 | | | | 11,172,187 | |
Landry's, Inc. (USD), 9.38%, 05/01/2020 (a) | | | 11,840,000 | | | | 12,876,000 | |
Laureate Education, Inc. (USD),
9.25%, 09/01/2019 (a) | | | 24,905,000 | | | | 27,520,025 | |
Level 3 Financing, Inc. | | | | | | | | |
(USD), 7.00%, 06/01/2020 | | | 23,730,000 | | | | 25,391,100 | |
(USD), 6.13%, 01/15/2021 | | | 1,425,000 | | | | 1,453,500 | |
Lynx I Corp. (GBP), 6.00%, 04/15/2021 (a) | | | 7,940,000 | | | | 13,208,402 | |
Marquette Transportation Co LLC / Marquette Transportation Finance Corp. (USD),
10.88%, 01/15/2017 | | | 25,125,000 | | | | 26,852,344 | |
McGraw-Hill Global Education Holdings LLC / McGraw-Hill Global Education Finance (USD), 9.75%, 04/01/2021 (a) | | | 6,900,000 | | | | 7,486,500 | |
Mellon Capital III (GBP), 6.37%, 09/05/2066 (c) | | | 7,650,000 | | | | 12,324,267 | |
MetroPCS Wireless, Inc. | | | | | | | | |
(USD), 6.63%, 11/15/2020 | | | 4,915,000 | | | | 5,216,044 | |
(USD), 6.25%, 04/01/2021 (a) | | | 7,110,000 | | | | 7,465,500 | |
Midstates Petroleum Co., Inc. / Midstates Petroleum Co. LLC (USD),
9.25%, 06/01/2021 | | | 27,360,000 | | | | 28,317,600 | |
Momentive Performance Materials, Inc. | | | | | | | | |
(USD), 8.88%, 10/15/2020 | | | 3,895,000 | | | | 4,138,438 | |
(EUR), 9.50%, 01/15/2021 | | | 15,585,000 | | | | 18,198,049 | |
Mythen Re Ltd., Series 2012-2, Class A (USD),
8.61%, 01/05/2017 (a)(c) | | | 5,875,000 | | | | 6,110,000 | |
Neiman Marcus Group, Inc. (USD),
8.00%, 10/15/2021 (a) | | | 2,400,000 | | | | 2,469,000 | |
Neiman Marcus Group, Inc. PIK (USD),
8.75%, 10/15/2021 (a) | | | 600,000 | | | | 619,500 | |
New Albertsons, Inc. | | | | | | | | |
(USD), 7.75%, 06/15/2026 | | | 9,462,000 | | | | 7,948,080 | |
Series C (USD), MTN, 6.63%, 06/01/2028 | | | 4,420,000 | | | | 3,315,000 | |
(USD), 7.45%, 08/01/2029 | | | 19,080,000 | | | | 15,645,600 | |
(USD), 8.70%, 05/01/2030 | | | 10,285,000 | | | | 8,999,375 | |
New Enterprise Stone & Lime Co Inc. (USD),
13.00%, 03/15/2018 | | | 11,221,028 | | | | 11,894,290 | |
Nortek, Inc. (USD), 8.50%, 04/15/2021 | | | 18,695,000 | | | | 20,587,869 | |
Palace Entertainment Holdings LLC / Palace Entertainment Holdings Corp. (USD),
8.88%, 04/15/2017 (a) | | | 31,575,000 | | | | 31,890,750 | |
PHH Corp. (USD), 6.38%, 08/15/2021 | | | 14,430,000 | | | | 14,357,850 | |
PNC Preferred Funding Trust I (USD),
1.90%, 03/15/2017 (a)(c) | | | 16,215,000 | | | | 13,985,437 | |
Residential Reinsurance 2011 Ltd. Series CL5 (USD), 8.79%, 12/06/2016 (a)(c) | | | 12,370,000 | | | | 13,279,195 | |
(USD), 8.94%, 06/06/2017 (a)(c) | | | 10,790,000 | | | | 11,265,839 | |
Reynolds Group Issuer, Inc. / Reynolds Group Issuer LLC / Reynolds Group Issuer Lu (USD), 9.00%, 04/15/2019 | | | 21,125,000 | | | | 22,709,375 | |
Samson Investment Co. (USD),
10.25%, 02/15/2020 (a) | | | 22,410,000 | | | | 24,314,850 | |
SandRidge Energy, Inc. | | | | | | | | |
(USD), 8.75%, 01/15/2020 | | | 5,573,000 | | | | 6,046,705 | |
(USD), 7.50%, 03/15/2021 | | | 6,675,000 | | | | 7,108,875 | |
(USD), 7.50%, 03/15/2021 (a) | | | 250 | | | | 266 | |
Spanish Broadcasting System, Inc. (USD), 12.50%, 04/15/2017 (a) | | | 13,595,000 | | | | 14,954,500 | |
SPL Logistics Escrow LLC / SPL Logistics Finance Corp. (USD), 8.88%, 08/01/2020 (a) | | | 15,060,000 | | | | 16,227,150 | |
Standard Pacific Corp. (USD),
8.38%, 01/15/2021 | | | 18,035,000 | | | | 20,785,337 | |
Successor X Ltd. | | | | | | | | |
(USD), 9.35%, 02/25/2014 (a)(c) | | | 14,115,000 | | | | 14,391,654 | |
(USD), 11.29%, 11/10/2015 (a)(c) | | | 6,845,000 | | | | 7,108,533 | |
SUPERVALU, Inc. (USD), 8.00%, 05/01/2016 | | | 13,125,000 | | | | 14,700,000 | |
T-Mobile USA, Inc. | | | | | | | | |
(USD), 6.46%, 04/28/2019 | | | 9,105,000 | | | | 9,674,062 | |
(USD), 6.73%, 04/28/2022 | | | 3,270,000 | | | | 3,466,200 | |
(USD), 6.84%, 04/28/2023 | | | 1,090,000 | | | | 1,156,763 | |
Tenet Healthcare Corp. (USD),
8.13%, 04/01/2022 (a) | | | 1,130,000 | | | | 1,240,175 | |
Townsquare Radio LLC / Townsquare Radio, Inc. (USD), 9.00%, 04/01/2019 (a) | | | 14,410,000 | | | | 15,490,750 | |
TransUnion Holding Co., Inc. (USD),
9.63%, 06/15/2018 | | | 8,285,000 | | | | 9,009,937 | |
See accompanying notes to financial statements.
Annual Report 2013
40
Statement of Investments (continued)
October 31, 2013
Aberdeen Global High Income Fund
| | | | | | | | |
| | | Shares or
Principal
Amount | | | Value | |
Verso Paper Holdings LLC / Verso Paper, Inc. (USD), 11.75%, 01/15/2019 | | $ | 17,850,000 | | | $ | 18,564,000 | |
Visteon Corp. (USD), 6.75%, 04/15/2019 | | | 16,542,000 | | | | 17,741,295 | |
Windstream Corp. (USD),
6.38%, 08/01/2023 | | | 13,080,000 | | | | 12,753,000 | |
WPX Energy, Inc. (USD),
6.00%, 01/15/2022 | | | 25,877,000 | | | | 27,300,235 | |
Wyle Services Corp. (USD),
10.50%, 04/01/2018 (a) | | | 18,350,000 | | | | 18,671,125 | |
YRC Worldwide, Inc. | | | | | | | | |
Series A (USD), 10.00%, 03/31/2015 (d) | | | 166,773 | | | | 136,754 | |
Series B (USD), 10.00%, 03/31/2015 (d) | | | 3,640,300 | | | | 3,633,423 | |
Zayo Group LLC / Zayo Capital, Inc. (USD), 10.13%, 07/01/2020 | | | 14,095,000 | | | | 16,350,200 | |
| | | | | | | | 1,232,613,944 | |
VIETNAM (0.4%) | | | | | | | | |
Vingroup JSC (USD),
11.63%, 05/07/2018 (a) | | | 10,730,000 | | | | 10,638,473 | |
Total Corporate Bonds | | | | | | | 1,885,332,415 | |
GOVERNMENT BONDS (2.5%) | | | | | | | | |
BRAZIL (0.9%) | | | | | | | | |
Brazil Notas do Tesouro Nacional
Serie F (BRL), 10.00%, 01/01/2023 | | | 56,735,000 | | | | 23,127,698 | |
MEXICO (1.2%) | | | | | | | | |
Mexico Fixed Rate Bonds, Series M10 (MXN), 8.00%, 12/17/2015 | | | 368,500,000 | | | | 30,540,995 | |
MOZAMBIQUE (0.4%) | | | | | | | | |
Mozambique EMATUM Finance 2020 BV (USD), 6.31%, 09/11/2020 (a) | | | 10,560,000 | | | | 10,005,600 | |
Total Government Bonds | | | | | | | 63,674,293 | |
TERM LOANS (9.6%) | | | | | | | | |
REPUBLIC OF IRELAND (1.0%) | | | | | | | | |
Eircom Finco S.A.R.L. (EUR),
4.23%, 12/11/2013 (c) | | | 18,104,148 | | | | 25,564,130 | |
UNITED STATES (8.6%) | | | | | | | | |
Cenevo Corp. (USD),
6.25%, 12/23/2013 (c) | | | 16,083,482 | | | | 16,314,682 | |
Commercial Barge Line Co. (USD),
7.50%, 03/31/2014 (c) | | | 24,263,075 | | | | 24,020,444 | |
Excelitas Technologies Corp. (USD), 1.00%, 09/30/2020 (c) | | | 8,360,379 | | | | 8,393,469 | |
Expera Specialty Solutions (USD),
7.50%, 12/31/2013 (c) | | | 10,019,887 | | | | 10,170,186 | |
Lonestar Intermediate Holdings LLC (USD), 11.00%, 12/31/2013 (c) | | | 16,570,000 | | | | 17,301,847 | |
McGraw-Hill Global Holdings (USD),
9.00%, 11/29/2013 (c) | | | 15,980,785 | | | | 16,275,438 | |
Navistar International, Inc. (USD),
5.75%, 11/01/2013 (c) | | | 4,446,907 | | | | 4,528,201 | |
Newpage Corp. (USD),
7.75%, 12/31/2013 (c) | | | 14,351,550 | | | | 14,614,657 | |
Pacific Industrial Services US Finco LLC (USD), 8.75%, 12/31/2013 (c) | | | 7,920,000 | | | | 8,043,750 | |
Philadelphia Energy (USD),
6.25%, 12/31/2013 (c) | | | 16,193,625 | | | | 14,290,874 | |
Pinnacle Operating Corp. (USD),
4.75%, 11/29/2013 (c) | | | 11,103,130 | | | | 11,195,653 | |
Texas Competitive Electric Co. (USD),
3.67%, 11/12/2013 (c) | | | 36,981,952 | | | | 24,878,055 | |
Van Wagner Communications LLC (USD), 6.25%, 12/31/2013 (c) | | | 16,346,905 | | | | 16,714,710 | |
Visant Holding Corp. (USD),
5.25%, 01/02/2014 (c) | | | 11,152,515 | | | | 10,951,246 | |
YRC Worldwide, Inc. | | | | | | | | |
(USD), 10.00%, 11/01/2013 (c) | | | 6,055,658 | | | | 6,016,496 | |
(USD), 11.25%, 01/01/2014 (c) | | | 16,671,262 | | | | 16,994,268 | |
| | | | | | | | 220,703,976 | |
Total Term Loans | | | | | | | 246,268,106 | |
COMMON STOCKS (1.7%) | | | | | | | | |
NORWAY (1.3%) | | | | | | | | |
Deep Ocean (e)(f) | | | 1,427,968 | | | | 32,749,750 | |
UNITED STATES (0.4%) | | | | | | | | |
General Motors Co.* | | | 236,410 | | | | 8,735,349 | |
Motors Liquidation Co. GUC Trust* | | | 59,350 | | | | 2,154,405 | |
| | | | | | | | 10,889,754 | |
Total Common Stocks | | | | | | | 43,639,504 | |
PREFERRED STOCKS (1.6%) | | | | | | | | |
UNITED STATES (1.6%) | | | | | | | | |
Ally Financial, Inc., Preferred Shares (a) | | | 22,432 | | | | 21,539,628 | |
General Motors Co. , Preferred Shares,
Series B | | | 204,000 | | | | 10,469,280 | |
GMAC Capital Trust I, Preferred Shares,
Series 2 (c) | | | 255,875 | | | | 6,872,803 | |
Merrill Lynch Capital Trust II, Preferred Shares (c) | | | 1,600 | | | | 39,712 | |
| | | | | | | | 38,921,423 | |
Total Preferred Stocks | | | | | | | 38,921,423 | |
WARRANTS (0.4%) | | | | | | | | |
UNITED STATES (0.4%) | | | | | | | | |
General Motors Co.* | | | 429,842 | | | | 10,182,957 | |
Total Warrants | | | | | | | 10,182,957 | |
See accompanying notes to financial statements.
2013 Annual Report
41
Statement of Investments (continued)
October 31, 2013
Aberdeen Global High Income Fund
| | | | | | | | |
| | | Shares or
Principal
Amount | | | Value | |
REPURCHASE AGREEMENT (8.5%) | | | | | | | | |
UNITED STATES (8.5%) | | | | | | | | |
State Street Bank,
0.00%, dated 10/31/2013,
due 11/01/2013, repurchase price $217,763,519 collateralized by United States Treasury and Government Agency securities, maturing ranging 09/10/2015-11/15/2015; total market value of $222,119,946 | | $ | 217,763,519 | | | $ | 217,763,519 | |
Total Repurchase Agreement | | | | | | | 217,763,519 | |
Total Investments
(Cost $2,413,124,665) (g)—98.2% | | | | | | | 2,505,782,217 | |
| | |
Other assets in excess of liabilities—1.8% | | | | | | | 47,011,282 | |
Net Assets—100.0% | | | | | | $ | 2,552,793,499 | |
| * | | Non-income producing security. |
| (a) | | Denotes a security issued under Regulation S or Rule 144A. |
| (b) | | Security is in default. |
| (c) | | Variable or Floating Rate Security. Rate disclosed is as of October 31, 2013. |
| (d) | | The Fund’s adviser has deemed this security to be illiquid based upon procedures approved by the Board of Trustees. Illiquid securities held by the Fund represent 0.15% of net assets as of October 31, 2013. (unaudited) |
| (e) | | Investment in affiliate. |
| (f) | | Fair Valued Security. Fair Values are determined pursuant to procedures approved by the Board of Trustees. See Note 2(a) of the accompanying notes to financial statements. |
| (g) | | See notes to financial statements for tax unrealized appreciation/depreciation of securities. |
| EMTN | | Euro Medium Term Note |
| GBP | | British Pound Sterling |
At October 31, 2013, the Fund's open forward foreign currency exchange contracts were as follows:
| | | | | | | | | | | | | | | | | | | | | | | | | | | | |
| Purchase Contracts Settlement Date* | | Counterparty | | | Amount
Purchased | | | Amount
Sold | | | Fair Value | | | Unrealized
Depreciation | |
| Canadian Dollar/United States Dollar | | | | | | | | | | | | | | | | | | | | | | | | | | | | |
| 12/05/2013 | | | JPMorgan Chase Bank N.A | | | | CAD | | | | 12,313,500 | | | | USD | | | | 12,018,917 | | | $ | 11,799,758 | | | $ | (219,159 | ) |
| | | | | | | | | | | | | | | | | | | | | | | | | | |
| Sale Contracts Settlement Date | | Counterparty | | Amount
Purchased | | | Amount
Sold | | | Fair Value | | | Unrealized
Appreciation/
(Depreciation) | |
| United States Dollar/Brazilian Real | | | | | | | | | | | | | | | | | | | | | | | | | | |
01/22/2014 | | JPMorgan Chase Bank N.A | | | USD | | | | 24,229,549 | | | | BRL | | | | 53,462,500 | | | $ | 23,436,909 | | | $ | 792,640 | |
| | | | | | | |
| United States Dollar/British Pound | | | | | | | | | | | | | | | | | | | | | | | | | | |
11/25/2013 | | Westpac Banking Corporation | | | USD | | | | 121,197,335 | | | | GBP | | | | 77,141,000 | | | | 123,668,377 | | | | (2,471,042 | ) |
| | | | | | | |
| United States Dollar/Canadian Dollar | | | | | | | | | | | | | | | | | | | | | | | | | | |
12/05/2013 | | JPMorgan Chase Bank N.A | | | USD | | | | 34,900,299 | | | | CAD | | | | 36,559,000 | | | | 35,033,690 | | | | (133,391 | ) |
| | | | | | | |
| United States Dollar/Euro | | | | | | | | | | | | | | | | | | | | | | | | | | |
11/13/2013 | | JPMorgan Chase Bank N.A | | | USD | | | | 78,848,005 | | | | EUR | | | | 59,057,000 | | | | 80,186,194 | | | | (1,338,189 | ) |
01/24/2014 | | JPMorgan Chase Bank N.A | | | USD | | | | 9,266,495 | | | | EUR | | | | 6,722,500 | | | | 9,128,568 | | | | 137,927 | |
01/29/2014 | | Deutsche Bank AG London | | | USD | | | | 103,375,482 | | | | EUR | | | | 74,900,000 | | | | 101,708,568 | | | | 1,666,914 | |
| | | | | | | |
| United States Dollar/Norwegian Krone | | | | | | | | | | | | | | | | | | | | | | | | | | |
| 11/13/2013 | | JPMorgan Chase Bank N.A | | | USD | | | | 29,316,742 | | | | NOK | | | | 172,101,000 | | | | 28,900,223 | | | | 416,519 | |
| | | | | | | | | | | | | | | | | | | | | $ | 402,062,529 | | | $ | (928,622 | ) |
| * | | Certain contracts with different trade dates and like characteristics have been shown net. |
See accompanying notes to financial statements.
Annual Report 2013
42
Statement of Investments (concluded)
October 31, 2013
Aberdeen Global High Income Fund
At October 31, 2013, the Fund held the following credit default swaps:
Sell Protection:
| | | | | | | | | | | | | | | | | | |
| Counterparty | | Expiration
Date | | | Notional
Amount | | | Swap Details | | Unrealized
Appreciation/
(Depreciation) | | | Implied
Credit
Spread* | |
| UBS AG | | | 12/20/2016 | | | | 4,320,000 | | | Pay: Grohe Holding Gmbh(T)
Receive: Fixed rate equal to 5.00% | | $ | 860,713 | | | | 0.38% | |
| Deutsche Bank | | | 12/20/2016 | | | | 4,320,000 | | | Pay: Grohe Holding Gmbh(T)
Receive: Fixed rate equal to 5.00% | | | 1,523,297 | | | | 0.38% | |
| Goldman Sachs International | | | 12/20/2017 | | | | 8,440,000 | | | Pay: Chesapeake Energy(T)
Receive: Fixed rate equal to 5.00% | | | 1,188,975 | | | | 1.49% | |
| Goldman Sachs International | | | 12/20/2017 | | | | 9,935,000 | | | Pay: Chesapeake Energy(T)
Receive: Fixed rate equal to 5.00% | | | 2,070,194 | | | | 1.49% | |
| Goldman Sachs International | | | 12/20/2017 | | | | 9,940,000 | | | Pay: Chesapeake Energy(T)
Receive: Fixed rate equal to 5.00% | | | 2,071,235 | | | | 1.49% | |
| Deutsche Bank | | | 03/20/2018 | | | | 3,460,000 | | | Pay: Rite Aid(T)
Receive: Fixed rate equal to 5.00% | | | 556,466 | | | | 1.99% | |
| Goldman Sachs International | | | 03/20/2018 | | | | 5,000,000 | | | Pay: Rite Aid(T)
Receive: Fixed rate equal to 5.00% | | | 804,142 | | | | 1.99% | |
| Goldman Sachs International | | | 03/20/2018 | | | | 5,000,000 | | | Pay: Rite Aid(T)
Receive: Fixed rate equal to 5.00% | | | 816,642 | | | | 1.99% | |
| Morgan Stanley | | | 06/20/2018 | | | | 4,500,000 | | | Pay: New Albertsons(T)
Receive: Fixed rate equal to 5.00% | | | 92,930 | | | | 7.00% | |
| Morgan Stanley | | | 06/20/2018 | | | | 4,515,000 | | | Pay: New Albertsons(T)
Receive: Fixed rate equal to 5.00% | | $ | 104,527 | | | | 7.00% | |
| | | | | | | | | | | | | $ | 10,089,121 | | | | | |
Centrally cleared interest rate swap agreements
| | | | | | | | | | | | | | | | | | |
| Pay/Receive Floating Rate | | Floating Rate Index | | Fixed
Rate | | | Maturity Date | | | Notional Amount | | | Unrealized
Appreciation/
(Depreciation) | |
| Pay | | Markit CDX North America High Yield (S20) | | | 5.00% | | | | 6/20/2018 | | | | USD50,600,000 | | | $ | 1,130,974 | |
| * | | Implied credit spreads, represented in absolute terms, are utilized in determining the market value of credit default swaps agreements on corporate issues or sovereign issues and serve as an indicator of the current status of the payment/performance risk and represent the likelihood or risk of default for the credit derivative. The implied credit spread of particular referenced entity reflects the cost of buying/selling protection and may include upfront payments required to be made prior to entering into the agreement. For credit default with asset-backed securities or credit indices as the underlying assets, the quoted market prices and resulting market values serve as an indicator of the current status of the payment/performance risk. Wider credit spreads and increasing market values, in absolute terms when compared to the notional amount of the swap, represent a deterioration of the reference entity's credit soundness and a greater likelihood or risk of default or other credit event occurring as defined under the terms of the agreement. |
See accompanying notes to financial statements.
2013 Annual Report
43
Statements of Assets and Liabilities
October 31, 2013
| | | | | | | | | | | | | | | | | | | | |
| | | Aberdeen
Global Select
Opportunities Fund | | | Aberdeen
Select International
Equity Fund | | | Aberdeen
Select International
Equity Fund II | | | Aberdeen
Total Return
Bond Fund | | | Aberdeen
Global High
Income Fund | |
Assets: | | | | | | | | | | | | | | | | | | | | |
Investments in securities, at fair value | | $ | 8,141,950 | | | $ | 659,383,843 | | | $ | 320,832,445 | | | $ | 1,648,278,729 | | | $ | 2,255,268,948 | |
Affiliated securities, at fair value | | | – | | | | 2,371,471 | | | | – | | | | – | | | | 32,749,750 | |
Repurchase agreements | | | 171,625 | | | | 1,007,688 | | | | – | | | | 78,162,894 | | | | 217,763,519 | |
| | | | | | | | | | | | | | | | | | | | |
Total investments | | | 8,313,575 | | | | 662,763,002 | | | | 320,832,445 | | | | 1,726,441,623 | | | | 2,505,782,217 | |
| | | | | | | | | | | | | | | | | | | | |
Foreign currency, at fair value | | | 829 | | | | 690,525 | | | | 2,301,296 | | | | 982,255 | | | | 13,074,303 | |
Cash | | | – | | | | – | | | | – | | | | 63,084 | | | | 10,130,000 | |
Cash on deposit for broker (Note 2) | | | – | | | | – | | | | – | | | | – | | | | 3,091,828 | |
Receivable for investments sold | | | – | | | | – | | | | – | | | | 80,855,493 | | | | 26,536,509 | |
Interest and dividends receivable | | | 20,165 | | | | 4,073,504 | | | | 3,762,673 | | | | 11,963,907 | | | | 40,112,633 | |
Receivable for capital shares issued | | | 7,500 | | | | 57,193 | | | | 84,505 | | | | 2,719,095 | | | | 5,656,775 | |
Unrealized appreciation on forward foreign currency exchange contracts | | | – | | | | – | | | | – | | | | 4,156,290 | | | | 3,014,000 | |
Variation margin receivable for centrally cleared swaps | | | – | | | | – | | | | – | | | | – | | | | 17,947 | |
Open swap contracts, at value | | | – | | | | – | | | | – | | | | – | | | | 7,546,281 | |
Prepaid expenses | | | 249 | | | | 18,095 | | | | 13,608 | | | | 30,419 | | | | 45,067 | |
| | | | | | | | | | | | | | | | | | | | |
Total assets | | | 8,342,318 | | | | 667,602,319 | | | | 326,994,527 | | | | 1,827,212,166 | | | | 2,615,007,560 | |
| | | | | | | | | | | | | | | | | | | | |
Liabilities: | | | | | | | | | | | | | | | | | | | | |
Payable for investments purchased | | | – | | | | – | | | | – | | | | 219,114,056 | | | | 45,254,188 | |
Collateral from broker | | | – | | | | – | | | | – | | | | – | | | | 7,620,000 | |
Unrealized depreciation on forward foreign currency exchange contracts | | | – | | | | – | | | | – | | | | 2,344,284 | | | | 4,161,781 | |
Payable for capital shares redeemed | | | 2,682 | | | | 811,126 | | | | 477,381 | | | | 1,864,006 | | | | 1,562,371 | |
Unfunded loan commitments (Note 2) | | | – | | | | – | | | | – | | | | – | | | | 922,805 | |
Open swap contracts, at value | | | – | | | | – | | | | – | | | | – | | | | 512,494 | |
Accrued expenses and other payables: | | | | | | | | | | | | | | | | | | | | |
Investment advisory fees | | | 15,373 | | | | 509,298 | | | | 251,339 | | | | 486,102 | | | | 1,554,853 | |
Distribution fees | | | 2,376 | | | | 140,068 | | | | 51,786 | | | | 45,944 | | | | 278,484 | |
Transfer agent fees | | | 1,343 | | | | 19,985 | | | | 54,908 | | | | 16,211 | | | | 94,004 | |
Custodian fees | | | 4,079 | | | | 27,316 | | | | 15,579 | | | | 31,886 | | | | 39,989 | |
Legal fees | | | 76 | | | | 6,343 | | | | 3,167 | | | | 15,402 | | | | 22,577 | |
Other | | | 38,164 | | | | 273,191 | | | | 235,999 | | | | 148,542 | | | | 190,515 | |
| | | | | | | | | | | | | | | | | | | | |
Total liabilities | | | 64,093 | | | | 1,787,327 | | | | 1,090,159 | | | | 224,066,433 | | | | 62,214,061 | |
| | | | | | | | | | | | | | | | | | | | |
Net Assets | | $ | 8,278,225 | | | $ | 665,814,992 | | | $ | 325,904,368 | | | $ | 1,603,145,733 | | | $ | 2,552,793,499 | |
| | | | | | | | | | | | | | | | | | | | |
Cost: | | | | | | | | | | | | | | | | | | | | |
Investments in securities, at cost | | $ | 7,884,823 | | | $ | 680,539,562 | | | $ | 308,013,257 | | | $ | 1,650,481,067 | | | $ | 2,165,278,021 | |
Affiliated securities, at cost | | | – | | | | 43,393,010 | | | | – | | | | – | | | | 30,083,125 | |
Repurchase agreements | | | 171,625 | | | | 1,007,688 | | | | – | | | | 78,162,894 | | | | 217,763,519 | |
Up-front payments made on open swaps | | | – | | | | – | | | | – | | | | – | | | | 3,058,922 | |
Up-front payments received on open swaps | | | – | | | | – | | | | – | | | | – | | | | (3,095,251 | ) |
Foreign currency | | | 833 | | | | 1,590,069 | | | | 2,290,216 | | | | 1,000,456 | | | | 13,129,312 | |
| | | | | |
Net Assets Consist of: | | | | | | | | | | | | | | | | | | | | |
Par value | | $ | 206 | | | $ | 23,162 | | | $ | 26,733 | | | $ | 121,970 | | | $ | 247,957 | |
Paid in capital in excess of par value | | | 35,852,440 | | | | 2,975,951,513 | | | | 3,033,319,629 | | | | 1,605,948,015 | | | | 2,423,998,542 | |
Accumulated net investment income/(loss) | | | 107,020 | | | | 12,327,507 | | | | (25,913 | ) | | | (194,575 | ) | | | (1,223,044 | ) |
Accumulated net realized gain/(loss) from investments and foreign currency transactions | | | (27,938,580 | ) | | | (2,259,428,068 | ) | | | (2,720,264,819 | ) | | | (2,317,502 | ) | | | 27,852,884 | |
Net unrealized appreciation/(depreciation) on investments and translation of assets and liabilities denominated in foreign currencies | | | 257,139 | | | | (63,059,122 | ) | | | 12,848,738 | | | | (412,175 | ) | | | 101,917,160 | |
| | | | | | | | | | | | | | | | | | | | |
Net Assets | | $ | 8,278,225 | | | $ | 665,814,992 | | | $ | 325,904,368 | | | $ | 1,603,145,733 | | | $ | 2,552,793,499 | |
| | | | | | | | | | | | | | | | | | | | |
Net Assets | | | | | | | | | | | | | | | | | | | | |
Class A Shares | | $ | 6,538,098 | | | $ | 554,922,297 | | | $ | 168,028,444 | | | $ | 153,370,104 | | | $ | 999,250,251 | |
Class I Shares | | | 1,740,127 | | | | 110,892,695 | | | | 157,875,924 | | | | 1,449,775,629 | | | | 1,553,543,248 | |
| | | | | | | | | | | | | | | | | | | | |
Total | | $ | 8,278,225 | | | $ | 665,814,992 | | | $ | 325,904,368 | | | $ | 1,603,145,733 | | | $ | 2,552,793,499 | |
| | | | | | | | | | | | | | | | | | | | |
Shares Outstanding (Note 8) | | | | | | | | | | | | | | | | | | | | |
Class A Shares | | | 163,385 | | | | 19,381,272 | | | | 13,790,679 | | | | 11,533,981 | | | | 94,147,629 | |
Class I Shares | | | 43,085 | | | | 3,780,552 | | | | 12,942,688 | | | | 110,436,054 | | | | 153,809,485 | |
| | | | | | | | | | | | | | | | | | | | |
Total | | | 206,470 | | | | 23,161,824 | | | | 26,733,367 | | | | 121,970,035 | | | | 247,957,114 | |
| | | | | | | | | | | | | | | | | | | | |
Net asset value and redemption price per share | | | | | | | | | | | | | | | | | | | | |
Class A Shares | | $ | 40.02 | | | $ | 28.63 | | | $ | 12.18 | | | $ | 13.30 | | | $ | 10.61 | |
Class I Shares | | $ | 40.39 | | | $ | 29.33 | | | $ | 12.20 | | | $ | 13.13 | | | $ | 10.10 | |
Amounts listed as "–" are $0 or round to $0.
See accompanying notes to financial statements.
Annual Report 2013
44
Statements of Operations
For the Year Ended October 31, 2013
| | | | | | | | | | | | | | | | | | | | |
| | | Aberdeen
Global Select
Opportunities Fund | | | Aberdeen
Select International
Equity Fund | | | Aberdeen
Select International
Equity Fund II | | | Aberdeen
Total Return
Bond Fund | | | Aberdeen
Global High
Income Fund | |
INVESTMENT INCOME: | | | | | | | | | | | | | | | | | | | | |
Dividend income | | $ | 276,320 | | | $ | 24,354,839 | | | $ | 13,746,881 | | | $ | – | | | $ | 2,867,228 | |
Interest income | | | 38 | | | | 1,404,913 | | | | 2,435 | | | | 56,427,407 | | | | 208,818,881 | |
Income from securities lending (Note 2) | | | 431 | | | | 193,817 | | | | 90,874 | | | | – | | | | – | |
Foreign tax withholding | | | (14,697 | ) | | | (2,016,503 | ) | | | (1,064,387 | ) | | | – | | | | – | |
Other income | | | – | | | | 219,513 | | | | 52,795 | | | | 35,605 | | | | – | |
| | | | | | | | | | | | | | | | | | | | |
| | | 262,092 | | | | 24,156,579 | | | | 12,828,598 | | | | 56,463,012 | | | | 211,686,109 | |
| | | | | | | | | | | | | | | | | | | | |
EXPENSES: | | | | | | | | | | | | | | | | | | | | |
Investment advisory fees | | | 111,802 | | | | 8,659,936 | | | | 5,285,321 | | | | 6,620,154 | | | | 17,564,398 | |
Distribution fees Class A | | | 13,841 | | | | 1,482,330 | | | | 440,653 | | | | 490,771 | | | | 2,356,400 | |
Custodian fees | | | 41,443 | | | | 281,843 | | | | 52,791 | | | | 348,784 | | | | 471,092 | |
Printing fees | | | 23,569 | | | | 227,266 | | | | 114,060 | | | | 271,842 | | | | 346,572 | |
Transfer agent fees | | | 8,707 | | | | 125,116 | | | | 112,053 | | | | 103,570 | | | | 572,829 | |
Trustee fees | | | 1,677 | | | | 126,220 | | | | 78,678 | | | | 254,098 | | | | 361,921 | |
Legal fees | | | 8,078 | | | | 54,873 | | | | 6,107 | | | | 220,883 | | | | 298,123 | |
Audit fees | | | 40,489 | | | | 78,666 | | | | 58,078 | | | | 55,251 | | | | 65,849 | |
Registration and filing fees | | | 32,698 | | | | 50,707 | | | | 54,435 | | | | 52,752 | | | | 87,332 | |
Other | | | 16,714 | | | | 388,702 | | | | 293,904 | | | | 271,691 | | | | 636,529 | |
| | | | | | | | | | | | | | | | | | | | |
Total expenses before reimbursed/waived expenses | | | 299,018 | | | | 11,475,659 | | | | 6,496,080 | | | | 8,689,796 | | | | 22,761,045 | |
Interest expense (Note 12) | | | 617 | | | | 40,935 | | | | 10,497 | | | | – | | | | 12,120 | |
| | | | | | | | | | | | | | | | | | | | |
Total operating expenses before reimbursed/waived expenses | | | 299,635 | | | | 11,516,594 | | | | 6,506,577 | | | | 8,689,796 | | | | 22,773,165 | |
Expenses reimbursed (Note 3) | | | (141,446 | ) | | | – | | | | – | | | | (29,356 | ) | | | (67,765 | ) |
Custody offset arrangement | | | – | | | | (15,988 | ) | | | (8,289 | ) | | | (26,495 | ) | | | (42,045 | ) |
Expenses waived by investment adviser | | | (621 | ) | | | (48,111 | ) | | | (29,363 | ) | | | (94,574 | ) | | | (135,111 | ) |
| | | | | | | | | | | | | | | | | | | | |
Net expenses | | | 157,568 | | | | 11,452,495 | | | | 6,468,925 | | | | 8,539,371 | | | | 22,528,244 | |
| | | | | | | | | | | | | | | | | | | | |
Net Investment Income | | | 104,524 | | | | 12,704,084 | | | | 6,359,673 | | | | 47,923,641 | | | | 189,157,865 | |
| | | | | | | | | | | | | | | | | | | | |
REALIZED/UNREALIZED GAIN/(LOSS) FROM INVESTMENTS: | | | | | | | | | | | | | | | | | | | | |
Realized gain/(loss) on investment transactions | | | 2,085,473 | | | | (39,216,370 | ) | | | 90,744,322 | | | | (9,417,003 | ) | | | 46,123,768 | |
Realized gain on swap contracts | | | – | | | | 18,167,196 | | | | 12,588,340 | | | | – | | | | 7,828,931 | |
Realized gain on futures contracts transactions | | | – | | | | 2,741,722 | | | | 1,569,244 | | | | – | | | | – | |
Written options | | | – | | | | – | | | | – | | | | (3,696 | ) | | | – | |
Realized gain/(loss) on foreign currency transactions | | | 27,537 | | | | 12,975,404 | | | | 8,427,174 | | | | 7,897,157 | | | | (8,161,837 | ) |
| | | | | | | | | | | | | | | | | | | | |
Net realized gain/(loss) from investments and foreign currency transactions | | | 2,113,010 | | | | (5,332,048 | ) | | | 113,329,080 | | | | (1,523,542 | ) | | | 45,790,862 | |
| | | | | | | | | | | | | | | | | | | | |
Net change in unrealized appreciation/depreciation on investment transactions | | | (450,811 | ) | | | 195,704,198 | | | | 15,952,085 | | | | (77,954,698 | ) | | | 35,693,920 | |
Net change in unrealized appreciation/depreciation on swap contracts | | | – | | | | (10,053,134 | ) | | | (5,652,964 | ) | | | – | | | | 6,867,330 | |
Net change in unrealized appreciation/depreciation on translation of assets and liabilities denominated in foreign currencies | | | 269 | | | | (501,651 | ) | | | 145,962 | | | | 885,929 | | | | (1,290,941 | ) |
| | | | | | | | | | | | | | | | | | | | |
Net change in unrealized appreciation/depreciation from investments and translation of assets and liabilities denominated in foreign currencies | | | (450,542 | ) | | | 185,149,413 | | | | 10,445,083 | | | | (77,068,769 | ) | | | 41,270,309 | |
| | | | | | | | | | | | | | | | | | | | |
Net realized/unrealized gain/(loss) from investments and foreign currency transactions | | | 1,662,468 | | | | 179,817,365 | | | | 123,774,163 | | | | (78,592,311 | ) | | | 87,061,171 | |
| | | | | | | | | | | | | | | | | | | | |
CHANGE IN NET ASSETS RESULTING FROM OPERATIONS | | $ | 1,766,992 | | | $ | 192,521,449 | | | $ | 130,133,836 | | | $ | (30,668,670 | ) | | $ | 276,219,036 | |
| | | | | | | | | | | | | | | | | | | | |
Amounts listed as "–" are $0 or round to $0.
See accompanying notes to financial statements.
2013 Annual Report
45
Statements of Changes in Net Assets
| | | | | | | | | | | | | | | | | | | | | | | | |
| | | Aberdeen
Global Select
Opportunities Fund | | | Aberdeen
Select International
Equity Fund | | | Aberdeen
Select International
Equity Fund II | |
| | | Year Ended
October 31,
2013 | | | Year Ended
October 31,
2012 | | | Year Ended
October 31,
2013 | | | Year Ended
October 31,
2012 | | | Year Ended
October 31,
2013 | | | Year Ended
October 31,
2012 | |
| | | | | | |
FROM INVESTMENT ACTIVITIES: | | | | | | | | | | | | | | | | | | | | | | | | |
Operations: | | | | | | | | | | | | | | | | | | | | | | | | |
Net investment income | | $ | 104,524 | | | $ | 194,490 | | | $ | 12,704,084 | | | $ | 50,527,461 | | | $ | 6,359,673 | | | $ | 35,138,820 | |
Net realized gain/(loss) from investments and foreign currency transactions | | | 2,113,010 | | | | (405,520 | ) | | | (5,332,048 | ) | | | (271,400,583 | ) | | | 113,329,080 | | | | (95,348,690 | ) |
Net change in unrealized appreciation/depreciation on investments and translation of assets and liabilities denominated in foreign currencies | | | (450,542 | ) | | | 2,650,204 | | | | 185,149,413 | | | | 79,114,331 | | | | 10,445,083 | | | | (14,221,525 | ) |
| | | | | | | | | | | | | | | | | | | | | | | | |
Changes in net assets resulting from operations | | | 1,766,992 | | | | 2,439,174 | | | | 192,521,449 | | | | (141,758,791 | ) | | | 130,133,836 | | | | (74,431,395 | ) |
| | | | | | | | | | | | | | | | | | | | | | | | |
Distributions to Shareholders From: | | | | | | | | | | | | | | | | | | | | | | | | |
Net investment income: | | | | | | | | | | | | | | | | | | | | | | | | |
Class A | | | (66,027 | ) | | | – | | | | (4,106,087 | ) | | | (29,892,907 | ) | | | (5,866,610 | ) | | | (17,413,839 | ) |
Class I | | | (121,751 | ) | | | (25,087 | ) | | | (3,400,872 | ) | | | (58,773,313 | ) | | | (19,825,207 | ) | | | (51,533,616 | ) |
Tax return of capital: | | | | | | | | | | | | | | | | | | | | | | | | |
Class A | | | – | | | | – | | | | – | | | | – | | | | (19,892 | ) | | | – | |
Class I | | | – | | | | – | | | | – | | | | – | | | | (67,223 | ) | | | – | |
| | | | | | | | | | | | | | | | | | | | | | | | |
Change in net assets from shareholder distributions | | | (187,778 | ) | | | (25,087 | ) | | | (7,506,959 | ) | | | (88,666,220 | ) | | | (25,778,932 | ) | | | (68,947,455 | ) |
| | | | | | | | | | | | | | | | | | | | | | | | |
Change in net assets from capital transactions | | | (13,423,051 | ) | | | (29,366,492 | ) | | | (1,535,775,674 | ) | | | (3,500,252,601 | ) | | | (862,862,469 | ) | | | (3,749,275,706 | ) |
| | | | | | | | | | | | | | | | | | | | | | | | |
Change in net assets | | | (11,843,837 | ) | | | (26,952,405 | ) | | | (1,350,761,184 | ) | | | (3,730,677,612 | ) | | | (758,507,565 | ) | | | (3,892,654,556 | ) |
| | | | | | | | | | | | | | | | | | | | | | | | |
Net Assets: | | | | | | | | | | | | | | | | | | | | | | | | |
Beginning of year | | | 20,122,062 | | | | 47,074,467 | | | | 2,016,576,176 | | | | 5,747,253,788 | | | | 1,084,411,933 | | | | 4,977,066,489 | |
| | | | | | | | | | | | | | | | | | | | | | | | |
End of year | | $ | 8,278,225 | | | $ | 20,122,062 | | | $ | 665,814,992 | | | $ | 2,016,576,176 | | | $ | 325,904,368 | | | $ | 1,084,411,933 | |
| | | | | | | | | | | | | | | | | | | | | | | | |
Accumulated net investment income/(loss) at end of year | | $ | 107,020 | | | $ | 187,778 | | | $ | 12,327,507 | | | $ | (6,578,729 | ) | | $ | (25,913 | ) | | $ | 20,194,152 | |
| | | | | | | | | | | | | | | | | | | | | | | | |
CAPITAL TRANSACTIONS: | | | | | | | | | | | | | | | | | | | | | | | | |
Class A Shares | | | | | | | | | | | | | | | | | | | | | | | | |
Proceeds from shares issued | | $ | 301,623 | | | $ | 707,054 | | | $ | 23,630,146 | | | $ | 94,592,323 | | | $ | 19,819,098 | | | $ | 152,425,573 | |
Dividends reinvested | | | 56,726 | | | | – | | | | 3,990,997 | | | | 29,284,391 | | | | 5,697,322 | | | | 15,787,932 | |
Cost of shares redeemed | | | (3,407,856 | ) | | | (2,618,378 | ) | | | (483,590,343 | ) | | | (1,226,061,711 | ) | | | (172,267,934 | ) | | | (1,158,590,968 | ) |
| | | | | | | | | | | | | | | | | | | | | | | | |
Total Class A | | | (3,049,507 | ) | | | (1,911,324 | ) | | | (455,969,200 | ) | | | (1,102,184,997 | ) | | | (146,751,514 | ) | | | (990,377,463 | ) |
| | | | | | | | | | | | | | | | | | | | | | | | |
Class I Shares | | | | | | | | | | | | | | | | | | | | | | | | |
Proceeds from shares issued | | | 795,739 | | | | 1,793,837 | | | | 31,099,736 | | | | 256,332,491 | | | | 44,087,986 | | | | 269,600,897 | |
Dividends reinvested | | | 106,344 | | | | 23,999 | | | | 3,218,155 | | | | 54,098,839 | | | | 15,429,334 | | | | 36,277,359 | |
Cost of shares redeemed | | | (11,275,627 | ) | | | (29,273,004 | ) | | | (1,114,124,365 | ) | | | (2,708,498,934 | ) | | | (775,628,275 | ) | | | (3,064,776,499 | ) |
| | | | | | | | | | | | | | | | | | | | | | | | |
Total Class I | | | (10,373,544 | ) | | | (27,455,168 | ) | | | (1,079,806,474 | ) | | | (2,398,067,604 | ) | | | (716,110,955 | ) | | | (2,758,898,243 | ) |
| | | | | | | | | | | | | | | | | | | | | | | | |
Change in net assets from capital transactions: | | $ | (13,423,051 | ) | | $ | (29,366,492 | ) | | $ | (1,535,775,674 | ) | | $ | (3,500,252,601 | ) | | $ | (862,862,469 | ) | | $ | (3,749,275,706 | ) |
| | | | | | | | | | | | | | | | | | | | | | | | |
SHARE TRANSACTIONS: | | | | | | | | | | | | | | | | | | | | | | | | |
Class A Shares | | | | | | | | | | | | | | | | | | | | | | | | |
Issued | | | 8,287 | | | | 20,870 | | | | 897,457 | | | | 3,995,350 | | | | 1,781,931 | | | | 15,184,958 | |
Reinvested | | | 1,608 | | | | – | | | | 158,310 | | | | 1,345,172 | | | | 526,555 | | | | 1,683,148 | |
Redeemed | | | (94,032 | ) | | | (74,910 | ) | | | (18,499,520 | ) | | | (52,389,555 | ) | | | (15,339,291 | ) | | | (115,363,238 | ) |
| | | | | | | | | | | | | | | | | | | | | | | | |
Total Class A Shares | | | (84,137 | ) | | | (54,040 | ) | | | (17,443,753 | ) | | | (47,049,033 | ) | | | (13,030,805 | ) | | | (98,495,132 | ) |
| | | | | | | | | | | | | | | | | | | | | | | | |
Class I Shares | | | | | | | | | | | | | | | | | | | | | | | | |
Issued | | | 21,588 | | | | 50,869 | | | | 1,169,982 | | | | 10,655,738 | | | | 3,954,574 | | | | 26,467,202 | |
Reinvested | | | 2,992 | | | | 733 | | | | 124,880 | | | | 2,427,045 | | | | 1,427,320 | | | | 3,851,100 | |
Redeemed | | | (303,630 | ) | | | (806,965 | ) | | | (44,111,272 | ) | | | (112,811,513 | ) | | | (69,588,993 | ) | | | (301,049,013 | ) |
| | | | | | | | | | | | | | | | | | | | | | | | |
Total Class I Shares | | | (279,050 | ) | | | (755,363 | ) | | | (42,816,410 | ) | | | (99,728,730 | ) | | | (64,207,099 | ) | | | (270,730,711 | ) |
| | | | | | | | | | | | | | | | | | | | | | | | |
Total change in shares: | | | (363,187 | ) | | | (809,403 | ) | | | (60,260,163 | ) | | | (146,777,763 | ) | | | (77,237,904 | ) | | | (369,225,843 | ) |
| | | | | | | | | | | | | | | | | | | | | | | | |
Amounts listed as "–" are $0 or round to $0.
See accompanying notes to financial statements.
Annual Report 2013
46
Statements of Changes in Net Assets (concluded)
| | | | | | | | | | | | | | | | |
| | | Aberdeen
Total Return
Bond Fund | | | Aberdeen
Global High
Income Fund | |
| | | Year Ended
October 31,
2013 | | | Year Ended
October 31,
2012 | | | Year Ended
October 31,
2013 | | | Year Ended
October 31,
2012 | |
FROM INVESTMENT ACTIVITIES: | | | | | | | | | | | | | | | | |
Operations: | | | | | | | | | | | | | | | | |
Net investment income | | $ | 47,923,641 | | | $ | 53,428,186 | | | $ | 189,157,865 | | | $ | 244,016,781 | |
Net realized gain/(loss) from investments, futures contracts, swaps and foreign currency transactions | | | (1,523,542 | ) | | | 38,691,238 | | | | 45,790,862 | | | | (12,803,335 | ) |
Net change in unrealized appreciation/depreciation on investments, futures contracts, swaps and translation of assets and liabilities denominated in foreign currencies | | | (77,068,769 | ) | | | 40,330,244 | | | | 41,270,309 | | | | 108,500,170 | |
| | | | | | | | | | | | | | | | |
Changes in net assets resulting from operations | | | (30,668,670 | ) | | | 132,449,668 | | | | 276,219,036 | | | | 339,713,616 | |
| | | | | | | | | | | | | | | | |
Distributions to Shareholders From: | | | | | | | | | | | | | | | | |
Net investment income: | | | | | | | | | | | | | | | | |
Class A | | | (4,299,327 | ) | | | (9,185,698 | ) | | | (65,954,427 | ) | | | (80,882,262 | ) |
Class I | | | (44,687,602 | ) | | | (67,054,088 | ) | | | (125,993,854 | ) | | | (165,950,161 | ) |
Net realized gains: | | | | | | | | | | | | | | | | |
Class A | | | (5,210,543 | ) | | | (4,921,570 | ) | | | – | | | | (18,449,251 | ) |
Class I | | | (38,408,459 | ) | | | (28,592,546 | ) | | | – | | | | (33,475,158 | ) |
Tax return of capital: | | | | | | | | | | | | | | | | |
Class A | | | (297,269 | ) | | | – | | | | – | | | | (1,643,402 | ) |
Class I | | | (3,004,325 | ) | | | – | | | | – | | | | (3,371,514 | ) |
| | | | | | | | | | | | | | | | |
Change in net assets from shareholder distributions | | | (95,907,525 | ) | | | (109,753,902 | ) | | | (191,948,281 | ) | | | (303,771,748 | ) |
| | | �� | | | | | | | | | | | | | |
Change in net assets from capital transactions | | | (366,632,551 | ) | | | 303,481,726 | | | | (728,529,427 | ) | | | (225,352,547 | ) |
| | | | | | | | | | | | | | | | |
Change in net assets | | | (493,208,746 | ) | | | 326,177,492 | | | | (644,258,672 | ) | | | (189,410,679 | ) |
| | | | | | | | | | | | | | | | |
Net Assets: | | | | | | | | | | | | | | | | |
Beginning of year | | | 2,096,354,479 | | | | 1,770,176,987 | | | | 3,197,052,171 | | | | 3,386,462,850 | |
| | | | | | | | | | | | | | | | |
End of year | | $ | 1,603,145,733 | | | $ | 2,096,354,479 | | | $ | 2,552,793,499 | | | $ | 3,197,052,171 | |
| | | | | | | | | | | | | | | | |
Accumulated net investment income/(loss) at end of year | | $ | (194,575 | ) | | $ | 2,847,607 | | | $ | (1,223,044 | ) | | $ | (1,631,203 | ) |
| | | | | | | | | | | | | | | | |
CAPITAL TRANSACTIONS: | | | | | | | | | | | | | | | | |
Class A Shares | | | | | | | | | | | | | | | | |
Proceeds from shares issued | | $ | 52,159,444 | | | $ | 89,929,318 | | | $ | 527,872,170 | | | $ | 383,609,386 | |
Dividends reinvested | | | 9,308,255 | | | | 13,378,383 | | | | 61,441,634 | | | | 90,532,888 | |
Cost of shares redeemed | | | (141,400,907 | ) | | | (130,134,771 | ) | | | (688,395,319 | ) | | | (728,612,636 | ) |
| | | | | | | | | | | | | | | | |
Total Class A | | | (79,933,208 | ) | | | (26,827,070 | ) | | | (99,081,515 | ) | | | (254,470,362 | ) |
| | | | | | | | | | | | | | | | |
Class I Shares | | | | | | | | | | | | | | | | |
Proceeds from shares issued | | | 631,907,782 | | | | 814,523,871 | | | | 601,335,385 | | | | 1,328,641,709 | |
Dividends reinvested | | | 76,876,705 | | | | 81,900,951 | | | | 73,429,672 | | | | 106,426,184 | |
Cost of shares redeemed | | | (995,483,830 | ) | | | (566,116,026 | ) | | | (1,304,212,969 | ) | | | (1,405,950,078 | ) |
| | | | | | | | | | | | | | | | |
Total Class I | | | (286,699,343 | ) | | | 330,308,796 | | | | (629,447,912 | ) | | | 29,117,815 | |
| | | | | | | | | | | | | | | | |
Change in net assets from capital transactions: | | $ | (366,632,551 | ) | | $ | 303,481,726 | | | $ | (728,529,427 | ) | | $ | (225,352,547 | ) |
| | | | | | | | | | | | | | | | |
SHARE TRANSACTIONS: | | | | | | | | | | | | | | | | |
Class A Shares | | | | | | | | | | | | | | | | |
Issued | | | 3,797,927 | | | | 6,460,204 | | | | 50,013,584 | | | | 38,098,477 | |
Reinvested | | | 676,714 | | | | 970,429 | | | | 5,837,364 | | | | 9,085,164 | |
Redeemed | | | (10,383,334 | ) | | | (9,348,002 | ) | | | (65,272,510 | ) | | | (72,615,332 | ) |
| | | | | | | | | | | | | | | | |
Total Class A Shares | | | (5,908,693 | ) | | | (1,917,369 | ) | | | (9,421,562 | ) | | | (25,431,691 | ) |
| | | | | | | | | | | | | | | | |
Class I Shares | | | | | | | | | | | | | | | | |
Issued | | | 46,775,581 | | | | 58,980,638 | | | | 59,865,847 | | | | 138,102,583 | |
Reinvested | | | 5,669,319 | | | | 5,993,318 | | | | 7,331,410 | | | | 11,160,159 | |
Redeemed | | | (73,808,272 | ) | | | (40,893,856 | ) | | | (129,908,352 | ) | | | (146,422,297 | ) |
| | | | | | | | | | | | | | | | |
Total Class I Shares | | | (21,363,372 | ) | | | 24,080,100 | | | | (62,711,095 | ) | | | 2,840,445 | |
| | | | | | | | | | | | | | | | |
Total change in shares: | | | (27,272,065 | ) | | | 22,162,731 | | | | (72,132,657 | ) | | | (22,591,246 | ) |
| | | | | | | | | | | | | | | | |
Amounts listed as "–" are $0 or round to $0.
See accompanying notes to financial statements.
2013 Annual Report
47
Financial Highlights
Selected Data for Each Share of Capital Outstanding Throughout the Periods Indicated
Aberdeen Global Select Opportunities Fund Inc.
| | | | | | | | | | | | | | | | | | | | | | | | |
| | | | | | Investment Activities | | | Distributions | |
| | | Net
Asset
Value,
Beginning
of Period | | | Net
Investment
Income
(Loss)
(a) | | | Net
Realized
and
Unrealized
Gains
(Losses)
on Investments | | | Total
from
Investment
Activities | | | Net
Investment
Income | | | Total
Distributions | |
Class A Shares | | | | | | | | | | | | | | | | | | | | | | | | |
Year Ended October 31, 2013 | | $ | 35.11 | | | $ | 0.32 | | | $ | 4.91 | | | $ | 5.23 | | | $ | (0.32 | ) | | $ | (0.32 | ) |
Year Ended October 31, 2012 | | | 33.90 | | | | 0.17 | | | | 1.04 | | | | 1.21 | | | | – | | | | – | |
Year Ended October 31, 2011 | | | 36.70 | | | | (0.08 | ) | | | (2.72 | ) | | | (2.80 | ) | | | – | | | | – | |
Year Ended October 31, 2010 | | | 32.55 | | | | (0.01 | ) | | | 5.05 | | | | 5.04 | | | | (0.89 | ) | | | (0.89 | ) |
Year Ended October 31, 2009 | | | 27.23 | | | | 0.27 | | | | 5.15 | | | | 5.42 | | | | (0.10 | ) | | | (0.10 | ) |
Class I Shares | | | | | | | | | | | | | | | | | | | | | | | | |
Year Ended October 31, 2013 | | | 35.48 | | | | 0.30 | | | | 5.04 | | | | 5.34 | | | | (0.43 | ) | | | (0.43 | ) |
Year Ended October 31, 2012 | | | 34.20 | | | | 0.25 | | | | 1.05 | | | | 1.30 | | | | (0.02 | ) | | | (0.02 | ) |
Year Ended October 31, 2011 | | | 37.01 | | | | 0.01 | | | | (2.74 | ) | | | (2.73 | ) | | | (0.08 | ) | | | (0.08 | ) |
Year Ended October 31, 2010 | | | 32.80 | | | | 0.07 | | | | 5.09 | | | | 5.16 | | | | (0.95 | ) | | | (0.95 | ) |
Year Ended October 31, 2009 | | | 27.55 | | | | 0.35 | | | | 5.17 | | | | 5.52 | | | | (0.27 | ) | | | (0.27 | ) |
| (a) | | Net investment income (loss) is based on average shares outstanding during the period. |
| (b) | | Not annualized for periods less than one year. |
| (c) | | Annualized for periods less than one year. |
Amounts listed as “–” are $0 or round to $0.
See accompanying notes to financial statements.
Annual Report 2013
48
Financial Highlights
Selected Data for Each Share of Capital Outstanding Throughout the Periods Indicated
Aberdeen Global Select Opportunities Fund Inc. (concluded)
| | | | | | | | | | | | | | | | | | | | | | | | | | |
| | | | | | | Ratios/Supplemental Data | |
Net
Asset
Value,
End of
Period | | | Total Return
(b) | | | Net Assets
at End of Period
(000’s) | | | Ratio of Expenses
to Average Net Assets
(c) | | | Ratio of Net
Investment Income (Loss)
to Average Net Assets
(c) | | | Ratio of Expenses
(Prior to Reimbursements)
to Average Net Assets
(c)(d) | | | Portfolio Turnover
(e) | |
| | | | | | | | | | | | | | | | | | | | | | | | | | |
| $ | 40.02 | | | | 15.02 | % | | $ | 6,538 | | | | 1.36 | %(f) | | | 0.86 | % | | | 2.54 | %(f) | | | 253 | % |
| | 35.11 | | | | 3.54 | % | | | 8,691 | | | | 1.39 | %(f) | | | 0.49 | % | | | 2.32 | %(f) | | | 182 | % |
| | 33.90 | | | | (7.60 | %) | | | 10,223 | | | | 1.40 | %(f) | | | (0.21 | %) | | | 1.79 | %(f) | | | 147 | % |
| | 36.70 | | | | 15.65 | % | | | 12,302 | | | | 1.40 | %(f) | | | (0.04 | %) | | | 1.78 | %(f) | | | 195 | % |
| | 32.55 | | | | 19.94 | % | | | 17,703 | | | | 1.40 | % | | | 0.99 | % | | | 1.89 | % | | | 320 | % |
| | | | | | | | | | | | | | | | | | | | | | | | | | |
| | 40.39 | | | | 15.23 | % | | | 1,740 | | | | 1.15 | %(f) | | | 0.82 | % | | | 2.25 | %(f) | | | 253 | % |
| | 35.48 | | | | 3.82 | % | | | 11,431 | | | | 1.14 | %(f) | | | 0.73 | % | | | 1.76 | %(f) | | | 182 | % |
| | 34.20 | | | | (7.40 | %) | | | 36,851 | | | | 1.15 | %(f) | | | 0.04 | % | | | 1.42 | %(f) | | | 147 | % |
| | 37.01 | | | | 15.94 | % | | | 63,354 | | | | 1.15 | %(f) | | | 0.21 | % | | | 1.44 | %(f) | | | 195 | % |
| | 32.80 | | | | 20.23 | % | | | 50,021 | | | | 1.15 | % | | | 1.27 | % | | | 1.50 | % | | | 320 | % |
| (d) | | During the period, certain fees were waived and/or reimbursed. If such waivers/reimbursements had not occurred, the ratios would have been as indicated. |
| (e) | | Portfolio turnover is calculated on the basis of the Fund as a whole without distinguishing among the classes of shares. |
| (f) | | Includes interest expense that amounts to less than 0.01%. |
See accompanying notes to financial statements.
2013 Annual Report
49
Financial Highlights
Selected Data for Each Share of Capital Outstanding Throughout the Periods Indicated
Aberdeen Select International Equity Fund
| | | | | | | | | | | | | | | | | | | | | | | | |
| | | | | | Investment Activities | | | Distributions | |
| | | Net
Asset
Value,
Beginning
of Period | | | Net
Investment
Income(a) | | | Net
Realized
and
Unrealized
Gains
(Losses)
on Investments | | | Total
from
Investment
Activities | | | Net
Investment
Income | | | Total
Distributions | |
Class A Shares | | | | | | | | | | | | | | | | | | | | | | | | |
Year Ended October 31, 2013 | | $ | 23.84 | | | $ | 0.37 | | | $ | 4.55 | | | $ | 4.92 | | | $ | (0.13 | ) | | $ | (0.13 | ) |
Year Ended October 31, 2012 | | | 24.55 | | | | 0.30 | | | | (0.62 | ) | | | (0.32 | ) | | | (0.39 | ) | | | (0.39 | ) |
Year Ended October 31, 2011 | | | 28.87 | | | | 0.19 | | | | (4.00 | ) | | | (3.81 | ) | | | (0.51 | ) | | | (0.51 | ) |
Year Ended October 31, 2010 | | | 28.20 | | | | 0.27 | | | | 2.48 | | | | 2.75 | | | | (2.08 | ) | | | (2.08 | ) |
Year Ended October 31, 2009 | | | 24.46 | (g) | | | 0.26 | | | | 3.94 | | | | 4.20 | | | | (0.46 | ) | | | (0.46 | ) |
Class I Shares | | | | | | | | | | | | | | | | | | | | | | | | |
Year Ended October 31, 2013 | | | 24.44 | | | | 0.31 | | | | 4.80 | | | | 5.11 | | | | (0.22 | ) | | | (0.22 | ) |
Year Ended October 31, 2012 | | | 25.20 | | | | 0.36 | | | | (0.64 | ) | | | (0.28 | ) | | | (0.48 | ) | | | (0.48 | ) |
Year Ended October 31, 2011 | | | 29.64 | | | | 0.28 | | | | (4.13 | ) | | | (3.85 | ) | | | (0.59 | ) | | | (0.59 | ) |
Year Ended October 31, 2010 | | | 28.89 | | | | 0.35 | | | | 2.55 | | | | 2.90 | | | | (2.15 | ) | | | (2.15 | ) |
Year Ended October 31, 2009 | | | 25.09 | (g) | | | 0.33 | | | | 4.03 | | | | 4.36 | | | | (0.56 | ) | | | (0.56 | ) |
| (a) | | Net investment income (loss) is based on average shares outstanding during the period. |
| (b) | | Not annualized for periods less than one year. |
| (c) | | Annualized for periods less than one year. |
| (d) | | During the period, certain fees were waived and/or reimbursed. If such waivers/reimbursements had not occurred, the ratios would have been as indicated. |
Amounts listed as “–” are $0 or round to $0.
See accompanying notes to financial statements.
Annual Report 2013
50
Financial Highlights
Selected Data for Each Share of Capital Outstanding Throughout the Periods Indicated
Aberdeen Select International Equity Fund (concluded)
| | | | | | | | | | | | | | | | | | | | | | | | | | |
| | | | | | | Ratios/Supplemental Data | |
Net
Asset
Value,
End of
Period | | | Total Return
(b) | | | Net Assets
at End of Period
(000’s) | | | Ratio of Expenses
to Average Net Assets
(c) | | | Ratio of Net
Investment Income
to Average Net Assets
(c) | | | Ratio of Expenses
(Prior to Reimbursements)
to Average Net Assets
(c)(d) | | | Portfolio Turnover
(e) | |
| | | | | | | | | | | | | | | | | | | | | | | | | | |
| $ | 28.63 | | | | 20.70 | % | | $ | 554,922 | | | | 1.25 | %(f) | | | 1.39 | % | | | 1.26 | %(f) | | | 94 | % |
| | 23.84 | | | | (1.14 | %) | | | 877,738 | | | | 1.23 | %(f) | | | 1.30 | % | | | 1.24 | %(f) | | | 35 | % |
| | 24.55 | | | | (13.49 | %) | | | 2,059,255 | | | | 1.29 | %(f) | | | 0.65 | % | | | 1.30 | %(f) | | | 41 | % |
| | 28.87 | | | | 10.06 | % | | | 3,692,638 | | | | 1.28 | %(f) | | | 1.00 | % | | | 1.28 | %(f) | | | 105 | % |
| | 28.20 | | | | 17.62 | % | | | 4,368,400 | | | | 1.21 | % | | | 1.09 | % | | | 1.21 | % | | | 201 | % |
| | | | | | | | | | | | | | | | | | | | | | | | | | |
| | 29.33 | | | | 21.04 | % | | | 110,893 | | | | 1.03 | %(f) | | | 1.15 | % | | | 1.04 | %(f) | | | 94 | % |
| | 24.44 | | | | (0.93 | %) | | | 1,138,838 | | | | 1.00 | %(f) | | | 1.51 | % | | | 1.01 | %(f) | | | 35 | % |
| | 25.20 | | | | (13.31 | %) | | | 3,687,999 | | | | 1.05 | %(f) | | | 0.95 | % | | | 1.05 | %(f) | | | 41 | % |
| | 29.64 | | | | 10.37 | % | | | 5,790,307 | | | | 1.02 | %(f) | | | 1.26 | % | | | 1.02 | %(f) | | | 105 | % |
| | 28.89 | | | | 17.91 | % | | | 6,389,926 | | | | 0.95 | % | | | 1.36 | % | | | 0.95 | % | | | 201 | % |
| (e) | | Portfolio turnover is calculated on the basis of the Fund as a whole without distinguishing among the classes of shares. |
| (f) | | Includes interest expense that amounts to less than 0.01%. |
| (g) | | The financial statements are prepared to conform to U.S. generally accepted accounting principles. As a result, the NAVs for certain funds reported in the financial statements may differ from the NAV used to process shareholder transactions. The reported NAV for shareholder transaction activity for the International Equity Fund Class A shares was $24.44 and Class I shares was $25.07. The NAV above was restated to correct an error which was identified subsequent to the close of the fiscal year end. |
See accompanying notes to financial statements.
2013 Annual Report
51
Financial Highlights
Selected Data for Each Share of Capital Outstanding Throughout the Periods Indicated
Aberdeen Select International Equity Fund II
| | | | | | | | | | | | | | | | | | | | | | | | | | | | |
| | | | | | Investment Activities | | | Distributions | |
| | | Net
Asset
Value,
Beginning
of Period | | | Net
Investment
Income
(a) | | | Net
Realized
and
Unrealized
Gains
(Losses)
on Investments | | | Total
from
Investment
Activities | | | Net
Investment
Income | | | Tax
Return
of
Capital | | | Total
Distributions | |
Class A Shares | | | | | | | | | | | | | | | | | | | | | | | | | | | | |
Year Ended October 31, 2013 | | $ | 10.38 | | | $ | 0.13 | | | $ | 1.92 | | | $ | 2.05 | | | $ | (0.25 | ) | | $ | – | | | $ | (0.25 | ) |
Year Ended October 31, 2012 | | | 10.46 | | | | 0.12 | | | | (0.05 | ) | | | 0.07 | | | | (0.15 | ) | | | – | | | | (0.15 | ) |
Year Ended October 31, 2011 | | | 12.18 | | | | 0.07 | | | | (1.56 | ) | | | (1.49 | ) | | | (0.23 | ) | | | – | | | | (0.23 | ) |
Year Ended October 31, 2010 | | | 11.62 | | | | 0.11 | | | | 1.00 | | | | 1.11 | | | | (0.55 | ) | | | – | | | | (0.55 | ) |
Year Ended October 31, 2009 | | | 10.15 | (g) | | | 0.09 | | | | 1.71 | | | | 1.80 | | | | (0.33 | ) | | | – | | | | (0.33 | ) |
Class I Shares | | | | | | | | | | | | | | | | | | | | | | | | | | | | |
Year Ended October 31, 2013 | | | 10.45 | | | | 0.11 | | | | 1.97 | | | | 2.08 | | | | (0.33 | ) | | | – | | | | (0.33 | ) |
Year Ended October 31, 2012 | | | 10.54 | | | | 0.14 | | | | (0.04 | ) | | | 0.10 | | | | (0.19 | ) | | | – | | | | (0.19 | ) |
Year Ended October 31, 2011 | | | 12.27 | | | | 0.10 | | | | (1.57 | ) | | | (1.47 | ) | | | (0.26 | ) | | | – | | | | (0.26 | ) |
Year Ended October 31, 2010 | | | 11.70 | | | | 0.14 | | | | 1.01 | | | | 1.15 | | | | (0.58 | ) | | | – | | | | (0.58 | ) |
Year Ended October 31, 2009 | | | 10.22 | (g) | | | 0.12 | | | | 1.72 | | | | 1.84 | | | | (0.36 | ) | | | – | | | | (0.36 | ) |
| (a) | | Net investment income (loss) is based on average shares outstanding during the period. |
| (b) | | Not annualized for periods less than one year. |
| (c) | | Annualized for periods less than one year. |
| (d) | | During the period, certain fees were waived and/or reimbursed. If such waivers/reimbursements had not occurred, the ratios would have been as indicated. |
Amounts listed as “–” are $0 or round to $0.
See accompanying notes to financial statements.
Annual Report 2013
52
Financial Highlights
Selected Data for Each Share of Capital Outstanding Throughout the Periods Indicated
Aberdeen Select International Equity Fund II (concluded)
| | | | | | | | | | | | | | | | | | | | | | | | | | |
| | | | | | | Ratios/Supplemental Data | |
Net
Asset
Value,
End of
Period | | | Total Return
(b) | | | Net Assets
at End of Period
(000’s) | | | Ratio of Expenses
to Average Net Assets
(c) | | | Ratio of Net
Investment Income
to Average Net Assets
(c) | | | Ratio of Expenses
(Prior to Reimbursements)
to Average Net Assets
(c)(d) | | | Portfolio Turnover
(e) | |
| | | | | | | | | | | | | | | | | | | | | | | | | | |
| $ | 12.18 | | | | 20.00 | % | | $ | 168,028 | | | | 1.21 | %(f) | | | 1.19 | % | | | 1.23 | %(f) | | | 97 | % |
| | 10.38 | | | | 0.91 | % | | | 278,360 | | | | 1.30 | %(f) | | | 1.21 | % | | | 1.32 | %(f) | | | 34 | % |
| | 10.46 | | | | (12.61 | %) | | | 1,310,435 | | | | 1.28 | %(f) | | | 0.54 | % | | | 1.28 | %(f) | | | 51 | % |
| | 12.18 | | | | 9.75 | % | | | 2,156,072 | | | | 1.28 | %(f) | | | 0.98 | % | | | 1.29 | %(f) | | | 123 | % |
| | 11.62 | | | | 18.23 | % | | | 2,146,222 | | | | 1.24 | % | | | 0.87 | % | | | 1.27 | % | | | 205 | % |
| | | | | | | | | | | | | | | | | | | | | | | | | | |
| | 12.20 | | | | 20.36 | % | | | 157,876 | | | | 1.04 | %(f) | | | 1.02 | % | | | 1.04 | %(f) | | | 97 | % |
| | 10.45 | | | | 1.11 | % | | | 806,052 | | | | 1.01 | %(f) | | | 1.33 | % | | | 1.02 | %(f) | | | 34 | % |
| | 10.54 | | | | (12.31 | %) | | | 3,666,631 | | | | 1.04 | %(f) | | | 0.79 | % | | | 1.04 | %(f) | | | 51 | % |
| | 12.27 | | | | 9.99 | % | | | 6,355,205 | | | | 1.04 | %(f) | | | 1.23 | % | | | 1.05 | %(f) | | | 123 | % |
| | 11.70 | | | | 18.59 | % | | | 6,985,273 | | | | 0.98 | % | | | 1.18 | % | | | 1.02 | % | | | 205 | % |
| (e) | | Portfolio turnover is calculated on the basis of the Fund as a whole without distinguishing among the classes of shares. |
| (f) | | Includes interest expense that amounts to less than 0.01%. |
| (g) | | The financial statements are prepared to conform to U.S. generally accepted accounting principles. As a result, the NAVs for certain funds reported in the financial statements may differ from the NAV used to process shareholder transactions. The reported NAV for shareholder transaction activity for the International Equity Fund II Class A shares was $10.16 and Class I shares was $10.23. |
See accompanying notes to financial statements.
2013 Annual Report
53
Financial Highlights
Selected Data for Each Share of Capital Outstanding Throughout the Periods Indicated
Aberdeen Total Return Bond Fund
| | | | | | | | | | | | | | | | | | | | | | | | | | | | | | | | |
| | | | | | Investment Activities | | | Distributions | |
| | | Net
Asset
Value,
Beginning
of Period | | | Net
Investment
Income
(a) | | | Net
Realized
and
Unrealized
Gains
(Losses)
on Investments | | | Total
from
Investment
Activities | | | Net
Investment
Income | | | Net
Realized
Gains | | | Tax
Return
of
Capital | | | Total
Distributions | |
Class A Shares | | | | | | | | | | | | | | | | | | | | | | | | | | | | | | | | |
Year Ended October 31, 2013 | | $ | 14.17 | | | $ | 0.31 | | | $ | (0.56 | ) | | $ | (0.25 | ) | | $ | (0.29 | ) | | $ | (0.30 | ) | | $ | (0.03 | ) | | $ | (0.62 | ) |
Year Ended October 31, 2012 | | | 14.02 | | | | 0.34 | | | | 0.56 | | | | 0.90 | | | | (0.49 | ) | | | (0.26 | ) | | | – | | | | (0.75 | ) |
Year Ended October 31, 2011 | | | 14.24 | | | | 0.55 | | | | 0.18 | | | | 0.73 | | | | (0.47 | ) | | | (0.48 | ) | | | – | | | | (0.95 | ) |
Year Ended October 31, 2010 | | | 13.51 | | | | 0.52 | | | | 0.69 | | | | 1.21 | | | | (0.48 | ) | | | – | | | | – | | | | (0.48 | ) |
Year Ended October 31, 2009 | | | 12.21 | | | | 0.51 | | | | 1.54 | | | | 2.05 | | | | (0.62 | ) | | | (0.13 | ) | | | – | | | | (0.75 | ) |
Class I Shares | | | | | | | | | | | | | | | | | | | | | | | | | | | | | | | | |
Year Ended October 31, 2013 | | | 14.03 | | | | 0.35 | | | | (0.56 | ) | | | (0.21 | ) | | | (0.36 | ) | | | (0.30 | ) | | | (0.03 | ) | | | (0.69 | ) |
Year Ended October 31, 2012 | | | 13.91 | | | | 0.38 | | | | 0.55 | | | | 0.93 | | | | (0.55 | ) | | | (0.26 | ) | | | – | | | | (0.81 | ) |
Year Ended October 31, 2011 | | | 14.16 | | | | 0.58 | | | | 0.18 | | | | 0.76 | | | | (0.53 | ) | | | (0.48 | ) | | | – | | | | (1.01 | ) |
Year Ended October 31, 2010 | | | 13.47 | | | | 0.55 | | | | 0.69 | | | | 1.24 | | | | (0.55 | ) | | | – | | | | – | | | | (0.55 | ) |
Year Ended October 31, 2009 | | | 12.20 | | | | 0.54 | | | | 1.53 | | | | 2.07 | | | | (0.67 | ) | | | (0.13 | ) | | | – | | | | (0.80 | ) |
| (a) | | Net investment income (loss) is based on average shares outstanding during the period. |
| (b) | | Not annualized for periods less than one year. |
| (c) | | Annualized for periods less than one year. |
Amounts listed as “–” are $0 or round to $0.
See accompanying notes to financial statements.
Annual Report 2013
54
Financial Highlights
Selected Data for Each Share of Capital Outstanding Throughout the Periods Indicated
Aberdeen Total Return Bond Fund (concluded)
| | | | | | | | | | | | | | | | | | | | | | | | | | |
| | | | | | | Ratios/Supplemental Data | |
Net
Asset
Value,
End of
Period | | | Total Return
(b) | | | Net Assets
at End of Period
(000’s) | | | Ratio of Expenses
to Average Net Assets
(c) | | | Ratio of Net
Investment Income
to Average Net Assets
(c) | | | Ratio of Expenses
(Prior to Reimbursements)
to Average Net Assets
(c)(d) | | | Portfolio Turnover
(e) | |
| | | | | | | | | | | | | | | | | | | | | | | | | | |
| $ | 13.30 | | | | (1.81 | %) | | $ | 153,370 | | | | 0.68 | % | | | 2.29 | % | | | 0.70 | % | | | 265 | % |
| | 14.17 | | | | 6.64 | % | | | 247,217 | | | | 0.69 | % | | | 2.47 | % | | | 0.69 | % | | | 236 | % |
| | 14.02 | | | | 5.49 | % | | | 271,444 | | | | 0.69 | % | | | 3.96 | % | | | 0.71 | % | | | 219 | % |
| | 14.24 | | | | 9.16 | % | | | 319,782 | | | | 0.69 | % | | | 3.77 | % | | | 0.70 | % | | | 193 | % |
| | 13.51 | | | | 17.27 | % | | | 331,224 | | | | 0.69 | % | | | 3.98 | % | | | 0.69 | % | | | 289 | % |
| | | | | | | | | | | | | | | | | | | | | | | | | | |
| | 13.13 | | | | (1.59 | %) | | | 1,449,776 | | | | 0.42 | % | | | 2.56 | % | | | 0.43 | % | | | 265 | % |
| | 14.03 | | | | 6.97 | % | | | 1,849,138 | | | | 0.41 | % | | | 2.73 | % | | | 0.41 | % | | | 236 | % |
| | 13.91 | | | | 5.79 | % | | | 1,498,733 | | | | 0.44 | % | | | 4.20 | % | | | 0.45 | % | | | 219 | % |
| | 14.16 | | | | 9.39 | % | | | 1,305,839 | | | | 0.44 | % | | | 4.01 | % | | | 0.44 | % | | | 193 | % |
| | 13.47 | | | | 17.56 | % | | | 1,238,512 | | | | 0.44 | % | | | 4.26 | % | | | 0.43 | % | | | 289 | % |
| (d) | | During the period, certain fees were waived and/or reimbursed. If such waivers/reimbursements had not occurred, the ratios would have been as indicated. |
| (e) | | Portfolio turnover is calculated on the basis of the Fund as a whole without distinguishing among the classes of shares. |
See accompanying notes to financial statements.
2013 Annual Report
55
Financial Highlights
Selected Data for Each Share of Capital Outstanding Throughout the Periods Indicated
Aberdeen Global High Income Fund
| | | | | | | | | | | | | | | | | | | | | | | | | | | | | | | | |
| | | | | | Investment Activities | | | Distributions | |
| | | Net
Asset
Value,
Beginning
of Period | | | Net
Investment
Income
(a) | | �� | Net
Realized
and
Unrealized
Gains
(Losses)
on Investments | | | Total
from
Investment
Activities | | | Net
Investment
Income | | | Net
Realized
Gains | | | Tax
Return
of
Capital | | | Total
Distributions | |
Class A Shares | | | | | | | | | | | | | | | | | | | | | | | | | | | | | | | | |
Year Ended October 31, 2013 | | $ | 10.30 | | | $ | 0.72 | | | $ | 0.30 | | | $ | 1.02 | | | $ | (0.71 | ) | | $ | – | | | $ | – | | | $ | (0.71 | ) |
Year Ended October 31, 2012 | | | 10.14 | | | | 0.73 | | | | 0.34 | | | | 1.07 | | | | (0.74 | ) | | | (0.16 | ) | | | (0.01 | ) | | | (0.91 | ) |
Year Ended October 31, 2011 | | | 11.06 | | | | 0.77 | | | | (0.62 | ) | | | 0.15 | | | | (0.79 | ) | | | (0.28 | ) | | | – | | | | (1.07 | ) |
Year Ended October 31, 2010 | | | 10.28 | | | | 0.82 | | | | 0.77 | | | | 1.59 | | | | (0.81 | ) | | | – | | | | – | | | | (0.81 | ) |
Year Ended October 31, 2009 | | | 8.08 | | | | 0.71 | | | | 2.42 | | | | 3.13 | | | | (0.78 | ) | | | – | | | | (0.15 | ) | | | (0.93 | ) |
Class I Shares | | | | | | | | | | | | | | | | | | | | | | | | | | | | | | | | |
Year Ended October 31, 2013 | | | 9.84 | | | | 0.71 | | | | 0.29 | | | | 1.00 | | | | (0.74 | ) | | | – | | | | – | | | | (0.74 | ) |
Year Ended October 31, 2012 | | | 9.72 | | | | 0.73 | | | | 0.31 | | | | 1.04 | | | | (0.74 | ) | | | (0.16 | ) | | | (0.02 | ) | | | (0.92 | ) |
Year Ended October 31, 2011 | | | 10.64 | | | | 0.76 | | | | (0.59 | ) | | | 0.17 | | | | (0.81 | ) | | | (0.28 | ) | | | – | | | | (1.09 | ) |
Year Ended October 31, 2010 | | | 9.90 | | | | 0.82 | | | | 0.74 | | | | 1.56 | | | | (0.82 | ) | | | – | | | | – | | | | (0.82 | ) |
Year Ended October 31, 2009 | | | 7.82 | | | | 0.70 | | | | 2.33 | | | | 3.03 | | | | (0.79 | ) | | | – | | | | (0.16 | ) | | | (0.95 | ) |
| (a) | | Net investment income (loss) is based on average shares outstanding during the period. |
| (b) | | During the period, certain fees were waived and/or reimbursed. If such waivers/reimbursements had not occurred, the ratios would have been as indicated. |
Amounts listed as “–” are $0 or round to $0.
See accompanying notes to financial statements.
Annual Report 2013
56
Financial Highlights
Selected Data for Each Share of Capital Outstanding Throughout the Periods Indicated
Aberdeen Global High Income Fund (concluded)
| | | | | | | | | | | | | | | | | | | | | | | | | | |
| | | | | | | Ratios/Supplemental Data | |
Net
Asset
Value,
End of
Period | | | Total Return | | | Net Assets
at End of Period
(000’s) | | | Ratio of Expenses
to Average Net Assets | | | Ratio of Net
Investment Income
to Average Net Assets | | | Ratio of Expenses
(Prior to Reimbursements)
to Average Net Assets
(b) | | | Portfolio Turnover
(c) | |
| | | | | | | | | | | | | | | | | | | | | | | | | | |
| $ | 10.61 | | | | 10.20 | % | | $ | 999,250 | | | | 0.99 | %(d) | | | 6.83 | % | | | 1.00 | %(d) | | | 57 | % |
| | 10.30 | | | | 11.22 | % | | | 1,066,487 | | | | 0.99 | %(d) | | | 7.26 | % | | | 1.01 | %(d) | | | 62 | % |
| | 10.14 | | | | 1.30 | % | | | 1,308,597 | | | | 0.99 | %(d) | | | 7.19 | % | | | 1.00 | %(d) | | | 78 | % |
| | 11.06 | | | | 16.08 | % | | | 1,222,933 | | | | 1.00 | % | | | 7.70 | % | | | 1.00 | % | | | 57 | % |
| | 10.28 | | | | 42.71 | % | | | 715,541 | | | | 1.00 | % | | | 7.83 | % | | | 1.01 | % | | | 43 | % |
| | | | | | | | | | | | | | | | | | | | | | | | | | |
| | 10.10 | | | | 10.53 | % | | | 1,553,543 | | | | 0.75 | %(d) | | | 7.10 | % | | | 0.75 | %(d) | | | 57 | % |
| | 9.84 | | | | 11.49 | % | | | 2,130,565 | | | | 0.73 | %(d) | | | 7.53 | % | | | 0.74 | %(d) | | | 62 | % |
| | 9.72 | | | | 1.52 | % | | | 2,077,865 | | | | 0.73 | %(d) | | | 7.44 | % | | | 0.74 | %(d) | | | 78 | % |
| | 10.64 | | | | 16.39 | % | | | 1,873,539 | | | | 0.75 | % | | | 7.96 | % | | | 0.74 | % | | | 57 | % |
| | 9.90 | | | | 42.99 | % | | | 934,054 | | | | 0.75 | % | | | 8.10 | % | | | 0.74 | % | | | 43 | % |
| (c) | | Portfolio turnover is calculated on the basis of the Fund as a whole without distinguishing among the classes of shares. |
| (d) | | Includes interest expense that amounts to less than 0.01%. |
See accompanying notes to financial statements.
2013 Annual Report
57
Notes to Financial Statements
October 31, 2013
1. Organization
Aberdeen Investment Funds (each, a “Fund” and collectively, the “Trust”) was organized as a business trust under the laws of the State of Massachusetts by a Master Trust Agreement adopted on April 30, 1992 and is registered with the U.S. Securities and Exchange Commission (“SEC”) under the Investment Company Act of 1940, as amended (the “1940 Act”) as an open-end management investment company. As of October 31, 2013, the Trust offered four diversified, open-ended investment funds: Aberdeen Select International Equity Fund (the “Select International Equity Fund”), Aberdeen Select International Equity Fund II (the “Select International Equity Fund II”), Aberdeen Total Return Bond Fund (the “Total Return Bond Fund”), and Aberdeen Global High Income Fund (the “Global High Income Fund”).
Aberdeen Global Select Opportunities Fund Inc. (the “Global Select Opportunities Fund”) was incorporated under the laws of the State of Maryland on May 23, 1990 and is registered with the SEC under the 1940 Act as a diversified, open-end management investment company.
Effective May 22, 2013, in conjunction with the acquisition of Artio Global Management LLC by Aberdeen Asset Management PLC, the Trust and the Global Select Opportunities Fund (collectively, the “Funds”) were rebranded (name change) as follows:
| | |
| Rebranded as: | | Formerly known as: |
Aberdeen Global Select Opportunities Fund Inc. | | Artio Select Opportunities Fund Inc. |
Aberdeen Select International Equity Fund, a series of Aberdeen Investment Funds | | Artio International Equity Fund, a series of Artio Global Investment Funds |
Aberdeen Select International Equity Fund II, a series of Aberdeen Investment Funds | | Artio International Equity Fund II, a series of Artio Global Investment Funds |
Aberdeen Total Return Bond Fund, a series of Aberdeen Investment Funds | | Artio Total Return Bond Fund, a series of Artio Global Investment Funds |
Aberdeen Global High Income Fund, a series of Aberdeen Investment Funds | | Artio Global High Income Fund, a series of Artio Global Investment Funds |
Each of the Funds offers multiple share classes. As of October 31, 2013, all of the Funds offered Class A and Class I shares. The classes of shares are offered to different types of investors and have different expense structures, as outlined in the Funds’ prospectus. Each class of shares has exclusive voting rights with respect to matters that affect that class. Income, realized gains and losses, unrealized appreciation and depreciation, and expenses that are not attributable to a specific class are allocated daily to each class based on its relative net assets. Expenses directly attributable to a Fund are charged to that Fund. Other expenses are allocated to the respective Fund based on average daily net assets.
Each Fund has distinct investment objectives. Following are the objectives for the Funds:
| | |
| Fund Name | | Investment Objective |
Global Select Opportunities Fund | | Seeks to maximize total return, principally through capital appreciation. |
Select International Equity Fund | | Seeks long term growth of capital. |
Select International Equity Fund II | | Seeks long term growth of capital. |
Total Return Bond Fund | | Seeks to provide total return, which consists of two components: (1) changes in the market value of the Fund’s portfolio securities (both realized and unrealized appreciation/depreciation) and (2) income received from its portfolio securities. |
Global High Income Fund | | Seeks to maximize total return, principally through a high level of current income, and secondarily through capital appreciation. |
2. Summary of Significant Accounting Policies
The following is a summary of significant accounting policies followed by the Funds in the preparation of their financial statements. The policies conform to accounting principles generally accepted in the United States of America (“GAAP”). The preparation of financial statements requires management to make estimates and assumptions that affect the reported amounts of assets and liabilities, disclosure of contingent assets and liabilities at the date of the financial statements, and the reported amounts of income and expenses for the period. Actual results could differ from those estimates. The books and records of the Funds are maintained in U.S. Dollars.
Annual Report 2013
58
Notes to Financial Statements (continued)
October 31, 2013
The Funds are required to value their securities at fair market value, which is defined as the price that would be received to sell an asset or paid to transfer a liability in an orderly transaction between market participants at the measurement date.
Each Fund’s assets for which market quotations are readily available are valued at fair value on the basis of quotations furnished by a pricing service or provided by securities dealers. Equity investments are generally valued using the last sale price or official closing price taken from the primary market in which each security trades, or if no sales occurred during the day, at the mean of the current quoted bid and ask prices.
Fixed income securities are generally valued using prices provided directly by independent third party services or provided directly from one or more broker dealers or market makers, each in accordance with valuation procedures (“Valuation Procedures”) approved by the Global Select Opportunities Fund’s Board of Director’s, and the Trust’s Board of Trustees (each, a “Board” and collectively, “the Boards”), as applicable. The pricing services may use valuation models or matrix pricing, which consider yield or prices with respect to comparable bond quotations from bond dealers or by reference to other securities that are considered comparable in such characteristics as credit rating, interest rates and maturity date, to determine current fair value.
Assets and liabilities initially expressed in foreign currency will be converted into U.S. dollar values. Short-term dollar-denominated investments of appropriate credit quality that mature in 60 days or less are valued on the basis of amortized cost, which approximates fair value. To the extent each Fund invests in other open-end funds, the Fund will calculate its Net Asset Value (“NAV”) based upon the NAV of the underlying funds in which it invests. The prospectuses of these underlying funds explain the circumstances under which they will use good faith fair value pricing and the effects of such fair value pricing.
When market quotations or exchange rates are not readily available, or if the Funds’ investment adviser, Aberdeen Asset Management Inc. (the “Adviser”), concludes that such market quotations do not accurately reflect fair value, the fair value of a Fund’s assets are determined in good faith in accordance with the Valuation Procedures. For options, swaps and warrants, a fair value price may be determined using readily available market quotations, prices provided by independent pricing services, or by using modeling tools provided by industry accepted financial data service providers. Key inputs to such tools may include yield and prices from comparable or reference assets, maturity or expiration dates, ratings, and interest rates. In addition, the Adviser, through its pricing committee, may determine the fair value price based upon multiple factors as set forth in the Valuation Procedures approved by the Boards.
The closing prices of domestic or foreign securities may not reflect their market values at the time the Funds calculate their respective NAVs if an event that materially affects the value of those securities has occurred since the closing prices were established on the domestic or foreign exchange market, but before the Funds’ NAV calculations. Under certain conditions, the Boards have approved an independent pricing service to fair value foreign securities. This is generally accomplished by adjusting the closing price for movements in correlated indices, securities or derivatives. Fair value pricing may cause the value of the security on the books of the Funds to be different from the closing value on the non-U.S. exchange and may affect the calculation of a Fund’s NAV. Certain Funds may fair value securities in other situations, for example, when a particular foreign market is closed but the Funds are pricing their shares.
In accordance with the authoritative guidance on fair value measurements and disclosures under GAAP, the Funds disclose the fair value of their investments using a three-level hierarchy that classifies the inputs to valuation techniques used to measure the fair value. The hierarchy assigns Level 1 measurements to valuations based upon unadjusted quoted prices in active markets for identical assets, Level 2 measurements to valuations, based upon significant observable inputs, including adjusted quoted prices in active markets for identical assets, and Level 3 measurements to valuations based upon unobservable inputs that are significant to the valuation. Inputs refer broadly to the assumptions that market participants would use in pricing the asset or liability, including assumptions about risk, for example, the risk inherent in a particular valuation technique used to measure fair value including a pricing model and/or the risk inherent in the inputs to the valuation technique. Inputs may be observable or unobservable. Observable inputs are inputs that reflect the assumptions market participants would use in pricing the asset or liability, which are based on market data obtained from sources independent of the reporting entity. Unobservable inputs are inputs that reflect the reporting entity's own assumptions about the assumptions market participants would use in pricing the asset or liability, which are based on the best information available in the circumstances. A financial instrument's level within the fair value hierarchy is based upon the lowest level of any input that is significant to the fair value measurement. The three-tier hierarchy of inputs is summarized below:
| | • | | Level 1-quoted prices in active markets for identical investments; |
| | • | | Level 2-other significant observable inputs (including quoted prices for similar securities, interest rates, prepayment speeds, and credit risk); or |
| | • | | Level 3-significant unobservable inputs (including the Fund’s own assumptions in determining the fair value of investments). |
2013 Annual Report
59
Notes to Financial Statements (continued)
October 31, 2013
For movements between the levels within the fair value hierarchy, the Funds have adopted a policy of recognizing transfers at the end of each period.
The Funds will fair value foreign securities when the Adviser does not believe that the closing prices are reflective of fair value due to significant events that occurred subsequent to the close of the foreign markets but before the Funds’ NAV calculations. When securities are fair valued under this method, they will be classified as Level 2 which may result in significant transfers between Level 1 and Level 2. The number of days on which fair value prices will be used depends on market activity. It is possible that fair value prices will be used by the Funds to a significant extent. Foreign securities in the Global Select Opportunities Fund, Select International Equity Fund and Select International Equity Fund II were not fair valued under this method at October 31, 2013 or October 31, 2012, resulting in no significant transfers from Level 1 to Level 2 in the fair value hierarchy.
The following is a summary of the inputs used as of October 31, 2013 in valuing the Funds' investments at fair value. The inputs or methodologies used for valuing securities are not necessarily an indication of the risk associated with investing in those securities.
| | | | | | | | | | | | | | | | |
| | | LEVEL 1–Quoted
Prices ($) | | | LEVEL 2–Other
Significant Observable
Inputs ($) | | | LEVEL 3–
Significant Unobservable
Inputs ($) | | | Total ($) | |
| Global Select Opportunities Fund | | | | | | | | | | | | | | | | |
| Investments in Securities | | | | | | | | | | | | | | | | |
Common Stocks | | | 7,365,358 | | | | – | | | | – | | | | 7,365,358 | |
Preferred Stocks | | | 776,592 | | | | – | | | | – | | | | 776,592 | |
Repurchase Agreement | | | – | | | | 171,625 | | | | – | | | | 171,625 | |
| | | | | | | | | | | | | | | | |
| | | 8,141,950 | | | | 171,625 | | | | – | | | | 8,313,575 | |
| | | | | | | | | | | | | | | | |
| Select International Equity Fund | | | | | | | | | | | | | | | | |
| Investments in Securities | | | | | | | | | | | | | | | | |
Common Stocks | | | 578,661,497 | | | | – | | | | 2,371,471 | | | | 581,032,968 | |
Exchange Traded Funds | | | – | | | | – | | | | 1,389,510 | | | | 1,389,510 | |
Government Bonds | | | – | | | | – | | | | 1,849,035 | | | | 1,849,035 | |
Preferred Stocks | | | 77,483,802 | | | | – | | | | – | | | | 77,483,802 | |
Repurchase Agreement | | | – | | | | 1,007,687 | | | | – | | | | 1,007,687 | |
| | | | | | | | | | | | | | | | |
| | | 656,145,299 | | | | 1,007,687 | | | | 5,610,016 | | | | 662,763,002 | |
| | | | | | | | | | | | | | | | |
Annual Report 2013
60
Notes to Financial Statements (continued)
October 31, 2013
Asset Valuation Inputs
| | | | | | | | | | | | | | | | | | | | | | | | | | | | | | | | | | | | | | | | |
Select International Equity Fund Rollforward of Level 3 Fair Value Measurement For the Year Ended October 31, 2013 | |
| Investments in Securities | | Balance as of
October 31,
2012 | | | Accrued
Discounts
(Premiums) | | | Realized
Gain (Loss) | | | Change in
Unrealized
Appreciation
(Depreciation) | | | Net
Purchases | | | Net Sales | | | Net
Transfers
in to
Level 3 | | | Net
Transfers
out of
Level 3 | | | Balance as of
October 31,
2013 | | | Change in
Unrealized
Appreciation
(Depreciation)
from
Investments
Held at
October 31,
2013 | |
COMMON STOCKS | | | | | | | | | | | | | | | | | | | | | | | | | | | | | | | | | | | | | | | | |
Bulgaria | | $ | 1,907,747 | | | $ | – | | | $ | (206,965 | ) | | $ | 143,935 | | | $ | – | | | $ | (5,772 | ) | | $ | 452,381 | | | $ | – | | | $ | 2,291,326 | | | $ | 143,935 | |
Latvia | | | – | | | | – | | | | – | | | | – | | | | – | | | | – | | | | – | | | | – | | | | – | | | | – | |
Serbia | | | 826,962 | | | | – | | | | – | | | | (746,817 | ) | | | – | | | | – | | | | – | | | | – | | | | 80,145 | | | | (746,817 | ) |
Ukraine | | | 4,832,395 | | | | – | | | | (42,584,735 | ) | | | 46,344,031 | | | | – | | | | (8,591,691 | ) | | | – | | | | – | | | | – | | | | – | |
Venezuela | | | 3,911,687 | | | | – | | | | – | | | | (3,539,409 | ) | | | – | | | | – | | | | – | | | | (372,278 | ) | | | – | | | | (3,539,409 | ) |
EQUITY LINKED NOTES | | | | | | | | | | | | | | | | | | | | | | | | | | | | | | | | | | | | | | | | |
Ukraine | | | 1,875,000 | | | | – | | | | (4,415,256 | ) | | | 2,855,827 | | | | – | | | | (315,571 | ) | | | – | | | | – | | | | – | | | | – | |
EXCHANGE TRADED FUNDS | | | | | | | | | | | | | | | | | | | | | | | | | | | | | | | | | | | | | | | | |
Russia | | | 1,389,510 | | | | – | | | | – | | | | – | | | | – | | | | – | | | | – | | | | – | | | | 1,389,510 | | | | – | |
GOVERNMENT BONDS | | | | | | | | | | | | | | | | | | | | | | | | | | | | | | | | | | | | | | | | |
Venezuela | | | 6,107,587 | | | | (32,622 | ) | | | – | | | | (4,225,930 | ) | | | – | | | | – | | | | – | | | | – | | | | 1,849,035 | | | | (4,225,930 | ) |
TOTAL | | $ | 20,850,888 | | | $ | (32,622 | ) | | $ | (47,206,956 | ) | | $ | 40,831,637 | | | $ | – | | | $ | (8,913,034 | ) | | $ | 452,381 | | | $ | (372,278 | ) | | $ | 5,610,016 | | | $ | (8,368,221 | ) |
| | | | | | | | | | | | | | | | |
| | | LEVEL 1–Quoted
Prices ($) | | | LEVEL 2–Other
Significant Observable
Inputs ($) | | | LEVEL 3–
Significant Unobservable
Inputs ($) | | | Total ($) | |
| Select International Equity Fund II | | | | | | | | | | | | | | | | |
| Investments in Securities | | | | | | | | | | | | | | | | |
Common Stocks | | | 282,100,712 | | | | – | | | | – | | | | 282,100,712 | |
Preferred Stocks | | | 38,731,733 | | | | – | | | | – | | | | 38,731,733 | |
| | | | | | | | | | | | | | | | |
| | | 320,832,445 | | | | – | | | | – | | | | 320,832,445 | |
| | | | | | | | | | | | | | | | |
| Total Return Bond Fund | | | | | | | | | | | | | | | | |
| Investments in Securities | | | | | | | | | | | | | | | | |
Asset-Backed Securities | | | – | | | | 164,361,684 | | | | – | | | | 164,361,684 | |
Commercial Mortgage-Backed Securities | | | – | | | | 301,817,349 | | | | 12,663,773 | | | | 314,481,122 | |
Corporate Bonds | | | – | | | | 471,917,377 | | | | – | | | | 471,917,377 | |
Municipal Bonds | | | – | | | | 66,205,555 | | | | – | | | | 66,205,555 | |
Government Bonds | | | – | | | | 290,101,003 | | | | – | | | | 290,101,003 | |
U.S. Agencies | | | – | | | | 236,792,522 | | | | – | | | | 236,792,522 | |
U.S. Treasuries | | | – | | | | 104,419,466 | | | | – | | | | 104,419,466 | |
Repurchase Agreement | | | – | | | | 78,162,894 | | | | – | | | | 78,162,894 | |
| Other Financial Instruments | | | | | | | | | | | | | | | | |
| Assets | | | | | | | | | | | | | | | | |
Forward Foreign Currency Exchange Contracts | | | – | | | | 4,156,290 | | | | – | | | | 4,156,290 | |
| Liabilities | | | | | | | | | | | | | | | | |
Forward Foreign Currency Exchange Contracts | | | – | | | | (2,344,284 | ) | | | – | | | | (2,344,284 | ) |
| | | | | | | | | | | | | | | | |
| | | – | | | | 1,715,589,856 | | | | 12,663,773 | | | | 1,728,253,629 | |
| | | | | | | | | | | | | | | | |
2013 Annual Report
61
Notes to Financial Statements (continued)
October 31, 2013
Asset Valuation Inputs
| | | | | | | | | | | | | | | | | | | | | | | | | | | | | | | | | | | | | | | | |
Total Return Bond Fund Rollforward of Level 3 Fair Value Measurement For the Year Ended October 31, 2013 | |
| Investments in Securities | | Balance as of
October 31,
2012 | | | Accrued
Discounts
(Premiums) | | | Realized
Gain (Loss) | | | Change in
Unrealized
Appreciation
(Depreciation) | | | Net
Purchases | | | Net Sales | | | Net
Transfers
in to
Level 3 | | | Net
Transfers
out of
Level 3 | | | Balance as of
October 31,
2013 | | | Change in
Unrealized
Appreciation
(Depreciation)
from
Investments
Held at
October 31,
2013 | |
ASSET-BACKED SECURITIES | | | | | | | | | | | | | | | | | | | | | | | | | | | | | | | | | | | | | | | | |
Russia | | $ | 96,894 | | | $ | – | | | $ | 2,032 | | | $ | 964 | | | $ | – | | | $ | (99,890 | ) | | $ | – | | | $ | – | | | $ | – | | | $ | – | |
United States | | | 11,138,254 | | | | – | | | | 67,691 | | | | (243,056 | ) | | | 172,987 | | | | (4,456,689 | ) | | | 5,984,586 | | | | – | | | | 12,663,773 | | | | (135,052 | ) |
TOTAL | | $ | 11,235,148 | | | $ | – | | | $ | 69,723 | | | $ | (242,092 | ) | | $ | 172,987 | | | $ | (4,556,579 | ) | | $ | 5,984,586 | | | $ | – | | | $ | 12,663,773 | | | $ | (135,052 | ) |
| | | | | | | | | | | | | | | | |
| | | LEVEL 1–Quoted
Prices ($) | | | LEVEL 2–Other
Significant Observable
Inputs ($) | | | LEVEL 3–
Significant Unobservable
Inputs ($) | | | Total ($) | |
| Global High Income Fund | | | | | | | | | | | | | | | | |
| Investments in Securities | | | | | | | | | | | | | | | | |
Corporate Bonds | | | – | | | | 1,807,262,911 | | | | 78,069,504 | | | | 1,885,332,415 | |
Government Bonds | | | – | | | | 63,674,293 | | | | – | | | | 63,674,293 | |
Term Loans | | | – | | | | 195,362,766 | | | | 50,905,340 | | | | 246,268,106 | |
Common Stocks | | | 10,889,754 | | | | – | | | | 32,749,750 | | | | 43,639,504 | |
Preferred Stocks | | | 17,381,795 | | | | 21,539,628 | | | | – | | | | 38,921,423 | |
Warrants | | | 10,182,957 | | | | – | | | | – | | | | 10,182,957 | |
Repurchase Agreement | | | – | | | | 217,763,519 | | | | – | | | | 217,763,519 | |
| Other Financial Instruments | | | | | | | | | | | | | | | | |
| Assets | | | | | | | | | | | | | | | | |
Forward Foreign Currency Exchange Contracts | | | – | | | | 3,014,000 | | | | – | | | | 3,014,000 | |
Credit Default Swaps Contracts | | | – | | | | 11,220,095 | | | | – | | | | 11,220,095 | |
| Liabilities | | | | | | | | | | | | | | | | |
Forward Foreign Currency Exchange Contracts | | | – | | | | (4,161,781 | ) | | | – | | | | (4,161,781 | ) |
| | | | | | | | | | | | | | | | |
| | | 38,454,506 | | | | 2,315,675,431 | | | | 161,724,594 | | | | 2,515,854,531 | |
| | | | | | | | | | | | | | | | |
Annual Report 2013
62
Notes to Financial Statements (continued)
October 31, 2013
Asset Valuation Inputs
| | | | | | | | | | | | | | | | | | | | | | | | | | | | | | | | | | | | | | | | |
Global High Income Fund Rollforward of Level 3 Fair Value Measurement For the Year Ended October 31, 2013 | |
| Investments in Securities | | Balance as of
October 31,
2012 | | | Accrued
Discounts
(Premiums) | | | Realized
Gain
(Loss) | | | Change in
Unrealized
Appreciation
(Depreciation) | | | Net
Purchases | | | Net Sales | | | Net
Transfers in
to Level 3 | | | Net
Transfers
out of
Level 3 | | | Balance as of
October 31,
2013 | | | Change in
Unrealized
Appreciation
(Depreciation)
from
Investments
Held at
October 31,
2013 | |
TERM LOANS | | | | | | | | | | | | | | | | | | | | | | | | | | | | | | | | | | | | | | | | |
Norway | | $ | 3,844,710 | | | $ | – | | | $ | – | | | $ | 3,558 | | | $ | – | | | $ | (3,848,268 | ) | | $ | – | | | $ | – | | | $ | – | | | $ | – | |
United States | | | 66,857,867 | | | | 193,342 | | | | (111,879 | ) | | | 1,266,573 | | | | 49,908,534 | | | | (67,209,097 | ) | | | – | | | | – | | | | 50,905,340 | | | | 1,167,037 | |
COMMON STOCK | | | | | | | | | | | | | | | | | | | | | | | | | | | | | | | | | | | | | | | | |
Norway | | | 25,191,626 | | | | – | | | | – | | | | 7,558,124 | | | | – | | | | – | | | | – | | | | – | | | | 32,749,750 | | | | 7,558,124 | |
CORPORATE BONDS | | | | | | | | | | | | | | | | | | | | | | | | | | | | | | | | | | | | | | | | |
United States | | | 51,920,753 | | | | – | | | | – | | | | 2,180,062 | | | | 7,832,000 | | | | – | | | | 16,136,689 | | | | – | | | | 78,069,504 | | | | 2,180,062 | |
TOTAL | | $ | 147,814,956 | | | $ | 193,342 | | | $ | (111,879 | ) | | $ | 11,008,317 | | | $ | 57,740,534 | | | $ | (71,057,365 | ) | | $ | 16,136,689 | | | $ | – | | | $ | 161,724,594 | | | $ | 10,905,223 | |
Amounts listed as “–” are $0 or round to $0.
The following is quantitative information about level 3 fair value measurements:
| | | | | | | | | | | | |
| Description | | Fair Value at
10/31/13 ($) | | | Valuation
Technique(s) | | Unobservable
Inputs | | Range | | Weighted
Average |
Global High Income Fund | | | | | | | | | | | | |
Bank Loans | | | 50,905,340 | | | Broker Pricing | | Bid/Ask Spread | | $99 – $102.5 | | $100.54 |
Common Stocks | | | 32,749,750 | | | Broker Pricing | | Bid/Ask Spread | | $21 – $25 | | $22.93 |
Corporate Bonds | | | 78,069,504 | | | Broker Pricing | | Bid/Ask Spread | | $2.925 – $107.35 | | $102.82 |
The Funds may enter into repurchase agreements, under the terms of a Master Repurchase Agreement. It is each Fund's policy that its custodian/counterparty segregate the underlying collateral securities, the value of which exceeds the principal amount of the repurchase transaction, including accrued interest. The repurchase price generally equals the price paid by a Fund plus interest negotiated on the basis of current short-term rates. To the extent that any repurchase transaction exceeds one business day, the collateral is valued on a daily basis to determine its adequacy. If the counterparty defaults and the value of the collateral declines or if bankruptcy proceedings are commenced with respect to the counterparty of the security, realization of the collateral by the Funds may be delayed or limited.
Restricted securities are privately-placed securities whose resale is restricted under U.S. securities laws. The Funds may invest in restricted securities, including unregistered securities eligible for resale without registration pursuant to Rule 144A and privately-placed securities of U.S. and non-U.S. issuers offered outside the U.S. without registration pursuant to Regulation S under the Securities Act of 1933, as amended (the "1933 Act"). Rule 144A securities may be freely traded among certain qualified institutional investors, such as the Funds, but resale of such securities in the U.S. is permitted only in limited circumstances.
| (d) | Foreign Currency Translation |
Foreign currency amounts are translated into U.S. Dollars at the current rate of exchange as of 11:00am Eastern time for Equity Funds and as of 4:00pm Eastern time for Fixed Income Funds ("Valuation Time"), to determine the value of investments, assets and liabilities. Purchases and sales of securities, and income and expenses are translated at the prevailing rate of exchange on the respective date of these transactions. The Funds do not isolate that portion of the results of operations resulting from changes in foreign exchange rates on investments from fluctuations arising from changes in market prices of securities held. These fluctuations are included with the net realized and unrealized gain or loss from investments and foreign currencies within the Statements of Operations.
2013 Annual Report
63
Notes to Financial Statements (continued)
October 31, 2013
Foreign securities, currencies, and other assets and liabilities denominated in foreign currencies are translated into U.S. Dollars at the exchange rate of said currencies against the U.S. Dollar, as of the Valuation Time, as provided by an independent pricing service.
Investments in emerging markets can be riskier and more volatile than investments in the United States and other developed markets. Adverse political and economic developments can make it more difficult for the International Equity Fund to sell its foreign securities which could reduce the NAV of the International Equity Fund. In contrast to more established markets, emerging markets may have governments that are less stable and markets that are less liquid, increasing your investment risk. At October 31, 2013, the International Equity Fund had 0.32% of its net assets invested in Venezuelan securities and held Venezuelan Bolivar valued at 0.07% of the International Equity Fund’s net assets. Venezuela currently imposes foreign exchange controls which prohibit the International Equity Fund from repatriating dividends, interest, or other income from investments or proceeds from the sale of Venezuelan securities.
| (e) | Derivative Financial Instruments |
The Funds are authorized to use derivatives to manage currency risk, credit risk, and interest rate risk and to replicate, or use as a substitute for, physical securities. Losses may arise due to changes in the value of the contract or if the counterparty does not perform under the contract. The use of derivative instruments involves, to varying degrees, elements of market risk in excess of the amount recognized in the Statements of Assets and Liabilities.
Forward Foreign Currency Exchange Contracts
A forward foreign currency exchange contract (“forward contract”) involves an obligation to purchase and sell a specific currency at a future date at a price set at the time of the contract. Forward contracts are used to manage a Fund’s currency exposure in an efficient manner. They are used to sell unwanted currency exposure that comes with holding securities in a market, or to buy currency exposure where the exposure from holding securities is insufficient to give the desired currency exposure either in absolute terms or relative to the benchmark. The use of forward contracts allows the separation of decision-making between markets and their currencies. The forward contract is marked-to-market daily and the change in market value is recorded by the Fund as unrealized appreciation or depreciation. Forward contracts' prices are received daily from an independent pricing provider. When the forward contract is closed, a Fund records a realized gain or loss equal to the difference between the value at the time it was opened and the value at the time it was closed. These realized and unrealized gains and losses are reported on the Statements of Operations. During the year, the Fund used forward contracts for the purposes of efficient portfolio management and managing active currency risk relative to the benchmark, the latter of which involves both hedging currency risk and adding currency risk in excess of underlying bond positions.
During the twelve month reporting period, the Funds used currency forward contracts for the purposes of efficient portfolio management and managing active currency risk relative to the benchmark, the latter of which involves both hedging currency risk and adding currency risk in excess of underlying bond positions.
Futures Contracts
Certain Funds may invest in financial futures contracts (“futures contracts”) for the purpose of hedging their existing portfolio securities, or securities that a Fund intends to purchase, against fluctuations in value caused by changes in prevailing market interest rates or prices. Futures contracts may also be entered into for non-hedging purposes; however, in those instances, the aggregate initial margin and premiums required to establish a Fund’s positions may not exceed 5% of a Fund’s NAV after taking into account unrealized profits and unrealized losses on any such contract it has entered.
Upon entering into a futures contract, a Fund is required to pledge to the broker an amount of cash and/or other assets equal to a certain percentage of the contract amount. This payment is known as "initial margin". Subsequent payments, known as “variation margin,” are calculated each day, depending on the daily fluctuations in the fair value/market value of the underlying assets. An unrealized gain/(loss) equal to the variation margin is recognized on a daily basis. When the contract expires or is closed, the gain/(loss) is realized and is presented in the Statements of Operations as a net realized gain/(loss) on futures contracts. Futures contracts are valued daily at their last quoted sale price on the exchange on which they are traded.
A “sale” of a futures contract means a contractual obligation to deliver the securities or foreign currency called for by the contract at a fixed price at a specified time in the future. A “purchase” of a futures contract means a contractual obligation to acquire the securities or foreign currency at a fixed price at a specified time in the future.
Should market conditions change unexpectedly, a Fund may not achieve the anticipated benefits of the futures contracts and may realize a loss. The use of futures transactions for hedging purposes involves the risk of imperfect correlation in movements in the price of futures contracts, interest rates and the value/market value of the underlying hedged assets. During the twelve month reporting period, futures contracts were used to manage the interest rate risks and raise the efficiency of the Funds.
Annual Report 2013
64
Notes to Financial Statements (continued)
October 31, 2013
The Funds entered into swap contracts that function similar to futures contracts (“synthetic futures”) to gain exposure and to protect against changes in security values. Generally, synthetic futures are counterparty agreements and do not require daily variation margin payments to be directly paid to the counterparty; however, they do require hard segregation of cash. These amounts are included on the Statement of Assets and Liabilities as cash on deposit with broker. In connection with their use of synthetic futures, the Funds are exposed to the credit risk of the counterparty in addition to the risks described above. The accounting treatment of synthetic futures is similar to that described above for standard futures contracts. The Funds disclose synthetic futures with other futures contracts. The Funds’ maximum risk of loss associated with futures contracts is minimal since futures contracts are exchange traded and the exchange’s clearinghouse, as counterparty to all exchange traded futures contracts, guarantees the futures contracts against default. The Fund’s maximum risk of loss due to counterparty credit risk for synthetic futures contracts is the unrealized appreciation for synthetic futures contracts.
Swaps
Certain Funds enter into swaps to efficiently gain or hedge interest rate or currency risk. A swap is an agreement that obligates two parties to exchange a series of cash flows at specified intervals based upon or calculated by reference to changes in specified prices or rates for a specified amount of an underlying asset or notional principal amount. A Fund will enter into swaps only on a net basis, which means that the two payment streams are netted out, with a Fund receiving or paying, as the case may be, only the net amount of the difference between the two payments. Risks may arise as a result of the failure of the counterparty to the swap contract to comply with the terms of the swap contract. The loss incurred by the failure of a counterparty is generally limited to the net interest payment to be received by a Fund, and/or the termination value at the end of the contract. Therefore, a Fund considers the creditworthiness of each counterparty to a swap contract in evaluating potential credit risk. Additionally, risks may arise from unanticipated movements in interest rates or in the value of the underlying reference asset or index. A Fund records unrealized gains/(losses) on a daily basis representing the value and the current net receivable or payable relating to open swap contracts. Net amounts received or paid on the swap contract are recorded as realized gains/(losses). Fluctuations in the value of swap contracts are recorded for financial statement purposes as unrealized appreciation or depreciation of swap contracts. Realized gains/(losses) from terminated swaps are included in net realized gains/(losses) on swap contracts transactions.
Certain Funds are a party to International Swap Dealers Association, Inc. Master Agreements (“ISDA Master Agreements”). These agreements are with select counterparties and they govern transactions, including certain over-the-counter derivative and foreign exchange contracts, entered into by certain Funds and the counterparty. The ISDA Master Agreements maintain provisions for general obligations, representations, agreements, collateral, and events of default or termination. The occurrence of a specified event of termination may give a counterparty the right to terminate all of its contracts and affect settlement of all outstanding transactions under the applicable ISDA Master Agreement.
Credit Default Swaps
Certain Funds use credit default swap contracts to limit or reduce risk exposure of defaults of corporate and sovereign issuers (i.e., to reduce risk when a Fund owns or has exposure to such issuers), or to create direct or synthetic short or long exposure to domestic or foreign corporate debt securities or certain sovereign debt securities to which a Fund is not otherwise exposed. As the seller in a credit default swap contract, a Fund would be required to pay the par (or other agreed-upon) value of a referenced debt obligation to the counterparty in the event of a default (or similar event) by a third party, such as a U.S. or foreign issuer, on the debt obligation. In return, a Fund would receive from the counterparty a periodic stream of payments over the term of the contract, provided that no event of default (or similar event) occurs. If no event of default (or similar event) occurs, a Fund would keep the stream of payments and would have no payment of obligations. As the seller in a credit default swap contract, a Fund effectively would add economic leverage to its portfolio because, in addition to its total net assets, a Fund would be subject to investment exposure on the notional amount of the swap. As the purchaser in a credit default swap contract, a Fund would function as the counterparty referenced in the preceding paragraph. This would involve the risk that the investment might expire worthless. It also would involve credit risk that the seller may fail to satisfy its payment obligations to a Fund in the event of a default (or similar event). As the purchaser in a credit default swap contract, a Fund's investment would generate income only in the event of an actual default (or similar event) by the issuer of the underlying obligation.
Total Return Swaps
The Funds entered into total return swaps primarily to preserve a return or spread on a particular investment or portion of their portfolio. A total return swap is an agreement to exchange the return on a stock, bond or index for a fixed or variable financing charge.
The Funds will usually enter into swaps on a net basis, that is, the two payment streams are netted out in a cash settlement on the payment date or dates specified in the instrument, with a Fund receiving or paying, as the case may be, only the net amount of the two payments. In as much as these swaps are entered into for good faith hedging purposes, the Adviser believes such obligations do not
2013 Annual Report
65
Notes to Financial Statements (continued)
October 31, 2013
constitute senior securities under the 1940 Act, and, accordingly, will not treat them as being subject to its borrowing restrictions. The Funds will not enter into any swap transaction unless, at the time of entering into such transaction, the unsecured long-term debt of the counterparty, combined with any credit enhancements on the swap contracts, is rated at least A by Standard & Poor’s (S&P) or Moody’s Investors Service (“Moody’s”) or has an equivalent rating from a nationally recognized statistical rating organization (“NRSRO”) or is determined to be of equivalent credit quality by the Adviser. If there is a default by the counterparty, the Funds may have contractual remedies pursuant to the agreements related to the transaction.
Entering into swap agreements involves, to varying degrees, elements of credit and market risk in excess of the amounts recognized on the Statements of Assets and Liabilities. Such risks involve the possibility that there will be no liquid market for these agreements, that the counterparty to the agreements may default on its obligation to perform and that there may be unfavorable changes in the value of the index or securities underlying the agreement. The Funds’ maximum risk of loss from counterparty risk related to swaps is the fair value of the contract. This risk is mitigated by having a master netting agreement between the Funds and the counterparties and by the posting of collateral by the counterparties to the Funds to cover the Funds’ exposure to the counterparty.
Summary of Derivative Instruments
Certain Funds may use derivatives for various purposes as noted above. The following is a summary of the fair value of Derivative Instruments, not accounted for as hedging instruments, as of October 31, 2013:
Global Select Opportunities Fund
The Effect of Derivative Instruments on the Statement of Operations for the Year Ended October 31, 2013
| | | | | | | | | | |
Derivatives not accounted for as hedging
instruments under Statement 133(a) | | Location of Gain or (Loss)
on Derivatives | | Realized Gain or (Loss)
on Derivatives | | | Change in
Unrealized
Appreciation/
Depreciation on
Derivatives | |
| | | |
| | Realized/Unrealized Gain/(Loss)
from Investments and Foreign Currency Transactions | | | | | | | | |
| Forward foreign exchange contracts | | | | | | | | | | |
(foreign exchange risk) | | | | $ | 29,233 | | | $ | – | |
Total | | | | $ | 29,233 | | | $ | – | |
Select International Equity Fund
The Effect of Derivative Instruments on the Statement of Operations for the Year Ended October 31, 2013
| | | | | | | | | | |
Derivatives not accounted for as hedging
instruments under Statement 133(a) | | Location of Gain or (Loss)
on Derivatives | | Realized Gain or (Loss)
on Derivatives | | | Change in
Unrealized
Appreciation/
Depreciation on
Derivatives | |
| | | |
| | Realized/Unrealized Gain/(Loss)
from Investments and Foreign Currency Transactions | | | | | | | | |
Total return swaps | | | | | | | | | | |
(equity contracts risk) | | | | $ | 18,167,196 | | | $ | (10,053,134 | ) |
| Forward foreign exchange contracts | | | | | | | | | | |
(foreign exchange risk) | | | | $ | 13,956,223 | | | $ | – | |
| Futures contracts | | | | | | | | | | |
(interest rate risk) | | | | $ | 2,741,722 | | | $ | – | |
Total | | | | $ | 34,865,141 | | | $ | (10,053,134 | ) |
Annual Report 2013
66
Notes to Financial Statements (continued)
October 31, 2013
Select International Equity Fund II
The Effect of Derivative Instruments on the Statement of Operations for the Year Ended October 31, 2013
| | | | | | | | | | |
Derivatives not accounted for as hedging
instruments under Statement 133(a) | | Location of Gain or (Loss)
on Derivatives | | Realized Gain or (Loss)
on Derivatives | | | Change in
Unrealized
Appreciation/
Depreciation on
Derivatives | |
| | | |
| | Realized/Unrealized Gain/(Loss)
from Investments and Foreign Currency Transactions | | | | | | | | |
Total return swaps | | | | | | | | | | |
(equity contracts risk) | | | | $ | 12,588,340 | | | $ | (5,652,964 | ) |
| Forward foreign exchange contracts | | | | | | | | | | |
(foreign exchange risk) | | | | $ | 9,225,010 | | | $ | – | |
| Futures contracts | | | | | | | | | | |
(interest rate risk) | | | | $ | 1,569,244 | | | $ | – | |
Total | | | | $ | 23,382,594 | | | $ | (5,652,964 | ) |
| | | | | | | | | | | | |
| Total Return Bond Fund | | Asset Derivatives | | | Liability Derivatives | |
| | | Year Ended October 31, 2013 | | | Year Ended October 31, 2013 | |
Derivatives not accounted for as hedging
instruments and risk exposure | | Statement of Assets and
Liabilities Location | | Fair Value | | | Statement of Assets and
Liabilities Location | | Fair Value | |
| Forward foreign exchange contracts | | | | | | | | | | | | |
(foreign exchange risk) | | Unrealized appreciation
on forward currency exchange contracts | | $ | 4,156,290 | | | Unrealized depreciation
on forward currency exchange contracts | | $ | 2,344,284 | |
Total | | | | $ | 4,156,290 | | | | | $ | 2,344,284 | |
The Effect of Derivative Instruments on the Statement of Operations for the Year Ended October 31, 2013
| | | | | | | | | | |
Derivatives not accounted for as
hedging instruments under Statement
133(a) | | Location of Gain or (Loss) on
Derivatives | | Realized Gain or (Loss)
on Derivatives | | | Change in
Unrealized
Appreciation/
Depreciation on
Derivatives | |
| | | |
| | Realized/Unrealized Gain/(Loss) from Investments, Futures Contracts and Foreign Currency Transactions | | | | | | | | |
| Forward foreign exchange contracts | | | | | | | | | | |
(foreign exchange risk) | | | | $ | 9,577,686 | | | $ | 908,408 | |
Total | | | | $ | 9,577,686 | | | $ | 908,408 | |
2013 Annual Report
67
Notes to Financial Statements (continued)
October 31, 2013
| | | | | | | | | | | | |
| Global High Income Fund | | Asset Derivatives | | | Liability Derivatives | |
| | | Year Ended October 31, 2013 | | | Year Ended October 31, 2013 | |
Derivatives not accounted for as hedging
instruments and risk exposure | | Statement of Assets and
Liabilities Location | | Fair Value | | | Statement of Assets and
Liabilities Location | | Fair Value | |
| Credit default swaps | | | | | | | | | | | | |
(credit risk) | | Open swap contracts,
at value | | $ | 7,546,281 | | | Open swap contracts,
at value | | $ | 512,494 | |
| Forward foreign exchange contracts | | | | | | | | | | | | |
(foreign exchange risk) | | Unrealized appreciation on forward currency exchange contracts | | $ | 3,014,000 | | | Unrealized depreciation on forward currency exchange contracts | | $ | 4,161,781 | |
Total | | | | $ | 10,560,281 | | | | | $ | 4,674,275 | |
The Effect of Derivative Instruments on the Statement of Operations for the Year Ended October 31, 2013
| | | | | | | | | | |
Derivatives not accounted for as
hedging instruments under
Statement 133(a) | | Location of Gain or (Loss) on
Derivatives | | Realized Gain or (Loss) on
Derivatives | | | Change in
Unrealized
Appreciation/
Depreciation on
Derivatives | |
| | | |
| | Realized/Unrealized Gain/(Loss) from Investments, Futures Contracts and Foreign Currency Transactions | | | | | | | | |
| Credit default swaps | | | | | | | | | | |
(credit risk) | | | | $ | 7,462,127 | | | $ | 6,867,330 | |
| Total return swaps | | | | | | | | | | |
(equity contracts risk) | | | | $ | 366,804 | | | $ | — | |
| Forward foreign exchange contracts | | | | | | | | | | |
(foreign exchange risk) | | | | $ | (8,462,711 | ) | | $ | (1,123,666 | ) |
Total | | | | $ | (633,780 | ) | | $ | 5,743,664 | |
The Funds value derivatives at fair value, as described in this note, and recognize changes in fair value currently in the results of operations. Accordingly, the Funds do not follow hedge accounting even for derivatives employed as economic hedges.
During January and February 2013, the Global Select Opportunities Fund held forward currency contracts in the Japanese Yen. The Fund sold out of all forward currency contracts in March 2013. The volume of forward contracts was unvaried throughout the period. The quarterly average notional values for the Fund’s forward contracts were as follows:
| | | | |
| Quarter | | Weighted Average
Notional Value | |
1st Quarter | | $ | 468,557 | |
2nd Quarter | | | 463,388 | |
During the first two quarters of the year ended October 31, 2013, the Select International Equity Fund held forward currency contracts in the Euro, Japanese Yen, Mexican Peso, and Swiss Franc. The Fund sold out of all forward currency contracts in May 2013. The volume of forward contracts varied throughout the period with an average notional value of $187,212,775. The quarterly average notional values for the Fund’s forward contracts were as follows:
| | |
| Quarter | | Weighted Average
Notional Value |
1st Quarter | | $153,175,315 |
2nd Quarter | | 221,250,236 |
Annual Report 2013
68
Notes to Financial Statements (continued)
October 31, 2013
During the first two quarters of the year ended October 31, 2013, the Select International Equity Fund held bond and equity total return swaps. The Fund sold out of all swap positions in May 2013. The volume of the total return swaps varied throughout the period with an average notional value of $(41,044,098) and 114,851, for total return bond swaps and total return equity swaps, respectively. The quarterly average notional values for the Fund’s total return swaps were as follows:
| | | | | | | | |
| Quarter | | Total Return Bond Swaps
Weighted Average
Notional Value | | | Total Return Equity Swaps
Weighted Average
Notional Value | |
1st Quarter | | $ | (51,261,408 | ) | | $ | 145,201 | |
2nd Quarter | | | (30,826,788 | ) | | | 84,500 | |
In April 2013, the Select International Equity Fund held Tokyo Stock Price Index futures contracts. The Fund sold out of all futures contracts in May 2013. The quarterly average contracts and notional values for the Fund’s futures contracts were 18 and $1,800,000, respectively.
During the first two quarters of the year ended October 31, 2013, the Select International Equity II Fund held forward currency contracts in the Euro, Japanese Yen, Mexican Peso, and Swiss Franc. The Fund sold out of all forward currency contracts in May 2013. The volume of forward contracts varied throughout the period with an average notional value of $136,782,538. The quarterly average notional values for the Fund’s forward contracts were as follows:
| | |
| Quarter | | Weighted Average
Notional Value |
1st Quarter | | $116,238,730 |
2nd Quarter | | 157,326,346 |
During the first two quarters of the year ended October 31, 2013, the Select International Equity II Fund held bond and equity total return swaps. The Fund sold out of all swap positions in May 2013. The volume of the total return swaps varied throughout the period with an average notional value of $(30,064,986) and 86,842, for total return bond swaps and total return equity swaps, respectively. The quarterly average notional values for the Fund’s total return swaps were as follows:
| | | | | | | | |
| Quarter | | Total Return Bond Swaps
Weighted Average
Notional Value | | | Total Return Equity Swaps
Weighted Average
Notional Value | |
1st Quarter | | $ | (40,375,441 | ) | | $ | 118,761 | |
2nd Quarter | | | (19,754,530 | ) | | | 54,924 | |
In April 2013, the Select International Equity II Fund held Tokyo Stock Price Index futures contracts. The Fund sold out of all swap positions in May 2013. The quarterly average contracts and notional values for the Fund’s futures contracts were 10 and $990,000, respectively.
For the Total Return Bond Fund information about forward currency contracts reflected as of the date of this report is generally indicative of the type of activity for the six months ended October 31, 2013. During the year the Fund also held forward currency contract in the Euro, Japanese Yen, and Russian Ruble. The volume of forward contracts varied throughout the period with an average notional value of $320,746,318. The quarterly average notional values for the Fund’s forward contracts were as follows:
| | | | |
| Quarter | | Weighted Average
Notional Value | |
1st Quarter | | $ | 383,011,585 | |
2nd Quarter | | | 334,299,483 | |
3rd Quarter | | | 255,429,945 | |
4th Quarter | | | 310,244,260 | |
2013 Annual Report
69
Notes to Financial Statements (continued)
October 31, 2013
For the Global High Income Fund information about forward currency contracts reflected as of the date of this report is generally indicative of the type of activity for the six months ended October 31, 2013. The volume of forward contracts varied throughout the period with an average notional value of $422,165,625. The quarterly average notional values for the Fund’s forward contracts were as follows:
| | | | |
| Quarter | | Weighted Average
Notional Value | |
1st Quarter | | $ | 444,691,911 | |
2nd Quarter | | | 392,559,240 | |
3rd Quarter | | | 436,637,817 | |
4th Quarter | | | 414,773,529 | |
Information about Global High Income Fund’s credit default swaps reflected as of the date of this report is generally indicative of the type of activity for the quarter ended October 31, 2013. The volume increased in the final two quarters, ending the year with an average notional value of $82,372,917. The quarterly average notional values for the Fund’s credit default swaps were as follows:
| | | | |
| Quarter | | Weighted Average
Notional Value | |
1st Quarter | | $ | 65,591,667 | |
2nd Quarter | | | 63,330,000 | |
3rd Quarter | | | 90,540,000 | |
4th Quarter | | | 110,030,000 | |
During the period January through May 2013, the Global High Income Fund held bond and equity total return swaps. The Fund sold out of all swap positions in June 2013. The volume of the total return swaps varied throughout the period with an average notional value of $41,666,667 and (192,053), for total return bond swaps and total return equity swaps, respectively. The quarterly average notional values for the Fund’s total return swaps were as follows:
| | | | | | | | |
| Quarter | | Total Return Bond Swaps
Weighted Average
Notional Value | | | Total Return Equity Swaps
Weighted Average
Notional Value | |
1st Quarter | | $ | 50,000,000 | | | $ | (230,389 | ) |
2nd Quarter | | | 40,000,001 | | | | (184,386 | ) |
3rd Quarter | | | 35,000,001 | | | | (161,384 | ) |
The Global High Income Fund may invest in term loans. Term loans include institutionally traded floating and fixed-rate debt obligations generally acquired as a participation interest in or assignment of a loan originated by a lender or financial institution. Assignments and participations involve credit, interest rate, and liquidity risk. Interest rates on floating rate securities adjust with interest rate changes and/or issuer credit quality. Many such loans are secured, although some may be unsecured. Loans that are fully secured offer a fund more protection than an unsecured loan in the event of non-payment of scheduled interest or principal. There is no assurance that any collateral securing a loan could be liquidated or, if liquidated, that such collateral would be of sufficient value to repay the loans taken against it. There may be limited secondary market liquidity for these instruments which could result in volatile pricing for the securities which in turn may affect the Global High Income Fund’s NAV.
The Global High Income Fund may enter into, or acquire participation in, delayed funding loans and revolving credit facilities. Delayed funding loans and revolving credit facilities are borrowings in which the Global High Income Fund agrees to make loans up to a maximum amount upon demand by the borrowing issuer for a specified term. A revolving credit facility differs from a delayed funding loan in that as the borrowing issuer repays the loan, an amount equal to the repayment is again made available to the borrowing issuer under the facility. The borrowing issuer may at any time borrow and repay amounts so long as, in the aggregate, at any given time the amount borrowed does not exceed the maximum amount. Delayed funding loans and revolving credit facilities usually provide for floating or variable rates of interest.
There are a number of risks associated with an investment in delayed funding loans and revolving credit facilities including credit, interest rate and liquidity risk and the risks of being a lender. There may be circumstances under which the borrowing issuer’s credit risk may be deteriorating and yet the Global High Income Fund may be obligated to make loans to the borrowing issuer as the borrowing issuer’s credit continues to deteriorate, including at a time when the borrowing issuer’s financial condition makes it unlikely that such amounts will be repaid. Delayed funding loans and revolving credit facilities may be subject to restrictions on transfer, and only limited opportunities may
Annual Report 2013
70
Notes to Financial Statements (continued)
October 31, 2013
exist to resell such instruments. As a result, the Global High Income Fund may be unable to sell such investments at an opportune time or may have to resell them at less than fair market value. These risks could cause the Global High Income Fund to lose money on its investment, which in turn could affect its returns. The Global High Income Fund currently intends to treat delayed funding loans and revolving credit facilities for which there is no readily available market as illiquid for purposes of its limitation on illiquid investments. Delayed funding loans and revolving credit facilities are considered to be debt obligations for purposes of the Trust’s investment restriction relating to the lending of funds or assets by the Global High Income Fund.
At October 31, 2013, there were three unfunded commitments which amounted to $27,296,626 of par and had cost and fair value of $18,160,446 and $17,237,641, respectively.
Global Select Opportunities Fund, Select International Equity Fund, and Select International Equity Fund II have established securities lending agreements with State Street Bank and Trust Company (“State Street”) in which the Funds lend portfolio securities to a broker. In exchange, collateral consisting of either cash or U.S. government securities in an amount of at least 102% of the value of the U.S. securities loaned and 105% of the value of the foreign securities loaned will be maintained at all times. These Funds may loan securities to brokers, dealers, and financial institutions determined by the Adviser to be creditworthy, subject to certain limitations. Under these agreements, these Funds continue to earn income on the securities loaned. Collateral received is generally cash, and such Funds invest the cash in the State Street Navigator Securities Lending Prime Portfolio. These Funds receive any interest on the amount invested, but they must also pay the broker a loan rebate fee computed as a varying percentage of the collateral received. In the event of counterparty default, these Funds are subject to potential loss if any such Fund is delayed or prevented from exercising its right to dispose of the collateral. These Funds each bear risk in the event that invested collateral is not sufficient to meet obligations due on the loans. The security lending income net of the loan rebate fee for the Global Select Opportunities Fund, Select International Equity Fund and Select International Equity Fund II, amounted to $431, $193,817 and $90,874, respectively, for the year ended October 31, 2013 and is included in securities lending income in the Statement of Operations.
On April 29, 2013, the Adviser elected to suspend the securities lending program for the Funds pending a suitability review.
| (h) | Security Transactions, Investment Income and Expenses |
Securities transactions are recorded on the trade date. Realized and unrealized gains/(losses) from security and currency transactions are calculated on the identified cost basis. Dividend income is recorded on the ex-dividend date except for certain dividends on foreign securities, which are recorded as soon as a Fund is informed after the ex-dividend date. Interest income is recorded on an accrual basis using the effective interest method. Expenses are recorded on an accrual basis. Expenses directly attributable to a Fund are charged to that Fund. Expenses not directly attributable to a Fund are allocated proportionately among all or certain funds of the Trust. For each of the Funds, the method for allocating income, fund level expenses, and realized and unrealized gains or losses is based on the total NAV of that class’s shares in proportion to the total net assets of the Fund. Expenses specific to a class (such as Rule 12b-1 and administrative services fees) are charged to that class.
Distributions from net investment income, if any, are declared and paid monthly for the Total Return Bond Fund and Global High Income Fund. Distributions from net investment income, if any, are declared and paid annually for the Global Select Opportunities Fund, Select International Equity Fund, and Select International Equity Fund II. The Funds will also declare and pay distributions annually from net realized gains on investment transactions and net realized foreign exchange gains, if any. Dividends and distributions to shareholders are recorded on the ex-dividend date. Additional distributions of net investment income and capital gains may be made at the discretion of the Boards of the Funds to avoid the application of the excise tax imposed under Section 4982 of the Internal Revenue Code of 1986, as amended (the "Code"), for certain undistributed amounts.
Dividends and distributions to shareholders are determined in accordance with federal income tax regulations, which may differ from GAAP. These differences are primarily due to differing treatments of income and gains on various investment securities held by the Funds, timing differences and differing characterization of distributions made by the Funds as a whole.
Each Fund intends to continue to qualify as a “regulated investment company” by complying with the provisions available to certain investment companies, as defined in Subchapter M of the Code, and to make distributions of net investment income and net realized capital gains sufficient to relieve the Funds from all, or substantially all, federal income taxes. Therefore, no federal income tax provision is required.
Management of the Funds has concluded that there are no significant uncertain tax positions that would require recognition in the financial statements. Since tax authorities can examine previously filed tax returns, the Funds' U.S. federal and state tax returns for each of the four fiscal years up to the most recent fiscal year ended October 31 are subject to such review.
2013 Annual Report
71
Notes to Financial Statements (continued)
October 31, 2013
3. Agreements and Transactions with Affiliates
Under the Investment Advisory Agreements with the Funds, effective May 22, 2013, Aberdeen Asset Management Inc. (“Aberdeen” or the “Adviser”) manages the Funds in accordance with the policies and procedures established by the Boards. Prior to May 22, 2013, the Funds were managed by Artio Global Management LLC.
For services provided under the terms of the current Investment Advisory Agreement, each Fund pays the Adviser an annual management fee paid monthly based on that Fund’s average daily net assets according to the following schedule:
| | | | | | | | |
| Fund | | Fee Schedule | | | | |
Global Select Opportunities Fund | | | On all assets | | | | 0.900% | |
Select International Equity Fund | | | Of the first $5 billion | | | | 0.900% | |
| | | On the next $2.5 billion | | | | 0.880% | |
| | | Over $7.5 billion | | | | 0.850% | |
Select International Equity Fund II | | | Of the first $5 billion | | | | 0.900% | |
| | | On the next $2.5 billion | | | | 0.880% | |
| | | Over $7.5 billion | | | | 0.850% | |
Total Return Bond Fund | | | On all assets | | | | 0.350% | |
Global High Income Fund | | | Of the first $5 billion | | | | 0.650% | |
| | | On the next $2.5 billion | | | | 0.630% | |
| | | On the next $2.5 billion | | | | 0.600% | |
| | | Over $10 billion | | | | 0.590% | |
Effective May 21, 2013, the Adviser agreed to continue to waive a portion of its management fee for each of the Funds at the annual rate of 0.005% of the respective Funds’ average daily assets. The waiver may be terminated at any time by the Funds' Boards.
The Adviser has engaged the services of an affiliate as a subadviser pursuant to a subadvisory agreement (the “Subadviser”). The Subadviser manages a portion of certain of the Funds' investments and has responsibility for making all investment decisions for the portion of a Fund’s assets that it manages. Pursuant to the subadvisory agreement, the Adviser pays fees to the Subadviser. For the year ended October 31, 2013, the Adviser paid the following amounts to the Subadviser for its services to the respective Funds:
| | | | | | |
| Fund | | Subadviser | | Amount | |
Global Select Opportunities Fund | | Aberdeen Asset Managers Limited (“AAML”) | | $ | 21,936 | |
Select International Equity Fund | | AAML | | | 1,862,917 | |
Select International Equity Fund II | | AAML | | | 922,545 | |
The Funds and Aberdeen have entered into a written contract (“Expense Limitation Agreement”) limiting operating expenses for all Classes of the Funds from exceeding the amounts listed below. This limit excludes certain expenses, including any taxes, interest, brokerage commissions, and other expenditures which are capitalized in accordance with U.S. GAAP, and extraordinary expenses not incurred in the ordinary course of the Funds’ business. This contract is in effect until the earlier of (a) the termination of the Investment Advisory Agreement or (b) February 28, 2014.
| | | | | | |
| Fund | | Class A Limit | | Class I Limit | |
Global Select Opportunities Fund | | 1.40% | | | 1.15 | % |
Total Return Bond Fund | | 0.69% | | | 0.44 | % |
Global High Income Fund | | 1.00% | | | 0.75 | % |
Aberdeen may request and receive reimbursement from a Fund of the advisory fees waived and other expenses reimbursed pursuant to the Expense Limitation Agreement at a later date not to exceed three years from the fiscal year in which the corresponding reimbursement to the Funds was made.
Annual Report 2013
72
Notes to Financial Statements (continued)
October 31, 2013
For fees waived, no reimbursement will be made unless:
(i) the total annual expense ratio of the class making such reimbursement is less than the limit set forth above; and
(ii) the payment of such reimbursement is approved by the Boards on a quarterly basis (the “Reimbursement Requirements”).
If the Boards approve any changes in the waiver terms or limitations, reimbursements are only permitted to the extent that the terms of the Expense Limitation Agreement in effect at the time of the waiver are met at the time that reimbursement is approved. Except as provided for in the Expense Limitation Agreement, reimbursement of amounts previously waived or assumed by Aberdeen is not permitted.
As of October 31, 2013, to the extent the Reimbursement Requirements are met, the cumulative potential reimbursements for each Fund, based on expenses reimbursed by Aberdeen would be:
| | | | | | | | | | | | | | | | |
| Fund | | Amount
Fiscal Year
2011
(Expires 10/31/14) | | | Amount
Fiscal Year
2012
(Expires 10/31/15) | | | Amount
Fiscal Year
2013
(Expires 10/31/16) | | | Total* | |
Global Select Opportunities Fund | | $ | 116,491 | | | $ | 206,366 | | | $ | 141,446 | | | $ | 464,303 | |
Select International Equity Fund | | | – | | | | – | | | | – | | | | – | |
Select International Equity Fund II | | | – | | | | – | | | | – | | | | – | |
Total Return Bond Fund | | | 7,002 | | | | 11,864 | | | | 29,356 | | | | 48,222 | |
Global High Income Fund | | | 129,674 | | | | 13,138 | | | | 67,765 | | | | 210,577 | |
| | * | | Amounts reported are subject to expire throughout the respective 3-year expiration period presented above. |
| | Amounts | | listed as “–” are $0 or round to $0. |
| (b) | Brokerage Rebate Commission |
The Funds listed below have entered into an agreement with State Street Global Markets, LLC whereby certain brokers will rebate, in cash, a portion of brokerage commissions. Rebated commissions are amounts earned by the Funds and are included with realized gain or loss on investment transactions presented in the Statement of Operations. For the year ended October 31, 2013, brokerage commissions rebated under these agreements were as follows:
| | | | |
| Fund | | Rebated Commissions | |
Global Select Opportunities Fund | | $ | 189 | |
Select International Equity Fund | | | 25,717 | |
Select International Equity Fund II | | | 25,090 | |
4. Distributor and Shareholder Services
Effective May 22, 2013, the Funds and Aberdeen Fund Distributors, LLC (the “Distributor” or “AFD”) are parties to the current Underwriting Agreement (the “Underwriting Agreement”) whereby the Distributor acts as principal underwriter for the Funds’ shares. Prior to May 22, 2013, Quasar Distributors, LLC (“Quasar”) was the Distributor of the Funds.
The Funds have adopted a Distribution and Shareholder Services Plan (the “Plan”), pursuant to Rule 12b-1 under the 1940 Act. Under the Plan, each Fund’s Class A shares may compensate certain financial institutions, including the Distributor, for certain distribution, shareholder servicing, administrative and accounting services. The Funds’ Class A shares may expend an aggregate amount, on an annual basis, not to exceed 0.25% of the value of the average daily net assets of a Fund attributable to Class A shares. The Funds will adjust accruals accordingly for any unused or surplus balances on an annual basis. The Adviser may pay additional marketing and other distribution costs out of its profits.
Under its terms, the Funds’ Plan shall remain in effect from year to year, provided such continuance is approved annually by a vote of a majority of the Boards’ members and a majority of those Boards’ members who are not “interested persons” of the Funds and who have no direct or indirect financial interest in the operation of the Plan or in any agreement related to the Plan.
2013 Annual Report
73
Notes to Financial Statements (continued)
October 31, 2013
5. Investment Transactions
Purchases and sales of securities (excluding short-term securities) for the year ended October 31, 2013, were as follows:
| | | | | | | | |
| Fund | | Purchases | | | Sales | |
Global Select Opportunities Fund | | $ | 30,087,300 | | | $ | 41,986,121 | |
Select International Equity Fund | | | 877,241,758 | | | | 2,400,988,701 | |
Select International Equity Fund II | | | 535,546,871 | | | | 1,412,644,487 | |
Total Return Bond Fund | | | 5,004,852,189 | | | | 5,086,293,025 | |
Global High Income Fund | | | 1,449,110,653 | | | | 2,215,920,702 | |
6. Shares of Beneficial Interest
The Global Select Opportunities Fund may issue 50 billion shares of beneficial interest with a par value of $0.001 per share. The Trust may issue an unlimited number of shares of beneficial interest of each Fund, with a par value of $0.001 per share.
7. Investments in Affiliated Issuers
An affiliated issuer, as defined under 1940 Act, is one in which a Fund’s holdings of an issuer represents 5% or more of the outstanding voting securities of the issuer. A summary of Funds’ investments in securities of these issuers for the period ended October 31, 2013, is set forth below:
| | | | | | | | | | | | | | | | | | | | |
| Affiliate | | Shares Held
October 31, 2013 | | | Purchases
(Cost) | | | Sales
(Proceeds) | | | Dividend
Income | | | Fair Value
October 31, 2013 | |
| Aberdeen Select International Equity Fund | | | | | | | | | | | | | | | | | | | | |
LEV Insurance | | | 4,078,860 | | | $ | – | | | $ | – | | | $ | – | | | $ | 1,933,107 | |
Sparki Eltos AD-Lovetch | | | 1,321,370 | | | | – | | | | 5,772 | | | | – | | | | 358,219 | |
Toza Markovic ad Kikinda | | | 78,160 | | | | – | | | | – | | | | – | | | | 80,145 | |
| | | | | | | | | | | | | | | | | | | $ | 2,371,471 | |
| | | | | | | | | | | | | | | | | | | | |
| Affiliate | | Shares Held
October 31, 2013 | | | Purchases
(Cost) | | | Sales
(Proceeds) | | | Dividend
Income | | | Fair Value
October 31, 2013 | |
| Aberdeen Global High Income Fund | | | | | | | | | | | | | | | | | | | | |
Deep Ocean | | | 1,427,968 | | | $ | – | | | $ | – | | | $ | – | | | $ | 32,749,750 | |
8. Portfolio Investment Risks
The prices of fixed income securities respond to economic developments, particularly interest rate changes, as well as to perceptions about the creditworthiness of individual issuers, including governments. Generally, a Fund’s fixed income securities will decrease in value if interest rates rise and vice versa, and the volatility of lower-rated securities is even greater than that of higher-rated securities. Also, longer-term securities are generally more volatile, so the average maturity or duration of these securities affects risk.
| (b) | Credit and Market Risk |
A debt instrument’s price depends, in part, on the credit quality of the issuer, borrower, counterparty, or underlying collateral and can decline in response to changes in the financial condition of the issuer, borrower, counterparty, or underlying collateral, or changes in specific or general market, economic, industry, political, regulatory, geopolitical, or other conditions. Funds that invest in high yield and emerging market instruments are subject to certain additional credit and market risks. The yields of high yield and emerging market debt obligations reflect, among other things, perceived credit risk. The Funds’ investments in securities rated below investment grade typically involve risks not associated with higher rated securities including, among others, greater risk of not receiving timely and/or ultimate payment of interest and principal, greater market price volatility, and less liquid secondary market trading.
Annual Report 2013
74
Notes to Financial Statements (continued)
October 31, 2013
| (c) | Risks Associated with Foreign Securities and Currencies |
Investments in securities of foreign issuers carry certain risks not ordinarily associated with investments in securities of U.S. issuers. These risks include future political and economic developments, and the possible imposition of exchange controls or other foreign governmental laws and restrictions. In addition, with respect to certain countries, there is the possibility of expropriation of assets, confiscatory taxation political or social instability or diplomatic developments, which could adversely affect investments in those countries.
Certain countries also may impose substantial restrictions on investments in their capital markets by foreign entities, including restrictions on investments in issuers of industries deemed sensitive to relevant national interests. These factors may limit the investment opportunities available and result in a lack of liquidity and high price volatility with respect to securities of issuers from developing countries. Venezuela currently imposes foreign exchange controls which prohibit the Fund from repatriating dividends, interest, or other income from investments or proceeds from the sale of Venezuelan securities.
| (d) | Risks Associated with Mortgage-backed Securities |
The value of mortgage-backed securities can fall if the owners of the underlying mortgages default or pay off their mortgages sooner than expected, which could happen when interest rates fall.
| (e) | Risks Associated with Asset-backed Securities |
Payment of interest and repayment of principal may be impacted by the cash flows generated by the assets backing these securities. The value of a Fund's asset-backed securities may also be affected by changes in interest rates, the availability of information concerning the interests in and structure of the pools of purchase contracts, financing leases or sales agreements that are represented by these securities, the creditworthiness of the underlying securities or the servicing agent of the pool, the originator of the loans or receivables, or the entities that provide any supporting letters of credit, surety bonds, or other credit enhancements.
| (f) | Risks Associated with Emerging Markets |
The emerging countries' securities markets are substantially smaller, less liquid and more volatile than the major securities markets in the United States. A high proportion of the securities of many companies in emerging countries may be held by a limited number of persons, which may limit the number of securities available for investment by a Fund. The limited liquidity of emerging country securities markets may also affect a Fund's ability to acquire or dispose of securities at the price and time it wishes to do so, which may negatively impact NAV.
| (g) | Risks Associated with European Markets |
A number of countries in Europe have experienced and continue to experience severe economic and financial difficulties. Many non-governmental issuers, and even certain governments, have defaulted on, or been forced to restructure, their debts; many other issuers have faced difficulties obtaining credit or refinancing existing obligations; financial institutions have in many cases required government or central bank support, have needed to raise capital, and/or have been impaired in their ability to extend credit; and financial markets in Europe and elsewhere have experienced extreme volatility and declines in asset values and liquidity. These difficulties may continue, worsen or spread within and outside of Europe. Whether or not a Fund invests in securities of issuers located in Europe or with significant exposure to European issuers or countries, these events could negatively affect the value and liquidity of a Fund’s investments.
Please read the prospectus for more detailed information regarding these and other risks.
9. Contingencies
In the normal course of business, the Funds may provide general indemnifications pursuant to certain contracts and organizational documents. The Funds’ maximum exposure under these arrangements is dependent on future claims that may be made against the Funds, and therefore, cannot be estimated; however, based on experience, the risk of loss from such claims is considered remote.
2013 Annual Report
75
Notes to Financial Statements (continued)
October 31, 2013
10. Tax Information
As of October 31, 2013, the tax cost of securities and the breakdown of unrealized appreciation/(depreciation) for each Fund were as follows:
| | | | | | | | | | | | | | | | |
| | | Tax Cost of
Securities | | | Unrealized
Appreciation | | | Unrealized
Depreciation | | | Net
Unrealized
Appreciation
(Depreciation) | |
Global Select Opportunities Fund | | $ | 8,058,028 | | | $ | 435,541 | | | $ | (179,994 | ) | | $ | 255,547 | |
Select International Equity Fund | | | 725,056,047 | | | | 43,603,897 | | | | (105,896,942 | ) | | | (62,293,045 | ) |
Select International Equity Fund II | | | 308,133,944 | | | | 19,927,582 | | | | (7,229,082 | ) | | | 12,698,500 | |
Total Return Bond Fund | | | 1,729,344,032 | | | | 30,543,149 | | | | (33,445,558 | ) | | | (2,902,409 | ) |
Global High Income Fund | | | 2,414,060,777 | | | | 128,803,288 | | | | (37,081,848 | ) | | | 91,721,440 | |
The tax character of distributions paid during the fiscal year ended October 31, 2013 was as follows (total distributions paid differ from the Statements of Changes in Net Assets because for tax purposes dividends are recognized when actually paid):
| | | | | | | | | | | | | | | | | | | | | | | | |
| | | Distributions paid from | |
| Fund | | Ordinary
Income | | | Net Long Term
Capital Gains | | | Total
Taxable
Distributions | | | Tax Exempt
Distributions | | | Return of
Capital | | | Total
Distributions Paid | |
Global Select Opportunities Fund | | $ | 187,778 | | | $ | – | | | $ | 187,778 | | | $ | – | | | $ | – | | | $ | 187,778 | |
Select International Equity Fund | | | 7,506,959 | | | | – | | | | 7,506,959 | | | | – | | | | – | | | | 7,506,959 | |
Select International Equity Fund II | | | 25,691,817 | | | | – | | | | 25,691,817 | | | | – | | | | 87,115 | | | | 25,778,932 | |
Total Return Bond Fund | | | 60,478,188 | | | | 32,127,743 | | | | 92,605,931 | | | | – | | | | 3,301,594 | | | | 95,907,525 | |
Global High Income Fund | | | 181,064,496 | | | | 10,883,785 | | | | 191,948,281 | | | | – | | | | – | | | | 191,948,281 | |
The tax character of distributions paid during the fiscal year ended October 31, 2012 was as follows (total distributions paid differ from the Statements of Changes in Net Assets because for tax purposes dividends are recognized when actually paid):
| | | | | | | | | | | | | | | | | | | | | | | | |
| | | Distributions paid from | |
| Fund | | Ordinary
Income | | | Net Long Term
Capital Gain | | | Total
Taxable
Distributions | | | Tax Exempt
Distributions | | | Return of
Capital | | | Total
Distributions Paid | |
Global Select Opportunities Fund | | $ | 25,087 | | | $ | – | | | $ | 25,087 | | | $ | – | | | $ | – | | | $ | 25,087 | |
Select International Equity Fund | | | 88,666,220 | | | | – | | | | 88,666,220 | | | | – | | | | – | | | | 88,666,220 | |
Select International Equity Fund II | | | 68,947,455 | | | | – | | | | 68,947,455 | | | | – | | | | – | | | | 68,947,455 | |
Total Return Bond Fund | | | 89,456,105 | | | | 20,297,797 | | | | 109,753,902 | | | | – | | | | – | | | | 109,753,902 | |
Global High Income Fund | | | 246,832,423 | | | | 51,924,409 | | | | 298,756,832 | | | | – | | | | 5,014,916 | | | | 303,771,748 | |
Annual Report 2013
76
Notes to Financial Statements (continued)
October 31, 2013
As of October 31, 2013, the components of accumulated earnings (deficit) on a tax basis were as follows:
| | | | | | | | | | | | | | | | | | | | | | | | | | | | | | | | | | | | | | | | |
| Fund | | Undistri-
buted
Tax
Exempt
Income | | | Undistri
-buted
Ordinary
Income | | | Undistri-
buted
Long-
Term
Capital
Gains | | | Accum-
ulated
Earnings | | | Distri-
butions
Payable | | | Late Year
Ordinary
and
Post-
October
Capital
Loss
Deferrals | | | Other
Temporary
Differences | | | Accumulated
Capital and
Other
Losses** | | | Unrealized
Appreciation/
Depreciation* | | | Total
Accum-
ulated
Earnings
(Deficit) | |
Global Select Opportunities Fund | | $ | – | | | $ | 107,020 | | | $ | – | | | $ | 107,020 | | | $ | – | | | $ | – | | | $ | – | | | $ | (27,937,000 | ) | | $ | 255,559 | | | $ | (27,574,421 | ) |
Select International Equity Fund | | | – | | | | 12,327,507 | | | | – | | | | 12,327,507 | | | | – | | | | – | | | | – | | | | (2,259,312,281 | ) | | | (63,174,909 | ) | | | (2,310,159,683 | ) |
Select International Equity Fund II | | | – | | | | – | | | | – | | | | – | | | | – | | | | – | | | | (25,913 | ) | | | (2,720,144,132 | ) | | | 12,728,051 | | | | (2,707,441,994 | ) |
Total Return Bond Fund | | | – | | | | – | | | | – | | | | – | | | | – | | | | – | | | | (1,812,006 | ) | | | – | | | | (1,112,246 | ) | | | (2,924,251 | ) |
Global High Income Fund | | | – | | | | – | | | | 27,301,497 | | | | 27,301,497 | | | | – | | | | – | | | | (1,223,044 | ) | | | – | | | | 102,488,547 | | | | 128,547,000 | |
| * | | The difference between the book-basis and tax-basis unrealized appreciation/(depreciation) is attributable primarily to: tax deferral of losses on wash sales; the difference between book and tax amortization methods for premium and market discount. |
| ** | | As of October 31, 2013, for Federal income tax purposes, the following Funds have capital loss carryforwards available to offset capital gains, if any, to the extent provided by the treasury obligations: |
| | | | | | |
| Fund | | Amount | | | Expires |
Global Select Opportunities Fund | | $ | 17,909,743 | | | 2016 |
Global Select Opportunities Fund | | | 10,012,137 | | | 2017 |
Global Select Opportunities Fund | | | 15,120 | | | Unlimited Short-Term |
Select International Equity Fund | | | 314,780,611 | | | 2016 |
Select International Equity Fund | | | 1,643,693,179 | | | 2017 |
Select International Equity Fund | | | 279,988,563 | | | Unlimited Long-Term |
Select International Equity Fund | | | 20,849,928 | | | Unlimited Short-Term |
Select International Equity Fund II | | | 1,379,336,238 | | | 2016 |
Select International Equity Fund II | | | 1,211,390,775 | | | 2017 |
Select International Equity Fund II | | | 121,152,924 | | | 2018 |
Select International Equity Fund II | | | 8,264,195 | | | Unlimited Short-Term |
Under the Regulated Investment Company Modernization Act of 2010, the Funds are permitted to carry forward capital losses incurred in taxable years beginning after December 22, 2010 for an unlimited period. However, any losses incurred during those taxable years will be required to be utilized prior to the losses incurred in pre-enactment taxable years. As a result of this ordering rule, pre-enactment capital loss carryforwards may be more likely to expire unused. Additionally, post-enactment capital losses that are carried forward will retain their character as either short-term or long-term capital losses rather than being considered all short-term as under previous law.
| | | | | | | | | | | | |
| Fund | | Paid-in
Capital | | | Accumulated
Net
Investment
Income/(Loss) | | | Accumulated
Net Realized
Gain/(Loss) | |
Global Select Opportunities Fund | | $ | (25 | ) | | $ | 2,496 | | | $ | (2,471 | ) |
Select International Equity Fund | | | – | | | | 13,709,111 | | | | (13,709,111 | ) |
Select International Equity Fund II | | | (87,115 | ) | | | (800,806 | ) | | | 887,921 | |
Total Return Bond Fund | | | (3,301,594 | ) | | | 1,322,700 | | | | 1,978,894 | |
Global High Income Fund | | | – | | | | 3,198,575 | | | | (3,198,575 | ) |
2013 Annual Report
77
Notes to Financial Statements (concluded)
October 31, 2013
11. Significant Shareholders
As of October 31, 2013, the following Funds had shareholders with the percentage ownership indicated, which are considered significant shareholders (holdings greater than 5.0%) for financial reporting purposes:
| | | | |
| Fund | | Record Ownership % | | Number of Account Owners |
Global Select Opportunities Fund | | 56.8% | | 5 |
Select International Equity Fund | | 64.7 | | 2 |
Select International Equity Fund II | | 57.4 | | 5 |
Total Return Bond Fund | | 67.7 | | 3 |
Global High Income Fund | | 68.2 | | 7 |
12. Line of Credit
Aberdeen Global Select Opportunities Fund Inc. and Aberdeen Investment Funds (the "Borrowers") entered into a Credit Agreement (the "Agreement") with State Street Bank and Trust Company (the "Bank"). The Agreement provides for a revolving credit facility (the "Facility Amount") to be utilized for temporary or emergency purposes to find shareholder redemptions or for other short-term liquidity purposes. The Facility Amount was $250,000,000 for the period ending April 21, 2013 and $175,000,000 for the period April 22, 2013 through October 31, 2013. The Funds may draw up to their stated sublimit (subject to certain other limitations therein):
| | | | | | | | | | | | |
| | | Sublimit
Amount | | | Average
Outstanding
Daily Balance | | | Average
Weighted
Interest Rate | |
Global Select Opportunities Fund | | $ | 5,000,000 | | | $ | 43,087 | | | | 1.40 | % |
Select International Equity Fund | | | 175,000,000 | | | | 2,876,680 | | | | 1.39 | % |
Select International Equity Fund II | | | 175,000,000 | | | | 745,880 | | | | 1.39 | % |
Total Return Bond Fund | | | 50,000,000 | | | | – | | | | – | |
In addition, the Global High Income Fund entered into a separate Credit Agreement (the “Global High Income Fund Credit Agreement”) with the Bank. The Global High Income Fund Credit Agreement provides for a Facility Amount to be utilized for temporary or emergency purposes to fund shareholder redemptions or for other short-term liquidity purposes.
| | | | | | | | | | | | |
| | | Sublimit
Amount | | | Average
Outstanding
Daily Balance | | | Average
Weighted
Interest Rate | |
Global High Income Fund | | $ | 250,000,000 | | | $ | 839,038 | | | | 1.39 | % |
Principal on each outstanding loan made under the Agreement and the Global High Income Fund Credit Agreement shall bear the interest at a variable rate per annum equal to the higher of (a) the Federal Funds Rate as in effect on that day plus 1.25% and (b) the Overnight LIBOR Rate as in effect on that day plus 1.25%. In addition, the Borrowers shall pay to the Bank a commitment fee at the rate of 0.10% per annum on the daily unused portion of the Facility Amount.
13. Recent Accounting Pronouncements
In December 2011, the Financial Accounting Standards Board (“FASB”) issued an Accounting Standards Update (“ASU”), Disclosures about Offsetting Assets and Liabilities. The amendments in this update require an entity to disclose both gross and net information for derivatives and other financial instruments that are either offset in the statement of assets and liabilities or subject to an enforceable master netting arrangement or similar agreement. The ASU is effective for annual reporting periods beginning on or after January 1, 2013 (and interim periods within those annual periods). Reporting entities will be required to provide both net amounts (those that are offset) and gross information (as if amounts are not offset) in the notes to the financial statements for relevant assets and liabilities.
Management is currently evaluating the implications of this ASU and its impact on the financial statements has not been determined.
14. Subsequent Events
On December 12, 2013, the Funds’ Boards of Trustees approved changing the name of Class I Shares of the Trust and the Global Select Opportunities Fund to Institutional Class Shares, effective as of February 28, 2014. Fees and expenses associated with Class I Shares will not be impacted as a result of the change in name to Institutional Class Shares.
Management has evaluated the need for disclosures and/or adjustments resulting from subsequent events through the date the Financial Statements were issued. Based on this evaluation, no disclosures and/or adjustments other than that noted above were required to the Financial Statements as of October 31, 2013.
Annual Report 2013
78
Shareholder Expense Examples (Unaudited)
As a shareholder of the Aberdeen Investment Funds or a stockholder of Aberdeen Global Select Opportunities Fund Inc. (the "Funds"), you incur ongoing costs, including investment advisory fees, shareholder service fees, distribution fees and other Fund expenses. The examples below are intended to help you understand your ongoing costs (in dollars) of investing in the Funds and to compare these costs with the ongoing costs of investing in other mutual funds.
The examples assume that you had a $1,000 investment in the Class at the beginning of the reporting period, May 1, 2013 and continued to hold your shares at the end of the reporting period, October 31, 2013.
Actual Expenses
The table below provides information about actual account values and actual expenses. You may use the information together with the amount you invested, to estimate the expenses that you paid over the period. Simply divide your account value by $1,000 (for example, an $8,600 account value divided by $1,000 = 8.6), then multiply the result by the number under the heading entitled “Actual Expenses Paid During Period” for the class of a Fund that you own to estimate the expenses you paid on your account during the period.
Hypothetical Example for Comparison Purposes
The table below provides information about hypothetical account values and hypothetical expenses based on the Class’ actual expense ratio and an assumed rate of return of 5% per year before expenses, which is not the Class’ actual return. The hypothetical account values and expenses may not be used to estimate the actual ending account balance or expenses you paid for the period. You may use this information to compare the ongoing costs of investing in the Class of a Fund and other funds. To do so, compare the 5% hypothetical example with the 5% hypothetical examples that appear in the shareholder reports of the other funds.
| | | | | | | | | | | | | | | | | | | | | | | | |
| | | Beginning Account
Value,
May 1, 2013 | | | Actual Ending
Account Value,
October 31, 2013 | | | Hypothetical
Ending Account
Value | | | Actual Expenses
Paid During
Period* | | | Hypothetical
Expenses
Paid During
Period*1 | | | Annualized
Expense
Ratio** | |
Aberdeen Global Select Opportunities Fund Inc. | |
Class A | | $ | 1,000.00 | | | $ | 1,058.20 | | | $ | 1,018.65 | | | $ | 6.74 | | | $ | 6.61 | | | | 1.30% | |
Class I | | $ | 1,000.00 | | | $ | 1,059.00 | | | $ | 1,019.36 | | | $ | 6.02 | | | $ | 5.90 | | | | 1.16% | |
Aberdeen Select International Equity Fund | |
Class A | | $ | 1,000.00 | | | $ | 1,036.20 | | | $ | 1,019.01 | | | $ | 6.31 | | | $ | 6.26 | | | | 1.23% | |
Class I | | $ | 1,000.00 | | | $ | 1,037.50 | | | $ | 1,020.22 | | | $ | 5.08 | | | $ | 5.04 | | | | 0.99% | |
Aberdeen Select International Equity Fund II | |
Class A | | $ | 1,000.00 | | | $ | 1,035.70 | | | $ | 1,019.06 | | | $ | 6.26 | | | $ | 6.21 | | | | 1.22% | |
Class I | | $ | 1,000.00 | | | $ | 1,038.30 | | | $ | 1,020.27 | | | $ | 5.03 | | | $ | 4.99 | | | | 0.98% | |
Aberdeen Total Return Bond Fund | |
Class A | | $ | 1,000.00 | | | $ | 964.40 | | | $ | 1,021.83 | | | $ | 3.32 | | | $ | 3.41 | | | | 0.67% | |
Class I | | $ | 1,000.00 | | | $ | 965.50 | | | $ | 1,023.04 | | | $ | 2.13 | | | $ | 2.19 | | | | 0.43% | |
Aberdeen Global High Income Fund | |
Class A | | $ | 1,000.00 | | | $ | 1,022.20 | | | $ | 1,020.27 | | | $ | 5.00 | | | $ | 4.99 | | | | 0.98% | |
Class I | | $ | 1,000.00 | | | $ | 1,024.20 | | | $ | 1,021.48 | | | $ | 3.78 | | | $ | 3.77 | | | | 0.74% | |
| * | | Expenses are equal to the Fund’s annualized expense ratio multiplied by the average account value over the period multiplied by 184/365 (to reflect the one-half year period). |
| ** | | The expense ratio presented represents a six-month, annualized ratio. |
| 1 | | Represents the hypothetical 5% return before expenses. |
2013 Annual Report
79
Report of Independent Registered Public Accounting Firm
The Shareholders and Board of Directors
Aberdeen Global Select Opportunities Fund Inc.
and
The Shareholders and Board of Trustees
Aberdeen Investment Funds
We have audited the accompanying statements of assets and liabilities, including the portfolios of investments, of Aberdeen Global Select Opportunities Fund Inc. and Aberdeen Select International Equity Fund, Aberdeen Select International Equity Fund II, Aberdeen Total Return Bond Fund, and Aberdeen Global High Income Fund, each a series of Aberdeen Global Investment Funds, (collectively, the “Funds”) as of October 31, 2013, and the related statements of operations for the year then ended, the statements of changes in net assets for each of the years or periods in the two-year period then ended, and the financial highlights for each of the years in the five-year period then ended. These financial statements and financial highlights are the responsibility of the Funds’ management. Our responsibility is to express an opinion on these financial statements and financial highlights based on our audits.
We conducted our audits in accordance with the standards of the Public Company Accounting Oversight Board (United States). Those standards require that we plan and perform the audits to obtain reasonable assurance about whether the financial statements and financial highlights are free of material misstatement. An audit includes examining, on a test basis, evidence supporting the amounts and disclosures in the financial statements. Our procedures included confirmation of securities owned as of October 31, 2013 by correspondence with the custodian and brokers, or by other appropriate auditing procedures where replies from brokers were not received. An audit also includes assessing the accounting principles used and significant estimates made by management, as well as evaluating the overall financial statement presentation. We believe that our audits provide a reasonable basis for our opinion.
In our opinion, the financial statements and financial highlights referred to above present fairly, in all material respects, the financial position of Aberdeen Global Select Opportunities Fund Inc. and Aberdeen Select International Equity Fund, Aberdeen Select International Equity Fund II, Aberdeen Total Return Bond Fund, and Aberdeen Global High Income Fund, each a series of Aberdeen Global Investment Funds as of October 31, 2013, and the results of their operations, the changes in their net assets and the financial highlights for each of the years described above, in conformity with U.S. generally accepted accounting principles.

Boston, MA
December 24, 2013
Annual Report 2013
80
Other Tax Information (Unaudited)
For the period ended October 31, 2013, certain dividends paid by the Funds may be subject to a maximum tax rate of 15% as provided for by the Jobs and Growth Tax Relief Reconciliation Act of 2003. The Funds intend to designate the maximum amount allowable as taxed as a maximum rate of 15%. Complete information will be reported in conjunction with your 2013 Form 1099-DIV.
During the year ended October 31, 2013, the following Funds designated dividends as long-term capital gains:
| | | | |
| Fund | | Amount | |
Total Return Bond Fund | | $ | 32,127,743 | |
Global High Income Fund | | | 10,883,785 | |
The Funds intend to elect to pass through to their shareholders the credit for taxes paid in foreign countries during its fiscal year ended October 31, 2013. In accordance with the current tax laws, the foreign income and foreign tax per share (for a share outstanding as of October 31, 2013) was as follows:
| | | | |
| Fund | | Foreign Tax | |
Select International Equity Fund | | | 0.06870 | |
Select International Equity Fund II | | | 0.03331 | |
For the year ended October 31, 2013, the following Funds paid qualified dividend income:
| | | | | | |
| Fund | | Qualified Dividend
Income | |
Global Select Opportunities Fund | | | | | 100.00% | |
Select International Equity Fund | | | | | 100.00% | |
Select International Equity Fund II | | | | | 42.25% | |
Global High Income Fund | | | | | 1.58% | |
For the taxable year ended October 31, 2013, the following percentage of income dividends paid by the Funds qualify for the dividends received deduction available to corporate shareholders:
| | | | | | |
| Fund | | Dividend Received
Deduction | |
Global Select Opportunities Fund | | | | | 99.00% | |
Global High Income Fund | | | | | 1.58% | |
2013 Annual Report
81
Management of the Funds (Unaudited)
As of October 31, 2013
Board of Directors/Trustees and Officers of the Funds
| | | | | | | | |
Name, Address,
and Year of Birth | | Position(s) Held,
Length of Time
Served and
Term of Office* | | Principal Occupation
During Past 5 Years | | Number of
Portfolios in
Fund Complex
Overseen by
Trustee** | | Other
Directorships
Held by
Trustee
During Past
5 Years*** |
Directors/Trustees Who are Not Interested Persons (as Defined in the 1940 Act) of the Funds |
Antoine Bernheim**** 1953 | | Trustee of the Trust since November 2004; Director of GSOF since July 1990; Chairman of the Fund Complex since December 2008. | | President, Dome Capital Management, Inc., 1984 – present (investment advisory firm); Chairman, Dome Securities Corp., 1995 – 2012 (broker/dealer); President, The U.S. Offshore Funds Directory, 1990 – present (publishing) | | 5 | | None |
Thomas Gibbons**** 1947 | | Trustee of the Trust since November 2004; Director of GSOF since December 1993. | | President, Cornerstone Associates Management, 1987 – present (consulting firm) | | 5 | | None |
Cynthia Hostetler**** 1962 | | Trustee of the Trust since September 2011; Director of GSOF since November 2010. | | Member of the Board of Directors of the Edgen Group (energy), 2012 – 2013, and TriLinc Global Impact Fund, 2013 – present; Vice President of Investment Funds, Overseas Private Investment Corporation, 2001 – 2009; President, First Manhattan Bancorporation, 1991 – 2006 | | 5 | | Director, Edgen Group (NYSE: EDG) 2012 – 2013; Director, TriLinc Global Impact Fund, 2013 – present. |
Robert S. Matthews**** 1943 | | Trustee of the Trust since June 1992; Director of GSOF since June 2002. | | Managing Partner, Matthews & Co. , 1990 – present (certified public accounting firm) | | 5 | | Trustee, Allstate Financial Investment Trust, 2008 – 2009, (investment company). |
Peter Wolfram**** 1953 | | Trustee of the Trust since June 1992; Director of GSOF since November 2004. | | Partner, Kelley Drye & Warren LLP, 1983 –present (law firm) | | 5 | | None |
| * | | Each Director/Trustee serves during the lifetime of the Funds or until he or she dies, resigns, retires, is declared bankrupt or incompetent, or is removed or, if sooner, until the next special meeting of the Funds’ shareholders/stockholders and until the election and qualification of his or her successor. The current retirement age is 75. |
| ** | | The Aberdeen Fund Complex consists of the Trust which currently consists of four portfolios, Aberdeen Global Select Opportunities Fund Inc., Aberdeen Funds, Aberdeen Asia-Pacific Income Fund, Inc., Aberdeen Global Income Fund, Inc., Aberdeen Australia Equity Fund, Inc., Aberdeen Chile Fund, Inc., Aberdeen Israel Fund, Inc., Aberdeen Indonesia Fund, Inc., Aberdeen Latin America Equity Fund, Inc., Aberdeen Emerging Markets Smaller Company Opportunities Fund, Inc., Aberdeen Singapore Fund, Inc., The Asia Tigers Fund, Inc., The India Fund, Inc., Aberdeen Greater China Fund, Inc. and The Japan Equity Fund, Inc. |
| *** | | Directorships held in (1) any other investment companies registered under the 1940 Act, (2) any company with a class of securities registered pursuant to Section 12 of the Securities Exchange Act of 1934, as amended (the “Exchange Act”) or (3) any company subject to the requirements of Section 15(d) of the Exchange Act. |
| **** | | Each Director/Trustee may be contacted by writing to the Director/Trustee c/o Aberdeen Asset Management Inc., 1735 Market Street, 32nd Floor, Philadelphia, Pennsylvania 19103, Attn: Alan Goodson. |
Annual Report 2013
82
Management of the Funds (Unaudited) (continued)
As of October 31, 2013
| | | | | | | | |
Name, Address,
and Year of Birth | | Position(s) Held,
Length of Time
Served and
Term of Office* | | Principal Occupation
During Past 5 Years | | Number of
Portfolios in
Fund Complex
Overseen by
Trustee** | | Other
Directorships
Held by Trustee
During Past 5
Years*** |
Directors/Trustees Who are Interested Persons (as Defined in the 1940 Act) of the Funds |
Gary Marshall****† 1961 | | President, Chief Executive Officer and Trustee of the Trust since 2013; President, Chief Executive Officer and Director of GSOF since 2013. | | Head of Americas since January 2010, which role includes responsibility for overseeing registered and unregistered investment companies in the US and Canada. Mr. Marshall is the Chief Executive of Aberdeen Asset Management Inc. and joined Aberdeen via the acquisition of Prolific Financial Management in 1997. | | 5 | | None |
| * | | Each Director/Trustee serves during the lifetime of the Funds or until he or she dies, resigns, retires, is declared bankrupt or incompetent, or is removed or, if sooner, until the next special meeting of the Funds’ shareholders/stockholders and until the election and qualification of his or her successor. The current retirement age is 75. |
| ** | | The Aberdeen Fund Complex consists of the Trust which currently consists of four portfolios, Aberdeen Global Select Opportunities Fund Inc., Aberdeen Funds, Aberdeen Asia-Pacific Income Fund, Inc., Aberdeen Global Income Fund, Inc., Aberdeen Australia Equity Fund, Inc., Aberdeen Chile Fund, Inc., Aberdeen Israel Fund, Inc., Aberdeen Indonesia Fund, Inc., Aberdeen Latin America Equity Fund, Inc., Aberdeen Emerging Markets Smaller Company Opportunities Fund, Inc., Aberdeen Singapore Fund, Inc., The Asia Tigers Fund, Inc., The India Fund, Inc., Aberdeen Greater China Fund, Inc. and The Japan Equity Fund, Inc. |
| *** | | Directorships held in (1) any other investment companies registered under the 1940 Act, (2) any company with a class of securities registered pursuant to Section 12 of the Securities Exchange Act of 1934, as amended (the “Exchange Act”) or (3) any company subject to the requirements of Section 15(d) of the Exchange Act. |
| **** | | Each Director/Trustee may be contacted by writing to the Director/Trustee c/o Aberdeen Asset Management Inc., 1735 Market Street, 32nd Floor, Philadelphia, Pennsylvania 19103, Attn: Alan Goodson. |
| † | | Mr. Marshall is considered to be an “interested person” of the Funds as defined in the 1940 Act because of his affiliation with the Adviser. |
Mr. Anthony Williams resigned as an Interested Director of the Fund on May 22, 2013.
| | | | |
Name, Address,
and Year of Birth | | Position(s) Held, Length of
Time Served and Term of Office1,2 | | Principal Occupation
During Past 5 Years |
Officers of the Funds |
Jeffrey Cotton* Aberdeen Asset Management Inc. 1735 Market Street, 32nd Floor Philadelphia, PA 19103 1977 | | Chief Compliance Officer and Vice President Officer of the Trust since 2013; Officer of GSOF since 2013. | | Currently, Vice President and Head of Compliance – US for Aberdeen Asset Management Inc. Mr. Cotton joined Aberdeen in 2010. Prior to joining Aberdeen, Mr. Cotton was a Senior Compliance Officer at Old Mutual Asset Management (2009-2010) supporting its affiliated investment advisers and mutual fund platform. Mr. Cotton was also a Vice President and Senior Compliance Manager at Bank of America/Columbia Management (2006-2009). |
Sofia Rosala* Aberdeen Asset Management Inc. 1735 Market Street, 32nd Floor, Philadelphia, PA 19103 1974 | | Deputy Chief Compliance Officer Officer of the Trust since 2013; Officer of GSOF since 2013. | | Currently, Deputy Chief Compliance Officer for the Funds and U.S. Counsel for Aberdeen Asset Management Inc. (since July 2012). Prior to joining Aberdeen, Ms. Rosala was Counsel for Vertex, Inc. from April 2011 to June 2012. She was also an Associate with Morgan, Lewis and Bockius from May 2008 – April 2011. |
2013 Annual Report
83
Management of the Funds (Unaudited) (continued)
As of October 31, 2013
| | | | |
Name, Address,
and Year of Birth | | Position(s) Held, Length of
Time Served and Term of Office1,2 | | Principal Occupation
During Past 5 Years |
Andrea Melia* Aberdeen Asset Management Inc. 1735 Market Street, 32nd Floor, Philadelphia, PA 19103 1969 | | Chief Financial Officer & Treasurer Officer of the Trust since 2013; Officer of GSOF since 2013. | | Currently, Head of Fund Accounting for Aberdeen Asset Management Inc. Ms. Melia joined Aberdeen Asset Management Inc. in September 2009. Prior to joining Aberdeen, Ms. Melia was Director of fund administration and accounting oversight for Princeton Administrators LLC, a division of BlackRock Inc. and had worked with Princeton Administrators since 1992. |
Megan Kennedy* Aberdeen Asset Management Inc. 1735 Market Street, 32nd Floor Philadelphia, PA 19103 1974 | | Assistant Secretary and Vice President Officer of the Trust since 2013; Officer of GSOF since 2013. | | Currently, Head of Product Management for Aberdeen Asset Management Inc. Ms. Kennedy joined Aberdeen Asset Management Inc. in 2005 as a Senior Fund Administrator. Ms. Kennedy was promoted to Assistant Treasurer Collective Funds/North American Mutual Funds in February 2008 and promoted to Treasurer Collective Funds/North American Mutual Funds in July 2008. |
Lucia Sitar* Aberdeen Asset Management Inc. 1735 Market Street, 32nd Floor Philadelphia, PA 19103 1971 | | Chief Legal Officer and Vice President Officer of the Trust since 2013; Officer of GSOF since 2013. | | Currently, U.S. Counsel for Aberdeen Asset Management Inc. Ms. Sitar joined Aberdeen Asset Management Inc. in July 2007. |
Alan Goodson* Aberdeen Asset Management Inc. 1735 Market Street, 32nd Floor Philadelphia, PA 19103 1974 | | Vice President Officer of the Trust since 2013; Officer of GSOF since 2013. | | Currently, Head of Product US, overseeing both Product Management and Product Development for Aberdeen’s registered and unregistered investment companies in the US and Canada. Mr. Goodson is Vice President of Aberdeen Asset Management Inc. and joined Aberdeen in 2000. |
Stephen Docherty* Aberdeen Asset Management Inc. 1735 Market Street, 32nd Floor Philadelphia, PA 19103 1970 | | Vice President Officer of the Trust since 2013; Officer of GSOF since 2013. | | Currently, Head of Global Equities for Aberdeen Asset Managers Limited. Mr. Docherty joined Aberdeen Asset Managers Limited in 1994. |
Greg Hopper Aberdeen Asset Management Inc. 1735 Market Street, 32nd Floor Philadelphia, PA 19103 1957 | | Vice President Officer of the Trust since 2002; Officer of GSOF since 2002. | | Senior Portfolio Manager, High Yield, Aberdeen Asset Management Inc. since 2013. Prior to joining Aberdeen, Mr. Hopper served as Senior Vice President (2009 – 2013) and First Vice President of Artio Global Management LLC (2002 – 2009). |
Jennifer Nichols* Aberdeen Asset Management Inc. 1735 Market Street, 32nd Floor Philadelphia, PA 19103 1978 | | Vice President Officer of the Trust since 2013; Officer of GSOF since 2013. | | Currently, Global Head of Legal for Aberdeen. Director, Vice President for Aberdeen Asset Management Inc. (since October 2006). |
Donald Quigley Aberdeen Asset Management Inc. 1735 Market Street, 32nd Floor Philadelphia, PA 19103 1965 | | Vice President Officer of the Trust since 2001. | | Senior Portfolio Manager, Aberdeen Asset Management Inc. since 2013. Prior to joining Aberdeen, Mr. Quigley served as Senior Vice President and Head of Global Fixed-Income of Artio Global Management LLC (2001 – 2013). |
Annual Report 2013
84
Management of the Funds (Unaudited) (concluded)
As of October 31, 2013
| | | | |
Name, Address,
and Year of Birth | | Position(s) Held, Length of
Time Served and Term of Office1,2 | | Principal Occupation
During Past 5 Years |
Andrew Smith Aberdeen Asset Management Inc. 1735 Market Street, 32nd Floor Philadelphia, PA 19103 1968 | | Vice President Officer of the Trust since 2013; Officer of GSOF since 2013. | | Currently, Chief Operating Officer – Americas for Aberdeen Asset Management Inc. Mr. Smith joined Aberdeen Asset Management Inc. in 1987 and has served in various financial roles throughout his career. |
Hugh Young* Aberdeen Asset Management Inc. 1735 Market Street, 32nd Floor Philadelphia, PA 19103 1958 | | Vice President Officer of the Trust since 2013; Officer of GSOF since 2013. | | Global Head of Equities and a member of the Executive Management Committee of Aberdeen Asset Management PLC (since 1991). He has been Managing Director of Aberdeen Asset Management Asia Limited (“AAMAL”), since 1991. |
Michael McVoy c/o U.S. Bancorp Fund Services, LLC 615 E. Michigan Street Milwaukee, WI 53202 1957 | | Anti-Money Laundering and Identity Theft Officer Officer of the Trust since 2004; Officer of GSOF since 2004. | | Chief Compliance Officer for U.S. Bancorp (2002 – present) and Senior Vice President and Risk Manager for U.S. Bancorp (1999 – present). |
Julie Tedesco State Street Bank and Trust Company 4 Copley Place, 5th Floor, CPH0326 Boston, Massachusetts, 02116 1957 | | Secretary Officer of the Trust since 2013; Officer of GSOF since 2013. | | Senior Vice President and Senior Managing Counsel, State Street Bank and Trust Company (since 2000). |
Pamela Wade* Aberdeen Asset Management Inc. 1735 Market Street, 32nd Floor Philadelphia, PA 19103 1971 | | Assistant Secretary Officer of the Trust since 2013; Officer of GSOF since 2013. | | Currently, Senior Product Manager for Aberdeen Asset Management Inc. Ms. Wade joined Aberdeen Asset Management Inc. in 2012 as Senior Product Manager. Prior to joining Aberdeen Asset Management Inc., Ms. Wade was a Vice President and Assistant Counsel with BNY Mellon Asset Servicing (2007-2012). |
Brian O’Neill* Aberdeen Asset Management Inc. 1735 Market Street, 32nd Floor, Philadelphia, PA 19103 1968 | | Assistant Treasurer Officer of the Trust since 2013; Officer of GSOF since 2013. | | Currently, Senior Fund Administration Manager – US for Aberdeen Asset Management Inc. Mr. O’Neill joined Aberdeen Asset Management Inc. in 2008 as Assistant Treasurer. Prior to joining Aberdeen Asset Management Inc., Mr. O’Neill was a Director of Fund Accounting with Nationwide Funds Group (2002-2008). |
| 1 | | Each officer of the Global Select Opportunities Fund is elected for a term of 1 year and until his or her successor is duly elected and qualified. |
| 2 | | Pursuant to the Trust’s By-laws, officers of the Trust are elected by the Board of Trustees to hold such office until his or her successor is chosen and qualified, or until they resign or are removed from office. |
| * | | Mr. Cotton, Ms. Rosala, Ms. Melia, Mr. O’Neill, Ms. Kennedy, Ms. Sitar, Mr. Goodson, Mr. Young, Ms. Wade and Ms. Nichols hold officer position(s) in one or more of the following: Aberdeen Asia-Pacific Income Fund, Inc., Aberdeen Australia Equity Fund, Inc., Aberdeen Global Income Fund, Inc., Aberdeen Chile Fund, Inc., Aberdeen Israel Fund, Inc., Aberdeen Indonesia Fund, Inc., Aberdeen Latin America Equity Fund, Inc., Aberdeen Emerging Markets Smaller Company Opportunities Fund, Inc., Aberdeen Singapore Fund, Inc., The Asia Tigers Fund, Inc., The India Fund, Inc., Aberdeen Greater China Fund, Inc., the Aberdeen Funds, The Japan Equity Fund, Inc., each of which may also be deemed to be a part of the same “Fund Complex” as the Funds. |
2013 Annual Report
85
| | |
Aberdeen Asset Management Inc. 1735 Market Street, 32nd Floor Philadelphia, PA 19103 aberdeen-asset.us | | |
AOE-0377-AR
Item 2. Code of Ethics.
As of the end of the period covered by this report, the registrant has adopted a code of ethics that applies to the registrant’s President/Chief Executive Officer and Chief Financial Officer pursuant to the Sarbanes-Oxley Act of 2002. During the period covered by this report, and related to the approval of a new investment adviser to the Fund and approval of new officers of the Fund, the registrant adopted a new code of ethics that applies to the registrant’s President/Chief Executive Officer and Chief Financial Officer pursuant to the Sarbanes-Oxley Act of 2002, which replaces the prior code of ethics. The new code of ethics is attached hereto as Exhibit 12(a)(1).
During the period covered by this report, the registrant did not grant any waivers, including any implicit waivers, from any provision of the codes of ethics.
Item 3. Audit Committee Financial Expert.
| (a) | (1) The Board of Directors of the registrant has determined that the registrant has one Board member serving on the Audit Committee that possesses the attributes identified in Instructions 2(b) of Item 3 to Form N-CSR to qualify as an “audit committee financial expert.” |
(2) Mr. Robert S. Matthews is the registrant’s audit committee financial expert. The Board also determined that Mr. Matthews is not an “interested person” of the registrant as that term is defined in Section 2(a)(19) of the Investment Company Act of 1940, as amended (“1940 Act”).
Item 4. Principal Accountant Fees and Services.
For the fiscal years ended October 31, 2013 and October 31, 2012, the aggregate audit fees billed for professional services rendered by the principal independent registered public accounting firm, KPMG LLP, for the audit of the registrant’s annual financial statements were $24,500 and $24,500, respectively.
For the fiscal year ended October 31, 2012, the aggregate audit fees billed by KPMG LLP for assurances and related services that are reasonably related to the performance of the audit of the registrant’s financial statements and are not reported under paragraph (a) of this Item were $4,100. There were no audit-related fees billed for the fiscal year ended October 31, 2013.
The aggregate fees billed for professional services rendered by KPMG LLP for the review of Form 1120-RIC, Form 8613, and review of excise tax distribution calculations for the fiscal years ended October 31, 2013 and October 31, 2012 were $10,000 and $10,000, respectively.
There were no other fees billed by KPMG LLP for the fiscal year ended October 31, 2012. There were no other fees billed by KPMG LLP for the fiscal year ended October 31, 2013.
(e)(1) Audit Committee Pre-Approval Policies and Procedures.
The registrant’s audit committee pre-approves all audit and non-audit services to be performed by the registrant’s accountant before the accountant is engaged by the registrant to perform such services.
| (e) | (2) The percentage of services described in each of paragraphs (b) through (d) of this Item that were approved by the audit committee pursuant to paragraph (c)(7)(i)(C) of Rule 2-01 of Regulation S-X are as follows: |
(f) Not applicable.
(g) The aggregate non-audit fees billed by KPMG LLP to the registrant for the fiscal years ended October 31, 2013 and October 31, 2012 were $10,000 and $10,000, respectively. The aggregate non-audit fees billed by KPMG to the registrant, the Adviser and all entities controlling, controlled by, or under common control with the Adviser that provide services to the registrant for the fiscal years ended October 31, 2013 and October 31, 2012 were $601,055 and $1,697,986, respectively.
(h) The registrant’s Audit Committee of the Board of Directors has considered whether the provision of non-audit services that were rendered to the registrant’s investment adviser (not including any sub-adviser whose role is primarily portfolio management and is subcontracted with or overseen by another investment adviser), and any entity controlling, controlled by, or under common control with the investment adviser that provides ongoing services to the registrant that were not pre-approved pursuant to paragraph (c)(7)(ii) or Rule 2-01 of Regulation S-X is compatible with maintaining the principal accountant’s independence and has concluded that it is.
Item 5. Audit Committee of Listed Registrants.
Not applicable to this registrant.
Item 6. Schedule of Investments
Schedule of Investments is included as a part of the report to shareholders filed under Item 1 of this
Form N-CSR.
Item 7. Disclosure of Proxy Voting Policies and Procedures for Closed-End Management Investment Companies.
Not applicable to this registrant.
Item 8. Portfolio Managers of Closed-end Management Investment Companies.
Not applicable to this registrant.
Item 9. Purchases of Equity Securities by Closed-End Management Investment Company and Affiliated Purchasers.
Not applicable to this registrant.
Item 10. Submission of Matters to a Vote of Security Holders.
There have been no material changes to the procedures by which the shareholders may recommend nominees to the registrant’s Board of Directors, where those changes were implemented after the registrant last provided disclosure in response to the requirements of Item 7(d)(2)(ii)(G) of Schedule 14A (17 CFR 240.14a-101), or this Item.
Item 11. Controls and Procedures.
(a) The registrant’s Principal Executive Officer and Principal Financial Officer concluded that the registrant’s disclosure controls and procedures (as defined in Rule 30a-3(c) under the 1940 Act) were effective as of a date within 90 days prior to the filing date of this report (the “Evaluation Date”), based on their evaluation of the effectiveness of the registrant’s disclosure controls and procedures as of the Evaluation Date.
(b) There were no significant changes in the registrant’s internal control over financial reporting (as defined in Rule 30a-3(d) under the 1940 Act) that occurred during the period covered by this report that has materially affected, or is reasonably likely to materially affect, the registrant’s internal control over financial reporting.
Item 12. Exhibits.
(a)(1) Code of Ethics is attached hereto.
(a)(2) The certifications required by Rule 30a-2(a) under the 1940 Act are attached hereto.
(a)(3) Not applicable
| | (b) | Certifications of the registrant’s Principal Executive Officer and Principal Financial Officer as required by Rule 30a-2(b) under the 1940 Act are attached hereto. These certifications are being furnished to the Securities and Exchange Commission solely pursuant to 18 U.S.C. section 1350 and are not being filed as part of the Form N-CSR with the Commission. |
SIGNATURES
Pursuant to the requirements of the Securities Exchange Act of 1934 and the Investment Company Act of 1940, the Registrant has duly caused this report to be signed on its behalf by the undersigned, thereunto duly authorized.
Aberdeen Global Select Opportunities Fund Inc.
| | | | |
| | |
| By: | | /s/ Gary Marshall | | |
| | Gary Marshall, Principal Executive Officer | | |
Date: January 7, 2014
Pursuant to the requirements of the Securities Exchange Act of 1934 and the Investment Company Act of 1940, this report has been signed below by the following persons on behalf of the registrant and in the capacities and on the dates indicated.
| | | | |
| | |
| By: | | /s/ Gary Marshall | | |
| | Gary Marshall, Principal Executive Officer | | |
Date: January 7, 2014
| | | | |
| | |
| By: | | /s/ Andrea Melia | | |
| | Andrea Melia, Principal Financial Officer | | |
Date: January 7, 2014