UNITED STATES
SECURITIES AND EXCHANGE COMMISSION
Washington, D.C. 20549
FORM N-CSR
CERTIFIED SHAREHOLDER REPORT OF
REGISTERED MANAGEMENT INVESTMENT COMPANIES
Investment Company Act file number: 811-06017
Aberdeen Global Select Opportunities Fund Inc.
(Exact name of registrant as specified in charter)
1735 Market Street, 32nd Floor
Philadelphia, PA 19103
(Address of principal executive offices) (Zip code)
Ms. Andrea Melia
c/o Aberdeen Asset Management Inc.
1735 Market Street, 32nd Floor
Philadelphia, PA 19103
(Name and address of agent for service)
Registrant’s telephone number, including area code: (800) 387-6977
Date of fiscal year end: October 31
Date of reporting period: October 31, 2014
Item 1. Reports to Shareholders.

Aberdeen Investment Funds
Aberdeen Global Select Opportunities Fund Inc.
Annual Report
October 31, 2014
Aberdeen Global Select Opportunities Fund Inc.
Aberdeen Select International Equity Fund
Aberdeen Select International Equity Fund II
Aberdeen Total Return Bond Fund
Aberdeen Global High Income Fund

Table of Contents
Investors should carefully consider a fund’s investment objectives, risks, fees, and expenses before investing any money. To obtain this and other fund information, please call 1-800-387-6977 to request a prospectus, or download a prospectus at www.aberdeen-asset.us. Please read it carefully before investing any money.
Investing in mutual funds involves risk, including possible loss of principal.
Aberdeen Select International Equity Fund, Aberdeen Select International Equity Fund II, Aberdeen Total Return Bond Fund, and Aberdeen Global High Income Fund, (collectively the “Aberdeen Investment Funds”) and Aberdeen Global Select Opportunities Fund Inc. (with the Aberdeen Investment Funds the “Funds”) are distributed by Aberdeen Fund Distributors, LLC, Member FINRA, 1735 Market Street, 32nd Floor, Philadelphia, PA 19103.
Aberdeen Asset Management Inc. (AAMI) has been registered as an investment adviser under the Investment Advisers Act of 1940 since August 23,1995.
Statement Regarding Availability of Quarterly Portfolio Schedule.
The complete schedule of portfolio holdings for Aberdeen Investment Funds and Aberdeen Global Select Opportunities Fund Inc. is included in the Funds’ semi-annual and annual reports to shareholders. Aberdeen Investment Funds and Aberdeen Global Select Opportunities Fund Inc. file complete schedules of portfolio holdings for each Fund with the Securities and Exchange Commission (the “SEC”) for the first and third quarters of each fiscal year on Form N-Q. The Funds’ Forms N-Q are available on the SEC’s website at http://www.sec.gov. The Funds’ Forms N-Q may be reviewed and copied at the SEC’s Public Reference Room in Washington, DC, and information on the operation of the Public Reference Room may be obtained by calling 800-SEC-0330. The Funds make their most recent Forms N-Q available to shareholders on www.aberdeen-asset.us or upon request without charge.
Statement Regarding Availability of Proxy Voting Record.
Information regarding the policies and procedures that the Funds use to determine how to vote proxies relating to portfolio securities is available without charge, upon request, by calling 1-800-387-6977. The information is also included in the Funds’ Statement of Additional Information, which is available on the Funds’ website at www.aberdeen-asset.us and on the SEC’s website at www.sec.gov.
Information relating to how each Fund voted proxies relating to portfolio securities held during the most recent twelve months ended June 30 is available by August 30 of the relevant year: (i) upon request and without charge by calling 1-800-387-6977; and (ii) on the SEC’s website at www.sec.gov.
Letter to Shareholders
October 31, 2014
Dear Valued Shareholder,
Welcome to the Aberdeen Investment Funds and Aberdeen Global Select Opportunities Fund Inc. Annual Report covering the activities for the 12-month period ended October 31, 2014.
Market overview
Global equity markets continued to be dominated by concerns over global economic growth levels during the reporting period, lagging their U.S. counterparts. Strong U.S. equity market performance buoyed global markets as deflationary pressures continued to cause headwinds in Europe. Meanwhile, emerging markets finished the period with weak returns as a strong sell-off in September overshadowed gains from earlier in the year. The fixed income universe was volatile over the period, as investment-grade core and total return bond markets delivered modest returns against the backdrop of struggling global equity markets and falling commodity prices. Meanwhile, the global high yield bond market came under significant pressure during the period after yields and spreads made new lows in late June.
Markets continue to brace for more headwinds as we enter 2015 given the environment of slow global growth, a potential U.S. interest rate hike on the horizon and falling oil prices. In the U.S., voters elected eight new Republican senators as the GOP will take control of both houses of Congress in January 2015. The implications of this shift remain unclear, but dramatic legislative moves are likely to be made regarding healthcare and government spending. In emerging markets, the election of pro-business candidate Narendra Modi as the new Prime Minister of India has buoyed the outlook for the world’s 10th largest economy. In Europe, tensions between Russia and the West continue to hinder Russian markets.
Anne Richards, Aberdeen Asset Management (Aberdeen) Global Chief Investment Officer, provides you with a detailed insight on the investment marketplace in the Global Market Review and Outlook on the following page.
Aberdeen developments
As of April 1, 2014, Aberdeen Asset Management PLC completed the acquisition of Scottish Widows Investment Partnership (SWIP) from Lloyds Banking Group in the UK. During the period, the integration of SWIP into the wider Aberdeen group continued to progress. The acquisition combines Aberdeen and SWIP’s strengths across fixed income, real estate, active and quantitative equities, investment solutions and alternatives. The acquisition of SWIP will not have a direct impact on any funds in the Aberdeen Fund family but will significantly add to Aberdeen’s global investment capabilities.
During the period, Aberdeen reached an agreement with the European Tour and the Scottish Government to extend our sponsorship of the Aberdeen Asset Management Scottish Open through 2020.
Aberdeen received several industry awards during the period, including 12 Mutual Fund Education Association (MFEA) STAR Awards for financial communications in both digital and direct marketing categories.
Thank you for choosing Aberdeen Investment Funds and Aberdeen Global Select Opportunities Fund, Inc. We value your investment with us.
Kind Regards,
Yours sincerely,
/s/ Bev Hendry
Bev Hendry
President
Aberdeen Investment Funds
Aberdeen Global Select Opportunities Fund Inc.
2014 Annual Report
1
Market Review
In our opinion, the performances of the major global equity markets for the 12-month period ended October 31, 2014, might be best described as “all over the map”—literally. There was marked divergence in stock returns among geographical regions. On the surface, it appeared that global equities generally posted respectable gains, with the MSCI World Index, the developed-market benchmark, rising 9.3% (in U.S. dollars) over the period. However, the strength in the markets was concentrated on the western side of the Atlantic Ocean, with the U.S. broader-market S&P 500 Index climbing 17.3%. In contrast, the MSCI World ex US Index was up just 0.2% during the period, dragged down mainly by investors’ concerns about economic growth in Europe and the continued rise in the U.S. dollar against most major global currencies. Both the euro and the Japanese yen declined sharply against the U.S. dollar over the period, with the latter currency experiencing particular weakness. The upturn in the U.S. market was the primary contributor to the outperformance of developed markets versus their emerging counterparts, as measured by the MSCI Emerging Markets Index, which returned 1.0% for the reporting period. The sharp decline in oil prices over the annual period had a mixed effect on the global markets: Importing nations were notable beneficiaries, whereas exporters such as Russia came under pressure as lower oil prices may aggravate revenue shortfalls caused by a raft of Western sanctions.
Unlike many other regions, the U.S. equity market benefited from a generally improving economy over the reporting period. Healthy gross domestic product (GDP) growth in the fourth quarter of 2013 and the second and third quarters of 2014 offset a decline in the first quarter of the year, most likely attributable to bad weather-induced weakness in consumer spending. Additionally, the unemployment rate fell substantially during the period, although the labor participation rate declined to its lowest level in 36 years. Investors remained focused on U.S. monetary policy for much of the period. Former Federal Reserve (Fed) vice chair Janet Yellen succeeded Ben Bernanke as head of the Fed in February 2014. The Fed began to reduce its $85 billion-per-month asset purchase program in $10 billion increments in January 2014, and ended its tapering in late October.
United Kingdom (UK) stocks saw marginal gains while European equities ended the period modestly lower. Economic recovery in the Eurozone1 remains fragile and much slower-paced than in the U.S. and UK. The European labor market has continued to improve, albeit unevenly, as has household confidence; however, inflation expectations are dangerously low for the region. Late in the reporting period, the European Central Bank (ECB) announced that, if required, it would use “unconventional policy instruments” in support of the Eurozone economy. However, there are doubts over the scale and potential effectiveness of such measures. In Japan, the yen’s weakness lifted equity markets overall, but gains were pared because of doubts over the efficacy of Prime Minister Shinzo Abe’s “third arrow” stimulus measures, as well as the impact of the consumption tax hike that was implemented in April 2014.
Within the global emerging equity markets, strong performance in India and, to a lesser extent, China, was counterbalanced by notable weakness in Latin America and Russia. Indian stocks rallied after the business-friendly Bharatiya Janata Party (BJP), headed by Narendra Modi, swept into power as that country’s first single-party majority in 25 years. The Chinese market was bolstered by signs of an upturn in economic growth. Additionally, investors appeared to take a favorable view of a proposed pilot program for mutual market connectivity between Hong Kong and Shanghai, as it was seen as a significant step towards cross-border capital market integration. The program commenced operations shortly after the end of the reporting period in mid-November. In Latin America, Brazilian equities were hampered as investor sentiment soured in reaction to the nation’s bitterly-contested presidential election. Brazil’s incumbent president, Dilma Rousseff, whose policies generally are perceived as unfriendly to business, edged out her opponent, Aecio Neves, to secure a second term. Ongoing geopolitical tensions surrounding Russia’s expanded military presence in Ukraine had a negative impact on the Russian market for the period.
The global bond markets experienced periods of volatility over the reporting period, which increased more significantly in August and October. Concerns over faltering global economic growth, combined with heightened fears of potential deflation in Europe, drove much of the uncertainty. Nonetheless, the global fixed income markets collectively finished in positive territory for the period. Investment-grade bonds outperformed high yield securities, with the Bank of America Merrill Lynch Global Broad Market Corporate Index advancing 6.4% versus the 5.9% return of the Bank of America Merrill Lynch Global High Yield Constrained Index. Emerging markets debt, as measured by the J.P. Morgan EMBI Global Diversified Index, was the strongest-performing segment within the global fixed income universe, climbing 8.6% for the period, as investors focused on the yield differential between emerging and developed markets, rather than the geopolitical tensions between Russia and Ukraine.
Outlook
In our opinion, the global economic and monetary environment remains supportive of equities relative to fixed income and cash. We believe that the end to U.S. quantitative easing in late October, higher interest rates in 2015, and improvement in the U.S. economy could lead to continued strengthening of the U.S. dollar. Our overall view on interest rates is that they will remain low for an extended period. Confidence in the global recovery has improved somewhat, given the pick-up in U.S. economic activity. However, we feel that the picture is less rosy elsewhere in the developed world. The Eurozone continues to suffer from high debt and unemployment. We remain cautious about Japan, as the recovery in household consumption has been slower than expected. However, these conditions have led to unprecedented monetary stimulus in both regions, which we think may potentially create investment opportunities. We believe that prospects for emerging economies also remain mixed, with recent market developments highlighting sensitivities to U.S. monetary policy. At the corporate level, we observe efforts to boost margins through cost-cuts and reorganization, although this has yet to translate into a broader trend of improving profitability.
Anne Richards
Chief Investment Officer
Aberdeen Asset Management
| * | | The Eurozone comprises 18 European Union member states that have adopted the euro as their common currency. |
Indexes are unmanaged and have been provided for comparison purposes only. No fees or expenses are reflected. You cannot invest directly in an index.
Annual Report 2014
2
Aberdeen Global Select Opportunities Fund Inc. (Unaudited)
The Aberdeen Global Select Opportunities Fund Inc. (Class A shares at net asset value net of fees) returned 3.98% for the 12-month period ended October 31, 2014, versus the 8.32% return of its benchmark, the MSCI All Country World Index (MSCI ACWI), during the same period. For broader comparison, the average return of the Fund’s Lipper peer category of Global Large-Cap Core Funds (consisting of 24 funds) was 7.39% for the period.
Global equities, as measured by the MSCI ACWI, rallied during the review period, attributable largely to improved economic data in the U.S., as well as loose monetary policy in the developed world. The U.S. Federal Reserve’s (Fed) commitment to keep interest rates low for a longer period, as well as the European Central Bank’s unexpected rate cuts and fresh stimulus measures, reassured investors. In Japan, the yen’s weakness lifted equity markets, but gains were pared owing to doubts over the efficacy of Prime Minister Shinzo Abe’s “third arrow”1 stimulus measures, as well as the impact of the consumption tax hike that was implemented in April. The prospect of rising U.S. interest rates alarmed investors, while worsening geopolitical tensions and generally weak manufacturing and services data in Europe and China also dented market sentiment.
Towards the end of the period, monetary policy was the key theme. Although the Fed officially ended its bond-buying program, the Bank of Japan’s increased stimulus, as well as positive corporate earnings, boosted confidence in the global economy. However, oil prices tumbled to multi-year lows,2 as Saudi Arabia’s move to cut prices for exports exacerbated worries over global demand and rising supplies. The fall in oil prices had a mixed effect on markets. Importing nations were notable beneficiaries, whereas exporters such as Russia came under pressure as the lower oil price may aggravate revenue shortfalls caused by a raft of Western sanctions.
The top detractors from Fund performance for the reporting period included lender Standard Chartered, miner Vale, and Italian exchange-listed pipe-maker Tenaris. Standard Chartered’s stock price weakened after the third profit warning in a year as the company delivered its results for the first nine months of its 2014 fiscal year. Management cited high impairment charges as some corporate and institutional clients were hurt by weakening commodity markets. Investor sentiment was also dampened by speculation that U.S. regulators could reinvestigate its alleged sanction violations. Some of its problems are cyclical and may be resolved in the medium term, in our opinion. More structural difficulties may potentially require management to reprioritize investments, divest non-core businesses and streamline riskier portfolios. While we believe that it is a solid franchise, we would not be surprised by a management change. Shares of Vale moved lower as fears of a slowdown in China’s economy weighed on iron ore prices, while Tenaris’s stock price declined on concerns that soft oil prices may weigh on demand for its products.
The main contributors to the Fund’s relative return for the period were U.S. retail drugstore chain operator and pharmacy benefit manager CVS Health, Taiwan Semiconductor Manufacturing Co. (TSMC), and freight railroad operator Canadian National Railway. Shares of CVS Health rallied after the company boosted its dividend and approved a significant share buyback. It also reported better-than-expected earnings over the period. TSMC’s stock price gained ground after the company reported record-high sales over multiple quarters, on robust demand for its products. Finally, Canadian National Railway benefited from better-than-expected profits due to greater market share and increased shipments.
In Fund activity, we initiated a position in U.S. payment-processing services company Visa and UK aircraft engine manufacturer Rolls Royce. In our view, Visa has a high-return business with an established market position and attractive growth drivers. We feel that Rolls Royce has an attractive high recurring revenue model, high barriers to entry and positive structural growth potential.
Conversely, we exited the position in U.S. healthcare company Quest Diagnostics, in view of its increasingly challenging environment and lower growth visibility. We also sold the Fund’s shares in Australia’s QBE Insurance as we feel that there are more attractive investment opportunities elsewhere.
The divergence between major global central banks’ monetary policies has become more pronounced, which we believe may create a more complex and challenging market environment ahead. How that translates into global capital flows is uncertain. Meanwhile, the global economic environment appears mixed; while the U.S. economic engine continues to power on, the Eurozone3 and Japan’s economic health remained anemic. However, the sharp drop in oil prices since June may potentially provide some relief to large net importers such as the Eurozone and Japan. Similarly, the appreciation in the U.S. dollar may increase the trade competitiveness of these economies.
For us at Aberdeen, investing in companies that we view as fundamentally sound and well managed is an imperative that we believe should help negate the vagaries of market sentiment. Recent earnings from our holdings have been largely steady or met expectations despite the muted economic backdrop. Renewed efforts to boost profits through cost cuts and improving margins are further along, even though it may be some time before a broader rebound is evident. Many of these companies are market leaders and have weathered periods of crises; we think it should be no different this time. If we feel that valuations are attractive, we will look to add to favored holdings when opportunities arise.
| 1 | | The “third arrow” is the last of Japanese Prime Minister Shinzo Abe’s economic programs, comprising structural reforms in an effort to boost Japan’s competitiveness. |
| 2 | | Source: Bloomberg, October 2014. |
| 3 | | The Eurozone comprises 18 European Union member states that have adopted the euro as their common currency. |
2014 Annual Report
3
Aberdeen Global Select Opportunities Fund Inc. (Unaudited) (concluded)
Portfolio Management:
Aberdeen Global Equity Team
PAST PERFORMANCE DOES NOT GUARANTEE FUTURE RESULTS.
The performance quoted represents past performance, which does not guarantee future results. Class A Shares have up to a 0.25% 12b-1 fee. The investment return and principal value of an investment will fluctuate so that an investor’s shares, when redeemed, may be worth more or less than their original cost. Current performance of the Fund may be lower or higher than the performance quoted. Performance data current to the most recent month-end may be obtained by calling 800-387-6977 or visiting www.aberdeen-asset.us.
Investing in mutual funds involves risk, including the possible loss of principal. There is no assurance that the investment objective of any fund will be achieved. Indexes are unmanaged and have been provided for comparison purposes only. No fees or expenses are reflected. You cannot invest directly in an index.
Lipper is a leading global provider of mutual fund information and analysis to fund companies, financial intermediaries and media organizations.
Risk Considerations
Foreign securities are more volatile, harder to price and less liquid than U.S. securities. They are subject to different accounting and regulatory standards, and political and economic risks. These risks are enhanced in emerging markets countries.
Equity stocks of small and mid-cap companies carry greater risk and more volatility than equity stocks of larger, more established companies.
Please read the prospectus for more detailed information regarding these and other risks.
Annual Report 2014
4
Aberdeen Global Select Opportunities Fund Inc. (Unaudited)
| | | | | | | | | | | | | | |
Average Annual Total Return (For periods ended October 31, 2014) | | 1 Yr. | | 5 Yr. | | | 10 Yr. | | | Inception | |
Class A1 | | 3.98% | | | 5.76% | | | | 4.88% | | | | 5.22% | |
Institutional Class2,3 | | 4.19% | | | 6.00% | | | | n/a | | | | 3.90% | |
| 1 | | Class commenced operations on July 01, 2004. |
| 2 | | Class commenced operations on March 14, 2005. |
2014 Annual Report
5
Aberdeen Global Select Opportunities Fund Inc. (Unaudited)
Performance of a $10,000 Investment (as of October 31, 2014)
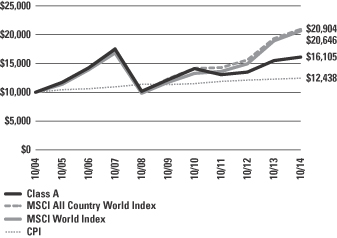
Comparative performance of $10,000 invested in Class A shares of the Aberdeen Global Select Opportunities Fund Inc., Morgan Stanley Capital International (MSCI) All Country World Index, the MSCI World Index and the Consumer Price Index (CPI) over a 10-year period ended October 31, 2014. Unlike the Fund’s returns, the returns for these unmanaged indexes do not reflect any fees or expenses. Investors cannot invest directly in market indexes.
The MSCI All Country World Index is a free float-adjusted market capitalization-weighted index that is designed to measure the equity market performance of 46 country indexes comprising 23 developed and 23 emerging market country indexes. The developed market country indexes included are: Australia, Austria, Belgium, Canada, Denmark, Finland, France, Germany, Hong Kong, Ireland, Israel, Italy, Japan, Netherlands, New Zealand, Norway, Portugal, Singapore, Spain, Sweden, Switzerland, the United Kingdom and the United States. The emerging market country indexes included are: Brazil, Chile, China, Colombia, Czech Republic, Egypt, Greece, Hungary, India, Indonesia, Korea, Malaysia, Mexico, Peru, Philippines, Poland, Qatar, Russia, South Africa, Taiwan, Thailand, Turkey and United Arab Emirates.
The MSCI World Index is a free float-adjusted market capitalization-weighted index that is designed to measure the equity market performance of developed markets. The MSCI World Index consists of the following 23 developed market country indexes: Australia, Austria, Belgium, Canada, Denmark, Finland, France, Germany, Hong Kong, Ireland, Israel, Italy, Japan, Netherlands, New Zealand, Norway, Portugal, Singapore, Spain, Sweden, Switzerland, the United Kingdom, and the United States.
The CPI represents changes in prices of all goods and services purchased for consumption by urban households.
Investment return and principal value will fluctuate, and when redeemed, shares may be worth more or less than original cost. Past performance is no guarantee of future results. The Average Annual Total Return table and performance graph do not reflect the deduction of taxes that a shareholder would pay on Fund distributions or the redemption of Fund shares. Investing in mutual funds involves market risk, including loss of principal. Performance returns assume the reinvestment of all distributions. Performance returns reflect fee waivers and reimbursements in effect without which returns would have been lower.
Portfolio Summary (as a percentage of net assets)
October 31, 2014 (Unaudited)
| | | | |
| Asset Allocation | | | |
Common Stocks | | | 90.9% | |
Preferred Stocks | | | 8.1% | |
Repurchase Agreement | | | 1.5% | |
Liabilities in excess of other assets | | | (0.5)% | |
| | | | 100.0% | |
The following table summarizes the composition of the Fund’s portfolio, in Standard & Poor’s Global Industry Classification Standard (GICS) sectors, expressed as a percentage of net assets. The GICS structure consists of 10 sectors, 24 industry groups, 67 industries and 156 sub-industries. As of October 31, 2014, the Fund did not have more than 25% of its assets invested in any single industry group.
| | | | |
| Top Sectors | | | |
Consumer Staples | | | 17.7% | |
Energy | | | 16.6% | |
Financials | | | 15.5% | |
Health Care | | | 12.3% | |
Information Technology | | | 11.2% | |
Industrials | | | 9.9% | |
Materials | | | 9.7% | |
Telecommunication Services | | | 2.6% | |
Consumer Discretionary | | | 2.0% | |
Utilities | | | 1.5% | |
Other | | | 1.0% | |
| | | | 100.0% | |
| | | | |
| Top Holdings* | | | |
Roche Holding AG | | | 4.2% | |
Taiwan Semiconductor Manufacturing Co. Ltd., ADR | | | 3.2% | |
CVS Health Corp. | | | 3.2% | |
Philip Morris International, Inc. | | | 3.1% | |
Johnson & Johnson | | | 3.1% | |
British American Tobacco PLC | | | 3.0% | |
Novartis AG | | | 3.0% | |
Tenaris SA, ADR | | | 2.9% | |
Royal Dutch Shell PLC, B Shares | | | 2.9% | |
Banco Bradesco SA, ADR, Preferred Shares | | | 2.8% | |
Other | | | 68.6% | |
| | | | 100.0% | |
| | | | |
| Top Countries | | | |
United States | | | 31.6% | |
United Kingdom | | | 15.3% | |
Switzerland | | | 11.9% | |
Japan | | | 6.7% | |
Brazil | | | 5.5% | |
Sweden | | | 5.2% | |
Italy | | | 4.7% | |
Canada | | | 4.2% | |
Taiwan | | | 3.2% | |
Republic of South Korea | | | 2.6% | |
Other | | | 9.1% | |
| | | | 100.0% | |
| * | | For the purpose of listing top holdings, repurchase agreements are included as part of Other. |
Annual Report 2014
6
Statement of Investments
October 31, 2014
Aberdeen Global Select Opportunities Fund Inc.
| | | | | | | | |
| | | Shares or
Principal
Amount | | | Value | |
COMMON STOCKS (90.9%) | | | | | | | | |
CANADA (4.2%) | | | | | | | | |
Industrials (2.1%) | | | | | | | | |
Canadian National Railway Co. | | | 2,100 | | | $ | 148,004 | |
Materials (2.1%) | | | | | | | | |
Potash Corp. of Saskatchewan, Inc. | | | 4,400 | | | | 150,134 | |
| | | | | | | | 298,138 | |
CHINA (1.5%) | | | | | | | | |
Energy (1.5%) | | | | | | | | |
PetroChina Co. Ltd., H Shares (a) | | | 82,000 | | | | 103,170 | |
FRANCE (1.0%) | | | | | | | | |
Industrials (1.0%) | | | | | | | | |
Schneider Electric SE (a) | | | 910 | | | | 72,025 | |
HONG KONG (2.6%) | | | | | | | | |
Financials (2.6%) | | | | | | | | |
AIA Group Ltd. (a) | | | 19,300 | | | | 107,683 | |
Swire Pacific Ltd., Class A (a) | | | 5,500 | | | | 72,216 | |
| | | | | | | | 179,899 | |
ITALY (4.7%) | | | | | | | | |
Energy (4.7%) | | | | | | | | |
Eni SpA (a) | | | 5,900 | | | | 125,629 | |
Tenaris SA, ADR | | | 5,200 | | | | 206,128 | |
| | | | | | | | 331,757 | |
JAPAN (6.7%) | | | | | | | | |
Consumer Staples (1.6%) | | | | | | | | |
Japan Tobacco, Inc. (a) | | | 3,200 | | | | 111,087 | |
Financials (1.1%) | | | | | | | | |
Daito Trust Construction Co. Ltd. (a) | | | 600 | | | | 75,919 | |
Industrials (1.5%) | | | | | | | | |
FANUC Corp. (a) | | | 610 | | | | 107,385 | |
Materials (2.5%) | | | | | | | | |
Shin-Etsu Chemical Co. Ltd. (a) | | | 2,780 | | | | 181,191 | |
| | | | | | | | 475,582 | |
MEXICO (2.1%) | | | | | | | | |
Consumer Staples (2.1%) | | | | | | | | |
Fomento Economico Mexicano SAB de CV, ADR | | | 1,500 | | | | 144,360 | |
SINGAPORE (0.9%) | | | | | | | | |
Financials (0.9%) | | | | | | | | |
City Developments Ltd. (a) | | | 9,000 | | | | 66,288 | |
SOUTH AFRICA (1.5%) | | | | | | | | |
Telecommunication Services (1.5%) | | | | | | | | |
MTN Group Ltd. (a) | | | 4,900 | | | $ | 108,298 | |
SWEDEN (5.2%) | | | | | | | | |
Financials (1.5%) | | | | | | | | |
Nordea Bank AB (a) | | | 8,300 | | | | 106,211 | |
Industrials (2.2%) | | | | | | | | |
Atlas Copco AB, A Shares (a) | | | 5,200 | | | | 149,918 | |
Information Technology (1.5%) | | | | | | | | |
Telefonaktiebolaget LM Ericsson, B Shares (a) | | | 9,100 | | | | 107,367 | |
| | | | | | | | 363,496 | |
SWITZERLAND (11.9%) | | | | | | | | |
Consumer Staples (2.1%) | | | | | | | | |
Nestle SA (a) | | | 1,990 | | | | 145,644 | |
Financials (2.6%) | | | | | | | | |
Zurich Insurance Group AG (a)(b) | | | 600 | | | | 181,530 | |
Health Care (7.2%) | | | | | | | | |
Novartis AG (a) | | | 2,300 | | | | 213,245 | |
Roche Holding AG (a) | | | 1,010 | | | | 298,217 | |
| | | | | | | | 511,462 | |
| | | | | | | | 838,636 | |
TAIWAN (3.2%) | | | | | | | | |
Information Technology (3.2%) | | | | | | | | |
Taiwan Semiconductor Manufacturing Co. Ltd., ADR | | | 10,400 | | | | 229,008 | |
UNITED KINGDOM (15.3%) | | | | | | | | |
Consumer Staples (3.0%) | | | | | | | | |
British American Tobacco PLC (a) | | | 3,800 | | | | 215,849 | |
Energy (2.9%) | | | | | | | | |
Royal Dutch Shell PLC, B Shares (a) | | | 5,470 | | | | 202,951 | |
Financials (4.0%) | | | | | | | | |
HSBC Holdings PLC (a) | | | 14,180 | | | | 145,170 | |
Standard Chartered PLC (a) | | | 9,291 | | | | 139,863 | |
| | | | | | | | 285,033 | |
Industrials (1.0%) | | | | | | | | |
Rolls-Royce Holdings PLC (a)(b) | | | 5,142 | | | | 69,478 | |
Materials (1.8%) | | | | | | | | |
BHP Billiton PLC (a) | | | 4,930 | | | | 127,655 | |
Telecommunication Services (1.1%) | | | | | | | | |
Vodafone Group PLC (a) | | | 22,600 | | | | 75,103 | |
Utilities (1.5%) | | | | | | | | |
Centrica PLC (a) | | | 21,500 | | | | 104,161 | |
| | | | | | | | 1,080,230 | |
UNITED STATES (30.1%) | | | | | | | | |
Consumer Discretionary (2.0%) | | | | | | | | |
Comcast Corp., Class A | | | 2,500 | | | | 138,375 | |
Consumer Staples (8.9%) | | | | | | | | |
CVS Health Corp. | | | 2,600 | | | | 223,106 | |
PepsiCo, Inc. | | | 1,900 | | | | 182,723 | |
Philip Morris International, Inc. | | | 2,500 | | | | 222,525 | |
| | | | | | | | 628,354 | |
See accompanying notes to financial statements.
2014 Annual Report
7
Statement of Investments (concluded)
October 31, 2014
Aberdeen Global Select Opportunities Fund Inc.
| | | | | | | | |
| | | Shares or
Principal
Amount | | | Value | |
Energy (6.6%) | | | | | | | | |
Chevron Corp. | | | 900 | | | $ | 107,955 | |
EOG Resources, Inc. | | | 1,900 | | | | 180,595 | |
Schlumberger Ltd. | | | 1,800 | | | | 177,588 | |
| | | | | | | | 466,138 | |
Health Care (5.1%) | | | | | | | | |
Baxter International, Inc. | | | 2,000 | | | | 140,280 | |
Johnson & Johnson | | | 2,040 | | | | 219,871 | |
| | | | | | | | 360,151 | |
Industrials (2.1%) | | | | | | | | |
United Technologies Corp. | | | 1,400 | | | | 149,800 | |
Information Technology (3.9%) | | | | | | | | |
Oracle Corp. | | | 4,500 | | | | 175,725 | |
Visa, Inc., Class A | | | 400 | | | | 96,572 | |
| | | | | | | | 272,297 | |
Materials (1.5%) | | | | | | | | |
Praxair, Inc. | | | 870 | | | | 109,611 | |
| | | | | | | | 2,124,726 | |
Total Common Stocks | | | | | | | 6,415,613 | |
PREFERRED STOCKS (8.1%) | | | | | | | | |
BRAZIL (5.5%) | | | | | | | | |
Energy (0.9%) | | | | | | | | |
Petroleo Brasileiro SA, ADR, Preferred Shares | | | 5,400 | | | | 66,042 | |
Financials (2.8%) | | | | | | | | |
Banco Bradesco SA, ADR, Preferred Shares | | | 13,279 | | | | 198,919 | |
Materials (1.8%) | | | | | | | | |
Vale SA, ADR, Preferred Shares | | | 14,400 | | | | 126,144 | |
| | | | | | | | 391,105 | |
REPUBLIC OF SOUTH KOREA (2.6%) | | | | | | | | |
Information Technology (2.6%) | | | | | | | | |
Samsung Electronics Co. Ltd., GDR, Preferred Shares (c) | | | 400 | | | | 182,880 | |
UNITED KINGDOM (0.0%) | | | | | | | | |
Industrials (0.0%) | | | | | | | | |
Rolls-Royce Holdings PLC, Preferred Shares (b) | | | 414,000 | | | | 662 | |
Total Preferred Stocks | | | | | | | 574,647 | |
REPURCHASE AGREEMENT (1.5%) | | | | | | | | |
UNITED STATES (1.5%) | | | | | | | | |
Repurchase Agreement, Fixed Income Clearing Corp., 0.00%, dated 10/31/2014, due 11/03/2014, repurchase price $103,593 collateralized by U.S. Treasury Note, maturing 04/30/2018; total market value of $107,938 | | $ | 103,593 | | | $ | 103,593 | |
Total Repurchase Agreement | | | | | | | 103,593 | |
Total Investments
(Cost $6,888,231) (d)—100.5% | | | | | | | 7,093,853 | |
| | |
Liabilities in excess of other assets—(0.5)% | | | | | | | (33,686 | ) |
Net Assets—100.0% | | | | | | $ | 7,060,167 | |
| (a) | | Fair Valued Security. Fair Values are determined pursuant to procedures approved by the Fund’s Board of Directors. See Note 2(a) of the accompanying Notes to Financial Statements. |
| (b) | | Non-income producing security. |
| (c) | | Denotes a security issued under Regulation S or Rule 144A. |
| (d) | | See notes to financial statements for tax unrealized appreciation/depreciation of securities. |
| ADR | | American Depositary Receipt |
| GDR | | Global Depositary Receipt |
See accompanying notes to financial statements.
Annual Report 2014
8
Aberdeen Select International Equity Fund (Unaudited)
The Aberdeen Select International Equity Fund (Class A shares at net asset value net of fees) returned -0.04% for the year ended October 31, 2014, versus 0.49% for its benchmark, the MSCI All Country World ex U.S. Index (MSCI ACWI ex-U.S.), during the same period. For broader comparison, the average return of the Fund’s Lipper peer category of International Large-Cap Growth Funds (consisting of 48 funds) was 1.20% for the period.
International equities, as measured by the MSCI ACWI ex-U.S., posted marginal gains during the review period, attributable largely to improved economic data in the U.S., as well as loose monetary policy in the developed world. The U.S. Federal Reserve’s (Fed) commitment to keep interest rates low for a longer period, as well as the European Central Bank’s unexpected rate cuts and fresh stimulus measures, reassured investors. In Japan, the yen’s weakness lifted equity markets, but gains were pared owing to doubts over the efficacy of Prime Minister Shinzo Abe’s “third arrow”1 stimulus measures, as well as the impact of the consumption tax hike that was implemented in April. The prospect of rising U.S. interest rates alarmed investors, while worsening geopolitical tensions and generally weak manufacturing and services data in Europe and China also dented market sentiment.
Towards the end of the period, monetary policy was the key theme. Although the Fed officially ended its bond-buying program, the Bank of Japan’s increased stimulus, as well as positive corporate earnings, boosted confidence in the global economy. However, oil prices tumbled to multi-year lows,2 as Saudi Arabia’s move to cut prices for exports exacerbated worries over global demand and rising supplies. The fall in oil prices had a mixed effect on markets. Importing nations were notable beneficiaries, whereas exporters such as Russia came under pressure as the lower oil price may aggravate revenue shortfalls caused by a raft of Western sanctions.
The top detractors from Fund performance for the period included lender Standard Chartered, miner Vale, and Australian insurer QBE Insurance. Standard Chartered’s stock price weakened after the third profit warning in a year as the company delivered its results for the first nine months of its 2014 fiscal year. Management cited high impairment charges as some corporate and institutional clients were hurt by weakening commodity markets. Investor sentiment was also dampened by speculation that U.S. regulators could reinvestigate its alleged sanction violations. Some of its problems are cyclical and may be resolved in the medium term, in our opinion. More structural difficulties may potentially require management to reprioritize investments, divest non-core businesses and streamline riskier portfolios. While we believe that it is a solid franchise, we would not be surprised by a management change. Shares of Vale moved lower as fears of a slowdown in China’s economy weighed on iron ore prices, while the stock price of QBE Insurance fell on the back of the company’s profit warning in its 2014 fiscal year. This followed a strategic review of its North American operations which resulted in additional loss provisions, restructuring charges and a goodwill write-down.
The main contributors to the Fund’s relative return for the period were Swiss drug-maker Novartis, Taiwan Semiconductor Manufacturing Co. (TSMC), and freight railroad operator Canadian National Railway. Novartis’s share price reacted positively to favorable drug trial data related to the treatment of heart failure, while its significant three-way transaction with GlaxoSmithKline earlier in the reporting period also supported investor sentiment. TSMC’s stock price gained ground after the company reported record-high sales over multiple quarters, on robust demand for its products. Finally, Canadian National Railway benefited from better-than-expected profits due to greater market share and increased shipments.
In Fund activity, we initiated a position in Singapore conglomerate Jardine Matheson, UK credit and marketing services company Experian, and UK aircraft engine manufacturer Rolls Royce. We believe that Jardine has an attractive collection of assets, and Experian is the largest international operator in a growing industry. Rolls Royce has an attractive high recurring revenue model, high barriers to entry and positive structural growth potential, in our opinion.
Conversely, we sold the holding in Verizon Communications, which the Fund had received from the return of cash and shares from Vodafone after it sold its stake in the Verizon Wireless joint venture. We also exited the remaining small position in QBE Insurance, as we feel that there are more attractive investment opportunities elsewhere. Additionally, we continued to sell illiquid stocks such as Bulgarian toolmaker Sparky Eltos Ad Lovech, which was in the original portfolio managed by Artio Global Investors prior to the company’s acquisition by Aberdeen Asset Management in 2013.
The divergence between major global central banks’ monetary policies has become more pronounced, which we believe may create a more complex and challenging market environment ahead. How that translates into global capital flows is uncertain. Meanwhile, the global economic environment appears mixed; while the U.S. economic engine continues to power on, the Eurozone3 and Japan’s economic health remained anemic. However, the sharp drop in oil prices since June may potentially provide some relief to large net importers such as the Eurozone and Japan. Similarly, the appreciation in the U.S. dollar may increase the trade competitiveness of these economies.
For us at Aberdeen, investing in companies that we view as fundamentally sound and well managed is an imperative that we believe should help negate the vagaries of market sentiment. Recent earnings from our holdings have been largely steady or met expectations despite the muted economic backdrop. Renewed efforts
| 1 | | The “third arrow” is the last of Japanese Prime Minister Shinzo Abe’s economic programs, comprising structural reforms in an effort to boost Japan’s competitiveness. |
| 2 | | Source: Bloomberg, October 2014. |
| 3 | | The Eurozone comprises 18 European Union member states that have adopted the euro as their common currency. |
2014 Annual Report
9
Aberdeen Select International Equity Fund (Unaudited) (concluded)
to boost profits through cost cuts and improving margins are further along, even though it may be some time before a broader rebound is evident. Many of these companies are market leaders and have weathered periods of crises; we think it should be no different this time. With valuations still attractive, in our view, we will be looking to add to favored holdings when opportunities arise.
Portfolio Management:
Aberdeen Global Equity Team
PAST PERFORMANCE DOES NOT GUARANTEE FUTURE RESULTS.
The performance quoted represents past performance, which does not guarantee future results. Class A shares have up to a 0.25% 12b-1 fee. The investment return and principal value of an investment will fluctuate so that an investor’s shares, when redeemed, may be worth more or less than their original cost. Current performance of the Fund may be lower or higher than the performance quoted. Performance data current to the most recent month-end may be obtained by calling 800-387-6977 or visiting www.aberdeen-asset.us.
Investing in mutual funds involves risk, including the possible loss of principal. There is no assurance that the investment objective of any fund will be achieved. Indexes are unmanaged and have been provided for comparison purposes only. No fees or expenses are reflected. You cannot invest directly in an index.
Lipper is a leading global provider of mutual fund information and analysis to fund companies, financial intermediaries and media organizations.
Risk Considerations
Foreign securities are more volatile, harder to price and less liquid than U.S. securities. They are subject to different accounting and regulatory standards, and political and economic risks. These risks are enhanced in emerging markets countries.
Equity stocks of small and mid-cap companies carry greater risk and more volatility than equity stocks of larger, more established companies.
Please read the prospectus for more detailed information regarding these and other risks.
Annual Report 2014
10
Aberdeen Select International Equity Fund (Unaudited)
| | | | | | | | | | |
Average Annual Total Return (For periods ended October 31, 2014) | | 1 Yr. | | 5 Yr. | | | 10 Yr. | |
Class A | | (0.04%) | | | 2.58% | | | | 4.33% | |
Institutional Class1 | | 0.19% | | | 2.83% | | | | 4.58% | |
2014 Annual Report
11
Aberdeen Select International Equity Fund (Unaudited)
Performance of a $10,000 Investment (as of October 31, 2014)
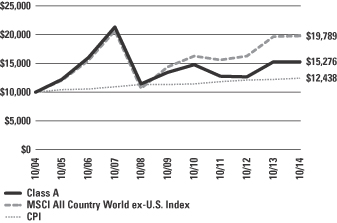
Comparative performance of $10,000 invested in Class A shares of the Aberdeen Select International Equity Fund, Morgan Stanley Capital International All Country World ex-U.S. Index (MSCI ACWI ex-U.S.), and the Consumer Price Index (CPI) over a 10-year period ended October 31, 2014. Unlike the Fund’s returns, the returns for these unmanaged indexes do not reflect any fees or expenses. Investors cannot invest directly in market indexes.
The MSCI ACWI ex-U.S. is a free float-adjusted market capitalization index that is designed to measure the equity market performance of developed and emerging markets excluding the U.S.
The CPI represents changes in prices of all goods and services purchased for consumption by urban households.
Investment return and principal value will fluctuate, and when redeemed, shares may be worth more or less than original cost. Past performance is no guarantee of future results. The Average Annual Total Return table and performance graph do not reflect the deduction of taxes that a shareholder would pay on Fund distributions or the redemption of Fund shares. Investing in mutual funds involves market risk, including loss of principal. Performance returns assume the reinvestment of all distributions. Performance returns reflect fee waivers and reimbursements in effect without which returns would have been lower.
Portfolio Summary (as a percentage of net assets)
October 31, 2014 (Unaudited)
| | | | |
| Asset Allocation | | | |
Common Stocks | | | 89.1% | |
Preferred Stocks | | | 9.5% | |
Repurchase Agreement | | | 0.5% | |
Government Bonds | | | 0.2% | |
Other assets in excess of liabilities | | | 0.7% | |
| | | | 100.0% | |
The following table summarizes the composition of the Fund’s portfolio, in Standard & Poor’s Global Industry Classification Standard (GICS) sectors, expressed as a percentage of net assets. The GICS structure consists of 10 sectors, 24 industry groups, 67 industries and 156 sub-industries. As of October 31, 2014, the Fund did not have more than 25% of its assets invested in any single industry group.
| | | | |
| Top Sectors | | | |
Financials | | | 18.0% | |
Industrials | | | 15.3% | |
Consumer Staples | | | 14.9% | |
Energy | | | 12.4% | |
Materials | | | 11.3% | |
Health Care | | | 9.0% | |
Information Technology | | | 8.5% | |
Telecommunication Services | | | 6.5% | |
Utilities | | | 2.7% | |
Other | | | 1.4% | |
| | | | 100.0% | |
| | | | |
| Top Holdings* | | | |
Roche Holding AG | | | 4.7% | |
Novartis AG | | | 4.3% | |
Nestle SA | | | 3.8% | |
British American Tobacco PLC | | | 3.7% | |
Taiwan Semiconductor Manufacturing Co. Ltd. | | | 3.5% | |
Samsung Electronics Co. Ltd., Preferred Shares | | | 3.4% | |
Royal Dutch Shell PLC, B Shares | | | 3.3% | |
Japan Tobacco, Inc. | | | 2.9% | |
Tenaris SA, ADR | | | 2.8% | |
Banco Bradesco SA, ADR, Preferred Shares | | | 2.8% | |
Other | | | 64.8% | |
| | | | 100.0% | |
| | | | |
| Top Countries | | | |
United Kingdom | | | 22.3% | |
Switzerland | | | 16.4% | |
Japan | | | 8.7% | |
Brazil | | | 6.1% | |
Canada | | | 5.8% | |
Singapore | | | 5.5% | |
Sweden | | | 5.5% | |
Italy | | | 5.2% | |
France | | | 4.4% | |
Hong Kong | | | 3.7% | |
Other | | | 16.4% | |
| | | | 100.0% | |
| * | | For the purpose of listing top holdings, repurchase agreements are included as part of Other. |
Annual Report 2014
12
Statement of Investments
October 31, 2014
Aberdeen Select International Equity Fund
| | | | | | | | |
| | | Shares or
Principal
Amount | | | Value | |
COMMON STOCKS (89.1%) | | | | | | | | |
BULGARIA (0.4%) | | | | | | | | |
Financials (0.4%) | | | | | | | | |
LEV Insurance (a)(b)(c)(d) | | | 4,078,860 | | | $ | 1,780,958 | |
CANADA (5.8%) | | | | | | | | |
Industrials (2.2%) | | | | | | | | |
Canadian National Railway Co. | | | 150,400 | | | | 10,599,835 | |
Materials (2.4%) | | | | | | | | |
Potash Corp. of Saskatchewan, Inc. | | | 330,400 | | | | 11,273,660 | |
Telecommunication Services (1.2%) | | | | | | | | |
TELUS Corp. | | | 163,500 | | | | 5,857,258 | |
| | | | | | | | 27,730,753 | |
CHINA (1.6%) | | | | | | | | |
Energy (1.6%) | | | | | | | | |
PetroChina Co. Ltd., H Shares (d) | | | 6,129,200 | | | | 7,711,609 | |
FRANCE (4.4%) | | | | | | | | |
Consumer Staples (2.0%) | | | | | | | | |
Casino Guichard-Perrachon SA (d) | | | 92,100 | | | | 9,465,437 | |
Industrials (1.3%) | | | | | | | | |
Schneider Electric SE (d) | | | 80,200 | | | | 6,347,658 | |
Utilities (1.1%) | | | | | | | | |
GDF Suez (d) | | | 209,100 | | | | 5,074,936 | |
| | | | | | | | 20,888,031 | |
GERMANY (1.6%) | | | | | | | | |
Materials (1.6%) | | | | | | | | |
Linde AG (d) | | | 42,600 | | | | 7,855,639 | |
HONG KONG (3.7%) | | | | | | | | |
Financials (3.7%) | | | | | | | | |
AIA Group Ltd. (d) | | | 2,020,000 | | | | 11,270,482 | |
Swire Pacific Ltd., Class A (d) | | | 490,900 | | | | 6,445,567 | |
| | | | | | | | 17,716,049 | |
ITALY (5.2%) | | | | | | | | |
Energy (5.2%) | | | | | | | | |
Eni SpA (d) | | | 528,456 | | | | 11,252,460 | |
Tenaris SA, ADR | | | 340,200 | | | | 13,485,528 | |
| | | | | | | | 24,737,988 | |
JAPAN (8.7%) | | | | | | | | |
Consumer Staples (2.9%) | | | | | | | | |
Japan Tobacco, Inc. (d) | | | 397,700 | | | | 13,806,072 | |
Financials (1.2%) | | | | | | | | |
Daito Trust Construction Co. Ltd. (d) | | | 44,600 | | | | 5,643,331 | |
Industrials (2.0%) | | | | | | | | |
FANUC Corp. (d) | | | 54,800 | | | | 9,646,998 | |
Materials (2.6%) | | | | | | | | |
Shin-Etsu Chemical Co. Ltd. (d) | | | 196,900 | | | | 12,833,307 | |
| | | | | | | | 41,929,708 | |
LATVIA (0.0%) | | | | | | | | |
Financials (0.0%) | | | | | | | | |
AS Parex Banka (b)(c)(d) | | | 1,424,182 | | | | 2 | |
MEXICO (2.5%) | | | | | | | | |
Consumer Staples (2.5%) | | | | | | | | |
Fomento Economico Mexicano SAB de CV, ADR | | | 126,700 | | | | 12,193,608 | |
SERBIA (0.0%) | | | | | | | | |
Industrials (0.0%) | | | | | | | | |
Toza Markovic ad Kikinda (a)(b)(c)(d) | | | 78,160 | | | | 0 | |
SINGAPORE (5.5%) | | | | | | | | |
Financials (1.5%) | | | | | | | | |
City Developments Ltd. (d) | | | 992,000 | | | | 7,306,373 | |
Industrials (1.8%) | | | | | | | | |
Jardine Matheson Holdings Ltd. (d) | | | 143,600 | | | | 8,651,727 | |
Telecommunication Services (2.2%) | | | | | | | | |
Singapore Telecommunications Ltd. (d) | | | 3,533,600 | | | | 10,395,928 | |
| | | | | | | | 26,354,028 | |
SOUTH AFRICA (2.0%) | | | | | | | | |
Telecommunication Services (2.0%) | | | | | | | | |
MTN Group Ltd. (d) | | | 428,900 | | | | 9,479,406 | |
SWEDEN (5.5%) | | | | | | | | |
Financials (1.6%) | | | | | | | | |
Nordea Bank AB (d) | | | 589,900 | | | | 7,548,621 | |
Industrials (2.3%) | | | | | | | | |
Atlas Copco AB, A Shares (d) | | | 392,262 | | | | 11,309,078 | |
Information Technology (1.6%) | | | | | | | | |
Telefonaktiebolaget LM Ericsson, B Shares (d) | | | 633,900 | | | | 7,479,125 | |
| | | | | | | | 26,336,824 | |
SWITZERLAND (16.4%) | | | | | | | | |
Consumer Staples (3.8%) | | | | | | | | |
Nestle SA (d) | | | 245,100 | | | | 17,938,357 | |
Financials (2.5%) | | | | | | | | |
Zurich Insurance Group AG (c)(d) | | | 39,900 | | | | 12,071,775 | |
Health Care (9.0%) | | | | | | | | |
Novartis AG (d) | | | 221,100 | | | | 20,499,309 | |
Roche Holding AG (d) | | | 77,300 | | | | 22,823,935 | |
| | | | | | | | 43,323,244 | |
Industrials (1.1%) | | | | | | | | |
Schindler Holding AG (d) | | | 38,000 | | | | 5,315,399 | |
| | | | | | | | 78,648,775 | |
TAIWAN (3.5%) | | | | | | | | |
Information Technology (3.5%) | | | | | | | | |
Taiwan Semiconductor Manufacturing Co. Ltd. (d) | | | 3,937,000 | | | | 16,993,786 | |
See accompanying notes to financial statements.
2014 Annual Report
13
Statement of Investments (concluded)
October 31, 2014
Aberdeen Select International Equity Fund
| | | | | | | | |
| | | Shares or
Principal
Amount | | | Value | |
UNITED KINGDOM (22.3%) | | | | | | | | |
Consumer Staples (3.7%) | | | | | | | | |
British American Tobacco PLC (d) | | | 312,000 | | | $ | 17,722,357 | |
Energy (4.7%) | | | | | | | | |
John Wood Group PLC (d) | | | 638,100 | | | | 6,775,749 | |
Royal Dutch Shell PLC, B Shares (d) | | | 427,100 | | | | 15,846,463 | |
| | | | | | | | 22,622,212 | |
Financials (4.3%) | | | | | | | | |
HSBC Holdings PLC (d) | | | 1,026,900 | | | | 10,513,067 | |
Standard Chartered PLC (d) | | | 682,551 | | | | 10,274,809 | |
| | | | | | | | 20,787,876 | |
Industrials (4.6%) | | | | | | | | |
Experian PLC (d) | | | 491,900 | | | | 7,393,465 | |
Rolls-Royce Holdings PLC (c)(d) | | | 388,003 | | | | 5,242,644 | |
Weir Group PLC (The) (d) | | | 253,600 | | | | 9,275,501 | |
| | | | | | | | 21,911,610 | |
Materials (2.3%) | | | | | | | | |
BHP Billiton PLC (d) | | | 433,800 | | | | 11,232,608 | |
Telecommunication Services (1.1%) | | | | | | | | |
Vodafone Group PLC (d) | | | 1,589,798 | | | | 5,283,125 | |
Utilities (1.6%) | | | | | | | | |
Centrica PLC (d) | | | 1,560,000 | | | | 7,557,734 | |
| | | | | | | | 107,117,522 | |
VENEZUELA (0.0%) | | | | | | | | |
Financials (0.0%) | | | | | | | | |
Banco Provincial SA-Banco Universal (b) | | | 18,422 | | | | 166,522 | |
Banco Venezolano de Credito SA (b)(c)(d) | | | 156 | | | | 0 | |
| | | | | | | | 166,522 | |
Industrials (0.0%) | | | | | | | | |
Cemex Venezuela SACA-I (b)(c)(d) | | | 15,843,815 | | | | 0 | |
Materials (0.0%) | | | | | | | | |
Siderurgica Venezolana Sivensa SACA, ADR (b)(c)(d) | | | 2,847,910 | | | | 3 | |
| | | | | | | | 166,525 | |
Total Common Stocks | | | | | | | 427,641,211 | |
EXCHANGE TRADED FUNDS (0.0%) | | | | | | | | |
RUSSIA (0.0%) | | | | | | | | |
Renaissance Pre-IPO Fund (b)(c)(d) | | $ | 92,634 | | | | 0 | |
Total Exchange Traded Funds | | | | | | | 0 | |
GOVERNMENT BONDS (0.2%) | | | | |
VENEZUELA (0.2%) | | | | |
Bonos de la Deuda Publica Nacional (VEF), 17.25%, 12/31/2015 (b)(d) | | | 10,000,000 | | | | 106,212 | |
Bonos de la Deuda Publica Nacional (VEF), 16.00%, 08/23/2018 (b)(d) | | | 49,500,000 | | | | 606,539 | |
Bonos de la Deuda Publica Nacional (VEF), 18.00%, 04/12/2018 (b)(d) | | | 20,000,000 | | | | 256,114 | |
| | | | | | | | 968,865 | |
Total Government Bonds | | | | | | | 968,865 | |
PREFERRED STOCKS (9.5%) | | | | |
BRAZIL (6.1%) | | | | |
Energy (0.9%) | | | | |
Petroleo Brasileiro SA, ADR, Preferred Shares | | | 372,100 | | | | 4,550,783 | |
Financials (2.8%) | | | | | | | | |
Banco Bradesco SA, ADR, Preferred Shares | | | 890,400 | | | | 13,338,192 | |
Materials (2.4%) | | | | | | | | |
Vale SA, ADR, Preferred Shares | | | 1,296,000 | | | | 11,352,960 | |
| | | | | | | | 29,241,935 | |
REPUBLIC OF SOUTH KOREA (3.4%) | | | | | | | | |
Information Technology (3.4%) | | | | | | | | |
Samsung Electronics Co. Ltd., Preferred Shares (d) | | | 17,200 | | | | 16,248,677 | |
UNITED KINGDOM (0.0%) | | | | | | | | |
Industrials (0.0%) | | | | | | | | |
Rolls-Royce Holdings PLC, Preferred Shares (c) | | | 28,791,000 | | | | 46,061 | |
Total Preferred Stocks | | | | | | | 45,536,673 | |
REPURCHASE AGREEMENT (0.5%) | | | | |
UNITED STATES (0.5%) | | | | |
Repurchase Agreement, Fixed Income Clearing Corp., 0.00%, dated 10/31/2014, due 11/03/2014, repurchase price $2,201,050 collateralized by U.S. Treasury Note, maturing 06/30/2018; total market value of $2,246,888 | | | 2,201,050 | | | | 2,201,050 | |
Total Repurchase Agreement | | | | | | | 2,201,050 | |
Total Investments
(Cost $546,972,377) (e)—99.3% | | | | | | | 476,347,799 | |
| | |
Other assets in excess of liabilities—0.7% | | | | | | | 3,576,658 | |
Net Assets—100.0% | | | | | | $ | 479,924,457 | |
| (a) | | Investment in affiliate. |
| (b) | | The Fund’s adviser has deemed this security to be illiquid based upon procedures approved by the Board of Trustees. Illiquid securities held by the Fund represent 0.6% of net assets as of October 31, 2014. |
| (c) | | Non-income producing security. |
| (d) | | Fair Valued Security. Fair Values are determined pursuant to procedures approved by the Fund’s Board of Trustees. See Note 2(a) of the accompanying Notes to Financial Statements. |
| (e) | | See notes to financial statements for tax unrealized appreciation/depreciation of securities. |
| ADR | | American Depositary Receipt |
| VEF | | Venezuela Bolivar Fuerte |
See accompanying notes to financial statements.
Annual Report 2014
14
Aberdeen Select International Equity Fund II (Unaudited)
The Aberdeen Select International Equity Fund II (Class A shares at net asset value net of fees) returned 0.46% for the year ended October 31, 2014, versus 0.49% for its benchmark, the MSCI All Country World ex-U.S. Index (MSCI ACWI ex-U.S.), during the same period. For broader comparison, the average return of the Fund’s Lipper peer category of International Large-cap Growth Funds (consisting of 48 funds) was 1.20% for the period.
International equities, as measured by the MSCI ACWI ex-U.S., posted marginal gains during the review period, attributable largely to improved economic data in the U.S., as well as loose monetary policy in the developed world. The U.S. Federal Reserve’s (Fed) commitment to keep interest rates low for a longer period, as well as the European Central Bank’s unexpected rate cuts and fresh stimulus measures, reassured investors. In Japan, the yen’s weakness lifted equity markets, but gains were pared owing to doubts over the efficacy of Prime Minister Shinzo Abe’s “third arrow”1 stimulus measures, as well as the impact of the consumption tax hike that was implemented in April. The prospect of rising U.S. interest rates alarmed investors, while worsening geopolitical tensions and generally weak manufacturing and services data in Europe and China also dented market sentiment.
Towards the end of the period, monetary policy was the key theme. Although the Fed officially ended its bond-buying program, the Bank of Japan’s increased stimulus, as well as positive corporate earnings, boosted confidence in the global economy. However, oil prices tumbled to multi-year lows,2 as Saudi Arabia’s move to cut prices for exports exacerbated worries over global demand and rising supplies. The fall in oil prices had a mixed effect on markets. Importing nations were notable beneficiaries, whereas exporters such as Russia came under pressure as the lower oil price may aggravate revenue shortfalls caused by a raft of Western sanctions.
The top detractors from Fund performance for the period included lender Standard Chartered, miner Vale, and Australian insurer QBE Insurance. Standard Chartered’s stock price weakened after the third profit warning in a year as the company delivered its results for the first nine months of its 2014 fiscal year. Management cited high impairment charges as some corporate and institutional clients were hurt by weakening commodity markets. Investor sentiment was also dampened by speculation that U.S. regulators could reinvestigate its alleged sanction violations. Some of its problems are cyclical and may be resolved in the medium term, in our opinion. More structural difficulties may potentially require management to reprioritize investments, divest non-core businesses and streamline riskier portfolios. While we believe that it is a solid franchise, we would not be surprised by a management change. Shares of Vale moved lower as fears of a slowdown in China’s economy weighed on iron ore prices, while the stock price of QBE Insurance fell on the back of the company’s profit warning in its 2013 fiscal year. This followed a strategic review of its North American operations which resulted in additional loss provisions, restructuring charges and a goodwill write-down.
The main contributors to the Fund’s relative return for the period were Swiss drug-maker Novartis, Taiwan Semiconductor Manufacturing Co. (TSMC), and freight railroad operator Canadian National Railway. Novartis’s share price reacted positively to favorable drug trial data related to the treatment of heart failure, while its significant three-way transaction with GlaxoSmithKline earlier in the reporting period also supported investor sentiment. TSMC’s stock price gained ground after the company reported record-high sales over multiple quarters, on robust demand for its products. Finally, Canadian National Railway benefited from better-than-expected profits due to greater market share and increased shipments.
In Fund activity, we initiated a position in Singapore conglomerate Jardine Matheson, UK credit and marketing services company Experian, and UK aircraft engine manufacturer Rolls Royce. We believe that Jardine has an attractive collection of assets, and Experian is the largest international operator in a growing industry. Rolls Royce has an attractive high recurring revenue model, high barriers to entry and positive structural growth potential, in our opinion.
Conversely, we exited the remaining small position in QBE Insurance, as we feel that there are more attractive investment opportunities elsewhere.
The divergence between major global central banks’ monetary policies has become more pronounced, which we believe may create a more complex and challenging market environment ahead. How that translates into global capital flows is uncertain. Meanwhile, the global economic environment appears mixed; while the U.S. economic engine continues to power on, the Eurozone3 and Japan’s economic health remained anemic. However, the sharp drop in oil prices since June may potentially provide some relief to large net importers such as the Eurozone and Japan. Similarly, the appreciation in the U.S. dollar may increase the trade competitiveness of these economies.
For us at Aberdeen, investing in companies that we view as fundamentally sound and well managed is an imperative that we believe should help negate the vagaries of market sentiment. Recent earnings from our holdings have been largely steady or met expectations despite the muted economic backdrop. Renewed efforts to boost profits through cost cuts and improving margins are further along, even though it may be some time before a broader rebound is evident. Many of these companies are market leaders and have weathered periods of crises; we think it should be no different this time. If we feel that valuations are attractive, we will look to add to favored holdings when opportunities arise.
| 1 | | The “third arrow” is the last of Japanese Prime Minister Shinzo Abe’s economic programs, comprising structural reforms in an effort to boost Japan’s competitiveness. |
| 2 | | Source: Bloomberg, October 2014. |
| 3 | | The Eurozone comprises 18 European Union member states that have adopted the euro as their common currency. |
2014 Annual Report
15
Aberdeen Select International Equity Fund II (Unaudited) (concluded)
Portfolio Management:
Aberdeen Global Equity Team
PAST PERFORMANCE DOES NOT GUARANTEE FUTURE RESULTS.
The performance quoted represents past performance, which does not guarantee future results. Class A Shares have up to a 0.25% 12b-1 fee. The investment return and principal value of an investment will fluctuate so that an investor’s shares, when redeemed, may be worth more or less than their original cost. Current performance of the Fund may be lower or higher than the performance quoted. Performance data current to the most recent month-end may be obtained by calling 800-387-6977 or visiting www.aberdeen-asset.us.
Investing in mutual funds involves risk, including the possible loss of principal. There is no assurance that the investment objective of any fund will be achieved. Indexes are unmanaged and have been provided for comparison purposes only. No fees or expenses are reflected. You cannot invest directly in an index.
Lipper is a leading global provider of mutual fund information and analysis to fund companies, financial intermediaries and media organizations.
Risk Considerations
Foreign securities are more volatile, harder to price and less liquid than U.S. securities. They are subject to different accounting and regulatory standards, and political and economic risks. These risks are enhanced in emerging markets countries.
Equity stocks of mid-cap companies carry greater risk and more volatility than equity stocks of larger, more established companies.
Please read the prospectus for more detailed information regarding these and other risks.
Annual Report 2014
16
Aberdeen Select International Equity Fund II (Unaudited)
| | | | | | | | | | |
Average Annual Total Return
(For periods ended October 31, 2014) | | 1 Yr. | | 5 Yr. | | | Inception1 | |
Class A | | 0.46% | | | 3.13% | | | | 3.94% | |
Institutional Class2 | | 0.64% | | | 3.39% | | | | 4.22% | |
| 1 | | Fund commenced operations on May 04, 2005. |
2014 Annual Report
17
Aberdeen Select International Equity Fund II (Unaudited)
Performance of a $10,000 Investment (as of October 31, 2014)
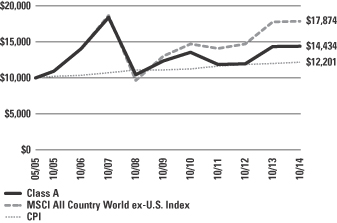
Comparative performance of $10,000 invested in Class A shares of the Aberdeen Select International Equity Fund II, Morgan Stanley Capital International All Country World ex-U.S. Index (MSCI ACWI ex-U.S.), and the Consumer Price Index (CPI) since inception. Unlike the Fund’s returns, the returns for these unmanaged indexes do not reflect any fees or expenses. Investors cannot invest directly in market indexes.
The MSCI ACWI ex-U.S. is a free float-adjusted market capitalization index that is designed to measure the equity market performance of developed and emerging markets excluding the U.S.
The CPI represents changes in prices of all goods and services purchased for consumption by urban households.
Investment return and principal value will fluctuate, and when redeemed, shares may be worth more or less than original cost. Past performance is no guarantee of future results. The Average Annual Total Return table and performance graph do not reflect the deduction of taxes that a shareholder would pay on Fund distributions or the redemption of Fund shares. Investing in mutual funds involves market risk, including loss of principal. Performance returns assume the reinvestment of all distributions. Performance returns reflect fee waivers and reimbursements in effect without which returns would have been lower.
Portfolio Summary (as a percentage of net assets)
October 31, 2014 (Unaudited)
| | | | |
| Asset Allocation | |
Common Stocks | | | 87.2% | |
Preferred Stocks | | | 10.4% | |
Repurchase Agreement | | | 1.7% | |
Other assets in excess of liabilities | | | 0.7% | |
| | | | 100.0% | |
The following table summarizes the composition of the Fund’s portfolio, in Standard & Poor’s Global Industry Classification Standard (GICS) sectors, expressed as a percentage of net assets. The GICS structure consists of 10 sectors, 24 industry groups, 67 industries and 156 sub-industries. As of October 31, 2014, the Fund did not have more than 25% of its assets invested in any single industry group.
| | | | |
| Top Sectors | | | |
Financials | | | 17.5% | |
Consumer Staples | | | 15.0% | |
Industrials | | | 14.9% | |
Energy | | | 12.2% | |
Materials | | | 11.1% | |
Information Technology | | | 9.5% | |
Health Care | | | 8.9% | |
Telecommunication Services | | | 6.0% | |
Utilities | | | 2.5% | |
Other | | | 2.4% | |
| | | | 100.0% | |
| | | | |
| Top Holdings* | | | |
Roche Holding AG | | | 4.8% | |
Novartis AG | | | 4.1% | |
Taiwan Semiconductor Manufacturing Co. Ltd. | | | 4.0% | |
Samsung Electronics Co. Ltd., Preferred Shares | | | 4.0% | |
British American Tobacco PLC | | | 3.7% | |
Nestle SA | | | 3.7% | |
Royal Dutch Shell PLC, B Shares | | | 3.3% | |
Banco Bradesco SA, ADR, Preferred Shares | | | 3.0% | |
Japan Tobacco, Inc. | | | 2.8% | |
Fomento Economico Mexicano SAB de CV, ADR | | | 2.8% | |
Other | | | 63.8% | |
| | | | 100.0% | |
| | | | |
| Top Countries | | | |
United Kingdom | | | 22.0% | |
Switzerland | | | 16.4% | |
Japan | | | 8.7% | |
Brazil | | | 6.4% | |
Canada | | | 5.3% | |
Sweden | | | 5.2% | |
Italy | | | 5.0% | |
Hong Kong | | | 5.0% | |
France | | | 4.4% | |
Taiwan | | | 4.0% | |
Other | | | 17.6% | |
| | | | 100.0% | |
| * | | For the purpose of listing top holdings, repurchase agreements are included as part of Other. |
Annual Report 2014
18
Statement of Investments
October 31, 2014
Aberdeen Select International Equity Fund II
| | | | | | | | |
| | | Shares or
Principal
Amount | | | Value | |
COMMON STOCKS (87.2%) | | | | | | | | |
CANADA (5.3%) | | | | | | | | |
Industrials (2.1%) | | | | | | | | |
Canadian National Railway Co. | | | 68,000 | | | $ | 4,792,479 | |
Materials (2.1%) | | | | | | | | |
Potash Corp. of Saskatchewan, Inc. | | | 139,500 | | | | 4,759,914 | |
Telecommunication Services (1.1%) | | | | | | | | |
TELUS Corp. | | | 70,700 | | | | 2,532,771 | |
| | | | | | | | 12,085,164 | |
CHINA (1.6%) | | | | | | | | |
Energy (1.6%) | | | | | | | | |
PetroChina Co. Ltd., H Shares (a) | | | 2,882,000 | | | | 3,626,062 | |
FRANCE (4.4%) | | | | | | | | |
Consumer Staples (2.0%) | | | | | | | | |
Casino Guichard-Perrachon SA (a) | | | 44,000 | | | | 4,522,033 | |
Industrials (1.4%) | | | | | | | | |
Schneider Electric SE (a) | | | 39,500 | | | | 3,126,340 | |
Utilities (1.0%) | | | | | | | | |
GDF Suez (a) | | | 99,400 | | | | 2,412,476 | |
| | | | | | | | 10,060,849 | |
GERMANY (1.5%) | | | | | | | | |
Materials (1.5%) | | | | | | | | |
Linde AG (a) | | | 18,900 | | | | 3,485,248 | |
HONG KONG (5.0%) | | | | | | | | |
Financials (3.4%) | | | | | | | | |
AIA Group Ltd. (a) | | | 936,000 | | | | 5,222,362 | |
Swire Pacific Ltd., Class A (a) | | | 188,000 | | | | 2,468,459 | |
| | | | | | | | 7,690,821 | |
Industrials (1.6%) | | | | | | | | |
Jardine Matheson Holdings Ltd. (a) | | | 61,200 | | | | 3,687,226 | |
| | | | | | | | 11,378,047 | |
ITALY (5.0%) | | | | | | | | |
Energy (5.0%) | | | | | | | | |
Eni SpA (a) | | | 247,222 | | | | 5,264,120 | |
Tenaris SA, ADR | | | 159,400 | | | | 6,318,616 | |
| | | | | | | | 11,582,736 | |
JAPAN (8.7%) | | | | | | | | |
Consumer Staples (2.8%) | | | | | | | | |
Japan Tobacco, Inc. (a) | | | 186,100 | | | | 6,460,422 | |
Financials (1.1%) | | | | | | | | |
Daito Trust Construction Co. Ltd. (a) | | | 20,500 | | | | 2,593,908 | |
Industrials (2.1%) | | | | | | | | |
FANUC Corp. (a) | | | 26,800 | | | | 4,717,875 | |
Materials (2.7%) | | | | | | | | |
Shin-Etsu Chemical Co. Ltd. (a) | | | 94,200 | | | | 6,139,652 | |
| | | | | | | | 19,911,857 | |
MEXICO (2.8%) | | | | | | | | |
Consumer Staples (2.8%) | | | | | | | | |
Fomento Economico Mexicano SAB de CV, ADR | | | 65,700 | | | | 6,322,968 | |
SINGAPORE (3.6%) | | | | | | | | |
Financials (1.5%) | | | | | | | | |
City Developments Ltd. (a) | | | 482,000 | | | | 3,550,072 | |
Telecommunication Services (2.1%) | | | | | | | | |
Singapore Telecommunications Ltd. (a) | | | 1,624,000 | | | | 4,777,844 | |
| | | | | | | | 8,327,916 | |
SOUTH AFRICA (1.7%) | | | | | | | | |
Telecommunication Services (1.7%) | | | | | | | | |
MTN Group Ltd. (a) | | | 172,100 | | | | 3,803,697 | |
SWEDEN (5.2%) | | | | | | | | |
Financials (1.6%) | | | | | | | | |
Nordea Bank AB (a) | | | 286,600 | | | | 3,667,460 | |
Industrials (2.1%) | | | | | | | | |
Atlas Copco AB, A Shares (a) | | | 168,600 | | | | 4,860,809 | |
Information Technology (1.5%) | | | | | | | | |
Telefonaktiebolaget LM Ericsson, B Shares (a) | | | 285,700 | | | | 3,370,857 | |
| | | | | | | | 11,899,126 | |
SWITZERLAND (16.4%) | | | | | | | | |
Consumer Staples (3.7%) | | | | | | | | |
Nestle SA (a) | | | 115,200 | | | | 8,431,247 | |
Financials (2.7%) | | | | | | | | |
Zurich Insurance Group AG (a)(b) | | | 20,300 | | | | 6,141,780 | |
Health Care (8.9%) | | | | | | | | |
Novartis AG (a) | | | 102,600 | | | | 9,512,570 | |
Roche Holding AG (a) | | | 37,000 | | | | 10,924,781 | |
| | | | | | | | 20,437,351 | |
Industrials (1.1%) | | | | | | | | |
Schindler Holding AG (a) | | | 18,200 | | | | 2,545,796 | |
| | | | | | | | 37,556,174 | |
TAIWAN (4.0%) | | | | | | | | |
Information Technology (4.0%) | | | | | | | | |
Taiwan Semiconductor Manufacturing Co. Ltd. (a) | | | 2,147,000 | | | | 9,267,376 | |
UNITED KINGDOM (22.0%) | | | | | | | | |
Consumer Staples (3.7%) | | | | | | | | |
British American Tobacco PLC (a) | | | 150,000 | | | | 8,520,364 | |
Energy (4.6%) | | | | | | | | |
John Wood Group PLC (a) | | | 294,800 | | | | 3,130,372 | |
Royal Dutch Shell PLC, B Shares (a) | | | 201,800 | | | | 7,487,278 | |
| | | | | | | | 10,617,650 | |
Financials (4.2%) | | | | | | | | |
HSBC Holdings PLC (a) | | | 476,800 | | | | 4,881,323 | |
Standard Chartered PLC (a) | | | 312,803 | | | | 4,708,792 | |
| | | | | | | | 9,590,115 | |
See accompanying notes to financial statements.
2014 Annual Report
19
Statement of Investments (concluded)
October 31, 2014
Aberdeen Select International Equity Fund II
| | | | | | | | |
| | | Shares or
Principal
Amount | | | Value | |
Industrials (4.5%) | | | | | | | | |
Experian PLC (a) | | | 229,200 | | | $ | 3,444,973 | |
Rolls-Royce Holdings PLC (a)(b) | | | 183,031 | | | | 2,473,090 | |
Weir Group PLC (The) (a) | | | 119,300 | | | | 4,363,436 | |
| | | | | | | | 10,281,499 | |
Materials (2.4%) | | | | | | | | |
BHP Billiton PLC (a) | | | 213,200 | | | | 5,520,498 | |
Telecommunication Services (1.1%) | | | | | | | | |
Vodafone Group PLC (a) | | | 730,300 | | | | 2,426,891 | |
Utilities (1.5%) | | | | | | | | |
Centrica PLC (a) | | | 729,800 | | | | 3,535,663 | |
| | | | | | | | 50,492,680 | |
Total Common Stocks | | | | | | | 199,799,900 | |
PREFERRED STOCKS (10.4%) | | | | | | | | |
BRAZIL (6.4%) | | | | | | | | |
Energy (1.0%) | | | | | | | | |
Petroleo Brasileiro SA, ADR, Preferred Shares | | | 178,500 | | | | 2,183,055 | |
Financials (3.0%) | | | | | | | | |
Banco Bradesco SA, ADR, Preferred Shares | | | 460,223 | | | | 6,894,141 | |
Materials (2.4%) | | | | | | | | |
Vale SA, ADR, Preferred Shares | | | 619,800 | | | | 5,429,448 | |
| | | | | | | | 14,506,644 | |
REPUBLIC OF SOUTH KOREA (4.0%) | | | | | | | | |
Information Technology (4.0%) | | | | | | | | |
Samsung Electronics Co. Ltd., Preferred Shares (a) | | | 9,700 | | | | 9,163,498 | |
UNITED KINGDOM (0.0%) | | | | | | | | |
Industrials (0.0%) | | | | | | | | |
Rolls-Royce Holdings PLC, Preferred Shares | | | 13,527,000 | | | | 21,641 | |
Total Preferred Stocks | | | | 23,691,783 | |
REPURCHASE AGREEMENT (1.7%) | | | | | | | | |
UNITED STATES (1.7%) | | | | | | | | |
Repurchase Agreement, Fixed Income Clearing Corp., 0.00%, dated 10/31/2014, due 11/03/2014, repurchase price $3,938,150, collateralized by U.S. Treasury Note, maturing 04/30/2018; total market value of $4,018,219 | | $ | 3,938,150 | | | $ | 3,938,150 | |
Total Repurchase Agreement | | | | 3,938,150 | |
Total Investments
(Cost $229,072,957) (c)—99.3% | | | | 227,429,833 | |
| |
Other assets in excess of liabilities—0.7% | | | | 1,621,962 | |
Net Assets—100.0% | | | $ | 229,051,795 | |
| (a) | | Fair Valued Security. Fair Values are determined pursuant to procedures approved by the Fund’s Board of Trustees. See Note 2(a) of the accompanying Notes to Financial Statements. |
| (b) | | Non-income producing security. |
| (c) | | See notes to financial statements for tax unrealized appreciation/depreciation of securities. |
| ADR | | American Depositary Receipt |
See accompanying notes to financial statements.
Annual Report 2014
20
Aberdeen Total Return Bond Fund (Unaudited)
The Aberdeen Total Return Bond Fund (Class A shares at net asset value net of fees) returned 3.96% for the 12-month period ended October 31, 2014, versus the 4.14% return of its benchmark, the Barclays Capital U.S. Aggregate Bond Index, for the same period. For broader comparison, the average return of the Fund’s Lipper peer category of Core Bond Funds (consisting of 521 funds) was 4.12% for the period.
The U.S. investment-grade fixed income market, as represented by the Barclays U.S. Aggregate Bond Index, gained 4.14% for the 12-month period ended October 31, 2014. The beginning of the review period was marked by volatility amid speculation concerning the Federal Reserve’s (Fed) possible tapering of monetary policy easing and the change in command at the central bank, as former Fed vice chair Janet Yellen succeeded Ben Bernanke as Fed chief in February. The Fed began to reduce its $85 billion-per-month purchases of government and mortgage-backed securities in $10 billion increments ($5 billion for each asset class) in January 2014, and ended its tapering in late October. Interest rates generally tracked investor expectations concerning the central bank’s tapering of its quantitative easing (QE) program. Yields rose sharply in December 2013, only to reverse direction the following month as a harsh winter blanketed the U.S., leading to a dramatic slowdown in economic activity. In March 2014, rates again moved higher as hawkish Fed statements, exhibited by an upward drift in its future rate projections, led investors to bring forward their interest-rate tightening expectations.
In our view, the gyrations in the U.S. Treasury yield curve over the last month of the reporting period in October 2014, might be viewed as a microcosm of the volatility over the 12-month period. Investors had to cope with continued weakness in the Eurozone1 and the Chinese economies, the Ebola epidemic, and, earlier in the month, a sharp correction in equity prices. Additionally, the Japanese yen weakened sharply at the end of October, depreciating about 3% in one day, bringing the decline to almost 11% since July 31.2 New York Mercantile Exchange crude oil dropped over $10 a barrel over the month and also hit a new five-year low. The price of crude fell nearly 21% over the last four months of the reporting period.3 The combination of increased supply from the U.S. and global growth concerns has put significant downward pressure on oil and many other commodity prices. Three-, five- and ten-year Treasury yields dipped 34, 41 and 37 basis points (bps)–or 0.34%, 0.41% and 0.37%–respectively, through October 15. However, more than half of the declines erased over the remainder of the month following improving economic data reports and a more hawkish-than-expected statement from the Federal Open Market Committee. Ultimately, over the reporting period, the short-term segment of the U.S. Treasury yield curve was virtually flat. There was a dichotomy, however, in performance between the intermediate- and long-term portions of the yield curve. For example, the yield on the five-year Treasury note increased by 31 bps over the period, while the ten-year Treasury yield moved 22 bps lower.
Fund performance over the reporting period was hampered primarily by an underweight duration3 profile relative to the benchmark in the U.S. and the exposure to some international markets—most notably Brazil, a market on which we remain positive. Brazil came under pressure as a result of the then-pending presidential election in which Marina Silva, the market-friendly challenger to incumbent President Dilma Rousseff, had slipped in the polls, pressuring both the currency and yields. A pro-business candidate, Aecio Neves, unexpectedly rode a late surge of support to gain over 33% of the votes in the first round of polling, leaving Marina Silva in a distant third place. While Rousseff subsequently eked out a win over Neves in a run-off election late in the month to secure a second term, her margin of victory was the narrowest since the nation’s transition to democracy three decades ago. The stock market dipped and the currency tumbled following the result.
Overweight positions versus the benchmark in commercial mortgage-backed securities (CMBS) and non-agency mortgaged-backed securities (MBS) enhanced Fund performance over the review period. Performance also benefited from holdings in investment-grade credit, as well as the exposure to Italian, Mexican, and Australian government bonds.
Regarding the use of derivatives during the reporting period, we employed U.S. Treasury futures to manage the Fund’s overall curve and interest rate exposure, and we used currency forwards to hedge some of the Fund’s foreign exchange holdings. This resulted in a positive contribution of approximately 50 bps to the Fund’s total return for the period.
During the reporting period, we increased the Fund’s exposure to Treasury Inflation-Protected Securities and non-agency MBS. We reduced the Fund’s holdings in non-U.S. dollar assets, which are not represented in the Fund’s benchmark, the Barclays U.S. Aggregate Bond Index. At the end of the period on October 31, 2014, the Fund was overweight relative to the benchmark in asset-backed securities (ABS), CMBS and non-agency MBS. Additionally, while we reduced the exposure to non-U.S. dollar assets, we maintain a sizeable position. Conversely, the most notable underweights included U.S. Treasuries and agency mortgage-backed securities.
Our view is that the Fed will begin to tighten monetary policy later than what the market is currently pricing in, with the move most likely to begin in 2016. Once the Fed has tightened, we think they will move at a very slow pace in an effort to ensure that they do not tilt the economy back into recession. We think that the Fed may end with a lower neutral target rate than what the central bank and some economists are expecting. Our base case for the terminal fed funds rate4 at 2.0% to 2.5%,5 as the Fed is still predicting pretty high terminal rates, which many market economists have revised downward.
| 1 | | The Eurozone comprises the bloc of nations which has adopted the euro as common currency and legal tender. |
| 2 | | Source: Bloomberg, October 2014 |
| 3 | | Duration is an estimate of bond price sensitivity to changes in interest rates. The higher the duration, the greater the change (i.e., high risk) in relation to interest-rate movements. |
| 4 | | Source: Bloomberg, November 2014 |
| 5 | | The terminal fed funds rate is the interest rate that the Federal Reserve charges for funds that banks borrow from for longer than a day, but generally less than 90 days. |
2014 Annual Report
21
Aberdeen Total Return Bond Fund (Unaudited) (concluded)
We believe that the first hike in the federal funds rate will be less important than the terminal rate and the amount on the balance sheet withdrawn at the end of the tightening cycle. The question of when the Fed starts tightening is most imminent, but we think investors must look past the date of the first hike and consider how its tightening program will be run and the duration of the tightening cycle.
Despite the fact that the U.S. seems to be on an improving trajectory, the rest of the world is moving in a very different direction, in our opinion. We think that the U.S. is still facing some of the headwinds from the global financial crisis, which have dissipated somewhat but are still lurking in the background. It now appears that some of those headwinds may have been replaced by forces outside of the U.S. Fortunately, the U.S. economy is dependent on the U.S. consumer and relies less on foreign markets (through exports) compared to many of our developed and developing market counterparts. The uncertainty stems from how the U.S. economy and the Fed handle the impact of the rising U.S. dollar. We remain committed to the overall themes that have benefited the Fund over the last few years, despite some of the volatility that might be associated with our strategy and philosophy of exploiting opportunities in U.S. and non-U.S. markets.
Our expectation for slow and steady global economic growth, combined with the artificial volatility dampening created by QE, brought us into the second half of 2014 with a low risk profile in the core sectors. Our general conservatism in the core sectors was driven by our belief that corporate debt-holders were not being compensated for risks from rising shareholder activism in the industrial sector, falling oil prices, and uncertainty surrounding total loss-absorbing capacity regulations7 for banks. In addition, we believe that the heavy supply of new issues may continue to put pressure on spread levels. Consequently, we anticipate staying very close to the Fund’s benchmark index-weight in corporate exposure in the near term. In the medium term, we believe that credit will underperform going into the early stages of the Fed’s tightening cycle and we’ll look to reduce the Fund’s exposure in early 2015. In our view, agency MBS investors similarly have not been compensated for the risk of higher volatility. We adapted to this in the securitized sectors by avoiding short-term securities with low spread volatility while preferring long-dated, high-quality credits in CMBS and new issue non-agency jumbo MBS.8 Despite the increase in volatility, we have maintained the Fund’s significant underweight in agency MBS, particularly in the production coupons,9 for which we anticipate greater supply as the economy improves and QE ends.
Portfolio Management:
Aberdeen North American Fixed Income Team
PAST PERFORMANCE DOES NOT GUARANTEE FUTURE RESULTS.
The performance quoted represents past performance, which does not guarantee future results. Class A shares have up to a 0.25% 12b-1 fee. The investment return and principal value of an investment will fluctuate so that an investor’s shares, when redeemed, may be worth more or less than their original cost. Current performance of the Fund may be lower or higher than the performance quoted. Performance data current to the most recent month-end may be obtained by calling 800-387-6977 or visiting www.aberdeen-asset.us.
Investing in mutual funds involves risk, including possible loss of principal. There is no assurance that the investment objective of any fund will be achieved. Indexes are unmanaged and have been provided for comparison purposes only. No fees or expenses are reflected. You cannot invest directly in an index.
Lipper is a leading global provider of mutual fund information and analysis to fund companies, financial intermediaries and media organizations.
Risk Considerations
Fixed income securities are subject to certain risks including, but not limited to: interest rate (changes in interest rates may cause a decline in the market value of an investment), credit (changes in the financial condition of the issuer, borrower, counterparty, or underlying collateral), prepayment (debt issuers may repay or refinance their loans or obligations earlier than anticipated), and extension (principal repayments may not occur as quickly as anticipated, causing the expected maturity of a security to increase).
Investments in asset-backed and mortgage-backed securities include additional risks that investors should be aware which include those associated with fixed income securities, as well as increased susceptibility to adverse economic developments.
Derivatives are speculative and may hurt the Fund’s performance. They present the risk of disproportionately increased losses and/or reduced gains when the financial asset or measure to which the derivative is linked changes in unexpected ways.
Foreign securities are more volatile, harder to price and less liquid than U.S. securities and are subject to different accounting and regulatory standards, and political and economic risks. These risks are enhanced in emerging markets countries.
Municipal securities can be affected by adverse tax, legislative or political changes and the financial condition of the issuers of municipal securities.
Please read the prospectus for more detailed information regarding these and other risks.
| 6 | | Forecasts and estimates are offered as opinion and are not reflective of potential performance, are not guaranteed and actual events or results may differ materially. |
| 7 | | Total loss-absorbing capacity comprises proposed regulations from the Financial Stability Board, an international group of regulators, that would require large banks to fund themselves with loss-absorbing capital equal to 16-20% of their risk-weighted assets (based on a percentage of a bank’s assets adjusted for their risk exposure) in an effort to relive taxpayers of the obligation to bail out failed banks during a crisis. |
| 8 | | Jumbo MBS comprise mortgages in amounts exceeding the conforming loan limits set by the Office of Federal Housing Enterprise Oversight. Therefore, they are not eligible to be purchased, guaranteed or securitized by Fannie Mae or Freddie Mac. |
| 9 | | Current production MBS carry a coupon rate that is close to the prevailing interest rates for similar investments at the time of issue. |
Annual Report 2014
22
Aberdeen Total Return Bond Fund (Unaudited)
| | | | | | | | | | |
Average Annual Total Return (For periods ended October 31, 2014) | | 1 Yr. | | 5 Yr. | | | 10 Yr. | |
Class A | | 3.96% | | | 4.62% | | | | 5.09% | |
Institutional Class1 | | 4.25% | | | 4.90% | | | | 5.36% | |
2014 Annual Report
23
Aberdeen Total Return Bond Fund (Unaudited)
Performance of a $10,000 Investment (as of October 31, 2014)
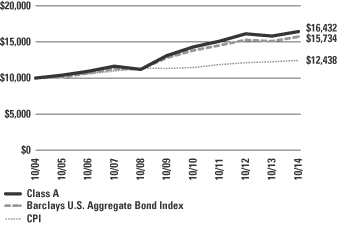
Comparative performance of $10,000 invested in Class A shares of the Aberdeen Total Return Bond Fund, Barclays U.S. Aggregate Bond Index and the Consumer Price Index (CPI) over a 10-year period ended October 31, 2014. Unlike the Fund’s returns, the returns for these unmanaged indexes do not reflect any fees or expenses. Investors cannot invest directly in market indexes.
The Barclays U.S. Aggregate Bond Index is a broad-based flagship benchmark that measures the investment grade, U.S. Dollar-denominated, fixed-rate taxable bond market. The index includes Treasuries, government-related and corporate securities, MBS (agency fixed-rate and hybrid ARM pass-throughs), ABS and CMBS (agency and non-agency).
The CPI represents changes in prices of all goods and services purchased for consumption by urban households.
Investment return and principal value will fluctuate, and when redeemed, shares may be worth more or less than original cost. Past performance is no guarantee of future results. The Average Annual Total Return table and performance graph do not reflect the deduction of taxes that a shareholder would pay on Fund distributions or the redemption of Fund shares. Investing in mutual funds involves market risk, including loss of principal. Performance returns assume the reinvestment of all distributions. Performance returns reflect fee waivers and reimbursements in effect without which returns would have been lower.
Portfolio Summary (as a percentage of net assets)
October 31, 2014 (Unaudited)
| | | | |
| Asset Allocation | | | |
Corporate Bonds | | | 31.7% | |
Commercial Mortgage-Backed Securities | | | 19.2% | |
Government Bonds | | | 12.6% | |
U.S. Agencies | | | 10.9% | |
U.S. Treasuries | | | 9.2% | |
Asset-Backed Securities | | | 9.0% | |
Municipal Bonds | | | 4.5% | |
Repurchase Agreement | | | 2.8% | |
Government Agencies | | | 0.2% | |
Liabilities in excess of other assets | | | (0.1% | ) |
| | | | 100.0% | |
The following table summarizes the composition of the Fund’s portfolio, in Bloomberg Industry Classification System (BICS) sectors, expressed as a percentage of net assets. The industries listed below may include more than one industry group. As of October 31, 2014, the Fund did not have more than 25% of its assets invested in any one industry group.
| | | | |
| Top Industries | | | |
Commercial Banks | | | 7.6% | |
Diversified Financial Services | | | 2.7% | |
Oil, Gas & Consumable Fuels | | | 2.6% | |
Banks | | | 1.9% | |
Beverages | | | 1.8% | |
Media | | | 1.7% | |
Aerospace & Defense | | | 1.4% | |
Insurance | | | 1.2% | |
Computers & Peripherals | | | 1.0% | |
Transportation | | | 1.0% | |
Other | | | 77.1% | |
| | | | 100.0% | |
| | | | |
| Top Holdings* | | | |
U.S. Treasury Inflation Index Notes 04/15/2019 | | | 2.5% | |
U.S. Treasury Notes 07/31/2019 | | | 2.4% | |
Mexican Bonos 05/29/2031 | | | 1.9% | |
New Zealand Government Bond 03/15/2019 | | | 1.8% | |
Mexico Fixed Rate Bonds, Series M20 12/05/2024 | | | 1.5% | |
U.S. Treasury Notes 05/15/2015 | | | 1.4% | |
Brazil Letras do Tesouro Nacional 01/01/2017 | | | 1.1% | |
Canada Housing Trust No 1 12/15/2019 | | | 1.0% | |
International Finance Corp. 05/15/2015 | | | 1.0% | |
Federal National Mortgage Association 10/01/2041 | | | 1.0% | |
Other | | | 84.4% | |
| | | | 100.0% | |
| | | | |
| Top Countries | | | |
United States | | | 73.9% | |
Mexico | | | 3.6% | |
Canada | | | 3.0% | |
Brazil | | | 2.4% | |
New Zealand | | | 2.2% | |
Italy | | | 2.1% | |
Australia | | | 2.0% | |
Supranational | | | 1.9% | |
Netherlands | | | 1.9% | |
Sweden | | | 0.9% | |
Other | | | 6.1% | |
| | | | 100.0% | |
| * | | For the purpose of listing top holdings, repurchase agreements are included as part of Other. |
Annual Report 2014
24
Statement of Investments
October 31, 2014
Aberdeen Total Return Bond Fund
| | | | | | | | |
| | | Shares or
Principal
Amount | | | Value
(US$) | |
ASSET-BACKED SECURITIES (9.0%) | | | | | | | | |
CANADA (0.8%) | | | | | | | | |
Ford Auto Securitization Trust, Series 2014-R2, Class A1 (CAD), 1.35%, 03/15/2016 | | $ | 1,166,052 | | | $ | 1,035,350 | |
Golden Credit Card Trust, Series 2012-5A, Class A (USD), 0.79%, 09/15/2017 (a) | | | 5,970,000 | | | | 5,979,791 | |
Master Credit Card Trust II, Series 2012-2A, Class A (USD), 0.78%, 04/21/2017 (a) | | | 4,640,000 | | | | 4,644,775 | |
| | | | | | | | 11,659,916 | |
UNITED STATES (8.2%) | | | | | | | | |
Ally Auto Recivables Trust, Series 2012-3, Class A3 (USD), 0.85%, 08/15/2015 | | | 2,635,251 | | | | 2,638,428 | |
Ally Master Owner Trust, Series 2012-1, Class A2 (USD), 1.44%, 02/15/2017 | | | 3,260,000 | | | | 3,268,011 | |
BMW Floorplan Master Owner Trust, Series 2012-1A, Class A (USD), 0.55%, 09/15/2017 (a)(b) | | | 6,170,000 | | | | 6,181,377 | |
Chase Issuance Trust, Series 2013-A2, Class A2 (USD), 0.25%, 02/15/2017 (b) | | | 6,240,000 | | | | 6,239,744 | |
Chesapeake Funding LLC, Series 2013-1A, Class A (USD), 0.60%, 01/07/2025 (a)(b) | | | 3,091,299 | | | | 3,088,370 | |
Citibank Credit Card Issuance Trust,
Series 2005-A2, Class A2 (USD), 4.85%, 03/10/2017 | | | 2,800,000 | | | | 2,844,699 | |
CNH Equipment Trust | | | | | | | | |
Series 2012-A, Class A3 (USD),
0.94%, 05/15/2017 | | | 830,423 | | | | 830,948 | |
Series 2013-A, Class A2 (USD), 0.44%, 07/15/2016 | | | 518,425 | | | | 518,442 | |
Series 2013-A, Class A3 (USD), 0.69%, 06/15/2018 | | | 2,595,000 | | | | 2,597,311 | |
CNH Wholesale Master Note Trust,
Series 2013-2A, Class A (USD),
0.75%, 08/15/2019 (a)(b) | | | 7,530,000 | | | | 7,550,979 | |
Discover Card Execution Note Trust,
Series 2012-A1, Class A1 (USD),
0.81%, 08/15/2017 | | | 6,630,000 | | | | 6,639,139 | |
Dryrock Issuance Trust, Series 2012-2, Class A (USD), 0.64%, 08/15/2018 | | | 4,290,000 | | | | 4,288,773 | |
Ford Credit Auto Owner Trust, Series 2013-C, Class A2 (USD), 0.55%, 04/15/2016 | | | 733,092 | | | | 733,289 | |
Ford Credit Floorplan Master Owner Trust,
Series 2010-3, Class A1 (USD),
4.20%, 02/15/2017 (a) | | | 8,140,000 | | | | 8,229,296 | |
GE Capital Credit Card Master Note Trust,
Series 2012-1, Class A (USD), 1.03%, 01/15/2018 | | | 4,765,000 | | | | 4,770,651 | |
GE Dealer Floorplan Master Note Trust | | | | | | | | |
Series 2012-4, Class A (USD), 0.60%, 10/20/2017 (b) | | | 3,210,000 | | | | 3,214,093 | |
Series 2013-1, Class A (USD), 0.56%, 04/20/2018 (b) | | | 1,970,000 | | | | 1,976,176 | |
GM Financial Automobile Leasing Trust, Series 2014-2A, Class A3 (USD), 1.22%, 01/22/2018 (a) | | | 4,380,000 | | | | 4,393,983 | |
Mercedes Benz Auto Lease Trust, Series 2014-A, Class A2A, ABS (USD), 0.48%, 06/15/2016 | | | 5,600,000 | | | | 5,602,929 | |
Mercedes-Benz Master Owner Trust,
Series 2012-BA, Class A (USD),
0.42%, 11/15/2016 (a)(b) | | | 3,870,000 | | | | 3,870,128 | |
Navistar Financial Dealer Note Master Trust | | | | | | | | |
Series 2013-1, Class A (USD), 0.82%, 01/25/2018 (a)(b) | | | 3,910,000 | | | | 3,912,301 | |
Series 2013-2, Class A (USD), 0.83%, 09/25/2018 (a)(b) | | | 4,170,000 | | | | 4,179,641 | |
Series 2014-1, Class A (USD), 0.90%, 10/25/2019 (a)(b) | | | 4,570,000 | | | | 4,570,000 | |
Nissan Auto Receivables Owner Trust | | | | | | | | |
Series 2013-B, Class A2 (USD), 0.52%, 04/15/2016 | | | 1,180,968 | | | | 1,181,221 | |
Series 2013-B, Class A3 (USD), 0.84%, 11/15/2017 | | | 2,400,000 | | | | 2,404,751 | |
SLM Student Loan Trust | | | | | | | | |
Series 2011-1, Class A1 (USD), 0.67%, 03/25/2026 (b) | | | 2,140,746 | | | | 2,155,637 | |
Series 2011-2, Class A1 (USD), 0.75%, 11/25/2027 (b) | | | 5,385,071 | | | | 5,397,955 | |
Series 2013-1, Class A1 (USD), 0.30%, 02/27/2017 (b) | | | 401,940 | | | | 401,897 | |
Series 2013-2, Class A (USD), 0.60%, 09/25/2026 (b) | | | 3,554,167 | | | | 3,552,050 | |
United States Small Business Administration | | | | | | | | |
Series 2005-P10B, Class 1 (USD), 4.94%, 08/10/2015 | | | 782,831 | | | | 803,879 | |
Series 2006-P10A, Class 1 (USD), 5.41%, 02/10/2016 | | | 15,093 | | | | 15,597 | |
Series 2007-P10A, Class 1 (USD), 5.46%, 02/10/2017 | | | 924,411 | | | | 988,745 | |
Volkswagen Auto Lease Trust, Series 2013-A, Class A3 (USD), 0.84%, 07/20/2016 | | | 3,620,000 | | | | 3,628,797 | |
Volkswagen Auto Loan Enhanced Trust, Series 2014-1, Class A2 (USD), 0.42%, 03/20/2017 | | | 6,140,000 | | | | 6,134,612 | |
Volvo Financial Equipment LLC, Series 2013-1A, Class A3 (USD), 0.74%, 03/15/2017 (a) | | | 5,845,000 | | | | 5,853,332 | |
| | | | | | | | 124,657,181 | |
Total Asset-Backed Securities | | | | | | | 136,317,097 | |
COMMERCIAL MORTGAGE-BACKED SECURITIES (19.2%) | | | | | | | | |
UNITED STATES (19.2%) | | | | | | | | |
Alternative Loan Trust | | | | | | | | |
Series 2004-28CB, Class 3A1 (USD), 6.00%, 01/25/2035 | | | 3,658,176 | | | | 3,647,077 | |
Series 2005-86CB, Class A8 (USD), 5.50%, 02/25/2036 | | | 3,190,891 | | | | 3,070,246 | |
Banc of America Commercial Mortgage Trust, Series 2006-5, Class AM (USD), 5.45%, 09/10/2047 | | | 3,550,000 | | | | 3,758,607 | |
Banc of America Mortgage Trust, Series 2004-7, Class 2A3 (USD), 5.75%, 08/25/2034 | | | 781,925 | | | | 810,138 | |
See accompanying notes to financial statements.
2014 Annual Report
25
Statement of Investments (continued)
October 31, 2014
Aberdeen Total Return Bond Fund
| | | | | | | | |
| | | Shares or
Principal
Amount | | | Value
(US$) | |
Bear Stearns Adjustable Rate Mortgage Trust, Series 2004-3, Class 4A (USD), 2.59%, 07/25/2034 (b) | | $ | 1,099,200 | | | $ | 1,081,675 | |
Bear Stearns Commercial Mortgage Securities Trust | | | | | | | | |
Series 2005-PW10, Class AM (USD), 5.45%, 12/11/2040 (b) | | | 4,082,000 | | | | 4,239,512 | |
Series 2007-PW17, Class AM (USD), 0.84%, 06/11/2050 (a)(b) | | | 6,054,750 | | | | 5,945,873 | |
CD Commercial Mortgage Trust,
Series 2007-CD4, Class A4 (USD),
5.32%, 12/11/2049 | | | 4,435,000 | | | | 4,744,834 | |
CHL Mortgage Pass-Through Trust,
Series 2005-21, Class A2 (USD), 5.50%, 10/25/2035 | | | 1,032,565 | | | | 1,045,100 | |
Citigroup Commercial Mortgage Trust,
Series 2007-C6, Class AM (USD),
5.71%, 12/10/2049 (b) | | | 3,600,000 | | | | 3,885,800 | |
Citigroup Mortgage Loan Trust | | | | | | | | |
Series 2014-A, Class A (USD), 4.00%, 01/25/2035 (a)(b) | | | 4,435,617 | | | | 4,642,765 | |
Series 2005-11, Class A3 (USD), 2.52%, 11/25/2035 (b) | | | 2,008,859 | | | | 1,996,707 | |
Series 2014-J1, Class A1 (USD), 3.50%, 06/25/2044 (a)(b) | | | 6,269,880 | | | | 6,387,550 | |
COMM 2013-300P Mortgage Trust,
Series 2013-300P, Class A1, (USD),
4.35%, 08/10/2030 (a) | | | 4,970,000 | | | | 5,413,866 | |
COMM 2014-LC17 Mortgage Trust,
Series 2014-LC17, Class AM (USD),
4.19%, 10/10/2047 | | | 1,740,000 | | | | 1,822,948 | |
COMM 2014-TWC Mortgage Trust,
Series 2014-TWC, Class B (USD),
1.75%, 02/13/2032 (a)(b) | | | 3,810,000 | | | | 3,824,895 | |
Commercial Mortgage Pass Through Certificates | | | | | | | | |
Series 2006-C4, Class A3 (USD), 5.47%, 09/15/2039 | | | 4,039,182 | | | | 4,290,666 | |
Series 2013-CR9, Class A1 (USD), 1.34%, 07/10/2045 | | | 2,531,639 | | | | 2,549,937 | |
Series 2014-CR20, Class AM (USD), 3.94%, 11/10/2047 | | | 3,720,000 | | | | 3,808,380 | |
Commercial Mortgage Trust, Series 2007-GG11, Class A4 (USD), 5.74%, 12/10/2049 | | | 4,255,000 | | | | 4,662,844 | |
Credit Suisse First Boston Mortgage Securities Corp., Series 2004-8, Class 5A1 (USD), 6.00%, 12/25/2034 | | | 3,293,798 | | | | 3,427,027 | |
Credit Suisse Mortgage Capital Trust | | | | | | | | |
Series 2013-6, Class2A1 (USD), 3.50%, 08/25/2043 (a)(b) | | | 5,540,238 | | | | 5,631,068 | |
Series 2013-7, Class A11 (USD), 3.50%, 08/25/2043 (a)(b) | | | 6,258,121 | | | | 6,360,719 | |
EverBank Mortgage Loan Trust, Series 2013-2, Class A (USD), 3.00%, 06/25/2043 (a)(b) | | | 5,465,513 | | | | 5,374,455 | |
FDIC Guaranteed Notes Trust | | | | | | | | |
Series 2010-C1, Class A (USD), 2.98%, 12/06/2020 (a) | | | 2,790,770 | | | | 2,884,005 | |
Series 2010-S2, Class 2A (USD), 2.57%, 07/29/2047 (a) | | | 2,853,478 | | | | 2,893,873 | |
FDIC Trust, Series 2010-R1, Class A (USD), 2.18%, 05/25/2050 (a) | | | 2,393,169 | | | | 2,408,716 | |
FREMF Mortgage Trust | | | | | | | | |
Series 2011-K704, Class B (USD), 4.53%, 10/25/2030 (a)(b) | | | 4,130,000 | | | | 4,399,611 | |
Series 2011-K703, Class B (USD), 4.88%, 07/25/2044 (a)(b) | | | 5,270,000 | | | | 5,673,795 | |
GRCE Mortgage Trust, Series 2014, Class A (USD), 3.37%, 06/10/2028 (a) | | | 3,990,000 | | | | 4,120,682 | |
GS Mortgage Securites Corp. Trust | | | | | | | | |
Series 2013-NYC5, Class A (USD), 2.32%, 01/10/2030 (a) | | | 3,990,000 | | | | 4,034,245 | |
Series 2012-SHOP, Class A (USD), 2.93%, 06/05/2031 (a) | | | 5,740,000 | | | | 5,906,890 | |
Series 2012-ALOH, Class A (USD), 3.55%, 04/10/2034 (a) | | | 5,450,000 | | | | 5,662,327 | |
GSR Mortgage Loan Trust, Series 2005-6F, Class 1A6 (USD), 5.25%, 07/25/2035 | | | 2,581,866 | | | | 2,679,844 | |
Hilton USA Trust 2013-HLT, Series 2013-HLT, Class CFX, (USD), 3.71%, 11/05/2030 (a) | | | 6,535,000 | | | | 6,597,406 | |
IndyMac INDA Mortgage Loan Trust | | | | | | | | |
Series 2005-AR2, Class 3A1 (USD), 2.66%, 01/25/2036 (b) | | | 3,050,165 | | | | 2,717,740 | |
Series 2006-AR1, Class A1 (USD), 4.99%, 08/25/2036 (b) | | | 466,490 | | | | 463,770 | |
JP Morgan Chase Commercial Mortgage Securities Corp., Series 2013-C13, Class A1 (USD), 1.30%, 01/15/2046 | | | 2,317,687 | | | | 2,331,257 | |
JP Morgan Chase Commercial Mortgage Securities Trust, Series 2014-INN, Class A (USD), 1.07%, 06/15/2029 (a)(b) | | | 5,420,000 | | | | 5,416,060 | |
JP Morgan Mortgage Trust | | | | | | | | |
Series 2005-A2, Class 3A2 (USD), 2.37%, 04/25/2035 (b) | | | 1,992,162 | | | | 1,945,605 | |
Series 2005-A4, Class 3A1 (USD), 2.20%, 07/25/2035 (b) | | | 2,352,025 | | | | 2,348,885 | |
Series 2005-A5, Class 2A2 (USD), 2.52%, 08/25/2035 (b) | | | 1,661,624 | | | | 1,669,233 | |
Series 2006-S1, Class 2A6 (USD), 6.00%, 04/25/2036 | | | 2,700,552 | | | | 2,859,082 | |
Series 2013-1, Class 1A2 (USD), 3.00%, 03/25/2043 (a)(b) | | | 7,222,029 | | | | 7,168,991 | |
Series 2013-1, Class B1 (USD), 3.55%, 03/25/2043 (a)(b) | | | 3,102,004 | | | | 3,097,900 | |
Series 2013-2, Class A2 (USD), 3.50%, 05/25/2043 (a)(b) | | | 4,366,960 | | | | 4,445,674 | |
Series 2013-3, Class A3 (USD), 3.48%, 07/25/2043 (a)(b) | | | 4,944,143 | | | | 5,024,609 | |
Series 2014-1, Class 2A2 (USD), 3.50%, 01/25/2044 (a)(b) | | | 7,415,580 | | | | 7,543,031 | |
LB-UBS Commercial Mortgage Trust | | | | | | | | |
Series 2006-C4, Class AM (USD), 5.85%, 06/15/2038 (b) | | | 3,040,000 | | | | 3,254,179 | |
Series 2007-C7, Class AM (USD), 6.16%, 09/15/2045 (b) | | | 3,760,000 | | | | 4,229,808 | |
Madison Avenue Trust, Series 2013-650M, Class A (USD), 3.84%, 10/12/2032 (a) | | | 2,610,000 | | | | 2,777,428 | |
See accompanying notes to financial statements.
Annual Report 2014
26
Statement of Investments (continued)
October 31, 2014
Aberdeen Total Return Bond Fund
| | | | | | | | |
| | | Shares or
Principal
Amount | | | Value
(US$) | |
MASTR Adjustable Rate Mortgages Trust, Series 2006-2, Class 4A1 (USD),
2.63%, 02/25/2036 (b) | | $ | 1,167,449 | | | $ | 1,150,926 | |
MASTR Alternative Loan Trust, Series 2004-3, Class 4A1 (USD), 5.50%, 04/25/2034 | | | 2,759,012 | | | | 2,964,390 | |
Merrill Lynch Mortgage Investors Trust | | | | | | | | |
Series 2006-1, Class 2A1 (USD), 2.12%, 02/25/2036 (b) | | | 2,355,625 | | | | 2,365,752 | |
Series 2007-2, Class 2A1 (USD), 2.53%, 06/25/2037 (b) | | | 1,646,681 | | | | 1,592,453 | |
Series 2007-3, Class 2A2 (USD), 2.46%, 09/25/2037 (b) | | | 1,551,685 | | | | 1,492,402 | |
Morgan Stanley Capital I Trust | | | | | | | | |
Series 2013-WLSR, Class A (USD), 2.70%, 01/11/2032 (a) | | | 4,590,000 | | | | 4,651,169 | |
Series 2006-IQ12, Class AM (USD), 5.37%, 12/15/2043 | | | 3,310,000 | | | | 3,527,004 | |
Series 2007-IQ16, Class A4 (USD), 5.81%, 12/12/2049 | | | 3,560,719 | | | | 3,903,021 | |
NCUA Guaranteed Notes Trust | | | | | | | | |
Series 2010-R2, Class 1A (USD), 0.52%, 11/06/2017 (b) | | | 3,184,340 | | | | 3,193,198 | |
Series 2010-R3, Class 1A (USD), 0.71%, 12/08/2020 (b) | | | 4,847,993 | | | | 4,895,041 | |
New Residential Mortgage Loan Trust | | | | | | | | |
Series 2014-1A, Class A (USD), 3.75%, 01/25/2054 (a)(b) | | | 1,600,278 | | | | 1,659,339 | |
Series 2014-2A, Class A3 (USD), 3.75%, 05/25/2054 (a)(b) | | | 5,377,965 | | | | 5,534,122 | |
PHH Mortgage Trust, Series 2008-CIM1, Class 21A1 (USD), 6.00%, 05/25/2038 | | | 2,582,133 | | | | 2,702,065 | |
Sequoia Mortgage Trust | | | | | | | | |
Series 2013-4, Class A2 (USD), 2.50%, 04/25/2043 (b) | | | 5,047,566 | | | | 4,820,738 | |
Series 2013-5, Class A1 (USD), 2.50%, 05/25/2043 (a)(b) | | | 5,710,484 | | | | 5,403,900 | |
Series 2013-6, Class A1 (USD), 2.50%, 05/25/2043 (b) | | | 5,138,269 | | | | 4,907,365 | |
Series 2013-7, Class A1 (USD), 2.50%, 06/25/2043 (b) | | | 5,834,989 | | | | 5,572,777 | |
Series 2014-3, Class A8 (USD), 4.00%, 10/25/2044 (a)(b) | | | 3,627,305 | | | | 3,802,083 | |
Structured Asset Securities Corp.,
Series 2004-18H, Class A5 (USD),
4.75%, 10/25/2034 | | | 4,094,044 | | | | 4,111,894 | |
Thornburg Mortgage Securities Trust | | | | | | | | |
Series 2007-4, Class 2A1 (USD), 2.44%, 09/25/2037 (b) | | | 3,516,327 | | | | 3,482,623 | |
Series 2007-4, Class 3A1 (USD), 6.05%, 09/25/2037 (b) | | | 430,404 | | | | 447,668 | |
Wachovia Bank Commercial Mortgage Trust, Series 2006-C28, Class AM (USD), 5.60%, 10/15/2048 (b) | | | 4,765,000 | | | | 5,120,671 | |
WaMu Mortgage Pass Through Certificates | | | | | | | | |
Series 2005-AR5, Class A5 (USD), 2.38%, 05/25/2035 (b) | | | 135,848 | | | | 135,983 | |
Series 2005-AR7, Class A3 (USD), 2.36%, 08/25/2035 (b) | | | 4,680,000 | | | | 4,575,327 | |
Wells Fargo Commercial Mortgage Trust, Series 2010-C1, Class A2 (USD), 4.39%, 11/15/2043 (a) | | | 3,100,000 | | | | 3,383,803 | |
Wells Fargo Mortgage Backed Securities Trust | | | | | | | | |
Series 2005-AR13, Class 4A1 (USD), 5.35%, 05/25/2035 (b) | | | 3,106,499 | | | | 3,101,264 | |
Series 2006-5, Class 1A5 (USD), 5.25%, 04/25/2036 | | | 2,794,497 | | | | 2,802,978 | |
Series 2006-10, Class A4 (USD), 6.00%, 08/25/2036 | | | 1,461,403 | | | | 1,505,764 | |
Series 2006-19, Class A4 (USD), 5.25%, 12/26/2036 | | | 730,003 | | | | 733,979 | |
| | | | | | | | 290,517,034 | |
Total Commercial Mortgage-Backed Securities | | | | | | | 290,517,034 | |
CORPORATE BONDS (31.7%) | | | | | | | | |
AUSTRALIA (1.0%) | | | | | | | | |
Commercial Banks (1.0%) | | | | | | | | |
National Australia Bank Ltd. (USD), 1.25%, 03/08/2018 (a) | | | 15,100,000 | | | | 14,961,986 | |
BRAZIL (0.4%) | | | | | | | | |
Oil, Gas & Consumable Fuels (0.4%) | | | | | | | | |
Petrobras International Finance Co. SA (USD), 5.88%, 03/01/2018 | | | 6,283,000 | | | | 6,768,236 | |
CANADA (1.0%) | | | | | | | | |
Commercial Banks (0.8%) | | | | | | | | |
National Bank of Canada (USD),
GMTN, 1.45%, 11/07/2017 | | | 3,860,000 | | | | 3,843,251 | |
Toronto-Dominion Bank (USD), 2.20%, 07/29/2015 (a) | | | 8,130,000 | | | | 8,242,682 | |
| | | | | | | | 12,085,933 | |
Oil, Gas & Consumable Fuels (0.2%) | | | | | | | | |
CNOOC Nexen Finance 2014 ULC (USD), 4.25%, 04/30/2024 | | | 3,510,000 | | | | 3,633,408 | |
| | | | | | | | 15,719,341 | |
COLOMBIA (0.2%) | | | | | | | | |
Oil, Gas & Consumable Fuels (0.2%) | | | | | | | | |
Ecopetrol SA (USD), 5.88%, 05/28/2045 | | | 2,340,000 | | | | 2,416,050 | |
FRANCE (0.9%) | | | | | | | | |
Apparel (0.3%) | | | | | | | | |
LVMH Moet Hennessy Louis Vuitton SA (USD), 1.63%, 06/29/2017 (a) | | | 4,250,000 | | | | 4,287,200 | |
Beverages (0.6%) | | | | | | | | |
Pernod-Ricard SA (USD), 4.25%, 07/15/2022 (a) | | | 8,280,000 | | | | 8,692,560 | |
| | | | | | | | 12,979,760 | |
GERMANY (0.2%) | | | | | | | | |
Commercial Banks (0.2%) | | | | | | | | |
KFW (USD), 0.63%, 04/24/2015 (c) | | | 2,790,000 | | | | 2,795,466 | |
See accompanying notes to financial statements.
2014 Annual Report
27
Statement of Investments (continued)
October 31, 2014
Aberdeen Total Return Bond Fund
| | | | | | | | |
| | | Shares or
Principal
Amount | | | Value
(US$) | |
HONG KONG (0.3%) | | | | | | | | |
Holding Companies-Diversified Operations (0.3%) | | | | | | | | |
Hutchison Whampoa International 14 Ltd. (USD),
3.63%, 10/31/2024 (a) | | $ | 5,200,000 | | | $ | 5,176,293 | |
ITALY (0.6%) | | | | | | | | |
Commercial Banks (0.6%) | | | | | | | | |
Intesa Sanpaolo SpA (USD), 3.13%, 01/15/2016 | | | 9,340,000 | | | | 9,538,998 | |
LUXEMBOURG (0.3%) | | | | | | | | |
Miscellaneous Manufacturing (0.3%) | | | | | | | | |
Ingersoll-Rand Luxembourg Finance SA (USD), 4.65%, 11/01/2044 | | | 3,520,000 | | | | 3,511,221 | |
Pentair Finance SA (USD), 3.15%, 09/15/2022 | | | 1,008,000 | | | | 993,118 | |
| | | | | | | | 4,504,339 | |
NETHERLANDS (1.9%) | | | | | | | | |
Beverages (0.4%) | | | | | | | | |
Diageo Finance BV (USD), 3.25%, 01/15/2015 | | | 6,300,000 | | | | 6,334,259 | |
Commercial Banks (0.4%) | | | | | | | | |
ABN AMRO Bank (USD), 2.50%, 10/30/2018 (a) | | | 5,550,000 | | | | 5,613,104 | |
Electric Utilities (0.5%) | | | | | | | | |
Enel Finance International (USD), 6.00%, 10/07/2039 (a) | | | 6,080,000 | | | | 6,993,234 | |
Oil, Gas & Consumable Fuels (0.6%) | | | | | | | | |
Shell International Finance BV (USD),
3.40%, 08/12/2023 | | | 8,902,000 | | | | 9,164,155 | |
| | | | | | | | 28,104,752 | |
NORWAY (0.6%) | | | | | | | | |
Commercial Banks (0.6%) | | | | | | | | |
DNB Bank ASA (USD), 3.20%, 04/03/2017 (a) | | | 8,220,000 | | | | 8,595,794 | |
PANAMA (0.7%) | | | | | | | | |
Leisure Time (0.7%) | | | | | | | | |
Carnival Corp. (USD), 3.95%, 10/15/2020 | | | 10,830,000 | | | | 11,396,106 | |
SUPRANATIONAL (1.9%) | | | | | | | | |
Banks (1.9%) | | | | | | | | |
International Finance Corp. (USD), 0.50%, 05/15/2015 | | | 15,150,000 | | | | 15,168,104 | |
International Bank for Reconstruction & Development | | | | | | | | |
(NZD), MTN, 4.63%, 02/26/2019 | | | 8,530,000 | | | | 6,747,088 | |
Series GDIF (AUD), MTN, 3.50%, 04/29/2019 | | | 8,110,000 | | | | 7,216,887 | |
| | | | | | | | 29,132,079 | |
SWEDEN (0.9%) | | | | | | | | |
Commercial Banks (0.9%) | | | | | | | | |
Nordea Bank AB (USD), 3.13%, 03/20/2017 (a) | | | 7,040,000 | | | | 7,342,790 | |
Svenska Handelsbanken AB (USD),
2.50%, 01/25/2019 | | | 5,570,000 | | | | 5,705,028 | |
| | | | | | | | 13,047,818 | |
SWITZERLAND (0.9%) | | | | | | | | |
Diversified Financial Services (0.9%) | | | | | | | | |
Credit Suisse AG (USD),
1.63%, 03/06/2015 (a) | | | 12,870,000 | | | | 12,926,770 | |
UNITED KINGDOM (0.8%) | | | | | | | | |
Advertising (0.4%) | | | | | | | | |
WPP Finance 2010 (USD),
5.63%, 11/15/2043 | | | 5,330,000 | | | | 5,946,921 | |
Aerospace & Defense (0.3%) | | | | | | | | |
BAE Systems PLC (USD),
4.75%, 10/11/2021 (a) | | | 4,095,000 | | | | 4,492,870 | |
Oil, Gas & Consumable Fuels (0.1%) | | | | | | | | |
BP Capital Markets PLC (USD),
1.70%, 12/05/2014 | | | 1,220,000 | | | | 1,221,380 | |
| | | | | | | | 11,661,171 | |
UNITED STATES (19.1%) | | | | | | | | |
Aerospace & Defense (1.1%) | | | | | | | | |
Boeing Co. (The) (USD), 3.50%, 02/15/2015 | | | 12,524,000 | | | | 12,633,723 | |
L-3 Communications Corp. (USD),
3.95%, 05/28/2024 | | | 4,545,000 | | | | 4,564,734 | |
| | | | | | | | 17,198,457 | |
Beverages (0.8%) | | | | | | | | |
Anheuser-Busch InBev Worldwide, Inc. (USD), 2.50%, 07/15/2022 | | | 6,860,000 | | | | 6,575,475 | |
PepsiCo, Inc. (USD),
0.75%, 03/05/2015 | | | 5,398,530 | | | | 5,406,968 | |
| | | | | | | | 11,982,443 | |
Biotechnology (0.5%) | | | | | | | | |
Gilead Sciences, Inc. | | | | | | | | |
(USD), 2.40%, 12/01/2014 | | | 4,745,000 | | | | 4,751,595 | |
(USD), 4.80%, 04/01/2044 | | | 2,320,000 | | | | 2,524,819 | |
| | | | | | | | 7,276,414 | |
Chemicals (0.5%) | | | | | | | | |
Dow Chemical Co. (The) | | | | | | | | |
(USD), 4.25%, 10/01/2034 | | | 5,180,000 | | | | 5,030,158 | |
(USD), 4.38%, 11/15/2042 | | | 2,460,000 | | | | 2,334,127 | |
| | | | | | | | 7,364,285 | |
Commercial Banks (3.1%) | | | | | | | | |
Bank of America Corp. | | | | | | | | |
(USD), 4.20%, 08/26/2024 | | | 3,750,000 | | | | 3,781,380 | |
(USD), MTN, 5.00%, 01/21/2044 | | | 4,840,000 | | | | 5,309,974 | |
Citigroup, Inc. (USD), 2.50%, 09/26/2018 | | | 9,720,000 | | | | 9,847,623 | |
Goldman Sachs Group, Inc. (The) (USD),
4.00%, 03/03/2024 | | | 4,380,000 | | | | 4,480,968 | |
JPMorgan Chase & Co. (USD), 4.35%, 08/15/2021 | | | 9,720,000 | | | | 10,454,181 | |
Morgan Stanley | | | | | | | | |
(USD), MTN, 5.63%, 09/23/2019 | | | 3,300,000 | | | | 3,742,193 | |
(USD), 3.70%, 10/23/2024 | | | 1,830,000 | | | | 1,829,993 | |
Wells Fargo & Co. (USD), MTN, 4.10%, 06/03/2026 | | | 7,250,000 | | | | 7,363,629 | |
| | | | | | | | 46,809,941 | |
See accompanying notes to financial statements.
Annual Report 2014
28
Statement of Investments (continued)
October 31, 2014
Aberdeen Total Return Bond Fund
| | | | | | | | |
| | | Shares or
Principal
Amount | | | Value
(US$) | |
Computers & Peripherals (1.0%) | | | | | | | | |
Apple, Inc. (USD), 2.40%, 05/03/2023 | | $ | 5,000,000 | | | $ | 4,829,495 | |
Hewlett-Packard Co. (USD), 2.63%, 12/09/2014 | | | 3,403,000 | | | | 3,409,558 | |
International Business Machines Corp. | | | | | | | | |
(USD), 7.00%, 10/30/2025 | | | 1,210,000 | | | | 1,605,912 | |
(USD), 6.22%, 08/01/2027 | | | 4,306,000 | | | | 5,432,686 | |
| | | | | | | | 15,277,651 | |
Diversified Financial Services (1.8%) | | | | | | | | |
Apollo Management Holdings LP (USD),
4.00%, 05/30/2024 (a) | | | 4,720,000 | | | | 4,766,723 | |
BlackRock, Inc. (USD), 3.50%, 12/10/2014 | | | 7,422,000 | | | | 7,444,786 | |
Harley-Davidson Financial Services, Inc. (USD), MTN, 3.88%, 03/15/2016 (a) | | | 5,260,000 | | | | 5,472,983 | |
KKR Group Finance Co. III LLC (USD), 5.13%, 06/01/2044 (a) | | | 3,800,000 | | | | 4,013,651 | |
Legg Mason, Inc. (USD), 5.63%, 01/15/2044 | | | 4,290,000 | | | | 4,802,020 | |
| | | | | | | | 26,500,163 | |
Diversified Telecommunication Services (0.7%) | | | | | | | | |
Verizon Communications, Inc. (USD),
4.86%, 08/21/2046 (a) | | | 10,300,000 | | | | 10,529,525 | |
Electric Utilities (0.5%) | | | | | | | | |
Edison International (USD),
3.75%, 09/15/2017 | | | 6,715,000 | | | | 7,119,324 | |
Electronics (0.3%) | | | | | | | | |
Thermo Fisher Scientific, Inc. (USD), 3.25%, 11/20/2014 | | | 4,740,000 | | | | 4,745,276 | |
Energy Equipment & Services (0.7%) | | | | | | | | |
Enable Midstream Partners LP (USD), 5.00%, 05/15/2044 (a) | | | 3,400,000 | | | | 3,444,499 | |
Energy Transfer Partners LP (USD), 4.15%, 10/01/2020 | | | 7,400,000 | | | | 7,723,069 | |
| | | | | | | | 11,167,568 | |
Food Products (0.6%) | | | | | | | | |
Bestfoods (USD),
7.25%, 12/15/2026 | | | 6,880,000 | | | | 9,412,927 | |
Healthcare Providers & Services (0.3%) | | | | | | | | |
WellPoint, Inc. (USD),
5.10%, 01/15/2044 | | | 4,650,000 | | | | 5,076,200 | |
Insurance (1.2%) | | | | | | | | |
American International Group, Inc. | | | | | | | | |
(USD), 4.13%, 02/15/2024 | | | 4,770,000 | | | | 5,033,304 | |
(USD), 4.50%, 07/16/2044 | | | 3,420,000 | | | | 3,487,367 | |
MetLife, Inc. (USD), 4.72%, 12/15/2044 | | | 760,000 | | | | 807,131 | |
Metropolitan Life Global Funding I (USD), 2.50%, 09/29/2015 (a) | | | 4,600,000 | | | | 4,686,678 | |
Travelers Property Casualty Corp. (USD), 7.75%, 04/15/2026 | | | 3,308,000 | | | | 4,465,466 | |
| | | | | | | | 18,479,946 | |
Iron/Steel (0.2%) | | | | | | | | |
Glencore Funding LLC (USD), 4.13%, 05/30/2023 (a) | | | 3,550,000 | | | | 3,542,318 | |
Media (1.7%) | | | | | | | | |
21st Century Fox America, Inc. | | | | | | | | |
(USD), 8.88%, 04/26/2023 | | | 845,000 | | | | 1,134,650 | |
(USD), 7.75%, 01/20/2024 | | | 530,000 | | | | 676,390 | |
(USD), 8.50%, 02/23/2025 | | | 350,000 | | | | 472,831 | |
(USD), 7.43%, 10/01/2026 | | | 3,902,000 | | | | 4,978,016 | |
CBS Corp. | | | | | | | | |
(USD), 2.30%, 08/15/2019 | | | 4,690,000 | | | | 4,633,621 | |
(USD), 4.90%, 08/15/2044 | | | 3,590,000 | | | | 3,597,920 | |
NBCUniversal Media LLC (USD), 3.65%, 04/30/2015 | | | 2,225,000 | | | | 2,260,297 | |
Time Warner Cos., Inc. (USD), 7.57%, 02/01/2024 | | | 6,627,000 | | | | 8,569,765 | |
| | | | | | | | 26,323,490 | |
Miscellaneous Manufacturing (0.3%) | | | | | | | | |
Pentair Finance SA (USD), 1.88%, 09/15/2017 | | | 4,260,000 | | | | 4,284,452 | |
Oil, Gas & Consumable Fuels (1.1%) | | | | | | | | |
Marathon Petroleum Corp. (USD), 4.75%, 09/15/2044 | | | 3,450,000 | | | | 3,485,066 | |
Noble Energy, Inc. (USD), 5.25%, 11/15/2043 | | | 4,560,000 | | | | 4,928,065 | |
Valero Energy Corp. (USD), 9.38%, 03/15/2019 | | | 6,019,000 | | | | 7,685,793 | |
| | | | | | | | 16,098,924 | |
Pharmaceutical (0.8%) | | | | | | | | |
Novartis Capital Corp. (USD), 2.90%, 04/24/2015 | | | 1,558,000 | | | | 1,577,017 | |
Pfizer, Inc. (USD), 5.35%, 03/15/2015 | | | 4,190,000 | | | | 4,263,731 | |
Wyeth LLC (USD), 6.45%, 02/01/2024 | | | 5,407,000 | | | | 6,726,692 | |
| | | | | | | | 12,567,440 | |
Retail (0.2%) | | | | | | | | |
Tiffany & Co. (USD), 4.90%, 10/01/2044 (a) | | | 1,770,000 | | | | 1,815,872 | |
Wal-Mart Stores, Inc. (USD), 4.25%, 04/15/2021 | | | 990,000 | | | | 1,090,354 | |
| | | | | | | | 2,906,226 | |
Software (0.7%) | | | | | | | | |
Oracle Corp. (USD), 2.80%, 07/08/2021 | | | 10,450,000 | | | | 10,502,302 | |
Transportation (1.0%) | | | | | | | | |
Burlington Northern Santa Fe LLC (USD), 4.90%, 04/01/2044 | | | 6,830,000 | | | | 7,379,740 | |
FedEx Corp. (USD), 4.90%, 01/15/2034 | | | 6,680,000 | | | | 7,337,653 | |
| | | | | | | | 14,717,393 | |
| | | | | | | | 289,882,665 | |
Total Corporate Bonds | | | | | | | 479,607,624 | |
See accompanying notes to financial statements.
2014 Annual Report
29
Statement of Investments (continued)
October 31, 2014
Aberdeen Total Return Bond Fund
| | | | | | | | |
| | | Shares or
Principal
Amount | | | Value
(US$) | |
MUNICIPAL BONDS (4.5%) | | | | | | | | |
UNITED STATES (4.5%) | | | | | | | | |
CALIFORNIA (2.0%) | | | | | | | | |
Los Angeles Unified School District General Obligation Unlimited Bonds | | | | | | | | |
(USD), 5.76%, 07/01/2029 | | $ | 2,185,000 | | | $ | 2,649,531 | |
(USD), 6.76%, 07/01/2034 | | | 10,380,000 | | | | 14,027,532 | |
San Francisco City & County Public Utilities Commission Water, Revenue Bonds (USD), 6.00%, 11/01/2040 | | | 3,370,000 | | | | 4,255,198 | |
State of California General Obligation Unlimited Bonds | | | | | | | | |
(USD), 7.55%, 04/01/2039 | | | 4,000,000 | | | | 6,011,400 | |
(USD), 7.35%, 11/01/2039 | | | 2,195,000 | | | | 3,166,353 | |
| | | | | | | | 30,110,014 | |
CONNECTICUT (0.5%) | | | | | | | | |
State of Connecticut General Obligation Unlimited Bonds | | | | | | | | |
(USD), 5.09%, 10/01/2030 | | | 1,225,000 | | | | 1,378,174 | |
Series A (USD), 5.85%, 03/15/2032 | | | 4,640,000 | | | | 5,691,470 | |
| | | | | | | | 7,069,644 | |
FLORIDA (0.1%) | | | | | | | | |
Florida Hurricane Catastrophe Fund Finance Corp., Revenue Bonds, Series A (USD), 1.30%, 07/01/2016 | | | 2,370,000 | | | | 2,397,800 | |
MASSACHUSETTS (0.5%) | | | | | | | | |
Commonwealth of Massachusetts General Obligation Limited Bonds | | | | | | | | |
Series E (USD), 4.20%, 12/01/2021 | | | 4,975,000 | | | | 5,452,102 | |
(USD), 4.91%, 05/01/2029 | | | 1,810,000 | | | | 2,045,626 | |
| | | | | | | | 7,497,728 | |
NEW YORK (1.1%) | | | | | | | | |
New York City Municipal Water Finance Authority Revenue Bonds (Build America Bonds) (USD), 5.44%, 06/15/2043 | | | 5,910,000 | | | | 7,210,259 | |
New York City Transitional Finance Authority Revenue Bonds (Qualified School Construction BD) | | | | | | | | |
(USD), 5.27%, 05/01/2027 | | | 3,360,000 | | | | 3,900,288 | |
(USD), 5.01%, 08/01/2027 | | | 3,780,000 | | | | 4,254,542 | |
New York State Dormitory Authority Revenue Bonds (Build America Bonds) (USD), 5.50%, 03/15/2030 | | | 810,000 | | | | 958,805 | |
| | | | | | | | 16,323,894 | |
PENNSYLVANIA (0.3%) | | | | | | | | |
Pennsylvania State General Obligation Unlimited Bonds (Build America Bonds), Series B (USD), 4.65%, 02/15/2026 | | | 4,360,000 | | | | 4,846,053 | |
| | | | | | | | 68,245,133 | |
Total Municipal Bonds | | | | | | | 68,245,133 | |
GOVERNMENT BONDS (12.6%) | | | | | | | | |
AUSTRALIA (1.0%) | | | | | | | | |
Australia Government Bond (AUD), 1.25%, 02/21/2022 (a)(f) | | | 15,620,000 | | | | 14,964,720 | |
BRAZIL (2.0%) | | | | | | | | |
Brazil Letras do Tesouro Nacional (BRL), 0.00%, 01/01/2017 (d) | | | 53,964,000 | | | | 16,955,376 | |
Brazil Notas do Tesouro Nacional, Series F (BRL), 10.00%, 01/01/2017 | | | 33,492,000 | | | | 12,941,568 | |
| | | | | | | | 29,896,944 | |
CANADA (1.2%) | | | | | | | | |
Canada Housing Trust No 1 (CAD), 2.00%, 12/15/2019 (a)(c) | | | 17,290,000 | | | | 15,419,173 | |
Province of British Columbia (USD), 2.85%, 06/15/2015 | | | 2,080,000 | | | | 2,114,122 | |
| | | | | | | | 17,533,295 | |
ITALY (1.5%) | | | | | | | | |
Italy Buoni Poliennali Del Tesoro | | | | | | | | |
(EUR), 4.50%, 03/01/2024 | | | 9,760,000 | | | | 14,518,139 | |
(EUR), 3.50%, 03/01/2030 (a) | | | 5,750,000 | | | | 7,629,880 | |
| | | | | | | | 22,148,019 | |
MEXICO (3.4%) | | | | | | | | |
Mexican Bonos (MXN), 7.75%, 05/29/2031 | | | 353,580,000 | | | | 29,325,826 | |
Mexico Fixed Rate Bonds, Series M20 (MXN), 10.00%, 12/05/2024 | | | 234,718,400 | | | | 22,828,669 | |
| | | | | | | | 52,154,495 | |
NEW ZEALAND (2.2%) | | | | | | | | |
New Zealand Government Bond | | | | | | | | |
(NZD), 5.00%, 03/15/2019 (a) | | | 32,880,000 | | | | 26,894,047 | |
Series 423 (NZD), 5.50%, 04/15/2023 (a) | | | 7,940,000 | | | | 6,851,971 | |
| | | | | | | | 33,746,018 | |
QATAR (0.6%) | | | | | | | | |
Qatar Government International Bond (USD), 4.00%, 01/20/2015 (a) | | | 9,310,000 | | | | 9,385,225 | |
REPUBLIC OF SOUTH KOREA (0.2%) | | | | | | | | |
Korea Housing Finance Corp. (USD), 1.63%, 09/15/2018 (a) | | | 3,230,000 | | | | 3,159,266 | |
SPAIN (0.5%) | | | | | | | | |
Spain Government Bond (EUR), 2.75%, 10/31/2024 (a) | | | 5,580,000 | | | | 7,396,888 | |
Total Government Bonds | | | | | | | 190,384,870 | |
GOVERNMENT AGENCIES (0.2%) | | | | | | | | |
MEXICO (0.2%) | | | | | | | | |
Petroleos Mexicanos (USD), 6.38%, 01/23/2045 | | | 2,480,000 | | | | 2,857,952 | |
Total Government Agencies | | | | | | | 2,857,952 | |
See accompanying notes to financial statements.
Annual Report 2014
30
Statement of Investments (continued)
October 31, 2014
Aberdeen Total Return Bond Fund
| | | | | | | | |
| | | Shares or
Principal
Amount | | | Value
(US$) | |
U.S. AGENCIES (10.9%) | | | | | | | | |
UNITED STATES (10.9%) | | | | | | | | |
Federal Home Loan Mortgage Corp. | | | | | | | | |
(USD), 6.50%, 05/01/2022 | | $ | 1,634 | | | $ | 1,853 | |
(USD), 6.50%, 08/01/2036 | | | 612,741 | | | | 694,961 | |
(USD), 6.50%, 09/01/2037 | | | 75,241 | | | | 85,325 | |
(USD), 6.50%, 12/01/2037 | | | 135,567 | | | | 153,772 | |
(USD), 6.50%, 05/01/2038 | | | 1,989,704 | | | | 2,259,634 | |
(USD), 6.50%, 09/01/2038 | | | 166,042 | | | | 188,305 | |
(USD), 6.50%, 10/01/2038 | | | 1,240,623 | | | | 1,406,769 | |
(USD), 6.50%, 10/01/2038 | | | 2,517 | | | | 2,855 | |
(USD), 6.50%, 11/01/2038 | | | 955,626 | | | | 1,088,164 | |
(USD), 6.50%, 12/01/2038 | | | 446,271 | | | | 506,056 | |
(USD), 5.00%, 10/01/2041 | | | 8,668,872 | | | | 9,619,380 | |
(USD), 4.50%, 11/01/2041 | | | 2,449,747 | | | | 2,668,854 | |
(USD), 3.00%, 02/01/2043 | | | 7,229,054 | | | | 7,253,212 | |
(USD), 3.00%, 04/01/2043 | | | 6,295,517 | | | | 6,315,649 | |
(USD), 4.50%, 10/01/2043 | | | 6,073,763 | | | | 6,588,485 | |
(USD), 4.50%, 10/01/2043 | | | 4,965,612 | | | | 5,386,300 | |
(USD), 4.50%, 07/01/2044 | | | 5,669,186 | | | | 6,155,464 | |
Federal National Mortgage Association | | | | | | | | |
(USD), 4.50%, 10/01/2019 | | | 2,498,915 | | | | 2,633,639 | |
(USD), 3.50%, 10/01/2023 | | | 10,924,697 | | | | 11,560,310 | |
(USD), 3.50%, 10/01/2023 | | | 4,677,975 | | | | 4,949,346 | |
(USD), 4.50%, 03/01/2025 | | | 3,637,152 | | | | 3,952,767 | |
(USD), 5.00%, 05/01/2035 | | | 3,118,202 | | | | 3,460,734 | |
(USD), 2.51%, 02/01/2036 (b) | | | 342,551 | | | | 368,248 | |
(USD), 5.50%, 11/01/2036 | | | 258,531 | | | | 288,436 | |
(USD), 5.50%, 05/01/2037 | | | 9,507,787 | | | | 10,649,528 | |
(USD), 5.50%, 02/01/2038 | | | 1,885,840 | | | | 2,103,983 | |
(USD), 5.50%, 11/01/2038 | | | 3,964,971 | | | | 4,423,616 | |
(USD), 5.00%, 04/01/2040 | | | 1,578,629 | | | | 1,757,482 | |
(USD), 5.00%, 05/01/2040 | | | 1,615,709 | | | | 1,790,680 | |
(USD), 4.50%, 12/01/2040 | | | 4,360,137 | | | | 4,740,152 | |
(USD), 5.00%, 02/01/2041 | | | 1,563,276 | | | | 1,740,932 | |
(USD), 5.00%, 04/01/2041 | | | 1,669,058 | | | | 1,848,066 | |
(USD), 4.00%, 10/01/2041 | | | 14,039,871 | | | | 14,982,839 | |
(USD), 3.50%, 06/01/2042 | | | 6,029,059 | | | | 6,251,299 | |
(USD), 4.00%, 06/01/2043 | | | 5,696,266 | | | | 6,078,937 | |
(USD), 4.50%, 03/01/2044 | | | 3,873,211 | | | | 4,204,136 | |
TBA (USD), 3.00%, 11/01/2044 | | | 12,570,000 | | | | 12,572,945 | |
Government National Mortgage Association | | | | | | | | |
(USD), 6.00%, 04/15/2037 | | | 201,106 | | | | 227,059 | |
(USD), 6.00%, 06/15/2037 | | | 174,005 | | | | 196,285 | |
(USD), 6.00%, 09/15/2037 | | | 257,159 | | | | 290,086 | |
(USD), 6.00%, 11/15/2037 | | | 760,134 | | | | 857,463 | |
(USD), 6.00%, 11/15/2037 | | | 196,127 | | | | 221,239 | |
(USD), 6.00%, 12/15/2037 | | | 202,687 | | | | 228,640 | |
(USD), 6.00%, 12/15/2037 | | | 81,964 | | | | 92,458 | |
(USD), 6.00%, 01/15/2038 | | | 157,212 | | | | 177,342 | |
(USD), 6.00%, 04/15/2038 | | | 324,992 | | | | 366,604 | |
(USD), 5.00%, 06/15/2038 | | | 78,534 | | | | 86,681 | |
(USD), 6.00%, 07/15/2038 | | | 110,470 | | | | 124,615 | |
(USD), 6.00%, 08/15/2038 | | | 48,715 | | | | 54,953 | |
(USD), 6.00%, 09/15/2038 | | | 393,735 | | | | 444,150 | |
(USD), 6.00%, 09/15/2038 | | | 251,278 | | | | 283,453 | |
(USD), 5.00%, 03/15/2039 | | | 727,290 | | | | 804,807 | |
(USD), 5.00%, 04/15/2039 | | | 244,681 | | | | 271,551 | |
(USD), 5.00%, 06/15/2039 | | | 273,577 | | | | 304,830 | |
(USD), 4.50%, 04/15/2040 | | | 1,791,210 | | | | 1,959,992 | |
(USD), 4.50%, 07/15/2040 | | | 2,270,609 | | | | 2,484,560 | |
(USD), 4.50%, 04/15/2041 | | | 3,306,524 | | | | 3,613,009 | |
(USD), 5.00%, 05/15/2041 | | | 337,456 | | | | 375,306 | |
(USD), 5.00%, 06/15/2041 | | | 301,674 | | | | 333,699 | |
(USD), 5.00%, 10/15/2041 | | | 8,862 | | | | 9,782 | |
| | | | | | | | 164,541,677 | |
Total U.S. Agencies | | | | | | | 164,541,677 | |
U.S. TREASURIES (9.2%) | | | | | | | | |
UNITED STATES (9.2%) | | | | | | | | |
U.S. Treasury Bonds | | | | | | | | |
(USD), 3.75%, 11/15/2043 | | | 5,000 | | | | 5,673 | |
(USD), 3.63%, 02/15/2044 | | | 3,250,000 | | | | 3,607,247 | |
(USD), 3.38%, 05/15/2044 | | | 2,340,000 | | | | 2,482,778 | |
U.S. Treasury Inflation Index Bonds (USD), 0.63%, 02/15/2043 (f) | | | 8,152,648 | | | | 7,466,040 | |
U.S. Treasury Inflation Index Notes (USD), 0.13%, 04/15/2019 (f) | | | 37,681,626 | | | | 37,993,667 | |
U.S. Treasury Notes | | | | | | | | |
(USD), 4.13%, 05/15/2015 | | | 21,580,000 | | | | 22,040,258 | |
(USD), 0.38%, 08/31/2015 | | | 4,370,000 | | | | 4,379,216 | |
(USD), 0.07%, 01/31/2016 (b) | | | 8,000,000 | | | | 8,000,120 | |
(USD), 0.88%, 08/15/2017 | | | 2,500,000 | | | | 2,500,780 | |
(USD), 1.63%, 04/30/2019 | | | 1,910,000 | | | | 1,918,654 | |
(USD), 1.50%, 05/31/2019 | | | 900,000 | | | | 898,383 | |
(USD), 1.63%, 07/31/2019 | | | 35,800,000 | | | | 35,889,500 | |
(USD), 1.75%, 09/30/2019 | | | 4,060,000 | | | | 4,087,279 | |
(USD), 1.75%, 10/31/2020 | | | 2,290,000 | | | | 2,270,677 | |
(USD), 2.00%, 02/28/2021 | | | 2,850,000 | | | | 2,856,011 | |
(USD), 2.38%, 08/15/2024 | | | 3,210,000 | | | | 3,222,789 | |
| | | | | | | | 139,619,072 | |
Total U.S. Treasuries | | | | | | | 139,619,072 | |
REPURCHASE AGREEMENT (2.8%) | | | | | | | | |
UNITED STATES (2.8%) | | | | | | | | |
Repurchase Agreement, Fixed Income Clearing Corp., 0.00%, dated 10/31/2014, due 11/03/2014, repurchase price $43,376,270, Collateralized by U.S. Treasury Notes, maturing ranging 9/30/2019; total market value of $44,245,294 | | | 43,376,270 | | | | 43,376,270 | |
Total Repurchase Agreement | | | | | | | 43,376,270 | |
Total Investments
(Cost $1,501,169,239) (e)—100.1% | | | | | | | 1,515,466,729 | |
| | |
Liabilities in excess of other assets—(0.1)% | | | | | | | (2,019,144 | ) |
Net Assets—100.0% | | | | | | $ | 1,513,447,585 | |
| (a) | | Denotes a security issued under Regulation S or Rule 144A. |
| (b) | | Variable or Floating Rate Security. Rate disclosed is as of October 31, 2014. |
| (c) | | This security is government guaranteed. |
| (d) | | Issued with a zero coupon. |
See accompanying notes to financial statements.
2014 Annual Report
31
Statement of Investments (concluded)
October 31, 2014
Aberdeen Total Return Bond Fund
| (e) | | See notes to financial statements for tax unrealized appreciation/depreciation of securities. |
| (f) | | Inflation linked security. |
| GMTN | | Global Medium Term Note |
| TBA | | Securities purchased on a forward commitment basis with an appropriate principal amount and no definitive maturity date. The actual principal and maturity date will be determined upon settlement date. |
At October 31, 2014, the Fund held the following futures contracts:
| | | | | | | | | | | | | | | | |
| Futures Contract | | Counterparty | | | Number of Contracts
Long (Short) | | | Expiration Date | | | Unrealized
Depreciation | |
United States Treasury Note 6%-10 year | | | JPMorgan Chase Bank N.A. | | | | (186 | ) | | | 12/19/2014 | | | $ | (66,844 | ) |
At October 31, 2014, the Fund’s open forward foreign currency exchange contracts were as follows:
| | | | | | | | | | | | | | | | | | | | | | | | | | |
| Purchase Contracts Settlement Date* | | Counterparty | | | | | Amount
Purchased | | | Amount
Sold | | | Fair Value | | | Unrealized
Appreciation/
(Depreciation) | |
Brazilian Real/United States Dollar
01/23/2015 | | JPMorgan Chase Bank N.A. | | | BRL | | | | 17,727,291 | | | | USD | | | | 7,005,173 | | | $ | 6,992,876 | | | $ | (12,297 | ) |
Indian Rupee/United States Dollar
01/21/2015 | | Citibank N.A. | | | INR | | | | 239,537,526 | | | | USD | | | | 3,864,755 | | | | 3,837,712 | | | | (27,043 | ) |
| 01/21/2015 | | JPMorgan Chase Bank N.A. | | | INR | | | | 463,646,615 | | | | USD | | | | 7,433,808 | | | | 7,428,240 | | | | (5,568 | ) |
| Indonesian Rupiah/United States Dollar 11/21/2014 | | JPMorgan Chase Bank N.A. | | | IDR | | | | 137,910,431,454 | | | | USD | | | | 11,399,653 | | | | 11,379,953 | | | | (19,700 | ) |
| Japanese Yen/United States Dollar 12/26/2014 | | Westpac Banking Corp. | | | JPY | | | | 1,630,958,046 | | | | USD | | | | 14,947,288 | | | | 14,528,933 | | | | (418,355 | ) |
| Mexican Peso/United States Dollar 11/26/2014 | | Citibank N.A. | | | MXN | | | | 163,786,725 | | | | USD | | | | 12,354,479 | | | | 12,146,221 | | | | (208,258 | ) |
| | | | | | | | | | | | | | | | | | | | | $ | 56,313,935 | | | $ | (691,221 | ) |
| | | | | | | | | | | | | | | | | | | | | | | | | | |
| Sale Contracts Settlement Date* | | Counterparty | | | | | Amount
Purchased | | | | | | Amount
Sold | | | Fair Value | | | Unrealized
Appreciation/
(Depreciation) | |
United States Dollar/Australian Dollar
01/21/2015 | | Westpac Banking Corp. | | | USD | | | | 21,599,917 | | | | AUD | | | | 24,725,628 | | | $ | 21,639,260 | | | $ | (39,343 | ) |
United States Dollar/Brazilian Real
01/23/2015 | | Credit Suisse International | | | USD | | | | 25,762,856 | | | | BRL | | | | 65,203,211 | | | | 25,720,681 | | | | 42,175 | |
| 01/23/2015 | | JPMorgan Chase Bank N.A. | | | USD | | | | 3,716,564 | | | | BRL | | | | 9,412,197 | | | | 3,712,825 | | | | 3,739 | |
United States Dollar/Canadian Dollar
12/23/2014 | | Deutsche Bank AG | | | USD | | | | 14,893,970 | | | | CAD | | | | 16,466,535 | | | | 14,592,253 | | | | 301,717 | |
United States Dollar/Euro
11/18/2014 | | Deutsche Bank AG | | | USD | | | | 30,060,821 | | | | EUR | | | | 22,724,635 | | | | 28,479,924 | | | | 1,580,897 | |
United States Dollar/Japanese Yen
12/26/2014 | | Westpac Banking Corp. | | | USD | | | | 14,954,526 | | | | JPY | | | | 1,630,958,046 | | | | 14,528,933 | | | | 425,593 | |
United States Dollar/Mexican Peso
11/26/2014 | | Citibank N.A. | | | USD | | | | 15,214,618 | | | | MXN | | | | 205,554,422 | | | | 15,243,661 | | | | (29,043 | ) |
United States Dollar/New Zealand Dollar
12/10/2014 | | Deutsche Bank AG | | | USD | | | | 7,349,706 | | | | NZD | | | | 8,932,012 | | | | 6,938,252 | | | | 411,454 | |
| 12/10/2014 | | JPMorgan Chase Bank N.A. | | | USD | | | | 14,376,503 | | | | NZD | | | | 17,825,794 | | | | 13,846,807 | | | | 529,696 | |
| 12/10/2014 | | Westpac Banking Corp. | | | USD | | | | 11,968,982 | | | | NZD | | | | 14,623,286 | | | | 11,359,147 | | | | 609,835 | |
| | | | | | | | | | | | | | | | | | | | | $ | 156,061,743 | | | $ | 3,836,720 | |
| * | | Certain contracts with different trade dates and like characteristics have been shown net. |
See accompanying notes to financial statements.
Annual Report 2014
32
Aberdeen Global High Income Fund (Unaudited)
The Aberdeen Global High Income Fund (Class A shares at NAV net of fees) returned 4.70% for the 12-month period ended October 31, 2014, versus the 5.94% return of its benchmark, the Bank of America Merrill Lynch (BofA ML) Global High Yield Constrained Index (hedged to the U.S. Dollar), during the same period. For broader comparison, the average return of the Fund’s Lipper peer category of High Yield Funds (consisting of 606 funds) was 4.45% for the period.
The global high yield markets performed well for the 12-month period ended October 31, 2014. The BofA ML Global High Yield Constrained Index (hedged to U.S. the Dollar) recorded a total return of 5.94%, outperforming global investment-grade bonds, as represented by the Barclays Global Aggregate Bond Index,1 and the U.S. high yield market, as measured by the BofA ML U.S. High Yield Master II Index,2 which returned 0.22% and 5.85%, respectively, for the same period. However, the global high yield sector lagged both the 17.27% gain of the broader U.S. equity market benchmark, the S&P 500 Index,3 and the 9.25% return of the global equity market, as measured by the MSCI World Index, for the reporting period. Developed-market high yield sectors outside the U.S., such as those in Europe/United Kingdom (UK) and Canada, also recorded positive returns over the reporting period. The Europe/UK and Canadian high yield markets posted corresponding gains of 6.15% and 7.23%, respectively, for the period. Emerging markets (EM) sovereigns and EM corporates returned 9.11% and 5.27%, respectively.4
The global high yield markets generated this strong performance despite the U.S. Federal Reserve (Fed) embarking on a path to the tapering of its purchases of government and mortgage-backed securities by $10 billion ($5 billion for each asset class) in January 2014. This led to several stretches of volatility across many global fixed income and equity markets over the review period. Interest rates rose sharply in December 2013 only to reverse direction the following month as a harsh winter blanketed the U.S., leading to a dramatic slowdown in economic activity. In March 2014, yields again moved higher as hawkish Fed statements, exhibited by an upward drift in its future rate projections, led investors to bring forward their interest-rate tightening expectations. The global high yield market came under some pressure over the past several months after yields and spreads made new lows in late June 2014. Option-adjusted spreads (OAS)5 on the BofA ML Global High Yield Constrained Index (hedged to the U.S. Dollar) bottomed in late June at 359 basis points (bps)–or 3.59%–then marched upward throughout the third quarter and into the first half of October, ultimately peaking at 530 bps. Buyers subsequently appeared and spreads closed October at essentially where they began the month, at 460 bps.
Default activity in the global high yield market over the reporting period remained relatively benign until April 2014, when electric utility TXU’s much-anticipated default finally occurred, affecting $16.6 billion in bonds and $19.5 billion in institutional loans. This resulted in a spike in the U.S. high yield par-weighted default rate6 from 0.61% to 2.15%.7 However, the issuer-weighted default rate8 in the U.S. market moved up by a much lower margin at that time. At the end of the reporting period on October 31, 2014, the par-weighted and issuer-weighted default rates stood at 1.85% and 1.34%, respectively.9 Default rates in both Europe and the emerging markets continued to trend lower over the period.10
| 1 | | The Barclays Global Aggregate Bond Index provides a broad-based measure of the global investment-grade fixed-rate debt markets. The Barclays Global Aggregate Index comprises primarily three major components: the U.S. Aggregate Index, the Pan-European Aggregate Index, and the Asian-Pacific Aggregate Index. In addition to securities from these three benchmarks, the Index includes Global Treasury, Eurodollar, Euro-Yen, Canadian, and Investment-Grade 144A index-eligible securities not already in the three regional aggregate indices. Indexes are unmanaged and have been provided for comparison purposes only. No fees or expenses are reflected. You cannot invest directly in an index. |
| 2 | | The BofA ML U.S. High Yield Master II Index tracks the performance of below-investment-grade US dollar-denominated corporate bonds issued in the U.S. domestic market. |
| 3 | | The S&P 500 Index is an index of 500 selected common stocks, most of which are listed on the New York Stock Exchange, that is a measure of the U.S. stock market as a whole. |
| 4 | | European/UK high yield is represented by the BofA ML Global High Yield European Issuers Constrained Index; Canadian high yield is represented by the BofA ML Canada High Yield Index; emerging markets sovereigns are represented by the BofA Merrill Lynch Global Emerging Markets Sovereign Index; and emerging markets high yield corporates are represented by the BofA ML High Yield U.S. Emerging Markets Corporate Plus Index. |
| | | The BofA ML Global High Yield European Issuers Constrained Index contains all securities in the BofA ML Global High Yield European Issuers High Yield Index but caps issuer exposure at 3%. Index constituents are capitalization-weighted, based on their current amount outstanding, provided the total allocation to an individual issuer does not exceed 3%. |
| | | The BofA ML Canada High Yield Index tracks the performance of Canadian dollar-denominated below-investment-grade corporate debt publicly issued in the Canadian domestic market. Qualifying securities must have a below-investment-grade rating (based on an average of Moody’s, S&P and Fitch). Credit ratings, which typically range from AAA/Aaa (highest) to D (lowest), are assigned by credit rating agencies such as Standard & Poor’s, Moody’s and/or Fitch, as an indication of the ability of an issuer, such as a corporation or state or city government, to meet its financial obligations in full and on time. |
| | | The BofA ML Global Emerging Markets Sovereign Index tracks the performance of U.S. dollar- and euro-denominated below-investment-grade sovereign debt. |
| | | The BofA ML High Yield U.S. Emerging Markets Corporate Plus Index tracks the performance of U.S. dollar-denominated below-investment-grade emerging markets corporate debt publicly issued in the major U.S. and eurobond markets. |
| 5 | | The option-adjusted spread (OAS) is a calculation of the relative value of a fixed-income security containing an embedded option, such as a borrower’s option to prepay a loan. The spread is measured relative to comparable-duration Treasury securities. A larger OAS implies a greater return for greater risks. |
| 6 | | The par-weighted default rate is calculated by dividing the dollar value of high yield issues in default by the total dollar value of the overall market. |
| 7 | | Source: JPMorgan Default Monitor, November 2014. |
| 8 | | The issuer-weighted default rate is expressed as a percentage of high yield debt issuers defaulting relative to the total number of issuers in the market. |
| 9,10 | | Source: JPMorgan Default Monitor, November 2014. |
2014 Annual Report
33
Aberdeen Global High Income Fund (Unaudited) (continued)
The Fund outperformed the benchmark BofA ML Global High Yield Constrained Index (hedged to the U.S. Dollar) for the majority of the annual period. In the third quarter of 2014, however, issue selection proved to be a drag on performance in a partial reversal of the patterns witnessed in the first and second quarters of the year. Specifically, security selection within Emerging Europe was a detractor—most notably holdings in Russia amid a downturn in that market attributable to fears of a wider economic fallout from an extended standoff between Russia and the West over Ukraine. The Fund’s investment in a Ukrainian agriculture company suffered in the quarter as financial problems at the company were exacerbated by geopolitical events in that country. The company is currently negotiating a restructuring with bondholders. The Fund reduced its position in this investment prior to the end of the period on October 31, 2014. Our investment in a Ukrainian steel company suffered a similar fate as macroeconomic events overwhelmed what we view as a solid fundamental story. We believed that both of these investments were appropriately sized given the macroeconomic risks; nonetheless, outsized price declines had a negative impact on Fund performance. We maintained the Fund’s positions in both of these investments as of the end of the period on October 31, 2014.
Fund performance for the reporting period was bolstered by security selection in the services and technology & electronics sectors, as well as security selection in high yield bonds in European developed markets. Security selection among BBB and BB rated11 issuers, as well as hard currency emerging market sovereigns, also contributed to performance.
Regarding the use of derivatives during the reporting period, the Fund employed CDX (a basket of credit derivatives) to hedge overall beta12 risk. We also employed individual credit default swaps12 to hedge individual exposures as well as to initiate new long positions that are more efficient than the cash market. While the Fund used derivatives during the reporting period, they had minimal impact on performance.
Major changes to the Fund during the reporting period included the reduction of the exposure to Eastern Europe and the U.S., and increases in the allocations to the European developed markets and Latin America. We increased the Fund’s positions in hard currency emerging market corporates and sovereigns by 3% and 1.5%, respectively, over the reporting period. We increased the exposure to BB and single B credits while reducing holdings in CCC rated issues. Additionally, we increased the Fund’s allocations to loans by roughly 4% over the reporting period.
What are we doing now to position the Fund going forward? First, we are monitoring the holdings in energy and coal companies for the impact of possible lower prices and seeking to ensure that we position the Fund in issues that we believe are still undervalued relative to the level of risk. In some cases this exercise has identified positions that we have exited; in some situations we have swapped into other parts of the capital structure within the same issuer that in our view were better valued; and, finally, in other cases we have identified new securities to add to the Fund. Secondly, we are seeking to take advantage of the recent market volatility. As part of this effort, we have identified a number of credits which we believe will benefit from the decline in energy prices. These have included the securities of a U.S. airline and several utilities which we added to the Fund towards the end of the reporting period.
Despite the fact that the U.S. seems to be on an improving trajectory, the rest of the world is moving in a very different direction, in our opinion. We think that the U.S. is still facing some of the headwinds from the global financial crisis, which have dissipated somewhat but are still lurking in the background. It now appears that some of those headwinds may have been replaced by forces outside of the U.S. Fortunately, the U.S. economy is dependent on the U.S. consumer and relies less on foreign markets (through exports) compared to many of our developed and developing market counterparts.
In our view, the backdrop for the global high yield market remains supportive. As we have discussed in recent commentaries, there are two elements to the decision-making process with regard to the high yield sector. There is a fundamental and valuation piece to the puzzle. We believe that the fundamentals continue to bode well for the sector as a very low default environment should prevail over the next several years. In our opinion, this view is supported by good revenue growth for global and U.S. high yield companies; significant free cash-flow-generation, which ultimately allows companies to improve coverage ratios; and finally, these positive fundamentals are augmented by a very supportive technical picture for the high yield sector. Consequently, we believe that the high yield sector is poised to maintain a positive fundamental backdrop for the next several years.
The second element of the process comprises the valuation side of the equation. Our view is that the U.S. and global high yield sectors should trade in an OAS range of between 300 and 575 bps. We believe this range is appropriate because, if trailing par-weighted default rates stay close to 1%, then after default costs, the high yield market becomes cheap when spreads move above the mid-point (above 450 bps) of our fair valuation range.
| 11 | | Standard & Poor’s, Moody’s, and Fitch are three international credit rating agencies that evaluate credit risk. Agency credit ratings are expressed as letter grades that range from “AAA” to “D” to communicate the respective agency’s opinion of relative level of credit risk. |
| 12 | | Beta is a measure of the volatility, or systematic risk, of a security or a portfolio in comparison to the market as a whole. |
| 13 | | Credit default swaps are used to transfer the credit exposure of fixed income products between parties. A credit default swap is also referred to as a credit derivative contract, where the purchaser of the swap makes payments up until the maturity date of a contract. |
Annual Report 2014
34
Aberdeen Global High Income Fund (Unaudited) (concluded)
Portfolio Management:
Aberdeen North American Fixed Income Team
PAST PERFORMANCE DOES NOT GUARANTEE FUTURE RESULTS.
The performance quoted represents past performance, which does not guarantee future results. Class A shares have up to a 0.25% 12b-1 fee. The investment return and principal value of an investment will fluctuate so that an investor’s shares, when redeemed, may be worth more or less than their original cost. Current performance of the Fund may be lower or higher than the performance quoted. Performance data current to the most recent month-end may be obtained by calling 800-387-6977 or visiting www.aberdeen-asset.us.
Investing in mutual funds involves risk, including the possible loss of principal. There is no assurance that the investment objective of any fund will be achieved. Indexes are unmanaged and have been provided for comparison purposes only. No fees or expenses are reflected. You cannot invest directly in an index.
Lipper is a leading global provider of mutual fund information and analysis to fund companies, financial intermediaries and media organizations.
Risk Considerations
Fixed income securities are subject to certain risks including, but not limited to: interest rate (changes in interest rates may cause a decline in the market value of an investment), credit (changes in the financial condition of the issuer, borrower, counterparty, or underlying collateral), prepayment (debt issuers may repay or refinance their loans or obligations earlier than anticipated), and extension (principal repayments may not occur as quickly as anticipated, causing the expected maturity of a security to increase).
The Fund’s investments in high-yield bonds (commonly referred to as “junk bonds”) and other lower-rated securities will subject the Fund to substantial risk of loss. Investments in high-yield bonds are speculative and issuers of these securities are generally considered to be less financially secure and less able to repay interest and principal than issuers of investment-grade securities. Prices of high-yield bonds tend to be very volatile. These securities are less liquid than investment-grade debt securities and may be difficult to price or sell, particularly in times of negative sentiment toward high-yield securities.
Derivatives are speculative and may hurt the Fund’s performance. They present the risk of disproportionately increased losses and/or reduced gains when the financial asset or measure to which the derivative is linked changes in unexpected ways.
Foreign securities are more volatile, harder to price and less liquid than U.S. securities; and are subject to different accounting and regulatory standards, and political and economic risks. These risks are enhanced in emerging markets countries.
Please read the prospectus for more detailed information regarding these and other risks.
2014 Annual Report
35
Aberdeen Global High Income Fund (Unaudited)
| | | | | | | | | | |
Average Annual Total Return (For periods ended October 31, 2014) | | 1 Yr. | | 5 Yr. | | | 10 Yr. | |
Class A | | 4.70% | | | 8.58% | | | | 7.88% | |
Institutional Class1 | | 5.01% | | | 8.86% | | | | 8.16% | |
Annual Report 2014
36
Aberdeen Global High Income Fund (Unaudited)
Performance of a $10,000 Investment (as of October 31, 2014)
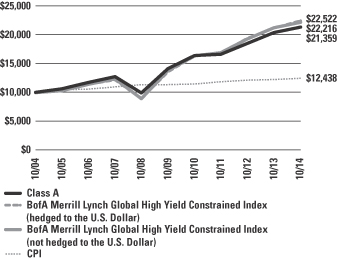
Comparative performance of $10,000 invested in Class A shares of the Aberdeen Global High Income Fund, BofA Merrill Lynch Global High Yield Constrained Index (hedged to the U.S. Dollar), the BofA Merrill Lynch Global High Yield Constrained Index (not hedged to the U.S. Dollar) and the Consumer Price Index (CPI) over a 10-year period ended October 31, 2014. Unlike the Fund’s returns, the returns for these unmanaged indexes do not reflect any fees or expenses. Investors cannot invest directly in market indexes.
The BofA Merrill Lynch Global High Yield Constrained Index (hedged to the U.S. Dollar) tracks the performance of below investment grade bonds of corporate issuers domiciled in countries having an investment grade foreign currency long term debt rating (based on a composite of Moody’s and S&P). The BofA Merrill Lynch Global High Yield Constrained Index (not hedged to the U.S. Dollar) tracks the performance of below investment grade bonds of corporate issuers domiciled in countries having an investment grade foreign currency long-term debt rating (based on a composite of Moody’s, S&P and Fitch). The indexes are weighted by outstanding issuance, but constrained such that the percentage of any one issuer may not represent more than 2% of the indexes. Effective with the 2014 prospectus, the BofA Merrill Lynch Global High Yield Constrained Index (hedged to the U.S. Dollar) became the Fund’s primary benchmark. Previously, the Fund’s average annual total returns were compared to the returns of the same index without hedging to the U.S. Dollar. The Adviser believes that the average annual total returns of the BofA Merrill Lynch Global High Yield Constrained Index (hedged to the U.S. Dollar) makes a more meaningful comparison index given the Fund’s investment strategy and composition.
The CPI represents changes in prices of all goods and services purchased for consumption by urban households.
Investment return and principal value will fluctuate, and when redeemed, shares may be worth more or less than original cost. Past performance is no guarantee of future results. The Average Annual Total Return table and performance graph do not reflect the deduction of taxes that a shareholder would pay on Fund distributions or the redemption of Fund shares. Investing in mutual funds involves market risk, including loss of principal. Performance returns assume the reinvestment of all distributions. Performance returns reflect fee waivers and reimbursements in effect without which returns would have been lower.
Portfolio Summary (as a percentage of net assets)
October 31, 2014 (Unaudited)
| | | | |
| Asset Allocation | | | |
Corporate Bonds | | | 68.7% | |
Bank Loans | | | 12.2% | |
Repurchase Agreement | | | 5.0% | |
Government Bonds | | | 4.0% | |
Common Stocks | | | 1.8% | |
Preferred Stocks | | | 0.8% | |
Government Agencies | | | 0.6% | |
Other assets in excess of liabilities | | | 6.9% | |
| | | | 100.0% | |
The following table summarizes the composition of the Fund’s portfolio, in Bloomberg Industry Classification System (BICS) sectors, expressed as a percentage of net assets. The industries listed below may include more than one industry group. As of October 31, 2014, the Fund did not have more than 25% of its assets invested in any one industry group.
| | | | |
| Top Industries | | | |
Diversified Telecommunication Services | | | 7.4% | |
Oil, Gas & Consumable Fuels | | | 5.9% | |
Commercial Banks | | | 5.3% | |
Diversified Financial Services | | | 4.3% | |
Electric Utilities | | | 3.4% | |
Commercial Services & Supplies | | | 2.5% | |
Transportation | | | 2.2% | |
Real Estate | | | 2.2% | |
Insurance | | | 2.1% | |
Paper & Forest Products | | | 2.0% | |
Other | | | 62.7% | |
| | | | 100.0% | |
| | | | |
| Top Holdings* | | | |
Deep Ocean | | | 1.6% | |
Avanti Communications Group PLC 10/01/2019 | | | 1.3% | |
Unique Pub Finance Co. PLC, Series M 03/28/2024 | | | 1.2% | |
Mexico Fixed Rate Bonds, Series M10 12/17/2015 | | | 1.2% | |
Kinder morgan, Inc. 08/01/2031 | | | 1.2% | |
Asurion LLC 03/03/2021 | | | 1.1% | |
Verso Paper Holdings LLC / Verso Paper, Inc. 01/15/2019 | | | 1.1% | |
Marquette Transportation Co LLC / Marquette Transportation Finance Corp. 01/15/2017 | | | 1.1% | |
Sprint Corp. 09/15/2023 | | | 1.1% | |
Dynegy Finance I, Inc. / Dynegy Finance II, Inc. 11/01/2024 | | | 1.0% | |
Other | | | 88.1% | |
| | | | 100.0% | |
| | | | |
| Top Countries | | | |
United States | | | 60.1% | |
United Kingdom | | | 6.1% | |
Canada | | | 4.4% | |
Luxembourg | | | 3.0% | |
Mexico | | | 2.8% | |
Indonesia | | | 2.4% | |
Brazil | | | 2.4% | |
Jersey | | | 1.7% | |
Norway | | | 1.6% | |
Sweden | | | 0.9% | |
Other | | | 14.6% | |
| | | | 100.0% | |
| * | | For the purpose of listing top holdings, repurchase agreements are included as part of Other. |
2014 Annual Report
37
Statement of Investments
October 31, 2014
Aberdeen Global High Income Fund
| | | | | | | | |
| | | Shares or
Principal
Amount | | | Value
(US$) | |
CORPORATE BONDS (68.7%) | | | | | | | | |
AUSTRIA (0.8%) | | | | | | | | |
Sappi Papier Holding GmbH | | | | | | | | |
(USD), 6.63%, 04/15/2021 (a) | | $ | 700,000 | | | $ | 731,500 | |
(USD), 7.50%, 06/15/2032 (a) | | | 19,492,000 | | | | 18,419,940 | |
| | | | | | | | 19,151,440 | |
BERMUDA (0.5%) | | | | | | | | |
Fly Leasing Ltd. (USD), 6.38%, 10/15/2021 | | | 11,860,000 | | | | 11,830,350 | |
BRAZIL (1.5%) | | | | | | | | |
Banco do Brasil SA (USD),
9.00%, 06/29/2049 (a)(b)(c) | | | 7,210,000 | | | | 7,123,480 | |
Petrobras Global Finance BV (USD), 6.25%, 03/17/2024 | | | 9,180,000 | | | | 9,783,677 | |
Petrobras International Finance Co. SA (USD), 7.88%, 03/15/2019 | | | 2,416,000 | | | | 2,782,580 | |
Samarco Mineracao SA (USD), 4.13%, 11/01/2022 (a) | | | 7,235,000 | | | | 6,900,381 | |
Tonon Bioenergia SA (USD), 9.25%, 01/24/2020 (a) | | | 11,375,000 | | | | 9,270,625 | |
| | | | | | | | 35,860,743 | |
CANADA (4.4%) | | | | | | | | |
Air Canada | | | | | | | | |
(USD), 8.75%, 04/01/2020 (a) | | | 2,080,000 | | | | 2,293,200 | |
(USD), 7.75%, 04/15/2021 (a) | | | 15,485,000 | | | | 16,259,250 | |
First Quantum Minerals Ltd. | | | | | | | | |
(USD), 7.25%, 10/15/2019 (a) | | | 12,320,000 | | | | 12,320,000 | |
(USD), 7.25%, 05/15/2022 (a) | | | 5,690,000 | | | | 5,561,975 | |
Garda World Security Corp. (USD), 7.25%, 11/15/2021 (a) | | | 5,445,000 | | | | 5,445,000 | |
Gateway Casinos & Entertainment Ltd. (CAD), 8.50%, 11/26/2020 (a)(d) | | | 13,460,000 | | | | 12,245,668 | |
Kissner Milling Co. Ltd. (USD), 7.25%, 06/01/2019 (a) | | | 18,615,000 | | | | 19,033,838 | |
MEG Energy Corp. (USD), 6.38%, 01/30/2023 (a) | | | 17,610,000 | | | | 17,521,950 | |
River Cree Enterprises LP (CAD), 11.00%, 01/20/2021 (a)(d) | | | 13,885,000 | | | | 13,373,729 | |
| | | | | | | | 104,054,610 | |
FRANCE (0.9%) | | | | | | | | |
Credit Agricole SA (USD), 7.88%, 01/29/2049 (a)(b)(c) | | | 3,640,000 | | | | 3,768,583 | |
Loxam SAS (EUR), 7.00%, 07/23/2022 (a) | | | 7,725,000 | | | | 9,027,145 | |
Societe Generale SA (USD), 7.88%, 12/29/2049 (a)(b)(c) | | | 8,760,000 | | | | 8,781,900 | |
| | | | | | | | 21,577,628 | |
GERMANY (0.6%) | | | | | | | | |
ALBA Group PLC & Co. KG (EUR), 8.00%, 05/15/2018 (a) | | | 4,375,000 | | | | 4,430,763 | |
Safari Holding Verwaltungs GmbH (EUR), 8.25%, 02/15/2021 (a) | | | 7,435,000 | | | | 9,457,860 | |
| | | | | | | | 13,888,623 | |
| | | | | | | | |
| | | | | | | |
GUATEMALA (0.7%) | | | | | | | | |
Cementos Progreso Trust (USD), 7.13%, 11/06/2023 (a) | | $ | 7,385,000 | | | $ | 7,957,337 | |
Comunicaciones Celulares SA (USD), 6.88%, 02/06/2024 (a) | | | 7,205,000 | | | | 7,727,363 | |
| | | | | | | | 15,684,700 | |
HONG KONG (0.5%) | | | | | | | | |
MIE Holdings Corp. (USD), 7.50%, 04/25/2019 (a) | | | 12,540,000 | | | | 12,320,550 | |
INDIA (0.3%) | | | | | | | | |
GCX Ltd. (USD), 7.00%, 08/01/2019 (a) | | | 6,220,000 | | | | 6,405,045 | |
INDONESIA (1.1%) | | | | | | | | |
Gajah Tunggal Tbk PT (USD), 7.75%, 02/06/2018 (a) | | | 12,880,000 | | | | 13,008,800 | |
Ottawa Holdings Pte Ltd. (USD), 5.88%, 05/16/2018 (a) | | | 15,655,000 | | | | 13,756,831 | |
| | | | | | | | 26,765,631 | |
ITALY (0.7%) | | | | | | | | |
Wind Acquisition Finance SA (USD), 7.38%, 04/23/2021 (a) | | | 18,080,000 | | | | 17,718,400 | |
JERSEY (1.7%) | | | | | | | | |
Consolidated Minerals Ltd. (USD), 8.00%, 05/15/2020 (a) | | | 10,395,000 | | | | 8,627,850 | |
Galaxy Bidco Ltd. | | | | | | | | |
(GBP), 5.56%, 11/15/2019 (a)(b) | | | 2,025,000 | | | | 3,177,845 | |
(GBP), 6.38%, 11/15/2020 (a) | | | 7,950,000 | | | | 12,183,479 | |
Galaxy Finco Ltd. (GBP), 7.88%, 11/15/2021 (a) | | | 1,600,000 | | | | 2,393,152 | |
Hastings Insurance Group Finance PLC | | | | | | | | |
(GBP), 6.55%, 10/21/2019 (a)(b) | | | 3,680,000 | | | | 5,850,841 | |
(GBP), 8.00%, 10/21/2020 (a) | | | 4,375,000 | | | | 7,279,513 | |
HBOS Sterling Finance Jersey LP (GBP), 7.88%, 12/29/2049 (b)(c) | | | 285,000 | | | | 549,377 | |
| | | | | | | | 40,062,057 | |
KAZAKHSTAN (0.3%) | | | | | | | | |
Uranium One Investments, Inc. (USD), 6.25%, 12/13/2018 (a) | | | 8,960,000 | | | | 8,064,000 | |
LUXEMBOURG (2.5%) | | | | | | | | |
ArcelorMittal (USD), 7.50%, 10/15/2039 | | | 22,925,000 | | | | 24,587,063 | |
Bank of New York Mellon Luxembourg SA (The), Series PRX (EUR), MTN, 0.00%, 12/15/2050 (e) | | | 9,600,000 | | | | 7,699,354 | |
Coveris Holdings SA (USD), 7.88%, 11/01/2019 (a) | | | 1,525,000 | | | | 1,608,875 | |
INEOS Group Holdings SA (USD), 6.13%, 08/15/2018 (a) | | | 1,935,000 | | | | 1,959,188 | |
Magnolia BC SA (EUR), 9.00%, 08/01/2020 (a) | | | 9,405,000 | | | | 11,373,371 | |
Mobile Challenger Intermediate Group SA | | | | | | | | |
PIK (CHF), 8.75%, 03/15/2019 (a) | | | 5,450,000 | | | | 5,777,685 | |
PIK (EUR), 8.75%, 03/15/2019 (a) | | | 4,390,000 | | | | 5,597,602 | |
| | | | | | | | 58,603,138 | |
See accompanying notes to financial statements.
Annual Report 2014
38
Statement of Investments (continued)
October 31, 2014
Aberdeen Global High Income Fund
| | | | | | | | |
| | | Shares or
Principal
Amount | | | Value
(US$) | |
MEXICO (1.6%) | | | | | | | | |
Alfa SAB de CV | | | | | | | | |
(USD), 5.25%, 03/25/2024 (a) | | $ | 2,730,000 | | | $ | 2,979,113 | |
(USD), 6.88%, 03/25/2044 (a) | | | 6,935,000 | | | | 7,819,212 | |
Axtel SAB de CV (USD), 8.00%, 01/31/2020 (a)(f) | | | 16,761,000 | | | | 16,928,610 | |
Cobre Del Mayo SA de CV (USD), 10.75%, 11/15/2018 (a) | | | 11,616,000 | | | | 11,761,200 | |
| | | | | | | | 39,488,135 | |
NETHERLANDS (0.5%) | | | | | | | | |
Adria Bidco BV (EUR), 7.88%, 11/15/2020 (a) | | | 9,150,000 | | | | 12,096,971 | |
PARAGUAY (0.3%) | | | | | | | | |
Banco Regional SAECA (USD), 8.13%, 01/24/2019 (a) | | | 5,755,000 | | | | 6,272,950 | |
PERU (0.9%) | | | | | | | | |
Banco de Credito del Peru (USD), 6.13%, 04/24/2027 (a)(b) | | | 7,170,000 | | | | 7,743,600 | |
Corp. Lindley SA (USD), 4.63%, 04/12/2023 (a) | | | 13,810,000 | | | | 13,533,800 | |
| | | | | | | | 21,277,400 | |
REPUBLIC OF IRELAND (0.3%) | | | | | | | | |
Ardagh Packaging Finance PLC / Ardagh Holdings USA, Inc. (USD), 6.75%, 01/31/2021 (a) | | | 3,600,000 | | | | 3,690,000 | |
Argon Capital PLC for Royal Bank of Scotland (GBP), EMTN, 2.90%, 10/29/2049 (b)(c) | | | 3,203,000 | | | | 4,243,678 | |
| | | | | | | | 7,933,678 | |
SWEDEN (0.9%) | | | | | | | | |
Unilabs Subholding AB (EUR), 8.50%, 07/15/2018 (a) | | | 9,405,000 | | | | 11,862,485 | |
Verisure Holding AB (EUR), MTN, 8.75%, 12/01/2018 (a) | | | 7,890,000 | | | | 10,564,638 | |
| | | | | | | | 22,427,123 | |
SWITZERLAND (0.3%) | | | | | | | | |
Credit Suisse Group AG (USD), 7.50%, 12/29/2049 (a)(b)(c) | | | 7,335,000 | | | | 7,813,975 | |
UKRAINE (0.3%) | | | | | | | | |
Metinvest BV (USD), 8.75%, 02/14/2018 (a) | | | 6,950,000 | | | | 4,956,462 | |
Mriya Agro Holding PLC (USD), 9.45%, 04/19/2018 (a)(g) | | | 10,755,000 | | | | 2,419,875 | |
| | | | | | | | 7,376,337 | |
UNITED KINGDOM (6.1%) | | | | | | | | |
Annington Finance No 5 PLC, PIK (GBP), 13.00%, 01/15/2023 (a) | | | 11,465,000 | | | | 22,925,708 | |
Avanti Communications Group PLC (USD), 10.00%, 10/01/2019 (a) | | | 32,630,000 | | | | 31,651,100 | |
Barclays Bank PLC (GBP), 6.13%, 04/29/2049 (b)(c) | | | 6,586,000 | | | | 10,779,317 | |
Lloyds Bank PLC (GBP), EMTN, 13.00%, 01/29/2049 (b)(c) | | | 4,475,000 | | | | 11,854,669 | |
National Westminster Bank PLC (GBP), EMTN, 5.98%, 01/29/2049 (b)(c) | | | 2,815,000 | | | | 4,440,113 | |
Pearl Group Holdings No 1 Ltd. (GBP), 6.59%, 11/29/2049 (b)(c) | | | 11,407,850 | | | | 17,964,457 | |
Royal Bank of Scotland Group PLC (EUR), 5.50%, 11/29/2049 (c) | | | 4,353,000 | | | | 5,287,223 | |
Unique Pub Finance Co. PLC, Series M (GBP), 7.40%, 03/28/2024 | | | 17,840,000 | | | | 29,822,897 | |
Virgin Media Finance PLC (USD), 6.00%, 10/15/2024 (a) | | | 1,000,000 | | | | 1,043,750 | |
Virgin Media Secured Finance PLC (GBP), 5.50%, 01/15/2025 (a) | | | 5,540,000 | | | | 9,021,863 | |
| | | | | | | | 144,791,097 | |
UNITED STATES (40.5%) | | | | | | | | |
AAF Holdings LLC/AAF Finance Co., PIK (USD), 12.00%, 07/01/2019 (a) | | | 15,845,000 | | | | 15,924,225 | |
AES Corp. | | | | | | | | |
(USD), 8.00%, 06/01/2020 | | | 20,670,000 | | | | 24,103,700 | |
(USD), 5.50%, 03/15/2024 | | | 1,025,000 | | | | 1,053,188 | |
Albertsons Holdings LLC/Saturn Acquisition Merger Sub, Inc. (USD), 7.75%, 10/15/2022 (a) | | | 6,695,000 | | | | 6,628,050 | |
Alcoa, Inc. (USD), 5.95%, 02/01/2037 | | | 5,640,000 | | | | 5,870,061 | |
Alpha Natural Resources, Inc. | | | | | | | | |
(USD), 3.75%, 12/15/2017 | | | 15,750,000 | | | | 10,050,469 | |
(USD), 6.00%, 06/01/2019 | | | 11,220,000 | | | | 5,722,200 | |
(USD), 6.25%, 06/01/2021 | | | 10,405,000 | | | | 4,994,400 | |
American International Group, Inc.,
Series A2 (GBP), 5.75%, 03/15/2067 (b) | | | 300,000 | | | | 499,621 | |
Arch Coal, Inc. | | | | | | | | |
(USD), 7.25%, 10/01/2020 | | | 11,870,000 | | | | 5,756,950 | |
(USD), 7.25%, 06/15/2021 | | | 3,806,000 | | | | 1,427,250 | |
Ashtead Capital, Inc. (USD), 5.63%, 10/01/2024 (a) | | | 10,325,000 | | | | 10,841,250 | |
Blue Danube Ltd. (USD), 10.75%, 04/10/2015 (a)(b)(d) | | | 9,355,000 | | | | 9,688,038 | |
Building Materials Corp. of America (USD), 5.38%, 11/15/2024 (a) | | | 16,185,000 | | | | 16,306,387 | |
Building Materials Holding Corp. (USD), 9.00%, 09/15/2018 (a) | | | 9,280,000 | | | | 10,045,600 | |
California Resources Corp. | | | | | | | | |
(USD), 5.50%, 09/15/2021 (a) | | | 5,375,000 | | | | 5,489,219 | |
(USD), 6.00%, 11/15/2024 (a) | | | 5,510,000 | | | | 5,633,975 | |
Calpine Corp. (USD), 5.75%, 01/15/2025 | | | 12,790,000 | | | | 12,965,862 | |
Carrizo Oil & Gas, Inc. (USD), 7.50%, 09/15/2020 (a) | | | 16,920,000 | | | | 17,077,375 | |
CBC Ammo LLC / CBC FinCo, Inc. (USD), 7.25%, 11/15/2021 (a) | | | 13,480,000 | | | | 13,412,600 | |
CCO Holdings LLC / CCO Holdings Capital Corp. (USD), 5.25%, 03/15/2021 | | | 18,610,000 | | | | 18,912,412 | |
CCOH Safari LLC | | | | | | | | |
(USD), 5.50%, 12/01/2022 | | | 1,755,000 | | | | 1,776,938 | |
(USD), 5.75%, 12/01/2024 | | | 2,910,000 | | | | 2,933,644 | |
CenturyLink, Inc. | | | | | | | | |
Series W (USD), 6.75%, 12/01/2023 | | | 5,860,000 | | | | 6,526,575 | |
Series P (USD), 7.60%, 09/15/2039 | | | 10,137,000 | | | | 10,289,055 | |
Series U (USD), 7.65%, 03/15/2042 | | | 4,460,000 | | | | 4,493,450 | |
Cenveo Corp. (USD), 6.00%, 08/01/2019 (a) | | | 14,400,000 | | | | 13,932,000 | |
Chaparral Energy, Inc. (USD), 7.63%, 11/15/2022 | | | 7,545,000 | | | | 7,394,100 | |
See accompanying notes to financial statements.
2014 Annual Report
39
Statement of Investments (continued)
October 31, 2014
Aberdeen Global High Income Fund
| | | | | | | | |
| | | Shares or
Principal
Amount | | | Value
(US$) | |
CHS/Community Health Systems, Inc. (USD), 6.88%, 02/01/2022 | | $ | 13,510,000 | | | $ | 14,607,687 | |
Clayton Williams Energy, Inc. (USD), 7.75%, 04/01/2019 | | | 24,450,000 | | | | 24,358,312 | |
Compass Re Ltd., Series CL3 (USD), 11.26%, 01/08/2015 (a)(b)(d) | | | 7,245,000 | | | | 7,371,788 | |
DPH Holdings Corp. (USD), 6.55%, 06/15/2006 (d)(g)(h) | | | 1,500,000 | | | | 51,938 | |
Dynegy Finance I, Inc. / Dynegy Finance II, Inc. | | | | | | | | |
(USD), 7.38%, 11/01/2022 (a) | | | 5,280,000 | | | | 5,590,200 | |
(USD), 7.63%, 11/01/2024 (a) | | | 23,335,000 | | | | 24,764,269 | |
Everglades Re Ltd. (USD), 9.46%, 03/28/2018 (a)(b) | | | 2,452,000 | | | | 2,624,253 | |
First Data Corp. | | | | | | | | |
(USD), 12.63%, 01/15/2021 | | | 8,000,000 | | | | 9,680,000 | |
(USD), 10.63%, 06/15/2021 | | | 10,000,000 | | | | 11,575,000 | |
(USD), 11.75%, 08/15/2021 | | | 7,822,000 | | | | 9,210,405 | |
First Maryland Capital I (USD), 1.23%, 01/15/2027 (b) | | | 8,420,000 | | | | 7,746,400 | |
Florida East Coast Holdings Corp. | | | | | | | | |
(USD), 6.75%, 05/01/2019 (a) | | | 14,480,000 | | | | 14,977,822 | |
(USD), 9.75%, 05/01/2020 (a) | | | 12,485,000 | | | | 12,781,519 | |
Freescale Semiconductor, Inc. (USD), 6.00%, 01/15/2022 (a) | | | 9,400,000 | | | | 9,658,500 | |
Frontier Communications Corp. | | | | | | | | |
(USD), 6.88%, 01/15/2025 | | | 5,080,000 | | | | 5,156,200 | |
(USD), 9.00%, 08/15/2031 | | | 14,195,000 | | | | 15,472,550 | |
General Motors (Escrow Shares) | | | | | | | | |
(USD), 7.13%, 07/15/2013 (d)(h) | | | 2,240,000 | | | | — | |
(USD), 8.25%, 07/15/2023 (d)(h) | | | 35,495,000 | | | | — | |
(USD), 8.10%, 06/15/2024 (d)(h) | | | 2,485,000 | | | | — | |
(USD), 7.38%, 05/23/2048 (d)(h) | | | 3,460,000 | | | | — | |
(USD), 8.80%, 03/01/2049 (d)(h) | | | 7,200,000 | | | | — | |
(USD), 8.38%, 07/15/2049 (d)(h) | | | 3,550,000 | | | | — | |
GenOn Americas Generation LLC (USD), 8.50%, 10/01/2021 | | | 14,476,000 | | | | 13,752,200 | |
Greektown Holdings LLC/Greektown Mothership Corp. (USD), 8.88%, 03/15/2019 (a) | | | 5,760,000 | | | | 5,817,600 | |
Hardwoods Acquisition, Inc. (USD), 7.50%, 08/01/2021 (a) | | | 11,011,000 | | | | 11,176,165 | |
HCA, Inc. | | | | | | | | |
(USD), 4.25%, 10/15/2019 | | | 4,305,000 | | | | 4,380,338 | |
(USD), 5.25%, 04/15/2025 | | | 8,605,000 | | | | 8,927,688 | |
iHeartCommunications, Inc. | | | | | | | | |
(USD), 9.00%, 03/01/2021 | | | 4,485,000 | | | | 4,501,819 | |
(USD), 9.00%, 09/15/2022 (a) | | | 11,510,000 | | | | 11,596,325 | |
Immucor, Inc. (USD), 11.13%, 08/15/2019 | | | 9,385,000 | | | | 10,276,575 | |
Jefferies Finance LLC / JFIN Co-Issuer Corp. | | | | | | | | |
(USD), 7.38%, 04/01/2020 (a) | | | 6,460,000 | | | | 6,460,000 | |
(USD), 6.88%, 04/15/2022 (a) | | | 5,195,000 | | | | 5,052,138 | |
Jurassic Holdings III, Inc. (USD), 6.88%, 02/15/2021 (a) | | | 11,691,000 | | | | 11,807,910 | |
Kinder Morgan, Inc. (USD), GMTN, 8.05%, 10/15/2030 | | | 1,330,000 | | | | 1,629,250 | |
Kinder Morgan, Inc. (USD), GMTN, 7.80%, 08/01/2031 | | | 23,249,000 | | | | 28,712,515 | |
Landry’s Holdings II, Inc. (USD), 10.25%, 01/01/2018 (a) | | | 10,515,000 | | | | 10,988,175 | |
Landry’s, Inc. (USD), 9.38%, 05/01/2020 (a) | | | 11,840,000 | | | | 12,713,200 | |
Light Tower Rentals, Inc. (USD), 8.13%, 08/01/2019 (a) | | | 8,204,000 | | | | 8,121,960 | |
Marquette Transportation Co LLC / Marquette Transportation Finance Corp. (USD), 10.88%, 01/15/2017 (d) | | | 25,125,000 | | | | 25,910,156 | |
Mellon Capital III (GBP), 6.37%, 09/05/2066 (b) | | | 7,750,000 | | | | 12,949,376 | |
Mythen Re Ltd., Series 2012-2, Class A (USD), 8.53%, 01/05/2017 (a)(b)(d) | | | 6,030,000 | | | | 6,491,597 | |
Neiman Marcus Group Ltd., LLC | | | | | | | | |
(USD), 8.00%, 10/15/2021 (a) | | | 2,400,000 | | | | 2,572,046 | |
PIK (USD), 8.75%, 10/15/2021 (a) | | | 600,000 | | | | 645,000 | |
New Enterprise Stone & Lime Co Inc., PIK (USD), 13.00%, 03/15/2018 | | | 12,409,673 | | | | 13,340,398 | |
Northgroup Preferred Capital Corp. (USD), 6.38%, 01/29/2049 (a)(b)(c) | | | 7,970,000 | | | | 8,248,950 | |
Palace Entertainment Holdings LLC / Palace Entertainment Holdings Corp. (USD), 8.88%, 04/15/2017 (a) | | | 21,975,000 | | | | 22,565,578 | |
PNC Preferred Funding Trust I (USD), 1.88%, 03/29/2049 (a)(b)(c) | | | 12,315,000 | | | | 12,007,125 | |
Residential Reinsurance 2011 Ltd. (USD), 8.91%, 06/06/2017 (a)(b)(d) | | | 10,790,000 | | | | 11,350,001 | |
Residential Reinsurance 2013 Ltd. (USD), 8.01%, 06/06/2019 (a)(b)(d) | | | 5,380,000 | | | | 5,809,055 | |
Sabine Pass Liquefaction LLC (USD), 5.75%, 05/15/2024 (a) | | | 8,105,000 | | | | 8,419,069 | |
Sanchez Energy Corp. (USD), 6.13%, 01/15/2023 (a) | | | 19,645,000 | | | | 18,760,975 | |
SandRidge Energy, Inc. | | | | | | | | |
(USD), 8.75%, 01/15/2020 | | | 7,633,000 | | | | 7,098,690 | |
(USD), 7.50%, 03/15/2021 | | | 4,620,000 | | | | 4,181,100 | |
(USD), 7.50%, 03/15/2021 (a) | | | 250 | | | | 226 | |
SCM Insurance Services, Inc. (CAD), 9.25%, 08/22/2019 (b) | | | 18,600,000 | | | | 16,420,744 | |
Seventy Seven Energy, Inc. (USD), 6.50%, 07/15/2022 (a) | | | 1,710,000 | | | | 1,615,950 | |
Sprint Corp. (USD), 7.88%, 09/15/2023 (a) | | | 23,315,000 | | | | 25,296,775 | |
Standard Pacific Corp. (USD), 8.38%, 01/15/2021 | | | 18,035,000 | | | | 21,146,037 | |
State Street Capital Trust IV (USD), 1.23%, 06/01/2077 (b) | | | 5,740,000 | | | | 4,922,050 | |
Steel Dynamics, Inc. | | | | | | | | |
(USD), 5.13%, 10/01/2021 (a) | | | 1,010,000 | | | | 1,045,350 | |
(USD), 5.50%, 10/01/2024 (a) | | | 1,465,000 | | | | 1,552,900 | |
Successor X Ltd. (USD), 11.26%, 11/10/2015 (a)(b)(d) | | | 6,845,000 | | | | 7,181,090 | |
TransDigm, Inc. | | | | | | | | |
(USD), 6.00%, 07/15/2022 | | | 5,240,000 | | | | 5,325,150 | |
(USD), 6.50%, 07/15/2024 | | | 23,910,000 | | | | 24,746,850 | |
United Continental Holdings, Inc. | | | | | | | | |
Series A (USD), 6.00%, 07/15/2026 | | | 14,415,000 | | | | 14,018,587 | |
Series B (USD), 6.00%, 07/15/2028 | | | 10,890,000 | | | | 10,427,175 | |
United Rentals North America, Inc. | | | | | | | | |
(USD), 6.13%, 06/15/2023 | | | 2,190,000 | | | | 2,367,938 | |
(USD), 5.75%, 11/15/2024 | | | 7,290,000 | | | | 7,663,613 | |
Verso Paper Holdings LLC / Verso Paper, Inc. (USD), 11.75%, 01/15/2019 | | | 25,527,000 | | | | 26,165,175 | |
See accompanying notes to financial statements.
Annual Report 2014
40
Statement of Investments (continued)
October 31, 2014
Aberdeen Global High Income Fund
| | | | | | | | |
| | | Shares or
Principal
Amount | | | Value
(US$) | |
Windstream Corp. (USD), 6.38%, 08/01/2023 | | $ | 14,370,000 | | | $ | 14,531,662 | |
WPX Energy, Inc. (USD), 6.00%, 01/15/2022 | | | 7,613,000 | | | | 8,012,683 | |
WR Grace & Co-Conn | | | | | | | | |
(USD), 5.13%, 10/01/2021 (a) | | | 6,330,000 | | | | 6,610,925 | |
(USD), 5.63%, 10/01/2024 (a) | | | 6,330,000 | | | | 6,693,975 | |
Zayo Group LLC / Zayo Capital, Inc. (USD), 10.13%, 07/01/2020 | | | 9,070,000 | | | | 10,101,712 | |
Zebra Technologies Corp. (USD), 7.25%, 10/15/2022 (a) | | | 7,685,000 | | | | 8,107,675 | |
| | | | | | | | 965,592,653 | |
VIETNAM (0.5%) | | | | | | | | |
Vingroup JSC (USD), 11.63%, 05/07/2018 (a) | | | 10,730,000 | | | | 11,883,475 | |
Total Corporate Bonds | | | | | | | 1,638,940,709 | |
GOVERNMENT BONDS (4.0%) | | | | | | | | |
ARGENTINA (0.5%) | | | | | | | | |
Argentina Bonar Bonds (USD), 8.75%, 05/07/2024 | | | 11,325,000 | | | | 10,225,924 | |
BRAZIL (0.9%) | | | | | | | | |
Brazil Notas do Tesouro Nacional, Series F
(BRL), 10.00%, 01/01/2023 | | | 56,735,000 | | | | 20,517,553 | |
INDONESIA (0.7%) | | | | | | | | |
Indonesia Government International Bond | | | | | | | | |
(USD), 5.88%, 01/15/2024 (a) | | | 6,910,000 | | | | 7,877,400 | |
(USD), 6.75%, 01/15/2044 (a) | | | 7,100,000 | | | | 8,724,125 | |
| | | | | | | | 16,601,525 | |
MEXICO (1.2%) | | | | | | | | |
Mexico Fixed Rate Bonds, Series M10 (MXN), 8.00%, 12/17/2015 | | | 368,500,000 | | | | 28,789,999 | |
MOZAMBIQUE (0.4%) | | | | | | | | |
Mozambique EMATUM Finance 2020 BV (USD), 6.31%, 09/11/2020 (a) | | | 10,560,000 | | | | 10,599,600 | |
ZAMBIA (0.4%) | | | | | | | | |
Zambia Government International Bond (USD), 8.50%, 04/14/2024 (a) | | | 7,930,000 | | | | 9,074,893 | |
Total Government Bonds | | | | | | | 95,809,494 | |
GOVERNMENT AGENCIES (0.6%) | | | | | | | | |
INDONESIA (0.6%) | | | | | | | | |
Pertamina Persero PT | | | | | | | | |
(USD), MTN, 4.30%, 05/20/2023 (a) | | | 10,705,000 | | | | 10,464,138 | |
(USD), 6.00%, 05/03/2042 (a) | | | 4,450,000 | | | | 4,461,125 | |
| | | | | | | | 14,925,263 | |
Total Government Agencies | | | | | | | 14,925,263 | |
BANK LOANS (12.2%) | | | | | | | | |
LUXEMBOURG (0.5%) | | | | | | | | |
SkillSoft Corp. (USD), 9.25%, 04/28/2022 (b) | | | 12,360,000 | | | | 11,680,200 | |
REPUBLIC OF IRELAND (0.4%) | | | | | | | | |
Eircom Finco S.A.R.L. (EUR), 4.59%, 09/30/2019 | | | 8,708,696 | | | | 10,414,249 | |
UNITED STATES (11.3%) | | | | | | | | |
Arch Coal, Inc. (USD), 0.00%, 05/16/2018 (b) | | | 16,575,000 | | | | 14,722,147 | |
Asurion LLC (USD), 8.50%, 03/03/2021 (b) | | | 26,625,000 | | | | 27,115,912 | |
Birch Communications, Inc. (USD), 7.75%, 07/17/2020 (b) | | | 14,800,000 | | | | 14,282,000 | |
Colouroz Investment | | | | | | | | |
(USD), 8.25%, 09/06/2022 | | | 7,095,000 | | | | 6,828,938 | |
Commercial Barge Line Co. (USD), 7.50%, 09/23/2019 (b) | | | 24,019,225 | | | | 24,079,273 | |
Del Monte Foods, Inc. (USD), 8.25%, 08/18/2021 (b) | | | 12,970,000 | | | | 11,818,912 | |
Dream Secured BondCo AB (EUR), 10.51%, 08/30/2019 | | | 13,926,846 | | | | 18,136,014 | |
Ethiopian Railways (USD), 2.80%, 07/11/2021 (d) | | | 7,224,575 | | | | 6,754,979 | |
Garda World Security Corp. (CAD), 3.98%, 11/06/2020 (b) | | | 2,621,119 | | | | 2,276,225 | |
Intertrust Group Holding (USD), 8.00%, 04/16/2022 | | | 14,470,000 | | | | 14,230,348 | |
Isola USA Corp. (USD), 9.25%, 11/28/2019 | | | 23,770,710 | | | | 23,830,136 | |
Newpage Corp. (USD), 9.50%, 02/11/2021 (b) | | | 20,715,000 | | | | 20,248,912 | |
Rexam PLC (USD), 4.25%, 05/02/2021 (b) | | | 5,248,248 | | | | 5,208,886 | |
Sun Products Corp. (USD), 5.50%, 03/23/2020 (b) | | | 18,047,314 | | | | 16,242,583 | |
Telepizza SA (EUR), 7.00%, 09/30/2020 | | | 9,320,000 | | | | 11,610,019 | |
Texas Competitive Electric Co. (USD), 4.65%, 10/10/2014 | | | 24,581,375 | | | | 18,036,584 | |
Visant Corp. (USD), 7.00%, 09/23/2021 (b) | | | 12,320,000 | | | | 12,176,263 | |
YRC Worldwide, Inc. (USD), 8.25%, 02/13/2019 (b) | | | 19,925,914 | | | | 19,826,285 | |
| | | | | | | | 267,424,416 | |
Total Bank Loans | | | | | | | 289,518,865 | |
COMMON STOCKS (1.8%) | | | | | | | | |
NORWAY (1.6%) | | | | | | | | |
Deep Ocean (d)(h)(i) | | | 1,427,968 | | | | 37,722,113 | |
UNITED STATES (0.2%) | | | | | | | | |
Cengage Learning Holdings II LP (j) | | | 226,414 | | | | 6,339,592 | |
Total Common Stocks | | | | | | | 44,061,705 | |
PREFERRED STOCKS (0.8%) | | | | | | | | |
UNITED STATES (0.8%) | | | | | | | | |
Ally Financial, Inc., Preferred Shares | | | 11,993 | | | | 12,070,955 | |
GMAC Capital Trust I, Preferred Shares, Series 2 | | | 258,150 | | | | 6,900,350 | |
Merrill Lynch Capital Trust II, Preferred Shares | | | 1,600 | | | | 40,640 | |
| | | | | | | | 19,011,945 | |
Total Preferred Stocks | | | | | | | 19,011,945 | |
See accompanying notes to financial statements.
2014 Annual Report
41
Statement of Investments (continued)
October 31, 2014
Aberdeen Global High Income Fund
| | | | | | | | |
| | | Shares or
Principal
Amount | | | Value
(US$) | |
REPURCHASE AGREEMENT (5.0%) | | | | | | | | |
UNITED STATES (5.0%) | | | | | | | | |
Repurchase Agreement, Fixed Income Clearing Corp., 0.00%, dated 10/31/2014, due 11/03/2014, repurchase price $118,170,083 collateralized by U.S. Treasury Notes, maturing 03/31/2016-11/21/2016; total market value of $120,536,706 | | $ | 118,170,083 | | | $ | 118,170,083 | |
Total Repurchase Agreement | | | | | | | 118,170,083 | |
Total Investments
(Cost $2,211,987,207) (k)—93.1% | | | | 2,220,438,064 | |
| |
Other assets in excess of liabilities—6.9% | | | | 164,663,033 | |
Net Assets—100.0% | | | $ | 2,385,101,097 | |
| (a) | | Denotes a security issued under Regulation S or Rule 144A. |
| (b) | | Variable or Floating Rate Security. Rate disclosed is as of October 31, 2014. |
| (c) | | Perpetual bond. This is a bond that has no maturity date, is redeemable and pays a steady stream of interest indefinitely. |
| (d) | | The Fund’s adviser has deemed this security to be illiquid based upon procedures approved by the Board of Trustees. Illiquid securities held by the Fund represent 6.0% of net assets as of October 31, 2014. |
| (e) | | Flat traded rate security. This bond traded without accrued interest. |
| (f) | | Indicates a stepped coupon bond. This bond was issued with a low coupon that gradually increases over the life of the bond. |
| (g) | | Security is in default. |
| (h) | | Fair Valued Security. Fair Values are determined pursuant to procedures approved by the Fund’s Board of Trustees. See Note 2(a) of the accompanying Notes to Financial Statements. |
| (i) | | Investment in affiliate. |
| (j) | | Non-income producing security. |
| (k) | | See notes to financial statements for tax unrealized appreciation/depreciation of securities. |
| EMTN | | Euro Medium Term Note |
| GBP | | British Pound Sterling |
| GMTN | | Global Medium Term Note |
At October 31, 2014, the Fund’s open forward foreign currency exchange contracts were as follows:
| | | | | | | | | | | | | | | | | | | | | | | | | | |
Purchase Contracts Settlement Date* | | Counterparty | | | | | Amount
Purchased | | | | | | Amount
Sold | | | Fair Value | | | Unrealized
Depreciation | |
| British Pound/United States Dollar | | | | | | | | | | | | | | | | | | | | | | | | | | |
| 11/14/2014 | | Westpac Banking Corp. | | | GBP | | | | 14,846,000 | | | | USD | | | | 24,248,566 | | | $ | 23,747,224 | | | $ | (501,342 | ) |
| | | | | | | | | | | | | | | | | | | | | | | | | | | | |
| Sale Contracts Settlement Date* | | Counterparty | | | | | | Amount
Purchased | | | | | | Amount
Sold | | | Fair Value | | | Unrealized
Appreciation/
(Depreciation) | |
| | | | | | | |
| United States Dollar/Brazilian Real | | | | | | | | | | | | | | | | | | | | | | | | | | | | |
01/20/2015 | | | JPMorgan Chase Bank N.A. | | | | USD | | | | 23,277,106 | | | | BRL | | | | 58,784,000 | | | $ | 23,209,784 | | | $ | 67,322 | |
| | | | | | | |
| United States Dollar/British Pound | | | | | | | | | | | | | | | | | | | | | | | | | | | | |
11/14/2014 | | | Westpac Banking Corp. | | | | USD | | | | 172,365,388 | | | | GBP | | | | 104,061,500 | | | | 166,453,707 | | | | 5,911,681 | |
| | | | | | | |
| United States Dollar/Canadian Dollar | | | | | | | | | | | | | | | | | | | | | | | | | | | | |
12/05/2014 | | | JPMorgan Chase Bank N.A. | | | | USD | | | | 53,792,370 | | | | CAD | | | | 58,702,000 | | | | 52,043,716 | | | | 1,748,654 | |
| | | | | | | |
| United States Dollar/Euro | | | | | | | | | | | | | | | | | | | | | | | | | | | | |
11/12/2014 | | | JPMorgan Chase Bank N.A. | | | | USD | | | | 58,595,981 | | | | EUR | | | | 43,663,500 | | | | 54,719,714 | | | | 3,876,267 | |
01/28/2015 | | | JPMorgan Chase Bank N.A. | | | | USD | | | | 85,085,384 | | | | EUR | | | | 67,114,000 | | | | 84,152,394 | | | | 932,990 | |
01/29/2015 | | | Deutsche Bank AG | | | | USD | | | | 72,809,171 | | | | EUR | | | | 57,236,000 | | | | 71,767,195 | | | | 1,041,976 | |
| | | | | | | |
| United States Dollar/Norwegian Krone | | | | | | | | | | | | | | | | | | | | | | | | | | | | |
| 11/13/2014 | | | JPMorgan Chase Bank N.A. | | | | USD | | | | 39,642,566 | | | | NOK | | | | 247,770,000 | | | | 36,722,765 | | | | 2,919,801 | |
| | | | | | | | | | | | | | | | | | | | | | | $ | 489,069,275 | | | $ | 16,498,691 | |
| * | | Certain contracts with different trade dates and like characteristics have been shown net. |
See accompanying notes to financial statements.
Annual Report 2014
42
Statement of Investments (concluded)
October 31, 2014
Aberdeen Global High Income Fund
At October 31, 2014, the Fund held the following over-the-counter credit default swaps:
Sell Protection:
| | | | | | | | | | | | | | | | | | |
| Counterparty | | Expiration
Date | | | Notional
Amount | | | Swap Details | | Unrealized
Appreciation/
(Depreciation) | | | Implied
Credit
Spread* | |
| Goldman Sachs International | | | 12/20/2017 | | | | 8,440,000 | | | Pay: Chesapeake Energy(T)
Receive: Fixed rate equal to 5.00% | | $ | 984,064 | | | | 1.86% | |
| Goldman Sachs International | | | 12/20/2017 | | | | 9,935,000 | | | Pay: Chesapeake Energy(T)
Receive: Fixed rate equal to 5.00% | | | 1,828,986 | | | | 1.86% | |
| Goldman Sachs International | | | 12/20/2017 | | | | 9,940,000 | | | Pay: Chesapeake Energy(T) Receive: Fixed rate equal to 5.00% | | | 1,829,906 | | | | 1.86% | |
| Deutsche Bank | | | 03/20/2018 | | | | 3,460,000 | | | Pay: Rite Aid(T)
Receive: Fixed rate equal to 5.00% | | | 471,607 | | | | 1.74% | |
| Goldman Sachs International | | | 03/20/2018 | | | | 5,000,000 | | | Pay: Rite Aid(T)
Receive: Fixed rate equal to 5.00% | | | 681,513 | | | | 1.74% | |
| Goldman Sachs International | | | 03/20/2018 | | | | 5,000,000 | | | Pay: Rite Aid(T)
Receive: Fixed rate equal to 5.00% | | | 694,013 | | | | 1.74% | |
| Morgan Stanley | | | 06/20/2018 | | | | 450,000 | | | Pay: New Albertsons(T)
Receive: Fixed rate equal to 5.00% | | | 63,243 | | | | 2.94% | |
| Morgan Stanley | | | 06/20/2018 | | | | 4,515,000 | | | Pay: New Albertsons(T)
Receive: Fixed rate equal to 5.00% | | | 645,830 | | | | 2.94% | |
| | | | | | | | | | | | | $ | 7,199,162 | | | | | |
| * | | Implied credit spreads, represented in absolute terms, are utilized in determining the market value of credit default swaps agreements on corporate issues or sovereign issues and serve as an indicator of the current status of the payment/performance risk and represent the likelihood or risk of default for the credit derivative. The implied credit spread of particular referenced entity reflects the cost of buying/selling protection and may include upfront payments required to be made prior to entering into the agreement. For credit default swap with asset-backed securities or credit indices as the underlying assets, the quoted market prices and resulting market values serve as an indicator of the current status of the payment/performance risk. Wider credit spreads and increasing market values, in absolute terms when compared to the notional amount of the swap, represent a deterioration of the reference entity’s credit soundness and a greater likelihood or risk of default or other credit event occurring as defined under the terms of the agreement. |
At October 31, 2014, the Fund held the following centrally cleared credit default swaps:
Sell Protection:
| | | | | | | | | | | | | | |
| Counterparty | | Expiration
Date | | | Notional
Amount | | | Swap Details | | Unrealized
Appreciation/
(Depreciation) | |
| JPMorgan Chase Bank N.A. | | | 6/20/2019 | | | | USD 19,000,000 | | | Pay: Markit CDX North America High Yield (S22)
Receive: Fixed rate equal to 5.00% | | $ | 509,223 | |
See accompanying notes to financial statements.
2014 Annual Report
43
Statements of Assets and Liabilities
October 31, 2014
| | | | | | | | | | | | | | | | | | | | |
| | | Aberdeen
Global Select
Opportunities
Fund | | | Aberdeen
Select
International
Equity Fund | | | Aberdeen
Select
International
Equity Fund II | | | Aberdeen Total Return Bond Fund | | | Aberdeen Global High
Income Fund | |
Assets: | | | | | | | | | | | | | | | | | | | | |
Investments in securities, at fair value | | $ | 6,990,260 | | | $ | 472,365,791 | | | $ | 223,491,683 | | | $ | 1,472,090,459 | | | $ | 2,064,545,868 | |
Affiliated securities, at fair value (Note 7) | | | – | | | | 1,780,958 | | | | – | | | | – | | | | 37,722,113 | |
Repurchase agreements | | | 103,593 | | | | 2,201,050 | | | | 3,938,150 | | | | 43,376,270 | | | | 118,170,083 | |
| | | | | | | | | | | | | | | | | | | | |
Total investments | | | 7,093,853 | | | | 476,347,799 | | | | 227,429,833 | | | | 1,515,466,729 | | | | 2,220,438,064 | |
| | | | | | | | | | | | | | | | | | | | |
Foreign currency, at fair value | | | – | | | | 398,621 | | | | 5,637 | | | | 767,359 | | | | 89,412,293 | |
Cash | | | – | | | | – | | | | – | | | | – | | | | 496,120 | |
Cash at broker | | | – | | | | – | | | | – | | | | 419,081 | | | | – | |
Cash on deposit for broker | | | – | | | | – | | | | – | | | | – | | | | 631,163 | |
Receivable for investments sold | | | – | | | | 2,475,193 | | | | – | | | | 44,453,812 | | | | 60,363,295 | |
Interest and dividends receivable | | | 20,727 | | | | 2,418,516 | | | | 2,422,703 | | | | 9,266,130 | | | | 35,530,108 | |
Unrealized appreciation on forward foreign currency exchange contracts | | | – | | | | – | | | | – | | | | 3,905,106 | | | | 16,498,691 | |
Variation margin receivable for centrally cleared credit default swaps | | | – | | | | – | | | | – | | | | – | | | | 84,457 | |
Receivable for capital shares issued | | | – | | | | 116,084 | | | | 11,933 | | | | 2,278,854 | | | | 14,642,041 | |
Receivable from Advisor (Note 3) | | | 3,122 | | | | – | | | | – | | | | – | | | | – | |
Open credit default swap contracts, at value | | | – | | | | – | | | | – | | | | – | | | | 6,596,200 | |
Prepaid expenses | | | 152 | | | | 11,296 | | | | 5,493 | | | | 27,908 | | | | 46,868 | |
| | | | | | | | | | | | | | | | | | | | |
Total assets | | | 7,117,854 | | | | 481,767,509 | | | | 229,875,599 | | | | 1,576,584,979 | | | | 2,444,739,300 | |
| | | | | | | | | | | | | | | | | | | | |
Liabilities: | | | | | | | | | | | | | | | | | | | | |
Payable for investments purchased | | | 35,354 | | | | 723,301 | | | | 346,984 | | | | 60,380,612 | | | | 40,476,561 | |
Payable for capital shares redeemed | | | – | | | | 513,519 | | | | 190,670 | | | | 1,283,969 | | | | 6,278,185 | |
Collateral due to broker | | | – | | | | – | | | | – | | | | – | | | | 6,071,475 | |
Due to custodian | | | – | | | | – | | | | – | | | | 1,116 | | | | – | |
Unrealized depreciation on forward foreign currency exchange contracts | | | – | | | | – | | | | – | | | | 759,607 | | | | 501,342 | |
Unfunded loan commitments (Note 2) | | | – | | | | – | | | | – | | | | – | | | | 4,527,105 | |
Variation margin payable for futures contracts | | | – | | | | – | | | | – | | | | 66,844 | | | | – | |
Distributions payable | | | – | | | | – | | | | – | | | | – | | | | 411 | |
Accrued expenses and other payables: | | | | | | | | | | | | | | | | | | | | |
Investment advisory fees | | | – | | | | 362,372 | | | | 173,137 | | | | 447,009 | | | | 1,297,153 | |
Distribution fees | | | 1,126 | | | | 92,766 | | | | 27,535 | | | | 26,776 | | | | 157,389 | |
Transfer agent fees | | | 1,846 | | | | 18,657 | | | | 27,125 | | | | 15,547 | | | | 99,065 | |
Legal fees | | | 166 | | | | 7,912 | | | | 1,620 | | | | 33,266 | | | | 54,241 | |
Custodian fees | | | 389 | | | | 1,196 | | | | 402 | | | | 605 | | | | 12,671 | |
Other | | | 18,806 | | | | 123,329 | | | | 56,331 | | | | 122,043 | | | | 162,605 | |
| | | | | | | | | | | | | | | | | | | | |
Total liabilities | | | 57,687 | | | | 1,843,052 | | | | 823,804 | | | | 63,137,394 | | | | 59,638,203 | |
| | | | | | | | | | | | | | | | | | | | |
Net Assets | | $ | 7,060,167 | | | $ | 479,924,457 | | | $ | 229,051,795 | | | $ | 1,513,447,585 | | | $ | 2,385,101,097 | |
| | | | | | | | | | | | | | | | | | | | |
Cost: | | | | | | | | | | | | | | | | | | | | |
Investments in securities, at cost | | $ | 6,784,638 | | | $ | 517,565,344 | | | $ | 225,134,807 | | | $ | 1,457,792,969 | | | $ | 2,063,733,999 | |
Affiliated securities, at cost (Note 7) | | | – | | | | 27,205,983 | | | | – | | | | – | | | | 30,083,125 | |
Repurchase agreements | | | 103,593 | | | | 2,201,050 | | | | 3,938,150 | | | | 43,376,270 | | | | 118,170,083 | |
Up-front payments made on open credit default swaps | | | – | | | | – | | | | – | | | | – | | | | (1,112,186 | ) |
Foreign currency | | | – | | | | 1,627,833 | | | | 5,632 | | | | 773,139 | | | | 90,936,436 | |
Net Assets Consist of: | | | | | | | | | | | | | | | | | | | | |
Par value | | $ | 172 | | | $ | 17,069 | | | $ | 18,710 | | | $ | 112,570 | | | $ | 237,897 | |
Paid in capital in excess of par value | | | 34,416,467 | | | | 2,802,070,823 | | | | 2,935,141,209 | | | | 1,482,449,991 | | | | 2,316,876,200 | |
Accumulated net investment income/(loss) | | | 250,700 | | | | 19,497,739 | | | | 9,328,109 | | | | (1,281,442 | ) | | | (1,187,763 | ) |
Accumulated net realized gain/(loss) from investments and foreign currency transactions | | | (27,812,212 | ) | | | (2,269,744,144 | ) | | | (2,713,757,978 | ) | | | 14,854,648 | | | | 40,715,080 | |
Net unrealized appreciation/(depreciation) on investments and translation of assets and liabilities denominated in foreign currencies | | | 205,040 | | | | (71,917,030 | ) | | | (1,678,255 | ) | | | 17,311,818 | | | | 28,459,683 | |
| | | | | | | | | | | | | | | | | | | | |
Net Assets | | $ | 7,060,167 | | | $ | 479,924,457 | | | $ | 229,051,795 | | | $ | 1,513,447,585 | | | $ | 2,385,101,097 | |
| | | | | | | | | | | | | | | | | | | | |
Amounts listed as “–” are $0 or round to $0.
See accompanying notes to financial statements.
Annual Report 2014
44
Statements of Assets and Liabilities (concluded)
October 31, 2014
| | | | | | | | | | | | | | | | | | | | |
| | | Aberdeen
Global Select
Opportunities
Fund | | | Aberdeen
Select
International
Equity Fund | | | Aberdeen
Select
International
Equity Fund II | | | Aberdeen Total Return Bond Fund | | | Aberdeen Global High
Income Fund | |
Net Assets | | | | | | | | | | | | | | | | | | | | |
Class A Shares | | $ | 5,608,616 | | | $ | 397,910,602 | | | $ | 120,386,938 | | | $ | 152,195,929 | | | $ | 823,807,881 | |
Institutional Class Shares (a) | | | 1,451,551 | | | | 82,013,855 | | | | 108,664,857 | | | | 1,361,251,656 | | | | 1,561,293,216 | |
| | | | | | | | | | | | | | | | | | | | |
Total | | $ | 7,060,167 | | | $ | 479,924,457 | | | $ | 229,051,795 | | | $ | 1,513,447,585 | | | $ | 2,385,101,097 | |
| | | | | | | | | | | | | | | | | | | | |
Shares Outstanding | | | | | | | | | | | | | | | | | | | | |
Class A Shares | | | 136,567 | | | | 14,211,017 | | | | 9,840,991 | | | | 11,188,460 | | | | 79,340,222 | |
Institutional Class Shares (a) | | | 35,037 | | | | 2,858,249 | | | | 8,869,429 | | | | 101,381,269 | | | | 158,556,975 | |
| | | | | | | | | | | | | | | | | | | | |
Total | | | 171,604 | | | | 17,069,266 | | | | 18,710,420 | | | | 112,569,729 | | | | 237,897,197 | |
| | | | | | | | | | | | | | | | | | | | |
Net asset value and redemption price per share | | | | | | | | | | | | | | | | | | | | |
Class A Shares | | $ | 41.07 | | | $ | 28.00 | | | $ | 12.23 | | | $ | 13.60 | | | $ | 10.38 | |
Institutional Class Shares (a) | | $ | 41.43 | | | $ | 28.69 | | | $ | 12.25 | | | $ | 13.43 | | | $ | 9.85 | |
| (a) | | Formerly Class I shares. |
See accompanying notes to financial statements.
2014 Annual Report
45
Statements of Operations
For the Year Ended October 31, 2014
| | | | | | | | | | | | | | | | | | | | |
| | | Aberdeen
Global Select
Opportunities
Fund | | | Aberdeen
Select
International
Equity Fund | | | Aberdeen
Select
International
Equity Fund II | | | Aberdeen
Total Return
Bond Fund | | | Aberdeen
Global High
Income Fund | |
INVESTMENT INCOME: | | | | | | | | | | | | | | | | | | | | |
Dividend income | | $ | 369,110 | | | $ | 29,006,385 | | | $ | 13,821,247 | | | $ | – | | | $ | 2,019,590 | |
Interest income | | | – | | | | 1,420,142 | | | | 292 | | | | 48,978,559 | | | | 178,652,463 | |
Foreign tax withholding | | | (15,859 | ) | | | (1,563,869 | ) | | | (754,176 | ) | | | – | | | | – | |
Other income | | | – | | | | 1,028 | | | | – | | | | 809,955 | | | | 126,372 | |
| | | | | | | | | | | | | | | | | | | | |
| | | 353,251 | | | | 28,863,686 | | | | 13,067,363 | | | | 49,788,514 | | | | 180,798,425 | |
| | | | | | | | | | | | | | | | | | | | |
EXPENSES: | | | | | | | | | | | | | | | | | | | | |
Investment advisory fees | | | 70,428 | | | | 5,103,609 | | | | 2,471,959 | | | | 5,395,876 | | | | 17,399,989 | |
Distribution fees Class A | | | 12,533 | | | | 1,128,086 | | | | 359,315 | | | | 322,224 | | | | 2,542,823 | |
Custodian fees | | | 32,368 | | | | 137,298 | | | | 77,994 | | | | 278,621 | | | | 549,744 | |
Trustee fees | | | 1,153 | | | | 88,406 | | | | 39,760 | | | | 235,398 | | | | 415,181 | |
Transfer agent fees | | | 7,244 | | | | 82,157 | | | | 80,878 | | | | 71,432 | | | | 465,279 | |
Legal fees | | | 801 | | | | 99,931 | | | | 69,971 | | | | 155,451 | | | | 281,187 | |
Printing fees | | | 4,921 | | | | 28,308 | | | | 36,662 | | | | 144,121 | | | | 188,305 | |
Registration and filing fees | | | 35,781 | | | | 54,125 | | | | 49,369 | | | | 56,394 | | | | 169,758 | |
Audit fees | | | 44,280 | | | | 64,292 | | | | 55,819 | | | | 49,050 | | | | 54,748 | |
Other | | | 8,482 | | | | 152,001 | | | | 115,004 | | | | 226,459 | | | | 646,813 | |
| | | | | | | | | | | | | | | | | | | | |
| | | 217,991 | | | | 6,938,213 | | | | 3,356,731 | | | | 6,935,026 | | | | 22,713,827 | |
Interest expense (Note 12) | | | 50 | | | | 4,923 | | | | 3,796 | | | | – | | | | – | |
| | | | | | | | | | | | | | | | | | | | |
Total operating expenses before reimbursed/waived expenses | | | 218,041 | | | | 6,943,136 | | | | 3,360,527 | | | | 6,935,026 | | | | 22,713,827 | |
Expenses reimbursed (Note 3) | | | (115,077 | ) | | | – | | | | – | | | | (22,047 | ) | | | (75,716 | ) |
Expenses waived by investment adviser | | | (391 | ) | | | (28,353 | ) | | | (13,733 | ) | | | (77,084 | ) | | | (133,846 | ) |
| | | | | | | | | | | | | | | | | | | | |
Total operating expenses | | | 102,573 | | | | 6,914,783 | | | | 3,346,794 | | | | 6,835,895 | | | | 22,504,265 | |
| | | | | | | | | | | | | | | | | | | | |
Net Investment Income | | | 250,678 | | | | 21,948,903 | | | | 9,720,569 | | | | 42,952,619 | | | | 158,294,160 | |
| | | | | | | | | | | | | | | | | | | | |
Realized gain/(loss) on investment transactions | | | 127,238 | | | | (10,320,840 | ) | | | 6,508,021 | | | | (3,446,224 | ) | | | 33,072,163 | |
Realized gain on swap contracts | | | – | | | | – | | | | – | | | | – | | | | 8,780,700 | |
Realized gain on futures contracts | | | – | | | | – | | | | – | | | | 87,755 | | | | – | |
Realized gain/(loss) on foreign currency transactions | | | (848 | ) | | | (1,284,359 | ) | | | 32,700 | | | | 5,536,053 | | | | 3,373,835 | |
| | | | | | | | | | | | | | | | | | | | |
Net realized gain/(loss) from investments and foreign currency transactions | | | 126,390 | | | | (11,605,199 | ) | | | 6,540,721 | | | | 2,177,584 | | | | 45,226,698 | |
| | | | | | | | | | | | | | | | | | | | |
Net change in unrealized appreciation/depreciation on investment transactions | | | (51,505 | ) | | | (8,447,320 | ) | | | (14,462,312 | ) | | | 16,499,828 | | | | (87,871,534 | ) |
Net change in unrealized appreciation/depreciation on swap contracts | | | – | | | | – | | | | – | | | | – | | | | (3,511,710 | ) |
Net change in unrealized appreciation/depreciation on futures contracts | | | – | | | | – | | | | – | | | | (66,844 | ) | | | – | |
Net change in unrealized appreciation/depreciation on translation of assets and liabilities denominated in foreign currencies | | | (594 | ) | | | (410,588 | ) | | | (64,681 | ) | | | 1,291,009 | | | | 17,925,767 | |
| | | | | | | | | | | | | | | | | | | | |
Net change in unrealized appreciation/depreciation from investments and translation of assets and liabilities denominated in foreign currencies | | | (52,099 | ) | | | (8,857,908 | ) | | | (14,526,993 | ) | | | 17,723,993 | | | | (73,457,477 | ) |
| | | | | | | | | | | | | | | | | | | | |
Net realized/unrealized gain/(loss) from investments and foreign currency transactions | | | 74,291 | | | | (20,463,107 | ) | | | (7,986,272 | ) | | | 19,901,577 | | | | (28,230,779 | ) |
| | | | | | | | | | | | | | | | | | | | |
CHANGE IN NET ASSETS RESULTING FROM OPERATIONS | | $ | 324,969 | | | $ | 1,485,796 | | | $ | 1,734,297 | | | $ | 62,854,196 | | | $ | 130,063,381 | |
| | | | | | | | | | | | | | | | | | | | |
Amounts listed as “–” are $0 or round to $0.
See accompanying notes to financial statements.
Annual Report 2014
46
Statements of Changes in Net Assets
| | | | | | | | | | | | | | | | | | | | | | | | |
| | | Aberdeen
Global Select Opportunities Fund | | | Aberdeen
Select International
Equity Fund | | | Aberdeen
Select International
Equity Fund II | |
| | | Year Ended October 31,
2014 | | | Year Ended October 31,
2013 | | | Year Ended October 31,
2014 | | | Year Ended October 31,
2013 | | | Year Ended October 31,
2014 | | | Year Ended October 31,
2013 | |
| | | | | | |
FROM INVESTMENT ACTIVITIES: | | | | | | | | | | | | | | | | | | | | | | | | |
Operations: | | | | | | | | | | | | | | | | | | | | | | | | |
Net investment income | | $ | 250,678 | | | $ | 104,524 | | | $ | 21,948,903 | | | $ | 12,704,084 | | | $ | 9,720,569 | | | $ | 6,359,673 | |
Net realized gain from investments and foreign currency transactions | | | 126,390 | | | | 2,113,010 | | | | (11,605,199 | ) | | | (5,332,048 | ) | | | 6,540,721 | | | | 113,329,080 | |
Net change in unrealized appreciation/depreciation on investments and translation of assets and liabilities denominated in foreign currencies | | | (52,099 | ) | | | (450,542 | ) | | | (8,857,908 | ) | | | 185,149,413 | | | | (14,526,993 | ) | | | 10,445,083 | |
| | | | | | | | | | | | | | | | | | | | | | | | |
Change in net assets resulting from operations | | | 324,969 | | | | 1,766,992 | | | | 1,485,796 | | | | 192,521,449 | | | | 1,734,297 | | | | 130,133,836 | |
| | | | | | | | | | | | | | | | | | | | | | | | |
Distributions to Shareholders From: | | | | | | | | | | | | | | | | | | | | | | | | |
Net investment income: | | | | | | | | | | | | | | | | | | | | | | | | |
Class A | | | (81,732 | ) | | | (66,027 | ) | | | (11,058,718 | ) | | | (4,106,087 | ) | | | (69,226 | ) | | | (5,866,610 | ) |
Institutional Class(a) | | | (25,288 | ) | | | (121,751 | ) | | | (2,430,830 | ) | | | (3,400,872 | ) | | | (331,201 | ) | | | (19,825,207 | ) |
Tax return of capital: | | | | | | | | | | | | | | | | | | | | | | | | |
Class A | | | – | | | | – | | | | – | | | | – | | | | – | | | | (19,892 | ) |
Institutional Class(a) | | | – | | | | – | | | | – | | | | – | | | | – | | | | (67,223 | ) |
| | | | | | | | | | | | | | | | | | | | | | | | |
Change in net assets from shareholder distributions | | | (107,020 | ) | | | (187,778 | ) | | | (13,489,548 | ) | | | (7,506,959 | ) | | | (400,427 | ) | | | (25,778,932 | ) |
| | | | | | | | | | | | | | | | | | | | | | | | |
Change in net assets from capital transactions | | | (1,436,007 | ) | | | (13,423,051 | ) | | | (173,886,783 | ) | | | (1,535,775,674 | ) | | | (98,186,443 | ) | | | (862,862,469 | ) |
| | | | | | | | | | | | | | | | | | | | | | | | |
Change in net assets | | | (1,218,058 | ) | | | (11,843,837 | ) | | | (185,890,535 | ) | | | (1,350,761,184 | ) | | | (96,852,573 | ) | | | (758,507,565 | ) |
| | | | | | | | | | | | | | | | | | | | | | | | |
Net Assets: | | | | | | | | | | | | | | | | | | | | | | | | |
Beginning of year | | | 8,278,225 | | | | 20,122,062 | | | | 665,814,992 | | | | 2,016,576,176 | | | | 325,904,368 | | | | 1,084,411,933 | |
| | | | | | | | | | | | | | | | | | | | | | | | |
End of year | | $ | 7,060,167 | | | $ | 8,278,225 | | | $ | 479,924,457 | | | $ | 665,814,992 | | | $ | 229,051,795 | | | $ | 325,904,368 | |
| | | | | | | | | | | | | | | | | | | | | | | | |
Accumulated net investment income/(loss) at end of year | | $ | 250,700 | | | $ | 107,020 | | | $ | 19,497,739 | | | $ | 12,327,507 | | | $ | 9,328,109 | | | $ | (25,913 | ) |
| | | | | | | | | | | | | | | | | | | | | | | | |
CAPITAL TRANSACTIONS: | | | | | | | | | | | | | | | | | | | | | | | | |
Class A Shares | | | | | | | | | | | | | | | | | | | | | | | | |
Proceeds from shares issued | | $ | 260,286 | | | $ | 301,623 | | | $ | 8,706,701 | | | $ | 23,630,146 | | | $ | 9,367,139 | | | $ | 19,819,098 | |
Dividends reinvested | | | 68,591 | | | | 56,726 | | | | 10,795,351 | | | | 3,990,997 | | | | 66,355 | | | | 5,697,322 | |
Cost of shares redeemed | | | (1,436,558 | ) | | | (3,407,856 | ) | | | (166,295,966 | ) | | | (483,590,343 | ) | | | (57,833,700 | ) | | | (172,267,934 | ) |
| | | | | | | | | | | | | | | | | | | | | | | | |
Total Class A | | | (1,107,681 | ) | | | (3,049,507 | ) | | | (146,793,914 | ) | | | (455,969,200 | ) | | | (48,400,206 | ) | | | (146,751,514 | ) |
| | | | | | | | | | | | | | | | | | | | | | | | |
Institutional Class Shares(a) | | | | | | | | | | | | | | | | | | | | | | | | |
Proceeds from shares issued | | | 102,557 | | | | 795,739 | | | | 4,143,592 | | | | 31,099,736 | | | | 7,838,242 | | | | 44,087,986 | |
Dividends reinvested | | | 9,372 | | | | 106,344 | | | | 2,318,673 | | | | 3,218,155 | | | | 283,163 | | | | 15,429,334 | |
Cost of shares redeemed | | | (440,255 | ) | | | (11,275,627 | ) | | | (33,555,134 | ) | | | (1,114,124,365 | ) | | | (57,907,642 | ) | | | (775,628,275 | ) |
| | | | | | | | | | | | | | | | | | | | | | | | |
Total Institutional Class | | | (328,326 | ) | | | (10,373,544 | ) | | | (27,092,869 | ) | | | (1,079,806,474 | ) | | | (49,786,237 | ) | | | (716,110,955 | ) |
| | | | | | | | | | | | | | | | | | | | | | | | |
Change in net assets from capital transactions: | | $ | (1,436,007 | ) | | $ | (13,423,051 | ) | | $ | (173,886,783 | ) | | $ | (1,535,775,674 | ) | | $ | (98,186,443 | ) | | $ | (862,862,469 | ) |
| | | | | | | | | | | | | | | | | | | | | | | | |
| (a) | | Formerly Class I shares. |
Amounts listed as “–” are $0 or round to $0.
See accompanying notes to financial statements.
2014 Annual Report
47
Statements of Changes in Net Assets (continued)
| | | | | | | | | | | | | | | | | | | | | | | | |
| | | Aberdeen
Global Select
Opportunities Fund | | | Aberdeen
Select International
Equity Fund | | | Aberdeen
Select International
Equity Fund II | |
| | | Year Ended October 31,
2014 | | | Year Ended October 31,
2013 | | | Year Ended October 31,
2014 | | | Year Ended October 31,
2013 | | | Year Ended October 31,
2014 | | | Year Ended October 31,
2013 | |
SHARE TRANSACTIONS: | | | | | | | | | | | | | | | | | | | | | | | | |
Class A Shares | | | | | | | | | | | | | | | | | | | | | | | | |
Issued | | | 6,565 | | | | 8,287 | | | | 308,600 | | | | 897,457 | | | | 759,666 | | | | 1,781,931 | |
Reinvested | | | 1,772 | | | | 1,608 | | | | 397,912 | | | | 158,310 | | | | 5,628 | | | | 526,555 | |
Redeemed | | | (35,155 | ) | | | (94,032 | ) | | | (5,876,767 | ) | | | (18,499,520 | ) | | | (4,714,982 | ) | | | (15,339,291 | ) |
| | | | | | | | | | | | | | | | | | | | | | | | |
Total Class A Shares | | | (26,818 | ) | | | (84,137 | ) | | | (5,170,255 | ) | | | (17,443,753 | ) | | | (3,949,688 | ) | | | (13,030,805 | ) |
| | | | | | | | | | | | | | | | | | | | | | | | |
Institutional Class Shares(a) | | | | | | | | | | | | | | | | | | | | | | | | |
Issued | | | 2,544 | | | | 21,588 | | | | 141,870 | | | | 1,169,982 | | | | 624,839 | | | | 3,954,574 | |
Reinvested | | | 240 | | | | 2,992 | | | | 83,556 | | | | 124,880 | | | | 24,017 | | | | 1,427,320 | |
Redeemed | | | (10,832 | ) | | | (303,630 | ) | | | (1,147,728 | ) | | | (44,111,272 | ) | | | (4,722,115 | ) | | | (69,588,993 | ) |
| | | | | | | | | | | | | | | | | | | | | | | | |
Total Institutional Class Shares | | | (8,048 | ) | | | (279,050 | ) | | | (922,302 | ) | | | (42,816,410 | ) | | | (4,073,259 | ) | | | (64,207,099 | ) |
| | | | | | | | | | | | | | | | | | | | | | | | |
Total change in shares: | | | (34,866 | ) | | | (363,187 | ) | | | (6,092,557 | ) | | | (60,260,163 | ) | | | (8,022,947 | ) | | | (77,237,904 | ) |
| | | | �� | | | | | | | | | | | | | | | | | | | | |
| (a) | | Formerly Class I shares. |
See accompanying notes to financial statements.
Annual Report 2014
48
Statements of Changes in Net Assets (continued)
| | | | | | | | | | | | | | | | |
| | | Aberdeen Total Return Bond Fund | | | Aberdeen Global High Income Fund | |
| | | Year Ended
October 31, 2014 | | | Year Ended
October 31, 2013 | | | Year Ended
October 31, 2014 | | | Year Ended
October 31, 2013 | |
| | | | |
FROM INVESTMENT ACTIVITIES: | | | | | | | | | | | | | | | | |
Operations: | | | | | | | | | | | | | | | | |
Net investment income | | $ | 42,952,619 | | | $ | 47,923,641 | | | $ | 158,294,160 | | | $ | 189,157,865 | |
Net realized gain from investments and foreign currency transactions | | | 2,177,584 | | | | (1,523,542 | ) | | | 45,226,698 | | | | 45,790,862 | |
Net change in unrealized appreciation/depreciation on investments and translation of assets and liabilities denominated in foreign currencies | | | 17,723,993 | | | | (77,068,769 | ) | | | (73,457,477 | ) | | | 41,270,309 | |
| | | | | | | | | | | | | | | | |
Change in net assets resulting from operations | | | 62,854,196 | | | | (30,668,670 | ) | | | 130,063,381 | | | | 276,219,036 | |
| | | | | | | | | | | | | | | | |
Distributions to Shareholders From: | | | | | | | | | | | | | | | | |
Net investment income: | | | | | | | | | | | | | | | | |
Class A | | | (2,317,155 | ) | | | (4,299,327 | ) | | | (58,784,001 | ) | | | (65,954,427 | ) |
Institutional Class(a) | | | (26,727,765 | ) | | | (44,687,602 | ) | | | (104,537,053 | ) | | | (125,993,854 | ) |
Net realized gains: | | | | | | | | | | | | | | | | |
Class A | | | – | | | | (5,210,543 | ) | | | (10,366,807 | ) | | | – | |
Institutional Class(a) | | | – | | | | (38,408,459 | ) | | | (16,935,520 | ) | | | – | |
Tax return of capital: | | | | | | | | | | | | | | | | |
Class A | | | – | | | | (297,269 | ) | | | – | | | | – | |
Institutional Class(a) | | | – | | | | (3,004,325 | ) | | | – | | | | – | |
| | | | | | | | | | | | | | | | |
Change in net assets from shareholder distributions | | | (29,044,920 | ) | | | (95,907,525 | ) | | | (190,623,381 | ) | | | (191,948,281 | ) |
| | | | | | | | | | | | | | | | |
Change in net assets from capital transactions | | | (123,507,424 | ) | | | (366,632,551 | ) | | | (107,132,402 | ) | | | (728,529,427 | ) |
| | | | | | | | | | | | | | | | |
Change in net assets | | | (89,698,148 | ) | | | (493,208,746 | ) | | | (167,692,402 | ) | | | (644,258,672 | ) |
| | | | | | | | | | | | | | | | |
Net Assets: | | | | | | | | | | | | | | | | |
Beginning of year | | | 1,603,145,733 | | | | 2,096,354,479 | | | | 2,552,793,499 | | | | 3,197,052,171 | |
| | | | | | | | | | | | | | | | |
End of year | | $ | 1,513,447,585 | | | $ | 1,603,145,733 | | | $ | 2,385,101,097 | | | $ | 2,552,793,499 | |
| | | | | | | | | | | | | | | | |
Accumulated net investment income/(loss) at end of year | | $ | (1,281,442 | ) | | $ | (194,575 | ) | | $ | (1,187,763 | ) | | $ | (1,223,044 | ) |
| | | | | | | | | | | | | | | | |
CAPITAL TRANSACTIONS: | | | | | | | | | | | | | | | | |
Class A Shares | | | | | | | | | | | | | | | | |
Proceeds from shares issued | | $ | 66,730,738 | | | $ | 52,159,444 | | | $ | 491,906,310 | | | $ | 527,872,170 | |
Dividends reinvested | | | 2,258,635 | | | | 9,308,255 | | | | 65,307,706 | | | | 61,441,634 | |
Cost of shares redeemed | | | (72,960,043 | ) | | | (141,400,907 | ) | | | (716,052,886 | ) | | | (688,395,319 | ) |
| | | | | | | | | | | | | | | | |
Total Class A | | | (3,970,670 | ) | | | (79,933,208 | ) | | | (158,838,870 | ) | | | (99,081,515 | ) |
| | | | | | | | | | | | | | | | |
Institutional Class Shares(a) | | | | | | | | | | | | | | | | |
Proceeds from shares issued | | | 337,708,864 | | | | 631,907,782 | | | | 857,985,100 | | | | 601,335,385 | |
Dividends reinvested | | | 24,841,421 | | | | 76,876,705 | | | | 75,297,454 | | | | 73,429,672 | |
Cost of shares redeemed | | | (482,087,039 | ) | | | (995,483,830 | ) | | | (881,576,086 | ) | | | (1,304,212,969 | ) |
| | | | | | | | | | | | | | | | |
Total Institutional Class | | | (119,536,754 | ) | | | (286,699,343 | ) | | | 51,706,468 | | | | (629,447,912 | ) |
| | | | | | | | | | | | | | | | |
Change in net assets from capital transactions: | | $ | (123,507,424 | ) | | $ | (366,632,551 | ) | | $ | (107,132,402 | ) | | $ | (728,529,427 | ) |
| | | | | | | | | | | | | | | | |
| (a) | | Formerly Class I shares. |
Amounts listed as “–” are $0 or round to $0.
See accompanying notes to financial statements.
2014 Annual Report
49
Statements of Changes in Net Assets (concluded)
| | | | | | | | | | | | | | | | |
| | | Aberdeen Total Return Bond Fund | | | Aberdeen Global High Income Fund | |
| | | Year Ended
October 31, 2014 | | | Year Ended
October 31, 2013 | | | Year Ended
October 31, 2014 | | | Year Ended
October 31, 2013 | |
SHARE TRANSACTIONS: | | | | | | | | | | | | | | | | |
Class A Shares | | | | | | | | | | | | | | | | |
Issued | | | 4,920,576 | | | | 3,797,927 | | | | 46,021,750 | | | | 50,013,584 | |
Reinvested | | | 168,402 | | | | 676,714 | | | | 6,129,870 | | | | 5,837,364 | |
Redeemed | | | (5,434,499 | ) | | | (10,383,334 | ) | | | (66,959,027 | ) | | | (65,272,510 | ) |
| | | | | | | | | | | | | | | | |
Total Class A Shares | | | (345,521 | ) | | | (5,908,693 | ) | | | (14,807,407 | ) | | | (9,421,562 | ) |
| | | | | | | | | | | | | | | | |
Institutional Class Shares(a) | | | | | | | | | | | | | | | | |
Issued | | | 25,459,872 | | | | 46,775,581 | | | | 84,457,459 | | | | 59,865,847 | |
Reinvested | | | 1,875,489 | | | | 5,669,319 | | | | 7,443,445 | | | | 7,331,410 | |
Redeemed | | | (36,390,145 | ) | | | (73,808,272 | ) | | | (87,153,414 | ) | | | (129,908,352 | ) |
| | | | | | | | | | | | | | | | |
Total Institutional Class Shares | | | (9,054,784 | ) | | | (21,363,372 | ) | | | 4,747,490 | | | | (62,711,095 | ) |
| | | | | | | | | | | | | | | | |
Total change in shares: | | | (9,400,305 | ) | | | (27,272,065 | ) | | | (10,059,917 | ) | | | (72,132,657 | ) |
| | | | | | | | | | | | | | | | |
| (a) | | Formerly Class I shares. |
See accompanying notes to financial statements.
Annual Report 2014
50
This page intentionally left blank.
Financial Highlights
Selected Data for Each Share of Capital Outstanding Throughout the Periods Indicated
Aberdeen Global Select Opportunities Fund Inc.
| | | | | | | | | | | | | | | | | | | | | | | | | | | | | | | | |
| | | | | | Investment Activities | | | Distributions | | | | |
| | | Net
Asset
Value,
Beginning
of Period | | | Net
Investment
Income
(Loss) (a) | | | Net
Realized
and
Unrealized
Gains
(Losses)
on Invest-
ments | | | Total
from
Invest-
ment
Activities | | | Net
Invest-
ment
Income | | | Tax
Return
of
Capital | | | Total
Distributions | | | Net
Asset
Value,
End of
Period | |
Class A Shares | | | | | | | | | | | | | | | | | | | | | | | | | | | | | | | | |
Year Ended October 31, 2014 | | $ | 40.02 | | | $ | 1.29 | | | $ | 0.27 | | | $ | 1.56 | | | $ | (0.51 | ) | | $ | – | | | $ | (0.51 | ) | | $ | 41.07 | |
Year Ended October 31, 2013 | | | 35.11 | | | | 0.32 | | | | 4.91 | | | | 5.23 | | | | (0.32 | ) | | | – | | | | (0.32 | ) | | | 40.02 | |
Year Ended October 31, 2012 | | | 33.90 | | | | 0.17 | | | | 1.04 | | | | 1.21 | | | | – | | | | – | | | | – | | | | 35.11 | |
Year Ended October 31, 2011 | | | 36.70 | | | | (0.08 | ) | | | (2.72 | ) | | | (2.80 | ) | | | – | | | | – | | | | – | | | | 33.90 | |
Year Ended October 31, 2010 | | | 32.55 | | | | (0.01 | ) | | | 5.05 | | | | 5.04 | | | | (0.89 | ) | | | – | | | | (0.89 | ) | | | 36.70 | |
Institutional Class Shares(f) | | | | | | | | | | | | | | | | | | | | | | | | | | | | | | | | |
Year Ended October 31, 2014 | | | 40.39 | | | | 1.39 | | | | 0.26 | | | | 1.65 | | | | (0.61 | ) | | | – | | | | (0.61 | ) | | | 41.43 | |
Year Ended October 31, 2013 | | | 35.48 | | | | 0.30 | | | | 5.04 | | | | 5.34 | | | | (0.43 | ) | | | – | | | | (0.43 | ) | | | 40.39 | |
Year Ended October 31, 2012 | | | 34.20 | | | | 0.25 | | | | 1.05 | | | | 1.30 | | | | (0.02 | ) | | | – | | | | (0.02 | ) | | | 35.48 | |
Year Ended October 31, 2011 | | | 37.01 | | | | 0.01 | | | | (2.74 | ) | | | (2.73 | ) | | | (0.08 | ) | | | – | | | | (0.08 | ) | | | 34.20 | |
Year Ended October 31, 2010 | | | 32.80 | | | | 0.07 | | | | 5.09 | | | | 5.16 | | | | (0.95 | ) | | | – | | | | (0.95 | ) | | | 37.01 | |
| (a) | | Net investment income (loss) is based on average shares outstanding during the period. |
| (b) | | Not annualized for periods less than one year. |
| (c) | | During the period, certain fees were waived and/or reimbursed. If such waivers/reimbursements had not occurred, the ratios would have been as indicated. |
Amounts listed as “–” are $0 or round to $0.
See accompanying notes to financial statements.
Annual Report 2014
52
Financial Highlights (continued)
Selected Data for Each Share of Capital Outstanding Throughout the Periods Indicated
Aberdeen Global Select Opportunities Fund Inc. (concluded)
| | | | | | | | | | | | | | | | | | | | | | |
| | | | Ratios/Supplemental Data | |
Total Return (b) | | | Net Assets
at End of Period
(000’s) | | | Ratio of Expenses to Average Net Assets | | | Ratio of Net
Investment Income (Loss) to Average Net Assets | | | Ratio of Expenses
(Prior to Reimbursements)
to Average Net Assets
(c)(d) | | | Portfolio Turnover
(e) | |
| | | | | | | | | | | | | | | | | | | | | | |
| | 3.98 | % | | $ | 5,609 | | | | 1.35 | % | | | 3.16 | % | | | 2.85 | % | | | 12 | % |
| | 15.02 | % | | | 6,538 | | | | 1.36 | % | | | 0.86 | % | | | 2.54 | % | | | 253 | % |
| | 3.54 | % | | | 8,691 | | | | 1.39 | % | | | 0.49 | % | | | 2.32 | % | | | 182 | % |
| | (7.60 | %) | | | 10,223 | | | | 1.40 | % | | | (0.21 | %) | | | 1.79 | % | | | 147 | % |
| | 15.65 | % | | | 12,302 | | | | 1.40 | % | | | (0.04 | %) | | | 1.78 | % | | | 195 | % |
| | | | | | | | | | | | | | | | | | | | | | |
| | 4.19 | % | | | 1,452 | | | | 1.15 | % | | | 3.39 | % | | | 2.55 | % | | | 12 | % |
| | 15.23 | % | | | 1,740 | | | | 1.15 | % | | | 0.82 | % | | | 2.25 | % | | | 253 | % |
| | 3.82 | % | | | 11,431 | | | | 1.14 | % | | | 0.73 | % | | | 1.76 | % | | | 182 | % |
| | (7.40 | %) | | | 36,851 | | | | 1.15 | % | | | 0.04 | % | | | 1.42 | % | | | 147 | % |
| | 15.94 | % | | | 63,354 | | | | 1.15 | % | | | 0.21 | % | | | 1.44 | % | | | 195 | % |
| (d) | | Includes interest expense that amounts to less than 0.01%. |
| (e) | | Portfolio turnover is calculated on the basis of the Fund as a whole without distinguishing among the classes of shares. |
| (f) | | Formerly Class I shares. |
2014 Annual Report
53
Financial Highlights (continued)
Selected Data for Each Share of Capital Outstanding Throughout the Periods Indicated
Aberdeen Select International Equity Fund
| | | | | | | | | | | | | | | | | | | | | | | | | | | | | | | | |
| | | | | | Investment Activities | | | Distributions | | | | |
| | | Net
Asset
Value,
Beginning
of Period | | | Net
Investment
Income (a) | | | Net
Realized
and
Unrealized
Gains
(Losses)
on Invest-
ments | | | Total
from
Invest-
ment
Activities | | | Net
Invest-
ment
Income | | | Tax
Return
of
Capital | | | Total
Distributions | | | Net
Asset
Value,
End of
Period | |
Class A Shares | | | | | | | | | | | | | | | | | | | | | | | | | | | | | | | | |
Year Ended October 31, 2014 | | $ | 28.63 | | | $ | 1.09 | | | $ | (1.12 | ) | | $ | (0.03 | ) | | $ | (0.60 | ) | | $ | – | | | $ | (0.60 | ) | | $ | 28.00 | |
Year Ended October 31, 2013 | | | 23.84 | | | | 0.37 | | | | 4.55 | | | | 4.92 | | | | (0.13 | ) | | | – | | | | (0.13 | ) | | | 28.63 | |
Year Ended October 31, 2012 | | | 24.55 | | | | 0.30 | | | | (0.62 | ) | | | (0.32 | ) | | | (0.39 | ) | | | – | | | | (0.39 | ) | | | 23.84 | |
Year Ended October 31, 2011 | | | 28.87 | | | | 0.19 | | | | (4.00 | ) | | | (3.81 | ) | | | (0.51 | ) | | | – | | | | (0.51 | ) | | | 24.55 | |
Year Ended October 31, 2010 | | | 28.20 | | | | 0.27 | | | | 2.48 | | | | 2.75 | | | | (2.08 | ) | | | – | | | | (2.08 | ) | | | 28.87 | |
Institutional Class Shares(g) | | | | | | | | | | | | | | | | | | | | | | | | | | | | | | | | |
Year Ended October 31, 2014 | | | 29.33 | | | | 1.19 | | | | (1.16 | ) | | | 0.03 | | | | (0.67 | ) | | | – | | | | (0.67 | ) | | | 28.69 | |
Year Ended October 31, 2013 | | | 24.44 | | | | 0.31 | | | | 4.80 | | | | 5.11 | | | | (0.22 | ) | | | – | | | | (0.22 | ) | | | 29.33 | |
Year Ended October 31, 2012 | | | 25.20 | | | | 0.36 | | | | (0.64 | ) | | | (0.28 | ) | | | (0.48 | ) | | | – | | | | (0.48 | ) | | | 24.44 | |
Year Ended October 31, 2011 | | | 29.64 | | | | 0.28 | | | | (4.13 | ) | | | (3.85 | ) | | | (0.59 | ) | | | – | | | | (0.59 | ) | | | 25.20 | |
Year Ended October 31, 2010 | | | 28.89 | | | | 0.35 | | | | 2.55 | | | | 2.90 | | | | (2.15 | ) | | | – | | | | (2.15 | ) | | | 29.64 | |
| (a) | | Net investment income (loss) is based on average shares outstanding during the period. |
| (b) | | Not annualized for periods less than one year. |
| (c) | | Annualized for periods less than one year. |
| (d) | | Includes interest expense that amounts to less than 0.01%. |
Amounts listed as “–” are $0 or round to $0.
See accompanying notes to financial statements.
Annual Report 2014
54
Financial Highlights (continued)
Selected Data for Each Share of Capital Outstanding Throughout the Periods Indicated
Aberdeen Select International Equity Fund (concluded)
| | | | | | | | | | | | | | | | | | | | | | |
| | | | Ratios/Supplemental Data | |
Total Return (b) | | | Net Assets
at End of Period
(000’s) | | | Ratio of Expenses
to Average Net Assets (c)(d) | | | Ratio of Net
Investment Income
to Average Net Assets (c) | | | Ratio of Expenses
(Prior to Reimbursements)
to Average Net Assets (c)(d)(e) | | | Portfolio Turnover (f) | |
| | | | | | | | | | | | | | | | | | | | | | |
| | (0.04 | %) | | | 397,911 | | | | 1.26 | % | | | 3.83 | % | | | 1.26 | % | | | 12 | % |
| | 20.70 | % | | | 554,922 | | | | 1.25 | % | | | 1.39 | % | | | 1.26 | % | | | 94 | % |
| | (1.14 | %) | | | 877,738 | | | | 1.23 | % | | | 1.30 | % | | | 1.24 | % | | | 35 | % |
| | (13.49 | %) | | | 2,059,255 | | | | 1.29 | % | | | 0.65 | % | | | 1.30 | % | | | 41 | % |
| | 10.06 | % | | | 3,692,638 | | | | 1.28 | % | | | 1.00 | % | | | 1.28 | % | | | 105 | % |
| | | | | | | | | | | | | | | | | | | | | | |
| | 0.19 | % | | | 82,014 | | | | 1.02 | % | | | 4.06 | % | | | 1.03 | % | | | 12 | % |
| | 21.04 | % | | | 110,893 | | | | 1.03 | % | | | 1.15 | % | | | 1.04 | % | | | 94 | % |
| | (0.93 | %) | | | 1,138,838 | | | | 1.00 | % | | | 1.51 | % | | | 1.01 | % | | | 35 | % |
| | (13.31 | %) | | | 3,687,999 | | | | 1.05 | % | | | 0.95 | % | | | 1.05 | % | | | 41 | % |
| | 10.37 | % | | | 5,790,307 | | | | 1.02 | % | | | 1.26 | % | | | 1.02 | % | | | 105 | % |
| (e) | | During the period, certain fees were waived and/or reimbursed. If such waivers/reimbursements had not occurred, the ratios would have been as indicated. |
| (f) | | Portfolio turnover is calculated on the basis of the Fund as a whole without distinguishing among the classes of shares. |
| (g) | | Formerly Class I shares. |
2014 Annual Report
55
Financial Highlights (continued)
Selected Data for Each Share of Capital Outstanding Throughout the Periods Indicated
Aberdeen Select International Equity Fund II
| | | | | | | | | | | | | | | | | | | | | | | | | | | | | | | | |
| | | | | | Investment Activities | | | Distributions | | | | |
| | | Net
Asset
Value,
Beginning
of Period | | | Net
Investment
Income (a) | | | Net
Realized
and
Unrealized
Gains
(Losses)
on Invest-
ments | | | Total
from
Invest-
ment Activities | | | Net
Invest-
ment Income | | | Tax
Return
of
Capital | | | Total
Distributions | | | Net
Asset
Value,
End of
Period | |
Class A Shares | | | | | | | | | | | | | | | | | | | | | | | | | | | | | | | | |
Year Ended October 31, 2014 | | $ | 12.18 | | | $ | 0.42 | | | $ | (0.36 | ) | | $ | 0.06 | | | $ | (0.01 | ) | | $ | – | | | $ | (0.01 | ) | | $ | 12.23 | |
Year Ended October 31, 2013 | | | 10.38 | | | | 0.13 | | | | 1.92 | | | | 2.05 | | | | (0.25 | ) | | | – | | | | (0.25 | ) | | | 12.18 | |
Year Ended October 31, 2012 | | | 10.46 | | | | 0.12 | | | | (0.05 | ) | | | 0.07 | | | | (0.15 | ) | | | – | | | | (0.15 | ) | | | 10.38 | |
Year Ended October 31, 2011 | | | 12.18 | | | | 0.07 | | | | (1.56 | ) | | | (1.49 | ) | | | (0.23 | ) | | | – | | | | (0.23 | ) | | | 10.46 | |
Year Ended October 31, 2010 | | | 11.62 | | | | 0.11 | | | | 1.00 | | | | 1.11 | | | | (0.55 | ) | | | – | | | | (0.55 | ) | | | 12.18 | |
Institutional Class Shares(g) | | | | | | | | | | | | | | | | | | | | | | | | | | | | | | | | |
Year Ended October 31, 2014 | | | 12.20 | | | | 0.46 | | | | (0.38 | ) | | | 0.08 | | | | (0.03 | ) | | | – | | | | (0.03 | ) | | | 12.25 | |
Year Ended October 31, 2013 | | | 10.45 | | | | 0.11 | | | | 1.97 | | | | 2.08 | | | | (0.33 | ) | | | – | | | | (0.33 | ) | | | 12.20 | |
Year Ended October 31, 2012 | | | 10.54 | | | | 0.14 | | | | (0.04 | ) | | | 0.10 | | | | (0.19 | ) | | | – | | | | (0.19 | ) | | | 10.45 | |
Year Ended October 31, 2011 | | | 12.27 | | | | 0.10 | | | | (1.57 | ) | | | (1.47 | ) | | | (0.26 | ) | | | – | | | | (0.26 | ) | | | 10.54 | |
Year Ended October 31, 2010 | | | 11.70 | | | | 0.14 | | | | 1.01 | | | | 1.15 | | | | (0.58 | ) | | | – | | | | (0.58 | ) | | | 12.27 | |
| (a) | | Net investment income (loss) is based on average shares outstanding during the period. |
| (b) | | Not annualized for periods less than one year. |
| (c) | | Annualized for periods less than one year. |
| (d) | | During the period, certain fees were waived and/or reimbursed. If such waivers/reimbursements had not occurred, the ratios would have been as indicated. |
Amounts listed as “–” are $0 or round to $0.
See accompanying notes to financial statements.
Annual Report 2014
56
Financial Highlights (continued)
Selected Data for Each Share of Capital Outstanding Throughout the Periods Indicated
Aberdeen Select International Equity Fund II (concluded)
| | | | | | | | | | | | | | | | | | | | | | |
| | | | Ratios/Supplemental Data | | | | |
Total Return (b) | | | Net Assets
at End of Period
(000’s) | | | Ratio of Expenses
to Average Net Assets (c) | | | Ratio of Net
Investment Income
to Average Net Assets (c) | | | Ratio of Expenses
(Prior to Reimbursements)
to Average Net Assets (c)(d)(e) | | | Portfolio Turnover (f) | |
| | | | | | | | | | | | | | | | | | | | | | |
| | 0.46 | % | | $ | 120,387 | | | | 1.32 | % | | | 3.41 | % | | | 1.33 | % | | | 11 | % |
| | 20.00 | % | | | 168,028 | | | | 1.21 | % | | | 1.19 | % | | | 1.23 | % | | | 97 | % |
| | 0.91 | % | | | 278,360 | | | | 1.30 | % | | | 1.21 | % | | | 1.32 | % | | | 34 | % |
| | (12.61 | %) | | | 1,310,435 | | | | 1.28 | % | | | 0.54 | % | | | 1.28 | % | | | 51 | % |
| | 9.75 | % | | | 2,156,072 | | | | 1.28 | % | | | 0.98 | % | | | 1.29 | % | | | 123 | % |
| | | | | | | | | | | | | | | | | | | | | | |
| | 0.64 | % | | | 108,665 | | | | 1.10 | % | | | 3.69 | % | | | 1.11 | % | | | 11 | % |
| | 20.36 | % | | | 157,876 | | | | 1.04 | % | | | 1.02 | % | | | 1.04 | % | | | 97 | % |
| | 1.11 | % | | | 806,052 | | | | 1.01 | % | | | 1.33 | % | | | 1.02 | % | | | 34 | % |
| | (12.31 | %) | | | 3,666,631 | | | | 1.04 | % | | | 0.79 | % | | | 1.04 | % | | | 51 | % |
| | 9.99 | % | | | 6,355,205 | | | | 1.04 | % | | | 1.23 | % | | | 1.05 | % | | | 123 | % |
| (e) | | Includes interest expense that amounts to less than 0.01%. |
| (f) | | Portfolio turnover is calculated on the basis of the Fund as a whole without distinguishing among the classes of shares. |
| (g) | | Formerly Class I shares. |
2014 Annual Report
57
Financial Highlights (continued)
Selected Data for Each Share of Capital Outstanding Throughout the Periods Indicated
Aberdeen Total Return Bond Fund
| | | | | | | | | | | | | | | | | | | | | | | | | | | | | | | | | | | | |
| | | | | | Investment Activities | | | Distributions | | | | |
| | | Net
Asset
Value,
Beginning of Period | | | Net
Investment
Income (a) | | | Net
Realized
and
Unrealized
Gains
(Losses)
on Invest-
ments | | | Total
from
Invest-
ment
Activities | | | Net
Invest-
ment
Income | | | Net
Realized
Gains | | | Tax
Return
of
Capital | | | Total
Distributions | | | Net
Asset
Value,
End of
Period | |
Class A Shares | | | | | | | | | | | | | | | | | | | | | | | | | | | | | | | | | | | | |
Year Ended October 31, 2014 | | $ | 13.30 | | | $ | 0.34 | | | $ | 0.18 | | | $ | 0.52 | | | $ | (0.22 | ) | | $ | – | | | $ | – | | | $ | (0.22 | ) | | $ | 13.60 | |
Year Ended October 31, 2013 | | | 14.17 | | | | 0.31 | | | | (0.56 | ) | | | (0.25 | ) | | | (0.29 | ) | | | (0.30 | ) | | | (0.03 | ) | | | (0.62 | ) | | | 13.30 | |
Year Ended October 31, 2012 | | | 14.02 | | | | 0.34 | | | | 0.56 | | | | 0.90 | | | | (0.49 | ) | | | (0.26 | ) | | | – | | | | (0.75 | ) | | | 14.17 | |
Year Ended October 31, 2011 | | | 14.24 | | | | 0.55 | | | | 0.18 | | | | 0.73 | | | | (0.47 | ) | | | (0.48 | ) | | | – | | | | (0.95 | ) | | | 14.02 | |
Year Ended October 31, 2010 | | | 13.51 | | | | 0.52 | | | | 0.69 | | | | 1.21 | | | | (0.48 | ) | | | – | | | | – | | | | (0.48 | ) | | | 14.24 | |
Institutional Class Shares(f) | | | | | | | | | | | | | | | | | | | | | | | | | | | | | | | | | | | | |
Year Ended October 31, 2014 | | | 13.13 | | | | 0.37 | | | | 0.18 | | | | 0.55 | | | | (0.25 | ) | | | – | | | | – | | | | (0.25 | ) | | | 13.43 | |
Year Ended October 31, 2013 | | | 14.03 | | | | 0.35 | | | | (0.56 | ) | | | (0.21 | ) | | | (0.36 | ) | | | (0.30 | ) | | | (0.03 | ) | | | (0.69 | ) | | | 13.13 | |
Year Ended October 31, 2012 | | | 13.91 | | | | 0.38 | | | | 0.55 | | | | 0.93 | | | | (0.55 | ) | | | (0.26 | ) | | | – | | | | (0.81 | ) | | | 14.03 | |
Year Ended October 31, 2011 | | | 14.16 | | | | 0.58 | | | | 0.18 | | | | 0.76 | | | | (0.53 | ) | | | (0.48 | ) | | | – | | | | (1.01 | ) | | | 13.91 | |
Year Ended October 31, 2010 | | | 13.47 | | | | 0.55 | | | | 0.69 | | | | 1.24 | | | | (0.55 | ) | | | – | | | | – | | | | (0.55 | ) | | | 14.16 | |
| (a) | | Net investment income (loss) is based on average shares outstanding during the period. |
| (b) | | Not annualized for periods less than one year. |
| (c) | | Annualized for periods less than one year. |
Amounts listed as “–” are $0 or round to $0.
See accompanying notes to financial statements.
Annual Report 2014
58
Financial Highlights (continued)
Selected Data for Each Share of Capital Outstanding Throughout the Periods Indicated
Aberdeen Total Return Bond Fund (concluded)
| | | | | | | | | | | | | | | | | | | | | | |
| | | | Ratios/Supplemental Data | |
Total Return (b) | | | Net Assets at End of Period (000’s) | | | Ratio of Expenses to Average Net Assets (c) | | | Ratio of Net
Investment Income
to Average Net Assets (c) | | | Ratio of Expenses
(Prior to Reimbursements)
to Average Net Assets (c)(d) | | | Portfolio Turnover (e) | |
| | | | | | | | | | | | | | | | | | | | | | |
| | 3.96 | % | | $ | 152,196 | | | | 0.68 | % | | | 2.56 | % | | | 0.69 | % | | | 128 | % |
| | (1.81 | %) | | | 153,370 | | | | 0.68 | % | | | 2.29 | % | | | 0.70 | % | | | 265 | % |
| | 6.64 | % | | | 247,217 | | | | 0.69 | % | | | 2.47 | % | | | 0.69 | % | | | 236 | % |
| | 5.49 | % | | | 271,444 | | | | 0.69 | % | | | 3.96 | % | | | 0.71 | % | | | 219 | % |
| | 9.16 | % | | | 319,782 | | | | 0.69 | % | | | 3.77 | % | | | 0.70 | % | | | 193 | % |
| | | | | | | | | | | | | | | | | | | | | | |
| | 4.25 | % | | | 1,361,252 | | | | 0.42 | % | | | 2.81 | % | | | 0.43 | % | | | 128 | % |
| | (1.59 | %) | | | 1,449,776 | | | | 0.42 | % | | | 2.56 | % | | | 0.43 | % | | | 265 | % |
| | 6.97 | % | | | 1,849,138 | | | | 0.41 | % | | | 2.73 | % | | | 0.41 | % | | | 236 | % |
| | 5.79 | % | | | 1,498,733 | | | | 0.44 | % | | | 4.20 | % | | | 0.45 | % | | | 219 | % |
| | 9.39 | % | | | 1,305,839 | | | | 0.44 | % | | | 4.01 | % | | | 0.44 | % | | | 193 | % |
| (d) | | During the period, certain fees were waived and/or reimbursed. If such waivers/reimbursements had not occurred, the ratios would have been as indicated. |
| (e) | | Portfolio turnover is calculated on the basis of the Fund as a whole without distinguishing among the classes of shares. |
| (f) | | Formerly Class I shares. |
2014 Annual Report
59
Financial Highlights (continued)
Selected Data for Each Share of Capital Outstanding Throughout the Periods Indicated
Aberdeen Global High Income Fund
| | | | | | | | | | | | | | | | | | | | | | | | | | | | | | | | | | | | |
| | | | | | Investment Activities | | | Distributions | | | | |
| | | Net
Asset
Value,
Beginning
of Period | | | Net
Investment
Income (a) | | | Net
Realized
and
Unrealized
Gains
(Losses)
on Invest-
ments | | | Total
from
Invest-
ment
Activities | | | Net
Invest-
ment
Income | | | Net
Realized
Gains | | | Tax
Return
of
Capital | | | Total
Distributions | | | Net
Asset
Value,
End of
Period | |
Class A Shares | | | | | | | | | | | | | | | | | | | | | | | | | | | | | | | | | | | | |
Year Ended October 31, 2014 | | $ | 10.61 | | | $ | 0.62 | | | $ | (0.13 | ) | | $ | 0.49 | | | $ | (0.61 | ) | | $ | (0.11 | ) | | $ | – | | | $ | (0.72 | ) | | $ | 10.38 | |
Year Ended October 31, 2013 | | | 10.30 | | | | 0.72 | | | | 0.30 | | | | 1.02 | | | | (0.71 | ) | | | – | | | | – | | | | (0.71 | ) | | | 10.61 | |
Year Ended October 31, 2012 | | | 10.14 | | | | 0.73 | | | | 0.34 | | | | 1.07 | | | | (0.74 | ) | | | (0.16 | ) | | | (0.01 | ) | | | (0.91 | ) | | | 10.30 | |
Year Ended October 31, 2011 | | | 11.06 | | | | 0.77 | | | | (0.62 | ) | | | 0.15 | | | | (0.79 | ) | | | (0.28 | ) | | | – | | | | (1.07 | ) | | | 10.14 | |
Year Ended October 31, 2010 | | | 10.28 | | | | 0.82 | | | | 0.77 | | | | 1.59 | | | | (0.81 | ) | | | – | | | | – | | | | (0.81 | ) | | | 11.06 | |
Institutional Class Shares(g) | | | | | | | | | | | | | | | | | | | | | | | | | | | | | | | | | | | | |
Year Ended October 31, 2014 | | | 10.10 | | | | 0.61 | | | | (0.11 | ) | | | 0.50 | | | | (0.64 | ) | | | (0.11 | ) | | | – | | | | (0.75 | ) | | | 9.85 | |
Year Ended October 31, 2013 | | | 9.84 | | | | 0.71 | | | | 0.29 | | | | 1.00 | | | | (0.74 | ) | | | – | | | | – | | | | (0.74 | ) | | | 10.10 | |
Year Ended October 31, 2012 | | | 9.72 | | | | 0.73 | | | | 0.31 | | | | 1.04 | | | | (0.74 | ) | | | (0.16 | ) | | | (0.02 | ) | | | (0.92 | ) | | | 9.84 | |
Year Ended October 31, 2011 | | | 10.64 | | | | 0.76 | | | | (0.59 | ) | | | 0.17 | | | | (0.81 | ) | | | (0.28 | ) | | | – | | | | (1.09 | ) | | | 9.72 | |
Year Ended October 31, 2010 | | | 9.90 | | | | 0.82 | | | | 0.74 | | | | 1.56 | | | | (0.82 | ) | | | – | | | | – | | | | (0.82 | ) | | | 10.64 | |
| (a) | | Net investment income (loss) is based on average shares outstanding during the period. |
| (b) | | Not annualized for periods less than one year. |
| (c) | | Annualized for periods less than one year. |
| (d) | | During the period, certain fees were waived and/or reimbursed. If such waivers/reimbursements had not occurred, the ratios would have been as indicated. |
Amounts listed as “–” are $0 or round to $0.
See accompanying notes to financial statements.
Annual Report 2014
60
Financial Highlights (concluded)
Selected Data for Each Share of Capital Outstanding Throughout the Periods Indicated
Aberdeen Global High Income Fund (concluded)
| | | | | | | | | | | | | | | | | | | | | | |
| | | | Ratios/Supplemental Data | |
Total Return (b) | | | Net Assets
at End of Period (000’s) | | | Ratio of Expenses to Average Net Assets
(c) | | | Ratio of Net
Investment Income
to Average Net Assets
(c) | | | Ratio of Expenses
(Prior to Reimbursements)
to Average Net Assets (c)(d) | | | Portfolio Turnover (e) | |
| | | | | | | | | | | | | | | | | | | | | | |
| | 4.70 | % | | $ | 823,808 | | | | 1.00 | %(f) | | | 5.76 | % | | | 1.01 | %(f) | | | 96 | % |
| | 10.20 | % | | | 999,250 | | | | 0.99 | %(f) | | | 6.83 | % | | | 1.00 | %(f) | | | 57 | % |
| | 11.22 | % | | | 1,066,487 | | | | 0.99 | %(f) | | | 7.26 | % | | | 1.01 | %(f) | | | 62 | % |
| | 1.30 | % | | | 1,308,597 | | | | 0.99 | %(f) | | | 7.19 | % | | | 1.00 | %(f) | | | 78 | % |
| | 16.08 | % | | | 1,222,933 | | | | 1.00 | % | | | 7.70 | % | | | 1.00 | % | | | 57 | % |
| | | | | | | | | | | | | | | | | | | | | | |
| | 5.01 | % | | | 1,561,293 | | | | 0.74 | %(f) | | | 6.01 | % | | | 0.75 | %(f) | | | 96 | % |
| | 10.53 | % | | | 1,553,543 | | | | 0.75 | %(f) | | | 7.10 | % | | | 0.75 | %(f) | | | 57 | % |
| | 11.49 | % | | | 2,130,565 | | | | 0.73 | %(f) | | | 7.53 | % | | | 0.74 | %(f) | | | 62 | % |
| | 1.52 | % | | | 2,077,865 | | | | 0.73 | %(f) | | | 7.44 | % | | | 0.74 | %(f) | | | 78 | % |
| | 16.39 | % | | | 1,873,539 | | | | 0.75 | % | | | 7.96 | % | | | 0.74 | % | | | 57 | % |
| (e) | | Portfolio turnover is calculated on the basis of the Fund as a whole without distinguishing among the classes of shares. |
| (f) | | Includes interest expense that amounts to less than 0.01%. |
| (g) | | Formerly Class I shares. |
2014 Annual Report
61
Notes to Financial Statements
October 31, 2014
1. Organization
Aberdeen Investment Funds (each, a “Fund” and collectively, the “Trust”) was organized as a business trust under the laws of the State of Massachusetts by a Master Trust Agreement adopted on April 30, 1992 and is registered with the U.S. Securities and Exchange Commission (“SEC”) under the Investment Company Act of 1940, as amended (the “1940 Act”) as an open-end management investment company. As of October 31, 2014, the Trust offered four diversified, open-ended investment funds: Aberdeen Select International Equity Fund (the “Select International Equity Fund”), Aberdeen Select International Equity Fund II (the “Select International Equity Fund II”), Aberdeen Total Return Bond Fund (the “Total Return Bond Fund”), and Aberdeen Global High Income Fund (the “Global High Income Fund”).
Aberdeen Global Select Opportunities Fund Inc. (the “Global Select Opportunities Fund” and collectively with the Trust, the “Funds”) was incorporated under the laws of the State of Maryland on May 23, 1990 and is registered with the SEC under the 1940 Act as a diversified, open-end management investment company.
Each of the Funds offers multiple share classes. As of October 31, 2014, all of the Funds offered Class A and Institutional Class shares. The classes of shares are offered to different types of investors and have different expense structures, as outlined in the Funds’ prospectus. Each class of shares has exclusive voting rights with respect to matters that affect that class. Income, realized gains and losses, unrealized appreciation and depreciation, and expenses that are not attributable to a specific class are allocated daily to each class based on its relative net assets. Expenses directly attributable to a Fund are charged to that Fund. Other expenses are allocated to the respective Fund based on average daily net assets.
On December 12, 2013, the Funds’ Board of Trustees and Board of Directors approved changing the name of Class I Shares of the Trust and the Global Select Opportunities Fund to Institutional Class Shares, effective with the 2014 prospectus. Fees and expenses associated with Class I Shares were not impacted as a result of the change in name to Institutional Class Shares.
Each Fund has distinct investment objectives. Following are the objectives for the Funds:
| | |
| Fund Name | | Investment Objective |
Global Select Opportunities Fund | | Seeks to maximize total return, principally through capital appreciation. |
Select International Equity Fund, a series of the Trust | | Seeks long-term growth of capital. |
Select International Equity Fund II, a series of the Trust | | Seeks long-term growth of capital. |
Total Return Bond Fund, a series of the Trust | | Seeks to provide total return, which consists of two components: (1) changes in the market value of the Fund’s portfolio securities (both realized and unrealized appreciation/depreciation) and (2) income received from its portfolio securities. |
Global High Income Fund, a series of the Trust | | Seeks to maximize total return, principally through a high level of current income, and secondarily through capital appreciation. |
2. Summary of Significant Accounting Policies
The following is a summary of significant accounting policies followed by the Funds in the preparation of their financial statements. The policies conform to accounting principles generally accepted in the United States of America (GAAP). The preparation of financial statements requires management to make estimates and assumptions that affect the reported amounts of assets and liabilities, disclosure of contingent assets and liabilities at the date of the financial statements, and the reported amounts of income and expenses for the period. Actual results could differ from those estimates. The books and records of the Funds are maintained in U.S. Dollars.
The Funds value their securities at current market value or fair value consistent with the Funds’ valuation procedures and regulatory requirements.
Each Fund’s assets for which market quotations are readily available are valued at fair value on the basis of quotations furnished by a pricing service or provided by securities dealers. Equity investments are generally valued using the last sale price or official closing price taken from the primary market in which each security trades, or if no sales occurred during the day, at the mean of the current quoted bid and ask prices.
Fixed income securities are generally valued using prices provided directly by independent third party services or provided directly from one or more broker dealers or market makers, each in accordance with valuation procedures (“Valuation Procedures”) approved by the Global
Annual Report 2014
62
Notes to Financial Statements (continued)
October 31, 2014
Select Opportunities Fund’s Board of Directors and the Trust’s Board of Trustees (each, a “Board” and together, “the Boards”), as applicable. The pricing services may use valuation models or matrix pricing, which consider yield or prices with respect to comparable bond quotations from bond dealers or by reference to other securities that are considered comparable in such characteristics as credit rating, interest rates and maturity date, to determine current fair value.
Assets and liabilities initially expressed in foreign currency will be converted into U.S. Dollar values. Short-term debt securities (such as commercial paper, and U.S. treasury bills) having a remaining maturity of 60 days or less are valued at the last quoted or evaluated mid price on the valuation date provided by an independent pricing service, or on the basis of amortized cost if it represents the best approximation for fair value. To the extent each Fund invests in other open-end funds, the Fund will calculate its Net Asset Value (“NAV”) based upon the NAV of the underlying funds in which it invests. The prospectuses of these underlying funds explain the circumstances under which they will use good faith fair value pricing and the effects of such fair value pricing.
When market quotations or exchange rates are not readily available, or if the Funds’ investment adviser, Aberdeen Asset Management Inc. (the “Adviser”), concludes that such market quotations do not accurately reflect fair value, the fair value of a Fund’s assets are determined in good faith in accordance with the Valuation Procedures. For options, swaps and warrants, a fair value price may be determined using readily available market quotations, prices provided by independent pricing services, or by using modeling tools provided by industry accepted financial data service providers. Key inputs to such tools may include yield and prices from comparable or reference assets, maturity or expiration dates, ratings, and interest rates. In addition, the Adviser, through its pricing committee, may determine the fair value price in accordance with the Valuation Procedures approved by the Boards.
The closing prices of domestic or foreign securities may not reflect their market values at the time the Funds calculate their respective NAVs if an event that materially affects the value of those securities has occurred since the closing prices were established on the domestic or foreign exchange market, but before the Funds’ NAV calculations. Under certain conditions, the Boards have approved an independent pricing service to fair value foreign securities in a manner consistent with the Valuation Procedures. The fair valuation is generally determined by adjusting the closing price taking into account movements in correlated indices, securities or derivatives. Fair value pricing may cause the value of the security on the books of the Funds to be different from the closing value on the non-U.S. exchange and may affect the calculation of a Fund’s NAV. Certain Funds may fair value securities in other situations, for example, when a particular foreign market is closed but the Funds are pricing their shares.
In accordance with the authoritative guidance on fair value measurements and disclosures under GAAP, the Funds disclose the fair value of their investments using a three-level hierarchy that classifies the inputs to valuation techniques used to measure the fair value. The hierarchy assigns Level 1 measurements to valuations based upon unadjusted quoted prices in active markets for identical assets, Level 2 measurements to valuations based upon significant observable inputs, including adjusted quoted prices in active markets for identical assets, and Level 3 measurements to valuations based upon unobservable inputs that are significant to the valuation. Inputs refer broadly to the assumptions that market participants would use in pricing the asset or liability, including assumptions about risk, for example, the risk inherent in a particular valuation technique used to measure fair value including a pricing model and/or the risk inherent in the inputs to the valuation technique. Inputs may be observable or unobservable. Observable inputs are inputs that reflect the assumptions market participants would use in pricing the asset or liability, which are based on market data obtained from sources independent of the reporting entity. Unobservable inputs are inputs that reflect the reporting entity’s own assumptions about the assumptions market participants would use in pricing the asset or liability developed based on the best information available in the circumstances. A financial instrument’s level within the fair value hierarchy is based upon the lowest level of any input that is significant to the fair value measurement. The three-level hierarchy of inputs is summarized below:
| | • | | Level 1- quoted prices in active markets for identical investments; |
| | • | | Level 2- other significant observable inputs (including quoted prices for similar securities, interest rates, prepayment speeds, and credit risk); or |
| | • | | Level 3- significant unobservable inputs (including a Fund’s own assumptions in determining the fair value of investments). |
For movements between the Levels within the fair value hierarchy, the Funds have adopted a policy of recognizing transfers at the end of each period. During the year ended October 31, 2014, there were no transfers between Levels, except as described below.
The Funds will fair value foreign securities when the Adviser does not believe that the closing prices are reflective of fair value due to significant events that occurred subsequent to the close of the foreign markets but before the Funds’ NAV calculations. When securities are fair valued under this method, they will be classified as Level 2 which may result in significant transfers between Level 1 and Level 2. The number of days on which fair value prices will be used depends on market activity. It is possible that fair value prices will be used by the Funds to a significant extent. Foreign securities in the Global Select Opportunities Fund, Select International Equity Fund and Select
2014 Annual Report
63
Notes to Financial Statements (continued)
October 31, 2014
International Equity Fund II were not fair valued under this method as of October 31, 2013 however, foreign securities were fair valued under this method as of October 31, 2014, resulting in the following transfers from Level 1 to Level 2 in the fair value hierarchy.
| | | | | | | | |
| Fund | | Transfer from Level 1 to Level 2 | | | Transfer from Level 2 to Level 1 | |
Global Select Opportunities Fund | | $ | 3,157,585 | | | | – | |
Select International Equity Fund | | | 351,565,625 | | | | – | |
Select International Equity Fund II | | | 167,426,636 | | | | – | |
The following is a summary of the inputs used as of October 31, 2014 in valuing the Funds’ investments and other financial instruments at fair value. The inputs or methodologies used for valuing securities are not necessarily an indication of the risk associated with investing in those securities.
| | | | | | | | | | | | | | | | |
| Investments, at Value | | LEVEL 1–Quoted Prices ($) | | | LEVEL 2–Other
Significant Observable
Inputs ($) | | | LEVEL 3–Significant
Unobservable Inputs ($) | | | Total ($) | |
| Global Select Opportunities Fund | | | | | | | | | | | | | | | | |
| Investments in Securities | | | | | | | | | | | | | | | | |
Common Stocks | | | 3,002,360 | | | | 3,413,253 | | | | – | | | | 6,415,613 | |
Preferred Stocks | | | 574,647 | | | | – | | | | – | | | | 574,647 | |
Repurchase Agreement | | | – | | | | 103,593 | | | | – | | | | 103,593 | |
| | | | | | | | | | | | | | | | |
| | | 3,577,007 | | | | 3,516,846 | | | | – | | | | 7,093,853 | |
| | | | | | | | | | | | | | | | |
| Select International Equity Fund | | | | | | | | | | | | | | | | |
| Investments in Securities | | | | | | | | | | | | | | | | |
Common Stocks | | | 53,576,411 | | | | 372,283,837 | | | | 1,780,963 | | | | 427,641,211 | |
Government Bonds | | | – | | | | – | | | | 968,865 | | | | 968,865 | |
Preferred Stocks | | | 29,287,996 | | | | 16,248,677 | | | | – | | | | 45,536,673 | |
Repurchase Agreement | | | – | | | | 2,201,050 | | | | – | | | | 2,201,050 | |
| | | | | | | | | | | | | | | | |
| | | 82,864,407 | | | | 390,733,564 | | | | 2,749,828 | | | | 476,347,799 | |
| | | | | | | | | | | | | | | | |
| Select International Equity Fund II | | | | | | | | | | | | | | | | |
| Investments in Securities | | | | | | | | | | | | | | | | |
Common Stocks | | | 24,726,748 | | | | 175,073,152 | | | | – | | | | 199,799,900 | |
Preferred Stocks | | | 14,528,285 | | | | 9,163,498 | | | | – | | | | 23,691,783 | |
Repurchase Agreement | | | – | | | | 3,938,150 | | | | – | | | | 3,938,150 | |
| | | | | | | | | | | | | | | | |
| | | 39,255,033 | | | | 188,174,800 | | | | – | | | | 227,429,833 | |
| | | | | | | | | | | | | | | | |
Annual Report 2014
64
Notes to Financial Statements (continued)
October 31, 2014
| | | | | | | | | | | | | | | | |
| Investments, at Value | | LEVEL 1–Quoted Prices ($) | | | LEVEL 2–Other
Significant Observable
Inputs ($) | | | LEVEL 3–Significant
Unobservable Inputs ($) | | | Total ($) | |
| Total Return Bond Fund | | | | | | | | | | | | | | | | |
| Investments in Securities | | | | | | | | | | | | | | | | |
Government Agencies | | | – | | | | 2,857,952 | | | | – | | | | 2,857,952 | |
Asset-Backed Securities | | | – | | | | 136,317,097 | | | | – | | | | 136,317,097 | |
Commercial Mortgage-Backed Securities | | | – | | | | 290,517,034 | | | | – | | | | 290,517,034 | |
Corporate Bonds | | | – | | | | 479,607,624 | | | | – | | | | 479,607,624 | |
Municipal Bonds | | | – | | | | 68,245,133 | | | | – | | | | 68,245,133 | |
Government Bonds | | | – | | | | 190,384,870 | | | | – | | | | 190,384,870 | |
U.S. Agencies | | | – | | | | 164,541,677 | | | | – | | | | 164,541,677 | |
U.S. Treasuries | | | – | | | | 139,619,072 | | | | – | | | | 139,619,072 | |
Repurchase Agreement | | | – | | | | 43,376,270 | | | | – | | | | 43,376,270 | |
| Other Financial Instruments | | | | | | | | | | | | | | | | |
| Assets | | | | | | | | | | | | | | | | |
Forward Foreign Currency Exchange Contracts | | | – | | | | 3,905,106 | | | | – | | | | 3,905,106 | |
| Liabilities | | | | | | | | | | | | | | | | |
Futures Contracts | | | (66,844 | ) | | | – | | | | – | | | | (66,844 | ) |
Forward Foreign Currency Exchange Contracts | | | – | | | | (759,607 | ) | | | – | | | | (759,607 | ) |
| | | | | | | | | | | | | | | | |
| | | (66,844 | ) | | | 1,518,612,228 | | | | – | | | | 1,518,545,384 | |
| | | | | | | | | | | | | | | | |
| Global High Income Fund | | | | | | | | | | | | | | | | |
| Investments in Securities | | | | | | | | | | | | | | | | |
Corporate Bonds | | | – | | | | 1,622,519,965 | | | | 16,420,744 | | | | 1,638,940,709 | |
Government Bonds | | | – | | | | 95,809,494 | | | | – | | | | 95,809,494 | |
Government Agencies | | | – | | | | 14,925,263 | | | | – | | | | 14,925,263 | |
Bank Loans | | | – | | | | 210,372,583 | | | | 79,146,282 | | | | 289,518,865 | |
Common Stocks | | | 6,339,592 | | | | – | | | | 37,722,113 | | | | 44,061,705 | |
Preferred Stocks | | | 6,940,990 | | | | 12,070,955 | | | | – | | | | 19,011,945 | |
Repurchase Agreement | | | – | | | | 118,170,083 | | | | – | | | | 118,170,083 | |
| Other Financial Instruments | | | | | | | | | | | | | | | | |
| Assets | | | | | | | | | | | | | | | | |
Forward Foreign Currency Exchange Contracts | | | – | | | | 16,498,691 | | | | – | | | | 16,498,691 | |
Centrally Cleared Credit Default Swap Contracts | | | – | | | | 509,223 | | | | – | | | | 509,223 | |
Credit Default Swap Contracts | | | – | | | | 7,199,162 | | | | – | | | | 7,199,162 | |
| Liabilities | | | | | | | | | | | | | | | | |
Forward Foreign Currency Exchange Contracts | | | – | | | | (501,342 | ) | | | – | | | | (501,342 | ) |
| | | | | | | | | | | | | | | | |
| | | 13,280,582 | | | | 2,097,574,077 | | | | 133,289,139 | | | | 2,244,143,798 | |
| | | | | | | | | | | | | | | | |
Amounts listed as “–” are $0 or round to $0.
2014 Annual Report
65
Notes to Financial Statements (continued)
October 31, 2014
| | | | | | | | | | | | | | | | | | | | | | | | | | | | | | | | | | | | | | | | |
Select International Equity Fund Rollforward of Level 3 Fair Value Measurement For the Year Ended October 31, 2014 | |
| Investments in Securities | | Balance as of
October 31,
2013 | | | Accrued
Discounts
(Premiums) | | | Realized
Gain (Loss) | | | Change in
Unrealized
Appreciation
(Depreciation) | | | Net
Purchases | | | Net Sales | | | Net
Transfers
in to
Level 3 | | | Net
Transfers
out of Level 3 | | | Balance as of
October 31,
2014 | | | Change in
Unrealized
Appreciation
(Depreciation)
from
Investments
Held at
October 31, 2014 | |
COMMON STOCK | | | | | | | | | | | | | | | | | | | | | | | | | | | | | | | | | | | | | | | | |
Bulgaria | | $ | 2,291,326 | | | $ | – | | | $ | (15,802,654 | ) | | $ | 15,676,664 | | | $ | – | | | $ | (384,372 | ) | | $ | – | | | $ | – | | | $ | 1,780,964 | | | $ | (152,149 | ) |
Latvia | | | – | | | | – | | | | – | | | | – | | | | 8,354,908 | | | | (8,354,908 | ) | | | – | | | | – | | | | – | | | | – | |
Serbia | | | 80,145 | | | | | | | | | | | | (80,145 | ) | | | | | | | | | | | – | | | | – | | | | – | | | | – | |
Venezuela | | | – | | | | – | | | | – | | | | – | | | | – | | | | – | | | | – | | | | – | | | | – | | | | – | |
EXCHANGE TRADED FUNDS | | | – | | | | – | | | | – | | | | – | | | | – | | | | – | | | | – | | | | – | | | | – | | | | – | |
Russia | | | 1,389,510 | | | | – | | | | – | | | | (1,389,510 | ) | | | – | | | | – | | | | – | | | | – | | | | – | | | | | |
GOVERNMENT BONDS | | | – | | | | – | | | | – | | | | – | | | | – | | | | – | | | | – | | | | – | | | | – | | | | – | |
Venezuela | | | 1,849,035 | | | | (14,528 | ) | | | – | | | | (865,643 | ) | | | – | | | | – | | | | – | | | | – | | | | 968,864 | | | | (865,644 | ) |
TOTAL | | | 5,610,016 | | | | (14,528 | ) | | | (15,802,654 | ) | | | 13,341,366 | | | | 8,354,908 | | | | (8,739,280 | ) | | | 0 | | | | 0 | | | | 2,749,828 | | | | (1,017,793 | ) |
| | | | | | | | | | | | | | | | | | | | | | | | | | | | | | | | | | | | | | | | |
Total Return Bond Fund Rollforward of Level 3 Fair Value Measurement For the Year Ended October 31, 2014 | |
| Investments in Securities | | Balance as of
October 31,
2013 | | | Accrued
Discounts
(Premiums) | | | Realized
Gain (Loss) | | | Change in
Unrealized
Appreciation
(Depreciation) | | | Net
Purchases | | | Net Sales | | | Net
Transfers
in to
Level 3 | | | Net
Transfers
out of Level 3 | | | Balance as of
October 31,
2014 | | | Change in
Unrealized
Appreciation
(Depreciation)
from
Investments
Held at
October 31, 2014 | |
ASSET-BACKED SECURITIES | | | | | | | | | | | | | | | | | | | | | | | | | | | | | | | | | | | | | | | | |
United States | | $ | 12,663,773 | | | $ | – | | | $ | – | | | $ | – | | | $ | – | | | $ | – | | | $ | – | | | $ | (12,663,773 | ) | | $ | – | | | $ | – | |
TOTAL | | $ | 12,663,773 | | | $ | – | | | $ | – | | | $ | – | | | $ | – | | | $ | – | | | $ | – | | | $ | (12,663,773 | ) | | $ | – | | | $ | – | |
| | | | | | | | | | | | | | | | | | | | | | | | | | | | | | | | | | | | | | | | |
Global High Income Fund Rollforward of Level 3 Fair Value Measurement For the Year Ended October 31, 2014 | |
| Investments in Securities | | Balance as of October 31, 2013 | | | Accrued
Discounts
(Premiums) | | | Realized Gain (Loss) | | | Change in
Unrealized
Appreciation
(Depreciation) | | | Net Purchases | | | Net Sales | | | Net
Transfers
in to
Level 3 | | | Net Transfers out of Level 3 | | | Balance as of
October 31, 2014 | | | Change in
Unrealized
Appreciation
(Depreciation)
from
Investments
Held at
October 31, 2014 | |
BANK LOANS | | | | | | | | | | | | | | | | | | | | | | | | | | | | | | | | | | | | | | | | |
United States | | $ | 50,905,340 | | | $ | 171,803 | | | $ | (3,212,360 | ) | | $ | (13,279,877 | ) | | $ | 117,324,923 | | | $ | (48,743,103 | ) | | $ | – | | | $ | (24,020,444 | ) | | $ | 79,146,282 | | | $ | (11,024,535 | ) |
COMMON STOCK | | | | | | | | | | | | | | | | | | | | | | | | | | | | | | | | | | | | | | | | |
Norway | | | 32,749,750 | | | | – | | | | – | | | | 4,972,363 | | | | – | | | | – | | | | – | | | | – | | | | 37,722,113 | | | | 4,972,363 | |
CORPORATE BONDS | | | | | | | | | | | | | | | | | | | | | | | | | | | | | | | | | | | | | | | | |
United States | | | 78,069,504 | | | | 6,573 | | | | 896,825 | | | | (1,596,568 | ) | | | 16,824,889 | | | | (27,381,825 | ) | | | – | | | | (50,398,654 | ) | | | 16,420,744 | | | | (410,718 | ) |
TOTAL | | $ | 161,724,594 | | | $ | 178,376 | | | $ | (2,315,535 | ) | | $ | (9,904,082 | ) | | $ | 134,149,812 | | | $ | (76,124,928 | ) | | $ | – | | | $ | (74,419,098 | ) | | $ | 133,289,139 | | | $ | (6,462,890 | ) |
Annual Report 2014
66
Notes to Financial Statements (continued)
October 31, 2014
The following is quantitative information about level 3 fair value measurements:
| | | | | | | | | | | | |
| Description | | Fair Value at
10/31/14 ($) | | | Valuation
Technique(s) | | Unobservable
Inputs | | Range | | Weighted
Average |
Global High Income Fund | | | | | | | | | | | | |
Bank Loans | | $ | 79,146,282 | | | Broker Pricing | | Bid/Ask Spread | | $73.4 –100.25 | | $89.68 |
Common Stocks | | | 37,772,113 | | | Evaluated Pricing | | Bid/Ask Spread | | $26.4 | | $26.4 |
Corporate Bonds | | | 16,420,744 | | | Broker Pricing | | Bid/Ask Spread | | $88.3 | | $88.3 |
Evaluated Pricing: In determining the fair value of the Common Stock as of October 31, 2014, the Global High Income Fund took an average of the values calculated using the Income Approach – Discounted Cash Flow Method and the Market Approach – Guideline Public Company Method, weighted equally, to derive an evaluated price.
Income Approach: A well-established technique used to estimate the equity value of a company through an analysis of projected income, such as using the Discounted Cash Flow Method. Using this analysis, value is indicated from all of the future cash flows attributable to the subject company discounted to present value at a required rate of return. If debt free cash flows are used, any long-term debt is deducted from the indicated value of the invested capital to determine equity value.
Market Approach: References actual transactions in the equity of the enterprise being valued or transactions in similar enterprises that are traded in private and public markets. Third-party transactions in the equity of an entity generally represent the best estimate of fair value if they are completed at arm’s length. The Guideline Public Company Method involves identifying and selecting publicly traded companies with financial and operating characteristics similar to the company being valued. Once publicly traded companies are identified, valuation multiples can be derived, adjusted for comparability, and then applied to the subject company to estimate the value of its equity or invested capital. Similarly, the Comparable Transactions Method analyzes transactions involving target companies operating in industries similar to the subject company. While it is known that no two companies are exactly alike, nor are any two transactions structured identically, consideration is given to comparisons of the capital structure, operations, size, and profitability, as well as other operating characteristics of the target companies. Once comparable transactions for reasonable targets are identified, valuation multiples can be derived, adjusted for comparability, and then applied to the subject company to estimate the value of its equity or invested capital.
The Funds may enter into repurchase agreements, under the terms of a Master Repurchase Agreement. It is each Fund’s policy that its custodian/counterparty segregate the underlying collateral securities, consisting of government securities, the value of which exceeds the principal amount of the repurchase transaction, including accrued interest. The repurchase price generally equals the price paid by a Fund plus interest negotiated on the basis of current short-term rates. To the extent that any repurchase transaction exceeds one business day, the collateral is valued on a daily basis to determine its adequacy. If the counterparty defaults and the value of the collateral declines or if bankruptcy proceedings are commenced with respect to the counterparty of the security, realization of the collateral by the Funds may be delayed or limited. Repurchase agreements are subject to contractual netting arrangements with the counterparty, Fixed Income Clearing Corp. For additional information on individual repurchase agreements, see the Statements of Investments.
Restricted securities are privately-placed securities whose resale is restricted under U.S. securities laws. The Funds may invest in restricted securities, including unregistered securities eligible for resale without registration pursuant to Rule 144A and privately-placed securities of U.S. and non-U.S. issuers offered outside the U.S. without registration pursuant to Regulation S under the Securities Act of 1933, as amended. Rule 144A securities may be freely traded among certain qualified institutional investors, such as the Funds, but resale of such securities in the U.S. is permitted only in limited circumstances.
| d. | Foreign Currency Translation |
Foreign currency amounts are translated into U.S. Dollars at the current rate of exchange as of 11:00 am Eastern time for Global Select Opportunities Fund, Select International Equity Fund, and Select International Equity Fund II and as of 4:00 pm Eastern time for Global High Income Fund and Total Return Bond (“Valuation Time”) to determine the value of investments, assets and liabilities. Purchases and sales of securities, and income and expenses are translated at the prevailing rate of exchange on the respective date of these transactions. The Funds do not isolate that portion of the results of operations resulting from changes in foreign exchange rates on investments from fluctuations arising from changes in market prices of securities held. These fluctuations are included with the net realized and unrealized gain or loss from investments and foreign currencies within the Statements of Operations.
2014 Annual Report
67
Notes to Financial Statements (continued)
October 31, 2014
Foreign securities, currencies, and other assets and liabilities denominated in foreign currencies are translated into U.S. Dollars at the exchange rate of said currencies against the U.S. Dollar, as of the Valuation Time, as provided by an independent pricing service.
Investments in emerging markets can be riskier and more volatile than investments in the United States and other developed markets. Adverse political and economic developments can make it more difficult for the Global Select Opportunities Fund, Select International Equity Fund, and Select International Equity Fund II to sell foreign securities which could reduce the NAV of the Funds. In contrast to more established markets, emerging markets may have governments that are less stable and markets that are less liquid, increasing your investment risk. At October 31, 2014, the Select International Equity Fund had 0.2% of its net assets invested in Venezuelan securities and held Venezuelan Bolivar valued at 0.1% of the Select International Equity Fund’s net assets. Venezuela currently imposes foreign exchange controls which prohibit the Select International Equity Fund from repatriating dividends, interest, or other income from investments or proceeds from the sale of Venezuelan securities.
| e. | Derivative Financial Instruments |
The Funds are authorized to use derivatives to manage currency risk, credit risk, and interest rate risk and to replicate, or use as a substitute for, physical securities. Losses may arise due to changes in the value of the contract or if the counterparty does not perform under the contract. The use of derivative instruments involves, to varying degrees, elements of market risk in excess of the amount recognized in the Statements of Assets and Liabilities.
Forward Foreign Currency Exchange Contracts
A forward foreign currency exchange contract (“forward contract”) involves an obligation to purchase and sell a specific currency at a future date, which may be any fixed number of days from the date of the contract agreed upon by the parties, at a price set at the time of the contract. Forward contracts are used to manage a Fund’s currency exposure in an efficient manner. They are used to sell unwanted currency exposure that comes with holding securities in a market, or to buy currency exposure where the exposure from holding securities is insufficient to give the desired currency exposure either in absolute terms or relative to the benchmark. The use of forward contracts allows the separation of decision-making between markets and their currencies. The forward contract is marked-to-market daily and the change in market value is recorded by a Fund as unrealized appreciation or depreciation. Forward contracts’ prices are received daily from an independent pricing provider. When the forward contract is closed, a Fund records a realized gain or loss equal to the difference between the value at the time it was opened and the value at the time it was closed. These realized and unrealized gains and losses are reported on the Statements of Operations. During the year ended October 31, 2014, the Funds used forward contracts forwards to hedge some of the Funds’ foreign currency holdings. Managing active currency risk involves both hedging currency risk and adding currency risk in excess of underlying bond positions. A Fund may also enter into forward currency transactions to obtain potential appreciation of a foreign currency, which also adds currency risk.
Futures Contracts
Certain Funds may invest in financial futures contracts (“futures contracts”) for the purpose of hedging their existing portfolio securities, or securities that a Fund intends to purchase, against fluctuations in value caused by changes in prevailing market interest rates or prices. Futures contracts may also be entered into for non-hedging purposes; however, in those instances, the aggregate initial margin and premiums required to establish a Fund’s positions may not exceed 5% of a Fund’s NAV after taking into account unrealized profits and unrealized losses on any such contract it has entered.
Upon entering into a futures contract, a Fund is required to pledge to the broker an amount of cash and/or other assets equal to a certain percentage of the contract amount. This payment is known as “initial margin”. Subsequent payments, known as “variation margin,” are calculated each day, depending on the daily fluctuations in the fair value/market value of the underlying assets. An unrealized gain/(loss) equal to the variation margin is recognized on a daily basis. When the contract expires or is closed, the gain/(loss) is realized and is presented in the Statements of Operations as a net realized gain/(loss) on futures contracts. Futures contracts are valued daily at their last quoted sale price on the exchange on which they are traded.
A “sale” of a futures contract means a contractual obligation to deliver the securities or foreign currency called for by the contract at a fixed price at a specified time in the future. A “purchase” of a futures contract means a contractual obligation to acquire the securities or foreign currency at a fixed price at a specified time in the future.
Should market conditions change unexpectedly, a Fund may not achieve the anticipated benefits of the futures contracts and may realize a loss. The use of futures transactions for hedging purposes involves the risk of imperfect correlation in movements in the price of futures contracts, interest rates and the value/market value of the underlying hedged assets. During the twelve month reporting period, U.S. Treasury futures contracts were used to manage Total Return Bond Fund’s overall curve and interest rate exposure.
Annual Report 2014
68
Notes to Financial Statements (continued)
October 31, 2014
Swaps
Certain Funds enter into swaps to efficiently gain or hedge interest rate or currency risk. A swap is an agreement that obligates two parties to exchange a series of cash flows at specified intervals based upon or calculated by reference to changes in specified prices or rates for a specified amount of an underlying asset or notional principal amount. A Fund will enter into swaps only on a net basis, which means that the two payment streams are netted out, with a Fund receiving or paying, as the case may be, only the net amount of the difference between the two payments. Risks may arise as a result of the failure of the counterparty to the swap contract to comply with the terms of the swap contract. The loss incurred by the failure of a counterparty is generally limited to the net interest payment to be received by a Fund, and/or the termination value at the end of the contract. Therefore, a Fund considers the creditworthiness of each counterparty to a swap contract in evaluating potential credit risk. Additionally, risks may arise from unanticipated movements in interest rates or in the value of the underlying reference asset or index. A Fund records unrealized gains/(losses) on a daily basis representing the value and the current net receivable or payable relating to open swap contracts. Net amounts received or paid on the swap contract are recorded as realized gains/(losses). Fluctuations in the value of swap contracts are recorded for financial statement purposes as unrealized appreciation or depreciation of swap contracts. Realized gains/(losses) from terminated swaps are included in net realized gains/(losses) on swap contracts transactions.
Certain Funds are a party to International Swap Dealers Association, Inc. Master Agreements (“ISDA Master Agreements”). These agreements are with select counterparties and they govern transactions, including certain over-the-counter derivative and foreign exchange contracts, entered into by certain Funds and the counterparty. The ISDA Master Agreements maintain provisions for general obligations, representations, agreements, collateral, and events of default or termination. The occurrence of a specified event of termination may give a counterparty the right to terminate all of its contracts and affect settlement of all outstanding transactions under the applicable ISDA Master Agreement. To the extent a Fund engages in transactions under these agreements, it is subject to counterparty risk, which is described with respect to swaps both above and below.
Certain swaps entered into after June 10, 2013, including some interest rate swaps and credit default swaps, must be cleared pursuant to U.S. Commodity Futures Trading Commission (“CFTC”) regulations. As a result, these swaps can no longer be traded over-the-counter and are subject to various regulations and rules of the CFTC.
Entering into swap agreements involves, to varying degrees, elements of credit and market risk in excess of the amounts recognized on the Statements of Assets and Liabilities. Such risks involve the possibility that there will be no liquid market for these agreements, that the counterparty to the agreements may default on its obligation to perform and that there may be unfavorable changes in the value of the index or securities underlying the agreement. The Funds’ maximum risk of loss from counterparty risk related to swaps is the fair value of the contract. This risk is mitigated by having a master netting agreement between the Funds and the counterparties and by the posting of collateral by the counterparties to the Funds to cover the Funds’ exposure to the counterparty. A Fund must also segregate liquid assets to “cover” its obligations under the swap.
Credit Default Swaps
A credit default swap is a credit derivative contract between two counterparties. The buyer makes periodic payments to the seller, and in return receives protection if an underlying financial instrument defaults. A Fund might use credit default swap contracts to limit or to reduce risk exposure of the Fund to defaults of corporate and sovereign issuers (i.e., to reduce risk when the Fund owns or has exposure to such issuers). A Fund also might use credit default swap contracts, to create direct or synthetic short or long exposure to domestic or foreign corporate debt securities or certain sovereign debt securities to which the Fund is not otherwise exposed. As the seller in a credit default swap contract, a Fund would be required to pay the par (or other agreed-upon) value of a referenced debt obligation to the counterparty in the event of a default (or similar event) by a third party, such as a U.S. or foreign issuer, on the debt obligation. In return, a Fund would receive from the counterparty a periodic stream of payments over the term of the contract, provided that no event of default (or similar event) occurs. If no event of default (or similar event) occurs, a Fund would keep the stream of payments and would have no payment of obligations. As the seller in a credit default swap contract, a Fund effectively would add economic leverage to its portfolio because, in addition to its total net assets, a Fund would be subject to investment exposure on the notional amount of the swap. As the purchaser in a credit default swap contract, a Fund would function as the counterparty referenced in the preceding paragraph. This would involve the risk that the investment might expire worthless. It also would involve credit risk that the seller may fail to satisfy its payment obligations to a Fund in the event of a default (or similar event). As the purchaser in a credit default swap contract, a Fund’s investment would generate income only in the event of an actual default (or similar event) by the issuer of the underlying obligation. During the year ended October 31, 2014, Global High Income Fund employed CDX (a basket of credit derivatives) to hedge overall beta risk, a measure of the volatility, or systematic risk, of a security or a portfolio in comparison to the market as a whole. The Global High Income Fund also employed individual credit default swaps to hedge individual exposures as well as to initiate new long positions that are more efficient than the cash market.
2014 Annual Report
69
Notes to Financial Statements (continued)
October 31, 2014
Summary of Derivative Instruments
Certain Funds may use derivatives for various purposes as noted above.
| | | | |
| | | Location on the Statement of Assets and Liabilities |
| Derivative Instrument Risk Type | | Asset Derivatives | | Liability Derivatives |
| Interest Rate Risk | | Unrealized appreciation on futures contracts | | Unrealized depreciation on futures contracts |
| | Variation margin receivable for futures contracts | | Variation margin payable for futures contracts |
| Foreign Exchange Risk | | Unrealized appreciation on forward foreign currency exchange contracts | | Unrealized depreciation on forward foreign currency exchange contracts |
| Credit Risk | | Unrealized appreciation on swap contracts | | Unrealized depreciation on swap contracts |
The following is a summary of the fair value of Derivative Instruments, not accounted for as hedging instruments, as of October 31, 2014:
| | | | | | | | | | | | | | | | | | | | |
| | | | | | Asset Derivatives | |
| Funds | | Total Value at
10/31/2014 | | | Over-the-Counter
Credit Default
Swaps
(credit risk) | | | Centrally Cleared
Credit Default
Swaps
(credit risk)* | | | Forward Foreign
Exchange Contracts
(Foreign
Exchange Risk) | | | Futures
Contracts
(interest
rate risk)* | |
Total Return Bond Fund | | $ | 3,905,106 | | | $ | – | | | $ | – | | | $ | 3,905,106 | | | $ | – | |
Global High Income Fund | | | 24,207,076 | | | | 7,199,162 | | | | 509,223 | | | | 16,498,691 | | | | – | |
| | | | | | | | | | | | | | | | | | | | |
| | | | | | Liability Derivatives | |
| Funds | | Total Value at
10/31/2014 | | | Over-the-Counter
Credit Default
Swaps
(credit risk) | | | Centrally Cleared
Credit Default
Swaps
(credit risk)* | | | Forward Foreign
Exchange Contracts
(Foreign
Exchange Risk) | | | Futures
Contracts
(interest
rate risk)* | |
Total Return Bond Fund | | $ | 826,451 | | | $ | – | | | $ | – | | | $ | 759,607 | | | $ | 66,844 | |
Global High Income Fund | | | 501,342 | | | | – | | | | – | | | | 501,342 | | | | – | |
| | * | | Includes cumulative appreciation/depreciation on centrally cleared credit default swap contracts as reported in the Portfolio of Investments. Only current days variation margin is reported within the Statements of Assets and Liabilities. |
Annual Report 2014
70
Notes to Financial Statements (continued)
October 31, 2014
The following is a summary by derivative type of the market value of financial derivative instruments and collateral (received)/pledged as of October 31, 2014.
| | | | | | | | | | | | | | | | | | | | | | | | | | | | | | | | |
| | | | | | Gross Amounts Not Offset
in Statement of
Assets and Liabilities | | | | | | Gross Amounts Not Offset
in Statement of
Assets and Liabilities | |
| Description | | Gross Amounts
of Assets
Presented in
Statement of
Assets and
Liabilities | | | Financial
Instruments | | | Collateral
Received (1) | | | Net
Amount (3) | | | Gross Amounts
of Liabilities
Presented in
Statement of
Assets and
Liabilities | | | Financial
Instruments | | | Collateral
Pledged (1) | | | Net
Amount (3) | |
| | | Assets | | | Liabilities | |
Total Return Bond Fund | | | | | | | | | | | | | | | | | | | | | | | | | | | | | | | | |
Forward foreign currency | | | | | | | | | | | | | | | | | | | | | | | | | | | | | | | | |
Citibank (2) | | | – | | | | – | | | | – | | | | – | | | | 264,344 | | | | – | | | | – | | | | 264,344 | |
Credit Suisse (2) | | | 42,175 | | | | – | | | | – | | | | 42,175 | | | | – | | | | – | | | | – | | | | – | |
Deutsche Bank (2) | | | 2,294,068 | | | | – | | | | – | | | | 2,294,068 | | | | – | | | | – | | | | – | | | | – | |
JPMorgan Chase | | | 533,435 | | | | (37,565 | ) | | | – | | | | 495,870 | | | | 37,565 | | | | (37,565 | ) | | | – | | | | – | |
Westpac Banking Corp. | | | 1,035,428 | | | | (457,698 | ) | | | – | | | | 577,730 | | | | 457,698 | | | | (457,698 | ) | | | – | | | | – | |
Futures | | | | | | | | | | | | | | | | | | | | | | | | | | | | | | | | |
JPMorgan (2) | | | – | | | | – | | | | – | | | | – | | | | 66,844 | | | | – | | | | (66,844 | ) | | | – | |
Global High Income Fund | | | | | | | | | | | | | | | | | | | | | | | | | | | | | | | | |
Forward foreign currency | | | | | | | | | | | | | | | | | | | | | | | | | | | | | | | | |
Deutsche Bank (2) | | | 1,041,976 | | | | – | | | | – | | | | 1,041,976 | | | | – | | | | – | | | | – | | | | – | |
JPMorgan Chase | | | 9,545,034 | | | | – | | | | – | | | | 9,545,034 | | | | – | | | | – | | | | – | | | | – | |
Westpac Banking Corp. | | | 5,911,681 | | | | (501,342 | ) | | | – | | | | 5,410,339 | | | | 501,342 | | | | (501,342 | ) | | | – | | | | – | |
Credit Default Swaps | | | | | | | | | | | | | | | | | | | | | | | | | | | | | | | | |
Deutsche Bank (2) | | | 471,607 | | | | – | | | | (350,000 | ) | | | 121,607 | | | | – | | | | – | | | | – | | | | – | |
Goldman Sachs (2) | | | 6,018,482 | | | | – | | | | (4,070,000 | ) | | | 1,948,482 | | | | – | | | | – | | | | – | | | | – | |
JPMorgan Chase | | | 509,223 | | | | – | | | | (509,223 | ) | | | – | | | | – | | | | – | | | | – | | | | – | |
Morgan Stanley | | | 709,073 | | | | – | | | | (270,000 | ) | | | 439,073 | | | | – | | | | – | | | | – | | | | – | |
| (1) | | In some instances, the actual collateral received and/or pledged may be more than the amount shown here due to overcollateralization. |
| (2) | | Includes financial derivative instruments (futures, swaps and forwards) which are not subject to master netting agreements, or another similar arrangement. |
| (3) | | Net amounts represent the net receivable/(payable) that would be due from/to the counterparty in the event of default. Exposure from financial derivative instruments can only be netted across transactions governed under the same master agreement with the same legal entity. |
The Effect of Derivative Instruments on the Statement of Operations for the Year Ended October 31, 2014:
| | | | | | | | | | | | | | | | |
| | | | | | Realized Gain or (Loss) on Derivatives
Recognized in the Statement of Operations | |
| | | Total | | | Credit Default
Swaps
(credit risk) | | | Forward Foreign
Exchange Contracts
(Foreign Exchange Risk) | | | Futures
Contracts
(interest
rate risk) | |
Total Return Bond Fund | | $ | 6,542,856 | | | $ | – | | | $ | 6,455,101 | | | $ | 87,755 | |
Global High Income Fund | | | 15,886,392 | | | | 8,780,700 | | | | 7,105,692 | | | | – | |
| | | | | | | | | | | | | | | | |
| | | | | | Change in Unrealized Appreciation (Depreciation) on Derivatives Recognized in the Statement of Operations | |
| | | Total | | | Credit Default
Swaps
(credit risk) | | | Forward Foreign
Exchange Contracts
(Foreign Exchange Risk) | | | Futures
Contracts
(interest
rate risk) | |
Total Return Bond Fund | | $ | 1,266,649 | | | $ | – | | | $ | 1,333,493 | | | $ | (66,844 | ) |
Global High Income Fund | | | 13,633,420 | | | | (3,511,710 | ) | | | 17,145,130 | | | | – | |
2014 Annual Report
71
Notes to Financial Statements (continued)
October 31, 2014
Information about derivatives reflected as of the date of this report is generally indicative of the type of activity for the year ended October 31, 2014. The table below summarizes the weighted average values of derivatives holdings for the Funds during the year ended October 31, 2014.
| | | | | | | | | | | | |
| Fund | | Forward foreign exchange
contracts (Average
Notional Value) | | | Futures contracts
(Average Notional
Value) | | | Swap contracts
(Average Notional
Value) | |
Global High Income Fund | | $ | 2,627,049 | | | $ | – | | | $ | 139,883,117 | |
Total Return Bond Fund | | | 836,348 | | | | (6,200,000) | | | | – | |
The Funds value derivatives at fair value, as described in this note, and recognize changes in fair value currently in the results of operations. Accordingly, the Funds do not follow hedge accounting even for derivatives employed as economic hedges.
The Global High Income Fund may invest in bank loans. Bank loans include floating and fixed-rate debt obligations. Floating rate loans are debt obligations issued by companies or other entities with floating interest rates that reset periodically. Floating rate loans are secured by specific collateral of the borrower and are senior to most other securities of the borrower (e.g., common stock or debt instruments) in the event of bankruptcy. Floating rate loans are often issued in connection with recapitalizations, acquisitions, leveraged buyouts, and refinancings. Floating rate loans are typically structured and administered by a financial institution that acts as the agent of the lenders participating in the floating rate loan. Floating rate loans may be acquired directly through the agent, as an assignment from another lender who holds a direct interest in the floating rate loan, or as a participation interest in another lender’s portion of the floating rate loan.
The Global High Income Fund may enter into, or acquire participation in, delayed funding loans and revolving credit facilities. Delayed funding loans and revolving credit facilities are borrowings in which the Global High Income Fund agrees to make loans up to a maximum amount upon demand by the borrowing issuer for a specified term. A revolving credit facility differs from a delayed funding loan in that as the borrowing issuer repays the loan, an amount equal to the repayment is again made available to the borrowing issuer under the facility. The borrowing issuer may at any time borrow and repay amounts so long as, in the aggregate, at any given time the amount borrowed does not exceed the maximum amount established by the loan agreement. Delayed funding loans and revolving credit facilities usually provide for floating or variable rates of interest.
There are a number of risks associated with an investment in delayed funding loans and revolving credit facilities including credit, interest rate and liquidity risk and the risks of being a lender. There may be circumstances under which the borrowing issuer’s credit risk may be deteriorating and yet the Global High Income Fund may be obligated to make loans to the borrowing issuer as the borrowing issuer’s credit continues to deteriorate, including at a time when the borrowing issuer’s financial condition makes it unlikely that such amounts will be repaid. Delayed funding loans and revolving credit facilities may be subject to restrictions on transfer, and only limited opportunities may exist to resell such instruments. As a result, the Global High Income Fund may be unable to sell such investments at an opportune time or may have to resell them at less than fair market value. These risks could cause the Global High Income Fund to lose money on its investment, which in turn could affect its returns. The Global High Income Fund currently intends to treat delayed funding loans and revolving credit facilities for which there is no readily available market as illiquid for purposes of its limitation on illiquid investments. Delayed funding loans and revolving credit facilities are considered to be debt obligations for purposes of the Trust’s investment restriction relating to the lending of funds or assets by the Global High Income Fund.
As of October 31, 2014, there were ten unfunded commitments with a cost and fair value of $63,593,680 and $59,066,575, respectively (Par of 17,162,066 USD and 38,215,000 EUR). The Fund also held three bridge term loans which amounted to $32,186,786 of par that remained unfunded as of October 31, 2014. There was no cost or fair value assigned to these bridge term loans.
| g. | Security Transactions, Investment Income and Expenses |
Security transactions are recorded on the trade date. Realized and unrealized gains/(losses) from security and currency transactions are calculated on the identified cost basis. Dividend income is recorded on the ex-dividend date except for certain dividends on foreign securities, which are recorded as soon as a Fund is informed after the ex-dividend date. Interest income is recorded on an accrual basis using the effective interest method. Expenses are recorded on an accrual basis. Expenses directly attributable to a Fund are charged to that Fund. Expenses not directly attributable to a Fund are allocated proportionately among all Funds of the Trust. For each of the Funds, the method for allocating income, fund level expenses, and realized and unrealized gains or losses among classes is based on the total net asset value of each class’s shares in proportion to the total net assets of the relevant Fund. Expenses specific to a class (such as Rule 12b-1 and Transfer Agent fees) are charged to that class.
Annual Report 2014
72
Notes to Financial Statements (continued)
October 31, 2014
Funds that invest in foreign securities are subject to foreign taxes that may be imposed by certain countries in which the Funds invest. The Funds generally record foreign taxes based on applicable foreign tax law. The Funds incur withholding taxes on certain foreign dividends and interest, and those taxes are accrued at the time the associated income is recorded. The Funds file withholding tax reclaims in certain jurisdictions to recover a portion of amounts previously withheld. The Funds record a reclaim receivable based on, among other things, a jurisdiction’s legal obligation to pay reclaims as well as payment history and market convention. In consideration of recent decisions rendered by European courts, the Aberdeen Select International Equity Fund and Aberdeen Select International Equity Fund II (the “International Equity Funds”) have filed for additional reclaims related to prior years in accordance with European Union law. However, consistent with US GAAP accrual requirements, the International Equity Funds have not recorded a corresponding receivable amount because there is limited historical precedent for US funds collecting reclaims of this magnitude and the amount of the reclaims that these funds may receive in the future, if any, is uncertain. Any amounts to which the International Equity Funds may be entitled, if and when recorded, likely would result in an increase in the net asset value per share of each fund at that time. As of October 31, 2014, the total amount of reclaims filed for the International Equity Funds in the countries that may be affected by the European courts’ decisions (namely, Spain, Finland, France, Germany, The Netherlands, and Poland) represents approximately 5% of the net asset value per share for each of the International Equity Funds; however, the recovery of any or all of this amount and timing of recovery, if any, is uncertain.
Distributions from net investment income, if any, are declared and paid monthly for the Total Return Bond Fund and Global High Income Fund. Distributions from net investment income, if any, are declared and paid annually for the Global Select Opportunities Fund, Select International Equity Fund, and Select International Equity Fund II. The Funds will also declare and pay distributions annually from net realized gains on investment transactions and net realized foreign exchange gains, if any. Dividends and distributions to shareholders are recorded on the ex-dividend date. Additional distributions of net investment income and capital gains may be made at the discretion of the Boards of the Funds to avoid the application of the excise tax imposed under Section 4982 of the Internal Revenue Code of 1986, as amended (the “Code”), for certain undistributed amounts.
Dividends and distributions to shareholders are determined in accordance with federal income tax regulations, which may differ from GAAP. These differences are primarily due to differing treatments of income and gains on various investment securities held by the Funds, timing differences and differing characterization of distributions made by the Funds as a whole.
Each Fund intends to continue to qualify as a “regulated investment company” by complying with the provisions available to certain investment companies, as defined in Subchapter M of the Code, and to make distributions of net investment income and net realized capital gains sufficient to relieve the Funds from all, federal income taxes. Therefore, no federal income tax provision is required.
Management of the Funds has concluded that there are no significant uncertain tax positions that would require recognition in the financial statements. Since tax authorities can examine previously filed tax returns, the Funds’ U.S. federal and state tax returns for each of the four fiscal years up to the most recent fiscal year ended October 31 are subject to such review.
3. Agreements and Transactions with Affiliates
Under the Investment Advisory Agreements with the Funds, effective May 22, 2013, Aberdeen Asset Management Inc. (“Aberdeen” or the “Adviser”) manages the Funds in accordance with the policies and procedures established by the Boards. Prior to May 22, 2013, the Funds were managed by Artio Global Management LLC (the “Predecessor Adviser”).
2014 Annual Report
73
Notes to Financial Statements (continued)
October 31, 2014
For services provided under the terms of the current Investment Advisory Agreement, each Fund pays the Adviser an annual management fee paid monthly based on that Fund’s average daily net assets according to the following schedule:
| | | | | | | | |
| Fund | | Fee Schedule | | | | |
Global Select Opportunities Fund | | | On all assets | | | | 0.900% | |
Select International Equity Fund | | | Of the first $5 billion | | | | 0.900% | |
| | | On the next $2.5 billion | | | | 0.880% | |
| | | Over $7.5 billion | | | | 0.850% | |
Select International Equity Fund II | | | Of the first $5 billion | | | | 0.900% | |
| | | On the next $2.5 billion | | | | 0.880% | |
| | | Over $7.5 billion | | | | 0.850% | |
Total Return Bond Fund | | | On all assets | | | | 0.350% | |
Global High Income Fund | | | Of the first $5 billion | | | | 0.650% | |
| | | On the next $2.5 billion | | | | 0.630% | |
| | | On the next $2.5 billion | | | | 0.600% | |
| | | Over $10 billion | | | | 0.590% | |
The Adviser has engaged the services of Aberdeen Asset Managers Limited (the “Subadviser”), an affiliate, pursuant to the subadvisory agreements. The Subadviser manages a portion of certain of the Funds’ investments and has responsibility for making all investment decisions for the portion of a Fund’s assets that it manages. Pursuant to the subadvisory agreements, the Adviser pays fees to the Subadviser. For the year ended October 31, 2014, the Adviser paid the following amounts to the Subadviser for its services to the respective Funds:
| | | | |
| Fund | | Amount | |
Global Select Opportunities Fund | | $ | 45,778 | |
Select International Equity Fund | | | 3,317,346 | |
Select International Equity Fund II | | | 1,606,773 | |
Certain of the Funds and Aberdeen have entered into written contracts (“Expense Limitation Agreements”) limiting operating expenses for all classes of each Fund from exceeding the amounts listed below. This limit excludes certain expenses, including taxes, interest, brokerage commissions, and other expenditures which are capitalized in accordance with U.S. GAAP, and other extraordinary expenses not incurred in the ordinary course of the Fund’s business. These contracts are in effect until the earlier of (a) the termination of the Investment Advisory Agreement or (b) February 28, 2015; and may be renewed by mutual agreement between each Fund and the Adviser.
| | | | | | |
| Fund | | Class A Limit | | Institutional
Class Limit | |
Global Select Opportunities Fund Inc. | | 1.40% | | | 1.15 | % |
Total Return Bond Fund | | 0.69% | | | 0.44 | % |
Global High Income Fund | | 1.00% | | | 0.75 | % |
The Adviser has agreed to continue to waive a portion of its management fee for each of the Funds at the annual rate of 0.005% of the respective Funds’ average daily assets. The waiver may be terminated at any time by the Funds’ Boards.
Aberdeen may request and receive reimbursement from a Fund of the advisory fees waived and other expenses reimbursed pursuant to the Expense Limitation Agreements at a later date not to exceed three years from the fiscal year in which the corresponding reimbursement to the Funds was made. However, no reimbursement will be made for fees waived prior to May 21, 2013 by the Predecessor Adviser.
For fees waived on or after May 22, 2013, no reimbursement will be made unless:
(i) the total annual expense ratio of the class making such reimbursement is less than the limit set forth above; and
(ii) the payment of such reimbursement is approved by the Board on a quarterly basis (the “Reimbursement Requirements”).
If the Boards approve any changes in the waiver terms or limitations, reimbursements are only permitted to the extent that the terms of the Expense Limitation Agreements in effect at the time of the waiver are met at the time that reimbursement is approved. Except as provided for in the Expense Limitation Agreements, reimbursement of amounts previously waived or assumed by Aberdeen is not permitted.
Annual Report 2014
74
Notes to Financial Statements (continued)
October 31, 2014
As of October 31, 2014, to the extent the Reimbursement Requirements are met, the cumulative potential reimbursements for each Fund, based on expenses reimbursed by Aberdeen would be:
| | | | | | | | | | | | | | | | |
| Fund | | Amount
Fiscal Year
2012
(Expires 10/31/15) | | | Amount
Fiscal Year
2013
(Expires 10/31/16) | | | Amount
Fiscal Year
2014
(Expires 10/31/17) | | | Total* | |
Global Select Opportunities Fund | | $ | – | | | $ | 55,855 | | | $ | 115,077 | | | $ | 170,932 | |
Select International Equity Fund | | | – | | | | – | | | | – | | | | – | |
Select International Equity Fund II | | | – | | | | – | | | | – | | | | – | |
Total Return Bond Fund | | | – | | | | 11,826 | | | | 22,047 | | | | 33,873 | |
Global High Income Fund | | | – | | | | – | | | | 75,716 | | | | 75,716 | |
| | * | | Amounts reported are due to expire throughout the respective 3-year expiration period presented above. |
Amounts listed as “–” are $0 or round to $0.
4. Distributor and Shareholder Services
The Funds and Aberdeen Fund Distributors, LLC (the “Distributor” or “AFD”) are parties to the current Underwriting Agreement (the “Underwriting Agreement”) whereby the Distributor acts as principal underwriter for the Funds’ shares. Prior to May 22, 2013, Quasar Distributors, LLC (“Quasar”) was the Distributor of the Funds.
The Funds have adopted a Distribution and Shareholder Services Plan (the “Plan”), pursuant to Rule 12b-1 under the 1940 Act. Under the Plan, each Fund’s Class A shares may compensate certain financial institutions, including the Distributor, for certain distribution, shareholder servicing, administrative and accounting services. The Funds’ Class A shares may expend an aggregate amount, on an annual basis, not to exceed 0.25% of the value of the average daily net assets of a Fund attributable to Class A shares. The Funds will adjust accruals accordingly for any unused or surplus balances on an annual basis. The Adviser may pay additional marketing and other distribution costs out of its profits.
Under its terms, the Funds’ Plan shall remain in effect from year to year, provided such continuance is approved annually by a vote of a majority of the Boards’ members and a majority of those Boards’ members who are not “interested persons” of the Funds and who have no direct or indirect financial interest in the operation of the Plan or in any agreement related to the Plan.
5. Investment Transactions
Purchases and sales of securities (excluding short-term securities) for the year ended October 31, 2014, were as follows:
| | | | | | | | |
| Fund | | Purchases | | | Sales | |
Global Select Opportunities Fund | | $ | 920,138 | | | $ | 2,153,386 | |
Select International Equity Fund | | | 66,795,330 | | | | 244,022,332 | |
Select International Equity Fund II | | | 28,470,285 | | | | 118,060,009 | |
Total Return Bond Fund | | | 1,893,461,546 | | | | 1,941,196,974 | |
Global High Income Fund | | | 2,385,817,715 | | | | 2,381,918,375 | |
6. Shares of Beneficial Interest
The Global Select Opportunities Fund may issue 50 billion shares of beneficial interest with a par value of $0.001 per share. The Trust may issue an unlimited number of shares of beneficial interest of each Fund, with a par value of $0.001 per share.
2014 Annual Report
75
Notes to Financial Statements (continued)
October 31, 2014
7. Investments in Affiliated Issuers
An affiliated issuer, as defined under the 1940 Act, includes, among other things, an issuer in which a Fund holds 5% or more of the issuer’s outstanding voting securities. A summary of the Funds’ investments in securities of these issuers for the period ended October 31, 2014 is set forth below:
| | | | | | | | | | | | | | | | | | | | |
| Affiliate | | Shares Held
October 31, 2014 | | | Purchases
(Cost) | | | Sales
(Proceeds) | | | Dividend
Income | | | Fair Value
October 31, 2014 | |
Aberdeen Select International Equity Fund | | | | | | | | | | | | | | | | | | | | |
LEV Insurance | | | 4,078,860 | | | $ | – | | | $ | – | | | $ | – | | | $ | 1,780,958 | |
Toza Markovic ad Kikinda | | | 78,160 | | | | – | | | | – | | | | – | | | | – | |
| | | | | | | | | | | | | | | | | | | $ | 1,780,958 | |
| | | | | | | | | | | | | | | | | | | | |
| Affiliate | | Shares Held
October 31, 2014 | | | Purchases
(Cost) | | | Sales
(Proceeds) | | | Dividend
Income | | | Fair Value
October 31, 2014 | |
Aberdeen Global High Income Fund | | | | | | | | | | | | | | | | | | | | |
Deep Ocean | | | 1,427,968 | | | $ | – | | | $ | – | | | $ | – | | | $ | 37,722,113 | |
8. Portfolio Investment Risks
Deteriorating market conditions might cause a general weakness in the market that reduces the prices of securities in that market in which the Fund invests.
| b. | Foreign Securities Risk |
Foreign securities may be more volatile, harder to price and less liquid than U.S. securities. Foreign securities also may involve risks relating to the impact of currency exchange rate fluctuation.
| c. | Foreign Currency Transaction Risk |
As foreign securities are usually denominated in foreign currencies, a Fund may employ strategies intended to protect the Fund’s portfolio from adverse currency fluctuations. A Fund may also employ strategies intended to increase exposure to certain currencies. Such currency transactions involve additional risks, and a Fund’s strategies, if unsuccessful, may decrease the value of a Fund.
| d. | Mortgage-Related Securities Risk |
A Fund may invest in mortgage-related securities. Rising interest rates may cause an issuer to exercise its right to pay principal later than expected which tends to extend the duration of mortgage-related securities, making them more sensitive to changes in interest rates. As a result, in a period of rising interest rates, a Fund that holds mortgage-related securities may exhibit additional volatility. This is known as extension risk. In addition, mortgage-related securities are subject to prepayment risk. When interest rates decline, borrowers may pay off their mortgages sooner than expected. This can reduce the returns of a Fund because the Fund will have to reinvest that money at the lower prevailing interest rates.
| e. | Asset-Backed Securities Risk |
Like traditional fixed income securities, the value of asset-backed securities typically increases when interest rates fall and decreases when interest rates rise. Certain asset-backed securities may also be subject to the risk of prepayment.
A magnification of the risks that apply to foreign securities. These risks are greater for securities of companies in emerging market countries because the countries may have less stable governments, more volatile currencies and less established markets (see “Foreign Securities Risk” above).
| g. | Securities Selection Risk |
The investment team may select securities that underperform the stock market or other funds with similar investment objectives and strategies.
| h. | Mid-Cap Securities Risk |
In general, stocks of mid-cap companies may be more volatile and less liquid than larger company stocks.
Annual Report 2014
76
Notes to Financial Statements (continued)
October 31, 2014
| i. | Small Cap Securities Risk |
Smaller companies are usually less stable in price, less liquid and harder to price than those of larger, more established companies. Therefore, they generally involve greater risk.
A Fund may engage in active and frequent trading of portfolio securities to achieve its investment objective. If a Fund does trade this way, it may incur increased costs, which can lower the actual return of the Fund.
Derivatives can be highly volatile and involve risks in addition to the risks of the underlying investment, index or rate. Derivatives involve special risks including correlation, counterparty, liquidity, operational, accounting and tax risks. Investing in derivatives also requires a specific skill set and may result in losses. Derivatives may be illiquid, difficult to price and leveraged so that small changes may produce disproportionate losses. Gains or losses from derivatives can be substantially greater than the derivatives’ original cost.
A Fund’s fixed income investments are subject to interest rate risk, which generally causes the value of a fixed income portfolio to decrease when interest rates rise resulting in a decrease in the Fund’s net assets. The Fund may be subject to a greater risk of rising interest rates due to the current period of historically low rates and the effect of potential government fiscal policy initiatives and resulting market reaction to those initiatives. Interest rate fluctuations tend to have a greater impact on fixed income-securities with a greater time to maturity and/or lower coupon. In periods of market volatility, the market values of fixed income securities may be more sensitive to changes in interest rates.
Certain transactions may give rise to a form of leverage. Such transactions may include, among others, loans of securities, and the use of when-issued, delayed delivery or forward commitment transactions. The use of derivatives may also cause leveraging risk.
| n. | Illiquid Securities Risk |
Illiquid securities are assets which may not be sold or disposed of in the ordinary course of business within seven days at approximately the price at which the Fund has valued the investment on its books and may include such securities as those not registered under U.S. securities laws or securities that cannot be sold in public transactions. An inability to sell a portfolio position can adversely affect the Fund’s value or prevent the Fund from being able to take advantage of other investment opportunities. Illiquid securities and relatively less liquid securities may also be difficult to value. Over recent years, the capacity of dealers to make markets in fixed income securities has been outpaced by the growth in the size of the fixed income markets. Liquidity risk may be magnified in a rising interest rate environment or when investor redemptions from fixed income funds may be higher than normal, due to the increased supply in the market that would result from selling activity.
| o. | Municipal Securities Risk |
A Fund may invest in municipal bonds which may be significantly affected by political and economic changes, including inflation, as well as uncertainties in the municipal market related to taxation, legislative changes, or the rights of municipal security holders. Municipal Bonds have varying levels of sensitivity to changes in interest rates. In general, the price of a Municipal Bond can fall when interest rates rise and can rise when interest rates fall. Interest rate risk is generally lower for shorter-term Municipal Bonds and higher for long term Municipal Bonds. Under certain market conditions, the Adviser may purchase Municipal Bonds that the Adviser perceives are undervalued. Undervalued Municipal Bonds are subject to the same market volatility and principal and interest rate risks described above. Lower quality Municipal Bonds involve greater risk of default or price changes due to changes in the credit quality of the issuer. The value of lower quality Municipal Bonds often fluctuates in response to political or economic developments and can decline significantly over short periods of time or during periods of general or regional economic difficulty. In the case of tax-exempt Municipal Bonds, if the Internal Revenue Service or state tax authorities determine that an issuer of a tax-exempt Municipal Bond has not complied with applicable tax requirements, interest from the security could become taxable at the federal, state and/or local level, and the security could decline significantly in value. Municipal Bonds are subject to credit or default risk. Credit risk is the risk that the issuer of a municipal security might not make interest and principal payments on the security as they become due.
| p. | Private Placements and Other Restricted Securities Risk |
Investments in private placements and other restricted securities, including Regulation S Securities and Rule 144A Securities, could have the effect of increasing a Fund’s level of illiquidity. Private placements and restricted securities may be less liquid than other investments because such securities may not always be readily sold in broad public markets and a Fund might be unable to dispose of such securities promptly or at prices reflecting their true value.
2014 Annual Report
77
Notes to Financial Statements (continued)
October 31, 2014
There are a number of risks associated with an investment in bank loans including credit risk, interest rate risk, illiquid securities risk, and prepayment risk. There is also the possibility that the collateral securing a loan, if any, may be difficult to liquidate or be insufficient to cover the amount owed under the loan. These risks could cause a Fund to lose income or principal on a particular investment, which in turn could affect a Fund’s returns.
Fixed income securities are subject to credit risk, which is the risk that an issuer of a bond may default on its obligation to pay or repay interest and principal. In the event of an unanticipated default, a Fund would experience a reduction in its income and could expect a decline in the market value of the securities so affected.
| s. | Delayed Funding Loans and Revolving Credit Facilities Risk |
There are a number of risks associated with an investment in delayed funding loans and revolving credit facilities including credit, interest rate and liquidity risk and the risks of being a lender. There may be circumstances under which the borrowing issuer’s credit risk may be deteriorating and yet a Fund may be obligated to make loans to the borrowing issuer as the borrowing issuer’s credit continues to deteriorate, including at a time when the borrowing issuer’s financial condition makes it unlikely that such amounts will be repaid. Delayed funding loans and revolving credit facilities may be subject to restrictions on transfer, and only limited opportunities may exist to resell such instruments.
| t. | High-Yield Bonds and Other Lower-Rated Securities Risk |
A Fund’s investments in high-yield bonds (commonly referred to as “junk bonds”) and other lower-rated securities will subject the Fund to substantial risk of loss. Investments in high-yield bonds are speculative and issuers of these securities are generally considered to be less financially secure and less able to repay interest and principal than issuers of investment-grade securities. Prices of high-yield bonds tend to be very volatile. These securities are less liquid than investment-grade debt securities and may be difficult to price or sell, particularly in times of negative sentiment toward high-yield securities.
As interest rates decline, debt issuers may repay or refinance their loans or obligations earlier than anticipated. The issuers of fixed income securities may, therefore, repay principal in advance. This forces a Fund to reinvest the proceeds from the principal prepayments at lower rates, which reduces the Fund’s income.
| v. | Impact of Large Redemptions and Purchases of Fund Shares |
Occasionally, shareholders may make large redemptions or purchases of a Fund’s shares, which may cause the Fund to have to sell securities or invest additional cash. These transactions may adversely affect the Fund’s performance and increase transaction costs. In addition, large redemption requests may exceed the cash balance of the Fund and result in credit line borrowing fees or overdraft charges to the Fund until the sale of portfolio securities to cover the redemption request settle.
Please read the prospectus for more detailed information regarding these and other risks.
9. Contingencies
In the normal course of business, the Funds may provide general indemnifications pursuant to certain contracts and organizational documents. The Funds’ maximum exposure under these arrangements is dependent on future claims that may be made against the Funds, and therefore, cannot be estimated; however, based on experience, the risk of loss from such claims is considered remote.
10. Tax Information
As of October 31, 2014, the tax cost of securities and the breakdown of unrealized appreciation/(depreciation) for each Fund were as follows:
| | | | | | | | | | | | | | | | |
| | | Tax Cost of
Securities | | | Unrealized
Appreciation | | | Unrealized
Depreciation | | | Net
Unrealized
Appreciation
(Depreciation) | |
Global Select Opportunities Fund | | $ | 6,890,021 | | | $ | 624,142 | | | $ | (420,310 | ) | | $ | 203,832 | |
Select International Equity Fund | | | 547,000,614 | | | | 34,430,093 | | | | (105,082,908 | ) | | | (70,652,815 | ) |
Select International Equity Fund II | | | 229,091,115 | | | | 15,899,598 | | | | (17,560,880 | ) | | | (1,661,282 | ) |
Total Return Bond Fund | | | 1,501,626,150 | | | | 27,506,669 | | | | (13,666,090 | ) | | | 13,840,579 | |
Global High Income Fund | | | 2,212,856,493 | | | | 73,254,390 | | | | (65,672,819 | ) | | | 7,581,571 | |
Annual Report 2014
78
Notes to Financial Statements (continued)
October 31, 2014
The tax character of distributions paid during the fiscal year ended October 31, 2014 was as follows (total distributions paid differ from the Statements of Changes in Net Assets because for tax purposes dividends are recognized when actually paid):
| | | | | | | | | | | | | | | | | | | | | | | | |
| | | Distributions paid from | |
| Fund | | Ordinary
Income | | | Net Long Term
Capital Gains | | | Total
Taxable
Distributions | | | Tax Exempt
Distributions | | | Return of
Capital | | | Total
Distributions Paid | |
Global Select Opportunities Fund | | $ | 107,020 | | | $ | – | | | $ | 107,020 | | | $ | – | | | $ | – | | | $ | 107,020 | |
Select International Equity Fund | | | 13,489,548 | | | | – | | | | 13,489,548 | | | | – | | | | – | | | | 13,489,548 | |
Select International Equity Fund II | | | 400,427 | | | | – | | | | 400,427 | | | | – | | | | – | | | | 400,427 | |
Total Return Bond Fund | | | 29,044,920 | | | | – | | | | 29,044,920 | | | | – | | | | – | | | | 29,044,920 | |
Global High Income Fund | | | 163,321,054 | | | | 27,302,327 | | | | 190,623,381 | | | | – | | | | – | | | | 190,623,381 | |
The tax character of distributions paid during the fiscal year ended October 31, 2013 was as follows (total distributions paid differ from the Statements of Changes in Net Assets because for tax purposes dividends are recognized when actually paid):
| | | | | | | | | | | | | | | | | | | | | | | | |
| | | Distributions paid from | |
| Fund | | Ordinary
Income | | | Net Long Term
Capital Gain | | | Total
Taxable
Distributions | | | Tax Exempt
Distributions | | | Return of
Capital | | | Total
Distributions Paid | |
Global Select Opportunities Fund | | $ | 187,778 | | | $ | – | | | $ | 187,778 | | | $ | – | | | $ | – | | | $ | 187,778 | |
Select International Equity Fund | | | 7,506,959 | | | | – | | | | 7,506,959 | | | | – | | | | – | | | | 7,506,959 | |
Select International Equity Fund II | | | 25,691,817 | | | | – | | | | 25,691,817 | | | | – | | | | 87,115 | | | | 25,778,932 | |
Total Return Bond Fund | | | 60,478,188 | | | | 32,127,743 | | | | 92,605,931 | | | | – | | | | 3,301,594 | | | | 95,907,525 | |
Global High Income Fund | | | 181,064,496 | | | | 10,883,785 | | | | 191,948,281 | | | | – | | | | – | | | | 191,948,281 | |
As of October 31, 2014, the components of accumulated earnings (deficit) on a tax basis were as follows:
| | | | | | | | | | | | | | | | | | | | | | | | | | | | | | | | | | | | | | | | |
| Fund | | Undistributed
Tax Exempt
Income | | | Undistributed
Ordinary
Income | | | Undistributed
Long-Term
Capital Gains | | | Accumulated
Earnings | | | Distributions
Payable | | | Late Year
Ordinary and
Post-October
Capital Loss
Deferrals | | | Other
Temporary
Differences | | | Accumulated
Capital and
Other Losses** | | | Unrealized
Appreciation/
Depreciation* | | | Total
Accumulated
Earnings
(Deficit) | |
Global Select Opportunities Fund | | $ | – | | | $ | 250,700 | | | $ | – | | | $ | 250,700 | | | $ | – | | | $ | – | | | $ | – | | | $ | (27,810,422 | ) | | $ | 203,250 | | | $ | (27,356,472 | ) |
Select International Equity Fund | | | – | | | | 19,497,739 | | | | – | | | | 19,497,739 | | | | – | | | | – | | | | – | | | | (2,269,715,906 | ) | | | (71,945,268 | ) | | | (2,322,163,435 | ) |
Select International Equity Fund II | | | – | | | | 9,350,035 | | | | – | | | | 9,350,035 | | | | – | | | | – | | | | (21,927 | ) | | | (2,713,739,819 | ) | | | (1,696,413 | ) | | | (2,706,108,124 | ) |
Total Return Bond Fund | | | – | | | | 8,740,721 | | | | 9,538,891 | | | | 18,279,612 | | | | – | | | | – | | | | (3,165,198 | ) | | | – | | | | 15,770,610 | | | | 30,885,024 | |
Global High Income Fund | | | – | | | | 10,710,831 | | | | 46,453,836 | | | | 57,164,667 | | | | – | | | | – | | | | (1,187,763 | ) | | | – | | | | 12,010,096 | | | | 67,987,000 | |
| * | | The difference between the book-basis and tax-basis unrealized appreciation/(depreciation) is attributable primarily to tax deferral of losses on wash sales. |
2014 Annual Report
79
Notes to Financial Statements (continued)
October 31, 2014
| ** | | As of October 31, 2014, for Federal income tax purposes, the following Funds have capital loss carryforwards available to offset capital gains, if any, to the extent provided by the Treasury regulations, which expire in the years set forth below: |
| | | | | | | | |
| Fund | | Amount | | | Expires | |
Global Select Opportunities Fund | | $ | 17,798,285 | | | | 2016 (short-term) | |
Global Select Opportunities Fund | | | 10,012,137 | | | | 2017 (short-term) | |
Select International Equity Fund | | | 314,780,611 | | | | 2016 (short-term) | |
Select International Equity Fund | | | 1,643,693,179 | | | | 2017 (short-term) | |
Select International Equity Fund | | | 17,599,661 | | | | unlimited (short-term) | |
Select International Equity Fund | | | 293,642,455 | | | | unlimited (long-term) | |
Select International Equity Fund II | | | 1,379,336,238 | | | | 2016 (short-term) | |
Select International Equity Fund II | | | 1,211,390,775 | | | | 2017 (short-term) | |
Select International Equity Fund II | | | 121,152,924 | | | | 2018 (short-term) | |
Select International Equity Fund II | | | 1,859,882 | | | | unlimited (short-term) | |
Under the Regulated Investment Company Modernization Act of 2010, the Funds are permitted to carry forward capital losses incurred in taxable years beginning after December 22, 2010 for an unlimited period. However, any losses incurred during those taxable years will be required to be utilized prior to the losses incurred in pre-enactment taxable years. As a result of this ordering rule, pre-enactment capital loss carryforwards may be more likely to expire unused. Additionally, post-enactment capital losses that are carried forward will retain their character as either short-term or long-term capital losses rather than being considered all short-term as under previous law.
GAAP requires that certain components of net assets be adjusted to reflect permanent differences between financial and tax reporting. Accordingly, the table below details the necessary reclassifications, which are a result of permanent differences primarily attributable to primarily attributable to foreign currency gain (loss), swap adjustments, book/tax differences related to amortization of premiums and discounts, paydown gains (losses) and redesignation of distributions. These reclassifications have no effect on net assets or net asset values per share.
| | | | | | | | | | | | |
| Fund | | Paid-in
Capital | | | Accumulated
Net Investment
Income/(Loss) | | | Accumulated
Net Realized
Gain/(Loss) | |
Global Select Opportunities Fund | | $ | – | | | $ | 22 | | | $ | (22 | ) |
Select International Equity Fund | | | – | | | | (1,289,123 | ) | | | 1,289,123 | |
Select International Equity Fund II | | | – | | | | 33,880 | | | | (33,880 | ) |
Total Return Bond Fund | | | – | | | | (14,994,566 | ) | | | 14,994,566 | |
Global High Income Fund | | | – | | | | 5,062,175 | | | | (5,062,175 | ) |
11. Significant Shareholders
As of October 31, 2014, the following Funds had shareholders with the percentage ownership indicated, which are considered significant shareholders (holdings greater than 5.0%) for financial reporting purposes:
| | | | | | |
| Fund | | Record Ownership % | | | Number of Account Owners |
Global Select Opportunities Fund | | | 61.3 | % | | 5 |
Select International Equity Fund | | | 64.2 | | | 2 |
Select International Equity Fund II | | | 60.7 | | | 5 |
Total Return Bond Fund | | | 71.2 | | | 3 |
Global High Income Fund | | | 75.2 | | | 8 |
12. Line of Credit
Aberdeen Global Select Opportunities Fund Inc. and Aberdeen Investment Funds (the “Borrowers”) entered into a Credit Agreement (the “Agreement”) with State Street Bank and Trust Company (the “Bank”). The Agreement provides for a revolving credit facility (the “Credit Facility”) to be utilized for temporary or emergency purposes to fund shareholder redemptions or for other short-term liquidity purposes. The
Annual Report 2014
80
Notes to Financial Statements (continued)
October 31, 2014
amount of the Credit Facility was $175,000,000 for the year ended October 31, 2014. The Funds may draw up to their stated sublimit (subject to certain other limitations therein):
| | | | | | | | | | | | |
| | | Sublimit
Amount | | | Average
Outstanding
Daily Balance | | | Average
Weighted
Interest Rate | |
Global Select Opportunities Fund | | | $5,000,000 | | | | $3,740 | | | | 1.346% | |
Select International Equity | | $ | 175,000,000 | | | $ | 379,956 | | | | 1.346 | % |
Select International Equity II | | $ | 175,000,000 | | | $ | 214,278 | | | | 1.346 | % |
Total Return Bond Fund* | | $ | 175,000,000 | | | $ | – | | | | – | |
| * | | The sublimit amount for the Total Return Bond Fund was increased during the period from $50,000,000.00. |
In addition, the Global High Income Fund entered into a separate Credit Agreement (the “Global High Income Fund Credit Agreement”) with the Bank. The Global High Income Fund Credit Agreement provides for a revolving credit facility (the “Global High Income Fund Credit Facility”) to be utilized for temporary or emergency purposes to fund shareholder redemptions or for other short-term liquidity purposes. The amount of the Global High Income Fund Credit Facility was $250,000,000 for the year ended October 31, 2014. The Global High Income Fund may draw the entire $250,000,000 (subject to certain limitations).
| | | | | | | | | | | | |
| | | Sublimit Amount | | | Average Outstanding Daily Balance | | | Average
Weighted
Interest Rate | |
Global High Income Fund | | $ | 250,000,000 | | | $ | — | | | | — | |
Principal on each outstanding loan made under the Agreement and the Global High Income Fund Credit Agreement shall bear the interest at a variable rate per annum equal to the higher of (a) the Federal Funds Rate as in effect on that day plus 1.25% and (b) the Overnight London Interbank Offered Rate (“LIBOR”) as in effect on that day plus 1.25%. In addition, the Borrowers shall pay to the Bank a commitment fee at the rate of 0.10% per annum on the daily unused portion of each of the Facility Amount or Aberdeen Global High Income Fund Facility Amount, as applicable, which is allocated among the Borrowers in such manner as is determined by the Boards to be reasonable.
13. Recent Accounting Pronouncements
In June 2014, the Financial Accounting Standards Board issued guidance to improve the financial reporting of repurchase agreements and other similar transactions. The guidance includes expanded disclosure requirements for entities that enter into repurchase agreements and similar transactions accounted for as secured borrowings. The guidance is effective for financial statements with fiscal years beginning on or after December 15, 2014 and interim periods within those fiscal years. Management is evaluating the impact, if any, of this guidance on the Funds’ financial statement disclosures.
14. Subsequent Events
Management has evaluated the need for disclosures and/or adjustments resulting from subsequent events through the date the financial statements were issued. Based on this evaluation, no disclosures and/or adjustments were required to the financial statements as of October 31, 2014.
On September 18, 2014, the Board of Directors of Global Select Opportunities Fund approved an Agreement and Plan of Reorganization relating to the reorganization (the “Reorganization”) of the Global Select Opportunities Fund into the Aberdeen Global Equity Fund (the “Acquiring Fund”), a series of Aberdeen Funds. Aberdeen also serves as investment adviser to the Acquiring Fund and has determined that the Acquiring Fund would be the accounting and performance survivor of the Reorganization. On September 18, 2014, the Board of Directors of the Global Select Opportunities Fund (the “Fund”) also approved a proposed Plan of Liquidation (“Liquidation Plan”) that provides for the complete liquidation of all of the assets of the Fund. The Liquidation Plan is subject to approval by the Global Select Opportunities Fund’s stockholders and would only be put into effect if either the Reorganization is not approved by stockholders or is not consummated for any other reason. Aberdeen proposed the Reorganization and Liquidation, in part, because it determined that the Global Select Opportunities Fund is not viable in the long term due to the Fund’s small asset size.
2014 Annual Report
81
Notes to Financial Statements (concluded)
October 31, 2014
The special meeting of stockholders will be held on February 3, 2015. Stockholders of record on November 19, 2014 will be entitled to vote at the meeting or any adjournments thereof and have been mailed proxy materials describing the proposed Reorganization and Liquidation.
In anticipation of the Reorganization or Liquidation, the Global Select Opportunities Fund will be closed to investments, effective as of the close of business on February 13, 2015. The closure will apply to all investments, including automatic investments, dividend reinvestments and any other investment options.
At a September 18, 2014 meeting, the Funds’ Boards of Directors/Trustees approved a new transfer agency agreement with Boston Financial Data Services, Inc. (“BFDS”). It is expected that BFDS will replace U.S. Bancorp Fund Services, LLC as the Funds’ Transfer Agent on or about February 20, 2015.
Annual Report 2014
82
Shareholder Expense Examples (Unaudited)
As a shareholder of the Aberdeen Investment Funds or a stockholder of Aberdeen Global Select Opportunities Fund Inc. (the “Funds”), you incur ongoing costs, including investment advisory fees, shareholder service fees, distribution fees and other Fund expenses. The examples below are intended to help you understand your ongoing costs (in dollars) of investing in the Funds and to compare these costs with the ongoing costs of investing in other mutual funds.
The examples assume that you had a $1,000 investment in the Class at the beginning of the reporting period, May 1, 2014 and continued to hold your shares at the end of the reporting period, October 31, 2014.
Actual Expenses
The table below provides information about actual account values and actual expenses. You may use the information together with the amount you invested, to estimate the expenses that you paid over the period. Simply divide your account value by $1,000 (for example, an $8,600 account value divided by $1,000 = 8.6), then multiply the result by the number under the heading entitled “Actual Expenses Paid During Period” for the class of a Fund that you own to estimate the expenses you paid on your account during the period.
Hypothetical Example for Comparison Purposes
The table below provides information about hypothetical account values and hypothetical expenses based on the Class’ actual expense ratio and an assumed rate of return of 5% per year before expenses, which is not the Class’ actual return. The hypothetical account values and expenses may not be used to estimate the actual ending account balance or expenses you paid for the period. You may use this information to compare the ongoing costs of investing in the Class of a Fund and other funds. To do so, compare the 5% hypothetical example with the 5% hypothetical examples that appear in the shareholder reports of the other funds.
| | | | | | | | | | | | | | | | | | | | | | | | | | |
| | | | | Beginning Account
Value,
May 1, 2014 | | | Actual Ending
Account Value,
October 31,
2014 | | | Hypothetical
Ending
Account Value | | | Actual
Expenses Paid
During Period* | | | Hypothetical
Expenses Paid
During Period*1 | | | Annualized
Expense
Ratio** | |
Aberdeen Global Select Opportunities Fund Inc. | | Class A | | $ | 1,000.00 | | | $ | 988.40 | | | $ | 1,018.40 | | | $ | 6.77 | | | $ | 6.87 | | | | 1.35% | |
| | Institutional Class | | $ | 1,000.00 | | | $ | 989.30 | | | $ | 1,019.41 | | | $ | 5.77 | | | $ | 5.85 | | | | 1.15% | |
Aberdeen Select International Equity Fund | | Class A | | $ | 1,000.00 | | | $ | 957.30 | | | $ | 1,019.11 | | | $ | 5.97 | | | $ | 6.16 | | | | 1.21% | |
| | Institutional Class | | $ | 1,000.00 | | | $ | 958.20 | | | $ | 1,020.32 | | | $ | 4.79 | | | $ | 4.94 | | | | 0.97% | |
Aberdeen Select International Equity Fund II | | Class A | | $ | 1,000.00 | | | $ | 960.70 | | | $ | 1,019.01 | | | $ | 6.08 | | | $ | 6.26 | | | | 1.23% | |
| | Institutional Class | | $ | 1,000.00 | | | $ | 961.50 | | | $ | 1,020.16 | | | $ | 4.94 | | | $ | 5.09 | | | | 1.00% | |
Aberdeen Total Return Bond Fund | | Class A | | $ | 1,000.00 | | | $ | 1,020.00 | | | $ | 1,046.70 | | | $ | 3.33 | | | $ | 3.38 | | | | 0.33% | |
| | Institutional Class | | $ | 1,000.00 | | | $ | 1,021.40 | | | $ | 1,048.00 | | | $ | 2.02 | | | $ | 2.05 | | | | 0.20% | |
Aberdeen Global High Income Fund | | Class A | | $ | 1,000.00 | | | $ | 995.30 | | | $ | 1,020.11 | | | $ | 5.08 | | | $ | 5.14 | | | | 1.01% | |
| | Institutional Class | | $ | 1,000.00 | | | $ | 997.40 | | | $ | 1,021.48 | | | $ | 3.73 | | | $ | 3.77 | | | | 0.74% | |
| * | | Expenses are equal to the Fund’s annualized expense ratio multiplied by the average account value over the period multiplied by 184/365 (to reflect the one-half year period). |
| ** | | The expense ratio presented represents a six-month, annualized ratio. |
| 1 | | Represents the hypothetical 5% return before expenses. |
2014 Annual Report
83
Report of Independent Registered Public Accounting Firm
The Shareholders and Board of Directors
Aberdeen Global Select Opportunities Fund Inc.
and
The Shareholders and Board of Trustees
Aberdeen Investment Funds
We have audited the accompanying statements of assets and liabilities, including the statements of investments, of the Aberdeen Global Select Opportunities Fund Inc. and the Aberdeen Investment Funds comprised of the Aberdeen Select International Equity Fund, Aberdeen Select International Equity Fund II, Aberdeen Total Return Bond Fund, and Aberdeen Global High Income Fund, (collectively, the “Funds”), as of October 31, 2014, and the related statements of operations for the year then ended, the statements of changes in net assets for each of the years in the two-year period then ended and the financial highlights for each of the years or periods in the five-year period then ended. These financial statements and financial highlights are the responsibility of the Funds’ management. Our responsibility is to express an opinion on these financial statements and financial highlights based on our audits.
We conducted our audits in accordance with the standards of the Public Company Accounting Oversight Board (United States). Those standards require that we plan and perform the audit to obtain reasonable assurance about whether the financial statements and financial highlights are free of material misstatement. An audit includes examining, on a test basis, evidence supporting the amounts and disclosures in the financial statements. Our procedures included confirmation of securities owned as of October 31, 2014, by correspondence with custodians and brokers, or by other appropriate auditing procedures. An audit also includes assessing the accounting principles used and significant estimates made by management, as well as evaluating the overall financial statement presentation. We believe that our audits provide a reasonable basis for our opinion.
In our opinion, the financial statements and financial highlights referred to above present fairly, in all material respects, the financial position of the Funds as of October 31, 2014, the results of their operations for the year then ended, the changes in their net assets for each of the years in the two-year period then ended, and the financial highlights for each of the years or periods in the five-year period then ended, in conformity with U.S. generally accepted accounting principles.

Philadelphia, Pennsylvania
December 26, 2014
Annual Report 2014
84
Other Tax Information (Unaudited)
For the period ended October 31, 2014, certain dividends paid by the Funds may be subject to a maximum tax rate of 15% as provided for by the Jobs and Growth Tax Relief Reconciliation Act of 2003. The Funds intend to designate the maximum amount allowable as taxed as a maximum rate of 15%. Complete information will be reported in conjunction with your 2013 Form 1099-DIV.
During the year ended October 31, 2014, the following Fund designated dividends as long-term capital gains:
| | | | |
| Fund | | Amount | |
Global High Income Fund | | $ | 27,302,327 | |
The Funds intend to elect to pass through to their shareholders the credit for taxes paid in foreign countries during its fiscal year ended October 31, 2014. In accordance with the current tax laws, the foreign income and foreign tax per share (for a share outstanding as of October 31, 2014) was as follows:
| | | | |
| Fund | | Foreign Tax | |
Global Select Opportunities Fund | | | 0.08510 | |
Select International Equity Fund | | | 0.07813 | |
Select International Equity Fund II | | | 0.03450 | |
For the year ended October 31, 2014, the following Funds paid qualified dividend income:
| | | | |
| Fund | | Qualified Dividend
Income | |
Global Select Opportunities Fund | | | 99.00% | |
Select International Equity Fund | | | 96.82% | |
Select International Equity Fund II | | | 82.00% | |
Global High Income Fund | | | 1.00% | |
For the taxable year ended October 31, 2014, the following percentage of income dividends paid by the Funds qualify for the dividends received deduction available to corporate shareholders:
| | | | |
| Fund | | Dividend Received
Deduction | |
Global Select Opportunities Fund | | | 89.00% | |
Global High Income Fund | | | 1.00% | |
2014 Annual Report
85
Supplemental Information (Unaudited)
Board Consideration of Advisory and Sub-Advisory Agreements
At an in-person joint meeting of the Board of Trustees of the Aberdeen Investment Funds (the “Trust”) and the Board of Directors of Aberdeen Global Select Opportunities Fund Inc., (the “Global Select Opportunities Fund”) held on June 12, 2014, the Board, including a including a majority of the Board Members who are not considered to be “interested persons” of the Trust or the Global Select Opportunities Fund (the “Independent Board Members”) under the Investment Company Act of 1940, as amended (the “1940 Act”), approved for an annual period the continuation of the Trust’s advisory agreement (the “Advisory Agreement”) between the Trust and Aberdeen Asset Management Inc. (the “Adviser”) with respect the each of Aberdeen Select International Equity Fund, Aberdeen Select International Equity Fund II, Aberdeen Total Return Bond Fund and Aberdeen Global High Income Fund (the “Aberdeen Investment Funds”); (ii) the investment advisory agreement (the “Global Select Opportunities Fund Advisory Agreement”) between the Global Select Opportunities Fund and the Adviser; and (iii) the sub-advisory agreements between the Adviser and Aberdeen Asset Managers Limited (the “Sub-Adviser”) with respect to certain Aberdeen Investment Funds and the Global Select Opportunities Fund (together, the Funds”) (the “Sub-Advisory Agreements” and, together with the Trust Advisory Agreement and the Global Select Opportunities Fund Advisory Agreement, the “Advisory Agreements”). The Sub-Adviser is an affiliate of the Adviser. The Adviser and the Sub-Adviser are sometimes referred to collectively as the “Advisers.”
In addition to the meeting on June 12, 2014, the Independent Board members formally met on April 14, 2014, May 20, 2014, May 27, 2014, and June 3, 2014, to discuss, among other things, the peer groups proposed by an independent third party to be used for comparison of fees and performance; the information request to the Advisers provided on their behalf by their independent legal counsel; the response of the Advisers to the information request; the legal standards that apply to their review; and supplemental information that they requested from the Advisers that they believed reasonably necessary for their review. In addition, the Investment Management and Service Contracts Committee met periodically to discuss the contract review process as a whole, the selection of the peer group by an independent third party, the independent third party’s report and the information provided the Adviser.
In connection with the contract review meetings, the Board reviewed a variety of information provided by the Advisers relating to the Funds, the Agreements and the Advisers, including comparative performance, fee and expense information and other information regarding the nature, extent and quality of services provided by the Advisers under their respective Agreements. The materials provided to the Board generally included, among other items:
| | • | | information on the investment performance of the Funds and the performance of peer groups of funds and the Funds’ performance benchmarks; |
| | • | | information on the Funds’ advisory fees and other expenses, including information comparing each Fund’s advisory fees and other expenses to those of a peer group of funds and information about any applicable expense limitations and fee “breakpoints”; |
| | • | | sales and redemption data with respect to each Fund; |
| | • | | information about the profitability of the Agreements to the Advisers; |
| | • | | a report prepared by the Advisers in response to a request submitted by the Independent Board Members’ independent legal counsel on behalf of the Independent Board Members; and |
| | • | | a memorandum from the Independent Board Members’ independent legal counsel on the responsibilities of the Board in considering for approval the investment advisory and investment sub-advisory arrangements under the 1940 Act and state law. |
The Board, including the Independent Board Members, also considered other matters such as:
| | • | | the Advisers’ financial results and financial condition; |
| | • | | each Fund’s investment objective and strategies; |
| | • | | the Advisers’ investment personnel and operations; |
| | • | | arrangements relating to the distribution of the Funds’ shares and the related costs; |
| | • | | the procedures employed to determine the value of the Funds’ assets; |
| | • | | the allocation of the Funds’ brokerage, if any, including, if applicable, allocations to brokers affiliated with the Advisers and the use, if any, of “soft” commission dollars to pay Fund expenses and to pay for research and other similar services; |
| | • | | the resources devoted to, and the record of compliance with, the Funds’ investment policies and restrictions, policies on personal securities transactions and other compliance policies; and |
| | • | | possible conflicts of interest. |
Annual Report 2014
86
Supplemental Information (Unaudited) (continued)
The Board also considered the nature, extent and quality of the services provided to the Funds by the Adviser’s affiliates. Throughout the process, the Independent Board Members were afforded the opportunity to ask questions of and request additional materials from the Adviser and the Sub-Adviser.
In addition to the materials requested by the Independent Board Members in connection with their annual consideration of the continuation of the Advisory Agreements, the Board receives materials in advance of each regular quarterly meeting of the Board that provide information relating to the services provided by the Advisers, including detailed information about the Funds’ investment performance. This information generally includes, among other things, third-party performance rankings for various periods (including prior to the Advisers’ management of the Funds) comparing each Fund against its peer group, total return information for various periods, and details of sales and redemptions of Fund shares for the period. The Board also receives periodic presentations from the portfolio management teams in connection with the performance of the Funds.
The Independent Board Members were advised by separate independent legal counsel throughout the process. The Independent Board Members also consulted in executive sessions with counsel to the Independent Board Members regarding consideration of the renewal of the Agreements. In considering whether to approve the continuation of the Agreements, the Board, including the Independent Board Members, did not identify any single factor as determinative. Individual Board members may have evaluated the information presented differently from one another, giving different weights to various factors. Matters considered by the Board, including the Independent Board Members, in connection with their approval of the continuation of the Advisory Agreements included the factors listed below.
The nature, extent and quality of the services provided to the Funds under the Agreements. The Board considered the nature, extent and quality of the services provided by Advisers, as applicable, to the Funds and the resources dedicated to the Funds by the Advisers and their affiliates. The Board considered, among other things:
| | • | | The Advisers’ investment experience; |
| | • | | The background and experience of the Advisers’ senior management personnel and the qualifications, background and responsibilities of the portfolio managers that are primarily responsible for the day-to-day portfolio management services for the Funds; |
| | • | | The allocation of responsibilities among the Advisers; |
| | • | | The Adviser’s role in coordinating the activities of the Funds’ other service providers was also considered; |
| | • | | The fact that it receives information on a regular basis from the Chief Compliance Officer of the Trust and the Global Select Opportunities Fund regarding the Advisers’ compliance policies and procedures; |
| | • | | The Advisers’ risk management processes; |
| | • | | The Advisers’ focus on the monitoring of the performance of the Funds and in addressing performance matters; |
| | • | | The benefits to shareholders of investing in a mutual fund that is part of a family of funds that offers shareholders the right to exchange shares of one type of fund for shares of another type of fund, and provides a variety of fund and shareholder services; and |
| | • | | Its knowledge of management and the quality of the performance of management’s duties through Board meetings, discussion and reports during the preceding year. |
After reviewing these and related factors, the Board concluded that the nature, extent and quality of the services provided to the Funds by the Advisers were extensive in nature and of high quality and supported the renewal of the Agreements.
Investment performance. The Board requested, and received, information about the performance of the Funds over various time periods, including information that compared the performance of each Fund to the performance of a relevant peer groups of funds and its performance benchmark. When applicable, the Board considered the performance of each Fund compared to the performance of comparable funds or accounts managed by the Adviser and its affiliates. In addition, the Board reviewed data prepared by an independent third party which analyzed the performance of each Fund using a variety of performance metrics.
The Board considered that the Adviser and its affiliates commenced management of the Funds in 2013, upon the acquisition by the Adviser’s parent of Artio Global Investors Inc., the parent of the Funds’ former investment adviser. The Board considered the Advisers’ performance and reputation generally, the performance of the Aberdeen fund family generally, and the Adviser’s responsiveness to the Board’s concerns about performance and their willingness to take steps intended to improve performance from the time they commenced management of the Funds.
2014 Annual Report
87
Supplemental Information (Unaudited) (continued)
In addition to the foregoing, the Board considered the specific factors set forth below with respect to the performance of each Fund for the periods ended March 31, 2014. In each case, the Board noted that the Advisers assumed management of each Fund on May 22, 2013, and that the Funds’ performance for periods prior to that time reflects the performance of the Funds’ previous investment adviser.
Aberdeen Select International Equity Fund. The Board noted that the Select International Equity Fund had performance in the bottom quintile when compared to its peer group over the 2-, 3-, 4-, 5- and 10-year periods. The Board considered that the Fund saw an improvement in performance following the change in portfolio managers, and that the Board was closely monitoring the Fund’s performance.
Aberdeen Select International Equity Fund II. The Board noted that for the 3- 4- and 5-year periods, the Select International Equity Fund II ranked in the bottom quintile, but that for the 1- and 2- year periods, it ranked in the third quintile. The Board considered that the Fund’s performance had improved since the change in portfolio managers, and that the Board would continue to closely monitor the Fund’s performance.
Aberdeen Global High Income Fund. The Board noted that the Fund compared favorably against the funds in its peer group and in the performance universe for the 1-, 2- and 10-year periods, when it ranked in the first quintile. The Board noted less favorable performance in the 3-, 4- and 5-year periods.
Aberdeen Total Return Bond Fund. The Board noted that the Fund underperformed its peer group average, performing in the fifth quintile, for the 1- and 2- year periods, but that performance was closer to the mean in the 3-, 4-, 5- and 10-year periods.
Aberdeen Global Select Opportunities Fund. The Board noted that the Fund had a challenging 5-year investment performance record but noted slight improvement in the most recent year. The Board recognized the small size of the Fund and noted that it would continue to monitor the Fund’s performance closely.
Fees paid for advisory services and expenses. The Board considered the fees charged to the Funds for advisory services as well as the total expense levels of the Funds. This information included comparisons (provided both by management and by an independent third party) of each Fund’s net management fee and total expense level to those of its peer group (the “Expense Group”) and information about the advisory fees charged by the Adviser to separately managed accounts with a similar investment strategy.
In comparing each Fund’s net management fee to that of comparable funds, the Board noted that such fee included advisory fees, but not fund administration fees. In considering the fees charged to any comparable accounts, the Board considered, among other things, management’s discussion of the differences required to manage the different types of accounts. In evaluating the Funds’ advisory fees, the Board also took into account the demands, complexity and quality of the investment management of the Funds.
The Board also noted that the sub-advisory fees, as applicable, for the Funds are paid by the Adviser, not the Funds, out of its advisory fee. The Board also considered that the Adviser had entered into expense limitation agreements with respect to the Aberdeen Global High Income Fund, the Aberdeen Total Return Bond Fund and the Aberdeen Global Select Opportunities Fund, pursuant to which the Adviser agreed to waive a portion of its advisory fee and/or reimburse certain expenses as a means of limiting each Fund’s total annual operating expenses for a period of time. Additionally, the Adviser has agreed to waive a portion of its management fees for each of the Funds at the annual rate of 0.005% of the respective Fund’s average daily net assets.
The Board also considered other benefits directly or indirectly received by Adviser and its affiliates from their relationships with the Funds, such as the engagement of affiliates of the Adviser to provide distribution services to the Funds.
In addition to the factors described above, the Board considered the specific factors set forth below with respect to each Fund’s fees and expenses. The Board considered the advisory fees, both contractual and after waivers and reimbursements, and also considered total expenses, both including Rule 12b-1 fees and non-Rule 12b-1 fees, and excluding such fees.
Aberdeen Select International Equity Fund. The Board noted that the Fund’s contractual management fees are slightly above the peer group median ranking 6 of 9 funds, while the Fund’s actual management fees are equal to or slightly greater than the peer group median ranking of 5 of 9 funds. The Board considered, however, that the Fund’s total expenses are lower than the median, ranking 2 of 9 funds in the peer group.
Aberdeen Select International Equity Fund II. The Board considered that the Fund’s contractual management fees are below the peer group median ranking 4 of 10 funds, while the Fund’s actual management fees are lower than the median ranking of 3 of 10 funds. The Board noted that the Fund’s total expenses are lower than the median, ranking 1 of 10 funds in the peer group.
Aberdeen Global High Income Fund. The Board considered that the Fund’s contractual management fees are above the peer group, ranking 13 of 15, and the Fund’s actual management fees are above the peer group median ranking 12 of 15 funds. The Board noted that the Fund’s total expenses are higher than the median, ranking 11 of 15 funds in the peer group. The Board noted the complexity of the securities held in the Fund’s portfolio.
Annual Report 2014
88
Supplemental Information (Unaudited) (concluded)
Aberdeen Total Return Bond Fund. The Board considered that the Fund’s contractual management fees are below the peer group median ranking 4 of 18 funds, while the Fund’s actual management fees are lower than the peer group median of 7 of 18 funds. The Board noted that the Fund’s total expenses are lower than the median, ranking 8 of 18 funds in the peer group.
Aberdeen Global Select Opportunities Fund. The Board considered that the Fund’s contractual management fees are higher than the peer group median, ranking 6 of 9 funds, while the Fund’s actual management fees are lower than the median ranking 1 of 9 funds. The Board noted that the Fund’s total expenses are lower than the median ranking 4 of 9 funds in the peer group.
The Independent Board Members asked for, and received, information about the fees paid by other funds and accounts managed by the Adviser. The Independent Board members considered the nature of the other accounts, which included comingled and private managed accounts. The Independent Board Members noted the differences in managing the Funds compared to other accounts managed by the Advisers, including, among other things, the complexity of managing the Funds in light of regulatory, tax and compliance considerations resulting from the Funds’ status as registered investment companies.
After reviewing these and related factors, and taking into account management’s discussion regarding Fund expenses, the Board concluded that the advisory fee, and as applicable, the sub-advisory fees, were fair and reasonable, and that the costs of these services generally and the related profitability of the Adviser and its affiliates from their relationships with the Funds were reasonable and supported the renewal of the Agreements.
Economies of Scale. The Board considered the existence of any economies of scale in the provision of services by Advisers and whether those economies would be shared with the Funds through breakpoints in the investment advisory fees or other means, such as expense waivers or limitations. The Board noted that the Aberdeen Global High Income Fund, the Aberdeen Total Return Bond Fund and the Aberdeen Global Select Opportunities Fund benefitted from an expense limitation agreement, and that the fees of Select International Equity Fund, Select International Equity Fund II and Global High Income Fund were subject to breakpoints. The Board considered the Adviser’s belief that the Total Return Bond Fund does not have breakpoints at this time because this Fund has a lower overall fee structure, and that the Global Select Opportunities Fund does not have breakpoints at this time due to the small size of the this Fund.
The Board also considered the potential effect of each Fund’s growth and size on fees, noting that if a Fund’s assets increase over time, the Fund may realize other economies of scale if assets increase proportionally more than some expenses.
Profitability and costs. The Board also examined the profitability of the Adviser and its affiliates on a Fund-by-Fund basis. The Board also considered information about the allocation of expenses used to calculate profitability. When reviewing Adviser’s profitability, the Board also considered guidance from the Securities and Exchange Commission and the courts regarding adviser profitability, the performance of the Funds, the expense levels of the Funds, and whether the Adviser had implemented breakpoints, if any, and expense limitations, with respect to the Funds.
Other factors. The Board also considered other factors, which included but were not limited to the following:
| | • | | the effect of any market and economic volatility on the performance, asset levels and expense ratios of the Funds. |
| | • | | whether the Funds have operated in accordance with their investment objectives and the Funds’ record of compliance with their investment restrictions, and the compliance programs of the Trust, the Global Select Opportunities Fund and the Adviser. The Trustees also considered the compliance-related resources that the Adviser and its affiliates provide to the Funds. |
| | • | | the Adviser’s financial condition and its ability to continue to provide a high level of service under the Advisory Agreement. |
| | • | | so-called “fallout benefits” to the Adviser, such as the benefits of research made available to the Adviser by reason of brokerage commissions generated by the Funds’ securities transactions or reputational and other indirect benefits. The Board considered any possible conflicts of interest associated with these fallout and other benefits, and the reporting, disclosure and other processes in place to disclose and monitor such possible conflicts of interest. |
* * *
Based on their evaluation of factors that they deemed to be material, including those factors described above, the Independent Board Members concluded that the advisory fee, and as applicable, sub-advisory fee structures, were reasonable in light of the nature and quality of the services provided, and recommended the that renewal of the Advisory Agreements would be in the best interest of each Fund and its shareholders. Accordingly, the Board, and the Independent Trustees voting separately, approved the Advisory Agreements for an additional one-year period.
2014 Annual Report
89
Management of the Funds (Unaudited)
As of October 31, 2014
Board of Trustees of Aberdeen Investment Funds (the “Trust”) and Board of Directors of Aberdeen Global Select Opportunities Fund Inc. (the “Global Select Opportunities Fund” or “GSOF”):
| | | | | | | | |
Name, Address,
and Year of Birth | | Position(s) Held,
Length of Time
Served and
Term of Office* | | Principal Occupation
During Past 5 Years | | Number of
Portfolios In Fund
Complex
Overseen by
Trustee** | | Other
Directorships
Held by Trustee
During Past 5 Years*** |
Directors/Trustees who are not Interested Persons (as Defined in the 1940 Act) of the Funds |
Antoine Bernheim**** 1953 | | Trustee of the Trust since November 2004; Director of GSOF since July 1990; Chairman of the Fund Complex since December 2008. | | President, Dome Capital Management, Inc., 1984–present (investment advisory firm); Chairman, Dome Securities Corp., 1995–2012 (broker/dealer); President, The U.S. Offshore Funds Directory, 1990–present (publishing). | | 5 | | None |
Thomas Gibbons**** 1947 | | Trustee of the Trust since November 2004; Director of GSOF since December 1993. | | President, Cornerstone Associates Management, 1987–present (consulting firm). | | 5 | | None |
Cynthia Hostetler**** 1962 | | Trustee of the Trust since September 2011; Director of GSOF since November 2010. | | Member of the Board of Directors of the Edgen Group (energy), 2012–2013, TriLinc Global Impact Fund, 2013–present, Vulcan Materials Company, 2014–present and Independent Directors Council (August 2014–present); Vice President of Investment Funds, Overseas Private Investment Corporation, 2001–2009; President, First Manhattan Bancorporation, 1991–2006. | | 5 | | Director, Edgen Group (NYSE: EDG) 2012–2013; Director, TriLinc Global Impact Fund, 2013–present; Director, Vulcan Materials Company, NYSE: VCM 2014–present (construction materials). |
Robert S. Matthews**** 1943 | | Trustee of the Trust since June 1992; Director of GSOF since June 2002. | | Managing Partner, Matthews & Co., 1990–present (certified public accounting firm). | | 5 | | Trustee, Allstate Financial Investment Trust, 2008–2009, (investment company). |
Peter Wolfram**** 1953 | | Trustee of the Trust since June 1992; Director of GSOF since November 2004. | | Partner, Kelley Drye & Warren LLP, 1983–present (law firm). | | 5 | | Friends of Atlantik-Bruecke e.V. Foundation, 2004–present. |
| * | | Each Director/Trustee serves during the lifetime of the Funds or until he or she dies, resigns, retires, is declared bankrupt or incompetent, or is removed or, if sooner, until the next special meeting of the Funds’ shareholders/stockholders and until the election and qualification of his or her successor. The current retirement age is 75. |
| ** | | The Aberdeen Fund Complex consists of the Trust which currently consists of four portfolios, Aberdeen Global Select Opportunities Fund Inc., Aberdeen Funds, Aberdeen Asia-Pacific Income Fund, Inc., Aberdeen Global Income Fund, Inc., Aberdeen Australia Equity Fund, Inc., Aberdeen Chile Fund, Inc., Aberdeen Israel Fund, Inc., Aberdeen Indonesia Fund, Inc., Aberdeen Latin America Equity Fund, Inc., Aberdeen Emerging Markets Smaller Company Opportunities Fund, Inc., Aberdeen Singapore Fund, Inc., The Asia Tigers Fund, Inc., The India Fund, Inc., Aberdeen Greater China Fund, Inc. and Aberdeen Japan Equity Fund, Inc. |
| *** | | Directorships held in (1) any other investment companies registered under the 1940 Act, (2) any company with a class of securities registered pursuant to Section 12 of the Securities Exchange Act of 1934, as amended (the “Exchange Act”) or (3) any company subject to the requirements of Section 15(d) of the Exchange Act. |
| **** | | Each Director/Trustee may be contacted by writing to the Director/Trustee c/o Aberdeen Asset Management Inc., 1735 Market Street, 32nd Floor, Philadelphia, Pennsylvania 19103, Attn: Alan Goodson. |
Annual Report 2014
90
Management of the Funds (Unaudited) (continued)
As of October 31, 2014
| | | | | | | | |
Name, Address,
and Year of Birth | | Position(s) Held,
Length of Time
Served and
Term of Office* | | Principal Occupation
During Past 5 Years | | Number of
Portfolios in Fund
Complex
Overseen by
Trustee** | | Other
Directorships
Held by Trustee
During Past 5
Years*** |
Director/Trustee who is an Interested Person (as Defined in the 1940 act) of the Funds |
Andrew Smith****† 1968 | | Trustee of the Trust since September 2014; Director of GSOF since September 2014. | | Co-Head of Americas for Aberdeen since June 2014. Mr. Smith is Chief Operating Officer of Aberdeen Asset Management Inc. He held various roles since he joined Aberdeen including Chief Compliance Officer for their North American Closed End Funds as well as Chief Financial Officer and Chief Operating Officer for Aberdeen in the Americas. Andrew joined Aberdeen in December 2000 as the result of the acquisition of Murray Johnstone. | | 5 | | Aberdeen Asset Management Inc. (2009–2014) (investment adviser) |
| * | | Each Director/Trustee serves during the lifetime of the Funds or until he or she dies, resigns, retires, is declared bankrupt or incompetent, or is removed or, if sooner, until the next special meeting of the Funds’ shareholders/stockholders and until the election and qualification of his or her successor. The current retirement age is 75. |
| ** | | The Aberdeen Fund Complex consists of the Trust, which currently consists of four portfolios, Aberdeen Global Select Opportunities Fund Inc., Aberdeen Funds, Aberdeen Asia-Pacific Income Fund, Inc., Aberdeen Global Income Fund, Inc., Aberdeen Australia Equity Fund, Inc., Aberdeen Chile Fund, Inc., Aberdeen Israel Fund, Inc., Aberdeen Indonesia Fund, Inc., Aberdeen Latin America Equity Fund, Inc., Aberdeen Emerging Markets Smaller Company Opportunities Fund, Inc., Aberdeen Singapore Fund, Inc., The Asia Tigers Fund, Inc., The India Fund, Inc., Aberdeen Greater China Fund, Inc. and Aberdeen Japan Equity Fund, Inc. |
| *** | | Directorships held in (1) any other investment companies registered under the 1940 Act, (2) any company with a class of securities registered pursuant to Section 12 of the Securities Exchange Act of 1934, as amended (the “Exchange Act”) or (3) any company subject to the requirements of Section 15(d) of the Exchange Act. |
| **** | | Each Director/Trustee may be contacted by writing to the Director/Trustee c/o Aberdeen Asset Management Inc., 1735 Market Street, 32nd Floor, Philadelphia, Pennsylvania 19103, Attn: Alan Goodson. |
| † | | Mr. Smith is considered to be an “interested person” of the Funds as defined in the 1940 Act because of his affiliation with the Adviser. |
2014 Annual Report
91
Management of the Funds (Unaudited) (continued)
As of October 31, 2014
Officers of the Funds
| | | | |
Name, Address,
and Year of Birth | | Position(s) Held, Length of Time
Served and Term of Office1,2 | | Principal Occupation
During Past 5 Years |
Bev Hendry* Aberdeen Asset Management Inc. 1735 Market Street, 32nd Floor Philadelphia, PA 19103 1953 | | President and Chief Executive Officer Officer of the Trust since September 2014; Officer of GSOF since September 2014 | | Currently, Co-Head of Americas and Chief Financial Officer for Aberdeen Asset Management Inc. since June 2014. He first joined Aberdeen in 1987 and helped establish Aberdeen’s business in the Americas in Fort Lauderdale. Mr. Hendry left Aberdeen in 2008 when the company moved to consolidate its headquarters in Philadelphia. Mr. Hendry re-joined Aberdeen from Hansberger Global Investors in Fort Lauderdale, Florida, where he worked for six years as Chief Operating Officer. |
Jeffrey Cotton* Aberdeen Asset Management Inc. 1735 Market Street, 32nd Floor Philadelphia, PA 19103 1977 | | Chief Compliance Officer and Vice President Officer of the Trust since 2013; Officer of GSOF since 2013 | | Currently, Vice President and Head of Compliance – Americas for Aberdeen Asset Management Inc. Mr. Cotton joined Aberdeen in 2010. Prior to joining Aberdeen, Mr. Cotton was a Senior Compliance Officer at Old Mutual Asset Management (2009-2010) supporting its affiliated investment advisers and mutual fund platform. Mr. Cotton was also a Vice President and Senior Compliance Manager at Bank of America/Columbia Management (2006–2009). |
Sofia Rosala* Aberdeen Asset Management Inc. 1735 Market Street, 32nd Floor, Philadelphia, PA 19103 1974 | | Deputy Fund Chief Compliance Officer and Vice President Officer of the Trust since 2013; Officer of GSOF since 2013 | | Currently, Deputy Fund Chief Compliance Officer and U.S. Counsel for Aberdeen Asset Management Inc. (since July, 2012). Prior to joining Aberdeen, Ms. Rosala was Counsel for Vertex, Inc. from April 2011 to June 2012. She was also an Associate Attorney with Morgan, Lewis and Bockius from May 2008–April 2011. |
Andrea Melia* Aberdeen Asset Management Inc. 1735 Market Street, 32nd Floor, Philadelphia, PA 19103 1969 | | Chief Financial Officer and Treasurer Officer of the Trust since 2013; Officer of GSOF since 2013 | | Currently, Vice President and Head of Fund Administration – U.S. for Aberdeen Asset Management Inc. Ms. Melia joined Aberdeen Asset Management Inc. in September 2009. Prior to joining Aberdeen, Ms. Melia was Director of fund administration and accounting oversight for Princeton Administrators LLC, a division of BlackRock Inc. and had worked with Princeton Administrators since 1992. |
Megan Kennedy* Aberdeen Asset Management Inc. 1735 Market Street, 32nd Floor Philadelphia, PA 19103 1974 | | Assistant Secretary and Vice President Officer of the Trust since 2013; Officer of GSOF since 2013 | | Currently, Head of Product Management for Aberdeen Asset Management Inc. Ms. Kennedy joined Aberdeen Asset Management Inc. in 2005 as a Senior Fund Administrator. Ms. Kennedy was promoted to Assistant Treasurer Collective Funds/North American Mutual Funds in February 2008 and promoted to Treasurer Collective Funds/North American Mutual Funds in July 2008. |
Lucia Sitar* Aberdeen Asset Management Inc. 1735 Market Street, 32nd Floor Philadelphia, PA 19103 1971 | | Chief Legal Officer and Vice President Officer of the Trust since 2013; Officer of GSOF since 2013 | | Currently, Managing U.S. Counsel for Aberdeen Asset Management Inc. Ms. Sitar joined Aberdeen Asset Management Inc. in July 2007. |
Alan Goodson* Aberdeen Asset Management Inc. 1735 Market Street, 32nd Floor Philadelphia, PA 19103 1974 | | Vice President Officer of the Trust since 2013; Officer of GSOF since 2013 | | Currently, Head of Product – U.S., overseeing Product Management, Product Development and Investor Services for Aberdeen’s registered and unregistered investment companies in the U.S. and Canada. Mr. Goodson is Vice President of Aberdeen Asset Management Inc. and joined Aberdeen in 2000. |
Annual Report 2014
92
Management of the Funds (Unaudited) (continued)
As of October 31, 2014
| | | | |
Name, Address,
and Year of Birth | | Position(s) Held, Length of Time
Served and Term of Office1,2 | | Principal Occupation
During Past 5 Years |
Stephen Docherty* Aberdeen Asset Management Inc. 1735 Market Street, 32nd Floor Philadelphia, PA 19103 1970 | | Vice President Officer of the Trust since 2013; Officer of GSOF since 2013 | | Currently, Head of Global Equities for Aberdeen Asset Managers Limited. Mr. Docherty joined Aberdeen Asset Managers Limited in 1994. |
Greg Hopper Aberdeen Asset Management Inc. 1735 Market Street, 32nd Floor Philadelphia, PA 19103 1957 | | Vice President Officer of the Trust since 2002; Officer of GSOF since 2002 | | Currently, Head of Global High Yield for Aberdeen Asset Management Inc. Prior to joining Aberdeen, Mr. Hopper served as Senior Vice President (2009–2013) and First Vice President of Artio Global Management LLC (2002–2009). |
Jennifer Nichols* Aberdeen Asset Management Inc. 1735 Market Street, 32nd Floor Philadelphia, PA 19103 1978 | | Vice President Officer of the Trust since 2013; Officer of GSOF since 2013 | | Currently, Global Head of Legal for Aberdeen. Director and Vice President for Aberdeen Asset Management Inc. (since October 2006). |
Donald Quigley Aberdeen Asset Management Inc. 1735 Market Street, 32nd Floor Philadelphia, PA 19103 1965 | | Vice President Officer of the Trust since 2001; Officer of GSOF since 2013 | | Currently, Head of US Total Return Bond for Aberdeen Asset Management Inc. Prior to joining Aberdeen, Mr. Quigley served as Senior Vice President and Head of High Grade Fixed-Income of Artio Global Management LLC (2001–2013). |
Andrew Smith Aberdeen Asset Management Inc. 1735 Market Street, 32nd Floor Philadelphia, PA 19103 1968 | | Vice President Officer of the Trust since 2013; Officer of GSOF since 2013 | | Currently, Co-Head of Americas for Aberdeen since June 2014. Mr. Smith is Chief Operating Officer of Aberdeen Asset Management Inc. He held various roles since he joined Aberdeen including Chief Compliance Officer for their North American Closed End Funds as well as Chief Financial Officer and Chief Operating Officer for Aberdeen in the Americas. Andrew joined Aberdeen in December 2000 as the result of the acquisition of Murray Johnstone. |
Hugh Young* Aberdeen Asset Management Inc. 1735 Market Street, 32nd Floor Philadelphia, PA 19103 1958 | | Vice President Officer of the Trust since 2013; Officer of GSOF since 2013 | | Currently, Managing Director of Aberdeen Asset Management Asia Limited (“AAMAL”) (since 1991) and member of the Executive Management Committee and Director of Aberdeen Asset Management PLC (since 1991 and 2011, respectively). Mr. Young joined Aberdeen in 1991. |
Michael McVoy U.S. Bancorp Fund Services, LLC 615 E. Michigan Street Milwaukee, WI 53202 1957 | | Anti-Money Laundering and Identity Theft Officer
Officer of the Trust since 2004; Officer of GSOF since 2004. | | Chief Compliance Officer for U.S. Bancorp (2002–present) and Senior Vice President and Risk Manager for U.S. Bancorp (1999–present). |
Brian Link State Street Bank and Trust Company 100 Huntington, CHP0026 Boston, MA 02116 1972 | | Secretary Officer of the Trust since September 2014; Officer of GSOF since September 2014 | | Vice President and Managing Counsel, State Street Bank and Trust Company (since 2007). |
Pamela Wade* Aberdeen Asset Management Inc. 1735 Market Street, 32nd Floor Philadelphia, PA 19103 1971 | | Assistant Secretary Officer of the Trust since 2013; Officer of GSOF since 2013 | | Currently, Senior Product Manager for Aberdeen Asset Management Inc. Ms. Wade joined Aberdeen Asset Management Inc. in 2012 as Senior Product Manager. Prior to joining Aberdeen Asset Management Inc., Ms. Wade was a Vice President and Assistant Counsel with BNY Mellon Asset Servicing (2007-2012). |
2014 Annual Report
93
Management of the Funds (Unaudited) (concluded)
As of October 31, 2014
| | | | |
Name, Address,
and Year of Birth | | Position(s) Held, Length of Time
Served and Term of Office1,2 | | Principal Occupation
During Past 5 Years |
Brian O’Neill* Aberdeen Asset Management Inc. 1735 Market Street, 32nd Floor, Philadelphia, PA 19103 1968 | | Assistant Treasurer Officer of the Trust since 2013; Officer of GSOF since 2013 | | Currently, Senior Fund Administration Manager – U.S. for Aberdeen Asset Management Inc. Mr. O’Neill joined Aberdeen Asset Management Inc. in 2008. Prior to joining Aberdeen Asset Management Inc., Mr. O’Neill was a Director of Fund Accounting with Nationwide Funds Group (2002-2008). |
| 1 | | Each officer of the Global Select Opportunities Fund is elected for a term of 1 year and until his or her successor is duly elected and qualified. |
| 2 | | Pursuant to the Trust’s By-laws, officers of the Trust are elected by the Board of Trustees to hold such office until his or her successor is chosen and qualified, or until they resign or are removed from office. |
| * | | Mr. Hendry, Mr. Cotton, Ms. Rosala, Ms. Melia, Mr. O’Neill, Ms. Kennedy, Ms. Sitar, Mr. Goodson, Mr. Young, Ms. Wade and Ms. Nichols hold officer position(s) in one or more of the following: Aberdeen Asia-Pacific Income Fund, Inc., Aberdeen Australia Equity Fund, Inc., Aberdeen Global Income Fund, Inc., Aberdeen Chile Fund, Inc., Aberdeen Israel Fund, Inc., Aberdeen Indonesia Fund, Inc., Aberdeen Latin America Equity Fund, Inc., Aberdeen Emerging Markets Smaller Company Opportunities Fund, Inc., Aberdeen Singapore Fund, Inc., The Asia Tigers Fund, Inc., The India Fund, Inc., Aberdeen Greater China Fund, Inc., Aberdeen Funds, Aberdeen Japan Equity Fund, Inc., each of which may also be deemed to be a part of the same “Fund Complex” as the Funds. |
Annual Report 2014
94
Management Information
Trustees/Directors
Antoine Bernheim, Chairman
Thomas Gibbons
Cynthia Hostetler
Robert S. Matthews
Peter Wolfram
Andrew Smith
Officers
Bev Hendry, President and Chief Executive Officer
Jeffrey Cotton, Chief Compliance Officer and Vice President
Sofia Rosala, Deputy Chief Compliance Officer and Vice President
Andrea Melia, Treasurer and Chief Financial Officer
Brian Link, Secretary
Megan Kennedy, Assistant Secretary and Vice President
Lucia Sitar, Chief Legal Officer and Vice President
Alan Goodson, Vice President
Stephen Docherty, Vice President
Greg Hopper, Vice President
Jennifer Nichols, Vice President
Donald Quigley, Vice President
Andrew Smith, Vice President
Hugh Young, Vice President
Michael McVoy, Anti-Money Laundering and Identity Theft Officer
Pamela Wade, Assistant Secretary
Brian O’Neill, Assistant Treasurer
Investment Manager
Aberdeen Asset Management Inc.
1735 Market Street, 32nd Floor
Philadelphia, PA 19103
Transfer Agent
U.S. Bancorp Fund Services, LLC
615 E. Michigan Street
Milwaukee, WI 53202
Distributor
Aberdeen Fund Distributors LLC
1735 Market Street, 32nd Floor
Philadelphia, PA 19103
Fund Administrator, Custodian & Fund Accountant
State Street Bank and Trust Company
1 Iron Street, 5th Floor
Boston, MA 02210
Independent Registered Public Accounting Firm
KPMG LLP
1601 Market Street
Philadelphia, PA 19103-2499
Fund Counsel
Morrison & Foerster LLP
250 West 55th Street
New York, NY 10019-9601
| | |
Aberdeen Asset Management Inc. 1735 Market Street, 32nd Floor Philadelphia, PA 19103 aberdeen-asset.us | | |
AOD-0377-AR
Item 2. Code of Ethics.
As of October 31, 2014, the Registrant had adopted a code of ethics that applies to the Registrant’s principal executive officer, principal financial officer, principal accounting officer or controller, or persons performing similar functions (the “Code of Ethics”). The Code of Ethics is included with this Form N-CSR as Exhibit 12(a)(1). During the period covered by the report, no material changes were made to the provisions of the Code of Ethics and the Registrant did not grant any waivers to the provisions of the Code of Ethics.
Item 3. Audit Committee Financial Expert.
The Registrant’s Board of Directors has determined that there is at least one member who qualifies as an “Audit Committee Financial Expert” serving on its Audit Committee. Mr. Robert S. Matthews is the “Audit Committee Financial Expert” and is considered to be an “Independent Director” as each term is defined in Item 3 of Form N-CSR.
Item 4. Principal Accountant Fees and Services.
| | | | | | | | | | |
| | | Fiscal Year Ended | | (a) Audit Fees | | (b) Audit-Related Fees | | (c)1 Tax Fees | | (d) All Other Fees |
October 31, 2014 | | $23,275 | | $ - | | $7,272 | | $ - |
| | | | |
October 31, 2013 | | $24,500 | | $ - | | $10,000 | | $ - |
| | 1 | The Tax Fees are the aggregate fees billed for professional services rendered by KPMG LLP for the review of Form 1120-RIC, Form 8613, and review of excise tax distribution calculations. |
(e)(1) Audit Committee Pre-Approval Policies and Procedures. The Registrant’s audit committee pre-approves all audit and non-audit services to be performed by the Registrant’s accountant before the accountant is engaged by the Registrant to perform such services.
(e)(2) The percentage of services described in each of paragraphs (b) through (d) of this Item that were approved by the audit committee pursuant to paragraph (c)(7)(i)(C) of Rule 2-01 of Regulation S-X are as follows:
(b) Not applicable.
(c) None.
(d) Not applicable.
(f) Not applicable.
(g) The aggregate non-audit fees billed by the Registrant’s accountant for services to the Registrant and to the Registrant’s investment adviser and all entities controlling, controlled by, or under common control with the Adviser that provide services to the Registrant for the Registrant’s fiscal years ended October 31, 2014 and October 31, 2013 were $562,372 and $601,055, respectively.
(h) The Registrant’s Audit Committee of the Board of Directors has considered whether the provision of non-audit services that were rendered to the Registrant’s investment adviser (not including any sub-adviser whose role is primarily portfolio management and is subcontracted with or overseen by another investment adviser), and any entity controlling, controlled by, or under common control with the investment adviser that provides ongoing services to the Registrant that were not pre-approved pursuant to paragraph (c)(7)(ii) or Rule 2-01 of Regulation S-X is compatible with maintaining the principal accountant’s independence and has concluded that it is.
Item 5. Audit Committee of Listed Registrants.
Not applicable.
Item 6. Schedule of Investments
(a) Included as part of the Reports to Shareholders under Item 1 of this Form N-CSR.
(b) Not applicable.
Item 7. Disclosure of Proxy Voting Policies and Procedures for Closed-End Management Investment Companies.
Not applicable.
Item 8. Portfolio Managers of Closed-end Management Investment Companies.
Not applicable.
Item 9. Purchases of Equity Securities by Closed-End Management Investment Company and Affiliated Purchasers.
Not applicable.
Item 10. Submission of Matters to a Vote of Security Holders.
During the period ended October 31, 2014, there were no material changes to the procedures by which shareholders may recommend nominees to the Registrant’s Board of Directors.
Item 11. Controls and Procedures.
(a) The Registrant’s principal executive and principal financial officers, or persons performing similar functions, have concluded that the Registrant’s disclosure controls and procedures (as defined in Rule 30a-3(c) under the Investment Company Act of 1940 (the “Act”) (17 CFR 270.30a-3(c))) are effective, as of a date within 90 days of the filing date of the report that includes the disclosure required by this paragraph, based on the evaluation of these controls and procedures required by Rule 30a-3(b) under the Act (17 CFR 270.30a3(b)) and Rule 13a-15(b) or 15d-15(b) under the Securities Exchange Act of 1934 (17 CFR 240.13a-15(b) or 240.15d15(b)).
(b) There were no changes in the Registrant’s internal control over financial reporting (as defined in Rule 30a-3(d) under the Act (17 CFR 270.30a-3(d)) that occurred during the second fiscal quarter of the period covered by this report that have materially affected, or is reasonably likely to materially affect, the Registrant’s internal control over financial reporting.
Item 12. Exhibits.
(a)(1) The code of ethics of the Registrant for the period covered by this report as required pursuant to Item 2 of this Form N-CSR.
(a)(2) Certifications of the Registrant pursuant to Rule 30a-2(a) under the Act are exhibits to this report.
(a)(3) Not applicable.
(b) Certifications of the Registrant pursuant to Rule 30a-2(b) under the Act are exhibits to this report.
SIGNATURES
Pursuant to the requirements of the Securities Exchange Act of 1934 and the Investment Company Act of 1940, the registrant has duly caused this report to be signed on its behalf by the undersigned, thereunto duly authorized.
Aberdeen Global Select Opportunities Fund Inc.
| | |
By: | | /s/ Bev Hendry |
Bev Hendry |
Principal Executive Officer of |
Aberdeen Global Select Opportunities Fund Inc. |
Date: January 7, 2015
Pursuant to the requirements of the Securities Exchange Act of 1934 and the Investment Company Act of 1940, this report has been signed below by the following persons on behalf of the registrant and in the capacities and on the dates indicated.
| | |
By: | | /s/ Bev Hendry |
Bev Hendry |
Principal Executive Officer of |
Aberdeen Global Select Opportunities Fund Inc. |
|
Date: January 7, 2015 |
| |
By: | | /s/ Andrea Melia |
Andrea Melia |
Principal Financial Officer of |
Aberdeen Global Select Opportunities Fund Inc. |
Date: January 7, 2015