UNITED STATES
SECURITIES AND EXCHANGE COMMISSION
Washington, D.C. 20549
FORM N-CSR
CERTIFIED SHAREHOLDER REPORT OF REGISTERED
MANAGEMENT INVESTMENT COMPANIES
Investment Company Act file number | 811-06017 |
|
Julius Baer Global Equity Fund Inc |
(Exact name of registrant as specified in charter) |
|
330 Madison Avenue, New York, NY | | 10017 |
(Address of principal executive offices) | | (Zip code) |
Tony Williams |
330 Madison Avenue, New York, NY 10017 |
(Name and address of agent for service) |
|
Registrant’s telephone number, including area code: | 212-297-3600 | |
|
Date of fiscal year end: | 10/31 | |
|
Date of reporting period: | 10/31/06 | |
| | | | | | | |
Item 1. Reports to Stockholders.
The annual report is attached.
2
Julius Bär
Annual Report
Julius Baer Funds
Julius Baer Global Equity Fund Inc.
Julius Baer International Equity Fund
Julius Baer International Equity Fund II
Julius Baer Total Return Bond Fund
Julius Baer Global High Income Fund
Julius Baer U.S. Microcap Fund
Julius Baer U.S. Smallcap Fund
Julius Baer U.S. Midcap Fund
Julius Baer U.S. Multicap Fund
October 31, 2006
SHAREHOLDERS LETTER October 31, 2006
December 22, 2006
Dear Shareholder
I am pleased to present the Annual Report for the Julius Baer Funds (the "Funds") for the fiscal year ending October 31, 2006 (the "Reporting Period").
The Reporting Period began with most of the major indices strongly advancing; however, all eyes were on the Federal Reserve's (the "Fed") activity. Not only had it been regularly increasing the Fed Funds rate (a key overnight lending rate) as a tool to curb growing inflationary pressures, but it would begin the new year without Alan Greenspan, who had served for nearly 18 years as its Chairman. Although the market had braced for further tightening to monetary policy, analysts scrutinized every statement uttered by his successor, Ben Bernanke, in the hope of determining when such activity would end. In May, most global equity markets reacted violently to yet another interest rate hike by the Fed. Much of the gains that occurred during the first half of the Reporting Period eroded, particularly in emerging market stocks. For several weeks, markets remained turbulent. The Fed continued its stance by raising rates further in June, but suggested that the current level set may remain steady for a while. With a sense of stability back in the marketplace, most global markets rebounded with most indices generating double digit returns over the Reporting Period. Even the political fallout over U.S./U.K. policy in Iraq has not had significant impact on markets.
Over the last several years, the falling U.S. dollar has helped most international markets outpace the Standard & Poor's 500 Index. As a result, investors continue to actively seek ways to diversify their portfolios. For some time now, such investors have been drawn to our flagship international equity products. Our fixed income funds, both of which have international components and strong track records, are now beginning to attract significant attention. For example, the Julius Baer Total Return Bond Fund raised nearly $294.4 million in new subscriptions, doubling the overall size of the Fund. We believe that this is a positive trend and hope that this will translate into better investment opportunities and cost savings to shareholders.
We are committed to ensuring that the investment parameters for each of the Funds continue to maximize the opportunities to generate returns for shareholders. In the past, we have said that the exposure to emerging markets within the Julius Baer International Equity Fund, Julius Baer International Equity Fund II, and Julius Baer Global Equity Fund, Inc. ("Global Equity Fund") was not then anticipated to exceed 25%. Over the last decade, the emerging market universe has undergone important fundamental changes. Not only has the market capitalization of such
Julius Baer Funds 2006 Annual Report
1
countries doubled during this time frame, but corporate governance standards have been introduced, making many of these markets much less risky. As economies have broadened, the universe has become more diversified in macroeconomic terms. In anticipation of this trend continuing, the Board of Directors has recently agreed to permit an emerging market exposure up to 35%. This applies to all the three Funds mentioned and will be effective from early March following formal notification to shareholders.
Julius Baer Investment Management LLC ("JBIM") is keen to strategically expand its investment set in asset classes where we believe we can add value for our clients over the long term. In July, JBIM launched four new U.S. equity funds focused on micro, small, mid and multi-cap equity. We believe that this represents a natural extension of our ability to deliver added value in U.S. equity investing, previously only available via our core global equity strategy. Mr. Sam Dedio, who joined the firm earlier this year from Deutsche Asset Management where he was Managing Director, Co-lead Portfolio Manager and Co-Head of U.S. Micro, Small and Midcap Investment Management, is managing the Julius Baer U.S. Microcap Fund (JMCAX, JMCIX), the Julius Baer U.S. Smallcap Fund (JSCAX, JSCIX), and the Julius Baer U.S. Midcap Fund (JMDAX, JMDIX). Mr. Dedio has also been co-managing the Julius Baer U.S. Multicap Fund (JMLAX, JMLIX) ("Multicap Fund") with Mr. B rett Gallagher, JBIM's Deputy Chief Investment Officer and the head of our U.S. large cap equity team.
In order to capitalize on JBIM's broader expertise across the U.S. capitalization spectrum and strengthen our core fundamental philosophy, the U.S. portion of the Global Equity Fund will transition toward a more multi-cap approach, although the Fund as a whole will continue to retain a large-cap bias. As a result, Mr. Dedio will take on management of the U.S. component of this product from Mr. Gallagher. Mr. Gallagher will serve in the capacity of Senior Investment Specialist on behalf of our Global Equity strategy, and he will retain his role as JBIM's Deputy Chief Investment Officer. Mr. Gallagher's considerable experience and credibility offer the necessary skill set to effectively serve the broad needs of JBIM's client base and he will continue to remain closely associated with the Funds. Replacing Mr. Gallagher on the Multicap Fund will be Mr. Keith Walter who has been serving under Mr. Gallagher's direction as a portfolio manager and i nvestment analyst since 1999. Prior to his career at JBIM, Mr. Walter was fixed income portfolio manager at both Morgan Stanley and Bankers Trust Company. Despite the short track record of these new funds, we are encouraged by their performance (see Manager's Commentary on the subsequent pages for details) to date and believe that incorporating them into our product mix will deliver a diversified range of strategies that will showcase the talents of our organization.
Julius Baer Funds 2006 Annual Report
2
In a world of change, it is important that we have a good system of checks and balances to ensure that we deliver the very best to our shareholders at all times. JBIM, as well as the Funds' Boards of Directors and Trustees, (the "Boards") share that vision. Thus, it is with great pleasure that I welcome Mr. Robert McGuire to the Boards as an additional independent Director/Trustee. Mr. McGuire is the former New York City Police Commissioner, former Chairman and Chief Executive Officer of Pinkerton's Inc., and former President of Kroll Associates, Inc., an international corporate investigations and security consulting firm. He is also a lawyer with a broad range of governmental and private sector experience. Throughout his career, he has served on numerous boards and commissions and we believe that this coupled with his experience in the mutual fund arena will be a valuable asset for shareholders.
In conclusion, I'd like to express JBIM's appreciation to you as shareholders for your continued support and to wish you and your families a happy and healthy holiday season.
Sincerely,

Tony Williams
Chief Executive Officer
This Material is provided for informational purposes only and does not in any sense constitute a solicitation or offer of the purchase or sale of securities unless preceded or accompanied by a prospectus.
Mutual funding investing involves risk; principle loss is possible.
Distributor: Quasar Distributors, LLC (12/06)
Julius Baer Funds 2006 Annual Report
3
MANAGEMENT'S COMMENTARY
JULIUS BAER GLOBAL EQUITY FUND INC.
Annual Report
Period Ending October 31, 2006
The Julius Baer Global Equity Fund Inc. ("the Fund") enjoyed its second full fiscal year in current form. The Fund, which has previously been known as the closed-end European Warrant Fund, became an open-ended fund on July 1, 2004 and changed its name to reflect the change in strategy and management team. This is the third annual report since the change and the second that covered a full 12-month period.
The Fund (Class A shares) returned 21.56% over the twelve months ending October 31, 2006 which compares favorably to its benchmark, the MSCI World Index (net dividends), which returned 21.32%. Since the change in format on July 1, 2004, the Fund has outperformed its benchmark by 7.74% (51.81% vs. 44.07% cumulative returns).
Market Review
The reporting period was a difficult one for most managers as very few underlying trends (either geographically or sector-wise) were able to persist for the full period. In other words, what worked well in one part of the period tended to underperform in other periods.
The United States was the weakest of the developed markets between October 31, 2005 and May 12, 2006 (-7.80% relative to MSCI World) while it was the strongest from May 12, 2006 through October 31, 2006 (+2.85% relative). Japan was just the opposite, outperforming early on by 10.97% and underperforming subsequently by 12.11%. Europe and the U.K. were the most consistent regions over the full period, outperforming by 3.65% and 7.63% respectively in the first half and by 0.98% and 0.94% in the second. For the full reporting period, we were underweight the U.S., the U.K. and Japan and overweight Continental Europe. The flip-flopping of relative performance from one period to the next made it difficult for any manager to gain traction without dramatically restructuring his or her portfolio mid-way through the year.
Similarly, what worked or failed across the various economic sectors exhibited the same positive/negative relative patterns over the course of the reporting period. The following chart details the performance of both MSCI U.S. and Global sector price-performance in local currency terms for the period October 31, 2005—October 31, 2006.
Julius Baer Funds 2006 Annual Report
4
Equity Sectors (U.S. and World in Local Currency Terms)
| | | 10/31/05-
4/28/06 | | 5/1/06-
10/31/06 | |
| MSCI U.S. - Consumer Staples | | | 1.43 | % | | | 9.07 | % | |
| MSCI Global - Consumer Staples | | | 4.76 | % | | | 7.72 | % | |
| MSCI U.S. - Consumer Discretionary | | | 7.04 | % | | | 8.24 | % | |
| MSCI Global - Consumer Discretionary | | | 13.28 | % | | | 4.19 | % | |
| MSCI U.S. - Health Care | | | 1.58 | % | | | 7.21 | % | |
| MSCI Global - Health Care | | | 4.54 | % | | | 5.27 | % | |
| MSCI U.S. - Utility Sector | | | (0.40 | %) | | | 13.72 | % | |
| MSCI Global - Utility Sector | | | 9.15 | % | | | 12.11 | % | |
| MSCI U.S. - Telecomm Services Sector | | | 12.79 | % | | | 14.99 | % | |
| MSCI Global - Telecomm Services Sector | | | 1.78 | % | | | 11.28 | % | |
| MSCI U.S. - Information Technology | | | 6.90 | % | | | 2.75 | % | |
| MSCI Global - Information Technology | | | 10.59 | % | | | 1.10 | % | |
| MSCI U.S. - Financials | | | 11.58 | % | | | 4.74 | % | |
| MSCI Global - Financials | | | 16.45 | % | | | 3.47 | % | |
| MSCI U.S. - Materials Sector | | | 19.35 | % | | | (0.46 | %) | |
| MSCI Global - Materials Sector | | | 27.63 | % | | | 0.50 | % | |
| MSCI U.S. - Energy Sector | | | 17.99 | % | | | 0.41 | % | |
| MSCI Global - Energy Sector | | | 15.46 | % | | | (3.64 | %) | |
| MSCI U.S. - Industrials | | | 14.97 | % | | | (0.74 | %) | |
| MSCI Global - Industrials | | | 19.35 | % | | | (1.40 | %) | |
Almost without exception (technology being the underperforming exception), the biggest underperformers relative to the index in the first half of the reporting period were leaders in the second half. The theme was to reward the more economically sensitive areas early on, while some caution seemed to build-up after the first calendar quarter as the traditional "late cyclical" sectors (materials, energy and industrials) turned from top performers to laggards and more defensive sectors such as consumer staples, utilities and healthcare rallied to take leadership positions.
Geographic Exposure in the Fund
Our biggest relative weighting geographically over the period was the underweight to Anglo-Saxon economies (primarily the U.S. and the U.K.) due to concerns regarding their overextended consumer base.
We were also underweight in Japan where relative valuations left us scratching our heads as the market roared upwards in 2005, due to what now looks to have been
Julius Baer Funds 2006 Annual Report
5
a momentum-led push. Cooler, more analytical heads have seemed to prevail in 2006 as Japan has lagged other global stock exchanges.
Our emerging markets exposure continues to be substantial with our focus on Central and Eastern Europe which, as we described last year, possess emerging market growth potential with developed market risk. This belief was rewarded during the year as emerging markets were the best performing region for the full period, rising by 38.2% in Eastern Europe, 34.6% in Latin America, and by 35.1% in Asia. Our decision to concentrate on Europe at the expense of Asia and Latin America has to do with the long-term drivers we see in each region. While Asia and Latin America remain export dependent (relying on those Anglo-Saxon consumers we talked about earlier), the dynamic within Eastern Europe remains economic convergence with their richer Western European neighbors.
Global Themes Revisited
Last year, a number of investment themes were detailed. Most of these worked well for the Fund.
Within Continental Europe, we spoke about three themes: consolidation within the Italian banking sector, infrastructure-related companies, and Scandinavian financials.
Shortly after we wrote last year's letter detailing the travails of Italy's central bank chief Antonio Fazio (the governor who was appointed for a life term but who subsequently was forced to resign), ABN Amro of the Netherlands succeeded in its quest to take over Banca Antonveneta SpA. Further bank deals occurred throughout the year, including the two most recent mergers between Banco Popolare di Verona Novara and Banca Popolare di Italiana, and, in turn, between Banca Intesa SpA and Sanpaolo IMI SpA. While this theme is now well-recognized in the markets, we still retain numerous holdings and expect it to persist into the new year.
Acquisitions also heated up in the infrastructure area with BAA PLC, Associated British Ports and Pensinsular & Oriental Steam Navigation Company ("P&O") all being acquired. BAA PLC was taken over by a consortium of companies including Grupo Ferrovial SA of Spain, the Government of Singapore and Caisse de Depot of Canada. Associated British Ports was acquired by another consortium consisting of Macquarie Bank of Australia, 3i Group PLC of the U.K., Infomedia of Australia and Canadian Pension Plan Investment Board. P&O was acquired by DP World, a Dubai-based company. Our preference for companies in this sector is driven by the increased global trade in China, India and other emerging countries that act as the world's factory as well as by the strain on European government budgets which is leading to more public/private partnerships over infrastructure assets.
Julius Baer Funds 2006 Annual Report
6
Scandinavian banks were also a favored sector last year due to their relatively cheap valuations, the better state of their local consumer balance sheets, and their exposure to the faster growth of their Eastern European neighbors. When we first invested in many of these names, they traded at substantial discounts to other European financial companies. Due to outperformance in the past three years, the valuation discount has disappeared, though faster growth still remains a lure.
We believe our caution with respect to Japan was well-founded. We felt the rally in late 2005 was driven by momentum and performance chasing and we could not find fundamental value in most segments of the market, and thus, continued to avoid it. While Japan finished 2005 strong, as stated above, Japan has since struggled and we believe such struggles are likely to continue as valuations remain rich. Some signs of slowdown in the economy are now apparent.
In the emerging markets, we spoke of opportunities in Russia, while at the same time acknowledging the increased level of risks inherent in such investments. Over the course of the reporting period, we experienced both the upside of reward and the downside of risk. The Russian market returned 52.3% over the reporting period, though not without falling by nearly 30% between May 9, 2006 and June 13, 2006. Only committed investors were likely to have reaped the full gains from the market as many short-term holders were certain to have fled during the downturn. We remain exposed to this market, primarily in energy and materials-related issues as well as through ownership in Sberbank, a Russian commercial bank.
China and India were also mentioned in last year's letter and both performed well, rising nearly 55% in the case of China and nearly 65% in the case of India during the reporting period. Our preference was for investment in India, albeit, acknowledging that investment in the country was not easy. We established and increased positions there over the course of the reporting period and like the progress we have seen. We still remain largely absent the mainland Chinese market given our earlier concerns over transparency, the quality of listed companies, and market valuation.
Turkey was a prominent theme this time last year and we continued to enjoy a strong run into the new year (climbing approximately 50% between October 31, 2005 and February 27, 2006). However, as the year continued, we began to see that progress in key areas such as inflation was beginning to slow while the current account continued to widen and equity valuations remained rich. We took this opportunity to reduce our holdings in Turkey and to "upgrade" the quality of our Fund by raising weights in Poland and Russia during the mid-year downturn. Today, Turkey represents approximately 0.6% of the portfolio, down from 1.8% on October 31, 2005.
Julius Baer Funds 2006 Annual Report
7
One theme that has not (yet) worked well, was our shunning of the U.S. consumer who has continued to find ways to spend even as the debt pile (now 24% of disposable income, not including mortgages) and debt servicing (now claiming more than $0.14 of every dollar earned) continues to hover at high levels. In fact, U.S. consumer cyclical stocks outperformed the market by nearly 1% during the reporting period and bested their more defensive consumer staples names by over 4%. While we believe our caution will eventually yield substantial fruit, one must approach this investment play cautiously. Should the U.S. consumer succumb to fatigue, many worry that the knock-on effects to the rest of the world will be substantial. While we agree there will be repercussions (affecting some companies and countries more than others), the worry is less than in previous periods due to the growth of the non-U.S. consumer. Whereas emerging markets consumption was only 40% of the U.S. consumption just three years ago, today it is over 50%. Three years from now it will be even higher. Thus, the world is finding an alternative to the U.S. consumer who has driven not only the U.S., but also global growth over the past years.
Global Themes Refreshed
While many of our global themes retain "legs" and we believe will continue to perform over the next reporting period, some new areas of interest have cropped up since our last review. These include plays on domestic economic recovery in Germany, attractive valuation and growth opportunities in Finland, and global luxury goods.
The economic boom which enveloped most of the world over the past decade seems to have passed by Germany. While real estate prices rose many-fold around the globe, they seemed to have stalled in Germany. We think this situation has changed and we are pursuing a multi-pronged approach to tap the fortunes of Europe's largest economy. Our focus includes builders, real estate (commercial and residential) and banks.
Finland would appear to be a sleepy market to many, known as the home of Nokia and good fishing. To us, Finland remains a source of inexpensive companies that are taking advantages of the growth opportunities with neighbors Russia and the Baltic States. Such a combination has led us to take up positions in a handful of Finnish companies.
Finally, the luxury goods makers have long had a place in our portfolio and we believe this still to be a "fresh" idea. While the Japanese have traditionally made up a large portion of the profits of such companies, the emergence of wealthy Chinese and Indian consumers, along with strong money flows accruing to the Middle East (as a result of high energy prices) have created new demand for companies such as LVMH, Richemont and Bulgari.
Julius Baer Funds 2006 Annual Report
8
The Coming Year
The coming year holds many promises and challenges. Hopefully, the log jam of rapidly changing preferences will end and some of our themes will take flight. While the emerging markets and economic recovery in Germany offer hope for global growth, we remain on guard against the U.S. and U.K. consumer who certainly have done little to correct imbalances in their personal balance sheets. Whether this coming reporting period is the one where exhaustion will catch up with them, or not, remains to be seen. Until that time, we will be cautious on building up positions in sectors or geographies dependent on them.
One of the more unusual aspects to the markets over the past few years has been the embrace of risk by investors across all asset classes. In the fixed income world, credit spreads have continued to shrink, allowing lower rated corporate and government issuers to access capital at rates not far from those accorded to better rated credits. The two charts below show the credit spreads for the Moody's Baa Corporate issuers and Sovereign Emerging Markets issuers relative to the U.S. Treasury Bonds (the horizontal line depicts current readings).
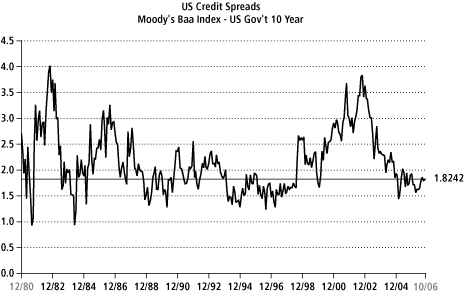
Source: Bloomberg
Julius Baer Funds 2006 Annual Report
9
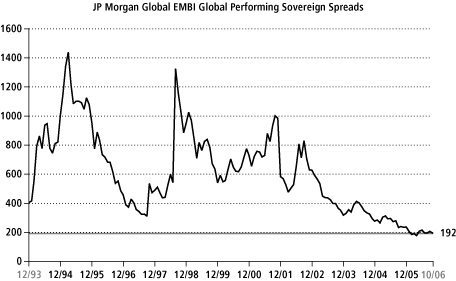
Source: Bloomberg
Also, in the credit default swap market (a kind of insurance pool to insulate fixed income investors against the risk of bond issuer defaults), premiums have fallen dramatically as seen in the chart below. Apparently, investors are not too concerned about credit risk despite what appears to be a slowing economy.

Source: Bloomberg
Such an embrace of risk as we have seen in the equity markets has dominated the larger and (usually) more stable large cap brethren in terms of performance. The following chart shows the relative performances of small versus large cap names globally, which have outperformed by more than 125% (relative to the MSCI World Index) since the trough in February 1999.
Julius Baer Funds 2006 Annual Report
10

Source: Bloomberg
Of course, valuation and growth plays a turn in determining such relative performance and at the start of this period small capitalization stocks sold at the discount to larger cap names and have since grown at a faster rate. Given near parity in valuations today, one wonders if an aversion to risk would mean a turn in the relative performance of "risky" equity assets.
Finally, there appears to be relative complacency across the board with respect to larger capitalization stocks. The following chart shows the percentage difference in the high vs. low price of the S&P 500 Index over rolling 12 month time frames. Today's narrow spread is historically low.
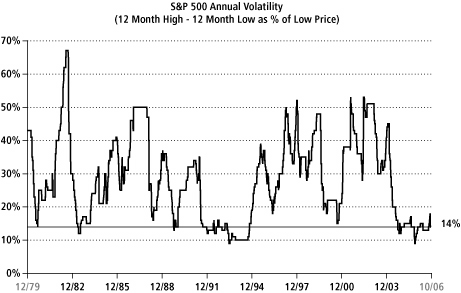
Source: Bloomberg
Julius Baer Funds 2006 Annual Report
11
As we move into the next reporting period, we remain focused on uncovering opportunities and managing risks presented by the global equity markets on behalf of our valued shareholders.

Brett Gallagher
Global Equity Fund Inc. Portfolio Manager
Past performance does not guarantee future results.
Investing internationally involves additional risks, such as currency fluctuations, social and economic instability, differing securities regulations and accounting standards, limited public information, possible changes in taxation, and periods of illiquidity.
The views expressed are subject to change based on market and other conditions. Furthermore, the opinions expressed do not constitute investment advice or recommendation by the individuals, JBIM, the funds, or any affiliated company.
The MSCI World Index is a market capitalization weighted index composed of companies representative of the market structure of developed market countries in the Americas, Europe/Middle East, and Asia/Pacific Regions. It is not possible to invest directly in an index.
Please see the Schedule of Investments in this report for complete fund holdings. Fund holdings and/or sector weightings are subject to change at any time and are not recommendations to buy or sell any security mentioned.
Julius Baer Funds 2006 Annual Report
12
MANAGEMENT'S COMMENTARY
JULIUS BAER INTERNATIONAL EQUITY FUND
JULIUS BAER INTERNATIONAL EQUITY FUND II
Annual Report
Period Ending October 31, 2006
Both the Julius Baer International Equity Fund ("IEF") and the Julius Baer International Equity Fund II ("IE II") outperformed their benchmark, the MSCI EAFE Index ("the Index"), for the period under review. For the twelve months ending October 31, 2006, IEF Class A Shares returned 31.20% and IE II Class A Shares returned 28.73% versus 27.52% for the Index. While IE II only invests in companies with a market capitalization of greater than U.S.$2.5 billion at the time of purchase (and IEF invests in securities of all market capitalizations), whenever feasible, the geographic and sector exposure for the two funds are similar.
Our ability to outperform the benchmark was the result of a number of factors, most notably our exposure to emerging markets. Top contributors included Russia, Poland and Turkey. Within Russia, our position in the nation's largest bank, OAO Sberbank, was a top contributor to our results for the period. Positions held in OAO Gazprom and OAO Lukoil, the country's biggest producers of natural gas and oil, were also among the top contributors. We have long been attracted to the country's energy reserves which trade at a discount to their Western European peers. Additionally, our position in OAO Norilsk Nickel, the world's largest nickel and palladium producer proved beneficial to results. Amid an era of industrialization for China and India, we believe Russia's vast natural resources provide an attractive long term investment opportunity.
Within Poland, our focus on many of the banks supported results. PKO Bank Polski and Bank Pekao, the two largest lenders in Poland exhibited strong results as did Bank Zachodni amid an expanding economic climate which has fuelled increased demand for financial services. However, the position held in Agora by the IEF, Poland's top publisher, detracted from results. The shares declined subsequent to disappointing earnings results for the fourth quarter of 2005.
We were effective in managing our exposure to the Turkish market amid a very turbulent environment. At the start of the period, we had over 3.5% invested. We aggressively reduced our weighting to less than 2% by the end of April and further reduced exposure to approximately 1% by the end of the review period. Concerns over a deteriorating fiscal position in the country and the U.S. Federal Reserve's hike in short term interest rates on May 10 struck many emerging markets hard, including Turkey. However, the market managed to recover somewhat and several of the positions retained over the period exhibited strong results.
Julius Baer Funds 2006 Annual Report
13
Within Continental Europe, holdings in cement, airports and banks were positive contributors to results. The global cement industry has been on a consolidating trend leading to more pricing power. The industry has also become less cyclical due to government spending to prop up demand in weak phases of the business cycle. High barriers to entry have created an industry which has become more defensive in nature. Our positions in LaFarge (France) and Holcim (Switzerland) produced strong results.
We view airports and seaports as quasi-monopolies able to leverage the increase in global travel and trade. Strained European government budgets have led to public/private partnerships with companies engaged in infrastructure construction and we own several throughout Europe and Asia. Our position held in Fraport, the operator of the Frankfurt airport, which is Europe's third busiest, was a top contributor to performance. Toward the end of the period, however the shares came under pressure after having lost a bid for the London City Airport.
The Italian banking industry has been undergoing a wave of consolidations, which we expect to continue. We have been attracted to a number of banks such as Unicredito Italiano which was a strong performer over the period. We continue to see opportunity for restructuring and efficiency gains, as well as growth potential within the credit market as demand for such products begins to converge toward European averages. Several positions held in Swedish banks were also supportive of results. In particular, Skandinaviska Enskilda Banken, Skandinavia's third-largest bank in terms of assets, was a strong performer. The prospect for possible consolidation within the banking sector has provided positive performance.
The utility sector was the strongest performer in the index over the period, powered by mergers and deregulation. The fact that we were underweight Spanish utilities, in particular, detracted from results. However, this was offset by our position in Fortum Oyj, Finland's largest utility, which outperformed over the period.
Within the telecommunication services sector, while we were roughly in line with the average index weight for the period, our stock selection outperformed the Index. We continue to think telecommunications carriers are being challenged due to new entrants, increased regulation and lower pricing power amid technological innovation.
Japan was the weakest of the major developed markets and our underweight to Japanese equities was supportive to results. Investors appeared concerned about the impact any slowdown in consumer demand, especially from the U.S., would have on the country's export sector. While the Japanese economy has made some structural progress, we still believe shares of many Japanese companies are expensive versus comparable stocks in Europe. We find more compelling valuations in Continental Europe where we are overweight relative to the Index.
Looking forward, we remain enthusiastic about long-term opportunities in Eastern and Central Europe. Countries in the region have made significant improvements on many fronts, encouraged by the prospect of European Union ("EU") membership and possible inclusion into the Eurozone. From a policy risk perspective, the ten emerging markets that joined the EU in 2004 differ little in our view from many of their developed
Julius Baer Funds 2006 Annual Report
14
EU counterparts. Structurally, these countries have been highly successful in encouraging domestic demand, which makes them steadily less susceptible to a slowdown elsewhere in the global economy. India is another market, which we have recently increased our investing. We see the market as offering long term growth potential, particularly within the banking sector which should benefit from an increase in loan volumes.
We believe Continental Europe remains relatively strong and our focus continues to be on those industries most prone to the wave of restructuring activity taking place. In Germany, we have been focused on companies that will likely benefit from what we expect to be a strengthening domestic economy. After a long period of underperformance, we feel German asset prices are inexpensive and expect a rebound that will be centered on domestic stocks such as retailers and real estate related companies.
We remain underweight in the United Kingdom. The U.K. is traditionally a defensive market and with the index skewed toward companies in the utility, pharmaceutical, energy and food and beverage industries it has tended to outperform during more difficult economic conditions. However, we remain concerned about the U.K.'s growth prospects and the impact this may have on the corporate sector. Much like the United States, the U.K. has high consumer debt and a declining savings rate, which presents potential vulnerability for the U.K. consumer.
With the 2006 fiscal year now behind us, we remain focused on identifying opportunities around the globe, while keeping the big picture clearly in view. We look forward to reporting our progress to you throughout the year.

Richard Pell
International Equity Fund and International Equity Fund II Portfolio Manager
Past performance does not guarantee future results.
Investing internationally involves additional risks, such as currency fluctuations, social and economic instability, differing securities regulations and accounting standards, limited public information, possible changes in taxation, and periods of illiquidity.
The views expressed are subject to change based on market and other conditions. Furthermore, the opinions expressed do not constitute investment advice or recommendation by the individuals, JBIM, the funds, or any affiliated company.
The MSCI EAFE Index is an unmanaged list of equity securities from Europe, Australasia, and the Far East with all values expressed in U.S. dollars. It is not possible to invest directly in an index or average.
Please see the Schedule of Investments in this report for complete fund holdings. Fund holdings and/or sector weightings are subject to change at any time and are not recommendations to buy or sell any security mentioned.
Julius Baer Funds 2006 Annual Report
15
MANAGEMENT'S COMMENTARY
JULIUS BAER TOTAL RETURN BOND FUND
Annual Report
Period Ending October 31, 2006
The Julius Baer Total Return Bond Fund (Class A Shares) (the "Fund") returned 4.98% for the twelve months ending October 31, 2006. Over the same period, the benchmark Lehman Brothers U.S. Aggregate Bond Index posted a 5.19% return.
In examining the Fund's relative performance for the annual period, one of the major detractors was a large underweight in U.S. interest rates from June through August. In early June, we expected the U.S. Federal Reserve Bank (the "Fed") to continue tightening, or at least pause, in its measured program of raising interest rates for the prior two years. Our primary concern was the ripple effects from inflation buildup that were expected to pass through the economy. We reasoned that this would push interest rates higher. At the end of June, the Fed hiked the prime short term interest rate to 5.25%, stating that "economic growth is moderating from its quite strong pace earlier this year." Long term rates began to subside. We equated these developments to a break in the Fed's tightening campaign. Consensus among fixed income investors leaned toward a slowdown in the economy and a possible recession in gross domestic product ("GDP") growth in th e near future. This led to a precipitous decline in U.S. interest rates. Our positioning during this time favored foreign bond markets and underweighting the overall duration of the benchmark. Consequently, we erred on the side of caution.
A major contributor to performance over the twelve month period was our currency positioning. As 2006 unfolded, we believed that the U.S. dollar was due to adjust downward, following the substantial rally in 2005. As the dollar weakened from the end of February through the middle of May, we were well positioned to undertake a sizable position in foreign currencies. The Euro, for example, appreciated over 8% during this time.
Outlook
The paramount question on investors' minds for the last twelve months was the health of the U.S. housing market. We think that this concern will probably prevail in the investment community for another year. Numerous studies were done on the housing market over the last few years. Some observers believe that the housing market will continue softening to a considerable extent, and the U.S. economy is heading toward recession. Others contend that current housing market conditions are more indicative of a mild correction and that home prices will strengthen again in the first half of 2007. Our view is more in the middle of these extremes with the
Julius Baer Funds 2006 Annual Report
16
caveat that the housing market may be soft for a much longer time than market consensus expects.
The U.S. housing market has indeed worsened over the reporting period. However, housing—albeit an integral part of the economy—is not the only driver of economic growth. The rest of the economy is progressing fairly well. Consumer spending, which accounts for more than two-thirds of GDP growth, continues at a robust pace. Also, employment continues to be encouraging, with a five-year low unemployment rate of 4.4% in October 2006.
The main reason we do not believe that the housing market will collapse in the immediate future lies in its inefficiency. There is no exchange or market maker to facilitate trades; if the seller and buyer cannot agree on a price, there is no trade. Listed houses may await sale for years. Due to the softness of the housing market over the past year, many potential sellers now face reduced prices compared to what they might have previously commanded. The forced seller (due to a dire need to move, financial hardship, etc.) usually experiences a large drop in their house price compared to higher offers not so long ago. The media tends to report on these types of sales as it makes for interesting reading. However, forced sellers comprise a very small percentage of home sellers and are by no means representative of the norm.
Most homeowners who intend to sell do not presently feel pressured to do so. They are willing to lower their price by a modest amount, but are also prepared to wait for what they consider to be the right price. We think that some potential sellers, knowing that the housing market has softened, have decided to extend residence for another year or two, in hopes of finding a more friendly market at that time. Hence, we believe that this inefficiency will prevent the housing market from cracking and completely undermining economic growth.
There has also been extensive literature over the last few years about the use of adjustable-rate mortgages ("ARMs") in home buying by less financially strong borrowers. ARMs usually have a fixed interest rate for a specified length of time, after which there are periodic rate adjustments. These adjustments are based on the trading levels of certain key market interest rates. The rate during the fixed period can be a very low rate, usually referred to as a "teaser" rate. These teaser rates are low enough to induce a buyer to purchase a higher-priced house. Some observers argue that when the fixed periods for ARMs end, ensuing adjustable rates will increase dramatically. Thereafter, monthly mortgage payments will rise so high that defaults will skyrocket, ultimately leading to a crash in the housing market.
We are unconvinced that such a scenario will fully materialize. Given the current low unemployment levels, we think that homeowners with ARMs would likely be able to meet their mortgage payments. One tactic would be to refinance into a new
Julius Baer Funds 2006 Annual Report
17
ARM with a different teaser rate. Demand for mortgage-backed securities ("MBS") based upon these types of ARMs remains strong from pension funds, insurance companies and hedge funds. Another option for these homeowners is to refinance into a traditional thirty-year fixed mortgage. Against a backdrop of the currently inverted yield curve, it is still a good time to have a fixed rate mortgage with predetermined payment amounts. Thus, we do not subscribe to an impending doomsday outcome for the housing market. However, we do expect that certain homeowners with ARMs will encounter difficulty in making payments, especially those who are unemployed in a stagnant or declining local real estate market.
To summarize our outlook on the housing market, while we expect the current slowdown to detract from GDP, we do not foresee the entire U.S. economy stalling in the near future as a result. Certain local markets that have become overbought and overdeveloped will probably correct significantly. This will be most apparent in markets where rampant speculation occurred. Housing prices may remain soft until the rest of the economy grows enough to continue the gains of the white-hot housing market of the last five years. This could take effect in a few quarters or a few years. Nonetheless, we are confident that housing softness will not be a crushing problem for the U.S. economy over the next few quarters.
Within the investment universe, we continue to believe that the U.S. dollar remains in a long term bear market. The nation's Current Account ("CA") deficit, based on the most recent data available, was at an $874 billion annual rate in the second quarter of 2006. This means the U.S. economy has to attract about $2.4 billion per day in order for the dollar not to lose value. To put this in perspective, a cautionary sign for investors considering exposure to fixed income emerging markets is that the CA deficit to GDP ratio should not exceed 6%. Based on the most recent data available, the CA deficit to GDP ratio for the U.S. stands at 6.6%.
For the U.S. trade deficit—the biggest component of the Current Account deficit—to decrease, there must be a fall in imports and/or a rise in exports. A viable way for this to take place would be for the U.S., as a nation, to save more and scale back imports. The trade deficit would further improve if foreigners, especially in the heavily export-based Far East, lowered their high savings rates and boosted consumption of U.S. imports. Of course, there are downsides to this scenario. A drop in U.S. consumption would adversely affect local businesses, as our economy is consumption driven. An additional problem is that even if there is an increase in foreign consumption of U.S. products, the U.S. economy is far more service than manufacturing-oriented. Many of these services are not easily translatable into foreign sales. Also, higher savings and less consumption of foreign goods by the U.S. consumer require changes in behavior. We thi nk that such behavioral changes are unlikely to happen without a major shift in government policy or the economy itself mandating the change.
Julius Baer Funds 2006 Annual Report
18
A separate school of thought stipulates that the U.S. should impose trade restrictions on foreign goods to protect domestic manufacturers. This might benefit some domestic firms but may also incur retaliatory barriers from trading partners. If protectionism triggers a shrinking in global trade, it may become problematic for the U.S., which is considered a trading leader on the world market, to attract foreign capital. Another view is that the U.S. government should try to bring about a currency devaluation, by using either verbal or actual currency intervention. A risk to this plan is that the government may be perceived as overly activist and the U.S. dollar could lose its status as the global reserve currency. The costs to the U.S. in this scenario could be high, as commodities may cease to be priced versus the U.S. dollar, interest rates may climb as the "risk" of investing in the U.S. would rise, and equity values would most likely decli ne.
An additional concern would be how foreign investors react if the reserve status was lost. If a foreign pension fund or insurance company currently holds, for example, 30% of its investments in the U.S. dollar, it would be considered a low risk position, so 30% would be justifiable. If the risk posed by the U.S. increased, even only in perception, then 30% may be too high an allocation. At the same time, if foreigners believed that they needed to exit a large portion of their U.S. assets, it may result in major problems for the worldwide financial system.
We believe that some combination of the above scenarios may transpire in such a way that the U.S. dollar could continue to lose value over the long term. If this is indeed the outcome, we hope it is a slow process thereby enabling markets to adjust without major disruptions. We believe our strategy of allocating between 0% and 40% in non-U.S. dollar currencies, with a natural habitat around 20%, is a way for U.S. fixed income investors to take advantage of this trend while minimizing currency risk.
In the fixed income markets, we continue to strive to find value in both domestic and international markets. In the U.S. market, we are encountering considerable challenges in finding value at the long end of the Treasury curve. We struggle to find value in 10-year bonds, amid a Federal funds rate of 5.25% (the short end of the yield curve) versus yields of around 4.6% for the 10-year Treasury note (the long end of the yield curve). Though the U.S. economy is clearly showing signs of wobbling, we expect GDP growth to muddle through around the 2.0% level in 2007. We also think that the Fed is committed to restraining inflation. In light of the new Fed chairman's stated intention to target inflation, we believe this Fed—with Mr. Bernanke at the helm—is more likely to be hawkish than it was under Mr. Greenspan. Accordingly, we do not expect the Fed funds rate to dip in the next few months. We think there are better ways to invest in t he U.S. fixed income market than through the long end of the Treasury curve, and we intend to focus on the spread sectors of the market in this capacity.
In the corporate bond sector, we plan to continue to be conservative in our positioning. Beyond the overall credit metrics that are fundamental to buying any corporate bond, we are concerned about the non-quantitative threats of leveraged
Julius Baer Funds 2006 Annual Report
19
buyouts ("LBOs") and mergers and acquisitions ("M&As"). Most shareholders welcome news of a company they have a stake in that is "in play." In contrast, bondholders are terrified of this scenario, due to the likelihood of new management taking on additional debt. Increased debt usually results in a deterioration of the company's credit metrics as well as multi-notch downgrades. As a result, bond values of such companies can tumble by 20% or more. Our approach is to avoid companies that may be perceived as targets of LBOs or M&As. Instead, we prefer to invest in companies whose high market value or capital structure renders them unlikely targets. If corporate bond spreads widen over the next year, we will reevaluate this conservatism as the risk/reward trade-off changes.
Going forward, we look to hold an ample position in mortgaged-backed securities. MBS offer value when the yield curve is not undergoing dramatic changes in shape and interest rates are stable or range bound. As we expect the U.S. economy to muddle through, we think the added yield that is inherent in MBS will enhance our ability to outperform over the next several months.
In conclusion, we believe that our defensive strategy for the Fund should produce higher returns than the benchmark over the long term, aided by our ability to capitalize on opportunities outside of the U.S. as well as our strategic allocations in the fixed income spread sectors.

Donald Quigley
Total Return Bond Fund Portfolio Manager
Past performance does not guarantee future results.
Investments in debt securities typically decrease in value when interest rates rise. This risk is usually greater for longer term debt securities. Investing internationally involves additional risks, such as currency fluctuations, social and economic instability, differing securities regulations and accounting standards, limited public information, possible changes in taxation, and periods of illiquidity.
The views expressed are subject to change based on market and other conditions. Furthermore, the opinions expressed do not constitute investment advice or recommendation by the individuals, JBIM, the funds, or any affiliated company.
The Lehman Brothers U.S. Aggregate Bond Index is a benchmark index composed of U.S. securities in Treasury, Government-Related, Corporate, and Securitized sectors. It includes securities that are of investment-grade quality or better, have at least one year to maturity, and have an outstanding par value of at least $250 million. It is not possible to invest directly in an index or average.
Please see the Schedule of Investments in this report for complete fund holdings. Fund holdings and/or sector weightings are subject to change at any time and are not recommendations to buy or sell any security mentioned.
Julius Baer Funds 2006 Annual Report
20
MANAGEMENT'S COMMENTARY
JULIUS BAER GLOBAL HIGH INCOME FUND
Annual Report
Period Ending October 31, 2006
The Julius Baer Global High Income Fund (the "Fund") completed another successful fiscal year in October, turning in a total return of 10.49% (Class A Shares). The year was paced by U.S. economic growth that ran at close to 3%, a somewhat more muted growth rate in Europe, and robust emerging economies, powered by Chinese growth and booming commodity markets. These developments continued trends that were in place for several years. They provided a healthy fundamental backdrop for global markets, which were tempered by U.S. Federal Reserve Bank tightening until the summer, concerns about the affects of rising energy prices, and mounting speculation over how the U.S. housing boom might end.
In this environment, high income securities of all types performed very well, again, defying the prognostications of much of the financial press and a substantial portion of the investing community. Our benchmark, the Merrill Lynch Global High Yield Constrained Index, returned 10.64%. The global credit foundation was strong. Global growth and ample liquidity helped issuers increase their revenues and execute productivity enhancing restructurings which improved margins and cash flow. Emerging sovereigns and corporations benefited from strong export demand, sounder fiscal policies, and improved currency and debt management. Investors met this credit environment with strong demand for issuers of high income securities. Only for a brief period in April and May did investors show any real hesitation. This pause in demand was sparked by concerns that the U.S. Federal Reserve Bank might increase interest rates too much or for too long. The speculat ion sparked a "risk aversion" trade that was more pronounced in energy and commodity-related securities, whose values were extended the most during the preceding years.
Within the global market for high income securities, there were some sectors that fared better than others. U.S. high yield outperformed European high yield as the credit impact of improved fundamentals offset the effects of an increasing interest rate environment. Auto and auto parts bonds both in the U.S. and Europe outperformed the general market, although there was a very wide dispersion of returns within the group. Airline bonds, much maligned in the past, were extremely strong performers. Healthcare bonds, meanwhile, one of the better performers last year, underperformed the market this year. Homebuilders also underperformed, although not until the later part of the period. In general, lower quality bonds (CCC rated and lower) outperformed higher quality bonds. This outperformance of issuers with the lowest margins of cash flow is unusual at this stage in the cycle. Emerging market bonds continued their multi-year run of strong returns , both in
Julius Baer Funds 2006 Annual Report
21
local currency and in hard currency markets. Following the "risk aversion" ripple during April and May, however, bonds of emerging market countries sporting substantial current account deficits tended to lag.
The performance of the Fund (Class A Shares) during this period placed it in the top 16% of high yield bond funds, as measured by Morningstar, Inc. (for the twelve months ending October 31, 2006, the Class A Shares ranked 84 out of 544 high yield bond funds based on total return). In addition to the strength of the overall market, the Fund's performance was enhanced by our positions in the local currency government and money market instruments of several emerging countries including Brazil, Columbia, and Indonesia. Our positions in several large emerging market corporates, such as Norilsk Nickel and CSN also bolstered returns. The Fund built several positions during the year in select auto and auto parts issuers that we believe will ultimately benefit from the on-going restructuring of the industry. Although volatile, these positions on balance helped the Fund's relative return. In a similar manner, we also benefited from positions in the ai rline sector including both defaulted securities and more senior, secured Equipment Trust Certificates.
These positive contributors to performance were somewhat offset during the year by other factors. Although we carried approximately a market weight in more risky CCC bonds for much of the period, we were not particularly aggressive about our issue selection in this area. Our discipline tended to keep us away from CCC issuers dependent on unpredictable events and led us to invest more in smaller CCC issuers that we believe are fundamentally under-rated. The Fund also had a very low representation of hard currency (Euro and U.S. dollar denominated) emerging market bonds, which continued to perform well during the period. Towards the end of the fiscal year, U.S. interest rates declined, benefiting more interest rate sensitive BB bonds in which the Fund was somewhat underweight.
While a number of different high income markets and security types both added and detracted from overall performance, we were careful not to let any one market dominate the Fund's returns, either negatively or positively. This balanced diversification across different geographies and security types forms a cornerstone of our investment philosophy, and we believe it should continue to help the Fund navigate the markets successfully.
As we enter the new fiscal year, the economic fundamentals and the market backdrop continue to be supportive of high income securities globally. Although we expect growth in North America will slow in the coming quarters, we do not expect outright recession. More importantly, we believe global growth will remain strong. Issuers of sovereign and corporate bonds should be able to continue the process of operational and cash flow improvement that has been in place now for several years. As always, even in a generally improving economy, there will be issuers that will become overextended, whole industries that will need to restructure, and difficult periods. Overall, however, we are constructive on the year ahead.
Julius Baer Funds 2006 Annual Report
22
The risks in our outlook still rest in the process of global trade, monetary and currency rebalancing that is required to incorporate China, India, Eastern Europe and other emerging countries into the global economic system. As long as this development continues in a relatively smooth manner, all markets, including the high income security markets, in particular, should benefit. We will be watchful, however, for central bank missteps, political events, and supply imbalances that might disrupt this process.

Greg Hopper
Global High Income Fund Portfolio Manager
Past performance does not guarantee future results.
The securities in which the Fund will invest may be considered more speculative in nature and are sometimes known as "junk bonds." These securities tend to offer higher yields than higher rated securities fixed income securities can present a greater risk of loss of income and principal than higher rated securities. Investing internationally involves additional risks, such as currency fluctuations, social and economic instability, differing securities regulations and accounting standards, limited public information, possible changes in taxation, and periods of illiquidity.
The views expressed are subject to change based on market and other conditions. Furthermore, the opinions expressed do not constitute investment advice or recommendation by the individuals, JBIM, the funds, or any affiliated company.
The Merrill Lynch Global High Yield Constrained Index tracks the performance of below investment grade bonds of corporate issuers domiciled in countries having an investment grade foreign currency long term debt rating (based on a composite of Moody's and S&P). The index is weighted by outstanding issuance, but constrained such that the percentage that any one issuer may not represent more than 3% of the index. It is not possible to invest in an index.
Please see the Schedule of Investments in this report for complete fund holdings. Fund holdings and/or sector weightings are subject to change at any time and are not recommendations to buy or sell any security mentioned.
Cash flow: measures the cash generating capability of a company by adding non-cash charges (e.g. depreciation) and interest expense to pretax income.
Morningstar Rankings represent a fund's total-return percentile rank relative to all funds that have the same Morningstar Category. The highest percentile rank is 1 and the lowest is 100. It is based on Morningstar total return, which includes both income and capital gains or losses and is not adjusted for sales charges or redemption fees.
Julius Baer Funds 2006 Annual Report
23
MANAGEMENT'S COMMENTARY
JULIUS BAER U.S. MICROCAP FUND
JULIUS BAER U.S. SMALLCAP FUND
JULIUS BAER U.S. MIDCAP FUND
JULIUS BAER U.S. MULTICAP FUND
Annual Report
Period Ending October 31, 2006
Equity Market Commentary
Equity markets were up sharply from the date of the launch of our four new funds on July 24, 2006, through October 31, 2006, with the Russell 2000 Index up 11.39% and the S&P 500 up 9.82%. Following a sharp correction in July, technology stocks rebounded through August and September to lead the rally. This can be attributed to a positive outlook for technology investment spending in both the seasonally strong fourth quarter period and a favorable outlook for 2007. Many corporate balance sheets have record cash levels and managers are under pressure by shareholders and the forces of an increasingly competitive global arena to begin investing capital into higher return propositions, rather than settling for current money-market rates of return. Technology spending continues to be an important part of capital spending, representing about 34% of the total. On the consumer front, spending held steady in 2006, and consumer discretionary stocks also performed well in the review period. Despite facing higher interest rates and greater costs for gasoline and home heating fuel, U.S. consumers continued to robustly purchase goods and services. On the bright side, gasoline prices declined significantly in October and it's been more than a year now since prices began moving sharply higher—consumers have had time to adjust to the higher fuel prices and have economized by optimizing trips and purchasing more fuel-efficient vehicles. With the significant increase in fuel prices that began in mid-2005, many pundits predicted a decline in consumer spending. Our belief is that if reduction occurs, it will be a temporary phenomenon and that consumer expenditures may be actually shifting away from the new housing market into home refurbishment, consumer electronics, clothing and dining out.
Portfolio Strategy and Investment Focus Areas
With smaller U.S. company stocks and indices having performed well for several years in a row versus their larger counterparts, there has been much debate as to when the current cycle of smallcap out-performance will end. Given the concentrated nature of the four funds under review, we are less concerned about the smallcap vs. largecap cycle debate, and more concerned about picking stocks that have the potential to outperform in both favorable and unfavorable equity market environments. To achieve this, we consistently seek out investment opportunities that are characterized by having a product or service that favorably changes consumption behavior. For example,
Julius Baer Funds 2006 Annual Report
24
equity markets earlier in the year were discounting a fairly significant slowdown in spending for the casual dining industry—many casual dining stocks declined markedly in price. Our view is that U.S. consumers changed their behavior significantly over the last several years and are dining out more often and spending more discretionary income to do so. Our belief is that consumers will continue on this course despite a modest decline in foot traffic that may have occurred in the short-run due to higher gasoline prices and rising interest rates. We believe the change in behavior to dining out will be long-lasting and will also benefit from population growth as well as other favorable demographic trends, including income growth and the aging of the "baby boomer" generation. As a result, we initiated our funds with an overweight position in the casual dining industry.
In terms of portfolio positioning, we are constructive on technology and remain overweight the sector as corporations invest in technology spending to upgrade aging computer systems. The last major upgrade cycle that occurred for computer systems in the corporate setting was in the 1998-2001 time frame. Typically, this type of capital equipment is replaced every five to seven years, so our analysis leads us to believe the installed base of technology had aged and spending should improve nicely. In addition, corporate managers are under increasing pressure to deploy ever-growing cash balances and boost productivity. As we look forward into 2007, we expect the market for financial services, primarily retail and commercial banking and asset management, to be favorable. This is attributable to income growth, high employment levels and low absolute interest rate levels. From a long term perspective, we also believe the healthcare sector is attrac tive due to aging demographics and growth in demand for aesthetic procedures, as a result of medical advances. We have a strong belief that in the next decade there will be many changes to the entire healthcare system in the U.S. that will offer companies the ability to gain market share as well as create new market opportunities. Some interesting investment areas on this front include the aforementioned aesthetic procedures such as laser applications, changes to how medical records are managed and maintained, and technological advances in non-invasive surgical procedures.
Julius Baer U.S. Microcap Fund
For the period from inception on July 24 through October 31, 2006 the U.S. Microcap Fund returned 12.60%, which outperformed the Russell 2000 Index return of 11.39% and the Russell Microcap Index return of 11.37%.
Outperformance versus the Russell 2000 benchmark was driven by our stock selection. In particular, our consumer discretionary, financial services and technology holdings performed well, which more than offset unfavorable relative stock performance in the energy and materials sectors. Our sector positioning had a modest negative impact
Julius Baer Funds 2006 Annual Report
25
to performance. In terms of portfolio positioning, the Fund is overweight in the technology and healthcare sectors and underweight in the utilities and materials sectors.
Julius Baer U.S. Smallcap Fund
For the period from inception on July 24 through October 31, 2006 the U.S. Smallcap Fund returned 11.00%, which underperformed the Russell 2000 Index return of 11.39%.
The Fund's modest underperformance relative to its benchmark, the Russell 2000, can be attributed to poor performance within the healthcare and energy sectors, which was mostly offset by strong performance within the technology and financials sectors. Our sector positioning had a modest negative impact to performance. In terms of portfolio positioning, the Fund is overweight in the technology, consumer and healthcare sectors and underweight in the industrials, utilities and telecommunications sectors.
Julius Baer U.S. Midcap Fund
For the period from inception on July 24 through October 31, 2006 the U.S. Midcap Fund returned 10.50%, which outperformed the Russell Midcap Index return of 9.84%.
Outperformance versus the Russell Midcap benchmark was driven by our stock selection. In particular, our technology, consumer discretionary and utilities holdings performed well, which more than offset unfavorable relative stock performance in the healthcare and energy sectors. Our sector positioning had a modest positive impact to performance. In terms of portfolio positioning, the Fund is overweight in the technology and health care sectors and underweight in the utilities and materials sectors.
Julius Baer U.S. Multicap Fund
For the period from inception on July 24 through October 31, 2006 the U.S. Multicap Fund returned 11.00%, which outperformed the Russell 3000 Index return of 9.95%.
Outperformance versus the Russell 3000 benchmark was driven by our stock selection. In particular, our technology and consumer discretionary sector holdings performed well, which more than offset unfavorable relative stock performance in the financials and industrials sectors. Our sector positioning had a modest positive impact to performance. In terms of portfolio positioning, the Fund is overweight in the technology and health care sectors and underweight in the utilities and materials sectors.
Julius Baer Funds 2006 Annual Report
26
In summary, we are in the business of discovering and investing in companies whose stock market values increase with the improvements and success of their respective businesses. We are excited about the collective potential of our portfolio holdings and the tremendous investment opportunities that abound.

Samuel Dedio
U.S. Microcap Fund, U.S. Smallcap Fund, U.S. Midcap Fund and U.S. Multicap Fund Portfolio Manager
Past performance does not guarantee future results.
Please refer to the prospectus for more complete information on the special risks associated with investing in the Julius Baer U.S. Equity Funds, including, but not limited to: stock market risk, smaller companies risk, liquidity risk, foreign investment risk, derivatives risk.
The views expressed are subject to change based on market and other conditions. Furthermore, the opinions expressed do not constitute investment advice or recommendation by the individuals, JBIM, the funds, or any affiliated company.
Please see the Schedule of Investments in this report for complete fund holdings. Fund holdings and/or sector weightings are subject to change at any time and are not recommendations to buy or sell any security mentioned.
The Russell 3000 Index measures the performance of the 3,000 largest U.S. companies based on total market capitalization, which represents approximately 98% of the investable U.S. equity market, with all values expressed in U.S. dollars.
The Russell Midcap Index measures the performance of the 800 smallest companies in the Russell 1000 Index, which represent approximately 25% of the total market capitalization of the Russell 1000 Index, with all values expressed in U.S. dollars.
The Russell 2000 Index measures the performance of the 2,000 smallest companies in the Russell 3000 Index, which represents approximately 8% of the total market capitalization of the Russell 3000 Index, with all values expressed in U.S. dollars.
Julius Baer Funds 2006 Annual Report
27
SHAREHOLDER EXPENSES (Unaudited)
As a stockholder of the Julius Baer Global Equity Fund, or a shareholder of Julius Baer International Equity Fund, Julius Baer International Equity II Fund, Julius Baer Total Return Bond Fund, Julius Baer Global High Income Fund, Julius Baer U.S. Microcap Fund, Julius Baer U.S. Smallcap Fund, Julius Baer U.S. Midcap Fund or Julius Baer U.S. Multicap Fund, you incur ongoing expenses, such as management fees, shareholder service fees, distribution fees and other fund expenses. The following table is intended to help you understand your ongoing expenses (in dollars and cents) of investing in Julius Baer Global Equity Fund, Julius Baer International Equity Fund, Julius Baer International Equity Fund II, Julius Baer Total Return Bond Fund, Julius Baer Global High Income Fund, Julius Baer U.S. Microcap Fund, Julius Baer U.S. Smallcap Fund, Julius Baer U.S. Midcap Fund or Julius Baer U.S. Multicap Fund and to compare these expenses with the ongoing expenses of investing in other funds.
The table is based on an investment of $1,000 invested at the beginning of the period and held for the entire period from May 1, 2006 to October 31, 2006.
Actual Expenses
The first line in the table below provides information about the actual account values and actual expenses. You may use the information in this line, together with the amount you invested, to estimate the expenses that you paid over the period. Simply divide your account value by $1,000 (for example, an $8,600 account value divided by $1,000 = 8.6), then multiply the result by the number in the first line for the Fund under the heading entitled "Expenses Paid During Period" to estimate the expenses you paid on your account during this period.
Hypothetical Example for Comparison Purposes
The second line in the table below provides information about the hypothetical account values and hypothetical expenses based on the Fund's actual expense ratio and an assumed rate of return of 5% per year before expenses, which is not the Fund's actual return. The hypothetical account value and expenses may not be used to estimate the actual ending account balance or expenses you paid for the period. You may use this information to compare the ongoing costs of investing in your Fund and other funds. To do so, compare this 5% hypothetical example with the 5% hypothetical examples that appear in the shareholder reports of the other funds.
Julius Baer Funds 2006 Annual Report
28
Global Equity Fund Class A
| | | Beginning Account
Value 05/01/06 | | Ending Account
Value 10/31/06 | | Annualized
Expense Ratio | | Expense Paid
during Period | |
| Actual | | $ | 1,000.00 | | | $ | 1,021.70 | | | | 1.40 | % | | $ | 7.13 | | |
| Hypothetical | | $ | 1,000.00 | | | $ | 1,018.10 | | | | 1.40 | % | | $ | 7.12 | | |
Global Equity Fund Class I
| | | Beginning Account
Value 05/01/06 | | Ending Account
Value 10/31/06 | | Annualized
Expense Ratio | | Expense Paid
during Period | |
| Actual | | $ | 1,000.00 | | | $ | 1,021.70 | | | | 1.15 | % | | $ | 5.86 | | |
| Hypothetical | | $ | 1,000.00 | | | $ | 1,019.40 | | | | 1.15 | % | | $ | 5.85 | | |
International Equity Fund Class A
| | | Beginning Account
Value 05/01/06 | | Ending Account
Value 10/31/06 | | Annualized
Expense Ratio | | Expense Paid
during Period | |
| Actual | | $ | 1,000.00 | | | $ | 1,018.00 | | | | 1.16 | % | | $ | 5.90 | | |
| Hypothetical | | $ | 1,000.00 | | | $ | 1,019.40 | | | | 1.16 | % | | $ | 5.90 | | |
International Equity Fund Class I
| | | Beginning Account
Value 05/01/06 | | Ending Account
Value 10/31/06 | | Annualized
Expense Ratio | | Expense Paid
during Period | |
| Actual | | $ | 1,000.00 | | | $ | 1,019.20 | | | | 0.92 | % | | $ | 4.68 | | |
| Hypothetical | | $ | 1,000.00 | | | $ | 1,020.60 | | | | 0.92 | % | | $ | 4.69 | | |
International Equity Fund II Class A
| | | Beginning Account
Value 05/01/06 | | Ending Account
Value 10/31/06 | | Annualized
Expense Ratio | | Expense Paid
during Period | |
| Actual | | $ | 1,000.00 | | | $ | 1,011.50 | | | | 1.32 | % | | $ | 6.64 | | |
| Hypothetical | | $ | 1,000.00 | | | $ | 1,018.60 | | | | 1.32 | % | | $ | 6.67 | | |
International Equity Fund II Class I
| | | Beginning Account
Value 05/01/06 | | Ending Account
Value 10/31/06 | | Annualized
Expense Ratio | | Expense Paid
during Period | |
| Actual | | $ | 1,000.00 | | | $ | 1,013.60 | | | | 1.05 | % | | $ | 5.28 | | |
| Hypothetical | | $ | 1,000.00 | | | $ | 1,020.00 | | | | 1.05 | % | | $ | 5.30 | | |
Total Return Bond Fund Class A
| | | Beginning Account
Value 05/01/06 | | Ending Account
Value 10/31/06 | | Annualized
Expense Ratio | | Expense Paid
during Period | |
| Actual | | $ | 1,000.00 | | | $ | 1,040.30 | | | | 0.69 | % | | $ | 3.55 | | |
| Hypothetical | | $ | 1,000.00 | | | $ | 1,021.70 | | | | 0.69 | % | | $ | 3.52 | | |
Total Return Bond Fund Class I
| | | Beginning Account
Value 05/01/06 | | Ending Account
Value 10/31/06 | | Annualized
Expense Ratio | | Expense Paid
during Period | |
| Actual | | $ | 1,000.00 | | | $ | 1,040.50 | | | | 0.44 | % | | $ | 2.26 | | |
| Hypothetical | | $ | 1,000.00 | | | $ | 1,023.00 | | | | 0.44 | % | | $ | 2.24 | | |
Julius Baer Funds 2006 Annual Report
29
Global High Income Fund Class A
| | | Beginning Account
Value 05/01/06 | | Ending Account
Value 10/31/06 | | Annualized
Expense Ratio | | Expense Paid
during Period | |
| Actual | | $ | 1,000.00 | | | $ | 1,037.80 | | | | 1.07 | % | | $ | 5.14 | | |
| Hypothetical | | $ | 1,000.00 | | | $ | 1,020.20 | | | | 1.07 | % | | $ | 5.09 | | |
Global High Income Fund Class I
| | | Beginning Account
Value 05/01/06 | | Ending Account
Value 10/31/06 | | Annualized
Expense Ratio | | Expense Paid
during Period | |
| Actual | | $ | 1,000.00 | | | $ | 1,039.20 | | | | 0.79 | % | | $ | 3.91 | | |
| Hypothetical | | $ | 1,000.00 | | | $ | 1,021.40 | | | | 0.79 | % | | $ | 3.87 | | |
U.S. Microcap Fund Class A
| | | Beginning Account
Value 07/24/06* | | Ending Account
Value 10/31/06 | | Annualized
Expense Ratio | | Expense Paid
during Period | |
| Actual | | $ | 1,000.00 | | | $ | 1,126.00 | | | | 0.97 | % | | $ | 5.19 | | |
| Hypothetical | | $ | 1,000.00 | | | $ | 1,020.30 | | | | 0.97 | % | | $ | 4.94 | | |
U.S. Microcap Fund Class I
| | | Beginning Account
Value 07/24/06* | | Ending Account
Value 10/31/06 | | Annualized
Expense Ratio | | Expense Paid
during Period | |
| Actual | | $ | 1,000.00 | | | $ | 1,126.00 | | | | 0.81 | % | | $ | 4.32 | | |
| Hypothetical | | $ | 1,000.00 | | | $ | 1,021.10 | | | | 0.81 | % | | $ | 4.13 | | |
U.S. Smallcap Fund Class A
| | | Beginning Account
Value 07/24/06* | | Ending Account
Value 10/31/06 | | Annualized
Expense Ratio | | Expense Paid
during Period | |
| Actual | | $ | 1,000.00 | | | $ | 1,110.00 | | | | 0.81 | % | | $ | 4.29 | | |
| Hypothetical | | $ | 1,000.00 | | | $ | 1,021.10 | | | | 0.81 | % | | $ | 4.13 | | |
U.S. Smallcap Fund Class I
| | | Beginning Account
Value 07/24/06* | | Ending Account
Value 10/31/06 | | Annualized
Expense Ratio | | Expense Paid
during Period | |
| Actual | | $ | 1,000.00 | | | $ | 1,111.00 | | | | 0.65 | % | | $ | 3.44 | | |
| Hypothetical | | $ | 1,000.00 | | | $ | 1,021.90 | | | | 0.65 | % | | $ | 3.31 | | |
U.S. Midcap Fund Class A
| | | Beginning Account
Value 07/24/06* | | Ending Account
Value 10/31/06 | | Annualized
Expense Ratio | | Expense Paid
during Period | |
| Actual | | $ | 1,000.00 | | | $ | 1,105.00 | | | | 0.73 | % | | $ | 3.85 | | |
| Hypothetical | | $ | 1,000.00 | | | $ | 1,021.50 | | | | 0.73 | % | | $ | 3.72 | | |
U.S. Midcap Fund Class I
| | | Beginning Account
Value 07/24/06* | | Ending Account
Value 10/31/06 | | Annualized
Expense Ratio | | Expense Paid
during Period | |
| Actual | | $ | 1,000.00 | | | $ | 1,106.00 | | | | 0.56 | % | | $ | 3.00 | | |
| Hypothetical | | $ | 1,000.00 | | | $ | 1,022.40 | | | | 0.56 | % | | $ | 2.85 | | |
* Commencement of operations
Julius Baer Funds 2006 Annual Report
30
U.S. Multicap Fund Class A
| | | Beginning Account
Value 07/24/06* | | Ending Account
Value 10/31/06 | | Annualized
Expense Ratio | | Expense Paid
during Period | |
| Actual | | $ | 1,000.00 | | | $ | 1,110.00 | | | | 0.70 | % | | $ | 3.72 | | |
| Hypothetical | | $ | 1,000.00 | | | $ | 1,021.70 | | | | 0.70 | % | | $ | 3.57 | | |
U.S. Multicap Fund Class I
| | | Beginning Account
Value 07/24/06* | | Ending Account
Value 10/31/06 | | Annualized
Expense Ratio | | Expense Paid
during Period | |
| Actual | | $ | 1,000.00 | | | $ | 1,111.00 | | | | 0.54 | % | | $ | 2.86 | | |
| Hypothetical | | $ | 1,000.00 | | | $ | 1,022.50 | | | | 0.54 | % | | $ | 2.75 | | |
* Commencement of operations
Julius Baer Funds 2006 Annual Report
31
Julius Baer Global Equity Fund Inc.(1)
It is the Julius Baer Global Equity Fund Inc.'s, policy to declare and pay annual dividends from its net investment income and distribute net realized capital gains, if any, annually.
Average Annual Total Return*—Class A
| Year Ended October 31, 2006 | | | 21.56 | % | |
| Five years ended 10/31/06 | | | (2.47 | )% | |
| Ten years ended 10/31/06 | | | (3.47 | )% | |
| 7/1/04 - 10/31/06(1) | | | 18.76 | % | |
* All average annual total return figures shown reflect the reinvestment of dividends and capital gains distributions. Total returns for the Fund reflect expenses, waived and reimbursed, if applicable, by the Adviser and/or Administrator. Without such waivers and reimbursements, total returns would have been lower.
Growth of $10,000 invested in shares of Julius Baer Global Equity Fund
Inc. vs. MSCI World Index (in U.S. dollars) July 1, 2004-October 31, 2006†
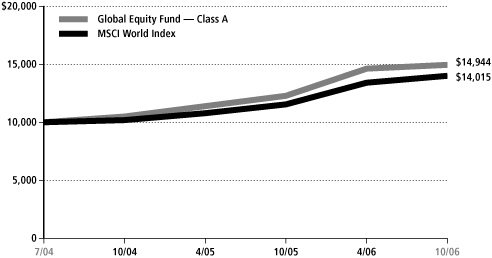
† Hypothetical illustration of $10,000 invested on July 1, 2004 assuming reinvestment of dividends and capital gains distributions through October 31, 2006. No adjustment has been made for shareholder tax liability on dividends or cap gains distributions. The MSCI World Index is a market capitalization weighted index composed of companies representative of the market structure of developed and emerging market countries in the Americas, Europe/Middle East and Asia/Pacific regions.
(1) On July 1, 2004, the Fund changed its name from The European Warrant Fund, Inc. and converted from a close-end, non diversified investment company ("closed-end fund") to an open-end diversified investment company with a different investment objective, different investment strategies, different management team and a new investment adviser (an affiliate of the closed-end Fund's adviser). Until the close of business on June 30, 2004, the Fund operated as a closed-end Fund and its common stock (which then comprised of a single share class) was listed on the NYSE. After the close of business on June 30, 2004, all of the common stock was converted into Class A shares of the Fund, and the Fund began seeking to maximize total return principally through capital appreciation by investing in a diversified portfolio of equity securities of issuers located throughout the world. For periods prior thereto, all historical performance informat ion for Class A shares reflects the Net Asset Value (NAV) performance of the Fund's common stock while it was a closed-end fund.
Note: All figures cited here and on the following pages represent past performance of the Global Equity Fund, Inc., and do not guarantee future results. Investment return and principal value of an investment will fluctuate so that an investor's shares upon redemption may be worth more or less than their original cost.
Julius Baer Funds 2006 Annual Report
32
Julius Baer International Equity Fund
It is the Julius Baer International Equity Fund's policy to declare and pay annual dividends from its net investment income and distribute net realized capital gains, if any, annually.
Average Annual Total Return*—Class A
| Year Ended 10/31/06 | | | 31.20 | % | |
| Five Years Ended 10/31/06 | | | 19.11 | % | |
| Ten Years Ended 10/31/06 | | | 6.47 | % | |
| Inception (10/4/93) through 10/31/06 | | | 12.16 | % | |
��
The performance quoted represents past performance, which does not guarantee future results. The investment return and principal value of an investment will fluctuate and will fluctuate so that an investor's shares, when redeemed, may be worth more or less than their original cost. Current performance of the Fund may be lower or higher than the performance quoted. For up to date month-end performance information, please call 800-387-6977.
* All average annual total return figures shown reflect the reinvestment of dividends and capital gains distributions. The International Equity Fund Class A commenced operations on October 4, 1993. Total returns for the Fund reflect expenses, waived and reimbursed, if applicable, by the Adviser and/or Administrator. Without such waivers and reimbursements, total returns would have been lower.
Growth of $10,000 invested in Class A shares of Julius Baer International Equity Fund vs. Morgan Stanley EAFE Index October 31, 1996-October 31, 2006†

† Hypothetical illustration of $10,000 invested on October 31, 1996 assuming reinvestment of dividends and capital gains distributions through October 31, 2006. This period was one in which stock and bond prices fluctuated and the results should not be considered as a representation of dividend income or capital gain or loss which may be realized from an investment in the Interational Equity Fund today. No adjustment has been made for shareholder tax liability on dividends or capital gains distributions. The Morgan Stanley EAFE Index is a composite portfolio consisting of equity total returns for the countries of Europe, Australia, New Zealand and countries in the Far East, weighted based on each country's gross domestic product. Indexes do not incur expenses and are not available for investment.
Julius Baer Funds 2006 Annual Report
33
Julius Baer International Equity Fund II
It is the Julius Baer International Equity Fund II's policy to declare and pay annual dividends from its net investment income and distribute net realized capital gains, if any, annually.
Average Annual Total Return*—Class A
| Year Ended 10/31/06 | | | 28.73 | % | |
| Inception (5/4/2005) through 10/31/06 | | | 25.64 | % | |
The performance quoted represents past performance, which does not guarantee future results. The investment return and principal value of an investment will fluctuate and will fluctuate so that an investor's shares, when redeemed, may be worth more or less than their original cost. Current performance of the Fund may be lower or higher than the performance quoted. For up to date month-end performance information, please call 800-387-6977.
* All average annual total return figures shown reflect the reinvestment of dividends and capital gains distributions. The International Equity Fund II Class A commenced operations on May 4, 2005. Total returns for the Fund reflect expenses, waived and reimbursed, if applicable, by the Adviser and/or Administrator. Without such waivers and reimbursements, total returns would have been lower.
Growth of $10,000 invested in Class A shares of Julius Baer International Equity Fund II vs. Morgan Stanley EAFE Index October 31, 1995-October 31, 2005†
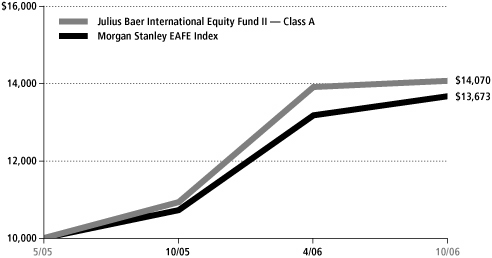
† Hypothetical illustration of $10,000 invested on May 4, 2005 assuming reinvestment of dividends and capital gains distributions through October 31, 2006. This period was one in which stock and bond prices fluctuated and the results should not be considered as a representation of dividend income or capital gain or loss which may be realized from an investment in the Interational Equity Fund today. No adjustment has been made for shareholder tax liability on dividends or capital gains distributions. The Morgan Stanley EAFE Index is a composite portfolio consisting of equity total returns for the countries of Europe, Australia, New Zealand and countries in the Far East, weighted based on each country's gross domestic product. Indexes do not incur expenses and are not available for investment.
Julius Baer Funds 2006 Annual Report
34
Julius Baer Total Return Bond Fund
It is the Julius Baer Total Return Bond Fund's policy to declare and pay monthly dividends from its net investment income and distribute net realized capital gains, if any, annually.
Average Annual Total Return*—Class A
| Year Ended 10/31/06 | | | 4.98 | % | |
| Five Years Ended 10/31/06 | | | 6.41 | % | |
| Ten Years Ended 10/31/06 | | | 5.63 | % | |
| Inception (7/1/92) through 10/31/06 | | | 6.09 | % | |
The performance quoted represents past performance, which does not guarantee future results. The investment return and principal value of an investment will fluctuate so that an investor's shares, when redeemed, may be worth more or less than their original cost. Current performance of the Fund may be lower or higher than the performance quoted. For up to date month-end performance information, please call 800-387-6977.
* All average annual total return figures shown reflect the reinvestment of dividends and capital gains distributions. The Julius Baer Total Return Bond Fund commenced operations on July 1, 1992 and the service providers waived their advisory, sub-advisory and administration fees from 7/1/92 to 10/31/92 and from 9/1/98 to 10/31/03; without such waivers and reimbursements, total returns would have been lower.
Growth of $10,000 invested in Class A shares of Julius Baer Total Return Bond Fund vs. a Blended Merrill Lynch and JP Morgan Index and Lehman Brothers U.S. Aggregate Bond Index October 31, 1995-October 31, 2006†
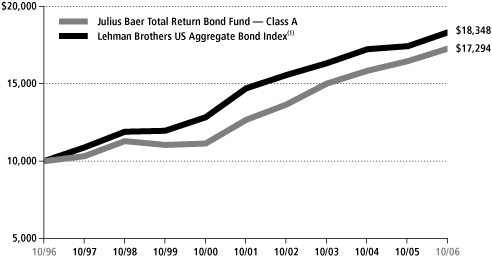
† Hypothetical illustration of $10,000 invested on October 31, 1996 assuming reinvestment of dividends and capital gains distributions and application of fee waivers through October 31, 2006. This period was one in which stock and bond prices fluctuated and the results should not be considered a representation of the income or capital gain or loss which may be realized from an investment in the Income Fund today. No adjustment has been made for shareholder tax liability on dividends or capital gains distributions. The Merrill Lynch and JP Morgan combined benchmark index for performance comparison consists of 80% of the Merrill Lynch 1-10 year U.S. Government/Corporate Index and 20% of the JP Morgan Global Government Bond (non-U.S.) Index. The Lehman Brothers U.S. Aggregate Bond Index, an unmanaged index used as a general measure of U.S. fixed income securities, tracks the performance of debt instruments issued by corporations and the U.S. Government and its agencies. Indexes do not incur expenses and are not available for investment.
(1) Effective July 1, 2005 the benchmark for comparison changed to the Lehman Brothers U.S. Aggregate Bond Index.
Julius Baer Funds 2006 Annual Report
35
Julius Baer Global High Income Fund
(Formerly Julius Baer Global High Yield Bond Fund)
It is the Julius Baer Global High Income Fund's policy to declare and pay monthly dividends from its net investment income and distribute net realized capital gains, if any, annually.
Total Return*—Class A
| Year Ended 10/31/06 | | | 10.49 | % | |
| Inception (12/17/02) through 10/31/06 | | | 12.83 | % | |
The performance quoted represents past performance, which does not guarantee future results. The investment return and principal value of an investment will fluctuate so that an investor's shares, when redeemed, may be worth more or less than their original cost. Current performance of the Fund may be lower or higher than the performance quoted. For up to date month-end performance information, please call 800-387-6977.
* Total return figures shown reflect the reinvestment of dividends and capital gains distributions. The Global High Income Fund commenced operations on December 17, 2002 and the Adviser had contractually agreed to reimburse certain expenses of the Fund through 2/28/2006; without such reimbursements total returns woiuld have been lower.
Growth of $10,000 invested in Class A shares of Julius Baer Global High Income Fund vs. Merrill Lynch Global High Yield Constrained Index December 17, 2002-October 31, 2006†

† Hypothetical illustration of $10,000 invested on December 17, 2002 assuming reinvestment of dividends and capital gains distributions and application of fee waivers through 2/28/2006. This period was one in which stock and bond prices fluctuated and the results should not be considered a representation of the income or capital gain or loss which may be realized from an investment in the Income Fund today. No adjustment has been made for shareholder tax liability on dividends or capital gains distributions. The Merrill Lynch Global High Yield Constrained Index tracks the performance of below investment grade bonds of corporate issuers domiciled in countries having an investment grade of foreign currency long-term debt rating (based on a composite of Moody's Investors Service, Inc. and Standard & Poor's Rating Service). Indexes do not incur expenses and are not available for investment.
Julius Baer Funds 2006 Annual Report
36
PORTFOLIO OF INVESTMENTS October 31, 2006
Julius Baer Global Equity Fund Inc. (Percentage of Net Assets)
Share
Amount | | Description | | Market
Value (Note 2) | |
| COMMON STOCKS—87.4% | | | |
| | | United States—35.9% | |
| | 11,287 | | | 3COM Corp* | | $ | 54,856 | | |
| | 8,700 | | | Aetna Inc | | | 358,614 | | |
| | 4,250 | | | Alltel Corp | | | 226,567 | | |
| | 4,570 | | | Altria Group | | | 371,678 | | |
| | 5,934 | | | American International Group | | | 398,587 | | |
| | 1,664 | | | Amgen Inc* | | | 126,314 | | |
| | 3,500 | | | Apple Computer* | | | 283,780 | | |
| | 3,700 | | | Avery Dennison | | | 233,618 | | |
| | 13,548 | | | Bank of America | | | 729,831 | | |
| | 6,420 | | | Bank of New York | | | 220,655 | | |
| | 5,304 | | | Baxter International | | | 243,825 | | |
| | 3,168 | | | Becton Dickinson | | | 221,855 | | |
| | 8,680 | | | Boeing Co | | | 693,185 | | |
| | 6,380 | | | Chevron Corp (2) | | | 428,736 | | |
| | 3,689 | | | Chipotle Mexican Grill-Class B* | | | 215,438 | | |
| | 24,980 | | | Cisco Systems* | | | 602,767 | | |
| | 9,930 | | | ConocoPhillips | | | 598,183 | | |
| | 7,570 | | | Conseco Inc* | | | 153,974 | | |
| | 4,160 | | | Corn Products International | | | 150,550 | | |
| | 4,210 | | | Dentsply International | | | 131,689 | | |
| | 1,030 | | | Eli Lilly | | | 57,690 | | |
| | 7,157 | | | Emerson Electric | | | 604,051 | | |
| | 5,030 | | | Fannie Mae | | | 298,078 | | |
| | 31,907 | | | General Electric | | | 1,120,255 | | |
| | 6,108 | | | Genworth Financial-Class A | | | 204,252 | | |
| | 650 | | | Google Inc-Class A* | | | 309,653 | | |
| | 3,420 | | | Henry Schein* (2) | | | 169,940 | | |
| | 7,690 | | | Hewlett-Packard | | | 297,911 | | |
| | 4,783 | | | Home Depot | | | 178,549 | | |
| | 1,900 | | | Humana Inc | | | 114,000 | | |
| | 7,136 | | | IBM Corp | | | 658,867 | | |
| | 16,790 | | | Intel Corp | | | 358,299 | | |
| | 11,895 | | | JPMorgan Chase | | | 564,299 | | |
| | 8,320 | | | Kroger Co | | | 187,117 | | |
| | 2,840 | | | Legg Mason (2) | | | 255,657 | | |
| | 3,430 | | | Lockheed Martin | | | 298,170 | | |
| | 11,659 | | | Macquarie Infrastructure | | | 347,788 | | |
| | 6,858 | | | McDonald's Corp | | | 287,350 | | |
| | 910 | | | Medco Health Solutions* | | | 48,685 | | |
See Notes to Financial Statements.
Julius Baer Funds 2006 Annual Report
37
PORTFOLIO OF INVESTMENTS (Continued) October 31, 2006
Julius Baer Global Equity Fund Inc. (Percentage of Net Assets)
Share
Amount | | Description | | Market
Value (Note 2) | |
| COMMON STOCKS—Continued | | | |
| | | United States—Continued | |
| | 3,770 | | | MedImmune Inc* (2) | | $ | 120,791 | | |
| | 6,940 | | | Merck & Co | | | 315,215 | | |
| | 2,292 | | | Merrill Lynch | | | 200,367 | | |
| | 2,473 | | | Molson Coors Brewing-Class B | | | 176,028 | | |
| | 7,920 | | | Morgan Stanley (2) | | | 605,326 | | |
| | 5,800 | | | Newfield Exploration | | | 236,582 | | |
| | 21,595 | | | News Corp-Class B* (2) | | | 469,475 | | |
| | 2,810 | | | Nuveen Investments-Class A | | | 138,533 | | |
| | 2,380 | | | Oceaneering International* | | | 85,656 | | |
| | 9,800 | | | Omnicom Group (2) | | | 994,210 | | |
| | 5,040 | | | Patterson Cos* (2) | | | 165,564 | | |
| | 5,924 | | | Pepsico Inc | | | 375,819 | | |
| | 18,435 | | | Pfizer Inc | | | 491,293 | | |
| | 5,522 | | | Procter & Gamble | | | 350,040 | | |
| | 5,037 | | | Prudential Financial | | | 387,496 | | |
| | 2,381 | | | Raytheon Co | | | 118,931 | | |
| | 4,240 | | | RenaissanceRe Holdings | | | 230,656 | | |
| | 3,870 | | | RTI International Metals* (2) | | | 237,308 | | |
| | 17,210 | | | Schering-Plough | | | 381,029 | | |
| | 5,870 | | | Sirona Dental Systems (2) | | | 217,190 | | |
| | 10,360 | | | Smurfit-Stone Container* | | | 110,438 | | |
| | 11,890 | | | Toll Brothers* | | | 343,740 | | |
| | 2,532 | | | United Parcel Service-Class B | | | 190,786 | | |
| | 5,540 | | | United Technologies | | | 364,089 | | |
| | 1,300 | | | Valero Energy | | | 68,029 | | |
| | 7,742 | | | Verizon Communications | | | 286,454 | | |
| | 7,170 | | | Wachovia Corp | | | 397,935 | | |
| | 5,910 | | | Wyeth | | | 301,587 | | |
| | 8,780 | | | Xerox Corp* | | | 149,260 | | |
| | | | 21,315,140 | | |
| | | France—6.0% | |
| | 1,073 | | | Air Liquide | | | 228,437 | | |
| | 436 | | | Atos Origin* | | | 24,819 | | |
| | 2,061 | | | BNP Paribas | | | 226,623 | | |
| | 1,567 | | | Bouygues SA | | | 91,362 | | |
| | 1,061 | | | CIE de Saint-Gobain | | | 78,205 | | |
| | 2,341 | | | Electricite de France | | | 141,957 | | |
| | 6,830 | | | France Telecom | | | 177,401 | | |
See Notes to Financial Statements.
Julius Baer Funds 2006 Annual Report
38
PORTFOLIO OF INVESTMENTS (Continued) October 31, 2006
Julius Baer Global Equity Fund Inc. (Percentage of Net Assets)
Share
Amount | | Description | | Market
Value (Note 2) | |
| COMMON STOCKS—Continued | | | |
| | | France—Continued | |
| | 640 | | | Gaz de France | | $ | 25,731 | | |
| | 1,213 | | | Generale de Sante | | | 43,598 | | |
| | 240 | | | Hermes International | | | 26,053 | | |
| | 1,783 | | | JC Decaux | | | 45,515 | | |
| | 2,984 | | | Lafarge SA | | | 401,049 | | |
| | 447 | | | Lagardere S.C.A. | | | 32,149 | | |
| | 3,007 | | | LVMH Moet Hennessy Louis Vuitton | | | 313,371 | | |
| | 1,020 | | | Neuf Cegetel* | | | 30,789 | | |
| | 909 | | | Pernod-Ricard | | | 182,036 | | |
| | 925 | | | PPR | | | 138,015 | | |
| | 985 | | | Publicis Groupe | | | 38,118 | | |
| | 478 | | | Renault SA | | | 55,915 | | |
| | 3,122 | | | Sanofi-Aventis | | | 265,385 | | |
| | 567 | | | Societe Generale | | | 94,224 | | |
| | 2,821 | | | Societe Television Francaise 1 | | | 95,848 | | |
| | 1,899 | | | Suez SA | | | 84,978 | | |
| | 8,380 | | | Total SA | | | 567,413 | | |
| | 580 | | | Veolia Environnement | | | 35,511 | | |
| | 565 | | | Vinci SA | | | 63,640 | | |
| | 1,510 | | | Vivendi | | | 57,183 | | |
| | | | 3,565,325 | | |
| | | United Kingdom—5.8% | |
| | 11,541 | | | Aegis Group | | | 29,440 | | |
| | 5,009 | | | Anglo American | | | 225,843 | | |
| | 2,919 | | | BAE Systems | | | 23,355 | | |
| | 2,683 | | | Balfour Beatty | | | 20,737 | | |
| | 1,530 | | | BHP Billiton | | | 29,502 | | |
| | 9,322 | | | BP PLC | | | 103,654 | | |
| | 4,757 | | | Burberry Group | | | 50,717 | | |
| | 26,195 | | | Compass Group | | | 140,139 | | |
| | 17,378 | | | Diageo PLC | | | 321,499 | | |
| | 3,040 | | | Firstgroup PLC | | | 31,150 | | |
| | 13,237 | | | GlaxoSmithkline PLC | | | 353,448 | | |
| | 9,190 | | | Highland Gold Mining* | | | 29,403 | | |
| | 1,807 | | | Imperial Tobacco | | | 64,000 | | |
| | 13,130 | | | KKR Private Equity Investors | | | 285,577 | | |
| | 1,010 | | | National Express | | | 18,782 | | |
| | 1,643 | | | Peter Hambro Mining* | | | 37,290 | | |
| | 5,665 | | | Prudential PLC | | | 69,419 | | |
| | 3,840 | | | Reckitt Benckiser | | | 167,057 | | |
See Notes to Financial Statements.
Julius Baer Funds 2006 Annual Report
39
PORTFOLIO OF INVESTMENTS (Continued) October 31, 2006
Julius Baer Global Equity Fund Inc. (Percentage of Net Assets)
Share
Amount | | Description | | Market
Value (Note 2) | |
| COMMON STOCKS—Continued | | | |
| | | United Kingdom—Continued | |
| | 7,460 | | | Rentokil Initial | | $ | 21,556 | | |
| | 1,120 | | | Rio Tinto | | | 61,777 | | |
| | 22,485 | | | Rolls-Royce Group | | | 201,450 | | |
| | 825,199 | | | Rolls-Royce Group-Class B* | | | 1,574 | | |
| | 893 | | | SABMiller PLC | | | 17,270 | | |
| | 4,823 | | | Scottish & Newcastle | | | 51,880 | | |
| | 15,860 | | | Smith & Nephew | | | 154,950 | | |
| | 1,703 | | | Smiths Group | | | 30,727 | | |
| | 33,900 | | | Tesco PLC | | | 254,420 | | |
| | 175,037 | | | Vodafone Group | | | 450,683 | | |
| | 7,359 | | | William Hill | | | 91,371 | | |
| | 1,024 | | | Wolseley PLC | | | 24,198 | | |
| | 6,655 | | | WPP Group | | | 85,232 | | |
| | | | 3,448,100 | | |
| | | Germany—4.9% | |
| | 1,531 | | | Aareal Bank* | | | 65,267 | | |
| | 576 | | | Adidas AG | | | 28,863 | | |
| | 476 | | | Bilfinger Berger | | | 29,672 | | |
| | 7,403 | | | Commerzbank AG | | | 262,772 | | |
| | 207 | | | Continental AG | | | 23,150 | | |
| | 1,487 | | | Deutsche Bank | | | 187,155 | | |
| | 1,048 | | | Deutsche Boerse | | | 168,994 | | |
| | 10,538 | | | Deutsche Post | | | 291,869 | | |
| | 1,022 | | | Deutsche Postbank | | | 76,022 | | |
| | 947 | | | E.ON AG | | | 113,618 | | |
| | 7,036 | | | Fraport AG | | | 483,594 | | |
| | 835 | | | Fresenius AG | | | 150,761 | | |
| | 910 | | | Fresenius Medical Care | | | 121,421 | | |
| | 630 | | | Gagfah SA* | | | 18,285 | | |
| | 804 | | | Henkel KGaA | | | 96,307 | | |
| | 1,243 | | | Hypo Real Estate Holding | | | 78,135 | | |
| | 870 | | | IKB Deutsche Industriebank | | | 30,570 | | |
| | 8,557 | | | IVG Immobilien | | | 308,320 | | |
| | 930 | | | KarstadtQuelle AG* | | | 21,841 | | |
| | 2,240 | | | Landesbank Berlin Holding* | | | 17,154 | | |
| | 320 | | | MAN AG | | | 28,447 | | |
| | 180 | | | Merck KGaA | | | 18,977 | | |
| | 60 | | | Puma AG | | | 21,276 | | |
| | 498 | | | Rhoen-Klinikum AG | | | 20,626 | | |
See Notes to Financial Statements.
Julius Baer Funds 2006 Annual Report
40
PORTFOLIO OF INVESTMENTS (Continued) October 31, 2006
Julius Baer Global Equity Fund Inc. (Percentage of Net Assets)
Share
Amount | | Description | | Market
Value (Note 2) | |
| COMMON STOCKS—Continued | | | |
| | | Germany—Continued | |
| | 300 | | | SAP AG | | $ | 59,687 | | |
| | 2,046 | | | Siemens AG | | | 184,105 | | |
| | 298 | | | Solarworld AG | | | 16,028 | | |
| | 110 | | | Wacker Chemie* | | | 13,220 | | |
| | | | 2,936,136 | | |
| | | Japan—4.8% | |
| | 260 | | | Acom Co | | | 9,987 | | |
| | 820 | | | Aeon Credit Service | | | 18,303 | | |
| | 330 | | | Aiful Corp | | | 11,380 | | |
| | 710 | | | Aisin Seiki | | | 21,817 | | |
| | 3,300 | | | Bosch Corp | | | 18,619 | | |
| | 1,995 | | | Canon Inc | | | 106,770 | | |
| | 3,040 | | | Chiba Bank | | | 27,194 | | |
| | 520 | | | Credit Saison | | | 18,775 | | |
| | 1,870 | | | Daihatsu Motor | | | 18,803 | | |
| | 1,300 | | | Daikin Industries | | | 36,618 | | |
| | 1,420 | | | Daiwa Securities | | | 16,084 | | |
| | 1,340 | | | Denso Corp | | | 51,013 | | |
| | 780 | | | Eisai Co | | | 39,880 | | |
| | 15 | | | Fuji Television Network | | | 31,241 | | |
| | 2,118 | | | Fujitsu Ltd | | | 17,247 | | |
| | 2,872 | | | Honda Motor | | | 101,490 | | |
| | 550 | | | Hoya Corp | | | 21,220 | | |
| | 330 | | | Ibiden Co | | | 17,267 | | |
| | 2,850 | | | Itochu Corp | | | 22,673 | | |
| | 12 | | | Japan Tobacco | | | 52,238 | | |
| | 753 | | | JS Group | | | 15,426 | | |
| | 740 | | | JSR Corp (2) | | | 18,570 | | |
| | 3,419 | | | Kubota Corp | | | 29,855 | | |
| | 300 | | | Kyocera Corp | | | 26,862 | | |
| | 820 | | | Makita Corp | | | 24,357 | | |
| | 8,674 | | | Matsushita Electric Industrial | | | 181,025 | | |
| | 2,000 | | | Mitsubishi Electric | | | 17,413 | | |
| | 13 | | | Mitsubishi UFJ Financial | | | 163,117 | | |
| | 1,817 | | | Mitsui Fudosan | | | 44,667 | | |
| | 23 | | | Mizuho Financial | | | 178,849 | | |
| | 1,008 | | | NGK Spark Plug | | | 21,209 | | |
| | 1,840 | | | NHK Spring | | | 20,307 | | |
| | 150 | | | Nintendo Co | | | 30,626 | | |
See Notes to Financial Statements.
Julius Baer Funds 2006 Annual Report
41
PORTFOLIO OF INVESTMENTS (Continued) October 31, 2006
Julius Baer Global Equity Fund Inc. (Percentage of Net Assets)
Share
Amount | | Description | | Market
Value (Note 2) | |
| COMMON STOCKS—Continued | | | |
| | | Japan—Continued | |
| | 1,000 | | | Nippon Electric Glass | | $ | 21,510 | | |
| | 4 | | | Nippon Telegraph & Telephone | | | 20,110 | | |
| | 840 | | | Nitto Denko | | | 47,824 | | |
| | 900 | | | NOK Corp | | | 23,584 | | |
| | 3,106 | | | Nomura Holdings | | | 54,747 | | |
| | 2,000 | | | NSK Ltd | | | 16,730 | | |
| | 20 | | | NTT DoCoMo | | | 30,558 | | |
| | 120 | | | ORIX Corp | | | 33,750 | | |
| | 480 | | | Promise Co | | | 17,331 | | |
| | 4,380 | | | Ricoh Co | | | 86,363 | | |
| | 2 | | | Sapporo Hokuyo | | | 19,974 | | |
| | 700 | | | Sega Sammy | | | 17,566 | | |
| | 14,630 | | | Seiyu Ltd* | | | 22,853 | | |
| | 1,960 | | | Sharp Corp | | | 34,882 | | |
| | 1,648 | | | Sony Corp | | | 68,224 | | |
| | 1,480 | | | Stanley Electric | | | 29,308 | | |
| | 4,000 | | | Sumitomo Chemical | | | 28,475 | | |
| | 1,288 | | | Sumitomo Corp | | | 16,909 | | |
| | 1,260 | | | Sumitomo Electric Industries | | | 17,810 | | |
| | 3,080 | | | Sumitomo Metal Industries | | | 11,568 | | |
| | 19 | | | Sumitomo Mitsui Financial | | | 207,588 | | |
| | 2,420 | | | Suzuki Motor | | | 68,579 | | |
| | 850 | | | Takeda Pharmaceutical | | | 54,488 | | |
| | 460 | | | Takefuji Corp | | | 16,648 | | |
| | 2,000 | | | Teijin Ltd | | | 11,148 | | |
| | 3,610 | | | The Bank of Fukuoka | | | 28,780 | | |
| | 6,118 | | | The Bank of Yokohama | | | 47,208 | | |
| | 2,230 | | | The Sumitomo Trust & Banking | | | 23,946 | | |
| | 2,000 | | | Toray Industries | | | 14,391 | | |
| | 3,510 | | | Toyota Motor | | | 207,625 | | |
| | 480 | | | Yamada Denki | | | 47,691 | | |
| | 1,270 | | | Yamaha Motor | | | 34,689 | | |
| | 1,400 | | | Yamato Holdings | | | 21,821 | | |
| | | | 2,835,580 | | |
| | | Switzerland—4.0% | |
| | 1,930 | | | Adecco SA | | | 119,243 | | |
| | 430 | | | BKW FMB Energie | | | 41,657 | | |
| | 3,757 | | | Compagnie Financiere Richemont | | | 185,909 | | |
See Notes to Financial Statements.
Julius Baer Funds 2006 Annual Report
42
PORTFOLIO OF INVESTMENTS (Continued) October 31, 2006
Julius Baer Global Equity Fund Inc. (Percentage of Net Assets)
Share
Amount | | Description | | Market
Value (Note 2) | |
| COMMON STOCKS—Continued | | | |
| | | Switzerland—Continued | |
| | 2,755 | | | Credit Suisse-Registered | | $ | 166,117 | | |
| | 383 | | | Dufry Group* | | | 30,730 | | |
| | 20 | | | Givaudan-Registered | | | 16,561 | | |
| | 3,925 | | | Holcim Ltd | | | 337,957 | | |
| | 1,293 | | | Nestle SA-Registered | | | 441,794 | | |
| | 5,939 | | | Novartis AG-Registered | | | 360,489 | | |
| | 1,593 | | | Roche Holding | | | 278,809 | | |
| | 119 | | | SGS SA | | | 126,381 | | |
| | 480 | | | Syngenta AG-Registered* | | | 77,527 | | |
| | 980 | | | The Swatch Group | | | 193,424 | | |
| | | | 2,376,598 | | |
| | | Italy—3.6% | |
| | 2,112 | | | Assicurazioni Generali* | | | 83,673 | | |
| | 28,819 | | | Banca CR Firenze | | | 96,004 | | |
| | 14,560 | | | Banca Intesa | | | 99,423 | | |
| | 36,254 | | | Banca Intesa-RNC | | | 240,341 | | |
| | 650 | | | Banca Italease | | | 36,296 | | |
| | 2,229 | | | Banca Popolare dell' Emilia Romagna | | | 52,632 | | |
| | 10,384 | | | Banca Popolare di Milano | | | 153,079 | | |
| | 13,860 | | | Banca Popolare Italiana* | | | 184,155 | | |
| | 2,984 | | | Banche Popolari Unite | | | 82,038 | | |
| | 3,055 | | | Banco Popolare di Verona e Novara | | | 81,962 | | |
| | 29,254 | | | Beni Stabili | | | 33,082 | | |
| | 2,760 | | | Bulgari SpA | | | 38,468 | | |
| | 4,100 | | | Buzzi Unicem | | | 108,585 | | |
| | 28,321 | | | Capitalia SpA | | | 249,599 | | |
| | 5,751 | | | Credito Emiliano | | | 82,872 | | |
| | 1,210 | | | Finmeccanica SpA | | | 29,158 | | |
| | 4,349 | | | Geox SpA | | | 57,451 | | |
| | 1,266 | | | Luxottica Group | | | 39,023 | | |
| | 5,755 | | | Parmalat SpA* | | | 20,604 | | |
| | 11,940 | | | Telecom Italia | | | 36,080 | | |
| | 39,729 | | | UniCredito Italiano | | | 328,842 | | |
| | | | 2,133,367 | | |
| | | Poland—2.9% | |
| | 421 | | | Agora SA | | | 3,960 | | |
| | 671 | | | Bank BPH | | | 191,901 | | |
| | 8,109 | | | Bank PEKAO | | | 546,380 | | |
See Notes to Financial Statements.
Julius Baer Funds 2006 Annual Report
43
PORTFOLIO OF INVESTMENTS (Continued) October 31, 2006
Julius Baer Global Equity Fund Inc. (Percentage of Net Assets)
Share
Amount | | Description | | Market
Value (Note 2) | |
| COMMON STOCKS—Continued | | | |
| | | Poland—Continued | |
| | 1,690 | | | Bank Zachodni WBK* | | $ | 114,985 | | |
| | 2,533 | | | Budimex SA* | | | 61,008 | | |
| | 2,837 | | | CCC SA* | | | 41,783 | | |
| | 1,428 | | | Opoczno SA* | | | 20,914 | | |
| | 45,406 | | | PKO Bank Polski | | | 572,241 | | |
| | 9,538 | | | Polski Koncern Miesny Duda* | | | 50,690 | | |
| | 12,683 | | | Telekomunikacja Polska | | | 93,188 | | |
| | | | 1,697,050 | | |
| | | Russia—2.2% | |
| | 400 | | | AvtoVAZ GDR | | | 26,548 | | |
| | 440 | | | Gazpromneft | | | 1,804 | | |
| | 1,426 | | | LUKOIL ADR | | | 113,738 | | |
| | 849 | | | MMC Norilsk Nickel ADR | | | 125,737 | | |
| | 21,814 | | | NovaTek OAO | | | 126,957 | | |
| | 5,458 | | | OAO Gazprom ADR (2) | | | 230,546 | | |
| | 1,477 | | | OAO Rosneft Oil | | | 12,658 | | |
| | 19,614 | | | OAO Rosneft Oil GDR | | | 168,680 | | |
| | 1,679 | | | Polyus Gold ADR* (2) | | | 79,920 | | |
| | 77 | | | Sberbank RF | | | 173,250 | | |
| | 2,510 | | | TMK OAO | | | 13,554 | | |
| | 32,521 | | | TNK-BP | | | 74,473 | | |
| | 1,418 | | | Unified Energy System GDR | | | 106,775 | | |
| | 5,830 | | | Uralkaliy CLS | | | 8,745 | | |
| | 5,300 | | | Uralsvyazinform ADR (2) | | | 40,598 | | |
| | 2,921 | | | VolgaTelecom ADR | | | 21,907 | | |
| | | | 1,325,890 | | |
| | | Netherlands—2.2% | |
| | 1,324 | | | Euronext NV | | | 132,656 | | |
| | 833 | | | Heineken NV | | | 37,754 | | |
| | 6,712 | | | ING Groep | | | 297,356 | | |
| | 6,812 | | | Royal KPN | | | 91,031 | | |
| | 1,862 | | | Royal Numico | | | 83,251 | | |
| | 6,117 | | | Royal Philips Electronics | | | 213,689 | | |
| | 6,189 | | | TNT NV | | | 238,244 | | |
| | 6,615 | | | Unilever NV | | | 163,120 | | |
| | 1,380 | | | Vedior NV | | | 25,240 | | |
| | | | 1,282,341 | | |
See Notes to Financial Statements.
Julius Baer Funds 2006 Annual Report
44
PORTFOLIO OF INVESTMENTS (Continued) October 31, 2006
Julius Baer Global Equity Fund Inc. (Percentage of Net Assets)
Share
Amount | | Description | | Market
Value (Note 2) | |
| COMMON STOCKS—Continued | | | |
| | | Sweden—1.8% | |
| | 2,509 | | | Capio AB (2) | | $ | 58,022 | | |
| | 2,701 | | | Getinge AB-Class B* | | | 47,782 | | |
| | 1,219 | | | Modern Times Group-Class B | | | 70,222 | | |
| | 15,052 | | | Nordea AB | | | 207,394 | | |
| | 8,915 | | | Skandinaviska Enskilda Banken | | | 249,374 | | |
| | 3,293 | | | Skanska AB-Class B | | | 58,711 | | |
| | 8,167 | | | Swedbank AB | | | 267,468 | | |
| | 13,009 | | | Telefonaktiebolaget LM Ericsson-Class B | | | 49,360 | | |
| | 8,433 | | | TeliaSonera AB | | | 61,308 | | |
| | | | 1,069,641 | | |
| | | Austria—1.6% | |
| | 2,997 | | | Erste Bank der Oesterreichischen Sparkassen | | | 204,076 | | |
| | 626 | | | Flughafen Wien | | | 56,129 | | |
| | 5,535 | | | Immoeast Immobilien Anlagen* | | | 69,516 | | |
| | 2,597 | | | OMV AG* | | | 141,172 | | |
| | 1,320 | | | Raiffeisen International Bank Holding | | | 151,041 | | |
| | 3,550 | | | Telekom Austria | | | 88,355 | | |
| | 1,649 | | | Wiener Staedtische Versicherung | | | 106,077 | | |
| | 2,030 | | | Wienerberger AG | | | 105,531 | | |
| | | | 921,897 | | |
| | | Czech Republic—1.1% | |
| | 4,278 | | | Komercni Banka | | | 665,550 | | |
| | | Finland—1.1% | |
| | 250 | | | Elisa Oyj-Class A | | | 6,318 | | |
| | 8,328 | | | Fortum Oyj | | | 229,171 | | |
| | 9,072 | | | Nokia Oyj | | | 180,054 | | |
| | 1,000 | | | Nokia Oyj ADR (2) | | | 19,880 | | |
| | 1,920 | | | Sampo Oyj-Class A | | | 41,611 | | |
| | 1,530 | | | Sanoma-WSOY Oyj-Class B | | | 39,466 | | |
| | 420 | | | Stockmann Oyj-Class B | | | 17,626 | | |
| | 550 | | | Wartsila Oyj-Class B | | | 25,237 | | |
| | 3,540 | | | YIT Oyj | | | 88,016 | | |
| | | | 647,379 | | |
| | | Australia—1.1% | |
| | 3,666 | | | BHP Billiton | | | 77,392 | | |
| | 4,087 | | | Brambles Industries | | | 39,471 | | |
See Notes to Financial Statements.
Julius Baer Funds 2006 Annual Report
45
PORTFOLIO OF INVESTMENTS (Continued) October 31, 2006
Julius Baer Global Equity Fund Inc. (Percentage of Net Assets)
Share
Amount | | Description | | Market
Value (Note 2) | |
| COMMON STOCKS—Continued | | | |
| | | Australia—Continued | |
| | 925 | | | CSL Ltd | | $ | 40,150 | | |
| | 1,580 | | | John Fairfax Holdings | | | 5,942 | | |
| | 81,945 | | | Macquarie Airports Management | | | 203,556 | | |
| | 10,060 | | | Newcrest Mining | | | 185,671 | | |
| | 800 | | | Publishing & Broadcasting | | | 11,998 | | |
| | 1,211 | | | Rio Tinto | | | 73,471 | | |
| | | | 637,651 | | |
| | | Hungary—1.0% | |
| | 29,506 | | | Magyar Telekom Telecommunications* | | | 137,326 | | |
| | 12,901 | | | OTP Bank | | | 453,488 | | |
| | 80 | | | Richter Gedeon | | | 16,775 | | |
| | | | 607,589 | | |
| | | Belgium—0.9% | |
| | 397 | | | Almancora Comm Va | | | 52,343 | | |
| | 2,708 | | | Fortis | | | 113,680 | | |
| | 3,413 | | | KBC Groupe | | | 372,889 | | |
| | | | 538,912 | | |
| | | Norway—0.7% | |
| | 5,696 | | | Acta Holding | | | 26,299 | | |
| | 1,200 | | | Cermaq ASA | | | 14,768 | | |
| | 6,014 | | | DnB NOR | | | 78,704 | | |
| | 2,530 | | | Norsk Hydro* | | | 58,116 | | |
| | 730 | | | Orkla ASA | | | 37,388 | | |
| | 77,890 | | | PAN Fish* | | | 60,969 | | |
| | 3,558 | | | Statoil ASA | | | 89,889 | | |
| | 4,300 | | | Telenor ASA | | | 67,876 | | |
| | | | 434,009 | | |
| | | Romania—0.6% | |
| | 16,490 | | | BRD-Groupe Societe Generale | | | 116,110 | | |
| | 90,930 | | | Impact SA* | | | 18,977 | | |
| | 1,019,413 | | | SNP Petrom | | | 233,097 | | |
| | | | 368,184 | | |
See Notes to Financial Statements.
Julius Baer Funds 2006 Annual Report
46
PORTFOLIO OF INVESTMENTS (Continued) October 31, 2006
Julius Baer Global Equity Fund Inc. (Percentage of Net Assets)
Share
Amount | | Description | | Market
Value (Note 2) | |
| COMMON STOCKS—Continued | | | |
| | | Hong Kong—0.6% | |
| | 11,320 | | | China Merchants Holdings International | | $ | 33,100 | | |
| | 16,000 | | | Clear Media* | | | 22,416 | | |
| | 64,630 | | | Emperor Entertainment Hotel | | | 11,547 | | |
| | 30,850 | | | Galaxy Entertainment* | | | 28,668 | | |
| | 14,790 | | | Hutchison Telecommunications International* | | | 28,476 | | |
| | 23,200 | | | Melco International Development | | | 56,835 | | |
| | 114,130 | | | Shun TAK | | | 150,799 | | |
| | 54,600 | | | Texwinca Holdings | | | 35,791 | | |
| | | | 367,632 | | |
| | | Turkey—0.6% | |
| | 3,984 | | | Acibadem Saglik Hizmetleri ve Ticaret | | | 43,690 | | |
| | 4,990 | | | Anadolu Sigorta* | | | 9,098 | | |
| | 23,563 | | | Dogan Sirketler Grubu | | | 100,938 | | |
| | 10,032 | | | Haci Omer Sabanci | | | 42,287 | | |
| | 19,589 | | | Turkiye Garanti Bankasi | | | 71,831 | | |
| | 13,637 | | | Turkiye Is Bankasi | | | 88,327 | | |
| | 1,520 | | | Yapi Kredi Sigorta* | | | 6,876 | | |
| | | | 363,047 | | |
| | | Canada—0.6% | |
| | 4,071 | | | Bema Gold* | | | 17,513 | | |
| | 510 | | | Centerra Gold* | | | 5,075 | | |
| | 3,929 | | | Eldorado Gold* | | | 16,727 | | |
| | 13,100 | | | Ivanhoe Mines* | | | 136,793 | | |
| | 1,230 | | | Potash Corp of Saskatchewan | | | 154,424 | | |
| | | | 330,532 | | |
| | | Mexico—0.5% | |
| | 750 | | | Cemex SAB ADR | | | 23,055 | | |
| | 630 | | | Desarrolladora Homex ADR* | | | 27,657 | | |
| | 240 | | | Fomento Economico Mexicano ADR | | | 23,206 | | |
| | 1,214 | | | Grupo Aeroportuario del Sureste ADR | | | 46,047 | | |
| | 23,004 | | | Grupo Financiero Banorte | | | 83,368 | | |
| | 2,570 | | | Grupo Televisa ADR | | | 63,428 | | |
| | | | 266,761 | | |
| | | Cyprus—0.4% | |
| | 22,993 | | | Bank of Cyprus | | | 260,602 | | |
See Notes to Financial Statements.
Julius Baer Funds 2006 Annual Report
47
PORTFOLIO OF INVESTMENTS (Continued) October 31, 2006
Julius Baer Global Equity Fund Inc. (Percentage of Net Assets)
Share
Amount | | Description | | Market
Value (Note 2) | |
| COMMON STOCKS—Continued | | | |
| | | China—0.3% | |
| | 175,970 | | | Beijing Capital International Airport-Class H | | $ | 112,861 | | |
| | 26,500 | | | Weiqiao Textile-Class H | | | 36,377 | | |
| | 49,040 | | | Wumart Stores-Class H* | | | 45,698 | | |
| | | | 194,936 | | |
| | | Greece—0.3% | |
| | 2,837 | | | Alpha Bank | | | 82,559 | | |
| | 4,241 | | | Hellenic Telecommunication Organization* | | | 109,884 | | |
| | | | 192,443 | | |
| | | Spain—0.3% | |
| | 17,645 | | | Corporacion Mapfre | | | 78,149 | | |
| | 382 | | | Inditex SA | | | 18,264 | | |
| | 4,720 | | | Telefonica SA | | | 90,968 | | |
| | | | 187,381 | | |
| | | South Korea—0.3% | |
| | 210 | | | Hyundai Motor | | | 17,073 | | |
| | 92 | | | NHN Corp* | | | 9,130 | | |
| | 208 | | | Samsung Electronics | | | 134,884 | | |
| | | | 161,087 | | |
| | | Croatia—0.2% | |
| | 102 | | | Atlantska Plovidba | | | 15,916 | | |
| | 528 | | | Dom Holding* | | | 15,561 | | |
| | 84 | | | Ericsson Nikola Tesla | | | 36,060 | | |
| | 205 | | | FIMA Validus* | | | 5,473 | | |
| | 18 | | | Institut Gradevinarstva Hrvatske | | | 12,483 | | |
| | 492 | | | Podravka d.d. | | | 41,798 | | |
| | 347 | | | Proficio Dd* (1) | | | 4,151 | | |
| | 32 | | | Viadukt Dd | | | 7,213 | | |
| | | | 138,655 | | |
| | | India—0.2% | |
| | 2,050 | | | State Bank of India GDR | | | 129,150 | | |
| | | Denmark—0.2% | |
| | 1,230 | | | Novo-Nordisk-Class B* | | | 92,890 | | |
See Notes to Financial Statements.
Julius Baer Funds 2006 Annual Report
48
PORTFOLIO OF INVESTMENTS (Continued) October 31, 2006
Julius Baer Global Equity Fund Inc. (Percentage of Net Assets)
Share
Amount | | Description | | Market
Value (Note 2) | |
| COMMON STOCKS—Continued | | | |
| | | Philippines—0.1% | |
| | 7,190 | | | Ayala Corp | | $ | 70,688 | | |
| | 12,084 | | | Bank of the Philippine Islands | | | 15,032 | | |
| | | | 85,720 | | |
| | | Portugal—0.1% | |
| | 6,600 | | | Energias de Portugal | | | 29,652 | | |
| | 2,914 | | | Portugal Telecom-Registered | | | 36,300 | | |
| | | | 65,952 | | |
| | | Ireland—0.1% | |
| | 20,332 | | | Dragon Oil* | | | 60,882 | | |
| | | Venezuela—0.1% | |
| | 2,860 | | | CIA Anonima Nacional TeleFonos De Venezuela ADR | | | 55,513 | | |
| | | Multinational—0.1% | |
| | 190 | | | Central European Media Enterprises-Class A* | | | 14,026 | | |
| | 640 | | | Millicom International Cellular* (2) | | | 31,923 | | |
| | | | 45,949 | | |
| | | Thailand—0.1% | |
| | 2,490 | | | Bangkok Bank | | | 7,798 | | |
| | 2,210 | | | Bangkok Bank-Foreign Registered Shares | | | 7,222 | | |
| | 59,600 | | | Krung Thai Bank | | | 21,100 | | |
| | | | 36,120 | | |
| | | Estonia—0.1% | |
| | 795 | | | Tallink Group* | | | 4,495 | | |
| | 3,974 | | | Tallink Group* | | | 22,470 | | |
| | | | 26,965 | | |
| | | Egypt—0.0% | |
| | 470 | | | Orascom Telecom Holding GDR | | | 26,461 | | |
| | | Brazil—0.0% | |
| | 1,121 | | | Diagnosticos da America | | | 22,022 | | |
| | | Kazakhstan—0.0% | |
| | 890 | | | Kazakhgold GDR* | | | 21,253 | | |
| | | | | TOTAL COMMON STOCKS (Cost $48,654,821) | | | 51,938,292 | | |
See Notes to Financial Statements.
Julius Baer Funds 2006 Annual Report
49
PORTFOLIO OF INVESTMENTS (Continued) October 31, 2006
Julius Baer Global Equity Fund Inc. (Percentage of Net Assets)
Share
Amount | | Description | | Market
Value (Note 2) | |
| PREFERRED STOCKS—0.2% | | | |
| | | Germany—0.2% | |
| | 3,280 | | | ProsiebenSat.1 Media | | $ | 93,776 | | |
| | | Croatia—0.0% | |
| | 32 | | | Adris Grupa | | | 24,722 | | |
| | | | | TOTAL PREFERRED STOCKS (Cost $103,476) | | | 118,498 | | |
| INVESTMENT FUNDS—3.6% | | | |
| | | United States—3.4% | |
| | 5,830 | | | Diamonds Trust Series I Index Fund-Large Capital (2) | | | 703,856 | | |
| | 11,550 | | | iShares S&P 100 Index Fund | | | 741,048 | | |
| | 4,280 | | | SPDR Trust Series 1 (2) | | | 589,741 | | |
| | | | 2,034,645 | | |
| | | Romania—0.2% | |
| | 19,500 | | | SIF 1 Banat Crisana Arad | | | 19,322 | | |
| | 21,000 | | | SIF 2 Moldova Bacau | | | 22,942 | | |
| | 16,000 | | | SIF 3 Transilvania Brasov | | | 14,982 | | |
| | 29,000 | | | SIF 4 Muntenia Bucuresti | | | 18,420 | | |
| | 18,500 | | | SIF 5 Oltenia Craiova | | | 22,024 | | |
| | | | 97,690 | | |
| | | Luxembourg—0.0% | |
| | 1,850 | | | Prologis European Properties | | | 34,946 | | |
| | | | | TOTAL INVESTMENT FUNDS (Cost $2,089,585) | | | 2,167,281 | | |
| RIGHTS—0.0% | | | |
| | | Italy—0.0% | |
| | 2,229 | | | Banca Popolare Emilia Romagna Rights, Expires 11/28/2006* | | | 825 | | |
| | 2,229 | | | Banca Popolare Emilia Romagna Rights, Expires 11/28/2006* | | | 447 | | |
| | | | | TOTAL RIGHTS (Cost $0) | | | 1,272 | | |
| WARRANTS—1.1% | | | |
| | | India—1.1% | |
| | 8,048 | | | Banking Index Benchmark Exchange Traded Scheme-Bank BeES,
Issued by Citigroup, Expires 01/20/2010* | | | 100,479 | | |
| | 5,506 | | | Bharti Airtel-Class A, Issued by CLSA, Expires 05/31/2010*† | | | 69,943 | | |
| | 8,741 | | | Canara Bank, Issued by Citigroup, Expires 01/19/2009* | | | 57,846 | | |
| | 5,200 | | | India Cements, Ltd, Issued by ABNA, Expires 06/04/2007* | | | 24,856 | | |
See Notes to Financial Statements.
Julius Baer Funds 2006 Annual Report
50
PORTFOLIO OF INVESTMENTS (Continued) October 31, 2006
Julius Baer Global Equity Fund Inc. (Percentage of Net Assets)
Share
Amount | | Description | | Market
Value (Note 2) | |
| WARRANTS—Continued | |
| | | India—Continued | |
| | 4,037 | | | State Bank of India, Issued by Citigroup, Expires 01/19/2009*† | | $ | 117,268 | | |
| | 8,820 | | | State Bank of India, Issued by CLSA, Expires 05/13/2010*† | | | 257,509 | | |
| | | TOTAL WARRANTS (Cost $519,883) | | | 627,901 | | |
Face
Value | |
Currency | |
| |
| |
| STRUCTURED NOTES—0.3% | | | |
| | | | | Philippines—0.3% | |
| | 8 | | | USD | | Phillippines Notes, due 10/17/2008 (Cost $182,307)†* | | | 191,409 | | |
| U.S. GOVERNMENT OBLIGATION—0.1% | | | |
| | | | | United States—0.1% | |
| | 50,000 | | | USD | | U.S. Treasury Bills 4.670% due 11/09/2006 | | | 49,949 | | |
| | 20,000 | | | USD | | U.S. Treasury Bills 4.725% due 11/09/2006 (3) | | | 19,979 | | |
TOTAL U.S. GOVERNMENT OBLIGATION
(Cost $69,928) | | | 69,928 | | |
SHORT-TERM INVESTMENTS PURCHASED WITH CASH COLLATERAL
FROM SECURITY LENDING—8.0% | |
| | 165,669 | | | | | Abbey National, with rates ranging from 5.270%-5.280%
and maturity dates ranging from 11/16/2006-12/01/2006 | | | 165,669 | | |
| | 75,305 | | | | | ABN Amro Bank NV 5.305% due 11/21/2006 | | | 75,305 | | |
| | 58,838 | | | | | Banco Santander Central Hispano 5.275% due 11/14/2006 | | | 58,838 | | |
| | 75,296 | | | | | BancoBilbao Vizcaya Argentaria 5.310% due 01/03/2007 | | | 75,296 | | |
| | 192,780 | | | | | Bank of America, with rates ranging from 5.270-5.310%
and maturity dates ranging from 11/10/2006-07/10/2007 | | | 192,780 | | |
| | 147,597 | | | | | Bank of Nova Scotia 5.270% due 11/13/2006 | | | 147,597 | | |
| | 240,976 | | | | | Barclays, with rates ranging from 5.300%-5.306% and
maturity dates ranging from 11/03/2006-01/03/2007 | | | 240,976 | | |
| | 239,942 | | | | | Barton Capital, with rates ranging from 5.266%-5.270%
and maturity dates ranging from 11/01/2006-11/07/2006 | | | 239,942 | | |
| | 139,765 | | | | | Bear Stearns & Co 5.447% due 03/07/2007 | | | 139,765 | | |
| | 180,731 | | | | | BGI Institutional 5.242% due 11/01/2006 | | | 180,731 | | |
| | 120,488 | | | | | BNP Paribas, with a rate of 5.280% and maturity dates
ranging from 12/12/2006-12/15/2006 | | | 120,488 | | |
| | 45,183 | | | | | CAFCO Funding 5.289% due 11/17/2006 | | | 45,183 | | |
| | 75,305 | | | | | Calyon 5.250% due 11/06/2006 | | | 75,305 | | |
See Notes to Financial Statements.
Julius Baer Funds 2006 Annual Report
51
PORTFOLIO OF INVESTMENTS (Continued) October 31, 2006
Julius Baer Global Equity Fund Inc. (Percentage of Net Assets)
Face
Value | |
Currency | |
Description | | Market
Value (Note 2) | |
SHORT-TERM INVESTMENTS PURCHASED WITH CASH COLLATERAL
FROM SECURITY LENDING—Continued | | | |
| | 90,366 | | | | | Canadian Imperial Bank of Commerce 5.280% due 11/29/2006 | | $ | 90,366 | | |
| | 77,060 | | | | | Charta 5.314% due 11/01/2006 | | | 77,060 | | |
| | 45,183 | | | | | Clipper Receivables 5.280% due 11/15/2006 | | | 45,183 | | |
| | 66,165 | | | | | Commonwealth Bank of Australia 5.286% due 11/30/2006 | | | 66,165 | | |
| | 124,596 | | | | | Compass Securitization, with rates ranging from 5.292%-5.305
and maturity dates ranging from 11/29/2006-12/15/2006 | | | 124,596 | | |
| | 30,122 | | | | | CRC Funding 5.314% due 12/19/2006 | | | 30,122 | | |
| | 150,610 | | | | | Credit Suisse First Boston, with a rate of 5.310% and
maturity dates ranging from 11/13/2006-11/14/2006 | | | 150,610 | | |
| | 210,370 | | | | | Fairway Finance, with rates ranging from 5.277%-5.299%
and maturity dates ranging from 11/15/2006-11/22/2006 | | | 210,370 | | |
| | 42,171 | | | | | Falcon Asset Securitization 5.292% due 11/14/2006 | | | 42,171 | | |
| | 90,365 | | | | | Fortis Bank, with rates ranging from 5.260%-5.300% and
maturity dates ranging from 11/07/2006-11/20/2006 | | | 90,365 | | |
| | 150,610 | | | | | General Electric Capital Corporation, with rates ranging from
5.265%-5.285% and maturity dates ranging from
11/03/2006-11/22/2006 | | | 150,610 | | |
| | 45,183 | | | | | Govco Incorporated 5.276% due 11/10/2006 | | | 45,183 | | |
| | 29,394 | | | | | Greyhawk Funding 5.296% due 11/27/2006 | | | 29,394 | | |
| | 45,183 | | | | | HBOS Halifax Bank of Scotland 5.300% due 01/08/2007 | | | 45,183 | | |
| | 65,586 | | | | | Jupiter Securitization 5.284% due 11/06/2006 | | | 65,586 | | |
| | 44,435 | | | | | Kitty Hawk Funding 5.286% due 11/29/2006 | | | 44,435 | | |
| | 59,648 | | | | | Lexington Parker Capital 5.291% due 11/09/2006 | | | 59,648 | | |
| | 59,562 | | | | | Liberty Street 5.284% due 11/13/2006 | | | 59,562 | | |
| | 576,577 | | | | | Merrimac Cash Fund-Premium Class 5.092% due 11/01/2006 | | | 576,577 | | |
| | 30,122 | | | | | Old Line Funding 5.276% due 11/15/2006 | | | 30,122 | | |
| | 73,871 | | | | | Ranger Funding, with rates ranging from 5.294%-5.296% and
maturity dates ranging from 11/16/2006-11/29/2006 | | | 73,871 | | |
| | 60,244 | | | | | Royal Bank of Canada 5.300% due 11/17/2006 | | | 60,244 | | |
| | 74,689 | | | | | Sheffiled Receivables, with rates ranging from
5.267%-5.275% and maturity dates ranging from
11/02/2006-11/08/2006 | | | 74,689 | | |
| | 60,244 | | | | | Skandinaviska Enskilda Banken 5.290% due 12/11/2006 | | | 60,244 | | |
| | 271,097 | | | | | Societe Generale, with rates ranging from 5.270%-5.280% and
maturity dates ranging from 11/01/2006-12/04/2006 | | | 271,097 | | |
| | 103,078 | | | | | Svenska Handlesbanken 5.300% due 11/01/2006 | | | 103,078 | | |
| | 44,457 | | | | | Three Pillars Funding 5.285% due 11/20/2006 | | | 44,457 | | |
| | 75,305 | | | | | Toronto Dominion Bank 5.300% due 12/11/2006 | | | 75,305 | | |
See Notes to Financial Statements.
Julius Baer Funds 2006 Annual Report
52
PORTFOLIO OF INVESTMENTS (Continued) October 31, 2006
Julius Baer Global Equity Fund Inc. (Percentage of Net Assets)
Face
Value | |
Currency | |
Description | | Market
Value (Note 2) | |
SHORT-TERM INVESTMENTS PURCHASED WITH CASH COLLATERAL
FROM SECURITY LENDING—Continued | | | |
| | 104,351 | | | | | Variable Funding Capital, with rates ranging from
5.267%-5.287% and maturity dates ranging from
11/07/2006-11/28/2006 | | $ | 104,351 | | |
| | 110,064 | | | | | Yorktown Capital, with rates ranging from 5.292%-5.297% and
maturity dates ranging from 11/15/2006-12/14/2006 | | | 110,064 | | |
| | | | | | | TOTAL SHORT-TERM INVESTMENTS PURCHASED
WITH CASH COLLATERAL FROM SECURITY LENDING
(Cost $4,768,583) | | | 4,768,583 | | |
| REPURCHASE AGREEMENT—3.0% | | | |
| | | | | United States—3.0% | |
| | 1,766,356 | | | USD | | Investors Bank & Trust company Repurchase Agreement,
dated 10/31/2006, due 11/01/2006, with a maturity
value $1,766,533 and an effective yield of 3.60%,
collateralized by a U.S. Government and Agent Obligation,
with a rate of 8.625%, a maturity date of 02/25/2015,
and an aggregate market value of $1,854,674.
(Cost $1,766,356) | | | 1,766,356 | | |
| | | | | | | TOTAL INVESTMENTS—103.7% (Cost $58,154,939) | | | 61,649,520 | | |
| | | | | | | OTHER ASSETS AND LIABILITIES (Net)—(3.7%) | | | (2,199,287 | ) | |
| | | | | | | TOTAL NET ASSETS—100.0% | | $ | 59,450,233 | | |
Notes to the Portfolio of Investments:
ADR American Depositary Receipt
GDR Global Depositary Receipt
(1) Illiquid security
(2) All or a portion of this security was on loan to brokers at October 31, 2006.
(3) Security has been pledged for futures collateral.
* Non-income producing security.
† Securities exempt from registration under Rule 144A of the Securities Act of 1933, as amended. These securities may be resold in transactions exempt from registrations, normally to qualified institutional buyers.
Aggregate cost for federal income tax purposes was $58,284,022.
Glossary of Currencies
USD — United States Dollar
See Notes to Financial Statements.
Julius Baer Funds 2006 Annual Report
53
SCHEDULE OF FORWARD FOREIGN EXCHANGE CONTRACTS
October 31, 2006
Julius Baer Global Equity Fund Inc.
FORWARD FOREIGN EXCHANGE CONTRACTS TO BUY
| | | Contracts to Receive | | | | | |
Expiration
Date | |
Local
Currency | |
Value in
USD | |
In Exchange
for USD | | Net Unrealized
Appreciation
(Depreciation) | |
| 11/14/2006 | | CAD | 1,455,110 | | | | 1,299,175 | | | | 1,302,928 | | | $ | (3,753 | ) | |
| 11/01/2006 | | CHF | 42,691 | | | | 34,322 | | | | 34,183 | | | | 139 | | |
| 12/27/2006 | | CZK | 1,208,532 | | | | 55,051 | | | | 54,744 | | | | 307 | | |
| 11/01/2006 | | EUR | 3,560 | | | | 4,543 | | | | 4,543 | | | | 0 | | |
| 01/31/2007 | | JPY | 265,445,000 | | | | 2,293,666 | | | | 2,289,948 | | | | 3,718 | | |
| 11/01/2006 | | NOK | 306,426 | | | | 46,847 | | | | 46,704 | | | | 143 | | |
| Net unrealized appreciation on forward foreign exchange contracts to buy | | | | | | | | | | | | | | $ | 554 | | |
FORWARD FOREIGN EXCHANGE CONTRACTS TO SELL
| | | Contracts to Deliver | | | | | |
Expiration
Date | | Local
Currency | | Value in
USD | | In Exchange
for USD | | Net Unrealized
Depreciation | |
| 12/27/2006 | | CZK | 7,797,582 | | | | 355,192 | | | | 351,936 | | | $ | (3,256 | ) | |
| 01/31/2007 | | EUR | 1,259,911 | | | | 1,615,308 | | | | 1,612,157 | | | | (3,151 | ) | |
| 11/03/2006 | | HUF | 2,703,036 | | | | 13,243 | | | | 13,211 | | | | (32 | ) | |
| 12/27/2006 | | HUF | 20,971,008 | | | | 102,330 | | | | 96,708 | | | | (5,622 | ) | |
| 11/01/2006 | | MXN | 348,889 | | | | 32,420 | | | | 32,417 | | | | (3 | ) | |
| 11/03/2006 | | PLN | 111,560 | | | | 36,757 | | | | 36,699 | | | | (58 | ) | |
| 12/27/2006 | | PLN | 577,920 | | | | 190,779 | | | | 187,014 | | | | (3,765 | ) | |
| 11/01/2006 | | TRY | 6,648 | | | | 4,556 | | | | 4,543 | | | | (13 | ) | |
| 12/22/2006 | | TRY | 207,110 | | | | 139,364 | | | | 136,077 | | | | (3,287 | ) | |
| Net unrealized depreciation on forward foreign exchange contracts to sell | | | | | | | | | | | | | | $ | (19,187 | ) | |
Glossary of Currencies
CAD — Canadian Dollar
CHF — Swiss Franc
CZK — Czech Koruna
EUR — Euro
HUF — Hungarian Forint
JPY — Japanese Yen
MXN — Mexican Nuevo Peso
NOK — Norwegian Krone
PLN — Polish Zloty
TRY — Turkish Lira
See Notes to Financial Statements.
Julius Baer Funds 2006 Annual Report
54
PORTFOLIO OF INVESTMENTS–Industry Sector (Unaudited) October 31, 2006
Julius Baer Global Equity Fund Inc. (Percentage of Net Assets)
At October 31, 2006, sector diversification of the Fund's investments were as follows:
| | | % of Net
Assets | | Market
Value (Note 2) | |
| INDUSTRY SECTOR | |
| Financials | | | 34.0 | % | | $ | 20,239,389 | | |
| Industrials | | | 11.2 | | | | 6,639,031 | | |
| Consumer Discretionary | | | 10.0 | | | | 5,952,915 | | |
| Healthcare | | | 8.1 | | | | 4,803,076 | | |
| Consumer Staples | | | 6.5 | | | | 3,850,971 | | |
| Energy | | | 6.1 | | | | 3,640,881 | | |
| Information Technology | | | 6.0 | | | | 3,566,621 | | |
| Materials | | | 5.5 | | | | 3,252,618 | | |
| Telecommunications | | | 3.8 | | | | 2,272,696 | | |
| Utilities | | | 1.4 | | | | 826,455 | | |
| Cash & Cash Equivalents | | | 11.1 | | | | 6,604,867 | * | |
| Total Investments | | | 103.7 | | | | 61,649,520 | | |
| Other Assets and Liabilities (Net) | | | (3.7 | ) | | | (2,199,287 | )* | |
| Net Assets | | | 100.0 | % | | $ | 59,450,233 | | |
* Cash and Cash Equivalents and Other Assets ans Liabilities (Net) include the margin requirements for $889,933 of notional market value for futures, which is 1.50% of net assets.
See Notes to Financial Statements.
Julius Baer Funds 2006 Annual Report
55
PORTFOLIO OF INVESTMENTS October 31, 2006
Julius Baer International Equity Fund (Percentage of Net Assets)
Share
Amount | | Description | | Market
Value (Note 2) | |
| COMMON STOCKS—89.7% | | | |
| | | France—9.7% | |
| | 125,691 | | | Accor SA | | $ | 8,727,158 | | |
| | 672,419 | | | Air Liquide | | | 143,154,764 | | |
| | 176,906 | | | Atos Origin* | | | 10,070,411 | | |
| | 969,858 | | | BNP Paribas | | | 106,643,212 | | |
| | 1,030,549 | | | Bouygues SA | | | 60,084,787 | | |
| | 488,634 | | | CIE de Saint-Gobain | | | 36,016,827 | | |
| | 1,348,427 | | | Electricite de France (1) | | | 81,767,789 | | |
| | 62,099 | | | Eurazeo | | | 7,926,006 | | |
| | 3,840,947 | | | France Telecom | | | 99,763,692 | | |
| | 264,485 | | | Gaz de France (1) | | | 10,633,626 | | |
| | 1,054,213 | | | Generale de Sante | | | 37,890,541 | | |
| | 1,905,570 | | | Havas SA (1) | | | 9,242,262 | | |
| | 121,326 | | | Hermes International | | | 13,170,370 | | |
| | 530,862 | | | JC Decaux | | | 13,551,314 | | |
| | 1,673,152 | | | Lafarge SA | | | 224,871,052 | | |
| | 167,858 | | | Lagardere S.C.A. | | | 12,072,737 | | |
| | 1,710,067 | | | LVMH Moet Hennessy Louis Vuitton (1) | | | 178,212,884 | | |
| | 479,412 | | | Neuf Cegetel* | | | 14,471,376 | | |
| | 510,356 | | | Pernod-Ricard (1) | | | 102,203,543 | | |
| | 471,183 | | | PPR | | | 70,303,008 | | |
| | 230,504 | | | Publicis Groupe | | | 8,920,259 | | |
| | 174,424 | | | Remy Cointreau | | | 9,323,580 | | |
| | 263,358 | | | Renault SA | | | 30,806,955 | | |
| | 1,779,637 | | | Sanofi-Aventis | | | 151,277,883 | | |
| | 189,298 | | | Societe Generale | | | 31,457,687 | | |
| | 1,725,825 | | | Societe Television Francaise 1 (1) | | | 58,637,384 | | |
| | 1,038,579 | | | Suez SA | | | 46,475,196 | | |
| | 4,360,320 | | | Total SA (1) | | | 295,238,870 | | |
| | 327,895 | | | Veolia Environnement | | | 20,075,866 | | |
| | 309,802 | | | Vinci SA (1) | | | 34,895,443 | | |
| | 953,597 | | | Vivendi | | | 36,112,055 | | |
| | | | 1,963,998,537 | | |
| | | United Kingdom—9.6% | |
| | 7,060,145 | | | Aegis Group | | | 18,010,055 | | |
| | 2,777,202 | | | Anglo American | | | 125,216,790 | | |
| | 779,302 | | | Arriva PLC | | | 10,627,215 | | |
| | 1,312,150 | | | Ashmore Group* | | | 4,873,810 | | |
| | 1,628,031 | | | BAE Systems | | | 13,025,736 | | |
See Notes to Financial Statements.
Julius Baer Funds 2006 Annual Report
56
PORTFOLIO OF INVESTMENTS (Continued) October 31, 2006
Julius Baer International Equity Fund (Percentage of Net Assets)
Share
Amount | | Description | | Market
Value (Note 2) | |
| COMMON STOCKS—Continued | | | |
| | | United Kingdom—Continued | |
| | 817,685 | | | Balfour Beatty | | $ | 6,319,994 | | |
| | 518,369 | | | BHP Billiton | | | 9,995,345 | | |
| | 2,152,109 | | | BP PLC | | | 23,929,876 | | |
| | 2,744,056 | | | Burberry Group | | | 29,255,829 | | |
| | 1,873,767 | | | Ceres Power* | | | 8,648,456 | | |
| | 14,121,095 | | | Compass Group | | | 75,545,546 | | |
| | 9,778,046 | | | Diageo PLC | | | 180,897,029 | | |
| | 1,037,480 | | | Firstgroup PLC | | | 10,630,747 | | |
| | 7,315,028 | | | GlaxoSmithkline PLC | | | 195,322,220 | | |
| | 157,468 | | | Go-Ahead Group | | | 6,048,663 | | |
| | 6,558,611 | | | Highland Gold Mining* | | | 20,983,698 | | |
| | 1,046,724 | | | Imperial Tobacco | | | 37,072,486 | | |
| | 1,178,029 | | | Intertek Group | | | 18,491,130 | | |
| | 7,327,894 | | | KKR Private Equity Investors*† | | | 159,381,694 | | |
| | 789,537 | | | Metro International-Class A* | | | 869,197 | | |
| | 320,183 | | | National Express | | | 5,954,023 | | |
| | 916,337 | | | Peter Hambro Mining* (1) | | | 20,797,437 | | |
| | 3,267,899 | | | Prudential PLC | | | 40,045,100 | | |
| | 6,671,454 | | | QinetiQ PLC | | | 23,476,021 | | |
| | 2,126,155 | | | Reckitt Benckiser | | | 92,497,039 | | |
| | 3,132,500 | | | Rentokil Initial | | | 9,051,308 | | |
| | 567,601 | | | Rio Tinto | | | 31,307,549 | | |
| | 10,596,667 | | | Rolls-Royce Group* | | | 94,938,792 | | |
| | 388,897,678 | | | Rolls-Royce Group-Class B | | | 741,725 | | |
| | 612,019 | | | SABMiller PLC* | | | 11,836,151 | | |
| | 2,108,678 | | | Scottish & Newcastle | | | 22,682,817 | | |
| | 8,922,330 | | | Smith & Nephew | | | 87,170,166 | | |
| | 810,869 | | | Smiths Group | | | 14,630,173 | | |
| | 672,416 | | | Southern Cross Healthcare* | | | 3,885,870 | | |
| | 2,447,538 | | | Stagecoach Group | | | 6,511,953 | | |
| | 19,111,745 | | | Tesco PLC | | | 143,434,196 | | |
| | 98,452,351 | | | Vodafone Group | | | 253,493,883 | | |
| | 3,345,744 | | | William Hill | | | 41,541,418 | | |
| | 607,022 | | | Wolseley PLC | | | 14,344,432 | | |
| | 4,675,852 | | | WPP Group | | | 59,884,496 | | |
| | | | 1,933,370,065 | | |
| | | Japan—7.9% | |
| | 86,660 | | | Acom Co | | | 3,328,667 | | |
See Notes to Financial Statements.
Julius Baer Funds 2006 Annual Report
57
PORTFOLIO OF INVESTMENTS (Continued) October 31, 2006
Julius Baer International Equity Fund (Percentage of Net Assets)
Share
Amount | | Description | | Market
Value (Note 2) | |
| COMMON STOCKS—Continued | | | |
| | | Japan—Continued | |
| | 465,349 | | | Aeon Credit Service | | $ | 10,386,988 | | |
| | 114,150 | | | Aiful Corp | | | 3,936,375 | | |
| | 421,927 | | | Aisin Seiki | | | 12,965,193 | | |
| | 1,107,556 | | | Bosch Corp (1) | | | 6,248,940 | | |
| | 1,157,188 | | | Canon Inc | | | 61,931,362 | | |
| | 1,230,000 | | | Chiba Bank | | | 11,002,859 | | |
| | 262,147 | | | Credit Saison | | | 9,465,083 | | |
| | 631,000 | | | Daihatsu Motor | | | 6,344,740 | | |
| | 356,400 | | | Daikin Industries | | | 10,039,008 | | |
| | 795,458 | | | Daiwa Securities | | | 9,010,053 | | |
| | 675,906 | | | Denso Corp | | | 25,731,217 | | |
| | 1,347 | | | Dentsu Inc | | | 3,702,224 | | |
| | 3,148 | | | East Japan Railway | | | 21,979,975 | | |
| | 282,500 | | | Eisai Co | | | 14,443,899 | | |
| | 171,600 | | | Exedy Corp | | | 5,024,011 | | |
| | 177,900 | | | Fanuc Ltd | | | 15,412,786 | | |
| | 4,086 | | | Fuji Television Network | | | 8,509,957 | | |
| | 1,059,000 | | | Fujitsu Ltd | | | 8,623,499 | | |
| | 1,743,752 | | | Honda Motor | | | 61,620,360 | | |
| | 558,132 | | | Hoya Corp | | | 21,533,495 | | |
| | 180,860 | | | Ibiden Co | | | 9,463,290 | | |
| | 1,366,297 | | | Itochu Corp | | | 10,869,266 | | |
| | 7,661 | | | Japan Tobacco | | | 33,349,921 | | |
| | 331,931 | | | JS Group | | | 6,799,833 | | |
| | 297,728 | | | JSR Corp (1) | | | 7,471,472 | | |
| | 22,990 | | | Keyence Corp | | | 5,082,506 | | |
| | 1,224,148 | | | Koito Manufacturing | | | 17,272,132 | | |
| | 1,149,269 | | | Kubota Corp | | | 10,035,442 | | |
| | 100,900 | | | Kyocera Corp | | | 9,034,535 | | |
| | 255,332 | | | Makita Corp | | | 7,584,442 | | |
| | 5,288,151 | | | Matsushita Electric Industrial | | | 110,362,590 | | |
| | 677,000 | | | Mitsubishi Electric | | | 5,894,243 | | |
| | 11,045 | | | Mitsubishi UFJ Financial | | | 138,586,915 | | |
| | 439,728 | | | Mitsubishi UFJ Securities | | | 5,367,343 | | |
| | 524,222 | | | Mitsui Fudosan (1) | | | 12,886,854 | | |
| | 857,326 | | | Mitsui Mining & Smelting | | | 4,141,919 | | |
| | 15,519 | | | Mizuho Financial | | | 120,676,104 | | |
| | 292,553 | | | NGK Spark Plug (1) | | | 6,155,462 | | |
| | 755,133 | | | NHK Spring | | | 8,334,147 | | |
See Notes to Financial Statements.
Julius Baer Funds 2006 Annual Report
58
PORTFOLIO OF INVESTMENTS (Continued) October 31, 2006
Julius Baer International Equity Fund (Percentage of Net Assets)
Share
Amount | | Description | | Market
Value (Note 2) | |
| COMMON STOCKS—Continued | | | |
| | | Japan—Continued | |
| | 70,606 | | | Nintendo Co | | $ | 14,415,906 | | |
| | 352,000 | | | Nippon Electric Glass | | | 7,571,508 | | |
| | 3,635 | | | Nippon Telegraph & Telephone | | | 18,275,063 | | |
| | 342,000 | | | Nissan Chemical Industries | | | 4,399,249 | | |
| | 905,126 | | | Nissan Motor | | | 10,823,964 | | |
| | 516,131 | | | Nitto Denko | | | 29,384,950 | | |
| | 405,100 | | | NOK Corp (1) | | | 10,615,484 | | |
| | 1,210,249 | | | Nomura Holdings | | | 21,332,117 | | |
| | 935,000 | | | NSK Ltd (1) | | | 7,821,262 | | |
| | 12,140 | | | NTT DoCoMo | | | 18,548,589 | | |
| | 69,450 | | | ORIX Corp | | | 19,532,905 | | |
| | 161,830 | | | Promise Co | | | 5,843,036 | | |
| | 1,747 | | | Resona Holdings (1) | | | 5,308,625 | | |
| | 1,356,000 | | | Ricoh Co | | | 26,736,887 | | |
| | 485 | | | Sapporo Hokuyo | | | 4,843,583 | | |
| | 412,400 | | | Sega Sammy | | | 10,349,161 | | |
| | 2,222,625 | | | Seiyu Ltd* (1) | | | 3,471,814 | | |
| | 169,841 | | | Seven & I | | | 5,436,420 | | |
| | 804,000 | | | Sharp Corp | | | 14,308,736 | | |
| | 937,608 | | | Sony Corp | | | 38,815,235 | | |
| | 443,688 | | | Stanley Electric | | | 8,786,276 | | |
| | 2,103,000 | | | Sumitomo Chemical | | | 14,970,782 | | |
| | 879,652 | | | Sumitomo Corp | | | 11,547,990 | | |
| | 713,700 | | | Sumitomo Electric Industries | | | 10,088,235 | | |
| | 1,345,175 | | | Sumitomo Metal Industries | | | 5,052,085 | | |
| | 8,310 | | | Sumitomo Mitsui Financial | | | 90,792,540 | | |
| | 425,000 | | | Suruga Bank | | | 5,274,636 | | |
| | 1,215,400 | | | Suzuki Motor (1) | | | 34,442,644 | | |
| | 318,800 | | | Takeda Pharmaceutical | | | 20,436,072 | | |
| | 153,720 | | | Takefuji Corp (1) | | | 5,563,337 | | |
| | 804,000 | | | Teijin Ltd | | | 4,481,345 | | |
| | 1,365,000 | | | The Bank of Fukuoka | | | 10,882,250 | | |
| | 361,726 | | | The Bank of Kyoto | | | 3,708,189 | | |
| | 2,052,686 | | | The Bank of Yokohama | | | 15,839,086 | | |
| | 1,093,000 | | | The Gunma Bank | | | 7,622,218 | | |
| | 454,603 | | | The Shizuoka Bank (1) | | | 4,850,444 | | |
| | 1,777,653 | | | The Sumitomo Trust & Banking | | | 19,088,280 | | |
| | 434,000 | | | Toppan Printing | | | 4,749,161 | | |
| | 1,135,431 | | | Toray Industries | | | 8,170,102 | | |
See Notes to Financial Statements.
Julius Baer Funds 2006 Annual Report
59
PORTFOLIO OF INVESTMENTS (Continued) October 31, 2006
Julius Baer International Equity Fund (Percentage of Net Assets)
Share
Amount | | Description | | Market
Value (Note 2) | |
| COMMON STOCKS—Continued | | | |
| | | Japan—Continued | |
| | 1,965,489 | | | Toyota Motor | | $ | 116,263,401 | | |
| | 146,900 | | | ULVAC Inc | | | 4,300,858 | | |
| | 218,380 | | | Yamada Denki | | | 21,697,266 | | |
| | 723,281 | | | Yamaha Motor | | | 19,755,872 | | |
| | 333,587 | | | Yamato Holdings | | | 5,199,350 | | |
| | 380,585 | | | Yokogawa Electric (1) | | | 5,213,938 | | |
| | | | 1,597,219,958 | | |
| | | Germany—7.7% | |
| | 934,625 | | | Aareal Bank* (1) | | | 39,843,148 | | |
| | 309,046 | | | Adidas AG | | | 15,486,141 | | |
| | 626,720 | | | Bilfinger Berger | | | 39,067,803 | | |
| | 4,123,525 | | | Commerzbank AG | | | 146,365,730 | | |
| | 124,463 | | | Continental AG | | | 13,919,169 | | |
| | 1,650,000 | | | Curanum AG | | | 16,889,940 | | |
| | 842,703 | | | Deutsche Bank | | | 106,063,336 | | |
| | 498,919 | | | Deutsche Boerse | | | 80,452,714 | | |
| | 5,510,424 | | | Deutsche Post | | | 152,621,084 | | |
| | 506,310 | | | Deutsche Postbank | | | 37,662,213 | | |
| | 610,160 | | | Deutsche Wohnen | | | 39,328,275 | | |
| | 298,967 | | | DIC Asset* | | | 10,569,947 | | |
| | 480,806 | | | E.ON AG | | | 57,685,613 | | |
| | 3,049,500 | | | Fraport AG (1) | | | 209,596,549 | | |
| | 322,212 | | | Fresenius AG | | | 58,176,173 | | |
| | 367,859 | | | Fresenius Medical Care | | | 49,083,290 | | |
| | 353,450 | | | Gagfah SA* | | | 10,258,603 | | |
| | 391,289 | | | Henkel KGaA | | | 46,870,728 | | |
| | 684,771 | | | Hypo Real Estate Holding | | | 43,044,868 | | |
| | 453,848 | | | IKB Deutsche Industriebank | | | 15,947,273 | | |
| | 100,019 | | | Interhyp AG* (1) | | | 9,421,253 | | |
| | 1,044,630 | | | IVG Immobilien | | | 37,639,440 | | |
| | 452,232 | | | KarstadtQuelle AG* (1) | | | 10,620,596 | | |
| | 584,894 | | | Landesbank Berlin Holding* | | | 4,479,177 | | |
| | 193,712 | | | MAN AG | | | 17,220,566 | | |
| | 233,899 | | | Marseille-Kliniken AG | | | 4,313,859 | | |
| | 1,047,872 | | | Medicilin AG* | | | 5,403,304 | | |
| | 140,634 | | | Merck KGaA (1) | | | 14,826,552 | | |
| | 347,003 | | | MTU Aero Engines Holding | | | 14,239,148 | | |
| | 307,601 | | | MVV Energie | | | 9,226,254 | | |
See Notes to Financial Statements.
Julius Baer Funds 2006 Annual Report
60
PORTFOLIO OF INVESTMENTS (Continued) October 31, 2006
Julius Baer International Equity Fund (Percentage of Net Assets)
Share
Amount | | Description | | Market
Value (Note 2) | |
| COMMON STOCKS—Continued | | | |
| | | Germany—Continued | |
| | 653,843 | | | Patrizia Immobilien* | | $ | 16,673,960 | | |
| | 532,355 | | | Praktiker Bau-Und Heimwerkermaerkte | | | 16,952,809 | | |
| | 10,324 | | | Puma AG | | | 3,660,976 | | |
| | 653,578 | | | Rhoen-Klinikum AG | | | 27,069,604 | | |
| | 177,182 | | | SAP AG | | | 35,251,677 | | |
| | 1,252,486 | | | Siemens AG | | | 112,702,041 | | |
| | 169,135 | | | Solarworld AG (1) | | | 9,096,992 | | |
| | 56,132 | | | Wacker Chemie* | | | 6,746,006 | | |
| | | | 1,544,476,811 | | |
| | | Switzerland—6.6% | |
| | 1,033,652 | | | Adecco SA* | | | 63,863,132 | | |
| | 130,657 | | | BKW FMB Energie | | | 12,657,610 | | |
| | 2,157,625 | | | Compagnie Financiere Richemont | | | 106,766,747 | | |
| | 1,541,874 | | | Credit Suisse-Registered | | | 92,969,852 | | |
| | 265,721 | | | Dufry Group* | | | 21,320,059 | | |
| | 135,222 | | | Flughafen Zuerich | | | 36,962,238 | | |
| | 11,723 | | | Givaudan-Registered | | | 9,707,513 | | |
| | 1,940,205 | | | Holcim Ltd | | | 167,058,693 | | |
| | 736,189 | | | Nestle SA-Registered | | | 251,541,846 | | |
| | 3,295,816 | | | Novartis AG-Registered | | | 200,051,540 | | |
| | 895,518 | | | Roche Holding | | | 156,734,549 | | |
| | 39,330 | | | SGS SA | | | 41,769,450 | | |
| | 317,637 | | | Syngenta AG-Registered* | | | 51,303,030 | | |
| | 552,673 | | | The Swatch Group | | | 109,081,659 | | |
| | 86,347 | | | Unilabs* | | | 2,846,185 | | |
| | | | 1,324,634,103 | | |
| | | Italy—5.7% | |
| | 1,459,225 | | | Assicurazioni Generali* | | | 57,811,436 | | |
| | 497,094 | | | Autostrada Torino-Milano (1) | | | 10,551,168 | | |
| | 15,123,033 | | | Banca CR Firenze | | | 50,378,959 | | |
| | 6,990,240 | | | Banca Intesa | | | 47,732,662 | | |
| | 17,400,467 | | | Banca Intesa-RNC | | | 115,353,993 | | |
| | 406,912 | | | Banca Italease | | | 22,722,093 | | |
| | 599,984 | | | Banca Popolare dell' Emilia Romagna (1) | | | 14,167,107 | | |
| | 391,498 | | | Banca Popolare dell'Etruria e del Lazio | | | 7,912,567 | | |
| | 449,825 | | | Banca Popolare di Intra* (1) | | | 7,916,161 | | |
| | 5,875,014 | | | Banca Popolare di Milano (1) | | | 86,608,531 | | |
See Notes to Financial Statements.
Julius Baer Funds 2006 Annual Report
61
PORTFOLIO OF INVESTMENTS (Continued) October 31, 2006
Julius Baer International Equity Fund (Percentage of Net Assets)
Share
Amount | | Description | | Market
Value (Note 2) | |
| COMMON STOCKS—Continued | | | |
| | | Italy—Continued | |
| | 1,217,726 | | | Banca Popolare di Sondrio (1) | | $ | 21,448,575 | | |
| | 7,757,350 | | | Banca Popolare Italiana* (1) | | | 103,070,385 | | |
| | 1,464,052 | | | Banche Popolari Unite (1) | | | 40,250,565 | | |
| | 1,317,296 | | | Banco Popolare di Verona e Novara (1) | | | 35,341,572 | | |
| | 6,696,801 | | | Beni Stabili (1) | | | 7,573,051 | | |
| | 1,145,390 | | | Bulgari SpA (1) | | | 15,964,150 | | |
| | 2,225,111 | | | Buzzi Unicem | | | 58,930,424 | | |
| | 13,125,163 | | | Capitalia SpA | | | 115,674,644 | | |
| | 3,379,666 | | | Credito Emiliano | | | 48,700,958 | | |
| | 657,492 | | | Finmeccanica SpA | | | 15,843,906 | | |
| | 753,641 | | | Geox SpA | | | 9,955,765 | | |
| | 3,124,699 | | | Impregilo SpA* | | | 13,928,822 | | |
| | 518,770 | | | Luxottica Group | | | 15,990,490 | | |
| | 2,922,880 | | | Parmalat SpA* | | | 10,464,383 | | |
| | 1,292,320 | | | Piccolo Credito Valtellinese | | | 21,012,377 | | |
| | 462,470 | | | Societa Iniziative Autostradali e Servizi (1) | | | 6,183,116 | | |
| | 6,718,143 | | | Telecom Italia | | | 20,300,607 | | |
| | 19,681,970 | | | UniCredito Italiano | | | 162,910,219 | | |
| | | | 1,144,698,686 | | |
| | | Poland—5.2% | |
| | 3,085,052 | | | Agora SA | | | 29,020,357 | | |
| | 246,037 | | | Bank BPH | | | 70,364,612 | | |
| | 684,562 | | | Bank Handlowy w Warszawie | | | 17,254,738 | | |
| | 14,495,985 | | | Bank Millenium | | | 33,099,018 | | |
| | 3,340,615 | | | Bank PEKAO | | | 225,088,802 | | |
| | 1,707,144 | | | Bank Zachodni WBK* | | | 116,151,377 | | |
| | 133,183 | | | BRE Bank | | | 12,725,678 | | |
| | 882,915 | | | Budimex SA* | | | 21,265,247 | | |
| | 725,544 | | | CCC SA* | | | 10,685,760 | | |
| | 2,858,730 | | | Cersanit-Krasnystaw* | | | 37,864,597 | | |
| | 870,600 | | | Globe Trade Centre* | | | 9,580,745 | | |
| | 444,274 | | | Grupa Kety | | | 28,778,527 | | |
| | 882,334 | | | Inter Cars* | | | 11,192,520 | | |
| | 89,026 | | | Inter Groclin Auto* | | | 1,705,692 | | |
| | 217,022 | | | JC Auto | | | 1,494,460 | | |
| | 1,316,446 | | | NFI Empik Media & Fashion* | | | 5,768,845 | | |
| | 598,502 | | | Opoczno SA* | | | 8,765,396 | | |
| | 366,592 | | | Orbis SA | | | 6,160,094 | | |
See Notes to Financial Statements.
Julius Baer Funds 2006 Annual Report
62
PORTFOLIO OF INVESTMENTS (Continued) October 31, 2006
Julius Baer International Equity Fund (Percentage of Net Assets)
Share
Amount | | Description | | Market
Value (Note 2) | |
| COMMON STOCKS—Continued | | | |
| | | Poland—Continued | |
| | 83,076 | | | PBG SA* | | $ | 6,350,351 | | |
| | 23,766,268 | | | PKO Bank Polski | | | 299,520,519 | | |
| | 334,695 | | | Polish Energy Partners | | | 1,421,465 | | |
| | 583,884 | | | Polska Grupa Farmaceutyczna | | | 14,457,384 | | |
| | 2,404,170 | | | Polski Koncern Miesny Duda* | | | 12,777,141 | | |
| | 709,930 | | | Sniezka SA | | | 8,537,732 | | |
| | 10,000,000 | | | Stalexport SA* | | | 9,785,671 | | |
| | 82,385 | | | Stomil Sanok | | | 4,533,136 | | |
| | 24,508 | | | Techmex SA* | | | 171,594 | | |
| | 6,988,086 | | | Telekomunikacja Polska | | | 51,344,893 | | |
| | | | 1,055,866,351 | | |
| | | Russia—3.9% | |
| | 433,831 | | | Alpha Cement JSC* (2) | | | 28,199,015 | | |
| | 289,222 | | | AvtoVAZ GDR | | | 19,195,722 | | |
| | 39,735,668 | | | Central Telecommunication | | | 23,344,705 | | |
| | 567,981 | | | CTC Media* (1) | | | 13,784,899 | | |
| | 135,748 | | | Gazpromneft | | | 556,567 | | |
| | 547,651 | | | Kuban Energetic Sale (2) | | | 0 | | |
| | 547,651 | | | Kuban Generation (2) | | | 5,613,423 | | |
| | 547,651 | | | Kubanenergo OJSC | | | 16,429,530 | | |
| | 720,248 | | | LUKOIL ADR (1) | | | 57,446,980 | | |
| | 415,902 | | | MMC Norilsk Nickel ADR (1) | | | 61,595,086 | | |
| | 336,961 | | | North-West Telecom ADR | | | 18,701,335 | | |
| | 4,746,683 | | | NovaTek OAO | | | 27,625,695 | | |
| | 80,262 | | | NovaTek OAO GDR† | | | 4,671,248 | | |
| | 66,772,886 | | | Novorossiysk Trade Port (2) | | | 2,874,573 | | |
| | 2,133,154 | | | OAO Gazprom ADR (1) | | | 90,104,425 | | |
| | 284,395 | | | OAO Rosneft Oil | | | 2,437,265 | | |
| | 8,360,267 | | | OAO Rosneft Oil GDR (1) | | | 71,898,296 | | |
| | 71,234 | | | Open Investments* | | | 14,941,331 | | |
| | 106,118 | | | Polyus Gold* | | | 5,051,217 | | |
| | 1,124,333 | | | Polyus Gold ADR* | | | 53,518,251 | | |
| | 754,914 | | | RBC Information Systems* | | | 8,077,580 | | |
| | 42,501 | | | Sberbank RF | | | 95,627,250 | | |
| | 131,021 | | | Sibirtelecom ADR* (1) | | | 8,699,794 | | |
| | 1,247,062 | | | Southern Telecommunication ADR (1) | | | 7,544,725 | | |
| | 1,411,552 | | | TMK OAO | | | 7,622,381 | | |
| | 8,001,294 | | | TNK-BP | | | 18,322,963 | | |
See Notes to Financial Statements.
Julius Baer Funds 2006 Annual Report
63
PORTFOLIO OF INVESTMENTS (Continued) October 31, 2006
Julius Baer International Equity Fund (Percentage of Net Assets)
Share
Amount | | Description | | Market
Value (Note 2) | |
| COMMON STOCKS—Continued | | | |
| | | Russia—Continued | |
| | 809,299 | | | Unified Energy System GDR (1) | | $ | 60,940,215 | | |
| | 4,837,848 | | | Uralkaliy CLS | | | 7,256,772 | | |
| | 1,042,702 | | | Urals Energy* | | | 7,755,904 | | |
| | 381,900 | | | Veropharm CLS* | | | 10,769,580 | | |
| | 2,725,137 | | | VolgaTelecom | | | 10,219,264 | | |
| | 205,040 | | | VolgaTelecom ADR | | | 1,537,800 | | |
| | 64,215 | | | Volskcement-Class BRD* (2) | | | 11,879,775 | | |
| | 477,522 | | | Wimm-Bill-Dann Foods ADR | | | 20,127,552 | | |
| | | | 794,371,118 | | |
| | | Netherlands—3.9% | |
| | 336,851 | | | Amrest Holdings | | | 6,936,686 | | |
| | 371,101 | | | Draka Holding | | | 8,052,131 | | |
| | 128,799 | | | Eurocastle Investment | | | 5,753,741 | | |
| | 719,428 | | | Euronext NV | | | 72,081,991 | | |
| | 502,956 | | | Heineken NV | | | 22,795,570 | | |
| | 3,652,842 | | | ING Groep | | | 161,828,603 | | |
| | 4,034,049 | | | Plaza Centers* | | | 14,079,910 | | |
| | 3,736,494 | | | Royal KPN | | | 49,932,206 | | |
| | 1,040,315 | | | Royal Numico (1) | | | 46,513,046 | | |
| | 3,414,262 | | | Royal Philips Electronics | | | 119,272,803 | | |
| | 2,155,992 | | | Spazio Investment | | | 36,929,161 | | |
| | 3,447,241 | | | TNT NV (1) | | | 132,700,563 | | |
| | 3,696,906 | | | Unilever NV (1) | | | 91,162,308 | | |
| | 787,639 | | | Vedior NV | | | 14,405,993 | | |
| | | | 782,444,712 | | |
| | | Sweden—3.2% | |
| | 191,146 | | | Autoliv Inc (1) | | | 10,839,212 | | |
| | 1,648,616 | | | Capio AB (1) | | | 38,125,415 | | |
| | 612,278 | | | Elekta AB-Class B | | | 12,717,991 | | |
| | 1,476,609 | | | Getinge AB-Class B* (1) | | | 26,121,915 | | |
| | 237,650 | | | Hennes & Mauritz-Class B | | | 10,251,194 | | |
| | 895,397 | | | KappAhl Holding (1) | | | 7,253,541 | | |
| | 687,195 | | | Modern Times Group-Class B | | | 39,586,939 | | |
| | 7,521,140 | | | Nordea AB | | | 103,629,965 | | |
| | 1,130,660 | | | Omhex AB | | | 20,549,911 | | |
| | 491,881 | | | Securitas AB-Class B | | | 6,470,864 | | |
| | 491,881 | | | Securitas Direct-Class B (1) | | | 1,498,516 | | |
See Notes to Financial Statements.
Julius Baer Funds 2006 Annual Report
64
PORTFOLIO OF INVESTMENTS (Continued) October 31, 2006
Julius Baer International Equity Fund (Percentage of Net Assets)
Share
Amount | | Description | | Market
Value (Note 2) | |
| COMMON STOCKS—Continued | | | |
| | | Sweden—Continued | |
| | 491,881 | | | Securitas Systems-Class B | | $ | 1,641,556 | | |
| | 5,003,229 | | | Skandinaviska Enskilda Banken | | | 139,952,399 | | |
| | 1,842,368 | | | Skanska AB-Class B | | | 32,847,492 | | |
| | 4,561,334 | | | Swedbank AB | | | 149,383,152 | | |
| | 7,103,522 | | | Telefonaktiebolaget LM Ericsson-Class B | | | 26,952,738 | | |
| | 3,689,048 | | | TeliaSonera AB | | | 26,819,595 | | |
| | | | 654,642,395 | | |
| | | Austria—2.7% | |
| | 1,992,379 | | | CA Immobilien International | | | 35,245,605 | | |
| | 1,669,827 | | | Erste Bank der Oesterreichischen Sparkassen | | | 113,703,985 | | |
| | 671,218 | | | Flughafen Wien | | | 60,183,814 | | |
| | 3,085,042 | | | Immoeast Immobilien Anlagen* (1) | | | 38,745,919 | | |
| | 1,465,599 | | | OMV AG* | | | 79,669,590 | | |
| | 746,829 | | | Raiffeisen International Bank (1) | | | 85,455,742 | | |
| | 2,042,601 | | | Telekom Austria | | | 50,837,939 | | |
| | 607,871 | | | Wiener Staedtische Versicherung | | | 39,103,150 | | |
| | 786,242 | | | Wienerberger AG | | | 40,873,369 | | |
| | | | 543,819,113 | | |
| | | Finland—2.2% | |
| | 273,783 | | | Atria Group* | | | 6,153,690 | | |
| | 139,492 | | | Elisa Oyj-Class A | | | 3,525,204 | | |
| | 4,693,907 | | | Fortum Oyj | | | 129,167,430 | | |
| | 1,467,618 | | | HK-Ruokatalo Oyj-Class A* | | | 21,073,435 | | |
| | 5,117,272 | | | Nokia Oyj | | | 101,563,738 | | |
| | 789,582 | | | Olvi Oyj | | | 19,248,655 | | |
| | 1,097,682 | | | Outokumpu Technology | | | 20,875,294 | | |
| | 411,564 | | | Rakentajain Konevuokraam-Class B | | | 7,926,773 | | |
| | 474,605 | | | Ramirent Oyj | | | 21,692,341 | | |
| | 943,050 | | | Sampo Oyj-Class A | | | 20,438,179 | | |
| | 725,049 | | | Sanoma-WSOY Oyj-Class B (1) | | | 18,702,663 | | |
| | 430,680 | | | Stockmann Oyj-Class B (1) | | | 18,074,084 | | |
| | 207,888 | | | Wartsila Oyj-Class B | | | 9,538,896 | | |
| | 1,980,514 | | | YIT Oyj | | | 49,242,110 | | |
| | | | 447,222,492 | | |
See Notes to Financial Statements.
Julius Baer Funds 2006 Annual Report
65
PORTFOLIO OF INVESTMENTS (Continued) October 31, 2006
Julius Baer International Equity Fund (Percentage of Net Assets)
Share
Amount | | Description | | Market
Value (Note 2) | |
| COMMON STOCKS—Continued | | | |
| | | Hungary—1.7% | |
| | 110,765 | | | Egis PLC | | $ | 14,488,860 | | |
| | 16,722,236 | | | Magyar Telekom Telecommunications* | | | 77,828,445 | | |
| | 6,739,270 | | | OTP Bank | | | 236,894,599 | | |
| | 21,132 | | | Richter Gedeon | | | 4,431,031 | | |
| | | | 333,642,935 | | |
| | | Hong Kong—1.6% | |
| | 7,300,217 | | | China Merchants Holdings International | | | 21,346,350 | | |
| | 30,433,082 | | | Clear Media* | | | 42,636,238 | | |
| | 40,296,244 | | | Emperor Entertainment Hotel | | | 7,199,226 | | |
| | 23,335,459 | | | Galaxy Entertainment* | | | 21,685,083 | | |
| | 38,099,570 | | | GOME Electrical Appliances | | | 32,809,629 | | |
| | 7,828,736 | | | Hutchison Telecommunications International* | | | 15,073,354 | | |
| | 32,617,305 | | | Melco International Development | | | 79,905,637 | | |
| | 64,805,107 | | | Shun TAK | | | 85,626,619 | | |
| | 23,667,274 | | | Texwinca Holdings | | | 15,514,038 | | |
| | | | 321,796,174 | | |
| | | Belgium—1.6% | |
| | 262,782 | | | Almancora Comm Va | | | 34,647,007 | | |
| | 1,865,126 | | | Fortis | | | 78,296,407 | | |
| | 1,888,853 | | | KBC Groupe | | | 206,367,692 | | |
| | | | 319,311,106 | | |
| | | Australia—1.6% | |
| | 1,190,950 | | | Austereo Group | | | 2,064,421 | | |
| | 2,140,069 | | | BHP Billiton | | | 45,178,201 | | |
| | 1,863,506 | | | Brambles Industries (1) | | | 17,997,085 | | |
| | 132,524 | | | CAT Oil* | | | 2,894,105 | | |
| | 534,771 | | | CSL Ltd | | | 23,211,867 | | |
| | 530,382 | | | John Fairfax | | | 1,994,719 | | |
| | 28,660,890 | | | Macquarie Airports Management | | | 71,195,327 | | |
| | 5,717,837 | | | Newcrest Mining | | | 105,530,244 | | |
| | 138,796 | | | Prime Television | | | 381,296 | | |
| | 134,226 | | | Publishing & Broadcasting | | | 2,013,016 | | |
| | 678,650 | | | Rio Tinto | | | 41,173,587 | | |
| | 178,845 | | | Southern Cross Broadcasting | | | 2,078,756 | | |
| | 786,814 | | | Ten Network | | | 2,094,533 | | |
| | | | 317,807,157 | | |
See Notes to Financial Statements.
Julius Baer Funds 2006 Annual Report
66
PORTFOLIO OF INVESTMENTS (Continued) October 31, 2006
Julius Baer International Equity Fund (Percentage of Net Assets)
Share
Amount | | Description | | Market
Value (Note 2) | |
| COMMON STOCKS—Continued | | | |
| | | Czech Republic—1.3% | |
| | 1,708,612 | | | Komercni Banka | | $ | 265,817,241 | | |
| | | Norway—1.2% | |
| | 2,164,722 | | | Acta Holding | | | 9,994,665 | | |
| | 2,503,800 | | | Austevoll Seafood* | | | 14,545,960 | | |
| | 839,468 | | | Cermaq ASA (1) | | | 10,331,400 | | |
| | 3,214,415 | | | DnB NOR | | | 42,066,355 | | |
| | 1,435,879 | | | Norsk Hydro* | | | 32,983,102 | | |
| | 420,773 | | | Orkla ASA | | | 21,550,227 | | |
| | 25,884,869 | | | PAN Fish* (1) | | | 20,261,664 | | |
| | 2,021,364 | | | Statoil ASA | | | 51,067,567 | | |
| | 2,026,030 | | | Telenor ASA | | | 31,981,226 | | |
| | 1,201,402 | | | Tomra Systems (1) | | | 8,072,469 | | |
| | | | 242,854,635 | | |
| | | Romania—1.2% | |
| | 1,950,900 | | | Antibiotice SA | | | 1,232,058 | | |
| | 1,900,000 | | | Asigurarea Romaneasca-Asirom* (2) | | | 235,086 | | |
| | 22,113,009 | | | Biofarm Bucuresti* | | | 5,497,754 | | |
| | 8,572,587 | | | BRD-Groupe Societe Generale | | | 60,361,566 | | |
| | 7,773,600 | | | Compa-Sibi* | | | 3,639,643 | | |
| | 16,622,500 | | | Condmag* | | | 5,037,670 | | |
| | 59,449,499 | | | Impact SA* | | | 12,406,889 | | |
| | 693,300 | | | Policolor* | | | 503,267 | | |
| | 2,164,000 | | | Rolast Pitesti* | | | 63,305 | | |
| | 363,488,100 | | | Rompetrol Rafinare | | | 11,556,897 | | |
| | 59,500 | | | Santierul Naval Braila* (2) | | | 82,711 | | |
| | 561,087,557 | | | SNP Petrom | | | 128,297,462 | | |
| | 10,251,100 | | | Socep Constanta | | | 930,159 | | |
| | 118,690 | | | Transelectrica SA* | | | 1,425,900 | | |
| | 8,152,018 | | | Zentiva SA* | | | 4,734,041 | | |
| | | | 236,004,408 | | |
| | | Turkey—1.1% | |
| | 2,625,287 | | | Acibadem Saglik Hizmetleri ve Ticaret | | | 28,789,988 | | |
| | 633,196 | | | Aksigorta AS | | | 2,647,358 | | |
| | 46,397 | | | Alarko Gayrimenkul Yatirim Ortakligi* | | | 906,316 | | |
| | 2,048,481 | | | Anadolu Sigorta* | | | 3,734,722 | | |
| | 401,142 | | | BIM Birlesik Magazalar | | | 17,733,831 | | |
| | 1,443,869 | | | Cimsa Cimento Sanayi ve Ticaret | | | 8,857,181 | | |
See Notes to Financial Statements.
Julius Baer Funds 2006 Annual Report
67
PORTFOLIO OF INVESTMENTS (Continued) October 31, 2006
Julius Baer International Equity Fund (Percentage of Net Assets)
Share
Amount | | Description | | Market
Value (Note 2) | |
| COMMON STOCKS—Continued | | | |
| | | Turkey—Continued | |
| | 12,510,546 | | | Dogan Sirketler Grubu | | $ | 53,592,126 | | |
| | 3,471,304 | | | Eczacibasi Ilac Sanayi* | | | 11,134,820 | | |
| | 3,555,326 | | | Haci Omer Sabanci | | | 14,986,467 | | |
| | 563,499 | | | Selcuk Ecza Deposu Ticaret ve Sanayi* | | | 1,892,491 | | |
| | 9,433,817 | | | Turkiye Garanti Bankasi | | | 34,592,818 | | |
| | 6,969,153 | | | Turkiye Is Bankasi | | | 45,139,476 | | |
| | 553,611 | | | Yapi Kredi Sigorta* | | | 2,504,340 | | |
| | | | 226,511,934 | | |
| | | Mexico—1.1% | |
| | 376,867 | | | Cemex SAB ADR | | | 11,584,892 | | |
| | 1,898,611 | | | Consorcio ARA | | | 10,770,922 | | |
| | 2,628,521 | | | Controladora Comercial Mexicana | | | 5,339,405 | | |
| | 9,613,131 | | | Corporacion Moctezuma | | | 22,332,436 | | |
| | 169,020 | | | Desarrolladora Homex ADR* | | | 7,419,978 | | |
| | 1,949,326 | | | Empresas ICA Sociedad Controladora* | | | 6,675,030 | | |
| | 120,801 | | | Fomento Economico Mexicano ADR | | | 11,680,249 | | |
| | 337,689 | | | Grupo Aeroportuario del Pacifico ADR | | | 12,744,383 | | |
| | 881,302 | | | Grupo Aeroportuario del Sureste ADR (1) | | | 33,427,785 | | |
| | 2,107,000 | | | Grupo Cementos de Chihuahua | | | 8,419,072 | | |
| | 12,537,547 | | | Grupo Financiero Banorte | | | 45,436,870 | | |
| | 1,437,086 | | | Grupo Televisa ADR | | | 35,467,282 | | |
| | 2,423,263 | | | Urbi Desarrollos Urbanos* | | | 7,388,189 | | |
| | | | 218,686,493 | | |
| | | Spain—0.8% | |
| | 9,772,530 | | | Corporacion Mapfre | | | 43,281,895 | | |
| | 745,171 | | | Grifols SA* | | | 7,799,012 | | |
| | 657,950 | | | Grupo Empresarial Ence (1) | | | 32,482,477 | | |
| | 211,749 | | | Inditex SA | | | 10,124,158 | | |
| | 3,705,241 | | | Telefonica SA | | | 71,410,684 | | |
| | | | 165,098,226 | | |
| | | Canada—0.7% | |
| | 2,136,661 | | | Bema Gold* | | | 9,191,580 | | |
| | 159,456 | | | Centerra Gold* | | | 1,586,804 | | |
| | 3,958,181 | | | Eldorado Gold* | | | 16,850,840 | | |
| | 4,450,055 | | | Ivanhoe Mines* | | | 46,468,511 | | |
See Notes to Financial Statements.
Julius Baer Funds 2006 Annual Report
68
PORTFOLIO OF INVESTMENTS (Continued) October 31, 2006
Julius Baer International Equity Fund (Percentage of Net Assets)
Share
Amount | | Description | | Market
Value (Note 2) | |
| COMMON STOCKS—Continued | | | |
| | | Canada—Continued | |
| | 577,853 | | | Potash Corp of Saskatchewan | | $ | 72,548,156 | | |
| | | | 146,645,891 | | |
| | | Ukraine—0.7% | |
| | 214,485 | | | Anthousa Ltd GDR† | | | 5,201,401 | | |
| | 191,865,265 | | | Bank Aval* (2) | | | 18,262,906 | | |
| | 3,601,515 | | | Bank Forum (2) | | | 23,950,522 | | |
| | 2,053,250 | | | Centrenergo* (2) | | | 2,317,166 | | |
| | 165,000 | | | Centrenergo ADR* (2) | | | 1,862,084 | | |
| | 20,500 | | | Dniproenergo* (2) | | | 2,014,392 | | |
| | 10,700 | | | Ivano-Frankivskcement (2) | | | 642,000 | | |
| | 5,285,714 | | | JSCB Ukrsotsbank* (2) | | | 1,840,950 | | |
| | 2,750,000 | | | Kirovogradoblenergo* (2) | | | 2,074,442 | | |
| | 69,861,005 | | | Lutsk Automobile Plant (2) | | | 6,636,795 | | |
| | 64,091 | | | Retail Group* (2) | | | 16,022,750 | | |
| | 18,800 | | | Rodovid Bank* (2) | | | 14,645,200 | | |
| | 2,750,000 | | | Slavutich Brewery* (2) | | | 3,523,821 | | |
| | 1,328,616,000 | | | Ukrinbank* (2) | | | 14,614,776 | | |
| | 24,898 | | | Ukrnafta Oil ADR* (2) | | | 9,009,222 | | |
| | 24,623,666 | | | UkrTelecom* | | | 4,176,858 | | |
| | 573,260 | | | UkrTelecom GDR | | | 4,755,923 | | |
| | 15,000 | | | Zakhidenergo* (2) | | | 573,797 | | |
| | 595,792 | | | Zakhidenergo GDR* (2) | | | 5,697,723 | | |
| | 400,000 | | | Zhytomyroblenergo* (2) | | | 308,883 | | |
| | | | 138,131,611 | | |
| | | Venezuela—0.7% | |
| | 730,579 | | | Banco Provincial (2) | | | 374,255 | | |
| | 112,623 | | | Banco Venezolano de Credito (2) | | | 186,193 | | |
| | 15,843,815 | | | Cemex Venezuela Saca-1 (2) | | | 6,271,710 | | |
| | 3,536,369 | | | CIA Anonima Nacional TeleFonos De Venezuela ADR | | | 68,640,922 | | |
| | 9,029,312 | | | Electricidad de Caracas (2) | | | 2,350,573 | | |
| | 19,969,105 | | | Mercantil Servicios Financieros-Class B (2)* | | | 43,708,282 | | |
| | 262,677,795 | | | Siderurgica Venezolana Sivensa SACA* (2) | | | 12,104,490 | | |
| | | | 133,636,425 | | |
| | | Denmark—0.6% | |
| | 113,550 | | | ALK-Abello A/S* (1) | | | 17,403,416 | | |
| | 678,749 | | | Novo-Nordisk-Class B* | | | 51,259,236 | | |
See Notes to Financial Statements.
Julius Baer Funds 2006 Annual Report
69
PORTFOLIO OF INVESTMENTS (Continued) October 31, 2006
Julius Baer International Equity Fund (Percentage of Net Assets)
Share
Amount | | Description | | Market
Value (Note 2) | |
| COMMON STOCKS—Continued | | | |
| | | Denmark—Continued | |
| | 335,340 | | | Royal UNIBREW (1) | | $ | 38,762,651 | | |
| | 212,657 | | | Vestas Wind Systems* (1) | | | 5,990,594 | | |
| | | | 113,415,897 | | |
| | | Cyprus—0.6% | |
| | 8,169,028 | | | Bank of Cyprus | | | 92,587,665 | | |
| | 1,369,000 | | | Cyprus Popular Bank | | | 11,672,119 | | |
| | 2,147,511 | | | Hellenic Bank | | | 8,716,303 | | |
| | | | 112,976,087 | | |
| | | United States—0.5% | |
| | 2,976,168 | | | News Corp | | | 65,293,101 | | |
| | 2,000,260 | | | News Corp-Class B (1) | | | 43,485,652 | | |
| | | | 108,778,753 | | |
| | | Greece—0.5% | |
| | 1,374,528 | | | Alpha Bank | | | 39,999,837 | | |
| | 128,599 | | | Fourlis SA | | | 2,494,887 | | |
| | 2,464,820 | | | Hellenic Telecommunication Organization* | | | 63,863,252 | | |
| | | | 106,357,976 | | |
| | | China—0.5% | |
| | 77,347,451 | | | Beijing Capital International Airport-Class H | | | 49,608,147 | | |
| | 10,867,372 | | | Shenzhen Chiwan Wharf-Class B | | | 17,725,260 | | |
| | 6,677,369 | | | Weiqiao Textile-Class H | | | 9,166,068 | | |
| | 27,342,132 | | | Wumart Stores-Class H* | | | 25,478,674 | | |
| | | | 101,978,149 | | |
| | | South Korea—0.4% | |
| | 117,813 | | | Hyundai Motor | | | 9,578,089 | | |
| | 22,812 | | | NHN Corp* | | | 2,263,768 | | |
| | 115,488 | | | Samsung Electronics | | | 74,891,921 | | |
| | | | 86,733,778 | | |
| | | Brazil—0.4% | |
| | 1,059,348 | | | Brascan Residential Properties* | | | 8,497,576 | | |
| | 813,940 | | | Diagnosticos da America | | | 15,989,467 | | |
| | 1,421,739 | | | Klabin Segall* | | | 9,974,782 | | |
| | 730,935 | | | Medial Saude* | | | 7,418,751 | | |
See Notes to Financial Statements.
Julius Baer Funds 2006 Annual Report
70
PORTFOLIO OF INVESTMENTS (Continued) October 31, 2006
Julius Baer International Equity Fund (Percentage of Net Assets)
Share
Amount | | Description | | Market
Value (Note 2) | |
| COMMON STOCKS—Continued | | | |
| | | Brazil—Continued | |
| | 244,357 | | | Medial Saude ADR*† | | $ | 2,474,429 | | |
| | 1,628,412 | | | Santos-Brasil SA* | | | 17,441,831 | | |
| | 1,016,783 | | | Terna Participacoes* | | | 10,738,522 | | |
| | | | 72,535,358 | | |
| | | Bulgaria—0.3% | |
| | 7,602,910 | | | Bulgarian Telecommunication | | | 50,069,094 | | |
| | 212,919 | | | DZI Insurance & Reinsurance* (2) | | | 19,177,510 | | |
| | 119,028 | | | Sopharma AD | | | 528,271 | | |
| | | | 69,774,875 | | |
| | | Ireland—0.3% | |
| | 18,833,648 | | | Dragon Oil* | | | 56,395,146 | | |
| | | Portugal—0.3% | |
| | 3,601,000 | | | Energias de Portugal | | | 16,178,400 | | |
| | 870,846 | | | Jeronimo Martins | | | 16,672,564 | | |
| | 1,706,095 | | | Portugal Telecom-Registered | | | 21,253,126 | | |
| | | | 54,104,090 | | |
| | | Multinational—0.2% | |
| | 119,605 | | | Central European Media Enterprises-Class A* (1) | | | 8,829,241 | | |
| | 736,174 | | | Millicom International Cellular* (1) | | | 36,720,359 | | |
| | | | 45,549,600 | | |
| | | India—0.2% | |
| | 601,919 | | | State Bank of India GDR (1) | | | 37,920,897 | | |
| | | Serbia—0.2% | |
| | 2,859 | | | Agrobanka AD* | | | 1,413,282 | | |
| | 344,461 | | | AIK Banka AD* | | | 28,288,232 | | |
| | 2,625 | | | Komercijalna Banka* (2) | | | 2,616,661 | | |
| | 130,820 | | | Tigar AD* | | | 3,678,650 | | |
| | | | 35,996,825 | | |
| | | Philippines—0.2% | |
| | 2,301,135 | | | Ayala Corp | | | 22,623,518 | | |
| | 14,065,941 | | | Ayala Land | | | 4,303,884 | | |
| | 1,885,377 | | | Bank of the Philippine Islands | | | 2,345,373 | | |
See Notes to Financial Statements.
Julius Baer Funds 2006 Annual Report
71
PORTFOLIO OF INVESTMENTS (Continued) October 31, 2006
Julius Baer International Equity Fund (Percentage of Net Assets)
Share
Amount | | Description | | Market
Value (Note 2) | |
| COMMON STOCKS—Continued | | | |
| | | Philippines—Continued | |
| | 101,369 | | | Philippine Long Distance Telephone | | $ | 4,799,977 | | |
| | | | 34,072,752 | | |
| | | Thailand—0.2% | |
| | 1,354,489 | | | Bangkok Bank | | | 4,242,000 | | |
| | 845,100 | | | Bangkok Bank-Foreign Registered Shares | | | 2,761,765 | | |
| | 37,329,500 | | | Bank of Ayudhya | | | 19,010,394 | | |
| | 20,018,473 | | | Krung Thai Bank | | | 7,087,150 | | |
| | | | 33,101,309 | | |
| | | New Zealand—0.1% | |
| | 18,940,995 | | | Auckland International Airport (1) | | | 25,871,164 | | |
| | | Indonesia—0.1% | |
| | 35,835,820 | | | Indofood Sukses Makmur | | | 5,230,358 | | |
| | 5,545,740 | | | Semen Gresik Persero | | | 17,709,853 | | |
| | | | 22,940,211 | | |
| | | Estonia—0.1% | |
| | 994,500 | | | Olympic Entertainment* | | | 7,907,926 | | |
| | 384,088 | | | Tallink Group* | | | 2,171,722 | | |
| | 1,920,438 | | | Tallink Group* | | | 10,858,599 | | |
| | | | 20,938,247 | | |
| | | Malaysia—0.1% | |
| | 5,508,346 | | | Steppe Cement* | | | 19,961,007 | | |
| | | Egypt—0.1% | |
| | 175,558 | | | Orascom Telecom Holding GDR (1) | | | 9,883,915 | | |
| | 3,016,090 | | | Telecom Egypt | | | 8,546,027 | | |
| | | | 18,429,942 | | |
| | | Kazakhstan—0.1% | |
| | 1,608,996 | | | BMB Munai* (1) | | | 9,299,997 | | |
| | 362,475 | | | Kazakhgold GDR* | | | 8,655,903 | | |
| | | | 17,955,900 | | |
| | | Latvia—0.1% | |
| | 1,424,182 | | | Parex Bank* (2)(3) | | | 11,747,446 | | |
See Notes to Financial Statements.
Julius Baer Funds 2006 Annual Report
72
PORTFOLIO OF INVESTMENTS (Continued) October 31, 2006
Julius Baer International Equity Fund (Percentage of Net Assets)
Share
Amount | | Description | | Market
Value (Note 2) | |
| COMMON STOCKS—Continued | | | |
| | | Croatia—0.0% | |
| | 8,149 | | | Atlantska Plovidba | | $ | 1,271,570 | | |
| | 20,979 | | | Dom Holding* | | | 618,304 | | |
| | 11,424 | | | Ericsson Nikola Tesla | | | 4,904,135 | | |
| | 12,811 | | | FIMA Validus* | | | 342,034 | | |
| | 779 | | | Institut Gradevinarstva Hrvatske (2) | | | 540,245 | | |
| | 27,137 | | | Podravka d.d. | | | 2,305,428 | | |
| | 3,957 | | | Proficio Dd* (2) | | | 47,338 | | |
| | | | 10,029,054 | | |
| | | Lebanon—0.0% | |
| | 386,000 | | | Solidere-Class A | | | 6,948,000 | | |
| | | Morocco—0.0% | |
| | 21,439 | | | Ciments du Maroc | | | 5,553,346 | | |
| | | Argentina—0.0% | |
| | 647,899 | | | Grupo Financiero Galicia ADR* (1) | | | 5,053,612 | | |
| | | Lithuania—0.0% | |
| | 179,733 | | | Rokiskio Suris | | | 2,923,298 | | |
| | | | | TOTAL COMMON STOCKS (Cost $13,090,635,165) | | | 18,090,751,296 | | |
| PREFERRED STOCKS—0.4% | | | |
| | | Germany—0.3% | |
| | 70,840 | | | Henkel KGaA | | | 9,489,226 | | |
| | 1,874,394 | | | ProsiebenSat.1 Media | | | 53,589,374 | | |
| | | | 63,078,600 | | |
| | | Croatia—0.1% | |
| | 4,541 | | | Adris Grupa | | | 3,508,271 | | |
| | | Russia—0.0% | |
| | 7,570 | | | Silvinit (2) | | | 1,324,750 | | |
| | | | | TOTAL PREFERRED STOCKS (Cost $38,397,244) | | | 67,911,621 | | |
| INVESTMENT FUNDS—0.4% | | | |
| | | Romania—0.2% | |
| | 5,488,000 | | | SIF 1 Banat Crisana Arad | | | 5,437,805 | | |
| | 5,190,500 | | | SIF 2 Moldova Bacau | | | 5,670,516 | | |
| | 5,460,500 | | | SIF 3 Transilvania Brasov | | | 5,113,273 | | |
See Notes to Financial Statements.
Julius Baer Funds 2006 Annual Report
73
PORTFOLIO OF INVESTMENTS (Continued) October 31, 2006
Julius Baer International Equity Fund (Percentage of Net Assets)
Share
Amount | | Description | | Market
Value (Note 2) | |
| INVESTMENT FUNDS—Continued | | | |
| | | Romania—Continued | |
| | 8,070,000 | | | SIF 4 Muntenia Bucuresti | | $ | 5,125,762 | | |
| | 5,801,500 | | | SIF 5 Oltenia Craiova | | | 6,906,548 | | |
| | | | 28,253,904 | | |
| | | Luxembourg—0.1% | |
| | 1,237,938 | | | Prologis European Properties | | | 23,384,624 | | |
| | | Australia—0.1% | |
| | 10,812,849 | | | Australian Infrastructure Fund | | | 18,910,602 | | |
| | | Russia—0.0% | |
| | 3,277,081 | | | RenShares Utilites* (2) | | | 6,685,245 | | |
| | | | | TOTAL INVESTMENT FUNDS (Cost $63,496,882) | | | 77,234,375 | | |
| RIGHTS—0.0% | | | |
| | | Italy—0.0% | |
| | 599,984 | | | Banca Popolare Emilia Romagna Rights, Expires 11/28/2006* | | | 222,079 | | |
| | 599,984 | | | Banca Popolare Emilia Romagna Rights, Expires 11/28/2006* | | | 120,229 | | |
| | | | | TOTAL RIGHTS (Cost $0) | | | 342,308 | | |
| WARRANTS—2.0% | | | |
| | | India—1.9% | |
| | 329,062 | | | Apollo Hospital Enterprise, issued by CLSA,
Expires 07/20/2010*† (2) | | | 3,239,813 | | |
| | 4,489,350 | | | Banking Index Benchmark Exchange Traded Scheme-
Bank BeES, Issued by Citigroup, Expires 01/20/2010* | | | 56,049,535 | | |
| | 3,136,819 | | | Bharti Airtel-Class A, Issued by CLSA,
Expires 05/31/2010*† | | | 39,847,126 | | |
| | 4,278,617 | | | Canara Bank, Issued by Citigroup, Expires 01/19/2009* | | | 28,314,901 | | |
| | 2,389,110 | | | India Cements, Ltd, Issued by ABNA,
Expires 06/04/2007* | | | 11,419,946 | | |
| | 1,665,305 | | | State Bank of India, Issued by Citigroup,
Expires 01/19/2009*† | | | 48,374,446 | | |
| | 6,355,228 | | | State Bank of India, Issued by CLSA, Expires 05/13/2010*† | | | 185,547,237 | | |
| | 929,807 | | | State Bank of India, issued by CLSA, Expires 08/11/2011† | | | 6,348,071 | | |
| | | | 379,141,075 | | |
See Notes to Financial Statements.
Julius Baer Funds 2006 Annual Report
74
PORTFOLIO OF INVESTMENTS (Continued) October 31, 2006
Julius Baer International Equity Fund (Percentage of Net Assets)
Share
Amount | | Description | | Market
Value (Note 2) | |
| WARRANTS—Continued | | | |
| | | Bulgaria—0.1% | |
| | 301,290 | | | Bulgarian American Credit Bank JSCO, Expires
03/30/2007* (2) | | $ | 7,464,653 | | |
| | 1,961,673 | | | DZI Insurance & Reinsurance, Expires
02/28/2007* (2) | | | 9,201,396 | | |
| | | | 16,666,049 | | |
| | | Austria—0.0% | |
| | 704,990 | | | Bank of Georgia, issued by Bank of Austria, Expires
09/14/2007 | | | 8,998,140 | | |
| | | Russia—0.0% | |
| | 117 | | | Russian Domestic Small-Cap Basket, issued by UBS,
Expires 12/22/2007*† | | | 1,532,700 | | |
| | | | | TOTAL WARRANTS (Cost $313,585,567) | | | 406,337,964 | | |
Face
Value | | Currency | | | | | |
| FOREIGN GOVERNMENT BONDS—0.1% | | | |
| | | | | Bulgaria—0.1% | |
| | 12,071,674 | | | BGN | | Bulgaria Compensation Notes* (2) | | | 4,892,804 | | |
| | 3,842,865 | | | BGN | | Bulgaria Housing Compensation Notes* (2) | | | 1,580,136 | | |
| | 29,663,486 | | | BGN | | Bulgaria Registered Compensation Vouchers* (2) | | | 11,926,187 | | |
| | | | | TOTAL FOREIGN GOVERNMENT BONDS
(Cost $19,710,351) | | | | | 18,399,127 | | |
| STRUCTURED NOTES—0.2% | | | |
| | | | | Philippines—0.2% | |
| | 1,679 | | | USD | | Phillippines Notes, due 10/17/2008
(Cost $38,261,791)† | | | 40,171,951 | | |
| U.S. GOVERNMENT AND AGENCY OBLIGATION—0.2% | | | |
| | | | | United States—0.2% | |
| | 39,980,000 | | | USD | | U.S. Treasury Bill 4.725% due 11/09/2006
(Cost $39,938,021) (4) | | | 39,938,021 | | |
See Notes to Financial Statements.
Julius Baer Funds 2006 Annual Report
75
PORTFOLIO OF INVESTMENTS (Continued) October 31, 2006
Julius Baer International Equity Fund (Percentage of Net Assets)
Face
Value | | Currency | | Description | | Market
Value (Note 2) | |
SHORT-TERM INVESTMENTS PURCHASED WITH CASH COLLATERAL
FROM SECURITY LENDING—6.7% | | | |
| | 47,184,634 | | | | | Abbey National, rates ranging from 5.270%-5.280% | | |
| | |
| | | | | | | and maturity dates ranging from | | |
| | |
| | | | | | | 11/16/2006-12/01/2006 | | $ | 47,184,634 | | |
| | 21,447,560 | | | | | ABN Amro Bank NV 5.305% due 11/21/2006 | | | 21,447,560 | | |
| | 16,757,694 | | | | | Banco Santander Central Hispano 5.275%
due 11/14/2006 | | | 16,757,694 | | |
| | 21,447,561 | | | | | BancoBilbao Vizcaya Argentaria 5.310%
due 01/03/2007 | | | 21,447,561 | | |
| | 54,905,757 | | | | | Bank of America, rates ranging from
5.270%-5.310% and maturity dates ranging
from 11/10/2006-07/10/2007 | | | 54,905,757 | | |
| | 42,037,220 | | | | | Bank of Nova Scotia 5.270% due 11/13/2006 | | | 42,037,220 | | |
| | 68,632,195 | | | | | Barclays, rates ranging from 5.300%-5.305% and
maturity dates ranging from
11/03/2006-01/03/2007 | | | 68,632,195 | | |
| | 68,338,185 | | | | | Barton Capital, rates ranging from
5.266%-5.270% and maturity dates ranging
from 11/01/2006-11/07/2006 | | | 68,338,185 | | |
| | 39,806,673 | | | | | Bear Stearns & Co 5.447% due 03/07/2007 | | | 39,806,673 | | |
| | 51,474,146 | | | | | BGI Institutional 5.242% due 11/01/2006 | | | 51,474,146 | | |
| | 34,316,098 | | | | | BNP Paribas, with a rate of 5.280% and maturity
dates ranging from 12/12/2006-12/15/2006 | | | 34,316,098 | | |
| | 12,868,536 | | | | | CAFCO Funding 5.289% due 11/17/2006 | | | 12,868,536 | | |
| | 21,447,561 | | | | | Calyon 5.250% due 11/06/2006 | | | 21,447,561 | | |
| | 25,737,073 | | | | | Canadian Imperial Bank of Commerce 5.280%
due 11/29/2006 | | | 25,737,073 | | |
| | 21,947,540 | | | | | Charta 5.314% due 11/01/2006 | | | 21,947,540 | | |
| | 12,868,537 | | | | | Clipper Receivables 5.280% due 11/15/2006 | | | 12,868,537 | | |
| | 18,844,527 | | | | | Commonwealth Bank of Australia 5.286% due
11/30/2006 | | | 18,844,527 | | |
| | 35,486,289 | | | | | Compass Securitization, rates ranging from
5.292%-5.305% and maturity dates ranging
from 11/29/2006-12/15/2006 | | | 35,486,289 | | |
| | 8,579,024 | | | | | CRC Funding 5.314% due 12/19/2006 | | | 8,579,024 | | |
| | 42,895,122 | | | | | Credit Suisse First Boston, with a rate of 5.310%
and maturity dates ranging from
11/13/2006-11/14/2006 | | | 42,895,122 | | |
See Notes to Financial Statements.
Julius Baer Funds 2006 Annual Report
76
PORTFOLIO OF INVESTMENTS (Continued) October 31, 2006
Julius Baer International Equity Fund (Percentage of Net Assets)
Face
Value | | Currency | | Description | | Market
Value (Note 2) | |
SHORT-TERM INVESTMENTS PURCHASED WITH CASH COLLATERAL
FROM SECURITY LENDING—Continued | | | |
| | 59,915,287 | | | | | Fairway Finance, rates ranging from | | |
| | |
| | | | | | | 5.277%-5.299% and maturity dates ranging | | |
| | |
| | | | | | | from 11/15/2006-11/22/2006 | | $ | 59,915,287 | | |
| | 12,010,634 | | | | | Falcon Asset Securitization 5.292% due
11/14/2006 | | | 12,010,634 | | |
| | 25,737,073 | | | | | Fortis Bank, rates ranging from 5.260%-5.300%
and maturity dates ranging from
11/07/2006-11/20/2006 | | | 25,737,073 | | |
| | 42,895,122 | | | | | General Electric Capital Corporation, rates ranging
from 5.265%-5.285% and maturity dates
ranging from 11/03/2006-11/22/2006 | | | 42,895,122 | | |
| | 12,868,537 | | | | | Govco Incorporated 5.276% due 11/10/2006 | | | 12,868,537 | | |
| | 8,371,806 | | | | | Greyhawk Funding 5.296% due 11/27/2006 | | | 8,371,806 | | |
| | 12,868,537 | | | | | HBOS Halifax Bank of Scotland 5.300% due
01/08/2007 | | | 12,868,537 | | |
| | 18,679,563 | | | | | Jupiter Securitization 5.284% due 11/06/2006 | | | 18,679,563 | | |
| | 12,655,443 | | | | | Kitty Hawk Funding 5.286% due 11/29/2006 | | | 12,655,443 | | |
| | 16,988,506 | | | | | Lexington Parker Capital 5.291% due 11/09/2006 | | | 16,988,506 | | |
| | 16,963,758 | | | | | Liberty Street 5.284% due 11/13/2006 | | | 16,963,758 | | |
| | 164,215,338 | | | | | Merrimac Cash Fund-Premium Class 5.092% due
11/01/2006 | | | 164,215,338 | | |
| | 8,579,024 | | | | | Old Line Funding 5.276% due 11/15/2006 | | | 8,579,024 | | |
| | 21,039,402 | | | | | Ranger Funding, rates ranging from
5.294%-5.296% and maturity dates ranging
from 11/16/2006-11/29/2006 | | | 21,039,402 | | |
| | 17,158,049 | | | | | Royal Bank of Canada 5.300% due 11/17/2006 | | | 17,158,049 | | |
| | 21,272,072 | | | | | Sheffiled Receivables, rates ranging from
5.267%-5.275% and maturity dates ranging
from 11/02/2006-11/08/2006 | | | 21,272,072 | | |
| | 17,158,049 | | | | | Skandinaviska Enskilda Banken 5.290% due
12/11/2006 | | | 17,158,049 | | |
| | 77,211,219 | | | | | Societe Generale, rates ranging from
5.270%-5.280% and maturity dates ranging
from 11/01/2006-12/04/2006 | | | 77,211,219 | | |
| | 29,357,624 | | | | | Svenska Handlesbanken 5.300% due 11/01/2006 | | | 29,357,624 | | |
| | 12,661,711 | | | | | Three Pillars Funding 5.285% due 11/20/2006 | | | 12,661,711 | | |
| | 21,447,561 | | | | | Toronto Dominion Bank 5.300% due 12/11/2006 | | | 21,447,561 | | |
See Notes to Financial Statements.
Julius Baer Funds 2006 Annual Report
77
PORTFOLIO OF INVESTMENTS (Continued) October 31, 2006
Julius Baer International Equity Fund (Percentage of Net Assets)
Face
Value | | Currency | | Description | | Market
Value (Note 2) | |
SHORT-TERM INVESTMENTS PURCHASED WITH CASH COLLATERAL
FROM SECURITY LENDING—Continued | | | |
| | 29,720,063 | | | | | Variable Funding Capital, rates ranging from | | |
| | |
| | | | | | | 5.267%-5.287% and maturity dates ranging | | |
| | |
| | | | | | | from 11/07/2006-11/28/2006 | | $ | 29,720,063 | | |
| | 31,347,183 | | | | | Yorktown Capital, rates ranging from
5.292%-5.297% and maturity dates ranging
from 11/15/2006-12/14/2006 | | | 31,347,183 | | |
| | | | | | | TOTAL SHORT-TERM INVESTMENTS
PURCHASED WITH CASH COLLATERAL
FROM SECURITY LENDING
(Cost $1,358,143,493) | | | 1,358,143,493 | | |
| REPURCHASE AGREEMENT—1.8% | | | |
| | | | | United States—1.8% | |
| | 366,018,019 | | | USD | | | | Investors Bank & Trust Company Repurchase
Agreement, dated 10/31/2006, due 11/01/2006,
with a maturity value of $366,054,621 and an
effective yield of 3.60%, collateralized by U.S.
Government and Agency Obligations, with rates
ranging from 4.221%-8.875%, maturities from
08/25/2015-08/15/2036, and an aggregate
market value of $384,318,920.
(Cost $366,01 8,019) | | | 366,018,019 | | |
| | | | | | | TOTAL INVESTMENTS—101.5%
(Cost $15,328,186,533) | | | 20,465,248,175 | | |
| | | | | | | OTHER ASSETS AND LIABILITIES (Net)—(1.5%) | | | (295,135,969 | ) | |
| | | | | | | TOTAL NET ASSETS—100.0% | | $ | 20,170,112,206 | | |
Notes to the Portfolio of Investments:
ADR American Depositary Receipt
GDR Global Depositary Receipt
(1) All or a portion of this security was on loan to brokers at October 31, 2006.
(2) Illiquid security
(3) Security valued at fair value utilizing the fair value model in accordance with valuation policies approved by the board of directors.
(4) Security has been pledged for futures collateral.
* Non-income producing security.
† Securities exempt from registration under Rule 144A of the Securities Act of 1933, as amended. These securities may be resold in transactions exempt from registrations, normally to qualified institutional buyers.
Aggregate cost for federal income tax purposes was $15,458,013,233.
Glossary of Currencies
BGN — Bulgarian Lev
USD — United States Dollar
See Notes to Financial Statements.
Julius Baer Funds 2006 Annual Report
78
SCHEDULE OF FORWARD FOREIGN EXCHANGE CONTRACTS
October 31, 2006
Julius Baer International Equity Fund
FORWARD FOREIGN EXCHANGE CONTRACTS TO BUY
| | | Contracts to Receive | | | | | |
Expiration
Date | | Local
Currency | | Value in
USD | | In Exchange
for USD | | Net Unrealized
Appreciation
(Depreciation) | |
| 11/02/2006 | | CAD | 10,100,000 | | | | 9,014,498 | | | | 8,977,779 | | | $ | 36,719 | | |
| 11/01/2006 | | CHF | 7,930,685 | | | | 6,375,918 | | | | 6,354,715 | | | | 21,203 | | |
| 11/01/2006 | | EUR | 62,000,000 | | | | 79,133,700 | | | | 78,913,600 | | | | 220,100 | | |
| 12/27/2006 | | GBP | 59,136,140 | | | | 112,835,034 | | | | 112,416,916 | | | | 418,118 | | |
| 12/26/2006 | | JPY | 43,589,880,789 | | | | 374,830,638 | | | | 377,976,296 | | | | (3,145,658 | ) | |
| 01/22/2007 | | JPY | 26,477,720,000 | | | | 228,513,260 | | | | 225,136,322 | | | | 3,376,938 | | |
| 01/30/2007 | | JPY | 27,695,000,000 | | | | 239,275,706 | | | | 236,259,096 | | | | 3,016,610 | | |
| 01/31/2007 | | JPY | 42,914,000,000 | | | | 370,812,675 | | | | 370,211,573 | | | | 601,102 | | |
| 11/02/2006 | | PLN | 1,396,411 | | | | 460,095 | | | | 458,637 | | | | 1,458 | | |
| 11/01/2006 | | RON | 2,211,300 | | | | 802,591 | | | | 801,777 | | | | 814 | | |
| 11/03/2006 | | UAH | 12,972,083 | | | | 2,574,982 | | | | 2,569,492 | | | | 5,490 | | |
| 11/06/2006 | | UAH | 645,645 | | | | 128,144 | | | | 129,000 | | | | (856 | ) | |
| 11/15/2006 | | UAH | 120,809,511 | | | | 23,967,386 | | | | 23,925,044 | | | | 42,342 | | |
| Net unrealized appreciation on forward foreign exchange contracts to buy | | | | | | | | | | | | | | $ | 4,594,380 | | |
FORWARD FOREIGN EXCHANGE CONTRACTS TO SELL
| | | Contracts to Deliver | | | | | |
Expiration
Date | | Local
Currency | | Value in
USD | | In Exchange
for USD | | Net Unrealized
Depreciation | |
| 12/27/2006 | | CZK | 4,596,912,098 | | | | 209,396,289 | | | | 207,547,442 | | | $ | (1,848,847 | ) | |
| 01/31/2007 | | EUR | 238,933,193 | | | | 306,331,640 | | | | 305,734,132 | | | | (597,508 | ) | |
| 12/27/2006 | | HUF | 6,413,325,474 | | | | 31,294,457 | | | | 29,574,939 | | | | (1,719,518 | ) | |
| 11/03/2006 | | PHP | 23,239,199 | | | | 466,276 | | | | 465,716 | | | | (560 | ) | |
| 12/27/2006 | | PLN | 272,254,543 | | | | 89,874,875 | | | | 88,101,139 | | | | (1,773,736 | ) | |
| 12/26/2006 | | TRY | 79,003,549 | | | | 53,087,076 | | | | 51,686,980 | | | | (1,400,096 | ) | |
| Net unrealized depreciation on forward foreign exchange contracts to sell | | | | | | | | | | | | | | $ | (7,340,265 | ) | |
Glossary of Currencies
CAD — Canadian Dollar
CHF — Swiss Franc
CZK — Czech Koruna
EUR — Euro
GBP — British Pound Sterling
HUF — Hungarian Forint
JPY — Japanese Yen
PHP — Philippine Peso
PLN — Polish Zloty
RON — Romania Lei
TRY — Turkish Lira
UAH — Ukraine Hryvna
See Notes to Financial Statements.
Julius Baer Funds 2006 Annual Report
79
PORTFOLIO OF INVESTMENTS–Industry Sector (Unaudited) October 31, 2006
Julius Baer International Equity Fund (Percentage of Net Assets)
At October 31, 2006, sector diversification of the Fund's non-cash equivalents investments were as follows:
| | | % of Net
Assets | | Market
Value
(Note 2) | |
| INDUSTRY SECTOR | |
| Financials | | | 35.5 | % | | $ | 7,155,453,500 | | |
| Consumer Discretionary | | | 10.4 | | | | 2,093,234,413 | | |
| Industrials | | | 9.4 | | | | 1,889,821,334 | | |
| Materials | | | 7.8 | | | | 1,565,553,123 | | |
| Consumer Staples | | | 7.0 | | | | 1,417,055,502 | | |
| Healthcare | | | 6.2 | | | | 1,244,680,995 | | |
| Telecommunications | | | 5.8 | | | | 1,172,867,544 | | |
| Energy | | | 5.8 | | | | 1,167,778,560 | | |
| Information Technology | | | 2.5 | | | | 509,818,283 | | |
| Utilities | | | 2.4 | | | | 484,885,388 | | |
| Cash & Cash Equivalents | | | 8.7 | | | | 1,764,099,533 | * | |
| Total Investments | | | 101.5 | | | | 20,465,248,175 | | |
| Other Assets and Liabilities (Net) | | | (1.5 | ) | | | (295,135,969 | )* | |
| Net Assets | | | 100.0 | % | | $ | 20,170,112,206 | | |
* Cash and Cash Equivalents and Other Assets and Liabilities (Net) include the margin requirements for $556,428,459 of notional market value for futures, which is 2.7% of net assets, and $53,870,686 in market value for swaps, which is 0.3% of net assets.
See Notes to Financial Statements.
Julius Baer Funds 2006 Annual Report
80
PORTFOLIO OF INVESTMENTS October 31, 2006
Julius Baer International Equity Fund II (Percentage of Net Assets)
Share
Amount | | Description | | Market
Value (Note 2) | |
| COMMON STOCKS—90.5% | | | |
| | | France—10.5% | |
| | 14,999 | | | Accor SA | | $ | 1,041,432 | | |
| | 122,015 | | | Air Liquide | | | 25,976,405 | | |
| | 26,536 | | | Atos Origin* | | | 1,510,567 | | |
| | 135,265 | | | BNP Paribas | | | 14,873,408 | | |
| | 208,237 | | | Bouygues SA | | | 12,140,981 | | |
| | 82,031 | | | CIE de Saint-Gobain | | | 6,046,440 | | |
| | 224,328 | | | Electricite de France (1) | | | 13,603,113 | | |
| | 8,899 | | | Eurazeo | | | 1,135,824 | | |
| | 703,623 | | | France Telecom | | | 18,275,709 | | |
| | 45,249 | | | Gaz de France (1) | | | 1,819,237 | | |
| | 7,356 | | | Havas SA | | | 35,678 | | |
| | 23,610 | | | Hermes International | | | 2,562,950 | | |
| | 139,617 | | | JC Decaux | | | 3,564,003 | | |
| | 276,403 | | | Lafarge SA | | | 37,148,468 | | |
| | 22,158 | | | Lagardere S.C.A. | | | 1,593,655 | | |
| | 314,431 | | | LVMH Moet Hennessy Louis Vuitton | | | 32,768,105 | | |
| | 106,672 | | | Neuf Cegetel* | | | 3,219,967 | | |
| | 97,749 | | | Pernod-Ricard (1) | | | 19,575,148 | | |
| | 115,358 | | | PPR | | | 17,212,027 | | |
| | 37,674 | | | Publicis Groupe | | | 1,457,944 | | |
| | 29,109 | | | Remy Cointreau | | | 1,555,979 | | |
| | 40,358 | | | Renault SA | | | 4,720,977 | | |
| | 293,123 | | | Sanofi-Aventis | | | 24,916,894 | | |
| | 32,818 | | | Societe Generale | | | 5,453,721 | | |
| | 355,705 | | | Societe Television Francaise 1 | | | 12,085,589 | | |
| | 143,472 | | | Suez SA | | | 6,420,204 | | |
| | 669,733 | | | Total SA (1) | | | 45,347,868 | | |
| | 56,249 | | | Veolia Environnement | | | 3,443,930 | | |
| | 48,697 | | | Vinci SA | | | 5,485,127 | | |
| | 149,665 | | | Vivendi | | | 5,667,709 | | |
| | | | 330,659,059 | | |
| | | United Kingdom—10.0% | |
| | 1,582,244 | | | Aegis Group | | | 4,036,220 | | |
| | 430,995 | | | Anglo American | | | 19,432,440 | | |
| | 128,473 | | | Arriva PLC | | | 1,751,965 | | |
| | 219,919 | | | BAE Systems | | | 1,759,553 | | |
| | 123,618 | | | Balfour Beatty | | | 955,460 | | |
| | 175,286 | | | BHP Billiton | | | 3,379,917 | | |
See Notes to Financial Statements.
Julius Baer Funds 2006 Annual Report
81
PORTFOLIO OF INVESTMENTS (Continued) October 31, 2006
Julius Baer International Equity Fund II (Percentage of Net Assets)
Share
Amount | | Description | | Market
Value (Note 2) | |
| COMMON STOCKS—Continued | | | |
| | | United Kingdom—Continued | |
| | 329,194 | | | BP PLC | | $ | 3,660,396 | | |
| | 438,193 | | | Burberry Group | | | 4,671,807 | | |
| | 2,797,815 | | | Compass Group | | | 14,967,852 | | |
| | 1,580,854 | | | Diageo PLC | | | 29,246,313 | | |
| | 235,227 | | | Firstgroup PLC | | | 2,410,301 | | |
| | 1,171,400 | | | GlaxoSmithkline PLC | | | 31,278,137 | | |
| | 161,626 | | | Imperial Tobacco | | | 5,724,410 | | |
| | 908,377 | | | KKR Private Equity Investors*† | | | 19,757,200 | | |
| | 209,458 | | | KKR Private Equity Investors† | | | 4,555,712 | | |
| | 72,595 | | | National Express | | | 1,349,954 | | |
| | 69,944 | | | Peter Hambro Mining* | | | 1,587,468 | | |
| | 465,273 | | | Prudential PLC | | | 5,701,493 | | |
| | 397,745 | | | Reckitt Benckiser | | | 17,303,647 | | |
| | 461,924 | | | Rentokil Initial | | | 1,334,722 | | |
| | 116,294 | | | Rio Tinto | | | 6,414,506 | | |
| | 1,945,925 | | | Rolls-Royce Group* | | | 17,434,139 | | |
| | 61,319,644 | | | Rolls-Royce Group-Class B | | | 116,952 | | |
| | 107,470 | | | SABMiller PLC | | | 2,078,418 | | |
| | 497,120 | | | Scottish & Newcastle | | | 5,347,465 | | |
| | 1,965,441 | | | Smith & Nephew | | | 19,202,139 | | |
| | 111,431 | | | Smiths Group | | | 2,010,503 | | |
| | 578,049 | | | Stagecoach Group | | | 1,537,965 | | |
| | 3,114,787 | | | Tesco PLC | | | 23,376,566 | | |
| | 16,455,695 | | | Vodafone Group | | | 42,369,918 | | |
| | 635,858 | | | William Hill | | | 7,894,939 | | |
| | 121,235 | | | Wolseley PLC | | | 2,864,883 | | |
| | 836,769 | | | WPP Group | | | 10,716,654 | | |
| | | | 316,230,014 | | |
| | | Germany—8.2% | |
| | 44,477 | | | Adidas AG | | | 2,228,720 | | |
| | 57,943 | | | Bilfinger Berger | | | 3,611,989 | | |
| | 723,733 | | | Commerzbank AG | | | 25,689,115 | | |
| | 20,348 | | | Continental AG | | | 2,275,594 | | |
| | 149,908 | | | Deutsche Bank | | | 18,867,552 | | |
| | 83,717 | | | Deutsche Boerse | | | 13,499,706 | | |
| | 1,056,493 | | | Deutsche Post | | | 29,261,470 | | |
| | 96,886 | | | Deutsche Postbank | | | 7,206,931 | | |
| | 69,468 | | | E.ON AG | | | 8,334,555 | | |
See Notes to Financial Statements.
Julius Baer Funds 2006 Annual Report
82
PORTFOLIO OF INVESTMENTS (Continued) October 31, 2006
Julius Baer International Equity Fund II (Percentage of Net Assets)
Share
Amount | | Description | | Market
Value (Note 2) | |
| COMMON STOCKS—Continued | | | |
| | | Germany—Continued | |
| | 635,715 | | | Fraport AG (1) | | $ | 43,693,612 | | |
| | 88,240 | | | Fresenius AG | | | 15,931,950 | | |
| | 101,492 | | | Fresenius Medical Care | | | 13,542,040 | | |
| | 103,675 | | | Gagfah SA* | | | 3,009,084 | | |
| | 82,266 | | | Henkel KGaA | | | 9,854,270 | | |
| | 131,192 | | | Hypo Real Estate | | | 8,246,760 | | |
| | 84,283 | | | IKB Deutsche Industriebank | | | 2,961,529 | | |
| | 283,935 | | | IVG Immobilien (1) | | | 10,230,564 | | |
| | 96,249 | | | KarstadtQuelle AG* (1) | | | 2,260,392 | | |
| | 143,137 | | | Landesbank Berlin* | | | 1,096,157 | | |
| | 30,728 | | | MAN AG | | | 2,731,651 | | |
| | 24,465 | | | Merck KGaA | | | 2,579,260 | | |
| | 2,455 | | | Puma AG | | | 870,563 | | |
| | 128,697 | | | Rhoen-Klinikum AG | | | 5,330,315 | | |
| | 27,469 | | | SAP AG | | | 5,465,162 | | |
| | 204,335 | | | Siemens AG | | | 18,386,610 | | |
| | 20,215 | | | Solarworld AG (1) | | | 1,087,272 | | |
| | 9,611 | | | Wacker Chemie* | | | 1,155,061 | | |
| | | | 259,407,884 | | |
| | | Japan—7.9% | |
| | 44,420 | | | Acom Co | | | 1,706,201 | | |
| | 110,316 | | | Aeon Credit Service | | | 2,462,348 | | |
| | 51,950 | | | Aiful Corp | | | 1,791,456 | | |
| | 83,048 | | | Aisin Seiki | | | 2,551,942 | | |
| | 155,616 | | | Canon Inc | | | 8,328,388 | | |
| | 189,000 | | | Chiba Bank | | | 1,690,683 | | |
| | 51,023 | | | Credit Saison | | | 1,842,237 | | |
| | 162,000 | | | Daihatsu Motor | | | 1,628,919 | | |
| | 64,700 | | | Daikin Industries | | | 1,822,457 | | |
| | 91,928 | | | Daiwa Securities | | | 1,041,257 | | |
| | 122,329 | | | Denso Corp | | | 4,656,970 | | |
| | 268 | | | Dentsu Inc | | | 736,597 | | |
| | 507 | | | East Japan Railway | | | 3,539,977 | | |
| | 40,200 | | | Eisai Co | | | 2,055,380 | | |
| | 31,100 | | | Fanuc Ltd | | | 2,694,422 | | |
| | 983 | | | Fuji Television Network | | | 2,047,305 | | |
| | 155,467 | | | Fujitsu Ltd | | | 1,265,977 | | |
| | 240,232 | | | Honda Motor | | | 8,489,270 | | |
See Notes to Financial Statements.
Julius Baer Funds 2006 Annual Report
83
PORTFOLIO OF INVESTMENTS (Continued) October 31, 2006
Julius Baer International Equity Fund II (Percentage of Net Assets)
Share
Amount | | Description | | Market
Value (Note 2) | |
| COMMON STOCKS—Continued | | | |
| | | Japan—Continued | |
| | 73,838 | | | Hoya Corp | | $ | 2,848,771 | | |
| | 43,110 | | | Ibiden Co | | | 2,255,681 | | |
| | 183,000 | | | Itochu Corp | | | 1,455,815 | | |
| | 1,250 | | | Japan Tobacco | | | 5,441,509 | | |
| | 60,291 | | | JS Group | | | 1,235,102 | | |
| | 61,717 | | | JSR Corp (1) | | | 1,548,786 | | |
| | 2,420 | | | Keyence Corp | | | 535,001 | | |
| | 280,484 | | | Kubota Corp | | | 2,449,192 | | |
| | 10,600 | | | Kyocera Corp | | | 949,119 | | |
| | 43,396 | | | Makita Corp | | | 1,289,045 | | |
| | 933,322 | | | Matsushita Electric Industrial | | | 19,478,232 | | |
| | 110,000 | | | Mitsubishi Electric | | | 957,706 | | |
| | 1,770 | | | Mitsubishi UFJ Financial | | | 22,209,039 | | |
| | 50,360 | | | Mitsubishi UFJ Securities | | | 614,697 | | |
| | 103,793 | | | Mitsui Fudosan | | | 2,551,524 | | |
| | 138,629 | | | Mitsui Mining & Smelting | | | 669,745 | | |
| | 2,411 | | | Mizuho Financial | | | 18,747,992 | | |
| | 63,361 | | | NGK Spark Plug | | | 1,333,147 | | |
| | 92,294 | | | NHK Spring | | | 1,018,618 | | |
| | 11,441 | | | Nintendo Co | | | 2,335,954 | | |
| | 69,000 | | | Nippon Electric Glass | | | 1,484,188 | | |
| | 447 | | | Nippon Telegraph & Telephone | | | 2,247,305 | | |
| | 58,000 | | | Nissan Chemical Industries | | | 746,071 | | |
| | 109,873 | | | Nissan Motor | | | 1,313,918 | | |
| | 87,878 | | | Nitto Denko | | | 5,003,169 | | |
| | 35,400 | | | NOK Corp | | | 927,643 | | |
| | 220,054 | | | Nomura Holdings | | | 3,878,721 | | |
| | 102,000 | | | NSK Ltd | | | 853,229 | | |
| | 1,480 | | | NTT DoCoMo | | | 2,261,278 | | |
| | 11,300 | | | ORIX Corp | | | 3,178,140 | | |
| | 59,300 | | | Promise Co | | | 2,141,087 | | |
| | 269 | | | Resona Holdings | | | 817,413 | | |
| | 254,000 | | | Ricoh Co | | | 5,008,237 | | |
| | 75 | | | Sapporo Hokuyo | | | 749,008 | | |
| | 69,200 | | | Sega Sammy | | | 1,736,571 | | |
| | 246,000 | | | Seiyu Ltd* (1) | | | 384,260 | | |
| | 19,554 | | | Seven & I | | | 625,902 | | |
| | 93,000 | | | Sharp Corp | | | 1,655,115 | | |
| | 169,348 | | | Sony Corp | | | 7,010,694 | | |
See Notes to Financial Statements.
Julius Baer Funds 2006 Annual Report
84
PORTFOLIO OF INVESTMENTS (Continued) October 31, 2006
Julius Baer International Equity Fund II (Percentage of Net Assets)
Share
Amount | | Description | | Market
Value (Note 2) | |
| COMMON STOCKS—Continued | | | |
| | | Japan—Continued | |
| | 42,161 | | | Stanley Electric | | $ | 834,907 | | |
| | 199,000 | | | Sumitomo Chemical | | | 1,416,636 | | |
| | 118,111 | | | Sumitomo Corp | | | 1,550,550 | | |
| | 145,000 | | | Sumitomo Electric Industries | | | 2,049,592 | | |
| | 147,158 | | | Sumitomo Metal Industries | | | 552,683 | | |
| | 1,065 | | | Sumitomo Mitsui Financial | | | 11,635,867 | | |
| | 65,000 | | | Suruga Bank | | | 806,709 | | |
| | 245,700 | | | Suzuki Motor | | | 6,962,776 | | |
| | 52,996 | | | Takeda Pharmaceutical | | | 3,397,208 | | |
| | 53,210 | | | Takefuji Corp (1) | | | 1,925,743 | | |
| | 91,000 | | | Teijin Ltd | | | 507,217 | | |
| | 221,000 | | | The Bank of Fukuoka | | | 1,761,888 | | |
| | 104,396 | | | The Bank of Kyoto | | | 1,070,203 | | |
| | 295,593 | | | The Bank of Yokohama | | | 2,280,876 | | |
| | 100,000 | | | The Gunma Bank | | | 697,367 | | |
| | 93,119 | | | The Shizuoka Bank | | | 993,545 | | |
| | 134,633 | | | The Sumitomo Trust & Banking | | | 1,445,677 | | |
| | 63,000 | | | Toppan Printing | | | 689,394 | | |
| | 172,286 | | | Toray Industries | | | 1,239,700 | | |
| | 309,294 | | | Toyota Motor | | | 18,295,484 | | |
| | 25,500 | | | Yamada Denki | | | 2,533,567 | | |
| | 122,647 | | | Yamaha Motor | | | 3,350,010 | | |
| | 40,505 | | | Yamato Holdings | | | 631,319 | | |
| | 38,665 | | | Yokogawa Electric | | | 529,703 | | |
| | | | 249,457,031 | | |
| | | Switzerland—7.0% | |
| | 193,483 | | | Adecco SA* | | | 11,954,149 | | |
| | 23,360 | | | BKW FMB Energie | | | 2,263,038 | | |
| | 392,322 | | | Compagnie Financiere Richemont | | | 19,413,449 | | |
| | 258,611 | | | Credit Suisse-Registered | | | 15,593,379 | | |
| | 2,384 | | | Givaudan-Registered | | | 1,974,129 | | |
| | 380,149 | | | Holcim Ltd | | | 32,732,209 | | |
| | 118,982 | | | Nestle SA-Registered | | | 40,653,897 | | |
| | 508,932 | | | Novartis AG-Registered | | | 30,891,479 | | |
| | 141,933 | | | Roche Holding | | | 24,841,270 | | |
| | 10,656 | | | SGS SA | | | 11,316,940 | | |
| | 68,506 | | | Syngenta AG-Registered* | | | 11,064,723 | | |
| | 102,194 | | | The Swatch Group | | | 20,170,139 | | |
| | | | 222,868,801 | | |
See Notes to Financial Statements.
Julius Baer Funds 2006 Annual Report
85
PORTFOLIO OF INVESTMENTS (Continued) October 31, 2006
Julius Baer International Equity Fund II (Percentage of Net Assets)
Share
Amount | | Description | | Market
Value (Note 2) | |
| COMMON STOCKS—Continued | | | |
| | | Italy—6.0% | |
| | 224,514 | | | Assicurazioni Generali* | | $ | 8,894,774 | | |
| | 2,314,607 | | | Banca CR Firenze | | | 7,710,589 | | |
| | 1,001,532 | | | Banca Intesa | | | 6,838,934 | | |
| | 3,592,568 | | | Banca Intesa-RNC | | | 23,816,433 | | |
| | 82,933 | | | Banca Italease | | | 4,631,005 | | |
| | 101,303 | | | Banca Popolare dell' Emilia Romagna (1) | | | 2,392,015 | | |
| | 984,865 | | | Banca Popolare di Milano (1) | | | 14,518,725 | | |
| | 209,784 | | | Banca Popolare di Sondrio | | | 3,695,058 | | |
| | 1,216,838 | | | Banca Popolare Italiana* | | | 16,167,887 | | |
| | 248,572 | | | Banche Popolari Unite | | | 6,833,885 | | |
| | 293,931 | | | Banco Popolare di Verona e Novara (1) | | | 7,885,839 | | |
| | 329,538 | | | Bulgari SpA | | | 4,593,016 | | |
| | 598,583 | | | Buzzi Unicem (1) | | | 15,853,029 | | |
| | 2,187,369 | | | Capitalia SpA | | | 19,277,713 | | |
| | 584,075 | | | Credito Emiliano | | | 8,416,516 | | |
| | 106,063 | | | Finmeccanica SpA | | | 2,555,852 | | |
| | 152,117 | | | Geox SpA | | | 2,009,499 | | |
| | 95,529 | | | Luxottica Group | | | 2,944,572 | | |
| | 455,327 | | | Parmalat SpA* | | | 1,630,144 | | |
| | 1,264,805 | | | Telecom Italia | | | 3,821,935 | | |
| | 3,055,177 | | | UniCredito Italiano | | | 25,288,096 | | |
| | | | 189,775,516 | | |
| | | Poland—5.1% | |
| | 58,025 | | | Bank BPH | | | 16,594,685 | | |
| | 261,315 | | | Bank Handlowy w Warszawie | | | 6,586,579 | | |
| | 605,326 | | | Bank PEKAO | | | 40,786,533 | | |
| | 318,944 | | | Bank Zachodni WBK* | | | 21,700,445 | | |
| | 21,677 | | | BRE Bank | | | 2,071,244 | | |
| | 195,540 | | | Globe Trade Centre | | | 2,151,871 | | |
| | 3,935,365 | | | PKO Bank Polski | | | 49,596,452 | | |
| | 2,974,768 | | | Telekomunikacja Polska | | | 21,857,079 | | |
| | | | 161,344,888 | | |
| | | Russia—3.9% | |
| | 130,713 | | | CTC Media* | | | 3,172,405 | | |
| | 18,923 | | | Gazpromneft | | | 77,584 | | |
| | 142,752 | | | LUKOIL ADR | | | 11,385,900 | | |
| | 108,705 | | | MMC Norilsk Nickel ADR | | | 16,099,211 | | |
See Notes to Financial Statements.
Julius Baer Funds 2006 Annual Report
86
PORTFOLIO OF INVESTMENTS (Continued) October 31, 2006
Julius Baer International Equity Fund II (Percentage of Net Assets)
Share
Amount | | Description | | Market
Value (Note 2) | |
| COMMON STOCKS—Continued | | | |
| | | Russia—Continued | |
| | 745,347 | | | NovaTek OAO | | $ | 4,337,920 | | |
| | 28,775 | | | NovaTek OAO GDR† | | | 1,674,705 | | |
| | 395,462 | | | OAO Gazprom ADR (1) | | | 16,704,315 | | |
| | 1,896,261 | | | OAO Rosneft Oil GDR (1) | | | 16,307,845 | | |
| | 151,956 | | | Polyus Gold* | | | 7,233,106 | | |
| | 74,092 | | | Polyus Gold ADR* (1) | | | 3,526,779 | | |
| | 7,758 | | | Sberbank RF | | | 17,455,500 | | |
| | 442,927 | | | TMK OAO | | | 2,391,806 | | |
| | 870,631 | | | TNK-BP | | | 1,993,745 | | |
| | 251,512 | | | Unified Energy System GDR (1) | | | 18,938,854 | | |
| | 953,776 | | | Uralkaliy CLS | | | 1,430,664 | | |
| | | | 122,730,339 | | |
| | | Netherlands—3.8% | |
| | 109,717 | | | Euronext NV | | | 10,992,928 | | |
| | 92,974 | | | Heineken NV | | | 4,213,878 | | |
| | 586,757 | | | ING Groep | | | 25,994,572 | | |
| | 588,677 | | | Royal KPN | | | 7,866,717 | | |
| | 241,823 | | | Royal Numico | | | 10,812,037 | | |
| | 562,244 | | | Royal Philips Electronics | | | 19,641,263 | | |
| | 573,628 | | | TNT NV | | | 22,081,647 | | |
| | 670,518 | | | Unilever NV (1) | | | 16,534,358 | | |
| | 181,435 | | | Vedior NV | | | 3,318,463 | | |
| | | | 121,455,863 | | |
| | | Sweden—3.4% | |
| | 30,708 | | | Autoliv Inc (1) | | | 1,741,342 | | |
| | 355,432 | | | Getinge AB-Class B* | | | 6,287,761 | | |
| | 54,574 | | | Hennes & Mauritz-Class B | | | 2,354,087 | | |
| | 152,968 | | | Modern Times Group-Class B | | | 8,811,960 | | |
| | 1,395,117 | | | Nordea AB | | | 19,222,608 | | |
| | 48,058 | | | Securitas AB-Class B | | | 632,220 | | |
| | 48,058 | | | Securitas Direct-Class B (1) | | | 146,409 | | |
| | 48,058 | | | Securitas Systems-Class B | | | 160,384 | | |
| | 849,876 | | | Skandinaviska Enskilda Banken | | | 23,773,084 | | |
| | 450,860 | | | Skanska AB-Class B | | | 8,038,362 | | |
| | 782,102 | | | Swedbank AB | | | 25,613,748 | | |
| | 1,195,312 | | | Telefonaktiebolaget LM Ericsson-Class B | | | 4,535,346 | | |
| | 707,049 | | | TeliaSonera AB | | | 5,140,288 | | |
| | | | 106,457,599 | | |
See Notes to Financial Statements.
Julius Baer Funds 2006 Annual Report
87
PORTFOLIO OF INVESTMENTS (Continued) October 31, 2006
Julius Baer International Equity Fund II (Percentage of Net Assets)
Share
Amount | | Description | | Market
Value (Note 2) | |
| COMMON STOCKS—Continued | | | |
| | | Austria—2.7% | |
| | 270,271 | | | Erste Bank der Oesterreichischen Sparkassen | | $ | 18,403,637 | | |
| | 900,125 | | | Immoeast Immobilien Anlagen* | | | 11,304,925 | | |
| | 98,310 | | | IMMOFINANZ Immobilien Anlagen* | | | 1,192,041 | | |
| | 267,335 | | | OMV AG* | | | 14,532,263 | | |
| | 115,007 | | | Raiffeisen International Bank Holding | | | 13,159,650 | | |
| | 372,908 | | | Telekom Austria | | | 9,281,242 | | |
| | 120,797 | | | Wiener Staedtische Versicherung | | | 7,770,634 | | |
| | 208,372 | | | Wienerberger AG | | | 10,832,372 | | |
| | | | 86,476,764 | | |
| | | Hungary—2.1% | |
| | 4,559,902 | | | Magyar Telekom Telecommunications* | | | 21,222,645 | | |
| | 1,226,570 | | | OTP Bank | | | 43,115,621 | | |
| | 14,947 | | | Richter Gedeon | | | 3,134,139 | | |
| | | | 67,472,405 | | |
| | | Australia—2.0% | |
| | 284,677 | | | BHP Billiton | | | 6,009,710 | | |
| | 292,762 | | | Brambles Industries (1) | | | 2,827,392 | | |
| | 104,588 | | | CSL Ltd | | | 4,539,668 | | |
| | 409,633 | | | John Fairfax | | | 1,540,593 | | |
| | 6,747,376 | | | Macquarie Airports Management | | | 16,760,877 | | |
| | 1,212,171 | | | Newcrest Mining | | | 22,372,219 | | |
| | 103,667 | | | Publishing & Broadcasting | | | 1,554,716 | | |
| | 131,297 | | | Rio Tinto | | | 7,965,768 | | |
| | | | 63,570,943 | | |
| | | Finland—2.0% | |
| | 30,639 | | | Elisa Oyj-Class A | | | 774,301 | | |
| | 785,761 | | | Fortum Oyj | | | 21,622,654 | | |
| | 806,036 | | | Nokia Oyj | | | 15,997,592 | | |
| | 159,787 | | | Sampo Oyj-Class A | | | 3,462,971 | | |
| | 130,213 | | | Sanoma-WSOY Oyj-Class B | | | 3,358,849 | | |
| | 28,110 | | | Wartsila Oyj-Class B | | | 1,289,821 | | |
| | 647,288 | | | YIT Oyj | | | 16,093,714 | | |
| | | | 62,599,902 | | |
See Notes to Financial Statements.
Julius Baer Funds 2006 Annual Report
88
PORTFOLIO OF INVESTMENTS (Continued) October 31, 2006
Julius Baer International Equity Fund II (Percentage of Net Assets)
Share
Amount | | Description | | Market
Value (Note 2) | |
| COMMON STOCKS—Continued | | | |
| | | Hong Kong—1.8% | |
| | 3,087,437 | | | China Merchants Holdings International | | $ | 9,027,884 | | |
| | 6,400,121 | | | Galaxy Entertainment* | | | 5,947,479 | | |
| | 2,323,899 | | | Hutchison Telecommunications International* | | | 4,474,407 | | |
| | 7,654,977 | | | Melco International Development | | | 18,753,107 | | |
| | 13,161,771 | | | Shun TAK Holdings | | | 17,390,573 | | |
| | | | 55,593,450 | | |
| | | Belgium—1.7% | |
| | 322,434 | | | Almancora Comm Va | | | 42,511,941 | | |
| | 292,084 | | | Fortis | | | 12,261,438 | | |
| | | | 54,773,379 | | |
| | | Czech Republic—1.5% | |
| | 283,610 | | | Komercni Banka | | | 44,122,614 | | |
| | 152,787 | | | Telefonica O2 Czech Republic | | | 3,215,511 | | |
| | | | 47,338,125 | | |
| | | Canada—1.3% | |
| | 511,605 | | | Bema Gold* | | | 2,200,844 | | |
| | 44,049 | | | Centerra Gold* | | | 438,347 | | |
| | 1,674,152 | | | Ivanhoe Mines* | | | 17,481,885 | | |
| | 154,726 | | | Potash Corp of Saskatchewan | | | 19,425,504 | | |
| | | | 39,546,580 | | |
| | | Mexico—1.2% | |
| | 137,585 | | | Cemex SAB ADR | | | 4,229,363 | | |
| | 480,154 | | | Fomento Economico Mexicano | | | 4,648,321 | | |
| | 3,370,166 | | | Grupo Financiero Banorte | | | 12,213,697 | | |
| | 362,266 | | | Grupo Televisa ADR | | | 8,940,725 | | |
| | 2,415,758 | | | Urbi Desarrollos Urbanos* | | | 7,365,307 | | |
| | | | 37,397,413 | | |
| | | Turkey—1.1% | |
| | 2,407,458 | | | Dogan Sirketler Grubu | | | 10,312,963 | | |
| | 1,795,903 | | | Haci Omer Sabanci | | | 7,570,119 | | |
| | 2,007,020 | | | Turkiye Garanti Bankasi | | | 7,359,532 | | |
| | 1,350,961 | | | Turkiye Is Bankasi | | | 8,750,227 | | |
| | | | 33,992,841 | | |
See Notes to Financial Statements.
Julius Baer Funds 2006 Annual Report
89
PORTFOLIO OF INVESTMENTS (Continued) October 31, 2006
Julius Baer International Equity Fund II (Percentage of Net Assets)
Share
Amount | | Description | | Market
Value (Note 2) | |
| COMMON STOCKS—Continued | | | |
| | | Norway—1.0% | |
| | 417,640 | | | DnB NOR | | $ | 5,465,564 | | |
| | 187,457 | | | Norsk Hydro* | | | 4,306,013 | | |
| | 91,371 | | | Orkla ASA | | | 4,679,639 | | |
| | 4,332,104 | | | PAN Fish* (1) | | | 3,391,002 | | |
| | 314,595 | | | Statoil ASA | | | 7,947,901 | | |
| | 382,930 | | | Telenor ASA | | | 6,044,615 | | |
| | | | 31,834,734 | | |
| | | Romania—0.9% | |
| | 1,198,017 | | | BRD-Groupe Societe Generale | | | 8,435,515 | | |
| | 90,824,880 | | | SNP Petrom | | | 20,767,884 | | |
| | | | 29,203,399 | | |
| | | Spain—0.8% | |
| | 2,052,490 | | | Corporacion Mapfre | | | 9,090,344 | | |
| | 46,382 | | | Inditex SA | | | 2,217,619 | | |
| | 659,287 | | | Telefonica SA | | | 12,706,363 | | |
| | | | 24,014,326 | | |
| | | South Korea—0.7% | |
| | 36,463 | | | Hyundai Motor | | | 2,964,409 | | |
| | 15,056 | | | NHN Corp* | | | 1,494,095 | | |
| | 24,899 | | | Samsung Electronics | | | 16,146,560 | | |
| | | | 20,605,064 | | |
| | | Cyprus—0.6% | |
| | 1,767,781 | | | Bank of Cyprus | | | 20,036,009 | | |
| | | United States—0.5% | |
| | 455,868 | | | News Corp | | | 10,001,127 | | |
| | 322,088 | | | News Corp-Class B (1) | | | 7,002,193 | | |
| | | | 17,003,320 | | |
| | | Greece—0.5% | |
| | 211,204 | | | Alpha Bank | | | 6,146,201 | | |
| | 398,822 | | | Hellenic Telecommunication Organization* | | | 10,333,440 | | |
| | | | 16,479,641 | | |
See Notes to Financial Statements.
Julius Baer Funds 2006 Annual Report
90
PORTFOLIO OF INVESTMENTS (Continued) October 31, 2006
Julius Baer International Equity Fund II (Percentage of Net Assets)
Share
Amount | | Description | | Market
Value (Note 2) | |
| COMMON STOCKS—Continued | | | |
| | | Philippines—0.4% | |
| | 554,278 | | | Ayala Corp | | $ | 5,449,362 | | |
| | 10,599,283 | | | Ayala Land | | | 3,243,159 | | |
| | 772,396 | | | Bank of the Philippine Islands | | | 960,846 | | |
| | 29,861 | | | Philippine Long Distance Telephone | | | 1,413,964 | | |
| | | | 11,067,331 | | |
| | | Multinational—0.3% | |
| | 65,954 | | | Central European Media Enterprises-Class A* (1) | | | 4,868,724 | | |
| | 106,967 | | | Millicom International Cellular* (1) | | | 5,335,514 | | |
| | | | 10,204,238 | | |
| | | Denmark—0.3% | |
| | 118,451 | | | Novo-Nordisk-Class B* | | | 8,945,439 | | |
| | 39,696 | | | Vestas Wind Systems* | | | 1,118,245 | | |
| | | | 10,063,684 | | |
| | | Ukraine—0.2% | |
| | 5,575 | | | Ukrnafta Oil ADR* (2) | | | 2,017,287 | | |
| | 1,876,334 | | | UkrTelecom* | | | 318,278 | | |
| | 627,195 | | | UkrTelecom GDR | | | 5,203,382 | | |
| | | | 7,538,947 | | |
| | | Venezuela—0.2% | |
| | 378,944 | | | CIA Anonima Nacional TeleFonos De Venezuela ADR | | | 7,355,303 | | |
| | | Portugal—0.2% | |
| | 657,161 | | | Energias de Portugal | | | 2,952,461 | | |
| | 233,460 | | | Portugal Telecom-Registered | | | 2,908,252 | | |
| | | | 5,860,713 | | |
| | | China—0.2% | |
| | 8,821,756 | | | Beijing Capital International Airport-Class H | | | 5,657,988 | | |
| | 173 | | | China Life Insurance-Class H | | | 364 | | |
| | | | 5,658,352 | | |
| | | Thailand—0.2% | |
| | 997,572 | | | Bangkok Bank | | | 3,124,204 | | |
| | 100,500 | | | Bangkok Bank-Foreign Registered Shares | | | 328,431 | | |
| | 5,208,672 | | | Krung Thai Bank | | | 1,844,029 | | |
| | | | 5,296,664 | | |
See Notes to Financial Statements.
Julius Baer Funds 2006 Annual Report
91
PORTFOLIO OF INVESTMENTS (Continued) October 31, 2006
Julius Baer International Equity Fund II (Percentage of Net Assets)
Share
Amount | | Description | | Market
Value (Note 2) | |
| COMMON STOCKS—Continued | | | |
| | | Egypt—0.1% | |
| | 35,133 | | | Orascom Telecom Holding GDR (1) | | $ | 1,977,988 | | |
| | 698,860 | | | Telecom Egypt | | | 1,980,205 | | |
| | | | 3,958,193 | | |
| | | India—0.1% | |
| | 62,525 | | | State Bank of India GDR | | | 3,939,075 | | |
| | | Brazil—0.1% | |
| | 129,433 | | | Voctorantim Celulose Papel ADR (1) | | | 2,362,152 | | |
| | | | | TOTAL COMMON STOCKS (Cost $2,531,326,940) | | | 2,861,629,941 | | |
| PREFERRED STOCKS—0.4% | | | |
| | | Germany—0.4% | |
| | 3,451 | | | Henkel KGaA | | | 462,272 | | |
| | 400,299 | | | ProsiebenSat.1 Media | | | 11,444,644 | | |
| | | | | TOTAL PREFERRED STOCKS (Cost $9,643,917) | | | 11,906,916 | | |
| INVESTMENT FUNDS—0.2% | | | |
| | | Luxembourg—0.2% | |
| | 238,710 | | | Prologis European Properties (Cost $4,393,478) | | | 4,509,227 | | |
| RIGHTS—0.0% | | | |
| | | Italy—0.0% | |
| | 101,303 | | | Banca Popolare Emilia Romagna Rights, Expires 11/28/2006* | | | 37,497 | | |
| | 101,303 | | | Banca Popolare Emilia Romagna Rights, Expires 11/28/2006* | | | 20,300 | | |
| | | | | TOTAL RIGHTS (Cost $0) | | | 57,797 | | |
| WARRANTS—2.4% | | | |
| | | India—2.4% | |
| | 1,169,169 | | | Banking Index Benchmark Exchange Traded Scheme-Bank BeES,
Issued by Citigroup, Expires 01/20/2010* | | | 14,597,075 | | |
| | 595,957 | | | Bharti Airtel-Class A, Issued by CLSA, Expires 05/31/2010*† | | | 7,570,463 | | |
| | 1,391,073 | | | Canara Bank, Issued by Citigroup, Expires 01/19/2009* | | | 9,205,801 | | |
| | 576,500 | | | State Bank of India, Issued by Citigroup, Expires 01/19/2009*† | | | 16,746,403 | | |
| | 984,752 | | | State Bank of India, Issued by CLSA, Expires 05/13/2010*† | | | 28,750,819 | | |
| | | | | TOTAL WARRANTS (Cost $63,437,211) | | | 76,870,561 | | |
See Notes to Financial Statements.
Julius Baer Funds 2006 Annual Report
92
PORTFOLIO OF INVESTMENTS (Continued) October 31, 2006
Julius Baer International Equity Fund II (Percentage of Net Assets)
Face
Value | |
Currency | |
Description | | Market
Value (Note 2) | |
| U.S. GOVERNMENT AND AGENCY OBLIGATION—0.2% | | | |
| | | | | United States—0.2% | |
| | | | | | | U.S. Treasury Bill | | |
| | |
| | 8,000,000 | | | | | 4.650% due 11/09/2006 (Cost $7,991,733) (3) | | $ | 7,991,733 | | |
SHORT-TERM INVESTMENTS PURCHASED WITH CASH COLLATERAL
FROM SECURITY LENDING—7.0% | | | |
| | 7,649,696 | | | | | Abbey National, rates ranging from 5.270%-5.280% and
maturity dates ranging from 11/16/2006-12/01/2006 | | | 7,649,696 | | |
| | 3,477,136 | | | | | ABN Amro Bank NV 5.305% due 11/21/2006 | | | 3,477,136 | | |
| | 2,716,801 | | | | | Banco Santander Central Hispano 5.275% due 11/14/2006 | | | 2,716,801 | | |
| | 3,477,134 | | | | | BancoBilbao Vizcaya Argentaria 5.310% due 01/03/2007 | | | 3,477,134 | | |
| | 8,901,464 | | | | | Bank of America, rates ranging from 5.270%-5.310% and
maturity dates ranging from 11/10/2006-07/10/2007 | | | 8,901,464 | | |
| | 6,815,183 | | | | | Bank of Nova Scotia 5.270% due 11/13/2006 | | | 6,815,183 | | |
| | 11,126,829 | | | | | Barclays, rates ranging from 5.300%-5.305% and maturity
dates ranging from 11/03/2006-01/03/2007 | | | 11,126,829 | | |
| | 11,079,165 | | | | | Barton Capital, rates ranging from 5.266%-5.270% and
maturity dates ranging from 11/07/2006-01/03/2007 | | | 11,079,165 | | |
| | 6,453,561 | | | | | Bear Stearns & Co 5.447% due 03/07/2007 | | | 6,453,561 | | |
| | 8,345,123 | | | | | BGI Institutional 5.242% due 11/01/2006 | | | 8,345,123 | | |
| | 5,563,415 | | | | | BNP Paribas, with a rate of 5.280% and maturity dates
ranging from 12/12/2006-12/15/2006 | | | 5,563,415 | | |
| | 2,086,281 | | | | | CAFCO Funding 5.289% due 11/17/2006 | | | 2,086,281 | | |
| | 3,477,134 | | | | | Calyon 5.250% due 11/06/2006 | | | 3,477,134 | | |
| | 4,172,561 | | | | | Canadian Imperial Bank of Commerce 5.280%
due 11/29/2006 | | | 4,172,561 | | |
| | 3,558,192 | | | | | Charta 5.314% due 11/01/2006 | | | 3,558,192 | | |
| | 2,086,281 | | | | | Clipper Receivables 5.280% due 11/15/2006 | | | 2,086,281 | | |
| | 3,055,124 | | | | | Commonwealth Bank of Australia 5.286% due 11/30/2006 | | | 3,055,124 | | |
| | 5,753,129 | | | | | Compass Securitization, rates ranging from 5.292%-5.305%
and maturity dates ranging from 11/29/2006-12/15/2006 | | | 5,753,129 | | |
| | 1,390,854 | | | | | CRC Funding 5.314% due 12/19/2006 | | | 1,390,854 | | |
| | 6,954,268 | | | | | Credit Suisse First Boston, with a rate of 5.310% and
maturity dates ranging from 11/13/2006-11/14/2006 | | | 6,954,268 | | |
| | 9,713,622 | | | | | Fairway Finance, rates ranging from 5.277%-5.299% and
maturity dates ranging from 11/15/2006-11/22/2006 | | | 9,713,622 | | |
| | 1,947,195 | | | | | Falcon Asset Securitization 5.292% due 11/14/2006 | | | 1,947,195 | | |
| | 4,172,562 | | | | | Fortis Bank, rates ranging from 5.260%-5.300% and
maturity dates ranging from 11/07/2006-11/20/2006 | | | 4,172,562 | | |
See Notes to Financial Statements.
Julius Baer Funds 2006 Annual Report
93
PORTFOLIO OF INVESTMENTS (Continued) October 31, 2006
Julius Baer International Equity Fund II (Percentage of Net Assets)
Face
Value | |
Currency | |
Description | | Market
Value (Note 2) | |
SHORT-TERM INVESTMENTS PURCHASED WITH CASH COLLATERAL
FROM SECURITY LENDING—Continued | | | |
| | 6,954,268 | | | | | General Electric Capital Corporation, rates ranging from
5.265%-5.285% and maturity dates ranging from
11/03/2006-11/22/2006 | | $ | 6,954,268 | | |
| | 2,086,281 | | | | | Govco Incorporated 5.276% due 11/10/2006 | | | 2,086,281 | | |
| | 1,357,259 | | | | | Greyhawk Funding 5.296% due 11/27/2006 | | | 1,357,259 | | |
| | 2,086,281 | | | | | HBOS Halifax Bank of Scotland 5.300% due 01/08/2007 | | | 2,086,281 | | |
| | 3,028,379 | | | | | Jupiter Securitization 5.284% due 11/06/2006 | | | 3,028,379 | | |
| | 2,051,733 | | | | | Kitty Hawk Funding 5.286% due 11/29/2006 | | | 2,051,733 | | |
| | 2,754,221 | | | | | Lexington Parker Capital 5.291% due 11/09/2006 | | | 2,754,221 | | |
| | 2,750,209 | | | | | Liberty Street 5.284% due 11/13/2006 | | | 2,750,209 | | |
| | 26,623,018 | | | | | Merrimac Cash Fund-Premium Class 5.092%
due 11/01/2006 | | | 26,623,018 | | |
| | 1,390,854 | | | | | Old Line Funding 5.276% due 11/15/2006 | | | 1,390,854 | | |
| | 3,410,963 | | | | | Ranger Funding, rates ranging from 5.294%-5.296% and
maturity dates ranging from 11/16/2006-11/29/2006 | | | 3,410,963 | | |
| | 2,781,708 | | | | | Royal Bank of Canada 5.300% due 11/17/2006 | | | 2,781,708 | | |
| | 3,448,684 | | | | | Sheffiled Receivables, rates ranging from 5.267%-5.275%
and maturity dates ranging from 11/02/2006-11/08/2006 | | | 3,448,684 | | |
| | 2,781,708 | | | | | Skandinaviska Enskilda Banken 5.290% due 12/11/2006 | | | 2,781,708 | | |
| | 12,517,683 | | | | | Societe Generale, rates ranging from 5.270%-5.280% and
maturity dates ranging from 11/01/2006-12/04/2006 | | | 12,517,683 | | |
| | 4,759,534 | | | | | Svenska Handlesbanken 5.300% due 11/01/2006 | | | 4,759,534 | | |
| | 2,052,750 | | | | | Three Pillars Funding 5.285% due 11/20/2006 | | | 2,052,750 | | |
| | 3,477,134 | | | | | Toronto Dominion Bank 5.300% due 12/11/2006 | | | 3,477,134 | | |
| | 4,818,294 | | | | | Variable Funding Capital, rates ranging from 5.267%-5.287%
and maturity dates ranging from 11/07/2006-11/28/2006 | | | 4,818,294 | | |
| | 5,082,087 | | | | | Yorktown Capital, rates ranging from 5.292%-5.297%
and maturity dates ranging from 11/15/2006-12/14/2006 | | | 5,082,087 | | |
| | | | | | | TOTAL SHORT-TERM INVESTMENTS PURCHASED
WITH CASH COLLATERAL FROM SECURITY LENDING
(Cost $220,185,758) | | | 220,185,758 | | |
See Notes to Financial Statements.
Julius Baer Funds 2006 Annual Report
94
PORTFOLIO OF INVESTMENTS (Continued) October 31, 2006
Julius Baer International Equity Fund II (Percentage of Net Assets)
Face
Value | |
Currency | |
Description | | Market
Value (Note 2) | |
| REPURCHASE AGREEMENT—3.3% | |
| | | | | United States—3.3% | |
| | 104,732,119 | | | USD | | Investors Bank & Trust Company Repurchase Agreement, | | |
| | |
| | | | | dated 10/31/2006, due 11/01/2006, with a maturity | | |
| | |
| | | | | value of $104,742,592 and an effective yield of 3.60%, | | |
| | |
| | | | | collateralized by U.S. Government and Agency Obligations, | | |
| | |
| | | | | with rates ranging from 5.670%-8.980%, maturities from | | |
| | |
| | | | | 12/25/2016-02/15/2036, and an aggregate market value | | |
| | |
| | | | | of $109,968,725. (Cost $104,732,119) | | $ | 104,732,119 | | |
| TOTAL INVESTMENTS—104.0% (Cost $2,941,711,156) | | | 3,287,884,052 | | |
| | | | | OTHER ASSETS AND LIABILITIES (NET)—(4.0%) | | | (125,599,057 | ) | |
| | | | | TOTAL NET ASSETS—100.0% | | $ | 3,162,284,995 | | |
Notes to the Portfolio of Investments:
ADR American Depositary Receipt
GDR Global Depositary Receipt
(1) All or a portion of this security was on loan to brokers at October 31, 2006.
(2) Illiquid security
(3) Security has been pledged for futures collateral.
* Non-income producing security.
† Securities exempt from registration under Rule 144A of the Securities Act of 1933, as amended. These securities may be resold in transactions exempt from registrations, normally to qualified institutional buyers.
Aggregate cost for federal income tax purposes was $2,962,333,921.
Glossary of Currencies
USD — United States Dollar
See Notes to Financial Statements.
Julius Baer Funds 2006 Annual Report
95
SCHEDULE OF FORWARD FOREIGN EXCHANGE CONTRACTS
October 31, 2006
Julius Baer International Equity Fund II
FORWARD FOREIGN EXCHANGE CONTRACTS TO BUY
| | | Contracts to Receive | | | | | |
Expiration
Date | | Local
Currency | | Value in
USD | | In Exchange
for USD | | Net Unrealized
Appreciation
(Depreciation) | |
| 11/01/2006 | | CHF | 2,194,020 | | | | 1,763,895 | | | | 1,756,762 | | | $ | 7,133 | | |
| 11/06/2006 | | DKK | 5,249,318 | | | | 899,115 | | | | 906,149 | | | | (7,034 | ) | |
| 11/01/2006 | | EUR | 7,317,413 | | | | 9,339,581 | | | | 9,347,264 | | | | (7,683 | ) | |
| 11/22/2006 | | EUR | 15,650,000 | | | | 19,996,396 | | | | 20,147,340 | | | | (150,944 | ) | |
| 11/29/2006 | | EUR | 21,727,000 | | | | 27,771,587 | | | | 27,886,604 | | | | (115,017 | ) | |
| 11/30/2006 | | EUR | 29,700,000 | | | | 37,964,767 | | | | 38,219,148 | | | | (254,381 | ) | |
| 11/06/2006 | | GBP | 401,427 | | | | 765,648 | | | | 754,904 | | | | 10,744 | | |
| 11/30/2006 | | GBP | 5,055,000 | | | | 9,643,449 | | | | 9,553,394 | | | | 90,055 | | |
| 12/11/2006 | | GBP | 558,634 | | | | 1,065,793 | | | | 1,048,164 | | | | 17,629 | | |
| 12/22/2006 | | GBP | 3,610,200 | | | | 6,888,238 | | | | 6,807,754 | | | | 80,484 | | |
| 12/27/2006 | | GBP | 1,668,000 | | | | 3,182,636 | | | | 3,171,001 | | | | 11,635 | | |
| 01/19/2007 | | GBP | 2,541,000 | | | | 4,849,046 | | | | 4,758,023 | | | | 91,023 | | |
| 01/22/2007 | | GBP | 5,740,000 | | | | 10,953,962 | | | | 10,731,045 | | | | 222,917 | | |
| 11/01/2006 | | HKD | 10,908,999 | | | | 1,402,140 | | | | 1,403,033 | | | | (893 | ) | |
| 11/07/2006 | | JPY | 806,855,000 | | | | 6,891,793 | | | | 7,102,347 | | | | (210,554 | ) | |
| 11/08/2006 | | JPY | 3,227,882,744 | | | | 27,574,907 | | | | 28,327,123 | | | | (752,216 | ) | |
| 11/16/2006 | | JPY | 1,169,000,000 | | | | 9,997,409 | | | | 10,168,224 | | | | (170,815 | ) | |
| 11/22/2006 | | JPY | 1,150,000,000 | | | | 9,843,025 | | | | 10,051,569 | | | | (208,544 | ) | |
| 11/27/2006 | | JPY | 1,004,286,400 | | | | 8,601,749 | | | | 8,731,331 | | | | (129,582 | ) | |
| 11/30/2006 | | JPY | 4,300,000,000 | | | | 36,844,847 | | | | 37,327,037 | | | | (482,190 | ) | |
| 12/22/2006 | | JPY | 2,552,164,780 | | | | 21,934,163 | | | | 22,046,273 | | | | (112,110 | ) | |
| 12/26/2006 | | JPY | 160,220,900 | | | | 1,377,744 | | | | 1,388,998 | | | | (11,254 | ) | |
| 01/09/2007 | | JPY | 734,252,640 | | | | 6,325,859 | | | | 6,303,572 | | | | 22,287 | | |
| 01/12/2007 | | JPY | 2,426,000,000 | | | | 20,909,291 | | | | 20,543,653 | | | | 365,638 | | |
| 01/19/2007 | | JPY | 2,125,618,000 | | | | 18,337,548 | | | | 18,144,369 | | | | 193,179 | | |
| 01/22/2007 | | JPY | 3,638,544,846 | | | | 31,402,090 | | | | 30,938,034 | | | | 464,056 | | |
| 01/31/2007 | | JPY | 5,886,000,000 | | | | 50,859,939 | | | | 50,777,493 | | | | 82,446 | | |
| 11/01/2006 | | NOK | 29,198,407 | | | | 4,463,940 | | | | 4,450,298 | | | | 13,642 | | |
| 11/30/2006 | | NOK | 216,500,000 | | | | 33,149,278 | | | | 33,372,898 | | | | (223,620 | ) | |
| 11/02/2006 | | PLN | 7,761,798 | | | | 2,557,387 | | | | 2,544,601 | | | | 12,786 | | |
| 11/01/2006 | | SEK | 28,654,866 | | | | 3,968,048 | | | | 3,959,550 | | | | 8,498 | | |
| Net unrealized depreciation on forward foreign exchange contracts to buy | | | | | | | | | | | | | | $ | (1,142,685 | ) | |
See Notes to Financial Statements.
Julius Baer Funds 2006 Annual Report
96
SCHEDULE OF FORWARD FOREIGN EXCHANGE CONTRACTS (Continued)
October 31, 2006
Julius Baer International Equity Fund II
FORWARD FOREIGN EXCHANGE CONTRACTS TO SELL
| | | Contracts to Deliver | | | | | |
Expiration
Date | | Local
Currency | | Value in
USD | | In Exchange
for USD | | Net Unrealized
Appreciation
(Depreciation) | |
| 11/22/2006 | | CZK | 32,582,000 | | | | 1,480,138 | | | | 1,506,146 | | | $ | 26,008 | | |
| 12/18/2006 | | CZK | 389,697,000 | | | | 17,738,962 | | | | 17,572,917 | | | | (166,045 | ) | |
| 12/27/2006 | | CZK | 26,279,692 | | | | 1,197,080 | | | | 1,186,014 | | | | (11,066 | ) | |
| 11/22/2006 | | EUR | 15,650,000 | | | | 19,996,396 | | | | 20,142,019 | | | | 145,623 | | |
| 11/29/2006 | | EUR | 21,727,000 | | | | 27,771,587 | | | | 27,973,947 | | | | 202,360 | | |
| 11/30/2006 | | EUR | 29,700,000 | | | | 37,964,767 | | | | 38,241,720 | | | | 276,953 | | |
| 01/31/2007 | | EUR | 31,100,000 | | | | 39,872,710 | | | | 39,794,938 | | | | (77,772 | ) | |
| 11/03/2006 | | HUF | 738,775,506 | | | | 3,619,369 | | | | 3,610,828 | | | | (8,541 | ) | |
| 12/18/2006 | | HUF | 1,782,641,000 | | | | 8,704,435 | | | | 8,254,114 | | | | (450,321 | ) | |
| 12/27/2006 | | HUF | 26,922,463 | | | | 131,371 | | | | 124,152 | | | | (7,219 | ) | |
| 11/01/2006 | | MXN | 30,440,168 | | | | 2,828,644 | | | | 2,828,355 | | | | (289 | ) | |
| 11/03/2006 | | PLN | 3,684,730 | | | | 1,214,059 | | | | 1,212,122 | | | | (1,937 | ) | |
| 12/27/2006 | | PLN | 1,313,945 | | | | 433,751 | | | | 425,190 | | | | (8,561 | ) | |
| 11/01/2006 | | TRY | 1,573,824 | | | | 1,078,700 | | | | 1,076,487 | | | | (2,213 | ) | |
| 12/26/2006 | | TRY | 403,460 | | | | 271,108 | | | | 263,958 | | | | (7,150 | ) | |
| Net unrealized depreciation on forward foreign exchange contracts to sell | | | | | | | | | | | | | | $ | (90,170 | ) | |
Glossary of Currencies
CHF — Swiss Franc
CZK — Czech Koruna
DKK — Danish Krone
EUR — Euro
GBP — British Pound Sterling
HKD — Hong Kong Dollar
HUF — Hungarian Forint
JPY — Japanese Yen
MXN — Mexican Nuevo Peso
NOK — Norwegian Krone
PLN — Polish Zloty
SEK — Swedish Krona
TRY — Turkish Lira
See Notes to Financial Statements.
Julius Baer Funds 2006 Annual Report
97
PORTFOLIO OF INVESTMENTS–Industry Sector (Unaudited) October 31, 2006
Julius Baer International Equity Fund II (Percentage of Net Assets)
At October 31, 2006, sector diversification of the Fund's non-cash equivalents investments were as follows:
| | | % of Net
Assets | | Market
Value (Note 2) | |
| INDUSTRY SECTOR | |
| Financials | | | 36.4 | % | | $ | 1,151,373,251 | | |
| Consumer Discretionary | | | 10.5 | | | | 331,491,264 | | |
| Industrials | | | 9.1 | | | | 286,706,297 | | |
| Materials | | | 8.1 | | | | 254,687,633 | | |
| Consumer Staples | | | 6.6 | | | | 209,343,032 | | |
| Telecommunications | | | 6.5 | | | | 204,667,278 | | |
| Energy | | | 5.8 | | | | 184,348,176 | | |
| Healthcare | | | 5.6 | | | | 178,459,584 | | |
| Information Technology | | | 2.5 | | | | 78,330,947 | | |
| Utilities | | | 2.4 | | | | 75,566,979 | | |
| Cash & Cash Equivalents | | | 10.5 | | | | 332,909,611 | * | |
| Total Investments | | | 104.0 | | | | 3,287,884,052 | | |
| Other Assets and Liabilities (Net) | | | (4.0 | ) | | | (125,599,057 | )* | |
| Net Assets | | | 100.0 | % | | $ | 3,162,284,995 | | |
* Cash and Cash Equivalents and Other Assets and Liabilities (Net) include the margin requirements for $92,875,019 of notional market value for futures, which is 2.94% of net assets.
See Notes to Financial Statements.
Julius Baer Funds 2006 Annual Report
98
PORTFOLIO OF INVESTMENTS October 31, 2006
Julius Baer Total Return Bond Fund (Percentage of Net Assets)
Face
Value | |
Currency | |
| | Market
Value (Note 2) | |
| U.S. GOVERNMENT AND AGENCY OBLIGATION—61.5% | | | |
| | | | | | | | | Federal Home Loan Bank | | | | | |
| | 18,000,000 | | | USD | | | | 0.000% due 11/07/2006 | | $ | 17,984,670 | | |
| | 2,000,000 | | | USD | | | | 4.580% due 02/22/2007 (1) | | | 1,998,172 | | |
| | 6,000,000 | | | USD | | | | 4.625% due 08/08/2007 | | | 5,974,290 | | |
| | 4,391,785 | | | USD | | | | 4.720% due 09/20/2012 | | | 4,299,832 | | |
| | | | 30,256,964 | | |
| | | | | | | | | Federal Home Loan Mortgage | | | | | |
| | 3,800,000 | | | USD | | | | 3.750% due 11/15/2006 | | | 3,797,667 | | |
| | 3,600,000 | | | USD | | | | 4.050% due 06/28/2007 | | | 3,572,942 | | |
| | 12,000,000 | | | USD | | | | 5.500% due 11/01/2021* | | | 12,007,500 | | |
| | 3,484,865 | | | USD | | | | 4.625% due 09/01/2035 (1) | | | 3,432,961 | | |
| | | | 22,811,070 | | |
| | | | | | | | | Federal National Mortgage Association | | | | | |
| | 15,000,000 | | | USD | | | | 5.500% due 11/01/2021* | | | 15,018,750 | | |
| | 33,500,000 | | | USD | | | | 6.000% due 11/01/2021* | | | 34,023,437 | | |
| | 2,548,457 | | | USD | | | | 4.404% due 01/01/2034 (1) | | | 2,515,787 | | |
| | 3,903,320 | | | USD | | | | 4.666% due 11/01/2035 (1) | | | 3,849,306 | | |
| | 19,100,000 | | | USD | | | | 5.000% due 11/01/2036* | | | 18,443,438 | | |
| | 40,200,000 | | | USD | | | | 6.500% due 11/01/2036* | | | 40,978,875 | | |
| | | | 114,829,593 | | |
| | | | | | | | | Government National Mortgage Association | | | | | |
| | 71,036 | | | USD | | | | 7.000% due 04/15/2032 | | | 73,493 | | |
| | 26,100,000 | | | USD | | | | 6.000% due 11/01/2036* | | | 26,458,875 | | |
| | | | 26,532,368 | | |
| | | | | | | | | U.S. Treasury Bond | | | | | |
| | 6,000,000 | | | USD | | | | 6.125% due 08/15/2023 | | | 6,984,378 | | |
| | | | | | | | | U.S. Treasury Inflation Indexed Bond | | | | | |
| | 5,135,950 | | | USD | | | | 2.375% due 01/15/2025 | | | 4,991,101 | | |
| | | | | | | | | U.S. Treasury Inflation Indexed Notes | | | | | |
| | 22,740,339 | | | USD | | | | 3.625% due 01/15/2008 | | | 22,781,203 | | |
| | 17,846,070 | | | USD | | | | 2.000% due 01/15/2016 | | | 18,070,556 | | |
| | | | 40,851,759 | | |
See Notes to Financial Statements.
Julius Baer Funds 2006 Annual Report
99
PORTFOLIO OF INVESTMENTS (Continued) October 31, 2006
Julius Baer Total Return Bond Fund (Percentage of Net Assets)
Face
Value | |
Currency | |
| | Market
Value (Note 2) | |
| U.S. GOVERNMENT AND AGENCY OBLIGATION—Continued | | | | | |
| | | | | | | | | U.S. Treasury Notes | | | | | |
| | 5,460,000 | | | USD | | | | 4.500% due 09/30/2011 | | $ | 5,442,725 | | |
| | 24,565,000 | | | USD | | | | 5.125% due 05/15/2016 | | | 25,543,768 | | |
| | 7,611,000 | | | USD | | | | 4.875% due 08/15/2016 | | | 7,771,546 | | |
| | 24,000,000 | | | USD | | | | 4.500% due 02/15/2036 | | | 23,171,256 | | |
| | | | 61,929,295 | | |
TOTAL U.S. GOVERNMENT AND AGENCY OBLIGATION
(Cost $307,350,675) | | | 309,186,528 | | |
| ASSET BACKED SECURITIES—33.4% | | | | | |
| | 3,000,000 | | | USD | | | | American Express Credit Account Master Trust,
Series 2002-1, Class A
5.430% due 09/15/2009 (1) | | | 3,003,013 | | |
| | 4,837,077 | | | USD | | | | Astoria Depositor Corp, Series 2005, Class A
5.744% due 05/01/2016† | | | 4,816,205 | | |
| | 2,700,000 | | | USD | | | | Banc of America Commercial Mortgage, Inc.,
Series 2006-5, Class A4
5.414% due 09/10/2047 | | | 2,723,370 | | |
| | 6,151,268 | | | USD | | | | Bank One Auto Securitization Trust,
Series 2003-1, Class A4
2.430% due 03/22/2010 | | | 6,070,092 | | |
| | 4,600,000 | | | USD | | | | Bank One Issuance Trust, Series 2002-A1, Class A1
5.430% due 01/15/2010 (1) | | | 4,606,064 | | |
| | 26,000,000 | | | USD | | | | Bank One Issuance Trust, Series 2004-A2, Class A2
5.350% due 10/15/2009 (1) | | | 26,019,994 | | |
| | 3,803,386 | | | USD | | | | Caterpillar Financial Asset Trust,
Series 2006-A, Class A1
5.455% due 06/25/2007 | | | 3,805,965 | | |
| | 10,800,000 | | | USD | | | | Chase Credit Card Master Trust,
Series 2001-6, Class A
5.450% due 03/16/2009 (1) | | | 10,806,604 | | |
| | 4,000,000 | | | USD | | | | Citibank Credit Card Issuance Trust,
Series 2002-A1, Class A1
4.950% due 02/09/2009 | | | 3,997,901 | | |
See Notes to Financial Statements.
Julius Baer Funds 2006 Annual Report
100
PORTFOLIO OF INVESTMENTS (Continued) October 31, 2006
Julius Baer Total Return Bond Fund (Percentage of Net Assets)
Face
Value | |
Currency | |
| | Market
Value (Note 2) | |
| ASSET BACKED SECURITIES—Continued | | | | | |
| | 12,000,000 | | | USD | | | | Citibank Credit Card Issuance Trust,
Series 2003-A4, Class A4
5.460% due 03/20/2009 (1) | | $ | 12,011,666 | | |
| | 4,000,000 | | | USD | | | | Citibank Credit Card Issuance Trust,
Series 2004-A1, Class A1
2.550% due 01/20/2009 | | | 3,978,310 | | |
| | 2,683,069 | | | USD | | | | City Mortgage MBS Finance B.V.,
Series 2006-1A, Class AFL
6.930% due 09/10/2033 (1)† | | | 2,693,131 | | |
| | 4,100,000 | | | USD | | | | Commercial Mortgage Pass Through Certificates,
Series 2006-C7, Class A4
5.769% due 06/10/2046 (1) | | | 4,260,196 | | |
| | 2,300,000 | | | USD | | | | Credit Suisse Mortgage Capital Certificates,
Series 2006-C4, Class A3
5.467% due 09/15/2039 | | | 2,325,310 | | |
| | 10,000,000 | | | USD | | | | Daimler Chrysler Master Owner Trust,
Series 2004-A, Class A
5.340% due 01/15/2009 (1) | | | 10,007,174 | | |
| | 7,000,000 | | | USD | | | | Discover Card Master Trust I, Series 2002-3, Class A
5.430% due 11/17/2009 (1) | | | 7,009,227 | | |
| | 2,000,000 | | | USD | | | | Discover Card Master Trust I, Series 2003-1, Class A3
5.460% due 04/16/2010 (1) | | | 2,003,882 | | |
| | 3,379,573 | | | USD | | | | Ford Credit Auto Owner Trust, Series 2006-B, Class A1
5.405% due 09/15/2007† | | | 3,381,396 | | |
| | 1,322,544 | | | USD | | | | GE Equipment Small Ticket LLC, Series 2005-1A, Class A2
4.280% due 10/22/2007† | | | 1,321,092 | | |
| | 3,181,504 | | | USD | | | | Harley-Davidson Motorcycle Trust, Series 2003-2, Class A2
2.070% due 02/15/2011 | | | 3,104,831 | | |
| | 3,640,377 | | | USD | | | | Honda Auto Receivables Owner Trust, Series 2006-2, A1
5.425% due 08/21/2007 | | | 3,642,899 | | |
| | 1,440,000 | | | USD | | | | JPMorgan Chase Commercial Mortgage Securities Corp,
Series 2002-CIB4 Class A3
6.162% due 05/12/2034 | | | 1,504,352 | | |
See Notes to Financial Statements.
Julius Baer Funds 2006 Annual Report
101
PORTFOLIO OF INVESTMENTS (Continued) October 31, 2006
Julius Baer Total Return Bond Fund (Percentage of Net Assets)
Face
Value | |
Currency | |
| | Market
Value (Note 2) | |
| ASSET BACKED SECURITIES—Continued | | | | | |
| | 3,400,000 | | | USD | | | | LB- UBS Commercial Mortgage Trust,
Series 2001-C3, Class A2
6.365% due 12/15/2028 | | $ | 3,567,316 | | |
| | 4,400,000 | | | USD | | | | LB- UBS Commercial Mortgage Trust,
Series 2006-C6, Class A4
5.372% due 09/15/2039 (1) | | | 4,426,421 | | |
| | 2,000,000 | | | USD | | | | MBNA Credit Card Master Note Trust,
Series 2002-A10, Class A10
5.460% due 02/16/2010 (1) | | | 2,003,674 | | |
| | 2,300,000 | | | USD | | | | Merrill Lynch/ Countrywide Commercial Mortgage Trust,
Series 2006-3, Class A4
5.414% due 07/12/2046 (1) | | | 2,317,181 | | |
| | 2,600,000 | | | USD | | | | Morgan Stanley Capital I, Series 2006-T23, Class A4
5.983% due 08/12/2041 (1) | | | 2,718,166 | | |
| | 3,350,000 | | | USD | | | | Morgan Stanley Dean Witter Capital I,
Series 2001-TOP5, Class A4
6.390% due 10/15/2035 | | | 3,519,088 | | |
| | 7,500,000 | | | USD | | | | Morgan Stanley Dean Witter Capital I,
Series 2002-TOP7, Class A2
5.980% due 01/15/2039 | | | 7,774,890 | | |
| | 4,400,000 | | | USD | | | | Pinnacle Capital, Inc., Series 2006-A, Class A1
5.415% due 11/25/2007† | | | 4,400,000 | | |
| | 474,516 | | | USD | | | | Russian Auto Loans Finance, Series 1, Class A1
7.095% due 08/10/2010 (1) | | | 475,109 | | |
| | 2,601,799 | | | USD | | | | Small Business Administration, Series 2005-P10B, Class 1
4.940% due 08/10/2015 | | | 2,581,921 | | |
| | 4,276,815 | | | USD | | | | Small Business Administration, Series 2006-P10A, Class 1
5.408% due 02/10/2016 | | | 4,312,716 | | |
| | 4,100,000 | | | USD | | | | Taganka Car Loan Finance PLC, Series 2006-1A, Class A
6.341% due 11/14/2013 (1)† | | | 4,130,110 | | |
| | 2,693,253 | | | USD | | | | USAA Auto Owner Trust, Series 2006-3, Class A1
5.405% due 08/15/2007 | | | 2,694,901 | | |
| TOTAL ASSET BACKED SECURITIES (Cost $167,277,858) | | | 168,014,167 | | |
See Notes to Financial Statements.
Julius Baer Funds 2006 Annual Report
102
PORTFOLIO OF INVESTMENTS (Continued) October 31, 2006
Julius Baer Total Return Bond Fund (Percentage of Net Assets)
Face
Value | |
Currency | |
| | Market
Value (Note 2) | |
| CORPORATE BONDS—20.3% | | | | | |
| | | | | United States—10.7% | |
| | 1,800,000 | | | USD | | | | Abbott Laboratories
5.600% due 05/15/2011 | | $ | 1,836,343 | | |
| | 2,300,000 | | | USD | | | | American Express
5.500% due 09/12/2016 | | | 2,319,502 | | |
| | 3,000,000 | | | USD | | | | BAE Systems Holdings
5.200% due 08/15/2015† | | | 2,880,192 | | |
| | 3,560,000 | | | USD | | | | BHP Billiton Finance
5.000% due 12/15/2010 | | | 3,547,077 | | |
| | 3,250,000 | | | USD | | | | Cargill Inc
3.625% due 03/04/2009† | | | 3,142,925 | | |
| | 1,985,000 | | | USD | | | | Centerior Energy
7.130% due 07/01/2007 | | | 2,007,812 | | |
| | 2,350,000 | | | USD | | | | Cisco Systems
5.250% due 02/22/2011 | | | 2,366,436 | | |
| | 2,700,000 | | | USD | | | | Citigroup Inc
5.850% due 08/02/2016 | | | 2,799,068 | | |
| | 2,850,000 | | | USD | | | | ConocoPhillips
8.750% due 05/25/2010 | | | 3,181,523 | | |
| | 4,200,000 | | | USD | | | | Coors Brewing
6.375% due 05/15/2012 | | | 4,380,445 | | |
| | 3,800,000 | | | USD | | | | HSBC Finance
5.700% due 06/01/2011 | | | 3,881,381 | | |
| | 2,600,000 | | | USD | | | | Morgan Stanley
6.600% due 04/01/2012 | | | 2,756,629 | | |
| | 2,700,000 | | | USD | | | | Principal Life Funding
5.150% due 09/30/2011 | | | 2,699,311 | | |
| | 3,040,000 | | | USD | | | | Private Export Funding, Series D
5.870% due 07/31/2008 | | | 3,090,063 | | |
| | 3,000,000 | | | USD | | | | Ryder System (MTN)
5.850% due 11/01/2016 | | | 3,025,947 | | |
| | 1,485,329 | | | USD | | | | Selkirk Cogen Funding, Series A
8.650% due 12/26/2007 | | | 1,517,958 | | |
See Notes to Financial Statements.
Julius Baer Funds 2006 Annual Report
103
PORTFOLIO OF INVESTMENTS (Continued) October 31, 2006
Julius Baer Total Return Bond Fund (Percentage of Net Assets)
Face
Value | |
Currency | |
| | Market
Value (Note 2) | |
| CORPORATE BONDS—Continued | | | | | |
| | | | | United States—Continued | |
| | 3,900,000 | | | USD | | | | Toyota Motor Credit
5.450% due 05/18/2011 | | $ | 3,966,920 | | |
| | 2,400,000 | | | USD | | | | Transatlantic Holdings
5.750% due 12/14/2015 | | | 2,385,562 | | |
| | 2,200,000 | | | USD | | | | Wells Fargo & Co
5.125% due 02/15/2007 | | | 2,198,192 | | |
| | | | 53,983,286 | | |
| | | | | Supra National—3.3% | |
| | 21,350,000 | | | NZD | | | | European Investment Bank
6.000% due 07/15/2009 | | | 13,880,970 | | |
| | 3,000,000 | | | USD | | | | Inter-American Development Bank
0.000% due 12/16/2008 | | | 2,700,753 | | |
| | | | 16,581,723 | | |
| | | | | Brazil—1.4% | |
| | 3,000,000 | | | USD | | | | Embraer Overseas
6.375% due 01/24/2017† | | | 3,007,500 | | |
| | 2,300,000 | | | USD | | | | Petrobras International
7.750% due 09/15/2014 | | | 2,561,050 | | |
| | 1,350,000 | | | USD | | | | Petrobras International Finance Co., Note
6.125% due 10/06/2016 | | | 1,356,750 | | |
| | | | 6,925,300 | | |
| | | | | Netherlands—1.3% | |
| | 1,800,000 | | | USD | | | | Shell International Finance
5.625% due 06/27/2011 | | | 1,847,309 | | |
| | 3,750,000 | | | USD | | | | Siemens Finacieringsmat
5.500% due 02/16/2012† | | | 3,805,762 | | |
| | 1,055,000 | | | USD | | | | Unilever NV, Series E
5.125% due 12/20/2006 | | | 1,054,178 | | |
| | | | 6,707,249 | | |
| | | | | United Kingdom—1.1% | |
| | 1,800,000 | | | USD | | | | Diageo Capital
5.125% due 01/30/2012 | | | 1,788,034 | | |
See Notes to Financial Statements.
Julius Baer Funds 2006 Annual Report
104
PORTFOLIO OF INVESTMENTS (Continued) October 31, 2006
Julius Baer Total Return Bond Fund (Percentage of Net Assets)
Face
Value | |
Currency | |
| | Market
Value (Note 2) | |
| CORPORATE BONDS—Continued | | | | | |
| | | | | United Kingdom—Continued | |
| | 3,450,000 | | | USD | | | | Vodafone Group
5.500% due 06/15/2011 | | $ | 3,477,289 | | |
| | | | 5,265,323 | | |
| | | | | Mexico—0.8% | |
| | 3,428,813 | | | USD | | | | Monterrey Power
9.625% due 11/15/2009† | | | 3,788,839 | | |
| | | | | Singapore—0.7% | |
| | 3,650,000 | | | USD | | | | PSA International
5.750% due 06/29/2011† | | | 3,739,655 | | |
| | | | | Russia—0.6% | |
| | 2,700,000 | | | USD | | | | Norilsk Nickel
7.125% due 09/30/2009 | | | 2,775,033 | | |
| | | | | Iceland—0.4% | |
| | 2,000,000 | | | USD | | | | Kaupthing Bank
5.750% due 10/04/2011† | | | 2,001,330 | | |
| TOTAL CORPORATE BONDS (Cost $101,036,731) | | | 101,767,738 | | |
| FOREIGN GOVERNMENT BONDS—8.9% | | | | | |
| | | | | Mexico—3.0% | |
| | 140,000,000 | | | MXN | | | | Mexican Bonos
10.000% due 12/05/2024 | | | 15,310,833 | | |
| | | | | Australia—2.9% | |
| | | | | | | | | New South Wales Treasury | | | | | |
| | 12,400,000 | | | AUD | | | | 8.000% due 03/01/2008 | | | 9,799,256 | | |
| | 6,400,000 | | | AUD | | | | 5.500% due 08/01/2014 | | | 4,799,821 | | |
| | | | 14,599,077 | | |
| | | | | Israel—1.2% | |
| | 5,961,000 | | | USD | | | | Israel Trust
0.000% due 11/15/2006 | | | 5,948,971 | | |
| | | | | Iceland—0.9% | |
| | 305,000,000 | | | ISK | | | | Iceland Rikisbref
9.500% due 06/13/2008 | | | 4,451,093 | | |
| | | | | Turkey—0.6% | |
| | 3,000,000 | | | USD | | | | Turkey Trust
0.000% due 11/15/2007 | | | 2,848,809 | | |
See Notes to Financial Statements.
Julius Baer Funds 2006 Annual Report
105
PORTFOLIO OF INVESTMENTS (Continued) October 31, 2006
Julius Baer Total Return Bond Fund (Percentage of Net Assets)
Face
Value | |
Currency | |
| | Market
Value (Note 2) | |
| FOREIGN GOVERNMENT BONDS—Continued | | | |
| | | | | France—0.2% | |
| | 1,400,000 | | | USD | | | | Ccce-Principal Certificate
0.000% due 05/01/2009 | | $ | 1,234,912 | | |
| | | | | Luxembourg—0.1% | |
| | 510,000 | | | USD | | | | VTB Capital (Vneshtorgbank)
5.970% due 08/01/2008 (1)† | | | 510,000 | | |
| TOTAL FOREIGN GOVERNMENT BONDS (Cost $43,219,781) | | | 44,903,695 | | |
| REPURCHASE AGREEMENT—4.8% | | | |
| | | | | United States—4.8% | |
| | 24,299,604 | | | USD | | Investors Bank & Trust Company Repurchase Agreement,
dated 10/31/2006, due 11/01/2006, with a maturity
value of $24,302,034 and an effective yield of 3.60%,
collateralized by U.S. Government and Agency
Obligations, with rates ranging from 4.041%-4.595%,
maturities ranging from 07/01/2034-09/01/2034,
and an aggregate market value of $25,514,585.
(Cost $24,299,604) | | | 24,299,604 | | |
| TOTAL INVESTMENTS—128.9% (Cost $643,184,649) | | | 648,171,732 | | |
| OTHER ASSETS AND LIABILITIES (NET)—(28.9%) | | | (145,252,542 | ) | |
| TOTAL NET ASSETS—100.0% | | $ | 502,919,190 | | |
Portfolio Footnotes:
(1) Variable rate security.
* TBA - To Be Announced: Securities purchased on a forward commitment basis with an approximate principal amount and maturity date. The actual principal amount and maturity date will be determined upon settlement.
† Securities exempt from registration under Rule 144A of the Securities Act of 1933, as amended. These securities may be resold in transactions exempt from registrations, normally to qualified institutional buyers.
Aggregate cost for federal income tax purposes was $643,592,687.
Glossary of Currencies
AUD — Australian Dollar
ISK — Icelandic Krona
MXN — Mexican Nuevo Peso
NZD — New Zealand Dollar
USD — United States Dollar
See Notes to Financial Statements.
Julius Baer Funds 2006 Annual Report
106
SCHEDULE OF FORWARD FOREIGN EXCHANGE CONTRACTS
October 31, 2006
Julius Baer Total Return Bond Fund
FORWARD FOREIGN EXCHANGE CONTRACTS TO BUY
| | | Contracts to Receive | | | | | |
Expiration
Date | | Local
Currency | | Value in
USD | | In Exchange
for USD | | Net Unrealized
Appreciation
(Depreciation) | |
| 01/17/2007 | | AUD | 11,415,012 | | | | 8,816,558 | | | | 8,700,000 | | | $ | 116,558 | | |
| 01/23/2007 | | AUD | 16,510,144 | | | | 12,749,847 | | | | 12,514,770 | | | | 235,077 | | |
| 12/15/2006 | | CAD | 5,037,075 | | | | 4,501,365 | | | | 4,500,000 | | | | 1,365 | | |
| 12/15/2006 | | CAD | 7,661,152 | | | | 6,846,362 | | | | 6,800,000 | | | | 46,362 | | |
| 01/30/2007 | | COP | 30,000,000,000 | | | | 12,895,353 | | | | 12,801,368 | | | | 93,985 | | |
| 12/27/2006 | | EUR | 18,600,000 | | | | 23,807,584 | | | | 23,902,820 | | | | (95,236 | ) | |
| 11/08/2006 | | GBP | 12,189,000 | | | | 23,248,659 | | | | 23,229,943 | | | | 18,716 | | |
| 11/24/2006 | | GBP | 6,310,000 | | | | 12,037,003 | | | | 12,016,133 | | | | 20,870 | | |
| 01/16/2007 | | HUF | 1,100,000,000 | | | | 5,359,138 | | | | 5,177,689 | | | | 181,449 | | |
| 12/15/2006 | | JPY | 1,029,610,200 | | | | 8,840,375 | | | | 8,900,000 | | | | (59,625 | ) | |
| 12/15/2006 | | JPY | 2,095,766,500 | | | | 17,994,540 | | | | 17,958,266 | | | | 36,274 | | |
| 11/15/2006 | | NZD | 7,246,100 | | | | 4,847,917 | | | | 4,750,000 | | | | 97,917 | | |
| 12/15/2006 | | NZD | 8,162,034 | | | | 5,451,044 | | | | 5,359,399 | | | | 91,645 | | |
| 12/20/2006 | | PLN | 30,000,000 | | | | 9,900,977 | | | | 9,689,609 | | | | 211,368 | | |
| 12/07/2006 | | SEK | 72,300,000 | | | | 10,036,346 | | | | 10,007,438 | | | | 28,908 | | |
| 01/17/2007 | | SKK | 280,000,000 | | | | 9,853,006 | | | | 9,569,705 | | | | 283,301 | | |
| 12/29/2006 | | THB | 139,500,000 | | | | 3,801,176 | | | | 3,777,417 | | | | 23,759 | | |
| 01/03/2007 | | THB | 139,500,000 | | | | 3,801,090 | | | | 3,778,952 | | | | 22,138 | | |
| 11/13/2006 | | ZAR | 55,800,000 | | | | 7,551,635 | | | | 8,225,236 | | | | (673,601 | ) | |
| 11/30/2006 | | ZAR | 74,400,000 | | | | 10,054,173 | | | | 10,012,516 | | | | 41,657 | | |
| Net unrealized appreciation on forward foreign exchange contracts to buy | | $ | 722,887 | | |
FORWARD FOREIGN EXCHANGE CONTRACTS TO SELL
| | | Contracts to Deliver | | | | | |
Expiration
Date | | Local
Currency | | Value in
USD | | In Exchange
for USD | | Net Unrealized
Appreciation
(Depreciation) | |
| 01/17/2007 | | AUD | 14,988,914 | | | | 11,576,916 | | | | 11,286,661 | | | $ | (290,255 | ) | |
| 12/15/2006 | | CAD | 9,955,703 | | | | 8,896,880 | | | | 8,900,000 | | | | 3,120 | | |
| 12/15/2006 | | CAD | 2,699,160 | | | | 2,412,095 | | | | 2,400,000 | | | | (12,095 | ) | |
| 11/08/2006 | | GBP | 12,189,000 | | | | 23,248,659 | | | | 23,295,956 | | | | 47,297 | | |
| 11/24/2006 | | GBP | 6,310,000 | | | | 12,037,003 | | | | 11,941,170 | | | | (95,833 | ) | |
| 12/15/2006 | | JPY | 528,070,500 | | | | 4,534,086 | | | | 4,500,000 | | | | (34,086 | ) | |
| 12/15/2006 | | JPY | 2,616,440,850 | | | | 22,465,122 | | | | 22,350,000 | | | | (115,122 | ) | |
| 11/15/2006 | | NZD | 18,830,064 | | | | 12,598,029 | | | | 12,270,000 | | | | (328,029 | ) | |
| 12/15/2006 | | NZD | 10,600,000 | | | | 7,079,248 | | | | 6,886,996 | | | | (192,252 | ) | |
| 12/20/2006 | | PLN | 30,000,000 | | | | 9,900,977 | | | | 9,568,310 | | | | (332,667 | ) | |
| 11/13/2006 | | ZAR | 55,800,000 | | | | 7,551,635 | | | | 7,903,683 | | | | 352,048 | | |
| 11/30/2006 | | ZAR | 37,200,000 | | | | 5,027,086 | | | | 4,914,329 | | | | (112,757 | ) | |
| Net unrealized depreciation on forward foreign exchange contracts to sell | | $ | (1,110,631 | ) | |
See Notes to Financial Statements.
Julius Baer Funds 2006 Annual Report
107
SCHEDULE OF FORWARD FOREIGN EXCHANGE CONTRACTS (Continued)
October 31, 2006
Julius Baer Total Return Bond Fund
Glossary of Currencies
AUD — Australian Dollar
CAD — Canadian Dollar
COP — Colombian Peso
EUR — Euro
GBP — British Pound Sterling
HUF — Hungarian Forint
JPY — Japanese Yen
NZD — New Zealand Dollar
PLN — Polish Zloty
SEK — Swedish Krona
SKK — Slovakia Koruna
THB — Thai Baht
ZAR — South African Rand
See Notes to Financial Statements.
Julius Baer Funds 2006 Annual Report
108
PORTFOLIO OF INVESTMENTS–Industry Sector (Unaudited) October 31, 2006
Julius Baer Total Return Bond Fund (Percentage of Net Assets)
At October 31, 2006, sector diversification of the Fund's non-cash equivalents investments were as follows:
| | | % of Net
Assets | | Market
Value (Note 2) | |
| INDUSTRY SECTOR | |
| U.S. Government and Agency Obligations | | | 61.5 | % | | $ | 309,186,528 | | |
| Asset Backed Securities | | | 33.4 | | | | 168,014,167 | | |
| Corporate Bonds | | | 20.3 | | | | 101,767,738 | | |
| Foreign Government Bonds | | | 8.9 | | | | 44,903,695 | | |
| Cash & Cash Equivalents | | | 4.8 | | | | 24,299,604 | | |
| Total Investments | | | 128.9 | | | | 648,171,732 | | |
| Other Assets and Liabilities (Net) | | | (28.9 | ) | | | (145,252,642 | ) | |
| Net Assets | | | 100.0 | % | | $ | 502,919,190 | | |
See Notes to Financial Statements.
Julius Baer Funds 2006 Annual Report
109
PORTFOLIO OF INVESTMENTS October 31, 2006
Julius Baer Global High Income Fund
(Formerly Julius Baer Global High Yield Bond Fund) (Percentage of Net Assets)
Face
Value | |
Currency | |
| | Market
Value (Note 2) | |
| CORPORATE BONDS—79.0% | | | | | |
| | | | | United States—59.9% | |
| | 1,070,000 | | | USD | | | | Airgas Inc
6.250% due 07/15/2014 | | $ | 1,024,526 | | |
| | 530,000 | | | USD | | | | Alliance Imaging
7.250% due 12/15/2012 | | | 498,200 | | |
| | 810,000 | | | USD | | | | Alliant Techsystems
6.750% due 04/01/2016 | | | 805,950 | | |
| | 1,205,000 | | | USD | | | | Allied Waste
7.250% due 03/15/2015 | | | 1,211,024 | | |
| | 560,000 | | | USD | | | | Alpha Natural Resources
10.000% due 06/01/2012 | | | 604,800 | | |
| | 800,000 | | | USD | | | | American Airlines Series 1999-1, Class B
7.324% due 10/15/2009 | | | 798,500 | | |
| | 420,000 | | | USD | | | | Buffets Inc
12.500% due 11/01/2014† | | | 424,200 | | |
| | 580,000 | | | USD | | | | Callon Petroleum
9.750% due 12/08/2010 | | | 598,850 | | |
| | 1,080,000 | | | USD | | | | Calpine Generating
10.773% due 04/01/2010 (2) (3) | | | 1,142,100 | | |
| | 150,000 | | | USD | | | | Carillon Ltd
15.390% due 01/08/2010 (2)† | | | 151,425 | | |
| | 460,000 | | | USD | | | | Case New Holland
6.000% due 06/01/2009 | | | 458,850 | | |
| | 825,000 | | | USD | | | | Choctaw Resort Development Enterprise
7.250% due 11/15/2019† | | | 825,000 | | |
| | 1,090,000 | | | USD | | | | Church & Dwight
6.000% due 12/15/2012 | | | 1,047,762 | | |
| | 1,050,000 | | | USD | | | | CMS Energy
8.500% due 04/15/2011 | | | 1,144,500 | | |
| | 635,000 | | | USD | | | | Constellation Brands
7.250% due 09/01/2016 | | | 648,494 | | |
See Notes to Financial Statements.
Julius Baer Funds 2006 Annual Report
110
PORTFOLIO OF INVESTMENTS (Continued) October 31, 2006
Julius Baer Global High Income Fund
(Formerly Julius Baer Global High Yield Bond Fund) (Percentage of Net Assets)
Face
Value | |
Currency | |
| | Market
Value (Note 2) | |
| CORPORATE BONDS—Continued | | | | | |
| | | | | United States—Continued | |
| | 495,000 | | | USD | | | | Cooper-Standard Automotive
8.375% due 12/15/2014 | | $ | 367,537 | | |
| | 950,000 | | | USD | | | | Crown Cork & Seal
7.500% due 12/15/2096 | | | 774,250 | | |
| | 1,095,000 | | | USD | | | | Delta Air Lines
7.111% due 09/18/2011 | | | 1,098,422 | | |
| | 300,000 | | | USD | | | | Dex Media
8.000% due 11/15/2013 | | | 304,875 | | |
| | 338,000 | | | USD | | | | Dex Media West
9.875% due 08/15/2013 | | | 368,843 | | |
| | 1,121,000 | | | USD | | | | Dresser-Rand Group
7.375% due 11/01/2014 | | | 1,113,994 | | |
| | 1,020,000 | | | USD | | | | Edison Mission Energy
7.500% due 06/15/2013† | | | 1,053,150 | | |
| | 400,000 | | | USD | | | | El Paso Performance-Linked
7.750% due 07/15/2011† | | | 416,000 | | |
| | 500,000 | | | USD | | | | Encore Medical Finance
11.750% due 11/15/2014† | | | 502,500 | | |
| | 750,000 | | | USD | | | | Ethyl Corp
8.875% due 05/01/2010 | | | 783,750 | | |
| | 145,000 | | | USD | | | | Eurus Ltd
11.750% due 04/08/2009 (2)† | | | 143,982 | | |
| | 445,000 | | | USD | | | | Festival Fun Parks
10.875% due 04/15/2014† | | | 439,438 | | |
| | 400,000 | | | USD | | | | Fisher Scientific International
6.750% due 08/15/2014 | | | 409,500 | | |
| | 1,300,000 | | | USD | | | | Ford Motor
7.125% due 11/15/2025 | | | 975,000 | | |
| | 500,000 | | | USD | | | | Ford Motor Credit
7.375% due 02/01/2011 | | | 478,166 | | |
See Notes to Financial Statements.
Julius Baer Funds 2006 Annual Report
111
PORTFOLIO OF INVESTMENTS (Continued) October 31, 2006
Julius Baer Global High Income Fund
(Formerly Julius Baer Global High Yield Bond Fund) (Percentage of Net Assets)
Face
Value | |
Currency | |
| | Market
Value (Note 2) | |
| CORPORATE BONDS—Continued | | | | | |
| | | | | United States—Continued | |
| | 980,000 | | | USD | | | | Foundation PA Coal
7.250% due 08/01/2014 | | $ | 977,550 | | |
| | 650,000 | | | USD | | | | General Motors
8.375% due 07/15/2033 | | | 581,750 | | |
| | 425,000 | | | USD | | | | Hertz Corp
10.500% due 01/01/2016† | | | 468,563 | | |
| | 1,100,000 | | | USD | | | | Hexcel Corp
6.750% due 02/01/2015 | | | 1,072,500 | | |
| | 645,000 | | | USD | | | | IASIS Healthcare Capital
8.750% due 06/15/2014 | | | 626,456 | | |
| | 985,000 | | | USD | | | | Intcomex Inc
11.750% due 01/15/2011† | | | 980,075 | | |
| | 1,000,000 | | | USD | | | | JBS SA
10.500% due 08/04/2016† | | | 1,044,500 | | |
| | 1,025,000 | | | USD | | | | KI Holdings, Multi-Coupon
0.000% due 11/15/2014 (2) | | | 784,125 | | |
| | 960,000 | | | USD | | | | Level 3 Financing
10.750% due 10/15/2011 | | | 1,024,800 | | |
| | 735,000 | | | USD | | | | Lyondell Chemical
8.250% due 09/15/2016 | | | 760,725 | | |
| | 855,000 | | | USD | | | | Mohegan Tribal Gaming Authority
6.125% due 02/15/2013 | | | 851,794 | | |
| | 900,000 | | | USD | | | | MSW Energy Holdings
7.375% due 09/01/2010 | | | 918,000 | | |
| | 300,000 | | | USD | | | | 8.500% due 09/01/2010 | | | 312,000 | | |
| | | | 1,230,000 | | |
| | 500,000 | | | USD | | | | Neff Rental/Neff Finance
11.250% due 06/15/2012† | | | 543,750 | | |
| | 1,005,000 | | | USD | | | | NRG Energy
7.375% due 02/01/2016 | | | 1,018,819 | | |
See Notes to Financial Statements.
Julius Baer Funds 2006 Annual Report
112
PORTFOLIO OF INVESTMENTS (Continued) October 31, 2006
Julius Baer Global High Income Fund
(Formerly Julius Baer Global High Yield Bond Fund) (Percentage of Net Assets)
Face
Value | |
Currency | |
| | Market
Value (Note 2) | |
| CORPORATE BONDS—Continued | | | | | |
| | | | | United States—Continued | |
| | 945,000 | | | USD | | | | OM Group
9.250% due 12/15/2011 | | $ | 989,888 | | |
| | 1,060,000 | | | USD | | | | Pinnacle Foods Holding
8.250% due 12/01/2013 | | | 1,067,950 | | |
| | 250,000 | | | USD | | | | Qwest Communications International
7.500% due 02/15/2014 | | | 256,250 | | |
| | 500,000 | | | USD | | | | Qwest Corp
7.875% due 09/01/2011 | | | 531,875 | | |
| | 545,000 | | | USD | | | | Range Resources
6.375% due 03/15/2015 | | | 525,925 | | |
| | 650,000 | | | USD | | | | RH Donnelley
6.875% due 01/15/2013 | | | 615,063 | | |
| | 325,000 | | | USD | | | | 6.875% due 01/15/2013 | | | 307,531 | | |
| | | | 922,594 | | |
| | 750,000 | | | USD | | | | Rural/Metro Holding, Step Note
0.000% due 03/15/2016 (2) | | | 570,000 | | |
| | 1,085,000 | | | USD | | | | Serena Software
10.375% due 03/15/2016 | | | 1,158,238 | | |
| | 900,000 | | | USD | | | | Service Corp International
7.000% due 06/15/2017 (2)† | | | 873,000 | | |
| | 600,000 | | | USD | | | | Stanadyne Corp
10.000% due 08/15/2014 | | | 615,000 | | |
| | 750,000 | | | USD | | | | Sunguard Data Systems
10.250% due 08/15/2015 | | | 789,375 | | |
| | 840,000 | | | USD | | | | Terex Corp
7.375% due 01/15/2014 | | | 856,800 | | |
| | 1,370,000 | | | USD | | | | UGS Corp
10.000% due 06/01/2012 | | | 1,486,450 | | |
| | 670,000 | | | USD | | | | Verso Paper Holdings
9.125% due 08/01/2014† | | | 683,400 | | |
See Notes to Financial Statements.
Julius Baer Funds 2006 Annual Report
113
PORTFOLIO OF INVESTMENTS (Continued) October 31, 2006
Julius Baer Global High Income Fund
(Formerly Julius Baer Global High Yield Bond Fund) (Percentage of Net Assets)
Face
Value | |
Currency | |
| | Market
Value (Note 2) | |
| CORPORATE BONDS—Continued | | | | | |
| | | | | United States—Continued | |
| | 1,000,000 | | | USD | | | | VWR International
8.000% due 04/15/2014 | | $ | 1,032,500 | | |
| | 1,000,000 | | | USD | | | | WCA Waste
9.250% due 06/15/2014† | | | 1,040,000 | | |
| | 500,000 | | | USD | | | | Wesco Distribution
7.500% due 10/15/2017 | | | 507,500 | | |
| | 633,000 | | | USD | | | | Witco Corp
6.875% due 02/01/2026 | | | 563,370 | | |
| | 1,495,000 | | | USD | | | | Wynn Las Vegas
6.625% due 12/01/2014 | | | 1,472,575 | | |
| | | | 48,521,685 | | |
| | | | | Canada—3.9% | |
| | 500,000 | | | USD | | | | Gerdau Ameristeel
10.375% due 07/15/2011 | | | 542,500 | | |
| | 670,000 | | | CAD | | | | Rogers Wireless
7.625% due 12/15/2011 | | | 658,704 | | |
| | 1,000,000 | | | CAD | | | | Shaw Communications
7.500% due 11/20/2013 | | | 968,771 | | |
| | 970,000 | | | USD | | | | Utilicorp Canada Finance
7.750% due 06/15/2011 | | | 1,029,188 | | |
| | | | 3,199,163 | | |
| | | | | Brazil—2.4% | |
| | 350,000 | | | USD | | | | Cia Energetica de Sao Paulo
9.250% due 08/11/2013† | | | 372,750 | | |
| | 350,000 | | | USD | | | | CSN Islands VIII, Multi-coupon
10.500% due 01/15/2015 | | | 407,312 | | |
| | 1,000,000 | | | USD | | | | Petrobras International
8.375% due 12/10/2018 | | | 1,177,500 | | |
| | | | 1,957,562 | | |
See Notes to Financial Statements.
Julius Baer Funds 2006 Annual Report
114
PORTFOLIO OF INVESTMENTS (Continued) October 31, 2006
Julius Baer Global High Income Fund
(Formerly Julius Baer Global High Yield Bond Fund) (Percentage of Net Assets)
Face
Value | |
Currency | |
| | Market
Value (Note 2) | |
| CORPORATE BONDS—Continued | | | | | |
| | | | | Russia—1.9% | |
| | 350,000 | | | USD | | | | ALROSA Finance
8.875% due 11/17/2014 | | $ | 402,150 | | |
| | 560,000 | | | USD | | | | Norilsk Nickel
7.125% due 09/30/2009 | | | 575,562 | | |
| | 520,000 | | | USD | | | | TNK-BP Finance
7.500% due 07/18/2016† | | | 544,993 | | |
| | | | 1,522,705 | | |
| | | | | Belgium—1.7% | |
| | 1,546,000 | | | USD | | | | Telenet Group Holding, Step Note
0.000% due 06/15/2014 (2)† | | | 1,397,197 | | |
| | | | | Norway—1.6% | |
| | 600,000 | | | USD | | | | Ocean RIG
9.481% due 04/04/2011 (2) | | | 598,500 | | |
| | 700,000 | | | USD | | | | Thule Drilling
12.000% due 09/28/2009† | | | 703,937 | | |
| | | | 1,302,437 | | |
| | | | | United Kingdom—1.5% | |
| | 280,000 | | | EUR | | | | Ineos Group Holdings
7.875% due 02/15/2016 † | | | 343,530 | | |
| | 635,000 | | | EUR | | | | Ono Finance
10.500% due 05/15/2014 | | | 883,426 | | |
| | | | 1,226,956 | | |
| | | | | Supra National—1.4% | |
| | 1,800,000 | | | NZD | | | | European Investment Bank
6.000% due 07/15/2009 | | | 1,170,293 | | |
| | | | | Netherlands—1.1% | |
| | 300,000 | | | EUR | | | | Bulgaria Steel Finance
12.000% due 05/04/2013 | | | 399,496 | | |
| | 470,000 | | | USD | | | | GT 2005 Bonds BV
10.250% due 07/21/2010 | | | 457,662 | | |
| | | | 857,158 | | |
See Notes to Financial Statements.
Julius Baer Funds 2006 Annual Report
115
PORTFOLIO OF INVESTMENTS (Continued) October 31, 2006
Julius Baer Global High Income Fund
(Formerly Julius Baer Global High Yield Bond Fund) (Percentage of Net Assets)
Face
Value | |
Currency | |
| | Market
Value (Note 2) | |
| CORPORATE BONDS—Continued | | | | | |
| | | | | Kazakhstan—0.8% | |
| | 500,000 | | | USD | | | | Kazkommerts International BV
8.000% due 11/03/2015† | | $ | 516,875 | | |
| | 100,000 | | | USD | | | | 8.000% due 11/03/2015 | | | 103,330 | | |
| | | | 620,205 | | |
| | | | | Denmark—0.7% | |
| | 400,000 | | | EUR | | | | Nordic Telephone
8.250% due 05/01/2016† | | | 559,041 | | |
| | | | | France—0.7% | |
| | 400,000 | | | EUR | | | | Europcar Groupe
8.125% due 05/15/2014† | | | 546,278 | | |
| | | | | Ireland—0.5% | |
| | 350,000 | | | EUR | | | | JSG Funding
7.750% due 04/01/2015 | | | 438,905 | | |
| | | | | Germany—0.5% | |
| | 320,000 | | | EUR | | | | TUI AG
5.125% due 12/10/2012 | | | 397,200 | | |
| | | | | Mexico—0.4% | |
| | 350,000 | | | USD | | | | Corp Durango Series B, Step Note
8.500% due 12/31/2012 (2) | | | 336,875 | | |
| TOTAL CORPORATE BONDS (Cost $62,647,746) | | | 64,053,660 | | |
| FOREIGN GOVERNMENT BONDS—7.5% | | | | | |
| | | | | Brazil—1.5% | |
| | 2,750,000 | | | BRL | | | | Brazil Notasdo Tesouro Nacional Series F
10.000% due 01/01/2010 | | | 1,177,367 | | |
| | | | | Mexico—1.3% | |
| | 10,000,000 | | | MXN | | | | Mexican Bonos
10.000% due 12/05/2024 | | | 1,093,631 | | |
| | | | | Iceland—1.2% | |
| | 67,000,000 | | | ISK | | | | Iceland Rikisbref
9.500% due 06/13/2008 | | | 977,781 | | |
See Notes to Financial Statements.
Julius Baer Funds 2006 Annual Report
116
PORTFOLIO OF INVESTMENTS (Continued) October 31, 2006
Julius Baer Global High Income Fund
(Formerly Julius Baer Global High Yield Bond Fund) (Percentage of Net Assets)
Face
Value | |
Currency | |
| | Market
Value (Note 2) | |
| FOREIGN GOVERNMENT BONDS—Continued | | | | | |
| | | | | Colombia—1.1% | |
| | 2,000,000,000 | | | COP | | | | Republic of Columbia
11.750% due 03/01/2010 | | $ | 929,777 | | |
| | | | | Hungary—0.9% | |
| | 550,000 | | | EUR | | | | Invitel Holdings
11.753% due 04/15/2013 (2)† | | | 723,052 | | |
| | | | | Vietnam—0.8% | |
| | 580,000 | | | USD | | | | Socialist Republic of Vietnam
6.875% due 01/15/2016† | | | 609,000 | | |
| | | | | United States—0.5% | |
| | 145,000 | | | USD | | | | Helix 04 Ltd
10.899% due 06/30/2009 (2)† | | | 142,606 | | |
| | 250,000 | | | USD | | | | Redwood Capital VII
10.620% due 01/09/2008 (2)† | | | 247,910 | | |
| | | | 390,516 | | |
| | | | | Ireland—0.2% | |
| | 150,000 | | | EUR | | | | BCM Ireland Finance
8.215% due 08/15/2016 (2)† | | | 200,068 | | |
TOTAL FOREIGN GOVERNMENT BONDS
(Cost $5,794,386) | | | 6,101,192 | | |
| BANK NOTES—1.2% | | | | | |
| | | | | United States—1.2% | |
| | 2,500 | | | | | | | Sensata Technologies
7.100% due 12/29/2006 | | | 2,489 | | |
| | 10,526 | | | | | | | 7.117% due 12/29/2006 | | | 10,475 | | |
| | 984,474 | | | | | | | 7.130% due 01/29/2007 | | | 979,704 | | |
| | | | 992,668 | | |
| TOTAL BANK NOTES (Cost $993,781) | | | 992,668 | | |
| CONVERTIBLE DEBT—0.5% | | | | | |
| | | | | United States—0.5% | |
| | 655,000 | | | USD | | | | Northwest Airlines Note Convertible
6.625% due 05/15/2023 (Cost $347,194) (3) | | | 410,194 | | |
See Notes to Financial Statements.
Julius Baer Funds 2006 Annual Report
117
PORTFOLIO OF INVESTMENTS (Continued) October 31, 2006
Julius Baer Global High Income Fund
(Formerly Julius Baer Global High Yield Bond Fund) (Percentage of Net Assets)
Face
Value | |
Currency | |
| | Market
Value (Note 2) | |
| COMMON STOCKS—0.3% | | | | | |
| | | | | Bulgaria—0.3% | |
| | 540,000 | | | | BGN | | | Bulgaria Registered Compensation Vouchers
(Cost $250,371)* (1) | | $ | 217,107 | | |
| INVESTMENT FUNDS—0.3% | | | | | |
| | | | | Canada—0.3% | |
| | 36,900 | | | CAD | | | | Osprey Media Income Fund
(Cost $227,417) | | | 209,126 | | |
| REPURCHASE AGREEMENT—1.8% | | | | | |
| | | | | United States—1.8% | |
| | 1,420,446 | | | USD | | | | Investors Bank & Trust Company Repurchase Agreement,
dated 10/31/2006, due 11/01/2006, with a maturity
value of $1,420,588 and an effective yield of 3.60%,
collateralized by a U.S. Government and Agent
Obligation, with a rate of 8.125%, a maturity of
09/25/2026, and an aggregate market value of
$1,491,469. (Cost $1,420,446) | | | 1,420,446 | | |
| COMMERCIAL PAPER—6.8% | | | | | |
| | | | | United States—6.8% | |
| | 1,000,000 | | | USD | | | | ConocoPhillips Co
5.300% due 11/03/2006† | | | 999,705 | | |
| | 1,000,000 | | | USD | | | | Danske Corp
5.260% due 12/28/2006 | | | 991,672 | | |
| | 1,000,000 | | | USD | | | | EI Dupont
5.210% due 11/03/2006 | | | 999,711 | | |
| | 1,500,000 | | | USD | | | | McCormick & Co
5.050% due 11/15/2006† | | | 1,497,055 | | |
| | 1,000,000 | | | USD | | | | United Parcel Service
4.960% due 11/15/2006 | | | 998,071 | | |
| | | | 5,486,214 | | |
| TOTAL COMMERCIAL PAPER (Cost $5,486,214) | | | 5,486,214 | | |
| TOTAL INVESTMENTS—97.4% (Cost $77,167,555) | | | 78,890,607 | | |
| OTHER ASSETS AND LIABILITIES (NET)—2.6% | | | 2,138,588 | | |
| TOTAL NET ASSETS—100.0% | | $ | 81,029,195 | | |
See Notes to Financial Statements.
Julius Baer Funds 2006 Annual Report
118
PORTFOLIO OF INVESTMENTS (Continued) October 31, 2006
Julius Baer Global High Income Fund
(Formerly Julius Baer Global High Yield Bond Fund) (Percentage of Net Assets)
Portfolio Footnotes:
(1) Illiquid security
(2) Variable rate security.
(3) Defaulted Security.
* Non-income producing security.
† Securities exempt from registration under Rule 144A of the Securities Act of 1933, as amended. These securities may be resold in transactions exempt from registrations, normally to qualified institutional buyers.
Aggregate cost for federal income tax purposes was $77,181,544.
Glossary of Currencies
BGN — Bulgarian Lev
BRL — Brazilian Real
CAD — Canadian Dollar
COP — Colombian Peso
EUR — Euro
ISK — Icelandic Krona
MXN — Mexican Nuevo Peso
NZD — New Zealand Dollar
USD — United States Dollar
See Notes to Financial Statements.
Julius Baer Funds 2006 Annual Report
119
SCHEDULE OF FORWARD FOREIGN EXCHANGE CONTRACTS
October 31, 2006
Julius Baer Global High Income Fund
(Formerly Julius Baer Global High Yield Bond Fund)
FORWARD FOREIGN EXCHANGE CONTRACTS TO BUY
| | | Contracts to Receive | | | | | |
Expiration
Date | | Local
Currency | | Value in
USD | | In Exchange
for USD | | Net Unrealized
Appreciation
(Depreciation) | |
| 11/15/2006 | | AUD | 1,307,908 | | | | 1,011,801 | | | | 1,000,000 | | | $ | 11,801 | | |
| 11/15/2006 | | CAD | 283,000 | | | | 252,680 | | | | 253,312 | | | | (632 | ) | |
| 11/15/2006 | | EUR | 962,884 | | | | 1,229,838 | | | | 1,214,251 | | | | 15,587 | | |
| 07/30/2007 | | IDR | 5,691,000,000 | | | | 604,670 | | | | 600,000 | | | | 4,670 | | |
| 09/18/2007 | | IDR | 4,755,000,000 | | | | 502,319 | | | | 500,000 | | | | 2,319 | | |
| 11/15/2006 | | JPY | 206,300,800 | | | | 1,764,064 | | | | 1,779,447 | | | | (15,383 | ) | |
| 11/15/2006 | | NZD | 1,462,000 | | | | 978,134 | | | | 962,084 | | | | 16,050 | | |
| Net unrealized appreciation on forward foreign exchange contracts to buy | | $ | 34,412 | | |
FORWARD FOREIGN EXCHANGE CONTRACTS TO SELL
| | | Contracts to Deliver | | | | | |
Expiration
Date | | Local
Currency | | Value in
USD | | In Exchange
for USD | | Net Unrealized
Appreciation
(Depreciation) | |
| 11/15/2006 | | AUD | 1,307,908 | | | | 1,011,800 | | | | 971,874 | | | $ | (39,926 | ) | |
| 11/15/2006 | | CAD | 2,050,000 | | | | 1,830,369 | | | | 1,838,202 | | | | 7,833 | | |
| 11/15/2006 | | EUR | 3,516,500 | | | | 4,491,428 | | | | 4,475,290 | | | | (16,138 | ) | |
| 11/15/2006 | | NZD | 1,462,000 | | | | 978,134 | | | | 944,057 | | | | (34,077 | ) | |
| Net unrealized depreciation on forward foreign exchange contracts to sell | | | | | | | | | | | | | | $ | (82,308 | ) | |
Glossary of Currencies
AUD — Australian Dollar
CAD — Canadian Dollar
EUR — Euro
IDR — Indonesian Rupiah
JPY — Japanese Yen
NZD — New Zealand Dollar
See Notes to Financial Statements.
Julius Baer Funds 2006 Annual Report
120
PORTFOLIO OF INVESTMENTS–Industry Sector October 31, 2006
Julius Baer Global High Income Fund
(Formerly Julius Baer Global High Yield Bond Fund) (Percentage of Net Assets)
At October 31, 2006, sector diversification of the Fund's investments were as follows:
| | | % of Net
Assets | | Market
Value (Note 2) | |
| INDUSTRY SECTOR | |
| Corporate Bonds | | | 79.0 | % | | $ | 64,053,660 | | |
| Foreign Government Bonds | | | 7.5 | | | | 6,101,191 | | |
| Bank Notes | | | 1.2 | | | | 992,668 | | |
| Convertible Debt | | | 0.5 | | | | 410,194 | | |
| Common Stock | | | 0.3 | | | | 217,107 | | |
| Investment Funds | | | 0.3 | | | | 209,126 | | |
| Cash & Cash Equivalents | | | 8.6 | | | | 6,906,660 | * | |
| Total Investments | | | 97.4 | | | | 78,890,606 | | |
| Other Assets and Liabilities (Net) | | | 2.6 | | | | 2,138,589 | * | |
| Net Assets | | | 100.0 | % | | $ | 81,029,195 | | |
* Cash and Cash Equivalents and Other Assets and Liabilities (Net) includes $56,136 in market value for swaps, which is 0.1% of net assets.
See Notes to Financial Statements.
Julius Baer Funds 2006 Annual Report
121
PORTFOLIO OF INVESTMENTS October 31, 2006
Julius Baer U.S. Microcap Fund (Percentage of Net Assets)
Share
Amount | | Description | | Market
Value (Note 2) | |
| COMMON STOCKS—99.6% | | | |
| | | Health Care Equipment & Services—15.4% | |
| | 8,430 | | | Cholestech Corp* | | $ | 130,412 | | |
| | 4,940 | | | Cutera Inc* | | | 140,741 | | |
| | 4,870 | | | Gentiva Health Services* | | | 90,339 | | |
| | 2,170 | | | ICU Medical* | | | 91,683 | | |
| | 4,640 | | | Intralase Corp* | | | 91,222 | | |
| | 2,020 | | | Matria Healthcare* | | | 56,964 | | |
| | 3,100 | | | Providence Service* | | | 85,219 | | |
| | 4,080 | | | SonoSite Inc* | | | 116,280 | | |
| | 3,000 | | | Viasys Healthcare* | | | 85,950 | | |
| | | | 888,810 | | |
| | | Banks—11.0% | |
| | 3,500 | | | Bank of the Ozarks | | | 109,655 | | |
| | 3,930 | | | Seacoast Banking Corp of Florida | | | 104,341 | | |
| | 7,820 | | | Southern Community Financial | | | 77,965 | | |
| | 3,400 | | | Sussex Bancorp | | | 51,340 | | |
| | 4,740 | | | TIB Financial | | | 83,993 | | |
| | 4,620 | | | Vineyard National Bancorp | | | 100,901 | | |
| | 5,110 | | | Virginia Commerce Bancorp* | | | 104,040 | | |
| | | | 632,235 | | |
| | | Semiconductors & Semiconductor Equipment—9.9% | |
| | 3,230 | | | ATMI Inc* | | | 102,359 | | |
| | 17,950 | | | MoSys Inc* | | | 136,061 | | |
| | 9,460 | | | Photronics Inc* | | | 132,345 | | |
| | 3,620 | | | Standard Microsystems* | | | 111,605 | | |
| | 6,210 | | | Ultratech Inc* | | | 88,741 | | |
| | | | 571,111 | | |
| | | Technology Hardware & Equipment—9.7% | |
| | 15,850 | | | CalAmp Corp* | | | 105,403 | | |
| | 11,390 | | | Ixia* | | | 104,219 | | |
| | 6,750 | | | Measurement Specialties* | | | 147,623 | | |
| | 6,750 | | | Methode Electronics | | | 74,723 | | |
| | 1,520 | | | Novatel Inc* | | | 56,711 | | |
| | 3,580 | | | Optium Corp* | | | 72,495 | | |
| | | | 561,174 | | |
See Notes to Financial Statements.
Julius Baer Funds 2006 Annual Report
122
PORTFOLIO OF INVESTMENTS (Continued) October 31, 2006
Julius Baer U.S. Microcap Fund (Percentage of Net Assets)
Share
Amount | | Description | | Market
Value (Note 2) | |
| COMMON STOCKS—Continued | | | |
| | | Consumer Durables & Apparel—7.4% | |
| | 9,790 | | | K2 Inc* | | $ | 133,731 | | |
| | 3,160 | | | K-Swiss Inc-Class A | | | 111,611 | | |
| | 4,440 | | | Movado Group | | | 114,330 | | |
| | 4,010 | | | WCI Communities* | | | 64,641 | | |
| | | | 424,313 | | |
| | | Capital Goods—7.1% | |
| | 4,310 | | | Badger Meter | | | 108,741 | | |
| | 6,450 | | | Essex Corp* | | | 126,936 | | |
| | 1,610 | | | Heico Corp | | | 58,411 | | |
| | 2,260 | | | Trex Company* | | | 59,709 | | |
| | 1,190 | | | Triumph Group | | | 57,298 | | |
| | | | 411,095 | | |
| | | Consumer Services—6.3% | |
| | 3,210 | | | Buffalo Wild Wings* | | | 165,957 | | |
| | 2,310 | | | PF Chang's China Bistro* | | | 96,604 | | |
| | 2,080 | | | Red Robin Gourmet Burgers* | | | 100,339 | | |
| | | | 362,900 | | |
| | | Software & Services—6.2% | |
| | 11,310 | | | 24/7 Real Media* | | | 111,969 | | |
| | 1,740 | | | Cass Information Systems | | | 65,093 | | |
| | 5,510 | | | Commvault Systems* | | | 98,464 | | |
| | 3,090 | | | Heartland Payment Systems | | | 82,565 | | |
| | | | 358,091 | | |
| | | Energy—5.4% | |
| | 4,460 | | | Bronco Drilling* | | | 75,998 | | |
| | 5,100 | | | Carrizo Oil & Gas* | | | 145,656 | | |
| | 15,480 | | | Newpark Resources* | | | 91,022 | | |
| | | | 312,676 | | |
| | | Real Estate—3.8% | |
| | 7,830 | | | Education Realty Trust | | | 121,130 | | |
| | 5,290 | | | Windrose Medical Properties Trust | | | 98,711 | | |
| | | | 219,841 | | |
See Notes to Financial Statements.
Julius Baer Funds 2006 Annual Report
123
PORTFOLIO OF INVESTMENTS (Continued) October 31, 2006
Julius Baer U.S. Microcap Fund (Percentage of Net Assets)
Share
Amount | | Description | | Market
Value (Note 2) | |
| COMMON STOCKS—Continued | | | |
| | | Insurance—3.0% | |
| | 12,650 | | | CRM Holdings* | | $ | 112,332 | | |
| | 3,080 | | | First Mercury Financial* | | | 63,756 | | |
| | | | 176,088 | | |
| | | Diversified Financials—2.6% | |
| | 1,220 | | | Epoch Holding* | | | 8,845 | | |
| | 3,910 | | | Evercore Partners Inc-Class A* | | | 143,419 | | |
| | | | 152,264 | | |
| | | Transportation—2.4% | |
| | 4,700 | | | Macquarie Infrastructure | | | 140,201 | | |
| | | Materials—2.3% | |
| | 5,670 | | | Schweitzer-Mauduit International | | | 130,750 | | |
| | | Household & Personal Products—2.2% | |
| | 3,760 | | | WD-40 Co | | | 127,802 | | |
| | | Food & Staples Retailing—1.8% | |
| | 5,650 | | | Wild Oats Markets* | | | 101,587 | | |
| | | Food, Beverage & Tobacco—1.7% | |
| | 2,470 | | | Green Mountain Coffee Roasters* | | | 97,738 | | |
| | | Commercial Services and Supplies—1.4% | |
| | 4,430 | | | Schawk Inc | | | 83,506 | | |
| | | | | TOTAL COMMON STOCKS (Cost $5,118,063) | | | 5,752,182 | | |
See Notes to Financial Statements.
Julius Baer Funds 2006 Annual Report
124
PORTFOLIO OF INVESTMENTS (Continued) October 31, 2006
Julius Baer U.S. Microcap Fund (Percentage of Net Assets)
Face
Value | | Currency | | Description | | Market
Value (Note 2) | |
| REPURCHASE AGREEMENT—1.7% | |
| | | | | Financial Services—1.7% | |
| | 96,592 | | | USD | | | | Investors Bank & Trust Company Repurchase Agreement,
dated 10/31/2006, due 11/01/2006, with a maturity value
of $96,602 and an effective yield of 3.60%, collateralized
by a U.S. Government and Agent Obligation, with a rate
of 6.875%, a maturity of 11/25/2019 and an aggregate
market value of $101,422. (Cost $96,592) | | $ | 96,592 | | |
| | | | | TOTAL INVESTMENTS—101.3% (Cost $5,214,655) | | | 5,848,774 | | |
| | | | | OTHER ASSETS AND LIABILITIES (Net)—(1.3%) | | | (77,025 | ) | |
| | | | | TOTAL NET ASSETS—100.0% | | $ | 5,771,749 | | |
Notes to the Portfolio of Investments:
* Non-income producing security.
Aggregate cost for federal income tax purposes was $5,212,516.
Glossary of Currencies
USD — United States Dollar
See Notes to Financial Statements.
Julius Baer Funds 2006 Annual Report
125
PORTFOLIO OF INVESTMENTS–Industry Sector October 31, 2006
Julius Baer U.S. Microcap Fund (Percentage of Net Assets)
At October 31, 2006, sector diversification of the Fund's non-cash equivalents investments were as follows:
| | | % of Net
Assets | | Market
Value (Note 2) | |
| INDUSTRY SECTOR | |
| Information Technology | | | 25.8 | % | | $ | 1,490,374 | | |
| Financials | | | 20.4 | | | | 1,180,429 | | |
| Healthcare | | | 15.4 | | | | 888,809 | | |
| Consumer Discretionary | | | 13.6 | | | | 787,214 | | |
| Industrials | | | 11.0 | | | | 634,802 | | |
| Consumer Staples | | | 5.7 | | | | 327,127 | | |
| Energy | | | 5.4 | | | | 312,677 | | |
| Materials | | | 2.3 | | | | 130,750 | | |
| Cash & Cash Equivalents | | | 1.7 | �� | | | 96,592 | | |
| Total Investments | | | 101.3 | | | | 5,848,774 | | |
| Other Assets and Liabilities (Net) | | | (1.3 | ) | | | (77,025 | ) | |
| Net Assets | | | 100.0 | % | | $ | 5,771,749 | | |
See Notes to Financial Statements.
Julius Baer Funds 2006 Annual Report
126
PORTFOLIO OF INVESTMENTS October 31, 2006
Julius Baer U.S. Smallcap Fund (Percentage of Net Assets)
Share
Amount | | Description | | Market
Value (Note 2) | |
| COMMON STOCKS—100.5% | | | |
| | | Banks—12.2% | |
| | 4,430 | | | Boston Private Financial Holdings | | $ | 122,445 | | |
| | 2,870 | | | Fidelity Bankshares | | | 113,882 | | |
| | 3,100 | | | PrivateBancorp Inc | | | 127,317 | | |
| | 3,380 | | | Signature Bank* | | | 102,515 | | |
| | 6,210 | | | UCBH Holdings | | | 106,439 | | |
| | 2,250 | | | Wintrust Financial | | | 108,585 | | |
| | | | 681,183 | | |
| | | Health Care Equipment & Services—10.9% | |
| | 4,160 | | | Angiodynamics Inc* | | | 90,064 | | |
| | 2,790 | | | ArthroCare Corp* | | | 112,744 | | |
| | 1,890 | | | Healthways Inc* | | | 80,041 | | |
| | 1,140 | | | Hologic Inc* | | | 54,891 | | |
| | 2,330 | | | MWI Veterinary Supply* | | | 78,078 | | |
| | 2,150 | | | Palomar Medical Technologies* | | | 101,243 | | |
| | 2,730 | | | Psychiatric Solutions* | | | 90,636 | | |
| | | | 607,697 | | |
| | | Semiconductors & Semiconductor Equipment—8.7% | |
| | 9,720 | | | Micrel Inc* | | | 108,475 | | |
| | 18,660 | | | MoSys Inc* | | | 141,443 | | |
| | 8,490 | | | Photronics Inc* | | | 118,775 | | |
| | 9,090 | | | Semtech Corp* | | | 118,443 | | |
| | | | 487,136 | | |
| | | Software & Services—8.7% | |
| | 4,440 | | | Commvault Systems* | | | 79,343 | | |
| | 2,320 | | | Factset Research Systems | | | 118,088 | | |
| | 2,560 | | | Hyperion Solutions* | | | 95,744 | | |
| | 2,730 | | | Kronos Inc* | | | 92,547 | | |
| | 3,270 | | | THQ Inc* | | | 98,329 | | |
| | | | 484,051 | | |
| | | Technology Hardware & Equipment—8.7% | |
| | 3,510 | | | Benchmark Electronics* | | | 93,191 | | |
| | 3,830 | | | Ciena Corp* | | | 90,043 | | |
| | 5,250 | | | Global Imaging Systems* | | | 114,293 | | |
| | 1,620 | | | Itron Inc* | | | 88,193 | | |
| | 2,060 | | | Optium Corp* | | | 41,715 | | |
See Notes to Financial Statements.
Julius Baer Funds 2006 Annual Report
127
PORTFOLIO OF INVESTMENTS (Continued) October 31, 2006
Julius Baer U.S. Smallcap Fund (Percentage of Net Assets)
Share
Amount | | Description | | Market
Value (Note 2) | |
| COMMON STOCKS—Continued | | | |
| | | Technology Hardware & Equipment—Continued | |
| | 2,660 | | | Plantronics Inc | | $ | 56,153 | | |
| | | | 483,588 | | |
| | | Capital Goods—8.0% | |
| | 2,580 | | | Baldor Electric | | | 82,766 | | |
| | 2,440 | | | Gardner Denver* | | | 82,936 | | |
| | 5,020 | | | Hexcel Corp* | | | 81,274 | | |
| | 2,080 | | | Toro Co | | | 89,773 | | |
| | 3,000 | | | Watts Water Technologies-Class A | | | 111,660 | | |
| | | | 448,409 | | |
| | | Real Estate—7.4% | |
| | 2,530 | | | CBL & Associates Properties REIT | | | 110,637 | | |
| | 1,700 | | | Maguire Properties REIT | | | 72,692 | | |
| | 1,730 | | | Sovran Self Storage REIT | | | 102,035 | | |
| | 6,850 | | | Windrose Medical Properties Trust REIT | | | 127,821 | | |
| | | | 413,185 | | |
| | | Consumer Services—6.1% | |
| | 1,710 | | | Chipoltle Mexican Grill-Class A* | | | 102,429 | | |
| | 2,900 | | | Orient-Express Hotels | | | 114,405 | | |
| | 4,460 | | | The Cheesecake Factory* | | | 125,995 | | |
| | | | 342,829 | | |
| | | Energy—5.1% | |
| | 3,140 | | | Alon USA Energy | | | 88,140 | | |
| | 3,920 | | | Carrizo Oil & Gas* | | | 111,955 | | |
| | 7,110 | | | Warren Resources* | | | 83,827 | | |
| | | | 283,922 | | |
| | | Diversified Financials—4.6% | |
| | 4,260 | | | Calamos Asset Management-Class A | | | 124,477 | | |
| | 2,540 | | | International Securities Exchange | | | 130,429 | | |
| | | | 254,906 | | |
| | | Consumer Durables & Apparel—4.4% | |
| | 3,510 | | | Jarden Corp* | | | 126,290 | | |
| | 2,580 | | | Phillips-Van Heusen | | | 118,061 | | |
| | | | 244,351 | | |
See Notes to Financial Statements.
Julius Baer Funds 2006 Annual Report
128
PORTFOLIO OF INVESTMENTS (Continued) October 31, 2006
Julius Baer U.S. Smallcap Fund (Percentage of Net Assets)
Share
Amount | | Description | | Market
Value (Note 2) | |
| COMMON STOCKS—Continued | | | |
| | | Media—3.8% | |
| | 2,700 | | | Catalina Marketing | | $ | 68,445 | | |
| | 3,500 | | | Morningstar Inc* | | | 143,220 | | |
| | | | 211,665 | | |
| | | Materials—3.5% | |
| | 2,060 | | | Cleveland-Cliffs Inc | | | 87,117 | | |
| | 1,790 | | | RTI International Metals* | | | 109,763 | | |
| | | | 196,880 | | |
| | | Food & Staples Retailing—2.0% | |
| | 3,270 | | | United Natural Foods* | | | 114,123 | | |
| | | Pharmaceuticals, Biotechnology & Life Sciences—1.8% | |
| | 2,490 | | | Ventana Medical Systems* | | | 100,571 | | |
| | | Retailing—1.8% | |
| | 1,760 | | | Guess? Inc* | | | 100,232 | | |
| | | Commercial Services and Supplies—1.7% | |
| | 2,540 | | | Brady Corp-Class A | | | 93,980 | | |
| | | Food, Beverage & Tobacco—1.1% | |
| | 1,710 | | | Corn Products International | | | 61,885 | | |
| | | | | TOTAL COMMON STOCKS (Cost $5,149,160) | | | 5,610,593 | | |
See Notes to Financial Statements.
Julius Baer Funds 2006 Annual Report
129
PORTFOLIO OF INVESTMENTS (Continued) October 31, 2006
Julius Baer U.S. Smallcap Fund (Percentage of Net Assets)
Face
Value | | Currency | | Description | | Market
Value (Note 2) | |
| REPURCHASE AGREEMENT—0.9% | |
| | | | | Financial Services—0.9% | |
| | 52,507 | | | USD | | | | Investors Bank & Trust Company Repurchase Agreement,
dated 10/31/2006, due 11/01/2006, with a maturity value
of $52,512 and an effective yield of 3.60%, collateralized
by a U.S. Government and Agent Obligation, with a rate
of 7.875%, a maturity of 03/25/2029 and an aggregate
market value of $55,132. (Cost $52,507) | | $ | 52,507 | | |
| | | | | TOTAL INVESTMENTS—101.4% (Cost $5,201,667) | | | 5,663,100 | | |
| | | | | OTHER ASSETS AND LIABILITIES (Net)—(1.4%) | | | (78,317 | ) | |
| | | | | TOTAL NET ASSETS—100.0% | | $ | 5,584,783 | | |
Notes to the Portfolio of Investments:
REIT Real Estate Investment Trust
* Non-income producing security.
Aggregate cost for federal income tax purposes was $5,199,620.
Glossary of Currencies
USD — United States Dollar
See Notes to Financial Statements.
Julius Baer Funds 2006 Annual Report
130
PORTFOLIO OF INVESTMENTS–Industry Sector October 31, 2006
Julius Baer U.S. Smallcap Fund (Percentage of Net Assets)
At October 31, 2006, sector diversification of the Fund's non-cash equivalents investments were as follows:
| | | % of Net
Assets | | Market
Value (Note 2) | |
| INDUSTRY SECTOR | |
| Financials | | | 24.2 | % | | $ | 1,349,276 | | |
| Industrials | | | 9.7 | | | | 542,389 | | |
| Consumer Discretionary | | | 16.1 | | | | 899,077 | | |
| Healthcare | | | 12.7 | | | | 708,269 | | |
| Consumer Staples | | | 3.2 | | | | 176,007 | | |
| Information Technology | | | 26.0 | | | | 1,454,773 | | |
| Energy | | | 5.1 | | | | 283,922 | | |
| Materials | | | 3.5 | | | | 196,880 | | |
| Cash & Cash Equivalents | | | 0.9 | | | | 52,507 | | |
| Total Investments | | | 101.4 | | | | 5,663,100 | | |
| Other Assets and Liabilities (Net) | | | (1.4 | ) | | | (78,317 | ) | |
| Net Assets | | | 100.0 | % | | $ | 5,584,783 | | |
See Notes to Financial Statements.
Julius Baer Funds 2006 Annual Report
131
PORTFOLIO OF INVESTMENTS October 31, 2006
Julius Baer U.S. Midcap Fund (Percentage of Net Assets)
Share
Amount | | Description | | Market
Value (Note 2) | |
| COMMON STOCKS—99.1% | | | |
| | | Diversified Financials—11.3% | |
| | 4,860 | | | E*Trade Financial* | | $ | 113,141 | | |
| | 1,290 | | | IntercontinentalExchange Inc* | | | 108,902 | | |
| | 1,420 | | | Legg Mason | | | 127,828 | | |
| | 1,980 | | | Moody's Corp | | | 131,274 | | |
| | 3,180 | | | Nuveen Investments-Class A | | | 156,774 | | |
| | | | 637,919 | | |
| | | Technology Hardware & Equipment—10.0% | |
| | 4,230 | | | Ciena Corp* | | | 99,447 | | |
| | 7,879 | | | Juniper Networks* | | | 135,676 | | |
| | 3,550 | | | National Instruments | | | 110,689 | | |
| | 3,080 | | | NCR Corp* | | | 127,882 | | |
| | 2,570 | | | Network Appliance* | | | 93,805 | | |
| | | | 567,499 | | |
| | | Health Care Equipment & Services—9.8% | |
| | 1,460 | | | CR Bard | | | 119,662 | | |
| | 1,770 | | | Express Scripts* | | | 112,784 | | |
| | 2,100 | | | Henry Schein* | | | 104,349 | | |
| | 1,010 | | | Intuitive Surgical* | | | 100,172 | | |
| | 1,680 | | | Laboratory Corp of America* | | | 115,063 | | |
| | | | 552,030 | | |
| | | Retailing—6.6% | |
| | 4,860 | | | Chico's FAS* | | | 116,300 | | |
| | 2,700 | | | Nordstrom Inc | | | 127,845 | | |
| | 7,510 | | | Urban Outfitters* | | | 131,425 | | |
| | | | 375,570 | | |
| | | Consumer Services—6.6% | |
| | 2,060 | | | Station Casinos | | | 124,218 | | |
| | 4,920 | | | The Cheesecake Factory* | | | 138,990 | | |
| | 2,500 | | | Weight Watchers International | | | 109,000 | | |
| | | | 372,208 | | |
| | | Energy—6.4% | |
| | 2,150 | | | BJ Services | | | 64,844 | | |
| | 2,060 | | | Helix Energy Solutions Group* | | | 66,538 | | |
| | 1,450 | | | Noble Corp | | | 101,645 | | |
See Notes to Financial Statements.
Julius Baer Funds 2006 Annual Report
132
PORTFOLIO OF INVESTMENTS (Continued) October 31, 2006
Julius Baer U.S. Midcap Fund (Percentage of Net Assets)
Share
Amount | | Description | | Market
Value (Note 2) | |
| COMMON STOCKS—Continued | | | |
| | | Energy—Continued | |
| | 2,360 | | | Ultra Petroleum* | | $ | 125,953 | | |
| | | | 358,980 | | |
| | | Banks—5.9% | |
| | 1,530 | | | City National | | | 101,837 | | |
| | 7,840 | | | Hudson City Bancorp | | | 107,643 | | |
| | 5,270 | | | The Colonial BancGroup | | | 125,637 | | |
| | | | 335,117 | | |
| | | Software & Services—5.6% | |
| | 6,550 | | | Activision Inc* | | | 101,001 | | |
| | 2,820 | | | Fair Isaac | | | 103,297 | | |
| | 2,540 | | | Iron Mountain* | | | 110,160 | | |
| | | | 314,458 | | |
| | | Capital Goods—5.3% | |
| | 1,730 | | | Oshkosh Truck | | | 78,213 | | |
| | 2,370 | | | Terex Corp* | | | 122,671 | | |
| | 2,060 | | | USG Corp* | | | 100,714 | | |
| | | | 301,598 | | |
| | | Consumer Durables & Apparel—5.0% | |
| | 3,800 | | | Coach Inc* | | | 150,632 | | |
| | 1,830 | | | Polo Ralph Lauren | | | 129,930 | | |
| | | | 280,562 | | |
| | | Commercial Services and Supplies—4.3% | |
| | 3,190 | | | Cintas Corp | | | 132,066 | | |
| | 1,600 | | | Stericycle Inc* | | | 113,136 | | |
| | | | 245,202 | | |
| | | Pharmaceuticals & Biotechnology—3.9% | |
| | 870 | | | Allergan Inc | | | 100,485 | | |
| | 2,280 | | | Celgene Corp* | | | 121,843 | | |
| | | | 222,328 | | |
| | | Semiconductors & Semiconductor Equipment—3.5% | |
| | 1,920 | | | KLA Tencor | | | 94,406 | | |
See Notes to Financial Statements.
Julius Baer Funds 2006 Annual Report
133
PORTFOLIO OF INVESTMENTS (Continued) October 31, 2006
Julius Baer U.S. Midcap Fund (Percentage of Net Assets)
Share
Amount | | Description | | Market
Value (Note 2) | |
| COMMON STOCKS—Continued | | | |
| | | Semiconductors & Semiconductor Equipment—Continued | |
| | 3,330 | | | Linear Technology | | $ | 103,630 | | |
| | | | 198,036 | | |
| | | Telecommunication Services—2.5% | |
| | 2,130 | | | NII Holdings-Class B* | | | 138,514 | | |
| | | Food & Staples Retailing—2.2% | |
| | 1,910 | | | Whole Foods Market | | | 121,934 | | |
| | | Household & Personal Products—2.1% | |
| | 2,370 | | | Alberto-Culver Co* | | | 120,420 | | |
| | | Real Estate—2.0% | |
| | 1,080 | | | Boston Properties | | | 115,376 | | |
| | | Utilities—2.0% | |
| | 4,640 | | | Aqua America | | | 112,520 | | |
| | | Insurance—1.5% | |
| | 4,190 | | | Conseco Inc* | | | 85,225 | | |
| | | Food, Beverage & Tobacco—1.5% | |
| | 4,130 | | | Coca-Cola Enterprises | | | 82,724 | | |
| | | Materials—1.1% | |
| | 2,320 | | | Commercial Metals | | | 61,735 | | |
| | | | | TOTAL COMMON STOCKS (Cost $5,089,212) | | | 5,599,955 | | |
See Notes to Financial Statements.
Julius Baer Funds 2006 Annual Report
134
PORTFOLIO OF INVESTMENTS (Continued) October 31, 2006
Julius Baer U.S. Midcap Fund (Percentage of Net Assets)
Face
Value | | Currency | | Description | | Market
Value (Note 2) | |
| REPURCHASE AGREEMENT—3.1% | |
| | | | | Financial Services—3.1% | |
| | 177,373 | | | USD | | | | Investors Bank & Trust Company Repurchase Agreement,
dated 10/31/2006, due 11/01/2006, with a maturity value
of $177,391 and an effective yield of 3.60%, collateralized
by a U.S. Government and Agent Obligation, with a rate
of 9.125%, a maturity of 02/25/2010 and an aggregate
market value of $186,241. (Cost $177,373) | | $ | 177,373 | | |
| | | | | TOTAL INVESTMENTS—102.2% (Cost $5,266,585) | | | 5,777,328 | | |
| | | | | OTHER ASSETS AND LIABILITIES (Net)—(2.2%) | | | (125,267 | ) | |
| | | | | TOTAL NET ASSETS—100.0% | | $ | 5,652,061 | | |
Notes to the Portfolio of Investments:
* Non-income producing security.
Aggregate cost for federal income tax purposes was $5,266,403.
Glossary of Currencies
USD — United States Dollar
See Notes to Financial Statements.
Julius Baer Funds 2006 Annual Report
135
PORTFOLIO OF INVESTMENTS–Industry Sector October 31, 2006
Julius Baer U.S. Midcap Fund (Percentage of Net Assets)
At October 31, 2006, sector diversification of the Fund's non-cash equivalents investments were as follows:
| | | % of Net
Assets | | Market
Value (Note 2) | |
| INDUSTRY SECTOR | |
| Financials | | | 20.8 | % | | $ | 1,173,637 | | |
| Information Technology | | | 19.1 | | | | 1,079,993 | | |
| Consumer Discretionary | | | 18.2 | | | | 1,028,340 | | |
| Healthcare | | | 13.7 | | | | 774,358 | | |
| Industrials | | | 7.9 | | | | 446,086 | | |
| Energy | | | 6.3 | | | | 358,980 | | |
| Consumer Staples | | | 5.8 | | | | 325,078 | | |
| Materials | | | 2.9 | | | | 162,449 | | |
| Telecommunications | | | 2.4 | | | | 138,514 | | |
| Utilities | | | 2.0 | | | | 112,520 | | |
| Cash & Cash Equivalents | | | 3.1 | | | | 177,373 | | |
| Total Investments | | | 102.2 | | | | 5,777,328 | | |
| Other Assets and Liabilities (Net) | | | (2.2 | ) | | | (125,267 | ) | |
| Net Assets | | | 100.0 | % | | $ | 5,652,061 | | |
See Notes to Financial Statements.
Julius Baer Funds 2006 Annual Report
136
PORTFOLIO OF INVESTMENTS October 31, 2006
Julius Baer U.S. Multicap Fund (Percentage of Net Assets)
Share
Amount | | Description | | Market
Value (Note 2) | |
| COMMON STOCKS—100.2% | | | |
| | | Diversified Financials—16.4% | |
| | 1,990 | | | Bank of America | | $ | 107,202 | | |
| | 4,840 | | | E*Trade Financial* | | | 112,675 | | |
| | 910 | | | IntercontinentalExchange Inc* | | | 76,822 | | |
| | 2,300 | | | JPMorgan Chase | | | 109,112 | | |
| | 1,350 | | | Legg Mason | | | 121,527 | | |
| | 1,730 | | | Moody's Corp | | | 114,699 | | |
| | 1,480 | | | Morgan Stanley | | | 113,116 | | |
| | 3,140 | | | Nuveen Investments-Class A | | | 154,802 | | |
| | | | 909,955 | | |
| | | Health Care Equipment & Services—11.8% | |
| | 2,560 | | | Aetna Inc | | | 105,523 | | |
| | 2,760 | | | ArthroCare Corp* | | | 111,532 | | |
| | 1,460 | | | CR Bard | | | 119,662 | | |
| | 2,100 | | | Henry Schein* | | | 104,349 | | |
| | 1,570 | | | Laboratory Corp of America* | | | 107,529 | | |
| | 2,060 | | | Medco Health Solutions* | | | 110,210 | | |
| | | | 658,805 | | |
| | | Technology Hardware & Equipment—7.9% | |
| | 1,650 | | | Apple Computer* | | | 133,782 | | |
| | 2,870 | | | Hewlett-Packard | | | 111,184 | | |
| | 5,881 | | | Juniper Networks* | | | 101,271 | | |
| | 2,600 | | | Network Appliance* | | | 94,900 | | |
| | | | 441,137 | | |
| | | Capital Goods—7.9% | |
| | 950 | | | Boeing Co | | | 75,867 | | |
| | 4,350 | | | General Electric | | | 152,729 | | |
| | 1,160 | | | Lockheed Martin | | | 100,839 | | |
| | 1,670 | | | United Technologies | | | 109,752 | | |
| | | | 439,187 | | |
| | | Energy—7.6% | |
| | 2,160 | | | BJ Services | | | 65,146 | | |
| | 3,650 | | | Carrizo Oil & Gas* | | | 104,244 | | |
| | 1,960 | | | Exxon Mobil | | | 139,983 | | |
| | 2,070 | | | Ultra Petroleum* | | | 110,476 | | |
| | | | 419,849 | | |
See Notes to Financial Statements.
Julius Baer Funds 2006 Annual Report
137
PORTFOLIO OF INVESTMENTS (Continued) October 31, 2006
Julius Baer U.S. Multicap Fund (Percentage of Net Assets)
Share
Amount | | Description | | Market
Value (Note 2) | |
| COMMON STOCKS—Continued | | | |
| | | Software & Services—5.7% | |
| | 6,360 | | | Activision Inc* | | $ | 98,071 | | |
| | 260 | | | Google Inc-Class A* | | | 123,861 | | |
| | 4,900 | | | Symantec Corp* | | | 97,216 | | |
| | | | 319,148 | | |
| | | Insurance—5.3% | |
| | 4,120 | | | Conseco Inc* | | | 83,801 | | |
| | 2,970 | | | Genworth Financial-Class A | | | 99,317 | | |
| | 2,010 | | | RenaissanceRe Holdings | | | 109,344 | | |
| | | | 292,462 | | |
| | | Semiconductors & Semiconductor Equipment—5.1% | |
| | 5,100 | | | Intel Corp | | | 108,834 | | |
| | 1,920 | | | KLA Tencor | | | 94,406 | | |
| | 2,500 | | | Linear Technology | | | 77,800 | | |
| | | | 281,040 | | |
| | | Pharmaceuticals & Biotechnology—4.8% | |
| | 2,210 | | | Celgene Corp* | | | 118,102 | | |
| | 1,170 | | | Genentech Inc* | | | 97,461 | | |
| | 1,870 | | | Pfizer Inc | | | 49,836 | | |
| | | | 265,399 | | |
| | | Consumer Services—4.2% | |
| | 4,370 | | | The Cheesecake Factory* | | | 123,453 | | |
| | 2,500 | | | Weight Watchers International | | | 109,000 | | |
| | | | 232,453 | | |
| | | Retailing—3.7% | |
| | 2,160 | | | Nordstrom Inc | | | 102,276 | | |
| | 6,020 | | | Urban Outfitters* | | | 105,350 | | |
| | | | 207,626 | | |
| | | Banks—3.4% | |
| | 5,530 | | | The Colonial BancGroup | | | 131,835 | | |
| | 1,010 | | | Wachovia Corp | | | 56,055 | | |
| | | | 187,890 | | |
See Notes to Financial Statements.
Julius Baer Funds 2006 Annual Report
138
PORTFOLIO OF INVESTMENTS (Continued) October 31, 2006
Julius Baer U.S. Multicap Fund (Percentage of Net Assets)
Share
Amount | | Description | | Market
Value (Note 2) | |
| COMMON STOCKS—Continued | | | |
| | | Telecommunication Services—2.5% | |
| | 2,110 | | | NII Holdings-Class B* | | $ | 137,213 | | |
| | | Household & Personal Products—2.3% | |
| | 2,010 | | | Procter & Gamble | | | 127,414 | | |
| | | Food, Beverage & Tobacco—2.3% | |
| | 1,990 | | | Pepsico Inc | | | 126,246 | | |
| | | Consumer Durables & Apparel—2.2% | |
| | 3,130 | | | Coach Inc* | | | 124,073 | | |
| | | Food & Staples Retailing—2.0% | |
| | 1,750 | | | Whole Foods Market | | | 111,720 | | |
| | | Media—1.8% | |
| | 1,000 | | | Omnicom Group | | | 101,450 | | |
| | | Utilities—1.7% | |
| | 3,950 | | | Aqua America | | | 95,788 | | |
| | | Commercial Services and Supplies—1.6% | |
| | 2,130 | | | Cintas Corp | | | 88,182 | | |
| | | | | TOTAL COMMON STOCKS (Cost $5,037,984) | | | 5,567,037 | | |
See Notes to Financial Statements.
Julius Baer Funds 2006 Annual Report
139
PORTFOLIO OF INVESTMENTS (Continued) October 31, 2006
Julius Baer U.S. Multicap Fund (Percentage of Net Assets)
Face
Value | | Currency | | Description | | Market
Value (Note 2) | |
| REPURCHASE AGREEMENT—1.4% | |
| | | | | Financial Services—1.4% | |
| | 81,148 | | | USD | | | | Investors Bank & Trust Company Repurchase Agreement,
dated 10/31/2006, due 11/01/2006, with a maturity value
of $81,157 and an effective yield of 3.60%, collateralized
by a U.S. Government and Agent Obligation, with a rate
of 5.50%, a maturity of 09/20/2031 and an aggregate
market value of $85,206. (Cost $81,148) | | $ | 81,148 | | |
| | | | | TOTAL INVESTMENTS—101.6% (Cost $5,119,132) | | | 5,648,185 | | |
| | | | | OTHER ASSETS AND LIABILITIES (Net)—(1.6%) | | | (90,528 | ) | |
| | | | | TOTAL NET ASSETS—100.0% | | $ | 5,557,657 | | |
Notes to the Portfolio of Investments:
* Non-income producing security.
Aggregate cost for federal income tax purposes was $5,119,132.
Glossary of Currencies
USD — United States Dollar
See Notes to Financial Statements.
Julius Baer Funds 2006 Annual Report
140
PORTFOLIO OF INVESTMENTS–Industry Sector October 31, 2006
Julius Baer U.S. Multicap Fund (Percentage of Net Assets)
At October 31, 2006, sector diversification of the Fund's non-cash equivalents investments were as follows:
| | | % of Net
Assets | | Market
Value (Note 2) | |
| INDUSTRY SECTOR | |
| Financials | | | 25.0 | % | | $ | 1,390,308 | | |
| Information Technology | | | 18.7 | | | | 1,041,326 | | |
| Healthcare | | | 16.6 | | | | 924,204 | | |
| Consumer Discretionary | | | 12.0 | | | | 665,602 | | |
| Industrials | | | 9.5 | | | | 527,369 | | |
| Energy | | | 7.5 | | | | 419,848 | | |
| Consumer Staples | | | 6.6 | | | | 365,379 | | |
| Telecommunications | | | 2.5 | | | | 137,213 | | |
| Utilities | | | 1.7 | | | | 95,788 | | |
| Cash & Cash Equivalents | | | 1.5 | | | | 81,148 | | |
| Total Investments | | | 101.6 | | | | 5,648,185 | | |
| Other Assets and Liabilities (Net) | | | (1.6 | ) | | | (90,528 | ) | |
| Net Assets | | | 100.0 | % | | $ | 5,557,657 | | |
See Notes to Financial Statements.
Julius Baer Funds 2006 Annual Report
141
STATEMENT OF ASSETS AND LIABILITIES October 31, 2006
| | | Julius Baer
Global Equity | | Julius Baer
International Equity | |
| ASSETS: | |
Investments in securities, at market value including market value
of securities on loan $4,636,490 and $1,283,495,918 respectively
(Cost $58,154,939 and $15,328,186,533 respectively) | | $ | 61,649,520 | | | $ | 20,465,248,175 | | |
Foreign currency, at market value
(Cost $1,624,625 and $727,755,875 respectively) | | | 1,631,956 | | | | 719,572,043 | | |
| Receivables: | |
| Investments sold | | | 5,949,678 | | | | 713,682,576 | | |
| Fund shares sold | | | 17,860 | | | | 23,744,203 | | |
| Interest and dividends | | | 66,536 | | | | 23,621,578 | | |
| Tax reclaim | | | 17,876 | | | | 1,790,682 | | |
| Miscellaneous | | | — | | | | 29,062 | | |
| Unrealized appreciation on open swap contracts | | | — | | | | 53,870,686 | | |
| Unrealized appreciation on forward foreign exchange contracts | | | 4,307 | | | | 7,740,894 | | |
| Prepaid expense | | | 53,266 | | | | 166,335 | | |
| Total Assets | | | 69,390,999 | | | | 22,009,466,234 | | |
| LIABILITIES: | |
| Payables: | |
| Investments purchased | | | 4,989,999 | | | | 445,615,645 | | |
| Fund shares repurchased | | | 17,832 | | | | 7,058,548 | | |
| Daily variation margin on open financial futures contracts | | | 1,612 | | | | 617,306 | | |
| Collateral for securities loaned (Note 10) | | | 4,768,583 | | | | 1,358,143,493 | | |
| Investment advisory fee (Note 3) | | | 55,740 | | | | 15,065,720 | | |
| Unrealized depreciation on forward foreign exchange contracts | | | 22,940 | | | | 10,486,779 | | |
| Accrued expenses and other payables | | | 84,060 | | | | 2,366,537 | | |
| Total Liabilities | | | 9,940,766 | | | | 1,839,354,028 | | |
| NET ASSETS | | $ | 59,450,233 | | | $ | 20,170,112,206 | | |
| NET ASSETS Consist of: | |
| Par value | | $ | 1,550 | | | $ | 462,946 | | |
| Paid in capital in excess of par value | | | 179,597,952 | | | | 13,008,447,833 | | |
| Undistributed net investment income | | | (60,212 | ) | | | 51,753,799 | | |
Accumulated net realized gain (loss) on investments sold,
financial futures contracts, forward foreign exchange contracts,
foreign currency related transactions, and swap contracts | | | (123,594,222 | ) | | | 1,912,781,149 | | |
Net unrealized appreciation on investments, financial futures contracts,
forward foreign exchange contracts, foreign currency related
transactions, and swap contracts | | | 3,505,165 | | | | 5,196,666,479 | | |
| NET ASSETS | | $ | 59,450,233 | | | $ | 20,170,112,206 | | |
| Class A | | $ | 29,851,842 | | | $ | 9,092,358,813 | | |
| Class I | | $ | 29,598,391 | | | $ | 11,077,753,393 | | |
| SHARES OUTSTANDING (Note 7) | |
| Class A | | | 780,875 | | | | 211,029,559 | | |
| Class I | | | 769,106 | | | | 251,916,543 | | |
| NET ASSET VALUE AND REDEMPTION PRICE PER SHARE | |
| Class A | | $ | 38.23 | | | $ | 43.09 | | |
| Class I | | $ | 38.48 | | | $ | 43.97 | | |
See Notes to Financial Statements.
Julius Baer Funds 2006 Annual Report
142
STATEMENT OF ASSETS AND LIABILITIES October 31, 2006
| | | Julius Baer
International Equity II | | Julius Baer
Total Return Bond | |
| ASSETS: | |
Investments in securities, at market value including market value
of securities on loan $209,228,238 and $0 respectively
(Cost $2,941,711,156 and $643,184,649 respectively) | | $ | 3,287,884,052 | | | $ | 648,171,732 | | |
Foreign currency, at market value
(Cost $20,589,712 and $685,061 respectively) | | | 20,744,172 | | | | 412,360 | | |
| Receivables: | |
| Investments sold | | | 151,058,280 | | | | 15,275,717 | | |
| Fund shares sold | | | 14,496,408 | | | | 5,751,324 | | |
| Interest and dividends | | | 2,832,862 | | | | 5,069,244 | | |
| Tax reclaim | | | 730,247 | | | | — | | |
| Unrealized appreciation on forward foreign exchange contracts | | | 2,345,096 | | | | 1,953,814 | | |
| Prepaid expense | | | 19,404 | | | | 3,146 | | |
| Total Assets | | | 3,480,110,521 | | | | 676,637,337 | | |
| LIABILITIES: | |
| Payables: | |
| Investments purchased | | | 89,445,196 | | | | 163,072,814 | | |
| Fund shares repurchased | | | 1,338,496 | | | | 60,984 | | |
| Daily variation margin on open financial futures contracts | | | 132,624 | | | | — | | |
| Collateral for securities loaned (Note 10) | | | 220,185,758 | | | | — | | |
| Payable for when-issued securities | | | — | | | | 7,993,187 | | |
| Investment advisory fee (Note 3) | | | 2,427,735 | | | | 129,691 | | |
| Unrealized depreciation on forward foreign exchange contracts | | | 3,577,951 | | | | 2,341,558 | | |
| Accrued expenses and other payables | | | 717,766 | | | | 119,913 | | |
| Total Liabilities | | | 317,825,526 | | | | 173,718,147 | | |
| NET ASSETS | | $ | 3,162,284,995 | | | $ | 502,919,190 | | |
| NET ASSETS Consist of: | |
| Par value | | $ | 223,824 | | | $ | 38,356 | | |
| Paid in capital in excess of par value | | | 2,808,219,921 | | | | 499,452,987 | | |
| Undistributed net investment income | | | 10,991,811 | | | | 1,172,581 | | |
Accumulated net realized loss on investments sold, financial futures
contracts, forward foreign exchange contracts, and foreign currency
related transactions | | | (4,257,364 | ) | | | (2,094,983 | ) | |
Net unrealized appreciation on investments, financial futures
contracts, forward foreign exchange contracts, and foreign
currency related transactions | | | 347,106,803 | | | | 4,350,249 | | |
| NET ASSETS | | $ | 3,162,284,995 | | | $ | 502,919,190 | | |
| Class A | | $ | 722,531,452 | | | $ | 103,732,173 | | |
| Class I | | $ | 2,439,753,543 | | | $ | 399,187,017 | | |
| SHARES OUTSTANDING (Note 7) | |
| Class A | | | 51,339,111 | | | | 7,933,581 | | |
| Class I | | | 172,485,179 | | | | 30,422,437 | | |
| NET ASSET VALUE AND REDEMPTION PRICE PER SHARE | |
| Class A | | $ | 14.07 | | | $ | 13.08 | | |
| Class I | | $ | 14.14 | | | $ | 13.12 | | |
See Notes to Financial Statements.
Julius Baer Funds 2006 Annual Report
143
STATEMENT OF ASSETS AND LIABILITIES October 31, 2006
| | | Julius Baer
Global High Income
(formerly Julius Baer
Global High Yield Bond) | | Julius Baer
U.S. Microcap | |
| ASSETS: | |
Investments in securities, at market value
(Cost $77,167,555 and $5,214,655 respectively) | | $ | 78,890,606 | | | $ | 5,848,774 | | |
Foreign currency, at market value
(Cost $180,712 and $0 respectively) | | | 182,130 | | | | — | | |
| Receivables: | |
| Investments sold | | | 811,145 | | | | 99,780 | | |
| Fund shares sold | | | 725,670 | | | | 115,680 | | |
| Interest and dividends | | | 1,558,734 | | | | 3,172 | | |
| Unrealized appreciation on open swap contracts | | | 56,136 | | | | — | | |
| Prepaid offering costs | | | — | | | | 30,534 | | |
| Unrealized appreciation on forward foreign exchange contracts | | | 58,260 | | | | — | | |
| Prepaid expense | | | 500 | | | | — | | |
| Total Assets | | | 82,283,181 | | | | 6,097,940 | | |
| LIABILITIES: | |
| Payables: | |
| Investments purchased | | | 920,000 | | | | 257,395 | | |
| Fund shares repurchased | | | 135,884 | | | | — | | |
| Investment advisory fee (Note 3) | | | 38,712 | | | | 14,068 | | |
| Due to investment advisor | | | — | | | | 34,593 | | |
| Accrued audit expense | | | — | | | | 15,000 | | |
| Unrealized depreciation on forward foreign exchange contracts | | | 106,156 | | | | — | | |
| Accrued expenses and other payables | | | 53,234 | | | | 5,135 | | |
| Total Liabilities | | | 1,253,986 | | | | 326,191 | | |
| NET ASSETS | | $ | 81,029,195 | | | $ | 5,771,749 | | |
| NET ASSETS Consist of: | |
| Par value | | $ | 7,470 | | | $ | 513 | | |
| Paid in capital in excess of par value | | | 78,275,307 | | | | 5,140,830 | | |
| Undistributed net investment income (loss) | | | 140,449 | | | | (5,852 | ) | |
Accumulated net realized gain on investments sold, forward
foreign exchange contracts, foreign currency related
transactions, and swap contracts | | | 864,096 | | | | 2,139 | | |
Net unrealized appreciation on investments , forward foreign exchange
contracts, foreign currency related transactions, and swap contracts | | | 1,741,873 | | | | 634,119 | | |
| NET ASSETS | | $ | 81,029,195 | | | $ | 5,771,749 | | |
| Class A | | $ | 45,929,655 | | | $ | 2,955,481 | | |
| Class I | | $ | 35,099,540 | | | $ | 2,816,268 | | |
| SHARES OUTSTANDING (Note 7) | |
| Class A | | | 4,178,183 | | | | 262,573 | | |
| Class I | | | 3,292,278 | | | | 250,000 | | |
| NET ASSET VALUE AND REDEMPTION PRICE PER SHARE | |
| Class A | | $ | 10.99 | | | $ | 11.26 | | |
| Class I | | $ | 10.66 | | | $ | 11.27 | | |
See Notes to Financial Statements.
Julius Baer Funds 2006 Annual Report
144
STATEMENT OF ASSETS AND LIABILITIES October 31, 2006
| | | Julius Baer
U.S. Smallcap | | Julius Baer
U.S. Midcap | |
| ASSETS: | |
Investments in securities, at market value including market value
(Cost $5,201,667 and $5,266,585 respectively) | | $ | 5,663,100 | | | $ | 5,777,328 | | |
| Receivables: | |
| Investments sold | | | 92,705 | | | | 127,695 | | |
| Interest and dividends | | | 1,467 | | | | 2,352 | | |
| Prepaid offering costs | | | 30,534 | | | | 27,983 | | |
| Total Assets | | | 5,787,806 | | | | 5,935,358 | | |
| LIABILITIES: | |
| Payables: | |
| Investments purchased | | | 135,550 | | | | 216,863 | | |
| Investment advisory fee (Note 3) | | | 12,860 | | | | 11,989 | | |
| Due to investment advisor | | | 34,593 | | | | 34,592 | | |
| Accrued audit expense | | | 15,000 | | | | 15,000 | | |
| Accrued expenses and other payables | | | 5,020 | | | | 4,853 | | |
| Total Liabilities | | | 203,023 | | | | 283,297 | | |
| NET ASSETS | | $ | 5,584,783 | | | $ | 5,652,061 | | |
| NET ASSETS Consist of: | |
| Par value | | $ | 503 | | | $ | 511 | | |
| Paid in capital in excess of par value | | | 5,031,752 | | | | 5,122,030 | | |
| Undistributed net investment loss | | | (4,396 | ) | | | (4,952 | ) | |
| Accumulated net realized gain on investments sold | | | 95,491 | | | | 23,729 | | |
| Net unrealized appreciation on investments | | | 461,433 | | | | 510,743 | | |
| NET ASSETS | | $ | 5,584,783 | | | $ | 5,652,061 | | |
| Class A | | $ | 2,807,499 | | | $ | 2,886,686 | | |
| Class I | | $ | 2,777,284 | | | $ | 2,765,375 | | |
| SHARES OUTSTANDING (Note 7) | |
| Class A | | | 252,925 | | | | 261,175 | | |
| Class I | | | 250,000 | | | | 250,000 | | |
| NET ASSET VALUE AND REDEMPTION PRICE PER SHARE | |
| Class A | | $ | 11.10 | | | $ | 11.05 | | |
| Class I | | $ | 11.11 | | | $ | 11.06 | | |
See Notes to Financial Statements.
Julius Baer Funds 2006 Annual Report
145
STATEMENT OF ASSETS AND LIABILITIES October 31, 2006
| | | Julius Baer
U.S. Multicap | |
| ASSETS: | |
| Investments in securities, at market value (Cost $5,119,132) | | $ | 5,648,185 | | |
| Receivables: | |
| Investments sold | | | 218,283 | | |
| Interest and dividends | | | 3,120 | | |
| Prepaid offering costs | | | 26,388 | | |
| Total Assets | | | 5,895,976 | | |
| LIABILITIES: | |
| Payables: | |
| Investments purchased | | | 272,429 | | |
| Investment advisory fee (Note 3) | | | 11,662 | | |
| Due to investment advisor | | | 34,593 | | |
| Accrued audit expense | | | 15,000 | | |
| Accrued expenses and other payables | | | 4,635 | | |
| Total Liabilities | | | 338,319 | | |
| NET ASSETS | | $ | 5,557,657 | | |
| NET ASSETS Consist of: | |
| Par value | | $ | 500 | | |
| Paid in capital in excess of par value | | | 5,003,240 | | |
| Undistributed net investment income | | | 1,721 | | |
| Accumulated net realized gain on investments sold | | | 23,143 | | |
| Net unrealized appreciation on investments | | | 529,053 | | |
| NET ASSETS | | $ | 5,557,657 | | |
| Class A | | $ | 2,779,785 | | |
| Class I | | $ | 2,777,872 | | |
| SHARES OUTSTANDING (Note 7) | |
| Class A | | | 250,376 | | |
| Class I | | | 250,000 | | |
| NET ASSET VALUE AND REDEMPTION PRICE PER SHARE | |
| Class A | | $ | 11.10 | | |
| Class I | | $ | 11.11 | | |
See Notes to Financial Statements.
Julius Baer Funds 2006 Annual Report
146
STATEMENT OF OPERATIONS
For the Year Ended October 31, 2006
| | | Julius Baer
Global Equity | | Julius Baer
International Equity | |
| INVESTMENT INCOME: | |
| Interest† | | $ | 55,355 | | | $ | 26,362,760 | | |
| Dividends†† | | | 1,080,905 | | | | 401,523,471 | | |
| Total investment income | | | 1,136,260 | | | | 427,886,231 | | |
| EXPENSES: | |
| Investment advisory fee (Note 3) | | | 483,185 | | | | 160,073,776 | | |
| Custody fees | | | 37,089 | | | | 13,364,705 | | |
| Administration fees | | | 243,430 | | | | 3,098,741 | | |
| Professional fees | | | 10,357 | | | | 1,029,577 | | |
| Trustees' fees and expenses | | | 83,080 | | | | 572,553 | | |
| Registration and filing fees | | | 34,028 | | | | 207,984 | | |
| Shareholder reports | | | 44,796 | | | | 937,404 | | |
| Insurance premium expense | | | 84,679 | | | | 268,348 | | |
| Interest expense | | | 2,513 | | | | — | | |
| Compliance expense | | | 955 | | | | 321,018 | | |
| Miscellaneous fees | | | 2,108 | | | | 105,406 | | |
| Total expenses common to all classes | | | 1,026,220 | | | | 179,979,512 | | |
| Transfer agent fees | |
| Class A | | | 19,446 | | | | 1,083,268 | | |
| Class I | | | 4,992 | | | | 290,783 | | |
| Distribution and shareholder servicing fees (Class A) (Note 4) | | | 80,425 | | | | 19,878,846 | | |
| Total gross expenses | | | 1,131,083 | | | | 201,232,409 | | |
| Less: | |
| Custody offset arrangement (Note 3) | | | (10,396 | ) | | | (8,984,383 | ) | |
| Expenses waived by investment advisor (Note 3) | | | (422,846 | ) | | | — | | |
| Net expenses | | | 697,841 | | | | 192,248,026 | | |
| NET INVESTMENT INCOME | | | 438,419 | | | | 235,638,205 | | |
| NET REALIZED AND UNREALIZED GAIN (LOSS) ON INVESTMENTS: | |
| Realized gain (loss) on: | |
| Investments | | | 8,388,177 | | | | 1,800,734,930 | | |
| Financial futures contracts | | | 282,653 | | | | 135,183,949 | | |
| Interest rate swap contracts | | | — | | | | 631,831 | | |
| Forward foreign exchange contracts | | | 118,242 | | | | 4,449,825 | | |
| Foreign currency transactions | | | (883,505 | ) | | | (205,316,795 | ) | |
| Net realized gain on investments | | | 7,905,567 | | | | 1,735,683,740 | | |
| Net change in unrealized appreciation (depreciation) on: | |
| Investments | | | 1,535,387 | | | | 2,745,473,841 | | |
| Financial futures contracts | | | (52,403 | ) | | | (15,733,745 | ) | |
| Interest rate swap contracts | | | — | | | | 15,422,846 | | |
| Forward foreign exchange contracts | | | 78,614 | | | | 79,765,982 | | |
| Foreign currency transactions | | | 2,475 | | | | 728,729 | | |
| Net change in unrealized appreciation of investments | | | 1,564,073 | | | | 2,825,657,653 | | |
| NET REALIZED AND UNREALIZED GAIN ON INVESTMENTS | | | 9,469,640 | | | | 4,561,341,393 | | |
| NET INCREASE IN NET ASSETS RESULTING FROM OPERATIONS | | $ | 9,908,059 | | | $ | 4,796,979,598 | | |
† Interest income includes security lending income of $10,653 and $18,808,988 for the Global Equity Fund and International Equity Fund, respectively.
†† Net of foreign withholdings taxes of $86,669 and $46,086,686 for the Global Equity Fund and International Equity Fund, respectively.
See Notes to Financial Statements.
Julius Baer Funds 2006 Annual Report
147
STATEMENT OF OPERATIONS
For the Year Ended October 31, 2006
| | | Julius Baer
International Equity II | | Julius Baer
Total Return Bond | |
| INVESTMENT INCOME: | |
| Interest† | | $ | 3,644,617 | | | $ | 16,036,592 | | |
| Dividends†† | | | 41,120,720 | | | | — | | |
| Total investment income | | | 44,765,337 | | | | 16,036,592 | | |
| EXPENSES: | |
| Investment advisory fee (Note 3) | | | 15,571,583 | | | | 1,426,234 | | |
| Custody fees | | | 646,490 | | | | 101,763 | | |
| Administration fees | | | 1,034,526 | | | | 77,511 | | |
| Professional fees | | | 126,740 | | | | 41,671 | | |
| Trustees' fees and expenses | | | 51,232 | | | | 10,014 | | |
| Registration and filing fees | | | 260,652 | | | | 62,125 | | |
| Shareholder reports | | | 295,094 | | | | 33,926 | | |
| Amortization of offering expenses | | | 30,472 | | | | — | | |
| Insurance premium expense | | | 11,145 | | | | 4,191 | | |
| Interest expense | | | — | | | | 5,028 | | |
| Compliance expense | | | 30,876 | | | | 5,447 | | |
| Miscellaneous fees | | | 3,810 | | | | 2,896 | | |
| Total expenses common to all classes | | | 18,062,620 | | | | 1,770,806 | | |
| Transfer agent fees | |
| Class A | | | 129,226 | | | | 17,612 | | |
| Class I | | | 47,289 | | | | 8,628 | | |
| Distribution and shareholder servicing fees (Class A) (Note 4) | | | 1,044,158 | | | | 209,336 | | |
| Total gross expenses | | | 19,283,293 | | | | 2,006,382 | | |
| Less: | |
| Custody offset arrangement (Note 3) | | | (195,667 | ) | | | (15,765 | ) | |
Recoupment of expenses previously assumed by
Investment Advisor (Note 3) | | | 206,916 | | | | — | | |
| Expenses waived by investment advisor (Note 3) | | | — | | | | (386,741 | ) | |
| Net expenses | | | 19,294,542 | | | | 1,603,876 | | |
| NET INVESTMENT INCOME | | | 25,470,795 | | | | 14,432,716 | | |
| NET REALIZED AND UNREALIZED GAIN (LOSS) ON INVESTMENTS: | |
| Realized gain (loss) on: | |
| Investments | | | (10,094,896 | ) | | | (1,587,857 | ) | |
| Financial futures contracts | | | 7,300,037 | | | | (139,900 | ) | |
| Forward foreign exchange contracts | | | (124,390 | ) | | | (402,989 | ) | |
| Foreign currency transactions | | | (16,207,001 | ) | | | 598,458 | | |
| Net realized gain on investments | | | (19,126,250 | ) | | | (1,532,288 | ) | |
| Net change in unrealized appreciation (depreciation) on: | |
| Investments | | | 339,415,278 | | | | 6,395,535 | | |
| Financial futures contracts | | | 649,211 | | | | — | | |
| Forward foreign exchange contracts | | | 972,566 | | | | (469,751 | ) | |
| Foreign currency transactions | | | 99,348 | | | | 114,256 | | |
| Net change in unrealized appreciation of investments | | | 341,136,403 | | | | 6,040,040 | | |
| NET REALIZED AND UNREALIZED GAIN ON INVESTMENTS | | | 322,010,153 | | | | 4,507,752 | | |
| NET INCREASE IN NET ASSETS RESULTING FROM OPERATIONS | | $ | 347,480,948 | | | $ | 18,940,468 | | |
† Interest income incudes security lending income of $342,389 for the International Equity Fund II.
†† Net of withholdings taxes of $4,689,154 for the International Equity Fund II.
See Notes to Financial Statements.
Julius Baer Funds 2006 Annual Report
148
STATEMENT OF OPERATIONS
For the Period Ended October 31, 2006
| | | Julius Baer
Global High Income
(formerly Julius Baer
Global High Yield Bond) | | Julius Baer
U.S. Microcap* | |
| INVESTMENT INCOME: | |
| Interest | | $ | 3,712,090 | | | $ | 2,049 | | |
| Dividends† | | | 69,759 | | | | 9,425 | | |
| Total investment income | | | 3,781,849 | | | | 11,474 | | |
| EXPENSES: | |
| Investment advisory fee (Note 3) | | | 389,284 | | | | 17,748 | | |
| Custody fees | | | 23,232 | | | | 345 | | |
| Administration fees | | | 41,745 | | | | 1,373 | | |
| Professional fees | | | 27,720 | | | | 20,775 | | |
| Trustees' fees and expenses | | | 1,686 | | | | 81 | | |
| Registration and filing fees | | | 47,572 | | | | 154 | | |
| Shareholder reports | | | 15,139 | | | | 952 | | |
| Amortization of offering expenses | | | — | | | | 11,522 | | |
| Insurance premium expense | | | 599 | | | | — | | |
| Interest expense | | | 10,088 | | | | — | | |
| Compliance expense | | | 807 | | | | 124 | | |
| Miscellaneous fees | | | 3,914 | | | | 661 | | |
| Total expenses common to all classes | | | 561,786 | | | | 53,735 | | |
| Transfer agent fees | |
| Class A | | | 11,702 | | | | 3,632 | | |
| Class I | | | 4,831 | | | | 1,519 | | |
| Distribution and shareholder servicing fees (Class A) (Note 4) | | | 92,117 | | | | 1,778 | | |
| Total gross expenses | | | 670,436 | | | | 60,664 | | |
| Less: | |
| Custody offset arrangement (Note 3) | | | (9,904 | ) | | | — | | |
| Expenses waived by investment advisor (Note 3) | | | (143,847 | ) | | | (37,233 | ) | |
| Net expenses | | | 516,685 | | | | 23,431 | | |
| NET INVESTMENT INCOME | | | 3,265,164 | | | | (11,957 | ) | |
| NET REALIZED AND UNREALIZED GAIN (LOSS) ON INVESTMENTS: | |
| Realized gain (loss) on: | |
| Investments | | | 875,866 | | | | 8,004 | | |
| Financial futures contracts | | | 17,649 | | | | — | | |
| Interest rate swap contracts | | | 150,081 | | | | — | | |
| Forward foreign exchange contracts | | | (8,688 | ) | | | — | | |
| Foreign currency transactions | | | (155,457 | ) | | | — | | |
| Net realized gain on investments | | | 879,451 | | | | 8,004 | | |
| Net change in unrealized appreciation on: | |
| Investments | | | 1,147,843 | | | | 634,119 | | |
| Interest rate swap contracts | | | 48,990 | | | | — | | |
| Forward foreign exchange contracts | | | 29,932 | | | | — | | |
| Foreign currency transactions | | | 16,230 | | | | — | | |
| Net change in unrealized appreciation of investments | | | 1,242,995 | | | | 634,119 | | |
| NET REALIZED AND UNREALIZED GAIN ON INVESTMENTS | | | 2,122,446 | | | | 642,123 | | |
| NET INCREASE IN NET ASSETS RESULTING FROM OPERATIONS | | $ | 5,387,610 | | | $ | 630,166 | | |
† Net of withholding taxes of $16,748 for the Global High Income Fund.
* For the period from July 24, 2006 (commencement of operations).
See Notes to Financial Statements.
Julius Baer Funds 2006 Annual Report
149
STATEMENT OF OPERATIONS
For the Period Ended October 31, 2006
| | | Julius Baer
U.S. Smallcap* | | Julius Baer
U.S. Midcap* | |
| INVESTMENT INCOME: | |
| Interest | | $ | 1,605 | | | $ | 2,502 | | |
| Dividends | | | 15,581 | | | | 9,402 | | |
| Total investment income | | | 17,186 | | | | 11,904 | | |
| EXPENSES: | |
| Investment advisory fee (Note 3) | | | 13,527 | | | | 11,459 | | |
| Custody fees | | | 346 | | | | 346 | | |
| Administration fees | | | 1,177 | | | | 1,189 | | |
| Professional fees | | | 20,778 | | | | 20,753 | | |
| Trustees' fees and expenses | | | 82 | | | | 67 | | |
| Registration and filing fees | | | 154 | | | | 154 | | |
| Shareholder reports | | | 954 | | | | 838 | | |
| Amortization of offering expenses | | | 11,522 | | | | 10,559 | | |
| Compliance expense | | | 124 | | | | 77 | | |
| Miscellaneous fees | | | 659 | | | | 659 | | |
| Total expenses common to all classes | | | 49,323 | | | | 46,101 | | |
| Transfer agent fees | |
| Class A | | | 3,632 | | | | 3,630 | | |
| Class I | | | 1,519 | | | | 1,517 | | |
| Distribution and shareholder servicing fees (Class A) (Note 4) | | | 1,780 | | | | 1,799 | | |
| Total gross expenses | | | 56,254 | | | | 53,047 | | |
| Expenses waived by investment advisor (Note 3) | | | (37,032 | ) | | | (35,848 | ) | |
| Net expenses | | | 19,222 | | | | 17,199 | | |
| NET INVESTMENT LOSS | | | (2,036 | ) | | | (5,295 | ) | |
| NET REALIZED AND UNREALIZED GAIN (LOSS) ON INVESTMENTS: | |
| Realized gain on: | |
| Investments | | | 93,131 | | | | 24,072 | | |
| Net realized gain on investments | | | 93,131 | | | | 24,072 | | |
| Net change in unrealized appreciation on: | |
| Investments | | | 461,433 | | | | 510,743 | | |
| Net change in unrealized appreciation of investments | | | 461,433 | | | | 510,743 | | |
| NET REALIZED AND UNREALIZED GAIN ON INVESTMENTS | | | 554,564 | | | | 534,815 | | |
| NET INCREASE IN NET ASSETS RESULTING FROM OPERATIONS | | $ | 552,528 | | | $ | 529,520 | | |
* For the period from July 24, 2006 (commencement of operations).
See Notes to Financial Statements.
Julius Baer Funds 2006 Annual Report
150
STATEMENT OF OPERATIONS
For the Period Ended October 31, 2006
| | | Julius Baer
U.S. Multicap* | |
| INVESTMENT INCOME: | |
| Interest | | $ | 1,939 | | |
| Dividends | | | 16,222 | | |
| Total investment income | | | 18,161 | | |
| EXPENSES: | |
| Investment advisory fee (Note 3) | | | 10,720 | | |
| Custody fees | | | 347 | | |
| Administration fees | | | 1,081 | | |
| Professional fees | | | 20,738 | | |
| Trustees' fees and expenses | | | 57 | | |
| Registration and filing fees | | | 154 | | |
| Shareholder reports | | | 763 | | |
| Amortization of offering expenses | | | 9,958 | | |
| Compliance expense | | | 47 | | |
| Miscellaneous fees | | | 661 | | |
| Total expenses common to all classes | | | 44,526 | | |
| Transfer agent fees | |
| Class A | | | 3,629 | | |
| Class I | | | 1,515 | | |
| Distribution and shareholder servicing fees (Class A) (Note 4) | | | 1,788 | | |
| Total gross expenses | | | 51,458 | | |
| Expenses waived by investment advisor (Note 3) | | | (35,018 | ) | |
| Net expenses | | | 16,440 | | |
| NET INVESTMENT INCOME | | | 1,721 | | |
| NET REALIZED AND UNREALIZED GAIN (LOSS) ON INVESTMENTS: | |
| Realized gain on: | |
| Investments | | | 23,143 | | |
| Net realized gain on investments | | | 23,143 | | |
| Net change in unrealized appreciation on: | |
| Investments | | | 529,053 | | |
| Net change in unrealized appreciation of investments | | | 529,053 | | |
| NET REALIZED AND UNREALIZED GAIN ON INVESTMENTS | | | 552,196 | | |
| NET INCREASE IN NET ASSETS RESULTING FROM OPERATIONS | | $ | 553,917 | | |
* For the period from July 24, 2006 (commencement of operations).
See Notes to Financial Statements.
Julius Baer Funds 2006 Annual Report
151
STATEMENT OF CHANGES IN NET ASSETS
Julius Baer Global Equity Fund
| | | For the
Year Ended
October 31,
2006 | | For the
Year Ended
October 31,
2005 | |
| INCREASE IN NET ASSETS FROM OPERATIONS | |
| Net investment income | | $ | 438,419 | | | $ | 327,084 | | |
| Net realized gain on investments | | | 7,905,567 | | | | 4,522,992 | | |
| Net change in unrealized appreciation of investments | | | 1,564,073 | | | | 734,401 | | |
| Net increase in net assets resulting from operations | | | 9,908,059 | | | | 5,584,477 | | |
| DISTRIBUTIONS TO SHAREHOLDERS (Note 2): | |
| Distributions from net investment income | |
| Class A | | | — | | | | (21,741 | ) | |
| Class I | | | (989 | ) | | | (4,503 | ) | |
| Total distributions to shareholders | | | (989 | ) | | | (26,244 | ) | |
| FUND SHARE TRANSACTIONS (Note 7): | |
| Proceeds from sale of shares | |
| Class A | | | 10,921,299 | | | | 14,982,802 | | |
| Class I | | | 18,354,968 | | | | 16,623,735 | | |
Net Asset Value of shares issued to shareholders
in payment of distributions declared | |
| Class A | | | — | | | | 17,724 | | |
| Class I | | | 637 | | | | 3,411 | | |
| Cost of shares redeemed | |
| Class A | | | (22,181,768 | ) | | | (9,572,684 | ) | |
| Class I | | | (8,973,789 | ) | | | (884,078 | ) | |
| Fees from redemptions | | | 3,539 | | | | 1,116 | | |
| Net increase (decrease) from Fund share transactions | | | (1,875,114 | ) | | | 21,172,026 | | |
| Net increase in net assets | | | 8,031,956 | | | | 26,730,259 | | |
| NET ASSETS: | |
| Beginning of period | | | 51,418,277 | | | | 24,688,018 | | |
End of period (including undistributed net investment
income of $(60,212) and $72,371, respectively) | | $ | 59,450,233 | | | $ | 51,418,277 | | |
See Notes to Financial Statements.
Julius Baer Funds 2006 Annual Report
152
STATEMENT OF CHANGES IN NET ASSETS
Julius Baer International Equity Fund
| | | For the
Year Ended
October 31,
2006 | | For the
Year Ended
October 31,
2005 | |
| INCREASE IN NET ASSETS FROM OPERATIONS | |
| Net investment income | | $ | 235,638,205 | | | $ | 150,589,093 | | |
| Net realized gain on investments | | | 1,735,683,740 | | | | 675,654,779 | | |
| Net change in unrealized appreciation of investments | | | 2,825,657,653 | | | | 1,384,631,278 | | |
| Net increase in net assets resulting from operations | | | 4,796,979,598 | | | | 2,210,875,150 | | |
| DISTRIBUTIONS TO SHAREHOLDERS (Note 2): | |
| Distributions from net investment income | |
| Class A | | | — | | | | (65,706,866 | ) | |
| Class I | | | — | | | | (71,893,528 | ) | |
| Distributions from realized gain | |
| Class A | | | (323,074,339 | ) | | | (84,704,257 | ) | |
| Class I | | | (394,079,789 | ) | | | (90,327,774 | ) | |
| Total distributions to shareholders | | | (717,154,128 | ) | | | (312,632,425 | ) | |
| FUND SHARE TRANSACTIONS (Note 7): | |
| Proceeds from sale of shares | |
| Class A | | | 1,516,430,147 | | | | 3,301,554,085 | | |
| Class I | | | 1,762,515,023 | | | | 3,854,830,556 | | |
Net Asset Value of shares issued to shareholders
in payment of distributions declared | |
| Class A | | | 303,135,073 | | | | 140,295,305 | | |
| Class I | | | 352,634,605 | | | | 139,663,385 | | |
| Cost of shares redeemed | |
| Class A | | | (1,596,363,910 | ) | | | (1,026,587,778 | ) | |
| Class I | | | (1,487,008,935 | ) | | | (636,445,754 | ) | |
| Fees from redemptions | | | 558,198 | | | | 711,284 | | |
| Net increase from Fund share transactions | | | 851,900,201 | | | | 5,774,021,083 | | |
| Net increase in net assets | | | 4,931,725,671 | | | | 7,672,263,808 | | |
| NET ASSETS: | |
| Beginning of period | | | 15,238,386,535 | | | | 7,566,122,727 | | |
End of period (including undistributed net investment
income of $51,753,799 and $15,823,649, respectively) | | $ | 20,170,112,206 | | | $ | 15,238,386,535 | | |
See Notes to Financial Statements.
Julius Baer Funds 2006 Annual Report
153
STATEMENT OF CHANGES IN NET ASSETS
Julius Baer International Equity Fund II
| | | For the
Year Ended
October 31,
2006 | | For the
Period Ended
October 31,
2005(1) | |
| INCREASE IN NET ASSETS FROM OPERATIONS | |
| Net investment income(loss) | | $ | 25,470,795 | | | $ | (24,836 | ) | |
| Net realized loss on investments | | | (19,126,250 | ) | | | (1,735,614 | ) | |
| Net change in unrealized appreciation of investments | | | 341,136,403 | | | | 5,970,400 | | |
| Net increase in net assets resulting from operations | | | 347,480,948 | | | | 4,209,950 | | |
| FUND SHARE TRANSACTIONS (Note 7): | |
| Proceeds from sale of shares | |
| Class A | | | 611,006,976 | | | | 136,031,555 | | |
| Class I | | | 1,992,799,751 | | | | 302,232,671 | | |
| Cost of shares redeemed | |
| Class A | | | (100,844,079 | ) | | | (10,286,728 | ) | |
| Class I | | | (113,397,417 | ) | | | (7,148,213 | ) | |
| Fees from redemptions | | | 186,601 | | | | 12,980 | | |
| Net increase from Fund share transactions | | | 2,389,751,832 | | | | 420,842,265 | | |
| Net increase in net assets | | | 2,737,232,780 | | | | 425,052,215 | | |
| NET ASSETS: | |
| Beginning of period | | | 425,052,215 | | | | — | | |
End of period (including undistributed net investment
income of $10,991,811 and $1,879,635, respectively) | | $ | 3,162,284,995 | | | $ | 425,052,215 | | |
(1) Commenced operations on May 4, 2005.
See Notes to Financial Statements.
Julius Baer Funds 2006 Annual Report
154
STATEMENT OF CHANGES IN NET ASSETS
Julius Baer Total Return Bond Fund
| | | For the
Year Ended
October 31,
2006 | | For the
Year Ended
October 31,
2005 | |
| INCREASE IN NET ASSETS FROM OPERATIONS | |
| Net investment income | | $ | 14,432,716 | | | $ | 5,535,005 | | |
| Net realized gain (loss) on investments | | | (1,532,288 | ) | | | 5,672,781 | | |
| Net change in unrealized appreciation (depreciation) of investments | | | 6,040,040 | | | | (6,516,844 | ) | |
| Net increase in net assets resulting from operations | | | 18,940,468 | | | | 4,690,942 | | |
| DISTRIBUTIONS TO SHAREHOLDERS (Note 2): | |
| Distributions from net investment income | |
| Class A | | | (4,633,879 | ) | | | (2,241,952 | ) | |
| Class I | | | (13,426,375 | ) | | | (3,494,839 | ) | |
| Distributions from realized gain | |
| Class A | | | (517,211 | ) | | | (434,145 | ) | |
| Class I | | | (1,194,669 | ) | | | (253,638 | ) | |
| Total distributions to shareholders | | | (19,772,134 | ) | | | (6,424,574 | ) | |
| FUND SHARE TRANSACTIONS (Note 7): | |
| Proceeds from sale of shares | |
| Class A | | | 72,384,334 | | | | 29,288,075 | | |
| Class I | | | 290,781,223 | | | | 124,690,812 | | |
Net Asset Value of shares issued to shareholders
in payment of distributions declared | |
| Class A | | | 4,578,373 | | | | 2,338,413 | | |
| Class I | | | 12,496,422 | | | | 3,491,042 | | |
| Cost of shares redeemed | |
| Class A | | | (40,748,651 | ) | | | (21,978,139 | ) | |
| Class I | | | (45,130,436 | ) | | | (17,419,639 | ) | |
| Fees from redemptions | | | 22,196 | | | | 5,764 | | |
| Net increase from Fund share transactions | | | 294,383,461 | | | | 120,416,328 | | |
| Net increase in net assets | | | 293,551,795 | | | | 118,682,696 | | |
| NET ASSETS: | |
| Beginning of period | | | 209,367,395 | | | | 90,684,699 | | |
End of period (including undistributed net investment
income of $1,172,581 and $4,329,021, respectively) | | $ | 502,919,190 | | | $ | 209,367,395 | | |
See Notes to Financial Statements.
Julius Baer Funds 2006 Annual Report
155
STATEMENT OF CHANGES IN NET ASSETS
Julius Baer Global High Income Fund (formerly Julius Baer Global High Yield Bond)
| | | For the
Year Ended
October 31,
2006 | | For the
Year Ended
October 31,
2005 | |
| INCREASE IN NET ASSETS FROM OPERATIONS | |
| Net investment income | | $ | 3,265,164 | | | $ | 4,164,813 | | |
| Net realized gain on investments | | | 879,451 | | | | 4,033,732 | | |
| Net change in unrealized appreciation (depreciation) of investments | | | 1,242,995 | | | | (4,903,911 | ) | |
| Net increase in net assets resulting from operations | | | 5,387,610 | | | | 3,294,634 | | |
| DISTRIBUTIONS TO SHAREHOLDERS (Note 1): | |
| Distributions from net investment income | |
| Class A | | | (3,603,396 | ) | | | (2,246,194 | ) | |
| Class I | | | (1,282,103 | ) | | | (1,813,691 | ) | |
| Distributions from realized gain | |
| Class A | | | (2,359,814 | ) | | | (523,278 | ) | |
| Class I | | | (499,032 | ) | | | (569,420 | ) | |
| Total distributions to shareholders | | | (7,744,345 | ) | | | (5,152,583 | ) | |
| FUND SHARE TRANSACTIONS (Note 7): | |
| Proceeds from sale of shares | |
| Class A | | | 33,421,918 | | | | 12,481,178 | | |
| Class I | | | 31,257,017 | | | | 2,897,931 | | |
Net Asset Value of shares issued to shareholders
in payment of distributions declared | |
| Class A | | | 5,028,917 | | | | 2,221,011 | | |
| Class I | | | 1,537,266 | | | | 535,898 | | |
| Cost of shares redeemed | |
| Class A | | | (26,442,289 | ) | | | (23,353,353 | ) | |
| Class I | | | (5,182,090 | ) | | | (39,975,454 | ) | |
| Fees from redemptions | | | 13,225 | | | | 2,836 | | |
| Net increase (decrease) from Fund share transactions | | | 39,633,964 | | | | (45,189,953 | ) | |
| Net increase (decrease) in net assets | | | 37,277,229 | | | | (47,047,902 | ) | |
| NET ASSETS: | |
| Beginning of period | | | 43,751,966 | | | | 90,799,868 | | |
End of period (including undistributed net investment
income (loss) of $140,449 and $1,745,535, respectively) | | $ | 81,029,195 | | | $ | 43,751,966 | | |
See Notes to Financial Statements.
Julius Baer Funds 2006 Annual Report
156
STATEMENT OF CHANGES IN NET ASSETS
Julius Baer U.S. Microcap Fund
| | | For the Period from
July 24, 2006*
to
October 31, 2006 | |
| INCREASE IN NET ASSETS FROM OPERATIONS | |
| Net investment loss | | $ | (11,957 | ) | |
| Net realized gain on investments | | | 8,004 | | |
| Net change in unrealized appreciation of investments | | | 634,119 | | |
| Net increase in net assets resulting from operations | | | 630,166 | | |
| FUND SHARE TRANSACTIONS (Note 7): | |
| Proceeds from sale of shares | |
| Class A | | | 2,661,894 | | |
| Class I | | | 2,500,000 | | |
| Cost of shares redeemed | |
| Class A | | | (20,311 | ) | |
| Net increase from Fund share transactions | | | 5,141,583 | | |
| Net increase in net assets | | | 5,771,749 | | |
| NET ASSETS: | |
| End of period (including undistributed net investment income of $(5,852)) | | $ | 5,771,749 | | |
* Commencement of operations
See Notes to Financial Statements.
Julius Baer Funds 2006 Annual Report
157
STATEMENT OF CHANGES IN NET ASSETS
Julius Baer U.S. Smallcap Fund
| | | For the Period from
July 24, 2006*
to
October 31, 2006 | |
| INCREASE IN NET ASSETS FROM OPERATIONS | |
| Net investment loss | | $ | (2,036 | ) | |
| Net realized gain on investments | | | 93,131 | | |
| Net change in unrealized appreciation of investments | | | 461,433 | | |
| Net increase in net assets resulting from operations | | | 552,528 | | |
| FUND SHARE TRANSACTIONS (Note 7): | |
| Proceeds from sale of shares | |
| Class A | | | 2,535,318 | | |
| Class I | | | 2,500,000 | | |
| Cost of shares redeemed | |
| Class A | | | (3,063 | ) | |
| Net increase from Fund share transactions | | | 5,032,255 | | |
| Net increase in net assets | | | 5,584,783 | | |
| NET ASSETS: | |
| End of period (including undistributed net investment income of $(4,396)) | | $ | 5,584,783 | | |
* Commencement of operations
See Notes to Financial Statements.
Julius Baer Funds 2006 Annual Report
158
STATEMENT OF CHANGES IN NET ASSETS
Julius Baer U.S. Midcap Fund
| | | For the Period from
July 24, 2006*
to
October 31, 2006 | |
| INCREASE IN NET ASSETS FROM OPERATIONS | |
| Net investment loss | | $ | (5,295 | ) | |
| Net realized gain on investments | | | 24,072 | | |
| Net change in unrealized appreciation of investments | | | 510,743 | | |
| Net increase in net assets resulting from operations | | | 529,520 | | |
| FUND SHARE TRANSACTIONS (Note 7): | |
| Proceeds from sale of shares | |
| Class A | | | 2,625,610 | | |
| Class I | | | 2,500,000 | | |
| Cost of shares redeemed | |
| Class A | | | (3,069 | ) | |
| Net increase from Fund share transactions | | | 5,122,541 | | |
| Net increase in net assets | | | 5,652,061 | | |
| NET ASSETS: | |
| End of period (including undistributed net investment income of $(4,952)) | | $ | 5,652,061 | | |
* Commencement of operations
See Notes to Financial Statements.
Julius Baer Funds 2006 Annual Report
159
STATEMENT OF CHANGES IN NET ASSETS
Julius Baer U.S. Multicap Fund
| | | For the Period from
July 24, 2006*
to
October 31, 2006 | |
| INCREASE IN NET ASSETS FROM OPERATIONS | |
| Net investment income | | $ | 1,721 | | |
| Net realized gain on investments | | | 23,143 | | |
| Net change in unrealized appreciation of investments | | | 529,053 | | |
| Net increase in net assets resulting from operations | | | 553,917 | | |
| FUND SHARE TRANSACTIONS (Note 7): | |
| Proceeds from sale of shares | |
| Class A | | | 2,515,010 | | |
| Class I | | | 2,500,000 | | |
| Cost of shares redeemed | |
| Class A | | | (11,270 | ) | |
| Net increase from Fund share transactions | | | 5,003,740 | | |
| Net increase in net assets | | | 5,557,657 | | |
| NET ASSETS: | |
| End of period (including undistributed net investment income of $1,721) | | $ | 5,557,657 | | |
* Commencement of operations
See Notes to Financial Statements.
Julius Baer Funds 2006 Annual Report
160
FINANCIAL HIGHLIGHTS
Julius Baer Global Equity Fund (8)
For a share outstanding throughout each period
| | | Class A | |
| | | Year Ended
October 31, | | April 01,
2004
through
October 31, | | Year Ended March 31, | |
| | | 2006 | | 2005(7) | | 2004(7) | | 2004(7) | | 2003(7) | | 2002(7) | |
| Net Asset Value, beginning of year | | $ | 31.45 | | | $ | 26.90 | | | $ | 25.30 | | | $ | 24.10 | | | $ | 42.50 | | | $ | 76.60 | | |
| Income (loss) from investment operations: | |
| Net investment income (loss) (2) | | | 0.23 | | | | 0.21 | | | | (0.30 | ) | | | (0.80 | ) | | | (0.60 | ) | | | (0.70 | ) | |
Net realized and unrealized gain (loss)
on investments | | | 6.55 | | | | 4.36 | | | | 1.90 | | | | 2.00 | | | | (17.50 | ) | | | (33.40 | ) | |
Total income (loss) from
investment operations | | | 6.78 | | | | 4.57 | | | | 1.60 | | | | 1.20 | | | | (18.10 | ) | | | (34.10 | ) | |
| Less distributions: | |
| From net investment income | | | — | | | | (0.02 | ) | | | — | | | | — | | | | (0.30 | ) | | | — | | |
| Total Distributions | | | — | | | | (0.02 | ) | | | — | | | | — | | | | (0.30 | ) | | | — | | |
| Net Asset Value, end of year | | $ | 38.23 | | | $ | 31.45 | | | $ | 26.90 | | | $ | 25.30 | | | $ | 24.10 | | | $ | 42.50 | | |
| Market Value, end of year (8) | | $ | — | | | $ | — | | | $ | — | | | $ | 23.600 | | | $ | 19.700 | | | $ | 39.700 | | |
| Total Return | | | 21.56 | % | | | 17.00 | % | | | 6.32 | %(5) | | | 19.80 | % | | | (49.75 | )% | | | (41.19 | )% | |
| Ratios/Supplemental Data: | |
| Net Assets, end of year (in 000's) | | $ | 29,852 | | | $ | 34,608 | | | $ | 24,688 | | | $ | 36,930 | | | $ | 35,122 | | | $ | 62,042 | | |
Ratio of net investment income
to average net assets | | | 0.65 | % | | | 0.71 | % | | | (1.80 | )%(4) | | | (3.25 | )% | | | (2.21 | )% | | | (1.11 | )% | |
Ratio of expenses to
average net assets (1) | | | 1.42 | % | | | 1.51 | % | | | 2.37 | %(4)(6) | | | 3.31 | % | | | 2.93 | % | | | 2.13 | % | |
Ratio of expenses to
average net assets (1)(3) | | | 1.40 | % | | | 1.50 | % | | | 2.30 | %(4)(6) | | | 3.25 | % | | | 2.82 | % | | | 1.85 | % | |
| Portfolio turnover rate | | | 162 | % | | | 118 | % | | | 204 | %(5) | | | 605 | % | | | 1024 | % | | | 778 | % | |
(1) The net expenses of the Fund reflect a waiver of fees by the Fund's investment advisor. Had such an action not been taken, the operating expenses ratios would have been:
Ratio of expenses to
average net assets (3) | | | 2.24 | % | | | 2.98 | % | | | 3.73 | % | | | 3.50 | % | | | 3.07 | % | | | 2.10 | % | |
Ratio of expenses to
average net assets | | | 2.26 | % | | | 2.99 | % | | | 3.80 | % | | | 3.56 | % | | | 3.18 | % | | | 2.38 | % | |
(2) Based on average shares outstanding during the period.
(3) Ratio of expenses including the effect of the expense offset arrangement.
(4) Annualized
(5) Not Annualized
(6) The current expenses for the period April 1, 2004 to October 31, 2004 exceed the expense cap of 1.75% due to the expense reimbursement not starting until July 1, 2004.
(7) Per share amounts were adjusted to reflect a 10 for 1 reverse stock split effective September 15, 2005
(8) On July 1, 2004, the Fund changed its name from The European Warrant Fund, Inc. and converted from a close-end, non diversified investment company ("closed-end fund") to an open-end diversified investment company with a different investment objective, different investment strategies, different management team and a new investment adviser (an affiliate of the closed-end Fund's adviser). Until the close of business on June 30, 2004, the Fund operated as a closed-end Fund and its common stock (which then comprised of a single share class) was listed on the NYSE. After the close of business on June 30, 2004, all of the common stock was converted into Class A shares of the Fund, and the Fund began seeking to maximize total return principally through capital appreciation by investing in a diversified portfolio of equity securities of issuers located throughout the world. For periods prior thereto, all historical perfo rmance information for Class A shares reflects the Net Asset Value (NAV) performance of the Fund's common stock while it was a closed-end fund.
See Notes to Financial Statements.
Julius Baer Funds 2006 Annual Report
161
FINANCIAL HIGHLIGHTS
Julius Baer Global Equity Fund
For a share outstanding throughout each period
| | | Class I | |
| | | Year
Ended
October 31,
2006 | | Period
Ended
October 31,
2005(6)(7) | |
| Net Asset Value, beginning of year | | $ | 31.58 | | | $ | 30.80 | | |
| Income from investment operations: | |
| Net investment income (2) | | | 0.38 | | | | 0.23 | | |
| Net realized and unrealized gain on investments | | | 6.52 | | | | 0.56 | | |
| Total income from investment operations | | | 6.90 | | | | 0.79 | | |
| Less distributions: | |
| From net investment income | | | — | (9) | | | (0.01 | ) | |
| Total Distributions | | | — | | | | (0.01 | ) | |
| Net Asset Value, end of year | | $ | 38.48 | | | $ | 31.58 | | |
| Total Return | | | 21.89 | % | | | 2.56 | %(5) | |
| Ratios/Supplemental Data: | |
| Net Assets, end of year (in 000's) | | $ | 29,598 | | | $ | 16,810 | | |
| Ratio of net investment income to average net assets | | | 1.06 | % | | | 1.15 | %(4) | |
| Ratio of expenses to average net assets (1) | | | 1.17 | % | | | 1.17 | %(4) | |
| Ratio of expenses to average net assets (1)(3) | | | 1.15 | % | | | 1.15 | %(4) | |
| Portfolio turnover rate | | | 162 | % | | | 118 | %(8) | |
(1) The net expenses of the Fund reflect a waiver of fees by the Fund's investment advisor . Had such an action not been taken, the operating expenses ratios would have been:
| Ratio of expenses to average net assets (3) | | | 1.86 | % | | | 2.49 | %(4) | |
| Ratio of expenses to average net assets | | | 1.88 | % | | | 2.51 | %(4) | |
(2) Based on average shares outstanding during the period.
(3) Ratio of expenses including the effect of the expense offset arrangement.
(4) Annualized.
(5) Not Annualized.
(6) Class I commenced operations on March 14, 2005.
(7) Per share amounts were adjusted to reflect a 10 for 1 reverse stock split effective September 15, 2005.
(8) Portfolio turnover is for the period ended October, 31 2005.
(9) Rounds to less than $0.01.
See Notes to Financial Statements.
Julius Baer Funds 2006 Annual Report
162
FINANCIAL HIGHLIGHTS
Julius Baer International Equity Fund
For a share outstanding throughout each period
| | | Class A | |
| | | Year Ended October 31, | |
| | | 2006 | | 2005 | | 2004 | | 2003 | | 2002 | |
| Net Asset Value, beginning of year | | $ | 34.29 | | | $ | 28.99 | | | $ | 24.45 | | | $ | 19.60 | | | $ | 19.95 | | |
| Income (loss) from investment operations: | |
| Net investment income (2) | | | 0.50 | | | | 0.35 | | | | 0.16 | | | | 0.24 | | | | 0.11 | | |
| Net realized and unrealized gain (loss) on investments | | | 9.87 | | | | 5.98 | | | | 4.71 | | | | 4.93 | | | | (0.46 | ) | |
| Total income (loss) from investment operations | | | 10.37 | | | | 6.33 | | | | 4.87 | | | | 5.17 | | | | (0.35 | ) | |
| Less distributions: | |
| From net investment income | | | — | | | | (0.45 | ) | | | (0.33 | ) | | | (0.32 | ) | | | — | | |
| From net realized gains on investments | | | (1.57 | ) | | | (0.58 | ) | | | — | | | | — | | | | — | | |
| Total Distributions | | | (1.57 | ) | | | (1.03 | ) | | | (0.33 | ) | | | (0.32 | ) | | | — | | |
| Net Asset Value, end of year | | $ | 43.09 | | | $ | 34.29 | | | $ | 28.99 | | | $ | 24.45 | | | $ | 19.60 | | |
| Total Return | | | 31.20 | % | | | 22.19 | % | | | 20.05 | % | | | 26.78 | % | | | (1.75 | )% | |
| Ratios/Supplemental Data: | |
| Net Assets, end of year (in 000's) | | $ | 9,092,359 | | | $ | 7,018,030 | | | $ | 3,721,409 | | | $ | 1,705,074 | | | $ | 615,897 | | |
| Ratio of net investment income to average net assets | | | 1.28 | % | | | 1.09 | % | | | 0.58 | % | | | 0.83 | % | | | 0.49 | % | |
| Ratio of expenses to average net assets (1) | | | 1.24 | % | | | 1.32 | % | | | 1.35 | % | | | 1.37 | % | | | 1.51 | % | |
| Ratio of expenses to average net assets | | | 1.19 | % | | | 1.31 | % | | | 1.32 | % | | | 1.31 | % | | | 1.43 | % | |
| Portfolio turnover rate | | | 62 | % | | | 57 | % | | | 100 | % | | | 114 | % | | | 93 | % | |
(1) Expense ratio without taking into consideration any expense reductions related to custody offset arrangement.
(2) Based on average shares outstanding during the period.
See Notes to Financial Statements.
Julius Baer Funds 2006 Annual Report
163
FINANCIAL HIGHLIGHTS
Julius Baer International Equity Fund
For a share outstanding throughout each period
| | | Class I | |
| | | Year Ended October 31, | |
| | | 2006 | | 2005 | | 2004 | | 2003 | | 2002 | |
| Net Asset Value, beginning of year | | $ | 34.96 | | | $ | 29.47 | | | $ | 24.79 | | | $ | 19.79 | | | $ | 20.08 | | |
| Income (loss) from investment operations: | |
| Net investment income (2) | | | 0.52 | | | | 0.44 | | | | 0.23 | | | | 0.28 | | | | 0.21 | | |
| Net realized and unrealized gain (loss) on investments | | | 10.15 | | | | 6.09 | | | | 4.79 | | | | 5.05 | | | | (0.45 | ) | |
| Total income (loss) from investment operations | | | 10.67 | | | | 6.53 | | | | 5.02 | | | | 5.33 | | | | (0.24 | ) | |
| Less distributions: | |
| From net investment income | | | — | | | | (0.46 | ) | | | (0.34 | ) | | | (0.33 | ) | | | (0.05 | ) | |
| From net realized gains on investments | | | (1.66 | ) | | | (0.58 | ) | | | — | | | | — | | | | — | | |
| Total Distributions | | | (1.66 | ) | | | (1.04 | ) | | | (0.34 | ) | | | (0.33 | ) | | | (0.05 | ) | |
| Net Asset Value, end of year | | $ | 43.97 | | | $ | 34.96 | | | $ | 29.47 | | | $ | 24.79 | | | $ | 19.79 | | |
| Total Return | | | 31.53 | % | | | 22.52 | % | | | 20.39 | % | | | 27.39 | % | | | (1.21 | )% | |
| Ratios/Supplemental Data: | |
| Net Assets, end of year (in 000's) | | $ | 11,077,753 | | | $ | 8,220,356 | | | $ | 3,844,713 | | | $ | 1,114,010 | | | $ | 415,159 | | |
| Ratio of net investment income to average net assets | | | 1.29 | % | | | 1.33 | % | | | 0.87 | % | | | 1.16 | % | | | 0.99 | % | |
| Ratio of expenses to average net assets (1) | | | 0.99 | % | | | 1.05 | % | | | 1.08 | % | | | 1.08 | % | | | 1.00 | % | |
| Ratio of expenses to average net assets | | | 0.94 | % | | | 1.04 | % | | | 1.05 | % | | | 1.02 | % | | | 0.92 | % | |
| Portfolio turnover rate | | | 62 | % | | | 57 | % | | | 100 | % | | | 114 | % | | | 93 | % | |
(1) Expense ratio without taking into consideration any expense reductions related to custody offset arrangement.
(2) Based on average shares outstanding during the period.
See Notes to Financial Statements.
Julius Baer Funds 2006 Annual Report
164
FINANCIAL HIGHLIGHTS
Julius Baer Internationl Equity Fund II
For a share outstanding throughout each period
| | | Class A | |
| | | Year
Ended
October 31,
2006 | | Period
Ended
October 31,
2005(5) | |
| Net Asset Value, beginning of year | | $ | 10.94 | | | $ | 10.00 | | |
| Income from investment operations: | |
| Net investment income (loss) (7) | | | 0.16 | | | | (0.01 | ) | |
| Net realized and unrealized gain on investments | | | 2.97 | | | | 0.95 | | |
| Total income from investment operations | | | 3.13 | | | | 0.94 | | |
| Net Asset Value, end of year | | $ | 14.07 | | | $ | 10.94 | | |
| Total Return | | | 28.73 | % | | | 9.30 | %(2) | |
| Ratios/Supplemental Data: | |
| Net Assets, end of year (in 000's) | | $ | 722,531 | | | $ | 127,435 | | |
| Ratio of net investment income to average net assets | | | 1.25 | % | | | (0.11 | )%(3) | |
| Ratio of expenses to average net assets (1)(6) | | | 1.33 | %(4) | | | 1.36 | %(3)(4) | |
| Ratio of expenses to average net assets | | | 1.32 | % | | | 1.35 | %(3) | |
| Portfolio turnover rate | | | 61 | % | | | 38 | %(2) | |
(1) Expense ratio without taking into consideration any expense reductions related to custody offset arrangement.
(2) Not annualized.
(3) Annualized.
(4) The net expenses of the Fund reflect a waiver of fees by the Fund's investment advisor. Had such action not been taken, the annualized operating expense ratios would have been 1.32% and 2.06% for the periods ended October 31, 2006 and October 31, 2005.
(5) Commenced operations on May 4, 2005.
(6) On March 1, 2006, the expense cap changed from 1.35% to 1.32%.
(7) Based on average shares outstanding during the period.
See Notes to Financial Statements.
Julius Baer Funds 2006 Annual Report
165
FINANCIAL HIGHLIGHTS
Julius Baer Internationl Equity Fund II
For a share outstanding throughout each period
| | | Class I | |
| | | Year
Ended
October 31,
2006 | | Period
Ended
October 31,
2005(5) | |
| Net Asset Value, beginning of year | | $ | 10.96 | | | $ | 10.00 | | |
| Income from investment operations: | |
| Net investment income (7) | | | 0.20 | | | | — | | |
| Net realized and unrealized gain on investments | | | 2.98 | | | | 0.96 | | |
| Total income from investment operations | | | 3.18 | | | | 0.96 | | |
| Net Asset Value, end of year | | $ | 14.14 | | | $ | 10.96 | | |
| Total Return | | | 29.11 | % | | | 9.60 | %(2) | |
| Ratios/Supplemental Data: | |
| Net Assets, end of year (in 000's) | | $ | 2,439,754 | | | $ | 297,617 | | |
| Ratio of net investment income to average net assets | | | 1.54 | % | | | (0.01 | )%(3) | |
| Ratio of expenses to average net assets (1)(6) | | | 1.06 | %(4) | | | 1.09 | %(3)(4) | |
| Ratio of expenses to average net assets | | | 1.05 | % | | | 1.08 | %(3) | |
| Portfolio turnover rate | | | 61 | % | | | 38 | %(2) | |
(1) Expense ratio without taking into consideration any expense reductions related to custody offset arrangement.
(2) Not annualized.
(3) Annualized.
(4) The net expenses of the Fund reflect a waiver of fees by the Fund's investment advisor. Had such action not been taken, the annualized operating expense ratio would have been 1.05% and 1.60% for the periods ended October 31, 2006 and October 31, 2005.
(5) Commenced operations on May 4, 2005.
(6) On March 1, 2006, the expense cap changed from 1.08% to 1.05%.
(7) Based on average shares outstanding during the period.
See Notes to Financial Statements.
Julius Baer Funds 2006 Annual Report
166
FINANCIAL HIGHLIGHTS
Julius Baer Total Return Bond Fund
For a share outstanding throughout each period
| | | Class A | |
| | | Year Ended October 31, | |
| | | 2006 | | 2005 | | 2004 | | 2003 | | 2002(1) | |
| Net Asset Value, beginning of year | | $ | 13.33 | | | $ | 13.37 | | | $ | 13.34 | | | $ | 12.55 | | | $ | 12.10 | | |
| Income from investment operations: | |
| Net investment income (4) | | | 0.56 | | | | 0.42 | | | | 0.37 | | | | 0.30 | | | | 0.44 | | |
| Net realized and unrealized gain on investments | | | 0.07 | | | | 0.10 | | | | 0.35 | | | | 0.92 | | | | 0.49 | | |
| Total income from investment operations | | | 0.63 | | | | 0.52 | | | | 0.72 | | | | 1.22 | | | | 0.93 | | |
| Less distributions: | |
| From net investment income | | | (0.77 | ) | | | (0.46 | ) | | | (0.46 | ) | | | (0.32 | ) | | | (0.47 | ) | |
| From net realized gains on investments | | | (0.11 | ) | | | (0.10 | ) | | | (0.23 | ) | | | (0.11 | ) | | | — | | |
| From capital (Note 2) | | | — | | | | — | | | | — | | | | — | | | | (0.01 | ) | |
| Total Distributions | | | (0.88 | ) | | | (0.56 | ) | | | (0.69 | ) | | | (0.43 | ) | | | (0.48 | ) | |
| Net Asset Value, end of year | | $ | 13.08 | | | $ | 13.33 | | | $ | 13.37 | | | $ | 13.34 | | | $ | 12.55 | | |
| Total Return | | | 4.98 | % | | | 3.93 | % | | | 5.50 | % | | | 9.83 | % | | | 7.86 | % | |
| Ratios/Supplemental Data: | |
| Net Assets, end of year (in 000's) | | $ | 103,732 | | | $ | 68,223 | | | $ | 58,823 | | | $ | 63,449 | | | $ | 33,858 | | |
| Ratio of net investment income to average net assets | | | 4.32 | % | | | 3.11 | % | | | 2.79 | % | | | 2.24 | % | | | 3.65 | % | |
| Ratio of expenses to average net assets (2) | | | 0.69 | % | | | 0.78 | % | | | 1.17 | % | | | 1.16 | % | | | 1.28 | % | |
| Ratio of expenses to average net assets | | | 0.69 | %(3) | | | 0.77 | %(3) | | | 1.17 | % | | | 1.16 | % | | | 1.28 | %(3) | |
| Portfolio turnover rate | | | 411 | % | | | 202 | % | | | 69 | % | | | 160 | % | | | 156 | % | |
(1) The Fund has adopted the provisions of the revised AICPA Audit and Accounting Guide for Investment Companies and began using the interest method to amortize premiums on fixed-income securities. The effect of this change for the year ended October 31, 2002 was to increase net investment income per share by $0.002, decrease net realized and unrealized gains per share by $0.002 and increase the ratio of net investment income to average net assets from 3.63% to 3.65%. Per share data and ratios for the periods prior to November 1, 2002 have not been restated to reflect this change in presentation.
(2) Expense ratio without taking into consideration any reductions related to custody offset arrangement.
(3) The net expenses of the Fund reflect a waiver of fees by the Fund's investment advisor. Had such action not been taken, the operating expense ratios would have been 0.83%, 0.93% and 1.38%for the periods ended October 31, 2006, 2005 and 2002, respectively.
(4) Based on average shares outstanding during the period.
See Notes to Financial Statements.
Julius Baer Funds 2006 Annual Report
167
FINANCIAL HIGHLIGHTS
Julius Baer Total Return Bond Fund
For a share outstanding throughout each period
| | | Class I | |
| | | Year Ended October 31, | |
| | | 2006 | | 2005 | | 2004 | | 2003 | | 2002(1) | |
| Net Asset Value, beginning of year | | $ | 13.38 | | | $ | 13.41 | | | $ | 13.37 | | | $ | 12.56 | | | $ | 12.07 | | |
| Income from investment operations: | |
| Net investment income (4) | | | 0.60 | | | | 0.47 | | | | 0.41 | | | | 0.37 | | | | 0.48 | | |
| Net realized and unrealized gain on investments | | | 0.07 | | | | 0.08 | | | | 0.34 | | | | 0.89 | | | | 0.50 | | |
| Total income from investment operations | | | 0.67 | | | | 0.55 | | | | 0.75 | | | | 1.26 | | | | 0.98 | | |
| Less distributions: | |
| From net investment income | | | (0.82 | ) | | | (0.48 | ) | | | (0.48 | ) | | | (0.34 | ) | | | (0.48 | ) | |
| From net realized gains on investments | | | (0.11 | ) | | | (0.10 | ) | | | (0.23 | ) | | | (0.11 | ) | | | — | | |
| From capital (Note 2) | | | — | | | | — | | | | — | | | | — | | | | (0.01 | ) | |
| Total Distributions | | | (0.93 | ) | | | (0.58 | ) | | | (0.71 | ) | | | (0.45 | ) | | | (0.49 | ) | |
| Net Asset Value, end of year | | $ | 13.12 | | | $ | 13.38 | | | $ | 13.41 | | | $ | 13.37 | | | $ | 12.56 | | |
| Total Return | | | 5.25 | % | | | 4.10 | % | | | 5.82 | % | | | 10.19 | % | | | 8.41 | % | |
| Ratios/Supplemental Data: | |
| Net Assets, end of year (in 000's) | | $ | 399,187 | | | $ | 141,145 | | | $ | 31,862 | | | $ | 14,188 | | | $ | 1,167 | | |
| Ratio of net investment income to average net assets | | | 4.64 | % | | | 3.50 | % | | | 3.08 | % | | | 2.50 | % | | | 4.00 | % | |
| Ratio of expenses to average net assets (2) | | | 0.44 | % | | | 0.47 | % | | | 0.88 | % | | | 0.90 | % | | | 0.85 | % | |
| Ratio of expenses to average net assets | | | 0.44 | %(3) | | | 0.47 | %(3) | | | 0.88 | % | | | 0.89 | % | | | 0.85 | %(3) | |
| Portfolio turnover rate | | | 411 | % | | | 202 | % | | | 69 | % | | | 160 | % | | | 156 | % | |
(1) The Fund has adopted the provisions of the revised AICPA Audit and Accounting Guide for Investment Companies and began using the interest method to amortize premiums on fixed-income securities. The effect of this change for the year ended October 31, 2002 was to increase net investment income per share by $0.002, decrease net realized and unrealized gains per share by $0.002 and increase the ratio of net investment income to average net assets from 3.98% to 4.00%. Per share data and ratios for the periods prior to November 1, 2002 have not been restated to reflect this change in presentation.
(2) Expense ratio without taking into consideration any reductions related to custody offset arrangement.
(3) The net expenses of the Fund reflect a waiver of fees by the Fund's investment advisor. Had such action not been taken, the operating expense ratios would have been 0.56%, 0.65% and 0.95% for periods ended October 31, 2006, 2005 and 2002, respectively.
(4) Based on average shares outstanding during the period.
See Notes to Financial Statements.
Julius Baer Funds 2006 Annual Report
168
FINANCIAL HIGHLIGHTS
Julius Baer Global High Income Fund (formerly the Julius Baer Global High Yield Bond Fund)
For a share outstanding throughout each period
| | | Class A | |
| | | Year Ended October 31, | | Period
Ended
October 31, | |
| | | 2006 | | 2005 | | 2004 | | 2003(1) | |
| Net Asset Value, beginning of year | | $ | 11.93 | | | $ | 12.07 | | | $ | 11.43 | | | $ | 10.00 | | |
| Income from investment operations: | |
| Net investment income (2) | | | 0.68 | | | | 0.73 | | | | 0.70 | | | | 0.64 | | |
| Net realized and unrealized gain (loss) on investments | | | 0.43 | | | | (0.01 | ) | | | 0.72 | | | | 1.37 | | |
| Total income from investment operations | | | 1.11 | | | | 0.72 | | | | 1.42 | | | | 2.01 | | |
| Less distributions: | |
| From net investment income | | | (1.17 | ) | | | (0.71 | ) | | | (0.71 | ) | | | (0.58 | ) | |
| From net realized gains on investments | | | (0.88 | ) | | | (0.15 | ) | | | (0.07 | ) | | | — | | |
| Total Distributions | | | (2.05 | ) | | | (0.86 | ) | | | (0.78 | ) | | | (0.58 | ) | |
| Net Asset Value, end of year | | $ | 10.99 | | | $ | 11.93 | | | $ | 12.07 | | | $ | 11.43 | | |
| Total Return | | | 10.49 | % | | | 6.15 | % | | | 12.87 | % | | | 20.57 | %(6) | |
| Ratios/Supplemental Data: | |
| Net Assets, end of year (in 000's) | | $ | 45,930 | | | $ | 36,166 | | | $ | 45,164 | | | $ | 28,195 | | |
| Ratio of net investment income to average net assets | | | 6.16 | % | | | 6.01 | % | | | 5.97 | % | | | 6.71 | %(3) | |
| Ratio of expenses to average net assets (4)(7) | | | 1.10 | % | | | 1.28 | % | | | 1.24 | % | | | 1.26 | %(3) | |
| Ratio of expenses to average net assets (7) | | | 1.08 | %(5) | | | 1.25 | %(5) | | | 1.25 | % | | | 1.25 | %(3)(5) | |
| Portfolio turnover rate | | | 96 | % | | | 99 | % | | | 93 | % | | | 83 | %(6) | |
(1) Class A shares commenced operations on December 17, 2002.
(2) Based on average shares outstanding during the period.
(3) Annualized.
(4) Expense ratio without taking into consideration any expense reductions related to custody offset arrangement and reimbursement of expense previously assumed by the Fund's investment advisor.
(5) The net expenses of the Fund reflect a waiver of fees by the Fund's investment advisor. Had such action not been taken, the operating expenses ratios would have been 1.35%, 1.30% and 1.95% for the periods ended October 31, 2006, October 31, 2005 and October 31, 2003.
(6) Not annualized.
(7) On March 1, 2006, the expense cap changed from 1.25% to 1.00%.
See Notes to Financial Statements.
Julius Baer Funds 2006 Annual Report
169
FINANCIAL HIGHLIGHTS
Julius Baer Global High Income Fund (formerly the Julius Baer Global High Yield Bond Fund)
For a share outstanding throughout each period
| | | Class I | |
| | | Year Ended October 31, | | Period
Ended
October 31, | |
| | | 2006 | | 2005 | | 2004 | | 2003(1) | |
| Net Asset Value, beginning of year | | $ | 11.61 | | | $ | 12.01 | | | $ | 11.36 | | | $ | 10.00 | | |
| Income from investment operations: | |
| Net investment income (2) | | | 0.70 | | | | 0.78 | | | | 0.73 | | | | 0.57 | | |
| Net realized and unrealized gain (loss) on investments | | | 0.40 | | | | (0.05 | ) | | | 0.72 | | | | 1.35 | | |
| Total income from investment operations | | | 1.10 | | | | 0.73 | | | | 1.45 | | | | 1.92 | | |
| Less distributions: | |
| From net investment income | | | (1.17 | ) | | | (0.98 | ) | | | (0.73 | ) | | | (0.56 | ) | |
| From net realized gains on investments | | | (0.88 | ) | | | (0.15 | ) | | | (0.07 | ) | | | — | | |
| Total Distributions | | | (2.05 | ) | | | (1.13 | ) | | | (0.80 | ) | | | (0.56 | ) | |
| Net Asset Value, end of year | | $ | 10.66 | | | $ | 11.61 | | | $ | 12.01 | | | $ | 11.36 | | |
| Total Return | | | 10.76 | % | | | 6.37 | % | | | 13.28 | % | | | 19.66 | %(6) | |
| Ratios/Supplemental Data: | |
| Net Assets, end of year (in 000's) | | $ | 35,100 | | | $ | 7,586 | | | $ | 45,636 | | | $ | 20,839 | | |
| Ratio of net investment income to average net assets | | | 6.61 | % | | | 6.47 | % | | | 6.24 | % | | | 6.91 | %(3) | |
| Ratio of expenses to average net assets (4)(7) | | | 0.81 | % | | | 1.03 | % | | | 0.97 | % | | | 1.02 | %(3) | |
| Ratio of expenses to average net assets (7) | | | 0.79 | %(5) | | | 1.00 | %(5) | | | 1.00 | % | | | 1.00 | %(3)(5) | |
| Portfolio turnover rate | | | 96 | % | | | 99 | % | | | 93 | % | | | 83 | %(6) | |
(1) Class I shares commenced operations on January 30, 2003.
(2) Based on average shares outstanding during the period.
(3) Annualized.
(4) Expense ratio without taking into consideration any expense reductions related to custody offset arrangement and reimbursement of expense previously assumed by the Fund's investment advisor.
(5) The net expenses of the Fund reflect a waiver of fees by the Fund's investment advisor. Had such an action not been taken, the operating expense ratios would have been 1.08%, 1.04% and 1.41% for the periods October 31, 2006, October 31, 2005 and October 31, 2003.
(6) Not annualized.
(7) On March 1, 2006, the expense cap changed from 1.00% to 0.75%.
See Notes to Financial Statements.
Julius Baer Funds 2006 Annual Report
170
FINANCIAL HIGHLIGHTS
Julius Baer U.S. Microcap Fund
For a share outstanding throughout each period
| | | Class A | |
| | | Period
Ended
October 31,
2006(1) | |
| Net Asset Value, beginning of period | | $ | 10.00 | | |
| Income from investment operations: | |
| Net investment loss (5) | | | (0.03 | ) | |
| Net realized and unrealized gain on investments | | | 1.29 | | |
| Total income from investment operations | | | 1.26 | | |
| Net Asset Value, end of period | | $ | 11.26 | | |
| Total Return | | | 12.60 | %(2) | |
| Ratios/Supplemental Data: | |
| Net Assets, end of period (in 000's) | | $ | 2,955 | | |
| Ratio of net investment loss to average net assets | | | (0.99 | )%(3) | |
| Ratio of expenses to average net assets | | | 1.80 | %(3)(4) | |
| Portfolio turnover rate | | | 19 | %(2) | |
(1) Commenced operations on July 24, 2006.
(2) Not annualized.
(3) Annualized.
(4) The net expenses of the Fund reflect a waiver of fees by the Fund's investment advisor. Had such action not been taken, the operating expense ratio would have been 4.52% for the period ended October 31, 2006.
(5) Based on average shares outstanding during the period.
See Notes to Financial Statements.
Julius Baer Funds 2006 Annual Report
171
FINANCIAL HIGHLIGHTS
Julius Baer U.S. Microcap Fund
For a share outstanding throughout each period
| | | Class I | |
| | | Period
Ended
October 31,
2006(1) | |
| Net Asset Value, beginning of period | | $ | 10.00 | | |
| Income from investment operations: | |
| Net investment loss (5) | | | (0.02 | ) | |
| Net realized and unrealized gain on investments | | | 1.29 | | |
| Total income from investment operations | | | 1.27 | | |
| Net Asset Value, end of period | | $ | 11.27 | | |
| Total Return | | | 12.60 | %(2) | |
| Ratios/Supplemental Data: | |
| Net Assets, end of period (in 000's) | | $ | 2,816 | | |
| Ratio of net investment loss to average net assets | | | (0.69 | )%(3) | |
| Ratio of expenses to average net assets | | | 1.50 | %(3)(4) | |
| Portfolio turnover rate | | | 19 | %(2) | |
(1) Commenced operations on July 24, 2006.
(2) Not annualized.
(3) Annualized.
(4) The net expenses of the Fund reflect a waiver of fees by the Fund's investment advisor. Had such action not been taken, the operating expense ratio would have been 4.03% for the period ended October 31, 2006.
(5) Based on average shares outstanding during the period.
See Notes to Financial Statements.
Julius Baer Funds 2006 Annual Report
172
FINANCIAL HIGHLIGHTS
Julius Baer U.S. Smallcap Fund
For a share outstanding throughout each period
| | | Class A | |
| | | Period
Ended
October 31,
2006(1) | |
| Net Asset Value, beginning of period | | $ | 10.00 | | |
| Income from investment operations: | |
| Net investment loss (5) | | | (0.01 | ) | |
| Net realized and unrealized gain on investments | | | 1.11 | | |
| Total income from investment operations | | | 1.10 | | |
| Net Asset Value, end of period | | $ | 11.10 | | |
| Total Return | | | 11.00 | %(2) | |
| Ratios/Supplemental Data: | |
| Net Assets, end of period (in 000's) | | $ | 2,807 | | |
| Ratio of net investment loss to average net assets | | | (0.29 | )%(3) | |
| Ratio of expenses to average net assets | | | 1.50 | %(3)(4) | |
| Portfolio turnover rate | | | 13 | %(2) | |
(1) Commenced operations on July 24, 2006.
(2) Not annualized.
(3) Annualized.
(4) The net expenses of the Fund reflect a waiver of fees by the Fund's investment advisor. Had such action not been taken, the operating expense ratio would have been 4.22% for the period ended October 31, 2006.
(5) Based on average shares outstanding during the period.
See Notes to Financial Statements.
Julius Baer Funds 2006 Annual Report
173
FINANCIAL HIGHLIGHTS
Julius Baer U.S. Smallcap Fund
For a share outstanding throughout each period
| | | Class I | |
| | | Period
Ended
October 31,
2006(1) | |
| Net Asset Value, beginning of period | | $ | 10.00 | | |
| Income from investment operations: | |
| Net investment income (5) | | | — | | |
| Net realized and unrealized gain on investments | | | 1.11 | | |
| Total income from investment operations | | | 1.11 | | |
| Net Asset Value, end of period | | $ | 11.11 | | |
| Total Return | | | 11.10 | %(2) | |
| Ratios/Supplemental Data: | |
| Net Assets, end of period (in 000's) | | $ | 2,777 | | |
| Ratio of net investment income to average net assets | | | 0.01 | %(3) | |
| Ratio of expenses to average net assets | | | 1.20 | %(3)(4) | |
| Portfolio turnover rate | | | 13 | %(2) | |
(1) Commenced operations on July 24, 2006.
(2) Not annualized.
(3) Annualized.
(4) The net expenses of the Fund reflect a waiver of fees by the Fund's investment advisor. Had such action not been taken, the operating expense ratio would have been 3.68% for the period ended October 31, 2006.
(5) Based on average shares outstanding during the period.
See Notes to Financial Statements.
Julius Baer Funds 2006 Annual Report
174
FINANCIAL HIGHLIGHTS
Julius Baer U.S. Midcap Fund
For a share outstanding throughout each period
| | | Class A | |
| | | Period
Ended
October 31,
2006(1) | |
| Net Asset Value, beginning of period | | $ | 10.00 | | |
| Income from investment operations: | |
| Net investment income (5) | | | 0.01 | | |
| Net realized and unrealized gain on investments | | | 1.04 | | |
| Total income from investment operations | | | 1.05 | | |
| Net Asset Value, end of period | | $ | 11.05 | | |
| Total Return | | | 10.50 | %(2) | |
| Ratios/Supplemental Data: | |
| Net Assets, end of period (in 000's) | | $ | 2,887 | | |
| Ratio of net investment income to average net assets | | | 0.52 | %(3) | |
| Ratio of expenses to average net assets | | | 1.35 | %(3)(4) | |
| Portfolio turnover rate | | | 11 | %(2) | |
(1) Commenced operations on July 24, 2006.
(2) Not annualized.
(3) Annualized.
(4) The net expenses of the Fund reflect a waiver of fees by the Fund's investment advisor. Had such action not been taken, the operating expense ratio would have been 3.94% for the period ended October 31, 2006.
(5) Based on average shares outstanding during the period.
See Notes to Financial Statements.
Julius Baer Funds 2006 Annual Report
175
FINANCIAL HIGHLIGHTS
Julius Baer U.S. Midcap Fund
For a share outstanding throughout each period
| | | Class I | |
| | | Period
Ended
October 31,
2006(1) | |
| Net Asset Value, beginning of period | | $ | 10.00 | | |
| Income from investment operations: | |
| Net investment income (5) | | | 0.01 | | |
| Net realized and unrealized gain on investments | | | 1.05 | | |
| Total income from investment operations | | | 1.06 | | |
| Net Asset Value, end of period | | $ | 11.06 | | |
| Total Return | | | 10.60 | %(2) | |
| Ratios/Supplemental Data: | |
| Net Assets, end of period (in 000's) | | $ | 2,765 | | |
| Ratio of net investment income to average net assets | | | 0.22 | %(3) | |
| Ratio of expenses to average net assets | | | 1.05 | %(3)(4) | |
| Portfolio turnover rate | | | 11 | %(2) | |
(1) Commenced operations on July 24, 2006.
(2) Not annualized.
(3) Annualized.
(4) The net expenses of the Fund reflect a waiver of fees by the Fund's investment advisor. Had such action not been taken, the operating expense ratio would have been 3.46% for the period ended October 31, 2006.
(5) Based on average shares outstanding during the period.
See Notes to Financial Statements.
Julius Baer Funds 2006 Annual Report
176
FINANCIAL HIGHLIGHTS
Julius Baer U.S. Multicap Fund
For a share outstanding throughout each period
| | | Class A | |
| | | Period
Ended
October 31,
2006(1) | |
| Net Asset Value, beginning of period | | $ | 10.00 | | |
| Income from investment operations: | |
| Net investment income (5) | | | — | | |
| Net realized and unrealized gain on investments | | | 1.10 | | |
| Total income from investment operations | | | 1.10 | | |
| Net Asset Value, end of period | | $ | 11.10 | | |
| Total Return | | | 11.00 | %(2) | |
| Ratios/Supplemental Data: | |
| Net Assets, end of period (in 000's) | | $ | 2,780 | | |
| Ratio of net investment loss to average net assets | | | (0.03 | )%(3) | |
| Ratio of expenses to average net assets | | | 1.30 | %(3)(4) | |
| Portfolio turnover rate | | | 15 | %(2) | |
(1) Commenced operations on July 24, 2006.
(2) Not Annualized.
(3) Annualized.
(4) The net expenses of the Fund reflect a waiver of fees by the Fund's investment advisor. Had such action not been taken, the operating expenses ratio would have been 3.87% for the period ended October 31, 2006.
(5) Amount was less than $0.01per share.
See Notes to Financial Statements.
Julius Baer Funds 2006 Annual Report
177
FINANCIAL HIGHLIGHTS
Julius Baer U.S. Multicap Fund
For a share outstanding throughout each period
| | | Class I | |
| | | Period
Ended
October 31,
2006(1) | |
| Net Asset Value, beginning of period | | $ | 10.00 | | |
| Income from investment operations: | |
| Net investment income (5) | | | 0.01 | | |
| Net realized and unrealized gain on investments | | | 1.10 | | |
| Total income from investment operations | | | 1.11 | | |
| Net Asset Value, end of period | | $ | 11.11 | | |
| Total Return | | | 11.10 | %(2) | |
| Ratios/Supplemental Data: | |
| Net Assets, end of period (in 000's) | | $ | 2,778 | | |
| Ratio of net investment income to average net assets | | | 0.27 | %(3) | |
| Ratio of expenses to average net assets | | | 1.00 | %(3)(4) | |
| Portfolio turnover rate | | | 15 | %(2) | |
(1) Commenced operations on July 24, 2006.
(2) Not Annualized.
(3) Annualized.
(4) The net expenses of the Fund reflect a waiver of fees by the Fund's investment advisor. Had such action not been taken, the operating expense ratio would have been 3.33% for the period ended October 31, 2006.
(5) Based on average shares outstanding during the period.
See Notes to Financial Statements.
Julius Baer Funds 2006 Annual Report
178
NOTES TO FINANCIAL STATEMENTS
1. Organization
The Julius Baer Funds consist of the Julius Baer Global Equity Fund Inc. ("Global Equity Fund") and the Julius Baer Investment Funds ( the "Trust"). As of October 31, 2006, the Julius Baer Funds consisted of nine funds (each a "Fund" and together, the "Funds").
The Global Equity Fund was incorporated under the laws of the State of Maryland on May 23, 1990 and is registered with the Securities and Exchange Commission ("SEC") under the Investment Company Act of 1940, as amended (the "1940 Act").
On July 1, 2004, the Fund changed its name from The European Warrant Fund, Inc. and converted from a close-end, non diversified investment company ("closed-end fund") to an open-end diversified investment company with a different investment objective, different investment strategies, different management team and a new investment adviser (an affiliate of the closed-end Fund's adviser). Until the close of business on June 30, 2004, the Fund operated as a closed-end Fund and its common stock (which then comprised of a single share class) was listed on the NYSE. After the close of business on June 30, 2004, all of the common stock was converted into Class A shares of the Fund, and the Fund began seeking to maximize total return principally through capital appreciation by investing in a diversified portfolio of equity securities of issuers located throughout the world. For periods prior thereto, all historical performance information for Class A shares reflects the Net Asset Value (NAV) performance of the Fund's common stock while it was a closed-end fund.
The Trust is registered with the SEC under the 1940 Act, as an open-end management investment company. As of October 31, 2006, the Trust offered eight investment funds: Julius Baer International Equity Fund (the "International Equity Fund"), Julius Baer International Equity Fund II (the "International Equity Fund II"), Julius Baer Total Return Bond Fund (the "Total Return Bond Fund"), Julius Baer Global High Income Fund (the "Global High Income Fund") (formerly known as the Julius Baer Global High Yield Bond Fund), Julius Baer U.S. Microcap Fund (the "U.S. Microcap Fund"), Julius Baer U.S. Smallcap Fund (the "U.S. Smallcap Fund"), Julius Baer U.S. Midcap Fund (the "U.S. Midcap Fund") and Julius Baer U.S. Multicap Fund (the "U.S. Multicap Fund"). On July 24, 2006 Julius Baer U.S. Microcap Fund, Julius Baer U.S. Smallcap Fund, Julius Baer U.S. Midcap Fund and the Julius Baer U.S. Multicap Fund commenced operations. On September 15, 2006, the J ulius Baer Global High Yield Bond Fund changed its name to Julius Baer Global High Income Fund.
The International Equity Fund is closed to new shareholders (at the account level). This excludes 401(k) plans that have existing investments in the Fund through related
Julius Baer Funds 2006 Annual Report
179
NOTES TO FINANCIAL STATEMENTS (Continued)
401(k) plans and new plan participants within 401(k) plans that hold positions in the Fund. In addition, existing shareholders may continue to invest.
Each Fund offers two share classes, Class A and Class I. The two classes of shares are offered to different types of investors and have different expense structures, as outlined in the Funds' Prospectus. Each class of shares has exclusive voting rights with respect to matters that affect that class. Income, realized gains and losses, unrealized appreciation and depreciation, and expenses that are not attributable to a specific class are allocated daily to each class based on its relative net assets. Expenses directly attributable to a Fund are charged to that Fund. Other expenses are allocated to the respective Fund based on average daily net assets.
Each Fund has distinct investment objectives. The following are the objectives for the Funds that are covered in this report:
| Fund Name | | Investment Objective | |
| Global Equity Fund | | Seeks to maximize total return, primarily through capital appreciation. | |
|
| International Equity Fund | | Seeks long-term growth of capital. | |
|
| International Equity Fund II | | Seeks long-term growth of capital. | |
|
| Total Return Bond Fund | | Seeks to provide total return, which consists of two components: (1) changes in the market value of the Fund's portfolio securities (both realized and unrealized appreciation/depreciation) and (2) income received from its portfolio securities. | |
|
| Global High Income Fund | | Seeks to maximize total return, principally through a high level of current income, and secondarily through capital appreciation. | |
|
| U.S. Microcap Fund | | Seeks to achieve long-term growth of capital. | |
|
| U.S. Smallcap Fund | | Seeks to achieve long-term growth of capital. | |
|
| U.S. Midcap Fund | | Seeks to achieve long-term growth of capital. | |
|
| U.S. Multicap Fund | | Seeks to achieve long-term growth of capital. | |
|
2. Significant Accounting Policies
The following is a summary of significant accounting policies consistently followed by the Funds in the preparation of their financial statements. The presentation of financial statements in conformity with U.S. generally accepted accounting principles requires management to make estimates and assumptions that affect the reported amounts of assets and liabilities and disclosure of contingent assets and liabilities at the
Julius Baer Funds 2006 Annual Report
180
NOTES TO FINANCIAL STATEMENTS (Continued)
date of the financial statements and the reported amounts of revenue and expenses during the reporting period. Actual results could differ from these estimates.
a) Portfolio valuation: Each Fund's investments are valued at market. Equity securities, which are traded primarily on a U.S. or foreign stock exchange are valued at the last sale price on that exchange or, if there were no sales during the day, at the mean of the current quoted bid and asked prices. Portfolio securities which are traded primarily on foreign securities exchanges are generally valued at the preceding closing values of such securities on their respective exchanges, except that when a significant event subsequent to that time is likely to have changed such value, including substantial changes in the values of U.S. markets subsequent to the close of a foreign market. In these circumstances, the fair value of those securities will be determined by consideration of other factors by or under the direction of the Global Equity Fund's Board of Directors, t he Trust's Board of Trustees (the "Board" and collectively, the "Boards") or their respective delegates. Debt securities (other than government securities and short-term obligations) are valued by independent pricing services approved by the respective Board. Investments in government securities (other than short-term securities) are valued at the mean of the quoted bid and asked prices in the over-the-counter market. Short-term investments that mature in 60 days or less are valued at amortized cost. Any securities for which market quotations are not readily available, or for which a significant event has occurred since the time of the most recent market quotations, are valued in accordance with fair value pricing approved by the respective Board. To the extent each Fund invests in other open-end funds, the Fund will calculate its NAV based upon the NAV of the underlying funds in which it invests. The prospectuses of these underlying funds explain the circumstances under which they will use fair value pricin g and the effects of such fair value pricing.
The Boards have identified certain circumstances in which the use of fair value pricing method is necessary. In such circumstances, the Boards have also approved an independent fair value service for foreign equities, which may provide the fair value price. For options and warrants, a fair value price may be determined using an industry accepted modeling tool. In addition, the Funds' Pricing Committees may determine a fair value price, subject to the approval of the respective Board, based upon factors that include the type of the security, the initial cost of the security and price quotations from dealers and/or pricing services in similar securities or in similar markets.
Julius Baer Funds 2006 Annual Report
181
NOTES TO FINANCIAL STATEMENTS (Continued)
b) Repurchase agreements: The Funds may engage in repurchase agreement transactions. Under the terms of a typical repurchase agreement, a Fund takes possession of an underlying debt obligation in return for the use of the Fund's available cash, subject to an obligation of the seller to repurchase and the Fund to resell the obligation, at an agreed-upon price and time. Thus, the yield during the Fund's holding period is determinable. This arrangement results in a fixed rate of return that is not subject to market fluctuations during a Fund's holding period. The value of the collateral at all times is equal to at least 100% of the total amount of the repurchase obligations, including accrued interest. In the event of counterparty default, the Fund has the right to use the collateral to offset losses incurred. There is potential loss to a Fund in the event the Fund i s delayed or prevented from exercising its rights to dispose of the collateral securities, including the risk of a possible decline in the value of the underlying securities during the period in which the Fund seeks to assert its rights. The Funds' investment advisor reviews the value of the collateral and the creditworthiness of those banks and dealers with whom the Funds enter into repurchase agreements to evaluate potential risks.
c) Foreign currency: The books and records of the Funds are maintained in U.S. dollars. Foreign currencies and investments and other assets and liabilities denominated in foreign currencies are translated into U.S. dollars at the exchange rates prevailing at the end of the period, purchases and sales of investment securities and income and expenses are translated on the respective dates of such transactions. Unrealized gains or losses on investments which result from changes in foreign currencies have been included in the net unrealized appreciation (depreciation) of investments. Net realized currency gains and losses include foreign currency gains and losses between trade date and settlement date on investment securities transactions, gains and losses from foreign currency transactions and the gains and losses from differences between the amounts of interest and dividends recorded on the books of the Funds and the amounts actually received. The portion of foreign currency gains and losses related to fluctuations in exchange rates between the purchase trade date and sale trade date is included in realized gains and losses on security transactions.
d) Forward foreign currency contracts: Forward foreign currency contracts are valued at the forward rate and are marked-to-market at each valuation date. The change in market value is recorded by a Fund as an unrealized gain or loss. When the contract is closed, a Fund records a realized gain or loss equal to the difference between the value of the contract at the time it was opened and the value at the time it was closed.
Julius Baer Funds 2006 Annual Report
182
NOTES TO FINANCIAL STATEMENTS (Continued)
As part of its investment strategy, a Fund may enter into forward foreign currency contracts to manage a Fund's portfolio holdings against currency risks. A Fund may also utilize forward foreign currency contracts to reduce or eliminate an underweighted position in a currency relative to its benchmark when purchasing underlying equities denominated in that currency is not advisable by the advisor. With respect to a Fund's obligations to purchase or sell currencies under forward foreign currency contracts, a Fund will either deposit with its custodian in a segregated account cash or other liquid securities having a value at least equal to its obligations, or continue to own or have the right to sell or acquire respectively, the currency subject to the forward foreign currency contract.
The use of forward foreign currency contracts does not eliminate fluctuations in the underlying prices of a Fund's portfolio securities, but it does establish a rate of exchange that can be achieved in the future. Although forward foreign currency contracts limit the risk of loss due to a decline in the value of the currency holdings, they also limit any potential gain that might result should the value of the currency increase. In addition, a Fund could be exposed to risks if the counterparties to the contracts are unable to meet the terms of the contracts.
e) Financial Futures Contracts: In order to gain exposure to or protect against changes in security values, the Funds may buy and sell futures contracts. The primary risks associated with the use of futures contracts are the imperfect correlation between changes in market values of securities held by the Funds and the prices of future contracts, and the possibility of an illiquid market.
Futures contracts are valued based upon their quoted daily settlement prices. The aggregate principal amounts of the contracts are not recorded in the financial statements. The Funds agree to receive from or pay to the broker an amount of cash equal to the daily fluctuations in the value of the contract. Such receipts or payments are known as "variation margin" and are recorded by a fund as unrealized gains or losses. Fluctuations in the value of the contracts are recorded in the Statement of Assets and Liabilities as an asset or liability and in the Statement of Operations as unrealized gains or losses until the contracts are closed, at which point they are recorded as net realized gains or losses on futures contracts. (see Note 12 for outstanding futures contracts at October 31, 2006)
f) Options: The Funds may write options to generate current income and to manage investment risk. Each Fund may write put and call options on up to 25% of the net
Julius Baer Funds 2006 Annual Report
183
NOTES TO FINANCIAL STATEMENTS (Continued)
asset value of the securities in its portfolio and will realize fees (referred to as "premiums") for granting the rights evidenced by the options. When a Fund writes a call option or a put option, an amount equal to the premium received by that Fund is recorded as a liability, the value of which is marked-to-market at each valuation date. When a written option expires, that Fund realizes a gain equal to the amount of the premium originally received. When a Fund enters into a closing purchase transaction, the Fund realizes a gain (or loss if the cost of the closing purchase transaction exceeds the premium originally received when the option was sold/written) without regard to any unrealized gain or loss on the underlying security, and the liability related to such option is eliminated. When a call option is exercised, a Fund realizes a gain or loss from the sale of the underlying security and the proceeds from such sale are increased by the a mount of the premium originally received. When a put option is exercised, the amount of the premium originally received will reduce the cost of the security which that Fund purchased upon exercise. The Funds will write only covered options.
The Funds may purchase put and call options that are traded on foreign as well as U.S. exchanges and in the over-the-counter market. Each Fund may utilize up to 2% of its assets to purchase both put and call options on portfolio securities. Purchases of put and call options are recorded as an investment, the value of which is marked-to-market at each valuation date. When a purchased option expires, no proceeds will be expected and a Fund will realize a loss. When a fund exercises a put option, it will realize a gain or loss from the sale of the underlying security and the proceeds from such sale will be decreased by the premium originally paid. When a Fund exercises a call option, the cost of the security which the Fund purchases upon exercise will be increased by the premium originally paid.
All the funds except the Total Return Bond Fund may purchase and sell call and put options on stock indices. A Fund's possible loss, in either case will be limited to the premium paid for the option, plus related transaction costs. In contrast to an option on a security, an option on a stock index provides the holder with the right but not the obligation to make or receive a cash settlement upon exercise of the option, rather than the right to purchase or sell a security. The amount of this settlement is equal to (i) the amount, if any, by which the fixed exercise price of the option exceeds (in the case of a call) or is below (in the case of a put) the closing value of the underlying index on the date of exercise, multiplied by (ii) a fixed "index multiplier."
Julius Baer Funds 2006 Annual Report
184
NOTES TO FINANCIAL STATEMENTS (Continued)
The risk associated with purchasing options is limited to the premium originally paid. The risk in writing a call option is that a Fund may forego the opportunity for profit if the market price of the underlying security increases and the option is exercised. The risk in writing a put option is that a Fund may incur a loss if the market price of the underlying security decreases and the option is exercised. There is also the risk a Fund may not be able to enter into a closing transaction because of an illiquid secondary market. In addition, a Fund could be exposed to risks if the counterparties to the transaction are unable to meet the terms of the contracts.
g) Swaps: The Funds may enter into interest rate, currency, index, total return and credit default swaps. The Funds expect to enter into these transactions primarily to preserve a return or spread on a particular investment or portion of its portfolio, to protect against currency fluctuations, as a duration management technique or to protect against any increase in the price of securities the Funds anticipate purchasing at a later date. Interest rate swaps involve the exchange with another party of their respective commitments to pay or receive interest, for example, an exchange of floating rate payments for fixed rate payments with respect to a notional amount of principal. A currency swap is an agreement to exchange cash flows on a notional amount of two or more currencies based on the relative value differential among them and an index swap is an agreement to s wap cash flows on a notional amount based on changes in the values of the reference indices. A total return swap is an agreement to exchange the return on a stock, bond or index for a fixed or variable financing charge. A credit default swap is an agreement between two counterparties that allows one counterparty to be "long" a third-party credit risk, and the other counterparty to be "short" the credit risk. Credit default swaps are designed to transfer the credit exposure of fixed income products between parties.
The Funds will usually enter into swaps on a net basis, that is, the two payment streams are netted out in a cash settlement on the payment date or dates specified in the instrument, with a Fund receiving or paying, as the case may be, only the net amount of the two payments. Inasmuch as these swaps are entered into for good faith hedging purposes, the investment advisor believes such obligations do not constitute senior securities under the 1940 Act, and, accordingly, will not treat them as being subject to its borrowing restrictions. The Funds will not enter into any swap transaction unless, at the time of entering into such transaction, the unsecured long-term debt of the counterparty, combined with any credit enhancements, is rated at least A by S&P or Moody's or has an equivalent rating from a NRSRO or is
Julius Baer Funds 2006 Annual Report
185
NOTES TO FINANCIAL STATEMENTS (Continued)
determined to be of equivalent credit quality by the investment advisor. If there is a default by the counterparty, the Funds may have contractual remedies pursuant to the agreements related to the transaction.
h) Securities Lending: The Global Equity Fund, the International Equity Fund, the International Equity Fund II, the U.S. Microcap Fund, the U.S. Smallcap Fund, the U.S. Midcap Fund and the U.S. Multicap Fund have established securities lending agreements with Investors Bank & Trust Company in which the Funds lend portfolio securities to a broker in exchange for collateral consisting of either cash or U.S. government securities in an amount at least equal to 100% of the market value of the securities on loan. These Funds may loan securities to brokers, dealers, and financial institutions determined by the Julius Baer Investment Management LLC ("JBIM" or "Advisor") to be creditworthy, subject to certain limitations. Under these agreements, these Funds continue to earn income on the securities loaned. Collateral received is generally cash, and such Funds invest t he cash and receive any interest on the amount invested, but they must also pay the broker a loan rebate fee computed as a varying percentage of the collateral received. In the event of counterparty default, these Funds are subject to potential loss if any such Fund is delayed or prevented from exercising its right to dispose of the collateral. These Funds each bear risk in the event that invested collateral is not sufficient to meet obligations due on the loans.
i) Securities transactions and investment income: Securities transactions are recorded as of the trade date. Realized gains and losses from securities transactions are recorded on the identified cost basis. Interest income is recorded on an accrual basis and includes amortization and accretion of bond premiums and discounts, respectively, using effective interest method. Dividend income is recorded in the statement of operations on the ex-dividend date or when the Fund becomes aware of dividend distribution. It is expected that certain capital gains earned by the Funds and certain dividends and interest received by the Funds will be subject to foreign withholding taxes.
j) Dividends and distributions to shareholders: Distributions to shareholders are recorded on the ex-dividend date. Each Fund intends to distribute annually to its shareholders substantially all of its taxable income. The Total Return Bond Fund and the Global High Income Fund declare and pay monthly dividends. The International Equity Fund, the International Equity Fund II, the Global Equity Fund, the U.S. Microcap Fund, the U.S. Smallcap Fund, the U.S. Multicap Fund and the U.S. Midcap Fund declare and pay dividends from net investment income, if any, annually. The Funds will distribute net realized capital gains, if any, annually. Additional distributions of net
Julius Baer Funds 2006 Annual Report
186
NOTES TO FINANCIAL STATEMENTS (Continued)
investment income and capital gains may be made at the discretion of the Board of the Funds to avoid the application of the excise tax imposed under Section 4982 of the Internal Revenue Code of 1986, as amended, for certain undistributed amounts. Income distributions and capital gain distributions are determined in accordance with income tax regulations which may differ from generally accepted accounting principles. These differences are primarily due to differing treatments of income and gains on various investment securities held by the Funds, timing differences and differing characterization of distributions made by the Funds as a whole.
k) Federal income taxes: The Global Equity Fund and the Trust intend that each Fund separately qualify as a regulated investment company for U.S. federal income tax purposes. Accordingly, the Funds do not anticipate that any income taxes will be paid.
l) Bank Loans: The Global High Income Fund may invest in Bank Loans. Bank Loans include institutionally traded floating and fixed-rate debt securities general acquired as a participation interest in or assignment of a loan originated by a lender or financial institution. Assignments and participations involve credit, interest rate, and liquidity risk. Interest rates on floating rate securities adjust with interest rate changes and/or issuer credit quality. Many such loans are secured, although some may be unsecured. Loans that are fully secured offer a fund more protection than an unsecured loan in the event of non-payment of scheduled interest or principal. There is no assurance that any collateral securing a loan could be liquidated or, if liquidated, that such collateral would be of sufficient value to repay the loans taken against it. There may be limited seco ndary market liquidity for these instruments which could result in volatile pricing for the securities which in turn may affect this Fund's NAV.
3. Investment Advisory Fee and Other Transactions
Julius Baer Investment Management LLC ("JBIM" or "Advisor") serves as the Funds' investment advisor. The Global Equity Fund pays JBIM a fee at an annual rate of 0.90% of average daily net assets.The International Equity Fund pays JBIM a fee at an annual rate of 0.90% for the first $7.5 billion dollars of average daily next assets, 0.88% for the next $2.5 billion dollars of average daily net assets and 0.85% for average daily net assets over $10.0 billion dollars. The Total Return Bond Fund, the Global High Income Fund and the International Equity Fund II pay JBIM a fee at an annual rate of 0.45%, 0.75% and 0.90% of average daily net assets, respectively. The U.S.
Julius Baer Funds 2006 Annual Report
187
NOTES TO FINANCIAL STATEMENTS (Continued)
Microcap Fund, the U.S. Smallcap Fund, the U.S. Midcap Fund and the U.S. Multicap Fund pay JBIM a fee at an annual rate of 1.25%, 0.95%, 0.80% and 0.75% of average daily net assets, respectively.
Commencing on March 1, 2005, the Advisor contractually agreed to reimburse certain expenses of the Global Equity Fund so that the net annual expenses of the Global Equity Fund based on average net assets were limited to 1.40% and 1.15% of the Class A and Class I shares, respectively.
Commencing March 1, 2006, January 1, 2005 and March 1, 2006, the Advisor has contractually agreed to reimburse certain expenses of the International Equity Fund II, the Total Return Bond Fund and the Global High Income Fund, respectively, through February 28, 2007, so that the net operating expenses of each Fund (excluding interest, taxes, brokerage commissions, and extraordinary expenses) based on average net assets are limited (the "Expense Limit") as specified in the table below. Commencing July 24, 2006, the Advisor has contractually agreed to reimburse certain expenses of the U.S. Microcap Fund, the U.S. Smallcap Fund, the U.S. Midcap Fund and the U.S. Multicap Fund respectively, through February 28, 2008, so that the net operating expenses of the each Fund (excluding interest, taxes, brokerage commissions, and extraordinary expenses) based on average net assets are limited (the "Expense Limit") as specified in the table below. In addit ion, any Fund with a reimbursement plan has agreed to allow the Advisor to recoup expenses reimbursed to each Fund provided that repayment does not cause each of the Fund's annual operating expenses to exceed the Expense Limit. Any such recoupment must be made within three years after the year in which the Advisor incurred the expense. The table below specifies the reimbursement made to each Fund by the Advisor for the period ended October 31, 2006 and the Advisor's potential recoupment as of October 31, 2006.
| | | Expense
Limitations | | Reimbursement
made by
Advisor
Beginning | | Expenses
Waived-
Current | | Waivers
Recouped-
Current | | Waivers
Expired
October 31, | | Total
Expenses
Eligible
for
Recoupment-
October 31, | |
| Fund | | Class A | | Class I | | of Year | | Year | | Year | | 2006 | | 2006 | |
Global Equity
Fund | | | 1.40 | % | | | 1.15 | % | | $ | 836,280 | | | $ | 422,846 | | | $ | — | | | $ | — | | | $ | 1,259,126 | | |
International
Equity Fund II | | | 1.32 | % | | | 1.05 | % | | | 403,870 | | | | — | | | | (206,916 | ) | | | — | | | | 196,954 | | |
Total Return
Bond Fund | | | 0.69 | % | | | 0.44 | % | | | 292,108 | | | | 386,741 | | | | — | | | | — | | | | 678,849 | | |
Julius Baer Funds 2006 Annual Report
188
NOTES TO FINANCIAL STATEMENTS (Continued)
| | | Expense
Limitations | | Reimbursement
made by
Advisor
Beginning | | Expenses
Waived-
Current | | Waivers
Recouped-
Current | | Waivers
Expired
October 31, | | Total
Expenses
Eligible
for
Recoupment-
October 31, | |
| Fund | | Class A | | Class I | | of Year | | Year | | Year | | 2006 | | 2006 | |
Global High
Income Fund | | | 1.00 | % | | | 0.75 | % | | $ | 109,461 | | | $ | 143,847 | | | $ | — | | | $ | (81,423 | ) | | $ | 171,885 | | |
U.S. Microcap
Fund | | | 1.80 | % | | | 1.50 | % | | | — | | | | 37,233 | | | | — | | | | — | | | | 37,233 | | |
U.S. Smallcap
Fund | | | 1.50 | % | | | 1.20 | % | | | — | | | | 37,032 | | | | — | | | | — | | | | 37,032 | | |
U.S. Midcap
Fund | | | 1.35 | % | | | 1.05 | % | | | — | | | | 35,848 | | | | — | | | | — | | | | 35,848 | | |
U.S. Multicap
Fund | | | 1.30 | % | | | 1.00 | % | | | — | | | | 35,018 | | | | — | | | | — | | | | 35,018 | | |
The expenses eligible for recoupment at October 31, 2006 are set to expire as follows:
| Fund | | Amount | | Expires
October 31, | |
| Global Equity Fund | | $ | 253,584 | | | | 2007 | | |
| | | | 582,696 | | | | 2008 | | |
| | | | 422,846 | | | | 2009 | | |
| International Equity Fund II | | $ | 196,954 | | | | 2008 | | |
| Total Return Bond Fund | | $ | 292,108 | | | | 2008 | | |
| | | | 386,741 | | | | 2009 | | |
| Global High Income Fund | | $ | 28,038 | | | | 2008 | | |
| | | | 143,847 | | | | 2009 | | |
| U.S. Microcap Fund | | $ | 37,233 | | | | 2009 | | |
| U.S. Smallcap Fund | | $ | 37,032 | | | | 2009 | | |
| U.S. Midcap Fund | | $ | 35,848 | | | | 2009 | | |
| U.S. Multicap Fund | | $ | 35,018 | | | | 2009 | | |
For the year ended October 31, 2006, the Global Equity Fund incurred total brokerage commissions of $164,569 of which $138 was paid to Kepler Equities, an affiliated broker dealer of the Advisor. Kepler Equities was an affiliated broker dealer through July 1, 2006.
For the year ended October 31, 2006, the International Equity Fund incurred total brokerage commissions of $34,883,977 of which $553,724 was paid to Kepler Equities, an affiliated broker dealer of the Advisor. Kepler Equities was an affiliated broker dealer through July 1, 2006.
Julius Baer Funds 2006 Annual Report
189
NOTES TO FINANCIAL STATEMENTS (Continued)
For the year ended October 31, 2006, the International Equity Fund II incurred total brokerage commissions of $5,101,306 of which $18,354 was paid to Kepler Equities, an affiliated broker dealers of the Advisor. Kepler Equities was an affiliated broker dealer through July 1, 2006.
During the year ended October 31, 2006, the Advisor reimbursed the Global Equity Fund and the International Equity for losses incurred on certain security transactions in the amount of $1,442 and $60,198. These reimbursement amounts are included in realized gains on investments in the fund's Statements of Operations. These reimbursements had no effect on the total return of the Funds.
The Funds entered into expense offset arrangements as part of their custody agreement with Investors Bank & Trust Company (the "Bank"). Under this agreement, each Fund's custody fees were reduced by $10,396, $8,984,383, $195,667, $15,765, and $9,904 respectively for the Global Equity Fund, International Equity Fund, International Equity Fund II, Total Return Bond Fund and the Global High Income Fund.
In June 2005, the Funds adopted a commission recapture program with Russell Implementation Services, Inc. Under the program, a percentage of commissions generated by the portfolio transactions of a Fund is rebated to that Fund by the broker-dealers and are recorded as short-term security gains. The commission recapture amounts for the Funds during the year ended October 31, 2006 were as follows:
| Fund | | Broker Commission
Recaptured
during the
year ended
October 31, 2006 | |
| Global Equity Fund | | $ | 2,083 | | |
| International Equity Fund | | | 301,195 | | |
| International Equity Fund II | | | 66,379 | | |
4. Distribution and Shareholder Servicing Plan
The Funds have adopted a Shareholder Services Plan and a Distribution Plan (the "Plans") for the Class A shares pursuant to Rule 12b-1 under the 1940 Act. Under the Plans, the Funds may compensate certain financial institutions, including the distributor, for certain distribution, shareholder servicing, administrative and accounting services for their clients and customers who are beneficial owners of each
Julius Baer Funds 2006 Annual Report
190
NOTES TO FINANCIAL STATEMENTS (Continued)
of the Funds' Class A Shares. A Fund may expend an aggregate amount, on an annual basis, not to exceed 0.25% of the value of the average daily net assets of a Fund attributable to Class A Shares. The Advisor may pay additional marketing and other distribution costs out of their profits.
Quasar Distributors, LLC ("Quasar" or "Distributor") is the Distributor of the Funds' shares.
Under their terms, the Funds' Plans shall remain in effect from year to year, provided such continuance is approved annually by a vote of a majority of the Directors/Trustees and a majority of those Directors/Trustees who are not "interested persons" of the Funds and who have no direct or indirect financial interest in the operation of the Plans or in any agreement related to the Plans.
5. Purchases and Sales of Securities
Cost of purchases and proceeds from sales (including paydowns) of securities, excluding short-term investments, during the year ended October 31, 2006 were as follows:
| | | Cost of
Purchases | | Proceeds
from Sales | |
| Global Equity Fund | | $ | 81,943,330 | | | $ | 82,077,235 | | |
| International Equity Fund | | | 11,533,258,774 | | | | 10,620,258,281 | | |
| International Equity Fund II | | | 3,279,300,214 | | | | 995,261,034 | | |
| Total Return Bond Fund | | | 2,000,929,371 | | | | 1,528,203,351 | | |
| Global High Income Fund | | | 79,174,381 | | | | 43,687,790 | | |
| U.S. Microcap Fund | | | 6,097,358 | | | | 987,299 | | |
| U.S. Smallcap Fund | | | 5,718,111 | | | | 662,082 | | |
| U.S. Midcap Fund | | | 5,630,774 | | | | 565,634 | | |
| U.S. Multicap Fund | | | 5,797,475 | | | | 782,635 | | |
Cost of purchases and proceeds from sales of long-term U.S. Government securities during the period ended October 31, 2006 were $1,259,336,965 and $1,098,756,176, respectively for the Total Return Bond Fund.
Julius Baer Funds 2006 Annual Report
191
NOTES TO FINANCIAL STATEMENTS (Continued)
At October 31, 2006, net unrealized appreciation/depreciation for federal income tax purposes is comprised of the following components:
| |
Federal
Income Tax
Cost | |
Gross
Unrealized
Appreciation | |
Gross
Unrealized
Depreciation | | Tax Basis
Net Unrealized
Appreciation/
(Depreciation) | |
| Global Equity Fund | | $ | 58,284,022 | | | $ | 4,231,915 | | | $ | (866,417 | ) | | $ | 3,365,498 | | |
| International Equity Fund | | | 15,458,013,233 | | | | 5,157,100,676 | | | | (149,865,734 | ) | | | 5,007,234,942 | | |
| International Equity Fund II | | | 2,962,333,921 | | | | 346,727,265 | | | | (21,177,134 | ) | | | 325,550,131 | | |
| Total Return Bond Fund | | | 643,592,687 | | | | 5,151,431 | | | | (572,386 | ) | | | 4,579,045 | | |
| Global High Income Fund | | | 77,181,544 | | | | 2,001,374 | | | | (292,312 | ) | | | 1,709,062 | | |
| U.S. Microcap Fund | | | 5,212,516 | | | | 694,842 | | | | (58,584 | ) | | | 636,258 | | |
| U.S. Smallcap Fund | | | 5,199,620 | | | | 559,181 | | | | (95,701 | ) | | | 463,480 | | |
| U.S. Midcap Fund | | | 5,266,403 | | | | 581,549 | | | | (70,624 | ) | | | 510,925 | | |
| U.S. Multicap Fund | | | 5,119,132 | | | | 568,548 | | | | (39,495 | ) | | | 529,053 | | |
Thacher Proffitt & Wood LLP are the legal counsel for the Funds and certain individuals of this firm served as principal officers of the Funds until November 11, 2005. The following fees were paid by the Funds during the period November 1, 2005 to November 30, 2005:
| Fund | �� | Fund Fees paid to Thacher
Proffitt & Wood LLP
during the period
from November 1, 2005
to November 30, 2005 | |
| Global Equity Fund | | $ | 133 | | |
| International Equity Fund | | | 42,931 | | |
| International Equity Fund II | | | 1,627 | | |
| Total Return Bond Fund | | | 565 | | |
| Global High Income Fund | | | 111 | | |
6. Investments in Affiliated Issuers
An affiliated issuer, as defined under 1940 Act is one in which a Fund's holdings of an issuer represents 5% or more of the outstanding voting securities of the issuer. A summary of International Equity Fund's investments in securities of these issuers for the period ended October 31, 2006, is set forth below:
Affiliate | | Shares Held
October 31,
2006 | |
Purchases
(Cost) | |
Proceeds
Sales | |
Dividend
Income | | Market Value
October 31,
2006 | |
| Agora SA | | | 3,085,052 | | | $ | 32,627,172 | | | $ | — | | | $ | 412,239 | | | $ | 29,020,357 | | |
| AIK Banka AD | | | 344,461 | | | $ | 15,211,215 | | | $ | — | | | $ | 63,864 | | | $ | 28,288,232 | | |
| Alpha Cement JSC | | | 433,831 | | | $ | 28,199,015 | | | $ | — | | | $ | — | | | $ | 28,199,015 | | |
| Bank Forum JSC | | | 3,601,515 | | | $ | 23,925,044 | | | $ | — | | | $ | — | | | $ | 23,950,522 | | |
Julius Baer Funds 2006 Annual Report
192
NOTES TO FINANCIAL STATEMENTS (Continued)
Affiliate | | Shares Held
October 31,
2006 | |
Purchases
(Cost) | |
Proceeds
Sales | |
Dividend
Income | | Market Value
October 31,
2006 | |
Beijing Capital
International
Airport – Class H | | | 77,347,451 | | | $ | 24,486,785 | | | $ | 637,790 | | | $ | 1,197,164 | | | $ | 49,608,147 | | |
| Clear Media | | | 30,433,082 | | | $ | 7,109,150 | | | $ | — | | | $ | — | | | $ | 42,636,238 | | |
Compania Anonima
Nacional Telefonos
De Venezuela – ADR | | | 3,536,369 | | | $ | 45,545,800 | | | $ | — | | | $ | 5,326,033 | | | $ | 68,640,922 | | |
| Compa-Sibiu | | | 7,773,600 | | | $ | 1,290,627 | | | $ | — | | | $ | — | | | $ | 3,639,643 | | |
| Condmag | | | 16,622,500 | | | $ | 4,544,913 | | | $ | — | | | $ | — | | | $ | 5,037,670 | | |
| Curanum AG | | | 1,650,000 | | | $ | 15,854,755 | | | $ | — | | | $ | 175,162 | | | $ | 16,889,940 | | |
DZI Insurance &
Reinsurance | | | 212,919 | | | $ | 940,319 | | | $ | — | | | $ | 192,446 | | | $ | 19,177,510 | | |
HK – Ruokatalo
Oyj – Class A | | | 1,467,618 | | | $ | 20,512,048 | | | $ | — | | | $ | 357,194 | | | $ | 21,073,435 | | |
| Impact SA | | | 59,449,499 | | | $ | 3,897,748 | | | $ | — | | | $ | — | | | $ | 12,406,889 | | |
| Inter Cars | | | 882,334 | | | $ | 2,309,529 | | | $ | — | | | $ | — | | | $ | 11,192,520 | | |
| Lutsk Automobile | | | 69,861,005 | | | $ | 6,889,727 | | | $ | — | | | $ | — | | | $ | 6,636,795 | | |
Mercantil Servicios
Financios CA | | | 19,969,105 | | | $ | 32,567,481 | | | $ | 1,572 | | | $ | 1,431,364 | | | $ | 43,708,282 | | |
| Olvi Oyj | | | 789,582 | | | $ | 12,629,422 | | | $ | — | | | $ | 349,971 | | | $ | 19,248,655 | | |
Polska Grupa
Farmaceutyczna | | | 583,884 | | | $ | 1,119,914 | | | $ | — | | | $ | 344,700 | | | $ | 14,457,384 | | |
| Royal UNIBREW | | | 335,340 | | | $ | — | | | $ | — | | | $ | 426,598 | | | $ | 38,762,651 | | |
Shenzen Chiwan
Wharf Holdings | | | 10,867,372 | | | $ | 10,451,218 | | | $ | — | | | $ | 1,012,792 | | | $ | 17,725,260 | | |
| Spazio Investment | | | 2,155,992 | | | $ | 37,500,008 | | | $ | 3,827,449 | | | $ | — | | | $ | 36,929,161 | | |
| Stalexport SA | | | 10,000,000 | | | $ | 8,987,721 | | | $ | — | | | $ | — | | | $ | 9,785,671 | | |
| Tigar AD | | | 130,820 | | | $ | 3,761,501 | | | $ | — | | | $ | 44,589 | | | $ | 3,678,650 | | |
| Ukrinbank | | | 1,328,616,000 | | | $ | 11,743,333 | | | $ | — | | | $ | — | | | $ | 14,614,776 | | |
| Wumart Stores – Class H | | | 27,342,132 | | | $ | 9,216,998 | | | $ | 6,912,748 | | | $ | 153,374 | | | $ | 25,478,674 | | |
Julius Baer Funds 2006 Annual Report
193
NOTES TO FINANCIAL STATEMENTS (Continued)
7. Shares of Beneficial Interest
The Global Equity Fund may issue 50,000,000,000 of shares of beneficial interest, with a par value of $.001 per share. The Funds of the Trust may issue an unlimited number of shares of beneficial interest of each Fund, with a par value of $.001 per share. Changes in outstanding shares of beneficial interest on the Funds were as follows:
| | | Year Ended
October 31, 2006 | | Year Ended
October 31, 2005 | |
| | | Shares | | Amount | | Shares | | Amount | |
| Global Equity Fund: | |
| Class A† | |
| Sold | | | 307,742 | | | $ | 10,921,299 | | | | 504,221 | | | $ | 14,982,802 | | |
| Issued as reinvestment of dividends | | | — | | | | — | | | | 595 | | | | 17,724 | | |
| Redeemed | | | (627,339 | ) | | | (22,181,768 | ) | | | (321,159 | ) | | | (9,572,684 | ) | |
| Net increase (decrease) | | | (319,597 | ) | | $ | (11,260,469 | ) | | | 183,657 | | | $ | 5,427,842 | | |
| Class I†* | |
| Sold | | | 503,222 | | | $ | 18,354,968 | | | | 562,288 | | | $ | 16,623,735 | | |
| Issued as reinvestment of dividends | | | 19 | | | | 637 | | | | 108 | | | | 3,411 | | |
| Redeemed | | | (266,446 | ) | | | (8,973,789 | ) | | | (30,084 | ) | | | (884,078 | ) | |
| Net increase | | | 236,795 | | | $ | 9,381,816 | | | | 532,312 | | | $ | 15,743,068 | | |
| International Equity Fund: | |
| Class A | |
| Sold | | | 38,738,115 | | | $ | 1,516,430,147 | | | | 103,621,498 | | | $ | 3,301,554,085 | | |
| Issued as reinvestment of dividends | | | 8,479,351 | | | | 303,135,073 | | �� | | 4,473,703 | | | | 140,295,305 | | |
| Redeemed | | | (40,843,025 | ) | | | (1,596,363,910 | ) | | | (31,794,210 | ) | | | (1,026,587,778 | ) | |
| Net increase | | | 6,374,441 | | | $ | 223,201,310 | | | | 76,300,991 | | | $ | 2,415,261,612 | | |
| Class I | |
| Sold | | | 44,263,719 | | | $ | 1,762,515,023 | | | | 119,507,433 | | | $ | 3,854,830,556 | | |
| Issued as reinvestment of dividends | | | 9,685,161 | | | | 352,634,605 | | | | 4,379,535 | | | | 139,663,385 | | |
| Redeemed | | | (37,169,804 | ) | | | (1,487,008,935 | ) | | | (19,229,479 | ) | | | (636,445,754 | ) | |
| Net increase | | | 16,779,076 | | | $ | 628,140,693 | | | | 104,657,489 | | | $ | 3,358,048,187 | | |
| International Equity Fund II: | |
| Class A** | |
| Sold | | | 47,435,232 | | | $ | 611,006,976 | | | | 12,611,282 | | | $ | 136,031,555 | | |
| Issued as reinvestment of dividends | | | — | | | | — | | | | — | | | | — | | |
| Redeemed | | | (7,746,566 | ) | | | (100,844,079 | ) | | | (960,837 | ) | | | (10,286,728 | ) | |
| Net increase | | | 39,688,666 | | | $ | 510,162,897 | | | | 11,650,445 | | | $ | 125,744,827 | | |
| Class I** | |
| Sold | | | 153,977,557 | | | $ | 1,992,799,751 | | | | 27,800,516 | | | $ | 302,232,671 | | |
| Issued as reinvestment of dividends | | | — | | | | — | | | | — | | | | — | | |
| Redeemed | | | (8,638,709 | ) | | | (113,397,417 | ) | | | (654,185 | ) | | | (7,148,213 | ) | |
| Net increase | | | 145,338,848 | | | $ | 1,879,402,334 | | | | 27,146,331 | | | $ | 295,084,458 | | |
Julius Baer Funds 2006 Annual Report
194
NOTES TO FINANCIAL STATEMENTS (Continued)
| | | Year Ended
October 31, 2006 | | Year Ended
October 31, 2005 | |
| | | Shares | | Amount | | Shares | | Amount | |
| Total Return Bond Fund: | |
| Class A | |
| Sold | | | 5,583,049 | | | $ | 72,384,334 | | | | 2,168,655 | | | $ | 29,288,075 | | |
| Issued as reinvestment of dividends | | | 352,886 | | | | 4,578,373 | | | | 173,411 | | | | 2,338,413 | | |
| Redeemed | | | (3,121,349 | ) | | | (40,748,651 | ) | | | (1,624,188 | ) | | | (21,978,139 | ) | |
| Net increase | | | 2,814,586 | | | $ | 36,214,056 | | | | 717,878 | | | $ | 9,648,349 | | |
| Class I | |
| Sold | | | 22,370,233 | | | $ | 290,781,223 | | | | 9,201,128 | | | $ | 124,690,812 | | |
| Issued as reinvestment of dividends | | | 960,754 | | | | 12,496,422 | | | | 258,094 | | | | 3,491,042 | | |
| Redeemed | | | (3,453,641 | ) | | | (45,130,436 | ) | | | (1,290,448 | ) | | | (17,419,639 | ) | |
| Net increase | | | 19,877,346 | | | $ | 258,147,209 | | | | 8,168,774 | | | $ | 110,762,215 | | |
| Global High Income Fund: | |
| Class A | |
| Sold | | | 3,073,565 | | | $ | 33,421,918 | | | | 1,027,360 | | | $ | 12,481,178 | | |
| Issued as reinvestment of dividends | | | 468,401 | | | | 5,028,917 | | | | 184,133 | | | | 2,221,011 | | |
| Redeemed | | | (2,394,459 | ) | | | (26,442,289 | ) | | | (1,922,780 | ) | | | (23,353,353 | ) | |
| Net increase | | | 1,147,507 | | | $ | 12,008,546 | | | | (711,287 | ) | | $ | (8,651,164 | ) | |
| Class I | |
| Sold | | | 2,972,452 | | | $ | 31,257,017 | | | | 243,650 | | | $ | 2,897,931 | | |
| Issued as reinvestment of dividends | | | 147,688 | | | | 1,537,266 | | | | 45,502 | | | | 535,898 | | |
| Redeemed | | | (481,176 | ) | | | (5,182,090 | ) | | | (3,436,553 | ) | | | (39,975,454 | ) | |
| Net increase | | | 2,638,964 | | | $ | 27,612,193 | | | | (3,147,401 | ) | | $ | (36,541,625 | ) | |
| U.S. Microcap Fund: | |
| Class A*** | |
| Sold | | | 264,561 | | | $ | 2,661,874 | | | | — | | | $ | — | | |
| Issued as reinvestment of dividends | | | — | | | | — | | | | — | | | | — | | |
| Redeemed | | | (1,988 | ) | | | (20,311 | ) | | | — | | | | — | | |
| Net increase | | | 262,573 | | | $ | 2,641,563 | | | | — | | | $ | — | | |
| Class I*** | |
| Sold | | | 250,000 | | | $ | 2,500,000 | | | | — | | | $ | — | | |
| Issued as reinvestment of dividends | | | — | | | | — | | | | — | | | | — | | |
| Redeemed | | | — | | | | — | | | | — | | | | — | | |
| Net increase | | | 250,000 | | | $ | 2,500,000 | | | | — | | | $ | — | | |
| U.S. Smallcap Fund: | |
| Class A*** | |
| Sold | | | 253,225 | | | $ | 2,535,318 | | | | — | | | $ | — | | |
| Issued as reinvestment of dividends | | | — | | | | — | | | | — | | | | — | | |
| Redeemed | | | (300 | ) | | | (3,063 | ) | | | — | | | | — | | |
| Net increase | | | 252,925 | | | $ | 2,532,255 | | | | — | | | $ | — | | |
Julius Baer Funds 2006 Annual Report
195
NOTES TO FINANCIAL STATEMENTS (Continued)
| | | Year Ended
October 31, 2006 | | Year Ended
October 31, 2005 | |
| | | Shares | | Amount | | Shares | | Amount | |
| Class I*** | |
| Sold | | | 250,000 | | | $ | 2,500,000 | | | | — | | | $ | — | | |
| Issued as reinvestment of dividends | | | — | | | | — | | | | — | | | | — | | |
| Redeemed | | | — | | | | — | | | | — | | | | — | | |
| Net increase | | | 250,000 | | | $ | 2,500,000 | | | | — | | | $ | — | | |
| U.S. Midcap Fund: | |
| Class A*** | |
| Sold | | | 261,475 | | | $ | 2,625,610 | | | | — | | | $ | — | | |
| Issued as reinvestment of dividends | | | — | | | | — | | | | — | | | | — | | |
| Redeemed | | | (300 | ) | | | (3,069 | ) | | | — | | | | — | | |
| Net increase | | | 261,175 | | | $ | 2,622,541 | | | | — | | | $ | — | | |
| Class I*** | |
| Sold | | | 250,000 | | | $ | 2,500,000 | | | | — | | | $ | — | | |
| Issued as reinvestment of dividends | | | — | | | | — | | | | — | | | | — | | |
| Redeemed | | | — | | | | — | | | | — | | | | — | | |
| Net increase | | | 250,000 | | | $ | 2,500,000 | | | | — | | | $ | — | | |
| U.S. Multicap Fund: | |
| Class A*** | |
| Sold | | | 251,404 | | | $ | 2,515,010 | | | | — | | | $ | — | | |
| Issued as reinvestment of dividends | | | — | | | | — | | | | — | | | | — | | |
| Redeemed | | | (1,028 | ) | | | (11,270 | ) | | | — | | | | — | | |
| Net increase | | | 250,376 | | | $ | 2,503,740 | | | | — | | | $ | — | | |
| Class I*** | |
| Sold | | | 250,000 | | | $ | 2,500,000 | | | | — | | | $ | — | | |
| Issued as reinvestment of dividends | | | — | | | | — | | | | — | | | | — | | |
| Redeemed | | | — | | | | — | | | | — | | | | — | | |
| Net increase | | | 250,000 | | | $ | 2,500,000 | | | | — | | | $ | — | | |
† Share transactions were adjusted to reflect a 10 for 1 reverse split effective September 15, 2005.
* Commenced operations on March 14, 2005.
** Commenced operations on May 4, 2005.
*** Commenced operations on July 24, 2006.
Through seed capital contributions by Julius Baer Group, an affiliate of the Advisor, ownership of beneficial shares outstanding at October 31, 2006 were:
| Fund | | % Ownership | |
| U.S. Microcap Fund – Class A shares | | | 92.5 | % | |
| U.S. Microcap Fund – Class I shares | | | 100.0 | % | |
| U.S. Smallcap Fund – Class A shares | | | 98.8 | % | |
| U.S. Smallcap Fund – Class I shares | | | 100.0 | % | |
| U.S. Midcap Fund – Class A shares | | | 95.7 | % | |
| U.S. Midcap Fund – Class I shares | | | 100.0 | % | |
| U.S. Multicap Fund – Class A shares | | | 99.8 | % | |
| U.S. Multicap Fund – Class I shares | | | 100.0 | % | |
Julius Baer Funds 2006 Annual Report
196
NOTES TO FINANCIAL STATEMENTS (Continued)
Prior to September 1, 2006, Global Equity Fund, International Equity Fund, International Equity Fund II, Total Return Bond Fund and Global High Income Fund assessed a redemption fee of 2% for shares redeemed within 90 days of purchase. For the year ended October 31, 2006, these Funds had the following redemption fee, which are disclosed in the statement of changes in net assets. As of September 1, 2006 the Funds no longer have redemption fees.
| Fund | | Redemption fee | |
| Global Equity Fund | | $ | 3,539 | | |
| International Equity Fund | | | 558,198 | | |
| International Equity Fund II | | | 186,601 | | |
| Total Return Bond Fund | | | 22,196 | | |
| Global High Income Fund | | | 13,225 | | |
8. Foreign Securities
Investing in securities of foreign companies and foreign governments involves special risks and considerations not typically associated with investing in U.S. companies and the U.S. government. These risks include the loss of value in investments of foreign securities because of currency exchange rate fluctuations, price volatility that may exceed the volatility of U.S. securities, uncertain political conditions, lack of timely and reliable financial information and other factors. These risks are increased for investment in emerging markets. Emerging market securities involve unique risks, such as exposure to economies less diverse and mature than that of the U.S. or more established foreign markets. Economic or political instability may cause larger price changes in emerging market securities than other foreign securities. Moreover, securities of many foreign companies and foreign governments and their markets may be less liquid and their p rices more volatile than those of securities of comparable U.S. companies and the U.S. government.
9. Federal Tax Information
Permanent book and tax differences, if any, relating to shareholder distributions will result in reclassifications to paid-in capital, net investment income or realized gains. These include net operating losses not utilized during the current year, commission adjustments, paydown gains and losses, bond premium amortization, foreign currency gains and losses, taxable overdistributions or returns of capital, recharacterized distributions, and adjustments relating to dispositions of Real Estate Investment Trust and Passive Foreign Investment Company securities. These reclassifications have no
Julius Baer Funds 2006 Annual Report
197
NOTES TO FINANCIAL STATEMENTS (Continued)
effect on net assets or net asset values per share. Any taxable gain remaining at fiscal year end is distributed in the following year.
| Fund | | Paid-In
Capital
Increase/
(Decrease) | | Undistributed
Net Investment
Income
Increase/
(Decrease) | | Accumulated
Net Realized
Gain/(Loss)
Increase/
(Decrease) | |
| Global Equity Fund | | $ | (183,228 | ) | | $ | (570,013 | ) | | $ | 753,241 | | |
| International Equity Fund | | | 711,286 | | | | (199,708,055 | ) | | | 198,996,769 | | |
| International Equity Fund II | | | 27,333 | | | | (16,358,619 | ) | | | 16,331,286 | | |
| Total Return Bond Fund | | | 5,764 | | | | 471,098 | | | | (476,862 | ) | |
| Global High Income Fund | | | 2,862 | | | | 15,249 | | | | (18,111 | ) | |
| U.S. Microcap Fund | | | (240 | ) | | | 6,105 | | | | (5,865 | ) | |
| U.S. Smallcap Fund | | | — | | | | (2,360 | ) | | | 2,360 | | |
| U.S. Midcap Fund | | | — | | | | 343 | | | | (343 | ) | |
| U.S. Multicap Fund | | | — | | | | — | | | | — | | |
The tax character of distributions paid for the year ended October 31, 2006 were as follows:
| | | Global
Equity
Fund | | International
Equity
Fund | | International
Equity
Fund II | | Total Return
Bond
Fund | | Global High
Income
Fund | |
| Ordinary Income | | $ | 989 | | | $ | 219,796,418 | | | $ | — | | | $ | 18,265,856 | | | $ | 5,283,652 | | |
| Long Term Capital Gains | | | — | | | | 497,357,710 | | | | — | | | | 1,506,278 | | | | 2,460,693 | | |
| | | U.S. Microcap
Fund | | U.S. Smallcap
Fund | | U.S. Midcap
Fund | | U.S. Multicap
Fund | |
| Ordinary Income | | $ | — | | | $ | — | | | $ | — | | | $ | — | | |
| Long Term Capital Gains | | | — | | | | — | | | | — | | | | — | | |
The tax character of distributions paid for the year ended October 31, 2005 were as follows:
| | | Global
Equity
Fund | | International
Equity Fund | | International
Equity Fund II | | Total Return
Bond Fund | | Global High
Income Fund | |
| Ordinary Income | | $ | 26,244 | | | $ | 239,978,606 | | | | — | | | $ | 5,736,791 | | | $ | 5,121,653 | | |
| Long Term Capital Gains | | | — | | | | 72,653,819 | | | | — | | | | 687,783 | | | | 30,930 | | |
The International Equity Fund II did not have any distributions for the year ended October 31, 2005.
At October 31, 2006, the Global Equity Fund had $87,329,168, $28,922,938 and $7,288,718 available as capital loss carryforwards which expire in 2010, 2011 and 2012, respectively.
Julius Baer Funds 2006 Annual Report
198
NOTES TO FINANCIAL STATEMENTS (Continued)
As of October 31, 2006, the components of Distributable Earnings on a tax basis for the Global Equity Fund were as follows:
| Undistributed Ordinary Income | | $ | — | | |
| Unrealized Appreciation | | $ | 3,391,555 | | |
| Undistributed Long Term Capital Gains | | $ | — | | |
The difference between the components of Distributable Earnings on a tax basis and the amounts reflected in the statements of assets and liabilities of the Global Equity Fund are primarily due to mark-to-market of forwards.
As of October 31, 2006, the components of Distributable Earnings on a tax basis for the International Equity Fund were as follows:
| Undistributed Ordinary Income | | $ | 774,343,029 | | |
| Unrealized Appreciation | | $ | 5,068,512,277 | | |
| Undistributed Long Term Capital Gains | | $ | 1,318,346,123 | | |
The differences between components of Distributable Earnings on a tax basis and the amounts reflected in the statements of assets and liabilities of the International Equity Fund are primarily due to wash sales, mark-to-market of passive foreign investment companies, futures and forwards.
As of October 31, 2006, the components of Distributable Earnings on a tax basis for the International Equity Fund II were as follows:
| Undistributed Ordinary Income | | $ | 24,492,466 | | |
| Unrealized Appreciation | | $ | 327,720,903 | | |
| Undistributed Long Term Capital Gains | | $ | 1,681,699 | | |
The differences between components of Distributable Earnings on a tax basis and the amounts reflected in the statements of assets and liabilities of the International Equity Fund II are primarily due to wash sales, mark-to-market of passive foreign investment companies, futures and forwards.
As of October 31, 2006, the components of Distributable Earnings on a tax basis for the Total Return Bond Fund were as follows:
| Undistributed Ordinary Income | | $ | 361,653 | | |
| Unrealized Depreciation | | $ | 4,761,357 | | |
| Undistributed Long Term Capital Gains | | $ | — | | |
The difference between the components of Distributable Earnings on a tax basis and the amounts reflected in the statements of assets and liabilities of the Total Return Bond Fund are primarily due to wash sales and forwards. In addition, short-term capital gains are considered ordinary income for income tax purposes.
Julius Baer Funds 2006 Annual Report
199
NOTES TO FINANCIAL STATEMENTS (Continued)
At October 31, 2006, the Total Return Bond Fund had $1,695,163 available as capital loss carryforwards which expire in 2014.
As of October 31, 2006, the components of Distributable Earnings on a tax basis for the Global High Income Fund were as follows:
| Undistributed Ordinary Income | | $ | 699,903 | | |
| Unrealized Appreciation | | $ | 1,726,634 | | |
| Undistributed Long Term Capital Gains | | $ | 328,563 | | |
The differences between components of Distributable Earnings on a tax basis and the amounts reflected in the statements of assets and liabilities of the Global High Income Fund are primarily due to wash sales and forwards. In addition, short-term capital gains are considered ordinary income for income tax purposes.
As of October 31, 2006, the components of Distributable Earnings on a tax basis for the U.S. Microcap Fund were as follows:
| Undistributed Ordinary Income | | $ | — | | |
| Unrealized Appreciation | | $ | 636,258 | | |
| Undistributed Long Term Capital Gains | | $ | — | | |
The differences between components of Distributable Earnings on a tax basis and the amounts reflected in the statements of assets and liabilities of the U.S. Microcap Fund are primarily due to organization cost adjustments. In addition, short-term capital gains are considered ordinary income for income tax purposes.
As of October 31, 2006, the components of Distributable Earnings on a tax basis for the U.S. Smallcap Fund were as follows:
| Undistributed Ordinary Income | | $ | 94,900 | | |
| Unrealized Appreciation | | $ | 463,480 | | |
| Undistributed Long Term Capital Gains | | $ | — | | |
The differences between components of Distributable Earnings on a tax basis and the amounts reflected in the statements of assets and liabilities of the U.S. Smallcap Fund are primarily due to organization cost adjustments. In addition, short-term capital gains are considered ordinary income for income tax purposes.
As of October 31, 2006, the components of Distributable Earnings on a tax basis for the U.S. Midcap Fund were as follows:
| Undistributed Ordinary Income | | $ | 23,249 | | |
| Unrealized Appreciation | | $ | 510,925 | | |
| Undistributed Long Term Capital Gains | | $ | 298 | | |
Julius Baer Funds 2006 Annual Report
200
NOTES TO FINANCIAL STATEMENTS (Continued)
The differences between components of Distributable Earnings on a tax basis and the amounts reflected in the statements of assets and liabilities of the U.S. Midcap Fund are primarily due to organization cost adjustments. In addition, short-term capital gains are considered ordinary income for income tax purposes.
As of October 31, 2006, the components of Distributable Earnings on a tax basis for the U.S. Multicap Fund were as follows:
| Undistributed Ordinary Income | | $ | 29,255 | | |
| Unrealized Appreciation | | $ | 529,053 | | |
| Undistributed Long Term Capital Gains | | $ | — | | |
The differences between components of Distributable Earnings on a tax basis and the amounts reflected in the statements of assets and liabilities of the U.S. Multicap Fund are primarily due to organization cost adjustments. In addition, short-term capital gains are considered ordinary income for income tax purposes.
10. Security Lending Agreement
The security lending income net of the loan rebate fee for the Global Equity Fund, the International Equity Fund and the International Equity Fund II amounted to $10,653, $18,808,988 and $342,389, respectively, for the period ended October 31, 2006 and is included in interest income in the statement of operations.
As of October 31, 2006, the value of the securities loaned and the value of the collateral amounted to approximately the following amounts:
| | | Market Value of
Securities Loaned | | Value of
Collateral | |
| Global Equity Fund | | $ | 4,636,490 | | | $ | 4,768,583 | | |
| International Equity Fund | | | 1,283,495,918 | | | | 1,358,143,493 | | |
| International Equity Fund II | | | 209,228,238 | | | | 220,185,758 | | |
11. Line of Credit
On September 28, 2005, Global Equity Fund, Total Return Bond Fund and Global High Income Fund (the "Borrowers") entered into a Credit Agreement (the "Agreement") with Investors Bank & Trust Company (the "Bank"). The Agreement is a $25,000,000 revolving credit facility to be utilized for temporary or emergency purposes to fund shareholder redemptions or for other short-term liquidity purposes. Total Return Bond Fund and Global High Income Fund may draw up to $10,000,000 and the Global Equity Fund may draw up to $5,000,000. The Borrowers
Julius Baer Funds 2006 Annual Report
201
NOTES TO FINANCIAL STATEMENTS (Continued)
will pay interest on the principal amount of the Loans outstanding at a floating rate per annum equal to the Federal Funds Rate plus 0.75%. In addition, the Borrowers shall pay to the Bank an annual commitment fee, in connection with the establishment and maintenance of the Credit Facility, at the rate of 0.10% per annum on the difference between $10.0 million and the average daily amount of Loans outstanding. Under the Agreement, the average daily outstanding balance utilized by the Global Equity Fund during the year ended was $39,031, at an average weighted interest rate of 5.87% and the Global High Income Fund during the year ended October 31, 2006 was $19,851, at an average weighted interest rate of 5.27%. The Total Return Bond Fund did not utilize the Agreement during the year ended October 31, 2006. As of October 31, 2006, Global Equity Fund, Total Return Bond Fund and Global High Income Fund had unused available balances of $5,000,00 0, 10,000,000 and 10,000,000 outstanding pursuant to the line of credit.
12. Financial Futures Contracts
The following financial futures contracts were outstanding on the Fund as of October 31, 2006:
| | |
Expiration
Date | |
Contracts | |
Description | |
Position | |
Face
Amount | | Net
Unrealized
Appreciation
(Depreciation) | |
| Global Equity Fund: | | 12/06 | | | 2 | | | TOPIX Index | | Long | | $ | 275,447 | | | $ | (6,412 | ) | |
| | | 12/06 | | | 12 | | | EUR STOXX | | Long | | | 614,486 | | | | 26,842 | | |
| | | | | | | | | | | | | | | | | $ | 20,430 | | |
| | |
Expiration
Date | |
Contracts | |
Description | |
Position | |
Face
Amount | | Net
Unrealized
Appreciation
(Depreciation) | |
International
Equity Fund: | | 12/06 | | | 7690 | | | EUR STOXX | | Long | | $ | 393,783,075 | | | $ | 18,803,229 | | |
| | | 12/06 | | | 522 | | | NIKKEI 225 Index | | Long | | | 72,849,643 | | | | (277,683 | ) | |
| | | 12/06 | | | 652 | | | TOPIX Index | | Long | | | 89,795,741 | | | | (2,090,421 | ) | |
| | | | | | | | | | | | | | | | | $ | 16,435,125 | | |
Julius Baer Funds 2006 Annual Report
202
NOTES TO FINANCIAL STATEMENTS (Continued)
| | |
Expiration
Date | |
Contracts | |
Description | |
Position | |
Face
Amount | | Net
Unrealized
Appreciation
(Depreciation) | |
International
Equity Fund II: | | 12/06 | | | 1227 | | | EUR STOXX | | Long | | $ | 62,831,188 | | | $ | 2,369,155 | | |
| | | 12/06 | | | 86 | | | NIKKEI 225 Index | | Long | | | 12,002,049 | | | | (45,749 | ) | |
| | | 12/06 | | | 131 | | | TOPIX Index | | Long | | | 18,041,782 | | | | (420,008 | ) | |
| | | | | | | | | | | | | | | | | $ | 1,903,398 | | |
13. Swaps
The International Equity Fund has entered into the following swap agreements:
A Total Return Swap Agreement with UBS AG (London) whereby this Fund will receive the dividend yield based on the Nikkei 225 Index net of any relevant withholding tax. In exchange, this Fund will make semi-annual payments equal to 1.10% on the 1,961,000,000 JPY face value plus the repo spread 0.47% on 1,800,000,000 JPY plus a spread of 0.25% on the same notional amount. The value of the contract, which terminates on September 17, 2008, is recorded as unrealized appreciation of $14,082,022 at October 31, 2006.
A Total Return Swap Agreement with UBS AG (London) whereby this Fund will receive the dividend yield based on the Nikkei 225 Index net of any relevant withholding tax. In exchange, this Fund will make semi-annual payments equal to 0.80% on the 1,958,000,000 JPY face value plus the repo spread 0.10% on 1,800,000,000 JPY plus a spread of 0.25% on the same notional amount. The value of the contract, which terminates on June 17, 2008, is recorded as unrealized appreciation of $12,841,404 at October 31, 2006.
A Total Return Swap Agreement with UBS AG (London) whereby this Fund will receive the dividend yield based on the TOPIX Index net of any relevant withholding tax. In exchange, this Fund will make semi-annual payments equal to 1.10% on the 1,961,000,000 JPY face value plus the repo spread 0.47% on 1,800,000,000 JPY plus a spread of 0.25% on the same notional amount. The value of the contract, which terminates on September 17, 2008, is recorded as unrealized appreciation of $14,027,325 at October 31, 2006.
A Total Return Swap Agreement with UBS AG (London) whereby this Fund will receive the dividend yield based on the TOPIX Index net of any relevant withholding
Julius Baer Funds 2006 Annual Report
203
NOTES TO FINANCIAL STATEMENTS (Continued)
tax. In exchange, this Fund will make semi-annual payments equal to 0.80% on the 1,958,000,000 JPY face value plus the repo spread 0.10% on 1,800,000,000 JPY plus a spread of 0.25% on the same notional amount. The value of the contract, which terminates on June 17, 2008, is recorded as unrealized appreciation of $12,788,713 at October 31, 2006.
A Total Return Swap Agreement with ING Bank N.V. whereby this fund will receive the notional amount multiplied by the return on SC Impact Bucuresti, variable rate 0.10%, 6 month Euribor + 6.5%, due 01/31/2009. In exchange, this Fund will pay the net coupon amounts on the notional amount converted into EUR at a specified FX rate. The value of the contract, which expires on March 1, 2009 is recorded as unrealized appreciation of $131,222 at October 31, 2006.
The Global High Income Fund has entered into the following swap agreements:
A Credit Default Swap Agreement with Goldman Sachs International whereby this Fund will receive the notional $600,000 amount multiplied by 0.50%. In exchange this Fund will pay the notional amount upon a default of Lear Corp., Inc., 5.00% due August 1, 2014. The value of the contract, which expires June 20, 2011 is unrealized appreciation for open swap contracts of $29,131, at October 31, 2006.
A Credit Default Swap Agreement with Merrill Lynch whereby this Fund will receive the notional amount of $600,000 multiplied by 0.50%. In exchange this Fund will pay the notional amount upon a default of Grohe Holding, 8.625% due October 1, 2014. The value of the contract, which expires December 20, 2011 is unrealized appreciation for open swap contracts of $27,005, at October 31, 2006.
14. Recent Accounting Pronouncements
In July 2006, FASB issued FASB Interpretation No. 48, (FIN 48) "Accounting for Uncertainty in Income Taxes—an interpretation of FASB Statement No. 109". FIN 48 clarifies the accounting for uncertainty in income taxes recognized in accordance with FASB Statement No. 109, "Accounting for Income Taxes." This interpretation prescribes a recognition threshold and measurement attribute for the financial statement recognition and measurement of a tax position taken or expected to be taken in a tax return. It also provides guidance on de-recognition, classification, interest and penalties, accounting in interim periods, disclosure and transition. FIN 48 is effective for fiscal years beginning after December 15, 2006. Management is
Julius Baer Funds 2006 Annual Report
204
NOTES TO FINANCIAL STATEMENTS (Continued)
currently evaluating the impact, if any, the adoption of FIN 48 will have on a Fund's net assets, results of operations and financial statement disclosures.
In September 2006, FASB issued Statement of Financial Accounting Standards No. 157, Fair Value Measurements ("FAS 157"). FAS 157 establishes a single authoritative definition of fair value, establishes a framework for measuring fair value and expands disclosures about fair value measurements. FAS 157 applies to fair value measurements already required or permitted by existing standards. The change to current generally accepted accounting principles from the application of FAS 157 relate to the definition of fair value, the methods used to measure fair value, and the expanded disclosures about fair value measurements. Management of the Funds do not believe the adoption of FAS 157 will materially impact the financial statement amounts, however, additional disclosures may be required about the inputs used to develop the measurements and the effect of certain of the measurements on changes in net assets for the period. FAS 157 is effective for f inancial statements issued for fiscal years beginning after November 15, 2007 and interim periods within those fiscal years.
15. Subsequent Events
The following changes to performance benchmark indices are effective March 1, 2007:
n International Equity Fund and International Equity Fund II: The Morgan Stanley Capital International, Inc. ("MSCI") All Country World ex-U.S. Index will replace the MSCI Europe Australasia and Far East Index. The MSCI All Country World ex-U.S. Index is a free float-adjusted market capitalization index that is designed to measure equity market performance in the global developed and emerging markets. As of June 2006, the MSCI All Country World ex-U.S. Index consisted of 47 developed and emerging market country indices.
n Global Equity Fund: The Morgan Stanley Capital International, Inc. ("MSCI") All Country World Index ("ACWI") will replace the MSCI World Index. The MSCI ACWI is a free float-adjusted market capitalization index that is designed to measure equity market performance in the global developed and emerging markets. As of June 2006, the MSCI ACWI consisted of 48 developed and emerging market country indices.
Julius Baer Funds 2006 Annual Report
205
REPORT OF INDEPENDENT REGISTERED PUBLIC ACCOUNTING FIRM
To the Stockholders and Board of Directors
Julius Baer Global Equity Fund, Inc.
and
To the Shareholders and Board of Trustees
Julius Baer Investment Funds
We have audited the accompanying statements of assets and liabilities, including the portfolios of investments, of the Julius Baer Global Equity Fund, Inc. and Julius Baer International Equity Fund, Julius Baer International Equity Fund II, Julius Baer Total Return Fund, Julius Baer Global High Income Fund (formerly Julius Baer Global High Yield Bond Fund), Julius Baer U.S. Microcap Fund, Julius Baer U.S. Smallcap Fund, Julius Baer U.S. Midcap Fund, and Julius Baer U.S. Multicap Fund, each a series of Julius Baer Investment Funds, as of October 31, 2006, and the related statement of operations for the year or period then ended, statements of changes in net assets for each of the years or periods in the two-year period then ended, and the financial highlights for each of the years or periods in the five-year period then ended. These financial statements and financial highlights are the responsibility of the Funds' management. Our responsibili ty is to express an opinion on these financial statements and financial highlights based on our audits.
We conducted our audits in accordance with the standards of the Public Company Accounting Oversight Board (United States). Those standards require that we plan and perform the audit to obtain reasonable assurance about whether the financial statements and financial highlights are free of material misstatement. An audit includes examining, on a test basis, evidence supporting the amounts and disclosures in the financial statements. Our procedures included confirmation of securities owned as of October 31, 2006 by correspondence with the custodian and brokers or by other appropriate auditing procedures. An audit also includes assessing the accounting principles used and significant estimates made by management, as well as evaluating the overall financial statement presentation. We believe that our audits provide a reasonable basis for our opinion.
In our opinion, the financial statements and financial highlights referred to above present fairly, in all material respects, the financial position of the Julius Baer Global Equity Fund, Inc., Julius Baer International Equity Fund, Julius Baer International Equity Fund II, Julius Baer Total Return Bond Fund, Julius Baer Global High Income Fund, Julius Baer U.S. Microcap Fund, Julius Baer U.S. Smallcap Fund, Julius Baer U.S. Midcap Fund, and Julius Baer U.S. Multicap Fund as of October 31, 2006, the results of their operations, changes in their net assets and financial highlights for each of the years or periods described above, in conformity with U.S. generally accepted accounting principles.

Boston, Massachusetts
December 22, 2006
Julius Baer Funds 2006 Annual Report
206
ADDITIONAL INFORMATION (Unaudited)
Investment Advisory Agreement
At a meeting held on June 28, 2006, the Board of Trustees of the Julius Baer Investment Funds (the "Board") approved the Investment Advisory Agreement with the Advisor for each of U.S. Microcap Fund, U.S. Smallcap Fund, U.S. Midcap Fund, and U.S. Multicap Fund (each a "Fund" and collectively, the "Funds")("Agreement"). The Advisor also contractually agreed to reimburse certain expenses of the Funds for the period July 24, 2006 (commencement of operations) through February 28, 2008.
In determining whether to approve the Agreement, the Trustees of the Board, including all of the Trustees who are not interested persons under the 1940 Act (the "Independent Trustees"), reviewed and considered, among other items: (1) a guide from independent counsel setting forth the Board's fiduciary duties, responsibilities and the factors the Board should consider in its evaluation of the Agreement; (2) comparative information, comparing each Fund's proposed advisory fees and expenses to those of its relevant peer group; (3) the Advisor's complete Form ADV; (4) the Advisor's Financial Statements for December 31, 2005 and 2004; and (5) other reports of and presentations by representatives of the Advisor that described: (i) the nature, extent and quality of the Advisor's services provided to the respective Funds; (ii) the experience and qualifications of the personnel providing those services, (iii) their investment advice; (iv) their asset s under management and client descriptions; (v) their soft dollar commission and trade allocation policies, including information on the types of research and services obtained in connection with soft dollar commissions; (vi) the proposed advisory fee arrangements with the Funds; (vii) compliance program information; (viii) the Advisor's financial information and profitability analysis related to providing service to the Funds; (ix) fees and other benefits; (x) methodologies to allocate securities among the Funds; (xi) outstanding lawsuits; and (xii) the extent to which economies of scale are relevant to the Funds.
In determining whether to approve the Agreement, the Board, including the Independent Trustees, reviewed and considered the materials presented at the June 28, 2006 meeting of the Board, and a financial forecast for the period July 2006 through December 31, 2006, and the twelve months ending December 31, 2007. The Board discussed the written materials, the Advisor's presentations and deliberated on the approval of the Agreement in light of this information. In their deliberations, the Board did not identify any single piece of information that was all important or controlling. U.S. Microcap Fund, U.S. Smallcap Fund, U.S. Midcap Fund, and U.S.
Julius Baer Funds 2006 Annual Report
207
ADDITIONAL INFORMATION (Unaudited) (Continued)
Multicap Fund are new funds and therefore had no historical investment performance for the Board to review when evaluating the Agreement for Funds. The Board will consider each Fund's investment performance, including each Fund's relative performance as compared to its respective benchmark indices and other mutual funds in its peer group, when each Fund has been in operation for at least one calendar year.
The Board, including the Independent Trustees, reached the following conclusions, among others, regarding the Advisor and the respective approvals: the Advisor has the capabilities, resources and personnel necessary to manage the Funds; the proposed management/advisory fees for each Fund are reasonable as compared to the median and the average fees paid by comparable funds in their respective peer groups; the proposed total annual portfolio operating expenses to be paid by the Funds are reasonable as compared to the median and average expenses paid by comparable funds in each Fund's respective peer group; the projected profitability of the Advisor for advisory services, based on the proposed fees, seems reasonable based on the data provided; and the expected benefits derived by the Advisor from managing the Funds, including how each uses soft dollars and the ways in which each conducts portfolio transactions and selects brokers is reasonable .
Based upon the Board's deliberations and evaluation of the information described above, the Trustees, including the Independent Trustees, determined that the Agreement is fair, the advisory fees are reasonable, and the Agreement is in the best interest of, each of the respective Funds and its shareholders.
Julius Baer Funds 2006 Annual Report
208
ADDITIONAL INFORMATION PAGE (Unaudited)
1. Proxy Voting Policies
A description of the Fund's proxy voting policies and procedures is available without charge, upon request, (1) on the Fund's website [www.us-funds.juliusbaer.com] and (2) on the SEC's (Securities and Exchange Commission) website [www.sec.gov].
Information regarding how the Fund voted proxies relating to portfolio securities during the most recent 12-month period ended June 30 is available via the methods noted above.
2. Quarterly Filing Requirements
A Fund files its complete schedule of portfolio holdings with the Securities and Exchange Commission for the first and third quarters of each fiscal year on Form N-Q, which when filed, will be available on the Commission's website at www.sec.gov or on the Funds' website at www.us-funds.juliusbaer.com.
A Fund's forms N-Q may be reviewed and copied at the Commission's Public Reference Room in Washington, DC. Information regarding the operation of the Public Reference Room may be obtained by calling 1-800-SEC-0330.
Julius Baer Funds 2006 Annual Report
209
RESULTS OF MEETINGS OF STOCKHOLDERS AND SHAREHOLDERS (Unaudited)
JULIUS BAER GLOBAL EQUITY FUND INC.
The Fund held the continuation of its Annual Meeting of Stockholders on August 10, 2006. 1,426,138.00 (83.073% of the record date common shares) were represented at the meeting. The matters below were voted by the Stockholders.
Proposal I: To amend and restate the Charter of the Fund to remove the requirement to hold an annual meeting of stockholders and declassify the Board of Directors of the Fund.
| Elected by All Stockholders | | Affirmative | | Against | | Abstain | |
| | | | 1,288,934.00 | | | | 130,793.00 | | | | 6,411.00 | | |
Proposal II: To elect the Directors of the Fund.
| Elected by All Stockholders | | Affirmative | | Withheld | |
| Robert S. Matthews | | | 1,407,706.00 | | | | 18,432.00 | | |
| Antoine Bernheim | | | 1,405,685.00 | | | | 20,453.00 | | |
| Harvey B. Kaplan | | | 1,407,658.00 | | | | 18,480.00 | | |
| Thomas J. Gibbons | | | 1,407,706.00 | | | | 18,432.00 | | |
| Gerard J.M. Vlak | | | 1,405,705.00 | | | | 20,433.00 | | |
| Peter Wolfram | | | 1,407,088.00 | | | | 19,050.00 | | |
| Glen Wisher | | | 1,407,644.00 | | | | 18,494.00 | | |
JULIUS BAER INVESTMENT FUNDS
Special Meetings of Shareholders
The continuation of a special meeting of Shareholders of the Julius Baer Global High Yield Bond Fund (now the Global High Income Fund), a series of the Julius Baer Investment Funds (the "Trust"), was held on September 15, 2006. 2,693,570.88 (50.06% of the record date common shares) were represented at the meeting. The matter below was voted by Shareholders of the Fund.
Proposal I: To consider the approval of a change in the fundamental investment policy of the Fund.
| Elected by All Shareholders | | Affirmative | | Against | | Abstain | |
| | | | 2,575,272.77 | | | | 73,638.44 | | | | 44,659.67 | | |
On August 30, 2006, all Shareholders of record of the Julius Baer U.S. Microcap Fund, the Julius Baer U.S. Smallcap Fund and the Julius Baer U.S. Midcap Fund, series of the Trust, authorized and directed, via a written consent, officers of the Trust to cause to be prepared and filed with the Securities and Exchange Commission an amendment to the Trust's registration statement to change these Funds' investment strategies to modify the definitions of their respective capitalization equity universes. There were no shares withheld or abstained. Such consent shall be treated for all purposes as a vote taken at a meeting of Shareholders.
Julius Baer Funds 2006 Annual Report
210
JULIUS BAER FUNDS as of October 31, 2006
Julius Baer Funds (Unaudited)
Disinterested Trustees of the Trust and Directors of Julius Baer Global Equity Fund Inc. (Global Equity Fund):
Name, Date of
Birth, and Address | | Position(s)
Held
with Fund | | Term of
Office and
Length of
Time
Served (1) | | Principal Occupation(s)
During the Past 5 Years | | Number of
Portfolios
in Fund
Complex
Overseen
by
Trustee/
Director* | | Other
Directorships
Held by
Trustee/
Director (2) | |
| Antoine Bernheim (May 30, 1953) 330 Madison Avenue New York, New York 10017 | | Trustee and Director | | Trustee since 2004; Director since 1990 | | President, Dome Capital Management, Inc.; Chairman, Dome Securities Corp. | | | 9 | | | None | |
|
| Thomas Gibbons (June 1, 1947) 330 Madison Avenue New York, New York 10017 | | Trustee and Director | | Trustee since 2004; Director since 1993 | | President, Cornerstone Associates Management (Consulting Firm). | | | 9 | | | None | |
|
| Harvey B. Kaplan (September 22, 1937) 330 Madison Avenue New York, New York 10017 | | Trustee and Director | | Trustee since 1995; Director since 1990 | | Retired since 2006; Controller (Chief Financial Officer), Easter Unlimited, Inc. (toy company). | | | 9 | | | None | |
|
| Robert S. Matthews (October 16, 1943) 330 Madison Avenue New York, New York 10017 | | Trustee and Director | | Trustee since 1992; Director since 2002 | | Partner, Matthews & Co. (certified public accountants). | | | 9 | | | None | |
|
| Gerard J.M. Vlak (September 28, 1933) 330 Madison Avenue New York, New York 10017 | | Trustee and Director | | Trustee of the Trust since 1992, Director since 2004 Chairman of the Fund Complex since 2005 | | Retired. | | | 9 | | | The Rouse Company (1996-present). | |
|
| Peter Wolfram (April 2, 1953) 330 Madison Avenue New York, New York 10017 | | Trustee and Director | | Trustee since 1992; Director since 2004 | | Partner, Kelley Drye & Warren (law firm). | | | 9 | | | None | |
|
Julius Baer Funds 2006 Annual Report
211
JULIUS BAER FUNDS as of October 31, 2006 (Continued)
Julius Baer Funds (Unaudited)
Disinterested Trustees of the Trust and Directors of Julius Baer Global Equity Fund Inc. (Global Equity Fund)—(Continued):
Name, Date of
Birth, and Address | | Position(s)
Held
with Fund | | Term of
Office and
Length of
Time
Served (1) | | Principal Occupation(s)
During the Past 5 Years | | Number of
Portfolios
in Fund
Complex
Overseen
by
Trustee/
Director* | | Other
Directorships
Held by
Trustee/
Director (2) | |
| Robert J. McGuire (December 8, 1936) 330 Madison Avenue New York, New York 10017 | | Trustee and Director | | Trustee since 2006; Director since 2006 | | Self-employed since 1998; Counsel, Morvillo, Abramowitz, Grand, Iasaon & Silberberg, P.C., (1998-2005). | | | 9 | | | Mutual of America Investment Corp., Six Flags, Inc. (entertainment), Protection One, Inc. (Security Systems), GAM Funds, Inc., GAM Avalon Multi-Strategy (TEI), LLC; GAM Avalon Lancelot, LLC; GAM Institutional Multi-Strategy, LLC; and GAM Multi-Strategy Investments, LLC. | |
|
Interested Trustees:
Name, Date of
Birth, and Address | | Position(s)
Held
with Fund | | Term of
Office and
Length of
Time
Served | | Principal Occupation(s)
During the Past 5 Years | | Number of
Portfolios
in Fund
Complex
Overseen
by
Trustee/
Director* | | Other
Directorships
Held by
Trustee/
Director (2) | |
| Glen Wisher (3) (October 10, 1963) 330 Madison Avenue New York, NY 10017 | | Trustee and Director | | Trustee since 2005; Director since 2005 | | CEO of Julius Baer Americas (since May 2004); Managing Director & Head of Institutional Asset Management Americas of Julius Baer Americas (October 2001-June 2004). Director of Fixed Income (London) (January 2001-October 2001). | | | 9 | | | None | |
|
* The Fund Complex, referred to in the charts above, is comprised of the eight current series of the Trust and Global Equity Fund.
(1) Each Trustee and Director serves during the lifetime of the Trust or Global Equity Fund until he or she dies, resigns, retires, is declared bankrupt or incompetent, or is removed or, if sooner, until the next meeting of the shareholders/stockholders and until the election and qualification of his or her successor.
(2) Directorships include public companies and any company registered as an investment company.
(3) Mr. Wisher is an interested Trustee/Director because he is an employee of Julius Baer Americas.
Julius Baer Funds 2006 Annual Report
212
JULIUS BAER FUNDS as of October 31, 2006 (Continued)
Julius Baer Funds (Unaudited)
Officers of Funds:
The business address for each officer to the Funds, except Ms. Sanders, Mr. Frost, Ms. McFarlane and Mr. McVoy, is Julius Baer Investment Management LLC, 330 Madison Avenue, New York, New York, 10177. The business address for Ms. Sanders, Mr. Frost, and Ms. McFarlane is Investors Bank & Trust Company, 200 Clarendon Street, Boston, Massachusetts 02116. The business address for Mr. McVoy is U.S. Bancorp Fund Services, LLC, 615 E. Michigan Street, Milwaukee, WI 53202.
Name, Date of Birth,
and Address | | Position(s)
Held
with Fund | | Term of Office
and Length of
Time Served | | Principal Occupation(s)
During the Past 5 Years | |
| Anthony Williams, (March 15, 1964) | | President, Chief Executive Officer and Principal Executive Officer | | Since 2004 | | Chief Executive Officer of Julius Baer Investment Management LLC (formerly, Julius Baer Investment Management, Inc.) and Asset Management Americas (since 2004); Head of Asset Management Americas and Chief Operating Officer, Julius Baer Investment Management LLC (since 2003); Director and Head of Cross Border Strategies, JP Morgan Fleming Asset Management (1989-2002); Chief Operating Officer, JP Morgan Fleming Asset Management (1998-2001). | |
|
| Denise Downey, (September 1, 1961) | | Vice President | | Since 1995 | | First Vice President, Director, Institutional Investments, Julius Baer Investment Management LLC (formerly Julius Baer Investment Management, Inc.) (2002-present); First Vice President, Head of Product Development, Bank Julius Baer (2001-2002); Vice President, Deputy Chief Investment Officer, Bank Julius Baer (1995-2001). | |
|
| Brett Gallagher, (August 28, 1961) | | Vice President | | Since 1999 for Trust; since 2004 for Global Equity Fund | | First Vice President and Deputy Chief Investment Officer of Julius Baer Investment Management LLC (formerly, Bank Julius Baer Investment Management, Inc.) (1999-present). | |
|
| Greg Hopper, (March 24, 1957) | | Vice President | | Since 2002 | | First Vice President of Julius Baer Investment Management LLC (formerly, Bank Julius Baer Investment Management, Inc.) (2002 - present); Senior Vice President and High Yield Bond Portfolio Manager, Zurich Scudder Investments (2000 - 2002); High Yield Bond Portfolio Manager, Harris Investment Management (1999 - 2000). | |
|
Julius Baer Funds 2006 Annual Report
213
JULIUS BAER FUNDS as of October 31, 2006 (Continued)
Julius Baer Funds (Unaudited)
Officers of Funds—(Continued):
Name, Date of Birth,
and Address | | Position(s)
Held
with Fund | | Term of Office
and Length of
Time Served | | Principal Occupation(s)
During the Past 5 Years | |
| Richard C. Pell, (September 21, 1954) | | Vice President | | Since 1999 for Trust; since 2004 for Global Equity Fund | | Senior Vice President and Chief Investment Officer of Julius Baer Investment Management LLC (formerly, Bank Julius Baer & Co., Ltd., New York Branch ) (1995 - present). | |
|
| Donald Quigley, (January 13, 1965) | | Vice President | | Since 2001 | | Vice President and Head of Global Fixed-Income Management for Julius Baer Investment Management LLC (2001 - present); Fixed Income Trader for Chase Asset Management (1993 - 2001). | |
|
| Rudolph-Riad Younes, (September 25, 1961) | | Vice President | | Since 1997 for Trust; since 2004 for Global Equity Fund | | Senior Vice President and Head of International Equity Management of Julius Baer Investment Management LLC (formerly, Bank Julius Baer & Co., Ltd., New York Branch ) (1993 - present). | |
|
| Craig M. Giunta, (December 20, 1971) | | Chief Financial Officer | | Since 2003 | | Vice President, Julius Baer Investment Management LLC (formerly Julius Baer Investment Management, Inc.) (2002 - present); Assistant Vice President, Bank Julius Baer & Co., Ltd. New York Branch (2001 - 2002); Supervisor of Fund Accounting, Neuberger Berman LLC (1994 - 2001). | |
|
| John Whilesmith, (March 8, 1967) | | Secretary | | Since 2005 | | Vice President for Julius Baer Investment Management LLC (formerly Julius Baer Investment Management, Inc.) (2005 - present); Compliance Officer, Morgan Stanley Investment Management (2002 - 2005); Vice President of Internal Audit, Deutche Bank, NA (1997 - 2002). | |
|
| Alex Bogaenko, (April 13, 1963) | | Treasurer | | Since 2005 | | Vice President, Julius Baer Investment Management LLC (formerly Julius Baer Investment Management, Inc.) (2005 - present); Manager of Accounting and Director of Portfolio Administration of Van Eck Global (1995 - 2005). | |
|
Julius Baer Funds 2006 Annual Report
214
JULIUS BAER FUNDS as of October 31, 2006 (Continued)
Julius Baer Funds (Unaudited)
Officers of Funds—(Continued):
Name, Date of Birth,
and Address | | Position(s)
Held
with Fund | | Term of Office
and Length of
Time Served | | Principal Occupation(s)
During the Past 5 Years | |
| Michael K. Quain, (July 6, 1957) | | Chief Compliance Officer | | Since 2004 | | First Vice President of Julius Baer Investment Management LLC (formerly Julius Baer Investment Management, Inc.) (since August 2002); First Vice President of Julius Baer Securities Inc. (1998 - 2002); First Vice President, Bank Julius Baer & Co., Ltd. New York Branch, (1998 - 2002); President and Chief Executive Officer of Julius Baer Global Equity Fund (formerly, The European Warrant Fund, Inc) (1997 - 2004); President and Chief Executive Officer of Julius Baer Investment Funds LLC (1998 - 2004). | |
|
| Michael McVoy, (August 8, 1957) | | Anti-Money Laundering Officer | | Since 2004 | | Legal Counsel for U.S. Bancorp (formerly, Firstar Corp.) (1986 - present); Senior Vice President and Risk Manager for U.S. Bancorp (1999 - Present). | |
|
| Dorothy Sanders, (May 18, 1955) | | Assistant Secretary | | Since 2005 | | Senior Director, Mutual Fund Administration, Investors Bank & Trust Company (2004 - present); Chief Legal Officer of Fred Algers (2000 - 2004). | |
|
| Rainer L.C. Frost, (March 5, 1957) | | Assistant Secretary | | Since 2005 | | Director and Counsel, Investors Bank & Trust Company (since 2005); Principal and General Counsel, Clarity Group (2000-2005); Chief Administrative Officer, Executive Vice President and General Counsel, GoldK, Inc. (2001-2002); Chief Executive Officer, Norfox Software, Inc. (1999-2000) | |
|
| Victoria McFarlane, (October 2, 1966) | | Assistant Treasurer | | Since 2003 | | Director, Mutual Fund Administration, Investors Bank & Trust Company (2001 - present); Manager/Assistant Vice President of Fund Treasury for MFS Investment Services (1997 - 2002). | |
|
Julius Baer Funds 2006 Annual Report
215
SUPPLEMENTAL TAX INFORMATION (Unaudited)
The International Equity Fund and International Equity Fund II paid foreign taxes of $44,144,305 and $4,509,859 and earned $445,566,550 and $45,159,724 of foreign income during the year ended October 31, 2006. Pursuant to Section 853 of the Internal Revenue Code, $0.9536 and $0.02015 per share were designated as foreign taxes paid for International Equity Fund and International Equity Fund II and $0.96246 and $0.20176 per share were designated as income earned from foreign sources for the International Equity Fund and International Equity Fund II for the year ended October 31, 2006.
The table below shows distributions paid from investment company taxable income earned in October 31, 2006, or the maximum amount allowable under the tax law, as Qualified Dividend Income in accordance with the Internal Revenue Code. Complete 2006 year end information will be reported to you on your 2006 Form 1099-DIV, which shall be provided to you in early 2007.
| Fund | | QDI | |
| Global Equity Fund | | $ | 1,055,587 | | |
| International Equity Fund | | | 218,164,484 | | |
| International Equity Fund II | | | 29,002,325 | | |
| Global High Income Fund | | | 79,541 | | |
| U.S. Smallcap Fund | | | 10,567 | | |
| U.S. Multicap Fund | | | 15,154 | | |
| U.S. Midcap Fund | | | 8,098 | | |
For corporate shareholders, a portion of the ordinary dividends paid during the Funds' year ended October 31, 2006 qualified dividends received deductions were the following:
| Fund | | DRD | |
| International Equity Fund | | | 0.25 | % | |
| International Equity Fund II | | | 0.54 | % | |
| Global High Income Fund | | | 0.21 | % | |
| U.S. Smallcap Fund | | | 10.97 | % | |
| U.S. Multicap Fund | | | 50.88 | % | |
| U.S. Midcap Fund | | | 36.16 | % | |
Pursuant to Sector 852 of the Internal Revenue Code, the Funds designated the following capital gain dividends for the year ended October 31, 2006:
| Fund | | Long Term
Capital Gain
Dividend | |
| Internationl Equity Fund | | $ | 497,357,710 | | |
| Total Return Bond Fund | | | 1,506,278 | | |
| Global High Income Fund | | | 2,460,694 | | |
Julius Baer Funds 2006 Annual Report
216
JULIUS BAER FUNDS
330 Madison Avenue
New York, New York 10017
This report is sent to shareholders of the Julius Baer Global Equity Fund Inc. and the Julius Baer Investment Funds for their information. It is not a Prospectus, circular or representation intended for use in the purchase or sale of shares of the funds or of any securities mentioned in the report.
www.us-funds.juliusbaer.com
Zurich (head office), Buenos Aires, Dubai, Frankfurt, Geneva, Hong Kong, London, Lugano, New York, Singapore, Tokyo and 21 other cities around the globe.
Item 2. Code of Ethics.
As of October 31, 2006, the Registrant has adopted a Code of Ethics that applies to the Registrant’s President/Chief Executive Officer and Chief Financial Officer pursuant to the Sarbanes-Oxley Act of 2002. During the year ended October 31, 2006, there were no amendments to a provision of the Code of Ethics nor were there any waivers granted from a provision of the Code of Ethics. A copy of its code of ethics is filed with this Form N-CSR under Item 12(a)(1).
Item 3. Audit Committee Financial Expert.
The Registrant’s Board of Directors has determined that the Registrant has one audit committee financial expert serving on its audit committee. The audit committee financial expert serving on the Registrant’s audit committee is Mr. Harvey B. Kaplan, who is an independent director.
Item 4. Principal Accountant Fees and Services.
(a) AUDIT FEES: The aggregate fees billed for professional services rendered by its principal “Independent Registered Accounting Firm”, KPMG LLP, for the audit of the Registrant’s annual financial statements for the years ended October 31, 2006 and 2005 were $18,000 and $32,500, respectively.
(b) AUDIT RELATED FEES: No such fees were billed to the Registrant by KPMG LLP for the fiscal years ending October 31, 2006 and 2005.
(c) TAX FEES: The aggregate fees billed for professional services rendered by KPMG LLP for the review of Form 1120-RIC, Form 8613, and review of excise tax distribution calculations for the fiscal years ending October 31, 2006 and 2005 were $8,000 and $7,500, respectively.
(d) ALL OTHER FEES: No such fees were billed to the Registrant by KPMG LLP for the fiscal years ending October 31, 2006 and 2005.
(e) (1)The Registrant’s audit committee pre-approves all audit and non-audit services to be performed by the Registrant’s accountant before the accountant is engaged by the Registrant to perform such services.
(e) (2)The percentage of services described in each of paragraphs (b) through (d) of this Item that were approved by the audit committee pursuant to paragraph (c)(7)(i)(C) of Rule 2-01 of Regulation S-X are as follows:
(b) Not applicable
(c) 100%
(d) Not applicable
(f) Not applicable.
(g) The aggregate non-audit fees billed by KPMG LLP to the Registrant for the fiscal years ending October 31, 2006 and October 31, 2005 were $8,000 and $7,500, respectively. The aggregate non-audit fees billed by KPMG to the Registrant, the Adviser and all entities controlling, controlled by, or under common control with the Adviser that provide services to the Registrant for the fiscal years ended October 31, 2006 and October 31, 2005 were $98,000 and $71,000, respectively.
(h) The Audit Committee has authorized the Chairman of the Audit Committee to pre-approve audit and non-audit services. For the fiscal years ended October 31, 2006 and October 31, 2005, the Audit Committee pre-approved all such services.
3
Items 5. Audit Committee of Listed Registrants
Not applicable to this filing.
Item 6. Schedule of Investments
Not applicable to this filing, included in Item 1.
Item 7. Disclosure of Proxy Voting Policies and Procedures for Closed-End Management Investment Companies.
Not applicable to this filing.
Item 8. Portfolio Managers of Closed-End Management Investment Companies
Not applicable to this filing.
Items 9. Purchase of Equity Securities by Closed-End Management Investment Company and Affiliated Purchasers.
Not applicable to this filing.
Items 10. Submission of Matters to a Vote of Security Holders.
There have been no material changes to the procedures by which the shareholders may recommend nominees to the Registrant’s Board of Directors, where those changes were implemented after the Registrant last provided disclosure in response to the requirements of Item 7(d)(2)(ii)(G) of Schedule 14A (17 CFR 240.14a-101), or this Item.
Item 11. Controls and Procedures.
(a) The Registrant’s Principal Executive Officer and Principal Financial Officer concluded that the Registrant’s disclosure controls and procedures (as defined in Rule 30a-3(c) under the Investment Company Act of 1940) were effective as of a date within 90 days prior to the filing date of this report (the “Evaluation Date”), based on their evaluation of the effectiveness of the Registrant’s disclosure controls and procedures as of the Evaluation Date.
(b) There were no changes in the Registrant’s internal control over financial reporting (as defined in Rule 30a-3(d) under the Investment Company Act of 1940 (17 CFR 270.30a-3(d)) that occurred during the Registrant’s second fiscal quarter of the period covered by this report that has materially affected, or is reasonably likely to materially affect, the Registrant’s internal control over financial reporting.
4
Item 12. Exhibits.
(a)(1) Code of Ethics is attached.
(a)(2) Separate certifications for the Registrant’s Principal Executive Officer and Principal Financial Officer, as required by Rule 30a-2(a) under the Investment Company Act of 1940 (17 CFR 270.30a-2(a)) are attached hereto as Exhibit 99CERT.
(b) Certifications for the Registrant’s Principal Executive Officer and Principal Financial Officer, as required by Rule 30a-2(b) under the Investment Company Act of 1940, are attached here to as Exhibit 99.906CERT. These certifications are being furnished to the Securities and Exchange Commission solely pursuant to 18 U.S.C. section 1350 and are not being filed as part of the Form N-CSR with the Commission.
5
SIGNATURES
Pursuant to the requirements of the Securities Exchange Act of 1934 and the Investment Company Act of 1940, the registrant has duly caused this report to be signed on its behalf by the undersigned, thereunto duly authorized.
(Registrant) | | Julius Baer Global Equity Fund Inc. |
| | |
By (Signature and Title) | | /s/ Tony Williams |
| | Tony Williams | President (Principal Executive Officer) |
| | | |
Date | | 01/05/07 | |
| | | | | | | | | |
Pursuant to the requirements of the Securities Exchange Act of 1934 and the Investment Company Act of 1940, this report has been signed below by the following persons on behalf of the registrant and in the capacities and on the dates indicated.
By (Signature and Title) | | /s/ Craig Giunta |
| | Craig Giunta | Chief Financial Officer (Principal Financial Officer) |
| | | |
Date | | 01/05/07 | |
| | |
By (Signature and Title) | | /s/ Tony Williams |
| | Tony Williams | President (Principal Executive Officer) |
| |
Date | | 01/05/07 | |
| | | | | | | | |
6