Table of Contents
UNITED STATES
SECURITIES AND EXCHANGE COMMISSION
Washington, D.C. 20549
FORM N-CSR
CERTIFIED SHAREHOLDER REPORT OF REGISTERED
MANAGEMENT INVESTMENT COMPANIES
Investment Company Act file number 811-06161
Allianz Funds
(Exact name of registrant as specified in charter)
| 1633 Broadway, New York, New York | 10019 | |
| (Address of principal executive offices) | (Zip code) |
Lawrence G. Altadonna
1633 Broadway,
New York, New York 10019
(Name and address of agent for service)
Registrant’s telephone number, including area code: 212-739-3371
Date of fiscal year end: June 30
Date of reporting period: December 31, 2017
Table of Contents
ITEM 1. REPORT TO SHAREHOLDERS

Allianz Funds
SHARE CLASSES A, C, R, P, INSTITUTIONAL, R6, ADMINISTRATIVE
Semiannual Report
December 31, 2017
AllianzGI Emerging Markets Opportunities Fund
AllianzGI Focused Growth Fund
AllianzGI Global Natural Resources Fund
AllianzGI Global Small-Cap Fund
AllianzGI Health Sciences Fund
AllianzGI Income & Growth Fund
AllianzGI Mid-Cap Fund
AllianzGI NFJ Dividend Value Fund
AllianzGI NFJ International Value Fund
AllianzGI NFJ Large-Cap Value Fund
AllianzGI NFJ Mid-Cap Value Fund
AllianzGI NFJ Small-Cap Value Fund
AllianzGI Small-Cap Blend Fund
AllianzGI Technology Fund
This material is authorized for use only when preceded or accompanied by the current Allianz Funds prospectus. Investors should consider the investment objectives, risks, charges and expenses of each Fund carefully before investing. This and other information is contained in the Funds’ prospectus or summary prospectus. Please read the prospectus carefully before you invest or send money.

Receive this report electronically and eliminate paper mailings.
To enroll, go to us.allianzgi.com/edelivery.
Table of Contents
A Word About Risk: A fund may be subject to various risks as described in its prospectus. Some of those risks may include, but are not limited to, the following: fixed-income risk, liquidity risk, derivatives risk, smaller company risk, non-US investment risk, focused investment risk and specific sector investment risks. Below investment grade securities involve a greater risk to principal than investment grade securities. Bond prices will normally decline as interest rates rise. The impact may be greater with longer-duration bonds. The market for certain securities may become illiquid, which could prevent a fund from purchasing or selling these securities at an advantageous time or price and possibly delay redemptions of fund shares. Use of derivative instruments may involve certain costs and risks such as liquidity risk, interest rate risk, market risk, credit and counterparty risk, management risk and the risk that a fund is unable to close out a position when it is most advantageous to do so. Portfolios investing in derivatives could lose more than the principal amount invested in those instruments. Investing in foreign securities may entail risk due to foreign economic and political developments; this risk may be enhanced when investing in emerging markets. Smaller companies may be more volatile than larger companies and may entail more risk. Concentrating investments in individual sectors may add additional risk and additional volatility compared to a diversified equity portfolio. The principal values of the funds are not guaranteed at any time. Please refer to the applicable fund’s current prospectus for complete details.
Table of Contents

Thomas J. Fuccillo
President & CEO
Dear Shareholder,
Economic growth in the US improved during the six-month fiscal reporting period ended December 31, 2017. This trend also occurred outside the US, and global inflation remained well-contained. Against this backdrop, US and international equities generated strong results. Elsewhere, the US bond market posted a positive return during the reporting period.
The Six-Month Fiscal Period in Review
For the six-month period ended December 31, 2017, US stocks rose 11.42%, as measured by the S&P 500 Index. Two measures of stock performance in developed international and global markets produced positive results, in dollar-denominated terms, with the MSCI EAFE (Europe, Australasia and Far East) Index returning 9.86% and the MSCI World Index gaining 10.61%. Elsewhere, the MSCI Emerging Markets Index rose 15.92% in dollar-denominated terms. With respect to bonds, the Bloomberg Barclays US Credit Index returned 2.41% and the Bloomberg Barclays Global High Yield Index returned 3.73%. The Bloomberg Barclays US Government Bond Index returned 0.43%, while the broader bond market, as measured by the Bloomberg Barclays US Aggregate Bond Index, returned 1.24%.
Turning to the US economy, gross domestic product (“GDP”), the value of goods and services produced in the country, the broadest measure of economic activity and the principal indicator of economic performance, expanded at a 3.1% annual pace during the second quarter of 2017. GDP growth then improved to an annual pace of 3.2% during the third quarter of 2017. Finally, the Commerce Department’s initial estimate — released after the reporting period had ended — showed that GDP grew at an annual pace of 2.6% for the fourth quarter of 2017.
After raising interest rates in March 2017 and June 2017, the US Federal Reserve (the “Fed”) raised rates to a range between 1.25% and 1.50% at its meeting in December 2017. Meanwhile, in October 2017 the Fed started to gradually reduce its balance sheet — a process that will likely take several years. The Fed’s actions during the year were well-telegraphed and there were minimal market disruptions.
Economic growth outside the US largely accelerated during the period. Despite this, a number of central banks, including the European Central Bank and the Bank of Japan maintained their accommodative monetary policies. One exception was the Bank of England, as it raised rates from 0.25% to 0.50% in November 2017 — the first increase since July 2007.
| 2 | December 31, 2017 | | Semiannual Report |
Table of Contents
Outlook
Since the depths of the global financial crisis, central banks have supported financial markets and the economies they serve through expansionary monetary policies, increasing their balance sheets to previously unheard-of sizes. In our opinion, the strong growth in corporate profits and diminishing fears of deflation show that this approach has worked, and central banks will be careful not to stifle current gains.
So, while we anticipate the scale of central bank support will diminish in 2018 — led by the Fed — we expect the overall shift to be slow and the precise actions to vary from one central bank to the next. In our view, interest rates will stay low overall in 2018. Consequently, we believe investors should continue to keep a careful eye on inflation, particularly because official data appear to understate rises in real-world costs. In addition to macroeconomic considerations, we feel several dominant investment themes, including geopolitical risk and business disruption, will persist in 2018.
Following muted conditions for much of last year, we have seen increased market volatility in recent weeks. This does not appear to be driven by a change in underlying market fundamentals, but rather driven by concerns that improving economic growth may trigger an uptick in inflation and more aggressive monetary policy tightening by the Fed.
Against this backdrop, we will continue to use our fundamental research and insights — and our strong global network — to help our clients balance risk and reward. Where appropriate, we will also seek to capitalize on volatility spikes and prepare to trim exposure to risky assets if cyclical data start to lose momentum.
On behalf of Allianz Global Investors U.S. LLC, thank you for investing with us. We encourage you to consult with your financial advisor and to visit our website, us.allianzgi.com, for additional information. We remain dedicated to serving your investment needs.
Sincerely,

Thomas J. Fuccillo
President & CEO
Past performance is no guarantee of future results. Unless otherwise noted, index returns reflect the reinvestment of income dividends and capital gains, if any, but do not reflect fees, brokerage commissions or other expenses of investing. It is not possible to invest directly in an index.
Receive this report electronically and eliminate paper mailings.
To enroll, go to us.allianzgi.com/edelivery.
| Semiannual Report | | December 31, 2017 | 3 |
Table of Contents
Unaudited
AllianzGI Emerging Markets Opportunities Fund
For the period of July 1, 2017 through December 31, 2017, as provided by Lu Yu, CFA, CIPM, Portfolio Manager.
Fund Insights
For the six-month period ended December 31, 2017, Class A shares at net asset value (“NAV”) of the AllianzGI Emerging Markets Opportunities Fund (the “Fund”) returned 15.39%, underperforming the MSCI Emerging Markets Index (the “benchmark”), which returned 15.92%.
Market Overview
Emerging market equities were beneficiaries of higher demand expectations and optimism over the health of the global economy. The double-digit advance in emerging markets earnings growth and an attractive valuation level translated to performance which topped developed markets during the period. Results for the benchmark were positive in five out of six months, which we believe is a testament to the strength of emerging markets equities.
Results for the benchmark were led by a rally in the energy sector, which rebounded alongside an increase in oil and natural gas prices, followed by advances in real estate, health care and materials. Meanwhile, telecommunications and industrials were modestly positive during the period. China was among the top country performers as economic growth exceeded expectations and Russian equities were helped by a turnaround in energy prices. Conversely, Pakistan fell under pressure after being promoted from frontier markets to emerging markets at the onset of the reporting period and Mexico was negatively impacted by two earthquakes and uncertainty over the future of the North American Free Trade Agreement (“NAFTA”).
Portfolio Review
The Fund seeks to deliver outperformance over time by investing in emerging market companies that are benefiting from change not yet fully reflected in the market. The investment team believes that investor behavioral biases contribute to market inefficiencies, which can be exploited through a transparent and repeatable investment process.
During the reporting period, the Fund’s results modestly trailed the benchmark due to more conservative stock selection, as the market was primarily led by high-beta, growth-oriented securities.
From a sector standpoint, industrials was the top performer thanks to stock picking in the airlines industry. Selections in consumer discretionary and a relative underweight allocation to consumer staples also contributed to results. Information technology was the primary source of underperformance due to selections in electronic equipment names as well as an underweight to the internet software & services industry. Selections in energy and financials trailed more modestly. Country results were buoyed by significant stock selection in Turkey, followed by an underweight to Mexico. Meanwhile, more conservative stock picking in South Korea and a relative underweight to Brazil offset results.
Outlook
Our positive viewpoint on emerging markets remains unwavered as we believe investors’ prior skepticism is increasingly turning toward optimism, consistent with past earnings growth cycles. Emerging markets have outperformed developed markets in each of the last two years and continue to trade at a meaningful price-to-earnings discount. This suggests the market has yet to fully buy into the recovery story. In addition, Wall Street analysts are forecasting double-digit earnings growth for emerging markets in 2018 and 2019, which is higher than developed markets for both periods. We believe this combination of positive sentiment, an attractive valuation level and resilient earnings growth suggests there is ample performance potential for the asset class over the coming periods.
| 4 | December 31, 2017 | | Semiannual Report |
Table of Contents
Unaudited
AllianzGI Emerging Markets Opportunities Fund (cont’d)
Average Annual Total Return for the period ended December 31, 2017
| 6 Month* | 1 Year | 5 Year | 10 Year | Since Inception† | ||||||||||||||||||
| AllianzGI Emerging Markets Opportunities Fund Class A | 15.39% | 37.90% | 4.50% | 0.30% | 10.23% | |||||||||||||||||
| AllianzGI Emerging Markets Opportunities Fund Class A (adjusted) | 9.04% | 30.31% | 3.32% | –0.27% | 9.77% | ||||||||||||||||
| AllianzGI Emerging Markets Opportunities Fund Class C | 14.96% | 36.85% | 3.72% | –0.45% | 9.40% | |||||||||||||||||
| AllianzGI Emerging Markets Opportunities Fund Class C (adjusted) | 13.96% | 35.85% | 3.72% | –0.45% | 9.40% | ||||||||||||||||
| AllianzGI Emerging Markets Opportunities Fund Class P | 15.54% | 38.25% | 4.77% | 0.56% | 10.53% | ||||||||||||||||
| AllianzGI Emerging Markets Opportunities Fund Institutional Class | 15.61% | 38.36% | 4.87% | 0.68% | 10.65% | ||||||||||||||||
| AllianzGI Emerging Markets Opportunities Fund R6 | 15.63% | 38.45% | 4.93% | 0.73% | 10.71% | ||||||||||||||||
| MSCI Emerging Markets Index | 15.92% | 37.28% | 4.35% | 1.68% | 10.10% | ||||||||||||||||
| Lipper Emerging Markets Funds Average | 14.19% | 34.57% | 4.26% | 1.49% | 9.59% | |||||||||||||||||
* Cumulative return
† The Fund began operations on 5/27/04. Benchmark comparisons began on the fund inception date. Lipper comparisons began on 5/31/04.
Performance quoted represents past performance and is no guarantee of future results. Current performance may be lower or higher than performance shown. For performance current to the most recent month-end, visit our website at us.allianzgi.com. Investment return and the principal value will fluctuate. Shares may be worth more or less than original cost when redeemed. The adjusted returns take into account the maximum sales charge of 5.50% on Class A shares and 1% contingent deferred sales charge (CDSC) on Class C shares, which may apply to shares redeemed during the first year of ownership. Returns do not reflect deduction of taxes that a shareholder would pay on fund distributions or redemption of fund shares. Please see pages 60-62 for more information. The Fund’s gross expense ratios are 1.62% for Class A shares, 2.37% for Class C shares, 1.37% for Class P shares, 1.27% for Institutional Class and 1.22% for Class R6 shares. These ratios do not include an expense reduction, contractually agreed through at least October 31, 2018. The Fund’s expense ratios net of these reductions and waivers are 1.27% for Class A shares, 2.02% for Class C shares, 1.02% for Class P shares, 0.92% for Institutional Class shares and 0.87% for Class R6 shares. Expense ratio information is as of the Fund’s current prospectus dated August 30, 2017, as supplemented to date.
Cumulative Returns Through December 31, 2017
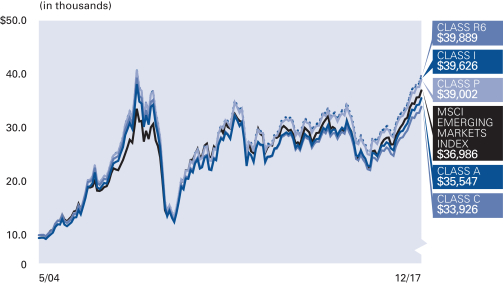
The Fund began operations on 5/27/04. Benchmark comparisons began on the fund inception date.
Country Allocation (as of December 31, 2017)
| China | 33.8% | |||
| Korea (Republic of) | 13.1% | |||
| India | 7.0% | |||
| Taiwan | 6.8% | |||
| Hong Kong | 6.2% | |||
| Turkey | 5.8% | |||
| Russian Federation | 5.4% | |||
| South Africa | 3.8% | |||
| Other | 16.9% | |||
| Cash & Equivalents — Net | 1.2% |
| Semiannual Report | | December 31, 2017 | 5 |
Table of Contents
Unaudited
AllianzGI Emerging Markets Opportunities Fund (cont’d)
| Shareholder Expense Example | Actual Performance | |||||||||
| Class A | Class C | Class P | Institutional Class | Class R6 | ||||||
| Beginning Account Value (7/1/17) | $1,000.00 | $1,000.00 | $1,000.00 | $1,000.00 | $1,000.00 | |||||
| Ending Account Value (12/31/17) | $1,153.90 | $1,149.60 | $1,155.40 | $1,156.10 | $1,156.30 | |||||
| Expenses Paid During Period | $6.89 | $10.94 | $5.54 | $5.00 | $4.73 | |||||
| Hypothetical Performance | ||||||||||
| (5% return before expenses) | ||||||||||
| Class A | Class C | Class P | Institutional Class | Class R6 | ||||||
| Beginning Account Value (7/1/17) | $1,000.00 | $1,000.00 | $1,000.00 | $1,000.00 | $1,000.00 | |||||
| Ending Account Value (12/31/17) | $1,018.80 | $1,015.02 | $1,020.06 | $1,020.57 | $1,020.82 | |||||
| Expenses Paid During Period | $6.46 | $10.26 | $5.19 | $4.69 | $4.43 | |||||
For each class of the Fund, expenses (net of fee waivers) are equal to the annualized expense ratio for the class (1.27% for Class A, 2.02% for Class C, 1.02% for Class P, 0.92% for Institutional Class and 0.87% for R6 Class), multiplied by the average account value over the period, multiplied by 184/365.
| 6 | December 31, 2017 | | Semiannual Report |
Table of Contents
(THIS PAGE INTENTIONALLY LEFT BLANK)
| Semiannual Report | | December 31, 2017 | 7 |
Table of Contents
Unaudited
For the period of July 1, 2017 through December 31, 2017, as provided by Karen Hiatt, CFA, Lead Portfolio Manager.
Fund Insights
For the six-month period ended December 31, 2017, Class A shares at net asset value (“NAV”) of the AllianzGI Focused Growth Fund (the “Fund”) returned 14.87%, outperforming the Russell 1000 Growth Index (the “benchmark”), which returned 14.23%.
Market Overview
US equities delivered double-digit gains over the second half of the year. Large-cap indices touched a series of fresh peaks and smaller companies also reached a record high in the closing days of the year. Share prices were buoyed by better-than-expected company earnings, renewed merger & acquisition activity, and optimism over the prospects for tax reform. In December, the Senate finally approved plans for $1.5 trillion of tax cuts, the most sweeping overhaul of the US tax system in more than three decades. Consistent with overall annual performance, growth stocks outperformed their value counterparts over the second half of the year.
Portfolio Review
The Fund’s relative performance was largely driven by stock selection in the consumer staples and technology sectors. While overall performance in the consumer staples sector lagged the benchmark’s return, the Fund’s stock selection within the sector helped relative performance. The Fund’s overweight positions in Estee Lauder and Monster Beverage, as well as not owning laggards such as Altria Group and Coca-Cola, boosted relative returns. Meanwhile, stocks in the technology sector generally delivered robust returns throughout the period, largely due to strong earnings growth. The Fund’s positions in Square, Visa, and Applied Materials were among the strongest contributors to relative performance.
Conversely, stock selection in the financials and consumer discretionary sectors detracted from relative returns. Positions in First Republic and Signature Bank were the largest detractors in the group. Due to company-specific challenges and limited upside potential relative to other holdings, the Fund exited positions in both stocks. Within the consumer discretionary sector, strong relative performance from positons in Burlington Stores and Home Depot was offset by weaker performance from Expedia and Newell Brands. Expedia is going through a management transition and increasing spending to fend off competition, while Newell Brands is going through an extended process of integrating acquisitions. The team exited both positions during the period.
We believe the portfolio holdings have attractive long-term growth prospects, and we remain comfortable with our overall positioning, despite short-term periods of volatility.
From a sector allocation perspective, an underweight in consumer staples and no exposure to the real estate sector helped relative performance. Conversely, an overweight in consumer discretionary and an underweight in industrials hurt relative performance.
Outlook
We maintain a positive view on US equities for 2018. In 2017, stocks generally performed well due to better than expected earnings growth, and we expect this to continue in 2018. While we may see modest pressure on equity multiples, we expect continued improvements in earnings growth to more than offset multiple compression. With tax reform completed, along with solid economic data and consumer sentiment, we estimate S&P 500 earnings should grow in the 10% to 15% range and GDP growth should reach 2.75% to 3.0% in 2018.
We believe that the market will ultimately reward companies that deliver consistent growth and increase shareholder value over time. Our focus continues to be on applying rigorous fundamental research to identify companies with strong or under-appreciated growth prospects and attractive risk-reward characteristics.
| 8 | December 31, 2017 | | Semiannual Report |
Table of Contents
Unaudited
AllianzGI Focused Growth Fund (cont’d)
Average Annual Total Return for the period ended December 31, 2017
| 6 Month* | 1 Year | 5 Year | 10 Year | Since Inception† | ||||||||||||||||||
| AllianzGI Focused Growth Fund Class A | 14.87% | 31.45% | 17.35% | 9.40% | 11.37% | |||||||||||||||||
| AllianzGI Focused Growth Fund Class A (adjusted) | 8.55% | 24.22% | 16.03% | 8.78% | 11.18% | ||||||||||||||||
| AllianzGI Focused Growth Fund Class C | 14.44% | 30.45% | 16.47% | 8.58% | 10.54% | |||||||||||||||||
| AllianzGI Focused Growth Fund Class C (adjusted) | 13.44% | 29.45% | 16.47% | 8.58% | 10.54% | ||||||||||||||||
| AllianzGI Focused Growth Fund Class R | 14.72% | 31.09% | 17.05% | 9.13% | 11.02% | ||||||||||||||||
| AllianzGI Focused Growth Fund Class P | 15.01% | 31.72% | 17.64% | 9.69% | 11.68% | ||||||||||||||||
| AllianzGI Focused Growth Fund Institutional Class | 15.05% | 31.88% | 17.76% | 9.79% | 11.79% | ||||||||||||||||
| AllianzGI Focused Growth Fund R6 | 15.11% | 31.94% | 17.81% | 9.85% | 11.84% | ||||||||||||||||
| AllianzGI Focused Growth Fund Administrative Class | 14.93% | 31.57% | 17.47% | 9.52% | 11.50% | |||||||||||||||||
| Russell 1000 Growth Index | 14.23% | 30.21% | 17.33% | 10.00% | 11.06% | ||||||||||||||||
| Lipper Large-Cap Growth Funds Average | 12.22% | 29.57% | 15.70% | 8.44% | 8.58% | |||||||||||||||||
* Cumulative return
† The Fund began operations on 2/24/84. Benchmark and Lipper performance comparisons began on 2/29/84.
Performance quoted represents past performance and is no guarantee of future results. Current performance may be lower or higher than performance shown. For performance current to the most recent month-end, visit our website at us.allianzgi.com. Investment return and the principal value will fluctuate. Shares may be worth more or less than original cost when redeemed. The adjusted returns take into account the maximum sales charge of 5.50% on Class A shares and 1% contingent deferred sales charge (CDSC) on Class C shares, which may apply to shares redeemed during the first year of ownership. Returns do not reflect deduction of taxes that a shareholder would pay on fund distributions or redemption of fund shares. Please see pages 60-62 for more information. The Fund’s gross expense ratios are 1.11% for Class A shares, 1.86% for Class C shares, 1.36% for Class R shares, 0.86% for Class P shares, 0.76% for Institutional Class, 0.71% for Class R6 shares, and 1.01% for Administrative Class shares. These ratios do not include an expense reduction, contractually agreed through at least October 31, 2018. The Fund’s expense ratios net of this reduction are 0.99% for Class A shares, 1.76% for Class C shares, 1.26% for Class R shares, 0.76% for Class P shares, 0.66% for Institutional Class shares, 0.61% for Class R6 shares, and 0.91% for Administrative Class shares. Expense ratio information is as of the Fund’s current prospectus dated August 30, 2017, as supplemented to date.
Cumulative Returns Through December 31, 2017
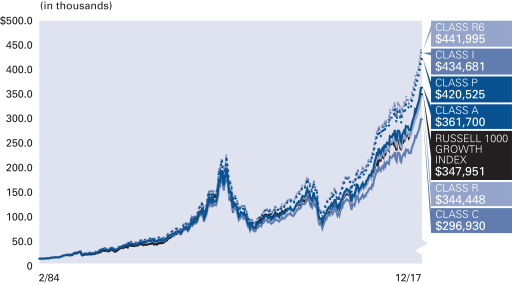
The Fund began operations on 2/24/84. Benchmark performance comparisons began on 2/29/84.
Industry/Sectors (as of December 31, 2017)
| Internet Software & Services | 12.1% | |||
| Software | 8.5% | |||
| Technology Hardware, Storage & Peripherals | 7.1% | |||
| IT Services | 6.9% | |||
| Specialty Retail | 6.1% | |||
| Internet & Catalog Retail | 6.1% | |||
| Semiconductors & Semiconductor Equipment | 6.0% | |||
| Biotechnology | 5.2% | |||
| Other | 41.8% | |||
| Cash & Equivalents — Net | 0.2% |
| Semiannual Report | | December 31, 2017 | 9 |
Table of Contents
Unaudited
AllianzGI Focused Growth Fund (cont’d)
| Shareholder Expense Example | Actual Performance | |||||||||||||
| Class A | Class C | Class R | Class P | Institutional Class | Class R6 | Administrative Class | ||||||||
| Beginning Account Value (7/1/17) | $1,000.00 | $1,000.00 | $1,000.00 | $1,000.00 | $1,000.00 | $1,000.00 | $1,000.00 | |||||||
| Ending Account Value (12/31/17) | $1,148.70 | $1,144.40 | $1,147.20 | $1,150.10 | $1,150.50 | $1,151.10 | $1,149.30 | |||||||
| Expenses Paid During Period | $5.42 | $9.57 | $6.87 | $4.17 | $3.63 | $3.36 | $4.98 | |||||||
| Hypothetical Performance | ||||||||||||||
| (5% return before expenses) | ||||||||||||||
| Class A | Class C | Class R | Class P | Institutional Class | Class R6 | Administrative Class | ||||||||
| Beginning Account Value (7/1/17) | $1,000.00 | $1,000.00 | $1,000.00 | $1,000.00 | $1,000.00 | $1,000.00 | $1,000.00 | |||||||
| Ending Account Value (12/31/17) | $1,020.16 | $1,016.28 | $1,018.80 | $1,021.32 | $1,021.83 | $1,022.08 | $1,020.57 | |||||||
| Expenses Paid During Period | $5.09 | $9.00 | $6.46 | $3.92 | $3.41 | $3.16 | $4.69 | |||||||
For each class of the Fund, expenses (net of fee waivers) are equal to the annualized expense ratio for the class (1.00% for Class A, 1.77% for Class C, 1.27% for Class R, 0.77% for Class P, 0.67% for Institutional Class, 0.62% for Class R6 and 0.92% for Administrative Class), multiplied by the average account value over the period, multiplied by 184/365.
| 10 | December 31, 2017 | | Semiannual Report |
Table of Contents
(THIS PAGE INTENTIONALLY LEFT BLANK)
| Semiannual Report | | December 31, 2017 | 11 |
Table of Contents
Unaudited
AllianzGI Global Natural Resources Fund
For the reporting period of July 1, 2017, through December 31, 2017, as provided by Paul Strand, CFA, Portfolio Manager.
Fund Insights
For the six-month reporting period ended December 31, 2017, Class A shares at net asset value (“NAV”) of the AllianzGI Global Natural Resources Fund (the “Fund”) returned 15.32%, underperforming the 60% MSCI World Energy/40% MSCI World Materials (the “benchmark”), which returned 16.79%.
Market overview
Crude oil markets rebounded sharply in the second half of 2017, bouncing off the lows for Brent crude seen in June of under $45 per barrel, touching over $65 per barrel at the end of the year. Crude oil rebounded as evidence suggests OPEC was adhering to its supply cutbacks, global demand/supply statistics turned more favorable and there appeared to be a better deployment of capital discipline among the US shale producers. However, partly because of the first half drop in energy prices the MSCI World Energy Index was the worst performing MSCI sector index for the 2017 calendar year, up only about 6%. By comparison, the MSCI World Index, the broad market gauge, rose over 20% for the year. Meanwhile, some upward moves in the prices of copper and base metals such as aluminum, nickel and iron ore, coupled with relatively accommodative global monetary conditions and strong metal demand from China, helped the MSCI World Materials Index to surge to nearly a 30% gain for calendar year 2018.
Portfolio review
The Fund’s underperformance was driven by adverse allocation effects from an overweight in both alternative energy and oilfield services. The Fund’s use of option call writing had a negligible impact on performance for the period.
The energy positions in oil and gas exploration and production (“E&P”), pressure pumping and integrated oil contributed the most to relative performance. In general, the E&P stocks were boosted by the second-half rebound in crude prices. The pressure pumping position, Propetro Holding Corp., was helped by improved pricing with the general pick up in US land rig activity. An underweight in Exxon Mobile Corp. positively impacted performance as the integrated oil companies tend to lag the higher beta energy industries in the context of higher crude prices. Finally, Chemours Company, a titanium dioxide producer, which is a raw material for paints, benefitted from favorable pricing.
The performance detractors were generally eclectic in nature including some positions in oil and gas exploration and production, a sand supplier to US-based land rigs and alternative energy. The wind turbine positions were hurt by overcapacity and the resulting unfavorable pricing in the industry. The E&P positions were negatively impacted by quarterly earnings misses and a shift toward more natural gas production than oil. Lastly a sand supplier was hit by capacity expansions, including some private companies.
Outlook
We believe the Fund is poised to benefit from the continued rebound in the energy sector including an improvement from what we believe was the overly pessimistic investor sentiment in the first half of the year. Over the intermediate term (one to two years), we expect oil prices to normalize to at least in the $55 to $65 range. Given our belief that the global economy and global energy demand will grow at least moderately over the next couple of years, and the fact that we believe that there is a substantial disconnect between current oil prices and energy stock valuations, we are currently overweight energy as we enter 2018. Furthermore, given our outlook for steady global economic growth, we are also maintaining our positioning in the materials sector. Additionally, we continue to hold a favorable view of the growth of EVs (electric vehicles), and have exposure to this theme through companies exposed to lithium and battery production. Finally, despite the Portfolio’s first half setback to performance from the energy exposure, we believe that the energy positioning will ultimately benefit the strategy, as natural global demand growth will lift energy prices longer term beyond our intermediate normalized forecast of $55 to $65. The Fund remains globally diversified.
We continue to favor our diversified, thematic and opportunistic approach to investing in natural resource-related companies, and maintain our belief that over the long term the performance of the equities should outperform the underlying commodities. Risks to the Fund include a relapse in the global economy, disruption to world bond markets and a sustained drop in commodity prices.
| 12 | December 31, 2017 | | Semiannual Report |
Table of Contents
Unaudited
AllianzGI Global Natural Resources Fund (cont’d)
Average Annual Total Return for the period ended December 31, 2017
| 6 Month* | 1 Year | 5 Year | 10 Year | Since Inception† | ||||||||||||||||||
| AllianzGI Global Natural Resources Fund Class A | 15.32% | –0.94% | 0.13% | –2.95% | 6.06% | |||||||||||||||||
| AllianzGI Global Natural Resources Fund Class A (adjusted) | 8.98% | –6.39% | –0.99% | –3.50% | 5.62% | ||||||||||||||||
| AllianzGI Global Natural Resources Fund Class C | 14.84% | –1.66% | –0.63% | –3.66% | 5.28% | |||||||||||||||||
| AllianzGI Global Natural Resources Fund Class C (adjusted) | 13.84% | –2.64% | –0.63% | –3.66% | 5.28% | ||||||||||||||||
| AllianzGI Global Natural Resources Fund Class P | 15.39% | –0.74% | 0.36% | –2.70% | 6.34% | ||||||||||||||||
| AllianzGI Global Natural Resources Fund Institutional Class | 15.48% | –0.57% | 0.48% | –2.61% | 6.44% | ||||||||||||||||
| 60% MSCI World Energy/40% MSCI World Materials | 16.79% | 14.24% | 3.24% | 0.51% | 6.97% | ||||||||||||||||
| MSCI World Index | 10.61% | 22.40% | 11.64% | 5.03% | 7.32% | ||||||||||||||||
| Custom Commodity Equity Benchmark | 14.69% | 18.62% | 4.93% | 1.72% | 8.89% | ||||||||||||||||
| Lipper Global Natural Resources Funds Average | 15.33% | 8.73% | 0.11% | –4.03% | 5.07% | |||||||||||||||||
* Cumulative return
† The Fund began operations on 6/30/04. Benchmark and Lipper comparisons began on the fund inception date.
Performance quoted represents past performance and is no guarantee of future results. Current performance may be lower or higher than performance shown. For performance current to the most recent month-end, visit our website at us.allianzgi.com. Investment return and the principal value will fluctuate. Shares may be worth more or less than original cost when redeemed. The adjusted returns take into account the maximum sales charge of 5.50% on Class A shares and 1% contingent deferred sales charge (CDSC) on Class C shares, which may apply to shares redeemed during the first year of ownership. Returns do not reflect deduction of taxes that a shareholder would pay on fund distributions or redemption of fund shares. Please see pages 60-62 for more information. The Fund’s expense ratios are 1.42% for Class A shares, 2.17% for Class C shares, 1.17% for Class P shares and 1.07% for Institutional Class shares. Expense ratio information is as of the Fund’s current prospectus dated August 30, 2017, as supplemented to date.
Cumulative Returns Through December 31, 2017

The Fund began operations on 6/30/04. Benchmark comparisons began on the fund inception date.
Country Allocation (as of December 31, 2017)
| United States | 60.4% | |||
| United Kingdom | 14.0% | |||
| Canada | 7.6% | |||
| France | 5.3% | |||
| Australia | 3.5% | |||
| Japan | 2.4% | |||
| Germany | 1.9% | |||
| Chile | 1.2% | |||
| Other | 2.6% | |||
| Cash & Equivalents — Net (including Options Written) | 1.1% |
| Semiannual Report | | December 31, 2017 | 13 |
Table of Contents
Unaudited
AllianzGI Global Natural Resources Fund (cont’d)
| Shareholder Expense Example | Actual Performance | |||||||
| Class A | Class C | Class P | Institutional Class | |||||
| Beginning Account Value (7/1/17) | $1,000.00 | $1,000.00 | $1,000.00 | $1,000.00 | ||||
| Ending Account Value (12/31/17) | $1,153.20 | $1,148.40 | $1,153.90 | $1,154.80 | ||||
| Expenses Paid During Period | $7.76 | $11.81 | $6.35 | $5.87 | ||||
| Hypothetical Performance | ||||||||
| (5% return before expenses) | ||||||||
| Class A | Class C | Class P | Institutional Class | |||||
| Beginning Account Value (7/1/17) | $1,000.00 | $1,000.00 | $1,000.00 | $1,000.00 | ||||
| Ending Account Value (12/31/17) | $1,018.00 | $1,014.22 | $1,019.31 | $1,019.76 | ||||
| Expenses Paid During Period | $7.27 | $11.07 | $5.96 | $5.50 | ||||
For each class of the Fund, expenses are equal to the annualized expense ratio for the class (1.43% for Class A, 2.18% for Class C, 1.17% for Class P and 1.08% for Institutional Class), multiplied by the average account value over the period, multiplied by 184/365.
| 14 | December 31, 2017 | | Semiannual Report |
Table of Contents
(THIS PAGE INTENTIONALLY LEFT BLANK)
| Semiannual Report | | December 31, 2017 | 15 |
Table of Contents
Unaudited
AllianzGI Global Small-Cap Fund
For the period of July 1, 2017 through December 31, 2017, as provided by Andrew Neville, Lead Portfolio Manager.
Fund Insights
For the six-month period ended December 31, 2017, the Class A shares at net asset value (“NAV”) of the AllianzGI Global Small-Cap Fund (the “Fund”) returned 14.05%, outperforming the MSCI World Small-Cap Index, (the “benchmark”), which returned 11.79%.
Market Overview
Global equities rallied strongly over the second half of 2017. Optimism over the health of the global economy and US tax reform helped stocks overcome heightened political tensions. Small-cap stocks in equity markets around the world performed ahead of their larger cap counterparts.
Economic data indicated the global economy was in robust health, with the US, Eurozone and Japan all recording third-quarter growth of at least 2.5% on an annualized basis. As widely expected, the US Federal Reserve (the “Fed”) raised interest rates by 25 basis points and started to unwind the $4.5 trillion of Treasury bonds and mortgage-backed securities amassed as part of its quantitative easing programs. While the European Central Bank kept interest rates on hold and extended its stimulus measures until September 2018, it halved the size of its monthly asset purchases starting in January 2018.
Portfolio review
The portfolio performed well ahead of the benchmark over the course of the second half of 2017 achieving a strong absolute return. The European, Asia-Pacific and Japanese sleeve portfolios performed well ahead of their regional markets whilst the US sleeve portfolio closed the period in line with the local market.
Sector positioning was a slight positive contributor to performance driven by the overweight in industrials and the underweight in real estate. Country-wise, the portfolio’s exposure to China and Taiwan within the Asian sleeve portfolio, the overweight in Germany within the European sleeve portfolio and the underweight in Canada were all meaningful positive contributors.
Successful stock selection, however, accounted for most of the outperformance achieved in the reporting period. Selection was particularly strong within the Asia-Pacific and Japanese sleeves of the portfolio. Sector-wise, stock selection contributed most within industrials, information technology and energy. On a single stock basis, the most meaningful positive contributors to performance were spread across all parts of the portfolio including the positions in Daifuku (Japan), Alcoa Corp., XPO Logistics (both US), Intermediate Capital (UK) and Santos (Australia).
Outlook
We believe the global economy is likely to remain on a moderate growth course, which should lead to further rises in corporate profits and share prices. We believe markets should also continue to benefit from the growth-oriented monetary policy of the world’s central banks, even though the Fed has already begun to raise interest rates. In Europe, unlike the US, rate rises are not yet on the horizon, and we believe Asian central banks are also likely to maintain a generous money supply for the time being. However, this could harbor a risk for equity markets, due to the increasing likelihood that peak liquidity will be reached in 2018. A significant shift in monetary policy could lead to a correction on the equity markets, as well as increased volatility in exchange rates.
| 16 | December 31, 2017 | | Semiannual Report |
Table of Contents
Unaudited
AllianzGI Global Small-Cap Fund (cont’d)
Average Annual Total Return for the period ended December 31, 2017
| 6 Month* | 1 Year | 5 Year | 10 Year | Since Inception† | ||||||||||||||||||
| AllianzGI Global Small-Cap Fund Class A | 14.05% | 26.86% | 12.55% | 6.07% | 10.57% | |||||||||||||||||
| AllianzGI Global Small-Cap Fund Class A (adjusted) | 7.79% | 19.89% | 11.29% | 5.47% | 10.27% | ||||||||||||||||
| AllianzGI Global Small-Cap Fund Class C | 13.63% | 25.92% | 11.72% | 5.27% | 9.76% | |||||||||||||||||
| AllianzGI Global Small-Cap Fund Class C (adjusted) | 12.63% | 24.92% | 11.72% | 5.27% | 9.76% | ||||||||||||||||
| AllianzGI Global Small-Cap Fund Class P | 14.20% | 27.20% | 12.84% | 6.35% | 10.89% | ||||||||||||||||
| AllianzGI Global Small-Cap Fund Institutional Class | 14.26% | 27.32% | 12.95% | 6.45% | 10.99% | ||||||||||||||||
| MSCI World Small-Cap Index | 11.79% | 22.66% | 13.20% | 7.70% | 8.52% | ||||||||||||||||
| Lipper Global Small-/Mid-Cap Funds Average | 12.45% | 26.26% | 12.49% | 5.91% | 9.31% | |||||||||||||||||
* Cumulative return
† The Fund began operations on 12/31/96. Benchmark and Lipper comparisons began on the fund inception date.
Performance quoted represents past performance and is no guarantee of future results. Current performance may be lower or higher than performance shown. For performance current to the most recent month-end, visit our website at us.allianzgi.com. Investment return and the principal value will fluctuate. Shares may be worth more or less than original cost when redeemed. The adjusted returns take into account the maximum sales charge of 5.50% on Class A shares and 1% contingent deferred sales charge (CDSC) on Class C shares, which may apply to shares redeemed during the first year of ownership. Returns do not reflect deduction of taxes that a shareholder would pay on fund distributions or redemption of fund shares. Please see pages 60-62 for more information. The Fund’s expense ratios are 1.62% for Class A shares, 2.37% for Class C shares, 1.37% for Class P shares and 1.27% for Institutional Class shares. Expense ratio information is as of the Fund’s current prospectus dated August 30, 2017, as supplemented to date.
Cumulative Returns Through December 31, 2017
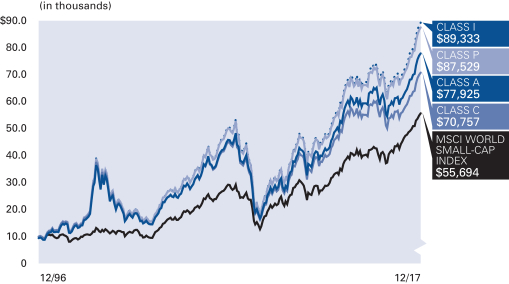
The Fund began operations on 12/31/96. Benchmark comparisons began on the fund inception date.
Country Allocation (as of December 31, 2017)
| United States | 48.8% | |||
| Japan | 15.0% | |||
| United Kingdom | 5.9% | |||
| Germany | 4.8% | |||
| Switzerland | 3.1% | |||
| Sweden | 2.5% | |||
| France | 2.2% | |||
| Austria | 1.7% | |||
| Other | 14.0% | |||
| Cash & Equivalents — Net | 2.0% |
| Semiannual Report | | December 31, 2017 | 17 |
Table of Contents
Unaudited
AllianzGI Global Small-Cap Fund (cont’d)
| Shareholder Expense Example | Actual Performance | |||||||
| Class A | Class C | Class P | Institutional Class | |||||
| Beginning Account Value (7/1/17) | $1,000.00 | $1,000.00 | $1,000.00 | $1,000.00 | ||||
| Ending Account Value (12/31/17) | $1,140.50 | $1,136.30 | $1,142.00 | $1,142.60 | ||||
| Expenses Paid During Period | $8.74 | $12.76 | $7.40 | $6.86 | ||||
| Hypothetical Performance | ||||||||
| (5% return before expenses) | ||||||||
| Class A | Class C | Class P | Institutional Class | |||||
| Beginning Account Value (7/1/17) | $1,000.00 | $1,000.00 | $1,000.00 | $1,000.00 | ||||
| Ending Account Value (12/31/17) | $1,017.04 | $1,013.26 | $1,018.30 | $1,018.80 | ||||
| Expenses Paid During Period | $8.24 | $12.03 | $6.97 | $6.46 | ||||
For each class of the Fund, expenses are equal to the annualized expense ratio for the class (1.62% for Class A, 2.37% for Class C, 1.37% for Class P and 1.27% for Institutional Class), multiplied by the average account value over the period, multiplied by 184/365.
| 18 | December 31, 2017 | | Semiannual Report |
Table of Contents
(THIS PAGE INTENTIONALLY LEFT BLANK)
| Semiannual Report | | December 31, 2017 | 19 |
Table of Contents
Unaudited
AllianzGI Health Sciences Fund
For the period of July1, 2017 through December, 2017, as provided by John Schroer, CFA, Lead Portfolio Manager.
Fund Insights
For the six-month reporting period ended December 31, 2017, Class A shares at net asset value (“NAV”) of the AllianzGI Health Sciences Fund (the “Fund”) returned 0.48%, underperforming the MSCI World Health Care Index (the “benchmark”), which returned 3.31%.
Market overview
For the six month period, global health care stocks underperformed the broader averages. The benchmark rose 1.0% versus the S&P 500 and the MSCI World indices’ larger gains. Overall, technology, materials and energy were some of the better performing sectors as investors focused on the more cyclical sectors of the global economy. Health care and utilities were among the worst performing sectors.
US stock markets surged to new all-time highs in December as the congressional passage of tax reform, signs of economic acceleration and pro-business deregulation buoyed markets. Worldwide, global equity markets continue to be supported by relatively accommodative monetary policies and low global interest rates. On monetary policy, the US Federal Reserve (the “Fed”) lifted interest rates an additional quarter point in mid-December. The Fed has indicated that it will raise short term interest rates an additional three times in 2018, and that it will do so very deliberately so as not to disrupt global capital markets. Other developed world central banks, such as the Bank of England, Bank of Japan and the European Central Bank are moving slowly to normalize monetary policy as well.
Portfolio review
Overall, the Fund’s underperformance was primarily driven by adverse stock selection in biotechnology.
An overweight in a large-cap managed-care company, UnitedHealth Group, was the biggest contributor for the six month period. The stock benefitted from solid quarterly earnings reports throughout the year and a strong year in general for stock returns for the large-cap managed-care industry. Another larger contributor to performance was a small-cap biotechnology holding, Exelixis Inc., which was helped by some positive pipeline reports for its advanced tumor treatments. The Fund also benefitted from zero-weights in a variety of drug-related companies, including the generics company, Teva Pharmaceutical, which was victimized by pricing pressure, subsequent earnings deterioration and worries about an overly leveraged balance sheet.
The largest individual detractors to performance were several biotechnology positions and pharmaceutical positions in specialty pharmaceuticals. These biopharmaceutical names encountered quarterly earnings release misses or diminished revenue outlooks, and/or various pipeline disappointments.
Outlook
2017 was a solid year for absolute returns in the global health care sector. Through mid-January of 2018, global stock markets and health care stocks continue to move higher. While we don’t see any immediate warning signs for a significant correction for the health care sector, the November 2018 congressional elections will soon be in focus. In our opinion, these elections could be a catalyst for an increase in general stock market risk and volatility. Additionally, we believe the present calm in the regulatory environment for drug price controls could be altered if the Democratic Party wins the majority control of either the House or Senate. Nonetheless, longer term we are bullish on the secular growth case for health care in general, as a variety of demographic factors support continued growth in global health care spending.
Our focus continues to be on companies and health care industries delivering innovative and profitable drug treatments and cost effective, productivity-enhancing medical solutions. These factors are driving solid long-term earnings growth and, in our opinion, attractive overall valuations for global health care stocks.
| 20 | December 31, 2017 | | Semiannual Report |
Table of Contents
Unaudited
AllianzGI Health Sciences Fund (cont’d)
Average Annual Total Return for the period ended December 31, 2017
| 6 Month* | 1 Year | 5 Year | 10 Year | Since Inception† | ||||||||||||||||||
| AllianzGI Health Sciences Fund Class A | 0.48% | 17.32% | 15.16% | 10.32% | 11.60% | |||||||||||||||||
| AllianzGI Health Sciences Fund Class A (adjusted) | –5.05% | 10.87% | 13.86% | 9.70% | 11.30% | ||||||||||||||||
| AllianzGI Health Sciences Fund Class C | 0.12% | 16.46% | 14.30% | 9.49% | 10.77% | |||||||||||||||||
| AllianzGI Health Sciences Fund Class C (adjusted) | –0.88% | 15.46% | 14.30% | 9.49% | 10.77% | ||||||||||||||||
| AllianzGI Health Sciences Fund Institutional Class | 0.66% | 17.75% | 15.57% | 10.70% | 12.02% | ||||||||||||||||
| MSCI World Health Care Index | 3.31% | 19.80% | 13.88% | 8.94% | 8.59% | ||||||||||||||||
| Lipper Health/Biotech Funds Average | 5.81% | 25.82% | 18.23% | 12.49% | 12.47% | |||||||||||||||||
* Cumulative return
† The Fund began operations on 12/31/96. Benchmark and Lipper comparisons began on the fund inception date.
Performance quoted represents past performance and is no guarantee of future results. Current performance may be lower or higher than performance shown. For performance current to the most recent month-end, visit our website at us.allianzgi.com. Investment return and the principal value will fluctuate. Shares may be worth more or less than original cost when redeemed. The adjusted returns take into account the maximum sales charge of 5.50% on Class A shares and 1% contingent deferred sales charge (CDSC) on Class C shares, which may apply to shares redeemed during the first year of ownership. Returns do not reflect deduction of taxes that a shareholder would pay on fund distributions or redemption of fund shares. Please see pages 60-62 for more information. The Fund’s expense ratios are 1.46% for Class A shares, 2.21% for Class C shares and 1.11% for Institutional Class Shares. Expense ratio information is as of the Fund’s current prospectus dated August 30, 2017, as supplemented to date.
Cumulative Returns Through December 31, 2017

The Fund began operations on 12/31/96. Benchmark comparisons began on the fund inception date.
Industry/Sectors (as of December 31, 2017)
| Biotechnology | 32.6% | |||
| Pharmaceuticals | 28.9% | |||
| Health Care Providers & Services | 16.8% | |||
| Health Care Equipment & Supplies | 12.1% | |||
| Life Sciences Tools & Services | 3.0% | |||
| Diversified Consumer Services | 0.7% | |||
| Cash & Equivalents — Net | 5.9% |
| Semiannual Report | | December 31, 2017 | 21 |
Table of Contents
Unaudited
AllianzGI Health Sciences Fund (cont’d)
| Shareholder Expense Example | Actual Performance | |||||||||||||||||||
| Class A | Class C | Institutional Class | ||||||||||||||||||
Beginning Account Value (7/1/17) | $1,000.00 | $1,000.00 | $1,000.00 | |||||||||||||||||
Ending Account Value (12/31/17) | $1,004.80 | $1,001.20 | $1,006.60 | |||||||||||||||||
Expenses Paid During Period | $7.43 | $11.20 | $5.66 | |||||||||||||||||
| Hypothetical Performance | ||||||||||||||||||||
| (5% return before expenses) | ||||||||||||||||||||
| Class A | Class C | Institutional Class | ||||||||||||||||||
Beginning Account Value (7/1/17) | $1,000.00 | $1,000.00 | $1,000.00 | |||||||||||||||||
Ending Account Value (12/31/17) | $1,017.80 | $1,014.01 | $1,019.56 | |||||||||||||||||
Expenses Paid During Period | $7.48 | $11.27 | $5.70 | |||||||||||||||||
For each class of the Fund, expenses are equal to the annualized expense ratio for the class (1.47% for Class A, 2.22% for Class C and 1.12% for Institutional Class ), multiplied by the average account value over the period, multiplied by 184/365.
| 22 | December 31, 2017 | | Semiannual Report |
Table of Contents
(THIS PAGE INTENTIONALLY LEFT BLANK)
| Semiannual Report | | December 31, 2017 | 23 |
Table of Contents
Unaudited
AllianzGI Income & Growth Fund
For the period of July 1, 2017, through December 31, 2017, as provided by Doug Forsyth, CFA, Portfolio Manager.
Fund Insights
For the six-month period ended December 31, 2017, Class A shares at net asset value (“NAV”) of the AllianzGI Income & Growth Fund (the “Fund”) returned 6.54%. During the same period, the S&P 500 Index gained 11.42% and the overall U.S. bond market, as measured by the Bloomberg Barclays US Aggregate Bond Index, returned 1.24%. The convertible universe returned 5.39%, as measured by the ICE BofA Merrill Lynch All US Convertibles Index; and high yield bonds, as measured by the ICE BofA Merrill Lynch US High Yield Master II Index, rose 2.45%. Lastly, the Russell 1000 Growth Index increased 14.23%.
Market Overview
Several factors influenced the three key markets including economic trends, corporate fundamentals, the US Federal Reserve’s (the “Fed’s”) actions and commentary, tax reform and rising commodity prices.
Strong US economic trends supported the market over the period. Housing prices rose and existing home sales reached the highest level in a decade. Manufacturing and nonmanufacturing indexes signaled expanding activity and US GDP growth exceeded 3% for the second straight quarter. In addition, consumer spending benefited from benign inflation and steady job gains.
Credit trends showed sustained improvement as most high-yield bond and convertible bond issuers reported financial results and provided outlooks that met or exceeded expectations. In particular, net leverage and interest coverage for the high-yield market were better quarter over quarter and year over year. With respect to large-cap equities, the third quarter marked another period of year-over-year earnings growth.
The Fed increased its benchmark interest rate by 25 basis points in December for a third time this year, to a range of 1.25% to 1.50%. A measured approach by the Fed, extended accommodation by central banks overseas and the expectation of monetary policy continuity under designated new Federal Reserve Board Chair Jerome Powell were market-supportive developments.
All three markets also benefited from optimism tied to tax reform progress and the resulting expectation of greater corporate profitability. The final tax bill included several positive elements such as a reduction in the corporate tax rate and the immediate expensing of capital expenditures. On balance, the prospect of US companies capturing tax savings lifted investor sentiment.
A synchronized global recovery and continued improvement in industry dynamics helped commodity-related sectors, which were among the market’s best performers. Crude oil settled above $60 a barrel, a two-year high, amid ebbing oversupply fears capped by rising demand and an extension of the production-cut agreement. Copper and other base metals also gained.
Against this backdrop, the trend of subdued volatility continued to persist as had been documented throughout the calendar year. The Chicago Board Options Exchange Volatility Index hit long-term lows multiple times and troughed intra-day with a sub-9 reading near the Christmas holiday.
Portfolio Review
The Fund provided consistent income—the primary goal of the fund—and a positive total return over the trailing six-month period.
In the equity sleeve, industrials, health care and consumer discretionary were the greatest contributors to relative performance. Conversely, only the energy sector detracted.
In the convertible sleeve, sectors that contributed positively to relative performance were energy, consumer staples and financials. On the other hand, technology, health care and industrials pressured relative performance.
In the high yield sleeve, industries that aided relative performance were retail, cable & satellite television and food & drug retailers. In contrast, energy, telecommunications and support-services hampered relative performance.
The covered call strategy captured some gains, but many option profits were offset as the covered call option sleeve was actively managed.
Outlook
US equity markets continue to record new all-time highs, volatility is near all-time lows and we believe the global economic outlook continues to improve. Historically, these factors have been positive indicators for corporate earnings growth and supportive of investments in risk assets.
| 24 | December 31, 2017 | | Semiannual Report |
Table of Contents
Unaudited
AllianzGI Income & Growth Fund (cont’d)
Average Annual Total Return for the period ended December 31, 2017
| 6 Month* | 1 Year | 5 Year | 10 Year | Since Inception† | ||||||||||||||||||
| AllianzGI Income & Growth Fund Class A | 6.54% | 13.45% | 8.61% | 6.70% | 7.04% | |||||||||||||||||
| AllianzGI Income & Growth Fund Class A (adjusted) | 0.68% | 7.21% | 7.39% | 6.10% | 6.48% | ||||||||||||||||
| AllianzGI Income & Growth Fund Class C | 6.19% | 12.63% | 7.80% | 5.91% | 6.24% | |||||||||||||||||
| AllianzGI Income & Growth Fund Class C (adjusted) | 5.19% | 11.63% | 7.80% | 5.91% | 6.24% | ||||||||||||||||
| AllianzGI Income & Growth Fund Class R | 6.42% | 13.17% | 8.33% | 6.44% | 6.78% | ||||||||||||||||
| AllianzGI Income & Growth Fund Class P | 6.70% | 13.79% | 8.88% | 6.98% | 7.32% | ||||||||||||||||
| AllianzGI Income & Growth Fund Institutional Class | 6.70% | 13.87% | 8.98% | 7.08% | 7.42% | ||||||||||||||||
| S&P 500 Index | 11.42% | 21.83% | 15.79% | 8.50% | 8.39% | ||||||||||||||||
| Bloomberg Barclays U.S. Aggregate Bond Index | 1.24% | 3.54% | 2.10% | 4.01% | 4.19% | ||||||||||||||||
| Lipper Flexible Portfolio Funds Average | 6.23% | 12.73% | 6.18% | 4.43% | 4.91% | |||||||||||||||||
* Cumulative return
† The Fund began operations on 2/28/07. Benchmark and Lipper comparisons began on the fund inception date.
Performance quoted represents past performance and is no guarantee of future results. Current performance may be lower or higher than performance shown. For performance current to the most recent month-end, visit our website at us.allianzgi.com. Investment return and the principal value will fluctuate. Shares may be worth more or less than original cost when redeemed. The adjusted returns take into account the maximum sales charge of 5.50% on Class A shares and 1% contingent deferred sales charge (CDSC) on Class C shares, which may apply to shares redeemed during the first year of ownership. Returns do not reflect deduction of taxes that a shareholder would pay on fund distributions or redemption of fund shares. Please see pages 60-62 for more information. The Fund’s expense ratios are 1.29% for Class A shares, 2.04% for Class C shares, 1.54% for Class R shares, 1.04% for Class P shares and 0.94% for Institutional Class shares. Expense ratio information is as of the Fund’s current prospectus dated August 30, 2017, as supplemented to date.
Cumulative Returns Through December 31, 2017
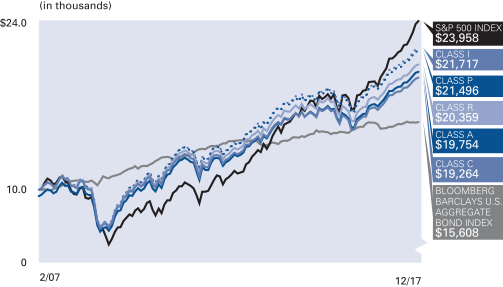
The Fund began operations on 2/28/07. Benchmark comparisons began on the fund inception date.
Industry/Sectors (as of December 31, 2017)
| Software | 7.3% | |||
| Oil, Gas & Consumable Fuels | 5.7% | |||
| Media | 5.7% | |||
| Semiconductors | 5.1% | |||
| Internet | 4.3% | |||
| Biotechnology | 4.0% | |||
| Pharmaceuticals | 4.0% | |||
| Telecommunications | 3.8% | |||
| Other | 57.1% | |||
| Cash & Equivalents — Net (including Options Written) | 3.0% |
S&P Ratings* (as of December 31, 2017)
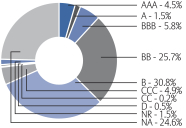
| * | As a percentage of fixed-income investments. Bond ratings refer to the underlying holdings of the Fund and are categorized from highest to lowest credit quality using ratings provided by S&P Global Ratings (“S&P”). S&P’s ratings have been selected for several reasons, including the portfolio managers’ usage of S&P ratings methodology among other credit quality information in managing the Fund, access to background information and other materials provided by S&P, as well as the Fund’s consideration of industry practice. The Fund also displays S&P credit ratings information in materials provided in client presentations. See “Important Information” for more detail on the selection of S&P for the Fund’s ratings presentation. Securities not rated by S&P and bonds that do not currently have a rating available are designated in the chart as “NR” and “NA”, respectively. |
| Semiannual Report | | December 31, 2017 | 25 |
Table of Contents
Unaudited
AllianzGI Income & Growth Fund (cont’d)
| Shareholder Expense Example | Actual Performance | |||||||||
| Class A | Class C | Class R | Class P | Institutional Class | ||||||
| Beginning Account Value (7/1/17) | $1,000.00 | $1,000.00 | $1,000.00 | $1,000.00 | $1,000.00 | |||||
| Ending Account Value (12/31/17) | $1,065.40 | $1,061.90 | $1,064.20 | $1,067.00 | $1,067.00 | |||||
| Expenses Paid During Period | $6.72 | $10.60 | $8.01 | $5.42 | $4.90 | |||||
| Hypothetical Performance | ||||||||||
| (5% return before expenses) | ||||||||||
| Class A | Class C | Class R | Class P | Institutional Class | ||||||
| Beginning Account Value (7/1/17) | $1,000.00 | $1,000.00 | $1,000.00 | $1,000.00 | $1,000.00 | |||||
| Ending Account Value (12/31/17) | $1,018.70 | $1,014.92 | $1,017.44 | $1,019.96 | $1,020.47 | |||||
| Expenses Paid During Period | $6.56 | $10.36 | $7.83 | $5.30 | $4.79 | |||||
For each class of the Fund, expenses (net of fee waivers) are equal to the annualized expense ratio for the class (1.29% for Class A, 2.04% for Class C, 1.54% for Class R, 1.04% for Class P and 0.94% for Institutional Class), multiplied by the average account value over the period, multiplied by 184/365.
| 26 | December 31, 2017 | | Semiannual Report |
Table of Contents
(THIS PAGE INTENTIONALLY LEFT BLANK)
| Semiannual Report | | December 31, 2017 | 27 |
Table of Contents
Unaudited
For the period July 1, 2017 through December 31, 2017, as provided by Steven Klopukh, CFA, Lead Portfolio Manager.
Fund Insights
For the six-month period ended December 31, 2017, Class A shares at net asset value (“NAV”) of the AllianzGI Mid-Cap Fund (the “Fund”) returned 10.90%, underperforming the Russell Midcap Growth Index (the “benchmark”), which returned 12.45%.
Market Overview
US equities posted strong returns over the period, with major indices continuing to reach new highs. Large- and mid-caps outperformed small-caps, and growth beat their value counterparts across the market cap spectrum. Share prices were supported by better-than-expected earnings, renewed merger and acquisitions activity, and optimism over the prospects for tax reform. The Senate approved plans for $1.5 trillion of tax cuts, the most sweeping overhaul of the US tax system in more than three decades.
Portfolio Review
Stock selection added notably to returns within consumer staples and industrials, although this was offset by stock selection in consumer discretionary and health care. Sector allocation overall was a modest detractor from returns.
The top contributor to relative returns was XPO Logistics, Inc., a global freight, transportation and logistics company, specializing in e-commerce. We initiated a position in June 2017. XPO enjoys a niche in delivering large items to the home, such as furniture or large consumer appliances, and then even unpacking and installing some items. Share gains were helped by news that Home Depot had expressed interest in acquiring the company. The fit would be complementary for Home Depot and keep XPO out of the hands of Amazon, which is expanding into the sale of larger items.
In contrast, consumer and commercial products company Newell Brands was the top detractor from relative returns. It is known for brands including Coleman, Sharpie pens, First Alert, and Mr. Coffee. Its e-commerce business was strong although there were significant declines in back-to-school related sales from its writing business segment. The company is absorbing commodity price increases while it works through excess inventories. The stock is trading at a discount to peers and versus its historical average. We saw an attractive risk/reward at these levels and added to the position on weakness.
As of December 31, 2017, the largest sector allocation was in information technology, followed by industrials and health care. The Fund held no stocks in energy, telecommunication services or utilities.
Outlook
US equity markets are coming off of a remarkably strong 2017. Since bottoming in early 2009, we have witnessed one of the longest equity market rallies. While concerns have focused on US equity valuations, they have been supported by low interest rates, double digit earnings growth, and the prospect, finally realized, of tax reform. We believe lower corporate tax rates should significantly help more domestically focused companies. Mid-cap stocks generally tend to pay higher effective tax rates and could be greater beneficiaries of lower tax rates and repatriation.
Uncertainties include just how fast interest rates across the yield curve will rise, and whether inflationary pressures ultimately become more visible. One key development that we would welcome is a return to more normal monetary policy. As central banks wind down their balance sheets, we believe share price performance is more likely to be driven by company fundamentals than by liquidity. This should, in our view, usher in more of a stock picker’s market, favoring active management.
As always, we continue to focus on stock selection, seeking to invest in high-quality, mid-cap companies with superior growth prospects that are attractively valued. Our portfolio emphasizes free cash flow yield and responsible capital allocation.
| 28 | December 31, 2017 | | Semiannual Report |
Table of Contents
Unaudited
AllianzGI Mid-Cap Fund (cont’d)
Average Annual Total Return for the period ended December 31, 2017
| 6 Month* | 1 Year | 5 Year | 10 Year | Since Inception† | ||||||||||||||||||
| AllianzGI Mid-Cap Fund Class A | 10.90% | 24.93% | 15.12% | 8.18% | 12.95% | |||||||||||||||||
| AllianzGI Mid-Cap Fund Class A (adjusted) | 4.80% | 18.06% | 13.82% | 7.57% | 12.78% | ||||||||||||||||
| AllianzGI Mid-Cap Fund Class C | 10.24% | 23.83% | 14.24% | 7.38% | 12.17% | |||||||||||||||||
| AllianzGI Mid-Cap Fund Class C (adjusted) | 9.26% | 22.83% | 14.24% | 7.38% | 12.17% | ||||||||||||||||
| AllianzGI Mid-Cap Fund Class R | 10.75% | 24.22% | 14.83% | 7.94% | 12.76% | ||||||||||||||||
| AllianzGI Mid-Cap Fund Class P | 10.92% | 25.27% | 15.37% | 8.47% | 13.40% | ||||||||||||||||
| AllianzGI Mid-Cap Fund Institutional Class | 10.85% | 25.11% | 15.44% | 8.55% | 13.50% | ||||||||||||||||
| AllianzGI Mid-Cap Fund Administrative Class | 10.58% | 24.83% | 15.16% | 8.27% | 13.20% | |||||||||||||||||
| Russell Midcap Growth Index | 12.45% | 25.27% | 15.30% | 9.10% | 12.38% | ||||||||||||||||
| Lipper Mid-Cap Growth Funds Average | 10.46% | 24.63% | 13.79% | 7.64% | 10.07% | |||||||||||||||||
| Lipper Multi-Cap Growth Funds Average | 11.88% | 28.04% | 14.82% | 8.13% | — | |||||||||||||||||
* Cumulative return
† The Fund began operations on 11/6/79. Benchmark and primary Lipper performance comparisons began on 10/31/79; secondary Lipper performance is available for trailing 10 years.
Performance quoted represents past performance and is no guarantee of future results. Current performance may be lower or higher than performance shown. For performance current to the most recent month-end, visit our website at us.allianzgi.com. Investment return and the principal value will fluctuate. Shares may be worth more or less than original cost when redeemed. The adjusted returns take into account the maximum sales charge of 5.50% on Class A shares and 1% contingent deferred sales charge (CDSC) on Class C shares, which may apply to shares redeemed during the first year of ownership. Returns do not reflect deduction of taxes that a shareholder would pay on fund distributions or redemption of fund shares. Please see pages 60-62 for more information. The Fund’s expense ratios are 1.14% for Class A shares, 1.89% for Class C shares, 1.39% for Class R shares, 0.89% for Class P shares, 0.79% for Institutional Class shares and 1.04% for Administrative Class shares. Expense ratio information is as of the Fund’s current prospectus dated August 30, 2017, as supplemented to date.
Cumulative Returns Through December 31, 2017
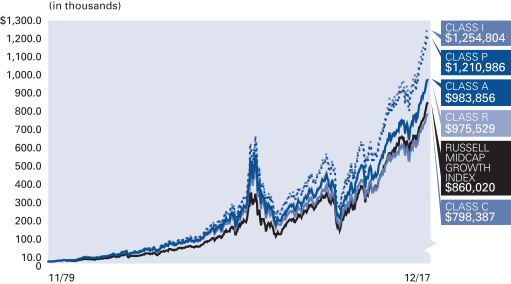
The Fund began operations on 11/6/79. Benchmark performance comparisons began on 10/31/79.
Industry/Sectors (as of December 31, 2017)
| Software | 8.7% | |||
| Electronic Equipment, Instruments & Components | 7.7% | |||
| Health Care Equipment & Supplies | 7.1% | |||
| Semiconductors & Semiconductor Equipment | 6.1% | |||
| Chemicals | 4.7% | |||
| Capital Markets | 4.0% | |||
| Life Sciences Tools & Services | 3.9% | |||
| Professional Services | 3.8% | |||
| Other | 53.3% | |||
| Cash & Equivalents — Net | 0.7% |
| Semiannual Report | | December 31, 2017 | 29 |
Table of Contents
Unaudited
AllianzGI Mid-Cap Fund (cont’d)
| Shareholder Expense Example | Actual Performance | |||||||||||
| Class A | Class C | Class R | Class P | Institutional Class | Administrative Class | |||||||
| Beginning Account Value (7/1/17) | $1,000.00 | $1,000.00 | $1,000.00 | $1,000.00 | $1,000.00 | $1,000.00 | ||||||
| Ending Account Value (12/31/17) | $1,109.00 | $1,102.40 | $1,107.50 | $1,109.20 | $1,108.50 | $1,105.80 | ||||||
| Expenses Paid During Period | $6.06 | $10.02 | $7.38 | $4.73 | $4.20 | $5.52 | ||||||
| Hypothetical Performance | ||||||||||||
| (5% return before expenses) | ||||||||||||
| Class A | Class C | Class R | Class P | Institutional Class | Administrative Class | |||||||
| Beginning Account Value (7/1/17) | $1,000.00 | $1,000.00 | $1,000.00 | $1,000.00 | $1,000.00 | $1,000.00 | ||||||
| Ending Account Value (12/31/17) | $1,019.46 | $1,015.68 | $1,018.20 | $1,020.72 | $1,021.22 | $1,019.96 | ||||||
| Expenses Paid During Period | $5.80 | $9.60 | $7.07 | $4.53 | $4.02 | $5.30 | ||||||
For each class of the Fund, expenses are equal to the annualized expense ratio for the class (1.14% for Class A, 1.89% for Class C, 1.39% for Class R, 0.89% for Class P, 0.79% for Institutional Class and 1.04% for Administrative Class), multiplied by the average account value over the period, multiplied by 184/365.
| 30 | December 31, 2017 | | Semiannual Report |
Table of Contents
(THIS PAGE INTENTIONALLY LEFT BLANK)
| Semiannual Report | | December 31, 2017 | 31 |
Table of Contents
Unaudited
AllianzGI NFJ Dividend Value Fund
For the period July 1, 2017 through December 31, 2017, as provided by the Dallas Investment team.
Fund Insights
For the six-month period ended December 31, 2017, Class A shares at net asset value (“NAV”) of the AllianzGI NFJ Dividend Value Fund (the “Fund”) returned 11.30%, outperforming the Russell 1000 Value Index (the “benchmark”), which returned 8.61%.
Market Overview
Over the reporting period, US equities delivered double-digit gains as large-cap indices touched a series of fresh peaks and smaller companies reached a record high in the closing days of the year. Share prices were buoyed by better-than-expected company earnings, renewed merger & acquisition activity, and optimism over the prospects for tax reform. In December, the Senate approved plans for USD 1.5 trillion of tax cuts, the most sweeping overhaul of the US tax system in more than three decades. In general, growth stocks outperformed their value counterparts. The US Federal Reserve (the “Fed”) continued to gradually normalize monetary policy, announcing it would start to reduce the USD 4.5 trillion of Treasury bonds and mortgage-backed backed securities it amassed through its quantitative easing programs. In December, the Fed raised interest rates by 25 basis points to a range of 1.25%-1.50%, and maintained its forecasts for three further rises in 2018 followed by two in 2019.
Portfolio Review
The Fund delivered a double-digit gain of 11.30% (A-shares, net of fees) over the trailing six-month period, outperforming its benchmark, which returned 8.61%. Relative performance results were due to positive stock selection and sector allocation. Selection across the consumer staples, health care and utilities sectors was strong, and offset holdings in the materials and consumer discretionary sectors that failed to keep pace with benchmark shares. During the latter half of the year, interest rate sensitive areas of the market stumbled, and the Fund’s underweights in the bond-proxy sectors, such as real estate and consumer staples, contributed to performance. An overweight in information technology was also additive, as tech names continued to perform well over the second half of the year. The lone detractor from an allocation standpoint was the Fund’s overweight in Industrials—the second weakest sector in the benchmark with a paltry 2% return during the reporting period.
Outlook
The 2017 calendar year was a notable period for equities, with markets reaching all-time highs in ten out of twelve months during the year. Monetary policy was also noteworthy in 2017, with the Fed removing liquidity from the system and some global central banks beginning their tightening cycles (e.g. Bank of England, European Central Bank and People’s Bank of China). The addition of US tax reform, which passed at year end, to a tightening environment, in our view, may be conducive to increased volatility across equity markets. Though the Chicago Board Options Exchange Volatility Index ended the year at 11, its long term average is close to double that at 20.5. With interest rates beginning to move upward, investors may find themselves looking beyond equities to access sufficient portfolio returns. Increased volatility typically ushers in lower correlations and higher dispersions in risk assets, and we believe active managers will be important resources to help investors sift through market winners and losers.
We believe our dividend and value-oriented equity portfolios have the potential to provide additional protection when investing in equities. Our dividend focus, for example, positions our portfolios with an inherent advantage relative to the benchmark, as dividends provide a tangible return and more predictable current income. Historical studies also suggest that dividend-paying stocks have exhibited less volatility than non-dividend paying securities. We believe these characteristics have been an important contributing factor to our portfolios’ history of downside relative performance. As US equity markets continue their meteoric rise, our team continues to identify investment opportunities with compelling valuations and stable earnings growth. Though we cannot predict when today’s bull market will run its course, we can design portfolios that seek attractive valuations that we believe will participate on the upside and aim to protect on the downside for our investors.
| 32 | December 31, 2017 | | Semiannual Report |
Table of Contents
Unaudited
AllianzGI NFJ Dividend Value Fund (cont’d)
Average Annual Total Return for the period ended December 31, 2017
| 6 Month* | 1 Year | 5 Year | 10 Year | Since Inception† | ||||||||||||||||||
| AllianzGI NFJ Dividend Value Fund Class A | 11.30% | 15.70% | 11.56% | 5.15% | 8.21% | |||||||||||||||||
| AllianzGI NFJ Dividend Value Fund Class A (adjusted) | 5.18% | 9.33% | 10.30% | 4.55% | 7.86% | ||||||||||||||||
| AllianzGI NFJ Dividend Value Fund Class C | 10.91% | 14.85% | 10.72% | 4.36% | 7.40% | |||||||||||||||||
| AllianzGI NFJ Dividend Value Fund Class C (adjusted) | 10.03% | 13.94% | 10.72% | 4.36% | 7.40% | ||||||||||||||||
| AllianzGI NFJ Dividend Value Fund Class R | 11.19% | 15.44% | 11.28% | 4.89% | 7.94% | ||||||||||||||||
| AllianzGI NFJ Dividend Value Fund Class P | 11.49% | 15.99% | 11.85% | 5.42% | 8.54% | ||||||||||||||||
| AllianzGI NFJ Dividend Value Fund Institutional Class | 11.47% | 16.08% | 11.95% | 5.52% | 8.64% | ||||||||||||||||
| AllianzGI NFJ Dividend Value Fund R6 | 11.54% | 16.21% | 12.00% | 5.57% | 8.70% | ||||||||||||||||
| AllianzGI NFJ Dividend Value Fund Administrative Class | 11.34% | 15.81% | 11.67% | 5.26% | 8.37% | |||||||||||||||||
| Russell 1000 Value Index | 8.61% | 13.66% | 14.04% | 7.10% | 7.18% | ||||||||||||||||
| Lipper Equity Income Funds Average | 9.20% | 15.45% | 12.31% | 6.99% | 6.81% | |||||||||||||||||
* Cumulative return
† The Fund began operations on 5/8/00. Benchmark comparisons began on the fund inception date. Lipper comparisons began on 4/30/00.
Performance quoted represents past performance and is no guarantee of future results. Current performance may be lower or higher than performance shown. For performance current to the most recent month-end, visit our website at us.allianzgi.com. Investment return and the principal value will fluctuate. Shares may be worth more or less than original cost when redeemed. The adjusted returns take into account the maximum sales charge of 5.50% on Class A shares and 1% contingent deferred sales charge (CDSC) on Class C shares, which may apply to shares redeemed during the first year of ownership. Returns do not reflect deduction of taxes that a shareholder would pay on fund distributions or redemption of fund shares. Please see pages 60-62 for more information. The Fund’s gross expense ratios are 1.09% for Class A shares, 1.84% for Class C shares, 1.34% for Class R shares, 0.84% for Class P shares, 0.74% for Institutional Class shares, 0.69% for R6 shares and 0.99% for Administrative Class shares. These ratios do not include an expense reduction, contractually agreed through at least October 31, 2018. The Fund’s expense ratios net of this reduction are 0.94% for Class A shares, 1.69% for Class C shares, 1.19% for Class R shares, 0.69% for Class P shares, 0.59% for Institutional Class shares, 0.54% for Class R6 shares and 0.84% for Administrative Class shares. Expense ratio information is as of the Fund’s current prospectus dated August 30, 2017, as supplemented to date.
Cumulative Returns Through December 31, 2017
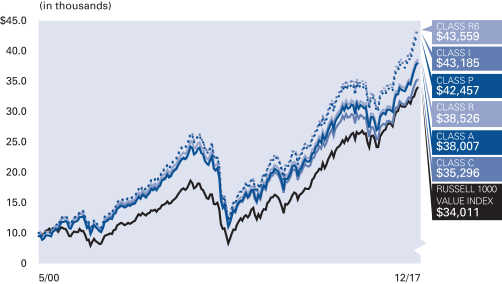
The Fund began operations on 5/8/00. Benchmark comparisons began on the fund inception date.
Industry/Sectors (as of December 31, 2017)
| Banks | 15.8% | |||
| Oil, Gas & Consumable Fuels | 10.1% | |||
| Insurance | 6.0% | |||
| Diversified Telecommunication Services | 4.1% | |||
| Aerospace & Defense | 4.0% | |||
| Healthcare Providers & Services | 4.0% | |||
| Pharmaceuticals | 4.0% | |||
| Capital Markets | 4.0% | |||
| Other | 47.6% | |||
| Cash & Equivalents — Net | 0.4% |
| Semiannual Report | | December 31, 2017 | 33 |
Table of Contents
Unaudited
AllianzGI NFJ Dividend Value Fund (cont’d)
| Shareholder Expense Example | Actual Performance | |||||||||||||
| Class A | Class C | Class R | Class P | Institutional Class | Class R6 | Administrative Class | ||||||||
| Beginning Account Value (7/1/17) | $1,000.00 | $1,000.00 | $1,000.00 | $1,000.00 | $1,000.00 | $1,000.00 | $1,000.00 | |||||||
| Ending Account Value (12/31/17) | $1,113.00 | $1,109.10 | $1,111.90 | $1,114.90 | $1,114.70 | $1,115.40 | $1,113.40 | |||||||
| Expenses Paid During Period | $5.06 | $9.04 | $6.39 | $3.73 | $3.20 | $2.93 | $4.53 | |||||||
| Hypothetical Performance | ||||||||||||||
| (5% return before expenses) | ||||||||||||||
| Class A | Class C | Class R | Class P | Institutional Class | Class R6 | Administrative Class | ||||||||
| Beginning Account Value (7/1/17) | $1,000.00 | $1,000.00 | $1,000.00 | $1,000.00 | $1,000.00 | $1,000.00 | $1,000.00 | |||||||
| Ending Account Value (12/31/17) | $1,020.42 | $1,016.64 | $1,019.16 | $1,021.68 | $1,022.18 | $1,022.43 | $1,020.92 | |||||||
| Expenses Paid During Period | $4.84 | $8.64 | $6.11 | $3.57 | $3.06 | $2.80 | $4.33 | |||||||
For each class of the Fund, expenses (net of fee waivers) are equal to the annualized expense ratio for the class (0.95% for Class A, 1.70% for Class C, 1.20% for Class R, 0.70% for Class P, 0.60% for Institutional Class, 0.55% for R6 Class and 0.85% for Administrative Class), multiplied by the average account value over the period, multiplied by 184/365.
| 34 | December 31, 2017 | | Semiannual Report |
Table of Contents
(THIS PAGE INTENTIONALLY LEFT BLANK)
| Semiannual Report | | December 31, 2017 | 35 |
Table of Contents
Unaudited
AllianzGI NFJ International Value Fund
For the period July 1, 2017 through December 31, 2017, as provided by the Dallas Investment team.
Fund Insights
For the six-month period ended December 31, 2017, Class A shares at net asset value (“NAV”) of the AllianzGI NFJ International Value Fund (the “Fund”) returned 9.61%, underperforming the MSCI All Country World ex-USA Index (the “benchmark”), which returned 11.48%.
Market Overview
Over the reporting period, emerging market equities rallied strongly, outpacing most developed markets, amid optimism over the health of the global economy and the prospects for global trade. Within the developed world, Japanese equities were among the strongest performers as a weak tone to the yen supported the market and shares were also boosted by Prime Minister Shinzo Abe’s decisive victory in October’s snap election. In the Asia/Pacific ex-Japan region, equities were boosted in part by signs of a pick-up in Asian trade, which helped markets overcome heightened political tensions relating to North Korea. Investors were cheered by news that the European Union judged that sufficient progress had been made for the Brexit negotiations to move onto the next phase, propelling United Kingdom equities upward. Within the Eurozone, returns were largely positive, but lagged many other regions as returns at the country level varied considerably, with Italy, Germany and France delivering some of the strongest returns, while Spain retreated slightly amid rising political risk.
Portfolio Review
The Fund returned 9.61% (A-shares, net of fees) over the trailing six-month period, but failed to keep pace with its benchmark, which returned 11.48%. Relative performance results were due to negative stock selection which outweighed the impact of positive sector and country allocations over the reporting period. Selection was strong in the telecommunication services, utilities and materials sectors, but positive results were overwhelmed by poor selection across the industrials, information technology (“IT”) and consumer discretionary sectors. The Fund’s underweight exposures in health care and consumer staples boosted performance results while an overweight in telecommunication services and underweight in IT dampened relative returns. By country, selection was positive in Israel, Canada and Norway, while stock picking across China, Japan and Brazil detracted. An underweight in Spain and overweight in China contributed to performance over the reporting period, while an underweight in Japan and overweight in Israel hampered gains.
Outlook
With the US Federal Reserve (the “Fed”) removing liquidity from the system, some global central banks are following suit and embarking on their own tightening cycles. During the quarter, the European Central Bank halved its monthly asset purchases, and the Bank of England raised rates, and the People’s Bank of China tightened policy slightly toward year end. While these shifts will likely remain gradual, we believe they may also signal the beginning of the end of financial repression, and with it a move away from lower volatility and increased correlations of stocks. In other words, we believe the current headwinds for stock-pickers, particularly those with a value-bent, may begin to abate.
How do slowing monetary stimulus and the potential for greater volatility impact investors? With increased volatility, investors typically witness lower correlations and higher dispersions in risk assets—giving active managers the opportunity to shine. We believe active managers that construct portfolios of higher quality, dividend paying equities that trade at attractive valuations can help position investors during times of shifting central bank policies and volatility. Though such a strategy may not keep pace during sharply rising market environments, we believe the Dallas team’s investment process will result in attractive longer term performance results for our clients.
| 36 | December 31, 2017 | | Semiannual Report |
Table of Contents
Unaudited
AllianzGI NFJ International Value Fund (cont’d)
Average Annual Total Return for the period ended December 31, 2017
| 6 Month* | 1 Year | 5 Year | 10 Year | Since Inception† | ||||||||||||||||||
| AllianzGI NFJ International Value Fund Class A | 9.61% | 22.81% | 0.65% | –0.36% | 9.30% | |||||||||||||||||
| AllianzGI NFJ International Value Fund Class A (adjusted) | 3.58% | 16.06% | –0.48% | –0.92% | 8.89% | ||||||||||||||||
| AllianzGI NFJ International Value Fund Class C | 9.15% | 21.85% | –0.11% | –1.11% | 8.49% | |||||||||||||||||
| AllianzGI NFJ International Value Fund Class C (adjusted) | 8.15% | 20.85% | –0.11% | –1.11% | 8.49% | ||||||||||||||||
| AllianzGI NFJ International Value Fund Class R | 9.42% | 22.45% | 0.39% | –0.61% | 9.05% | ||||||||||||||||
| AllianzGI NFJ International Value Fund Class P | 9.69% | 23.03% | 0.89% | –0.11% | 9.59% | ||||||||||||||||
| AllianzGI NFJ International Value Fund Institutional Class | 9.76% | 23.16% | 0.99% | –0.01% | 9.70% | ||||||||||||||||
| AllianzGI NFJ International Value Fund R6 | 9.78% | 23.21% | 1.03% | 0.04% | 9.75% | ||||||||||||||||
| AllianzGI NFJ International Value Fund Administrative Class | 9.61% | 22.88% | 0.75% | –0.26% | 9.42% | |||||||||||||||||
| MSCI All Country World ex-USA Index | 11.48% | 27.19% | 6.80% | 1.84% | 9.07% | ||||||||||||||||
| Lipper International Multi-Cap Value Funds Average | 8.92% | 22.53% | 6.76% | 1.16% | 7.93% | |||||||||||||||||
* Cumulative return
† The Fund began operations on 1/31/03. Benchmark comparisons began on the fund inception date. Lipper comparisons began on 1/31/03.
Performance quoted represents past performance and is no guarantee of future results. Current performance may be lower or higher than performance shown. For performance current to the most recent month-end, visit our website at us.allianzgi.com. Investment return and the principal value will fluctuate. Shares may be worth more or less than original cost when redeemed. The adjusted returns take into account the maximum sales charge of 5.50% on Class A shares and 1% contingent deferred sales charge (CDSC) on Class C shares, which may apply to shares redeemed during the first year of ownership. Returns do not reflect deduction of taxes that a shareholder would pay on fund distributions or redemption of fund shares. Please see pages 60-62 for more information. The Fund’s gross expense ratios are 1.37% for Class A shares, 2.12% for Class C shares, 1.62% for Class R shares, 1.12% for Class P shares, 1.02% for Institutional Class shares, 0.97% for Class R6 shares, and 1.27% for Administrative Class shares. These ratios do not include an expense reduction, contractually agreed through at least October 31, 2018. The Fund’s expense ratios net of this reduction are 1.30% for Class A shares, 2.05% for Class C shares, 1.55% for Class R shares, 1.05% for Class P shares, 0.95% for Institutional Class shares, 0.90% for Class R6 shares and 1.20% for Administrative Class shares. Expense ratio information is as of the Fund’s current prospectus dated August 30, 2017, as supplemented to date.
Cumulative Returns Through December 31, 2017

The Fund began operations on 1/31/03. Benchmark comparisons began on the fund inception date.
Country Allocation (as of December 31, 2017)
| United Kingdom | 13.3% | |||
| Japan | 12.7% | |||
| France | 11.2% | |||
| Canada | 9.9% | |||
| China | 8.7% | |||
| Germany | 8.2% | |||
| Netherlands | 4.9% | |||
| Taiwan | 3.4% | |||
| Other | 27.4% | |||
| Cash & Equivalents — Net | 0.3% |
| Semiannual Report | | December 31, 2017 | 37 |
Table of Contents
Unaudited
AllianzGI NFJ International Value Fund (cont’d)
| Shareholder Expense Example | Actual Performance | |||||||||||||
| Class A | Class C | Class R | Class P | Institutional Class | Class R6 | Administrative Class | ||||||||
| Beginning Account Value (7/1/17) | $1,000.00 | $1,000.00 | $1,000.00 | $1,000.00 | $1,000.00 | $1,000.00 | $1,000.00 | |||||||
| Ending Account Value (12/31/17) | $1,096.10 | $1,091.50 | $1,094.20 | $1,096.90 | $1,097.60 | $1,097.80 | $1,096.10 | |||||||
| Expenses Paid During Period | $6.82 | $10.75 | $8.13 | $5.50 | $4.97 | $4.60 | $6.29 | |||||||
| Hypothetical Performance | ||||||||||||||
| (5% return before expenses) | ||||||||||||||
| Class A | Class C | Class R | Class P | Institutional Class | Class R6 | Administrative Class | ||||||||
| Beginning Account Value (7/1/17) | $1,000.00 | $1,000.00 | $1,000.00 | $1,000.00 | $1,000.00 | $1,000.00 | $1,000.00 | |||||||
| Ending Account Value (12/31/17) | $1,018.70 | $1,014.92 | $1,017.44 | $1,019.96 | $1,020.47 | $1,020.82 | $1,019.21 | |||||||
| Expenses Paid During Period | $6.56 | $10.36 | $7.83 | $5.30 | $4.79 | $4.43 | $6.06 | |||||||
For each class of the Fund, expenses (net of fee waiver) are equal to the annualized expense ratio for the class (1.29% for Class A, 2.04% for Class C, 1.54% for Class R, 1.04% for Class P, 0.94% for Institutional Class, 0.87% for Class R6 and 1.19% for Administrative Class), multiplied by the average account value over the period, multiplied by 184/365.
| 38 | December 31, 2017 | | Semiannual Report |
Table of Contents
(THIS PAGE INTENTIONALLY LEFT BLANK)
| Semiannual Report | | December 31, 2017 | 39 |
Table of Contents
Unaudited
AllianzGI NFJ Large-Cap Value Fund
For the period July 1, 2017 through December 31, 2017, as provided by the Dallas Investment team.
Fund Insights
For the six-month period ended December 31, 2017, Class A shares at net asset value (“NAV”) of the AllianzGI NFJ Large-Cap Value Fund (the “Fund”) returned 11.47%, outperforming the Russell Top 200 Value Index (the “benchmark”), which returned 9.01%.
Market Overview
Over the reporting period, US equities delivered double-digit gains as large-cap indices touched a series of fresh peaks and smaller companies reached a record high in the closing days of the year. Share prices were buoyed by better-than-expected company earnings, renewed merger & acquisition activity, and optimism over the prospects for tax reform. In December, the US Senate approved plans for USD 1.5 trillion of tax cuts, the most sweeping overhaul of the US tax system in more than three decades. In general, growth stocks outperformed their value counterparts. The US Federal Reserve (the “Fed”) continued to gradually normalize monetary policy, announcing it would start to reduce the USD 4.5 trillion of Treasury bonds and mortgage-backed backed securities it amassed through its quantitative easing programs. In December, the Fed raised interest rates by 25 basis points to a range of 1.25%-1.50%, and maintained its forecasts for three further rises in 2018 followed by two in 2019.
Portfolio Review
The Fund delivered a double-digit gain of 11.47% (A-shares, net of fees) over the trailing six-month period outperforming its benchmark, which returned 9.01%. Relative performance results were due to positive stock selection; sector allocation was net neutral over the reporting period. Selection across the industrials, consumer staples and energy sectors was strong and offset holdings in the consumer discretionary and financials sectors that failed to keep pace with benchmark shares. During the latter half of the year, interest rate sensitive areas of the market stumbled, and the portfolio’s underweights in the more defensive, bond-proxy sectors, such as consumer staples and health care, contributed to performance. Overweight exposures in materials and information technology were also additive as commodity prices generally rose and tech names continued to perform well over the second half of the year. The Fund’s overweight in industrials—the weakest sector in the benchmark with a -5% return—detracted from performance during the reporting period. Financials also performed well in the second half of the year, and an underweight in the sector detracted from relative returns.
Outlook
The 2017 calendar year was a notable period for equities, with markets reaching all-time highs in ten out of twelve months during the year. Monetary policy was also noteworthy in 2017, with the Fed removing liquidity from the system and some global central banks beginning their tightening cycles (e.g. Bank of England, European Central Bank and People’s Bank of China). The addition of US tax reform, which passed at year end, to a tightening environment, in our view, may be conducive to increased volatility across equity markets. Though the Chicago Board Options Exchange Volatility Index ended the year at 11, its long term average is close to double that at 20.5. With interest rates beginning to move upward, investors may find themselves looking beyond equities to access sufficient portfolio returns. Increased volatility typically ushers in lower correlations and higher dispersions in risk assets, and we believe active managers will be important resources to help investors sift through market winners and losers.
We believe our dividend and value-oriented equity portfolios have the potential to provide additional protection when investing in equities. Our dividend focus, for example, positions our portfolios with an inherent advantage relative to the benchmark, as dividends provide a tangible return and more predictable current income. Historical studies also suggest that dividend-paying stocks have exhibited less volatility than non-dividend paying securities. As US equity markets continue their meteoric rise, our team continues to identify investment opportunities with compelling valuations and stable earnings growth. Though we cannot predict when today’s bull market will run its course, we can design portfolios that seek attractive valuations that we believe will participate on the upside and aim to protect on the downside for our investors.
| 40 | December 31, 2017 | | Semiannual Report |
Table of Contents
Unaudited
AllianzGI NFJ Large-Cap Value Fund (cont’d)
Average Annual Total Return for the period ended December 31, 2017
| 6 Month* | 1 Year | 5 Year | 10 Year | Since Inception† | ||||||||||||||||||
| AllianzGI NFJ Large-Cap Value Fund Class A | 11.47% | 20.95% | 13.84% | 5.43% | 7.90% | |||||||||||||||||
| AllianzGI NFJ Large-Cap Value Fund Class A (adjusted) | 5.34% | 14.30% | 12.56% | 4.83% | 7.55% | ||||||||||||||||
| AllianzGI NFJ Large-Cap Value Fund Class C | 11.05% | 20.00% | 12.98% | 4.64% | 7.10% | |||||||||||||||||
| AllianzGI NFJ Large-Cap Value Fund Class C (adjusted) | 10.05% | 19.00% | 12.98% | 4.64% | 7.10% | ||||||||||||||||
| AllianzGI NFJ Large-Cap Value Fund Class R | 11.31% | 20.66% | 13.54% | 5.16% | 7.66% | ||||||||||||||||
| AllianzGI NFJ Large-Cap Value Fund Class P | 11.63% | 21.28% | 14.12% | 5.72% | 8.23% | ||||||||||||||||
| AllianzGI NFJ Large-Cap Value Fund Institutional Class | 11.68% | 21.36% | 14.23% | 5.81% | 8.33% | ||||||||||||||||
| AllianzGI NFJ Large-Cap Value Fund Administrative Class | 11.53% | 21.09% | 13.95% | 5.55% | 8.06% | |||||||||||||||||
| Russell Top 200 Value Index | 9.01% | 13.83% | 13.78% | 6.32% | 5.76% | ||||||||||||||||
| Lipper Large-Cap Value Funds Average | 9.71% | 15.92% | 13.34% | 6.56% | 7.04% | |||||||||||||||||
† The Fund began operations on 5/8/00. Benchmark comparisons began on the fund inception date. Lipper comparisons began on 4/30/00.
Performance quoted represents past performance and is no guarantee of future results. Current performance may be lower or higher than performance shown. For performance current to the most recent month-end, visit our website at us.allianzgi.com. Investment return and the principal value will fluctuate. Shares may be worth more or less than original cost when redeemed. The adjusted returns take into account the maximum sales charge of 5.50% on Class A shares and 1% contingent deferred sales charge (CDSC) on Class C shares, which may apply to shares redeemed during the first year of ownership. Returns do not reflect deduction of taxes that a shareholder would pay on fund distributions or redemption of fund shares. Please see pages 60-62 for more information. The Fund’s expense ratios are 1.12% for Class A shares, 1.87% for Class C shares, 1.37% for Class R shares, 0.87% for Class P shares, 0.77% for Institutional Class shares and 1.02% for Administrative Class shares. Expense ratio information is as of the Fund’s current prospectus dated August 30, 2017, as supplemented to date.
Cumulative Returns Through December 31, 2017
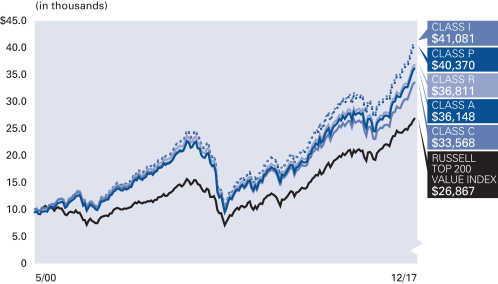
The Fund began operations on 5/8/00. Benchmark comparisons began on the fund inception date.
Industry/Sectors (as of December 31, 2017)
| Banks | 16.2% | |||
| Oil, Gas & Consumable Fuels | 10.4% | |||
| Pharmaceuticals | 6.7% | |||
| Insurance | 5.0% | |||
| Capital Markets | 4.1% | |||
| Electric Utilities | 3.9% | |||
| Semiconductors & Semiconductor Equipment | 3.8% | |||
| Healthcare Providers & Services | 3.6% | |||
| Other | 45.4% | |||
| Cash & Equivalents — Net | 0.9% |
| Semiannual Report | | December 31, 2017 | 41 |
Table of Contents
Unaudited
AllianzGI NFJ Large-Cap Value Fund (cont’d)
| Shareholder Expense Example | Actual Performance | |||||||||||
| Class A | Class C | Class R | Class P | Institutional Class | Administrative Class | |||||||
| Beginning Account Value (7/1/17) | $1,000.00 | $1,000.00 | $1,000.00 | $1,000.00 | $1,000.00 | $1,000.00 | ||||||
| Ending Account Value (12/31/17) | $1,114.70 | $1,110.50 | $1,113.10 | $1,116.30 | $1,116.80 | $1,115.30 | ||||||
| Expenses Paid During Period | $5.44 | $9.42 | $6.76 | $4.11 | $3.57 | $4.91 | ||||||
| Hypothetical Performance | ||||||||||||
| (5% return before expenses) | ||||||||||||
| Class A | Class C | Class R | Class P | Institutional Class | Administrative Class | |||||||
| Beginning Account Value (7/1/17) | $1,000.00 | $1,000.00 | $1,000.00 | $1,000.00 | $1,000.00 | $1,000.00 | ||||||
| Ending Account Value (12/31/17) | $1,020.06 | $1,016.28 | $1,018.80 | $1,021.32 | $1,021.83 | $1,020.57 | ||||||
| Expenses Paid During Period | $5.19 | $9.00 | $6.46 | $3.92 | $3.41 | $4.69 | ||||||
For each class of the Fund, expenses (net of fee waiver) are equal to the annualized expense ratio for the class (1.02% for Class A, 1.77% for Class C, 1.27% for Class R, 0.77% for Class P, 0.67% for Institutional Class and 0.92% for Administrative Class), multiplied by the average account value over the period, multiplied by 184/365.
| 42 | December 31, 2017 | | Semiannual Report |
Table of Contents
(THIS PAGE INTENTIONALLY LEFT BLANK)
| Semiannual Report | | December 31, 2017 | 43 |
Table of Contents
Unaudited
AllianzGI NFJ Mid-Cap Value Fund
For the period July 1, 2017 through December 31, 2017, as provided by the Dallas Investment team.
Fund Insights
For the six-month period ended December 31, 2017, Class A shares at net asset value (“NAV”) of the AllianzGI NFJ Mid-Cap Value Fund (the “Fund”) returned 9.28%, outperforming the Russell Midcap Value Index (the “benchmark”), which returned 7.76%.
Market Overview
Over the reporting period, US equities delivered double-digit gains as large-cap indices touched a series of fresh peaks and smaller companies reached a record high in the closing days of the year. Share prices were buoyed by better-than-expected company earnings, renewed merger & acquisition activity, and optimism over the prospects for tax reform. In December, the US Senate approved plans for USD 1.5 trillion of tax cuts, the most sweeping overhaul of the US tax system in more than three decades. In general, growth stocks outperformed their value counterparts. The US Federal Reserve (the “Fed”) continued to gradually normalize monetary policy, announcing it would start to reduce the USD 4.5 trillion of Treasury bonds and mortgage-backed backed securities it amassed through its quantitative easing programs. In December, the Fed raised interest rates by 25 basis points to a range of 1.25%-1.50%, and maintained its forecasts for three further rises in 2018 followed by two in 2019.
Portfolio Review
The Fund generated strong absolute and relative returns of 9.28% (A-shares, net of fees) over the trailing six-month period and outpaced its benchmark, which returned 7.76%. Relative performance results were due to positive sector allocation and stock selection. Selection across the industrials, consumer discretionary and financials sectors was strong and offset holdings in the energy, utilities and materials sectors that failed to keep pace with benchmark shares. During the latter half of the year, interest rate sensitive areas of the market stumbled, and the portfolio’s underweights in bond-proxy sectors, such as real estate, utilities and telecommunication services, contributed to performance. An overweight in Industrials was also additive, as the sector appreciated 12% within the benchmark over the second half of the year. The lone detractor from an allocation standpoint was the Fund’s underweight in energy—the second strongest sector in the benchmark with an impressive 14% return during the reporting period.
Outlook
The 2017 calendar year was a notable period for equities, with markets reaching all-time highs in ten out of twelve months during the year. Monetary policy was also noteworthy in 2017, with the Fed removing liquidity from the system and some global central banks beginning their tightening cycles (e.g. Bank of England, European Central Bank and People’s Bank of China). The addition of US tax reform, which passed at year end, to a tightening environment, in our view, may be conducive to increased volatility across equity markets. Though the Chicago Board Options Exchange Volatility Index ended the year at 11, its long term average is close to double that at 20.5. With interest rates beginning to move upward, investors may find themselves looking beyond equities to access sufficient portfolio returns. Increased volatility typically ushers in lower correlations and higher dispersions in risk assets, and we believe active managers will be important resources to help investors sift through market winners and losers.
We believe our dividend and value-oriented equity portfolios have the potential to provide additional protection when investing in equities. Our dividend focus, for example, positions our portfolios with an inherent advantage relative to the benchmark, as dividends provide a tangible return and more predictable current income. Historical studies also suggest that dividend-paying stocks have exhibited less volatility than non-dividend paying securities. As US equity markets continue their meteoric rise, our team continues to identify investment opportunities with compelling valuations and stable earnings growth. Though we cannot predict when today’s bull market will run its course, we can design portfolios that seek attractive valuations that we believe will participate on the upside and aim to protect on the downside for our investors.
| 44 | December 31, 2017 | | Semiannual Report |
Table of Contents
Unaudited
AllianzGI NFJ Mid-Cap Value Fund (cont’d)
Average Annual Total Return for the period ended December 31, 2017
| 6 Month* | 1 Year | 5 Year | 10 Year | Since Inception† | ||||||||||||||||||
| AllianzGI NFJ Mid-Cap Value Fund Class A | 9.28% | 26.61% | 15.36% | 8.43% | 11.65% | |||||||||||||||||
| AllianzGI NFJ Mid-Cap Value Fund Class A (adjusted) | 3.27% | 19.65% | 14.07% | 7.82% | 11.44% | ||||||||||||||||
| AllianzGI NFJ Mid-Cap Value Fund Class C | 8.87% | 25.65% | 14.51% | 7.62% | 10.81% | |||||||||||||||||
| AllianzGI NFJ Mid-Cap Value Fund Class C (adjusted) | 7.89% | 24.65% | 14.51% | 7.62% | 10.81% | ||||||||||||||||
| AllianzGI NFJ Mid-Cap Value Fund Class R | 9.15% | 26.30% | 15.08% | 8.15% | 11.30% | ||||||||||||||||
| AllianzGI NFJ Mid-Cap Value Fund Class P | 9.44% | 26.91% | 15.67% | 8.72% | 11.94% | ||||||||||||||||
| AllianzGI NFJ Mid-Cap Value Fund Institutional Class | 9.48% | 27.05% | 15.78% | 8.82% | 12.05% | ||||||||||||||||
| AllianzGI NFJ Mid-Cap Value Fund R6 | 9.48% | 27.07% | 15.82% | 8.87% | 12.11% | ||||||||||||||||
| AllianzGI NFJ Mid-Cap Value Fund Administrative Class | 9.35% | 26.74% | 15.49% | 8.55% | 11.80% | |||||||||||||||||
| Russell Midcap Value Index | 7.76% | 13.34% | 14.68% | 9.10% | 12.06% | ||||||||||||||||
| Lipper Multi-Cap Value Funds Average | 9.63% | 15.25% | 13.30% | 6.84% | 7.37% | |||||||||||||||||
* Cumulative return
† The Fund began operations on 4/18/88. Benchmark and Lipper performance comparisons began on 4/30/88.
Performance quoted represents past performance and is no guarantee of future results. Current performance may be lower or higher than performance shown. For performance current to the most recent month-end, visit our website at us.allianzgi.com. Investment return and the principal value will fluctuate. Shares may be worth more or less than original cost when redeemed. The adjusted returns take into account the maximum sales charge of 5.50% on Class A shares and 1% contingent deferred sales charge (CDSC) on Class C shares, which may apply to shares redeemed during the first year of ownership. Returns do not reflect deduction of taxes that a shareholder would pay on fund distributions or redemption of fund shares. Please see pages 60-62 for more information. The Fund’s gross expense ratios are 1.21% for Class A shares, 1.96% for Class C shares, 1.46% for Class R shares, 0.96% for Class P shares, 0.86% for Institutional Class shares, 0.81% for Class R6 shares and 1.11% for Administrative Class shares. These ratios do not include an expense reduction, contractually agree through at least September 30, 2019. The Fund’s expense ratios net of this reduction are 0.99% for Class A shares, 1.74% for Class C shares, 1.24% for Class R shares, 0.74% for Class P shares, 0.64% for Institutional Class shares, 0.59% for Class R6 shares and 0.89% for Administrative Class shares. Expense ratio information is as of the Fund’s current prospectus dated August 30, 2017, as supplemented to date.
Cumulative Returns Through December 31, 2017
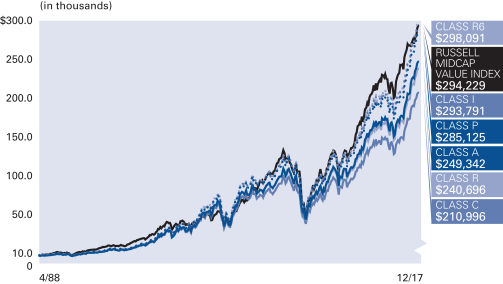
The Fund began operations on 4/18/88. Benchmark performance comparisons began on 4/30/88.
Industry/Sectors (as of December 31, 2017)
| Equity Real Estate Investment Trusts (REITs) | 7.8% | |||
| Insurance | 7.7% | |||
| Banks | 7.3% | |||
| Oil, Gas & Consumable Fuels | 6.3% | |||
| Capital Markets | 6.2% | |||
| Aerospace & Defense | 4.2% | |||
| Healthcare Providers & Services | 4.2% | |||
| IT Services | 3.9% | |||
| Other | 48.2% | |||
| Cash & Equivalents — Net | 4.2% |
| Semiannual Report | | December 31, 2017 | 45 |
Table of Contents
Unaudited
AllianzGI NFJ Mid-Cap Value Fund (cont’d)
| Shareholder Expense Example | Actual Performance | |||||||||||||
| Class A | Class C | Class R | Class P | Institutional Class | Class R6 | Administrative Class | ||||||||
| Beginning Account Value* | $1,000.00 | $1,000.00 | $1,000.00 | $1,000.00 | $1,000.00 | $1,000.00 | $1,000.00 | |||||||
| Ending Account Value (12/31/17) | $1,092.80 | $1,088.70 | $1,091.50 | $1,094.40 | $1,094.80 | $995.40 | $1,093.50 | |||||||
| Expenses Paid During Period | $5.75 | $9.69 | $7.06 | $4.38 | $3.80 | $0.21 | $5.12 | |||||||
| Hypothetical Performance | ||||||||||||||
| (5% return before expenses) | ||||||||||||||
| Class A | Class C | Class R | Class P | Institutional Class | Class R6 | Administrative Class | ||||||||
| Beginning Account Value (7/1/17) | $1,000.00 | $1,000.00 | $1,000.00 | $1,000.00 | $1,000.00 | $1,000.00 | $1,000.00 | |||||||
| Ending Account Value (12/31/17) | $1,019.71 | $1,015.93 | $1,018.45 | $1,021.02 | $1,021.58 | $1,022.28 | $1,020.32 | |||||||
| Expenses Paid During Period | $5.55 | $9.35 | $6.82 | $4.23 | $3.67 | $2.96 | $4.94 | |||||||
* Class R6 commenced operations on December 18, 2017. The Actual expense example for Class R6 is based on the period since inception; the Actual expense example for Class A, Class C, Class R, Class P, Institutional Class, Administrative Class and the Hypothetical expense example are based on the period beginning July 1, 2017. If the Hypothetical expense example for Class R6 had been based on the period since inception, the Ending Account Value and Expenses Paid During the Period would have been: $1,001.57 and $0.21, respectively.
For each class of the Fund, expenses ( net of fee waiver) are equal to the annualized expense ratio for the class (1.09% for Class A, 1.84% for Class C, 1.34% for Class R, 0.83% for Class P, 0.72% for Institutional Class, 0.58% for Class R6 and 0.97% for Administrative Class), multiplied by the average account value over the period, multiplied by 184 (13 for Class R6)/365 for the Actual expense example and 184/365 for the Hypothetical expense example.
| 46 | December 31, 2017 | | Semiannual Report |
Table of Contents
(THIS PAGE INTENTIONALLY LEFT BLANK)
| Semiannual Report | | December 31, 2017 | 47 |
Table of Contents
Unaudited
AllianzGI NFJ Small-Cap Value Fund
For the period July 1, 2017 through December 31, 2017, as provided by the Dallas Investment team.
Fund Insights
For the six-month period ended December 31, 2017, Class A shares at net asset value (“NAV”) of the AllianzGI NFJ Small-Cap Value Fund (the “Fund”) returned 6.84%, underperforming the Russell 2000 Value Index (the “benchmark”), which returned 7.26%.
Market Overview
Over the reporting period, US equities delivered double-digit gains as large-cap indices touched a series of fresh peaks and smaller companies reached a record high in the closing days of the year. Share prices were buoyed by better-than-expected company earnings, renewed merger & acquisition activity, and optimism over the prospects for tax reform. In December, the US Senate approved plans for USD 1.5 trillion of tax cuts, the most sweeping overhaul of the US tax system in more than three decades. In general, growth stocks outperformed their value counterparts. The US Federal Reserve (the “Fed”) continued to gradually normalize monetary policy, announcing it would start to reduce the USD 4.5 trillion of Treasury bonds and mortgage-backed backed securities it amassed through its quantitative easing programs. In December, the Fed raised interest rates by 25 basis points to a range of 1.25%-1.50%, and maintained its forecasts for three further rises in 2018 followed by two in 2019.
Portfolio Review
The Fund returned 6.84% (A-shares, net of fees) over the trailing six-month period, but failed to keep pace with its benchmark, which rose 7.26%. Relative performance results were due to negative stock selection which outweighed the impact of positive sector allocations. Selection was strong in the information technology (“IT”), financials and consumer discretionary sectors, but positive results were overwhelmed by poor selection across the energy, consumer staples and industrials sectors. Overweight exposures in industrials and materials were additive, as the sectors appreciated 13% and 12%, respectively, within the benchmark. During the latter half of the year, interest rate sensitive areas of the market stumbled, and the Fund’s underweights in bond-proxy sectors, such as real estate and telecommunication services, contributed to performance. Conversely, an underweight in health care and overweight in IT dampened relative returns during the reporting period.
Outlook
The 2017 calendar year was a notable period for equities, with markets reaching all-time highs in ten of 12-months during the year. Monetary policy was also noteworthy in 2017, with the US Federal Reserve removing liquidity from the system and some global central banks beginning their tightening cycles (e.g. Bank of England, European Central Bank and People’s Bank of China). The addition of US tax reform, which passed at year end, to a tightening environment, in our view, may be conducive to increased volatility across equity markets. Though the Chicago Board Options Exchange Volatility Index ended the year at 11, its long term average is close to double that at 20.5. With interest rates beginning to move upward, investors may find themselves looking beyond equities to access sufficient portfolio returns. Increased volatility typically ushers in lower correlations and higher dispersions in risk assets, and we believe active managers will be important resources to help investors sift through market winners and losers.
We believe our dividend and value-oriented equity portfolios have the potential to provide additional protection when investing in equities. Our dividend focus, for example, positions our portfolios with an inherent advantage relative to the benchmark, as dividends provide a tangible return and more predictable current income. Historical studies also suggest that dividend-paying stocks have exhibited less volatility than non-dividend paying securities. As US equity markets continue their meteoric rise, our team continues to identify investment opportunities with compelling valuations and stable earnings growth. Though we cannot predict when today’s bull market will run its course, we can design portfolios that seek attractive valuations that we believe will participate on the upside and aim to protect on the downside for our investors.
| 48 | December 31, 2017 | | Semiannual Report |
Table of Contents
Unaudited
AllianzGI NFJ Small-Cap Value Fund (cont’d)
Average Annual Total Return for the period ended December 31, 2017
| 6 Month* | 1 Year | 5 Year | 10 Year | Since Inception† | ||||||||||||||||||
| AllianzGI NFJ Small-Cap Value Fund Class A | 6.84% | 9.68% | 10.56% | 7.80% | 11.42% | |||||||||||||||||
| AllianzGI NFJ Small-Cap Value Fund Class A (adjusted) | 0.96% | 3.65% | 9.32% | 7.19% | 11.18% | ||||||||||||||||
| AllianzGI NFJ Small-Cap Value Fund Class C | 6.42% | 8.83% | 9.73% | 6.99% | 10.59% | |||||||||||||||||
| AllianzGI NFJ Small-Cap Value Fund Class C (adjusted) | 5.55% | 7.94% | 9.73% | 6.99% | 10.59% | ||||||||||||||||
| AllianzGI NFJ Small-Cap Value Fund Class R | 6.67% | 9.36% | 10.28% | 7.53% | 11.10% | ||||||||||||||||
| AllianzGI NFJ Small-Cap Value Fund Class P | 6.96% | 9.93% | 10.84% | 8.07% | 11.74% | ||||||||||||||||
| AllianzGI NFJ Small-Cap Value Fund Institutional Class | 7.03% | 10.02% | 10.99% | 8.22% | 11.87% | ||||||||||||||||
| AllianzGI NFJ Small-Cap Value Fund R6 | 7.05% | 10.09% | 11.04% | 8.28% | 11.93% | ||||||||||||||||
| AllianzGI NFJ Small-Cap Value Fund Administrative Class | 6.89% | 9.78% | 10.72% | 7.96% | 11.55% | |||||||||||||||||
| Russell 2000 Value Index | 7.26% | 7.84% | 13.01% | 8.17% | 11.42% | ||||||||||||||||
| Lipper Small-Cap Value Funds Average | 8.49% | 8.97% | 11.99% | 7.98% | 9.06% | |||||||||||||||||
* Cumulative return
† The Fund began operations on 10/1/91. Benchmark comparisons began on the fund inception date. Lipper comparisons began on 9/30/91.
Performance quoted represents past performance and is no guarantee of future results. Current performance may be lower or higher than performance shown. For performance current to the most recent month-end, visit our website at us.allianzgi.com. Investment return and the principal value will fluctuate. Shares may be worth more or less than original cost when redeemed. The adjusted returns take into account the maximum sales charge of 5.50% on Class A shares and 1% contingent deferred sales charge (CDSC) on Class C shares, which may apply to shares redeemed during the first year of ownership. Returns do not reflect deduction of taxes that a shareholder would pay on fund distributions or redemption of fund shares. Please see pages 60-62 for more information. The Fund’s gross expense ratios are 1.24% for Class A shares, 1.99% for Class C shares, 1.49% for Class R shares, 0.99% for Class P shares, 0.89% for Institutional Class shares, 0.84% for Class R6 shares and 1.14% for Administrative Class shares. These ratios do not include an expense reduction, contractually agreed through at least October 31, 2018. The Fund’s expense ratios net of this reduction are 1.19% for Class A shares, 1.94% for Class C shares, 1.44% for Class R shares, 0.94% for Class P shares, 0.84% for Institutional Class shares, 0.79% for Class R6 shares and 1.09% for Administrative Class shares. Expense ratio information is as of the Fund’s current prospectus dated August 30, 2017, as supplemented to date.
Cumulative Returns Through December 31, 2017
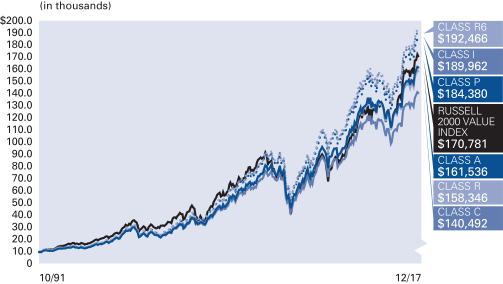
The Fund began operations on 10/1/91. Benchmark comparisons began on the fund inception date.
Industry/Sectors (as of December 31, 2017)
| Banks | 16.4% | |||
| Oil, Gas & Consumable Fuels | 6.5% | |||
| Equity Real Estate Investment Trusts (REITs) | 5.9% | |||
| Machinery | 5.6% | |||
| IT Services | 5.5% | |||
| Chemicals | 5.2% | |||
| Insurance | 4.9% | |||
| Electronic Equipment, Instruments & Components | 4.5% | |||
| Other | 43.9% | |||
| Cash & Equivalents — Net | 1.6% |
| Semiannual Report | | December 31, 2017 | 49 |
Table of Contents
Unaudited
AllianzGI NFJ Small-Cap Value Fund (cont’d)
| Shareholder Expense Example | Actual Performance | |||||||||||||
| Class A | Class C | Class R | Class P | Institutional Class | Class R6 | Administrative Class | ||||||||
| Beginning Account Value (7/1/17) | $1,000.00 | $1,000.00 | $1,000.00 | $1,000.00 | $1,000.00 | $1,000.00 | $1,000.00 | |||||||
| Ending Account Value (12/31/17) | $1,068.40 | $1,064.20 | $1,066.70 | $1,069.60 | $1,070.30 | $1,070.50 | $1,068.90 | |||||||
| Expenses Paid During Period | $6.26 | $10.15 | $7.55 | $4.96 | $4.44 | $4.18 | $5.74 | |||||||
| Hypothetical Performance | ||||||||||||||
| (5% return before expenses) | ||||||||||||||
| Class A | Class C | Class R | Class P | Institutional Class | Class R6 | Administrative Class | ||||||||
| Beginning Account Value (7/1/17) | $1,000.00 | $1,000.00 | $1,000.00 | $1,000.00 | $1,000.00 | $1,000.00 | $1,000.00 | |||||||
| Ending Account Value (12/31/17) | $1,019.16 | $1,015.38 | $1,017.90 | $1,020.42 | $1,020.92 | $1,021.17 | $1,019.66 | |||||||
| Expenses Paid During Period | $6.11 | $9.91 | $7.37 | $4.84 | $4.33 | $4.08 | $5.60 | |||||||
For each class of the Fund, expenses (net of fee waiver) are equal to the annualized expense ratio for the class (1.20% for Class A, 1.95% for Class C, 1.45% for Class R, 0.95% for Class P, 0.85% for Institutional Class , 0.80% for Class R6 and 1.10% for Administrative Class), multiplied by the average account value over the period, multiplied by 184/365.
| 50 | December 31, 2017 | | Semiannual Report |
Table of Contents
(THIS PAGE INTENTIONALLY LEFT BLANK)
| Semiannual Report | | December 31, 2017 | 51 |
Table of Contents
Unaudited
AllianzGI Small-Cap Blend Fund
For the period of July 1, 2017 through December 31, 2017, as provided by Kunal Ghosh, Portfolio Manager.
Fund Insights
For the six-month period ended December 31, 2017, Class A shares at net asset value (“NAV”) of the AllianzGI Small-Cap Blend Fund (the “Fund”) returned 11.75%, outperforming the Russell 2000 Index (the “benchmark”), which returned 9.20%.
Market Overview
During the reporting period, the broader US equity stock market hit new all-time highs, notching the ninth calendar year of positive performance since the bull market started in 2009. Investor sentiment was bolstered by favorable corporate earnings results, renewed merger and acquisition activity, and a strong third quarter GDP growth of 3.2%. With Republicans delivering their promised major tax overhaul, investors had an additional reason to support the rally into year end.
Against this backdrop, the benchmark underperformed the Russell 1000 Index’s return of 11.36%, which was bolstered by the strength of mega-cap technology companies. Within the small-cap universe, pro cyclical sectors were the best performers, led by industrials, energy and consumer discretionary. Meanwhile, telecommunication services and real estate were the weakest performing sectors.
Portfolio Review
The Fund outperformed the benchmark over the six-month period, with stock selection driving the majority of the excess returns while sector allocation had a marginally positive effect. Stock picking was strongest within the information technology sector, followed by telecommunication services and consumer discretionary. On the other hand, stock selection was negative in the real estate, industrials and materials sectors. Benefits from underweighting the real estate sector were partially offset by an underweight to industrials.
A top contributor, MyoKardia Inc., a biopharmaceutical company that specializes in developing precision cardiovascular medicine, rallied after the company released strong top-line data for a phase II therapy that treats a rare form of heart disease. The largest absolute detractor was medical supply and logistics provider Owens & Minor Inc., which traded lower as a competitor was speculated to be entering the industry.
At the end of the period, the Fund was positioned with overweight allocations to the health care, consumer discretionary and consumer staples sectors. Financials was the largest underweight position in the Fund, followed by the real estate and industrials sectors.
Outlook
For 2018, we expect the trend of moderate economic expansion to continue. Although the yield curve has flattened over the past year, the slope remains positive and seems to confirm the notion of further growth. Other economic indicators are also pointing to a similar direction as the housing sector remains healthy; consumer confidence and retail sales exhibit strength; and key manufacturing and service surveys are in expansion territory.
The Federal Reserve (the “Fed”) is expected to continue its gradual approach to normalization, with incoming Fed Chairman Jerome Powell favoring policy continuity. Overall, we welcome the return to a more normalized interest rate environment, which encourages price discovery based on company fundamentals and should be a tailwind for active management.
On the policy front, the passage of the Tax Cuts and Jobs Act represents the largest change to the tax code in 30 years. The legislation should produce tax relief of over USD1.5 trillion, providing an incremental boost to the U.S. economy. We believe the new tax regime should favor small-cap companies, which have a greater domestic focus and can benefit from the drop in corporate tax rates.
The Fund continues to combine four unique small-cap strategies in one investment, including a small-cap core, small-cap growth, micro-cap and a managed volatility sleeve. We remain confident that Fund will provide diversification benefits and may help reduce overall portfolio volatility through the combination of four separately managed small-cap portfolios.
| 52 | December 31, 2017 | | Semiannual Report |
Table of Contents
Unaudited
AllianzGI Small-Cap Blend Fund (cont’d)
Average Annual Total Return for the period ended December 31, 2017
| 6 Month* | 1 Year | Since Inception† | ||||||||||||
| AllianzGI Small-Cap Blend Fund Class A | 11.75% | 20.80% | 12.27% | |||||||||||
| AllianzGI Small-Cap Blend Fund Class A (adjusted) | 5.60% | 14.15% | 10.87% | ||||||||||
| AllianzGI Small-Cap Blend Fund Class C | 11.36% | 19.83% | 11.45% | |||||||||||
| AllianzGI Small-Cap Blend Fund Class C (adjusted) | 10.38% | 18.83% | 11.45% | ||||||||||
| AllianzGI Small-Cap Blend Fund Class P | 11.87% | 21.03% | 12.56% | ||||||||||
| AllianzGI Small-Cap Blend Fund Institutional Class | 11.96% | 21.22% | 12.67% | ||||||||||
| Russell 2000 Index | 9.20% | 14.65% | 11.77% | ||||||||||
| Lipper Small-Cap Core Funds Average | 8.78% | 12.55% | 11.02% | |||||||||||
* Cumulative return
† The Fund began operations on 7/1/13. Benchmark performance comparison began on 7/1/13. Lipper performance comparisons began on 6/30/13.
Performance quoted represents past performance and is no guarantee of future results. Current performance may be lower or higher than performance shown. For performance current to the most recent month-end, visit our website at us.allianzgi.com. Investment return and the principal value will fluctuate. Shares may be worth more or less than original cost when redeemed. The adjusted returns take into account the maximum sales charge of 5.50% on Class A shares and 1% contingent deferred sales charge (CDSC) on Class C shares, which may apply to shares redeemed during the first year of ownership. Returns do not reflect deduction of taxes that a shareholder would pay on fund distributions or redemption of fund shares. Please see pages 60-62 for more information. The Fund’s expense ratios are 1.31% for Class A shares, 2.06% for Class C shares, 1.06% for Class P shares and 0.96% for Institutional Class shares. Expense ratio information is as of the Fund’s current prospectus dated August 30, 2017, as supplemented to date.
Cumulative Returns Through December 31, 2017
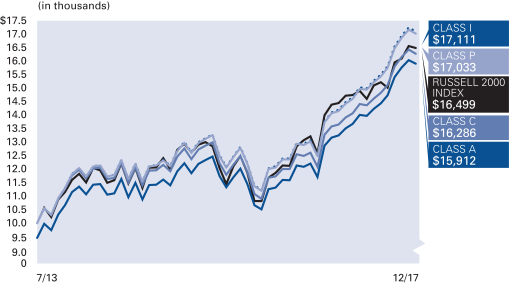
The Fund began operations on 7/1/13. Benchmark performance comparisons began on 7/1/13.
Industry/Sectors (as of December 31, 2017)
| Hotels, Restaurants & Leisure | 6.2% | |||
| Health Care Equipment & Supplies | 6.1% | |||
| Biotechnology | 4.8% | |||
| Banks | 4.4% | |||
| Software | 4.3% | |||
| Equity Real Estate Investment Trusts (REITs) | 4.0% | |||
| Oil, Gas & Consumable Fuels | 4.0% | |||
| Pharmaceuticals | 3.4% | |||
| Other | 60.3% | |||
| Cash & Equivalents — Net | 2.5% |
| Semiannual Report | | December 31, 2017 | 53 |
Table of Contents
Unaudited
AllianzGI Small-Cap Blend Fund (cont’d)
| Shareholder Expense Example | Actual Performance | |||||||
| Class A | Class C | Class P | Institutional Class | |||||
| Beginning Account Value (7/1/17) | $1,000.00 | $1,000.00 | $1,000.00 | $1,000.00 | ||||
| Ending Account Value (12/31/17) | $1,117.50 | $1,113.60 | $1,118.70 | $1,119.60 | ||||
| Expenses Paid During Period | $7.05 | $11.03 | $5.71 | $5.18 | ||||
| Hypothetical Performance | ||||||||
| (5% return before expenses) | ||||||||
| Class A | Class C | Class P | Institutional Class | |||||
| Beginning Account Value (7/1/17) | $1,000.00 | $1,000.00 | $1,000.00 | $1,000.00 | ||||
| Ending Account Value (12/31/17) | $1,018.55 | $1,014.77 | $1,019.81 | $1,020.32 | ||||
| Expenses Paid During Period | $6.72 | $10.51 | $5.45 | $4.94 | ||||
For each class of the Fund, expenses are equal to the annualized expense ratio for the class (1.32% for Class A, 2.07% for Class C, 1.07% for Class P, and 0.97% for Institutional Class), multiplied by the average account value over the period, multiplied by 184/365.
| 54 | December 31, 2017 | | Semiannual Report |
Table of Contents
(THIS PAGE INTENTIONALLY LEFT BLANK)
| Semiannual Report | | December 31, 2017 | 55 |
Table of Contents
Unaudited
AllianzGI Technology Fund
For the period of July 1, 2017 to December 31, 2017, as provided by Huachen Chen, CFA and Walter Price, CFA, Senior Portfolio Managers.
Fund Insights
For the six-month period ended December 31, 2017, Class A shares at net asset value (“NAV”) of the AllianzGI Technology Fund (the “Fund”) returned 18.79%, outperforming the benchmark, the S&P North American Technology Sector Index (the “benchmark”) which returned 17.26%.
Market Overview
The technology sector delivered strong performance during the period as the NASDAQ returned 13% for the period. The sector’s performance was fueled by multiple factors, including robust earnings growth across most of the sector and improving global growth. For most of 2017, technology investors gravitated toward secular growth opportunities in areas such as software and Internet shares. In addition, semiconductors were a stand out driven by favorable supply/demand dynamics. The final quarter of 2017 appeared to continue this trend until the last week of November when the market reversed sharply in favor of year-to-date laggards. However, this rotation abated somewhat in the latter part of December and the sector closed the year with robust gains.
Portfolio Review
The primary drivers of the Fund’s relative performance included overweight positions in some high-growth software companies such as Square and ServiceNow, as well as overweight positions in Arista Networks and Marvell Technologies. These stocks performed well during the period due to higher demand for their innovative product offerings, which led to consistently strong earnings growth. Within semiconductors, our holdings in Micron Technology and Lam Research were among the strongest performers. Additionally, an underweight in Oracle and not owning IBM helped relative performance.
The portfolio’s underweight to some mega-cap technology companies such as Amazon and Microsoft detracted from relative performance. While the underweight positions hurt relative performance, these stocks remain a sizeable portion of the portfolio and our positions helped the Fund’s absolute returns. Other top detractors included overweight positions in some data security companies such as Proofpoint and Palo Alto Networks, as well as not owning Intel.
The core of our investment process is the identification of major themes impacting the technology sector and investing in the primary beneficiaries/drivers of these trends. We maintain our conviction in the core secular growth names in our portfolio, but we are also attentive to present market conditions and valuations.
Outlook
While some investors assume technology companies may see a small benefit from US tax reform, we believe this can significantly help the sector. In our view, new tax rules would allow companies to repatriate cash balances held offshore at lower tax rates. We believe, cash repatriation can lead to larger cash returns to shareholders of large technology companies, and could spark mergers and acquisitions activity in the technology sector, benefiting smaller technology companies. Additionally, we believe companies across the economy will likely spend at least some of the tax savings to invest in their businesses. We expect more spending to flow to technology companies that offer innovative products and services designed to help businesses increase productivity and improve efficiency.
We continue to believe the technology sector can provide some of the best absolute and relative return opportunities in the equity markets—especially for bottom-up stock pickers. The growth in technology is coming from the creation of new markets, rather than simply GDP growth. Investors need to find companies generating organic growth by creating new markets or effecting significant change on old markets. Sectors such as automobiles, advertising, security, retail, and manufacturing are all being shaped and transformed by advances in technology.
We are seeing an ongoing wave of innovation in the sector that we believe has the potential to produce attractive returns for companies with best-in-class solutions.
| 56 | December 31, 2017 | | Semiannual Report |
Table of Contents
Unaudited
AllianzGI Technology Fund (cont’d)
Average Annual Total Return for the period ended December 31, 2017
| 6 Month* | 1 Year | 5 Year | 10 Year | Since Inception† | ||||||||||||||||||
| AllianzGI Technology Fund Class A | 18.79% | 46.70% | 21.07% | 10.62% | 13.85% | |||||||||||||||||
| AllianzGI Technology Fund Class A (adjusted) | 12.26% | 38.63% | 19.71% | 10.00% | 13.56% | ||||||||||||||||
| AllianzGI Technology Fund Class C | 18.35% | 45.62% | 20.17% | 9.80% | 13.00% | |||||||||||||||||
| AllianzGI Technology Fund Class C (adjusted) | 17.38% | 44.62% | 20.17% | 9.80% | 13.00% | ||||||||||||||||
| AllianzGI Technology Fund Class P | 18.95% | 47.08% | 21.37% | 10.91% | 14.23% | ||||||||||||||||
| AllianzGI Technology Fund Institutional Class | 19.00% | 47.22% | 21.50% | 11.02% | 14.34% | ||||||||||||||||
| AllianzGI Technology Fund Administrative Class | 18.85% | 46.83% | 21.19% | 10.74% | 14.06% | |||||||||||||||||
| S&P North American Technology Sector Index | 17.26% | 37.78% | 21.68% | 12.25% | 10.70% | ||||||||||||||||
| NASDAQ Composite Index | 12.43% | 28.24% | 17.98% | 10.04% | 8.93% | ||||||||||||||||
| Lipper Global Science/Technology Funds Average | 17.71% | 43.97% | 21.27% | 11.54% | 11.21% | |||||||||||||||||
* Cumulative return
† The Fund began operations on 12/27/95. Benchmark and Lipper performance comparisons began on 12/31/95.
Performance quoted represents past performance and is no guarantee of future results. Current performance may be lower or higher than performance shown. For performance current to the most recent month-end, visit our website at us.allianzgi.com. Investment return and the principal value will fluctuate. Shares may be worth more or less than original cost when redeemed. The adjusted returns take into account the maximum sales charge of 5.50% on Class A shares and 1% contingent deferred sales charge (CDSC) on Class C shares, which may apply to shares redeemed during the first year of ownership. Returns do not reflect deduction of taxes that a shareholder would pay on fund distributions or redemption of fund shares. Please see pages 60-62 for more information. The Fund’s gross expense ratios are 1.60% for Class A shares, 2.35% for Class C shares, 1.35% for Class P shares, 1.25% for Institutional Class shares and 1.50% for Administrative Class shares. These ratios do not include an expense reduction, contractually agreed through at least October 31, 2018. The Fund’s expense ratios net of this reduction are 1.45% for Class A shares, 2.20% for Class C shares, 1.20% for Class P shares, 1.10% for Institutional Class shares and 1.35% for Administrative Class shares. Expense ratio information is as of the Fund’s current prospectus dated August 30, 2017, as supplemented to date.
Cumulative Returns Through December 31, 2017
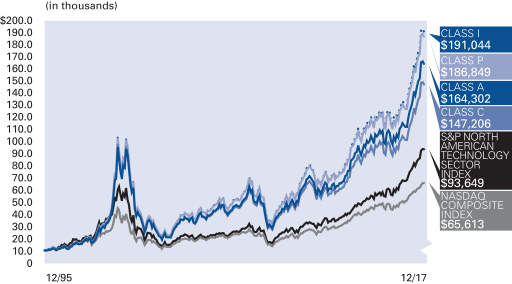
The Fund began operations on 12/27/95. Benchmark and Lipper performance comparisons began on 12/31/95.
Industry/Sectors (as of December 31, 2017)
| Software | 30.6% | |||
| Semiconductors & Semiconductor Equipment | 16.4% | |||
| Internet Software & Services | 15.1% | |||
| IT Services | 10.5% | |||
| Internet & Catalog Retail | 7.8% | |||
| Technology Hardware, Storage & Peripherals | 6.9% | |||
| Communications Equipment | 6.2% | |||
| Other | 1.9% | |||
| Securities Sold Short | –2.4% | |||
| Cash & Equivalents — Net (including Options Purchased & Options Written ) | 7.0% |
| * | Table below details the industry allocation for securities sold short. |
Industry Allocation - Securities Sold Short
| Technology Hardware, Storage & Peripherals | –1.6% | |||
| Semiconductors & Semiconductor Equipment | –0.8% |
| Semiannual Report | | December 31, 2017 | 57 |
Table of Contents
Unaudited
AllianzGI Technology Fund (cont’d)
| Shareholder Expense Example | Actual Performance | |||||||||
| Class A | Class C | Class P | Institutional Class | Administrative Class | ||||||
| Beginning Account Value (7/1/17) | $1,000.00 | $1,000.00 | $1,000.00 | $1,000.00 | $1,000.00 | |||||
| Ending Account Value (12/31/17) | $1,187.90 | $1,183.50 | $1,189.50 | $1,190.00 | $1,188.50 | |||||
| Expenses Paid During Period | $7.83 | $11.94 | $6.46 | $5.91 | $7.28 | |||||
| Hypothetical Performance | ||||||||||
| (5% return before expenses) | ||||||||||
| Class A | Class C | Class P | Institutional Class | Administrative Class | ||||||
| Beginning Account Value (7/1/17) | $1,000.00 | $1,000.00 | $1,000.00 | $1,000.00 | $1,000.00 | |||||
| Ending Account Value (12/31/17) | $1,018.05 | $1,014.27 | $1,019.31 | $1,019.81 | $1,018.55 | |||||
| Expenses Paid During Period | $7.22 | $11.02 | $5.96 | $5.45 | $6.72 | |||||
For each class of the Fund, expenses (net of fee waiver) are equal to the annualized expense ratio for the class (1.42% for Class A, 2.17% for Class C, 1.17% for Class P, 1.07% for Institutional Class and 1.32% for Administrative Class), multiplied by the average account value over the period, multiplied by 184/365.
| 58 | December 31, 2017 | | Semiannual Report |
Table of Contents
(THIS PAGE INTENTIONALLY LEFT BLANK)
| Semiannual Report | | December 31, 2017 | 59 |
Table of Contents
Unaudited
Share Class (A/C)
The inception date on each Fund Summary page is the inception date of the Fund’s oldest share class or classes. The oldest share class for the following Funds is the Institutional share class, and the Class A and/or C shares were first offered in the month/year indicated in parentheses after each Fund name: AllianzGI NFJ Dividend Value (10/01), AllianzGI NFJ Large-Cap Value (7/02), AllianzGI NFJ Small-Cap Value (1/97), AllianzGI Mid-Cap (2/02), AllianzGI Emerging Markets Opportunities (8/06), AllianzGI Global Natural Resources (3/06), AllianzGI Global Small-Cap (2/02) and AllianzGI Technology (2/02). The oldest share class for the following Funds is C, and the A shares were first offered in the month/year indicated in parentheses after each Fund name: AllianzGI NFJ Mid-Cap Value (2/91) and AllianzGI Focused Growth (10/90). The oldest share class for AllianzGI Health Sciences was the D share class, and the A and C shares were first offered in 2/02. For AllianzGI NFJ International Value the oldest share class is the Institutional share class and A and C shares were first offered in 4/05. For AllianzGI Small-Cap Blend, A and C shares were each first offered in 7/13. For the AllianzGI Income & Growth Fund, Class A and Class C shares were first offered simultaneously with Institutional shares in 2/07.
Class A shares are subject to an initial sales charge. Class C shares are subject to a 1% CDSC for shares redeemed in the first year.
Share Class (R)
The inception date on each Fund Summary page is the inception date of the Fund’s oldest share class or classes. The oldest share classes are (Fund/share class): AllianzGI NFJ Dividend Value/Institutional and Administrative, AllianzGI NFJ Mid-Cap Value/C, AllianzGI NFJ Small-Cap Value/Institutional, AllianzGI Focused Growth/C and AllianzGI Mid-Cap/Institutional. Class R shares for these Funds were first offered in 12/02. The oldest share class for AllianzGI NFJ Large-Cap Value is the Institutional share class and it first offered Class R shares in 11/09. The oldest share class for AllianzGI NFJ International Value is the Institutional share class and the Fund first offered Class R shares in 11/09. The oldest share classes for AllianzGI Income & Growth are the Institutional, Class A and Class C share classes and the Fund first offered Class R shares in 2/11.
Share Class (P)
Class P shares were launched in July 2008, except for Class P shares of AllianzGI NFJ Mid-Cap Value Fund, which were launched February 28, 2011, Class P shares of AllianzGI Mid-Cap Fund, which were launched April 2, 2012, and Class P shares of AllianzGI Small-Cap Blend, which were launched July 1, 2013.
Share Class (Institutional/Administrative)
The inception date on each Fund Summary page is the inception date of the Fund’s oldest share class or classes. Unless otherwise indicated, the noted Institutional or Administrative share class is one of the Fund’s oldest share classes. The oldest share class for the following Funds is the C shares, and the Institutional and Administrative shares
were first offered in the month/year indicated in parentheses after each Fund name: AllianzGI NFJ Mid-Cap Value (4/88) and AllianzGI Focused Growth (3/99). The oldest share class for the AllianzGI Health Sciences Fund was the D share class, and the Institutional share class was first offered in 12/14. The oldest share class for the following Funds is the Institutional class and the Administrative shares were first offered in the month/year indicated in parentheses after each Fund name: AllianzGI NFJ International Value (5/10), AllianzGI NFJ Large-Cap Value (9/06), AllianzGI NFJ Small-Cap Value (11/95), AllianzGI Technology (3/05) and AllianzGI Mid-Cap (2/02).
Share Class (R6)
The inception date on each Fund Summary page is the inception date of the Fund’s oldest share class or classes. The oldest share class for the following funds is the Institutional class and Class R6 shares were first offered in the month/year indicated in parentheses after each Fund name: AllianzGI Emerging Markets Opportunities (12/15), AllianzGI NFJ Dividend Value (12/13), AllianzGI NFJ International Value (12/13), AllianzGI NFJ Small-Cap Value (12/13) and AllianzGI NFJ Mid-Cap Value (12/17). For AllianzGI Focused Growth, Class C is the oldest share class and Class R6 shares were first offered in 12/15.
Returns shown in the “Fund Summaries” section of this report measure performance from the inception of the oldest share class to the present; therefore some returns predate the inception of the noted share class. Those returns are calculated by adjusting the returns of the oldest share class to reflect the fees and expenses paid by the newer class. Total return performance assumes that all dividend and capital gain distributions were reinvested on the payable date.
The Lipper Averages are calculated by Lipper, Inc. They are based on the total return performance, with distributions reinvested and operating expenses deducted, of funds included by Lipper in the stated category. Lipper does not take into account sales charges.
The Average Annual Total Return charts for each Fund assume the initial investment was made on the first day of the Fund’s initial fiscal year. The charts reflect any sales load that would have applied at the time of purchase or any CDSC that would have applied if a full redemption occurred on the last business day of the most recent fiscal year. Results assume that all dividend and capital gain distributions were reinvested. They do not take into account the effect of taxes. The benchmark index cumulative return began on the last day of the month of the respective Fund’s inception date, unless otherwise noted.
Proxy Voting
The Funds’ Investment Adviser has adopted written proxy voting policies and procedures (the “Proxy Policy”) as required by Rule 206(4)-6 under the Investment Advisers Act of 1940. The Proxy Policy has been adopted by the Trust as the policies and procedures that the Investment Adviser will use when voting proxies on behalf of the Funds. Copies of the written Proxy Policy, the factors that the
| 60 | December 31, 2017 | | Semiannual Report |
Table of Contents
Investment Adviser may consider in determining how to vote proxies for each Fund and information about how each Fund voted proxies relating to portfolio securities held during the most recent twelve-month period ended June 30, are provided without charge, upon request, by calling the Trust at 1-800-988-8380 (Class A, Class C and Class R) or 1-800-498-5413 (Class P, Class R6, Institutional and Administrative classes), on the Allianz Global Investors website at us.allianzgi.com, and on the Securities and Exchange Commission (the “SEC”) Website at http://www.sec.gov.
Form N-Q
The Trust files complete schedules of each Fund’s portfolio holdings with the SEC on Form N-Q for the first and third quarters of the fiscal year; such filings are available on the SEC’s website at http://www.sec.gov. A copy of the Trust’s Form N-Q, when available, will be provided without charge, upon request, by calling 1-800-988-8380 (Class A, Class C and Class R) or 1-800-498-5413 (Class P, Class R6, Institutional and Administrative classes). In addition, the Trust’s Form N-Q may be reviewed and copied at the SEC’s Public Reference Room in Washington, DC. Information on the operation of the Public Reference Room may be obtained by calling 1-800-SEC-0330.
The following disclosure provides important information regarding each Fund’s Shareholder Expense Example, which appears on each Fund Summary page in this Semiannual Report. Please refer to this information when reviewing the Shareholder Expense Example for a Fund.
Shareholder Expense Example
The Shareholder Expense Example is based on $1,000.00 invested at the beginning of and held for the entire period. Shareholders of the Funds incur two types of costs: (1) transaction costs; and (2) ongoing costs, including investment advisory and administration fees; distribution and/or service (12b-1) fees and other Fund expenses. The Shareholder Expense Example is intended to help you understand your ongoing costs (in dollars) of investing in each Fund and to compare these costs with the ongoing costs of investing in other mutual funds. The Shareholder Expense Example is based on $1,000.00 invested at the beginning and held for the entire period July 1, 2017 through December 31, 2017.
Actual Expenses
The information in the table under the heading “Actual Performance” provides information about actual account values and actual expenses. You may use the information in these columns, together with the amount you invested, to estimate the expenses that you paid over the period. Simply divide your account value by $1,000.00 (for example, an $8,600.00 account value divided by $1,000.00 = 8.6), then multiply the result by the number in the appropriate column for your share class, in the row entitled “Expenses Paid During Period”, to estimate the expenses you paid on your account during this period.
Hypothetical Example for Comparison Purposes
The information in the table under the heading “Hypothetical Performance (5% return before expenses)” provides information about hypothetical account values and hypothetical expenses based on the Fund’s actual expense ratio and an assumed rate of return of 5% per year before expenses, which is not the Fund’s actual return. The hypothetical account values and expenses may not be used to estimate the actual ending account balance or expenses you paid for the period. You may use this information to compare the ongoing costs of investing in the Fund to those of other funds. To do so, compare this 5% hypothetical example with the 5% hypothetical examples that appear in the shareholder reports of the other funds.
Please note that the expenses shown in the table are meant to highlight your ongoing costs only and do not reflect any transactional costs, such as sales charges. Therefore, the information under the heading “Hypothetical Performance (5% return before expenses)” is useful in comparing ongoing costs only, and will not help you determine the relative total costs of owning different funds. In addition, if these transactional costs were included, your costs may have been higher.
Expense ratios may vary from period to period because of various factors such as increases in expenses not covered by advisory and administration fees (for example, expenses of the trustees and their counsel or litigation expenses) and/or because of reductions in the administration fees resulting from the size of the fund.
Credit Ratings
Bond ratings apply to the underlying holdings of a Fund and not the Fund itself and are divided into categories ranging from highest to lowest credit quality, determined for purposes of presentations in this report by using ratings provided by S&P Global Ratings (“S&P”). Presentations of credit ratings information in this report use ratings provided by S&P for this purpose, among other reasons, because of the access to background information and other materials provided by S&P, as well as the Funds’ considerations of industry practice. Bonds not rated by S&P, or bonds that do not have a rating available from S&P, or bonds that had a rating withdrawn by S&P are designated as “NR” or “NA”, respectively. Credit quality ratings assigned by a rating agency are subjective opinions, not statements of fact, and are subject to change periodically, even as frequently as daily. Ratings assigned by S&P or another rating agency are not absolute standards of credit quality and do not evaluate market risk. Rating agencies may fail to make timely changes in credit ratings, and an issuer’s current financial condition may be better or worse than a rating indicates. In formulating investment decisions for the applicable Funds, the Investment Adviser develops its own analysis of the credit quality and risks associated with individual debt instruments, rather than relying exclusively on rating agencies or third-party research.
All of the information on the Fund Summary pages, including Fund Insights, Average Annual Total Return and Cumulative Returns charts, Shareholder Expense Examples and Allocation/Credit Ratings Summaries are unaudited.
| Semiannual Report | | December 31, 2017 | 61 |
Table of Contents
Unaudited
Important Information (cont’d)
Allianz Global Investors Distributors LLC, 1633 Broadway, New York, NY, 10019, us.allianzgi.com, 1-800-988-8380 (retail classes: A, C & R) or 1-800-498-5413 (Class P, Class R6, Institutional and Administrative classes).
| 62 | December 31, 2017 | | Semiannual Report |
Table of Contents
Unaudited
Unless otherwise noted, index returns reflect the reinvestment of income dividends and capital gains, if any, but do not reflect fees, brokerage commissions or other expenses of investing. It is not possible to invest directly in an index.
Prior to November 1, 2006, performance data for the MSCI Indices was calculated gross of dividend tax withholding. Performance data presently shown for the Indices is net of dividend tax withholding. This recalculation results in lower performance for the Indices.
| Index | Description | |
| Bloomberg Barclays US Aggregate Bond Index | The Bloomberg Barclays US Aggregate Bond Index represents securities that are SEC-registered, taxable, and US dollar denominated. The index covers the US investment grade fixed rate bond market, with index components for government and corporate securities, mortgage pass-through securities, and asset-backed securities. | |
| Bloomberg Barclays US Credit Index | The Bloomberg Barclays US Credit Index is the credit component of the US Government/Credit Index. It includes publicly issued US corporate and specified foreign debentures and secured notes that meet the specified maturity, liquidity, and quality requirements. To qualify, bonds must be SEC-registered. | |
| Bloomberg Barclays US Government Bond Index | The Bloomberg Barclays US Government Bond Index is the US Government component of the US Government/Credit Index. It includes US Dollar-denominated, fixed-rate, nominal US Treasuries and US agency debentures (securities issued by US government owned or government sponsored entities) and debt explicitly guaranteed by the US government. | |
| Bloomberg Barclays Global High Yield Index | The Bloomberg Barclays Global High Yield Index is a multi-currency flagship measure of the global high yield debt market. The index represents the union of the US High Yield, the Pan-European High Yield and Emerging Markets (EM) Hard Currency High Yield Indices. | |
| ICE BofA Merrill Lynch All Convertibles Index | The ICE BofA Merrill Lynch All Convertibles Index is a widely used, unmanaged index that measures the performance of US dollar-denominated convertible securities not currently in bankruptcy with a total market value greater than $50 million at issuance. | |
| ICE BofA Merrill Lynch US High Yield Master II Index | The ICE BofA Merrill Lynch High Yield Master II Index is an unmanaged index consisting of US dollar denominated bonds that are issued in countries having a BBB3 or higher debt rating with at least one year remaining until maturity. All bonds must have a credit rating below investment grade but not in default. | |
| Chicago Board Options Exchange (CBOE) Volatility Index (VIX) | The Chicago Board Options Exchange (CBOE) Volatility Index (VIX) is a key measure of market expectations of near-term volatility conveyed by S&P 500 stock index option prices. | |
| Custom Commodity Equity Benchmark | The Custom Commodity Equity Benchmark represents the performance of a hypothetical index developed by the Adviser. This blended benchmark is comprised of four underlying indices in the following proportions: 25% DAX Global Agribusiness Index, 30% MSCI World Energy Index, 25% MSCI World Materials Index and 20% MSCI ACWI Industrials (equal-weighted) Index. The DAX Global Agribusiness Index replicates the performance of the largest and most liquid agribusiness companies. The MSCI World Energy Index is a component of the MSCI World Index and represents the energy securities defined by MSCI. The MSCI World Materials Index is a component of the MSCI World Index and represents the materials securities defined by MSCI. The MSCI ACWI Industrials (equal-weighted) Index is a component of the MSCI All Country World Index and represents the industrials securities defined by MSCI calculated equal-weighted. Performance data presently shown for MSCI and DAX Indexes is net of dividend tax withholding. It is not possible to invest directly in the blended benchmark or in the indices from which it is derived. | |
| MSCI All Country World ex-USA Index (Also known as MSCI ACWI ex-USA Index) | The MSCI All Country World Index (ACWI) ex-USA Index captures large and mid cap representation across Developed Markets countries (excluding the US) and Emerging Markets countries. The index covers approximately 85% of the global equity opportunity set outside the US. | |
| MSCI All Country World Index (Also known as: MSCI AC World Index and MSCI ACWI) | The MSCI All Country World Index (ACWI) captures large and mid cap representation across Developed Markets and Emerging Markets countries. The index covers approximately 85% of the global investable equity opportunity set. | |
| Semiannual Report | | December 31, 2017 | 63 |
Table of Contents
Unaudited
Benchmark Descriptions (cont’d)
| Index | Description | |
| MSCI EAFE Index | The MSCI EAFE Index is an equity index which captures large and mid cap representation across the Developed Markets countries around the world, excluding the US and Canada. | |
| MSCI Emerging Markets Index | The MSCI Emerging Markets Index captures large and mid cap representation across Emerging Markets countries. The index covers approximately 85% of the free float-adjusted market capitalization in each country. | |
| MSCI World Energy Index | The MSCI World Energy Index is designed to capture the large and mid-cap segments across Developed Markets countries. All securities in the index are classified in the Energy sector as per the Global Industry Classification Standard. | |
| MSCI World Health Care Index | The MSCI World Health Care Index is designed to capture the large and mid cap segments across Developed Markets countries. All securities in the index are classified in the Health Care sector as per the Global Industry Classification Standard. | |
| MSCI World Index | The MSCI World Index captures large and mid cap representation across Developed Markets countries. The index covers approximately 85% of the free float-adjusted market capitalization in each country. | |
| MSCI World Materials Index | The MSCI World Materials Index is designed to capture the large and mid cap segments across Developed Markets countries. All securities in the index are classified in the Materials sector as per the Global Industry Classification Standard. | |
| MSCI World Small-Cap Index | The MSCI World Small-Cap Index captures small-cap representation across Developed Markets countries. The index covers approximately 14% of the free float-adjusted market capitalization in each country. | |
| NASDAQ Composite Index | The NASDAQ Composite Index is an unmanaged market-value weighted index of all common stocks listed on the NASDAQ Stock Market. | |
| Russell 1000 Growth Index | The Russell 1000 Growth Index is an unmanaged index that measures the performance of the large-cap growth segment of the US equity universe. It includes those Russell 1000 companies with higher price-to-book ratios and higher forecasted growth values. The Russell 1000 Index measures the performance of the 1,000 largest companies in the Russell 3000® Index, which consists of the 3,000 largest US companies based on total market capitalization. | |
| Russell 1000 Index | The Russell 1000 Index is an unmanaged index that consists of the 1,000 largest companies in the Russell 3000 Index and represents approximately 90% of the total market capitalization of the Russell 3000 Index. It is highly correlated with the S&P 500 Index. | |
| Russell 1000 Value Index | The Russell 1000 Value Index is an unmanaged index that measures the performance of the large-cap value segment of the US equity universe. It includes those Russell 1000 companies with lower price-to-book ratios and lower expected growth values. | |
| Russell 2000 Index | The Russell 2000 Index measures the performance of the small-cap segment of the US equity universe. The Russell 2000 is a subset of the Russell 3000® Index representing approximately 10% of the total market capitalization of that index. It includes approximately 2000 of the smallest securities based on a combination of their market cap and current index membership. | |
| Russell 2000 Value Index | The Russell 2000 Value Index is an unmanaged index that measures the performance of the small-cap value segment of the US equity universe. It includes those Russell 2000 Index companies with lower price-to-book ratios and lower forecasted growth values. | |
| Russell Midcap Growth Index | The Russell Midcap Growth Index is an unmanaged index that measures the performance of the mid-cap growth segment of the US equity universe. It includes those Russell Midcap Index companies with higher price-to-book ratios and higher forecasted growth values. | |
| Russell Midcap Value Index | The Russell Midcap Value Index is an unmanaged index that measures the performance of the mid-cap value segment of the US equity universe. It includes those Russell Midcap Index companies with lower price-to-book ratios and lower forecasted growth values. | |
| Russell Top 200 Value Index | The Russell Top 200 Value Index is an unmanaged index that measures the performance of the especially large-cap segment of the US equity universe. It includes those Russell Top 200 Index companies with lower price-to-book ratios and lower forecasted growth values. | |
| S&P 500 Index | The S&P 500 Index is an unmanaged index of large capitalization common stocks. | |
| S&P North American Technology Sector Index | The S&P North American Technology Sector Index is a modified capitalization-weighted index of selected technology and internet-related stocks. | |
| 64 | December 31, 2017 | | Semiannual Report |
Table of Contents
December 31, 2017 (unaudited)
AllianzGI Emerging Markets Opportunities Fund
| Shares | Value | |||||||
| Common Stock—98.2% | ||||||||
| Brazil—3.3% | ||||||||
Estacio Participacoes S.A. | 231,900 | $2,294,461 | ||||||
Fibria Celulose S.A. | 218,900 | 3,161,751 | ||||||
Porto Seguro S.A. | 155,676 | 1,704,979 | ||||||
Suzano Papel e Celulose S.A. | 214,100 | 1,206,333 | ||||||
Via Varejo S.A. UNIT | 198,600 | 1,466,388 | ||||||
|
| |||||||
| 9,833,912 | ||||||||
|
| |||||||
| China—33.8% | ||||||||
Agricultural Bank of China Ltd., Class H | 5,422,000 | 2,519,818 | ||||||
Air China Ltd., Class H | 1,366,000 | 1,654,254 | ||||||
Alibaba Group Holding Ltd. ADR (d) | 25,800 | 4,448,694 | ||||||
China Merchants Bank Co., Ltd., Class H | 1,346,500 | 5,330,878 | ||||||
China Petroleum & Chemical Corp., Class H | 5,170,000 | 3,786,679 | ||||||
China Shenhua Energy Co., Ltd., Class H | 2,238,000 | 5,781,743 | ||||||
China Vanke Co., Ltd., Class H | 1,228,300 | 4,888,000 | ||||||
CNOOC Ltd. | 5,437,000 | 7,805,444 | ||||||
Guangzhou Automobile Group Co., Ltd., Class H | 3,684,000 | 8,701,715 | ||||||
Hengan International Group Co., Ltd. | 574,500 | 6,360,852 | ||||||
Industrial & Commercial Bank of China Ltd., Class H | 18,088,000 | 14,499,958 | ||||||
Ping An Insurance Group Co. of China Ltd., Class H | 405,000 | 4,200,688 | ||||||
Sinopec Shanghai Petrochemical Co., Ltd., Class H | 4,464,000 | 2,537,683 | ||||||
Tencent Holdings Ltd. | 479,000 | 24,792,040 | ||||||
Weichai Power Co., Ltd., Class H | 3,020,000 | 3,299,233 | ||||||
|
| |||||||
| 100,607,679 | ||||||||
|
| |||||||
| Hong Kong—6.2% | ||||||||
CK Asset Holdings Ltd. | 532,500 | 4,641,889 | ||||||
Hang Seng Bank Ltd. | 236,400 | 5,864,827 | ||||||
Link REIT | 285,000 | 2,636,766 | ||||||
Melco Resorts & Entertainment Ltd. ADR | 181,800 | 5,279,472 | ||||||
|
| |||||||
| 18,422,954 | ||||||||
|
| |||||||
| India—7.0% | ||||||||
CESC Ltd. | 197,327 | 3,238,380 | ||||||
HCL Technologies Ltd. | 120,690 | 1,694,132 | ||||||
HDFC Bank Ltd. ADR | 30,000 | 3,050,100 | ||||||
Hero MotoCorp Ltd. | 17,294 | 1,030,263 | ||||||
Hindustan Unilever Ltd. | 111,928 | 2,388,844 | ||||||
Indraprastha Gas Ltd. (d) | 165,245 | 868,845 | ||||||
Oil & Natural Gas Corp., Ltd. | 712,422 | 2,170,066 | ||||||
Tata Consultancy Services Ltd. | 63,458 | 2,681,932 | ||||||
Tata Steel Ltd. | 318,816 | 3,643,983 | ||||||
|
| |||||||
| 20,766,545 | ||||||||
|
| |||||||
Shares | Value | |||||||
| Indonesia—3.0% | ||||||||
Bank Central Asia Tbk PT | 1,551,600 | $ | 2,503,421 | |||||
Bank Rakyat Indonesia Persero Tbk PT | 24,199,400 | 6,492,413 | ||||||
|
| |||||||
| 8,995,834 | ||||||||
|
| |||||||
| Korea (Republic of)—13.1% | ||||||||
Hotel Shilla Co., Ltd. | 35,567 | 2,820,642 | ||||||
KB Financial Group, Inc. | 68,743 | 4,068,424 | ||||||
LG Electronics, Inc. | 27,165 | 2,685,916 | ||||||
LG Innotek Co., Ltd. | 11,763 | 1,577,560 | ||||||
Lotte Chemical Corp. | 7,214 | 2,477,077 | ||||||
POSCO | 14,342 | 4,461,095 | ||||||
Samsung Electronics Co., Ltd. | 4,937 | 11,729,869 | ||||||
Shinhan Financial Group Co., Ltd. | 47,357 | 2,185,866 | ||||||
SK Hynix, Inc. | 63,846 | 4,534,743 | ||||||
SK Telecom Co., Ltd. | 9,673 | 2,412,490 | ||||||
|
| |||||||
| 38,953,682 | ||||||||
|
| |||||||
| Malaysia—0.5% | ||||||||
Malayan Banking Bhd. | 670,800 | 1,623,388 | ||||||
|
| |||||||
| Peru—3.2% | ||||||||
Credicorp Ltd. | 45,900 | 9,521,037 | ||||||
|
| |||||||
| Poland—0.9% | ||||||||
Powszechny Zaklad Ubezpieczen S.A. | 220,047 | 2,661,614 | ||||||
|
| |||||||
| Russian Federation—4.8% | ||||||||
LUKOIL PJSC ADR | 152,241 | 8,776,694 | ||||||
Mobile TeleSystems PJSC ADR | 142,000 | 1,446,980 | ||||||
Sberbank of Russia PJSC (b)(c) | 1,012,065 | 3,957,174 | ||||||
|
| |||||||
| 14,180,848 | ||||||||
|
| |||||||
| South Africa—3.8% | ||||||||
Astral Foods Ltd. | 59,322 | 1,284,491 | ||||||
AVI Ltd. | 89,864 | 803,020 | ||||||
Exxaro Resources Ltd. | 97,599 | 1,281,862 | ||||||
Mr Price Group Ltd. | 398,185 | 7,852,833 | ||||||
|
| |||||||
| 11,222,206 | ||||||||
|
| |||||||
| Taiwan—6.8% | ||||||||
Cathay Financial Holding Co., Ltd. | 2,825,000 | 5,061,112 | ||||||
Epistar Corp. (d) | 924,000 | 1,392,466 | ||||||
Innolux Corp. | 3,179,000 | 1,319,631 | ||||||
Powertech Technology, Inc. | 769,000 | 2,264,743 | ||||||
St Shine Optical Co., Ltd. | 27,000 | 881,052 | ||||||
Taiwan Semiconductor Manufacturing Co., Ltd. | 1,215,000 | 9,303,342 | ||||||
|
| |||||||
| 20,222,346 | ||||||||
|
| |||||||
| Thailand—2.4% | ||||||||
PTT Global Chemical PCL (b)(c) | 1,792,700 | 4,672,416 | ||||||
PTT PCL (b)(c) | 190,600 | 2,568,570 | ||||||
|
| |||||||
| 7,240,986 | ||||||||
|
| |||||||
| Turkey—5.8% | ||||||||
Eregli Demir ve Celik Fabrikalari TAS | 1,499,927 | 3,957,525 | ||||||
Tupras Turkiye Petrol Rafinerileri AS | 169,470 | 5,430,895 | ||||||
Turk Hava Yollari AO (d) | 1,913,931 | 7,923,031 | ||||||
|
| |||||||
| 17,311,451 | ||||||||
|
| |||||||
Shares | Value | |||||||
| United States—3.6% | ||||||||
Copa Holdings S.A., Class A | 68,000 | $ | 9,116,080 | |||||
Lear Corp. | 9,434 | 1,666,610 | ||||||
|
| |||||||
| 10,782,690 | ||||||||
|
| |||||||
| Total Common Stock (cost—$251,038,472) | 292,347,172 | |||||||
|
| |||||||
| Preferred Stock—0.6% | ||||||||
| Russian Federation—0.6% | ||||||||
Surgutneftegas OJSC (b)(c) | 3,404,886 | 1,668,394 | ||||||
|
| |||||||
| Principal Amount (000s) | ||||||||
| Repurchase Agreements—0.4% | ||||||||
State Street Bank and Trust Co., dated 12/29/17, 0.20%, due 1/2/18, proceeds $1,222,027; collateralized by U.S. Treasury Notes, 1.625%, due 2/15/26, valued at $1,247,380 including accrued interest |
| |||||||
(cost—$1,222,000) | $1,222 | 1,222,000 | ||||||
|
| |||||||
| Total Investments (cost—$254,114,360) (a)—99.2% | 295,237,566 | |||||||
|
| |||||||
| Other assets less liabilities (e)—0.8% | 2,469,444 | |||||||
|
| |||||||
| Net Assets—100.0% | $297,707,010 | |||||||
|
| |||||||
Notes to Schedule of Investments:
(a) Securities with an aggregate value of $214,295,812, representing 72.0% of net assets, were valued utilizing modeling tools provided by a third-party vendor. See Note 1(a) and Note 1(b) in the Notes to Financial Statements.
(b) Fair-Valued—Securities with an aggregate value of $12,866,554, representing 4.3% of net assets. See Note 1(a) and Note 1(b) in the Notes to Financial Statements.
(c) Level 3 security. See Note 1(a) and Note 1(b) in the Notes to Financial Statements.
(d) Non-income producing.
| See accompanying Notes to Financial Statements | | December 31, 2017 | | Semiannual Report | 65 |
Table of Contents
Schedule of Investments
December 31, 2017 (unaudited)
(e) Includes net unrealized appreciation (depreciation) of other financial instruments as follows:
| Forward foreign currency contracts outstanding at December 31, 2017: | ||||||||||||||
| Counterparty | U.S.$ Value on Origination Date | U.S.$ Value December 31, 2017 | Unrealized Appreciation | |||||||||||
605,521 Turkish Lira settling 1/2/18 | Northern Trust Company | $ | 160,205 | $ | 159,747 | $ | 458 | |||||||
|
| |||||||||||||
| $ | 458 | |||||||||||||
|
| |||||||||||||
Glossary:
ADR—American Depositary Receipt
REIT—Real Estate Investment Trust
UNIT—More than one class of securities traded together.
The industry classification of portfolio holdings and other assets less liabilities shown as a percentage of net assets were as follows:
Banks | 20.7% | |||
Oil, Gas & Consumable Fuels | 13.2% | |||
Internet Software & Services | 9.8% | |||
Airlines | 6.3% | |||
Semiconductors & Semiconductor Equipment | 5.9% | |||
Insurance | 4.6% | |||
Specialty Retail | 4.1% | |||
Metals & Mining | 4.0% | |||
Technology Hardware, Storage & Peripherals | 3.9% | |||
Automobiles | 3.3% | |||
Chemicals | 3.2% | |||
Real Estate Management & Development | 3.2% | |||
Personal Products | 2.1% | |||
Hotels, Restaurants & Leisure | 1.8% | |||
IT Services | 1.5% | |||
Paper & Forest Products | 1.5% | |||
Wireless Telecommunication Services | 1.3% | |||
Machinery | 1.1% | |||
Electric Utilities | 1.1% | |||
Electronic Equipment, Instruments & Components | 1.0% | |||
Household Durables | 0.9% | |||
Equity Real Estate Investment Trusts (REITs) | 0.9% | |||
Household Products | 0.8% | |||
Diversified Consumer Services | 0.8% | |||
Food Products | 0.7% | |||
Auto Components | 0.5% | |||
Healthcare Equipment & Supplies | 0.3% | |||
Gas Utilities | 0.3% | |||
Repurchase Agreements | 0.4% | |||
Other assets less liabilities | 0.8% | |||
|
| |||
| 100.0% | ||||
|
|
| 66 | Semiannual Report | | December 31, 2017 | | See accompanying Notes to Financial Statements |
Table of Contents
Schedule of Investments
December 31, 2017 (unaudited)
AllianzGI Focused Growth Fund
| Shares | Value | |||||||
| Common Stock—99.8% | ||||||||
| Aerospace & Defense—2.6% | ||||||||
Lockheed Martin Corp. | 81,557 | $26,183,875 | ||||||
|
| |||||||
| Auto Components—0.5% | ||||||||
Aptiv PLC | 62,105 | 5,268,367 | ||||||
|
| |||||||
| Automobiles—1.0% | ||||||||
Tesla, Inc. (a) | 31,865 | 9,921,168 | ||||||
|
| |||||||
| Banks—2.3% | ||||||||
Bank of America Corp. | 806,740 | 23,814,965 | ||||||
|
| |||||||
| Beverages—3.5% | ||||||||
Constellation Brands, Inc. | 110,773 | 25,319,385 | ||||||
Monster Beverage Corp. (a) | 174,088 | 11,018,029 | ||||||
|
| |||||||
| 36,337,414 | ||||||||
|
| |||||||
| Biotechnology—5.2% | ||||||||
AbbVie, Inc. | 430,345 | 41,618,665 | ||||||
Celgene Corp. (a) | 110,035 | 11,483,253 | ||||||
|
| |||||||
| 53,101,918 | ||||||||
|
| |||||||
| Capital Markets—2.0% | ||||||||
MSCI, Inc. | 161,410 | 20,424,821 | ||||||
|
| |||||||
| Chemicals—1.7% | ||||||||
Albemarle Corp. | 137,975 | 17,645,623 | ||||||
|
| |||||||
| Construction Materials—1.4% | ||||||||
Vulcan Materials Co. | 113,595 | 14,582,190 | ||||||
|
| |||||||
| Diversified Financial Services—1.3% | ||||||||
MarketAxess Holdings, Inc. | 66,995 | 13,516,241 | ||||||
|
| |||||||
| Electronic Equipment, Instruments & Components—1.7% | ||||||||
Coherent, Inc. (a) | 60,250 | 17,003,755 | ||||||
|
| |||||||
| Healthcare Providers & Services—5.1% | ||||||||
UnitedHealth Group, Inc. | 234,870 | 51,779,440 | ||||||
|
| |||||||
| Hotels, Restaurants & Leisure—1.7% | ||||||||
MGM Resorts International | 512,850 | 17,124,062 | ||||||
|
| |||||||
| Internet & Catalog Retail—6.1% | ||||||||
Amazon.com, Inc. (a) | 53,202 | 62,218,143 | ||||||
|
| |||||||
| Internet Software & Services—12.1% | ||||||||
Alphabet, Inc., Class A (a) | 34,379 | 36,214,839 | ||||||
Facebook, Inc., Class A (a) | 360,226 | 63,565,480 | ||||||
Tencent Holdings Ltd. ADR | 464,685 | 24,126,445 | ||||||
|
| |||||||
| 123,906,764 | ||||||||
|
| |||||||
| IT Services—6.9% | ||||||||
Square, Inc. Class A (a) | 569,760 | 19,753,579 | ||||||
Visa, Inc., Class A | 444,650 | 50,698,993 | ||||||
|
| |||||||
| 70,452,572 | ||||||||
|
| |||||||
| Machinery—5.2% | ||||||||
Fortive Corp. | 368,495 | 26,660,613 | ||||||
Parker-Hannifin Corp. | 132,360 | 26,416,409 | ||||||
|
| |||||||
| 53,077,022 | ||||||||
|
| |||||||
| Oil, Gas & Consumable Fuels—1.9% | ||||||||
EOG Resources, Inc. | 177,420 | 19,145,392 | ||||||
|
| |||||||
| Personal Products—2.6% | ||||||||
Estee Lauder Cos., Inc., Class A | 211,690 | 26,935,436 | ||||||
|
| |||||||
| Pharmaceuticals—2.2% | ||||||||
Zoetis, Inc. | 313,380 | 22,575,895 | ||||||
|
| |||||||
Shares | Value | |||||||
| Road & Rail—3.0% | ||||||||
Union Pacific Corp. | 226,495 | $ | 30,372,979 | |||||
|
| |||||||
| Semiconductors & Semiconductor Equipment—6.0% | ||||||||
Applied Materials, Inc. | 601,795 | 30,763,760 | ||||||
Broadcom Ltd. | 120,355 | 30,919,200 | ||||||
|
| |||||||
| 61,682,960 | ||||||||
|
| |||||||
| Software—8.5% | ||||||||
Microsoft Corp. | 525,205 | 44,926,036 | ||||||
Salesforce.com, Inc. (a) | 343,615 | 35,127,761 | ||||||
ServiceNow, Inc. (a) | 50,590 | 6,596,430 | ||||||
|
| |||||||
| 86,650,227 | ||||||||
|
| |||||||
| Specialty Retail—6.1% | ||||||||
Burlington Stores, Inc. (a) | 161,330 | 19,848,430 | ||||||
Home Depot, Inc. | 226,743 | 42,974,601 | ||||||
|
| |||||||
| 62,823,031 | ||||||||
|
| |||||||
| Technology Hardware, Storage & Peripherals—7.1% | ||||||||
Apple, Inc. | 430,105 | 72,786,669 | ||||||
|
| |||||||
| Trading Companies & Distributors—2.1% | ||||||||
United Rentals, Inc. (a) | 125,570 | 21,586,739 | ||||||
|
| |||||||
| Total Common Stock (cost—$597,515,705) | 1,020,917,668 | |||||||
|
| |||||||
| Principal Amount (000s) | ||||||||
| Repurchase Agreements—0.4% | ||||||||
State Street Bank and Trust Co., dated 12/29/17, 0.20%, due 1/2/18, proceeds $4,445,099; collateralized by U.S. Treasury Notes, 1.625%, due 2/15/26, valued at $4,534,203 including accrued interest |
| |||||||
(cost—$4,445,000) | $4,445 | 4,445,000 | ||||||
|
| |||||||
| Total Investments (cost-$601,960,705)—100.2% | 1,025,362,668 | |||||||
|
| |||||||
| Liabilities in excess of other assets—(0.2)% | (1,640,959 | ) | ||||||
|
| |||||||
| Net Assets—100.0% | $1,023,721,709 | |||||||
|
| |||||||
Notes to Schedule of Investments:
(a) Non-income producing.
Glossary:
ADR—American Depositary Receipt
AllianzGI Global Natural Resources Fund
| Shares | Value | |||||||
| Common Stock—97.9% | ||||||||
| Australia—3.5% | ||||||||
BHP Billiton Ltd. | 28,973 | $665,536 | ||||||
South32 Ltd. | 88,233 | 239,160 | ||||||
|
| |||||||
| 904,696 | ||||||||
|
| |||||||
| Brazil—0.6% | ||||||||
Vale S.A. ADR | 13,180 | 161,191 | ||||||
|
| |||||||
| Canada—7.6% | ||||||||
Agrium, Inc. | 2,833 | 325,851 | ||||||
Canadian Natural Resources Ltd. | 8,188 | 292,605 | ||||||
Encana Corp. | 11,010 | 146,888 | ||||||
First Quantum Minerals Ltd. | 23,051 | 322,934 | ||||||
Suncor Energy, Inc. | 20,760 | 762,191 | ||||||
Teck Resources Ltd., Class B | 5,140 | 134,514 | ||||||
|
| |||||||
| 1,984,983 | ||||||||
|
| |||||||
| Chile—1.2% | ||||||||
Sociedad Quimica y Minera de Chile S.A. ADR | 5,190 | 308,130 | ||||||
|
| |||||||
| France—5.3% | ||||||||
ArcelorMittal (c) | 8,750 | 283,878 | ||||||
Arkema S.A. | 2,140 | 260,748 | ||||||
Total S.A. | 15,207 | 839,425 | ||||||
|
| |||||||
| 1,384,051 | ||||||||
|
| |||||||
| Germany—1.9% | ||||||||
BASF SE | 4,420 | 484,571 | ||||||
|
| |||||||
| Japan—2.4% | ||||||||
Mitsubishi Chemical Holdings Corp. | 12,600 | 137,868 | ||||||
Panasonic Corp. | 9,800 | 143,020 | ||||||
Shin-Etsu Chemical Co., Ltd. | 2,100 | 212,778 | ||||||
Sumitomo Chemical Co., Ltd. | 18,000 | 128,802 | ||||||
|
| |||||||
| 622,468 | ||||||||
|
| |||||||
| Korea (Republic of)—1.0% | ||||||||
LG Chem Ltd. | 350 | 132,408 | ||||||
Samsung SDI Co., Ltd. | 610 | 116,294 | ||||||
|
| |||||||
| 248,702 | ||||||||
|
| |||||||
| United Kingdom—14.0% | ||||||||
BP PLC | 130,367 | 914,562 | ||||||
Glencore PLC (c) | 91,190 | 477,285 | ||||||
Rio Tinto PLC | 13,174 | 691,077 | ||||||
Royal Dutch Shell PLC, Class A | 24,469 | 816,853 | ||||||
Royal Dutch Shell PLC, Class B | 22,085 | 743,691 | ||||||
|
| |||||||
| 3,643,468 | ||||||||
|
| |||||||
| United States—60.4% | ||||||||
Albemarle Corp. | 4,730 | 604,920 | ||||||
Alcoa Corp. (c) | 5,670 | 305,443 | ||||||
Anadarko Petroleum Corp. | 2,510 | 134,636 | ||||||
Andeavor | 1,600 | 182,944 | ||||||
Cabot Oil & Gas Corp. | 5,620 | 160,732 | ||||||
Centennial Resource Development, Inc., Class A (c) | 8,095 | 160,281 | ||||||
Chemours Co. | 2,945 | 147,427 | ||||||
Chevron Corp. | 7,295 | 913,261 | ||||||
Concho Resources, | 4,415 | 663,221 | ||||||
ConocoPhillips | 8,365 | 459,155 | ||||||
Continental Resources, Inc. (c) | 17,245 | 913,468 | ||||||
Core Laboratories NV | 2,460 | 269,493 | ||||||
Diamondback Energy, Inc. (c) | 5,305 | 669,756 | ||||||
DowDuPont, Inc. | 7,260 | 517,057 | ||||||
Eagle Materials, Inc. | 2,745 | 311,009 | ||||||
Ecolab, Inc. (b) | 2,390 | 320,690 | ||||||
| See accompanying Notes to Financial Statements | | December 31, 2017 | | Semiannual Report | 67 |
Table of Contents
Schedule of Investments
December 31, 2017 (unaudited)
Shares | Value | |||||||
Ensco PLC, Class A | 14,180 | $ | 83,804 | |||||
EOG Resources, Inc. | 8,250 | 890,257 | ||||||
Exxon Mobil Corp. | 9,810 | 820,508 | ||||||
Fairmount Santrol Holdings, Inc. (c) | 23,840 | 124,683 | ||||||
FMC Corp. | 4,405 | 416,977 | ||||||
Halliburton Co. (b) | 9,500 | 464,265 | ||||||
HollyFrontier Corp. | 4,030 | 206,417 | ||||||
Huntsman Corp. | 9,320 | 310,263 | ||||||
Laredo Petroleum, Inc. (b)(c) | 11,650 | 123,607 | ||||||
LyondellBasell Industries NV, Class A | 2,260 | 249,323 | ||||||
Marathon Petroleum Corp. | 2,985 | 196,950 | ||||||
Occidental Petroleum Corp. | 7,975 | 587,438 | ||||||
Parsley Energy, Inc., Class A (c) | 11,590 | 341,210 | ||||||
Patterson-UTI Energy, Inc. | 6,765 | 155,663 | ||||||
Phillips 66 | 4,075 | 412,186 | ||||||
Pioneer Natural Resources Co. | 2,453 | 424,001 | ||||||
ProPetro Holding Corp. (c) | 23,750 | 478,800 | ||||||
RPC, Inc. | 20,675 | 527,833 | ||||||
Schlumberger Ltd. | 8,740 | 588,989 | ||||||
SM Energy Co. | 11,260 | 248,621 | ||||||
Transocean Ltd. (c) | 15,400 | 164,472 | ||||||
U.S. Silica Holdings, Inc. | 5,605 | 182,499 | ||||||
Union Pacific Corp. | 2,305 | 309,101 | ||||||
Valero Energy Corp. | 4,230 | 388,779 | ||||||
Valvoline, Inc. | 5,035 | 126,177 | ||||||
Weatherford International | 36,620 | 152,705 | ||||||
|
| |||||||
| 15,709,021 | ||||||||
|
| |||||||
| Total Common Stock (cost—$21,453,660) | 25,451,281 | |||||||
|
| |||||||
| Exchange-Traded Funds—1.0% | ||||||||
Guggenheim Solar | 10,480 | 263,362 | ||||||
|
| |||||||
| Principal Amount (000s) | ||||||||
| Repurchase Agreements—0.6% | ||||||||
State Street Bank and Trust Co., dated 12/29/17, 0.20%, due 1/2/18, proceeds $163,004; collateralized by U.S. Treasury Notes, 1.625%, due 2/15/26, valued at $170,744 including accrued interest |
| |||||||
(cost—$163,000) | $163 | 163,000 | ||||||
|
| |||||||
| Total Investments (cost—$21,821,675) (a)—99.5% | 25,877,643 | |||||||
|
| |||||||
| Other assets less liabilities—0.5% | 120,451 | |||||||
|
| |||||||
| Net Assets—100.0% | $25,998,094 | |||||||
|
| |||||||
Notes to Schedule of Investments:
(a) Securities with an aggregate value of $6,894,800, representing 26.5% of net assets, were valued utilizing modeling tools provided by a third-party vendor. See Note 1(a) and Note 1(b) in the Notes to Financial Statements.
(b) All or partial amount segregated for the benefit of the counterparty as collateral for options written. There were no open options written at December 31, 2017, however the Fund had securities segregated as collateral for any transactions in the future.
(c) Non-income producing.
Glossary:
ADR—American Depositary Receipt
The industry classification of portfolio holdings and other assets less liabilities shown as a percentage of net assets were as follows:
Oil, Gas & Consumable Fuels | 51.6% | |||
Chemicals | 18.0% | |||
Metals & Mining | 12.6% | |||
Energy Equipment & Services | 12.3% | |||
Construction Materials | 1.2% | |||
Road & Rail | 1.2% | |||
Exchange-Traded Funds | 1.0% | |||
Household Durables | 0.6% | |||
Electronic Equipment, Instruments & Components | 0.4% | |||
Repurchase Agreements | 0.6% | |||
Other assets less liabilities | 0.5% | |||
|
| |||
| 100.0% | ||||
|
|
AllianzGI Global Small-Cap Fund
| Shares | Value | |||||||
| Common Stock—97.3% | ||||||||
| Australia—1.5% | ||||||||
Boral Ltd. | 120,634 | $730,294 | ||||||
Challenger Ltd. | 39,492 | 430,680 | ||||||
Downer EDI Ltd. | 137,456 | 739,471 | ||||||
Mantra Group Ltd. | 43,938 | 133,702 | ||||||
Santos Ltd. (c) | 214,678 | 908,683 | ||||||
|
| |||||||
| 2,942,830 | ||||||||
|
| |||||||
| Austria—1.7% | ||||||||
Schoeller-Bleckmann Oilfield Equipment AG (c) | 9,627 | 981,831 | ||||||
UNIQA Insurance Group AG | 96,256 | 1,018,646 | ||||||
Wienerberger AG | 53,200 | 1,287,555 | ||||||
|
| |||||||
| 3,288,032 | ||||||||
|
| |||||||
| Bermuda—1.2% | ||||||||
Essent Group Ltd. (c) | 28,195 | 1,224,227 | ||||||
Triton International Ltd. (c) | 28,542 | 1,068,898 | ||||||
|
| |||||||
| 2,293,125 | ||||||||
|
| |||||||
| China—1.6% | ||||||||
Angel Yeast Co., Ltd., Class A | 108,800 | 546,840 | ||||||
China Everbright Greentech Ltd. (a)(c) | 473,488 | 436,347 | ||||||
China Everbright International Ltd. | 337,000 | 480,779 | ||||||
China State Construction International Holdings Ltd. | 360,000 | 502,878 | ||||||
CIFI Holdings Group Co., Ltd. | 692,000 | 415,766 | ||||||
Nexteer Automotive Group Ltd. (c) | 26,000 | 61,787 | ||||||
Sunny Optical Technology Group Co., Ltd. | 30,000 | 380,918 | ||||||
Zhejiang Dingli Machinery Co., Ltd., Class A | 21,800 | 262,691 | ||||||
|
| |||||||
| 3,088,006 | ||||||||
|
| |||||||
| Denmark—1.3% | ||||||||
Ambu A/S, Class B | 18,534 | 1,657,152 | ||||||
SimCorp A/S | 16,817 | 957,214 | ||||||
|
| |||||||
| 2,614,366 | ||||||||
|
| |||||||
| Finland—1.3% | ||||||||
Huhtamaki Oyj | 26,689 | 1,120,261 | ||||||
Outotec Oyj (c) | 162,170 | 1,380,718 | ||||||
|
| |||||||
| 2,500,979 | ||||||||
|
| |||||||
| France—2.2% | ||||||||
APERAM S.A. | 24,628 | 1,265,219 | ||||||
Korian S.A. | 35,679 | 1,260,523 | ||||||
Nexity S.A. (c) | 13,265 | 789,058 | ||||||
Sartorius Stedim Biotech | 15,731 | 1,137,963 | ||||||
|
| |||||||
| 4,452,763 | ||||||||
|
| |||||||
| Germany—4.1% | ||||||||
Aareal Bank AG | 32,641 | 1,473,813 | ||||||
Bechtle AG | 18,847 | 1,567,195 | ||||||
CANCOM SE | 21,292 | 1,767,039 | ||||||
Deutsche Pfandbriefbank AG (a) | 116,323 | 1,858,223 | ||||||
Hella GmbH & Co. KGaA | 22,397 | 1,382,419 | ||||||
|
| |||||||
| 8,048,689 | ||||||||
|
| |||||||
| Hong Kong—1.1% | ||||||||
Johnson Electric Holdings Ltd. | 139,500 | 583,348 | ||||||
Man Wah Holdings Ltd. | 353,200 | 334,899 | ||||||
Melco International Development Ltd. | 113,000 | 331,372 | ||||||
Microport Scientific Corp. | 400,000 | 386,542 | ||||||
Techtronic Industries Co., Ltd. | 93,000 | 605,005 | ||||||
|
| |||||||
| 2,241,166 | ||||||||
|
| |||||||
| 68 | Semiannual Report | | December 31, 2017 | | See accompanying Notes to Financial Statements |
Table of Contents
Schedule of Investments
December 31, 2017 (unaudited)
Shares | Value | |||||||
| Indonesia—0.4% | ||||||||
Jasa Marga Persero Tbk PT | 874,500 | $ | 411,942 | |||||
Waskita Beton Precast Tbk PT | 11,650,400 | 350,349 | ||||||
|
| |||||||
| 762,291 | ||||||||
|
| |||||||
| Ireland—0.8% | ||||||||
Kingspan Group PLC | 35,885 | 1,572,408 | ||||||
|
| |||||||
| Italy—1.4% | ||||||||
De’ Longhi SpA | 40,136 | 1,215,005 | ||||||
FinecoBank Banca Fineco SpA | 159,006 | 1,624,182 | ||||||
|
| |||||||
| 2,839,187 | ||||||||
|
| |||||||
| Japan—15.0% | ||||||||
Arata Corp. | 11,200 | 609,421 | ||||||
COMSYS Holdings Corp. | 56,800 | 1,646,783 | ||||||
Daifuku Co., Ltd. | 33,500 | 1,820,076 | ||||||
Disco Corp. | 7,800 | 1,728,788 | ||||||
Fujitsu General Ltd. | 29,800 | 653,273 | ||||||
Gunma Bank Ltd. | 269,992 | 1,626,757 | ||||||
Kenko Mayonnaise Co., Ltd. | 18,100 | 654,385 | ||||||
KH Neochem Co., Ltd. | 28,400 | 726,511 | ||||||
Lion Corp. | 40,900 | 773,091 | ||||||
MISUMI Group, Inc. | 70,500 | 2,046,764 | ||||||
Mitsubishi UFJ Lease & Finance Co., Ltd. | 278,300 | 1,651,788 | ||||||
Mitsui Mining & Smelting Co., Ltd. | 5,400 | 314,245 | ||||||
Morinaga Milk Industry Co., Ltd. | 15,300 | 692,523 | ||||||
Nippon Carbon Co., Ltd. (c) | 7,000 | 313,562 | ||||||
Nissha Co., Ltd. | 12,000 | 347,996 | ||||||
Okamura Corp. | 99,400 | 1,452,120 | ||||||
Persol Holdings Co., Ltd. | 87,000 | 2,178,164 | ||||||
Pigeon Corp. | 11,000 | 417,947 | ||||||
Rengo Co., Ltd. | 223,500 | 1,629,852 | ||||||
Ryohin Keikaku Co., Ltd. | 5,000 | 1,556,445 | ||||||
Sanwa Holdings Corp. | 142,100 | 1,952,806 | ||||||
Siix Corp. | 11,500 | 492,681 | ||||||
Start Today Co., Ltd. | 29,600 | 898,451 | ||||||
Teijin Ltd. | 81,000 | 1,799,812 | ||||||
Ube Industries Ltd. | 61,900 | 1,813,268 | ||||||
|
| |||||||
| 29,797,509 | ||||||||
|
| |||||||
| Korea (Republic of)—0.2% | ||||||||
HyVision System, Inc. | 27,168 | 329,246 | ||||||
|
| |||||||
| Netherlands—1.4% | ||||||||
Aalberts Industries NV | 28,461 | 1,445,980 | ||||||
ASR Nederland NV | 33,811 | 1,391,890 | ||||||
|
| |||||||
| 2,837,870 | ||||||||
|
| |||||||
| Philippines—0.1% | ||||||||
Robinsons Land Corp. | 650,800 | 277,296 | ||||||
|
| |||||||
| Spain—0.6% | ||||||||
Melia Hotels International S.A. | 92,501 | 1,272,790 | ||||||
|
| |||||||
| Sweden—2.5% | ||||||||
AAK AB | 17,460 | 1,495,286 | ||||||
Fastighets AB Balder, Class B (c) | 42,929 | 1,147,899 | ||||||
Indutrade AB | 48,929 | 1,333,390 | ||||||
NetEnt AB (c) | 134,828 | 928,647 | ||||||
|
| |||||||
| 4,905,222 | ||||||||
|
| |||||||
| Switzerland—3.1% | ||||||||
ams AG (c) | 19,613 | 1,776,777 | ||||||
Shares | Value | |||||||
Georg Fischer AG | 1,080 | $ | 1,425,780 | |||||
Interroll Holding AG | 889 | 1,316,462 | ||||||
OC Oerlikon Corp. AG (c) | 90,469 | 1,527,082 | ||||||
|
| |||||||
| 6,046,101 | ||||||||
|
| |||||||
| Taiwan—1.1% | ||||||||
ASPEED Technology, Inc. | 16,000 | 386,041 | ||||||
Ennoconn Corp. | 19,113 | 288,052 | ||||||
Faraday Technology Corp. | 171,000 | 330,889 | ||||||
Globalwafers Co., Ltd. | 47,000 | 623,578 | ||||||
Merry Electronics Co., Ltd. | 57,000 | 370,152 | ||||||
Sunonwealth Electric Machine Industry Co., Ltd. | 118,000 | 207,131 | ||||||
|
| |||||||
| 2,205,843 | ||||||||
|
| |||||||
| United Kingdom—5.9% | ||||||||
ASOS PLC (c) | 19,064 | 1,719,883 | ||||||
Auto Trader Group PLC (a) | 203,625 | 969,934 | ||||||
Genus PLC | 41,011 | 1,401,441 | ||||||
Intermediate Capital Group PLC | 123,958 | 1,914,019 | ||||||
RPC Group PLC | 108,230 | 1,285,579 | ||||||
Senior PLC | 404,479 | 1,423,703 | ||||||
Spectris PLC | 28,120 | 941,350 | ||||||
SuperGroup PLC | 27,158 | 724,914 | ||||||
Tullow Oil PLC (c) | 463,435 | 1,290,337 | ||||||
|
| |||||||
| 11,671,160 | ||||||||
|
| |||||||
| United States—48.8% | ||||||||
ABM Industries, Inc. | 28,484 | 1,074,416 | ||||||
Air Lease Corp. | 20,293 | 975,890 | ||||||
Air Transport Services Group, Inc. (c) | 58,318 | 1,349,478 | ||||||
Alcoa Corp. (c) | 28,730 | 1,547,685 | ||||||
Ameris Bancorp | 30,724 | 1,480,897 | ||||||
Berry Global Group, | 24,757 | 1,452,493 | ||||||
Bio-Rad Laboratories, Inc., Class A (c) | 5,867 | 1,400,277 | ||||||
Bioverativ, Inc. (c) | 16,798 | 905,748 | ||||||
Boingo Wireless, Inc. (c) | 30,136 | 678,060 | ||||||
Bright Horizons Family Solutions, Inc. (c) | 15,569 | 1,463,486 | ||||||
Brown & Brown, Inc. | 28,567 | 1,470,058 | ||||||
Callaway Golf Co. | 62,059 | 864,482 | ||||||
Callon Petroleum Co. (c) | 104,584 | 1,270,696 | ||||||
Carter’s, Inc. | 10,258 | 1,205,212 | ||||||
Catalent, Inc. (c) | 25,748 | 1,057,728 | ||||||
CenterState Bank Corp. | 45,792 | 1,178,228 | ||||||
Charles River Laboratories International, Inc. (c) | 8,654 | 947,180 | ||||||
Children’s Place, Inc. | 4,646 | 675,296 | ||||||
Colfax Corp. (c) | 28,137 | 1,114,788 | ||||||
Columbus McKinnon Corp. | 24,101 | 963,558 | ||||||
Dave & Buster’s Entertainment, Inc. (c) | 16,180 | 892,651 | ||||||
Eagle Materials, Inc. | 11,052 | 1,252,192 | ||||||
Energen Corp. (c) | 20,708 | 1,192,160 | ||||||
EnPro Industries, Inc. | 13,987 | 1,307,924 | ||||||
Entegris, Inc. | 16,938 | 515,762 | ||||||
EPAM Systems, Inc. (c) | 4,162 | 447,124 | ||||||
Equity LifeStyle Properties, Inc. REIT | 14,345 | 1,276,992 | ||||||
Euronet Worldwide, Inc. (c) | 4,849 | 408,625 | ||||||
Exelixis, Inc. (c) | 30,784 | 935,834 | ||||||
Extreme Networks, Inc. (c) | 58,289 | 729,778 | ||||||
First Industrial Realty Trust, Inc. REIT | 48,859 | 1,537,593 | ||||||
First Merchants Corp. | 20,174 | 848,518 | ||||||
Five9, Inc. (c) | 29,834 | 742,270 | ||||||
Granite Construction, Inc. | 15,656 | 993,060 | ||||||
GTT Communications, Inc. (c) | 26,368 | 1,237,978 | ||||||
Shares | Value | |||||||
Harsco Corp. (c) | 53,523 | $ | 998,204 | |||||
Herc Holdings, Inc. (c) | 16,905 | 1,058,422 | ||||||
Hill-Rom Holdings, Inc. | 16,844 | 1,419,781 | ||||||
Howard Hughes Corp. (c) | 11,067 | 1,452,765 | ||||||
Huntsman Corp. | 28,637 | 953,326 | ||||||
Ichor Holdings Ltd. (c) | 17,419 | 428,507 | ||||||
Installed Building Products, Inc. (c) | 8,802 | 668,512 | ||||||
Instructure, Inc. (c) | 35,431 | 1,172,766 | ||||||
Itron, Inc. (c) | 17,311 | 1,180,610 | ||||||
Jack in the Box, Inc. | 5,948 | 583,558 | ||||||
John Bean Technologies Corp. | 7,295 | 808,286 | ||||||
KAR Auction Services, Inc. | 26,241 | 1,325,433 | ||||||
Kilroy Realty Corp. REIT | 19,503 | 1,455,899 | ||||||
Kinsale Capital Group, Inc. | 29,421 | 1,323,945 | ||||||
Lamb Weston Holdings, Inc. | 25,765 | 1,454,434 | ||||||
Ligand Pharmaceuticals, Inc. (c) | 4,732 | 647,953 | ||||||
LogMeIn, Inc. | 9,703 | 1,110,993 | ||||||
LPL Financial Holdings, Inc. | 14,869 | 849,615 | ||||||
MDU Resources Group, Inc. | 42,735 | 1,148,717 | ||||||
Merit Medical Systems, Inc. (c) | 19,475 | 841,320 | ||||||
Microsemi Corp. (c) | 16,023 | 827,588 | ||||||
National Fuel Gas Co. | 22,181 | 1,217,959 | ||||||
Navistar International Corp. (c) | 17,939 | 769,224 | ||||||
Neurocrine Biosciences, Inc. (c) | 7,104 | 551,199 | ||||||
Oasis Petroleum, Inc. (c) | 95,933 | 806,797 | ||||||
ON Semiconductor Corp. (c) | 26,818 | 561,569 | ||||||
ORBCOMM, Inc. (c) | 107,465 | 1,093,994 | ||||||
Ormat Technologies, Inc. | 23,088 | 1,476,708 | ||||||
Owens Corning | 8,620 | 792,523 | ||||||
Owens-Illinois, Inc. (c) | 51,335 | 1,138,097 | ||||||
Pacific Premier Bancorp, Inc. (c) | 35,973 | 1,438,920 | ||||||
Patterson-UTI Energy, Inc. | 38,790 | 892,558 | ||||||
Performance Food Group Co. (c) | 21,166 | 700,595 | ||||||
Pinnacle Foods, Inc. | 26,410 | 1,570,603 | ||||||
Planet Fitness, Inc., Class A (c) | 15,936 | 551,864 | ||||||
Pool Corp. | 7,149 | 926,868 | ||||||
PRA Health Sciences, Inc. (c) | 12,884 | 1,173,346 | ||||||
Preferred Bank | 20,679 | 1,215,512 | ||||||
PTC, Inc. (c) | 14,185 | 862,022 | ||||||
QTS Realty Trust, Inc., Class A REIT | 27,100 | 1,467,736 | ||||||
RPM International, Inc. | 23,403 | 1,226,785 | ||||||
Seacoast Banking Corp. of Florida (c) | 59,790 | 1,507,306 | ||||||
Service Corp. International | 29,715 | 1,108,964 | ||||||
STAG Industrial, Inc. REIT | 56,209 | 1,536,192 | ||||||
Supernus Pharmaceuticals, Inc. (c) | 16,825 | 670,476 | ||||||
Texas Roadhouse, Inc. | 19,261 | 1,014,669 | ||||||
Thor Industries, Inc. | 5,409 | 815,244 | ||||||
TopBuild Corp. (c) | 18,778 | 1,422,246 | ||||||
Trex Co., Inc. (c) | 5,427 | 588,233 | ||||||
Tyler Technologies, Inc. (c) | 5,776 | 1,022,641 | ||||||
U.S. Silica Holdings, Inc. | 14,585 | 474,888 | ||||||
Ultimate Software Group, Inc. (c) | 2,628 | 573,508 | ||||||
Universal Display Corp. | 3,272 | 564,911 | ||||||
Vail Resorts, Inc. | 1,935 | 411,129 | ||||||
WellCare Health Plans, Inc. (c) | 5,711 | 1,148,539 | ||||||
West Pharmaceutical Services, Inc. | 8,800 | 868,296 | ||||||
Western Alliance Bancorp (c) | 28,183 | 1,595,721 | ||||||
| See accompanying Notes to Financial Statements | | December 31, 2017 | | Semiannual Report | 69 |
Table of Contents
Schedule of Investments
December 31, 2017 (unaudited)
Shares | Value | |||||||
XPO Logistics, Inc. (c) | 19,598 | $ | 1,794,981 | |||||
|
| |||||||
| 96,657,574 | ||||||||
|
| |||||||
| Total Common Stock (cost—$143,680,933) | 192,644,453 | |||||||
|
| |||||||
| Preferred Stock—0.7% | ||||||||
| Germany—0.7% | ||||||||
Jungheinrich AG | 30,758 | 1,446,126 | ||||||
|
| |||||||
Principal | Value | |||||||
| Repurchase Agreements—2.2% | ||||||||
State Street Bank and Trust Co., dated 12/29/17, 0.20%, due 1/2/18, proceeds $4,396,098; collateralized by U.S. Treasury Notes, 1.625%, due 2/15/26, valued at $4,486,774 including accrued interest |
| |||||||
(cost—$4,396,000) | $4,396 | $ | 4,396,000 | |||||
|
| |||||||
| Total Investments (cost—$149,012,848) (b)—100.2% | 198,486,579 | |||||||
|
| |||||||
| Liabilities in excess of other assets (d)—(0.2)% | (472,499 | ) | ||||||
|
| |||||||
| Net Assets—100.0% | $198,014,080 | |||||||
|
| |||||||
Notes to Schedule of Investments:
(a) 144A—Exempt from registration under Rule 144A of the Securities Act of 1933. These securities may be resold in transactions exempt from registration, typically only to qualified institutional buyers. Securities with an aggregate value of $3,264,504, representing 1.6% of net assets.
(b) Securities with an aggregate value of $79,565,776, representing 40.2% of net assets, were valued utilizing modeling tools provided by a third-party vendor. See Note 1(a) and Note 1(b) in the Notes to Financial Statements.
(c) Non-income producing.
(d) Includes net unrealized appreciation (depreciation) of other financial instruments as follows:
| Forward foreign currency contracts outstanding at December 31, 2017: | ||||||||||||||||||||
| Counterparty | U.S.$ Value on Origination Date | U.S.$ Value December 31, 2017 | Unrealized Appreciation | Unrealized Depreciation | ||||||||||||||||
Purchased: | ||||||||||||||||||||
35,536,713 Japanese Yen settling 1/4/18 | Northern Trust Company | $ | 313,478 | $ | 315,391 | $ | 1,913 | $ | — | |||||||||||
Sold: | ||||||||||||||||||||
40,388,223 Japanese Yen settling 1/4/18 | Northern Trust Company | 356,275 | 358,449 | — | (2,174 | ) | ||||||||||||||
|
|
|
| |||||||||||||||||
| $ | 1,913 | $ | (2,174 | ) | ||||||||||||||||
|
|
|
| |||||||||||||||||
Glossary:
REIT—Real Estate Investment Trust
| 70 | Semiannual Report | | December 31, 2017 | | See accompanying Notes to Financial Statements |
Table of Contents
Schedule of Investments
December 31, 2017 (unaudited)
The industry classification of portfolio holdings and liabilities in excess of other assets shown as a percentage of net assets were as follows:
Machinery | 7.8% | |||
Banks | 6.3% | |||
Equity Real Estate Investment Trusts (REITs) | 3.7% | |||
Semiconductors & Semiconductor Equipment | 3.6% | |||
Containers & Packaging | 3.3% | |||
Chemicals | 3.3% | |||
Trading Companies & Distributors | 3.3% | |||
Food Products | 3.2% | |||
Healthcare Equipment & Supplies | 3.2% | |||
Internet Software & Services | 3.1% | |||
Oil, Gas & Consumable Fuels | 2.8% | |||
Commercial Services & Supplies | 2.7% | |||
Insurance | 2.6% | |||
Hotels, Restaurants & Leisure | 2.6% | |||
Building Products | 2.5% | |||
Household Durables | 2.5% | |||
Thrifts & Mortgage Finance | 2.3% | |||
Metals & Mining | 2.3% | |||
Biotechnology | 2.2% | |||
Electronic Equipment, Instruments & Components | 2.1% | |||
IT Services | 2.1% | |||
Real Estate Management & Development | 2.1% | |||
Construction Materials | 1.8% | |||
Life Sciences Tools & Services | 1.8% | |||
Software | 1.7% | |||
Air Freight & Logistics | 1.6% | |||
Construction & Engineering | 1.6% | |||
Capital Markets | 1.4% | |||
Internet & Catalog Retail | 1.3% | |||
Diversified Consumer Services | 1.3% | |||
Healthcare Providers & Services | 1.2% | |||
Energy Equipment & Services | 1.2% | |||
Professional Services | 1.1% | |||
Diversified Financial Services | 1.1% | |||
Independent Power Producers & Energy Traders | 1.0% | |||
Pharmaceuticals | 0.9% | |||
Multi-Line Retail | 0.8% | |||
Distributors | 0.8% | |||
Auto Components | 0.7% | |||
Aerospace & Defense | 0.7% | |||
Specialty Retail | 0.7% | |||
Gas Utilities | 0.6% | |||
Textiles, Apparel & Luxury Goods | 0.6% | |||
Household Products | 0.6% | |||
Multi-Utilities | 0.6% | |||
Diversified Telecommunication Services | 0.6% | |||
Electrical Equipment | 0.5% | |||
Leisure Equipment & Products | 0.4% | |||
Automobiles | 0.4% | |||
Communications Equipment | 0.4% | |||
Food & Staples Retailing | 0.4% | |||
Wireless Telecommunication Services | 0.3% | |||
Transportation Infrastructure | 0.2% | |||
Technology Hardware, Storage & Peripherals | 0.1% | |||
Repurchase Agreements | 2.2% | |||
Liabilities in excess of other assets | (0.2)% | |||
|
| |||
| 100.0% | ||||
|
|
AllianzGI Health Sciences Fund
| Shares | Value | |||||||
| Common Stock—94.1% | ||||||||
| Biotechnology—32.6% | ||||||||
AbbVie, Inc. | 58,231 | $5,631,520 | ||||||
Alexion Pharmaceuticals, Inc. (b) | 1,600 | 191,344 | ||||||
Alkermes PLC (b) | 13,435 | 735,297 | ||||||
Alnylam Pharmaceuticals, Inc. (b) | 6,040 | 767,382 | ||||||
Amgen, Inc. | 26,250 | 4,564,875 | ||||||
Amicus Therapeutics, Inc. (b) | 94,285 | 1,356,761 | ||||||
Array BioPharma, Inc. (b) | 45,805 | 586,304 | ||||||
Ascendis Pharma A/S ADR (b) | 21,700 | 869,302 | ||||||
BeiGene Ltd. ADR (b) | 4,445 | 434,365 | ||||||
Biogen, Inc. (b) | 2,153 | 685,881 | ||||||
BioMarin Pharmaceutical, Inc. (b) | 18,704 | 1,667,836 | ||||||
Bioverativ, Inc. (b) | 19,151 | 1,032,622 | ||||||
Bluebird Bio, Inc. (b) | 5,185 | 923,448 | ||||||
Blueprint Medicines Corp. (b) | 3,485 | 262,804 | ||||||
Celgene Corp. (b) | 14,050 | 1,466,258 | ||||||
Clovis Oncology, Inc. (b) | 21,810 | 1,483,080 | ||||||
CRISPR Therapeutics AG (b) | 33,480 | 786,110 | ||||||
Denali Therapeutics, Inc. (b) | 27,600 | 431,664 | ||||||
Eagle Pharmaceuticals, Inc. (b) | 25,687 | 1,372,199 | ||||||
Editas Medicine, Inc. (b) | 17,220 | 529,171 | ||||||
Exelixis, Inc. (b) | 90,330 | 2,746,032 | ||||||
Genmab A/S (b) | 4,644 | 770,170 | ||||||
Gilead Sciences, Inc. | 89,536 | 6,414,359 | ||||||
Global Blood Therapeutics, Inc. (b) | 4,180 | 164,483 | ||||||
Incyte Corp. (b) | 43,218 | 4,093,177 | ||||||
Juno Therapeutics, Inc. (b) | 11,453 | 523,517 | ||||||
Neurocrine Biosciences, Inc. (b) | 11,900 | 923,321 | ||||||
Portola Pharmaceuticals, Inc. (b) | 23,645 | 1,151,039 | ||||||
Regeneron Pharmaceuticals, Inc. (b) | 5,135 | 1,930,555 | ||||||
TESARO, Inc. (b) | 10,680 | 885,052 | ||||||
Vertex Pharmaceuticals, Inc. (b) | 33,510 | 5,021,809 | ||||||
|
| |||||||
| 50,401,737 | ||||||||
|
| |||||||
| Diversified Consumer Services—0.7% | ||||||||
Service Corp. International | 26,750 | 998,310 | ||||||
|
| |||||||
| Healthcare Equipment & Supplies—12.1% | ||||||||
Abbott Laboratories | 32,268 | 1,841,535 | ||||||
ABIOMED, Inc. (b) | 6,998 | 1,311,495 | ||||||
Baxter International, Inc. | 35,556 | 2,298,340 | ||||||
Boston Scientific Corp. (b) | 50,927 | 1,262,480 | ||||||
IDEXX Laboratories, Inc. (b) | 6,425 | 1,004,742 | ||||||
Intuitive Surgical, Inc. (b) | 5,280 | 1,926,883 | ||||||
Medtronic PLC | 38,947 | 3,144,970 | ||||||
Teleflex, Inc. | 7,035 | 1,750,449 | ||||||
Zimmer Biomet Holdings, Inc. | 34,455 | 4,157,685 | ||||||
|
| |||||||
| 18,698,579 | ||||||||
|
| |||||||
| Healthcare Providers & Services—16.8% | ||||||||
Anthem, Inc. | 29,280 | 6,588,293 | ||||||
Centene Corp. (b) | 28,300 | 2,854,904 | ||||||
Humana, Inc. | 8,105 | 2,010,607 | ||||||
UnitedHealth Group, Inc. | 65,681 | 14,480,033 | ||||||
|
| |||||||
| 25,933,837 | ||||||||
|
| |||||||
Shares | Value | |||||||
| Life Sciences Tools & Services—3.0% | ||||||||
Agilent Technologies, Inc. | 33,640 | $ | 2,252,871 | |||||
Illumina, Inc. (b) | 5,390 | 1,177,661 | ||||||
Thermo Fisher Scientific, Inc. | 6,420 | 1,219,029 | ||||||
|
| |||||||
| 4,649,561 | ||||||||
|
| |||||||
| Pharmaceuticals—28.9% | ||||||||
Allergan PLC | 14,236 | 2,328,725 | ||||||
AstraZeneca PLC ADR | 42,685 | 1,481,169 | ||||||
Bristol-Myers Squibb Co. | 75,835 | 4,647,169 | ||||||
Catalent, Inc. (b) | 65,240 | 2,680,059 | ||||||
Eli Lilly & Co. | 19,055 | 1,609,385 | ||||||
Johnson & Johnson | 72,082 | 10,071,297 | ||||||
Merck & Co., Inc. | 103,877 | 5,845,159 | ||||||
Novartis AG ADR | 19,878 | 1,668,957 | ||||||
Novo Nordisk A/S, Class B | 12,462 | 669,652 | ||||||
Odonate Therapeutics, Inc. (b) | 31,000 | 775,000 | ||||||
Pfizer, Inc. | 197,414 | 7,150,335 | ||||||
Roche Holding AG | 11,850 | 2,996,334 | ||||||
Zoetis, Inc. | 36,945 | 2,661,518 | ||||||
|
| |||||||
| 44,584,759 | ||||||||
|
| |||||||
Total Common Stock (cost-$120,990,814) | 145,266,783 | |||||||
|
| |||||||
| Principal Amount (000s) | ||||||||
| Repurchase Agreements—6.0% | ||||||||
State Street Bank and Trust Co., dated 12/29/17, 0.20%, due 1/2/18, proceeds $9,322,207; collateralized by U.S. Treasury Inflation Indexed Notes, 0.625%, due 1/15/26, valued at $9,511,491 including accrued interest |
| |||||||
(cost—$9,322,000) | $9,322 | 9,322,000 | ||||||
|
| |||||||
Total Investments (cost-$130,312,814) (a)—100.1% |
| 154,588,783 | ||||||
|
| |||||||
| Liabilities in excess of other assets—(0.1)% | (126,473 | ) | ||||||
|
| |||||||
| Net Assets—100.0% | $154,462,310 | |||||||
|
| |||||||
Notes to Schedule of Investments:
(a) Securities with an aggregate value of $3,665,986, representing 2.4% of net assets, were valued utilizing modeling tools provided by a third-party vendor. See Note 1(a) and Note 1(b) in the Notes to Financial Statements.
(b) Non-income producing.
Glossary:
ADR—American Depositary Receipt
| See accompanying Notes to Financial Statements | | December 31, 2017 | | Semiannual Report | 71 |
Table of Contents
Schedule of Investments
December 31, 2017 (unaudited)
AllianzGI Income & Growth Fund
| Shares | Value | |||||||
| Common Stock—34.4% | ||||||||
| Advertising—0.0% | ||||||||
Affinion Group Holdings, Inc. | 80,205 | $926,368 | ||||||
Mood Media | 286,500 | 300,825 | ||||||
|
| |||||||
| 1,227,193 | ||||||||
|
| |||||||
| Aerospace & Defense—1.1% | ||||||||
Arconic, Inc. | 286,070 | 7,795,407 | ||||||
Boeing Co. | 99,700 | 29,402,527 | ||||||
Erickson, | 10,866 | 343,040 | ||||||
|
| |||||||
| 37,540,974 | ||||||||
|
| |||||||
| Apparel & Textiles—0.0% | ||||||||
Quiksilver, | 2,328 | 65,254 | ||||||
|
| |||||||
| Automobiles—0.4% | ||||||||
Ford Motor Co. | 1,199,700 | 14,984,253 | ||||||
|
| |||||||
| Banks—1.5% | ||||||||
Bank of America Corp. (g) | 838,500 | 24,752,520 | ||||||
JPMorgan Chase & Co. | 229,800 | 24,574,812 | ||||||
|
| |||||||
| 49,327,332 | ||||||||
|
| |||||||
| Beverages—0.4% | ||||||||
PepsiCo, Inc. | 120,300 | 14,426,376 | ||||||
|
| |||||||
| Biotechnology—2.7% | ||||||||
AbbVie, Inc. (g) | 279,300 | 27,011,103 | ||||||
Amgen, Inc. | 124,000 | 21,563,600 | ||||||
Biogen, Inc. (j) | 54,800 | 17,457,636 | ||||||
Bioverativ, Inc. (j) | 27,400 | 1,477,408 | ||||||
Gilead Sciences, Inc. | 239,250 | 17,139,870 | ||||||
Vertex Pharmaceuticals, Inc. (j) | 60,800 | 9,111,488 | ||||||
|
| |||||||
| 93,761,105 | ||||||||
|
| |||||||
| Building Products—0.4% | ||||||||
Johnson Controls International PLC | 370,382 | 14,115,258 | ||||||
|
| |||||||
| Chemicals—1.2% | ||||||||
Chemours Co. | 238,400 | 11,934,304 | ||||||
DowDuPont, Inc. | 124,400 | 8,859,768 | ||||||
Monsanto Co. | 179,600 | 20,973,688 | ||||||
|
| |||||||
| 41,767,760 | ||||||||
|
| |||||||
| Construction & Engineering—0.3% | ||||||||
Fluor Corp. | 209,800 | 10,836,170 | ||||||
|
| |||||||
| Diversified Telecommunication Services—0.3% | ||||||||
Intelsat S.A. (j) | 121,250 | 411,037 | ||||||
Verizon Communications, Inc. | 211,200 | 11,178,816 | ||||||
|
| |||||||
| 11,589,853 | ||||||||
|
| |||||||
| Electronic Equipment, Instruments & Components—0.3% | ||||||||
Amphenol Corp. Class A | 109,600 | 9,622,880 | ||||||
|
| |||||||
| Energy Equipment & Services—0.4% | ||||||||
National Oilwell Varco, Inc. | 93,000 | 3,349,860 | ||||||
Schlumberger Ltd. | 172,400 | 11,618,036 | ||||||
|
| |||||||
| 14,967,896 | ||||||||
|
| |||||||
Shares | Value | |||||||
| Food & Staples Retailing—1.4% | ||||||||
Costco Wholesale Corp. (g) | 83,200 | $ | 15,485,184 | |||||
Kroger Co. | 472,000 | 12,956,400 | ||||||
Walgreens Boots Alliance, Inc. | 286,600 | 20,812,892 | ||||||
|
| |||||||
| 49,254,476 | ||||||||
|
| |||||||
| Food Products—0.2% | ||||||||
Archer-Daniels-Midland Co. | 159,650 | 6,398,772 | ||||||
|
| |||||||
| Healthcare Equipment & Supplies—0.6% | ||||||||
Baxter International, Inc. | 300,700 | 19,437,248 | ||||||
|
| |||||||
| Healthcare Providers & Services—1.3% | ||||||||
McKesson Corp. | 114,300 | 17,825,085 | ||||||
UnitedHealth Group, Inc. (g) | 123,700 | 27,270,902 | ||||||
|
| |||||||
| 45,095,987 | ||||||||
|
| |||||||
| Hotels, Restaurants & Leisure—1.1% | ||||||||
McDonald’s Corp. | 117,200 | 20,172,464 | ||||||
Starbucks Corp. | 325,600 | 18,699,208 | ||||||
|
| |||||||
| 38,871,672 | ||||||||
|
| |||||||
| Household Durables—0.4% | ||||||||
DR Horton, Inc. (g) | 253,000 | 12,920,710 | ||||||
|
| |||||||
| Independent Power Producers & Energy Traders—0.1% | ||||||||
Dynegy, Inc. (j) | 221,015 | 2,619,028 | ||||||
|
| |||||||
| Industrial Conglomerates—0.7% | ||||||||
3M Co. | 50,100 | 11,792,037 | ||||||
General Electric Co. | 326,200 | 5,692,190 | ||||||
Honeywell International, Inc. | 39,200 | 6,011,712 | ||||||
|
| |||||||
| 23,495,939 | ||||||||
|
| |||||||
| Internet & Catalog Retail—1.1% | ||||||||
Amazon.com, Inc. (j) | 30,800 | 36,019,676 | ||||||
|
| |||||||
| Internet Software & Services—2.6% | ||||||||
Alibaba Group Holding Ltd. | 114,600 | 19,760,478 | ||||||
Alphabet, Inc., Class A (j) | 32,900 | 34,656,860 | ||||||
Facebook, Inc., Class A (j) | 186,000 | 32,821,560 | ||||||
|
| |||||||
| 87,238,898 | ||||||||
|
| |||||||
| IT Services—1.8% | ||||||||
International Business Machines Corp. | 92,200 | 14,145,324 | ||||||
Square, Inc. Class A (g)(j) | 407,500 | 14,128,025 | ||||||
Visa, Inc., Class A | 300,600 | 34,274,412 | ||||||
|
| |||||||
| 62,547,761 | ||||||||
|
| |||||||
| Machinery—1.5% | ||||||||
Caterpillar, Inc. | 194,300 | 30,617,794 | ||||||
Deere & Co. | 133,200 | 20,847,132 | ||||||
|
| |||||||
| 51,464,926 | ||||||||
|
| |||||||
| Media—1.6% | ||||||||
Comcast Corp., Class A (g) | 629,800 | 25,223,490 | ||||||
LiveStyle, | 202,319 | 20 | ||||||
Postmedia Network Canada | 1,018,823 | 2,190,470 | ||||||
Walt Disney Co. | 238,900 | 25,684,139 | ||||||
|
| |||||||
| 53,098,119 | ||||||||
|
| |||||||
Shares | Value | |||||||
| Metals & Mining—0.2% | ||||||||
ArcelorMittal (j) | 180,611 | $ | 5,835,541 | |||||
Freeport-McMoRan, Inc. (j) | 113,100 | 2,144,376 | ||||||
|
| |||||||
| 7,979,917 | ||||||||
|
| |||||||
| Multi-Line Retail—0.6% | ||||||||
Target Corp. | 299,900 | 19,568,475 | ||||||
|
| |||||||
| Oil, Gas & Consumable Fuels—0.8% | ||||||||
Arch Coal, Inc., Class A | 1,858 | 173,091 | ||||||
Chesapeake Energy Corp. (j) | 1,250,759 | 4,953,006 | ||||||
Energy XXI Gulf Coast, Inc. (j) | 44,964 | 258,093 | ||||||
Hercules Offshore, Inc. (d)(f)(j) | 174,935 | 197,676 | ||||||
Linn Energy, Inc. (j) | 25,527 | 1,027,462 | ||||||
Occidental Petroleum Corp. | 94,700 | 6,975,602 | ||||||
Stone Energy Corp. (j) | 98,625 | 3,171,780 | ||||||
Valero Energy Corp. (g) | 117,200 | 10,771,852 | ||||||
Vanguard Natural Resources, Inc. (d)(f)(j) | 12,187 | 250,687 | ||||||
|
| |||||||
| 27,779,249 | ||||||||
|
| |||||||
| Pharmaceuticals—0.4% | ||||||||
Bristol-Myers Squibb Co. | 242,700 | 14,872,656 | ||||||
|
| |||||||
| Road & Rail—0.7% | ||||||||
Union Pacific Corp. (g) | 165,300 | 22,166,730 | ||||||
|
| |||||||
| Semiconductors—0.0% | ||||||||
GT Advanced Technologies, Inc. (d)(f)(j) | 463 | 10,552 | ||||||
|
| |||||||
| Semiconductors & Semiconductor Equipment—3.0% | ||||||||
Broadcom Ltd. (g) | 90,800 | 23,326,520 | ||||||
Intel Corp. (g) | 386,400 | 17,836,224 | ||||||
Micron Technology, Inc. (g)(j) | 136,200 | 5,600,544 | ||||||
NVIDIA Corp. | 104,300 | 20,182,050 | ||||||
QUALCOMM, Inc. | 237,700 | 15,217,554 | ||||||
Texas Instruments, Inc. (g) | 196,000 | 20,470,240 | ||||||
|
| |||||||
| 102,633,132 | ||||||||
|
| |||||||
| Software—2.8% | ||||||||
Adobe Systems, Inc. (g)(j) | 125,400 | 21,975,096 | ||||||
Microsoft Corp. | 424,900 | 36,345,946 | ||||||
Oracle Corp. (g) | 274,300 | 12,968,904 | ||||||
ServiceNow, | 71,800 | 9,362,002 | ||||||
Take-Two Interactive | 142,000 | 15,588,760 | ||||||
|
| |||||||
| 96,240,708 | ||||||||
|
| |||||||
| Specialty Retail—0.9% | ||||||||
Home Depot, Inc. | 164,600 | 31,196,638 | ||||||
|
| |||||||
| Technology Hardware, Storage & Peripherals—1.1% | ||||||||
Apple, Inc. | 213,100 | 36,062,913 | ||||||
Western Digital Corp. | 1,953 | 155,322 | ||||||
|
| |||||||
| 36,218,235 | ||||||||
|
| |||||||
| Trading Companies & Distributors—0.1% | ||||||||
WESCO International, Inc. (j) | 54,455 | 3,711,108 | ||||||
|
| |||||||
| 72 | Semiannual Report | | December 31, 2017 | | See accompanying Notes to Financial Statements |
Table of Contents
Schedule of Investments
December 31, 2017 (unaudited)
Shares | Value | |||||||
| Wireless Telecommunication Services—0.4% | ||||||||
T-Mobile U.S., Inc. (j) | 183,361 | $ | 11,645,257 | |||||
|
| |||||||
Total Common Stock (cost—$1,328,923,069) |
| 1,176,718,173 | ||||||
|
| |||||||
| Principal Amount (000s) | ||||||||
| Corporate Bonds & Notes—31.4% | ||||||||
| Aerospace & Defense—0.9% | ||||||||
Arconic, Inc., 5.90%, 2/1/27 | $2,795 | 3,153,299 | ||||||
KLX, Inc. (a)(b), 5.875%, 12/1/22 | 6,135 | 6,447,578 | ||||||
Kratos Defense & Security Solutions, 6.50%, 11/30/25 | 5,190 | 5,404,088 | ||||||
TransDigm, Inc., 6.50%, 5/15/25 | 9,645 | 9,886,125 | ||||||
Triumph Group, 7.75%, 8/15/25 | 4,175 | 4,462,031 | ||||||
|
| |||||||
| 29,353,121 | ||||||||
|
| |||||||
| Apparel & Textiles—0.0% | ||||||||
Hanesbrands, 4.625%, 5/15/24 | 1,645 | 1,686,125 | ||||||
Quicksilver, 10.00%, 8/1/20 | 1,000 | — | ||||||
|
| |||||||
| 1,686,125 | ||||||||
|
| |||||||
| Auto Components—0.4% | ||||||||
American Axle & Manufacturing, Inc., 6.625%, 10/15/22 | 5,265 | 5,469,019 | ||||||
Delphi Technologies PLC (a)(b), 5.00%, 10/1/25 | 5,000 | 5,075,000 | ||||||
Goodyear Tire & Rubber Co., 5.125%, 11/15/23 | 3,350 | 3,503,731 | ||||||
|
| |||||||
| 14,047,750 | ||||||||
|
| |||||||
| Auto Manufacturers—0.3% | ||||||||
Navistar International Corp. (a)(b), 6.625%, 11/1/25 | 8,585 | 8,978,880 | ||||||
|
| |||||||
| Building Materials—0.3% | ||||||||
Builders FirstSource, Inc. (a)(b), 5.625%, 9/1/24 | 7,415 | 7,744,597 | ||||||
Jeld-Wen, 4.875%, 12/15/27 | 3,895 | 3,943,687 | ||||||
|
| |||||||
| 11,688,284 | ||||||||
|
| |||||||
| Chemicals—1.5% | ||||||||
Chemours Co., 6.625%, 5/15/23 | 7,000 | 7,437,500 | ||||||
7.00%, 5/15/25 | 7,520 | 8,196,800 | ||||||
Kraton Polymers LLC (a)(b), 7.00%, 4/15/25 | 6,865 | 7,405,619 | ||||||
Platform Specialty Products Corp. (a)(b), 6.50%, 2/1/22 | 8,445 | 8,740,575 | ||||||
PQ Corp. (a)(b), 5.75%, 12/15/25 | 1,215 | 1,239,300 | ||||||
Principal | Value | |||||||
Trinseo Materials Operating 5.375%, 9/1/25 | $5,200 | $ | 5,395,000 | |||||
Tronox Finance LLC (a)(b), 7.50%, 3/15/22 | 2,885 | 3,022,037 | ||||||
Tronox Finance PLC (a)(b), 5.75%, 10/1/25 | 5,510 | 5,675,300 | ||||||
Univar USA, Inc. (a)(b), 6.75%, 7/15/23 | 4,665 | 4,898,250 | ||||||
|
| |||||||
| 52,010,381 | ||||||||
|
| |||||||
| Coal—0.2% | ||||||||
CNX Resources Corp., | 5,530 | 5,675,163 | ||||||
|
| |||||||
| Commercial Services—1.6% | ||||||||
Cardtronics, Inc., 5.125%, 8/1/22 | 3,105 | 2,965,275 | ||||||
5.50%, 5/1/25 (a)(b) | 2,490 | 2,259,675 | ||||||
Cenveo Corp. (a)(b), 6.00%, 8/1/19 | 2,060 | 1,472,900 | ||||||
6.00%, 5/15/24 | 8,116 | 6,715,990 | ||||||
8.50%, 9/15/22 | 1,520 | 258,400 | ||||||
Gartner, Inc. (a)(b), 5.125%, 4/1/25 | 4,320 | 4,525,200 | ||||||
Hertz Corp. (a)(b), 5.50%, 10/15/24 | 5,215 | 4,732,613 | ||||||
KAR Auction Services, Inc. (a)(b), 5.125%, 6/1/25 | 5,930 | 6,093,075 | ||||||
Monitronics International, Inc., 9.125%, 4/1/20 | 6,450 | 5,385,750 | ||||||
RR Donnelley & Sons Co., 6.00%, 4/1/24 | 3,195 | 2,999,306 | ||||||
7.00%, 2/15/22 | 5,500 | 5,706,250 | ||||||
United Rentals North America, Inc., 4.625%, 10/15/25 | 3,780 | 3,817,800 | ||||||
5.50%, 7/15/25 | 7,835 | 8,334,481 | ||||||
|
| |||||||
| 55,266,715 | ||||||||
|
| |||||||
| Computers—0.9% | ||||||||
Dell International LLC (a)(b), 7.125%, 6/15/24 | 7,485 | 8,197,887 | ||||||
DynCorp International, Inc., PIK 1.50%, 11.875%, 11/30/20 | 698 | 741,250 | ||||||
Harland Clarke Holdings 9.25%, 3/1/21 | 7,620 | 7,753,350 | ||||||
Seagate HDD Cayman, 4.75%, 1/1/25 | 7,055 | 6,931,118 | ||||||
Western Digital Corp., 10.50%, 4/1/24 | 5,500 | 6,386,875 | ||||||
|
| |||||||
| 30,010,480 | ||||||||
|
| |||||||
| Distribution/Wholesale—0.4% | ||||||||
H&E Equipment Services, Inc. (a)(b), |
| |||||||
5.625%, 9/1/25 | 7,070 | 7,405,825 | ||||||
HD Supply, Inc. (a)(b), | ||||||||
5.75%, 4/15/24 | 5,050 | 5,378,250 | ||||||
|
| |||||||
| 12,784,075 | ||||||||
|
| |||||||
| Diversified Financial Services—1.5% | ||||||||
Ally Financial, Inc., | ||||||||
5.75%, 11/20/25 | 5,210 | 5,698,438 | ||||||
8.00%, 3/15/20 | 2,995 | 3,309,475 | ||||||
Community Choice Financial, Inc., |
| |||||||
10.75%, 5/1/19 | 7,915 | 7,083,925 | ||||||
Principal | Value | |||||||
Energizer Holdings, Inc. (a)(b), |
| |||||||
5.50%, 6/15/25 | $5,545 | $ | 5,789,257 | |||||
Nationstar Mortgage LLC, | ||||||||
7.875%, 10/1/20 | 5,105 | 5,216,672 | ||||||
9.625%, 5/1/19 | 4,260 | 4,383,540 | ||||||
Navient Corp., | ||||||||
6.625%, 7/26/21 | 820 | 867,150 | ||||||
7.25%, 9/25/23 | 5,915 | 6,329,050 | ||||||
8.45%, 6/15/18 | 3,920 | 4,029,760 | ||||||
Springleaf Finance Corp., | ||||||||
5.625%, 3/15/23 | 4,645 | 4,661,025 | ||||||
8.25%, 10/1/23 | 4,360 | 4,894,100 | ||||||
|
| |||||||
| 52,262,392 | ||||||||
|
| |||||||
| Electric Utilities—0.6% | ||||||||
Calpine Corp., | ||||||||
5.75%, 1/15/25 | 6,140 | 5,856,025 | ||||||
NRG Energy, Inc., | ||||||||
5.75%, 1/15/28 (a)(b) | 8,655 | 8,763,188 | ||||||
6.25%, 5/1/24 | 4,498 | 4,734,145 | ||||||
Talen Energy Supply LLC, | ||||||||
6.50%, 6/1/25 | 3,365 | 2,742,475 | ||||||
|
| |||||||
| 22,095,833 | ||||||||
|
| |||||||
| Engineering & Construction—0.5% | ||||||||
AECOM, | ||||||||
5.875%, 10/15/24 | 8,550 | 9,304,110 | ||||||
Tutor Perini | ||||||||
6.875%, 5/1/25 | 6,675 | 7,192,313 | ||||||
|
| |||||||
| 16,496,423 | ||||||||
|
| |||||||
| Entertainment—0.7% | ||||||||
AMC Entertainment Holdings, Inc., |
| |||||||
6.125%, 5/15/27 | 7,920 | 7,900,200 | ||||||
Cedar Fair L.P., | ||||||||
5.375%, 6/1/24 | 5,900 | 6,195,000 | ||||||
5.375%, | 2,465 | 2,594,412 | ||||||
International Game Technology PLC (a)(b), |
| |||||||
6.25%, 2/15/22 | 6,340 | 6,863,050 | ||||||
|
| |||||||
| 23,552,662 | ||||||||
|
| |||||||
| Equity Real Estate Investment Trusts (REITs)—0.5% | ||||||||
Crown Castle International Corp., |
| |||||||
3.70%, 6/15/26 | 4,210 | 4,213,596 | ||||||
CyrusOne L.P. (a)(b), | ||||||||
5.00%, 3/15/24 | 4,560 | 4,742,400 | ||||||
5.375%, 3/15/27 | 2,565 | 2,699,662 | ||||||
Equinix, Inc., | ||||||||
5.375%, 5/15/27 | 1,960 | 2,102,100 | ||||||
Uniti Group | ||||||||
7.125%, 12/15/24 | 2,500 | 2,287,500 | ||||||
|
| |||||||
| 16,045,258 | ||||||||
|
| |||||||
| Food & Beverage—0.8% | ||||||||
Albertsons Cos. LLC, | ||||||||
6.625%, 6/15/24 | 2,250 | 2,160,000 | ||||||
B&G Foods, Inc., | ||||||||
5.25%, 4/1/25 | 4,190 | 4,272,334 | ||||||
Lamb Weston Holdings, | ||||||||
4.875%, 11/1/26 | 4,955 | 5,190,362 | ||||||
Post Holdings, | ||||||||
5.75%, 3/1/27 | 7,400 | 7,548,000 | ||||||
SUPERVALU, Inc., | ||||||||
6.75%, 6/1/21 | 7,400 | 7,409,250 | ||||||
|
| |||||||
| 26,579,946 | ||||||||
|
| |||||||
| Healthcare-Products—0.3% | ||||||||
Hill-Rom Holdings, | ||||||||
5.00%, 2/15/25 | 3,450 | 3,535,215 | ||||||
| See accompanying Notes to Financial Statements | | December 31, 2017 | | Semiannual Report | 73 |
Table of Contents
Schedule of Investments
December 31, 2017 (unaudited)
Principal | Value | |||||||
Teleflex, Inc., | ||||||||
5.25%, 6/15/24 | $4,820 | $ | 5,048,950 | |||||
|
| |||||||
| 8,584,165 | ||||||||
|
| |||||||
| Healthcare-Services—1.7% | ||||||||
Centene Corp., | ||||||||
4.75%, 1/15/25 | 3,135 | 3,197,700 | ||||||
Community Health Systems, Inc., |
| |||||||
6.25%, 3/31/23 | 1,985 | 1,796,425 | ||||||
6.875%, 2/1/22 | 2,500 | 1,450,000 | ||||||
7.125%, 7/15/20 | 4,595 | 3,457,738 | ||||||
8.00%, 11/15/19 | 5,730 | 4,884,825 | ||||||
DaVita, Inc., | ||||||||
5.125%, 7/15/24 | 8,370 | 8,547,862 | ||||||
Envision Healthcare Corp. (a)(b), |
| |||||||
5.125%, 7/1/22 | 5,785 | 5,640,375 | ||||||
6.25%, 12/1/24 | 2,420 | 2,504,700 | ||||||
HCA, Inc., | ||||||||
7.50%, 2/15/22 | 6,185 | 6,973,588 | ||||||
Kindred Healthcare, Inc., | ||||||||
6.375%, 4/15/22 | 6,098 | 6,219,960 | ||||||
8.75%, 1/15/23 | 2,630 | 2,800,950 | ||||||
Tenet Healthcare Corp., | ||||||||
5.125%, 5/1/25 (a)(b) | 2,280 | 2,245,800 | ||||||
8.125%, 4/1/22 | 7,010 | 7,158,962 | ||||||
|
| |||||||
| 56,878,885 | ||||||||
|
| |||||||
| Home Builders—0.9% | ||||||||
Beazer Homes USA, Inc., | ||||||||
5.875%, 10/15/27 (a)(b) | 1,885 | 1,903,850 | ||||||
7.25%, 2/1/23 | 138 | 144,210 | ||||||
8.75%, 3/15/22 | 1,880 | 2,077,212 | ||||||
Brookfield Residential Properties, Inc. (a)(b), |
| |||||||
6.125%, 7/1/22 | 4,765 | 5,003,250 | ||||||
6.50%, 12/15/20 | 8,735 | 8,931,537 | ||||||
CalAtlantic Group, Inc., | ||||||||
5.875%, 11/15/24 | 2,665 | 2,972,275 | ||||||
8.375%, 5/15/18 | 4,650 | 4,754,625 | ||||||
KB Home, | ||||||||
8.00%, 3/15/20 | 5,535 | 6,088,500 | ||||||
|
| |||||||
| 31,875,459 | ||||||||
|
| |||||||
| Household Products/Wares—0.1% | ||||||||
Spectrum Brands, Inc., | ||||||||
5.75%, 7/15/25 | 4,370 | 4,621,275 | ||||||
|
| |||||||
| Insurance—0.1% | ||||||||
CNO Financial Group, Inc., | ||||||||
5.25%, 5/30/25 | 4,025 | 4,266,500 | ||||||
|
| |||||||
| Internet—0.4% | ||||||||
Match Group, | ||||||||
5.00%, 12/15/27 | 1,195 | 1,215,913 | ||||||
Mood Media Borrower LLC, 6 mo. LIBOR + 14.00%, PIK |
| |||||||
8.00% (d)(f)(i),7/1/24 | 955 | 955,000 | ||||||
Symantec | ||||||||
5.00%, 4/15/25 | 5,155 | 5,374,088 | ||||||
Zayo Group | ||||||||
5.75%, 1/15/27 | 7,190 | 7,396,712 | ||||||
|
| |||||||
| 14,941,713 | ||||||||
|
| |||||||
| Internet & Catalog Retail—0.2% | ||||||||
Netflix, Inc., 5.875%, 2/15/25 | 7,090 | 7,550,850 | ||||||
|
| |||||||
| Iron/Steel—0.5% | ||||||||
AK Steel Corp., 7.00%, 3/15/27 | 2,580 | 2,638,050 | ||||||
7.50%, 7/15/23 | 2,635 | 2,865,563 | ||||||
Steel Dynamics, Inc., 5.50%, 10/1/24 | 1,270 | 1,352,550 | ||||||
Principal | Value | |||||||
United States Steel Corp., 6.875%, 8/15/25 | $5,420 | $ | 5,684,496 | |||||
8.375%, 7/1/21 (a)(b) | 3,725 | 4,043,487 | ||||||
|
| |||||||
| 16,584,146 | ||||||||
|
| |||||||
| Leisure—0.1% | ||||||||
Viking Cruises 5.875%, 9/15/27 | 2,100 | 2,142,000 | ||||||
|
| |||||||
| Lodging—0.1% | ||||||||
Wynn Las Vegas LLC (a)(b), 5.50%, 3/1/25 | 3,800 | 3,961,500 | ||||||
|
| |||||||
| Machinery-Construction & Mining—0.2% | ||||||||
Terex Corp. (a)(b), 5.625%, 2/1/25 | 7,460 | 7,805,025 | ||||||
|
| |||||||
| Machinery-Diversified—0.1% | ||||||||
Tennant Co. (a)(b), 5.625%, 5/1/25 | 4,205 | 4,436,275 | ||||||
|
| |||||||
| Media—2.0% | ||||||||
Cablevision Systems Corp., 8.00%, 4/15/20 | 6,250 | 6,687,500 | ||||||
CCO Holdings LLC, 5.125%, 5/1/27 (a)(b) | 1,625 | 1,604,688 | ||||||
5.50%, 5/1/26 (a)(b) | 2,500 | 2,568,750 | ||||||
5.75%, 1/15/24 | 6,915 | 7,139,737 | ||||||
Clear Channel Worldwide Holdings, Inc., Ser. B, 6.50%, 11/15/22 | 6,610 | 6,750,463 | ||||||
DISH DBS Corp., 5.875%, 7/15/22 | 4,880 | 4,922,700 | ||||||
6.75%, 6/1/21 | 6,000 | 6,322,500 | ||||||
Gray Television, Inc. (a)(b), 5.875%, 7/15/26 | 8,235 | 8,461,462 | ||||||
LIN Television Corp., 5.875%, 11/15/22 | 5,755 | 6,013,975 | ||||||
LiveStyle, | ||||||||
9.625%, 2/1/19 | 7,628 | 153 | ||||||
McClatchy Co., 9.00%, 12/15/22 | 7,035 | 7,369,162 | ||||||
Mediacom Broadband LLC, 6.375%, 4/1/23 | 2,700 | 2,787,750 | ||||||
Nexstar Broadcasting, Inc. (a)(b), 5.625%, 8/1/24 | 3,000 | 3,105,000 | ||||||
Sirius XM Radio, Inc. (a)(b), 5.00%, 8/1/27 | 4,790 | 4,825,925 | ||||||
|
| |||||||
| 68,559,765 | ||||||||
|
| |||||||
| Metal Fabricate/Hardware—0.2% | ||||||||
Park-Ohio Industries, Inc., 6.625%, 4/15/27 | 3,535 | 3,826,637 | ||||||
TriMas Corp. (a)(b), 4.875%, 10/15/25 | 2,105 | 2,116,841 | ||||||
|
| |||||||
| 5,943,478 | ||||||||
|
| |||||||
| Mining—0.8% | ||||||||
Alcoa Nederland Holding BV (a)(b), 6.75%, 9/30/24 | 4,205 | 4,604,475 | ||||||
7.00%, 9/30/26 | 950 | 1,071,125 | ||||||
Principal | Value | |||||||
Constellium 6.625%, 3/1/25 | $6,080 | $ | 6,422,000 | |||||
Freeport-McMoRan, Inc., 3.55%, 3/1/22 | 1,635 | 1,620,694 | ||||||
3.875%, 3/15/23 | 7,645 | 7,645,000 | ||||||
Hudbay Minerals, Inc. (a)(b), 7.25%, 1/15/23 | 1,515 | 1,613,475 | ||||||
7.625%, 1/15/25 | 4,030 | 4,433,000 | ||||||
Joseph T. Ryerson & Son, Inc. (a)(b), 11.00%, 5/15/22 | 1,500 | 1,681,875 | ||||||
|
| |||||||
| 29,091,644 | ||||||||
|
| |||||||
| Miscellaneous Manufacturing—0.1% | ||||||||
Koppers, Inc. (a)(b), 6.00%, 2/15/25 | 4,100 | 4,356,250 | ||||||
|
| |||||||
| Oil, Gas & Consumable Fuels—3.3% | ||||||||
AmeriGas Partners L.P., 5.875%, 8/20/26 | 4,185 | 4,331,475 | ||||||
BreitBurn Energy Partners L.P. (c), 7.875%, 4/15/22 | 1,870 | 6,919 | ||||||
8.625%, 10/15/20 | 5,475 | 20,531 | ||||||
Callon Petroleum Co., 6.125%, 10/1/24 | 3,280 | 3,394,800 | ||||||
Calumet Specialty Products Partners L.P., 6.50%, 4/15/21 | 9,925 | 9,925,000 | ||||||
Carrizo Oil & Gas, Inc., 6.25%, 4/15/23 | 5,175 | 5,394,937 | ||||||
Chesapeake Energy Corp., 6.625%, 8/15/20 | 6,055 | 6,327,475 | ||||||
8.00%, 1/15/25 (a)(b) | 2,465 | 2,492,731 | ||||||
Cobalt International Energy, Inc. (c), 7.75%, 12/1/23 | 9,216 | 8,640,000 | ||||||
11.75%, 12/1/21 | 11,500 | 12,535,000 | ||||||
Continental Resources, Inc., 5.00%, 9/15/22 | 4,010 | 4,085,188 | ||||||
CVR Refining LLC, 6.50%, 11/1/22 | 4,525 | 4,683,375 | ||||||
Ensco PLC, 5.20%, 3/15/25 | 1,295 | 1,107,225 | ||||||
EP Energy LLC, 9.375%, 5/1/20 | 8,765 | 7,450,250 | ||||||
Noble Holding International Ltd., 7.75%, 1/15/24 | 2,690 | 2,326,850 | ||||||
Oasis Petroleum, Inc., 6.875%, 3/15/22 | 5,705 | 5,869,019 | ||||||
Range Resources Corp., 4.875%, 5/15/25 | 7,750 | 7,595,000 | ||||||
Sable Permian Resources Land LLC (a)(b), 7.375%, 11/1/21 | 5,000 | 4,050,000 | ||||||
Sanchez Energy Corp., 6.125%, 1/15/23 | 6,240 | 5,319,600 | ||||||
Stone Energy Corp., 7.50%, 5/31/22 | 1,168 | 1,188,371 | ||||||
Sunoco L.P., 6.375%, 4/1/23 | 9,115 | 9,627,719 | ||||||
Transocean, 7.50%, 1/15/26 | 4,680 | 4,804,254 | ||||||
Weatherford International Ltd., 8.25%, 6/15/23 | 2,170 | 2,197,125 | ||||||
|
| |||||||
| 113,372,844 | ||||||||
|
| |||||||
| 74 | Semiannual Report | | December 31, 2017 | | See accompanying Notes to Financial Statements |
Table of Contents
Schedule of Investments
December 31, 2017 (unaudited)
Principal | Value | |||||||
| Paper & Forest Products—0.3% | ||||||||
Mercer International, Inc., 5.50%, 1/15/26 (a)(b) | $4,900 | $ | 4,985,750 | |||||
7.75%, 12/1/22 | 5,505 | 5,835,300 | ||||||
|
| |||||||
| 10,821,050 | ||||||||
|
| |||||||
| Pharmaceuticals—0.8% | ||||||||
Endo Finance LLC (a)(b), 5.375%, 1/15/23 | 8,010 | 6,287,850 | ||||||
Horizon Pharma, Inc., 6.625%, 5/1/23 | 8,115 | 8,115,000 | ||||||
Valeant Pharmaceuticals International, Inc. (a)(b), 6.125%, 4/15/25 | 6,280 | 5,769,750 | ||||||
7.50%, 7/15/21 | 6,450 | 6,587,062 | ||||||
|
| |||||||
| 26,759,662 | ||||||||
|
| |||||||
| Pipelines—0.5% | ||||||||
Andeavor Logistics L.P., 6.25%, 10/15/22 | 1,789 | 1,900,312 | ||||||
Crestwood Midstream Partners L.P., 5.75%, 4/1/25 | 2,790 | 2,891,137 | ||||||
Energy Transfer Equity L.P., 5.875%, 1/15/24 | 5,259 | 5,548,245 | ||||||
Sabine Pass Liquefaction LLC, 5.75%, 5/15/24 | 5,648 | 6,284,610 | ||||||
|
| |||||||
| 16,624,304 | ||||||||
|
| |||||||
| Real Estate—0.7% | ||||||||
Equinix, Inc., 5.375%, 1/1/22 | 3,855 | 4,018,837 | ||||||
Iron Mountain, 4.875%, 9/15/27 | 5,525 | 5,552,625 | ||||||
Kennedy-Wilson, Inc., 5.875%, 4/1/24 | 7,213 | 7,465,455 | ||||||
Uniti Group L.P., 8.25%, 10/15/23 | 6,230 | 6,027,525 | ||||||
|
| |||||||
| 23,064,442 | ||||||||
|
| |||||||
| Retail—1.1% | ||||||||
1011778 BC 5.00%, 10/15/25 | 6,245 | 6,323,063 | ||||||
Conn’s, Inc., 7.25%, 7/15/22 | 7,620 | 7,677,150 | ||||||
Dollar Tree, Inc., 5.75%, 3/1/23 | 7,915 | 8,305,803 | ||||||
KFC Holding 4.75%, 6/1/27 | 4,140 | 4,243,500 | ||||||
L Brands, Inc., 6.875%, 11/1/35 | 3,190 | 3,237,850 | ||||||
Neiman Marcus Group Ltd. LLC (a)(b), 8.00%, 10/15/21 | 6,810 | 3,951,162 | ||||||
Rite Aid Corp., 9.25%, 3/15/20 | 3,000 | 3,048,150 | ||||||
|
| |||||||
| 36,786,678 | ||||||||
|
| |||||||
| Semiconductors—1.1% | ||||||||
Advanced Micro Devices, Inc., 7.00%, 7/1/24 | 4,500 | 4,685,625 | ||||||
7.50%, 8/15/22 | 1,670 | 1,841,175 | ||||||
Amkor Technology, Inc., 6.375%, 10/1/22 | 5,710 | 5,914,133 | ||||||
Broadcom Corp. (a)(b), 3.875%, 1/15/27 | 7,955 | 7,840,683 | ||||||
Principal | Value | |||||||
Entegris, Inc. (a)(b), 4.625%, 2/10/26 | $2,125 | $ | 2,167,500 | |||||
Qorvo, Inc., 7.00%, 12/1/25 | 6,945 | 7,787,081 | ||||||
Sensata Technologies BV (a)(b), 5.625%, 11/1/24 | 5,810 | 6,405,525 | ||||||
|
| |||||||
| 36,641,722 | ||||||||
|
| |||||||
| Software—1.5% | ||||||||
Activision Blizzard, Inc. (a)(b), 6.125%, 9/15/23 | 3,770 | 3,997,299 | ||||||
Camelot Finance S.A. (a)(b), 7.875%, 10/15/24 | 6,185 | 6,617,950 | ||||||
First Data Corp. (a)(b), 7.00%, 12/1/23 | 8,610 | 9,126,600 | ||||||
j2 Cloud Services LLC (a)(b), 6.00%, 7/15/25 | 6,965 | 7,365,487 | ||||||
MSCI, Inc. (a)(b), 5.25%, 11/15/24 | 5,620 | 5,950,175 | ||||||
Open Text Corp. (a)(b), 5.625%, 1/15/23 | 6,695 | 7,004,644 | ||||||
Rackspace Hosting, Inc. (a)(b), 8.625%, 11/15/24 | 4,810 | 5,146,700 | ||||||
SS&C Technologies Holdings, Inc., 5.875%, 7/15/23 | 4,375 | 4,637,500 | ||||||
|
| |||||||
| 49,846,355 | ||||||||
|
| |||||||
| Telecommunications—3.0% | ||||||||
CenturyLink, Inc., 6.75%, 12/1/23, Ser. W | 2,000 | 1,967,500 | ||||||
7.50%, 4/1/24, Ser. Y | 5,230 | 5,230,000 | ||||||
Cincinnati Bell, 7.00%, 7/15/24 | 7,435 | 7,397,825 | ||||||
CommScope Technologies LLC (a)(b), 5.00%, 3/15/27 | 4,460 | 4,471,150 | ||||||
6.00%, 6/15/25 | 5,940 | 6,340,950 | ||||||
Consolidated Communications, Inc., 6.50%, 10/1/22 | 7,565 | 6,846,325 | ||||||
Frontier Communications Corp., 10.50%, 9/15/22 | 9,315 | 7,067,756 | ||||||
GTT Communications, Inc. (a)(b), 7.875%, 12/31/24 | 4,435 | 4,690,012 | ||||||
Hughes Satellite Systems Corp., 6.625%, 8/1/26 | 5,160 | 5,418,000 | ||||||
7.625%, 6/15/21 | 7,440 | 8,249,100 | ||||||
Intelsat Jackson Holdings S.A., 5.50%, 8/1/23 | 3,500 | 2,870,000 | ||||||
Level 3 Financing, Inc., 5.375%, 5/1/25 | 6,275 | 6,282,844 | ||||||
Sprint Capital Corp., 6.875%, 11/15/28 | 6,890 | 6,950,287 | ||||||
Sprint Communications, Inc., 6.00%, 11/15/22 | 3,925 | 3,934,813 | ||||||
11.50%, 11/15/21 | 6,610 | 8,014,625 | ||||||
Sprint Corp., 7.125%, 6/15/24 | 2,250 | 2,295,000 | ||||||
Principal | Value | |||||||
T-Mobile USA, Inc., 6.625%, 4/1/23 | $4,000 | $ | 4,180,000 | |||||
6.836%, 4/28/23 | 6,405 | 6,725,250 | ||||||
Windstream Services 6.375%, 8/1/23 | 6,339 | 3,835,095 | ||||||
|
| |||||||
| 102,766,532 | ||||||||
|
| |||||||
| Transportation—0.2% | ||||||||
XPO Logistics, Inc. (a)(b), 6.125%, 9/1/23 | 2,045 | 2,170,256 | ||||||
6.50%, 6/15/22 | 4,245 | 4,446,638 | ||||||
|
| |||||||
| 6,616,894 | ||||||||
|
| |||||||
| Total Corporate Bonds & Notes (cost-$1,096,312,676) | 1,073,432,901 | |||||||
|
| |||||||
| Convertible Bonds & Notes—25.5% | ||||||||
| Apparel & Textiles—0.1% | ||||||||
Iconix Brand Group, Inc., 1.50%, 3/15/18 | 4,185 | 3,473,550 | ||||||
|
| |||||||
| Auto Components—0.2% | ||||||||
Meritor, Inc. (a)(b), 3.25%, 10/15/37 | 5,200 | 5,424,250 | ||||||
|
| |||||||
| Auto Manufacturers—0.7% | ||||||||
Tesla, Inc., 0.25%, 3/1/19 | 8,930 | 9,449,056 | ||||||
1.25%, 3/1/21 | 10,965 | 11,883,319 | ||||||
2.375%, 3/15/22 | 2,550 | 2,972,344 | ||||||
|
| |||||||
| 24,304,719 | ||||||||
|
| |||||||
| Biotechnology—1.3% | ||||||||
Acorda Therapeutics, Inc., 1.75%, 6/15/21 | 945 | 805,022 | ||||||
Aegerion Pharmaceuticals, Inc., 2.00%, 8/15/19 | 5,500 | 4,427,500 | ||||||
BioMarin Pharmaceutical, Inc., 0.599%, 8/1/24 | 1,760 | 1,757,800 | ||||||
0.75%, 10/15/18 | 7,730 | 8,401,544 | ||||||
1.50%, 10/15/20 | 1,000 | 1,189,375 | ||||||
Illumina, Inc., 0.50%, 6/15/21 | 9,065 | 10,759,022 | ||||||
Innoviva, Inc., 2.125%, 1/15/23 | 1,360 | 1,351,500 | ||||||
2.50%, 8/15/25 (a)(b) | 2,970 | 3,163,050 | ||||||
Intercept Pharmaceuticals, Inc., 3.25%, 7/1/23 | 4,000 | 3,200,000 | ||||||
Ionis Pharmaceuticals, Inc., 1.00%, 11/15/21 | 5,990 | 6,338,169 | ||||||
Ligand Pharmaceuticals, Inc., 0.75%, 8/15/19 | 795 | 1,452,365 | ||||||
Medicines Co., 2.50%, 1/15/22 | 1,140 | 1,204,837 | ||||||
2.75%, 7/15/23 | 630 | 579,206 | ||||||
|
| |||||||
| 44,629,390 | ||||||||
|
| |||||||
| Building Materials—0.2% | ||||||||
Cemex S.A.B de C.V., 3.75%, 3/15/18 | 7,905 | 8,048,278 | ||||||
|
| |||||||
| Commercial Services—0.6% | ||||||||
Cardtronics, Inc., 1.00%, 12/1/20 | 1,500 | 1,337,813 | ||||||
Huron Consulting Group, Inc., 1.25%, 10/1/19 | 7,480 | 6,998,475 | ||||||
| See accompanying Notes to Financial Statements | | December 31, 2017 | | Semiannual Report | 75 |
Table of Contents
Schedule of Investments
December 31, 2017 (unaudited)
Principal | Value | |||||||
Macquarie Infrastructure Corp., |
| |||||||
2.00%, 10/1/23 | $3,410 | $ | 3,273,600 | |||||
2.875%, 7/15/19 | 5,500 | 5,695,937 | ||||||
Square, Inc. (a)(b), 0.375%, 3/1/22 | 2,470 | 4,039,994 | ||||||
|
| |||||||
| 21,345,819 | ||||||||
|
| |||||||
| Computers—0.3% | ||||||||
Brocade Communications Systems, Inc., 1.375%, 1/1/20 | 4,450 | 4,527,875 | ||||||
Lumentum Holdings, Inc. (a)(b), 0.25%, 3/15/24 | 4,745 | 5,284,744 | ||||||
|
| |||||||
| 9,812,619 | ||||||||
|
| |||||||
| Diversified Financial Services—0.5% | ||||||||
Blackhawk Network Holdings, Inc., 1.50%, 1/15/22 | 7,760 | 7,920,050 | ||||||
Encore Capital Group, Inc., 2.875%, 3/15/21 | 6,960 | 6,820,800 | ||||||
3.00%, 7/1/20 | 590 | 656,375 | ||||||
3.25%, 3/15/22 (a)(b) | 1,970 | 2,205,169 | ||||||
|
| |||||||
| 17,602,394 | ||||||||
|
| |||||||
| Electrical Equipment—0.0% | ||||||||
SunPower Corp., 4.00%, 1/15/23 | 410 | 350,806 | ||||||
|
| |||||||
| Electronics—0.2% | ||||||||
OSI Systems, Inc. (a)(b), 1.25%, 9/1/22 | 6,325 | 5,724,125 | ||||||
|
| |||||||
| Energy-Alternate Sources—0.4% | ||||||||
NextEra Energy Partners L.P. (a)(b), 1.50%, 9/15/20 | 4,800 | 4,809,000 | ||||||
SolarCity Corp., 1.625%, 11/1/19 | 10,475 | 9,748,297 | ||||||
SunEdison, 0.25%, 1/15/20 | 9,565 | 215,212 | ||||||
2.625%, 6/1/23 | 11,270 | 253,575 | ||||||
3.375%, 6/1/25 | 4,565 | 102,713 | ||||||
|
| |||||||
| 15,128,797 | ||||||||
|
| |||||||
| Engineering & Construction—0.3% | ||||||||
Dycom Industries, Inc., 0.75%, 9/15/21 | 8,305 | 10,869,169 | ||||||
|
| |||||||
| Equity Real Estate Investment Trusts (REITs)—0.5% | ||||||||
Extra Space Storage L.P. (a)(b), 3.125%, 10/1/35 | 6,580 | 7,386,050 | ||||||
Spirit Realty Capital, Inc., 3.75%, 5/15/21 | 930 | 965,461 | ||||||
Starwood Property Trust, Inc., 4.55%, 3/1/18 | 3,215 | 3,353,647 | ||||||
Principal | Value | |||||||
Two Harbors Investment Corp., 6.25%, 1/15/22 | $ | 5,000 | $ | 5,309,375 | ||||
|
| |||||||
| 17,014,533 | ||||||||
|
| |||||||
| Healthcare Providers & Services—0.1% | ||||||||
Brookdale Senior Living, Inc., |
| |||||||
2.75%, 6/15/18 | 3,435 | 3,437,147 | ||||||
|
| |||||||
| Healthcare-Products—0.6% | ||||||||
Insulet Corp. (a)(b), |
| |||||||
1.375%, 11/15/24 | 3,270 | 3,321,094 | ||||||
NuVasive, Inc., |
| |||||||
2.25%, 3/15/21 | 7,265 | 8,554,537 | ||||||
Quidel Corp., |
| |||||||
3.25%, 12/15/20 | 455 | 688,472 | ||||||
Wright Medical Group, Inc., |
| |||||||
2.00%, 2/15/20 | 9,435 | 9,723,947 | ||||||
|
| |||||||
| 22,288,050 | ||||||||
|
| |||||||
| Healthcare-Services—0.6% | ||||||||
Anthem, Inc., |
| |||||||
2.75%, 10/15/42 | 2,850 | 8,779,781 | ||||||
Molina Healthcare, Inc., |
| |||||||
1.125%, 1/15/20 | 5,020 | 9,613,300 | ||||||
Teladoc, Inc. (a)(b), |
| |||||||
3.00%, 12/15/22 | 690 | 779,269 | ||||||
|
| |||||||
| 19,172,350 | ||||||||
|
| |||||||
| Home Builders—0.1% | ||||||||
KB Home, |
| |||||||
1.375%, 2/1/19 | 3,875 | 4,761,406 | ||||||
|
| |||||||
| Hotels, Restaurants & Leisure—0.0% | ||||||||
Credit Suisse AG (MGM Resorts International) (f)(l), |
| |||||||
zero coupon, 11/19/20 | 1,000 | 1,007,900 | ||||||
|
| |||||||
| Internet—3.9% | ||||||||
Altaba, Inc., |
| |||||||
zero coupon, 12/1/18 | 9,085 | 12,270,428 | ||||||
Ctrip.com International Ltd., |
| |||||||
1.25%, 9/15/22 | 10,635 | 10,887,581 | ||||||
FireEye, Inc., |
| |||||||
1.00%, 6/1/35, Ser. A | 4,035 | 3,787,856 | ||||||
1.625%, 6/1/35, Ser. B | 4,650 | 4,272,188 | ||||||
IAC FinanceCo, Inc. (a)(b), |
| |||||||
0.875%, 10/1/22 | 7,840 | 8,300,600 | ||||||
Liberty Expedia Holdings, Inc. (a)(b), |
| |||||||
1.00%, 6/30/47 | 5,580 | 5,593,950 | ||||||
Palo Alto Networks, Inc., |
| |||||||
zero coupon, 7/1/19 | 5,040 | 6,914,250 | ||||||
Priceline Group, Inc., |
| |||||||
0.35%, 6/15/20 | 1,530 | 2,113,313 | ||||||
0.90%, 9/15/21 | 19,145 | 22,435,547 | ||||||
Twitter, Inc., |
| |||||||
0.25%, 9/15/19 | 4,500 | 4,308,750 | ||||||
1.00%, 9/15/21 | 9,690 | 9,054,094 | ||||||
VeriSign, Inc., |
| |||||||
4.702%, 8/15/37 | 5,075 | 16,969,531 | ||||||
Vipshop Holdings Ltd., |
| |||||||
1.50%, 3/15/19 | 9,665 | 9,665,000 | ||||||
Wayfair, Inc. (a)(b), |
| |||||||
0.375%, 9/1/22 | 4,930 | 5,158,012 | ||||||
Weibo Corp. (a)(b), |
| |||||||
1.25%, 11/15/22 | 5,410 | 5,954,381 | ||||||
Zillow Group, Inc., |
| |||||||
2.00%, 12/1/21 | 6,850 | 7,500,750 | ||||||
|
| |||||||
| 135,186,231 | ||||||||
|
| |||||||
| Iron/Steel—0.2% | ||||||||
Allegheny Technologies, Inc., |
| |||||||
4.75%, 7/1/22 | 1,410 | 2,615,550 | ||||||
Cleveland-Cliffs, Inc., |
| |||||||
1.50%, 1/15/25 | 3,780 | 4,148,550 | ||||||
|
| |||||||
| 6,764,100 | ||||||||
|
| |||||||
Principal | Value | |||||||
| Lodging—0.4% | ||||||||
Caesars Entertainment Corp. (a), |
| |||||||
5.00%, 10/1/24 | $ | 7,610 | $ | 14,758,644 | ||||
|
| |||||||
| Machinery-Diversified—0.2% | ||||||||
Chart Industries, Inc., |
| |||||||
1.00%, 11/15/24 (a)(b) | 3,530 | 3,708,706 | ||||||
2.00%, 8/1/18 | 3,165 | 3,172,913 | ||||||
|
| |||||||
| 6,881,619 | ||||||||
|
| |||||||
| Media—1.5% | ||||||||
DISH Network Corp., |
| |||||||
2.375%, 3/15/24 (a)(b) | 13,010 | 12,530,256 | ||||||
3.375%, 8/15/26 | 9,755 | 10,639,047 | ||||||
Liberty Interactive LLC (a)(b), |
| |||||||
1.75%, 9/30/46 | 7,175 | 8,318,516 | ||||||
Liberty Media Corp-Liberty Formula One (a)(b), |
| |||||||
1.00%, 1/30/23 | 4,195 | 4,703,644 | ||||||
Liberty Media Corp., |
| |||||||
1.375%, 10/15/23 | 9,375 | 10,834,687 | ||||||
2.25%, 9/30/46 | 2,580 | 2,699,325 | ||||||
|
| |||||||
| 49,725,475 | ||||||||
|
| |||||||
| Metal Fabricate/Hardware—0.2% | ||||||||
RTI International Metals, Inc., |
| |||||||
1.625%, 10/15/19 | 4,715 | 5,404,569 | ||||||
|
| |||||||
| Mining—0.0% | ||||||||
Royal Gold, Inc., |
| |||||||
2.875%, 6/15/19 | 500 | 538,750 | ||||||
|
| |||||||
| Miscellaneous Manufacturing—0.1% | ||||||||
Trinity Industries, Inc., |
| |||||||
3.875%, 6/1/36 | 2,230 | 3,522,006 | ||||||
|
| |||||||
| Oil, Gas & Consumable Fuels—1.2% | ||||||||
Bristow Group, Inc., |
| |||||||
4.50%, 6/1/23 | 1,420 | 1,569,988 | ||||||
Chesapeake Energy Corp. (a)(b), |
| |||||||
5.50%, 9/15/26 | 7,865 | 7,201,391 | ||||||
Ensco Jersey Finance Ltd., |
| |||||||
3.00%, 1/31/24 | 6,295 | 5,618,287 | ||||||
Helix Energy Solutions Group, Inc., |
| |||||||
4.25%, 5/1/22 | 4,510 | 4,504,362 | ||||||
Nabors Industries, Inc. (a)(b), |
| |||||||
0.75%, 1/15/24 | 8,145 | 6,261,469 | ||||||
Oasis Petroleum, Inc., |
| |||||||
2.625%, 9/15/23 | 7,990 | 8,609,225 | ||||||
Weatherford International Ltd., |
| |||||||
5.875%, 7/1/21 | 7,080 | 7,690,650 | ||||||
|
| |||||||
| 41,455,372 | ||||||||
|
| |||||||
| Pharmaceuticals—2.2% | ||||||||
Array BioPharma, Inc. (a)(b), |
| |||||||
2.625%, 12/1/24 | 500 | 562,812 | ||||||
Clovis Oncology, Inc., |
| |||||||
2.50%, 9/15/21 | 2,985 | 4,031,616 | ||||||
Depomed, Inc., |
| |||||||
2.50%, 9/1/21 | 3,335 | 2,828,497 | ||||||
DexCom, Inc. (a)(b), |
| |||||||
0.75%, 5/15/22 | 3,695 | 3,489,466 | ||||||
Flexion Therapeutics, Inc. (a)(b), |
| |||||||
3.375%, 5/1/24 | 2,520 | 3,068,087 | ||||||
Herbalife Ltd., |
| |||||||
2.00%, 8/15/19 | 7,690 | 7,747,675 | ||||||
Impax Laboratories, Inc., |
| |||||||
2.00%, 6/15/22 | 9,060 | 8,833,500 | ||||||
Jazz Investments I Ltd., |
| |||||||
1.50%, 8/15/24 (a)(b) | 11,585 | 10,969,547 | ||||||
1.875%, 8/15/21 | 9,950 | 10,005,969 | ||||||
Neurocrine Biosciences, Inc. (a)(b), |
| |||||||
2.25%, 5/15/24 | 6,240 | 7,983,300 | ||||||
| 76 | Semiannual Report | | December 31, 2017 | | See accompanying Notes to Financial Statements |
Table of Contents
Schedule of Investments
December 31, 2017 (unaudited)
Principal | Value | |||||||
Pacira Pharmaceuticals, Inc. (a)(b), |
| |||||||
2.375%, 4/1/22 | $4,180 | $4,389,000 | ||||||
Sarepta Therapeutics, Inc. (a)(b), |
| |||||||
1.50%, 11/15/24 | 3,695 | 3,958,269 | ||||||
Teva Pharmaceutical Finance Co. LLC, Ser. C, |
| |||||||
0.25%, 2/1/26 | 7,285 | 6,429,012 | ||||||
|
| |||||||
| 74,296,750 | ||||||||
|
| |||||||
| Pipelines—0.3% | ||||||||
Cheniere Energy, Inc., |
| |||||||
4.25%, 3/15/45 | 12,605 | 9,004,697 | ||||||
|
| |||||||
| Retail—0.2% | ||||||||
RH (a)(b), |
| |||||||
zero coupon, 7/15/20 | 5,765 | 5,635,287 | ||||||
|
| |||||||
| Semiconductors—4.0% | ||||||||
Advanced Micro Devices, Inc., |
| |||||||
2.125%, 9/1/26 | 4,730 | 7,115,694 | ||||||
Cypress Semiconductor Corp., |
| |||||||
2.00%, 2/1/23 (a)(b) | 2,450 | 2,546,469 | ||||||
4.50%, 1/15/22 | 5,140 | 6,759,100 | ||||||
Inphi Corp., |
| |||||||
0.75%, 9/1/21 | 5,535 | 5,510,784 | ||||||
1.125%, 12/1/20 | 2,025 | 2,355,328 | ||||||
Integrated Device Technology, Inc., |
| |||||||
0.875%, 11/15/22 | 6,325 | 7,072,141 | ||||||
Intel Corp., |
| |||||||
3.25%, 8/1/39 | 9,795 | 21,775,558 | ||||||
Lam Research Corp., |
| |||||||
1.25%, 5/15/18 | 3,875 | 11,869,609 | ||||||
Microchip Technology, Inc. (a)(b), |
| |||||||
1.625%, 2/15/27 | 19,050 | 22,419,469 | ||||||
Micron Technology, Inc., Ser. G, |
| |||||||
3.00%, 11/15/43 | 11,707 | 16,938,566 | ||||||
Novellus Systems, Inc., |
| |||||||
2.625%, 5/15/41 | 495 | 2,726,212 | ||||||
ON Semiconductor Corp., |
| |||||||
1.00%, 12/1/20 | 825 | 1,057,031 | ||||||
1.625%, 10/15/23 (a)(b) | 9,290 | 11,490,569 | ||||||
Synaptics, Inc. (a)(b), |
| |||||||
0.50%, 6/15/22 | 7,195 | 6,655,375 | ||||||
Teradyne, Inc., |
| |||||||
1.25%, 12/15/23 | 3,475 | 4,967,078 | ||||||
Veeco Instruments, Inc., |
| |||||||
2.70%, 1/15/23 | 6,560 | 5,727,700 | ||||||
|
| |||||||
| 136,986,683 | ||||||||
|
| |||||||
| Software—3.0% | ||||||||
Akamai Technologies, Inc., |
| |||||||
zero coupon, 2/15/19 | 7,525 | 7,586,178 | ||||||
Allscripts Healthcare Solutions, Inc., |
| |||||||
1.25%, 7/1/20 | 6,585 | 7,066,528 | ||||||
Citrix Systems, Inc., |
| |||||||
0.50%, 4/15/19 | 11,035 | 14,297,222 | ||||||
CSG Systems International, Inc., |
| |||||||
4.25%, 3/15/36 | 3,800 | 4,151,500 | ||||||
HubSpot, Inc. (a)(b), |
| |||||||
0.25%, 6/1/22 | 2,410 | 2,779,031 | ||||||
Medidata Solutions, Inc., |
| |||||||
1.00%, 8/1/18 | 680 | 788,800 | ||||||
Nuance Communications, Inc., |
| |||||||
1.00%, 12/15/35 | 5,560 | 5,334,125 | ||||||
1.25%, 4/1/25 (a)(b) | 5,100 | 5,233,875 | ||||||
PROS Holdings, Inc. (a)(b), |
| |||||||
2.00%, 6/1/47 | 1,270 | 1,155,700 | ||||||
RealPage, Inc. (a)(b), |
| |||||||
1.50%, 11/15/22 | 835 | 1,037,488 | ||||||
Red Hat, Inc., |
| |||||||
0.25%, 10/1/19 | 6,680 | 11,022,000 | ||||||
Principal | Value | |||||||
Salesforce.com, Inc., |
| |||||||
0.25%, 4/1/18 | $ | 9,680 | $ | 14,846,700 | ||||
ServiceNow, Inc. (a)(b), |
| |||||||
zero coupon, 6/1/22 | 8,090 | 9,298,444 | ||||||
Verint Systems, Inc., |
| |||||||
1.50%, 6/1/21 | 6,875 | 6,711,719 | ||||||
Workday, Inc., |
| |||||||
0.25%, 10/1/22 (a)(b) | 7,270 | 7,206,387 | ||||||
0.75%, 7/15/18 | 4,095 | 5,131,547 | ||||||
|
| |||||||
| 103,647,244 | ||||||||
|
| |||||||
| Telecommunications—0.8% | ||||||||
CalAmp Corp., |
| |||||||
1.625%, 5/15/20 | 825 | 876,563 | ||||||
Ciena Corp., |
| |||||||
3.75%, 10/15/18 | 1,885 | 2,196,025 | ||||||
Finisar Corp., |
| |||||||
0.50%, 12/15/36 | 13,830 | 12,896,475 | ||||||
Viavi Solutions, Inc., |
| |||||||
0.625%, 8/15/33 | 9,815 | 10,133,987 | ||||||
|
| |||||||
| 26,103,050 | ||||||||
|
| |||||||
| Transportation—0.6% | ||||||||
Atlas Air Worldwide Holdings, Inc., |
| |||||||
2.25%, 6/1/22 | 5,500 | 6,335,312 | ||||||
Echo Global Logistics, Inc., |
| |||||||
2.50%, 5/1/20 | 3,345 | 3,470,438 | ||||||
Greenbrier Cos., Inc. (a)(b), |
| |||||||
2.875%, 2/1/24 | 2,480 | 2,966,700 | ||||||
Hornbeck Offshore Services, Inc., |
| |||||||
1.50%, 9/1/19 | 4,860 | 3,669,300 | ||||||
Scorpio Tankers, Inc. (a)(b), |
| |||||||
2.375%, 7/1/19 | 4,440 | 4,012,650 | ||||||
|
| |||||||
| 20,454,400 | ||||||||
|
| |||||||
| Total Convertible Bonds & Notes (cost—$910,599,744) | 874,760,179 | |||||||
|
| |||||||
| Shares | ||||||||
| Convertible Preferred Stock—5.1% | ||||||||
| Agriculture—0.0% | ||||||||
Bunge Ltd. (e), |
| |||||||
4.875% | 3,125 | 325,977 | ||||||
|
| |||||||
| Banks—0.6% | ||||||||
Bank of America Corp., Ser. L (e), |
| |||||||
7.25% | 4,415 | 5,823,385 | ||||||
Wells Fargo & Co., Ser. L (e), |
| |||||||
7.50% | 11,155 | 14,612,938 | ||||||
|
| |||||||
| 20,436,323 | ||||||||
|
| |||||||
| Commercial Services & Supplies—0.1% | ||||||||
Stericycle, Inc., |
| |||||||
5.25%, 9/15/18 | 91,075 | 4,821,511 | ||||||
|
| |||||||
| Computers—0.3% | ||||||||
NCR Corp., Ser. A, PIK 5.50% (e), |
| |||||||
5.50% | 8,410 | 11,241,227 | ||||||
|
| |||||||
| Diversified Financial Services—0.2% | ||||||||
2017 Mandatory Exchangeable Trust (a)(b), |
| |||||||
5.188%, 12/1/20 | 68,595 | 7,096,153 | ||||||
|
| |||||||
| Diversified Telecommunication Services—0.1% | ||||||||
Frontier Communications Corp., Ser. A, |
| |||||||
11.125%, 6/29/18 | 158,090 | 1,710,534 | ||||||
|
| |||||||
| Electric Utilities—0.5% | ||||||||
Dominion Energy, Inc., Ser. A, |
| |||||||
6.75%, 8/15/19 | 148,370 | 7,664,794 | ||||||
Shares | Value | |||||||
NextEra Energy, Inc., | ||||||||
6.123%, 9/1/19 | 183,635 | 10,320,287 | ||||||
|
| |||||||
| 17,985,081 | ||||||||
|
| |||||||
| Electronic Equipment, Instruments & Components—0.3% | ||||||||
Belden, Inc., |
| |||||||
6.75%, 7/15/19 | 80,925 | 8,339,321 | ||||||
|
| |||||||
| Equity Real Estate Investment Trusts (REITs)—0.7% | ||||||||
American Tower Corp., |
| |||||||
5.50%, 2/15/18 | 81,795 | 10,285,721 | ||||||
Crown Castle International Corp., Ser. A, |
| |||||||
6.875%, 8/1/20 | 9,485 | 10,706,668 | ||||||
Welltower, Inc., Ser. I (e), |
| |||||||
6.50% | 25,875 | 1,549,136 | ||||||
|
| |||||||
| 22,541,525 | ||||||||
|
| |||||||
| Food & Beverage—0.3% | ||||||||
Post Holdings, Inc. (e), |
| |||||||
2.50% | 64,725 | 9,745,158 | ||||||
3.75% | 8,940 | 1,518,682 | ||||||
|
| |||||||
| 11,263,840 | ||||||||
|
| |||||||
| Hand/Machine Tools—0.3% | ||||||||
Stanley Black & Decker, Inc., |
| |||||||
5.375%, 5/15/20 | 90,400 | 11,096,600 | ||||||
|
| |||||||
| Healthcare Providers & Services—0.2% | ||||||||
Anthem, Inc., | ||||||||
5.25%, 5/1/18 | 114,220 | 6,396,320 | ||||||
|
| |||||||
| Healthcare-Products—0.5% | ||||||||
Becton Dickinson and Co., Ser. A, |
| |||||||
6.125%, 5/1/20 | 290,980 | 16,999,052 | ||||||
|
| |||||||
| Oil, Gas & Consumable Fuels—0.4% | ||||||||
Hess Corp., | ||||||||
8.00%, 2/1/19 | 137,195 | 7,940,847 | ||||||
Kinder Morgan, Inc., Ser. A, |
| |||||||
9.75%, 10/26/18 | 103,505 | 3,929,050 | ||||||
Southwestern Energy Co., Ser. B, |
| |||||||
6.25%, 1/15/18 | 233,685 | 2,780,851 | ||||||
|
| |||||||
| 14,650,748 | ||||||||
|
| |||||||
| Pharmaceuticals—0.6% | ||||||||
Allergan PLC, Ser. A, | ||||||||
5.50%, 3/1/18 | 28,090 | 16,467,762 | ||||||
Teva Pharmaceutical Industries Ltd., |
| |||||||
7.00%, 12/15/18 | 13,035 | 4,633,291 | ||||||
|
| |||||||
| 21,101,053 | ||||||||
|
| |||||||
| Total Convertible Preferred Stock (cost—$227,799,558) | 176,005,265 | |||||||
|
| |||||||
| Preferred Stock (a)(d)(f)(j)(m)—0.6% | ||||||||
| Media—0.6% | ||||||||
LiveStyle, Inc., Ser. A | 18,676 | 1,867,600 | ||||||
LiveStyle, Inc., Ser. B | 171,344 | 17,134,400 | ||||||
LiveStyle, Inc., Ser. B | 8,000 | 80 | ||||||
|
| |||||||
| Total Preferred Stock (cost—$26,629,464) | 19,002,080 | |||||||
|
| |||||||
| Equity-Linked Securities (d)(f)(j)—0.0% | ||||||||
| Coal—0.0% | ||||||||
Arch Coal, Inc., | 4,002 | 164,436 | ||||||
|
| |||||||
| See accompanying Notes to Financial Statements | | December 31, 2017 | | Semiannual Report | 77 |
Table of Contents
Schedule of Investments
December 31, 2017 (unaudited)
Shares | Value | |||||||
| Oil, Gas & Consumable Fuels—0.0% | ||||||||
Energy XXI Gulf Coast, Inc., | 14,350 | $ | 647 | |||||
|
| |||||||
| Total Equity-Linked Securities (cost—$601,986) | 165,083 | |||||||
|
| |||||||
| Units | ||||||||
| Warrants (d)(f)(j)—0.0% | ||||||||
| Commercial Services—0.0% | ||||||||
Cenveo, Inc., strike price $12.00, | 858,030 | 18,448 | ||||||
|
| |||||||
| Media—0.0% | ||||||||
LiveStyle, Inc., Ser. C, | 43,500 | 4 | ||||||
|
| |||||||
| Semiconductors—0.0% | ||||||||
GT Advanced Technologies, Inc., | 2,860,795 | — | ||||||
|
| |||||||
| Total Warrants (cost—$237,932) | 18,452 | |||||||
|
| |||||||
Principal Amount (000s) | Value | |||||||
| Repurchase Agreements—2.6% | ||||||||
State Street Bank and Trust Co., dated 12/29/17, 0.20%, due 1/2/18, proceeds $90,735,016; collateralized by U.S. Treasury Notes, 1.625%, due 2/15/26, valued at $92,548,013 including accrued interest |
| |||||||
(cost—$90,733,000) | $90,733 | $ | 90,733,000 | |||||
|
| |||||||
| Total Investments, before options written (cost—$3,681,837,429)—99.6% | 3,410,835,133 | |||||||
|
| |||||||
| Total Options Written—(0.0)% (premiums received—$829,034) (j)(k)(n) | (769,940 | ) | ||||||
|
| |||||||
| Total Investments, net of options written (cost—$3,681,008,395)—99.6% | 3,410,065,193 | |||||||
|
| |||||||
| Other assets less other liabilities—0.4% | 14,689,498 | |||||||
|
| |||||||
| Net Assets—100.0% | $3,424,754,691 | |||||||
|
| |||||||
Notes to Schedule of Investments:
(a) Private Placement—Restricted as to resale and may not have a readily available market. Securities with an aggregate value of $721,050,210, representing 21.1% of net assets.
(b) 144A—Exempt from registration under Rule 144A of the Securities Act of 1933. These securities may be resold in transactions exempt from registration, typically only to qualified institutional buyers. Securities with an aggregate value of $686,001,606, representing 20.0% of net assets.
(c) In default.
(d) Fair-Valued—Securities with an aggregate value of $24,997,007, representing 0.7% of net assets. See Note 1(a) and Note 1(b) in the Notes to Financial Statements.
(e) Perpetual maturity. The date shown, if any, is the next call date.
(f) Level 3 security. See Note 1(a) and Note 1(b) in the Notes to Financial Statements.
(g) All or partial amount segregated for the benefit of the counterparty as collateral for options written.
(h) Restricted. The aggregate acquisition cost of such securities is $35,796,364. The aggregate value is $1,498,021, representing less than 0.05% of net assets.
(i) Variable or Floating Rate Security—Security with an interest rate that changes periodically. The interest rate disclosed reflects the rate in effect on December 31, 2017.
(j) Non-income producing.
(k) Exchange traded—Chicago Board Options Exchange.
(l) Securities exchangeable or convertible into securities of an entity different than the issuer or structured by the issuer to provide exposure to securities of an entity different than the issuer (synthetic convertible securities). Such entity is identified in the parenthetical.
(m) A member of the Fund’s portfolio management team is a member of the board of directors of LiveStyle, Inc. The Fund’s aggregate value of investments in LiveStyle, Inc. represents 0.6% of net assets.
(n) Exchange traded option contracts outstanding at December 31, 2017:
| Options written contracts outstanding at December 31, 2017: | ||||||||||||||||||||||||||||
| Description | Exercise Price | Expiration Date | Number of Contracts | Notional Amount | Market Value | Premiums Received | Unrealized Appreciation (Depreciation) | |||||||||||||||||||||
Call options: |
| |||||||||||||||||||||||||||
Abbvie, Inc. | 105.00 USD | 1/19/18 | (1,555 | ) | $ | (155,500 | ) | $ | (8,552 | ) | $ | (62,849 | ) | $ | 54,297 | |||||||||||||
Adobe Systems, Inc. | 190.00 USD | 1/19/18 | (750 | ) | (75,000 | ) | (13,125 | ) | (56,278 | ) | 43,153 | |||||||||||||||||
Alibaba Group Holding Ltd. | 190.00 USD | 1/19/18 | (575 | ) | (57,500 | ) | (14,088 | ) | (34,896 | ) | 20,808 | |||||||||||||||||
Bank of America Corp. | 31.00 USD | 1/19/18 | (3,460 | ) | (346,000 | ) | (51,900 | ) | (63,207 | ) | 11,307 | |||||||||||||||||
Broadcom Ltd. | 290.00 USD | 1/19/18 | (455 | ) | (45,500 | ) | (13,650 | ) | (54,967 | ) | 41,317 | |||||||||||||||||
Comcast Corp. | 41.25 USD | 1/19/18 | (3,150 | ) | (315,000 | ) | (107,100 | ) | (66,301 | ) | (40,799 | ) | ||||||||||||||||
Costco Wholesale Corp. | 200.00 USD | 1/19/18 | (420 | ) | (42,000 | ) | (5,460 | ) | (49,541 | ) | 44,081 | |||||||||||||||||
DR Horton, Inc | 54.00 USD | 1/19/18 | (1,265 | ) | (126,500 | ) | (15,813 | ) | (20,516 | ) | 4,703 | |||||||||||||||||
Intel Corp. | 49.00 USD | 1/19/18 | (1,930 | ) | (193,000 | ) | (20,265 | ) | (35,103 | ) | 14,838 | |||||||||||||||||
Micron Technology, Inc. | 51.00 USD | 1/19/18 | (815 | ) | (81,500 | ) | (6,112 | ) | (37,544 | ) | 31,432 | |||||||||||||||||
NVIDIA Corp. | 220.00 USD | 1/19/18 | (525 | ) | (52,500 | ) | (9,187 | ) | (41,473 | ) | 32,286 | |||||||||||||||||
Oracle Corp. | 55.00 USD | 1/19/18 | (1,645 | ) | (164,500 | ) | (3,290 | ) | (31,202 | ) | 27,912 | |||||||||||||||||
ServiceNow, Inc | 136.00 USD | 1/19/18 | (360 | ) | (36,000 | ) | (25,200 | ) | (34,973 | ) | 9,773 | |||||||||||||||||
Square, Inc. | 42.00 USD | 1/19/18 | (2,040 | ) | (204,000 | ) | (15,300 | ) | (27,903 | ) | 12,603 | |||||||||||||||||
Take-Two Interactive Software, Inc. | 118.00 USD | 1/19/18 | (710 | ) | (71,000 | ) | (28,400 | ) | (31,402 | ) | 3,002 | |||||||||||||||||
Texas Instruments, Inc. | 105.00 USD | 1/19/18 | (1,135 | ) | (113,500 | ) | (152,658 | ) | (58,155 | ) | (94,503 | ) | ||||||||||||||||
Union Pacific Corp. | 144.00 USD | 1/19/18 | (825 | ) | (82,500 | ) | (19,800 | ) | (31,274 | ) | 11,474 | |||||||||||||||||
UnitedHealth Group, Inc. | 232.50 USD | 1/19/18 | (620 | ) | (62,000 | ) | (57,040 | ) | (53,603 | ) | (3,437 | ) | ||||||||||||||||
Valero Energy Corp. | 90.00 USD | 1/19/18 | (700 | ) | (70,000 | ) | (203,000 | ) | (37,847 | ) | (165,153 | ) | ||||||||||||||||
|
| |||||||||||||||||||||||||||
| Total options written contracts | $ | (769,940 | ) | $ | (829,034 | ) | $ | 59,094 | ||||||||||||||||||||
|
| |||||||||||||||||||||||||||
| 78 | Semiannual Report | | December 31, 2017 | | See accompanying Notes to Financial Statements |
Table of Contents
Schedule of Investments
December 31, 2017 (unaudited)
Glossary:
ADR—American Depositary Receipt
LIBOR—London Inter-Bank Offered Rate
PIK—Payment-in-Kind
REIT—Real Estate Investment Trust
AllianzGI Mid-Cap Fund
| Shares | Value | |||||||
| Common Stock—99.3% | ||||||||
| Aerospace & Defense—1.5% | ||||||||
L3 Technologies, Inc. | 24,145 | $4,777,088 | ||||||
|
| |||||||
| Air Freight & Logistics—2.8% | ||||||||
XPO Logistics, Inc. (a) | 96,260 | 8,816,453 | ||||||
|
| |||||||
| Banks—3.2% | ||||||||
First Republic Bank | 53,275 | 4,615,746 | ||||||
Signature Bank (a) | 40,245 | 5,524,029 | ||||||
|
| |||||||
| 10,139,775 | ||||||||
|
| |||||||
| Biotechnology—2.3% | ||||||||
Clovis Oncology, Inc. (a) | 21,735 | 1,477,980 | ||||||
Incyte Corp. (a) | 25,040 | 2,371,538 | ||||||
Neurocrine Biosciences, | 44,110 | 3,422,495 | ||||||
|
| |||||||
| 7,272,013 | ||||||||
|
| |||||||
| Building Products—1.2% | ||||||||
AO Smith Corp. | 63,030 | 3,862,478 | ||||||
|
| |||||||
| Capital Markets—4.0% | ||||||||
E*TRADE Financial Corp. (a) | 135,790 | 6,731,110 | ||||||
SEI Investments Co. | 78,420 | 5,635,261 | ||||||
|
| |||||||
| 12,366,371 | ||||||||
|
| |||||||
| Chemicals—4.7% | ||||||||
Albemarle Corp. | 24,815 | 3,173,590 | ||||||
FMC Corp. | 59,465 | 5,628,957 | ||||||
Huntsman Corp. | 173,535 | 5,776,980 | ||||||
|
| |||||||
| 14,579,527 | ||||||||
|
| |||||||
| Commercial Services & Supplies—1.8% | ||||||||
Waste Connections, Inc. | 77,870 | 5,524,098 | ||||||
|
| |||||||
| Construction Materials—1.0% | ||||||||
Eagle Materials, Inc. | 28,740 | 3,256,242 | ||||||
|
| |||||||
| Consumer Finance—2.0% | ||||||||
Synchrony Financial | 159,615 | 6,162,735 | ||||||
|
| |||||||
| Containers & Packaging—1.4% | ||||||||
Berry Global Group, Inc. (a) | 72,845 | 4,273,816 | ||||||
|
| |||||||
| Distributors—1.5% | ||||||||
LKQ Corp. (a) | 117,785 | 4,790,316 | ||||||
|
| |||||||
| Diversified Financial Services—1.3% | ||||||||
MarketAxess Holdings, Inc. | 19,905 | 4,015,834 | ||||||
|
| |||||||
| Electrical Equipment—1.9% | ||||||||
AMETEK, Inc. | 79,595 | 5,768,250 | ||||||
|
| |||||||
| Electronic Equipment, Instruments & Components—7.7% | ||||||||
Coherent, Inc. (a) | 13,545 | 3,822,670 | ||||||
Dolby Laboratories, Inc., Class A | 92,790 | 5,752,980 | ||||||
Flex Ltd. (a) | 248,275 | 4,466,468 | ||||||
TE Connectivity Ltd. | 49,130 | 4,669,315 | ||||||
Trimble, Inc. (a) | 134,905 | 5,482,539 | ||||||
|
| |||||||
| 24,193,972 | ||||||||
|
| |||||||
| Equity Real Estate Investment Trusts (REITs)—3.3% | ||||||||
DCT Industrial Trust, Inc. | 49,560 | 2,913,137 | ||||||
Equinix, Inc. | 16,335 | 7,403,349 | ||||||
|
| |||||||
| 10,316,486 | ||||||||
|
| |||||||
| Food Products—1.8% | ||||||||
Blue Buffalo Pet Products, Inc. (a) | 167,721 | 5,499,572 | ||||||
|
| |||||||
| Healthcare Equipment & Supplies—7.1% | ||||||||
Align Technology, Inc. (a) | 16,660 | 3,701,685 | ||||||
Shares | Value | |||||||
DexCom, Inc. (a) | 91,030 | $ | 5,224,212 | |||||
Hill-Rom Holdings, Inc. | 66,900 | 5,639,001 | ||||||
IDEXX Laboratories, Inc. (a) | 29,080 | 4,547,530 | ||||||
Novocure Ltd. (a) | 154,145 | 3,113,729 | ||||||
|
| |||||||
| 22,226,157 | ||||||||
|
| |||||||
| Hotels, Restaurants & Leisure—2.8% | ||||||||
Cedar Fair L.P. | 65,470 | 4,254,895 | ||||||
Royal Caribbean Cruises Ltd. | 37,685 | 4,495,067 | ||||||
|
| |||||||
| 8,749,962 | ||||||||
|
| |||||||
| Household Durables—3.8% | ||||||||
Mohawk Industries, Inc. (a) | 23,690 | 6,536,071 | ||||||
Newell Brands, Inc. | 171,775 | 5,307,847 | ||||||
|
| |||||||
| 11,843,918 | ||||||||
|
| |||||||
| Internet Software & Services—1.5% | ||||||||
Trade Desk, Inc., Class A (a) | 103,415 | 4,729,168 | ||||||
|
| |||||||
| IT Services—3.2% | ||||||||
EPAM Systems, Inc. (a) | 22,025 | 2,366,146 | ||||||
Vantiv, Inc., Class A (a) | 102,070 | 7,507,248 | ||||||
|
| |||||||
| 9,873,394 | ||||||||
|
| |||||||
| Life Sciences Tools & Services—3.9% | ||||||||
Agilent Technologies, Inc. | 98,915 | 6,624,337 | ||||||
Bruker Corp. | 162,630 | 5,581,462 | ||||||
|
| |||||||
| 12,205,799 | ||||||||
|
| |||||||
| Machinery—1.5% | ||||||||
Nordson Corp. | 30,940 | 4,529,616 | ||||||
|
| |||||||
| Multi-Line Retail—2.9% | ||||||||
Dollar Tree, Inc. (a) | 85,175 | 9,140,129 | ||||||
|
| |||||||
| Pharmaceuticals—1.7% | ||||||||
Catalent, Inc. (a) | 132,705 | 5,451,521 | ||||||
|
| |||||||
| Professional Services—3.8% | ||||||||
Equifax, Inc. | 46,125 | 5,439,060 | ||||||
Verisk Analytics, Inc., | 68,445 | 6,570,720 | ||||||
|
| |||||||
| 12,009,780 | ||||||||
|
| |||||||
| Real Estate Management & Development—1.4% | ||||||||
CBRE Group, Inc., Class A (a) | 102,570 | 4,442,307 | ||||||
|
| |||||||
| Semiconductors & Semiconductor Equipment—6.1% | ||||||||
Entegris, Inc. | 87,600 | 2,667,420 | ||||||
Marvell Technology Group Ltd. | 170,165 | 3,653,443 | ||||||
MKS Instruments, Inc. | 46,735 | 4,416,458 | ||||||
Monolithic Power Systems, Inc. | 31,340 | 3,521,362 | ||||||
Skyworks Solutions, Inc. | 49,535 | 4,703,348 | ||||||
|
| |||||||
| 18,962,031 | ||||||||
|
| |||||||
| Software—8.7% | ||||||||
Activision Blizzard, Inc. | 111,725 | 7,074,427 | ||||||
PTC, Inc. (a) | 74,575 | 4,531,923 | ||||||
Snap, Inc., Class A (a) | 163,005 | 2,381,503 | ||||||
Splunk, Inc. (a) | 61,360 | 5,083,063 | ||||||
Workday, Inc., Class A (a) | 44,560 | 4,533,534 | ||||||
Zynga, Inc., Class A (a) | 896,450 | 3,585,800 | ||||||
|
| |||||||
| 27,190,250 | ||||||||
|
| |||||||
| Technology Hardware, Storage & Peripherals—2.4% | ||||||||
NetApp, Inc. | 135,080 | 7,472,626 | ||||||
|
| |||||||
| Textiles, Apparel & Luxury Goods—3.1% | ||||||||
Hanesbrands, Inc. | 220,125 | 4,602,814 | ||||||
Tapestry, Inc. | 111,725 | 4,941,597 | ||||||
|
| |||||||
| 9,544,411 | ||||||||
|
| |||||||
| See accompanying Notes to Financial Statements | | December 31, 2017 | | Semiannual Report | 79 |
Table of Contents
Schedule of Investments
December 31, 2017 (unaudited)
Shares | Value | |||||||
| Trading Companies & Distributors—2.0% | ||||||||
United Rentals, Inc. (a) | 36,200 | $ | 6,223,142 | |||||
|
| |||||||
| Total Common Stock (cost—$256,436,155) | 310,209,237 | |||||||
|
| |||||||
| Principal Amount (000s) | ||||||||
| Repurchase Agreements—0.8% | ||||||||
State Street Bank and Trust Co., dated |
| |||||||
(cost—$2,480,000) | $2,480 | 2,480,000 | ||||||
|
| |||||||
| Total Investments (cost—$258,916,155)—100.1% | 312,689,237 | |||||||
|
| |||||||
| Liabilities in excess of other assets—(0.1)% | (210,207 | ) | ||||||
|
| |||||||
| Net Assets—100.0% | $312,479,030 | |||||||
|
| |||||||
Notes to Schedule of Investments:
(a) Non-income producing.
Glossary:
REIT—Real Estate Investment Trust
AllianzGI NFJ Dividend Value Fund
| Shares | Value | |||||||||||
| Common Stock—99.6% | ||||||||||||
| Aerospace & Defense—4.0% | ||||||||||||
General Dynamics Corp. | 223,885 | $45,549,403 | ||||||||||
United Technologies Corp. | 353,545 | 45,101,736 | ||||||||||
|
| |||||||||||
| 90,651,139 | ||||||||||||
|
| |||||||||||
| Automobiles—2.0% | ||||||||||||
General Motors Co. | 1,074,975 | 44,063,225 | ||||||||||
|
| |||||||||||
| Banks—15.8% | ||||||||||||
Bank of America Corp. | 1,521,710 | 44,920,879 | ||||||||||
BB&T Corp. | 896,485 | 44,573,234 | ||||||||||
Citigroup, Inc. | 601,270 | 44,740,501 | ||||||||||
Citizens Financial Group, Inc. | 1,064,035 | 44,668,189 | ||||||||||
JPMorgan Chase & Co. | 813,740 | 87,021,355 | ||||||||||
SunTrust Banks, Inc. | 690,120 | 44,574,851 | ||||||||||
U.S. Bancorp | 827,615 | 44,343,612 | ||||||||||
|
| |||||||||||
| 354,842,621 | ||||||||||||
|
| |||||||||||
| Beverages—2.1% | ||||||||||||
Dr. Pepper Snapple Group, Inc. | 471,700 | 45,783,202 | ||||||||||
|
| |||||||||||
| Biotechnology—2.0% | ||||||||||||
AbbVie, Inc. | 461,760 | 44,656,810 | ||||||||||
|
| |||||||||||
| Capital Markets—4.0% | ||||||||||||
Ameriprise Financial, Inc. | 264,046 | 44,747,876 | ||||||||||
Morgan Stanley | 853,445 | 44,780,259 | ||||||||||
|
| |||||||||||
| 89,528,135 | ||||||||||||
|
| |||||||||||
| Chemicals—2.0% | ||||||||||||
Eastman Chemical Co. | 484,620 | 44,895,197 | ||||||||||
|
| |||||||||||
| Communications Equipment—2.0% | ||||||||||||
Cisco Systems, Inc. | 1,175,770 | 45,031,991 | ||||||||||
|
| |||||||||||
| Consumer Finance—2.0% | ||||||||||||
American Express Co. | 456,835 | 45,368,284 | ||||||||||
|
| |||||||||||
| Containers & Packaging—2.0% | ||||||||||||
International Paper Co. | 780,475 | 45,220,722 | ||||||||||
|
| |||||||||||
| Diversified Telecommunication Services—4.1% | ||||||||||||
AT&T, Inc. | 1,169,887 | 45,485,207 | ||||||||||
Verizon Communications, Inc. | 854,750 | 45,241,917 | ||||||||||
|
| |||||||||||
| 90,727,124 | ||||||||||||
|
| |||||||||||
| Electric Utilities—3.9% | ||||||||||||
American Electric Power Co., Inc. | 593,250 | 43,645,402 | ||||||||||
Entergy Corp. | 543,115 | 44,204,130 | ||||||||||
|
| |||||||||||
| 87,849,532 | ||||||||||||
|
| |||||||||||
| Electrical Equipment—2.0% | ||||||||||||
Eaton Corp. PLC | 578,210 | 45,684,372 | ||||||||||
|
| |||||||||||
| Energy Equipment & Services—2.0% | ||||||||||||
Schlumberger Ltd. | 654,940 | 44,136,407 | ||||||||||
|
| |||||||||||
| Food & Staples Retailing—2.0% | ||||||||||||
Wal-Mart Stores, Inc. | 462,750 | 45,696,563 | ||||||||||
|
| |||||||||||
| Food Products—1.0% | ||||||||||||
Ingredion, Inc. | 161,620 | 22,594,476 | ||||||||||
|
| |||||||||||
| Healthcare Equipment & Supplies—2.0% | ||||||||||||
Medtronic PLC | 553,970 | 44,733,078 | ||||||||||
|
| |||||||||||
Shares | Value | |||||||||||
| Healthcare Providers & Services—4.0% | ||||||||||||
Anthem, Inc. | 200,785 | $ | 45,178,633 | |||||||||
Quest Diagnostics, Inc. | 457,460 | 45,055,235 | ||||||||||
|
| |||||||||||
| 90,233,868 | ||||||||||||
|
| |||||||||||
| Hotels, Restaurants & Leisure—2.0% | ||||||||||||
Carnival Corp. | 677,349 | 44,955,653 | ||||||||||
|
| |||||||||||
| Household Products—1.0% | ||||||||||||
Procter & Gamble Co. | 244,905 | 22,501,871 | ||||||||||
|
| |||||||||||
| Industrial Conglomerates—2.0% | ||||||||||||
Honeywell International, Inc. | 293,270 | 44,975,887 | ||||||||||
|
| |||||||||||
| Insurance—6.0% | ||||||||||||
Allstate Corp. | 434,375 | 45,483,406 | ||||||||||
MetLife, Inc. | 879,165 | 44,450,583 | ||||||||||
Reinsurance Group of America, Inc. | 285,125 | 44,459,541 | ||||||||||
|
| |||||||||||
| 134,393,530 | ||||||||||||
|
| |||||||||||
| Multi-Utilities—2.0% | ||||||||||||
Public Service Enterprise Group, Inc. | 880,430 | 45,342,145 | ||||||||||
|
| |||||||||||
| Oil, Gas & Consumable Fuels—10.1% | ||||||||||||
Chevron Corp. | 366,015 | 45,821,418 | ||||||||||
ConocoPhillips | 823,765 | 45,216,461 | ||||||||||
Exxon Mobil Corp. | 542,690 | 45,390,591 | ||||||||||
Royal Dutch Shell PLC, Class A ADR | 1,339,735 | 89,373,722 | ||||||||||
|
| |||||||||||
| 225,802,192 | ||||||||||||
|
| |||||||||||
| Pharmaceuticals—4.0% | ||||||||||||
Johnson & Johnson | 320,280 | 44,749,521 | ||||||||||
Pfizer, Inc. | 1,242,885 | 45,017,295 | ||||||||||
|
| |||||||||||
| 89,766,816 | ||||||||||||
|
| |||||||||||
| Road & Rail—1.9% | ||||||||||||
Kansas City Southern | 411,250 | 43,271,725 | ||||||||||
|
| |||||||||||
| Semiconductors & Semiconductor Equipment—3.9% | ||||||||||||
Intel Corp. | 974,644 | 44,989,567 | ||||||||||
Lam Research Corp. | 235,580 | 43,363,211 | ||||||||||
|
| |||||||||||
| 88,352,778 | ||||||||||||
|
| |||||||||||
| Software—1.9% | ||||||||||||
Oracle Corp. | 913,305 | 43,181,060 | ||||||||||
|
| |||||||||||
| Technology Hardware, Storage & Peripherals—3.9% | ||||||||||||
Apple, Inc. | 258,440 | 43,735,801 | ||||||||||
HP, Inc. | 2,127,080 | 44,689,951 | ||||||||||
|
| |||||||||||
| 88,425,752 | ||||||||||||
|
| |||||||||||
| Textiles, Apparel & Luxury Goods—2.0% | ||||||||||||
V.F. Corp. | 614,970 | 45,507,780 | ||||||||||
|
| |||||||||||
| Total Common Stock (cost—$1,803,450,003) | 2,238,173,935 | |||||||||||
|
| |||||||||||
| 80 | Semiannual Report | | December 31, 2017 | | See accompanying Notes to Financial Statements |
Table of Contents
Schedule of Investments
December 31, 2017 (unaudited)
Principal Amount (000s) | Value | |||||||||||
| Repurchase Agreements—1.4% | ||||||||||||
State Street Bank and Trust Co., |
| |||||||||||
(cost—$32,377,000) | $32,377 | $ | 32,377,000 | |||||||||
|
| |||||||||||
| Total Investments (cost—$1,835,827,003)—101.0% | 2,270,550,935 | |||||||||||
|
| |||||||||||
| Liabilities in excess of other assets—(1.0)% | (22,079,158 | ) | ||||||||||
|
| |||||||||||
| Net Assets—100.0% | $2,248,471,777 | |||||||||||
|
| |||||||||||
Glossary:
ADR—American Depositary Receipt
AllianzGI NFJ International Value Fund
| Shares | Value | |||||||
| Common Stock—99.7% | ||||||||
| Australia—1.9% | ||||||||
Macquarie Group Ltd. | 95,118 | $7,356,888 | ||||||
|
| |||||||
| Brazil—1.6% | ||||||||
Hypermarcas S.A. | 206,300 | 2,238,943 | ||||||
Qualicorp S.A. | 222,400 | 2,078,143 | ||||||
Smiles Fidelidade S.A. | 83,800 | 1,917,464 | ||||||
|
| |||||||
| 6,234,550 | ||||||||
|
| |||||||
| Canada—9.9% | ||||||||
Canadian Pacific Railway Ltd. | 21,190 | 3,872,684 | ||||||
Magna International, Inc. | 130,840 | 7,414,703 | ||||||
Manulife Financial Corp. | 347,068 | 7,239,838 | ||||||
Toronto-Dominion Bank | 271,340 | 15,895,097 | ||||||
TransCanada Corp. | 80,190 | 3,900,442 | ||||||
|
| |||||||
| 38,322,764 | ||||||||
|
| |||||||
| China—8.7% | ||||||||
China Construction Bank Corp., Class H | 6,489,100 | 5,973,556 | ||||||
China Medical System Holdings Ltd. | 956,000 | 2,225,367 | ||||||
China Mobile Ltd. | 196,100 | 1,982,971 | ||||||
China Shenhua Energy Co., Ltd., Class H | 2,374,500 | 6,134,383 | ||||||
Dali Foods Group Co., Ltd. (a) | 2,342,000 | 2,126,101 | ||||||
ENN Energy Holdings Ltd. | 555,000 | 3,947,416 | ||||||
Lee & Man Paper Manufacturing Ltd. | 3,428,000 | 4,036,316 | ||||||
PICC Property & Casualty Co., Ltd., Class H | 1,982,000 | 3,797,064 | ||||||
Sinopec Shanghai Petrochemical Co., Ltd., Class H | 5,920,900 | 3,365,898 | ||||||
|
| |||||||
| 33,589,072 | ||||||||
|
| |||||||
| Denmark—1.0% | ||||||||
Danske Bank A/S | 95,818 | 3,729,427 | ||||||
|
| |||||||
| France—11.2% | ||||||||
Atos SE | 25,328 | 3,682,442 | ||||||
AXA S.A. | 263,160 | 7,798,278 | ||||||
Capgemini SE | 67,275 | 7,968,170 | ||||||
Cie Generale des Etablissements Michelin | 53,607 | 7,668,756 | ||||||
Danone S.A. | 94,121 | 7,886,475 | ||||||
Euronext NV (a) | 70,300 | 4,360,624 | ||||||
Unibail-Rodamco SE REIT | 15,700 | 3,950,931 | ||||||
|
| |||||||
| 43,315,676 | ||||||||
|
| |||||||
| Germany—8.2% | ||||||||
BASF SE | 37,000 | 4,056,360 | ||||||
Bayer AG | 31,719 | 3,941,501 | ||||||
Continental AG | 15,399 | 4,140,481 | ||||||
Covestro AG (a) | 39,074 | 4,023,310 | ||||||
Fresenius Medical Care AG & Co. KGaA | 40,485 | 4,251,316 | ||||||
Henkel AG & Co. KGaA | 28,667 | 3,432,787 | ||||||
Muenchener Rueckversicherungs-Gesellschaft AG in Muenchen | 35,158 | 7,592,361 | ||||||
|
| |||||||
| 31,438,116 | ||||||||
|
| |||||||
| Hong Kong—2.5% | ||||||||
BOC Hong Kong Holdings Ltd. | 1,152,400 | 5,823,968 | ||||||
Shares | Value | |||||||
WH Group Ltd. (a) | 3,226,700 | $ | 3,642,652 | |||||
|
| |||||||
| 9,466,620 | ||||||||
|
| |||||||
| Indonesia—1.1% | ||||||||
Bank Rakyat Indonesia Persero Tbk PT | 16,104,000 | 4,320,513 | ||||||
|
| |||||||
| Ireland—1.9% | ||||||||
Smurfit Kappa Group PLC | 222,257 | 7,517,566 | ||||||
|
| |||||||
| Israel—2.0% | ||||||||
Bank Hapoalim BM | 1,043,690 | 7,664,616 | ||||||
|
| |||||||
| Italy—1.0% | ||||||||
Terna Rete Elettrica Nazionale SpA | 655,062 | 3,807,913 | ||||||
|
| |||||||
| Japan—12.7% | ||||||||
Asahi Group Holdings Ltd. | �� | 76,200 | 3,781,010 | |||||
Astellas Pharma, Inc. | 247,200 | 3,140,249 | ||||||
Daiwa House Industry Co., Ltd. | 110,800 | 4,248,889 | ||||||
Fujitsu Ltd. | 545,200 | 3,865,210 | ||||||
Hitachi Ltd. | 464,200 | 3,601,355 | ||||||
Hoya Corp. | 75,900 | 3,780,060 | ||||||
Mitsubishi Electric Corp. | 238,900 | 3,959,189 | ||||||
MS&AD Insurance Group Holdings, Inc. | 220,700 | 7,444,311 | ||||||
Nippon Telegraph & Telephone Corp. | 157,100 | 7,385,911 | ||||||
West Japan Railway Co. | 104,500 | 7,623,691 | ||||||
|
| |||||||
| 48,829,875 | ||||||||
|
| |||||||
| Korea (Republic of)—3.0% | ||||||||
POSCO ADR | 74,960 | 5,856,625 | ||||||
Samsung Electronics Co., Ltd. | 2,410 | 5,725,944 | ||||||
|
| |||||||
| 11,582,569 | ||||||||
|
| |||||||
| Mexico—1.1% | ||||||||
Grupo Aeroportuario del Pacifico S.A.B de C.V., Class B | 403,700 | 4,147,357 | ||||||
|
| |||||||
| Netherlands—4.9% | ||||||||
Coca-Cola European Partners PLC | 89,130 | 3,551,830 | ||||||
Heineken NV | 37,042 | 3,861,525 | ||||||
ING Groep NV | 624,397 | 11,461,884 | ||||||
|
| |||||||
| 18,875,239 | ||||||||
|
| |||||||
| Norway—2.0% | ||||||||
Telenor ASA | 351,726 | 7,529,326 | ||||||
|
| |||||||
| Russian Federation—1.5% | ||||||||
LUKOIL PJSC ADR | 99,570 | 5,740,210 | ||||||
|
| |||||||
| Singapore—2.1% | ||||||||
DBS Group Holdings Ltd. | 432,900 | 8,007,040 | ||||||
|
| |||||||
| South Africa—1.8% | ||||||||
Rand Merchant Investment Holdings Ltd. | 576,886 | 2,135,834 | ||||||
Standard Bank Group Ltd. | 312,904 | 4,926,801 | ||||||
|
| |||||||
| 7,062,635 | ||||||||
|
| |||||||
| Sweden—0.9% | ||||||||
Electrolux AB, Ser. B | 110,740 | 3,565,314 | ||||||
|
| |||||||
| Taiwan—3.4% | ||||||||
Hon Hai Precision Industry Co., Ltd. GDR | 553,293 | 3,502,345 | ||||||
| See accompanying Notes to Financial Statements | | December 31, 2017 | | Semiannual Report | 81 |
Table of Contents
Schedule of Investments
December 31, 2017 (unaudited)
Shares | Value | |||||||
Taiwan Semiconductor Manufacturing Co., Ltd. ADR | 241,730 | $ | 9,584,594 | |||||
|
| |||||||
| 13,086,939 | ||||||||
|
| |||||||
| United Kingdom—13.3% | ||||||||
3i Group PLC | 329,500 | 4,056,513 | ||||||
BAE Systems PLC ADR | 124,190 | 3,872,244 | ||||||
Carnival PLC | 58,785 | 3,867,788 | ||||||
Compass Group PLC | 188,600 | 4,066,633 | ||||||
Howden Joinery Group PLC | 665,400 | 4,188,599 | ||||||
Imperial Brands PLC | 190,440 | 8,123,150 | ||||||
Legal & General Group PLC | 2,032,252 | 7,481,902 | ||||||
Rio Tinto PLC | 153,480 | 8,051,192 | ||||||
Royal Dutch Shell PLC, Class A ADR | 111,240 | 7,420,820 | ||||||
|
| |||||||
| 51,128,841 | ||||||||
|
| |||||||
| United States—2.0% | ||||||||
Broadcom Ltd. | 14,900 | 3,827,810 | ||||||
TE Connectivity Ltd. | 40,700 | 3,868,128 | ||||||
|
| |||||||
| 7,695,938 | ||||||||
|
| |||||||
| Total Common Stock (cost—$329,269,862) | 384,015,004 | |||||||
|
| |||||||
| Principal Amount (000s) | ||||||||
| Repurchase Agreements—0.6% | ||||||||
State Street Bank and Trust Co., |
| |||||||
(cost—$2,166,000) | $2,166 | 2,166,000 | ||||||
|
| |||||||
| Total Investments (cost—$331,435,862) (b)—100.3% | 386,181,004 | |||||||
|
| |||||||
| Liabilities in excess of other assets—(0.3)% | (1,083,952 | ) | ||||||
|
| |||||||
| Net Assets—100.0% | $385,097,052 | |||||||
|
| |||||||
Notes to Schedule of Investments:
(a) 144A—Exempt from registration under Rule 144A of the Securities Act of 1933. These securities may be resold in transactions exempt from registration, typically only to qualified institutional buyers. Securities with an aggregate value of $14,152,687, representing 3.7% of net assets.
(b) Securities with an aggregate value of $274,683,139, representing 71.3% of net assets, were valued utilizing modeling tools provided by a third-party vendor. See Note 1(a) and Note 1(b) in the Notes to Financial Statements.
Glossary:
ADR—American Depositary Receipt
GDR—Global Depositary Receipt
REIT—Real Estate Investment Trust
The industry classification of portfolio holdings and liabilities in excess of other assets shown as a percentage of net assets were as follows:
Banks | 17.6% | |||
Insurance | 11.3% | |||
Oil, Gas & Consumable Fuels | 6.0% | |||
Auto Components | 5.0% | |||
Capital Markets | 4.1% | |||
IT Services | 4.0% | |||
Diversified Telecommunication Services | 3.9% | |||
Metals & Mining | 3.6% | |||
Food Products | 3.5% | |||
Semiconductors & Semiconductor Equipment | 3.5% | |||
Road & Rail | 3.0% | |||
Chemicals | 3.0% | |||
Beverages | 2.9% | |||
Electronic Equipment, Instruments & Components | 2.9% | |||
Pharmaceuticals | 2.4% | |||
Tobacco | 2.1% | |||
Hotels, Restaurants & Leisure | 2.1% | |||
Containers & Packaging | 2.0% | |||
Healthcare Providers & Services | 1.6% | |||
Technology Hardware, Storage & Peripherals | 1.5% | |||
Real Estate Management & Development | 1.1% | |||
Trading Companies & Distributors | 1.1% | |||
Transportation Infrastructure | 1.1% | |||
Paper & Forest Products | 1.0% | |||
Electrical Equipment | 1.0% | |||
Equity Real Estate Investment Trusts (REITs) | 1.0% | |||
Gas Utilities | 1.0% | |||
Aerospace & Defense | 1.0% | |||
Electric Utilities | 1.0% | |||
Healthcare Equipment & Supplies | 1.0% | |||
Household Durables | 0.9% | |||
Household Products | 0.9% | |||
Personal Products | 0.6% | |||
Wireless Telecommunication Services | 0.5% | |||
Advertising | 0.5% | |||
Repurchase Agreements | 0.6% | |||
Liabilities in excess of other assets | (0.3)% | |||
|
| |||
| 100.0% | ||||
|
|
AllianzGI NFJ Large-Cap Value Fund
| Shares | Value | |||||||
| Common Stock—99.1% | ||||||||
| Aerospace & Defense—2.0% | ||||||||
Huntington Ingalls Industries, Inc. | 15,800 | $3,724,060 | ||||||
United Technologies Corp. | 30,500 | 3,890,885 | ||||||
|
| |||||||
| 7,614,945 | ||||||||
|
| |||||||
| Air Freight & Logistics—1.0% | ||||||||
FedEx Corp. | 15,000 | 3,743,100 | ||||||
|
| |||||||
| Auto Components—1.6% | ||||||||
BorgWarner, Inc. | 61,700 | 3,152,253 | ||||||
Lear Corp. | 18,100 | 3,197,546 | ||||||
|
| |||||||
| 6,349,799 | ||||||||
|
| |||||||
| Banks—16.2% | ||||||||
Bank of America Corp. | 392,300 | 11,580,696 | ||||||
BB&T Corp. | 77,900 | 3,873,188 | ||||||
Citigroup, Inc. | 161,200 | 11,994,892 | ||||||
Citizens Financial Group, Inc. | 97,200 | 4,080,456 | ||||||
JPMorgan Chase & Co. | 146,100 | 15,623,934 | ||||||
Regions Financial Corp. | 255,300 | 4,411,584 | ||||||
SunTrust Banks, Inc. | 118,000 | 7,621,620 | ||||||
U.S. Bancorp | 68,200 | 3,654,156 | ||||||
|
| |||||||
| 62,840,526 | ||||||||
|
| |||||||
| Beverages—1.9% | ||||||||
Dr. Pepper Snapple Group, Inc. | 39,300 | 3,814,458 | ||||||
PepsiCo, Inc. | 31,000 | 3,717,520 | ||||||
|
| |||||||
| 7,531,978 | ||||||||
|
| |||||||
| Biotechnology—1.0% | ||||||||
AbbVie, Inc. | 38,800 | 3,752,348 | ||||||
|
| |||||||
| Building Products—1.2% | ||||||||
Owens Corning | 51,000 | 4,688,940 | ||||||
|
| |||||||
| Capital Markets—4.1% | ||||||||
Bank of New York Mellon Corp. | 69,800 | 3,759,428 | ||||||
Goldman Sachs Group, Inc. | 15,500 | 3,948,780 | ||||||
Invesco Ltd. | 99,400 | 3,632,076 | ||||||
Morgan Stanley | 83,500 | 4,381,245 | ||||||
|
| |||||||
| 15,721,529 | ||||||||
|
| |||||||
| Chemicals—2.6% | ||||||||
Cabot Corp. | 58,300 | 3,590,697 | ||||||
DowDuPont, Inc. | 43,800 | 3,119,436 | ||||||
Eastman Chemical Co. | 35,600 | 3,297,984 | ||||||
|
| |||||||
| 10,008,117 | ||||||||
|
| |||||||
| Communications Equipment—2.3% | ||||||||
Cisco Systems, Inc. | 234,400 | 8,977,520 | ||||||
|
| |||||||
| Consumer Finance—2.3% | ||||||||
American Express Co. | 90,300 | 8,967,693 | ||||||
|
| |||||||
| Containers & Packaging—0.9% | ||||||||
Packaging Corp. of America | 27,900 | 3,363,345 | ||||||
|
| |||||||
| Diversified Telecommunication Services—1.9% | ||||||||
AT&T, Inc. | 93,500 | 3,635,280 | ||||||
Verizon Communications, Inc. | 73,300 | 3,879,769 | ||||||
|
| |||||||
| 7,515,049 | ||||||||
|
| |||||||
| Electric Utilities—3.9% | ||||||||
American Electric Power Co., Inc. | 50,900 | 3,744,713 | ||||||
Entergy Corp. | 90,300 | 7,349,517 | ||||||
Great Plains Energy, Inc. | 120,400 | 3,881,696 | ||||||
|
| |||||||
| 14,975,926 | ||||||||
|
| |||||||
| 82 | Semiannual Report | | December 31, 2017 | | See accompanying Notes to Financial Statements |
Table of Contents
Schedule of Investments
December 31, 2017 (unaudited)
Shares | Value | |||||||
| Electronic Equipment, Instruments & Components—0.9% | ||||||||
TE Connectivity Ltd. | 36,400 | $ | 3,459,456 | |||||
|
| |||||||
| Energy Equipment & Services—1.9% | ||||||||
Halliburton Co. | 79,300 | 3,875,391 | ||||||
Schlumberger Ltd. | 52,600 | 3,544,714 | ||||||
|
| |||||||
| 7,420,105 | ||||||||
|
| |||||||
| Food & Staples Retailing—2.2% | ||||||||
Wal-Mart Stores, Inc. | 88,300 | 8,719,625 | ||||||
|
| |||||||
| Food Products—2.1% | ||||||||
Ingredion, Inc. | 27,800 | 3,886,440 | ||||||
Tyson Foods, Inc., Class A | 51,100 | 4,142,677 | ||||||
|
| |||||||
| 8,029,117 | ||||||||
|
| |||||||
| Healthcare Equipment & Supplies—0.9% | ||||||||
Medtronic PLC | 44,100 | 3,561,075 | ||||||
|
| |||||||
| Healthcare Providers & Services—3.6% | ||||||||
Anthem, Inc. | 31,000 | 6,975,310 | ||||||
Encompass Health Corp. | 75,700 | 3,740,337 | ||||||
Quest Diagnostics, Inc. | 33,400 | 3,289,566 | ||||||
|
| |||||||
| 14,005,213 | ||||||||
|
| |||||||
| Hotels, Restaurants & Leisure—1.1% | ||||||||
Royal Caribbean Cruises Ltd. | 37,100 | 4,425,288 | ||||||
|
| |||||||
| Household Products—0.8% | ||||||||
Kimberly-Clark Corp. | 26,100 | 3,149,226 | ||||||
|
| |||||||
| Industrial Conglomerates—2.0% | ||||||||
Honeywell International, Inc. | 51,600 | 7,913,376 | ||||||
|
| |||||||
| Insurance—5.0% | ||||||||
Allstate Corp. | 39,400 | 4,125,574 | ||||||
CNA Financial Corp. | 69,900 | 3,708,195 | ||||||
Reinsurance Group of America, Inc. | 24,900 | 3,882,657 | ||||||
Unum Group | 138,800 | 7,618,732 | ||||||
|
| |||||||
| 19,335,158 | ||||||||
|
| |||||||
| Machinery—2.0% | ||||||||
Ingersoll-Rand PLC | 39,600 | 3,531,924 | ||||||
Oshkosh Corp. | 47,200 | 4,290,008 | ||||||
|
| |||||||
| 7,821,932 | ||||||||
|
| |||||||
| Media—1.0% | ||||||||
Comcast Corp., Class A | 97,800 | 3,916,890 | ||||||
|
| |||||||
| Multi-Utilities—1.1% | ||||||||
Public Service Enterprise Group, Inc. | 81,100 | 4,176,650 | ||||||
|
| |||||||
| Oil, Gas & Consumable Fuels—10.4% | ||||||||
Chevron Corp. | 64,200 | 8,037,198 | ||||||
ConocoPhillips | 152,300 | 8,359,747 | ||||||
Devon Energy Corp. | 183,800 | 7,609,320 | ||||||
EOG Resources, Inc. | 36,000 | 3,884,760 | ||||||
Royal Dutch Shell PLC, Class A ADR | 65,300 | 4,356,163 | ||||||
Total S.A. ADR | 70,300 | 3,886,184 | ||||||
Valero Energy Corp. | 47,500 | 4,365,725 | ||||||
|
| |||||||
| 40,499,097 | ||||||||
|
| |||||||
| Pharmaceuticals—6.7% | ||||||||
Bristol-Myers Squibb Co. | 56,000 | 3,431,680 | ||||||
Johnson & Johnson | 85,800 | 11,987,976 | ||||||
Merck & Co., Inc. | 57,400 | 3,229,898 | ||||||
Pfizer, Inc. | 207,000 | 7,497,540 | ||||||
|
| |||||||
| 26,147,094 | ||||||||
|
| |||||||
Shares | Value | |||||||
| Road & Rail—1.7% | ||||||||
Kansas City Southern | 29,700 | $ | 3,125,034 | |||||
Union Pacific Corp. | 25,100 | 3,365,910 | ||||||
|
| |||||||
| 6,490,944 | ||||||||
|
| |||||||
| Semiconductors & Semiconductor Equipment—3.8% | ||||||||
Intel Corp. | 169,500 | 7,824,120 | ||||||
Lam Research Corp. | 38,100 | 7,013,067 | ||||||
|
| |||||||
| 14,837,187 | ||||||||
|
| |||||||
| Software—1.9% | ||||||||
Microsoft Corp. | 43,800 | 3,746,652 | ||||||
Oracle Corp. | 79,400 | 3,754,032 | ||||||
|
| |||||||
| 7,500,684 | ||||||||
|
| |||||||
| Specialty Retail—1.1% | ||||||||
Lowe’s Cos., Inc. | 46,400 | 4,312,416 | ||||||
|
| |||||||
| Technology Hardware, Storage & Peripherals—2.8% | ||||||||
Apple, Inc. | 23,900 | 4,044,597 | ||||||
HP, Inc. | 181,600 | 3,815,416 | ||||||
Xerox Corp. | 106,400 | 3,101,560 | ||||||
|
| |||||||
| 10,961,573 | ||||||||
|
| |||||||
| Textiles, Apparel & Luxury Goods—2.0% | ||||||||
V.F. Corp. | 102,600 | 7,592,400 | ||||||
|
| |||||||
| Tobacco—1.2% | ||||||||
Altria Group, Inc. | 66,600 | 4,755,906 | ||||||
|
| |||||||
Total Common Stock (cost—$323,078,500) |
| 385,081,227 | ||||||
|
| |||||||
| Principal Amount (000s) | ||||||||
| Repurchase Agreements—0.8% | ||||||||
State Street Bank and Trust Co.,dated 12/29/17, 0.20%, due 1/2/18, proceeds $3,062,068; collateralized by U.S. Treasury Notes, 1.625%, due 2/15/26, valued at $3,125,565 including accrued interest |
| |||||||
(cost—$3,062,000) | $3,062 | 3,062,000 | ||||||
|
| |||||||
| Total Investments (cost—$326,140,500)—99.9% | 388,143,227 | |||||||
|
| |||||||
| Other assets less liabilities—0.1% | 240,261 | |||||||
|
| |||||||
| Net Assets—100.0% | $388,383,488 | |||||||
|
| |||||||
Glossary:
ADR—American Depositary Receipt
AllianzGI NFJ Mid-Cap Value Fund
| Shares | Value | |||||||
| Common Stock—95.8% | ||||||||
| Aerospace & Defense—4.2% | ||||||||
Huntington Ingalls Industries, Inc. | 45,800 | $10,795,060 | ||||||
Orbital ATK, Inc. | 81,800 | 10,756,700 | ||||||
Rockwell Collins, Inc. | 73,200 | 9,927,384 | ||||||
Spirit AeroSystems Holdings, Inc., Class A | 136,200 | 11,883,450 | ||||||
|
| |||||||
| 43,362,594 | ||||||||
|
| |||||||
| Air Freight & Logistics—1.1% | ||||||||
FedEx Corp. | 44,150 | 11,017,191 | ||||||
|
| |||||||
| Airlines—1.2% | ||||||||
Southwest Airlines Co. | 186,100 | 12,180,245 | ||||||
|
| |||||||
| Auto Components—2.1% | ||||||||
Lear Corp. | 60,100 | 10,617,266 | ||||||
Magna International, Inc. | 189,700 | 10,750,299 | ||||||
|
| |||||||
| 21,367,565 | ||||||||
|
| |||||||
| Automobiles—1.2% | ||||||||
Thor Industries, Inc. | 79,300 | 11,952,096 | ||||||
|
| |||||||
| Banks—7.3% | ||||||||
BB&T Corp. | 197,600 | 9,824,672 | ||||||
BOK Financial Corp. | 114,100 | 10,533,712 | ||||||
Comerica, Inc. | 130,900 | 11,363,429 | ||||||
Fifth Third Bancorp | 305,700 | 9,274,938 | ||||||
KeyCorp | 562,400 | 11,343,608 | ||||||
Regions Financial Corp. | 644,200 | 11,131,776 | ||||||
SunTrust Banks, Inc. | 167,500 | 10,818,825 | ||||||
|
| |||||||
| 74,290,960 | ||||||||
|
| |||||||
| Beverages—2.0% | ||||||||
Coca-Cola European Partners PLC | 270,100 | 10,763,485 | ||||||
Molson Coors Brewing Co., Class B | 117,300 | 9,626,811 | ||||||
|
| |||||||
| 20,390,296 | ||||||||
|
| |||||||
| Building Products—1.1% | ||||||||
Owens Corning | 122,100 | 11,225,874 | ||||||
|
| |||||||
| Capital Markets—6.2% | ||||||||
Affiliated Managers Group, Inc. | 53,000 | 10,878,250 | ||||||
Ameriprise Financial, Inc. | 63,900 | 10,829,133 | ||||||
Bank of New York Mellon Corp. | 197,000 | 10,610,420 | ||||||
Invesco Ltd. | 290,400 | 10,611,216 | ||||||
Raymond James Financial, Inc. | 108,900 | 9,724,770 | ||||||
State Street Corp. | 110,800 | 10,815,188 | ||||||
|
| |||||||
| 63,468,977 | ||||||||
|
| |||||||
| Chemicals—2.9% | ||||||||
Celanese Corp., Ser. A | 96,800 | 10,365,344 | ||||||
Eastman Chemical Co. | 115,800 | 10,727,712 | ||||||
PPG Industries, Inc. | 75,200 | 8,784,864 | ||||||
|
| |||||||
| 29,877,920 | ||||||||
|
| |||||||
| Communications Equipment—1.8% | ||||||||
Harris Corp. | 62,400 | 8,838,960 | ||||||
Juniper Networks, Inc. | 320,700 | 9,139,950 | ||||||
|
| |||||||
| 17,978,910 | ||||||||
|
| |||||||
| Construction & Engineering—2.2% | ||||||||
EMCOR Group, Inc. | 133,400 | 10,905,450 | ||||||
Jacobs Engineering Group, Inc. | 172,100 | 11,351,716 | ||||||
|
| |||||||
| 22,257,166 | ||||||||
|
| |||||||
| See accompanying Notes to Financial Statements | | December 31, 2017 | | Semiannual Report | 83 |
Table of Contents
Schedule of Investments
December 31, 2017 (unaudited)
Shares | Value | |||||||
| Consumer Finance—1.1% | ||||||||
Discover Financial Services | 149,800 | $ | 11,522,616 | |||||
|
| |||||||
| Containers & Packaging—2.9% | ||||||||
International Paper Co. | 185,700 | 10,759,458 | ||||||
Packaging Corp. of America | 70,300 | 8,474,665 | ||||||
Sonoco Products Co. | 186,900 | 9,931,866 | ||||||
|
| |||||||
| 29,165,989 | ||||||||
|
| |||||||
| Distributors—1.0% | ||||||||
Genuine Parts Co. | 111,200 | 10,565,112 | ||||||
|
| |||||||
| Electric Utilities—3.4% | ||||||||
American Electric Power Co., Inc. | 104,800 | 7,710,136 | ||||||
Entergy Corp. | 104,500 | 8,505,255 | ||||||
PPL Corp. | 343,600 | 10,634,420 | ||||||
Southern Co. | 171,300 | 8,237,817 | ||||||
|
| |||||||
| 35,087,628 | ||||||||
|
| |||||||
| Electrical Equipment—1.1% | ||||||||
Eaton Corp. PLC | 138,300 | 10,927,083 | ||||||
|
| |||||||
| Electronic Equipment, Instruments & Components—2.0% | ||||||||
Corning, Inc. | 286,500 | 9,165,135 | ||||||
TE Connectivity Ltd. | 113,100 | 10,749,024 | ||||||
|
| |||||||
| 19,914,159 | ||||||||
|
| |||||||
| Equity Real Estate Investment Trusts (REITs)—7.8% | ||||||||
American Tower Corp. | 75,500 | 10,771,585 | ||||||
Digital Realty Trust, Inc. | 94,800 | 10,797,720 | ||||||
Lamar Advertising Co., Class A | 143,600 | 10,660,864 | ||||||
Mid-America Apartment Communities, Inc. | 106,500 | 10,709,640 | ||||||
National Health Investors, Inc. | 139,900 | 10,545,662 | ||||||
Prologis, Inc. | 166,300 | 10,728,013 | ||||||
Ventas, Inc. | 86,600 | 5,196,866 | ||||||
Weyerhaeuser Co. | 304,300 | 10,729,618 | ||||||
|
| |||||||
| 80,139,968 | ||||||||
|
| |||||||
| Food Products—2.9% | ||||||||
Archer-Daniels-Midland Co. | 199,300 | 7,987,944 | ||||||
General Mills, Inc. | 90,000 | 5,336,100 | ||||||
Ingredion, Inc. | 78,200 | 10,932,360 | ||||||
JM Smucker Co. | 43,400 | 5,392,016 | ||||||
|
| |||||||
| 29,648,420 | ||||||||
|
| |||||||
| Healthcare Equipment & Supplies—1.5% | ||||||||
STERIS PLC | 93,800 | 8,204,686 | ||||||
Zimmer Biomet Holdings, Inc. | 58,800 | 7,095,396 | ||||||
|
| |||||||
| 15,300,082 | ||||||||
|
| |||||||
| Healthcare Providers & Services—4.2% | ||||||||
Anthem, Inc. | 39,000 | 8,775,390 | ||||||
Cardinal Health, Inc. | 97,000 | 5,943,190 | ||||||
Fresenius Medical Care AG & Co. KGaA ADR | 206,100 | 10,830,555 | ||||||
McKesson Corp. | 45,300 | 7,064,535 | ||||||
Universal Health Services, Inc., Class B | 90,100 | 10,212,835 | ||||||
|
| |||||||
| 42,826,505 | ||||||||
|
| |||||||
| Household Durables—1.2% | ||||||||
DR Horton, Inc. | 241,100 | 12,312,977 | ||||||
|
| |||||||
Shares | Value | |||||||
| Household Products—1.1% | ||||||||
Church & Dwight Co., Inc. | 215,800 | $ | 10,826,686 | |||||
|
| |||||||
| Insurance—7.7% | ||||||||
American Financial Group, Inc. | 93,900 | 10,191,906 | ||||||
Aon PLC | 57,900 | 7,758,600 | ||||||
Everest Re Group Ltd. | 44,100 | 9,757,566 | ||||||
Hartford Financial Services Group, Inc. | 156,600 | 8,813,448 | ||||||
Lincoln National Corp. | 138,200 | 10,623,434 | ||||||
Principal Financial Group, Inc. | 150,300 | 10,605,168 | ||||||
Prudential Financial, Inc. | 90,900 | 10,451,682 | ||||||
Unum Group | 195,100 | 10,709,039 | ||||||
|
| |||||||
| 78,910,843 | ||||||||
|
| |||||||
| IT Services—3.9% | ||||||||
Amdocs Ltd. | 110,700 | 7,248,636 | ||||||
Booz Allen Hamilton Holding Corp. | 171,800 | 6,550,734 | ||||||
DXC Technology Co. | 103,200 | 9,793,680 | ||||||
Fidelity National Information Services, Inc. | 80,000 | 7,527,200 | ||||||
Genpact Ltd. | 284,900 | 9,042,726 | ||||||
|
| |||||||
| 40,162,976 | ||||||||
| �� | |||||||
| Leisure Equipment & Products—0.9% | ||||||||
Brunswick Corp. | 165,300 | 9,127,866 | ||||||
|
| |||||||
| Machinery—3.6% | ||||||||
Crane Co. | 93,400 | 8,333,148 | ||||||
Cummins, Inc. | 62,800 | 11,092,992 | ||||||
Illinois Tool Works, Inc. | 48,900 | 8,158,965 | ||||||
Ingersoll-Rand PLC | 103,500 | 9,231,165 | ||||||
|
| |||||||
| 36,816,270 | ||||||||
|
| |||||||
| Media—0.7% | ||||||||
WPP PLC ADR | 78,000 | 7,063,680 | ||||||
|
| |||||||
| Metals & Mining—1.0% | ||||||||
Nucor Corp. | 166,400 | 10,579,712 | ||||||
|
| |||||||
| Multi-Utilities—0.9% | ||||||||
Public Service Enterprise Group, Inc. | 183,400 | 9,445,100 | ||||||
|
| |||||||
| Oil, Gas & Consumable Fuels—6.3% | ||||||||
Buckeye Partners L.P. | 149,700 | 7,417,635 | ||||||
EQT Midstream Partners L.P. | 159,500 | 11,659,450 | ||||||
Magellan Midstream Partners L.P. | 160,100 | 11,357,494 | ||||||
Marathon Petroleum Corp. | 172,800 | 11,401,344 | ||||||
Spectra Energy Partners L.P. | 267,200 | 10,565,088 | ||||||
Valero Energy Corp. | 126,000 | 11,580,660 | ||||||
|
| |||||||
| 63,981,671 | ||||||||
|
| |||||||
| Professional Services—1.0% | ||||||||
ManpowerGroup, Inc. | 84,300 | 10,631,073 | ||||||
|
| |||||||
| Road & Rail—3.2% | ||||||||
Canadian Pacific Railway Ltd. | 59,800 | 10,929,048 | ||||||
Kansas City Southern | 99,500 | 10,469,390 | ||||||
Norfolk Southern Corp. | 78,900 | 11,432,610 | ||||||
|
| |||||||
| 32,831,048 | ||||||||
|
| |||||||
Shares | Value | |||||||
| Semiconductors & Semiconductor Equipment—3.1% | ||||||||
Applied Materials, Inc. | 210,900 | $ | 10,781,208 | |||||
Lam Research Corp. | 58,200 | 10,712,874 | ||||||
Skyworks Solutions, Inc. | 110,200 | 10,463,490 | ||||||
|
| |||||||
| 31,957,572 | ||||||||
|
| |||||||
| Total Common Stock (cost—$753,090,890) | 979,114,830 | |||||||
|
| |||||||
| Principal Amount (000s) | ||||||||
| Repurchase Agreements—4.2% | ||||||||
State Street Bank and Trust Co., dated 12/29/17, 0.20%, due 1/2/18, proceeds $43,324,963; collateralized by U.S. Treasury Notes, 1.625%, due 2/15/26, valued at $44,194,249 including accrued interest |
| |||||||
(cost—$43,324,000) | $43,324 | 43,324,000 | ||||||
|
| |||||||
Total Investments (cost—$796,414,890)—100.0% |
| 1,022,438,830 | ||||||
|
| |||||||
| Other assets less liabilities—0.0% | 272,317 | |||||||
|
| |||||||
| Net Assets—100.0% | $1,022,711,147 | |||||||
|
| |||||||
Glossary:
ADR—American Depositary Receipt
REIT—Real Estate Investment Trust
| 84 | Semiannual Report | | December 31, 2017 | | See accompanying Notes to Financial Statements |
Table of Contents
Schedule of Investments
December 31, 2017 (unaudited)
AllianzGI NFJ Small-Cap Value Fund
| Shares | Value | |||||||
| Common Stock—98.4% | ||||||||
| Aerospace & Defense—2.4% | ||||||||
CAE, Inc. | 1,610,800 | $29,896,448 | ||||||
Elbit Systems Ltd. | 28,348 | 3,778,505 | ||||||
Orbital ATK, Inc. | 248,175 | 32,635,012 | ||||||
|
| |||||||
| 66,309,965 | ||||||||
|
| |||||||
| Airlines—1.0% | ||||||||
WestJet Airlines Ltd. | 1,252,486 | 26,265,339 | ||||||
|
| |||||||
| Auto Components—2.1% | ||||||||
Dana, Inc. | 1,055,210 | 33,777,272 | ||||||
Tenneco, Inc. | 407,000 | 23,825,780 | ||||||
|
| |||||||
| 57,603,052 | ||||||||
|
| |||||||
| Automobiles—1.3% | ||||||||
Thor Industries, Inc. | 225,450 | 33,979,824 | ||||||
|
| |||||||
| Banks—16.4% | ||||||||
Associated Banc-Corp | 1,083,200 | 27,513,280 | ||||||
Berkshire Hills Bancorp, Inc. | 722,874 | 26,457,188 | ||||||
East West Bancorp, Inc. | 461,990 | 28,102,852 | ||||||
Fidelity Southern Corp. | 1,113,400 | 24,272,120 | ||||||
First Horizon National Corp. | 1,379,100 | 27,568,209 | ||||||
First Interstate Bancsystem, Inc., Class A | 687,548 | 27,536,297 | ||||||
First Midwest Bancorp, Inc. | 1,123,722 | 26,980,565 | ||||||
FNB Corp. | 1,969,255 | 27,215,104 | ||||||
Great Western Bancorp, Inc. | 677,195 | 26,952,361 | ||||||
Heartland Financial USA, Inc. | 541,270 | 29,039,136 | ||||||
Hilltop Holdings, Inc. | 1,078,100 | 27,308,273 | ||||||
Old National Bancorp | 1,542,720 | 26,920,464 | ||||||
Simmons First National Corp., Class A | 495,400 | 28,287,340 | ||||||
TCF Financial Corp. | 1,358,640 | 27,852,120 | ||||||
Umpqua Holdings Corp. | 1,262,340 | 26,256,672 | ||||||
United Community Banks, Inc. | 983,730 | 27,682,162 | ||||||
WesBanco, Inc. | 198,021 | 8,049,554 | ||||||
|
| |||||||
| 443,993,697 | ||||||||
|
| |||||||
| Building Products—1.2% | ||||||||
Universal Forest Products, Inc. | 900,592 | 33,880,271 | ||||||
|
| |||||||
| Capital Markets—2.0% | ||||||||
AllianceBernstein Holding L.P. | 533,012 | 13,351,951 | ||||||
Houlihan Lokey, Inc. | 596,950 | 27,119,438 | ||||||
OM Asset Management PLC | 814,344 | 13,640,262 | ||||||
|
| |||||||
| 54,111,651 | ||||||||
|
| |||||||
| Chemicals—5.2% | ||||||||
Cabot Corp. | 532,260 | 32,781,893 | ||||||
Innophos Holdings, Inc. | 511,852 | 23,918,844 | ||||||
Methanex Corp. | 476,600 | 28,858,130 | ||||||
Orion Engineered Carbons S.A. | 1,249,275 | 31,981,440 | ||||||
Rentech Nitrogen Partners | 555,768 | 56 | ||||||
Stepan Co. | 291,958 | 23,055,923 | ||||||
|
| |||||||
| 140,596,286 | ||||||||
|
| |||||||
Shares | Value | |||||||
| Commercial Services & Supplies—3.4% | ||||||||
Deluxe Corp. | 448,550 | $ | 34,466,582 | |||||
Ennis, Inc. | 808,501 | 16,776,396 | ||||||
Interface, Inc. | 1,384,358 | 34,816,604 | ||||||
Knoll, Inc. | 216,690 | 4,992,537 | ||||||
|
| |||||||
| 91,052,119 | ||||||||
|
| |||||||
| Construction & Engineering—3.5% | ||||||||
Argan, Inc. | 399,523 | 17,978,535 | ||||||
Comfort Systems USA, Inc. | 785,870 | 34,303,226 | ||||||
EMCOR Group, Inc. | 227,700 | 18,614,475 | ||||||
KBR, Inc. | 1,205,610 | 23,907,246 | ||||||
|
| |||||||
| 94,803,482 | ||||||||
|
| |||||||
| Containers & Packaging—2.1% | ||||||||
Graphic Packaging Holding Co. | 1,898,020 | 29,324,409 | ||||||
Silgan Holdings, Inc. | 915,306 | 26,900,843 | ||||||
|
| |||||||
| 56,225,252 | ||||||||
|
| |||||||
| Electrical Equipment—2.0% | ||||||||
EnerSys | 355,051 | 24,722,201 | ||||||
Regal Beloit Corp. | 380,720 | 29,163,152 | ||||||
|
| |||||||
| 53,885,353 | ||||||||
|
| |||||||
| Electronic Equipment, Instruments & Components—4.5% | ||||||||
Belden, Inc. | 354,790 | 27,379,144 | ||||||
Methode Electronics, Inc. | 696,912 | 27,946,171 | ||||||
SYNNEX Corp. | 250,171 | 34,010,748 | ||||||
Vishay Intertechnology, Inc. | 1,503,000 | 31,187,250 | ||||||
|
| |||||||
| 120,523,313 | ||||||||
|
| |||||||
| Equity Real Estate Investment Trusts (REITs)—5.9% | ||||||||
Cousins Properties, Inc. | 2,680,730 | 24,796,753 | ||||||
CyrusOne, Inc. | 523,444 | 31,160,621 | ||||||
InfraREIT, Inc. | 1,377,620 | 25,596,180 | ||||||
Monmouth Real Estate Investment Corp. | 1,935,498 | 34,451,864 | ||||||
National Health Investors, Inc. | 388,800 | 29,307,744 | ||||||
Potlatch Corp. | 257,500 | 12,849,250 | ||||||
|
| |||||||
| 158,162,412 | ||||||||
|
| |||||||
| Food Products—1.7% | ||||||||
Ingredion, Inc. | 241,960 | 33,826,008 | ||||||
Sanderson Farms, Inc. | 85,900 | 11,921,202 | ||||||
|
| |||||||
| 45,747,210 | ||||||||
|
| |||||||
| Gas Utilities—2.2% | ||||||||
AmeriGas Partners L.P. | 692,100 | 31,995,783 | ||||||
National Fuel Gas Co. | 513,990 | 28,223,191 | ||||||
|
| |||||||
| 60,218,974 | ||||||||
|
| |||||||
| Healthcare Equipment & Supplies—1.1% | ||||||||
Hill-Rom Holdings, Inc. | 358,750 | 30,239,037 | ||||||
|
| |||||||
| Healthcare Providers & Services—1.3% | ||||||||
Encompass Health Corp. (d) | 690,809 | 34,132,873 | ||||||
|
| |||||||
| Hotels, Restaurants & Leisure—1.1% | ||||||||
Ruth’s Hospitality Group, Inc. | 1,367,905 | 29,615,143 | ||||||
|
| |||||||
| Household Durables—1.1% | ||||||||
MDC Holdings, Inc. | 902,944 | 28,785,855 | ||||||
|
| |||||||
| Household Products—1.0% | ||||||||
Energizer Holdings, Inc. | 552,720 | 26,519,506 | ||||||
|
| |||||||
Shares | Value | |||||||
| Insurance—4.9% | ||||||||
American Financial Group, Inc. | 272,270 | $ | 29,552,186 | |||||
CNO Financial Group, Inc. | 1,388,490 | 34,281,818 | ||||||
First American Financial Corp. | 612,530 | 34,326,181 | ||||||
Old Republic International Corp. | 1,594,690 | 34,094,472 | ||||||
|
| |||||||
| 132,254,657 | ||||||||
|
| |||||||
| IT Services—5.5% | ||||||||
Booz Allen Hamilton Holding Corp. | 750,080 | 28,600,550 | ||||||
Convergys Corp. | 1,190,846 | 27,984,881 | ||||||
CSRA, Inc. | 876,300 | 26,218,896 | ||||||
DST Systems, Inc. | 505,250 | 31,360,867 | ||||||
Genpact Ltd. | 1,065,740 | 33,826,588 | ||||||
|
| |||||||
| 147,991,782 | ||||||||
|
| |||||||
| Leisure Equipment & Products—1.0% | ||||||||
Brunswick Corp. | 469,000 | 25,898,180 | ||||||
|
| |||||||
| Machinery—5.6% | ||||||||
Barnes Group, Inc. | 391,545 | 24,773,052 | ||||||
Crane Co. | 384,380 | 34,294,384 | ||||||
Global Brass & Copper Holdings, Inc. | 841,452 | 27,852,061 | ||||||
ITT, Inc. | 637,095 | 34,001,760 | ||||||
Wabash National Corp. | 1,350,020 | 29,295,434 | ||||||
|
| |||||||
| 150,216,691 | ||||||||
|
| |||||||
| Media—1.1% | ||||||||
Meredith Corp. | 470,092 | 31,049,577 | ||||||
|
| |||||||
| Metals & Mining—1.6% | ||||||||
Steel Dynamics, Inc. | 635,100 | 27,391,863 | ||||||
SunCoke Energy Partners L.P. | 859,307 | 14,994,907 | ||||||
|
| |||||||
| 42,386,770 | ||||||||
|
| |||||||
| Multi-Utilities—0.9% | ||||||||
Black Hills Corp. | 389,160 | 23,392,408 | ||||||
|
| |||||||
| Oil, Gas & Consumable Fuels—6.5% | ||||||||
Alliance Resource Partners L.P. | 1,515,870 | 29,862,639 | ||||||
Boardwalk Pipeline Partners L.P. | 2,116,639 | 27,325,809 | ||||||
CNX Midstream Partners | 1,623,371 | 27,223,932 | ||||||
Delek Logistics Partners L.P. | 516,764 | 16,381,419 | ||||||
NuStar GP Holdings LLC | 850,050 | 13,345,785 | ||||||
SandRidge Permian Trust | 1,440,458 | 2,952,939 | ||||||
TC Pipelines L.P. | 629,893 | 33,447,318 | ||||||
Valero Energy Partners L.P. | 353,962 | 15,751,309 | ||||||
World Fuel Services Corp. | 321,758 | 9,054,270 | ||||||
|
| |||||||
| 175,345,420 | ||||||||
|
| |||||||
| Paper & Forest Products—2.8% | ||||||||
Neenah Paper, Inc. | 373,503 | 33,858,047 | ||||||
Schweitzer-Mauduit International, Inc. | 424,654 | 19,262,306 | ||||||
Western Forest Products, Inc. | 11,667,960 | 22,741,847 | ||||||
|
| |||||||
| 75,862,200 | ||||||||
|
| |||||||
| See accompanying Notes to Financial Statements | | December 31, 2017 | | Semiannual Report | 85 |
Table of Contents
Schedule of Investments
December 31, 2017 (unaudited)
Shares | Value | |||||||
| Professional Services—1.2% | ||||||||
Korn/Ferry International | 816,262 | $ | 33,776,922 | |||||
|
| |||||||
| Semiconductors & Semiconductor Equipment—2.5% | ||||||||
MKS Instruments, Inc. | 360,900 | 34,105,050 | ||||||
Versum Materials, Inc. | 902,746 | 34,168,936 | ||||||
|
| |||||||
| 68,273,986 | ||||||||
|
| |||||||
| Textiles, Apparel & Luxury Goods—0.6% | ||||||||
Carter’s, Inc. | 150,510 | 17,683,420 | ||||||
|
| |||||||
| Thrifts & Mortgage Finance—1.0% | ||||||||
Washington Federal, Inc. | 810,880 | 27,772,640 | ||||||
|
| |||||||
| Tobacco—0.7% | ||||||||
Universal Corp. | 375,519 | 19,714,748 | ||||||
|
| |||||||
Total Common Stock (cost—$2,099,151,552) |
| 2,658,270,015 | ||||||
|
| |||||||
| Principal Amount (000s) | ||||||||
| Repurchase Agreements—2.0% | ||||||||
State Street Bank and Trust Co., dated 12/29/17, 0.20%, due 1/2/18, proceeds $53,751,194; collateralized by U.S. Treasury Notes, 1.625%, due 2/15/26, valued at $54,827,808 including accrued interest |
| |||||||
(cost—$53,750,000) | $53,750 | 53,750,000 | ||||||
|
| |||||||
Total Investments (cost—$2,152,901,552)—100.4% |
| 2,712,020,015 | ||||||
|
| |||||||
| Liabilities in excess of other assets—(0.4)% | (11,023,198 | ) | ||||||
|
| |||||||
| Net Assets—100.0% | $2,700,996,817 | |||||||
|
| |||||||
Notes to Schedule of Investments:
(a) Fair-Valued—Security with a value of $56, representing less than 0.05% of net assets. See Note 1(a) and Note 1(b) in the Notes to Financial Statements.
(b) Level 3 security. See Note 1(a) and Note 1(b) in the Notes to Financial Statements.
(c) Affiliated security.
(d) Non-income producing.
Glossary:
REIT—Real Estate Investment Trust
AllianzGI Small-Cap Blend Fund
| Shares | Value | |||||||
| Common Stock—97.5% | ||||||||
| Aerospace & Defense—1.1% | ||||||||
AAR Corp. | 7,422 | $291,610 | ||||||
BWX Technologies, Inc. | 3,195 | 193,265 | ||||||
HEICO Corp. | 1,485 | 140,110 | ||||||
HEICO Corp., Class A | 3,038 | 240,154 | ||||||
Moog, Inc., Class A (c) | 635 | 55,150 | ||||||
|
| |||||||
| 920,289 | ||||||||
|
| |||||||
| Air Freight & Logistics—0.8% | ||||||||
Air Transport Services Group, Inc. (c) | 11,107 | 257,016 | ||||||
Echo Global Logistics, Inc. (c) | 8,030 | 224,840 | ||||||
Forward Air Corp. | 3,185 | 182,946 | ||||||
|
| |||||||
| 664,802 | ||||||||
|
| |||||||
| Airlines—0.2% | ||||||||
SkyWest, Inc. | 2,789 | 148,096 | ||||||
|
| |||||||
| Auto Components—1.2% | ||||||||
Dana, Inc. | 25,360 | 811,773 | ||||||
Modine Manufacturing Co. (c) | 9,079 | 183,396 | ||||||
Motorcar Parts of America, Inc. (c) | 1,219 | 30,463 | ||||||
Tower International, Inc. | 1,218 | 37,210 | ||||||
|
| |||||||
| 1,062,842 | ||||||||
|
| |||||||
| Banks—4.4% | ||||||||
Bancorp, Inc. (c) | 66,725 | 659,243 | ||||||
Carolina Financial Corp. | 963 | 35,775 | ||||||
Enterprise Financial Services Corp. | 3,875 | 174,956 | ||||||
Equity Bancshares, Inc., Class A (c) | 1,209 | 42,811 | ||||||
First Foundation, Inc. (c) | 2,801 | 51,931 | ||||||
First Internet Bancorp | 1,150 | 43,873 | ||||||
First Merchants Corp. | 11,165 | 469,600 | ||||||
Franklin Financial Network, Inc. (c) | 1,173 | 39,999 | ||||||
National Commerce Corp. (c) | 725 | 29,181 | ||||||
Old Line Bancshares, Inc. | 9,840 | 289,690 | ||||||
Pacific Premier Bancorp, Inc. (c) | 6,760 | 270,400 | ||||||
Peapack Gladstone Financial Corp. | 15,680 | 549,114 | ||||||
Preferred Bank | 797 | 46,848 | ||||||
Seacoast Banking Corp. of Florida (c) | 2,320 | 58,487 | ||||||
Shore Bancshares, Inc. | 5,400 | 90,180 | ||||||
TCF Financial Corp. | 37,355 | 765,777 | ||||||
Texas Capital Bancshares, Inc. (c) | 2,576 | 229,006 | ||||||
|
| |||||||
| 3,846,871 | ||||||||
|
| |||||||
| Beverages—0.2% | ||||||||
Boston Beer Co., Inc., Class A (c) | 335 | 64,019 | ||||||
MGP Ingredients, Inc. | 920 | 70,730 | ||||||
National Beverage Corp. | 310 | 30,206 | ||||||
Primo Water Corp. (c) | 3,120 | 39,218 | ||||||
|
| |||||||
| 204,173 | ||||||||
|
| |||||||
| Biotechnology—4.8% | ||||||||
Abeona Therapeutics, Inc. (c) | 1,292 | 20,478 | ||||||
Achaogen, Inc. (c) | 921 | 9,892 | ||||||
Adamas Pharmaceuticals, Inc. (c) | 572 | 19,385 | ||||||
Agenus, Inc. (c) | 2,966 | 9,669 | ||||||
Amicus Therapeutics, Inc. (c) | 5,641 | 81,174 | ||||||
Arrowhead Pharmaceuticals, Inc. (c) | 154,465 | 568,431 | ||||||
Shares | Value | |||||||
BioCryst Pharmaceuticals, Inc. (c) | 1,989 | $ | 9,766 | |||||
BioSpecifics Technologies Corp. (c) | 4,278 | 185,366 | ||||||
Bluebird Bio, Inc. (c) | 335 | 59,663 | ||||||
Blueprint Medicines Corp. (c) | 664 | 50,072 | ||||||
Calithera Biosciences, Inc. (c) | 1,021 | 8,525 | ||||||
Cara Therapeutics, Inc. (c) | 1,274 | 15,594 | ||||||
Clovis Oncology, Inc. (c) | 910 | 61,880 | ||||||
Concert Pharmaceuticals, Inc. (c) | 1,497 | 38,727 | ||||||
Corbus Pharmaceuticals Holdings, Inc. (c) | 1,535 | 10,898 | ||||||
Cytokinetics, Inc. (c) | 1,445 | 11,777 | ||||||
CytomX Therapeutics, Inc. (c) | 979 | 20,667 | ||||||
Dynavax Technologies Corp. (c) | 587 | 10,977 | ||||||
Emergent Biosolutions, Inc. (c) | 17,225 | 800,446 | ||||||
FibroGen, Inc. (c) | 1,636 | 77,546 | ||||||
Flexion Therapeutics, Inc. (c) | 9,874 | 247,245 | ||||||
Genomic Health, Inc. (c) | 17,090 | 584,478 | ||||||
Halozyme Therapeutics, Inc. (c) | 3,257 | 65,987 | ||||||
Heron Therapeutics, Inc. (c) | 1,301 | 23,548 | ||||||
Ignyta, Inc. (c) | 1,668 | 44,536 | ||||||
ImmunoGen, Inc. (c) | 2,858 | 18,320 | ||||||
Immunomedics, Inc. (c) | 1,594 | 25,759 | ||||||
Inovio Pharmaceuticals, Inc. (c) | 2,730 | 11,275 | ||||||
Iovance Biotherapeutics, Inc. (c) | 2,482 | 19,856 | ||||||
La Jolla Pharmaceutical Co. (c) | 1,043 | 33,564 | ||||||
Ligand Pharmaceuticals, Inc. (c) | 405 | 55,457 | ||||||
MacroGenics, Inc. (c) | 988 | 18,772 | ||||||
Myriad Genetics, Inc. (c) | 1,955 | 67,144 | ||||||
NewLink Genetics Corp. (c) | 660 | 5,353 | ||||||
Portola Pharmaceuticals, Inc. (c) | 1,167 | 56,810 | ||||||
Progenics Pharmaceuticals, Inc. (c) | 2,607 | 15,512 | ||||||
Puma Biotechnology, Inc. (c) | 724 | 71,567 | ||||||
Repligen Corp. (c) | 12,883 | 467,395 | ||||||
Sage Therapeutics, Inc. (c) | 688 | 113,320 | ||||||
Sangamo Therapeutics, Inc. (c) | 1,379 | 22,616 | ||||||
Sarepta Therapeutics, Inc. (c) | 988 | 54,972 | ||||||
Selecta Biosciences, Inc. (c) | 646 | 6,337 | ||||||
Synergy Pharmaceuticals, Inc. (c) | 7,106 | 15,846 | ||||||
TG Therapeutics, Inc. (c) | 1,768 | 14,498 | ||||||
Vanda Pharmaceuticals, Inc. (c) | 1,803 | 27,406 | ||||||
|
| |||||||
| 4,158,506 | ||||||||
|
| |||||||
| Building Products—0.6% | ||||||||
Patrick Industries, Inc. (c) | 4,557 | 316,483 | ||||||
PGT Innovations, Inc. (c) | 2,622 | 44,181 | ||||||
Trex Co., Inc. (c) | 1,323 | 143,400 | ||||||
|
| |||||||
| 504,064 | ||||||||
|
| |||||||
| Capital Markets—1.5% | ||||||||
Carlyle Group L.P. | 25,210 | 577,309 | ||||||
Golub Capital BDC, Inc. | 9,250 | 168,350 | ||||||
Interactive Brokers Group, Inc., Class A | 840 | 49,736 | ||||||
Main Street Capital Corp. | 2,675 | 106,278 | ||||||
New Mountain Finance Corp. | 3,385 | 45,867 | ||||||
TCP Capital Corp. | 4,785 | 73,115 | ||||||
TPG Specialty Lending, Inc. | 2,520 | 49,896 | ||||||
Tri Continental Corp. | 8,230 | 221,716 | ||||||
|
| |||||||
| 1,292,267 | ||||||||
|
| |||||||
| 86 | Semiannual Report | | December 31, 2017 | | See accompanying Notes to Financial Statements |
Table of Contents
Schedule of Investments
December 31, 2017 (unaudited)
Shares | Value | |||||||
| Chemicals—1.2% | ||||||||
American Vanguard Corp. | 9,927 | $ | 195,065 | |||||
Balchem Corp. | 1,060 | 85,436 | ||||||
Ferro Corp. (c) | 1,695 | 39,985 | ||||||
KMG Chemicals, Inc. | 763 | 50,419 | ||||||
Koppers Holdings, Inc. (c) | 1,124 | 57,212 | ||||||
Sensient Technologies Corp. | 1,300 | 95,095 | ||||||
Tronox Ltd., Class A | 15,260 | 312,983 | ||||||
Westlake Chemical Partners L.P. | 9,655 | 240,892 | ||||||
|
| |||||||
| 1,077,087 | ||||||||
|
| |||||||
| Commercial Services & Supplies—2.1% | ||||||||
Herman Miller, Inc. | 16,250 | 650,812 | ||||||
Hudson Technologies, Inc. (c) | 4,572 | 27,752 | ||||||
MSA Safety, Inc. | 7,230 | 560,470 | ||||||
Tetra Tech, Inc. | 11,740 | 565,281 | ||||||
|
| |||||||
| 1,804,315 | ||||||||
|
| |||||||
| Communications Equipment—0.4% | ||||||||
Extreme Networks, Inc. (c) | 12,660 | 158,503 | ||||||
Lumentum Holdings, Inc. (c) | 2,952 | 144,353 | ||||||
|
| |||||||
| 302,856 | ||||||||
|
| |||||||
| Construction & Engineering—0.8% | ||||||||
Granite Construction, Inc. | 4,363 | 276,745 | ||||||
MasTec, Inc. (c) | 5,380 | 263,351 | ||||||
NV5 Global, Inc. (c) | 1,190 | 64,439 | ||||||
Sterling Construction Co., Inc. (c) | 3,037 | 49,442 | ||||||
|
| |||||||
| 653,977 | ||||||||
|
| |||||||
| Construction Materials—0.1% | ||||||||
U.S. Concrete, Inc. (c) | 943 | 78,882 | ||||||
|
| |||||||
| Consumer Finance—0.0% | ||||||||
Green Dot Corp., Class A (c) | 710 | 42,785 | ||||||
|
| |||||||
| Containers & Packaging—1.5% | ||||||||
Greif, Inc., Class A | 9,555 | 578,842 | ||||||
Owens-Illinois, Inc. (c) | 31,255 | 692,923 | ||||||
Silgan Holdings, Inc. | 1,935 | 56,870 | ||||||
|
| |||||||
| 1,328,635 | ||||||||
|
| |||||||
| Diversified Consumer Services—0.8% | ||||||||
Bright Horizons Family Solutions, Inc. (c) | 4,272 | 401,568 | ||||||
Carriage Services, Inc. | 1,843 | 47,384 | ||||||
Chegg, Inc. (c) | 13,500 | 220,320 | ||||||
Grand Canyon Education, Inc. (c) | 355 | 31,783 | ||||||
|
| |||||||
| 701,055 | ||||||||
|
| |||||||
| Diversified Financial Services—0.1% | ||||||||
Compass Diversified Holdings | 7,260 | 123,057 | ||||||
|
| |||||||
| Diversified Telecommunication Services—0.3% | ||||||||
ORBCOMM, Inc. (c) | 29,559 | 300,911 | ||||||
|
| |||||||
| Electric Utilities—1.4% | ||||||||
Hawaiian Electric Industries, Inc. | 8,625 | 311,794 | ||||||
IDACORP, Inc. | 3,725 | 340,316 | ||||||
Otter Tail Corp. | 1,785 | 79,343 | ||||||
PNM Resources, Inc. | 3,980 | 160,991 | ||||||
Portland General Electric Co. | 6,545 | 298,321 | ||||||
|
| |||||||
| 1,190,765 | ||||||||
|
| |||||||
| Electrical Equipment—0.2% | ||||||||
Plug Power, Inc. (c) | 79,741 | 188,189 | ||||||
|
| |||||||
| Electronic Equipment, Instruments & Components—2.7% | ||||||||
ePlus, Inc. (c) | 437 | 32,862 | ||||||
Shares | Value | |||||||
II-VI, Inc. (c) | 2,764 | $ | 129,770 | |||||
Itron, Inc. (c) | 11,421 | 778,912 | ||||||
Mesa Laboratories, Inc. | 295 | 36,669 | ||||||
Novanta, Inc. (c) | 9,070 | 453,500 | ||||||
OSI Systems, Inc. (c) | 690 | 44,422 | ||||||
Tech Data Corp. (c) | 8,645 | 846,951 | ||||||
|
| |||||||
| 2,323,086 | ||||||||
|
| |||||||
| Energy Equipment & Services—0.5% | ||||||||
ProPetro Holding Corp. (c) | 13,509 | 272,341 | ||||||
U.S. Silica Holdings, Inc. | 4,455 | 145,055 | ||||||
|
| |||||||
| 417,396 | ||||||||
|
| |||||||
| Equity Real Estate Investment Trusts (REITs)—4.0% | ||||||||
Chatham Lodging Trust | 20,835 | 474,205 | ||||||
Getty Realty Corp. | 26,750 | 726,530 | ||||||
Gladstone Commercial Corp. | 34,340 | 723,200 | ||||||
InfraREIT, Inc. | 23,495 | 436,537 | ||||||
Piedmont Office Realty Trust, Inc., Class A | 27,180 | 533,000 | ||||||
QTS Realty Trust, Inc., Class A | 5,192 | 281,199 | ||||||
STAG Industrial, Inc. | 8,576 | 234,382 | ||||||
Winthrop Realty | 12,960 | 80,352 | ||||||
|
| |||||||
| 3,489,405 | ||||||||
|
| |||||||
| Food & Staples Retailing—0.3% | ||||||||
Performance Food Group Co. (c) | 7,161 | 237,029 | ||||||
PriceSmart, Inc. | 555 | 47,786 | ||||||
|
| |||||||
| 284,815 | ||||||||
|
| |||||||
| Food Products—0.9% | ||||||||
J&J Snack Foods Corp. | 1,895 | 287,718 | ||||||
John B Sanfilippo & Son, Inc. | 760 | 48,070 | ||||||
Lancaster Colony Corp. | 330 | 42,640 | ||||||
Pinnacle Foods, Inc. | 3,360 | 199,819 | ||||||
Sanderson Farms, Inc. | 490 | 68,002 | ||||||
Tootsie Roll Industries, Inc. | 2,603 | 94,749 | ||||||
|
| |||||||
| 740,998 | ||||||||
|
| |||||||
| Gas Utilities—0.4% | ||||||||
New Jersey Resources Corp. (c) | 960 | 38,592 | ||||||
Spire, Inc. | 1,910 | 143,536 | ||||||
Star Group L.P. | 15,160 | 162,970 | ||||||
|
| |||||||
| 345,098 | ||||||||
|
| |||||||
| Healthcare Equipment & Supplies—6.1% | ||||||||
Antares Pharma, Inc. (c) | 9,635 | 19,174 | ||||||
AtriCure, Inc. (c) | 1,869 | 34,090 | ||||||
Atrion Corp. | 85 | 53,601 | ||||||
AxoGen, Inc. (c) | 3,233 | 91,494 | ||||||
Cantel Medical Corp. | 1,109 | 114,083 | ||||||
CryoLife, Inc. (c) | 2,278 | 43,624 | ||||||
CryoPort, Inc. (c) | 5,038 | 43,276 | ||||||
Cutera, Inc. (c) | 1,814 | 82,265 | ||||||
GenMark Diagnostics, Inc. (c) | 3,610 | 15,054 | ||||||
Haemonetics Corp. (c) | 580 | 33,686 | ||||||
Halyard Health, Inc. (c) | 14,420 | 665,915 | ||||||
Heska Corp. (c) | 342 | 27,432 | ||||||
Hill-Rom Holdings, Inc. | 8,118 | 684,266 | ||||||
ICU Medical, Inc. (c) | 165 | 35,640 | ||||||
Inogen, Inc. (c) | 1,425 | 169,689 | ||||||
Insulet Corp. (c) | 2,344 | 161,736 | ||||||
Integra LifeSciences Holdings Corp. (c) | 1,060 | 50,732 | ||||||
LeMaitre Vascular, Inc. | 6,581 | 209,539 | ||||||
LivaNova PLC (c) | 4,890 | 390,809 | ||||||
Masimo Corp. (c) | 9,655 | 818,744 | ||||||
Novocure Ltd. (c) | 9,341 | 188,688 | ||||||
Shares | Value | |||||||
Penumbra, Inc. (c) | 1,556 | $ | 146,420 | |||||
RTI Surgical, Inc. (c) | 130,705 | 535,890 | ||||||
Surmodics, Inc. (c) | 1,203 | 33,684 | ||||||
Tactile Systems Technology, Inc. (c) | 7,763 | 224,972 | ||||||
Utah Medical Products, Inc. | 2,915 | 237,281 | ||||||
West Pharmaceutical Services, Inc. | 1,370 | 135,178 | ||||||
|
| |||||||
| 5,246,962 | ||||||||
|
| |||||||
| Healthcare Providers & Services—1.4% | ||||||||
BioTelemetry, Inc. (c) | 8,716 | 260,609 | ||||||
Chemed Corp. | 440 | 106,929 | ||||||
Cross Country Healthcare, Inc. (c) | 3,117 | 39,773 | ||||||
Encompass Health Corp. (c) | 2,025 | 100,055 | ||||||
LHC Group, Inc. (c) | 635 | 38,894 | ||||||
Owens & Minor, Inc. | 20,040 | 378,355 | ||||||
Premier, Inc., | 1,765 | 51,520 | ||||||
Providence Service Corp. (c) | 750 | 44,505 | ||||||
RadNet, Inc. (c) | 3,222 | 32,542 | ||||||
Triple-S Management Corp., Class B (c) | 5,255 | 130,587 | ||||||
|
| |||||||
| 1,183,769 | ||||||||
|
| |||||||
| Healthcare Technology—1.0% | ||||||||
Tabula Rasa HealthCare, Inc. (c) | 10,687 | 299,771 | ||||||
Teladoc, Inc. (c) | 4,566 | 159,125 | ||||||
Vocera Communications, Inc. (c) | 12,119 | 366,236 | ||||||
|
| |||||||
| 825,132 | ||||||||
|
| |||||||
| Hotels, Restaurants & Leisure—6.2% | ||||||||
Carrols Restaurant Group, Inc. (c) | 4,137 | 50,264 | ||||||
Century Casinos, Inc. (c) | 4,224 | 38,565 | ||||||
Choice Hotels International, Inc. | 1,315 | 102,044 | ||||||
Churchill Downs, Inc. | 3,279 | 763,023 | ||||||
Dave & Buster’s Entertainment, Inc. (c) | 5,599 | 308,897 | ||||||
Eldorado Resorts, Inc. (c) | 7,630 | 252,934 | ||||||
Extended Stay America, Inc. UNIT | 30,775 | 584,725 | ||||||
Golden Entertainment, Inc. (c) | 16,945 | 553,254 | ||||||
Hyatt Hotels Corp., Class A (c) | 13,285 | 976,979 | ||||||
Jack in the Box, Inc. | 2,783 | 273,040 | ||||||
Marriott Vacations Worldwide Corp. | 5,560 | 751,768 | ||||||
Penn National Gaming, Inc. (c) | 2,660 | 83,338 | ||||||
Planet Fitness, Inc., Class A (c) | 5,084 | 176,059 | ||||||
Texas Roadhouse, Inc. | 6,095 | 321,085 | ||||||
Tropicana Entertainment, Inc. (c) | 2,340 | 132,374 | ||||||
|
| |||||||
| 5,368,349 | ||||||||
|
| |||||||
| Household Durables—3.3% | ||||||||
Installed Building Products, Inc. (c) | 2,021 | 153,495 | ||||||
Lennar Corp., Class B | 5,530 | 285,790 | ||||||
LGI Homes, Inc. (c) | 1,188 | 89,136 | ||||||
M/I Homes, Inc. (c) | 23,629 | 812,838 | ||||||
Taylor Morrison Home Corp., Class A (c) | 24,140 | 590,706 | ||||||
William Lyon Homes, Class A (c) | 30,989 | 901,160 | ||||||
|
| |||||||
| 2,833,125 | ||||||||
|
| |||||||
| See accompanying Notes to Financial Statements | | December 31, 2017 | | Semiannual Report | 87 |
Table of Contents
Schedule of Investments
December 31, 2017 (unaudited)
Shares | Value | |||||||
| Household Products—1.6% | ||||||||
Central Garden & Pet Co. (c) | 15,210 | $ | 591,973 | |||||
Central Garden & Pet Co., Class A (c) | 13,105 | 494,190 | ||||||
Energizer Holdings, Inc. | 1,335 | 64,053 | ||||||
WD-40 Co. | 1,695 | 200,010 | ||||||
|
| |||||||
| 1,350,226 | ||||||||
|
| |||||||
| Independent Power Producers & Energy Traders—0.3% | ||||||||
Ormat Technologies, Inc. | 3,628 | 232,047 | ||||||
|
| |||||||
| Insurance—1.5% | ||||||||
American Equity Investment Life Holding Co. | 1,050 | 32,267 | ||||||
Argo Group International Holdings Ltd. | 1,155 | 71,206 | ||||||
CNO Financial Group, Inc. | 1,440 | 35,554 | ||||||
Donegal Group, Inc., Class A | 24,205 | 418,746 | ||||||
EMC Insurance Group, Inc. | 3,075 | 88,222 | ||||||
Infinity Property & Casualty Corp. | 310 | 32,860 | ||||||
Kemper Corp. | 485 | 33,416 | ||||||
Mercury General Corp. | 1,280 | 68,403 | ||||||
Primerica, Inc. | 495 | 50,267 | ||||||
ProAssurance Corp. | 1,905 | 108,871 | ||||||
RLI Corp. | 570 | 34,576 | ||||||
Third Point Reinsurance Ltd. (c) | 19,305 | 282,818 | ||||||
|
| |||||||
| 1,257,206 | ||||||||
|
| |||||||
| Internet & Catalog Retail—0.6% | ||||||||
Duluth Holdings, Inc., Class B (c) | 1,357 | 24,222 | ||||||
Groupon, Inc. (c) | 39,226 | 200,053 | ||||||
Nutrisystem, Inc. | 5,127 | 269,680 | ||||||
|
| |||||||
| 493,955 | ||||||||
|
| |||||||
| Internet Software & Services—3.1% | ||||||||
2U, Inc. (c) | 2,476 | 159,727 | ||||||
Alarm.com Holdings, Inc. (c) | 4,687 | 176,934 | ||||||
Amber Road, Inc. (c) | 4,790 | 35,159 | ||||||
Box, Inc., Class A (c) | 7,174 | 151,515 | ||||||
Carbonite, Inc. (c) | 9,630 | 241,713 | ||||||
CommerceHub, Inc., Ser. C (c) | 3,325 | 68,462 | ||||||
Five9, Inc. (c) | 9,471 | 235,638 | ||||||
GTT Communications, Inc. (c) | 7,993 | 375,271 | ||||||
Hortonworks, Inc. (c) | 19,511 | 392,366 | ||||||
Instructure, Inc. (c) | 6,400 | 211,840 | ||||||
LivePerson, Inc. (c) | 18,218 | 209,507 | ||||||
LogMeIn, Inc. | 290 | 33,205 | ||||||
New Relic, Inc. (c) | 700 | 40,439 | ||||||
Quotient Technology, Inc. (c) | 14,599 | 171,538 | ||||||
Yelp, Inc. (c) | 3,858 | 161,882 | ||||||
|
| |||||||
| 2,665,196 | ||||||||
|
| |||||||
| IT Services—3.4% | ||||||||
CoreLogic, Inc. (c) | 1,355 | 62,615 | ||||||
DST Systems, Inc. | 8,535 | 529,767 | ||||||
EPAM Systems, Inc. (c) | 2,181 | 234,305 | ||||||
ExlService Holdings, Inc. (c) | 3,380 | 203,983 | ||||||
First Data Corp., Class A (c) | 32,695 | 546,333 | ||||||
Hackett Group, Inc. | 2,564 | 40,280 | ||||||
Mantech International Corp., Class A | 13,910 | 698,143 | ||||||
MAXIMUS, Inc. | 1,265 | 90,549 | ||||||
Travelport Worldwide Ltd. | 42,200 | 551,554 | ||||||
|
| |||||||
| 2,957,529 | ||||||||
|
| |||||||
| Leisure Equipment & Products—1.2% | ||||||||
Callaway Golf Co. | 13,109 | 182,608 | ||||||
Clarus Corp. (c) | 24,175 | 189,774 | ||||||
Shares | Value | |||||||
Johnson Outdoors, Inc., Class A | 685 | $ | 42,532 | |||||
MCBC Holdings, Inc. (c) | 25,605 | 568,943 | ||||||
Nautilus, Inc. (c) | 2,678 | 35,751 | ||||||
|
| |||||||
| 1,019,608 | ||||||||
|
| |||||||
| Life Sciences Tools & Services—3.3% | ||||||||
Bio-Rad Laboratories, Inc., Class A (c) | 635 | 151,555 | ||||||
Bruker Corp. | 4,760 | 163,363 | ||||||
Charles River Laboratories International, Inc. (c) | 10,450 | 1,143,753 | ||||||
Enzo Biochem, Inc. (c) | 4,268 | 34,784 | ||||||
NeoGenomics, Inc. (c) | 6,982 | 61,861 | ||||||
PRA Health Sciences, Inc. (c) | 14,506 | 1,321,061 | ||||||
|
| |||||||
| 2,876,377 | ||||||||
|
| |||||||
| Machinery—3.0% | ||||||||
Blue Bird Corp. (c) | 14,810 | 294,719 | ||||||
Columbus McKinnon Corp. | 3,779 | 151,085 | ||||||
Energy Recovery, Inc. (c) | 2,142 | 18,743 | ||||||
Global Brass & Copper Holdings, Inc. | 1,072 | 35,483 | ||||||
John Bean Technologies Corp. | 1,896 | 210,077 | ||||||
Kadant, Inc. | 765 | 76,806 | ||||||
Kennametal, Inc. | 4,464 | 216,102 | ||||||
Kornit Digital Ltd. (c) | 10,954 | 176,907 | ||||||
Lydall, Inc. (c) | 10,779 | 547,034 | ||||||
NN, Inc. | 7,370 | 203,412 | ||||||
Park-Ohio Holdings Corp. | 12,115 | 556,684 | ||||||
Spartan Motors, Inc. | 2,776 | 43,722 | ||||||
Titan International, Inc. | 4,043 | 52,074 | ||||||
|
| |||||||
| 2,582,848 | ||||||||
|
| |||||||
| Marine—0.0% | ||||||||
Kirby Corp. (c) | 570 | 38,076 | ||||||
|
| |||||||
| Media—1.2% | ||||||||
IMAX Corp. (c) | 8,631 | 199,808 | ||||||
John Wiley & Sons, Inc., Class A | 1,630 | 107,172 | ||||||
Liberty Broadband Corp., Class A (c) | 1,500 | 127,575 | ||||||
MDC Partners, Inc., Class A (c) | 38,960 | 379,860 | ||||||
New York Times Co., Class A | 2,285 | 42,273 | ||||||
News Corp., Class B | 11,810 | 196,046 | ||||||
|
| |||||||
| 1,052,734 | ||||||||
|
| |||||||
| Metals & Mining—0.2% | ||||||||
Allegheny Technologies, Inc. (c) | 6,104 | 147,351 | ||||||
|
| |||||||
| Mortgage Real Estate Investment Trusts (REITs)—2.9% | ||||||||
Apollo Commercial Real Estate Finance, Inc. | 17,610 | 324,904 | ||||||
ARMOUR Residential REIT, Inc. | 3,070 | 78,960 | ||||||
Blackstone Mortgage Trust, Inc., Class A | 12,775 | 411,099 | ||||||
Cherry Hill Mortgage Investment Corp. | 3,980 | 71,600 | ||||||
Chimera Investment Corp. | 10,085 | 186,371 | ||||||
CYS Investments, Inc. | 31,305 | 251,379 | ||||||
Dynex Capital, Inc. | 11,400 | 79,914 | ||||||
Granite Point Mortgage Trust, Inc. | 4,915 | 87,192 | ||||||
Invesco Mortgage Capital, Inc. | 12,665 | 225,817 | ||||||
Ladder Capital Corp. | 4,050 | 55,202 | ||||||
MFA Financial, Inc. | 38,435 | 304,405 | ||||||
MTGE Investment Corp. | 3,515 | 65,028 | ||||||
Orchid Island Capital, Inc. | 3,485 | 32,341 | ||||||
PennyMac Mortgage Investment Trust | 2,660 | 42,746 | ||||||
TPG RE Finance Trust, Inc. | 1,835 | 34,957 | ||||||
Two Harbors Investment Corp. | 16,195 | 263,331 | ||||||
|
| |||||||
| 2,515,246 | ||||||||
|
| |||||||
Shares | Value | |||||||
| Multi-Utilities—0.2% | ||||||||
NorthWestern Corp. | 3,220 | $ | 192,234 | |||||
|
| |||||||
| Oil, Gas & Consumable Fuels—4.0% | ||||||||
Alon USA Partners L.P. | 47,865 | 818,013 | ||||||
Antero Midstream GP L.P. | 1,860 | 36,679 | ||||||
Antero Midstream Partners L.P. | 1,945 | 56,483 | ||||||
Arch Coal, Inc., Class A | 575 | 53,567 | ||||||
Black Stone Minerals L.P. | 4,285 | 76,873 | ||||||
Boardwalk Pipeline Partners L.P. | 9,155 | 118,191 | ||||||
Callon Petroleum Co. (c) | 17,761 | 215,796 | ||||||
CNX Midstream Partners L.P. (c) | 2,670 | 44,776 | ||||||
CNX Resources Corp. (c) | 2,615 | 38,257 | ||||||
Crestwood Equity Partners L.P. | 1,375 | 35,475 | ||||||
Dominion Energy Midstream Partners L.P. | 1,040 | 31,668 | ||||||
Dorchester Minerals L.P. | 5,055 | 76,836 | ||||||
Evolution Petroleum Corp. | 5,114 | 35,031 | ||||||
Hess Midstream Partners L.P. | 11,770 | 233,164 | ||||||
Linn Energy, Inc. (c) | 985 | 39,646 | ||||||
Matador Resources Co. (c) | 1,250 | 38,913 | ||||||
Noble Midstream Partners L.P. | 955 | 47,750 | ||||||
Oasis Petroleum, Inc. (c) | 20,701 | 174,095 | ||||||
Par Pacific Holdings, Inc. (c) | 5,305 | 102,280 | ||||||
PBF Energy, Inc., Class A | 13,435 | 476,271 | ||||||
Peabody Energy Corp. (c) | 1,335 | 52,559 | ||||||
Plains GP Holdings L.P., Class A (c) | 1,875 | 41,156 | ||||||
Ring Energy, Inc. (c) | 3,402 | 47,288 | ||||||
Sanchez Energy Corp. (c) | 3,982 | 21,144 | ||||||
Ship Finance International Ltd. | 2,660 | 41,230 | ||||||
Sunoco L.P. | 10,695 | 303,738 | ||||||
Tallgrass Energy Partners L.P. | 1,540 | 70,609 | ||||||
Valero Energy Partners L.P. | 805 | 35,823 | ||||||
Viper Energy Partners L.P. | 2,730 | 63,691 | ||||||
|
| |||||||
| 3,427,002 | ||||||||
|
| |||||||
| Paper & Forest Products—0.2% | ||||||||
Louisiana-Pacific Corp. (c) | 7,293 | 191,514 | ||||||
|
| |||||||
| Personal Products—0.6% | ||||||||
Edgewell Personal Care Co. (c) | 1,820 | 108,090 | ||||||
Inter Parfums, Inc. | 940 | 40,843 | ||||||
Medifast, Inc. | 1,805 | 126,007 | ||||||
Nu Skin Enterprises, Inc., Class A | 1,840 | 125,543 | ||||||
USANA Health Sciences, Inc. (c) | 2,105 | 155,875 | ||||||
|
| |||||||
| 556,358 | ||||||||
|
| |||||||
| Pharmaceuticals—3.4% | ||||||||
Amphastar Pharmaceuticals, Inc. (c) | 1,520 | 29,245 | ||||||
ANI Pharmaceuticals, Inc. (c) | 5,413 | 348,868 | ||||||
Catalent, Inc. (c) | 27,292 | 1,121,155 | ||||||
Cymabay Therapeutics, Inc. (c) | 1,509 | 13,883 | ||||||
Innoviva, Inc. (c) | 28,535 | 404,912 | ||||||
Intersect ENT, Inc. (c) | 1,627 | 52,715 | ||||||
Nektar Therapeutics (c) | 1,870 | 111,676 | ||||||
Omeros Corp. (c) | 1,211 | 23,530 | ||||||
Paratek Pharmaceuticals, Inc. (c) | 816 | 14,606 | ||||||
Phibro Animal Health Corp., Class A | 17,500 | 586,250 | ||||||
Revance Therapeutics, Inc. (c) | 2,548 | 91,091 | ||||||
Supernus Pharmaceuticals, Inc. (c) | 3,677 | 146,528 | ||||||
Teligent, Inc. (c) | 5,479 | 19,889 | ||||||
WaVe Life Sciences Ltd. (c) | 475 | 16,672 | ||||||
|
| |||||||
| 2,981,020 | ||||||||
|
| |||||||
| 88 | Semiannual Report | | December 31, 2017 | | See accompanying Notes to Financial Statements |
Table of Contents
Schedule of Investments
December 31, 2017 (unaudited)
Shares | Value | |||||||
| Professional Services—2.7% | ||||||||
Barrett Business Services, Inc. | 7,835 | $ | 505,279 | |||||
CRA International, Inc. | 723 | 32,499 | ||||||
GP Strategies Corp. (c) | 1,182 | 27,422 | ||||||
Heidrick & Struggles International, Inc. | 23,245 | 570,665 | ||||||
Kforce, Inc. | 1,653 | 41,738 | ||||||
Korn/Ferry International | 22,015 | 910,981 | ||||||
WageWorks, Inc. (c) | 4,450 | 275,900 | ||||||
|
| |||||||
| 2,364,484 | ||||||||
|
| |||||||
| Road & Rail—0.5% | ||||||||
Daseke, Inc. (c) | 15,805 | 225,853 | ||||||
Saia, Inc. (c) | 2,136 | 151,122 | ||||||
Universal Logistics Holdings, Inc. | 1,970 | 46,788 | ||||||
|
| |||||||
| 423,763 | ||||||||
|
| |||||||
| Semiconductors & Semiconductor Equipment—3.3% | ||||||||
Amkor Technology, Inc. (c) | 55,965 | 562,448 | ||||||
Axcelis Technologies, Inc. (c) | 1,691 | 48,532 | ||||||
AXT, Inc. (c) | 5,905 | 51,374 | ||||||
Brooks Automation, Inc. | 4,466 | 106,514 | ||||||
CEVA, Inc. (c) | 1,298 | 59,903 | ||||||
Entegris, Inc. | 24,747 | 753,546 | ||||||
FormFactor, Inc. (c) | 11,231 | 175,765 | ||||||
Ichor Holdings Ltd. (c) | 6,280 | 154,488 | ||||||
Impinj, Inc. (c) | 3,832 | 86,335 | ||||||
Integrated Device Technology, Inc. (c) | 7,707 | 229,129 | ||||||
MKS Instruments, Inc. | 6,385 | 603,382 | ||||||
PDF Solutions, Inc. (c) | 2,261 | 35,498 | ||||||
|
| |||||||
| 2,866,914 | ||||||||
|
| |||||||
| Software—4.3% | ||||||||
A10 Networks, Inc. (c) | 48,265 | 372,606 | ||||||
Aspen Technology, Inc. (c) | 4,740 | 313,788 | ||||||
Asure Software, Inc. (c) | 2,449 | 34,580 | ||||||
Datawatch Corp. (c) | 3,126 | 29,697 | ||||||
Everbridge, Inc. (c) | 1,773 | 52,694 | ||||||
Fair Isaac Corp. | 2,106 | 322,639 | ||||||
Imperva, Inc. (c) | 12,855 | 510,343 | ||||||
Model N, Inc. (c) | 28,965 | 456,199 | ||||||
Progress Software Corp. | 21,270 | 905,464 | ||||||
PROS Holdings, Inc. (c) | 1,255 | 33,195 | ||||||
Rapid7, Inc. (c) | 6,836 | 127,560 | ||||||
RealPage, Inc. (c) | 4,111 | 182,117 | ||||||
Upland Software, Inc. (c) | 1,962 | 42,497 | ||||||
Varonis Systems, Inc. (c) | 3,091 | 150,068 | ||||||
Verint Systems, Inc. (c) | 1,010 | 42,268 | ||||||
Zynga, Inc., Class A (c) | 43,055 | 172,220 | ||||||
|
| |||||||
| 3,747,935 | ||||||||
|
| |||||||
| Specialty Retail—0.8% | ||||||||
Camping World Holdings, Inc., Class A | 7,140 | 319,372 | ||||||
Children’s Place, Inc. | 1,081 | 157,124 | ||||||
Five Below, Inc. (c) | 510 | 33,823 | ||||||
GameStop Corp., Class A | 11,595 | 208,130 | ||||||
|
| |||||||
| 718,449 | ||||||||
|
| |||||||
| Technology Hardware, Storage & Peripherals—0.1% | ||||||||
USA Technologies, Inc. (c) | 7,223 | 70,424 | ||||||
|
| |||||||
| Textiles, Apparel & Luxury Goods—1.0% | ||||||||
Crocs, Inc. (c) | 3,835 | 48,475 | ||||||
G-III Apparel Group Ltd. (c) | 3,942 | 145,420 | ||||||
Movado Group, Inc. | 18,230 | 587,006 | ||||||
Skechers U.S.A., Inc., Class A (c) | 1,675 | 63,382 | ||||||
|
| |||||||
| 844,283 | ||||||||
|
| |||||||
Shares | Value | |||||||
| Thrifts & Mortgage Finance—1.7% | ||||||||
America First Multifamily Investors L.P. | 6,680 | $ | 40,414 | |||||
Charter Financial Corp. | 4,715 | 82,701 | ||||||
Essent Group Ltd. (c) | 14,670 | 636,971 | ||||||
First Defiance Financial Corp. | 916 | 47,605 | ||||||
Flagstar Bancorp, Inc. (c) | 1,610 | 60,246 | ||||||
Meridian Bancorp, Inc. | 2,888 | 59,493 | ||||||
United Financial Bancorp, Inc. | 30,940 | 545,782 | ||||||
|
| |||||||
| 1,473,212 | ||||||||
|
| |||||||
| Tobacco—0.4% | ||||||||
Turning Point Brands, Inc. | 3,040 | 64,235 | ||||||
Universal Corp. | 1,655 | 86,888 | ||||||
Vector Group Ltd. | 7,351 | 164,515 | ||||||
|
| |||||||
| 315,638 | ||||||||
|
| |||||||
| Trading Companies & Distributors—1.1% | ||||||||
Air Lease Corp. | 7,671 | 368,898 | ||||||
Rush Enterprises, Inc., Class B (c) | 7,210 | 347,594 | ||||||
Titan Machinery, Inc. (c) | 6,290 | 133,159 | ||||||
Triton International Ltd. (c) | 3,366 | 126,057 | ||||||
|
| |||||||
| 975,708 | ||||||||
|
| |||||||
| Wireless Telecommunication Services—0.4% | ||||||||
Boingo Wireless, Inc. (c) | 15,067 | 339,007 | ||||||
|
| |||||||
| Total Investments (cost—$71,832,998)—97.5% | 84,328,903 | |||||||
|
| |||||||
| Other assets less liabilities—2.5% | 2,160,416 | |||||||
|
| |||||||
| Net Assets—100.0% | $86,489,319 | |||||||
|
| |||||||
Notes to Schedule of Investments:
(a) Fair-Valued—Security with a value of $80,352, representing 0.1% of net assets. See Note 1(a) and Note 1(b) in the Notes to Financial Statements.
(b) Level 3 security. See Note 1(a) and Note 1(b) in the Notes to Financial Statements.
(c) Non-income producing.
Glossary:
REIT—Real Estate Investment Trust.
UNIT—More than one class of securities traded together.
AllianzGI Technology Fund
| Shares | Value | |||||||
| Common Stock—95.4% | ||||||||
| Automobiles—0.2% | ||||||||
Tesla, Inc. (d) | 8,461 | $2,634,332 | ||||||
|
| |||||||
| Chemicals—0.0% | ||||||||
Monsanto Co. | 100 | 11,678 | ||||||
|
| |||||||
| Communications Equipment—6.2% | ||||||||
Arista Networks, Inc. (d) | 213,520 | 50,301,041 | ||||||
Cisco Systems, Inc. (c) | 100 | 3,830 | ||||||
Juniper Networks, Inc. | 100 | 2,850 | ||||||
Lumentum Holdings, Inc. (d) | 100 | 4,890 | ||||||
Motorola Solutions, Inc. | 100 | 9,034 | ||||||
Nokia Oyj ADR | 100 | 466 | ||||||
Palo Alto Networks, Inc. (d) | 216,970 | 31,447,632 | ||||||
|
| |||||||
| 81,769,743 | ||||||||
|
| |||||||
| Diversified Consumer Services—0.0% | ||||||||
New Oriental Education & Technology Group, Inc. ADR | 100 | 9,400 | ||||||
|
| |||||||
| Diversified Telecommunication Services—0.0% | ||||||||
AT&T, Inc. | 100 | 3,888 | ||||||
Verizon Communications, Inc. | 100 | 5,293 | ||||||
|
| |||||||
| 9,181 | ||||||||
|
| |||||||
| Electrical Equipment—0.0% | ||||||||
Nidec Corp. | 100 | 14,002 | ||||||
OSRAM Licht AG | 100 | 8,954 | ||||||
|
| |||||||
| 22,956 | ||||||||
|
| |||||||
| Electronic Equipment, Instruments & Components—1.4% | ||||||||
CDW Corp. | 148,985 | 10,352,968 | ||||||
Cognex Corp. | 32,995 | 2,017,974 | ||||||
Corning, Inc. | 100 | 3,199 | ||||||
Flex Ltd. (d) | 100 | 1,799 | ||||||
IPG Photonics Corp. (d) | 30,325 | 6,493,492 | ||||||
LG Display Co., Ltd. | 1,000 | 27,835 | ||||||
Murata Manufacturing Co., Ltd. | 100 | 13,389 | ||||||
Samsung Electro-Mechanics Co., Ltd. | 170 | 15,847 | ||||||
Tech Data Corp. (d) | 100 | 9,797 | ||||||
|
| |||||||
| 18,936,300 | ||||||||
|
| |||||||
| Equity Real Estate Investment Trusts (REITs)—0.0% | ||||||||
CyrusOne, Inc. | 100 | 5,953 | ||||||
|
| |||||||
| Healthcare Equipment & Supplies—0.0% | ||||||||
Hoya Corp. | 100 | 4,980 | ||||||
|
| |||||||
| Healthcare Technology—0.3% | ||||||||
Veeva Systems, Inc., Class A (d) | 62,630 | 3,462,186 | ||||||
|
| |||||||
| Household Durables—0.0% | ||||||||
Garmin Ltd. | 100 | 5,957 | ||||||
|
| |||||||
| Internet & Catalog Retail—7.8% | ||||||||
Amazon.com, Inc. (d) | 60,470 | 70,717,851 | ||||||
Ctrip.com International Ltd. ADR (d) | 100 | 4,410 | ||||||
Expedia, Inc. | 100 | 11,977 | ||||||
JD.com, Inc. ADR (d) | 2,835 | 117,426 | ||||||
Netflix, Inc. (d) | 169,285 | 32,495,948 | ||||||
Rakuten, Inc. | 1,000 | 9,141 | ||||||
TripAdvisor, Inc. (d) | 100 | 3,446 | ||||||
| See accompanying Notes to Financial Statements | | December 31, 2017 | | Semiannual Report | 89 |
Table of Contents
Schedule of Investments
December 31, 2017 (unaudited)
Shares | Value | |||||||
Vipshop Holdings Ltd. ADR (d) | 100 | $ | 1,172 | |||||
|
| |||||||
| 103,361,371 | ||||||||
|
| |||||||
| Internet Software & Services—15.1% | ||||||||
58.com, Inc. ADR (d) | 100 | 7,157 | ||||||
Akamai Technologies, Inc. (d) | 100 | 6,504 | ||||||
Alibaba Group Holding Ltd. ADR (d) | 114,495 | 19,742,373 | ||||||
Alphabet, Inc., Class A (c)(d) | 31,230 | 32,897,682 | ||||||
Alphabet, Inc., Class C (d) | 25,175 | 26,343,120 | ||||||
Baidu, Inc. ADR (d) | 54,320 | 12,722,287 | ||||||
Cornerstone OnDemand, Inc. (d) | 100 | 3,533 | ||||||
Criteo S.A. ADR (d) | 100 | 2,603 | ||||||
eBay, Inc. (c)(d) | 100 | 3,774 | ||||||
Facebook, Inc., Class A (d) | 462,464 | 81,606,397 | ||||||
GoDaddy, Inc., Class A (d) | 100 | 5,028 | ||||||
GrubHub, Inc. (d) | 37,085 | 2,662,703 | ||||||
MongoDB, Inc. (d) | 10 | 297 | ||||||
MuleSoft, Inc., Class A (d) | 29,712 | 691,101 | ||||||
NAVER Corp. | 100 | 81,238 | ||||||
NetEase, Inc. ADR | 13,380 | 4,617,037 | ||||||
Okta, Inc. (d) | 276,150 | 7,072,202 | ||||||
SINA Corp. (d) | 100 | 10,031 | ||||||
Tencent Holdings Ltd. | 246,600 | 12,763,501 | ||||||
Twitter, Inc. (d) | 100 | 2,401 | ||||||
Weibo Corp. ADR (d) | 20 | 2,069 | ||||||
Yelp, Inc. (d) | 100 | 4,196 | ||||||
Zillow Group, Inc., Class A (d) | 100 | 4,074 | ||||||
Zillow Group, Inc., Class C (d) | 200 | 8,184 | ||||||
|
| |||||||
| 201,259,492 | ||||||||
|
| |||||||
| IT Services—10.5% | ||||||||
Accenture PLC, Class A | 100 | 15,309 | ||||||
Alliance Data Systems Corp. | 100 | 25,348 | ||||||
Amadeus IT Group S.A. | 100 | 7,196 | ||||||
Automatic Data Processing, Inc. | 100 | 11,719 | ||||||
Cognizant Technology Solutions Corp., Class A | 124,425 | 8,836,664 | ||||||
CSRA, Inc. | 100 | 2,992 | ||||||
DXC Technology Co. | 448,535 | 42,565,971 | ||||||
Fidelity National Information Services, Inc. | 13,580 | 1,277,742 | ||||||
First Data Corp., Class A (d) | 100 | 1,671 | ||||||
Fiserv, Inc. (d) | 100 | 13,113 | ||||||
Global Payments, Inc. | 113,090 | 11,336,142 | ||||||
Mastercard, Inc., Class A | 38,270 | 5,792,547 | ||||||
Paychex, Inc. | 100 | 6,808 | ||||||
PayPal Holdings, Inc. (d) | 100 | 7,362 | ||||||
Sabre Corp. | 100 | 2,050 | ||||||
Square, Inc. Class A (c)(d) | 1,533,180 | 53,155,351 | ||||||
Tata Consultancy Services Ltd. | 1,000 | 42,263 | ||||||
Total System Services, Inc. | 156,025 | 12,340,017 | ||||||
Vantiv, Inc., Class A (d) | 100 | 7,355 | ||||||
Shares | Value | |||||||
Visa, Inc., Class A (c) | 37,540 | $ | 4,280,311 | |||||
|
| |||||||
| 139,727,931 | ||||||||
|
| |||||||
| Media—0.0% | ||||||||
Comcast Corp., Class A | 200 | 8,010 | ||||||
|
| |||||||
| Professional Services—0.0% | ||||||||
Nielsen Holdings PLC | 100 | 3,640 | ||||||
Verisk Analytics, Inc., Class A (d) | 100 | 9,600 | ||||||
|
| |||||||
| 13,240 | ||||||||
|
| |||||||
| Semiconductors & Semiconductor Equipment—16.4% | ||||||||
ams AG (d) | 30,700 | 2,781,168 | ||||||
Analog Devices, Inc. | 100 | 8,903 | ||||||
Applied Materials, Inc. | 405,975 | 20,753,442 | ||||||
Broadcom Ltd. | 99,654 | 25,601,113 | ||||||
Cree, Inc. (d) | 204,245 | 7,585,659 | ||||||
Cypress Semiconductor Corp. | 100 | 1,524 | ||||||
Infineon Technologies AG | 349,330 | 9,513,721 | ||||||
Intel Corp. | 100 | 4,616 | ||||||
KLA-Tencor Corp. | 100 | 10,507 | ||||||
Lam Research Corp. | 139,200 | 25,622,544 | ||||||
Marvell Technology Group Ltd. | 1,405,845 | 30,183,492 | ||||||
Maxim Integrated Products, Inc. | 100 | 5,228 | ||||||
MediaTek, Inc. | 1,000 | 9,830 | ||||||
Microchip Technology, Inc. | 399,207 | 35,082,311 | ||||||
Micron Technology, Inc. (c)(d) | 829,640 | 34,114,797 | ||||||
NVIDIA Corp. | 101,060 | 19,555,110 | ||||||
Qorvo, Inc. (d) | 100 | 6,660 | ||||||
QUALCOMM, Inc. | 100 | 6,402 | ||||||
SK Hynix, Inc. | 1,000 | 71,026 | ||||||
Skyworks Solutions, Inc. | 100 | 9,495 | ||||||
SunPower Corp. (d) | 100 | 843 | ||||||
Taiwan Semiconductor Manufacturing Co., Ltd. ADR | 100 | 3,965 | ||||||
Teradyne, Inc. | 174,395 | 7,301,919 | ||||||
Texas Instruments, Inc. | 100 | 10,444 | ||||||
Tokyo Electron Ltd. | 800 | 144,311 | ||||||
|
| |||||||
| 218,389,030 | ||||||||
|
| |||||||
| Software—30.6% | ||||||||
Activision Blizzard, Inc. | 10 | 633 | ||||||
Adobe Systems, Inc. (d) | 14,850 | 2,602,314 | ||||||
Alfa Financial Software Holdings PLC (a)(d) | 100 | 722 | ||||||
Aspen Technology, Inc. (d) | 100 | 6,620 | ||||||
Atlassian Corp. PLC, Class A (d) | 10 | 455 | ||||||
CyberArk Software Ltd. (d) | 100 | 4,139 | ||||||
Dell Technologies, Inc., Class V (d) | 100 | 8,128 | ||||||
Electronic Arts, Inc. (d) | 37,930 | 3,984,926 | ||||||
FireEye, Inc. (d) | 10 | 142 | ||||||
Fortinet, Inc. (d) | 100 | 4,369 | ||||||
Imperva, Inc. (d) | 100 | 3,970 | ||||||
Intuit, Inc. | 100 | 15,778 | ||||||
Micro Focus International PLC (d) | 128,680 | 4,373,422 | ||||||
Micro Focus International PLC ADR (d) | 13 | 437 | ||||||
Shares | Value | |||||||
Microsoft Corp. (c) | 1,070,906 | $ | 91,605,299 | |||||
Oracle Corp. | 100 | 4,728 | ||||||
Paycom Software, Inc. (d) | 492,614 | 39,571,683 | ||||||
Proofpoint, Inc. (d) | 348,455 | 30,946,289 | ||||||
Red Hat, Inc. (d) | 160,405 | 19,264,641 | ||||||
Salesforce.com, Inc. (d) | 350,695 | 35,851,550 | ||||||
SAP SE ADR | 100 | 11,236 | ||||||
ServiceNow, Inc. (d) | 452,160 | 58,957,142 | ||||||
Sophos Group PLC (a) | 2,946,895 | 22,690,476 | ||||||
Splunk, Inc. (d) | 100 | 8,284 | ||||||
Symantec Corp. | 100 | 2,806 | ||||||
Tableau Software, Inc., Class A (d) | 50,595 | 3,501,174 | ||||||
Take-Two Interactive Software, Inc. (d) | 217,465 | 23,873,308 | ||||||
VMware, Inc., Class A (d) | 249,875 | 31,314,335 | ||||||
Workday, Inc., Class A (d) | 375,700 | 38,223,718 | ||||||
Zendesk, Inc. (d) | 100 | 3,384 | ||||||
|
| |||||||
| 406,836,108 | ||||||||
|
| |||||||
| Technology Hardware, Storage & Peripherals—6.9% | ||||||||
Apple, Inc. (c) | 272,450 | 46,106,714 | ||||||
Catcher Technology Co., Ltd. | 1,000 | 10,958 | ||||||
Diebold Nixdorf, Inc. | 100 | 1,635 | ||||||
FUJIFILM Holdings Corp. | 100 | 4,080 | ||||||
Hewlett Packard Enterprise Co. | 100 | 1,436 | ||||||
HP, Inc. | 100 | 2,101 | ||||||
Lenovo Group Ltd. | 1,000 | 563 | ||||||
NEC Corp. | 1,600 | 43,100 | ||||||
NetApp, Inc. (c) | 521,545 | 28,851,869 | ||||||
Pure Storage, Inc., Class A (d) | 235,555 | 3,735,902 | ||||||
Samsung Electronics Co., Ltd. | 5,604 | 13,314,602 | ||||||
|
| |||||||
| 92,072,960 | ||||||||
|
| |||||||
| Wireless Telecommunication Services—0.0% | ||||||||
T-Mobile U.S., Inc. (d) | 100 | 6,351 | ||||||
|
| |||||||
| Total Common Stock (cost—$791,075,681) | 1,268,547,159 | |||||||
|
| |||||||
| Exchange-Traded Funds—0.0% | ||||||||
iShares FTSE A50 China Index | 1,000 | 1,920 | ||||||
iShares MSCI Emerging Markets Index | 100 | 4,712 | ||||||
|
| |||||||
| Total Exchange-Traded Funds (cost—$5,747) | 6,632 | |||||||
|
| |||||||
| 90 | Semiannual Report | | December 31, 2017 | | See accompanying Notes to Financial Statements |
Table of Contents
Principal Amount (000s) | Value | |||||||
| Repurchase Agreements—7.8% | ||||||||
State Street Bank and Trust Co., dated 12/29/17, 0.20%, due 1/2/18, proceeds $103,341,296; collateralized by U.S. Treasury Notes, 1.625%, due 2/15/26, valued at $105,405,987 including accrued interest |
| |||||||
(cost—$103,339,000) | $103,339 | $ | 103,339,000 | |||||
|
| |||||||
| Total Options Purchased—1.1% (cost—$10,068,706) (d)(e)(f) | 14,683,910 | |||||||
|
| |||||||
| Total Investments, before options written and securities sold short (cost—$904,489,134)—104.3% | 1,386,576,701 | |||||||
|
| |||||||
| Total Options Written—(0.5)% (premiums received—$15,968,536) (d)(e)(f) | (7,187,120 | ) | ||||||
|
| |||||||
Shares | Value | |||||||
| Securities Sold Short—(2.4)% | ||||||||
| Common Stock—(2.4)% | ||||||||
| Electronic Equipment, Instruments & Components—(0.0)% | ||||||||
AU Optronics Corp. ADR | $ | 4,135 | $ | (17,201 | ) | |||
Fitbit, Inc., Class A (d) | 100 | (571 | ) | |||||
LG Display Co., Ltd. ADR | 1,280 | (17,613 | ) | |||||
|
| |||||||
| (35,385 | ) | |||||||
|
| |||||||
| IT Services—(0.0)% | ||||||||
International Business Machines Corp. | 1 | (153 | ) | |||||
|
| |||||||
| Semiconductors & Semiconductor Equipment—(0.8)% | ||||||||
ASML Holding NV | 58,175 | (10,111,979 | ) | |||||
|
| |||||||
| Software—(0.0)% | ||||||||
LINE Corp. ADR (d) | 430 | (17,626 | ) | |||||
|
| |||||||
| Technology Hardware, Storage & Peripherals—(1.6)% | ||||||||
Western Digital Corp. | 263,685 | (20,970,868 | ) | |||||
|
| |||||||
| Total Securities Sold Short (proceeds received—$32,024,638) | (31,136,011 | ) | ||||||
|
| |||||||
| Total Investments, net of options written and securities sold short (cost—$856,495,960) (b)—101.4% | 1,348,253,570 | |||||||
|
| |||||||
| Other liabilities in excess of other assets—(1.4)% | (18,753,046 | ) | ||||||
|
| |||||||
| Net Assets—100.0% | $1,329,500,524 | |||||||
|
| |||||||
Notes to Schedule of Investments:
(a) 144A—Exempt from registration under Rule 144A of the Securities Act of 1933. These securities may be resold in transactions exempt from registration, typically only to qualified institutional buyers. Securities with an aggregate value of $22,691,198, representing 1.7% of net assets.
(b) Securities (net of securities sold short) with an aggregate value of $65,947,523, representing 5.0% of net assets, were valued utilizing modeling tools provided by a third-party vendor. See Note 1(a) and Note 1(b) in the Notes to Financial Statements.
(c) All or partial amount segregated for the benefit of the counterparty as collateral for securities sold short and options written.
(d) Non-income producing.
(e) Exchange traded-Chicago Board Options Exchange.
(f) Exchange traded option contracts outstanding at December 31, 2017:
| Options purchased contracts outstanding at December 31, 2017: | ||||||||||||||||||||||||||||
| Description | Exercise Price | Expiration Date | Number of Contracts | Notional Amount | Market Value | Cost | Unrealized Appreciation (Depreciation) | |||||||||||||||||||||
Call options: | ||||||||||||||||||||||||||||
Apple, Inc. | 170.00 USD | 1/18/19 | 4,008 | $ | 400,800 | $ | 6,823,620 | $ | 5,102,143 | $ | 1,721,477 | |||||||||||||||||
NetApp, Inc. | 50.00 USD | 1/18/19 | 4,800 | 480,000 | 4,320,000 | 1,404,931 | 2,915,069 | |||||||||||||||||||||
Tesla, Inc. | 350.00 USD | 1/18/19 | 964 | 96,400 | 3,540,290 | 3,561,632 | (21,342 | ) | ||||||||||||||||||||
|
| |||||||||||||||||||||||||||
| Total options purchased contracts | $ | 14,683,910 | $ | 10,068,706 | $ | 4,615,204 | ||||||||||||||||||||||
|
| |||||||||||||||||||||||||||
| Options written contracts outstanding at December 31, 2017: | ||||||||||||||||||||||||||||
| Description | Exercise Price | Expiration Date | Number of Contracts | Notional Amount | Market Value | Premiums Received | Unrealized Appreciation | |||||||||||||||||||||
Call options: |
| |||||||||||||||||||||||||||
Square, Inc. | 38.00 USD | 3/16/18 | (6,000 | ) | $ | (600,000 | ) | $ | (1,065,000 | ) | $ | (1,228,333 | ) | $ | 163,333 | |||||||||||||
Square, Inc. | 44.00 USD | 3/16/18 | (5,000 | ) | (500,000 | ) | (312,500 | ) | (1,269,763 | ) | 957,263 | |||||||||||||||||
Square, Inc. | 50.00 USD | 3/16/18 | (6,100 | ) | (610,000 | ) | (152,500 | ) | (2,726,383 | ) | 2,573,883 | |||||||||||||||||
|
| |||||||||||||||||||||||||||
| Total call options | $ | (1,530,000 | ) | $ | (5,224,479 | ) | $ | 3,694,479 | ||||||||||||||||||||
|
| |||||||||||||||||||||||||||
| Semiannual Report | | December 31, 2017 | 91 |
Table of Contents
Schedule of Investments
December 31, 2017 (unaudited)
| Options written contracts outstanding at December 31, 2017: | ||||||||||||||||||||||||||||
| Description | Exercise Price | Expiration Date | Number of Contracts | Notional Amount | Market Value | Premiums Received | Unrealized Appreciation | |||||||||||||||||||||
Put options: |
| |||||||||||||||||||||||||||
Apple, Inc. | 100.00 USD | 1/19/18 | (2,200 | ) | $ | (220,000 | ) | $ | (3,300 | ) | $ | (1,450,779 | ) | $ | 1,447,479 | |||||||||||||
Apple, Inc. | 145.00 USD | 1/18/19 | (4,008 | ) | (400,800 | ) | (2,715,420 | ) | (4,497,211 | ) | 1,781,791 | |||||||||||||||||
NetApp, Inc. | 40.00 USD | 1/18/19 | (4,800 | ) | (480,000 | ) | (559,200 | ) | (1,460,259 | ) | 901,059 | |||||||||||||||||
Tesla, Inc. | 250.00 USD | 1/18/19 | (964 | ) | (96,400 | ) | (2,289,500 | ) | (2,782,767 | ) | 493,267 | |||||||||||||||||
Western Digital Corp. | 72.50 USD | 1/19/18 | (1,150 | ) | (115,000 | ) | (28,750 | ) | (224,197 | ) | 195,447 | |||||||||||||||||
Western Digital Corp. | 75.00 USD | 1/19/18 | (1,150 | ) | (115,000 | ) | (60,950 | ) | (328,844 | ) | 267,894 | |||||||||||||||||
|
| |||||||||||||||||||||||||||
| Total put options | $ | (5,657,120 | ) | $ | (10,744,057 | ) | $ | 5,086,937 | ||||||||||||||||||||
|
| |||||||||||||||||||||||||||
| Total options written contracts | $ | (7,187,120 | ) | $ | (15,968,536 | ) | $ | 8,781,416 | ||||||||||||||||||||
|
| |||||||||||||||||||||||||||
(g) At December 31, 2017, the Fund pledged $500,000 in cash as collateral for options written contracts and securities sold short.
Glossary:
ADR—American Depositary Receipt
MSCI—Morgan Stanley Capital International
REIT—Real Estate Investment Trust
| 92 | Semiannual Report | | December 31, 2017 | | See accompanying Notes to Financial Statements |
Table of Contents
(THIS PAGE INTENTIONALLY LEFT BLANK)
| Semiannual Report | | December 31, 2017 | 93 |
Table of Contents
Statements of Assets and Liabilities
December 31, 2017 (Unaudited)
| AllianzGI Emerging Markets Opportunities | AllianzGI Focused Growth | AllianzGI Global Natural Resources | AllianzGI Global Small-Cap | |||||||||||||
| Assets: | ||||||||||||||||
| Investments, at value | $ | 295,237,566 | $ | 1,025,362,668 | $ | 25,877,643 | $ | 198,486,579 | ||||||||
| Cash | 489 | 702 | 650 | 493 | ||||||||||||
| Foreign currency, at value | 2,226,071 | — | 5,269 | 12,608 | ||||||||||||
| Dividends and interest receivable (net of foreign withholding taxes) | 368,825 | 44,226 | 28,341 | 143,872 | ||||||||||||
| Receivable for Fund shares sold | 207,407 | 459,110 | 7,897 | 77,692 | ||||||||||||
| Receivable for investments sold | 159,747 | — | 123,947 | 481,333 | ||||||||||||
| Tax reclaims receivable | 56,036 | — | 14,370 | 107,868 | ||||||||||||
| Investments in Affiliated Funds — Trustees Deferred Compensation Plan (see Note 4) | 44,587 | 194,730 | 10,816 | 50,489 | ||||||||||||
| Unrealized appreciation of forward foreign currency contracts | 458 | — | — | 1,913 | ||||||||||||
| Prepaid expenses and other assets | — | — | 7 | — | ||||||||||||
Total Assets | 298,301,186 | 1,026,061,436 | 26,068,940 | 199,362,847 | ||||||||||||
| Liabilities: | ||||||||||||||||
| Payable for Fund shares redeemed | 199,437 | 1,224,892 | 31,824 | 231,656 | ||||||||||||
| Investment advisory fees payable | 159,730 | 305,185 | 14,816 | 73,505 | ||||||||||||
| Administration fees payable | 74,686 | 316,944 | 8,728 | 67,406 | ||||||||||||
| Trustees Deferred Compensation Plan payable (see Note 4) | 44,587 | 194,730 | 10,816 | 50,489 | ||||||||||||
| Servicing fees payable | 29,169 | 141,850 | 3,041 | 17,021 | ||||||||||||
| Distribution fees payable | 5,987 | 156,126 | 1,614 | 12,869 | ||||||||||||
| Options written, at value | — | — | — | — | ||||||||||||
| Unrealized depreciation of forward foreign currency contracts | — | — | — | 2,174 | ||||||||||||
| Payable for investments purchased | — | — | — | 893,647 | ||||||||||||
| Accrued expenses and other liabilities | 80,580 | — | 7 | — | ||||||||||||
Total Liabilities | 594,176 | 2,339,727 | 70,846 | 1,348,767 | ||||||||||||
| Net Assets | $ | 297,707,010 | $ | 1,023,721,709 | $ | 25,998,094 | $ | 198,014,080 | ||||||||
| Net Assets Consist of: | ||||||||||||||||
| Paid-in-capital | $ | 270,265,843 | $ | 594,632,246 | $ | 38,169,463 | $ | 143,439,134 | ||||||||
| Undistributed (dividends in excess of) net investment income | 1,859,742 | (489,449 | ) | 60,967 | (1,687,660 | ) | ||||||||||
| Accumulated net realized gain (loss) | (15,441,754 | ) | 6,176,949 | (16,289,285 | ) | 6,812,211 | ||||||||||
| Net unrealized appreciation (depreciation) | 41,023,179 | 423,401,963 | 4,056,949 | 49,450,395 | ||||||||||||
| Net Assets | $ | 297,707,010 | $ | 1,023,721,709 | $ | 25,998,094 | $ | 198,014,080 | ||||||||
| Cost of Investments | $ | 254,114,360 | $ | 601,960,705 | $ | 21,821,675 | $ | 149,012,848 | ||||||||
| Cost of Foreign Currency | $ | 2,207,560 | $ | — | $ | 5,183 | $ | 12,526 | ||||||||
| Premiums Received for Options Written | $ | — | $ | — | $ | — | $ | — | ||||||||
| 94 | Semiannual Report | | December 31, 2017 | | See accompanying Notes to Financial Statements |
Table of Contents
AllianzGI | AllianzGI Income & Growth | AllianzGI Mid-Cap | AllianzGI NFJ Dividend Value | AllianzGI NFJ International Value | ||||||||||||||||||
| $ | 154,588,783 | $ | 3,410,835,133 | $ | 312,689,237 | $ | 2,270,550,935 | $ | 386,181,004 | |||||||||||||
| 151 | 851 | 963 | 177 | 118 | ||||||||||||||||||
| — | — | — | — | 156,859 | ||||||||||||||||||
| 91,107 | 22,594,631 | 160,682 | 2,661,486 | 259,126 | ||||||||||||||||||
| 3,410 | 3,444,118 | 732,312 | 2,821,856 | 224,679 | ||||||||||||||||||
| — | 304,259 | — | 24,028,092 | 448,962 | ||||||||||||||||||
| 107,001 | — | — | 184,449 | 442,818 | ||||||||||||||||||
| 42,600 |
| 384,312 | 53,458 | 1,935,944 | 429,298 | ||||||||||||||||
| — | — | — | — | — | ||||||||||||||||||
| 61,566 | 11,920 | — | — | — | ||||||||||||||||||
| 154,894,618 | 3,437,575,224 | 313,636,652 | 2,302,182,939 | 388,142,864 | ||||||||||||||||||
| 192,667 | 6,223,586 | 119,566 | 49,681,063 | 2,194,987 | ||||||||||||||||||
| 105,939 | 1,873,360 | 122,987 | 615,067 | 180,985 | ||||||||||||||||||
| 52,745 | 1,060,533 | 102,194 | 712,861 | 146,793 | ||||||||||||||||||
| 42,600 | 384,312 | 53,458 | 1,935,944 | 429,298 | ||||||||||||||||||
| 32,547 | 481,662 | 56,968 | 197,589 | 36,545 | ||||||||||||||||||
| 5,810 | 693,258 | 99,475 | 568,638 | 56,080 | ||||||||||||||||||
| — | 769,940 | — | — | — | ||||||||||||||||||
| — | — | — | — | — | ||||||||||||||||||
| — | 1,333,882 | 602,974 | — | — | ||||||||||||||||||
| — | — | — | — | 1,124 | ||||||||||||||||||
| 432,308 | 12,820,533 | 1,157,622 | 53,711,162 | 3,045,812 | ||||||||||||||||||
| $ | 154,462,310 | $ | 3,424,754,691 | $ | 312,479,030 | $ | 2,248,471,777 | $ | 385,097,052 | |||||||||||||
| $ | 132,536,632 | $ | 3,704,442,529 | $ | 247,081,362 | $ | 1,704,193,072 | $ | 953,834,695 | |||||||||||||
| (180,961 | ) | (33,149,025 | ) | (2,397,998 | ) | 876,502 | (969,011 | ) | ||||||||||||||
| (2,166,767 | ) | 24,404,389 | 14,023,366 | 108,669,271 | (622,520,174 | ) | ||||||||||||||||
| 24,273,406 | (270,943,202 | ) | 53,772,300 | 434,732,932 | 54,751,542 | |||||||||||||||||
| $ | 154,462,310 | $ | 3,424,754,691 | $ | 312,479,030 | $ | 2,248,471,777 | $ | 385,097,052 | |||||||||||||
| $ | 130,312,814 | $ | 3,681,837,429 | $ | 258,916,155 | $ | 1,835,827,003 | $ | 331,435,862 | |||||||||||||
| $ | — | $ | — | $ | — | $ | — | $ | 156,821 | |||||||||||||
| $ | — | $ | 829,034 | $ | — | $ | — | $ | — | |||||||||||||
| See accompanying Notes to Financial Statements | | December 31, 2017 | | Semiannual Report | 95 |
Table of Contents
Statements of Assets and Liabilities (cont’d)
December 31, 2017 (Unaudited)
| AllianzGI Emerging Markets Opportunities | AllianzGI Focused Growth | AllianzGI Global Natural Resources | AllianzGI Global Small-Cap | |||||||||||||
| Net Assets: | ||||||||||||||||
| Class A | $ | 123,569,768 | $ | 406,295,662 | $ | 12,269,677 | $ | 60,807,426 | ||||||||
| Class C | 9,683,008 | 234,943,557 | 2,576,392 | 20,483,431 | ||||||||||||
| Class R | — | 23,191,272 | — | — | ||||||||||||
| Class P | 28,798,667 | 92,529,922 | 1,247,594 | 18,967,229 | ||||||||||||
| Institutional Class | 134,726,833 | 220,911,238 | 9,904,431 | 97,755,994 | ||||||||||||
| Class R6 | 928,734 | 41,150,318 | — | — | ||||||||||||
| Administrative Class | — | 4,699,740 | — | — | ||||||||||||
| Shares Issued and Outstanding: | ||||||||||||||||
| Class A | 4,069,904 | 7,687,757 | 774,144 | 1,214,377 | ||||||||||||
| Class C | 323,172 | 6,386,630 | 173,409 | 464,173 | ||||||||||||
| Class R | — | 572,056 | — | — | ||||||||||||
| Class P | 967,003 | 2,255,000 | 77,388 | 357,222 | ||||||||||||
| Institutional Class | 4,415,496 | 4,531,217 | 609,360 | 1,827,373 | ||||||||||||
| Class R6 | 30,600 | 843,574 | — | — | ||||||||||||
| Administrative Class | — | 102,490 | — | — | ||||||||||||
| Net Asset Value and Redemption Price Per Share:* | ||||||||||||||||
| Class A | $ | 30.36 | $ | 52.85 | $ | 15.85 | $ | 50.07 | ||||||||
| Class C | 29.96 | 36.79 | 14.86 | 44.13 | ||||||||||||
| Class R | — | 40.54 | — | — | ||||||||||||
| Class P | 29.78 | 41.03 | 16.12 | 53.10 | ||||||||||||
| Institutional Class | 30.51 | 48.75 | 16.25 | 53.50 | ||||||||||||
| Class R6 | 30.35 | 48.78 | — | — | ||||||||||||
| Administrative Class | — | 45.86 | — | — | ||||||||||||
| * | Net asset value and redemption price per share may not recalculate exactly due to rounding. |
| 96 | Semiannual Report | | December 31, 2017 | | See accompanying Notes to Financial Statements |
Table of Contents
AllianzGI | AllianzGI Income & Growth | AllianzGI Mid-Cap | AllianzGI NFJ Dividend Value | AllianzGI NFJ International Value | ||||||||||||||||||
| $ | 142,939,852 | $ | 1,183,087,750 | $ | 119,897,906 | $ | 554,471,833 | $ | 112,815,575 | |||||||||||||
| 9,024,788 | 1,079,655,629 | 148,403,596 | 266,004,087 | 47,519,893 | ||||||||||||||||||
| — | 3,151,662 | 3,149,335 | 109,508,135 | 10,193,060 | ||||||||||||||||||
| — | 781,657,394 | 10,872,938 | 628,717,396 | 138,681,577 | ||||||||||||||||||
| 2,497,670 | 377,202,256 | 28,764,116 | 497,950,265 | 67,859,037 | ||||||||||||||||||
| — | — | — | 87,920,372 | 2,785,937 | ||||||||||||||||||
| — | — | 1,391,139 | 103,899,689 | 5,241,973 | ||||||||||||||||||
| 4,498,670 | 103,089,379 | 31,821,840 | 36,628,207 | 5,707,841 | ||||||||||||||||||
| 356,189 | 101,611,310 | 47,220,702 | 17,388,911 | 2,445,909 | ||||||||||||||||||
| — | 274,615 | 848,893 | 7,258,216 | 515,590 | ||||||||||||||||||
| — | 66,587,617 | 2,546,885 | 41,209,988 | 6,982,212 | ||||||||||||||||||
| 77,761 | 31,851,919 | 6,699,258 | 32,647,642 | 3,409,552 | ||||||||||||||||||
| — | — | — | 5,777,263 | 140,035 | ||||||||||||||||||
| — | — | 349,336 | 6,737,644 | 264,308 | ||||||||||||||||||
| $ | 31.77 | $ | 11.48 | $ | 3.77 | $ | 15.14 | $ | 19.77 | |||||||||||||
| 25.34 | 10.63 | 3.14 | 15.30 | 19.43 | ||||||||||||||||||
| — | 11.48 | 3.71 | 15.09 | 19.77 | ||||||||||||||||||
| — | 11.74 | 4.27 | 15.26 | 19.86 | ||||||||||||||||||
| 32.12 | 11.84 | 4.29 | 15.25 | 19.90 | ||||||||||||||||||
| — | — | — | 15.22 | 19.89 | ||||||||||||||||||
| — | — | 3.98 | 15.42 | 19.83 | ||||||||||||||||||
| See accompanying Notes to Financial Statements | | December 31, 2017 | | Semiannual Report | 97 |
Table of Contents
Statements of Assets and Liabilities (cont’d)
December 31, 2017 (Unaudited)
| AllianzGI NFJ Large-Cap Value | AllianzGI NFJ Mid-Cap | AllianzGI NFJ Small-Cap | AllianzGI Small-Cap Blend | |||||||||||||
| Assets: | ||||||||||||||||
| Investments, at value | $ | 388,143,227 | $ | 1,022,438,830 | $ | 2,684,796,083 | $ | 84,328,903 | ||||||||
| Investments in Affiliates, at value | — | — | 27,223,932 | — | ||||||||||||
| Cash | 18,585 | — | 136,577 | 1,971,969 | ||||||||||||
| Foreign currency, at value | — | — | 118,573 | — | ||||||||||||
| Dividends and interest receivable (net of foreign withholding taxes) | 562,272 | 1,420,059 | 3,147,970 | 126,824 | ||||||||||||
| Receivable for investments sold | — | — | 12,247,176 | 106,174 | ||||||||||||
| Deposits with brokers for derivatives collateral | — | — | — | — | ||||||||||||
| Receivable for Fund shares sold | 177,362 | 2,767,310 | 2,255,387 | 124,905 | ||||||||||||
| Tax reclaims receivable | 29,829 | 3,846 | — | — | ||||||||||||
| Investments in Affiliated Funds — Trustees Deferred Compensation Plan (see Note 4) | 216,127 | 276,003 | 1,499,190 | 7,271 | ||||||||||||
| Prepaid expenses and other assets | — | — | 3,755 | — | ||||||||||||
Total Assets | 389,147,402 | 1,026,906,048 | 2,731,428,643 | 86,666,046 | ||||||||||||
| Liabilities: | ||||||||||||||||
| Payable for investments purchased | — | — | 887,083 | 6,531 | ||||||||||||
| Payable for Fund shares redeemed | 181,581 | 2,969,220 | 25,208,553 | 49,380 | ||||||||||||
| Payable to custodian for cash overdraft | — | 68,599 | — | — | ||||||||||||
| Dividends payable on securities sold short | — | — | — | — | ||||||||||||
| Securities sold short, at value | — | — | — | — | ||||||||||||
| Options written, at value | — | — | — | — | ||||||||||||
| Investment advisory fees payable | 147,513 | 466,673 | 1,381,710 | 47,024 | ||||||||||||
| Distribution fees payable | 47,818 | 118,850 | 676,609 | 21,627 | ||||||||||||
| Servicing fees payable | 50,581 | 156,118 | 182,988 | 16,318 | ||||||||||||
| Administration fees payable | 120,294 | 139,438 | 595,693 | 28,576 | ||||||||||||
| Trustees Deferred Compensation Plan payable (see Note 4) | 216,127 | 276,003 | 1,499,190 | 7,271 | ||||||||||||
Total Liabilities | 763,914 | 4,194,901 | 30,431,826 | 176,727 | ||||||||||||
| Net Assets | $ | 388,383,488 | $ | 1,022,711,147 | $ | 2,700,996,817 | $ | 86,489,319 | ||||||||
| Net Assets Consist of: | ||||||||||||||||
| Paid-in-capital | $ | 547,860,121 | $ | 799,474,602 | $ | 2,073,667,582 | $ | 70,977,147 | ||||||||
| Undistributed (dividends in excess of) net investment income | 194,552 | 86,522 | (77,905 | ) | (98,904 | ) | ||||||||||
| Accumulated net realized gain (loss) | (221,673,912 | ) | (1,460,428 | ) | 79,790,485 | 3,147,603 | ||||||||||
| Net unrealized appreciation | 62,002,727 | 224,610,451 | 547,616,655 | 12,463,473 | ||||||||||||
| Net Assets | $ | 388,383,488 | $ | 1,022,711,147 | $ | 2,700,996,817 | $ | 86,489,319 | ||||||||
| Cost of Investments | $ | 326,140,500 | $ | 796,414,890 | $ | 2,120,038,602 | $ | 71,832,998 | ||||||||
| Cost of Investments in Affiliates | $ | — | $ | — | $ | 32,862,950 | $ | — | ||||||||
| Cost of Foreign Currency | $ | — | $ | — | $ | 118,572 | $ | — | ||||||||
| Proceeds Received on Securities Sold Short | $ | — | $ | — | $ | — | $ | — | ||||||||
| Premiums Received for Options Written | $ | — | $ | — | $ | — | $ | — | ||||||||
| 98 | Semiannual Report | | December 31, 2017 | | See accompanying Notes to Financial Statements |
Table of Contents
AllianzGI | ||||||
| $ | 1,386,576,701 | |||||
| — | ||||||
| 74 | ||||||
| 4,340,738 | ||||||
| 329,645 | ||||||
| 147,351,597 | ||||||
| 500,000 | ||||||
| 4,649,264 | ||||||
| 3,149 | ||||||
| 335,746 |
| ||||
| 5,919 | ||||||
| 1,544,092,833 | ||||||
| 4,001,457 | ||||||
| 170,186,168 | ||||||
| — | ||||||
| 131,843 | ||||||
| 31,136,011 | ||||||
| 7,187,120 | ||||||
| 968,894 | ||||||
| 81,010 | ||||||
| 129,771 | ||||||
| 434,289 | ||||||
| 335,746 | ||||||
| 214,592,309 | ||||||
| $ | 1,329,500,524 | |||||
| $ | 769,812,342 | |||||
| (7,209,575 | ) | |||||
| 74,770,860 | ||||||
| 492,126,897 | ||||||
| $ | 1,329,500,524 | |||||
| $ | 904,489,134 | |||||
| $ | — | |||||
| $ | 4,016,891 | |||||
| $ | 32,024,638 | |||||
| $ | 15,968,536 | |||||
| See accompanying Notes to Financial Statements | | December 31, 2017 | | Semiannual Report | 99 |
Table of Contents
Statements of Assets and Liabilities (cont’d)
December 31, 2017 (Unaudited)
| AllianzGI NFJ Large- Cap Value | AllianzGI NFJ Mid-Cap | AllianzGI NFJ Small-Cap | AllianzGI Small-Cap Blend | |||||||||||||
| Net Assets: | ||||||||||||||||
| Class A | $ | 159,140,172 | $ | 553,432,400 | $ | 689,677,630 | $ | 43,387,394 | ||||||||
| Class C | 72,276,297 | 181,882,310 | 122,577,985 | 34,049,240 | ||||||||||||
| Class R | 7,507,865 | 11,163,035 | 45,731,446 | — | ||||||||||||
| Class P | 20,246,495 | 113,053,967 | 70,006,537 | 4,397,239 | ||||||||||||
| Institutional Class | 127,723,686 | 151,978,297 | 1,053,580,496 | 4,655,446 | ||||||||||||
| Class R6 | — | 223,650 | 430,287,824 | — | ||||||||||||
| Administrative Class | 1,488,973 | 10,977,488 | 289,134,899 | — | ||||||||||||
| Shares Issued and Outstanding: | ||||||||||||||||
| Class A | 5,927,783 | 17,672,226 | 31,826,430 | 2,155,425 | ||||||||||||
| Class C | 2,662,730 | 7,063,061 | 6,340,317 | 1,740,725 | ||||||||||||
| Class R | 276,910 | 415,013 | 1,981,159 | — | ||||||||||||
| Class P | 747,210 | 4,461,767 | 2,903,885 | 216,717 | ||||||||||||
| Institutional Class | 4,778,964 | 4,545,382 | 43,445,140 | 227,995 | ||||||||||||
| Class R6 | — | 6,696 | 17,813,253 | — | ||||||||||||
| Administrative Class | 54,710 | 339,988 | 13,387,408 | — | ||||||||||||
| Net Asset Value and Redemption Price Per Share:* | ||||||||||||||||
| Class A | $ | 26.85 | $ | 31.32 | $ | 21.67 | $ | 20.13 | ||||||||
| Class C | 27.14 | 25.75 | 19.33 | 19.56 | ||||||||||||
| Class R | 27.11 | 26.90 | 23.08 | — | ||||||||||||
| Class P | 27.10 | 25.34 | 24.11 | 20.29 | ||||||||||||
| Institutional Class | 26.73 | 33.44 | 24.25 | 20.42 | ||||||||||||
| Class R6 | — | 33.40 | 24.16 | — | ||||||||||||
| Administrative Class | 27.22 | 32.29 | 21.60 | — | ||||||||||||
| * | Net asset value and redemption price per share may not recalculate exactly due to rounding. |
| 100 | Semiannual Report | | December 31, 2017 | | See accompanying Notes to Financial Statements |
Table of Contents
AllianzGI | ||||||
| $ | 485,142,757 | |||||
| 123,034,734 | ||||||
| — | ||||||
| 68,599,514 | ||||||
| 635,026,736 | ||||||
| — | ||||||
| 17,696,783 | ||||||
| 7,920,844 | ||||||
| 2,590,362 | ||||||
| — | ||||||
| 1,015,734 | ||||||
| 9,249,086 | ||||||
| — | ||||||
| 273,203 | ||||||
| $ | 61.25 | |||||
| 47.50 | ||||||
| — | ||||||
| 67.54 | ||||||
| 68.66 | ||||||
| — | ||||||
| 64.78 | ||||||
| See accompanying Notes to Financial Statements | | December 31, 2017 | | Semiannual Report | 101 |
Table of Contents
Six Months ended December 31, 2017 (Unaudited)
| AllianzGI Emerging Markets Opportunities | AllianzGI Focused Growth | AllianzGI Global Natural Resources | AllianzGI Global Small-Cap | |||||||||||||
| Investment Income: | ||||||||||||||||
| Dividends, net of foreign withholding taxes* | $ | 3,514,692 | $ | 4,974,097 | $ | 204,874 | $ | 871,118 | ||||||||
| Interest | 1,468 | 2,479 | 163 | 2,616 | ||||||||||||
| Non-cash income | — | — | 52,741 | — | ||||||||||||
| Miscellaneous | — | — | 233 | 41 | ||||||||||||
Total Investment Income | 3,516,160 | 4,976,576 | 258,011 | 873,775 | ||||||||||||
| Expenses: | ||||||||||||||||
| Investment advisory | 1,189,904 | 2,227,001 | 89,394 | 929,753 | ||||||||||||
| Administration | 650,611 | 1,842,169 | 52,567 | 411,348 | ||||||||||||
| Distribution — Class C | 35,922 | 858,213 | 10,103 | 75,246 | ||||||||||||
| Distribution — Class R | — | 27,785 | — | — | ||||||||||||
| Servicing — Class A | 191,385 | 494,976 | 14,351 | 73,867 | ||||||||||||
| Servicing — Class C | 11,974 | 286,071 | 3,368 | 25,082 | ||||||||||||
| Servicing — Class R | — | 27,785 | — | — | ||||||||||||
| Distribution and/or servicing — Administrative Class | — | 5,667 | — | — | ||||||||||||
| Legal | 945 | 3,173 | 163 | 797 | ||||||||||||
| Trustees | 15,462 | 55,510 | 1,593 | 12,466 | ||||||||||||
| Securities sold short | — | — | 7 | — | ||||||||||||
| Line of credit commitment | 3,204 | 11,316 | 357 | 2,494 | ||||||||||||
| Miscellaneous | 7,614 | 7,650 | 1,359 | 3,295 | ||||||||||||
Total Expenses | 2,107,021 | 5,847,316 | 173,262 | 1,534,348 | ||||||||||||
Less: Investment advisory/Administration waived | (489,960 | ) | (534,529 | ) | — | — | ||||||||||
Net Expenses | 1,617,061 | 5,312,787 | 173,262 | 1,534,348 | ||||||||||||
| Net Investment Income (Loss) | 1,899,099 | (336,211 | ) | 84,749 | (660,573 | ) | ||||||||||
| Realized and Change in Unrealized Gain (Loss): | ||||||||||||||||
| Net realized gain (loss) on: | ||||||||||||||||
Investments | 1,826,050 | 12,330,833 | (502,837 | ) | 17,753,034 | |||||||||||
Options written | — | — | 67,286 | — | ||||||||||||
Forward currency contracts | 96,533 | — | (2,361 | ) | 8,490 | |||||||||||
Foreign currency transactions | (151,125 | ) | — | 528 | (36,298 | ) | ||||||||||
| Payments from Affiliates (See Note 11) | — | — | — | 78,097 | ||||||||||||
| Net change in unrealized appreciation/depreciation of: | ||||||||||||||||
Investments | 35,858,627 | 123,701,763 | 3,910,408 | 9,783,917 | ||||||||||||
Options written | — | — | 7,736 | — | ||||||||||||
Forward currency contracts | (2,248 | ) | — | — | 1,133 | |||||||||||
Foreign currency transactions | 39,054 | — | 1,301 | 6,111 | ||||||||||||
| Net realized and change in unrealized gain | 37,666,891 | 136,032,596 | 3,482,061 | 27,594,484 | ||||||||||||
| Net Increase in Net Assets Resulting from Investment Operations | $ | 39,565,990 | $ | 135,696,385 | $ | 3,566,810 | $ | 26,933,911 | ||||||||
| *Foreign withholding taxes | $ | 478,314 | $ | — | $ | 9,897 | $ | 32,192 | ||||||||
| 102 | Semiannual Report | | December 31, 2017 | | See accompanying Notes to Financial Statements |
Table of Contents
AllianzGI | AllianzGI Income & Growth | AllianzGI Mid-Cap | AllianzGI NFJ Dividend Value | AllianzGI NFJ International Value | ||||||||||||||||||
| $ | 1,098,436 | $ | 16,838,095 | $ | 1,113,292 | $ | 36,088,565 | $ | 4,919,689 | |||||||||||||
| 3,703 | 38,306,598 | 655 | 9,268 | 2,066 | ||||||||||||||||||
| — | — | — | — | — | ||||||||||||||||||
| — | 105,998 | — | — | — | ||||||||||||||||||
| 1,102,139 | 55,250,691 | 1,113,947 | 36,097,833 | 4,921,755 | ||||||||||||||||||
| 650,453 | 10,916,990 | 714,293 | 6,069,247 | 1,261,473 | ||||||||||||||||||
| 323,603 | 6,136,673 | 593,989 | 4,592,366 | 985,347 | ||||||||||||||||||
| 36,991 | 4,115,131 | 549,561 | 1,023,700 | 195,287 | ||||||||||||||||||
| — | 3,299 | 3,321 | 143,713 | 13,293 | ||||||||||||||||||
| 186,878 | 1,434,209 | 146,177 | 726,745 | 154,191 | ||||||||||||||||||
| 12,330 | 1,371,710 | 183,187 | 341,233 | 65,096 | ||||||||||||||||||
| — | 3,299 | 3,321 | 143,713 | 13,293 | ||||||||||||||||||
| — | — | 784 | 377,872 | 6,471 | ||||||||||||||||||
| 634 | 10,843 | 1,057 | 11,591 | 2,136 | ||||||||||||||||||
| 9,533 | 189,053 | 17,389 | 161,540 | 25,993 | ||||||||||||||||||
| — | — | — | — | — | ||||||||||||||||||
| 1,966 | 38,733 | 3,547 | 36,534 | 5,456 | ||||||||||||||||||
| 1,508 | 19,087 | 1,752 | 24,736 | 17,895 | ||||||||||||||||||
| 1,223,896 | 24,239,027 | 2,218,378 | 13,652,990 | 2,745,931 | ||||||||||||||||||
| — | (92,213 | ) | — | (2,023,082 | ) | (157,684 | ) | |||||||||||||||
| 1,223,896 | 24,146,814 | 2,218,378 | 11,629,908 | 2,588,247 | ||||||||||||||||||
| (121,757 | ) | 31,103,877 | (1,104,431 | ) | 24,467,925 | 2,333,508 | ||||||||||||||||
| 3,391,105 | 107,545,585 | 27,768,947 | 268,226,464 | 19,232,370 | ||||||||||||||||||
| — | (5,457,578 | ) | — | — | — | |||||||||||||||||
| — | — | — | — | (66,403 | ) | |||||||||||||||||
| (288 | ) | — | — | — | (140,525 | ) | ||||||||||||||||
| — | — | — | — | — | ||||||||||||||||||
| (2,420,858 | ) | 75,495,622 | 3,741,248 | (2,350,693 | ) | 17,541,325 | ||||||||||||||||
| — | (67,136 | ) | — | — | — | |||||||||||||||||
| — | — | — | — | (346 | ) | |||||||||||||||||
| (1,341 | ) | — | — | — | 15,260 | |||||||||||||||||
| 968,618 | 177,516,493 | 31,510,195 | 265,875,771 | 36,581,681 | ||||||||||||||||||
| $ | 846,861 | $ | 208,620,370 | $ | 30,405,764 | $ | 290,343,696 | $ | 38,915,189 | |||||||||||||
| $ | 886 | $ | 68,434 | $ | — | $ | 500,832 | $ | 440,101 | |||||||||||||
| See accompanying Notes to Financial Statements | | December 31, 2017 | | Semiannual Report | 103 |
Table of Contents
Statements of Operations (cont’d)
Six Months ended December 31, 2017 (Unaudited)
| AllianzGI NFJ Large-Cap Value | AllianzGI NFJ Mid-Cap Value | AllianzGI NFJ Small-Cap Value | AllianzGI Small-Cap Blend | |||||||||||||
| Investment Income: | ||||||||||||||||
| Dividends, net of foreign withholding taxes* | $ | 5,522,086 | $ | 10,115,032 | $ | 33,013,130 | $ | 599,000 | ||||||||
| Interest | 1,090 | 28,017 | 60,906 | 113 | ||||||||||||
| Dividends from investments in Affiliates | — | — | 1,063,766 | — | ||||||||||||
| Non-cash income | — | 1,210,922 | — | 58,594 | ||||||||||||
| Miscellaneous | — | — | — | — | ||||||||||||
Total Investment Income | 5,523,176 | 11,353,971 | 34,137,802 | 657,707 | ||||||||||||
| Expenses: | ||||||||||||||||
| Investment advisory | 834,498 | 2,454,004 | 8,611,974 | 269,829 | ||||||||||||
| Distribution — Class C | 264,519 | 654,877 | 484,769 | 127,746 | ||||||||||||
| Distribution — Class R | 8,981 | 8,023 | 60,828 | — | ||||||||||||
| Servicing — Class A | 192,759 | 651,446 | 909,678 | 51,857 | ||||||||||||
| Servicing — Class C | 88,173 | 218,292 | 161,590 | 42,582 | ||||||||||||
| Servicing — Class R | 8,981 | 8,023 | 60,828 | — | ||||||||||||
| Distribution and/or servicing — Administrative Class | 1,727 | 9,364 | 398,908 | — | ||||||||||||
| Administration | 681,909 | 1,731,964 | 4,407,929 | 164,199 | ||||||||||||
| Trustees | 21,034 | 45,093 | 172,879 | 4,730 | ||||||||||||
| Line of credit commitment | 4,388 | 9,251 | 37,916 | 980 | ||||||||||||
| Legal | 1,325 | 2,953 | 11,012 | 328 | ||||||||||||
| Dividends on securities sold short | — | — | — | — | ||||||||||||
| Miscellaneous | 2,216 | 4,596 | 14,901 | 485 | ||||||||||||
Total Expenses | 2,110,510 | 5,797,886 | 15,333,212 | 662,736 | ||||||||||||
Less: Investment advisory/Administration waived | (182,866 | ) | (575,920 | ) | (719,557 | ) | — | |||||||||
Net Expenses | 1,927,644 | 5,221,966 | 14,613,655 | 662,736 | ||||||||||||
| Net Investment Income (Loss) | 3,595,532 | 6,132,005 | 19,524,147 | (5,029 | ) | |||||||||||
| Realized and Change in Unrealized Gain (Loss): | ||||||||||||||||
| Net realized gain (loss) on: | ||||||||||||||||
Investments | 37,307,986 | 9,455,886 | 158,527,506 | 8,545,183 | ||||||||||||
Investments in Affiliates | — | — | (6,039,671 | ) | — | |||||||||||
Options written | — | — | — | — | ||||||||||||
Forward currency contracts | — | — | (16,900 | ) | — | |||||||||||
Foreign currency transactions | — | 164 | 21,912 | — | ||||||||||||
| Net change in unrealized appreciation/depreciation of: | ||||||||||||||||
Investments | (688,491 | ) | 64,161,171 | 20,831,055 | 445,081 | |||||||||||
Investments in Affiliates | — | — | (5,965,639 | ) | — | |||||||||||
Securities sold short | — | — | — | — | ||||||||||||
Options written | — | — | — | — | ||||||||||||
Foreign currency transactions | — | (92 | ) | (211 | ) | — | ||||||||||
| Net realized and change in unrealized gain | 36,619,495 | 73,617,129 | 167,358,052 | 8,990,264 | ||||||||||||
| Net Increase in Net Assets Resulting from Investment Operations | $ | 40,215,027 | $ | 79,749,134 | $ | 186,882,199 | $ | 8,985,235 | ||||||||
| *Foreign withholding taxes | $ | 48,587 | $ | 22,692 | $ | 240,799 | $ | — | ||||||||
| 104 | Semiannual Report | | December 31, 2017 | | See accompanying Notes to Financial Statements |
Table of Contents
AllianzGI | ||||||
| $ | 4,124,877 | |||||
| 42,416 | ||||||
| — | ||||||
| — | ||||||
| 5,288 | ||||||
| 4,172,581 | ||||||
| 6,763,932 | ||||||
| 458,026 | ||||||
| — | ||||||
| 614,005 | ||||||
| 152,675 | ||||||
| — | ||||||
| 21,060 | ||||||
| 2,532,775 | ||||||
| 83,052 | ||||||
| 16,425 | ||||||
| 4,679 | ||||||
| 132,526 | ||||||
| 8,166 | ||||||
| 10,787,321 | ||||||
| (1,127,322 | ) | |||||
| 9,659,999 | ||||||
| (5,487,418 | ) | |||||
| 173,443,046 | ||||||
| — | ||||||
| (2,711,150 | ) | |||||
| 29,583 | ||||||
| (35,004 | ) | |||||
| 79,371,507 | ||||||
| — | ||||||
| 894,576 | ||||||
| 7,440,637 | ||||||
| 139,778 | ||||||
| 258,572,973 | ||||||
| $ | 253,085,555 | |||||
| $ | 72,739 | |||||
| See accompanying Notes to Financial Statements | | December 31, 2017 | | Semiannual Report | 105 |
Table of Contents
Statements of Changes in Net Assets
| AllianzGI Emerging Markets Opportunities | AllianzGI Focused Growth | |||||||||||||||||||
| Six Months ended December 31, 2017 (unaudited) | Year ended June 30, 2017 | Six Months ended December 31, 2017 (unaudited) | Year ended June 30, 2017 | |||||||||||||||||
| Increase (Decrease) in Net Assets from: | ||||||||||||||||||||
Investment Operations: | ||||||||||||||||||||
| Net investment income (loss) | $ | 1,899,099 | $ | 4,285,757 | $ | (336,211 | ) | $ | 356,169 | |||||||||||
| Net realized gain (loss) | 1,771,458 | 52,794,378 | 12,330,833 | 23,204,768 | ||||||||||||||||
| Net change in unrealized appreciation/depreciation | 35,895,433 | (12,507,730 | ) | 123,701,763 | 116,397,656 | |||||||||||||||
| Net increase (decrease) in net assets resulting from investment operations | 39,565,990 | 44,572,405 | 135,696,385 | 139,958,593 | ||||||||||||||||
| Dividends and Distributions to Shareholders from: | ||||||||||||||||||||
| Net investment income: | ||||||||||||||||||||
Class A | (1,285,169 | ) | (2,309,777 | ) | (23,468 | ) | — | |||||||||||||
Class C | (25,141 | ) | (51,545 | ) | (879 | ) | — | |||||||||||||
Class R | — | — | (6 | ) | — | |||||||||||||||
Class P | (448,520 | ) | (422,889 | ) | (113,936 | ) | — | |||||||||||||
Institutional Class | (2,113,250 | ) | (1,195,198 | ) | (203,158 | ) | — | |||||||||||||
Class R6 | (14,883 | ) | (7,558 | ) | (51,061 | ) | — | |||||||||||||
Administrative Class | — | — | (10 | ) | — | |||||||||||||||
| Net realized capital gains: | ||||||||||||||||||||
Class A | — | — | (5,392,533 | ) | (8,648,851 | ) | ||||||||||||||
Class C | — | — | (4,432,087 | ) | (7,638,039 | ) | ||||||||||||||
Class R | — | — | (398,509 | ) | (626,456 | ) | ||||||||||||||
Class P | — | — | (1,561,919 | ) | (1,500,077 | ) | ||||||||||||||
Institutional Class | — | — | (3,156,079 | ) | (4,721,926 | ) | ||||||||||||||
Class R6 | — | — | (586,283 | ) | (437,297 | ) | ||||||||||||||
Administrative Class | — | — | (71,082 | ) | (247,880 | ) | ||||||||||||||
| Total dividends and distributions to shareholders | (3,886,963 | ) | (3,986,967 | ) | (15,991,010 | ) | (23,820,526 | ) | ||||||||||||
| Fund Share Transactions: | ||||||||||||||||||||
| Net proceeds from the sale of shares | 77,694,640 | 70,735,565 | 65,582,749 | 275,851,959 | ||||||||||||||||
| Issued in reinvestment of dividends and distributions | 3,503,706 | 3,486,344 | 14,454,334 | 21,097,132 | ||||||||||||||||
| Cost of shares redeemed | (77,475,624 | ) | (97,108,941 | ) | (104,189,275 | ) | (300,770,123 | ) | ||||||||||||
| Net increase (decrease) from Fund share transactions | 3,722,722 | (22,887,032 | ) | (24,152,192 | ) | (3,821,032 | ) | |||||||||||||
| Total increase (decrease) in net assets | 39,401,749 | 17,698,406 | 95,553,183 | 112,317,035 | ||||||||||||||||
| Net Assets: | ||||||||||||||||||||
| Beginning of period | 258,305,261 | 240,606,855 | 928,168,526 | 815,851,491 | ||||||||||||||||
| End of period* | $ | 297,707,010 | $ | 258,305,261 | $ | 1,023,721,709 | $ | 928,168,526 | ||||||||||||
* Including undistributed (dividends in excess of) net investment income of: | $ | 1,859,742 | $ | 3,847,606 | $ | (489,449 | ) | $ | 239,280 | |||||||||||
| 106 | Semiannual Report | | December 31, 2017 | | See accompanying Notes to Financial Statements |
Table of Contents
| AllianzGI Global Natural Resources | AllianzGI Global Small-Cap | AllianzGI Health Sciences | ||||||||||||||||||||||||
| Six Months ended December 31, 2017 (unaudited) | Year ended June 30, 2017 | Six Months ended December 31, 2017 (unaudited) | Year ended June 30, 2017 | Six Months ended December 31, 2017 (unaudited) | Year ended June 30, 2017 | |||||||||||||||||||||
| $ | 84,749 | $ | 53,920 | $ | (660,573 | ) | $ | (376,033 | ) | $ | (121,757 | ) | $ | (148,857 | ) | |||||||||||
| (437,384 | ) | 2,348,771 | 17,803,323 | 23,473,562 | 3,390,817 | 7,368,599 | ||||||||||||||||||||
| 3,919,445 | (2,686,384 | ) | 9,791,161 | 9,785,618 | (2,422,199 | ) | 14,339,992 | |||||||||||||||||||
| 3,566,810 | (283,693 | ) | 26,933,911 | 32,883,147 | 846,861 | 21,559,734 | ||||||||||||||||||||
| (22,600 | ) | (114,721 | ) | (104,607 | ) | — | — | — | ||||||||||||||||||
| (2 | ) | (1,234 | ) | (4 | ) | — | — | — | ||||||||||||||||||
| — | — | — | — | — | — | |||||||||||||||||||||
| (1 | ) | (54,906 | ) | (53,154 | ) | — | — | — | ||||||||||||||||||
| (33,505 | ) | (96,356 | ) | (363,320 | ) | — | — | — | ||||||||||||||||||
| — | — | — | — | — | — | |||||||||||||||||||||
| — | — | — | — | — | — | |||||||||||||||||||||
| — | — | (4,831,503 | ) | — | — | — | ||||||||||||||||||||
| — | — | (1,825,089 | ) | — | — | — | ||||||||||||||||||||
| — | — | — | — | — | — | |||||||||||||||||||||
| — | — | (1,455,425 | ) | — | — | — | ||||||||||||||||||||
| — | — | (7,466,205 | ) | — | — | — | ||||||||||||||||||||
| — | — | — | — | — | — | |||||||||||||||||||||
| — | — | — | — | — | — | |||||||||||||||||||||
| (56,108 | ) | (267,217 | ) | (16,099,307 | ) | — | — | — | ||||||||||||||||||
| 3,082,751 | 13,242,086 | 6,834,390 | 26,459,697 | 1,532,467 | 13,085,659 | |||||||||||||||||||||
| 49,377 | 199,638 | 14,938,951 | — | — | — | |||||||||||||||||||||
| (6,714,072 | ) | (30,892,339 | ) | (49,148,212 | ) | (79,683,619 | ) | (12,722,957 | ) | (52,986,422 | ) | |||||||||||||||
| (3,581,944 | ) | (17,450,615 | ) | (27,374,871 | ) | (53,223,922 | ) | (11,190,490 | ) | (39,900,763 | ) | |||||||||||||||
| (71,242 | ) | (18,001,525 | ) | (16,540,267 | ) | (20,340,775 | ) | (10,343,629 | ) | (18,341,029 | ) | |||||||||||||||
| 26,069,336 | 44,070,861 | 214,554,347 | 234,895,122 | 164,805,939 | 183,146,968 | |||||||||||||||||||||
| $ | 25,998,094 | $ | 26,069,336 | $ | 198,014,080 | $ | 214,554,347 | $ | 154,462,310 | $ | 164,805,939 | |||||||||||||||
| $ | 60,967 | $ | 32,326 | $ | (1,687,660 | ) | $ | (506,002 | ) | $ | (180,961 | ) | $ | 59,204 | ||||||||||||
| See accompanying Notes to Financial Statements | | December 31, 2017 | | Semiannual Report | 107 |
Table of Contents
Statements of Changes in Net Assets (cont’d)
| AllianzGI Income & Growth | AllianzGI Mid-Cap | |||||||||||||||||||
| Six Months ended December 31, 2017 (unaudited) | Year ended June 30, 2017 | Six Months ended December 31, 2017 (unaudited) | Year ended June 30, 2017 | |||||||||||||||||
| Increase (Decrease) in Net Assets from: | ||||||||||||||||||||
Investment Operations: | ||||||||||||||||||||
| Net investment income (loss) | $ | 31,103,877 | $ | 68,287,602 | $ | (1,104,431 | ) | $ | (2,267,760 | ) | ||||||||||
| Net realized gain (loss) | 102,088,007 | 199,080,977 | 27,768,947 | 34,231,785 | ||||||||||||||||
| Net change in unrealized appreciation/depreciation | 75,428,486 | 118,630,380 | 3,741,248 | 16,434,946 | ||||||||||||||||
Net increase in net assets resulting from investment operations | 208,620,370 | 385,998,959 | 30,405,764 | 48,398,971 | ||||||||||||||||
| Dividends and Distributions to Shareholders from: | ||||||||||||||||||||
| Net investment income: | ||||||||||||||||||||
Class A | (15,603,393 | ) | (30,393,654 | ) | — | — | ||||||||||||||
Class C | (12,314,830 | ) | (27,613,762 | ) | — | — | ||||||||||||||
Class R | (31,696 | ) | (59,326 | ) | — | — | ||||||||||||||
Class P | (10,797,986 | ) | (18,146,874 | ) | — | — | ||||||||||||||
Institutional Class | (5,429,425 | ) | (7,019,228 | ) | — | — | ||||||||||||||
Class R6 | — | — | — | — | ||||||||||||||||
Administrative Class | — | — | — | — | ||||||||||||||||
| Net realized capital gains: | ||||||||||||||||||||
Class A | (32,421,464 | ) | (64,970,584 | ) | (10,987,891 | ) | (6,571,494 | ) | ||||||||||||
Class C | (33,334,756 | ) | (74,191,277 | ) | (16,017,048 | ) | (14,149,273 | ) | ||||||||||||
Class R | (75,376 | ) | (136,768 | ) | (266,285 | ) | (165,683 | ) | ||||||||||||
Class P | (20,735,276 | ) | (36,923,763 | ) | (879,671 | ) | (229,821 | ) | ||||||||||||
Institutional Class | (10,065,824 | ) | (14,889,752 | ) | (2,321,396 | ) | (1,528,881 | ) | ||||||||||||
Class R6 | — | — | — | — | ||||||||||||||||
Administrative Class | — | — | (121,353 | ) | (35,296 | ) | ||||||||||||||
| Total dividends and distributions to shareholders | (140,810,026 | ) | (274,344,988 | ) | (30,593,644 | ) | (22,680,448 | ) | ||||||||||||
| Fund Share Transactions: | ||||||||||||||||||||
| Net proceeds from the sale of shares | 519,361,076 | 1,169,566,362 | 14,120,707 | 47,828,831 | ||||||||||||||||
| Issued in reinvestment of dividends and distributions | 119,435,758 | 230,302,494 | 26,897,880 | 19,332,333 | ||||||||||||||||
| Cost of shares redeemed | (499,207,216 | ) | (1,207,589,158 | ) | (22,175,382 | ) | (81,167,855 | ) | ||||||||||||
| Net increase (decrease) from Fund share transactions | 139,589,618 | 192,279,698 | 18,843,205 | (14,006,691 | ) | |||||||||||||||
| Total increase (decrease) in net assets | 207,399,962 | 303,933,669 | 18,655,325 | 11,711,832 | ||||||||||||||||
| Net Assets: | ||||||||||||||||||||
| Beginning of period | 3,217,354,729 | 2,913,421,060 | 293,823,705 | 282,111,873 | ||||||||||||||||
| End of period* | $ | 3,424,754,691 | $ | 3,217,354,729 | $ | 312,479,030 | $ | 293,823,705 | ||||||||||||
* Including undistributed (dividends in excess of) net investment income of: | $ | (33,149,025 | ) | $ | (20,075,572 | ) | $ | (2,397,998 | ) | $ | (1,293,567 | ) | ||||||||
| 108 | Semiannual Report | | December 31, 2017 | | See accompanying Notes to Financial Statements |
Table of Contents
| AllianzGI NFJ Dividend Value | AllianzGI NFJ International Value | AllianzGI NFJ Large-Cap Value | ||||||||||||||||||||||||
| Six Months ended December 31, 2017 (unaudited) | Year ended June 30, 2017 | Six Months ended December 31, 2017 (unaudited) | Year ended June 30, 2017 | Six Months ended December 31, 2017 (unaudited) | Year ended June 30, 2017 | |||||||||||||||||||||
| $ | 24,467,925 | $ | 91,841,355 | $ | 2,333,508 | $ | 14,649,844 | $ | 3,595,532 | $ | 6,124,361 | |||||||||||||||
| 268,226,464 | 456,237,862 | 19,025,442 | (110,918,005 | ) | 37,307,986 | 40,155,316 | ||||||||||||||||||||
| (2,350,693 | ) | 103,316,669 | 17,556,239 | 175,723,566 | (688,491 | ) | 29,009,543 | |||||||||||||||||||
| 290,343,696 | 651,395,886 | 38,915,189 | 79,455,405 | 40,215,027 | 75,289,220 | |||||||||||||||||||||
| (4,862,176 | ) | (14,498,541 | ) | (638,293 | ) | (4,551,669 | ) | (1,411,243 | ) | (2,342,025 | ) | |||||||||||||||
| (1,274,165 | ) | (4,513,161 | ) | (174,028 | ) | (1,254,233 | ) | (373,810 | ) | (416,485 | ) | |||||||||||||||
| (802,903 | ) | (2,821,243 | ) | (48,077 | ) | (297,588 | ) | (57,010 | ) | (88,178 | ) | |||||||||||||||
| (6,247,837 | ) | (19,936,986 | ) | (871,124 | ) | (6,105,853 | ) | (197,913 | ) | (320,992 | ) | |||||||||||||||
| (6,431,471 | ) | (38,668,446 | ) | (426,146 | ) | (4,452,007 | ) | (1,303,976 | ) | (2,808,114 | ) | |||||||||||||||
| (1,009,410 | ) | (3,119,124 | ) | (14,594 | ) | (1,252,799 | ) | — | — | |||||||||||||||||
| (1,680,213 | ) | (8,445,098 | ) | (27,824 | ) | (186,218 | ) | (13,264 | ) | (23,169 | ) | |||||||||||||||
| (115,990,710 | ) | (22,924,930 | ) | — | — | — | — | |||||||||||||||||||
| (55,260,593 | ) | (11,578,517 | ) | — | — | — | — | |||||||||||||||||||
| (22,482,364 | ) | (5,203,691 | ) | — | — | — | — | |||||||||||||||||||
| (132,040,626 | ) | (33,631,608 | ) | — | — | — | — | |||||||||||||||||||
| (114,068,933 | ) | (64,638,395 | ) | — | — | — | — | |||||||||||||||||||
| (18,448,365 | ) | (4,458,458 | ) | — | — | — | — | |||||||||||||||||||
| (20,836,660 | ) | (13,194,889 | ) | — | — | — | — | |||||||||||||||||||
| (501,436,426 | ) | (247,633,087 | ) | (2,200,086 | ) | (18,100,367 | ) | (3,357,216 | ) | (5,998,963 | ) | |||||||||||||||
| 167,412,373 | 546,158,602 | 29,322,784 | 144,569,747 | 16,120,173 | 42,111,766 | |||||||||||||||||||||
| 428,269,423 | 211,480,087 | 1,955,629 | 14,501,039 | 3,067,371 | 5,549,915 | |||||||||||||||||||||
| (953,392,367 | ) | (3,472,133,004 | ) | (132,629,884 | ) | (857,363,130 | ) | (29,936,679 | ) | (158,522,465 | ) | |||||||||||||||
| (357,710,571 | ) | (2,714,494,315 | ) | (101,351,471 | ) | (698,292,344 | ) | (10,749,135 | ) | (110,860,784 | ) | |||||||||||||||
| (568,803,301 | ) | (2,310,731,516 | ) | (64,636,368 | ) | (636,937,306 | ) | 26,108,676 | (41,570,527 | ) | ||||||||||||||||
| 2,817,275,078 | 5,128,006,594 | 449,733,420 | 1,086,670,726 | 362,274,812 | 403,845,339 | |||||||||||||||||||||
| $ | 2,248,471,777 | $ | 2,817,275,078 | $ | 385,097,052 | $ | 449,733,420 | $ | 388,383,488 | $ | 362,274,812 | |||||||||||||||
| $ | 876,502 | $ | (1,283,248 | ) | $ | (969,011 | ) | $ | (1,102,433 | ) | $ | 194,552 | $ | (43,764 | ) | |||||||||||
| See accompanying Notes to Financial Statements | | December 31, 2017 | | Semiannual Report | 109 |
Table of Contents
Statements of Changes in Net Assets (cont’d)
| AllianzGI NFJ Mid-Cap Value | AllianzGI NFJ Small-Cap Value | |||||||||||||||||||
| Six Months ended December 31, 2017 (unaudited) | Year ended June 30, 2017 | Six Months ended December 31, 2017 (unaudited) | Year ended June 30, 2017 | |||||||||||||||||
| Increase (Decrease) in Net Assets from: | ||||||||||||||||||||
Investment Operations: | ||||||||||||||||||||
| Net investment income (loss) | $ | 6,132,005 | $ | 7,346,158 | $ | 19,524,147 | $ | 53,529,473 | ||||||||||||
| Net realized gain | 9,456,050 | 89,005,453 | 152,492,847 | 366,921,834 | ||||||||||||||||
| Net change in unrealized appreciation/depreciation | 64,161,079 | 76,365,847 | 14,865,205 | 312,852,651 | ||||||||||||||||
Net increase in net assets resulting from investment operations | 79,749,134 | 172,717,458 | 186,882,199 | 733,303,958 | ||||||||||||||||
| Dividends and Distributions to Shareholders from: | ||||||||||||||||||||
| Net investment income: | ||||||||||||||||||||
Class A | (4,171,641 | ) | (4,679,368 | ) | (3,377,554 | ) | (13,615,646 | ) | ||||||||||||
Class C | (318,297 | ) | (1,530,440 | ) | (53 | ) | (1,587,555 | ) | ||||||||||||
Class R | (77,400 | ) | (48,570 | ) | (63,699 | ) | (654,721 | ) | ||||||||||||
Class P | (1,511,170 | ) | (384,256 | ) | (521,236 | ) | (914,362 | ) | ||||||||||||
Institutional Class | (1,586,074 | ) | (671,301 | ) | (8,284,457 | ) | (24,726,987 | ) | ||||||||||||
Class R6 | (2,590 | ) | — | (3,628,783 | ) | (6,921,568 | ) | |||||||||||||
Administrative Class | (103,493 | ) | (48,945 | ) | (1,623,000 | ) | (7,657,350 | ) | ||||||||||||
| Net realized capital gains: | ||||||||||||||||||||
Class A | (44,702,947 | ) | (211,304 | ) | (115,908,454 | ) | (23,284,921 | ) | ||||||||||||
Class C | (17,643,815 | ) | (118,490 | ) | (22,666,813 | ) | (4,632,425 | ) | ||||||||||||
Class R | (819,284 | ) | (3,214 | ) | (7,153,419 | ) | (1,409,558 | ) | ||||||||||||
Class P | (10,998,117 | ) | (13,491 | ) | (10,801,192 | ) | (1,311,420 | ) | ||||||||||||
Institutional Class | (11,199,186 | ) | (25,143 | ) | (158,591,956 | ) | (33,801,726 | ) | ||||||||||||
Class R6 | (16,847 | ) | — | (63,789,144 | ) | (8,752,834 | ) | |||||||||||||
Administrative Class | (849,232 | ) | (2,094 | ) | (48,474,051 | ) | (11,580,298 | ) | ||||||||||||
| Total dividends and distributions to shareholders | (94,000,093 | ) | (7,736,616 | ) | (444,883,811 | ) | (140,851,371 | ) | ||||||||||||
| Fund Share Transactions: | ||||||||||||||||||||
| Net proceeds from the sale of shares | 276,496,805 | 153,185,338 | 191,872,110 | 765,614,390 | ||||||||||||||||
| Issued in reinvestment of dividends and distributions | 84,180,542 | 6,934,848 | 414,202,015 | 130,232,751 | ||||||||||||||||
| Cost of shares redeemed | (89,539,443 | ) | (179,652,943 | ) | (738,557,966 | ) | (2,399,290,863 | ) | ||||||||||||
| Net increase (decrease) from Fund share transactions | 271,137,904 | (19,532,757 | ) | (132,483,841 | ) | (1,503,443,722 | ) | |||||||||||||
| Total increase (decrease) in net assets | 256,886,945 | 145,448,085 | (390,485,453 | ) | (910,991,135 | ) | ||||||||||||||
| Net Assets: | ||||||||||||||||||||
| Beginning of period | 765,824,202 | 620,376,117 | 3,091,482,270 | 4,002,473,405 | ||||||||||||||||
| End of period* | $ | 1,022,711,147 | $ | 765,824,202 | $ | 2,700,996,817 | $ | 3,091,482,270 | ||||||||||||
* Including undistributed (dividends in excess of) net investment income of: | $ | 86,522 | $ | 1,725,182 | $ | (77,905 | ) | $ | (2,103,270 | ) | ||||||||||
| 110 | Semiannual Report | | December 31, 2017 | | See accompanying Notes to Financial Statements |
Table of Contents
| AllianzGI Small-Cap Blend | AllianzGI Technology | |||||||||||||||||
| Six Months ended December 31, 2017 (unaudited) | Year ended June 30, 2017 | Six Months ended December 31, 2017 (unaudited) | Year ended June 30, 2017 | |||||||||||||||
| $ | (5,029 | ) | $ | (144,130 | ) | $ | (5,487,418 | ) | $ | (2,174,864 | ) | |||||||
| 8,545,183 | 10,970,059 | 170,726,475 | 180,279,307 | |||||||||||||||
| 445,081 | 4,927,314 | 87,846,498 | 179,357,328 | |||||||||||||||
| 8,985,235 | 15,753,243 | 253,085,555 | 357,461,771 | |||||||||||||||
| — | (11,646 | ) | — | — | ||||||||||||||
| — | (20 | ) | — | — | ||||||||||||||
| — | — | — | — | |||||||||||||||
| — | (1,743 | ) | — | — | ||||||||||||||
| — | (2,229 | ) | — | — | ||||||||||||||
| — | — | — | — | |||||||||||||||
| — | — | — | — | |||||||||||||||
| (5,340,498 | ) | (10,782 | ) | (76,541,985 | ) | (21,338,200 | ) | |||||||||||
| (4,343,421 | ) | (12,314 | ) | (23,797,863 | ) | (7,150,744 | ) | |||||||||||
| — | — | — | — | |||||||||||||||
| (550,506 | ) | (1,076 | ) | (9,980,800 | ) | (2,049,654 | ) | |||||||||||
| (520,890 | ) | (920 | ) | (114,417,733 | ) | (26,627,420 | ) | |||||||||||
| — | — | — | — | |||||||||||||||
| — | — | (2,594,308 | ) | (3,335,296 | ) | |||||||||||||
| (10,755,315 | ) | (40,730 | ) | (227,332,689 | ) | (60,501,314 | ) | |||||||||||
| 7,371,625 | 9,714,702 | 166,146,750 | 306,519,513 | |||||||||||||||
| 9,698,353 | 36,823 | 216,039,082 | 57,677,478 | |||||||||||||||
| (7,583,199 | ) | (21,942,727 | ) | (454,481,619 | ) | (441,397,378 | ) | |||||||||||
| 9,486,779 | (12,191,202 | ) | (72,295,787 | ) | (77,200,387 | ) | ||||||||||||
| 7,716,699 | 3,521,311 | (46,542,921 | ) | 219,760,070 | ||||||||||||||
| 78,772,620 | 75,251,309 | 1,376,043,445 | 1,156,283,375 | |||||||||||||||
| $ | 86,489,319 | $ | 78,772,620 | $ | 1,329,500,524 | $ | 1,376,043,445 | |||||||||||
| $ | (98,904 | ) | $ | (93,875 | ) | $ | (7,209,575 | ) | $ | (1,722,157 | ) | |||||||
| See accompanying Notes to Financial Statements | | December 31, 2017 | | Semiannual Report | | 111 | |
Table of Contents
For a Share Outstanding for the Period ended:
Net Asset Value, Beginning of Period | Net Investment Income (a) | and Change in Unrealized Gain (Loss) | Total from Investment Operations | Dividends from Net Investment Income | Net Asset Value, End of Period | |||||||||||||||||||||||
| AllianzGI Emerging Markets Opportunities: | ||||||||||||||||||||||||||||
| Class A | ||||||||||||||||||||||||||||
12/31/2017+ | $ | 26.59 | $ | 0.20 | $ | 3.89 | $ | 4.09 | $ | (0.32 | ) | $ | 30.36 | |||||||||||||||
6/30/2017 | 22.60 | 0.41 | 3.98 | 4.39 | (0.40 | ) | 26.59 | |||||||||||||||||||||
6/30/2016 | 25.90 | 0.34 | (3.39 | ) | (3.05 | ) | (0.25 | ) | 22.60 | |||||||||||||||||||
6/30/2015 | 27.00 | 0.35 | (1.10 | ) | (0.75 | ) | (0.35 | ) | 25.90 | |||||||||||||||||||
6/30/2014 | 23.96 | 0.30 | 3.06 | 3.36 | (0.32 | ) | 27.00 | |||||||||||||||||||||
6/30/2013 | 22.76 | 0.31 | 1.20 | 1.51 | (0.31 | ) | 23.96 | |||||||||||||||||||||
| Class C | ||||||||||||||||||||||||||||
12/31/2017+ | $ | 26.13 | $ | 0.07 | $ | 3.84 | $ | 3.91 | $ | (0.08 | ) | $ | 29.96 | |||||||||||||||
6/30/2017 | 22.09 | 0.19 | �� | 3.96 | 4.15 | (0.11 | ) | 26.13 | ||||||||||||||||||||
6/30/2016 | 25.21 | 0.22 | (3.34 | ) | (3.12 | ) | — | (d) | 22.09 | |||||||||||||||||||
6/30/2015 | 26.25 | 0.14 | (1.07 | ) | (0.93 | ) | (0.11 | ) | 25.21 | |||||||||||||||||||
6/30/2014 | 23.28 | 0.11 | 2.97 | 3.08 | (0.11 | ) | 26.25 | |||||||||||||||||||||
6/30/2013 | 22.15 | 0.11 | 1.17 | 1.28 | (0.15 | ) | 23.28 | |||||||||||||||||||||
| Class P | ||||||||||||||||||||||||||||
12/31/2017+ | $ | 26.17 | $ | 0.20 | $ | 3.86 | $ | 4.06 | $ | (0.45 | ) | $ | 29.78 | |||||||||||||||
6/30/2017 | 22.23 | 0.44 | 3.94 | 4.38 | (0.44 | ) | 26.17 | |||||||||||||||||||||
6/30/2016 | 25.44 | 0.46 | (3.40 | ) | (2.94 | ) | (0.27 | ) | 22.23 | |||||||||||||||||||
6/30/2015 | 26.63 | 0.42 | (1.11 | ) | (0.69 | ) | (0.50 | ) | 25.44 | |||||||||||||||||||
6/30/2014 | 23.63 | 0.38 | 2.99 | 3.37 | (0.37 | ) | 26.63 | |||||||||||||||||||||
6/30/2013 | 22.43 | 0.36 | 1.19 | 1.55 | (0.35 | ) | 23.63 | |||||||||||||||||||||
| Institutional Class | ||||||||||||||||||||||||||||
12/31/2017+ | $ | 26.83 | $ | 0.21 | $ | 3.96 | $ | 4.17 | $ | (0.49 | ) | $ | 30.51 | |||||||||||||||
6/30/2017 | 22.74 | 0.49 | 4.03 | 4.52 | (0.43 | ) | 26.83 | |||||||||||||||||||||
6/30/2016 | 25.95 | 0.44 | (3.42 | ) | (2.98 | ) | (0.23 | ) | 22.74 | |||||||||||||||||||
6/30/2015 | 27.11 | 0.43 | (1.11 | ) | (0.68 | ) | (0.48 | ) | 25.95 | |||||||||||||||||||
6/30/2014 | 24.10 | 0.39 | 3.07 | 3.46 | (0.45 | ) | 27.11 | |||||||||||||||||||||
6/30/2013 | 22.85 | 0.38 | 1.23 | 1.61 | (0.36 | ) | 24.10 | |||||||||||||||||||||
| Class R6 | ||||||||||||||||||||||||||||
12/31/2017+ | $ | 26.69 | $ | 0.23 | $ | 3.93 | $ | 4.16 | $ | (0.50 | ) | $ | 30.35 | |||||||||||||||
6/30/2017 | 22.69 | 0.60 | 3.90 | 4.50 | (0.50 | ) | 26.69 | |||||||||||||||||||||
12/14/2015* - 6/30/2016 | 21.21 | 0.31 | 1.47 | 1.78 | (0.30 | ) | 22.69 | |||||||||||||||||||||
| + | Unaudited |
| * | Commencement of operations. |
| (a) | Calculated on average shares outstanding during the period. |
| (b) | Total return is calculated assuming a purchase of a share on the first day of the period and a sale of a share on the last day of each period reported. Dividends and distributions, if any, are assumed, for purposes of this calculation, to be reinvested. Total return does not reflect sales charges and includes the effect of fee waivers and reimbursements. Total return may reflect adjustments to conform to U.S. GAAP. Total return for a period of less than one year is not annualized. |
| (c) | Annualized, unless otherwise noted. |
| (d) | Actual amount rounds to less than $(0.01) per share. |
| 112 | Semiannual Report | | December 31, 2017 | | See accompanying Notes to Financial Statements |
Table of Contents
| Total Return (b) | Net Assets, End of Period (000s) | Ratio of Expenses to Average Net Assets with Fee Waiver/ Reimbursement | Ratio of Expenses to Average Net Assets without Fee Waiver/ Reimbursement | Ratio of Net Investment Income to Average Net Assets | Portfolio Turnover Rate | |||||||||||||||||||||
| 15.39 | % | $ | 123,569 | 1.27 | %(c) | 1.62 | %(c) | 1.36 | %(c) | 52 | % | |||||||||||||||
| 19.76 | 154,357 | 1.42 | 1.62 | 1.69 | 155 | |||||||||||||||||||||
| (11.73 | ) | 143,677 | 1.48 | 1.62 | 1.59 | 85 | ||||||||||||||||||||
| (2.76 | ) | 28,690 | 1.67 | 1.67 | 1.30 | 99 | ||||||||||||||||||||
| 14.12 | 29,361 | 1.67 | 1.67 | 1.21 | 120 | |||||||||||||||||||||
| 6.61 | 34,563 | 1.67 | 1.67 | 1.22 | 102 | |||||||||||||||||||||
| 14.96 | % | $ | 9,683 | 2.02 | %(c) | 2.37 | %(c) | 0.52 | %(c) | 52 | % | |||||||||||||||
| 18.91 | 8,982 | 2.17 | 2.37 | 0.80 | 155 | |||||||||||||||||||||
| (12.38 | ) | 11,862 | 2.27 | 2.37 | 1.02 | 85 | ||||||||||||||||||||
| (3.53 | ) | 15,069 | 2.42 | 2.42 | 0.53 | 99 | ||||||||||||||||||||
| 13.26 | 18,170 | 2.42 | 2.42 | 0.44 | 120 | |||||||||||||||||||||
| 5.84 | 20,746 | 2.42 | 2.42 | 0.47 | 102 | |||||||||||||||||||||
| 15.54 | % | $ | 28,799 | 1.02 | %(c) | 1.37 | %(c) | 1.37 | %(c) | 52 | % | |||||||||||||||
| 20.11 | 21,586 | 1.17 | 1.37 | 1.86 | 155 | |||||||||||||||||||||
| (11.51 | ) | 20,262 | 1.26 | 1.37 | 2.11 | 85 | ||||||||||||||||||||
| (2.53 | ) | 12,229 | 1.42 | 1.42 | 1.63 | 99 | ||||||||||||||||||||
| 14.38 | 2,066 | 1.42 | 1.42 | 1.54 | 120 | |||||||||||||||||||||
| 6.90 | 2,594 | 1.42 | 1.42 | 1.46 | 102 | |||||||||||||||||||||
| 15.57 | % | $ | 134,727 | 0.92 | %(c) | 1.27 | %(c) | 1.44 | %(c) | 52 | % | |||||||||||||||
| 20.26 | 72,688 | 1.07 | 1.27 | 2.02 | 155 | |||||||||||||||||||||
| (11.41 | ) | 64,785 | 1.17 | 1.27 | 2.00 | 85 | ||||||||||||||||||||
| (2.45 | ) | 62,339 | 1.32 | 1.32 | 1.60 | 99 | ||||||||||||||||||||
| 14.51 | 56,709 | 1.32 | 1.32 | 1.53 | 120 | |||||||||||||||||||||
| 7.01 | 57,572 | 1.32 | 1.32 | 1.53 | 102 | |||||||||||||||||||||
| 15.63 | % | $ | 929 | 0.87 | %(c) | 1.22 | %(c) | 1.60 | %(c) | 52 | % | |||||||||||||||
| 20.27 | 692 | 1.02 | 1.22 | 2.46 | 155 | |||||||||||||||||||||
| 8.46 | 21 | 1.07 | (c) | 1.22 | (c) | 2.63 | (c) | 85 | ||||||||||||||||||
| See accompanying Notes to Financial Statements | | December 31, 2017 | | Semiannual Report | 113 |
Table of Contents
Financial Highlights (cont’d)
For a Share Outstanding for the Period ended:
| Net Asset Value, Beginning of Period | Net Investment Income (Loss) (a) | Net Realized and Change in Unrealized Gain (Loss) | Total from Investment Operations | Dividends from Net Investment Income | from Net Realized Capital | |||||||||||||||||||||||
| AllianzGI Focused Growth: | ||||||||||||||||||||||||||||
| Class A | ||||||||||||||||||||||||||||
12/31/2017+ | $ | 46.62 | $ | — | (c) | $ | 6.94 | $ | 6.94 | $ | — | (d) | $ | (0.71 | ) | |||||||||||||
6/30/2017 | 40.72 | 0.06 | 6.85 | 6.91 | — | (1.01 | ) | |||||||||||||||||||||
6/30/2016 | 42.73 | 0.08 | 0.62 | 0.70 | — | (2.71 | ) | |||||||||||||||||||||
6/30/2015 | 41.93 | (0.03 | ) | 4.57 | 4.54 | (0.17 | ) | (3.57 | ) | |||||||||||||||||||
6/30/2014 | 34.82 | 0.05 | 10.40 | 10.45 | (0.02 | ) | (3.32 | ) | ||||||||||||||||||||
6/30/2013 | 31.57 | 0.14 | 5.14 | 5.28 | — | (2.03 | ) | |||||||||||||||||||||
| Class C | ||||||||||||||||||||||||||||
12/31/2017+ | $ | 32.76 | $ | (0.13 | ) | $ | 4.87 | $ | 4.74 | $ | — | (d) | $ | (0.71 | ) | |||||||||||||
6/30/2017 | 29.12 | (0.19 | ) | 4.84 | 4.65 | — | (1.01 | ) | ||||||||||||||||||||
6/30/2016 | 31.53 | (0.17 | ) | 0.47 | 0.30 | — | (2.71 | ) | ||||||||||||||||||||
6/30/2015 | 31.96 | (0.25 | ) | 3.40 | 3.15 | (0.01 | ) | (3.57 | ) | |||||||||||||||||||
6/30/2014 | 27.38 | (0.19 | ) | 8.09 | 7.90 | — | (d) | (3.32 | ) | |||||||||||||||||||
6/30/2013 | 25.43 | (0.09 | ) | 4.07 | 3.98 | — | (2.03 | ) | ||||||||||||||||||||
| Class R | ||||||||||||||||||||||||||||
12/31/2017+ | $ | 35.95 | $ | (0.05 | ) | $ | 5.35 | $ | 5.30 | $ | — | (d) | $ | (0.71 | ) | |||||||||||||
6/30/2017 | 31.71 | (0.04 | ) | 5.29 | 5.25 | — | (1.01 | ) | ||||||||||||||||||||
6/30/2016 | 33.93 | (0.02 | ) | 0.51 | 0.49 | — | (2.71 | ) | ||||||||||||||||||||
6/30/2015 | 34.08 | (0.11 | ) | 3.66 | 3.55 | (0.13 | ) | (3.57 | ) | |||||||||||||||||||
6/30/2014 | 28.89 | (0.04 | ) | 8.56 | 8.52 | (0.01 | ) | (3.32 | ) | |||||||||||||||||||
6/30/2013 | 26.59 | 0.04 | 4.29 | 4.33 | — | (2.03 | ) | |||||||||||||||||||||
| Class P | ||||||||||||||||||||||||||||
12/31/2017+ | $ | 36.33 | $ | 0.05 | $ | 5.41 | $ | 5.46 | $ | (0.05 | ) | $ | (0.71 | ) | ||||||||||||||
6/30/2017 | 31.88 | 0.14 | 5.32 | 5.46 | — | (1.01 | ) | |||||||||||||||||||||
6/30/2016 | 33.94 | 0.15 | 0.50 | 0.65 | — | (2.71 | ) | |||||||||||||||||||||
6/30/2015 | 34.09 | 0.06 | 3.66 | 3.72 | (0.30 | ) | (3.57 | ) | ||||||||||||||||||||
6/30/2014 | 28.86 | 0.12 | 8.56 | 8.68 | (0.13 | ) | (3.32 | ) | ||||||||||||||||||||
6/30/2013 | 26.43 | 0.18 | 4.28 | 4.46 | — | (2.03 | ) | |||||||||||||||||||||
| Institutional Class | ||||||||||||||||||||||||||||
12/31/2017+ | $ | 43.02 | $ | 0.08 | $ | 6.41 | $ | 6.49 | $ | (0.05 | ) | $ | (0.71 | ) | ||||||||||||||
6/30/2017 | 37.53 | 0.20 | 6.30 | 6.50 | — | (1.01 | ) | |||||||||||||||||||||
6/30/2016 | 39.45 | 0.21 | 0.58 | 0.79 | — | (2.71 | ) | |||||||||||||||||||||
6/30/2015 | 39.01 | 0.11 | 4.23 | 4.34 | (0.33 | ) | (3.57 | ) | ||||||||||||||||||||
6/30/2014 | 32.58 | 0.17 | 9.72 | 9.89 | (0.14 | ) | (3.32 | ) | ||||||||||||||||||||
6/30/2013 | 29.57 | 0.23 | 4.81 | 5.04 | — | (2.03 | ) | |||||||||||||||||||||
| Class R6 | ||||||||||||||||||||||||||||
12/31/2017+ | $ | 43.04 | $ | 0.09 | $ | 6.42 | $ | 6.51 | $ | (0.06 | ) | $ | (0.71 | ) | ||||||||||||||
6/30/2017 | 37.53 | 0.21 | 6.31 | 6.52 | — | (1.01 | ) | |||||||||||||||||||||
12/14/2015* - 6/30/2016 | 37.51 | 0.12 | (0.10 | ) | 0.02 | — | — | |||||||||||||||||||||
| Administrative Class | ||||||||||||||||||||||||||||
12/31/2017+ | $ | 40.51 | $ | 0.02 | $ | 6.04 | $ | 6.06 | $ | — | (d) | $ | (0.71 | ) | ||||||||||||||
6/30/2017 | 35.48 | 0.09 | 5.95 | 6.04 | — | (1.01 | ) | |||||||||||||||||||||
6/30/2016 | 37.53 | 0.11 | 0.55 | 0.66 | — | (2.71 | ) | |||||||||||||||||||||
6/30/2015 | 37.31 | 0.01 | 4.02 | 4.03 | (0.24 | ) | (3.57 | ) | ||||||||||||||||||||
6/30/2014 | 31.24 | 0.08 | 9.31 | 9.39 | — | (d) | (3.32 | ) | ||||||||||||||||||||
6/30/2013 | 28.50 | 0.15 | 4.62 | 4.77 | — | (2.03 | ) | |||||||||||||||||||||
| + | Unaudited |
| * | Commencement of operations. |
| (a) | Calculated on average shares outstanding during the period. |
| (b) | Total return is calculated assuming a purchase of a share on the first day of the period and a sale of a share on the last day of each period reported. Dividends and distributions, if any, are assumed, for purposes of this calculation, to be reinvested. Total return does not reflect sales charges and includes the effect of fee waivers and reimbursements. Total return may reflect adjustments to conform to U.S. GAAP. Total return for a period of less than one year is not annualized. |
| (c) | Actual amount rounds to less than $0.01 per share. |
| (d) | Actual amount rounds to less than $(0.01) per share. |
| (e) | Annualized, unless otherwise noted. |
| 114 | Semiannual Report | | December 31, 2017 | | See accompanying Notes to Financial Statements |
Table of Contents
Total Dividends and Distributions | Net Asset Value, End of Period | Total Return (b) | Net Assets, End of Period (000s) | Ratio of Fee Waiver/ | Ratio of Expenses to Average Net Assets without Fee Waiver/ Reimbursement | Ratio of Net Investment Income (Loss) to Average Net Assets | Portfolio Turnover Rate | |||||||||||||||||||||||||||
| $ | (0.71 | ) | $ | 52.85 | 14.87 | % | $ | 406,296 | 1.00 | %(e) | 1.12 | %(e) | 0.01 | %(e) | 19 | % | ||||||||||||||||||
| (1.01 | ) | 46.62 | 17.29 | 373,359 | 1.05 | 1.11 | 0.15 | 46 | ||||||||||||||||||||||||||
| (2.71 | ) | 40.72 | 1.54 | 357,077 | 1.11 | 1.11 | 0.20 | 55 | ||||||||||||||||||||||||||
| (3.74 | ) | 42.73 | 11.57 | 297,572 | 1.11 | 1.11 | (0.06 | ) | 58 | |||||||||||||||||||||||||
| (3.34 | ) | 41.93 | 30.97 | 282,561 | 1.11 | 1.11 | 0.13 | 51 | ||||||||||||||||||||||||||
| (2.03 | ) | 34.82 | 17.48 | 209,790 | 1.12 | 1.12 | 0.41 | 141 | ||||||||||||||||||||||||||
| $ | (0.71 | ) | $ | 36.79 | 14.44 | % | $ | 234,944 | 1.77 | %(e) | 1.87 | %(e) | (0.76 | )%(e) | 19 | % | ||||||||||||||||||
| (1.01 | ) | 32.76 | 16.40 | 217,685 | 1.81 | 1.86 | (0.62 | ) | 46 | |||||||||||||||||||||||||
| (2.71 | ) | 29.12 | 0.79 | 230,432 | 1.86 | 1.86 | (0.56 | ) | 55 | |||||||||||||||||||||||||
| (3.58 | ) | 31.53 | 10.76 | 227,519 | 1.86 | 1.86 | (0.81 | ) | 58 | |||||||||||||||||||||||||
| (3.32 | ) | 31.96 | 29.99 | 223,035 | 1.86 | 1.86 | (0.62 | ) | 51 | |||||||||||||||||||||||||
| (2.03 | ) | 27.38 | 16.56 | 182,921 | 1.87 | 1.87 | (0.36 | ) | 141 | |||||||||||||||||||||||||
| $ | (0.71 | ) | $ | 40.54 | 14.72 | % | $ | 23,191 | 1.27 | %(e) | 1.37 | %(e) | (0.26 | )%(e) | 19 | % | ||||||||||||||||||
| (1.01 | ) | 35.95 | 16.96 | 20,635 | 1.31 | 1.36 | (0.11 | ) | 46 | |||||||||||||||||||||||||
| (2.71 | ) | 31.71 | 1.31 | 17,877 | 1.36 | 1.36 | (0.05 | ) | 55 | |||||||||||||||||||||||||
| (3.70 | ) | 33.93 | 11.32 | 14,751 | 1.36 | 1.36 | (0.31 | ) | 58 | |||||||||||||||||||||||||
| (3.33 | ) | 34.08 | 30.62 | 15,989 | 1.36 | 1.36 | (0.12 | ) | 51 | |||||||||||||||||||||||||
| (2.03 | ) | 28.89 | 17.17 | 12,866 | 1.37 | 1.37 | 0.14 | 141 | ||||||||||||||||||||||||||
| $ | (0.76 | ) | $ | 41.03 | 15.01 | % | $ | 92,530 | 0.77 | %(e) | 0.87 | %(e) | 0.24 | %(e) | 19 | % | ||||||||||||||||||
| (1.01 | ) | 36.33 | 17.54 | 80,667 | 0.81 | 0.86 | 0.41 | 46 | ||||||||||||||||||||||||||
| (2.71 | ) | 31.88 | 1.81 | 35,025 | 0.86 | 0.86 | 0.46 | 55 | ||||||||||||||||||||||||||
| (3.87 | ) | 33.94 | 11.88 | 16,050 | 0.86 | 0.86 | 0.19 | 58 | ||||||||||||||||||||||||||
| (3.45 | ) | 34.09 | 31.26 | 14,774 | 0.86 | 0.86 | 0.38 | 51 | ||||||||||||||||||||||||||
| (2.03 | ) | 28.86 | 17.79 | 9,953 | 0.87 | 0.87 | 0.64 | 141 | ||||||||||||||||||||||||||
| $ | (0.76 | ) | $ | 48.75 | 15.05 | % | $ | 220,911 | 0.67 | %(e) | 0.77 | %(e) | 0.34 | %(e) | 19 | % | ||||||||||||||||||
| (1.01 | ) | 43.02 | 17.67 | 195,161 | 0.71 | 0.76 | 0.50 | 46 | ||||||||||||||||||||||||||
| (2.71 | ) | 37.53 | 1.92 | 155,976 | 0.76 | 0.76 | 0.55 | 55 | ||||||||||||||||||||||||||
| (3.90 | ) | 39.45 | 11.99 | 122,979 | 0.76 | 0.76 | 0.29 | 58 | ||||||||||||||||||||||||||
| (3.46 | ) | 39.01 | 31.39 | 95,990 | 0.76 | 0.76 | 0.47 | 51 | ||||||||||||||||||||||||||
| (2.03 | ) | 32.58 | 17.90 | 38,077 | 0.77 | 0.77 | 0.75 | 141 | ||||||||||||||||||||||||||
| $ | (0.77 | ) | $ | 48.78 | 15.11 | % | $ | 41,150 | 0.62 | %(e) | 0.72 | %(e) | 0.40 | %(e) | 19 | % | ||||||||||||||||||
| (1.01 | ) | 43.04 | 17.72 | 36,374 | 0.66 | 0.71 | 0.53 | 46 | ||||||||||||||||||||||||||
| — | 37.53 | 0.05 | 11,564 | 0.71 | (e) | 0.71 | (e) | 0.60 | (e) | 55 | ||||||||||||||||||||||||
| $ | (0.71 | ) | $ | 45.86 | 14.93 | % | $ | 4,700 | 0.92 | %(e) | 1.02 | %(e) | 0.09 | %(e) | 19 | % | ||||||||||||||||||
| (1.01 | ) | 40.51 | 17.39 | 4,288 | 0.96 | 1.01 | 0.25 | 46 | ||||||||||||||||||||||||||
| (2.71 | ) | 35.48 | 1.65 | 7,900 | 1.01 | 1.01 | 0.29 | 55 | ||||||||||||||||||||||||||
| (3.81 | ) | 37.53 | 11.67 | 6,439 | 1.01 | 1.01 | 0.04 | 58 | ||||||||||||||||||||||||||
| (3.32 | ) | 37.31 | 31.07 | 5,996 | 1.01 | 1.01 | 0.22 | 51 | ||||||||||||||||||||||||||
| (2.03 | ) | 31.24 | 17.62 | 3,885 | 1.02 | 1.02 | 0.51 | 141 | ||||||||||||||||||||||||||
| See accompanying Notes to Financial Statements | | December 31, 2017 | | Semiannual Report | 115 |
Table of Contents
Financial Highlights (cont’d)
For a Share Outstanding for the Period ended:
Net Asset | Net Investment Income (Loss) (a) | Net Realized and Change in Unrealized Gain (Loss) | Total from Investment Operations | Dividends from Net Investment Income | Net Asset Value, End of Period | |||||||||||||||||||||||
| AllianzGI Global Natural Resources: | ||||||||||||||||||||||||||||
| Class A | ||||||||||||||||||||||||||||
12/31/2017+ | $ | 13.77 | $ | 0.04 | $ | 2.07 | $ | 2.11 | $ | (0.03 | ) | $ | 15.85 | |||||||||||||||
6/30/2017 | 14.67 | 0.01 | (0.78 | ) | (0.77 | ) | (0.13 | ) | 13.77 | |||||||||||||||||||
6/30/2016 | 16.66 | 0.05 | (1.97 | ) | (1.92 | ) | (0.07 | ) | 14.67 | |||||||||||||||||||
6/30/2015 | 20.71 | 0.06 | (4.11 | ) | (4.05 | ) | — | (e) | 16.66 | |||||||||||||||||||
6/30/2014 | 16.19 | — | (e) | 4.58 | 4.58 | (0.06 | ) | 20.71 | ||||||||||||||||||||
6/30/2013 | 14.65 | 0.08 | 1.50 | 1.58 | (0.04 | ) | 16.19 | |||||||||||||||||||||
| Class C | ||||||||||||||||||||||||||||
12/31/2017+ | $ | 12.93 | $ | (0.01 | ) | $ | 1.94 | $ | 1.93 | $ | — | (e) | $ | 14.86 | ||||||||||||||
6/30/2017 | 13.77 | (0.10 | ) | (0.74 | ) | (0.84 | ) | — | (e) | 12.93 | ||||||||||||||||||
6/30/2016 | 15.67 | (0.06 | ) | (1.84 | ) | (1.90 | ) | — | (e) | 13.77 | ||||||||||||||||||
6/30/2015 | 19.63 | (0.07 | ) | (3.89 | ) | (3.96 | ) | — | (e) | 15.67 | ||||||||||||||||||
6/30/2014 | 15.41 | (0.13 | ) | 4.35 | 4.22 | — | (e) | 19.63 | ||||||||||||||||||||
6/30/2013 | 14.01 | (0.04 | ) | 1.44 | 1.40 | — | (e) | 15.41 | ||||||||||||||||||||
| Class P | ||||||||||||||||||||||||||||
12/31/2017+ | $ | 13.96 | $ | 0.06 | $ | 2.10 | $ | 2.16 | $ | — | (e) | $ | 16.12 | |||||||||||||||
6/30/2017 | 14.86 | 0.03 | (0.78 | ) | (0.75 | ) | (0.15 | ) | 13.96 | |||||||||||||||||||
6/30/2016 | 16.87 | 0.09 | (1.99 | ) | (1.90 | ) | (0.11 | ) | 14.86 | |||||||||||||||||||
6/30/2015 | 20.98 | 0.13 | (4.20 | ) | (4.07 | ) | (0.04 | ) | 16.87 | |||||||||||||||||||
6/30/2014 | 16.41 | 0.05 | 4.65 | 4.70 | (0.13 | ) | 20.98 | |||||||||||||||||||||
6/30/2013 | 14.83 | 0.12 | 1.52 | 1.64 | (0.06 | ) | 16.41 | |||||||||||||||||||||
| Institutional Class | ||||||||||||||||||||||||||||
12/31/2017+ | $ | 14.12 | $ | 0.07 | $ | 2.12 | $ | 2.19 | $ | (0.06 | ) | $ | 16.25 | |||||||||||||||
6/30/2017 | 14.99 | 0.07 | (0.81 | ) | (0.74 | ) | (0.13 | ) | 14.12 | |||||||||||||||||||
6/30/2016 | 17.00 | 0.09 | (1.99 | ) | (1.90 | ) | (0.11 | ) | 14.99 | |||||||||||||||||||
6/30/2015 | 21.10 | 0.12 | (4.19 | ) | (4.07 | ) | (0.03 | ) | 17.00 | |||||||||||||||||||
6/30/2014 | 16.49 | 0.06 | 4.68 | 4.74 | (0.13 | ) | 21.10 | |||||||||||||||||||||
6/30/2013 | 14.93 | 0.14 | 1.52 | 1.66 | (0.10 | ) | 16.49 | |||||||||||||||||||||
| + | Unaudited |
| (a) | Calculated on average shares outstanding during the period. |
| (b) | Total return is calculated assuming a purchase of a share on the first day of the period and a sale of a share on the last day of each period reported. Dividends and distributions, if any, are assumed, for purposes of this calculation, to be reinvested. Total return does not reflect sales charges and includes the effect of fee waivers and reimbursements. Total return may reflect adjustments to conform to U.S. GAAP. Total return for a period of less than one year is not annualized. |
| (c) | Annualized, unless otherwise noted. |
| (d) | Does not include expenses of the investment companies in which the Fund invests. |
| (e) | Actual amount rounds to less than $(0.01) per share. |
| (f) | Less than (0.005)%. |
| 116 | Semiannual Report | | December 31, 2017 | | See accompanying Notes to Financial Statements |
Table of Contents
| Total Return (b) | Net Assets, End of Period (000s) | Ratio of Expenses to Average Net Assets | Ratio of Net Investment Income (Loss) to Average Net Assets | Portfolio Turnover Rate | ||||||||||||||||||
| 15.32 | % | $ | 12,270 | 1.43 | %(c)(d) | 0.58 | %(c)(d) | 56 | % | |||||||||||||
| (5.37 | ) | 11,135 | 1.42 | (d) | 0.08 | (d) | 108 | |||||||||||||||
| (11.44 | ) | 14,175 | 1.42 | (d) | 0.34 | (d) | 177 | |||||||||||||||
| (19.56 | ) | 11,395 | 1.41 | 0.32 | 107 | |||||||||||||||||
| 28.36 | 12,320 | 1.41 | — | (f) | 93 | |||||||||||||||||
| 10.80 | 9,131 | 1.42 | 0.53 | 116 | ||||||||||||||||||
| 14.93 | % | $ | 2,576 | 2.18 | %(c)(d) | (0.16 | )%(c)(d) | 56 | % | |||||||||||||
| (6.07 | ) | 2,896 | 2.17 | (d) | (0.70 | )(d) | 108 | |||||||||||||||
| (12.13 | ) | 4,200 | 2.17 | (d) | (0.43 | )(d) | 177 | |||||||||||||||
| (20.17 | ) | 4,579 | 2.16 | (0.42 | ) | 107 | ||||||||||||||||
| 27.38 | 4,002 | 2.16 | (0.77 | ) | 93 | |||||||||||||||||
| 9.99 | 4,181 | 2.17 | (0.25 | ) | 116 | |||||||||||||||||
| 15.47 | % | $ | 1,248 | 1.17 | %(c)(d) | 0.82 | %(c)(d) | 56 | % | |||||||||||||
| (5.18 | ) | 1,970 | 1.17 | (d) | 0.19 | (d) | 108 | |||||||||||||||
| (11.20 | ) | 8,025 | 1.17 | (d) | 0.61 | (d) | 177 | |||||||||||||||
| (19.38 | ) | 8,128 | 1.16 | 0.73 | 107 | |||||||||||||||||
| 28.73 | 1,308 | 1.16 | 0.24 | 93 | ||||||||||||||||||
| 11.06 | 435 | 1.17 | 0.76 | 116 | ||||||||||||||||||
| 15.48 | % | $ | 9,904 | 1.08 | %(c)(d) | 0.96 | %(c)(d) | 56 | % | |||||||||||||
| (5.07 | ) | 10,068 | 1.07 | (d) | 0.43 | (d) | 108 | |||||||||||||||
| (11.12 | ) | 17,671 | 1.07 | (d) | 0.64 | (d) | 177 | |||||||||||||||
| (19.28 | ) | 30,751 | 1.06 | 0.67 | 107 | |||||||||||||||||
| 28.86 | 31,709 | 1.06 | 0.34 | 93 | ||||||||||||||||||
| 11.14 | 24,612 | 1.07 | 0.86 | 116 | ||||||||||||||||||
| See accompanying Notes to Financial Statements | | December 31, 2017 | | Semiannual Report | | 117 | |
Table of Contents
Financial Highlights (cont’d)
For a Share Outstanding for the Period ended:
| Net Asset Value, Beginning of Period | Net Investment Income (Loss) (a) | Net Realized and Change in Unrealized Gain (Loss) | Total from Investment Operations | Dividends from Net Investment Income | Distributions from Net Realized Capital Gains | |||||||||||||||||||||||
| AllianzGI Global Small-Cap: | ||||||||||||||||||||||||||||
| Class A | ||||||||||||||||||||||||||||
12/31/2017+ | $ | 47.75 | $ | (0.20 | ) | $ | 6.88 | $ | 6.68 | $ | (0.09 | ) | $ | (4.27 | ) | |||||||||||||
6/30/2017 | 41.18 | (0.14 | ) | 6.71 | 6.57 | — | — | |||||||||||||||||||||
6/30/2016 | 45.05 | (0.13 | ) | (3.74 | ) | (3.87 | ) | — | — | |||||||||||||||||||
6/30/2015 | 43.12 | (0.19 | ) | 2.12 | 1.93 | — | — | |||||||||||||||||||||
6/30/2014 | 34.59 | (0.23 | ) | 8.76 | 8.53 | — | — | |||||||||||||||||||||
6/30/2013 | 27.95 | (0.13 | ) | 6.77 | 6.64 | — | — | |||||||||||||||||||||
| Class C | ||||||||||||||||||||||||||||
12/31/2017+ | $ | 42.62 | $ | (0.34 | ) | $ | 6.12 | $ | 5.78 | $ | — | (e) | $ | (4.27 | ) | |||||||||||||
6/30/2017 | 37.03 | (0.42 | ) | 6.01 | 5.59 | — | — | |||||||||||||||||||||
6/30/2016 | 40.81 | (0.41 | ) | (3.37 | ) | (3.78 | ) | — | — | |||||||||||||||||||
6/30/2015 | 39.36 | (0.46 | ) | 1.91 | 1.45 | — | — | |||||||||||||||||||||
6/30/2014 | 31.81 | (0.48 | ) | 8.03 | 7.55 | — | — | |||||||||||||||||||||
6/30/2013 | 25.90 | (0.34 | ) | 6.25 | 5.91 | — | — | |||||||||||||||||||||
| Class P | ||||||||||||||||||||||||||||
12/31/2017+ | $ | 50.40 | $ | (0.14 | ) | $ | 7.27 | $ | 7.13 | $ | (0.16 | ) | $ | (4.27 | ) | |||||||||||||
6/30/2017 | 43.36 | 0.02 | 7.02 | 7.04 | — | — | ||||||||||||||||||||||
6/30/2016 | 47.30 | (0.05 | ) | (3.89 | ) | (3.94 | ) | — | — | |||||||||||||||||||
6/30/2015 | 45.17 | (0.06 | ) | 2.19 | 2.13 | — | — | |||||||||||||||||||||
6/30/2014 | 36.14 | (0.03 | ) | 9.06 | 9.03 | — | — | |||||||||||||||||||||
6/30/2013 | 29.13 | (0.03 | ) | 7.04 | 7.01 | — | — | |||||||||||||||||||||
| Institutional Class | ||||||||||||||||||||||||||||
12/31/2017+ | $ | 50.77 | $ | (0.12 | ) | $ | 7.33 | $ | 7.21 | $ | (0.21 | ) | $ | (4.27 | ) | |||||||||||||
6/30/2017 | 43.63 | 0.02 | 7.12 | 7.14 | — | — | ||||||||||||||||||||||
6/30/2016 | 47.55 | 0.02 | (3.94 | ) | (3.92 | ) | — | — | ||||||||||||||||||||
6/30/2015 | 45.37 | (0.05 | ) | 2.23 | 2.18 | — | — | |||||||||||||||||||||
6/30/2014 | 36.26 | (0.09 | ) | 9.20 | 9.11 | — | — | |||||||||||||||||||||
6/30/2013 | 29.20 | 0.02 | 7.04 | 7.06 | — | — | ||||||||||||||||||||||
| + | Unaudited |
| (a) | Calculated on average shares outstanding during the period. |
| (b) | Total return is calculated assuming a purchase of a share on the first day of the period and a sale of a share on the last day of each period reported. Dividends and distributions, if any, are assumed, for purposes of this calculation, to be reinvested. Total return does not reflect sales charges and includes the effect of fee waivers and reimbursements. Total return may reflect adjustments to conform to U.S. GAAP. Total return for a period of less than one year is not annualized. |
| (c) | Payments from Affiliates increased the end of period net asset value and total return by less than $0.01 and 0.01%, respectively. |
| (d) | Annualized, unless otherwise noted. |
| (e) | Actual amount rounds to less than $(0.01) per share. |
| 118 | Semiannual Report | | December 31, 2017 | | See accompanying Notes to Financial Statements |
Table of Contents
| Total Dividends and Distributions | Net Asset Value, End of Period | Total Return (b) | Net Assets, End of Period (000s) | Ratio of Expenses to Average Net Assets | Ratio of Net Investment Income (Loss) to Average Net Assets | Portfolio Turnover Rate | ||||||||||||||||||||||||
| $ | (4.36 | ) | $ | 50.07 | (c) | 14.05 | %(c) | $ | 60,807 | 1.62 | %(d) | (0.77 | )%(d) | 32 | % | |||||||||||||||
| — | 47.75 | (c) | 15.96 | (c) | 56,686 | 1.61 | (0.32 | ) | 80 | |||||||||||||||||||||
| — | 41.18 | (8.59 | ) | 68,625 | 1.61 | (0.31 | ) | 87 | ||||||||||||||||||||||
| — | 45.05 | 4.48 | 57,590 | 1.61 | (0.45 | ) | 64 | |||||||||||||||||||||||
| — | 43.12 | 24.66 | 55,955 | 1.61 | (0.56 | ) | 73 | |||||||||||||||||||||||
| — | 34.59 | 23.76 | 34,054 | 1.61 | (0.41 | ) | 108 | |||||||||||||||||||||||
| $ | (4.27 | ) | $ | 44.13 | (c) | 13.63 | %(c) | $ | 20,484 | 2.37 | %(d) | (1.52 | )%(d) | 32 | % | |||||||||||||||
| — | 42.62 | (c) | 15.10 | (c) | 19,729 | 2.36 | (1.06 | ) | 80 | |||||||||||||||||||||
| — | 37.03 | (9.26 | ) | 23,055 | 2.36 | (1.09 | ) | 87 | ||||||||||||||||||||||
| — | 40.81 | 3.69 | 25,959 | 2.36 | (1.19 | ) | 64 | |||||||||||||||||||||||
| — | 39.36 | 23.73 | 23,560 | 2.36 | (1.30 | ) | 73 | |||||||||||||||||||||||
| — | 31.81 | 22.82 | 12,948 | 2.36 | (1.16 | ) | 108 | |||||||||||||||||||||||
| $ | (4.43 | ) | $ | 53.10 | (c) | 14.20 | %(c) | $ | 18,967 | 1.37 | %(d) | (0.53 | )%(d) | 32 | % | |||||||||||||||
| — | 50.40 | (c) | 16.24 | (c) | 23,214 | 1.36 | 0.03 | 80 | ||||||||||||||||||||||
| — | 43.36 | (8.33 | ) | 20,921 | 1.36 | (0.11 | ) | 87 | ||||||||||||||||||||||
| — | 47.30 | 4.72 | 26,662 | 1.36 | (0.14 | ) | 64 | |||||||||||||||||||||||
| — | 45.17 | 24.99 | 18,179 | 1.36 | (0.07 | ) | 73 | |||||||||||||||||||||||
| — | 36.14 | 24.06 | 2,419 | 1.36 | (0.09 | ) | 108 | |||||||||||||||||||||||
| $ | (4.48 | ) | $ | 53.50 | (c) | 14.26 | %(c) | $ | 97,756 | 1.27 | %(d) | (0.43 | )%(d) | 32 | % | |||||||||||||||
| — | 50.77 | (c) | 16.36 | (c) | 114,925 | 1.26 | 0.05 | 80 | ||||||||||||||||||||||
| — | 43.63 | (8.25 | ) | 122,294 | 1.26 | 0.06 | 87 | |||||||||||||||||||||||
| — | 47.55 | 4.80 | 80,319 | 1.26 | (0.12 | ) | 64 | |||||||||||||||||||||||
| — | 45.37 | 25.12 | 64,282 | 1.26 | (0.21 | ) | 73 | |||||||||||||||||||||||
| — | 36.26 | 24.18 | 32,643 | 1.26 | 0.07 | 108 | ||||||||||||||||||||||||
| See accompanying Notes to Financial Statements | | December 31, 2017 | | Semiannual Report | 119 |
Table of Contents
Financial Highlights (cont’d)
For a Share Outstanding for the Period ended:
Net Asset Value, Beginning of Period | Net Investment Income (Loss) (a) | Net Realized and Change in Unrealized Gain (Loss) | Total from Investment Operations | Distributions from Net Realized Capital Gains | ||||||||||||||||||||
| AllianzGI Health Sciences: | ||||||||||||||||||||||||
| Class A | ||||||||||||||||||||||||
12/31/2017+ | $ | 31.61 | $ | (0.02 | ) | $ | 0.18 | $ | 0.16 | $ | — | |||||||||||||
6/30/2017 | 27.77 | (0.01 | ) | 3.85 | 3.84 | — | ||||||||||||||||||
6/30/2016 | 38.48 | (0.02 | ) | (3.87 | ) | (3.89 | ) | (6.82 | ) | |||||||||||||||
6/30/2015 | 33.91 | (0.26 | ) | 9.79 | 9.53 | (4.96 | ) | |||||||||||||||||
6/30/2014 | 30.82 | (0.17 | ) | 9.34 | 9.17 | (6.08 | ) | |||||||||||||||||
6/30/2013 | 27.85 | (0.06 | ) | 5.22 | 5.16 | (2.19 | ) | |||||||||||||||||
| Class C | ||||||||||||||||||||||||
12/31/2017+ | $ | 25.30 | $ | (0.11 | ) | $ | 0.15 | $ | 0.04 | $ | — | |||||||||||||
6/30/2017 | 22.40 | (0.18 | ) | 3.08 | 2.90 | — | ||||||||||||||||||
6/30/2016 | 32.67 | (0.28 | ) | (3.17 | ) | (3.45 | ) | (6.82 | ) | |||||||||||||||
6/30/2015 | 29.66 | (0.45 | ) | 8.42 | 7.97 | (4.96 | ) | |||||||||||||||||
6/30/2014 | 27.82 | (0.37 | ) | 8.29 | 7.92 | (6.08 | ) | |||||||||||||||||
6/30/2013 | 25.52 | (0.26 | ) | 4.75 | 4.49 | (2.19 | ) | |||||||||||||||||
| Institutional Class | ||||||||||||||||||||||||
12/31/2017+ | $ | 31.90 | $ | 0.04 | $ | 0.18 | $ | 0.22 | $ | — | ||||||||||||||
6/30/2017 | 27.93 | 0.09 | 3.88 | 3.97 | — | |||||||||||||||||||
6/30/2016 | 38.53 | 0.04 | (3.82 | ) | (3.78 | ) | (6.82 | ) | ||||||||||||||||
12/22/2014* - 6/30/2015 | 33.09 | (0.04 | ) | 5.48 | 5.44 | — | ||||||||||||||||||
| + | Unaudited |
| * | Commencement of operations. |
| (a) | Calculated on average shares outstanding during the period. |
| (b) | Total return is calculated assuming a purchase of a share on the first day of the period and a sale of a share on the last day of each period reported. Dividends and distributions, if any, are assumed, for purposes of this calculation, to be reinvested. Total return does not reflect sales charges and includes the effect of fee waivers and reimbursements. Total return may reflect adjustments to conform to U.S. GAAP. Total return for a period of less than one year is not annualized. |
| (c) | Annualized, unless otherwise noted. |
| 120 | Semiannual Report | | December 31, 2017 | | See accompanying Notes to Financial Statements |
Table of Contents
Net Asset Value, End of Period | Total Return (b) | Net Assets, End of Period (000s) | Ratio of Expenses to Average Net Assets | Ratio of Net Investment Income (Loss) to Average Net Assets | Portfolio Turnover Rate | |||||||||||||||||||||
| $ | 31.77 | 0.51 | % | $ | 142,939 | 1.47 | %(c) | (0.11 | )%(c) | 22 | % | |||||||||||||||
| 31.61 | 13.83 | 150,756 | 1.46 | (0.04 | ) | 82 | ||||||||||||||||||||
| 27.77 | (10.82 | ) | 167,724 | 1.47 | (0.07 | ) | 113 | |||||||||||||||||||
| 38.48 | 30.53 | 45,093 | 1.46 | (0.72 | ) | 76 | ||||||||||||||||||||
| 33.91 | 34.03 | 28,019 | 1.46 | (0.54 | ) | 119 | ||||||||||||||||||||
| 30.82 | 19.62 | 21,345 | 1.46 | (0.22 | ) | 134 | ||||||||||||||||||||
| $ | 25.34 | 0.16 | % | $ | 9,025 | 2.22 | %(c) | (0.86 | )%(c) | 22 | % | |||||||||||||||
| 25.30 | 12.95 | 10,358 | 2.21 | (0.79 | ) | 82 | ||||||||||||||||||||
| 22.40 | (11.48 | ) | 13,446 | 2.22 | (1.07 | ) | 113 | |||||||||||||||||||
| 32.67 | 29.57 | 20,902 | 2.21 | (1.46 | ) | 76 | ||||||||||||||||||||
| 29.66 | 33.05 | 10,828 | 2.21 | (1.29 | ) | 119 | ||||||||||||||||||||
| 27.82 | 18.75 | 8,370 | 2.21 | (0.97 | ) | 134 | ||||||||||||||||||||
| $ | 32.12 | 0.69 | % | $ | 2,498 | 1.12 | %(c) | 0.23 | %(c) | 22 | % | |||||||||||||||
| 31.90 | 14.21 | 3,692 | 1.11 | 0.31 | 82 | |||||||||||||||||||||
| 27.93 | (10.49 | ) | 1,977 | 1.12 | 0.14 | 113 | ||||||||||||||||||||
| 38.53 | 16.44 | 1,240 | 1.10(c | ) | (0.21 | )(c) | 76 | |||||||||||||||||||
| See accompanying Notes to Financial Statements | | December 31, 2017 | | Semiannual Report | 121 |
Table of Contents
Financial Highlights (cont’d)
For a Share Outstanding for the Period ended:
Net Asset Value, Beginning of Period | Net Investment Income (a) | Net Realized and Change in Unrealized Gain (Loss) | Total from Investment Operations | Dividends from Net Investment Income | Distributions from Net Realized Capital Gains | |||||||||||||||||||||||
| AllianzGI Income & Growth: | ||||||||||||||||||||||||||||
| Class A | ||||||||||||||||||||||||||||
12/31/2017+ | $ | 11.24 | $ | 0.11 | $ | 0.61 | $ | 0.72 | $ | (0.16 | ) | $ | (0.32 | ) | ||||||||||||||
6/30/2017 | 10.80 | 0.27 | 1.17 | �� | 1.44 | (0.32 | ) | (0.68 | ) | |||||||||||||||||||
6/30/2016 | 12.12 | 0.28 | (0.55 | ) | (0.27 | ) | (0.37 | ) | (0.68 | ) | ||||||||||||||||||
6/30/2015 | 12.95 | 0.27 | (0.05 | ) | 0.22 | (0.26 | ) | (0.79 | ) | |||||||||||||||||||
6/30/2014 | 12.02 | 0.30 | 1.68 | 1.98 | (0.26 | ) | (0.79 | ) | ||||||||||||||||||||
6/30/2013 | 11.55 | 0.34 | 1.18 | 1.52 | (0.35 | ) | (0.70 | ) | ||||||||||||||||||||
| Class C | ||||||||||||||||||||||||||||
12/31/2017+ | $ | 10.44 | $ | 0.07 | $ | 0.56 | $ | 0.63 | $ | (0.12 | ) | $ | (0.32 | ) | ||||||||||||||
6/30/2017 | 10.10 | 0.18 | 1.09 | 1.27 | (0.25 | ) | (0.68 | ) | ||||||||||||||||||||
6/30/2016 | 11.46 | 0.19 | (0.53 | ) | (0.34 | ) | (0.34 | ) | (0.68 | ) | ||||||||||||||||||
6/30/2015 | 12.38 | 0.17 | (0.06 | ) | 0.11 | (0.24 | ) | (0.79 | ) | |||||||||||||||||||
6/30/2014 | 11.59 | 0.19 | 1.63 | 1.82 | (0.24 | ) | (0.79 | ) | ||||||||||||||||||||
6/30/2013 | 11.23 | 0.25 | 1.13 | 1.38 | (0.32 | ) | (0.70 | ) | ||||||||||||||||||||
| Class R | ||||||||||||||||||||||||||||
12/31/2017+ | $ | 11.24 | $ | 0.10 | $ | 0.60 | $ | 0.70 | $ | (0.14 | ) | $ | (0.32 | ) | ||||||||||||||
6/30/2017 | 10.80 | 0.25 | 1.16 | 1.41 | (0.29 | ) | (0.68 | ) | ||||||||||||||||||||
6/30/2016 | 12.14 | 0.26 | (0.56 | ) | (0.30 | ) | (0.36 | ) | (0.68 | ) | ||||||||||||||||||
6/30/2015 | 13.00 | 0.24 | (0.05 | ) | 0.19 | (0.26 | ) | (0.79 | ) | |||||||||||||||||||
6/30/2014 | 12.08 | 0.27 | 1.70 | 1.97 | (0.26 | ) | (0.79 | ) | ||||||||||||||||||||
6/30/2013 | 11.62 | 0.31 | 1.19 | 1.50 | (0.34 | ) | (0.70 | ) | ||||||||||||||||||||
| Class P | ||||||||||||||||||||||||||||
12/31/2017+ | $ | 11.48 | $ | 0.13 | $ | 0.62 | $ | 0.75 | $ | (0.17 | ) | $ | (0.32 | ) | ||||||||||||||
6/30/2017 | 11.01 | 0.31 | 1.19 | 1.50 | (0.35 | ) | (0.68 | ) | ||||||||||||||||||||
6/30/2016 | 12.32 | 0.32 | (0.57 | ) | (0.25 | ) | (0.38 | ) | (0.68 | ) | ||||||||||||||||||
6/30/2015 | 13.12 | 0.31 | (0.05 | ) | 0.26 | (0.27 | ) | (0.79 | ) | |||||||||||||||||||
6/30/2014 | 12.15 | 0.33 | 1.70 | 2.03 | (0.27 | ) | (0.79 | ) | ||||||||||||||||||||
6/30/2013 | 11.64 | 0.38 | 1.19 | 1.57 | (0.36 | ) | (0.70 | ) | ||||||||||||||||||||
| Institutional Class | ||||||||||||||||||||||||||||
12/31/2017+ | $ | 11.58 | $ | 0.14 | $ | 0.62 | $ | 0.76 | $ | (0.18 | ) | $ | (0.32 | ) | ||||||||||||||
6/30/2017 | 11.09 | 0.32 | 1.21 | 1.53 | (0.36 | ) | (0.68 | ) | ||||||||||||||||||||
6/30/2016 | 12.40 | 0.33 | (0.57 | ) | (0.24 | ) | (0.39 | ) | (0.68 | ) | ||||||||||||||||||
6/30/2015 | 13.19 | 0.32 | (0.05 | ) | 0.27 | (0.27 | ) | (0.79 | ) | |||||||||||||||||||
6/30/2014 | 12.20 | 0.35 | 1.70 | 2.05 | (0.27 | ) | (0.79 | ) | ||||||||||||||||||||
6/30/2013 | 11.67 | 0.39 | 1.20 | 1.59 | (0.36 | ) | (0.70 | ) | ||||||||||||||||||||
| + | Unaudited |
| (a) | Calculated on average shares outstanding during the period. |
| (b) | Total return is calculated assuming a purchase of a share on the first day of the period and a sale of a share on the last day of each period reported. Dividends and distributions, if any, are assumed, for purposes of this calculation, to be reinvested. Total return does not reflect sales charges and includes the effect of fee waivers and reimbursements. Total return may reflect adjustments to conform to U.S. GAAP. Total return for a period of less than one year is not annualized. |
| (c) | Annualized, unless otherwise noted. |
| (d) | Payments from Affiliates increased the end of period net asset value and total return by less than $0.01 and 0.01%, respectively. |
| 122 | Semiannual Report | | December 31, 2017 | | See accompanying Notes to Financial Statements |
Table of Contents
Total Dividends and Distributions | Net Asset Value, End of Period | Total Return (b) | Net Assets, End of Period (000s) | Ratio of Expenses to Average Net Assets with Fee Waiver/ Reimbursement | Ratio of Expenses to Average Net Assets without Fee Waiver/ Reimbursement | Ratio of Net Investment Income to Average Net Assets | Portfolio Turnover Rate | |||||||||||||||||||||||||||
| $ | (0.48 | ) | $ | 11.48 | 6.54 | % | $ | 1,183,088 | 1.29 | %(c) | 1.29 | %(c) | 2.00 | %(c) | 63 | % | ||||||||||||||||||
| (1.00 | ) | 11.24 | 13.88 | 1,091,888 | 1.29 | 1.29 | 2.45 | 159 | ||||||||||||||||||||||||||
| (1.05 | ) | 10.80 | (2.02 | ) | 1,009,542 | 1.34 | 1.34 | 2.56 | 94 | |||||||||||||||||||||||||
| (1.05 | ) | 12.12 | 1.80 | 897,530 | 1.32 | 1.32 | 2.16 | 84 | ||||||||||||||||||||||||||
| (1.05 | ) | 12.95 | (d) | 17.03 | (d) | 863,378 | 1.32 | 1.32 | 2.34 | 114 | ||||||||||||||||||||||||
| (1.05 | ) | 12.02 | (d) | 13.63 | (d) | 473,578 | 1.32 | 1.32 | 2.88 | 193 | ||||||||||||||||||||||||
| $ | (0.44 | ) | $ | 10.63 | 6.19 | % | $ | 1,079,656 | 2.04 | %(c) | 2.04 | %(c) | 1.25 | %(c) | 63 | % | ||||||||||||||||||
| (0.93 | ) | 10.44 | 13.08 | 1,090,887 | 2.04 | 2.04 | 1.70 | 159 | ||||||||||||||||||||||||||
| (1.02 | ) | 10.10 | (2.79 | ) | 1,159,303 | 2.09 | 2.09 | 1.81 | 94 | |||||||||||||||||||||||||
| (1.03 | ) | 11.46 | 0.95 | 1,195,391 | 2.07 | 2.07 | 1.41 | 84 | ||||||||||||||||||||||||||
| (1.03 | ) | 12.38 | (d) | 16.14 | (d) | 933,126 | 2.07 | 2.07 | 1.59 | 114 | ||||||||||||||||||||||||
| (1.02 | ) | 11.59 | (d) | 12.78 | (d) | 482,554 | 2.07 | 2.07 | 2.13 | 193 | ||||||||||||||||||||||||
| $ | (0.46 | ) | $ | 11.48 | 6.42 | % | $ | 3,152 | 1.54 | %(c) | 1.54 | %(c) | 1.75 | %(c) | 63 | % | ||||||||||||||||||
| (0.97 | ) | 11.24 | 13.59 | 1,781 | 1.54 | 1.54 | 2.20 | 159 | ||||||||||||||||||||||||||
| (1.04 | ) | 10.80 | (2.31 | ) | 2,261 | 1.59 | 1.59 | 2.30 | 94 | |||||||||||||||||||||||||
| (1.05 | ) | 12.14 | 1.49 | 2,543 | 1.57 | 1.57 | 1.89 | 84 | ||||||||||||||||||||||||||
| (1.05 | ) | 13.00 | (d) | 16.71 | (d) | 3,733 | 1.57 | 1.57 | 2.09 | 114 | ||||||||||||||||||||||||
| (1.04 | ) | 12.08 | (d) | 13.38 | (d) | 2,547 | 1.57 | 1.57 | 2.61 | 193 | ||||||||||||||||||||||||
| $ | (0.49 | ) | $ | 11.74 | 6.70 | % | $ | 781,657 | 1.04 | %(c) | 1.04 | %(c) | 2.25 | %(c) | 63 | % | ||||||||||||||||||
| (1.03 | ) | 11.48 | 14.14 | 690,147 | 1.04 | 1.04 | 2.69 | 159 | ||||||||||||||||||||||||||
| (1.06 | ) | 11.01 | (1.81 | ) | 560,425 | 1.09 | 1.09 | 2.81 | 94 | |||||||||||||||||||||||||
| (1.06 | ) | 12.32 | 2.07 | 676,865 | 1.07 | 1.07 | 2.42 | 84 | ||||||||||||||||||||||||||
| (1.06 | ) | 13.12 | (d) | 17.26 | (d) | 443,278 | 1.07 | 1.07 | 2.59 | 114 | ||||||||||||||||||||||||
| (1.06 | ) | 12.15 | (d) | 13.97 | (d) | 212,734 | 1.07 | 1.07 | 3.13 | 193 | ||||||||||||||||||||||||
| $ | (0.50 | ) | $ | 11.84 | 6.70 | % | $ | 377,202 | 0.94 | %(c) | 0.94 | %(c) | 2.35 | %(c) | 63 | % | ||||||||||||||||||
| (1.04 | ) | 11.58 | 14.33 | 342,652 | 0.94 | 0.94 | 2.76 | 159 | ||||||||||||||||||||||||||
| (1.07 | ) | 11.09 | (1.76 | ) | 181,890 | 0.99 | 0.99 | 2.91 | 94 | |||||||||||||||||||||||||
| (1.06 | ) | 12.40 | 2.17 | 190,675 | 0.97 | 0.97 | 2.51 | 84 | ||||||||||||||||||||||||||
| (1.06 | ) | 13.19 | (d) | 17.38 | (d) | 163,155 | 0.97 | 0.97 | 2.71 | 114 | ||||||||||||||||||||||||
| (1.06 | ) | 12.20 | (d) | 14.14 | (d) | 126,146 | 0.97 | 0.97 | 3.23 | 193 | ||||||||||||||||||||||||
| See accompanying Notes to Financial Statements | | December 31, 2017 | | Semiannual Report | 123 |
Table of Contents
Financial Highlights (cont’d)
For a Share Outstanding for the Period ended:
| Net Asset Value, Beginning of Period | Net Investment Income (Loss) (a) | Net Realized and Change in Unrealized Gain (Loss) | Total from Investment Operations | Distributions from Net Realized Capital Gains | Net Asset Value, End of Period | |||||||||||||||||||||||
| AllianzGI Mid-Cap: | ||||||||||||||||||||||||||||
| Class A | ||||||||||||||||||||||||||||
12/31/2017+ | $ | 3.74 | $ | (0.01 | ) | $ | 0.42 | $ | 0.41 | $ | (0.38 | ) | $ | 3.77 | ||||||||||||||
6/30/2017 | 3.40 | (0.01 | ) | 0.62 | 0.61 | (0.27 | ) | 3.74 | ||||||||||||||||||||
6/30/2016 | 3.65 | (0.01 | ) | (0.03 | ) | (0.04 | ) | (0.21 | ) | 3.40 | ||||||||||||||||||
6/30/2015 | 3.92 | (0.01 | ) | 0.28 | 0.27 | (0.54 | ) | 3.65 | ||||||||||||||||||||
6/30/2014 | 3.20 | (0.01 | ) | 0.73 | 0.72 | — | 3.92 | |||||||||||||||||||||
6/30/2013 | 2.83 | — | (d) | 0.60 | 0.60 | (0.23 | ) | 3.20 | (e) | |||||||||||||||||||
| Class C | ||||||||||||||||||||||||||||
12/31/2017+ | $ | 3.19 | $ | (0.02 | ) | $ | 0.35 | $ | 0.33 | $ | (0.38 | ) | $ | 3.14 | ||||||||||||||
6/30/2017 | 2.96 | (0.04 | ) | 0.54 | 0.50 | (0.27 | ) | 3.19 | ||||||||||||||||||||
6/30/2016 | 3.22 | (0.03 | ) | (0.02 | ) | (0.05 | ) | (0.21 | ) | 2.96 | ||||||||||||||||||
6/30/2015 | 3.55 | (0.04 | ) | 0.25 | 0.21 | (0.54 | ) | 3.22 | ||||||||||||||||||||
6/30/2014 | 2.92 | (0.03 | ) | 0.66 | 0.63 | — | 3.55 | |||||||||||||||||||||
6/30/2013 | 2.62 | (0.02 | ) | 0.55 | 0.53 | (0.23 | ) | 2.92 | (e) | |||||||||||||||||||
| Class R | ||||||||||||||||||||||||||||
12/31/2017+ | $ | 3.69 | $ | (0.01 | ) | $ | 0.41 | $ | 0.40 | $ | (0.38 | ) | $ | 3.71 | ||||||||||||||
6/30/2017 | 3.37 | (0.02 | ) | 0.61 | 0.59 | (0.27 | ) | 3.69 | ||||||||||||||||||||
6/30/2016 | 3.62 | (0.02 | ) | (0.02 | ) | (0.04 | ) | (0.21 | ) | 3.37 | ||||||||||||||||||
6/30/2015 | 3.91 | (0.02 | ) | �� | 0.27 | 0.25 | (0.54 | ) | 3.62 | |||||||||||||||||||
6/30/2014 | 3.20 | (0.02 | ) | 0.73 | 0.71 | — | 3.91 | |||||||||||||||||||||
6/30/2013 | 2.84 | (0.01 | ) | 0.60 | 0.59 | (0.23 | ) | 3.20 | (e) | |||||||||||||||||||
| Class P | ||||||||||||||||||||||||||||
12/31/2017+ | $ | 4.19 | $ | — | (d) | $ | 0.46 | $ | 0.46 | $ | (0.38 | ) | $ | 4.27 | ||||||||||||||
6/30/2017 | 3.77 | (0.01 | ) | 0.70 | 0.69 | (0.27 | ) | 4.19 | ||||||||||||||||||||
6/30/2016 | 4.01 | — | (d) | (0.03 | ) | (0.03 | ) | (0.21 | ) | 3.77 | ||||||||||||||||||
6/30/2015 | 4.24 | — | (d) | 0.31 | 0.31 | (0.54 | ) | 4.01 | ||||||||||||||||||||
6/30/2014 | 3.45 | — | (f) | 0.79 | 0.79 | — | 4.24 | |||||||||||||||||||||
6/30/2013 | 3.03 | 0.01 | 0.64 | 0.65 | (0.23 | ) | 3.45 | (e) | ||||||||||||||||||||
| Institutional Class | ||||||||||||||||||||||||||||
12/31/2017+ | $ | 4.21 | $ | — | (d) | $ | 0.46 | $ | 0.46 | $ | (0.38 | ) | $ | 4.29 | ||||||||||||||
6/30/2017 | 3.78 | — | 0.70 | 0.70 | (0.27 | ) | 4.21 | |||||||||||||||||||||
6/30/2016 | 4.02 | — | (f) | (0.03 | ) | (0.03 | ) | (0.21 | ) | 3.78 | ||||||||||||||||||
6/30/2015 | 4.25 | — | (d) | 0.31 | 0.31 | (0.54 | ) | 4.02 | ||||||||||||||||||||
6/30/2014 | 3.46 | 0.01 | 0.78 | 0.79 | — | 4.25 | ||||||||||||||||||||||
6/30/2013 | 3.03 | 0.01 | 0.65 | 0.66 | (0.23 | ) | 3.46 | (e) | ||||||||||||||||||||
| Administrative Class | ||||||||||||||||||||||||||||
12/31/2017+ | $ | 3.94 | $ | (0.01 | ) | $ | 0.43 | $ | 0.42 | $ | (0.38 | ) | $ | 3.98 | ||||||||||||||
6/30/2017 | 3.56 | (0.01 | ) | 0.66 | 0.65 | (0.27 | ) | 3.94 | ||||||||||||||||||||
6/30/2016 | 3.80 | (0.01 | ) | (0.02 | ) | (0.03 | ) | (0.21 | ) | 3.56 | ||||||||||||||||||
6/30/2015 | 4.06 | (0.01 | ) | 0.29 | 0.28 | (0.54 | ) | 3.80 | ||||||||||||||||||||
6/30/2014 | 3.32 | — | (d) | 0.74 | 0.74 | — | 4.06 | |||||||||||||||||||||
6/30/2013 | 2.92 | — | (d) | 0.63 | 0.63 | (0.23 | ) | 3.32 | (e) | |||||||||||||||||||
| + | Unaudited |
| (a) | Calculated on average shares outstanding during the period. |
| (b) | Total return is calculated assuming a purchase of a share on the first day of the period and a sale of a share on the last day of each period reported. Dividends and distributions, if any, are assumed, for purposes of this calculation, to be reinvested. Total return does not reflect sales charges and includes the effect of fee waivers and reimbursements. Total return may reflect adjustments to conform to U.S. GAAP. Total return for a period of less than one year is not annualized. |
| (c) | Annualized, unless otherwise noted. |
| (d) | Actual amount rounds to less than $(0.01) per share. |
| (e) | Payments from Affiliates increased the end of period net asset value and total return by less than $0.01 and 0.01%, respectively. |
| (f) | Actual amount rounds to less than $0.01 per share. |
| 124 | Semiannual Report | | December 31, 2017 | | See accompanying Notes to Financial Statements |
Table of Contents
| Total Return (b) | Net Assets, End of Period (000s) | Ratio of Expenses to Average Net Assets | Ratio of Net Investment Income (Loss) to Average Net Assets | Portfolio Turnover Rate | ||||||||||||||||||
| 10.90 | % | $ | 119,898 | 1.14 | %(c) | (0.40 | )%(c) | 45 | % | |||||||||||||
| 18.89 | 112,947 | 1.13 | (0.40 | ) | 77 | |||||||||||||||||
| (1.05 | ) | 86,224 | 1.13 | (0.26 | ) | 73 | ||||||||||||||||
| 7.91 | 98,253 | 1.13 | (0.38 | ) | 79 | |||||||||||||||||
| 22.50 | 106,116 | 1.13 | (0.18 | ) | 88 | |||||||||||||||||
| 22.89 | (e) | 95,365 | 1.13 | (0.02 | ) | 76 | ||||||||||||||||
| 10.24 | % | $ | 148,404 | 1.89 | %(c) | (1.15 | )%(c) | 45 | % | |||||||||||||
| 17.95 | 142,565 | 1.88 | (1.15 | ) | 77 | |||||||||||||||||
| (1.51 | ) | 162,104 | 1.88 | (1.01 | ) | 73 | ||||||||||||||||
| 6.98 | 183,765 | 1.88 | (1.13 | ) | 79 | |||||||||||||||||
| 21.58 | 193,481 | 1.88 | (0.93 | ) | 88 | |||||||||||||||||
| 21.99 | (e) | 176,602 | 1.88 | (0.76 | ) | 76 | ||||||||||||||||
| 10.75 | % | $ | 3,149 | 1.39 | %(c) | (0.65 | )%(c) | 45 | % | |||||||||||||
| 18.45 | 2,345 | 1.38 | (0.65 | ) | 77 | |||||||||||||||||
| (1.05 | ) | 2,195 | 1.38 | (0.51 | ) | 73 | ||||||||||||||||
| 7.38 | 2,867 | 1.38 | (0.63 | ) | 79 | |||||||||||||||||
| 22.19 | 2,795 | 1.38 | (0.44 | ) | 88 | |||||||||||||||||
| 22.46 | (e) | 2,398 | 1.38 | (0.23 | ) | 76 | ||||||||||||||||
| 10.92 | % | $ | 10,873 | 0.89 | %(c) | (0.15 | )%(c) | 45 | % | |||||||||||||
| 19.18 | 8,604 | 0.88 | (0.15 | ) | 77 | |||||||||||||||||
| (0.69 | ) | 2,009 | 0.88 | (0.01 | ) | 73 | ||||||||||||||||
| 8.31 | 2,010 | 0.88 | (0.12 | ) | 79 | |||||||||||||||||
| 22.90 | 1,339 | 0.88 | 0.07 | 88 | ||||||||||||||||||
| 23.02 | (e) | 1,077 | 0.88 | 0.21 | 76 | |||||||||||||||||
| 10.85 | % | $ | 28,764 | 0.79 | %(c) | (0.05 | )%(c) | 45 | % | |||||||||||||
| 19.39 | 26,788 | 0.78 | (0.05 | ) | 77 | |||||||||||||||||
| (0.69 | ) | 29,092 | 0.78 | 0.11 | 73 | |||||||||||||||||
| 8.29 | 24,130 | 0.78 | (0.04 | ) | 79 | |||||||||||||||||
| 22.83 | 34,540 | 0.78 | 0.16 | 88 | ||||||||||||||||||
| 23.38 | (e) | 33,050 | 0.78 | 0.41 | 76 | |||||||||||||||||
| 10.58 | % | $ | 1,391 | 1.04 | %(c) | (0.28 | )%(c) | 45 | % | |||||||||||||
| 19.19 | 575 | 1.03 | (0.30 | ) | 77 | |||||||||||||||||
| (0.73 | ) | 488 | 1.03 | (0.16 | ) | 73 | ||||||||||||||||
| 7.88 | 532 | 1.03 | (0.28 | ) | 79 | |||||||||||||||||
| 22.29 | 494 | 1.03 | (0.09 | ) | 88 | |||||||||||||||||
| 23.21 | (e) | 1,453 | 1.03 | (0.06 | ) | 76 | ||||||||||||||||
| See accompanying Notes to Financial Statements | | December 31, 2017 | | Semiannual Report | 125 |
Table of Contents
Financial Highlights (cont’d)
For a Share Outstanding for the Period ended:
Net Asset Value, Beginning of | Net Investment Income (a) | Net Realized and Change in Unrealized Gain (Loss) | Total from Investment Operations | Dividends from Net Investment Income | Distributions from Net Realized Capital Gains | |||||||||||||||||||||||
| AllianzGI NFJ Dividend Value: | ||||||||||||||||||||||||||||
| Class A | ||||||||||||||||||||||||||||
12/31/2017+ | $ | 17.20 | $ | 0.15 | $ | 1.81 | $ | 1.96 | $ | (0.16 | ) | $ | (3.86 | ) | ||||||||||||||
6/30/2017 | 15.74 | 0.34 | 2.08 | 2.42 | (0.37 | ) | (0.59 | ) | ||||||||||||||||||||
6/30/2016 | 16.68 | 0.37 | (0.92 | ) | (0.55 | ) | (0.39 | ) | — | |||||||||||||||||||
6/30/2015 | 17.12 | 0.33 | (0.44 | ) | (0.11 | ) | (0.33 | ) | — | |||||||||||||||||||
6/30/2014 | 14.14 | 0.29 | 3.01 | 3.30 | (0.32 | ) | — | |||||||||||||||||||||
6/30/2013 | 11.87 | 0.33 | 2.25 | 2.58 | (0.31 | ) | — | |||||||||||||||||||||
| Class C | ||||||||||||||||||||||||||||
12/31/2017+ | $ | 17.34 | $ | 0.09 | $ | 1.82 | $ | 1.91 | $ | (0.09 | ) | $ | (3.86 | ) | ||||||||||||||
6/30/2017 | 15.86 | 0.21 | 2.10 | 2.31 | (0.24 | ) | (0.59 | ) | ||||||||||||||||||||
6/30/2016 | 16.83 | 0.25 | (0.93 | ) | (0.68 | ) | (0.29 | ) | — | |||||||||||||||||||
6/30/2015 | 17.27 | 0.20 | (0.43 | ) | (0.23 | ) | (0.21 | ) | — | |||||||||||||||||||
6/30/2014 | 14.27 | 0.18 | 3.02 | 3.20 | (0.20 | ) | — | |||||||||||||||||||||
6/30/2013 | 11.93 | 0.23 | 2.26 | 2.49 | (0.15 | ) | — | |||||||||||||||||||||
| Class R | ||||||||||||||||||||||||||||
12/31/2017+ | $ | 17.15 | $ | 0.13 | $ | 1.80 | $ | 1.93 | $ | (0.13 | ) | $ | (3.86 | ) | ||||||||||||||
6/30/2017 | 15.70 | 0.29 | 2.08 | 2.37 | (0.33 | ) | (0.59 | ) | ||||||||||||||||||||
6/30/2016 | 16.65 | 0.33 | (0.92 | ) | (0.59 | ) | (0.36 | ) | — | |||||||||||||||||||
6/30/2015 | 17.09 | 0.28 | (0.43 | ) | (0.15 | ) | (0.29 | ) | — | |||||||||||||||||||
6/30/2014 | 14.12 | 0.26 | 2.99 | 3.25 | (0.28 | ) | — | |||||||||||||||||||||
6/30/2013 | 11.84 | 0.30 | 2.24 | 2.54 | (0.26 | ) | — | |||||||||||||||||||||
| Class P | ||||||||||||||||||||||||||||
12/31/2017+ | $ | 17.30 | $ | 0.18 | $ | 1.82 | $ | 2.00 | $ | (0.18 | ) | $ | (3.86 | ) | ||||||||||||||
6/30/2017 | 15.83 | 0.38 | 2.09 | 2.47 | (0.41 | ) | (0.59 | ) | ||||||||||||||||||||
6/30/2016 | 16.77 | 0.41 | (0.93 | ) | (0.52 | ) | (0.42 | ) | — | |||||||||||||||||||
6/30/2015 | 17.21 | 0.37 | (0.43 | ) | (0.06 | ) | (0.38 | ) | — | |||||||||||||||||||
6/30/2014 | 14.21 | 0.34 | 3.01 | 3.35 | (0.35 | ) | — | |||||||||||||||||||||
6/30/2013 | 11.96 | 0.37 | 2.25 | 2.62 | (0.37 | ) | — | |||||||||||||||||||||
| Institutional Class | ||||||||||||||||||||||||||||
12/31/2017+ | $ | 17.30 | $ | 0.19 | $ | 1.81 | $ | 2.00 | $ | (0.19 | ) | $ | (3.86 | ) | ||||||||||||||
6/30/2017 | 15.82 | 0.41 | 2.08 | 2.49 | (0.42 | ) | (0.59 | ) | ||||||||||||||||||||
6/30/2016 | 16.76 | 0.42 | (0.93 | ) | (0.51 | ) | (0.43 | ) | — | |||||||||||||||||||
6/30/2015 | 17.20 | 0.39 | (0.43 | ) | (0.04 | ) | (0.40 | ) | — | |||||||||||||||||||
6/30/2014 | 14.20 | 0.35 | 3.02 | 3.37 | (0.37 | ) | — | |||||||||||||||||||||
6/30/2013 | 11.96 | 0.38 | 2.25 | 2.63 | (0.39 | ) | — | |||||||||||||||||||||
| Class R6 | ||||||||||||||||||||||||||||
12/31/2017+ | $ | 17.27 | $ | 0.19 | $ | 1.81 | $ | 2.00 | $ | (0.19 | ) | $ | (3.86 | ) | ||||||||||||||
6/30/2017 | 15.80 | 0.41 | 2.09 | 2.50 | (0.44 | ) | (0.59 | ) | ||||||||||||||||||||
6/30/2016 | 16.74 | 0.42 | (0.92 | ) | (0.50 | ) | (0.44 | ) | — | |||||||||||||||||||
6/30/2015 | 17.19 | 0.39 | (0.42 | ) | (0.03 | ) | (0.42 | ) | — | |||||||||||||||||||
12/19/2013* - 6/30/2014 | 15.62 | 0.19 | 1.56 | 1.75 | (0.18 | ) | — | |||||||||||||||||||||
| Administrative Class | ||||||||||||||||||||||||||||
12/31/2017+ | $ | 17.41 | $ | 0.17 | $ | 1.82 | $ | 1.99 | $ | (0.12 | ) | $ | (3.86 | ) | ||||||||||||||
6/30/2017 | 15.92 | 0.36 | 2.11 | 2.47 | (0.39 | ) | (0.59 | ) | ||||||||||||||||||||
6/30/2016 | 16.87 | 0.39 | (0.94 | ) | (0.55 | ) | (0.40 | ) | — | |||||||||||||||||||
6/30/2015 | 17.31 | 0.35 | (0.44 | ) | (0.09 | ) | (0.35 | ) | — | |||||||||||||||||||
6/30/2014 | 14.29 | 0.31 | 3.04 | 3.35 | (0.33 | ) | — | |||||||||||||||||||||
6/30/2013 | 12.01 | 0.34 | 2.27 | 2.61 | (0.33 | ) | — | |||||||||||||||||||||
| + | Unaudited |
| * | Commencement of operations. |
| (a) | Calculated on average shares outstanding during the period. |
| (b) | Total return is calculated assuming a purchase of a share on the first day of the period and a sale of a share on the last day of each period reported. Dividends and distributions, if any, are assumed, for purposes of this calculation, to be reinvested. Total return does not reflect sales charges and includes the effect of fee waivers and reimbursements. Total return may reflect adjustments to conform to U.S. GAAP. Total return for a period of less than one year is not annualized. |
| (c) | Annualized, unless otherwise noted. |
| 126 | Semiannual Report | | December 31, 2017 | | See accompanying Notes to Financial Statements |
Table of Contents
Total Dividends and Distributions | Net Asset Value, End of Period | Total Return (b) | Net Assets, End of Period (000s) | Ratio of Expenses to Average Net Assets with Fee Waiver/ Reimbursement | Ratio of Expenses to Average Net Assets without Fee Waiver/ Reimbursement | Ratio of Net Investment Income to Average Net Assets | Portfolio Turnover Rate | |||||||||||||||||||||||||||
| $ | (4.02 | ) | $ | 15.14 | 11.30 | % | $ | 554,472 | 0.95 | %(c) | 1.10 | %(c) | 1.71 | %(c) | 25 | % | ||||||||||||||||||
| (0.96 | ) | 17.20 | 15.55 | 599,510 | 0.99 | 1.09 | 2.02 | 41 | ||||||||||||||||||||||||||
| (0.39 | ) | 15.74 | (3.25 | ) | 814,993 | 1.07 | 1.07 | 2.34 | 42 | |||||||||||||||||||||||||
| (0.33 | ) | 16.68 | (0.65 | ) | 1,363,171 | 1.05 | 1.05 | 1.92 | 44 | |||||||||||||||||||||||||
| (0.32 | ) | 17.12 | 23.50 | 1,913,130 | 1.05 | 1.05 | 1.89 | 26 | ||||||||||||||||||||||||||
| (0.31 | ) | 14.14 | 21.88 | 1,683,290 | 1.06 | 1.06 | 2.52 | 32 | ||||||||||||||||||||||||||
| $ | (3.95 | ) | $ | 15.30 | 10.91 | % | $ | 266,004 | 1.70 | %(c) | 1.85 | %(c) | 0.96 | %(c) | 25 | % | ||||||||||||||||||
| (0.83 | ) | 17.34 | 14.67 | 274,212 | 1.74 | 1.84 | 1.28 | 41 | ||||||||||||||||||||||||||
| (0.29 | ) | 15.86 | (3.97 | ) | 347,825 | 1.82 | 1.82 | 1.59 | 42 | |||||||||||||||||||||||||
| (0.21 | ) | 16.83 | (1.38 | ) | 440,554 | 1.80 | 1.80 | 1.18 | 44 | |||||||||||||||||||||||||
| (0.20 | ) | 17.27 | 22.51 | 497,725 | 1.80 | 1.80 | 1.14 | 26 | ||||||||||||||||||||||||||
| (0.15 | ) | 14.27 | 20.94 | 449,708 | 1.81 | 1.81 | 1.77 | 32 | ||||||||||||||||||||||||||
| $ | (3.99 | ) | $ | 15.09 | 11.19 | % | $ | 109,508 | 1.20 | %(c) | 1.35 | %(c) | 1.47 | %(c) | 25 | % | ||||||||||||||||||
| (0.92 | ) | 17.15 | 15.24 | 130,630 | 1.24 | 1.34 | 1.77 | 41 | ||||||||||||||||||||||||||
| (0.36 | ) | 15.70 | (3.50 | ) | 157,199 | 1.32 | 1.32 | 2.09 | 42 | |||||||||||||||||||||||||
| (0.29 | ) | 16.65 | (0.89 | ) | 226,101 | 1.30 | 1.30 | 1.68 | 44 | |||||||||||||||||||||||||
| (0.28 | ) | 17.09 | 23.16 | 272,790 | 1.30 | 1.30 | 1.65 | 26 | ||||||||||||||||||||||||||
| (0.26 | ) | 14.12 | 21.56 | 261,167 | 1.31 | 1.31 | 2.27 | 32 | ||||||||||||||||||||||||||
| $ | (4.04 | ) | $ | 15.26 | 11.49 | % | $ | 628,718 | 0.70 | %(c) | 0.85 | %(c) | 1.96 | %(c) | 25 | % | ||||||||||||||||||
| (1.00 | ) | 17.30 | 15.79 | 639,847 | 0.74 | 0.84 | 2.27 | 41 | ||||||||||||||||||||||||||
| (0.42 | ) | 15.83 | (3.03 | ) | 1,057,863 | 0.82 | 0.82 | 2.60 | 42 | |||||||||||||||||||||||||
| (0.38 | ) | 16.77 | (0.38 | ) | 1,543,701 | 0.80 | 0.80 | 2.18 | 44 | |||||||||||||||||||||||||
| (0.35 | ) | 17.21 | 23.82 | 1,446,734 | 0.80 | 0.80 | 2.15 | 26 | ||||||||||||||||||||||||||
| (0.37 | ) | 14.21 | 22.11 | 1,247,867 | 0.81 | 0.81 | 2.77 | 32 | ||||||||||||||||||||||||||
| $ | (4.05 | ) | $ | 15.25 | 11.47 | % | $ | 497,950 | 0.60 | %(c) | 0.75 | %(c) | 2.08 | %(c) | 25 | % | ||||||||||||||||||
| (1.01 | ) | 17.30 | 15.96 | 731,788 | 0.64 | 0.74 | 2.44 | 41 | ||||||||||||||||||||||||||
| (0.43 | ) | 15.82 | (2.95 | ) | 2,233,140 | 0.72 | 0.72 | 2.69 | 42 | |||||||||||||||||||||||||
| (0.40 | ) | 16.76 | (0.29 | ) | 3,402,951 | 0.70 | 0.70 | 2.27 | 44 | |||||||||||||||||||||||||
| (0.37 | ) | 17.20 | 23.96 | 4,078,876 | 0.70 | 0.70 | 2.24 | 26 | ||||||||||||||||||||||||||
| (0.39 | ) | 14.20 | 22.25 | 3,751,107 | 0.71 | 0.71 | 2.87 | 32 | ||||||||||||||||||||||||||
| $ | (4.05 | ) | $ | 15.22 | 11.54 | % | $ | 87,920 | 0.55 | %(c) | 0.70 | %(c) | 2.10 | %(c) | 25 | % | ||||||||||||||||||
| (1.03 | ) | 17.27 | 16.01 | 95,755 | 0.59 | 0.69 | 2.44 | 41 | ||||||||||||||||||||||||||
| (0.44 | ) | 15.80 | (2.90 | ) | 128,994 | 0.67 | 0.67 | 2.72 | 42 | |||||||||||||||||||||||||
| (0.42 | ) | 16.74 | (0.22 | ) | 119,483 | 0.65 | 0.65 | 2.30 | 44 | |||||||||||||||||||||||||
| (0.18 | ) | 17.19 | 11.27 | 968 | 0.65 | (c) | 0.65 | (c) | 2.13 | (c) | 26 | |||||||||||||||||||||||
| $ | (3.98 | ) | $ | 15.42 | 11.34 | % | $ | 103,900 | 0.85 | %(c) | 1.00 | %(c) | 1.91 | %(c) | 25 | % | ||||||||||||||||||
| (0.98 | ) | 17.41 | 15.68 | 345,533 | 0.89 | 0.99 | 2.11 | 41 | ||||||||||||||||||||||||||
| (0.40 | ) | 15.92 | (3.19 | ) | 387,993 | 0.97 | 0.97 | 2.44 | 42 | |||||||||||||||||||||||||
| (0.35 | ) | 16.87 | (0.55 | ) | 628,008 | 0.95 | 0.95 | 2.03 | 44 | |||||||||||||||||||||||||
| (0.33 | ) | 17.31 | 23.64 | 871,543 | 0.95 | 0.95 | 1.99 | 26 | ||||||||||||||||||||||||||
| (0.33 | ) | 14.29 | 21.96 | 864,167 | 0.96 | 0.96 | 2.61 | 32 | ||||||||||||||||||||||||||
| See accompanying Notes to Financial Statements | | December 31, 2017 | | Semiannual Report | 127 |
Table of Contents
Financial Highlights (cont’d)
For a Share Outstanding for the Period ended:
Net Asset Value, Beginning of Period | Net Investment Income (a) | Net Realized and Change in Unrealized Gain (Loss) | Total from Investment Operations | Dividends from Net Investment Income | Net Asset Value, End of Period | |||||||||||||||||||||||
| AllianzGI NFJ International Value: | ||||||||||||||||||||||||||||
| Class A | ||||||||||||||||||||||||||||
12/31/2017+ | $ | 18.13 | $ | 0.10 | $ | 1.64 | $ | 1.74 | $ | (0.10 | ) | $ | 19.77 | |||||||||||||||
6/30/2017 | 16.32 | 0.34 | 1.92 | 2.26 | (0.45 | ) | 18.13 | |||||||||||||||||||||
6/30/2016 | 21.61 | 0.37 | (5.15 | ) | (4.78 | ) | (0.51 | ) | 16.32 | |||||||||||||||||||
6/30/2015 | 24.17 | 0.41 | (2.40 | ) | (1.99 | ) | (0.57 | ) | 21.61 | |||||||||||||||||||
6/30/2014 | 20.80 | 0.46 | 3.32 | 3.78 | (0.41 | ) | 24.17 | |||||||||||||||||||||
6/30/2013 | 18.80 | 0.44 | 1.84 | 2.28 | (0.28 | ) | 20.80 | |||||||||||||||||||||
| Class C | ||||||||||||||||||||||||||||
12/31/2017+ | $ | 17.86 | $ | 0.03 | $ | 1.60 | $ | 1.63 | $ | (0.06 | ) | $ | 19.43 | |||||||||||||||
6/30/2017 | 16.09 | 0.23 | 1.86 | 2.09 | (0.32 | ) | 17.86 | |||||||||||||||||||||
6/30/2016 | 21.37 | 0.24 | (5.08 | ) | (4.84 | ) | (0.44 | ) | 16.09 | |||||||||||||||||||
6/30/2015 | 23.91 | 0.24 | (2.37 | ) | (2.13 | ) | (0.41 | ) | 21.37 | |||||||||||||||||||
6/30/2014 | 20.62 | 0.28 | 3.29 | 3.57 | (0.28 | ) | 23.91 | |||||||||||||||||||||
6/30/2013 | 18.65 | 0.27 | 1.83 | 2.10 | (0.13 | ) | 20.62 | |||||||||||||||||||||
| Class R | ||||||||||||||||||||||||||||
12/31/2017+ | $ | 18.15 | $ | 0.08 | $ | 1.63 | $ | 1.71 | $ | (0.09 | ) | $ | 19.77 | |||||||||||||||
6/30/2017 | 16.35 | 0.33 | 1.88 | 2.21 | (0.41 | ) | 18.15 | |||||||||||||||||||||
6/30/2016 | 21.66 | 0.35 | (5.17 | ) | (4.82 | ) | (0.49 | ) | 16.35 | |||||||||||||||||||
6/30/2015 | 24.23 | 0.37 | (2.41 | ) | (2.04 | ) | (0.53 | ) | 21.66 | |||||||||||||||||||
6/30/2014 | 20.87 | 0.42 | 3.31 | 3.73 | (0.37 | ) | 24.23 | |||||||||||||||||||||
6/30/2013 | 18.89 | 0.42 | 1.81 | 2.23 | (0.25 | ) | 20.87 | |||||||||||||||||||||
| Class P | ||||||||||||||||||||||||||||
12/31/2017+ | $ | 18.21 | $ | 0.13 | $ | 1.63 | $ | 1.76 | $ | (0.11 | ) | $ | 19.86 | |||||||||||||||
6/30/2017 | 16.40 | 0.40 | 1.90 | 2.30 | (0.49 | ) | 18.21 | |||||||||||||||||||||
6/30/2016 | 21.70 | 0.43 | (5.18 | ) | (4.75 | ) | (0.55 | ) | 16.40 | |||||||||||||||||||
6/30/2015 | 24.28 | 0.48 | (2.41 | ) | (1.93 | ) | (0.65 | ) | 21.70 | |||||||||||||||||||
6/30/2014 | 20.88 | 0.51 | 3.34 | 3.85 | (0.45 | ) | 24.28 | |||||||||||||||||||||
6/30/2013 | 18.90 | 0.50 | 1.85 | 2.35 | (0.37 | ) | 20.88 | |||||||||||||||||||||
| Institutional Class | ||||||||||||||||||||||||||||
12/31/2017+ | $ | 18.24 | $ | 0.14 | $ | 1.63 | $ | 1.77 | $ | (0.11 | ) | $ | 19.90 | |||||||||||||||
6/30/2017 | 16.42 | 0.37 | 1.95 | 2.32 | (0.50 | ) | 18.24 | |||||||||||||||||||||
6/30/2016 | 21.71 | 0.40 | (5.13 | ) | (4.73 | ) | (0.56 | ) | 16.42 | |||||||||||||||||||
6/30/2015 | 24.29 | 0.50 | (2.42 | ) | (1.92 | ) | (0.66 | ) | 21.71 | |||||||||||||||||||
6/30/2014 | 20.88 | 0.52 | 3.36 | 3.88 | (0.47 | ) | 24.29 | |||||||||||||||||||||
6/30/2013 | 18.92 | 0.53 | 1.83 | 2.36 | (0.40 | ) | 20.88 | |||||||||||||||||||||
| Class R6 | ||||||||||||||||||||||||||||
12/31/2017+ | $ | 18.19 | $ | 0.10 | $ | 1.68 | $ | 1.78 | $ | (0.08 | ) | $ | 19.89 | |||||||||||||||
6/30/2017 | 16.38 | 0.40 | 1.93 | 2.33 | (0.52 | ) | 18.19 | |||||||||||||||||||||
6/30/2016 | 21.68 | 0.48 | (5.20 | ) | (4.72 | ) | (0.58 | ) | 16.38 | |||||||||||||||||||
6/30/2015 | 24.28 | 0.55 | (2.46 | ) | (1.91 | ) | (0.69 | ) | 21.68 | |||||||||||||||||||
12/19/2013* - 6/30/2014 | 22.59 | 0.59 | 1.30 | 1.89 | (0.20 | ) | 24.28 | |||||||||||||||||||||
| Administrative Class | ||||||||||||||||||||||||||||
12/31/2017+ | $ | 18.19 | $ | 0.11 | $ | 1.63 | $ | 1.74 | $ | (0.10 | ) | $ | 19.83 | |||||||||||||||
6/30/2017 | 16.37 | 0.36 | 1.92 | 2.28 | (0.46 | ) | 18.19 | |||||||||||||||||||||
6/30/2016 | 21.68 | 0.42 | (5.20 | ) | (4.78 | ) | (0.53 | ) | 16.37 | |||||||||||||||||||
6/30/2015 | 24.25 | 0.45 | (2.41 | ) | (1.96 | ) | (0.61 | ) | 21.68 | |||||||||||||||||||
6/30/2014 | 20.83 | 0.46 | 3.36 | 3.82 | (0.40 | ) | 24.25 | |||||||||||||||||||||
6/30/2013 | 18.89 | 0.48 | 1.82 | 2.30 | (0.36 | ) | 20.83 | |||||||||||||||||||||
| + | Unaudited |
| * | Commencement of operations. |
| (a) | Calculated on average shares outstanding during the period. |
| (b) | Total return is calculated assuming a purchase of a share on the first day of the period and a sale of a share on the last day of each period reported. Dividends and distributions, if any, are assumed, for purposes of this calculation, to be reinvested. Total return does not reflect sales charges and includes the effect of fee waivers and reimbursements. Total return may reflect adjustments to conform to U.S. GAAP. Total return for a period of less than one year is not annualized. |
| (c) | Annualized, unless otherwise noted. |
| 128 | Semiannual Report | | December 31, 2017 | | See accompanying Notes to Financial Statements |
Table of Contents
| Total Return (b) | Net Assets, End of Period (000s) | Ratio of Expenses to Average Net Assets with Fee Waiver/ Reimbursement | Ratio of Expenses to Average Net Assets without Fee Waiver/ Reimbursement | Ratio of Net Investment Income to Average Net Assets | Portfolio Turnover Rate | |||||||||||||||||||||
| 9.61 | % | $ | 112,815 | 1.29 | %(c) | 1.37 | %(c) | 1.06 | %(c) | 29 | % | |||||||||||||||
| 13.99 | 127,642 | 1.30 | 1.35 | 2.01 | 63 | |||||||||||||||||||||
| (22.28 | ) | 258,429 | 1.29 | 1.32 | 2.04 | 50 | ||||||||||||||||||||
| (8.30 | ) | 466,262 | 1.27 | 1.30 | 1.83 | 54 | ||||||||||||||||||||
| 18.25 | 924,201 | 1.24 | 1.29 | 2.01 | 33 | |||||||||||||||||||||
| 12.08 | 855,773 | 1.22 | 1.30 | 2.10 | 19 | |||||||||||||||||||||
| 9.15 | % | $ | 47,520 | 2.04 | %(c) | 2.12 | %(c) | 0.32 | %(c) | 29 | % | |||||||||||||||
| 13.10 | 54,546 | 2.05 | 2.10 | 1.37 | 63 | |||||||||||||||||||||
| (22.81 | ) | 83,722 | 2.04 | 2.07 | 1.33 | 50 | ||||||||||||||||||||
| (8.99 | ) | 154,476 | 2.02 | 2.05 | 1.09 | 54 | ||||||||||||||||||||
| 17.36 | 203,445 | 1.99 | 2.04 | 1.23 | 33 | |||||||||||||||||||||
| 11.21 | 198,600 | 1.97 | 2.05 | 1.30 | 19 | |||||||||||||||||||||
| 9.42 | % | $ | 10,193 | 1.54 | %(c) | 1.62 | %(c) | 0.81 | %(c) | 29 | % | |||||||||||||||
| 13.68 | 11,300 | 1.55 | 1.60 | 1.91 | 63 | |||||||||||||||||||||
| (22.43 | ) | 13,915 | 1.54 | 1.57 | 1.89 | 50 | ||||||||||||||||||||
| (8.52 | ) | 22,511 | 1.52 | 1.55 | 1.63 | 54 | ||||||||||||||||||||
| 17.95 | 28,344 | 1.49 | 1.54 | 1.85 | 33 | |||||||||||||||||||||
| 11.75 | 18,306 | 1.47 | 1.55 | 1.99 | 19 | |||||||||||||||||||||
| 9.69 | % | $ | 138,682 | 1.04 | %(c) | 1.11 | %(c) | 1.31 | %(c) | 29 | % | |||||||||||||||
| 14.20 | 148,540 | 1.05 | 1.10 | 2.34 | 63 | |||||||||||||||||||||
| (22.07 | ) | 350,745 | 1.04 | 1.07 | 2.34 | 50 | ||||||||||||||||||||
| (8.04 | ) | 659,204 | 1.02 | 1.05 | 2.15 | 54 | ||||||||||||||||||||
| 18.54 | 500,111 | 0.99 | 1.04 | 2.24 | 33 | |||||||||||||||||||||
| 12.35 | 458,708 | 0.97 | 1.05 | 2.34 | 19 | |||||||||||||||||||||
| 9.76 | % | $ | 67,859 | 0.94 | %(c) | 1.02 | %(c) | 1.41 | %(c) | 29 | % | |||||||||||||||
| 14.33 | 74,272 | 0.95 | 1.00 | 2.18 | 63 | |||||||||||||||||||||
| (21.97 | ) | 309,622 | 0.94 | 0.97 | 2.17 | 50 | ||||||||||||||||||||
| (7.98 | ) | 1,095,977 | 0.92 | 0.95 | 2.21 | 54 | ||||||||||||||||||||
| 18.68 | 1,392,488 | 0.89 | 0.94 | 2.29 | 33 | |||||||||||||||||||||
| 12.49 | 1,311,993 | 0.87 | 0.95 | 2.50 | 19 | |||||||||||||||||||||
| 9.78 | % | $ | 2,786 | 0.87 | %(c) | 0.95 | %(c) | 1.00 | %(c) | 29 | % | |||||||||||||||
| 14.42 | 28,460 | 0.90 | 0.95 | 2.33 | 63 | |||||||||||||||||||||
| (21.97 | ) | 55,751 | 0.89 | 0.92 | 2.64 | 50 | ||||||||||||||||||||
| (7.94 | ) | 66,164 | 0.87 | 0.90 | 2.51 | 54 | ||||||||||||||||||||
| 8.38 | 1,441 | 0.87 | (c) | 0.89 | (c) | 4.65 | (c) | 33 | ||||||||||||||||||
| 9.61 | % | $ | 5,242 | 1.19 | %(c) | 1.26 | %(c) | 1.13 | %(c) | 29 | % | |||||||||||||||
| 14.09 | 4,973 | 1.20 | 1.25 | 2.08 | 63 | |||||||||||||||||||||
| (22.22 | ) | 14,487 | 1.19 | 1.22 | 2.31 | 50 | ||||||||||||||||||||
| (8.18 | ) | 19,020 | 1.17 | 1.20 | 2.00 | 54 | ||||||||||||||||||||
| 18.42 | 20,604 | 1.14 | 1.19 | 2.01 | 33 | |||||||||||||||||||||
| 12.18 | 40,909 | 1.12 | 1.20 | 2.26 | 19 | |||||||||||||||||||||
| See accompanying Notes to Financial Statements | | December 31, 2017 | | Semiannual Report | 129 |
Table of Contents
Financial Highlights (cont’d)
For a Share Outstanding for the Period ended:
| Net Asset Value, Beginning of Period | Net Investment Income (a) | Net Realized and Change in Unrealized Gain (Loss) | Total from Investment Operations | Dividends from Net Investment Income | Net Asset Value, End of Period | |||||||||||||||||||||||
| AllianzGI NFJ Large-Cap Value: | ||||||||||||||||||||||||||||
| Class A | ||||||||||||||||||||||||||||
12/31/2017+ | $ | 24.31 | $ | 0.25 | $ | 2.52 | $ | 2.77 | $ | (0.23 | ) | $ | 26.85 | |||||||||||||||
6/30/2017 | 20.34 | 0.36 | 3.97 | (d) | 4.33 | (0.36 | ) | 24.31 | (d) | |||||||||||||||||||
6/30/2016 | 21.44 | 0.37 | (1.09 | ) | (0.72 | ) | (0.38 | ) | 20.34 | |||||||||||||||||||
6/30/2015 | 21.13 | 0.35 | 0.30 | 0.65 | (0.34 | ) | 21.44 | |||||||||||||||||||||
6/30/2014 | 17.56 | 0.32 | 3.57 | 3.89 | (0.32 | ) | 21.13 | |||||||||||||||||||||
6/30/2013 | 14.56 | 0.32 | 3.03 | 3.35 | (0.35 | ) | 17.56 | |||||||||||||||||||||
| Class C | ||||||||||||||||||||||||||||
12/31/2017+ | $ | 24.57 | $ | 0.16 | $ | 2.55 | $ | 2.71 | $ | (0.14 | ) | $ | 27.14 | |||||||||||||||
6/30/2017 | 20.50 | 0.19 | 4.01 | (d) | 4.20 | (0.13 | ) | 24.57 | (d) | |||||||||||||||||||
6/30/2016 | 21.57 | 0.22 | (1.09 | ) | (0.87 | ) | (0.20 | ) | 20.50 | |||||||||||||||||||
6/30/2015 | 21.22 | 0.19 | 0.30 | 0.49 | (0.14 | ) | 21.57 | |||||||||||||||||||||
6/30/2014 | 17.64 | 0.18 | 3.57 | 3.75 | (0.17 | ) | 21.22 | |||||||||||||||||||||
6/30/2013 | 14.53 | 0.20 | 3.04 | 3.24 | (0.13 | ) | 17.64 | |||||||||||||||||||||
| Class R | ||||||||||||||||||||||||||||
12/31/2017+ | $ | 24.55 | $ | 0.22 | $ | 2.54 | $ | 2.76 | $ | (0.20 | ) | $ | 27.11 | |||||||||||||||
6/30/2017 | 20.51 | 0.30 | 4.02 | (d) | 4.32 | (0.28 | ) | 24.55 | (d) | |||||||||||||||||||
6/30/2016 | 21.60 | 0.32 | (1.09 | ) | (0.77 | ) | (0.32 | ) | 20.51 | |||||||||||||||||||
6/30/2015 | 21.26 | 0.30 | 0.30 | 0.60 | (0.26 | ) | 21.60 | |||||||||||||||||||||
6/30/2014 | 17.67 | 0.27 | 3.60 | 3.87 | (0.28 | ) | 21.26 | |||||||||||||||||||||
6/30/2013 | 14.63 | 0.28 | 3.04 | 3.32 | (0.28 | ) | 17.67 | |||||||||||||||||||||
| Class P | ||||||||||||||||||||||||||||
12/31/2017+ | $ | 24.53 | $ | 0.28 | $ | 2.56 | $ | 2.84 | $ | (0.27 | ) | $ | 27.10 | |||||||||||||||
6/30/2017 | 20.56 | 0.42 | 4.01 | (d) | 4.43 | (0.46 | ) | 24.53 | (d) | |||||||||||||||||||
6/30/2016 | 21.68 | 0.42 | (1.09 | ) | (0.67 | ) | (0.45 | ) | 20.56 | |||||||||||||||||||
6/30/2015 | 21.42 | 0.41 | 0.31 | 0.72 | (0.46 | ) | 21.68 | |||||||||||||||||||||
6/30/2014 | 17.80 | 0.37 | 3.62 | 3.99 | (0.37 | ) | 21.42 | |||||||||||||||||||||
6/30/2013 | 14.78 | 0.37 | 3.07 | 3.44 | (0.42 | ) | 17.80 | |||||||||||||||||||||
| Institutional Class | ||||||||||||||||||||||||||||
12/31/2017+ | $ | 24.20 | $ | 0.29 | $ | 2.52 | $ | 2.81 | $ | (0.28 | ) | $ | 26.73 | |||||||||||||||
6/30/2017 | 20.27 | 0.43 | 3.97 | (d) | 4.40 | (0.47 | ) | 24.20 | (d) | |||||||||||||||||||
6/30/2016 | 21.39 | 0.44 | (1.09 | ) | (0.65 | ) | (0.47 | ) | 20.27 | |||||||||||||||||||
6/30/2015 | 21.13 | 0.42 | 0.31 | 0.73 | (0.47 | ) | 21.39 | |||||||||||||||||||||
6/30/2014 | 17.56 | 0.39 | 3.57 | 3.96 | (0.39 | ) | 21.13 | |||||||||||||||||||||
6/30/2013 | 14.60 | 0.38 | 3.02 | 3.40 | (0.44 | ) | 17.56 | |||||||||||||||||||||
| Administrative Class | ||||||||||||||||||||||||||||
12/31/2017+ | $ | 24.64 | $ | 0.26 | $ | 2.57 | $ | 2.83 | $ | (0.25 | ) | $ | 27.22 | |||||||||||||||
6/30/2017 | 20.61 | 0.38 | 4.04 | (d) | 4.42 | (0.39 | ) | 24.64 | (d) | |||||||||||||||||||
6/30/2016 | 21.73 | 0.39 | (1.10 | ) | (0.71 | ) | (0.41 | ) | 20.61 | |||||||||||||||||||
6/30/2015 | 21.26 | 0.39 | 0.29 | 0.68 | (0.21 | ) | 21.73 | |||||||||||||||||||||
6/30/2014 | 17.67 | 0.34 | 3.59 | 3.93 | (0.34 | ) | 21.26 | |||||||||||||||||||||
6/30/2013 | 14.66 | 0.34 | 3.05 | 3.39 | (0.38 | ) | 17.67 | |||||||||||||||||||||
| + | Unaudited |
| (a) | Calculated on average shares outstanding during the period. |
| (b) | Total return is calculated assuming a purchase of a share on the first day of the period and a sale of a share on the last day of each period reported. Dividends and distributions, if any, are assumed, for purposes of this calculation, to be reinvested. Total return does not reflect sales charges and includes the effect of fee waivers and reimbursements. Total return may reflect adjustments to conform to U.S. GAAP. Total return for a period of less than one year is not annualized. |
| (c) | Annualized, unless otherwise noted. |
| (d) | Payments from securities litigation increased net realized and change in unrealized gain (loss) and net asset value per share by approximately $0.65 for Class A; $0.68 for Class C; $0.71 for Class R; $0.75 for Class P; $0.57 for Institutional Class and $0.65 for Administrative Class. The increase in total return per class was approximately 3.24% for Class A; 3.33% for Class C; 3.50% for Class R; 3.72% for Class P; 2.87% for Institutional Class and 3.21% for Administrative Class. |
| 130 | Semiannual Report | | December 31, 2017 | | See accompanying Notes to Financial Statements |
Table of Contents
| Total Return (b) | Net Assets, End of Period (000s) | Ratio of Expenses to Average Net Assets with Fee Waiver/ Reimbursement | Ratio of Expenses to Average Net Assets without Fee Waiver/ Reimbursement | Ratio of Net Investment Income to Average Net Assets | Portfolio Turnover Rate | |||||||||||||||||||||
| 11.47 | % | $ | 159,140 | 1.02 | %(c) | 1.12 | %(c) | 1.97 | %(c) | 43 | % | |||||||||||||||
| 21.42 | (d) | 151,306 | 1.02 | 1.12 | 1.60 | 67 | ||||||||||||||||||||
| (3.30 | ) | 150,436 | 1.11 | 1.11 | 1.82 | 51 | ||||||||||||||||||||
| 3.06 | 145,039 | 1.11 | 1.11 | 1.63 | 26 | |||||||||||||||||||||
| 22.30 | 172,182 | 1.11 | 1.11 | 1.65 | 22 | |||||||||||||||||||||
| 23.21 | 164,174 | 1.11 | 1.11 | 2.00 | 23 | |||||||||||||||||||||
| 11.05 | % | $ | 72,276 | 1.77 | %(c) | 1.87 | %(c) | 1.22 | %(c) | 43 | % | |||||||||||||||
| 20.52 | (d) | 70,159 | 1.77 | 1.87 | 0.86 | 67 | ||||||||||||||||||||
| (4.04 | ) | 79,758 | 1.86 | 1.86 | 1.06 | 51 | ||||||||||||||||||||
| 2.28 | 94,367 | 1.86 | 1.86 | 0.88 | 26 | |||||||||||||||||||||
| 21.35 | 103,838 | 1.86 | 1.86 | 0.90 | 22 | |||||||||||||||||||||
| 22.35 | 97,106 | 1.86 | 1.86 | 1.25 | 23 | |||||||||||||||||||||
| 11.31 | % | $ | 7,508 | 1.27 | %(c) | 1.37 | %(c) | 1.71 | %(c) | 43 | % | |||||||||||||||
| 21.14 | (d) | 6,997 | 1.27 | 1.37 | 1.35 | 67 | ||||||||||||||||||||
| (3.53 | ) | 7,200 | 1.36 | 1.36 | 1.56 | 51 | ||||||||||||||||||||
| 2.80 | 8,641 | 1.36 | 1.36 | 1.39 | 26 | |||||||||||||||||||||
| 22.00 | 11,546 | 1.36 | 1.36 | 1.40 | 22 | |||||||||||||||||||||
| 22.86 | 8,507 | 1.36 | 1.36 | 1.76 | 23 | |||||||||||||||||||||
| 11.63 | % | $ | 20,246 | 0.77 | %(c) | 0.87 | %(c) | 2.19 | %(c) | 43 | % | |||||||||||||||
| 21.71 | (d) | 18,164 | 0.77 | 0.87 | 1.85 | 67 | ||||||||||||||||||||
| (3.06 | ) | 14,197 | 0.86 | 0.86 | 2.06 | 51 | ||||||||||||||||||||
| 3.35 | 17,699 | 0.86 | 0.86 | 1.88 | 26 | |||||||||||||||||||||
| 22.57 | 12,148 | 0.86 | 0.86 | 1.90 | 22 | |||||||||||||||||||||
| 23.51 | 10,265 | 0.86 | 0.86 | 2.25 | 23 | |||||||||||||||||||||
| 11.68 | % | $ | 127,724 | 0.67 | %(c) | 0.77 | %(c) | 2.30 | %(c) | 43 | % | |||||||||||||||
| 21.88 | (d) | 114,377 | 0.67 | 0.77 | 1.95 | 67 | ||||||||||||||||||||
| (2.99 | ) | 150,909 | 0.76 | 0.76 | 2.18 | 51 | ||||||||||||||||||||
| 3.44 | 312,294 | 0.76 | 0.76 | 1.97 | 26 | |||||||||||||||||||||
| 22.73 | 431,318 | 0.76 | 0.76 | 2.00 | 22 | |||||||||||||||||||||
| 23.58 | 366,609 | 0.76 | 0.76 | 2.35 | 23 | |||||||||||||||||||||
| 11.53 | % | $ | 1,489 | 0.92 | %(c) | 1.02 | %(c) | 2.03 | %(c) | 43 | % | |||||||||||||||
| 21.58 | (d) | 1,272 | 0.92 | 1.02 | 1.71 | 67 | ||||||||||||||||||||
| (3.23 | ) | 1,345 | 1.01 | 1.01 | 1.91 | 51 | ||||||||||||||||||||
| 3.20 | 1,655 | 1.01 | 1.01 | 1.79 | 26 | |||||||||||||||||||||
| 22.38 | 6,391 | 1.01 | 1.01 | 1.76 | 22 | |||||||||||||||||||||
| 23.28 | 6,830 | 1.01 | 1.01 | 2.10 | 23 | |||||||||||||||||||||
| See accompanying Notes to Financial Statements | | December 31, 2017 | | Semiannual Report | 131 |
Table of Contents
Financial Highlights (cont’d)
For a Share Outstanding for the Period ended:
| Net Asset Value, Beginning of Period | Net Investment Income (a) | Net Realized and Change in Unrealized Gain (Loss) | Total from Investment Operations | Dividends from Net Investment Income | Distributions from Net Realized Capital Gains | |||||||||||||||||||||||
| AllianzGI NFJ Mid-Cap Value: | ||||||||||||||||||||||||||||
| Class A | ||||||||||||||||||||||||||||
12/31/2017+ | $ | 31.41 | $ | 0.23 | $ | 2.69 | $ | 2.92 | $ | (0.26 | ) | $ | (2.75 | ) | ||||||||||||||
6/30/2017 | 24.37 | 0.36 | 7.03 | (e) | 7.39 | (0.33 | ) | (0.02 | ) | |||||||||||||||||||
6/30/2016 | 25.82 | 0.45 | (0.87 | ) | (0.42 | ) | (0.32 | ) | (0.71 | ) | ||||||||||||||||||
6/30/2015 | 25.52 | 0.31 | 0.36 | 0.67 | (0.37 | ) | — | |||||||||||||||||||||
6/30/2014 | 20.33 | 0.29 | 5.10 | 5.39 | (0.20 | ) | — | |||||||||||||||||||||
6/30/2013 | 16.85 | 0.27 | 3.56 | 3.83 | (0.35 | ) | — | |||||||||||||||||||||
| Class C | ||||||||||||||||||||||||||||
12/31/2017+ | $ | 26.22 | $ | 0.09 | $ | 2.24 | $ | 2.33 | $ | (0.05 | ) | $ | (2.75 | ) | ||||||||||||||
6/30/2017 | 20.43 | 0.13 | 5.87 | (e) | 6.00 | (0.19 | ) | (0.02 | ) | |||||||||||||||||||
6/30/2016 | 21.83 | 0.23 | (0.73 | ) | (0.50 | ) | (0.19 | ) | (0.71 | ) | ||||||||||||||||||
6/30/2015 | 21.66 | 0.10 | 0.30 | 0.40 | (0.23 | ) | — | |||||||||||||||||||||
6/30/2014 | 17.30 | 0.10 | 4.34 | 4.44 | (0.08 | ) | — | |||||||||||||||||||||
6/30/2013 | 14.40 | 0.11 | 3.04 | 3.15 | (0.25 | ) | — | |||||||||||||||||||||
| Class R | ||||||||||||||||||||||||||||
12/31/2017+ | $ | 27.40 | $ | 0.17 | $ | 2.35 | $ | 2.52 | $ | (0.27 | ) | $ | (2.75 | ) | ||||||||||||||
6/30/2017 | 21.26 | 0.26 | 6.13 | (e) | 6.39 | (0.23 | ) | (0.02 | ) | |||||||||||||||||||
6/30/2016 | 22.68 | 0.34 | (0.76 | ) | (0.42 | ) | (0.29 | ) | (0.71 | ) | ||||||||||||||||||
6/30/2015 | 22.48 | 0.22 | 0.32 | 0.54 | (0.34 | ) | — | |||||||||||||||||||||
6/30/2014 | 17.95 | 0.21 | 4.49 | 4.70 | (0.17 | ) | — | |||||||||||||||||||||
6/30/2013 | 14.93 | 0.20 | 3.14 | 3.34 | (0.32 | ) | — | |||||||||||||||||||||
| Class P | ||||||||||||||||||||||||||||
12/31/2017+ | $ | 26.01 | $ | 0.24 | $ | 2.22 | $ | 2.46 | $ | (0.38 | ) | $ | (2.75 | ) | ||||||||||||||
6/30/2017 | 20.27 | 0.32 | 5.87 | (e) | 6.19 | (0.43 | ) | (0.02 | ) | |||||||||||||||||||
6/30/2016 | 21.70 | 0.43 | (0.74 | ) | (0.31 | ) | (0.41 | ) | (0.71 | ) | ||||||||||||||||||
6/30/2015 | 21.57 | 0.33 | 0.29 | 0.62 | (0.49 | ) | — | |||||||||||||||||||||
6/30/2014 | 17.23 | 0.29 | 4.32 | 4.61 | (0.27 | ) | — | |||||||||||||||||||||
6/30/2013 | 14.38 | 0.26 | 3.04 | 3.30 | (0.45 | ) | — | |||||||||||||||||||||
| Institutional Class | ||||||||||||||||||||||||||||
12/31/2017+ | $ | 33.41 | $ | 0.34 | $ | 2.84 | $ | 3.18 | $ | (0.40 | ) | $ | (2.75 | ) | ||||||||||||||
6/30/2017 | 25.88 | 0.48 | 7.47 | (e) | 7.95 | (0.40 | ) | (0.02 | ) | |||||||||||||||||||
6/30/2016 | 27.33 | 0.56 | (0.90 | ) | (0.34 | ) | (0.40 | ) | (0.71 | ) | ||||||||||||||||||
6/30/2015 | 26.99 | 0.43 | 0.37 | 0.80 | (0.46 | ) | — | |||||||||||||||||||||
6/30/2014 | 21.49 | 0.41 | 5.38 | 5.79 | (0.29 | ) | — | |||||||||||||||||||||
6/30/2013 | 17.80 | 0.36 | 3.76 | 4.12 | (0.43 | ) | — | |||||||||||||||||||||
| Class R6 | ||||||||||||||||||||||||||||
12/18/2017* - 12/31/2017+ | $ | 36.74 | $ | 0.02 | $ | (0.18 | ) | $ | (0.16 | ) | $ | (0.43 | ) | $ | (2.75 | ) | ||||||||||||
| Administrative Class | ||||||||||||||||||||||||||||
12/31/2017+ | $ | 32.35 | $ | 0.28 | $ | 2.75 | $ | 3.03 | $ | (0.34 | ) | $ | (2.75 | ) | ||||||||||||||
6/30/2017 | 25.08 | 0.40 | 7.24 | (e) | 7.64 | (0.35 | ) | (0.02 | ) | |||||||||||||||||||
6/30/2016 | 26.54 | 0.49 | (0.89 | ) | (0.40 | ) | (0.35 | ) | (0.71 | ) | ||||||||||||||||||
6/30/2015 | 26.23 | 0.35 | 0.37 | 0.72 | (0.41 | ) | — | |||||||||||||||||||||
6/30/2014 | 20.89 | 0.32 | 5.25 | 5.57 | (0.23 | ) | — | |||||||||||||||||||||
6/30/2013 | 17.30 | 0.30 | 3.65 | 3.95 | (0.36 | ) | — | |||||||||||||||||||||
| + | Unaudited |
| * | Commencement of operations. |
| (a) | Calculated on average shares outstanding during the period. |
| (b) | Total return is calculated assuming a purchase of a share on the first day of the period and a sale of a share on the last day of each period reported. Dividends and distributions, if any, are assumed, for purposes of this calculation, to be reinvested. Total return does not reflect sales charges and includes the effect of fee waivers and reimbursements. Total return may reflect adjustments to conform to U.S. GAAP. Total return for a period of less than one year is not annualized. |
| (c) | Annualized, unless otherwise noted. |
| (d) | Does not include expenses of the investment companies in which the Fund invests. |
| (e) | Payments from securities litigation increased net realized and change in unrealized gain (loss) and net asset value per share by approximately $1.41 for Class A; $1.23 for Class C; $1.13 for Class R; $1.93 for Class P; $1.19 for Institutional Class and $1.63 for Administrative Class. The increase in total return per class was approximately 5.86% for Class A; 6.08% for Class C; 5.37% for Class R; 9.70% for Class P; 4.66% for Institutional Class and 6.58% for Administrative Class. |
| 132 | Semiannual Report | | December 31, 2017 | | See accompanying Notes to Financial Statements |
Table of Contents
| Total Dividends and Distributions | Net Asset Value, End of Period | Total Return (b) | Net Assets, End of Period (000s) | Ratio of Expenses to Average Net Assets with Fee Waiver/ Reimbursement | Ratio of Expenses to Average Net Assets without Fee Waiver/ Reimbursement | Ratio of Net Income to Average | Portfolio Turnover Rate | |||||||||||||||||||||||||||
| $ | (3.01 | ) | $ | 31.32 | 9.28 | % | $ | 553,433 | 1.09 | %(c) | 1.21 | %(c) | 1.43 | %(c) | 16 | % | ||||||||||||||||||
| (0.35 | ) | 31.41 | (e) | 30.53 | (e) | 480,691 | 1.21 | (d) | 1.21 | (d) | 1.30 | (d) | 45 | |||||||||||||||||||||
| (1.03 | ) | 24.37 | (1.46 | ) | 363,166 | 1.23 | (d) | 1.23 | (d) | 1.88 | (d) | 50 | ||||||||||||||||||||||
| (0.37 | ) | 25.82 | 2.66 | 408,706 | 1.26 | (d) | 1.26 | (d) | 1.23 | (d) | 48 | |||||||||||||||||||||||
| (0.20 | ) | 25.52 | 26.63 | 459,875 | 1.26 | (d) | 1.26 | (d) | 1.28 | (d) | 40 | |||||||||||||||||||||||
| (0.35 | ) | 20.33 | 22.94 | 409,581 | 1.26 | 1.26 | 1.46 | 28 | ||||||||||||||||||||||||||
| $ | (2.80 | ) | $ | 25.75 | 8.87 | % | $ | 181,882 | 1.84 | %(c) | 1.96 | %(c) | 0.67 | %(c) | 16 | % | ||||||||||||||||||
| (0.21 | ) | 26.22 | (e) | 29.52 | (e) | 168,922 | 1.96 | (d) | 1.96 | (d) | 0.59 | (d) | 45 | |||||||||||||||||||||
| (0.90 | ) | 20.43 | (2.16 | ) | 173,304 | 1.98 | (d) | 1.98 | (d) | 1.13 | (d) | 50 | ||||||||||||||||||||||
| (0.23 | ) | 21.83 | 1.88 | 198,432 | 2.01 | (d) | 2.01 | (d) | 0.48 | (d) | 48 | |||||||||||||||||||||||
| (0.08 | ) | 21.66 | 25.72 | 217,181 | 2.01 | (d) | 2.01 | (d) | 0.53 | (d) | 40 | |||||||||||||||||||||||
| (0.25 | ) | 17.30 | 22.02 | 194,591 | 2.01 | 2.01 | 0.71 | 28 | ||||||||||||||||||||||||||
| $ | (3.02 | ) | $ | 26.90 | 9.15 | % | $ | 11,163 | 1.34 | %(c) | 1.47 | %(c) | 1.21 | %(c) | 16 | % | ||||||||||||||||||
| (0.25 | ) | 27.40 | (e) | 30.19 | (e) | 5,591 | 1.46 | (d) | 1.46 | (d) | 1.09 | (d) | 45 | |||||||||||||||||||||
| (1.00 | ) | 21.26 | (1.70 | ) | 6,969 | 1.48 | (d) | 1.48 | (d) | 1.58 | (d) | 50 | ||||||||||||||||||||||
| (0.34 | ) | 22.68 | 2.43 | 11,665 | 1.51 | (d) | 1.51 | (d) | 0.96 | (d) | 48 | |||||||||||||||||||||||
| (0.17 | ) | 22.48 | 26.29 | 14,103 | 1.51 | (d) | 1.51 | (d) | 1.01 | (d) | 40 | |||||||||||||||||||||||
| (0.32 | ) | 17.95 | 22.59 | 12,738 | 1.51 | 1.51 | 1.21 | 28 | ||||||||||||||||||||||||||
| $ | (3.13 | ) | $ | 25.34 | 9.44 | % | $ | 113,054 | 0.83 | %(c) | 0.97 | %(c) | 1.78 | %(c) | 16 | % | ||||||||||||||||||
| (0.45 | ) | 26.01 | (e) | 30.82 | (e) | 52,167 | 0.96 | (d) | 0.96 | (d) | 1.39 | (d) | 45 | |||||||||||||||||||||
| (1.12 | ) | 20.27 | (1.19 | ) | 17,268 | 0.98 | (d) | 0.98 | (d) | 2.14 | (d) | 50 | ||||||||||||||||||||||
| (0.49 | ) | 21.70 | 2.93 | 15,307 | 1.01 | (d) | 1.01 | (d) | 1.55 | (d) | 48 | |||||||||||||||||||||||
| (0.27 | ) | 21.57 | 26.92 | 6,687 | 1.01 | (d) | 1.01 | (d) | 1.50 | (d) | 40 | |||||||||||||||||||||||
| (0.45 | ) | 17.23 | 23.28 | 6,707 | 1.01 | 1.01 | 1.64 | 28 | ||||||||||||||||||||||||||
| $ | (3.15 | ) | $ | 33.44 | 9.48 | % | $ | 151,978 | 0.72 | %(c) | 0.87 | %(c) | 1.95 | %(c) | 16 | % | ||||||||||||||||||
| (0.42 | ) | 33.41 | (e) | 30.95 | (e) | 53,333 | 0.86 | (d) | 0.86 | (d) | 1.66 | (d) | 45 | |||||||||||||||||||||
| (1.11 | ) | 25.88 | (1.08 | ) | 55,877 | 0.88 | (d) | 0.88 | (d) | 2.16 | (d) | 50 | ||||||||||||||||||||||
| (0.46 | ) | 27.33 | 3.01 | 92,289 | 0.91 | (d) | 0.91 | (d) | 1.60 | (d) | 48 | |||||||||||||||||||||||
| (0.29 | ) | 26.99 | 27.09 | 89,928 | 0.91 | (d) | 0.91 | (d) | 1.66 | (d) | 40 | |||||||||||||||||||||||
| (0.43 | ) | 21.49 | 23.39 | 66,059 | 0.91 | 0.91 | 1.84 | 28 | ||||||||||||||||||||||||||
| $ | (3.18 | ) | $ | 33.40 | (0.46 | )% | $ | 224 | 0.58 | %(c) | 0.80 | %(c) | 1.63 | %(c) | 16 | % | ||||||||||||||||||
| $ | (3.09 | ) | $ | 32.29 | 9.35 | % | $ | 10,977 | 0.97 | %(c) | 1.12 | %(c) | 1.69 | %(c) | 16 | % | ||||||||||||||||||
| (0.37 | ) | 32.35 | (e) | 30.66 | (e) | 5,120 | 1.11 | (d) | 1.11 | (d) | 1.40 | (d) | 45 | |||||||||||||||||||||
| (1.06 | ) | 25.08 | (1.36 | ) | 3,792 | 1.13 | (d) | 1.13 | (d) | 1.98 | (d) | 50 | ||||||||||||||||||||||
| (0.41 | ) | 26.54 | 2.77 | 4,698 | 1.16 | (d) | 1.16 | (d) | 1.33 | (d) | 48 | |||||||||||||||||||||||
| (0.23 | ) | 26.23 | 26.77 | 4,961 | 1.16 | (d) | 1.16 | (d) | 1.36 | (d) | 40 | |||||||||||||||||||||||
| (0.36 | ) | 20.89 | 23.07 | 4,737 | 1.16 | 1.16 | 1.56 | 28 | ||||||||||||||||||||||||||
| See accompanying Notes to Financial Statements | | December 31, 2017 | | Semiannual Report | 133 |
Table of Contents
Financial Highlights (cont’d)
For a Share Outstanding for the Period ended:
| Net Asset Value, Beginning of Period | Net Investment Income (a) | Net Realized and Change in Unrealized Gain (Loss) | Total from Investment Operations | Dividends from Net Investment Income | Distributions from Net Realized Capital Gains | |||||||||||||||||||||||
| AllianzGI NFJ Small-Cap Value: | ||||||||||||||||||||||||||||
| Class A | ||||||||||||||||||||||||||||
12/31/2017+ | $ | 24.36 | $ | 0.15 | $ | 1.54 | $ | 1.69 | $ | (0.12 | ) | $ | (4.26 | ) | ||||||||||||||
6/30/2017 | 20.82 | 0.30 | 4.12 | 4.42 | (0.32 | ) | (0.56 | ) | ||||||||||||||||||||
6/30/2016 | 25.91 | 0.41 | (1.92 | ) | (1.51 | ) | (0.35 | ) | (3.23 | ) | ||||||||||||||||||
6/30/2015 | 35.24 | 0.41 | (1.95 | ) | (1.54 | ) | (0.67 | ) | (7.12 | ) | ||||||||||||||||||
6/30/2014 | 31.96 | 0.39 | 6.96 | 7.35 | (0.35 | ) | (3.72 | ) | ||||||||||||||||||||
6/30/2013 | 28.25 | 0.53 | 5.41 | 5.94 | (0.38 | ) | (1.85 | ) | ||||||||||||||||||||
| Class C | ||||||||||||||||||||||||||||
12/31/2017+ | $ | 22.14 | $ | 0.05 | $ | 1.40 | $ | 1.45 | $ | — | (f) | $ | (4.26 | ) | ||||||||||||||
6/30/2017 | 19.02 | 0.12 | 3.75 | 3.87 | (0.19 | ) | (0.56 | ) | ||||||||||||||||||||
6/30/2016 | 23.99 | 0.23 | (1.78 | ) | (1.55 | ) | (0.19 | ) | (3.23 | ) | ||||||||||||||||||
6/30/2015 | 33.27 | 0.17 | (1.85 | ) | (1.68 | ) | (0.48 | ) | (7.12 | ) | ||||||||||||||||||
6/30/2014 | 30.40 | 0.13 | 6.59 | 6.72 | (0.13 | ) | (3.72 | ) | ||||||||||||||||||||
6/30/2013 | 26.97 | 0.29 | 5.16 | 5.45 | (0.17 | ) | (1.85 | ) | ||||||||||||||||||||
| Class R | ||||||||||||||||||||||||||||
12/31/2017+ | $ | 25.64 | $ | 0.12 | $ | 1.62 | $ | 1.74 | $ | (0.04 | ) | $ | (4.26 | ) | ||||||||||||||
6/30/2017 | 21.87 | 0.25 | 4.34 | 4.59 | (0.26 | ) | (0.56 | ) | ||||||||||||||||||||
6/30/2016 | 26.99 | 0.37 | (1.99 | ) | (1.62 | ) | (0.27 | ) | (3.23 | ) | ||||||||||||||||||
6/30/2015 | 36.37 | 0.34 | (2.02 | ) | (1.68 | ) | (0.58 | ) | (7.12 | ) | ||||||||||||||||||
6/30/2014 | 32.87 | 0.31 | 7.17 | 7.48 | (0.26 | ) | (3.72 | ) | ||||||||||||||||||||
6/30/2013 | 28.96 | 0.47 | 5.56 | 6.03 | (0.27 | ) | (1.85 | ) | ||||||||||||||||||||
| Class P | ||||||||||||||||||||||||||||
12/31/2017+ | $ | 26.69 | $ | 0.20 | $ | 1.68 | $ | 1.88 | $ | (0.20 | ) | $ | (4.26 | ) | ||||||||||||||
6/30/2017 | 22.74 | 0.36 | 4.54 | 4.90 | (0.39 | ) | (0.56 | ) | ||||||||||||||||||||
6/30/2016 | 27.92 | 0.51 | (2.06 | ) | (1.55 | ) | (0.40 | ) | (3.23 | ) | ||||||||||||||||||
6/30/2015 | 37.36 | 0.51 | (2.07 | ) | (1.56 | ) | (0.76 | ) | (7.12 | ) | ||||||||||||||||||
6/30/2014 | 33.59 | 0.48 | 7.37 | 7.85 | (0.36 | ) | (3.72 | ) | ||||||||||||||||||||
6/30/2013 | 29.59 | 0.64 | 5.67 | 6.31 | (0.46 | ) | (1.85 | ) | ||||||||||||||||||||
| Institutional Class | ||||||||||||||||||||||||||||
12/31/2017+ | $ | 26.82 | $ | 0.21 | $ | 1.70 | $ | 1.91 | $ | (0.22 | ) | $ | (4.26 | ) | ||||||||||||||
6/30/2017 | 22.84 | 0.42 | 4.53 | 4.95 | (0.41 | ) | (0.56 | ) | ||||||||||||||||||||
6/30/2016 | 28.05 | 0.55 | (2.08 | ) | (1.53 | ) | (0.45 | ) | (3.23 | ) | ||||||||||||||||||
6/30/2015 | 37.46 | 0.56 | (2.07 | ) | (1.51 | ) | (0.78 | ) | (7.12 | ) | ||||||||||||||||||
6/30/2014 | 33.73 | 0.56 | 7.36 | 7.92 | (0.47 | ) | (3.72 | ) | ||||||||||||||||||||
6/30/2013 | 29.70 | 0.69 | 5.70 | 6.39 | (0.51 | ) | (1.85 | ) | ||||||||||||||||||||
| Class R6 | ||||||||||||||||||||||||||||
12/31/2017+ | $ | 26.75 | $ | 0.22 | $ | 1.69 | $ | 1.91 | $ | (0.24 | ) | $ | (4.26 | ) | ||||||||||||||
6/30/2017 | 22.79 | 0.41 | 4.55 | 4.96 | (0.44 | ) | (0.56 | ) | ||||||||||||||||||||
6/30/2016 | 28.02 | 0.56 | (2.08 | ) | (1.52 | ) | (0.48 | ) | (3.23 | ) | ||||||||||||||||||
6/30/2015 | 37.47 | 0.40 | (1.90 | ) | (1.50 | ) | (0.83 | ) | (7.12 | ) | ||||||||||||||||||
12/19/2013* - 6/30/2014 | 34.19 | 0.29 | 2.99 | 3.28 | — | — | ||||||||||||||||||||||
| Administrative Class | ||||||||||||||||||||||||||||
12/31/2017+ | $ | 24.30 | $ | 0.16 | $ | 1.54 | $ | 1.70 | $ | (0.14 | ) | $ | (4.26 | ) | ||||||||||||||
6/30/2017 | 20.78 | 0.33 | 4.11 | 4.44 | (0.36 | ) | (0.56 | ) | ||||||||||||||||||||
6/30/2016 | 25.87 | 0.45 | (1.92 | ) | (1.47 | ) | (0.39 | ) | (3.23 | ) | ||||||||||||||||||
6/30/2015 | 35.19 | 0.46 | (1.96 | ) | (1.50 | ) | (0.70 | ) | (7.12 | ) | ||||||||||||||||||
6/30/2014 | 31.92 | 0.44 | 6.95 | 7.39 | (0.40 | ) | (3.72 | ) | ||||||||||||||||||||
6/30/2013 | 28.23 | 0.58 | 5.39 | 5.97 | (0.43 | ) | (1.85 | ) | ||||||||||||||||||||
| + | Unaudited |
| * | Commencement of operations. |
| (a) | Calculated on average shares outstanding during the period. |
| (b) | Total return is calculated assuming a purchase of a share on the first day of the period and a sale of a share on the last day of each period reported. Dividends and distributions, if any, are assumed, for purposes of this calculation, to be reinvested. Total return does not reflect sales charges and includes the effect of fee waivers and reimbursements. Total return may reflect adjustments to conform to U.S. GAAP. Total return for a period of less than one year is not annualized. |
| (c) | Annualized, unless otherwise noted. |
| (d) | Does not include expenses of the investment companies in which the Fund invests. |
| (e) | Payments from Affiliates increased the end of year net asset value and total return by less than $0.01 and 0.00%, respectively. |
| (f) | Actual amount rounds to less than $(0.01) per share. |
| 134 | Semiannual Report | | December 31, 2017 | | See accompanying Notes to Financial Statements |
Table of Contents
| Total Dividends and Distributions | Net Asset Value, End of Period | Total Return (b) | Net Assets, End of Period (000s) | Ratio of Fee Waiver/ | Ratio of Expenses to Average Net Assets without Fee Waiver/ Reimbursement | Ratio of Net Investment Income to Average Net Assets | Portfolio Turnover Rate | |||||||||||||||||||||||||||
| $ | (4.38 | ) | $ | 21.67 | 6.84 | % | $ | 689,678 | 1.20 | %(c) | 1.25 | %(c) | 1.17 | %(c) | 10 | % | ||||||||||||||||||
| (0.88 | ) | 24.36 | 21.38 | 788,438 | 1.20 | (d) | 1.24 | (d) | 1.31 | (d) | 30 | |||||||||||||||||||||||
| (3.58 | ) | 20.82 | (5.31 | ) | 1,037,525 | 1.22 | (d) | 1.23 | (d) | 1.88 | (d) | 48 | ||||||||||||||||||||||
| (7.79 | ) | 25.91 | (e) | (3.77 | )(e) | 1,592,000 | 1.18 | 1.21 | 1.39 | 42 | ||||||||||||||||||||||||
| (4.07 | ) | 35.24 | 24.36 | 2,250,556 | 1.17 | 1.21 | 1.15 | 29 | ||||||||||||||||||||||||||
| (2.23 | ) | 31.96 | 22.10 | 2,139,306 | 1.18 | 1.18 | 1.77 | 31 | ||||||||||||||||||||||||||
| $ | (4.26 | ) | $ | 19.33 | 6.42 | % | $ | 122,578 | 1.95 | %(c) | 2.00 | %(c) | 0.44 | %(c) | 10 | % | ||||||||||||||||||
| (0.75 | ) | 22.14 | 20.45 | 135,225 | 1.95 | (d) | 1.99 | (d) | 0.56 | (d) | 30 | |||||||||||||||||||||||
| (3.42 | ) | 19.02 | (5.99 | ) | 175,139 | 1.97 | (d) | 1.98 | (d) | 1.14 | (d) | 48 | ||||||||||||||||||||||
| (7.60 | ) | 23.99 | (e) | (4.52 | )(e) | 259,629 | 1.93 | 1.96 | 0.63 | 42 | ||||||||||||||||||||||||
| (3.85 | ) | 33.27 | 23.43 | 342,352 | 1.92 | 1.96 | 0.40 | 29 | ||||||||||||||||||||||||||
| (2.02 | ) | 30.40 | 21.25 | 326,520 | 1.93 | 1.93 | 1.02 | 31 | ||||||||||||||||||||||||||
| $ | (4.30 | ) | $ | 23.08 | 6.67 | % | $ | 45,731 | 1.45 | %(c) | 1.50 | %(c) | 0.93 | %(c) | 10 | % | ||||||||||||||||||
| (0.82 | ) | 25.64 | 21.09 | 51,759 | 1.45 | (d) | 1.49 | (d) | 1.04 | (d) | 30 | |||||||||||||||||||||||
| (3.50 | ) | 21.87 | (5.52 | ) | 64,707 | 1.47 | (d) | 1.48 | (d) | 1.62 | (d) | 48 | ||||||||||||||||||||||
| (7.70 | ) | 26.99 | (e) | (4.06 | )(e) | 97,345 | 1.43 | 1.46 | 1.13 | 42 | ||||||||||||||||||||||||
| (3.98 | ) | 36.37 | 24.06 | 131,571 | 1.42 | 1.46 | 0.90 | 29 | ||||||||||||||||||||||||||
| (2.12 | ) | 32.87 | 21.82 | 132,478 | 1.43 | 1.43 | 1.50 | 31 | ||||||||||||||||||||||||||
| $ | (4.46 | ) | $ | 24.11 | 6.96 | % | $ | 70,007 | 0.95 | %(c) | 1.00 | %(c) | 1.45 | %(c) | 10 | % | ||||||||||||||||||
| (0.95 | ) | 26.69 | 21.66 | 72,679 | 0.95 | (d) | 0.99 | (d) | 1.42 | (d) | 30 | |||||||||||||||||||||||
| (3.63 | ) | 22.74 | (5.01 | ) | 58,556 | 0.97 | (d) | 0.98 | (d) | 2.13 | (d) | 48 | ||||||||||||||||||||||
| (7.88 | ) | 27.92 | (e) | (3.58 | )(e) | 106,077 | 0.93 | 0.96 | 1.63 | 42 | ||||||||||||||||||||||||
| (4.08 | ) | 37.36 | 24.68 | 93,195 | 0.92 | 0.96 | 1.34 | 29 | ||||||||||||||||||||||||||
| (2.31 | ) | 33.59 | 22.43 | 125,247 | 0.93 | 0.93 | 2.03 | 31 | ||||||||||||||||||||||||||
| $ | (4.48 | ) | $ | 24.25 | 7.03 | % | $ | 1,053,580 | 0.85 | %(c) | 0.90 | %(c) | 1.54 | %(c) | 10 | % | ||||||||||||||||||
| (0.97 | ) | 26.82 | 21.82 | 1,213,861 | 0.83 | (d) | 0.89 | (d) | 1.68 | (d) | 30 | |||||||||||||||||||||||
| (3.68 | ) | 22.84 | (4.93 | ) | 1,800,472 | 0.82 | (d) | 0.88 | (d) | 2.28 | (d) | 48 | ||||||||||||||||||||||
| (7.90 | ) | 28.05 | (e) | (3.40 | )(e) | 2,866,196 | 0.78 | 0.86 | 1.78 | 42 | ||||||||||||||||||||||||
| (4.19 | ) | 37.46 | 24.85 | 3,749,112 | 0.77 | 0.86 | 1.55 | 29 | ||||||||||||||||||||||||||
| (2.36 | ) | 33.73 | 22.63 | 3,537,603 | 0.78 | 0.83 | 2.17 | 31 | ||||||||||||||||||||||||||
| $ | (4.50 | ) | $ | 24.16 | 7.05 | % | $ | 430,288 | 0.80 | %(c) | 0.85 | %(c) | 1.58 | %(c) | 10 | % | ||||||||||||||||||
| (1.00 | ) | 26.75 | 21.90 | 464,279 | 0.79 | (d) | 0.84 | (d) | 1.60 | (d) | 30 | |||||||||||||||||||||||
| (3.71 | ) | 22.79 | (4.86 | ) | 371,453 | 0.77 | (d) | 0.83 | (d) | 2.39 | (d) | 48 | ||||||||||||||||||||||
| (7.95 | ) | 28.02 | (e) | (3.37 | )(e) | 235,613 | 0.73 | 0.81 | 1.36 | 42 | ||||||||||||||||||||||||
| — | 37.47 | 9.59 | 27,994 | 0.72 | (c) | 0.81 | (c) | 1.49 | (c) | 29 | ||||||||||||||||||||||||
| $ | (4.40 | ) | $ | 21.60 | 6.89 | % | $ | 289,135 | 1.10 | %(c) | 1.15 | %(c) | 1.27 | %(c) | 10 | % | ||||||||||||||||||
| (0.92 | ) | 24.30 | 21.52 | 365,241 | 1.09 | (d) | 1.14 | (d) | 1.43 | (d) | 30 | |||||||||||||||||||||||
| (3.62 | ) | 20.78 | (5.11 | ) | 494,621 | 1.07 | (d) | 1.13 | (d) | 2.03 | (d) | 48 | ||||||||||||||||||||||
| (7.82 | ) | 25.87 | (e) | (3.62 | )(e) | 811,305 | 1.03 | 1.11 | 1.54 | 42 | ||||||||||||||||||||||||
| (4.12 | ) | 35.19 | 24.55 | 1,220,261 | 1.02 | 1.11 | 1.30 | 29 | ||||||||||||||||||||||||||
| (2.28 | ) | 31.92 | 22.30 | 1,209,716 | 1.03 | 1.08 | 1.92 | 31 | ||||||||||||||||||||||||||
| See accompanying Notes to Financial Statements | | December 31, 2017 | | Semiannual Report | 135 |
Table of Contents
Financial Highlights (cont’d)
For a Share Outstanding for the Period ended:
| Net Asset Value, Beginning of Period | Net Investment Income (Loss) (a) | Net Realized and Change in Unrealized Gain (Loss) | Total from Investment Operations | Dividends from Net Investment Income | Distributions from Net Realized Capital Gains | |||||||||||||||||||||||
| AllianzGI Small-Cap Blend: | ||||||||||||||||||||||||||||
| Class A | ||||||||||||||||||||||||||||
12/31/2017+ | $ | 20.51 | $ | 0.03 | $ | 2.39 | $ | 2.42 | $ | — | $ | (2.80 | ) | |||||||||||||||
6/30/2017 | 16.71 | 0.03 | 3.79 | 3.82 | (0.01 | ) | (0.01 | ) | ||||||||||||||||||||
6/30/2016 | 18.41 | 0.03 | (1.14 | ) | (1.11 | ) | (0.09 | ) | (0.50 | ) | ||||||||||||||||||
6/30/2015 | 18.28 | 0.09 | 0.93 | 1.02 | (0.05 | ) | (0.84 | ) | ||||||||||||||||||||
7/2/2013* - 6/30/2014 | 15.00 | 0.08 | 3.38 | 3.46 | (0.06 | ) | (0.12 | ) | ||||||||||||||||||||
| Class C | ||||||||||||||||||||||||||||
12/31/2017+ | $ | 20.07 | $ | (0.05 | ) | $ | 2.34 | $ | 2.29 | $ | — | $ | (2.80 | ) | ||||||||||||||
6/30/2017 | 16.48 | (0.11 | ) | 3.71 | 3.60 | — | (e) | (0.01 | ) | |||||||||||||||||||
6/30/2016 | 18.20 | (0.10 | ) | (1.12 | ) | (1.22 | ) | — | (e) | (0.50 | ) | |||||||||||||||||
6/30/2015 | 18.16 | (0.05 | ) | 0.93 | 0.88 | — | (e) | (0.84 | ) | |||||||||||||||||||
7/2/2013* - 6/30/2014 | 15.00 | (0.07 | ) | 3.40 | 3.33 | (0.05 | ) | (0.12 | ) | |||||||||||||||||||
| Class P | ||||||||||||||||||||||||||||
12/31/2017+ | $ | 20.63 | $ | 0.06 | $ | 2.40 | $ | 2.46 | $ | — | $ | (2.80 | ) | |||||||||||||||
6/30/2017 | 16.77 | 0.07 | 3.81 | 3.88 | (0.01 | ) | (0.01 | ) | ||||||||||||||||||||
6/30/2016 | 18.49 | 0.07 | (1.15 | ) | (1.08 | ) | (0.14 | ) | (0.50 | ) | ||||||||||||||||||
6/30/2015 | 18.33 | 0.13 | 0.95 | 1.08 | (0.08 | ) | (0.84 | ) | ||||||||||||||||||||
7/2/2013* - 6/30/2014 | 15.00 | 0.10 | 3.41 | 3.51 | (0.06 | ) | (0.12 | ) | ||||||||||||||||||||
| Institutional Class | ||||||||||||||||||||||||||||
12/31/2017+ | $ | 20.73 | $ | 0.08 | $ | 2.41 | $ | 2.49 | $ | — | $ | (2.80 | ) | |||||||||||||||
6/30/2017 | 16.84 | 0.10 | 3.81 | 3.91 | (0.01 | ) | (0.01 | ) | ||||||||||||||||||||
6/30/2016 | 18.49 | 0.08 | (1.13 | ) | (1.05 | ) | (0.10 | ) | (0.50 | ) | ||||||||||||||||||
6/30/2015 | 18.34 | 0.15 | 0.94 | 1.09 | (0.10 | ) | (0.84 | ) | ||||||||||||||||||||
7/2/2013* - 6/30/2014 | 15.00 | 0.11 | 3.42 | 3.53 | (0.07 | ) | (0.12 | ) | ||||||||||||||||||||
| + | Unaudited |
| * | Commencement of operations. |
| (a) | Calculated on average shares outstanding during the period. |
| (b) | Total return is calculated assuming a purchase of a share on the first day of the period and a sale of a share on the last day of each period reported. Dividends and distributions, if any, are assumed, for purposes of this calculation, to be reinvested. Total return does not reflect sales charges and includes the effect of fee waivers and reimbursements. Total return may reflect adjustments to conform to U.S. GAAP. Total return for a period of less than one year is not annualized. |
| (c) | Annualized, unless otherwise noted. |
| (d) | Payments from Affiliates increased the end of period net asset value and total return by less than $0.01 and 0.01%, respectively. |
| (e) | Actual amount rounds to less than $(0.01) per share. |
| 136 | Semiannual Report | | December 31, 2017 | | See accompanying Notes to Financial Statements |
Table of Contents
| Total Dividends and Distributions | Net Asset Value, End of Period | Total Return (b) | Net Assets, End of Period (000s) | Ratio of Expenses to Average Net Assets with Fee Waiver/ Reimbursement | Ratio of Expenses to Average Net Assets without Fee Waiver/ Reimbursement | Ratio of Net Investment Income (Loss) to Average Net Assets | Portfolio Turnover Rate | |||||||||||||||||||||||||||
| $ | (2.80 | ) | $ | 20.13 | 11.75 | % | $ | 43,388 | 1.32 | %(c) | 1.32 | %(c) | 0.27 | %(c) | 68 | % | ||||||||||||||||||
| (0.02 | ) | 20.51 | (d) | 22.82 | (d) | 39,509 | 1.31 | 1.31 | 0.15 | 152 | ||||||||||||||||||||||||
| (0.59 | ) | 16.71 | (6.02 | ) | 32,660 | 1.27 | 1.31 | 0.17 | 139 | |||||||||||||||||||||||||
| (0.89 | ) | 18.41 | 6.01 | 38,579 | 1.24 | 1.30 | 0.47 | 148 | ||||||||||||||||||||||||||
| (0.18 | ) | 18.28 | 23.15 | 103 | 1.31 | (c) | 3.19 | (c) | 0.46 | (c) | 119 | |||||||||||||||||||||||
| $ | (2.80 | ) | $ | 19.56 | 11.36 | % | $ | 34,049 | 2.07 | %(c) | 2.07 | %(c) | (0.49 | )%(c) | 68 | % | ||||||||||||||||||
| (0.01 | ) | 20.07 | (d) | 21.82 | (d) | 32,802 | 2.06 | 2.06 | (0.60 | ) | 152 | |||||||||||||||||||||||
| (0.50 | ) | 16.48 | (6.72 | ) | 36,607 | 2.02 | 2.06 | (0.58 | ) | 139 | ||||||||||||||||||||||||
| (0.84 | ) | 18.20 | 5.27 | 44,067 | 1.99 | 2.05 | (0.29 | ) | 148 | |||||||||||||||||||||||||
| (0.17 | ) | 18.16 | 22.28 | 39 | 2.06 | (c) | 3.99 | (c) | (0.38 | )(c) | 119 | |||||||||||||||||||||||
| $ | (2.80 | ) | $ | 20.29 | 11.87 | % | $ | 4,397 | 1.07 | %(c) | 1.07 | %(c) | 0.55 | %(c) | 68 | % | ||||||||||||||||||
| (0.02 | ) | 20.63 | (d) | 23.12 | (d) | 3,425 | 1.06 | 1.06 | 0.39 | 152 | ||||||||||||||||||||||||
| (0.64 | ) | 16.77 | (5.82 | ) | 3,246 | 1.02 | 1.06 | 0.43 | 139 | |||||||||||||||||||||||||
| (0.92 | ) | 18.49 | 6.36 | 2,143 | 0.99 | 1.05 | 0.73 | 148 | ||||||||||||||||||||||||||
| (0.18 | ) | 18.33 | 23.43 | 13 | 1.06 | (c) | 3.40 | (c) | 0.56 | (c) | 119 | |||||||||||||||||||||||
| $ | (2.80 | ) | $ | 20.42 | 11.96 | % | $ | 4,655 | 0.97 | %(c) | 0.97 | %(c) | 0.68 | %(c) | 68 | % | ||||||||||||||||||
| (0.02 | ) | 20.73 | (d) | 23.22 | (d) | 3,037 | 0.96 | 0.96 | 0.52 | 152 | ||||||||||||||||||||||||
| (0.60 | ) | 16.84 | (5.69 | ) | 2,738 | 0.92 | 0.96 | 0.46 | 139 | |||||||||||||||||||||||||
| (0.94 | ) | 18.49 | 6.41 | 6,656 | 0.93 | 0.95 | 0.86 | 148 | ||||||||||||||||||||||||||
| (0.19 | ) | 18.34 | 23.56 | 6,277 | 0.96 | (c) | 3.30 | (c) | 0.66 | (c) | 119 | |||||||||||||||||||||||
| See accompanying Notes to Financial Statements | | December 31, 2017 | | Semiannual Report | 137 |
Table of Contents
Financial Highlights (cont’d)
For a Share Outstanding for the Period ended:
| Net Asset Value, Beginning of Period | Net Investment Income (Loss) (a) | Net Realized and Change in Unrealized Gain (Loss) | Total from Investment Operations | Distributions from Net Realized Capital Gains | Net Asset Value, End of Period | |||||||||||||||||||||||
| AllianzGI Technology: | ||||||||||||||||||||||||||||
| Class A | ||||||||||||||||||||||||||||
12/31/2017+ | $ | 60.82 | $ | (0.30 | ) | $ | 11.89 | $ | 11.59 | $ | (11.16 | ) | $ | 61.25 | ||||||||||||||
6/30/2017 | 48.03 | (0.17 | )(e) | 15.75 | 15.58 | (2.79 | ) | 60.82 | (e) | |||||||||||||||||||
6/30/2016 | 58.15 | (0.38 | ) | (1.07 | ) | (1.45 | ) | (8.67 | ) | 48.03 | ||||||||||||||||||
6/30/2015 | 63.49 | (0.54 | ) | 6.49 | 5.95 | (11.29 | ) | 58.15 | ||||||||||||||||||||
6/30/2014 | 50.70 | (0.54 | ) | 17.81 | 17.27 | (4.48 | ) | 63.49 | ||||||||||||||||||||
6/30/2013 | 45.66 | (0.30 | ) | 8.11 | 7.81 | (2.77 | ) | 50.70 | ||||||||||||||||||||
| Class C | ||||||||||||||||||||||||||||
12/31/2017+ | $ | 49.43 | $ | (0.44 | ) | $ | 9.67 | $ | 9.23 | $ | (11.16 | ) | $ | 47.50 | ||||||||||||||
6/30/2017 | 39.80 | (0.46 | )(e) | 12.88 | 12.42 | (2.79 | ) | 49.43 | (e) | |||||||||||||||||||
6/30/2016 | 49.98 | (0.66 | ) | (0.85 | ) | (1.51 | ) | (8.67 | ) | 39.80 | ||||||||||||||||||
6/30/2015 | 56.46 | (0.87 | ) | 5.68 | 4.81 | (11.29 | ) | 49.98 | ||||||||||||||||||||
6/30/2014 | 45.82 | (0.88 | ) | 16.00 | 15.12 | (4.48 | ) | 56.46 | ||||||||||||||||||||
6/30/2013 | 41.83 | (0.59 | ) | 7.35 | 6.76 | (2.77 | ) | 45.82 | ||||||||||||||||||||
| Class P | ||||||||||||||||||||||||||||
12/31/2017+ | $ | 66.03 | $ | (0.23 | ) | $ | 12.90 | $ | 12.67 | $ | (11.16 | ) | $ | 67.54 | ||||||||||||||
6/30/2017 | 51.80 | (0.00 | )(e)(f) | 17.02 | 17.02 | (2.79 | ) | 66.03 | (e) | |||||||||||||||||||
6/30/2016 | 61.90 | (0.27 | ) | (1.16 | ) | (1.43 | ) | (8.67 | ) | 51.80 | ||||||||||||||||||
6/30/2015 | 66.74 | (0.42 | ) | 6.87 | 6.45 | (11.29 | ) | 61.90 | ||||||||||||||||||||
6/30/2014 | 52.97 | (0.42 | ) | 18.67 | 18.25 | (4.48 | ) | 66.74 | ||||||||||||||||||||
6/30/2013 | 47.48 | (0.18 | ) | 8.44 | 8.26 | (2.77 | ) | 52.97 | ||||||||||||||||||||
| Institutional Class | ||||||||||||||||||||||||||||
12/31/2017+ | $ | 66.94 | $ | (0.19 | ) | $ | 13.07 | $ | 12.88 | $ | (11.16 | ) | $ | 68.66 | ||||||||||||||
6/30/2017 | 52.43 | 0.06 | (e) | 17.24 | 17.30 | (2.79 | ) | 66.94 | (e) | |||||||||||||||||||
6/30/2016 | 62.49 | (0.24 | ) | (1.15 | ) | (1.39 | ) | (8.67 | ) | 52.43 | ||||||||||||||||||
6/30/2015 | 67.21 | (0.36 | ) | 6.93 | 6.57 | (11.29 | ) | 62.49 | ||||||||||||||||||||
6/30/2014 | 53.27 | (0.36 | ) | 18.78 | 18.42 | (4.48 | ) | 67.21 | ||||||||||||||||||||
6/30/2013 | 47.68 | (0.14 | ) | 8.50 | 8.36 | (2.77 | ) | 53.27 | ||||||||||||||||||||
| Administrative Class | ||||||||||||||||||||||||||||
12/31/2017+ | $ | 63.76 | $ | (0.27 | ) | $ | 12.45 | $ | 12.18 | $ | (11.16 | ) | $ | 64.78 | ||||||||||||||
6/30/2017 | 50.18 | (0.23 | )(e) | 16.60 | 16.37 | (2.79 | ) | 63.76 | (e) | |||||||||||||||||||
6/30/2016 | 60.32 | (0.36 | ) | (1.11 | ) | (1.47 | ) | (8.67 | ) | 50.18 | ||||||||||||||||||
6/30/2015 | 65.40 | (0.50 | ) | 6.71 | 6.21 | (11.29 | ) | 60.32 | ||||||||||||||||||||
6/30/2014 | 52.06 | (0.50 | ) | 18.32 | 17.82 | (4.48 | ) | 65.40 | ||||||||||||||||||||
6/30/2013 | 46.77 | (0.25 | ) | 8.31 | 8.06 | (2.77 | ) | 52.06 | ||||||||||||||||||||
| + | Unaudited |
| (a) | Calculated on average shares outstanding during the period. |
| (b) | Total return is calculated assuming a purchase of a share on the first day of the period and a sale of a share on the last day of each period reported. Dividends and distributions, if any, are assumed, for purposes of this calculation, to be reinvested. Total return does not reflect sales charges and includes the effect of fee waivers and reimbursements. Total return may reflect adjustments to conform to U.S. GAAP. Total return for a period of less than one year is not annualized. |
| (c) | Annualized, unless otherwise noted. |
| (d) | Does not include expenses of the investment companies in which the Fund invests. |
| (e) | An out of period adjustment of $3,694,541, which is included in miscellaneous income, related to income earned in previous years, decreased net investment loss per share and increased net asset value per share by approximately $0.15 for Class A; $0.13 for Class C; $0.20 for Class P; $0.20 for Institutional Class and $0.04 for Administrative Class. The increase in total return and decrease in ratio of net investment loss to average net assets relating to this income for each share class was approximately 0.33% and 0.28% for Class A; 0.35% and 0.29% for Class C; 0.40% and 0.33% for Class P; 0.40% and 0.32% for Institutional Class; 0.09% and 0.08% for Administrative Class, respectively. |
| (f) | Actual amount rounds to less than $(0.01) per share. |
| 138 | Semiannual Report | | December 31, 2017 | | See accompanying Notes to Financial Statements |
Table of Contents
| Total Return (b) | Net Assets, End of Period (000s) | Ratio of Fee Waiver/ | Ratio of Expenses to Average Net Assets without Fee Waiver/ Reimbursement | Ratio of Net Investment Income (Loss) to Average Net Assets | Portfolio Turnover Rate | |||||||||||||||||||||
| 18.81 | % | $ | 485,142 | 1.42 | %(c)(d) | 1.57 | %(c)(d) | (0.87 | )%(c)(d) | 46 | % | |||||||||||||||
| 33.69 | (e) | 452,039 | 1.51 | (d) | 1.61 | (d) | (0.31 | )(d)(e) | 128 | |||||||||||||||||
| (3.24 | ) | 417,305 | 1.66 | (d) | 1.66 | (d) | (0.74 | )(d) | 171 | |||||||||||||||||
| 10.33 | 340,765 | 1.61 | 1.61 | (0.90 | ) | 165 | ||||||||||||||||||||
| 35.10 | 330,421 | 1.59 | 1.59 | (0.92 | ) | 152 | ||||||||||||||||||||
| 17.95 | 259,132 | 1.57 | 1.57 | (0.63 | ) | 161 | ||||||||||||||||||||
| 18.37 | % | $ | 123,035 | 2.17 | %(c)(d) | 2.32 | %(c)(d) | (1.62 | )%(c)(d) | 46 | % | |||||||||||||||
| 32.69 | (e) | 113,411 | 2.26 | (d) | 2.36 | (d) | (1.05 | )(d)(e) | 128 | |||||||||||||||||
| (3.95 | ) | 112,423 | 2.41 | (d) | 2.41 | (d) | (1.53 | )(d) | 171 | |||||||||||||||||
| 9.51 | 130,395 | 2.36 | 2.36 | (1.65 | ) | 165 | ||||||||||||||||||||
| 34.08 | 127,243 | 2.34 | 2.34 | (1.67 | ) | 152 | ||||||||||||||||||||
| 17.08 | 104,421 | 2.32 | 2.32 | (1.37 | ) | 161 | ||||||||||||||||||||
| 18.96 | % | $ | 68,600 | 1.17 | %(c)(d) | 1.32 | %(c)(d) | (0.62 | )%(c)(d) | 46 | % | |||||||||||||||
| 34.03 | (e) | 59,369 | 1.26 | (d) | 1.35 | (d) | (0.01 | )(d)(e) | 128 | |||||||||||||||||
| (2.99 | ) | 44,881 | 1.41 | (d) | 1.41 | (d) | (0.50 | )(d) | 171 | |||||||||||||||||
| 10.62 | 53,710 | 1.36 | 1.36 | (0.66 | ) | 165 | ||||||||||||||||||||
| 35.43 | 45,425 | 1.34 | 1.34 | (0.67 | ) | 152 | ||||||||||||||||||||
| 18.24 | 33,833 | 1.32 | 1.32 | (0.38 | ) | 161 | ||||||||||||||||||||
| 19.02 | % | $ | 635,027 | 1.07 | %(c)(d) | 1.22 | %(c)(d) | (0.52 | )%(c)(d) | 46 | % | |||||||||||||||
| 34.16 | (e) | 736,162 | 1.16 | (d) | 1.25 | (d) | 0.09 | (d)(e) | 128 | |||||||||||||||||
| (2.89 | ) | 518,761 | 1.31 | (d) | 1.31 | (d) | (0.43 | )(d) | 171 | |||||||||||||||||
| 10.71 | 617,315 | 1.26 | 1.26 | (0.55 | ) | 165 | ||||||||||||||||||||
| 35.56 | 544,216 | 1.24 | 1.24 | (0.57 | ) | 152 | ||||||||||||||||||||
| 18.38 | 399,840 | 1.22 | 1.22 | (0.28 | ) | 161 | ||||||||||||||||||||
| 18.87 | % | $ | 17,697 | 1.32 | %(c)(d) | 1.47 | %(c)(d) | (0.77 | )%(c)(d) | 46 | % | |||||||||||||||
| 33.83 | (e) | 15,062 | 1.44 | (d) | 1.52 | (d) | (0.41 | )(d)(e) | 128 | |||||||||||||||||
| (3.15 | ) | 62,913 | 1.56 | (d) | 1.56 | (d) | (0.68 | )(d) | 171 | |||||||||||||||||
| 10.44 | 72,947 | 1.51 | 1.51 | (0.80 | ) | 165 | ||||||||||||||||||||
| 35.25 | 65,147 | 1.49 | 1.49 | (0.82 | ) | 152 | ||||||||||||||||||||
| 18.06 | 49,124 | 1.47 | 1.47 | (0.53 | ) | 161 | ||||||||||||||||||||
| See accompanying Notes to Financial Statements | | December 31, 2017 | | Semiannual Report | 139 |
Table of Contents
December 31, 2017 (unaudited)
| 1. | ORGANIZATION AND SIGNIFICANT ACCOUNTING POLICIES |
Allianz Funds (the “Trust”) is registered under the Investment Company Act of 1940, as amended, as an open-end management investment company organized as a Massachusetts business trust and accordingly, follows the investment company accounting and reporting guidance of the Financial Accounting Standards Board (“FASB”) Accounting Standards Codification (“ASC”) Topic 946 Financial Services—Investment Companies. As of December 31, 2017, the Trust consisted of fourteen separate investment funds (each a “Fund” and collectively the “Funds”). Allianz Global Investors U.S. LLC (“AllianzGI U.S.” or the “Investment Adviser”) serves as the Funds’ investment adviser. On July 1, 2017, NFJ Investment Group LLC (“NFJ”), which had previously served as sub-adviser to certain Funds merged with and into AllianzGI U.S. (the “NFJ Merger”). Following the NFJ Merger, all Funds for which NFJ served as sub-adviser on June 30, 2017, no longer had a sub-adviser. The NFJ Merger did not result in any personnel changes and otherwise had no practical effect on the management of the Funds. The Investment Adviser is, and NFJ prior to its merger with and into AllianzGI U.S. on July 1, 2017, was, an indirect wholly-owned subsidiaries of Allianz Asset Management of America L.P. (“AAM”). AAM is an indirect, wholly-owned subsidiary of Allianz SE, a publicly traded European insurance and financial services company. Currently, the Trust may offer up to seven classes of shares to new and existing investors: A, C, R, P, Institutional, R6 and Administrative.
The following Funds sold and issued shares of beneficial interest to Allianz Fund Investments, Inc. (“AFI”), an indirect wholly-owned subsidiary of Allianz SE, during the six months ended December 31, 2017:
| AllianzGI NFJ Mid-Cap Value | ||||||||||||
| Class | Date | Shares | Amount | |||||||||
R6 | 12/18/17 | 272 | $ | 10,000 | ||||||||
The investment objective of AllianzGI Emerging Markets Opportunities is to seek maximum long-term capital appreciation. The investment objective of AllianzGI Focused Growth, AllianzGI Global Natural Resources, AllianzGI Global Small-Cap, AllianzGI Health Sciences, AllianzGI Mid-Cap, AllianzGI Small-Cap Blend and AllianzGI Technology is to seek long-term capital appreciation. The investment objective of AllianzGI NFJ Dividend Value, AllianzGI NFJ International Value, AllianzGI NFJ Large-Cap Value, AllianzGI NFJ Mid-Cap Value and AllianzGI NFJ Small-Cap Value is to seek long-term growth of capital and income. The investment objective of AllianzGI Income & Growth is to seek total return comprised of current income, current gains and capital appreciation. There can be no assurance that the Funds will meet their stated objectives.
The preparation of the Funds’ financial statements in accordance with accounting principles generally accepted in the United States of America (“U.S. GAAP”) requires the Funds’ management to make estimates and assumptions that affect the reported amounts and disclosures in each Fund’s financial statements. Actual results could differ from those estimates.
In the normal course of business, the Funds enter into contracts that contain a variety of representations that provide general indemnifications. The Funds’ maximum exposures under these arrangements are unknown as this would involve future claims that may be made against the Funds that have not yet occurred. However, based on experience, the risk of loss is expected to be remote.
In October 2016, the U.S. Securities and Exchange Commission (“SEC”) adopted new rules and forms, and amendments to certain current rules and forms, to modernize reporting and disclosure of information by registered investment companies. The amendments to Regulation S-X require standardized, enhanced disclosure about derivatives in investment company financial statements, and also change the rules governing the form and content of such financial statements. The amendments to Regulation S-X took effect on August 1, 2017 and the financial statements have been modified accordingly, as applicable.
The following is a summary of significant accounting policies consistently followed by the Funds:
(a) Valuation of Investments. Portfolio securities and other financial instruments for which market quotations are readily available are stated at market value. Market value is generally determined on the basis of official closing prices, last reported sales prices, or if no sales or closing prices are reported, on the basis of quotes obtained from a quotation reporting system, established market makers, or independent pricing services. Investments in mutual funds are valued at the net asset value (“NAV”) as reported on each business day. The Funds’ investments are valued daily using prices supplied by an independent pricing service or broker/dealer quotations, or by using the last sale or settlement price on the exchange that is the primary market for such securities, or the mean between the last bid and ask quotations. The market value for NASDAQ Global Market and NASDAQ Capital Market securities may also be calculated using the NASDAQ Official Closing Price instead of the last reported sales price. Independent pricing services use information provided by market makers or estimates of market values obtained from yield data relating to investments or securities with similar characteristics. Exchange traded futures are valued at the price determined by the relevant exchange.
The Board of Trustees (the “Board”) has adopted procedures for valuing portfolio securities and other financial instruments in circumstances where market quotations are not readily available (including in cases where available market quotations are deemed to be unreliable), and has delegated primary responsibility for applying the valuation methods to the Investment Adviser. The Trust’s Valuation Committee was established by the Board to oversee the implementation of the Funds’ valuation methods and to make fair value determinations on behalf of the Board, as necessary. The Investment Adviser monitors the continued appropriateness of methods applied and identifies circumstances and events that may require fair valuation. The Investment Adviser determines if adjustments should be made in light of market changes, events
| 140 | December 31, 2017 | | Semiannual Report |
Table of Contents
affecting the issuer or other factors. If the Investment Adviser determines that a valuation method may no longer be appropriate, another valuation method previously approved by the Trust’s Valuation Committee may be selected or the Trust’s Valuation Committee will be convened to consider the matter and take any appropriate action in accordance with procedures adopted by the Board. The Board shall review and ratify the appropriateness of the valuation methods and these methods may be amended or supplemented from time to time by the Trust’s Valuation Committee.
Synthetic convertible securities are valued based on quotations obtained from unaffiliated brokers who are the principal market-makers in such securities. Such valuations are derived by the brokers from proprietary models which are generally based on readily available market information including valuations of the common stock underlying the synthetic security.
Short-term debt instruments maturing in 60 days or less are valued at amortized cost, if their original term to maturity was 60 days or less, or by amortizing premiums or discounts based on their value on the 61st day prior to maturity, if the original term to maturity exceeded 60 days.
Investments initially valued in currencies other than the U.S. dollar are converted to the U.S. dollar using exchange rates obtained from pricing services. As a result, the NAV of each share class of a Fund may be affected by changes in the value of currencies in relation to the U.S. dollar. The value of securities traded in markets outside the United States or denominated in currencies other than the U.S. dollar may be affected significantly on a day that the New York Stock Exchange (“NYSE”) is closed.
The prices used by the Funds to value investments may differ from the value that would be realized if the investments were sold, and these differences could be material to the Funds’ financial statements. The NAV of each share class of a Fund is normally determined as of the close of regular trading (normally, 4:00 p.m. Eastern Time) on the NYSE on each day the NYSE is open for business. In unusual circumstances, the Board may determine the NAV as of 4:00 p.m., Eastern Time, notwithstanding an earlier, unscheduled close or halt of trading on the NYSE.
The prices of certain portfolio securities or financial instruments may be determined at a time prior to the close of regular trading on the NYSE. When fair-valuing the securities, the Funds may, among other things, consider significant events (which may be considered to include changes in the value of U.S. securities or securities indices) that occur after the close of the relevant market and before the time the NAV of each share class of a Fund is calculated. With respect to certain foreign securities, the Funds may fair-value securities using modeling tools provided by third-party vendors. The Funds have retained a statistical research service to assist in determining the fair value of foreign securities. This service utilizes statistics and programs based on historical performance of markets and other economic data to assist in making fair value estimates. Fair value estimates used by the Funds for foreign securities may differ from the value realized from the sale of those securities and the difference could be material
to the financial statements. Fair value pricing may require subjective determinations about the value of a security or other assets, and fair values used to determine the NAV of each share class of a Fund may differ from quoted or published prices, or from prices that are used by others, for the same investments. In addition, the use of fair value pricing may not always result in adjustments to the prices of securities or other assets held by a Fund.
(b) Fair Value Measurements. Fair value is defined as the price that would be received to sell an asset or paid to transfer a liability (i.e., the “exit price”) in an orderly transaction between market participants. The three levels of the fair value hierarchy are described below:
| ∎ | Level 1—quoted prices in active markets for identical investments that the Funds have the ability to access |
| ∎ | Level 2—valuations based on other significant observable inputs, which may include, but are not limited to, quoted prices for similar assets or liabilities, interest rates, yield curves, volatilities, prepayment speeds, loss severities, credit risks and default rates or other market corroborated inputs |
| ∎ | Level 3—valuations based on significant unobservable inputs (including the Investment Adviser’s or Trust’s Valuation Committee’s own assumptions and securities whose price was determined by using a single broker’s quote) |
The valuation techniques used by the Funds to measure fair value during the six months ended December 31, 2017 were intended to maximize the use of observable inputs and to minimize the use of unobservable inputs.
The Funds’ policy is to recognize transfers between levels at the end of the reporting period. An investment asset’s or liability’s level within the fair value hierarchy is based on the lowest level input, individually or in aggregate, that is significant to the fair value measurement. The objective of fair value measurement remains the same even when there is a significant decrease in the volume and level of activity for an asset or liability and regardless of the valuation techniques used. Investments categorized as Level 1 or 2 as of period end may have been transferred between Levels 1 and 2 since the prior period due to changes in the valuation method utilized in valuing the investments.
The inputs or methodology used for valuing securities are not necessarily an indication of the risk associated with investing in those securities. The following are certain inputs and techniques that the Funds generally use to evaluate how to classify each major category of assets and liabilities within Level 2 and Level 3, in accordance with U.S. GAAP.
Equity Securities (Common and Preferred Stock and Warrants)—Equity securities traded in inactive markets and certain foreign equity securities are valued using inputs which include broker-dealer quotes, recently executed transactions adjusted for changes in the benchmark index, or evaluated price quotes received from independent pricing services that take into account the integrity of the market sector and issuer, the individual characteristics of the security, and information received from broker-dealers and other market sources pertaining to the issuer or security. To the extent that these inputs are observable, the values of equity securities are categorized as Level 2. To the extent that these inputs are unobservable, the values are categorized as Level 3.
| Semiannual Report | | December 31, 2017 | 141 |
Table of Contents
Notes to Financial Statements (cont’d)
December 31, 2017 (unaudited)
Corporate Bonds & Notes—Corporate bonds & notes are generally comprised of two main categories: investment grade bonds and high yield bonds. Investment grade bonds are valued by independent pricing services using various inputs and techniques, which include broker-dealer quotations, live trading levels, recently executed transactions in securities of the issuer or comparable issuers, and option adjusted spread models that include base curve and spread curve inputs. Adjustments to individual bonds can be applied to recognize trading differences compared to other bonds issued by the same issuer. High yield bonds are valued by independent pricing services based primarily on broker-dealer quotations from relevant market makers and recently executed transactions in securities of the issuer or comparable issuers. The broker-dealer quotations received are supported by credit analysis of the issuer that takes into consideration credit quality assessments, daily trading activity, and the activity of the underlying equities, listed bonds and sector-specific trends. To the extent that these inputs are observable, the values of corporate bonds & notes are categorized as Level 2. To the extent that these inputs are unobservable, the values are categorized as Level 3.
Convertible Bonds & Notes—Convertible bonds & notes are valued by independent pricing services based on various inputs and techniques, which include broker-dealer quotations from relevant market makers and recently executed transactions in securities of the issuer or comparable issuers. The broker-dealer quotations received are supported by credit analysis of the issuer that takes into
consideration credit quality assessments, daily trading activity, and the activity of the underlying equities, listed bonds and sector-specific trends. To the extent that these inputs are observable, the values of convertible bonds & notes are categorized as Level 2. To the extent that these inputs are unobservable, the values are categorized as Level 3.
Option Contracts—Option contracts traded over-the-counter (“OTC”) and FLexible EXchange (“FLEX”) options are valued by independent pricing services based on pricing models that incorporate various inputs such as interest rates, credit spreads, currency exchange rates and volatility measurements for in-the-money, at-the-money, and out-of-the-money contracts based on a given strike price. To the extent that these inputs are observable, the values of OTC and FLEX option contracts are categorized as Level 2. To the extent that these inputs are unobservable, the values are categorized as Level 3.
Forward Foreign Currency Contracts—Forward foreign currency contracts are valued by independent pricing services using various inputs and techniques, which include broker-dealer quotations, actual trading information and foreign currency exchange rates gathered from leading market makers and foreign currency exchange trading centers throughout the world. To the extent that these inputs are observable, the values of forward foreign currency contracts are categorized as Level 2. To the extent that these inputs are unobservable, the values are categorized as Level 3.
A summary of the inputs used at December 31, 2017 in valuing each Fund’s assets and liabilities is listed below (refer to the Schedules of Investments and Notes to Schedules of Investments for more detailed information on Investments in Securities and Other Financial Instruments):
| AllianzGI Emerging Markets Opportunities: | ||||||||||||||||
Investments in Securities – Assets | Level 1– Quoted Prices | Level 2– Other Significant Observable Inputs | Level 3– Significant Unobservable Inputs | Value at 12/31/17 | ||||||||||||
Common Stock: | ||||||||||||||||
Brazil | $ | 3,500,794 | $ | 6,333,118 | — | $ | 9,833,912 | |||||||||
China | 4,448,694 | 96,158,985 | — | 100,607,679 | ||||||||||||
Hong Kong | 5,279,472 | 13,143,482 | — | 18,422,954 | ||||||||||||
India | 8,001,921 | 12,764,624 | — | 20,766,545 | ||||||||||||
Indonesia | 6,492,413 | 2,503,421 | — | 8,995,834 | ||||||||||||
Korea (Republic of) | 5,233,132 | 33,720,550 | — | 38,953,682 | ||||||||||||
Peru | 9,521,037 | — | — | 9,521,037 | ||||||||||||
Russian Federation | 10,223,674 | — | $ | 3,957,174 | 14,180,848 | |||||||||||
South Africa | 3,369,373 | 7,852,833 | — | 11,222,206 | ||||||||||||
Thailand | — | — | 7,240,986 | 7,240,986 | ||||||||||||
United States | 10,782,690 | — | — | 10,782,690 | ||||||||||||
All Other | — | 41,818,799 | — | 41,818,799 | ||||||||||||
Preferred Stock | — | — | 1,668,394 | 1,668,394 | ||||||||||||
Repurchase Agreements | — | 1,222,000 | — | 1,222,000 | ||||||||||||
| 66,853,200 | 215,517,812 | 12,866,554 | 295,237,566 | |||||||||||||
Other Financial Instruments* – Assets |
| |||||||||||||||
Foreign Exchange Contracts | — | 458 | — | 458 | ||||||||||||
Totals | $ | 66,853,200 | $ | 215,518,270 | $ | 12,866,554 | $ | 295,238,024 | ||||||||
| 142 | December 31, 2017 | | Semiannual Report |
Table of Contents
| AllianzGI Focused Growth: | ||||||||||||||||
Investments in Securities – Assets | Level 1– Quoted Prices | Level 2– Other Significant Observable Inputs | Level 3– Significant Unobservable Inputs | Value at 12/31/17 | ||||||||||||
Common Stock | $ | 1,020,917,668 | — | — | $ | 1,020,917,668 | ||||||||||
Repurchase Agreements | — | $ | 4,445,000 | — | 4,445,000 | |||||||||||
Totals | $ | 1,020,917,668 | $ | 4,445,000 | — | $ | 1,025,362,668 | |||||||||
| AllianzGI Global Natural Resources: | ||||||||||||||||
| Investments in Securities – Assets | Level 1– Quoted Prices | Level 2– Other Significant Observable Inputs | Level 3– Significant Unobservable Inputs | Value at 12/31/17 | ||||||||||||
Common Stock: | ||||||||||||||||
Australia | — | $ | 904,696 | — | $ | 904,696 | ||||||||||
France | $ | 260,748 | 1,123,303 | — | 1,384,051 | |||||||||||
Germany | — | 484,571 | — | 484,571 | ||||||||||||
Japan | — | 622,468 | — | 622,468 | ||||||||||||
Korea (Republic of) | 132,409 | 116,294 | — | 248,703 | ||||||||||||
United Kingdom | — | 3,643,468 | — | 3,643,468 | ||||||||||||
All Other | 18,163,324 | — | — | 18,163,324 | ||||||||||||
Exchange-Traded Funds | 263,362 | — | — | 263,362 | ||||||||||||
Repurchase Agreements | — | 163,000 | — | 163,000 | ||||||||||||
Totals | $ | 18,819,843 | $ | 7,057,800 | — | $ | 25,877,643 | |||||||||
| AllianzGI Global Small-Cap: | ||||||||||||||||
| Investments in Securities – Assets | Level 1– Quoted Prices | Level 2– Other Significant Observable Inputs | Level 3– Significant Unobservable Inputs | Value at 12/31/17 | ||||||||||||
Common Stock: |
| |||||||||||||||
Australia | $ | 133,702 | $ | 2,809,128 | — | $ | 2,942,830 | |||||||||
Austria | 2,000,477 | 1,287,555 | — | 3,288,032 | ||||||||||||
China | 1,245,878 | 1,842,128 | — | 3,088,006 | ||||||||||||
Denmark | — | 2,614,366 | — | 2,614,366 | ||||||||||||
Finland | — | 2,500,979 | — | 2,500,979 | ||||||||||||
France | 2,398,486 | 2,054,277 | — | 4,452,763 | ||||||||||||
Germany | — | 8,048,689 | — | 8,048,689 | ||||||||||||
Hong Kong | 386,542 | 1,854,624 | — | 2,241,166 | ||||||||||||
Indonesia | 350,349 | 411,942 | — | 762,291 | ||||||||||||
Ireland | — | 1,572,408 | — | 1,572,408 | ||||||||||||
Italy | 1,215,005 | 1,624,182 | — | 2,839,187 | ||||||||||||
Japan | 692,523 | 29,104,986 | — | 29,797,509 | ||||||||||||
Korea (Republic of) | — | 329,246 | — | 329,246 | ||||||||||||
Netherlands | — | 2,837,870 | — | 2,837,870 | ||||||||||||
Philippines | — | 277,296 | — | 277,296 | ||||||||||||
Spain | — | 1,272,790 | — | 1,272,790 | ||||||||||||
Sweden | 928,647 | 3,976,575 | — | 4,905,222 | ||||||||||||
Switzerland | 1,316,462 | 4,729,639 | — | 6,046,101 | ||||||||||||
Taiwan | 386,041 | 1,819,802 | — | 2,205,843 | ||||||||||||
United Kingdom | 4,519,992 | 7,151,168 | — | 11,671,160 | ||||||||||||
All Other | 98,950,699 | — | — | 98,950,699 | ||||||||||||
Preferred Stock | — | 1,446,126 | — | 1,446,126 | ||||||||||||
Repurchase Agreements | — | 4,396,000 | — | 4,396,000 | ||||||||||||
| 114,524,803 | 83,961,776 | — | 198,486,579 | |||||||||||||
| Semiannual Report | | December 31, 2017 | 143 |
Table of Contents
Notes to Financial Statements (cont’d)
December 31, 2017 (unaudited)
| AllianzGI Global Small-Cap (cont’d) | ||||||||||||||||
| Investments in Securities – Assets | Level 1– Quoted Prices | Level 2– Other Significant Observable Inputs | Level 3– Significant Unobservable Inputs | Value at 12/31/17 | ||||||||||||
Other Financial Instruments* – Assets |
| |||||||||||||||
Foreign Exchange Contracts | — | $ | 1,913 | — | $ | 1,913 | ||||||||||
Other Financial Instruments* – Liabilities |
| |||||||||||||||
Foreign Exchange Contracts | — | (2,174 | ) | — | (2,174 | ) | ||||||||||
Totals | $ | 114,524,803 | $ | 83,961,515 | — | $ | 198,486,318 | |||||||||
| AllianzGI Health Sciences: | ||||||||||||||||
| Investments in Securities – Assets | Level 1– Quoted Prices | Level 2– Other Significant Observable Inputs | Level 3– Significant Unobservable Inputs | Value at 12/31/17 | ||||||||||||
Common Stock: |
| |||||||||||||||
Pharmaceuticals | $ | 40,918,773 | $ | 3,665,986 | — | $ | 44,584,759 | |||||||||
All Other | 100,682,024 | — | — | 100,682,024 | ||||||||||||
Repurchase Agreements | — | 9,322,000 | — | 9,322,000 | ||||||||||||
Totals | $ | 141,600,797 | $ | 12,987,986 | — | $ | 154,588,783 | |||||||||
| AllianzGI Income & Growth: | ||||||||||||||||
| Investments in Securities – Assets | Level 1– Quoted Prices | Level 2– Other Significant Observable Inputs | Level 3– Significant Unobservable Inputs | Value at 12/31/17 | ||||||||||||
Common Stock: | ||||||||||||||||
Advertising | — | — | $ | 1,227,193 | $ | 1,227,193 | ||||||||||
Aerospace & Defense | $ | 37,197,934 | — | 343,040 | 37,540,974 | |||||||||||
Apparel & Textiles | — | — | 65,254 | 65,254 | ||||||||||||
Media | 50,907,629 | — | 2,190,490 | 53,098,119 | ||||||||||||
Oil, Gas & Consumable Fuels | 27,330,886 | — | 448,363 | 27,779,249 | ||||||||||||
Semiconductors | — | — | 10,552 | 10,552 | ||||||||||||
All Other | 1,056,996,832 | — | — | 1,056,996,832 | ||||||||||||
Corporate Bonds & Notes: | ||||||||||||||||
Internet | — | $ | 13,986,713 | 955,000 | 14,941,713 | |||||||||||
All Other | — | 1,058,491,188 | — | 1,058,491,188 | ||||||||||||
Convertible Bonds & Notes: | ||||||||||||||||
Energy-Alternate Sources | — | 14,557,297 | 571,500 | 15,128,797 | ||||||||||||
Hotels, Restaurants & Leisure | — | — | 1,007,900 | 1,007,900 | ||||||||||||
All Other | — | 858,623,482 | — | 858,623,482 | ||||||||||||
Convertible Preferred Stock: | ||||||||||||||||
Agriculture | — | 325,977 | — | 325,977 | ||||||||||||
Computers | — | 11,241,227 | — | 11,241,227 | ||||||||||||
Food & Beverage | — | 11,263,840 | — | 11,263,840 | ||||||||||||
Healthcare-Products | — | 16,999,052 | — | 16,999,052 | ||||||||||||
Pharmaceuticals | 16,467,762 | 4,633,291 | — | 21,101,053 | ||||||||||||
All Other | 115,074,116 | — | — | 115,074,116 | ||||||||||||
Preferred Stock | — | — | 19,002,080 | 19,002,080 | ||||||||||||
Equity-Linked Securities | — | — | 165,083 | 165,083 | ||||||||||||
Warrants | — | — | 18,452 | 18,452 | ||||||||||||
Repurchase Agreements | — | 90,733,000 | — | 90,733,000 | ||||||||||||
| 1,303,975,159 | 2,080,855,067 | 26,004,907 | 3,410,835,133 | |||||||||||||
Investments in Securities – Liabilities | ||||||||||||||||
Options Written: | ||||||||||||||||
Market Price | (769,940 | ) | — | — | (769,940 | ) | ||||||||||
Totals | $ | 1,303,205,219 | $ | 2,080,855,067 | $ | 26,004,907 | $ | 3,410,065,193 | ||||||||
| 144 | December 31, 2017 | | Semiannual Report |
Table of Contents
| AllianzGI Mid-Cap: | ||||||||||||||||
| Investments in Securities – Assets | Level 1– Quoted Prices | Level 2– Other Significant Observable Inputs | Level 3– Significant Unobservable Inputs | Value at 12/31/17 | ||||||||||||
Common Stock | $ | 310,209,237 | — | — | $ | 310,209,237 | ||||||||||
Repurchase Agreements | — | $ | 2,480,000 | — | 2,480,000 | |||||||||||
Totals | $ | 310,209,237 | $ | 2,480,000 | — | $ | 312,689,237 | |||||||||
| AllianzGI NFJ Dividend Value: | ||||||||||||||||
| Investments in Securities – Assets | Level 1– Quoted Prices | Level 2– Other Significant Observable Inputs | Level 3– Significant Unobservable Inputs | Value at 12/31/17 | ||||||||||||
Common Stock | $ | 2,238,173,935 | — | — | $ | 2,238,173,935 | ||||||||||
Repurchase Agreements | — | $ | 32,377,000 | — | 32,377,000 | |||||||||||
Totals | $ | 2,238,173,935 | $ | 32,377,000 | — | $ | 2,270,550,935 | |||||||||
| AllianzGI NFJ International Value: | ||||||||||||||||
| Investments in Securities—Assets | Level 1– Quoted Prices | Level 2– Other Significant Observable Inputs | Level 3– Significant Unobservable Inputs | Value at 12/31/17 | ||||||||||||
Common Stock: | ||||||||||||||||
Brazil | $ | 4,156,407 | $ | 2,078,143 | — | $ | 6,234,550 | |||||||||
Canada | 38,322,764 | — | — | 38,322,764 | ||||||||||||
Hong Kong | 3,642,652 | 5,823,968 | — | 9,466,620 | ||||||||||||
Indonesia | 4,320,513 | — | — | 4,320,513 | ||||||||||||
Ireland | 7,517,566 | — | — | 7,517,566 | ||||||||||||
Korea (Republic of) | 5,856,625 | 5,725,944 | — | 11,582,569 | ||||||||||||
Mexico | 4,147,357 | — | — | 4,147,357 | ||||||||||||
Netherlands | 3,551,830 | 15,323,409 | — | 18,875,239 | ||||||||||||
Russian Federation | 5,740,210 | — | — | 5,740,210 | ||||||||||||
Taiwan | 13,086,939 | — | — | 13,086,939 | ||||||||||||
United Kingdom | 11,293,064 | 39,835,777 | — | 51,128,841 | ||||||||||||
United States | 7,695,938 | — | — | 7,695,938 | ||||||||||||
All Other | — | 205,895,898 | — | 205,895,898 | ||||||||||||
Repurchase Agreements | — | 2,166,000 | — | 2,166,000 | ||||||||||||
Totals | $ | 109,331,865 | $ | 276,849,139 | — | $ | 386,181,004 | |||||||||
| AllianzGI NFJ Large-Cap Value: | ||||||||||||||||
| Investments in Securities – Assets | Level 1– Quoted Prices | Level 2– Other Significant Observable Inputs | Level 3– Significant Unobservable Inputs | Value at 12/31/17 | ||||||||||||
Common Stock | $ | 385,081,227 | — | — | $ | 385,081,227 | ||||||||||
Repurchase Agreements | — | $ | 3,062,000 | — | 3,062,000 | |||||||||||
Totals | $ | 385,081,227 | $ | 3,062,000 | — | $ | 388,143,227 | |||||||||
| AllianzGI NFJ Mid-Cap Value: | ||||||||||||||||
| Investments in Securities – Assets | Level 1– Quoted Prices | Level 2– Other Significant Observable Inputs | Level 3– Significant Unobservable Inputs | Value at 12/31/17 | ||||||||||||
Common Stock | $ | 979,114,830 | — | — | $ | 979,114,830 | ||||||||||
Repurchase Agreements | — | $ | 43,324,000 | — | 43,324,000 | |||||||||||
Totals | $ | 979,114,830 | $ | 43,324,000 | — | $ | 1,022,438,830 | |||||||||
| Semiannual Report | | December 31, 2017 | 145 |
Table of Contents
Notes to Financial Statements (cont’d)
December 31, 2017 (unaudited)
| AllianzGI NFJ Small-Cap Value: | ||||||||||||||||
| Investments in Securities – Assets | Level 1– Quoted Prices | Level 2– Other Significant Observable Inputs | Level 3– Significant Unobservable Inputs | Value at 12/31/17 | ||||||||||||
Common Stock: | ||||||||||||||||
Chemicals | $ | 140,596,230 | — | $ | 56 | $ | 140,596,286 | |||||||||
All Other | 2,517,673,729 | — | — | 2,517,673,729 | ||||||||||||
Repurchase Agreements | — | $ | 53,750,000 | — | 53,750,000 | |||||||||||
Totals | $ | 2,658,269,959 | $ | 53,750,000 | $ | 56 | $ | 2,712,020,015 | ||||||||
| AllianzGI Small-Cap Blend: | ||||||||||||||||
| Investments in Securities – Assets | Level 1– Quoted Prices | Level 2– Other Significant Observable Inputs | Level 3– Significant Unobservable Inputs | Value at 12/31/17 | ||||||||||||
Common Stock: | ||||||||||||||||
Equity Real Estate Investment Trusts (REITs) | $ | 3,409,053 | — | $ | 80,352 | $ | 3,489,405 | |||||||||
All Other | 80,839,498 | — | — | 80,839,498 | ||||||||||||
Totals | $ | 84,248,551 | — | $ | 80,352 | $ | 84,328,903 | |||||||||
| AllianzGI Technology: | ||||||||||||||||
| Investments in Securities – Assets | Level 1 - Quoted Prices | Level 2– Other Significant Observable Inputs | Level 3– Significant Unobservable Inputs | Value at 12/31/17 | ||||||||||||
Common Stock: |
| |||||||||||||||
Electrical Equipment | — | $ | 22,956 | — | $ | 22,956 | ||||||||||
Electronic Equipment, Instruments & Components | $ | 18,879,229 | 57,071 | — | 18,936,300 | |||||||||||
Healthcare Equipment & Supplies | — | 4,980 | — | 4,980 | ||||||||||||
Internet & Catalog Retail | 103,352,230 | 9,141 | — | 103,361,371 | ||||||||||||
Internet Software & Services | 188,414,753 | 12,844,739 | — | 201,259,492 | ||||||||||||
IT Services | 139,678,472 | 49,459 | — | 139,727,931 | ||||||||||||
Semiconductors & Semiconductor Equipment | 205,868,974 | 12,520,056 | — | 218,389,030 | ||||||||||||
Software | 379,772,210 | 27,063,898 | — | 406,836,108 | ||||||||||||
Technology Hardware, Storage & Peripherals | 78,699,657 | 13,373,303 | — | 92,072,960 | ||||||||||||
All Other | 87,936,031 | — | — | 87,936,031 | ||||||||||||
Exchange-Traded Funds | 4,712 | 1,920 | — | 6,632 | ||||||||||||
Repurchase Agreements | — | 103,339,000 | — | 103,339,000 | ||||||||||||
Options Purchased: |
| |||||||||||||||
Market Price | 14,683,910 | — | — | 14,683,910 | ||||||||||||
| 1,217,290,178 | 169,286,523 | — | 1,386,576,701 | |||||||||||||
Investments in Securities – Liabilities | ||||||||||||||||
Options Written: | ||||||||||||||||
Market Price | (7,187,120 | ) | — | — | (7,187,120 | ) | ||||||||||
Securities Sold Short, at value | (31,136,011 | ) | — | — | (31,136,011 | ) | ||||||||||
| (38,323,131 | ) | — | — | (38,323,131 | ) | |||||||||||
Totals | $ | 1,178,967,047 | $ | 169,286,523 | — | $ | 1,348,253,570 | |||||||||
| 146 | December 31, 2017 | | Semiannual Report |
Table of Contents
At December 31, 2017, the following Funds had transfers between Levels 1 and 2:
| Transfers | ||||||||
| Level 1 to Level 2 (a) | Level 2 to Level 1(b) | |||||||
AllianzGI Emerging Markets Opportunities | $ | 4,866,730 | $ | 8,186,545 | ||||
AllianzGI Global Natural Resources | 914,562 | 260,748 | ||||||
AllianzGI Global Small-Cap | 5,089,674 | 7,075,188 | ||||||
AllianzGI Health Sciences | — | 770,170 | ||||||
AllianzGI NFJ International Value | — | 7,963,165 | ||||||
| (a) | This transfer was a result of securities trading outside the U.S. whose values were not adjusted by the application of a modeling tool at June 30, 2017, which was applied on December 31, 2017. |
| (b) | This transfer was a result of securities trading outside the U.S. whose values were adjusted by the application of a modeling tool at June 30, 2017, which was not applied on December 31, 2017. |
A roll forward of fair value measurements using significant unobservable inputs (Level 3) for the six months ended December 31, 2017, was as follows:
| AllianzGI Emerging Markets Opportunities: | ||||||||||||||||||||||||||||||||||||
| Investments in Securities – Assets | Beginning Balance 6/30/17 | Purchases | Sales | Accrued Discount (Premiums) | Net Realized Gain (Loss) | Net Change in Unrealized Appreciation/ Depreciation | Transfers into Level 3 | Transfers out of Level 3 | Ending Balance 12/31/17 | |||||||||||||||||||||||||||
Common Stock: |
| |||||||||||||||||||||||||||||||||||
Russian Federation | — | $ | 3,366,263 | — | — | — | $ | 590,911 | — | — | $ | 3,957,174 | ||||||||||||||||||||||||
Thailand | $ | 1,971,931 | 4,424,625 | — | — | — | 844,430 | — | — | 7,240,986 | ||||||||||||||||||||||||||
Preferred Stock | 3,096,389 | 51,305 | (1,472,324 | ) | — | $ | (455,433 | ) | 448,457 | — | — | 1,668,394 | ||||||||||||||||||||||||
Totals | $ | 5,068,320 | $ | 7,842,193 | $ | (1,472,324 | ) | — | $ | (455,433 | ) | $ | 1,883,798 | — | — | $ | 12,866,554 | |||||||||||||||||||
| AllianzGI Income & Growth: | ||||||||||||||||||||||||||||||||||||
| Investments in Securities �� Assets | Beginning Balance 6/30/17 | Purchases | Sales | Accrued Discount (Premiums) | Net Realized Gain (Loss) | Net Change in Unrealized Appreciation/ Depreciation | Transfers into Level 3** | Transfers out of Level 3*** | Ending Balance 12/31/17 | |||||||||||||||||||||||||||
Common Stock: | ||||||||||||||||||||||||||||||||||||
Advertising | $ | 1,232,287 | — | — | — | — | $ | (5,094 | ) | — | — | $ | 1,227,193 | |||||||||||||||||||||||
Aerospace & Defense | 280,388 | — | — | — | — | 62,652 | — | — | 343,040 | |||||||||||||||||||||||||||
Apparel & Textiles | 47,375 | — | — | — | — | 17,879 | — | — | 65,254 | |||||||||||||||||||||||||||
Media | 2,149,737 | — | — | — | — | 40,753 | — | — | 2,190,490 | |||||||||||||||||||||||||||
Oil, Gas & Consumable Fuels | 197,677 | $ | 1,456,157 | — | — | — | (1,205,471 | ) | — | — | 448,363 | |||||||||||||||||||||||||
Semiconductors | 10,552 | — | — | — | — | — | — | — | 10,552 | |||||||||||||||||||||||||||
Corporate Bonds & Notes: | ||||||||||||||||||||||||||||||||||||
Internet | 955,000 | — | — | — | — | — | — | — | 955,000 | |||||||||||||||||||||||||||
Convertible Bonds & Notes: | ||||||||||||||||||||||||||||||||||||
Energy-Alternate Sources | — | — | — | — | — | — | $ | 571,500 | — | 571,500 | ||||||||||||||||||||||||||
Hotels, Restaurants & Leisure | 1,010,800 | — | — | — | — | (2,900 | ) | — | — | 1,007,900 | ||||||||||||||||||||||||||
Convertible Preferred Stock: | ||||||||||||||||||||||||||||||||||||
Agriculture | 329,703 | — | — | — | — | (3,726 | ) | — | $ | (325,977 | ) | — | ||||||||||||||||||||||||
Preferred Stock | 19,002,080 | — | — | — | — | — | — | — | 19,002,080 | |||||||||||||||||||||||||||
Equity-Linked Securities: | ||||||||||||||||||||||||||||||||||||
Coal | 98,599 | — | — | — | — | 65,837 | — | — | 164,436 | |||||||||||||||||||||||||||
Oil, Gas & Consumable Fuels | 23,402 | — | — | — | — | (22,755 | ) | — | — | 647 | ||||||||||||||||||||||||||
Warrants: | ||||||||||||||||||||||||||||||||||||
Commercial Services | 203,959 | — | — | — | — | (185,511 | ) | — | — | 18,448 | ||||||||||||||||||||||||||
Media | 4 | — | — | — | — | — | — | — | 4 | |||||||||||||||||||||||||||
Totals | $ | 25,541,563 | $ | 1,456,157 | — | — | — | $ | (1,238,336 | ) | $ | 571,500 | $ | (325,977 | ) | $ | 26,004,907 | |||||||||||||||||||
| Semiannual Report | | December 31, 2017 | 147 |
Table of Contents
Notes to Financial Statements (cont’d)
December 31, 2017 (unaudited)
| AllianzGI NFJ Small-Cap Value: | ||||||||||||||||||||||||||||||||||||
| Investments in Securities – Assets | Beginning Balance 6/30/17 | Purchases | Sales | Accrued Discount (Premiums) | Net Realized Gain (Loss) | Net Change in Unrealized | Transfers into Level 3 | Transfers out of Level 3 | Ending Balance 12/31/17 | |||||||||||||||||||||||||||
Common Stock: | ||||||||||||||||||||||||||||||||||||
Chemicals | $ | 55 | — | — | — | — | $ | 1 | — | — | $ | 56 | ||||||||||||||||||||||||
| AllianzGI Small Cap Blend: | ||||||||||||||||||||||||||||||||||||
| Investments in Securities – Assets | Beginning Balance 6/30/17 | Purchases | Sales | Accrued Discount (Premiums) | Net Realized Gain (Loss) | Net Change in Unrealized | Transfers into Level 3 | Transfers out of Level 3 | Ending Balance 12/31/17 | |||||||||||||||||||||||||||
Common Stock: | ||||||||||||||||||||||||||||||||||||
Equity Real Estate Investment Trusts (REITs) | $ | 99,662 | — | $ | (19,440 | )† | — | — | $ | 130 | — | — | $ | 80,352 | ||||||||||||||||||||||
The following table presents additional information about valuation techniques and inputs used for investments that are measured at fair value and categorized within Level 3 at December 31, 2017:
| AllianzGI Emerging Markets Opportunities: | ||||||||||||
| Investments in Securities – Assets | Ending Balance at 12/31/17 | Valuation Technique Used | Unobservable Inputs | Input Values | ||||||||
Common Stock: | ||||||||||||
Russian | $ | 3,957,174 | Market/Value of Foreign Security Traded on Foreign Exchange | Price of Non-Resident Shares on Foreign Exchange | $ | 3.91 | ||||||
Thailand | $ | 7,240,986 | Market/Value of Foreign Security Traded on Foreign Exchange | Price of Non-Resident Shares on Foreign Exchange | THB 84.94-439.19 | |||||||
Preferred Stock | $ | 1,668,394 | Market/Value of Foreign Security Traded on Foreign Exchange | Price of Non-Resident Shares on Foreign Exchange | $ | 0.49 | ||||||
| AllianzGI Income & Growth: | ||||||||||||
| Investments in Securities – Assets | Ending Balance at 12/31/17 | Valuation Technique Used | Unobservable Inputs | Input Values | ||||||||
Common Stock: | $ | 926,368 | Market and Company Comparables | Broker quotes | $ | 12.35 ($11.50-$13.75 | ) | |||||
| EV Multiples | 1.05x (0.25x-1.54x | ) | ||||||||||
| $ | 300,825 | Market and Company Comparables | EV Multiples | 1.79x (0.40x-3.94x | ) | |||||||
| Illiquidity Discount | 20 | % | ||||||||||
| $ | 343,040 | Market and Company Comparables | EV Multiples | 0.88x (0.78x-2.51x | ) | |||||||
| Illiquidity Discount | 40 | % | ||||||||||
| $ | 65,254 | Market and Company Comparables | EV Multiples | 0.69x (0.19x-1.22x | ) | |||||||
| Illiquidity Discount | 20 | % | ||||||||||
| $ | 2,190,470 | Market and Company Comparables | EV Multiples | 0.97x (0.12x-1.64x | ) | |||||||
| Illiquidity Discount | 10 | % | ||||||||||
| $ | 197,676 | Market/Last Exchange-Traded Price | Discount to Last Exchange-Traded Price | 0 | % | |||||||
| $ | 250,687 | Market and Company Comparables | Broker quotes | $ | 19.02 ($18.60-$20.40 | ) | ||||||
| EV Multiples | 3.59x (2.46x-4.24x | ) | ||||||||||
| Illiquidity Discount | 40 | % | ||||||||||
| 148 | December 31, 2017 | | Semiannual Report |
Table of Contents
| AllianzGI Income & Growth (cont’d) | ||||||||||||
| Investments in Securities – Assets | Ending Balance at 12/31/17 | Valuation Technique Used | Unobservable Inputs | Input Values | ||||||||
Corporate Bonds & Notes | $ | 955,000 | Market and Company Comparables | EV Multiples | 1.79x (0.40x-3.94x | ) | ||||||
| Illiquidity Discount | 20 | % | ||||||||||
Convertible Bonds & Notes: | $ | 571,500 | Third-Party Pricing Vendor | Current Evaluated Mean Price | $ | 2.25 ($2.00-$2.50 | ) | |||||
| $ | 1,007,900 | Third-Party Pricing Vendor | Single Broker Quote | $ | 100.79 | |||||||
Preferred Stock | $ | 19,002,080 | Market and Company Comparables | EV Multiples | 0.75x (0.28x-1.11x | ) | ||||||
| Illiquidity Discount | 20 | % | ||||||||||
Equity-Linked Securities | $ | 164,436 | Black Scholes Model | Volatility | 26 | % | ||||||
Warrants | $ | 18,448 | Black Scholes Model | Volatility | 71 | % | ||||||
| AllianzGI Small-Cap Blend: | ||||||||||||
| Investments in Securities – Assets | Ending Balance at 12/31/17 | Valuation Technique Used | Unobservable Inputs | Input Values | ||||||||
Common Stock | $ 80,352 | Net Assets Approach | Total Proceeds Change | 7.18% ($184M-$197M | ) | |||||||
| Liquidation Approach | Index Value Change | 6.95% (7.49%-7.99% | ) | |||||||||
| * | Other financial instruments are derivatives, such as futures contracts and forward foreign currency contracts, which are valued at the unrealized appreciation (depreciation) of the instrument. |
| ** | Transferred out of Level 2 into Level 3 because an evaluated mean price was not available at December 31, 2017. |
| *** | Transferred out of Level 3 into Level 2 because an evaluated mean price was available at December 31, 2017. |
| † | Reduced due to Return of Capital payments. |
THB – Thai Baht
The net change in unrealized appreciation/depreciation of Level 3 investments which the following Funds held at December 31, 2017 was:
AllianzGI Emerging Markets Opportunities | $ | 1,469,390 | ||
AllianzGI Income & Growth | (1,234,610 | ) | ||
AllianzGI NFJ Small-Cap Value | 1 | |||
AllianzGI Small-Cap Blend | 130 |
Net realized gain (loss) and net change in unrealized appreciation/depreciation are reflected on the Statements of Operations.
(c) Investment Transactions and Investment Income. Investment transactions are accounted for on the trade date. Securities purchased or sold on a when-issued or delayed-delivery basis may be settled beyond a standard settlement period for the security after the trade date. Realized gains and losses on investments are determined on an identified cost basis. Estimated tax liabilities on certain foreign securities are recorded on an accrual basis and are reflected as a component of net change in unrealized appreciation (depreciation) of investments on the Statements of Operations. Tax liabilities realized as a result of such security sales are reflected as a component of net realized gain (loss) on investments on the Statements of Operations. Interest income adjusted for the accretion of discounts and amortization of premiums is recorded on an accrual basis. Discounts or premiums on debt securities purchased are accreted or amortized, respectively, to interest income. Conversion premium is not amortized. Dividend income is recorded on the ex-dividend date, except for certain dividends from foreign securities where the ex-dividend date may have passed, and then are recorded as soon after the ex-dividend date as the Funds, using reasonable diligence, become aware of such dividends. Dividend and interest income on the
Statements of Operations are shown net of any foreign taxes withheld on income from foreign securities. Payments received from real estate investment trust securities may be comprised of dividends, realized gains and return of capital. The payment may initially be recorded as dividend income and may subsequently be reclassified as realized gains and/or return of capital upon receipt of information from the issuer. Payments considered return of capital reduce the cost basis of the respective security. Distributions, if any, in excess of the cost basis of a security are recognized as capital gains. Dividends from underlying funds are recorded as dividend income, while capital gain distributions are recorded as net capital gain distributions received from underlying funds on the Statements of Operations. Consent fees relating to corporate actions are recorded as miscellaneous income upon receipt. Expenses are recorded on an accrual basis and such expenses exclude those of the underlying funds. Expenses of the underlying funds are reflected in the net asset values of those funds.
During the year ended June 30, 2017, an out of period adjustment was recorded in AllianzGI Technology in the amount of $3,694,541 related to net income on cash balances held at a broker for securities sold short in periods prior to 2017. This amount was included in the Fund’s miscellaneous income on the Statements of Operations. The impact on the net investment income per share, total return ratio and ratio of net investment income to average net assets for each share class, is included in the Fund’s Financial Highlights. Management evaluated the impact of such amount on previously issued financial statements and concluded the impact was not material and as such reflected the amount in the 2017 financial statements.
(d) Federal Income Taxes. The Funds intend to distribute all of their taxable income and to comply with the other requirements of
| Semiannual Report | | December 31, 2017 | 149 |
Table of Contents
Notes to Financial Statements (cont’d)
December 31, 2017 (unaudited)
Subchapter M of the U.S. Internal Revenue Code of 1986, as amended, applicable to regulated investment companies. Accordingly, no provision for U.S. federal income taxes is required. The Funds may be subject to excise tax based on distributions to shareholders.
Accounting for uncertainty in income taxes establishes for all entities, including pass-through entities such as the Funds, a minimum threshold for financial statement recognition of the benefit of positions taken in filing tax returns (including whether an entity is taxable in a particular jurisdiction), and requires certain expanded tax disclosures. In accordance with provisions set forth under U.S. GAAP, the Investment Adviser has reviewed the Funds’ tax positions for all open tax years. As of December 31, 2017, the Funds have recorded no liability for net unrecognized tax benefits relating to uncertain income tax positions they have taken. The Funds’ federal income tax returns for the prior three years, as applicable, remain subject to examination by the Internal Revenue Service.
(e) Dividends and Distributions to Shareholders. Dividends from net investment income, if any, of each Fund (except AllianzGI Income & Growth, AllianzGI NFJ Dividend Value, AllianzGI NFJ International Value and AllianzGI NFJ Large-Cap Value), are declared and distributed to shareholders annually. Dividends from net investment income and/or distributions from short-term capital gains for AllianzGI Income & Growth, if any, are declared and distributed monthly. Dividends from net investment income, if any, for AllianzGI NFJ Dividend Value, AllianzGI NFJ International Value and AllianzGI NFJ Large-Cap Value are declared and distributed quarterly. Net realized capital gains, if any, earned by each Fund, will be distributed annually. The Funds record dividends and distributions to their respective shareholders on the ex-dividend date. The amount of dividends from net investment income and distributions from net realized capital gains is determined in accordance with federal income tax regulations, which may differ from U.S. GAAP. These “book-tax” differences are considered either temporary or permanent in nature. To the extent these differences are permanent in nature, such amounts are reclassified within the capital accounts based on their federal income tax treatment. Temporary differences do not require reclassification. To the extent dividends and/or distributions exceed current and accumulated earnings and profits for federal income tax purposes, they are reported as dividends and/or distributions to shareholders from return of capital.
(f) Multi-Class Operations. Each class offered by the Funds has equal rights as to assets and voting privileges (except that shareholders of a class have exclusive voting rights regarding any matter relating solely to that class of shares). Income, non-class specific expenses, and realized and unrealized capital gains and losses of each Fund are allocated daily to each class of shares based on the relative net assets of each class. Class specific expenses, where applicable, include administration, distribution and servicing fees.
(g) Foreign Currency Translation. The Funds’ accounting records are maintained in U.S. dollars as follows: (1) the foreign currency market values of investments and other assets and liabilities denominated in foreign currencies are translated at the prevailing exchange rate at the
end of the period; and (2) purchases and sales, income and expenses are translated at the prevailing exchange rate on the respective dates of such transactions. The resulting net foreign currency gain (loss) is included in the Funds’ Statements of Operations.
The Funds do not generally isolate that portion of the results of operations arising as a result of changes in foreign currency exchange rates from the fluctuations arising from changes in the market prices of securities. Accordingly, such foreign currency gain (loss) is included in net realized and unrealized gain (loss) on investments. However, the Funds do isolate the effect of fluctuations in foreign currency exchange rates when determining the gain (loss) upon the sale or maturity of foreign currency denominated debt obligations pursuant to U.S. federal income tax regulations; such amount is categorized as foreign currency gain (loss) for both financial reporting and income tax reporting purposes.
(h) Repurchase Agreements. The Funds are parties to Master Repurchase Agreements (“Master Repo Agreements”) with select counterparties. The Master Repo Agreements include provisions for initiation of repurchase transactions, income payments, events of default, and maintenance of collateral.
The Funds enter into transactions, under the Master Repo Agreements, with their custodian bank or securities brokerage firms whereby they purchase securities under agreements (i.e., repurchase agreements) to resell such securities at an agreed upon price and date. The Funds, through their custodian, take possession of securities collateralizing the repurchase agreement. Such agreements are carried at the contract amount in the financial statements, which is considered to represent fair value. The collateral that is pledged (i.e. the securities received by the Funds), which consists primarily of U.S. government obligations and asset-backed securities, is held by the custodian bank for the benefit of the Funds until maturity of the repurchase agreement. Provisions of the repurchase agreements and the procedures adopted by the Funds require that the market value of the collateral, including accrued interest thereon, be sufficient in the event of default by the counterparty. If the counterparty defaults under the Master Repo Agreements and the value of the collateral declines or if the counterparty enters an insolvency proceeding, realization of the collateral by the Funds may be delayed or limited. The gross values are included in the Funds’ Schedules of Investments. As of December 31, 2017, the value of the related collateral exceeded the value of the repurchase agreements.
(i) Securities Sold Short. Certain Funds engage in short sales for investment and risk management purposes. Short sales are transactions in which a Fund sells a security or other instrument (such as an option, forward, future or other derivative contract) it does not own. When a Fund engages in a short sale, it must borrow the security sold short and deliver it to the counterparty. The Funds will ordinarily have to pay a fee or premium to borrow a security and be obligated to repay the lender of the security any dividend or interest that accrues on the security during the period of the loan. Until a short position is closed out, the net proceeds of the short sale will be retained by the lending broker to the extent necessary to meet margin requirements,
| 150 | December 31, 2017 | | Semiannual Report |
Table of Contents
together with any additional assets the broker requires as collateral. This collateral earns interest and the interest is used to pay each lender a fee for borrowed securities, to compensate the broker for its services, and to provide a rebate to the borrower (the Fund) for posting the collateral. The net proceeds from these transactions are shown as miscellaneous income or miscellaneous expense on the Statement of Operations. A Fund is also required to designate, on its books or the books of its custodian, liquid assets (less any additional collateral held by the broker) to cover the short sale obligation, marked to market daily. Short sales expose the Funds to the risk that they will be required to cover the short position at a time when the security or other asset has appreciated in value, thus resulting in losses to the applicable Fund. A short sale is “against the box” if a Fund holds in its portfolio or has the right to acquire the security sold short at no additional cost. The Funds will be subject to additional risks to the extent that they engage in short sales that are not “against the box.” A Fund’s loss on a short sale could theoretically be unlimited in cases where the Fund is unable, for whatever reason, to close out its short position.
(j) Warrants. The Funds may receive warrants. Warrants are securities that are usually issued together with a debt security or preferred stock and that give the holder the right to buy a proportionate amount of common stock at a specified price. Warrants may be freely transferable and are often traded on major exchanges. Warrants normally have a life that is measured in years and entitle the holder to buy common stock of a company at a price that is usually higher than the market price at the time the warrant is issued. Warrants may entail greater risks than certain other types of investments. Generally, warrants do not carry the right to receive dividends or exercise voting rights with respect to the underlying securities, and they do not represent any rights in the assets of the issuer. In addition, their value does not necessarily change with the value of the underlying securities, and they cease to have value if they are not exercised on or before their expiration date. If the market price of the underlying stock does not exceed the exercise price during the life of the warrant, the warrant will expire worthless. Warrants may increase the potential profit or loss to be realized from the investment as compared with investing the same amount in the underlying securities. Similarly, the percentage increase or decrease in the value of an equity security warrant may be greater than the percentage increase or decrease in the value of the underlying common stock. Warrants may relate to the purchase of equity or debt securities. Debt obligations with warrants attached to purchase equity securities have many characteristics of convertible securities and their prices may, to some degree, reflect the performance of the underlying stock. Debt obligations also may be issued with warrants attached to purchase additional debt securities at the same coupon rate. A decline in interest rates would permit a Fund to sell such warrants at a profit. If interest rates rise, these warrants would generally expire with no value.
(k) Rights. The Funds may receive rights. A right is a privilege granted to existing shareholders of a corporation to subscribe for shares of a new issue of common stock before it is issued. Rights normally have a short life, usually two to four weeks, are freely transferable and entitle the holder to buy the new common stock at a
lower price than the public offering price. Rights may entail greater risks than certain other types of investments. Generally, rights do not carry the right to receive dividends or exercise voting rights with respect to the underlying securities, and they do not represent any rights in the assets of the issuer. In addition, their value does not necessarily change with the value of the underlying securities, and they cease to have value if they are not exercised on or before their expiration date. If the market price of the underlying stock does not exceed the exercise price during the life of the right, the right will expire worthless. Rights may increase the potential profit or loss to be realized from the investment as compared with investing the same amount in the underlying securities.
(l) Senior Loans. The Funds may purchase assignments of, and participations in, Senior Loans originated, negotiated and structured by a U.S. or foreign commercial bank, insurance company, finance company or other financial institution for a lending syndicate of financial institutions (the “Lender”). When purchasing an assignment, the Funds succeed to all the rights and obligations under the loan agreement with the same rights and obligations as the assigning Lender. Assignments may, however, be arranged through private negotiations between potential assignees and potential assignors, and the rights and obligations acquired by the purchaser of an assignment may differ from, and be more limited than, those held by the assigning Lender. The Funds may also enter into lending arrangements involving unfunded loan commitments, which are contractual obligations for future funding. Unfunded loan commitments may include revolving credit facilities, which may obligate the Funds to supply additional cash to the borrower on demand. Unfunded loan commitments represent a future obligation in full, even though a percentage of the principal amounts may never be utilized by the borrower.
Certain Funds may purchase the securities of distressed companies (including assignments or direct investments), including companies engaged in restructurings or bankruptcy proceedings. Investments in distressed companies may include senior obligations of an issuer issued in connection with a restructuring under Chapter 11 of the U.S. Bankruptcy Code (commonly known as “debtor-in-possession” or “DIP” financings). Debtor-in-possession financings generally allow the issuer to continue its operations while reorganizing. Such financings constitute senior liens on unencumbered collateral (i.e., collateral not subject to other creditors’ claims). There is risk that the issuer under a debtor-in-possession financing will not emerge from Chapter 11 and be forced to liquidate its assets under Chapter 7 of the U.S. Bankruptcy Code. In the event of liquidation, the Funds’ only recourse would be against the collateral securing the debtor-in-possession financing.
(m) Exchange-Traded Funds. Certain Funds may invest in exchange-traded funds (“ETFs”), which typically are index-based investment companies that hold substantially all of their assets in securities representing their specific index, but may also be actively-managed investment companies. Shares of ETFs trade throughout the day on an exchange and represent an investment in a portfolio of securities and other assets. As a shareholder of another investment company, the Funds would bear their pro rata portion of the other investment company’s
| Semiannual Report | | December 31, 2017 | 151 |
Table of Contents
Notes to Financial Statements (cont’d)
December 31, 2017 (unaudited)
expenses, including advisory fees, in addition to the expenses the Funds bear directly in connection with their own operations.
(n) Convertible Securities. Certain Funds’ may invest a portion of their assets in convertible securities. Although convertible securities derive part of their value from that of the securities into which they are convertible, they are not considered derivative financial instruments. However, certain of the Funds’ investments in convertible securities include features which render them sensitive to price changes in their underlying securities. The value of structured/synthetic convertible securities can be affected by interest rate changes and credit risks of the issuer. Such securities may be structured in ways that limit their potential for capital appreciation and the entire value of the security may be at risk of loss depending on the performance of the underlying equity security. Consequently, the Funds are exposed to greater downside risk than traditional convertible securities, but typically still less than that of the underlying stock.
(o) Payment In-Kind Securities. The Funds may invest in payment in-kind securities, which are debt or preferred stock securities that require or permit payment of interest in the form of additional securities. Payment in-kind securities allow the issuer to avoid or delay the need to generate cash to meet current interest payments and, as a result, may involve greater risk than securities that pay interest currently or in cash.
(p) Loan Interest Expense. Loan interest expense relates to the amounts borrowed under the credit facility (See Note 12). Loan interest expense is recorded as it is incurred.
(q) Contingent Value Rights. A Fund may invest in contingent value rights (“CVRs”). A CVR gives the holder the right to receive an amount (which may be a fixed amount or determined by a formula) in the event that a specified corporate action, business milestone, or other trigger occurs (or does not occur) which is often subject to an expiration date. CVRs often are awarded to shareholders in the context of a corporate acquisition or major restructuring. For example, shareholders of an acquired company may receive a CVR that enables them to receive additional shares of the acquiring company in the event that the acquiring company’s share price falls below a certain level by a specified date. Risks associated with the use of CVRs are generally similar to risks associated with the use of options, such as the risk that the required trigger does not (or does) occur prior to a CVR’s expiration, causing the CVR to expire with no value. CVRs also present illiquidity risk, as they may not be registered securities or may otherwise be non-transferable or difficult to transfer, as well as counterparty risk and credit risk. Further, because CVRs are valued based on the likelihood of the occurrence of a trigger, valuation often requires modeling and judgment, which increases the risk of mispricing or improper valuation.
(r) Restricted Securities. The Funds are permitted to invest in securities that are subject to legal or contractual restrictions on resale. These securities generally may be resold in transactions exempt from registration or to the public if the securities are registered. Disposal of these securities may involve time-consuming negotiations and expenses, and prompt sale at an acceptable price may be difficult.
| 2. | PRINCIPAL RISKS |
In the normal course of business, the Funds trade financial instruments and enter into financial transactions where risk of potential loss exists due to, among other things, changes in the market (market risk) or failure of the other party to a transaction to perform (counterparty risk). The Funds are also exposed to other risks such as, but not limited to, interest rate, foreign currency, credit and leverage risks.
Interest rate risk is the risk that fixed income securities’ valuations will change because of changes in interest rates. During periods of rising nominal interest rates, the values of fixed income instruments are generally expected to decline. Conversely, during periods of declining nominal interest rates, the values of fixed income instruments are generally expected to rise. A nominal interest rate can be described as the sum of a real interest rate and an expected inflation rate. Fixed income securities with longer durations tend to be more sensitive to changes in interest rates, usually making them more volatile than securities with shorter durations. Duration is used primarily as a measure of the sensitivity of a fixed income security’s market price to interest rate (i.e., yield) movements. Interest rate changes can be sudden and unpredictable, and the Funds may lose money as a result of movements in interest rates. High-yield or junk bonds are subject to greater levels of credit and liquidity risk, may be speculative and may decline in value due to increase in interest rates or an issuer’s deterioration or default. The Funds may not be able to hedge against changes in interest rates or may choose not to do so for cost or other reasons. In addition, any hedges may not work as intended. The values of equity and other non-fixed income securities may decline due to fluctuations in interest rates.
Variable and floating rate securities generally are less sensitive to interest rate changes but may decline in value if their interest rates do not rise as much, or as quickly, as interest rates in general. Conversely, floating rate securities will not generally increase in value if interest rates decline. Inverse floating rate securities may decrease in value if interest rates increase. Inverse floating rate securities may also exhibit greater price volatility than a fixed rate obligation with similar credit quality. When the Funds hold variable or floating rate securities, a decrease (or, in the case of inverse floating rate securities, an increase) in market interest rates will adversely affect the income received from such securities and the NAV of the Funds’ shares.
The Funds are exposed to credit risk, which is the risk of losing money if the issuer or guarantor of a fixed income security is unable or unwilling, or is perceived (whether by market participants, rating agencies, pricing services or otherwise) as unable or unwilling, to make timely principal and/or interest payments, or to otherwise honor its obligations. Securities are subject to varying degrees of credit risk, which are often reflected in credit ratings.
To the extent the Funds directly invest in foreign currencies or in securities that trade in, and receive revenues in, foreign currencies, or in derivatives that provide exposure to foreign currencies, they will be subject to the risk that those currencies will decline in value relative to the U.S. dollar, or, in the case of hedging positions, that the U.S. dollar will decline in value relative to the currency being hedged. Currency
| 152 | December 31, 2017 | | Semiannual Report |
Table of Contents
rates in foreign countries may fluctuate significantly over short periods of time for a number of reasons, including economic growth, inflation, changes in interest rates, intervention (or the failure to intervene) by U.S. or foreign governments, central banks or supranational entities such as the International Monetary Fund, or the imposition of currency controls or other political developments in the United States or abroad. As a result, the Funds’ investments in foreign currency-denominated securities may reduce the returns of the Funds. The local emerging market currencies in which the Funds may be invested may experience substantially greater volatility against the U.S. dollar than the major convertible currencies in developed countries.
The Funds are subject to elements of risk not typically associated with investments in the U.S., due to concentrated investments in foreign issuers located in a specific country or region. Such concentrations will subject the Funds to additional risks resulting from future political or economic conditions in such country or region and the possible imposition of adverse governmental laws or currency exchange restrictions affecting such country or region, which could cause the securities and their markets to be less liquid and prices more volatile than those of comparable U.S. companies.
The market values of securities may decline due to general market conditions (market risk) which are not specifically related to a particular company, such as real or perceived adverse economic conditions, changes in the general outlook for corporate earnings, changes in interest or currency rates, adverse changes to credit markets or adverse investor sentiment. They may also decline due to factors that affect a particular industry or industries, such as labor shortages or increased production costs and competitive conditions within an industry. Equity securities and equity-related investments generally have greater market price volatility than fixed income securities, although under certain market conditions fixed income securities may have comparable or greater price volatility. Credit ratings downgrades may also negatively affect securities held by the Funds. Even when markets perform well, there is no assurance that the investments held by the Funds will increase in value along with the broader market. In addition, market risk includes the risk that geopolitical events will disrupt the economy on a national or global level.
The Funds are exposed to counterparty risk, or the risk that an institution or other entity with which the Funds have unsettled or open transactions will default. The potential loss to the Funds could exceed the value of the financial assets recorded in the Funds’ financial statements. Financial assets, which potentially expose the Funds to counterparty risk, consist principally of cash due from counterparties and investments. The Investment Adviser seeks to minimize the Funds’ counterparty risk by performing reviews of each counterparty and by minimizing concentration of counterparty risk by undertaking transactions with multiple customers and counterparties on recognized and reputable exchanges. Delivery of securities sold is only made once the Funds have received payment. Payment is made on a purchase once the securities have been delivered by the counterparty. The trade will fail if either party fails to meet its obligation.
The Funds are exposed to risks associated with leverage. Leverage may cause the value of the Funds’ shares to be more volatile than if the Funds did not use leverage. This is because leverage tends to exaggerate the effect of any increase or decrease in the value of the Funds’ portfolio securities. The Funds may engage in transactions or purchase instruments that give rise to forms of leverage. In addition, to the extent the Funds employ leverage, dividend and interest costs may not be recovered by any appreciation of the securities purchased with the leverage proceeds and could exceed the Funds’ investment returns, resulting in greater losses.
The Funds may hold defaulted securities that may involve special considerations including bankruptcy proceedings, other regulatory and legal restrictions affecting the Funds’ ability to trade, and the availability of prices from independent pricing services or dealer quotations. Defaulted securities are often illiquid and may not be actively traded. Sale of securities in bankrupt companies at an acceptable price may be difficult and differences compared to the value of the securities used by the Funds could be material. A Fund may incur additional expenses to the extent it is required to seek recovery upon a portfolio security’s default in the payment of principal or interest. In any bankruptcy proceeding relating to a defaulted investment, a Fund may lose its entire investment or may be required to accept cash or securities with a value substantially less than its original investment.
Investments in senior loans and repurchase agreements also involve special risks. Although typically secured, senior loans may not be backed by sufficient collateral to satisfy their issuers’ obligations in the event of bankruptcy or similar scenarios. Senior loans may also be illiquid. Similarly, repurchase agreements may result in losses if the collateral associated with such positions is insufficient in the event of a counterparty default or similar scenario. Repurchase agreement positions may also be illiquid.
The considerations and factors surrounding the settlement of certain purchases and sales made on a delayed-delivery basis are governed by Master Securities Forward Transaction Agreements (“Master Forward Agreements”) between the Funds and select counterparties. The Master Forward Agreements maintain provisions for, among other things, initiation and confirmation, payment and transfer, events of default, termination, and maintenance of collateral.
The counterparty risk associated with certain contracts may be reduced by master netting arrangements to the extent that if an event of default occurs, all amounts with the counterparty are terminated and settled on a net basis. The Funds’ overall exposure to counterparty risk with respect to transactions subject to master netting arrangements can change substantially within a short period, as it is affected by each transaction subject to the arrangement.
The Funds may invest in other investment companies, including investment companies advised by the Investment Adviser or its affiliates. Investing in other investment companies involves certain additional expenses and tax results that would not be present in a direct investment in such other investment companies. Each Fund’s
| Semiannual Report | | December 31, 2017 | 153 |
Table of Contents
Notes to Financial Statements (cont’d)
December 31, 2017 (unaudited)
NAV will fluctuate in response to changes in the NAVs of the other investment companies in which it invests. The extent to which the investment performance and risks associated with each Fund correlate to those of a particular investment company will depend upon the extent to which each Fund’s assets are allocated from time to time for investment in such investment company, which will vary. To the extent that a Fund invests a significant portion of its assets in another investment company, it will be particularly sensitive to the risks associated with that investment company.
| 3. | FINANCIAL DERIVATIVE INSTRUMENTS |
Disclosure about derivatives and hedging activities requires qualitative disclosure regarding objectives and strategies for using derivatives, quantitative disclosure about fair value amounts of gains and losses on derivatives, and disclosure about credit-risk-related contingent features in derivative agreements. The disclosure requirements distinguish between derivatives which are accounted for as “hedges”, and those that do not qualify for such accounting. Although the Funds at times use derivatives for hedging purposes, the Funds reflect derivatives at fair value and recognize changes in fair value through the Funds’ Statements of Operations, and such derivatives do not qualify for hedge accounting treatment.
Option Transactions. The Funds purchase put and call options on securities and indices for hedging purposes, risk management purposes or otherwise as part of their investment strategies. The risks associated with purchasing an option include the risk that the Funds pay a premium whether or not the option is exercised. Additionally, the Funds bear the risk of loss of premiums and changes in market value should the counterparty not perform under the contract. Put and call options purchased are accounted for in the same manner as portfolio securities. The cost of securities acquired through the exercise of call options is increased by the premiums paid. The proceeds from securities sold through the exercise of put options are decreased by the premiums paid.
The Funds may write (sell) put and call options on securities and indices to earn premiums, for hedging purposes, risk management purposes or otherwise as part of their investment strategies. When an option is written, the premium received is recorded as an asset with an equal liability that is subsequently marked to market to reflect the market value of the option written. These liabilities, if any, are reflected as options written in the Funds’ Statements of Assets and Liabilities. Premiums received from writing options which expire unexercised are recorded on the expiration date as a realized gain. The difference between the premium received and the amount paid on effecting a closing purchase transaction, including brokerage commissions, is also treated as a realized gain, or if the premium is less than the amount paid for the closing purchase transaction, as a realized loss. If a call option written is exercised, the premium is added to the proceeds from the sale of the underlying security in determining whether there has been a realized gain or loss. If a put option written is exercised, the premium reduces the cost basis of the security. In writing an option, the Funds bear the market risk of an unfavorable change in the price of the security underlying the written option. Exercise of a written
option could result in the Funds purchasing a security at a price different from its current market value.
There are several risks associated with option transactions on securities. For example, there are significant differences between the securities and options markets that could result in an imperfect correlation between these markets, causing a given transaction not to achieve its objective. The Funds’ ability to use options successfully will depend on the Investment Manager’s ability to predict pertinent market movements, which cannot be assured. As the writer of a covered call option, a Fund foregoes, during the option’s life, the opportunity to profit from increases in the market value of the security covering the call option above the sum of the premium and the strike price of the call, but has retained the risk of loss should the price of the underlying security decline.
Futures Contracts. The Funds use futures contracts to manage their exposure to the securities markets or the movements in interest rates and currency values. A futures contract is an agreement between two parties to buy and sell a financial instrument at a set price on a future date. Upon entering into such a contract, the Funds are required to pledge to the broker an amount of cash or securities equal to the minimum “initial margin” requirements of the exchange. Pursuant to the contracts, the Funds agree to receive from or pay to the broker an amount of cash or securities equal to the daily fluctuation in the value of the contracts. Such receipts or payments are known as “variation margin” and are recorded by the Funds as unrealized appreciation or depreciation. When the contracts are closed, the Funds record a realized gain or loss equal to the difference between the value of the contracts at the time they were opened and the value at the time they were closed. Any unrealized appreciation or depreciation recorded is simultaneously reversed. The use of futures transactions involves various risks, including the risk of an imperfect correlation in the movements in the price of futures contracts, interest rates and underlying hedging assets, and possible inability or unwillingness of counterparties to meet the terms of their contracts.
Forward Foreign Currency Contracts. A forward foreign currency contract is an agreement between two parties to buy and sell a currency at a set exchange rate on a future date. The Funds enter into forward foreign currency contracts for the purpose of hedging against foreign currency risk arising from the investment or anticipated investment in securities denominated in foreign currencies. The Funds also enter into these contracts for purposes of increasing exposure to a foreign currency or shifting exposure to foreign currency fluctuations from one country to another. The market value of a forward foreign currency contract fluctuates with changes in foreign currency exchange rates. All commitments are marked to market daily at the applicable exchange rates and any resulting unrealized appreciation or depreciation is recorded. Realized gains or losses are recorded at the time the forward contract matures or by delivery of the currency. Risks may arise upon entering into these contracts from the potential inability of counterparties to meet the terms of their contracts and from unanticipated movements in the value of a foreign currency relative to the U.S. dollar. In addition, these contracts may involve
| 154 | December 31, 2017 | | Semiannual Report |
Table of Contents
market risk in excess of the unrealized appreciation (depreciation) reflected in the Funds’ Statements of Assets and Liabilities.
The following is a summary of the Funds’ derivatives categorized by risk exposure.
The effect of derivatives on the Statements of Assets and Liabilities at December 31, 2017:
| AllianzGI Emerging Markets Opportunities: | ||||
| Location | Foreign Exchange Contracts | |||
Asset derivatives: | ||||
Unrealized appreciation of forward foreign currency contracts | $ | 458 | ||
| AllianzGI Global Small-Cap: | ||||
| Location | Foreign Exchange Contracts | |||
Asset derivatives: | ||||
Unrealized appreciation of forward foreign currency contracts | $ | 1,913 | ||
Liability derivatives: | ||||
Unrealized depreciation of forward foreign currency contracts | $ | (2,174 | ) | |
| AllianzGI Income & Growth: | ||||
| Location | Market Price | |||
Liability derivatives: | ||||
Options written, at value | $ | (769,940 | ) | |
| AllianzGI Technology: | ||||
| Location | Market Price | |||
Asset derivatives: | ||||
Investments, at value (options purchased) | $ | 14,683,910 | ||
Liability derivatives: | ||||
Options written, at value | $ | (7,187,120 | ) | |
The effect of derivatives on the Statements of Operations for the six months ended December 31, 2017:
| AllianzGI Emerging Markets Opportunities: | ||||
| Location | Foreign Exchange Contracts | |||
Net realized gain on: | ||||
Foreign currency transaction (forward currency contracts) | $ | 96,533 | ||
Net change in unrealized appreciation/depreciation of: | ||||
Foreign currency transaction (forward currency contracts) | $ | (2,248 | ) | |
| AllianzGI Global Natural Resources: | ||||||||||||
| Location | Market Price | Foreign Exchange Contracts | Total | |||||||||
Net realized gain (loss) on: | ||||||||||||
Options written | $ | 67,286 | — | $ | 67,286 | |||||||
Foreign currency transaction (forward currency contracts) | — | $ | (2,361 | ) | (2,361 | ) | ||||||
Total net realized gain (loss) | $ | 67,286 | $ | (2,361 | ) | $ | 64,925 | |||||
Net change in unrealized appreciation/depreciation of: | ||||||||||||
Options written | $ | 7,736 | — | $ | 7,736 | |||||||
| AllianzGI Global Small-Cap: | ||||
| Location | Foreign Exchange Contracts | |||
Net realized gain on: | ||||
Foreign currency transaction | $ | 8,490 | ||
Net change in unrealized appreciation/depreciation of: | ||||
Foreign currency transaction | $ | 1,133 | ||
| AllianzGI Income & Growth: | ||||
| Location | Market Price | |||
Net realized loss on: | ||||
Options written | $ | (5,457,578 | ) | |
Net change in unrealized appreciation/depreciation of: | ||||
Options written | $ | (67,136 | ) | |
| AllianzGI NFJ International Value: | ||||
| Location | Foreign Exchange Contracts | |||
Net realized loss on: | ||||
Forward currency contracts | $ | (66,403 | ) | |
Net change in unrealized appreciation/depreciation of: | ||||
Forward currency contracts | $ | (346 | ) | |
| AllianzGI NFJ Small-Cap Value: | ||||
| Location | Foreign Exchange Contracts | |||
Net realized loss on: | ||||
Forward currency contracts | $ | (16,900 | ) | |
| Semiannual Report | | December 31, 2017 | 155 |
Table of Contents
Notes to Financial Statements (cont’d)
December 31, 2017 (unaudited)
| AllianzGI Technology: | ||||||||||||
| Location | Market Price | Foreign Exchange Contracts | Total | |||||||||
Net realized gain on: | ||||||||||||
Investments (options purchased) | $ | 11,389,473 | — | $ | 11,389,473 | |||||||
Options written | (2,711,150 | ) | — | (2,711,150 | ) | |||||||
Foreign currency transaction (forward currency contracts) | — | $ | 29,583 | 29,583 | ||||||||
Total net realized gain | $ | 8,678,323 | $ | 29,583 | $ | 8,707,906 | ||||||
Net change in unrealized appreciation/depreciation of: |
| |||||||||||
Investments (options purchased) | $ | 1,418,089 | — | $ | 1,418,089 | |||||||
Options written | 7,440,637 | — | 7,440,637 | |||||||||
Total net change in unrealized appreciation/depreciation | $ | 8,858,726 | $ | — | $ | 8,858,726 | ||||||
The average volume (based on the open positions at each month-end) of derivative activity during the six months ended December 31, 2017:
| Options Purchased | Options Written | Forward Foreign Currency Contracts(2) | ||||||||||||||
| Contracts(1) | Contracts(1) | Purchased | Sold | |||||||||||||
AllianzGI Emerging Markets Opportunities | — | — | $ | 578,586 | $ | 440,445 | ||||||||||
AllianzGI Global Natural Resources | — | 751 | 8,920 | 13,761 | ||||||||||||
AllianzGI Global Small-Cap | — | — | 143,105 | 327,349 | ||||||||||||
AllianzGI Income & Growth | — | 24,427 | — | — | ||||||||||||
AllianzGI NFJ International Value | — | — | — | † | 232,845 | |||||||||||
AllianzGI NFJ Small-Cap Value | — | — | — | — | † | |||||||||||
AllianzGI Technology | 5,807 | 10,196 | — | — | † | |||||||||||
| † | Fund had derivative activity during the period but it did not have open positions at any month-end in the period. |
| (1) | Number of contracts |
| (2) | U.S. $ value on origination date |
The following tables present by counterparty, the Funds’ derivative assets and liabilities net of related collateral held by the Funds at December 31, 2017 which has not been offset in the Statements of Assets and Liabilities, but would be available for offset to the extent of a default by the counterparty to the transaction.
Financial Assets and Derivative Assets, and Collateral Received at December 31, 2017:
| AllianzGI Emerging Markets Opportunities: | ||||||||||||||||
| Gross Amounts Not Offset in the Statement of Assets and Liabilities | ||||||||||||||||
| Counterparty | Gross Asset Derivatives Presented in Statement of Assets and Liabilities | Financial Instrument/ Derivative Offset | Cash Collateral Received | Net Amount | ||||||||||||
Foreign Currency Exchange Contracts |
| |||||||||||||||
Northern Trust Company | $ | 458 | — | — | $ | 458 | ||||||||||
| AllianzGI Global Small-Cap: | ||||||||||||||||
| Gross Amounts Not Offset in the Statement of Assets and Liabilities | ||||||||||||||||
| Counterparty | Gross Asset Derivatives Presented in Statement of Assets and Liabilities | Financial Instrument/ Derivative Offset | Cash Collateral Received | Net Amount | ||||||||||||
Foreign Currency Exchange Contracts |
| |||||||||||||||
Northern Trust Company | $ | 1,913 | $ | (1,913 | ) | — | — | |||||||||
| 156 | December 31, 2017 | | Semiannual Report |
Table of Contents
Financial Liabilities and Derivative Liabilities, and Collateral Received (Pledged) at December 31, 2017:
| AllianzGI Global Small-Cap: | ||||||||||||||||
| Gross Amounts Not Offset in the Statement of Assets and Liabilities | ||||||||||||||||
| Counterparty | Gross Liability Derivatives Presented in Statement of Assets and Liabilities | Financial Instrument/ Derivative Offset | Cash Collateral Received (Pledged) | Net Amount | ||||||||||||
Foreign Currency Exchange Contracts |
| |||||||||||||||
Northern Trust Company | $ | 2,174 | $ | (1,913 | ) | — | $ | 261 | ||||||||
| 4. | INVESTMENT ADVISER/ADMINISTRATOR/DISTRIBUTOR FEES/ EXPENSES & DEFERRED COMPENSATION |
Investment Advisory Fee. AllianzGI U.S. serves as investment adviser to the Funds, pursuant to an investment advisory contract. AllianzGI U.S. receives a monthly fee (the “Investment Advisory Fee”) from each Fund at an annual rate based on the average daily net assets of each Fund.
Administration Fee. AllianzGI U.S. provides administrative services to the Funds and also bears the cost of most third-party administrative services required by the Funds, and in return it receives from each share class of each Fund a monthly administration fee based on each share class’ average daily net assets (the “Administration Fee”).
The Investment Advisory Fee and Administration Fee for all classes are charged at an annual rate as indicated in the following table:
| All Classes | Class A, C, and R | Class P | Institutional Class | Class R6 | Administrative Class | |||||||||||||||||||||||||||||||||||||||||||
| Investment Advisory Fee | Effective Advisory Fee | Administ- ration Fee | Effective Fee | Administ- ration Fee | Effective Fee | Administ- ration Fee | Effective Fee | Administ- ration Fee | Effective Administ- ration Fee | Administ- ration Fee | Effective Fee | |||||||||||||||||||||||||||||||||||||
AllianzGI Emerging Markets Opportunities(1) | 0.85 | % | 0.65 | %(4) | 0.50 | % | 0.35 | %(5) | 0.50 | % | 0.35 | %(5) | 0.40 | % | 0.25 | %(5) | 0.35 | % | 0.20 | %(5) | N/A | N/A | ||||||||||||||||||||||||||
AllianzGI Focused Growth(3) | 0.45 | 0.35 | (6) | 0.40 | † | (7) | 0.40 | 0.40 | 0.30 | 0.30 | 0.25 | 0.25 | 0.30 | % | 0.30 | % | ||||||||||||||||||||||||||||||||
AllianzGI Global Natural Resources(2) | 0.70 | 0.70 | 0.45 | 0.45 | 0.45 | 0.45 | 0.35 | 0.35 | N/A | N/A | N/A | N/A | ||||||||||||||||||||||||||||||||||||
AllianzGI Global Small-Cap(2) | 0.90 | 0.90 | 0.45 | 0.45 | 0.45 | 0.45 | 0.35 | 0.35 | N/A | N/A | N/A | N/A | ||||||||||||||||||||||||||||||||||||
AllianzGI Health Sciences(3) | 0.80 | 0.80 | 0.40 | 0.40 | N/A | N/A | 0.30 | 0.30 | N/A | N/A | N/A | N/A | ||||||||||||||||||||||||||||||||||||
AllianzGI Income & Growth(3) | 0.65 | 0.65 | (9) | 0.40 | 0.38 | 0.40 | 0.38 | 0.30 | 0.28 | N/A | N/A | N/A | N/A | |||||||||||||||||||||||||||||||||||
AllianzGI Mid-Cap(3) | 0.47 | 0.47 | 0.40 | 0.40 | 0.40 | 0.40 | 0.30 | 0.30 | N/A | N/A | 0.30 | 0.30 | ||||||||||||||||||||||||||||||||||||
AllianzGI NFJ Dividend Value(3) | 0.45 | 0.30 | (10) | 0.40 | 0.38 | 0.40 | 0.38 | 0.30 | 0.28 | 0.25 | 0.23 | 0.30 | 0.28 | |||||||||||||||||||||||||||||||||||
AllianzGI NFJ International Value(1) | 0.60 | 0.55 | (11) | 0.50 | 0.46 | (12) | 0.50 | 0.47 | (12) | 0.40 | 0.36 | (12) | 0.35 | 0.31 | (12) | 0.40 | 0.37 | (12) | ||||||||||||||||||||||||||||||
AllianzGI NFJ Large-Cap Value(3) | 0.45 | 0.35 | (16) | 0.40 | 0.40 | 0.40 | 0.40 | 0.30 | 0.30 | N/A | N/A | 0.30 | 0.30 | |||||||||||||||||||||||||||||||||||
AllianzGI NFJ Mid-Cap Value(3) | 0.55 | 0.55 | 0.40 | # | (13) | 0.40 | 0.26 | (13) | 0.30 | 0.15 | (13) | 0.25 | 0.03 | (13) | 0.30 | 0.15 | (13) | |||||||||||||||||||||||||||||||
AllianzGI NFJ Small-Cap Value(3) | 0.60 | 0.60 | (14) | 0.40 | 0.33 | (15) | 0.40 | 0.33 | (15) | 0.30 | 0.23 | (15) | 0.25 | 0.18 | (15) | 0.30 | 0.23 | (15) | ||||||||||||||||||||||||||||||
AllianzGI Small-Cap Blend(3) | 0.65 | 0.65 | 0.40 | 0.40 | 0.40 | 0.40 | 0.30 | 0.30 | N/A | N/A | N/A | N/A | ||||||||||||||||||||||||||||||||||||
AllianzGI Technology(3) | 0.90 | 0.75 | (8) | 0.40 | 0.39 | 0.40 | 0.39 | 0.30 | 0.29 | N/A | N/A | 0.30 | 0.29 | |||||||||||||||||||||||||||||||||||
| (1) | The total Administration Fee rate for each class of shares shall be reduced according to the following schedule, each based on such Fund’s aggregate average daily net assets: by 0.025% per annum on assets in excess of $250 million, by an additional 0.025% per annum on assets in excess of $500 million, by an additional 0.025% per annum on assets in excess of $1 billion, by an additional 0.025% per annum on assets in excess of $2.5 billion, by an additional 0.025% per annum on assets in excess of $5 billion and by an additional 0.025% per annum on assets in excess of $7.5 billion. To the extent that any such reduction in the fee rate applies, the dollar amount of the fee reduction with respect to each share class is calculated and applied on a pro rata basis by reference to the percentage of the Fund’s average daily net assets attributable to that class. |
| Semiannual Report | | December 31, 2017 | 157 |
Table of Contents
Notes to Financial Statements (cont’d)
December 31, 2017 (unaudited)
| (2) | The total Administration Fee rate for each class of shares shall be reduced according to the following schedule, each based on such Fund’s aggregate average daily net assets: by 0.025% per annum on assets in excess of $500 million, by an additional 0.025% per annum on assets in excess of $1 billion, by an additional 0.025% per annum on assets in excess of $2.5 billion, by an additional 0.025% per annum on assets in excess of $5 billion and by an additional 0.025% per annum on assets in excess of $7.5 billion. To the extent that any such reduction in the fee rate applies, the dollar amount of the fee reduction with respect to each share class is calculated and applied on a pro rata basis by reference to the percentage of the Fund’s average daily net assets attributable to that class. |
| (3) | The total Administration Fee rate for each class of shares shall be reduced according to the following schedule, each based on such Fund’s aggregate average daily net assets: by 0.025% per annum on assets in excess of $1 billion, by an additional 0.025% per annum on assets in excess of $2.5 billion, by an additional 0.025% per annum on assets in excess of $5 billion and by an additional 0.025% per annum on assets in excess of $7.5 billion. To the extent that any such reduction in the fee rate applies, the dollar amount of the fee reduction with respect to each share class is calculated and applied on a pro rata basis by reference to the percentage of the Fund’s average daily net assets attributable to that class. |
| (4) | The Adviser has contractually agreed to observe, through October 31, 2018, an irrevocable waiver of a portion of its Investment Advisory Fee currently in place, which reduces the 0.85% contractual fee rate by 0.20% to 0.65%. This waiver arrangement has been in effect since April 1, 2017. |
| (5) | The Administrator has contractually agreed to observe, through October 31, 2018, an irrevocable waiver of a portion of its Administration Fees, which reduces the contractual fee rate by 0.15%. This waiver has been in effect since before the beginning of the Fund’s most recent fiscal year. |
| (6) | The Adviser has contractually agreed to observe, through October 31, 2018, an irrevocable waiver of a portion of its Investment Advisory Fee currently in place, which reduces the 0.45% contractual fee rate by 0.10% to 0.35%. This waiver has been in effect since January 1, 2017. |
| (7) | The Administrator has contractually agreed to observe, through October 31, 2018, an irrevocable waiver of a portion of its Administration Fees for Class A shares currently in place, which reduces the contractual fee rate by 0.02%. This waiver has been in effect since January 1, 2017. |
| (8) | The Adviser has contractually agreed to observe, through October 31, 2018, an irrevocable waiver of a portion of the Investment Advisory Fee, which reduces the 0.90% contractual fee rate by 0.15% to 0.75%, and then an additional 0.01% on net assets in excess of $2 billion, by an additional 0.015% on net assets in excess of $3 billion and by an additional 0.025% on net assets in excess of $5 billion, each based on the Fund’s average daily net assets. This waiver arrangement has been in effect since November 1, 2016. |
| (9) | The Adviser has contractually agreed to observe, through October 31, 2018, an irrevocable waiver of a portion of the Investment Advisory Fee, which reduces the 0.65% contractual fee rate by 0.01% on net assets in excess of $2 billion, by an additional 0.015% on net assets in excess of $3 billion and by an additional 0.025% on net assets in excess of $5 billion, each based on the Fund’s average daily net assets. An identical waiver arrangement has been in effect since before the beginning of the Fund’s most recent fiscal year. |
| (10) | The Adviser has contractually agreed to observe, through October 31, 2018, an irrevocable waiver of a portion of its Investment Advisory Fee, which reduces the 0.45% contractual fee rate by 0.15% to 0.30%, and by an additional 0.025% on net assets in excess of $7.5 billion, and by an additional 0.025% on net assets in excess of $10 billion, each based on the Fund’s average daily net assets. An identical waiver arrangement has been in place for the Fund since November 1, 2016. |
| (11) | The Adviser has contractually agreed to observe, through October 31, 2018, an irrevocable waiver of a portion of the Investment Advisory Fee, which reduces the 0.60% contractual fee rate by 0.05% to 0.55%, and an additional 0.01% on net assets in excess of $4 billion, by an additional 0.015% on net assets in excess of $5 billion and by an additional 0.025% on net assets in excess of $7.5 billion, each based on the Fund’s average daily net assets. An identical waiver arrangement has been in effect since November 1, 2016. |
| (12) | The Administrator has contractually agreed to observe, through October 31, 2018, an irrevocable waiver of a portion of its Administration Fees, which reduces the contractual fee rate by 0.025%. This waiver has been in effect since before the beginning of the Fund’s most recent fiscal year. |
| (13)The | Administrator has contractually agreed to observe through September 30, 2019, an irrevocable waiver of a portion of its Administration Fees for all classes, which reduces the contractual fee rate by 0.22%. This waiver has been in effect since September 22, 2017. |
| (14) | The Adviser has contractually agreed to observe, through October 31, 2018, an irrevocable waiver of a portion of the Investment Advisory Fee, which reduces the 0.60% contractual fee rate by 0.025% on net assets in excess of $3 billion, by an additional 0.025% on net assets in excess of $4 billion and by an additional 0.025% on net assets in excess of $5 billion, each based on the Fund’s average daily net assets. An identical fee waiver has been in effect since November 1, 2016. |
| (15) | The Administrator has contractually agreed to observe, through October 31, 2018, an irrevocable waiver of a portion of its Administration Fees which reduces the contractual fee rate of each class in the amount of 0.05%. An identical fee waiver has been in effect since November 1, 2016. |
| (16) | Effective November 1, 2016, the Adviser had contractually agreed to observe, through October 31, 2017, an irrevocable waiver of a portion of its Investment Advisory Fee, which reduced the 0.45% contractual fee rate by 0.15% to 0.30%. |
| † | The effective Administration Fee rate for Class A is 0.38%; for Class C and Class R is 0.40%, respectively. |
| # | The effective Administration Fee rate for Class A and Class C is 0.28%; for Class R is 0.27%, respectively. |
Distribution and Servicing Fees. Allianz Global Investors Distributors LLC (the “Distributor”), an affiliate of AllianzGI U.S., serves as the distributor of the Trust’s shares. The Funds are permitted to reimburse the Distributor on a quarterly basis, out of the Administrative Class assets of each Fund offering Administrative Class shares, in an amount up to 0.25% on an annual basis of the average daily net assets of that class, for payments made to financial intermediaries that provide services in connection with the distribution of shares or administration of plans or programs that use Fund shares as their funding medium. Unreimbursed costs may be carried forward for reimbursement for up to twelve months beyond the date in which they are incurred, subject always to the limit that not more than 0.25% of the average daily net assets attributable to the Administrative Class may be expensed.
Pursuant to the Distribution and Servicing Plans adopted by the A, C and R classes, the Distributor receives (i) in connection with the distribution of C and R class shares of the Trust, certain distribution fees from the Trust, and (ii) in connection with personal services rendered to A, C and R class shareholders of the Trust and the maintenance of shareholder accounts, certain servicing fees from the Trust.
The Funds paid the Distributor distribution and/or servicing fees at an effective rate as set forth below (calculated as a percentage of each Fund’s average daily net assets attributable to each class):
| Allowable Rate | ||||||||
Distribution Fee | Servicing Fee | |||||||
Class A | ||||||||
All Funds | — | 0.25 | % | |||||
Class C | ||||||||
All Funds | 0.75 | % | 0.25 | |||||
Class R | ||||||||
All Funds | 0.25 | 0.25 | ||||||
The Distributor also receives the proceeds of the initial sales charges paid by the shareholders upon the purchase of Class A shares and contingent deferred sales charges (“CDSC”) paid by the shareholders upon certain redemptions of Class A and C shares. For the six months ended December 31, 2017, the Distributor received $902,279, representing commissions (sales charges) and CDSC from the Funds.
Expenses. The Trust is responsible for the following expenses: (i) salaries and other compensation of any of the Trust’s executive officers and employees who are not officers, directors, stockholders or employees of the Investment Adviser or its subsidiaries or affiliates; (ii) taxes and governmental fees; (iii) brokerage fees and commissions and other portfolio transaction expenses; (iv) the costs of borrowing money, including interest expense and bank overdraft charges;
| 158 | December 31, 2017 | | Semiannual Report |
Table of Contents
(v) fees and expenses of the Trustees who are not “interested persons” of the Investment Adviser or the Trust, and any counsel or other experts retained exclusively for their benefit; (vi) extraordinary expenses, including costs of litigation and indemnification expenses; (vii) organization expenses, if any and (viii) any expenses allocated or allocable to a specific class of shares, which include service fees payable with respect to the Administrative Class shares and may include certain other expenses as permitted by the Trust’s Amended and Restated Multi-Class Plan adopted pursuant to Rule 18f-3 under the Investment Company Act of 1940 and subject to review and approval by the Trustees. The Funds may invest in other investment companies, including investment companies advised or sub-advised by the Investment Adviser or its affiliates. Investing in other investment companies involves certain additional expenses and tax results that would not be present in a direct investment in such other investment companies. The ratio of expenses to average net assets per share class, as disclosed in the Financial Highlights, may differ from the estimated annual fund operating expenses per share class as disclosed in the Prospectus for the reasons set forth above.
Deferred Compensation. The Trustees do not currently receive any pension or retirement benefits from the Trust or the Fund Complex. The Trust has adopted a deferred compensation plan (the “Plan”) for the Trustees, which permits the Trustees to defer their receipt of compensation from the Trust, at their election, in accordance with the terms of the Plan. Under the Plan, each Trustee may elect not to receive fees from the Trust on a current basis but to receive in a subsequent period, chosen by the Trustee, an amount equal to the value of such compensation if such compensation had been invested in one or more
series of the Trust or Allianz Funds Multi-Strategy Trust selected by the Trustees from and after the normal payment dates for such compensation. The deferred compensation program is structured such that the Trust remains in substantially the same financial position whether the Trustee fees are paid when earned or deferred.
| 5. | INVESTMENTS IN SECURITIES |
For the six months ended December 31, 2017, purchases and sales of investments, other than short-term securities were:
| Purchases | Sales | |||||||
AllianzGI Emerging Markets Opportunities | $ | 146,603,511 | $ | 140,695,318 | ||||
AllianzGI Focused Growth | 189,965,157 | 225,790,713 | ||||||
AllianzGI Global Natural Resources | 13,995,532 | 17,420,792 | ||||||
AllianzGI Global Small-Cap | 64,919,367 | 108,607,826 | ||||||
AllianzGI Health Sciences | 33,825,564 | 49,302,920 | ||||||
AllianzGI Income & Growth | 2,039,626,485 | 2,038,474,722 | ||||||
AllianzGI Mid-Cap | 134,788,079 | 147,751,213 | ||||||
AllianzGI NFJ Dividend Value | 674,907,001 | 1,505,636,148 | ||||||
AllianzGI NFJ International Value | 120,383,475 | 222,988,625 | ||||||
AllianzGI NFJ Large-Cap Value | 157,440,758 | 170,402,220 | ||||||
AllianzGI NFJ Mid-Cap Value | 314,179,730 | 138,761,293 | ||||||
AllianzGI NFJ Small-Cap Value | 283,377,795 | 845,296,280 | ||||||
AllianzGI Small-Cap Blend | 55,527,336 | 57,952,682 | ||||||
AllianzGI Technology* | 650,967,766 | 980,304,248 | ||||||
| * | Securities sold short of $0; covers on securities sold short of $31,975,520. |
| 6. | INCOME TAX INFORMATION |
At December 31, 2017, the aggregate cost basis and the net unrealized appreciation (depreciation) of investments in securities and other financial instruments for federal income tax purposes were:
Federal Tax Cost Basis(1) | Unrealized Appreciation | Unrealized Depreciation | Net Unrealized Appreciation (Depreciation) | |||||||||||||
AllianzGI Emerging Markets Opportunities | $ | 254,471,054 | $ | 42,845,312 | $ | 2,078,342 | $ | 40,766,970 | ||||||||
AllianzGI Focused Growth | 602,355,246 | 424,162,110 | 1,154,688 | 423,007,422 | ||||||||||||
AllianzGI Global Natural Resources | 22,539,886 | 3,419,259 | 81,502 | 3,337,757 | ||||||||||||
AllianzGI Global Small-Cap | 149,377,487 | 50,209,444 | 1,100,613 | 49,108,831 | ||||||||||||
AllianzGI Health Sciences | 131,209,225 | 27,282,234 | 3,902,676 | 23,379,558 | ||||||||||||
AllianzGI Income & Growth | 3,691,849,031 | 81,424,261 | 363,208,099 | (281,783,838 | ) | |||||||||||
AllianzGI Mid-Cap | 259,344,719 | 56,564,838 | 3,220,320 | 53,344,518 | ||||||||||||
AllianzGI NFJ Dividend Value | 1,853,470,067 | 424,503,107 | 7,422,239 | 417,080,868 | ||||||||||||
AllianzGI NFJ International Value | 334,072,767 | 54,767,398 | 2,659,161 | 52,108,237 | ||||||||||||
AllianzGI NFJ Large-Cap Value | 327,571,459 | 61,613,978 | 1,042,210 | 60,571,768 | ||||||||||||
AllianzGI NFJ Mid-Cap Value | 796,815,818 | 235,192,844 | 9,569,832 | 225,623,012 | ||||||||||||
AllianzGI NFJ Small-Cap Value | 2,155,658,469 | 631,553,378 | 75,191,832 | 556,361,546 | ||||||||||||
AllianzGI Small-Cap Blend | 72,023,373 | 13,919,802 | 1,614,272 | 12,305,530 | ||||||||||||
AllianzGI Technology | 862,999,239 | 486,591,405 | 1,337,074 | 485,254,331 | ||||||||||||
| (1) | Differences, if any, between book and tax cost basis are primarily attributable to wash sale loss deferrals and the differing treatment of bond premium amortization. |
| Semiannual Report | | December 31, 2017 | 159 |
Table of Contents
Notes to Financial Statements (cont’d)
December 31, 2017 (unaudited)
| 7. | SHARES OF BENEFICIAL INTEREST |
The Trust may issue an unlimited number of shares of beneficial interest with $0.0001 par value. Changes in shares of beneficial interest were as follows:
| AllianzGI Emerging Markets Opportunities | AllianzGI Focused Growth | |||||||||||||||||||||||||||||||||||
| Six Months ended December 31, 2017 (unaudited) | Year ended June 30, 2017 | Six Months ended December 31, 2017 (unaudited) | Year ended June 30, 2017 | |||||||||||||||||||||||||||||||||
| Shares | Amount | Shares | Amount | Shares | Amount | Shares | Amount | |||||||||||||||||||||||||||||
Shares sold: | ||||||||||||||||||||||||||||||||||||
Class A | 448,758 | $ | 12,995,848 | 1,359,848 | $ | 32,806,007 | 396,527 | $ | 19,814,101 | 1,723,880 | $ | 75,672,861 | ||||||||||||||||||||||||
Class C | 21,111 | 604,984 | 31,210 | 748,018 | 108,493 | 3,791,269 | 402,952 | 12,269,127 | ||||||||||||||||||||||||||||
Class R | — | — | — | — | 63,858 | 2,492,312 | 276,515 | 9,153,506 | ||||||||||||||||||||||||||||
Class P | 284,372 | 8,143,466 | 584,570 | 13,715,463 | 375,141 | 14,478,557 | 1,951,795 | 65,865,369 | ||||||||||||||||||||||||||||
Institutional Class | 1,889,871 | 55,773,160 | 923,461 | 22,715,217 | 433,632 | 20,011,953 | 2,155,403 | 85,089,560 | ||||||||||||||||||||||||||||
Class R6 | 5,924 | 177,182 | 30,966 | 750,860 | 100,342 | 4,763,444 | 616,560 | 25,650,573 | ||||||||||||||||||||||||||||
Administrative Class | — | — | — | — | 5,237 | 231,113 | 58,173 | 2,150,963 | ||||||||||||||||||||||||||||
Issued in reinvestment of dividends and distributions: |
| |||||||||||||||||||||||||||||||||||
Class A | 41,572 | 1,242,157 | 103,068 | 2,273,688 | 86,992 | 4,626,239 | 189,226 | 7,815,051 | ||||||||||||||||||||||||||||
Class C | 786 | 23,182 | 1,764 | 38,395 | 116,094 | 4,297,784 | 227,807 | 6,638,298 | ||||||||||||||||||||||||||||
Class R | — | — | — | — | 8,375 | 341,603 | 16,379 | 522,340 | ||||||||||||||||||||||||||||
Class P | 13,849 | 405,788 | 17,611 | 381,805 | 32,582 | 1,344,967 | 32,041 | 1,029,790 | ||||||||||||||||||||||||||||
Institutional Class | 60,550 | 1,817,696 | 35,340 | 784,898 | 63,921 | 3,135,323 | 115,839 | 4,406,502 | ||||||||||||||||||||||||||||
Class R6 | 498 | 14,883 | 342 | 7,558 | 12,986 | 637,344 | 11,493 | 437,297 | ||||||||||||||||||||||||||||
Administrative Class | — | — | — | — | 1,540 | 71,074 | 6,910 | 247,854 | ||||||||||||||||||||||||||||
Cost of shares redeemed: | ||||||||||||||||||||||||||||||||||||
Class A | (2,224,912 | ) | (64,588,903 | ) | (2,017,120 | ) | (48,050,216 | ) | (804,805 | ) | (40,548,955 | ) | (2,672,316 | ) | (115,477,647 | ) | ||||||||||||||||||||
Class C | (42,409 | ) | (1,221,416 | ) | (226,199 | ) | (5,452,427 | ) | (482,989 | ) | (16,986,259 | ) | (1,898,183 | ) | (59,455,971 | ) | ||||||||||||||||||||
Class R | — | — | — | — | (74,191 | ) | (2,906,277 | ) | (282,712 | ) | (9,518,099 | ) | ||||||||||||||||||||||||
Class P | (155,964 | ) | (4,471,886 | ) | (688,756 | ) | (16,570,537 | ) | (373,049 | ) | (14,640,175 | ) | (862,224 | ) | (29,124,991 | ) | ||||||||||||||||||||
Institutional Class | (244,503 | ) | (7,143,553 | ) | (1,097,576 | ) | (26,888,800 | ) | (503,254 | ) | (23,208,456 | ) | (1,890,718 | ) | (76,411,345 | ) | ||||||||||||||||||||
Class R6 | (1,746 | ) | (49,866 | )�� | (6,294 | ) | (146,961 | ) | (114,820 | ) | (5,454,006 | ) | (91,098 | ) | (3,651,732 | ) | ||||||||||||||||||||
Administrative Class | — | — | — | — | (10,132 | ) | (445,147 | ) | (181,872 | ) | (7,130,338 | ) | ||||||||||||||||||||||||
Net increase (decrease) resulting from Fund share transactions | 97,757 | $ | 3,722,722 | (947,765 | ) | $ | (22,887,032 | ) | (557,520 | ) | $ | (24,152,192 | ) | (94,150 | ) | $ | (3,821,032 | ) | ||||||||||||||||||
| * | Actual amount rounds to less than one share. |
| 160 | December 31, 2017 | | Semiannual Report |
Table of Contents
| AllianzGI Global Natural Resources | AllianzGI Global Small-Cap | AllianzGI Health Sciences | ||||||||||||||||||||||||||||||||||||||||||||||||
Six Months ended December 31, 2017 (unaudited) | Year ended June 30, 2017 | Six Months ended December 31, 2017 (unaudited) | Year ended June 30, 2017 | Six Months ended December 31, 2017 (unaudited) | Year ended June 30, 2017 | |||||||||||||||||||||||||||||||||||||||||||||
| Shares | Amount | Shares | Amount | Shares | Amount | Shares | Amount | Shares | Amount | Shares | Amount | |||||||||||||||||||||||||||||||||||||||
| 65,651 | $ | 964,109 | 326,765 | $ | 5,021,950 | 37,420 | $ | 1,879,808 | 85,524 | $ | 3,823,006 | 35,247 | $ | 1,122,508 | 335,142 | $ | 9,450,290 | |||||||||||||||||||||||||||||||||
| 7,016 | 96,725 | 26,535 | 397,801 | 11,825 | 537,713 | 41,777 | 1,641,811 | 5,979 | 152,470 | 53,897 | 1,216,538 | |||||||||||||||||||||||||||||||||||||||
| — | — | — | — | — | — | — | — | — | — | — | — | |||||||||||||||||||||||||||||||||||||||
| 7,294 | 108,927 | 80,637 | 1,261,419 | 28,772 | 1,553,228 | 220,727 | 10,361,413 | — | — | — | — | |||||||||||||||||||||||||||||||||||||||
| 127,814 | 1,912,990 | 410,899 | 6,560,916 | 53,063 | 2,863,641 | 232,582 | 10,633,467 | 7,965 | 257,489 | 81,326 | 2,418,831 | |||||||||||||||||||||||||||||||||||||||
| — | — | — | — | — | — | — | — | — | — | — | — | |||||||||||||||||||||||||||||||||||||||
| — | — | — | — | — | — | — | — | — | — | — | — | |||||||||||||||||||||||||||||||||||||||
| �� | ||||||||||||||||||||||||||||||||||||||||||||||||||
| 1,014 | 15,872 | 5,261 | 85,168 | 90,251 | 4,491,798 | — | — | — | — | — | — | |||||||||||||||||||||||||||||||||||||||
| — | * | 2 | 68 | 1,042 | 40,034 | 1,756,287 | — | — | — | — | — | — | ||||||||||||||||||||||||||||||||||||||
| — | — | — | — | — | — | — | — | — | — | — | — | |||||||||||||||||||||||||||||||||||||||
| — | — | 1,041 | 17,075 | 17,947 | 947,048 | — | — | — | — | — | — | |||||||||||||||||||||||||||||||||||||||
| 2,086 | 33,503 | 5,815 | 96,353 | 145,643 | 7,743,818 | — | — | — | — | — | — | |||||||||||||||||||||||||||||||||||||||
| — | — | — | — | — | — | — | — | — | — | — | — | |||||||||||||||||||||||||||||||||||||||
| — | — | — | — | — | — | — | — | — | — | — | — | |||||||||||||||||||||||||||||||||||||||
| (101,069 | ) | (1,456,095 | ) | (489,665 | ) | (7,626,901 | ) | (100,349 | ) | (5,044,414 | ) | (564,746 | ) | (24,666,544 | ) | (306,109 | ) | (9,736,242 | ) | (1,604,550 | ) | (46,260,523 | ) | |||||||||||||||||||||||||||
| (57,479 | ) | (776,808 | ) | (107,613 | ) | (1,595,853 | ) | (50,584 | ) | (2,262,347 | ) | (201,426 | ) | (7,950,841 | ) | (59,200 | ) | (1,500,926 | ) | (244,807 | ) | (5,652,860 | ) | |||||||||||||||||||||||||||
| — | — | — | — | — | — | — | — | — | — | — | — | |||||||||||||||||||||||||||||||||||||||
| (70,945 | ) | (1,035,064 | ) | (480,638 | ) | (7,397,250 | ) | (150,104 | ) | (7,913,112 | ) | (242,669 | ) | (11,283,080 | ) | — | — | — | — | |||||||||||||||||||||||||||||||
| (233,533 | ) | (3,446,105 | ) | (882,891 | ) | (14,272,335 | ) | (635,096 | ) | (33,928,339 | ) | (771,790 | ) | (35,783,154 | ) | (45,948 | ) | (1,485,789 | ) | (36,349 | ) | (1,073,039 | ) | |||||||||||||||||||||||||||
| — | — | — | — | — | — | — | — | — | — | — | — | |||||||||||||||||||||||||||||||||||||||
| — | — | — | — | — | — | — | — | — | — | — | — | |||||||||||||||||||||||||||||||||||||||
| | (252,151 | ) | $ | (3,581,944 | ) | (1,103,786 | ) | $ | (17,450,615 | ) | (511,178 | ) | $ | (27,374,871 | ) | (1,200,021 | ) | $ | (53,223,922 | ) | (362,066 | ) | $ | (11,190,490 | ) | (1,415,341 | ) | $ | (39,900,763 | ) | ||||||||||||||||||||
| Semiannual Report | | December 31, 2017 | 161 |
Table of Contents
Notes to Financial Statements (cont’d)
December 31, 2017 (unaudited)
| AllianzGI Income & Growth | AllianzGI Mid-Cap | |||||||||||||||||||||||||||||||||||
| Six Months ended December 31, 2017 (unaudited) | Year ended June 30, 2017 | Six Months ended December 31, 2017 (unaudited) | Year ended June 30, 2017 | |||||||||||||||||||||||||||||||||
| Shares | Amount | Shares | Amount | Shares | Amount | Shares | Amount | |||||||||||||||||||||||||||||
Shares sold: | ||||||||||||||||||||||||||||||||||||
Class A | 16,448,208 | $ | 186,933,421 | 32,601,873 | $ | 364,032,414 | 1,627,974 | $ | 6,244,921 | 8,300,695 | $ | 30,967,903 | ||||||||||||||||||||||||
Class C | 7,757,000 | 81,810,696 | 16,540,753 | 172,370,954 | 224,421 | 727,966 | 1,315,911 | 3,896,255 | ||||||||||||||||||||||||||||
Class R | 132,829 | 1,507,605 | 48,658 | 543,484 | 203,579 | 770,229 | 258,256 | 927,920 | ||||||||||||||||||||||||||||
Class P | 14,293,940 | 166,132,894 | 34,886,082 | 399,117,875 | 707,844 | 3,070,775 | 1,653,976 | 6,744,207 | ||||||||||||||||||||||||||||
Institutional Class | 7,087,444 | 82,976,460 | 20,155,048 | 233,501,635 | 564,667 | 2,479,904 | 1,293,302 | 5,218,824 | ||||||||||||||||||||||||||||
Class R6 | — | — | — | — | — | — | — | — | ||||||||||||||||||||||||||||
Administrative Class | — | — | — | — | 190,792 | 826,912 | 19,592 | 73,722 | ||||||||||||||||||||||||||||
Issued in reinvestment of dividends and distributions: |
| |||||||||||||||||||||||||||||||||||
Class A | 3,595,663 | 40,744,942 | 7,319,290 | 81,403,847 | 2,104,396 | 7,912,529 | 1,679,569 | 5,693,738 | ||||||||||||||||||||||||||||
Class C | 3,813,482 | 40,065,923 | 8,356,706 | 86,698,716 | 5,010,745 | 15,733,738 | 4,036,994 | 11,707,282 | ||||||||||||||||||||||||||||
Class R | 9,447 | 107,072 | 17,637 | 196,094 | 62,655 | 232,450 | 42,924 | 143,794 | ||||||||||||||||||||||||||||
Class P | 1,991,937 | 23,072,226 | 3,542,930 | 40,239,864 | 135,406 | 576,829 | 59,009 | 223,644 | ||||||||||||||||||||||||||||
Institutional Class | 1,322,412 | 15,445,595 | 1,898,838 | 21,763,973 | 541,021 | 2,320,981 | 401,202 | 1,528,579 | ||||||||||||||||||||||||||||
Class R6 | — | — | — | — | — | — | — | — | ||||||||||||||||||||||||||||
Administrative Class | — | — | — | — | 30,491 | 121,353 | 9,915 | 35,296 | ||||||||||||||||||||||||||||
Cost of shares redeemed: | ||||||||||||||||||||||||||||||||||||
Class A | (14,131,365 | ) | (160,735,659 | ) | (36,250,960 | ) | (405,087,734 | ) | (2,084,370 | ) | (8,097,930 | ) | (5,146,996 | ) | (18,553,742 | ) | ||||||||||||||||||||
Class C | (14,449,587 | ) | (152,349,567 | ) | (35,135,631 | ) | (364,896,381 | ) | (2,699,081 | ) | (8,927,168 | ) | (15,459,005 | ) | (48,597,500 | ) | ||||||||||||||||||||
Class R | (26,156 | ) | (297,097 | ) | (117,232 | ) | (1,313,826 | ) | (52,119 | ) | (200,843 | ) | (317,966 | ) | (1,115,179 | ) | ||||||||||||||||||||
Class P | (9,807,292 | ) | (113,994,483 | ) | (29,220,545 | ) | (334,219,785 | ) | (349,727 | ) | (1,528,675 | ) | (192,857 | ) | (772,866 | ) | ||||||||||||||||||||
Institutional Class | (6,151,607 | ) | (71,830,410 | ) | (8,854,833 | ) | (102,071,432 | ) | (768,822 | ) | (3,347,788 | ) | (3,023,933 | ) | (12,052,333 | ) | ||||||||||||||||||||
Class R6 | — | — | — | — | — | — | — | — | ||||||||||||||||||||||||||||
Administrative Class | — | — | — | — | (18,099 | ) | (72,978 | ) | (20,430 | ) | (76,235 | ) | ||||||||||||||||||||||||
Net increase (decrease) resulting from Fund share transactions | 11,886,355 | $ | 139,589,618 | 15,788,614 | $ | 192,279,698 | 5,431,773 | $ | 18,843,205 | (5,089,842 | ) | $ | (14,006,691 | ) | ||||||||||||||||||||||
| 162 | December 31, 2017 | | Semiannual Report |
Table of Contents
| AllianzGI NFJ Dividend Value | AllianzGI NFJ International Value | AllianzGI NFJ Large-Cap Value | ||||||||||||||||||||||||||||||||||||||||||||||||
Six Months ended December 31, 2017 (unaudited) | Year ended June 30, 2017 | Six Months ended December 31, 2017 (unaudited) | Year ended June 30, 2017 | Six Months ended December 31, 2017 (unaudited) | Year ended June 30, 2017 | |||||||||||||||||||||||||||||||||||||||||||||
| Shares | Amount | Shares | Amount | Shares | Amount | Shares | Amount | Shares | Amount | Shares | Amount | |||||||||||||||||||||||||||||||||||||||
| 1,755,126 | $ | 28,924,193 | 5,795,267 | $ | 97,356,292 | 360,312 | $ | 6,835,081 | 1,597,251 | $ | 27,164,170 | 108,236 | $ | 2,775,014 | 542,952 | $ | 12,745,229 | |||||||||||||||||||||||||||||||||
| 422,332 | 6,838,829 | 698,576 | 11,736,765 | 35,325 | 664,831 | 143,412 | 2,405,278 | 36,493 | 972,720 | 97,693 | 2,215,058 | |||||||||||||||||||||||||||||||||||||||
| 208,009 | 3,577,824 | 661,986 | 11,025,165 | 38,836 | 743,290 | 126,820 | 2,140,259 | 21,284 | 554,431 | 33,347 | 748,428 | |||||||||||||||||||||||||||||||||||||||
| 3,465,581 | 56,836,485 | 7,542,898 | 126,416,044 | 769,398 | 14,558,562 | 4,297,177 | 73,086,189 | 79,761 | 2,045,970 | 299,077 | 6,877,311 | |||||||||||||||||||||||||||||||||||||||
| 2,530,615 | 44,730,227 | 10,008,503 | 166,375,901 | 290,107 | 5,539,569 | 1,665,487 | 28,274,166 | 380,170 | 9,684,584 | 849,322 | 18,413,070 | |||||||||||||||||||||||||||||||||||||||
| 700,089 | 12,425,647 | 2,567,650 | 42,656,575 | 26,875 | 511,269 | 599,549 | 10,171,429 | — | — | — | — | |||||||||||||||||||||||||||||||||||||||
| 777,044 | 14,079,168 | 5,359,236 | 90,591,860 | 24,243 | 470,182 | 78,365 | 1,328,256 | 3,481 | 87,454 | 47,725 | 1,112,670 | |||||||||||||||||||||||||||||||||||||||
| 6,824,857 | 104,127,525 | 1,980,437 | 33,505,626 | 31,193 | 593,599 | 244,596 | 4,195,186 | 48,830 | 1,241,271 | 93,627 | 2,132,383 | |||||||||||||||||||||||||||||||||||||||
| 3,334,822 | 51,347,473 | 737,626 | 12,582,408 | 8,398 | 157,383 | 62,685 | 1,062,337 | 13,993 | 355,137 | 15,780 | 363,071 | |||||||||||||||||||||||||||||||||||||||
| 1,503,038 | 22,847,891 | 467,307 | 7,884,111 | 2,525 | 48,077 | 17,299 | 297,589 | 2,179 | 55,837 | 3,738 | 85,952 | |||||||||||||||||||||||||||||||||||||||
| 6,579,741 | 101,205,892 | 1,749,803 | 29,774,915 | 36,052 | 688,960 | 186,016 | 3,225,805 | 6,388 | 164,251 | 11,543 | 266,616 | |||||||||||||||||||||||||||||||||||||||
| 6,937,440 | 106,766,524 | 5,798,797 | 98,515,800 | 22,215 | 425,192 | 248,818 | 4,283,102 | 48,726 | 1,237,611 | 118,595 | 2,678,724 | |||||||||||||||||||||||||||||||||||||||
| 1,267,361 | 19,457,775 | 446,406 | 7,577,582 | 763 | 14,594 | 72,876 | 1,250,802 | — | — | — | — | |||||||||||||||||||||||||||||||||||||||
| 1,440,245 | 22,516,343 | 1,263,933 | 21,639,645 | 1,458 | 27,824 | 10,830 | 186,218 | 514 | 13,264 | 1,006 | 23,169 | |||||||||||||||||||||||||||||||||||||||
| (6,813,989 | ) | (119,303,685 | ) | (24,692,406 | ) | (405,530,503 | ) | (1,723,550 | ) | (32,860,828 | ) | (10,634,057 | ) | (179,302,853 | ) | (454,368 | ) | (11,479,662 | ) | (1,808,823 | ) | (40,142,557 | ) | |||||||||||||||||||||||||||
| (2,181,644 | ) | (38,038,732 | ) | (7,552,597 | ) | (127,261,685 | ) | (652,431 | ) | (12,239,984 | ) | (2,356,431 | ) | (39,220,864 | ) | (242,817 | ) | (6,196,682 | ) | (1,148,524 | ) | (26,350,179 | ) | |||||||||||||||||||||||||||
| (2,069,940 | ) | (36,349,517 | ) | (3,524,766 | ) | (58,667,570 | ) | (148,513 | ) | (2,825,695 | ) | (372,681 | ) | (6,369,939 | ) | (31,587 | ) | (810,532 | ) | (103,147 | ) | (2,386,243 | ) | |||||||||||||||||||||||||||
| (5,813,797 | ) | (100,776,614 | ) | (39,139,123 | ) | (656,924,717 | ) | (1,980,882 | ) | (37,882,211 | ) | (17,718,091 | ) | (295,563,131 | ) | (79,466 | ) | (2,048,406 | ) | (260,768 | ) | (5,859,844 | ) | |||||||||||||||||||||||||||
| (19,126,043 | ) | (338,901,136 | ) | (114,637,229 | ) | (1,940,664,400 | ) | (974,651 | ) | (18,709,967 | ) | (16,702,856 | ) | (282,046,337 | ) | (376,702 | ) | (9,378,316 | ) | (3,684,773 | ) | (82,325,541 | ) | |||||||||||||||||||||||||||
| (1,735,002 | ) | (30,764,985 | ) | (5,633,225 | ) | (95,116,426 | ) | (1,452,045 | ) | (27,443,161 | ) | (2,511,013 | ) | (42,954,142 | ) | — | — | — | — | |||||||||||||||||||||||||||||||
| (15,329,501 | ) | (289,257,698 | ) | (11,141,755 | ) | (187,967,703 | ) | (34,797 | ) | (668,038 | ) | (700,673 | ) | (11,905,864 | ) | (907 | ) | (23,081 | ) | (62,370 | ) | (1,458,101 | ) | |||||||||||||||||||||||||||
| | (15,323,616 | ) | $ | (357,710,571 | ) | (161,242,676 | ) | $ | (2,714,494,315 | ) | (5,319,169 | ) | $ | (101,351,471 | ) | (41,644,621 | ) | $ | (698,292,344 | ) | (435,792 | ) | $ | (10,749,135 | ) | (4,954,000 | ) | $ | (110,860,784 | ) | ||||||||||||||||||||
| Semiannual Report | | December 31, 2017 | 163 |
Table of Contents
Notes to Financial Statements (cont’d)
December 31, 2017 (unaudited)
| AllianzGI NFJ Mid-Cap Value | AllianzGI NFJ Small-Cap Value | |||||||||||||||||||||||||||||||||||
| Six Months ended December 31, 2017 (unaudited) | Year ended June 30, 2017 | Six Months ended December 31, 2017 (unaudited) | Year ended June 30, 2017 | |||||||||||||||||||||||||||||||||
| Shares | Amount | Shares | Amount | Shares | Amount | Shares | Amount | |||||||||||||||||||||||||||||
Shares sold: | ||||||||||||||||||||||||||||||||||||
Class A | 2,430,952 | $ | 78,613,727 | 2,929,648 | $ | 89,112,902 | 1,462,056 | $ | 34,248,563 | 5,870,482 | $ | 138,164,344 | ||||||||||||||||||||||||
Class C | 374,446 | 10,226,670 | 172,405 | 4,029,533 | 111,653 | 2,338,087 | 122,755 | 2,648,474 | ||||||||||||||||||||||||||||
Class R | 214,826 | 6,061,203 | 83,670 | 2,005,344 | 101,217 | 2,616,773 | 374,799 | 9,266,833 | ||||||||||||||||||||||||||||
Class P | 2,602,142 | 69,989,185 | 1,429,932 | 34,181,871 | 435,436 | 11,512,048 | 1,439,962 | 37,334,359 | ||||||||||||||||||||||||||||
Institutional Class | 3,033,467 | 105,461,630 | 706,598 | 22,140,970 | 2,229,216 | 59,449,529 | 9,236,039 | 238,621,205 | ||||||||||||||||||||||||||||
Class R6 | 6,115 | # | 224,674 | # | — | — | 2,592,856 | 69,368,518 | 9,761,937 | 251,967,592 | ||||||||||||||||||||||||||
Administrative Class | 174,407 | 5,919,716 | 59,934 | 1,714,718 | 505,203 | 12,338,592 | 3,781,945 | 87,611,583 | ||||||||||||||||||||||||||||
Issued in reinvestment of dividends and distributions: |
| |||||||||||||||||||||||||||||||||||
Class A | 1,354,253 | 42,523,330 | 163,495 | 4,460,543 | 4,827,870 | 105,247,563 | 1,395,333 | 33,424,672 | ||||||||||||||||||||||||||||
Class C | 681,614 | 17,599,274 | 60,204 | 1,376,953 | 1,101,049 | 21,415,391 | 223,692 | 4,879,131 | ||||||||||||||||||||||||||||
Class R | 30,983 | 835,615 | 1,999 | 47,650 | 306,683 | 7,121,185 | 81,033 | 2,042,503 | ||||||||||||||||||||||||||||
Class P | 416,454 | 10,577,921 | 13,550 | 305,865 | 348,613 | 8,453,860 | 65,053 | 1,705,328 | ||||||||||||||||||||||||||||
Institutional Class | 348,217 | 11,672,240 | 23,912 | 692,798 | 6,448,975 | 157,290,488 | 2,062,474 | 54,342,597 | ||||||||||||||||||||||||||||
Class R6 | 581 | # | 19,437 | # | — | — | 2,686,009 | 65,270,025 | 580,542 | 15,252,734 | ||||||||||||||||||||||||||
Administrative Class | 29,432 | 952,725 | 1,817 | 51,039 | 2,273,516 | 49,403,503 | 777,588 | 18,585,786 | ||||||||||||||||||||||||||||
Cost of shares redeemed: | ||||||||||||||||||||||||||||||||||||
Class A | (1,418,908 | ) | (45,956,766 | ) | (2,689,666 | ) | (74,402,560 | ) | (6,825,335 | ) | (165,909,967 | ) | (24,728,726 | ) | (575,783,473 | ) | ||||||||||||||||||||
Class C | (434,925 | ) | (11,721,665 | ) | (2,274,945 | ) | (54,725,859 | ) | (979,182 | ) | (21,616,046 | ) | (3,447,241 | ) | (73,533,805 | ) | ||||||||||||||||||||
Class R | (34,855 | ) | (979,161 | ) | (209,420 | ) | (4,922,149 | ) | (445,549 | ) | (11,602,888 | ) | (1,395,219 | ) | (34,012,971 | ) | ||||||||||||||||||||
Class P | (562,237 | ) | (15,129,592 | ) | (290,064 | ) | (6,740,021 | ) | (603,448 | ) | (16,165,905 | ) | (1,357,196 | ) | (34,611,893 | ) | ||||||||||||||||||||
Institutional Class | (432,709 | ) | (15,010,969 | ) | (1,293,569 | ) | (37,349,954 | ) | (10,484,167 | ) | (283,677,171 | ) | (44,861,230 | ) | (1,133,190,840 | ) | ||||||||||||||||||||
Class R6 | — | # | — | # | — | — | (4,824,263 | ) | (131,197,365 | ) | (9,281,544 | ) | (237,967,266 | ) | ||||||||||||||||||||||
Administrative Class | (22,128 | ) | (741,290 | ) | (54,657 | ) | (1,512,400 | ) | (4,421,723 | ) | (108,388,624 | ) | (13,330,250 | ) | (310,190,615 | ) | ||||||||||||||||||||
Net increase (decrease) resulting from Fund share transactions | 8,792,127 | $ | 271,137,904 | (1,165,157 | ) | $ | (19,532,757 | ) | (3,153,315 | ) | $ | (132,483,841 | ) | (62,627,772 | ) | $ | (1,503,443,722 | ) | ||||||||||||||||||
| # | For the period December 18, 2017 (commencement of share class) through December 31, 2017. “Shares sold” includes shares sold to AFI. |
| 164 | December 31, 2017 | | Semiannual Report |
Table of Contents
| AllianzGI Small-Cap Blend | AllianzGI Technology | |||||||||||||||||||||||||||||||||
| Six Months ended December 31, 2017 (unaudited) | Year ended June 30, 2017 | Six Months ended December 31, 2017 (unaudited) | Year ended June 30, 2017 | |||||||||||||||||||||||||||||||
| Shares | Amount | Shares | Amount | Shares | Amount | Shares | Amount | |||||||||||||||||||||||||||
| 184,159 | $ | 4,049,002 | 317,890 | $ | 6,322,342 | 677,584 | $ | 45,959,448 | 1,273,337 | $ | 70,821,503 | |||||||||||||||||||||||
| 22,564 | 469,384 | 27,881 | 499,252 | 76,801 | 4,157,889 | 110,182 | 4,897,251 | |||||||||||||||||||||||||||
| — | — | — | — | — | — | — | — | |||||||||||||||||||||||||||
| 55,620 | 1,235,082 | 105,486 | 2,030,677 | 134,587 | 9,798,321 | 369,205 | 22,151,404 | |||||||||||||||||||||||||||
| 74,900 | 1,618,157 | 44,052 | 862,431 | 1,389,053 | 104,732,930 | 3,220,143 | 196,118,546 | |||||||||||||||||||||||||||
| — | — | — | — | — | — | — | — | |||||||||||||||||||||||||||
| — | — | — | — | 20,721 | 1,498,162 | 224,403 | 12,530,809 | |||||||||||||||||||||||||||
| 222,628 | 4,506,000 | 1,105 | 21,226 | 1,130,131 | 70,158,545 | 400,248 | 19,996,402 | |||||||||||||||||||||||||||
| 217,695 | 4,282,069 | 554 | 10,366 | 474,556 | 22,849,887 | 153,862 | 6,272,953 | |||||||||||||||||||||||||||
| — | — | — | — | — | — | — | — | |||||||||||||||||||||||||||
| 19,088 | 389,394 | 108 | 2,082 | 128,482 | 8,794,567 | 33,725 | 1,826,886 | |||||||||||||||||||||||||||
| 25,372 | 520,890 | 162 | 3,149 | 1,604,512 | 111,641,922 | 478,155 | 26,245,941 | |||||||||||||||||||||||||||
| — | — | — | — | — | — | — | — | |||||||||||||||||||||||||||
| — | — | — | — | 39,515 | 2,594,161 | 63,711 | 3,335,296 | |||||||||||||||||||||||||||
| (177,931 | ) | (3,867,257 | ) | (346,512 | ) | (6,521,593 | ) | (1,319,007 | ) | (89,683,687 | ) | (2,931,615 | ) | (156,728,305 | ) | |||||||||||||||||||
| (133,668 | ) | (2,797,897 | ) | (615,876 | ) | (11,696,958 | ) | (255,312 | ) | (13,769,097 | ) | (795,177 | ) | (36,208,143 | ) | |||||||||||||||||||
| — | — | — | — | — | — | — | — | |||||||||||||||||||||||||||
| (24,049 | ) | (521,538 | ) | (133,080 | ) | (2,542,922 | ) | (146,412 | ) | (10,607,015 | ) | (370,430 | ) | (21,107,541 | ) | |||||||||||||||||||
| (18,785 | ) | (396,507 | ) | (60,248 | ) | (1,181,254 | ) | (4,741,442 | ) | (338,768,686 | ) | (2,597,618 | ) | (152,233,924 | ) | |||||||||||||||||||
| — | — | — | — | — | — | — | — | |||||||||||||||||||||||||||
| — | — | — | — | (23,265 | ) | (1,653,134 | ) | (1,305,825 | ) | (75,119,465 | ) | |||||||||||||||||||||||
|
467,593 |
| $ | 9,486,779 | (658,478 | ) | $ | (12,191,202 | ) | (809,496 | ) | $ | (72,295,787 | ) | (1,673,694 | ) | $ | (77,200,387 | ) | |||||||||||||||
| Semiannual Report | | December 31, 2017 | 165 |
Table of Contents
Notes to Financial Statements (cont’d)
December 31, 2017 (unaudited)
| 8. | SIGNIFICANT ACCOUNT HOLDERS |
From time to time, a Fund may have a concentration of shareholders, which may include the Investment Adviser or affiliates of the Investment Adviser, holding a significant percentage of shares outstanding. Investment activities of these shareholders could have a material impact to a Fund.
At December 31, 2017, the significant account-holders, owners of 5% or greater of each respective Fund’s outstanding shares were as follows:
| Unaffiliated | ||||||||
| Number of Account Holders | Approximate Ownership | |||||||
AllianzGI Emerging Markets Opportunities | 5 | 67 | % | |||||
AllianzGI Focused Growth | 4 | 27 | % | |||||
AllianzGI Global Natural Resources | 5 | 54 | % | |||||
AllianzGI Global Small-Cap | 5 | 47 | % | |||||
AllianzGI Health Sciences | 3 | 57 | % | |||||
AllianzGI Income & Growth | 7 | 52 | % | |||||
AllianzGI Mid-Cap | 6 | 52 | % | |||||
AllianzGI NFJ Dividend Value | 4 | 32 | % | |||||
AllianzGI NFJ International Value | 5 | 44 | % | |||||
AllianzGI NFJ Large-Cap Value | 7 | 48 | % | |||||
AllianzGI NFJ Mid-Cap Value | 4 | 32 | % | |||||
AllianzGI NFJ Small-Cap Value | 3 | 39 | % | |||||
AllianzGI Small-Cap Blend | 4 | 42 | % | |||||
AllianzGI Technology | 4 | 30 | % | |||||
| 9. | AFFILIATED TRANSACTIONS |
An affiliate includes any company in which a Fund held 5% or more of a company’s outstanding voting securities at any point during the reporting period. The table below represents transactions in and earnings from these affiliated issuers during the six months ended December 31, 2017:
| AllianzGI NFJ Small-Cap Value: | ||||||||||||||||||||||||||||||||
| Market Value 6/30/2017 | Purchases at Cost | Proceeds from Sales | Change in Unrealized Appreciation (Depreciation) | Market Value 12/31/2017 | Dividend Income | Shares as of 12/31/2017 | Net Realized Gain (Loss) | |||||||||||||||||||||||||
CNX Midstream Partners LP. | $ | 33,867,838 | — | $ | (2,749,449 | ) | $ | (3,874,877 | ) | $ | 27,223,932 | $ | 1,037,072 | 1,623,371 | $ | (19,580 | ) | |||||||||||||||
Insteel Industries, Inc.† | 36,573,291 | — | (28,462,438 | ) | (2,090,762 | ) | — | 26,694 | — | (6,020,091 | ) | |||||||||||||||||||||
Totals | $ | 70,441,129 | — | $ | (31,211,887 | ) | $ | (5,965,639 | ) | $ | 27,223,932 | $ | 1,063,766 | $ | (6,039,671 | ) | ||||||||||||||||
| † | Not affiliated at Fund level at December 31, 2017. |
Certain additional purchases of existing portfolio holdings that were not considered affiliated in prior years, resulted in the Funds owning in excess of 5% of the outstanding shares of certain issues at December 31, 2017. The percentages and market values of the affiliated transactions presented below include both acquisitions of new investments and prior year holdings that became affiliated during the reporting period.
| AllianzGI NFJ Small-Cap Value: | ||||||||||||
| Issuer Name | Fund’s % Holding | Market Value | Market Value as a % of Fund’s Net Assets | |||||||||
CNX Midstream Partners LP. | 5.14 | % | $ | 27,223,932 | 1.01 | % | ||||||
| 10. | FUND EVENTS |
(a) Sub-Adviser Merger
On July 1, 2017, NFJ merged with and into AllianzGI U.S. As of the July 1, 2017, AllianzGI U.S. assumed all services and responsibilities that had been provided by NFJ and AllianzGI NFJ Dividend Value, AllianzGI NFJ International Value, AllianzGI NFJ Large-Cap, AllianzGI NFJ Mid-Cap Value and AllianzGI NFJ Small-Cap Value ceased to have a sub-adviser. The merger did not result in any change to the manner in which investment advisory
| 166 | December 31, 2017 | | Semiannual Report |
Table of Contents
services are provided to the Funds the personnel responsible for providing investment advisory services to the Funds or the personnel ultimately responsible for overseeing the provision of such services, as described in greater detail in Note 1.
(b) New Share Classes
Effective December 18, 2017, AllianzGI NFJ Mid-Cap Value began offering Class R6 shares.
(c) Transfer Agency Services Provider
On December 28, 2017, AllianzGI U.S. as Administrator, on behalf of the Trust, entered into a Novation Framework Agreement with State Street Bank and Trust Company (“SSB”) and DST Asset Manager Solutions, Inc. (“DST”) (formerly known as Boston Financial Data Services, Inc.) whereby SSB replaced DST as the named provider of transfer agency services to the Funds. SSB then delegated its duties and obligations as transfer agent to DST. This transition was undertaken solely to promote efficiency and administrative simplicity, allowing SSB and DST to consolidate certain contracts and streamline their relationship, and had no effect on the services provided to the Trust.
| 11. | PAYMENTS FROM AFFILIATES |
During the six months ended December 31, 2017, the AllianzGI U.S. reimbursed AllianzGI Global Small-Cap $78,097 for realized losses resulting from a trading error.
During the year ended June 30, 2017, AllianzGI U.S. reimbursed AllianzGI Global Small-Cap and AllianzGI Small-Cap Blend $1,440 and $1,173, respectively, for realized losses resulting from trading errors.
| 12. | BORROWINGS |
The Trust has entered into a credit agreement (the “State Street Agreement”), among the Trust, AllianzGI Institutional Multi-Series Trust, Allianz Funds Multi-Strategy Trust and Premier Multi-Series VIT, as borrowers (collectively, the “AllianzGI Borrowers” and each series thereof, an “AllianzGI Borrower Fund”), and State Street Bank and Trust Company, as agent and lender, for a committed line of credit. The State Street Agreement was amended on October 26, 2017 and has a term through October 25, 2018 and permits the AllianzGI Borrowers to borrow up to $200 million in aggregate, subject to (i) a requirement that each AllianzGI Borrower Fund’s asset coverage with respect to senior securities representing indebtedness be 300% or higher, and (ii) certain other limitations and conditions. Each AllianzGI Borrower Fund must pay interest on any amounts borrowed under the facility at a rate per annum equal to 1.25% plus the higher of the then-current federal funds overnight rate or the one-month LIBOR rate, subject to upward adjustment when any past due payments are outstanding. The AllianzGI Borrowers will also pay a usage fee at an annualized rate of 0.25% on undrawn amounts, allocated pro rata among the AllianzGI Borrower Funds on the basis of net assets. Amounts borrowed may be repaid and reborrowed on a revolving basis during the term of the facility.
The Funds did not utilize the line of credit during the six months ended December 31, 2017.
Pursuant to an exemptive order issued by the SEC (the “Order”), the Funds are authorized to enter into a master interfund lending agreement (the “Interfund Program”) with each other and certain funds advised by the Investment Adviser. The Interfund Program permits certain funds to lend money directly to and borrow money directly from other funds for temporary purposes. During the six months ended December 31, 2017, the Funds did not participate as a borrower or lender in the Interfund Program.
| 13. | RELATED PARTY TRANSACTIONS |
The Investment Adviser is a related party. Fees payable to this party are disclosed in Note 4 and the accrued related party fee amounts are disclosed on the Statements of Assets and Liabilities.
Certain Funds are permitted to purchase or sell securities from or to certain related affiliated funds under specified conditions outlined in procedures adopted by the Board. The procedures have been designed to ensure that any purchase or sale of securities by the Funds from or to another fund or portfolio that are, or could be, considered an affiliate by virtue of having a common investment adviser (or affiliated investment advisers), common Trustees and/or common officers comply with Rule 17a-7 of the 1940 Act. Further, as defined under the procedures, each transaction is effected at the current market price.
During the six months ended December 31, 2017, the Funds were not engaged in any purchases and sales of securities pursuant to Rule 17a-7 of the 1940 Act.
| 14. | SUBSEQUENT EVENTS |
In preparing these financial statements, the Funds’ management has evaluated events and transactions for potential recognition or disclosure through the date the financial statements were issued.
On January 18, 2018, AllianzGI Income & Growth declared per-share net investment income dividends and short-term capital gain distributions to shareholders, payable January 18, 2018 to shareholders of record on January 17, 2018 as follows:
| Share Class | Dividend Rate | Short-Term Capital Gains | ||||||
Class A | $ | 0.01785 | $ | 0.05965 | ||||
Class C | $ | 0.01142 | $ | 0.05965 | ||||
Institutional Class | $ | 0.02124 | $ | 0.05965 | ||||
Class R | $ | 0.01547 | $ | 0.05965 | ||||
Class P | $ | 0.02023 | $ | 0.05965 | ||||
There were no other subsequent events identified that require recognition or disclosure.
| Semiannual Report | | December 31, 2017 | 167 |
Table of Contents
Unaudited
Changes to the Board of Trustees and Fund Officers
Effective December 12, 2017, Barbara R. Claussen resigned as a Trustee of the Funds and Erick R. Holt became a Trustee of the Funds. Mr. Holt is an “interested person” of the Funds, as defined in Section 2(a) (19) of the 1940 Act, due to his positions with the Investment Adviser and its affiliates.
Effective December 12, 2017, Craig A. Ruckman was appointed Assistant Secretary to the Funds.
| 168 | December 31, 2017 | | Semiannual Report |
Table of Contents
Unaudited
Please read this Policy carefully. It gives you important information about how Allianz Global Investors U.S. and its U.S. affiliates (“AllianzGI US,” “we” or “us”) handle non-public personal information (“Personal Information”) that we may receive about you. It applies to all of our past, present and future clients and shareholders of AllianzGI US and the funds and accounts it manages, advises, sub-advises, administers or distributes, and will continue to apply when you are no longer a client or shareholder. As used throughout this Policy, “AllianzGI US” means Allianz Global Investors U.S. LLC, Allianz Global Investors Distributors LLC, and the family of registered and unregistered funds managed by one or more of these firms. AllianzGI US is part of a global investment management group, and the privacy policies of other Allianz Global Investors entities outside of the United States may have provisions in their policies that differ from this Privacy Policy. Please refer to the website of the specific non-US Allianz Global Investors entity for its policy on privacy.
We Care about Your Privacy
We consider your privacy to be a fundamental aspect of our relationship with you, and we strive to maintain the confidentiality, integrity and security of your Personal Information. To ensure your privacy, we have developed policies that are designed to protect your Personal Information while allowing your needs to be served.
Information We May Collect
In the course of providing you with products and services, we may obtain Personal Information about you, which may come from sources such as account application and other forms, from other written, electronic, or verbal communications, from account transactions, from a brokerage or financial advisory firm, financial advisor or consultant, and/or from information you provide on our website.
You are not required to supply any of the Personal Information that we may request. However, failure to do so may result in us being unable to open and maintain your account, or to provide services to you.
How Your Information Is Shared
We do not disclose your Personal Information to anyone for marketing purposes. We disclose your Personal Information only to those service providers, affiliated and non-affiliated, who need the information for everyday business purposes, such as to respond to your inquiries, to perform services, and/or to service and maintain your account. This applies to all of the categories of Personal Information we collect about you. The affiliated and non-affiliated service providers who receive your Personal Information also may use it to process your transactions, provide you with materials (including preparing and mailing prospectuses and shareholder reports and gathering shareholder proxies), and provide you with account statements and other materials relating to your account. These service providers provide services at our direction, and under their agreements with us, are required to keep your Personal Information confidential and to use it only for providing the contractually required services. Our service providers may not use your Personal Information to market products and services to you except in conformance with applicable laws and regulations. We also may provide your Personal Information to your respective brokerage or financial advisory firm, custodian, and/or to your financial advisor or consultant.
In addition, we reserve the right to disclose or report Personal Information to non-affiliated third parties, in limited circumstances, where we believe in good faith that disclosure is required under law, to cooperate with regulators or law enforcement authorities or pursuant to other legal process, or to protect our rights or property, including to enforce our Privacy Policy or other agreements with you. Personal Information collected by us may also be transferred as part of a corporate sale, restructuring, bankruptcy, or other transfer of assets.
Security of Your Information
We maintain your Personal Information for as long as necessary for legitimate business purposes or otherwise as required by law. In maintaining this information, we have implemented appropriate procedures that are designed to restrict access to your Personal Information only to those who need to know that information in order to provide products and/or services to you. In addition, we have implemented physical, electronic and procedural safeguards to help protect your Personal Information.
Privacy and the Internet
The Personal Information that you provide through our website, as applicable, is handled in the same way as the Personal Information that you provide by any other means, as described above. This section of the Policy gives you additional information about the way in which Personal Information that is obtained online is handled.
| ∎ | Online Enrollment, Account Access and Transactions: When you visit our website, you can visit pages that are open to the general public, or, where available, log into protected pages to enroll online, access information about your account, or conduct certain transactions. Access to the secure pages of our website is permitted only after you have created a User ID and Password. The User ID and Password must be supplied each time |
| Semiannual Report | | December 31, 2017 | 169 |
Table of Contents
Unaudited
Privacy Policy (cont’d)
| you want to access your account information online. This information serves to verify your identity. When you enter Personal Information into our website to enroll or access your account online, you will log into secure pages. By using our website, you consent to this Privacy Policy and to the use of your Personal Information in accordance with the practices described in this Policy. If you provide Personal Information to effect transactions, a record of the transactions you have performed while on the site is retained by us. For additional terms and conditions governing your use of our website, please refer to the Investor Mutual Fund Access—Disclaimer which is incorporated herein by reference and is available on our website. |
| ∎ | Cookies and Similar Technologies: Cookies are small text files stored in your computer’s hard drive when you visit certain web pages. Clear GIFs (also known as Web Beacons) are typically transparent very small graphic images (usually 1 pixel x 1 pixel) that are placed on a website that may be included on our services provided via our website and typically work in conjunction with cookies to identify our users and user behavior. We may use cookies and automatically collected information to: (i) personalize our website and the services provided via our website, such as remembering your information so that you will not have to re-enter it during your use of, or the next time you use, our website and the services provided via our website; (ii) provide customized advertisements, content, and information; (iii) monitor and analyze the effectiveness of our website and the services provided via our website and third-party marketing activities; (iv) monitor aggregate site usage metrics such as total number of visitors and pages viewed; and (v) track your entries, submissions, and status in any promotions or other activities offered through our website and the services provided via our website. Tracking technology also helps us manage and improve the usability of our website, (i) detecting whether there has been any contact between your computer and us in the past and (ii) to identify the most popular sections of our website. Because an industry-standard Do-Not-Track protocol is not yet established, our website will continue to operate as described in this Privacy Policy and will not be affected by any Do-Not-Track signals from any browser. |
| ∎ | Use of Social Media Plugins: Our website uses the following Social Media Plugins (“Plugins”): |
| ∎ | Facebook Share Button operated by Facebook Inc., 1601 S. California Ave, Palo Alto, CA 94304, USA |
| ∎ | Tweet Button operated by Twitter Inc., 795 Folsom St., Suite 600, San Francisco, CA 94107, USA |
| ∎ | LinkedIn Share Button operated by LinkedIn Corporation, 2029 Stierlin Court, Mountain View, CA 94043, USA |
All Plugins are marked with the brand of the respective operators Facebook, Twitter and LinkedIn (“Operators”). When you visit our website that contains a social plugin, your browser establishes a direct connection to the servers of the Operator. The Operator directly transfers the plugin content to your browser which embeds the latter into our website, enabling the Operator to receive information about you having accessed the respective page of our website. Thus, AllianzGI US has no influence on the data gathered by the plugin and we inform you according to our state of knowledge: The embedded plugins provide the Operator with the information that you have accessed the corresponding page of our website. If you do not wish to have such data transferred to the Operators, you need to log out of your respective account before visiting our website. Please see the Operators’ data privacy statements in order to get further information about purpose and scope of the data collection and the processing and use:
| ∎ | Facebook: https://de-de.facebook.com/about/privacy/ |
| ∎ | Twitter: https://twitter.com/privacy |
| ∎ | Linked In: https://www.linkedin.com/legal/privacy-policy |
Changes to Our Privacy Policy
We may modify this Privacy Policy from time-to-time to reflect changes in related practices and procedures, or applicable laws and regulations. If we make changes, we will notify you on our website and the revised Policy will become effective immediately upon posting to our website. We also will provide account owners with a copy of our Privacy Policy annually, if required. We encourage you to visit our website periodically to remain up to date on our Privacy Policy. You acknowledge that by using our website after we have posted changes to this Privacy Policy, you are agreeing to the terms of the Privacy Policy as modified.
Obtaining Additional Information
If you have any questions about this Privacy Policy or our privacy related practices in the United States, you may contact us via our dedicated email at PrivacyUS@allianzgi.com.
| 170 | December 31, 2017 | | Semiannual Report |
Table of Contents
Unaudited
Matters Relating to the Trustees’ Consideration of the Investment Management Agreement
The Investment Company Act of 1940, as amended, requires that both the full Board of Trustees (the “Board” or the “Trustees”) and a majority of the Trustees who are not interested persons of the Trust (the “Independent Trustees”), voting separately, annually approve the continuation of the Trust’s Amended and Restated Investment Advisory Agreement (the “Agreement”) on behalf of each Fund (as defined below) with Allianz Global Investors U.S. LLC (the “Investment Adviser”).
The Independent Trustees met in person on October 10-11, 2017 for the specific purpose of considering whether to approve the continuation of the Agreement for an additional year. The Contracts Committee of the Board of Trustees, which is comprised of all of the Independent Trustees, met on September 20, 2017 and October 10, 2017 (the “contract review meetings”) with independent counsel to discuss the materials provided by the Investment Adviser in response to the Independent Trustees’ written request for information regarding the annual renewal. Representatives from fund management attended portions of those meetings to, among other topics, review the comparative fee and expense information and comparative performance information prepared and provided by Broadridge Financial Solutions, Inc. (“Broadridge”), an independent third party, for each Fund using its respective Broadridge peer groups for performance and expense comparisons.
At their meeting held on October 10, 2017, the Board and the Independent Trustees unanimously approved the continuation of the Agreements for an additional one-year period commencing January 1, 2018 with respect to AllianzGI Emerging Markets Opportunities Fund, AllianzGI Focused Growth Fund, AllianzGI Global Natural Resources Fund, AllianzGI Global-Small-Cap Fund, AllianzGI Health Sciences Fund, AllianzGI Income & Growth Fund, AllianzGI Mid-Cap Fund, AllianzGI Small-Cap Blend Fund, AllianzGI Technology Fund (each, a “Fund,” and together, the “AllianzGI Funds”); and, AllianzGI NFJ Dividend Value Fund, AllianzGI NFJ International Value Fund, AllianzGI NFJ Large-Cap Fund, AllianzGI NFJ Mid-Cap Value Fund, AllianzGI NFJ Small-Cap Value Fund (each, also a “Fund,” together, the “NFJ Funds,” and with the AllianzGI Funds, the “Funds”).
The material factors and conclusions that formed the basis of these approvals for the Funds are discussed below.
In connection with their deliberations regarding the approval of the Agreement, the Independent Trustees considered such information and factors as they believed, in light of the legal advice furnished to them and their own business judgment, to be relevant. As described below, the Independent Trustees considered the nature, quality and extent of the various investment management, administrative and other services to be performed by the Investment Adviser under the Agreement.
It was noted that, on October 1, 2016, Allianz Global Investors Fund Management LLC (“AGIFM”), the former investment adviser to the Funds, merged into AllianzGI U.S., a former sub-adviser to various
Funds, after which AllianzGI U.S. assumed AGIFM’s roles as investment adviser and administrator to the Funds and continued to provide the day-to-day portfolio management services it previously provided as sub-adviser in its new capacity as Investment Adviser, and the applicable sub-advisory agreements with AllianzGI U.S. were terminated. In addition, it was noted that NFJ Investment Group LLC (“NFJ LLC”), a former sub-adviser to NFJ Funds, merged with and into the Investment Adviser effective July 1, 2017. It was further noted that, from and after this merger, the Investment Adviser assumed the sole day-to-day portfolio management responsibilities for the NFJ Funds in its capacity as the Investment Adviser, directly providing all of the services previously provided by NFJ LLC, and the applicable sub-advisory contracts with NFJ LLC terminated. In the course of their deliberations regarding the approval of the Agreement, the Trustees took into account that the personnel at AGIFM and NFJ LLC who had previously provided advisory services to the Funds prior to the aforementioned mergers continued to do so in the same capacities as employees of the Investment Adviser following the mergers. The Trustees considered that neither the merger of AGIFM into the Investment Adviser nor the merger of NFJ LLC into the Investment Adviser had, or was expected have in the future, any impact on the nature or quality of investment advisory or administrative services provided to the Funds.
In connection with their contract review meetings, the Independent Trustees received and relied upon materials provided by the Investment Adviser including, among other items: (i) information provided by Broadridge, for the Funds on the investment performance of a group of funds with investment classifications and/or objectives comparable to those of the Funds identified by Broadridge (the “Broadridge Performance Universe”), the performance of applicable benchmark indices and the total return investment performance (based on net assets) of the Funds for various time periods; (ii) information on the Funds’ advisory fees and other expenses and information compiled by Broadridge, as applicable, on the advisory fees and other expenses of comparable funds identified by Broadridge (the “Broadridge Expense Group”); (iii) to the extent applicable, information regarding the investment performance and fees for other mutual funds and separately managed accounts managed by the Investment Adviser or its affiliates with similar investment objective(s) and policies to those of the Funds, if any; (iv) an estimate of the profitability to the Investment Adviser from its relationship with the Funds for the twelve months ended December 31, 2016; (v) descriptions of various functions performed by the Investment Adviser for the Funds, such as portfolio management, compliance monitoring, portfolio trading practices and oversight of third party service providers; (vi) information regarding the overall organization and business functions of the Investment Adviser, including, without limitation, information regarding senior management, portfolio managers and other personnel providing or proposed to provide investment management, administrative and other services, and corporate ownership and business operations unrelated to the Funds;
| Semiannual Report | | December 31, 2017 | 171 |
Table of Contents
Unaudited
Matters Relating to the Trustees’ Consideration of the Investment Management Agreement (cont’d)
(vii) fact cards for each Fund including, among other information, performance comparisons between the Funds and their Broadridge Performance Universe, total return investment performance based on net asset value, investment objectives, total net assets, annual fund operating expenses for each share class, portfolio managers, total expense ratio and management fee comparisons between each Fund and its Broadridge Expense Group and trends in profitability to the Investment Adviser of its advisory relationship with each Fund; and (viii) summaries assigning a quadrant placement to each Fund for an institutional and retail share class based on an average of certain measures of performance and fees/expenses versus peer group medians.
The Independent Trustees’ conclusions as to the approval of the Agreement was based on a comprehensive consideration of all information provided to the Independent Trustees and were not the result of any single factor. Some of the factors that figured particularly in the Independent Trustees’ deliberations are described below, although individual Independent Trustees may have evaluated the information presented differently from one another, attributing different weights to various factors. The Independent Trustees recognized that the fee arrangements for the Funds are the result of review and discussion in the prior years between the Independent Trustees and the Investment Adviser, that certain aspects of such arrangements may receive greater scrutiny in some years than in others, and that the Independent Trustees’ conclusions may be based, in part, on their consideration of these same arrangements during the course of the year and in prior years. The Independent Trustees evaluated information available to them on a Fund-by-Fund basis, and their determinations were made separately in respect of each Fund. However, they also took into account the common interests of all series of the Trust in their review. The Independent Trustees also took into account that the Investment Adviser had proposed the continuation, modification or adoption of certain advisory or administrative fee breakpoints, waivers or reductions for certain Funds. The Independent Trustees also considered the risk profiles of the Funds.
The Independent Trustees considered, among other matters, that the Investment Adviser provides or procures through third-party service providers most administrative services that are required by the Funds under a separate Administration Agreement. These services include accounting, bookkeeping, tax, legal, audit, custody, transfer agency, sub-transfer agency, valuation and compliance services, preparation of prospectuses, shareholder reports and other regulatory filings, oversight and coordination of activities of third-party service providers and various shareholder services. The Independent Trustees took into account the “unitary” administrative fee structure applicable to the Funds, under which certain third-party services that are ordinarily the financial responsibility of a mutual fund (e.g., audit, custody, accounting, legal, transfer agency, sub-transfer agency and printing services) are, in the case of the Funds, paid for by the Investment Adviser out of its administrative fee. They also took into account that
the Investment Adviser provides the Funds with office space, administrative services and personnel to serve as Fund officers, and that the Investment Adviser and its affiliates pay all of the compensation of the Funds’ interested Trustees and officers (in their capacities as employees of the Investment Adviser or such affiliates).
Performance Information
Fund-specific performance results reviewed by the Independent Trustees are discussed below. The comparative performance information was prepared and provided by Broadridge and was not independently verified by the Independent Trustees. The Independent Trustees reviewed comparative information showing performance for Class A and Institutional Class shares of the Funds against their respective Broadridge Performance Universes for the one-year, three-year, five-year and ten-year periods (to the extent each such Fund had been in existence), each ended June 30, 2017. Institutional Class performance relative to the median for each Fund’s Broadridge Performance Universe is described below, and for those Funds with performance that ranked below median for their respective Broadridge Performance Universes, the specific quintile rankings for Institutional Class shares are also noted below with respect to the relevant periods of underperformance.
AllianzGI Funds. For the AllianzGI Emerging Markets Opportunities Fund, performance was below median for the one-year and ten-year periods (in the third and fourth quintiles respectively) and above median for the three- and five-year periods. For the AllianzGI Focused Growth Fund, performance was below median (in the fourth quintile) for the one-year period and above median for the three-, five- and ten-year periods. For the AllianzGI Global Natural Resources Fund, performance was below median for the one-year period (in the fifth quintile) and above median for the three-, five- and ten-year periods. For the AllianzGI Global Small-Cap Fund, performance was below median for the one- and three-year periods (in the fifth and third quintiles respectively) and above median for the five- and ten-year periods. For the AllianzGI Health Sciences Fund, performance was below median (in the fourth quintile) for the one-year period. The AllianzGI Health Sciences Fund’s Institutional Class shares have less than three years of history; its Class A shares’ performance was above median for the three-year period and below median for the five- and ten-year periods (in the fifth and fourth quintiles, respectively). For the AllianzGI Income & Growth Fund, performance was above median for the one-, three-, five- and ten-year periods. For the AllianzGI Mid-Cap Fund, performance was above median for the one-, three-, five-, and ten-year periods. For the AllianzGI Small-Cap Blend Fund, performance was above median for the one- and three-year periods. For the AllianzGI Technology Fund, performance was below median (in the fourth quintile) for the one- and three-year periods and above median for the five- and ten-year periods.
NFJ Funds. For the AllianzGI NFJ Dividend Value Fund, performance was above median for the one-year period and below median for the three-, five- and ten-year periods (in the fifth quintile for the three-
| 172 | December 31, 2017 | | Semiannual Report |
Table of Contents
and ten-year periods and in the fourth quintile for the five-year period). For the AllianzGI NFJ International Value Fund, performance was below median for the one-, three-, five- and ten-year periods (in the fifth quintile for the one-, three-, and five-year periods and the fourth quintile for the ten-year period). For the AllianzGI NFJ Large-Cap Value Fund, performance was above median for the one-, three- and five-year periods and below median (in the fourth quintile) for the ten-year period. For the AllianzGI NFJ Mid-Cap Value Fund, performance was above median for the one-, three-, five- and ten-year periods. For the AllianzGI NFJ Small-Cap Value Fund, performance was above median for the one- and ten-year periods and below median (in the fourth quintile) for the three- and five-year periods.
In addition, the Independent Trustees considered matters bearing on the Funds and their advisory arrangements at their meetings throughout the year, including a review of performance data at each regular meeting (either by the full Board or by the Performance Committee of the Board).
As part of their review, the Independent Trustees examined the ability of the Investment Adviser to provide high-quality investment management and other services to the Funds. Among other information, the Independent Trustees considered the investment philosophy and research and decision-making processes of the Investment Adviser; the experience of key advisory personnel of the Investment Adviser or their affiliates, as applicable, responsible for portfolio management of the Funds; the ability of the Investment Adviser to attract and retain capable personnel; the background and capabilities of the senior management and staff of the Investment Adviser; employee compensation; and the operational infrastructure, including technology and systems, of the Investment Adviser. In addition, the Independent Trustees reviewed the extent and quality of the Investment Adviser’s services with respect to regulatory compliance and ability to comply with the investment policies of the Funds; the compliance programs and risk controls of the Investment Adviser; the specific contractual obligations of the Investment Adviser pursuant to the Agreement; the nature, extent and quality of certain administrative services the Investment Adviser is responsible for providing to the Funds; the Investment Adviser’s risk management function; and conditions that might affect the ability of the Investment Adviser to provide high quality services to the Funds in the future under the Agreement, including, but not limited to, the organization’s financial condition and operational stability. Based on the foregoing, the Independent Trustees concluded that the Investment Adviser’s investment processes, research capabilities and philosophy were well-suited to each Fund given its investment objective and policies, that the Investment Adviser would be able to continue to meet any reasonably foreseeable obligations under the Agreement, and that the Investment Adviser would otherwise be able to provide services to the Funds of sufficient extent and quality.
Fee and Expense Information
In assessing the reasonableness of the Funds’ fees and expenses under the Agreement, the Independent Trustees considered, among other information, each Fund’s advisory fee and total expense ratio as a percentage of average daily net assets and the advisory fees and total expense ratios in comparison to such Fund’s Broadridge Expense Group. The Independent Trustees also noted certain advisory or administrative fee breakpoints, waivers or reductions for certain Funds that had been proposed by the Investment Adviser for continuation, modification or adoption, and also noted any such preexisting waivers that were not being continued. The Independent Trustees also considered, among other items: (i) that the Funds pay a unitary administrative fee for non-advisory services, which differentiates the Funds from many in the industry, and (ii) current Fund asset levels as compared to prior years.
The Independent Trustees also considered information showing the contractual advisory fees charged by the Investment Adviser to other funds and accounts, including institutional and separate accounts, with similar investment objective(s) and policies to those of the Funds, if any. In comparing these fees, the Independent Trustees considered information provided by the Investment Adviser as to the generally broader and more extensive services provided to the Funds in comparison to institutional or separate accounts; the higher demands placed on the Investment Adviser’s investment personnel and trading infrastructure as a result of the daily cash in-flows and out-flows of the Funds; the greater entrepreneurial risk in managing retail mutual funds; and the impact on the Investment Adviser and expenses associated with the more extensive regulatory regime to which the Funds are subject in comparison to institutional or separate accounts.
The Independent Trustees considered and evaluated the unitary administrative fees paid by each Fund under the Administration Agreement, including in light of the total expenses of the Funds and the total expenses of competitor funds as reflected in the Broadridge materials. The Independent Trustees noted that, in connection with the contract review process in prior years, they had negotiated with the Investment Adviser to observe administrative fee breakpoints for each Fund and share class under the Administration Agreement, and to apply breakpoints based on the entire net assets of each Fund (rather than on net assets attributable to particular share classes).
The Trustees also considered, among other information, the Investment Adviser’s business model of providing advisory and administrative services as part of a comprehensive program wherein the services cannot readily be separated and the Investment Adviser’s indication that it would not be willing to outsource its provision of administrative services while continuing to provide advisory services. They also took into account disclosure in the Funds’ prospectuses regarding administrative fees.
| Semiannual Report | | December 31, 2017 | 173 |
Table of Contents
Unaudited
Matters Relating to the Trustees’ Consideration of the Investment Management Agreement (cont’d)
The Independent Trustees reviewed, among other information, information provided by Broadridge comparing each Fund’s advisory fee, and ratios of total expenses to net assets (“Total Expense Ratios”) for two share classes (Class A and Institutional Class share classes) to the Funds’ respective Broadridge Expense Groups for the most recent fiscal year ended June 30, 2017. Class A shares of the applicable Broadridge-selected group of comparable funds are referred to below as the “retail expense group,” and Institutional Class are referred to as the “institutional expense group.” The Independent Trustees noted that the Broadridge data takes into account any fee reductions or expense limitations that were in effect during a Fund’s last fiscal year. The Fund-specific fee and expense results discussed below were prepared and provided by Broadridge and were not independently verified by the Independent Trustees. The Funds’ fee and expense rankings are discussed below relative to the median of the applicable Broadridge Expense Groups. A Fund whose fees and expenses were below median had fees and expenses that were less than the median fees and expenses of its peer group, while a Fund whose fees and expenses were above median had fees and expenses that were higher than the median fees and expenses of its peer group. For those Funds whose fees or expenses were higher than the median, the specific quintile rankings are also noted below with respect to the relevant above-median fee or expense categories (unless quintile rankings were not provided to the Independent Trustees by Broadridge, in which case fund rankings are provided). For the purposes of Broadridge Expense Group quintile rankings, higher fees and expenses result in a lower quintile ranking, with the first quintile corresponding to low fees and expenses the fifth quintile corresponding to high fees and expenses.
AllianzGI Funds. For the AllianzGI Emerging Markets Opportunities Fund, AllianzGI Focused Growth Fund, AllianzGI Mid-Cap Fund and AllianzGI Small-Cap Blend Fund, both the advisory fees and total expense ratios (taking fee waivers and/or expense limitations into account) were below the median for both the retail and institutional expense groups. For the AllianzGI Global Natural Resources Fund, advisory fees were below median for the retail expense group and at median for the institutional expense group, and total expense ratios were below median for both the retail and institutional expense groups (taking fee waivers and/or expense limitations into account in each case). For the AllianzGI Global Small-Cap Fund, advisory fees were at median for the retail expense group and above median (ranking 6/8) for the institutional expense group, and total expense ratios were above median for both the retail (in the fifth quintile) and institutional expense group (in the fourth quintile) (taking fee waivers and/or expense limitations into account in each case). For the AllianzGI Health Sciences Fund, advisory fees were below median for the retail and institutional expense groups and total expense ratios were above median (in the third quintile) for both the retail and institutional expense groups (taking fee waivers and/or expense limitations into account in each case). For the AllianzGI Income & Growth Fund, advisory fees were above median (ranking 7/11) for both the retail expense group and the institutional expense group and
total expense ratios were above median (in the fifth quintile) for both the retail and institutional expense groups (taking fee waivers and/or expense limitations into account in each case). For the AllianzGI Technology Fund, advisory fees were above median for both the retail (ranking 4/6) and institutional (ranking 4/5) expense groups and total expense ratios were above median for both the retail (in the fifth quintile) and institutional (ranking 4/5) expense groups (taking fee waivers and/or expense limitations into account in each case).
NFJ Funds. For the AllianzGI NFJ Dividend Value Fund, AllianzGI NFJ International Value Fund and AllianzGI NFJ Large-Cap Value Fund, both the advisory fees and total expense ratios (taking fee waivers and/or expense limitations into account) were below median for both the retail and institutional expense groups. For the AllianzGI NFJ Mid-Cap Value Fund, advisory fees were below median for both the retail and institutional expense groups and total expense ratios were above median for the retail expense group (in the third quintile) and the institutional expense group (in the fourth quintile) (taking fee waivers and/or expense limitations into account in each case). For the AllianzGI NFJ Small-Cap Value Fund, advisory fees were below median (for both the retail and institutional expense groups and total expense ratios were at median for the retail expense group and below median for the institutional expense group.
The Trustees evaluated each Fund’s advisory fees based on a variety of factors, including comparative fee and expense information, the Investment Adviser’s estimated profitability from its relationship with each Fund (described below), possible economies of scale (described below) and Fund performance. In light of these factors, the Independent Trustees recommended, and the Investment Adviser agreed, that voluntary fee waivers of a portion of the advisory fees of certain Funds be implemented or continued for a one-year period through October 31, 2018 as follows: for the AllianzGI Emerging Markets Opportunities Fund, a waiver of 20 basis points of the advisory fee; for the AllianzGI Income & Growth Fund, a waiver of 1 basis point on net assets in excess of $2 billion, an additional waiver of 1.5 basis points on net assets in excess of $3 billion and an additional waiver of 2.5 basis points on net assets in excess of $5 billion; for the AllianzGI NFJ Dividend Value Fund, a waiver of 15 basis points of the advisory fee, and then an additional waiver of 2.5 basis points on net assets in excess of $7.5 billion and an additional waiver of 2.5 basis points on net assets in excess of $10 billion; for the AllianzGI NFJ International Value Fund, a waiver of 5 basis points of the advisory fee, and then an additional waiver of 1 basis point on net assets in excess of $4 billion, an additional waiver of 1.5 basis points on net assets in excess of $5 billion and an additional waiver of 2.5 basis points on net assets in excess of $7.5 billion; for the AllianzGI Focused Growth Fund, a 10 basis point waiver of the advisory fee; for the AllianzGI NFJ Small-Cap Value Fund, a 2.5 basis point waiver on net assets in excess of $3 billion, and addition 2.5 basis points on net assets in excess of $4 billion, and an additional 2.5 basis points on assets of $5 billion; and for the AllianzGI Technology Fund, a waiver of 15 basis points of the advisory fee, and then an additional waiver of 1 basis point on net
| 174 | December 31, 2017 | | Semiannual Report |
Table of Contents
assets in excess of $2 billion, an additional waiver of 1.5 basis points on net assets in excess of $3 billion and an additional waiver of 2.5 basis points on net assets in excess of $5 billion. It also was agreed that the Investment Adviser would observe the following additional voluntary fee waivers of a portion of the administrative fees for certain Funds for a one-year period through October 31, 2018 as follows: for the AllianzGI Emerging Markets Opportunities Fund, a waiver of 15 basis points of the administration fee; for AllianzGI Focused Growth Fund, a waiver of 2 basis points of the administration fee for Class A shares; for AllianzGI NFJ International Value Fund, a waiver of 2.5 basis points of the administration fee; and for AllianzGI NFJ Small-Cap Value Fund, a waiver of 5 basis points of the administration fee. The Trustees also noted the Investment Adviser’s willingness to review with the Trustees the adequacy of existing breakpoints and the possibility for additional breakpoints in the event of unexpected asset growth in individual Funds.
The Independent Trustees also considered the estimated profitability to the Investment Adviser of its relationship with each Fund and determined that such profitability did not appear to be excessive. The Independent Trustees considered the extent to which the Investment Adviser may realize economies of scale or other efficiencies in managing and supporting the Funds. The Independent Trustees took into account that, as open-end investment companies, the Funds intend to raise additional assets, so as the assets of the Funds grow over time, certain economies of scale and other efficiencies may be realized through spreading certain fixed costs across a larger asset base or across a variety of products and services, while also taking into account the breakpoints and fee waiver and expense limitation arrangements observed by the Investment Adviser for applicable Funds. Additionally, the Independent Trustees considered so-called “fall-out benefits” to the Investment Adviser and its affiliates, such as reputational value derived from serving as Investment Adviser to the Funds. They also considered that the unitary administrative fee generally results in increased profitability benefits as the asset base of the Funds increases and such benefits generally inure to the Investment Adviser, and that the Investment Adviser’s profitability likewise generally declines under the unitary administrative fee structure when Fund assets decline. The Independent Trustees considered that the unitary fee also insulates shareholders from increased expense ratios arising from declines in net assets. The Trustees considered it appropriate to consider breakpoints in the Funds’ administrative fee as a means of sharing any economies of scale or efficiencies concerning administration services with Fund shareholders. The Independent Trustees also took into account the entrepreneurial, legal, regulatory and business risks the Investment Adviser has undertaken as investment manager and sponsor of the Funds. The Independent Trustees also took into account that the Investment Adviser agreed to advisory and/or administrative fee waivers and/or breakpoints for certain Funds that would be effective as of November 1, 2017 through at least October 31, 2018.
The Independent Trustees recognized that it is difficult to make comparisons of profitability from mutual fund advisory and administration contracts because comparative information is not generally available and is affected by numerous factors, including the structure of the particular adviser, the types of funds it manages, its business mix, numerous assumptions about allocations and the adviser’s capital structure and cost of capital. The Independent Trustees considered the overall profitability to the Investment Adviser on a Fund-by-Fund basis, as well as profitability separately as to advisory and administrative functions on a Fund-by-Fund basis. The Independent Trustees reviewed information regarding profitability of other investment advisers with publicly-traded parent companies. The Independent Trustees concluded that pre-tax profitability for advisory services was not unreasonable, although it varied between Funds, and that pre-tax profitability for advisory and administrative services combined, including when calculated on a net revenue basis regarding the administrative fee, is sizeable for certain Funds, but generally not unreasonable under the circumstances.
After reviewing these and other factors described herein, the Independent Trustees concluded, with respect to each Fund, within the context of their overall conclusions regarding the Agreement, that they were satisfied with the Investment Adviser’s responses and on-going efforts relating to the investment performance of the Funds, including efforts to improve performance for underperforming Funds. The Independent Trustees also concluded that the fees payable under the Agreement represents reasonable compensation in light of the nature, extent and quality of services provided by the Investment Adviser, as the case may be, and should be continued, taking into account the Investment Adviser’s agreement to observe waivers and/or breakpoints for certain Funds. Based on their evaluation of factors that they deemed to be material, including, but not limited to, those factors described above, the Independent Trustees unanimously concluded that the continuation of the Agreement with respect to the Funds was in the interests of the applicable Funds and their shareholders, and determined to recommend that the continuance of the Agreement be approved by the full Board.
The Independent Trustees also considered the proposed continuance of the Administration Agreement between Allianz Funds and AllianzGI U.S. for the Funds and determined to recommend the same for approval by the full Board.
The Independent Trustees also discussed the distribution arrangements and plans for the Funds and determined that there is a reasonable likelihood that the arrangements will continue to benefit the Funds and their shareholders, and to recommend the continuance of the same for approval by the full Board.
| Semiannual Report | | December 31, 2017 | 175 |
Table of Contents
Allianz Funds
Trustees
Davey S. Scoon
Chairman of the Board of Trustees
Deborah A. DeCotis
F. Ford Drummond
A. Douglas Eu
Bradford K. Gallagher
Erick R. Holt
James A. Jacobson
Hans W. Kertess
James S. MacLeod
William B. Ogden, IV
Alan Rappaport
Officers
Thomas J. Fuccillo
President and Chief Executive Officer
Lawrence G. Altadonna
Treasurer, Principal Financial and Accounting Officer
Angela Borreggine
Chief Legal Officer and Secretary
Thomas L. Harter
Chief Compliance Officer
Scott Whisten
Assistant Treasurer
Richard J. Cochran
Assistant Treasurer
Orhan Dzemaili
Assistant Treasurer
Debra Rubano
Assistant Secretary
Craig A. Ruckman
Assistant Secretary
Paul Koo(1)
Assistant Secretary
Investment Adviser
Allianz Global Investors U.S. LLC
1633 Broadway
New York, NY 10019
Distributor
Allianz Global Investors Distributors LLC
1633 Broadway
New York, NY 10019
Custodian & Accounting Agent
State Street Bank & Trust Co.
801 Pennsylvania Avenue
Kansas City, MO 64105
Shareholder Servicing and Transfer Agent
State Street Bank & Trust Company,
which has delegated its obligations as transfer agent to:
DST Asset Management Solutions, Inc.
(Class A, Class C and Class R shares)
P.O. Box 8050
Boston, MA 02266-8050
(Class P, Institutional Class, Class R6 and Administrative Class shares)
330 West 9th Street, 5th Floor
Kansas City, MO 64105
Independent Registered Public Accounting Firm
PricewaterhouseCoopers LLP
1100 Walnut Street, Suite 1300
Kansas City, MO 64105
Legal Counsel
Ropes & Gray LLP
Prudential Tower
800 Boylston Street
Boston, MA 02199
This report, including the financial information herein, is transmitted to the shareholders of the Trust for their information. It is not a prospectus, circular or representation intended for use in the purchase of shares of each Fund or any securities mentioned in this report.
The financial information included herein is taken from the records of the Funds without examination by an independent registered public accounting firm, who did not express an opinion herein.
| (1) | Paul Koo is Assistant Secretary of the Trust with a limited authority to open, maintain and close certain custodial and trading accounts for all series of the Trust. |
For Account Information
Contact your financial adviser, or if you receive account statements directly from Allianz Global Investors, you can also call (800) 988-8380 for Class A, C and R shares or (800) 498-5413 for Class P, Institutional, R6 and Administrative shares. Telephone representatives are available Monday-Friday 8:30 am to 6:00 pm Eastern Time. Or visit our website, us.allianzgi.com.
Table of Contents
About Allianz Global Investors
Understand. Act. This two-word philosophy is at the core of what we do. To stand out as the investment partner our clients trust, we listen closely to understand their needs, then act decisively to deliver solutions. We are a diversified active investment manager with a strong parent company, a culture of risk management and more than $583 billion in assets under management.* With 25 offices worldwide and over 650 investment professionals, we provide global investment and research capabilities with consultative local delivery.
* Data as of September 30, 2017
Investors should consider the investment objectives, risks, charges and expenses of the above mentioned Funds carefully before investing. This and other information is contained in the Funds’ prospectus, which may be obtained by contacting your financial advisor, by visiting us.allianzgi.com or by calling 1-800-988-8380 (retail classes: A, C and R) or 1-800-498-5413 (Class P, Class R6, Institutional and Administrative classes). Please read the prospectus carefully before you invest or send money.
Allianz Global Investors U.S. LLC serves as the investment manager for the Allianz Funds and the Allianz Multi-Strategy Funds. Allianz Funds and the Allianz Multi-Strategy Funds are distributed by Allianz Global Investors Distributors LLC. © 2015. For information about any product, contact your financial advisor.
us.allianzgi.com
Receive this report electronically and eliminate paper mailings.
To enroll, go to us.allianzgi.com/edelivery.
| AZ1005SA_123117 |
433944
Table of Contents
| ITEM 2. | CODE OF ETHICS |
(a) Not required in this filing.
| ITEM 3. | AUDIT COMMITTEE FINANCIAL EXPERT |
Not required in this filing.
| ITEM 4. | PRINCIPAL ACCOUNTANT FEES AND SERVICES |
Not required in this filing.
| ITEM 5. | AUDIT COMMITTEE OF LISTED REGISTRANT |
Disclosure not required for open-end management investment companies.
| ITEM 6. | SCHEDULE OF INVESTMENTS |
| (a) | The registrant’s Schedule of Investments is included as part of the report to shareholders filed under Item 1 of this form. |
| (b) | Not applicable. |
ITEM 7. DISCLOSURE OF PROXY VOTING POLICIES AND PROCEDURES FOR CLOSED-END MANAGEMENT INVESTMENT COMPANIES
Disclosure not required for open-end management investment companies.
| ITEM 8. | PORTFOLIO MANAGERS OF CLOSED-END MANAGEMENT INVESTMENT COMPANIES |
Disclosure not required for open-end management investment companies.
ITEM 9. PURCHASES OF EQUITY SECURITIES BY CLOSED-END MANAGEMENT INVESTMENT COMPANY AND AFFILIATED COMPANIES.
Disclosure not required for open-end management investment companies.
| ITEM 10. | SUBMISSION OF MATTERS TO A VOTE OF SECURITY HOLDERS |
There have been no material changes to the procedures by which shareholders may recommend nominees to the Fund’s Board of Trustees since the Fund’s last provided disclosure in response to this item.
Table of Contents
| ITEM 11. | CONTROLS AND PROCEDURES |
| (a) | The registrant’s President & Chief Executive Officer and Treasurer, Principal Financial & Accounting Officer have concluded that the registrant’s disclosure controls and procedures (as defined in Rule 30a-3(c) under the Investment Company Act of 1940 (the “1940 Act”) (17 CFR 270.30a-3(c))), are effective based on their evaluation of these controls and procedures as of a date within 90 days of the filing date of this document. |
| (b) | There were no significant changes in the registrant’s internal control over financial reporting (as defined in Rule 30a-3(d) under the 1940 Act (17 CFR 270.30a-3(d))) that occurred during the second fiscal quarter of the period covered by this report that has materially affected, or is reasonably likely to materially affect, the registrant’s internal control over financial reporting. |
| ITEM 12. | EXHIBITS |
(a) | (1) Not required in this filing. | |
(a) | (2) Exhibit 99. Cert. — Certification pursuant to Section 302 of the Sarbanes-Oxley Act of 2002 | |
(a)(3) | Not applicable | |
(b) | Exhibit 99.906 Cert. — Certification pursuant to Section 906 of the Sarbanes-Oxley Act of 2002 | |
Table of Contents
Signatures
Pursuant to the requirements of the Securities Exchange Act of 1934 and the Investment Company Act of 1940, the registrant has duly caused this report to be signed on its behalf by the undersigned, thereunto duly authorized.
| Allianz Funds | ||
| By: | /s/ Thomas J. Fuccillo | |
Thomas J. Fuccillo, President & Chief Executive Officer | ||
| Date: February 28, 2018 | ||
| By: | /s/ Lawrence G. Altadonna | |
| Lawrence G. Altadonna | ||
| Treasurer, Principal Financial & Accounting Officer | ||
| Date: February 28, 2018 | ||
Pursuant to the requirements of the Securities Exchange Act of 1934 and the Investment Company Act of 1940, this report has been signed below by the following persons on behalf of the registrant and in the capacities and on the dates indicated.
| By: | /s/ Thomas J. Fuccillo | |
Thomas J. Fuccillo, President & Chief Executive Officer | ||
| Date: February 28, 2018 | ||
| By: | /s/ Lawrence G. Altadonna | |
| Lawrence G. Altadonna | ||
| Treasurer, Principal Financial & Accounting Officer | ||
| Date: February 28, 2018 | ||