UNITED STATES
SECURITIES AND EXCHANGE COMMISSION
Washington, D.C. 20549
FORMN-CSR
CERTIFIED SHAREHOLDER REPORT OF REGISTERED
MANAGEMENT INVESTMENT COMPANIES
Investment Company Act file number:811-06161
Allianz Funds
(Exact name of registrant as specified in charter)
1633 Broadway, New York, NY 10019
(Address of principal executive offices) (Zip code)
Scott Whisten
1633 Broadway, New York, NY 10019
(Name and address of agent for service)
Registrant’s telephone number, including area code:212-739-3367
Date of fiscal year end: June 30
Date of reporting period: December 31, 2019
ITEM 1. Report to Shareholders

Allianz Funds
SHARE CLASSES A, C, R, P, INSTITUTIONAL, R6, ADMINISTRATIVE
Semiannual Report
December 31, 2019
AllianzGI Emerging Markets Opportunities Fund
AllianzGI Focused Growth Fund
AllianzGI Global Natural Resources Fund
AllianzGI Global Small-Cap Fund
AllianzGI Health Sciences Fund
AllianzGI Income & Growth Fund
AllianzGI Mid-Cap Fund
AllianzGI NFJ Dividend Value Fund
AllianzGI NFJ International Value Fund
AllianzGI NFJ Large-Cap Value Fund
AllianzGI NFJ Mid-Cap Value Fund
AllianzGI NFJ Small-Cap Value Fund
AllianzGI Small-Cap Fund
AllianzGI Technology Fund
This material is authorized for use only when preceded or accompanied by the current Allianz Funds prospectus. Investors should consider the investment objectives, risks, charges and expenses of each Fund carefully before investing. This and other information is contained in the Funds’ prospectus or summary prospectus. Please read the prospectus carefully before you invest or send money.
Beginning on January 1, 2021, as permitted by regulations adopted by the U.S. Securities and Exchange Commission, paper copies of shareholder reports will no longer be sent by mail, unless you specifically request paper copies of the reports. Instead, the reports will be made available on the Funds’ website (us.allianzgi.com), and you will be notified by mail each time a report is posted and provided with a website link to access the report.
If you already elected to receive shareholder reports electronically, you will not be affected by this change and you need not take any action. You may elect to receive shareholder reports and other communications from a Fund electronically anytime by contacting your financial intermediary (such as a broker-dealer or bank) or, if you are a direct investor, by enrolling at us.allianzgi.com/edelivery.
If you prefer to receive paper copies of your shareholder reports after January 1, 2021, direct investors may inform a Fund at any time. If you invest through a financial intermediary, you should contact your financial intermediary directly. Paper copies are provided free of charge and your election to receive reports in paper will apply to all funds held with the fund complex if you invest directly with a Fund or all funds held in your account if you invest through your financial intermediary.

Receive this report electronically and eliminate paper mailings.
To enroll, go to us.allianzgi.com/edelivery.
Table of Contents
A Word About Risk: A fund may be subject to various risks as described in its prospectus. Some of those risks may include, but are not limited to, the following: fixed-income risk, liquidity risk, derivatives risk, smaller company risk, non-US investment risk, focused investment risk and specific sector investment risks. Below investment grade securities involve a greater risk to principal than investment grade securities. Bond prices will normally decline as interest rates rise. The impact may be greater with longer-duration bonds. The market for certain securities may become illiquid, which could prevent a fund from purchasing or selling these securities at an advantageous time or price and possibly delay redemptions of fund shares. Use of derivative instruments may involve certain costs and risks such as liquidity risk, interest rate risk, market risk, credit and counterparty risk, management risk and the risk that a fund is unable to close out a position when it is most advantageous to do so. Portfolios investing in derivatives could lose more than the principal amount invested in those instruments. Investing in foreign securities may entail risk due to foreign economic and political developments; this risk may be enhanced when investing in emerging markets. Smaller companies may be more volatile than larger companies and may entail more risk. Concentrating investments in individual sectors may add additional risk and additional volatility compared to a diversified equity portfolio. The principal values of the funds are not guaranteed at any time. Please refer to the applicable fund’s current prospectus for complete details.
Letter from the President

Thomas J. Fuccillo
President & CEO
Dear Shareholder,
The US economy was resilient and continued to expand during the six-month fiscal reporting period ended December 31, 2019. In contrast, economic growth overseas remained weak. Over this period, global equities generated strong results. Meanwhile, the overall US bond market posted a modest gain during the period.
The Six-Month Fiscal Period in Review
For the six-month period ended December 31, 2019, US stocks returned 10.92%, as measured by the S&P 500 Index. Two measures of stock performance in developed international and global markets produced weak results, in dollar-denominated terms, with the MSCI EAFE (Europe, Australasia and Far East) Index returning 7.01% and the MSCI World Index returning 9.14%. Elsewhere, the MSCI Emerging Markets Index returned 7.09% in dollar-denominated terms. With respect to bonds of US-domiciled issuers, the Bloomberg Barclays US Universal Bond Index rose 2.58% and the Bloomberg Barclays US Government Bond Index returned 2.23%, while the broader US bond market, as measured by the Bloomberg Barclays US Aggregate Bond Index, gained 2.45%.
Turning to the US economy, gross domestic product (“GDP”), the value of goods and services produced in the country, the broadest measure of economic activity and the principal indicator of economic performance, expanded at a 2.0% and 2.1% annual pace during the second and third quarters of 2019, respectively. Finally, the Commerce Department’s initial reading for fourth quarter 2019 GDP growth — released after the reporting period ended — was 2.1%.
While the US Federal Reserve (the “Fed”) raised the federal funds rate four times in 2018, at its January 2019 meeting, the Fed had a “dovish pivot” and indicated that it expected to pause from tightening monetary policy as it monitored incoming economic data. As expected, at its meetings in July, September and October 2019, the Fed lowered the federal funds rate. The Fed’s last rate cut pushed the federal funds rate to a range between 1. 50% and 1.75%. In the minutes from its December 2019 meeting, the Fed appeared comfortable keeping interest rates steady in the months ahead.
Economic growth outside the US was weak overall during the reporting period. Against this backdrop, in September 2019, the European Central Bank cut its key interest rate and announced a new package of bond purchases. The Bank of England kept rates on hold, but indicated it would be flexible given the uncertainties related to the United Kingdom’s decision to leave the European Union (“Brexit”). Meanwhile, the Bank of Japan maintained its accommodative monetary policy during the reporting period.
| | | | | | |
| 2 | | December 31, 2019 | | | Semiannual Report | | |
Outlook
As we head into 2020, markets have priced in a substantial amount of favorable news, including global central bank easing (and quantitative easing), a potential bottoming in economic data and some thawing of geopolitical risks. Is the good news now completely priced into risk assets?
In our view, the backdrop remains benign for risk assets, with low growth, rates and inflation — a mild Goldilocks in many ways — which can support modest upside in 2020. Nonetheless, given 2019’s rally, we believe that markets remain vulnerable to corrections and volatility in the near term and expect them to be driven largely by economic data and politics in the year ahead.
On behalf of Allianz Global Investors U.S. LLC, the Funds’ investment adviser, thank you for investing with us. We encourage you to consult with your financial advisor and to visit our website, us.allianzgi.com, for additional information. We remain dedicated to serving your investment needs.
Sincerely,

Thomas J. Fuccillo
President & CEO
Past performance is no guarantee of future results. Unless otherwise noted, index returns reflect the reinvestment of income dividends and capital gains, if any, but do not reflect fees, brokerage commissions or other expenses of investing. It is not possible to invest directly in an index.
Receive this report electronically and eliminate paper mailings.
To enroll, go to us.allianzgi.com/edelivery.
| | | | | | |
| | Semiannual Report | | | December 31, 2019 | | 3 |
Unaudited
AllianzGI Emerging Markets Opportunities Fund
For the period of July 1, 2019 through December 31, 2019, as provided by Lu Yu, CFA, CIPM, Portfolio Manager.
Fund Insights
For the six-month period ended December 31, 2019, the Class A shares at net asset value (“NAV”) of the AllianzGI Emerging Markets Opportunities (the “Fund”) returned 7.16%, outperforming the MSCI Emerging Markets Index (the “benchmark”), which returned 7.09%.
Market Overview
Emerging market equities were the beneficiaries of positive global growth expectations and improving trade relations which led to an uptick in sentiment during the six-month period ended December 31, 2019.
The asset class initially declined in July due to concerns of slowing global demand and the strength of the US dollar and volatility picked up in August following the reescalation of the US/China trade war. Emerging markets equities advanced in September amid signs of easing trade tensions as well as by cuts in interest rates from central banks in both developed and developing economies. The rebound continued in October as sentiment was lifted by optimism over an improvement in US/China trade relations. The asset class performance was flat in November amid hopes that the US and China would soon agree on “phase one” of a trade deal lifted sentiment which soured slightly towards the month end amid fears that China would retaliate after US president Donald Trump signed into law a bill backing Hong Kong’s anti-government demonstrators. The positive asset class performance accelerated in December thanks to the agreement of a “phase one” trade deal between the US and China, as well as a rebound in global growth expectations.
Country results were mixed with 14 of 26 countries posting gains during the period. Taiwan was one of the top performers with a near 25% advance due to strong technology-related demand, followed by a 16% rally in Russia as investors gravitated toward high dividend-payers and the relative stability afforded by the country. China was higher by more than 9% due to improving US trade relations and a rebound in the country’s purchasing managers index (“PMI”), which may have signaled a bottoming of its economy. Alternatively, Argentine stocks declined more than 38% as Alberto Fernández’s victory in Argentina’s elections put an end to the pro-business economic policies of Mauricio Macri, while Chile was lower by 15% as civil unrest and lackluster consumer spending were headwinds in the country.
Information technology was the clear winner, gaining more than 26% due primarily to a strong advance in the semiconductor industry. Consumer discretionary notched a 13% gain followed by high single-digit advances in real estate and health care sectors. Meanwhile, materials and utilities were each up less than 1% during the semi-annual reporting period.
Portfolio Review
The Fund seeks to deliver outperformance over time by investing in emerging-market companies that are benefiting from change not yet fully reflected in the market, via the team’s behavioral finance-focused investment process.
During the six-month period, the Fund’s performance was flat relative to the benchmark as positive stock selection was neutralized by short-term country and sector allocation decisions. Strong stock selection in materials, particularly the metals & mining industry, contributed to results as did bottom-up stock selection in utilities, industrials and energy sectors. Alternatively, communication services was the primary sector laggard due to underperformance in the diversified telecommunications industry. A relative underweight allocation to consumer discretionary, the benchmark’s second best performer and stockpicking in real estate detracted from results more modestly. From a country perspective, Russia was the top performer thanks to positive stockpicking coupled with an overweight allocation. Selections in Taiwan and a relative underweight to Saudi Arabia also favorably impacted results. Conversely, more conservative stock selection in China, South Korea and South Africa offset results during the semi-annual period.
Outlook
Investors appear to have gained confidence in emerging markets equities as evidenced by the annual performance and in particular the fourth quarter rally, which outpaced developed markets equities as measured by the MSCI World Index. The “phase one” agreement between the United States and China, which is slated to suspend certain tariffs, provide greater currency transparency and increase trade for agricultural and financial services, is seen as a step in the right direction in terms providing sought-after market clarity. Emerging markets equities may also benefit from positive global sentiment as well as the more attractive growth and valuation levels relative to developed market equites. Asset class risks remain in terms of the late cycle bull market alongside a shift from globalization to localization, which is likely a culprit for the depressed return on equity experience by emerging market equities over the last several years. Middle class expansion, particularly in Asia, is potentially at a tipping point and may be a driver of the asset class for the next several years. Our view is this growth is likely underappreciated by the market.
| | | | | | |
| 4 | | December 31, 2019 | | | Semiannual Report | | |
Unaudited
AllianzGI Emerging Markets Opportunities Fund (cont’d)
Average Annual Total Return for the period ended December 31, 2019
| | | | | | | | | | | | | | | | | | | | | | |
| | | | | | |
| | | | | 6 Month* | | | 1 Year | | | 5 Year | | | 10 Year | | | Since Inception† | |
| | | AllianzGI Emerging Markets Opportunities Fund Class A | | | 7.16% | | | | 17.21% | | | | 3.89% | | | | 3.68% | | | | 8.68% | |
| | AllianzGI Emerging Markets Opportunities Fund Class A (adjusted) | | | 1.27% | | | | 10.77% | | | | 2.72% | | | | 3.09% | | | | 8.28% | |
| | | AllianzGI Emerging Markets Opportunities Fund Class C | | | 6.79% | | | | 16.34% | | | | 3.12% | | | | 2.91% | | | | 7.86% | |
| | AllianzGI Emerging Markets Opportunities Fund Class C (adjusted) | | | 5.79% | | | | 15.34% | | | | 3.12% | | | | 2.91% | | | | 7.86% | |
| | AllianzGI Emerging Markets Opportunities Fund Class P | | | 7.32% | | | | 17.53% | | | | 4.15% | | | | 3.94% | | | | 8.97% | |
| | AllianzGI Emerging Markets Opportunities Fund Institutional Class | | | 7.41% | | | | 17.66% | | | | 4.26% | | | | 4.07% | | | | 9.09% | |
| | AllianzGI Emerging Markets Opportunities Fund Class R6 | | | 7.43% | | | | 17.69% | | | | 4.31% | | | | 4.12% | | | | 9.15% | |
| | MSCI Emerging Markets Index | | | 7.09% | | | | 18.42% | | | | 5.61% | | | | 3.68% | | | | 8.83% | |
| | | Lipper Emerging Markets Funds Average | | | 6.85% | | | | 20.53% | | | | 5.02% | | | | 3.89% | | | | 8.51% | |
* Cumulative return
† The Fund began operations on 5/27/04. Benchmark comparisons began on the fund inception date. Lipper comparisons began on 5/31/04.
Performance quoted represents past performance and is no guarantee of future results. Current performance may be lower or higher than performance shown. For performance current to the most recent month-end, visit our website at us.allianzgi.com. Investment return and the principal value will fluctuate. Shares may be worth more or less than original cost when redeemed.The adjusted returns take into account the maximum sales charge of 5.50% on Class A shares and 1% contingent deferred sales charge (CDSC) on Class C shares, which may apply to shares redeemed during the first year of ownership. Returns do not reflect deduction of taxes that a shareholder would pay on fund distributions or redemption of fund shares. Please see pages 60-62 for more information. The Fund’s gross expense ratios are 1.61% for Class A shares, 2.36% for Class C shares, 1.36% for Class P shares, 1.26% for Institutional Class and 1.21% for Class R6 shares. These ratios do not include an expense reduction, contractually agreed through at least August 31, 2020. The Fund’s expense ratios net of these reductions and waivers are 1.26% for Class A shares, 2.01% for Class C shares, 1.01% for Class P shares, 0.91% for Institutional Class shares and 0.86% for Class R6 shares. Expense ratio information is as of the Fund’s current prospectus dated August 28, 2019, as further revised or supplemented from time to time.
Cumulative Returns Through December 31, 2019
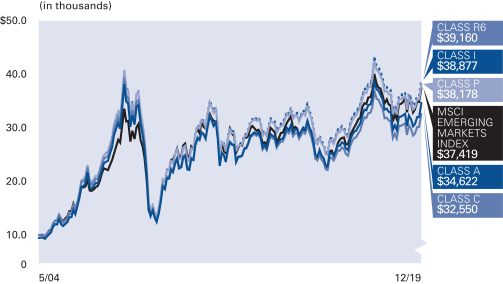
The Fund began operations on 5/27/04. Benchmark comparisons began on the fund inception date.
Country Allocation (as of December 31, 2019)
| | | | |
| |
| China | | | 31.4% | |
| |
| Taiwan | | | 16.5% | |
| |
| Korea (Republic of) | | | 13.5% | |
| |
| Russian Federation | | | 8.6% | |
| |
| India | | | 7.7% | |
| |
| Brazil | | | 7.6% | |
| |
| Thailand | | | 5.0% | |
| |
| South Africa | | | 3.1% | |
| |
| Other | | | 5.9% | |
| |
| Cash & Equivalents — Net | | | 0.7% | |
| | | | | | |
| | Semiannual Report | | | December 31, 2019 | | 5 |
Unaudited
AllianzGI Emerging Markets Opportunities Fund (cont’d)
| | | | | | | | | | |
| |
| Shareholder Expense Example | | Actual Performance |
| | | Class A | | Class C | | Class P | | Institutional
Class | | Class R6 |
| | | | | |
| Beginning Account Value (7/1/19) | | $1,000.00 | | $1,000.00 | | $1,000.00 | | $1,000.00 | | $1,000.00 |
| | | | | |
| Ending Account Value (12/31/19) | | $1,071.60 | | $1,067.90 | | $1,073.20 | | $1,074.10 | | $1,074.30 |
| | | | | |
| Expenses Paid During Period | | $6.61 | | $10.50 | | $5.32 | | $4.80 | | $4.54 |
| | | | | | | | | | | |
| |
| | | Hypothetical Performance |
| | | (5% return before expenses) |
| | | Class A | | Class C | | Class P | | Institutional
Class | | Class R6 |
| | | | | |
| Beginning Account Value (7/1/19) | | $1,000.00 | | $1,000.00 | | $1,000.00 | | $1,000.00 | | $1,000.00 |
| | | | | |
| Ending Account Value (12/31/19) | | $1,018.75 | | $1,014.98 | | $1,020.01 | | $1,020.51 | | $1,020.76 |
| | | | | |
| Expenses Paid During Period | | $6.44 | | $10.23 | | $5.18 | | $4.67 | | $4.42 |
For each class of the Fund, expenses (net of fee waivers) are equal to the annualized expense ratio for the class (1.27% for Class A, 2.02% for Class C, 1.02% for Class P, 0.92% for Institutional Class and 0.87% for Class R6), multiplied by the average account value over the period, multiplied by 184/366. These expenses do not include the expenses of the investment companies in which the Fund invests, which are indirectly borne by Fund shareholders.
| | | | | | |
| 6 | | December 31, 2019 | | | Semiannual Report | | |
(THIS PAGE INTENTIONALLY LEFT BLANK)
| | | | | | |
| | Semiannual Report | | | December 31, 2019 | | 7 |
Unaudited
AllianzGI Focused Growth Fund
For the period of July 1, 2019 through December 31, 2019, as provided by Karen Hiatt, CFA, Lead Portfolio Manager.
Fund Insights
For the six-month period ended December 31, 2019, the Class A shares at net asset value (“NAV”) of the AllianzGI Focused Growth Fund (the “Fund”) returned 9.93%, underperforming the Russell 1000 Growth Index (the “benchmark”), which returned 12.27%.
Market Overview
Global equities overcame a sharp set-back in August to deliver robust gains over the second half of 2019, with many markets closing the year at or near fresh/multi-month highs. Sentiment was lifted by a plethora of interest rate cuts across the developed and developing world, better-than-expected corporate earnings and optimism over a “phase one” trade deal between the US and China. At a sector level, technology stocks were the standout performers, helped by a rebound in semiconductor manufacturers. Energy was the only sector to retreat as oil prices remained mostly range bound, despite some year-end strength.
Within the technology sector, there was a wide divergence in performance as high growth, high valuation stocks were sharply sold in favor of cyclical and value technology stocks. Apple drove strong returns in the hardware segment as the company’s iPhone averted additional tariffs with the trade truce. Semiconductor stocks also benefitted from the trade news along with signs of firming demand conditions with tight inventories. Software stocks lagged mostly due to the shift in sentiment as fundamentals remain quite strong.
Portfolio Review
The Fund’s positioning within the technology sector amid the high growth sell-off was the largest driver of the relative performance shortfall. The underweight to Apple and Alphabet (Google), and the overweights to high growth stock such as Twilio, Paypal, and Servicenow were the largest stock detractors.
On the positive side, stock selection in the health care sector contributed to relative returns. Dexcom and Insulet benefited from robust growth in diabetes devices. Additionally, our overweight to consumer discretionary holding, Burlington, added to relative returns as the company has consistently delivered strong results in off price retail. Other contributors included not owning Netflix or Cisco Systems.
From a sector allocation perspective, underweight positions to the consumer discretionary and consumer staples sectors helped relative performance. Conversely, an overweight to materials and an underweight to the real estate sector hurt relative performance.
Outlook
We are generally optimistic on US equities as we begin the year. US employment data remains strong and corporate profits are expected to accelerate in 2020. Additionally, the US Federal Reserve and major central banks around the world are more dovish and continue to maintain low interest rates, which we believe should help boost economic growth. However, we may see periods of higher market volatility due to macro and political uncertainties. We will be closely monitoring trade negotiations as we move beyond the phase one deal between the US and China, the US Presidential election, and the ongoing challenges in the Middle East. Given the multitude of cross-currents and varying growth prospects at the country level, we expect the global economy to generally remain in a low growth environment for the foreseeable future. While market valuations are elevated, high valuations should not necessarily be a headwind. Other factors like earnings and growth should matter more, particularly in a low interest rate environment. Despite the macro and political uncertainties, we believe high quality growth companies remain well-positioned to deliver attractive returns.
Over the long term, we expect that the market will ultimately reward companies that deliver consistent growth and increase shareholder value over time. Our focus continues to be on applying rigorous fundamental research to identify companies with strong or under-appreciated growth prospects and attractive risk-reward characteristics.
| | | | | | |
| 8 | | December 31, 2019 | | | Semiannual Report | | |
Unaudited
AllianzGI Focused Growth Fund (cont’d)
Average Annual Total Return for the period ended December 31, 2019
| | | | | | | | | | | | | | | | | | | | | | |
| | | | | | |
| | | | | 6 Month* | | | 1 Year | | | 5 Year | | | 10 Year | | | Since Inception† | |
| | | AllianzGI Focused Growth Fund Class A | | | 9.93% | | | | 33.84% | | | | 13.13% | | | | 14.00% | | | | 11.42% | |
| | AllianzGI Focused Growth Fund Class A (adjusted) | | | 3.88% | | | | 26.48% | | | | 11.86% | | | | 13.36% | | | | 11.25% | |
| | | AllianzGI Focused Growth Fund Class C | | | 9.51% | | | | 32.77% | | | | 12.27% | | | | 13.14% | | | | 10.59% | |
| | AllianzGI Focused Growth Fund Class C (adjusted) | | | 8.62% | | | | 31.77% | | | | 12.27% | | | | 13.14% | | | | 10.59% | |
| | AllianzGI Focused Growth Fund Class R | | | 9.80% | | | | 33.48% | | | | 12.85% | | | | 13.71% | | | | 11.08% | |
| | AllianzGI Focused Growth Fund Class P | | | 10.06% | | | | 34.12% | | | | 13.41% | | | | 14.28% | | | | 11.73% | |
| | AllianzGI Focused Growth Fund Institutional Class | | | 10.11% | | | | 34.29% | | | | 13.52% | | | | 14.40% | | | | 11.84% | |
| | AllianzGI Focused Growth Fund Class R6 | | | 10.14% | | | | 34.35% | | | | 13.57% | | | | 14.46% | | | | 11.90% | |
| | | AllianzGI Focused Growth Fund Administrative Class | | | 10.00% | | | | 33.96% | | | | 13.23% | | | | 14.12% | | | | 11.55% | |
| | Russell 1000 Growth Index | | | 12.27% | | | | 36.39% | | | | 14.63% | | | | 15.22% | | | | 11.32% | |
| | | Lipper Large-Cap Growth Funds Average | | | 9.50% | | | | 33.30% | | | | 13.04% | | | | 13.72% | | | | 8.09% | |
* Cumulative return
† The Fund began operations on 2/24/84. Benchmark and Lipper performance comparisons began on 2/29/84.
Performance quoted represents past performance and is no guarantee of future results. Current performance may be lower or higher than performance shown. For performance current to the most recent month-end, visit our website at us.allianzgi.com. Investment return and the principal value will fluctuate. Shares may be worth more or less than original cost when redeemed.The adjusted returns take into account the maximum sales charge of 5.50% on Class A shares and 1% contingent deferred sales charge (CDSC) on Class C shares, which may apply to shares redeemed during the first year of ownership. Returns do not reflect deduction of taxes that a shareholder would pay on fund distributions or redemption of fund shares. Please see pages 60-62 for more information. The Fund’s gross expense ratios are 1.12% for Class A shares, 1.87% for Class C shares, 1.37% for Class R shares, 0.87% for Class P shares, 0.77% for Institutional Class, 0.72% for Class R6 shares, and 1.02% for Administrative Class shares. These ratios do not include an expense reduction, contractually agreed through at least August 31, 2020. The Fund’s expense ratios net of this reduction are 1.00% for Class A shares, 1.77% for Class C shares, 1.27% for Class R shares, 0.77% for Class P shares, 0.67% for Institutional Class shares, 0.62% for Class R6 shares, and 0.92% for Administrative Class shares. Expense ratio information is as of the Fund’s current prospectus dated August 28, 2019, as further revised or supplemented from time to time.
Cumulative Returns Through December 31, 2019
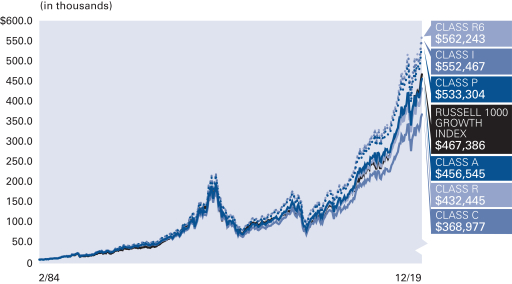
The Fund began operations on 2/24/84. Benchmark performance comparisons began on 2/29/84.
Industry/Sectors (as of December 31, 2019)
| | | | |
| |
| IT Services | | | 14.7% | |
| |
| Software | | | 12.5% | |
| |
| Interactive Media & Services | | | 7.9% | |
| |
| Semiconductors & Semiconductor Equipment | | | 6.7% | |
| |
| Technology Hardware, Storage & Peripherals | | | 6.6% | |
| |
| Healthcare Equipment & Supplies | | | 6.6% | |
| |
| Specialty Retail | | | 6.5% | |
| |
| Pharmaceuticals | | | 6.5% | |
| |
| Other | | | 30.9% | |
| |
| Cash & Equivalents — Net | | | 1.1% | |
| | | | | | |
| | Semiannual Report | | | December 31, 2019 | | 9 |
Unaudited
AllianzGI Focused Growth Fund (cont’d)
| | | | | | | | | | | | | | |
| |
| Shareholder Expense Example | | Actual Performance |
| | | Class A | | Class C | | Class R | | Class P | | Institutional
Class | | Class R6 | | Administrative
Class |
| | | | | | | |
| Beginning Account Value (7/1/19) | | $1,000.00 | | $1,000.00 | | $1,000.00 | | $1,000.00 | | $1,000.00 | | $1,000.00 | | $1,000.00 |
| | | | | | | |
| Ending Account Value (12/31/19) | | $1,099.30 | | $1,095.10 | | $1,098.00 | | $1,100.60 | | $1,101.10 | | $1,101.40 | | $1,100.00 |
| | | | | | | |
| Expenses Paid During Period | | $5.28 | | $9.32 | | $6.70 | | $4.07 | | $3.54 | | $3.27 | | $4.86 |
| | | | | | | | | | | | | | | |
| |
| | | Hypothetical Performance |
| | | (5% return before expenses) |
| | | Class A | | Class C | | Class R | | Class P | | Institutional
Class | | Class R6 | | Administrative
Class |
| | | | | | | |
| Beginning Account Value (7/1/19) | | $1,000.00 | | $1,000.00 | | $1,000.00 | | $1,000.00 | | $1,000.00 | | $1,000.00 | | $1,000.00 |
| | | | | | | |
| Ending Account Value (12/31/19) | | $1,020.11 | | $1,016.24 | | $1,018.75 | | $1,021.27 | | $1,021.77 | | $1,022.02 | | $1,020.51 |
| | | | | | | |
| Expenses Paid During Period | | $5.08 | | $8.97 | | $6.44 | | $3.91 | | $3.40 | | $3.15 | | $4.67 |
For each class of the Fund, expenses (net of fee waivers) are equal to the annualized expense ratio for the class (1.00% for Class A, 1.77% for Class C, 1.27% for Class R, 0.77% for Class P, 0.67% for Institutional Class, 0.62% for Class R6 and 0.92% for Administrative Class), multiplied by the average account value over the period, multiplied by 184/366.
| | | | | | |
| 10 | | December 31, 2019 | | | Semiannual Report | | |
(THIS PAGE INTENTIONALLY LEFT BLANK)
| | | | | | |
| | Semiannual Report | | | December 31, 2019 | | 11 |
Unaudited
AllianzGI Global Natural Resources Fund
For the reporting period of July 1, 2019 through December 31, 2019, as provided by Paul D. Strand, CFA, Portfolio Manager.
Fund Insights
For the six-month period ended December 31, 2019, the Class A shares at net asset value (“NAV”) of the AllianzGI Global Natural Resources Fund (the “Fund”) returned -3.16%, underperforming the 60% MSCI World Energy/40% MSCI World Materials Benchmark (the “benchmark”), which returned 1.39%.
Market Overview
Global equities overcame a sharp set-back in August 2019 to deliver robust gains over the second half of 2019. With global growth weighed down by a slowdown in global trade, fears grew over the outlook for the global economy. Central banks across the developed and developing world cut rates to stave off the threat of a global recession. Having been range bound for much of the six-month period, in December 2019, oil prices advanced to a seven-month high, with Brent crude trading just above $68 a barrel, on news that the Organization of the Petroleum Exporting Countries (“OPEC”) and Russia had agreed to curb production. Gold also surged, topping $1,500 an ounce in August for the first time in more than six years as the stock market turmoil boosted demand for “safe haven” assets. Meanwhile, copper prices surged, reaching an eight-month high in December, amid hopes of renewed Chinese demand.
Portfolio Review
The Fund’s underperformance was primarily driven by stock selection in the materials and energy sectors.
The largest contributors to relative performance included an overweight in the gold miner ETF, GDX, an overweight in railroad company KSU, and an overweight in agricultural chemicals company FMC. The largest detractors from relative performance included an overweight in exploration & production (“E&P”) company Continental Resources and underweights in gold miners Barrick Gold and Newmont.
From time to time, the Fund utilizes a “Buy-Write” options strategy in which call options are written against some equity holdings. For the reporting period, the use of this strategy was very limited and had no material impact on overall performance.
Outlook
We are seeing signs that the prolonged industrial/manufacturing/trade recession that has proven to be a difficult headwind for natural resources stocks is abating. Looking ahead, we have more conviction now than we have had in a very long time about bullish prospects for natural resources sector investing. Further evidence that the macro environment is improving combined with normalization of trade relations should provide a robust catalyst to these stocks, many of which are at historical lows relative to the broader market.
At present, we are exposed to over 26 different investment themes in the portfolio. As the new year commences, the Fund is currently underweight energy overall, with overweight in E&P as we see improving financial metrics driven by capital discipline. In materials, we are overweight copper, iron ore, and industrial gas. We have been increasing our exposure to the energy transition theme, which will likely gain momentum in the coming years and be a tailwind to performance. We expect that decreasing costs of renewables combined with policy support will lead to solid long term demand for solar, wind, and storage. Finally, we are overweight the railroads, on expectation for ongoing business efficiency improvements as we await stronger volumes in 2020. Throughout the Fund, we continue to favor high quality holdings (high free cash flow, low net debt, larger cap, strong assets) and attractive valuations. We remain confident this focus on high quality is the best long term risk/reward approach for this strategy.
| | | | | | |
| 12 | | December 31, 2019 | | | Semiannual Report | | |
Unaudited
AllianzGI Global Natural Resources Fund (cont’d)
Average Annual Total Return for the period ended December 31, 2019
| | | | | | | | | | | | | | | | | | | | | | |
| | | | | | |
| | | | | 6 Month* | | | 1 Year | | | 5 Year | | | 10 Year | | | Since Inception† | |
| | | AllianzGI Global Natural Resources Fund Class A | | | –3.16% | | | | 9.66% | | | | –2.86% | | | | –0.77% | | | | 4.43% | |
| | AllianzGI Global Natural Resources Fund Class A (adjusted) | | | –8.49% | | | | 3.63% | | | | –3.95% | | | | –1.33% | | | | 4.05% | |
| | | AllianzGI Global Natural Resources Fund Class C | | | –3.51% | | | | 8.95% | | | | –3.57% | | | | –1.51% | | | | 3.66% | |
| | AllianzGI Global Natural Resources Fund Class C (adjusted) | | | –4.46% | | | | 7.95% | | | | –3.57% | | | | –1.51% | | | | 3.66% | |
| | AllianzGI Global Natural Resources Fund Class P | | | –3.05% | | | | 10.06% | | | | –2.60% | | | | –0.51% | | | | 4.71% | |
| | AllianzGI Global Natural Resources Fund Institutional Class | | | –2.98% | | | | 10.08% | | | | –2.50% | | | | –0.42% | | | | 4.81% | |
| | 60% MSCI World Energy/40% MSCI World Materials Benchmark | | | 1.39% | | | | 16.14% | | | | 2.26% | | | | 2.52% | | | | 5.87% | |
| | MSCI World Index | | | 9.14% | | | | 27.67% | | | | 8.74% | | | | 9.47% | | | | 7.40% | |
| | | Lipper Global Natural Resources Funds Average | | | 2.14% | | | | 16.13% | | | | –1.00% | | | | –1.23% | | | | 3.51% | |
* Cumulative return
† The Fund began operations on 6/30/04. Benchmark and Lipper comparisons began on the fund inception date.
Performance quoted represents past performance and is no guarantee of future results. Current performance may be lower or higher than performance shown. For performance current to the most recent month-end, visit our website at us.allianzgi.com. Investment return and the principal value will fluctuate. Shares may be worth more or less than original cost when redeemed.The adjusted returns take into account the maximum sales charge of 5.50% on Class A shares and 1% contingent deferred sales charge (CDSC) on Class C shares, which may apply to shares redeemed during the first year of ownership. Returns do not reflect deduction of taxes that a shareholder would pay on fund distributions or redemption of fund shares. Please see pages 60-62 for more information. The Fund’s expense ratios are 1.44% for Class A shares, 2.19% for Class C shares, 1.19% for Class P shares and 1.09% for Institutional Class shares. Expense ratio information is as of the Fund’s current prospectus dated August 28, 2019, as further revised or supplemented from time to time.
Cumulative Returns Through December 31, 2019
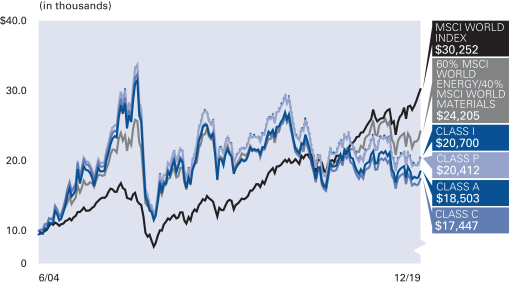
The Fund began operations on 6/30/04. Benchmark comparisons began on the fund inception date.
Country/Location Allocation (as of December 31, 2019)
| | | | |
| |
| United States | | | 61.0% | |
| |
| United Kingdom | | | 9.9% | |
| |
| Canada | | | 7.8% | |
| |
| France | | | 5.0% | |
| |
| Australia | | | 4.5% | |
| |
| Japan | | | 3.8% | |
| |
| Finland | | | 1.1% | |
| |
| Norway | | | 1.0% | |
| |
| Other | | | 7.4% | |
| |
| Cash & Equivalents — Net | | | –1.5% | |
| | | | | | |
| | Semiannual Report | | | December 31, 2019 | | 13 |
Unaudited
AllianzGI Global Natural Resources Fund (cont’d)
| | | | | | | | |
| |
| Shareholder Expense Example | | Actual Performance |
| | | Class A | | Class C | | Class P | | Institutional
Class |
| | | | |
| Beginning Account Value (7/1/19) | | $1,000.00 | | $1,000.00 | | $1,000.00 | | $1,000.00 |
| | | | |
| Ending Account Value (12/31/19) | | $968.40 | | $964.90 | | $969.50 | | $970.20 |
| | | | |
| Expenses Paid During Period | | $7.08 | | $10.77 | | $5.84 | | $5.35 |
| | | | | | | | | |
| |
| | | Hypothetical Performance |
| | | (5% return before expenses) |
| | | Class A | | Class C | | Class P | | Institutional
Class |
| | | | |
| Beginning Account Value (7/1/19) | | $1,000.00 | | $1,000.00 | | $1,000.00 | | $1,000.00 |
| | | | |
| Ending Account Value (12/31/19) | | $1,017.95 | | $1,014.18 | | $1,019.20 | | $1,019.71 |
| | | | |
| Expenses Paid During Period | | $7.25 | | $11.04 | | $5.99 | | $5.48 |
For each class of the Fund, expenses are equal to the annualized expense ratio for the class (1.43% for Class A, 2.18% for Class C, 1.18% for Class P and 1.08% for Institutional Class), multiplied by the average account value over the period, multiplied by 184/366. These expenses do not include the expenses of the investment companies in which the Fund invests, which are indirectly borne by Fund shareholders.
| | | | | | |
| 14 | | December 31, 2019 | | | Semiannual Report | | |
(THIS PAGE INTENTIONALLY LEFT BLANK)
| | | | | | |
| | Semiannual Report | | | December 31, 2019 | | 15 |
Unaudited
AllianzGI Global Small-Cap Fund
For the period of July 1, 2019 through December 31, 2019, as provided by Andrew Neville, Lead Portfolio Manager.
Fund Insights
For the six-month period ended December 31, 2019, the Class A shares at net asset value (“NAV”) of the AllianzGI Global Small-Cap Fund (the “Fund”) returned 4.23%, underperforming the MSCI World Small-Cap Index (the “benchmark”), which returned 8.82%.
Market Overview
Global equities overcame a sharp set-back in August to deliver robust gains over the second half of 2019. The rally meant many equity markets recorded their strongest annual gains in several years, with many markets closing the year at or near fresh/multi-month highs. Sentiment was lifted by a plethora of interest rate cuts across the developed and developing world, better-than-expected corporate earnings and optimism over a “phase one” trade deal between the US and China. Small caps as measured by the benchmark performed almost in line with large caps over in the six-month period.
Portfolio Review
The Fund represents the highest conviction names from four underlying regional small cap strategies: US, Europe, Japan, and Asia ex-Japan. Stock selection is the key driver of relative returns as the regional allocation of the fund is neutral to the benchmark and there are risk controls to ensure sector deviations do not become too large.
In absolute terms, all four small cap markets showed gains. Japanese small caps registered the strongest gains followed by small caps from Europe, the US and finally Pacific ex Japan. In relative terms, the Pacific ex Japan and the Japanese sleeve portfolios were able to outperform their local markets. The other sleeve portfolios lagged their indices.
The Fund’s underperformance was driven primarily by the negative stock selection in industrial stocks and the health care and consumer discretionary positions. The Fund’s largest contributors to performance came from the IT industry. ASM International (Netherlands) and Acacia Communications (US) particularly positively impacted performance. ASM International operates in more than 14 countries and makes equipment for front-end chip-making processes. In the third quarter, ASM International reported solid second quarter 2019 results, beating consensus on revenues (+8%) and operating result (+11%). Acacia Communications, a US maker of optical interconnect technologies like modules and semiconductors, announced a definitive agreement to be acquired by Cisco for $70.00 per share, implying a 43% premium.
The largest detractors to performance were Merit Medical, a US-based, global healthcare company. Management executed poorly in launching new products and the company’s attempt to bolster margins through vertically integrating product parts did not work. We sold the holding in the third quarter of 2019. Another detractor was Pluralsight. The US-based company provides online development and IT training services for software professionals. The company had a slowdown in billings in the second quarter of 2019 and several peers have seen a similar deceleration.
Outlook
While the outlook for the global economy appears cautiously favorable, growth looks set to remain weak, and geopolitics (take, for example, the trade conflict between the US and China) spell downside risks, despite some signs pointing towards a resolution. The generous monetary policy of the major international central banks should continue to support the equity markets for now, but is increasingly likely to meet its limits. At the same time, investors’ attention will probably shift towards economic data and corporate earnings. Overall, we believe that volatility will remain elevated and that we will see increasing disparity between individual stocks, sectors and countries. Small cap performance globally will be influenced by both the economic conditions and stimulus measures and the resulting balance between the two. The Fund will continue to focus on high quality growth stocks that we believe will deliver outperformance above the benchmark over the long-term.
| | | | | | |
| 16 | | December 31, 2019 | | | Semiannual Report | | |
Unaudited
AllianzGI Global Small-Cap Fund (cont’d)
Average Annual Total Return for the period ended December 31, 2019
| | | | | | | | | | | | | | | | | | | | | | |
| | | | | | |
| | | | | 6 Month* | | | 1 Year | | | 5 Year | | | 10 Year | | | Since Inception† | |
| | | AllianzGI Global Small-Cap Fund Class A | | | 4.23% | | | | 22.57% | | | | 6.02% | | | | 10.63% | | | | 9.70% | |
| | AllianzGI Global Small-Cap Fund Class A (adjusted) | | | –1.50% | | | | 15.83% | | | | 4.83% | | | | 10.00% | | | | 9.43% | |
| | | AllianzGI Global Small-Cap Fund Class C | | | 3.85% | | | | 21.64% | | | | 5.23% | | | | 9.80% | | | | 8.90% | |
| | AllianzGI Global Small-Cap Fund Class C (adjusted) | | | 2.91% | | | | 20.64% | | | | 5.23% | | | | 9.80% | | | | 8.90% | |
| | AllianzGI Global Small-Cap Fund Class P | | | 4.37% | | | | 22.86% | | | | 6.29% | | | | 10.91% | | | | 10.01% | |
| | AllianzGI Global Small-Cap Fund Institutional Class | | | 4.44% | | | | 22.98% | | | | 6.40% | | | | 11.01% | | | | 10.12% | |
| | MSCI World Small-Cap Index | | | 8.82% | | | | 26.19% | | | | 8.42% | | | | 10.54% | | | | 8.14% | |
| | | Lipper Global Small-/Mid-Cap Funds Average | | | 6.65% | | | | 25.76% | | | | 8.25% | | | | 9.74% | | | | 7.88% | |
* Cumulative return
† The Fund began operations on 12/31/96. Benchmark and Lipper comparisons began on the fund inception date.
Performance quoted represents past performance and is no guarantee of future results. Current performance may be lower or higher than performance shown. For performance current to the most recent month-end, visit our website at us.allianzgi.com. Investment return and the principal value will fluctuate. Shares may be worth more or less than original cost when redeemed.The adjusted returns take into account the maximum sales charge of 5.50% on Class A shares and 1% contingent deferred sales charge (CDSC) on Class C shares, which may apply to shares redeemed during the first year of ownership. Returns do not reflect deduction of taxes that a shareholder would pay on fund distributions or redemption of fund shares. Please see pages 60-62 for more information. The Fund’s expense ratios are 1.62% for Class A shares, 2.37% for Class C shares, 1.37% for Class P shares and 1.27% for Institutional Class shares. Expense ratio information is as of the Fund’s current prospectus dated August 28, 2019, as further revised or supplemented from time to time.
Cumulative Returns Through December 31, 2019
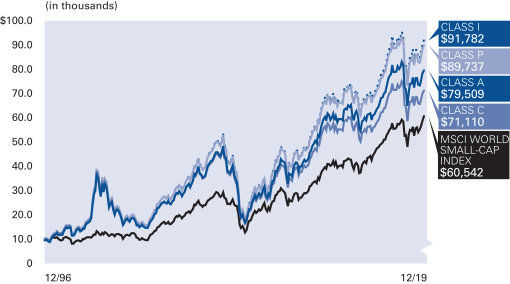
The Fund began operations on 12/31/96. Benchmark comparisons began on the fund inception date.
Country/Location Allocation (as of December 31, 2019)
| | | | |
| |
| United States | | | 55.4% | |
| |
| Japan | | | 13.3% | |
| |
| United Kingdom | | | 6.6% | |
| |
| Germany | | | 4.2% | |
| |
| Switzerland | | | 2.5% | |
| |
| Australia | | | 2.4% | |
| |
| France | | | 2.0% | |
| |
| Austria | | | 1.9% | |
| |
| Other | | | 9.6% | |
| |
| Cash & Equivalents — Net | | | 2.1% | |
| | | | | | |
| | Semiannual Report | | | December 31, 2019 | | 17 |
Unaudited
AllianzGI Global Small-Cap Fund (cont’d)
| | | | | | | | |
| |
| Shareholder Expense Example | | Actual Performance |
| | | Class A | | Class C | | Class P | | Institutional
Class |
| | | | |
| Beginning Account Value (7/1/19) | | $1,000.00 | | $1,000.00 | | $1,000.00 | | $1,000.00 |
| | | | |
| Ending Account Value (12/31/19) | | $1,042.30 | | $1,038.50 | | $1,043.70 | | $1,044.40 |
| | | | |
| Expenses Paid During Period | | $8.37 | | $12.20 | | $7.09 | | $6.58 |
| | | | | | | | | |
| |
| | | Hypothetical Performance |
| | | (5% return before expenses) |
| | | Class A | | Class C | | Class P | | Institutional
Class |
| | | | |
| Beginning Account Value (7/1/19) | | $1,000.00 | | $1,000.00 | | $1,000.00 | | $1,000.00 |
| | | | |
| Ending Account Value (12/31/19) | | $1,016.94 | | $1,013.17 | | $1,018.20 | | $1,018.70 |
| | | | |
| Expenses Paid During Period | | $8.26 | | $12.04 | | $7.00 | | $6.50 |
For each class of the Fund, expenses are equal to the annualized expense ratio for the class (1.63% for Class A, 2.38% for Class C, 1.38% for Class P and 1.28% for Institutional Class), multiplied by the average account value over the period, multiplied by 184/366.
| | | | | | |
| 18 | | December 31, 2019 | | | Semiannual Report | | |
(THIS PAGE INTENTIONALLY LEFT BLANK)
| | | | | | |
| | Semiannual Report | | | December 31, 2019 | | 19 |
Unaudited
AllianzGI Health Sciences Fund
For the period of July 1, 2019 through December 31, 2019, as provided by Peter Pirsch, CFA, Lead Portfolio Manager.
Fund Insights
For the six-month period ended December 31, 2019, the Class A shares at net asset value (“NAV”) of the AllianzGI Health Sciences Fund (the “Fund”) returned 11.85%, underperforming the MSCI World Health Care Index (the “benchmark”), which returned 12.28%.
Market Overview
Health care stocks were higher for the six-month period as investors were broadly optimistic about global equities in light of accommodative central bank policies and better-than-expected corporate profits.
The asset class initially posted lackluster results with flat-to-negative performance during each of the first three months of the period. Investors were apprehensive about health care valuations and uncertainty from the upcoming US presidential election, due in part to Elizabeth Warren’s ascendancy to “front runner” status for the democratic nomination. Sentiment improved meaningfully with broad-based gains in each of the final three months of the semi-annual reporting period and the benchmark reached new all-time highs. Global markets were lifted by improving trade relations between the US and China, signs of further central bank easing and expectations that the worst of the slowdown in the global economy may be over. Health care stocks were among the top performers thanks to an asset class rerating and expectations of improved profit growth.
Results for the benchmark were higher across the board with all six industries posting gains. Biotechnology was the top performer with a greater than 18% advance, followed by double digit gains in healthcare providers and pharmaceuticals. Meanwhile, the life sciences tools & services industry was up only modestly for the period.
Portfolio Review
The Fund seeks to deliver outperformance over time via a conviction portfolio via the implementation of a top-down and bottom-up investment process focused on rigorous fundamental analysis.
During the six-month period, the Fund’s performance was in line with the benchmark as positive bottom-up stock selection and industry weightings which were neutralized by country allocation decisions. Bottom-up stockpicking in pharmaceutical and health care provider industries outpaced the benchmark for the period. Meanwhile, healthcare equipment and biotechnology were modest laggards on a relative basis.
A sizeable overweight allocation to Bristol-Myers Squibb Company proved advantageous as the company benefited from an upside earnings surprise, an attractive valuation and a general flight to dividend paying defensive names. The relative underweight allocation to pharmaceutical giant Pfizer Inc. contributed to results as the stock declined following the company’s decision to combine their off-patent drug division with Mylan, while Horizon Therapeutics rallied thanks to an acceleration in earnings results. Alternatively, largest relative detractor to performance was Vapotherm Inc. The respiratory device maker came under pressure as the market digested the company’s earnings miss and the announcement of a secondary offering of shares. Medical equipment maker Alcon Inc. was lower following earnings which trailed Street expectations, while specialty animal products provider Elanco Animal Health, Inc. was lower due in part to acquisition of Bayer’s animal health business.
Outlook
Looking forward, we are optimistic about the opportunities in the health care sector over the next year. Although the sector modestly lagged the broader industries in 2019, there appears to be an increasing level of optimism in recent months thanks to earnings growth expectations and the defensive nature of the sector. This year’s US presidential election and the ongoing impeachment proceedings of President Donald Trump may result in greater uncertainty in markets, which could impact the health care sector.
Overall, the Fund’s positioning is centered on what we believe are the significant long-term growth drivers for healthcare—drug innovation and cost-containment and we continue to focus on more mature, defensive core holdings. However, we recently added a few “riskier” assets in medical technology, genomics and biotechnology to help balance the portfolio during this positive volatility spike. We believe this barbell approach will continue to drive the potential for risk-adjusted alpha without taking outsized risk on any one holding.
| | | | | | |
| 20 | | December 31, 2019 | | | Semiannual Report | | |
Unaudited
AllianzGI Health Sciences Fund (cont’d)
Average Annual Total Return for the period ended December 31, 2019
| | | | | | | | | | | | | | | | | | | | | | |
| | | | | | |
| | | | | 6 Month* | | | 1 Year | | | 5 Year | | | 10 Year | | | Since Inception† | |
| | | AllianzGI Health Sciences Fund Class A | | | 11.85% | | | | 26.64% | | | | 9.82% | | | | 13.92% | | | | 11.91% | |
| | AllianzGI Health Sciences Fund Class A (adjusted) | | | 5.69% | | | | 19.68% | | | | 8.59% | | | | 13.28% | | | | 11.63% | |
| | | AllianzGI Health Sciences Fund Class C | | | 11.41% | | | | 25.71% | | | | 9.01% | | | | 13.08% | | | | 11.07% | |
| | AllianzGI Health Sciences Fund Class C (adjusted) | | | 10.41% | | | | 24.71% | | | | 9.01% | | | | 13.08% | | | | 11.07% | |
| | AllianzGI Health Sciences Fund Institutional Class | | | 12.03% | | | | 27.08% | | | | 10.21% | | | | 14.32% | | | | 12.32% | |
| | MSCI World Health Care Index | | | 12.28% | | | | 23.24% | | | | 8.50% | | | | 12.29% | | | | 8.91% | |
| | | Lipper Health/Biotechnology Funds Average | | | 10.69% | | | | 26.22% | | | | 8.72% | | | | 15.22% | | | | 10.94% | |
* Cumulative return
† The Fund began operations on 12/31/96. Benchmark and Lipper comparisons began on the fund inception date.
Performance quoted represents past performance and is no guarantee of future results. Current performance may be lower or higher than performance shown. For performance current to the most recent month-end, visit our website at us.allianzgi.com. Investment return and the principal value will fluctuate. Shares may be worth more or less than original cost when redeemed.The adjusted returns take into account the maximum sales charge of 5.50% on Class A shares and 1% contingent deferred sales charge (CDSC) on Class C shares, which may apply to shares redeemed during the first year of ownership. Returns do not reflect deduction of taxes that a shareholder would pay on fund distributions or redemption of fund shares. Please see pages 60-62 for more information. The Fund’s expense ratios are 1.47% for Class A shares, 2.22% for Class C shares and 1.12% for Institutional Class shares. Expense ratio information is as of the Fund’s current prospectus dated August 28, 2019, as further revised or supplemented from time to time.
Cumulative Returns Through December 31, 2019
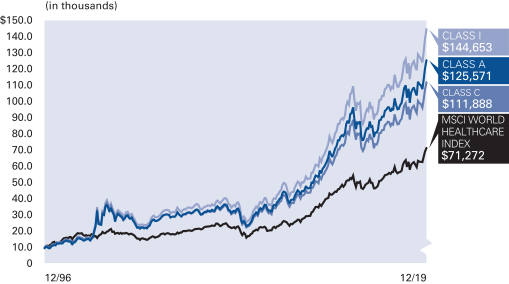
The Fund began operations on 12/31/96. Benchmark comparisons began on the fund inception date.
Industry/Sectors (as of December 31, 2019)
| | | | |
| |
| Pharmaceuticals | | | 43.2% | |
| |
| HealthCare Equipment & Supplies | | | 20.9% | |
| |
| HealthCare Providers & Services | | | 14.2% | |
| |
| Biotechnology | | | 12.3% | |
| |
| Life Sciences Tools & Services | | | 6.2% | |
| |
| Cash & Equivalents — Net | | | 3.2% | |
| | | | | | |
| | Semiannual Report | | | December 31, 2019 | | 21 |
Unaudited
AllianzGI Health Sciences Fund (cont’d)
| | | | | | | | | | |
| |
| Shareholder Expense Example | | Actual Performance |
| | | | | | | Class A | | Class C | | Institutional
Class |
| | | | | |
| Beginning Account Value (7/1/19) | | | | | | $1,000.00 | | $1,000.00 | | $1,000.00 |
| | | | | |
| Ending Account Value (12/31/19) | | | | | | $1,118.50 | | $1,114.10 | | $1,120.30 |
| | | | | |
| Expenses Paid During Period | | | | | | $7.83 | | $11.80 | | $5.97 |
| | | | | | | | | | | |
| |
| | | Hypothetical Performance |
| | | (5% return before expenses) |
| | | | | | | Class A | | Class C | | Institutional
Class |
| | | | | |
| Beginning Account Value (7/1/19) | | | | | | $1,000.00 | | $1,000.00 | | $1,000.00 |
| | | | | |
| Ending Account Value (12/31/19) | | | | | | $1,017.75 | | $1,013.98 | | $1,019.51 |
| | | | | |
| Expenses Paid During Period | | | | | | $7.46 | | $11.24 | | $5.69 |
For each class of the Fund, expenses are equal to the annualized expense ratio for the class (1.47% for Class A, 2.22% for Class C and 1.12% for Institutional Class ), multiplied by the average account value over the period, multiplied by 184/366.
| | | | | | |
| 22 | | December 31, 2019 | | | Semiannual Report | | |
(THIS PAGE INTENTIONALLY LEFT BLANK)
| | | | | | |
| | Semiannual Report | | | December 31, 2019 | | 23 |
Unaudited
AllianzGI Income & Growth Fund
For the period of July 1, 2019 through December 31, 2019, as provided by Douglas G. Forsyth, CFA, Portfolio Manager.
Fund Insights
For the six-month period ended December 31, 2019, the Class A shares, at net asset value (“NAV”) of the AllianzGI Income & Growth Fund (the “Fund”) returned 5.89%. During the same period, the S&P 500 Index increased 10.92% and the overall U.S. bond market, as measured by the Bloomberg Barclays U.S. Aggregate Bond Index, rose 2.45%. The convertible universe returned 7.55%, as measured by the ICE BofA US Convertible Index; and high yield bonds, as measured by the ICE BofA US High Yield Master II Index, increased 3.86%. Lastly, the Russell 1000 Growth Index gained 12.27%.
Market Overview
Risk assets produced strong returns over the reporting period and, in stark contrast to 2018, finished 2019 on a firm footing. US equities posted double-digit gains in the second half of 2019 and major indices hit a series of fresh highs going into year-end. Convertible bonds benefited from underlying stock price strength. A globally depressed yield environment continued to lend support to high-yield bonds.
Third-quarter financial results and guidance for most US issuers were generally better than expected. Correspondingly, 76% of the companies in the S&P 500 reported earnings above analyst estimates and 60% reported revenues above expectations, according to FactSet.
Key economic reports in the final months of the year indicated continued US expansion. Third-quarter gross domestic product (“GDP”) growth exceeded expectations; unemployment fell to a 50-year low; housing data showed signs of renewed momentum; and consumer sentiment rebounded. In contrast, manufacturing data remained weak.
In addition to overseas monetary policy stimulus, the US Federal Reserve (“Fed”) reduced rates by a total of 75 basis points. After cutting rates for a third time in October to a range of 1.50% to 1.75%, the Fed left rates unchanged at its December meeting and indicated that it would keep rate changes on hold until there was either a persistent move up in inflation or deterioration in its economic outlook.
The 10-year US Treasury bond yield fluctuated substantially over the reporting period. After starting the period at 2.0%, the yield fell below 1.5% in late summer. Fading geopolitical risks on the back of progress in US/China trade negotiations helped drive the yield higher in the fourth quarter. By year-end, it stood at 1.9% and caused the yield curve (3-month vs. 10-year) to steepen sharply from an inverted position.
Portfolio Review
The Fund provided consistent income—the primary goal of the strategy—and a positive total return over the six-month reporting period. Equity holdings had the greatest positive impact on the Fund’s performance followed by convertible exposure and high-yield bond holdings.
Information technology, health care and consumer discretionary were the top-contributing sectors to the equity sleeve’s performance during the period. Conversely, only two sectors—materials and energy—detracted from performance and their combined impact insignificantly influenced performance.
In the convertible sleeve, sectors that contributed positively to relative performance were technology, health care and consumer discretionary. Sector exposure that hindered performance in the period was limited to three sectors—energy, materials and transportation.
In the high yield sleeve, industries that aided performance were technology & electronics, health care and support-services. In contrast, only energy and retail exposures were performance headwinds.
Several option positions expired below strike and the portfolio was able to retain the set premiums. Against a depressed equity volatility backdrop, the percent of equities with a covered call structure trended lower over the reporting period.
Outlook
We believe that synchronized global central bank accommodation and stable US economic growth should support earnings growth and risk asset performance in 2020.
After three interest rate cuts in 2019, the Fed has signaled a pause in the easing cycle but has resumed expansion of its balance sheet. According to the Fed, US monetary policy is not on any pre-set course and adjustments will continue to provide support to the economy.
The US economy is expected to expand at a moderate pace in 2020 given recent economic data points. In our view, even stronger US growth is possible if the global manufacturing environment improves. Geopolitical risks and US politics including the Democratic Party nominee and 2020 elections may cause market volatility, but could also provide investment opportunities.
After flat growth in 2019, we believe that corporate profits should accelerate in 2020 with easier comparisons versus the prior year and revenue growth should also increase relative to 2019. Based on bottom-up estimates, we believe that earnings are poised to trend higher throughout the year and we believe could result in year-over-year earnings growth of 10% for the S&P 500 Index.
| | | | | | |
| 24 | | December 31, 2019 | | | Semiannual Report | | |
Unaudited
AllianzGI Income & Growth Fund (cont’d)
Average Annual Total Return for the period ended December 31, 2019
| | | | | | | | | | | | | | | | | | | | | | |
| | | | | | |
| | | | | 6 Month* | | | 1 Year | | | 5 Year | | | 10 Year | | | Since Inception† | |
| | | AllianzGI Income & Growth Fund Class A | | | 5.89% | | | | 19.73% | | | | 6.88% | | | | 8.40% | | | | 7.05% | |
| | AllianzGI Income & Growth Fund Class A (adjusted) | | | 0.06% | | | | 13.15% | | | | 5.68% | | | | 7.78% | | | | 6.58% | |
| | | AllianzGI Income & Growth Fund Class C | | | 5.47% | | | | 18.83% | | | | 6.08% | | | | 7.59% | | | | 6.25% | |
| | AllianzGI Income & Growth Fund Class C (adjusted) | | | 4.47% | | | | 17.83% | | | | 6.08% | | | | 7.59% | | | | 6.25% | |
| | AllianzGI Income & Growth Fund Class R | | | 5.75% | | | | 19.44% | | | | 6.62% | | | | 8.12% | | | | 6.79% | |
| | AllianzGI Income & Growth Fund Class P | | | 6.03% | | | | 20.11% | | | | 7.16% | | | | 8.67% | | | | 7.33% | |
| | AllianzGI Income & Growth Fund Institutional Class | | | 6.11% | | | | 20.23% | | | | 7.25% | | | | 8.77% | | | | 7.44% | |
| | S&P 500 Index | | | 10.92% | | | | 31.49% | | | | 11.70% | | | | 13.56% | | | | 8.97% | |
| | Bloomberg Barclays U.S. Aggregate Bond Index | | | 2.45% | | | | 8.72% | | | | 3.05% | | | | 3.75% | | | | 4.21% | |
| | | Lipper Flexible Portfolio Funds Average | | | 5.02% | | | | 15.96% | | | | 4.68% | | | | 6.49% | | | | 4.99% | |
† The Fund began operations on 2/28/07. Benchmark and Lipper comparisons began on the fund inception date.
Performance quoted represents past performance and is no guarantee of future results. Current performance may be lower or higher than performance shown. For performance current to the most recent month-end, visit our website at us.allianzgi.com. Investment return and the principal value will fluctuate. Shares may be worth more or less than original cost when redeemed.The adjusted returns take into account the maximum sales charge of 5.50% on Class A shares and 1% contingent deferred sales charge (CDSC) on Class C shares, which may apply to shares redeemed during the first year of ownership. Returns do not reflect deduction of taxes that a shareholder would pay on fund distributions or redemption of fund shares. Please see pages 60-62 for more information. The Fund’s gross expense ratios are 1.29% for Class A shares, 2.04% for Class C shares, 1.54% for Class R shares, 1.04% for Class P shares and 0.94% for Institutional Class shares. These ratios do not include an expense reduction, contractually agreed through at least August 31, 2020. The Fund’s expense ratios net of this reduction are 1.28% for Class A shares, 2.03% for Class C shares, 1.53% for Class R shares, 1.03% for Class P shares and 0.93% for Institutional Class shares. Expense ratio information is as of the Fund’s current prospectus dated August 28, 2019, as further revised or supplemented from time to time.
Cumulative Returns Through December 31, 2019
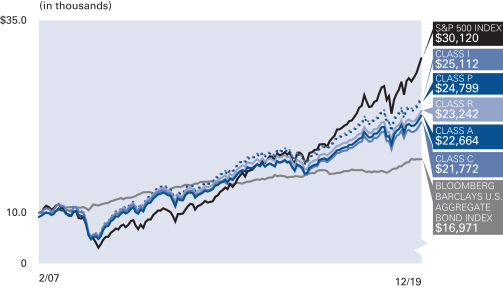
The Fund began operations on 2/28/07. Benchmark comparisons began on the fund inception date.
Industry/Sectors (as of December 31, 2019)
| | | | |
| |
| Software | | | 8.9% | |
| |
| Internet | | | 5.6% | |
| |
| Media | | | 5.5% | |
| |
| Pharmaceuticals | | | 4.5% | |
| |
| Semiconductors & Semiconductor Equipment | | | 4.3% | |
| |
| Telecommunications | | | 3.7% | |
| |
| Oil, Gas & Consumable Fuels | | | 3.6% | |
| |
| Biotechnology | | | 3.1% | |
| |
| Other | | | 56.4% | |
| |
| Cash & Equivalents — Net | | | 4.4% | |
S&P Ratings* (as of December 31, 2019)
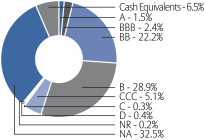
| * | As a percentage of fixed-income investments. Bond ratings refer to the underlying holdings of the Fund and are categorized from highest to lowest credit quality using ratings provided by S&P Global Ratings (“S&P”). S&P’s ratings have been selected for several reasons, including the portfolio managers’ usage of S&P ratings methodology among other credit quality information in managing the Fund, access to background information and other materials provided by S&P, as well as the Fund’s consideration of industry practice. The Fund also displays S&P credit ratings information in materials provided in client presentations. See “Important Information” for more detail on the selection of S&P for the Fund’s ratings presentation. Securities not rated by S&P and bonds that do not currently have a rating available are designated in the chart above as “NR” and “NA”, respectively. |
| | | | | | |
| | Semiannual Report | | | December 31, 2019 | | 25 |
Unaudited
AllianzGI Income & Growth Fund (cont’d)
| | | | | | | | | | |
| |
| Shareholder Expense Example | | Actual Performance |
| | | Class A | | Class C | | Class R | | Class P | | Institutional
Class |
| | | | | |
| Beginning Account Value (7/1/19) | | $1,000.00 | | $1,000.00 | | $1,000.00 | | $1,000.00 | | $1,000.00 |
| | | | | |
| Ending Account Value (12/31/19) | | $1,058.90 | | $1,054.70 | | $1,057.50 | | $1,060.30 | | $1,061.10 |
| | | | | |
| Expenses Paid During Period | | $6.62 | | $10.48 | | $7.91 | | $5.33 | | $4.82 |
| | | | | | | | | | | |
| |
| | | Hypothetical Performance |
| | | (5% return before expenses) |
| | | Class A | | Class C | | Class R | | Class P | | Institutional
Class |
| | | | | |
| Beginning Account Value (7/1/19) | | $1,000.00 | | $1,000.00 | | $1,000.00 | | $1,000.00 | | $1,000.00 |
| | | | | |
| Ending Account Value (12/31/19) | | $1,018.70 | | $1,014.93 | | $1,017.44 | | $1,019.96 | | $1,020.46 |
| | | | | |
| Expenses Paid During Period | | $6.50 | | $10.28 | | $7.76 | | $5.23 | | $4.72 |
For each class of the Fund, expenses (net of fee waivers) are equal to the annualized expense ratio for the class (1.28% for Class A, 2.03% for Class C, 1.53% for Class R, 1.03% for Class P and 0.93% for Institutional Class), multiplied by the average account value over the period, multiplied by 184/366.
| | | | | | |
| 26 | | December 31, 2019 | | | Semiannual Report | | |
(THIS PAGE INTENTIONALLY LEFT BLANK)
| | | | | | |
| | Semiannual Report | | | December 31, 2019 | | 27 |
Unaudited
AllianzGI Mid-Cap Fund
For the period July 1, 2019 through December 31, 2019, as provided by Steven Klopukh, CFA, Lead Portfolio Manager.
Fund Insights
For the six-month period ended December 31, 2019, the Class A Shares at net asset value (“NAV”) of the AllianzGI Mid-Cap Fund (the “Fund”) returned 7.02%, underperforming the Russell Midcap Growth Index (the “benchmark”), which returned 7.45%.
Market Overview
Global equities overcame a sharp set-back in August 2019 to deliver robust gains over the second half of 2019. The rally meant many equity markets recorded their strongest annual gains in several years, with many markets closing the year at or near fresh/multi-month highs. Sentiment was lifted by a plethora of interest rate cuts across the developed and developing world, better-than-expected corporate earnings and optimism over a “phase one” trade deal between the US and China. Against this backdrop, the Russell Midcap Index returned 7.58%, underperforming the Russell 1000 Index’s return of 10.59%. Within the mid cap universe, growth stocks underperformed value stocks by 0.21%.
Portfolio Review
Sector allocation had a negative effect on performance while positive security selection was offsetting. Stockpicking in materials was the primary contributor, followed by the health care and consumer staples sectors. This was balanced by weaker security selections in the information technology, financials and consumer discretionary sectors. The overweight to the health care sector detracted from returns. This was partially offset by an underweight to consumer discretionary.
A top contributor to relative returns was DexCom, Inc. (“DexCom”), medical device company that specializes in continuous glucose monitoring systems with smart device connectivity. The stock benefited from quarterly earnings results and guidance that exceeded consensus expectations. DexCom continues to see strong patient adoption of their newest G6 system. With low penetration in a large addressable market and strong product offerings, we believe DexCom’s growth trajectory remains robust.
The top detractor to relative returns was Workday, Inc. (“Workday”), which provides cloud based enterprise software for applications that include finance and human resources. Shares fell as management’s forward guidance was below high investor expectations. Looking forward, we are likely in the middle of a major upgrade cycle, as enterprises switch from legacy software to modern cloud based systems. Workday’s compelling enterprise resource software positions the company to capture this trend and generate sustainable double digit growth. However, recent volatility in share price warrants close monitoring of the situation.
As of December 31, 2019, the largest sector overweight was in consumer staples, followed by health care and financials. Consumer discretionary was the largest underweight position in the Fund, followed by the information technology and real estate sectors.
Outlook
For calendar year 2020, we continue to expect moderate growth for the US economy. Leading economic indicators continue to signal benign conditions and employment metrics remains positive. On the US-China trade front, the “phase one” trade deal has been regarded as a positive development, removing a measure of uncertainty for future corporate capital investments. From a global monetary policy perspective, 49 central banks around the world cut rates 71 times in 2019. We believe that this synchronized global monetary easing should stabilize investor appetite for risk assets. While US mid cap earnings valuations currently trade above historical averages, it is important to highlight that 2019 was a year when analysts lowered earnings expectations amid a slowing economic environment. Looking to 2020, we believe analysts have not fully built in the effects of stabilizing economic growth. It is our belief that as companies start reporting forward guidance for this year, we should start seeing upward earnings revisions, especially for cyclical industries.
As always, we continue to focus on stock selection, seeking to invest in high quality mid cap companies with attractive growth prospects that are attractively valued. The Fund’s portfolio emphasizes free cash flow yield and responsible capital allocation.
| | | | | | |
| 28 | | December 31, 2019 | | | Semiannual Report | | |
Unaudited
AllianzGI Mid-Cap Fund (cont’d)
Average Annual Total Return for the period ended December 31, 2019
| | | | | | | | | | | | | | | | | | | | | | |
| | | | | | |
| | | | | 6 Month* | | | 1 Year | | | 5 Year | | | 10 Year | | | Since Inception† | |
| | | AllianzGI Mid-Cap Fund Class A | | | 7.02% | | | | 41.00% | | | | 11.42% | | | | 12.36% | | | | 12.89% | |
| | AllianzGI Mid-Cap Fund Class A (adjusted) | | | 1.13% | | | | 33.24% | | | | 10.16% | | | | 11.72% | | | | 12.73% | |
| | | AllianzGI Mid-Cap Fund Class C | | | 6.83% | | | | 40.48% | | | | 10.62% | | | | 11.53% | | | | 12.12% | |
| | AllianzGI Mid-Cap Fund Class C (adjusted) | | | 5.83% | | | | 39.48% | | | | 10.62% | | | | 11.53% | | | | 12.12% | |
| | AllianzGI Mid-Cap Fund Class R | | | 7.19% | | | | 40.81% | | | | 11.17% | | | | 12.08% | | | | 12.70% | |
| | AllianzGI Mid-Cap Fund Class P | | | 7.19% | | | | 41.35% | | | | 11.72% | | | | 12.65% | | | | 13.34% | |
| | AllianzGI Mid-Cap Fund Institutional Class | | | 7.37% | | | | 41.70% | | | | 11.81% | | | | 12.75% | | | | 13.45% | |
| | | AllianzGI Mid-Cap Fund Administrative Class | | | 7.06% | | | | 41.40% | | | | 11.52% | | | | 12.44% | | | | 13.15% | |
| | Russell Midcap Growth Index | | | 7.45% | | | | 35.47% | | | | 11.60% | | | | 14.24% | | | | 12.44% | |
| | | Lipper Mid-Cap Growth Funds Average | | | 5.86% | | | | 34.02% | | | | 11.13% | | | | 13.13% | | | | 9.53% | |
| | | Lipper Multi-Cap Growth Funds Average | | | 7.29% | | | | 31.41% | | | | 11.38% | | | | 13.30% | | | | —% | |
* Cumulative return
† The Fund began operations on 11/6/79. Benchmark and primary Lipper performance comparisons began on 10/31/79; secondary Lipper performance is available for trailing 10 years.
Performance quoted represents past performance and is no guarantee of future results. Current performance may be lower or higher than performance shown. For performance current to the most recent month-end, visit our website at us.allianzgi.com. Investment return and the principal value will fluctuate. Shares may be worth more or less than original cost when redeemed.The adjusted returns take into account the maximum sales charge of 5.50% on Class A shares and 1% contingent deferred sales charge (CDSC) on Class C shares, which may apply to shares redeemed during the first year of ownership. Returns do not reflect deduction of taxes that a shareholder would pay on fund distributions or redemption of fund shares. Please see pages 60-62 for more information. The Fund’s expense ratios are 1.14% for Class A shares, 1.89% for Class C shares, 1.39% for Class R shares, 0.89% for Class P shares, 0.79% for Institutional Class shares and 1.04% for Administrative Class shares. Expense ratio information is as of the Fund’s current prospectus dated August 28, 2019, as further revised or supplemented from time to time.
Cumulative Returns Through December 31, 2019
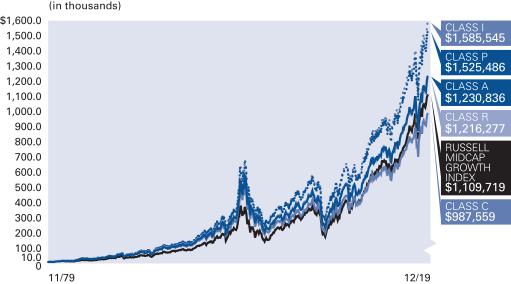
The Fund began operations on 11/6/79. Benchmark performance comparisons began on 10/31/79.
Industry/Sectors (as of December 31, 2019)
| | | | |
| |
| IT Services | | | 10.7% | |
| |
| Health Care Equipment & Supplies | | | 10.6% | |
| |
| Software | | | 8.2% | |
| |
| Semiconductors & Semiconductor Equipment | | | 7.4% | |
| |
| Food products | | | 4.6% | |
| |
| Entertainment | | | 4.6% | |
| |
| pharmaceuticals | | | 4.4% | |
| |
| Electronic Equipment, Instruments & Components | | | 4.0% | |
| |
| Other | | | 44.3% | |
| |
| Cash & Equivalents — Net | | | 1.2% | |
| | | | | | |
| | Semiannual Report | | | December 31, 2019 | | 29 |
Unaudited
AllianzGI Mid-Cap Fund (cont’d)
| | | | | | | | | | | | |
| |
| Shareholder Expense Example | | Actual Performance |
| | | Class A | | Class C | | Class R | | Class P | | Institutional
Class | | Administrative
Class |
| | | | | | |
| Beginning Account Value (7/1/19) | | $1,000.00 | | $1,000.00 | | $1,000.00 | | $1,000.00 | | $1,000.00 | | $1,000.00 |
| | | | | | |
| Ending Account Value (12/31/19) | | $1,070.20 | | $1,068.30 | | $1,071.90 | | $1,071.90 | | $1,073.70 | | $1,070.60 |
| | | | | | |
| Expenses Paid During Period | | $5.93 | | $9.83 | | $7.24 | | $4.64 | | $4.12 | | $5.41 |
| | | | | | | | | | | | | |
| |
| | | Hypothetical Performance |
| | | (5% return before expenses) |
| | | Class A | | Class C | | Class R | | Class P | | Institutional
Class | | Administrative
Class |
| | | | | | |
| Beginning Account Value (7/1/19) | | $1,000.00 | | $1,000.00 | | $1,000.00 | | $1,000.00 | | $1,000.00 | | $1,000.00 |
| | | | | | |
| Ending Account Value (12/31/19) | | $1,019.41 | | $1,015.63 | | $1,018.15 | | $1,020.66 | | $1,021.17 | | $1,019.91 |
| | | | | | |
| Expenses Paid During Period | | $5.79 | | $9.58 | | $7.05 | | $4.52 | | $4.01 | | $5.28 |
For each class of the Fund, expenses are equal to the annualized expense ratio for the class (1.14% for Class A, 1.89% for Class C, 1.39% for Class R, 0.89% for Class P, 0.80% for Institutional Class and 1.04% for Administrative Class), multiplied by the average account value over the period, multiplied by 184/366.
| | | | | | |
| 30 | | December 31, 2019 | | | Semiannual Report | | |
(THIS PAGE INTENTIONALLY LEFT BLANK)
| | | | | | |
| | Semiannual Report | | | December 31, 2019 | | 31 |
Unaudited
AllianzGI NFJ Dividend Value Fund
For the period July 1, 2019 through December 31, 2019, as provided by the Value Equity, US team.
Fund Insights
For the six-month period ended December 31, 2019, the Class A shares at net asset value (“NAV”) of the AllianzGI NFJ Dividend Value Fund (the “Fund”) returned 9.05%, outperforming the Russell 1000 Value Index (the “benchmark”), which returned 8.86%.
Market Overview
US equities posted double-digit gains in the second half of 2019, closing the year with the strongest annual returns since 2013. Despite a notable set-back in August, major indices hit a series of fresh highs as risk appetite was boosted by lower interest rates and a “phase one” trade deal between the US and China. Corporate earnings also beat, albeit lowered, expectations. Growth stocks continued to outperform value stocks. Amid growing concerns that the pace of US growth was moderating, the US Federal Reserve (“Fed”) cut rates by 25 basis points, 0.25%, in July, its first reduction since 2008, followed by two further cuts in September and October. In December, the Fed signaled it would maintain its current policy throughout 2020. It also delivered an upbeat assessment of the US economy, saying that the current stance of monetary policy was “appropriate”, a change from October’s statement that referred to “uncertainties” in its outlook. The Fed indicated that it would keep rates on hold until there was a persistent move up in inflation or a deterioration in the global economic outlook.
Portfolio Review
Relative performance results were due to positive stock selection, while sector allocation was moderately negative over the reporting period. Selections across the materials, energy and industrials sectors were the largest contributors and boosted relative returns. In contrast, holdings in the technology and utilities sectors failed to keep pace with benchmark shares and detracted from performance results. Within the benchmark, ten of the eleven GICS economic sectors advanced over the second half of 2019. The information technology sector was the top performer, while energy was the only sector to lose ground as oil prices remained mostly range bound. The Fund’s overweight in energy detracted from relative returns, while an overweight in technology contributed to performance results during the six-month period.
Outlook
Going into 2020, equity market valuations appear to us to have positive news baked in, with the S&P’s forward price-to-earnings ratio multiple hovering over 19x, up from 15x at this time last year. Without the tailwind of continued multiple expansion, stocks will likely have to rely on earnings growth to continue the decade-long bull market, so advances will likely be muted compared to 2019’s gains. The good news is that the Fed has signaled that it will likely be on hold this year, which is positive for risk assets as a whole, and value equities more specifically. The consumer continues to be the pillar holding up the slow-but-steady economic expansion, and with low unemployment, clean consumer balance sheets and nascent signs of wage growth, we believe that should at least continue to be the case for the balance of 2020. In our opinion, the two factors that could throw a curveball into forecasts are a re-escalation of trade conflicts and the Presidential election. There is a wider divergence of outcomes between possible candidates this year than we have seen in several decades, meaning that as the likelihood of election outcomes shifts throughout the year, market volatility may be on the rise.
In the face of these uncertainties, slower returns and higher volatility, we believe the best strategy for investors is to focus on companies with stable earnings and clean balance sheets. Dividend payers at a reasonable price should also provide more predictable returns, as well as taking advantage of company-specific stories as a potential mean of enhancing returns. As active managers, we believe this approach will become critical in the current environment for clients seeking strong absolute returns and moderated volatility over the long term.
| | | | | | |
| 32 | | December 31, 2019 | | | Semiannual Report | | |
Unaudited
AllianzGI NFJ Dividend Value Fund (cont’d)
Average Annual Total Return for the period ended December 31, 2019
| | | | | | | | | | | | | | | | | | | | | | |
| | | | | | |
| | | | | 6 Month* | | | 1 Year | | | 5 Year | | | 10 Year | | | Since Inception† | |
| | | AllianzGI NFJ Dividend Value Fund Class A | | | 9.05% | | | | 24.66% | | | | 6.54% | | | | 9.90% | | | | 7.97% | |
| | AllianzGI NFJ Dividend Value Fund Class A (adjusted) | | | 3.05% | | | | 17.80% | | | | 5.34% | | | | 9.28% | | | | 7.66% | |
| | | AllianzGI NFJ Dividend Value Fund Class C | | | 8.68% | | | | 23.76% | | | | 5.73% | | | | 9.08% | | | | 7.16% | |
| | AllianzGI NFJ Dividend Value Fund Class C (adjusted) | | | 7.71% | | | | 22.76% | | | | 5.73% | | | | 9.08% | | | | 7.16% | |
| | AllianzGI NFJ Dividend Value Fund Class R | | | 9.00% | | | | 24.36% | | | | 6.27% | | | | 9.64% | | | | 7.70% | |
| | AllianzGI NFJ Dividend Value Fund Class P | | | 9.27% | | | | 25.04% | | | | 6.80% | | | | 10.18% | | | | 8.29% | |
| | AllianzGI NFJ Dividend Value Fund Institutional Class | | | 9.25% | | | | 25.09% | | | | 6.91% | | | | 10.30% | | | | 8.39% | |
| | AllianzGI NFJ Dividend Value Fund Class R6 | | | 9.33% | | | | 25.16% | | | | 6.97% | | | | 10.35% | | | | 8.45% | |
| | | AllianzGI NFJ Dividend Value Fund Administrative Class | | | 9.19% | | | | 24.77% | | | | 6.64% | | | | 10.02% | | | | 8.12% | |
| | Russell 1000 Value Index | | | 8.86% | | | | 26.54% | | | | 8.29% | | | | 11.80% | | | | 7.24% | |
| | | Lipper Equity Income Funds Average | | | 8.56% | | | | 24.41% | | | | 8.05% | | | | 10.74% | | | | 6.99% | |
* Cumulative return
† The Fund began operations on 5/8/00. Benchmark comparisons began on the fund inception date. Lipper comparisons began on 4/30/00.
Performance quoted represents past performance and is no guarantee of future results. Current performance may be lower or higher than performance shown. For performance current to the most recent month-end, visit our website at us.allianzgi.com. Investment return and the principal value will fluctuate. Shares may be worth more or less than original cost when redeemed.The adjusted returns take into account the maximum sales charge of 5.50% on Class A shares and 1% contingent deferred sales charge (CDSC) on Class C shares, which may apply to shares redeemed during the first year of ownership. Returns do not reflect deduction of taxes that a shareholder would pay on fund distributions or redemption of fund shares. Please see pages 60-62 for more information. The Fund’s gross expense ratios are 1.11% for Class A shares, 1.86% for Class C shares, 1.36% for Class R shares, 0.86% for Class P shares, 0.76% for Institutional Class shares, 0.71% for Class R6 shares and 1.01% for Administrative Class shares. Theses ratios do not include an expense reduction, contractually agreed through at least August 31, 2020. The Fund’s expense ratios net of this reduction are 1.04% for Class A shares, 1.79% for Class C shares, 1.29% for Class R shares, 0.79% for Class P shares, 0.69% for Institutional Class shares, 0.64% for Class R6 shares and 0.94% for Administrative Class shares. Expense ratio information is as of the Fund’s current prospectus dated August 28, 2019, as further revised or supplemented from time to time.
Cumulative Returns Through December 31, 2019
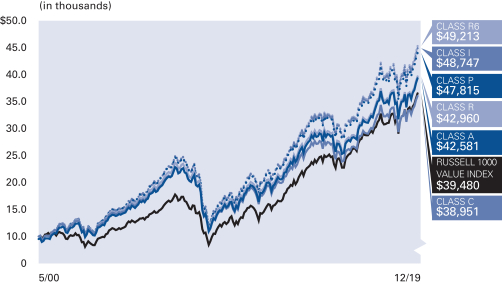
The Fund began operations on 5/8/00. Benchmark comparisons began on the fund inception date.
Industry/Sectors (as of December 31, 2019)
| | | | |
| |
| Banks | | | 13.1% | |
| |
| Oil, Gas & Consumable Fuels | | | 10.3% | |
| |
| Insurance | | | 6.8% | |
| |
| Pharmaceuticals | | | 6.5% | |
| |
| Aerospace & Defense | | | 5.0% | |
| |
| Specialty Retail | | | 4.0% | |
| |
| Healthcare Equipment & Supplies | | | 4.0% | |
| |
| Machinery | | | 3.1% | |
| |
| Other | | | 47.0% | |
| |
| Cash & Equivalents — Net | | | 0.2% | |
| | | | | | |
| | Semiannual Report | | | December 31, 2019 | | 33 |
Unaudited
AllianzGI NFJ Dividend Value Fund (cont’d)
| | | | | | | | | | | | | | |
| |
| Shareholder Expense Example | | Actual Performance |
| | | Class A | | Class C | | Class R | | Class P | | Institutional
Class | | Class R6 | | Administrative
Class |
| | | | | | | |
| Beginning Account Value (7/1/19) | | $1,000.00 | | $1,000.00 | | $1,000.00 | | $1,000.00 | | $1,000.00 | | $1,000.00 | | $1,000.00 |
| | | | | | | |
| Ending Account Value (12/31/19) | | $1,090.50 | | $1,086.80 | | $1,090.00 | | $1,092.70 | | $1,092.50 | | $1,093.30 | | $1,091.90 |
| | | | | | | |
| Expenses Paid During Period | | $5.47 | | $9.39 | | $6.78 | | $4.16 | | $3.63 | | $3.37 | | $4.94 |
| | | | | | | | | | | | | | | |
| |
| | | Hypothetical Performance |
| | | (5% return before expenses) |
| | | Class A | | Class C | | Class R | | Class P | | Institutional
Class | | Class R6 | | Administrative
Class |
| | | | | | | |
| Beginning Account Value (7/1/19) | | $1,000.00 | | $1,000.00 | | $1,000.00 | | $1,000.00 | | $1,000.00 | | $1,000.00 | | $1,000.00 |
| | | | | | | |
| Ending Account Value (12/31/19) | | $1,019.91 | | $1,016.14 | | $1,018.65 | | $1,021.17 | | $1,021.67 | | $1,021.98 | | $1,020.41 |
| | | | | | | |
| Expenses Paid During Period | | $5.28 | | $9.07 | | $6.55 | | $4.01 | | $3.51 | | $3.26 | | $4.77 |
For each class of the Fund, expenses (net of fee waivers) are equal to the annualized expense ratio for the class (1.04% for Class A, 1.79% for Class C, 1.29% for Class R, 0.79% for Class P, 0.69% for Institutional Class, 0.64% for class R6 and 0.94% for Administrative Class), multiplied by the average account value over the period, multiplied by 184/366.
| | | | | | |
| 34 | | December 31, 2019 | | | Semiannual Report | | |
(THIS PAGE INTENTIONALLY LEFT BLANK)
| | | | | | |
| | Semiannual Report | | | December 31, 2019 | | 35 |
Unaudited
AllianzGI NFJ International Value Fund
For the period July 1, 2019 through December 31, 2019, as provided by the Value Equity, US team.
Fund Insights
For the six-month period ended December 31, 2019, the Class A shares at net asset value (“NAV”) of the AllianzGI NFJ International Value Fund (the “Fund”) returned 6.16%, underperforming the MSCI AC World Index ex USA (the “benchmark”), which returned 6.96%.
Market Overview
With global growth weighed down by a slowdown in global trade, fears grew over the outlook for the global economy during the second half of 2019. Central banks across the developed and developing world cut rates to stave off the threat of a global recession. In July, the US Federal Reserve (“Fed”) cut rates for the first time since 2008, with two further rate cuts following in September and October. The European Central Bank also lowered rates and reinstated its bond-buying program, while Japan announced its first fiscal stimulus measures since 2016. The central bank measures helped to bolster confidence in the economic outlook, with data showing signs that the slowdown may have bottomed out during the fourth quarter.
In general, international equities overcame a sharp set-back in August to deliver robust gains over the six-month reporting period. The rally meant many equity markets recorded their strongest annual gains in several years, with many markets closing the year at or near fresh/multi-month highs. Sentiment was lifted by a plethora of interest rate cuts across the developed and developing world, better-than-expected corporate earnings and optimism over a “phase one” trade deal between the US and China.
Portfolio Review
Performance results over the reporting period were due to negative country allocation, net neutral sector allocation and modestly negative stock selection. Selection across the consumer discretionary and materials sectors boosted relative returns. These gains were dampened by holdings in the consumer staples and technology sectors, which failed to keep pace with benchmark shares. Within the benchmark, technology stocks were the standout performers, helped by a rebound in semiconductor manufacturers. The health care and consumer discretionary sectors also posted double-digit returns during the reporting period. In contrast, the energy sector had the weakest performance as oil prices remained mostly range bound, despite some year-end strength. The Fund’s underweight in communication services paired with overweight exposures in technology and health care contributed to relative returns, while overweight positions in energy and financials detracted from performance during the trailing six-month period. By country, selection was positive across Japan and the UK, while the Fund realized negative results from holdings based in France and China. Underweight exposures across Taiwan and Japan detracted over the reporting period. In contrast, overweight positions in Ireland and China boosted relative performance.
Outlook
It is difficult to find another time in the last ten years when there had been as many precarious situations globally as there were in 2019. In Europe, the UK faced a “hard Brexit”. Both the German and Italian economies, which combined make up just over 50% of Eurozone gross domestic product, looked to be at a minimum in the midst of a mild recession. In Asia, protests in Hong Kong unfolded without any real solution in sight. In addition, the ongoing trade war between the US and China left investors faced with a very shaky backdrop across the world’s largest economies. Japan officially moved forward with a value-added tax increase, after postponing the change since 2015, and this pinch on the consumer will be felt going forward. There is also no shortage of issues revolving around Syria and Turkey, the Ukraine, as well as between Saudi Arabia and Iran. The list could go on further but simply put, the risks are many and varied.
Political forces will continue to play a dominant role in the financial markets and will impact market sentiments into the new year of 2020. Our team’s value oriented approach tends to lead our products toward investment in high-quality, cyclically depressed companies with attractive valuations and strong fundamentals, where we believe the prospects for capital appreciation and downside protection remain more favorable for our clients.
| | | | | | |
| 36 | | December 31, 2019 | | | Semiannual Report | | |
Unaudited
AllianzGI NFJ International Value Fund (cont’d)
Average Annual Total Return for the period ended December 31, 2019
| | | | | | | | | | | | | | | | | | | | | | |
| | | | | | |
| | | | | 6 Month* | | | 1 Year | | | 5 Year | | | 10 Year | | | Since Inception† | |
| | | AllianzGI NFJ International Value Fund Class A | | | 6.16% | | | | 21.55% | | | | 0.28% | | | | 2.32% | | | | 8.29% | |
| | AllianzGI NFJ International Value Fund Class A (adjusted) | | | 0.32% | | | | 14.87% | | | | –0.85% | | | | 1.74% | | | | 7.93% | |
| | | AllianzGI NFJ International Value Fund Class C | | | 5.78% | | | | 20.70% | | | | –0.46% | | | | 1.56% | | | | 7.49% | |
| | AllianzGI NFJ International Value Fund Class C (adjusted) | | | 4.78% | | | | 19.70% | | | | –0.46% | | | | 1.56% | | | | 7.49% | |
| | AllianzGI NFJ International Value Fund Class R | | | 6.01% | | | | 21.25% | | | | 0.04% | | | | 2.07% | | | | 8.04% | |
| | AllianzGI NFJ International Value Fund Class P | | | 6.30% | | | | 21.89% | | | | 0.53% | | | | 2.58% | | | | 8.58% | |
| | AllianzGI NFJ International Value Fund Institutional Class | | | 6.36% | | | | 22.01% | | | | 0.63% | | | | 2.68% | | | | 8.69% | |
| | AllianzGI NFJ International Value Fund Class R6 | | | 6.39% | | | | 22.07% | | | | 0.68% | | | | 2.72% | | | | 8.74% | |
| | | AllianzGI NFJ International Value Fund Administrative Class | | | 6.18% | | | | 21.76% | | | | 0.39% | | | | 2.43% | | | | 8.42% | |
| | MSCI AC World Index ex USA | | | 6.96% | | | | 21.51% | | | | 5.51% | | | | 4.97% | | | | 8.22% | |
| | | Lipper International Large-Cap Core Funds Average | | | 7.21% | | | | 22.34% | | | | 3.86% | | | | 4.30% | | | | 7.43% | |
* Cumulative return
† The Fund began operations on 1/31/03. Benchmark comparisons began on the fund inception date. Lipper comparisons began on 1/31/03.
Performance quoted represents past performance and is no guarantee of future results. Current performance may be lower or higher than performance shown. For performance current to the most recent month-end, visit our website at us.allianzgi.com. Investment return and the principal value will fluctuate. Shares may be worth more or less than original cost when redeemed.The adjusted returns take into account the maximum sales charge of 5.50% on Class A shares and 1% contingent deferred sales charge (CDSC) on Class C shares, which may apply to shares redeemed during the first year of ownership.Returns do not reflect deduction of taxes that a shareholder would pay on fund distributions or redemption of fund shares. Please see pages 60-62 for more information. The Fund’s gross expense ratios are 1.38% for Class A shares, 2.13% for Class C shares, 1.63% for Class R shares, 1.13% for Class P shares, 1.03% for Institutional Class shares, 0.98% for Class R6 shares and 1.28% for Administrative Class shares. Theses ratios do not include an expense reduction, contractually agreed through at least August 31, 2020. The Fund’s expense ratios net of this reduction are 1.31% for Class A shares, 2.06% for Class C shares, 1.56% for Class R shares, 1.06% for Class P shares, 0.96% for Institutional Class shares, 0.91% for Class R6 shares and 1.21% for Administrative Class shares. Expense ratio information is as of the Fund’s current prospectus dated August 28, 2019, as further revised or supplemented from time to time.
Cumulative Returns Through December 31, 2019
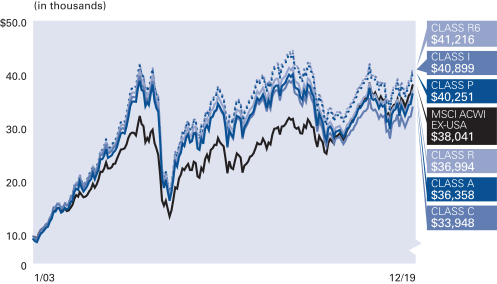
The Fund began operations on 1/31/03. Benchmark comparisons began on the fund inception date.
Country/Location Allocation (as of December 31, 2019)
| | | | |
| |
| United Kingdom | | | 17.3% | |
| |
| China | | | 12.1% | |
| |
| Canada | | | 10.5% | |
| |
| Japan | | | 9.9% | |
| |
| Germany | | | 8.1% | |
| |
| France | | | 8.0% | |
| |
| Switzerland | | | 5.3% | |
| |
| Hong Kong | | | 4.1% | |
| |
| Other | | | 24.6% | |
| |
| Cash & Equivalents — Net | | | 0.1% | |
| | | | | | |
| | Semiannual Report | | | December 31, 2019 | | 37 |
Unaudited
AllianzGI NFJ International Value Fund (cont’d)
| | | | | | | | | | | | | | |
| |
| Shareholder Expense Example | | Actual Performance |
| | | Class A | | Class C | | Class R | | Class P | | Institutional Class | | Class R6 | | Administrative Class |
| | | | | | | |
| Beginning Account Value (7/1/19) | | $1,000.00 | | $1,000.00 | | $1,000.00 | | $1,000.00 | | $1,000.00 | | $1,000.00 | | $1,000.00 |
| | | | | | | |
| Ending Account Value (12/31/19) | | $1,061.60 | | $1,057.80 | | $1,060.10 | | $1,063.00 | | $1,063.60 | | $1,063.90 | | $1,061.80 |
| | | | | | | |
| Expenses Paid During Period | | $6.74 | | $10.60 | | $8.03 | | $5.44 | | $4.93 | | $4.67 | | $6.22 |
| | | | | | | | | | | | | | | |
| |
| | | Hypothetical Performance |
| | | (5% return before expenses) |
| | | Class A | | Class C | | Class R | | Class P | | Institutional Class | | Class R6 | | Administrative Class |
| | | | | | | |
| Beginning Account Value (7/1/19) | | $1,000.00 | | $1,000.00 | | $1,000.00 | | $1,000.00 | | $1,000.00 | | $1,000.00 | | $1,000.00 |
| | | | | | | |
| Ending Account Value (12/31/19) | | $1,018.60 | | $1,014.83 | | $1,017.34 | | $1,019.86 | | $1,020.36 | | $1,020.61 | | $1,019.10 |
| | | | | | | |
| Expenses Paid During Period | | $6.60 | | $10.38 | | $7.86 | | $5.33 | | $4.82 | | $4.57 | | $6.09 |
For each class of the Fund, expenses (net of fee waiver) are equal to the annualized expense ratio for the class (1.30% for Class A, 2.05% for Class C, 1.55% for Class R, 1.05% for Class P, 0.95% for Institutional Class , 0.90% for Class R6 and 1.20% for Administrative Class), multiplied by the average account value over the period, multiplied by 184/366.
| | | | | | |
| 38 | | December 31, 2019 | | | Semiannual Report | | |
(THIS PAGE INTENTIONALLY LEFT BLANK)
| | | | | | |
| | Semiannual Report | | | December 31, 2019 | | 39 |
Unaudited
AllianzGI NFJ Large-Cap Value Fund
For the period July 1, 2019 through December 31, 2019, as provided by the Value Equity, US team.
Fund Insights
For the six-month period ended December 31, 2019, the Class A shares at net asset value (“NAV”) of the AllianzGI NFJ Large-Cap Value Fund (the “Fund”) returned 9.68%, outperforming the Russell 1000 Value Index (the “benchmark”), which returned 8.86%.
Market Overview
US equities posted double-digit gains in the second half of 2019, closing the year with the strongest annual returns since 2013. Despite a notable set-back in August, major indices hit a series of fresh highs as risk appetite was boosted by lower interest rates and a “phase one” trade deal between the US and China. Corporate earnings also beat, albeit lowered, expectations. Growth stocks continued to outperform value stocks. Amid growing concerns that the pace of US growth was moderating, the US Federal Reserve (“Fed”) cut rates by 25 basis points, 0.25%, in July, its first reduction since 2008, followed by two further cuts in September and October. In December, the Fed signaled it would maintain its current policy throughout 2020. It also delivered an upbeat assessment of the US economy, saying that the current stance of monetary policy was “appropriate”, a change from October’s statement that referred to “uncertainties” in its outlook. The Fed indicated that it would keep rates on hold until there was a persistent move up in inflation or a deterioration in the global economic outlook.
Portfolio Review
Relative performance results were due to positive stock selection, while sector allocation was negative over the reporting period. Selections across the materials, consumer discretionary and energy sectors were the largest contributors and boosted relative returns. In contrast, holdings in the technology and utilities sectors failed to keep pace with benchmark shares and detracted from performance results. Within the benchmark, ten of the eleven GICS economic sectors advanced over the second half of 2019. The information technology sector was the top performer, while energy was the only sector to lose ground as oil prices remained mostly range bound. The Fund’s overweight exposure in energy detracted from relative returns, while an overweight in technology contributed to performance results during the six-month period.
Outlook
Going into 2020, equity market valuations appear to us to have positive news baked in, with the S&P’s forward price-to-earnings ratio multiple hovering over 19x, up from 15x at this time last year. Without the tailwind of continued multiple expansion, stocks will likely have to rely on earnings growth to continue the decade-long bull market, so advances will likely be muted compared to 2019’s gains. The good news is that the Fed has signaled that it will likely be on hold this year, which is positive for risk assets as a whole, and value equities more specifically. The consumer continues to be the pillar holding up the slow-but-steady economic expansion, and with low unemployment, clean consumer balance sheets and nascent signs of wage growth, we believe that should at least continue to be the case for the balance of 2020. In our opinion, the two factors that could throw a curveball into forecasts are a re-escalation of trade conflicts and the Presidential election. There is a wider divergence of outcomes between possible candidates this year than we have seen in several decades, meaning that as the likelihood of election outcomes shifts throughout the year, market volatility may be on the rise.
In the face of these uncertainties, slower returns and higher volatility, we believe the best strategy for investors is to focus on companies with stable earnings and clean balance sheets. Dividend payers at a reasonable price should also provide more predictable returns, as well as taking advantage of company-specific stories as a potential mean of enhancing returns. As active managers, we believe this approach will become critical in the current environment for clients seeking strong absolute returns and moderated volatility over the long term.
| | | | | | |
| 40 | | December 31, 2019 | | | Semiannual Report | | |
Unaudited
AllianzGI NFJ Large-Cap Value Fund (cont’d)
Average Annual Total Return for the period ended December 31, 2019
| | | | | | | | | | | | | | | | | | | | | | |
| | | | | | |
| | | | | 6 Month* | | | 1 Year | | | 5 Year | | | 10 Year | | | Since Inception† | |
| | | AllianzGI NFJ Large-Cap Value Fund Class A | | | 9.68% | | | | 24.60% | | | | 7.91% | | | | 10.79% | | | | 7.71% | |
| | AllianzGI NFJ Large-Cap Value Fund Class A (adjusted) | | | 3.65% | | | | 17.75% | | | | 6.70% | | | | 10.17% | | | | 7.40% | |
| | | AllianzGI NFJ Large-Cap Value Fund Class C | | | 9.28% | | | | 23.66% | | | | 7.10% | | | | 9.96% | | | | 6.91% | |
| | AllianzGI NFJ Large-Cap Value Fund Class C (adjusted) | | | 8.28% | | | | 22.66% | | | | 7.10% | | | | 9.96% | | | | 6.91% | |
| | AllianzGI NFJ Large-Cap Value Fund Class R | | | 9.55% | | | | 24.28% | | | | 7.65% | | | | 10.52% | | | | 7.47% | |
| | AllianzGI NFJ Large-Cap Value Fund Class P | | | 9.84% | | | | 24.88% | | | | 8.18% | | | | 11.07% | | | | 8.04% | |
| | AllianzGI NFJ Large-Cap Value Fund Institutional Class | | | 9.88% | | | | 25.02% | | | | 8.29% | | | | 11.19% | | | | 8.14% | |
| | | AllianzGI NFJ Large-Cap Value Fund Administrative Class | | | 9.74% | | | | 24.70% | | | | 8.01% | | | | 10.91% | | | | 7.87% | |
| | Russell 1000 Value Index | | | 8.86% | | | | 26.54% | | | | 8.29% | | | | 11.80% | | | | 7.24% | |
| | | Lipper Large-Cap Value Funds Average | | | 9.39% | | | | 26.10% | | | | 8.05% | | | | 10.87% | | | | 6.77% | |
* Cumulative return
† The Fund began operations on 5/8/00. Benchmark comparisons began on the fund inception date. Lipper comparisons began on 4/30/00.
Performance quoted represents past performance and is no guarantee of future results. Current performance may be lower or higher than performance shown. For performance current to the most recent month-end, visit our website at us.allianzgi.com. Investment return and the principal value will fluctuate. Shares may be worth more or less than original cost when redeemed.The adjusted returns take into account the maximum sales charge of 5.50% on Class A shares and 1% contingent deferred sales charge (CDSC) on Class C shares, which may apply to shares redeemed during the first year of ownership. Returns do not reflect deduction of taxes that a shareholder would pay on fund distributions or redemption of fund shares. Please see pages 60-62 for more information. The Fund’s expense ratios are 1.12% for Class A shares, 1.87% for Class C shares, 1.37% for Class R shares, 0.87% for Class P shares, 0.77% for Institutional Class shares and 1.02% for Administrative Class shares. Expense ratio information is as of the Fund’s current prospectus dated August 28, 2019, as further revised or supplemented from time to time.
Cumulative Returns Through December 31, 2019
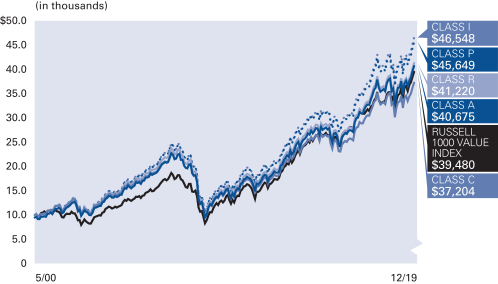
The Fund began operations on 5/8/00. Benchmark comparisons began on the fund inception date.
Industry/Sectors (as of December 31,
2019)
| | | | |
| |
| Banks | | | 13.4% | |
| |
| Oil, Gas & Consumable Fuels | | | 10.3% | |
| |
| Insurance | | | 5.7% | |
| |
| Pharmaceuticals | | | 5.6% | |
| |
| Specialty Retail | | | 4.6% | |
| |
| Capital Markets | | | 4.2% | |
| |
| Equity Real Estate Investment Trusts (REITs) | | | 3.8% | |
| |
| Aerospace & Defense | | | 3.7% | |
| |
| Other | | | 48.4% | |
| |
| Cash & Equivalents — Net | | | 0.3% | |
| | | | | | |
| | Semiannual Report | | | December 31, 2019 | | 41 |
Unaudited
AllianzGI NFJ Large-Cap Value Fund (cont’d)
| | | | | | | | | | | | |
| |
| Shareholder Expense Example | | Actual Performance |
| | | Class A | | Class C | | Class R | | Class P | | Institutional Class | | Administrative Class |
| | | | | | |
| Beginning Account Value (7/1/19) | | $1,000.00 | | $1,000.00 | | $1,000.00 | | $1,000.00 | | $1,000.00 | | $1,000.00 |
| | | | | | |
| Ending Account Value (12/31/19) | | $1,096.80 | | $1,092.80 | | $1,095.50 | | $1,098.40 | | $1,098.80 | | $1,097.40 |
| | | | | | |
| Expenses Paid During Period | | $5.90 | | $9.84 | | $7.22 | | $4.59 | | $4.06 | | $5.38 |
| | | | | | | | | | | | | |
| |
| | | Hypothetical Performance |
| | | (5% return before expenses) |
| | | Class A | | Class C | | Class R | | Class P | | Institutional Class | | Administrative Class |
| | | | | | |
| Beginning Account Value (7/1/19) | | $1,000.00 | | $1,000.00 | | $1,000.00 | | $1,000.00 | | $1,000.00 | | $1,000.00 |
| | | | | | |
| Ending Account Value (12/31/19) | | $1,019.51 | | $1,015.74 | | $1,018.25 | | $1,020.76 | | $1,021.27 | | $1,020.01 |
| | | | | | |
| Expenses Paid During Period | | $5.69 | | $9.48 | | $6.95 | | $4.42 | | $3.91 | | $5.18 |
For each class of the Fund, expenses are equal to the annualized expense ratio for the class (1.12% for Class A, 1.87 % for Class C, 1.37% for Class R, 0.87% for Class P, 0.77 % for Institutional Class and 1.02% for Administrative Class), multiplied by the average account value over the period, multiplied by 184/366.
| | | | | | |
| 42 | | December 31, 2019 | | | Semiannual Report | | |
(THIS PAGE INTENTIONALLY LEFT BLANK)
| | | | | | |
| | Semiannual Report | | | December 31, 2019 | | 43 |
Unaudited
AllianzGI NFJ Mid-Cap Value Fund
For the period July 1, 2019 through December 31, 2019, as provided by the Value Equity, US team.
Fund Insights
For the six-month period ended December 31, 2019, the Class A shares at net asset value (“NAV”) of the AllianzGI NFJ Mid-Cap Value Fund (the “Fund”) returned 8.74%, outperforming the Russell Midcap Value Index (the “benchmark”), which returned 7.66%.
Market Overview
US equities posted double-digit gains in the second half of 2019, closing the year with the strongest annual returns since 2013. Despite a notable set-back in August, major indices hit a series of fresh highs as risk appetite was boosted by lower interest rates and a “phase one” trade deal between the US and China. Corporate earnings also beat, albeit lowered, expectations. Growth stocks continued to outperform value stocks. Amid growing concerns that the pace of US growth was moderating, the US Federal Reserve (“Fed”) cut rates by 25 basis points, 0.25%, in July, its first reduction since 2008, followed by two further cuts in September and October. In December, the Fed signaled it would maintain its current policy throughout 2020. It also delivered an upbeat assessment of the US economy, saying that the current stance of monetary policy was “appropriate”, a change from October’s statement that referred to “uncertainties” in its outlook. The Fed indicated that it would keep rates on hold until there was a persistent move up in inflation or a deterioration in the global economic outlook.
Portfolio Review
Relative performance results were due to positive stock selection. Sector positioning was also positive, albeit to a lesser degree. Selections across the health care, materials and industrials sectors were the largest contributors and boosted relative returns. In contrast, our financials and utilities holdings failed to keep pace with benchmark shares and detracted from performance results. Within the benchmark, ten of the eleven GICS economic sectors advanced over the second half of 2019. The consumer staples sector was the top performer, followed by the technology sector. Conversely, energy stocks lost ground as oil prices remained mostly range bound. The Fund’s overweight exposures in health care and consumer staples contributed to relative returns, while an underweight in real estate was the only significant detractor from a sector allocation standpoint during the six-month period.
Outlook
Going into 2020, equity market valuations appear to us to have positive news baked in, with the S&P’s forward price-to-earnings ratio multiple hovering over 19x, up from 15x at this time last year. Without the tailwind of continued multiple expansion, stocks will likely have to rely on earnings growth to continue the long bull market, so advances will likely be muted compared to 2019’s gains. The good news is that the Fed has signaled that it will likely be on hold this year, which is positive for risk assets as a whole, and value equities more specifically. The consumer continues to be the pillar holding up the slow-but-steady economic expansion, and with low unemployment, clean consumer balance sheets and nascent signs of wage growth, we believe that should at least continue to be the case for the balance of 2020. In our opinion, the two factors that could throw a curveball into forecasts are a re-escalation of trade conflicts and the Presidential election. There is a wider divergence of outcomes between possible candidates this year than we have seen in several decades, meaning that as the likelihood of election outcomes shifts throughout the year, market volatility may be on the rise.
In the face of these uncertainties, slower returns and higher volatility, we believe the best strategy for investors is to focus on companies with stable earnings and clean balance sheets. Dividend payers at a reasonable price should also provide more predictable returns, as well as taking advantage of company-specific stories as a potential mean of enhancing returns. As active managers, we believe this approach will become critical in the current environment for clients seeking strong absolute returns and moderated volatility over the long term.
| | | | | | |
| 44 | | December 31, 2019 | | | Semiannual Report | | |
Unaudited
AllianzGI NFJ Mid-Cap Value Fund (cont’d)
Average Annual Total Return for the period ended December 31, 2019
| | | | | | | | | | | | | | | | | | | | | | |
| | | | | | |
| | | | | 6 Month* | | | 1 Year | | | 5 Year | | | 10 Year | | | Since Inception† | |
| | | AllianzGI NFJ Mid-Cap Value Fund Class A | | | 8.74% | | | | 28.97% | | | | 9.05% | | | | 11.71% | | | | 11.14% | |
| | AllianzGI NFJ Mid-Cap Value Fund Class A (adjusted) | | | 2.75% | | | | 21.87% | | | | 7.82% | | | | 11.08% | | | | 10.95% | |
| | | AllianzGI NFJ Mid-Cap Value Fund Class C | | | 8.31% | | | | 28.00% | | | | 8.23% | | | | 10.88% | | | | 10.31% | |
| | AllianzGI NFJ Mid-Cap Value Fund Class C (adjusted) | | | 7.32% | | | | 27.00% | | | | 8.23% | | | | 10.88% | | | | 10.31% | |
| | AllianzGI NFJ Mid-Cap Value Fund Class R | | | 8.57% | | | | 28.63% | | | | 8.78% | | | | 11.43% | | | | 10.80% | |
| | AllianzGI NFJ Mid-Cap Value Fund Class P | | | 8.82% | | | | 29.24% | | | | 9.32% | | | | 12.00% | | | | 11.43% | |
| | AllianzGI NFJ Mid-Cap Value Fund Institutional Class | | | 8.93% | | | | 29.42% | | | | 9.43% | | | | 12.11% | | | | 11.54% | |
| | AllianzGI NFJ Mid-Cap Value Fund Class R6 | | | 8.93% | | | | 29.44% | | | | 9.50% | | | | 12.16% | | | | 11.60% | |
| | | AllianzGI NFJ Mid-Cap Value Fund Administrative Class | | | 8.77% | | | | 29.04% | | | | 9.16% | | | | 11.82% | | | | 11.29% | |
| | Russell Midcap Value Index | | | 7.66% | | | | 27.06% | | | | 7.62% | | | | 12.41% | | | | 11.64% | |
| | | Lipper Multi-Cap Value Funds Average | | | 8.38% | | | | 25.04% | | | | 7.20% | | | | 10.46% | | | | 6.83% | |
* Cumulative return
† The Fund began operations on 4/18/88. Benchmark and Lipper performance comparisons began on 4/30/88.
Performance quoted represents past performance and is no guarantee of future results. Current performance may be lower or higher than performance shown. For performance current to the most recent month-end, visit our website at us.allianzgi.com. Investment return and the principal value will fluctuate. Shares may be worth more or less than original cost when redeemed.The adjusted returns take into account the maximum sales charge of 5.50% on Class A shares and 1% contingent deferred sales charge (CDSC) on Class C shares, which may apply to shares redeemed during the first year of ownership. Returns do not reflect deduction of taxes that a shareholder would pay on fund distributions or redemption of fund shares. Please see pages 60-62 for more information. The Fund’s gross expense ratios are 1.21% for Class A shares, 1.96% for Class C shares, 1.46% for Class R shares, 0.96% for Class P shares, 0.86% for Institutional Class shares, 0.81% for Class R6 shares and 1.11% for Administrative Class shares. These ratios do not include an expense reduction, contractually agree through at least August 31, 2020. The Fund’s expense ratios net of this reduction are 0.99% for Class A shares, 1.74% for Class C shares, 1.24% for Class R shares, 0.74% for Class P shares, 0.64% for Institutional Class shares, 0.59% for Class R6 shares and 0.89% for Administrative Class shares. Expense ratio information is as of the Fund’s current prospectus dated August 28, 2019, as further revised or supplemented from time to time.
Cumulative Returns Through December 31, 2019
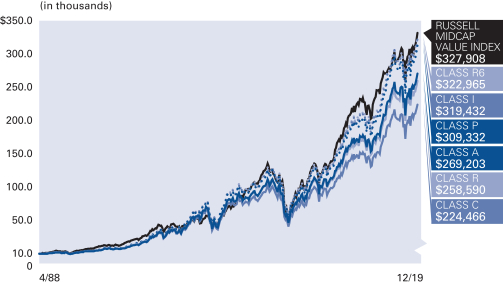
The Fund began operations on 4/18/88. Benchmark performance comparisons began on 4/30/88.
Industry/Sectors (as of December 31,
2019)
| | | | |
| |
| Equity Real Estate Investment Trusts (REITs) | | | 11.3% | |
| |
| Insurance | | | 8.9% | |
| |
| Banks | | | 7.1% | |
| |
| Oil, Gas & Consumable Fuels | | | 5.1% | |
| |
| Capital Markets | | | 5.0% | |
| |
| Hotels, Restaurants & Leisure | | | 4.5% | |
| |
| IT Services | | | 4.3% | |
| |
| Machinery | | | 4.1% | |
| |
| Other | | | 48.4% | |
| |
| Cash & Equivalents — Net | | | 1.3% | |
| | | | | | |
| | Semiannual Report | | | December 31, 2019 | | 45 |
Unaudited
AllianzGI NFJ Mid-Cap Value Fund (cont’d)
| | | | | | | | | | | | | | |
| |
| Shareholder Expense Example | | Actual Performance |
| | | Class A | | Class C | | Class R | | Class P | | Institutional Class | | Class R6 | | Administrative Class |
| | | | | | | |
| Beginning Account Value (7/1/19) | | $1,000.00 | | $1,000.00 | | $1,000.00 | | $1,000.00 | | $1,000.00 | | $1,000.00 | | $1,000.00 |
| | | | | | | |
| Ending Account Value (12/31/19) | | $1,087.40 | | $1,083.10 | | $1,085.70 | | $1,088.20 | | $1,089.30 | | $1,089.30 | | $1,087.70 |
| | | | | | | |
| Expenses Paid During Period | | $5.25 | | $9.16 | | $6.55 | | $3.94 | | $3.41 | | $3.15 | | $4.72 |
| | | | | | | | | | | | | | | |
| |
| | | Hypothetical Performance |
| | | (5% return before expenses) |
| | | Class A | | Class C | | Class R | | Class P | | Institutional Class | | Class R6 | | Administrative Class |
| | | | | | | |
| Beginning Account Value (7/1/19) | | $1,000.00 | | $1,000.00 | | $1,000.00 | | $1,000.00 | | $1,000.00 | | $1,000.00 | | $1,000.00 |
| | | | | | | |
| Ending Account Value (12/31/19) | | $1,020.11 | | $1,016.34 | | $1,018.85 | | $1,021.37 | | $1,021.87 | | $1,022.12 | | $1,020.61 |
| | | | | | | |
| Expenses Paid During Period | | $5.08 | | $8.87 | | $6.34 | | $3.81 | | $3.30 | | $3.05 | | $4.57 |
For each class of the Fund, expenses ( net of fee waiver) are equal to the annualized expense ratio for the class (1.00% for Class A, 1.75% for Class C, 1.25% for Class R, 0.75% for Class P, 0.65% for Institutional Class, 0.60% for Class R6 and 0.90% for Administrative Class), multiplied by the average account value over the period, multiplied by 184/366.
| | | | | | |
| 46 | | December 31, 2019 | | | Semiannual Report | | |
(THIS PAGE INTENTIONALLY LEFT BLANK)
| | | | | | |
| | Semiannual Report | | | December 31, 2019 | | 47 |
Unaudited
AllianzGI NFJ Small-Cap Value Fund
For the period July 1, 2019 through December 31, 2019, as provided by the Value Equity, US team.
Fund Insights
For the six-month period ended December 31, 2019, the Class A shares at net asset value (“NAV”) of the AllianzGI NFJ Small-Cap Value Fund (the “Fund”) returned 8.46%, outperforming the Russell 2000 Value Index (the “benchmark”), which returned 7.87%.
Market Overview
US equities posted double-digit gains in the second half of 2019, closing the year with the strongest annual returns since 2013. Despite a notable set-back in August, major indices hit a series of fresh highs as risk appetite was boosted by lower interest rates and a “phase one” trade deal between the US and China. Corporate earnings also beat, albeit lowered, expectations. Growth stocks continued to outperform value stocks. Amid growing concerns that the pace of US growth was moderating, the US Federal Reserve (“Fed”) cut rates by 25 basis points, 0.25%, in July, its first reduction since 2008, followed by two further cuts in September and October. In December, the Fed signaled it would maintain its current policy throughout 2020. It also delivered an upbeat assessment of the US economy, saying that the current stance of monetary policy was “appropriate”, a change from October’s statement that referred to “uncertainties” in its outlook. The Fed indicated that it would keep rates on hold until there was a persistent move up in inflation or a deterioration in the global economic outlook.
Portfolio Review
Relative performance results were due to positive stock selection. Sector positioning was also positive, albeit to a lesser degree. Selections across the energy, consumer discretionary and industrials sectors were the largest contributors and boosted relative returns. In contrast, holdings in the technology and communication services sectors failed to keep pace with benchmark shares and detracted from performance results. Within the benchmark, nine of the eleven GICS economic sectors advanced over the second half of 2019. The information technology sector was the top performer, followed by the consumer staples and discretionary sectors. Conversely, the energy sector lost the most ground as oil prices remained mostly range bound. Communication services names also lagged. The Fund’s overweight in technology and underweight in communication services contributed to relative returns, while an underweight in consumer discretionary was the only significant detractor from a sector allocation standpoint during the trailing six-month period.
Outlook
Going into 2020, equity market valuations appear to us to have positive news baked in, with the S&P’s forward price-to-earnings ratio multiple hovering over 19x, up from 15x at this time last year. Without the tailwind of continued multiple expansion, stocks will likely have to rely on earnings growth to continue the decade-long bull market, so advances will likely be muted compared to 2019’s gains. The good news is that the Fed has signaled that it will likely be on hold this year, which is positive for risk assets as a whole, and value equities more specifically. The consumer continues to be the pillar holding up the slow-but-steady economic expansion, and with low unemployment, clean consumer balance sheets and nascent signs of wage growth, we believe that should at least continue to be the case for the balance of 2020. In our opinion, the two factors that could throw a curveball into forecasts are a re-escalation of trade conflicts and the Presidential election. There is a wider divergence of outcomes between possible candidates this year than we have seen in several decades, meaning that as the likelihood of election outcomes shifts throughout the year, market volatility may be on the rise.
In the face of these uncertainties, slower returns and higher volatility, we believe the best strategy for investors is to focus on companies with stable earnings and clean balance sheets. Dividend payers at a reasonable price should also provide more predictable returns, as well as taking advantage of company-specific stories as a potential mean of enhancing returns. As active managers, we believe this approach will become critical in the current environment for clients seeking strong absolute returns and moderated volatility over the long term.
| | | | | | |
| 48 | | December 31, 2019 | | | Semiannual Report | | |
Unaudited
AllianzGI NFJ Small-Cap Value Fund (cont’d)
Average Annual Total Return for the period ended December 31, 2019
| | | | | | | | | | | | | | | | | | | | | | |
| | | | | | |
| | | | | 6 Month* | | | 1 Year | | | 5 Year | | | 10 Year | | | Since Inception† | |
| | | AllianzGI NFJ Small-Cap Value Fund Class A | | | 8.46% | | | | 24.28% | | | | 4.39% | | | | 8.83% | | | | 10.58% | |
| | AllianzGI NFJ Small-Cap Value Fund Class A (adjusted) | | | 2.49% | | | | 17.45% | | | | 3.21% | | | | 8.22% | | | | 10.36% | |
| | | AllianzGI NFJ Small-Cap Value Fund Class C | | | 8.05% | | | | 23.36% | | | | 3.63% | | | | 8.03% | | | | 9.76% | |
| | AllianzGI NFJ Small-Cap Value Fund Class C (adjusted) | | | 7.07% | | | | 22.36% | | | | 3.63% | | | | 8.03% | | | | 9.76% | |
| | AllianzGI NFJ Small-Cap Value Fund Class R | | | 8.39% | | | | 24.04% | | | | 4.14% | | | | 8.56% | | | | 10.27% | |
| | AllianzGI NFJ Small-Cap Value Fund Class P | | | 8.62% | | | | 24.65% | | | | 4.65% | | | | 9.10% | | | | 10.90% | |
| | AllianzGI NFJ Small-Cap Value Fund Institutional Class | | | 8.74% | | | | 24.79% | | | | 4.78% | | | | 9.25% | | | | 11.03% | |
| | AllianzGI NFJ Small-Cap Value Fund Class R6 | | | 8.77% | | | | 24.85% | | | | 4.84% | | | | 9.31% | | | | 11.08% | |
| | | AllianzGI NFJ Small-Cap Value Fund Administrative Class | | | 8.55% | | | | 24.45% | | | | 4.53% | | | | 8.99% | | | | 10.71% | |
| | Russell 2000 Value Index | | | 7.87% | | | | 22.39% | | | | 6.99% | | | | 10.56% | | | | 10.82% | |
| | | Lipper Small-Cap Core Funds Average | | | 6.74% | | | | 23.81% | | | | 6.90% | | | | 10.77% | | | | 8.33% | |
* Cumulative return
† The Fund began operations on 10/1/91. Benchmark comparisons began on the fund inception date. Lipper comparisons began on 9/30/91.
Performance quoted represents past performance and is no guarantee of future results. Current performance may be lower or higher than performance shown. For performance current to the most recent month-end, visit our website at us.allianzgi.com. Investment return and the principal value will fluctuate. Shares may be worth more or less than original cost when redeemed.The adjusted returns take into account the maximum sales charge of 5.50% on Class A shares and 1% contingent deferred sales charge (CDSC) on Class C shares, which may apply to shares redeemed during the first year of ownership. Returns do not reflect deduction of taxes that a shareholder would pay on fund distributions or redemption of fund shares. Please see pages 60-62 for more information. The Fund’s gross expense ratios are 1.27% for Class A shares, 2.02% for Class C shares, 1.52% for Class R shares, 1.02% for Class P shares, 0.92% for Institutional Class shares, 0.87% for Class R6 shares and 1.17% for Administrative Class Shares. These ratios do not include an expense reduction, contractually agreed through at least August 31, 2020. The Fund’s expense ratios net of this reduction are 1.17% for Class A shares, 1.92% for Class C shares, 1.42% for Class R shares, 0.92% for Class P shares, 0.82% for Institutional Class shares, 0.77% for Class R6 shares and 1.07% for Administrative Class Shares. Expense ratio information is as of the Fund’s current prospectus dated August 28, 2019, as further revised or supplement from time to time.
Cumulative Returns Through December 31, 2019
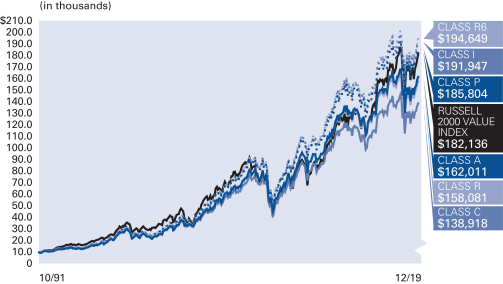
The Fund began operations on 10/1/91. Benchmark comparisons began on the fund inception date.
Industry/Sectors (as of December 31, 2019)
| | | | |
| |
| Banks | | | 16.9% | |
| |
| Equity Real Estate Investment Trusts (REITs) | | | 8.7% | |
| |
| Insurance | | | 5.8% | |
| |
| Oil, Gas & Consumable Fuels | | | 5.1% | |
| |
| Thrifts & Mortgage Finance | | | 4.6% | |
| |
| Machinery | | | 4.2% | |
| |
| Hotels, Restaurants & Leisure | | | 3.8% | |
| |
| Electronic Equipment, Instuments & Components | | | 3.7% | |
| |
| Other | | | 47.4% | |
| |
| Cash & Equivalents — Net | | | –0.2% | |
| | | | | | |
| | Semiannual Report | | | December 31, 2019 | | 49 |
Unaudited
AllianzGI NFJ Small-Cap Value Fund (cont’d)
| | | | | | | | | | | | | | |
| |
| Shareholder Expense Example | | Actual Performance |
| | | Class A | | Class C | | Class R | | Class P | | Institutional
Class | | Class R6 | | Administrative
Class |
| | | | | | | |
| Beginning Account Value (7/1/19) | | $1,000.00 | | $1,000.00 | | $1,000.00 | | $1,000.00 | | $1,000.00 | | $1,000.00 | | $1,000.00 |
| | | | | | | |
| Ending Account Value (12/31/19) | | $1,084.60 | | $1,080.50 | | $1,083.90 | | $1,086.20 | | $1,087.40 | | $1,087.70 | | $1,085.50 |
| | | | | | | |
| Expenses Paid During Period | | $6.18 | | $10.09 | | $7.49 | | $4.88 | | $4.36 | | $4.09 | | $5.66 |
| | | | | | | | | | | | | | | |
| |
| | | Hypothetical Performance |
| | | (5% return before expenses) |
| | | Class A | | Class C | | Class R | | Class P | | Institutional
Class | | Class R6 | | Administrative
Class |
| | | | | | | |
| Beginning Account Value (7/1/19) | | $1,000.00 | | $1,000.00 | | $1,000.00 | | $1,000.00 | | $1,000.00 | | $1,000.00 | | $1,000.00 |
| | | | | | | |
| Ending Account Value (12/31/19) | | $1,019.20 | | $1,015.43 | | $1,017.95 | | $1,020.46 | | $1,020.96 | | $1,021.22 | | $1,019.71 |
| | | | | | | |
| Expenses Paid During Period | | $5.99 | | $9.78 | | $7.25 | | $4.72 | | $4.22 | | $3.96 | | $5.48 |
For each class of the Fund, expenses (net of fee waiver) are equal to the annualized expense ratio for the class (1.18% for Class A, 1.93% for Class C, 1.43% for Class R, 0.93% for Class P, 0.83% for Institutional Class , 0.78% for Class R6 and 1.08% for Administrative Class), multiplied by the average account value over the period, multiplied by 184/366. These expenses do not include the expenses of the investment companies in which the Fund invests,which are indirectly borne by Fund shareholders.
| | | | | | |
| 50 | | December 31, 2019 | | | Semiannual Report | | |
(THIS PAGE INTENTIONALLY LEFT BLANK)
| | | | | | |
| | Semiannual Report | | | December 31, 2019 | | 51 |
Unaudited
AllianzGISmall-Cap Fund
For the period of July 1, 2019 through December 31, 2019, as provided by Kunal Ghosh, Lead Portfolio Manager.
Fund Insights
For the six-month period ended December 31, 2019, the Class A Shares at net asset value (“NAV”) of the AllianzGI Small-Cap Fund (the “Fund”) returned 5.23%, underperforming the Russell 2000 Index (the “benchmark”), which returned 7.30%.
Market Overview
Global equities overcame a sharp set-back in August 2019 to deliver robust gains over the second half of 2019. The rally meant many equity markets recorded their strongest annual gains in several years, with many markets closing the year at or near fresh/multi-month highs. Sentiment was lifted by a plethora of interest rate cuts across the developed and developing world, better-than-expected corporate earnings and optimism over a “phase one” trade deal between the US and China. The Russell 2000, which is representative of US small cap equities, underperformed the Russell 1000 large cap index by 3.3%. Within the small cap universe, growth slightly outperformed value.
Portfolio Review
Security selection was the primary detractor, while sector allocation was modestly offsetting. Stock picking was most negative in health care. This was primarily due to the Fund’s underweight to early stage biopharma companies, which had outsized returns due to a handful of positive binary events. Real estate and consumer discretionary sectors were also detractors. Positive selections in the information technology, energy and communication services sectors were partially offsetting.
A top contributor, Model N, Inc., is a cloud software company with a focus on revenue management solutions for the life sciences industry and was a top contributor over the period. The stock rallied after the company reported better-than-expected earnings and raised guidance. The largest relative detractor was surgical implant provider RTI Surgical Holdings, Inc. whose stock traded lower on disappointing earnings and lowered guidance.
At the end of the period, the Fund was positioned with overweight allocations to the consumer staples, health care and utilities sectors. Real estate was the largest underweight position in the Fund, followed by the materials and energy sectors.
Outlook
Looking forward into 2020, we expect a moderate to slow level of growth for the US economy. Leading economic indicators continue to signal benign conditions and employment numbers remain solid. Key manufacturing and service surveys have been softer recently but the positive developments on the US-China trade front should be supportive. The phase one trade deal has been received as a positive development, removing a measure of uncertainty for future corporate capital investments. The deal outlined agricultural purchases, as well as the suspension and rollback of tariffs. Phases two and three will focus on intellectual property and technology transfer. From a global monetary policy perspective, 49 central banks around the world cut rates 71 times in 2019. We believe that this synchronized global easing should stabilize investor appetite for risk assets. From a valuation perspective, small caps continue to trade at a discount relative to large cap stocks that has not been seen since the early 2000s, which was the start of a multi-year outperformance cycle of small caps above large caps.
The Fund combines three unique small-cap strategies in one investment, including a quantitative core, a fundamental growth and a managed volatility sleeve. Each individual small-cap sleeve is managed independently as a standalone portfolio by its respective portfolio management team, providing investors with access to a wide range of small-cap strategies in a single investment. We believe the Fund provides diversification benefits and may help reduce overall portfolio volatility through the combination of three separately managed small-cap portfolios.
| | | | | | |
| 52 | | December 31, 2019 | | | Semiannual Report | | |
Unaudited
AllianzGI Small-Cap Fund (cont’d)
Average Annual Total Return for the period ended December 31, 2019
| | | | | | | | | | | | | | | | | | |
| | | | | |
| | | | | 6 Month* | | | 1 Year | | | 5 Year | | | Since Inception† | |
| | | AllianzGI Small-Cap Fund Class A | | | 5.23% | | | | 23.92% | | | | 9.00% | | | | 10.29% | |
| | AllianzGI Small-Cap Fund Class A (adjusted) | | | –0.55% | | | | 17.10% | | | | 7.77% | | | | 9.34% | |
| | | AllianzGI Small-Cap Fund Class C | | | 4.87% | | | | 23.00% | | | | 8.18% | | | | 9.48% | |
| | AllianzGI Small-Cap Fund Class C (adjusted) | | | 3.87% | | | | 22.00% | | | | 8.18% | | | | 9.48% | |
| | AllianzGI Small-Cap Fund Class P | | | 5.35% | | | | 24.22% | | | | 9.27% | | | | 10.57% | |
| | AllianzGI Small-Cap Fund Institutional Class | | | 5.46% | | | | 24.35% | | | | 9.39% | | | | 10.68% | |
| | AllianzGI Small-Cap Fund Class R6 | | | 5.43% | | | | 24.38% | | | | 9.43% | | | | 10.73% | |
| | Russell 2000 Index | | | 7.30% | | | | 25.52% | | | | 8.23% | | | | 9.86% | |
| | | Lipper Small-Cap Core Funds Average | | | 6.74% | | | | 23.81% | | | | 6.90% | | | | 8.81% | |
* Cumulative return
† The Fund began operations on 7/1/13. Benchmark performance comparison began on 7/1/13. Lipper performance comparisons began on 6/30/13.
Performance quoted represents past performance and is no guarantee of future results. Current performance may be lower or higher than performance shown. For performance current to the most recent month-end, visit our website at us.allianzgi.com. Investment return and the principal value will fluctuate. Shares may be worth more or less than original cost when redeemed.The adjusted returns take into account the maximum sales charge of 5.50% on Class A shares and 1% contingent deferred sales charge (CDSC) on Class C shares, which may apply to shares redeemed during the first year of ownership. Returns do not reflect deduction of taxes that a shareholder would pay on fund distributions or redemption of fund shares. Please see pages 60-62 for more information. The Fund’s expense ratios are 1.29% for Class A shares, 2.04% for Class C shares, 1.04% for Class P shares, 0.94% for Institutional Class shares and 0.89% for Class R6 shares. Theses ratios do not include an expense reduction, contractually agreed through at least August 31, 2020. The Fund’s expense ratios net of this reduction are 1.19% for Class A shares, 1.94% for Class C shares, 0.94% for Class P shares, 0.84% for Institutional Class shares and 0.79% for Class R6 shares. Expense ratio information is as of the Fund’s current prospectus dated August 28, 2019, as further revised or supplemented from time to time.
Cumulative Returns Through December 31, 2019
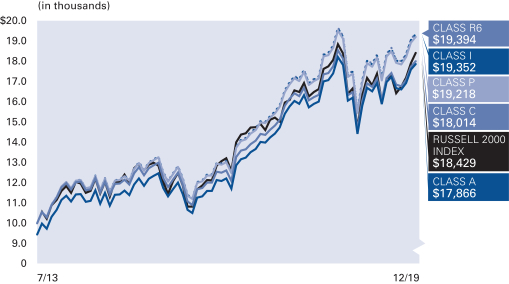
The Fund began operations on 7/1/13. Benchmark performance comparisons began on 7/1/13.
Industry/Sectors (as of December 31, 2019)
| | | | |
| |
| Software | | | 5.6% | |
| |
| Thrifts & Mortgage Finance | | | 5.5% | |
| |
| Healthcare Equipment & Supplies | | | 5.1% | |
| |
| Life Sciences Tools & Services | | | 4.7% | |
| |
| Biotechnology | | | 4.7% | |
| |
| Food Products | | | 3.7% | |
| |
| HealthCare Providers & Services | | | 3.7% | |
| |
| Mortgage Real Estate Investment Trusts (REITS) | | | 3.5% | |
| |
| Other | | | 61.8% | |
| |
| Cash & Equivalents — Net | | | 1.7% | |
| | | | | | |
| | Semiannual Report | | | December 31, 2019 | | 53 |
Unaudited
AllianzGI Small-Cap Fund (cont’d)
| | | | | | | | | | |
| |
| Shareholder Expense Example | | Actual Performance |
| | | Class A | | Class C | | Class P | | Institutional
Class | | Class R6 |
| | | | | |
| Beginning Account Value (7/1/19) | | $1,000.00 | | $1,000.00 | | $1,000.00 | | $1,000.00 | | $1,000.00 |
| | | | | |
| Ending Account Value (12/31/19) | | $1,052.30 | | $1,048.70 | | $1,053.50 | | $1,054.60 | | $1,054.30 |
| | | | | |
| Expenses Paid During Period | | $6.04 | | $9.89 | | $4.75 | | $4.23 | | $3.98 |
| | | | | | | | | | | |
| |
| | | Hypothetical Performance |
| | | (5% return before expenses) |
| | | Class A | | Class C | | Class P | | Institutional
Class | | Class R6 |
| | | | | |
| Beginning Account Value (7/1/19) | | $1,000.00 | | $1,000.00 | | $1,000.00 | | $1,000.00 | | $1,000.00 |
| | | | | |
| Ending Account Value (12/31/19) | | $1,019.25 | | $1,015.48 | | $1,020.51 | | $1,021.01 | | $1,021.27 |
| | | | | |
| Expenses Paid During Period | | $5.94 | | $9.73 | | $4.67 | | $4.17 | | $3.91 |
For each class of the Fund, expenses (net of fee waiver) are equal to the annualized expense ratio for the class (1.17% for Class A, 1.92% for Class C, 0.92% for Class P, 0.82% for Institutional Class and 0.77% for Class R6), multiplied by the average account value over the period, multiplied by 184 /366. These expenses do not include the expenses of the investment companies in which the Fund invests, which are indirectly borne by Fund shareholders.
| | | | | | |
| 54 | | December 31, 2019 | | | Semiannual Report | | |
(THIS PAGE INTENTIONALLY LEFT BLANK)
| | | | | | |
| | Semiannual Report | | | December 31, 2019 | | 55 |
Unaudited
AllianzGI Technology Fund
For the period of July 1, 2019 to December 31, 2019, as provided by Huachen Chen, CFA and Walter C. Price, Jr., CFA, Senior Portfolio Managers.
Fund Insights
For the six-month period ended December 31, 2019, the Class A Shares at net asset value (“NAV”) of the AllianzGI Technology Fund (the “Fund”) returned 3.20%, underperforming the benchmark, the S&P North American Technology Sector Index (the “benchmark”), which returned 13.27%.
Market Overview
Global equities overcame a sharp set-back in August to deliver robust gains over the second half of 2019, with many markets closing the year at or near fresh/multi-month highs. Sentiment was lifted by a plethora of interest rate cuts across the developed and developing world, better-than-expected corporate earnings and optimism over a “phase one” trade deal between the US and China. At a sector level, technology stocks were the standout performers, helped by a rebound in semiconductor manufacturers. Energy was the only sector to retreat as oil prices remained mostly range bound, despite some year-end strength.
While the broad technology sector delivered strong gains, there was a wide divergence within the sector as high growth, high valuation stocks were sharply sold in favor of cyclical and value technology stocks.
Apple drove strong returns in the hardware segment as the company’s iPhone averted additional tariffs with the phase one US-China trade deal. Semiconductor stocks also benefitted from the phase one trade deal along with signs of firming demand conditions with tight inventories. Software stocks lagged mostly due to the shift in sentiment as fundamentals remain quite strong.
Portfolio Review
The Fund’s relative performance was negatively impacted by the sharp rotation from high growth stocks to value and cyclical stocks. The Fund was overweight in higher growth stocks — mostly cloud and software as a service (“SaaS”) companies. Meanwhile, the Fund was underweight in the cyclical segments of technology with a large underweight to Apple.
At the holdings level, the largest detractors from relative performance included underweight positions to Apple and Alphabet (Google), as well as overweight positions in high growth software companies such as Twilio, Zscaler, and Okta. Apple dramatically outperformed the technology sector due to improved trade sentiment, strong growth within its services business, and share repurchases. Despite the sharp sell-off in high growth stocks, we believe the fundamentals remain strong for many of these companies.
Conversely, the Fund’s overweight positions in Advanced Micro Devices, RingCentral, and Taiwan Semiconductors contributed to relative performance. Additionally, performance benefited from underweight positions in Cisco Systems and Amazon.
The core of our investment process is the identification of major themes impacting the technology sector and investing in the primary beneficiaries/drivers of these trends. We maintain our conviction in the core secular growth names in our portfolio, but we are also attentive to present market conditions and valuations.
Outlook
In our view, the technology sector continues to benefit from strong tailwinds which should continue to drive attractive long term appreciation. Digital transformation is the top priority for many companies across the economy, as these technologies are increasingly becoming critical drivers of growth, productivity, and competitive positioning. This transition is a multi-year process, and we believe we are still in the fairly early stages. For the semiconductors and hardware segments, we believe the environment will remain mixed as companies work through production and inventory adjustments amid the trade conflict between the US and China. We believe that from a fundamental perspective, these companies are much stronger after years of consolidation, and we expect growth to reaccelerate in 2020. We maintain exposure to companies that we believe will benefit from secular growth themes. Despite periods of volatility driven by geopolitical uncertainty, we expect the broad technology sector to see attractive growth in the future.
| | | | | | |
| 56 | | December 31, 2019 | | | Semiannual Report | | |
Unaudited
AllianzGI Technology Fund (cont’d)
Average Annual Total Return for the period ended December 31, 2019
| | | | | | | | | | | | | | | | | | | | | | |
| | | | | | |
| | | | | 6 Month* | | | 1 Year | | | 5 Year | | | 10 Year | | | Since Inception† | |
| | | AllianzGI Technology Fund Class A | | | 3.20% | | | | 28.86% | | | | 16.94% | | | | 16.34% | | | | 14.06% | |
| | AllianzGI Technology Fund Class A (adjusted) | | | –2.48% | | | | 21.78% | | | | 15.63% | | | | 15.68% | | | | 13.80% | |
| | | AllianzGI Technology Fund Class C | | | 2.82% | | | | 27.91% | | | | 16.07% | | | | 15.48% | | | | 13.21% | |
| | AllianzGI Technology Fund Class C (adjusted) | | | 2.04% | | | | 26.94% | | | | 16.07% | | | | 15.48% | | | | 13.21% | |
| | AllianzGI Technology Fund Class P | | | 3.35% | | | | 29.19% | | | | 17.24% | | | | 16.63% | | | | 14.43% | |
| | AllianzGI Technology Fund Institutional Class | | | 3.38% | | | | 29.31% | | | | 17.35% | | | | 16.75% | | | | 14.55% | |
| | | AllianzGI Technology Fund Administrative Class | | | 3.27% | | | | 29.01% | | | | 17.06% | | | | 16.46% | | | | 14.27% | |
| | S&P North American Technology Sector Index | | | 13.27% | | | | 42.68% | | | | 20.34% | | | | 17.55% | | | | 11.54% | |
| | NASDAQ Composite Index | | | 12.67% | | | | 36.69% | | | | 14.93% | | | | 16.05% | | | | 10.08% | |
| | | Lipper Global Science & Technology Funds Average | | | 10.79% | | | | 38.58% | | | | 17.99% | | | | 15.70% | | | | 10.02% | |
* Cumulative return
† The Fund began operations on 12/27/95. Benchmark and Lipper performance comparisons began on 12/31/95.
Performance quoted represents past performance and is no guarantee of future results. Current performance may be lower or higher than performance shown. For performance current to the most recent month-end, visit our website at us.allianzgi.com. Investment return and the principal value will fluctuate. Shares may be worth more or less than original cost when redeemed.The adjusted returns take into account the maximum sales charge of 5.50% on Class A shares and 1% contingent deferred sales charge (CDSC) on Class C shares, which may apply to shares redeemed during the first year of ownership. Returns do not reflect deduction of taxes that a shareholder would pay on fund distributions or redemption of fund shares. Please see pages 60-62 for more information. The Fund’s gross expense ratios are 1.56% for Class A shares, 2.31% for Class C shares, 1.31% for Class P shares, 1.21% for Institutional Class shares and 1.46% for Administrative Class shares. Expense ratio information is as of the Fund’s current prospectus dated August 28, 2019, as further revised or supplemented from time to time.
Cumulative Returns Through December 31, 2019
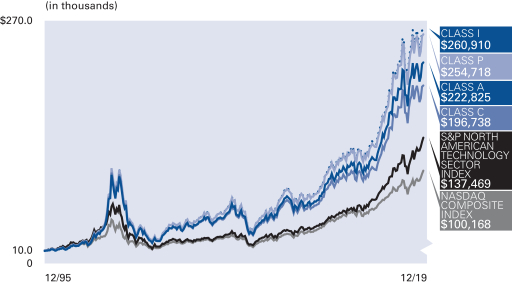
The Fund began operations on 12/27/95. Benchmark and Lipper performance comparisons began on 12/31/95.
Industry/Sectors (as of December 31,
2019)
| | | | |
| |
| Software | | | 30.7% | |
| |
| Semiconductors & Semiconductor Equipment | | | 21.3% | |
| |
| IT Services | | | 20.2% | |
| |
| Interactive Media & Services | | | 11.6% | |
| |
| Technology Hardware, Storage & Peripherals | | | 5.8% | |
| |
| Entertainment | | | 3.2% | |
| |
| Internet & Direct Marketing Retail | | | 2.8% | |
| |
| Other | | | 1.3% | |
| |
| Securities Sold Short* | | | –0.0% | |
| |
| Cash & Equivalents — Net | | | 3.1% | |
| | * | Table below details the industry allocation for securities sold short |
Industry/Sectors - Securities Sold Short
| | | | | | |
| | Semiannual Report | | | December 31, 2019 | | 57 |
Unaudited
AllianzGI Technology Fund (cont’d)
| | | | | | | | | | |
| |
| Shareholder Expense Example | | Actual Performance |
| | | Class A | | Class C | | Class P | | Institutional
Class | | Administrative
Class |
| | | | | |
| Beginning Account Value (7/1/19) | | $1,000.00 | | $1,000.00 | | $1,000.00 | | $1,000.00 | | $1,000.00 |
| | | | | |
| Ending Account Value (12/31/19) | | $1,032.00 | | $1,028.20 | | $1,033.50 | | $1,033.80 | | $1,032.70 |
| | | | | |
| Expenses Paid During Period | | $8.02 | | $11.83 | | $6.75 | | $6.24 | | $7.51 |
| | | | | | | | | | | |
| |
| | | Hypothetical Performance |
| | | (5% return before expenses) |
| | | Class A | | Class C | | Class P | | Institutional
Class | | Administrative
Class |
| | | | | |
| Beginning Account Value (7/1/19) | | $1,000.00 | | $1,000.00 | | $1,000.00 | | $1,000.00 | | $1,000.00 |
| | | | | |
| Ending Account Value (12/31/19) | | $1,017.24 | | $1,013.47 | | $1,018.50 | | $1,019.00 | | $1,017.75 |
| | | | | |
| Expenses Paid During Period | | $7.96 | | $11.74 | | $6.70 | | $6.19 | | $7.46 |
For each class of the Fund, expenses are equal to the annualized expense ratio for the class (1.57% for Class A, 2.32% for Class C, 1.32% for Class P, 1.22% for Institutional Class and 1.47% for Administrative Class), multiplied by the average account value over the period, multiplied by 184/366. These expenses do not include the expenses of the investment companies in which the Fund invests, which are indirectly borne by Fund shareholders.
| | | | | | |
| 58 | | December 31, 2019 | | | Semiannual Report | | |
(THIS PAGE INTENTIONALLY LEFT BLANK)
| | | | | | |
| | Semiannual Report | | | December 31, 2019 | | 59 |
Unaudited
Important Information
Share Class (A/C)
The inception date on each Fund Summary page is the inception date of the Fund’s oldest share class or classes. The oldest share class for the following Funds is the Institutional share class, and the Class A and/or C shares were first offered in the month/year indicated in parentheses after each Fund name: AllianzGI NFJ Dividend Value (10/01), AllianzGI NFJ Large-Cap Value (7/02), AllianzGI NFJ Small-Cap Value (1/97), AllianzGIMid-Cap (2/02), AllianzGI Emerging Markets Opportunities (8/06), AllianzGI Global Natural Resources (3/06), AllianzGI Global Small-Cap (2/02) and AllianzGI Technology (2/02). The oldest share class for the following Funds is C, and the A shares were first offered in the month/year indicated in parentheses after each Fund name: AllianzGI NFJ Mid-Cap Value (2/91) and AllianzGI Focused Growth (10/90). The oldest share class for AllianzGI Health Sciences was the D share class, and the A and C shares were first offered in 2/02. For AllianzGI NFJ International Value the oldest share class is the Institutional share class and A and C shares were first offered in 4/05. For AllianzGI Small-Cap, A and C shares were each first offered in 7/13. For the AllianzGI Income & Growth Fund, Class A and Class C shares were first offered simultaneously with Institutional shares in 2/07.
Class A shares are subject to an initial sales charge. Class C shares are subject to a 1% CDSC for shares redeemed in the first year.
Share Class (R)
The inception date on each Fund Summary page is the inception date of the Fund’s oldest share class or classes. The oldest share classes are (Fund/share class): AllianzGI NFJ Dividend Value/Institutional and Administrative, AllianzGI NFJ Mid-Cap Value/C, AllianzGI NFJ Small-Cap Value/Institutional, AllianzGI Focused Growth/C and AllianzGI Mid-Cap/Institutional. Class R shares for these Funds were first offered in 12/02. The oldest share class for AllianzGI NFJ Large-Cap Value is the Institutional share class and it first offered Class R shares in 11/09. The oldest share class for AllianzGI NFJ International Value is the Institutional share class and the Fund first offered Class R shares in 11/09. The oldest share classes for AllianzGI Income & Growth are the Institutional, Class A and Class C share classes and the Fund first offered Class R shares in 2/11.
Share Class (P)
Class P shares were launched in July 2008, except for Class P shares of AllianzGI NFJ Mid-Cap Value Fund, which were launched February 28, 2011, Class P shares of AllianzGI Mid-Cap Fund, which were launched April 2, 2012, and Class P shares of AllianzGI Small-Cap, which were launched July 1, 2013.
Share Class (Institutional/Administrative)
The inception date on each Fund Summary page is the inception date of the Fund’s oldest share class or classes. Unless otherwise indicated, the noted Institutional or Administrative share class is one of the Fund’s oldest share classes. The oldest share class for the following Funds is the C shares, and the Institutional and Administrative shares
were first offered in the month/year indicated in parentheses after each Fund name: AllianzGI NFJ Mid-Cap Value (4/88) and AllianzGI Focused Growth (3/99). The oldest share class for the AllianzGI Health Sciences Fund was the D share class, and the Institutional share class was first offered in 12/14. The oldest share class for the following Funds is the Institutional class and the Administrative shares were first offered in the month/year indicated in parentheses after each Fund name: AllianzGI NFJ International Value (5/10), AllianzGI NFJ Large-Cap Value (9/06), AllianzGI NFJ Small-Cap Value (11/95), AllianzGI Technology (3/05) and AllianzGI Mid-Cap (2/02).
Share Class (R6)
The inception date on each Fund Summary page is the inception date of the Fund’s oldest share class or classes. The oldest share class for the following funds is the Institutional class and Class R6 shares were first offered in the month/year indicated in parentheses after each Fund name: AllianzGI Emerging Markets Opportunities (12/15), AllianzGI NFJ Dividend Value (12/13), AllianzGI NFJ International Value (12/13), AllianzGI NFJ Small-Cap Value (12/13), AllianzGI NFJ Mid Cap Value (12/17) and AllianzGI Small-Cap (8/18). For AllianzGI Focused Growth, Class C is the oldest share class and Class R6 shares were first offered in 12/15.
Returns shown in the “Fund Summaries” section of this report measure performance from the inception of the oldest share class to the present; therefore some returns predate the inception of the noted share class. Those returns are calculated by adjusting the returns of the oldest share class to reflect the fees and expenses paid by the newer class. Total return performance assumes that all dividend and capital gain distributions were reinvested on the payable date.
The Lipper Averages are calculated by Lipper, Inc. (“Lipper”). They are based on the total return performance, with distributions reinvested and operating expenses deducted, of funds included by Lipper in the stated category. Lipper does not take into account sales charges.
The Average Annual Total Return tables for each Fund assume the initial investment was made on the first day of the Fund’s initial fiscal year. The tables reflect any sales load that would have applied at the time of purchase or any CDSC that would have applied if a full redemption occurred on the last business day of the most recent fiscal year. Results assume that all dividend and capital gain distributions were reinvested. They do not take into account the effect of taxes. The benchmark index cumulative return began on the last day of the month of the respective Fund’s inception date, unless otherwise noted.
“Cash & Equivalents — Net” in the Allocation Summaries may be comprised of cash, repurchase agreements, U.S. Treasury Bills, options purchased, options written and other assets net of other liabilities including net unrealized appreciation (depreciation) on futures contracts, forward foreign currency contracts and swap agreements, as applicable.
| | | | | | |
| 60 | | December 31, 2019 | | | Semiannual Report | | |
Proxy Voting
Allianz Global Investors U.S. LLC (the “Investment Adviser”) has adopted written proxy voting policies and procedures (the “Proxy Policy”) as required byRule 206(4)-6 under the Investment Advisers Act of 1940. The Proxy Policy has been adopted by the Trust as the policies and procedures that the Investment Adviser will use when voting proxies on behalf of the Funds. Copies of the written Proxy Policy, the factors that the Investment Adviser may consider in determining how to vote proxies for each Fund and information about how each Fund voted proxies relating to portfolio securities held during the most recent twelve-month period ended June 30, are provided without charge, upon request, by calling the Trust at 1-800-988-8380 (Class A, Class C and Class R) or1-800-498-5413 (Class P, Class R6, Institutional and Administrative classes), on the Allianz Global Investors Distributors LLC website at us.allianzgi.com, and on the Securities and Exchange Commission (the “SEC”) Website at http://www.sec.gov.
Form N-PORT
The Trust files complete schedules of each Fund’s portfolio holdings with the SEC on Form N-PORT for the first and third quarters of the fiscal year; such filings are available on the SEC’s website at http://www.sec.gov. A copy of the Trust’s Form N-PORT, when available, will be provided without charge, upon request, by calling1-800-988-8380 (Class A, Class C and Class R) or1-800-498-5413 (Class P, Class R6, Institutional and Administrative classes). A description of the Trust’s policies and procedures with respect to the disclosure of each Fund’s portfolio holdings is available in the Trust’s Statement of Additional Information. The Investment Adviser will post each Fund’s holdings information on the Fund’s website at us.allianzgi.com. Each Fund’s website will contain a complete schedule of portfolio holdings as of the relevant month end. The information will be posted on the website approximately thirty (30) calendar days after the relevant month’s end. Portfolio holdings information for each Fund will remain accessible on its website until the Trust files its Form N-CSR, or Form N-PORT (for the last month of the Fund’s first or third fiscal quarters), with the SEC for the period that includes the date as of which the website information is current. The Trust’s policies with respect to the disclosure of the portfolio holdings are subject to change without notice.
The following disclosure provides important information regarding each Fund’s Shareholder Expense Example, which appears on each Fund Summary page in this Semi-Annual Report. Please refer to this information when reviewing the Shareholder Expense Example for a Fund.
Shareholder Expense Example
Shareholders of the Funds incur two types of costs: (1) transaction costs; and (2) ongoing costs, including investment advisory and administration fees; distribution and/or service (12b-1) fees and other Fund expenses. The Shareholder Expense Example is intended to help you understand your ongoing costs (in dollars) of investing in each Fund and to compare these costs with the ongoing costs of investing in other mutual funds. The Shareholder Expense Example is based on
$1,000.00 invested at the beginning and held for the entire period of July 1, 2019 through December 31, 2019.
Actual Expenses
The information in the table under the heading “Actual Performance” provides information about actual account values and actual expenses. You may use the information in these columns, together with the amount you invested, to estimate the expenses that you paid over the period. Simply divide your account value by $1,000.00 (for example, an $8,600.00 account value divided by $1,000.00 = 8.6), then multiply the result by the number in the appropriate column for your share class, in the row entitled “Expenses Paid During Period”, to estimate the expenses you paid on your account during this period.
Hypothetical Example for Comparison Purposes
The information in the table under the heading “Hypothetical Performance (5% return before expenses)” provides information about hypothetical account values and hypothetical expenses based on a Fund’s actual expense ratio and an assumed rate of return of 5% per year before expenses, which is not a Fund’s actual return. The hypothetical account values and expenses may not be used to estimate the actual ending account balance or expenses you paid for the period. You may use this information to compare the ongoing costs of investing in the Fund and other funds. To do so, compare this 5% hypothetical example with the 5% hypothetical examples that appear in the shareholder reports of the other funds.
Please note that the expenses shown in the table are meant to highlight your ongoing costs only and do not reflect any transactional costs, such as sales charges. Therefore, the information under the heading “Hypothetical Performance (5% return before expenses)” is useful in comparing ongoing costs only, and will not help you determine the relative total costs of owning different funds. In addition, if these transactional costs were included, your costs may have been higher.
Expense ratios may vary from period to period because of various factors such as increases in expenses not covered by advisory and administration fees (for example, expenses of the Trustees and their counsel or litigation expenses) and/or because of reductions in the administration fees resulting from the size of the fund.
Credit Ratings
Bond ratings apply to the underlying holdings of a Fund and not the Fund itself and are divided into categories ranging from highest to lowest credit quality. Presentations of credit ratings information in this report use ratings provided by S&P Global Ratings (“S&P”), because of among other reasons, the access to background information and other materials provided by S&P, as well as the Funds’ considerations of industry practice. Bonds not rated by S&P, or bonds that do not have a rating available from S&P, or bonds that had a rating withdrawn by S&P are designated as “NR” or “NA”, respectively. Credit quality ratings assigned by a rating agency are subjective opinions, not statements of fact, and are subject to change periodically, even as frequently as daily.
| | | | | | |
| | Semiannual Report | | | December 31, 2019 | | 61 |
Unaudited
Important Information (cont’d)
Ratings assigned by S&P or another rating agency are not absolute standards of credit quality and do not evaluate market risk. Rating agencies may fail to make timely changes in credit ratings, and an issuer’s current financial condition may be better or worse than a rating indicates. In formulating investment decisions for the applicable Funds, the Investment Adviser develops its own analysis of the credit quality and risks associated with individual debt instruments, rather than relying exclusively on rating agencies or third-party research.
All of the information on the Fund Summary pages, including Fund Insights, Average Annual Total Return tables and Cumulative Returns charts, Shareholder Expense Examples and Allocation/Credit Ratings Summaries are unaudited.
Allianz Global Investors Distributors LLC, 1633 Broadway, New York, NY, 10019, us.allianzgi.com, 1-800-988-8380 (retail classes: A, C & R) or1-800-498-5413 (Class P, Class R6, Institutional and Administrative classes).
| | | | | | |
| 62 | | December 31, 2019 | | | Semiannual Report | | |
Unaudited
Benchmark Descriptions
Unless otherwise noted, index returns reflect the reinvestment of income dividends and capital gains, if any, but do not reflect fees, brokerage commissions or other expenses of investing. It is not possible to invest directly in an index.
Prior to November 1, 2006, performance data for the MSCI Indices was calculated gross of dividend tax withholding. Performance data presently shown for the Indices is net of dividend tax withholding. This recalculation results in lower performance for the Indices.
| | |
| Index | | Description |
| Bloomberg Barclays US Aggregate Bond Index | | The Bloomberg Barclays US Aggregate Bond Index represents securities that are SEC-registered, taxable, and US dollar denominated. The index covers the US investment grade fixed rate bond market, with index components for government and corporate securities, mortgage pass-through securities, and asset-backed securities. |
| |
| Bloomberg Barclays US Credit Index | | The Bloomberg Barclays US Credit Index is the credit component of the US Government/Credit Index. It includes publicly issued US corporate and specified foreign debentures and secured notes that meet the specified maturity, liquidity, and quality requirements. To qualify, bonds must be SEC-registered. |
| |
| Bloomberg Barclays US Government Bond Index | | The Bloomberg Barclays US Government Bond Index is the US Government component of the US Government/Credit Index. It includes US Dollar-denominated, fixed-rate, nominal US Treasuries and US agency debentures (securities issued by US government owned or government sponsored entities) and debt explicitly guaranteed by the US government. |
| |
| Bloomberg Barclays Global High Yield Index | | The Bloomberg Barclays Global High Yield Index is a multi-currency flagship measure of the global high yield debt market. The index represents the union of the US High Yield, the Pan-European High Yield and Emerging Markets (EM) Hard Currency High Yield Indices. |
| |
| ICE BofA US Convertible Index | | The ICE BofA US Convertible Index is a widely used, unmanaged index that measures the performance of U.S. dollar-denominated convertible securities not currently in bankruptcy with a total market value greater than $50 million at issuance. |
| |
| ICE BofA US High Yield Master II Index | | The ICE BofA US High Yield Master II Index is an unmanaged index consisting of US dollar denominated bonds that are issued in countries having a BBB3 or higher debt rating with at least one year remaining until maturity. All bonds must have a credit rating below investment grade but not in default. |
| |
| Chicago Board Options Exchange (CBOE) Volatility Index (VIX) | | The Chicago Board Options Exchange (CBOE) Volatility Index (VIX) is a key measure of market expectations of near-term volatility conveyed by S&P 500 stock index option prices. |
| |
| MSCI AC World Index ex USA (Also known as MSCI ACWI ex USA Index) | | The MSCI AC World Index ex USA Index captures large and mid cap representation across Developed Markets countries (excluding the US) and Emerging Markets countries. The index covers approximately 85% of the global equity opportunity set outside the US. |
| |
| MSCI EAFE Index | | The MSCI EAFE Index is an equity index which captures large and mid cap representation across the Developed Markets countries around the world, excluding the US and Canada. |
| |
| MSCI Emerging Markets Index | | The MSCI Emerging Markets Index captures large and mid cap representation across Emerging Markets countries. The index covers approximately 85% of the free float-adjusted market capitalization in each country. |
| |
| MSCI World Energy Index | | The MSCI World Energy Index is designed to capture the large and mid-cap segments across Developed Markets countries. All securities in the index are classified in the Energy sector as per the Global Industry Classification Standard. |
| |
| MSCI World Health Care Index | | The MSCI World Health Care Index is designed to capture the large and mid cap segments across Developed Markets countries. All securities in the index are classified in the Health Care sector as per the Global Industry Classification Standard. |
| |
| MSCI World Index | | The MSCI World Index captures large and mid cap representation across Developed Markets countries. The index covers approximately 85% of the free float-adjusted market capitalization in each country. |
| |
| MSCI World Materials Index | | The MSCI World Materials Index is designed to capture the large and mid cap segments across Developed Markets countries. All securities in the index are classified in the Materials sector as per the Global Industry Classification Standard. |
| | | | | | |
| | Semiannual Report | | | December 31, 2019 | | 63 |
Unaudited
Benchmark Descriptions (cont’d)
| | |
| Index | | Description |
| MSCI World Small-Cap Index | | The MSCI World Small-Cap Index captures small-cap representation across Developed Markets countries. The index covers approximately 14% of the free float-adjusted market capitalization in each country. |
| |
| NASDAQ Composite Index | | The NASDAQ Composite Index is an unmanaged market-value weighted index of all common stocks listed on the NASDAQ Stock Market. |
| |
| Russell 1000 Growth Index | | The Russell 1000 Growth Index is an unmanaged index that measures the performance of the large-cap growth segment of the US equity universe. It includes those Russell 1000 companies with higher price-to-book ratios and higher forecasted growth values. The Russell 1000 Index measures the performance of the 1,000 largest companies in the Russell 3000® Index, which consists of the 3,000 largest US companies based on total market capitalization. |
| |
| Russell 1000 Index | | The Russell 1000 Index is an unmanaged index that consists of the 1,000 largest companies in the Russell 3000 Index and represents approximately 90% of the total market capitalization of the Russell 3000 Index. It is highly correlated with the S&P 500 Index. |
| |
| Russell 1000 Value Index | | The Russell 1000 Value Index is an unmanaged index that measures the performance of the large-cap value segment of the US equity universe. It includes those Russell 1000 companies with lower price-to-book ratios and lower expected growth values. |
| |
| Russell 2000 Index | | The Russell 2000 Index measures the performance of the small-cap segment of the US equity universe. The Russell 2000 is a subset of the Russell 3000 Index representing approximately 10% of the total market capitalization of that index. It includes approximately 2000 of the smallest securities based on a combination of their market cap and current index membership. |
| |
| Russell 2000 Value Index | | The Russell 2000 Value Index is an unmanaged index that measures the performance of the small-cap value segment of the US equity universe. It includes those Russell 2000 Index companies with lower price-to-book ratios and lower forecasted growth values. |
| |
| Russell Midcap Growth Index | | The Russell Midcap Growth Index is an unmanaged index that measures the performance of the mid-cap growth segment of the US equity universe. It includes those Russell Midcap Index companies with higher price-to-book ratios and higher forecasted growth values. |
| |
| Russell Midcap Index | | The Russell Midcap Index is an unmanaged index that measures the performance of the mid-cap segment of the U.S. equity universe. The Russell Midcap Index is a subset of the Russell 1000 Index. It includes approximately 800 of the smallest securities based on a combination of their market cap and current index membership. |
| |
| Russell Midcap Value Index | | The Russell Midcap Value Index is an unmanaged index that measures the performance of the mid-cap value segment of the US equity universe represented by stocks in the largest 200 by market cap that exhibit value characteristics. It includes Russell Midcap companies with lower price-to-book ratios and lower forecasted growth values. |
| |
| S&P 500 Index | | The S&P 500 Index is an unmanaged index of large capitalization common stocks. |
| |
| S&P North American Technology Sector Index | | The S&P North American Technology Sector Index is a modified capitalization-weighted index of selected technology and internet-related stocks. |
| | | | | | |
| 64 | | December 31, 2019 | | | Semiannual Report | | |
Schedule of Investments
December 31, 2019 (Unaudited)
AllianzGI Emerging Markets Opportunities Fund
| | | | | | | | |
| | | Shares | | | Value | |
| |
| Common Stock—96.5% | | | | | |
| |
| Brazil—4.8% | | | | | |
Ambev S.A. | | | 787,000 | | | | $3,663,705 | |
Banco BTG Pactual S.A. UNIT | | | 104,400 | | | | 1,983,180 | |
Banco do Brasil S.A. | | | 134,800 | | | | 1,779,160 | |
Cia de Saneamento Basico do Estado de Sao Paulo ADR | | | 251,900 | | | | 3,791,095 | |
IRB Brasil Resseguros S.A. | | | 164,400 | | | | 1,597,134 | |
Porto Seguro S.A. | | | 144,676 | | | | 2,261,885 | |
Qualicorp Consultoria e Corretora de Seguros S.A. | | | 285,300 | | | | 2,640,900 | |
| | | | | | | | |
| | | | | | | 17,717,059 | |
| | | | | | | | |
| |
| China—31.4% | | | | | |
Alibaba Group Holding Ltd. ADR (d) | | | 70,200 | | | | 14,889,420 | |
Anhui Conch Cement Co., Ltd., Class H | | | 1,922,000 | | | | 14,003,937 | |
China Merchants Bank Co., Ltd., Class H | | | 1,514,000 | | | | 7,783,668 | |
China Telecom Corp., Ltd., Class H | | | 3,288,000 | | | | 1,354,619 | |
CNOOC Ltd. | | | 2,593,000 | | | | 4,311,717 | |
Daqin Railway Co., Ltd., Class A | | | 1,429,900 | | | | 1,686,226 | |
Gemdale Corp., Class A | | | 1,266,770 | | | | 2,638,237 | |
Industrial & Commercial Bank of China Ltd., Class H | | | 5,128,000 | | | | 3,956,398 | |
Jiangsu Expressway Co., Ltd., Class H | | | 1,052,000 | | | | 1,441,576 | |
Kweichow Moutai Co., Ltd., Class A | | | 24,900 | | | | 4,237,414 | |
Lenovo Group Ltd. | | | 10,796,000 | | | | 7,250,088 | |
New Oriental Education & Technology Group, Inc. ADR (d) | | | 29,300 | | | | 3,552,625 | |
Ping An Bank Co., Ltd., Class A | | | 1,584,093 | | | | 3,748,083 | |
Ping An Insurance Group Co. of China Ltd., Class H | | | 206,000 | | | | 2,437,693 | |
RiseSun Real Estate Development Co., Ltd., Class A | | | 1,191,852 | | | | 1,683,532 | |
Tencent Holdings Ltd. | | | 385,200 | | | | 18,557,443 | |
Tsingtao Brewery Co., Ltd., Class A | | | 824,964 | | | | 6,047,701 | |
Weichai Power Co., Ltd., Class H | | | 3,831,000 | | | | 8,086,185 | |
Wuliangye Yibin Co., Ltd., Class A | | | 194,179 | | | | 3,716,097 | |
Yum China Holdings, Inc. | | | 60,300 | | | | 2,895,003 | |
Zoomlion Heavy Industry Science and Technology Co., Ltd., Class H | | | 3,677,400 | | | | 3,082,555 | |
| | | | | | | | |
| | | | | | | 117,360,217 | |
| | | | | | | | |
| |
| Hong Kong—0.5% | | | | | |
Link REIT | | | 183,500 | | | | 1,943,994 | |
| | | | | | | | |
| |
| India—7.7% | | | | | |
Bajaj Finance Ltd. | | | 67,154 | | | | 3,986,110 | |
HDFC Asset Management Co., Ltd. | | | 54,166 | | | | 2,428,750 | |
HDFC Bank Ltd. ADR | | | 197,000 | | | | 12,483,890 | |
| | | | | | | | |
| | | Shares | | | Value | |
Hindustan Petroleum Corp., Ltd. | | | 650,827 | | | $ | 2,407,304 | |
Hindustan Unilever Ltd. | | | 107,657 | | | | 2,901,250 | |
REC Ltd. | | | 685,068 | | | | 1,373,836 | |
Tech Mahindra Ltd. | | | 305,213 | | | | 3,259,595 | |
| | | | | | | | |
| | | | | | | 28,840,735 | |
| | | | | | | | |
| |
| Indonesia—1.2% | | | | | |
Bank Central Asia Tbk PT | | | 1,906,100 | | | | 4,584,182 | |
| | | | | | | | |
| |
| Korea (Republic of)—13.5% | | | | | |
Kia Motors Corp. | | | 259,313 | | | | 9,903,296 | |
LG Electronics, Inc. | | | 63,402 | | | | 3,938,352 | |
Partron Co., Ltd. | | | 156,097 | | | | 1,778,814 | |
Samsung Electronics Co., Ltd. | | | 399,552 | | | | 19,253,150 | |
Shinhan Financial Group Co., Ltd. | | | 122,252 | | | | 4,583,569 | |
SK Hynix, Inc. | | | 135,638 | | | | 11,032,487 | |
| | | | | | | | |
| | | | | | | 50,489,668 | |
| | | | | | | | |
| |
| Mexico—1.7% | | | | | |
Grupo Financiero Banorte S.A.B de C.V., Class O | | | 1,136,000 | | | | 6,347,661 | |
| | | | | | | | |
| |
| Russian Federation—8.6% | | | | | |
Alrosa PJSC (b)(c) | | | 734,500 | | | | 997,275 | |
Lukoil PJSC ADR | | | 169,563 | | | | 16,737,564 | |
MMC Norilsk Nickel PJSC ADR | | | 467,460 | | | | 14,252,855 | |
| | | | | | | | |
| | | | | | | 31,987,694 | |
| | | | | | | | |
| |
| South Africa—3.1% | | | | | |
AngloGold Ashanti Ltd. ADR | | | 198,000 | | | | 4,423,320 | |
Gold Fields Ltd. ADR | | | 358,300 | | | | 2,364,780 | |
Impala Platinum Holdings Ltd. (d) | | | 229,769 | | | | 2,347,628 | |
Kumba Iron Ore Ltd. | | | 26,922 | | | | 800,991 | |
MTN Group Ltd. | | | 300,523 | | | | 1,771,626 | |
| | | | | | | | |
| | | | | | | 11,708,345 | |
| | | | | | | | |
| |
| Taiwan—16.5% | | | | | |
Cathay Financial Holding Co., Ltd. | | | 668,000 | | | | 948,474 | |
Compeq Manufacturing Co., Ltd. | | | 3,648,000 | | | | 5,500,991 | |
CTBC Financial Holding Co., Ltd. | | | 1,268,000 | | | | 948,644 | |
Hon Hai Precision Industry Co., Ltd. | | | 2,147,000 | | | | 6,512,955 | |
Nanya Technology Corp. | | | 652,000 | | | | 1,824,680 | |
Radiant Opto-Electronics Corp. | | | 968,000 | | | | 3,875,750 | |
Sino-American Silicon Products, Inc. | | | 572,000 | | | | 1,899,862 | |
Taiwan Semiconductor Manufacturing Co., Ltd. | | | 2,236,000 | | | | 24,747,655 | |
Uni-President Enterprises Corp. | | | 1,188,000 | | | | 2,946,035 | |
Unimicron Technology Corp. | | | 1,402,000 | | | | 1,975,501 | |
United Microelectronics Corp. | | | 10,045,000 | | | | 5,504,153 | |
Zhen Ding Technology Holding Ltd. | | | 1,013,000 | | | | 4,860,448 | |
| | | | | | | | |
| | | | | | | 61,545,148 | |
| | | | | | | | |
| |
| Thailand—5.0% | | | | | |
Advanced Info Service PCL (b)(c) | | | 1,382,200 | | | | 9,814,784 | |
| | | | | | | | |
| | | Shares | | | Value | |
Charoen Pokphand Foods PCL (b)(c) | | | 7,963,400 | | | $ | 7,300,337 | |
Land & Houses PCL (b)(c) | | | 4,408,300 | | | | 1,441,794 | |
| | | | | | | | |
| | | | | | | 18,556,915 | |
| | | | | | | | |
| |
| Turkey—1.4% | | | | | |
KOC Holding AS | | | 278,300 | | | | 951,087 | |
Turkiye Is Bankasi AS (d) | | | 3,907,994 | | | | 4,208,642 | |
| | | | | | | | |
| | | | | | | 5,159,729 | |
| | | | | | | | |
| |
| United States—1.1% | | | | | |
AutoZone, Inc. (d) | | | 3,500 | | | | 4,169,585 | |
| | | | | | | | |
Total Common Stock
(cost—$299,513,359) | | | | 360,410,932 | |
| | | | | | | | |
| | | | | | | | |
| |
| Preferred Stock—2.8% | | | | | |
| |
| Brazil—2.8% | | | | | |
Banco Bradesco S.A. | | | 259,020 | | | | 2,340,819 | |
Banco do Estado do Rio Grande do Sul S.A., Class B | | | 260,900 | | | | 1,410,283 | |
Cia Paranaense de Energia | | | 381,500 | | | | 6,579,377 | |
| | | | | | | | |
Total Preferred Stock
(cost—$6,236,524) | | | | 10,330,479 | |
| | | | | | | | |
| | | | | | | | |
| | |
| | | Principal
Amount
(000s) | | | | |
|
| Repurchase Agreements—0.2% | |
State Street Bank and Trust Co.,
dated 12/31/19, 0.25%, due 1/2/20, proceeds $870,012; collateralized by U.S. Treasury Bonds, 2.50%, due 2/15/46, valued at $888,620 including accrued interest | |
(cost—$870,000) | | | $870 | | | | 870,000 | |
| | | | | | | | |
| |
Total Investments
(cost—$306,619,883) (a)—99.5% | | | | 371,611,411 | |
| | | | | | | | |
| | |
Other assets less
liabilities—0.5% | | | | | | | 1,811,734 | |
| | | | | | | | |
| | |
| Net Assets—100.0% | | | | | | | $373,423,145 | |
| | | | | | | | |
Notes to Schedule of Investments:
(a) Securities with an aggregate value of $262,019,828, representing 70.2% of net assets, were valued utilizing modeling tools provided by a third-party vendor. See Note 1(a) and Note 1(b) in the Notes to Financial Statements.
(b) Fair-Valued—Securities with an aggregate value of $19,554,190, representing 5.2% of net assets. See Note 1(a) and Note 1(b) in the Notes to Financial Statements.
(c) Level 3 security. See Note 1(a) and Note 1(b) in the Notes to Financial Statements.
(d)Non-income producing.
Glossary:
ADR—American Depositary Receipt
REIT—Real Estate Investment Trust
UNIT—More than one class of securities traded together
| | | | | | | | |
| See accompanying Notes to Financial Statements | | | December 31, 2019 | | | Semiannual Report | | | 65 | |
Schedule of Investments
December 31, 2019 (Unaudited)
The industry classification of portfolio holdings and other assets less liabilities shown as a percentage of net assets were as follows:
| | | | |
Banks | | | 14.5% | |
Semiconductors & Semiconductor Equipment | | | 13.1% | |
Technology Hardware, Storage & Peripherals | | | 7.1% | |
Metals & Mining | | | 6.7% | |
Oil, Gas & Consumable Fuels | | | 6.3% | |
Electronic Equipment, Instruments & Components | | | 5.5% | |
Interactive Media & Services | | | 5.0% | |
Beverages | | | 4.7% | |
Internet & Direct Marketing Retail | | | 4.0% | |
Construction Materials | | | 3.7% | |
Wireless Telecommunication Services | | | 3.1% | |
Machinery | | | 3.0% | |
Food Products | | | 2.7% | |
Automobiles | | | 2.7% | |
Insurance | | | 1.9% | |
Electric Utilities | | | 1.8% | |
Real Estate Management & Development | | | 1.5% | |
Capital Markets | | | 1.2% | |
Specialty Retail | | | 1.1% | |
Consumer Finance | | | 1.1% | |
Household Durables | | | 1.1% | |
Water Utilities | | | 1.0% | |
Diversified Consumer Services | | | 0.9% | |
IT Services | | | 0.9% | |
Household Products | | | 0.8% | |
Hotels, Restaurants & Leisure | | | 0.8% | |
Healthcare Providers & Services | | | 0.7% | |
Equity Real Estate Investment Trusts (REITs) | | | 0.5% | |
Road & Rail | | | 0.4% | |
Transportation Infrastructure | | | 0.4% | |
Diversified Financial Services | | | 0.4% | |
Diversified Telecommunication Services | | | 0.4% | |
Industrial Conglomerates | | | 0.3% | |
Repurchase Agreements | | | 0.2% | |
Other assets less liabilities | | | 0.5% | |
| | | | |
| | | 100.0% | |
| | | | |
AllianzGI Focused Growth Fund
| | | | | | | | |
| | | Shares | | | Value | |
| |
| Common Stock—98.9% | | | | | |
| |
| Aerospace & Defense—3.0% | | | | | |
Lockheed Martin Corp. | | | 80,722 | | | | $31,431,532 | |
| | | | | | | | |
| |
| Biotechnology—1.8% | | | | | |
Exact Sciences Corp. (a) | | | 93,910 | | | | 8,684,797 | |
Vertex Pharmaceuticals, Inc. (a) | | | 45,905 | | | | 10,050,900 | |
| | | | | | | | |
| | | | | | | 18,735,697 | |
| | | | | | | | |
| |
| Capital Markets—3.6% | | | | | |
MSCI, Inc. | | | 61,500 | | | | 15,878,070 | |
S&P Global, Inc. | | | 76,760 | | | | 20,959,318 | |
| | | | | | | | |
| | | | | | | 36,837,388 | |
| | | | | | | | |
| |
| Construction Materials—2.1% | | | | | |
Vulcan Materials Co. | | | 153,715 | | | | 22,133,423 | |
| | | | | | | | |
| |
| Entertainment—1.4% | | | | | |
Roku, Inc. (a) | | | 109,445 | | | | 14,654,685 | |
| | | | | | | | |
|
| Equity Real Estate Investment Trusts (REITs)—1.1% | |
American Tower Corp. | | | 51,525 | | | | 11,841,475 | |
| | | | | | | | |
|
| Healthcare Equipment & Supplies—6.6% | |
Boston Scientific Corp. (a) | | | 467,580 | | | | 21,143,968 | |
DexCom, Inc. (a) | | | 113,335 | | | | 24,790,898 | |
Insulet Corp. (a) | | | 79,530 | | | | 13,615,536 | |
Tandem Diabetes Care, Inc. (a) | | | 146,550 | | | | 8,735,845 | |
| | | | | | | | |
| | | | | | | 68,286,247 | |
| | | | | | | | |
|
| Healthcare Providers & Services—2.0% | |
Anthem, Inc. | | | 68,030 | | | | 20,547,101 | |
| | | | | | | | |
|
| Hotels, Restaurants & Leisure—1.1% | |
Chipotle Mexican Grill, Inc. (a) | | | 13,600 | | | | 11,384,696 | |
| | | | | | | | |
|
| Industrial Conglomerates—2.1% | |
General Electric Co. | | | 1,970,585 | | | | 21,991,729 | |
| | | | | | | | |
| |
| Insurance—1.1% | | | | | |
Progressive Corp. | | | 155,005 | | | | 11,220,812 | |
| | | | | | | | |
|
| Interactive Media & Services—7.9% | |
Alphabet, Inc., Class A (a) | | | 9,110 | | | | 12,201,843 | |
Facebook, Inc., Class A (a) | | | 291,640 | | | | 59,859,110 | |
Tencent Holdings Ltd. ADR | | | 207,815 | | | | 9,977,198 | |
| | | | | | | | |
| | | | | | | 82,038,151 | |
| | | | | | | | |
|
| Internet & Direct Marketing Retail—3.3% | |
Amazon.com, Inc. (a) | | | 18,702 | | | | 34,558,304 | |
| | | | | | | | |
| |
| IT Services—14.7% | | | | | |
EPAM Systems, Inc. (a) | | | 107,250 | | | | 22,754,160 | |
Mastercard, Inc., Class A | | | 140,795 | | | | 42,039,979 | |
Okta, Inc. (a) | | | 42,635 | | | | 4,918,800 | |
PayPal Holdings, Inc. (a) | | | 226,990 | | | | 24,553,508 | |
Twilio, Inc., Class A (a) | | | 97,245 | | | | 9,557,239 | |
Visa, Inc., Class A | | | 260,005 | | | | 48,854,939 | |
| | | | | | | | |
| | | | | | | 152,678,625 | |
| | | | | | | | |
|
| Life Sciences Tools & Services—1.6% | |
Agilent Technologies, Inc. | | | 191,555 | | | | 16,341,557 | |
| | | | | | | | |
| |
| Media—2.2% | | | | | |
Comcast Corp., Class A | | | 503,045 | | | | 22,621,934 | |
| | | | | | | | |
| |
| Multi-Line Retail—0.8% | | | | | |
Dollar General Corp. | | | 49,585 | | | | 7,734,268 | |
| | | | | | | | |
| | | | | | | | |
| | | Shares | | | Value | |
| |
| Personal Products—1.0% | | | | | |
Estee Lauder Cos., Inc., Class A | | | 50,660 | | | $ | 10,463,316 | |
| | | | | | | | |
| |
| Pharmaceuticals—6.5% | | | | | |
AstraZeneca PLC ADR | | | 557,965 | | | | 27,820,135 | |
Bristol-Myers Squibb Co. | | | 216,040 | | | | 13,867,607 | |
Zoetis, Inc. | | | 191,180 | | | | 25,302,673 | |
| | | | | | | | |
| | | | | | | 66,990,415 | |
| | | | | | | | |
| |
| Road & Rail—2.7% | | | | | |
Union Pacific Corp. | | | 151,745 | | | | 27,433,979 | |
| | | | | | | | |
|
| Semiconductors & Semiconductor Equipment—6.7% | |
Broadcom, Inc. | | | 103,040 | | | | 32,562,701 | |
Lam Research Corp. | | | 72,485 | | | | 21,194,614 | |
ON Semiconductor Corp. (a) | | | 661,160 | | | | 16,119,081 | |
| | | | | | | | |
| | | | | | | 69,876,396 | |
| | | | | | | | |
| |
| Software—12.5% | | | | | |
Microsoft Corp. | | | 610,820 | | | | 96,326,314 | |
Salesforce.com, Inc. (a) | | | 113,300 | | | | 18,427,112 | |
ServiceNow, Inc. (a) | | | 52,835 | | | | 14,916,377 | |
| | | | | | | | |
| | | | | | | 129,669,803 | |
| | | | | | | | |
| |
| Specialty Retail—6.5% | | | | | |
Burlington Stores, Inc. (a) | | | 112,350 | | | | 25,619,171 | |
Lowe’s Cos., Inc. | | | 217,205 | | | | 26,012,471 | |
O’Reilly Automotive, Inc. (a) | | | 36,655 | | | | 16,064,420 | |
| | | | | | | | |
| | | | | | | 67,696,062 | |
| | | | | | | | |
|
| Technology Hardware, Storage & Peripherals—6.6% | |
Apple, Inc. | | | 234,560 | | | | 68,878,544 | |
| | | | | | | | |
Total Common Stock
(cost-$634,364,065) | | | | 1,026,046,139 | |
| | | | | | | | |
| | | | | | | | |
| | |
| | | Principal
Amount
(000s) | | | | |
|
| Repurchase Agreements—1.4% | |
State Street Bank and Trust Co.,
dated 12/31/19, 0.25%, due 1/2/20, proceeds $14,402,200; collateralized by U.S. Treasury Bonds, 2.50%, due 5/15/46, valued at $14,690,995 including accrued interest | |
(cost—$14,402,000) | | | $14,402 | | | | 14,402,000 | |
| | | | | | | | |
| |
Total Investments
(cost—$648,766,065)—
100.3% | | | | 1,040,448,139 | |
| | | | | | | | |
| | |
| Liabilities in excess of other assets—(0.3)% | | | | | | | (3,304,750 | ) |
| | | | | | | | |
| | |
| Net Assets—100.0% | | | | | | | $1,037,143,389 | |
| | | | | | | | |
Notes to Schedule of Investments:
(a)Non-income producing.
Glossary
ADR—American Depositary Receipt
REIT—Real Estate Investment Trust
| | | | | | |
| 66 | | Semiannual Report | | | December 31, 2019 | | | See accompanying Notes to Financial Statements |
Schedule of Investments
December 31, 2019 (Unaudited)
AllianzGI Global Natural Resources Fund
| | | | | | | | |
| | | Shares | | | Value | |
| |
| Common Stock—98.2% | | | | | |
| |
| Australia—4.5% | | | | | |
BHP Group Ltd. | | | 13,947 | | | | $381,901 | |
Woodside Petroleum Ltd. | | | 2,812 | | | | 67,990 | |
| | | | | | | | |
| | | | | | | 449,891 | |
| | | | | | | | |
| |
| Belgium—0.5% | | | | | |
Umicore S.A. | | | 1,023 | | | | 49,855 | |
| | | | | | | | |
| |
| Bermuda—0.4% | | | | | |
Golar LNG Ltd. | | | 2,960 | | | | 42,091 | |
| | | | | | | | |
| |
| Canada—7.8% | | | | | |
Canadian Natural Resources Ltd. | | | 3,416 | | | | 110,486 | |
First Quantum Minerals Ltd. | | | 14,452 | | | | 146,573 | |
Lundin Mining Corp. | | | 18,443 | | | | 110,213 | |
Nutrien Ltd. | | | 1,285 | | | | 61,521 | |
Suncor Energy, Inc. | | | 4,993 | | | | 163,646 | |
TC Energy Corp. | | | 1,849 | | | | 98,477 | |
Teck Resources Ltd., Class B | | | 4,958 | | | | 85,984 | |
| | | | | | | | |
| | | | | | | 776,900 | |
| | | | | | | | |
| |
| Chile—0.4% | | | | | |
Sociedad Quimica y Minera de Chile S.A. ADR | | | 1,290 | | | | 34,430 | |
| | | | | | | | |
| |
| Denmark—0.9% | | | | | |
Orsted A/S (a) | | | 827 | | | | 85,532 | |
| | | | | | | | |
| |
| Finland—1.1% | | | | | |
Neste Oyj | | | 3,080 | | | | 107,169 | |
| | | | | | | | |
| |
| France—5.0% | | | | | |
Air Liquide S.A. | | | 1,235 | | | | 175,087 | |
Total S.A. | | | 5,707 | | | | 316,684 | |
| | | | | | | | |
| | | | | | | 491,771 | |
| | | | | | | | |
| |
| Ireland—0.7% | | | | | |
CRH PLC | | | 1,660 | | | | 66,951 | |
| | | | | | | | |
| |
| Israel—0.3% | | | | | |
SolarEdge Technologies, Inc. (c) | | | 340 | | | | 32,331 | |
| | | | | | | | |
| |
| Japan—3.8% | | | | | |
NEC Corp. | | | 1,400 | | | | 57,938 | |
Oji Holdings Corp. | | | 8,600 | | | | 46,509 | |
Shin-Etsu Chemical Co., Ltd. | | | 900 | | | | 98,976 | |
SMC Corp. | | | 100 | | | | 45,731 | |
Sumitomo Metal Mining Co., Ltd. | | | 2,100 | | | | 67,620 | |
Taiheiyo Cement Corp. | | | 2,000 | | | | 58,706 | |
| | | | | | | | |
| | | | | | | 375,480 | |
| | | | | | | | |
| |
| Korea (Republic of)—0.5% | | | | | |
Samsung SDI Co., Ltd. | | | 235 | | | | 47,873 | |
| | | | | | | | |
| |
| Norway—1.0% | | | | | |
Equinor ASA | | | 5,130 | | | | 102,304 | |
| | | | | | | | |
| |
| Peru—0.4% | | | | | |
Southern Copper Corp. | | | 850 | | | | 36,108 | |
| | | | | | | | |
| |
| United Kingdom—9.9% | | | | | |
Antofagasta PLC | | | 3,100 | | | | 37,534 | |
BP PLC | | | 35,412 | | | | 222,770 | |
Rio Tinto PLC | | | 4,679 | | | | 276,973 | |
Royal Dutch Shell PLC, Class A | | | 5,044 | | | | 149,374 | |
Royal Dutch Shell PLC, Class B | | | 6,075 | | | | 180,329 | |
TechnipFMC PLC | | | 5,500 | | | | 117,920 | |
| | | | | | | | |
| | | | | | | 984,900 | |
| | | | | | | | |
| |
| United States—61.0% | | | | | |
Air Products & Chemicals, Inc. | | | 950 | | | | 223,241 | |
AMETEK, Inc. | | | 655 | | | | 65,330 | |
Axalta Coating Systems Ltd. (c) | | | 1,700 | | | | 51,680 | |
| | | | | | | | |
| | | Shares | | | Value | |
Baker Hughes Co. | | | 4,170 | | | $ | 106,877 | |
Ball Corp. | | | 1,530 | | | | 98,945 | |
Chart Industries, Inc. (c) | | | 1,010 | | | | 68,165 | |
Chevron Corp. | | | 4,100 | | | | 494,091 | |
Concho Resources, Inc. | | | 1,210 | | | | 105,960 | |
ConocoPhillips | | | 4,340 | | | | 282,230 | |
Continental Resources, Inc. | | | 1,830 | | | | 62,769 | |
Devon Energy Corp. | | | 1,795 | | | | 46,616 | |
Diamondback Energy, Inc. | | | 1,120 | | | | 104,003 | |
Dow, Inc. | | | 2,545 | | | | 139,288 | |
Eaton Corp. PLC | | | 645 | | | | 61,094 | |
Ecolab, Inc. | | | 1,060 | | | | 204,569 | |
Enphase Energy, Inc. (c) | | | 965 | | | | 25,215 | |
EOG Resources, Inc. | | | 2,305 | | | | 193,067 | |
Exxon Mobil Corp. | | | 8,865 | | | | 618,600 | |
First Solar, Inc. (c) | | | 600 | | | | 33,576 | |
FMC Corp. | | | 1,240 | | | | 123,777 | |
Freeport-McMoRan, Inc. | | | 9,790 | | | | 128,445 | |
Hess Corp. | | | 1,525 | | | | 101,885 | |
Itron, Inc. (c) | | | 570 | | | | 47,852 | |
Kansas City Southern | | | 655 | | | | 100,320 | |
Kinder Morgan, Inc. | | | 6,515 | | | | 137,923 | |
Linde PLC | | | 1,445 | | | | 307,641 | |
LyondellBasell Industries NV, Class A | | | 1,480 | | | | 139,830 | |
Marathon Petroleum Corp. | | | 2,665 | | | | 160,566 | |
Noble Energy, Inc. | | | 3,885 | | | | 96,503 | |
Occidental Petroleum Corp. | | | 3,295 | | | | 135,787 | |
ONEOK, Inc. | | | 1,820 | | | | 137,719 | |
Parsley Energy, Inc., Class A | | | 1,995 | | | | 37,726 | |
Phillips 66 | | | 1,370 | | | | 152,632 | |
Pioneer Natural Resources Co. | | | 1,173 | | | | 177,557 | |
Schlumberger Ltd. | | | 7,125 | | | | 286,425 | |
Sherwin-Williams Co. | | | 165 | | | | 96,284 | |
SM Energy Co. | | | 3,305 | | | | 37,148 | |
Sunrun, Inc. (c) | | | 2,125 | | | | 29,346 | |
Transocean Ltd. (c) | | | 7,890 | | | | 54,283 | |
Union Pacific Corp. | | | 575 | | | | 103,954 | |
Valero Energy Corp. | | | 1,825 | | | | 170,911 | |
Vulcan Materials Co. | | | 665 | | | | 95,753 | |
Williams Cos., Inc. | | | 5,875 | | | | 139,355 | |
WPX Energy, Inc. (c) | | | 4,520 | | | | 62,105 | |
| | | | | | | | |
| | | | | | | 6,047,043 | |
| | | | | | | | |
Total Common Stock
(cost—$9,038,587) | | | | 9,730,629 | |
| | | | | | | | |
| | | | | | | | |
| |
| Exchange-Traded funds—3.3% | | | | | |
Invesco Solar | | | 6,335 | | | | 195,118 | |
VanEck Vectors Gold Miners | | | 4,620 | | | | 135,274 | |
| | | | | | | | |
Total Exchange-Traded Funds
(cost—$281,689) | | | | 330,392 | |
| | | | | | | | |
| |
Total Investments
(cost—$9,320,276) (b)—101.5% | | | | 10,061,021 | |
| | | | | | | | |
| | |
| Liabilities in excess of other assets—(1.5)% | | | | | | | (148,059 | ) |
| | | | | | | | |
| |
| Net Assets—100.0% | | | | $9,912,962 | |
| | | | | | | | |
Notes to Schedule of Investments:
(a) 144A—Exempt from registration under Rule 144A of the Securities Act of 1933. These securities may be resold in transactions exempt from registration, typically only to qualified institutional buyers. Security with a value of $85,532, representing 0.9% of net assets.
(b) Securities with an aggregate value of $2,451,105, representing 24.7% of net assets, were valued utilizing modeling tools provided by a third-party vendor. See Note 1(a) and Note 1(b) in the Notes to Financial Statements.
(c)Non-income producing.
Glossary:
ADR—American Depositary Receipt
The industry classification of portfolio holdings and liabilities in excess of other assets shown as a percentage of net assets were as follows:
| | | | |
Oil, Gas & Consumable Fuels | | | 50.6% | |
Chemicals | | | 17.2% | |
Metals & Mining | | | 12.8% | |
Energy Equipment & Services | | | 5.7% | |
Exchange-Traded Funds | | | 3.3% | |
Construction Materials | | | 2.2% | |
Road & Rail | | | 2.1% | |
Electrical Equipment | | | 1.6% | |
Machinery | | | 1.1% | |
Containers & Packaging | | | 1.0% | |
Electronic Equipment, Instruments & Components | | | 1.0% | |
Semiconductors & Semiconductor Equipment | | | 0.9% | |
Electric Utilities | | | 0.9% | |
IT Services | | | 0.6% | |
Paper & Forest Products | | | 0.5% | |
Liabilities in excess of other assets | | | (1.5)% | |
| | | | |
| | | 100.0% | |
| | | | |
| | | | | | | | |
| See accompanying Notes to Financial Statements | | | December 31, 2019 | | | Semiannual Report | | | 67 | |
Schedule of Investments
December 31, 2019 (Unaudited)
AllianzGI Global Small-Cap Fund
| | | | | | | | |
| | | Shares | | | Value | |
|
| Common Stock—97.4% | |
|
| Australia—2.4% | |
Austal Ltd. | | | 117,502 | | | | $314,693 | |
Charter Hall Retail REIT | | | 99,249 | | | | 297,463 | |
Cleanaway Waste Management Ltd. | | | 161,584 | | | | 228,062 | |
Downer EDI Ltd. | | | 56,513 | | | | 323,616 | |
Growthpoint Properties Australia Ltd. REIT | | | 36,021 | | | | 104,918 | |
GUD Holdings Ltd. | | | 39,130 | | | | 304,724 | |
NEXTDC Ltd. (e) | | | 55,644 | | | | 257,085 | |
Reliance Worldwide Corp. Ltd. | | | 78,700 | | | | 223,043 | |
Seven Group Holdings Ltd. | | | 19,100 | | | | 261,014 | |
Starpharma Holdings Ltd. (e) | | | 45,700 | | | | 38,678 | |
Worley Ltd. | | | 21,000 | | | | 226,854 | |
| | | | | | | | |
| | | | | | | 2,580,150 | |
| | | | | | | | |
|
| Austria—1.9% | |
ANDRITZ AG | | | 13,516 | | | | 581,056 | |
UNIQA Insurance Group AG | | | 74,054 | | | | 753,782 | |
Wienerberger AG | | | 24,295 | | | | 719,990 | |
| | | | | | | | |
| | | | | | | 2,054,828 | |
| | | | | | | | |
|
| China—0.2% | |
Ping An Healthcare and Technology Co., Ltd. (a)(e) | | | 23,000 | | | | 167,870 | |
| | | | | | | | |
|
| Denmark—1.1% | |
Ambu A/S, Class B | | | 25,052 | | | | 420,049 | |
SimCorp A/S | | | 6,622 | | | | 752,969 | |
| | | | | | | | |
| | | | | | | 1,173,018 | |
| | | | | | | | |
|
| Finland—0.5% | |
Huhtamaki Oyj | | | 10,660 | | | | 494,794 | |
| | | | | | | | |
|
| France—2.0% | |
Ingenico Group S.A. | | | 6,502 | | | | 707,276 | |
Korian S.A. | | | 15,170 | | | | 715,102 | |
Nexity S.A. | | | 14,075 | | | | 707,430 | |
| | | | | | | | |
| | | | | | | 2,129,808 | |
| | | | | | | | |
|
| Germany—3.7% | |
Alstria officeREIT-AG | | | 36,493 | | | | 685,648 | |
Bechtle AG | | | 4,890 | | | | 682,790 | |
CANCOM SE | | | 12,060 | | | | 708,680 | |
Hella GmbH & Co. KGaA | | | 12,280 | | | | 678,609 | |
Scout24 AG (a) | | | 10,391 | | | | 687,606 | |
TLG Immobilien AG | | | 15,608 | | | | 498,088 | |
| | | | | | | | |
| | | | | | | 3,941,421 | |
| | | | | | | | |
|
| Hong Kong—0.3% | |
Minth Group Ltd. | | | 10,000 | | | | 35,311 | |
Techtronic Industries Co., Ltd. | | | 34,500 | | | | 281,578 | |
| | | | | | | | |
| | | | | | | 316,889 | |
| | | | | | | | |
|
| Indonesia—0.2% | |
Jasa Marga Persero Tbk PT | | | 587,600 | | | | 218,746 | |
| | | | | | | | |
|
| Ireland—0.6% | |
Dalata Hotel Group PLC | | | 111,308 | | | | 642,999 | |
| | | | | | | | |
|
| Italy—1.2% | |
Buzzi Unicem SpA | | | 26,716 | | | | 673,427 | |
De’ Longhi SpA | | | 25,784 | | | | 545,626 | |
| | | | | | | | |
| | | | | | | 1,219,053 | |
| | | | | | | | |
|
| Japan—13.3% | |
Anritsu Corp. | | | 22,900 | | | | 453,261 | |
Azbil Corp. | | | 33,400 | | | | 940,735 | |
CKD Corp. | | | 42,100 | | | | 698,549 | |
COMSYS Holdings Corp. | | | 26,600 | | | | 761,936 | |
| | | | | | | | |
| | | Shares | | | Value | |
Dai-ichi Seiko Co., Ltd. | | | 6,000 | | | $ | 144,750 | |
Fuji Electric Co., Ltd. | | | 27,300 | | | | 829,300 | |
Fuji Oil Holdings, Inc. | | | 14,000 | | | | 376,591 | |
Glory Ltd. | | | 10,900 | | | | 329,387 | |
Hisamitsu Pharmaceutical Co., Inc. | | | 10,300 | | | | 501,625 | |
Ichigo, Inc. | | | 67,800 | | | | 285,479 | |
Itochu Techno-Solutions Corp. | | | 20,900 | | | | 588,589 | |
Jeol Ltd. | | | 30,600 | | | | 923,911 | |
Marui Group Co., Ltd. | | | 6,000 | | | | 146,295 | |
Maruwa Co., Ltd. | | | 8,600 | | | | 665,174 | |
Mitsubishi UFJ Lease & Finance Co., Ltd. | | | 155,100 | | | | 998,486 | |
Nihon Unisys Ltd. | | | 14,200 | | | | 445,439 | |
Nishio Rent All Co., Ltd. | | | 6,200 | | | | 176,655 | |
Penta-Ocean Construction Co., Ltd. | | | 121,700 | | | | 753,414 | |
PeptiDream, Inc. (e) | | | 4,600 | | | | 235,075 | |
Ship Healthcare Holdings, Inc. | | | 10,300 | | | | 475,152 | |
Sojitz Corp. | | | 158,700 | | | | 511,505 | |
T&D Holdings, Inc. | | | 78,600 | | | | 993,952 | |
Taiheiyo Cement Corp. | | | 11,200 | | | | 328,755 | |
TechnoPro Holdings, Inc. | | | 9,400 | | | | 656,036 | |
Tokyu Fudosan Holdings Corp. | | | 129,500 | | | | 894,238 | |
| | | | | | | | |
| | | | | | | 14,114,289 | |
| | | | | | | | |
| |
| Korea (Republic of)—0.2% | | | | | |
Fila Korea Ltd. | | | 5,147 | | | | 235,185 | |
| | | | | | | | |
| |
| Netherlands—1.3% | | | | | |
ASM International NV | | | 6,297 | | | | 710,758 | |
ASR Nederland NV | | | 16,801 | | | | 629,625 | |
| | | | | | | | |
| | | | | | | 1,340,383 | |
| | | | | | | | |
| |
| Norway—1.2% | | | | | |
Elkem ASA (a) | | | 191,576 | | | | 540,235 | |
Storebrand ASA | | | 92,220 | | | | 726,516 | |
| | | | | | | | |
| | | | | | | 1,266,751 | |
| | | | | | | | |
| |
| Singapore—1.0% | | | | | |
Frasers Centrepoint Trust | | | 178,500 | | | | 373,278 | |
Mapletree Commercial Trust REIT | | | 204,688 | | | | 363,987 | |
Mapletree Industrial Trust REIT | | | 158,000 | | | | 305,573 | |
| | | | | | | | |
| | | | | | | 1,042,838 | |
| | | | | | | | |
| |
| Sweden—1.3% | | | | | |
AAK AB | | | 36,665 | | | | 697,377 | |
Elekta AB, Class B | | | 50,549 | | | | 665,704 | |
| | | | | | | | |
| | | | | | | 1,363,081 | |
| | | | | | | | |
| |
| Switzerland—2.5% | | | | | |
Galenica AG (a) | | | 11,589 | | | | 715,750 | |
Georg Fischer AG | | | 605 | | | | 613,485 | |
Interroll Holding AG | | | 310 | | | | 696,683 | |
OC Oerlikon Corp. AG | | | 52,709 | | | | 617,687 | |
| | | | | | | | |
| | | | | | | 2,643,605 | |
| | | | | | | | |
| |
| Taiwan—0.3% | | | | | |
Win Semiconductors Corp. | | | 9,000 | | | | 88,681 | |
Yageo Corp. | | | 16,000 | | | | 233,104 | |
| | | | | | | | |
| | | | | | | 321,785 | |
| | | | | | | | |
| |
| Thailand—0.2% | | | | | |
Amata Corp. PCL (c)(d) | | | 248,000 | | | | 166,051 | |
| | | | | | | | |
| |
| United Kingdom—6.6% | | | | | |
ASOS PLC (e) | | | 11,889 | | | | 532,778 | |
Auto Trader Group PLC (a) | | | 90,253 | | | | 712,741 | |
Derwent London PLC REIT | | | 14,302 | | | | 759,672 | |
Genus PLC | | | 17,170 | | | | 723,210 | |
| | | | | | | | |
| | | Shares | | | Value | |
HomeServe PLC | | | 42,607 | | | $ | 713,367 | |
Howden Joinery Group PLC | | | 82,125 | | | | 731,672 | |
Intermediate Capital Group PLC | | | 33,916 | | | | 723,392 | |
Moneysupermarket.com Group PLC | | | 137,624 | | | | 604,146 | |
Rotork PLC | | | 151,855 | | | | 675,042 | |
Spectris PLC | | | 17,134 | | | | 660,304 | |
Tullow Oil PLC | | | 206,123 | | | | 175,323 | |
| | | | | | | | |
| | | | | | | 7,011,647 | |
| | | | | | | | |
| |
| United States—55.4% | | | | | |
Addus HomeCare Corp. (e) | | | 8,149 | | | | 792,246 | |
Air Transport Services Group, Inc. (e) | | | 39,671 | | | | 930,682 | |
Alteryx, Inc., Class A (e) | | | 6,597 | | | | 660,162 | |
Americold Realty Trust REIT | | | 20,231 | | | | 709,299 | |
Ameris Bancorp | | | 21,858 | | | | 929,839 | |
Axcelis Technologies, Inc. (e) | | | 13,893 | | | | 334,752 | |
Axon Enterprise, Inc. (e) | | | 7,281 | | | | 533,552 | |
Bio-Rad Laboratories, Inc., Class A (e) | | | 1,635 | | | | 604,999 | |
Bright Horizons Family Solutions, Inc. (e) | | | 3,592 | | | | 539,842 | |
Brink’s Co. | | | 10,149 | | | | 920,311 | |
Brown & Brown, Inc. | | | 23,126 | | | | 913,015 | |
CACI International, Inc.,
Class A (e) | | | 2,716 | | | | 678,973 | |
CareTrust REIT, Inc. | | | 28,610 | | | | 590,224 | |
CBIZ, Inc. (e) | | | 23,238 | | | | 626,497 | |
CenterState Bank Corp. | | | 33,880 | | | | 846,322 | |
Century Communities, Inc. (e) | | | 27,989 | | | | 765,499 | |
Chart Industries, Inc. (e) | | | 6,347 | | | | 428,359 | |
Chegg, Inc. (e) | | | 13,321 | | | | 504,999 | |
Churchill Downs, Inc. | | | 5,932 | | | | 813,870 | |
Columbus McKinnon Corp. | | | 19,371 | | | | 775,421 | |
eHealth, Inc. (e) | | | 6,321 | | | | 607,322 | |
Eldorado Resorts, Inc. (e) | | | 15,561 | | | | 928,058 | |
Essent Group Ltd. | | | 18,073 | | | | 939,615 | |
Etsy, Inc. (e) | | | 6,299 | | | | 279,046 | |
First Industrial Realty Trust, Inc. REIT | | | 23,739 | | | | 985,406 | |
First Merchants Corp. | | | 21,658 | | | | 900,756 | |
Five9, Inc. (e) | | | 8,907 | | | | 584,121 | |
Fox Factory Holding Corp. (e) | | | 6,325 | | | | 440,030 | |
Freshpet, Inc. (e) | | | 11,907 | | | | 703,585 | |
Gibraltar Industries, Inc. (e) | | | 9,831 | | | | 495,876 | |
Haemonetics Corp. (e) | | | 6,721 | | | | 772,243 | |
Hanover Insurance Group, Inc. | | | 4,938 | | | | 674,876 | |
Health Catalyst, Inc. (e) | | | 10,762 | | | | 373,441 | |
HEICO Corp., Class A | | | 4,338 | | | | 388,381 | |
Horizon Therapeutics PLC (e) | | | 23,090 | | | | 835,858 | |
HubSpot, Inc. (e) | | | 2,985 | | | | 473,123 | |
ICF International, Inc. | | | 7,057 | | | | 646,562 | |
Ingevity Corp. (e) | | | 8,417 | | | | 735,477 | |
Invitae Corp. (e) | | | 25,735 | | | | 415,106 | |
ITT, Inc. | | | 7,010 | | | | 518,109 | |
KBR, Inc. | | | 13,040 | | | | 397,720 | |
Kilroy Realty Corp. REIT | | | 14,570 | | | | 1,222,423 | |
Kinsale Capital Group, Inc. | | | 6,710 | | | | 682,139 | |
Koppers Holdings, Inc. (e) | | | 11,808 | | | | 451,302 | |
Kratos Defense & Security Solutions, Inc. (e) | | | 31,295 | | | | 563,623 | |
LendingTree, Inc. (e) | | | 1,465 | | | | 444,540 | |
LHC Group, Inc. (e) | | | 5,814 | | | | 800,937 | |
LivePerson, Inc. (e) | | | 13,280 | | | | 491,360 | |
LiveRamp Holdings, Inc. (e) | | | 7,676 | | | | 368,985 | |
LPL Financial Holdings, Inc. | | | 8,473 | | | | 781,634 | |
| | | | | | |
| 68 | | Semiannual Report | | | December 31, 2019 | | | See accompanying Notes to Financial Statements |
Schedule of Investments
December 31, 2019 (Unaudited)
| | | | | | | | |
| | | Shares | | | Value | |
Madison Square Garden Co., Class A (e) | | | 1,627 | | | $ | 478,647 | |
Mercury Systems, Inc. (e) | | | 9,539 | | | | 659,240 | |
MKS Instruments, Inc. | | | 7,969 | | | | 876,670 | |
Monolithic Power Systems, Inc. | | | 3,465 | | | | 616,839 | |
Natera, Inc. (e) | | | 15,253 | | | | 513,874 | |
Nexstar Media Group, Inc., Class A | | | 8,536 | | | | 1,000,846 | |
Omnicell, Inc. (e) | | | 6,585 | | | | 538,126 | |
Perficient, Inc. (e) | | | 16,276 | | | | 749,835 | |
Performance Food Group
Co. (e) | | | 18,671 | | | | 961,183 | |
Planet Fitness, Inc., Class A (e) | | | 4,793 | | | | 357,941 | |
PolyOne Corp. | | | 25,724 | | | | 946,386 | |
Pool Corp. | | | 2,039 | | | | 433,043 | |
PRA Health Sciences, Inc. (e) | | | 6,448 | | | | 716,695 | |
Quanterix Corp. (e) | | | 12,862 | | | | 303,929 | |
R1 RCM, Inc. (e) | | | 56,796 | | | | 737,212 | |
Rapid7, Inc. (e) | | | 13,702 | | | | 767,586 | |
Sage Therapeutics, Inc. (e) | | | 1,230 | | | | 88,794 | |
Saia, Inc. (e) | | | 6,123 | | | | 570,174 | |
Semtech Corp. (e) | | | 6,308 | | | | 333,693 | |
Simply Good Foods Co. (e) | | | 29,524 | | | | 842,615 | |
Skyline Champion Corp. (e) | | | 22,199 | | | | 703,708 | |
STAG Industrial, Inc. REIT | | | 35,271 | | | | 1,113,505 | |
Strategic Education, Inc. | | | 3,576 | | | | 568,226 | |
Summit Materials, Inc.,
Class A (e) | | | 24,167 | | | | 577,591 | |
SVMK, Inc. (e) | | | 32,050 | | | | 572,734 | |
Tandem Diabetes Care, Inc. (e) | | | 6,539 | | | | 389,790 | |
TechTarget, Inc. (e) | | | 22,912 | | | | 598,003 | |
Teladoc Health, Inc. (e) | | | 8,064 | | | | 675,118 | |
Tetra Tech, Inc. | | | 8,721 | | | | 751,401 | |
Trex Co., Inc. (e) | | | 4,835 | | | | 434,570 | |
Ultra Clean Holdings, Inc. (e) | | | 17,230 | | | | 404,388 | |
Veracyte, Inc. (e) | | | 20,254 | | | | 565,492 | |
| | | | | | | | |
| | | Shares | | | Value | |
Vericel Corp. (e) | | | 23,365 | | | $ | 406,551 | |
Verint Systems, Inc. (e) | | | 5,607 | | | | 310,404 | |
Viavi Solutions, Inc. (e) | | | 54,685 | | | | 820,275 | |
Western Alliance Bancorp | | | 18,334 | | | | 1,045,038 | |
WEX, Inc. (e) | | | 3,307 | | | | 692,684 | |
WPX Energy, Inc. (e) | | | 55,426 | | | | 761,553 | |
YETI Holdings, Inc. (e) | | | 25,579 | | | | 889,638 | |
Zix Corp. (e) | | | 45,555 | | | | 308,863 | |
Zynga, Inc., Class A (e) | | | 110,061 | | | | 673,573 | |
| | | | | | | | |
| | | | | | | 58,556,950 | |
| | | | | | | | |
Total Common Stock
(cost—$82,648,029) | | | | 103,002,141 | |
| | | | | | | | |
| | | | | | | | |
| |
| Preferred Stock—0.5% | | | | | |
| |
| Germany—0.5% | | | | | |
Jungheinrich AG
(cost—$598,885) | | | 20,233 | | | | 485,956 | |
| | | | | | | | |
| | | | | | | | |
| | |
| | | Principal
Amount
(000s) | | | | |
|
| Repurchase Agreements—1.6% | |
State Street Bank and Trust Co.,
dated 12/31/19, 0.25%, due 1/2/20, proceeds $1,670,023; collateralized by U.S. Treasury Bonds, 3.00%, due 11/15/45, valued at $1,708,912 including accrued interest | |
(cost—$1,670,000) | | | $1,670 | | | | 1,670,000 | |
| | | | | | | | |
| |
Total Investments
(cost—$84,916,914) (b)—99.5% | | | | 105,158,097 | |
| | | | | | | | |
| | |
| Other assets less liabilities (f)—0.5% | | | | | | | 555,587 | |
| | | | | | | | |
| | |
| Net Assets—100.0% | | | | | | | $105,713,684 | |
| | | | | | | | |
Notes to Schedule of Investments:
(a) 144A—Exempt from registration under Rule 144A of the Securities Act of 1933. These securities may be resold in transactions exempt from registration, typically only to qualified institutional buyers. Securities with an aggregate value of $2,824,202, representing 2.7% of net assets.
(b) Securities with an aggregate value of $38,474,805, representing 35.7% of net assets, were valued utilizing modeling tools provided by a third-party vendor. See Note 1(a) and Note 1(b) in the Notes to Financial Statements.
(c) Fair-Valued—Security with a value of $166,051, representing 0.2% of net assets. See Note 1(a) and Note 1(b) in the Notes to Financial Statements.
(d) Level 3 security. See Note 1(a) and Note 1(b) in the Notes to Financial Statements.
(e)Non-income producing.
(f) Includes net unrealized appreciation of other financial instruments as follows:
| | | | | | | | | | | | | | | | |
|
| Forward foreign currency contracts outstanding at December 31, 2019: | |
| Description | | Counterparty | | | U.S.$ Value on
Origination Date | | | U.S.$ Value
December 31, 2019 | | | Unrealized
Appreciation | |
Sold: | | | | | | | | | | | | | | | | |
1,172,393 Hong Kong Dollar settling 1/3/20 | | | State Street Bank London | | | $ | 150,555 | | | $ | 150,455 | | | $ | 100 | |
| | | | | | | | | | | | | | | | |
Glossary:
REIT—Real Estate Investment Trust
| | | | | | | | |
| See accompanying Notes to Financial Statements | | | December 31, 2019 | | | Semiannual Report | | | 69 | |
Schedule of Investments
December 31, 2019 (Unaudited)
The industry classification of portfolio holdings and other assets less liabilities shown as a percentage of net assets were as follows:
| | | | |
Equity Real Estate Investment Trusts (REITs) | | | 7.1% | |
Machinery | | | 6.3% | |
Insurance | | | 5.7% | |
IT Services | | | 5.3% | |
Software | | | 4.7% | |
Healthcare Providers & Services | | | 4.0% | |
Electronic Equipment, Instruments & Components | | | 3.6% | |
Banks | | | 3.5% | |
Semiconductors & Semiconductor Equipment | | | 3.2% | |
Healthcare Equipment & Supplies | | | 3.0% | |
Biotechnology | | | 2.8% | |
Commercial Services & Supplies | | | 2.8% | |
Hotels, Restaurants & Leisure | | | 2.6% | |
Chemicals | | | 2.5% | |
Food Products | | | 2.5% | |
Real Estate Management & Development | | | 2.4% | |
Aerospace & Defense | | | 2.3% | |
Construction Materials | | | 2.2% | |
Household Durables | | | 1.9% | |
Professional Services | | | 1.8% | |
Healthcare Technology | | | 1.7% | |
Trading Companies & Distributors | | | 1.6% | |
Life Sciences Tools & Services | | | 1.5% | |
Diversified Consumer Services | | | 1.5% | |
Media | | | 1.5% | |
Construction & Engineering | | | 1.4% | |
Capital Markets | | | 1.4% | |
Auto Components | | | 1.4% | |
Internet & Direct Marketing Retail | | | 1.3% | |
Interactive Media & Services | | | 1.3% | |
Thrifts & Mortgage Finance | | | 1.3% | |
Pharmaceuticals | | | 1.3% | |
Building Products | | | 1.1% | |
Entertainment | | | 1.1% | |
Diversified Financial Services | | | 1.0% | |
Food & Staples Retailing | | | 0.9% | |
Oil, Gas & Consumable Fuels | | | 0.9% | |
Air Freight & Logistics | | | 0.9% | |
Leisure Equipment & Products | | | 0.9% | |
Electrical Equipment | | | 0.8% | |
Communications Equipment | | | 0.8% | |
Road & Rail | | | 0.5% | |
Containers & Packaging | | | 0.5% | |
Distributors | | | 0.4% | |
Textiles, Apparel & Luxury Goods | | | 0.2% | |
Energy Equipment & Services | | | 0.2% | |
Transportation Infrastructure | | | 0.2% | |
Multi-Line Retail | | | 0.1% | |
Repurchase Agreements | | | 1.6% | |
Other assets less liabilities | | | 0.5% | |
| | | | |
| | | 100.0% | |
| | | | |
AllianzGI Health Sciences Fund
| | | | | | | | |
| | | Shares | | | Value | |
|
| Common Stock—96.7% | |
|
| Biotechnology—12.3% | |
AbbVie, Inc. | | | 47,300 | | | | $4,187,942 | |
ACADIA Pharmaceuticals, Inc. (d) | | | 10,725 | | | | 458,815 | |
Amgen, Inc. | | | 20,595 | | | | 4,964,837 | |
Arena Pharmaceuticals, Inc. (d) | | | 4,970 | | | | 225,737 | |
Aurinia Pharmaceuticals, Inc. (d) | | | 25,900 | | | | 524,734 | |
BioMarin Pharmaceutical, Inc. (d) | | | 5,309 | | | | 448,876 | |
Bridgebio Pharma, Inc. (d) | | | 8,555 | | | | 299,853 | |
Deciphera Pharmaceuticals, Inc. (d) | | | 3,285 | | | | 204,458 | |
Dicerna Pharmaceuticals, Inc. (d) | | | 11,760 | | | | 259,073 | |
Exact Sciences Corp. (d) | | | 22,725 | | | | 2,101,608 | |
Forty Seven, Inc. (d) | | | 13,450 | | | | 529,526 | |
Halozyme Therapeutics, Inc. (d) | | | 17,820 | | | | 315,949 | |
Heron Therapeutics, Inc. (d) | | | 20,560 | | | | 483,160 | |
Iovance Biotherapeutics, Inc. (d) | | | 22,750 | | | | 629,720 | |
Kindred Biosciences, Inc. (d) | | | 29,602 | | | | 251,025 | |
Momenta Pharmaceuticals, Inc. (d) | | | 18,970 | | | | 374,278 | |
Seattle Genetics, Inc. (d) | | | 3,270 | | | | 373,630 | |
uniQure NV (d) | | | 5,925 | | | | 424,586 | |
Vertex Pharmaceuticals, Inc. (d) | | | 14,500 | | | | 3,174,775 | |
| | | | | | | | |
| | | | | | | 20,232,582 | |
| | | | | | | | |
|
| Healthcare Equipment & Supplies—20.9% | |
Abbott Laboratories | | | 42,128 | | | | 3,659,238 | |
Alcon, Inc. (d) | | | 41,740 | | | | 2,361,232 | |
Align Technology, Inc. (d) | | | 2,225 | | | | 620,864 | |
Axonics Modulation Technologies, Inc. (d) | | | 32,140 | | | | 890,599 | |
Baxter International, Inc. | | | 37,085 | | | | 3,101,048 | |
Becton Dickinson and Co. | | | 4,895 | | | | 1,331,293 | |
Beyond Air, Inc. (d) | | | 123,899 | | | | 647,992 | |
Boston Scientific Corp. (d) | | | 90,897 | | | | 4,110,362 | |
CONMED Corp. | | | 3,895 | | | | 435,578 | |
Cooper Cos., Inc. | | | 2,535 | | | | 814,470 | |
Danaher Corp. | | | 5,460 | | | | 838,001 | |
DexCom, Inc. (d) | | | 9,930 | | | | 2,172,088 | |
Edwards Lifesciences Corp. (d) | | | 3,455 | | | | 806,017 | |
Intuitive Surgical, Inc. (d) | | | 6,030 | | | | 3,564,635 | |
Quotient Ltd. (d) | | | 166,654 | | | | 1,584,880 | |
Shockwave Medical, Inc. (d) | | | 18,020 | | | | 791,438 | |
Silk Road Medical, Inc. (d) | | | 18,365 | | | | 741,579 | |
Tandem Diabetes Care, Inc. (d) | | | 26,260 | | | | 1,565,359 | |
Vapotherm, Inc. (d) | | | 70,690 | | | | 859,590 | |
Zimmer Biomet Holdings, Inc. | | | 21,940 | | | | 3,283,979 | |
| | | | | | | | |
| | | | | | | 34,180,242 | |
| | | | | | | | |
|
| Healthcare Providers & Services—14.2% | |
Anthem, Inc. | | | 15,250 | | | | 4,605,958 | |
Centene Corp. (d) | | | 53,595 | | | | 3,369,518 | |
CVS Health Corp. | | | 36,980 | | | | 2,747,244 | |
Guardant Health, Inc. (d) | | | 7,970 | | | | 622,776 | |
HCA Healthcare, Inc. | | | 7,925 | | | | 1,171,394 | |
Humana, Inc. | | | 8,220 | | | | 3,012,794 | |
UnitedHealth Group, Inc. | | | 26,486 | | | | 7,786,354 | |
| | | | | | | | |
| | | | | | | 23,316,038 | |
| | | | | | | | |
|
| Life Sciences Tools & Services—6.2% | |
Adaptive Biotechnologies Corp. (d) | | | 20,380 | | | | 609,770 | |
| | | | | | | | |
| | | Shares | | | Value | |
Agilent Technologies, Inc. | | | 27,990 | | | $ | 2,387,827 | |
Bio-Rad Laboratories, Inc., Class A (d) | | | 4,495 | | | | 1,663,285 | |
Illumina, Inc. (d) | | | 4,145 | | | | 1,375,062 | |
PerkinElmer, Inc. | | | 11,770 | | | | 1,142,867 | |
Thermo Fisher Scientific, Inc. | | | 9,135 | | | | 2,967,687 | |
| | | | | | | | |
| | | | | | | 10,146,498 | |
| | | | | | | | |
|
| Pharmaceuticals—43.1% | |
Allergan PLC | | | 9,506 | | | | 1,817,262 | |
Astellas Pharma, Inc. | | | 72,600 | | | | 1,239,281 | |
AstraZeneca PLC ADR | | | 160,650 | | | | 8,010,009 | |
Bayer AG | | | 24,755 | | | | 2,012,497 | |
Bristol-Myers Squibb Co. | | | 135,780 | | | | 8,715,718 | |
Catalent, Inc. (d) | | | 39,255 | | | | 2,210,057 | |
Daiichi Sankyo Co., Ltd. | | | 33,900 | | | | 2,238,900 | |
Dermira, Inc. (d) | | | 54,385 | | | | 824,477 | |
Horizon Therapeutics PLC (d) | | | 81,030 | | | | 2,933,286 | |
Johnson & Johnson | | | 58,497 | | | | 8,532,957 | |
Merck & Co., Inc. | | | 100,637 | | | | 9,152,935 | |
Mylan NV (d) | | | 15,621 | | | | 313,982 | |
Novartis AG ADR | | | 98,053 | | | | 9,284,639 | |
Pfizer, Inc. | | | 65,679 | | | | 2,573,303 | |
Sanofi ADR | | | 142,630 | | | | 7,160,026 | |
Zoetis, Inc. | | | 26,570 | | | | 3,516,539 | |
| | | | | | | | |
| | | | | | | 70,535,868 | |
| | | | | | | | |
| Total Common Stock (cost—$127,142,339) | | | | | | | 158,411,228 | |
| | | | | | | | |
| | | | | | | | |
| | |
| | | Units | | | | |
|
| Warrants—0.1% | |
|
| Pharmaceuticals—0.1% | |
AIT Therapeutics, Inc., exercise price $4.25, expires 2/14/21 (b)(c)(d)
(cost—$1,239) | | | 123,899 | | | | 91,313 | |
| | | | | | | | |
| | | | | | | | |
| | |
| | | Shares | | | | |
|
| Rights—0.0% | |
|
| Pharmaceuticals—0.0% | |
Elanco Animal Health, Inc. CVR (b)(c)(d)
(cost—$957) | | | 38,000 | | | | 957 | |
| | | | | | | | |
| | | | | | | | |
| | |
| | | Principal
Amount
(000s) | | | | |
|
| Repurchase Agreements—3.2% | |
State Street Bank and Trust Co.,
dated 12/31/19, 0.25%, due 1/2/20, proceeds $5,167,072; collateralized by U.S. Treasury Bonds, 3.00%, due 11/15/45, valued at $5,273,862 including accrued interest | |
(cost—$5,167,000) | | | $5,167 | | | | 5,167,000 | |
| | | | | | | | |
| |
Total Investments (cost—$132,311,535) (a)—100.0% | | | | 163,670,498 | |
| | | | | | | | |
| | |
| Other assets less liabilities—0.0% | | | | | | | 31,960 | |
| | | | | | | | |
| | |
| Net Assets—100.0% | | | | | | | $163,702,458 | |
| | | | | | | | |
| | | | | | |
| 70 | | Semiannual Report | | | December 31, 2019 | | | See accompanying Notes to Financial Statements |
Schedule of Investments
December 31, 2019 (Unaudited)
Notes to Schedule of Investments:
(a) Securities with an aggregate value of $5,490,678, representing 3.4% of net assets, were valued utilizing modeling tools provided by a third-party vendor. See Note 1(a) and Note 1(b) in the Notes to Financial Statements.
(b) Fair-Valued—Securities with an aggregate value of $92,270, representing 0.1% of net assets. See Note 1(a) and Note 1(b) in the Notes to Financial Statements.
(c) Level 3 security. See Note 1(a) and Note 1(b) in the Notes to Financial Statements.
(d)Non-income producing.
Glossary:
ADR—American Depositary Receipt
CVR—Contingent Value Rights
AllianzGI Income & Growth Fund
| | | | | | | | |
| | | Shares | | | Value | |
|
| Common Stock—34.1% | |
|
| Advertising—0.0% | |
Mood Media
Corp. (d)(f)(j) | | | 286,500 | | | | $163,305 | |
| | | | | | | | |
|
| Aerospace & Defense—0.9% | |
Boeing Co. | | | 65,500 | | | | 21,337,280 | |
Erickson, Inc. (d)(f)(j) | | | 10,866 | | | | 222,536 | |
Raytheon Co. | | | 96,400 | | | | 21,182,936 | |
| | | | | | | | |
| | | | | | | 42,742,752 | |
| | | | | | | | |
|
| Apparel & Textiles—0.0% | |
Quiksilver, Inc. (d)(f)(j) | | | 2,328 | | | | 47,468 | |
| | | | | | | | |
|
| Automobiles—0.2% | |
Ford Motor Co. | | | 1,199,700 | | | | 11,157,210 | |
| | | | | | | | |
|
| Banks—0.5% | |
CCF Holdings LLC Class A (cost—$0; purchased 12/18/18) (d)(f)(i)(j) | | | 31,304 | | | | 3 | |
CCF Holdings LLC Class B (cost—$0; purchased
12/12/18)
(d)(f)(h)(i)(j) | | | 42,857 | | | | 4 | |
JPMorgan Chase & Co. | | | 180,000 | | | | 25,092,000 | |
| | | | | | | | |
| | | | | | | 25,092,007 | |
| | | | | | | | |
|
| Beverages—0.3% | |
PepsiCo, Inc. | | | 120,300 | | | | 16,441,401 | |
| | | | | | | | |
|
| Biotechnology—1.3% | |
AbbVie, Inc. | | | 215,900 | | | | 19,115,786 | |
Biogen, Inc. (j) | | | 29,700 | | | | 8,812,881 | |
BioMarin Pharmaceutical, Inc. (j) | | | 3,926 | | | | 331,943 | |
Gilead Sciences, Inc. | | | 239,250 | | | | 15,546,465 | |
Vertex Pharmaceuticals, Inc. (g)(j) | | | 101,200 | | | | 22,157,740 | |
| | | | | | | | |
| | | | | | | 65,964,815 | |
| | | | | | | | |
|
| Building Products—0.3% | |
Johnson Controls International PLC | | | 335,482 | | | | 13,657,472 | |
| | | | | | | | |
|
| Capital Markets—0.7% | |
Charles Schwab Corp. | | | 344,800 | | | | 16,398,688 | |
S&P Global, Inc. | | | 73,200 | | | | 19,987,260 | |
| | | | | | | | |
| | | | | | | 36,385,948 | |
| | | | | | | | |
|
| Chemicals—0.3% | |
Chemours Co. | | | 238,400 | | | | 4,312,656 | |
Corteva, Inc. (j) | | | 59,533 | | | | 1,759,795 | |
Dow, Inc. (j) | | | 59,533 | | | | 3,258,241 | |
DuPont de Nemours, Inc. | | | 59,533 | | | | 3,822,019 | |
| | | | | | | | |
| | | | | | | 13,152,711 | |
| | | | | | | | |
|
| Commercial Services—0.0% | |
Cenveo
Corp. (d)(f)(h)(j) | | | 19,074 | | | | 576,798 | |
| | | | | | | | |
|
| Commercial Services & Supplies—0.1% | |
Stericycle, Inc. (j) | | | 66,843 | | | | 4,265,252 | |
| | | | | | | | |
|
| Communications Equipment—0.5% | |
Cisco Systems, Inc. | | | 535,600 | | | | 25,687,376 | |
| | | | | | | | |
|
| Construction & Engineering—0.1% | |
Fluor Corp. | | | 209,800 | | | | 3,961,024 | |
| | | | | | | | |
|
| Diversified Telecommunication Services—0.0% | |
Frontier Communications Corp. (j) | | | 210,781 | | | | 187,511 | |
| | | | | | | | |
| | | | | | | | |
| | | Shares | | | Value | |
|
| Electronic Equipment, Instruments & Components—0.1% | |
Belden, Inc. | | | 125,172 | | | $ | 6,884,460 | |
| | | | | | | | |
|
| Energy Equipment & Services—0.3% | |
Bristow Group, Inc. (d)(f)(j) | | | 5,653 | | | | — | † |
National Oilwell Varco, Inc. | | | 145,600 | | | | 3,647,280 | |
Schlumberger Ltd. | | | 172,400 | | | | 6,930,480 | |
Weatherford International PLC (j) | | | 83,938 | | | | 2,346,067 | |
| | | | | | | | |
| | | | | | | 12,923,827 | |
| | | | | | | | |
|
| Entertainment—0.8% | |
Netflix, Inc. (j) | | | 83,100 | | | | 26,888,667 | |
Walt Disney Co. | | | 90,500 | | | | 13,089,015 | |
| | | | | | | | |
| | | | | | | 39,977,682 | |
| | | | | | | | |
|
| Equity Real Estate Investment Trusts (REITs)—0.3% | |
Crown Castle International Corp. | | | 83,700 | | | | 11,897,955 | |
| | | | | | | | |
|
| Food & Staples Retailing—1.1% | |
Costco Wholesale Corp. | | | 80,100 | | | | 23,542,992 | |
Kroger Co. | | | 472,000 | | | | 13,683,280 | |
Walgreens Boots Alliance, Inc. | | | 286,600 | | | | 16,897,936 | |
| | | | | | | | |
| | | | | | | 54,124,208 | |
| | | | | | | | |
|
| Food Products—0.2% | |
Archer-Daniels-Midland Co. | | | 159,650 | | | | 7,399,778 | |
| | | | | | | | |
|
| Healthcare Equipment & Supplies—1.5% | |
Align Technology, Inc. (j) | | | 73,900 | | | | 20,621,056 | |
Boston Scientific Corp. (j) | | | 611,600 | | | | 27,656,552 | |
Intuitive Surgical, Inc. (j) | | | 41,800 | | | | 24,710,070 | |
| | | | | | | | |
| | | | | | | 72,987,678 | |
| | | | | | | | |
|
| Healthcare Providers & Services—1.2% | |
Laboratory Corp. of America
Holdings (j) | | | 49,000 | | | | 8,289,330 | |
McKesson Corp. | | | 114,300 | | | | 15,809,976 | |
UnitedHealth Group, Inc. | | | 125,700 | | | | 36,953,286 | |
| | | | | | | | |
| | | | | | | 61,052,592 | |
| | | | | | | | |
|
| Hotels, Restaurants & Leisure—1.1% | |
McDonald’s Corp. | | | 112,000 | | | | 22,132,320 | |
Starbucks Corp. | | | 214,000 | | | | 18,814,880 | |
Wynn Resorts Ltd. | | | 76,700 | | | | 10,651,329 | |
| | | | | | | | |
| | | | | | | 51,598,529 | |
| | | | | | | | |
|
| Household Durables—0.3% | |
DR Horton, Inc. (g) | | | 292,500 | | | | 15,429,375 | |
| | | | | | | | |
|
| Independent Power Producers & Energy Traders—0.1% | |
Vistra Energy Corp. | | | 144,101 | | | | 3,312,882 | |
| | | | | | | | |
|
| Industrial Conglomerates—0.7% | |
3M Co. | | | 50,100 | | | | 8,838,642 | |
General Electric Co. | | | 326,200 | | | | 3,640,392 | |
Honeywell International, Inc. | | | 131,500 | | | | 23,275,500 | |
| | | | | | | | |
| | | | | | | 35,754,534 | |
| | | | | | | | |
|
| Insurance—0.2% | |
Progressive Corp. | | | 115,600 | | | | 8,368,284 | |
| | | | | | | | |
|
| Interactive Media & Services—2.1% | |
Alphabet, Inc., Class A (j) | | | 37,400 | | | | 50,093,186 | |
Facebook, Inc., Class A (j) | | | 247,600 | | | | 50,819,900 | |
| | | | | | | | |
| | | | | | | 100,913,086 | |
| | | | | | | | |
| | | | | | | | |
| See accompanying Notes to Financial Statements | | | December 31, 2019 | | | Semiannual Report | | | 71 | |
Schedule of Investments
December 31, 2019 (Unaudited)
| | | | | | | | |
| | | Shares | | | Value | |
|
| Internet & Direct Marketing Retail—1.2% | |
Alibaba Group Holding Ltd. ADR (g)(j) | | | 61,300 | | | $ | 13,001,730 | |
Amazon.com, Inc. (j) | | | 23,600 | | | | 43,609,024 | |
| | | | | | | | |
| | | | | | | 56,610,754 | |
| | | | | | | | |
|
| IT Services—2.9% | |
Fiserv, Inc. (j) | | | 217,500 | | | | 25,149,525 | |
International Business Machines Corp. | | | 92,200 | | | | 12,358,488 | |
Mastercard, Inc., Class A | | | 112,700 | | | | 33,651,093 | |
PayPal Holdings, Inc. (g)(j) | | | 195,200 | | | | 21,114,784 | |
Visa, Inc., Class A | | | 262,000 | | | | 49,229,800 | |
| | | | | | | | |
| | | | | | | 141,503,690 | |
| | | | | | | | |
|
| Life Sciences Tools & Services—0.5% | |
Thermo Fisher Scientific, Inc. | | | 79,700 | | | | 25,892,139 | |
| | | | | | | | |
|
| Machinery—1.0% | |
Caterpillar, Inc. | | | 202,500 | | | | 29,905,200 | |
Deere & Co. | | | 111,900 | | | | 19,387,794 | |
| | | | | | | | |
| | | | | | | 49,292,994 | |
| | | | | | | | |
|
| Media—0.3% | |
Comcast Corp., Class A | | | 290,100 | | | | 13,045,797 | |
LiveStyle, Inc. (a)(d)(f)(h)(j)(k) | | | 202,319 | | | | 20 | |
Postmedia Network Canada Corp. (d)(f)(j) | | | 1,018,823 | | | | 845,623 | |
| | | | | | | | |
| | | | | | | 13,891,440 | |
| | | | | | | | |
|
| Metals & Mining—0.1% | |
ArcelorMittal S.A. | | | 180,611 | | | | 3,167,917 | |
Freeport-McMoRan, Inc. | | | 113,100 | | | | 1,483,872 | |
| | | | | | | | |
| | | | | | | 4,651,789 | |
| | | | | | | | |
|
| Multi-Line Retail—0.8% | |
Dollar General Corp. (g) | | | 122,200 | | | | 19,060,756 | |
Target Corp. | | | 163,700 | | | | 20,987,977 | |
| | | | | | | | |
| | | | | | | 40,048,733 | |
| | | | | | | | |
|
| Oil, Gas & Consumable Fuels—0.7% | |
Arch Coal, Inc., Class A | | | 1,858 | | | | 133,293 | |
Chesapeake Energy Corp. (j) | | | 1,250,759 | | | | 1,032,627 | |
Hercules Offshore, Inc. (d)(f)(j) | | | 174,935 | | | | 18 | |
Kinder Morgan, Inc. | | | 187,778 | | | | 3,975,260 | |
Occidental Petroleum Corp. | | | 229,700 | | | | 9,465,937 | |
Riviera Resources, Inc. | | | 25,527 | | | | 203,705 | |
Southwestern Energy Co. (j) | | | 508,010 | | | | 1,229,384 | |
Talos Energy, Inc. (j) | | | 98,625 | | | | 2,973,544 | |
Valero Energy Corp. | | | 171,200 | | | | 16,032,880 | |
| | | | | | | | |
| | | | | | | 35,046,648 | |
| | | | | | | | |
|
| Pharmaceuticals—1.5% | |
Allergan PLC | | | 99,241 | | | | 18,971,902 | |
Amryt Pharma PLC ADR (d)(f)(j) | | | 243,958 | | | | 1,971,344 | |
Bristol-Myers Squibb Co. | | | 419,400 | | | | 26,921,286 | |
Merck & Co., Inc. | | | 239,900 | | | | 21,818,905 | |
Teva Pharmaceutical Industries Ltd. ADR (j) | | | 248,006 | | | | 2,430,459 | |
Zoetis, Inc. | | | 25,800 | | | | 3,414,630 | |
| | | | | | | | |
| | | | | | | 75,528,526 | |
| | | | | | | | |
|
| Road & Rail—0.3% | |
Union Pacific Corp. | | | 87,500 | | | | 15,819,125 | |
| | | | | | | | |
| | | | | | | | |
| | | Shares | | | Value | |
|
| Semiconductors—0.0% | |
GT Advanced Technologies, Inc. (d)(f)(j) | | | 537 | | | $ | — | † |
| | | | | | | | |
|
| Semiconductors & Semiconductor Equipment—3.9% | |
Advanced Micro Devices, Inc. (g)(j) | | | 489,300 | | | | 22,439,298 | |
Broadcom, Inc. (g) | | | 62,600 | | | | 19,782,852 | |
Lam Research Corp. (g) | | | 101,000 | | | | 29,532,400 | |
Marvell Technology Group Ltd. | | | 665,500 | | | | 17,675,680 | |
Micron Technology, Inc. (g)(j) | | | 491,800 | | | | 26,449,004 | |
NVIDIA Corp. (g) | | | 165,200 | | | | 38,871,560 | |
QUALCOMM, Inc. | | | 185,700 | | | | 16,384,311 | |
Texas Instruments, Inc. | | | 177,900 | | | | 22,822,791 | |
| | | | | | | | |
| | | | | | | 193,957,896 | |
| | | | | | | | |
|
| Software—3.2% | |
Adobe, Inc. (j) | | | 77,600 | | | | 25,593,256 | |
Atlassian Corp. PLC, Class A (j) | | | 58,800 | | | | 7,075,992 | |
Intuit, Inc. | | | 56,800 | | | | 14,877,624 | |
Microsoft Corp. | | | 350,300 | | | | 55,242,310 | |
Salesforce.com, Inc. (g)(j) | | | 140,300 | | | | 22,818,392 | |
ServiceNow, Inc. (g)(j) | | | 86,200 | | | | 24,335,984 | |
Workday, Inc., Class A (j) | | | 55,900 | | | | 9,192,755 | |
| | | | | | | | |
| | | | | | | 159,136,313 | |
| | | | | | | | |
|
| Specialty Retail—0.6% | |
Home Depot, Inc. | | | 134,000 | | | | 29,262,920 | |
| | | | | | | | |
|
| Technology Hardware, Storage & Peripherals—1.4% | |
Apple, Inc. | | | 197,100 | | | | 57,878,415 | |
NetApp, Inc. | | | 196,300 | | | | 12,219,675 | |
Western Digital Corp. | | | 1,953 | | | | 123,957 | |
| | | | | | | | |
| | | | | | | 70,222,047 | |
| | | | | | | | |
|
| Textiles, Apparel & Luxury Goods—0.4% | |
NIKE, Inc., Class B (g) | | | 210,000 | | | | 21,275,100 | |
| | | | | | | | |
|
| Trading Companies & Distributors—0.1% | |
WESCO International, Inc. (j) | | | 54,455 | | | | 3,234,082 | |
| | | | | | | | |
| Total Common Stock (cost—$1,944,458,450) | | | | | | | 1,677,482,116 | |
| | | | | | | | |
| | | | | | | | |
| | |
| | | Principal
Amount
(000s) | | | | |
|
| Corporate Bonds & Notes—30.1% | |
|
| Advertising—0.2% | |
Mood Media Borrower LLC (a)(b), | |
16.213%, 12/31/23 | | | $1,164 | | | | 1,006,953 | |
National CineMedia LLC (a)(b), | |
5.875%, 4/15/28 | | | 7,220 | | | | 7,691,809 | |
| | | | | | | | |
| | | | | | | 8,698,762 | |
| | | | | | | | |
|
| Aerospace & Defense—0.8% | |
Kratos Defense & Security Solutions, Inc. (a)(b), | |
6.50%, 11/30/25 | | | 5,660 | | | | 6,072,699 | |
TransDigm, Inc., | | | | | | | | |
5.50%, 11/15/27 (a)(b) | | | 13,690 | | | | 13,869,065 | |
6.50%, 7/15/24 | | | 2,195 | | | | 2,268,390 | |
6.50%, 5/15/25 | | | 10,155 | | | | 10,582,373 | |
Triumph Group, Inc. (a)(b), | |
6.25%, 9/15/24 | | | 8,290 | | | | 8,732,147 | |
| | | | | | | | |
| | | | | | | 41,524,674 | |
| | | | | | | | |
| | | | | | | | |
| | | Principal
Amount
(000s) | | | Value | |
|
| Auto Components—0.8% | |
Adient U.S. LLC (a)(b), | |
7.00%, 5/15/26 | | $ | 7,210 | | | $ | 7,872,412 | |
Delphi Technologies PLC (a)(b), | |
5.00%, 10/1/25 | | | 8,155 | | | | 7,563,763 | |
Goodyear Tire & Rubber Co., | |
5.00%, 5/31/26 | | | 8,985 | | | | 9,361,022 | |
Panther BF Aggregator 2 L.P. (a)(b), | |
8.50%, 5/15/27 | | | 12,895 | | | | 13,724,793 | |
| | | | | | | | |
| | | | | | | 38,521,990 | |
| | | | | | | | |
|
| Auto Manufacturers—0.5% | |
Navistar International Corp. (a)(b), | |
6.625%, 11/1/25 | | | 11,315 | | | | 11,550,748 | |
Tesla, Inc. (a)(b), | | | | | | | | |
5.30%, 8/15/25 | | | 13,625 | | | | 13,250,176 | |
| | | | | | | | |
| | | | | | | 24,800,924 | |
| | | | | | | | |
|
| Banks—0.1% | |
CIT Group, Inc., | | | | | | | | |
6.125%, 3/9/28 | | | 4,265 | | | | 5,044,845 | |
| | | | | | | | |
|
| Building Materials—0.2% | |
Builders FirstSource, Inc. (a)(b), | |
5.625%, 9/1/24 | | | 6,456 | | | | 6,727,701 | |
Jeld-Wen, Inc. (a)(b), | | | | | | | | |
4.875%, 12/15/27 | | | 4,635 | | | | 4,752,485 | |
| | | | | | | | |
| | | | | | | 11,480,186 | |
| | | | | | | | |
|
| Chemicals—0.9% | |
Chemours Co., | | | | | | | | |
6.625%, 5/15/23 | | | 7,000 | | | | 7,041,405 | |
7.00%, 5/15/25 | | | 4,115 | | | | 4,154,442 | |
Kraton Polymers LLC (a)(b), | |
7.00%, 4/15/25 | | | 6,305 | | | | 6,511,867 | |
Olin Corp., | | | | | | | | |
5.00%, 2/1/30 | | | 6,460 | | | | 6,568,851 | |
PQ Corp. (a)(b), | | | | | | | | |
5.75%, 12/15/25 | | | 2,635 | | | | 2,761,256 | |
Trinseo Materials Operating SCA (a)(b), | |
5.375%, 9/1/25 | | | 5,645 | | | | 5,659,113 | |
Tronox Finance PLC (a)(b), | |
5.75%, 10/1/25 | | | 5,510 | | | | 5,629,209 | |
Tronox, Inc. (a)(b), | | | | | | | | |
6.50%, 4/15/26 | | | 5,835 | | | | 6,025,950 | |
| | | | | | | | |
| | | | | | | 44,352,093 | |
| | | | | | | | |
|
| Commercial Services—1.4% | |
Cardtronics, Inc. (a)(b), | | | | | | | | |
5.50%, 5/1/25 | | | 2,345 | | | | 2,439,773 | |
Cenveo Corp. (c)(d)(f)(i), | | | | | | | | |
6.00%, 5/15/24
(cost—$9,157,703; purchased 3/22/12-3/11/16) | | | 8,116 | | | | 1 | |
8.50%, 9/15/22
(cost—$1,520,130; purchased 7/19/14-7/25/14) | | | 1,520 | | | | 30,400 | |
Herc Holdings, Inc. (a)(b), | |
5.50%, 7/15/27 | | | 11,005 | | | | 11,610,550 | |
Hertz Corp. (a)(b), | | | | | | | | |
7.125%, 8/1/26 | | | 11,340 | | | | 12,302,483 | |
7.625%, 6/1/22 | | | 1,631 | | | | 1,700,318 | |
Laureate Education, Inc. (a)(b), | |
8.25%, 5/1/25 | | | 9,795 | | | | 10,566,258 | |
RR Donnelley & Sons Co., | |
6.00%, 4/1/24 | | | 3,195 | | | | 3,293,518 | |
7.00%, 2/15/22 | | | 5,500 | | | | 5,707,966 | |
United Rentals North America, Inc., | |
5.25%, 1/15/30 | | | 9,695 | | | | 10,452,664 | |
5.50%, 7/15/25 | | | 8,930 | | | | 9,297,447 | |
| | | | | | | | |
| | | | | | | 67,401,378 | |
| | | | | | | | |
| | | | | | |
| 72 | | Semiannual Report | | | December 31, 2019 | | | See accompanying Notes to Financial Statements |
Schedule of Investments
December 31, 2019 (Unaudited)
| | | | | | | | |
| | | Principal
Amount
(000s) | | | Value | |
|
| Computers—0.3% | |
Dell International LLC (a)(b), | |
7.125%, 6/15/24 | | $ | 7,485 | | | $ | 7,906,031 | |
Harland Clarke Holdings Corp. (a)(b), | |
9.25%, 3/1/21 | | | 7,165 | | | | 7,084,394 | |
Monitronics International, Inc. (d)(f), | |
9.125%, 4/1/20 | | | 6,450 | | | | 65 | |
| | | | | | | | |
| | | | | | | 14,990,490 | |
| | | | | | | | |
|
| Containers & Packaging—0.5% | |
Berry Global, Inc. (a)(b), | |
5.625%, 7/15/27 | | | 11,590 | | | | 12,459,540 | |
Trivium Packaging Finance BV (a)(b), | |
8.50%, 8/15/27 | | | 9,545 | | | | 10,636,471 | |
| | | | | | | | |
| | | | | | | 23,096,011 | |
| | | | | | | | |
|
| Distribution/Wholesale—0.4% | |
H&E Equipment Services, Inc., | |
5.625%, 9/1/25 | | | 9,845 | | | | 10,341,336 | |
Performance Food Group, Inc. (a)(b), | |
5.50%, 10/15/27 | | | 10,055 | | | | 10,771,670 | |
| | | | | | | | |
| | | | | | | 21,113,006 | |
| | | | | | | | |
|
| Diversified Financial Services—1.3% | |
Ally Financial, Inc., | | | | | | | | |
5.75%, 11/20/25 | | | 4,685 | | | | 5,253,056 | |
8.00%, 3/15/20 | | | 2,995 | | | | 3,028,245 | |
CCF Holdings LLC, PIK 10.75% (a)(b)(d)(f), | |
10.75%, 12/15/23 | | | 11,338 | | | | 4,725,743 | |
Community Choice Financial Issuer LLC
(cost—$12,000,000; purchased 9/6/18) (a)(b)(i), | |
9.00%, 6/15/23 | | | 12,000 | | | | 12,015,000 | |
Navient Corp., | | | | | | | | |
6.75%, 6/15/26 | | | 14,315 | | | | 15,760,099 | |
7.25%, 9/25/23 | | | 3,940 | | | | 4,462,129 | |
Springleaf Finance Corp., | | | | | | | | |
6.625%, 1/15/28 | | | 10,165 | | | | 11,493,057 | |
8.25%, 10/1/23 | | | 8,080 | | | | 9,436,753 | |
| | | | | | | | |
| | | | | | | 66,174,082 | |
| | | | | | | | |
|
| Electric Utilities—0.3% | |
NRG Energy, Inc., | | | | | | | | |
5.75%, 1/15/28 | | | 11,135 | | | | 12,102,075 | |
Talen Energy Supply LLC, | | | | | | | | |
6.50%, 6/1/25 | | | 3,365 | | | | 2,881,601 | |
| | | | | | | | |
| | | | | | | 14,983,676 | |
| | | | | | | | |
|
| Electronic Equipment, Instruments & Components—0.4% | |
Energizer Holdings, Inc. (a)(b), | |
5.50%, 6/15/25 | | | 9,890 | | | | 10,281,496 | |
7.75%, 1/15/27 | | | 7,545 | | | | 8,445,873 | |
| | | | | | | | |
| | | | | | | 18,727,369 | |
| | | | | | | | |
|
| Engineering & Construction—0.6% | |
AECOM, | |
5.875%, 10/15/24 | | | 8,550 | | | | 9,480,026 | |
TopBuild Corp. (a)(b), | |
5.625%, 5/1/26 | | | 5,965 | | | | 6,250,411 | |
Tutor Perini Corp. (a)(b), | |
6.875%, 5/1/25 | | | 13,030 | | | | 12,606,525 | |
| | | | | | | | |
| | | | | | | 28,336,962 | |
| | | | | | | | |
| |
| Entertainment—1.4% | | | | | |
AMC Entertainment Holdings, Inc., | |
6.125%, 5/15/27 | | | 13,610 | | | | 12,453,490 | |
Cedar Fair L.P., | |
5.375%, 6/1/24 | | | 5,550 | | | | 5,718,803 | |
5.375%, 4/15/27 | | | 2,465 | | | | 2,658,262 | |
International Game Technology PLC (a)(b), | |
6.25%, 1/15/27 | | | 5,225 | | | | 5,887,791 | |
6.50%, 2/15/25 | | | 4,715 | | | | 5,304,328 | |
| | | | | | | | |
| | | Principal
Amount
(000s) | | | Value | |
Lions Gate Capital Holdings LLC (a)(b), | |
6.375%, 2/1/24 | | $ | 11,370 | | | $ | 11,910,189 | |
Live Nation Entertainment, Inc. (a)(b), | |
5.625%, 3/15/26 | | | 4,145 | | | | 4,426,228 | |
Scientific Games International, Inc. (a)(b), | |
5.00%, 10/15/25 | | | 10,510 | | | | 11,035,500 | |
Stars Group Holdings BV (a)(b), | |
7.00%, 7/15/26 | | | 8,350 | | | | 9,064,760 | |
| | | | | | | | |
| | | | | | | 68,459,351 | |
| | | | | | | | |
|
| Equity Real Estate Investment Trusts (REITs)—0.2% | |
Uniti Group L.P., | |
7.125%, 12/15/24 (a)(b) | | | 2,500 | | | | 2,124,975 | |
8.25%, 10/15/23 | | | 6,445 | | | | 5,639,375 | |
| | | | | | | | |
| | | | | | | 7,764,350 | |
| | | | | | | | |
| |
| Food & Beverage—0.5% | | | | | |
Albertsons Cos., Inc., | |
6.625%, 6/15/24 | | | 9,805 | | | | 10,286,916 | |
7.50%, 3/15/26 (a)(b) | | | 4,535 | | | | 5,099,036 | |
Post Holdings, Inc. (a)(b), | |
5.75%, 3/1/27 | | | 9,655 | | | | 10,377,411 | |
| | | | | | | | |
| | | | | | | 25,763,363 | |
| | | | | | | | |
| |
| Food Service—0.2% | | | | | |
Aramark Services, Inc. (a)(b), | |
5.00%, 2/1/28 | | | 10,730 | | | | 11,326,588 | |
| | | | | | | | |
|
| Hand/Machine Tools—0.2% | |
Colfax Corp. (a)(b), | | | | | | | | |
6.375%, 2/15/26 | | | 6,655 | | | | 7,262,269 | |
| | | | | | | | |
|
| Healthcare-Products—0.2% | |
Avantor, Inc. (a)(b), | |
9.00%, 10/1/25 | | | 4,190 | | | | 4,691,187 | |
Hill-Rom Holdings, Inc. (a)(b), | |
5.00%, 2/15/25 | | | 4,255 | | | | 4,437,603 | |
| | | | | | | | |
| | | | | | | 9,128,790 | |
| | | | | | | | |
|
| Healthcare-Services—2.0% | |
Centene Corp. (a)(b), | |
4.625%, 12/15/29 | | | 4,635 | | | | 4,881,698 | |
5.375%, 6/1/26 | | | 6,975 | | | | 7,419,495 | |
Charles River Laboratories International, Inc. (a)(b), | |
5.50%, 4/1/26 | | | 5,340 | | | | 5,752,902 | |
CHS/Community Health Systems, Inc., | |
6.25%, 3/31/23 | | | 1,985 | | | | 2,019,738 | |
6.875%, 2/1/22 | | | 2,500 | | | | 2,031,250 | |
DaVita, Inc., | |
5.125%, 7/15/24 | | | 8,620 | | | | 8,853,473 | |
Encompass Health Corp., | |
4.50%, 2/1/28 | | | 2,095 | | | | 2,174,819 | |
4.75%, 2/1/30 | | | 2,095 | | | | 2,177,438 | |
HCA, Inc., | |
5.375%, 9/1/26 | | | 3,515 | | | | 3,923,707 | |
5.625%, 9/1/28 | | | 2,420 | | | | 2,762,309 | |
7.50%, 2/15/22 | | | 8,185 | | | | 9,058,994 | |
Select Medical Corp. (a)(b), | |
6.25%, 8/15/26 | | | 13,085 | | | | 14,188,785 | |
Tenet Healthcare Corp., | |
6.25%, 2/1/27 (a)(b) | | | 13,260 | | | | 14,287,650 | |
7.00%, 8/1/25 | | | 5,000 | | | | 5,291,675 | |
8.125%, 4/1/22 | | | 7,030 | | | | 7,789,451 | |
WellCare Health Plans, Inc. (a)(b), | |
5.375%, 8/15/26 | | | 6,135 | | | | 6,545,125 | |
| | | | | | | | |
| | | | | | | 99,158,509 | |
| | | | | | | | |
|
| Home Builders—0.2% | |
Beazer Homes USA, Inc., | |
5.875%, 10/15/27 | | | 1,885 | | | | 1,908,610 | |
KB Home, | |
4.80%, 11/15/29 | | | 2,935 | | | | 3,001,037 | |
| | | | | | | | |
| | | Principal
Amount
(000s) | | | Value | |
Taylor Morrison Communities, Inc. (a)(b), | |
5.75%, 1/15/28 | | $ | 5,975 | | | $ | 6,529,764 | |
| | | | | | | | |
| | | | | | | 11,439,411 | |
| | | | | | | | |
|
| Household Products/Wares—0.2% | |
Prestige Brands, Inc. (a)(b), | |
5.125%, 1/15/28 | | | 4,905 | | | | 5,150,250 | |
Spectrum Brands, Inc., | |
5.75%, 7/15/25 | | | 4,725 | | | | 4,943,579 | |
| | | | | | | | |
| | | | | | | 10,093,829 | |
| | | | | | | | |
| |
| Internet—1.0% | | | | | |
Go Daddy Operating Co. LLC (a)(b), | |
5.25%, 12/1/27 | | | 8,500 | | | | 8,961,975 | |
Match Group, Inc. (a)(b), | |
5.00%, 12/15/27 | | | 10,860 | | | | 11,352,474 | |
Netflix, Inc. (a)(b), | |
5.375%, 11/15/29 | | | 13,010 | | | | 13,879,458 | |
NortonLifeLock, Inc. (a)(b), | |
5.00%, 4/15/25 | | | 5,390 | | | | 5,507,624 | |
Zayo Group LLC (a)(b), | |
5.75%, 1/15/27 | | | 8,250 | | | | 8,407,554 | |
| | | | | | | | |
| | | | | | | 48,109,085 | |
| | | | | | | | |
| |
| Iron/Steel—0.2% | | | | | |
United States Steel Corp., | |
6.875%, 8/15/25 | | | 8,595 | | | | 8,042,470 | |
| | | | | | | | |
| |
| Lodging—0.6% | | | | | |
Hilton Domestic Operating Co., Inc., | |
5.125%, 5/1/26 | | | 6,795 | | | | 7,171,086 | |
MGM Resorts International, | |
5.50%, 4/15/27 | | | 7,270 | | | | 8,083,149 | |
Wyndham Hotels & Resorts, Inc. (a)(b), | |
5.375%, 4/15/26 | | | 7,110 | | | | 7,517,563 | |
Wynn Las Vegas LLC (a)(b), | |
5.50%, 3/1/25 | | | 7,275 | | | | 7,811,459 | |
| | | | | | | | |
| | | | | | | 30,583,257 | |
| | | | | | | | |
|
| Machinery-Construction & Mining—0.2% | |
Terex Corp. (a)(b), | |
5.625%, 2/1/25 | | | 7,370 | | | | 7,618,738 | |
| | | | | | | | |
| |
| Machinery-Diversified—0.1% | | | | | |
Mueller Water Products, Inc. (a)(b), | |
5.50%, 6/15/26 | | | 3,840 | | | | 4,057,334 | |
| | | | | | | | |
| |
| Media—3.0% | | | | | |
CCO Holdings LLC (a)(b), | | | | | | | | |
5.125%, 5/1/23 | | | 3,165 | | | | 3,236,893 | |
5.125%, 5/1/27 | | | 6,955 | | | | 7,350,392 | |
5.50%, 5/1/26 | | | 9,460 | | | | 9,990,446 | |
Clear Channel Worldwide Holdings, Inc. (a)(b), | |
9.25%, 2/15/24 | | | 10,204 | | | | 11,322,205 | |
CSC Holdings LLC (a)(b), | | | | | | | | |
7.50%, 4/1/28 | | | 9,860 | | | | 11,164,700 | |
7.75%, 7/15/25 | | | 6,160 | | | | 6,583,192 | |
10.875%, 10/15/25 | | | 5,145 | | | | 5,759,184 | |
Diamond Sports Group LLC (a)(b), | |
5.375%, 8/15/26 | | | 3,640 | | | | 3,688,871 | |
6.625%, 8/15/27 | | | 13,005 | | | | 12,671,422 | |
DISH DBS Corp., | |
5.875%, 7/15/22 | | | 4,335 | | | | 4,602,816 | |
5.875%, 11/15/24 | | | 10,820 | | | | 11,079,247 | |
6.75%, 6/1/21 | | | 9,250 | | | | 9,741,452 | |
Gray Television, Inc. (a)(b), | |
5.875%, 7/15/26 | | | 10,065 | | | | 10,725,264 | |
LiveStyle, Inc.
(cost—$7,083,190;
purchased1/31/14-10/7/15) (a)(b)(c)(d)(f)(i)(k),
| |
9.625%, 2/1/19 | | | 7,628 | | | | 8 | |
Meredith Corp., | | | | | | | | |
6.875%, 2/1/26 | | | 9,370 | | | | 9,768,670 | |
| | | | | | | | |
| See accompanying Notes to Financial Statements | | | December 31, 2019 | | | Semiannual Report | | | 73 | |
Schedule of Investments
December 31, 2019 (Unaudited)
| | | | | | | | |
| | | Principal
Amount
(000s) | | | Value | |
Nexstar Broadcasting, Inc. (a)(b), | |
5.625%, 7/15/27 | | $ | 12,385 | | | $ | 13,074,225 | |
Sirius XM Radio, Inc. (a)(b), | |
5.00%, 8/1/27 | | | 9,715 | | | | 10,267,298 | |
Virgin Media Secured Finance PLC (a)(b), | |
5.50%, 5/15/29 | | | 6,995 | | | | 7,418,897 | |
| | | | | | | | |
| | | | | | | 148,445,182 | |
| | | | | | | | |
|
| Metal Fabricate/Hardware—0.2% | |
Park-Ohio Industries, Inc., | | | | | |
6.625%, 4/15/27 | | | 9,915 | | | | 10,122,248 | |
| | | | | | | | |
| |
| Mining—0.7% | | | | | |
Alcoa Nederland Holding BV (a)(b), | |
6.75%, 9/30/24 | | | 10,405 | | | | 10,972,905 | |
Constellium SE (a)(b), | | | | | | | | |
6.625%, 3/1/25 | | | 9,605 | | | | 9,990,064 | |
Freeport-McMoRan, Inc., | | | | | | | | |
5.25%, 9/1/29 | | | 2,440 | | | | 2,618,486 | |
Hudbay Minerals, Inc. (a)(b), | |
7.625%, 1/15/25 | | | 4,965 | | | | 5,250,910 | |
Joseph T. Ryerson & Son, Inc. (a)(b), | |
11.00%, 5/15/22 | | | 7,500 | | | | 7,931,197 | |
| | | | | | | | |
| | | | | | | 36,763,562 | |
| | | | | | | | |
|
| Miscellaneous Manufacturing—0.2% | |
Koppers, Inc. (a)(b), | | | | | |
6.00%, 2/15/25 | | | 8,595 | | | | 9,024,664 | |
| | | | | | | | |
|
| Oil, Gas & Consumable Fuels—2.1% | |
Callon Petroleum Co., | |
6.125%, 10/1/24 | | | 6,110 | | | | 6,240,998 | |
Carrizo Oil & Gas, Inc., | | | | | | | | |
6.25%, 4/15/23 | | | 9,725 | | | | 9,893,631 | |
Chesapeake Energy Corp., | |
8.00%, 1/15/25 | | | 7,730 | | | | 4,618,830 | |
8.00%, 3/15/26 (a)(b) | | | 6,301 | | | | 3,606,519 | |
Cobalt International Energy, Inc. (c), | |
7.75%, 12/1/23 | | | 9,216 | | | | 299,520 | |
CVR Refining LLC, | | | | | | | | |
6.50%, 11/1/22 | | | 5,550 | | | | 5,633,211 | |
EP Energy LLC (c), | | | | | | | | |
9.375%, 5/1/20 | | | 8,765 | | | | 19,721 | |
Nabors Industries, Inc., | | | | | | | | |
5.75%, 2/1/25 | | | 1,910 | | | | 1,724,568 | |
Noble Holding International Ltd., | |
7.75%, 1/15/24 | | | 6,955 | | | | 3,633,396 | |
Oasis Petroleum, Inc., | | | | | | | | |
6.875%, 3/15/22 | | | 8,460 | | | | 8,248,500 | |
Range Resources Corp., | | | | | | | | |
4.875%, 5/15/25 | | | 8,965 | | | | 7,687,488 | |
Sable Permian Resources Land LLC (a)(b)(c), | |
7.375%, 11/1/21 | | | 5,000 | | | | 1,075,000 | |
Sanchez Energy Corp. (c), | | | | | | | | |
6.125%, 1/15/23 | | | 6,240 | | | | 312,000 | |
SM Energy Co., | | | | | | | | |
6.625%, 1/15/27 | | | 11,360 | | | | 11,191,616 | |
Sunoco L.P., | | | | | | | | |
5.50%, 2/15/26 | | | 4,605 | | | | 4,790,800 | |
5.875%, 3/15/28 | | | 4,830 | | | | 5,142,272 | |
Talos Production LLC, | | | | | | | | |
11.00%, 4/3/22 | | | 1,168 | | | | 1,197,495 | |
Transocean, Inc. (a)(b), | | | | | | | | |
7.50%, 1/15/26 | | | 12,010 | | | | 11,887,768 | |
USA Compression Partners L.P., | |
6.875%, 9/1/27 | | | 10,045 | | | | 10,481,455 | |
Valaris PLC, | | | | | | | | |
5.20%, 3/15/25 | | | 1,295 | | | | 721,963 | |
7.75%, 2/1/26 | | | 6,640 | | | | 3,768,034 | |
Weatherford International Ltd. (a)(b), | |
11.00%, 12/1/24 | | | 605 | | | | 655,669 | |
| | | | | | | | |
| | | | | | | 102,830,454 | |
| | | | | | | | |
| | | | | | | | |
| | | Principal
Amount
(000s) | | | Value | |
|
| Paper & Forest Products—0.2% | |
Mercer International, Inc., | |
5.50%, 1/15/26 | | $ | 5,370 | | | $ | 5,477,534 | |
7.375%, 1/15/25 | | | 4,825 | | | | 5,207,936 | |
| | | | | | | | |
| | | | | | | 10,685,470 | |
| | | | | | | | |
| |
| Pharmaceuticals—1.0% | | | | | |
Bausch Health Americas, Inc. (a)(b), | |
8.50%, 1/31/27 | | | 7,790 | | | | 8,885,663 | |
Bausch Health Cos., Inc. (a)(b), | |
5.25%, 1/30/30 | | | 1,275 | | | | 1,325,363 | |
6.125%, 4/15/25 | | | 3,280 | | | | 3,395,833 | |
7.25%, 5/30/29 | | | 10,120 | | | | 11,580,822 | |
Endo Finance LLC (a)(b), | |
5.375%, 1/15/23 | | | 10,730 | | | | 7,265,122 | |
Horizon Pharma USA, Inc. (a)(b), | |
5.50%, 8/1/27 | | | 10,185 | | | | 11,019,661 | |
Mallinckrodt International Finance S.A. (a)(b), | |
5.75%, 8/1/22 | | | 10,965 | | | | 4,523,063 | |
| | | | | | | | |
| | | | | | | 47,995,527 | |
| | | | | | | | |
|
| Pipelines—1.1% | |
Cheniere Energy Partners L.P., | |
5.625%, 10/1/26 | | | 8,410 | | | | 8,909,335 | |
Crestwood Midstream Partners L.P., | |
5.75%, 4/1/25 | | | 10,735 | | | | 11,003,268 | |
DCP Midstream Operating L.P., | |
5.125%, 5/15/29 | | | 7,470 | | | | 7,763,944 | |
NGL Energy Partners L.P. (a)(b), | |
7.50%, 4/15/26 | | | 10,465 | | | | 10,149,716 | |
Targa Resources Partners L.P. (a)(b), | |
6.50%, 7/15/27 | | | 4,170 | | | | 4,573,865 | |
6.875%, 1/15/29 | | | 9,670 | | | | 10,751,589 | |
| | | | | | | | |
| | | | | | | 53,151,717 | |
| | | | | | | | |
|
| Real Estate—0.4% | |
Iron Mountain, Inc. (a)(b), | |
4.875%, 9/15/27 | | | 9,335 | | | | 9,660,068 | |
Kennedy-Wilson, Inc., | |
5.875%, 4/1/24 | | | 11,023 | | | | 11,326,022 | |
| | | | | | | | |
| | | | | | | 20,986,090 | |
| | | | | | | | |
|
| Retail—1.0% | |
1011778 BC ULC (a)(b), | |
5.00%, 10/15/25 | | | 10,990 | | | | 11,370,089 | |
Beacon Roofing Supply, Inc. (a)(b), | |
4.875%, 11/1/25 | | | 7,725 | | | | 7,779,731 | |
Conn’s, Inc., | |
7.25%, 7/15/22 | | | 12,570 | | | | 12,542,497 | |
L Brands, Inc., | |
6.875%, 11/1/35 | | | 2,655 | | | | 2,380,938 | |
Neiman Marcus Group Ltd. LLC (a)(b), | |
8.00%, 10/15/21 | | | 6,810 | | | | 5,277,750 | |
Party City Holdings, Inc. (a)(b), | |
6.625%, 8/1/26 | | | 11,755 | | | | 8,314,576 | |
| | | | | | | | |
| | | | | | | 47,665,581 | |
| | | | | | | | |
| |
| Semiconductors—0.4% | | | | | |
Advanced Micro Devices, Inc., | |
7.50%, 8/15/22 | | | 2,670 | | | | 3,014,595 | |
Amkor Technology, Inc. (a)(b), | |
6.625%, 9/15/27 | | | 11,410 | | | | 12,586,371 | |
Broadcom Corp., | |
3.875%, 1/15/27 | | | 5,195 | | | | 5,391,333 | |
| | | | | | | | |
| | | | | | | 20,992,299 | |
| | | | | | | | |
| |
| Software—0.7% | | | | | |
IQVIA, Inc. (a)(b), | |
5.00%, 5/15/27 | | | 10,210 | | | | 10,824,412 | |
j2 Cloud Services LLC (a)(b), | |
6.00%, 7/15/25 | | | 9,810 | | | | 10,419,054 | |
Rackspace Hosting, Inc. (a)(b), | |
8.625%, 11/15/24 | | | 3,120 | | | | 3,057,600 | |
| | | | | | | | |
| | | Principal
Amount
(000s) | | | Value | |
SS&C Technologies, Inc. (a)(b), | |
5.50%, 9/30/27 | | $ | 11,305 | | | $ | 12,089,285 | |
| | | | | | | | |
| | | | | | | 36,390,351 | |
| | | | | | | | |
|
| Telecommunications—3.1% | |
CenturyLink, Inc., | |
5.125%, 12/15/26 (a)(b) | | | 7,770 | | | | 7,926,410 | |
7.50%, 4/1/24, Ser. Y | | | 9,535 | | | | 10,770,593 | |
Cincinnati Bell, Inc. (a)(b), | |
7.00%, 7/15/24 | | | 9,590 | | | | 10,081,392 | |
CommScope Technologies LLC (a)(b), | |
5.00%, 3/15/27 | | | 4,460 | | | | 4,203,662 | |
6.00%, 6/15/25 | | | 10,465 | | | | 10,502,988 | |
Consolidated Communications, Inc., | |
6.50%, 10/1/22 | | | 9,435 | | | | 8,656,612 | |
Frontier CommunicationsCorp., | |
10.50%, 9/15/22 | | | 9,315 | | | | 4,567,256 | |
GTT Communications, Inc. (a)(b), | |
7.875%, 12/31/24 | | | 10,045 | | | | 7,606,174 | |
Hughes Satellite Systems Corp., | |
6.625%, 8/1/26 | | | 9,080 | | | | 10,104,655 | |
7.625%, 6/15/21 | | | 7,440 | | | | 7,962,809 | |
Intelsat Connect Finance S.A. (a)(b), | |
9.50%, 2/15/23 | | | 3,195 | | | | 2,243,529 | |
Intelsat Jackson Holdings S.A., | |
5.50%, 8/1/23 | | | 10,370 | | | | 8,929,866 | |
9.75%, 7/15/25 (a)(b) | | | 6,940 | | | | 6,433,970 | |
Level 3 Financing, Inc., | |
5.375%, 5/1/25 | | | 8,420 | | | | 8,732,256 | |
Sprint Capital Corp., | |
6.875%, 11/15/28 | | | 6,890 | | | | 7,436,722 | |
Sprint Communications, Inc., | |
11.50%, 11/15/21 | | | 7,890 | | | | 9,028,685 | |
Sprint Corp., | |
7.125%, 6/15/24 | | | 2,250 | | | | 2,431,879 | |
7.625%, 3/1/26 | | | 6,855 | | | | 7,572,376 | |
T-Mobile USA, Inc., | |
4.75%, 2/1/28 | | | 3,190 | | | | 3,348,415 | |
6.50%, 1/15/26 | | | 11,940 | | | | 12,824,276 | |
Windstream Services LLC
(cost—$6,524,710; purchased
12/4/13-11/15/18) (a)(b)(c)(i), | |
6.375%, 8/1/23 | | | 7,464 | | | | 1,007,640 | |
| | | | | | | | |
| | | | | | | 152,372,165 | |
| | | | | | | | |
| |
| Toys/Games/Hobbies—0.0% | | | | | |
Mattel, Inc. (a)(b),
| |
5.875%, 12/15/27 | | | 1,080 | | | | 1,140,048 | |
| | | | | | | | |
| |
| Transportation—0.1% | | | | | |
XPO Logistics, Inc. (a)(b),
| |
6.125%, 9/1/23 | | | 2,705 | | | | 2,798,011 | |
6.50%, 6/15/22 | | | 3,184 | | | | 3,250,164 | |
| | | | | | | | |
| | | | | | | 6,048,175 | |
| | | | | | | | |
Total Corporate Bonds & Notes
(cost—$1,533,399,684) | | | | 1,482,667,325 | |
| | | | | | | | |
| | | | | | | | |
|
| Convertible Bonds & Notes—26.2% | |
| |
| Apparel & Textiles—0.0% | | | | | |
Iconix Brand Group, Inc.,
| |
5.75%, 8/15/23 | | | 4,185 | | | | 2,113,425 | |
| | | | | | | | |
| |
| Auto Components—0.2% | | | | | |
Meritor, Inc.,
| |
3.25%, 10/15/37 | | | 8,095 | | | | 8,827,533 | |
| | | | | | | | |
| |
| Auto Manufacturers—0.7% | | | | | |
Tesla, Inc.,
| |
1.25%, 3/1/21 | | | 22,475 | | | | 28,703,697 | |
2.375%, 3/15/22 | | | 2,795 | | | | 3,960,032 | |
| | | | | | | | |
| | | | | | | 32,663,729 | |
| | | | | | | | |
| | | | | | |
| 74 | | Semiannual Report | | | December 31, 2019 | | | See accompanying Notes to Financial Statements |
Schedule of Investments
December 31, 2019 (Unaudited)
| | | | | | | | |
| | | Principal
Amount
(000s) | | | Value | |
| |
| Biotechnology—1.8% | | | | | |
Aegerion Pharmaceuticals, Inc. (a)(b), | |
5.00%, 4/1/25 | | $ | 1,753 | | | $ | 1,708,944 | |
Aeltus CBO II Ltd. (c)(d)(f), | |
2.00%, 8/15/19 | | | 5,270 | | | | 1 | |
AMAG Pharmaceuticals, Inc., | |
3.25%, 6/1/22 | | | 2,025 | | | | 1,708,811 | |
BioMarin Pharmaceutical, Inc., | |
1.50%, 10/15/20 | | | 6,830 | | | | 7,436,548 | |
Exact Sciences Corp., | |
0.375%, 3/15/27 | | | 15,400 | | | | 17,488,625 | |
Halozyme Therapeutics, Inc. (a)(b), | |
1.25%, 12/1/24 | | | 5,065 | | | | 5,060,359 | |
Illumina, Inc., | |
zero coupon, 8/15/23 | | | 17,390 | | | | 19,250,843 | |
0.50%, 6/15/21 | | | 715 | | | | 997,663 | |
Insmed, Inc., | |
1.75%, 1/15/25 | | | 7,110 | | | | 6,866,913 | |
Intercept Pharmaceuticals, Inc., | |
3.25%, 7/1/23 | | | 8,585 | | | | 8,677,997 | |
Ligand Pharmaceuticals, Inc., | |
0.75%, 5/15/23 | | | 12,485 | | | | 10,806,258 | |
Radius Health, Inc., | |
3.00%, 9/1/24 | | | 3,805 | | | | 3,231,967 | |
Verastem, Inc., | |
5.00%, 11/1/48 | | | 5,910 | | | | 2,857,238 | |
| | | | | | | | |
| | | | | | | 86,092,167 | |
| | | | | | | | |
| |
| Commercial Services—1.1% | | | | | |
Chegg, Inc. (a)(b), | |
0.125%, 3/15/25 | | | 15,225 | | | | 15,697,101 | |
Euronet Worldwide, Inc. (a)(b), | |
0.75%, 3/15/49 | | | 9,060 | | | | 10,829,289 | |
Macquarie Infrastructure Corp., | |
2.00%, 10/1/23 | | | 10,410 | | | | 9,981,149 | |
Square, Inc., | |
0.50%, 5/15/23 | | | 17,705 | | | | 19,829,210 | |
| | | | | | | | |
| | | | | | | 56,336,749 | |
| | | | | | | | |
| |
| Computers—1.0% | | | | | |
CyberArk Software Ltd. (a)(b), | |
zero coupon, 11/15/24 | | | 9,510 | | | | 9,868,233 | |
Lumentum Holdings, Inc., | |
0.25%, 3/15/24 | | | 5,330 | | | | 7,795,125 | |
0.50%, 12/15/26, Ser. QIB (a)(b) | | | 8,170 | | | | 8,884,875 | |
Pure Storage, Inc., | |
0.125%, 4/15/23 | | | 10,020 | | | | 9,986,453 | |
Western Digital Corp., | |
1.50%, 2/1/24 | | | 14,900 | | | | 14,667,188 | |
| | | | | | | | |
| | | | | | | 51,201,874 | |
| | | | | | | | |
|
| Diversified Financial Services—0.3% | |
Encore Capital Group, Inc., | |
2.875%, 3/15/21 | | | 6,960 | | | | 6,868,323 | |
3.00%, 7/1/20 | | | 1,215 | | | | 1,231,225 | |
3.25%, 3/15/22 | | | 3,400 | | | | 3,531,389 | |
LendingTree, Inc.,
| |
0.625%, 6/1/22 | | | 2,600 | | | | 4,073,924 | |
| | | | | | | | |
| | | | | | | 15,704,861 | |
| | | | | | | | |
| |
| Electric Utilities—0.2% | | | | | |
NRG Energy, Inc., | |
2.75%, 6/1/48 | | | 8,025 | | | | 9,118,406 | |
| | | | | | | | |
| |
| Electronics—0.3% | | | | | |
Fortive Corp. (a)(b), | |
0.875%, 2/15/22 | | | 6,360 | | | | 6,447,290 | |
II-VI, Inc., | |
0.25%, 9/1/22 | | | 3,290 | | | | 3,359,913 | |
OSI Systems, Inc., | |
1.25%, 9/1/22 | | | 1,050 | | | | 1,150,317 | |
| | | | | | | | |
| | | Principal
Amount
(000s) | | | Value | |
Vishay Intertechnology, Inc., | |
2.25%, 6/15/25 | | $ | 1,355 | | | $ | 1,360,816 | |
| | | | | | | | |
| | | | | | | 12,318,336 | |
| | | | | | | | |
|
| Energy-Alternate Sources—0.0% | |
SunEdison, Inc. (c), | | | | | | | | |
0.25%, 1/15/20 | | | 9,565 | | | | 215,212 | |
2.625%, 6/1/23 | | | 11,270 | | | | 253,575 | |
3.375%, 6/1/25 | | | 4,565 | | | | 102,713 | |
| | | | | | | | |
| | | | | | | 571,500 | |
| | | | | | | | |
|
| Engineering & Construction—0.3% | |
Dycom Industries, Inc., | | | | | | | | |
0.75%, 9/15/21 | | | 7,690 | | | | 7,491,370 | |
KBR, Inc. (a)(b), | | | | | | | | |
2.50%, 11/1/23 | | | 5,450 | | | | 7,241,688 | |
| | | | | | | | |
| | | | | | | 14,733,058 | |
| | | | | | | | |
| |
| Entertainment—0.3% | | | | | |
Live Nation Entertainment, Inc., | |
2.50%, 3/15/23 | | | 10,070 | | | | 12,304,533 | |
Marriott Vacations Worldwide Corp., | |
1.50%, 9/15/22 | | | 2,670 | | | | 2,860,609 | |
| | | | | | | | |
| | | | | | | 15,165,142 | |
| | | | | | | | |
|
| Equity Real Estate Investment Trusts (REITs)—0.1% | |
Extra Space Storage L.P. (a)(b), | |
3.125%, 10/1/35 | | | 5,105 | | | | 6,004,756 | |
| | | | | | | | |
| |
| Healthcare-Products—0.8% | | | | | |
CONMED Corp. (a)(b), | | | | | | | | |
2.625%, 2/1/24 | | | 3,885 | | | | 5,380,917 | |
Insulet Corp. (a)(b), | | | | | | | | |
0.375%, 9/1/26 | | | 17,135 | | | | 17,854,478 | |
NuVasive, Inc., | | | | | | | | |
2.25%, 3/15/21 | | | 4,355 | | | | 5,813,107 | |
Wright Medical Group, Inc., | | | | | |
1.625%, 6/15/23 | | | 10,863 | | | | 11,501,560 | |
| | | | | | | | |
| | | | | | | 40,550,062 | |
| | | | | | | | |
| |
| Healthcare-Services—0.4% | | | | | |
Anthem, Inc., | | | | | | | | |
2.75%, 10/15/42 | | | 2,200 | | | | 9,250,332 | |
Invitae Corp. (a)(b), | | | | | | | | |
2.00%, 9/1/24 | | | 700 | | | | 636,802 | |
Teladoc Health, Inc., | | | | | | | | |
1.375%, 5/15/25 | | | 6,525 | | | | 11,349,137 | |
| | | | | | | | |
| | | | | | | 21,236,271 | |
| | | | | | | | |
| |
| Insurance—0.2% | | | | | |
AXA S.A. (a)(b), | | | | | | | | |
7.25%, 5/15/21 | | | 6,930 | | | | 8,003,284 | |
| | | | | | | | |
| |
| Internet—4.6% | | | | | |
Boingo Wireless, Inc., | | | | | | | | |
1.00%, 10/1/23 | | | 3,435 | | | | 3,051,891 | |
Booking Holdings, Inc., | | | | | | | | |
0.35%, 6/15/20 | | | 5,325 | | | | 8,277,066 | |
0.90%, 9/15/21 | | | 14,735 | | | | 17,017,075 | |
Etsy Inc (a)(b), | | | | | | | | |
0.125%, 10/1/26 | | | 15,455 | | | | 13,978,172 | |
FireEye, Inc., | | | | | | | | |
0.875%, 6/1/24 | | | 8,985 | | | | 9,076,303 | |
1.625%, 6/1/35, Ser. B | | | 4,650 | | | | 4,511,511 | |
IAC FinanceCo 2, Inc. (a)(b), | |
0.875%, 6/15/26 | | | 9,480 | | | | 10,677,324 | |
IAC FinanceCo 3, Inc. (a)(b), | |
2.00%, 1/15/30 | | | 6,310 | | | | 7,386,486 | |
Okta, Inc. (a)(b), | | | | | | | | |
0.125%, 9/1/25 | | | 17,575 | | | | 17,084,952 | |
Palo Alto Networks, Inc., | | | | | | | | |
0.75%, 7/1/23 | | | 20,025 | | | | 22,137,455 | |
| | | | | | | | |
| | | Principal
Amount
(000s) | | | Value | |
Proofpoint, Inc. (a)(b), | | | | | | | | |
0.25%, 8/15/24 | | $ | 14,480 | | | $ | 14,949,171 | |
Q2 Holdings, Inc. (a)(b), | | | | | | | | |
0.75%, 6/1/26 | | | 4,685 | | | | 5,407,846 | |
RingCentral, Inc., | | | | | | | | |
zero coupon, 3/15/23 | | | 4,900 | | | | 10,301,271 | |
Snap, Inc. (a)(b), | | | | | | | | |
0.75%, 8/1/26 | | | 16,030 | | | | 16,717,522 | |
Trip.com Group Ltd., | | | | | | | | |
1.00%, 7/1/20 | | | 3,500 | | | | 3,452,365 | |
Twitter, Inc., | | | | | | | | |
0.25%, 6/15/24 | | | 15,170 | | | | 14,695,937 | |
Wayfair, Inc., | | | | | | | | |
1.00%, 8/15/26 (a)(b) | | | 9,095 | | | | 8,043,835 | |
1.125%, 11/1/24 | | | 6,385 | | | | 6,633,660 | |
Weibo Corp., | | | | | | | | |
1.25%, 11/15/22 | | | 6,415 | | | | 6,034,109 | |
Wix.com Ltd., | | | | | | | | |
zero coupon, 7/1/23 | | | 6,570 | | | | 7,506,225 | |
Zendesk, Inc., | | | | | | | | |
0.25%, 3/15/23 | | | 6,845 | | | | 9,361,588 | |
Zillow Group, Inc., | | | | | | | | |
1.50%, 7/1/23 | | | 3,865 | | | | 3,719,791 | |
2.00%, 12/1/21 | | | 7,500 | | | | 8,408,685 | |
| | | | | | | | |
| | | | | | | 228,430,240 | |
| | | | | | | | |
| |
| Investment Companies—0.1% | | | | | |
Prospect Capital Corp., | | | | | | | | |
6.375%, 3/1/25 | | | 5,000 | | | | 5,332,242 | |
| | | | | | | | |
| |
| Iron/Steel—0.1% | | | | | |
Cleveland-Cliffs, Inc., | | | | | | | | |
1.50%, 1/15/25 | | | 2,575 | | | | 3,084,444 | |
| | | | | | | | |
| |
| Lodging—0.2% | | | | | |
Caesars Entertainment Corp., | |
5.00%, 10/1/24 | | | 5,800 | | | | 11,172,250 | |
| | | | | | | | |
| |
| Media—1.8% | | | | | |
DISH Network Corp., | | | | | | | | |
2.375%, 3/15/24 | | | 14,960 | | | | 13,716,076 | |
3.375%, 8/15/26 | | | 17,910 | | | | 17,272,404 | |
Liberty Interactive LLC (a)(b), | |
1.75%, 9/30/46 | | | 8,700 | | | | 12,794,156 | |
Liberty Media Corp-Liberty Formula One, | |
1.00%, 1/30/23 | | | 6,570 | | | | 8,755,858 | |
Liberty Media Corp., | | | | | | | | |
1.375%, 10/15/23 | | | 11,375 | | | | 15,334,637 | |
2.25%, 9/30/46 | | | 2,580 | | | | 1,497,668 | |
2.75%, 12/1/49 (a)(b) | | | 12,185 | | | | 12,824,713 | |
World Wrestling Entertainment, Inc., | |
3.375%, 12/15/23 | | | 2,520 | | | | 6,783,525 | |
| | | | | | | | |
| | | | | | | 88,979,037 | |
| | | | | | | | |
|
| Oil, Gas & Consumable Fuels—0.8% | |
Bristow Group, Inc., | | | | | | | | |
4.50%, 6/1/23 | | | 1,625 | | | | 105,625 | |
Chesapeake Energy Corp., | |
5.50%, 9/15/26 | | | 17,205 | | | | 8,368,237 | |
Ensco Jersey Finance Ltd., | | | | | |
3.00%, 1/31/24 | | | 9,245 | | | | 6,650,622 | |
Nabors Industries, Inc., | | | | | | | | |
0.75%, 1/15/24 | | | 8,145 | | | | 6,107,426 | |
Oasis Petroleum, Inc., | | | | | | | | |
2.625%, 9/15/23 | | | 9,190 | | | | 7,225,637 | |
Oil States International, Inc., | |
1.50%, 2/15/23 | | | 2,450 | | | | 2,211,370 | |
Transocean, Inc., | | | | | | | | |
0.50%, 1/30/23 | | | 8,635 | | | | 8,645,794 | |
| | | | | | | | |
| | | | | | | 39,314,711 | |
| | | | | | | | |
| |
| Pharmaceuticals—2.0% | | | | | |
Clovis Oncology, Inc., | | | | | | | | |
1.25%, 5/1/25 | | | 4,440 | | | | 2,852,700 | |
2.50%, 9/15/21 | | | 4,020 | | | | 3,513,916 | |
| | | | | | | | |
| See accompanying Notes to Financial Statements | | | December 31, 2019 | | | Semiannual Report | | | 75 | |
Schedule of Investments
December 31, 2019 (Unaudited)
| | | | | | | | |
| | | Principal
Amount
(000s) | | | Value | |
Dermira, Inc., | | | | | | | | |
3.00%, 5/15/22 | | $ | 3,065 | | | $ | 2,833,890 | |
DexCom, Inc., | | | | | | | | |
0.75%, 12/1/23 | | | 13,680 | | | | 20,296,977 | |
Flexion Therapeutics, Inc., | | | | | | | | |
3.375%, 5/1/24 | | | 3,510 | | | | 3,762,418 | |
Herbalife Nutrition Ltd., | | | | | | | | |
2.625%, 3/15/24 | | | 6,575 | | | | 6,836,892 | |
Horizon Pharma Investment Ltd., | |
2.50%, 3/15/22 | | | 4,915 | | | | 6,515,447 | |
Jazz Investments I Ltd., | | | | | | | | |
1.875%, 8/15/21 | | | 9,950 | | | | 10,269,636 | |
Neurocrine Biosciences, Inc., | |
2.25%, 5/15/24 | | | 7,750 | | | | 11,906,226 | |
Sarepta Therapeutics, Inc., | |
1.50%, 11/15/24 | | | 7,465 | | | | 14,538,088 | |
Supernus Pharmaceuticals, Inc., | |
0.625%, 4/1/23 | | | 6,355 | | | | 5,784,134 | |
Teva Pharmaceutical Finance Co. LLC, Ser. C, | |
0.25%, 2/1/26 | | | 7,285 | | | | 6,942,100 | |
Tilray, Inc., | | | | | | | | |
5.00%, 10/1/23 | | | 2,975 | | | | 1,591,625 | |
| | | | | | | | |
| | | | | | | 97,644,049 | |
| | | | | | | | |
| |
| Pipelines—0.3% | | | | | |
Cheniere Energy, Inc., | | | | | | | | |
4.25%, 3/15/45 | | | 15,605 | | | | 12,367,783 | |
| | | | | | | | |
| |
| Retail—0.2% | | | | | |
RH, | | | | | | | | |
zero coupon, 6/15/23 | | | 8,610 | | | | 10,945,945 | |
| | | | | | | | |
| |
| Semiconductors—2.5% | | | | | |
Cree, Inc., | | | | | | | | |
0.875%, 9/1/23 | | | 6,805 | | | | 7,231,145 | |
Inphi Corp., | | | | | | | | |
0.75%, 9/1/21 | | | 8,470 | | | | 11,992,294 | |
Microchip Technology, Inc., | |
1.625%, 2/15/27 | | | 32,480 | | | | 46,365,200 | |
2.25%, 2/15/37 | | | 3,150 | | | | 4,583,545 | |
Micron Technology, Inc., Ser. D, | |
3.125%, 5/1/32 | | | 1,530 | | | | 8,243,907 | |
ON Semiconductor Corp., | | | | | | | | |
1.625%, 10/15/23 | | | 13,400 | | | | 18,508,750 | |
Silicon Laboratories, Inc., | | | | | | | | |
1.375%, 3/1/22 | | | 565 | | | | 752,337 | |
Synaptics, Inc., | | | | | | | | |
0.50%, 6/15/22 | | | 8,045 | | | | 8,940,285 | |
Teradyne, Inc., | | | | | | | | |
1.25%, 12/15/23 | | | 5,215 | | | | 11,450,228 | |
Veeco Instruments, Inc., | | | | | | | | |
2.70%, 1/15/23 | | | 6,560 | | | | 6,200,964 | |
| | | | | | | | |
| | | | | | | 124,268,655 | |
| | | | | | | | |
| |
| Software—5.0% | | | | | |
Akamai Technologies, Inc., | |
0.125%, 5/1/25 | | | 17,390 | | | | 19,298,495 | |
0.375%, 9/1/27 (a)(b) | | | 4,240 | | | | 4,194,185 | |
Allscripts Healthcare Solutions, Inc., | |
1.25%, 7/1/20 | | | 6,585 | | | | 6,536,041 | |
Alteryx, Inc. (a)(b), | | | | | | | | |
0.50%, 8/1/24 | | | 5,740 | | | | 5,497,130 | |
1.00%, 8/1/26 | | | 8,250 | | | | 7,751,614 | |
Atlassian, Inc., | | | | | | | | |
0.625%, 5/1/23 | | | 9,880 | | | | 15,638,023 | |
Avaya Holdings Corp., | | | | | | | | |
2.25%, 6/15/23 | | | 5,740 | | | | 5,123,478 | |
Coupa Software, Inc. (a)(b), | |
0.125%, 6/15/25 | | | 10,050 | | | | 11,907,867 | |
DocuSign, Inc., | | | | | | | | |
0.50%, 9/15/23 | | | 8,610 | | | | 10,733,969 | |
Envestnet, Inc., | | | | | | | | |
1.75%, 6/1/23 | | | 6,090 | | | | 7,318,037 | |
| | | | | | | | |
| | | Principal
Amount
(000s) | | | Value | |
Everbridge, Inc. (a)(b), | | | | | | | | |
0.125%, 12/15/24 | | $ | 5,325 | | | $ | 5,289,052 | |
Evolent Health, Inc., | | | | | | | | |
1.50%, 10/15/25 | | | 3,470 | | | | 2,455,126 | |
2.00%, 12/1/21 | | | 1,400 | | | | 1,258,337 | |
Guidewire Software, Inc., | | | | | | | | |
1.25%, 3/15/25 | | | 5,420 | | | | 6,396,253 | |
HubSpot, Inc., | | | | | | | | |
0.25%, 6/1/22 | | | 1,565 | | | | 2,711,876 | |
j2 Global, Inc. (a)(b), | | | | | | | | |
1.75%, 11/1/26 | | | 8,180 | | | | 8,339,431 | |
Momo, Inc., | | | | | | | | |
1.25%, 7/1/25 | | | 3,990 | | | | 3,718,181 | |
MongoDB, Inc., | | | | | | | | |
0.75%, 6/15/24 | | | 2,555 | | | | 5,172,278 | |
New Relic, Inc., | | | | | | | | |
0.50%, 5/1/23 | | | 7,910 | | | | 7,706,584 | |
Nutanix, Inc., | | | | | | | | |
zero coupon, 1/15/23 | | | 9,845 | | | | 9,817,053 | |
Pluralsight, Inc. (a)(b), | | | | | | | | |
0.375%, 3/1/24 | | | 8,240 | | | | 7,172,287 | |
SailPoint Technologies Holding, Inc. (a)(b), | |
0.125%, 9/15/24 | | | 4,605 | | | | 4,976,809 | |
Sea Ltd. (a)(b), | | | | | | | | |
1.00%, 12/1/24 | | | 7,540 | | | | 8,243,496 | |
ServiceNow, Inc., | | | | | | | | |
zero coupon, 6/1/22 | | | 8,765 | | | | 18,513,075 | |
Splunk, Inc., | | | | | | | | |
0.50%, 9/15/23 | | | 9,455 | | | | 11,405,094 | |
1.125%, 9/15/25 | | | 12,010 | | | | 14,839,856 | |
Tabula Rasa HealthCare, Inc. (a)(b), | |
1.75%, 2/15/26 | | | 3,845 | | | | 3,861,822 | |
Twilio, Inc., | | | | | | | | |
0.25%, 6/1/23 | | | 4,755 | | | | 7,270,081 | |
Workday, Inc., | | | | | | | | |
0.25%, 10/1/22 | | | 14,135 | | | | 18,127,140 | |
Workiva, Inc. (a)(b), | | | | | | | | |
1.125%, 8/15/26 | | | 4,675 | | | | 4,203,995 | |
| | | | | | | | |
| | | | | | | 245,476,665 | |
| | | | | | | | |
| |
| Telecommunications—0.6% | | | | | |
Brocade Communications Systems, Inc., | |
1.375%, 1/1/20 | | | 4,450 | | | | 4,438,875 | |
CalAmp Corp., | | | | | | | | |
2.00%, 8/1/25 | | | 2,330 | | | | 1,941,050 | |
Infinera Corp., | | | | | | | | |
2.125%, 9/1/24 | | | 6,265 | | | | 6,644,780 | |
Viavi Solutions, Inc., | | | | | | | | |
1.00%, 3/1/24 | | | 2,185 | | | | 2,824,098 | |
1.75%, 6/1/23 | | | 7,478 | | | | 9,421,887 | |
Vonage Holdings Corp. (a)(b), | |
1.75%, 6/1/24 | | | 5,075 | | | | 4,556,822 | |
| | | | | | | | |
| | | | | | | 29,827,512 | |
| | | | | | | | |
| |
| Transportation—0.3% | | | | | |
Atlas Air Worldwide Holdings, Inc., | |
1.875%, 6/1/24 | | | 1,400 | | | | 1,187,340 | |
2.25%, 6/1/22 | | | 6,445 | | | | 5,889,119 | |
Greenbrier Cos., Inc., | | | | | | | | |
2.875%, 2/1/24 | | | 4,515 | | | | 4,392,289 | |
Teekay Corp., | | | | | | | | |
5.00%, 1/15/23 | | | 1,625 | | | | 1,429,602 | |
| | | | | | | | |
| | | | | | | 12,898,350 | |
| | | | | | | | |
Total Convertible Bonds & Notes
(cost—$1,323,800,478) | | | | 1,290,383,036 | |
| | | | | | | | |
| | | | | | | | |
| | |
| | | Shares | | | | |
|
| Convertible Preferred Stock—4.8% | |
| |
| Banks—1.0% | | | | | |
Bank of America Corp., Ser. L (e), | |
7.25% | | | 10,840 | | | | 15,707,160 | |
| | | | | | | | |
| | | Shares | | | Value | |
Wells Fargo & Co., Ser. L (e), | | | | | |
7.50% | | | 22,805 | | | $ | 33,067,250 | |
| | | | | | | | |
| | | | | | | 48,774,410 | |
| | | | | | | | |
| |
| Chemicals—0.3% | | | | | |
International Flavors & Fragrances, Inc., | |
6.00%, 9/15/21 | | | 250,765 | | | | 12,039,228 | |
| | | | | | | | |
| |
| Computers—0.3% | | | | | |
NCR Corp., Ser. A, PIK 5.50% (e), | |
5.50% | | | 9,377 | | | | 12,244,635 | |
| | | | | | | | |
|
| Diversified Financial Services—0.1% | |
AMG Capital Trust II, | | | | | | | | |
5.15%, 10/15/37 | | | 104,490 | | | | 5,067,765 | |
| | | | | | | | |
| |
| Electric Utilities—0.1% | | | | | |
NextEra Energy, Inc., | | | | | | | | |
4.872%, 9/1/22 | | | 15,000 | | | | 769,200 | |
Southern Co., Ser. 2019, | | | | | | | | |
6.75%, 8/1/22 | | | 84,000 | | | | 4,527,600 | |
| | | | | | | | |
| | | | | | | 5,296,800 | |
| | | | | | | | |
|
Equity Real Estate Investment Trusts
(REITs)—0.4% | |
Crown Castle International Corp., Ser. A, | |
6.875%, 8/1/20 | | | 15,115 | | | | 19,373,500 | |
| | | | | | | | |
| |
| Hand/Machine Tools—0.3% | | | | | |
Stanley Black & Decker, Inc., | |
5.375%, 5/15/20 | | | 148,435 | | | | 16,198,711 | |
| | | | | | | | |
|
| Healthcare Equipment & Supplies—0.8% | |
Becton Dickinson and Co., Ser. A, | |
6.125%, 5/1/20 | | | 279,770 | | | | 18,313,744 | |
Danaher Corp., Ser. A, | | | | | | | | |
4.75%, 4/15/22 | | | 18,435 | | | | 21,735,603 | |
| | | | | | | | |
| | | | | | | 40,049,347 | |
| | | | | | | | |
| |
| Healthcare-Products—0.2% | | | | | |
Avantor, Inc., Ser. A, | | | | | | | | |
6.25%, 5/15/22 | | | 183,425 | | | | 11,555,775 | |
| | | | | | | | |
| |
| Insurance—0.2% | | | | | |
Assurant, Inc., Ser. D, | | | | | | | | |
6.50%, 3/15/21 | | | 63,295 | | | | 8,141,003 | |
| | | | | | | | |
| |
| Machinery—0.4% | | | | | |
Fortive Corp., Ser. A, | | | | | | | | |
5.00%, 7/1/21 | | | 17,690 | | | | 17,208,124 | |
| | | | | | | | |
| |
| Multi-Utilities—0.3% | | | | | |
Sempra Energy, Ser. A, | | | | | | | | |
6.00%, 1/15/21 | | | 133,900 | | | | 16,070,678 | |
| | | | | | | | |
|
| Oil, Gas & Consumable Fuels—0.0% | |
Nabors Industries Ltd., Ser. A, | |
zero coupon | | | 53,040 | | | | 1,198,174 | |
| | | | | | | | |
|
| Semiconductors & Semiconductor Equipment—0.4% | |
Broadcom, Inc., Ser. A, | | | | | | | | |
8.00%, 9/30/22 | | | 18,305 | | | | 21,562,741 | |
| | | | | | | | |
Total Convertible Preferred Stock
(cost—$224,089,517) | | | | 234,780,891 | |
| | | | | | | | |
| | | | | | | | |
|
| Preferred Stock(a)(d)(f)(j)(k)—0.4% | |
| |
| Media—0.4% | | | | | |
LiveStyle, Inc., Ser. A | | | 7,960 | | | | 1,202,358 | |
LiveStyle, Inc., Ser. B (h) | | | 171,344 | | | | 17,134,400 | |
LiveStyle, Inc., Ser. B (h) | | | 8,000 | | | | 80 | |
| | | | | | | | |
Total Preferred Stock
(cost—$25,578,848) | | | | 18,336,838 | |
| | | | | | | | |
| | | | | | |
| 76 | | Semiannual Report | | | December 31, 2019 | | | See accompanying Notes to Financial Statements |
Schedule of Investments
December 31, 2019 (Unaudited)
| | | | | | | | |
| | | Shares | | | Value | |
|
| Equity-linked Security—0.0% | |
| |
| Coal—0.0% | | | | | |
Arch Coal, Inc., expires
| |
10/5/23 (d)(f)(j)
(cost-$0) | | $ | 4,002 | | | $ | 100,383 | |
| | | | | | | | |
| | | | | | | | |
| | |
| | | Units | | | | |
| |
| Warrants(d)(f)(j)—0.0% | | | | | |
| |
| Advertising—0.0% | | | | | |
Affinion Group Holdings, Inc.,
| |
exercise price $67.12, expires 4/1/24
(cost—$1,422,155; purchased 4/1/19) (i) | | | 7,203 | | | | 56,977 | |
| | | | | | | | |
| |
| Media—0.0% | | | | | |
LiveStyle, Inc., Ser. C,
expires 11/30/21 (k) | | | 43,500 | | | | 4 | |
| | | | | | | | |
| |
| Semiconductors—0.0% | | | | | |
GT Advanced Technologies, Inc.,
expires 10/1/17 (c) | | | 2,860,000 | | | | — | † |
| | | | | | | | |
Total Warrants
(cost—$1,422,155) | | | | 56,981 | |
| | | | | | | | |
| | | | | | | | |
| | | | | | | | |
| | | Principal
Amount
(000s) | | | Value | |
|
| Repurchase Agreements—3.9% | |
State Street Bank and Trust Co.,
dated 12/31/19, 0.25%, due 1/2/20, proceeds $193,216,684; collateralized by U.S. Treasury Bonds, 2.50%, due 2/15/46, valued at $197,081,434 including accrued interest | |
(cost—$193,214,000) | | | $193,214 | | | $ | 193,214,000 | |
| | | | | | | | |
| |
Total Investments, before options written
(cost—$5,245,963,132)—99.5% | | | | 4,897,021,570 | |
| | | | | | | | |
| |
| Total Options Written —(0.0)% (premiums received—$389,131) (j)(l)(m) | | | | (226,131 | ) |
| | | | | | | | |
| |
Total Investments, net of options written
(cost—$5,245,574,001)—99.5% | | | | 4,896,795,439 | |
| | | | | | | | |
| | |
Other assets less
other liabilities—0.5% | | | | | | | 25,983,086 | |
| | | | | | | | |
| | |
| Net Assets—100.0% | | | | | | | $4,922,778,525 | |
| | | | | | | | |
Notes to Schedule of Investments:
† Actual amount rounds to less than $1.
(a) Private Placement—Restricted as to resale and may not have a readily available market. Securities with an aggregate value of $1,217,527,270, representing 24.7% of net assets.
(b) 144A—Exempt from registration under Rule 144A of the Securities Act of 1933. These securities may be resold in transactions exempt from registration, typically only to qualified institutional buyers. Securities with an aggregate value of $1,199,190,412, representing 24.4% of net assets.
(c) In default.
(d) Fair-Valued—Securities with an aggregate value of $27,077,539, representing 0.6% of net assets. See Note 1(a) and Note 1(b) in the Notes to Financial Statements.
(e) Perpetual maturity. The date shown, if any, is the next call date.
(f) Level 3 security. See Note 1(a) and Note 1(b) in the Notes to Financial Statements.
(g) All or partial amount segregated for the benefit of the counterparty as collateral for options written.
(h) Affiliated security.
(i) Restricted. The aggregate cost of such securities is $37,707,888. The aggregate value is $13,110,033, representing 0.3% of net assets.
(j)Non-income producing.
(k) A member of the Fund’s portfolio management team is a member of the board of directors of LiveStyle, Inc. The Fund’s aggregate value of investments in LiveStyle, Inc. represents 0.4% of net assets.
(l) Exchange traded-Chicago Board Options Exchange.
(m) Exchange traded option contracts outstanding at December 31, 2019:
| | | | | | | | | | | | | | | | | | | | | | | | | | | | |
| | | |
| Options written contracts outstanding at December 31, 2019: | | | | | | | | | | |
| Description | | Exercise
Price | | | Expiration
Date | | | Number of
Contracts | | | Notional
Amount | | | Market
Value | | | Premiums
Received | | | Unrealized
Appreciation
(Depreciation) | |
| | | | | | | |
Call options: | | | | | | | | | | | | | | | | | | | | | | | | | | | | |
Advanced Micro Devices, Inc. | | | 49.00 USD | | | | 1/17/20 | | | | (1,710 | ) | | $ | (171,000 | ) | | $ | (97,470 | ) | | $ | (49,215 | ) | | $ | (48,255 | ) |
Alibaba Group Holding Ltd. | | | 220.00 USD | | | | 1/17/20 | | | | (305 | ) | | | (30,500 | ) | | | (42,395 | ) | | | (42,992 | ) | | | 597 | |
Broadcom, Inc. | | | 335.00 USD | | | | 1/17/20 | | | | (155 | ) | | | (15,500 | ) | | | (8,525 | ) | | | (8,364 | ) | | | (161 | ) |
Dollar General Corp. | | | 170.00 USD | | | | 1/17/20 | | | | (390 | ) | | | (39,000 | ) | | | (975 | ) | | | (19,184 | ) | | | 18,209 | |
DR Horton, Inc. | | | 56.00 USD | | | | 1/17/20 | | | | (520 | ) | | | (52,000 | ) | | | (5,200 | ) | | | (9,194 | ) | | | 3,994 | |
Lam Research Corp. | | | 317.50 USD | | | | 1/17/20 | | | | (252 | ) | | | (25,200 | ) | | | (6,426 | ) | | | (23,224 | ) | | | 16,798 | |
Micron Technology, Inc. | | | 62.50 USD | | | | 1/17/20 | | | | (1,230 | ) | | | (123,000 | ) | | | (5,535 | ) | | | (34,490 | ) | | | 28,955 | |
Nike, Inc. | | | 110.00 USD | | | | 1/17/20 | | | | (820 | ) | | | (82,000 | ) | | | (2,050 | ) | | | (20,878 | ) | | | 18,828 | |
NVIDIA Corp. | | | 265.00 USD | | | | 1/17/20 | | | | (415 | ) | | | (41,500 | ) | | | (9,545 | ) | | | (29,291 | ) | | | 19,746 | |
PayPal Holdings, Inc. | | | 115.00 USD | | | | 1/17/20 | | | | (975 | ) | | | (97,500 | ) | | | (21,938 | ) | | | (77,474 | ) | | | 55,536 | |
Salesforce.com, Inc. | | | 175.00 USD | | | | 1/17/20 | | | | (705 | ) | | | (70,500 | ) | | | (8,460 | ) | | | (26,212 | ) | | | 17,752 | |
ServiceNow, Inc. | | | 305.00 USD | | | | 1/17/20 | | | | (250 | ) | | | (25,000 | ) | | | (11,875 | ) | | | (36,129 | ) | | | 24,254 | |
Vertex Pharmaceuticals, Inc. | | | 240.00 USD | | | | 1/17/20 | | | | (255 | ) | | | (25,500 | ) | | | (5,737 | ) | | | (12,484 | ) | | | 6,747 | |
| | | | | | | | | | | | | | | | | | | | |
| Total options written contracts | | | $ | (226,131 | ) | | $ | (389,131 | ) | | $ | 163,000 | |
| | | | | | | | | | | | | | | | | | | | |
Glossary:
ADR—American Depositary Receipt
PIK—Payment-in-Kind
REIT—Real Estate Investment Trust
| | | | | | | | |
| See accompanying Notes to Financial Statements | | | December 31, 2019 | | | Semiannual Report | | | 77 | |
Schedule of Investments
December 31, 2019 (Unaudited)
AllianzGIMid-Cap Fund
| | | | | | | | |
| | | Shares | | | Value | |
|
| Common Stock—98.8% | |
|
| Aerospace & Defense—3.2% | |
HEICO Corp., Class A | | | 52,430 | | | | $4,694,058 | |
L3Harris Technologies, Inc. | | | 29,879 | | | | 5,912,158 | |
| | | | | | | | |
| | | | | | | 10,606,216 | |
| | | | | | | | |
|
| Air Freight & Logistics—1.6% | |
XPO Logistics, Inc. (a) | | | 67,279 | | | | 5,362,136 | |
| | | | | | | | |
|
| Beverages—1.0% | |
MGP Ingredients, Inc. | | | 70,990 | | | | 3,439,466 | |
| | | | | | | | |
|
| Biotechnology—1.4% | |
Exact Sciences Corp. (a) | | | 50,365 | | | | 4,657,755 | |
| | | | | | | | |
|
| Capital Markets—2.3% | |
E*TRADE Financial Corp. | | | 88,752 | | | | 4,026,678 | |
Tradeweb Markets, Inc., Class A | | | 77,605 | | | | 3,596,992 | |
| | | | | | | | |
| | | | | | | 7,623,670 | |
| | | | | | | | |
|
| Chemicals—1.4% | |
FMC Corp. | | | 48,835 | | | | 4,874,710 | |
| | | | | | | | |
|
| Commercial Services & Supplies—3.9% | |
Clean Harbors, Inc. (a) | | | 72,560 | | | | 6,222,020 | |
Waste Connections, Inc. | | | 75,632 | | | | 6,866,629 | |
| | | | | | | | |
| | | | | | | 13,088,649 | |
| | | | | | | | |
| |
| Containers & Packaging—2.2% | | | | | |
Crown Holdings, Inc. (a) | | | 102,980 | | | | 7,470,169 | |
| | | | | | | | |
| |
| Electrical Equipment—2.2% | | | | | |
AMETEK, Inc. | | | 74,942 | | | | 7,474,715 | |
| | | | | | | | |
|
| Electronic Equipment, Instruments & Components—4.0% | |
IPG Photonics Corp. (a) | | | 10,705 | | | | 1,551,369 | |
Keysight Technologies, Inc. (a) | | | 49,535 | | | | 5,083,777 | |
TE Connectivity Ltd. | | | 37,151 | | | | 3,560,552 | |
Trimble, Inc. (a) | | | 81,522 | | | | 3,398,652 | |
| | | | | | | | |
| | | | | | | 13,594,350 | |
| | | | | | | | |
|
| Entertainment—4.6% | |
Take-Two Interactive Software, Inc. (a) | | | 78,435 | | | | 9,602,797 | |
Zynga, Inc., Class A (a) | | | 957,201 | | | | 5,858,070 | |
| | | | | | | | |
| | | | | | | 15,460,867 | |
| | | | | | | | |
|
| Food & Staples Retailing—1.3% | |
Grocery Outlet Holding Corp. (a) | | | 134,365 | | | | 4,360,144 | |
| | | | | | | | |
|
| Food Products—4.6% | |
Freshpet, Inc. (a) | | | 95,015 | | | | 5,614,436 | |
Lamb Weston Holdings, Inc. | | | 65,205 | | | | 5,609,586 | |
Sanderson Farms, Inc. | | | 24,525 | | | | 4,321,796 | |
| | | | | | | | |
| | | | | | | 15,545,818 | |
| | | | | | | | |
|
| Healthcare Equipment & Supplies—10.6% | |
Cooper Cos., Inc. | | | 16,760 | | | | 5,384,820 | |
DexCom, Inc. (a) | | | 63,782 | | | | 13,951,675 | |
Edwards Lifesciences Corp. (a) | | | 22,083 | | | | 5,151,743 | |
Haemonetics Corp. (a) | | | 41,643 | | | | 4,784,781 | |
IDEXX Laboratories, Inc. (a) | | | 23,845 | | | | 6,226,645 | |
| | | | | | | | |
| | | | | | | 35,499,664 | |
| | | | | | | | |
|
| Hotels, Restaurants & Leisure—3.4% | |
Chipotle Mexican Grill, Inc. (a) | | | 7,560 | | | | 6,328,552 | |
Royal Caribbean Cruises Ltd. | | | 38,583 | | | | 5,151,216 | |
| | | | | | | | |
| | | | | | | 11,479,768 | |
| | | | | | | | |
| | | | | | | | |
| | | Shares | | | Value | |
|
| Insurance—3.7% | |
Arthur J Gallagher & Co. | | | 68,705 | | | $ | 6,542,777 | |
James River Group Holdings Ltd. | | | 143,025 | | | | 5,894,060 | |
| | | | | | | | |
| | | | | | | 12,436,837 | |
| | | | | | | | |
|
| IT Services—10.7% | |
Booz Allen Hamilton Holding Corp. | | | 83,230 | | | | 5,920,150 | |
EPAM Systems, Inc. (a) | | | 44,788 | | | | 9,502,222 | |
Fidelity National Information Services, Inc. | | | 67,459 | | | | 9,382,872 | |
Repay Holdings Corp. (a) | | | 144,440 | | | | 2,116,046 | |
WEX, Inc. (a) | | | 29,328 | | | | 6,143,043 | |
Wix.com Ltd. (a) | | | 23,044 | | | | 2,820,125 | |
| | | | | | | | |
| | | | | | | 35,884,458 | |
| | | | | | | | |
|
| Life Sciences Tools & Services—1.3% | |
Agilent Technologies, Inc. | | | 51,449 | | | | 4,389,114 | |
| | | | | | | | |
|
| Machinery—0.9% | |
Parker-Hannifin Corp. | | | 13,935 | | | | 2,868,102 | |
| | | | | | | | |
|
| Multi-Line Retail—1.7% | |
Dollar Tree, Inc. (a) | | | 60,462 | | | | 5,686,451 | |
| | | | | | | | |
| |
| Pharmaceuticals—4.4% | | | | | |
Catalent, Inc. (a) | | | 107,632 | | | | 6,059,682 | |
Elanco Animal Health, Inc. (a) | | | 178,090 | | | | 5,244,750 | |
Horizon Therapeutics PLC (a) | | | 100,555 | | | | 3,640,091 | |
| | | | | | | | |
| | | | | | | 14,944,523 | |
| | | | | | | | |
|
| Professional Services—3.6% | |
Equifax, Inc. | | | 35,218 | | | | 4,934,746 | |
Verisk Analytics, Inc. | | | 49,168 | | | | 7,342,749 | |
| | | | | | | | |
| | | | | | | 12,277,495 | |
| | | | | | | | |
|
| Real Estate Management & Development—1.4% | |
CBRE Group, Inc., Class A (a) | | | 75,481 | | | | 4,626,231 | |
| | | | | | | | |
|
| Road & Rail—1.4% | |
Kansas City Southern | | | 30,190 | | | | 4,623,900 | |
| | | | | | | | |
|
| Semiconductors & Semiconductor Equipment—7.4% | |
Advanced Micro Devices, Inc. (a) | | | 189,955 | | | | 8,711,336 | |
Entegris, Inc. | | | 84,196 | | | | 4,217,378 | |
Lam Research Corp. | | | 25,010 | | | | 7,312,924 | |
Monolithic Power Systems, Inc. | | | 25,204 | | | | 4,486,816 | |
| | | | | | | | |
| | | | | | | 24,728,454 | |
| | | | | | | | |
|
| Software—8.2% | |
Atlassian Corp. PLC, Class A (a) | | | 40,745 | | | | 4,903,253 | |
Ceridian HCM Holding, Inc. (a) | | | 82,330 | | | | 5,588,561 | |
Splunk, Inc. (a) | | | 55,494 | | | | 8,311,336 | |
Trade Desk, Inc., Class A (a) | | | 18,033 | | | | 4,684,613 | |
Workday, Inc., Class A (a) | | | 24,689 | | | | 4,060,106 | |
| | | | | | | | |
| | | | | | | 27,547,869 | |
| | | | | | | | |
|
| Specialty Retail—1.2% | |
Floor & Decor Holdings, Inc., Class A (a) | | | 80,865 | | | | 4,108,751 | |
| | | | | | | | |
|
| Textiles, Apparel & Luxury Goods—3.6% | |
Lululemon Athletica, Inc. (a) | | | 33,940 | | | | 7,862,880 | |
VF Corp. | | | 42,005 | | | | 4,186,218 | |
| | | | | | | | |
| | | | | | | 12,049,098 | |
| | | | | | | | |
| | | | | | | | |
| | | Shares | | | Value | |
|
| Trading Companies & Distributors—1.6% | |
United Rentals, Inc. (a) | | | 33,279 | | | $ | 5,549,939 | |
| | | | | | | | |
Total Common Stock
(cost—$244,671,187) | | | | 332,259,319 | |
| | | | | |
| | | | | | | | |
| | |
| | | Principal
Amount
(000s) | | | | |
|
| Repurchase Agreements—1.0% | |
State Street Bank and Trust Co., dated 12/31/19, 0.25%, due 1/2/20, proceeds $3,282,046; collateralized by U.S. Treasury Bonds, 3.00%, due 11/15/45, valued at $3,349,921 including accrued interest | |
(cost—$3,282,000) | | | $3,282 | | | | 3,282,000 | |
| | | | | | | | |
| |
Total Investments
(cost—$247,953,187)—99.8% | | | | 335,541,319 | |
| | | | | | | | |
| | |
| Other assets less liabilities—0.2% | | | | | | | 555,913 | |
| | | | | | | | |
| | |
| Net Assets—100.0% | | | | | | | $336,097,232 | |
| | | | | | | | |
Notes to Schedule of Investments:
(a)Non-income producing.
| | | | | | |
| 78 | | Semiannual Report | | | December 31, 2019 | | | See accompanying Notes to Financial Statements |
Schedule of Investments
December 31, 2019 (Unaudited)
AllianzGI NFJ Dividend Value Fund
| | | | | | | | |
| | | Shares | | | Value | |
| |
| Common Stock—99.8% | | | | | |
|
| Aerospace & Defense—5.0% | |
Curtiss-Wright Corp. | | | 86,761 | | | | $12,223,757 | |
General Dynamics Corp. | | | 36,438 | | | | 6,425,841 | |
Lockheed Martin Corp. | | | 64,365 | | | | 25,062,444 | |
United Technologies Corp. | | | 124,015 | | | | 18,572,487 | |
| | | | | | | | |
| | | | | | | 62,284,529 | |
| | | | | | | | |
|
| Air Freight & Logistics—1.0% | |
Expeditors International of Washington, Inc. | | | 160,138 | | | | 12,493,967 | |
| | | | | | | | |
|
| Automobiles—0.9% | |
General Motors Co. | | | 317,314 | | | | 11,613,692 | |
| | | | | | | | |
|
| Banks—13.1% | |
Bank of America Corp. | | | 703,210 | | | | 24,767,056 | |
Citigroup, Inc. | | | 312,870 | | | | 24,995,184 | |
Citizens Financial Group, Inc. | | | 300,177 | | | | 12,190,188 | |
Comerica, Inc. | | | 174,063 | | | | 12,489,020 | |
JPMorgan Chase & Co. | | | 361,440 | | | | 50,384,736 | |
M&T Bank Corp. | | | 74,994 | | | | 12,730,232 | |
PNC Financial Services Group, Inc. | | | 75,711 | | | | 12,085,747 | |
U.S. Bancorp | | | 207,704 | | | | 12,314,770 | |
| | | | | | | | |
| | | | | | | 161,956,933 | |
| | | | | | | | |
|
| Beverages—1.0% | |
Diageo PLC ADR | | | 74,200 | | | | 12,496,764 | |
| | | | | | | | |
|
| Capital Markets—3.0% | |
Ameriprise Financial, Inc. | | | 74,500 | | | | 12,410,210 | |
Morgan Stanley | | | 485,145 | | | | 24,800,612 | |
| | | | | | | | |
| | | | | | | 37,210,822 | |
| | | | | | | | |
|
| Chemicals—2.0% | |
Celanese Corp. | | | 97,600 | | | | 12,016,512 | |
Dow, Inc. | | | 230,206 | | | | 12,599,174 | |
| | | | | | | | |
| | | | | | | 24,615,686 | |
| | | | | | | | |
|
| Communications Equipment—1.0% | |
Cisco Systems, Inc. | | | 262,615 | | | | 12,595,015 | |
| | | | | | | | |
|
| Construction & Engineering—0.9% | |
EMCOR Group, Inc. | | | 133,050 | | | | 11,482,215 | |
| | | | | | | | |
|
| Construction Materials—1.0% | |
Vulcan Materials Co. | | | 87,111 | | | | 12,543,113 | |
| | | | | | | | |
|
| Containers & Packaging—1.0% | |
Avery Dennison Corp. | | | 93,866 | | | | 12,279,550 | |
| | | | | | | | |
|
| Diversified Telecommunication Services—3.0% | |
AT&T, Inc. | | | 645,263 | | | | 25,216,878 | |
Verizon Communications, Inc. | | | 200,121 | | | | 12,287,429 | |
| | | | | | | | |
| | | | | | | 37,504,307 | |
| | | | | | | | |
|
| Electric Utilities—3.0% | |
American Electric Power Co., Inc. | | | 132,354 | | | | 12,508,777 | |
Exelon Corp. | | | 269,798 | | | | 12,300,091 | |
Pinnacle West Capital Corp. | | | 133,769 | | | | 12,029,846 | |
| | | | | | | | |
| | | | | | | 36,838,714 | |
| | | | | | | | |
|
| Electrical Equipment—1.0% | |
Eaton Corp. PLC | | | 130,119 | | | | 12,324,872 | |
| | | | | | | | |
|
| Entertainment—1.0% | |
Walt Disney Co. | | | 85,317 | | | | 12,339,398 | |
| | | | | | | | |
|
| Equity Real Estate Investment Trusts (REITs)—3.0% | |
Alexandria Real Estate Equities, Inc. | | | 75,691 | | | | 12,230,152 | |
CoreSite Realty Corp. | | | 106,019 | | | | 11,886,850 | |
| | | | | | | | |
| | | Shares | | | Value | |
Crown Castle International Corp. | | | 86,693 | | | $ | 12,323,410 | |
| | | | | | | | |
| | | | | | | 36,440,412 | |
| | | | | | | | |
|
| Food Products—2.0% | |
Lamb Weston Holdings, Inc. | | | 143,262 | | | | 12,324,830 | |
Mondelez International, Inc., Class A | | | 229,171 | | | | 12,622,739 | |
| | | | | | | | |
| | | | | | | 24,947,569 | |
| | | | | | | | |
|
| Healthcare Equipment & Supplies—4.0% | |
Hill-Rom Holdings, Inc. | | | 107,644 | | | | 12,220,823 | |
Medtronic PLC | | | 217,970 | | | | 24,728,697 | |
Stryker Corp. | | | 59,526 | | | | 12,496,888 | |
| | | | | | | | |
| | | | | | | 49,446,408 | |
| | | | | | | | |
|
| Healthcare Providers & Services—2.0% | |
Humana, Inc. | | | 33,126 | | | | 12,141,342 | |
Quest Diagnostics, Inc. | | | 113,347 | | | | 12,104,326 | |
| | | | | | | | |
| | | | | | | 24,245,668 | |
| | | | | | | | |
|
| Hotels, Restaurants & Leisure—1.9% | |
Darden Restaurants, Inc. | | | 106,210 | | | | 11,577,952 | |
Royal Caribbean Cruises Ltd. | | | 91,930 | | | | 12,273,574 | |
| | | | | | | | |
| | | | | | | 23,851,526 | |
| | | | | | | | |
|
| Household Products—1.0% | |
Church & Dwight Co., Inc. | | | 176,192 | | | | 12,393,345 | |
| | | | | | | | |
|
| Industrial Conglomerates—1.6% | |
General Electric Co. | | | 564,112 | | | | 6,295,490 | |
Roper Technologies, Inc. | | | 36,361 | | | | 12,880,157 | |
| | | | | | | | |
| | | | | | | 19,175,647 | |
| | | | | | | | |
|
| Insurance—6.8% | |
Allstate Corp. | | | 110,697 | | | | 12,447,878 | |
MetLife, Inc. | | | 243,999 | | | | 12,436,629 | |
Primerica, Inc. | | | 89,766 | | | | 11,719,849 | |
Progressive Corp. | | | 306,496 | | | | 22,187,245 | |
Reinsurance Group of America, Inc. | | | 151,325 | | | | 24,675,055 | |
| | | | | | | | |
| | | | | | | 83,466,656 | |
| | | | | | | | |
|
| IT Services—1.0% | |
Automatic Data Processing, Inc. | | | 73,423 | | | | 12,518,622 | |
| | | | | | | | |
|
| Life Sciences Tools & Services—1.0% | |
Agilent Technologies, Inc. | | | 144,540 | | | | 12,330,707 | |
| | | | | | | | |
|
| Machinery—3.1% | |
Crane Co. | | | 145,674 | | | | 12,583,320 | |
Stanley Black & Decker, Inc. | | | 76,399 | | | | 12,662,371 | |
Toro Co. | | | 155,451 | | | | 12,384,781 | |
| | | | | | | | |
| | | | | | | 37,630,472 | |
| | | | | | | | |
|
| Media—3.0% | |
Comcast Corp., Class A | | | 822,100 | | | | 36,969,837 | |
| | | | | | | | |
|
| Multi-Utilities—1.0% | |
Public Service Enterprise Group, Inc. | | | 203,649 | | | | 12,025,473 | |
| | | | | | | | |
|
| Oil, Gas & Consumable Fuels—10.3% | |
Chevron Corp. | | | 362,054 | | | | 43,631,128 | |
ConocoPhillips | | | 359,165 | | | | 23,356,500 | |
EOG Resources, Inc. | | | 136,480 | | | | 11,431,565 | |
Marathon Petroleum Corp. | | | 197,198 | | | | 11,881,179 | |
Royal Dutch Shell PLC, Class A ADR | | | 217,158 | | | | 12,807,979 | |
TC Energy Corp. | | | 235,642 | | | | 12,562,075 | |
Valero Energy Corp. | | | 126,249 | | | | 11,823,219 | |
| | | | | | | | |
| | | | | | | 127,493,645 | |
| | | | | | | | |
| | | | | | | | |
| | | Shares | | | Value | |
|
| Personal Products—1.0% | |
Unilever NV | | | 218,148 | | | $ | 12,534,784 | |
| | | | | | | | |
|
| Pharmaceuticals—6.5% | |
Bristol-Myers Squibb Co. | | | 194,137 | | | | 12,461,654 | |
Johnson & Johnson | | | 298,294 | | | | 43,512,146 | |
Pfizer, Inc. | | | 310,947 | | | | 12,182,903 | |
Roche Holding AG ADR | | | 307,248 | | | | 12,492,704 | |
| | | | | | | | |
| | | | | | | 80,649,407 | |
| | | | | | | | |
|
| Road & Rail—1.0% | |
Kansas City Southern | | | 82,358 | | | | 12,613,951 | |
| | | | | | | | |
|
| Semiconductors & Semiconductor Equipment—3.1% | |
Broadcom, Inc. | | | 37,838 | | | | 11,957,565 | |
Intel Corp. | | | 428,344 | | | | 25,636,388 | |
| | | | | | | | |
| | | | | | | 37,593,953 | |
| | | | | | | | |
|
| Software—1.9% | |
Oracle Corp. | | | 443,169 | | | | 23,479,094 | |
| | | | | | | | |
|
| Specialty Retail—4.0% | |
Lowe’s Cos., Inc. | | | 209,436 | | | | 25,082,055 | |
TJX Cos., Inc. | | | 203,604 | | | | 12,432,060 | |
Tractor Supply Co. | | | 130,335 | | | | 12,178,503 | |
| | | | | | | | |
| | | | | | | 49,692,618 | |
| | | | | | | | |
|
| Textiles, Apparel & Luxury Goods—1.0% | |
Columbia Sportswear Co. | | | 121,200 | | | | 12,143,028 | |
| | | | | | | | |
|
| Tobacco—1.7% | |
Philip Morris International, Inc. | | | 240,747 | | | | 20,485,162 | |
| | | | | | | | |
Total Common Stock
(cost—$1,076,279,479) | | | | 1,232,707,561 | |
| | | | | |
| | | | | | | | |
| | |
| | | Principal
Amount
(000s) | | | | |
|
| Repurchase Agreements—0.6% | |
State Street Bank and Trust Co., dated 12/31/19, 0.25%, due 1/2/20, proceeds $7,594,105; collateralized by U.S. Treasury Bonds, 2.50%, due 2/15/46-5/15/46, valued at $7,746,570 including accrued interest | |
(cost—$7,594,000) | | | $7,594 | | | | 7,594,000 | |
| | | | | | | | |
| |
Total Investments
(cost—$1,083,873,479)
—100.4% | | | | 1,240,301,561 | |
| | | | | | | | |
| | |
| Liabilities in excess of other assets—(0.4)% | | | | | | | (4,360,493 | ) |
| | | | | | | | |
| | |
| Net Assets—100.0% | | | | | | | $1,235,941,068 | |
| | | | | | | | |
Glossary:
ADR—American Depositary Receipt
REIT—Real Estate Investment Trust
| | | | | | | | |
| See accompanying Notes to Financial Statements | | | December 31, 2019 | | | Semiannual Report | | | 79 | |
Schedule of Investments
December 31, 2019 (Unaudited)
AllianzGI NFJ International Value Fund
| | | | | | | | |
| | | Shares | | | Value | |
| |
| Common Stock—98.0% | | | | | |
|
| Australia—1.9% | |
Macquarie Group Ltd. | | | 17,871 | | | | $1,730,704 | |
Westpac Banking Corp. | | | 89,154 | | | | 1,522,459 | |
| | | | | | | | |
| | | | | | | 3,253,163 | |
| | | | | | | | |
|
| Belgium—1.0% | |
Anheuser-Busch InBev S.A. ADR | | | 20,999 | | | | 1,722,758 | |
| | | | | | | | |
|
| Brazil—1.1% | |
Banco Bradesco S.A. ADR | | | 207,670 | | | | 1,858,646 | |
| | | | | | | | |
|
| Canada—10.5% | |
Bank of Montreal | | | 23,200 | | | | 1,798,000 | |
Canadian Pacific Railway Ltd. | | | 13,441 | | | | 3,426,783 | |
Enerplus Corp. | | | 175,900 | | | | 1,254,167 | |
Magna International, Inc. | | | 27,256 | | | | 1,494,719 | |
Manulife Financial Corp. | | | 86,068 | | | | 1,746,320 | |
TC Energy Corp. | | | 63,460 | | | | 3,383,052 | |
Toronto-Dominion Bank | | | 83,540 | | | | 4,689,100 | |
| | | | | | | | |
| | | | | | | 17,792,141 | |
| | | | | | | | |
|
| China—12.1% | |
Anhui Conch Cement Co., Ltd., Class H | | | 498,500 | | | | 3,632,134 | |
China Construction Bank Corp., Class H | | | 2,135,100 | | | | 1,851,220 | |
China Mobile Ltd. | | | 361,500 | | | | 3,054,623 | |
China Shenhua Energy Co., Ltd., Class H | | | 744,000 | | | | 1,555,632 | |
Haier Electronics Group Co., Ltd. | | | 646,000 | | | | 2,018,323 | |
Hengan International Group Co., Ltd. | | | 239,500 | | | | 1,705,975 | |
Longfor Group Holdings Ltd. (a) | | | 357,500 | | | | 1,674,165 | |
Ping An Insurance Group Co of China Ltd., Class A | | | 117,117 | | | | 1,439,254 | |
Shenzhen Expressway Co., Ltd., Class H | | | 1,144,000 | | | | 1,641,592 | |
Tencent Holdings Ltd. | | | 40,000 | | | | 1,927,045 | |
| | | | | | | | |
| | | | | | | 20,499,963 | |
| | | | | | | | |
|
| France—8.0% | |
Capgemini SE | | | 28,002 | | | | 3,424,780 | |
Euronext NV (a) | | | 22,128 | | | | 1,808,740 | |
Kering S.A. | | | 2,608 | | | | 1,718,449 | |
Sanofi | | | 35,329 | | | | 3,548,001 | |
Thales S.A. | | | 29,325 | | | | 3,051,407 | |
| | | | | | | | |
| | | | | | | 13,551,377 | |
| | | | | | | | |
|
| Germany—6.2% | |
BASF SE | | | 18,879 | | | | 1,422,280 | |
Bayer AG | | | 22,143 | | | | 1,800,151 | |
Deutsche Telekom AG | | | 99,558 | | | | 1,626,994 | |
Fresenius SE & Co. KGaA | | | 34,684 | | | | 1,951,788 | |
Muenchener Rueckversicherungs-Gesellschaft AG in Muenchen | | | 5,897 | | | | 1,740,163 | |
SAP SE | | | 13,761 | | | | 1,852,205 | |
| | | | | | | | |
| | | | | | | 10,393,581 | |
| | | | | | | | |
|
| Hong Kong—4.1% | |
AIA Group Ltd. | | | 330,800 | | | | 3,479,341 | |
CLP Holdings Ltd. | | | 147,500 | | | | 1,548,369 | |
Sands China Ltd. | | | 345,600 | | | | 1,846,565 | |
| | | | | | | | |
| | | | | | | 6,874,275 | |
| | | | | | | | |
|
| India—0.8% | |
Reliance Industries Ltd. GDR (a) | | | 32,098 | | | | 1,365,770 | |
| | | | | | | | |
| | | | | | | | |
| | | Shares | | | Value | |
|
| Ireland—1.1% | |
Smurfit Kappa Group PLC | | | 46,602 | | | $ | 1,796,840 | |
| | | | | | | | |
|
| Italy—1.1% | |
Terna Rete Elettrica Nazionale SpA | | | 285,796 | | | | 1,911,378 | |
| | | | | | | | |
|
| Japan—9.9% | |
Astellas Pharma, Inc. | | | 103,000 | | | | 1,758,208 | |
Daiwa House Industry Co., Ltd. | | | 47,700 | | | | 1,476,641 | |
Hitachi Ltd. | | | 46,040 | | | | 1,942,692 | |
KDDI Corp. | | | 56,000 | | | | 1,670,835 | |
Mitsubishi Corp. | | | 64,400 | | | | 1,706,043 | |
Sony Corp. | | | 71,600 | | | | 4,861,473 | |
Tokio Marine Holdings, Inc. | | | 57,400 | | | | 3,213,756 | |
| | | | | | | | |
| | | | | | | 16,629,648 | |
| | | | | | | | |
|
| Korea (Republic of)—2.1% | |
Samsung Electronics Co., Ltd. | | | 73,547 | | | | 3,543,998 | |
| | | | | | | | |
|
| Netherlands—2.9% | |
ING Groep NV | | | 132,412 | | | | 1,591,911 | |
Unilever NV | | | 56,508 | | | | 3,243,032 | |
| | | | | | | | |
| | | | | | | 4,834,943 | |
| | | | | | | | |
|
| Russian Federation—1.1% | |
Lukoil PJSC ADR | | | 19,070 | | | | 1,882,400 | |
| | | | | | | | |
|
| Singapore—3.1% | |
DBS Group Holdings Ltd. | | | 173,600 | | | | 3,347,223 | |
Singapore Exchange Ltd. | | | 279,500 | | | | 1,840,823 | |
| | | | | | | | |
| | | | | | | 5,188,046 | |
| | | | | | | | |
|
| South Africa—0.7% | |
Naspers Ltd., Class N | | | 6,957 | | | | 1,138,491 | |
| | | | | | | | |
|
| Spain—2.8% | |
Banco Santander S.A. | | | 739,141 | | | | 3,099,032 | |
Iberdrola S.A. | | | 165,526 | | | | 1,705,839 | |
| | | | | | | | |
| | | | | | | 4,804,871 | |
| | | | | | | | |
|
| Switzerland—5.3% | |
Nestle S.A. | | | 31,102 | | | | 3,367,264 | |
Roche Holding AG | | | 17,192 | | | | 5,587,446 | |
| | | | | | | | |
| | | | | | | 8,954,710 | |
| | | | | | | | |
|
| Taiwan—1.9% | |
Taiwan Semiconductor Manufacturing Co., Ltd. ADR | | | 54,876 | | | | 3,188,296 | |
| | | | | | | | |
|
| United Kingdom—17.3% | |
3i Group PLC | | | 111,998 | | | | 1,629,763 | |
BAE Systems PLC ADR | | | 105,368 | | | | 3,190,543 | |
Carnival PLC | | | 35,252 | | | | 1,689,753 | |
Coca-Cola HBC AG (c) | | | 52,676 | | | | 1,790,456 | |
Compass Group PLC | | | 69,386 | | | | 1,738,936 | |
Diageo PLC ADR | | | 9,676 | | | | 1,629,632 | |
GlaxoSmithKline PLC | | | 142,186 | | | | 3,340,948 | |
Imperial Brands PLC | | | 126,757 | | | | 3,136,004 | |
Legal & General Group PLC | | | 792,268 | | | | 3,182,586 | |
Rio Tinto PLC | | | 27,884 | | | | 1,650,592 | |
Royal Dutch Shell PLC, Class A ADR | | | 105,140 | | | | 6,201,157 | |
| | | | | | | | |
| | | | | | | 29,180,370 | |
| | | | | | | | |
|
| United States—3.0% | |
Broadcom, Inc. | | | 5,500 | | | | 1,738,110 | |
Constellation Brands, Inc., Class A | | | 8,501 | | | | 1,613,065 | |
Expeditors International of Washington, Inc. | | | 22,330 | | | | 1,742,186 | |
| | | | | | | | |
| | | | | | | 5,093,361 | |
| | | | | | | | |
Total Common Stock
(cost—$149,490,444) | | | | 165,459,026 | |
| | | | | |
| | | | | | | | |
| | | Shares | | | Value | |
|
| Preferred Stock—1.9% | |
|
| Germany—1.9% | |
Porsche Automobil Holding SE
(cost—$2,917,393) | | | 41,698 | | | $ | 3,093,917 | |
| | | | | | | | |
| | | | | | | | |
| | |
| | | Principal
Amount
(000s) | | | | |
|
| Repurchase Agreements—0.2% | |
State Street Bank and Trust Co., dated 12/31/19, 0.25%, due 1/2/20, proceeds $414,006; collateralized by U.S. Treasury Bonds, 2.50%, due 2/15/46, valued at $426,122 including accrued interest | |
(cost—$414,000) | | | $414 | | | | 414,000 | |
| | | | | | | | |
| |
Total Investments (cost—$152,821,837) (b)
—100.1% | | | | 168,966,943 | |
| | | | | | | | |
| | |
| Liabilities in excess of other assets—(0.1)% | | | | | | | (177,500 | ) |
| | | | | | | | |
| | |
| Net Assets—100.0% | | | | | | | $168,789,443 | |
| | | | | | | | |
Notes to Schedule of Investments:
(a) 144A—Exempt from registration under Rule 144A of the Securities Act of 1933. These securities may be resold in transactions exempt from registration, typically only to qualified institutional buyers. Securities with an aggregate value of $4,848,675, representing 2.9% of net assets.
(b) Securities with an aggregate value of $124,628,239, representing 73.8% of net assets, were valued utilizing modeling tools provided by a third-party vendor. See Note 1(a) and Note 1(b) in the Notes to Financial Statements.
(c)Non-income producing.
Glossary:
ADR—American Depositary Receipt
GDR—Global Depositary Receipt
| | | | | | |
| 80 | | Semiannual Report | | | December 31, 2019 | | | See accompanying Notes to Financial Statements |
Schedule of Investments
December 31, 2019 (Unaudited)
The industry classification of portfolio holdings and liabilities in excess of other assets shown as a percentage of net assets were as follows:
| | | | |
Banks | | | 11.7% | |
Pharmaceuticals | | | 9.5% | |
Oil, Gas & Consumable Fuels | | | 9.3% | |
Insurance | | | 8.8% | |
Capital Markets | | | 4.2% | |
Household Durables | | | 4.1% | |
Beverages | | | 4.0% | |
Aerospace & Defense | | | 3.7% | |
Hotels, Restaurants & Leisure | | | 3.1% | |
Electric Utilities | | | 3.1% | |
Personal Products | | | 2.9% | |
Semiconductors & Semiconductor Equipment | | | 2.9% | |
Wireless Telecommunication Services | | | 2.8% | |
Construction Materials | | | 2.1% | |
Technology Hardware, Storage & Peripherals | | | 2.1% | |
Road & Rail | | | 2.0% | |
IT Services | | | 2.0% | |
Food Products | | | 2.0% | |
Real Estate Management & Development | | | 1.9% | |
Tobacco | | | 1.9% | |
Automobiles | | | 1.8% | |
Healthcare Providers & Services | | | 1.2% | |
Electronic Equipment, Instruments & Components | | | 1.1% | |
Interactive Media & Services | | | 1.1% | |
Software | | | 1.1% | |
Containers & Packaging | | | 1.1% | |
Air Freight & Logistics | | | 1.0% | |
Textiles, Apparel & Luxury Goods | | | 1.0% | |
Trading Companies & Distributors | | | 1.0% | |
Metals & Mining | | | 1.0% | |
Transportation Infrastructure | | | 1.0% | |
Diversified Telecommunication Services | | | 1.0% | |
Auto Components | | | 0.9% | |
Chemicals | | | 0.8% | |
Internet & Direct Marketing Retail | | | 0.7% | |
Repurchase Agreements | | | 0.2% | |
Liabilities in excess of other assets | | | (0.1)% | |
| | | | |
| | | 100.0% | |
| | | | |
AllianzGI NFJLarge-Cap Value Fund
| | | | | | | | |
| | | Shares | | | Value | |
| |
| Common Stock—99.7% | | | | | |
|
| Aerospace & Defense—3.7% | |
Curtiss-Wright Corp. | | | 29,916 | | | | $4,214,865 | |
General Dynamics Corp. | | | 8,908 | | | | 1,570,926 | |
Lockheed Martin Corp. | | | 8,000 | | | | 3,115,040 | |
United Technologies Corp. | | | 21,788 | | | | 3,262,971 | |
| | | | | | | | |
| | | | | | | 12,163,802 | |
| | | | | | | | |
|
| Air Freight & Logistics—1.0% | |
Expeditors International of Washington, Inc. | | | 40,976 | | | | 3,196,947 | |
| | | | | | | | |
|
| Banks—13.4% | |
Bank of America Corp. | | | 256,167 | | | | 9,022,202 | |
Citigroup, Inc. | | | 87,400 | | | | 6,982,386 | |
Citizens Financial Group, Inc. | | | 81,165 | | | | 3,296,110 | |
Comerica, Inc. | | | 47,165 | | | | 3,384,089 | |
JPMorgan Chase & Co. | | | 99,700 | | | | 13,898,180 | |
PNC Financial Services Group, Inc. | | | 23,441 | | | | 3,741,887 | |
U.S. Bancorp | | | 52,576 | | | | 3,117,231 | |
| | | | | | | | |
| | | | | | | 43,442,085 | |
| | | | | | | | |
|
| Beverages—1.0% | |
Diageo PLC ADR | | | 18,500 | | | | 3,115,770 | |
| | | | | | | | |
|
| Capital Markets—4.2% | |
Ameriprise Financial, Inc. | | | 21,760 | | | | 3,624,781 | |
Morgan Stanley | | | 134,000 | | | | 6,850,080 | |
Nasdaq, Inc. | | | 29,361 | | | | 3,144,563 | |
| | | | | | | | |
| | | | | | | 13,619,424 | |
| | | | | | | | |
| |
| Chemicals—2.1% | | | | | |
Celanese Corp. | | | 25,800 | | | | 3,176,496 | |
Dow, Inc. | | | 66,846 | | | | 3,658,482 | |
| | | | | | | | |
| | | | | | | 6,834,978 | |
| | | | | | | | |
|
| Communications Equipment—0.9% | |
Cisco Systems, Inc. | | | 58,117 | | | | 2,787,291 | |
| | | | | | | | |
|
| Construction & Engineering—1.0% | |
EMCOR Group, Inc. | | | 37,268 | | | | 3,216,228 | |
| | | | | | | | |
|
| Construction Materials—1.0% | |
Vulcan Materials Co. | | | 22,893 | | | | 3,296,363 | |
| | | | | | | | |
|
| Consumer Finance—1.0% | |
Discover Financial Services | | | 37,300 | | | | 3,163,786 | |
| | | | | | | | |
|
| Containers & Packaging—1.1% | |
Avery Dennison Corp. | | | 26,252 | | | | 3,434,287 | |
| | | | | | | | |
|
| Diversified Telecommunication Services—2.8% | |
AT&T, Inc. | | | 156,789 | | | | 6,127,314 | |
Verizon Communications, Inc. | | | 50,871 | | | | 3,123,479 | |
| | | | | | | | |
| | | | | | | 9,250,793 | |
| | | | | | | | |
|
| Electric Utilities—2.7% | |
Entergy Corp. | | | 24,865 | | | | 2,978,827 | |
Exelon Corp. | | | 66,592 | | | | 3,035,930 | |
Pinnacle West Capital Corp. | | | 29,839 | | | | 2,683,421 | |
| | | | | | | | |
| | | | | | | 8,698,178 | |
| | | | | | | | |
|
| Electrical Equipment—1.1% | |
Eaton Corp. PLC | | | 36,600 | | | | 3,466,752 | |
| | | | | | | | |
|
| Entertainment—1.0% | |
Walt Disney Co. | | | 23,376 | | | | 3,380,871 | |
| | | | | | | | |
|
| Equity Real Estate Investment Trusts (REITs)—3.8% | |
Alexandria Real Estate Equities, Inc. | | | 21,081 | | | | 3,406,268 | |
CoreSite Realty Corp. | | | 23,805 | | | | 2,669,016 | |
| | | | | | | | |
| | | Shares | | | Value | |
Crown Castle International Corp. | | | 21,299 | | | $ | 3,027,653 | |
Prologis, Inc. | | | 34,599 | | | | 3,084,155 | |
| | | | | | | | |
| | | | | | | 12,187,092 | |
| | | | | | | | |
|
| Food & Staples Retailing—0.5% | |
Sysco Corp. | | | 19,445 | | | | 1,663,325 | |
| | | | | | | | |
|
| Food Products—1.9% | |
Lamb Weston Holdings, Inc. | | | 37,792 | | | | 3,251,246 | |
Mondelez International, Inc., Class A | | | 56,000 | | | | 3,084,480 | |
| | | | | | | | |
| | | | | | | 6,335,726 | |
| | | | | | | | |
|
| Healthcare Equipment & Supplies—3.4% | |
Abbott Laboratories | | | 18,507 | | | | 1,607,518 | |
Baxter International, Inc. | | | 18,506 | | | | 1,547,472 | |
Hill-Rom Holdings, Inc. | | | 28,317 | | | | 3,214,829 | |
Medtronic PLC | | | 39,900 | | | | 4,526,655 | |
| | | | | | | | |
| | | | | | | 10,896,474 | |
| | | | | | | | |
|
| Healthcare Providers & Services—3.5% | |
CVS Health Corp. | | | 24,208 | | | | 1,798,412 | |
HCA Healthcare, Inc. | | | 18,700 | | | | 2,764,047 | |
Humana, Inc. | | | 9,526 | | | | 3,491,470 | |
Quest Diagnostics, Inc. | | | 29,700 | | | | 3,171,663 | |
| | | | | | | | |
| | | | | | | 11,225,592 | |
| | | | | | | | |
|
| Hotels, Restaurants & Leisure—2.4% | |
Darden Restaurants, Inc. | | | 24,820 | | | | 2,705,628 | |
Domino’s Pizza, Inc. | | | 6,027 | | | | 1,770,612 | |
Royal Caribbean Cruises Ltd. | | | 25,700 | | | | 3,431,207 | |
| | | | | | | | |
| | | | | | | 7,907,447 | |
| | | | | | | | |
|
| Household Products—1.5% | |
Church & Dwight Co., Inc. | | | 46,725 | | | | 3,286,637 | |
Procter & Gamble Co. | | | 13,138 | | | | 1,640,936 | |
| | | | | | | | |
| | | | | | | 4,927,573 | |
| | | | | | | | |
|
| Industrial Conglomerates—2.1% | |
General Electric Co. | | | 170,872 | | | | 1,906,931 | |
Honeywell International, Inc. | | | 8,713 | | | | 1,542,201 | |
Roper Technologies, Inc. | | | 9,094 | | | | 3,221,368 | |
| | | | | | | | |
| | | | | | | 6,670,500 | |
| | | | | | | | |
|
| Insurance—5.7% | |
Allstate Corp. | | | 29,200 | | | | 3,283,540 | |
MetLife, Inc. | | | 61,428 | | | | 3,130,985 | |
Primerica, Inc. | | | 26,421 | | | | 3,449,526 | |
Progressive Corp. | | | 73,688 | | | | 5,334,274 | |
Reinsurance Group of America, Inc. | | | 20,100 | | | | 3,277,506 | |
| | | | | | | | |
| | | | | | | 18,475,831 | |
| | | | | | | | |
|
| IT Services—1.0% | |
Automatic Data Processing, Inc. | | | 18,715 | | | | 3,190,907 | |
| | | | | | | | |
|
| Life Sciences Tools & Services—0.5% | |
Agilent Technologies, Inc. | | | 20,918 | | | | 1,784,515 | |
| | | | | | | | |
|
| Machinery—2.6% | |
Crane Co. | | | 19,494 | | | | 1,683,892 | |
Stanley Black & Decker, Inc. | | | 20,298 | | | | 3,364,190 | |
Toro Co. | | | 41,040 | | | | 3,269,657 | |
| | | | | | | | |
| | | | | | | 8,317,739 | |
| | | | | | | | |
|
| Media—1.9% | |
Comcast Corp., Class A | | | 138,100 | | | | 6,210,357 | |
| | | | | | | | |
|
| Multi-Utilities—0.9% | |
Public Service Enterprise Group, Inc. | | | 49,368 | | | | 2,915,180 | |
| | | | | | | | |
| | | | | | | | |
| See accompanying Notes to Financial Statements | | | December 31, 2019 | | | Semiannual Report | | | 81 | |
Schedule of Investments
December 31, 2019 (Unaudited)
| | | | | | | | |
| | | Shares | | | Value | |
|
| Oil, Gas & Consumable Fuels—10.3% | |
Chevron Corp. | | | 89,545 | | | $ | 10,791,068 | |
ConocoPhillips | | | 111,700 | | | | 7,263,851 | |
EOG Resources, Inc. | | | 37,458 | | | | 3,137,482 | |
Kinder Morgan, Inc. | | | 151,522 | | | | 3,207,721 | |
Marathon Oil Corp. | | | 231,292 | | | | 3,140,945 | |
Marathon Petroleum Corp. | | | 49,338 | | | | 2,972,615 | |
Royal Dutch Shell PLC, Class A ADR | | | 26,465 | | | | 1,560,906 | |
Valero Energy Corp. | | | 15,793 | | | | 1,479,014 | |
| | | | | | | | |
| | | | | | | 33,553,602 | |
| | | | | | | | |
|
| Personal Products—0.9% | |
Unilever NV | | | 50,562 | | | | 2,905,293 | |
| | | | | | | | |
|
| Pharmaceuticals—5.6% | |
Bristol-Myers Squibb Co. | | | 13,926 | | | | 893,910 | |
Johnson & Johnson | | | 70,424 | | | | 10,272,749 | |
Pfizer, Inc. | | | 84,597 | | | | 3,314,510 | |
Roche Holding AG ADR | | | 87,144 | | | | 3,543,275 | |
| | | | | | | | |
| | | | | | | 18,024,444 | |
| | | | | | | | |
|
| Road & Rail—0.9% | |
Union Pacific Corp. | | | 17,000 | | | | 3,073,430 | |
| | | | | | | | |
|
| Semiconductors & Semiconductor Equipment—3.1% | |
Broadcom, Inc. | | | 10,281 | | | | 3,249,002 | |
Intel Corp. | | | 116,500 | | | | 6,972,525 | |
| | | | | | | | |
| | | | | | | 10,221,527 | |
| | | | | | | | |
|
| Software—2.1% | |
Microsoft Corp. | | | 22,280 | | | | 3,513,556 | |
Oracle Corp. | | | 60,800 | | | | 3,221,184 | |
| | | | | | | | |
| | | | | | | 6,734,740 | |
| | | | | | | | |
|
| Specialty Retail—4.6% | |
Best Buy Co., Inc. | | | 24,485 | | | | 2,149,783 | |
Lowe’s Cos., Inc. | | | 53,485 | | | | 6,405,364 | |
TJX Cos., Inc. | | | 55,090 | | | | 3,363,795 | |
Tractor Supply Co. | | | 33,154 | | | | 3,097,910 | |
| | | | | | | | |
| | | | | | | 15,016,852 | |
| | | | | | | | |
|
| Textiles, Apparel & Luxury Goods—1.0% | |
Columbia Sportswear Co. | | | 31,118 | | | | 3,117,712 | |
| | | | | | | | |
|
| Tobacco—1.5% | |
Philip Morris International, Inc. | | | 58,130 | | | | 4,946,282 | |
| | | | | | | | |
| |
Total Investments
(cost—$292,190,104)—99.7% | | | | 323,369,695 | |
| | | | | | | | |
| | |
| Other assets less liabilities—0.3% | | | | | | | 924,649 | |
| | | | | | | | |
| | |
| Net Assets—100.0% | | | | | | | $324,294,344 | |
| | | | | | | | |
Glossary:
ADR—American Depositary Receipt
REIT—Real Estate Investment Trust
AllianzGI NFJMid-Cap Value Fund
| | | | | | | | |
| | | Shares | | | Value | |
| |
| Common Stock—98.7% | | | | | |
|
| Aerospace & Defense—2.7% | |
Curtiss-Wright Corp. | | | 100,514 | | | | $14,161,418 | |
L3Harris Technologies, Inc. | | | 59,090 | | | | 11,692,138 | |
Northrop Grumman Corp. | | | 39,990 | | | | 13,755,360 | |
| | | | | | | | |
| | | | | | | 39,608,916 | |
| | | | | | | | |
|
| Air Freight & Logistics—1.0% | |
Expeditors International of Washington, Inc. | | | 183,463 | | | | 14,313,783 | |
| | | | | | | | |
|
| Airlines—0.4% | |
Copa Holdings S.A., Class A | | | 55,531 | | | | 6,001,791 | |
| | | | | | | | |
|
| Banks—7.1% | |
Citizens Financial Group, Inc. | | | 371,950 | | | | 15,104,890 | |
Comerica, Inc. | | | 199,680 | | | | 14,327,040 | |
Fifth Third Bancorp | | | 589,269 | | | | 18,114,129 | |
KeyCorp | | | 363,660 | | | | 7,360,479 | |
M&T Bank Corp. | | | 86,187 | | | | 14,630,243 | |
Regions Financial Corp. | | | 840,570 | | | | 14,424,181 | |
TCF Financial Corp. | | | 156,604 | | | | 7,329,067 | |
Western Alliance Bancorp | | | 213,623 | | | | 12,176,511 | |
| | | | | | | | |
| | | | | | | 103,466,540 | |
| | | | | | | | |
|
| Beverages—1.0% | |
Constellation Brands, Inc., Class A | | | 38,634 | | | | 7,330,801 | |
Keurig Dr Pepper, Inc. | | | 239,409 | | | | 6,930,891 | |
| | | | | | | | |
| | | | | | | 14,261,692 | |
| | | | | | | | |
|
| Capital Markets—5.0% | |
Ameriprise Financial, Inc. | | | 85,076 | | | | 14,171,960 | |
Cboe Global Markets, Inc. | | | 56,697 | | | | 6,803,640 | |
Intercontinental Exchange, Inc. | | | 117,559 | | | | 10,880,086 | |
Northern Trust Corp. | | | 112,849 | | | | 11,989,078 | |
SEI Investments Co. | | | 227,180 | | | | 14,875,746 | |
Stifel Financial Corp. | | | 232,165 | | | | 14,080,807 | |
| | | | | | | | |
| | | | | | | 72,801,317 | |
| | | | | | | | |
|
| Chemicals—2.7% | |
Celanese Corp. | | | 56,494 | | | | 6,955,541 | |
Ecolab, Inc. | | | 38,390 | | | | 7,408,886 | |
FMC Corp. | | | 35,937 | | | | 3,587,232 | |
LyondellBasell Industries NV, Class A | | | 77,996 | | | | 7,369,062 | |
ScottsMiracle-Gro Co. | | | 130,150 | | | | 13,819,327 | |
| | | | | | | | |
| | | | | | | 39,140,048 | |
| | | | | | | | |
|
| Commercial Services & Supplies—1.0% | |
Republic Services, Inc. | | | 157,810 | | | | 14,144,510 | |
| | | | | | | | |
|
| Communications Equipment—0.5% | |
Motorola Solutions, Inc. | | | 45,042 | | | | 7,258,068 | |
| | | | | | | | |
|
| Construction & Engineering—0.4% | |
EMCOR Group, Inc. | | | 76,809 | | | | 6,628,617 | |
| | | | | | | | |
|
| Construction Materials—1.0% | |
Vulcan Materials Co. | | | 101,270 | | | | 14,581,867 | |
| | | | | | | | |
|
| Consumer Finance—0.9% | |
Discover Financial Services | | | 159,410 | | | | 13,521,156 | |
| | | | | | | | |
|
| Containers & Packaging—1.8% | |
Avery Dennison Corp. | | | 52,567 | | | | 6,876,815 | |
Sealed Air Corp. | | | 287,486 | | | | 11,450,567 | |
Sonoco Products Co. | | | 118,861 | | | | 7,336,101 | |
| | | | | | | | |
| | | | | | | 25,663,483 | |
| | | | | | | | |
| | | | | | | | |
| | | Shares | | | Value | |
|
| Diversified Consumer Services—1.1% | |
Service Corp. International | | | 158,040 | | | $ | 7,274,581 | |
Strategic Education, Inc. | | | 52,549 | | | | 8,350,036 | |
| | | | | | | | |
| | | | | | | 15,624,617 | |
| | | | | | | | |
|
| Electric Utilities—2.2% | |
Evergy, Inc. | | | 213,648 | | | | 13,906,348 | |
Otter Tail Corp. | | | 72,285 | | | | 3,707,498 | |
Xcel Energy, Inc. | | | 232,297 | | | | 14,748,537 | |
| | | | | | | | |
| | | | | | | 32,362,383 | |
| | | | | | | | |
|
| Electrical Equipment—0.9% | |
AMETEK, Inc. | | | 139,035 | | | | 13,867,351 | |
| | | | | | | | |
|
| Electronic Equipment, Instruments & Components—0.7% | |
Amphenol Corp., Class A | | | 33,758 | | | | 3,653,628 | |
FLIR Systems, Inc. | | | 128,256 | | | | 6,678,290 | |
| | | | | | | | |
| | | | | | | 10,331,918 | |
| | | | | | | | |
|
| Entertainment—0.9% | |
Activision Blizzard, Inc. | | | 122,296 | | | | 7,266,828 | |
World Wrestling Entertainment, Inc., Class A | | | 93,701 | | | | 6,078,384 | |
| | | | | | | | |
| | | | | | | 13,345,212 | |
| | | | | | | | |
|
Equity Real Estate Investment Trusts
(REITs)—11.3% | |
Alexandria Real Estate Equities, Inc. | | | 87,156 | | | | 14,082,666 | |
AvalonBay Communities, Inc. | | | 56,940 | | | | 11,940,318 | |
Boston Properties, Inc. | | | 96,003 | | | | 13,234,974 | |
CoreSite Realty Corp. | | | 113,860 | | | | 12,765,983 | |
Crown Castle International Corp. | | | 105,429 | | | | 14,986,732 | |
Douglas Emmett, Inc. | | | 310,580 | | | | 13,634,462 | |
Equinix, Inc. | | | 5,843 | | | | 3,410,559 | |
Extra Space Storage, Inc. | | | 132,690 | | | | 14,014,718 | |
Lamar Advertising Co., Class A | | | 113,190 | | | | 10,103,339 | |
National Health Investors, Inc. | | | 160,330 | | | | 13,063,688 | |
Prologis, Inc. | | | 153,640 | | | | 13,695,470 | |
Public Storage | | | 32,584 | | | | 6,939,089 | |
Terreno Realty Corp. | | | 49,076 | | | | 2,656,975 | |
UDR, Inc. | | | 196,550 | | | | 9,178,885 | |
Ventas, Inc. | | | 184,050 | | | | 10,627,047 | |
| | | | | | | | |
| | | | | | | 164,334,905 | |
| | | | | | | | |
|
| Food Products—1.8% | |
Lamb Weston Holdings, Inc. | | | 166,688 | | | | 14,340,169 | |
Tyson Foods, Inc., Class A | | | 125,884 | | | | 11,460,479 | |
| | | | | | | | |
| | | | | | | 25,800,648 | |
| | | | | | | | |
|
| Gas Utilities—2.4% | |
Atmos Energy Corp. | | | 66,642 | | | | 7,454,574 | |
ONE Gas, Inc. | | | 155,969 | | | | 14,594,019 | |
Southwest Gas Holdings, Inc. | | | 181,305 | | | | 13,773,741 | |
| | | | | | | | |
| | | | | | | 35,822,334 | |
| | | | | | | | |
|
| Healthcare Equipment & Supplies—1.4% | |
STERIS PLC | | | 86,990 | | | | 13,259,016 | |
Stryker Corp. | | | 34,781 | | | | 7,301,923 | |
| | | | | | | | |
| | | | | | | 20,560,939 | |
| | | | | | | | |
|
| Healthcare Providers & Services—2.6% | |
Encompass Health Corp. | | | 160,113 | | | | 11,091,027 | |
Humana, Inc. | | | 35,841 | | | | 13,136,443 | |
Quest Diagnostics, Inc. | | | 124,221 | | | | 13,265,561 | |
| | | | | | | | |
| | | | | | | 37,493,031 | |
| | | | | | | | |
| | | | | | |
| 82 | | Semiannual Report | | | December 31, 2019 | | | See accompanying Notes to Financial Statements |
Schedule of Investments
December 31, 2019 (Unaudited)
| | | | | | | | |
| | | Shares | | | Value | |
|
| Hotels, Restaurants & Leisure—4.5% | |
Cedar Fair L.P. | | | 122,244 | | | $ | 6,777,207 | |
Darden Restaurants, Inc. | | | 61,120 | | | | 6,662,691 | |
Domino’s Pizza, Inc. | | | 24,532 | | | | 7,207,011 | |
Dunkin’ Brands Group, Inc. | | | 92,537 | | | | 6,990,245 | |
Royal Caribbean Cruises Ltd. | | | 165,942 | | | | 22,154,917 | |
Vail Resorts, Inc. | | | 28,131 | | | | 6,746,658 | |
Yum China Holdings, Inc. | | | 179,789 | | | | 8,631,670 | |
| | | | | | | | |
| | | | | | | 65,170,399 | |
| | | | | | | | |
|
| Household Durables—1.0% | |
Garmin Ltd. | | | 36,547 | | | | 3,565,525 | |
PulteGroup, Inc. | | | 269,615 | | | | 10,461,062 | |
| | | | | | | | |
| | | | | | | 14,026,587 | |
| | | | | | | | |
|
| Household Products—0.7% | |
Church & Dwight Co., Inc. | | | 146,206 | | | | 10,284,130 | |
| | | | | | | | |
|
| Industrial Conglomerates—1.0% | |
Roper Technologies, Inc. | | | 40,493 | | | | 14,343,835 | |
| | | | | | | | |
|
| Insurance—8.9% | |
Allstate Corp. | | | 93,891 | | | | 10,558,043 | |
American Financial Group, Inc. | | | 126,730 | | | | 13,895,944 | |
Aon PLC | | | 33,709 | | | | 7,021,248 | |
Cincinnati Financial Corp. | | | 83,369 | | | | 8,766,250 | |
Hanover Insurance Group, Inc. | | | 100,607 | | | | 13,749,959 | |
Lincoln National Corp. | | | 242,890 | | | | 14,332,939 | |
Primerica, Inc. | | | 82,050 | | | | 10,712,448 | |
Progressive Corp. | | | 232,091 | | | | 16,801,067 | |
Reinsurance Group of America, Inc. | | | 80,183 | | | | 13,074,640 | |
Selective Insurance Group, Inc. | | | 209,867 | | | | 13,681,230 | |
Unum Group | | | 236,154 | | | | 6,886,251 | |
| | | | | | | | |
| | | | | | | 129,480,019 | |
| | | | | | | | |
|
| IT Services—4.3% | |
Amdocs Ltd. | | | 182,674 | | | | 13,187,236 | |
Automatic Data Processing, Inc. | | | 41,235 | | | | 7,030,567 | |
MAXIMUS, Inc. | | | 139,880 | | | | 10,405,673 | |
Paychex, Inc. | | | 118,731 | | | | 10,099,259 | |
Science Applications International Corp. | | | 81,693 | | | | 7,108,925 | |
VeriSign, Inc. (a) | | | 76,367 | | | | 14,714,394 | |
| | | | | | | | |
| | | | | | | 62,546,054 | |
| | | | | | | | |
|
| Life Sciences Tools & Services—2.4% | |
Agilent Technologies, Inc. | | | 240,313 | | | | 20,501,102 | |
PerkinElmer, Inc. | | | 155,426 | | | | 15,091,865 | |
| | | | | | | | |
| | | | | | | 35,592,967 | |
| | | | | | | | |
|
| Machinery—4.1% | |
Crane Co. | | | 148,220 | | | | 12,803,244 | |
ITT, Inc. | | | 98,946 | | | | 7,313,099 | |
Oshkosh Corp. | | | 90,508 | | | | 8,566,582 | |
Stanley Black & Decker, Inc. | | | 48,829 | | | | 8,092,918 | |
Toro Co. | | | 166,637 | | | | 13,275,970 | |
Woodward, Inc. | | | 79,945 | | | | 9,468,686 | |
| | | | | | | | |
| | | | | | | 59,520,499 | |
| | | | | | | | |
|
| Metals & Mining—1.1% | |
Reliance Steel & Aluminum Co. | | | 30,100 | | | | 3,604,776 | |
Royal Gold, Inc. | | | 62,078 | | | | 7,589,035 | |
Steel Dynamics, Inc. | | | 160,814 | | | | 5,474,109 | |
| | | | | | | | |
| | | | | | | 16,667,920 | |
| | | | | | | | |
| | | | | | | | |
| | | Shares | | | Value | |
|
| Mortgage Real Estate Investment Trusts (REITs)—0.5% | |
New Residential Investment Corp. | | | 435,448 | | | $ | 7,015,067 | |
| | | | | | | | |
|
| Multi-Utilities—3.6% | |
DTE Energy Co. | | | 143,978 | | | | 18,698,423 | |
NiSource, Inc. | | | 673,781 | | | | 18,758,063 | |
Sempra Energy | | | 97,303 | | | | 14,739,458 | |
| | | | | | | | |
| | | | | | | 52,195,944 | |
| | | | | | | | |
|
| Oil, Gas & Consumable Fuels—5.1% | |
Cabot Oil & Gas Corp. | | | 213,753 | | | | 3,721,440 | |
ConocoPhillips | | | 116,697 | | | | 7,588,806 | |
Devon Energy Corp. | | | 277,790 | | | | 7,214,206 | |
Diamondback Energy, Inc. | | | 73,630 | | | | 6,837,282 | |
EOG Resources, Inc. | | | 93,270 | | | | 7,812,295 | |
Marathon Oil Corp. | | | 533,580 | | | | 7,246,017 | |
Marathon Petroleum Corp. | | | 108,253 | | | | 6,522,243 | |
ONEOK, Inc. | | | 135,267 | | | | 10,235,654 | |
Pioneer Natural Resources Co. | | | 53,870 | | | | 8,154,302 | |
Williams Cos., Inc. | | | 400,110 | | | | 9,490,609 | |
| | | | | | | | |
| | | | | | | 74,822,854 | |
| | | | | | | | |
|
| Personal Products—0.5% | |
Estee Lauder Cos., Inc., Class A | | | 36,097 | | | | 7,455,474 | |
| | | | | | | | |
|
| Pharmaceuticals—0.5% | |
Zoetis, Inc. | | | 59,101 | | | | 7,822,017 | |
| | | | | | | | |
|
| Professional Services—0.5% | |
TransUnion | | | 83,711 | | | | 7,166,499 | |
| | | | | | | | |
|
| Road & Rail—1.3% | |
Canadian Pacific Railway Ltd. | | | 46,064 | | | | 11,744,017 | |
Kansas City Southern | | | 50,572 | | | | 7,745,607 | |
| | | | | | | | |
| | | | | | | 19,489,624 | |
| | | | | | | | |
|
| Semiconductors & Semiconductor Equipment—1.3% | |
Broadcom, Inc. | | | 33,596 | | | | 10,617,008 | |
NXP Semiconductors NV | | | 64,079 | | | | 8,154,694 | |
| | | | | | | | |
| | | | | | | 18,771,702 | |
| | | | | | | | |
|
| Software—1.0% | |
SS&C Technologies Holdings, Inc. | | | 241,484 | | | | 14,827,118 | |
| | | | | | | | |
|
| Specialty Retail—2.9% | |
Best Buy Co., Inc. | | | 162,409 | | | | 14,259,510 | |
Lowe’s Cos., Inc. | | | 115,628 | | | | 13,847,609 | |
Tractor Supply Co. | | | 155,790 | | | | 14,557,018 | |
| | | | | | | | |
| | | | | | | 42,664,137 | |
| | | | | | | | |
|
| Textiles, Apparel & Luxury Goods—1.7% | |
Columbia Sportswear Co. | | | 168,797 | | | | 16,911,771 | |
Ralph Lauren Corp. | | | 62,207 | | | | 7,291,905 | |
| | | | | | | | |
| | | | | | | 24,203,676 | |
| | | | | | | | |
|
| Water Utilities—1.0% | |
American Water Works Co., Inc. | | | 88,976 | | | | 10,930,702 | |
California Water Service Group | | | 72,743 | | | | 3,750,629 | |
| | | | | | | | |
| | | | | | | 14,681,331 | |
| | | | | | | | |
Total Common Stock
(cost—$1,272,768,444) | | | | 1,439,682,979 | |
| | | | | |
| | | | | | | | |
| | | | | | | | |
| | | Principal
Amount
(000s) | | | Value | |
|
| Repurchase Agreements—0.9% | |
State Street Bank and Trust Co., dated 12/31/19, 0.25%, due 1/2/20, proceeds $12,973,180; collateralized by U.S. Treasury Bonds, 2.50%, due 5/15/46, valued at $13,234,293 including accrued interest | |
(cost—$12,973,000) | | | $12,973 | | | $ | 12,973,000 | |
| | | | | | | | |
| |
Total Investments
(cost—$1,285,741,444)—99.6% | | | | 1,452,655,979 | |
| | | | | | | | |
| | |
| Other assets less liabilities—0.4% | | | | | | | 5,277,420 | |
| | | | | | | | |
| | |
| Net Assets—100.0% | | | | | | | $1,457,933,399 | |
| | | | | | | | |
Notes to Schedule of Investments:
(a)Non-income producing.
Glossary:
REIT—Real Estate Investment Trust
| | | | | | | | |
| See accompanying Notes to Financial Statements | | | December 31, 2019 | | | Semiannual Report | | | 83 | |
Schedule of Investments
December 31, 2019 (Unaudited)
AllianzGI NFJ Small-Cap Value Fund
| | | | | | | | |
| | | Shares | | | Value | |
|
| Common Stock—99.8% | |
|
| Aerospace & Defense—1.7% | |
Curtiss-Wright Corp. | | | 69,852 | | | | $9,841,448 | |
Hexcel Corp. | | | 55,259 | | | | 4,051,038 | |
| | | | | | | | |
| | | | | | | 13,892,486 | |
| | | | | | | | |
| |
| Airlines—1.0% | | | | | |
SkyWest, Inc. | | | 127,598 | | | | 8,246,659 | |
| | | | | | | | |
|
| Auto Components—1.1% | |
Dana, Inc. | | | 263,244 | | | | 4,791,041 | |
Standard Motor Products, Inc. | | | 83,460 | | | | 4,441,741 | |
| | | | | | | | |
| | | | | | | 9,232,782 | |
| | | | | | | | |
| |
| Banks—16.9% | | | | | |
Ameris Bancorp | | | 97,906 | | | | 4,164,921 | |
Associated Banc-Corp | | | 446,966 | | | | 9,851,131 | |
Atlantic Union Bankshares Corp. | | | 218,615 | | | | 8,208,993 | |
BancFirst Corp. | | | 77,165 | | | | 4,818,183 | |
CenterState Bank Corp. | | | 373,146 | | | | 9,321,187 | |
Enterprise Financial Services Corp. | | | 202,556 | | | | 9,765,225 | |
First Interstate Bancsystem, Inc., Class A | | | 196,790 | | | | 8,249,437 | |
First Merchants Corp. | | | 217,079 | | | | 9,028,316 | |
FNB Corp. | | | 343,566 | | | | 4,363,288 | |
Glacier Bancorp, Inc. | | | 179,965 | | | | 8,276,590 | |
IBERIABANK Corp. | | | 113,457 | | | | 8,489,987 | |
Independent Bank Corp. | | | 50,984 | | | | 4,244,418 | |
Simmons First National Corp., Class A | | | 321,506 | | | | 8,613,146 | |
South State Corp. | | | 106,126 | | | | 9,206,430 | |
TCF Financial Corp. | | | 136,081 | | | | 6,368,591 | |
Umpqua Holdings Corp. | | | 232,139 | | | | 4,108,860 | |
United Community Banks, Inc. | | | 133,532 | | | | 4,123,468 | |
Valley National Bancorp | | | 737,249 | | | | 8,441,501 | |
Western Alliance Bancorp | | | 129,566 | | | | 7,385,262 | |
| | | | | | | | |
| | | | | | | 137,028,934 | |
| | | | | | | | |
| |
| Beverages—0.8% | | | | | |
Coca-Cola Consolidated, Inc. | | | 24,042 | | | | 6,829,130 | |
| | | | | | | | |
| |
| Building Products—0.5% | | | | | |
Universal Forest Products, Inc. | | | 84,056 | | | | 4,009,471 | |
| | | | | | | | |
| |
| Capital Markets—3.3% | | | | | |
AllianceBernstein Holding L.P. | | | 287,028 | | | | 8,685,467 | |
Houlihan Lokey, Inc. | | | 202,919 | | | | 9,916,652 | |
Stifel Financial Corp. | | | 140,728 | | | | 8,535,153 | |
| | | | | | | | |
| | | | | | | 27,137,272 | |
| | | | | | | | |
| |
| Chemicals—1.8% | | | | | |
Cabot Corp. | | | 139,851 | | | | 6,645,719 | |
Innophos Holdings, Inc. | | | 39,664 | | | | 1,268,455 | |
Innospec, Inc. | | | 45,940 | | | | 4,752,034 | |
Stepan Co. | | | 20,922 | | | | 2,143,250 | |
| | | | | | | | |
| | | | | | | 14,809,458 | |
| | | | | | | | |
|
| Commercial Services & Supplies—2.2% | |
Ennis, Inc. | | | 196,491 | | | | 4,254,030 | |
McGrath RentCorp | | | 115,665 | | | | 8,852,999 | |
Tetra Tech, Inc. | | | 50,349 | | | | 4,338,070 | |
| | | | | | | | |
| | | | | | | 17,445,099 | |
| | | | | | | | |
|
| Construction & Engineering—0.5% | |
EMCOR Group, Inc. | | | 46,616 | | | | 4,022,961 | |
| | | | | | | | |
|
| Containers & Packaging—1.6% | |
Silgan Holdings, Inc. | | | 136,336 | | | | 4,237,323 | |
Sonoco Products Co. | | | 142,638 | | | | 8,803,617 | |
| | | | | | | | |
| | | | | | | 13,040,940 | |
| | | | | | | | |
| | | | | | | | |
| | | Shares | | | Value | |
|
| Diversified Consumer Services—0.6% | |
Strategic Education, Inc. | | | 30,797 | | | $ | 4,893,643 | |
| | | | | | | | |
| |
| Electric Utilities—2.4% | | | | | |
IDACORP, Inc. | | | 78,336 | | | | 8,366,285 | |
Otter Tail Corp. | | | 42,237 | | | | 2,166,336 | |
PNM Resources, Inc. | | | 170,408 | | | | 8,641,389 | |
| | | | | | | | |
| | | | | | | 19,174,010 | |
| | | | | | | | |
| |
| Electrical Equipment—0.5% | | | | | |
Encore Wire Corp. | | | 75,256 | | | | 4,319,694 | |
| | | | | | | | |
|
| Electronic Equipment, Instruments & Components—3.7% | |
Dolby Laboratories, Inc., Class A | | | 60,617 | | | | 4,170,450 | |
FLIR Systems, Inc. | | | 154,478 | | | | 8,043,669 | |
Methode Electronics, Inc. | | | 238,205 | | | | 9,373,367 | |
SYNNEX Corp. | | | 64,273 | | | | 8,278,362 | |
| | | | | | | | |
| | | | | | | 29,865,848 | |
| | | | | | | | |
|
| Energy Equipment & Services—1.1% | |
Archrock, Inc. | | | 855,273 | | | | 8,586,941 | |
| | | | | | | | |
| |
| Entertainment—0.8% | | | | | |
Marcus Corp. | | | 68,566 | | | | 2,178,342 | |
World Wrestling Entertainment, Inc., Class A | | | 59,831 | | | | 3,881,237 | |
| | | | | | | | |
| | | | | | | 6,059,579 | |
| | | | | | | | |
|
| Equity Real Estate Investment Trusts (REITs)—8.7% | |
American Assets Trust, Inc. | | | 92,429 | | | | 4,242,491 | |
Americold Realty Trust | | | 122,200 | | | | 4,284,332 | |
CoreSite Realty Corp. | | | 68,754 | | | | 7,708,698 | |
CyrusOne, Inc. | | | 17,875 | | | | 1,169,561 | |
Douglas Emmett, Inc. | | | 189,779 | | | | 8,331,298 | |
First Industrial Realty Trust, Inc. | | | 198,198 | | | | 8,227,199 | |
Hudson Pacific Properties, Inc. | | | 178,670 | | | | 6,726,926 | |
Life Storage, Inc. | | | 64,460 | | | | 6,979,729 | |
Monmouth Real Estate Investment Corp. | | | 146,693 | | | | 2,124,115 | |
National Health Investors, Inc. | | | 153,350 | | | | 12,494,958 | |
Sunstone Hotel Investors, Inc. | | | 449,252 | | | | 6,253,588 | |
Terreno Realty Corp. | | | 42,700 | | | | 2,311,778 | |
| | | | | | | | |
| | | | | | | 70,854,673 | |
| | | | | | | | |
| |
| Food Products—1.9% | | | | | |
Calavo Growers, Inc. | | | 48,254 | | | | 4,371,330 | |
Ingredion, Inc. | | | 25,452 | | | | 2,365,763 | |
Lamb Weston Holdings, Inc. | | | 47,995 | | | | 4,129,010 | |
Simply Good Foods Co. (a) | | | 150,032 | | | | 4,281,913 | |
| | | | | | | | |
| | | | | | | 15,148,016 | |
| | | | | | | | |
| |
| Gas Utilities—2.1% | | | | | |
ONE Gas, Inc. | | | 97,425 | | | | 9,116,057 | |
Southwest Gas Holdings, Inc. | | | 107,989 | | | | 8,203,925 | |
| | | | | | | | |
| | | | | | | 17,319,982 | |
| | | | | | | | |
|
| Healthcare Equipment & Supplies—1.2% | |
Hill-Rom Holdings, Inc. | | | 83,861 | | | | 9,520,739 | |
| | | | | | | | |
|
| Healthcare Providers & Services—1.9% | |
Encompass Health Corp. | | | 118,801 | | | | 8,229,345 | |
Ensign Group, Inc. | | | 164,551 | | | | 7,465,679 | |
| | | | | | | | |
| | | | | | | 15,695,024 | |
| | | | | | | | |
|
| Hotels, Restaurants & Leisure—3.8% | |
Cedar Fair L.P. | | | 73,341 | | | | 4,066,025 | |
Cracker Barrel Old Country Store, Inc. | | | 27,451 | | | | 4,220,317 | |
| | | | | | | | |
| | | Shares | | | Value | |
Dunkin’ Brands Group, Inc. | | | 56,362 | | | $ | 4,257,586 | |
Marriott Vacations Worldwide Corp. | | | 68,990 | | | | 8,883,152 | |
Ruth’s Hospitality Group, Inc. | | | 414,706 | | | | 9,026,076 | |
| | | | | | | | |
| | | | | | | 30,453,156 | |
| | | | | | | | |
| |
| Household Durables—1.7% | | | | | |
La-Z-Boy, Inc. | | | 182,449 | | | | 5,743,495 | |
MDC Holdings, Inc. | | | 209,926 | | | | 8,010,776 | |
| | | | | | | | |
| | | | | | | 13,754,271 | |
| | | | | | | | |
| |
| Household Products—0.5% | | | | | |
WD-40 Co. | | | 21,279 | | | | 4,131,105 | |
| | | | | | | | |
| |
| Insurance—5.8% | | | | | |
American Financial Group, Inc. | | | 81,558 | | | | 8,942,835 | |
CNO Financial Group, Inc. | | | 258,395 | | | | 4,684,701 | |
First American Financial Corp. | | | 158,116 | | | | 9,221,325 | |
Old Republic International Corp. | | | 351,751 | | | | 7,868,670 | |
Primerica, Inc. | | | 63,412 | | | | 8,279,071 | |
Selective Insurance Group, Inc. | | | 127,272 | | | | 8,296,861 | |
| | | | | | | | |
| | | | | | | 47,293,463 | |
| | | | | | | | |
| |
| IT Services—3.5% | | | | | |
KBR, Inc. | | | 215,087 | | | | 6,560,153 | |
MAXIMUS, Inc. | | | 112,531 | | | | 8,371,181 | |
Perspecta, Inc. | | | 191,815 | | | | 5,071,589 | |
Science Applications International Corp. | | | 100,401 | | | | 8,736,895 | |
| | | | | | | | |
| | | | | | | 28,739,818 | |
| | | | | | | | |
|
| Leisure Equipment & Products—0.4% | |
Acushnet Holdings Corp. | | | 104,185 | | | | 3,386,012 | |
| | | | | | | | |
|
| Life Sciences Tools & Services—0.5% | |
Bruker Corp. | | | 81,675 | | | | 4,162,975 | |
| | | | | | | | |
| |
| Machinery—4.2% | | | | | |
Crane Co. | | | 105,479 | | | | 9,111,276 | |
Federal Signal Corp. | | | 128,585 | | | | 4,146,866 | |
Hillenbrand, Inc. | | | 193,752 | | | | 6,453,879 | |
ITT, Inc. | | | 56,759 | | | | 4,195,058 | |
Toro Co. | | | 98,324 | | | | 7,833,473 | |
Woodward, Inc. | | | 17,810 | | | | 2,109,417 | |
| | | | | | | | |
| | | | | | | 33,849,969 | |
| | | | | | | | |
| |
| Metals & Mining—2.1% | | | | | |
Commercial Metals Co. | | | 380,304 | | | | 8,469,370 | |
Kaiser Aluminum Corp. | | | 43,190 | | | | 4,789,339 | |
Materion Corp. | | | 65,169 | | | | 3,874,297 | |
| | | | | | | | |
| | | | | | | 17,133,006 | |
| | | | | | | | |
|
Mortgage Real Estate Investment Trusts
(REITs)—1.6% | |
Apollo Commercial Real Estate Finance, Inc. | | | 346,303 | | | | 6,333,882 | |
Blackstone Mortgage Trust, Inc., Class A | | | 182,644 | | | | 6,798,010 | |
| | | | | | | | |
| | | | | | | 13,131,892 | |
| | | | | | | | |
| |
| Multi-Utilities—2.2% | | | | | |
Black Hills Corp. | | | 116,351 | | | | 9,138,207 | |
NorthWestern Corp. | | | 116,713 | | | | 8,364,821 | |
| | | | | | | | |
| | | | | | | 17,503,028 | |
| | | | | | | | |
|
| Oil, Gas & Consumable Fuels—5.1% | |
Cimarex Energy Co. | | | 145,135 | | | | 7,618,136 | |
CVR Energy, Inc. | | | 129,144 | | | | 5,221,292 | |
Delek Logistics Partners L.P. | | | 143,168 | | | | 4,575,649 | |
Delek U.S. Holdings, Inc. | | | 114,782 | | | | 3,848,640 | |
| | | | | | |
| 84 | | Semiannual Report | | | December 31, 2019 | | | See accompanying Notes to Financial Statements |
Schedule of Investments
December 31, 2019 (Unaudited)
| | | | | | | | |
| | | Shares | | | Value | |
Enerplus Corp. | | | 1,224,459 | | | $ | 8,730,393 | |
Murphy Oil Corp. | | | 239,605 | | | | 6,421,414 | |
SFL Corp. Ltd. | | | 318,363 | | | | 4,628,998 | |
| | | | | | | | |
| | | | | | | 41,044,522 | |
| | | | | | | | |
| |
| Professional Services—1.5% | | | | | |
ICF International, Inc. | | | 45,657 | | | | 4,183,094 | |
Korn Ferry | | | 197,117 | | | | 8,357,761 | |
| | | | | | | | |
| | | | | | | 12,540,855 | |
| | | | | | | | |
| |
| Road & Rail—0.5% | | | | | |
Werner Enterprises, Inc. | | | 110,448 | | | | 4,019,203 | |
| | | | | | | | |
|
| Semiconductors & Semiconductor Equipment—1.2% | |
Cabot Microelectronics Corp. | | | 56,101 | | | | 8,096,496 | |
MKS Instruments, Inc. | | | 17,640 | | | | 1,940,577 | |
| | | | | | | | |
| | | | | | | 10,037,073 | |
| | | | | | | | |
| |
| Software—0.8% | | | | | |
Progress Software Corp. | | | 155,347 | | | | 6,454,668 | |
| | | | | | | | |
|
| Specialty Retail—1.5% | |
Lithia Motors, Inc., Class A | | | 10,386 | | | | 1,526,742 | |
Shoe Carnival, Inc. | | | 131,475 | | | | 4,901,388 | |
Tractor Supply Co. | | | 43,919 | | | | 4,103,791 | |
Winmark Corp. | | | 9,178 | | | | 1,819,998 | |
| | | | | | | | |
| | | | | | | 12,351,919 | |
| | | | | | | | |
|
| Textiles, Apparel & Luxury Goods—1.7% | |
Columbia Sportswear Co. | | | 81,023 | | | | 8,117,694 | |
Ralph Lauren Corp. | | | 48,111 | | | | 5,639,572 | |
| | | | | | | | |
| | | | | | | 13,757,266 | |
| | | | | | | | |
|
| Thrifts & Mortgage Finance—4.6% | |
Essent Group Ltd. | | | 133,239 | | | | 6,927,096 | |
First Defiance Financial Corp. | | | 80,993 | | | | 2,550,469 | |
Radian Group, Inc. | | | 329,761 | | | | 8,296,787 | |
Walker & Dunlop, Inc. | | | 76,106 | | | | 4,922,536 | |
Washington Federal, Inc. | | | 223,154 | | | | 8,178,594 | |
WSFS Financial Corp. | | | 139,074 | | | | 6,117,865 | |
| | | | | | | | |
| | | | | | | 36,993,347 | |
| | | | | | | | |
|
| Water Utilities—0.3% | |
California Water Service Group | | | 42,279 | | | | 2,179,905 | |
| | | | | | | | |
Total Common Stock
(cost—$726,862,838) | | | | | | | 810,050,794 | |
| | | | | | | | |
| | | | | | | | |
|
| Exchange-Traded Funds—0.4% | |
SPDR S&P Biotech
(cost—$2,711,184) | | | 32,434 | | | | 3,084,798 | |
| | | | | | | | |
| |
Total Investments
(cost—$729,574,022)—100.2% | | | | 813,135,592 | |
| | | | | | | | |
| | |
| Liabilities in excess of other assets—(0.2)% | | | | | | | (1,677,366 | ) |
| | | | | | | | |
| |
| Net Assets—100.0% | | | | $811,458,226 | |
| | | | | | | | |
Notes to Schedule of Investments:
(a)Non-income producing.
Glossary:
REIT—Real Estate Investment Trust
AllianzGI Small-Cap Fund
| | | | | | | | |
| | | Shares | | | Value | |
| |
| Common Stock—98.3% | | | | | |
| |
| Aerospace & Defense—1.2% | | | | | |
Axon Enterprise, Inc. (c) | | | 6,449 | | | | $472,583 | |
BWX Technologies, Inc. | | | 3,455 | | | | 214,486 | |
HEICO Corp. | | | 1,080 | | | | 123,282 | |
Kratos Defense & Security Solutions, Inc. (c) | | | 23,083 | | | | 415,725 | |
Moog, Inc., Class A | | | 4,745 | | | | 404,891 | |
| | | | | | | | |
| | | | | | | 1,630,967 | |
| | | | | | | | |
| |
| Airlines—0.7% | | | | | |
SkyWest, Inc. | | | 15,165 | | | | 980,114 | |
| | | | | | | | |
| |
| Auto Components—0.4% | | | | | |
Dana, Inc. | | | 20,960 | | | | 381,472 | |
Fox Factory Holding Corp. (c) | | | 2,968 | | | | 206,484 | |
| | | | | | | | |
| | | | | | | 587,956 | |
| | | | | | | | |
| |
| Banks—3.2% | | | | | |
Ameris Bancorp | | | 7,013 | | | | 298,333 | |
BancorpSouth Bank | | | 30,655 | | | | 962,873 | |
BankFinancial Corp. | | | 6,970 | | | | 91,168 | |
Berkshire Hills Bancorp, Inc. | | | 13,175 | | | | 433,194 | |
Carolina Financial Corp. | | | 1,217 | | | | 52,611 | |
First Financial Bankshares, Inc. | | | 14,100 | | | | 494,910 | |
First Foundation, Inc. | | | 3,866 | | | | 67,268 | |
HarborOne Bancorp, Inc. (c) | | | 7,231 | | | | 79,469 | |
Hilltop Holdings, Inc. | | | 38,290 | | | | 954,570 | |
Preferred Bank | | | 1,058 | | | | 63,575 | |
Simmons First National Corp., Class A | | | 15,020 | | | | 402,386 | |
Southern National Bancorp of Virginia, Inc. | | | 5,825 | | | | 95,239 | |
Tristate Capital Holdings, Inc. (c) | | | 2,118 | | | | 55,322 | |
Valley National Bancorp | | | 20,748 | | | | 237,564 | |
| | | | | | | | |
| | | | | | | 4,288,482 | |
| | | | | | | | |
| |
| Beverages—0.2% | | | | | |
Boston Beer Co., Inc., Class A (c) | | | 320 | | | | 120,912 | |
Coca-Cola Consolidated, Inc. | | | 310 | | | | 88,055 | |
MGP Ingredients, Inc. | | | 988 | | | | 47,869 | |
| | | | | | | | |
| | | | | | | 256,836 | |
| | | | | | | | |
| |
| Biotechnology—4.7% | | | | | |
ACADIA Pharmaceuticals, Inc. (c) | | | 5,228 | | | | 223,654 | |
Adverum Biotechnologies, Inc. (c) | | | 2,498 | | | | 28,777 | |
Amicus Therapeutics, Inc. (c) | | | 17,473 | | | | 170,187 | |
Arena Pharmaceuticals, Inc. (c) | | | 1,530 | | | | 69,493 | |
Arrowhead Pharmaceuticals, Inc. (c) | | | 2,014 | | | | 127,748 | |
Audentes Therapeutics, Inc. (c) | | | 4,340 | | | | 259,706 | |
Avrobio, Inc. (c) | | | 1,010 | | | | 20,331 | |
BioSpecifics Technologies Corp. (c) | | | 787 | | | | 44,812 | |
Blueprint Medicines Corp. (c) | | | 1,237 | | | | 99,096 | |
CRISPR Therapeutics AG (c) | | | 3,278 | | | | 199,647 | |
Dicerna Pharmaceuticals, Inc. (c) | | | 2,298 | | | | 50,625 | |
Dynavax Technologies Corp. (c) | | | 3,649 | | | | 20,872 | |
Eagle Pharmaceuticals, Inc. (c) | | | 1,005 | | | | 60,380 | |
Exact Sciences Corp. (c) | | | 4,046 | | | | 374,174 | |
Fate Therapeutics, Inc. (c) | | | 2,129 | | | | 41,664 | |
Global Blood Therapeutics, Inc. (c) | | | 1,346 | | | | 106,993 | |
| | | | | | | | |
| | | Shares | | | Value | |
Homology Medicines, Inc. (c) | | | 1,314 | | | $ | 27,200 | |
Intellia Therapeutics, Inc. (c) | | | 10,309 | | | | 151,233 | |
Invitae Corp. (c) | | | 23,697 | | | | 382,233 | |
Iovance Biotherapeutics, Inc. (c) | | | 7,420 | | | | 205,386 | |
Kadmon Holdings, Inc. (c) | | | 7,311 | | | | 33,119 | |
Karyopharm Therapeutics, Inc. (c) | | | 1,931 | | | | 37,017 | |
Kindred Biosciences, Inc. (c) | | | 3,758 | | | | 31,868 | |
Krystal Biotech, Inc. (c) | | | 528 | | | | 29,241 | |
Kura Oncology, Inc. (c) | | | 1,984 | | | | 27,280 | |
MeiraGTx Holdings PLC (c) | | | 4,793 | | | | 95,956 | |
Natera, Inc. (c) | | | 15,845 | | | | 533,818 | |
Progenics Pharmaceuticals, Inc. (c) | | | 3,804 | | | | 19,362 | |
PTC Therapeutics, Inc. (c) | | | 21,868 | | | | 1,050,320 | |
REGENXBIO, Inc. (c) | | | 3,881 | | | | 159,005 | |
Rocket Pharmaceuticals, Inc. (c) | | | 1,189 | | | | 27,062 | |
Stemline Therapeutics, Inc. (c) | | | 2,012 | | | | 21,388 | |
TG Therapeutics, Inc. (c) | | | 3,432 | | | | 38,095 | |
Twist Bioscience Corp. (c) | | | 8,943 | | | | 187,803 | |
uniQure NV (c) | | | 2,459 | | | | 176,212 | |
Vanda Pharmaceuticals, Inc. (c) | | | 2,165 | | | | 35,528 | |
Veracyte, Inc. (c) | | | 19,779 | | | | 552,230 | |
Vericel Corp. (c) | | | 23,446 | | | | 407,960 | |
Viking Therapeutics, Inc. (c) | | | 3,214 | | | | 25,776 | |
Voyager Therapeutics, Inc. (c) | | | 1,439 | | | | 20,074 | |
Xencor, Inc. (c) | | | 1,545 | | | | 53,132 | |
ZIOPHARM Oncology, Inc. (c) | | | 7,859 | | | | 37,094 | |
| | | | | | | | |
| | | | | | | 6,263,551 | |
| | | | | | | | |
| |
| Building Products—1.3% | | | | | |
Builders FirstSource, Inc. (c) | | | 40,175 | | | | 1,020,847 | |
PGT Innovations, Inc. (c) | | | 2,704 | | | | 40,317 | |
Simpson Manufacturing Co., Inc. | | | 4,580 | | | | 367,453 | |
Trex Co., Inc. (c) | | | 3,924 | | | | 352,689 | |
| | | | | | | | |
| | | | | | | 1,781,306 | |
| | | | | | | | |
|
| Capital Markets—1.4% | |
Artisan Partners Asset Management, Inc., Class A | | | 30,250 | | | | 977,680 | |
Barings BDC, Inc. | | | 16,870 | | | | 173,424 | |
BlackRock TCP Capital Corp. | | | 5,845 | | | | 82,122 | |
Freedom Holding Corp. (c) | | | 4,125 | | | | 59,977 | |
Golub Capital BDC, Inc. | | | 18,910 | | | | 348,984 | |
Hercules Capital, Inc. | | | 9,585 | | | | 134,382 | |
Main Street Capital Corp. | | | 2,348 | | | | 101,222 | |
| | | | | | | | |
| | | | | | | 1,877,791 | |
| | | | | | | | |
| |
| Chemicals—0.6% | | | | | |
Balchem Corp. | | | 740 | | | | 75,206 | |
Ingevity Corp. (c) | | | 2,251 | | | | 196,692 | |
Koppers Holdings, Inc. (c) | | | 4,896 | | | | 187,125 | |
PolyOne Corp. | | | 6,498 | | | | 239,062 | |
Westlake Chemical Partners L.P. | | | 2,395 | | | | 63,276 | |
| | | | | | | | |
| | | | | | | 761,361 | |
| | | | | | | | |
|
| Commercial Services & Supplies—3.4% | |
Brink’s Co. | | | 5,288 | | | | 479,516 | |
Casella Waste Systems, Inc., Class A (c) | | | 19,370 | | | | 891,601 | |
Herman Miller, Inc. | | | 11,345 | | | | 472,519 | |
MSA Safety, Inc. | | | 6,505 | | | | 821,972 | |
Tetra Tech, Inc. | | | 22,029 | | | | 1,898,019 | |
| | | | | | | | |
| | | | | | | 4,563,627 | |
| | | | | | | | |
|
| Communications Equipment—0.1% | |
EchoStar Corp., Class A (c) | | | 2,610 | | | | 113,039 | |
| | | | | | | | |
| | | | | | | | |
| See accompanying Notes to Financial Statements | | | December 31, 2019 | | | Semiannual Report | | | 85 | |
Schedule of Investments
December 31, 2019 (Unaudited)
| | | | | | | | |
| | | Shares | | | Value | |
|
| Construction & Engineering—1.4% | |
Construction Partners, Inc., Class A (c) | | | 3,039 | | | $ | 51,268 | |
EMCOR Group, Inc. | | | 7,960 | | | | 686,948 | |
MasTec, Inc. (c) | | | 14,960 | | | | 959,834 | |
NV5 Global, Inc. (c) | | | 1,482 | | | | 74,767 | |
Sterling Construction Co., Inc. (c) | | | 4,617 | | | | 65,007 | |
| | | | | | | | |
| | | | | | | 1,837,824 | |
| | | | | | | | |
| |
| Construction Materials—0.0% | | | | | |
U.S. Concrete, Inc. (c) | | | 1,128 | | | | 46,992 | |
| | | | | | | | |
| |
| Containers & Packaging—0.1% | | | | | |
Silgan Holdings, Inc. | | | 4,580 | | | | 142,346 | |
| | | | | | | | |
|
| Diversified Consumer Services—1.5% | |
Bright Horizons Family Solutions, Inc. (c) | | | 3,265 | | | | 490,697 | |
Carriage Services, Inc. | | | 6,538 | | | | 167,373 | |
Chegg, Inc. (c) | | | 12,115 | | | | 459,280 | |
Grand Canyon Education, Inc. (c) | | | 880 | | | | 84,295 | |
OneSpaWorld Holdings Ltd. (c) | | | 3,580 | | | | 60,287 | |
Strategic Education, Inc. | | | 4,647 | | | | 738,408 | |
| | | | | | | | |
| | | | | | | 2,000,340 | |
| | | | | | | | |
|
| Diversified Financial Services—0.3% | |
Compass Diversified Holdings | | | 18,415 | | | | 457,797 | |
| | | | | | | | |
|
| Diversified Telecommunication Services—0.2% | |
Bandwidth, Inc., Class A (c) | | | 940 | | | | 60,207 | |
Cogent Communications Holdings, Inc. | | | 2,870 | | | | 188,875 | |
| | | | | | | | |
| | | | | | | 249,082 | |
| | | | | | | | |
| |
| Electric Utilities—1.8% | | | | | |
ALLETE, Inc. | | | 3,685 | | | | 299,112 | |
El Paso Electric Co. | | | 4,780 | | | | 324,514 | |
Hawaiian Electric Industries, Inc. | | | 14,950 | | | | 700,557 | |
IDACORP, Inc. | | | 2,100 | | | | 224,280 | |
Otter Tail Corp. | | | 1,715 | | | | 87,962 | |
PNM Resources, Inc. | | | 3,740 | | | | 189,656 | |
Portland General Electric Co. | | | 9,265 | | | | 516,894 | |
| | | | | | | | |
| | | | | | | 2,342,975 | |
| | | | | | | | |
| |
| Electrical Equipment—1.1% | | | | | |
Allied Motion Technologies, Inc. | | | 874 | | | | 42,389 | |
Atkore International Group, Inc. (c) | | | 34,120 | | | | 1,380,495 | |
| | | | | | | | |
| | | | | | | 1,422,884 | |
| | | | | | | | |
|
| Electronic Equipment, Instruments & Components—3.2% | |
Fabrinet (c) | | | 13,590 | | | | 881,176 | |
Methode Electronics, Inc. | | | 28,605 | | | | 1,125,607 | |
Napco Security Technologies, Inc. (c) | | | 12,360 | | | | 363,260 | |
Sanmina Corp. (c) | | | 19,235 | | | | 658,606 | |
SYNNEX Corp. | | | 9,320 | | | | 1,200,416 | |
| | | | | | | | |
| | | | | | | 4,229,065 | |
| | | | | | | | |
|
| Energy Equipment & Services—0.1% | |
DMC Global, Inc. | | | 1,084 | | | | 48,715 | |
USA Compression Partners L.P. | | | 4,530 | | | | 82,174 | |
| | | | | | | | |
| | | | | | | 130,889 | |
| | | | | | | | |
| |
| Entertainment—1.1% | | | | | |
Liberty Media Corp-Liberty Braves, Class A (c) | | | 9,580 | | | | 284,047 | |
| | | | | | | | |
| | | Shares | | | Value | |
Liberty Media Corp-Liberty Braves, Class C (c) | | | 9,595 | | | $ | 283,436 | |
Liberty Media Corp-Liberty Formula One, Class A (c) | | | 2,820 | | | | 123,460 | |
Madison Square Garden Co., Class A (c) | | | 695 | | | | 204,462 | |
Reading International, Inc., Class A (c) | | | 9,100 | | | | 101,829 | |
Zynga, Inc., Class A (c) | | | 77,521 | | | | 474,428 | |
| | | | | | | | |
| | | | | | | 1,471,662 | |
| | | | | | | | |
|
| Equity Real Estate Investment Trusts (REITs)—3.0% | |
CareTrust REIT, Inc. | | | 20,320 | | | | 419,201 | |
Chatham Lodging Trust | | | 15,085 | | | | 276,659 | |
CoreCivic, Inc. | | | 43,485 | | | | 755,769 | |
Industrial Logistics Properties Trust | | | 41,750 | | | | 936,035 | |
Outfront Media, Inc. | | | 27,665 | | | | 741,975 | |
PS Business Parks, Inc. | | | 2,795 | | | | 460,812 | |
Ryman Hospitality Properties, Inc. | | | 4,795 | | | | 415,535 | |
Winthrop Realty Trust (a)(b)(c) | | | 12,960 | | | | 1,296 | |
| | | | | | | | |
| | | | | | | 4,007,282 | |
| | | | | | | | |
| |
| Food & Staples Retailing—1.7% | | | | | |
Casey’s General Stores, Inc. | | | 1,650 | | | | 262,334 | |
Chefs’ Warehouse, Inc. (c) | | | 1,595 | | | | 60,785 | |
Grocery Outlet Holding Corp. (c) | | | 2,635 | | | | 85,506 | |
Ingles Markets, Inc., Class A | | | 5,270 | | | | 250,378 | |
Performance Food Group Co. (c) | | | 16,400 | | | | 844,272 | |
PriceSmart, Inc. | | | 6,855 | | | | 486,842 | |
Sprouts Farmers Market, Inc. (c) | | | 11,355 | | | | 219,719 | |
Weis Markets, Inc. | | | 2,655 | | | | 107,501 | |
| | | | | | | | |
| | | | | | | 2,317,337 | |
| | | | | | | | |
| |
| Food Products—3.7% | | | | | |
Alico, Inc. | | | 1,880 | | | | 67,360 | |
Cal-Maine Foods, Inc. | | | 1,945 | | | | 83,149 | |
Calavo Growers, Inc. | | | 1,325 | | | | 120,032 | |
Flowers Foods, Inc. | | | 34,925 | | | | 759,269 | |
Freshpet, Inc. (c) | | | 6,976 | | | | 412,212 | |
Hain Celestial Group, Inc. (c) | | | 2,565 | | | | 66,575 | |
Hostess Brands, Inc. (c) | | | 14,030 | | | | 203,996 | |
J&J Snack Foods Corp. | | | 3,010 | | | | 554,653 | |
John B Sanfilippo & Son, Inc. | | | 4,036 | | | | 368,406 | |
Lancaster Colony Corp. | | | 2,350 | | | | 376,235 | |
Sanderson Farms, Inc. | | | 6,080 | | | | 1,071,418 | |
Simply Good Foods Co. (c) | | | 21,558 | | | | 615,265 | |
Tootsie Roll Industries, Inc. | | | 7,700 | | | | 262,878 | |
| | | | | | | | |
| | | | | | | 4,961,448 | |
| | | | | | | | |
| |
| Gas Utilities—1.0% | | | | | |
Northwest Natural Holding Co. | | | 1,100 | | | | 81,103 | |
ONE Gas, Inc. | | | 8,815 | | | | 824,820 | |
Southwest Gas Holdings, Inc. | | | 6,360 | | | | 483,169 | |
| | | | | | | | |
| | | | | | | 1,389,092 | |
| | | | | | | | |
|
| Healthcare Equipment & Supplies—5.1% | |
Antares Pharma, Inc. (c) | | | 14,911 | | | | 70,082 | |
Axogen, Inc. (c) | | | 2,674 | | | | 47,838 | |
Axonics Modulation Technologies, Inc. (c) | | | 1,996 | | | | 55,309 | |
BioLife Solutions, Inc. (c) | | | 3,595 | | | | 58,167 | |
Cerus Corp. (c) | | | 8,700 | | | | 36,714 | |
CONMED Corp. | | | 10,335 | | | | 1,155,763 | |
CryoLife, Inc. (c) | | | 1,996 | | | | 54,072 | |
CryoPort, Inc. (c) | | | 30,745 | | | | 506,063 | |
| | | | | | | | |
| | | Shares | | | Value | |
Globus Medical, Inc., Class A (c) | | | 9,205 | | | $ | 541,990 | |
Haemonetics Corp. (c) | | | 10,700 | | | | 1,229,430 | |
Integer Holdings Corp. (c) | | | 9,090 | | | | 731,109 | |
Masimo Corp. (c) | | | 5,450 | | | | 861,427 | |
Mesa Laboratories, Inc. | | | 281 | | | | 70,081 | |
Novocure Ltd. (c) | | | 5,129 | | | | 432,221 | |
OrthoPediatrics Corp. (c) | | | 2,105 | | | | 98,914 | |
Surmodics, Inc. (c) | | | 1,279 | | | | 52,989 | |
Tactile Systems Technology, Inc. (c) | | | 1,575 | | | | 106,328 | |
Tandem Diabetes Care, Inc. (c) | | | 3,530 | | | | 210,423 | |
Utah Medical Products, Inc. | | | 3,030 | | | | 326,937 | |
West Pharmaceutical Services, Inc. | | | 840 | | | | 126,277 | |
| | | | | | | | |
| | | | | | | 6,772,134 | |
| | | | | | | | |
|
| Healthcare Providers & Services—3.7% | |
Addus HomeCare Corp. (c) | | | 7,186 | | | | 698,623 | |
Amedisys, Inc. (c) | | | 5,205 | | | | 868,819 | |
BioTelemetry, Inc. (c) | | | 1,531 | | | | 70,885 | |
Catasys, Inc. (c) | | | 3,538 | | | | 57,705 | |
Chemed Corp. | | | 200 | | | | 87,852 | |
Encompass Health Corp. | | | 1,305 | | | | 90,397 | |
Hanger, Inc. (c) | | | 2,230 | | | | 61,570 | |
Joint Corp. (c) | | | 4,004 | | | | 64,624 | |
LHC Group, Inc. (c) | | | 3,418 | | | | 470,864 | |
National HealthCare Corp. | | | 2,140 | | | | 184,960 | |
R1 RCM, Inc. (c) | | | 88,160 | | | | 1,144,317 | |
RadNet, Inc. (c) | | | 4,167 | | | | 84,590 | |
Select Medical Holdings Corp. (c) | | | 42,270 | | | | 986,582 | |
| | | | | | | | |
| | | | | | | 4,871,788 | |
| | | | | | | | |
| |
| Healthcare Technology—1.0% | | | | | |
Health Catalyst, Inc. (c) | | | 9,490 | | | | 329,303 | |
Omnicell, Inc. (c) | | | 3,694 | | | | 301,874 | |
Tabula Rasa HealthCare, Inc. (c) | | | 1,741 | | | | 84,752 | |
Teladoc Health, Inc. (c) | | | 6,341 | | | | 530,868 | |
Vocera Communications, Inc. (c) | | | 2,092 | | | | 43,430 | |
| | | | | | | | |
| | | | | | | 1,290,227 | |
| | | | | | | | |
|
| Hotels, Restaurants & Leisure—2.4% | |
Accel Entertainment, Inc. (c) | | | 22,775 | | | | 284,687 | |
Carrols Restaurant Group, Inc. (c) | | | 5,164 | | | | 36,406 | |
Cedar Fair L.P. | | | 1,730 | | | | 95,911 | |
Century Casinos, Inc. (c) | | | 5,848 | | | | 46,316 | |
Churchill Downs, Inc. | | | 5,921 | | | | 812,361 | |
Denny’s Corp. (c) | | | 3,710 | | | | 73,755 | |
Eldorado Resorts, Inc. (c) | | | 8,081 | | | | 481,951 | |
Hyatt Hotels Corp., Class A | | | 9,545 | | | | 856,282 | |
Kura Sushi USA, Inc., Class A (c) | | | 2,567 | | | | 65,330 | |
Lindblad Expeditions Holdings, Inc. (c) | | | 18,625 | | | | 304,519 | |
Monarch Casino & Resort, Inc. (c) | | | 3,330 | | | | 161,672 | |
| | | | | | | | |
| | | | | | | 3,219,190 | |
| | | | | | | | |
| |
| Household Durables—1.8% | | | | | |
KB Home | | | 14,955 | | | | 512,508 | |
Lennar Corp., Class B | | | 15,550 | | | | 695,085 | |
LGI Homes, Inc. (c) | | | 888 | | | | 62,737 | |
MDC Holdings, Inc. | | | 9,173 | | | | 350,042 | |
Skyline Champion Corp. (c) | | | 10,643 | | | | 337,383 | |
Taylor Morrison Home Corp., Class A (c) | | | 22,550 | | | | 492,943 | |
| | | | | | | | |
| | | | | | | 2,450,698 | |
| | | | | | | | |
| | | | | | |
| 86 | | Semiannual Report | | | December 31, 2019 | | | See accompanying Notes to Financial Statements |
Schedule of Investments
December 31, 2019 (Unaudited)
| | | | | | | | |
| | | Shares | | | Value | |
| |
| Household Products—0.2% | | | | | |
WD-40 Co. | | | 1,605 | | | $ | 311,595 | |
| | | | | | | | |
|
| Independent Power Producers & Energy Traders—0.5% | |
Ormat Technologies, Inc. | | | 4,100 | | | | 305,532 | |
TerraForm Power, Inc., Class A | | | 19,370 | | | | 298,104 | |
| | | | | | | | |
| | | | | | | 603,636 | |
| | | | | | | | |
| |
| Insurance—2.3% | | | | | |
American Equity Investment Life Holding Co. | | | 11,205 | | | | 335,366 | |
American National Insurance Co. | | | 1,555 | | | | 182,992 | |
AMERISAFE, Inc. | | | 3,820 | | | | 252,235 | |
Argo Group International Holdings Ltd. | | | 1,857 | | | | 122,098 | |
Donegal Group, Inc., Class A | | | 7,570 | | | | 112,187 | |
eHealth, Inc. (c) | | | 3,773 | | | | 362,510 | |
Employers Holdings, Inc. | | | 1,910 | | | | 79,743 | |
Enstar Group Ltd. (c) | | | 605 | | | | 125,150 | |
Investors Title Co. | | | 480 | | | | 76,416 | |
Kemper Corp. | | | 6,225 | | | | 482,437 | |
NI Holdings, Inc. (c) | | | 4,860 | | | | 83,592 | |
Palomar Holdings, Inc. (c) | | | 1,445 | | | | 72,958 | |
ProAssurance Corp. | | | 3,345 | | | | 120,888 | |
RLI Corp. | | | 3,385 | | | | 304,718 | |
Safety Insurance Group, Inc. | | | 1,190 | | | | 110,111 | |
State Auto Financial Corp. | | | 7,240 | | | | 224,585 | |
| | | | | | | | |
| | | | | | | 3,047,986 | |
| | | | | | | | |
|
| Interactive Media & Services—0.2% | |
QuinStreet, Inc. (c) | | | 18,011 | | | | 275,748 | |
| | | | | | | | |
|
| Internet & Direct Marketing Retail—0.1% | |
Rubicon Project, Inc. (c) | | | 8,397 | | | | 68,520 | |
| | | | | | | | |
| |
| IT Services—3.0% | | | | | |
Brightcove, Inc. (c) | | | 6,402 | | | | 55,633 | |
Hackett Group, Inc. | | | 3,100 | | | | 50,034 | |
LiveRamp Holdings, Inc. (c) | | | 7,497 | | | | 360,381 | |
ManTech International Corp., Class A | | | 20,165 | | | | 1,610,780 | |
MAXIMUS, Inc. | | | 10,985 | | | | 817,174 | |
Paysign, Inc. (c) | | | 3,996 | | | | 40,560 | |
Perficient, Inc. (c) | | | 1,490 | | | | 68,644 | |
Repay Holdings Corp. (c) | | | 4,125 | | | | 60,431 | |
Science Applications International Corp. | | | 10,825 | | | | 941,992 | |
| | | | | | | | |
| | | | | | | 4,005,629 | |
| | | | | | | | |
|
| Leisure Equipment & Products—0.8% | |
Acushnet Holdings Corp. | | | 1,870 | | | | 60,775 | |
Clarus Corp. | | | 11,170 | | | | 151,465 | |
Malibu Boats, Inc., Class A (c) | | | 6,305 | | | | 258,190 | |
MasterCraft Boat Holdings, Inc. (c) | | | 16,900 | | | | 266,175 | |
YETI Holdings, Inc. (c) | | | 10,787 | | | | 375,172 | |
| | | | | | | | |
| | | | | | | 1,111,777 | |
| | | | | | | | |
|
| Life Sciences Tools & Services—4.7% | |
Charles River Laboratories International, Inc. (c) | | | 10,070 | | | | 1,538,293 | |
Codexis, Inc. (c) | | | 2,687 | | | | 42,965 | |
Medpace Holdings, Inc. (c) | | | 12,955 | | | | 1,088,997 | |
NanoString Technologies, Inc. (c) | | | 16,359 | | | | 455,108 | |
NeoGenomics, Inc. (c) | | | 21,256 | | | | 621,738 | |
PRA Health Sciences, Inc. (c) | | | 9,800 | | | | 1,089,270 | |
Quanterix Corp. (c) | | | 16,745 | | | | 395,684 | |
Repligen Corp. (c) | | | 11,425 | | | | 1,056,813 | |
| | | | | | | | |
| | | | | | | 6,288,868 | |
| | | | | | | | |
| | | | | | | | |
| | | Shares | | | Value | |
| |
| Machinery—2.6% | | | | | |
Chart Industries, Inc. (c) | | | 4,778 | | | $ | 322,467 | |
Columbus McKinnon Corp. | | | 6,954 | | | | 278,369 | |
Kadant, Inc. | | | 734 | | | | 77,320 | |
Kornit Digital Ltd. (c) | | | 14,006 | | | | 479,425 | |
Park-Ohio Holdings Corp. | | | 4,250 | | | | 143,013 | |
Spartan Motors, Inc. | | | 1,804 | | | | 32,616 | |
SPX Corp. (c) | | | 23,690 | | | | 1,205,347 | |
SPX FLOW, Inc. (c) | | | 19,875 | | | | 971,291 | |
| | | | | | | | |
| | | | | | | 3,509,848 | |
| | | | | | | | |
|
| Media—1.5% | |
Cable One, Inc. | | | 485 | | | | 721,908 | |
Cardlytics, Inc. (c) | | | 2,518 | | | | 158,282 | |
Liberty Broadband Corp.,
Class A (c) | | | 2,130 | | | | 265,313 | |
Loral Space & Communications, Inc. (c) | | | 2,170 | | | | 70,134 | |
Nexstar Media Group, Inc., Class A | | | 4,077 | | | | 478,028 | |
TechTarget, Inc. (c) | | | 13,489 | | | | 352,063 | |
| | | | | | | | |
| | | | | | | 2,045,728 | |
| | | | | | | | |
|
| Metals & Mining—0.2% | |
Coeur Mining, Inc. (c) | | | 7,570 | | | | 61,166 | |
Hecla Mining Co. | | | 18,100 | | | | 61,359 | |
Novagold Resources, Inc. (c) | | | 13,000 | | | | 116,480 | |
| | | | | | | | |
| | | | | | | 239,005 | |
| | | | | | | | |
| |
| Mortgage Real Estate Investment Trusts (REITs)—3.5% | | | | | |
Arbor Realty Trust, Inc. | | | 6,450 | | | | 92,558 | |
ARMOUR Residential REIT, Inc. | | | 5,915 | | | | 105,701 | |
Blackstone Mortgage Trust, Inc., Class A | | | 8,060 | | | | 299,993 | |
Capstead Mortgage Corp. | | | 34,960 | | | | 276,883 | |
Ellington Financial, Inc. | | | 11,885 | | | | 217,852 | |
Exantas Capital Corp. | | | 24,945 | | | | 294,600 | |
Granite Point Mortgage Trust, Inc. | | | 40,460 | | | | 743,655 | |
Invesco Mortgage Capital, Inc. | | | 58,115 | | | | 967,615 | |
MFA Financial, Inc. | | | 95,440 | | | | 730,116 | |
Ready Capital Corp. | | | 39,500 | | | | 609,090 | |
TPG RE Finance Trust, Inc. | | | 18,840 | | | | 381,887 | |
| | | | | | | | |
| | | | | | | 4,719,950 | |
| | | | | | | | |
|
| Multi-Utilities—1.1% | |
Avista Corp. | | | 2,145 | | | | 103,153 | |
Black Hills Corp. | | | 8,650 | | | | 679,371 | |
NorthWestern Corp. | | | 6,475 | | | | 464,063 | |
Unitil Corp. | | | 4,025 | | | | 248,826 | |
| | | | | | | | |
| | | | | | | 1,495,413 | |
| | | | | | | | |
|
| Oil, Gas & Consumable Fuels—1.3% | |
Black Stone Minerals L.P. | | | 8,300 | | | | 105,576 | |
Crestwood Equity Partners L.P. | | | 2,235 | | | | 68,883 | |
Delek Logistics Partners L.P. | | | 1,960 | | | | 62,642 | |
Enviva Partners L.P. | | | 5,450 | | | | 203,340 | |
Global Partners L.P. | | | 5,795 | | | | 116,827 | |
Holly Energy Partners L.P. | | | 3,215 | | | | 71,212 | |
NuStar Energy L.P. | | | 3,865 | | | | 99,910 | |
Oasis Midstream Partners L.P. | | | 19,565 | | | | 324,583 | |
Par Pacific Holdings, Inc. (c) | | | 6,175 | | | | 143,507 | |
PBF Logistics L.P. | | | 7,805 | | | | 158,051 | |
Sunoco L.P. | | | 4,895 | | | | 149,787 | |
TC Pipelines L.P. | | | 4,425 | | | | 187,178 | |
World Fuel Services Corp. | | | 1,950 | | | | 84,669 | |
| | | | | | | | |
| | | | | | | 1,776,165 | |
| | | | | | | | |
|
| Personal Products—0.2% | |
Lifevantage Corp. (c) | | | 8,660 | | | | 135,183 | |
| | | | | | | | |
| | | Shares | | | Value | |
USANA Health Sciences, Inc. (c) | | | 1,275 | | | $ | 100,151 | |
| | | | | | | | |
| | | | | | | 235,334 | |
| | | | | | | | |
|
| Pharmaceuticals—1.5% | |
Amphastar Pharmaceuticals,
Inc. (c) | | | 2,442 | | | | 47,106 | |
ANI Pharmaceuticals, Inc. (c) | | | 1,904 | | | | 117,420 | |
Axsome Therapeutics, Inc. (c) | | | 1,177 | | | | 121,655 | |
Cara Therapeutics, Inc. (c) | | | 1,511 | | | | 24,342 | |
Catalent, Inc. (c) | | | 16,975 | | | | 955,692 | |
Collegium Pharmaceutical,
Inc. (c) | | | 2,045 | | | | 42,086 | |
Durect Corp. (c) | | | 18,655 | | | | 70,889 | |
Evofem Biosciences, Inc. (c) | | | 9,505 | | | | 58,646 | |
Horizon Therapeutics PLC (c) | | | 11,657 | | | | 421,983 | |
Omeros Corp. (c) | | | 1,508 | | | | 21,248 | |
Prestige Consumer Healthcare, Inc. (c) | | | 1,780 | | | | 72,090 | |
| | | | | | | | |
| | | | | | | 1,953,157 | |
| | | | | | | | |
|
| Professional Services—2.4% | |
ASGN, Inc. (c) | | | 10,790 | | | | 765,766 | |
CRA International, Inc. | | | 1,123 | | | | 61,170 | |
Franklin Covey Co. (c) | | | 1,512 | | | | 48,732 | |
FTI Consulting, Inc. (c) | | | 9,390 | | | | 1,039,097 | |
Heidrick & Struggles International, Inc. | | | 27,140 | | | | 882,050 | |
Kforce, Inc. | | | 2,078 | | | | 82,497 | |
TriNet Group, Inc. (c) | | | 6,355 | | | | 359,756 | |
| | | | | | | | |
| | | | | | | 3,239,068 | |
| | | | | | | | |
|
| Real Estate Management & Development—1.2% | |
Jones Lang LaSalle, Inc. | | | 3,354 | | | | 583,898 | |
Newmark Group, Inc., Class A | | | 70,520 | | | | 948,846 | |
| | | | | | | | |
| | | | | | | 1,532,744 | |
| | | | | | | | |
| |
| Road & Rail—0.2% | | | | | |
Saia, Inc. (c) | | | 2,802 | | | | 260,922 | |
| | | | | | | | |
|
Semiconductors & Semiconductor
Equipment—2.3% | |
ACM Research, Inc., Class A (c) | | | 1,928 | | | | 35,572 | |
Adesto Technologies Corp. (c) | | | 7,463 | | | | 63,435 | |
Ambarella, Inc. (c) | | | 7,634 | | | | 462,315 | |
Axcelis Technologies, Inc. (c) | | | 18,953 | | | | 456,672 | |
FormFactor, Inc. (c) | | | 3,735 | | | | 96,998 | |
Ichor Holdings Ltd. (c) | | | 2,242 | | | | 74,591 | |
Inphi Corp. (c) | | | 3,645 | | | | 269,803 | |
MKS Instruments, Inc. | | | 3,286 | | | | 361,493 | |
Power Integrations, Inc. | | | 9,680 | | | | 957,449 | |
Semtech Corp. (c) | | | 4,612 | | | | 243,975 | |
| | | | | | | | |
| | | | | | | 3,022,303 | |
| | | | | | | | |
| |
| Software—5.6% | | | | | |
ACI Worldwide, Inc. (c) | | | 10,425 | | | | 394,951 | |
Agilysys, Inc. (c) | | | 2,678 | | | | 68,048 | |
Alteryx, Inc., Class A (c) | | | 2,409 | | | | 241,069 | |
Aspen Technology, Inc. (c) | | | 5,550 | | | | 671,161 | |
Blackline, Inc. (c) | | | 4,738 | | | | 244,291 | |
Cerence, Inc. (c) | | | 1,946 | | | | 44,038 | |
Digital Turbine, Inc. (c) | | | 47,507 | | | | 338,725 | |
Everbridge, Inc. (c) | | | 4,861 | | | | 379,547 | |
Five9, Inc. (c) | | | 7,034 | | | | 461,290 | |
LivePerson, Inc. (c) | | | 14,434 | | | | 534,058 | |
Model N, Inc. (c) | | | 42,639 | | | | 1,495,350 | |
PROS Holdings, Inc. (c) | | | 1,034 | | | | 61,957 | |
Rapid7, Inc. (c) | | | 8,198 | | | | 459,252 | |
RealPage, Inc. (c) | | | 3,492 | | | | 187,695 | |
Sapiens International Corp. NV | | | 2,806 | | | | 64,538 | |
SPS Commerce, Inc. (c) | | | 19,745 | | | | 1,094,268 | |
| | | | | | | | |
| See accompanying Notes to Financial Statements | | | December 31, 2019 | | | Semiannual Report | | | 87 | |
Schedule of Investments
December 31, 2019 (Unaudited)
| | | | | | | | |
| | | Shares | | | Value | |
SVMK, Inc. (c) | | | 14,569 | | | $ | 260,348 | |
Upland Software, Inc. (c) | | | 2,383 | | | | 85,097 | |
Verint Systems, Inc. (c) | | | 3,700 | | | | 204,832 | |
Zix Corp. (c) | | | 33,087 | | | | 224,330 | |
| | | | | | | | |
| | | | | | | 7,514,845 | |
| | | | | | | | |
| |
| Specialty Retail—2.4% | | | | | |
Boot Barn Holdings, Inc. (c) | | | 12,345 | | | | 549,723 | |
Cato Corp., Class A | | | 16,040 | | | | 279,096 | |
Citi Trends, Inc. | | | 2,685 | | | | 62,077 | |
Group 1 Automotive, Inc. | | | 9,795 | | | | 979,500 | |
Lithia Motors, Inc., Class A | | | 6,275 | | | | 922,425 | |
Murphy USA, Inc. (c) | | | 510 | | | | 59,670 | |
Williams-Sonoma, Inc. | | | 5,270 | | | | 387,029 | |
| | | | | | | | |
| | | | | | | 3,239,520 | |
| | | | | | | | |
|
| Textiles, Apparel & Luxury Goods—1.3% | |
Crocs, Inc. (c) | | | 31,415 | | | | 1,315,974 | |
Deckers Outdoor Corp. (c) | | | 2,640 | | | | 445,791 | |
| | | | | | | | |
| | | | | | | 1,761,765 | |
| | | | | | | | |
|
| Thrifts & Mortgage Finance—5.5% | |
America First Multifamily Investors L.P. | | | 25,955 | | | | 199,853 | |
Capitol Federal Financial, Inc. | | | 37,900 | | | | 520,367 | |
ESSA Bancorp, Inc. | | | 5,785 | | | | 98,056 | |
Essent Group Ltd. | | | 20,118 | | | | 1,045,935 | |
First Defiance Financial Corp. | | | 2,228 | | | | 70,160 | |
Flagstar Bancorp, Inc. | | | 26,660 | | | | 1,019,745 | |
Kearny Financial Corp. | | | 21,600 | | | | 298,728 | |
LendingTree, Inc. (c) | | | 1,297 | | | | 393,562 | |
Meridian Bancorp, Inc. | | | 9,298 | | | | 186,797 | |
MGIC Investment Corp. | | | 60,500 | | | | 857,285 | |
NMI Holdings, Inc., Class A (c) | | | 6,294 | | | | 208,835 | |
Northwest Bancshares, Inc. | | | 5,960 | | | | 99,115 | |
OceanFirst Financial Corp. | | | 3,135 | | | | 80,068 | |
PCSB Financial Corp. | | | 9,430 | | | | 190,957 | |
PennyMac Financial Services, Inc. | | | 2,150 | | | | 73,186 | |
Pioneer Bancorp,
Inc. (c) | | | 4,100 | | | | 62,771 | |
Radian Group, Inc. | | | 52,520 | | | | 1,321,403 | |
Territorial Bancorp, Inc. | | | 5,140 | | | | 159,032 | |
Waterstone Financial, Inc. | | | 24,715 | | | | 470,326 | |
| | | | | | | | |
| | | | | | | 7,356,181 | |
| | | | | | | | |
|
| Tobacco—0.2% | |
Universal Corp. | | | 3,755 | | | | 214,260 | |
| | | | | | | | |
|
| Trading Companies & Distributors—1.0% | |
BMC Stock Holdings, Inc. (c) | | | 31,805 | | | | 912,485 | |
Rush Enterprises, Inc., Class B | | | 8,330 | | | | 380,681 | |
| | | | | | | | |
| | | | | | | 1,293,166 | |
| | | | | | | | |
|
| Water Utilities—1.1% | |
American States Water Co. | | | 8,675 | | | | 751,602 | |
California Water Service Group | | | 3,630 | | | | 187,163 | |
SJW Group | | | 7,170 | | | | 509,500 | |
| | | | | | | | |
| | | | | | | 1,448,265 | |
| | | | | | | | |
|
| Wireless Telecommunication Services—0.0% | |
Boingo Wireless,
Inc. (c) | | | 4,243 | | | | 46,461 | |
| | | | | | | | |
Total Common Stock
(cost—$109,129,814) | | | | 131,333,941 | |
| | | | | | | | |
| | | | | | | | |
| | | Principal
Amount
(000s) | | | Value | |
|
| Repurchase Agreements—1.8% | |
State Street Bank and Trust Co., dated 12/31/19, 0.25%, due 1/2/20, proceeds $2,409,033; collateralized by U.S. Treasury Bonds, 2.50%, due 2/15/46, valued at $2,457,997 including accrued interest | |
(cost—$2,409,000) | | | $2,409 | | | $ | 2,409,000 | |
| |
Total Investments
(cost—$111,538,814)—100.1% | | | | 133,742,941 | |
| | | | | | | | |
| | |
| Liabilities in excess of other assets—(0.1)% | | | | | | | (78,296 | ) |
| | | | | | | | |
| |
| Net Assets—100.0% | | | | $133,664,645 | |
| | | | | | | | |
Notes to Schedule of Investments:
(a) Fair-Valued—Security with a value of $1,296, representing less than 0.05% of net assets. See Note 1(a) and Note 1(b) in the Notes to Financial Statements.
(b) Level 3 security. See Note 1(a) and Note 1(b) in the Notes to Financial Statements.
(c)Non-income producing.
Glossary:
REIT—Real Estate Investment Trust
AllianzGI Technology Fund
| | | | | | | | |
| | | Shares | | | Value | |
| |
| COMMON STOCK—96.9% | | | | | |
|
| Communications Equipment—0.3% | |
Arista Networks, Inc. (d) | | | 100 | | | | $20,340 | |
Cisco Systems, Inc. | | | 100 | | | | 4,796 | |
Juniper Networks, Inc. | | | 95 | | | | 2,340 | |
Lumentum Holdings, Inc. (d) | | | 95 | | | | 7,534 | |
Motorola Solutions, Inc. | | | 95 | | | | 15,308 | |
Nokia Oyj ADR | | | 95 | | | | 352 | |
Telefonaktiebolaget LM Ericsson ADR | | | 340,540 | | | | 2,989,941 | |
Telefonaktiebolaget LM Ericsson, Class B | | | 262,250 | | | | 2,291,491 | |
| | | | | | | | |
| | | | | | | 5,332,102 | |
| | | | | | | | |
|
| Diversified Consumer Services—0.0% | |
New Oriental Education & Technology Group, Inc. ADR (d) | | | 95 | | | | 11,519 | |
| | | | | | | | |
|
| Diversified Telecommunication Services—0.0% | |
AT&T, Inc. | | | 95 | | | | 3,713 | |
Verizon Communications, Inc. | | | 95 | | | | 5,833 | |
| | | | | | | | |
| | | | | | | 9,546 | |
| | | | | | | | |
|
| Electrical Equipment—0.0% | |
Bloom Energy Corp.,
Class A (d) | | | 12,930 | | | | 96,587 | |
Nidec Corp. | | | 100 | | | | 13,659 | |
| | | | | | | | |
| | | | | | | 110,246 | |
| | | | | | | | |
|
| Electronic Equipment, Instruments & Components—0.1% | |
CDW Corp. | | | 12,970 | | | | 1,852,635 | |
Cognex Corp. | | | 100 | | | | 5,604 | |
IPG Photonics Corp. (d) | | | 95 | | | | 13,767 | |
Murata Manufacturing Co., Ltd. | | | 300 | | | | 18,465 | |
Samsung Electro-Mechanics Co., Ltd. | | | 165 | | | | 17,748 | |
Samsung SDI Co., Ltd. | | | 950 | | | | 193,527 | |
| | | | | | | | |
| | | | | | | 2,101,746 | |
| | | | | | | | |
|
| Entertainment—3.2% | |
Activision Blizzard, Inc. | | | 311,895 | | | | 18,532,801 | |
Electronic Arts, Inc. (d) | | | 84,800 | | | | 9,116,848 | |
Netflix, Inc. (d) | | | 100 | | | | 32,357 | |
Nintendo Co., Ltd. | | | 100 | | | | 39,996 | |
Roku, Inc. (d) | | | 33,115 | | | | 4,434,098 | |
Take-Two Interactive Software, Inc. (d) | | | 143,090 | | | | 17,518,509 | |
| | | | | | | | |
| | | | | | | 49,674,609 | |
| | | | | | | | |
|
| Healthcare Technology—0.9% | |
Veeva Systems, Inc.,
Class A (d) | | | 93,370 | | | | 13,133,424 | |
| | | | | | | | |
| |
| Household Durables—0.0% | | | | | |
Garmin Ltd. | | | 95 | | | | 9,268 | |
| | | | | | | | |
|
| Industrial Conglomerates—0.0% | |
Roper Technologies, Inc. | | | 100 | | | | 35,423 | |
| | | | | | | | |
|
| Interactive Media & Services—11.6% | |
58.com, Inc. ADR (d) | | | 95 | | | | 6,149 | |
Alphabet, Inc., Class A (c)(d) | | | 15,525 | | | | 20,794,030 | |
Alphabet, Inc., Class C (d) | | | 42,415 | | | | 56,709,703 | |
Baidu, Inc. ADR (d) | | | 95 | | | | 12,008 | |
Facebook, Inc., Class A (c)(d) | | | 433,955 | | | | 89,069,264 | |
NAVER Corp. | | | 475 | | | | 76,425 | |
Snap, Inc., Class A (d) | | | 738,485 | | | | 12,059,460 | |
| | | | | | |
| 88 | | Semiannual Report | | | December 31, 2019 | | | See accompanying Notes to Financial Statements |
Schedule of Investments
December 31, 2019 (Unaudited)
| | | | | | | | |
| | | Shares | | | Value | |
Tencent Holdings Ltd. | | | 100 | | | $ | 4,818 | |
TripAdvisor, Inc. | | | 95 | | | | 2,886 | |
Twitter, Inc. (d) | | | 95 | | | | 3,045 | |
Weibo Corp. ADR (d) | | | 20 | | | | 927 | |
Yandex NV, Class A (d) | | | 95 | | | | 4,131 | |
Yelp, Inc. (d) | | | 95 | | | | 3,309 | |
Zillow Group, Inc., Class A (d) | | | 95 | | | | 4,345 | |
| | | | | | | | |
| | | | | | | 178,750,500 | |
| | | | | | | | |
|
| Internet & Direct Marketing Retail—2.8% | |
Alibaba Group Holding Ltd. ADR (d) | | | 100 | | | | 21,210 | |
Amazon.com, Inc. (d) | | | 23,145 | | | | 42,768,257 | |
eBay, Inc. | | | 95 | | | | 3,431 | |
Expedia Group, Inc. | | | 95 | | | | 10,273 | |
GrubHub, Inc. (d) | | | 95 | | | | 4,621 | |
JD.com, Inc. ADR (d) | | | 95 | | | | 3,347 | |
Trip.com Group Ltd. ADR (d) | | | 95 | | | | 3,186 | |
| | | | | | | | |
| | | | | | | 42,814,325 | |
| | | | | | | | |
| |
| IT Services—20.2% | | | | | |
Accenture PLC, Class A | | | 95 | | | | 20,004 | |
Adyen NV (a)(d) | | | 95 | | | | 78,147 | |
Akamai Technologies, Inc. (d) | | | 151,870 | | | | 13,118,531 | |
Amadeus IT Group S.A. | | | 95 | | | | 7,780 | |
Automatic Data Processing, Inc. | | | 95 | | | | 16,197 | |
DXC Technology Co. | | | 480,095 | | | | 18,046,771 | |
EPAM Systems, Inc. | | | 39,975 | | | | 8,481,096 | |
Fidelity National Information Services, Inc. | | | 134,573 | | | | 18,717,759 | |
Fiserv, Inc. (d) | | | 219,025 | | | | 25,325,861 | |
Global Payments, Inc. | | | 149,279 | | | | 27,252,374 | |
GoDaddy, Inc., Class A (d) | | | 95 | | | | 6,452 | |
International Business Machines Corp. | | | — | | | | — | |
Mastercard, Inc., Class A | | | 163,600 | | | | 48,849,324 | |
MongoDB, Inc. (d) | | | 247,190 | | | | 32,532,676 | |
Okta, Inc. (d) | | | 482,090 | | | | 55,618,723 | |
PayPal Holdings, Inc. (d) | | | 151,025 | | | | 16,336,374 | |
Perspecta, Inc. | | | 2,645 | | | | 69,934 | |
Sabre Corp. | | | 95 | | | | 2,132 | |
Square, Inc., Class A (c)(d) | | | 86,585 | | | | 5,416,758 | |
Tata Consultancy Services Ltd. | | | 2,000 | | | | 60,570 | |
Twilio, Inc., Class A (d) | | | 420,365 | | | | 41,313,472 | |
Visa, Inc., Class A | | | 100 | | | | 18,790 | |
| | | | | | | | |
| | | | | | | 311,289,725 | |
| | | | | | | | |
| |
| Media—0.0% | | | | | |
Comcast Corp., Class A | | | 95 | | | | 4,272 | |
| | | | | | | | |
| |
| Professional Services—0.0% | | | | | |
Verisk Analytics, Inc. | | | 95 | | | | 14,187 | |
| | | | | | | | |
| |
| Road & Rail—0.0% | | | | | |
Lyft, Inc., Class A (d) | | | 100 | | | | 4,302 | |
| | | | | | | | |
|
| Semiconductors & Semiconductor Equipment—21.3% | |
Advanced Micro Devices, Inc. (d) | | | 1,234,440 | | | | 56,611,418 | |
ams AG (d) | | | 95 | | | | 3,857 | |
Analog Devices, Inc. | | | 10,830 | | | | 1,287,037 | |
Applied Materials, Inc. | | | 255,265 | | | | 15,581,376 | |
ASML Holding NV | | | 1,820 | | | | 538,611 | |
Broadcom, Inc. | | | 21,040 | | | | 6,649,061 | |
Cree, Inc. (d) | | | 19,625 | | | | 905,694 | |
Cypress Semiconductor Corp. | | | 100 | | | | 2,333 | |
| | | | | | | | |
| | | Shares | | | Value | |
Infineon Technologies AG | | | 14,545 | | | $ | 328,635 | |
Intel Corp. | | | 100 | | | | 5,985 | |
KLA Corp. | | | 122,710 | | | | 21,863,241 | |
Lam Research Corp. | | | 82,340 | | | | 24,076,216 | |
Maxim Integrated Products, Inc. | | | 95 | | | | 5,843 | |
MediaTek, Inc. | | | 1,000 | | | | 14,817 | |
Microchip Technology, Inc. | | | 100 | | | | 10,472 | |
Micron Technology, Inc. (c)(d) | | | 440,635 | | | | 23,697,350 | |
NVIDIA Corp. | | | 140,615 | | | | 33,086,709 | |
NXP Semiconductors NV | | | 151,480 | | | | 19,277,345 | |
ON Semiconductor Corp. (d) | | | 100 | | | | 2,438 | |
QUALCOMM, Inc. | | | 244,255 | | | | 21,550,619 | |
SK Hynix, Inc. | | | 6,270 | | | | 509,987 | |
Skyworks Solutions, Inc. | | | 100 | | | | 12,088 | |
STMicroelectronics NV | | | 556,670 | | | | 14,979,990 | |
Taiwan Semiconductor Manufacturing Co., Ltd. ADR | | | 824,890 | | | | 47,926,109 | |
Teradyne, Inc. | | | 587,555 | | | | 40,065,375 | |
Texas Instruments, Inc. | | | 100 | | | | 12,829 | |
Tokyo Electron Ltd. | | | 800 | | | | 174,664 | |
Universal Display Corp. | | | 95 | | | | 19,577 | |
Xilinx, Inc. | | | 100 | | | | 9,777 | |
| | | | | | | | |
| | | | | | | 329,209,453 | |
| | | | | | | | |
| |
| Software—30.7% | | | | | |
Adobe, Inc. (d) | | | 100 | | | | 32,981 | |
Alteryx, Inc., Class A (d) | | | 404,825 | | | | 40,510,838 | |
Aspen Technology, Inc. (d) | | | 95 | | | | 11,488 | |
Atlassian Corp. PLC, Class A (d) | | | 220,520 | | | | 26,537,377 | |
Box, Inc., Class A (d) | | | 95 | | | | 1,594 | |
Cadence Design Systems, Inc. (d) | | | 4,450 | | | | 308,652 | |
Cornerstone OnDemand, Inc. (d) | | | 95 | | | | 5,562 | |
Coupa Software, Inc. (d) | | | 95 | | | | 13,894 | |
Datadog, Inc., Class A (d) | | | 3,070 | | | | 115,985 | |
DocuSign, Inc. (d) | | | 95 | | | | 7,040 | |
Dropbox, Inc., Class A (d) | | | 95 | | | | 1,701 | |
Dynatrace, Inc. (d) | | | 21,105 | | | | 533,957 | |
Elastic NV (d) | | | 100 | | | | 6,430 | |
Fortinet, Inc. (d) | | | 238,985 | | | | 25,514,039 | |
HubSpot, Inc. (d) | | | 100 | | | | 15,850 | |
Intuit, Inc. | | | 95 | | | | 24,883 | |
Microsoft Corp. (c) | | | 992,601 | | | | 156,533,178 | |
Nutanix, Inc., Class A (d) | | | 100 | | | | 3,126 | |
Oracle Corp. | | | 95 | | | | 5,033 | |
Palo Alto Networks, Inc. (d) | | | 100 | | | | 23,125 | |
Paycom Software, Inc. (d) | | | 351,539 | | | | 93,073,466 | |
Proofpoint, Inc. (d) | | | 82,860 | | | | 9,510,671 | |
Rapid7, Inc. (d) | | | 73,640 | | | | 4,125,313 | |
RealPage, Inc. (d) | | | 100 | | | | 5,375 | |
RingCentral, Inc., Class A (d) | | | 305,720 | | | | 51,565,792 | |
Salesforce.com, Inc. (d) | | | 70,886 | | | | 11,528,899 | |
SAP SE ADR | | | 95 | | | | 12,729 | |
ServiceNow, Inc. (d) | | | 100 | | | | 28,232 | |
Sophos Group PLC (a) | | | 95 | | | | 702 | |
Splunk, Inc. (d) | | | 81,295 | | | | 12,175,552 | |
Synopsys, Inc. (d) | | | 2,440 | | | | 339,648 | |
Temenos AG (d) | | | 95 | | | | 15,028 | |
VMware, Inc., Class A (d) | | | 95 | | | | 14,420 | |
Workday, Inc., Class A (d) | | | 63,890 | | | | 10,506,710 | |
Zendesk, Inc. (d) | | | 100 | | | | 7,663 | |
Zscaler, Inc. (d) | | | 664,900 | | | | 30,917,850 | |
Zuora, Inc., Class A (d) | | | 95 | | | | 1,361 | |
| | | | | | | | |
| | | | | | | 474,036,144 | |
| | | | | | | | |
| | | | | | | | |
| | | Shares | | | Value | |
|
| Technology Hardware, Storage & Peripherals—5.8% | |
Apple, Inc. (c) | | | 97,350 | | | $ | 28,586,828 | |
Catcher Technology Co., Ltd. | | | 1,000 | | | | 7,574 | |
Dell Technologies, Inc., Class C (d) | | | 175 | | | | 8,993 | |
Hewlett Packard Enterprise Co. | | | 95 | | | | 1,507 | |
HP, Inc. | | | 95 | | | | 1,952 | |
NetApp, Inc. (c) | | | 283,745 | | | | 17,663,126 | |
Pure Storage, Inc., Class A (d) | | | 100 | | | | 1,711 | |
Samsung Electronics Co., Ltd. | | | 904,735 | | | | 43,596,323 | |
Western Digital Corp. | | | 95 | | | | 6,030 | |
| | | | | | | | |
| | | | | | | 89,874,044 | |
| | | | | | | | |
|
| Wireless Telecommunication Services—0.0% | |
T-Mobile U.S., Inc. (d) | | | 95 | | | | 7,450 | |
| | | | | | | | |
Total Common Stock
(cost-$998,364,460) | | | | | | | 1,496,422,285 | |
| | | | | | | | |
|
| EXCHANGE-TRADED FUNDS—0.0% | |
iShares FTSE A50 China Index, FTSE
(cost-$1,524) | | | 1,000 | | | | 1,965 | |
| | | | | | | | |
| | | | | | | | |
| | |
| | | Principal
Amount
(000s) | | | | |
|
| Repurchase Agreements—2.8% | |
State Street Bank and Trust Co.,
dated 12/31/19, 0.25%, due 1/2/20, proceeds $42,714,593; collateralized by U.S. Treasury Bonds, 3.00%, due 11/15/45, valued at $43,571,605 including accrued interest | |
(cost-$42,714,000) | | | $42,714 | | | | 42,714,000 | |
| | | | | | | | |
Total Options Purchased—0.5%
(cost—$7,100,880) (d)(e)(f) | | | | 7,715,600 | |
| | | | | | | | |
| |
Total Investments, before options written and securities sold short
(cost—$1,048,180,864)—100.2% | | | | 1,546,853,850 | |
| | | | | | | | |
| | | | | | | | |
| | |
| | | Shares | | | | |
|
| SECURITIES SOLD SHORT—(0.0)% | |
|
| Common Stock—(0.0)% | |
| |
| IT Services—(0.0)% | | | | | |
International Business Machines Corp. (proceeds received—$162) | | | 1 | | | | (134 | ) |
| | | | | | | | |
Total Options Written —(0.2)% (premiums received—$4,510,925) (d)(e)(f) | | | | (3,544,475 | ) |
| | | | | | | | |
| |
Total Investments, net of options written and securities sold short
(cost—$1,043,669,777) (b)—100.0% | | | | 1,543,309,241 | |
| | | | | | | | |
Other liabilities in excess of other assets—(0.0)% | | | | (100,850 | ) |
| | | | | | | | |
| |
| Net Assets—100.0% | | | | $1,543,208,391 | |
| | | | | | | | |
| | | | | | | | |
| See accompanying Notes to Financial Statements | | | December 31, 2019 | | | Semiannual Report | | | 89 | |
Schedule of Investments
December 31, 2019 (Unaudited)
Notes to Schedule of Investments:
(a) 144A—Exempt from registration under Rule 144A of the Securities Act of 1933. These securities may be resold in transactions exempt from registration, typically only to qualified institutional buyers. Securities with an aggregate value of $78,849, representing less than 0.05% of net assets.
(b) Securities (net of security sold short) with an aggregate value of $47,395,608, representing 3.1% of net assets, were valued utilizing modeling tools provided by a third-party vendor. See Note 1(a) and Note 1(b) in the Notes to Financial Statements.
(c) All or partial amount segregated for the benefit of the counterparty as collateral for security sold short and options written.
(d)Non-income producing.
(e) Exchange traded-Chicago Board Options Exchange.
(f) Exchange traded option contracts outstanding at December 31, 2019:
| | | | | | | | | | | | | | | | | | | | | | | | | | | | |
| | | |
| Options purchased contracts outstanding at December 31, 2019: | | | | | | | | | | |
| Description | | Exercise
Price | | | Expiration
Date | | | Number of
Contracts | | | Notional
Amount | | | Market
Value | | | Cost | | | Unrealized
Appreciation | |
|
Call options: | |
Amazon.com, Inc. | | | 2,070.00 USD | | | | 1/15/21 | | | | 310 | | | $ | 31,000 | | | $ | 3,800,600 | | | $ | 3,452,482 | | | $ | 348,118 | |
Pure Storage, Inc. | | | 20.00 USD | | | | 1/15/21 | | | | 18,000 | | | | 1,800,000 | | | | 3,915,000 | | | | 3,648,398 | | | | 266,602 | |
| | | | | | | | | | | | | | | | | | | | |
| Total options purchased contracts | | | $ | 7,715,600 | | | $ | 7,100,880 | | | $ | 614,720 | |
| | | | | | | | | | | | | |
| | | | | | | | | | | | | | | | | | | | | | | | | | | | |
| | | |
| Options written contracts outstanding at December 31, 2019: | | | | | | | | | | |
| Description | | Exercise
Price | | | Expiration
Date | | | Number of
Contracts | | | Notional
Amount | | | Market
Value | | | Premiums
Received | | | Unrealized
Appreciation | |
|
Put options: | |
Amazon.com, Inc. | | | 1,500.00 USD | | | | 1/15/21 | | | | (310 | ) | | $ | (31,000 | ) | | $ | (1,789,475 | ) | | $ | (2,242,171 | ) | | $ | 452,696 | |
Pure Storage, Inc. | | | 12.50 USD | | | | 1/15/21 | | | | (18,000 | ) | | | (1,800,000 | ) | | | (1,755,000 | ) | | | (2,268,754 | ) | | | 513,754 | |
| | | | | | | | | | | | | | | | | | | | |
| Total options written contracts | | | $ | (3,544,475 | ) | | $ | (4,510,925 | ) | | $ | 966,450 | |
| | | | | | | | | | | | | |
Glossary:
ADR—American Depositary Receipt
FTSE—Financial Times Stock Exchange
| | | | | | |
| 90 | | Semiannual Report | | | December 31, 2019 | | | See accompanying Notes to Financial Statements |
(THIS PAGE INTENTIONALLY LEFT BLANK)
| | | | | | | | |
| See accompanying Notes to Financial Statements | | | December 31, 2019 | | | Semiannual Report | | | 91 | |
Statements of Assets and Liabilities
December 31, 2019 (Unaudited)
| | | | | | | | | | | | | | | | |
| | | AllianzGI Emerging Markets Opportunities | | | AllianzGI Focused Growth | | | AllianzGI Global Natural Resources | | | AllianzGI Global Small-Cap | |
| Assets: | | | | | | | | | | | | |
| Investments, at value | | $ | 371,611,411 | | | $ | 1,040,448,139 | | | $ | 10,061,021 | | | $ | 105,158,097 | |
| Investments in Affiliates, at value | | | — | | | | — | | | | — | | | | — | |
| Cash | | | 698 | | | | 372 | | | | 53,987 | | | | 398 | |
| Foreign currency, at value | | | 847,846 | | | | — | | | | 17 | | | | 169,779 | |
| Dividends and interest receivable (net of foreign withholding taxes) | | | 1,472,461 | | | | 161,442 | | | | 11,309 | | | | 65,082 | |
| Receivable for Fund shares sold | | | 334,428 | | | | 186,358 | | | | 847 | | | | 14,562 | |
| Investments in Affiliated Funds — Trustees Deferred Compensation Plan (see Note 4) | | | 70,144 | | | | 249,374 | | | | 9,699 | | | | 55,239 | |
| Tax reclaims receivable | | | 50,108 | | | | — | | | | 12,271 | | | | 147,252 | |
| Receivable for investments sold | | | — | | | | — | | | | — | | | | 367,080 | |
| Unrealized appreciation of forward foreign currency contracts | | | — | | | | — | | | | — | | | | 100 | |
Total Assets | | | 374,387,096 | | | | 1,041,045,685 | | | | 10,149,151 | | | | 105,977,589 | |
| Liabilities: | | | | | | | | | | | | |
| Payable for Fund shares redeemed | | | 612,891 | | | | 2,899,056 | | | | 215,754 | | | | 80,509 | |
| Investment Advisory fees payable | | | 192,808 | | | | 293,287 | | | | 5,727 | | | | 78,118 | |
| Administration fees payable | | | 76,232 | | | | 295,315 | | | | 3,325 | | | | 35,205 | |
| Trustees Deferred Compensation Plan payable (see Note 4) | | | 70,144 | | | | 249,374 | | | | 9,699 | | | | 55,239 | |
| Servicing fees payable | | | 9,953 | | | | 132,195 | | | | 1,076 | | | | 10,110 | |
| Distribution fees payable | | | 1,840 | | | | 33,069 | | | | 608 | | | | 3,547 | |
| Options written, at value | | | — | | | | — | | | | — | | | | — | |
| Payable for investments purchased | | | — | | | | — | | | | — | | | | — | |
| Accrued expenses and other liabilities | | | 83 | | | | — | | | | — | | | | 1,177 | |
Total Liabilities | | | 963,951 | | | | 3,902,296 | | | | 236,189 | | | | 263,905 | |
| Net Assets | | $ | 373,423,145 | | | $ | 1,037,143,389 | | | $ | 9,912,962 | | | $ | 105,713,684 | |
| Net Assets Consist of: | | | | | | | | | | | | |
| Paid-in-capital | | $ | 364,776,292 | | | $ | 624,560,265 | | | $ | 20,490,303 | | | $ | 87,559,768 | |
| Total distributable earnings (loss) | | | 8,646,853 | | | | 412,583,124 | | | | (10,577,341 | ) | | | 18,153,916 | |
| Net Assets | | $ | 373,423,145 | | | $ | 1,037,143,389 | | | $ | 9,912,962 | | | $ | 105,713,684 | |
| Cost of Investments | | $ | 306,619,883 | | | $ | 648,766,065 | | | $ | 9,320,276 | | | $ | 84,916,914 | |
| Cost of Investments in Affiliates | | $ | — | | | $ | — | | | $ | — | | | $ | — | |
| Cost of Foreign Currency | | $ | 841,499 | | | $ | — | | | $ | 17 | | | $ | 167,255 | |
| Premiums Received for Options Written | | $ | — | | | $ | — | | | $ | — | | | $ | — | |
| | | | | | |
| 92 | | Semiannual Report | | | December 31, 2019 | | | See accompanying Notes to Financial Statements |
| | | | | | | | | | | | | | | | | | | | | | |
| | | | AllianzGI Health Sciences | | | AllianzGI Income & Growth | | | AllianzGI Mid-Cap | | | AllianzGI NFJ Dividend Value | | | AllianzGI NFJ International Value | |
| | | | | | | | | | | | | | | | | |
| | | | | $ | 163,670,498 | | | $ | 4,879,310,268 | | | $ | 335,541,319 | | | $ | 1,240,301,561 | | | $ | 168,966,943 | |
| | | | | | — | | | | 17,711,302 | | | | — | | | | — | | | | — | |
| | | | | | 855 | | | | 474,646 | | | | 337 | | | | 163 | | | | 213 | |
| | | | | | — | | | | — | | | | — | | | | — | | | | 120,890 | |
| | | | | | 88,774 | | | | 32,960,047 | | | | 100,125 | | | | 1,426,977 | | | | 210,818 | |
| | | | | | 114,363 | | | | 10,505,148 | | | | 52,074 | | | | 1,312,541 | | | | 34,351 | |
| | | | | | 45,606 | | | | 625,749 | | | | 67,182 | | | | 1,555,341 | | | | 317,956 | |
| | | | | | 139,855 | | | | — | | | | — | | | | 471,404 | | | | 222,846 | |
| | | | | | 25 | | | | 83,491,838 | | | | 3,050,499 | | | | — | | | | — | |
| | | | | | — | | | | — | | | | — | | | | — | | | | — | |
| | | | | 164,059,976 | | | | 5,025,078,998 | | | | 338,811,536 | | | | 1,245,067,987 | | | | 169,874,017 | |
| | | | | | | | | | | | | | | | | |
| | | | | | 119,875 | | | | 6,069,184 | | | | 197,518 | | | | 6,300,448 | | | | 579,294 | |
| | | | | | 105,340 | | | | 2,540,710 | | | | 127,562 | | | | 380,750 | | | | 74,858 | |
| | | | | | 52,281 | | | | 1,400,984 | | | | 103,885 | | | | 371,628 | | | | 60,690 | |
| | | | | | 45,606 | | | | 625,749 | | | | 67,182 | | | | 1,555,341 | | | | 317,956 | |
| | | | | | 31,945 | | | | 587,165 | | | | 53,651 | | | | 117,125 | | | | 17,601 | |
| | | | | | 2,471 | | | | 778,390 | | | | 15,150 | | | | 401,627 | | | | 33,960 | |
| | | | | | — | | | | 226,131 | | | | — | | | | — | | | | — | |
| | | | | | — | | | | 90,072,160 | | | | 2,149,356 | | | | — | | | | — | |
| | | | | | — | | | | — | | | | — | | | | — | | | | 215 | |
| | | | | | 357,518 | | | | 102,300,473 | | | | 2,714,304 | | | | 9,126,919 | | | | 1,084,574 | |
| | | | $ | 163,702,458 | | | $ | 4,922,778,525 | | | $ | 336,097,232 | | | $ | 1,235,941,068 | | | $ | 168,789,443 | |
| | | | | | | | | | | | | | | | | |
| | | | | $ | 129,494,691 | | | $ | 5,287,403,713 | | | $ | 250,170,518 | | | $ | 1,057,745,612 | | | $ | 603,433,722 | |
| | | | | | 34,207,767 | | | | (364,625,188 | ) | | | 85,926,714 | | | | 178,195,456 | | | | (434,644,279 | ) |
| | | | | $ | 163,702,458 | | | $ | 4,922,778,525 | | | $ | 336,097,232 | | | $ | 1,235,941,068 | | | $ | 168,789,443 | |
| | | | | $ | 132,311,535 | | | $ | 5,219,204,533 | | | $ | 247,953,187 | | | $ | 1,083,873,479 | | | $ | 152,821,837 | |
| | | | | $ | — | | | $ | 26,758,599 | | | $ | — | | | $ | — | | | $ | — | |
| | | | | $ | — | | | $ | — | | | $ | — | | | $ | — | | | $ | 119,589 | |
| | | | | $ | — | | | $ | 389,131 | | | $ | — | | | $ | — | | | $ | — | |
| | | | | | | | |
| See accompanying Notes to Financial Statements | | | December 31, 2019 | | | Semiannual Report | | | 93 | |
Statements of Assets and Liabilities (cont’d)
December 31, 2019 (Unaudited)
| | | | | | | | | | | | | | | | |
| | | AllianzGI Emerging Markets Opportunities | | | AllianzGI Focused Growth | | | AllianzGI Global Natural Resources | | | AllianzGI Global Small-Cap | |
| Net Assets: | | | | | | | | | | | | |
| Class A | | $ | 46,464,836 | | | $ | 589,892,082 | | | $ | 4,015,954 | | | $ | 43,446,666 | |
| Class C | | | 3,058,133 | | | | 45,640,526 | | | | 1,011,014 | | | | 5,701,689 | |
| Class R | | | — | | | | 20,003,884 | | | | — | | | | — | |
| Class P | | | 17,023,701 | | | | 84,571,573 | | | | 377,075 | | | | 9,417,398 | |
| Institutional Class | | | 281,908,781 | | | | 149,105,621 | | | | 4,508,919 | | | | 47,147,931 | |
| Class R6 | | | 24,967,694 | | | | 143,222,235 | | | | — | | | | — | |
| Administrative Class | | | — | | | | 4,707,468 | | | | — | | | | — | |
| Shares Issued and Outstanding: | | | | | | | | | | | | |
| Class A | | | 1,634,087 | | | | 11,448,723 | | | | 299,899 | | | | 1,141,189 | |
| Class C | | | 107,932 | | | | 1,491,812 | | | | 80,578 | | | | 181,515 | |
| Class R | | | — | | | | 559,855 | | | | — | | | | — | |
| Class P | | | 613,249 | | | | 2,296,614 | | | | 27,683 | | | | 227,461 | |
| Institutional Class | | | 9,917,589 | | �� | | 3,190,845 | | | | 328,664 | | | | 1,124,936 | |
| Class R6 | | | 883,146 | | | | 3,058,682 | | | | — | | | | — | |
| Administrative Class | | | — | | | | 110,046 | | | | — | | | | — | |
| Net Asset Value and Redemption Price Per Share:* | | | | | | | | | | | | |
| Class A | | $ | 28.43 | | | $ | 51.52 | | | $ | 13.39 | | | $ | 38.07 | |
| Class C | | | 28.33 | | | | 30.59 | | | | 12.55 | | | | 31.41 | |
| Class R | | | — | | | | 35.73 | | | | — | | | | — | |
| Class P | | | 27.76 | | | | 36.82 | | | | 13.62 | | | | 41.40 | |
| Institutional Class | | | 28.43 | | | | 46.73 | | | | 13.72 | | | | 41.91 | |
| Class R6 | | | 28.27 | | | | 46.82 | | | | — | | | | — | |
| Administrative Class | | | — | | | | 42.78 | | | | — | | | | — | |
| * | Net asset value and redemption price per share may not recalculate exactly due to rounding. |
| | | | | | |
| 94 | | Semiannual Report | | | December 31, 2019 | | | See accompanying Notes to Financial Statements |
| | | | | | | | | | | | | | | | | | | | | | |
| | | | AllianzGI Health Sciences | | | AllianzGI Income & Growth | | | AllianzGI Mid-Cap | | | AllianzGI NFJ Dividend Value | | | AllianzGI NFJ International Value | |
| | | | | | | | | | | | | | | | | |
| | | | | $ | 154,580,150 | | | $ | 1,615,915,350 | | | $ | 248,518,978 | | | $ | 442,347,471 | | | $ | 70,670,025 | |
| | | | | | 4,137,392 | | | | 1,275,909,018 | | | | 15,516,334 | | | | 57,753,475 | | | | 10,963,524 | |
| | | | | | — | | | | 6,271,795 | | | | 1,296,194 | | | | 71,491,521 | | | | 5,464,130 | |
| | | | | | — | | | | 1,234,069,336 | | | | 12,526,990 | | | | 336,898,416 | | | | 32,896,619 | |
| | | | | | 4,984,916 | | | | 790,613,026 | | | | 56,560,497 | | | | 220,646,471 | | | | 46,149,881 | |
| | | | | | — | | | | — | | | | — | | | | 73,324,233 | | | | 1,418,392 | |
| | | | | — | | | | — | | | | 1,678,239 | | | | 33,479,481 | | | | 1,226,872 | |
| | | | | | | | | | | | | | | | | |
| | | | | | 4,579,837 | | | | 144,103,390 | | | | 64,810,083 | | | | 37,841,837 | | | | 3,653,923 | |
| | | | | | 164,218 | | | | 124,821,151 | | | | 5,175,145 | | | | 4,840,655 | | | | 576,806 | |
| | | | | | — | | | | 559,343 | | | | 346,536 | | | | 6,117,255 | | | | 281,797 | |
| | | | | | — | | | | 107,127,396 | | | | 2,789,150 | | | | 28,533,148 | | | | 1,690,574 | |
| | | | | | 145,233 | | | | 67,920,420 | | | | 12,485,394 | | | | 18,716,808 | | | | 2,369,311 | |
| | | | | | — | | | | — | | | | — | | | | 6,247,160 | | | | 72,859 | |
| | | | | — | | | | — | | | | 408,068 | | | | 2,783,404 | | | | 63,198 | |
| | | | | | | | | | | | | | | | | |
| | | | | $ | 33.75 | | | $ | 11.21 | | | $ | 3.83 | | | $ | 11.69 | | | $ | 19.34 | |
| | | | | | 25.19 | | | | 10.22 | | | | 3.00 | | | | 11.93 | | | | 19.01 | |
| | | | | | — | | | | 11.21 | | | | 3.74 | | | | 11.69 | | | | 19.39 | |
| | | | | | — | | | | 11.52 | | | | 4.49 | | | | 11.81 | | | | 19.46 | |
| | | | | | 34.32 | | | | 11.64 | | | | 4.53 | | | | 11.79 | | | | 19.48 | |
| | | | | | — | | | | — | | | | — | | | | 11.74 | | | | 19.47 | |
| | | | | | — | | | | — | | | | 4.11 | | | | 12.03 | | | | 19.41 | |
| | | | | | | | |
| See accompanying Notes to Financial Statements | | | December 31, 2019 | | | Semiannual Report | | | 95 | |
Statements of Assets and Liabilities (cont’d)
December 31, 2019 (Unaudited)
| | | | | | | | | | | | | | | | |
| | | AllianzGI NFJ Large-Cap
Value | | | AllianzGI NFJ Mid-Cap Value | | | AllianzGI NFJ Small-Cap Value | | | AllianzGI Small-Cap | |
| Assets: | | | | | | | | | | | | |
| Investments, at value | | $ | 323,369,695 | | | $ | 1,452,655,979 | | | $ | 813,135,592 | | | $ | 133,742,941 | |
| Cash | | | — | | | | 569 | | | | — | | | | 56,469 | |
| Foreign currency, at value | | | — | | | | — | | | | — | | | | — | |
| Dividends and interest receivable (net of foreign withholding taxes) | | | 324,712 | | | | 2,862,021 | | | | 1,555,632 | | | | 166,422 | |
| Receivable for investments sold | | | 1,889,168 | | | | 28,981,288 | | | | 24,042,183 | | | | 907 | |
| Receivable for Fund shares sold | | | 139,033 | | | | 5,711,877 | | | | 1,648,268 | | | | 51,656 | |
| Tax reclaims receivable | | | 70,016 | | | | 15,519 | | | | — | | | | — | |
| Investments in Affiliated Funds — Trustees Deferred Compensation Plan (see Note 4) | | | 189,464 | | | | 315,367 | | | | 1,280,625 | | | | 14,333 | |
| Prepaid expenses and other assets | | | — | | | | — | | | | 888 | | | | — | |
Total Assets | | | 325,982,088 | | | | 1,490,542,620 | | | | 841,663,188 | | | | 134,032,728 | |
| Liabilities: | | | | | | | | | | | | |
| Payable to custodian for cash overdraft | | | 628,023 | | | | — | | | | 3,238,427 | | | | — | |
| Payable for Fund shares redeemed | | | 607,986 | | | | 6,935,671 | | | | 12,578,932 | | | | 183,141 | |
| Trustees Deferred Compensation Plan payable (see Note 4) | | | 189,464 | | | | 315,367 | | | | 1,280,625 | | | | 14,333 | |
| Investment Advisory fees payable | | | 118,489 | | | | 645,869 | | | | 343,684 | | | | 63,490 | |
| Administration fees payable | | | 96,622 | | | | 154,892 | | | | 238,334 | | | | 27,604 | |
| Servicing fees payable | | | 40,074 | | | | 138,176 | | | | 86,716 | | | | 15,145 | |
| Distribution fees payable | | | 7,086 | | | | 43,502 | | | | 717,852 | | | | 3,144 | |
| Dividends payable to shareholders | | | — | | | | — | | | | — | | | | — | |
| Securities sold short, at value | | | — | | | | — | | | | — | | | | — | |
| Options written, at value | | | — | | | | — | | | | — | | | | — | |
| Payable for investments purchased | | | — | | | | 24,375,744 | | | | 11,720,392 | | | | 61,226 | |
| Dividends payable on securities sold short | | | — | | | | — | | | | — | | | | — | |
| Accrued expenses and other liabilities | | | — | | | | — | | | | — | | | | — | |
Total Liabilities | | | 1,687,744 | | | | 32,609,221 | | | | 30,204,962 | | | | 368,083 | |
| Net Assets | | $ | 324,294,344 | | | $ | 1,457,933,399 | | | $ | 811,458,226 | | | $ | 133,664,645 | |
| Net Assets Consist of: | | | | | | | | | | | | |
| Paid-in-capital | | $ | 291,043,291 | | | $ | 1,261,924,429 | | | $ | 695,670,666 | | | $ | 113,335,540 | |
| Total distributable earnings | | | 33,251,053 | | | | 196,008,970 | | | | 115,787,560 | | | | 20,329,105 | |
| Net Assets | | $ | 324,294,344 | | | $ | 1,457,933,399 | | | $ | 811,458,226 | | | $ | 133,664,645 | |
| Cost of Investments | | $ | 292,190,104 | | | $ | 1,285,741,444 | | | $ | 729,574,022 | | | $ | 111,538,814 | |
| Cost of Foreign Currency | | $ | — | | | $ | — | | | $ | — | | | $ | — | |
| Proceeds Received on Securities Sold Short | | $ | — | | | $ | — | | | $ | — | | | $ | — | |
| Premiums Received for Options Written | | $ | — | | | $ | — | | | $ | — | | | $ | — | |
| | | | | | |
| 96 | | Semiannual Report | | | December 31, 2019 | | | See accompanying Notes to Financial Statements |
| | | | | | |
| | | | AllianzGI Technology | |
| | | | | |
| | | | | $ | 1,546,853,850 | |
| | | | | | — | |
| | | | | | 4,309,081 | |
| | | | | | 509,911 | |
| | | | | | 162 | |
| | | | | | 1,130,435 | |
| | | | | | 37,735 | |
| | | | | | 387,897 | |
| | | | | | — | |
| | | | | 1,553,229,071 | |
| | | | | |
| | | | | | 528 | |
| | | | | | 4,383,490 | |
| | | | | | 387,897 | |
| | | | | | 1,123,986 | |
| | | | | | 424,796 | |
| | | | | | 124,386 | |
| | | | | | 27,836 | |
| | | | | | 1 | |
| | | | | | 134 | |
| | | | | | 3,544,475 | |
| | | | | | — | |
| | | | | | 2 | |
| | | | | | 3,149 | |
| | | | | | 10,020,680 | |
| | | | $ | 1,543,208,391 | |
| | | | | |
| | | | | $ | 1,029,412,665 | |
| | | | | | 513,795,726 | |
| | | | | $ | 1,543,208,391 | |
| | | | | $ | 1,048,180,864 | |
| | | | | $ | 4,016,883 | |
| | | | | $ | 162 | |
| | | | | $ | 4,510,925 | |
| | | | | | | | |
| See accompanying Notes to Financial Statements | | | December 31, 2019 | | | Semiannual Report | | | 97 | |
Statements of Assets and Liabilities (cont’d)
December 31, 2019 (Unaudited)
| | | | | | | | | | | | | | | | |
| | | AllianzGI NFJ Large-Cap
Value | | | AllianzGI NFJ Mid-Cap Value | | | AllianzGI NFJ Small-Cap Value | | | AllianzGI Small-Cap | |
| Net Assets: | | | | | | | | | | | | |
| Class A | | $ | 185,387,876 | | | $ | 608,046,223 | | | $ | 398,546,431 | | | $ | 69,199,654 | |
| Class C | | | 10,636,943 | | | | 49,910,502 | | | | 2,410,480 | | | | 5,211,811 | |
| Class R | | | 2,065,290 | | | | 21,589,255 | | | | 20,732,778 | | | | — | |
| Class P | | | 19,837,253 | | | | 223,103,672 | | | | 34,584,395 | | | | 17,425,375 | |
| Institutional Class | | | 104,967,296 | | | | 444,879,537 | | | | 144,007,478 | | | | 16,981,358 | |
| Class R6 | | | — | | | | 75,119,971 | | | | 128,563,381 | | | | 24,846,447 | |
| Administrative Class | | | 1,399,686 | | | | 35,284,239 | | | | 82,613,283 | | | | — | |
| Shares Issued and Outstanding: | | | | | | | | | | | | |
| Class A | | | 6,435,772 | | | | 19,801,907 | | | | 27,671,722 | | | | 3,373,686 | |
| Class C | | | 364,571 | | | | 2,007,991 | | | | 189,490 | | | | 266,089 | |
| Class R | | | 70,933 | | | | 834,263 | | | | 1,305,675 | | | | — | |
| Class P | | | 681,967 | | | | 9,217,350 | | | | 2,051,971 | | | | 840,483 | |
| Institutional Class | | | 3,661,380 | | | | 13,474,182 | | | | 8,443,236 | | | | 812,273 | |
| Class R6 | | | — | | | | 2,277,608 | | | | 7,604,341 | | | | 1,188,670 | |
| Administrative Class | | | 47,883 | | | | 1,111,984 | | | | 5,760,347 | | | | — | |
| Net Asset Value and Redemption Price Per Share:* | | | | | | | | | | | | |
| Class A | | $ | 28.81 | | | $ | 30.71 | | | $ | 14.40 | | | $ | 20.51 | |
| Class C | | | 29.18 | | | | 24.86 | | | | 12.72 | | | | 19.59 | |
| Class R | | | 29.12 | | | | 25.88 | | | | 15.88 | | | | — | |
| Class P | | | 29.09 | | | | 24.20 | | | | 16.85 | | | | 20.73 | |
| Institutional Class | | | 28.67 | | | | 33.02 | | | | 17.06 | | | | 20.91 | |
| Class R6 | | | — | | | | 32.98 | | | | 16.91 | | | | 20.90 | |
| Administrative Class | | | 29.23 | | | | 31.73 | | | | 14.34 | | | | — | |
| * | Net asset value and redemption price per share may not recalculate exactly due to rounding. |
| | | | | | |
| 98 | | Semiannual Report | | | December 31, 2019 | | | See accompanying Notes to Financial Statements |
| | | | | | |
| | | | AllianzGI Technology | |
| | | | | |
| | | | | $ | 572,273,445 | |
| | | | | | 42,073,245 | |
| | | | | | — | |
| | | | | | 136,555,309 | |
| | | | | | 781,900,558 | |
| | | | | | — | |
| | | | | 10,405,834 | |
| | | | | |
| | | | | | 10,455,448 | |
| | | | | | 1,193,250 | |
| | | | | | — | |
| | | | | | 2,144,520 | |
| | | | | | 11,960,397 | |
| | | | | | — | |
| | | | | 174,371 | |
| | | | | |
| | | | | $ | 54.73 | |
| | | | | | 35.26 | |
| | | | | | — | |
| | | | | | 63.68 | |
| | | | | | 65.37 | |
| | | | | | — | |
| | | | | | 59.68 | |
| | | | | | | | |
| See accompanying Notes to Financial Statements | | | December 31, 2019 | | | Semiannual Report | | | 99 | |
Statements of Operations
Six Months ended December 31, 2019 (Unaudited)
| | | | | | | | | | | | | | | | |
| | | AllianzGI Emerging Markets Opportunities | | | AllianzGI Focused Growth | | | AllianzGI Global Natural Resources | | | AllianzGI Global Small-Cap | |
| Investment Income: | | | | | | | | | | | | |
| Dividends, net of foreign withholding taxes* | | $ | 6,708,874 | | | $ | 3,988,719 | | | $ | 174,118 | | | $ | 492,814 | |
| Interest | | | 6,216 | | | | 21,400 | | | | 115 | | | | 5,620 | |
| Miscellaneous | | | — | | | | — | | | | 7 | | | | — | |
Total Investment Income | | | 6,715,090 | | | | 4,010,119 | | | | 174,240 | | | | 498,434 | |
| Expenses: | | | | | | | | | | | | |
| Investment advisory | | | 1,500,508 | | | | 2,314,666 | | | | 37,101 | | | | 490,410 | |
| Administration | | | 720,559 | | | | 1,870,505 | | | | 21,617 | | | | 221,020 | |
| Distribution — Class C | | | 11,625 | | | | 170,588 | | | | 3,806 | | | | 23,699 | |
| Distribution — Class R | | | — | | | | 26,648 | | | | — | | | | — | |
| Servicing — Class A | | | 56,787 | | | | 719,914 | | | | 5,838 | | | | 55,365 | |
| Servicing — Class C | | | 3,875 | | | | 56,863 | | | | 1,269 | | | | 7,899 | |
| Servicing — Class R | | | — | | | | 26,648 | | | | — | | | | — | |
| Distribution and/or servicing — Administrative Class | | | — | | | | 5,729 | | | | — | | | | — | |
| Trustees | | | 36,577 | | | | 107,005 | | | | 1,120 | | | | 12,333 | |
| Line of credit commitment | | | 4,118 | | | | 11,694 | | | | 129 | | | | 1,369 | |
| Legal | | | 416 | | | | 1,098 | | | | 75 | | | | 174 | |
| Miscellaneous | | | 8,554 | | | | 144 | | | | 370 | | | | 1,306 | |
Total Expenses | | | 2,343,019 | | | | 5,311,502 | | | | 71,325 | | | | 813,575 | |
Less: Investment Advisory/Administration waived | | | (617,856 | ) | | | (571,963 | ) | | | — | | | | — | |
Net Expenses | | | 1,725,163 | | | | 4,739,539 | | | | 71,325 | | | | 813,575 | |
| Net Investment Income (Loss) | | | 4,989,927 | | | | (729,420 | ) | | | 102,915 | | | | (315,141 | ) |
| Realized and Change in Unrealized Gain (Loss): | | | | | | | | | | | | |
| Net realized gain (loss) on: | | | | | | | | | | | | | | | | |
Investments | | | (10,705,672 | ) | | | 103,926,085 | | | | (506,227 | ) | | | 4,908,694 | |
Options written | | | — | | | | — | | | | — | | | | — | |
Forward foreign currency contracts | | | — | | | | — | | | | (645 | ) | | | (2,259 | ) |
Foreign currency transactions | | | (263,090 | ) | | | — | | | | 970 | | | | 5,408 | |
| Net change in unrealized appreciation/depreciation of: | | | | | | | | | | | | | | | | |
Investments | | | 31,058,936 | | | | (6,183,912 | ) | | | (17,667 | ) | | | (85,726 | ) |
Investments in Affiliates | | | — | | | | — | | | | — | | | | — | |
Options written | | | — | | | | — | | | | — | | | | — | |
Forward foreign currency contracts | | | — | | | | — | | | | — | | | | 100 | |
Foreign currency transactions | | | (16,047 | ) | | | — | | | | (30 | ) | | | 1,445 | |
| Net realized and change in unrealized gain (loss) | | | 20,074,127 | | | | 97,742,173 | | | | (523,599 | ) | | | 4,827,662 | |
| Net Increase (Decrease) in Net Assets Resulting from Investment Operations | | $ | 25,064,054 | | | $ | 97,012,753 | | | $ | (420,684 | ) | | $ | 4,512,521 | |
| * Foreign withholding taxes | | $ | 932,449 | | | $ | — | | | $ | 4,377 | | | $ | 27,361 | |
| | | | | | |
| 100 | | Semiannual Report | | | December 31, 2019 | | | See accompanying Notes to Financial Statements |
| | | | | | | | | | | | | | | | | | | | | | |
| | | | AllianzGI Health Sciences | | | AllianzGI Income & Growth | | | AllianzGI Mid-Cap | | | AllianzGI NFJ Dividend Value | | | AllianzGI NFJ International Value | |
| | | | | | | | | | | | | | | | | |
| | | | | $ | 915,155 | | | $ | 17,095,341 | | | $ | 773,689 | | | $ | 16,824,142 | | | $ | 2,811,555 | |
| | | | | | 7,443 | | | | 51,118,026 | | | | 3,365 | | | | 21,428 | | | | 1,636 | |
| | | | | | — | | | | 206,660 | | | | — | | | | — | | | | — | |
| | | | | 922,598 | | | | 68,420,027 | | | | 777,054 | | | | 16,845,570 | | | | 2,813,191 | |
| | | | | | | | | | | | | | | | | |
| | | | | | 612,674 | | | | 15,232,178 | | | | 752,190 | | | | 2,894,770 | | | | 501,659 | |
| | | | | | 304,182 | | | | 8,265,483 | | | | 616,369 | | | | 2,346,276 | | | | 394,076 | |
| | | | | | 14,672 | | | | 4,639,761 | | | | 59,961 | | | | 235,083 | | | | 43,538 | |
| | | | | | — | | | | 7,274 | | | | 1,608 | | | | 89,832 | | | | 7,101 | |
| | | | | | 181,182 | | | | 1,913,851 | | | | 304,114 | | | | 560,076 | | | | 85,998 | |
| | | | | | 4,891 | | | | 1,546,587 | | | | 19,987 | | | | 78,361 | | | | 14,513 | |
| | | | | | — | | | | 7,274 | | | | 1,608 | | | | 89,832 | | | | 7,101 | |
| | | | | | — | | | | — | | | | 1,938 | | | | 44,267 | | | | 1,563 | |
| | | | | | 15,898 | | | | 480,885 | | | | 32,758 | | | | 135,655 | | | | 17,500 | |
| | | | | | 1,723 | | | | 52,325 | | | | 3,594 | | | | 15,075 | | | | 1,961 | |
| | | | | | 218 | | | | 4,816 | | | | 386 | | | | 1,368 | | | | 232 | |
| | | | | | 363 | | | | 25,887 | | | | 2,250 | | | | 8,774 | | | | 2,159 | |
| | | | | | 1,135,803 | | | | 32,176,321 | | | | 1,796,763 | | | | 6,499,369 | | | | 1,077,401 | |
| | | | | | — | | | | (259,077 | ) | | | — | | | | (482,462 | ) | | | (62,707 | ) |
| | | | | | 1,135,803 | | | | 31,917,244 | | | | 1,796,763 | | | | 6,016,907 | | | | 1,014,694 | |
| | | | | (213,205 | ) | | | 36,502,783 | | | | (1,019,709 | ) | | | 10,828,663 | | | | 1,798,497 | |
| | | | | | | | | | | | | | | | | |
| | | | | | | | | | | | | | | | | | | | | | |
| | | | | | 7,935,309 | | | | 134,850,915 | | | | 8,343,044 | | | | 117,953,247 | | | | (1,915,579 | ) |
| | | | | | — | | | | 770,405 | | | | — | | | | — | | | | — | |
| | | | | | — | | | | — | | | | — | | | | — | | | | — | |
| | | | | | (3,001 | ) | | | — | | | | (19 | ) | | | (182 | ) | | | (20,695 | ) |
| | | | | | | | | | | | | | | | | | | | | | |
| | | | | | 9,809,417 | | | | 99,238,465 | | | | 15,463,351 | | | | (19,457,769 | ) | | | 9,693,032 | |
| | | | | | — | | | | (1,383,366 | ) | | | — | | | | — | | | | — | |
| | | | | | — | | | | 312,453 | | | | — | | | | — | | | | — | |
| | | | | | — | | | | — | | | | — | | | | — | | | | — | |
| | | | | | (1,176 | ) | | | — | | | | — | | | | 220 | | | | (2,794 | ) |
| | | | | | 17,740,549 | | | | 233,788,872 | | | | 23,806,376 | | | | 98,495,516 | | | | 7,753,964 | |
| | | | | $ | 17,527,344 | | | $ | 270,291,655 | | | $ | 22,786,667 | | | $ | 109,324,179 | | | $ | 9,552,461 | |
| | | | | $ | 947 | | | $ | — | | | $ | 3,811 | | | $ | 156,832 | | | $ | 189,202 | |
| | | | | | | | |
| See accompanying Notes to Financial Statements | | | December 31, 2019 | | | Semiannual Report | | | 101 | |
Statements of Operations (cont’d)
Six Months ended December 31, 2019 (Unaudited)
| | | | | | | | | | | | | | | | |
| | | AllianzGI NFJ Large-Cap Value | | | AllianzGI NFJ Mid-Cap Value | | | AllianzGI NFJ Small-Cap Value | | | AllianzGI Small-Cap | |
| Investment Income: | | | | | | | | | | | | |
| Dividends, net of foreign withholding taxes* | | $ | 4,218,492 | | | $ | 15,350,383 | | | $ | 11,558,828 | | | $ | 1,024,649 | |
| Interest | | | 3,892 | | | | 21,104 | | | | 16,228 | | | | 5,248 | |
| Miscellaneous | | | — | | | | — | | | | 8,865 | | | | — | |
Total Investment Income | | | 4,222,384 | | | | 15,371,487 | | | | 11,583,921 | | | | 1,029,897 | |
| Expenses: | | | | | | | | | | | | |
| Investment advisory | | | 758,853 | | | | 3,748,829 | | | | 2,701,925 | | | | 355,039 | |
| Administration | | | 611,394 | | | | 2,425,968 | | | | 1,553,309 | | | | 215,466 | |
| Distribution — Class C | | | 40,661 | | | | 177,101 | | | | 10,679 | | | | 19,986 | |
| Distribution — Class R | | | 2,545 | | | | 25,736 | | | | 26,227 | | | | — | |
| Servicing — Class A | | | 223,863 | | | | 746,518 | | | | 515,647 | | | | 84,525 | |
| Servicing — Class C | | | 13,554 | | | | 59,034 | | | | 3,560 | | | | 6,662 | |
| Servicing — Class R | | | 2,545 | | | | 25,736 | | | | 26,227 | | | | — | |
| Distribution and/or servicing — Administrative Class | | | 1,690 | | | | 38,693 | | | | 128,769 | | | | — | |
| Trustees | | | 34,588 | | | | 139,734 | | | | 99,050 | | | | 11,981 | |
| Line of credit commitment | | | 3,959 | | | | 15,335 | | | | 11,053 | | | | 1,287 | |
| Legal | | | 400 | | | | 1,444 | | | | 958 | | | | 185 | |
| Dividends on securities sold short | | | — | | | | — | | | | — | | | | — | |
| Securities sold short | | | — | | | | — | | | | — | | | | — | |
| Miscellaneous | | | 815 | | | | 3,460 | | | | 8,117 | | | | 73 | |
Total Expenses | | | 1,694,867 | | | | 7,407,588 | | | | 5,085,521 | | | | 695,204 | |
Less: Investment Advisory/Administration waived | | | — | | | | (1,499,531 | ) | | | (450,321 | ) | | | (59,173 | ) |
Net Expenses | | | 1,694,867 | | | | 5,908,057 | | | | 4,635,200 | | | | 636,031 | |
| Net Investment Income (Loss) | | | 2,527,517 | | | | 9,463,430 | | | | 6,948,721 | | | | 393,866 | |
| Realized and Change in Unrealized Gain (Loss): | | | | | | | | | | | | |
| Net realized gain (loss) on: | | | | | | | | | | | | | | | | |
Investments | | | 14,925,402 | | | | 97,720,547 | | | | 82,961,519 | | | | (118,032 | ) |
Securities sold short | | | — | | | | — | | | | — | | | | — | |
Options written | | | — | | | | — | | | | — | | | | — | |
Foreign currency transactions | | | (102 | ) | | | (393 | ) | | | 8,454 | | | | — | |
| Payments from Affiliates (See Note 10) | | | — | | | | — | | | | — | | | | 706 | |
| Net change in unrealized appreciation/depreciation of: | | | | | | | | | | | | | | | | |
Investments | | | 13,143,169 | | | | 10,301,773 | | | | (22,124,779 | ) | | | 6,425,715 | |
Securities sold short | | | — | | | | — | | | | �� | | | | — | |
Options written | | | — | | | | — | | | | — | | | | — | |
Foreign currency transactions | | | (54 | ) | | | 49 | | | | (376 | ) | | | — | |
| Net realized and change in unrealized gain | | | 28,068,415 | | | | 108,021,976 | | | | 60,844,818 | | | | 6,308,389 | |
| Net Increase in Net Assets Resulting from Investment Operations | | $ | 30,595,932 | | | $ | 117,485,406 | | | $ | 67,793,539 | | | $ | 6,702,255 | |
| * Foreign withholding taxes | | $ | 15,540 | | | $ | 11,580 | | | $ | 47,927 | | | $ | — | |
| | | | | | |
| 102 | | Semiannual Report | | | December 31, 2019 | | | See accompanying Notes to Financial Statements |
| | | | | | |
| | | | AllianzGI Technology | |
| | | | | |
| | | | | $ | 3,823,798 | |
| | | | | | 182,726 | |
| | | | | | 7 | |
| | | | | 4,006,531 | |
| | | | | |
| | | | | | 7,052,967 | |
| | | | | | 2,667,699 | |
| | | | | | 168,133 | |
| | | | | | — | |
| | | | | | 725,942 | |
| | | | | | 56,044 | |
| | | | | | — | |
| | | | | | 13,847 | |
| | | | | | 164,765 | |
| | | | | | 17,687 | |
| | | | | | 1,616 | |
| | | | | | 3 | |
| | | | | | 51,689 | |
| | | | | | 3,361 | |
| | | | | | 10,923,753 | |
| | | | | | — | |
| | | | | | 10,923,753 | |
| | | | | (6,917,222 | ) |
| | | | | |
| | | | | | |
| | | | | | 138,887,942 | |
| | | | | | (1,218,852 | ) |
| | | | | | 3,086,845 | |
| | | | | | (133,234 | ) |
| | | | | | — | |
| | | | | | |
| | | | | | (84,312,720 | ) |
| | | | | | 4 | |
| | | | | | (1,464,631 | ) |
| | | | | | 149,661 | |
| | | | | | 54,995,015 | |
| | | | | $ | 48,077,793 | |
| | | | | $ | 112,628 | |
| | | | | | | | |
| See accompanying Notes to Financial Statements | | | December 31, 2019 | | | Semiannual Report | | | 103 | |
Statements of Changes in Net Assets
| | | | | | | | | | | | | | | | | | | | |
| | | AllianzGI Emerging Markets Opportunities | | | AllianzGI Focused Growth | | | | |
| | | | | | |
| | | Six Months ended December 31, 2019 (Unaudited) | | | Year ended June 30, 2019 | | | Six Months ended December 31, 2019 (Unaudited) | | | Year ended June 30, 2019 | | | | |
| Increase (Decrease) in Net Assets from: | | | | | | | | | | | | | | | |
| | | | | | |
Investment Operations: | | | | | | | | | | | | | | | | | | | | |
| Net investment income (loss) | | $ | 4,989,927 | | | $ | 7,163,044 | | | $ | (729,420 | ) | | $ | (1,139,936 | ) | | | | |
| Net realized gain (loss) | | | (10,968,762 | ) | | | (34,340,091 | ) | | | 103,926,085 | | | | 129,030,700 | | | | | |
| Net change in unrealized appreciation/depreciation | | | 31,042,889 | | | | 15,603,950 | | | | (6,183,912 | ) | | | (63,725,778 | ) | | | | |
| | | | | | |
Net increase (decrease) in net assets resulting from investment operations | | | 25,064,054 | | | | (11,573,097 | ) | | | 97,012,753 | | | | 64,164,986 | | | | | |
| Distributions to Shareholders from: | | | | | | | | | | | | | | | |
| | | | | | |
| Distributable earnings: | | | | | | | | | | | | | | | | | | | | |
Class A | | | (917,791 | ) | | | (969,272 | ) | | | (71,954,089 | ) | | | (59,884,650 | ) | | | | |
Class C | | | (32,037 | ) | | | (15,097 | ) | | | (8,748,772 | ) | | | (8,093,814 | ) | | | | |
Class R | | | — | | | | — | | | | (3,434,752 | ) | | | (3,051,304 | ) | | | | |
Class P | | | (381,714 | ) | | | (507,886 | ) | | | (14,030,851 | ) | | | (14,260,002 | ) | | | | |
Institutional Class | | | (6,546,783 | ) | | | (6,130,461 | ) | | | (20,050,942 | ) | | | (18,778,168 | ) | | | | |
Class R6 | | | (582,626 | ) | | | (591,467 | ) | | | (18,688,902 | ) | | | (13,248,091 | ) | | | | |
Administrative Class | | | — | | | | — | | | | (695,736 | ) | | | (568,572 | ) | | | | |
| Total distributions to shareholders | | | (8,460,951 | ) | | | (8,214,183 | ) | | | (137,604,044 | ) | | | (117,884,601 | ) | | | | |
| Fund Share Transactions: | | | | | | | | | | | | | | | |
| Net proceeds from the sale of shares | | | 32,716,222 | | | | 169,185,889 | | | | 61,515,248 | | | | 332,235,487 | | | | | |
| Issued in reinvestment of distributions | | | 8,039,929 | | | | 7,717,648 | | | | 123,886,800 | | | | 105,500,697 | | | | | |
| Cost of shares redeemed | | | (62,295,706 | ) | | | (146,848,611 | ) | | | (149,051,157 | ) | | | (426,260,678 | ) | | | | |
| Net increase (decrease) from Fund share transactions | | | (21,539,555 | ) | | | 30,054,926 | | | | 36,350,891 | | | | 11,475,506 | | | | | |
| Total increase (decrease) in net assets | | | (4,936,452 | ) | | | 10,267,646 | | | | (4,240,400 | ) | | | (42,244,109 | ) | | | | |
| Net Assets: | | | | | | | | | | | | | | | |
| Beginning of period | | | 378,359,597 | | | | 368,091,951 | | | | 1,041,383,789 | | | | 1,083,627,898 | | | | | |
| End of period | | $ | 373,423,145 | | | $ | 378,359,597 | | | $ | 1,037,143,389 | | | $ | 1,041,383,789 | | | | | |
| — | May reflect actual amounts rounding to less than $1. |
| | | | | | |
| 104 | | Semiannual Report | | | December 31, 2019 | | | See accompanying Notes to Financial Statements |
| | | | | | | | | | | | | | | | | | | | | | | | | | |
| | | | AllianzGI Global Natural Resources | | | AllianzGI Global Small-Cap | | | AllianzGI Health Sciences | |
| | | | | | | |
| | | | Six Months ended December 31, 2019 (Unaudited) | | | Year ended June 30, 2019 | | | Six Months ended December 31, 2019 (Unaudited) | | | Year ended June 30, 2019 | | | Six Months ended December 31, 2019 (Unaudited) | | | Year ended June 30, 2019 | |
| | | | | | | | | | | | | | | | | | | | |
| | | | | | | |
| | | | | | | | | | | | | | | | | | | | |
| | | | | $ | 102,915 | | | $ | 300,932 | | | $ | (315,141 | ) | | $ | (321,870 | ) | | $ | (213,205 | ) | | $ | 56,912 | |
| | | | | | (505,902 | ) | | | (620,330 | ) | | | 4,911,843 | | | | 3,514,942 | | | | 7,932,308 | | | | 18,936,286 | |
| | | | | | (17,697 | ) | | | (1,778,722 | ) | | | (84,181 | ) | | | (15,621,622 | ) | | | 9,808,241 | | | | (372,630 | ) |
| | | | | | | |
| | | | | (420,684 | ) | | | (2,098,120 | ) | | | 4,512,521 | | | | (12,428,550 | ) | | | 17,527,344 | | | | 18,620,568 | |
| | | | | | | | | | | | | | | | | | | | |
| | | | | | | |
| | | | | | | | | | | | | | | | | | | | | | | | | | |
| | | | | | (111,986 | ) | | | (106,938 | ) | | | (3,176,268 | ) | | | (9,059,158 | ) | | | (10,065,053 | ) | | | (19,287,433 | ) |
| | | | | | (21,445 | ) | | | (13,875 | ) | | | (499,188 | ) | | | (2,028,346 | ) | | | (345,656 | ) | | | (661,505 | ) |
| | | | | | — | | | | — | | | | — | | | | — | | | | — | | | | — | |
| | | | | | (10,341 | ) | | | (42,273 | ) | | | (646,423 | ) | | | (2,305,369 | ) | | | — | | | | — | |
| | | | | | (134,320 | ) | | | (116,198 | ) | | | (3,167,395 | ) | | | (13,171,798 | ) | | | (313,756 | ) | | | (324,420 | ) |
| | | | | | — | | | | — | | | | — | | | | — | | | | — | | | | — | |
| | | | | | — | | | | — | | | | — | | | | — | | | | — | | | | — | |
| | | | | (278,092 | ) | | | (279,284 | ) | | | (7,489,274 | ) | | | (26,564,671 | ) | | | (10,724,465 | ) | | | (20,273,358 | ) |
| | | | | | | | | | | | | | | | | | | | |
| | | | | | 973,361 | | | | 3,404,031 | | | | 2,721,955 | | | | 22,603,210 | | | | 2,467,590 | | | | 12,144,594 | |
| | | | | | 263,944 | | | | 256,399 | | | | 6,996,507 | | | | 24,879,822 | | | | 10,356,965 | | | | 19,582,484 | |
| | | | | | (2,854,765 | ) | | | (9,715,627 | ) | | | (34,919,832 | ) | | | (68,042,255 | ) | | | (11,413,543 | ) | | | (26,779,664 | ) |
| | | | | | (1,617,460 | ) | | | (6,055,197 | ) | | | (25,201,370 | ) | | | (20,559,223 | ) | | | 1,411,012 | | | | 4,947,414 | |
| | | | | (2,316,236 | ) | | | (8,432,601 | ) | | | (28,178,123 | ) | | | (59,552,444 | ) | | | 8,213,891 | | | | 3,294,624 | |
| | | | | | | | | | | | | | | | | | | | |
| | | | | | 12,229,198 | | | | 20,661,799 | | | | 133,891,807 | | | | 193,444,251 | | | | 155,488,567 | | | | 152,193,943 | |
| | | | | $ | 9,912,962 | | | $ | 12,229,198 | | | $ | 105,713,684 | | | $ | 133,891,807 | | | $ | 163,702,458 | | | $ | 155,488,567 | |
| | | | | | | | |
| See accompanying Notes to Financial Statements | | | December 31, 2019 | | | Semiannual Report | | | 105 | |
Statements of Changes in Net Assets (cont’d)
| | | | | | | | | | | | | | | | | | | | |
| | | AllianzGI Income & Growth | | | AllianzGI Mid-Cap | | | | |
| | | | | | |
| | | Six Months ended December 31, 2019 (Unaudited) | | | Year ended June 30, 2019 | | | Six Months ended December 31, 2019 (Unaudited) | | | Year ended June 30, 2019 | | | | |
| Increase (Decrease) in Net Assets from: | | | | | | | | | | | | | | | |
| | | | | | |
Investment Operations: | | | | | | | | | | | | | | | | | | | | |
| Net investment income (loss) | | $ | 36,502,783 | | | $ | 71,178,883 | | | $ | (1,019,709 | ) | | $ | (2,168,597 | ) | | | | |
| Net realized gain (loss) | | | 135,621,320 | | | | 240,336,412 | | | | 8,343,025 | | | | 7,637,737 | | | | | |
| Net change in unrealized appreciation/depreciation | | | 98,167,552 | | | | (99,581,375 | ) | | | 15,463,351 | | | | 31,311,937 | | | | | |
| | | | | | |
Net increase (decrease) in net assets resulting from investment operations | | | 270,291,655 | | | | 211,933,920 | | | | 22,786,667 | | | | 36,781,077 | | | | | |
| Distributions to Shareholders from: | | | | | | | | | | | | | | | |
| | | | | | |
| Distributable earnings: | | | | | | | | | | | | | | | | | | | | |
Class A | | | (58,552,885 | ) | | | (110,411,831 | ) | | | (11,314,973 | ) | | | (27,816,569 | ) | | | | |
Class C | | | (47,509,447 | ) | | | (96,161,658 | ) | | | (890,197 | ) | | | (3,319,825 | ) | | | | |
Class R | | | (213,013 | ) | | | (343,496 | ) | | | (62,933 | ) | | | (183,135 | ) | | | | |
Class P | | | (44,522,383 | ) | | | (84,862,532 | ) | | | (486,183 | ) | | | (1,150,131 | ) | | | | |
Institutional Class | | | (28,946,428 | ) | | | (47,989,045 | ) | | | (2,171,232 | ) | | | (3,438,770 | ) | | | | |
Class R6 | | | — | | | | — | | | | — | | | | — | | | | | |
Administrative Class | | | — | | | | — | | | | (70,695 | ) | | | (163,523 | ) | | | | |
| Total distributions to shareholders | | | (179,744,156 | ) | | | (339,768,562 | ) | | | (14,996,213 | ) | | | (36,071,953 | ) | | | | |
| Fund Share Transactions: | | | | | | | | | | | | | | | |
| Net proceeds from the sale of shares | | | 736,773,210 | | | | 1,709,498,560 | | | | 39,079,647 | | | | 147,501,131 | | | | | |
| Issued in reinvestment of distributions | | | 162,237,922 | | | | 303,320,720 | | | | 13,532,766 | | | | 32,092,605 | | | | | |
| Cost of shares redeemed | | | (589,785,660 | ) | | | (1,090,296,297 | ) | | | (36,473,058 | ) | | | (173,708,354 | ) | | | | |
| Net increase (decrease) from Fund share transactions | | | 309,225,472 | | | | 922,522,983 | | | | 16,139,355 | | | | 5,885,382 | | | | | |
| Total increase (decrease) in net assets | | | 399,772,971 | | | | 794,688,341 | | | | 23,929,809 | | | | 6,594,506 | | | | | |
| Net Assets: | | | | | | | | | | | | | | | |
| Beginning of period | | | 4,523,005,554 | | | | 3,728,317,213 | | | | 312,167,423 | | | | 305,572,917 | | | | | |
| End of period | | $ | 4,922,778,525 | | | $ | 4,523,005,554 | | | $ | 336,097,232 | | | $ | 312,167,423 | | | | | |
| — | May reflect actual amounts rounding to less than $1. |
| | | | | | |
| 106 | | Semiannual Report | | | December 31, 2019 | | | See accompanying Notes to Financial Statements |
| | | | | | | | | | | | | | | | | | | | | | | | | | |
| | | | AllianzGI NFJ Dividend Value | | | AllianzGI NFJ International Value | | | AllianzGI NFJ Large-Cap Value | |
| | | | | | | |
| | | | Six Months ended December 31, 2019 (Unaudited) | | | Year ended June 30, 2019 | | | Six Months ended December 31, 2019 (Unaudited) | | | Year ended June 30, 2019 | | | Six Months ended December 31, 2019 (Unaudited) | | | Year ended June 30, 2019 | |
| | | | | | | | | | | | | | | | | | | | |
| | | | | | | |
| | | | | | | | | | | | | | | | | | | | |
| | | | | $ | 10,828,663 | | | $ | 34,147,685 | | | $ | 1,798,497 | | | $ | 4,017,249 | | | $ | 2,527,517 | | | $ | 5,744,563 | |
| | | | | | 117,953,065 | | | | 130,028,369 | | | | (1,936,274 | ) | | | 6,397,576 | | | | 14,925,300 | | | | (5,989,507 | ) |
| | | | | | (19,457,549 | ) | | | (113,531,589 | ) | | | 9,690,238 | | | | (12,701,695 | ) | | | 13,143,115 | | | | 17,171,832 | |
| | | | | | | |
| | | | | 109,324,179 | | | | 50,644,465 | | | | 9,552,461 | | | | (2,286,870 | ) | | | 30,595,932 | | | | 16,926,888 | |
| | | | | | | | | | | | | | | | | | | | |
| | | | | | | |
| | | | | | | | | | | | | | | | | | | | | | | | | | |
| | | | | | (51,873,207 | ) | | | (103,972,637 | ) | | | (947,709 | ) | | | (1,240,282 | ) | | | (4,345,111 | ) | | | (2,878,118 | ) |
| | | | | | (6,382,564 | ) | | | (19,705,892 | ) | | | (110,567 | ) | | | (150,145 | ) | | | (200,328 | ) | | | (156,046 | ) |
| | | | | | (8,317,152 | ) | | | (15,736,853 | ) | | | (69,991 | ) | | | (92,441 | ) | | | (45,179 | ) | | | (37,054 | ) |
| | | | | | (40,126,430 | ) | | | (93,724,314 | ) | | | (491,372 | ) | | | (886,735 | ) | | | (481,260 | ) | | | (361,691 | ) |
| | | | | | (25,933,344 | ) | | | (71,655,918 | ) | | | (692,377 | ) | | | (914,475 | ) | | | (2,814,506 | ) | | | (2,637,372 | ) |
| | | | | | (8,488,359 | ) | | | (15,698,988 | ) | | | (20,578 | ) | | | (28,658 | ) | | | — | | | | — | |
| | | | | | (3,769,765 | ) | | | (13,203,454 | ) | | | (17,404 | ) | | | (40,736 | ) | | | (32,685 | ) | | | (22,170 | ) |
| | | | | (144,890,821 | ) | | | (333,698,056 | ) | | | (2,349,998 | ) | | | (3,353,472 | ) | | | (7,919,069 | ) | | | (6,092,451 | ) |
| | | | | | | | | | | | | | | | | | | | |
| | | | | | 84,586,003 | | | | 301,776,596 | | | | 8,097,823 | | | | 37,499,896 | | | | 12,073,396 | | | | 74,280,028 | |
| | | | | | 127,296,692 | | | | 286,170,219 | | | | 2,140,785 | | | | 2,985,084 | | | | 7,427,296 | | | | 5,653,505 | |
| | | | | | (297,618,199 | ) | | | (912,899,785 | ) | | | (28,457,197 | ) | | | (141,030,657 | ) | | | (63,413,946 | ) | | | (107,300,262 | ) |
| | | | | | (85,735,504 | ) | | | (324,952,970 | ) | | | (18,218,589 | ) | | | (100,545,677 | ) | | | (43,913,254 | ) | | | (27,366,729 | ) |
| | | | | (121,302,146 | ) | | | (608,006,561 | ) | | | (11,016,126 | ) | | | (106,186,019 | ) | | | (21,236,391 | ) | | | (16,532,292 | ) |
| | | | | | | | | | | | | | | | | | | | |
| | | | | | 1,357,243,214 | | | | 1,965,249,775 | | | | 179,805,569 | | | | 285,991,588 | | | | 345,530,735 | | | | 362,063,027 | |
| | | | | $ | 1,235,941,068 | | | $ | 1,357,243,214 | | | $ | 168,789,443 | | | $ | 179,805,569 | | | $ | 324,294,344 | | | $ | 345,530,735 | |
| | | | | | | | |
| See accompanying Notes to Financial Statements | | | December 31, 2019 | | | Semiannual Report | | | 107 | |
Statements of Changes in Net Assets (cont’d)
| | | | | | | | | | | | | | | | | | | | |
| | | AllianzGI NFJ Mid-Cap Value | | | AllianzGI NFJ Small-Cap Value | | | | |
| | | | | | |
| | | Six Months ended December 31, 2019 (Unaudited) | | | Year ended June 30, 2019 | | | Six Months ended December 31, 2019 (Unaudited) | | | Year ended June 30, 2019 | | | | |
| Increase (Decrease) in Net Assets from: | | | | | | | | | | | | | | | |
| | | | | | |
Investment Operations: | | | | | | | | | | | | | | | | | | | | |
| Net investment income (loss) | | $ | 9,463,430 | | | $ | 19,748,593 | | | $ | 6,948,721 | | | $ | 28,314,977 | | | | | |
| Net realized gain (loss) | | | 97,720,154 | | | | 34,862,826 | | | | 82,969,973 | | | | 52,161,420 | | | | | |
| Net change in unrealized appreciation/depreciation | | | 10,301,822 | | | | (9,947,114 | ) | | | (22,125,155 | ) | | | (252,683,722 | ) | | | | |
| | | | | | |
Net increase (decrease) in net assets resulting from investment operations | | | 117,485,406 | | | | 44,664,305 | | | | 67,793,539 | | | | (172,207,325 | ) | | | | |
| Distributions to Shareholders from: | | | | | | | | | | | | | | | |
| | | | | | |
| Distributable earnings: | | | | | | | | | | | | | | | | | | | | |
Class A | | | (47,351,316 | ) | | | (8,958,098 | ) | | | (34,922,642 | ) | | | (125,664,406 | ) | | | | |
Class C | | | (4,322,367 | ) | | | (259,371 | ) | | | (223,274 | ) | | | (3,447,097 | ) | | | | |
Class R | | | (1,914,476 | ) | | | (286,719 | ) | | | (1,588,320 | ) | | | (6,171,694 | ) | | | | |
Class P | | | (21,721,615 | ) | | | (3,913,377 | ) | | | (2,577,066 | ) | | | (11,101,354 | ) | | | | |
Institutional Class | | | (33,543,054 | ) | | | (6,182,427 | ) | | | (11,170,094 | ) | | | (94,888,377 | ) | | | | |
Class R6 | | | (5,444,939 | ) | | | (220,071 | ) | | | (10,202,555 | ) | | | (46,791,068 | ) | | | | |
Administrative Class | | | (2,689,085 | ) | | | (393,619 | ) | | | (9,276,658 | ) | | | (34,340,757 | ) | | | | |
| Total distributions to shareholders | | | (116,986,852 | ) | | | (20,213,682 | ) | | | (69,960,609 | ) | | | (322,404,753 | ) | | | | |
| Fund Share Transactions: | | | | | | | | | | | | | | | |
| Net proceeds from the sale of shares | | | 206,268,956 | | | | 552,773,876 | | | | 44,014,457 | | | | 283,770,753 | | | | | |
| Issued in reinvestment of distributions | | | 104,661,156 | | | | 18,064,016 | | | | 64,678,073 | | | | 294,059,205 | | | | | |
| Cost of shares redeemed | | | (166,296,427 | ) | | | (551,921,766 | ) | | | (346,685,248 | ) | | | (1,291,552,009 | ) | | | | |
| Net increase (decrease) from Fund share transactions | | | 144,633,685 | | | | 18,916,126 | | | | (237,992,718 | ) | | | (713,722,051 | ) | | | | |
| Total increase (decrease) in net assets | | | 145,132,239 | | | | 43,366,749 | | | | (240,159,788 | ) | | | (1,208,334,129 | ) | | | | |
| Net Assets: | | | | | | | | | | | | | | | |
| Beginning of period | | | 1,312,801,160 | | | | 1,269,434,411 | | | | 1,051,618,014 | | | | 2,259,952,143 | | | | | |
| End of period | | $ | 1,457,933,399 | | | $ | 1,312,801,160 | | | $ | 811,458,226 | | | $ | 1,051,618,014 | | | | | |
| — | May reflect actual amounts rounding to less than $1. |
| | | | | | |
| 108 | | Semiannual Report | | | December 31, 2019 | | | See accompanying Notes to Financial Statements |
| | | | | | | | | | | | | | | | | | |
| | | | AllianzGI Small-Cap | | | AllianzGI Technology | |
| | | | | |
| | | | Six Months ended December 31, 2019 (Unaudited) | | | Year ended June 30, 2019 | | | Six Months ended December 31, 2019 (Unaudited) | | | Year ended June 30, 2019 | |
| | | | | | | | | | | | | | |
| | | | | |
| | | | | | | | | | | | | | |
| | | | | $ | 393,866 | | | $ | 299,803 | | | $ | (6,917,222 | ) | | $ | (14,093,871 | ) |
| | | | | | (117,326 | ) | | | (971,773 | ) | | | 140,622,701 | | | | 180,784,054 | |
| | | | | | 6,425,715 | | | | (85,006 | ) | | | (85,627,686 | ) | | | 14,943,453 | |
| | | | | |
| | | | | 6,702,255 | | | | (756,976 | ) | | | 48,077,793 | | | | 181,633,636 | |
| | | | | | | | | | | | | | |
| | | | | |
| | | | | | | | | | | | | | | | | | |
| | | | | | (36,355 | ) | | | (5,374,154 | ) | | | (99,007,393 | ) | | | (103,779,572 | ) |
| | | | | | (3 | ) | | | (708,974 | ) | | | (10,444,134 | ) | | | (11,594,326 | ) |
| | | | | | — | | | | — | | | | — | | | | — | |
| | | | | | (54,723 | ) | | | (673,909 | ) | | | (20,909,955 | ) | | | (21,155,444 | ) |
| | | | | | (51,869 | ) | | | (553,729 | ) | | | (115,521,539 | ) | | | (126,878,404 | ) |
| | | | | | (96,047 | ) | | | (43,874 | ) | | | — | | | | — | |
| | | | | | — | | | | — | | | | (1,647,783 | ) | | | (3,019,512 | ) |
| | | | | (238,997 | ) | | | (7,354,640 | ) | | | (247,530,804 | ) | | | (266,427,258 | ) |
| | | | | | | | | | | | | | |
| | | | | | 27,968,037 | | | | 64,704,067 | | | | 121,077,875 | | | | 528,506,555 | |
| | | | | | 234,792 | | | | 6,805,302 | | | | 236,602,850 | | | | 252,764,407 | |
| | | | | | (11,649,277 | ) | | | (47,676,925 | ) | | | (232,275,527 | ) | | | (661,953,777 | ) |
| | | | | | 16,553,552 | | | | 23,832,444 | | | | 125,405,198 | | | | 119,317,185 | |
| | | | | 23,016,810 | | | | 15,720,828 | | | | (74,047,813 | ) | | | 34,523,563 | |
| | | | | | | | | | | | | | |
| | | | | | 110,647,835 | | | | 94,927,007 | | | | 1,617,256,204 | | | | 1,582,732,641 | |
| | | | | $ | 133,664,645 | | | $ | 110,647,835 | | | $ | 1,543,208,391 | | | $ | 1,617,256,204 | |
| | | | | | | | |
| See accompanying Notes to Financial Statements | | | December 31, 2019 | | | Semiannual Report | | | 109 | |
Financial Highlights
For a Share Outstanding for the Period ended:^
| | | | | | | | | | | | | | | | | | | | | | | | | | | | |
| | | Net Asset Value, Beginning of Period | | | Net Investment Income (a) | | | Net Realized and Change in Unrealized Gain (Loss) | | | Total from Investment Operations | | | Dividends from Net Investment Income | | | Net Asset Value, End of Period | | | | |
| AllianzGI Emerging Markets Opportunities: | | | | | | | | | | | | | | | | | | | | | |
| Class A | | | | | | | | | | | | | | | | | | | | | | | | | | | | |
12/31/2019† | | $ | 27.06 | | | $ | 0.34 | | | $ | 1.59 | | | $ | 1.93 | | | $ | (0.56 | ) | | $ | 28.43 | | | | | |
6/30/2019 | | | 28.53 | | | | 0.56 | | | | (1.55 | ) | | | (0.99 | ) | | | (0.48 | ) | | | 27.06 | | | | | |
6/30/2018 | | | 26.59 | | | | 0.41 | | | | 1.85 | | | | 2.26 | | | | (0.32 | ) | | | 28.53 | | | | | |
6/30/2017 | | | 22.60 | | | | 0.41 | | | | 3.98 | | | | 4.39 | | | | (0.40 | ) | | | 26.59 | | | | | |
6/30/2016 | | | 25.90 | | | | 0.34 | | | | (3.39 | ) | | | (3.05 | ) | | | (0.25 | ) | | | 22.60 | | | | | |
6/30/2015 | | | 27.00 | | | | 0.35 | | | | (1.10 | ) | | | (0.75 | ) | | | (0.35 | ) | | | 25.90 | | | | | |
| Class C | | | | | | | | | | | | | | | | | | | | | | | | | | | | |
12/31/2019† | | $ | 26.81 | | | $ | 0.26 | | | $ | 1.56 | | | $ | 1.82 | | | $ | (0.30 | ) | | $ | 28.33 | | | | | |
6/30/2019 | | | 28.05 | | | | 0.31 | | | | (1.45 | ) | | | (1.14 | ) | | | (0.10 | ) | | | 26.81 | | | | | |
6/30/2018 | | | 26.13 | | | | 0.16 | | | | 1.84 | | | | 2.00 | | | | (0.08 | ) | | | 28.05 | | | | | |
6/30/2017 | | | 22.09 | | | | 0.19 | | | | 3.96 | | | | 4.15 | | | | (0.11 | ) | | | 26.13 | | | | | |
6/30/2016 | | | 25.21 | | | | 0.22 | | | | (3.34 | ) | | | (3.12 | ) | | | — | | | | 22.09 | | | | | |
6/30/2015 | | | 26.25 | | | | 0.14 | | | | (1.07 | ) | | | (0.93 | ) | | | (0.11 | ) | | | 25.21 | | | | | |
| Class P | | | | | | | | | | | | | | | | | | | | | | | | | | | | |
12/31/2019† | | $ | 26.46 | | | $ | 0.38 | | | $ | 1.55 | | | $ | 1.93 | | | $ | (0.63 | ) | | $ | 27.76 | | | | | |
6/30/2019 | | | 28.02 | | | | 0.55 | | | | (1.47 | ) | | | (0.92 | ) | | | (0.64 | ) | | | 26.46 | | | | | |
6/30/2018 | | | 26.17 | | | | 0.46 | | | | 1.84 | | | | 2.30 | | | | (0.45 | ) | | | 28.02 | | | | | |
6/30/2017 | | | 22.23 | | | | 0.44 | | | | 3.94 | | | | 4.38 | | | | (0.44 | ) | | | 26.17 | | | | | |
6/30/2016 | | | 25.44 | | | | 0.46 | | | | (3.40 | ) | | | (2.94 | ) | | | (0.27 | ) | | | 22.23 | | | | | |
6/30/2015 | | | 26.63 | | | | 0.42 | | | | (1.11 | ) | | | (0.69 | ) | | | (0.50 | ) | | | 25.44 | | | | | |
| Institutional Class | | | | | | | | | | | | | | | | | | | | | | | | | | | | |
12/31/2019† | | $ | 27.10 | | | $ | 0.38 | | | $ | 1.62 | | | $ | 2.00 | | | $ | (0.67 | ) | | $ | 28.43 | | | | | |
6/30/2019 | | | 28.72 | | | | 0.54 | | | | (1.47 | ) | | | (0.93 | ) | | | (0.69 | ) | | | 27.10 | | | | | |
6/30/2018 | | | 26.83 | | | | 0.53 | | | | 1.85 | | | | 2.38 | | | | (0.49 | ) | | | 28.72 | | | | | |
6/30/2017 | | | 22.74 | | | | 0.49 | | | | 4.03 | | | | 4.52 | | | | (0.43 | ) | | | 26.83 | | | | | |
6/30/2016 | | | 25.95 | | | | 0.44 | | | | (3.42 | ) | | | (2.98 | ) | | | (0.23 | ) | | | 22.74 | | | | | |
6/30/2015 | | | 27.11 | | | | 0.43 | | | | (1.11 | ) | | | (0.68 | ) | | | (0.48 | ) | | | 25.95 | | | | | |
| Class R6 | | | | | | | | | | | | | | | | | | | | | | | | | | | | |
12/31/2019† | | $ | 26.96 | | | $ | 0.39 | | | $ | 1.61 | | | $ | 2.00 | | | $ | (0.69 | ) | | $ | 28.27 | | | | | |
6/30/2019 | | | 28.57 | | | | 0.57 | | | | (1.48 | ) | | | (0.91 | ) | | | (0.70 | ) | | | 26.96 | | | | | |
6/30/2018 | | | 26.69 | | | | 0.62 | | | | 1.76 | | | | 2.38 | | | | (0.50 | ) | | | 28.57 | | | | | |
6/30/2017 | | | 22.69 | | | | 0.60 | | | | 3.90 | | | | 4.50 | | | | (0.50 | ) | | | 26.69 | | | | | |
12/14/2015* - 6/30/2016 | | | 21.21 | | | | 0.31 | | | | 1.47 | | | | 1.78 | | | | (0.30 | ) | | | 22.69 | | | | | |
| ^ | A “—” may reflect actual amounts rounding to less than $0.01 or 0.01%. |
| * | Commencement of operations. |
| (a) | Calculated on average shares outstanding during the period. |
| (b) | Total return is calculated assuming a purchase of a share on the first day of the period and a sale of a share on the last day of each period reported. Dividends and distributions, if any, are assumed, for purposes of this calculation, to be reinvested. Total return does not reflect sales charges and includes the effect of fee waivers and reimbursements. Total return may reflect adjustments to conform to U.S. GAAP. Total return for a period of less than one year is not annualized. |
| (c) | Annualized, unless otherwise noted. |
| | | | | | |
| 110 | | Semiannual Report | | | December 31, 2019 | | | See accompanying Notes to Financial Statements |
| | | | | | | | | | | | | | | | | | | | | | | | | | |
| | | | Total Return (b) | | | Net Assets, End of Period (000s) | | | Ratio of Expenses to Average Net Assets with Fee Waiver/ Reimbursement | | | Ratio of Expenses to Average Net Assets without Fee Waiver/ Reimbursement | | | Ratio of Net Investment Income to Average Net Assets | | | Portfolio Turnover Rate | |
| | | | | | | | | | | | | | | | | | | | |
| | | | | | | | | | | | | | | | | | | | | | | | | | |
| | | | | | 7.16 | % | | $ | 46,465 | | | | 1.27 | %(c) | | | 1.62 | %(c) | | | 2.53 | %(c) | | | 38 | % |
| | | | | | (3.29 | ) | | | 48,388 | | | | 1.26 | | | | 1.61 | | | | 2.08 | | | | 101 | |
| | | | | | 8.44 | | | | 108,279 | | | | 1.26 | | | | 1.61 | | | | 1.36 | | | | 88 | |
| | | | | | 19.76 | | | | 154,357 | | | | 1.42 | | | | 1.62 | | | | 1.69 | | | | 155 | |
| | | | | | (11.73 | ) | | | 143,677 | | | | 1.48 | | | | 1.62 | | | | 1.59 | | | | 85 | |
| | | | | | (2.76 | ) | | | 28,690 | | | | 1.67 | | | | 1.67 | | | | 1.30 | | | | 99 | |
| | | | | | | | | | | | | | | | | | | | | | | | | | |
| | | | | | 6.79 | % | | $ | 3,058 | | | | 2.02 | %(c) | | | 2.37 | %(c) | | | 1.93 | %(c) | | | 38 | % |
| | | | | | (4.05 | ) | | | 3,675 | | | | 2.01 | | | | 2.36 | | | | 1.15 | | | | 101 | |
| | | | | | 7.63 | | | | 8,113 | | | | 2.01 | | | | 2.36 | | | | 0.55 | | | | 88 | |
| | | | | | 18.91 | | | | 8,982 | | | | 2.17 | | | | 2.37 | | | | 0.80 | | | | 155 | |
| | | | | | (12.38 | ) | | | 11,862 | | | | 2.27 | | | | 2.37 | | | | 1.02 | | | | 85 | |
| | | | | | (3.53 | ) | | | 15,069 | | | | 2.42 | | | | 2.42 | | | | 0.53 | | | | 99 | |
| | | | | | | | | | | | | | | | | | | | | | | | | | |
| | | | | | 7.32 | % | | $ | 17,023 | | | | 1.02 | %(c) | | | 1.37 | %(c) | | | 2.94 | %(c) | | | 38 | % |
| | | | | | (3.05 | ) | | | 20,454 | | | | 1.01 | | | | 1.36 | | | | 2.08 | | | | 101 | |
| | | | | | 8.71 | | | | 29,887 | | | | 1.01 | | | | 1.36 | | | | 1.55 | | | | 88 | |
| | | | | | 20.11 | | | | 21,586 | | | | 1.17 | | | | 1.37 | | | | 1.86 | | | | 155 | |
| | | | | | (11.51 | ) | | | 20,262 | | | | 1.26 | | | | 1.37 | | | | 2.11 | | | | 85 | |
| | | | | | (2.53 | ) | | | 12,229 | | | | 1.42 | | | | 1.42 | | | | 1.63 | | | | 99 | |
| | | | | | | | | | | | | | | | | | | | | | | | | | |
| | | | | | 7.41 | % | | $ | 281,909 | | | | 0.92 | %(c) | | | 1.27 | %(c) | | | 2.87 | %(c) | | | 38 | % |
| | | | | | (2.97 | ) | | | 282,196 | | | | 0.91 | | | | 1.26 | | | | 2.03 | | | | 101 | |
| | | | | | 8.79 | | | | 197,536 | | | | 0.91 | | | | 1.26 | | | | 1.74 | | | | 88 | |
| | | | | | 20.26 | | | | 72,688 | | | | 1.07 | | | | 1.27 | | | | 2.02 | | | | 155 | |
| | | | | | (11.41 | ) | | | 64,785 | | | | 1.17 | | | | 1.27 | | | | 2.00 | | | | 85 | |
| | | | | | (2.45 | ) | | | 62,339 | | | | 1.32 | | | | 1.32 | | | | 1.60 | | | | 99 | |
| | | | | | | | | | | | | | | | | | | | | | | | | | |
| | | | | | 7.43 | % | | $ | 24,968 | | | | 0.87 | %(c) | | | 1.22 | %(c) | | | 2.91 | %(c) | | | 38 | % |
| | | | | | (2.93 | ) | | | 23,647 | | | | 0.86 | | | | 1.21 | | | | 2.13 | | | | 101 | |
| | | | | | 8.85 | | | | 24,277 | | | | 0.86 | | | | 1.21 | | | | 2.03 | | | | 88 | |
| | | | | | 20.27 | | | | 692 | | | | 1.02 | | | | 1.22 | | | | 2.46 | | | | 155 | |
| | | | | | 8.46 | | | | 21 | | | | 1.07 | (c) | | | 1.22 | (c) | | | 2.63 | (c) | | | 85 | |
| | | | | | | | |
| See accompanying Notes to Financial Statements | | | December 31, 2019 | | | Semiannual Report | | | 111 | |
Financial Highlights (cont’d)
For a Share Outstanding for the Period ended:^
| | | | | | | | | | | | | | | | | | | | | | | | | | | | |
| | | Net Asset Value, Beginning of Period | | | Net Investment Income (Loss) (a) | | | Net Realized and Change in Unrealized Gain (Loss) | | | Total from Investment Operations | | | Dividends from Net Investment Income | | | Distributions from Net Realized Capital Gains | | | | |
| AllianzGI Focused Growth: | | | | | | | | | | | | | | | | | | | | | |
| Class A | | | | | | | | | | | | | | | | | | | | | | | | | | | | |
12/31/2019† | | $ | 53.33 | | | $ | (0.06 | ) | | $ | 5.30 | | | $ | 5.24 | | | $ | — | | | $ | (7.05 | ) | | | | |
6/30/2019 | | | 56.83 | | | | (0.08 | ) | | | 2.48 | | | | 2.40 | | | | — | | | | (5.90 | ) | | | | |
6/30/2018 | | | 46.62 | | | | — | | | | 10.92 | | | | 10.92 | | | | — | | | | (0.71 | ) | | | | |
6/30/2017 | | | 40.72 | | | | 0.06 | | | | 6.85 | | | | 6.91 | | | | — | | | | (1.01 | ) | | | | |
6/30/2016 | | | 42.73 | | | | 0.08 | | | | 0.62 | | | | 0.70 | | | | — | | | | (2.71 | ) | | | | |
6/30/2015 | | | 41.93 | | | | (0.03 | ) | | | 4.57 | | | | 4.54 | | | | (0.17 | ) | | | (3.57 | ) | | | | |
| Class C | | | | | | | | | | | | | | | | | | | | | | | | | | | | |
12/31/2019† | | $ | 34.42 | | | $ | (0.17 | ) | | $ | 3.39 | | | $ | 3.22 | | | $ | — | | | $ | (7.05 | ) | | | | |
6/30/2019 | | | 39.41 | | | | (0.36 | ) | | | 1.27 | | | | 0.91 | | | | — | | | | (5.90 | ) | | | | |
6/30/2018 | | | 32.76 | | | | (0.29 | ) | | | 7.65 | | | | 7.36 | | | | — | | | | (0.71 | ) | | | | |
6/30/2017 | | | 29.12 | | | | (0.19 | ) | | | 4.84 | | | | 4.65 | | | | — | | | | (1.01 | ) | | | | |
6/30/2016 | | | 31.53 | | | | (0.17 | ) | | | 0.47 | | | | 0.30 | | | | — | | | | (2.71 | ) | | | | |
6/30/2015 | | | 31.96 | | | | (0.25 | ) | | | 3.40 | | | | 3.15 | | | | (0.01 | ) | | | (3.57 | ) | | | | |
| Class R | | | | | | | | | | | | | | | | | | | | | | | | | | | | |
12/31/2019† | | $ | 39.02 | | | $ | (0.10 | ) | | $ | 3.86 | | | $ | 3.76 | | | $ | — | | | $ | (7.05 | ) | | | | |
6/30/2019 | | | 43.54 | | | | (0.16 | ) | | | 1.54 | | | | 1.38 | | | | — | | | | (5.90 | ) | | | | |
6/30/2018 | | | 35.95 | | | | (0.11 | ) | | | 8.41 | | | | 8.30 | | | | — | | | | (0.71 | ) | | | | |
6/30/2017 | | | 31.71 | | | | (0.04 | ) | | | 5.29 | | | | 5.25 | | | | — | | | | (1.01 | ) | | | | |
6/30/2016 | | | 33.93 | | | | (0.02 | ) | | | 0.51 | | | | 0.49 | | | | — | | | | (2.71 | ) | | | | |
6/30/2015 | | | 34.08 | | | | (0.11 | ) | | | 3.66 | | | | 3.55 | | | | (0.13 | ) | | | (3.57 | ) | | | | |
| Class P | | | | | | | | | | | | | | | | | | | | | | | | | | | | |
12/31/2019† | | $ | 39.91 | | | $ | — | | | $ | 3.96 | | | $ | 3.96 | | | $ | — | | | $ | (7.05 | ) | | | | |
6/30/2019 | | | 44.18 | | | | 0.03 | | | | 1.60 | | | | 1.63 | | | | — | | | | (5.90 | ) | | | | |
6/30/2018 | | | 36.33 | | | | 0.09 | | | | 8.52 | | | | 8.61 | | | | (0.05 | ) | | | (0.71 | ) | | | | |
6/30/2017 | | | 31.88 | | | | 0.14 | | | | 5.32 | | | | 5.46 | | | | — | | | | (1.01 | ) | | | | |
6/30/2016 | | | 33.94 | | | | 0.15 | | | | 0.50 | | | | 0.65 | | | | — | | | | (2.71 | ) | | | | |
6/30/2015 | | | 34.09 | | | | 0.06 | | | | 3.66 | | | | 3.72 | | | | (0.30 | ) | | | (3.57 | ) | | | | |
| Institutional Class | | | | | | | | | | | | | | | | | | | | | | | | | | | | |
12/31/2019† | | $ | 48.89 | | | $ | 0.03 | | | $ | 4.86 | | | $ | 4.89 | | | $ | — | | | $ | (7.05 | ) | | | | |
6/30/2019 | | | 52.51 | | | | 0.09 | | | | 2.19 | | | | 2.28 | | | | — | | | | (5.90 | ) | | | | |
6/30/2018 | | | 43.02 | | | | 0.16 | | | | 10.08 | | | | 10.24 | | | | (0.04 | ) | | | (0.71 | ) | | | | |
6/30/2017 | | | 37.53 | | | | 0.20 | | | | 6.30 | | | | 6.50 | | | | — | | | | (1.01 | ) | | | | |
6/30/2016 | | | 39.45 | | | | 0.21 | | | | 0.58 | | | | 0.79 | | | | — | | | | (2.71 | ) | | | | |
6/30/2015 | | | 39.01 | | | | 0.11 | | | | 4.23 | | | | 4.34 | | | | (0.33 | ) | | | (3.57 | ) | | | | |
| Class R6 | | | | | | | | | | | | | | | | | | | | | | | | | | | | |
12/31/2019† | | $ | 48.96 | | | $ | 0.04 | | | $ | 4.87 | | | $ | 4.91 | | | $ | — | | | $ | (7.05 | ) | | | | |
6/30/2019 | | | 52.56 | | | | 0.11 | | | | 2.19 | | | | 2.30 | | | | — | | | | (5.90 | ) | | | | |
6/30/2018 | | | 43.04 | | | | 0.19 | | | | 10.10 | | | | 10.29 | | | | (0.06 | ) | | | (0.71 | ) | | | | |
6/30/2017 | | | 37.53 | | | | 0.21 | | | | 6.31 | | | | 6.52 | | | | — | | | | (1.01 | ) | | | | |
12/14/2015* - 6/30/2016 | | | 37.51 | | | | 0.12 | | | | (0.10 | ) | | | 0.02 | | | | — | | | | — | | | | | |
| Administrative Class | | | | | | | | | | | | | | | | | | | | | | | | | | | | |
12/31/2019† | | $ | 45.36 | | | $ | (0.04 | ) | | $ | 4.51 | | | $ | 4.47 | | | $ | — | | | $ | (7.05 | ) | | | | |
6/30/2019 | | | 49.33 | | | | (0.04 | ) | | | 1.97 | | | | 1.93 | | | | — | | | | (5.90 | ) | | | | |
6/30/2018 | | | 40.51 | | | | 0.03 | | | | 9.50 | | | | 9.53 | | | | — | | | | (0.71 | ) | | | | |
6/30/2017 | | | 35.48 | | | | 0.09 | | | | 5.95 | | | | 6.04 | | | | — | | | | (1.01 | ) | | | | |
6/30/2016 | | | 37.53 | | | | 0.11 | | | | 0.55 | | | | 0.66 | | | | — | | | | (2.71 | ) | | | | |
6/30/2015 | | | 37.31 | | | | 0.01 | | | | 4.02 | | | | 4.03 | | | | (0.24 | ) | | | (3.57 | ) | | | | |
| ^ | A “—” may reflect actual amounts rounding to less than $0.01 or 0.01%. |
| * | Commencement of operations. |
| (a) | Calculated on average shares outstanding during the period. |
| (b) | Total return is calculated assuming a purchase of a share on the first day of the period and a sale of a share on the last day of each period reported. Dividends and distributions, if any, are assumed, for purposes of this calculation, to be reinvested. Total return does not reflect sales charges and includes the effect of fee waivers and reimbursements. Total return may reflect adjustments to conform to U.S. GAAP. Total return for a period of less than one year is not annualized. |
| (c) | Annualized, unless otherwise noted. |
| | | | | | |
| 112 | | Semiannual Report | | | December 31, 2019 | | | See accompanying Notes to Financial Statements |
| | | | | | | | | | | | | | | | | | | | | | | | | | | | | | | | | | |
| | | | Total Dividends and Distributions | | | Net Asset Value, End of Period | | | Total Return (b) | | | Net Assets, End of Period (000s) | | | Ratio of Expenses to Average Net Assets with Fee Waiver/ Reimbursement | | | Ratio of Expenses to Average Net Assets without Fee Waiver/ Reimbursement | | | Ratio of Net Investment Income (Loss) to Average Net Assets | | | Portfolio Turnover Rate | |
| | | | | | | | | | | | | | | | | | | | | | | | | | |
| | | | | | | | | | | | | | | | | | | | | | | | | | | | | | | | | | |
| | | | | $ | (7.05 | ) | | $ | 51.52 | | | | 9.93 | % | | $ | 589,892 | | | | 1.00 | %(c) | | | 1.12 | %(c) | | | (0.22 | )%(c) | | | 32 | % |
| | | | | | (5.90 | ) | | | 53.33 | | | | 6.79 | | | | 577,106 | | | | 1.00 | | | | 1.12 | | | | (0.15 | ) | | | 50 | |
| | | | | | (0.71 | ) | | | 56.83 | | | | 23.53 | | | | 421,188 | | | | 0.99 | | | | 1.11 | | | | — | | | | 40 | |
| | | | | | (1.01 | ) | | | 46.62 | | | | 17.29 | | | | 373,359 | | | | 1.05 | | | | 1.11 | | | | 0.15 | | | | 46 | |
| | | | | | (2.71 | ) | | | 40.72 | | | | 1.54 | | | | 357,077 | | | | 1.11 | | | | 1.11 | | | | 0.20 | | | | 55 | |
| | | | | | (3.74 | ) | | | 42.73 | | | | 11.57 | | | | 297,572 | | | | 1.11 | | | | 1.11 | | | | (0.06 | ) | | | 58 | |
| | | | | | | | | | | | | | | | | | | | | | | | | | | | | | | | | | |
| | | | | $ | (7.05 | ) | | $ | 30.59 | | | | 9.51 | % | | $ | 45,640 | | | | 1.77 | %(c) | | | 1.87 | %(c) | | | (1.00 | )%(c) | | | 32 | % |
| | | | | | (5.90 | ) | | | 34.42 | | | | 5.93 | | | | 48,706 | | | | 1.77 | | | | 1.87 | | | | (0.93 | ) | | | 50 | |
| | | | | | (0.71 | ) | | | 39.41 | | | | 22.59 | | | | 233,854 | | | | 1.76 | | | | 1.86 | | | | (0.77 | ) | | | 40 | |
| | | | | | (1.01 | ) | | | 32.76 | | | | 16.40 | | | | 217,685 | | | | 1.81 | | | | 1.86 | | | | (0.62 | ) | | | 46 | |
| | | | | | (2.71 | ) | | | 29.12 | | | | 0.79 | | | | 230,432 | | | | 1.86 | | | | 1.86 | | | | (0.56 | ) | | | 55 | |
| | | | | | (3.58 | ) | | | 31.53 | | | | 10.76 | | | | 227,519 | | | | 1.86 | | | | 1.86 | | | | (0.81 | ) | | | 58 | |
| | | | | | | | | | | | | | | | | | | | | | | | | | | | | | | | | | |
| | | | | $ | (7.05 | ) | | $ | 35.73 | | | | 9.78 | % | | $ | 20,004 | | | | 1.27 | %(c) | | | 1.37 | %(c) | | | (0.50 | )%(c) | | | 32 | % |
| | | | | | (5.90 | ) | | | 39.02 | | | | 6.50 | | | | 22,511 | | | | 1.27 | | | | 1.37 | | | | (0.41 | ) | | | 50 | |
| | | | | | (0.71 | ) | | | 43.54 | | | | 23.21 | | | | 23,781 | | | | 1.26 | | | | 1.36 | | | | (0.27 | ) | | | 40 | |
| | | | | | (1.01 | ) | | | 35.95 | | | | 16.96 | | | | 20,635 | | | | 1.31 | | | | 1.36 | | | | (0.11 | ) | | | 46 | |
| | | | | | (2.71 | ) | | | 31.71 | | | | 1.31 | | | | 17,877 | | | | 1.36 | | | | 1.36 | | | | (0.05 | ) | | | 55 | |
| | | | | | (3.70 | ) | | | 33.93 | | | | 11.32 | | | | 14,751 | | | | 1.36 | | | | 1.36 | | | | (0.31 | ) | | | 58 | |
| | | | | | | | | | | | | | | | | | | | | | | | | | | | | | | | | | |
| | | | | $ | (7.05 | ) | | $ | 36.82 | | | | 10.06 | % | | $ | 84,572 | | | | 0.77 | %(c) | | | 0.87 | %(c) | | | 0.01 | %(c) | | | 32 | % |
| | | | | | (5.90 | ) | | | 39.91 | | | | 7.01 | | | | 91,265 | | | | 0.77 | | | | 0.87 | | | | 0.09 | | | | 50 | |
| | | | | | (0.76 | ) | | | 44.18 | | | | 23.84 | | | | 109,456 | | | | 0.76 | | | | 0.86 | | | | 0.23 | | | | 40 | |
| | | | | | (1.01 | ) | | | 36.33 | | | | 17.54 | | | | 80,667 | | | | 0.81 | | | | 0.86 | | | | 0.41 | | | | 46 | |
| | | | | | (2.71 | ) | | | 31.88 | | | | 1.81 | | | | 35,025 | | | | 0.86 | | | | 0.86 | | | | 0.46 | | | | 55 | |
| | | | | | (3.87 | ) | | | 33.94 | | | | 11.88 | | | | 16,050 | | | | 0.86 | | | | 0.86 | | | | 0.19 | | | | 58 | |
| | | | | | | | | | | | | | | | | | | | | | | | | | | | | | | | | | |
| | | | | $ | (7.05 | ) | | $ | 46.73 | | | | 10.11 | % | | $ | 149,106 | | | | 0.67 | %(c) | | | 0.77 | %(c) | | | 0.10 | %(c) | | | 32 | % |
| | | | | | (5.90 | ) | | | 48.89 | | | | 7.15 | | | | 162,173 | | | | 0.67 | | | | 0.77 | | | | 0.18 | | | | 50 | |
| | | | | | (0.75 | ) | | | 52.51 | | | | 23.93 | | | | 177,278 | | | | 0.66 | | | | 0.76 | | | | 0.33 | | | | 40 | |
| | | | | | (1.01 | ) | | | 43.02 | | | | 17.67 | | | | 195,161 | | | | 0.71 | | | | 0.76 | | | | 0.50 | | | | 46 | |
| | | | | | (2.71 | ) | | | 37.53 | | | | 1.92 | | | | 155,976 | | | | 0.76 | | | | 0.76 | | | | 0.55 | | | | 55 | |
| | | | | | (3.90 | ) | | | 39.45 | | | | 11.99 | | | | 122,979 | | | | 0.76 | | | | 0.76 | | | | 0.29 | | | | 58 | |
| | | | | | | | | | | | | | | | | | | | | | | | | | | | | | | | | | |
| | | | | $ | (7.05 | ) | | $ | 46.82 | | | | 10.14 | % | | $ | 143,222 | | | | 0.62 | %(c) | | | 0.72 | %(c) | | | 0.16 | %(c) | | | 32 | % |
| | | | | | (5.90 | ) | | | 48.96 | | | | 7.18 | | | | 134,485 | | | | 0.62 | | | | 0.72 | | | | 0.23 | | | | 50 | |
| | | | | | (0.77 | ) | | | 52.56 | | | | 24.03 | | | | 114,054 | | | | 0.61 | | | | 0.71 | | | | 0.38 | | | | 40 | |
| | | | | | (1.01 | ) | | | 43.04 | | | | 17.72 | | | | 36,374 | | | | 0.66 | | | | 0.71 | | | | 0.53 | | | | 46 | |
| | | | | | — | | | | 37.53 | | | | 0.05 | | | | 11,564 | | | | 0.71 | (c) | | | 0.71 | (c) | | | 0.60 | (c) | | | 55 | |
| | | | | | | | | | | | | | | | | | | | | | | | | | | | | | | | | | |
| | | | | $ | (7.05 | ) | | $ | 42.78 | | | | 9.98 | % | | $ | 4,707 | | | | 0.92 | %(c) | | | 1.02 | %(c) | | | (0.15 | )%(c) | | | 32 | % |
| | | | | | (5.90 | ) | | | 45.36 | | | | 6.88 | | | | 5,138 | | | | 0.92 | | | | 1.02 | | | | (0.08 | ) | | | 50 | |
| | | | | | (0.71 | ) | | | 49.33 | | | | 23.63 | | | | 4,017 | | | | 0.91 | | | | 1.01 | | | | 0.07 | | | | 40 | |
| | | | | | (1.01 | ) | | | 40.51 | | | | 17.39 | | | | 4,288 | | | | 0.96 | | | | 1.01 | | | | 0.25 | | | | 46 | |
| | | | | | (2.71 | ) | | | 35.48 | | | | 1.65 | | | | 7,900 | | | | 1.01 | | | | 1.01 | | | | 0.29 | | | | 55 | |
| | | | | | (3.81 | ) | | | 37.53 | | | | 11.67 | | | | 6,439 | | | | 1.01 | | | | 1.01 | | | | 0.04 | | | | 58 | |
| | | | | | | | |
| See accompanying Notes to Financial Statements | | | December 31, 2019 | | | Semiannual Report | | | 113 | |
Financial Highlights (cont’d)
For a Share Outstanding for the Period ended:^
| | | | | | | | | | | | | | | | | | | | | | | | | | | | |
| | | Net Asset Value, Beginning of Period | | | Net Investment Income (Loss) (a) | | | Net Realized and Change in Unrealized Gain (Loss) | | | Total from Investment Operations | | | Dividends from Net Investment Income | | | Net Asset Value, End of Period | | | | |
| AllianzGI Global Natural Resources: | | | | | | | | | | | | | | | | | | | | | |
| Class A | | | | | | | | | | | | | | | | | | | | | | | | | | | | |
12/31/2019† | | $ | 14.20 | | | $ | 0.12 | | | $ | (0.57 | ) | | $ | (0.45 | ) | | $ | (0.36 | ) | | $ | 13.39 | | | | | |
6/30/2019 | | | 15.95 | | | | 0.27 | | | | (1.78 | ) | | | (1.51 | ) | | | (0.24 | ) | | | 14.20 | | | | | |
6/30/2018 | | | 13.77 | | | | 0.13 | | | | 2.08 | | | | 2.21 | | | | (0.03 | ) | | | 15.95 | | | | | |
6/30/2017 | | | 14.67 | | | | 0.01 | | | | (0.78 | ) | | | (0.77 | ) | | | (0.13 | ) | | | 13.77 | | | | | |
6/30/2016 | | | 16.66 | | | | 0.05 | | | | (1.97 | ) | | | (1.92 | ) | | | (0.07 | ) | | | 14.67 | | | | | |
6/30/2015 | | | 20.71 | | | | 0.06 | | | | (4.11 | ) | | | (4.05 | ) | | | — | | | | 16.66 | | | | | |
| Class C | | | | | | | | | | | | | | | | | | | | | | | | | | | | |
12/31/2019† | | $ | 13.29 | | | $ | 0.07 | | | $ | (0.54 | ) | | $ | (0.47 | ) | | $ | (0.27 | ) | | $ | 12.55 | | | | | |
6/30/2019 | | | 14.90 | | | | 0.15 | | | | (1.64 | ) | | | (1.49 | ) | | | (0.12 | ) | | | 13.29 | | | | | |
6/30/2018 | | | 12.93 | | | | 0.02 | | | | 1.95 | | | | 1.97 | | | | — | | | | 14.90 | | | | | |
6/30/2017 | | | 13.77 | | | | (0.10 | ) | | | (0.74 | ) | | | (0.84 | ) | | | — | | | | 12.93 | | | | | |
6/30/2016 | | | 15.67 | | | | (0.06 | ) | | | (1.84 | ) | | | (1.90 | ) | | | — | | | | 13.77 | | | | | |
6/30/2015 | | | 19.63 | | | | (0.07 | ) | | | (3.89 | ) | | | (3.96 | ) | | | — | | | | 15.67 | | | | | |
| Class P | | | | | | | | | | | | | | | | | | | | | | | | | | | | |
12/31/2019† | | $ | 14.44 | | | $ | 0.14 | | | $ | (0.59 | ) | | $ | (0.45 | ) | | $ | (0.37 | ) | | $ | 13.62 | | | | | |
6/30/2019 | | | 16.25 | | | | 0.29 | | | | (1.79 | ) | | | (1.50 | ) | | | (0.31 | ) | | | 14.44 | | | | | |
6/30/2018 | | | 13.96 | | | | 0.18 | | | | 2.11 | | | | 2.29 | | | | — | | | | 16.25 | | | | | |
6/30/2017 | | | 14.86 | | | | 0.03 | | | | (0.78 | ) | | | (0.75 | ) | | | (0.15 | ) | | | 13.96 | | | | | |
6/30/2016 | | | 16.87 | | | | 0.09 | | | | (1.99 | ) | | | (1.90 | ) | | | (0.11 | ) | | | 14.86 | | | | | |
6/30/2015 | | | 20.98 | | | | 0.13 | | | | (4.20 | ) | | | (4.07 | ) | | | (0.04 | ) | | | 16.87 | | | | | |
| Institutional Class | | | | | | | | | | | | | | | | | | | | | | | | | | | | |
12/31/2019† | | $ | 14.58 | | | $ | 0.15 | | | $ | (0.59 | ) | | $ | (0.44 | ) | | $ | (0.42 | ) | | $ | 13.72 | | | | | |
6/30/2019 | | | 16.39 | | | | 0.33 | | | | (1.84 | ) | | | (1.51 | ) | | | (0.30 | ) | | | 14.58 | | | | | |
6/30/2018 | | | 14.12 | | | | 0.19 | | | | 2.14 | | | | 2.33 | | | | (0.06 | ) | | | 16.39 | | | | | |
6/30/2017 | | | 14.99 | | | | 0.07 | | | | (0.81 | ) | | | (0.74 | ) | | | (0.13 | ) | | | 14.12 | | | | | |
6/30/2016 | | | 17.00 | | | | 0.09 | | | | (1.99 | ) | | | (1.90 | ) | | | (0.11 | ) | | | 14.99 | | | | | |
6/30/2015 | | | 21.10 | | | | 0.12 | | | | (4.19 | ) | | | (4.07 | ) | | | (0.03 | ) | | | 17.00 | | | | | |
| ^ | A “—” may reflect actual amounts rounding to less than $0.01 or 0.01%. |
| (a) | Calculated on average shares outstanding during the period. |
| (b) | Total return is calculated assuming a purchase of a share on the first day of the year and a sale of a share on the last day of each year reported. Dividends and distributions, if any, are assumed, for purposes of this calculation, to be reinvested. Total return does not reflect sales charges and includes the effect of fee waivers and reimbursements. Total return may reflect adjustments to conform to U.S. GAAP. Total return for a period of less than one year is not annualized. |
| (c) | Annualized, unless otherwise noted. |
| (d) | Does not include expenses of the investment companies in which the Fund invests. |
| | | | | | |
| 114 | | Semiannual Report | | | December 31, 2019 | | | See accompanying Notes to Financial Statements |
| | | | | | | | | | | | | | | | | | | | | | |
| | | | Total Return (b) | | | Net Assets, End of Period (000s) | | | Ratio of Expenses to Average Net Assets | | | Ratio of Net Investment Income (Loss) to Average Net Assets | | | Portfolio Turnover Rate | |
| | | | | | | | | | | | | | | | | |
| | | | | | | | | | | | | | | | | | | | | | |
| | | | | | (3.16 | )% | | $ | 4,016 | | | | 1.43 | %(c)(d) | | | 1.85 | %(c)(d) | | | 89 | % |
| | | | | | (9.24 | ) | | | 5,466 | | | | 1.43 | (d) | | | 1.91 | (d) | | | 76 | |
| | | | | | 16.05 | | | | 7,812 | | | | 1.43 | (d) | | | 0.84 | (d) | | | 113 | |
| | | | | | (5.37 | ) | | | 11,135 | | | | 1.42 | (d) | | | 0.08 | (d) | | | 108 | |
| | | | | | (11.44 | ) | | | 14,175 | | | | 1.42 | (d) | | | 0.34 | (d) | | | 177 | |
| | | | | | (19.56 | ) | | | 11,395 | | | | 1.41 | | | | 0.32 | | | | 107 | |
| | | | | | | | | | | | | | | | | | | | | | |
| | | | | | (3.51 | )% | | $ | 1,011 | | | | 2.18 | %(c)(d) | | | 1.11 | %(c)(d) | | | 89 | % |
| | | | | | (9.90 | ) | | | 1,154 | | | | 2.18 | (d) | | | 1.10 | (d) | | | 76 | |
| | | | | | 15.24 | | | | 2,102 | | | | 2.18 | (d) | | | 0.13 | (d) | | | 113 | |
| | | | | | (6.07 | ) | | | 2,896 | | | | 2.17 | (d) | | | (0.70 | )(d) | | | 108 | |
| | | | | | (12.13 | ) | | | 4,200 | | | | 2.17 | (d) | | | (0.43 | )(d) | | | 177 | |
| | | | | | (20.17 | ) | | | 4,579 | | | | 2.16 | | | | (0.42 | ) | | | 107 | |
| | | | | | | | | | | | | | | | | | | | | | |
| | | | | | (3.05 | )% | | $ | 377 | | | | 1.18 | %(c)(d) | | | 2.07 | %(c)(d) | | | 89 | % |
| | | | | | (8.94 | ) | | | 600 | | | | 1.18 | (d) | | | 1.93 | (d) | | | 76 | |
| | | | | | 16.40 | | | | 2,435 | | | | 1.18 | (d) | | | 1.20 | (d) | | | 113 | |
| | | | | | (5.18 | ) | | | 1,970 | | | | 1.17 | (d) | | | 0.19 | (d) | | | 108 | |
| | | | | | (11.20 | ) | | | 8,025 | | | | 1.17 | (d) | | | 0.61 | (d) | | | 177 | |
| | | | | | (19.38 | ) | | | 8,128 | | | | 1.16 | | | | 0.73 | | | | 107 | |
| | | | | | | | | | | | | | | | | | | | | | |
| | | | | | (2.98 | )% | | $ | 4,509 | | | | 1.08 | %(c)(d) | | | 2.21 | %(c)(d) | | | 89 | % |
| | | | | | (8.92 | ) | | | 5,009 | | | | 1.08 | (d) | | | 2.21 | (d) | | | 76 | |
| | | | | | 16.48 | | | | 8,313 | | | | 1.08 | (d) | | | 1.24 | (d) | | | 113 | |
| | | | | | (5.07 | ) | | | 10,068 | | | | 1.07 | (d) | | | 0.43 | (d) | | | 108 | |
| | | | | | (11.12 | ) | | | 17,671 | | | | 1.07 | (d) | | | 0.64 | (d) | | | 177 | |
| | | | | | (19.28 | ) | | | 30,751 | | | | 1.06 | | | | 0.67 | | | | 107 | |
| | | | | | | | |
| See accompanying Notes to Financial Statements | | | December 31, 2019 | | | Semiannual Report | | | 115 | |
Financial Highlights (cont’d)
For a Share Outstanding for the Period ended:^
| | | | | | | | | | | | | | | | | | | | | | | | | | | | |
| | | Net Asset
Value,
Beginning
of Period | | | Net
Investment
Income
(Loss) (a) | | | Net Realized
and Change in
Unrealized
Gain (Loss) | | | Total from
Investment
Operations | | | Dividends
from Net
Investment
Income | | | Distributions
from Net
Realized Capital
Gains | | | | |
| AllianzGI Global Small-Cap: | | | | | | | | | | | | | | | | | | | | | |
| Class A | | | | | | | | | | | | | | | | | | | | | | | | | | | | |
12/31/2019† | | $ | 39.37 | | | $ | (0.14 | ) | | $ | 1.79 | | | $ | 1.65 | | | $ | — | | | $ | (2.95 | ) | | | | |
6/30/2019 | | | 51.40 | | | | (0.14 | ) | | | (3.88 | ) | | | (4.02 | ) | | | — | | | | (8.01 | ) | | | | |
6/30/2018 | | | 47.75 | | | | (0.26 | ) | | | 8.28 | | | | 8.02 | | | | (0.10 | ) | | | (4.27 | ) | | | | |
6/30/2017 | | | 41.18 | | | | (0.14 | ) | | | 6.71 | | | | 6.57 | | | | — | | | | — | | | | | |
6/30/2016 | | | 45.05 | | | | (0.13 | ) | | | (3.74 | ) | | | (3.87 | ) | | | — | | | | — | | | | | |
6/30/2015 | | | 43.12 | | | | (0.19 | ) | | | 2.12 | | | | 1.93 | | | | — | | | | — | | | | | |
| Class C | | | | | | | | | | | | | | | | | | | | | | | | | | | | |
12/31/2019† | | $ | 33.10 | | | $ | (0.24 | ) | | $ | 1.50 | | | $ | 1.26 | | | $ | — | | | $ | (2.95 | ) | | | | |
6/30/2019 | | | 45.13 | | | | (0.45 | ) | | | (3.57 | ) | | | (4.02 | ) | | | — | | | | (8.01 | ) | | | | |
6/30/2018 | | | 42.62 | | | | (0.57 | ) | | | 7.35 | | | | 6.78 | | | | — | | | | (4.27 | ) | | | | |
6/30/2017 | | | 37.03 | | | | (0.42 | ) | | | 6.01 | | | | 5.59 | | | | — | | | | — | | | | | |
6/30/2016 | | | 40.81 | | | | (0.41 | ) | | | (3.37 | ) | | | (3.78 | ) | | | — | | | | — | | | | | |
6/30/2015 | | | 39.36 | | | | (0.46 | ) | | | 1.91 | | | | 1.45 | | | | — | | | | — | | | | | |
| Class P | | | | | | | | | | | | | | | | | | | | | | | | | | | | |
12/31/2019† | | $ | 42.51 | | | $ | (0.10 | ) | | $ | 1.94 | | | $ | 1.84 | | | $ | — | | | $ | (2.95 | ) | | | | |
6/30/2019 | | | 54.57 | | | | (0.06 | ) | | | (3.99 | ) | | | (4.05 | ) | | | — | | | | (8.01 | ) | | | | |
6/30/2018 | | | 50.40 | | | | (0.15 | ) | | | 8.75 | | | | 8.60 | | | | (0.16 | ) | | | (4.27 | ) | | | | |
6/30/2017 | | | 43.36 | | | | 0.02 | | | | 7.02 | | | | 7.04 | | | | — | | | | — | | | | | |
6/30/2016 | | | 47.30 | | | | (0.05 | ) | | | (3.89 | ) | | | (3.94 | ) | | | — | | | | — | | | | | |
6/30/2015 | | | 45.17 | | | | (0.06 | ) | | | 2.19 | | | | 2.13 | | | | — | | | | — | | | | | |
| Institutional Class | | | | | | | | | | | | | | | | | | | | | | | | | | | | |
12/31/2019† | | $ | 42.97 | | | $ | (0.08 | ) | | $ | 1.97 | | | $ | 1.89 | | | $ | — | | | $ | (2.95 | ) | | | | |
6/30/2019 | | | 55.01 | | | | 0.01 | | | | (4.04 | ) | | | (4.03 | ) | | | — | | | | (8.01 | ) | | | | |
6/30/2018 | | | 50.77 | | | | (0.09 | ) | | | 8.81 | | | | 8.72 | | | | (0.21 | ) | | | (4.27 | ) | | | | |
6/30/2017 | | | 43.63 | | | | 0.02 | | | | 7.12 | | | | 7.14 | | | | — | | | | — | | | | | |
6/30/2016 | | | 47.55 | | | | 0.02 | | | | (3.94 | ) | | | (3.92 | ) | | | — | | | | — | | | | | |
6/30/2015 | | | 45.37 | | | | (0.05 | ) | | | 2.23 | | | | 2.18 | | | | — | | | | — | | | | | |
| ^ | A “—” may reflect actual amounts rounding to less than $0.01 or 0.01%. |
| (a) | Calculated on average shares outstanding during the period. |
| (b) | Total return is calculated assuming a purchase of a share on the first day of the year and a sale of a share on the last day of each year reported. Dividends and distributions, if any, are assumed, for purposes of this calculation, to be reinvested. Total return does not reflect sales charges and includes the effect of fee waivers and reimbursements. Total return may reflect adjustments to conform to U.S. GAAP. Total return for a period of less than one year is not annualized. |
| (c) | Annualized, unless otherwise noted. |
| (d) | Payments from Affiliates increased the end of period net asset value and total return by less than $0.01 and 0.01%, respectively. |
| | | | | | |
| 116 | | Semiannual Report | | | December 31, 2019 | | | See accompanying Notes to Financial Statements |
| | | | | | | | | | | | | | | | | | | | | | | | | | | | | | |
| | | | Total
Dividends and
Distributions | | | Net Asset
Value, End
of Period | | | Total Return (b) | | | Net Assets,
End of Period
(000s) | | | Ratio of
Expenses
to Average
Net Assets | | | Ratio of Net
Investment
Income (Loss)
to Average
Net Assets | | | Portfolio
Turnover Rate | |
| | | | | | | | | | | | | | | | | | | | | | | |
| | | | | | | | | | | | | | | | | | | | | | | | | | | | | | |
| | | | | $ | (2.95 | ) | | $ | 38.07 | | | | 4.23 | % | | $ | 43,447 | | | | 1.63 | %(c) | | | (0.71 | )%(c) | | | 38 | % |
| | | | | | (8.01 | ) | | | 39.37 | | | | (4.64 | ) | | | 46,947 | | | | 1.62 | | | | (0.34 | ) | | | 85 | |
| | | | | | (4.37 | ) | | | 51.40 | (d) | | | 17.08 | (d) | | | 56,929 | | | | 1.62 | | | | (0.51 | ) | | | 77 | |
| | | | | | — | | | | 47.75 | (d) | | | 15.96 | (d) | | | 56,686 | | | | 1.61 | | | | (0.32 | ) | | | 80 | |
| | | | | | — | | | | 41.18 | | | | (8.59 | ) | | | 68,625 | | | | 1.61 | | | | (0.31 | ) | | | 87 | |
| | | | | | — | | | | 45.05 | | | | 4.48 | | | | 57,590 | | | | 1.61 | | | | (0.45 | ) | | | 64 | |
| | | | | | | | | | | | | | | | | | | | | | | | | | | | | | |
| | | | | $ | (2.95 | ) | | $ | 31.41 | | | | 3.85 | % | | $ | 5,702 | | | | 2.38 | %(c) | | | (1.47 | )%(c) | | | 38 | % |
| | | | | | (8.01 | ) | | | 33.10 | | | | (5.37 | ) | | | 7,354 | | | | 2.37 | | | | (1.18 | ) | | | 85 | |
| | | | | | (4.27 | ) | | | 45.13 | (d) | | | 16.21 | (d) | | | 19,630 | | | | 2.37 | | | | (1.25 | ) | | | 77 | |
| | | | | | — | | | | 42.62 | (d) | | | 15.10 | (d) | | | 19,729 | | | | 2.36 | | | | (1.06 | ) | | | 80 | |
| | | | | | — | | | | 37.03 | | | | (9.26 | ) | | | 23,055 | | | | 2.36 | | | | (1.09 | ) | | | 87 | |
| | | | | | — | | | | 40.81 | | | | 3.69 | | | | 25,959 | | | | 2.36 | | | | (1.19 | ) | | | 64 | |
| | | | | | | | | | | | | | | | | | | | | | | | | | | | | | |
| | | | | $ | (2.95 | ) | | $ | 41.40 | | | | 4.37 | % | | $ | 9,417 | | | | 1.38 | %(c) | | | (0.47 | )%(c) | | | 38 | % |
| | | | | | (8.01 | ) | | | 42.51 | | | | (4.40 | ) | | | 11,675 | | | | 1.37 | | | | (0.13 | ) | | | 85 | |
| | | | | | (4.43 | ) | | | 54.57 | (d) | | | 17.36 | (d) | | | 18,262 | | | | 1.37 | | | | (0.27 | ) | | | 77 | |
| | | | | | — | | | | 50.40 | (d) | | | 16.24 | (d) | | | 23,214 | | | | 1.36 | | | | 0.03 | | | | 80 | |
| | | | | | — | | | | 43.36 | | | | (8.33 | ) | | | 20,921 | | | | 1.36 | | | | (0.11 | ) | | | 87 | |
| | | | | | — | | | | 47.30 | | | | 4.72 | | | | 26,662 | | | | 1.36 | | | | (0.14 | ) | | | 64 | |
| | | | | | | | | | | | | | | | | | | | | | | | | | | | | | |
| | | | | $ | (2.95 | ) | | $ | 41.91 | | | | 4.44 | % | | $ | 47,148 | | | | 1.28 | %(c) | | | (0.36 | )%(c) | | | 38 | % |
| | | | | | (8.01 | ) | | | 42.97 | | | | (4.32 | ) | | | 67,916 | | | | 1.27 | | | | 0.01 | | | | 85 | |
| | | | | | (4.48 | ) | | | 55.01 | (d) | | | 17.48 | (d) | | | 98,623 | | | | 1.27 | | | | (0.17 | ) | | | 77 | |
| | | | | | — | | | | 50.77 | (d) | | | 16.36 | (d) | | | 114,925 | | | | 1.26 | | | | 0.05 | | | | 80 | |
| | | | | | — | | | | 43.63 | | | | (8.25 | ) | | | 122,294 | | | | 1.26 | | | | 0.06 | | | | 87 | |
| | | | | | — | | | | 47.55 | | | | 4.80 | | | | 80,319 | | | | 1.26 | | | | (0.12 | ) | | | 64 | |
| | | | | | | | |
| See accompanying Notes to Financial Statements | | | December 31, 2019 | | | Semiannual Report | | | 117 | |
Financial Highlights (cont’d)
For a Share Outstanding for the Period ended:^
| | | | | | | | | | | | | | | | | | | | | | | | | | | | |
| | | Net Asset
Value,
Beginning
of Period | | | Net
Investment
Income
(Loss) (a) | | | Net Realized
and Change
in Unrealized
Gain (Loss) | | | Total from
Investment
Operations | | | Dividends
from Net
Investment
Income | | | Distributions
from Net
Realized Capital
Gains | | | | |
| AllianzGI Health Sciences: | | | | | | | | | | | | | | | | | | | | | |
| Class A | | | | | | | | | | | | | | | | | | | | | | | | | | | | |
12/31/2019† | | $ | 32.27 | | | $ | (0.04 | ) | | $ | 3.85 | | | $ | 3.81 | | | $ | (0.01 | ) | | $ | (2.32 | ) | | | | |
6/30/2019 | | | 33.27 | | | | 0.02 | | | | 3.57 | | | | 3.59 | | | | (0.31 | ) | | | (4.28 | ) | | | | |
6/30/2018 | | | 31.61 | | | | (0.02 | ) | | | 1.68 | | | | 1.66 | | | | — | | | | — | | | | | |
6/30/2017 | | | 27.77 | | | | (0.01 | ) | | | 3.85 | | | | 3.84 | | | | — | | | | — | | | | | |
6/30/2016 | | | 38.48 | | | | (0.02 | ) | | | (3.87 | ) | | | (3.89 | ) | | | — | | | | (6.82 | ) | | | | |
6/30/2015 | | | 33.91 | | | | (0.26 | ) | | | 9.79 | | | | 9.53 | | | | — | | | | (4.96 | ) | | | | |
| Class C | | | | | | | | | | | | | | | | | | | | | | | | | | | | |
12/31/2019† | | $ | 24.71 | | | $ | (0.13 | ) | | $ | 2.93 | | | $ | 2.80 | | | $ | — | | | $ | (2.32 | ) | | | | |
6/30/2019 | | | 26.43 | | | | (0.19 | ) | | | 2.75 | | | | 2.56 | | | | — | | | | (4.28 | ) | | | | |
6/30/2018 | | | 25.30 | | | | (0.21 | ) | | | 1.34 | | | | 1.13 | | | | — | | | | — | | | | | |
6/30/2017 | | | 22.40 | | | | (0.18 | ) | | | 3.08 | | | | 2.90 | | | | — | | | | — | | | | | |
6/30/2016 | | | 32.67 | | | | (0.28 | ) | | | (3.17 | ) | | | (3.45 | ) | | | — | | | | (6.82 | ) | | | | |
6/30/2015 | | | 29.66 | | | | (0.45 | ) | | | 8.42 | | | | 7.97 | | | | — | | | | (4.96 | ) | | | | |
| Institutional Class | | | | | | | | | | | | | | | | | | | | | | | | | | | | |
12/31/2019† | | $ | 32.76 | | | $ | 0.01 | | | $ | 3.91 | | | $ | 3.92 | | | $ | (0.04 | ) | | $ | (2.32 | ) | | | | |
6/30/2019 | | | 33.69 | | | | 0.13 | | | | 3.63 | | | | 3.76 | | | | (0.41 | ) | | | (4.28 | ) | | | | |
6/30/2018 | | | 31.90 | | | | 0.10 | | | | 1.69 | | | | 1.79 | | | | — | | | | — | | | | | |
6/30/2017 | | | 27.93 | | | | 0.09 | | | | 3.88 | | | | 3.97 | | | | — | | | | — | | | | | |
6/30/2016 | | | 38.53 | | | | 0.04 | | | | (3.82 | ) | | | (3.78 | ) | | | — | | | | (6.82 | ) | | | | |
12/22/2014* - 6/30/2015 | | | 33.09 | | | | (0.04 | ) | | | 5.48 | | | | 5.44 | | | | — | | | | — | | | | | |
| ^ | A “—” may reflect actual amounts rounding to less than $0.01 or 0.01%. |
| * | Commencement of operations. |
| (a) | Calculated on average shares outstanding during the period. |
| (b) | Total return is calculated assuming a purchase of a share on the first day of the period and a sale of a share on the last day of each period reported. Dividends and distributions, if any, are assumed, for purposes of this calculation, to be reinvested. Total return does not reflect sales charges and includes the effect of fee waivers and reimbursements. Total return may reflect adjustments to conform to U.S. GAAP. Total return for a period of less than one year is not annualized. |
| (c) | Annualized, unless otherwise noted. |
| | | | | | |
| 118 | | Semiannual Report | | | December 31, 2019 | | | See accompanying Notes to Financial Statements |
| | | | | | | | | | | | | | | | | | | | | | | | | | | | | | |
| | | | Total
Dividends and
Distributions | | | Net Asset
Value, End
of Period | | | Total Return (b) | | | Net Assets,
End of Period
(000s) | | | Ratio of
Expenses
to Average
Net Assets | | | Ratio of Net
Investment
Income (Loss)
to Average
Net Assets | | | Portfolio
Turnover Rate | |
| | | | | | | | | | | | | | | | | | | | | | | |
| | | | | | | | | | | | | | | | | | | | | | | | | | | | | | |
| | | | | $ | (2.33 | ) | | $ | 33.75 | | | | 11.85 | % | | $ | 154,580 | | | | 1.47 | %(c) | | | (0.27 | )%(c) | | | 37 | % |
| | | | | | (4.59 | ) | | | 32.27 | | | | 13.14 | | | | 147,068 | | | | 1.47 | | | | 0.06 | | | | 102 | |
| | | | | | — | | | | 33.27 | | | | 5.25 | | | | 141,122 | | | | 1.47 | | | | (0.05 | ) | | | 55 | |
| | | | | | — | | | | 31.61 | | | | 13.83 | | | | 150,756 | | | | 1.46 | | | | (0.04 | ) | | | 82 | |
| | | | | | (6.82 | ) | | | 27.77 | | | | (10.82 | ) | | | 167,724 | | | | 1.47 | | | | (0.07 | ) | | | 113 | |
| | | | | | (4.96 | ) | | | 38.48 | | | | 30.53 | | | | 45,093 | | | | 1.46 | | | | (0.72 | ) | | | 76 | |
| | | | | | | | | | | | | | | | | | | | | | | | | | | | | | |
| | | | | $ | (2.32 | ) | | $ | 25.19 | | | | 11.41 | % | | $ | 4,137 | | | | 2.22 | %(c) | | | (1.02 | )%(c) | | | 37 | % |
| | | | | | (4.28 | ) | | | 24.71 | | | | 12.34 | | | | 4,131 | | | | 2.22 | | | | (0.75 | ) | | | 102 | |
| | | | | | — | | | | 26.43 | | | | 4.47 | | | | 8,218 | | | | 2.22 | | | | (0.81 | ) | | | 55 | |
| | | | | | — | | | | 25.30 | | | | 12.95 | | | | 10,358 | | | | 2.21 | | | | (0.79 | ) | | | 82 | |
| | | | | | (6.82 | ) | | | 22.40 | | | | (11.48 | ) | | | 13,446 | | | | 2.22 | | | | (1.07 | ) | | | 113 | |
| | | | | | (4.96 | ) | | | 32.67 | | | | 29.57 | | | | 20,902 | | | | 2.21 | | | | (1.46 | ) | | | 76 | |
| | | | | | | | | | | | | | | | | | | | | | | | | | | | | | |
| | | | | $ | (2.36 | ) | | $ | 34.32 | | | | 12.03 | % | | $ | 4,985 | | | | 1.12 | %(c) | | | 0.08 | %(c) | | | 37 | % |
| | | | | | (4.69 | ) | | | 32.76 | | | | 13.54 | | | | 4,290 | | | | 1.12 | | | | 0.39 | | | | 102 | |
| | | | | | — | | | | 33.69 | | | | 5.61 | | | | 2,854 | | | | 1.12 | | | | 0.29 | | | | 55 | |
| | | | | | — | | | | 31.90 | | | | 14.21 | | | | 3,692 | | | | 1.11 | | | | 0.31 | | | | 82 | |
| | | | | | (6.82 | ) | | | 27.93 | | | | (10.49 | ) | | | 1,977 | | | | 1.12 | | | | 0.14 | | | | 113 | |
| | | | | | — | | | | 38.53 | | | | 16.44 | | | | 1,240 | | | | 1.10 | (c) | | | (0.21 | )(c) | | | 76 | |
| | | | | | | | |
| See accompanying Notes to Financial Statements | | | December 31, 2019 | | | Semiannual Report | | | 119 | |
Financial Highlights (cont’d)
For a Share Outstanding for the Period ended:^
| | | | | | | | | | | | | | | | | | | | | | | | | | | | |
| | | Net Asset
Value,
Beginning
of Period | | | Net
Investment
Income (a) | | | Net Realized
and Change
in Unrealized
Gain (Loss) | | | Total from
Investment
Operations | | | Dividends
from Net
Investment
Income | | | Distributions
from Net
Realized Capital
Gains | | | | |
| AllianzGI Income & Growth: | | | | | | | | | | | | | | | | | | | | | |
| Class A | | | | | | | | | | | | | | | | | | | | | | | | | | | | |
12/31/2019† | | $ | 11.01 | | | $ | 0.09 | | | $ | 0.53 | | | $ | 0.62 | | | $ | (0.12 | ) | | $ | (0.30 | ) | | | | |
6/30/2019 | | | 11.34 | | | | 0.20 | | | | 0.38 | | | | 0.58 | | | | (0.25 | ) | | | (0.66 | ) | | | | |
6/30/2018 | | | 11.24 | | | | 0.23 | | | | 0.82 | | | | 1.05 | | | | (0.28 | ) | | | (0.67 | ) | | | | |
6/30/2017 | | | 10.80 | | | | 0.27 | | | | 1.17 | | | | 1.44 | | | | (0.32 | ) | | | (0.68 | ) | | | | |
6/30/2016 | | | 12.12 | | | | 0.28 | | | | (0.55 | ) | | | (0.27 | ) | | | (0.37 | ) | | | (0.68 | ) | | | | |
6/30/2015 | | | 12.95 | | | | 0.27 | | | | (0.05 | ) | | | 0.22 | | | | (0.26 | ) | | | (0.79 | ) | | | | |
| Class C | | | | | | | | | | | | | | | | | | | | | | | | | | | | |
12/31/2019† | | $ | 10.07 | | | $ | 0.04 | | | $ | 0.50 | | | $ | 0.54 | | | $ | (0.09 | ) | | $ | (0.30 | ) | | | | |
6/30/2019 | | | 10.46 | | | | 0.11 | | | | 0.34 | | | | 0.45 | | | | (0.18 | ) | | | (0.66 | ) | | | | |
6/30/2018 | | | 10.44 | | | | 0.13 | | | | 0.76 | | | | 0.89 | | | | (0.20 | ) | | | (0.67 | ) | | | | |
6/30/2017 | | | 10.10 | | | | 0.18 | | | | 1.09 | | | | 1.27 | | | | (0.25 | ) | | | (0.68 | ) | | | | |
6/30/2016 | | | 11.46 | | | | 0.19 | | | | (0.53 | ) | | | (0.34 | ) | | | (0.34 | ) | | | (0.68 | ) | | | | |
6/30/2015 | | | 12.38 | | | | 0.17 | | | | (0.06 | ) | | | 0.11 | | | | (0.24 | ) | | | (0.79 | ) | | | | |
| Class R | | | | | | | | | | | | | | | | | | | | | | | | | | | | |
12/31/2019† | | $ | 11.01 | | | $ | 0.08 | | | $ | 0.53 | | | $ | 0.61 | | | $ | (0.11 | ) | | $ | (0.30 | ) | | | | |
6/30/2019 | | | 11.34 | | | | 0.17 | | | | 0.38 | | | | 0.55 | | | | (0.22 | ) | | | (0.66 | ) | | | | |
6/30/2018 | | | 11.24 | | | | 0.20 | | | | 0.82 | | | | 1.02 | | | | (0.25 | ) | | | (0.67 | ) | | | | |
6/30/2017 | | | 10.80 | | | | 0.25 | | | | 1.16 | | | | 1.41 | | | | (0.29 | ) | | | (0.68 | ) | | | | |
6/30/2016 | | | 12.14 | | | | 0.26 | | | | (0.56 | ) | | | (0.30 | ) | | | (0.36 | ) | | | (0.68 | ) | | | | |
6/30/2015 | | | 13.00 | | | | 0.24 | | | | (0.05 | ) | | | 0.19 | | | | (0.26 | ) | | | (0.79 | ) | | | | |
| Class P | | | | | | | | | | | | | | | | | | | | | | | | | | | | |
12/31/2019† | | $ | 11.29 | | | $ | 0.11 | | | $ | 0.55 | | | $ | 0.66 | | | $ | (0.13 | ) | | $ | (0.30 | ) | | | | |
6/30/2019 | | | 11.61 | | | | 0.23 | | | | 0.38 | | | | 0.61 | | | | (0.27 | ) | | | (0.66 | ) | | | | |
6/30/2018 | | | 11.48 | | | | 0.26 | | | | 0.84 | | | | 1.10 | | | | (0.30 | ) | | | (0.67 | ) | | | | |
6/30/2017 | | | 11.01 | | | | 0.31 | | | | 1.19 | | | | 1.50 | | | | (0.35 | ) | | | (0.68 | ) | | | | |
6/30/2016 | | | 12.32 | | | | 0.32 | | | | (0.57 | ) | | | (0.25 | ) | | | (0.38 | ) | | | (0.68 | ) | | | | |
6/30/2015 | | | 13.12 | | | | 0.31 | | | | (0.05 | ) | | | 0.26 | | | | (0.27 | ) | | | (0.79 | ) | | | | |
| Institutional Class | | | | | | | | | | | | | | | | | | | | | | | | | | | | |
12/31/2019† | | $ | 11.41 | | | $ | 0.11 | | | $ | 0.56 | | | $ | 0.67 | | | $ | (0.14 | ) | | $ | (0.30 | ) | | | | |
6/30/2019 | | | 11.72 | | | | 0.25 | | | | 0.38 | | | | 0.63 | | | | (0.28 | ) | | | (0.66 | ) | | | | |
6/30/2018 | | | 11.58 | | | | 0.28 | | | | 0.84 | | | | 1.12 | | | | (0.31 | ) | | | (0.67 | ) | | | | |
6/30/2017 | | | 11.09 | | | | 0.32 | | | | 1.21 | | | | 1.53 | | | | (0.36 | ) | | | (0.68 | ) | | | | |
6/30/2016 | | | 12.40 | | | | 0.33 | | | | (0.57 | ) | | | (0.24 | ) | | | (0.39 | ) | | | (0.68 | ) | | | | |
6/30/2015 | | | 13.19 | | | | 0.32 | | | | (0.05 | ) | | | 0.27 | | | | (0.27 | ) | | | (0.79 | ) | | | | |
| ^ | A “—” may reflect actual amounts rounding to less than $0.01 or 0.01%. |
| (a) | Calculated on average shares outstanding during the period. |
| (b) | Total return is calculated assuming a purchase of a share on the first day of the period and a sale of a share on the last day of each period reported. Dividends and distributions, if any, are assumed, for purposes of this calculation, to be reinvested. Total return does not reflect sales charges and includes the effect of fee waivers and reimbursements. Total return may reflect adjustments to conform to U.S. GAAP. Total return for a period of less than one year is not annualized. |
| (c) | Annualized, unless otherwise noted. |
| (d) | Payments from Affiliates increased the end of period net asset value and total return by less than $0.01 and 0.01%, respectively. |
| | | | | | |
| 120 | | Semiannual Report | | | December 31, 2019 | | | See accompanying Notes to Financial Statements |
| | | | | | | | | | | | | | | | | | | | | | | | | | | | | | | | | | |
| | | | Total
Dividends and
Distributions | | | Net Asset
Value, End
of Period | | | Total Return (b) | | | Net Assets,
End of Period
(000s) | | | Ratio of
Expenses to
Average Net
Assets with
Fee Waiver/
Reimbursement | | | Ratio of
Expenses to
Average Net
Assets without
Fee Waiver/
Reimbursement | | | Ratio of Net
Investment
Income to
Average
Net Assets | | | Portfolio
Turnover Rate | |
| | | | | | | | | | | | | | | | | | | | | | | | | | |
| | | | | | | | | | | | | | | | | | | | | | | | | | | | | | | | | | |
| | | | | $ | (0.42 | ) | | $ | 11.21 | | | | 5.79 | % | | $ | 1,615,916 | | | | 1.28 | %(c) | | | 1.29 | %(c) | | | 1.64 | %(c) | | | 39 | % |
| | | | | | (0.91 | ) | | | 11.01 | (d) | | | 5.45 | (d) | | | 1,458,642 | | | | 1.28 | | | | 1.29 | | | | 1.84 | | | | 66 | |
| | | | | | (0.95 | ) | | | 11.34 | | | | 9.58 | | | | 1,250,639 | | | | 1.28 | | | | 1.29 | | | | 1.99 | | | | 102 | |
| | | | | | (1.00 | ) | | | 11.24 | | | | 13.88 | | | | 1,091,888 | | | | 1.29 | | | | 1.29 | | | | 2.45 | | | | 159 | |
| | | | | | (1.05 | ) | | | 10.80 | | | | (2.02 | ) | | | 1,009,542 | | | | 1.34 | | | | 1.34 | | | | 2.56 | | | | 94 | |
| | | | | | (1.05 | ) | | | 12.12 | | | | 1.80 | | | | 897,530 | | | | 1.32 | | | | 1.32 | | | | 2.16 | | | | 84 | |
| | | | | | | | | | | | | | | | | | | | | | | | | | | | | | | | | | |
| | | | | $ | (0.39 | ) | | $ | 10.22 | | | | 5.47 | % | | $ | 1,275,909 | | | | 2.03 | %(c) | | | 2.04 | %(c) | | | 0.89 | %(c) | | | 39 | % |
| | | | | | (0.84 | ) | | | 10.07 | (d) | | | 4.60 | (d) | | | 1,234,667 | | | | 2.03 | | | | 2.04 | | | | 1.09 | | | | 66 | |
| | | | | | (0.87 | ) | | | 10.46 | | | | 8.78 | | | | 1,116,788 | | | | 2.03 | | | | 2.04 | | | | 1.24 | | | | 102 | |
| | | | | | (0.93 | ) | | | 10.44 | | | | 13.08 | | | | 1,090,887 | | | | 2.04 | | | | 2.04 | | | | 1.70 | | | | 159 | |
| | | | | | (1.02 | ) | | | 10.10 | | | | (2.79 | ) | | | 1,159,303 | | | | 2.09 | | | | 2.09 | | | | 1.81 | | | | 94 | |
| | | | | | (1.03 | ) | | | 11.46 | | | | 0.95 | | | | 1,195,391 | | | | 2.07 | | | | 2.07 | | | | 1.41 | | | | 84 | |
| | | | | | | | | | | | | | | | | | | | | | | | | | | | | | | | | | |
| | | | | $ | (0.41 | ) | | $ | 11.21 | | | | 5.66 | % | | $ | 6,272 | | | | 1.53 | %(c) | | | 1.54 | %(c) | | | 1.39 | %(c) | | | 39 | % |
| | | | | | (0.88 | ) | | | 11.01 | (d) | | | 5.19 | (d) | | | 4,873 | | | | 1.53 | | | | 1.54 | | | | 1.60 | | | | 66 | |
| | | | | | (0.92 | ) | | | 11.34 | | | | 9.32 | | | | 3,150 | | | | 1.53 | | | | 1.54 | | | | 1.73 | | | | 102 | |
| | | | | | (0.97 | ) | | | 11.24 | | | | 13.59 | | | | 1,781 | | | | 1.54 | | | | 1.54 | | | | 2.20 | | | | 159 | |
| | | | | | (1.04 | ) | | | 10.80 | | | | (2.31 | ) | | | 2,261 | | | | 1.59 | | | | 1.59 | | | | 2.30 | | | | 94 | |
| | | | | | (1.05 | ) | | | 12.14 | | | | 1.49 | | | | 2,543 | | | | 1.57 | | | | 1.57 | | | | 1.89 | | | | 84 | |
| | | | | | | | | | | | | | | | | | | | | | | | | | | | | | | | | | |
| | | | | $ | (0.43 | ) | | $ | 11.52 | | | | 6.03 | % | | $ | 1,234,069 | | | | 1.03 | %(c) | | | 1.04 | %(c) | | | 1.89 | %(c) | | | 39 | % |
| | | | | | (0.93 | ) | | | 11.29 | (d) | | | 5.64 | (d) | | | 1,122,083 | | | | 1.03 | | | | 1.04 | | | | 2.09 | | | | 66 | |
| | | | | | (0.97 | ) | | | 11.61 | | | | 9.90 | | | | 897,716 | | | | 1.03 | | | | 1.04 | | | | 2.24 | | | | 102 | |
| | | | | | (1.03 | ) | | | 11.48 | | | | 14.14 | | | | 690,147 | | | | 1.04 | | | | 1.04 | | | | 2.69 | | | | 159 | |
| | | | | | (1.06 | ) | | | 11.01 | | | | (1.81 | ) | | | 560,425 | | | | 1.09 | | | | 1.09 | | | | 2.81 | | | | 94 | |
| | | | | | (1.06 | ) | | | 12.32 | | | | 2.07 | | | | 676,865 | | | | 1.07 | | | | 1.07 | | | | 2.42 | | | | 84 | |
| | | | | | | | | | | | | | | | | | | | | | | | | | | | | | | | | | |
| | | | | $ | (0.44 | ) | | $ | 11.64 | | | | 6.02 | % | | $ | 790,613 | | | | 0.93 | %(c) | | | 0.94 | %(c) | | | 1.99 | %(c) | | | 39 | % |
| | | | | | (0.94 | ) | | | 11.41 | (d) | | | 5.78 | (d) | | | 702,741 | | | | 0.93 | | | | 0.94 | | | | 2.19 | | | | 66 | |
| | | | | | (0.98 | ) | | | 11.72 | | | | 10.00 | | | | 460,024 | | | | 0.93 | | | | 0.94 | | | | 2.34 | | | | 102 | |
| | | | | | (1.04 | ) | | | 11.58 | | | | 14.33 | | | | 342,652 | | | | 0.94 | | | | 0.94 | | | | 2.76 | | | | 159 | |
| | | | | | (1.07 | ) | | | 11.09 | | | | (1.76 | ) | | | 181,890 | | | | 0.99 | | | | 0.99 | | | | 2.91 | | | | 94 | |
| | | | | | (1.06 | ) | | | 12.40 | | | | 2.17 | | | | 190,675 | | | | 0.97 | | | | 0.97 | | | | 2.51 | | | | 84 | |
| | | | | | | | |
| See accompanying Notes to Financial Statements | | | December 31, 2019 | | | Semiannual Report | | | 121 | |
Financial Highlights (cont’d)
For a Share Outstanding for the Period ended:^
| | | | | | | | | | | | | | | | | | | | | | | | | | | | |
| | | Net Asset
Value,
Beginning
of Period | | | Net
Investment
Income
(Loss) (a) | | | Net Realized
and Change
in Unrealized
Gain (Loss) | | | Total from
Investment
Operations | | | Distributions
from Net
Realized Capital
Gains | | | Net Asset
Value, End
of Period | | | | |
| AllianzGI Mid-Cap: | | | | | | | | | | | | | | | | | | | | | |
| Class A | | | | | | | | | | | | | | | | | | | | | | | | | | | | |
12/31/2019† | | $ | 3.75 | | | $ | (0.01 | ) | | $ | 0.27 | | | $ | 0.26 | | | $ | (0.18 | ) | | $ | 3.83 | | | | | |
6/30/2019 | | | 3.88 | | | | (0.02 | ) | | | 0.37 | | | | 0.35 | | | | (0.48 | ) | | | 3.75 | | | | | |
6/30/2018 | | | 3.74 | | | | (0.02 | ) | | | 0.54 | | | | 0.52 | | | | (0.38 | ) | | | 3.88 | | | | | |
6/30/2017 | | | 3.40 | | | | (0.01 | ) | | | 0.62 | | | | 0.61 | | | | (0.27 | ) | | | 3.74 | | | | | |
6/30/2016 | | | 3.65 | | | | (0.01 | ) | | | (0.03 | ) | | | (0.04 | ) | | | (0.21 | ) | | | 3.40 | | | | | |
6/30/2015 | | | 3.92 | | | | (0.01 | ) | | | 0.28 | | | | 0.27 | | | | (0.54 | ) | | | 3.65 | | | | | |
| Class C | | | | | | | | | | | | | | | | | | | | | | | | | | | | |
12/31/2019† | | $ | 2.98 | | | $ | (0.02 | ) | | $ | 0.22 | | | $ | 0.20 | | | $ | (0.18 | ) | | $ | 3.00 | | | | | |
6/30/2019 | | | 3.23 | | | | (0.04 | ) | | | 0.27 | | | | 0.23 | | | | (0.48 | ) | | | 2.98 | | | | | |
6/30/2018 | | | 3.19 | | | | (0.04 | ) | | | 0.46 | | | | 0.42 | | | | (0.38 | ) | | | 3.23 | | | | | |
6/30/2017 | | | 2.96 | | | | (0.04 | ) | | | 0.54 | | | | 0.50 | | | | (0.27 | ) | | | 3.19 | | | | | |
6/30/2016 | | | 3.22 | | | | (0.03 | ) | | | (0.02 | ) | | | (0.05 | ) | | | (0.21 | ) | | | 2.96 | | | | | |
6/30/2015 | | | 3.55 | | | | (0.04 | ) | | | 0.25 | | | | 0.21 | | | | (0.54 | ) | | | 3.22 | | | | | |
| Class R | | | | | | | | | | | | | | | | | | | | | | | | | | | | |
12/31/2019† | | $ | 3.66 | | | $ | (0.02 | ) | | $ | 0.28 | | | $ | 0.26 | | | $ | (0.18 | ) | | $ | 3.74 | | | | | |
6/30/2019 | | | 3.82 | | | | (0.03 | ) | | | 0.35 | | | | 0.32 | | | | (0.48 | ) | | | 3.66 | | | | | |
6/30/2018 | | | 3.69 | | | | (0.03 | ) | | | 0.54 | | | | 0.51 | | | | (0.38 | ) | | | 3.82 | | | | | |
6/30/2017 | | | 3.37 | | | | (0.02 | ) | | | 0.61 | | | | 0.59 | | | | (0.27 | ) | | | 3.69 | | | | | |
6/30/2016 | | | 3.62 | | | | (0.02 | ) | | | (0.02 | ) | | | (0.04 | ) | | | (0.21 | ) | | | 3.37 | | | | | |
6/30/2015 | | | 3.91 | | | | (0.02 | ) | | | 0.27 | | | | 0.25 | | | | (0.54 | ) | | | 3.62 | | | | | |
| Class P | | | | | | | | | | | | | | | | | | | | | | | | | | | | |
12/31/2019† | | $ | 4.36 | | | $ | (0.01 | ) | | $ | 0.32 | | | $ | 0.31 | | | $ | (0.18 | ) | | $ | 4.49 | | | | | |
6/30/2019 | | | 4.41 | | | | (0.02 | ) | | | 0.45 | | | | 0.43 | | | | (0.48 | ) | | | 4.36 | | | | | |
6/30/2018 | | | 4.19 | | | | (0.01 | ) | | | 0.61 | | | | 0.60 | | | | (0.38 | ) | | | 4.41 | | | | | |
6/30/2017 | | | 3.77 | | | | (0.01 | ) | | | 0.70 | | | | 0.69 | | | | (0.27 | ) | | | 4.19 | | | | | |
6/30/2016 | | | 4.01 | | | | — | | | | (0.03 | ) | | | (0.03 | ) | | | (0.21 | ) | | | 3.77 | | | | | |
6/30/2015 | | | 4.24 | | | | — | | | | 0.31 | | | | 0.31 | | | | (0.54 | ) | | | 4.01 | | | | | |
| Institutional Class | | | | | | | | | | | | | | | | | | | | | | | | | | | | |
12/31/2019† | | $ | 4.39 | | | $ | (0.01 | ) | | $ | 0.33 | | | $ | 0.32 | | | $ | (0.18 | ) | | $ | 4.53 | | | | | |
6/30/2019 | | | 4.43 | | | | (0.01 | ) | | | 0.45 | | | | 0.44 | | | | (0.48 | ) | | | 4.39 | | | | | |
6/30/2018 | | | 4.21 | | | | (0.01 | ) | | | 0.61 | | | | 0.60 | | | | (0.38 | ) | | | 4.43 | | | | | |
6/30/2017 | | | 3.78 | | | | — | | | | 0.70 | | | | 0.70 | | | | (0.27 | ) | | | 4.21 | | | | | |
6/30/2016 | | | 4.02 | | | | — | | | | (0.03 | ) | | | (0.03 | ) | | | (0.21 | ) | | | 3.78 | | | | | |
6/30/2015 | | | 4.25 | | | | — | | | | 0.31 | | | | 0.31 | | | | (0.54 | ) | | | 4.02 | | | | | |
| Administrative Class | | | | | | | | | | | | | | | | | | | | | | | | | | | | |
12/31/2019† | | $ | 4.01 | | | $ | (0.01 | ) | | $ | 0.29 | | | $ | 0.28 | | | $ | (0.18 | ) | | $ | 4.11 | | | | | |
6/30/2019 | | | 4.11 | | | | (0.02 | ) | | | 0.40 | | | | 0.38 | | | | (0.48 | ) | | | 4.01 | | | | | |
6/30/2018 | | | 3.94 | | | | (0.02 | ) | | | 0.57 | | | | 0.55 | | | | (0.38 | ) | | | 4.11 | | | | | |
6/30/2017 | | | 3.56 | | | | (0.01 | ) | | | 0.66 | | | | 0.65 | | | | (0.27 | ) | | | 3.94 | | | | | |
6/30/2016 | | | 3.80 | | | | (0.01 | ) | | | (0.02 | ) | | | (0.03 | ) | | | (0.21 | ) | | | 3.56 | | | | | |
6/30/2015 | | | 4.06 | | | | (0.01 | ) | | | 0.29 | | | | 0.28 | | | | (0.54 | ) | | | 3.80 | | | | | |
| ^ | A “—” may reflect actual amounts rounding to less than $0.01 or 0.01%. |
| (a) | Calculated on average shares outstanding during the period. |
| (b) | Total return is calculated assuming a purchase of a share on the first day of the year and a sale of a share on the last day of each year reported. Dividends and distributions, if any, are assumed, for purposes of this calculation, to be reinvested. Total return does not reflect sales charges and includes the effect of fee waivers and reimbursements. Total return may reflect adjustments to conform to U.S. GAAP. Total return for a period of less than one year is not annualized. |
| (c) | Annualized, unless otherwise noted. |
| | | | | | |
| 122 | | Semiannual Report | | | December 31, 2019 | | | See accompanying Notes to Financial Statements |
| | | | | | | | | | | | | | | | | | | | | | |
| | | | Total Return (b) | | | Net Assets,
End of Period
(000s) | | | Ratio of
Expenses
to Average
Net Assets | | | Ratio of Net
Investment
Income (Loss)
to Average
Net Assets | | | Portfolio
Turnover Rate | |
| | | | | | | | | | | | | | | | | |
| | | | | | | | | | | | | | | | | | | | | | |
| | | | | | 7.02 | % | | $ | 248,519 | | | | 1.14 | %(c) | | | (0.66 | )%(c) | | | 25 | % |
| | | | | | 13.58 | | | | 240,017 | | | | 1.14 | | | | (0.66 | ) | | | 60 | |
| | | | | | 14.14 | | | | 116,673 | | | | 1.13 | | | | (0.48 | ) | | | 79 | |
| | | | | | 18.89 | | | | 112,947 | | | | 1.13 | | | | (0.40 | ) | | | 77 | |
| | | | | | (1.05 | ) | | | 86,224 | | | | 1.13 | | | | (0.26 | ) | | | 73 | |
| | | | | | 7.91 | | | | 98,253 | | | | 1.13 | | | | (0.38 | ) | | | 79 | |
| | | | | | | | | | | | | | | | | | | | | | |
| | | | | | 6.83 | % | | $ | 15,516 | | | | 1.89 | %(c) | | | (1.42 | )%(c) | | | 25 | % |
| | | | | | 12.56 | | | | 21,251 | | | | 1.89 | | | | (1.34 | ) | | | 60 | |
| | | | | | 13.40 | | | | 142,931 | | | | 1.88 | | | | (1.23 | ) | | | 79 | |
| | | | | | 17.95 | | | | 142,565 | | | | 1.88 | | | | (1.15 | ) | | | 77 | |
| | | | | | (1.51 | ) | | | 162,104 | | | | 1.88 | | | | (1.01 | ) | | | 73 | |
| | | | | | 6.98 | | | | 183,765 | | | | 1.88 | | | | (1.13 | ) | | | 79 | |
| | | | | | | | | | | | | | | | | | | | | | |
| | | | | | 7.19 | % | | $ | 1,296 | | | | 1.39 | %(c) | | | (0.91 | )%(c) | | | 25 | % |
| | | | | | 12.97 | | | | 1,384 | | | | 1.39 | | | | (0.89 | ) | | | 60 | |
| | | | | | 14.03 | | | | 1,463 | | | | 1.38 | | | | (0.72 | ) | | | 79 | |
| | | | | | 18.45 | | | | 2,345 | | | | 1.38 | | | | (0.65 | ) | | | 77 | |
| | | | | | (1.05 | ) | | | 2,195 | | | | 1.38 | | | | (0.51 | ) | | | 73 | |
| | | | | | 7.38 | | | | 2,867 | | | | 1.38 | | | | (0.63 | ) | | | 79 | |
| | | | | | | | | | | | | | | | | | | | | | |
| | | | | | 7.19 | % | | $ | 12,527 | | | | 0.89 | %(c) | | | (0.41 | )%(c) | | | 25 | % |
| | | | | | 13.79 | | | | 11,617 | | | | 0.89 | | | | (0.39 | ) | | | 60 | |
| | | | | | 14.56 | | | | 11,189 | | | | 0.88 | | | | (0.23 | ) | | | 79 | |
| | | | | | 19.18 | | | | 8,604 | | | | 0.88 | | | | (0.15 | ) | | | 77 | |
| | | | | | (0.69 | ) | | | 2,009 | | | | 0.88 | | | | (0.01 | ) | | | 73 | |
| | | | | | 8.31 | | | | 2,010 | | | | 0.88 | | | | (0.12 | ) | | | 79 | |
| | | | | | | | | | | | | | | | | | | | | | |
| | | | | | 7.37 | % | | $ | 56,561 | | | | 0.80 | %(c) | | | (0.30 | )%(c) | | | 25 | % |
| | | | | | 13.97 | | | | 36,373 | | | | 0.79 | | | | (0.29 | ) | | | 60 | |
| | | | | | 14.47 | | | | 31,876 | | | | 0.78 | | | | (0.13 | ) | | | 79 | |
| | | | | | 19.39 | | | | 26,788 | | | | 0.78 | | | | (0.05 | ) | | | 77 | |
| | | | | | (0.69 | ) | | | 29,092 | | | | 0.78 | | | | 0.11 | | | | 73 | |
| | | | | | 8.29 | | | | 24,130 | | | | 0.78 | | | | (0.04 | ) | | | 79 | |
| | | | | | | | | | | | | | | | | | | | | | |
| | | | | | 7.06 | % | | $ | 1,678 | | | | 1.04 | %(c) | | | (0.56 | )%(c) | | | 25 | % |
| | | | | | 13.61 | | | | 1,525 | | | | 1.04 | | | | (0.54 | ) | | | 60 | |
| | | | | | 14.19 | | | | 1,441 | | | | 1.03 | | | | (0.40 | ) | | | 79 | |
| | | | | | 19.19 | | | | 575 | | | | 1.03 | | | | (0.30 | ) | | | 77 | |
| | | | | | (0.73 | ) | | | 488 | | | | 1.03 | | | | (0.16 | ) | | | 73 | |
| | | | | | 7.88 | | | | 532 | | | | 1.03 | | | | (0.28 | ) | | | 79 | |
| | | | | | | | |
| See accompanying Notes to Financial Statements | | | December 31, 2019 | | | Semiannual Report | | | 123 | |
Financial Highlights (cont’d)
For a Share Outstanding for the Period ended:^
| | | | | | | | | | | | | | | | | | | | | | | | | | | | |
| | | Net Asset
Value,
Beginning
of Period | | | Net
Investment
Income (a) | | | Net Realized
and Change
in Unrealized
Gain (Loss) | | | Total from
Investment
Operations | | | Dividends
from Net
Investment
Income | | | Distributions
from Net
Realized Capital
Gains | | | | |
| AllianzGI NFJ Dividend Value: | | | | | | | | | | | | | | | | | | | | | |
| Class A | | | | | | | | | | | | | | | | | | | | | | | | | | | | |
12/31/2019† | | $ | 12.11 | | | $ | 0.10 | | | $ | 0.98 | | | $ | 1.08 | | | $ | (0.08 | ) | | $ | (1.42 | ) | | | | |
6/30/2019 | | | 14.76 | | | | 0.26 | | | | (0.05 | ) | | | 0.21 | | | | (0.26 | ) | | | (2.60 | ) | | | | |
6/30/2018 | | | 17.20 | | | | 0.27 | | | | 1.45 | | | | 1.72 | | | | (0.28 | ) | | | (3.88 | ) | | | | |
6/30/2017 | | | 15.74 | | | | 0.34 | | | | 2.08 | | | | 2.42 | | | | (0.37 | ) | | | (0.59 | ) | | | | |
6/30/2016 | | | 16.68 | | | | 0.37 | | | | (0.92 | ) | | | (0.55 | ) | | | (0.39 | ) | | | — | | | | | |
6/30/2015 | | | 17.12 | | | | 0.33 | | | | (0.44 | ) | | | (0.11 | ) | | | (0.33 | ) | | | — | | | | | |
| Class C | | | | | | | | | | | | | | | | | | | | | | | | | | | | |
12/31/2019† | | $ | 12.32 | | | $ | 0.05 | | | $ | 1.01 | | | $ | 1.06 | | | $ | (0.03 | ) | | $ | (1.42 | ) | | | | |
6/30/2019 | | | 14.92 | | | | 0.17 | | | | (0.05 | ) | | | 0.12 | | | | (0.12 | ) | | | (2.60 | ) | | | | |
6/30/2018 | | | 17.34 | | | | 0.15 | | | | 1.46 | | | | 1.61 | | | | (0.15 | ) | | | (3.88 | ) | | | | |
6/30/2017 | | | 15.86 | | | | 0.21 | | | | 2.10 | | | | 2.31 | | | | (0.24 | ) | | | (0.59 | ) | | | | |
6/30/2016 | | | 16.83 | | | | 0.25 | | | | (0.93 | ) | | | (0.68 | ) | | | (0.29 | ) | | | — | | | | | |
6/30/2015 | | | 17.27 | | | | 0.20 | | | | (0.43 | ) | | | (0.23 | ) | | | (0.21 | ) | | | — | | | | | |
| Class R | | | | | | | | | | | | | | | | | | | | | | | | | | | | |
12/31/2019† | | $ | 12.10 | | | $ | 0.08 | | | $ | 1.00 | | | $ | 1.08 | | | $ | (0.07 | ) | | $ | (1.42 | ) | | | | |
6/30/2019 | | | 14.71 | | | | 0.23 | | | | (0.05 | ) | | | 0.18 | | | | (0.19 | ) | | | (2.60 | ) | | | | |
6/30/2018 | | | 17.15 | | | | 0.23 | | | | 1.45 | | | | 1.68 | | | | (0.24 | ) | | | (3.88 | ) | | | | |
6/30/2017 | | | 15.70 | | | | 0.29 | | | | 2.08 | | | | 2.37 | | | | (0.33 | ) | | | (0.59 | ) | | | | |
6/30/2016 | | | 16.65 | | | | 0.33 | | | | (0.92 | ) | | | (0.59 | ) | | | (0.36 | ) | | | — | | | | | |
6/30/2015 | | | 17.09 | | | | 0.28 | | | | (0.43 | ) | | | (0.15 | ) | | | (0.29 | ) | | | — | | | | | |
| Class P | | | | | | | | | | | | | | | | | | | | | | | | | | | | |
12/31/2019† | | $ | 12.21 | | | $ | 0.11 | | | $ | 1.01 | | | $ | 1.12 | | | $ | (0.10 | ) | | $ | (1.42 | ) | | | | |
6/30/2019 | | | 14.87 | | | | 0.30 | | | | (0.05 | ) | | | 0.25 | | | | (0.31 | ) | | | (2.60 | ) | | | | |
6/30/2018 | | | 17.30 | | | | 0.32 | | | | 1.45 | | | | 1.77 | | | | (0.32 | ) | | | (3.88 | ) | | | | |
6/30/2017 | | | 15.83 | | | | 0.38 | | | | 2.09 | | | | 2.47 | | | | (0.41 | ) | | | (0.59 | ) | | | | |
6/30/2016 | | | 16.77 | | | | 0.41 | | | | (0.93 | ) | | | (0.52 | ) | | | (0.42 | ) | | | — | | | | | |
6/30/2015 | | | 17.21 | | | | 0.37 | | | | (0.43 | ) | | | (0.06 | ) | | | (0.38 | ) | | | — | | | | | |
| Institutional Class | | | | | | | | | | | | | | | | | | | | | | | | | | | | |
12/31/2019† | | $ | 12.20 | | | $ | 0.12 | | | $ | 0.99 | | | $ | 1.11 | | | $ | (0.10 | ) | | $ | (1.42 | ) | | | | |
6/30/2019 | | | 14.87 | | | | 0.31 | | | | (0.05 | ) | | | 0.26 | | | | (0.33 | ) | | | (2.60 | ) | | | | |
6/30/2018 | | | 17.30 | | | | 0.34 | | | | 1.45 | | | | 1.79 | | | | (0.34 | ) | | | (3.88 | ) | | | | |
6/30/2017 | | | 15.82 | | | | 0.41 | | | | 2.08 | | | | 2.49 | | | | (0.42 | ) | | | (0.59 | ) | | | | |
6/30/2016 | | | 16.76 | | | | 0.42 | | | | (0.93 | ) | | | (0.51 | ) | | | (0.43 | ) | | | — | | | | | |
6/30/2015 | | | 17.20 | | | | 0.39 | | | | (0.43 | ) | | | (0.04 | ) | | | (0.40 | ) | | | — | | | | | |
| Class R6 | | | | | | | | | | | | | | | | | | | | | | | | | | | | |
12/31/2019† | | $ | 12.15 | | | $ | 0.12 | | | $ | ��1.00 | | | $ | 1.12 | | | $ | (0.11 | ) | | $ | (1.42 | ) | | | | |
6/30/2019 | | | 14.83 | | | | 0.31 | | | | (0.04 | ) | | | 0.27 | | | | (0.35 | ) | | | (2.60 | ) | | | | |
6/30/2018 | | | 17.27 | | | | 0.34 | | | | 1.45 | | | | 1.79 | | | | (0.35 | ) | | | (3.88 | ) | | | | |
6/30/2017 | | | 15.80 | | | | 0.41 | | | | 2.09 | | | | 2.50 | | | | (0.44 | ) | | | (0.59 | ) | | | | |
6/30/2016 | | | 16.74 | | | | 0.42 | | | | (0.92 | ) | | | (0.50 | ) | | | (0.44 | ) | | | — | | | | | |
6/30/2015 | | | 17.19 | | | | 0.39 | | | | (0.42 | ) | | | (0.03 | ) | | | (0.42 | ) | | | — | | | | | |
| Administrative Class | | | | | | | | | | | | | | | | | | | | | | | | | | | | |
12/31/2019† | | $ | 12.41 | | | $ | 0.11 | | | $ | 1.01 | | | $ | 1.12 | | | $ | (0.08 | ) | | $ | (1.42 | ) | | | | |
6/30/2019 | | | 15.04 | | | | 0.28 | | | | (0.05 | ) | | | 0.23 | | | | (0.26 | ) | | | (2.60 | ) | | | | |
6/30/2018 | | | 17.41 | | | | 0.32 | | | | 1.43 | | | | 1.75 | | | | (0.24 | ) | | | (3.88 | ) | | | | |
6/30/2017 | | | 15.92 | | | | 0.36 | | | | 2.11 | | | | 2.47 | | | | (0.39 | ) | | | (0.59 | ) | | | | |
6/30/2016 | | | 16.87 | | | | 0.39 | | | | (0.94 | ) | | | (0.55 | ) | | | (0.40 | ) | | | — | | | | | |
6/30/2015 | | | 17.31 | | | | 0.35 | | | | (0.44 | ) | | | (0.09 | ) | | | (0.35 | ) | | | — | | | | | |
| ^ | A “—” may reflect actual amounts rounding to less than $0.01 or 0.01%. |
| (a) | Calculated on average shares outstanding during the period. |
| (b) | Total return is calculated assuming a purchase of a share on the first day of the year and a sale of a share on the last day of each year reported. Dividends and distributions, if any, are assumed, for purposes of this calculation, to be reinvested. Total return does not reflect sales charges and includes the effect of fee waivers and reimbursements. Total return may reflect adjustments to conform to U.S. GAAP. Total return for a period of less than one year is not annualized. |
| (c) | Annualized, unless otherwise noted. |
| | | | | | |
| 124 | | Semiannual Report | | | December 31, 2019 | | | See accompanying Notes to Financial Statements |
| | | | | | | | | | | | | | | | | | | | | | | | | | | | | | | | | | |
| | | | Total
Dividends and
Distributions | | | Net Asset
Value, End
of Period | | | Total Return (b) | | | Net Assets,
End of Period
(000s) | | | Ratio of
Expenses to
Average Net
Assets with
Fee Waiver/
Reimbursement | | | Ratio of
Expenses to
Average Net
Assets without
Fee Waiver/
Reimbursement | | | Ratio of Net
Investment
Income
to Average
Net Assets | | | Portfolio
Turnover Rate | |
| | | | | | | | | | | | | | | | | | | | | | | | | | |
| | | | | | | | | | | | | | | | | | | | | | | | | | | | | | | | | | |
| | | | | $ | (1.50 | ) | | $ | 11.69 | | | | 9.05 | % | | $ | 442,348 | | | | 1.04 | %(c) | | | 1.12 | %(c) | | | 1.57 | %(c) | | | 47 | % |
| | | | | | (2.86 | ) | | | 12.11 | | | | 4.39 | | | | 453,255 | | | | 1.01 | | | | 1.11 | | | | 1.97 | | | | 52 | |
| | | | | | (4.16 | ) | | | 14.76 | | | | 9.55 | | | | 480,068 | | | | 0.95 | | | | 1.10 | | | | 1.66 | | | | 47 | |
| | | | | | (0.96 | ) | | | 17.20 | | | | 15.55 | | | | 599,510 | | | | 0.99 | | | | 1.09 | | | | 2.02 | | | | 41 | |
| | | | | | (0.39 | ) | | | 15.74 | | | | (3.25 | ) | | | 814,993 | | | | 1.07 | | | | 1.07 | | | | 2.34 | | | | 42 | |
| | | | | | (0.33 | ) | | | 16.68 | | | | (0.65 | ) | | | 1,363,171 | | | | 1.05 | | | | 1.05 | | | | 1.92 | | | | 44 | |
| | | | | | | | | | | | | | | | | | | | | | | | | | | | | | | | | | |
| | | | | $ | (1.45 | ) | | $ | 11.93 | | | | 8.68 | % | | $ | 57,754 | | | | 1.79 | %(c) | | | 1.87 | %(c) | | | 0.82 | %(c) | | | 47 | % |
| | | | | | (2.72 | ) | | | 12.32 | | | | 3.56 | | | | 75,395 | | | | 1.76 | | | | 1.86 | | | | 1.23 | | | | 52 | |
| | | | | | (4.03 | ) | | | 14.92 | | | | 8.77 | | | | 231,933 | | | | 1.70 | | | | 1.85 | | | | 0.91 | | | | 47 | |
| | | | | | (0.83 | ) | | | 17.34 | | | | 14.67 | | | | 274,212 | | | | 1.74 | | | | 1.84 | | | | 1.28 | | | | 41 | |
| | | | | | (0.29 | ) | | | 15.86 | | | | (3.97 | ) | | | 347,825 | | | | 1.82 | | | | 1.82 | | | | 1.59 | | | | 42 | |
| | | | | | (0.21 | ) | | | 16.83 | | | | (1.38 | ) | | | 440,554 | | | | 1.80 | | | | 1.80 | | | | 1.18 | | | | 44 | |
| | | | | | | | | | | | | | | | | | | | | | | | | | | | | | | | | | |
| | | | | $ | (1.49 | ) | | $ | 11.69 | | | | 9.00 | % | | $ | 71,492 | | | | 1.29 | %(c) | | | 1.37 | %(c) | | | 1.32 | %(c) | | | 47 | % |
| | | | | | (2.79 | ) | | | 12.10 | | | | 4.07 | | | | 73,610 | | | | 1.26 | | | | 1.36 | | | | 1.72 | | | | 52 | |
| | | | | | (4.12 | ) | | | 14.71 | | | | 9.30 | | | | 94,437 | | | | 1.20 | | | | 1.35 | | | | 1.41 | | | | 47 | |
| | | | | | (0.92 | ) | | | 17.15 | | | | 15.24 | | | | 130,630 | | | | 1.24 | | | | 1.34 | | | | 1.77 | | | | 41 | |
| | | | | | (0.36 | ) | | | 15.70 | | | | (3.50 | ) | | | 157,199 | | | | 1.32 | | | | 1.32 | | | | 2.09 | | | | 42 | |
| | | | | | (0.29 | ) | | | 16.65 | | | | (0.89 | ) | | | 226,101 | | | | 1.30 | | | | 1.30 | | | | 1.68 | | | | 44 | |
| | | | | | | | | | | | | | | | | | | | | | | | | | | | | | | | | | |
| | | | | $ | (1.52 | ) | | $ | 11.81 | | | | 9.27 | % | | $ | 336,898 | | | | 0.79 | %(c) | | | 0.87 | %(c) | | | 1.82 | %(c) | | | 47 | % |
| | | | | | (2.91 | ) | | | 12.21 | | | | 4.62 | | | | 378,642 | | | | 0.76 | | | | 0.86 | | | | 2.22 | | | | 52 | |
| | | | | | (4.20 | ) | | | 14.87 | | | | 9.83 | | | | 551,096 | | | | 0.70 | | | | 0.85 | | | | 1.91 | | | | 47 | |
| | | | | | (1.00 | ) | | | 17.30 | | | | 15.79 | | | | 639,847 | | | | 0.74 | | | | 0.84 | | | | 2.27 | | | | 41 | |
| | | | | | (0.42 | ) | | | 15.83 | | | | (3.03 | ) | | | 1,057,863 | | | | 0.82 | | | | 0.82 | | | | 2.60 | | | | 42 | |
| | | | | | (0.38 | ) | | | 16.77 | | | | (0.38 | ) | | | 1,543,701 | | | | 0.80 | | | | 0.80 | | | | 2.18 | | | | 44 | |
| | | | | | | | | | | | | | | | | | | | | | | | | | | | | | | | | | |
| | | | | $ | (1.52 | ) | | $ | 11.79 | | | | 9.25 | % | | $ | 220,646 | | | | 0.69 | %(c) | | | 0.77 | %(c) | | | 1.92 | %(c) | | | 47 | % |
| | | | | | (2.93 | ) | | | 12.20 | | | | 4.75 | | | | 263,357 | | | | 0.66 | | | | 0.76 | | | | 2.32 | | | | 52 | |
| | | | | | (4.22 | ) | | | 14.87 | | | | 9.94 | | | | 438,422 | | | | 0.60 | | | | 0.75 | | | | 2.03 | | | | 47 | |
| | | | | | (1.01 | ) | | | 17.30 | | | | 15.96 | | | | 731,788 | | | | 0.64 | | | | 0.74 | | | | 2.44 | | | | 41 | |
| | | | | | (0.43 | ) | | | 15.82 | | | | (2.95 | ) | | | 2,233,140 | | | | 0.72 | | | | 0.72 | | | | 2.69 | | | | 42 | |
| | | | | | (0.40 | ) | | | 16.76 | | | | (0.29 | ) | | | 3,402,951 | | | | 0.70 | | | | 0.70 | | | | 2.27 | | | | 44 | |
| | | | | | | | | | | | | | | | | | | | | | | | | | | | | | | | | | |
| | | | | $ | (1.53 | ) | | $ | 11.74 | | | | 9.33 | % | | $ | 73,324 | | | | 0.64 | %(c) | | | 0.72 | %(c) | | | 1.97 | %(c) | | | 47 | % |
| | | | | | (2.95 | ) | | | 12.15 | | | | 4.82 | | | | 65,935 | | | | 0.61 | | | | 0.71 | | | | 2.38 | | | | 52 | |
| | | | | | (4.23 | ) | | | 14.83 | | | | 9.96 | | | | 85,285 | | | | 0.55 | | | | 0.70 | | | | 2.06 | | | | 47 | |
| | | | | | (1.03 | ) | | | 17.27 | | | | 16.01 | | | | 95,755 | | | | 0.59 | | | | 0.69 | | | | 2.44 | | | | 41 | |
| | | | | | (0.44 | ) | | | 15.80 | | | | (2.90 | ) | | | 128,994 | | | | 0.67 | | | | 0.67 | | | | 2.72 | | | | 42 | |
| | | | | | (0.42 | ) | | | 16.74 | | | | (0.22 | ) | | | 119,483 | | | | 0.65 | | | | 0.65 | | | | 2.30 | | | | 44 | |
| | | | | | | | | | | | | | | | | | | | | | | | | | | | | | | | | | |
| | | | | $ | (1.50 | ) | | $ | 12.03 | | | | 9.19 | % | | $ | 33,479 | | | | 0.94 | %(c) | | | 1.02 | %(c) | | | 1.69 | %(c) | | | 47 | % |
| | | | | | (2.86 | ) | | | 12.41 | | | | 4.42 | | | | 47,049 | | | | 0.91 | | | | 1.01 | | | | 2.07 | | | | 52 | |
| | | | | | (4.12 | ) | | | 15.04 | | | | 9.67 | | | | 84,009 | | | | 0.85 | | | | 1.00 | | | | 1.87 | | | | 47 | |
| | | | | | (0.98 | ) | | | 17.41 | | | | 15.68 | | | | 345,533 | | | | 0.89 | | | | 0.99 | | | | 2.11 | | | | 41 | |
| | | | | | (0.40 | ) | | | 15.92 | | | | (3.19 | ) | | | 387,993 | | | | 0.97 | | | | 0.97 | | | | 2.44 | | | | 42 | |
| | | | | | (0.35 | ) | | | 16.87 | | | | (0.55 | ) | | | 628,008 | | | | 0.95 | | | | 0.95 | | | | 2.03 | | | | 44 | |
| | | | | | | | |
| See accompanying Notes to Financial Statements | | | December 31, 2019 | | | Semiannual Report | | | 125 | |
Financial Highlights (cont’d)
For a Share Outstanding for the Period ended:^
| | | | | | | | | | | | | | | | | | | | | | | | | | | | |
| | | Net Asset Value,
Beginning
of Period | | | Net
Investment
Income (a) | | | Net Realized and Change in Unrealized
Gain (Loss) | | | Total from
Investment
Operations | | | Dividends
from Net
Investment
Income | | | Distributions from Return
of Capital | | | | |
| AllianzGI NFJ International Value: | | | | | | | | | | | | | | | | | | | | | |
| Class A | | | | | | | | | | | | | | | | | | | | | | | | | | | | |
12/31/2019† | | $ | 18.47 | | | $ | 0.19 | | | $ | 0.94 | | | $ | 1.13 | | | $ | (0.26 | ) | | $ | — | | | | | |
6/30/2019 | | | 18.52 | | | | 0.33 | | | | (0.08 | ) | | | 0.25 | | | | (0.30 | ) | | | — | | | | | |
6/30/2018 | | | 18.13 | | | | 0.34 | | | | 0.38 | | | | 0.72 | | | | (0.32 | ) | | | (0.01 | ) | | | | |
6/30/2017 | | | 16.32 | | | | 0.34 | | | | 1.92 | | | | 2.26 | | | | (0.45 | ) | | | — | | | | | |
6/30/2016 | | | 21.61 | | | | 0.37 | | | | (5.15 | ) | | | (4.78 | ) | | | (0.51 | ) | | | — | | | | | |
6/30/2015 | | | 24.17 | | | | 0.41 | | | | (2.40 | ) | | | (1.99 | ) | | | (0.57 | ) | | | — | | | | | |
| Class C | | | | | | | | | | | | | | | | | | | | | | | | | | | | |
12/31/2019† | | $ | 18.15 | | | $ | 0.12 | | | $ | 0.92 | | | $ | 1.04 | | | $ | (0.18 | ) | | $ | — | | | | | |
6/30/2019 | | | 18.20 | | | | 0.17 | | | | (0.04 | ) | | | 0.13 | | | | (0.18 | ) | | | — | | | | | |
6/30/2018 | | | 17.86 | | | | 0.19 | | | | 0.37 | | | | 0.56 | | | | (0.21 | ) | | | (0.01 | ) | | | | |
6/30/2017 | | | 16.09 | | | | 0.23 | | | | 1.86 | | | | 2.09 | | | | (0.32 | ) | | | — | | | | | |
6/30/2016 | | | 21.37 | | | | 0.24 | | | | (5.08 | ) | | | (4.84 | ) | | | (0.44 | ) | | | — | | | | | |
6/30/2015 | | | 23.91 | | | | 0.24 | | | | (2.37 | ) | | | (2.13 | ) | | | (0.41 | ) | | | — | | | | | |
| Class R | | | | | | | | | | | | | | | | | | | | | | | | | | | | |
12/31/2019† | | $ | 18.52 | | | $ | 0.17 | | | $ | 0.93 | | | $ | 1.10 | | | $ | (0.23 | ) | | $ | — | | | | | |
6/30/2019 | | | 18.56 | | | | 0.29 | | | | (0.07 | ) | | | 0.22 | | | | (0.26 | ) | | | — | | | | | |
6/30/2018 | | | 18.15 | | | | 0.31 | | | | 0.35 | | | | 0.66 | | | | (0.24 | ) | | | (0.01 | ) | | | | |
6/30/2017 | | | 16.35 | | | | 0.33 | | | | 1.88 | | | | 2.21 | | | | (0.41 | ) | | | — | | | | | |
6/30/2016 | | | 21.66 | | | | 0.35 | | | | (5.17 | ) | | | (4.82 | ) | | | (0.49 | ) | | | — | | | | | |
6/30/2015 | | | 24.23 | | | | 0.37 | | | | (2.41 | ) | | | (2.04 | ) | | | (0.53 | ) | | | — | | | | | |
| Class P | | | | | | | | | | | | | | | | | | | | | | | | | | | | |
12/31/2019† | | $ | 18.58 | | | $ | 0.21 | | | $ | 0.95 | | | $ | 1.16 | | | $ | (0.28 | ) | | $ | — | | | | | |
6/30/2019 | | | 18.61 | | | | 0.35 | | | | (0.04 | ) | | | 0.31 | | | | (0.34 | ) | | | — | | | | | |
6/30/2018 | | | 18.21 | | | | 0.36 | | | | 0.41 | | | | 0.77 | | | | (0.36 | ) | | | (0.01 | ) | | | | |
6/30/2017 | | | 16.40 | | | | 0.40 | | | | 1.90 | | | | 2.30 | | | | (0.49 | ) | | | — | | | | | |
6/30/2016 | | | 21.70 | | | | 0.43 | | | | (5.18 | ) | | | (4.75 | ) | | | (0.55 | ) | | | — | | | | | |
6/30/2015 | | | 24.28 | | | | 0.48 | | | | (2.41 | ) | | | (1.93 | ) | | | (0.65 | ) | | | — | | | | | |
| Institutional Class | | | | | | | | | | | | | | | | | | | | | | | | | | | | |
12/31/2019† | | $ | 18.60 | | | $ | 0.22 | | | $ | 0.95 | | | $ | 1.17 | | | $ | (0.29 | ) | | $ | — | | | | | |
6/30/2019 | | | 18.64 | | | | 0.41 | | | | (0.08 | ) | | | 0.33 | | | | (0.37 | ) | | | — | | | | | |
6/30/2018 | | | 18.24 | | | | 0.42 | | | | 0.36 | | | | 0.78 | | | | (0.37 | ) | | | (0.01 | ) | | | | |
6/30/2017 | | | 16.42 | | | | 0.37 | | | | 1.95 | | | | 2.32 | | | | (0.50 | ) | | | — | | | | | |
6/30/2016 | | | 21.71 | | | | 0.40 | | | | (5.13 | ) | | | (4.73 | ) | | | (0.56 | ) | | | — | | | | | |
6/30/2015 | | | 24.29 | | | | 0.50 | | | | (2.42 | ) | | | (1.92 | ) | | | (0.66 | ) | | | — | | | | | |
| Class R6 | | | | | | | | | | | | | | | | | | | | | | | | | | | | |
12/31/2019† | | $ | 18.59 | | | $ | 0.23 | | | $ | 0.94 | | | $ | 1.17 | | | $ | (0.29 | ) | | $ | — | | | | | |
6/30/2019 | | | 18.63 | | | | 0.37 | | | | (0.04 | ) | | | 0.33 | | | | (0.37 | ) | | | — | | | | | |
6/30/2018 | | | 18.19 | | | | 0.29 | | | | 0.50 | | | | 0.79 | | | | (0.34 | ) | | | (0.01 | ) | | | | |
6/30/2017 | | | 16.38 | | | | 0.40 | | | | 1.93 | | | | 2.33 | | | | (0.52 | ) | | | — | | | | | |
6/30/2016 | | | 21.68 | | | | 0.48 | | | | (5.20 | ) | | | (4.72 | ) | | | (0.58 | ) | | | — | | | | | |
6/30/2015 | | | 24.28 | | | | 0.55 | | | | (2.46 | ) | | | (1.91 | ) | | | (0.69 | ) | | | — | | | | | |
| Administrative Class | | | | | | | | | | | | | | | | | | | | | | | | | | | | |
12/31/2019† | | $ | 18.54 | | | $ | 0.20 | | | $ | 0.93 | | | $ | 1.13 | | | $ | (0.26 | ) | | $ | — | | | | | |
6/30/2019 | | | 18.56 | | | | 0.29 | | | | 0.01 | | | | 0.30 | | | | (0.32 | ) | | | — | | | | | |
6/30/2018 | | | 18.19 | | | | 0.38 | | | | 0.35 | | | | 0.73 | | | | (0.35 | ) | | | (0.01 | ) | | | | |
6/30/2017 | | | 16.37 | | | | 0.36 | | | | 1.92 | | | | 2.28 | | | | (0.46 | ) | | | — | | | | | |
6/30/2016 | | | 21.68 | | | | 0.42 | | | | (5.20 | ) | | | (4.78 | ) | | | (0.53 | ) | | | — | | | | | |
6/30/2015 | | | 24.25 | | | | 0.45 | | | | (2.41 | ) | | | (1.96 | ) | | | (0.61 | ) | | | — | | | | | |
| ^ | A “—” may reflect actual amounts rounding to less than $0.01 or 0.01%. |
| (a) | Calculated on average shares outstanding during the period. |
| (b) | Total return is calculated assuming a purchase of a share on the first day of the year and a sale of a share on the last day of each year reported. Dividends and distributions, if any, are assumed, for purposes of this calculation, to be reinvested. Total return does not reflect sales charges and includes the effect of fee waivers and reimbursements. Total return may reflect adjustments to conform to U.S. GAAP. Total return for a period of less than one year is not annualized. |
| (c) | Annualized, unless otherwise noted. |
| | | | | | |
| 126 | | Semiannual Report | | | December 31, 2019 | | | See accompanying Notes to Financial Statements |
| | | | | | | | | | | | | | | | | | | | | | | | | | | | | | | | | | |
| | | | Total
Dividends and
Distributions | | | Net Asset
Value, End
of Period | | | Total Return (b) | | | Net Assets,
End of Period
(000s) | | | Ratio of
Expenses to Average Net Assets with
Fee Waiver/
Reimbursement | | | Ratio of
Expenses to Average Net
Assets without Fee Waiver/
Reimbursement | | | Ratio of Net
Investment
Income
to Average
Net Assets | | | Portfolio
Turnover Rate | |
| | | | | | | | | | | | | | | | | | | | | | | | | | |
| | | | | | | | | | | | | | | | | | | | | | | | | | | | | | | | | | |
| | | | | $ | (0.26 | ) | | $ | 19.34 | | | | 6.16 | % | | $ | 70,670 | | | | 1.30 | %(c) | | | 1.38 | %(c) | | | 2.07 | %(c) | | | 25 | % |
| | | | | | (0.30 | ) | | | 18.47 | | | | 1.44 | | | | 71,931 | | | | 1.30 | | | | 1.38 | | | | 1.84 | | | | 49 | |
| | | | | | (0.33 | ) | | | 18.52 | | | | 3.95 | | | | 88,385 | | | | 1.29 | | | | 1.37 | | | | 1.76 | | | | 63 | |
| | | | | | (0.45 | ) | | | 18.13 | | | | 13.99 | | | | 127,642 | | | | 1.30 | | | | 1.35 | | | | 2.01 | | | | 63 | |
| | | | | | (0.51 | ) | | | 16.32 | | | | (22.28 | ) | | | 258,429 | | | | 1.29 | | | | 1.32 | | | | 2.04 | | | | 50 | |
| | | | | | (0.57 | ) | | | 21.61 | | | | (8.30 | ) | | | 466,262 | | | | 1.27 | | | | 1.30 | | | | 1.83 | | | | 54 | |
| | | | | | | | | | | | | | | | | | | | | | | | | | | | | | | | | | |
| | | | | $ | (0.18 | ) | | $ | 19.01 | | | | 5.78 | % | | $ | 10,963 | | | | 2.05 | %(c) | | | 2.13 | %(c) | | | 1.28 | %(c) | | | 25 | % |
| | | | | | (0.18 | ) | | | 18.15 | | | | 0.76 | | | | 13,926 | | | | 2.05 | | | | 2.13 | | | | 0.98 | | | | 49 | |
| | | | | | (0.22 | ) | | | 18.20 | | | | 3.11 | | | | 36,184 | | | | 2.04 | | | | 2.12 | | | | 0.99 | | | | 63 | |
| | | | | | (0.32 | ) | | | 17.86 | | | | 13.10 | | | | 54,546 | | | | 2.05 | | | | 2.10 | | | | 1.37 | | | | 63 | |
| | | | | | (0.44 | ) | | | 16.09 | | | | (22.81 | ) | | | 83,722 | | | | 2.04 | | | | 2.07 | | | | 1.33 | | | | 50 | |
| | | | | | (0.41 | ) | | | 21.37 | | | | (8.99 | ) | | | 154,476 | | | | 2.02 | | | | 2.05 | | | | 1.09 | | | | 54 | |
| | | | | | | | | | | | | | | | | | | | | | | | | | | | | | | | | | |
| | | | | $ | (0.23 | ) | | $ | 19.39 | | | | 6.01 | % | | $ | 5,464 | | | | 1.55 | %(c) | | | 1.63 | %(c) | | | 1.81 | %(c) | | | 25 | % |
| | | | | | (0.26 | ) | | | 18.52 | | | | 1.23 | | | | 6,108 | | | | 1.55 | | | | 1.63 | | | | 1.58 | | | | 49 | |
| | | | | | (0.25 | ) | | | 18.56 | | | | 3.64 | | | | 9,190 | | | | 1.54 | | | | 1.62 | | | | 1.58 | | | | 63 | |
| | | | | | (0.41 | ) | | | 18.15 | | | | 13.68 | | | | 11,300 | | | | 1.55 | | | | 1.60 | | | | 1.91 | | | | 63 | |
| | | | | | (0.49 | ) | | | 16.35 | | | | (22.43 | ) | | | 13,915 | | | | 1.54 | | | | 1.57 | | | | 1.89 | | | | 50 | |
| | | | | | (0.53 | ) | | | 21.66 | | | | (8.52 | ) | | | 22,511 | | | | 1.52 | | | | 1.55 | | | | 1.63 | | | | 54 | |
| | | | | | | | | | | | | | | | | | | | | | | | | | | | | | | | | | |
| | | | | $ | (0.28 | ) | | $ | 19.46 | | | | 6.30 | % | | $ | 32,897 | | | | 1.05 | %(c) | | | 1.13 | %(c) | | | 2.31 | %(c) | | | 25 | % |
| | | | | | (0.34 | ) | | | 18.58 | | | | 1.76 | | | | 38,655 | | | | 1.05 | | | | 1.13 | | | | 1.93 | | | | 49 | |
| | | | | | (0.37 | ) | | | 18.61 | | | | 4.17 | | | | 89,644 | | | | 1.04 | | | | 1.12 | | | | 1.87 | | | | 63 | |
| | | | | | (0.49 | ) | | | 18.21 | | | | 14.20 | | | | 148,540 | | | | 1.05 | | | | 1.10 | | | | 2.34 | | | | 63 | |
| | | | | | (0.55 | ) | | | 16.40 | | | | (22.07 | ) | | | 350,745 | | | | 1.04 | | | | 1.07 | | | | 2.34 | | | | 50 | |
| | | | | | (0.65 | ) | | | 21.70 | | | | (8.04 | ) | | | 659,204 | | | | 1.02 | | | | 1.05 | | | | 2.15 | | | | 54 | |
| | | | | | | | | | | | | | | | | | | | | | | | | | | | | | | | | | |
| | | | | $ | (0.29 | ) | | $ | 19.48 | | | | 6.36 | % | | $ | 46,150 | | | | 0.95 | %(c) | | | 1.03 | %(c) | | | 2.42 | %(c) | | | 25 | % |
| | | | | | (0.37 | ) | | | 18.60 | | | | 1.84 | | | | 46,473 | | | | 0.95 | | | | 1.03 | | | | 2.24 | | | | 49 | |
| | | | | | (0.38 | ) | | | 18.64 | | | | 4.27 | | | | 55,924 | | | | 0.94 | | | | 1.02 | | | | 2.14 | | | | 63 | |
| | | | | | (0.50 | ) | | | 18.24 | | | | 14.33 | | | | 74,272 | | | | 0.95 | | | | 1.00 | | | | 2.18 | | | | 63 | |
| | | | | | (0.56 | ) | | | 16.42 | | | | (21.97 | ) | | | 309,622 | | | | 0.94 | | | | 0.97 | | | | 2.17 | | | | 50 | |
| | | | | | (0.66 | ) | | | 21.71 | | | | (7.98 | ) | | | 1,095,977 | | | | 0.92 | | | | 0.95 | | | | 2.21 | | | | 54 | |
| | | | | | | | | | | | | | | | | | | | | | | | | | | | | | | | | | |
| | | | | $ | (0.29 | ) | | $ | 19.47 | | | | 6.39 | % | | $ | 1,418 | | | | 0.90 | %(c) | | | 0.98 | %(c) | | | 2.45 | %(c) | | | 25 | % |
| | | | | | (0.37 | ) | | | 18.59 | | | | 1.88 | | | | 1,277 | | | | 0.90 | | | | 0.98 | | | | 2.07 | | | | 49 | |
| | | | | | (0.35 | ) | | | 18.63 | | | | 4.31 | | | | 1,836 | | | | 0.89 | | | | 0.97 | | | | 1.48 | | | | 63 | |
| | | | | | (0.52 | ) | | | 18.19 | | | | 14.42 | | | | 28,460 | | | | 0.90 | | | | 0.95 | | | | 2.33 | | | | 63 | |
| | | | | | (0.58 | ) | | | 16.38 | | | | (21.97 | ) | | | 55,751 | | | | 0.89 | | | | 0.92 | | | | 2.64 | | | | 50 | |
| | | | | | (0.69 | ) | | | 21.68 | | | | (7.94 | ) | | | 66,164 | | | | 0.87 | | | | 0.90 | | | | 2.51 | | | | 54 | |
| | | | | | | | | | | | | | | | | | | | | | | | | | | | | | | | | | |
| | | | | $ | (0.26 | ) | | $ | 19.41 | | | | 6.18 | % | | $ | 1,227 | | | | 1.20 | %(c) | | | 1.28 | %(c) | | | 2.16 | %(c) | | | 25 | % |
| | | | | | (0.32 | ) | | | 18.54 | | | | 1.68 | | | | 1,436 | | | | 1.20 | | | | 1.28 | | | | 1.60 | | | | 49 | |
| | | | | | (0.36 | ) | | | 18.56 | | | | 4.01 | | | | 4,829 | | | | 1.19 | | | | 1.27 | | | | 1.96 | | | | 63 | |
| | | | | | (0.46 | ) | | | 18.19 | | | | 14.09 | | | | 4,973 | | | | 1.20 | | | | 1.25 | | | | 2.08 | | | | 63 | |
| | | | | | (0.53 | ) | | | 16.37 | | | | (22.22 | ) | | | 14,487 | | | | 1.19 | | | | 1.22 | | | | 2.31 | | | | 50 | |
| | | | | | (0.61 | ) | | | 21.68 | | | | (8.18 | ) | | | 19,020 | | | | 1.17 | | | | 1.20 | | | | 2.00 | | | | 54 | |
| | | | | | | | |
| See accompanying Notes to Financial Statements | | | December 31, 2019 | | | Semiannual Report | | | 127 | |
Financial Highlights (cont’d)
For a Share Outstanding for the Period ended:^
| | | | | | | | | | | | | | | | | | | | | | | | | | | | |
| | | Net Asset
Value,
Beginning
of Period | | | Net
Investment
Income (a) | | | Net Realized
and Change
in Unrealized
Gain (Loss) | | | Total from
Investment
Operations | | | Dividends
from Net
Investment
Income | | | Distributions
from Net
Realized Capital
Gains | | | | |
| AllianzGI NFJ Large-Cap Value: | | | | | | | | | | | | | | | | | | | | | |
| Class A | | | | | | | | | | | | | | | | | | | | | | | | | | | | |
12/31/2019† | | $ | 26.90 | | | $ | 0.19 | | | $ | 2.40 | | | $ | 2.59 | | | $ | (0.17 | ) | | $ | (0.51 | ) | | | | |
6/30/2019 | | | 26.14 | | | | 0.41 | | | | 0.79 | | | | 1.20 | | | | (0.39 | ) | | | (0.05 | ) | | | | |
6/30/2018 | | | 24.31 | | | | 0.41 | | | | 1.83 | | | | 2.24 | | | | (0.41 | ) | | | — | | | | | |
6/30/2017 | | | 20.34 | | | | 0.36 | | | | 3.97 | (d) | | | 4.33 | | | | (0.36 | ) | | | — | | | | | |
6/30/2016 | | | 21.44 | | | | 0.37 | | | | (1.09 | ) | | | (0.72 | ) | | | (0.38 | ) | | | — | | | | | |
6/30/2015 | | | 21.13 | | | | 0.35 | | | | 0.30 | | | | 0.65 | | | | (0.34 | ) | | | — | | | | | |
| Class C | | | | | | | | | | | | | | | | | | | | | | | | | | | | |
12/31/2019† | | $ | 27.23 | | | $ | 0.09 | | | $ | 2.43 | | | $ | 2.52 | | | $ | (0.06 | ) | | $ | (0.51 | ) | | | | |
6/30/2019 | | | 26.44 | | | | 0.19 | | | | 0.81 | | | | 1.00 | | | | (0.16 | ) | | | (0.05 | ) | | | | |
6/30/2018 | | | 24.57 | | | | 0.22 | | | | 1.86 | | | | 2.08 | | | | (0.21 | ) | | | — | | | | | |
6/30/2017 | | | 20.50 | | | | 0.19 | | | | 4.01 | (d) | | | 4.20 | | | | (0.13 | ) | | | — | | | | | |
6/30/2016 | | | 21.57 | | | | 0.22 | | | | (1.09 | ) | | | (0.87 | ) | | | (0.20 | ) | | | — | | | | | |
6/30/2015 | | | 21.22 | | | | 0.19 | | | | 0.30 | | | | 0.49 | | | | (0.14 | ) | | | — | | | | | |
| Class R | | | | | | | | | | | | | | | | | | | | | | | | | | | | |
12/31/2019† | | $ | 27.18 | | | $ | 0.16 | | | $ | 2.43 | | | $ | 2.59 | | | $ | (0.14 | ) | | $ | (0.51 | ) | | | | |
6/30/2019 | | | 26.41 | | | | 0.34 | | | | 0.80 | | | | 1.14 | | | | (0.32 | ) | | | (0.05 | ) | | | | |
6/30/2018 | | | 24.55 | | | | 0.35 | | | | 1.85 | | | | 2.20 | | | | (0.34 | ) | | | — | | | | | |
6/30/2017 | | | 20.51 | | | | 0.30 | | | | 4.02 | (d) | | | 4.32 | | | | (0.28 | ) | | | — | | | | | |
6/30/2016 | | | 21.60 | | | | 0.32 | | | | (1.09 | ) | | | (0.77 | ) | | | (0.32 | ) | | | — | | | | | |
6/30/2015 | | | 21.26 | | | | 0.30 | | | | 0.30 | | | | 0.60 | | | | (0.26 | ) | | | — | | | | | |
| Class P | | | | | | | | | | | | | | | | | | | | | | | | | | | | |
12/31/2019† | | $ | 27.16 | | | $ | 0.23 | | | $ | 2.42 | | | $ | 2.65 | | | $ | (0.21 | ) | | $ | (0.51 | ) | | | | |
6/30/2019 | | | 26.38 | | | | 0.48 | | | | 0.81 | | | | 1.29 | | | | (0.46 | ) | | | (0.05 | ) | | | | |
6/30/2018 | | | 24.53 | | | | 0.47 | | | | 1.86 | | | | 2.33 | | | | (0.48 | ) | | | — | | | | | |
6/30/2017 | | | 20.56 | | | | 0.42 | | | | 4.01 | (d) | | | 4.43 | | | | (0.46 | ) | | | — | | | | | |
6/30/2016 | | | 21.68 | | | | 0.42 | | | | (1.09 | ) | | | (0.67 | ) | | | (0.45 | ) | | | — | | | | | |
6/30/2015 | | | 21.42 | | | | 0.41 | | | | 0.31 | | | | 0.72 | | | | (0.46 | ) | | | — | | | | | |
| Institutional Class | | | | | | | | | | | | | | | | | | | | | | | | | | | | |
12/31/2019† | | $ | 26.77 | | | $ | 0.24 | | | $ | 2.39 | | | $ | 2.63 | | | $ | (0.22 | ) | | $ | (0.51 | ) | | | | |
6/30/2019 | | | 26.02 | | | | 0.50 | | | | 0.79 | | | | 1.29 | | | | (0.49 | ) | | | (0.05 | ) | | | | |
6/30/2018 | | | 24.20 | | | | 0.49 | | | | 1.84 | | | | 2.33 | | | | (0.51 | ) | | | — | | | | | |
6/30/2017 | | | 20.27 | | | | 0.43 | | | | 3.97 | (d) | | | 4.40 | | | | (0.47 | ) | | | — | | | | | |
6/30/2016 | | | 21.39 | | | | 0.44 | | | | (1.09 | ) | | | (0.65 | ) | | | (0.47 | ) | | | — | | | | | |
6/30/2015 | | | 21.13 | | | | 0.42 | | | | 0.31 | | | | 0.73 | | | | (0.47 | ) | | | — | | | | | |
| Administrative Class | | | | | | | | | | | | | | | | | | | | | | | | | | | | |
12/31/2019† | | $ | 27.29 | | | $ | 0.21 | | | $ | 2.43 | | | $ | 2.64 | | | $ | (0.19 | ) | | $ | (0.51 | ) | | | | |
6/30/2019 | | | 26.51 | | | | 0.45 | | | | 0.80 | | | | 1.25 | | | | (0.42 | ) | | | (0.05 | ) | | | | |
6/30/2018 | | | 24.64 | | | | 0.43 | | | | 1.88 | | | | 2.31 | | | | (0.44 | ) | | | — | | | | | |
6/30/2017 | | | 20.61 | | | | 0.38 | | | | 4.04 | (d) | | | 4.42 | | | | (0.39 | ) | | | — | | | | | |
6/30/2016 | | | 21.73 | | | | 0.39 | | | | (1.10 | ) | | | (0.71 | ) | | | (0.41 | ) | | | — | | | | | |
6/30/2015 | | | 21.26 | | | | 0.39 | | | | 0.29 | | | | 0.68 | | | | (0.21 | ) | | | — | | | | | |
| ^ | A “—” may reflect actual amounts rounding to less than $0.01 or 0.01%. |
| (a) | Calculated on average shares outstanding during the period. |
| (b) | Total return is calculated assuming a purchase of a share on the first day of the period and a sale of a share on the last day of each period reported. Dividends and distributions, if any, are assumed, for purposes of this calculation, to be reinvested. Total return does not reflect sales charges and includes the effect of fee waivers and reimbursements. Total return may reflect adjustments to conform to U.S. GAAP. Total return for a period of less than one year is not annualized. |
| (c) | Annualized, unless otherwise noted. |
| (d) | Payments from securities litigation increased net realized and change in unrealized gain (loss) and net asset value per share by approximately $0.65 for Class A; $0.68 for Class C; $0.71 for Class R; $0.75 for Class P; $0.57 for Institutional Class and $0.65 for Administrative Class. The increase in total return per class was approximately 3.24% for Class A; 3.33% for Class C; 3.50% for Class R; 3.72% for Class P; 2.87% for Institutional Class and 3.21% for Administrative Class. |
| | | | | | |
| 128 | | Semiannual Report | | | December 31, 2019 | | | See accompanying Notes to Financial Statements |
| | | | | | | | | | | | | | | | | | | | | | | | | | | | | | | | | | |
| | | | Total
Dividends and
Distributions | | | Net Asset
Value, End
of Period | | | Total Return (b) | | | Net Assets,
End of Period
(000s) | | | Ratio of
Expenses to
Average Net
Assets with
Fee Waiver/
Reimbursement | | | Ratio of
Expenses to
Average Net
Assets without
Fee Waiver/
Reimbursement | | | Ratio of Net
Investment
Income
to Average
Net Assets | | | Portfolio
Turnover Rate | |
| | | | | | | | | | | | | | | | | | | | | | | | | | |
| | | | | | | | | | | | | | | | | | | | | | | | | | | | | | | | | | |
| | | | | $ | (0.68 | ) | | $ | 28.81 | | | | 9.68 | % | | $ | 185,388 | | | | 1.12 | %(c) | | | 1.12 | %(c) | | | 1.38 | %(c) | | | 35 | % |
| | | | | | (0.44 | ) | | | 26.90 | | | | 4.67 | | | | 178,311 | | | | 1.12 | | | | 1.12 | | | | 1.57 | | | | 68 | |
| | | | | | (0.41 | ) | | | 26.14 | | | | 9.27 | | | | 145,338 | | | | 1.06 | | | | 1.11 | | | | 1.56 | | | | 110 | |
| | | | | | (0.36 | ) | | | 24.31 | (d) | | | 21.42 | (d) | | | 151,306 | | | | 1.02 | | | | 1.12 | | | | 1.60 | | | | 67 | |
| | | | | | (0.38 | ) | | | 20.34 | | | | (3.30 | ) | | | 150,436 | | | | 1.11 | | | | 1.11 | | | | 1.82 | | | | 51 | |
| | | | | | (0.34 | ) | | | 21.44 | | | | 3.06 | | | | 145,039 | | | | 1.11 | | | | 1.11 | | | | 1.63 | | | | 26 | |
| | | | | | | | | | | | | | | | | | | | | | | | | | | | | | | | | | |
| | | | | $ | (0.57 | ) | | $ | 29.18 | | | | 9.28 | % | | $ | 10,637 | | | | 1.87 | %(c) | | | 1.87 | %(c) | | | 0.63 | %(c) | | | 35 | % |
| | | | | | (0.21 | ) | | | 27.23 | | | | 3.82 | | | | 12,080 | | | | 1.87 | | | | 1.87 | | | | 0.70 | | | | 68 | |
| | | | | | (0.21 | ) | | | 26.44 | | | | 8.49 | | | | 62,232 | | | | 1.81 | | | | 1.86 | | | | 0.82 | | | | 110 | |
| | | | | | (0.13 | ) | | | 24.57 | (d) | | | 20.52 | (d) | | | 70,159 | | | | 1.77 | | | | 1.87 | | | | 0.86 | | | | 67 | |
| | | | | | (0.20 | ) | | | 20.50 | | | | (4.04 | ) | | | 79,758 | | | | 1.86 | | | | 1.86 | | | | 1.06 | | | | 51 | |
| | | | | | (0.14 | ) | | | 21.57 | | | | 2.28 | | | | 94,367 | | | | 1.86 | | | | 1.86 | | | | 0.88 | | | | 26 | |
| | | | | | | | | | | | | | | | | | | | | | | | | | | | | | | | | | |
| | | | | $ | (0.65 | ) | | $ | 29.12 | | | | 9.55 | % | | $ | 2,065 | | | | 1.37 | %(c) | | | 1.37 | %(c) | | | 1.13 | %(c) | | | 35 | % |
| | | | | | (0.37 | ) | | | 27.18 | | | | 4.37 | | | | 2,090 | | | | 1.37 | | | | 1.37 | | | | 1.24 | | | | 68 | |
| | | | | | (0.34 | ) | | | 26.41 | | | | 9.00 | | | | 5,200 | | | | 1.31 | | | | 1.36 | | | | 1.35 | | | | 110 | |
| | | | | | (0.28 | ) | | | 24.55 | (d) | | | 21.14 | (d) | | | 6,997 | | | | 1.27 | | | | 1.37 | | | | 1.35 | | | | 67 | |
| | | | | | (0.32 | ) | | | 20.51 | | | | (3.53 | ) | | | 7,200 | | | | 1.36 | | | | 1.36 | | | | 1.56 | | | | 51 | |
| | | | | | (0.26 | ) | | | 21.60 | | | | 2.80 | | | | 8,641 | | | | 1.36 | | | | 1.36 | | | | 1.39 | | | | 26 | |
| | | | | | | | | | | | | | | | | | | | | | | | | | | | | | | | | | |
| | | | | $ | (0.72 | ) | | $ | 29.09 | | | | 9.80 | % | | $ | 19,837 | | | | 0.87 | %(c) | | | 0.87 | %(c) | | | 1.63 | %(c) | | | 35 | % |
| | | | | | (0.51 | ) | | | 27.16 | | | | 4.95 | | | | 19,097 | | | | 0.87 | | | | 0.87 | | | | 1.80 | | | | 68 | |
| | | | | | (0.48 | ) | | | 26.38 | | | | 9.54 | | | | 20,242 | | | | 0.81 | | | | 0.86 | | | | 1.80 | | | | 110 | |
| | | | | | (0.46 | ) | | | 24.53 | (d) | | | 21.71 | (d) | | | 18,164 | | | | 0.77 | | | | 0.87 | | | | 1.85 | | | | 67 | |
| | | | | | (0.45 | ) | | | 20.56 | | | | (3.06 | ) | | | 14,197 | | | | 0.86 | | | | 0.86 | | | | 2.06 | | | | 51 | |
| | | | | | (0.46 | ) | | | 21.68 | | | | 3.35 | | | | 17,699 | | | | 0.86 | | | | 0.86 | | | | 1.88 | | | | 26 | |
| | | | | | | | | | | | | | | | | | | | | | | | | | | | | | | | | | |
| | | | | $ | (0.73 | ) | | $ | 28.67 | | | | 9.88 | % | | $ | 104,967 | | | | 0.77 | %(c) | | | 0.77 | %(c) | | | 1.73 | %(c) | | | 35 | % |
| | | | | | (0.54 | ) | | | 26.77 | | | | 5.02 | | | | 132,572 | | | | 0.77 | | | | 0.77 | | | | 1.91 | | | | 68 | |
| | | | | | (0.51 | ) | | | 26.02 | | | | 9.66 | | | | 127,728 | | | | 0.71 | | | | 0.76 | | | | 1.89 | | | | 110 | |
| | | | | | (0.47 | ) | | | 24.20 | (d) | | | 21.88 | (d) | | | 114,377 | | | | 0.67 | | | | 0.77 | | | | 1.95 | | | | 67 | |
| | | | | | (0.47 | ) | | | 20.27 | | | | (2.99 | ) | | | 150,909 | | | | 0.76 | | | | 0.76 | | | | 2.18 | | | | 51 | |
| | | | | | (0.47 | ) | | | 21.39 | | | | 3.44 | | | | 312,294 | | | | 0.76 | | | | 0.76 | | | | 1.97 | | | | 26 | |
| | | | | | | | | | | | | | | | | | | | | | | | | | | | | | | | | | |
| | | | | $ | (0.70 | ) | | $ | 29.23 | | | | 9.70 | % | | $ | 1,400 | | | | 1.02 | %(c) | | | 1.02 | %(c) | | | 1.48 | %(c) | | | 35 | % |
| | | | | | (0.47 | ) | | | 27.29 | | | | 4.77 | | | | 1,381 | | | | 1.02 | | | | 1.02 | | | | 1.66 | | | | 68 | |
| | | | | | (0.44 | ) | | | 26.51 | | | | 9.40 | | | | 1,323 | | | | 0.96 | | | | 1.01 | | | | 1.64 | | | | 110 | |
| | | | | | (0.39 | ) | | | 24.64 | (d) | | | 21.58 | (d) | | | 1,272 | | | | 0.92 | | | | 1.02 | | | | 1.71 | | | | 67 | |
| | | | | | (0.41 | ) | | | 20.61 | | | | (3.23 | ) | | | 1,345 | | | | 1.01 | | | | 1.01 | | | | 1.91 | | | | 51 | |
| | | | | | (0.21 | ) | | | 21.73 | | | | 3.20 | | | | 1,655 | | | | 1.01 | | | | 1.01 | | | | 1.79 | | | | 26 | |
| | | | | | | | |
| See accompanying Notes to Financial Statements | | | December 31, 2019 | | | Semiannual Report | | | 129 | |
Financial Highlights (cont’d)
For a Share Outstanding for the Period ended:^
| | | | | | | | | | | | | | | | | | | | | | | | | | | | |
| | | Net Asset
Value,
Beginning
of Period | | | Net
Investment
Income (a) | | | Net Realized
and Change
in Unrealized
Gain (Loss) | | | Total from
Investment
Operations | | | Dividends
from Net
Investment
Income | | | Distributions
from Net
Realized Capital
Gains | | | | |
| AllianzGI NFJ Mid-Cap Value: | | | | | | | | | | | | | | | | | | | | | |
| Class A | | | | | | | | | | | | | | | | | | | | | | | | | | | | |
12/31/2019† | | $ | 30.60 | | | $ | 0.19 | | | $ | 2.46 | | | $ | 2.65 | | | $ | (0.33 | ) | | $ | (2.21 | ) | | | | |
6/30/2019 | | | 30.06 | | | | 0.44 | | | | 0.54 | | | | 0.98 | | | | (0.31 | ) | | | (0.13 | ) | | | | |
6/30/2018 | | | 31.41 | | | | 0.39 | | | | 1.27 | | | | 1.66 | | | | (0.26 | ) | | | (2.75 | ) | | | | |
6/30/2017 | | | 24.37 | | | | 0.36 | | | | 7.03 | (e) | | | 7.39 | | | | (0.33 | ) | | | (0.02 | ) | | | | |
6/30/2016 | | | 25.82 | | | | 0.45 | | | | (0.87 | ) | | | (0.42 | ) | | | (0.32 | ) | | | (0.71 | ) | | | | |
6/30/2015 | | | 25.52 | | | | 0.31 | | | | 0.36 | | | | 0.67 | | | | (0.37 | ) | | | — | | | | | |
| Class C | | | | | | | | | | | | | | | | | | | | | | | | | | | | |
12/31/2019† | | $ | 25.16 | | | $ | 0.06 | | | $ | 2.01 | | | $ | 2.07 | | | $ | (0.16 | ) | | $ | (2.21 | ) | | | | |
6/30/2019 | | | 24.62 | | | | 0.13 | | | | 0.54 | | | | 0.67 | | | | — | | | | (0.13 | ) | | | | |
6/30/2018 | | | 26.22 | | | | 0.12 | | | | 1.08 | | | | 1.20 | | | | (0.05 | ) | | | (2.75 | ) | | | | |
6/30/2017 | | | 20.43 | | | | 0.13 | | | | 5.87 | (e) | | | 6.00 | | | | (0.19 | ) | | | (0.02 | ) | | | | |
6/30/2016 | | | 21.83 | | | | 0.23 | | | | (0.73 | ) | | | (0.50 | ) | | | (0.19 | ) | | | (0.71 | ) | | | | |
6/30/2015 | | | 21.66 | | | | 0.10 | | | | 0.30 | | | | 0.40 | | | | (0.23 | ) | | | — | | | | | |
| Class R | | | | | | | | | | | | | | | | | | | | | | | | | | | | |
12/31/2019† | | $ | 26.16 | | | $ | 0.13 | | | $ | 2.10 | | | $ | 2.23 | | | $ | (0.30 | ) | | $ | (2.21 | ) | | | | |
6/30/2019 | | | 25.79 | | | | 0.31 | | | | 0.46 | | | | 0.77 | | | | (0.27 | ) | | | (0.13 | ) | | | | |
6/30/2018 | | | 27.40 | | | | 0.24 | | | | 1.17 | | | | 1.41 | | | | (0.27 | ) | | | (2.75 | ) | | | | |
6/30/2017 | | | 21.26 | | | | 0.26 | | | | 6.13 | (e) | | | 6.39 | | | | (0.23 | ) | | | (0.02 | ) | | | | |
6/30/2016 | | | 22.68 | | | | 0.34 | | | | (0.76 | ) | | | (0.42 | ) | | | (0.29 | ) | | | (0.71 | ) | | | | |
6/30/2015 | | | 22.48 | | | | 0.22 | | | | 0.32 | | | | 0.54 | | | | (0.34 | ) | | | — | | | | | |
| Class P | | | | | | | | | | | | | | | | | | | | | | | | | | | | |
12/31/2019† | | $ | 24.68 | | | $ | 0.19 | | | $ | 1.97 | | | $ | 2.16 | | | $ | (0.43 | ) | | $ | (2.21 | ) | | | | |
6/30/2019 | | | 24.35 | | | | 0.41 | | | | 0.43 | | | | 0.84 | | | | (0.38 | ) | | | (0.13 | ) | | | | |
6/30/2018 | | | 26.01 | | | | 0.37 | | | | 1.10 | | | | 1.47 | | | | (0.38 | ) | | | (2.75 | ) | | | | |
6/30/2017 | | | 20.27 | | | | 0.32 | | | | 5.87 | (e) | | | 6.19 | | | | (0.43 | ) | | | (0.02 | ) | | | | |
6/30/2016 | | | 21.70 | | | | 0.43 | | | | (0.74 | ) | | | (0.31 | ) | | | (0.41 | ) | | | (0.71 | ) | | | | |
6/30/2015 | | | 21.57 | | | | 0.33 | | | | 0.29 | | | | 0.62 | | | | (0.49 | ) | | | — | | | | | |
| Institutional Class | | | | | | | | | | | | | | | | | | | | | | | | | | | | |
12/31/2019† | | $ | 32.77 | | | $ | 0.27 | | | $ | 2.64 | | | $ | 2.91 | | | $ | (0.45 | ) | | $ | (2.21 | ) | | | | |
6/30/2019 | | | 32.15 | | | | 0.58 | | | | 0.57 | | | | 1.15 | | | | (0.40 | ) | | | (0.13 | ) | | | | |
6/30/2018 | | | 33.41 | | | | 0.51 | | | | 1.38 | | | | 1.89 | | | | (0.40 | ) | | | (2.75 | ) | | | | |
6/30/2017 | | | 25.88 | | | | 0.48 | | | | 7.47 | (e) | | | 7.95 | | | | (0.40 | ) | | | (0.02 | ) | | | | |
6/30/2016 | | | 27.33 | | | | 0.56 | | | | (0.90 | ) | | | (0.34 | ) | | | (0.40 | ) | | | (0.71 | ) | | | | |
6/30/2015 | | | 26.99 | | | | 0.43 | | | | 0.37 | | | | 0.80 | | | | (0.46 | ) | | | — | | | | | |
| Class R6 | | | | | | | | | | | | | | | | | | | | | | | | | | | | |
12/31/2019† | | $ | 32.75 | | | $ | 0.33 | | | $ | 2.58 | | | $ | 2.91 | | | $ | (0.47 | ) | | $ | (2.21 | ) | | | | |
6/30/2019 | | | 32.13 | | | | 0.63 | | | | 0.53 | | | | 1.16 | | | | (0.41 | ) | | | (0.13 | ) | | | | |
12/18/2017* - 6/30/2018 | | | 36.74 | | | | 0.18 | | | | (1.61 | ) | | | (1.43 | ) | | | (0.43 | ) | | | (2.75 | ) | | | | |
| Administrative Class | | | | | | | | | | | | | | | | | | | | | | | | | | | | |
12/31/2019† | | $ | 31.57 | | | $ | 0.22 | | | $ | 2.53 | | | $ | 2.75 | | | $ | (0.38 | ) | | $ | (2.21 | ) | | | | |
6/30/2019 | | | 31.00 | | | | 0.48 | | | | 0.56 | | | | 1.04 | | | | (0.34 | ) | | | (0.13 | ) | | | | |
6/30/2018 | | | 32.35 | | | | 0.42 | | | | 1.32 | | | | 1.74 | | | | (0.34 | ) | | | (2.75 | ) | | | | |
6/30/2017 | | | 25.08 | | | | 0.40 | | | | 7.24 | (e) | | | 7.64 | | | | (0.35 | ) | | | (0.02 | ) | | | | |
6/30/2016 | | | 26.54 | | | | 0.49 | | | | (0.89 | ) | | | (0.40 | ) | | | (0.35 | ) | | | (0.71 | ) | | | | |
6/30/2015 | | | 26.23 | | | | 0.35 | | | | 0.37 | | | | 0.72 | | | | (0.41 | ) | | | — | | | | | |
| ^ | A “—” may reflect actual amounts rounding to less than $0.01 or 0.01%. |
| * | Commencement of operations. |
| (a) | Calculated on average shares outstanding during the period. |
| (b) | Total return is calculated assuming a purchase of a share on the first day of the period and a sale of a share on the last day of each period reported. Dividends and distributions, if any, are assumed, for purposes of this calculation, to be reinvested. Total return does not reflect sales charges and includes the effect of fee waivers and reimbursements. Total return may reflect adjustments to conform to U.S. GAAP. Total return for a period of less than one year is not annualized. |
| (c) | Annualized, unless otherwise noted. |
| | | | | | |
| 130 | | Semiannual Report | | | December 31, 2019 | | | See accompanying Notes to Financial Statements |
| | | | | | | | | | | | | | | | | | | | | | | | | | | | | | | | | | |
| | | | Total
Dividends and
Distributions | | | Net Asset
Value, End
of Period | | | Total Return (b) | | | Net Assets,
End of Period
(000s) | | | Ratio of
Expenses to
Average Net
Assets with
Fee Waiver/
Reimbursement | | | Ratio of
Expenses to
Average Net
Assets without
Fee Waiver/
Reimbursement | | | Ratio of Net
Investment
Income
to Average
Net Assets | | | Portfolio
Turnover Rate | |
| | | | | | | | | | | | | | | | | | | | | | | | | | |
| | | | | | | | | | | | | | | | | | | | | | | | | | | | | | | | | | |
| | | | | $ | (2.54 | ) | | $ | 30.71 | | | | 8.74 | % | | $ | 608,046 | | | | 1.00 | %(c) | | | 1.22 | %(c) | | | 1.24 | %(c) | | | 78 | % |
| | | | | | (0.44 | ) | | | 30.60 | | | | 3.46 | | | | 595,707 | | | | 0.99 | | | | 1.21 | | | | 1.48 | | | | 81 | |
| | | | | | (3.01 | ) | | | 30.06 | | | | 4.88 | | | | 518,293 | | | | 1.04 | (d) | | | 1.21 | (d) | | | 1.22 | (d) | | | 31 | |
| | | | | | (0.35 | ) | | | 31.41 | (e) | | | 30.53 | (e) | | | 480,691 | | | | 1.21 | (d) | | | 1.21 | (d) | | | 1.30 | (d) | | | 45 | |
| | | | | | (1.03 | ) | | | 24.37 | | | | (1.46 | ) | | | 363,166 | | | | 1.23 | (d) | | | 1.23 | (d) | | | 1.88 | (d) | | | 50 | |
| | | | | | (0.37 | ) | | | 25.82 | | | | 2.66 | | | | 408,706 | | | | 1.26 | (d) | | | 1.26 | (d) | | | 1.23 | (d) | | | 48 | |
| | | | | | | | | | | | | | | | | | | | | | | | | | | | | | | | | | |
| | | | | $ | (2.37 | ) | | $ | 24.86 | | | | 8.31 | % | | $ | 49,910 | | | | 1.75 | %(c) | | | 1.97 | %(c) | | | 0.50 | %(c) | | | 78 | % |
| | | | | | (0.13 | ) | | | 25.16 | | | | 2.73 | | | | 48,176 | | | | 1.74 | | | | 1.96 | | | | 0.54 | | | | 81 | |
| | | | | | (2.80 | ) | | | 24.62 | | | | 4.10 | | | | 182,192 | | | | 1.79 | (d) | | | 1.96 | (d) | | | 0.46 | (d) | | | 31 | |
| | | | | | (0.21 | ) | | | 26.22 | (e) | | | 29.52 | (e) | | | 168,922 | | | | 1.96 | (d) | | | 1.96 | (d) | | | 0.59 | (d) | | | 45 | |
| | | | | | (0.90 | ) | | | 20.43 | | | | (2.16 | ) | | | 173,304 | | | | 1.98 | (d) | | | 1.98 | (d) | | | 1.13 | (d) | | | 50 | |
| | | | | | (0.23 | ) | | | 21.83 | | | | 1.88 | | | | 198,432 | | | | 2.01 | (d) | | | 2.01 | (d) | | | 0.48 | (d) | | | 48 | |
| | | | | | | | | | | | | | | | | | | | | | | | | | | | | | | | | | |
| | | | | $ | (2.51 | ) | | $ | 25.88 | | | | 8.57 | % | | $ | 21,589 | | | | 1.25 | %(c) | | | 1.47 | %(c) | | | 1.00 | %(c) | | | 78 | % |
| | | | | | (0.40 | ) | | | 26.16 | | | | 3.21 | | | | 20,087 | | | | 1.24 | | | | 1.46 | | | | 1.22 | | | | 81 | |
| | | | | | (3.02 | ) | | | 25.79 | | | | 4.65 | | | | 15,644 | | | | 1.27 | (d) | | | 1.46 | (d) | | | 0.90 | (d) | | | 31 | |
| | | | | | (0.25 | ) | | | 27.40 | (e) | | | 30.19 | (e) | | | 5,591 | | | | 1.46 | (d) | | | 1.46 | (d) | | | 1.09 | (d) | | | 45 | |
| | | | | | (1.00 | ) | | | 21.26 | | | | (1.70 | ) | | | 6,969 | | | | 1.48 | (d) | | | 1.48 | (d) | | | 1.58 | (d) | | | 50 | |
| | | | | | (0.34 | ) | | | 22.68 | | | | 2.43 | | | | 11,665 | | | | 1.51 | (d) | | | 1.51 | (d) | | | 0.96 | (d) | | | 48 | |
| | | | | | | | | | | | | | | | | | | | | | | | | | | | | | | | | | |
| | | | | $ | (2.64 | ) | | $ | 24.20 | | | | 8.82 | % | | $ | 223,104 | | | | 0.75 | %(c) | | | 0.97 | %(c) | | | 1.51 | %(c) | | | 78 | % |
| | | | | | (0.51 | ) | | | 24.68 | | | | 3.75 | | | | 197,201 | | | | 0.74 | | | | 0.96 | | | | 1.70 | | | | 81 | |
| | | | | | (3.13 | ) | | | 24.35 | | | | 5.17 | | | | 200,081 | | | | 0.77 | (d) | | | 0.96 | (d) | | | 1.46 | (d) | | | 31 | |
| | | | | | (0.45 | ) | | | 26.01 | (e) | | | 30.82 | (e) | | | 52,167 | | | | 0.96 | (d) | | | 0.96 | (d) | | | 1.39 | (d) | | | 45 | |
| | | | | | (1.12 | ) | | | 20.27 | | | | (1.19 | ) | | | 17,268 | | | | 0.98 | (d) | | | 0.98 | (d) | | | 2.14 | (d) | | | 50 | |
| | | | | | (0.49 | ) | | | 21.70 | | | | 2.93 | | | | 15,307 | | | | 1.01 | (d) | | | 1.01 | (d) | | | 1.55 | (d) | | | 48 | |
| | | | | | | | | | | | | | | | | | | | | | | | | | | | | | | | | | |
| | | | | $ | (2.66 | ) | | $ | 33.02 | | | | 8.93 | % | | $ | 444,880 | | | | 0.65 | %(c) | | | 0.87 | %(c) | | | 1.60 | %(c) | | | 78 | % |
| | | | | | (0.53 | ) | | | 32.77 | | | | 3.83 | | | | 406,173 | | | | 0.64 | | | | 0.86 | | | | 1.82 | | | | 81 | |
| | | | | | (3.15 | ) | | | 32.15 | | | | 5.26 | | | | 332,110 | | | | 0.66 | (d) | | | 0.86 | (d) | | | 1.53 | (d) | | | 31 | |
| | | | | | (0.42 | ) | | | 33.41 | (e) | | | 30.95 | (e) | | | 53,333 | | | | 0.86 | (d) | | | 0.86 | (d) | | | 1.66 | (d) | | | 45 | |
| | | | | | (1.11 | ) | | | 25.88 | | | | (1.08 | ) | | | 55,877 | | | | 0.88 | (d) | | | 0.88 | (d) | | | 2.16 | (d) | | | 50 | |
| | | | | | (0.46 | ) | | | 27.33 | | | | 3.01 | | | | 92,289 | | | | 0.91 | (d) | | | 0.91 | (d) | | | 1.60 | (d) | | | 48 | |
| | | | | | | | | | | | | | | | | | | | | | | | | | | | | | | | | | |
| | | | | $ | (2.68 | ) | | $ | 32.98 | | | | 8.93 | % | | $ | 75,120 | | | | 0.60 | %(c) | | | 0.82 | %(c) | | | 1.98 | %(c) | | | 78 | % |
| | | | | | (0.54 | ) | | | 32.75 | | | | 3.89 | | | | 18,052 | | | | 0.59 | | | | 0.81 | | | | 2.03 | | | | 81 | |
| | | | | | (3.18 | ) | | | 32.13 | | | | (4.25 | ) | | | 2,167 | | | | 0.59 | (c)(d) | | | 0.81 | (c)(d) | | | 1.04 | (c)(d) | | | 31 | |
| | | | | | | | | | | | | | | | | | | | | | | | | | | | | | | | | | |
| | | | | $ | (2.59 | ) | | $ | 31.73 | | | | 8.77 | % | | $ | 35,284 | | | | 0.90 | %(c) | | | 1.12 | %(c) | | | 1.38 | %(c) | | | 78 | % |
| | | | | | (0.47 | ) | | | 31.57 | | | | 3.60 | | | | 27,405 | | | | 0.89 | | | | 1.11 | | | | 1.58 | | | | 81 | |
| | | | | | (3.09 | ) | | | 31.00 | | | | 4.98 | | | | 18,947 | | | | 0.92 | (d) | | | 1.11 | (d) | | | 1.32 | (d) | | | 31 | |
| | | | | | (0.37 | ) | | | 32.35 | (e) | | | 30.66 | (e) | | | 5,120 | | | | 1.11 | (d) | | | 1.11 | (d) | | | 1.40 | (d) | | | 45 | |
| | | | | | (1.06 | ) | | | 25.08 | | | | (1.36 | ) | | | 3,792 | | | | 1.13 | (d) | | | 1.13 | (d) | | | 1.98 | (d) | | | 50 | |
| | | | | | (0.41 | ) | | | 26.54 | | | | 2.77 | | | | 4,698 | | | | 1.16 | (d) | | | 1.16 | (d) | | | 1.33 | (d) | | | 48 | |
| | (d) | Does not include expenses of the investment companies in which the Fund invests. |
| | (e) | Payments from securities litigation increased net realized and change in unrealized gain (loss) and net asset value per share by approximately $1.41 for Class A; $1.23 for Class C; $1.13 for Class R; $1.93 for Class P; $1.19 for Institutional Class and $1.63 for Administrative Class. The increase in total return per class was approximately 5.86% for Class A; 6.08% for Class C; 5.37% for Class R; 9.70% for Class P; 4.66% for Institutional Class and 6.58% for Administrative Class. |
| | | | | | | | |
| See accompanying Notes to Financial Statements | | | December 31, 2019 | | | Semiannual Report | | | 131 | |
Financial Highlights (cont’d)
For a Share Outstanding for the Period ended:^
| | | | | | | | | | | | | | | | | | | | | | | | | | | | |
| | | Net Asset
Value,
Beginning of Period | | | Net
Investment
Income (a) | | | Net Realized
and Change
in Unrealized
Gain (Loss) | | | Total from
Investment
Operations | | | Dividends
from Net
Investment
Income | | | Distributions
from Net
Realized Capital
Gains | | | | |
| AllianzGI NFJ Small-Cap Value: | | | | | | | | | | | | | | | | | | | | | |
| Class A | | | | | | | | | | | | | | | | | | | | | | | | | | | | |
12/31/2019† | | $ | 14.53 | | | $ | 0.11 | | | $ | 1.12 | | | $ | 1.23 | | | $ | (0.06 | ) | | $ | (1.30 | ) | | | | |
6/30/2019 | | | 21.71 | | | | 0.29 | | | | (2.73 | ) | | | (2.44 | ) | | | (0.62 | ) | | | (4.12 | ) | | | | |
6/30/2018 | | | 24.36 | | | | 0.29 | | | | 1.44 | | | | 1.73 | | | | (0.12 | ) | | | (4.26 | ) | | | | |
6/30/2017 | | | 20.82 | | | | 0.30 | | | | 4.12 | | | | 4.42 | | | | (0.32 | ) | | | (0.56 | ) | | | | |
6/30/2016 | | | 25.91 | | | | 0.41 | | | | (1.92 | ) | | | (1.51 | ) | | | (0.35 | ) | | | (3.23 | ) | | | | |
6/30/2015 | | | 35.24 | | | | 0.41 | | | | (1.95 | ) | | | (1.54 | ) | | | (0.67 | ) | | | (7.12 | ) | | | | |
| Class C | | | | | | | | | | | | | | | | | | | | | | | | | | | | |
12/31/2019† | | $ | 12.97 | | | $ | 0.04 | | | $ | 1.01 | | | $ | 1.05 | | | $ | — | | | $ | (1.30 | ) | | | | |
6/30/2019 | | | 19.30 | | | | 0.16 | | | | (2.41 | ) | | | (2.25 | ) | | | — | | | | (4.08 | )* | | | | |
6/30/2018 | | | 22.14 | | | | 0.11 | | | | 1.31 | | | | 1.42 | | | | — | | | | (4.26 | ) | | | | |
6/30/2017 | | | 19.02 | | | | 0.12 | | | | 3.75 | | | | 3.87 | | | | (0.19 | ) | | | (0.56 | ) | | | | |
6/30/2016 | | | 23.99 | | | | 0.23 | | | | (1.78 | ) | | | (1.55 | ) | | | (0.19 | ) | | | (3.23 | ) | | | | |
6/30/2015 | | | 33.27 | | | | 0.17 | | | | (1.85 | ) | | | (1.68 | ) | | | (0.48 | ) | | | (7.12 | ) | | | | |
| Class R | | | | | | | | | | | | | | | | | | | | | | | | | | | | |
12/31/2019† | | $ | 15.85 | | | $ | 0.10 | | | $ | 1.23 | | | $ | 1.33 | | | $ | — | | | $ | (1.30 | ) | | | | |
6/30/2019 | | | 23.10 | | | | 0.26 | | | | (2.85 | ) | | | (2.59 | ) | | | (0.54 | ) | | | (4.12 | ) | | | | |
6/30/2018 | | | 25.64 | | | | 0.25 | | | | 1.51 | | | | 1.76 | | | | (0.04 | ) | | | (4.26 | ) | | | | |
6/30/2017 | | | 21.87 | | | | 0.25 | | | | 4.34 | | | | 4.59 | | | | (0.26 | ) | | | (0.56 | ) | | | | |
6/30/2016 | | | 26.99 | | | | 0.37 | | | | (1.99 | ) | | | (1.62 | ) | | | (0.27 | ) | | | (3.23 | ) | | | | |
6/30/2015 | | | 36.37 | | | | 0.34 | | | | (2.02 | ) | | | (1.68 | ) | | | (0.58 | ) | | | (7.12 | ) | | | | |
| Class P | | | | | | | | | | | | | | | | | | | | | | | | | | | | |
12/31/2019† | | $ | 16.79 | | | $ | 0.14 | | | $ | 1.31 | | | $ | 1.45 | | | $ | (0.09 | ) | | $ | (1.30 | ) | | | | |
6/30/2019 | | | 24.18 | | | | 0.38 | | | | (2.97 | ) | | | (2.59 | ) | | | (0.68 | ) | | | (4.12 | ) | | | | |
6/30/2018 | | | 26.69 | | | | 0.39 | | | | 1.56 | | | | 1.95 | | | | (0.20 | ) | | | (4.26 | ) | | | | |
6/30/2017 | | | 22.74 | | | | 0.36 | | | | 4.54 | | | | 4.90 | | | | (0.39 | ) | | | (0.56 | ) | | | | |
6/30/2016 | | | 27.92 | | | | 0.51 | | | | (2.06 | ) | | | (1.55 | ) | | | (0.40 | ) | | | (3.23 | ) | | | | |
6/30/2015 | | | 37.36 | | | | 0.51 | | | | (2.07 | ) | | | (1.56 | ) | | | (0.76 | ) | | | (7.12 | ) | | | | |
| Institutional Class | | | | | | | | | | | | | | | | | | | | | | | | | | | | |
12/31/2019† | | $ | 16.95 | | | $ | 0.15 | | | $ | 1.33 | | | $ | 1.48 | | | $ | (0.07 | ) | | $ | (1.30 | ) | | | | |
6/30/2019 | | | 24.34 | | | | 0.41 | | | | (3.00 | ) | | | (2.59 | ) | | | (0.68 | ) | | | (4.12 | ) | | | | |
6/30/2018 | | | 26.82 | | | | 0.42 | | | | 1.58 | | | | 2.00 | | | | (0.22 | ) | | | (4.26 | ) | | | | |
6/30/2017 | | | 22.84 | | | | 0.42 | | | | 4.53 | | | | 4.95 | | | | (0.41 | ) | | | (0.56 | ) | | | | |
6/30/2016 | | | 28.05 | | | | 0.55 | | | | (2.08 | ) | | | (1.53 | ) | | | (0.45 | ) | | | (3.23 | ) | | | | |
6/30/2015 | | | 37.46 | | | | 0.56 | | | | (2.07 | ) | | | (1.51 | ) | | | (0.78 | ) | | | (7.12 | ) | | | | |
| Class R6 | | | | | | | | | | | | | | | | | | | | | | | | | | | | |
12/31/2019† | | $ | 16.85 | | | $ | 0.15 | | | $ | 1.33 | | | $ | 1.48 | | | $ | (0.12 | ) | | $ | (1.30 | ) | | | | |
6/30/2019 | | | 24.25 | | | | 0.41 | | | | (2.99 | ) | | | (2.58 | ) | | | (0.70 | ) | | | (4.12 | ) | | | | |
6/30/2018 | | | 26.75 | | | | 0.44 | | | | 1.56 | | | | 2.00 | | | | (0.24 | ) | | | (4.26 | ) | | | | |
6/30/2017 | | | 22.79 | | | | 0.41 | | | | 4.55 | | | | 4.96 | | | | (0.44 | ) | | | (0.56 | ) | | | | |
6/30/2016 | | | 28.02 | | | | 0.56 | | | | (2.08 | ) | | | (1.52 | ) | | | (0.48 | ) | | | (3.23 | ) | | | | |
6/30/2015 | | | 37.47 | | | | 0.40 | | | | (1.90 | ) | | | (1.50 | ) | �� | | (0.83 | ) | | | (7.12 | ) | | | | |
| Administrative Class | | | | | | | | | | | | | | | | | | | | | | | | | | | | |
12/31/2019† | | $ | 14.48 | | | $ | 0.11 | | | $ | 1.13 | | | $ | 1.24 | | | $ | (0.08 | ) | | $ | (1.30 | ) | | | | |
6/30/2019 | | | 21.65 | | | | 0.30 | | | | (2.73 | ) | | | (2.43 | ) | | | (0.62 | ) | | | (4.12 | ) | | | | |
6/30/2018 | | | 24.30 | | | | 0.32 | | | | 1.43 | | | | 1.75 | | | | (0.14 | ) | | | (4.26 | ) | | | | |
6/30/2017 | | | 20.78 | | | | 0.33 | | | | 4.11 | | | | 4.44 | | | | (0.36 | ) | | | (0.56 | ) | | | | |
6/30/2016 | | | 25.87 | | | | 0.45 | | | | (1.92 | ) | | | (1.47 | ) | | | (0.39 | ) | | | (3.23 | ) | | | | |
6/30/2015 | | | 35.19 | | | | 0.46 | | | | (1.96 | ) | | | (1.50 | ) | | | (0.70 | ) | | | (7.12 | ) | | | | |
| ^ | A “—” may reflect actual amounts rounding to less than $0.01 or 0.01%. |
| * | The character of a portion of the distribution was redesignated from net investment income to net realized capital gain for the year ended June 30, 2019. The per share amount for Class C differs from other classes, as at the time the distribution was made, Class C had minimal distributable net investment income, therefore no redesignation for Class C was made. |
| (a) | Calculated on average shares outstanding during the period. |
| (b) | Total return is calculated assuming a purchase of a share on the first day of the period and a sale of a share on the last day of each period reported. Dividends and distributions, if any, are assumed, for purposes of this calculation, to be reinvested. Total return does not reflect sales charges and includes the effect of fee waivers and reimbursements. Total return may reflect adjustments to conform to U.S. GAAP. Total return for a period of less than one year is not annualized. |
| | | | | | |
| 132 | | Semiannual Report | | | December 31, 2019 | | | See accompanying Notes to Financial Statements |
| | | | | | | | | | | | | | | | | | | | | | | | | | | | | | | | | | |
| | | | Total
Dividends and
Distributions | | | Net Asset
Value, End
of Period | | | Total Return (b) | | | Net Assets,
End of Period
(000s) | | | Ratio of
Expenses to
Average Net
Assets with
Fee Waiver/
Reimbursement | | | Ratio of
Expenses to
Average Net
Assets without
Fee Waiver/
Reimbursement | | | Ratio of Net
Investment
Income
to Average
Net Assets | | | Portfolio
Turnover Rate | |
| | | | | | | | | | | | | | | | | | | | | | | | | | |
| | | | | | | | | | | | | | | | | | | | | | | | | | | | | | | | | | |
| | | | | $ | (1.36 | ) | | $ | 14.40 | | | | 8.46 | % | | $ | 398,546 | | | | 1.18 | %(c)(d) | | | 1.28 | %(c)(d) | | | 1.42 | %(c)(d) | | | 54 | % |
| | | | | | (4.74 | ) | | | 14.53 | | | | (7.70 | ) | | | 439,710 | | | | 1.18 | | | | 1.26 | | | | 1.65 | | | | 47 | |
| | | | | | (4.38 | ) | | | 21.71 | | | | 7.04 | | | | 718,104 | | | | 1.20 | | | | 1.25 | | | | 1.27 | | | | 24 | |
| | | | | | (0.88 | ) | | | 24.36 | | | | 21.38 | | | | 788,438 | | | | 1.20 | (d) | | | 1.24 | (d) | | | 1.31 | (d) | | | 30 | |
| | | | | | (3.58 | ) | | | 20.82 | | | | (5.31 | ) | | | 1,037,525 | | | | 1.22 | (d) | | | 1.23 | (d) | | | 1.88 | (d) | | | 48 | |
| | | | | | (7.79 | ) | | | 25.91 | (e) | | | (3.77 | )(e) | | | 1,592,000 | | | | 1.18 | | | | 1.21 | | | | 1.39 | | | | 42 | |
| | | | | | | | | | | | | | | | | | | | | | | | | | | | | | | | | | |
| | | | | $ | (1.30 | ) | | $ | 12.72 | | | | 8.05 | % | | $ | 2,410 | | | | 1.93 | %(c)(d) | | | 2.03 | %(c)(d) | | | 0.60 | %(c)(d) | | | 54 | % |
| | | | | | (4.08 | ) | | | 12.97 | | | | (8.35 | ) | | | 3,984 | | | | 1.93 | | | | 2.01 | | | | 0.88 | | | | 47 | |
| | | | | | (4.26 | ) | | | 19.30 | | | | 6.26 | | | | 106,052 | | | | 1.95 | | | | 2.00 | | | | 0.54 | | | | 24 | |
| | | | | | (0.75 | ) | | | 22.14 | | | | 20.45 | | | | 135,225 | | | | 1.95 | (d) | | | 1.99 | (d) | | | 0.56 | (d) | | | 30 | |
| | | | | | (3.42 | ) | | | 19.02 | | | | (5.99 | ) | | | 175,139 | | | | 1.97 | (d) | | | 1.98 | (d) | | | 1.14 | (d) | | | 48 | |
| | | | | | (7.60 | ) | | | 23.99 | (e) | | | (4.52 | )(e) | | | 259,629 | | | | 1.93 | | | | 1.96 | | | | 0.63 | | | | 42 | |
| | | | | | | | | | | | | | | | | | | | | | | | | | | | | | | | | | |
| | | | | $ | (1.30 | ) | | $ | 15.88 | | | | 8.39 | % | | $ | 20,733 | | | | 1.43 | %(c)(d) | | | 1.53 | %(c)(d) | | | 1.18 | %(c)(d) | | | 54 | % |
| | | | | | (4.66 | ) | | | 15.85 | | | | (7.97 | ) | | | 22,153 | | | | 1.43 | | | | 1.51 | | | | 1.41 | | | | 47 | |
| | | | | | (4.30 | ) | | | 23.10 | | | | 6.77 | | | | 37,655 | | | | 1.45 | | | | 1.50 | | | | 1.02 | | | | 24 | |
| | | | | | (0.82 | ) | | | 25.64 | | | | 21.09 | | | | 51,759 | | | | 1.45 | (d) | | | 1.49 | (d) | | | 1.04 | (d) | | | 30 | |
| | | | | | (3.50 | ) | | | 21.87 | | | | (5.52 | ) | | | 64,707 | | | | 1.47 | (d) | | | 1.48 | (d) | | | 1.62 | (d) | | | 48 | |
| | | | | | (7.70 | ) | | | 26.99 | (e) | | | (4.06 | )(e) | | | 97,345 | | | | 1.43 | | | | 1.46 | | | | 1.13 | | | | 42 | |
| | | | | | | | | | | | | | | | | | | | | | | | | | | | | | | | | | |
| | | | | $ | (1.39 | ) | | $ | 16.85 | | | | 8.62 | % | | $ | 34,584 | | | | 0.93 | %(c)(d) | | | 1.03 | %(c)(d) | | | 1.66 | %(c)(d) | | | 54 | % |
| | | | | | (4.80 | ) | | | 16.79 | | | | (7.49 | ) | | | 39,426 | | | | 0.93 | | | | 1.01 | | | | 1.91 | | | | 47 | |
| | | | | | (4.46 | ) | | | 24.18 | | | | 7.27 | | | | 65,466 | | | | 0.95 | | | | 1.00 | | �� | | 1.54 | | | | 24 | |
| | | | | | (0.95 | ) | | | 26.69 | | | | 21.66 | | | | 72,679 | | | | 0.95 | (d) | | | 0.99 | (d) | | | 1.42 | (d) | | | 30 | |
| | | | | | (3.63 | ) | | | 22.74 | | | | (5.01 | ) | | | 58,556 | | | | 0.97 | (d) | | | 0.98 | (d) | | | 2.13 | (d) | | | 48 | |
| | | | | | (7.88 | ) | | | 27.92 | (e) | | | (3.58 | )(e) | | | 106,077 | | | | 0.93 | | | | 0.96 | | | | 1.63 | | | | 42 | |
| | | | | | | | | | | | | | | | | | | | | | | | | | | | | | | | | | |
| | | | | $ | (1.37 | ) | | $ | 17.06 | | | | 8.74 | % | | $ | 144,007 | | | | 0.83 | %(c)(d) | | | 0.92 | %(c)(d) | | | 1.69 | %(c)(d) | | | 54 | % |
| | | | | | (4.80 | ) | | | 16.95 | | | | (7.42 | ) | | | 288,309 | | | | 0.83 | | | | 0.91 | | | | 1.98 | | | | 47 | |
| | | | | | (4.48 | ) | | | 24.34 | | | | 7.43 | | | | 778,547 | | | | 0.85 | | | | 0.90 | | | | 1.61 | | | | 24 | |
| | | | | | (0.97 | ) | | | 26.82 | | | | 21.82 | | | | 1,213,861 | | | | 0.83 | (d) | | | 0.89 | (d) | | | 1.68 | (d) | | | 30 | |
| | | | | | (3.68 | ) | | | 22.84 | | | | (4.93 | ) | | | 1,800,472 | | | | 0.82 | (d) | | | 0.88 | (d) | | | 2.28 | (d) | | | 48 | |
| | | | | | (7.90 | ) | | | 28.05 | (e) | | | (3.40 | )(e) | | | 2,866,196 | | | | 0.78 | | | | 0.86 | | | | 1.78 | | | | 42 | |
| | | | | | | | | | | | | | | | | | | | | | | | | | | | | | | | | | |
| | | | | $ | (1.42 | ) | | $ | 16.91 | | | | 8.77 | % | | $ | 128,563 | | | | 0.78 | %(c)(d) | | | 0.88 | %(c)(d) | | | 1.80 | %(c)(d) | | | 54 | % |
| | | | | | (4.82 | ) | | | 16.85 | | | | (7.37 | ) | | | 150,200 | | | | 0.78 | | | | 0.86 | | | | 2.04 | | | | 47 | |
| | | | | | (4.50 | ) | | | 24.25 | | | | 7.44 | | | | 347,379 | | | | 0.80 | | | | 0.85 | | | | 1.70 | | | | 24 | |
| | | | | | (1.00 | ) | | | 26.75 | | | | 21.90 | | | | 464,279 | | | | 0.79 | (d) | | | 0.84 | (d) | | | 1.60 | (d) | | | 30 | |
| | | | | | (3.71 | ) | | | 22.79 | | | | (4.86 | ) | | | 371,453 | | | | 0.77 | (d) | | | 0.83 | (d) | | | 2.39 | (d) | | | 48 | |
| | | | | | (7.95 | ) | | | 28.02 | (e) | | | (3.37 | )(e) | | | 235,613 | | | | 0.73 | | | | 0.81 | | | | 1.36 | | | | 42 | |
| | | | | | | | | | | | | | | | | | | | | | | | | | | | | | | | | | |
| | | | | $ | (1.38 | ) | | $ | 14.34 | | | | 8.55 | % | | $ | 82,613 | | | | 1.08 | %(c)(d) | | | 1.18 | %(c)(d) | | | 1.48 | %(c)(d) | | | 54 | % |
| | | | | | (4.74 | ) | | | 14.48 | | | | (7.64 | ) | | | 107,836 | | | | 1.08 | | | | 1.16 | | | | 1.74 | | | | 47 | |
| | | | | | (4.40 | ) | | | 21.65 | | | | 7.14 | | | | 206,749 | | | | 1.10 | | | | 1.15 | | | | 1.38 | | | | 24 | |
| | | | | | (0.92 | ) | | | 24.30 | | | | 21.52 | | | | 365,241 | | | | 1.09 | (d) | | | 1.14 | (d) | | | 1.43 | (d) | | | 30 | |
| | | | | | (3.62 | ) | | | 20.78 | | | | (5.11 | ) | | | 494,621 | | | | 1.07 | (d) | | | 1.13 | (d) | | | 2.03 | (d) | | | 48 | |
| | | | | | (7.82 | ) | | | 25.87 | (e) | | | (3.62 | )(e) | | | 811,305 | | | | 1.03 | | | | 1.11 | | | | 1.54 | | | | 42 | |
| | (c) | Annualized, unless otherwise noted. |
| | (d) | Does not include expenses of the investment companies in which the Fund invests. |
| | (e) | Payments from Affiliates increased the end of period net asset value and total return by less than $0.01 and 0.01%, respectively. |
| | | | | | | | |
| See accompanying Notes to Financial Statements | | | December 31, 2019 | | | Semiannual Report | | | 133 | |
Financial Highlights (cont’d)
For a Share Outstanding for the Period ended:^
| | | | | | | | | | | | | | | | | | | | | | | | | | | | |
| | | Net Asset
Value,
Beginning
of Period | | | Net
Investment
Income
(Loss) (a) | | | Net Realized
and Change
in Unrealized
Gain (Loss) | | | Total from
Investment
Operations | | | Dividends
from Net
Investment
Income | | | Distributions
from Net
Realized Capital
Gains | | | | |
| AllianzGI Small-Cap: | | | | | | | | | | | | | | | | | | | | | |
| Class A | | | | | | | | | | | | | | | | | | | | | | | | | | | | |
12/31/2019† | | $ | 19.50 | | | $ | 0.05 | | | $ | 0.97 | | | $ | 1.02 | | | $ | (0.01 | ) | | $ | — | | | | | |
6/30/2019 | | | 21.61 | | | | 0.07 | | | | (0.53 | ) | | | (0.46 | ) | | | (0.02 | ) | | | (1.63 | ) | | | | |
6/30/2018 | | | 20.51 | | | | (0.02 | ) | | | 3.92 | | | | 3.90 | | | | — | | | | (2.80 | ) | | | | |
6/30/2017 | | | 16.71 | | | | 0.03 | | | | 3.79 | | | | 3.82 | | | | (0.01 | ) | | | (0.01 | ) | | | | |
6/30/2016 | | | 18.41 | | | | 0.03 | | | | (1.14 | ) | | | (1.11 | ) | | | (0.09 | ) | | | (0.50 | ) | | | | |
6/30/2015 | | | 18.28 | | | | 0.09 | | | | 0.93 | | | | 1.02 | | | | (0.05 | ) | | | (0.84 | ) | | | | |
| Class C | | | | | | | | | | | | | | | | | | | | | | | | | | | | |
12/31/2019† | | $ | 18.68 | | | $ | (0.02 | ) | | $ | 0.93 | | | $ | 0.91 | | | $ | — | | | $ | — | | | | | |
6/30/2019 | | | 20.92 | | | | (0.07 | ) | | | (0.54 | ) | | | (0.61 | ) | | | — | | | | (1.63 | ) | | | | |
6/30/2018 | | | 20.07 | | | | (0.17 | ) | | | 3.82 | | | | 3.65 | | | | — | | | | (2.80 | ) | | | | |
6/30/2017 | | | 16.48 | | | | (0.11 | ) | | | 3.71 | | | | 3.60 | | | | — | | | | (0.01 | ) | | | | |
6/30/2016 | | | 18.20 | | | | (0.10 | ) | | | (1.12 | ) | | | (1.22 | ) | | | — | | | | (0.50 | ) | | | | |
6/30/2015 | | | 18.16 | | | | (0.05 | ) | | | 0.93 | | | | 0.88 | | | | — | | | | (0.84 | ) | | | | |
| Class P | | | | | | | | | | | | | | | | | | | | | | | | | | | | |
12/31/2019† | | $ | 19.74 | | | $ | 0.08 | | | $ | 0.98 | | | $ | 1.06 | | | $ | (0.07 | ) | | $ | — | | | | | |
6/30/2019 | | | 21.81 | | | | 0.12 | | | | (0.53 | ) | | | (0.41 | ) | | | (0.03 | ) | | | (1.63 | ) | | | | |
6/30/2018 | | | 20.63 | | | | 0.03 | | | | 3.95 | | | | 3.98 | | | | — | | | | (2.80 | ) | | | | |
6/30/2017 | | | 16.77 | | | | 0.07 | | | | 3.81 | | | | 3.88 | | | | (0.01 | ) | | | (0.01 | ) | | | | |
6/30/2016 | | | 18.49 | | | | 0.07 | | | | (1.15 | ) | | | (1.08 | ) | | | (0.14 | ) | | | (0.50 | ) | | | | |
6/30/2015 | | | 18.33 | | | | 0.13 | | | | 0.95 | | | | 1.08 | | | | (0.08 | ) | | | (0.84 | ) | | | | |
| Institutional Class | | | | | | | | | | | | | | | | | | | | | | | | | | | | |
12/31/2019† | | $ | 19.90 | | | $ | 0.10 | | | $ | 0.99 | | | $ | 1.09 | | | $ | (0.08 | ) | | $ | — | | | | | |
6/30/2019 | | | 21.96 | | | | 0.14 | | | | (0.53 | ) | | | (0.39 | ) | | | (0.04 | ) | | | (1.63 | ) | | | | |
6/30/2018 | | | 20.73 | | | | 0.05 | | | | 3.98 | | | | 4.03 | | | | — | | | | (2.80 | ) | | | | |
6/30/2017 | | | 16.84 | | | | 0.10 | | | | 3.81 | | | | 3.91 | | | | (0.01 | ) | | | (0.01 | ) | | | | |
6/30/2016 | | | 18.49 | | | | 0.08 | | | | (1.13 | ) | | | (1.05 | ) | | | (0.10 | ) | | | (0.50 | ) | | | | |
6/30/2015 | | | 18.34 | | | | 0.15 | | | | 0.94 | | | | 1.09 | | | | (0.10 | ) | | | (0.84 | ) | | | | |
| Class R6 | | | | | | | | | | | | | | | | | | | | | | | | | | | | |
12/31/2019† | | $ | 19.90 | | | $ | 0.10 | | | $ | 0.98 | | | $ | 1.08 | | | $ | (0.08 | ) | | $ | — | | | | | |
8/22/2018* - 6/30/2019 | | | 23.16 | | | | 0.13 | | | | (1.71 | ) | | | (1.58 | ) | | | (0.05 | ) | | | (1.63 | ) | | | | |
| ^ | A “—” may reflect actual amounts rounding to less than $0.01 or 0.01%. |
| * | Commencement of operations. |
| (a) | Calculated on average shares outstanding during the period. |
| (b) | Total return is calculated assuming a purchase of a share on the first day of the period and a sale of a share on the last day of each period reported. Dividends and distributions, if any, are assumed, for purposes of this calculation, to be reinvested. Total return does not reflect sales charges and includes the effect of fee waivers and reimbursements. Total return may reflect adjustments to conform to U.S. GAAP. Total return for a period of less than one year is not annualized. |
| (c) | Payments from Affiliates increased the end of period net asset value and total return by less than $0.01 and 0.01%, respectively. |
| (d) | Annualized, unless otherwise noted. |
| (e) | Does not include expenses of the investment companies in which the Fund invests. |
| | | | | | |
| 134 | | Semiannual Report | | | December 31, 2019 | | | See accompanying Notes to Financial Statements |
| | | | | | | | | | | | | | | | | | | | | | | | | | | | | | | | | | |
| | | | Total
Dividends and
Distributions | | | Net Asset
Value, End
of Period | | | Total Return (b) | | | Net Assets,
End of Period
(000s) | | | Ratio of
Expenses to
Average Net
Assets with
Fee Waiver/
Reimbursement | | | Ratio of
Expenses to
Average Net
Assets without
Fee Waiver/
Reimbursement | | | Ratio of Net
Investment
Income (Loss)
to Average
Net Assets | | | Portfolio
Turnover Rate | |
| | | | | | | | | | | | | | | | | | | | | | | | | | |
| | | | | | | | | | | | | | | | | | | | | | | | | | | | | | | | | | |
| | | | | $ | (0.01 | ) | | $ | 20.51 | (c) | | | 5.23 | %(c) | | $ | 69,200 | | | | 1.17 | %(d) | | | 1.27 | %(d) | | | 0.55 | %(d) | | | 40 | % |
| | | | | | (1.65 | ) | | | 19.50 | | | | (0.62 | ) | | | 66,269 | | | | 1.18 | | | | 1.27 | | | | 0.35 | | | | 78 | |
| | | | | | (2.80 | ) | | | 21.61 | | | | 19.96 | | | | 44,860 | | | | 1.31 | (e) | | | 1.31 | (e) | | | (0.07 | )(e) | | | 126 | |
| | | | | | (0.02 | ) | | | 20.51 | (c) | | | 22.82 | (c) | | | 39,509 | | | | 1.31 | | | | 1.31 | | | | 0.15 | | | | 152 | |
| | | | | | (0.59 | ) | | | 16.71 | | | | (6.02 | ) | | | 32,660 | | | | 1.27 | | | | 1.31 | | | | 0.17 | | | | 139 | |
| | | | | | (0.89 | ) | | | 18.41 | | | | 6.01 | | | | 38,579 | | | | 1.24 | | | | 1.30 | | | | 0.47 | | | | 148 | |
| | | | | | | | | | | | | | | | | | | | | | | | | | | | | | | | | | |
| | | | | $ | — | | | $ | 19.59 | (c) | | | 4.87 | %(c) | | $ | 5,212 | | | | 1.92 | %(d) | | | 2.02 | %(d) | | | (0.24 | )%(d) | | | 40 | % |
| | | | | | (1.63 | ) | | | 18.68 | | | | (1.39 | ) | | | 7,873 | | | | 1.93 | | | | 2.02 | | | | (0.36 | ) | | | 78 | |
| | | | | | (2.80 | ) | | | 20.92 | | | | 19.10 | | | | 35,080 | | | | 2.06 | (e) | | | 2.06 | (e) | | | (0.82 | )(e) | | | 126 | |
| | | | | | (0.01 | ) | | | 20.07 | (c) | | | 21.82 | (c) | | | 32,802 | | | | 2.06 | | | | 2.06 | | | | (0.60 | ) | | | 152 | |
| | | | | | (0.50 | ) | | | 16.48 | | | | (6.72 | ) | | | 36,607 | | | | 2.02 | | | | 2.06 | | | | (0.58 | ) | | | 139 | |
| | | | | | (0.84 | ) | | | 18.20 | | | | 5.27 | | | | 44,067 | | | | 1.99 | | | | 2.05 | | | | (0.29 | ) | | | 148 | |
| | | | | | | | | | | | | | | | | | | | | | | | | | | | | | | | | | |
| | | | | $ | (0.07 | ) | | $ | 20.73 | (c) | | | 5.35 | %(c) | | $ | 17,426 | | | | 0.92 | %(d) | | | 1.02 | %(d) | | | 0.84 | %(d) | | | 40 | % |
| | | | | | (1.66 | ) | | | 19.74 | | | | (0.36 | ) | | | 9,637 | | | | 0.93 | | | | 1.02 | | | | 0.61 | | | | 78 | |
| | | | | | (2.80 | ) | | | 21.81 | | | | 20.25 | | | | 6,883 | | | | 1.06 | (e) | | | 1.06 | (e) | | | 0.12 | (e) | | | 126 | |
| | | | | | (0.02 | ) | | | 20.63 | (c) | | | 23.12 | (c) | | | 3,425 | | | | 1.06 | | | | 1.06 | | | | 0.39 | | | | 152 | |
| | | | | | (0.64 | ) | | | 16.77 | | | | (5.82 | ) | | | 3,246 | | | | 1.02 | | | | 1.06 | | | | 0.43 | | | | 139 | |
| | | | | | (0.92 | ) | | | 18.49 | | | | 6.36 | | | | 2,143 | | | | 0.99 | | | | 1.05 | | | | 0.73 | | | | 148 | |
| | | | | | | | | | | | | | | | | | | | | | | | | | | | | | | | | | |
| | | | | $ | (0.08 | ) | | $ | 20.91 | (c) | | | 5.46 | %(c) | | $ | 16,981 | | | | 0.82 | %(d) | | | 0.92 | %(d) | | | 0.98 | %(d) | | | 40 | % |
| | | | | | (1.67 | ) | | | 19.90 | | | | (0.29 | ) | | | 9,077 | | | | 0.83 | | | | 0.92 | | | | 0.70 | | | | 78 | |
| | | | | | (2.80 | ) | | | 21.96 | | | | 20.40 | | | | 8,104 | | | | 0.96 | (e) | | | 0.96 | (e) | | | 0.21 | (e) | | | 126 | |
| | | | | | (0.02 | ) | | | 20.73 | (c) | | | 23.22 | (c) | | | 3,037 | | | | 0.96 | | | | 0.96 | | | | 0.52 | | | | 152 | |
| | | | | | (0.60 | ) | | | 16.84 | | | | (5.69 | ) | | | 2,738 | | | | 0.92 | | | | 0.96 | | | | 0.46 | | | | 139 | |
| | | | | | (0.94 | ) | | | 18.49 | | | | 6.41 | | | | 6,656 | | | | 0.93 | | | | 0.95 | | | | 0.86 | | | | 148 | |
| | | | | | | | | | | | | | | | | | | | | | | | | | | | | | | | | | |
| | | | | $ | (0.08 | ) | | $ | 20.90 | (c) | | | 5.43 | %(c) | | $ | 24,846 | | | | 0.77 | %(d) | | | 0.87 | %(d) | | | 0.99 | %(d) | | | 40 | % |
| | | | | | (1.68 | ) | | | 19.90 | | | | (5.42 | ) | | | 17,792 | | | | 0.77 | (d) | | | 0.87 | (d) | | | 0.76 | (d) | | | 78 | |
| | | | | | | | |
| See accompanying Notes to Financial Statements | | | December 31, 2019 | | | Semiannual Report | | | 135 | |
Financial Highlights (cont’d)
For a Share Outstanding for the Period ended:^
| | | | | | | | | | | | | | | | | | | | | | | | | | | | |
| | | Net Asset
Value,
Beginning
of Period | | | Net
Investment
Income
(Loss) (a) | | | Net Realized
and Change
in Unrealized
Gain (Loss) | | | Total from
Investment
Operations | | | Distributions
from Net
Realized Capital
Gains | | | Net Asset
Value, End
of Period | | | | |
| AllianzGI Technology: | | | | | | | | | | | | | | | | | | | | | |
| Class A | | | | | | | | | | | | | | | | | | | | | | | | | | | | |
12/31/2019† | | $ | 63.92 | | | $ | (0.33 | ) | | $ | 2.33 | | | $ | 2.00 | | | $ | (11.19 | ) | | $ | 54.73 | | | | | |
6/30/2019 | | | 71.60 | | | | (0.68 | ) | | | 5.90 | | | | 5.22 | | | | (12.90 | ) | | | 63.92 | | | | | |
6/30/2018 | | | 60.82 | | | | (0.64 | ) | | | 22.58 | | | | 21.94 | | | | (11.16 | ) | | | 71.60 | | | | | |
6/30/2017 | | | 48.03 | | | | (0.17 | )(e) | | | 15.75 | | | | 15.58 | | | | (2.79 | ) | | | 60.82 | (e) | | | | |
6/30/2016 | | | 58.15 | | | | (0.38 | ) | | | (1.07 | ) | | | (1.45 | ) | | | (8.67 | ) | | | 48.03 | | | | | |
6/30/2015 | | | 63.49 | | | | (0.54 | ) | | | 6.49 | | | | 5.95 | | | | (11.29 | ) | | | 58.15 | | | | | |
| Class C | | | | | | | | | | | | | | | | | | | | | | | | | | | | |
12/31/2019† | | $ | 45.22 | | | $ | (0.40 | ) | | $ | 1.63 | | | $ | 1.23 | | | $ | (11.19 | ) | | $ | 35.26 | | | | | |
6/30/2019 | | | 55.32 | | | | (0.92 | ) | | | 3.72 | | | | 2.80 | | | | (12.90 | ) | | | 45.22 | | | | | |
6/30/2018 | | | 49.43 | | | | (0.91 | ) | | | 17.96 | | | | 17.05 | | | | (11.16 | ) | | | 55.32 | | | | | |
6/30/2017 | | | 39.80 | | | | (0.46 | )(e) | | | 12.88 | | | | 12.42 | | | | (2.79 | ) | | | 49.43 | (e) | | | | |
6/30/2016 | | | 49.98 | | | | (0.66 | ) | | | (0.85 | ) | | | (1.51 | ) | | | (8.67 | ) | | | 39.80 | | | | | |
6/30/2015 | | | 56.46 | | | | (0.87 | ) | | | 5.68 | | | | 4.81 | | | | (11.29 | ) | | | 49.98 | | | | | |
| Class P | | | | | | | | | | | | | | | | | | | | | | | | | | | | |
12/31/2019† | | $ | 72.49 | | | $ | (0.29 | ) | | $ | 2.67 | | | $ | 2.38 | | | $ | (11.19 | ) | | $ | 63.68 | | | | | |
6/30/2019 | | | 79.05 | | | | (0.58 | ) | | | 6.92 | | | | 6.34 | | | | (12.90 | ) | | | 72.49 | | | | | |
6/30/2018 | | | 66.03 | | | | (0.53 | ) | | | 24.71 | | | | 24.18 | | | | (11.16 | ) | | | 79.05 | | | | | |
6/30/2017 | | | 51.80 | | | | — | (e) | | | 17.02 | | | | 17.02 | | | | (2.79 | ) | | | 66.03 | (e) | | | | |
6/30/2016 | | | 61.90 | | | | (0.27 | ) | | | (1.16 | ) | | | (1.43 | ) | | | (8.67 | ) | | | 51.80 | | | | | |
6/30/2015 | | | 66.74 | | | | (0.42 | ) | | | 6.87 | | | | 6.45 | | | | (11.29 | ) | | | 61.90 | | | | | |
| Institutional Class | | | | | | | | | | | | | | | | | | | | | | | | | | | | |
12/31/2019† | | $ | 74.10 | | | $ | (0.26 | ) | | $ | 2.72 | | | $ | 2.46 | | | $ | (11.19 | ) | | $ | 65.37 | | | | | |
6/30/2019 | | | 80.40 | | | | (0.52 | ) | | | 7.12 | | | | 6.60 | | | | (12.90 | ) | | | 74.10 | | | | | |
6/30/2018 | | | 66.94 | | | | (0.45 | ) | | | 25.07 | | | | 24.62 | | | | (11.16 | ) | | | 80.40 | | | | | |
6/30/2017 | | | 52.43 | | | | 0.06 | (e) | | | 17.24 | | | | 17.30 | | | | (2.79 | ) | | | 66.94 | (e) | | | | |
6/30/2016 | | | 62.49 | | | | (0.24 | ) | | | (1.15 | ) | | | (1.39 | ) | | | (8.67 | ) | | | 52.43 | | | | | |
6/30/2015 | | | 67.21 | | | | (0.36 | ) | | | 6.93 | | | | 6.57 | | | | (11.29 | ) | | | 62.49 | | | | | |
| Administrative Class | | | | | | | | | | | | | | | | | | | | | | | | | | | | |
12/31/2019† | | $ | 68.67 | | | $ | (0.33 | ) | | $ | 2.53 | | | $ | 2.20 | | | $ | (11.19 | ) | | $ | 59.68 | | | | | |
6/30/2019 | | | 75.76 | | | | (0.67 | ) | | | 6.48 | | | | 5.81 | | | | (12.90 | ) | | | 68.67 | | | | | |
6/30/2018 | | | 63.76 | | | | (0.61 | ) | | | 23.77 | | | | 23.16 | | | | (11.16 | ) | | | 75.76 | | | | | |
6/30/2017 | | | 50.18 | | | | (0.23 | )(e) | | | 16.60 | | | | 16.37 | | | | (2.79 | ) | | | 63.76 | (e) | | | | |
6/30/2016 | | | 60.32 | | | | (0.36 | ) | | | (1.11 | ) | | | (1.47 | ) | | | (8.67 | ) | | | 50.18 | | | | | |
6/30/2015 | | | 65.40 | | | | (0.50 | ) | | | 6.71 | | | | 6.21 | | | | (11.29 | ) | | | 60.32 | | | | | |
| ^ | A “—” may reflect actual amounts rounding to less than $0.01 or 0.01%. |
| (a) | Calculated on average shares outstanding during the period. |
| (b) | Total return is calculated assuming a purchase of a share on the first day of the period and a sale of a share on the last day of each period reported. Dividends and distributions, if any, are assumed, for purposes of this calculation, to be reinvested. Total return does not reflect sales charges and includes the effect of fee waivers and reimbursements. Total return may reflect adjustments to conform to U.S. GAAP. Total return for a period of less than one year is not annualized. |
| (c) | Annualized, unless otherwise noted. |
| (d) | Does not include expenses of the investment companies in which the Fund invests. |
| (e) | An out of period adjustment of $3,694,541, which is included in miscellaneous income, related to income earned in previous years, decreased net investment loss per share and increased net asset value per share by approximately $0.15 for Class A; $0.13 for Class C; $0.20 for Class P; $0.20 for Institutional Class and $0.04 for Administrative Class. The increase in total return and decrease in ratio of net investment loss to average net assets relating to this income for each share class was approximately 0.33% and 0.28% for Class A; 0.35% and 0.29% for Class C; 0.40% and 0.33% for Class P; 0.40% and 0.32% for Institutional Class; 0.09% and 0.08% for Administrative Class, respectively. |
| | | | | | |
| 136 | | Semiannual Report | | | December 31, 2019 | | | See accompanying Notes to Financial Statements |
| | | | | | | | | | | | | | | | | | | | | | | | | | |
| | | | Total Return (b) | | | Net Assets,
End of Period
(000s) | | | Ratio of
Expenses to
Average Net
Assets with
Fee Waiver/
Reimbursement | | | Ratio of
Expenses to
Average Net
Assets without
Fee Waiver/
Reimbursement | | | Ratio of Net
Investment
Income (Loss)
to Average
Net Assets | | | Portfolio
Turnover Rate | |
| | | | | | | | | | | | | | | | | | | | |
| | | | | | | | | | | | | | | | | | | | | | | | | | |
| | | | | | 3.20 | % | | $ | 572,273 | | | | 1.57 | %(c)(d) | | | 1.57 | %(c)(d) | | | (1.06 | )%(c)(d) | | | 62 | % |
| | | | | | 12.40 | | | | 601,112 | | | | 1.51 | (d) | | | 1.56 | (d) | | | (1.05 | )(d) | | | 109 | |
| | | | | | 38.89 | | | | 530,127 | | | | 1.42 | (d) | | | 1.57 | (d) | | | (0.95 | )(d) | | | 104 | |
| | | | | | 33.69 | (e) | | | 452,039 | | | | 1.51 | (d) | | | 1.61 | (d) | | | (0.31 | )(d)(e) | | | 128 | |
| | | | | | (3.24 | ) | | | 417,305 | | | | 1.66 | (d) | | | 1.66 | (d) | | | (0.74 | )(d) | | | 171 | |
| | | | | | 10.33 | | | | 340,765 | | | | 1.61 | | | | 1.61 | | | | (0.90 | ) | | | 165 | |
| | | | | | | | | | | | | | | | | | | | | | | | | | |
| | | | | | 2.82 | % | | $ | 42,073 | | | | 2.32 | %(c)(d) | | | 2.32 | %(c)(d) | | | (1.81 | )%(c)(d) | | | 62 | % |
| | | | | | 11.57 | | | | 48,842 | | | | 2.23 | (d) | | | 2.31 | (d) | | | (1.78 | )(d) | | | 109 | |
| | | | | | 37.86 | | | | 138,589 | | | | 2.17 | (d) | | | 2.32 | (d) | | | (1.70 | )(d) | | | 104 | |
| | | | | | 32.69 | (e) | | | 113,411 | | | | 2.26 | (d) | | | 2.36 | (d) | | | (1.05 | )(d)(e) | | | 128 | |
| | | | | | (3.95 | ) | | | 112,423 | | | | 2.41 | (d) | | | 2.41 | (d) | | | (1.53 | )(d) | | | 171 | |
| | | | | | 9.51 | | | | 130,395 | | | | 2.36 | | | | 2.36 | | | | (1.65 | ) | | | 165 | |
| | | | | | | | | | | | | | | | | | | | | | | | | | |
| | | | | | 3.35 | % | | $ | 136,555 | | | | 1.32 | %(c)(d) | | | 1.32 | %(c)(d) | | | (0.81 | )%(c)(d) | | | 62 | % |
| | | | | | 12.68 | | | | 155,553 | | | | 1.27 | (d) | | | 1.31 | (d) | | | (0.80 | )(d) | | | 109 | |
| | | | | | 39.24 | | | | 100,560 | | | | 1.17 | (d) | | | 1.32 | (d) | | | (0.71 | )(d) | | | 104 | |
| | | | | | 34.03 | (e) | | | 59,369 | | | | 1.26 | (d) | | | 1.35 | (d) | | | (0.01 | )(d)(e) | | | 128 | |
| | | | | | (2.99 | ) | | | 44,881 | | | | 1.41 | (d) | | | 1.41 | (d) | | | (0.50 | )(d) | | | 171 | |
| | | | | | 10.62 | | | | 53,710 | | | | 1.36 | | | | 1.36 | | | | (0.66 | ) | | | 165 | |
| | | | | | | | | | | | | | | | | | | | | | | | | | |
| | | | | | 3.38 | % | | $ | 781,901 | | | | 1.22 | %(c)(d) | | | 1.22 | %(c)(d) | | | (0.71 | )%(c)(d) | | | 62 | % |
| | | | | | 12.81 | | | | 800,061 | | | | 1.16 | (d) | | | 1.21 | (d) | | | (0.69 | )(d) | | | 109 | |
| | | | | | 39.37 | | | | 789,922 | | | | 1.07 | (d) | | | 1.22 | (d) | | | (0.59 | )(d) | | | 104 | |
| | | | | | 34.16 | (e) | | | 736,162 | | | | 1.16 | (d) | | | 1.25 | (d) | | | 0.09 | (d)(e) | | | 128 | |
| | | | | | (2.89 | ) | | | 518,761 | | | | 1.31 | (d) | | | 1.31 | (d) | | | (0.43 | )(d) | | | 171 | |
| | | | | | 10.71 | | | | 617,315 | | | | 1.26 | | | | 1.26 | | | | (0.55 | ) | | | 165 | |
| | | | | | | | | | | | | | | | | | | | | | | | | | |
| | | | | | 3.27 | % | | $ | 10,406 | | | | 1.47 | %(c)(d) | | | 1.47 | %(c)(d) | | | (0.96 | )%(c)(d) | | | 62 | % |
| | | | | | 12.52 | | | | 11,688 | | | | 1.40 | (d) | | | 1.46 | (d) | | | (0.95 | )(d) | | | 109 | |
| | | | | | 39.02 | | | | 23,535 | | | | 1.32 | (d) | | | 1.47 | (d) | | | (0.85 | )(d) | | | 104 | |
| | | | | | 33.83 | (e) | | | 15,062 | | | | 1.44 | (d) | | | 1.52 | (d) | | | (0.41 | )(d)(e) | | | 128 | |
| | | | | | (3.15 | ) | | | 62,913 | | | | 1.56 | (d) | | | 1.56 | (d) | | | (0.68 | )(d) | | | 171 | |
| | | | | | 10.44 | | | | 72,947 | | | | 1.51 | | | | 1.51 | | | | (0.80 | ) | | | 165 | |
| | | | | | | | |
| See accompanying Notes to Financial Statements | | | December 31, 2019 | | | Semiannual Report | | | 137 | |
Notes to Financial Statements
December 31, 2019 (Unaudited)
| 1. | ORGANIZATION AND SIGNIFICANT ACCOUNTING POLICIES |
Allianz Funds (the “Trust”) is registered under the Investment Company Act of 1940 (the “1940 Act”), as amended, as anopen-end management investment company organized as a Massachusetts business trust and accordingly, follows the investment company accounting and reporting guidance of the Financial Accounting Standards Board (“FASB”) Accounting Standards Codification Topic 946 Financial Services—Investment Companies. As of December 31, 2019, the Trust consisted of fourteen separate investment series (each a “Fund” and collectively the “Funds”). Allianz Global Investors U.S. LLC (“AllianzGI U.S.” or the “Investment Adviser”) serves as the Funds’ investment adviser. The Investment Adviser is an indirect wholly-owned subsidiary of Allianz Asset Management of America L.P. (“AAM”). AAM is an indirect, wholly-owned subsidiary of Allianz SE, a publicly traded European insurance and financial services company. Currently, the Trust may offer up to seven classes of shares to new and existing investors: A, C, R, P, Institutional, R6 and Administrative. Class C shares of a Fund will automatically convert to Class A shares of the same Fund following theten-year anniversary of purchase. Such conversions are subject to certain limitations.
The investment objective of AllianzGI Emerging Markets Opportunities is to seek maximum long-term capital appreciation. The investment objective of AllianzGI Focused Growth, AllianzGI Global Natural Resources, AllianzGI GlobalSmall-Cap, AllianzGI Health Sciences, AllianzGIMid-Cap, AllianzGISmall-Cap and AllianzGI Technology is to seek long-term capital appreciation. The investment objective of AllianzGI NFJ Dividend Value, AllianzGI NFJ International Value, AllianzGI NFJLarge-Cap Value, AllianzGI NFJMid-Cap Value and AllianzGI NFJSmall-Cap Value is to seek long-term growth of capital and income. The investment objective of AllianzGI Income & Growth is to seek total return comprised of current income, current gains and capital appreciation. There can be no assurance that the Funds will meet their stated objectives.
The preparation of the Funds’ financial statements in accordance with accounting principles generally accepted in the United States of America (“U.S. GAAP”) requires the Funds’ management to make estimates and assumptions that affect the reported amounts and disclosures in each Fund’s financial statements. Actual results could differ from those estimates.
Like many other companies, the Trust’s organizational documents provide that its officers (“Officers”) and the Board of Trustees (the “Board” or the “Trustees”) are indemnified against certain liabilities arising out of the performance of their duties to the Trust. In addition, both in some of its principal service contracts and in the normal course of its business, the Trust enters into contracts that provide indemnifications to other parties for certain types of losses or liabilities. The Trust’s maximum exposure under these arrangements is unknown as this could involve future claims against the Trust.
The following is a summary of significant accounting policies consistently followed by the Funds:
(a) Valuation of Investments. Portfolio securities and other financial instruments for which market quotations are readily available are valued at market value. Market values for various types of securities and other instruments are determined on the basis of closing prices or last sales prices on an exchange or other market, or based on quotes or other market information obtained from quotation reporting systems, established market makers or pricing services. Investments in mutual funds are valued at the net asset value (“NAV”) as reported on each business day, and, under normal circumstances, ETFs are valued at their current market trading price. The Funds’ investments are valued daily using prices supplied by an independent pricing service or broker/dealer quotations, or by using the last sale or settlement price on the exchange that is the primary market for such securities, or the mean between the last bid and ask quotations. The market value for NASDAQ Global Market and NASDAQ Capital Market securities may also be calculated using the NASDAQ Official Closing Price instead of the last reported sales price. Independent pricing services use information provided by market makers or estimates of market values obtained from yield data relating to investments or securities with similar characteristics.
The Board has adopted procedures for valuing portfolio securities and other financial derivative instruments in circumstances where market quotes are not readily available (including in cases where available market quotes are deemed to be unreliable), and has delegated responsibility for applying the valuation methods to the Investment Adviser. The Trust’s Valuation Committee was established by the Board to oversee the implementation of the Funds’ valuation methods and to make fair value determinations on behalf of the Board, as instructed. The Investment Adviser monitors the continued appropriateness of methods applied and identifies circumstances and events that may require fair valuation. The Investment Adviser determines if adjustments should be made in light of market changes, events affecting the issuer or other factors. If the Investment Adviser determines that a valuation method may no longer be appropriate, another valuation method previously approved by the Trust’s Valuation Committee may be selected or the Trust’s Valuation Committee will be convened to consider the matter and take any appropriate action in accordance with procedures set forth by the Board. The Board shall review and ratify the appropriateness of the valuation methods and these methods may be amended or supplemented from time to time by the Valuation Committee.
Short-term debt investments having a remaining maturity of 60 days or less are valued at amortized cost unless the Board or its Valuation Committee determines that particular circumstances dictate otherwise.
Investments initially valued in currencies other than the U.S. dollar are converted to the U.S. dollar using exchange rates obtained from pricing services. As a result, the NAV of each share class of a Fund may be affected by changes in the value of currencies in relation to the U.S.
| | | | | | |
| 138 | | December 31, 2019 | | | Semiannual Report | | |
dollar. The value of securities traded in markets outside the United States or denominated in currencies other than the U.S. dollar may be affected significantly on a day that the New York Stock Exchange (“NYSE”) is closed and the NAV of a Fund’s shares may change on days when an investor is not able to purchase or redeem or exchange shares.
The prices used by the Funds to value investments may differ from the value that would be realized if the investments were sold, and these differences could be material to the Funds’ financial statements. The NAV of each share class of a Fund is normally determined as of the close of regular trading (normally, 4:00 p.m., Eastern Time) on the NYSE on each day the NYSE is open for business. In unusual circumstances, the Board or the Valuation Committee may in good faith determine the NAV as of 4:00 p.m., Eastern Time, notwithstanding an earlier, unscheduled close or halt of trading on the NYSE.
The prices of certain portfolio securities or financial instruments may be determined at a time prior to the close of regular trading on the NYSE. In considering whether fair value pricing is required and in determining fair values, the Funds may, among other things, consider significant events (which may be considered to include changes in the value of U.S. securities or securities indices) that occur after the close of the relevant market and before the time the NAV of each share class of a Fund is calculated. With respect to certain foreign securities, the Funds may fair-value securities using modeling tools provided by third-party vendors, where appropriate. The Funds have retained a statistical research service to assist in determining the fair value of foreign securities. This service utilizes statistics and programs based on historical performance of markets and other economic data to assist in making fair value estimates. Fair value estimates used by the Funds for foreign securities may differ from the value realized from the sale of those securities and the difference could be material to the financial statements. Fair value pricing may require subjective determinations about the value of a security or other assets, and fair values used to determine the NAV of each share class of a Fund may differ from quoted or published prices, or from prices that are used by others, for the same investments. In addition, the use of fair value pricing may not always result in adjustments to the prices of securities or other assets held by a Fund.
(b) Fair Value Measurements. Fair value is defined as the price that would be received to sell an asset or paid to transfer a liability (i.e., the “exit price”) in an orderly transaction between market participants. The three levels of the fair value hierarchy are described below:
| ∎ | | Level 1—quoted prices in active markets for identical investments that the Funds have the ability to access |
| ∎ | | Level 2—valuations based on other significant observable inputs, which may include, but are not limited to, quoted prices for similar assets or liabilities, interest rates, yield curves, volatilities, prepayment speeds, loss severities, credit risks and default rates or other market corroborated inputs |
| ∎ | | Level 3—valuations based on significant unobservable inputs (including the Investment Adviser’s or the Trust’s Valuation Committee’s own assumptions and securities whose price was determined by using a single broker’s quote) |
The valuation techniques used by the Funds to measure fair value during the six months ended December 31, 2019 were intended to maximize the use of observable inputs and to minimize the use of unobservable inputs.
An investment asset’s or liability’s level within the fair value hierarchy is based on the lowest level input, individually or in aggregate, that is significant to the fair value measurement. The objective of fair value measurement remains the same even when there is a significant decrease in the volume and level of activity for an asset or liability and regardless of the valuation techniques used.
The inputs or methodology used for valuing securities are not necessarily an indication of the risk associated with investing in those securities. The following are certain inputs and techniques that the Funds generally use to evaluate how to classify each major category of assets and liabilities within Level 2 and Level 3, in accordance with U.S. GAAP.
An asset or liability for which market values cannot be measured using the methodologies described above is valued by methods deemed reasonable in good faith by the Valuation Committee, following the procedures established by the Board, to represent fair value. Under these procedures, the Funds generally use a market-based approach which may use related or comparable assets or liabilities, recent transactions, market multiples, book values and other relevant information. Fair value determinations involve the consideration of a number of subjective factors, an analysis of applicable facts and circumstances and the exercise of judgment. As a result, it is possible that the fair value for a security determined in good faith in accordance with the Funds’ valuation procedures may differ from valuations for the same security determined by other funds using their own valuation procedures. Although the Funds’ valuation procedures are designed to value a security at the price the Funds may reasonably expect to receive upon the security’s sale in an orderly transaction, there can be no assurance that any fair value determination thereunder would, in fact, approximate the amount that the Funds would actually realize upon the sale of the security or the price at which the security would trade if a reliable market price were readily available.
Equity Securities (Common and Preferred Stock and Warrants)—Equity securities traded in inactive markets and certain foreign equity securities are valued using inputs which include broker-dealer quotes, recently executed transactions adjusted for changes in the benchmark index, or evaluated price quotes received from independent pricing services that take into account the integrity of the market sector and issuer, the individual characteristics of the security, and information received from broker-dealers and other market sources pertaining to the issuer or security. To the extent that these inputs are observable, the values of equity securities are categorized as Level 2. To the extent that these inputs are unobservable, the values are categorized as Level 3.
Corporate Bonds & Notes—Corporate bonds & notes are generally comprised of two main categories: investment grade bonds and high yield bonds. Investment grade bonds are valued by independent pricing services using various inputs and techniques, which include
| | | | | | |
| | Semiannual Report | | | December 31, 2019 | | 139 |
Notes to Financial Statements (cont’d)
December 31, 2019 (Unaudited)
broker-dealer quotations, live trading levels, recently executed transactions in securities of the issuer or comparable issuers, and option adjusted spread models that include base curve and spread curve inputs. Adjustments to individual bonds can be applied to recognize trading differences compared to other bonds issued by the same issuer. High yield bonds are valued by independent pricing services based primarily on broker-dealer quotations from relevant market makers and recently executed transactions in securities of the issuer or comparable issuers. The broker-dealer quotations received are supported by credit analysis of the issuer that takes into consideration credit quality assessments, daily trading activity, and the activity of the underlying equities, listed bonds and sector-specific trends. To the extent that these inputs are observable, the values of corporate bonds & notes are categorized as Level 2. To the extent that these inputs are unobservable, the values are categorized as Level 3.
Convertible Bonds & Notes—Convertible bonds & notes are valued by independent pricing services based on various inputs and techniques, which include broker-dealer quotations from relevant market makers and recently executed transactions in securities of the issuer or comparable issuers. The broker-dealer quotations received are supported by credit analysis of the issuer that takes into consideration credit quality assessments, daily trading activity, and the activity of the underlying equities, listed bonds and sector-specific trends. To the extent that these
inputs are observable, the values of convertible bonds & notes are categorized as Level 2. To the extent that these inputs are unobservable, the values are categorized as Level 3.
Option Contracts—Option contracts tradedover-the-counter (“OTC”) and FLexible EXchange (“FLEX”) options are valued by independent pricing services based on pricing models that incorporate various inputs such as interest rates, credit spreads, currency exchange rates and volatility measurements forin-the-money,at-the-money, andout-of-the-money contracts based on a given strike price. To the extent that these inputs are observable, the values of OTC and FLEX option contracts are categorized as Level 2. To the extent that these inputs are unobservable, the values are categorized as Level 3.
Forward Foreign Currency Contracts—Forward foreign currency contracts are valued by independent pricing services using various inputs and techniques, which include broker-dealer quotations, actual trading information and foreign currency exchange rates gathered from leading market makers and foreign currency exchange trading centers throughout the world. To the extent that these inputs are observable, the values of forward foreign currency contracts are categorized as Level 2. To the extent that these inputs are unobservable, the values are categorized as Level 3.
A summary of the inputs used at December 31, 2019 in valuing each Fund’s assets and liabilities is listed below (refer to the Schedules of Investments and Notes to Schedules of Investments for more detailed information on Investments in Securities and Other Financial Instruments):
| | | | | | | | | | | | | | | | |
|
| AllianzGI Emerging Markets Opportunities: | |
| Investments in Securities – Assets | | Level 1–
Quoted Prices | | | Level 2–
Other Significant
Observable Inputs | | | Level 3–
Significant
Unobservable Inputs | | | Value at
12/31/19 | |
Common Stock: | |
Brazil | | $ | 3,791,095 | | | $ | 13,925,964 | | | | — | | | $ | 17,717,059 | |
China | | | 21,337,048 | | | | 96,023,169 | | | | — | | | | 117,360,217 | |
India | | | 15,743,485 | | | | 13,097,250 | | | | — | | | | 28,840,735 | |
Mexico | | | 6,347,661 | | | | — | | | | — | | | | 6,347,661 | |
Russian Federation | | | 30,990,419 | | | | — | | | $ | 997,275 | | | | 31,987,694 | |
South Africa | | | 6,788,100 | | | | 4,920,245 | | | | — | | | | 11,708,345 | |
Thailand | | | — | | | | — | | | | 18,556,915 | | | | 18,556,915 | |
United States | | | 4,169,585 | | | | — | | | | — | | | | 4,169,585 | |
All Other | | | — | | | | 123,722,721 | | | | — | | | | 123,722,721 | |
Preferred Stock | | | — | | | | 10,330,479 | | | | — | | | | 10,330,479 | |
Repurchase Agreements | | | — | | | | 870,000 | | | | — | | | | 870,000 | |
Totals | | $ | 89,167,393 | | | $ | 262,889,828 | | | $ | 19,554,190 | | | $ | 371,611,411 | |
| | | | | | | | | | | | | | | | |
|
| AllianzGI Focused Growth: | |
| Investments in Securities – Assets | | Level 1–
Quoted Prices | | | Level 2–
Other Significant
Observable Inputs | | | Level 3–
Significant
Unobservable Inputs | | | Value at
12/31/19 | |
Common Stock | | $ | 1,026,046,139 | | | | — | | | | — | | | $ | 1,026,046,139 | |
Repurchase Agreements | | | — | | | $ | 14,402,000 | | | | — | | | | 14,402,000 | |
Totals | | $ | 1,026,046,139 | | | $ | 14,402,000 | | | | — | | | $ | 1,040,448,139 | |
| | | | | | |
| 140 | | December 31, 2019 | | | Semiannual Report | | |
| | | | | | | | | | | | | | | | |
|
| AllianzGI Global Natural Resources: | |
| Investments in Securities – Assets | | Level 1–
Quoted Prices | | | Level 2–
Other Significant
Observable Inputs | | | Level 3–
Significant
Unobservable Inputs | | | Value at
12/31/19 | |
Common Stock: | |
Australia | | | — | | | $ | 449,891 | | | | — | | | $ | 449,891 | |
Belgium | | | — | | | | 49,855 | | | | — | | | | 49,855 | |
France | | | — | | | | 491,771 | | | | — | | | | 491,771 | |
Ireland | | | — | | | | 66,951 | | | | — | | | | 66,951 | |
Japan | | | — | | | | 375,480 | | | | — | | | | 375,480 | |
Korea (Republic of) | | | — | | | | 47,873 | | | | — | | | | 47,873 | |
Norway | | | — | | | | 102,304 | | | | — | | | | 102,304 | |
United Kingdom | | $ | 117,920 | | | | 866,980 | | | | — | | | | 984,900 | |
All Other | | | 7,161,604 | | | | — | | | | — | | | | 7,161,604 | |
Exchange-Traded Funds | | | 330,392 | | | | — | | | | — | | | | 330,392 | |
Totals | | $ | 7,609,916 | | | $ | 2,451,105 | | | | — | | | $ | 10,061,021 | |
| | | | | | | | | | | | | | | | |
|
| AllianzGI GlobalSmall-Cap: | |
| Investments in Securities – Assets | | Level 1–
Quoted Prices | | | Level 2–
Other Significant
Observable Inputs | | | Level 3–
Significant
Unobservable Inputs | | | Value at
12/31/19 | |
Common Stock: | |
Australia | | | — | | | $ | 2,580,150 | | | | — | | | $ | 2,580,150 | |
Austria | | $ | 719,990 | | | | 1,334,838 | | | | — | | | | 2,054,828 | |
China | | | — | | | | 167,870 | | | | — | | | | 167,870 | |
France | | | — | | | | 2,129,808 | | | | — | | | | 2,129,808 | |
Germany | | | 1,183,736 | | | | 2,757,685 | | | | — | | | | 3,941,421 | |
Hong Kong | | | — | | | | 316,889 | | | | — | | | | 316,889 | |
Indonesia | | | — | | | | 218,746 | | | | — | | | | 218,746 | |
Italy | | | — | | | | 1,219,053 | | | | — | | | | 1,219,053 | |
Japan | | | — | | | | 14,114,289 | | | | — | | | | 14,114,289 | |
Korea (Republic of) | | | — | | | | 235,185 | | | | — | | | | 235,185 | |
Netherlands | | | — | | | | 1,340,383 | | | | — | | | | 1,340,383 | |
Norway | | | — | | | | 1,266,751 | | | | — | | | | 1,266,751 | |
Singapore | | | — | | | | 1,042,838 | | | | — | | | | 1,042,838 | |
Sweden | | | 665,704 | | | | 697,377 | | | | — | | | | 1,363,081 | |
Switzerland | | | 696,683 | | | | 1,946,922 | | | | — | | | | 2,643,605 | |
Taiwan | | | — | | | | 321,785 | | | | — | | | | 321,785 | |
Thailand | | | — | | | | — | | | $ | 166,051 | | | | 166,051 | |
United Kingdom | | | 713,367 | | | | 6,298,280 | | | | — | | | | 7,011,647 | |
All Other | | | 60,867,761 | | | | — | | | | — | | | | 60,867,761 | |
Preferred Stock | | | — | | | | 485,956 | | | | — | | | | 485,956 | |
Repurchase Agreements | | | — | | | | 1,670,000 | | | | — | | | | 1,670,000 | |
| | | | 64,847,241 | | | | 40,144,805 | | | | 166,051 | | | | 105,158,097 | |
Other Financial Instruments* – Assets | |
Foreign Exchange Contracts | | | — | | | | 100 | | | | — | | | | 100 | |
Totals | | $ | 64,847,241 | | | $ | 40,144,905 | | | $ | 166,051 | | | $ | 105,158,197 | |
| | | | | | |
| | Semiannual Report | | | December 31, 2019 | | 141 |
Notes to Financial Statements (cont’d)
December 31, 2019 (Unaudited)
| | | | | | | | | | | | | | | | |
|
| AllianzGI Health Sciences: | |
| Investments in Securities – Assets | | Level 1–
Quoted Prices | | | Level 2–
Other Significant
Observable Inputs | | | Level 3–
Significant
Unobservable Inputs | | | Value at
12/31/19 | |
Common Stock: | |
Pharmaceuticals | | $ | 65,045,190 | | | $ | 5,490,678 | | | | — | | | $ | 70,535,868 | |
All Other | | | 87,875,360 | | | | — | | | | — | | | | 87,875,360 | |
Warrants | | | — | | | | — | | | $ | 91,313 | | | | 91,313 | |
Rights | | | — | | | | — | | | | 957 | | | | 957 | |
Repurchase Agreements | | | — | | | | 5,167,000 | | | | — | | | | 5,167,000 | |
Totals | | $ | 152,920,550 | | | $ | 10,657,678 | | | $ | 92,270 | | | $ | 163,670,498 | |
| | | | | | | | | | | | | | | | |
|
| AllianzGI Income & Growth: | |
| Investments in Securities – Assets | | Level 1–
Quoted Prices | | | Level 2–
Other Significant
Observable Inputs | | | Level 3–
Significant
Unobservable Inputs | | | Value at
12/31/19 | |
Common Stock: | |
Advertising | | | — | | | | — | | | $ | 163,305 | | | $ | 163,305 | |
Aerospace & Defense | | $ | 42,520,216 | | | | — | | | | 222,536 | | | | 42,742,752 | |
Apparel & Textiles | | | — | | | | — | | | | 47,468 | | | | 47,468 | |
Banks | | | 25,092,000 | | | | — | | | | 7 | | | | 25,092,007 | |
Commercial Services | | | — | | | | — | | | | 576,798 | | | | 576,798 | |
Media | | | 13,045,797 | | | | — | | | | 845,643 | | | | 13,891,440 | |
Oil, Gas & Consumable Fuels | | | 35,046,630 | | | | — | | | | 18 | | | | 35,046,648 | |
Pharmaceuticals | | | 73,557,182 | | | | — | | | | 1,971,344 | | | | 75,528,526 | |
All Other | | | 1,484,393,172 | | | | — | | | | — | | | | 1,484,393,172 | |
Corporate Bonds & Notes: | |
Commercial Services | | | — | | | $ | 67,370,977 | | | | 30,401 | | | | 67,401,378 | |
Computers | | | — | | | | 14,990,425 | | | | 65 | | | | 14,990,490 | |
Diversified Financial Services | | | — | | | | 61,448,339 | | | | 4,725,743 | | | | 66,174,082 | |
Media | | | — | | | | 148,445,174 | | | | 8 | | | | 148,445,182 | |
All Other | | | — | | | | 1,185,656,193 | | | | — | | | | 1,185,656,193 | |
Convertible Bonds & Notes: | |
Biotechnology | | | — | | | | 86,092,166 | | | | 1 | | | | 86,092,167 | |
All Other | | | — | | | | 1,204,290,869 | | | | — | | | | 1,204,290,869 | |
Convertible Preferred Stock: | |
Computers | | | — | | | | 12,244,635 | | | | — | | | | 12,244,635 | |
Diversified Financial Services | | | — | | | | 5,067,765 | | | | — | | | | 5,067,765 | |
All Other | | | 217,468,491 | | | | — | | | | — | | | | 217,468,491 | |
Preferred Stock | | | — | | | | — | | | | 18,336,838 | | | | 18,336,838 | |
Equity-Linked Security | | | — | | | | — | | | | 100,383 | | | | 100,383 | |
Warrants | | | — | | | | — | | | | 56,981 | | | | 56,981 | |
Repurchase Agreements | | | — | | | | 193,214,000 | | | | — | | | | 193,214,000 | |
| | | | 1,891,123,488 | | | | 2,978,820,543 | | | | 27,077,539 | | | | 4,897,021,570 | |
Investments in Securities – Liabilities | |
Options Written: | |
Market Price | | | (226,131 | ) | | | — | | | | — | | | | (226,131 | ) |
Totals | | $ | 1,890,897,357 | | | $ | 2,978,820,543 | | | $ | 27,077,539 | | | $ | 4,896,795,439 | |
| | | | | | |
| 142 | | December 31, 2019 | | | Semiannual Report | | |
| | | | | | | | | | | | | | | | |
|
| AllianzGIMid-Cap: | |
| Investments in Securities – Assets | | Level 1–
Quoted Prices | | | Level 2–
Other Significant
Observable Inputs | | | Level 3–
Significant
Unobservable Inputs | | | Value at
12/31/19 | |
Common Stock | | $ | 332,259,319 | | | | — | | | | — | | | $ | 332,259,319 | |
Repurchase Agreements | | | — | | | $ | 3,282,000 | | | | — | | | | 3,282,000 | |
Totals | | $ | 332,259,319 | | | $ | 3,282,000 | | | | — | | | $ | 335,541,319 | |
| | | | | | | | | | | | | | | | |
|
| AllianzGI NFJ Dividend Value: | |
| Investments in Securities – Assets | | Level 1–
Quoted Prices | | | Level 2–
Other Significant
Observable Inputs | | | Level 3–
Significant
Unobservable Inputs | | | Value at
12/31/19 | |
Common Stock | | $ | 1,232,707,561 | | | | — | | | | — | | | $ | 1,232,707,561 | |
Repurchase Agreements | | | — | | | $ | 7,594,000 | | | | — | | | | 7,594,000 | |
Totals | | $ | 1,232,707,561 | | | $ | 7,594,000 | | | | — | | | $ | 1,240,301,561 | |
| | | | | | | | | | | | | | | | |
|
| AllianzGI NFJ International Value: | |
| Investments in Securities – Assets | | Level 1–
Quoted Prices | | | Level 2–
Other Significant
Observable Inputs | | | Level 3–
Significant
Unobservable Inputs | | | Value at
12/31/19 | |
Common Stock: | |
Belgium | | $ | 1,722,758 | | | | — | | | | — | | | $ | 1,722,758 | |
Brazil | | | 1,858,646 | | | | — | | | | — | | | | 1,858,646 | |
Canada | | | 17,792,141 | | | | — | | | | — | | | | 17,792,141 | |
India | | | 1,365,770 | | | | — | | | | — | | | | 1,365,770 | |
Russian Federation | | | 1,882,400 | | | | — | | | | — | | | | 1,882,400 | |
Taiwan | | | 3,188,296 | | | | — | | | | — | | | | 3,188,296 | |
United Kingdom | | | 11,021,332 | | | $ | 18,159,038 | | | | — | | | | 29,180,370 | |
United States | | | 5,093,361 | | | | — | | | | — | | | | 5,093,361 | |
All Other | | | — | | | | 103,375,284 | | | | — | | | | 103,375,284 | |
Preferred Stock | | | — | | | | 3,093,917 | | | | — | | | | 3,093,917 | |
Repurchase Agreements | | | — | | | | 414,000 | | | | — | | | | 414,000 | |
Totals | | $ | 43,924,704 | | | $ | 125,042,239 | | | | — | | | $ | 168,966,943 | |
| | | | | | | | | | | | | | | | |
|
| AllianzGI NFJLarge-Cap Value: | |
| Investments in Securities – Assets | | Level 1–
Quoted Prices | | | Level 2–
Other Significant
Observable Inputs | | | Level 3–
Significant
Unobservable Inputs | | | Value at
12/31/19 | |
Common Stock | | $ | 323,369,695 | | | | — | | | | — | | | $ | 323,369,695 | |
| | | | | | | | | | | | | | | | |
|
| AllianzGI NFJMid-Cap Value: | |
| Investments in Securities – Assets | | Level 1–
Quoted Prices | | | Level 2–
Other Significant
Observable Inputs | | | Level 3–
Significant
Unobservable Inputs | | | Value at
12/31/19 | |
Common Stock | | $ | 1,439,682,979 | | | | — | | | | — | | | $ | 1,439,682,979 | |
Repurchase Agreements | | | — | | | $ | 12,973,000 | | | | — | | | | 12,973,000 | |
Totals | | $ | 1,439,682,979 | | | $ | 12,973,000 | | | | — | | | $ | 1,452,655,979 | |
| | | | | | | | | | | | | | | | |
|
| AllianzGI NFJSmall-Cap Value: | |
| Investments in Securities – Assets | | Level 1–
Quoted Prices | | | Level 2–
Other Significant
Observable Inputs | | | Level 3–
Significant
Unobservable Inputs | | | Value at
12/31/19 | |
Common Stock | | $ | 810,050,794 | | | | — | | | | — | | | $ | 810,050,794 | |
Exchange-Traded Funds | | | 3,084,798 | | | | — | | | | — | | | | 3,084,798 | |
Totals | | $ | 813,135,592 | | | | — | | | | — | | | $ | 813,135,592 | |
| | | | | | |
| | Semiannual Report | | | December 31, 2019 | | 143 |
Notes to Financial Statements (cont’d)
December 31, 2019 (Unaudited)
| | | | | | | | | | | | | | | | |
|
| AllianzGISmall-Cap: | |
| Investments in Securities – Assets | | Level 1–
Quoted Prices | | | Level 2–
Other Significant
Observable Inputs | | | Level 3–
Significant
Unobservable Inputs | | | Value at
12/31/19 | |
Common Stock: | |
Equity Real Estate Investment Trusts (REITs) | | $ | 4,005,986 | | | | — | | | $ | 1,296 | | | $ | 4,007,282 | |
All Other | | | 127,326,659 | | | | — | | | | — | | | | 127,326,659 | |
Repurchase Agreements | | | — | | | $ | 2,409,000 | | | | — | | | | 2,409,000 | |
Totals | | $ | 131,332,645 | | | $ | 2,409,000 | | | $ | 1,296 | | | $ | 133,742,941 | |
| | | | | | | | | | | | | | | | |
|
| AllianzGI Technology: | |
| Investments in Securities – Assets | | Level 1–
Quoted Prices | | | Level 2–
Other Significant
Observable Inputs | | | Level 3–
Significant
Unobservable Inputs | | | Value at
12/31/19 | |
Common Stock: | |
Communications Equipment | | $ | 3,040,611 | | | $ | 2,291,491 | | | | — | | | $ | 5,332,102 | |
Electrical Equipment | | | 96,587 | | | | 13,659 | | | | — | | | | 110,246 | |
Electronic Equipment, Instruments & Components | | | 1,872,006 | | | | 229,740 | | | | — | | | | 2,101,746 | |
Entertainment | | | 49,634,613 | | | | 39,996 | | | | — | | | | 49,674,609 | |
Interactive Media & Services | | | 178,669,257 | | | | 81,243 | | | | — | | | | 178,750,500 | |
IT Services | | | 311,203,798 | | | | 85,927 | | | | — | | | | 311,289,725 | |
Semiconductors & Semiconductor Equipment | | | 328,177,493 | | | | 1,031,960 | | | | — | | | | 329,209,453 | |
Software | | | 474,020,414 | | | | 15,730 | | | | — | | | | 474,036,144 | |
Technology Hardware, Storage & Peripherals | | | 46,270,147 | | | | 43,603,897 | | | | — | | | | 89,874,044 | |
All Other | | | 56,043,716 | | | | — | | | | — | | | | 56,043,716 | |
Exchange-Traded Funds | | | — | | | | 1,965 | | | | — | | | | 1,965 | |
Repurchase Agreements | | | — | | | | 42,714,000 | | | | — | | | | 42,714,000 | |
Options Purchased: | |
Market Price | | | 7,715,600 | | | | — | | | | — | | | | 7,715,600 | |
| | | | 1,456,744,242 | | | | 90,109,608 | | | | — | | | | 1,546,853,850 | |
Investments in Securities – Liabilities | | | | | | | | | | | | | | | | |
Options Written: | |
Market Price | | | (3,544,475 | ) | | | — | | | | — | | | | (3,544,475 | ) |
Securities Sold Short, at value | | | (134 | ) | | | — | | | | — | | | | (134 | ) |
| | | (3,544,609 | ) | | | — | | | | — | | | | (3,544,609 | ) |
Totals | | $ | 1,453,199,633 | | | $ | 90,109,608 | | | | — | | | $ | 1,543,309,241 | |
A roll forward of fair value measurements using significant unobservable inputs (Level 3) for the six months ended December 31, 2019, was as follows:
| | | | | | | | | | | | | | | | | | | | | | | | | | | | | | | | | | | | |
|
| AllianzGI Emerging Markets Opportunities: | |
| Investments in Securities – Assets | | Beginning Balance 6/30/19 | | | Purchases | | | Sales | | | Accrued Discount (Premiums) | | | Net Realized Gain (Loss) | | | Net Change in Unrealized Appreciation/ Depreciation | | | Transfers into Level 3 | | | Transfers out
of Level 3 | | | Ending Balance 12/31/19 | |
Common Stock: | |
Russian Federation | | $ | 3,377,025 | | | $ | — | | | $ | (2,163,036 | ) | | | — | | | $ | (695,569 | ) | | $ | 478,855 | | | | — | | | | — | | | $ | 997,275 | |
Thailand | | | 7,596,712 | | | | 11,653,555 | | | | (283,160 | ) | | | — | | | | 11,316 | | | | (421,508 | ) | | | — | | | | — | | | | 18,556,915 | |
Preferred Stock | | | 5,739,783 | | | | — | | | | (4,246,035 | ) | | | — | | | | (401,688 | ) | | | (1,092,060 | ) | | | — | | | | — | | | | — | |
Totals | | $ | 16,713,520 | | | $ | 11,653,555 | | | $ | (6,692,231 | ) | | | — | | | $ | (1,085,941 | ) | | $ | (1,034,713 | ) | | | — | | | | — | | | $ | 19,554,190 | |
| | | | | | |
| 144 | | December 31, 2019 | | | Semiannual Report | | |
| | | | | | | | | | | | | | | | | | | | | | | | | | | | | | | | | | | | |
|
| AllianzGI GlobalSmall-Cap: | |
| Investments in Securities – Assets | | Beginning
Balance
6/30/19 | | | Purchases | | | Sales | | | Accrued
Discount
(Premiums) | | | Net
Realized
Gain (Loss) | | | Net Change
in Unrealized
Appreciation/
Depreciation | | | Transfers into
Level 3 | | | Transfers out
of Level 3 | | | Ending
Balance
12/31/19 | |
Common Stock: | |
Australia | | $ | 46,051 | | | | — | | | $ | (44,355 | )† | | | — | | | | — | | | $ | (1,696 | ) | | | — | | | | — | | | $ | — | |
Thailand | | | 257,201 | | | $ | 10,864 | | | | (69,174 | ) | | | — | | | $ | 5,359 | | | | (38,199 | ) | | | — | | | | — | | | | 166,051 | |
Totals | | $ | 303,252 | | | $ | 10,864 | | | $ | (113,529 | ) | | | — | | | $ | 5,359 | | | $ | (39,895 | ) | | | — | | | | — | | | $ | 166,051 | |
| | | | | | | | | | | | | | | | | | | | | | | | | | | | | | | | | | | | |
|
| AllianzGI Health Sciences: | |
| Investments in Securities – Assets | | Beginning
Balance
6/30/19 | | | Purchases | | | Sales | | | Accrued
Discount
(Premiums) | | | Net
Realized
Gain (Loss) | | | Net Change
in Unrealized
Appreciation/
Depreciation | | | Transfers into
Level 3 | | | Transfers out
of Level 3 | | | Ending
Balance
12/31/19 | |
Warrants | | $ | 184,981 | | | | — | | | | — | | | | — | | | | — | | | $ | (93,668 | ) | | | — | | | | — | | | $ | 91,313 | |
Rights | | | — | | | $ | 957 | † | | | — | | | | — | | | | — | | | | — | | | | — | | | | — | | | | 957 | |
Totals | | $ | 184,981 | | | $ | 957 | | | | — | | | | — | | | | — | | | $ | (93,668 | ) | | | — | | | | — | | | $ | 92,270 | |
| | | | | | | | | | | | | | | | | | | | | | | | | | | | | | | | | | | | |
|
| AllianzGI Income & Growth: | |
| Investments in Securities – Assets | | Beginning
Balance
6/30/19 | | | Purchases | | | Sales | | | Accrued
Discount
(Premiums) | | | Net
Realized
Gain (Loss) | | | Net Change
in Unrealized
Appreciation/
Depreciation | | | Transfers into
Level 3** | | | Transfers out
of Level 3 | | | Ending
Balance
12/31/19 | |
Common Stock: | |
Advertising | | $ | 266,445 | | | | — | | | | — | | | | — | | | | — | | | $ | (103,140 | ) | | | — | | | | — | | | $ | 163,305 | |
Aerospace & Defense | | | 272,411 | | | | — | | | | — | | | | — | | | | — | | | | (49,875 | ) | | | — | | | | — | | | | 222,536 | |
Apparel & Textiles | | | 44,930 | | | | — | | | | — | | | | — | | | | — | | | | 2,538 | | | | — | | | | — | | | | 47,468 | |
Banks | | | 7 | | | | — | | | | — | | | | — | | | | — | | | | — | | | | — | | | | — | | | | 7 | |
Commercial Services | | | 576,798 | | | | — | | | | — | | | | — | | | | — | | | | — | | | | — | | | | — | | | | 576,798 | |
Media | | | 1,018,843 | | | | — | | | | — | | | | — | | | | — | | | | (173,200 | ) | | | — | | | | — | | | | 845,643 | |
Oil, Gas & Consumable Fuels | | | 18 | | | | — | | | | — | | | | — | | | | — | | | | — | | | | — | | | | — | | | | 18 | |
Pharmaceuticals | | | — | | | $ | 2,799,297 | † | | | — | † | | | — | | | | (8 | ) | | | (827,945 | ) | | | — | | | | — | | | | 1,971,344 | |
Corporate Bonds & Notes: | |
Commercial Services | | | 476,780 | | | | — | | | $ | (98,805 | )†† | | $ | 24 | | | | — | | | | (347,598 | ) | | | — | | | | — | | | | 30,401 | |
Computers | | | — | | | | 1 | † | | | — | | | | — | | | | — | | | | 64 | | | | — | | | | — | | | | 65 | |
Diversified Financial Services | | | 3,683,024 | | | | 1,138,698 | † | | | — | | | | 54,171 | | | | — | | | | (150,150 | ) | | | — | | | | — | | | | 4,725,743 | |
Media | | | 8 | | | | — | | | | — | | | | — | | | | — | | | | — | | | | — | | | | — | | | | 8 | |
Convertible Bonds & Notes: | |
Banks | | | 17,201,932 | | | | — | | | | (17,491,543 | ) | | | — | | | $ | (253,758 | ) | | | 543,369 | | | | — | | | | — | | | | — | |
Biotechnology | | | — | | | | 74 | † | | | — | | | | — | | | | — | | | | (73 | ) | | | — | | | | — | | | | 1 | |
Preferred Stock | | | 18,217,438 | | | | — | | | | — | | | | — | | | | — | | | | 119,400 | | | | — | | | | — | | | | 18,336,838 | |
Equity-Linked Security: | |
Coal | | | — | | | | — | | | | — | | | | — | | | | — | | | | — | | | $ | 100,383 | | | | — | | | | 100,383 | |
Warrants: | |
Advertising | | | 69,799 | | | | — | | | | — | | | | — | | | | — | | | | (12,822 | ) | | | — | | | | — | | | | 56,977 | |
Media | | | 4 | | | | — | | | | — | | | | — | | | | — | | | | — | | | | — | | | | — | | | | 4 | |
Totals | | $ | 41,828,437 | | | $ | 3,938,070 | | | $ | (17,590,348 | ) | | $ | 54,195 | | | $ | (253,766 | ) | | $ | (999,432 | ) | | $ | 100,383 | | | | — | | | $ | 27,077,539 | |
The table for AllianzGI Income & Growth includes Level 3 investments that are valued by brokers and independent pricing services. The inputs for these investments are not readily available or cannot be reasonably estimated and are generally those inputs described in Note 1(b).
| | | | | | |
| | Semiannual Report | | | December 31, 2019 | | 145 |
Notes to Financial Statements (cont’d)
December 31, 2019 (Unaudited)
| | | | | | | | | | | | | | | | | | | | | | | | | | | | | | | | | | | | |
|
| AllianzGI NFJSmall-Cap Value: | |
| Investments in Securities – Assets | | Beginning
Balance
6/30/19 | | | Purchases | | | Sales | | | Accrued
Discount
(Premiums) | | | Net
Realized
Gain (Loss) | | | Net Change
in Unrealized
Appreciation/
Depreciation | | | Transfers into
Level 3 | | | Transfers out
of Level 3 | | | Ending
Balance
12/31/19 | |
Common Stock: | |
Chemicals | | $ | 56 | | | | — | | | | — | | | | — | | | | — | | | $ | (56 | ) | | | — | | | | — | | | | — | |
| | | | | | | | | | | | | | | | | | | | | | | | | | | | | | | | | | | | |
|
| AllianzGISmall-Cap: | |
| Investments in Securities – Assets | | Beginning
Balance
6/30/19 | | | Purchases | | | Sales | | | Accrued
Discount
(Premiums) | | | Net
Realized
Gain (Loss) | | | Net Change
in Unrealized
Appreciation/
Depreciation | | | Transfers into
Level 3 | | | Transfers out
of Level 3 | | | Ending
Balance
12/31/19 | |
Common Stock: | |
Equity Real Estate Investment Trusts (REITs) | | $ | 2,074 | | | | — | | | | — | | | | — | | | | — | | | $ | (778 | ) | | | — | | | | — | | | $ | 1,296 | |
The tables above may include Level 3 investments that are valued by brokers and independent pricing services.
The following tables presents additional information about valuation techniques and inputs used for investments that are measured at fair value and categorized within Level 3 at December 31, 2019:
| | | | | | | | | | | | |
|
| AllianzGI Health Sciences: | |
| Investments in Securities – Assets | | Ending
Balance
at 12/31/19 | | | Valuation Technique Used | | Unobservable
Inputs | | Input Values | |
Warrants: | | | | | | | | | | | | |
Pharmaceuticals | | $ | 91,313 | | | Black Scholes Model | | Implied Price | | $ | 4.480 | |
| | | | | | | | | Volatility | | | 43.83 | % |
| | | | | | | | | | | | |
| | | | |
| AllianzGI Income & Growth: | | | | | | | | | | |
| Investments in Securities – Assets | | Ending
Balance
at 12/31/19 | | | Valuation Technique Used | | Unobservable
Inputs | | Input Values
(Ranges) | |
Common Stock: | | | | | | | | | | | | |
Advertising | | $ | 163,305 | | | Market and Company Comparables | | EV Multiples | | | 4.78x (0.99x-10.07x | ) |
| | | | | | | | M&A Transaction Multiples | | | 1.90x (1.32x-2.50x | ) |
| | | | | | | | | Illiquidity Discount | | | 20 | % |
Aerospace & Defense | | $ | 222,536 | | | Market and Company Comparables | | EV Multiples | | | 0.68x (0.36x-0.83x | ) |
| | | | | | | | M&A Transaction Multiples | | | 0.91x (0.38x-2.12x | ) |
| | | | | | | | | Illiquidity Discount | | | 40 | % |
Apparel & Textiles | | $ | 47,468 | | | Market and Company Comparables | | EV Multiples | | | 0.69x (0.19x-1.12x | ) |
| | | | | | | | | | | 11.25x (3.87x-22.96x | ) |
| | | | | | | | | | | 0.85x (0.22x-1.67x | ) |
| | | | | | | | | Illiquidity Discount | | | 20 | % |
Media | | $ | 845,623 | | | Market and Company Comparables | | EV Multiples | | | 0.84x (0.47x-2.71x | ) |
| | | | | | | | | | | 5.18x (4.57x-20.39x | ) |
| | | | | | | | M&A Transaction Multiples | | | 8.52x (6.65x-10.11x | ) |
| | | | | | | | | Illiquidity Discount | | | 10 | % |
Pharmaceuticals | | $ | 1,971,344 | | | Market and Company Comparables | | Implied Price | | $ | 8.08 | |
Corporate Bonds & Notes: | | | | | | | | | | | | |
Diversified Financial Services | | $ | 4,725,743 | | | Market and Company Comparables | | EV Multiples | | | 1.75x (0.38x-5.16x | ) |
| | | | | | | | | Illiquidity Discount | | | 20 | % |
Preferred Stock: | | | | | | | | | | | | |
Media | | $ | 18,336,758 | | | Market and Company Comparables | | EV Multiples | | | 0.90x (0.30x-1.53x | ) |
| | | | | | | | | Illiquidity Discount | | | 25 | % |
Equity-Linked Security: | | | | | | | | | | | | |
Coal | | $ | 100,383 | | | Black-Sholes Model | | Implied Volume | | | 38.97 | % |
| | | | | | | | | Implied Price | | $ | 25.08 | |
Warrants: | | | | | | | | | | | | |
Advertising | | $ | 56,977 | | | Market and Company Comparables | | EV Multiples | | | 6.42x (1.21x-27.11x | ) |
| | | | | | | | | | | 6.39x (1.26x-19.85x | ) |
| | | | | | Black-Sholes Model | | Expected Volatility | | | 26.52 | % |
| | | | | | | | | Implied Price | | $ | 52.24 | |
| | | | | | |
| 146 | | December 31, 2019 | | | Semiannual Report | | |
| | | | | | | | | | | | |
|
| AllianzGISmall-Cap: | |
| Investments in Securities – Assets | | Ending
Balance
at 12/31/19 | | | Valuation Technique Used | | Unobservable
Inputs | | Input
Values | |
Common Stock: | | | | | | | | | | | | |
Equity Real Estate Investment Trusts (REITs) | | $ | 1,296 | | | Net Assets Approach | | Estimated Movement of Proceeds | | | 7.18 | % |
The tables above do not include Level 3 Investments that are valued by the brokers or independent pricing services.
| * | Other financial instruments are derivatives, such as forward foreign currency contracts which are valued at the unrealized appreciation (depreciation) of the instrument. |
| ** | Transferred out of Level 1 and into Level 3 because of the insufficient trading volume. |
| † | Issued or removed via corporate action. |
The net change in unrealized depreciation of Level 3 investments which the following Funds held at December 31, 2019 was:
| | | | |
AllianzGI Emerging Markets Opportunities | | $ | (352,990 | ) |
AllianzGI GlobalSmall-Cap | | | (31,428 | ) |
AllianzGI Health Sciences | | | (93,668 | ) |
AllianzGI Income & Growth | | | (1,583,145 | ) |
AllianzGISmall-Cap | | | (778 | ) |
Net realized gain (loss) and net change in unrealized appreciation/depreciation are reflected on the Statements of Operations.
(c) Investment Transactions and Investment Income. Investment transactions are accounted for on the trade date. Securities purchased and sold on a when-issued or delayed-delivery basis may be settled beyond a standard settlement period for the security after the trade date. Realized gains and losses on investments are determined on an identified cost basis. Estimated tax liabilities on certain foreign securities are recorded on an accrual basis and are reflected as a component of net change in unrealized appreciation (depreciation) of investments on the Statements of Operations. Tax liabilities realized as a result of such security sales are reflected as a component of net realized gain (loss) on investments on the Statements of Operations. Interest income adjusted for the accretion of discounts and amortization of premiums is recorded on an accrual basis. Discounts or premiums on debt securities purchased are accreted or amortized, respectively, to interest income. Conversion premium is not amortized. Dividend income is recorded on theex-dividend date, except for certain dividends from foreign securities where theex-dividend date may have passed, and then are recorded as soon after theex-dividend date as the Funds, using reasonable diligence, become aware of such dividends. Dividend and interest income on the Statements of Operations are shown net of any foreign taxes withheld on income from foreign securities. Payments received from real estate investment trust securities may be comprised of dividends, realized gains and return of capital. The payment may initially be recorded as dividend income and may subsequently be reclassified as realized gains and/or return of capital upon receipt of information from the issuer. Payments considered return of capital reduce the cost basis of the respective security. Distributions, if any, in excess of the cost basis of a security are recognized as capital gains. Dividends from underlying funds are recorded as dividend income, while capital gain
distributions are recorded as net capital gain distributions received from underlying funds on the Statements of Operations. Consent fees relating to corporate actions are recorded as miscellaneous income upon receipt. Expenses are recorded on an accrual basis and such expenses exclude those of the underlying funds. Expenses of the underlying funds are reflected in the net asset values of those funds.
(d) Federal Income Taxes. The Funds intend to distribute all of their taxable income and to comply with the other requirements of Subchapter M of the U.S. Internal Revenue Code of 1986, as amended, applicable to regulated investment companies. Accordingly, no provision for U.S. federal income taxes is required. The Funds may be subject to excise tax based on distributions to shareholders.
Accounting for uncertainty in income taxes establishes for all entities, including pass-through entities such as the Funds, a minimum threshold for financial statement recognition of the benefit of positions taken in filing tax returns (including whether an entity is taxable in a particular jurisdiction), and requires certain expanded tax disclosures. In accordance with provisions set forth under U.S. GAAP, the Investment Adviser has reviewed the Funds’ tax positions for all open tax years. As of December 31, 2019, the Funds have recorded no liability for net unrecognized tax benefits relating to uncertain income tax positions they have taken. The Funds’ U.S. federal income tax returns for the prior three years, as applicable, remain subject to examination by the Internal Revenue Service.
(e) Dividends and Distributions to Shareholders. Dividends from net investment income, if any, of each Fund (except AllianzGI Income & Growth, AllianzGI NFJ Dividend Value, AllianzGI NFJ International Value and AllianzGI NFJLarge-Cap Value), are declared and distributed to shareholders annually. Dividends from net investment income and/or distributions from short-term capital gains for AllianzGI Income & Growth, if any, are declared and distributed monthly. Dividends from net investment income, if any, for AllianzGI NFJ Dividend Value, AllianzGI NFJ International Value and AllianzGI NFJLarge-Cap Value are declared and distributed quarterly. Net realized capital gains, if any, earned by each Fund, will be distributed annually. The Funds record dividends and distributions to their respective shareholders on theex-dividend date. The amount of dividends from net investment income and distributions from net realized capital gains is determined in accordance with federal income tax regulations, which may differ from U.S. GAAP. These“book-tax”
| | | | | | |
| | Semiannual Report | | | December 31, 2019 | | 147 |
Notes to Financial Statements (cont’d)
December 31, 2019 (Unaudited)
differences are considered either temporary or permanent in nature. To the extent these differences are permanent in nature, such amounts are reclassified within the capital accounts based on their U.S. federal income tax treatment. Temporary differences do not require reclassification. To the extent dividends and/or distributions exceed current and accumulated earnings and profits for U.S. federal income tax purposes, they are reported as dividends and/or distributions to shareholders from return of capital.
(f) Multi-Class Operations. Each class offered by the Funds has equal rights as to assets and voting privileges (except that shareholders of a class have exclusive voting rights regarding any matter relating solely to that class of shares). Income,non-class specific expenses, and realized and unrealized capital gains and losses of each Fund are allocated daily to each class of shares based on the relative net assets of each class. Class specific expenses, where applicable, include administration, distribution and servicing fees.
(g) Foreign Currency Translation. The Funds’ accounting records are maintained in U.S. dollars as follows: (1) the foreign currency market values of investments and other assets and liabilities denominated in foreign currencies are translated at the prevailing exchange rate at the end of the period; and (2) purchases and sales, income and expenses are translated at the prevailing exchange rate on the respective dates of such transactions. The resulting net foreign currency gain (loss) is included in the Funds’ Statements of Operations.
The Funds do not generally isolate that portion of the results of operations arising as a result of changes in foreign currency exchange rates from the fluctuations arising from changes in the market prices of securities. Accordingly, such foreign currency gain (loss) is included in net realized and unrealized gain (loss) on investments. However, the Funds do isolate the effect of fluctuations in foreign currency exchange rates when determining the gain (loss) upon the sale or maturity of foreign currency denominated debt obligations pursuant to U.S. federal income tax regulations; such amount is categorized as foreign currency gain (loss) for both financial reporting and income tax reporting purposes.
(h) Repurchase Agreements. The Funds are parties to Master Repurchase Agreements (“Master Repo Agreements”) with select counterparties. The Master Repo Agreements include provisions for initiation of repurchase transactions, income payments, events of default, and maintenance of collateral.
The Funds enter into transactions, under the Master Repo Agreements, with their custodian bank or securities brokerage firms whereby they purchase securities under agreements (i.e., repurchase agreements) to resell such securities at an agreed upon price and date. The Funds, through their custodian, take possession of securities collateralizing the repurchase agreement. Such agreements are carried at the contract amount in the financial statements, which is considered to represent fair value. The collateral that is pledged (i.e. the securities received by the Funds), which consists primarily of U.S. government obligations and asset-backed securities, is held by the custodian bank for the benefit of the Funds until the maturity of the
repurchase agreement. Provisions of the repurchase agreements and the procedures adopted by the Funds require that the market value of the collateral, including accrued interest thereon, be sufficient in the event of default by the counterparty. If the counterparty defaults under the Master Repo Agreements and the value of the collateral declines or if the counterparty enters an insolvency proceeding, realization of the collateral by the Funds may be delayed or limited. The gross values are included in the Funds’ Schedules of Investments. As of December 31, 2019, the value of the related collateral exceeded the value of the repurchase agreements for each Fund.
(i) Securities Sold Short. Certain Funds engage in short sales for investment and risk management purposes. Short sales are transactions in which a Fund sells a security or other instrument (such as an option, forward, future or other derivative contract) it does not own. When a Fund engages in a short sale, it must borrow the security sold short and deliver it to the counterparty. The Funds will ordinarily have to pay a fee or premium to borrow a security and be obligated to repay the lender of the security any dividend or interest that accrues on the security during the period of the loan. Until a short position is closed out, the net proceeds of the short sale will be retained by the lending broker to the extent necessary to meet margin requirements, together with any additional assets the broker requires as collateral. This collateral earns interest and the interest is used to pay each lender a fee for borrowed securities, to compensate the broker for its services, and to provide a rebate to the borrower (the Fund) for posting the collateral. The net proceeds from these transactions are shown as miscellaneous income or miscellaneous expense on the Statements of Operations. A Fund is also required to designate, on its books or the books of its custodian, liquid assets (less any additional collateral held by the broker) to cover the short sale obligation, marked to market daily. Short sales expose the Funds to the risk that they will be required to cover the short position at a time when the security or other asset has appreciated in value, thus resulting in losses to the applicable Fund. A short sale is “against the box” if a Fund holds in its portfolio or has the right to acquire the security sold short at no additional cost. The Funds will be subject to additional risks to the extent that they engage in short sales that are not “against the box.” A Fund’s loss on a short sale could theoretically be unlimited in cases where the Fund is unable, for whatever reason, to close out its short position.
(j) Warrants. The Funds may receive warrants. Warrants are securities that are usually issued together with a debt security or preferred stock and that give the holder the right to buy a proportionate amount of common stock at a specified price. Warrants may be freely transferable and are often traded on major exchanges. Warrants normally have a life that is measured in years and entitle the holder to buy common stock of a company at a price that is usually higher than the market price at the time the warrant is issued. Warrants may entail greater risks than certain other types of investments. Generally, warrants do not carry the right to receive dividends or exercise voting rights with respect to the underlying securities, and they do not represent any rights in the assets of the issuer. In addition, their value does not necessarily change with the
| | | | | | |
| 148 | | December 31, 2019 | | | Semiannual Report | | |
value of the underlying securities, and they cease to have value if they are not exercised on or before their expiration date. If the market price of the underlying stock does not exceed the exercise price during the life of the warrant, the warrant will expire worthless. Warrants may increase the potential profit or loss to be realized from the investment as compared with investing the same amount in the underlying securities. Similarly, the percentage increase or decrease in the value of an equity security warrant may be greater than the percentage increase or decrease in the value of the underlying common stock. Warrants may relate to the purchase of equity or debt securities. Debt obligations with warrants attached to purchase equity securities have many characteristics of convertible securities and their prices may, to some degree, reflect the performance of the underlying stock. Debt obligations also may be issued with warrants attached to purchase additional debt securities at the same coupon rate. A decline in interest rates would permit a Fund to sell such warrants at a profit. If interest rates rise, these warrants would generally expire with no value.
(k) Rights. The Funds may receive rights. A right is a privilege granted to existing shareholders of a corporation to subscribe for shares of a new issue of common stock before it is issued. Rights normally have a short life, usually two to four weeks, are freely transferable and entitle the holder to buy the new common stock at a lower price than the public offering price. Rights may entail greater risks than certain other types of investments. Generally, rights do not carry the right to receive dividends or exercise voting rights with respect to the underlying securities, and they do not represent any rights in the assets of the issuer. In addition, their value does not necessarily change with the value of the underlying securities, and they cease to have value if they are not exercised on or before their expiration date. If the market price of the underlying stock does not exceed the exercise price during the life of the right, the right will expire worthless. Rights may increase the potential profit or loss to be realized from the investment as compared with investing the same amount in the underlying securities.
(l) Exchange-Traded Funds. Certain Funds may invest in exchange-traded-funds (“ETFs”), which typically are index-based investment companies that hold substantially all of their assets in securities representing their specific index, but may also be actively-managed investment companies. Shares of ETFs trade throughout the day on an exchange and represent an investment in a portfolio of securities and other assets. As a shareholder of another investment company, the Funds would bear their pro rata portion of the other investment company’s expenses, including advisory fees, in addition to the expenses the Funds bear directly in connection with their own operations.
(m) Convertible Securities. Certain Funds may invest a portion of their assets in convertible securities. Although convertible securities derive part of their value from that of the securities into which they are convertible, they are not considered derivative financial instruments. However, certain of the Funds’ investments in convertible securities include features which render them sensitive to price changes in their underlying securities. The value of structured/
synthetic convertible securities can be affected by interest rate changes and credit risks of the issuer. Such securities may be structured in ways that limit their potential for capital appreciation and the entire value of the security may be at risk of loss depending on the performance of the underlying equity security. Consequently, the Funds are exposed to greater downside risk than traditional convertible securities, but typically still less than that of the underlying stock.
(n) PaymentIn-Kind Securities. The Funds may invest in paymentin-kind securities, which are debt or preferred stock securities that require or permit payment of interest in the form of additional securities. Paymentin-kind securities allow the issuer to avoid or delay the need to generate cash to meet current interest payments and, as a result, may involve greater risk than securities that pay interest currently or in cash.
(o) Loan Interest Expense. Loan interest expense relates to the amounts borrowed under the credit facility (See Note 11). Loan interest expense is recorded as it is incurred.
(p) Contingent Value Rights. A Fund may invest in contingent value rights (“CVRs”). A CVR gives the holder the right to receive an amount (which may be a fixed amount or determined by a formula) in the event that a specified corporate action, business milestone, or other trigger occurs (or does not occur) which is often subject to an expiration date. CVRs often are awarded to shareholders in the context of a corporate acquisition or major restructuring. For example, shareholders of an acquired company may receive a CVR that enables them to receive additional shares of the acquiring company in the event that the acquiring company’s share price falls below a certain level by a specified date. Risks associated with the use of CVRs are generally similar to risks associated with the use of options, such as the risk that the required trigger does not (or does) occur prior to a CVR’s expiration, causing the CVR to expire with no value. CVRs also present illiquidity risk, as they may not be registered securities or may otherwise benon-transferable or difficult to transfer, as well as counterparty risk and credit risk. Further, because CVRs are valued based on the likelihood of the occurrence of a trigger, valuation often requires modeling and judgment, which increases the risk of mispricing or improper valuation.
(q) Restricted Securities. The Funds are permitted to invest in securities that are subject to legal or contractual restrictions on resale. These securities generally may be resold in transactions exempt from registration or to the public if the securities are registered. Disposal of these securities may involve time-consuming negotiations and expenses, and prompt sale at an acceptable price may be difficult.
In the normal course of business, the Funds trade financial instruments and enter into financial transactions where risk of potential loss exists due to, among other things, changes in the market (market risk) or failure of the other party to a transaction to perform (counterparty risk). The Funds are also exposed to other risks such as, but not limited to, interest rate, foreign currency, credit and leverage risks.
| | | | | | |
| | Semiannual Report | | | December 31, 2019 | | 149 |
Notes to Financial Statements (cont’d)
December 31, 2019 (Unaudited)
Interest rate risk is the risk that fixed income securities’ valuations will change because of changes in interest rates. During periods of rising nominal interest rates, the values of fixed income instruments are generally expected to decline. Conversely, during periods of declining nominal interest rates, the values of fixed income instruments are generally expected to rise. To the extent that a Fund effectively has short positions with respect to fixed income instruments, the values of such short positions would generally be expected to rise when nominal interest rates rise and to decline when nominal interest rates decline. A nominal interest rate can be described as the sum of a real interest rate and an expected inflation rate. Fixed income securities with longer durations tend to be more sensitive to changes in interest rates, usually making them more volatile than securities with shorter durations. Duration is used primarily as a measure of the sensitivity of a fixed income security’s market price to interest rate (i.e., yield) movements. Interest rate changes can be sudden and unpredictable, and the Funds may lose money as a result of movements in interest rates. High-yield or junk bonds are subject to greater levels of credit and liquidity risk, may be speculative and may decline in value due to increase in interest rates or an issuer’s deterioration and/or default. The Funds may not be able to hedge against changes in interest rates or may choose not to do so for cost or other reasons. In addition, any hedges may not work as intended. The values of equity and othernon-fixed income securities may also decline due to fluctuations in interest rates.
Variable and floating rate securities generally are less sensitive to interest rate changes but may decline in value if their interest rates do not rise as much, or as quickly, as interest rates in general. Conversely, floating rate securities will not generally increase in value if interest rates decline. Inverse floating rate securities may decrease in value if interest rates increase. Inverse floating rate securities may also exhibit greater price volatility than a fixed rate obligation with similar credit quality. When the Funds hold variable or floating rate securities, a decrease (or, in the case of inverse floating rate securities, an increase) in market interest rates will adversely affect the income received from such securities and the NAV of the Funds’ shares.
The Funds are exposed to credit risk, which is the risk of losing money if the issuer or guarantor of a fixed income security is unable or unwilling, or is perceived (whether by market participants, rating agencies, pricing services or otherwise) as unable or unwilling, to make timely principal and/or interest payments, or to otherwise honor its obligations. Securities are subject to varying degrees of credit risk, which are often reflected in credit ratings.
To the extent the Funds directly invest in foreign currencies or in securities that trade in, and receive revenues in, foreign currencies, or in derivatives that provide exposure to foreign currencies, they will be subject to the risk that those currencies will decline in value relative to the U.S. dollar, or, in the case of hedging positions, that the U.S. dollar will decline in value relative to the currency being hedged. Currency rates in foreign countries may fluctuate significantly over short periods of time for a number of reasons, including economic growth, inflation, changes in interest rates, intervention (or the failure to intervene) by U.S. or foreign governments, central banks or supranational entities
such as the International Monetary Fund, or the imposition of currency controls or other political developments in the United States or abroad. As a result, the Funds’ investments in foreign currency-denominated securities may reduce the returns of the Funds. The local emerging market currencies in which the Funds may be invested may experience substantially greater volatility against the U.S. dollar than the major convertible currencies in developed countries.
The Funds are subject to elements of risk not typically associated with investments in the U.S., due to concentrated investments in foreign issuers located in a specific country or region. Such concentrations will subject the Funds to additional risks resulting from future political or economic conditions in such country or region and the possible imposition of adverse governmental laws or currency exchange restrictions affecting such country or region, which could cause the securities and their markets to be less liquid and prices more volatile than those of comparable U.S. companies.
The market values of securities may decline due to general market conditions (market risk) which are not specifically related to a particular company, such as real or perceived adverse economic conditions, changes in the general outlook for corporate earnings, changes in interest or currency rates, adverse changes to credit markets or adverse investor sentiment. They may also decline due to factors that affect a particular industry or industries, such as labor shortages or increased production costs and competitive conditions within an industry. Equity securities and equity-related investments generally have greater market price volatility than fixed income securities, although under certain market conditions fixed income securities may have comparable or greater price volatility. Credit ratings downgrades may also negatively affect securities held by the Funds. Even when markets perform well, there is no assurance that the investments held by the Funds will increase in value along with the broader market. In addition, market risk includes the risk that geopolitical events will disrupt the economy on a national or global level.
Certain of the Funds invest in ETFs. Shareholders will indirectly bear fees and expenses associated with the ETFs in which a Fund invests, in addition to a Fund’s direct fees and expenses. The cost of investing in a Fund, therefore, may be higher than the cost of investing in a mutual fund that invests directly in individual stocks and bonds. In addition, a Fund’s NAV will be subject to fluctuations in the market values of the ETFs in which it invests. A Fund is also subject to the risks associated with the securities or other investments in which the ETFs invest, and the ability of a Fund to meet its investment objective will directly depend on the ability of the ETFs to meet their investment objectives. An index based ETF’s performance may not match that of the index it seeks to track.
The Funds are exposed to counterparty risk, or the risk that an institution or other entity with which the Funds have unsettled or open transactions will default. The potential loss to the Funds could exceed the value of the financial assets recorded in the Funds’ financial statements. Financial assets, which potentially expose the Funds to counterparty risk, consist principally of cash due from counterparties and investments. The Investment Adviser seeks to minimize the Funds’ counterparty risk by performing reviews of each counterparty
| | | | | | |
| 150 | | December 31, 2019 | | | Semiannual Report | | |
and by minimizing concentration of counterparty risk by undertaking transactions with multiple customers and counterparties on recognized and reputable exchanges. Delivery of securities sold is only made once the Funds have received payment. Payment is made on a purchase once the securities have been delivered by the counterparty. The trade will fail if either party fails to meet its obligation.
The Funds are exposed to risks associated with leverage. Leverage may cause the value of the Funds’ shares to be more volatile than if the Funds did not use leverage. This is because leverage tends to exaggerate the effect of any increase or decrease in the value of the Funds’ portfolio securities. The Funds may engage in transactions or purchase instruments that give rise to forms of leverage. In addition, to the extent the Funds employ leverage, dividend and interest costs on such leverage may not be recovered by any appreciation of the securities purchased with the leverage proceeds and could exceed the Funds’ investment returns, resulting in greater losses.
The Funds may hold defaulted securities that may involve special considerations including bankruptcy proceedings, other regulatory and legal restrictions affecting the Funds’ ability to trade, and the availability of prices from independent pricing services or dealer quotations. Defaulted securities are often illiquid and may not be actively traded. Sale of securities in bankrupt companies at an acceptable price may be difficult and differences compared to the value of the securities used by the Funds could be material. A Fund may incur additional expenses to the extent it is required to seek recovery upon a portfolio security’s default in the payment of principal or interest. In any bankruptcy proceeding relating to a defaulted investment, a Fund may lose its entire investment or may be required to accept cash or securities with a value substantially less than its original investment.
Short sales may be used by certain Funds. When a Fund engages in a short sale on a security, it must borrow the security sold short and deliver it to the counterparty. The Fund will ordinarily have to pay a fee or premium to borrow particular securities and be obligated to repay the lender of the security any dividends or interest that accrue on the security during the period of the loan. The amount of any gain from a short sale will be decreased, and the amount of any loss increased, by the amount of the premium, dividends, interest or expenses a Fund pays in connection with the short sale. Short sales expose a Fund to the risk that it will be required to cover its short position at a time when the securities have appreciated in value, thus resulting in a loss to the Fund.
Investments in senior loans and repurchase agreements also involve special risks. Although typically secured, senior loans may not be backed by sufficient collateral to satisfy their issuers’ obligations in the event of bankruptcy or similar scenarios. Senior loans may also be illiquid. Similarly, repurchase agreements may result in losses if the collateral associated with such positions is insufficient in the event of a counterparty default or similar scenario. Repurchase agreement positions may also be illiquid.
The considerations and factors surrounding the settlement of certain purchases and sales made on a delayed-delivery basis are governed by Master Securities Forward Transaction Agreements (“Master Forward Agreements”) between the Funds and select counterparties. The Master Forward Agreements maintain provisions for, among other things, initiation and confirmation, payment and transfer, events of default, termination, and maintenance of collateral.
The counterparty risk associated with certain contracts may be reduced by master netting arrangements to the extent that if an event of default occurs, all amounts with the counterparty are terminated and settled on a net basis. The Funds’ overall exposure to counterparty risk with respect to transactions subject to master netting arrangements can change substantially within a short period, as it is affected by each transaction subject to the arrangement.
The Funds may invest in other investment companies, including investment companies advised by the Investment Adviser or its affiliates. Investing in other investment companies involves certain additional expenses and tax results that would not be present in a direct investment in such other investment companies. Each Fund’s NAV will fluctuate in response to changes in the NAVs of the other investment companies in which it invests. The extent to which the investment performance and risks associated with each Fund correlate to those of a particular investment company will depend upon the extent to which each Fund’s assets are allocated from time to time for investment in such investment company, which will vary. To the extent that a Fund invests a significant portion of its assets in another investment company, it will be particularly sensitive to the risks associated with that investment company.
| 3. | FINANCIAL DERIVATIVE INSTRUMENTS |
Disclosure about derivatives and hedging activities requires qualitative disclosure regarding objectives and strategies for using derivatives, quantitative disclosure about fair value amounts of gains and losses on derivatives, and disclosure about credit-risk-related contingent features in derivative agreements. The disclosure requirements distinguish between derivatives which are accounted for as “hedges”, and those that do not qualify for such accounting. Although the Funds at times use derivatives for hedging purposes, the Funds reflect derivatives at fair value and recognize changes in fair value through the Funds’ Statements of Operations, and such derivatives do not qualify for hedge accounting treatment.
Option Transactions. The Funds purchase put and call options on securities and indices for hedging purposes, risk management purposes or otherwise as part of their investment strategies. The risks associated with purchasing an option include the risk that the Funds pay a premium whether or not the option is exercised. Additionally, the Funds bear the risk of loss of premiums and changes in market value should the counterparty not perform under the contract. Put and call options purchased are accounted for in the same manner as portfolio securities. The cost of securities acquired through the exercise of call options is increased by the premiums paid. The
| | | | | | |
| | Semiannual Report | | | December 31, 2019 | | 151 |
Notes to Financial Statements (cont’d)
December 31, 2019 (Unaudited)
proceeds from securities sold through the exercise of put options are decreased by the premiums paid.
The Funds may write (sell) put and call options on securities and indices to earn premiums, for hedging purposes, risk management purposes or otherwise as part of their investment strategies. When an option is written, the premium received is recorded as an asset with an equal liability that is subsequently marked to market to reflect the market value of the option written. These liabilities, if any, are reflected as options written in the Funds’ Statements of Assets and Liabilities. Premiums received from writing options which expire unexercised are recorded on the expiration date as a realized gain. The difference between the premium received and the amount paid on effecting a closing purchase transaction, including brokerage commissions, is also treated as a realized gain, or if the premium is less than the amount paid for the closing purchase transaction, as a realized loss. If a call option written is exercised, the premium is added to the proceeds from the sale of the underlying security in determining whether there has been a realized gain or loss. If a put option written is exercised, the premium reduces the cost basis of the security. In writing an option, the Funds bear the market risk of an unfavorable change in the price of the security underlying the written option. Exercise of a written option could result in the Funds purchasing a security at a price different from its current market value.
There are several risks associated with option transactions on securities. For example, there are significant differences between the securities and options markets that could result in an imperfect correlation between these markets, causing a given transaction not to achieve its objective. The Funds’ ability to use options successfully will depend on the Investment Adviser’s ability to predict pertinent market movements, which cannot be assured. As the writer of a covered call option, a Fund foregoes, during the option’s life, the opportunity to profit from increases in the market value of the security covering the call option above the sum of the premium and the strike price of the call, but has retained the risk of loss should the price of the underlying security decline.
Forward Foreign Currency Contracts. A forward foreign currency contract is an agreement between two parties to buy and sell a currency at a set exchange rate on a future date. The Funds enter into forward foreign currency contracts for the purpose of hedging against foreign currency risk arising from the investment or anticipated investment in securities denominated in foreign currencies. The Funds also enter into these contracts for purposes of increasing exposure to a foreign currency or shifting exposure to foreign currency fluctuations from one country to another. The market value of a forward foreign currency contract fluctuates with changes in foreign currency exchange rates. All commitments are marked to market daily at the applicable exchange rates and any resulting unrealized appreciation or depreciation is recorded. Realized gains or losses are recorded at the time the forward contract matures or by delivery of the currency. Risks may arise upon entering into these contracts from the potential inability of counterparties to meet the terms of their contracts and from unanticipated movements in the value of a foreign
currency relative to the U.S. dollar. In addition, these contracts may involve market risk in excess of the unrealized appreciation (depreciation) reflected in the Funds’ Statements of Assets and Liabilities.
The following is a summary of the Funds’ derivatives categorized by risk exposure.
The effect of derivatives on the Statements of Assets and Liabilities at December 31, 2019:
| | | | |
|
| AllianzGI GlobalSmall-Cap: | |
| Location | | Foreign
Exchange
Contracts | |
Asset derivatives: | | | | |
Unrealized appreciation of forward foreign currency contracts | | $ | 100 | |
| |
|
| AllianzGI Income & Growth: | |
| Location | | Market Price | |
Liability derivatives: | | | | |
Options written, at value | | $ | (226,131 | ) |
| |
|
| AllianzGI Technology: | |
| Location | | Market Price | |
Asset derivatives: | | | | |
Investments, at value (options purchased) | | $ | 7,715,600 | |
Liability derivatives: | | | | |
Options written, at value | | $ | (3,544,475 | ) |
The effect of derivatives on the Statements of Operations for the six months ended December 31, 2019:
| | | | |
|
| AllianzGI Global Natural Resources: | |
| Location | | Foreign
Exchange
Contracts | |
Net realized loss on: | | | | |
Forward foreign currency contracts | | $ | (645 | ) |
| |
|
| AllianzGI GlobalSmall-Cap: | |
| Location | | Foreign
Exchange
Contracts | |
Net realized loss on: | | | | |
Forward foreign currency contracts | | $ | (2,259 | ) |
Net change in unrealized appreciation/depreciation of: | | | | |
Forward foreign currency contracts | | $ | 100 | |
| | | | | | |
| 152 | | December 31, 2019 | | | Semiannual Report | | |
| | | | |
|
| AllianzGI Income & Growth: | |
| Location | | Market
Price | |
Net realized gain on: | | | | |
Options written | | $ | 770,405 | |
Net change in unrealized appreciation/depreciation of: | | | | |
Options written | | $ | 312,453 | |
| |
|
| AllianzGI Technology: | |
| Location | | Market
Price | |
Net realized gain (loss) on: | | | | |
Investments (options purchased) | | $ | (12,469 | ) |
Options written | | | 3,086,845 | |
Total net realized gain | | $ | 3,074,376 | |
Net change in unrealized appreciation/depreciation of: | | | | |
Investments (options purchased) | | $ | (431,197 | ) |
Options written | | | (1,464,631 | ) |
Total net change in unrealized
appreciation/depreciation | | $ | (1,895,828 | ) |
The average volume (based on the open positions at eachmonth-end) of derivative activity during the six months ended December 31, 2019:
| | | | | | | | | | | | | | | | |
| | | |
| | | Options
Purchased | | | Options
Written | | | Forward
Foreign
Currency
Contracts (2) | |
| | | | |
| | | Contracts (1) | | | Contracts (1) | | | Purchased | | | Sold | |
AllianzGI Global Natural Resources | | | — | | | | — | | | | — | | | | — | † |
AllianzGI GlobalSmall-Cap | | | — | | | | — | | | | — | | | $ | 21,508 | |
AllianzGI Income & Growth | | | — | | | | (14,734 | ) | | | — | | | | — | |
AllianzGI Technology | | | 5,409 | | | | (6,009 | ) | | | — | | | | — | |
| † | Fund had derivative activity during the period but it did not have open positions at anymonth-end in the period. |
| (2) | U.S. $ value on origination date |
The following table presents by counterparty, the Funds’ derivative assets and liabilities net of related collateral held by the Fund at December 31, 2019 which has not been offset in the Statements of Assets and Liabilities, but would be available for offset to the extent of a default by the counterparty to the transaction.
Financial Assets and Derivative Assets, and Collateral Received at December 31, 2019:
| | | | | | | | | | | | | | | | |
| | | | |
| AllianzGI GlobalSmall-Cap: | | | | | | | | | | | | |
| Gross Amounts Not Offset in the Statement of Assets and Liabilities | |
| Counterparty | | Gross Asset Derivatives
Presented in Statement of
Assets and Liabilities | | | Financial
Instrument/
Derivative
Offset | | | Cash
Collateral
Received | | | Net Amount | |
Foreign Currency Exchange Contracts | |
State Street Bank London | | $ | 100 | | | $ | — | | | $ | — | | | $ | 100 | |
| 4. | INVESTMENT ADVISER/ADMINISTRATOR/DISTRIBUTOR FEES/EXPENSES & DEFERRED COMPENSATION |
Investment Advisory Fee. AllianzGI U.S. serves as the investment adviser to the Funds, pursuant to an investment advisory contract. AllianzGI U.S. receives a monthly fee (the “Investment Advisory Fee”) from each Fund at an annual rate based on the average daily net assets of each Fund.
Administration Fee. AllianzGI U.S. provides administrative services to the Funds and also bears the cost of most third-party administrative services required by the Funds, and in return it receives from each share class of each Fund a monthly administration fee based on each share class’ average daily net assets (the “Administration Fee”).
| | | | | | |
| | Semiannual Report | | | December 31, 2019 | | 153 |
Notes to Financial Statements (cont’d)
December 31, 2019 (Unaudited)
The Investment Advisory Fee and Administration Fee for all classes are charged at an annual rate as indicated in the following table:
| | | | | | | | | | | | | | | | | | | | | | | | | | | | | | | | | | | | | | | | | | | | | | | | |
| | | | | | |
| | | All Classes | | | Class A, C, and R | | | Class P | | | Institutional Class | | | Class R6 | | | Administrative Class | |
| | | | | | | | | | | | |
| | | Investment
Advisory
Fee | | | Effective
Advisory
Fee | | | Administ-
ration
Fee | | | Effective
Administ-
ration
Fee | | | Administ-
ration
Fee | | | Effective
Administ-
ration
Fee | | | Administ-
ration
Fee | | | Effective
Administ-
ration
Fee | | | Administ-
ration
Fee | | | Effective
Administ-
ration
Fee | | | Administ-
ration
Fee | | | Effective
Administ-
ration
Fee | |
AllianzGI Emerging Markets Opportunities(1) | | | 0.85 | % | | | 0.65 | %(4) | | | 0.50 | % | | | 0.34 | %(5) | | | 0.50 | % | | | 0.34 | %(5) | | | 0.40 | % | | | 0.24 | %(5) | | | 0.35 | % | | | 0.19 | %(5) | | | N/A | | | | N/A | |
AllianzGI Focused Growth(3) | | | 0.45 | | | | 0.35 | (6) | | | 0.40 | | | | † | (7) | | | 0.40 | | | | 0.40 | | | | 0.30 | | | | 0.30 | | | | 0.25 | | | | 0.25 | | | | 0.30 | % | | | 0.30 | % |
AllianzGI Global Natural Resources(2) | | | 0.70 | | | | 0.70 | | | | 0.45 | | | | 0.45 | | | | 0.45 | | | | 0.45 | | | | 0.35 | | | | 0.35 | | | | N/A | | | | N/A | | | | N/A | | | | N/A | |
AllianzGI GlobalSmall-Cap(2) | | | 0.90 | | | | 0.90 | | | | 0.45 | | | | 0.45 | | | | 0.45 | | | | 0.45 | | | | 0.35 | | | | 0.35 | | | | N/A | | | | N/A | | | | N/A | | | | N/A | |
AllianzGI Health Sciences(3) | | | 0.80 | | | | 0.80 | | | | 0.40 | | | | 0.40 | | | | N/A | | | | N/A | | | | 0.30 | | | | 0.30 | | | | N/A | | | | N/A | | | | N/A | | | | N/A | |
AllianzGI Income & Growth(3) | | | 0.65 | | | | 0.64 | (9) | | | 0.40 | | | | 0.37 | | | | 0.40 | | | | 0.37 | | | | 0.30 | | | | 0.27 | | | | N/A | | | | N/A | | | | N/A | | | | N/A | |
AllianzGIMid-Cap(3) | | | 0.47 | | | | 0.47 | | | | 0.40 | | | | 0.40 | | | | 0.40 | | | | 0.40 | | | | 0.30 | | | | 0.30 | | | | N/A | | | | N/A | | | | 0.30 | | | | 0.30 | |
AllianzGI NFJ Dividend Value(3) | | | 0.45 | | | | 0.37 | (10) | | | 0.40 | | | | 0.39 | | | | 0.40 | | | | 0.39 | | | | 0.30 | | | | 0.29 | | | | 0.25 | | | | 0.24 | | | | 0.30 | | | | 0.29 | |
AllianzGI NFJ International Value(1) | | | 0.60 | | | | 0.55 | (11) | | | 0.50 | | | | 0.47 | (12) | | | 0.50 | | | | 0.47 | (12) | | | 0.40 | | | | 0.37 | (12) | | | 0.35 | | | | 0.32 | (12) | | | 0.40 | | | | 0.37 | (12) |
AllianzGI NFJLarge-Cap Value(3) | | | 0.45 | | | | 0.45 | | | | 0.40 | | | | 0.40 | | | | 0.40 | | | | 0.40 | | | | 0.30 | | | | 0.30 | | | | N/A | | | | N/A | | | | 0.30 | | | | 0.30 | |
AllianzGI NFJMid-Cap Value(3) | | | 0.55 | | | | 0.55 | | | | 0.40 | | | | 0.17 | (13) | | | 0.40 | | | | 0.17 | (13) | | | 0.30 | | | | 0.07 | (13) | | | 0.25 | | | | 0.02 | (13) | | | 0.30 | | | | 0.07 | (13) |
AllianzGI NFJSmall-Cap Value(3) | | | 0.60 | | | | 0.50 | (14) | | | 0.40 | | | | 0.40 | | | | 0.40 | | | | 0.40 | | | | 0.30 | | | | 0.30 | | | | 0.25 | | | | 0.25 | | | | 0.30 | | | | 0.30 | |
AllianzGISmall-Cap(3) | | | 0.60 | | | | 0.60 | | | | 0.40 | | | | 0.30 | (15) | | | 0.40 | | | | 0.30 | (15) | | | 0.30 | | | | 0.20 | (15) | | | 0.25 | | | | 0.15 | (15) | | | N/A | | | | N/A | |
AllianzGI Technology(3) | | | 0.90 | | | | 0.90 | (8) | | | 0.40 | | | | 0.39 | | | | 0.40 | | | | 0.39 | | | | 0.30 | | | | 0.29 | | | | N/A | | | | N/A | | | | 0.30 | | | | 0.29 | |
| (1) | The total Administration Fee rate for each class of shares shall be reduced according to the following schedule, each based on such Fund’s aggregate average daily net assets: by 0.025% per annum on assets in excess of $250 million, by an additional 0.025% per annum on assets in excess of $500 million, by an additional 0.025% per annum on assets in excess of $1 billion, by an additional 0.025% per annum on assets in excess of $2.5 billion, by an additional 0.025% per annum on assets in excess of $5 billion and by an additional 0.025% per annum on assets in excess of $7.5 billion. To the extent that any such reduction in the fee rate applies, the dollar amount of the fee reduction with respect to each share class is calculated and applied on a pro rata basis by reference to the percentage of the Fund’s average daily net assets attributable to that class. |
| (2) | The total Administration Fee rate for each class of shares shall be reduced according to the following schedule, each based on such Fund’s aggregate average daily net assets: by 0.025% per annum on assets in excess of $500 million, by an additional 0.025% per annum on assets in excess of $1 billion, by an additional 0.025% per annum on assets in excess of $2.5 billion, by an additional 0.025% per annum on assets in excess of $5 billion and by an additional 0.025% per annum on assets in excess of $7.5 billion. To the extent that any such reduction in the fee rate applies, the dollar amount of the fee reduction with respect to each share class is calculated and applied on a pro rata basis by reference to the percentage of the Fund’s average daily net assets attributable to that class. |
| (3) | The total Administration Fee rate for each class of shares shall be reduced according to the following schedule, each based on such Fund’s aggregate average daily net assets: by 0.025% per annum on assets in excess of $1 billion, by an additional 0.025% per annum on assets in excess of $2.5 billion, by an additional 0.025% per annum on assets in excess of $5 billion and by an additional 0.025% per annum on assets in excess of $7.5 billion. To the extent that any such reduction in the fee rate applies, the dollar amount of the fee reduction with respect to each share class is calculated and applied on a pro rata basis by reference to the percentage of the Fund’s average daily net assets attributable to that class. |
| (4) | The Adviser has contractually agreed to observe, through August 31, 2020, an irrevocable waiver of a portion of its Investment Advisory Fee currently in place, which reduces the 0.85% contractual fee rate by 0.20% to 0.65%. An identical waiver arrangement has been in effect since before the beginning of the Fund’s most recent fiscal year. |
| (5) | The Administrator has contractually agreed to observe, through August 31, 2020, an irrevocable waiver of a portion of its Administration Fees, which reduces the contractual fee rate by 0.15%. This waiver has been in effect since before the beginning of the Fund’s most recent fiscal year. |
| (6) | The Adviser has contractually agreed to observe, through August 31, 2020, an irrevocable waiver of a portion of its Investment Advisory Fee currently in place, which reduces the 0.45% contractual fee rate by 0.10% to 0.35%. This waiver has been in effect since before the beginning of the Fund’s most recent fiscal year. |
| (7) | The Administrator has contractually agreed to observe, through August 31, 2020, an irrevocable waiver of a portion of its Administration Fees for Class A shares, which reduces the contractual fee rate by 0.02%. This waiver has been in effect since before the beginning of the Fund’s most recent fiscal year. |
| | | | | | |
| 154 | | December 31, 2019 | | | Semiannual Report | | |
| (8) | The Adviser has contractually agreed to observe, through August 31, 2020, an irrevocable waiver of a portion of the Investment Advisory Fee, which reduces the 0.90% contractual fee rate by 0.01% on net assets in excess of $2 billion, by an additional 0.015% on net assets in excess of $3 billion and by an additional 0.025% on net assets in excess of $5 billion, each based on the Fund’s average daily net assets. An identical waiver arrangement has been in effect since before the beginning of the Fund’s most recent fiscal year. |
| (9) | The Adviser has contractually agreed to observe, through August 31, 2020, an irrevocable waiver of a portion of the Investment Advisory Fee, which reduces the 0.65% contractual fee rate by 0.01% on net assets in excess of $2 billion, by an additional 0.015% on net assets in excess of $3 billion and by an additional 0.025% on net assets in excess of $5 billion, each based on the Fund’s average daily net assets. An identical waiver arrangement has been in effect since before the beginning of the Fund’s most recent fiscal year. |
| (10) | The Adviser has contractually agreed to observe, through August 31, 2020, an irrevocable waiver of a portion of its Investment Advisory fee, which reduces the 0.45% contractual fee rate by 0.075% to 0.375%, and by an additional 0.025% on net assets in excess of $7.5 billion, and by an additional 0.025% on net assets in excess of $10 billion, each based on the Fund’s average daily net assets. This waiver has been in effect since before the beginning of the Fund’s most recent fiscal year. |
| (11) | The Adviser has contractually agreed to observe, through August 31, 2020, an irrevocable waiver of a portion of the Investment Advisory Fee, which reduces the 0.60% contractual fee rate by 0.05% to 0.55%, and an additional 0.01% on net assets in excess of $4 billion, by an additional 0.015% on net assets in excess of $5 billion and by an additional 0.025% on net assets in excess of $7.5 billion, each based on the Fund’s average daily net assets. An identical waiver arrangement has been in effect since before the beginning of the Fund’s most recent fiscal year. |
| (12) | The Administrator has contractually agreed to observe, through August 31, 2020, an irrevocable waiver of a portion of its Administration Fees, which reduces the contractual fee rate by 0.025%. This waiver has been in effect since before the beginning of the Fund’s most recent fiscal year. |
| (13) | The Administrator has contractually agreed to observe through August 31, 2020, an irrevocable waiver of a portion of its Administration Fees for all classes, which reduces the contractual fee rate by 0.22%. This waiver has been in effect since before the beginning of the Fund’s most recent fiscal year. |
| (14) | The Adviser has contractually agreed to observe, through August 31, 2020, an irrevocable waiver of a portion of the Investment Advisory Fee, which reduces the 0.60% contractual fee rate by 0.10% to 0.50%, and then by an additional 0.025% on net assets in excess of $3 billion, by an additional 0.025% on net assets in excess of $4 billion and by an additional 0.025% on net assets in excess of $5 billion, each based on the Fund’s average daily net assets. |
| (15) | The Administrator has contractually agreed to observe, through August 31, 2020, an irrevocable waiver of a portion of its Administration Fees for all classes, which reduces the contractual fee rate by 0.10%. This waiver has been in effect since before the beginning of the Fund’s most recent fiscal year. |
| † | The effective Administration Fee rate for Class A is 0.38%; for Class C and Class R is 0.40%, respectively. |
Distribution and Servicing Fees. Allianz Global Investors Distributors LLC (the “Distributor”), an affiliate of AllianzGI U.S., serves as the distributor of the Trust’s shares. The Funds are permitted to reimburse the Distributor on a quarterly basis, out of the Administrative Class assets of each Fund offering Administrative Class shares, in an amount up to 0.25% on an annual basis of the average daily net assets of that class, for payments made to financial intermediaries that provide services in connection with the distribution of shares or administration of plans or programs that use Fund shares as their funding medium. Unreimbursed costs may be carried forward for reimbursement for up to twelve months beyond the date in which they are incurred, subject always to the limit that not more than 0.25% of the average daily net assets attributable to the Administrative Class may be expensed.
Pursuant to the Distribution and Servicing Plans adopted by the A, C and R classes, the Distributor receives (i) in connection with the distribution of C and R class shares of the Trust, certain distribution fees from the Trust, and (ii) in connection with personal services rendered to A, C and R class shareholders of the Trust and the maintenance of shareholder accounts, certain servicing fees from the Trust.
The Funds paid the Distributor distribution and/or servicing fees at an effective rate as set forth below (calculated as a percentage of each Fund’s average daily net assets attributable to each class):
| | | | | | | | |
| |
| | | Allowable Rate | |
| | |
| | | Distribution Fee | | | Servicing Fee | |
Class A | | | | | | | | |
All Funds | | | — | | | | 0.25 | % |
Class C | | | | | | | | |
All Funds | | | 0.75 | % | | | 0.25 | |
Class R | | | | | | | | |
All Funds | | | 0.25 | | | | 0.25 | |
The Distributor also receives the proceeds of the initial sales charges paid by the shareholders upon the purchase of Class A shares and contingent deferred sales charges (“CDSC”) paid by the shareholders upon certain redemptions of Class A and C shares. For the six months ended December 31, 2019, the Distributor received $933,141, representing commissions (sales charges) and CDSC from the Funds.
Expenses. The Trust is responsible for the following expenses: (i) salaries and other compensation of any of the Trust’s executive officers and employees who are not officers, directors, stockholders or employees of the Investment Adviser or its subsidiaries or affiliates; (ii) taxes and governmental fees; (iii) brokerage fees and commissions and other portfolio transaction expenses; (iv) the costs of borrowing money, including interest expense and bank overdraft charges; (v) fees and expenses of the Trustees who are not “interested persons” of the Investment Adviser or the Trust, and any counsel or other experts retained exclusively for their benefit; (vi) extraordinary expenses, including costs of litigation and indemnification expenses; (vii) organization expenses, if any and (viii) any expenses allocated or allocable to a specific class of shares, which include service fees payable with respect to the Administrative Class shares and may include certain other expenses as permitted by the Trust’s Amended and Restated Multi-Class Plan adopted pursuant to Rule18f-3 under the 1940 Act and subject to review and approval by the Trustees. The Funds may invest in other investment companies, including investment companies advised orsub-advised by the Investment Adviser or its affiliates. Investing in other investment companies involves certain additional expenses and tax results that would not be present in a direct investment in such other investment companies. The ratio of expenses to average net assets per share class, as disclosed in the Financial Highlights, may differ from the estimated annual fund operating expenses per share class as disclosed in the Prospectus for the reasons set forth above.
| | | | | | |
| | Semiannual Report | | | December 31, 2019 | | 155 |
Notes to Financial Statements (cont’d)
December 31, 2019 (Unaudited)
Deferred Compensation. The Trustees do not currently receive any pension or retirement benefits from the Trust. In calendar year 2018 and certain prior periods, the Trust maintained a deferred compensation plan pursuant to which each Independent Trustee had the opportunity to elect not to receive all or a portion of his or her fees from the Trust on a current basis, but instead to receive in a subsequent period chosen by the Trustee an amount equal to the value of such compensation if such compensation had been invested in one or more series of Allianz Funds Multi-Strategy Trust or the Trust selected by the Trustees from and after the normal payment dates for such compensation. The deferred compensation program was closed to new deferrals effective January 1, 2019, and all Trustee fees earned with respect to service in calendar year 2019 and beyond have been or will be paid in cash, on a current basis, unless the Board of Trustees of the Allianz-Sponsored Funds reopens the program to new deferrals. Allianz Funds Multi-Strategy Trust and the Trust still have obligations with respect to Trustee fees deferred in 2018 and in prior periods, and will continue to have such obligations until all deferred Trustee fees are paid out pursuant to the terms of the deferred compensation plan.
| 5. | INVESTMENTS IN SECURITIES |
For the six months ended December 31, 2019, purchases and sales of investments, other than short-term securities were:
| | | | | | | | |
| | |
| | | Purchases | | | Sales | |
AllianzGI Emerging Markets Opportunities | | $ | 132,565,853 | | | $ | 152,753,318 | |
AllianzGI Focused Growth | | | 321,190,222 | | | | 398,542,081 | |
AllianzGI Global Natural Resources | | | 9,341,839 | | | | 10,894,767 | |
AllianzGI GlobalSmall-Cap | | | 40,535,020 | | | | 69,235,580 | |
AllianzGI Health Sciences | | | 55,119,467 | | | | 66,673,111 | |
AllianzGI Income & Growth | | | 1,885,127,868 | | | | 1,722,314,149 | |
AllianzGIMid-Cap | | | 79,110,272 | | | | 80,407,261 | |
AllianzGI NFJ Dividend Value | | | 602,904,793 | | | | 803,847,823 | |
AllianzGI NFJ International Value | | | 41,408,950 | | | | 59,416,703 | |
AllianzGI NFJLarge-Cap Value | | | 116,452,890 | | | | 165,305,718 | |
AllianzGI NFJMid-Cap Value | | | 1,078,348,538 | | | | 1,051,663,234 | |
AllianzGI NFJSmall-Cap Value | | | 483,729,681 | | | | 789,625,969 | |
AllianzGISmall-Cap | | | 63,462,316 | | | | 46,487,249 | |
AllianzGI Technology* | | | 903,068,312 | | | | 927,340,214 | |
| * | Securities sold short of $15,083,732; covers on securities sold short of $16,302,583. |
At December 31, 2019, the aggregate cost basis and the net unrealized appreciation (depreciation) of investments in securities and other financial instruments for federal income tax purposes were:
| | | | | | | | | | | | | | | | |
| | | Federal Tax
Cost Basis | | | Unrealized
Appreciation | | | Unrealized
Depreciation | | | Net Unrealized
Appreciation
(Depreciation) | |
AllianzGI Emerging Markets Opportunities | | $ | 306,952,042 | | | $ | 68,817,239 | | | $ | 4,157,870 | | | $ | 64,659,369 | |
AllianzGI Focused Growth | | | 649,020,573 | | | | 394,676,062 | | | | 3,248,496 | | | | 391,427,566 | |
AllianzGI Global Natural Resources | | | 9,865,165 | | | | 337,519 | | | | 141,663 | | | | 195,856 | |
AllianzGI Global Small-Cap | | | 85,433,684 | | | | 21,682,909 | | | | 1,958,396 | | | | 19,724,513 | |
AllianzGI Health Sciences | | | 132,573,654 | | | | 32,049,044 | | | | 952,200 | | | | 31,096,844 | |
AllianzGI Income & Growth | | | 5,258,203,326 | | | | 162,501,548 | | | | 523,909,435 | | | | (361,407,887 | ) |
AllianzGI Mid-Cap | | | 248,902,973 | | | | 88,604,041 | | | | 1,965,695 | | | | 86,638,346 | |
AllianzGI NFJ Dividend Value | | | 1,088,776,008 | | | | 165,711,569 | | | | 14,186,016 | | | | 151,525,553 | |
AllianzGI NFJ International Value | | | 153,751,921 | | | | 20,893,148 | | | | 5,678,126 | | | | 15,215,022 | |
AllianzGI NFJ Large-Cap Value | | | 292,796,994 | | | | 33,290,966 | | | | 2,718,265 | | | | 30,572,701 | |
AllianzGI NFJ Mid-Cap Value | | | 1,288,818,151 | | | | 176,152,751 | | | | 12,314,923 | | | | 163,837,828 | |
AllianzGI NFJ Small-Cap Value | | | 732,246,186 | | | | 101,945,558 | | | | 21,056,152 | | | | 80,889,406 | |
AllianzGI Small-Cap | | | 111,858,121 | | | | 23,538,885 | | | | 1,654,065 | | | | 21,884,820 | |
AllianzGI Technology | | | 1,054,032,768 | | | | 491,866,300 | | | | 2,589,827 | | | | 489,276,473 | |
| (1) | Differences, if any, between book and tax cost basis are primarily attributable to wash sale loss deferrals and the differing treatment of bond premium amortization. |
| | | | | | |
| 156 | | December 31, 2019 | | | Semiannual Report | | |
(THIS PAGE INTENTIONALLY LEFT BLANK)
| | | | | | |
| | Semiannual Report | | | December 31, 2019 | | 157 |
Notes to Financial Statements (cont’d)
December 31, 2019 (Unaudited)
| 7. | SHARES OF BENEFICIAL INTEREST |
The Trust may issue an unlimited number of shares of beneficial interest with $0.0001 par value. Changes in shares of beneficial interest were as follows:
| | | | | | | | | | | | | | | | | | | | | | | | | | | | | | | | | | | | |
| | | AllianzGI Emerging Markets Opportunities | | | AllianzGI Focused Growth | | | | |
| | | | | |
| | | Six Months ended
December 31, 2019
(unaudited) | | | Year ended
June 30, 2019 | | | Six Months ended
December 31, 2019
(unaudited) | | | Year ended
June 30, 2019 | | | | |
| | | Shares | | | Amount | | | Shares | | | Amount | | | Shares | | | Amount | | | Shares | | | Amount | | | | |
Shares sold: | | | | | | | | | | | | | | | | | | | | | | | | | | | | | | | | | | | | |
Class A | | | 84,902 | | | $ | 2,238,395 | | | | 268,619 | | | $ | 7,217,505 | | | | 367,225 | | | $ | 19,496,311 | | | | 3,957,145 | | | $ | 230,547,285 | | | | | |
Class C | | | 1,261 | | | | 32,409 | | | | 16,147 | | | | 410,475 | | | | 67,103 | | | | 2,220,926 | | | | 237,512 | | | | 7,807,792 | | | | | |
Class R | | | — | | | | — | | | | — | | | | — | | | | 40,260 | | | | 1,550,562 | | | | 130,920 | | | | 5,187,343 | | | | | |
Class P | | | 37,362 | | | | 982,763 | | | | 352,083 | | | | 9,091,300 | | | | 212,391 | | | | 8,309,627 | | | | 684,624 | | | | 27,975,772 | | | | | |
Institutional Class | | | 1,049,364 | | | | 27,990,022 | | | | 5,354,528 | | | | 145,969,084 | | | | 303,693 | | | | 15,005,365 | | | | 589,652 | | | | 28,467,542 | | | | | |
Class R6 | | | 54,647 | | | | 1,472,633 | | | | 244,198 | | | | 6,497,525 | | | | 293,242 | | | | 14,362,280 | | | | 648,134 | | | | 30,278,729 | | | | | |
Administrative Class | | | — | | | | — | | | | — | | | | — | | | | 12,070 | | | | 570,177 | | | | 38,603 | | | | 1,971,024 | | | | | |
| | | | | | |
Issued in reinvestment of dividends and distributions: | | | | | | | | | | | | | | | | | | | | | |
Class A | | | 30,762 | | | | 867,174 | | | | 37,329 | | | | 916,062 | | | | 1,281,065 | | | | 65,462,399 | | | | 1,264,993 | | | | 54,065,784 | | | | | |
Class C | | | 1,087 | | | | 30,545 | | | | 592 | | | | 14,456 | | | | 263,084 | | | | 7,984,592 | | | | 266,353 | | | | 7,377,992 | | | | | |
Class R | | | — | | | | — | | | | — | | | | — | | | | 89,301 | | | | 3,164,830 | | | | 83,352 | | | | 2,609,751 | | | | | |
Class P | | | 13,671 | | | | 376,224 | | | | 20,942 | | | | 501,782 | | | | 302,105 | | | | 11,032,878 | | | | 354,870 | | | | 11,338,112 | | | | | |
Institutional Class | | | 219,424 | | | | 6,183,360 | | | | 232,119 | | | | 5,693,881 | | | | 363,782 | | | | 16,857,643 | | | | 416,583 | | | | 16,292,546 | | | | | |
Class R6 | | | 20,786 | | | | 582,626 | | | | 24,240 | | | | 591,467 | | | | 402,518 | | | | 18,688,902 | | | | 338,307 | | | | 13,248,091 | | | | | |
Administrative Class | | | — | | | | — | | | | — | | | | — | | | | 16,397 | | | | 695,556 | | | | 15,646 | | | | 568,421 | | | | | |
| | | | | | | | |
Cost of shares redeemed: | | | | | | | | | | | | | | | | | | | | | | | | | | | | | | | | | |
Class A | | | (270,006 | ) | | | (7,151,842 | ) | | | (2,312,650 | ) | | | (64,223,641 | ) | | | (1,020,998 | ) | | | (54,823,357 | ) | | | (1,811,609 | ) | | | (94,018,724 | ) | | | | |
Class C | | | (31,481 | ) | | | (816,766 | ) | | | (168,881 | ) | | | (4,468,000 | ) | | | (253,326 | ) | | | (8,636,842 | ) | | | (5,022,966 | ) | | | (204,819,789 | ) | | | | |
Class R | | | — | | | | — | | | | — | | | | — | | | | (146,692 | ) | | | (5,738,602 | ) | | | (183,497 | ) | | | (7,438,619 | ) | | | | |
Class P | | | (210,899 | ) | | | (5,476,704 | ) | | | (666,508 | ) | | | (17,465,149 | ) | | | (504,506 | ) | | | (20,254,532 | ) | | | (1,230,579 | ) | | | (47,289,017 | ) | | | | |
Institutional Class | | | (1,763,411 | ) | | | (47,026,526 | ) | | | (2,051,506 | ) | | | (54,282,563 | ) | | | (793,916 | ) | | | (38,773,388 | ) | | | (1,064,847 | ) | | | (51,812,375 | ) | | | | |
Class R6 | | | (69,255 | ) | | | (1,823,868 | ) | | | (241,071 | ) | | | (6,409,258 | ) | | | (383,765 | ) | | | (19,377,721 | ) | | | (409,798 | ) | | | (19,780,076 | ) | | | | |
Administrative Class | | | — | | | | — | | | | — | | | | — | | | | (31,691 | ) | | | (1,446,715 | ) | | | (22,413 | ) | | | (1,102,078 | ) | | | | |
Net increase (decrease) resulting from Fund share transactions | | | (831,786 | ) | | $ | (21,539,555 | ) | | | 1,110,181 | | | $ | 30,054,926 | | | | 879,342 | | | $ | 36,350,891 | | | | (719,015 | ) | | $ | 11,475,506 | | | | | |
| – | May reflect actual amounts rounding to less than $1 or less than 1 share. |
| | | | | | |
| 158 | | December 31, 2019 | | | Semiannual Report | | |
| | | | | | | | | | | | | | | | | | | | | | | | | | | | | | | | | | | | | | | | | | | | | | | | | | |
| | | | AllianzGI Global Natural Resources | | | AllianzGI GlobalSmall-Cap | | | AllianzGI Health Sciences | |
| | | | | | |
| | | | Six Months ended
December 31, 2019
(unaudited) | | | Year ended
June 30, 2019 | | | Six Months ended
December 31, 2019
(unaudited) | | | Year ended
June 30, 2019 | | | Six Months ended
December 31, 2019
(unaudited) | | | Year ended
June 30, 2019 | |
| | | | Shares | | | Amount | | | Shares | | | Amount | | | Shares | | | Amount | | | Shares | | | Amount | | | Shares | | | Amount | | | Shares | | | Amount | |
| | | | | | | | | | | | | | | | | | | | | | | | | | | | | | | | | | | | | | | | | | | | | | | | | | |
| | | | | | 15,177 | | | $ | 203,160 | | | | 75,279 | | | $ | 1,112,678 | | | | 23,279 | | | $ | 897,878 | | | | 182,657 | | | $ | 8,479,807 | | | | 45,443 | | | $ | 1,479,865 | | | | 246,715 | | | $ | 8,399,331 | |
| | | | | | 3,806 | | | | 46,294 | | | | 25,966 | | | | 389,023 | | | | 3,928 | | | | 126,657 | | | | 13,645 | | | | 500,947 | | | | 9,189 | | | | 226,752 | | | | 28,328 | | | | 702,965 | |
| | | | | | — | | | | — | | | | — | | | | — | | | | — | | | | — | | | | — | | | | — | | | | — | | | | — | | | | — | | | | — | |
| | | | | | 778 | | | | 10,662 | | | | 26,683 | | | | 381,175 | | | | 9,745 | | | | 405,137 | | | | 91,215 | | | | 3,811,875 | | | | — | | | | — | | | | — | | | | — | |
| | | | | | 52,594 | | | | 713,245 | | | | 102,865 | | | | 1,521,155 | | | | 30,428 | | | | 1,292,283 | | | | 205,859 | | | | 9,810,581 | | | | 22,610 | | | | 760,973 | | | | 95,913 | | | | 3,042,298 | |
| | | | | | — | | | | — | | | | — | | | | — | | | | — | | | | — | | | | — | | | | — | | | | — | | | | — | | | | — | | | | — | |
| | | | | | — | | | | — | | | | — | | | | — | | | | — | | | | — | | | | — | | | | — | | | | — | | | | — | | | | — | | | | — | |
| | | | | | | | | | | | |
| | | | | | | | | | | | | | | | | | | | | | | | | | | | | | | | | | | | | | | | | | | | | | | | | | |
| | | | | | 7,463 | | | | 98,593 | | | | 6,938 | | | | 85,340 | | | | 78,232 | | | | 2,957,958 | | | | 254,078 | | | | 8,310,892 | | | | 290,557 | | | | 9,736,819 | | | | 674,933 | | | | 18,634,889 | |
| | | | | | 1,709 | | | | 21,162 | | | | 1,122 | | | | 12,975 | | | | 14,869 | | | | 463,904 | | | | 69,797 | | | | 1,927,792 | | | | 12,951 | | | | 324,031 | | | | 29,367 | | | | 623,175 | |
| | | | | | — | | | | — | | | | — | | | | — | | | | — | | | | — | | | | — | | | | — | | | | — | | | | — | | | | — | | | | — | |
| | | | | | 735 | | | | 9,879 | | | | 3,357 | | | | 41,893 | | | | 9,904 | | | | 407,250 | | | | 41,648 | | | | 1,469,340 | | | | — | | | | — | | | | — | | | | — | |
| | | | | | 9,927 | | | | 134,310 | | | | 9,214 | | | | 116,191 | | | | 76,103 | | | | 3,167,395 | | | | 369,475 | | | | 13,171,798 | | | | 8,689 | | | | 296,115 | | | | 11,595 | | | | 324,420 | |
| | | | | | — | | | | — | | | | — | | | | — | | | | — | | | | — | | | | — | | | | — | | | | — | | | | — | | | | — | | | | — | |
| | | | | | — | | | | — | | | | — | | | | — | | | | — | | | | — | | | | — | | | | — | | | | — | | | | — | | | | — | | | | — | |
| | | | | | | | | | | | |
| | | | | | | | | | | | | | | | | | | | | | | | | | | | | | | | | | | | | | | | | | | | | | | | | | |
| | | | | | (107,640 | ) | | | (1,432,812 | ) | | | (187,050 | ) | | | (2,646,485 | ) | | | (152,913 | ) | | | (5,932,356 | ) | | | (351,706 | ) | | | (13,990,314 | ) | | | (313,509 | ) | | | (10,227,407 | ) | | | (605,927 | ) | | | (19,209,271 | ) |
| | | | | | (11,759 | ) | | | (147,905 | ) | | | (81,341 | ) | | | (1,115,775 | ) | | | (59,433 | ) | | | (1,947,788 | ) | | | (296,247 | ) | | | (11,728,861 | ) | | | (25,083 | ) | | | (621,998 | ) | | | (201,451 | ) | | | (5,567,805 | ) |
| | | | | | — | | | | — | | | | — | | | | — | | | | — | | | | — | | | | — | | | | — | | | | — | | | | — | | | | — | | | | — | |
| | | | | | (15,418 | ) | | | (210,644 | ) | | | (138,349 | ) | | | (1,878,798 | ) | | | (66,851 | ) | | | (2,823,758 | ) | | | (192,848 | ) | | | (7,992,579 | ) | | | — | | | | — | | | | — | | | | — | |
| | | | | | (77,435 | ) | | | (1,063,404 | ) | | | (275,795 | ) | | | (4,074,569 | ) | | | (561,977 | ) | | | (24,215,930 | ) | | | (787,779 | ) | | | (34,330,501 | ) | | | (17,024 | ) | | | (564,138 | ) | | | (61,267 | ) | | | (2,002,588 | ) |
| | | | | | — | | | | — | | | | — | | | | — | | | | — | | | | — | | | | — | | | | — | | | | — | | | | — | | | | — | | | | — | |
| | | | | | — | | | | — | | | | — | | | | — | | | | — | | | | — | | | | — | | | | — | | | | — | | | | — | | | | — | | | | — | |
| | | | | | (120,063 | ) | | $ | (1,617,460 | ) | | | (431,111 | ) | | $ | (6,055,197 | ) | | | (594,686 | ) | | $ | (25,201,370 | ) | | | (400,206 | ) | | $ | (20,559,223 | ) | | | 33,823 | | | $ | 1,411,012 | | | | 218,206 | | | $ | 4,947,414 | |
| | | | | | |
| | Semiannual Report | | | December 31, 2019 | | 159 |
Notes to Financial Statements (cont’d)
December 31, 2019 (Unaudited)
| | | | | | | | | | | | | | | | | | | | | | | | | | | | | | | | | | | | |
| | | AllianzGI Income & Growth | | | AllianzGIMid-Cap | | | | |
| | | | | |
| | | Six Months ended
December 31, 2019
(unaudited) | | | Year ended
June 30, 2019 | | | Six Months ended
December 31, 2019
(unaudited) | | | Year ended
June 30, 2019 | | | | |
| | | Shares | | | Amount | | | Shares | | | Amount | | | Shares | | | Amount | | | Shares | | | Amount | | | | |
Shares sold: | | | | | | | | | | | | | | | | | | | | | | | | | | | | | | | | | | | | |
Class A | | | 21,788,361 | | | $ | 238,369,463 | | | | 41,382,233 | | | $ | 454,899,809 | | | | 3,833,466 | | | $ | 14,698,209 | | | | 34,421,548 | | | $ | 134,256,480 | | | | | |
Class C | | | 14,191,824 | | | | 141,752,609 | | | | 34,217,239 | | | | 346,930,172 | | | | 113,091 | | | | 337,986 | | | | 650,165 | | | | 1,783,093 | | | | | |
Class R | | | 133,633 | | | | 1,467,770 | | | | 224,610 | | | | 2,466,861 | | | | 66,035 | | | | 242,706 | | | | 121,412 | | | | 433,020 | | | | | |
Class P | | | 17,805,719 | | | | 199,889,189 | | | | 47,385,649 | | | | 533,269,666 | | | | 274,955 | | | | 1,217,404 | | | | 905,697 | | | | 3,633,083 | | | | | |
Institutional Class | | | 13,674,510 | | | | 155,294,179 | | | | 32,549,042 | | | | 371,932,052 | | | | 5,145,752 | | | | 22,406,410 | | | | 1,762,730 | | | | 7,253,419 | | | | | |
Class R6 | | | — | | | | — | | | | — | | | | — | | | | — | | | | — | | | | — | | | | — | | | | | |
Administrative Class | | | — | | | | — | | | | — | | | | — | | | | 44,079 | | | | 176,932 | | | | 37,587 | | | | 142,036 | | | | | |
| | | | | | |
Issued in reinvestment of dividends and distributions: | | | | | | | | | | | | | | | | | | | | | |
Class A | | | 5,094,461 | | | | 55,726,562 | | | | 9,562,038 | | | | 104,635,655 | | | | 2,610,485 | | | | 9,919,842 | | | | 8,735,577 | | | | 24,085,907 | | | | | |
Class C | | | 4,320,390 | | | | 43,163,495 | | | | 8,650,069 | | | | 87,008,778 | | | | 285,007 | | | | 846,472 | | | | 1,440,361 | | | | 3,162,218 | | | | | |
Class R | | | 19,477 | | | | 213,013 | | | | 31,419 | | | | 343,496 | | | | 15,966 | | | | 59,233 | | | | 63,092 | | | | 170,148 | | | | | |
Class P | | | 3,050,045 | | | | 34,260,659 | | | | 5,654,704 | | | | 63,437,381 | | | | 104,605 | | | | 465,493 | | | | 335,351 | | | | 1,072,570 | | | | | |
Institutional Class | | | 2,545,549 | | | | 28,874,193 | | | | 4,232,229 | | | | 47,895,410 | | | | 483,526 | | | | 2,171,031 | | | | 1,068,157 | | | | 3,438,239 | | | | | |
Class R6 | | | — | | | | — | | | | — | | | | — | | | | — | | | | — | | | | — | | | | — | | | | | |
Administrative Class | | | — | | | | — | | | | — | | | | — | | | | 17,328 | | | | 70,695 | | | | 55,660 | | | | 163,523 | | | | | |
| | | | | | | | |
Cost of shares redeemed: | | | | | | | | | | | | | | | | | | | | | | | | | | | | | | | | | |
Class A | | | (15,317,412 | ) | | | (167,457,729 | ) | | | (28,677,604 | ) | | | (313,221,154 | ) | | | (5,667,074 | ) | | | (21,374,505 | ) | | | (9,160,991 | ) | | | (31,143,673 | ) | | | | |
Class C | | | (16,272,447 | ) | | | (162,753,617 | ) | | | (27,028,004 | ) | | | (271,243,863 | ) | | | (2,353,186 | ) | | | (7,076,966 | ) | | | (39,239,512 | ) | | | (130,038,680 | ) | | | | |
Class R | | | (36,585 | ) | | | (402,215 | ) | | | (90,982 | ) | | | (987,313 | ) | | | (113,278 | ) | | | (423,045 | ) | | | (189,750 | ) | | | (653,794 | ) | | | | |
Class P | | | (13,086,885 | ) | | | (146,834,481 | ) | | | (30,988,364 | ) | | | (344,028,854 | ) | | | (257,622 | ) | | | (1,137,282 | ) | | | (1,112,672 | ) | | | (4,488,191 | ) | | | | |
Institutional Class | | | (9,906,213 | ) | | | (112,337,618 | ) | | | (14,427,667 | ) | | | (160,815,113 | ) | | | (1,430,065 | ) | | | (6,324,390 | ) | | | (1,733,318 | ) | | | (7,146,904 | ) | | | | |
Class R6 | | | — | | | | — | | | | — | | | | — | | | | — | | | | — | | | | — | | | | — | | | | | |
Administrative Class | | | — | | | | — | | | | — | | | | — | | | | (34,104 | ) | | | (136,870 | ) | | | (63,233 | ) | | | (237,112 | ) | | | | |
Net increase (decrease) resulting from Fund share transactions | | | 28,004,427 | | | $ | 309,225,472 | | | | 82,676,611 | | | $ | 922,522,983 | | | | 3,138,966 | | | $ | 16,139,355 | | | | (1,902,139 | ) | | $ | 5,885,382 | | | | | |
| – | May reflect actual amounts rounding to less than $1 or less than 1 share. |
| | | | | | |
| 160 | | December 31, 2019 | | | Semiannual Report | | |
| | | | | | | | | | | | | | | | | | | | | | | | | | | | | | | | | | | | | | | | | | | | | | | | | | |
| | | | AllianzGI NFJ Dividend Value | | | AllianzGI NFJ International Value | | | AllianzGI NFJLarge-Cap Value | |
| | | | | | |
| | | | Six Months ended
December 31, 2019
(unaudited) | | | Year ended
June 30, 2019 | | | Six Months ended
December 31, 2019
(unaudited) | | | Year ended
June 30, 2019 | | | Six Months ended
December 31, 2019
(unaudited) | | | Year ended
June 30, 2019 | |
| | | | Shares | | | Amount | | | Shares | | | Amount | | | Shares | | | Amount | | | Shares | | | Amount | | | Shares | | | Amount | | | Shares | | | Amount | |
| | | | | | | | | | | | | | | | | | | | | | | | | | | | | | | | | | | | | | | | | | | | | | | | | | |
| | | | | | 2,639,605 | | | $ | 32,014,672 | | | | 11,313,357 | | | $ | 160,679,320 | | | | 297,459 | | | $ | 5,403,307 | | | | 1,209,396 | | | $ | 21,910,051 | | | | 121,248 | | | $ | 3,330,559 | | | | 2,041,454 | | | $ | 56,350,922 | |
| | | | | | 131,017 | | | | 1,591,097 | | | | 631,855 | | | | 7,621,144 | | | | 11,273 | | | | 205,695 | | | | 28,057 | | | | 479,855 | | | | 19,876 | | | | 566,399 | | | | 84,599 | | | | 2,188,878 | |
| | | | | | 176,913 | | | | 2,162,842 | | | | 527,472 | | | | 6,693,820 | | | | 23,179 | | | | 423,538 | | | | 72,665 | | | | 1,308,299 | | | | 1,880 | | | | 52,246 | | | | 11,595 | | | | 314,013 | |
| | | | | | 1,486,745 | | | | 17,843,675 | | | | 5,601,788 | | | | 67,818,148 | | | | 24,865 | | | | 453,211 | | | | 217,867 | | | | 3,906,233 | | | | 35,161 | | | | 974,742 | | | | 126,157 | | | | 3,352,016 | |
| | | | | | 1,626,277 | | | | 20,014,084 | | | | 3,180,003 | | | | 43,151,601 | | | | 77,473 | | | | 1,426,575 | | | | 493,776 | | | | 8,984,985 | | | | 261,186 | | | | 7,123,457 | | | | 449,862 | | | | 11,791,096 | |
| | | | | | 819,701 | | | | 10,214,527 | | | | 816,704 | | | | 10,596,590 | | | | 4,422 | | | | 81,393 | | | | 29,903 | | | | 547,843 | | | | — | | | | — | | | | — | | | | — | |
| | | | | | 59,326 | | | | 745,106 | | | | 389,033 | | | | 5,215,973 | | | | 5,641 | | | | 104,101 | | | | 20,222 | | | | 362,630 | | | | 935 | | | | 25,993 | | | | 10,773 | | | | 283,103 | |
| | | | | | | | | | | | |
| | | | | | | | | | | | | | | | | | | | | | | | | | | | | | | | | | | | | | | | | | | | | | | | | | |
| | | | | | 3,953,464 | | | | 45,945,129 | | | | 8,603,057 | | | | 91,771,627 | | | | 48,535 | | | | 895,116 | | | | 65,410 | | | | 1,163,992 | | | | 138,433 | | | | 3,935,512 | | | | 100,269 | | | | 2,601,467 | |
| | | | | | 458,103 | | | | 5,427,768 | | | | 1,550,267 | | | | 16,835,328 | | | | 5,395 | | | | 97,585 | | | | 7,567 | | | | 132,250 | | | | 5,997 | | | | 173,299 | | | | 5,291 | | | | 143,588 | |
| | | | | | 707,494 | | | | 8,219,493 | | | | 1,449,485 | | | | 15,468,682 | | | | 3,788 | | | | 69,991 | | | | 5,192 | | | | 92,441 | | | | 1,567 | | | | 45,060 | | | | 1,366 | | | | 36,380 | |
| | | | | | 2,563,585 | | | | 30,084,753 | | | | 6,500,134 | | | | 70,165,546 | | | | 19,058 | | | | 353,644 | | | | 34,618 | | | | 620,705 | | | | 15,725 | | | | 451,052 | | | | 12,869 | | | | 339,075 | |
| | | | | | 2,164,010 | | | | 25,361,626 | | | | 5,850,039 | | | | 63,026,975 | | | | 36,939 | | | | 686,467 | | | | 50,379 | | | | 906,302 | | | | 98,899 | | | | 2,789,688 | | | | 96,666 | | | | 2,510,825 | |
| | | | | | 727,716 | | | | 8,488,359 | | | | 1,462,567 | | | | 15,698,988 | | | | 1,106 | | | | 20,578 | | | | 1,609 | | | | 28,658 | | | | — | | | | — | | | | — | | | | — | |
| | | | | | 315,378 | | | | 3,769,564 | | | | 1,206,182 | | | | 13,203,073 | | | | 941 | | | | 17,404 | | | | 2,333 | | | | 40,736 | | | | 1,133 | | | | 32,685 | | | | 838 | | | | 22,170 | |
| | | | | | | | | | | | |
| | | | | | | | | | | | | | | | | | | | | | | | | | | | | | | | | | | | | | | | | | | | | | | | | | |
| | | | | | (6,189,368 | ) | | | (75,529,769 | ) | | | (15,011,198 | ) | | | (186,349,526 | ) | | | (585,622 | ) | | | (10,618,795 | ) | | | (2,154,736 | ) | | | (37,906,923 | ) | | | (452,609 | ) | | | (12,422,929 | ) | | | (1,072,771 | ) | | | (28,418,904 | ) |
| | | | | | (1,866,808 | ) | | | (23,064,358 | ) | | | (11,613,283 | ) | | | (169,595,677 | ) | | | (206,967 | ) | | | (3,672,782 | ) | | | (1,256,420 | ) | | | (22,357,425 | ) | | | (104,879 | ) | | | (2,884,477 | ) | | | (2,000,144 | ) | | | (56,114,974 | ) |
| | | | | | (848,143 | ) | | | (10,323,293 | ) | | | (2,317,010 | ) | | | (30,660,555 | ) | | | (74,950 | ) | | | (1,388,268 | ) | | | (243,205 | ) | | | (4,386,885 | ) | | | (9,387 | ) | | | (261,297 | ) | | | (132,987 | ) | | | (3,709,071 | ) |
| | | | | | (6,516,479 | ) | | | (79,988,111 | ) | | | (18,158,983 | ) | | | (228,744,792 | ) | | | (433,371 | ) | | | (7,901,736 | ) | | | (2,989,399 | ) | | | (52,767,678 | ) | | | (72,149 | ) | | | (2,000,717 | ) | | | (202,995 | ) | | | (5,481,385 | ) |
| | | | | | (6,663,857 | ) | | | (82,226,344 | ) | | | (16,927,973 | ) | | | (220,910,069 | ) | | | (243,168 | ) | | | (4,469,446 | ) | | | (1,045,715 | ) | | | (18,990,289 | ) | | | (1,650,655 | ) | | | (45,713,043 | ) | | | (503,342 | ) | | | (13,275,287 | ) |
| | | | | | (726,440 | ) | | | (9,041,570 | ) | | | (2,602,536 | ) | | | (33,374,156 | ) | | | (1,354 | ) | | | (24,286 | ) | | | (61,401 | ) | | | (1,100,132 | ) | | | — | | | | — | | | | — | | | | — | |
| | | | | | (1,381,221 | ) | | | (17,444,754 | ) | | | (3,392,334 | ) | | | (43,265,010 | ) | | | (20,855 | ) | | | (381,881 | ) | | | (205,207 | ) | | | (3,521,325 | ) | | | (4,799 | ) | | | (131,483 | ) | | | (10,918 | ) | | | (300,641 | ) |
| | | | | | (6,362,982 | ) | | $ | (85,735,504 | ) | | | (20,941,374 | ) | | $ | (324,952,970 | ) | | | (1,006,213 | ) | | $ | (18,218,589 | ) | | | (5,717,089 | ) | | $ | (100,545,677 | ) | | | (1,592,438 | ) | | $ | (43,913,254 | ) | | | (981,418 | ) | | $ | (27,366,729 | ) |
| | | | | | |
| | Semiannual Report | | | December 31, 2019 | | 161 |
Notes to Financial Statements (cont’d)
December 31, 2019 (Unaudited)
| | | | | | | | | | | | | | | | | | | | | | | | | | | | | | | | | | | | |
| | | AllianzGI NFJMid-Cap Value | | | AllianzGI NFJSmall-Cap Value | | | | |
| | | | | |
| | | Six Months ended
December 31, 2019
(unaudited) | | | Year ended
June 30, 2019 | | | Six Months ended
December 31, 2019
(unaudited) | | | Year ended
June 30, 2019 | | | | |
| | | Shares | | | Amount | | | Shares | | | Amount | | | Shares | | | Amount | | | Shares | | | Amount | | | | |
Shares sold: | | | | | | | | | | | | | | | | | | | | | | | | | | | | | | | | | | | | |
Class A | | | 974,996 | | | $ | 30,233,104 | | | | 6,698,495 | | | $ | 204,685,318 | | | | 710,603 | | | $ | 10,403,596 | | | | 7,098,648 | | | $ | 130,945,310 | | | | | |
Class C | | | 181,282 | | | | 4,594,095 | | | | 630,222 | | | | 15,246,842 | | | | 7,218 | | | | 94,321 | | | | 84,780 | | | | 1,077,299 | | | | | |
Class R | | | 157,853 | | | | 4,146,575 | | | | 358,914 | | | | 9,057,683 | | | | 61,927 | | | | 997,516 | | | | 205,692 | | | | 3,727,798 | | | | | |
Class P | | | 1,641,369 | | | | 41,035,076 | | | | 4,293,177 | | | | 101,871,414 | | | | 252,696 | | | | 4,303,609 | | | | 717,227 | | | | 13,249,790 | | | | | |
Institutional Class | | | 1,771,735 | | | | 58,997,348 | | | | 5,936,147 | | | | 186,319,815 | | | | 588,097 | | | | 9,961,934 | | | | 3,242,577 | | | | 62,341,662 | | | | | |
Class R6 | | | 1,699,171 | | | | 57,299,635 | | | | 560,276 | | | | 17,538,456 | | | | 713,365 | | | | 12,165,864 | | | | 3,019,919 | | | | 57,555,186 | | | | | |
Administrative Class | | | 308,451 | | | | 9,963,123 | | | | 594,563 | | | | 18,054,348 | | | | 408,833 | | | | 6,087,617 | | | | 911,459 | | | | 14,873,708 | | | | | |
| | | | | | |
Issued in reinvestment of dividends and distributions: | | | | | | | | | | | | | | | | | | | | | |
Class A | | | 1,366,588 | | | | 41,667,263 | | | | 296,346 | | | | 7,931,688 | | | | 2,205,554 | | | | 31,782,029 | | | | 9,034,371 | | | | 112,929,635 | | | | | |
Class C | | | 159,899 | | | | 3,947,915 | | | | 9,718 | | | | 240,700 | | | | 16,900 | | | | 215,135 | | | | 258,108 | | | | 2,893,396 | | | | | |
Class R | | | 74,035 | | | | 1,902,697 | | | | 12,096 | | | | 279,668 | | | | 99,180 | | | | 1,575,974 | | | | 445,976 | | | | 6,092,035 | | | | | |
Class P | | | 749,548 | | | | 18,019,137 | | | | 151,593 | | | | 3,261,952 | | | | 107,314 | | | | 1,809,314 | | | | 584,374 | | | | 8,432,510 | | | | | |
Institutional Class | | | 945,832 | | | | 31,013,835 | | | | 202,468 | | | | 5,761,385 | | | | 611,030 | | | | 10,424,180 | | | | 6,135,775 | | | | 89,336,886 | | | | | |
Class R6 | | | 166,258 | | | | 5,444,939 | | | | 7,723 | | | | 220,071 | | | | 567,653 | | | | 9,599,019 | | | | 2,768,426 | | | | 40,059,127 | | | | | |
Administrative Class | | | 84,588 | | | | 2,665,370 | | | | 13,345 | | | | 368,552 | | | | 646,162 | | | | 9,272,422 | | | | 2,756,274 | | | | 34,315,616 | | | | | |
| | | | | | | | |
Cost of shares redeemed: | | | | | | | | | | | | | | | | | | | | | | | | | | | | | | | | | |
Class A | | | (2,005,505 | ) | | | (62,372,485 | ) | | | (4,772,658 | ) | | | (139,781,481 | ) | | | (5,510,625 | ) | | | (81,233,557 | ) | | | (18,946,945 | ) | | | (333,203,625 | ) | | | | |
Class C | | | (248,299 | ) | | | (6,285,989 | ) | | | (6,123,795 | ) | | | (154,795,781 | ) | | | (141,889 | ) | | | (1,862,114 | ) | | | (5,531,901 | ) | | | (99,879,070 | ) | | | | |
Class R | | | (165,537 | ) | | | (4,404,360 | ) | | | (209,787 | ) | | | (5,294,056 | ) | | | (252,731 | ) | | | (4,046,611 | ) | | | (884,803 | ) | | | (16,636,078 | ) | | | | |
Class P | | | (1,164,738 | ) | | | (29,117,813 | ) | | | (4,670,512 | ) | | | (110,205,538 | ) | | | (655,865 | ) | | | (11,168,229 | ) | | | (1,661,186 | ) | | | (30,717,023 | ) | | | | |
Institutional Class | | | (1,636,785 | ) | | | (54,671,940 | ) | | | (4,076,024 | ) | | | (128,754,450 | ) | | | (9,761,588 | ) | | | (165,379,465 | ) | | | (24,363,929 | ) | | | (484,952,787 | ) | | | | |
Class R6 | | | (139,028 | ) | | | (4,654,746 | ) | | | (84,239 | ) | | | (2,605,186 | ) | | | (2,588,130 | ) | | | (43,291,147 | ) | | | (11,202,983 | ) | | | (227,278,706 | ) | | | | |
Administrative Class | | | (149,080 | ) | | | (4,789,094 | ) | | | (350,996 | ) | | | (10,485,274 | ) | | | (2,741,269 | ) | | | (39,704,125 | ) | | | (5,772,549 | ) | | | (98,884,720 | ) | | | | |
Net increase (decrease) resulting from Fund share transactions | | | 4,772,633 | | | $ | 144,633,685 | | | | (522,928 | ) | | $ | 18,916,126 | | | | (14,655,565 | ) | | $ | (237,992,718 | ) | | | (31,100,690 | ) | | $ | (713,722,051 | ) | | | | |
| – | May reflect actual amounts rounding to less than $1 or less than 1 share. |
| # | For the period August 22, 2018 (commencement of share class) through June 30, 2019. “Shares sold” includes shares sold to Allianz of America, Inc. (“AZOA”). |
| | | | | | |
| 162 | | December 31, 2019 | | | Semiannual Report | | |
| | | | | | | | | | | | | | | | | | | | | | | | | | | | | | | | | | |
| | | | AllianzGI Small-Cap | | | AllianzGI Technology | |
| | | | |
| | | | Six Months ended
December 31, 2019
(unaudited) | | | Year ended
June 30, 2019 | | | Six Months ended
December 31, 2019
(unaudited) | | | Year ended
June 30, 2019 | |
| | | | Shares | | | Amount | | | Shares | | | Amount | | | Shares | | | Amount | | | Shares | | | Amount | |
| | | | | | | | | | | | | | | | | | | | | | | | | | | | | | | | | | |
| | | | | | 201,522 | | | $ | 3,968,017 | | | | 1,600,232 | | | $ | 34,264,966 | | | | 529,594 | | | $ | 32,470,010 | | | | 2,550,443 | | | $ | 179,133,866 | |
| | | | | | 14,032 | | | | 266,301 | | | | 92,047 | | | | 1,720,365 | | | | 80,475 | | | | 3,368,512 | | | | 257,142 | | | | 12,544,036 | |
| | | | | | — | | | | — | | | | — | | | | — | | | | — | | | | — | | | | — | | | | — | |
| | | | | | 427,995 | | | | 8,385,200 | | | | 254,122 | | | | 5,248,183 | | | | 193,434 | | | | 13,521,265 | | | | 1,128,423 | | | | 84,211,489 | |
| | | | | | 436,335 | | | | 8,861,911 | | | | 288,688 | | | | 5,869,487 | | | | 972,695 | | | | 70,569,572 | | | | 3,351,624 | | | | 247,227,588 | |
| | | | | | 330,189 | | | | 6,486,608 | | | | 891,912 | # | | | 17,601,066 | # | | | — | | | | — | | | | — | | | | — | |
| | | | | | — | | | | — | | | | — | | | | — | | | | 16,746 | | | | 1,148,516 | | | | 75,889 | | | | 5,389,576 | |
| | | | | | | | |
| | | | | | | | | | | | | | | | | | | | | | | | | | | | | | | | | | |
| | | | | | 1,632 | | | | 33,389 | | | | 298,477 | | | | 4,867,765 | | | | 1,716,811 | | | | 93,583,377 | | | | 1,934,896 | | | | 96,280,422 | |
| | | | | | — | | | | 3 | | | | 44,482 | | | | 695,030 | | | | 271,884 | | | | 9,548,573 | | | | 300,556 | | | | 10,621,661 | |
| | | | | | — | | | | — | | | | — | | | | — | | | | — | | | | — | | | | — | | | | — | |
| | | | | | 2,586 | | | | 53,483 | | | | 39,051 | | | | 644,904 | | | | 293,745 | | | | 18,626,410 | | | | 332,385 | | | | 18,733,242 | |
| | | | | | 2,488 | | | | 51,869 | | | | 33,246 | | | | 553,729 | | | | 1,738,813 | | | | 113,196,707 | | | | 2,155,428 | | | | 124,109,570 | |
| | | | | | 4,607 | | | | 96,048 | | | | 2,227 | # | | | 43,874 | # | | | — | | | | — | | | | — | | | | — | |
| | | | | | — | | | | — | | | | — | | | | — | | | | 27,726 | | | | 1,647,783 | | | | 56,513 | | | | 3,019,512 | |
| | | | | | | | |
| | | | | | | | | | | | | | | | | | | | | | | | | | | | | | | | | | |
| | | | | | (227,844 | ) | | | (4,443,429 | ) | | | (576,351 | ) | | | (11,497,437 | ) | | | (1,195,406 | ) | | | (73,352,610 | ) | | | (2,484,799 | ) | | | (161,222,406 | ) |
| | | | | | (169,429 | ) | | | (3,190,084 | ) | | | (1,391,922 | ) | | | (28,904,196 | ) | | | (239,293 | ) | | | (10,349,364 | ) | | | (1,982,776 | ) | | | (111,120,158 | ) |
| | | | | | — | | | | — | | | | — | | | | — | | | | — | | | | — | | | | — | | | | — | |
| | | | | | (78,322 | ) | | | (1,555,815 | ) | | | (120,551 | ) | | | (2,401,996 | ) | | | (488,462 | ) | | | (34,708,425 | ) | | | (587,099 | ) | | | (41,087,752 | ) |
| | | | | | (82,580 | ) | | | (1,650,950 | ) | | | (234,956 | ) | | | (4,873,058 | ) | | | (1,548,588 | ) | | | (111,200,213 | ) | | | (4,534,231 | ) | | | (329,752,909 | ) |
| | | | | | (40,253 | ) | | | (808,999 | ) | | | (12 | )# | | | (238 | )# | | | — | | | | — | | | | — | | | | — | |
| | | | | | — | | | | — | | | | — | | | | — | | | | (40,306 | ) | | | (2,664,915 | ) | | | (272,847 | ) | | | (18,770,552 | ) |
| | | | | | 822,958 | | | $ | 16,553,552 | | | | 1,220,692 | | | $ | 23,832,444 | | | | 2,329,868 | | | $ | 125,405,198 | | | | 2,281,547 | | | $ | 119,317,185 | |
| | | | | | |
| | Semiannual Report | | | December 31, 2019 | | 163 |
Notes to Financial Statements (cont’d)
December 31, 2019 (Unaudited)
| 8. | SIGNIFICANT ACCOUNT HOLDERS |
From time to time, a Fund may have a concentration of shareholders, which may include the Investment Adviser or affiliates of the Investment Adviser, holding a significant percentage of shares outstanding. Investment activities of these shareholders could have a material impact to a Fund.
At December 31, 2019, the significant account-holders, owners of 5% or greater of each respective Fund’s outstanding shares were as follows:
| | | | | | | | | | | | | | | | | | | | |
| | | Unaffiliated | | | Affiliated | | | | |
| | | Number of
Account
Holders | | | Approximate
Ownership | | | Number of
Account
Holders | | | Approximate
Ownership* | | | AFI/Allianz
of America | |
AllianzGI Emerging Markets Opportunities | | | 3 | | | | 80 | % | | | — | | | | — | | | | — | |
AllianzGI Focused Growth | | | 5 | | | | 49 | % | | | 1 | | | | 5 | % | | | — | |
AllianzGI Global Natural Resources | | | 7 | | | | 77 | % | | | — | | | | — | | | | — | |
AllianzGI Global Small-Cap | | | 5 | | | | 68 | % | | | — | | | | — | | | | — | |
AllianzGI Health Sciences | | | 3 | | | | 57 | % | | | — | | | | — | | | | — | |
AllianzGI Income & Growth | | | 9 | | | | 83 | % | | | — | | | | — | | | | — | |
AllianzGI Mid-Cap | | | 7 | | | | 58 | % | | | — | | | | — | | | | — | |
AllianzGI NFJ Dividend Value | | | 7 | | | | 64 | % | | | — | | | | — | | | | — | |
AllianzGI NFJ International Value | | | 8 | | | | 68 | % | | | — | | | | — | | | | — | |
AllianzGI NFJ Large-Cap Value | | | 9 | | | | 69 | % | | | — | | | | — | | | | — | |
AllianzGI NFJ Mid-Cap Value | | | 6 | | | | 51 | % | | | — | | | | — | | | | — | |
AllianzGI NFJ Small-Cap Value | | | 3 | | | | 33 | % | | | 1 | | | | 14 | % | | | — | |
AllianzGI Small-Cap | | | 6 | | | | 49 | % | | | — | | | | — | | | | 13 | % |
AllianzGI Technology | | | 3 | | | | 44 | % | | | — | | | | — | | | | — | |
| * | This represents the aggregate percentage of affiliated entities that own 5% or more of the Fund’s outstanding shares. These affiliated entities include OklahomaDream 529 Plan |
| 9. | AFFILIATED TRANSACTIONS |
An affiliate includes any company in which a Fund held 5% or more of a company’s outstanding voting securities at any point during the reporting period. The table below represents transactions in and earnings from these affiliated issuers during the six months ended December 31, 2019:
| | | | | | | | | | | | | | | | | | | | | | | | | | | | | | | | | | | | |
| |
| AllianzGI Income & Growth: | | | | |
| | | Market Value
6/30/2019 | | | Purchases
at Cost | | | Proceeds from Sales | | | Change in
Unrealized
Appreciation
(Depreciation)* | | | Market Value
12/31/2019 | | | Dividend
Income | | | Shares as of 12/31/2019 | | | Net Realized
Gain (Loss) | | | Net Capital Gain Distributions Received | |
CCF Holdings LLC, Class B | | $ | 4 | | | $ | — | | | $ | — | | | $ | — | | | $ | 4 | | | $ | — | | | | 42,857 | | | $ | — | | | $ | — | |
Cenveo Corp. † | | | 576,798 | | | | — | | | | — | | | | — | | | | 576,798 | | | | — | | | | 19,074 | | | | — | | | | — | |
LiveStyle, Inc. | | | 20 | | | | — | | | | — | | | | — | | | | 20 | | | | — | | | | 202,319 | | | | — | | | | — | |
LiveStyle, Inc., Ser. B | | | 17,134,400 | | | | — | | | | — | | | | — | | | | 17,134,400 | | | | — | | | | 171,344 | | | | — | | | | — | |
LiveStyle, Inc., Ser. B | | | 80 | | | | — | | | | — | | | | — | | | | 80 | | | | — | | | | 8,000 | | | | — | | | | — | |
Totals | | $ | 17,711,302 | | | $ | — | | | $ | — | | | $ | — | | | $ | 17,711,302 | | | $ | — | | | | 443,594 | | | $ | — | | | $ | — | |
| † | Not affiliated at June 30, 2019. |
| * | Does not tie to Net change in unrealized appreciation/depreciation on the Statements of Operations as a result of previously unaffiliated securities moving to affiliated. |
| 10. | PAYMENTS FROM AFFILIATES |
During the year ended June 30, 2019, AllianzGI U.S. reimbursed AllianzGI Income & Growth $2,600 for realized losses resulting from a trading error.
During the six months ended December 31, 2019, AllianzGI U.S. reimbursed AllianzGISmall-Cap $706 for realized losses resulting from a trading error.
The Trust entered into a credit agreement (the “State Street Agreement”), among the Trust, AllianzGI Institutional Multi-Series Trust, Allianz Funds Multi-Strategy Trust and Premier Multi-Series VIT, as borrowers (collectively, the “AllianzGI Borrowers” and each series thereof, an “AllianzGI Borrower Fund”), and State Street Bank and Trust Company, as agent and lender, for a committed line of credit. The State Street Agreement permits the AllianzGI Borrowers to borrow up to $200 million in aggregate, subject to (i) a requirement that each
| | | | | | |
| 164 | | December 31, 2019 | | | Semiannual Report | | |
AllianzGI Borrower Fund’s asset coverage with respect to senior securities representing indebtedness be 300% or higher, and (ii) certain other limitations and conditions. Each AllianzGI Borrower Fund must pay interest on any amounts borrowed under the facility at a rate per annum equal to 1.25% plus the higher of the then-current federal funds overnight rate or theone-month LIBOR rate, subject to upward adjustment when any past due payments are outstanding. The State Street Agreement was extended by an additional364-day period by an amendment effective October 24, 2019 with an expiration date of October 22, 2020 (the “Amendment”). The Amendment includes a usage fee on undrawn amounts at an annualized rate of 0.20%, to be allocated pro rata among the AllianzGI Borrower Funds on the basis of net assets. Amounts borrowed may be repaid and reborrowed on a revolving basis during the term of the facility.
The Funds did not utilize the line of credit during the six months ended December 31, 2019.
Pursuant to an exemptive order issued by the SEC (the “Order”), the Funds are authorized to enter into a master interfund lending agreement (the “Interfund Program”) with each other and certain funds advised by the Investment Adviser (each a “Participating Fund”). The Interfund Program allows each Participating Fund, whose policies permit it to do so, to lend money directly to and borrow money directly from other Funds for temporary purposes through the Interfund Program. During the six months ended December 31, 2019, the Funds did not participate as a borrower or lender in the Interfund Program.
| 12. | RELATED PARTY TRANSACTIONS |
The Investment Adviser and Distributor are related parties. Fees payable to and amounts due from these parties are disclosed in Note 4 and the accrued related party fee and receivable amounts are disclosed on the Statements of Assets and Liabilities.
In preparing these financial statements, the Funds’ management has evaluated events and transactions for potential recognition or disclosure through the date the financial statements were issued.
On January 16, 2020, AllianzGI Income & Growth declaredper-share net investment income dividends and short-term capital gain distributions to shareholders, payable January 16, 2020 to shareholders of record on January 15, 2020 as follows:
| | | | | | | | |
| | |
| Share Class | | Dividend Rate | | | Short-Term
Capital Gains | |
Class A | | $ | 0.01579 | | | $ | 0.05421 | |
Class C | | $ | 0.00978 | | | $ | 0.05421 | |
Class R | | $ | 0.01322 | | | $ | 0.05421 | |
Class P | | $ | 0.01810 | | | $ | 0.05421 | |
Institutional Class | | $ | 0.01908 | | | $ | 0.05421 | |
On February 20, 2020, AllianzGI Income & Growth declaredper-share net investment income dividends and short-term capital gain
distributions to shareholders, payable February 20, 2020 to shareholders of record on February 19, 2020 as follows:
| | | | | | | | |
| | |
| Share Class | | Dividend Rate | | | Short-Term
Capital Gains | |
Class A | | $ | 0.00933 | | | $ | 0.06067 | |
Class C | | $ | 0.00403 | | | $ | 0.06067 | |
Class R | | $ | 0.00723 | | | $ | 0.06067 | |
Class P | | $ | 0.01135 | | | $ | 0.06067 | |
Institutional Class | | $ | 0.01219 | | | $ | 0.06067 | |
There were no other subsequent events identified that require recognition or disclosure.
| | | | | | |
| | Semiannual Report | | | December 31, 2019 | | 165 |
Unaudited
Changes to the Board of Trustees
Effective December 31, 2019, Bradford K. Gallagher retired as an Independent Trustee of the Trust.
| | | | | | |
| 166 | | December 31, 2019 | | | Semiannual Report | | |
Unaudited
Privacy Policy
Please read this Policy carefully. It gives you important information about how Allianz Global Investors U.S. and its U.S. affiliates (“AllianzGI US,” “we” or “us”) handlenon-public personal information (“Personal Information”) that we may receive about you. It applies to all of our past, present and future clients and shareholders of AllianzGI US and the funds and accounts it manages, advises, administers or distributes, and will continue to apply when you are no longer a client or shareholder. As used throughout this Policy, “AllianzGI US” means Allianz Global Investors U.S. LLC, Allianz Global Investors Distributors LLC, and the family of registered and unregistered funds managed by one or more of these firms. AllianzGI US is part of a global investment management group, and the privacy policies of other Allianz Global Investors entities outside of the United States may have provisions in their policies that differ from this Privacy Policy. Please refer to the website of the specificnon-US Allianz Global Investors entity for its policy on privacy.
We Care about Your Privacy
We consider your privacy to be a fundamental aspect of our relationship with you, and we strive to maintain the confidentiality, integrity and security of your Personal Information. To ensure your privacy, we have developed policies that are designed to protect your Personal Information while allowing your needs to be served.
Information We May Collect
In the course of providing you with products and services, we may obtain Personal Information about you, which may come from sources such as account application and other forms, from other written, electronic, or verbal communications, from account transactions, from a brokerage or financial advisory firm, financial advisor or consultant, and/or from information you provide on our website.
You are not required to supply any of the Personal Information that we may request. However, failure to do so may result in us being unable to open and maintain your account, or to provide services to you.
How Your Information Is Shared
We do not disclose your Personal Information to anyone for marketing purposes. We disclose your Personal Information only to those service providers, affiliated andnon-affiliated, who need the information for everyday business purposes, such as to respond to your inquiries, to perform services, and/or to service and maintain your account. This applies to all of the categories of Personal Information we collect about you. The affiliated andnon-affiliated service providers who receive your Personal Information also may use it to process your transactions, provide you with materials (including preparing and mailing prospectuses and shareholder reports and gathering shareholder proxies), and provide you with account statements and other materials relating to your account. These service providers provide services at our direction, and under their agreements with us, are required to keep your Personal Information confidential and to use it only for providing the contractually required services. Our service providers may not use your Personal Information to market products and services to you except in conformance with applicable laws and regulations. We also may provide your Personal Information to your respective brokerage or financial advisory firm, custodian, and/or to your financial advisor or consultant.
In addition, we reserve the right to disclose or report Personal Information tonon-affiliated third parties, in limited circumstances, where we believe in good faith that disclosure is required under law, to cooperate with regulators or law enforcement authorities or pursuant to other legal process, or to protect our rights or property, including to enforce our Privacy Policy or other agreements with you. Personal Information collected by us may also be transferred as part of a corporate sale, restructuring, bankruptcy, or other transfer of assets.
Security of Your Information
We maintain your Personal Information for as long as necessary for legitimate business purposes or otherwise as required by law. In maintaining this information, we have implemented appropriate procedures that are designed to restrict access to your Personal Information only to those who need to know that information in order to provide products and/or services to you. In addition, we have implemented physical, electronic and procedural safeguards to help protect your Personal Information.
Privacy and the Internet
The Personal Information that you provide through our website, as applicable, is handled in the same way as the Personal Information that you provide by any other means, as described above. This section of the Policy gives you additional information about the way in which Personal Information that is obtained online is handled.
| | ∎ | | Online Enrollment, Account Access and Transactions:When you visit our website, you can visit pages that are open to the general public, or, where available, log into protected pages to enroll online, access information about your account, or conduct certain transactions. Access to these secure pages is permitted only after you have created a User ID and Password. The User ID and Password must be supplied each time you want to |
| | | | | | |
| | Semiannual Report | | | December 31, 2019 | | 167 |
Unaudited
Privacy Policy (cont’d)
| | access your account information online. This information serves to verify your identity. When you enter Personal Information into our website to enroll or access your account online, you will log into secure pages. By using our website, you consent to this Privacy Policy and to the use of your Personal Information in accordance with the practices described in this Policy. If you provide Personal Information to effect transactions, a record of the transactions you have performed while on the site is retained by us. For additional terms and conditions governing your use of our website, please refer to the Investor Mutual Fund Access – Disclaimer which is incorporated herein by reference and is available on our website. |
| | ∎ | | Cookies and Similar Technologies: Cookies are small text files stored in your computer’s hard drive when you visit certain web pages. Clear GIFs (also known as Web Beacons) are typically transparent very small graphic images (usually 1 pixel x 1 pixel) that are placed on a website that may be included on our services provided via our website and typically work in conjunction with cookies to identify our users and user behavior. We may use cookies and automatically collected information to: (i) personalize our website and the services provided via our website, such as remembering your information so that you will not have tore-enter it during your use of, or the next time you use, our website and the services provided via our website; (ii) provide customized advertisements, content, and information; (iii) monitor and analyze the effectiveness of our website and the services provided via our website and third-party marketing activities; (iv) monitor aggregate site usage metrics such as total number of visitors and pages viewed; and (v) track your entries, submissions, and status in any promotions or other activities offered through our website and the services provided via our website. Tracking technology also helps us manage and improve the usability of our website, (i) detecting whether there has been any contact between your computer and us in the past and (ii) to identify the most popular sections of our website. Because an industry-standardDo-Not-Track protocol is not yet established, our website will continue to operate as described in this Privacy Policy and will not be affected by anyDo-Not-Track signals from any browser. |
| | ∎ | | Use of Social Media Plugins Our website uses the following Social Media Plugins (“Plugins”): |
| | ∎ | | Facebook Share Button operated by Facebook Inc., 1601 S. California Ave, Palo Alto, CA 94304, USA |
| | ∎ | | Tweet Button operated by Twitter Inc., 795 Folsom St., Suite 600, San Francisco, CA 94107, USA |
| | ∎ | | LinkedIn Share Button operated by LinkedIn Corporation, 2029 Stierlin Court, Mountain View, CA 94043, USA |
All Plugins are marked with the brand of the respective operators Facebook, Twitter and LinkedIn (“Operators”). When you visit our website that contains a social plugin, your browser establishes a direct connection to the servers of the Operator. The Operator directly transfers the plugin content to your browser which embeds the latter into our website, enabling the Operator to receive information about you having accessed the respective page of our website. Thus, AllianzGI US has no influence on the data gathered by the plugin and we inform you according to our state of knowledge: The embedded plugins provide the Operator with the information that you have accessed the corresponding page of our website. If you do not wish to have such data transferred to the Operators, you need to log out of your respective account before visiting our website. Please see the Operators’ data privacy statements in order to get further information about purpose and scope of the data collection and the processing and use:
| | ∎ | | Facebook:https://de-de.facebook.com/about/privacy |
| | ∎ | | Twitter: https://twitter.com/privacy |
| | ∎ | | Linked In: https://www.linkedin.com/legal/privacy-policy |
Changes to Our Privacy Policy
We may modify this Privacy Policy fromtime-to-time to reflect changes in related practices and procedures, or applicable laws and regulations. If we make changes, we will notify you on our website and the revised Policy will become effective immediately upon posting to our website. We also will provide account owners with a copy of our Privacy Policy, annually if required. We encourage you to visit our website periodically to remain up to date on our Privacy Policy. You acknowledge that by using our website after we have posted changes to this Privacy Policy, you are agreeing to the terms of the Privacy Policy as modified.
Obtaining Additional Information
If you have any questions about this Privacy Policy or our privacy related practices in the United States, you may contact us via our dedicated email at PrivacyUS@allianzgi.com.
| | | | | | |
| 168 | | December 31, 2019 | | | Semiannual Report | | |
Allianz Funds
Trustees
Alan Rappaport
Chairman of the Board of Trustees
Sarah E. Cogan
Deborah A. DeCotis
F. Ford Drummond
Thomas J. Fuccillo
Erick R. Holt
James A. Jacobson
Hans W. Kertess
James S. MacLeod
William B. Ogden, IV
Davey S. Scoon
Officers
Thomas J. Fuccillo
President and Chief Executive Officer
Scott Whisten
Treasurer, Principal Financial & Accounting Officer
Angela Borreggine
Chief Legal Officer & Secretary
Thomas L. Harter
Chief Compliance Officer
Richard J. Cochran
Assistant Treasurer
Orhan Dzemaili
Assistant Treasurer
Debra Rubano
Assistant Secretary
Craig A. Ruckman
Assistant Secretary
Investment Adviser
Allianz Global Investors U.S. LLC
1633 Broadway
New York, NY 10019
Distributor
Allianz Global Investors Distributors LLC
1633 Broadway
New York, NY 10019
Custodian & Accounting Agent
State Street Bank and Trust Co.
801 Pennsylvania Avenue
Kansas City, MO 64105
Shareholder Servicing and Transfer Agents
State Street Bank and Trust Company, which has delegated its obligations
as transfer agent to:
DST Asset Manager Solutions, Inc.
(Class A, Class C and Class R Shares)
P.O. Box 219723
Kansas City, MO 64121-9723
(Class P, Institutional Class, Class R6 and Administrative Class shares)
P.O. Box 219968
Kansas City, MO 64121-9968
Independent Registered Public Accounting Firm
PricewaterhouseCoopers LLP
300 Madison Ave
New York, NY 10017
Legal Counsel
Ropes & Gray LLP
Prudential Tower
800 Boylston Street
Boston, MA 02199
This report, including the financial information herein, is transmitted to the shareholders of the Trust for their information. It is not a prospectus, circular or representation intended for use in the purchase of shares of each Fund or any securities mentioned in this report.
The financial information included herein is taken from the records of the Funds without examination by an independent registered public accounting firm, who did not express an opinion herein.
For Account Information
Contact your financial adviser, or if you receive account statements directly from Allianz Global Investors, you can also call (800)988-8380 for Class A, C and R shares or (800)498-5413 for Class P, Institutional, R6 and Administrative shares. Telephone representatives are available Monday-Friday 8:30 am to 6:00 pm Eastern Time. Or visit our website, us.allianzgi.com.
About Allianz Global Investors
Allianz Global Investors is a leading active asset manager with over 800 investment professionals in 25 offices worldwide and managing $608 billion in assets for individuals, families and institutions.*
Active is the most important word in our vocabulary. Active is how we create and share value with clients. We believe in solving, not selling, and in adding value beyond pure economic gain. We invest for the long term, employing our innovative investment expertise and global resources. Our goal is to ensure a superior experience for our clients, wherever they are based and whatever their investment needs.
Active is: Allianz Global Investors
* Data as of September 30, 2019.
Investors should consider the investment objectives, risks, charges and expenses of the above mentioned Funds carefully before investing. This and other information is contained in the Funds’ prospectus, which may be obtained by contacting your financial advisor, by visiting us.allianzgi.com or by calling 1-800-988-8380 (retail classes: A, C and R) or 1-800-498-5413 (Class P, Class R6, Institutional and Administrative classes). Please read the prospectus carefully before you invest or send money.
Allianz Global Investors U.S. LLC serves as the investment manager for the Allianz Funds and the Allianz Multi-Strategy Funds. Allianz Funds and the Allianz Multi-Strategy Funds are distributed by Allianz Global Investors Distributors LLC.© 2020. For information about any product, contact your financial advisor.
us.allianzgi.com
Receive this report electronically and eliminate paper mailings.
To enroll, go to us.allianzgi.com/edelivery.
1047725
(a) Not required in this filing.
| ITEM 3. | AUDIT COMMITTEE FINANCIAL EXPERT |
Not required in this filing.
| ITEM 4. | PRINCIPAL ACCOUNTANT FEES AND SERVICES |
Not required in this filing.
| ITEM 5. | AUDIT COMMITTEE OF LISTED REGISTRANT |
Disclosure not required foropen-end management investment companies.
(a) Schedule of Investments is included as part of the report to shareholders filed under Item 1 of this form.
(b) Not applicable.
| ITEM 7. | DISCLOSURE OF PROXY VOTING POLICIES AND PROCEDURES FORCLOSED-END MANAGEMENT INVESTMENT COMPANIES |
Disclosure not required foropen-end management investment companies.
| ITEM 8. | PORTFOLIO MANAGERS OFCLOSED-END MANAGEMENT INVESTMENT COMPANIES |
Disclosure not required foropen-end management investment companies.
| ITEM 9. | PURCHASES OF EQUITY SECURITIES BYCLOSED-END MANAGEMENT INVESTMENT COMPANY AND AFFILIATED COMPANIES. |
Disclosure not required foropen-end management investment companies.
| ITEM 10. | SUBMISSION OF MATTERS TO A VOTE OF SECURITY HOLDERS |
There were no material changes to the procedures by which shareholders may recommend nominees to the Trust’s Board of Trustees since the Trust’s last provided disclosure in response to this item.
| ITEM 11. | CONTROLS AND PROCEDURES |
| (a) | The registrant’s President & Chief Executive Officer and Treasurer, Principal Financial & Accounting Officer have concluded that the registrant’s disclosure controls and procedures (as defined in Rule30a-3(c) under the Investment Company Act of 1940 (the “1940 Act”) (17 CFR270.30a-3(c)), as amended) are effective based on their evaluation of these controls and procedures as of a date within 90 days of the filing date of this document. |
| (b) | There were no changes in the registrant’s internal control over financial reporting (as defined in Rule30a-3(d) under the 1940 Act (17 CFR270.30a-3(d))) that occurred during the second fiscal quarter of the period covered by this report that has materially affected, or is reasonably likely to materially affect, the registrant’s internal control over financial reporting. |
| ITEM 12. | DISCLOSURE OF SECURITIES LENDING ACTIVITIES FORCLOSED-END MANAGEMENT INVESTMENT COMPANIES. |
Disclosure not required foropen-end management investment companies.
(a)(1) Not required in this filing
(a)(2) Exhibit 99_CERT. – Certification pursuant to Section 302 of the Sarbanes-Oxley Act of 2002
(a)(3) Not applicable
(b) Exhibit 99.906 CERT. – Certification pursuant to Section 906 of the Sarbanes-Oxley Act of 2002
Signatures
Pursuant to the requirements of the Securities Exchange Act of 1934 and the Investment Company Act of 1940, the registrant has duly caused this report to be signed on its behalf by the undersigned, thereunto duly authorized.
| | |
| Allianz Funds |
| |
| By: | | /s/ Thomas J. Fuccillo |
| | Thomas J. Fuccillo |
| | President & Chief Executive Officer |
|
| Date: February 28, 2020 |
| |
| By: | | /s/ Scott Whisten |
| | Scott Whisten |
| | Treasurer, Principal Financial & Accounting Officer |
|
| Date: February 28, 2020 |
Pursuant to the requirements of the Securities Exchange Act of 1934 and the Investment Company Act of 1940, this report has been signed below by the following persons on behalf of the registrant and in the capacities and on the dates indicated.
| | |
| By: | | /s/ Thomas J. Fuccillo |
| | Thomas J. Fuccillo |
| | President & Chief Executive Officer |
|
| Date: February 28, 2020 |
| |
| By: | | /s/ Scott Whisten |
| | Scott Whisten |
| | Treasurer, Principal Financial & Accounting Officer |
|
| Date: February 28, 2020 |