UNITED STATES
SECURITIES AND EXCHANGE COMMISSION
Washington, D.C. 20549
FORMN-CSR
CERTIFIED SHAREHOLDER REPORT OF REGISTERED
MANAGEMENT INVESTMENT COMPANIES
Investment Company Act file number:811-06161
Allianz Funds
(Exact name of registrant as specified in charter)
1633 Broadway, New York, NY 10019
(Address of principal executive offices) (Zip code)
Scott Whisten
1633 Broadway, New York, NY 10019
(Name and address of agent for service)
Registrant’s telephone number, including area code:212-739-3367
Date of fiscal year end: June 30
Date of reporting period: December 31, 2018
ITEM 1. REPORT TO SHAREHOLDERS

Allianz Funds
SHARE CLASSES A, C, R, P, INSTITUTIONAL, R6, ADMINISTRATIVE
Semiannual Report
December 31, 2018
AllianzGI Emerging Markets Opportunities Fund
AllianzGI Focused Growth Fund
AllianzGI Global Natural Resources Fund
AllianzGI Global Small-Cap Fund
AllianzGI Health Sciences Fund
AllianzGI Income & Growth Fund
AllianzGI Mid-Cap Fund
AllianzGI NFJ Dividend Value Fund
AllianzGI NFJ International Value Fund
AllianzGI NFJ Large-Cap Value Fund
AllianzGI NFJ Mid-Cap Value Fund
AllianzGI NFJ Small-Cap Value Fund
AllianzGI Small-Cap Fund
AllianzGI Technology Fund
This material is authorized for use only when preceded or accompanied by the current Allianz Funds prospectus. Investors should consider the investment objectives, risks, charges and expenses of each Fund carefully before investing. This and other information is contained in the Funds’ prospectus or summary prospectus. Please read the prospectus carefully before you invest or send money.
Beginning on January 1, 2021, as permitted by regulations adopted by the U.S. Securities and Exchange Commission, paper copies of shareholder reports will no longer be sent by mail, unless you specifically request paper copies of the reports. Instead, the reports will be made available on the Funds’ website (us.allianzgi.com), and you will be notified by mail each time a report is posted and provided with a website link to access the report.
If you already elected to receive shareholder reports electronically, you will not be affected by this change and you need not take any action. You may elect to receive shareholder reports and other communications from a Fund electronically anytime by contacting your financial intermediary (such as a broker-dealer or bank) or, if you are a direct investor, by enrolling at us.allianzgi.com/edelivery.
If you prefer to receive paper copies of your shareholder reports after January 1, 2021, direct investors may inform a Fund at any time. If you invest through a financial intermediary, you should contact your financial intermediary directly. Paper copies are provided free of charge and your election to receive reports in paper will apply to all funds held with the fund complex if you invest directly with a Fund or all funds held in your account if you invest through your financial intermediary.

Receive this report electronically and eliminate paper mailings.
To enroll, go to us.allianzgi.com/edelivery.
Table of Contents
A Word About Risk: A fund may be subject to various risks as described in its prospectus. Some of those risks may include, but are not limited to, the following: fixed-income risk, liquidity risk, derivatives risk, smaller company risk, non-US investment risk, focused investment risk and specific sector investment risks. Below investment grade securities involve a greater risk to principal than investment grade securities. Bond prices will normally decline as interest rates rise. The impact may be greater with longer-duration bonds. The market for certain securities may become illiquid, which could prevent a fund from purchasing or selling these securities at an advantageous time or price and possibly delay redemptions of fund shares. Use of derivative instruments may involve certain costs and risks such as liquidity risk, interest rate risk, market risk, credit and counterparty risk, management risk and the risk that a fund is unable to close out a position when it is most advantageous to do so. Portfolios investing in derivatives could lose more than the principal amount invested in those instruments. Investing in foreign securities may entail risk due to foreign economic and political developments; this risk may be enhanced when investing in emerging markets. Smaller companies may be more volatile than larger companies and may entail more risk. Concentrating investments in individual sectors may add additional risk and additional volatility compared to a diversified equity portfolio. The principal values of the funds are not guaranteed at any time. Please refer to the applicable fund’s current prospectus for complete details.
Letter from the President

Thomas J. Fuccillo
President & CEO
Dear Shareholder,
The economic expansion continued at a solid pace during the six-month fiscal reporting period ended December 31, 2018. In contrast, economic growth overseas moderated. Due to a sharp decline in the fourth quarter of 2018, both US and international equities generated weak results. The overall US bond market posted a modest gain during the reporting period.
The Six-Month Fiscal Period in Review
For the six-month period ended December 31, 2018, US stocks returned -6.85%, as measured by the S&P 500 Index. Two measures of stock performance in developed international and global markets produced weak results, in dollar-denominated terms, with the MSCI EAFE (Europe, Australasia and Far East) Index returning -11.35% and the MSCI World Index returning-9.10%. Elsewhere, the MSCI Emerging Markets Index returned -8.49% in dollar-denominated terms. With respect to bonds, the Bloomberg Barclays US Credit Index returned 0.90% and the Bloomberg Barclays Global High Yield Index returned -1.57%. The Bloomberg Barclays US Government Bond Index returned -1.41%, while the broader bond market, as measured by the Bloomberg Barclays US Aggregate Bond Index, returned 1.65%.
Turning to the US economy, gross domestic product (“GDP”), the value of goods and services produced in the country, the broadest measure of economic activity and the principal indicator of economic performance, expanded at a 4.2% annualized pace during the second quarter of 2018 — the best reading since the third quarter of 2014. GDP grew at an annual pace of 3.4% during the third quarter of 2018. The Commerce Department’s initial GDP growth estimate for the fourth quarter of 2018 was delayed due to the partial government shutdown.
After raising interest rates twice during the first half of 2018, the US Federal Reserve (the “Fed”) again raised rates at its meetings in September and December 2018. The last hike pushed the federal funds rate to a range between 2.25% and 2.50%. The Fed currently anticipates making two additional rate hikes in 2019, but this may change based on incoming economic data.
Economic growth outside the US decelerated during the reporting period. Unlike the Fed, the European Central Bank (“ECB”) and the Bank of Japan largely maintained their accommodative monetary policies. While the ECB concluded its bond buying program at the end of the 2018, it stated that it does not anticipate raising interest rates “at least through the summer of 2019.” Elsewhere, in August 2018, the Bank of England raised rates from 0.50% to 0.75%, but then remained on hold through the remainder of the year.
| | | | | | |
| 2 | | December 31, 2018 | | | Semiannual Report | | |
Outlook
In our view, higher interest rates in the US — and less quantitative easing from the Fed and ECB — will likely reduce liquidity and create higher market volatility for investors in 2019. Because navigating the markets successfully may take greater skill, we believe investors should consider actively selecting where to invest, rather than passively accept market returns – understanding there is no guarantee that any type of strategy will outperform its relevant benchmark or the broader market.
The global economy — which has been doing fairly well — is likely to become even less synchronized and more fragmented. This would continue a trend that began in earnest in 2018, as market returns turned negative. We believe that trade tensions and political uncertainty may be primary drags on performance, while high oil prices and tight labor markets in the US, UK, Germany and Japan could heighten fears of rising rates and inflation.
In recent years, investors have been able to follow the herd as markets have risen, but we feel that continuing that approach now could destroy value rather than create it. As we enter into a period of lower cross-asset correlations, higher volatility and lower returns — particularly for equities — active asset allocation and active security selection is likely to become increasingly important, in our opinion.
On behalf of Allianz Global Investors U.S. LLC, the Funds’ investment adviser, thank you for investing with us. We encourage you to consult with your financial advisor and to visit our website, us.allianzgi.com, for additional information. We remain dedicated to serving your investment needs.
Sincerely,

Thomas J. Fuccillo
President & CEO
Past performance is no guarantee of future results. Unless otherwise noted, index returns reflect the reinvestment of income dividends and capital gains, if any, but do not reflect fees, brokerage commissions or other expenses of investing. It is not possible to invest directly in an index.
Receive this report electronically and eliminate paper mailings.
To enroll, go to us.allianzgi.com/edelivery.
| | | | | | |
| | Semiannual Report | | | December 31, 2018 | | | 3 |
Unaudited
AllianzGI Emerging Markets Opportunities Fund
For the period of July 1, 2018 through December 31, 2018, as provided by Lu Yu, CFA, CIPM, Portfolio Manager.
Fund Insights
For the six-month period ended December 31, 2018, Class A shares at net asset value (“NAV”) of the AllianzGI Emerging Markets Opportunities Fund (the “Fund”) returned -11.58%, underperforming the MSCI Emerging Markets Index (the “benchmark”) which returned -8.49%.
Market Overview
Emerging market equities were negatively impacted by apprehension over a global trade war between the US and China, mounting geopolitical tensions in Russia and concerns of rising inflation expectations, which could lead the US Federal Reserve to accelerate rate hikes. Emerging market currencies broadly declined as a result of a moderation in asset class sentiment and earnings estimates were subsequently lowered. These headwinds were present during the majority of the reporting period, with July and November the only positive performance months to counteract this trend.
Country results were mostly lower with 16 of 24 benchmark countries posting declines. Performance was led to the upside by Qatar, which posted strong gains due in part to demand for oil and gas. Brazil outperformed as investors reacted positively to the election of the country’s new president, which led to an advance in the Brazilian real. Meanwhile, Greece was cut nearly in one-third as investors weighed the risk-reward tradeoff following the country’s exit from its bailout program. Pakistan, Colombia and Turkey were also down significantly due to macroeconomic headwinds in each country.
Sector results were mostly lower with nine out of 11 sectors in the benchmark posting declines. Energy was the top performer thanks to robust oil and gas demand globally, followed by a modest gain in financials. Meanwhile, health care, consumer discretionary and information technology sectors each posted double-digit losses for the period due to a moderation in local consumer-related demand.
Portfolio Review
The Fund seeks to deliver outperformance over time by investing in emerging-market companies that are benefiting from change not yet fully reflected in the market. The investment team believes that investor behavioral biases contribute to market inefficiencies, which can be exploited through a transparent and repeatable investment process.
During the six-month period, the Fund trailed the benchmark due to stock selection. From a sector standpoint, a relative underweight allocation to health care contributed to results as did bottom-up selections in information technology and communication services sectors. Meanwhile, stock picking in materials was the primary source of underperformance. Financials and consumer discretionary sectors detracted more modestly. From a country standpoint, a relative overweight allocation and stock picking within Russia aided returns as did stock selection in China and overweight allocation to India. Conversely, negative stock selection in South Korea offset results as did an underweight allocation and more conservative stock picking in Brazil.
Outlook
Our belief is that emerging market equities may be bottoming as headwinds over tariffs, deleveraging in China and currency weakness are likely subsiding. There appears to be willingness on both the US and China to come to a trade truce, and timing is particularly important post US midterm elections where President Trump has the potential to relax his protectionist stance. While recent deleveraging in China has resulted in slowing near-term growth, longer-term we believe this will be beneficial for the asset class as the quality of future growth should be more sustainable. The US dollar has been very strong relative to emerging market currencies in 2018 due in part to tax cuts and repatriation of foreign capital back to the US, which in our view, the emerging market currencies are rebounding. Valuations remain low and significant when compared to recent history. We believe earnings growth will follow projections and remain at a healthy high single-digit level for the calendar year.
| | | | | | |
| 4 | | December 31, 2018 | | | Semiannual Report | | |
Unaudited
AllianzGI Emerging Markets Opportunities Fund (cont’d)
Average Annual Total Return for the period ended December 31, 2018
| | | | | | | | | | | | | | | | | | | | | | |
| | | | | | |
| | | | | 6 Month* | | | 1 Year | | | 5 Year | | | 10 Year | | | Since Inception† | |
| | | AllianzGI Emerging Markets Opportunities Fund Class A | | | –11.58% | | | | –16.91% | | | | 0.87% | | | | 7.38% | | | | 8.11% | |
| | AllianzGI Emerging Markets Opportunities Fund Class A (adjusted) | | | –16.45% | | | | –21.48% | | | | –0.27% | | | | 6.78% | | | | 7.70% | |
| | | AllianzGI Emerging Markets Opportunities Fund Class C | | | –11.92% | | | | –17.53% | | | | 0.12% | | | | 6.58% | | | | 7.30% | |
| | AllianzGI Emerging Markets Opportunities Fund Class C (adjusted) | | | –12.80% | | | | –18.36% | | | | 0.12% | | | | 6.58% | | | | 7.30% | |
| | AllianzGI Emerging Markets Opportunities Fund Class P | | | –11.48% | | | | –16.71% | | | | 1.12% | | | | 7.65% | | | | 8.41% | |
| | AllianzGI Emerging Markets Opportunities Fund Institutional Class | | | –11.42% | | | | –16.62% | | | | 1.22% | | | | 7.78% | | | | 8.53% | |
| | AllianzGI Emerging Markets Opportunities Fund Class R6 | | | –11.42% | | | | –16.58% | | | | 1.27% | | | | 7.84% | | | | 8.58% | |
| | MSCI Emerging Markets Index | | | –8.49% | | | | –14.58% | | | | 1.65% | | | | 8.02% | | | | 8.20% | |
| | | Lipper Emerging Markets Funds Average | | | –9.92% | | | | –16.27% | | | | 0.37% | | | | 7.53% | | | | 7.57% | |
* Cumulative return
† The Fund began operations on 5/27/04. Benchmark comparisons began on the fund inception date. Lipper comparisons began on 5/31/04.
Performance quoted represents past performance and is no guarantee of future results. Current performance may be lower or higher than performance shown. For performance current to the most recent month-end, visit our website at us.allianzgi.com. Investment return and the principal value will fluctuate. Shares may be worth more or less than original cost when redeemed.The adjusted returns take into account the maximum sales charge of 5.50% on Class A shares and 1% contingent deferred sales charge (CDSC) on Class C shares, which may apply to shares redeemed during the first year of ownership. Returns do not reflect deduction of taxes that a shareholder would pay on fund distributions or redemption of fund shares. Please see pages 60-62 for more information. The Fund’s gross expense ratios are 1.61% for Class A shares, 2.36% for Class C shares, 1.36% for Class P shares, 1.26% for Institutional Class and 1.21% for Class R6 shares. These ratios do not include an expense reduction, contractually agreed through at least October 31, 2019. The Fund’s expense ratios net of these reductions and waivers are 1.26% for Class A shares, 2.01% for Class C shares, 1.01% for Class P shares, 0.91% for Institutional Class shares and 0.86% for Class R6 shares. Expense ratio information is as of the Fund’s current prospectus dated August 30, 2018, as supplemented to date.
Cumulative Returns Through December 31, 2018
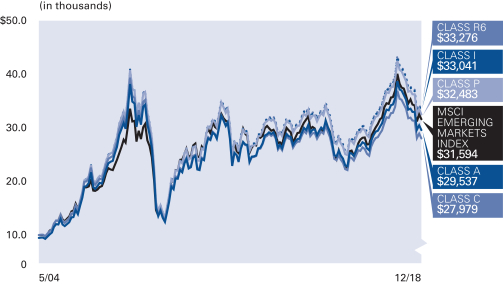
The Fund began operations on 5/27/04. Benchmark comparisons began on the fund inception date.
Country Allocation (as of December 31, 2018)
| | | | |
| |
| China | | | 29.9% | |
| |
| India | | | 13.0% | |
| |
| Korea (Republic of) | | | 12.4% | |
| |
| Taiwan | | | 8.9% | |
| |
| Russian Federation | | | 7.1% | |
| |
| Brazil | | | 6.1% | |
| |
| Peru | | | 3.8% | |
| |
| Hong Kong | | | 3.4% | |
| |
| Other | | | 13.0% | |
| |
| Cash & Equivalents — Net | | | 2.4% | |
| | | | | | |
| | Semiannual Report | | | December 31, 2018 | | 5 |
Unaudited
AllianzGI Emerging Markets Opportunities Fund (cont’d)
| | | | | | | | | | |
| |
| Shareholder Expense Example | | Actual Performance |
| | | Class A | | Class C | | Class P | | Institutional
Class | | Class R6 |
| | | | | |
| Beginning Account Value (7/1/18) | | $1,000.00 | | $1,000.00 | | $1,000.00 | | $1,000.00 | | $1,000.00 |
| | | | | |
| Ending Account Value (12/31/18) | | $884.20 | | $880.80 | | $885.20 | | $885.80 | | $885.80 |
| | | | | |
| Expenses Paid During Period | | $5.98 | | $9.53 | | $4.80 | | $4.33 | | $4.09 |
| | | | | | | | | | | |
| |
| | | Hypothetical Performance |
| | | (5% return before expenses) |
| | | Class A | | Class C | | Class P | | Institutional
Class | | Class R6 |
| | | | | |
| Beginning Account Value (7/1/18) | | $1,000.00 | | $1,000.00 | | $1,000.00 | | $1,000.00 | | $1,000.00 |
| | | | | |
| Ending Account Value (12/31/18) | | $1,018.85 | | $1,015.07 | | $1,020.11 | | $1,020.62 | | $1,020.87 |
| | | | | |
| Expenses Paid During Period | | $6.41 | | $10.21 | | $5.14 | | $4.63 | | $4.38 |
For each class of the Fund, expenses (net of fee waivers) are equal to the annualized expense ratio for the class (1.26% for Class A, 2.01% for Class C, 1.01% for Class P, 0.91% for Institutional Class and 0.86% for R6 Class), multiplied by the average account value over the period, multiplied by 184/365.
| | | | | | |
| 6 | | December 31, 2018 | | | Semiannual Report | | |
(THIS PAGE INTENTIONALLY LEFT BLANK)
| | | | | | |
| | Semiannual Report | | | December 31, 2018 | | 7 |
Unaudited
AllianzGI Focused Growth Fund
For the period of July 1, 2018 through December 31, 2018, as provided by Karen Hiatt, CFA, Lead Portfolio Manager.
Fund Insights
For the six-month period ended December 31, 2018, Class A shares at net asset value (“NAV”) of the AllianzGI Focused Growth Fund (the “Fund”) returned -12.29%, underperforming the Russell 1000 Growth Index (the “benchmark”), which returned -8.17%.
Market Overview
US equities ratcheted steadily higher over the third quarter, with major indices touching a series of fresh peaks bolstered by corporate earnings growth and positive economic data. However, the bull market ended abruptly in the final quarter of 2018 when US stocks plummeted, recording their weakest fourth-quarter returns since 2008. The S&P 500 index touched its lowest level since September 2017, while both the tech-heavy NASDAQ index and the small-cap Russell 2000 index entered official bear markets. A sudden rise in bond yields provided the catalyst for the initial downward movement in October. The sell-off intensified as worries over impact of higher tariffs and the outlook for global growth added to concerns. Politics also unsettled investors, with a US government shutdown and continued uncertainty over Brexit.
Portfolio Review
The Fund’s higher growth tilt relative to its benchmark hurt relative performance as investors rushed to defensive sectors amid the market sell-off.
Within the technology sector, our overweight position in semiconductor holdings NVIDIA Corp. and Applied Materials, Inc. underperformed as investors grew concerned about future growth amid rising inventories and trade issues with China. Our position in financial services company SVB Financial Group also underperformed, mostly due to its lending exposure to technology companies amid the deep sell-off. Other detractors included overweight positions in Floor & Décor Holdings, Inc. and United Rentals, Inc.
On the positive side, stock selection in the health care sector contributed to relative returns. Anthem, Inc. and UnitedHealth Group, Inc. were the largest contributors within the sector as they have delivered positive business results mostly due to the ongoing company initiatives in value based health care and cost savings. Within consumer discretionary, Burlington Stores, Inc. has consistently delivered strong results in off price retail. Other contributors included an overweight position in Agilent Technologies, Inc. and not owning Netflix, Inc.
We believe the portfolio holdings have attractive long-term growth prospects, and we remain comfortable with our overall positioning, despite short-term periods of volatility.
From a sector allocation perspective, an overweight position in health care and an underweight position in communication services helped relative performance. Conversely, an overweight position in technology and an underweight position in consumer staples hurt relative performance.
Outlook
We are assuming ongoing volatility in equity markets in the new year, which we believe should drive increasing dispersion of individual stock performance. In our opinion, the fallout from a prolonged partial government shutdown, ongoing trade disputes and geopolitical issues with China, rising interest rates in the US, ongoing political disputes in the US, and weakening data from emerging markets and Europe will likely weigh on global growth and increase stock volatility in 2019. Given the strong corporate earnings and employment trends in the US, we do not believe a US recession is imminent; however, we do believe it is prudent to be more selective in picking stocks.
Despite the sharp sell-off in the fourth quarter, many high quality companies continue to deliver strong operational execution. With more reasonable valuations and less euphoria in the market, we believe high quality companies should exceed expectations and deliver attractive stock returns in 2019.
Over the long term, we believe that the market will ultimately reward companies that deliver consistent growth and increase shareholder value over time. Our focus continues to be on applying rigorous fundamental research to identify companies with strong or under-appreciated growth prospects and attractive risk-reward characteristics.
| | | | | | |
| 8 | | December 31, 2018 | | | Semiannual Report | | |
Unaudited
AllianzGI Focused Growth Fund (cont’d)
Average Annual Total Return for the period ended December 31, 2018
| | | | | | | | | | | | | | | | | | | | | | |
| | | | | | |
| | | | | 6 Month* | | | 1 Year | | | 5 Year | | | 10 Year | | | Since Inception† | |
| | | AllianzGI Focused Growth Fund Class A | | | –12.29% | | | | –5.69% | | | | 8.62% | | | | 13.96% | | | | 10.84% | |
| | AllianzGI Focused Growth Fund Class A (adjusted) | | | –17.11% | | | | –10.87% | | | | 7.39% | | | | 13.31% | | | | 10.66% | |
| | | AllianzGI Focused Growth Fund Class C | | | –12.62% | | | | –6.40% | | | | 7.80% | | | | 13.10% | | | | 10.01% | |
| | AllianzGI Focused Growth Fund Class C (adjusted) | | | –13.34% | | | | –7.17% | | | | 7.80% | | | | 13.10% | | | | 10.01% | |
| | AllianzGI Focused Growth Fund Class R | | | –12.41% | | | | –5.93% | | | | 8.34% | | | | 13.67% | | | | 10.50% | |
| | AllianzGI Focused Growth Fund Class P | | | –12.19% | | | | –5.44% | | | | 8.89% | | | | 14.24% | | | | 11.15% | |
| | AllianzGI Focused Growth Fund Institutional Class | | | –12.14% | | | | –5.36% | | | | 8.99% | | | | 14.35% | | | | 11.26% | |
| | AllianzGI Focused Growth Fund Class R6 | | | –12.13% | | | | –5.32% | | | | 9.04% | | | | 14.40% | | | | 11.31% | |
| | | AllianzGI Focused Growth Fund Administrative Class | | | –12.25% | | | | –5.62% | | | | 8.72% | | | | 14.07% | | | | 10.97% | |
| | Russell 1000 Growth Index | | | –8.17% | | | | –1.51% | | | | 10.40% | | | | 15.29% | | | | 10.68% | |
| | | Lipper Large-Cap Growth Funds Average | | | –9.03% | | | | –0.80% | | | | 8.92% | | | | 14.13% | | | | 8.25% | |
* Cumulative return
† The Fund began operations on 2/24/84. Benchmark and Lipper performance comparisons began on 2/29/84.
Performance quoted represents past performance and is no guarantee of future results. Current performance may be lower or higher than performance shown. For performance current to the most recent month-end, visit our website at us.allianzgi.com. Investment return and the principal value will fluctuate. Shares may be worth more or less than original cost when redeemed.The adjusted returns take into account the maximum sales charge of 5.50% on Class A shares and 1% contingent deferred sales charge (CDSC) on Class C shares, which may apply to shares redeemed during the first year of ownership. Returns do not reflect deduction of taxes that a shareholder would pay on fund distributions or redemption of fund shares. Please see pages 60-62 for more information. The Fund’s gross expense ratios are 1.11% for Class A shares, 1.86% for Class C shares, 1.36% for Class R shares, 0.86% for Class P shares, 0.76% for Institutional Class, 0.71% for Class R6 shares, and 1.01% for Administrative Class shares. These ratios do not include an expense reduction, contractually agreed through at least October 31, 2019. The Fund’s expense ratios net of this reduction are 0.99% for Class A shares, 1.76% for Class C shares, 1.26% for Class R shares, 0.76% for Class P shares, 0.66% for Institutional Class shares, 0.61% for Class R6 shares, and 0.91% for Administrative Class shares. Expense ratio information is as of the Fund’s current prospectus dated August 30, 2018, as supplemented to date.
Cumulative Returns Through December 31, 2018
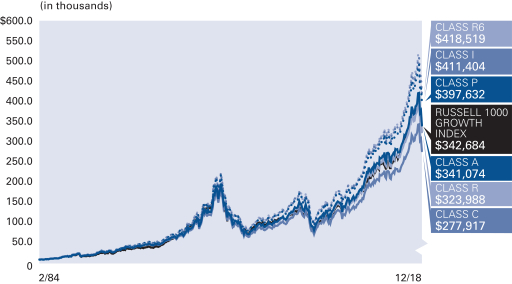
The Fund began operations on 2/24/84. Benchmark performance comparisons began on 2/29/84.
Industry/Sectors (as of December 31, 2018)
| | | | |
| |
| IT Services | | | 13.5% | |
| |
| Software | | | 13.5% | |
| |
| Healthcare Providers & Services | | | 11.7% | |
| |
| Specialty Retail | | | 7.6% | |
| |
| Internet & Direct Marketing Retail | | | 7.2% | |
| |
| Interactive Media & Services | | | 7.0% | |
| |
| Technology Hardware, Storage & Peripherals | | | 5.2% | |
| |
| Road & Rail | | | 3.6% | |
| |
| Other | | | 30.3% | |
| |
| Cash & Equivalents — Net | | | 0.4% | |
| | | | | | |
| | Semiannual Report | | | December 31, 2018 | | 9 |
Unaudited
AllianzGI Focused Growth Fund (cont’d)
| | | | | | | | | | | | | | |
| |
| Shareholder Expense Example | | Actual Performance |
| | | Class A | | Class C | | Class R | | Class P | | Institutional
Class | | Class R6 | | Administrative
Class |
| | | | | | | |
| Beginning Account Value (7/1/18) | | $1,000.00 | | $1,000.00 | | $1,000.00 | | $1,000.00 | | $1,000.00 | | $1,000.00 | | $1,000.00 |
| | | | | | | |
| Ending Account Value (12/31/18) | | $877.10 | | $873.80 | | $875.90 | | $878.10 | | $878.60 | | $878.70 | | $877.50 |
| | | | | | | |
| Expenses Paid During Period | | $4.68 | | $8.31 | | $5.96 | | $3.60 | | $3.13 | | $2.89 | | $4.31 |
| | | | | | | | | | | | | | | |
| |
| | | Hypothetical Performance |
| | | (5% return before expenses) |
| | | Class A | | Class C | | Class R | | Class P | | Institutional
Class | | Class R6 | | Administrative
Class |
| | | | | | | |
| Beginning Account Value (7/1/18) | | $1,000.00 | | $1,000.00 | | $1,000.00 | | $1,000.00 | | $1,000.00 | | $1,000.00 | | $1,000.00 |
| | | | | | | |
| Ending Account Value (12/31/18) | | $1,020.21 | | $1,016.33 | | $1,018.85 | | $1,021.37 | | $1,021.88 | | $1,022.13 | | $1,020.62 |
| | | | | | | |
| Expenses Paid During Period | | $5.04 | | $8.94 | | $6.41 | | $3.87 | | $3.36 | | $3.11 | | $4.63 |
For each class of the Fund, expenses (net of fee waivers) are equal to the annualized expense ratio for the class (0.99% for Class A, 1.76% for Class C, 1.26% for Class R, 0.76% for Class P, 0.66% for Institutional Class, 0.61% for Class R6 and 0.91% for Administrative Class), multiplied by the average account value over the period, multiplied by 184/365.
| | | | | | |
| 10 | | December 31, 2018 | | | Semiannual Report | | |
(THIS PAGE INTENTIONALLY LEFT BLANK)
| | | | | | |
| | Semiannual Report | | | December 31, 2018 | | 11 |
Unaudited
AllianzGI Global Natural Resources Fund
For the reporting period of July 1, 2018, through December 31, 2018, as provided by Paul Strand, CFA, Portfolio Manager.
Fund Insights
For the six-month period ended December 31, 2018, Class A shares at net asset value (“NAV”) of the AllianzGI Global Natural Resources Fund (the “Fund”) returned -19.85%, underperforming the 60% MSCI World Energy Index/40% MSCI World Materials (the “benchmark”), which returned -18.40%.
Market overview
Crude oil markets fell sharply in the fourth quarter of 2018, falling over 40% to a Brent crude level of $50 a barrel, after hitting a year’s high of $85 in September. The significant drop in crude was a result of many factors including pressure from the Trump Administration on Saudi Arabia to maintain production, Iranian supplies higher than expected despite the sanctions, strong production from US shale producers and worries of a possible global economic slowdown impacting global demand. Largely due to the fourth quarter drop in energy prices, the MSCI World Energy Index was one of the worst performing MSCI World sector indexes in the second half of 2018, down 21%. Meanwhile, similar worries of a global economic contraction, particularly in China, and the ongoing trade tensions, helped push the MSCI World Materials Index down in the fourth quarter as well. The MSCI World Materials Index fell 14% for the six-months period, largely impacted by the fourth quarter sell-off.
Portfolio review
The Fund’s underperformance was driven by stock selection effects primarily in the oil and gas exploration and production industry. The Fund’s use of option call writing had a negligible impact on performance for the six month period.
A variety of industries were represented in the largest contributors to relative performance. The Van Eck Vectors Gold Miners ETF was a large contributor to relative performance. Gold stocks generally outperform the broader market during periods of uncertainty like the market sell-off in the fourth quarter. The Fund’s position in specialty chemical companies, Air Products & Chemicals, Inc. and Ecolab, Inc., as well as the mining giant, BHP Group Ltd., added to performance as well. All three positions generated modest positive total returns for the Fund versus the benchmark’s larger decline. Finally, the US rail company, Union Pacific Corp., also contributed to performance.
The largest performance detractors were energy-related positions, including some positions in oil and gas exploration and production and a refiner. In general, oil and gas exploration and production stocks, which are in an industry that has a relatively higher beta than most other energy-related industries, tend to underperform in the energy sector when oil prices drop quickly and significantly like we saw in the fourth quarter. The refiner, Valero Energy Corp., negatively impacted performance as refining margins for the US refiners also contracted in the second-half of 2018.
Outlook
It was a difficult 2018 for natural resource-related funds, in general, largely due to the significant sell-off in the underlying commodities in the fourth quarter. During the latter part of the third quarter and throughout the fourth quarter, the Fund lowered its overall portfolio beta and layered in more energy exposure with yield support, such as the integrated oils. While this action helped to contain losses, particularly relative to some of the Fund’s peers which suffered larger drawdowns, the fourth quarter pressure on the natural resource sectors led to a significant absolute decline for the Fund in the fourth quarter.
As we enter 2019, we hope the worst is over for the more cyclical sectors of the economy. Valuations for some energy and materials stocks have reached levels that have not been seen since the recession in 2007-08. Given these depressed valuations and the prospect for the stabilization of energy prices after major declines, we anticipate layering more beta in the portfolio through these stocks at the beginning of the year. The Fund’s current focus is adding exposure in relatively higher quality energy names, particularly oil and gas exploration and production companies. The Fund is currently overweight in energy and underweight materials and remains globally diversified.
We continue to favor our diversified, thematic and opportunistic approach to investing in natural resource-related companies, and maintain our belief that over the long-term the performance of the equities may outperform the underlying commodities. Risks to the Fund include a relapse in the global economy, disruption to world bond markets and a sustained drop in commodity prices.
| | | | | | |
| 12 | | December 31, 2018 | | | Semiannual Report | | |
Unaudited
AllianzGI Global Natural Resources Fund (cont’d)
Average Annual Total Return for the period ended December 31, 2018
| | | | | | | | | | | | | | | | | | | | | | |
| | | | | | |
| | | | | 6 Month* | | | 1 Year | | | 5 Year | | | 10 Year | | | Since Inception† | |
| | | AllianzGI Global Natural Resources Fund Class A | | | –19.85% | | | | –19.34% | | | | –7.11% | | | | 2.72% | | | | 4.08% | |
| | AllianzGI Global Natural Resources Fund Class A (adjusted) | | | –24.26% | | | | –23.78% | | | | –8.16% | | | | 2.14% | | | | 3.67% | |
| | | AllianzGI Global Natural Resources Fund Class C | | | –20.21% | | | | –19.99% | | | | –7.81% | | | | 1.94% | | | | 3.30% | |
| | AllianzGI Global Natural Resources Fund Class C (adjusted) | | | –21.00% | | | | –20.78% | | | | –7.81% | | | | 1.94% | | | | 3.30% | |
| | AllianzGI Global Natural Resources Fund Class P | | | –19.73% | | | | –19.14% | | | | –6.88% | | | | 2.98% | | | | 4.35% | |
| | AllianzGI Global Natural Resources Fund Institutional Class | | | –19.73% | | | | –19.04% | | | | –6.78% | | | | 3.08% | | | | 4.45% | |
| | 60% MSCI World Energy/40% MSCI World Materials Benchmark | | | –18.40% | | | | –16.12% | | | | –2.57% | | | | 4.43% | | | | 5.19% | |
| | MSCI World Index | | | –9.10% | | | | –8.71% | | | | 4.56% | | | | 9.67% | | | | 6.13% | |
| | | Lipper Global Natural Resources Funds Average | | | –20.29% | | | | –20.21% | | | | –6.64% | | | | 1.20% | | | | 2.83% | |
* Cumulative return
† The Fund began operations on 6/30/04. Benchmark and Lipper comparisons began on the fund inception date.
Performance quoted represents past performance and is no guarantee of future results. Current performance may be lower or higher than performance shown. For performance current to the most recent month-end, visit our website at us.allianzgi.com. Investment return and the principal value will fluctuate. Shares may be worth more or less than original cost when redeemed.The adjusted returns take into account the maximum sales charge of 5.50% on Class A shares and 1% contingent deferred sales charge (CDSC) on Class C shares, which may apply to shares redeemed during the first year of ownership. Returns do not reflect deduction of taxes that a shareholder would pay on fund distributions or redemption of fund shares. Please see pages 60-62 for more information. The Fund’s expense ratios are 1.45% for Class A shares, 2.20% for Class C shares, 1.20% for Class P shares and 1.10% for Institutional Class shares. Expense ratio information is as of the Fund’s current prospectus dated August 30, 2018, as supplemented to date.
Cumulative Returns Through December 31, 2018
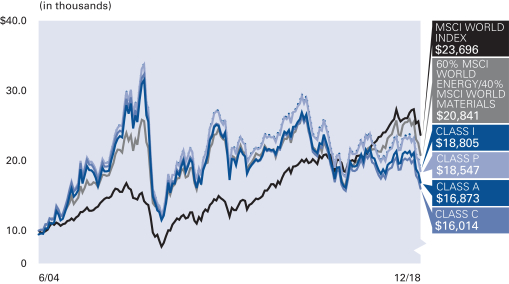
The Fund began operations on 6/30/04. Benchmark comparisons began on the fund inception date.
Country Allocation (as of December 31, 2018)
| | | | |
| |
| United States | | | 61.1% | |
| |
| United Kingdom | | | 15.7% | |
| |
| Canada | | | 6.4% | |
| |
| France | | | 6.3% | |
| |
| Australia | | | 6.1% | |
| |
| Germany | | | 1.1% | |
| |
| Denmark | | | 0.9% | |
| |
| Japan | | | 0.8% | |
| |
| Other | | | 1.7% | |
| |
| Cash & Equivalents — Net | | | –0.1% | |
| | | | | | |
| | Semiannual Report | | | December 31, 2018 | | 13 |
Unaudited
AllianzGI Global Natural Resources Fund (cont’d)
| | | | | | | | |
| |
| Shareholder Expense Example | | Actual Performance |
| | | Class A | | Class C | | Class P | | Institutional
Class |
| | | | |
| Beginning Account Value (7/1/18) | | $1,000.00 | | $1,000.00 | | $1,000.00 | | $1,000.00 |
| | | | |
| Ending Account Value (12/31/18) | | $801.50 | | $797.90 | | $802.70 | | $802.70 |
| | | | |
| Expenses Paid During Period | | $6.49 | | $9.88 | | $5.36 | | $4.91 |
| | | | | | | | | |
| |
| | | Hypothetical Performance |
| | | (5% return before expenses) |
| | | Class A | | Class C | | Class P | | Institutional
Class |
| | | | |
| Beginning Account Value (7/1/18) | | $1,000.00 | | $1,000.00 | | $1,000.00 | | $1,000.00 |
| | | | |
| Ending Account Value (12/31/18) | | $1,018.00 | | $1,014.22 | | $1,019.26 | | $1,019.76 |
| | | | |
| Expenses Paid During Period | | $7.27 | | $11.07 | | $6.01 | | $5.50 |
For each class of the Fund, expenses are equal to the annualized expense ratio for the class (1.43% for Class A, 2.18% for Class C, 1.18% for Class P and 1.08% for Institutional Class), multiplied by the average account value over the period, multiplied by 184/365.
| | | | | | |
| 14 | | December 31, 2018 | | | Semiannual Report | | |
(THIS PAGE INTENTIONALLY LEFT BLANK)
| | | | | | |
| | Semiannual Report | | | December 31, 2018 | | 15 |
Unaudited
AllianzGI Global Small-Cap Fund
For the period of July 1, 2018 through December 31, 2018, as provided by Andrew Neville, Lead Portfolio Manager.
Fund Insights
For the six-month period ended December 31, 2018, the Class A shares at net asset value (“NAV”) of the AllianzGI Global Small-Cap Fund (the “Fund”) returned -18.90%, underperforming the MSCI World Small-Cap Index (the “benchmark”), which returned -16.12%.
Market Overview
Global equities fell sharply over the second half of 2018, with many markets entering bear territory (defined as a drop of at least 20% from a recent peak) in the fourth quarter. In general, markets continued to ratchet higher during the third quarter, but a sudden rise in bond yields at the start of October sent stocks into reverse. The sell-off intensified as worries over earnings added to concerns over the impact of higher tariffs and the outlook for global growth. Politics also unsettled investors, with a US government shutdown, continued uncertainty over Brexit, Italy’s controversial budget and political unrest in France, all adding to the downward pressure on prices.
Global small-caps closed the second half of 2018 with losses and overall lagging their large-cap counterparts.
Portfolio review
The Fund underperformed its benchmark during the six-month period ended December 31, 2018 (net of fees, in USD). In absolute terms, all four small-cap markets showed losses. European small-caps registered the strongest losses followed by small-caps from the US, Japan and finally Asia ex Japan. In relative terms, whilst the US sleeve portfolio was able to perform almost in line with the local market, the Japanese, the European and the Asia ex-Japan sleeve portfolios lagged their respective regional indices.
Both stock selection and sector allocation had a negative effect on performance. The overweight in materials stocks as well as the underweight in real estate and utilities weighed on the fund’s relative performance. Nevertheless, our overweight exposure to the consumer staples sector and our underweight in consumer discretionary were favourable. Stock selection in the industrials , information technology and real estate sectors had a particularly negative impact on performance. Stock selection in the communication services, consumer staples and energy sectors worked well, however. Detractors to performance came in the form of Japanese, American and Swiss stocks. Nevertheless, stock selection in France and the Netherlands contributed positively.
On single stock basis, the positions in The Simply Good Foods Co., Service Corp International and NRG Energy, Inc. (all US) were the most positive contributors. On the other hand, the positions in ASOS Plc (UK), ams AG (Switzerland) and USA Technologies, Inc. (US) were the most significant detractors.
Outlook
We believe that geopolitical risks will remain a burden for global equities. In Europe, the Brexit date is relentlessly approaching, and the fiscal policy conflict between Italy and the European Commission is still not resolved. In addition, the trade conflict between the US and China is going into the next round, and growth rates are diverging more and more. While the US economy is still quite healthy and acting as a global growth engine, we believe the first signs of weakness are emerging in other regions. Nevertheless, the global economy as a whole does not seem to be at the brink of a recession. The major central banks look set to stick to their monetary normalisation course (peak liquidity), even though the recent oil price decline has had a dampening effect on long-term inflation expectations. Overall, we believe that volatility will rise and different sectors and countries will move in different directions.
| | | | | | |
| 16 | | December 31, 2018 | | | Semiannual Report | | |
Unaudited
AllianzGI Global Small-Cap Fund (cont’d)
Average Annual Total Return for the period ended December 31, 2018
| | | | | | | | | | | | | | | | | | | | | | |
| | | | | | |
| | | | | 6 Month* | | | 1 Year | | | 5 Year | | | 10 Year | | | Since Inception† | |
| | | AllianzGI Global Small-Cap Fund Class A | | | –18.90% | | | | –16.75% | | | | 1.46% | | | | 12.36% | | | | 9.15% | |
| | AllianzGI Global Small-Cap Fund Class A (adjusted) | | | –23.36% | | | | –21.33% | | | | 0.32% | | | | 11.73% | | | | 8.87% | |
| | | AllianzGI Global Small-Cap Fund Class C | | | –19.21% | | | | –17.38% | | | | 0.71% | | | | 11.52% | | | | 8.35% | |
| | AllianzGI Global Small-Cap Fund Class C (adjusted) | | | –19.84% | | | | –18.02% | | | | 0.71% | | | | 11.52% | | | | 8.35% | |
| | AllianzGI Global Small-Cap Fund Class P | | | –18.80% | | | | –16.55% | | | | 1.72% | | | | 12.66% | | | | 9.46% | |
| | AllianzGI Global Small-Cap Fund Institutional Class | | | –18.75% | | | | –16.46% | | | | 1.83% | | | | 12.76% | | | | 9.57% | |
| | MSCI World Small-Cap Index | | | –16.12% | | | | –13.86% | | | | 3.88% | | | | 12.02% | | | | 7.39% | |
| | | Lipper Global Small-/Mid-Cap Funds Average | | | –15.20% | | | | –13.39% | | | | 2.90% | | | | 11.61% | | | | 7.94% | |
* Cumulative return
† The Fund began operations on 12/31/96. Benchmark and Lipper comparisons began on the fund inception date.
Performance quoted represents past performance and is no guarantee of future results. Current performance may be lower or higher than performance shown. For performance current to the most recent month-end, visit our website at us.allianzgi.com. Investment return and the principal value will fluctuate. Shares may be worth more or less than original cost when redeemed.The adjusted returns take into account the maximum sales charge of 5.50% on Class A shares and 1% contingent deferred sales charge (CDSC) on Class C shares, which may apply to shares redeemed during the first year of ownership. Returns do not reflect deduction of taxes that a shareholder would pay on fund distributions or redemption of fund shares. Please see pages 60-62 for more information. The Fund’s expense ratios are 1.62% for Class A shares, 2.37% for Class C shares, 1.37% for Class P shares and 1.27% for Institutional Class shares. Expense ratio information is as of the Fund’s current prospectus dated August 30, 2018, as supplemented to date.
Cumulative Returns Through December 31, 2018
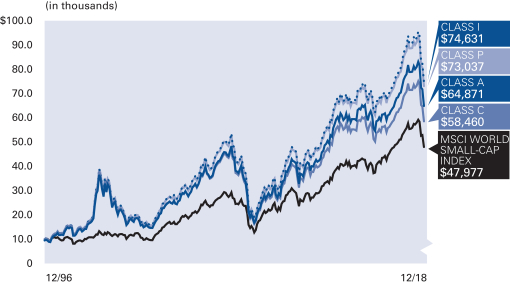
The Fund began operations on 12/31/96. Benchmark comparisons began on the fund inception date.
Country Allocation (as of December 31, 2018)
| | | | |
| |
| United States | | | 58.5% | |
| |
| Japan | | | 13.1% | |
| |
| United Kingdom | | | 4.8% | |
| |
| Germany | | | 4.1% | |
| |
| France | | | 2.4% | |
| |
| Denmark | | | 2.4% | |
| |
| Switzerland | | | 2.3% | |
| |
| Austria | | | 2.2% | |
| |
| Other | | | 8.9% | |
| |
| Cash & Equivalents — Net | | | 1.3% | |
| | | | | | |
| | Semiannual Report | | | December 31, 2018 | | 17 |
Unaudited
AllianzGI Global Small-Cap Fund (cont’d)
| | | | | | | | |
| |
| Shareholder Expense Example | | Actual Performance |
| | | Class A | | Class C | | Class P | | Institutional
Class |
| | | | |
| Beginning Account Value (7/1/18) | | $1,000.00 | | $1,000.00 | | $1,000.00 | | $1,000.00 |
| | | | |
| Ending Account Value (12/31/18) | | $811.00 | | $807.90 | | $812.00 | | $812.50 |
| | | | |
| Expenses Paid During Period | | $7.39 | | $10.80 | | $6.26 | | $5.80 |
| | | | | | | | | |
| |
| | | Hypothetical Performance |
| | | (5% return before expenses) |
| | | Class A | | Class C | | Class P | | Institutional
Class |
| | | | |
| Beginning Account Value (7/1/18) | | $1,000.00 | | $1,000.00 | | $1,000.00 | | $1,000.00 |
| | | | |
| Ending Account Value (12/31/18) | | $1,017.04 | | $1,013.26 | | $1,018.30 | | $1,018.80 |
| | | | |
| Expenses Paid During Period | | $8.24 | | $12.03 | | $6.97 | | $6.46 |
For each class of the Fund, expenses are equal to the annualized expense ratio for the class (1.62% for Class A, 2.37% for Class C, 1.37% for Class P and 1.27% for Institutional Class), multiplied by the average account value over the period, multiplied by 184/365.
| | | | | | |
| 18 | | December 31, 2018 | | | Semiannual Report | | |
(THIS PAGE INTENTIONALLY LEFT BLANK)
| | | | | | |
| | Semiannual Report | | | December 31, 2018 | | 19 |
Unaudited
AllianzGI Health Sciences Fund
For the period of July 1, 2018 through December 31, 2018, as provided by Peter Pirsch, CFA, Lead Portfolio Manager.
Fund Insights
For the six-month period ended December 31, 2018, the Class A shares at net asset value (“NAV”) of the AllianzGI Health Sciences Fund (the “Fund”) returned -0.08%, underperforming the MSCI World Healthcare Index (the “benchmark”), which returned 0.98%.
Market overview
For the six-month period, global health care stocks significantly outperformed the broader averages. The benchmark rose 0.98% versus the S&P 500 Index and the MSCI World Index declines of -6.9% and -9.1%, respectively. Given the overall market’s fourth quarter declines, the more defensive sectors of the market outperformed less defensive sectors, such as health care, consumer staples, utilities and telecommunications. Conversly, the more cyclical sectors such as energy, materials and industrials were among the worst performing sectors for the second half of 2018.
It was a difficult fourth quarter for global equity markets. A big concern is whether the global equity sell-off is signaling a significant economic contraction. The combination of several factors including the US Federal Reserve’s desire to normalize higher interest rates, the unwinding of the US Federal Reserve’s quantitative easing programs, trade tensions and the outcome of the US midterm elections have elevated market volatility. Despite the uncertain current market environment and the sell-off in the fourth quarter, the global health care sector enjoyed a very solid full year of relative returns in 2018 and was one of the few sectors to post a positive return for the calendar year. The focus of the Trump administration continues to be on containing drug pricing and health care costs in general, although other non-health care related matters are currently more center stage.
Portfolio review
Overall, the Fund’s underperformance was primarily driven by adverse stock selection in biotechnology. The managed care company, Anthem Inc., was one the biggest contributors to performance for the six-month period. The stock benefitted from solid quarterly earnings reports throughout the year and a strong year in general for stock returns for the large cap managed care industry. Another larger contributor to performance was a small-cap biotechnology holding, Addus Homecare Corp., which provides a broad range of social and medical services to the home. The zero weights throughout the six month period in Bayer AG and Fresenius Medical Care AG & Co. KGaA, and the underweight position in GlaxoSmithKline Plc also benefitted performance.
The largest individual detractors to performance were centered on the positioning in several biopharma stocks. The underweight positions in Eli Lilly Co., Pfizer, Inc. and Roche Holdings AG hurt performance as the stocks of large-cap pharmaceutical companies generally outperformed the Fund’s benchmark during the fourth quarter sell-off due to their defensive characteristics. Other detractors included Allergan Plc and Heron Therapeutics, Inc. Allergan’s estimates were reduced several times throughout the year.
Outlook
2018 was a solid year for relative returns for the global health care sector. As we enter 2019, we are both committed and focused on what we believe are the significant secular, long-term growth drivers for health care, drug and cost innovation. Areas of focus and where the Fund is currently overweight include emerging biopharma therapies, unique medical device technology, drug retail and managed care. The Fund remains underweight in the larger pharmaceutical companies whose pipelines lack the comparative innovation of biotechnology and whose pricing power has eroded as more and more legacy products are subjected to generic competition. We believe that pricing power is particularly critical given the recent pick- up in rhetoric about drug price controls. The overall current beta in the Fund’s portfolio is relatively more conservative now given the recent market volatility.
| | | | | | |
| 20 | | December 31, 2018 | | | Semiannual Report | | |
Unaudited
AllianzGI Health Sciences Fund (cont’d)
Average Annual Total Return for the period ended December 31, 2018
| | | | | | | | | | | | | | | | | | | | | | |
| | | | | | |
| | | | | 6 Month* | | | 1 Year | | | 5 Year | | | 10 Year | | | Since Inception† | |
| | | AllianzGI Health Sciences Fund Class A | | | –0.08% | | | | 4.67% | | | | 9.57% | | | | 14.28% | | | | 11.28% | |
| | AllianzGI Health Sciences Fund Class A (adjusted) | | | –5.58% | | | | –1.09% | | | | 8.34% | | | | 13.63% | | | | 10.99% | |
| | | AllianzGI Health Sciences Fund Class C | | | –0.44% | | | | 3.89% | | | | 8.75% | | | | 13.42% | | | | 10.45% | |
| | AllianzGI Health Sciences Fund Class C (adjusted) | | | –1.26% | | | | 3.02% | | | | 8.75% | | | | 13.42% | | | | 10.45% | |
| | AllianzGI Health Sciences Fund Institutional Class | | | 0.09% | | | | 5.02% | | | | 9.95% | | | | 14.67% | | | | 11.69% | |
| | MSCI World Health Care Index | | | 0.98% | | | | 2.51% | | | | 7.58% | | | | 11.89% | | | | 8.30% | |
| | | Lipper Health/Biotech Funds Average | | | –8.17% | | | | –0.84% | | | | 9.14% | | | | 15.46% | | | | 11.26% | |
* Cumulative return
† The Fund began operations on 12/31/96. Benchmark and Lipper comparisons began on the fund inception date.
Performance quoted represents past performance and is no guarantee of future results. Current performance may be lower or higher than performance shown. For performance current to the most recent month-end, visit our website at us.allianzgi.com. Investment return and the principal value will fluctuate. Shares may be worth more or less than original cost when redeemed.The adjusted returns take into account the maximum sales charge of 5.50% on Class A shares and 1% contingent deferred sales charge (CDSC) on Class C shares, which may apply to shares redeemed during the first year of ownership. Returns do not reflect deduction of taxes that a shareholder would pay on fund distributions or redemption of fund shares. Please see pages 60-62 for more information. The Fund’s expense ratios are 1.47% for Class A shares, 2.22% for Class C shares and 1.12% for Institutional Class shares. Expense ratio information is as of the Fund’s current prospectus dated August 30, 2018, as supplemented to date.
Cumulative Returns Through December 31, 2018
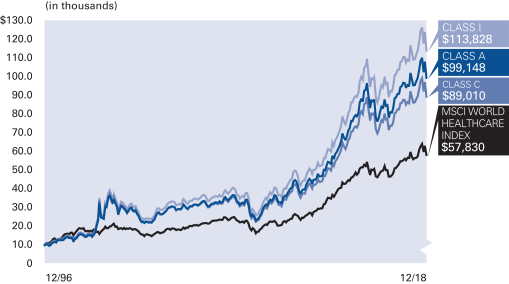
The Fund began operations on 12/31/96. Benchmark comparisons began on the fund inception date.
Industry/Sectors (as of December 31, 2018)
| | | | |
| |
| Pharmaceuticals | | | 37.2% | |
| |
| HealthCare Providers & Services | | | 20.7% | |
| |
| HealthCare Equipment & Supplies | | | 18.3% | |
| |
| Biotechnology | | | 15.4% | |
| |
| Life Sciences Tools & Services | | | 6.6% | |
| |
| Cash & Equivalents — Net | | | 1.8% | |
| | | | | | |
| | Semiannual Report | | | December 31, 2018 | | 21 |
Unaudited
AllianzGI Health Sciences Fund (cont’d)
| | | | | | | | | | |
| |
| Shareholder Expense Example | | Actual Performance |
| | | | | | | Class A | | Class C | | Institutional
Class |
| | | | | |
| Beginning Account Value (7/1/18) | | | | | | $1,000.00 | | $1,000.00 | | $1,000.00 |
| | | | | |
| Ending Account Value (12/31/18) | | | | | | $999.20 | | $995.60 | | $1,000.90 |
| | | | | |
| Expenses Paid During Period | | | | | | $7.36 | | $11.12 | | $5.60 |
| | | | | | | | | | | |
| |
| | | Hypothetical Performance |
| | | (5% return before expenses) |
| | | | | | | Class A | | Class C | | Institutional
Class |
| | | | | |
| Beginning Account Value (7/1/18) | | | | | | $1,000.00 | | $1,000.00 | | $1,000.00 |
| | | | | |
| Ending Account Value (12/31/18) | | | | | | $1,017.85 | | $1,014.06 | | $1,019.61 |
| | | | | |
| Expenses Paid During Period | | | | | | $7.43 | | $11.22 | | $5.65 |
For each class of the Fund, expenses are equal to the annualized expense ratio for the class (1.46% for Class A, 2.21% for Class C and 1.11% for Institutional Class), multiplied by the average account value over the period, multiplied by 184/365.
| | | | | | |
| 22 | | December 31, 2018 | | | Semiannual Report | | |
(THIS PAGE INTENTIONALLY LEFT BLANK)
| | | | | | |
| | Semiannual Report | | | December 31, 2018 | | 23 |
Unaudited
AllianzGI Income & Growth Fund
For the period of July 1, 2018, through December 31, 2018, as provided by Doug Forsyth, CFA, Portfolio Manager.
Fund Insights
For the six-month period ended December 31, 2018, Class A shares at net asset value (“NAV”) of the AllianzGI Income & Growth Fund (the “Fund”) returned -6.83%. During the same period, the S&P 500 Index declined -6.85% and the overall U.S. bond market, as measured by the Bloomberg Barclays U.S. Aggregate Bond Index, rose 1.65%. The convertible universe returned -5.75%, as measured by the ICE BofA Merrill Lynch All US Convertibles Index; and high yield bonds, as measured by the ICE BofA Merrill Lynch US High Yield Master II Index, declined -2.34%. Lastly, the Russell 1000 Growth Index fell-8.17%.
Market Overview
Risk assets were set to deliver strong annual returns exiting the third quarter of 2018 based on fundamental strength and economic momentum. However, US stocks, convertibles and high yield bonds faded in the fourth quarter as investors lost confidence in the staying power of earnings and the stability of the economy, fearing that trade wars and the US Federal Reserve’s path would lessen their durability. Overseas growth concerns and headlines—sources of persistent angst throughout 2018—in combination with crude oil weakness and US political uncertainty, also eroded sentiment. That being said, there was no change in overall fundamentals to substantiate the sharp selloff.
US stocks turned in their worst fourth quarter and annual performances since 2008. Convertibles and high-yield bonds experienced selling pressure alongside equities. Although the two asset classes finished lower, both continued to perform as expected, holding up much better than stocks.
Corporate fundamentals continued to improve with most US companies reporting better-than-expected financial results. Earnings growth for the S&P 500 Index rose more than 25% on a year-over-year basis, according to FactSet Research. Additionally, high-yield credit fundamentals strengthened, continuing a multi-year trend.
The strength of the US economy was supportive of the markets and contrasted overseas slowing. US reports revealed robust growth with third-quarter GDP increasing 3.4%. Unemployment stayed low, industrial production increased and consumer spending was strong. Not all data were positive, however. Auto, housing and semiconductor reports confirmed further easing in these industries.
With the US economy growing above trend the US Federal Reserve continued to reduce its balance sheet and, as expected, raised rates. The federal funds rate reached a range of 2.25 to 2.50%. Fearing a policy mistake, risk assets were sold following the Fed’s December communication.
Lastly, crude oil settled near $45 per barrel after falling 55% from its October peak to its December trough amid oversupply and slowing demand concerns and US dollar strength.
Portfolio Review
The Fund provided consistent income—the primary goal of the Fund—over the six-month period. Convertible and high-yield bond holdings experienced selling pressure alongside equity positions, but held up better, dampening downside volatility and benefiting the Fund’s overall performance.
In the equity sleeve, consumer discretionary, information technology and consumer staples helped relative performance. Conversely, the energy, health care and materials sectors hindered relative performance.
In the convertible sleeve, sectors that contributed positively to relative performance were technology, materials and media. On the other hand, energy, financials and telecommunications pressured relative performance.
In the high yield sleeve, industries that aided relative performance were basic industry & real estate, printing & publishing and media content. In contrast, financials services, chemicals and theaters & entertainment hampered relative performance.
The Fund took advantage of the new opportunities provided by the elevated volatility environment over the latter half of the reporting period and was able to retain many of the option premiums within these months. The period ended with the percent of equity holdings with a covered call structure near the upper end of the last twelve month range of 25-50%.
Outlook
Volatility remained elevated throughout the fourth quarter of 2018. However, the US economy and corporate earnings are expected to deliver continued growth in 2019. Corporations are expected to continue to invest for growth and create shareholder value. While some cyclical areas have exhibited weakness, we believe the overall credit and fundamental profiles of risk assets remain healthy and are not signaling an economic downturn. In our opinion, these factors should be market supportive going forward.
| | | | | | |
| 24 | | December 31, 2018 | | | Semiannual Report | | |
Unaudited
AllianzGI Income & Growth Fund (cont’d)
Average Annual Total Return for the period ended December 31, 2018
| | | | | | | | | | | | | | | | | | | | | | |
| | | | | | |
| | | | | 6 Month* | | | 1 Year | | | 5 Year | | | 10 Year | | | Since Inception† | |
| | | AllianzGI Income & Growth Fund Class A | | | –6.83% | | | | –4.18% | | | | 4.04% | | | | 10.74% | | | | 6.04% | |
| | AllianzGI Income & Growth Fund Class A (adjusted) | | | –11.96% | | | | –9.45% | | | | 2.87% | | | | 10.11% | | | | 5.54% | |
| | | AllianzGI Income & Growth Fund Class C | | | –7.16% | | | | –4.89% | | | | 3.27% | | | | 9.92% | | | | 5.25% | |
| | AllianzGI Income & Growth Fund Class C (adjusted) | | | –8.05% | | | | –5.77% | | | | 3.27% | | | | 9.92% | | | | 5.25% | |
| | AllianzGI Income & Growth Fund Class R | | | –6.95% | | | | –4.42% | | | | 3.77% | | | | 10.47% | | | | 5.79% | |
| | AllianzGI Income & Growth Fund Class P | | | –6.74% | | | | –3.95% | | | | 4.30% | | | | 11.02% | | | | 6.32% | |
| | AllianzGI Income & Growth Fund Institutional Class | | | –6.72% | | | | –3.82% | | | | 4.40% | | | | 11.13% | | | | 6.42% | |
| | Bloomberg Barclays U.S. Aggregate Bond Index | | | 1.65% | | | | 0.01% | | | | 2.52% | | | | 3.48% | | | | 3.83% | |
| | S&P 500 Index | | | –6.85% | | | | –4.38% | | | | 8.49% | | | | 13.12% | | | | 7.25% | |
| | | Lipper Flexible Portfolio Funds Average | | | –6.54% | | | | –7.23% | | | | 2.02% | | | | 7.38% | | | | 3.93% | |
* Cumulative return
† The Fund began operations on 2/28/07. Benchmark and Lipper comparisons began on the fund inception date.
Performance quoted represents past performance and is no guarantee of future results. Current performance may be lower or higher than performance shown. For performance current to the most recent month-end, visit our website at us.allianzgi.com. Investment return and the principal value will fluctuate. Shares may be worth more or less than original cost when redeemed.The adjusted returns take into account the maximum sales charge of 5.50% on Class A shares and 1% contingent deferred sales charge (CDSC) on Class C shares, which may apply to shares redeemed during the first year of ownership. Returns do not reflect deduction of taxes that a shareholder would pay on fund distributions or redemption of fund shares. Please see pages 60-62 for more information. The Fund’s gross expense ratios are 1.28% for Class A shares, 2.03% for Class C shares, 1.53% for Class R shares, 1.03% for Class P shares and 0.93% for Institutional Class shares. These ratios do not include an expense reduction, contractually agreed through at least October 31, 2019. The Fund’s expense ratios net of this reduction are 1.27% for Class A shares, 2.02% for Class C shares, 1.52% for Class R shares, 1.02% for Class P shares and 0.92% for Institutional Class shares. Expense ratio information is as of the Fund’s current prospectus dated August 30, 2018, as supplemented to date.
Cumulative Returns Through December 31, 2018
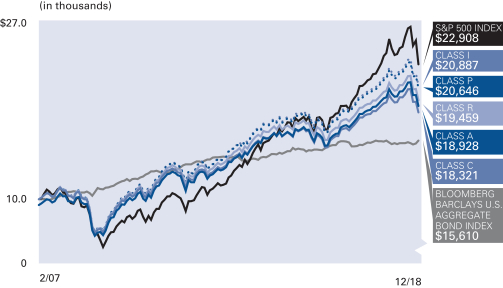
The Fund began operations on 2/28/07. Benchmark comparisons began on the fund inception date.
Industry/Sectors (as of December 31, 2018)
| | | | |
| |
| Software | | | 8.1% | |
| |
| Oil, Gas & Consumable Fuels | | | 5.1% | |
| |
| Internet | | | 5.1% | |
| |
| Media | | | 4.7% | |
| |
| Semiconductors | | | 4.2% | |
| |
| Telecommunications | | | 4.1% | |
| |
| Biotechnology | | | 4.0% | |
| |
| Pharmaceuticals | | | 3.9% | |
| |
| Other | | | 57.6% | |
| |
| Cash & Equivalents — Net | | | 3.2% | |
S&P Ratings* (as of December 31, 2018)
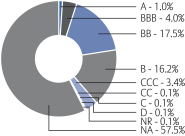
| * | As a percentage of fixed-income investments. Bond ratings refer to the underlying holdings of the Fund and are categorized from highest to lowest credit quality using ratings provided by S&P Global Ratings (“S&P”). S&P’s ratings have been selected for several reasons, including the portfolio managers’ usage of S&P ratings methodology among other credit quality information in managing the Fund, access to background information and other materials provided by S&P, as well as the Fund’s consideration of industry practice. The Fund also displays S&P credit ratings information in materials provided in client presentations. See “Important Information” for more detail on the selection of S&P for the Fund’s ratings presentation. Securities not rated by S&P and bonds that do not currently have a rating available are designated in the chart as “NR” and “NA”, respectively. |
| | | | | | |
| | Semiannual Report | | | December 31, 2018 | | 25 |
Unaudited
AllianzGI Income & Growth Fund (cont’d)
| | | | | | | | | | |
| |
| Shareholder Expense Example | | Actual Performance |
| | | Class A | | Class C | | Class R | | Class P | | Institutional
Class |
| | | | | |
| Beginning Account Value (7/1/18) | | $1,000.00 | | $1,000.00 | | $1,000.00 | | $1,000.00 | | $1,000.00 |
| | | | | |
| Ending Account Value (12/31/18) | | $931.70 | | $928.40 | | $930.50 | | $932.60 | | $932.80 |
| | | | | |
| Expenses Paid During Period | | $6.23 | | $9.87 | | $7.44 | | $5.02 | | $4.53 |
| | | | | | | | | | | |
| |
| | | Hypothetical Performance |
| | | (5% return before expenses) |
| | | Class A | | Class C | | Class R | | Class P | | Institutional
Class |
| | | | | |
| Beginning Account Value (7/1/18) | | $1,000.00 | | $1,000.00 | | $1,000.00 | | $1,000.00 | | $1,000.00 |
| | | | | |
| Ending Account Value (12/31/18) | | $1,018.75 | | $1,014.97 | | $1,017.49 | | $1,020.01 | | $1,020.52 |
| | | | | |
| Expenses Paid During Period | | $6.51 | | $10.31 | | $7.78 | | $5.24 | | $4.74 |
For each class of the Fund, expenses (net of fee waivers) are equal to the annualized expense ratio for the class (1.28% for Class A, 2.03% for Class C, 1.53% for Class R, 1.03% for Class P and 0.93% for Institutional Class), multiplied by the average account value over the period, multiplied by 184/365.
| | | | | | |
| 26 | | December 31, 2018 | | | Semiannual Report | | |
(THIS PAGE INTENTIONALLY LEFT BLANK)
| | | | | | |
| | Semiannual Report | | | December 31, 2018 | | 27 |
Unaudited
AllianzGI Mid-Cap Fund
For the period July 1, 2018 through December 31, 2018, as provided by Steven Klopukh, CFA, Lead Portfolio Manager.
Fund Insights
For the six-month period ended December 31, 2018, Class A shares at net asset value (“NAV”) of the AllianzGI Mid-Cap Fund (the “Fund”) returned-13.79%, underperforming the Russell Midcap Growth Index (the “benchmark”), which returned -9.63%.
Market Overview
Broader US equity markets posted losses over the six-month period. In early October, the combination of the potential for a decelerating economic environment and investors’ hawkish interpretation of US Federal Reserve Chairman Jerome Powell’s commentary on monetary policy provided the catalyst for the sharp selloff. Despite volatility in the equity markets, economic fundamentals were positive. Third quarter GDP grew at 3.4% and corporate earnings growth remained robust. Against this backdrop, the Russell Midcap Index returned -11.1%, underperforming the Russell 1000 Index’s return of -7.4%.
Portfolio Review
Security selection was the main driver of the underperformance while sector allocation had a negligible effect. Stock picking in industrials was the primary detractor, followed by the information technology and consumer discretionary sectors. Positive security selection was partly offsetting from the health care, materials and real estate sectors.
The top active contributor over the period was DexCom, Inc., which is a medical device company that specializes in continuous glucose monitoring (CGM) systems with smart device connectivity. The stock benefited from quarterly earnings results and guidance that exceeded investor expectations. With low penetration in a large addressable market and strong product offerings, including the upcoming Dexcom G6 that does not require finger prick calibration, DexCom’s growth trajectory remains robust.
A top detractor over the period, XPO Logistics, Inc. is a leading global freight, transportation and logistics company with a focus on e-commerce. The stock fell during the period after the company posted lowered earnings guidance and a hedge fund released a short-sell report on XPO. Overall, we believe the report is based on exaggerated claims and we maintain a constructive long-term outlook for the company. However, given the recent volatility, we continue to monitor the situation closely.
As of December 31, 2018, the largest sector overweight was in information technology, followed by health care and consumer discretionary. Financials was the largest underweight position in the Fund, followed by the real estate and utilities sectors.
Outlook
We maintain a constructive outlook for the US economy, which we believe should continue its pace of moderate growth. Overall recession risk appears benign as key manufacturing and service surveys flash expansionary numbers; employment metrics remain positive; and leading indicators signal favorable conditions. However when compared to 2018, we believe economic growth should decelerate, as the temporary boost from tax reform and inventory build ahead of tariffs rolls off in 2019.
With regard to Jerome Powell’s communications misstep that contributed to the equity market selloff, the US Federal Reserve Chairman has since clarified that monetary policy remains data dependent and will be flexible according to changing conditions. In our opinion, this clarification should help stabilize investor appetite for risk assets into the New Year. As for decelerating economic conditions, we suspect that the recent sharp selloff in equity markets has more than discounted the prospects of slower growth. Indeed, the Russell Midcap Index’s price to earnings ratio experienced significant multiple contraction. From our research, we believe this was a negative two standard deviation event and current levels are comparable to the tail end of previous distressed environments. Overall, we think the risk return outlook of the asset class appears attractive.
As always, we continue to focus on stock selection, seeking to invest in high quality mid-cap companies with attractive growth prospects that are attractively valued. The Fund emphasizes free cash flow yield and responsible capital allocation.
| | | | | | |
| 28 | | December 31, 2018 | | | Semiannual Report | | |
Unaudited
AllianzGI Mid-Cap Fund (cont’d)
Average Annual Total Return for the period ended December 31, 2018
| | | | | | | | | | | | | | | | | | | | | | |
| | | | | | |
| | | | | 6 Month* | | | 1 Year | | | 5 Year | | | 10 Year | | | Since Inception† | |
| | | AllianzGI Mid-Cap Fund Class A | | | –13.79% | | | | –11.28% | | | | 5.42% | | | | 12.85% | | | | 12.25% | |
| | AllianzGI Mid-Cap Fund Class A (adjusted) | | | –18.54% | | | | –16.16% | | | | 4.24% | | | | 12.21% | | | | 12.09% | |
| | | AllianzGI Mid-Cap Fund Class C | | | –14.40% | | | | –11.95% | | | | 4.60% | | | | 12.00% | | | | 11.47% | |
| | AllianzGI Mid-Cap Fund Class C (adjusted) | | | –15.10% | | | | –12.67% | | | | 4.60% | | | | 12.00% | | | | 11.47% | |
| | AllianzGI Mid-Cap Fund Class R | | | –14.00% | | | | –11.45% | | | | 5.12% | | | | 12.56% | | | | 12.06% | |
| | AllianzGI Mid-Cap Fund Class P | | | –13.71% | | | | –10.88% | | | | 5.71% | | | | 13.19% | | | | 12.70% | |
| | AllianzGI Mid-Cap Fund Institutional Class | | | –13.65% | | | | –10.83% | | | | 5.79% | | | | 13.27% | | | | 12.81% | |
| | | AllianzGI Mid-Cap Fund Administrative Class | | | –13.98% | | | | –11.17% | | | | 5.47% | | | | 12.99% | | | | 12.51% | |
| | Russell Midcap Growth Index | | | –9.63% | | | | –4.75% | | | | 7.42% | | | | 15.12% | | | | 11.91% | |
| | | Lipper Mid-Cap Growth Funds Average | | | –12.00% | | | | –5.37% | | | | 6.05% | | | | 13.33% | | | | 9.63% | |
| | | Lipper Multi-Cap Growth Funds Average | | | –10.07% | | | | –2.95% | | | | 7.24% | | | | 13.65% | | | | —% | |
* Cumulative return
† The Fund began operations on 11/6/79. Benchmark and primary Lipper performance comparisons began on 10/31/79; secondary Lipper performance is available for trailing 10 years.
Performance quoted represents past performance and is no guarantee of future results. Current performance may be lower or higher than performance shown. For performance current to the most recent month-end, visit our website at us.allianzgi.com. Investment return and the principal value will fluctuate. Shares may be worth more or less than original cost when redeemed.The adjusted returns take into account the maximum sales charge of 5.50% on Class A shares and 1% contingent deferred sales charge (CDSC) on Class C shares, which may apply to shares redeemed during the first year of ownership. Returns do not reflect deduction of taxes that a shareholder would pay on fund distributions or redemption of fund shares. Please see pages 60-62 for more information. The Fund’s expense ratios are 1.13% for Class A shares, 1.88% for Class C shares, 1.38% for Class R shares, 0.88% for Class P shares, 0.78% for Institutional Class shares and 1.03% for Administrative Class shares. Expense ratio information is as of the Fund’s current prospectus dated August 30, 2018, as supplemented to date.
Cumulative Returns Through December 31, 2018
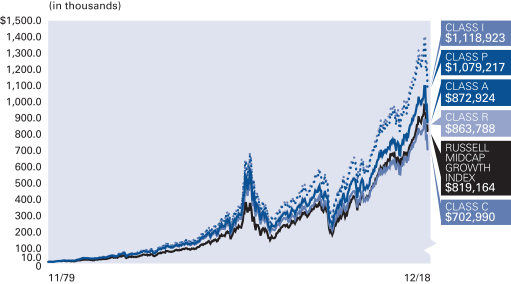
The Fund began operations on 11/6/79. Benchmark performance comparisons began on 10/31/79.
Industry/Sectors (as of December 31, 2018)
| | | | |
| |
| Health Care Equipment & Supplies | | | 13.1% | |
| |
| Software | | | 9.6% | |
| |
| IT Services | | | 8.9% | |
| |
| Semiconductors & Semiconductor Equipment | | | 6.6% | |
| |
| Entertainment | | | 5.4% | |
| |
| Specialty Retail | | | 4.5% | |
| |
| Hotels, Restaurants & Leisure | | | 4.3% | |
| |
| Textiles, Apparel & Luxury Goods | | | 4.1% | |
| |
| Other | | | 44.2% | |
| |
| Cash & Equivalents — Net | | | –0.7% | |
| | | | | | |
| | Semiannual Report | | | December 31, 2018 | | 29 |
Unaudited
AllianzGI Mid-Cap Fund (cont’d)
| | | | | | | | | | | | |
| |
| Shareholder Expense Example | | Actual Performance |
| | | Class A | | Class C | | Class R | | Class P | | Institutional
Class | | Administrative
Class |
| | | | | | |
| Beginning Account Value (7/1/18) | | $1,000.00 | | $1,000.00 | | $1,000.00 | | $1,000.00 | | $1,000.00 | | $1,000.00 |
| | | | | | |
| Ending Account Value (12/31/18) | | $862.10 | | $856.00 | | $860.00 | | $862.90 | | $863.50 | | $860.20 |
| | | | | | |
| Expenses Paid During Period | | $5.35 | | $8.84 | | $6.52 | | $4.18 | | $3.71 | | $4.88 |
| | | | | | | | | | | | | |
| |
| | | Hypothetical Performance |
| | | (5% return before expenses) |
| | | Class A | | Class C | | Class R | | Class P | | Institutional
Class | | Administrative
Class |
| | | | | | |
| Beginning Account Value (7/1/18) | | $1,000.00 | | $1,000.00 | | $1,000.00 | | $1,000.00 | | $1,000.00 | | $1,000.00 |
| | | | | | |
| Ending Account Value (12/31/18) | | $1,019.46 | | $1,015.68 | | $1,018.20 | | $1,020.72 | | $1,021.22 | | $1,019.96 |
| | | | | | |
| Expenses Paid During Period | | $5.80 | | $9.60 | | $7.07 | | $4.53 | | $4.02 | | $5.30 |
For each class of the Fund, expenses are equal to the annualized expense ratio for the class (1.14% for Class A, 1.89% for Class C, 1.39% for Class R, 0.89% for Class P, 0.79% for Institutional Class and 1.04% for Administrative Class), multiplied by the average account value over the period, multiplied by 184/365.
| | | | | | |
| 30 | | December 31, 2018 | | | Semiannual Report | | |
(THIS PAGE INTENTIONALLY LEFT BLANK)
| | | | | | |
| | Semiannual Report | | | December 31, 2018 | | 31 |
Unaudited
AllianzGI NFJ Dividend Value Fund
For the period July 1, 2018 through December 31, 2018, as provided by the Value Equity, US team.
Fund Insights
For the six-month period ended December 31, 2018, Class A shares at net asset value (“NAV”) of the AllianzGI NFJ Dividend Value Fund (the “Fund”) returned -8.62%, underperforming the Russell 1000 Value Index (the “benchmark”), which returned -6.69%.
Market Overview
US equities ratcheted steadily higher over the third quarter of 2018, with major indices touching a series of fresh peaks bolstered by corporate earnings growth and positive economic data. The gains propelled the market to its longest bull run in history, surpassing the previous record set between 1990 and 2000. However, the bull market ended abruptly in the final quarter of 2018 when US stocks plummeted, recording their weakest fourth-quarter returns since 2008. The S&P 500 index touched its lowest level since September 2017, while both the tech-heavy Nasdaq index and the small-cap Russell 2000 index entered official bear markets. A sudden rise in bond yields provided the catalyst for the initial downward movement in October, with stocks plunging further in December amid concerns over the outlook for growth and company profits, with political tensions providing further fuel for the selloff. Economic news showed that the US economy remained in robust health, while the US Federal Reserve (the “Fed”) raised interest rates in both September and December, taking them to a range of 2.25%-2.5%, as was widely expected.
Portfolio Review
Relative performance results were due to negative stock selection and sector allocation. Selection across the health care and industrials sectors was strong; however, these gains were offset by holdings in the consumer staples and financials sectors that failed to keep pace with benchmark shares. During the latter half of the year, oil prices suffered a sharp selloff, and the portfolio’s overweight in the energy sector, as well as an underweight in consumer staples, detracted from performance. Conversely, an overweight in health care—the best-performing sector in the benchmark—contributed to results during the reporting period.
Outlook
US investors endured a rocky 2018—the third down year in a decade—as monetary policy worldwide diverged, political uncertainty escalated and trade tensions flared. In the US, negative market returns took place amidst accelerated economic growth, fueled by tax cuts and increased government spending, while growth once again outpaced their value counterparts. We believe that many of last year’s burdens on performance—including trade tensions and political uncertainty—appear poised to increase market volatility in 2019. Furthermore, with the Fed in an apparent quantitative tightening regime, we believe that debt-laden companies, formerly buoyed by low interest rates and a generally improving economy, face real challenges as investors once more appreciate the appeal of safer assets.
By our assessment, we do not see a recession in the US over the next 12 months; however we do believe volatility will remain somewhat elevated in this later cycle environment. With peak growth rates likely in the rear view mirror, we believe market participants must determine how to position their investments for the prospects of decelerating economic and earnings growth. As slower growth can exacerbate market reactions to uncertainty, we continue to favor higher-quality companies that pay dividends to help dampen market swings. Rather than passively accepting market returns—particularly as reduced liquidity and less monetary stimulus filter into the markets—we favor an active approach and use a disciplined, valuation-based fundamental process to identify portfolio candidates.
| | | | | | |
| 32 | | December 31, 2018 | | | Semiannual Report | | |
Unaudited
AllianzGI NFJ Dividend Value Fund (cont’d)
Average Annual Total Return for the period ended December 31, 2018
| | | | | | | | | | | | | | | | | | | | | | |
| | | | | | |
| | | | | 6 Month* | | | 1 Year | | | 5 Year | | | 10 Year | | | Since Inception† | |
| | | AllianzGI NFJ Dividend Value Fund Class A | | | –8.62% | | | | –10.12% | | | | 3.84% | | | | 8.82% | | | | 7.14% | |
| | AllianzGI NFJ Dividend Value Fund Class A (adjusted) | | | –13.65% | | | | –15.06% | | | | 2.67% | | | | 8.21% | | | | 6.81% | |
| | | AllianzGI NFJ Dividend Value Fund Class C | | | –9.01% | | | | –10.83% | | �� | | 3.04% | | | | 8.01% | | | | 6.34% | |
| | AllianzGI NFJ Dividend Value Fund Class C (adjusted) | | | –9.74% | | | | –11.54% | | | | 3.04% | | | | 8.01% | | | | 6.34% | |
| | AllianzGI NFJ Dividend Value Fund Class R | | | –8.72% | | | | –10.33% | | | | 3.57% | | | | 8.56% | | | | 6.87% | |
| | AllianzGI NFJ Dividend Value Fund Class P | | | –8.57% | | | | –9.94% | | | | 4.08% | | | | 9.09% | | | | 7.46% | |
| | AllianzGI NFJ Dividend Value Fund Institutional Class | | | –8.45% | | | | –9.77% | | | | 4.19% | | | | 9.22% | | | | 7.57% | |
| | AllianzGI NFJ Dividend Value Fund Class R6 | | | –8.44% | | | | –9.74% | | | | 4.24% | | | | 9.27% | | | | 7.62% | |
| | | AllianzGI NFJ Dividend Value Fund Administrative Class | | | –8.56% | | | | –9.99% | | | | 3.95% | | | | 8.94% | | | | 7.29% | |
| | Russell 1000 Value Index | | | –6.69% | | | | –8.27% | | | | 5.95% | | | | 11.18% | | | | 6.29% | |
| | | Lipper Equity Income Funds Average | | | –6.59% | | | | –7.24% | | | | 5.44% | | | | 10.60% | | | | 6.05% | |
* Cumulative return.
† The Fund began operations on 5/8/00. Benchmark comparisons began on the fund inception date. Lipper comparisons began on 4/30/00.
Performance quoted represents past performance and is no guarantee of future results. Current performance may be lower or higher than performance shown. For performance current to the most recent month-end, visit our website at us.allianzgi.com. Investment return and the principal value will fluctuate. Shares may be worth more or less than original cost when redeemed.The adjusted returns take into account the maximum sales charge of 5.50% on Class A shares and 1% contingent deferred sales charge (CDSC) on Class C shares, which may apply to shares redeemed during the first year of ownership. Returns do not reflect deduction of taxes that a shareholder would pay on fund distributions or redemption of fund shares. Please see pages 60-62 for more information. The Fund’s gross expense ratios are 1.11% for Class A shares, 1.86% for Class C shares, 1.36 for Class R shares, 0.86% for Class P shares, 0.76% for Institutional Class shares, 0.71% for Class R6 shares and 1.01% for Administrative Class shares. Theses ratios do not include an expense reduction, contractually agreed through at least October 31, 2019. The Fund’s expense ratios net of this reduction are 1.04% for Class A shares, 1.79% for Class C shares, 1.29 for Class R shares, 0.79% for Class P shares, 0.69% for Institutional Class shares, 0.64% for Class R6 shares and 0.94% for Administrative Class shares. Expense ratio information is as of the Fund’s current prospectus dated August 30, 2018, as supplemented to date.
Cumulative Returns Through December 31, 2018
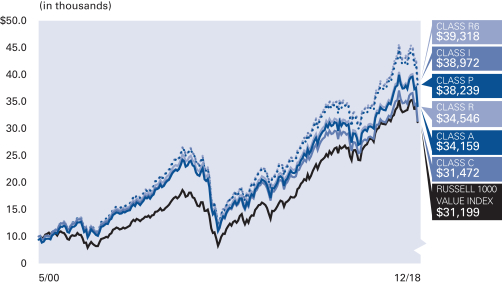
The Fund began operations on 5/8/00. Benchmark comparisons began on the fund inception date.
Industry/Sectors (as of December 31, 2018)
| | | | |
| |
| Banks | | | 13.6% | |
| |
| Oil, Gas & Consumable Fuels | | | 12.1% | |
| |
| Pharmaceuticals | | | 8.2% | |
| |
| Insurance | | | 6.0% | |
| |
| Electric Utilities | | | 4.2% | |
| |
| Diversified Telecommunication Services | | | 4.2% | |
| |
| Healthcare Providers & Services | | | 4.1% | |
| |
| Healthcare Equipment & Supplies | | | 4.0% | |
| |
| Other | | | 43.9% | |
| |
| Cash & Equivalents — Net | | | –0.3% | |
| | | | | | |
| | Semiannual Report | | | December 31, 2018 | | 33 |
Unaudited
AllianzGI NFJ Dividend Value Fund (cont’d)
| | | | | | | | | | | | | | |
| |
| Shareholder Expense Example | | Actual Performance |
| | | Class A | | Class C | | Class R | | Class P | | Institutional
Class | | Class R6 | | Administrative
Class |
| | | | | | | |
| Beginning Account Value (7/1/18) | | $1,000.00 | | $1,000.00 | | $1,000.00 | | $1,000.00 | | $1,000.00 | | $1,000.00 | | $1,000.00 |
| | | | | | | |
| Ending Account Value (12/31/18) | | $913.80 | | $909.90 | | $912.80 | | $914.30 | | $915.50 | | $915.60 | | $914.40 |
| | | | | | | |
| Expenses Paid During Period | | $4.73 | | $8.33 | | $5.93 | | $3.52 | | $3.04 | | $2.80 | | $4.25 |
| | | | | | | | | | | | | | | |
| |
| | | Hypothetical Performance |
| | | (5% return before expenses) |
| | | Class A | | Class C | | Class R | | Class P | | Institutional
Class | | Class R6 | | Administrative
Class |
| | | | | | | |
| Beginning Account Value (7/1/18) | | $1,000.00 | | $1,000.00 | | $1,000.00 | | $1,000.00 | | $1,000.00 | | $1,000.00 | | $1,000.00 |
| | | | | | | |
| Ending Account Value (12/31/18) | | $1,020.27 | | $1,016.48 | | $1,019.00 | | $1,021.53 | | $1,022.03 | | $1,022.28 | | $1,020.77 |
| | | | | | | |
| Expenses Paid During Period | | $4.99 | | $8.79 | | $6.26 | | $3.72 | | $3.21 | | $2.96 | | $4.48 |
For each class of the Fund, expenses (net of fee waivers) are equal to the annualized expense ratio for the class (0.98% for Class A, 1.73% for Class C, 1.23% for Class R, 0.73% for Class P, 0.63% for Institutional Class, 0.58% for R6 class and 0.88% for Administrative Class), multiplied by the average account value over the period, multiplied by 184/365.
| | | | | | |
| 34 | | December 31, 2018 | | | Semiannual Report | | |
(THIS PAGE INTENTIONALLY LEFT BLANK)
| | | | | | |
| | Semiannual Report | | | December 31, 2018 | | 35 |
Unaudited
AllianzGI NFJ International Value Fund
For the period July 1, 2018 through December 31, 2018, as provided by the Value Equity, US team.
Fund Insights
For the six-month period ended December 31, 2018, Class A shares at net asset value (“NAV”) of the AllianzGI NFJ International Value Fund (the “Fund”) returned -11.40%, underperforming the MSCI All Country World ex-USA Index (the “benchmark”), which returned -10.84%.
Market Overview
Global equities fell sharply over the second half of 2018, with many markets entering bear territory (defined as a drop of at least 20% from a recent peak) in the fourth quarter. In general, markets continued to ratchet higher during the third quarter, but a sudden rise in bond yields at the start of October sent stocks into reverse. The selloff intensified as worries over earnings added to concerns over the impact of higher tariffs and the outlook for global growth. Politics also unsettled investors, with a US government shutdown, continued uncertainty over Brexit, Italy’s controversial budget and political unrest in France all adding to the downward pressure on prices. Many emerging markets outperformed their developed counterparts over the reporting period, helped by indications that the US Federal Reserve may not increase interest rates as aggressively as previously feared.
Portfolio Review
Relative performance results were due to negative sector and country allocations, which outweighed the impact of positive stock selection over the reporting period. Selection was strong in the health care and energy sectors, and these gains were only partially offset by poor selection across the materials and industrials sectors. The portfolio’s underweight in communications services detracted from results, while an overweight in financials boosted performance returns. By country, selection was positive in Japan, the Netherlands and Russia, while stock picking across South Korea, the UK and Canada detracted. Underweight positions in Brazil and Switzerland hampered gains while overweight exposures across Russia and Hong Kong contributed to performance over the reporting period.
Outlook
Over the course of several months, quantitative easing policies began to come to an end worldwide. The US Federal Reserve raised rates four times in 2018. The European Central Bank stopped its bond purchasing program as scheduled in December and the UK, Canada, and several emerging market nations hiked interest rates last year. Markets largely pushed back on these moves by forcing stock indices lower, signaling that the global economy would not take too kindly to a less accommodative stance. With these headwinds in place, economic outlooks were rerated downward, corporate earnings growth slowed and valuation multiples contracted. In response to this ensuing economic slowdown, we anticipate seeing politicians implementing fiscal policies to cushion the blow for constituents and market participants.
In response to these shifting market dynamics, we expect greater inflation in certain parts of the world, higher interest rates globally (on a long term basis), tighter credit conditions, and heightened volatility. We believe that this environment could lead to a market where value stocks will be favored over their growth counterparts. Our investment process seeks to capture the value premium by identifying higher-quality companies trading at low absolute and relative valuation multiples, and we expect our strategy is well-positioned going forward. Furthermore, we believe a higher-quality, dividend-focused approach can help moderate volatility during periods of market uncertainty. Consistently investing at this intersection between value and dividends has been crucial to the strength of our long-term performance results, and we believe this disciplined process will help us continue that trend as we look to future market environments.
| | | | | | |
| 36 | | December 31, 2018 | | | Semiannual Report | | |
Unaudited
AllianzGI NFJ International Value Fund (cont’d)
Average Annual Total Return for the period ended December 31, 2018
| | | | | | | | | | | | | | | | | | | | | | |
| | | | | | |
| | | | | 6 Month* | | | 1 Year | | | 5 Year | | | 10 Year | | | Since Inception† | |
| | | AllianzGI NFJ International Value Fund Class A | | | –11.40% | | | | –15.98% | | | | –4.66% | | | | 3.88% | | | | 7.51% | |
| | AllianzGI NFJ International Value Fund Class A (adjusted) | | | –16.28% | | | | –20.60% | | | | –5.74% | | | | 3.29% | | | | 7.13% | |
| | | AllianzGI NFJ International Value Fund Class C | | | –11.69% | | | | –16.58% | | | | –5.37% | | | | 3.11% | | | | 6.71% | |
| | AllianzGI NFJ International Value Fund Class C (adjusted) | | | –12.57% | | | | –17.40% | | | | –5.37% | | | | 3.11% | | | | 6.71% | |
| | AllianzGI NFJ International Value Fund Class R | | | –11.49% | | | | –16.16% | | | | –4.90% | | | | 3.63% | | | | 7.26% | |
| | AllianzGI NFJ International Value Fund Class P | | | –11.25% | | | | –15.72% | | | | –4.43% | | | | 4.14% | | | | 7.80% | |
| | AllianzGI NFJ International Value Fund Institutional Class | | | –11.23% | | | | –15.66% | | | | –4.34% | | | | 4.25% | | | | 7.90% | |
| | AllianzGI NFJ International Value Fund Class R6 | | | –11.20% | | | | –15.63% | | | | –4.30% | | | | 4.30% | | | | 7.95% | |
| | | AllianzGI NFJ International Value Fund Administrative Class | | | –11.33% | | | | –15.86% | | | | –4.58% | | | | 3.99% | | | | 7.63% | |
| | MSCI ACWI ex-USA Index | | | –10.84% | | | | –14.20% | | | | 0.68% | | | | 6.57% | | | | 7.43% | |
| | | Lipper Int’l. Multi-Cap Value Funds Average | | | –13.13% | | | | –17.27% | | | | –1.11% | | | | 4.97% | | | | 5.84% | |
* Cumulative return
† The Fund began operations on 1/31/03. Benchmark comparisons began on the fund inception date. Lipper comparisons began on 1/31/03.
Performance quoted represents past performance and is no guarantee of future results. Current performance may be lower or higher than performance shown. For performance current to the most recent month-end, visit our website at us.allianzgi.com. Investment return and the principal value will fluctuate. Shares may be worth more or less than original cost when redeemed.The adjusted returns take into account the maximum sales charge of 5.50% on Class A shares and 1% contingent deferred sales charge (CDSC) on Class C shares, which may apply to shares redeemed during the first year of ownership.Returns do not reflect deduction of taxes that a shareholder would pay on fund distributions or redemption of fund shares. Please see pages 60-62 for more information. The Fund’s gross expense ratios are 1.37% for Class A shares, 2.12% for Class C shares, 1.62 for Class R shares, 1.12% for Class P shares, 1.02% for Institutional Class shares, 0.97% for Class R6 shares and 1.27% for Administrative Class shares. Theses ratios do not include an expense reduction, contractually agreed through at least October 31, 2019. The Fund’s expense ratios net of this reduction are 1.30% for Class A shares, 2.05% for Class C shares, 1.55 for Class R shares, 1.05% for Class P shares, 0.95% for Institutional Class shares, 0.90% for Class R6 shares and 1.20% for Administrative Class shares. Expense ratio information is as of the Fund’s current prospectus dated August 30, 2018, as supplemented to date.
Cumulative Returns Through December 31, 2018
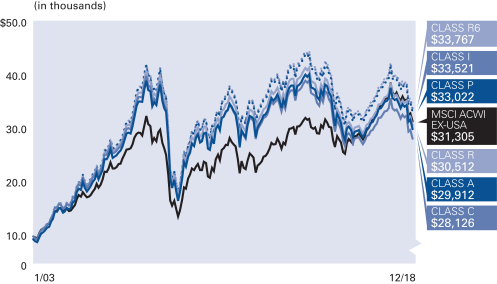
The Fund began operations on 1/31/03. Benchmark comparisons began on the fund inception date.
Country Allocation (as of December 31, 2018)
| | | | |
| |
| United Kingdom | | | 17.0% | |
| |
| Japan | | | 17.0% | |
| |
| Canada | | | 11.0% | |
| |
| Hong Kong | | | 9.1% | |
| |
| China | | | 8.9% | |
| |
| France | | | 5.9% | |
| |
| Germany | | | 4.2% | |
| |
| Korea (Republic of) | | | 3.8% | |
| |
| Other | | | 24.2% | |
| |
| Cash & Equivalents — Net | | | –1.1% | |
| | | | | | |
| | Semiannual Report | | | December 31, 2018 | | 37 |
Unaudited
AllianzGI NFJ International Value Fund (cont’d)
| | | | | | | | | | | | | | |
| |
| Shareholder Expense Example | | Actual Performance |
| | | Class A | | Class C | | Class R | | Class P | | Institutional
Class | | Class R6 | | Administrative
Class |
| | | | | | | |
| Beginning Account Value (7/1/18) | | $1,000.00 | | $1,000.00 | | $1,000.00 | | $1,000.00 | | $1,000.00 | | $1,000.00 | | $1,000.00 |
| | | | | | | |
| Ending Account Value (12/31/18) | | $886.00 | | $883.10 | | $885.10 | | $887.50 | | $887.70 | | $888.00 | | $886.70 |
| | | | | | | |
| Expenses Paid During Period | | $6.18 | | $9.73 | | $7.36 | | $5.00 | | $4.52 | | $4.28 | | $5.71 |
| | | | | | | | | | | | | | | |
| |
| | | Hypothetical Performance |
| | | (5% return before expenses) |
| | | Class A | | Class C | | Class R | | Class P | | Institutional
Class | | Class R6 | | Administrative
Class |
| | | | | | | |
| Beginning Account Value (7/1/18) | | $1,000.00 | | $1,000.00 | | $1,000.00 | | $1,000.00 | | $1,000.00 | | $1,000.00 | | $1,000.00 |
| | | | | | | |
| Ending Account Value (12/31/18) | | $1,018.65 | | $1,014.87 | | $1,017.39 | | $1,019.91 | | $1,020.42 | | $1,020.67 | | $1,019.16 |
| | | | | | | |
| Expenses Paid During Period | | $6.61 | | $10.41 | | $7.88 | | $5.35 | | $4.84 | | $4.58 | | $6.11 |
For each class of the Fund, expenses (net of fee waiver) are equal to the annualized expense ratio for the class (1.30% for Class A, 2.05% for Class C, 1.55% for Class R, 1.05% for Class P, 0.95% for Institutional Class , 0.90% for Class R6 and 1.20% for Administrative Class), multiplied by the average account value over the period, multiplied by 184/365.
| | | | | | |
| 38 | | December 31, 2018 | | | Semiannual Report | | |
(THIS PAGE INTENTIONALLY LEFT BLANK)
| | | | | | |
| | Semiannual Report | | | December 31, 2018 | | 39 |
Unaudited
AllianzGI NFJ Large-Cap Value Fund
For the period July 1, 2018 through December 31, 2018, as provided by the Value Equity, US team.
Fund Insights
For the six-month period ended December 31, 2018, Class A shares at net asset value (“NAV”) of the AllianzGI NFJ Large-Cap Value Fund (the “Fund”) returned -7.90%, underperforming the Russell 1000 Value Index (the “benchmark”), which returned -6.69%.
Market Overview
US equities ratcheted steadily higher over the third quarter of 2018, with major indices touching a series of fresh peaks bolstered by corporate earnings growth and positive economic data. The gains propelled the market to its longest bull run in history, surpassing the previous record set between 1990 and 2000. However, the bull market ended abruptly in the final quarter of 2018 when US stocks plummeted, recording their weakest fourth-quarter returns since 2008. The S&P 500 Index touched its lowest level since September 2017, while both the tech-heavy Nasdaq Index and the small-cap-centric Russell 2000 Index entered official bear markets. A sudden rise in bond yields provided the catalyst for the initial downward movement in October, with stocks plunging further in December amid concerns over the outlook for growth and company profits, with political tensions providing further fuel for the selloff. Economic news showed that the US economy remained in robust health, while the US Federal Reserve raised interest rates in both September and December, taking them to a range of 2.25%-2.5%, as widely expected.
Portfolio Review
Relative performance results were due to negative sector allocation and stock selection, albeit to a lesser degree. Selection across the health care and industrials sectors was strong; however, these gains were offset by holdings in the consumer staples and materials sectors that failed to keep pace with benchmark shares. During the latter half of the year, oil prices suffered a sharp selloff, and the Fund’s overweight in the energy sector, as well as its underweight in communication services, detracted from performance. Conversely, an overweight in health care—the best-performing sector in the benchmark —contributed to results during the reporting period.
Outlook
US investors endured a rocky 2018—the third down year in a decade—as monetary policy worldwide diverged, political uncertainty escalated and trade tensions flared. In the US, negative market returns took place amidst accelerated economic growth, fueled by tax cuts and increased government spending, while growth once again outpaced their value counterparts. We believe that many of last year’s burdens on performance—including trade tensions and political uncertainty—appear poised to increase market volatility in 2019. Furthermore, with the US Federal Reserve in a quantitative tightening regime, we believe debt-laden companies, formerly buoyed by low interest rates and a generally improving economy, face real challenges as investors once more appreciate the appeal of safer assets.
By our assessment, we do not see a recession in the US over the next 12 months; however we do believe volatility will remain somewhat elevated in this later cycle environment. With peak growth rates likely in the rear view mirror, we believe that market participants must determine how to position their investments for the prospects of decelerating economic and earnings growth. As slower growth can exacerbate market reactions to uncertainty, we continue to favor higher-quality companies that pay dividends to help dampen market swings. Rather than passively accepting market returns—particularly as reduced liquidity and less monetary stimulus filter into the markets—we favor an active approach and use a disciplined, valuation-based fundamental process to identify portfolio candidates.
| | | | | | |
| 40 | | December 31, 2018 | | | Semiannual Report | | |
Unaudited
AllianzGI NFJ Large-Cap Value Fund (cont’d)
Average Annual Total Return for the period ended December 31, 2018
| | | | | | | | | | | | | | | | | | | | | | |
| | | | | | |
| | | | | 6 Month* | | | 1 Year | | | 5 Year | | | 10 Year | | | Since Inception† | |
| | | AllianzGI NFJ Large-Cap Value Fund Class A | | | –7.90% | | | | –9.69% | | | | 5.48% | | | | 9.98% | | | | 6.87% | |
| | AllianzGI NFJ Large-Cap Value Fund Class A (adjusted) | | | –12.97% | | | | –14.66% | | | | 4.29% | | | | 9.36% | | | | 6.55% | |
| | | AllianzGI NFJ Large-Cap Value Fund Class C | | | –8.29% | | | | –10.37% | | | | 4.68% | | | | 9.16% | | | | 6.08% | |
| | AllianzGI NFJ Large-Cap Value Fund Class C (adjusted) | | | –9.20% | | | | –11.26% | | | | 4.68% | | | | 9.16% | | | | 6.08% | |
| | AllianzGI NFJ Large-Cap Value Fund Class R | | | –8.03% | | | | –9.90% | | | | 5.22% | | | | 9.71% | | | | 6.64% | |
| | AllianzGI NFJ Large-Cap Value Fund Class P | | | –7.76% | | | | –9.45% | | | | 5.74% | | | | 10.27% | | | | 7.20% | |
| | AllianzGI NFJ Large-Cap Value Fund Institutional Class | | | –7.73% | | | | –9.36% | | | | 5.85% | | | | 10.37% | | | | 7.30% | |
| | | AllianzGI NFJ Large-Cap Value Fund Administrative Class | | | –7.87% | | | | –9.60% | | | | 5.59% | | | | 10.10% | | | | 7.03% | |
| | Russell 1000 Value Index | | | –6.69% | | | | –8.27% | | | | 5.95% | | | | 11.18% | | | | 6.29% | |
| | Russell Top 200 Value Index | | | –3.90% | | | | –6.22% | | | | 6.23% | | | | 10.47% | | | | 5.08% | |
| | | Lipper Large-Cap Value Funds Average | | | –7.54% | | | | –8.68% | | | | 5.29% | | | | 10.79% | | | | 6.01% | |
* Cumulative return
† The Fund began operations on 5/8/00. Benchmark comparisons began on the fund inception date. Lipper comparisons began on 4/30/00.
Performance quoted represents past performance and is no guarantee of future results. Current performance may be lower or higher than performance shown. For performance current to the most recent month-end, visit our website at us.allianzgi.com. Investment return and the principal value will fluctuate. Shares may be worth more or less than original cost when redeemed.The adjusted returns take into account the maximum sales charge of 5.50% on Class A shares and 1% contingent deferred sales charge (CDSC) on Class C shares, which may apply to shares redeemed during the first year of ownership. Returns do not reflect deduction of taxes that a shareholder would pay on fund distributions or redemption of fund shares. Please see pages 60-62 for more information. The Fund’s expense ratios are 1.11% for Class A shares, 1.86% for Class C shares, 1.36% for Class R shares, 0.86% for Class P shares, 0.76% for Institutional Class shares and 1.01% for Administrative Class shares. Expense ratio information is as of the Fund’s current prospectus dated August 30, 2018, as supplemented to date.
Cumulative Returns Through December 31, 2018
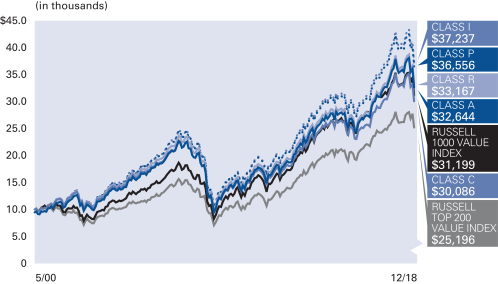
The Fund began operations on 5/8/00. Benchmark comparisons began on the fund inception date.
Industry/Sectors (as of December 31, 2018)
| | | | |
| |
| Banks | | | 13.2% | |
| |
| Oil, Gas & Consumable Fuels | | | 11.1% | |
| |
| Pharmaceuticals | | | 7.1% | |
| |
| Healthcare Providers & Services | | | 5.8% | |
| |
| Insurance | | | 4.1% | |
| |
| Semiconductors & Semiconductor Equipment | | | 3.7% | |
| |
| Diversified Telecommunication Services | | | 3.4% | |
| |
| Healthcare Equipment & Supplies | | | 3.4% | |
| |
| Other | | | 45.5% | |
| |
| Cash & Equivalents — Net | | | 2.7% | |
| | | | | | |
| | Semiannual Report | | | December 31, 2018 | | 41 |
Unaudited
AllianzGI NFJ Large-Cap Value Fund (cont’d)
| | | | | | | | | | | | |
| |
| Shareholder Expense Example | | Actual Performance |
| | | Class A | | Class C | | Class R | | Class P | | Institutional
Class | | Administrative
Class |
| | | | | | |
| Beginning Account Value (7/1/18) | | $1,000.00 | | $1,000.00 | | $1,000.00 | | $1,000.00 | | $1,000.00 | | $1,000.00 |
| | | | | | |
| Ending Account Value (12/31/18) | | $921.00 | | $917.10 | | $919.70 | | $922.40 | | $922.70 | | $921.30 |
| | | | | | |
| Expenses Paid During Period | | $5.42 | | $9.04 | | $6.63 | | $4.22 | | $3.73 | | $4.94 |
| | | | | | | | | | | | | |
| |
| | | Hypothetical Performance |
| | | (5% return before expenses) |
| | | Class A | | Class C | | Class R | | Class P | | Institutional
Class | | Administrative
Class |
| | | | | | |
| Beginning Account Value (7/1/18) | | $1,000.00 | | $1,000.00 | | $1,000.00 | | $1,000.00 | | $1,000.00 | | $1,000.00 |
| | | | | | |
| Ending Account Value (12/31/18) | | $1,019.56 | | $1,015.78 | | $1,018.30 | | $1,020.82 | | $1,021.32 | | $1,020.06 |
| | | | | | |
| Expenses Paid During Period | | $5.70 | | $9.50 | | $6.97 | | $4.43 | | $3.92 | | $5.19 |
For each class of the Fund, expenses are equal to the annualized expense ratio for the class (1.12% for Class A, 1.87 % for Class C, 1.37% for Class R, 0.87% for Class P, 0.77 % for Institutional Class and 1.02% for Administrative Class), multiplied by the average account value over the period, multiplied by 184/365.
| | | | | | |
| 42 | | December 31, 2018 | | | Semiannual Report | | |
(THIS PAGE INTENTIONALLY LEFT BLANK)
| | | | | | |
| | Semiannual Report | | | December 31, 2018 | | 43 |
Unaudited
AllianzGI NFJ Mid-Cap Value Fund
For the period July 1, 2018 through December 31, 2018, as provided by the Value Equity, US team.
Fund Insights
For the six-month period ended December 31, 2018, Class A shares at net asset value (“NAV”) of the AllianzGI NFJ Mid-Cap Value Fund (the “Fund”) returned -12.77%, underperforming the Russell Midcap Value Index (the “benchmark”), which returned -12.15%.
Market Overview
US equities ratcheted steadily higher over the third quarter of 2018, with major indices touching a series of fresh peaks bolstered by corporate earnings growth and positive economic data. The gains propelled the market to its longest bull run in history, surpassing the previous record set between 1990 and 2000. However, the bull market ended abruptly in the final quarter of 2018 when US stocks plummeted, recording their weakest fourth-quarter returns since 2008. The S&P 500 Index touched its lowest level since September 2017, while both the tech-heavy Nasdaq Index and the small-cap-centric Russell 2000 Index entered official bear markets. A sudden rise in bond yields provided the catalyst for the initial downward movement in October, with stocks plunging further in December amid concerns over the outlook for growth and company profits, with political tensions providing further fuel for the selloff. Economic news showed that the US economy remained in robust health, while the US Federal Reserve raised interest rates in both September and December, taking them to a range of 2.25%-2.5%, as widely expected.
Portfolio Review
Relative performance results were due to negative sector allocation which countered positive stock selection. Selection across the energy and consumer staples sectors was strong and outweighed the negative effects of holdings in the information technology and financials sectors that failed to keep pace with benchmark shares. During the latter half of the year, investors flocked to more bond proxy-like areas of the market, such as utilities and real estate, amid rising volatility, and our underweight in these sectors detracted over the reporting period. Further, the portfolio’s overweight in energy hampered results as oil prices suffered a sharp selloff, with Brent Crude ending the calendar year just below $55 per barrel after touching peaks of $85 per barrel in early October. In contrast, an overweight in industrials contributed slightly to results during the reporting period.
Outlook
US investors endured a rocky 2018—the third down year in a decade—as monetary policy worldwide diverged, political uncertainty escalated and trade tensions flared. In the US, negative market returns took place amidst accelerated economic growth, fueled by tax cuts and increased government spending, while growth once again outpaced their value counterparts. We believe that many of last year’s burdens on performance—including trade tensions and political uncertainty—appear poised to increase market volatility in 2019. Furthermore, with the US Federal Reserve in a quantitative tightening regime, we believe that debt-laden companies, formerly buoyed by low interest rates and a generally improving economy, face real challenges as investors once more appreciate the appeal of safer assets.
By our assessment, we do not see a recession in the US over the next 12 months; however we do believe volatility will remain somewhat elevated in this later cycle environment. With peak growth rates likely in the rear view mirror, we believe that market participants must determine how to position their investments for the prospects of decelerating economic and earnings growth. As slower growth can exacerbate market reactions to uncertainty, we continue to favor higher-quality companies that pay dividends to help dampen market swings. Rather than passively accepting market returns—particularly as reduced liquidity and less monetary stimulus filter into the markets—we favor an active approach and use a disciplined, valuation-based fundamental process to identify portfolio candidates.
| | | | | | |
| 44 | | December 31, 2018 | | | Semiannual Report | | |
Unaudited
AllianzGI NFJ Mid-Cap Value Fund (cont’d)
Average Annual Total Return for the period ended December 31, 2018
| | | | | | | | | | | | | | | | | | | | | | |
| | | | | | |
| | | | | 6 Month* | | | 1 Year | | | 5 Year | | | 10 Year | | | Since Inception† | |
| | | AllianzGI NFJ Mid-Cap Value Fund Class A | | | –12.77% | | | | –16.28% | | | | 5.33% | | | | 12.11% | | | | 10.61% | |
| | AllianzGI NFJ Mid-Cap Value Fund Class A (adjusted) | | | –17.56% | | | | –20.88% | | | | 4.15% | | | | 11.47% | | | | 10.40% | |
| | | AllianzGI NFJ Mid-Cap Value Fund Class C | | | –13.11% | | | | –16.89% | | | | 4.55% | | | | 11.27% | | | | 9.78% | |
| | AllianzGI NFJ Mid-Cap Value Fund Class C (adjusted) | | | –13.98% | | | | –17.72% | | | | 4.55% | | | | 11.27% | | | | 9.78% | |
| | AllianzGI NFJ Mid-Cap Value Fund Class R | | | –12.88% | | | | –16.48% | | | | 5.07% | | | | 11.83% | | | | 10.27% | |
| | AllianzGI NFJ Mid-Cap Value Fund Class P | | | –12.64% | | | | –16.06% | | | | 5.60% | | | | 12.40% | | | | 10.90% | |
| | AllianzGI NFJ Mid-Cap Value Fund Institutional Class | | | –12.62% | | | | –15.99% | | | | 5.70% | | | | 12.51% | | | | 11.00% | |
| | AllianzGI NFJ Mid-Cap Value Fund Class R6 | | | –12.57% | | | | –15.90% | | | | 5.77% | | | | 12.57% | | | | 11.06% | |
| | | AllianzGI NFJ Mid-Cap Value Fund Administrative Class | | | –12.71% | | | | –16.17% | | | | 5.44% | | | | 12.23% | | | | 10.75% | |
| | Russell Midcap Value Index | | | –12.15% | | | | –12.29% | | | | 5.44% | | | | 13.03% | | | | 11.17% | |
| | | Lipper Multi-Cap Value Funds Average | | | –10.57% | | | | –11.42% | | | | 4.24% | | | | 10.74% | | | | 6.98% | |
* Cumulative return
† The Fund began operations on 4/18/88. Benchmark and Lipper performance comparisons began on 4/30/88.
Performance quoted represents past performance and is no guarantee of future results. Current performance may be lower or higher than performance shown. For performance current to the most recent month-end, visit our website at us.allianzgi.com. Investment return and the principal value will fluctuate. Shares may be worth more or less than original cost when redeemed.The adjusted returns take into account the maximum sales charge of 5.50% on Class A shares and 1% contingent deferred sales charge (CDSC) on Class C shares, which may apply to shares redeemed during the first year of ownership. Returns do not reflect deduction of taxes that a shareholder would pay on fund distributions or redemption of fund shares. Please see pages 60-62 for more information. The Fund’s gross expense ratios are 1.21% for Class A shares, 1.96% for Class C shares, 1.46% for Class R shares, 0.96% for Class P shares, 0.86% for Institutional Class shares, 0.81% for Class R6 shares and 1.11% for Administrative Class shares. These ratios do not include an expense reduction, contractually agree through at least September 30, 2019. The Fund’s expense ratios net of this reduction are 0.99% for Class A shares, 1.74% for Class C shares, 1.24% for Class R shares, 0.74% for Class P shares, 0.64% for Institutional Class shares, 0.59% for Class R6 shares and 0.89% for Administrative Class shares. Expense ratio information is as of the Fund’s current prospectus dated August 30, 2018, as supplemented to date.
Cumulative Returns Through December 31, 2018
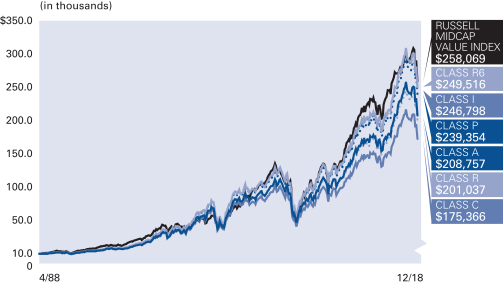
The Fund began operations on 4/18/88. Benchmark performance comparisons began on 4/30/88.
Industry/Sectors (as of December 31, 2018)
| | | | |
| |
| Insurance | | | 9.1% | |
| |
| Banks | | | 8.0% | |
| |
| Oil, Gas & Consumable Fuels | | | 7.5% | |
| |
| Equity Real Estate Investment Trusts (REITs) | | | 6.8% | |
| |
| Machinery | | | 5.3% | |
| |
| Capital Markets | | | 5.2% | |
| |
| Electric Utilities | | | 4.0% | |
| |
| Aerospace & Defense | | | 4.0% | |
| |
| Other | | | 48.5% | |
| |
| Cash & Equivalents — Net | | | 1.6% | |
| | | | | | |
| | Semiannual Report | | | December 31, 2018 | | 45 |
Unaudited
AllianzGI NFJ Mid-Cap Value Fund (cont’d)
| | | | | | | | | | | | | | |
| |
| Shareholder Expense Example | | Actual Performance |
| | | Class A | | Class C | | Class R | | Class P | | Institutional
Class | | Class R6 | | Administrative
Class |
| | | | | | | |
| Beginning Account Value (7/1/18) | | $1,000.00 | | $1,000.00 | | $1,000.00 | | $1,000.00 | | $1,000.00 | | $1,000.00 | | $1,000.00 |
| | | | | | | |
| Ending Account Value (12/31/18) | | $872.30 | | $868.90 | | $871.20 | | $873.60 | | $873.80 | | $874.30 | | $872.90 |
| | | | | | | |
| Expenses Paid During Period | | $4.67 | | $8.20 | | $5.85 | | $3.49 | | $3.02 | | $2.79 | | $4.20 |
| | | | | | | | | | | | | | | |
| |
| | | Hypothetical Performance |
| | | (5% return before expenses) |
| | | Class A | | Class C | | Class R | | Class P | | Institutional
Class | | Class R6 | | Administrative
Class |
| | | | | | | |
| Beginning Account Value (7/1/18) | | $1,000.00 | | $1,000.00 | | $1,000.00 | | $1,000.00 | | $1,000.00 | | $1,000.00 | | $1,000.00 |
| | | | | | | |
| Ending Account Value (12/31/18) | | $1,020.21 | | $1,016.43 | | $1,018.95 | | $1,021.48 | | $1,021.98 | | $1,022.23 | | $1,020.72 |
| | | | | | | |
| Expenses Paid During Period | | $5.04 | | $8.84 | | $6.31 | | $3.77 | | $3.26 | | $3.01 | | $4.53 |
For each class of the Fund, expenses (net of fee waiver) are equal to the annualized expense ratio for the class (0.99% for Class A, 1.74% for Class C, 1.24% for Class R, 0.74% for Class P, 0.64% for Institutional Class, 0.59% for Class R6 and 0.89% for Administrative Class), multiplied by the average account value over the period, multiplied by 184/365.
| | | | | | |
| 46 | | December 31, 2018 | | | Semiannual Report | | |
(THIS PAGE INTENTIONALLY LEFT BLANK)
| | | | | | |
| | Semiannual Report | | | December 31, 2018 | | 47 |
Unaudited
AllianzGI NFJ Small-Cap Value Fund
For the period July 1, 2018 through December 31, 2018, as provided by the Value Equity, US team.
Fund Insights
For the six-month period ended December 31, 2018, Class A shares at net asset value (“NAV”) of the AllianzGI NFJ Small-Cap Value Fund (the “Fund”) returned -19.46%, underperforming the Russell 2000 Value Index (the “benchmark”), which returned -17.36%.
Market Overview
US equities ratcheted steadily higher over the third quarter of 2018, with major indices touching a series of fresh peaks bolstered by corporate earnings growth and positive economic data. The gains propelled the market to its longest bull run in history, surpassing the previous record set between 1990 and 2000. However, the bull market ended abruptly in the final quarter of 2018 when US stocks plummeted, recording their weakest fourth-quarter returns since 2008. The S&P 500 Index touched its lowest level since September 2017, while both the tech-heavy Nasdaq Index and the small-cap-centric Russell 2000 Index entered official bear markets. A sudden rise in bond yields provided the catalyst for the initial downward movement in October, with stocks plunging further in December amid concerns over the outlook for growth and company profits, with political tensions providing further fuel for the selloff. Economic news showed that the US economy remained in robust health, while the US Federal Reserve (“Fed”) raised interest rates in both September and December, taking them to a range of 2.25%-2.5%, as widely expected.
Portfolio Review
Relative performance results were due to negative sector allocation which countered positive stock selection. Selection across the energy and health care sectors was strong and outweighed the negative effects of holdings in the financials and information technology sectors that failed to keep pace with benchmark shares. During the latter half of the year, investors flocked to more bond proxy-like areas of the market, such as utilities, amid rising volatility, and our underweight in the sector, as well as an overweight in materials, detracted over the reporting period. In contrast, an overweight in financials contributed slightly to results during the reporting period.
Outlook
US investors endured a rocky 2018—the third down year in a decade—as monetary policy worldwide diverged, political uncertainty escalated and trade tensions flared. In the US, negative market returns took place amidst accelerated economic growth, fueled by tax cuts and increased government spending, while growth once again outpaced their value counterparts. We believe that many of last year’s burdens on performance—including trade tensions and political uncertainty—appear poised to increase market volatility in 2019. Furthermore, with the Fed in a quantitative tightening regime, we believe that debt-laden companies, formerly buoyed by low interest rates and a generally improving economy, face real challenges as investors once more appreciate the appeal of safer assets.
By our assessment, we do not see a recession in the US over the next 12 months; however we do believe volatility will remain somewhat elevated in this later cycle environment. With peak growth rates likely in the rear view mirror, we believe that market participants must determine how to position their investments for the prospects of decelerating economic and earnings growth. As slower growth can exacerbate market reactions to uncertainty, we continue to favor higher-quality companies that pay dividends to help dampen market swings. Rather than passively accepting market returns—particularly as reduced liquidity and less monetary stimulus filter into the markets—we favor an active approach and use a disciplined, valuation-based fundamental process to identify portfolio candidates.
| | | | | | |
| 48 | | December 31, 2018 | | | Semiannual Report | | |
Unaudited
AllianzGI NFJ Small-Cap Value Fund (cont’d)
Average Annual Total Return for the period ended December 31, 2018
| | | | | | | | | | | | | | | | | | | | | | |
| | | | | | |
| | | | | 6 Month* | | | 1 Year | | | 5 Year | | | 10 Year | | | Since Inception† | |
| | | AllianzGI NFJ Small-Cap Value Fund Class A | | | –19.46% | | | | –19.31% | | | | 0.27% | | | | 8.80% | | | | 10.11% | |
| | AllianzGI NFJ Small-Cap Value Fund Class A (adjusted) | | | –23.89% | | | | –23.75% | | | | –0.86% | | | | 8.19% | | | | 9.88% | |
| | | AllianzGI NFJ Small-Cap Value Fund Class C | | | –19.72% | | | | –19.85% | | | | –0.47% | | | | 8.00% | | | | 9.29% | |
| | AllianzGI NFJ Small-Cap Value Fund Class C (adjusted) | | | –20.31% | | | | –20.44% | | | | –0.47% | | | | 8.00% | | | | 9.29% | |
| | AllianzGI NFJ Small-Cap Value Fund Class R | | | –19.59% | | | | –19.52% | | | | 0.01% | | | | 8.53% | | | | 9.79% | |
| | AllianzGI NFJ Small-Cap Value Fund Class P | | | –19.39% | | | | –19.16% | | | | 0.51% | | | | 9.07% | | | | 10.43% | |
| | AllianzGI NFJ Small-Cap Value Fund Institutional Class | | | –19.33% | | | | –19.03% | | | | 0.64% | | | | 9.23% | | | | 10.55% | |
| | AllianzGI NFJ Small-Cap Value Fund Class R6 | | | –19.30% | | | | –18.99% | | | | 0.70% | | | | 9.28% | | | | 10.61% | |
| | | AllianzGI NFJ Small-Cap Value Fund Administrative Class | | | –19.44% | | | | –19.25% | | | | 0.40% | | | | 8.96% | | | | 10.23% | |
| | Russell 2000 Value Index | | | –17.36% | | | | –12.86% | | | | 3.61% | | | | 10.40% | | | | 10.42% | |
| | | Lipper Small-Cap Value Funds Average | | | –18.86% | | | | –15.89% | | | | 1.69% | | | | 10.83% | | | | 8.53% | |
* Cumulative return
† The Fund began operations on 10/1/91. Benchmark comparisons began on the fund inception date. Lipper comparisons began on 9/30/91.
Performance quoted represents past performance and is no guarantee of future results. Current performance may be lower or higher than performance shown. For performance current to the most recent month-end, visit our website at us.allianzgi.com. Investment return and the principal value will fluctuate. Shares may be worth more or less than original cost when redeemed.The adjusted returns take into account the maximum sales charge of 5.50% on Class A shares and 1% contingent deferred sales charge (CDSC) on Class C shares, which may apply to shares redeemed during the first year of ownership. Returns do not reflect deduction of taxes that a shareholder would pay on fund distributions or redemption of fund shares. Please see pages 60-62 for more information. The Fund’s gross expense ratios are 1.26% for Class A shares, 2.01% for Class C shares, 1.51 for Class R shares, 1.01% for Class P shares, 0.91% for Institutional Class shares, 0.86% for Class R6 shares and 1.16% for Administrative Class Shares. These ratios do not include an expense reduction, contractually agreed through at least October 31, 2019. The Fund’s expense ratios net of this reduction are 1.16% for Class A shares, 1.91% for Class C shares, 1.41 for Class R shares, 0.91% for Class P shares, 0.81% for Institutional Class shares, 0.76% for Class R6 shares and 1.06% for Administrative Class Shares. Expense ratio information is as of the Fund’s current prospectus dated August 30, 2018, as supplemented to date.
Cumulative Returns Through December 31, 2018
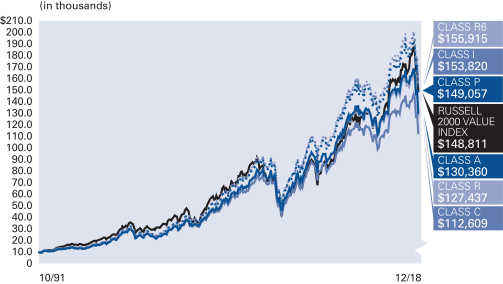
The Fund began operations on 10/1/91. Benchmark comparisons began on the fund inception date.
Industry/Sectors (as of December 31, 2018)
| | | | |
| |
| Banks | | | 22.4% | |
| |
| Oil, Gas & Consumable Fuels | | | 7.2% | |
| |
| Chemicals | | | 4.9% | |
| |
| Machinery | | | 4.8% | |
| |
| Insurance | | | 4.6% | |
| |
| Capital Markets | | | 4.5% | |
| |
| Equity Real Estate Investment Trusts (REITs) | | | 4.4% | |
| |
| Construction & Engineering | | | 3.2% | |
| |
| Other | | | 44.2% | |
| |
| Cash & Equivalents — Net | | | –0.2% | |
| | | | | | |
| | Semiannual Report | | | December 31, 2018 | | 49 |
Unaudited
AllianzGI NFJ Small-Cap Value Fund (cont’d)
| | | | | | | | | | | | | | |
| |
| Shareholder Expense Example | | Actual Performance |
| | | Class A | | Class C | | Class R | | Class P | | Institutional
Class | | Class R6 | | Administrative
Class |
| | | | | | | |
| Beginning Account Value (7/1/18) | | $1,000.00 | | $1,000.00 | | $1,000.00 | | $1,000.00 | | $1,000.00 | | $1,000.00 | | $1,000.00 |
| | | | | | | |
| Ending Account Value (12/31/18) | | $805.40 | | $802.80 | | $804.10 | | $806.10 | | $806.70 | | $807.00 | | $805.60 |
| | | | | | | |
| Expenses Paid During Period | | $5.46 | | $8.86 | | $6.59 | | $4.32 | | $3.87 | | $3.64 | | $5.01 |
| | | | | | | | | | | | | | | |
| |
| | | Hypothetical Performance |
| | | (5% return before expenses) |
| | | Class A | | Class C | | Class R | | Class P | | Institutional
Class | | Class R6 | | Administrative
Class |
| | | | | | | |
| Beginning Account Value (7/1/18) | | $1,000.00 | | $1,000.00 | | $1,000.00 | | $1,000.00 | | $1,000.00 | | $1,000.00 | | $1,000.00 |
| | | | | | | |
| Ending Account Value (12/31/18) | | $1,019.16 | | $1,015.38 | | $1,017.90 | | $1,020.42 | | $1,020.92 | | $1,021.17 | | $1,019.66 |
| | | | | | | |
| Expenses Paid During Period | | $6.11 | | $9.91 | | $7.37 | | $4.84 | | $4.33 | | $4.08 | | $5.60 |
For each class of the Fund, expenses (net of fee waiver) are equal to the annualized expense ratio for the class (1.20% for Class A, 1.95% for Class C, 1.45% for Class R, 0.95% for Class P, 0.85% for Institutional Class, 0.80% for Class R6 and 1.10% for Administrative Class), multiplied by the average account value over the period, multiplied by 184/365.
| | | | | | |
| 50 | | December 31, 2018 | | | Semiannual Report | | |
(THIS PAGE INTENTIONALLY LEFT BLANK)
| | | | | | |
| | Semiannual Report | | | December 31, 2018 | | 51 |
Unaudited
AllianzGISmall-Cap Fund
For the period of July 1, 2018 through December 31, 2018, as provided by Kunal Ghosh, Lead Portfolio Manager.
Fund Insights
For the six-month period ended December 31, 2018, Class A shares at net asset value (“NAV”) of the AllianzGI Small-Cap Fund (the “Fund”) returned-15.60%, outperforming the Russell 2000 Index (the “benchmark”), which returned -17.35%.
Market Overview
Broader US equity markets posted losses over the period. In early October, the combination of elevated interest rates and investors’ hawkish interpretation of US Federal Reserve (“Fed”) Chairman Jerome Powell’s commentary on monetary policy provided the catalyst for the sharp selloff. Despite volatility in the equity markets, economic fundamentals were positive. Third quarter GDP grew at 3.4% and corporate earnings growth remained robust. The unemployment rate fell to its lowest level since 1969 and wages picked up, rising on a year-on-year basis. The benchmark, which is representative of US small-caps, underperformed the Russell 1000 large cap index by 9.9%. Within the small-cap universe, growth slightly outperformed value.
Portfolio Review
Security selection was the primary driver of outperformance, and sector allocation modestly detracted from returns. Stock picking was positive in the health care, energy and financials sectors, while weak selections in the consumer discretionary, information technology and industrials sectors were partly offsetting. Separately, the overweight to health care was a drag on performance while an underweight to materials was a slight positive.
A top contributor, Genomic Health Inc. provides genomic based diagnostic tests, allowing doctors to create individualized cancer treatment regiments. The stock rallied after the company reported better than expected sales for its diagnostic tests and strong overall earnings. The largest absolute detractor was premium watch provider Movado Group, Inc. The stock traded lower given investor concerns on a slowdown in consumer spending.
At the end of the period, the Fund was positioned with overweight allocations to the health care, consumer discretionary and consumer staples sectors. Real estate was the largest underweight position in the Fund, followed by the information technology and industrials sectors.
Outlook
For our 2019 outlook, we maintain the view that the current expansion should continue at a moderate pace. In our opinion, overall economic fundamentals appear solid given that financial conditions appear fair; employment conditions remains strong; and key manufacturing and service surveys flash expansionary numbers.
In regards to the sharp selloff in the fourth quarter, it is our view that it was primarily driven by higher interest rates and communication issues on the nuances of monetary policy. However, we have seen long term rates fall significantly from October highs, providing a more supportive environment for risk assets and equities. Further, Fed Chair Powell clarified that the Fed maintains a flexible approach with regards to monetary policy.
As for small-cap equities, we have seen significant contraction of the benchmark’s price-to-earnings multiple. This appears to be a negative two standard deviation event, which was seen previously in the tail-end of distressed environments. Overall, we believe that small-cap equities have absorbed a meaningful level of negative sentiment and the risk-reward outlook appears attractive.
The Fund combines three unique small-cap strategies in one investment, including a quantitative core, a fundamental growth and a managed volatility sleeve. Each individual small-cap sleeve is managed independently as a standalone portfolio by its respective portfolio management team, providing investors with access to a wide range of small-cap strategies in a single investment. We believe the Fund provides diversification benefits and may help reduce overall portfolio volatility through the combination of three separately managed small-cap portfolios.
| | | | | | |
| 52 | | December 31, 2018 | | | Semiannual Report | | |
Unaudited
AllianzGI Small-Cap Fund (cont’d)
Average Annual Total Return for the period ended December 31, 2018
| | | | | | | | | | | | | | | | | | |
| | | | | |
| | | | | 6 Month* | | | 1 Year | | | 5 Year | | | Since Inception† | |
| | | AllianzGI Small-Cap Fund Class A | | | –15.60% | | | | –9.40% | | | | 4.89% | | | | 7.98% | |
| | AllianzGI Small-Cap Fund Class A (adjusted) | | | –20.25% | | | | –14.38% | | | | 3.71% | | | | 6.88% | |
| | | AllianzGI Small-Cap Fund Class C | | | –15.92% | | | | –10.07% | | | | 4.10% | | | | 7.18% | |
| | AllianzGI Small-Cap Fund Class C (adjusted) | | | –16.68% | | | | –10.89% | | | | 4.10% | | | | 7.18% | |
| | AllianzGI Small-Cap Fund Class P | | | –15.50% | | | | –9.17% | | | | 5.14% | | | | 8.25% | |
| | AllianzGI Small-Cap Fund Institutional Class | | | –15.44% | | | | –9.06% | | | | 5.25% | | | | 8.36% | |
| | AllianzGI Small-Cap Fund Class R6 | | | –15.44% | | | | –9.04% | | | | 5.29% | | | | 8.41% | |
| | Russell 2000 Index | | | –17.35% | | | | –11.01% | | | | 4.41% | | | | 7.23% | |
| | | Lipper Small-Cap Core Funds Average | | | –16.69% | | | | –12.66% | | | | 3.41% | | | | 6.41% | |
* Cumulative return
† The Fund began operations on 7/1/13. Benchmark performance comparison began on 7/1/13. Lipper performance comparisons began on 6/30/13.
Performance quoted represents past performance and is no guarantee of future results. Current performance may be lower or higher than performance shown. For performance current to the most recent month-end, visit our website at us.allianzgi.com. Investment return and the principal value will fluctuate. Shares may be worth more or less than original cost when redeemed.The adjusted returns take into account the maximum sales charge of 5.50% on Class A shares and 1% contingent deferred sales charge (CDSC) on Class C shares, which may apply to shares redeemed during the first year of ownership. Returns do not reflect deduction of taxes that a shareholder would pay on fund distributions or redemption of fund shares. Please see pages 60-62 for more information. The Fund’s expense ratios are 1.28% for Class A shares, 2.03% for Class C shares, 1.03% for Class P shares, 0.93% for Institutional Class shares and 0.88% for Class R6 shares. Theses ratios do not include an expense reduction, contractually agreed through at least October 31, 2019. The Fund’s expense ratios net of this reduction are 1.18% for Class A shares, 1.93% for Class C shares, 0.93% for Class P shares, 0.83% for Institutional Class shares and 0.78% for Class R6 shares. Expense ratio information is as of the Fund’s current prospectus dated August 30, 2018, as supplemented to date.
Cumulative Returns Through December 31, 2018
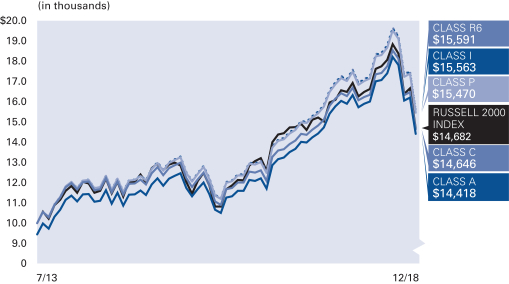
The Fund began operations on 7/1/13. Benchmark performance comparisons began on 7/1/13.
Industry/Sectors (as of December 31, 2018)
| | | | |
| |
| HealthCare Equipment & Supplies | | | 7.4% | |
| |
| Software | | | 6.6% | |
| |
| Biotechnology | | | 5.8% | |
| |
| HealthCare Providers & Services | | | 4.8% | |
| |
| Thrifts & Mortgage Finance | | | 3.9% | |
| |
| Banks | | | 3.9% | |
| |
| Life Sciences Tools & Services | | | 3.9% | |
| |
| Textiles, Apparel & Luxury Goods | | | 3.8% | |
| |
| Other | | | 58.1% | |
| |
| Cash & Equivalents - Net | | | 1.8% | |
| | | | | | |
| | Semiannual Report | | | December 31, 2018 | | 53 |
Unaudited
AllianzGI Small-Cap Fund (cont’d)
| | | | | | | | | | |
| |
| Shareholder Expense Example | | Actual Performance |
| | | Class A | | Class C | | Class P | | Institutional
Class | | Class R6* |
| | | | | |
| Beginning Account Value (7/1/18) | | $1,000.00 | | $1,000.00 | | $1,000.00 | | $1,000.00 | | $1,000.00 |
| | | | | |
| Ending Account Value (12/31/18) | | $844.00 | | $840.80 | | $845.00 | | $845.60 | | $845.60 |
| | | | | |
| Expenses Paid During Period | | $5.53 | | $9.00 | | $4.37 | | $3.91 | | $2.62 |
| | | | | | | | | | | |
| |
| | | Hypothetical Performance |
| | | (5% return before expenses) |
| | | Class A | | Class C | | Class P | | Institutional
Class | | Class R6* |
| | | | | |
| Beginning Account Value (7/1/18) | | $1,000.00 | | $1,000.00 | | $1,000.00 | | $1,000.00 | | $1,000.00 |
| | | | | |
| Ending Account Value (12/31/18) | | $1,019.21 | | $1,015.43 | | $1,020.47 | | $1,020.97 | | $1,021.22 |
| | | | | |
| Expenses Paid During Period | | $6.06 | | $9.86 | | $4.79 | | $4.28 | | $4.02 |
*Class R6 commenced operations on August 22, 2018. The Actual expense example for Class R6 is based on the period since inception; the actual expense example for Class A, Class C, Class R, Class P, and Institutional Class, and the Hypothetical expense example are based on the period beginning July 1, 2018. If the Hypothetical expense example for Class R6 had been based on the period since inception, the Ending Account Value and Expenses Paid During the Period would have been: $1,015.11 and $2.86, respectively.
For each class of the Fund, expenses (net of fee waiver) are equal to the annualized expense ratio for the class (1.19% for Class A, 1.94% for Class C, 0.94% for Class P, 0.84% for Institutional Class and 0.79% for Class R6), multiplied by the average account value over the period, multiplied by 184 (131 for Class R6)/365 for the Actual expense example and 184/365 for the Hypothetical expense example.
| | | | | | |
| 54 | | December 31, 2018 | | | Semiannual Report | | |
(THIS PAGE INTENTIONALLY LEFT BLANK)
| | | | | | |
| | Semiannual Report | | | December 31, 2018 | | 55 |
Unaudited
AllianzGI Technology Fund
For the period of July 1, 2018 to December 31, 2018, as provided by Huachen Chen, CFA and Walter C. Price, Jr., CFA, Senior Portfolio Managers.
Fund Insights
For the six-month period ended December 31, 2018, Class A shares at net asset value (“NAV”), of the AllianzGI Technology Fund (the “Fund”) returned-9.98%, outperforming the S&P North American Technology Sector Index (the “benchmark”), which returned -10.51%.
Market Overview
Global equities fell sharply over the second half of 2018, with many markets entering bear territory (defined as a drop of at least 20% from a recent peak) in the fourth quarter. In general, markets continued to ratchet higher during the third quarter, but a sudden rise in bond yields at the start of October sent stocks into reverse. The sell-off intensified as worries over the impact of higher tariffs and the outlook for global growth added to concerns. Politics also unsettled investors, with a US government shutdown and continued uncertainty over Brexit.
Technology stocks underperformed the broader equity market over the period. Hardware was the hardest hit sub-segment within tech, and the pressure was nearly all attributable to the stock of Apple, Inc. Reports of poor sell-through and production cuts of the most recently introduced iPhone models weighed on the shares. The semiconductor segment was volatile amid the issues with Apple and news surrounding US-China trade negotiations held at the beginning of December. Meanwhile, the FAANG (Facebook, Apple, Amazon, Netflix, Google/Alphabet) complex fell on mixed earnings results and a broad de-risking environment.
Portfolio Review
The primary drivers of the Fund’s relative performance included overweight positions in some high-growth software companies such as Workday, Inc., MongoDB, Inc. and Paycom Software, Inc. Despite the sharp sell-off in the fourth quarter, these stocks performed well during the six-month period due to higher demand for their innovative product offerings, which led to consistently strong revenue and earnings growth. Additionally, an underweight to Facebook, Inc. helped relative performance.
Conversely, an overweight position in NetApp, Inc. detracted from relative performance. Despite the weaker near-term revenue guidance, we believe the company remains well-positioned for attractive long term growth. DXC Technology Co. was also a detractor as the company faced challenges staffing its sales team, which led to slower revenue growth. We believe the company is resolving this issue via a recent acquisition. Other detractors included an overweight position in Proofpoint, Inc. and not owning Cisco Systems, Inc.
The core of our investment process is the identification of major themes impacting the technology sector and investing in the primary beneficiaries/drivers of these trends. We maintain our conviction in the core secular growth names in the Fund, but we are also attentive to present market conditions and valuations.
Outlook
Despite the recent market volatility, our view is that technology is well-positioned to remain a major driver of market returns. The ongoing digital transformation among corporations should continue to drive growth in information technology spending. Feedback from our discussions with company management teams, as well as management surveys from multiple sources, indicate that companies across the economy are turning to technology solutions to increase revenue, improve productivity, and enhance operating efficiency.
We continue to believe the technology sector can provide some of the best absolute and relative return opportunities in the equity markets – especially for bottom-up stock pickers. In our opinion, the growth in technology is coming from the creation of new markets, rather than simply GDP growth. We believe investors need to find companies generating organic growth by creating new markets or effecting significant change on old markets. Industries such as automobiles, advertising, security, retail, and manufacturing are all being shaped and transformed by advances in technology.
We are seeing an ongoing wave of innovation in the sector that we believe has the potential to produce attractive returns for companies with best-in-class solutions.
| | | | | | |
| 56 | | December 31, 2018 | | | Semiannual Report | | |
Unaudited
AllianzGI Technology Fund (cont’d)
Average Annual Total Return for the period ended December 31, 2018
| | | | | | | | | | | | | | | | | | | | | | |
| | | | | | |
| | | | | 6 Month* | | | 1 Year | | | 5 Year | | | 10 Year | | | Since Inception† | |
| | | AllianzGI Technology Fund Class A | | | –9.98% | | | | 5.25% | | | | 13.79% | | | | 18.68% | | | | 13.46% | |
| | AllianzGI Technology Fund Class A (adjusted) | | | –14.93% | | | | –0.54% | | | | 12.50% | | | | 18.01% | | | | 13.18% | |
| | | AllianzGI Technology Fund Class C | | | –10.31% | | | | 4.47% | | | | 12.94% | | | | 17.80% | | | | 12.61% | |
| | AllianzGI Technology Fund Class C (adjusted) | | | –10.97% | | | | 3.71% | | | | 12.94% | | | | 17.80% | | | | 12.61% | |
| | AllianzGI Technology Fund Class P | | | –9.86% | | | | 5.52% | | | | 14.07% | | | | 18.98% | | | | 13.83% | |
| | AllianzGI Technology Fund Institutional Class | | | –9.81% | | | | 5.62% | | | | 14.19% | | | | 19.10% | | | | 13.95% | |
| | | AllianzGI Technology Fund Administrative Class | | | –9.93% | | | | 5.35% | | | | 13.90% | | | | 18.81% | | | | 13.66% | |
| | S&P North American Technology Sector Index | | | –10.51% | | | | 2.88% | | | | 15.32% | | | | 19.14% | | | | 10.35% | |
| | NASDAQ Composite Index | | | –11.16% | | | | –2.84% | | | | 10.97% | | | | 16.76% | | | | 9.05% | |
| | | Lipper Global Science & Technology Funds Average | | | –14.55% | | | | –5.45% | | | | 12.48% | | | | 17.28% | | | | 10.23% | |
* Cumulative return
† The Fund began operations on 12/27/95. Benchmark and Lipper performance comparisons began on 12/31/95.
Performance quoted represents past performance and is no guarantee of future results. Current performance may be lower or higher than performance shown. For performance current to the most recent month-end, visit our website at us.allianzgi.com. Investment return and the principal value will fluctuate. Shares may be worth more or less than original cost when redeemed.The adjusted returns take into account the maximum sales charge of 5.50% on Class A shares and 1% contingent deferred sales charge (CDSC) on Class C shares, which may apply to shares redeemed during the first year of ownership. Returns do not reflect deduction of taxes that a shareholder would pay on fund distributions or redemption of fund shares. Please see pages 60-62 for more information. The Fund’s gross expense ratios are 1.57% for Class A shares, 2.32% for Class C shares, 1.32% for Class P shares, 1.22% for Institutional Class shares and 1.47% for Administrative Class shares. Expense ratio information is as of the Fund’s current prospectus dated August 30, 2018, as supplemented to date.
Cumulative Returns Through December 31, 2018
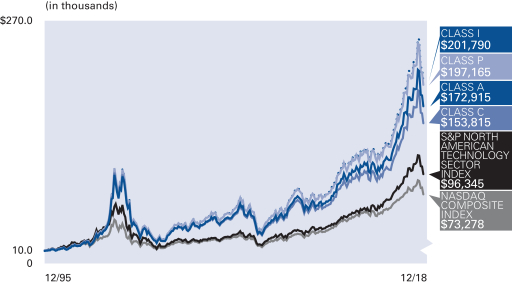
The Fund began operations on 12/27/95. Benchmark and Lipper performance comparisons began on 12/31/95.
Industry/Sectors (as of December 31, 2018)
| | | | |
| |
| Software | | | 34.7% | |
| |
| IT Services | | | 18.9% | |
| |
| Interactive Media & Services | | | 8.9% | |
| |
| Internet & Direct Marketing Retail | | | 7.9% | |
| |
| Semiconductors & Semiconductor Equipment | | | 7.1% | |
| |
| Technology Hardware, Storage & Peripherals | | | 6.8% | |
| |
| Communications Equipment | | | 2.3% | |
| |
| Other | | | 3.4% | |
| |
| Securities Sold Short* | | | –0.1% | |
| |
| Cash & Equivalents — Net | | | 10.1% | |
| | * | Table below details the industry allocation for securities sold short |
Industry/Sectors - Securities Sold Short
| | | | |
| |
| Semiconductors & Semiconductor Equipment | | | –0.1% | |
| |
| IT Services | | | 0.0% | |
| | | | | | |
| | Semiannual Report | | | December 31, 2018 | | 57 |
Unaudited
AllianzGI Technology Fund (cont’d)
| | | | | | | | | | |
| |
| Shareholder Expense Example | | Actual Performance |
| | | Class A | | Class C | | Class P | | Institutional
Class | | Administrative
Class |
| | | | | |
| Beginning Account Value (7/1/18) | | $1,000.00 | | $1,000.00 | | $1,000.00 | | $1,000.00 | | $1,000.00 |
| | | | | |
| Ending Account Value (12/31/18) | | $900.20 | | $896.90 | | $901.40 | | $901.90 | | $900.70 |
| | | | | |
| Expenses Paid During Period | | $6.99 | | $10.57 | | $5.80 | | $5.32 | | $6.52 |
| | | | | | | | | | | |
| |
| | | Hypothetical Performance |
| | | (5% return before expenses) |
| | | Class A | | Class C | | Class P | | Institutional
Class | | Administrative
Class |
| | | | | |
| Beginning Account Value (7/1/18) | | $1,000.00 | | $1,000.00 | | $1,000.00 | | $1,000.00 | | $1,000.00 |
| | | | | |
| Ending Account Value (12/31/18) | | $1,017.85 | | $1,014.06 | | $1,019.11 | | $1,019.61 | | $1,018.35 |
| | | | | |
| Expenses Paid During Period | | $7.43 | | $11.22 | | $6.16 | | $5.65 | | $6.92 |
For each class of the Fund, expenses (net of fee waiver) are equal to the annualized expense ratio for the class (1.46% for Class A, 2.21% for Class C, 1.21% for Class P, 1.11% for Institutional Class and 1.36% for Administrative Class), multiplied by the average account value over the period, multiplied by 184/365.
| | | | | | |
| 58 | | December 31, 2018 | | | Semiannual Report | | |
(THIS PAGE INTENTIONALLY LEFT BLANK)
| | | | | | |
| | Semiannual Report | | | December 31, 2018 | | 59 |
Unaudited
Important Information
Share Class (A/C)
The inception date on each Fund Summary page is the inception date of the Fund’s oldest share class or classes. The oldest share class for the following Funds is the Institutional share class, and the Class A and/or C shares were first offered in the month/year indicated in parentheses after each Fund name: AllianzGI NFJ Dividend Value (10/01), AllianzGI NFJ Large-Cap Value (7/02), AllianzGI NFJ Small-Cap Value (1/97), AllianzGIMid-Cap (2/02), AllianzGI Emerging Markets Opportunities (8/06), AllianzGI Global Natural Resources (3/06), AllianzGI Global Small-Cap (2/02) and AllianzGI Technology (2/02). The oldest share class for the following Funds is C, and the A shares were first offered in the month/year indicated in parentheses after each Fund name: AllianzGI NFJ Mid-Cap Value (2/91) and AllianzGI Focused Growth (10/90). The oldest share class for AllianzGI Health Sciences was the D share class, and the A and C shares were first offered in 2/02. For AllianzGI NFJ International Value the oldest share class is the Institutional share class and A and C shares were first offered in 4/05. For AllianzGI Small-Cap, A and C shares were each first offered in 7/13. For the AllianzGI Income & Growth Fund, Class A and Class C shares were first offered simultaneously with Institutional shares in 2/07.
Class A shares are subject to an initial sales charge. Class C shares are subject to a 1% CDSC for shares redeemed in the first year.
Share Class (R)
The inception date on each Fund Summary page is the inception date of the Fund’s oldest share class or classes. The oldest share classes are (Fund/share class): AllianzGI NFJ Dividend Value/Institutional and Administrative, AllianzGI NFJ Mid-Cap Value/C, AllianzGI NFJ Small-Cap Value/Institutional, AllianzGI Focused Growth/C and AllianzGI Mid-Cap/Institutional. Class R shares for these Funds were first offered in 12/02. The oldest share class for AllianzGI NFJ Large-Cap Value is the Institutional share class and it first offered Class R shares in 11/09. The oldest share class for AllianzGI NFJ International Value is the Institutional share class and the Fund first offered Class R shares in 11/09. The oldest share classes for AllianzGI Income & Growth are the Institutional, Class A and Class C share classes and the Fund first offered Class R shares in 2/11.
Share Class (P)
Class P shares were launched in July 2008, except for Class P shares of AllianzGI NFJ Mid-Cap Value Fund, which were launched February 28, 2011, Class P shares of AllianzGI Mid-Cap Fund, which were launched April 2, 2012, and Class P shares of AllianzGI Small-Cap, which were launched July 1, 2013.
Share Class (Institutional/Administrative)
The inception date on each Fund Summary page is the inception date of the Fund’s oldest share class or classes. Unless otherwise indicated, the noted Institutional or Administrative share class is one of the Fund’s oldest share classes. The oldest share class for the following Funds is the C shares, and the Institutional and Administrative shares
were first offered in the month/year indicated in parentheses after each Fund name: AllianzGI NFJ Mid-Cap Value (4/88) and AllianzGI Focused Growth (3/99). The oldest share class for the AllianzGI Health Sciences Fund was the D share class, and the Institutional share class was first offered in 12/14. The oldest share class for the following Funds is the Institutional class and the Administrative shares were first offered in the month/year indicated in parentheses after each Fund name: AllianzGI NFJ International Value (5/10), AllianzGI NFJ Large-Cap Value (9/06), AllianzGI NFJ Small-Cap Value (11/95), AllianzGI Technology (3/05) and AllianzGI Mid-Cap (2/02).
Share Class (R6)
The inception date on each Fund Summary page is the inception date of the Fund’s oldest share class or classes. The oldest share class for the following funds is the Institutional class and Class R6 shares were first offered in the month/year indicated in parentheses after each Fund name: AllianzGI Emerging Markets Opportunities (12/15), AllianzGI NFJ Dividend Value (12/13), AllianzGI NFJ International Value (12/13), AllianzGI NFJ Small-Cap Value (12/13), AllianzGI NFJ Mid Cap Value (12/17) and AllianzGI Small-Cap (8/18). For AllianzGI Focused Growth, Class C is the oldest share class and Class R6 shares were first offered in 12/15.
Returns shown in the “Fund Summaries” section of this report measure performance from the inception of the oldest share class to the present; therefore some returns predate the inception of the noted share class. Those returns are calculated by adjusting the returns of the oldest share class to reflect the fees and expenses paid by the newer class. Total return performance assumes that all dividend and capital gain distributions were reinvested on the payable date.
The Lipper Averages are calculated by Lipper, Inc. (“Lipper”). They are based on the total return performance, with distributions reinvested and operating expenses deducted, of funds included by Lipper in the stated category. Lipper does not take into account sales charges.
The Average Annual Total Return charts for each Fund assume the initial investment was made on the first day of the Fund’s initial fiscal year. The charts reflect any sales load that would have applied at the time of purchase or any CDSC that would have applied if a full redemption occurred on the last business day of the most recent fiscal year. Results assume that all dividend and capital gain distributions were reinvested. They do not take into account the effect of taxes. The benchmark index cumulative return began on the last day of the month of the respective Fund’s inception date, unless otherwise noted.
“Cash & Equivalents — Net” in the Allocation Summaries may be comprised of cash, repurchase agreements, U.S. Treasury Bills, options purchased, options written and other assets net of other liabilities including net unrealized appreciation (depreciation) on futures contracts, forward foreign currency contracts and swap agreements, as applicable.
| | | | | | |
| 60 | | December 31, 2018 | | | Semiannual Report | | |
Proxy Voting
Allianz Global Investors U.S. LLC (the “Investment Adviser”) has adopted written proxy voting policies and procedures (the “Proxy Policy”) as required byRule 206(4)-6 under the Investment Advisers Act of 1940. The Proxy Policy has been adopted by the Trust as the policies and procedures that the Investment Adviser will use when voting proxies on behalf of the Funds. Copies of the written Proxy Policy, the factors that the Investment Adviser may consider in determining how to vote proxies for each Fund and information about how each Fund voted proxies relating to portfolio securities held during the most recent twelve-month period ended June 30, are provided without charge, upon request, by calling the Trust at 1-800-988-8380 (Class A, Class C and Class R) or1-800-498-5413 (Class P, Class R6, Institutional and Administrative classes), on the Allianz Global Investors website at us.allianzgi.com, and on the Securities and Exchange Commission (the “SEC”) Website at http://www.sec.gov.
Form N-Q
The Trust files complete schedules of each Fund’s portfolio holdings with the SEC on Form N-Q for the first and third quarters of the fiscal year; such filings are available on the SEC’s website at http://www.sec.gov. A copy of the Trust’s Form N-Q, when available, will be provided without charge, upon request, by calling1-800-988-8380 (Class A, Class C and Class R) or1-800-498-5413 (Class P, Class R6, Institutional and Administrative classes). Effective for periods ending from and after March 31, 2019, this information will no longer be filed on Form N-Q and instead will be filed on Form N-PORT.
The following disclosure provides important information regarding each Fund’s Shareholder Expense Example, which appears on each Fund Summary page in this Semiannual Report. Please refer to this information when reviewing the Shareholder Expense Example for a Fund.
Shareholder Expense Example
The Shareholder Expense Example is based on $1,000.00 invested at the beginning of and held for the entire period. Shareholders of the Funds incur two types of costs: (1) transaction costs; and (2) ongoing costs, including investment advisory and administration fees; distribution and/or service (12b-1) fees and other Fund expenses. The Shareholder Expense Example is intended to help you understand your ongoing costs (in dollars) of investing in each Fund and to compare these costs with the ongoing costs of investing in other mutual funds. The Shareholder Expense Example is based on $1,000.00 invested at the beginning and held for the entire period July 1, 2018 through December 31, 2018.
Actual Expenses
The information in the table under the heading “Actual Performance” provides information about actual account values and actual expenses. You may use the information in these columns, together with the amount you invested, to estimate the expenses that you paid over the period. Simply divide your account value by $1,000.00 (for
example, an $8,600.00 account value divided by $1,000.00 = 8.6), then multiply the result by the number in the appropriate column for your share class, in the row entitled “Expenses Paid During Period”, to estimate the expenses you paid on your account during this period.
Hypothetical Example for Comparison Purposes
The information in the table for “Hypothetical Performance (5% return before expenses)” provides information about hypothetical account values and hypothetical expenses based on the Fund’s actual expense ratio and an assumed rate of return of 5% per year before expenses, which is not the Fund’s actual return. The hypothetical account values and expenses may not be used to estimate the actual ending account balance or expenses you paid for the period. You may use this information to compare the ongoing costs of investing in the Fund and other funds. To do so, compare this 5% hypothetical example with the 5% hypothetical examples that appear in the shareholder reports of the other funds.
Please note that the expenses shown in the table are meant to highlight your ongoing costs only and do not reflect any transactional costs, such as sales charges. Therefore, the information under the heading “Hypothetical Performance (5% return before expenses)” is useful in comparing ongoing costs only, and will not help you determine the relative total costs of owning different funds. In addition, if these transactional costs were included, your costs may have been higher.
Expense ratios may vary from period to period because of various factors such as increases in expenses not covered by advisory and administration fees (for example, expenses of the trustees and their counsel or litigation expenses) and/or because of reductions in the administration fees resulting from the size of the fund.
Credit Ratings
Bond ratings apply to the underlying holdings of a Fund and not the Fund itself and are divided into categories ranging from highest to lowest credit quality, determined for purposes of presentations in this report by using ratings provided by S&P Global Ratings (“S&P”). Presentations of credit ratings information in this report use ratings provided by S&P for this purpose, among other reasons, because of the access to background information and other materials provided by S&P, as well as the Funds’ considerations of industry practice. Bonds not rated by S&P, or bonds that do not have a rating available from S&P, or bonds that had a rating withdrawn by S&P are designated as “NR” or “NA”, respectively. Credit quality ratings assigned by a rating agency are subjective opinions, not statements of fact, and are subject to change periodically, even as frequently as daily. Ratings assigned by S&P or another rating agency are not absolute standards of credit quality and do not evaluate market risk. Rating agencies may fail to make timely changes in credit ratings, and an issuer’s current financial condition may be better or worse than a rating indicates. In formulating investment decisions for the applicable Funds, the Investment Adviser develops its own analysis of the credit quality and risks associated with individual debt instruments, rather than relying exclusively on rating agencies or third-party research.
| | | | | | |
| | Semiannual Report | | | December 31, 2018 | | 61 |
Unaudited
Important Information (cont’d)
All of the information on the Fund Summary pages, including Fund Insights, Average Annual Total Return and Cumulative Returns charts, Shareholder Expense Examples and Allocation/Credit Ratings Summaries are unaudited.
Allianz Global Investors Distributors LLC, 1633 Broadway, New York, NY, 10019, us.allianzgi.com, 1-800-988-8380 (retail classes: A, C & R) or1-800-498-5413 (Class P, Class R6, Institutional and Administrative classes).
| | | | | | |
| 62 | | December 31, 2018 | | | Semiannual Report | | |
Unaudited
Benchmark Descriptions
Unless otherwise noted, index returns reflect the reinvestment of income dividends and capital gains, if any, but do not reflect fees, brokerage commissions or other expenses of investing. It is not possible to invest directly in an index.
Prior to November 1, 2006, performance data for the MSCI Indices was calculated gross of dividend tax withholding. Performance data presently shown for the Indices is net of dividend tax withholding. This recalculation results in lower performance for the Indices.
| | |
| Index | | Description |
| Bloomberg Barclays US Aggregate Bond Index | | The Bloomberg Barclays US Aggregate Bond Index represents securities that are SEC-registered, taxable, and US dollar denominated. The index covers the US investment grade fixed rate bond market, with index components for government and corporate securities, mortgage pass-through securities, and asset-backed securities. |
| |
| Bloomberg Barclays US Credit Index | | The Bloomberg Barclays US Credit Index is the credit component of the US Government/Credit Index. It includes publicly issued US corporate and specified foreign debentures and secured notes that meet the specified maturity, liquidity, and quality requirements. To qualify, bonds must be SEC-registered. |
| |
| Bloomberg Barclays US Government Bond Index | | The Bloomberg Barclays US Government Bond Index is the US Government component of the US Government/Credit Index. It includes US Dollar-denominated, fixed-rate, nominal US Treasuries and US agency debentures (securities issued by US government owned or government sponsored entities) and debt explicitly guaranteed by the US government. |
| |
| Bloomberg Barclays Global High Yield Index | | The Bloomberg Barclays Global High Yield Index is a multi-currency flagship measure of the global high yield debt market. The index represents the union of the US High Yield, the Pan-European High Yield and Emerging Markets (EM) Hard Currency High Yield Indices. |
| |
| ICE BofA Merrill Lynch All Convertibles Index | | The ICE BofA Merrill Lynch All Convertibles Index is a widely used, unmanaged index that measures the performance of US dollar-denominated convertible securities not currently in bankruptcy with a total market value greater than $50 million at issuance. |
| |
| ICE BofA Merrill Lynch US High Yield Master II Index | | The ICE BofA Merrill Lynch High Yield Master II Index is an unmanaged index consisting of US dollar denominated bonds that are issued in countries having a BBB3 or higher debt rating with at least one year remaining until maturity. All bonds must have a credit rating below investment grade but not in default. |
| |
| Chicago Board Options Exchange (CBOE) Volatility Index (VIX) | | The Chicago Board Options Exchange (CBOE) Volatility Index (VIX) is a key measure of market expectations of near-term volatility conveyed by S&P 500 stock index option prices. |
| |
| Custom Commodity Equity Benchmark | | The Custom Commodity Equity Benchmark represents the performance of a hypothetical index developed by the Adviser. This blended benchmark is comprised of four underlying indices in the following proportions: 25% DAX Global Agribusiness Index, 30% MSCI World Energy Index, 25% MSCI World Materials Index and 20% MSCI ACWI Industrials (equal-weighted) Index. The DAX Global Agribusiness Index replicates the performance of the largest and most liquid agribusiness companies. The MSCI World Energy Index is a component of the MSCI World Index and represents the energy securities defined by MSCI. The MSCI World Materials Index is a component of the MSCI World Index and represents the materials securities defined by MSCI. The MSCI ACWI Industrials (equal-weighted) Index is a component of the MSCI All Country World Index and represents the industrials securities defined by MSCI calculated equal-weighted. Performance data presently shown for MSCI and DAX Indexes is net of dividend tax withholding. It is not possible to invest directly in the blended benchmark or in the indices from which it is derived. |
| |
| MSCI All Country World ex-USA Index (Also known as MSCI ACWI ex-USA Index) | | The MSCI All Country World Index (ACWI) ex-USA Index captures large and mid cap representation across Developed Markets countries (excluding the US) and Emerging Markets countries. The index covers approximately 85% of the global equity opportunity set outside the US. |
| |
| MSCI EAFE Index | | The MSCI EAFE Index is an equity index which captures large and mid cap representation across the Developed Markets countries around the world, excluding the US and Canada. |
| | | | | | |
| | Semiannual Report | | | December 31, 2018 | | 63 |
Unaudited
Benchmark Descriptions (cont’d)
| | |
| Index | | Description |
| MSCI Emerging Markets Index | | The MSCI Emerging Markets Index captures large and mid cap representation across Emerging Markets countries. The index covers approximately 85% of the free float-adjusted market capitalization in each country. |
| |
| MSCI World Energy Index | | The MSCI World Energy Index is designed to capture the large and mid-cap segments across Developed Markets countries. All securities in the index are classified in the Energy sector as per the Global Industry Classification Standard. |
| |
| MSCI World Health Care Index | | The MSCI World Health Care Index is designed to capture the large and mid cap segments across Developed Markets countries. All securities in the index are classified in the Health Care sector as per the Global Industry Classification Standard. |
| |
| MSCI World Index | | The MSCI World Index captures large and mid cap representation across Developed Markets countries. The index covers approximately 85% of the free float-adjusted market capitalization in each country. |
| |
| MSCI World Materials Index | | The MSCI World Materials Index is designed to capture the large and mid cap segments across Developed Markets countries. All securities in the index are classified in the Materials sector as per the Global Industry Classification Standard. |
| |
| MSCI World Small-Cap Index | | The MSCI World Small-Cap Index captures small-cap representation across Developed Markets countries. The index covers approximately 14% of the free float-adjusted market capitalization in each country. |
| |
| NASDAQ Composite Index | | The NASDAQ Composite Index is an unmanaged market-value weighted index of all common stocks listed on the NASDAQ Stock Market. |
| |
| Russell 1000 Growth Index | | The Russell 1000 Growth Index is an unmanaged index that measures the performance of the large-cap growth segment of the US equity universe. It includes those Russell 1000 companies with higher price-to-book ratios and higher forecasted growth values. The Russell 1000 Index measures the performance of the 1,000 largest companies in the Russell 3000® Index, which consists of the 3,000 largest US companies based on total market capitalization. |
| |
| Russell 1000 Index | | The Russell 1000 Index is an unmanaged index that consists of the 1,000 largest companies in the Russell 3000 Index and represents approximately 90% of the total market capitalization of the Russell 3000 Index. It is highly correlated with the S&P 500 Index. |
| |
| Russell 1000 Value Index | | The Russell 1000 Value Index is an unmanaged index that measures the performance of the large-cap value segment of the US equity universe. It includes those Russell 1000 companies with lower price-to-book ratios and lower expected growth values. |
| |
| Russell 2000 Index | | The Russell 2000 Index measures the performance of the small-cap segment of the US equity universe. The Russell 2000 is a subset of the Russell 3000 Index representing approximately 10% of the total market capitalization of that index. It includes approximately 2000 of the smallest securities based on a combination of their market cap and current index membership. |
| |
| Russell 2000 Value Index | | The Russell 2000 Value Index is an unmanaged index that measures the performance of the small-cap value segment of the US equity universe. It includes those Russell 2000 Index companies with lower price-to-book ratios and lower forecasted growth values. |
| |
| Russell Midcap Growth Index | | The Russell Midcap Growth Index is an unmanaged index that measures the performance of the mid-cap growth segment of the US equity universe. It includes those Russell Midcap Index companies with higher price-to-book ratios and higher forecasted growth values. |
| |
| Russell Midcap Index | | The Russell Midcap Index is an unmanaged index that measures the performance of the mid-cap segment of the U.S. equity universe. The Russell Midcap Index is a subset of the Russell 1000 Index. It includes approximately 800 of the smallest securities based on a combination of their market cap and current index membership. |
| |
| Russell Midcap Value Index | | The Russell Midcap Value Index is an unmanaged index that measures the performance of the mid-cap value segment of the US equity universe represented by stocks in the largest 200 by market cap that exhibit value characteristics. It includes Russell Midcap companies with lower price-to-book ratios and lower forecasted growth values. |
| |
| Russell Top 200 Value Index | | The Russell Top 200 Value Index is an unmanaged index that measures the performance of the especially large-cap segment of the US equity universe. It includes those Russell Top 200 Index companies with lower price-to-book ratios and lower forecasted growth values. |
| |
| S&P 500 Index | | The S&P 500 Index is an unmanaged index of large capitalization common stocks. |
| |
| S&P North American Technology Sector Index | | The S&P North American Technology Sector Index is a modified capitalization-weighted index of selected technology and internet-related stocks. |
| | | | | | |
| 64 | | December 31, 2018 | | | Semiannual Report | | |
Schedule of Investments
December 31, 2018 (unaudited)
AllianzGI Emerging Markets
Opportunities Fund
| | | | | | | | |
| | | Shares | | | Value | |
|
| Common Stock—91.7% | |
| | |
| Brazil—1.6% | | | | | | | | |
Cia de Saneamento Basico do Estado de Sao Paulo ADR | | | 172,700 | | | | $1,393,689 | |
IRB Brasil Resseguros S.A. | | | 52,900 | | | | 1,139,143 | |
Porto Seguro S.A. | | | 175,576 | | | | 2,363,810 | |
| | | | | | | | |
| | | | | | | 4,896,642 | |
| | | | | | | | |
| | |
| China—29.9% | | | | | | | | |
Alibaba Group Holding Ltd. ADR (e) | | | 67,700 | | | | 9,279,639 | |
Anhui Conch Cement Co., Ltd., Class H | | | 1,416,000 | | | | 6,847,452 | |
China Merchants Bank Co., Ltd., Class H | | | 3,125,500 | | | | 11,413,676 | |
China Petroleum & Chemical Corp., Class H | | | 2,296,000 | | | | 1,636,610 | |
China Shenhua Energy Co., Ltd., Class H | | | 2,084,500 | | | | 4,546,180 | |
China Tower Corp. Ltd.,
Class H (a)(e) | | | 12,340,000 | | | | 2,333,509 | |
China Vanke Co., Ltd., Class H | | | 1,240,000 | | | | 4,199,429 | |
CNOOC Ltd. | | | 2,501,000 | | | | 3,852,347 | |
Guangzhou Baiyunshan Pharmaceutical Holdings Co., Ltd., Class H | | | 272,000 | | | | 973,602 | |
Hengan International Group Co., Ltd. | | | 341,500 | | | | 2,479,416 | |
Industrial & Commercial Bank of China Ltd., Class H | | | 4,836,000 | | | | 3,439,651 | |
Lenovo Group Ltd. | | | 12,972,000 | | | | 8,763,067 | |
Maanshan Iron & Steel Co., Ltd., Class H | | | 4,718,000 | | | | 2,081,500 | |
Ping An Insurance Group Co. of China Ltd., Class H | | | 551,500 | | | | 4,865,341 | |
Tencent Holdings Ltd. | | | 579,600 | | | | 23,230,555 | |
Weichai Power Co., Ltd., Class H | | | 4,117,000 | | | | 4,713,381 | |
| | | | | | | | |
| | | | | | | 94,655,355 | |
| | | | | | | | |
| | |
| Hong Kong—3.4% | | | | | | | | |
CK Asset Holdings Ltd. | | | 403,500 | | | | 2,952,238 | |
Hang Seng Bank Ltd. | | | 166,700 | | | | 3,734,286 | |
Link REIT | | | 388,000 | | | | 3,933,436 | |
| | | | | | | | |
| | | | | | | 10,619,960 | |
| | | | | | | | |
| | |
| India—13.0% | | | | | | | | |
GAIL India Ltd. (e) | | | 381,402 | | | | 1,961,408 | |
HDFC Bank Ltd. ADR | | | 40,800 | | | | 4,226,472 | |
Hindustan Unilever Ltd. | | | 359,460 | | | | 9,357,255 | |
Infosys Ltd. | | | 837,202 | | | | 7,917,957 | |
Jubilant Foodworks Ltd. | | | 219,526 | | | | 3,939,630 | |
Tata Consultancy Services Ltd. | | | 328,431 | | | | 8,913,356 | |
Tech Mahindra Ltd. (e) | | | 459,774 | | | | 4,751,889 | |
| | | | | | | | |
| | | | | | | 41,067,967 | |
| | | | | | | | |
| | |
| Indonesia—1.5% | | | | | | | | |
Bank Central Asia Tbk PT | | | 2,568,100 | | | | 4,644,276 | |
| | | | | | | | |
| |
| Korea (Republic of)—12.4% | | | | | |
KB Financial Group, Inc. (e) | | | 113,316 | | | | 4,727,182 | |
LG Uplus Corp. | | | 433,102 | | | | 6,844,824 | |
Lotte Chemical Corp. | | | 12,671 | | | | 3,150,416 | |
POSCO | | | 39,136 | | | | 8,560,279 | |
| | | | | | | | |
| | | Shares | | | Value | |
Samsung Electronics Co., Ltd. | | | 352,168 | | | $ | 12,259,562 | |
SK Hynix, Inc. (e) | | | 67,783 | | | | 3,695,290 | |
| | | | | | | | |
| | | | | | | 39,237,553 | |
| | | | | | | | |
| | |
| Malaysia—1.8% | | | | | | | | |
Public Bank Bhd. | | | 958,000 | | | | 5,735,306 | |
| | | | | | | | |
| | |
| Mexico—1.4% | | | | | | | | |
Grupo Financiero Banorte S.A.B de C.V., Class O | | | 924,300 | | | | 4,511,970 | |
| | | | | | | | |
| | |
| Peru—3.8% | | | | | | | | |
Credicorp Ltd. | | | 54,796 | | | | 12,146,629 | |
| | | | | | | | |
| |
| Russian Federation—5.7% | | | | | |
Alrosa PJSC (c)(d)(e) | | | 1,880,400 | | | | 2,673,064 | |
LUKOIL PJSC ADR | | | 216,712 | | | | 15,460,234 | |
| | | | | | | | |
| | |
| | | | | | | 18,133,298 | |
| | | | | | | | |
|
| South Africa—1.4% | |
Exxaro Resources Ltd. | | | 133,117 | | | | 1,284,144 | |
Sasol Ltd. | | | 104,634 | | | | 3,109,356 | |
| | | | | | | | |
| | |
| | | | | | | 4,393,500 | |
| | | | | | | | |
| | |
| Taiwan—8.9% | | | | | | | | |
Cathay Financial Holding Co., Ltd. | | | 4,469,000 | | | | 6,841,278 | |
Chlitina Holding Ltd. | | | 228,000 | | | | 1,908,346 | |
CTBC Financial Holding Co., Ltd. | | | 1,223,000 | | | | 804,408 | |
Formosa Chemicals & Fibre Corp. | | | 1,816,000 | | | | 6,212,612 | |
Radiant Opto-Electronics Corp. | | | 588,000 | | | | 1,623,552 | |
Taiwan Cement Corp. | | | 1,541,000 | | | | 1,778,640 | |
Taiwan Semiconductor Manufacturing Co., Ltd. | | | 1,040,000 | | | | 7,551,678 | |
Uni-President Enterprises Corp. | | | 561,000 | | | | 1,272,717 | |
| | | | | | | | |
| | | | | | | 27,993,231 | |
| | | | | | | | |
| | |
| Thailand—1.4% | | | | | | | | |
Krung Thai Bank PCL (c)(d) | | | 3,006,100 | | | | 1,773,644 | |
Land & Houses PCL (c)(d) | | | 4,252,700 | | | | 1,294,686 | |
PTT Exploration & Production
PCL (c)(d) | | | 423,600 | | | | 1,470,050 | |
| | | | | | | | |
| | |
| | | | | | | 4,538,380 | |
| | | | | | | | |
| | |
| Turkey—3.4% | | | | | | | | |
Eregli Demir ve Celik Fabrikalari TAS | | | 816,727 | | | | 1,110,398 | |
Petkim Petrokimya Holding AS | | | 2,002,296 | | | | 1,902,758 | |
Turk Hava Yollari AO (e) | | | 2,587,859 | | | | 7,853,968 | |
| | | | | | | | |
| | | | | | | 10,867,124 | |
| | | | | | | | |
| |
| United Kingdom—1.0% | | | | | |
Mondi PLC | | | 146,644 | | | | 3,054,261 | |
| | | | | | | | |
| |
| United States—1.1% | | | | | |
AutoZone, Inc. (e) | | | 4,000 | | | | 3,353,360 | |
| | | | | | | | |
Total Common Stock
(cost—$298,974,105) | | | | 289,848,812 | |
| | | | | | | | |
| | | | | | | | |
|
| Preferred Stock—5.9% | |
| | |
| Brazil—4.5% | | | | | | | | |
Banco Bradesco S.A. | | | 486,500 | | | | 4,842,948 | |
Banco do Estado do Rio Grande do Sul S.A., Class B | | | 251,700 | | | | 1,439,885 | |
| | | | | | | | |
| | | Shares | | | Value | |
Cia Paranaense de Energia (e) | | | 368,000 | | | $ | 2,895,934 | |
Itau Unibanco Holding S.A. | | | 531,600 | | | | 4,865,270 | |
| | | | | | | | |
| | | | | | | 14,044,037 | |
| | | | | | | | |
| |
| Russian Federation—1.4% | | | | | |
Surgutneftegas PJSC (c)(d) | | | 7,848,124 | | | | 4,473,431 | |
| | | | | | | | |
Total Preferred Stock
(cost—$17,666,086) | | | | 18,517,468 | |
| | | | | | | | |
| | | | | | | | |
| | |
| | | Principal
Amount
(000s) | | | | |
|
| Repurchase Agreements—1.6% | |
State Street Bank and Trust Co., dated 12/31/18, 0.50%, due 1/2/19, proceeds $5,055,140; collateralized by U.S. Treasury Inflation Indexed Notes, 0.125%, due 7/15/26, valued at $5,157,124 including accrued interest | |
(cost—$5,055,000) | | | $5,055 | | | | 5,055,000 | |
| | | | | | | | |
| |
Total Investments
(cost—$321,695,191)—99.2% | | | | 313,421,280 | |
| | | | | | | | |
| | |
| Other assets less liabilities—0.8% | | | | | | | 2,637,498 | |
| | | | | | | | |
| |
| Net Assets—100.0% | | | | $316,058,778 | |
| | | | | | | | |
Notes to Schedule of Investments:
(a) 144A—Exempt from registration under Rule 144A of the Securities Act of 1933. These securities may be resold in transactions exempt from registration, typically only to qualified institutional buyers. Security with a value of $2,333,509, representing 0.7% of net assets.
(b) Securities with an aggregate value of $245,170,269, representing 77.6% of net assets, were valued utilizing modeling tools provided by a third-party vendor. See Note 1(a) and Note 1(b) in the Notes to Financial Statements.
(c) Fair-Valued—Securities with an aggregate value of $11,684,875, representing 3.7% of net assets. See Note 1(a) and Note 1(b) in the Notes to Financial Statements.
(d) Level 3 security. See Note 1(a) and Note 1(b) in the Notes to Financial Statements.
(e) Non-income producing.
Glossary:
ADR—American Depositary Receipt
REIT—Real Estate Investment Trust
| | | | | | | | |
| See accompanying Notes to Financial Statements | | | December 31, 2018 | | | Semiannual Report | | | 65 | |
Schedule of Investments
December 31, 2018 (unaudited)
The industry classification of portfolio holdings and other assets less liabilities shown as a percentage of net assets were as follows:
| | | | |
Banks | | | 21.6% | |
Oil, Gas & Consumable Fuels | | | 10.4% | |
Interactive Media & Services | | | 7.4% | |
IT Services | | | 6.8% | |
Technology Hardware, Storage & Peripherals | | | 6.7% | |
Insurance | | | 4.8% | |
Metals & Mining | | | 4.6% | |
Chemicals | | | 4.5% | |
Semiconductors & Semiconductor Equipment | | | 4.1% | |
Household Products | | | 3.0% | |
Internet & Direct Marketing Retail | | | 2.9% | |
Diversified Telecommunication Services | | | 2.9% | |
Construction Materials | | | 2.7% | |
Real Estate Management & Development | | | 2.7% | |
Airlines | | | 2.5% | |
Machinery | | | 1.5% | |
Personal Products | | | 1.4% | |
Hotels, Restaurants & Leisure | | | 1.2% | |
Equity Real Estate Investment Trusts (REITs) | | | 1.2% | |
Specialty Retail | | | 1.1% | |
Paper & Forest Products | | | 1.0% | |
Electric Utilities | | | 0.9% | |
Gas Utilities | | | 0.6% | |
Water Utilities | | | 0.4% | |
Food Products | | | 0.4% | |
Pharmaceuticals | | | 0.3% | |
Repurchase Agreements | | | 1.6% | |
Other assets less liabilities | | | 0.8% | |
| | | | |
| | | 100.0% | |
| | | | |
AllianzGI Focused Growth Fund
| | | | | | | | |
| | | Shares | | | Value | |
|
| Common Stock—99.6% | |
| |
| Aerospace & Defense—3.3% | | | | | |
Lockheed Martin Corp. | | | 115,052 | | | | $30,125,216 | |
| | | | | | | | |
| | |
| Banks—1.9% | | | | | | | | |
SVB Financial Group (a) | | | 88,895 | | | | 16,882,938 | |
| | | | | | | | |
|
| Beverages—1.6% | |
Constellation Brands, Inc., Class A | | | 91,943 | | | | 14,786,273 | |
| | | | | | | | |
|
| Biotechnology—2.7% | |
Heron Therapeutics, Inc. (a) | | | 372,660 | | | | 9,666,800 | |
Vertex Pharmaceuticals, Inc. (a) | | | 90,780 | | | | 15,043,154 | |
| | | | | | | | |
| | | | | | | 24,709,954 | |
| | | | | | | | |
|
| Capital Markets—2.3% | |
Cboe Global Markets, Inc. | | | 95,080 | | | | 9,301,677 | |
MSCI, Inc. | | | 75,645 | | | | 11,152,342 | |
| | | | | | | | |
| | | | | | | 20,454,019 | |
| | | | | | | | |
|
| Chemicals—1.4% | |
DowDuPont, Inc. | | | 239,575 | | | | 12,812,471 | |
| | | | | | | | |
|
| Communications Equipment—1.1% | |
Arista Networks, Inc. (a) | | | 46,000 | | | | 9,692,200 | |
| | | | | | | | |
|
| Construction Materials—1.2% | |
Vulcan Materials Co. | | | 113,595 | | | | 11,223,186 | |
| | | | | | | | |
|
| Electrical Equipment—0.2% | |
Bloom Energy Corp., Class A (a) | | | 212,895 | | | | 2,124,692 | |
| | | | | | | | |
|
| Healthcare Equipment & Supplies—1.7% | |
Boston Scientific Corp. (a) | | | 424,860 | | | | 15,014,552 | |
| | | | | | | | |
|
| Healthcare Providers & Services—11.7% | |
Anthem, Inc. | | | 120,515 | | | | 31,650,854 | |
CVS Health Corp. | | | 451,090 | | | | 29,555,417 | |
UnitedHealth Group, Inc. | | | 182,190 | | | | 45,387,173 | |
| | | | | | | | |
| | | | | | | 106,593,444 | |
| | | | | | | | |
|
| Interactive Media & Services—7.0% | |
Alphabet, Inc., Class A (a) | | | 24,534 | | | | 25,637,049 | |
Facebook, Inc., Class A (a) | | | 132,590 | | | | 17,381,223 | |
Tencent Holdings Ltd. ADR | | | 515,655 | | | | 20,352,903 | |
| | | | | | | | |
| | | | | | | 63,371,175 | |
| | | | | | | | |
|
| Internet & Direct Marketing Retail—7.2% | |
Amazon.com, Inc. (a) | | | 43,432 | | | | 65,233,561 | |
| | | | | | | | |
|
| IT Services—13.5% | |
Mastercard, Inc., Class A | | | 137,200 | | | | 25,882,780 | |
PayPal Holdings, Inc. (a) | | | 360,155 | | | | 30,285,434 | |
Square, Inc. Class A (a) | | | 336,050 | | | | 18,849,044 | |
Visa, Inc., Class A | | | 358,885 | | | | 47,351,287 | |
| | | | | | | | |
| | | | | | | 122,368,545 | |
| | | | | | | | |
|
| Life Sciences Tools & Services—2.4% | |
Agilent Technologies, Inc. | | | 318,415 | | | | 21,480,276 | |
| | | | | | | | |
|
| Machinery—2.5% | |
Fortive Corp. | | | 333,410 | | | | 22,558,521 | |
| | | | | | | | |
|
| Oil, Gas & Consumable Fuels—1.2% | |
EOG Resources, Inc. | | | 127,630 | | | | 11,130,612 | |
| | | | | | | | |
|
| Personal Products—1.3% | |
Estee Lauder Cos., Inc., Class A | | | 90,720 | | | | 11,802,672 | |
| | | | | | | | |
|
| Pharmaceuticals—2.2% | |
Zoetis, Inc. | | | 237,435 | | | | 20,310,190 | |
| | | | | | | | |
|
| Road & Rail—3.6% | |
Union Pacific Corp. | | | 238,165 | | | | 32,921,548 | |
| | | | | | | | |
| | | | | | | | |
| | | Shares | | | Value | |
|
| Semiconductors & Semiconductor Equipment—1.6% | |
NVIDIA Corp. | | | 106,465 | | | $ | 14,213,078 | |
| | | | | | | | |
| | |
| Software—13.5% | | | | | | | | |
Microsoft Corp. | | | 503,200 | | | | 51,110,024 | |
Salesforce.com, Inc. (a) | | | 313,880 | | | | 42,992,144 | |
ServiceNow, Inc. (a) | | | 157,985 | | | | 28,129,229 | |
| | | | | | | | |
| | | | | | | 122,231,397 | |
| | | | | | | | |
| | |
| Specialty Retail—7.6% | | | | | | | | |
Burlington Stores, Inc. (a) | | | 214,420 | | | | 34,879,701 | |
Floor & Decor Holdings, Inc., Class A (a) | | | 102,315 | | | | 2,649,959 | |
Home Depot, Inc. | | | 183,878 | | | | 31,593,918 | |
| | | | | | | | |
| | | | | | | 69,123,578 | |
| | | | | | | | |
|
| Technology Hardware, Storage & Peripherals—5.2% | |
Apple, Inc. | | | 297,565 | | | | 46,937,903 | |
| | | | | | | | |
|
| Trading Companies & Distributors—1.7% | |
United Rentals, Inc. (a) | | | 147,115 | | | | 15,083,701 | |
| | | | | | | | |
Total Common Stock
(cost—$649,125,640) | | | | 903,185,702 | |
| | | | | | | | |
| | | | | | | | |
| | |
| | | Principal
Amount
(000s) | | | | |
|
| Repurchase Agreements—0.7% | |
State Street Bank and Trust Co., dated 12/31/18, 0.50%, due 1/2/19, proceeds $6,043,168; collateralized by U.S. Treasury Inflation Indexed Notes, 0.125%, due 7/15/26, valued at $6,165,804 including accrued interest | |
(cost—$6,043,000) | | | $6,043 | | | | 6,043,000 | |
| | | | | | | | |
| |
Total Investments
(cost—$655,168,640)—100.3% | | | | 909,228,702 | |
| | | | | | | | |
| | |
| Liabilities in excess of other assets—(0.3)% | | | | | | | (2,413,377 | ) |
| | | | | | | | |
| | |
| Net Assets—100.0% | | | | | | | $906,815,325 | |
| | | | | | | | |
Notes to Schedule of Investments:
(a) Non-income producing.
Glossary:
ADR—American Depositary Receipt
MSCI—Morgan Stanley Capital International
| | | | | | |
| 66 | | Semiannual Report | | | December 31, 2018 | | | See accompanying Notes to Financial Statements |
Schedule of Investments
December 31, 2018 (unaudited)
AllianzGI Global Natural Resources Fund
| | | | | | | | |
| | | Shares | | | Value | |
|
| Common Stock—98.4% | |
| | |
| Australia—6.1% | | | | | | | | |
BHP Group Ltd. | | | 25,569 | | | | $618,029 | |
South32 Ltd. | | | 71,874 | | | | 170,975 | |
| | | | | | | | |
| | | | | | | 789,004 | |
| | | | | | | | |
| | |
| Canada—6.4% | | | | | | | | |
Enbridge, Inc. | | | 9,009 | | | | 279,865 | |
Nutrien Ltd. | | | 4,207 | | | | 197,592 | |
Suncor Energy, Inc. | | | 10,421 | | | | 291,059 | |
Teck Resources Ltd., Class B | | | 3,135 | | | | 67,490 | |
| | | | | | | | |
| | | | | | | 836,006 | |
| | | | | | | | |
| | |
| Denmark—0.9% | | | | | | | | |
Vestas Wind Systems A/S | | | 1,456 | | | | 110,217 | |
| | | | | | | | |
| | |
| France—6.3% | | | | | | | | |
Air Liquide S.A. | | | 2,380 | | | | 295,538 | |
Total S.A. | | | 9,997 | | | | 527,293 | |
| | | | | | | | |
| | | | | | | 822,831 | |
| | | | | | | | |
| | |
| Germany—1.1% | | | | | | | | |
HeidelbergCement AG | | | 2,235 | | | | 137,000 | |
| | | | | | | | |
| | |
| Japan—0.8% | | | | | | | | |
Shin-Etsu Chemical Co., Ltd. | | | 1,400 | | | | 107,566 | |
| | | | | | | | |
| | |
| United Kingdom—15.7% | | | | | | | | |
BP PLC | | | 84,322 | | | | 533,057 | |
Rio Tinto PLC | | | 10,354 | | | | 495,878 | |
Royal Dutch Shell PLC, Class A | | | 18,784 | | | | 552,866 | |
Royal Dutch Shell PLC, Class B | | | 15,035 | | | | 449,509 | |
| | | | | | | | |
| | | | | | | 2,031,310 | |
| | | | | | | | |
| | |
| United States—61.1% | | | | | | | | |
Air Products & Chemicals, Inc. | | | 1,970 | | | | 315,298 | |
Albemarle Corp. | | | 1,295 | | | | 99,806 | |
Anadarko Petroleum Corp. | | | 1,935 | | | | 84,830 | |
Berry Global Group, Inc. (c) | | | 4,525 | | | | 215,073 | |
Cabot Oil & Gas Corp. | | | 5,265 | | | | 117,673 | |
CF Industries Holdings, Inc. | | | 2,560 | | | | 111,386 | |
Chevron Corp. | | | 7,560 | | | | 822,452 | |
Concho Resources, Inc. (b)(c) | | | 1,890 | | | | 194,273 | |
ConocoPhillips | | | 6,875 | | | | 428,656 | |
Continental Resources, Inc. (c) | | | 3,175 | | | | 127,603 | |
Diamondback Energy, Inc. | | | 1,875 | | | | 173,813 | |
DowDuPont, Inc. | | | 5,110 | | | | 273,283 | |
Ecolab, Inc. (b) | | | 2,175 | | | | 320,486 | |
EOG Resources, Inc. | | | 4,280 | | | | 373,259 | |
Exxon Mobil Corp. | | | 12,620 | | | | 860,558 | |
FMC Corp. | | | 2,190 | | | | 161,972 | |
HollyFrontier Corp. | | | 1,260 | | | | 64,411 | |
Kansas City Southern | | | 1,830 | | | | 174,674 | |
Kinder Morgan, Inc. | | | 17,355 | | | | 266,920 | |
Linde PLC | | | 2,650 | | | | 413,506 | |
Marathon Oil Corp. | | | 16,205 | | | | 232,380 | |
Marathon Petroleum Corp. | | | 3,780 | | | | 223,058 | |
Mosaic Co. | | | 3,125 | | | | 91,281 | |
Occidental Petroleum Corp. | | | 6,135 | | | | 376,566 | |
Parsley Energy, Inc., Class A (c) | | | 3,010 | | | | 48,100 | |
Phillips 66 | | | 2,120 | | | | 182,638 | |
Pioneer Natural Resources Co. | | | 1,243 | | | | 163,479 | |
Sherwin-Williams Co. | | | 560 | | | | 220,338 | |
SM Energy Co. | | | 3,745 | | | | 57,973 | |
Union Pacific Corp. | | | 1,820 | | | | 251,579 | |
Valero Energy Corp. | | | 2,185 | | | | 163,809 | |
Williams Cos., Inc. | | | 11,825 | | | | 260,741 | |
WPX Energy, Inc. (c) | | | 5,500 | | | | 62,425 | |
| | | | | | | | |
| | | | | | | 7,934,299 | |
| | | | | | | | |
Total Common Stock
(cost—$13,603,376) | | | | 12,768,233 | |
| | | | | | | | |
| | | | | | | | |
| | | Shares | | | Value | |
|
| Exchange-Traded Funds—1.7% | |
VanEck Vectors Gold Miners (cost—$211,170) | | | 10,580 | | | $ | 223,132 | |
| | | | | | | | |
| | | | | | | | |
| | |
| | | Principal
Amount
(000s) | | | | |
|
| Repurchase Agreements—0.8% | |
State Street Bank and Trust Co., dated 12/31/18, 0.50%, due 1/2/19, proceeds $110,003; collateralized by U.S. Treasury Inflation Indexed Notes, 0.125%, due 7/15/26, valued at $113,724 including accrued interest | |
(cost—$110,000) | | | $110 | | | | 110,000 | |
| | | | | | | | |
| |
Total Investments
(cost—$13,924,546) (a)—100.9% | | | | 13,101,365 | |
| | | | | | | | |
| | |
| Liabilities in excess of other assets—(0.9)% | | | | | | | (111,613 | ) |
| | | | | | | | |
| | |
| Net Assets—100.0% | | | | | | | $12,989,752 | |
| | | | | | | | |
Notes to Schedule of Investments:
(a) Securities with an aggregate value of $3,997,928, representing 30.8% of net assets, were valued utilizing modeling tools provided by a third-party vendor. See Note 1(a) and Note 1(b) in the Notes to Financial Statements.
(b) All or partial amount segregated for the benefit of the counterparty as collateral for options written. There were no open options written at December 31, 2018, however the Fund had securities segregated as collateral for any transactions in the future.
(c) Non-income producing.
The industry classification of portfolio holdings and liabilities in excess of other assets shown as a percentage of net assets were as follows:
| | | | |
Oil, Gas & Consumable Fuels | | | 61.0% | |
Chemicals | | | 20.1% | |
Metals & Mining | | | 10.4% | |
Road & Rail | | | 3.3% | |
Exchange-Traded Funds | | | 1.7% | |
Containers & Packaging | | | 1.7% | |
Construction Materials | | | 1.1% | |
Electrical Equipment | | | 0.8% | |
Repurchase Agreements | | | 0.8% | |
Liabilities in excess of other assets | | | (0.9)% | |
| | | | |
| | | 100.0% | |
| | | | |
AllianzGI Global Small-Cap Fund
| | | | | | | | |
| | | Shares | | | Value | |
|
| Common Stock—98.2% | |
| | |
| Australia—2.2% | | | | | | | | |
ALS Ltd. | | | 59,715 | | | | $285,315 | |
Beach Energy Ltd. | | | 241,166 | | | | 227,856 | |
Boral Ltd. | | | 125,634 | | | | 437,208 | |
Challenger Ltd. | | | 49,177 | | | | 328,779 | |
Downer EDI Ltd. | | | 105,257 | | | | 501,384 | |
Eclipx Group Ltd. | | | 190,420 | | | | 326,296 | |
GUD Holdings Ltd. | | | 43,330 | | | | 343,307 | |
Santos Ltd. | | | 71,443 | | | | 275,529 | |
WorleyParsons Ltd. | | | 15,900 | | | | 127,707 | |
| | | | | | | | |
| | | | | | | 2,853,381 | |
| | | | | | | | |
| | |
| Austria—2.2% | | | | | | | | |
ANDRITZ AG | | | 16,137 | | | | 741,109 | |
Schoeller-Bleckmann Oilfield Equipment AG | | | 8,213 | | | | 538,903 | |
UNIQA Insurance Group AG | | | 92,017 | | | | 828,794 | |
Wienerberger AG | | | 38,109 | | | | 786,442 | |
| | | | | | | | |
| | | | | | | 2,895,248 | |
| | | | | | | | |
| | |
| China—0.4% | | | | | | | | |
China Everbright Greentech Ltd. (a) | | | 438,488 | | | | 311,847 | |
Zhejiang Dingli Machinery Co., Ltd., Class A | | | 24,874 | | | | 204,365 | |
| | | | | | | | |
| | | | | | | 516,212 | |
| | | | | | | | |
| | |
| Denmark—2.4% | | | | | | | | |
Ambu A/S, Class B | | | 29,910 | | | | 722,549 | |
FLSmidth & Co. A/S | | | 15,502 | | | | 699,214 | |
ISS A/S | | | 25,758 | | | | 721,141 | |
SimCorp A/S | | | 15,364 | | | | 1,053,682 | |
| | | | | | | | |
| | | | | | | 3,196,586 | |
| | | | | | | | |
| | |
| Finland—0.3% | | | | | | | | |
Huhtamaki Oyj | | | 12,727 | | | | 393,817 | |
| | | | | | | | |
| | |
| France—2.4% | | | | | | | | |
Ingenico Group S.A. | | | 12,021 | | | | 681,920 | |
Korian S.A. | | | 25,218 | | | | 897,522 | |
Nexity S.A. | | | 18,006 | | | | 812,951 | |
Sartorius Stedim Biotech | | | 8,111 | | | | 812,068 | |
| | | | | | | | |
| | | | | | | 3,204,461 | |
| | | | | | | | |
| | |
| Germany—3.6% | | | | | | | | |
Aareal Bank AG | | | 27,382 | | | | 845,476 | |
alstria office REIT-AG REIT | | | 63,769 | | | | 892,812 | |
Bechtle AG | | | 10,651 | | | | 829,658 | |
CANCOM SE | | | 22,033 | | | | 723,108 | |
Hella GmbH & Co. KGaA | | | 17,356 | | | | 695,110 | |
TLG Immobilien AG | | | 28,632 | | | | 792,123 | |
| | | | | | | | |
| | | | | | | 4,778,287 | |
| | | | | | | | |
| | |
| Hong Kong—0.7% | | | | | | | | |
Johnson Electric Holdings Ltd. | | | 173,000 | | | | 352,870 | |
Techtronic Industries Co., Ltd. | | | 74,500 | | | | 395,346 | |
VTech Holdings Ltd. | | | 20,300 | | | | 168,375 | |
| | | | | | | | |
| | | | | | | 916,591 | |
| | | | | | | | |
| | |
| Indonesia—0.3% | | | | | | | | |
Jasa Marga Persero Tbk PT | | | 1,194,500 | | | | 355,810 | |
| | | | | | | | |
| | |
| Italy—1.2% | | | | | | | | |
Buzzi Unicem SpA | | | 44,768 | | | | 772,169 | |
De’ Longhi SpA | | | 30,785 | | | | 779,877 | |
| | | | | | | | |
| | | | | | | 1,552,046 | |
| | | | | | | | |
| | |
| Japan—13.1% | | | | | | | | |
Aozora Bank Ltd. | | | 23,800 | | | | 709,356 | |
COMSYS Holdings Corp. | | | 58,300 | | | | 1,422,771 | |
| | | | | | | | |
| See accompanying Notes to Financial Statements | | | December 31, 2018 | | | Semiannual Report | | | 67 | |
Schedule of Investments
December 31, 2018 (unaudited)
| | | | | | | | |
| | | Shares | | | Value | |
Hitachi Transport System Ltd. | | | 54,700 | | | $ | 1,554,829 | |
Ichigo, Inc. | | | 107,600 | | | | 311,766 | |
IHI Corp. | | | 8,900 | | | | 245,121 | |
Itochu Techno-Solutions Corp. | | | 64,300 | | | | 1,245,139 | |
KH Neochem Co., Ltd. | | | 14,400 | | | | 302,910 | |
Kobe Bussan Co., Ltd. | | | 21,900 | | | | 645,101 | |
Link And Motivation, Inc. | | | 22,800 | | | | 174,955 | |
Lion Corp. | | | 47,700 | | | | 985,840 | |
Maruwa Co., Ltd. | | | 10,800 | | | | 552,321 | |
Mitsubishi UFJ Lease & Finance Co., Ltd. | | | 204,800 | | | | 981,611 | |
Miura Co., Ltd. | | | 16,600 | | | | 377,059 | |
Nichirei Corp. | | | 13,300 | | | | 364,020 | |
Nippon Shinyaku Co., Ltd. | | | 11,200 | | | | 709,872 | |
Oji Holdings Corp. | | | 51,200 | | | | 261,603 | |
Okamura Corp. | | | 118,900 | | | | 1,534,453 | |
OSAKA Titanium Technologies Co., Ltd. | | | 20,100 | | | | 305,875 | |
Pigeon Corp. | | | 9,200 | | | | 392,405 | |
Rengo Co., Ltd. | | | 203,100 | | | | 1,602,436 | |
Rohto Pharmaceutical Co., Ltd. | | | 36,900 | | | | 1,007,192 | |
Sanyo Special Steel Co., Ltd. | | | 18,700 | | | | 394,878 | |
Sojitz Corp. | | | 161,000 | | | | 557,494 | |
Ube Industries Ltd. | | | 33,800 | | | | 683,549 | |
| | | | | | | | |
| | | | | | | 17,322,556 | |
| | | | | | | | |
|
| Korea (Republic of)—0.3% | |
DB Insurance Co., Ltd. | | | 5,512 | | | | 347,143 | |
| | | | | | | | |
| | |
| Netherlands—0.6% | | | | | | | | |
ASR Nederland NV | | | 21,538 | | | | 852,236 | |
| | | | | | | | |
| | |
| Norway—1.1% | | | | | | | | |
Elkem ASA (a)(c) | | | 261,706 | | | | 670,791 | |
Storebrand ASA | | | 110,104 | | | | 785,462 | |
| | | | | | | | |
| | | | | | | 1,456,253 | |
| | | | | | | | |
| | |
| Singapore—0.3% | | | | | | | | |
Frasers Centrepoint Trust | | | 98,200 | | | | 156,274 | |
Venture Corp., Ltd. | | | 23,500 | | | | 241,270 | |
| | | | | | | | |
| | | | | | | 397,544 | |
| | | | | | | | |
| | |
| Spain—0.5% | | | | | | | | |
Unicaja Banco S.A. (a) | | | 542,981 | | | | 716,508 | |
| | | | | | | | |
| | |
| Sweden—0.7% | | | | | | | | |
AAK AB | | | 67,239 | | | | 932,599 | |
| | | | | | | | |
| | |
| Switzerland—2.3% | | | | | | | | |
Galenica AG (a)(c) | | | 20,963 | | | | 923,411 | |
Georg Fischer AG | | | 722 | | | | 579,246 | |
Interroll Holding AG | | | 558 | | | | 824,342 | |
OC Oerlikon Corp. AG (c) | | | 67,741 | | | | 762,777 | |
| | | | | | | | |
| | | | | | | 3,089,776 | |
| | | | | | | | |
| | |
| Taiwan—0.3% | | | | | | | | |
ASPEED Technology, Inc. | | | 7,000 | | | | 134,561 | |
Ennoconn Corp. | | | 31,113 | | | | 248,371 | |
| | | | | | | | |
| | | | | | | 382,932 | |
| | | | | | | | |
| | |
| United Kingdom—4.8% | | | | | | | | |
ASOS PLC (c) | | | 14,195 | | | | 412,091 | |
Auto Trader Group PLC (a) | | | 175,057 | | | | 1,015,924 | |
Genus PLC | | | 31,189 | | | | 853,110 | |
HomeServe PLC | | | 82,136 | | | | 907,265 | |
Intermediate Capital Group PLC | | | 62,970 | | | | 751,119 | |
Moneysupermarket.com Group PLC | | | 228,494 | | | | 802,236 | |
RPC Group PLC | | | 35,764 | | | | 297,318 | |
Senior PLC | | | 42,099 | | | | 101,767 | |
Spectris PLC | | | 16,212 | | | | 471,135 | |
Tullow Oil PLC (c) | | | 354,380 | | | | 805,680 | |
| | | | | | | | |
| | | | | | | 6,417,645 | |
| | | | | | | | |
| | | | | | | | |
| | | Shares | | | Value | |
| | |
| United States—58.5% | | | | | | | | |
AAR Corp. | | | 15,209 | | | $ | 567,904 | |
Air Lease Corp. | | | 22,132 | | | | 668,608 | |
Air Transport Services Group, Inc. (c) | | | 37,089 | | | | 846,000 | |
Alcoa Corp. (c) | | | 5,956 | | | | 158,310 | |
Allegheny Technologies, Inc. (c) | | | 20,828 | | | | 453,426 | |
Ameris Bancorp | | | 13,885 | | | | 439,738 | |
Avanos Medical, Inc. (c) | | | 10,651 | | | | 477,058 | |
Bio-Rad Laboratories, Inc., Class A (c) | | | 5,859 | | | | 1,360,577 | |
Bluebird Bio, Inc. (c) | | | 3,830 | | | | 379,936 | |
Boingo Wireless, Inc. (c) | | | 31,623 | | | | 650,485 | |
Bright Horizons Family Solutions, Inc. (c) | | | 11,257 | | | | 1,254,593 | |
Brink’s Co. | | | 10,240 | | | | 662,016 | |
Brown & Brown, Inc. | | | 53,319 | | | | 1,469,472 | |
Calavo Growers, Inc. | | | 7,339 | | | | 535,453 | |
Callaway Golf Co. | | | 26,144 | | | | 400,003 | |
Callon Petroleum Co. (c) | | | 97,566 | | | | 633,203 | |
Carter’s, Inc. | | | 7,461 | | | | 608,967 | |
Catalent, Inc. (c) | | | 4,992 | | | | 155,651 | |
CBIZ, Inc. (c) | | | 44,926 | | | | 885,042 | |
CenterState Bank Corp. | | | 24,250 | | | | 510,220 | |
Charles River Laboratories International, Inc. (c) | | | 8,450 | | | | 956,371 | |
Chart Industries, Inc. (c) | | | 22,253 | | | | 1,447,113 | |
Children’s Place, Inc. | | | 3,346 | | | | 301,441 | |
Churchill Downs, Inc. | | | 4,805 | | | | 1,172,132 | |
Columbus McKinnon Corp. | | | 21,083 | | | | 635,442 | |
Dine Brands Global, Inc. | | | 16,487 | | | | 1,110,235 | |
Dolby Laboratories, Inc., Class A | | | 17,129 | | | | 1,059,257 | |
Encompass Health Corp. | | | 11,711 | | | | 722,569 | |
Envestnet, Inc. (c) | | | 11,898 | | | | 585,263 | |
EPAM Systems, Inc. (c) | | | 7,075 | | | | 820,771 | |
Equity LifeStyle Properties, Inc. REIT | | | 14,823 | | | | 1,439,758 | |
Everbridge, Inc. (c) | | | 17,349 | | | | 984,729 | |
Exact Sciences Corp. (c) | | | 9,440 | | | | 595,664 | |
First Industrial Realty Trust, Inc. REIT | | | 50,417 | | | | 1,455,035 | |
First Merchants Corp. | | | 21,002 | | | | 719,738 | |
Five9, Inc. (c) | | | 22,094 | | | | 965,950 | |
G-III Apparel Group Ltd. (c) | | | 15,733 | | | | 438,793 | |
Green Dot Corp., Class A (c) | | | 8,597 | | | | 683,633 | |
Hanover Insurance Group, Inc. | | | 13,990 | | | | 1,633,612 | |
Harsco Corp. (c) | | | 38,706 | | | | 768,701 | |
HealthEquity, Inc. (c) | | | 6,731 | | | | 401,504 | |
Hill-Rom Holdings, Inc. | | | 8,548 | | | | 756,925 | |
Immunomedics, Inc. (c) | | | 22,020 | | | | 314,225 | |
Ingevity Corp. (c) | | | 15,007 | | | | 1,255,936 | |
Insulet Corp. (c) | | | 11,698 | | | | 927,885 | |
KAR Auction Services, Inc. | | | 15,529 | | | | 741,044 | |
Keysight Technologies, Inc. (c) | | | 9,157 | | | | 568,466 | |
Kilroy Realty Corp. REIT | | | 20,927 | | | | 1,315,890 | |
Kinsale Capital Group, Inc. | | | 30,356 | | | | 1,686,579 | |
Kratos Defense & Security Solutions, Inc. (c) | | | 50,452 | | | | 710,869 | |
Lamb Weston Holdings, Inc. | | | 22,187 | | | | 1,632,076 | |
Ligand Pharmaceuticals, Inc. (c) | | | 4,898 | | | | 664,659 | |
LPL Financial Holdings, Inc. | | | 31,220 | | | | 1,906,918 | |
Madison Square Garden Co., Class A (c) | | | 2,640 | | | | 706,728 | |
Merit Medical Systems, Inc. (c) | | | 23,042 | | | | 1,285,974 | |
Monolithic Power Systems, Inc. | | | 7,268 | | | | 844,905 | |
Neurocrine Biosciences, Inc. (c) | | | 4,215 | | | | 300,993 | |
| | | | | | | | |
| | | Shares | | | Value | |
Nexstar Media Group, Inc., Class A | | | 11,015 | | | $ | 866,220 | |
NRG Energy, Inc. | | | 42,962 | | | | 1,701,295 | |
Omnicell, Inc. (c) | | | 17,392 | | | | 1,065,086 | |
Pacific Premier Bancorp, Inc. (c) | | | 17,056 | | | | 435,269 | |
Penn Virginia Corp. (c) | | | 9,162 | | | | 495,298 | |
Performance Food Group Co. (c) | | | 20,145 | | | | 650,079 | |
Pool Corp. | | | 5,750 | | | | 854,737 | |
PRA Health Sciences, Inc. (c) | | | 8,813 | | | | 810,443 | |
Preferred Bank | | | 13,162 | | | | 570,573 | |
Primo Water Corp. (c) | | | 56,073 | | | | 785,583 | |
ProPetro Holding Corp. (c) | | | 59,474 | | | | 732,720 | |
PTC, Inc. (c) | | | 9,365 | | | | 776,358 | |
R1 RCM, Inc. (c) | | | 88,357 | | | | 702,438 | |
Rapid7, Inc. (c) | | | 22,287 | | | | 694,463 | |
RealPage, Inc. (c) | | | 10,073 | | | | 485,418 | |
Retail Opportunity Investments Corp. | | | 45,269 | | | | 718,872 | |
Rosetta Stone, Inc. (c) | | | 33,853 | | | | 555,189 | |
Sarepta Therapeutics, Inc. (c) | | | 4,466 | | | | 487,375 | |
Service Corp. International | | | 40,339 | | | | 1,624,048 | |
Simply Good Foods Co. (c) | | | 77,910 | | | | 1,472,499 | |
STAG Industrial, Inc. REIT | | | 55,792 | | | | 1,388,105 | |
Strategic Education, Inc. | | | 6,538 | | | | 741,540 | |
Supernus Pharmaceuticals, Inc. (c) | | | 9,336 | | | | 310,142 | |
Tabula Rasa HealthCare, Inc. (c) | | | 7,999 | | | | 510,016 | |
Teladoc, Inc. (c) | | | 12,240 | | | | 606,737 | |
Tetra Tech, Inc. | | | 18,991 | | | | 983,164 | |
Texas Roadhouse, Inc. | | | 16,535 | | | | 987,139 | |
TPI Composites, Inc. (c) | | | 20,979 | | | | 515,664 | |
Tyler Technologies, Inc. (c) | | | 3,017 | | | | 560,619 | |
Universal Display Corp. | | | 3,789 | | | | 354,537 | |
WellCare Health Plans, Inc. (c) | | | 3,370 | | | | 795,623 | |
West Pharmaceutical Services, Inc. | | | 4,686 | | | | 459,369 | |
Western Alliance Bancorp (c) | | | 25,903 | | | | 1,022,909 | |
WEX, Inc. (c) | | | 5,979 | | | | 837,419 | |
WildHorse Resource Development Corp. (c) | | | 34,638 | | | | 488,742 | |
Willscot Corp. (c) | | | 50,062 | | | | 471,584 | |
Yext, Inc. (c) | | | 26,456 | | | | 392,872 | |
Zendesk, Inc. (c) | | | 13,655 | | | | 797,042 | |
Zynga, Inc., Class A (c) | | | 267,230 | | | | 1,050,214 | |
| | | | | | | | |
| | | | | | | 77,391,845 | |
| | | | | | | | |
Total Common Stock
(cost—$126,874,172) | | | | | | | 129,969,476 | |
| | | | | | | | |
| | | | | | | | |
|
| Preferred Stock—0.5% | |
| | |
| Germany—0.5% | | | | | | | | |
Jungheinrich AG
(cost—$731,631) | | | 24,157 | | | | 633,153 | |
| | | | | | | | |
| | | | | | |
| 68 | | Semiannual Report | | | December 31, 2018 | | | See accompanying Notes to Financial Statements |
Schedule of Investments
December 31, 2018 (unaudited)
| | | | | | | | |
| | | Principal
Amount
(000s) | | | Value | |
|
| Repurchase Agreements—1.3% | |
State Street Bank and Trust Co., dated 12/31/18, 0.50%, due 1/2/19, proceeds $1,674,047; collateralized by U.S. Treasury Inflation Indexed Notes, 0.125%, due 7/15/26, valued at $1,710,800 including accrued interest | |
(cost—$1,674,000) | | | $1,674 | | | $ | 1,674,000 | |
| | | | | | | | |
| |
Total Investments
(cost—$129,279,803) (b)—100.0% | | | | 132,276,629 | |
| | | | | | | | |
| | |
| Other assets less liabilities—0.0% | | | | | | | 34,896 | |
| | | | | | | | |
| | |
| Net Assets—100.0% | | | | | | | $132,311,525 | |
| | | | | | | | |
Notes to Schedule of Investments:
(a) 144A—Exempt from registration under Rule 144A of the Securities Act of 1933. These securities may be resold in transactions exempt from registration, typically only to qualified institutional buyers. Securities with an aggregate value of $3,638,481, representing 2.7% of net assets.
(b) Securities with an aggregate value of $52,357,674, representing 39.6% of net assets, were valued utilizing modeling tools provided by a third-party vendor. See Note 1(a) and Note 1(b) in the Notes to Financial Statements.
(c) Non-income producing.
Glossary:
REIT—Real Estate Investment Trust
The industry classification of portfolio holdings and other assets less liabilities shown as a percentage of net assets were as follows:
| | | | |
Insurance | | | 5.7% | |
Equity Real Estate Investment Trusts (REITs) | | | 5.6% | |
Software | | | 5.5% | |
Machinery | | | 5.5% | |
Commercial Services & Supplies | | | 4.6% | |
Banks | | | 3.9% | |
Food Products | | | 3.7% | |
Healthcare Equipment & Supplies | | | 3.5% | |
IT Services | | | 3.4% | |
Life Sciences Tools & Services | | | 3.0% | |
Diversified Consumer Services | | | 2.7% | |
Biotechnology | | | 2.7% | |
Electronic Equipment, Instruments & Components | | | 2.7% | |
Healthcare Providers & Services | | | 2.7% | |
Hotels, Restaurants & Leisure | | | 2.5% | |
Pharmaceuticals | | | 2.3% | |
Oil, Gas & Consumable Fuels | | | 2.2% | |
Chemicals | | | 2.2% | |
Capital Markets | | | 2.0% | |
Construction & Engineering | | | 2.0% | |
Entertainment | | | 1.7% | |
Containers & Packaging | | | 1.7% | |
Healthcare Technology | | | 1.7% | |
Independent Power Producers & Energy Traders | | | 1.5% | |
Construction Materials | | | 1.5% | |
Real Estate Management & Development | | | 1.4% | |
Road & Rail | | | 1.2% | |
Energy Equipment & Services | | | 1.1% | |
Aerospace & Defense | | | 1.0% | |
Household Products | | | 1.0% | |
Professional Services | | | 1.0% | |
Semiconductors & Semiconductor Equipment | | | 1.0% | |
Metals & Mining | | | 1.0% | |
Diversified Financial Services | | | 1.0% | |
Food & Staples Retailing | | | 1.0% | |
Trading Companies & Distributors | | | 0.9% | |
Internet & Direct Marketing Retail | | | 0.9% | |
Household Durables | | | 0.9% | |
Textiles, Apparel & Luxury Goods | | | 0.8% | |
Auto Components | | | 0.8% | |
Interactive Media & Services | | | 0.8% | |
Consumer Finance | | | 0.8% | |
Electrical Equipment | | | 0.7% | |
Media | | | 0.7% | |
Distributors | | | 0.6% | |
Air Freight & Logistics | | | 0.6% | |
Thrifts & Mortgage Finance | | | 0.6% | |
Beverages | | | 0.6% | |
Wireless Telecommunication Services | | | 0.5% | |
Leisure Equipment & Products | | | 0.3% | |
Transportation Infrastructure | | | 0.3% | |
Specialty Retail | | | 0.2% | |
Paper & Forest Products | | | 0.2% | |
Technology Hardware, Storage & Peripherals | | | 0.2% | |
Communications Equipment | | | 0.1% | |
Repurchase Agreements | | | 1.3% | |
Other assets less liabilities | | | 0.0% | |
| | | | |
| | | 100.0% | |
| | | | |
AllianzGI Health Sciences Fund
| | | | | | | | |
| | | Shares | | | Value | |
|
| Common Stock—98.1% | |
| | |
| Biotechnology—15.4% | | | | | | | | |
Alnylam Pharmaceuticals, Inc. (d) | | | 4,300 | | | | $313,513 | |
Amgen, Inc. | | | 15,480 | | | | 3,013,492 | |
Arena Pharmaceuticals, Inc. (d) | | | 10,090 | | | | 393,006 | |
Argenx SE ADR (d) | | | 4,150 | | | | 398,691 | |
Autolus Therapeutics PLC ADR (d) | | | 11,480 | | | | 377,003 | |
BeiGene Ltd. ADR (d) | | | 4,865 | | | | 682,365 | |
Biogen, Inc. (d) | | | 6,008 | | | | 1,807,927 | |
BioMarin Pharmaceutical, Inc. (d) | | | 21,909 | | | | 1,865,551 | |
Bluebird Bio, Inc. (d) | | | 3,400 | | | | 337,280 | |
Celgene Corp. (d) | | | 11,600 | | | | 743,444 | |
CytomX Therapeutics, Inc. (d) | | | 25,104 | | | | 379,070 | |
Exact Sciences Corp. (d) | | | 10,000 | | | | 631,000 | |
Gilead Sciences, Inc. | | | 43,711 | | | | 2,734,123 | |
Heron Therapeutics, Inc. (d) | | | 74,835 | | | | 1,941,220 | |
Immunomedics, Inc. (d) | | | 17,100 | | | | 244,017 | |
Invitae Corp. (d) | | | 77,505 | | | | 857,205 | |
Iovance Biotherapeutics, Inc. (d) | | | 49,015 | | | | 433,783 | |
Neurocrine Biosciences, Inc. (d) | | | 13,805 | | | | 985,815 | |
Proteostasis Therapeutics, Inc. (d) | | | 22,410 | | | | 72,608 | |
Sarepta Therapeutics, Inc. (d) | | | 6,115 | | | | 667,330 | |
Vertex Pharmaceuticals, Inc. (d) | | | 19,245 | | | | 3,189,089 | |
| | | | | | | | |
| | | | | | | 22,067,532 | |
| | | | | | | | |
|
| Healthcare Equipment & Supplies—18.3% | |
Abbott Laboratories | | | 71,863 | | | | 5,197,851 | |
Align Technology, Inc. (d) | | | 3,080 | | | | 645,044 | |
Baxter International, Inc. | | | 9,806 | | | | 645,431 | |
Boston Scientific Corp. (d) | | | 120,937 | | | | 4,273,914 | |
DENTSPLY SIRONA, Inc. | | | 31,805 | | | | 1,183,464 | |
DexCom, Inc. (d) | | | 9,075 | | | | 1,087,185 | |
Edwards Lifesciences Corp. (d) | | | 6,655 | | | | 1,019,346 | |
Glaukos Corp. (d) | | | 11,810 | | | | 663,368 | |
Insulet Corp. (d) | | | 13,660 | | | | 1,083,511 | |
Intuitive Surgical, Inc. (d) | | | 8,015 | | | | 3,838,544 | |
Nevro Corp. (d) | | | 20,380 | | | | 792,578 | |
Novocure Ltd. (d) | | | 17,725 | | | | 593,433 | |
Quotient Ltd. (d) | | | 172,575 | | | | 1,056,159 | |
Teleflex, Inc. | | | 5,915 | | | | 1,528,909 | |
Vapotherm, Inc. (d) | | | 54,255 | | | | 1,082,387 | |
Wright Medical Group NV (d) | | | 54,550 | | | | 1,484,851 | |
| | | | | | | | |
| | | | | | | 26,175,975 | |
| | | | | | | | |
|
| Healthcare Providers & Services—20.7% | |
Addus HomeCare Corp. (d) | | | 14,631 | | | | 993,152 | |
Anthem, Inc. | | | 24,210 | | | | 6,358,272 | |
Cigna Corp. (d) | | | 7,380 | | | | 1,401,610 | |
CVS Health Corp. | | | 85,805 | | | | 5,621,944 | |
Quest Diagnostics, Inc. | | | 4,225 | | | | 351,816 | |
UnitedHealth Group, Inc. | | | 42,681 | | | | 10,632,691 | |
WellCare Health Plans, Inc. (d) | | | 17,950 | | | | 4,237,815 | |
| | | | | | | | |
| | | | | | | 29,597,300 | |
| | | | | | | | |
|
| Life Sciences Tools & Services—6.6% | |
Agilent Technologies, Inc. | | | 47,230 | | | | 3,186,136 | |
Illumina, Inc. (d) | | | 8,530 | | | | 2,558,403 | |
PerkinElmer, Inc. | | | 13,920 | | | | 1,093,416 | |
| | | | | | | | |
| See accompanying Notes to Financial Statements | | | December 31, 2018 | | | Semiannual Report | | | 69 | |
Schedule of Investments
December 31, 2018 (unaudited)
| | | | | | | | |
| | | Shares | | | Value | |
Thermo Fisher Scientific, Inc. | | | 12,105 | | | $ | 2,708,978 | |
| | | | | | | | |
| | | | | | | 9,546,933 | |
| | | | | | | | |
|
| Pharmaceuticals—37.1% | |
Aerie Pharmaceuticals, Inc. (d) | | | 8,730 | | | | 315,153 | |
AIT Therapeutics, Inc. (d) | | | 123,899 | | | | 576,130 | |
Allergan PLC | | | 25,681 | | | | 3,432,522 | |
AstraZeneca PLC ADR | | | 128,450 | | | | 4,878,531 | |
Bristol-Myers Squibb Co. | | | 56,835 | | | | 2,954,283 | |
Catalent, Inc. (d) | | | 43,075 | | | | 1,343,079 | |
Eisai Co., Ltd. | | | 7,600 | | | | 588,391 | |
GlaxoSmithKline PLC ADR | | | 72,245 | | | | 2,760,481 | |
Intersect ENT, Inc. (d) | | | 31,850 | | | | 897,533 | |
Johnson & Johnson | | | 31,992 | | | | 4,128,568 | |
Merck & Co., Inc. | | | 113,552 | | | | 8,676,508 | |
Mylan NV (d) | | | 20,091 | | | | 550,493 | |
Novartis AG ADR | | | 93,013 | | | | 7,981,446 | |
Odonate Therapeutics, Inc. (d) | | | 30,790 | | | | 433,523 | |
Pfizer, Inc. | | | 138,674 | | | | 6,053,120 | |
Sanofi ADR | | | 113,290 | | | | 4,917,919 | |
Zoetis, Inc. | | | 29,990 | | | | 2,565,345 | |
| | | | | | | | |
| | | | | | | 53,053,025 | |
| | | | | | | | |
Total Common Stock
(cost—$132,572,206) | | | | | | | 140,440,765 | |
| | | | | | | | |
| | | | | | | | |
| | |
| | | Units | | | | |
|
| Warrants—0.1% | |
| | |
| Pharmaceuticals—0.1% | | | | | | | | |
AIT Therapeutics, Inc., (b)(c)(d)
(cost—$1,239) | | | 123,899 | | | | 120,926 | |
| | | | | | | | |
| | | | | | | | |
| | |
| | | Principal
Amount
(000s) | | | | |
|
| Repurchase Agreements—0.6% | |
State Street Bank and Trust Co., dated 12/31/18, 0.50%, due 1/2/19, proceeds $885,025; collateralized by U.S. Treasury Inflation Indexed Notes, 0.125%, due 7/15/26, valued at $904,845 including accrued interest | |
(cost—$885,000) | | | $885 | | | | 885,000 | |
| | | | | | | | |
| |
Total Investments
(cost—$133,458,445) (a)—98.8% | | | | 141,446,691 | |
| | | | | | | | |
| | |
| Other assets less liabilities—1.2% | | | | | | | 1,696,902 | |
| | | | | | | | |
| | |
| Net Assets—100.0% | | | | | | | $143,143,593 | |
| | | | | | | | |
Notes to Schedule of Investments:
(a) Security with a value of $588,391, representing 0.4% of net assets, was valued utilizing modeling tools provided by a third-party vendor. See Note 1(a) and Note 1(b) in the Notes to Financial Statements.
(b) Fair-Valued—Security with a value of $120,926, representing 0.1% of net assets. See Note 1(a) and Note 1(b) in the Notes to Financial Statements.
(c) Level 3 security. See Note 1(a) and Note 1(b) in the Notes to Financial Statements.
(d) Non-income producing.
Glossary:
ADR—American Depositary Receipt
AllianzGI Income & Growth Fund
| | | | | | | | |
| | | Shares | | | Value | |
|
| Common Stock—32.4% | |
|
| Advertising—0.0% | |
Affinion Group Holdings,
Inc. Class A
(cost—$1,422,155;
purchased
11/4/15) (a)(d)(f)(h)(j) | | | 80,205 | | | | $634,422 | |
Mood Media
Corp. (d)(f)(j) | | | 286,500 | | | | 272,175 | |
| | | | | | | | |
| | | | | | | 906,597 | |
| | | | | | | | |
|
| Aerospace & Defense—1.0% | |
Arconic, Inc. | | | 286,070 | | | | 4,823,140 | |
Boeing Co. (g) | | | 56,500 | | | | 18,221,250 | |
Erickson, Inc. (d)(f)(j) | | | 10,866 | | | | 279,256 | |
Raytheon Co. | | | 80,100 | | | | 12,283,335 | |
| | | | | | | | |
| | | | | | | 35,606,981 | |
| | | | | | | | |
|
| Apparel & Textiles—0.0% | |
Quiksilver, Inc. (d)(f)(j) | | | 2,328 | | | | 47,677 | |
| | | | | | | | |
| | |
| Automobiles—0.2% | | | | | | | | |
Ford Motor Co. | | | 1,199,700 | | | | 9,177,705 | |
| | | | | | | | |
| | |
| Banks—1.2% | | | | | | | | |
Bank of America Corp. | | | 676,900 | | | | 16,678,816 | |
CCF Holdings LLC (d)(f)(j) | | | 31,304 | | | | 3 | |
CCF Holdings LLC L.P. (d)(f)(j) | | | 42,857 | | | | 4 | |
JPMorgan Chase & Co. (g) | | | 274,100 | | | | 26,757,642 | |
| | | | | | | | |
| | | | | | | 43,436,465 | |
| | | | | | | | |
| | |
| Beverages—0.4% | | | | | | | | |
PepsiCo, Inc. (g) | | | 120,300 | | | | 13,290,744 | |
| | | | | | | | |
| | |
| Biotechnology—1.8% | | | | | | | | |
AbbVie, Inc. | | | 215,900 | | | | 19,903,821 | |
Biogen, Inc. (j) | | | 29,700 | | | | 8,937,324 | |
BioMarin Pharmaceutical, Inc. (j) | | | 3,926 | | | | 334,299 | |
Gilead Sciences, Inc. | | | 239,250 | | | | 14,965,087 | |
Vertex Pharmaceuticals, Inc. (g)(j) | | | 137,300 | | | | 22,751,983 | |
| | | | | | | | |
| | | | | | | 66,892,514 | |
| | | | | | | | |
|
| Building Products—0.3% | |
Johnson Controls International PLC | | | 370,382 | | | | 10,981,826 | |
Resideo Technologies, Inc. (j) | | | 11,016 | | | | 226,379 | |
| | | | | | | | |
| | | | | | | 11,208,205 | |
| | | | | | | | |
| | |
| Chemicals—0.4% | | | | | | | | |
Chemours Co. | | | 238,400 | | | | 6,727,648 | |
DowDuPont, Inc. | | | 178,600 | | | | 9,551,528 | |
| | | | | | | | |
| | | | | | | 16,279,176 | |
| | | | | | | | |
|
| Commercial Services—0.0% | |
Cenveo Corp. (d)(f)(j) | | | 19,074 | | | | 576,798 | |
| | | | | | | | |
|
| Commercial Services & Supplies—0.1% | |
Stericycle, Inc. (j) | | | 66,843 | | | | 2,452,470 | |
| | | | | | | | |
|
| Construction & Engineering—0.2% | |
Fluor Corp. | | | 209,800 | | | | 6,755,560 | |
| | | | | | | | |
|
| Diversified Telecommunication Services—0.0% | |
Frontier Communications Corp. (j) | | | 210,781 | | | | 501,659 | |
| | | | | | | | |
| | | | | | | | |
| | | Shares | | | Value | |
|
| Electronic Equipment, Instruments & Components—0.2% | |
Amphenol Corp. Class A (g) | | | 109,600 | | | $ | 8,879,792 | |
| | | | | | | | |
|
| Energy Equipment & Services—0.3% | |
National Oilwell Varco, Inc. | | | 145,600 | | | | 3,741,920 | |
Schlumberger Ltd. | | | 172,400 | | | | 6,220,192 | |
| | | | | | | | |
| | | | | | | 9,962,112 | |
| | | | | | | | |
|
| Entertainment—1.6% | |
Netflix, Inc. (j) | | | 66,100 | | | | 17,692,326 | |
Take-Two Interactive Software, Inc. (g)(j) | | | 139,700 | | | | 14,380,718 | |
Walt Disney Co. (g) | | | 238,900 | | | | 26,195,385 | |
| | | | | | | | |
| | | | | | | 58,268,429 | |
| | | | | | | | |
|
| Food & Staples Retailing—1.5% | |
Costco Wholesale Corp. (g) | | | 106,400 | | | | 21,674,744 | |
Kroger Co. | | | 472,000 | | | | 12,980,000 | |
Walgreens Boots Alliance, Inc. | | | 286,600 | | | | 19,583,378 | |
| | | | | | | | |
| | | | | | | 54,238,122 | |
| | | | | | | | |
|
| Food Products—0.2% | |
Archer-Daniels-Midland Co. (g) | | | 159,650 | | | | 6,540,861 | |
| | | | | | | | |
|
| Healthcare Equipment & Supplies—1.6% | |
Align Technology, Inc. (j) | | | 46,600 | | | | 9,759,438 | |
Baxter International, Inc. | | | 238,100 | | | | 15,671,742 | |
Boston Scientific Corp. (g)(j) | | | 458,400 | | | | 16,199,856 | |
Intuitive Surgical, Inc. (g)(j) | | | 41,800 | | | | 20,018,856 | |
| | | | | | | | |
| | | | | | | 61,649,892 | |
| | | | | | | | |
|
| Healthcare Providers & Services—1.2% | |
Laboratory Corp. of America Holdings (j) | | | 49,000 | | | | 6,191,640 | |
McKesson Corp. | | | 114,300 | | | | 12,626,721 | |
UnitedHealth Group, Inc. (g) | | | 106,600 | | | | 26,556,192 | |
| | | | | | | | |
| | | | | | | 45,374,553 | |
| | | | | | | | |
|
| Hotels, Restaurants & Leisure—1.1% | |
McDonald’s Corp. (g) | | | 112,000 | | | | 19,887,840 | |
Starbucks Corp. (g) | | | 251,400 | | | | 16,190,160 | |
Wynn Resorts Ltd. | | | 54,700 | | | | 5,410,377 | |
| | | | | | | | |
| | | | | | | 41,488,377 | |
| | | | | | | | |
|
| Household Durables—0.3% | |
DR Horton, Inc. | | | 320,000 | | | | 11,091,200 | |
| | | | | | | | |
|
| Independent Power Producers & Energy Traders—0.1% | |
Vistra Energy Corp. (j) | | | 144,101 | | | | 3,298,472 | |
| | | | | | | | |
|
| Industrial Conglomerates—0.6% | |
3M Co. (g) | | | 50,100 | | | | 9,546,054 | |
General Electric Co. | | | 326,200 | | | | 2,469,334 | |
Honeywell International, Inc. | | | 66,100 | | | | 8,733,132 | |
| | | | | | | | |
| | | | | | | 20,748,520 | |
| | | | | | | | |
|
| Insurance—0.3% | |
Progressive Corp. | | | 192,300 | | | | 11,601,459 | |
| | | | | | | | |
|
| Interactive Media & Services—1.5% | |
Alphabet, Inc., Class A (g)(j) | | | 33,400 | | | | 34,901,664 | |
Facebook, Inc., Class A (j) | | | 153,700 | | | | 20,148,533 | |
| | | | | | | | |
| | | | | | | 55,050,197 | |
| | | | | | | | |
| | | | | | |
| 70 | | Semiannual Report | | | December 31, 2018 | | | See accompanying Notes to Financial Statements |
Schedule of Investments
December 31, 2018 (unaudited)
| | | | | | | | |
| | | Shares | | | Value | |
|
| Internet & Direct Marketing Retail—1.3% | |
Alibaba Group Holding Ltd. ADR (g)(j) | | | 114,600 | | | $ | 15,708,222 | |
Amazon.com, Inc. (g)(j) | | | 21,800 | | | | 32,742,946 | |
| | | | | | | | |
| | | | | | | 48,451,168 | |
| | | | | | | | |
|
| IT Services—2.2% | |
International Business Machines Corp. | | | 92,200 | | | | 10,480,374 | |
PayPal Holdings, Inc. (g)(j) | | | 280,900 | | | | 23,620,881 | |
Visa, Inc., Class A (g) | | | 284,200 | | | | 37,497,348 | |
Worldpay, Inc., Class A (g)(j) | | | 141,200 | | | | 10,791,916 | |
| | | | | | | | |
| | | | | | | 82,390,519 | |
| | | | | | | | |
| Machinery—1.3% | |
Caterpillar, Inc. | | | 202,500 | | | | 25,731,675 | |
Deere & Co. (g) | | | 157,900 | | | | 23,553,943 | |
| | | | | | | | |
| | | | | | | 49,285,618 | |
| | | | | | | | |
|
| Media—0.4% | |
Comcast Corp., Class A | | | 437,700 | | | | 14,903,685 | |
LiveStyle,
Inc. (d)(f)(j)(l) | | | 202,319 | | | | 20 | |
Postmedia Network Canada
Corp. (d)(f)(j) | | | 1,018,823 | | | | 1,222,588 | |
| | | | | | | | |
| | | | | | | 16,126,293 | |
| | | | | | | | |
|
| Metals & Mining—0.1% | |
ArcelorMittal | | | 180,611 | | | | 3,733,229 | |
Freeport-McMoRan, Inc. | | | 113,100 | | | | 1,166,061 | |
| | | | | | | | |
| | | | | | | 4,899,290 | |
| | | | | | | | |
|
| Multi-Line Retail—0.6% | |
Target Corp. (g) | | | 311,900 | | | | 20,613,471 | |
| | | | | | | | |
|
| Oil, Gas & Consumable Fuels—0.9% | |
Arch Coal, Inc., Class A | | | 1,858 | | | | 154,195 | |
Chesapeake Energy Corp. (j) | | | 1,250,759 | | | | 2,626,594 | |
Hercules Offshore, Inc. (d)(f)(j) | | | 174,935 | | | | 18 | |
Kinder Morgan, Inc. | | | 187,778 | | | | 2,888,026 | |
Occidental Petroleum Corp. | | | 229,700 | | | | 14,098,986 | |
Riviera Resources, Inc. (j) | | | 25,527 | | | | 403,327 | |
Roan Resources, Inc. (j) | | | 25,527 | | | | 213,916 | |
Southwestern Energy Co. (j) | | | 508,010 | | | | 1,732,314 | |
Talos Energy, Inc. (j) | | | 98,625 | | | | 1,609,560 | |
Valero Energy Corp. | | | 147,800 | | | | 11,080,566 | |
Vanguard Natural Resources, Inc. (d)(f)(j) | | | 12,187 | | | | 47,407 | |
| | | | | | | | |
| | | | | | | 34,854,909 | |
| | | | | | | | |
|
| Pharmaceuticals—0.9% | |
Allergan PLC | | | 99,241 | | | | 13,264,552 | |
Bristol-Myers Squibb Co. | | | 242,700 | | | | 12,615,546 | |
Merck & Co., Inc. (g) | | | 40,500 | | | | 3,094,605 | |
Teva Pharmaceutical Industries Ltd. ADR (j) | | | 248,006 | | | | 3,824,253 | |
| | | | | | | | |
| | | | | | | 32,798,956 | |
| | | | | | | | |
|
| Road & Rail—0.6% | |
Union Pacific Corp. (g) | | | 165,300 | | | | 22,849,419 | |
| | | | | | | | |
|
| Semiconductors—0.0% | |
GT Advanced Technologies, Inc. (d)(f)(j) | | | 463 | | | | 10,552 | |
| | | | | | | | |
| | | | | | | | |
| | | Shares | | | Value | |
|
| Semiconductors & Semiconductor Equipment—2.6% | |
Broadcom, Inc. (g) | | | 90,800 | | | $ | 23,088,624 | |
Intel Corp. (g) | | | 350,600 | | | | 16,453,658 | |
Micron Technology, Inc. (j) | | | 379,100 | | | | 12,028,843 | |
NVIDIA Corp. | | | 102,500 | | | | 13,683,750 | |
QUALCOMM, Inc. | | | 237,700 | | | | 13,527,507 | |
Texas Instruments, Inc. | | | 196,000 | | | | 18,522,000 | |
| | | | | | | | |
| | | | | | | 97,304,382 | |
| | | | | | | | |
|
| Software—3.2% | |
Adobe, Inc. (g)(j) | | | 107,200 | | | | 24,252,928 | |
Intuit, Inc. (g) | | | 64,300 | | | | 12,657,455 | |
Microsoft Corp. (g) | | | 382,000 | | | | 38,799,740 | |
Salesforce.com, Inc. (g)(j) | | | 233,000 | | | | 31,914,010 | |
ServiceNow,
Inc. (g)(j) | | | 70,900 | | | | 12,623,745 | |
| | | | | | | | |
| | | | | | | 120,247,878 | |
| | | | | | | | |
|
| Specialty Retail—0.6% | |
Home Depot, Inc. | | | 140,800 | | | | 24,192,256 | |
| | | | | | | | |
|
| Technology Hardware, Storage & Peripherals—1.2% | |
Apple, Inc. | | | 194,100 | | | | 30,617,334 | |
NetApp, Inc. | | | 246,400 | | | | 14,702,688 | |
Western Digital Corp. | | | 1,953 | | | | 72,202 | |
| | | | | | | | |
| | | | | | | 45,392,224 | |
| | | | | | | | |
|
| Textiles, Apparel & Luxury Goods—0.3% | |
NIKE, Inc., Class B (g) | | | 171,500 | | | | 12,715,010 | |
| | | | | | | | |
|
| Trading Companies & Distributors—0.1% | |
WESCO International, Inc. (j) | | | 54,455 | | | | 2,613,840 | |
| | | | | | | | |
Total Common Stock
(cost—$1,686,872,869) | | | | 1,210,070,322 | |
| | | | | | | | |
| | | | | | | | |
| | |
| | | Principal
Amount
(000s) | | | | |
|
| Corporate Bonds & Notes—32.3% | |
|
| Advertising—0.0% | |
Mood Media Borrower LLC, 6 mo. LIBOR + 14.00%, PIK 8.00% (i), | |
9.25%, 7/1/24 | | | $1,034 | | | | 1,023,253 | |
| | | | | | | | |
|
| Aerospace & Defense—0.6% | |
Arconic, Inc., | |
5.90%, 2/1/27 | | | 2,795 | | | | 2,688,440 | |
Kratos Defense & Security Solutions, Inc. (a)(b), | |
6.50%, 11/30/25 | | | 5,660 | | | | 5,843,950 | |
TransDigm, Inc., | |
6.50%, 5/15/25 | | | 9,645 | | | | 9,247,144 | |
Triumph Group, Inc., | |
7.75%, 8/15/25 | | | 4,175 | | | | 3,694,875 | |
| | | | | | | | |
| | | | | | | 21,474,409 | |
| | | | | | | | |
|
| Auto Components—0.5% | |
American Axle & Manufacturing, Inc., | |
6.625%, 10/15/22 | | | 4,808 | | | | 4,771,940 | |
Delphi Technologies PLC (a)(b), | |
5.00%, 10/1/25 | | | 8,155 | | | | 6,884,777 | |
Goodyear Tire & Rubber Co., | |
5.125%, 11/15/23 | | | 6,065 | | | | 5,966,444 | |
| | | | | | | | |
| | | | | | | 17,623,161 | |
| | | | | | | | |
|
| Auto Manufacturers—0.4% | |
Navistar International Corp. (a)(b), | |
6.625%, 11/1/25 | | | 9,585 | | | | 9,297,450 | |
Tesla, Inc. (a)(b), | |
5.30%, 8/15/25 | | | 4,405 | | | | 3,843,363 | |
| | | | | | | | |
| | | | | | | 13,140,813 | |
| | | | | | | | |
| | | | | | | | |
| | | Principal
Amount
(000s) | | | Value | |
|
| Banks—0.1% | |
CIT Group, Inc., | |
6.125%, 3/9/28 | | $ | 5,640 | | | $ | 5,625,900 | |
| | | | | | | | |
|
| Building Materials—0.3% | |
Builders FirstSource, Inc. (a)(b), | |
5.625%, 9/1/24 | | | 7,415 | | | | 6,905,219 | |
Jeld-Wen, Inc. (a)(b), | |
4.875%, 12/15/27 | | | 4,635 | | | | 3,928,162 | |
| | | | | | | | |
| | | | | | | 10,833,381 | |
| | | | | | | | |
|
| Chemicals—1.4% | |
Chemours Co., | |
6.625%, 5/15/23 | | | 7,000 | | | | 7,096,250 | |
7.00%, 5/15/25 | | | 7,520 | | | | 7,614,000 | |
Kraton Polymers LLC (a)(b), | |
7.00%, 4/15/25 | | | 6,865 | | | | 6,350,125 | |
Olin Corp., | |
5.00%, 2/1/30 | | | 8,130 | | | | 7,154,400 | |
Platform Specialty Products Corp. (a)(b), | |
6.50%, 2/1/22 | | | 8,445 | | | | 8,476,669 | |
PQ Corp. (a)(b), | |
5.75%, 12/15/25 | | | 3,100 | | | | 2,883,000 | |
Trinseo Materials Operating SCA (a)(b), | |
5.375%, 9/1/25 | | | 5,645 | | | | 4,961,955 | |
Tronox Finance PLC (a)(b), | |
5.75%, 10/1/25 | | | 5,510 | | | | 4,483,762 | |
Tronox, Inc. (a)(b), | |
6.50%, 4/15/26 | | | 4,765 | | | | 3,972,819 | |
| | | | | | | | |
| | | | | | | 52,992,980 | |
| | | | | | | | |
|
| Commercial Services—1.5% | |
Ashtead Capital, Inc. (a)(b), | |
5.25%, 8/1/26 | | | 6,870 | | | | 6,649,588 | |
Cardtronics, Inc. (a)(b), | |
5.50%, 5/1/25 | | | 2,490 | | | | 2,315,700 | |
Cenveo Corp. (a)(b)(c)(d)(f), | |
6.00%, 5/15/24
(cost—$9,488,150; purchased3/22/12-3/11/16) (h) | | | 8,116 | | | | 446,380 | |
8.50%, 9/15/22 | | | 1,520 | | | | 30,400 | |
Gartner, Inc. (a)(b), | |
5.125%, 4/1/25 | | | 8,400 | | | | 8,191,596 | |
Hertz Corp. (a)(b), | |
5.50%, 10/15/24 | | | 5,215 | | | | 3,833,025 | |
7.625%, 6/1/22 | | | 5,380 | | | | 5,084,100 | |
Laureate Education, Inc. (a)(b), | |
8.25%, 5/1/25 | | | 6,795 | | | | 7,168,725 | |
Monitronics International, Inc., | |
9.125%, 4/1/20 | | | 6,450 | | | | 1,668,938 | |
RR Donnelley & Sons Co., | |
6.00%, 4/1/24 | | | 3,195 | | | | 3,155,062 | |
7.00%, 2/15/22 | | | 5,500 | | | | 5,486,250 | |
United Rentals North America, Inc., | |
4.625%, 10/15/25 | | | 3,780 | | | | 3,383,100 | |
5.50%, 7/15/25 | | | 8,930 | | | | 8,438,850 | |
| | | | | | | | |
| | | | | | | 55,851,714 | |
| | | | | | | | |
|
| Computers—0.6% | |
Dell International LLC (a)(b), | |
7.125%, 6/15/24 | | | 7,485 | | | | 7,621,748 | |
DynCorp International, Inc., PIK 1.50%, | |
11.875%, 11/30/20 | | | 708 | | | | 732,935 | |
Harland Clarke Holdings Corp. (a)(b), | |
9.25%, 3/1/21 | | | 7,620 | | | | 6,934,200 | |
Seagate HDD Cayman, | |
4.75%, 1/1/25 | | | 7,055 | | | | 6,267,412 | |
| | | | | | | | |
| | | | | | | 21,556,295 | |
| | | | | | | | |
|
| Distribution/Wholesale—0.5% | |
H&E Equipment Services, Inc., | |
5.625%, 9/1/25 | | | 8,070 | | | | 7,434,487 | |
| | | | | | | | |
| See accompanying Notes to Financial Statements | | | December 31, 2018 | | | Semiannual Report | | | 71 | |
Schedule of Investments
December 31, 2018 (unaudited)
| | | | | | | | |
| | | Principal
Amount
(000s) | | | Value | |
KAR Auction Services, Inc. (a)(b), | |
5.125%, 6/1/25 | | $ | 7,885 | | | $ | 7,155,638 | |
Univar USA, Inc. (a)(b), | |
6.75%, 7/15/23 | | | 4,455 | | | | 4,416,019 | |
| | | | | | | | |
| | | | | | | 19,006,144 | |
| | | | | | | | |
|
| Diversified Financial Services—1.4% | |
Ally Financial, Inc., | |
5.75%, 11/20/25 | | | 8,010 | | | | 7,999,987 | |
8.00%, 3/15/20 | | | 2,995 | | | | 3,107,313 | |
CCF Holdings LLC, PIK 10.75% (a)(b)(d)(f), | |
10.75%, 12/15/23 | | | 10,199 | | | | 4,971,639 | |
Community Choice Financial Issuer
LLC (a)(b), | |
9.00%, 6/15/23 | | | 12,000 | | | | 11,994,672 | |
Navient Corp., | |
6.625%, 7/26/21 | | | 820 | | | | 793,350 | |
7.25%, 9/25/23 | | | 7,655 | | | | 7,052,169 | |
Springleaf Finance Corp., | |
5.625%, 3/15/23 | | | 4,645 | | | | 4,296,625 | |
8.25%, 10/1/23 | | | 6,780 | | | | 7,000,350 | |
Travelport Corporate Finance PLC (a)(b), | |
6.00%, 3/15/26 | | | 5,030 | | | | 5,092,875 | |
| | | | | | | | |
| | | | | | | 52,308,980 | |
| | | | | | | | |
|
| Electric Utilities—0.5% | |
Calpine Corp., | |
5.75%, 1/15/25 | | | 6,140 | | | | 5,633,450 | |
NRG Energy, Inc., | |
5.75%, 1/15/28 | | | 9,190 | | | | 8,856,862 | |
6.25%, 5/1/24 | | | 1,938 | | | | 1,974,338 | |
Talen Energy Supply LLC, | |
6.50%, 6/1/25 | | | 3,365 | | | | 2,405,975 | |
| | | | | | | | |
| | | | | | | 18,870,625 | |
| | | | | | | | |
|
| Electronic Equipment, Instruments & Components—0.3% | |
Energizer Gamma Acquisition, Inc. (a)(b), | |
6.375%, 7/15/26 | | | 1,495 | | | | 1,375,400 | |
Energizer Holdings, Inc. (a)(b), | |
5.50%, 6/15/25 | | | 9,985 | | | | 9,036,425 | |
| | | | | | | | |
| | | | | | | 10,411,825 | |
| | | | | | | | |
|
| Electronics—0.2% | |
Sensata Technologies BV (a)(b), | |
5.625%, 11/1/24 | | | 5,810 | | | | 5,744,638 | |
| | | | | | | | |
|
| Engineering & Construction—0.6% | |
AECOM, | |
5.125%, 3/15/27 | | | 2,125 | | | | 1,827,500 | |
5.875%, 10/15/24 | | | 8,550 | | | | 8,453,813 | |
TopBuild Corp. (a)(b), | |
5.625%, 5/1/26 | | | 5,965 | | | | 5,487,800 | |
Tutor Perini Corp. (a)(b), | |
6.875%, 5/1/25 | | | 6,780 | | | | 6,322,350 | |
| | | | | | | | |
| | | | | | | 22,091,463 | |
| | | | | | | | |
|
| Entertainment—1.5% | |
AMC Entertainment Holdings, Inc., | |
6.125%, 5/15/27 | | | 8,420 | | | | 7,241,200 | |
Cedar Fair L.P., | |
5.375%, 6/1/24 | | | 5,900 | | | | 5,796,750 | |
5.375%, 4/15/27 | | | 2,465 | | | | 2,338,669 | |
Eldorado Resorts, Inc., | |
6.00%, 4/1/25 | | | 6,145 | | | | 5,958,438 | |
6.00%, 9/15/26 (a)(b) | | | 5,625 | | | | 5,329,687 | |
International Game Technology PLC (a)(b), | |
6.25%, 1/15/27 | | | 5,405 | | | | 5,198,934 | |
6.50%, 2/15/25 | | | 6,225 | | | | 6,162,750 | |
Live Nation Entertainment, Inc. (a)(b), | |
5.625%, 3/15/26 | | | 4,145 | | | | 4,062,100 | |
Scientific Games International, Inc. (a)(b), | |
5.00%, 10/15/25 | | | 7,280 | | | | 6,552,000 | |
Stars Group Holdings BV (a)(b), | |
7.00%, 7/15/26 | | | 9,065 | | | | 8,838,375 | |
| | | | | | | | |
| | | | | | | 57,478,903 | |
| | | | | | | | |
| | | | | | | | |
| | | Principal
Amount
(000s) | | | Value | |
|
| Equity Real Estate Investment Trusts (REITs)—0.5% | |
Crown Castle International Corp., | |
3.70%, 6/15/26 | | $ | 4,210 | | | $ | 4,005,542 | |
CyrusOne L.P., | |
5.00%, 3/15/24 | | | 5,425 | | | | 5,353,797 | |
5.375%, 3/15/27 | | | 2,565 | | | | 2,512,631 | |
Equinix, Inc., | |
5.375%, 5/15/27 | | | 4,700 | | | | 4,606,000 | |
Uniti Group L.P. (a)(b), | |
7.125%, 12/15/24 | | | 2,500 | | | | 2,062,500 | |
| | | | | | | | |
| | | | | | | 18,540,470 | |
| | | | | | | | |
|
| Food & Beverage—0.3% | |
B&G Foods, Inc., | |
5.25%, 4/1/25 | | | 1,415 | | | | 1,321,256 | |
Post Holdings, Inc. (a)(b), | |
5.75%, 3/1/27 | | | 9,655 | | | | 9,099,838 | |
| | | | | | | | |
| | | | | | | 10,421,094 | |
| | | | | | | | |
|
| Food Service—0.2% | |
Aramark Services, Inc. (a)(b), | |
5.00%, 2/1/28 | | | 9,360 | | | | 8,751,600 | |
| | | | | | | | |
|
| Healthcare Providers & Services—0.2% | |
WellCare Health Plans, Inc. (a)(b), | |
5.375%, 8/15/26 | | | 9,575 | | | | 9,263,813 | |
| | | | | | | | |
|
| Healthcare-Products—0.5% | |
Hill-Rom Holdings, Inc. (a)(b), | |
5.00%, 2/15/25 | | | 4,255 | | | | 4,063,525 | |
Hologic, Inc. (a)(b), | |
4.625%, 2/1/28 | | | 4,180 | | | | 3,782,900 | |
Mallinckrodt International Finance S.A. (a)(b), | |
5.75%, 8/1/22 | | | 4,280 | | | | 3,702,200 | |
Teleflex, Inc., | |
5.25%, 6/15/24 | | | 5,490 | | | | 5,490,000 | |
| | | | | | | | |
| | | | | | | 17,038,625 | |
| | | | | | | | |
|
| Healthcare-Services—1.7% | |
Centene Corp., | |
4.75%, 1/15/25 | | | 2,055 | | | | 1,967,662 | |
5.375%, 6/1/26 (a)(b) | | | 7,895 | | | | 7,697,625 | |
Charles River Laboratories International,
Inc. (a)(b), | |
5.50%, 4/1/26 | | | 5,340 | | | | 5,273,250 | |
Community Health Systems, Inc., | |
6.25%, 3/31/23 | | | 1,985 | | | | 1,811,412 | |
6.875%, 2/1/22 | | | 2,500 | | | | 1,150,000 | |
7.125%, 7/15/20 | | | 4,595 | | | | 3,882,775 | |
8.00%, 11/15/19 | | | 1,705 | | | | 1,628,275 | |
DaVita, Inc., | |
5.125%, 7/15/24 | | | 8,620 | | | | 8,102,800 | |
Encompass Health Corp., | |
5.75%, 11/1/24 | | | 8,345 | | | | 8,292,844 | |
HCA, Inc., | |
5.375%, 9/1/26 | | | 2,965 | | | | 2,890,875 | |
5.625%, 9/1/28 | | | 1,965 | | | | 1,901,138 | |
7.50%, 2/15/22 | | | 8,185 | | | | 8,717,025 | |
Tenet Healthcare Corp., | |
5.125%, 5/1/25 | | | 2,280 | | | | 2,131,800 | |
8.125%, 4/1/22 | | | 8,010 | | | | 8,060,062 | |
| | | | | | | | |
| | | | | | | 63,507,543 | |
| | | | | | | | |
|
| Home Builders—0.5% | |
Beazer Homes USA, Inc., | |
5.875%, 10/15/27 | | | 1,885 | | | | 1,498,575 | |
7.25%, 2/1/23 | | | 138 | | | | 129,030 | |
Brookfield Residential Properties, Inc. (a)(b), | |
6.125%, 7/1/22 | | | 4,765 | | | | 4,520,794 | |
6.50%, 12/15/20 | | | 6,050 | | | | 6,057,562 | |
KB Home, | |
8.00%, 3/15/20 | | | 3,905 | | | | 4,041,675 | |
Lennar Corp., | |
5.875%, 11/15/24 | | | 2,665 | | | | 2,674,994 | |
| | | | | | | | |
| | | | | | | 18,922,630 | |
| | | | | | | | |
| | | | | | | | |
| | | Principal
Amount
(000s) | | | Value | |
|
| Household Products/Wares—0.1% | |
Spectrum Brands, Inc., | |
5.75%, 7/15/25 | | $ | 4,725 | | | $ | 4,510,958 | |
| | | | | | | | |
|
| Insurance—0.3% | |
CNO Financial Group, Inc., | |
5.25%, 5/30/25 | | | 6,205 | | | | 5,929,653 | |
Prudential Financial, Inc., (converts to FRN on 9/15/28) (i), | |
5.70%, 9/15/48 | | | 4,550 | | | | 4,229,399 | |
| | | | | | | | |
| | | | | | | 10,159,052 | |
| | | | | | | | |
|
| Internet—0.8% | |
Match Group, Inc. (a)(b), | |
5.00%, 12/15/27 | | | 8,485 | | | | 7,827,412 | |
Netflix, Inc., | |
5.875%, 2/15/25 | | | 7,090 | | | | 7,169,763 | |
5.875%, 11/15/28 (a)(b) | | | 3,015 | | | | 2,945,444 | |
Symantec Corp. (a)(b), | |
5.00%, 4/15/25 | | | 5,390 | | | | 5,042,679 | |
Zayo Group LLC (a)(b), | |
5.75%, 1/15/27 | | | 7,975 | | | | 7,137,625 | |
| | | | | | | | |
| | | | | | | 30,122,923 | |
| | | | | | | | |
|
| Iron/Steel—0.3% | |
AK Steel Corp., | |
7.00%, 3/15/27 | | | 3,580 | | | | 2,810,300 | |
7.50%, 7/15/23 | | | 1,555 | | | | 1,551,112 | |
Steel Dynamics, Inc., | |
5.50%, 10/1/24 | | | 355 | | | | 352,338 | |
United States Steel Corp., | |
6.875%, 8/15/25 | | | 8,595 | | | | 7,907,400 | |
| | | | | | | | |
| | | | | | | 12,621,150 | |
| | | | | | | | |
|
| Leisure—0.1% | |
Viking Cruises Ltd. (a)(b), | |
5.875%, 9/15/27 | | | 2,100 | | | | 1,963,500 | |
| | | | | | | | |
|
| Lodging—0.7% | |
Hilton Domestic Operating Co., Inc. (a)(b), | |
5.125%, 5/1/26 | | | 6,795 | | | | 6,540,187 | |
Hilton Worldwide Finance LLC, | |
4.625%, 4/1/25 | | | 3,145 | | | | 2,987,750 | |
MGM Resorts International, | |
6.00%, 3/15/23 | | | 4,500 | | | | 4,533,750 | |
Wyndham Hotels & Resorts, Inc. (a)(b), | |
5.375%, 4/15/26 | | | 7,110 | | | | 6,861,150 | |
Wynn Las Vegas LLC (a)(b), | |
5.50%, 3/1/25 | | | 6,405 | | | | 5,988,675 | |
| | | | | | | | |
| | | | | | | 26,911,512 | |
| | | | | | | | |
|
| Machinery-Construction & Mining—0.2% | |
Terex Corp. (a)(b), | |
5.625%, 2/1/25 | | | 7,570 | | | | 7,059,025 | |
| | | | | | | | |
|
| Machinery-Diversified—0.2% | |
Mueller Water Products, Inc. (a)(b), | |
5.50%, 6/15/26 | | | 5,165 | | | | 5,022,962 | |
Tennant Co., | |
5.625%, 5/1/25 | | | 3,645 | | | | 3,453,638 | |
| | | | | | | | |
| | | | | | | 8,476,600 | |
| | | | | | | | |
|
| Media—2.5% | |
Cablevision Systems Corp., | |
8.00%, 4/15/20 | | | 6,250 | | | | 6,343,750 | |
CCO Holdings LLC, | |
5.125%, 5/1/27 (a)(b) | | | 1,625 | | | | 1,517,588 | |
5.50%, 5/1/26 (a)(b) | | | 6,460 | | | | 6,225,825 | |
5.75%, 1/15/24 | | | 6,915 | | | | 6,897,712 | |
Clear Channel Worldwide Holdings, Inc., Ser. B, | |
6.50%, 11/15/22 | | | 9,610 | | | | 9,658,050 | |
CSC Holdings LLC, | |
6.75%, 11/15/21 | | | 2,075 | | | | 2,132,063 | |
7.75%, 7/15/25 (a)(b) | | | 6,160 | | | | 6,283,200 | |
10.875%, 10/15/25 (a)(b) | | | 5,455 | | | | 6,139,166 | |
| | | | | | |
| 72 | | Semiannual Report | | | December 31, 2018 | | | See accompanying Notes to Financial Statements |
Schedule of Investments
December 31, 2018 (unaudited)
| | | | | | | | |
| | | Principal
Amount
(000s) | | | Value | |
DISH DBS Corp., | |
5.875%, 7/15/22 | | $ | 4,880 | | | $ | 4,507,900 | |
6.75%, 6/1/21 | | | 8,250 | | | | 8,185,650 | |
Gray Television, Inc. (a)(b), | |
5.875%, 7/15/26 | | | 9,250 | | | | 8,646,900 | |
LiveStyle, Inc., (cost—$7,083,190; purchased 1/31/14-10/7/15) (a)(b)(c)(d)(f)(h)(l), | |
9.625%, 2/1/19 | | | 7,628 | | | | 153 | |
Meredith Corp. (a)(b), | |
6.875%, 2/1/26 | | | 7,925 | | | | 7,786,312 | |
Nexstar Broadcasting, Inc., | |
5.625%, 8/1/24 (a)(b) | | | 6,765 | | | | 6,342,187 | |
5.875%, 11/15/22 | | | 5,755 | | | | 5,755,000 | |
Sinclair Television Group, Inc., | |
6.125%, 10/1/22 | | | 1,000 | | | | 1,010,000 | |
Sirius XM Radio, Inc. (a)(b), | |
5.00%, 8/1/27 | | | 8,140 | | | | 7,468,450 | |
| | | | | | | | |
| | | | | | | 94,899,906 | |
| | | | | | | | |
|
| Metal Fabricate/Hardware—0.1% | |
Park-Ohio Industries, Inc., | |
6.625%, 4/15/27 | | | 3,790 | | | | 3,619,450 | |
| | | | | | | | |
|
| Mining—0.9% | |
Alcoa Nederland Holding BV (a)(b), | |
6.125%, 5/15/28 | | | 3,060 | | | | 2,937,600 | |
6.75%, 9/30/24 | | | 4,605 | | | | 4,697,100 | |
7.00%, 9/30/26 | | | 950 | | | | 973,750 | |
Constellium NV (a)(b), | |
6.625%, 3/1/25 | | | 6,930 | | | | 6,444,900 | |
Freeport-McMoRan, Inc., | |
3.55%, 3/1/22 | | | 1,030 | | | | 977,213 | |
3.875%, 3/15/23 | | | 9,250 | | | | 8,579,375 | |
Hudbay Minerals, Inc. (a)(b), | |
7.25%, 1/15/23 | | | 1,515 | | | | 1,503,637 | |
7.625%, 1/15/25 | | | 4,965 | | | | 4,878,112 | |
Joseph T. Ryerson & Son, Inc. (a)(b), | |
11.00%, 5/15/22 | | | 1,500 | | | | 1,515,000 | |
| | | | | | | | |
| | | | | | | 32,506,687 | |
| | | | | | | | |
|
| Miscellaneous Manufacturing—0.1% | |
Koppers, Inc. (a)(b), | |
6.00%, 2/15/25 | | | 6,095 | | | | 5,394,075 | |
| | | | | | | | |
|
| Oil, Gas & Consumable Fuels—2.9% | |
AmeriGas Partners L.P., | |
5.875%, 8/20/26 | | | 6,865 | | | | 6,298,638 | |
Callon Petroleum Co., | |
6.125%, 10/1/24 | | | 4,820 | | | | 4,506,700 | |
Calumet Specialty Products Partners L.P., | |
6.50%, 4/15/21 | | | 9,925 | | | | 8,312,187 | |
Carrizo Oil & Gas, Inc., | |
6.25%, 4/15/23 | | | 8,625 | | | | 8,021,250 | |
Chesapeake Energy Corp., | |
6.625%, 8/15/20 | | | 6,055 | | | | 5,888,488 | |
8.00%, 1/15/25 | | | 5,415 | | | | 4,805,813 | |
CNX Resources Corp., | |
5.875%, 4/15/22 | | | 5,530 | | | | 5,322,625 | |
Cobalt International Energy, Inc. (b)(c)(d)(f), | |
7.75%, 12/1/23 | | | 9,216 | | | | 645,120 | |
Continental Resources, Inc., | |
5.00%, 9/15/22 | | | 1,043 | | | | 1,035,178 | |
CVR Refining LLC, | |
6.50%, 11/1/22 | | | 5,550 | | | | 5,494,500 | |
Ensco PLC, | |
5.20%, 3/15/25 | | | 1,295 | | | | 867,650 | |
7.75%, 2/1/26 | | | 6,520 | | | | 4,857,400 | |
EP Energy LLC, | |
9.375%, 5/1/20 | | | 8,765 | | | | 6,902,437 | |
Nabors Industries, Inc., | |
5.75%, 2/1/25 | | | 1,910 | | | | 1,451,320 | |
Noble Holding International Ltd., | |
7.75%, 1/15/24 | | | 6,955 | | | | 5,442,288 | |
| | | | | | | | |
| | | Principal
Amount
(000s) | | | Value | |
Oasis Petroleum, Inc., | |
6.875%, 3/15/22 | | $ | 6,745 | | | $ | 6,441,475 | |
Range Resources Corp., | |
4.875%, 5/15/25 | | | 7,750 | | | | 6,393,750 | |
Sable Permian Resources Land LLC (a)(b), | |
7.375%, 11/1/21 | | | 5,000 | | | | 1,225,000 | |
Sanchez Energy Corp., | |
6.125%, 1/15/23 | | | 6,240 | | | | 1,154,400 | |
SM Energy Co., | |
6.625%, 1/15/27 | | | 7,360 | | | | 6,587,200 | |
Sunoco L.P., | |
5.50%, 2/15/26 | | | 4,605 | | | | 4,374,750 | |
5.875%, 3/15/28 | | | 4,030 | | | | 3,779,656 | |
Talos Production LLC (a), | |
11.00%, 4/3/22 | | | 1,168 | | | | 1,125,594 | |
Transocean, Inc. (a)(b), | |
7.50%, 1/15/26 | | | 8,445 | | | | 7,452,712 | |
Weatherford International Ltd., | |
8.25%, 6/15/23 | | | 2,170 | | | | 1,318,275 | |
| | | | | | | | |
| | | | | | | 109,704,406 | |
| | | | | | | | |
|
| Paper & Forest Products—0.2% | |
Mercer International, Inc., | |
5.50%, 1/15/26 | | | 5,370 | | | | 4,833,000 | |
7.375%, 1/15/25 (a)(b) | | | 2,825 | | | | 2,825,000 | |
| | | | | | | | |
| | | | | | | 7,658,000 | |
| | | | | | | | |
|
| Pharmaceuticals—0.9% | |
Bausch Health Cos., Inc. (a)(b), | |
6.125%, 4/15/25 | | | 10,315 | | | | 9,025,625 | |
7.00%, 3/15/24 | | | 7,845 | | | | 7,943,062 | |
Endo Finance LLC (a)(b), | |
5.375%, 1/15/23 | | | 8,230 | | | | 6,295,950 | |
Horizon Pharma USA, Inc., | |
6.625%, 5/1/23 | | | 8,115 | | | | 7,871,550 | |
8.75%, 11/1/24 (a)(b) | | | 1,370 | | | | 1,397,400 | |
| | | | | | | | |
| | | | | | | 32,533,587 | |
| | | | | | | | |
|
| Pipelines—0.6% | |
Cheniere Energy Partners L.P. (a)(b), | |
5.625%, 10/1/26 | | | 8,410 | | | | 7,884,375 | |
Crestwood Midstream Partners L.P., | |
5.75%, 4/1/25 | | | 8,310 | | | | 7,749,075 | |
Energy Transfer L.P., | |
5.875%, 1/15/24 | | | 4,596 | | | | 4,703,454 | |
Sabine Pass Liquefaction LLC, | |
5.75%, 5/15/24 | | | 1,000 | | | | 1,050,435 | |
| | | | | | | | |
| | | | | | | 21,387,339 | |
| | | | | | | | |
|
| Real Estate—0.6% | |
Equinix, Inc., | |
5.375%, 1/1/22 | | | 3,220 | | | | 3,252,200 | |
Iron Mountain, Inc. (a)(b), | |
4.875%, 9/15/27 | | | 5,525 | | | | 4,848,188 | |
Kennedy-Wilson, Inc., | |
5.875%, 4/1/24 | | | 10,198 | | | | 9,586,120 | |
Uniti Group L.P., | |
8.25%, 10/15/23 | | | 6,445 | | | | 5,639,375 | |
| | | | | | | | |
| | | | | | | 23,325,883 | |
| | | | | | | | |
|
| Retail—1.3% | |
1011778 BC ULC (a)(b), | |
5.00%, 10/15/25 | | | 10,990 | | | | 10,138,275 | |
Beacon Roofing Supply, Inc. (a)(b), | |
4.875%, 11/1/25 | | | 7,725 | | | | 6,817,312 | |
Conn’s, Inc., | |
7.25%, 7/15/22 | | | 10,370 | | | | 10,058,900 | |
KFC Holding Co. (a)(b), | |
4.75%, 6/1/27 | | | 7,310 | | | | 6,816,575 | |
L Brands, Inc., | |
6.875%, 11/1/35 | | | 2,655 | | | | 2,230,731 | |
Men’s Wearhouse, Inc., | |
7.00%, 7/1/22 | | | 4,023 | | | | 4,063,230 | |
| | | | | | | | |
| | | Principal
Amount
(000s) | | | Value | |
Neiman Marcus Group Ltd. LLC (a)(b), | |
8.00%, 10/15/21 | | $ | 6,810 | | | $ | 2,843,175 | |
Party City Holdings, Inc. (a)(b), | |
6.625%, 8/1/26 | | | 6,605 | | | | 6,027,063 | |
| | | | | | | | |
| | | | | | | 48,995,261 | |
| | | | | | | | |
|
| Semiconductors—0.9% | |
Advanced Micro Devices, Inc., | |
7.00%, 7/1/24 | | | 4,500 | | | | 4,635,000 | |
7.50%, 8/15/22 | | | 2,670 | | | | 2,870,250 | |
Amkor Technology, Inc., | |
6.375%, 10/1/22 | | | 5,710 | | | | 5,740,263 | |
Broadcom Corp., | |
3.875%, 1/15/27 | | | 7,955 | | | | 7,147,380 | |
Entegris, Inc. (a)(b), | |
4.625%, 2/10/26 | | | 2,125 | | | | 1,965,625 | |
Qorvo, Inc., | |
5.50%, 7/15/26 (a)(b) | | | 3,810 | | | | 3,648,075 | |
7.00%, 12/1/25 | | | 6,200 | | | | 6,595,250 | |
| | | | | | | | |
| | | | | | | 32,601,843 | |
| | | | | | | | |
|
| Software—0.8% | |
Camelot Finance S.A. (a)(b), | |
7.875%, 10/15/24 | | | 6,185 | | | | 6,013,366 | |
First Data Corp. (a)(b), | |
5.75%, 1/15/24 | | | 5,470 | | | | 5,362,460 | |
j2 Cloud Services LLC (a)(b), | |
6.00%, 7/15/25 | | | 7,965 | | | | 7,815,657 | |
MSCI, Inc. (a)(b), | |
5.25%, 11/15/24 | | | 1,675 | | | | 1,675,000 | |
5.375%, 5/15/27 | | | 6,725 | | | | 6,598,906 | |
Open Text Corp. (a)(b), | |
5.625%, 1/15/23 | | | 870 | | | | 870,000 | |
Rackspace Hosting, Inc. (a)(b), | |
8.625%, 11/15/24 | | | 3,120 | | | | 2,441,400 | |
| | | | | | | | |
| | | | | | | 30,776,789 | |
| | | | | | | | |
|
| Telecommunications—3.3% | |
CenturyLink, Inc., | |
6.45%, 6/15/21, Ser. S | | | 3,275 | | | | 3,279,094 | |
6.75%, 12/1/23, Ser. W | | | 2,000 | | | | 1,932,500 | |
7.50%, 4/1/24, Ser. Y | | | 9,535 | | | | 9,296,625 | |
Cincinnati Bell, Inc. (a)(b), | |
7.00%, 7/15/24 | | | 8,170 | | | | 6,781,100 | |
CommScope Technologies LLC (a)(b), | |
5.00%, 3/15/27 | | | 4,460 | | | | 3,623,750 | |
6.00%, 6/15/25 | | | 5,940 | | | | 5,435,100 | |
Consolidated Communications, Inc., | |
6.50%, 10/1/22 | | | 7,565 | | | | 6,695,025 | |
Frontier Communications Corp., | |
10.50%, 9/15/22 | | | 9,315 | | | | 6,520,500 | |
GTT Communications, Inc. (a)(b), | |
7.875%, 12/31/24 | | | 5,945 | | | | 5,172,150 | |
Hughes Satellite Systems Corp., | |
6.625%, 8/1/26 | | | 7,125 | | | | 6,546,094 | |
7.625%, 6/15/21 | | | 7,440 | | | | 7,737,600 | |
Intelsat Connect Finance S.A. (a)(b), | |
9.50%, 2/15/23 | | | 3,195 | | | | 2,763,675 | |
Intelsat Jackson Holdings S.A., | |
5.50%, 8/1/23 | | | 8,720 | | | | 7,673,600 | |
9.75%, 7/15/25 (a)(b) | | | 1,500 | | | | 1,511,700 | |
Level 3 Financing, Inc., | |
5.375%, 5/1/25 | | | 8,420 | | | | 7,914,800 | |
Sprint Capital Corp., | |
6.875%, 11/15/28 | | | 6,890 | | | | 6,528,275 | |
Sprint Communications, Inc., | |
6.00%, 11/15/22 | | | 2,615 | | | | 2,572,715 | |
11.50%, 11/15/21 | | | 7,890 | | | | 8,974,875 | |
Sprint Corp., | |
7.125%, 6/15/24 | | | 2,250 | | | | 2,235,510 | |
7.625%, 3/1/26 | | | 5,530 | | | | 5,474,700 | |
T-Mobile USA, Inc., | |
4.50%, 2/1/26 | | | 1,545 | | | | 1,423,331 | |
| | | | | | | | |
| See accompanying Notes to Financial Statements | | | December 31, 2018 | | | Semiannual Report | | | 73 | |
Schedule of Investments
December 31, 2018 (unaudited)
| | | | | | | | |
| | | Principal
Amount
(000s) | | | Value | |
4.75%, 2/1/28 | | $ | 5,410 | | | $ | 4,916,338 | |
6.50%, 1/15/26 | | | 3,760 | | | | 3,844,600 | |
Windstream Services LLC (a)(b), | |
6.375%, 8/1/23 | | | 7,464 | | | | 3,172,200 | |
| | | | | | | | |
| | | | | | | 122,025,857 | |
| | | | | | | | |
|
| Transportation—0.2% | |
XPO Logistics, Inc. (a)(b), | |
6.125%, 9/1/23 | | | 2,705 | | | | 2,613,706 | |
6.50%, 6/15/22 | | | 3,184 | | | | 3,168,080 | |
| | | | | | | | |
| | | | | | | 5,781,786 | |
| | | | | | | | |
Total Corporate Bonds & Notes
(cost—$1,343,853,529) | | | | 1,205,515,848 | |
| | | | | | | | |
| | | | | | | | |
|
| Convertible Bonds & Notes—27.4% | |
|
| Aerospace & Defense—0.1% | |
Arconic, Inc., | |
1.625%, 10/15/19 | | | 4,715 | | | | 4,703,213 | |
| | | | | | | | |
|
| Apparel & Textiles—0.0% | |
Iconix Brand Group, Inc., | |
5.75%, 8/15/23 | | | 4,185 | | | | 1,747,656 | |
| | | | | | | | |
|
| Auto Components—0.1% | |
Meritor, Inc., | |
3.25%, 10/15/37 | | | 5,405 | | | | 4,732,726 | |
| | | | | | | | |
|
| Auto Manufacturers—0.5% | |
Navistar International Corp., | |
4.75%, 4/15/19 | | | 1,540 | | | | 1,539,986 | |
Tesla, Inc., | |
0.25%, 3/1/19 | | | 6,820 | | | | 7,102,396 | |
1.25%, 3/1/21 | | | 5,005 | | | | 5,634,684 | |
2.375%, 3/15/22 | | | 2,425 | | | | 2,948,412 | |
| | | | | | | | |
| | | | | | | 17,225,478 | |
| | | | | | | | |
|
| Banks—0.5% | |
BofA Finance LLC, (f), | |
0.25%, 5/1/23 | | | 1,000 | | | | 882,500 | |
Deutsche Bank AG, (f), | |
1.00%, 5/1/23 | | | 17,460 | | | | 15,975,701 | |
| | | | | | | | |
| | | | | | | 16,858,201 | |
| | | | | | | | |
|
| Biotechnology—2.2% | |
Aegerion Pharmaceuticals, Inc., | |
2.00%, 8/15/19 | | | 5,270 | | | | 3,998,612 | |
Alder Biopharmaceuticals, Inc., | |
2.50%, 2/1/25 | | | 1,785 | | | | 1,428,330 | |
AMAG Pharmaceuticals, Inc., | |
3.25%, 6/1/22 | | | 2,025 | | | | 1,856,243 | |
BioMarin Pharmaceutical, Inc., | |
0.599%, 8/1/24 | | | 3,260 | | | | 3,249,891 | |
1.50%, 10/15/20 | | | 4,830 | | | | 5,385,450 | |
Exact Sciences Corp., | |
1.00%, 1/15/25 | | | 11,105 | | | | 12,222,163 | |
Illumina,
Inc. (a)(b), | | | | | | | | |
zero coupon, 8/15/23 | | | 18,790 | | | | 19,367,830 | |
Insmed, Inc., | |
1.75%, 1/15/25 | | | 2,220 | | | | 1,589,515 | |
Intercept Pharmaceuticals, Inc., | |
3.25%, 7/1/23 | | | 5,500 | | | | 5,095,068 | |
Ionis Pharmaceuticals, Inc., | |
1.00%, 11/15/21 | | | 7,515 | | | | 8,079,399 | |
Ligand Pharmaceuticals, Inc. (a)(b), | |
0.75%, 5/15/23 | | | 10,535 | | | | 9,355,175 | |
Medicines Co., | |
2.50%, 1/15/22 | | | 1,140 | | | | 983,753 | |
2.75%, 7/15/23 | | | 905 | | | | 686,574 | |
Omeros Corp. (a)(b), | |
6.25%, 11/15/23 | | | 3,000 | | | | 2,629,260 | |
PTC Therapeutics, Inc., | |
3.00%, 8/15/22 | | | 1,000 | | | | 1,001,250 | |
| | | | | | | | |
| | | Principal
Amount
(000s) | | | Value | |
Radius Health, Inc., | |
3.00%, 9/1/24 | | $ | 1,200 | | | $ | 925,500 | |
Verastem, Inc., | |
5.00%, 11/1/48 | | | 5,910 | | | | 4,637,985 | |
| | | | | | | | |
| | | | | | | 82,491,998 | |
| | | | | | | | |
|
| Building Materials—0.0% | |
Patrick Industries, Inc. (a)(b), | |
1.00%, 2/1/23 | | | 1,015 | | | | 771,942 | |
| | | | | | | | |
|
| Commercial Services—1.0% | |
Cardtronics, Inc., | |
1.00%, 12/1/20 | | | 3,000 | | | | 2,789,760 | |
Euronet Worldwide, Inc., | |
1.50%, 10/1/44 | | | 500 | | | | 711,529 | |
Huron Consulting Group, Inc., | |
1.25%, 10/1/19 | | | 7,480 | | | | 7,366,977 | |
Macquarie Infrastructure Corp., | |
2.00%, 10/1/23 | | | 5,410 | | | | 4,694,787 | |
2.875%, 7/15/19 | | | 5,500 | | | | 5,479,463 | |
Square, Inc., | |
0.375%, 3/1/22 | | | 225 | | | | 550,397 | |
0.50%, 5/15/23 (a)(b) | | | 14,725 | | | | 15,359,662 | |
| | | | | | | | |
| | | | | | | 36,952,575 | |
| | | | | | | | |
|
| Computers—0.8% | |
Lumentum Holdings, Inc., | |
0.25%, 3/15/24 | | | 6,920 | | | | 6,977,124 | |
Nutanix, Inc. (a)(b), | |
zero coupon, 1/15/23 | | | 6,245 | | | | 6,854,225 | |
Pure Storage, Inc. (a)(b), | |
0.125%, 4/15/23 | | | 6,250 | | | | 5,836,250 | |
Rapid7, Inc. (a)(b), | |
1.25%, 8/1/23 | | | 550 | | | | 558,489 | |
Western Digital Corp. (a)(b), | |
1.50%, 2/1/24 | | | 10,920 | | | | 8,876,879 | |
| | | | | | | | |
| | | | | | | 29,102,967 | |
| | | | | | | | |
|
| Diversified Financial Services—0.5% | |
Encore Capital Group, Inc., | |
2.875%, 3/15/21 | | | 6,960 | | | | 5,812,623 | |
3.00%, 7/1/20 | | | 1,215 | | | | 1,102,388 | |
JPMorgan Chase Financial Co. LLC (a)(b), | |
0.25%, 5/1/23 | | | 7,590 | | | | 6,883,371 | |
LendingTree, Inc., | |
0.625%, 6/1/22 | | | 3,680 | | | | 4,578,987 | |
| | | | | | | | |
| | | | | | | 18,377,369 | |
| | | | | | | | |
|
| Electric Utilities—0.3% | |
NRG Energy, Inc. (a)(b), | |
2.75%, 6/1/48 | | | 9,615 | | | | 10,378,239 | |
| | | | | | | | |
|
| Electrical Equipment—0.0% | |
SunPower Corp., | |
4.00%, 1/15/23 | | | 1,360 | | | | 1,097,487 | |
| | | | | | | | |
|
| Electronics—0.3% | |
II-VI, Inc., | |
0.25%, 9/1/22 | | | 2,290 | | | | 2,236,389 | |
OSI Systems, Inc., | |
1.25%, 9/1/22 | | | 6,645 | | | | 6,192,701 | |
Vishay Intertechnology, Inc. (a)(b), | |
2.25%, 6/15/25 | | | 895 | | | | 793,950 | |
| | | | | | | | |
| | | | | | | 9,223,040 | |
| | | | | | | | |
|
| Energy-Alternate Sources—0.4% | |
NextEra Energy Partners L.P. (a)(b), | |
1.50%, 9/15/20 | | | 4,800 | | | | 4,614,423 | |
SunEdison, Inc. (a)(b)(c)(d)(f), | |
0.25%, 1/15/20 | | | 9,565 | | | | 215,213 | |
2.625%, 6/1/23 | | | 11,270 | | | | 253,575 | |
3.375%, 6/1/25 | | | 4,565 | | | | 102,712 | |
Tesla Energy Operations, Inc., | |
1.625%, 11/1/19 | | | 10,475 | | | | 9,831,709 | |
| | | | | | | | |
| | | | | | | 15,017,632 | |
| | | | | | | | |
| | | | | | | | |
| | | Principal
Amount
(000s) | | | Value | |
|
| Engineering & Construction—0.2% | |
Dycom Industries, Inc., | |
0.75%, 9/15/21 | | $ | 6,890 | | | $ | 6,431,657 | |
KBR, Inc. (a)(b), | |
2.50%, 11/1/23 | | | 3,110 | | | | 2,780,486 | |
| | | | | | | | |
| | | | | | | 9,212,143 | |
| | | | | | | | |
|
| Entertainment—0.3% | |
Live Nation Entertainment, Inc. (a)(b), | |
2.50%, 3/15/23 | | | 8,605 | | | | 8,783,433 | |
Marriott Vacations Worldwide Corp., | |
1.50%, 9/15/22 | | | 3,230 | | | | 2,787,209 | |
| | | | | | | | |
| | | | | | | 11,570,642 | |
| | | | | | | | |
|
| Equity Real Estate Investment Trusts (REITs)—0.5% | |
Apollo Commercial Real Estate Finance, Inc., | |
5.375%, 10/15/23 | | | 4,850 | | | | 4,669,536 | |
Extra Space Storage L.P. (a)(b), | |
3.125%, 10/1/35 | | | 7,020 | | | | 7,609,470 | |
Spirit Realty Capital, Inc., | |
3.75%, 5/15/21 | | | 1,200 | | | | 1,176,810 | |
Starwood Property Trust, Inc., | |
4.375%, 4/1/23 | | | 1,620 | | | | 1,607,803 | |
Two Harbors Investment Corp., | |
6.25%, 1/15/22 | | | 3,000 | | | | 2,937,486 | |
| | | | | | | | |
| | | | | | | 18,001,105 | |
| | | | | | | | |
|
| Healthcare-Products—0.7% | |
Insulet Corp. (a)(b), | |
1.375%, 11/15/24 | | | 5,780 | | | | 6,152,897 | |
NuVasive, Inc., | |
2.25%, 3/15/21 | | | 8,065 | | | | 8,508,212 | |
Wright Medical Group, Inc. (a)(b), | |
1.625%, 6/15/23 | | | 9,613 | | | | 9,837,386 | |
| | | | | | | | |
| | | | | | | 24,498,495 | |
| | | | | | | | |
|
| Healthcare-Services—0.3% | |
Anthem, Inc., | |
2.75%, 10/15/42 | | | 2,495 | | | | 9,034,095 | |
Teladoc Health, Inc. (a)(b), | |
1.375%, 5/15/25 | | | 1,575 | | | | 1,849,641 | |
| | | | | | | | |
| | | | | | | 10,883,736 | |
| | | | | | | | |
|
| Home Builders—0.1% | |
KB Home, | |
1.375%, 2/1/19 | | | 3,195 | | | | 3,187,006 | |
| | | | | | | | |
|
| Insurance—0.2% | |
AXA S.A. (a)(b), | |
7.25%, 5/15/21 | | | 8,235 | | | | 7,195,792 | |
| | | | | | | | |
|
| Internet—4.3% | |
Boingo Wireless, Inc. (a)(b), | |
1.00%, 10/1/23 | | | 2,460 | | | | 2,088,909 | |
Booking Holdings, Inc., | |
0.35%, 6/15/20 | | | 3,125 | | | | 4,216,762 | |
0.90%, 9/15/21 | | | 13,575 | | | | 15,014,452 | |
Ctrip.com International Ltd., | |
1.25%, 9/15/22 | | | 10,635 | | | | 10,309,526 | |
Etsy, Inc. (a)(b), | | | | | | | | |
zero coupon, 3/1/23 | | | 1,980 | | | | 2,874,713 | |
FireEye, Inc., | |
0.875%, 6/1/24 (a)(b) | | | 6,780 | | | | 6,833,508 | |
1.00%, 6/1/35, Ser. A | | | 4,035 | | | | 3,878,676 | |
1.625%, 6/1/35, Ser. B | | | 4,650 | | | | 4,247,761 | |
IAC FinanceCo., Inc. (a)(b), | |
0.875%, 10/1/22 | | | 6,975 | | | | 9,282,142 | |
Liberty Expedia Holdings, Inc. (a)(b), | |
1.00%, 6/30/47 | | | 5,580 | | | | 5,347,041 | |
MercadoLibre, Inc. (a)(b), | |
2.00%, 8/15/28 | | | 7,370 | | | | 6,651,425 | |
Okta, Inc. (a)(b), | |
0.25%, 2/15/23 | | | 3,410 | | | | 4,985,304 | |
| | | | | | |
| 74 | | Semiannual Report | | | December 31, 2018 | | | See accompanying Notes to Financial Statements |
Schedule of Investments
December 31, 2018 (unaudited)
| | | | | | | | |
| | | Principal
Amount
(000s) | | | Value | |
Palo Alto Networks, Inc. (a)(b), | |
0.75%, 7/1/23 | | $ | 17,235 | | | $ | 17,131,400 | |
Q2 Holdings, Inc. (a)(b), | |
0.75%, 2/15/23 | | | 1,005 | | | | 1,052,794 | |
RingCentral,
Inc. (a)(b), | | | | | | | | |
zero coupon, 3/15/23 | | | 3,595 | | | | 4,272,194 | |
Twilio, Inc. (a)(b), | |
0.25%, 6/1/23 | | | 5,405 | | | | 7,729,318 | |
Twitter, Inc., | |
0.25%, 6/15/24 (a)(b) | | | 11,865 | | | | 10,370,283 | |
1.00%, 9/15/21 | | | 9,690 | | | | 8,861,805 | |
Vipshop Holdings Ltd., | |
1.50%, 3/15/19 | | | 8,515 | | | | 8,408,562 | |
Wayfair, Inc. (a)(b), | |
1.125%, 11/1/24 | | | 1,690 | | | | 1,724,880 | |
Weibo Corp. (a)(b), | |
1.25%, 11/15/22 | | | 6,415 | | | | 5,860,936 | |
Wix.com Ltd. (a)(b), | | | | | | | | |
zero coupon, 7/1/23 | | | 4,935 | | | | 4,681,780 | |
Zendesk, Inc. (a)(b), | |
0.25%, 3/15/23 | | | 5,330 | | | | 6,056,916 | |
Zillow Group, Inc., | |
1.50%, 7/1/23 | | | 3,365 | | | | 2,907,424 | |
2.00%, 12/1/21 | | | 4,020 | | | | 3,926,447 | |
| | | | | | | | |
| | | | | | | 158,714,958 | |
| | | | | | | | |
|
| Iron/Steel—0.1% | |
Allegheny Technologies, Inc., | |
4.75%, 7/1/22 | | | 1,275 | | | | 2,145,330 | |
Cleveland-Cliffs, Inc., | |
1.50%, 1/15/25 | | | 1,230 | | | | 1,372,615 | |
| | | | | | | | |
| | | | | | | 3,517,945 | |
| | | | | | | | |
|
| Lodging—0.3% | |
Caesars Entertainment Corp., | |
5.00%, 10/1/24 | | | 9,620 | | | | 11,965,029 | |
| | | | | | | | |
|
| Machinery-Diversified—0.1% | |
Chart Industries, Inc. (a)(b), | |
1.00%, 11/15/24 | | | 2,740 | | | | 3,413,629 | |
| | | | | | | | |
|
| Media—1.3% | |
DISH Network Corp., | |
2.375%, 3/15/24 | | | 13,010 | | | | 10,406,907 | |
3.375%, 8/15/26 | | | 9,755 | | | | 7,901,706 | |
Liberty Interactive LLC (a)(b), | |
1.75%, 9/30/46 | | | 8,700 | | | | 8,927,940 | |
Liberty Media Corp., | |
1.00%, 1/30/23 | | | 5,425 | | | | 5,600,879 | |
1.375%, 10/15/23 | | | 7,875 | | | | 8,452,238 | |
2.125%, 3/31/48 (a)(b) | | | 7,620 | | | | 7,201,814 | |
2.25%, 9/30/46 | | | 2,580 | | | | 1,227,048 | |
| | | | | | | | |
| | | | | | | 49,718,532 | |
| | | | | | | | |
|
| Mining—0.0% | |
Royal Gold, Inc., | |
2.875%, 6/15/19 | | | 500 | | | | 503,770 | |
| | | | | | | | |
|
| Oil, Gas & Consumable Fuels—1.1% | |
Bristow Group, Inc., | |
4.50%, 6/1/23 | | | 1,625 | | | | 637,813 | |
Chesapeake Energy Corp., | |
5.50%, 9/15/26 | | | 13,655 | | | | 11,024,528 | |
Ensco Jersey Finance Ltd., | |
3.00%, 1/31/24 | | | 7,710 | | | | 5,117,621 | |
Helix Energy Solutions Group, Inc., | |
4.25%, 5/1/22 | | | 2,510 | | | | 2,328,793 | |
Nabors Industries, Inc., | |
0.75%, 1/15/24 | | | 8,145 | | | | 5,042,447 | |
Oasis Petroleum, Inc., | |
2.625%, 9/15/23 | | | 7,990 | | | | 7,044,072 | |
Oil States International, Inc. (a)(b), | |
1.50%, 2/15/23 | | | 2,450 | | | | 2,020,319 | |
Transocean, Inc., | |
0.50%, 1/30/23 | | | 5,325 | | | | 5,058,079 | |
| | | | | | | | |
| | | Principal
Amount
(000s) | | | Value | |
Weatherford International Ltd., | |
5.875%, 7/1/21 | | $ | 6,780 | | | $ | 4,318,480 | |
| | | | | | | | |
| | | | | | | 42,592,152 | |
| | | | | | | | |
|
| Pharmaceuticals—2.1% | |
Clovis Oncology, Inc., | |
1.25%, 5/1/25 | | | 4,440 | | | | 3,121,093 | |
2.50%, 9/15/21 | | | 4,020 | | | | 3,376,535 | |
Dermira, Inc., | |
3.00%, 5/15/22 | | | 3,225 | | | | 2,499,917 | |
DexCom, Inc., | |
0.75%, 5/15/22 | | | 4,020 | | | | 5,432,379 | |
0.75%, 12/1/23 (a)(b) | | | 6,160 | | | | 6,237,339 | |
Flexion Therapeutics, Inc., | |
3.375%, 5/1/24 | | | 2,670 | | | | 2,208,835 | |
Herbalife Nutrition Ltd. (a)(b), | |
2.625%, 3/15/24 | | | 8,295 | | | | 9,330,208 | |
Horizon Pharma Investment Ltd., | |
2.50%, 3/15/22 | | | 1,905 | | | | 1,903,762 | |
Jazz Investments I Ltd., | |
1.50%, 8/15/24 | | | 6,195 | | | | 5,624,577 | |
1.875%, 8/15/21 | | | 9,950 | | | | 9,674,166 | |
Neurocrine Biosciences, Inc., | |
2.25%, 5/15/24 | | | 6,250 | | | | 7,476,450 | |
Pacira Pharmaceuticals, Inc., | |
2.375%, 4/1/22 | | | 4,420 | | | | 4,395,137 | |
Sarepta Therapeutics, Inc. (a)(b), | |
1.50%, 11/15/24 | | | 1,800 | | | | 3,014,761 | |
Supernus Pharmaceuticals, Inc. (a)(b), | |
0.625%, 4/1/23 | | | 5,605 | | | | 5,296,725 | |
Teva Pharmaceutical Finance Co. LLC, Ser. C, | |
0.25%, 2/1/26 | | | 7,285 | | | | 6,611,137 | |
Tilray, Inc. (a)(b), | |
5.00%, 10/1/23 | | | 2,975 | | | | 2,138,430 | |
| | | | | | | | |
| | | | | | | 78,341,451 | |
| | | | | | | | |
|
| Pipelines—0.2% | |
Cheniere Energy, Inc., | |
4.25%, 3/15/45 | | | 12,605 | | | | 8,831,063 | |
| | | | | | | | |
|
| Retail—0.2% | |
RH (a)(b), | |
zero coupon, 6/15/23 | | | 7,635 | | | | 6,812,077 | |
| | | | | | | | |
|
| Semiconductors—3.3% | |
Advanced Micro Devices, Inc., | |
2.125%, 9/1/26 | | | 3,095 | | | | 7,532,456 | |
Brocade Communications Systems, Inc., | |
1.375%, 1/1/20 | | | 4,450 | | | | 4,450,000 | |
Cree, Inc. (a)(b), | |
0.875%, 9/1/23 | | | 6,595 | | | | 6,397,592 | |
Cypress Semiconductor Corp., | |
2.00%, 2/1/23 | | | 7,285 | | | | 6,984,858 | |
Inphi Corp., | |
0.75%, 9/1/21 | | | 5,535 | | | | 5,130,624 | |
1.125%, 12/1/20 | | | 3,510 | | | | 3,700,098 | |
Intel Corp., | |
3.25%, 8/1/39 | | | 4,235 | | | | 9,687,562 | |
Microchip Technology, Inc., | |
1.625%, 2/15/27 | | | 24,795 | | | | 24,297,067 | |
2.25%, 2/15/37 | | | 1,885 | | | | 1,853,081 | |
Micron Technology, Inc., | |
2.125%, 2/15/33, Ser. F | | | 600 | | | | 1,738,075 | |
3.00%, 11/15/43, Ser. G | | | 8,717 | | | | 9,684,761 | |
Novellus Systems, Inc., | |
2.625%, 5/15/41 | | | 1,895 | | | | 7,824,072 | |
NXP Semiconductors NV, | |
1.00%, 12/1/19 | | | 10,620 | | | | 10,651,924 | |
ON Semiconductor Corp., | |
1.625%, 10/15/23 | | | 7,965 | | | | 8,572,929 | |
Synaptics, Inc., | |
0.50%, 6/15/22 | | | 7,195 | | | | 6,340,954 | |
Teradyne, Inc., | |
1.25%, 12/15/23 | | | 3,475 | | | | 4,128,734 | |
| | | | | | | | |
| | | Principal
Amount
(000s) | | | Value | |
Veeco Instruments, Inc., | |
2.70%, 1/15/23 | | $ | 6,560 | | | $ | 4,979,978 | |
| | | | | | | | |
| | | | | | | 123,954,765 | |
| | | | | | | | |
|
| Software—4.1% | |
Akamai Technologies, Inc., | | | | | | | | |
zero coupon, 2/15/19 | | | 6,130 | | | | 6,107,166 | |
0.125%, 5/1/25 (a)(b) | | | 6,930 | | | | 6,372,481 | |
Allscripts Healthcare Solutions, Inc., | |
1.25%, 7/1/20 | | | 6,585 | | | | 6,363,599 | |
Atlassian, Inc. (a)(b), | |
0.625%, 5/1/23 | | | 11,095 | | | | 14,121,217 | |
Avaya Holdings Corp. (a)(b), | |
2.25%, 6/15/23 | | | 4,890 | | | | 4,184,124 | |
Citrix Systems, Inc., | |
0.50%, 4/15/19 | | | 8,075 | | | | 11,485,605 | |
CSG Systems International, Inc., | |
4.25%, 3/15/36 | | | 3,800 | | | | 3,785,697 | |
DocuSign, Inc. (a)(b), | |
0.50%, 9/15/23 | | | 15,280 | | | | 14,036,621 | |
Envestnet, Inc. (a)(b), | |
1.75%, 6/1/23 | | | 815 | | | | 817,438 | |
Evolent Health, Inc. (a)(b), | |
1.50%, 10/15/25 | | | 2,470 | | | | 2,282,258 | |
Five9, Inc. (a)(b), | |
0.125%, 5/1/23 | | | 3,170 | | | | 3,878,783 | |
Guidewire Software, Inc., | |
1.25%, 3/15/25 | | | 3,075 | | | | 2,961,926 | |
Momo, Inc. (a)(b), | |
1.25%, 7/1/25 | | | 3,470 | | | | 2,706,600 | |
MongoDB, Inc. (a)(b), | |
0.75%, 6/15/24 | | | 2,185 | | | | 3,012,907 | |
New Relic, Inc. (a)(b), | |
0.50%, 5/1/23 | | | 5,530 | | | | 5,550,212 | |
Nuance Communications, Inc., | |
1.00%, 12/15/35 | | | 5,560 | | | | 4,843,561 | |
1.25%, 4/1/25 | | | 5,375 | | | | 4,761,239 | |
RealPage, Inc., | |
1.50%, 11/15/22 | | | 2,795 | | | | 3,625,286 | |
ServiceNow, Inc., | | | | | | | | |
zero coupon, 6/1/22 | | | 8,245 | | | | 11,528,885 | |
Splunk, Inc. (a)(b), | |
0.50%, 9/15/23 | | | 5,880 | | | | 5,855,651 | |
1.125%, 9/15/25 | | | 7,460 | | | | 7,368,384 | |
Verint Systems, Inc., | |
1.50%, 6/1/21 | | | 6,875 | | | | 6,685,140 | |
Workday, Inc., | |
0.25%, 10/1/22 | | | 15,255 | | | | 18,713,873 | |
| | | | | | | | |
| | | | | | | 151,048,653 | |
| | | | | | | | |
|
| Telecommunications—0.8% | |
CalAmp Corp. (a)(b), | |
2.00%, 8/1/25 | | | 2,330 | | | | 1,802,837 | |
Finisar Corp., | |
0.50%, 12/15/36 | | | 13,830 | | | | 13,162,288 | |
GDS Holdings Ltd. (a)(b), | |
2.00%, 6/1/25 | | | 2,750 | | | | 1,989,625 | |
Infinera Corp., | |
2.125%, 9/1/24 | | | 4,090 | | | | 2,980,792 | |
Viavi Solutions, Inc. (a)(b), | |
1.75%, 6/1/23 | | | 10,078 | | | | 10,092,109 | |
| | | | | | | | |
| | | | | | | 30,027,651 | |
| | | | | | | | |
|
| Transportation—0.5% | |
Atlas Air Worldwide Holdings, Inc., | |
2.25%, 6/1/22 | | | 5,195 | | | | 5,032,952 | |
Echo Global Logistics, Inc., | | | | | | | | |
2.50%, 5/1/20 | | | 3,345 | | | | 3,255,103 | |
Greenbrier Cos., Inc., | | | | | | | | |
2.875%, 2/1/24 | | | 2,265 | | | | 2,237,014 | |
Hornbeck Offshore Services, Inc., | |
1.50%, 9/1/19 | | | 4,860 | | | | 3,610,339 | |
| | | | | | | | |
| See accompanying Notes to Financial Statements | | | December 31, 2018 | | | Semiannual Report | | | 75 | |
Schedule of Investments
December 31, 2018 (unaudited)
| | | | | | | | |
| | | Principal
Amount
(000s) | | | Value | |
Scorpio Tankers, Inc., | | | | | | | | |
3.00%, 5/15/22 | | $ | 4,440 | | | $ | 3,535,070 | |
Teekay Corp. (a)(b), | | | | | | | | |
5.00%, 1/15/23 | | | 1,625 | | | | 1,092,476 | |
| | | | | | | | |
| | | | | | | 18,762,954 | |
| | | | | | | | |
Total Convertible Bonds & Notes
(cost—$1,150,762,906) | | | | 1,021,434,071 | |
| | | | | | | | |
| | | | | | | | |
| | |
| | | Shares | | | | |
|
| Convertible Preferred Stock—4.2% | |
|
| Banks—0.8% | |
Bank of America Corp., Ser. L (e), | |
7.25% | | | 8,615 | | | | 10,790,288 | |
Wells Fargo & Co., Ser. L (e), | |
7.50% | | | 15,355 | | | | 19,377,549 | |
| | | | | | | | |
| | | | | | | 30,167,837 | |
| | | | | | | | |
|
| Chemicals—0.3% | |
International Flavors & Fragrances, Inc., | |
6.00%, 9/15/21 | | | 197,775 | | | | 10,027,192 | |
| | | | | | | | |
|
| Computers—0.2% | |
NCR Corp., Ser. A, PIK 5.50% (e), | |
5.50% | | | 8,880 | | | | 9,081,022 | |
| | | | | | | | |
|
| Electric Utilities—0.9% | |
CenterPoint Energy, Inc., Ser. B, | |
7.00%, 9/1/21 | | | 81,910 | | | | 4,125,807 | |
Dominion Energy, Inc., Ser. A, | |
6.75%, 8/15/19 | | | 148,370 | | | | 7,102,472 | |
NextEra Energy, Inc., | |
6.123%, 9/1/19 | | | 200,570 | | | | 11,560,855 | |
Sempra Energy, Ser. A, | |
6.00%, 1/15/21 | | | 113,785 | | | | 10,822,091 | |
| | | | | | | | |
| | | | | | | 33,611,225 | |
| | | | | | | | |
|
| Electronic Equipment, Instruments & Components—0.1% | |
Belden, Inc., | |
6.75%, 7/15/19 | | | 94,470 | | | | 5,512,324 | |
| | | | | | | | |
|
| Electronics—0.3% | |
Fortive Corp., Ser. A, | |
5.00%, 7/1/21 | | | 12,030 | | | | 10,938,277 | |
| | | | | | | | |
|
| Equity Real Estate Investment Trusts (REITs)—0.5% | |
Crown Castle International Corp., Ser. A, | |
6.875%, 8/1/20 | | | 11,255 | | | | 11,813,764 | |
Welltower, Inc., Ser. I (e), | |
6.50% | | | 80,055 | | | | 5,055,473 | |
| | | | | | | | |
| | | | | | | 16,869,237 | |
| | | | | | | | |
|
| Hand/Machine Tools—0.2% | |
Stanley Black & Decker, Inc., | |
5.375%, 5/15/20 | | | 96,315 | | | | 8,777,311 | |
| | | | | | | | |
|
| Healthcare-Products—0.5% | |
Becton Dickinson and Co., Ser. A, | |
6.125%, 5/1/20 | | | 312,150 | | | | 17,955,243 | |
| | | | | | | | |
|
| Insurance—0.2% | |
Assurant, Inc., Ser. D, | |
6.50%, 3/15/21 | | | 65,750 | | | | 6,454,020 | |
| | | | | | | | |
|
| Oil, Gas & Consumable Fuels—0.2% | |
Hess Corp., | |
8.00%, 2/1/19 | | | 137,195 | | | | 6,811,732 | |
Nabors Industries Ltd., | |
6.00%, 5/1/21 | | | 53,040 | | | | 949,416 | |
| | | | | | | | |
| | | | | | | 7,761,148 | |
| | | | | | | | |
Total Convertible Preferred Stock
(cost—$175,799,848) | | | | 157,154,836 | |
| | | | | | | | |
| | | | | | | | |
| | | Shares | | | Value | |
|
| Preferred Stock(a)(d)(f)(j)(l)—0.5% | |
| | |
| Media—0.5% | | | | | | | | |
LiveStyle, Inc., Ser. A | | $ | 7,960 | | | $ | 1,082,958 | |
LiveStyle, Inc., Ser. B | | | 171,344 | | | | 15,508,346 | |
LiveStyle, Inc., Ser. B | | | 8,000 | | | | 80 | |
| | | | | | | | |
Total Preferred Stock
(cost—$25,578,848) | | | | 16,591,384 | |
| | | | | | | | |
| | | | | | | | |
|
| Equity-Linked Security(j)—0.0% | |
| | |
| Coal—0.0% | | | | | | | | |
Arch Coal, Inc., expires 10/5/23 (cost—$0) | | | 4,002 | | | | 148,074 | |
| | | | | | | | |
| | | | | | | | |
| | |
| | | Units | | | | |
|
| Warrants(d)(f)(j)—0.0% | |
| | |
| Media—0.0% | | | | | | | | |
LiveStyle, Inc., expires 11/30/21,
Ser. C, (a)(l) | | | 43,500 | | | | 4 | |
| | | | | | | | |
|
| Semiconductors—0.0% | |
GT Advanced Technologies, Inc., expires 10/1/17 (c) | | | 2,860,000 | | | | — | |
GT Advanced Technologies, Inc., expires 3/17/19 | | | 795 | | | | — | |
| | | | | | | | |
| | | | | | | — | |
| | | | | | | | |
| Total Warrants (cost—$0) | | | | 4 | |
| | | | | | | | |
| | | | | | | | |
| | |
| | | Principal
Amount
(000s) | | | | |
|
| Repurchase Agreements—2.7% | |
State Street Bank and Trust Co., dated 12/31/18, 0.50%, due 1/2/19, proceeds $101,364,816; collateralized by U.S. Treasury Inflation Indexed Notes, 0.625%, due 1/15/26, valued at $103,391,990 including accrued interest | |
(cost—
$101,362,000) | | | $101,362 | | | | 101,362,000 | |
| | | | | | | | |
| |
Total Investments, before options written
(cost—$4,484,230,000)—99.5% | | | | 3,712,276,539 | |
| | | | | | | | |
Total Options Written—(0.0)%
(premiums received—$997,660) (j)(k)(m) | | | | (1,145,770 | ) |
| | | | | | | | |
| |
Total Investments, net of options written
(cost—$4,483,232,340)—99.5% | | | | 3,711,130,769 | |
| | | | | | | | |
| |
| Other assets less other liabilities—0.5% | | | | 19,614,790 | |
| | | | | | | | |
| |
| Net Assets—100.0% | | | | $3,730,745,559 | |
| | | | | | | | |
Notes to Schedule of Investments:
(a) Private Placement—Restricted as to resale and may not have a readily available market. Securities with an aggregate value of $963,747,702, representing 25.8% of net assets.
(b) 144A—Exempt from registration under Rule 144A of the Securities Act of 1933. These securities may be resold in transactions exempt from registration, typically only to qualified institutional buyers. Securities with an aggregate value of $946,041,418, representing 25.4% of net assets.
(c) In default.
(d) Fair-Valued—Securities with an aggregate value of $26,347,500, representing 0.7% of net assets. See Note 1(a) and Note 1(b) in the Notes to Financial Statements.
(e) Perpetual maturity. The date shown, if any, is the next call date.
(f) Level 3 security. See Note 1(a) and Note 1(b) in the Notes to Financial Statements.
(g) All or partial amount segregated for the benefit of the counterparty as collateral for options written.
(h) Restricted. The aggregate cost of such securities is $17,993,495. The aggregate value is $1,080,955, representing less than 0.05% of net assets.
(i) Variable or Floating Rate Security—Securities with an interest rate that changes periodically. The interest rate disclosed reflects the rate in effect on December 31, 2018.
(j) Non-income producing.
(k) Exchange traded-Chicago Board Options Exchange.
(l) A member of the Fund’s portfolio management team is a member of the board of directors of LiveStyle, Inc. The Fund’s aggregate value of investments in LiveStyle, Inc. represents 0.4% of net assets.
(m) Exchange traded option contracts outstanding at December 31, 2018:
| | | | | | |
| 76 | | Semiannual Report | | | December 31, 2018 | | | See accompanying Notes to Financial Statements |
Schedule of Investments
December 31, 2018 (unaudited)
| | | | | | | | | | | | | | | | | | | | | | | | | | | | |
|
| Options written contracts outstanding at December 31, 2018: | |
| Description | | Exercise
Price | | | Expiration
Date | | | Number of
Contracts | | | Notional
Amount | | | Market
Value | | | Premiums
Received | | | Unrealized
Appreciation
(Depreciation) | |
Call options: | | | | | | | | | | | | | | | | | | | | | | | | | | | | |
3M Co. | | | 220.00 USD | | | | 2/15/19 | | | | (225 | ) | | $ | (22,500 | ) | | $ | (10,687 | ) | | $ | (10,792 | ) | | $ | 105 | |
Adobe, Inc. | | | 260.00 USD | | | | 1/18/19 | | | | (645 | ) | | | (64,500 | ) | | | (29,992 | ) | | | (41,308 | ) | | | 11,316 | |
Alibaba Group Holding Ltd. | | | 200.00 USD | | | | 2/15/19 | | | | (575 | ) | | | (57,500 | ) | | | (5,750 | ) | | | (6,328 | ) | | | 578 | |
Alphabet, Inc. | | | 1,250.00 USD | | | | 2/15/19 | | | | (165 | ) | | | (16,500 | ) | | | (64,350 | ) | | | (63,962 | ) | | | (388 | ) |
Amazon.com, Inc. | | | 1,950.00 USD | | | | 2/15/19 | | | | (55 | ) | | | (5,500 | ) | | | (24,475 | ) | | | (30,358 | ) | | | 5,883 | |
Amphenol Corp. | | | 90.00 USD | | | | 2/15/19 | | | | (135 | ) | | | (13,500 | ) | | | (6,075 | ) | | | (6,880 | ) | | | 805 | |
Archer-Daniels-Midland Co. | | | 55.00 USD | | | | 2/15/19 | | | | (1,115 | ) | | | (111,500 | ) | | | (4,460 | ) | | | (2,192 | ) | | | (2,268 | ) |
Boeing Co. | | | 360.00 USD | | | | 1/18/19 | | | | (340 | ) | | | (34,000 | ) | | | (26,690 | ) | | | (22,795 | ) | | | (3,895 | ) |
Boston Scientific Corp. | | | 37.50 USD | | | | 1/18/19 | | | | (245 | ) | | | (24,500 | ) | | | (7,472 | ) | | | (5,510 | ) | | | (1,962 | ) |
Broadcom Ltd. | | | 270.00 USD | | | | 1/18/19 | | | | (545 | ) | | | (54,500 | ) | | | (151,238 | ) | | | (91,328 | ) | | | (59,910 | ) |
Costco Wholesale Corp. | | | 223.00 USD | | | | 1/18/19 | | | | (535 | ) | | | (53,500 | ) | | | (15,515 | ) | | | (16,893 | ) | | | 1,378 | |
Deere & Co. | | | 162.50 USD | | | | 1/18/19 | | | | (665 | ) | | | (66,500 | ) | | | (46,883 | ) | | | (33,327 | ) | | | (13,556 | ) |
Intel Corp. | | | 55.00 USD | | | | 2/15/19 | | | | (2,105 | ) | | | (210,500 | ) | | | (43,153 | ) | | | (34,134 | ) | | | (9,019 | ) |
Intuit, Inc. | | | 220.00 USD | | | | 1/18/19 | | | | (165 | ) | | | (16,500 | ) | | | (4,537 | ) | | | (5,633 | ) | | | 1,096 | |
Intuitive Surgical, Inc. | | | 550.00 USD | | | | 1/18/19 | | | | (105 | ) | | | (10,500 | ) | | | (13,387 | ) | | | (10,996 | ) | | | (2,391 | ) |
JPMorgan Chase & Co. | | | 120.00 USD | | | | 1/18/19 | | | | (1,370 | ) | | | (137,000 | ) | | | (2,055 | ) | | | (59,561 | ) | | | 57,506 | |
McDonald’s Corp. | | | 185.00 USD | | | | 1/18/19 | | | | (670 | ) | | | (67,000 | ) | | | (58,960 | ) | | | (41,872 | ) | | | (17,088 | ) |
Merck & Co., Inc. | | | 80.00 USD | | | | 1/18/19 | | | | (280 | ) | | | (28,000 | ) | | | (6,580 | ) | | | (7,830 | ) | | | 1,250 | |
Microsoft Corp. | | | 112.00 USD | | | | 1/18/19 | | | | (1,340 | ) | | | (134,000 | ) | | | (30,820 | ) | | | (48,810 | ) | | | 17,990 | |
NIKE, Inc. | | | 83.00 USD | | | | 1/18/19 | | | | (650 | ) | | | (65,000 | ) | | | (5,850 | ) | | | (6,289 | ) | | | 439 | |
PayPal Holdings, Inc. | | | 94.00 USD | | | | 1/18/19 | | | | (1,685 | ) | | | (168,500 | ) | | | (39,598 | ) | | | (50,779 | ) | | | 11,181 | |
PepsiCo., Inc. | | | 118.00 USD | | | | 1/18/19 | | | | (720 | ) | | | (72,000 | ) | | | (17,280 | ) | | | (13,965 | ) | | | (3,315 | ) |
Salesforce.com, Inc. | | | 155.00 USD | | | | 1/18/19 | | | | (1,400 | ) | | | (140,000 | ) | | | (49,700 | ) | | | (41,783 | ) | | | (7,917 | ) |
ServiceNow, Inc. | | | 200.00 USD | | | | 1/18/19 | | | | (425 | ) | | | (42,500 | ) | | | (40,375 | ) | | | (30,917 | ) | | | (9,458 | ) |
Starbucks Corp. | | | 69.00 USD | | | | 1/18/19 | | | | (630 | ) | | | (63,000 | ) | | | (7,560 | ) | | | (6,908 | ) | | | (652 | ) |
Take-Two Interactive Software, Inc. | | | 135.00 USD | | | | 2/15/19 | | | | (840 | ) | | | (84,000 | ) | | | (44,100 | ) | | | (58,275 | ) | | | 14,175 | |
Target Corp. | | | 80.00 USD | | | | 2/15/19 | | | | (150 | ) | | | (15,000 | ) | | | (2,700 | ) | | | (2,245 | ) | | | (455 | ) |
Union Pacific Corp. | | | 165.00 USD | | | | 1/18/19 | | | | (990 | ) | | | (99,000 | ) | | | (4,455 | ) | | | (61,669 | ) | | | 57,214 | |
UnitedHealth Group, Inc. | | | 270.00 USD | | | | 1/18/19 | | | | (640 | ) | | | (64,000 | ) | | | (67,520 | ) | | | (32,982 | ) | | | (34,538 | ) |
Vertex Pharmaceuticals, Inc. | | | 185.00 USD | | | | 1/18/19 | | | | (820 | ) | | | (82,000 | ) | | | (96,350 | ) | | | (47,047 | ) | | | (49,303 | ) |
Visa, Inc. | | | 142.00 USD | | | | 1/18/19 | | | | (1,425 | ) | | | (142,500 | ) | | | (80,513 | ) | | | (47,660 | ) | | | (32,853 | ) |
Walt Disney Co. | | | 120.00 USD | | | | 2/15/19 | | | | (1,435 | ) | | | (143,500 | ) | | | (124,128 | ) | | | (45,254 | ) | | | (78,874 | ) |
Worldpay, Inc. | | | 97.50 USD | | | | 1/18/19 | | | | (335 | ) | | | (33,500 | ) | | | (12,562 | ) | | | (11,378 | ) | | | (1,184 | ) |
| | | | | | | | | | | | | | | | | | | | |
| Total options written contracts | | | $ | (1,145,770 | ) | | $ | (997,660 | ) | | $ | (148,110 | ) |
| | | | | | | | | | | | | | | | | | | | |
Glossary:
ADR—American Depositary Receipt
FRN—Floating Rate Note
LIBOR—London Inter-Bank Offered Rate
PIK—Payment-in-Kind
REIT—Real Estate Investment Trust
| | | | | | | | |
| See accompanying Notes to Financial Statements | | | December 31, 2018 | | | Semiannual Report | | | 77 | |
Schedule of Investments
December 31, 2018 (unaudited)
AllianzGI Mid-Cap Fund
| | | | | | | | |
| | | Shares | | | Value | |
|
| Common Stock—100.7% | |
|
| Aerospace & Defense—1.7% | |
L3 Technologies, Inc. | | | 24,358 | | | | $4,230,010 | |
| | | | | | | | |
|
| Air Freight & Logistics—2.6% | |
XPO Logistics, Inc. (a) | | | 111,239 | | | | 6,345,073 | |
| | | | | | | | |
| | |
| Banks—1.2% | | | | | | | | |
First Republic Bank | | | 33,434 | | | | 2,905,415 | |
| | | | | | | | |
| | |
| Beverages—2.1% | | | | | | | | |
Monster Beverage Corp. (a) | | | 103,261 | | | | 5,082,506 | |
| | | | | | | | |
| | |
| Biotechnology—3.2% | | | | | | | | |
Exact Sciences Corp. (a) | | | 55,525 | | | | 3,503,627 | |
Heron Therapeutics, Inc. (a) | | | 98,723 | | | | 2,560,875 | |
Neurocrine Biosciences, Inc. (a) | | | 27,053 | | | | 1,931,855 | |
| | | | | | | | |
| | | | | | | 7,996,357 | |
| | | | | | | | |
| | |
| Capital Markets—2.1% | | | | | | | | |
E*TRADE Financial Corp. | | | 116,967 | | | | 5,132,512 | |
| | | | | | | | |
| | |
| Chemicals—2.2% | | | | | | | | |
FMC Corp. | | | 72,700 | | | | 5,376,892 | |
| | | | | | | | |
|
| Commercial Services & Supplies—3.8% | |
Clean Harbors, Inc. (a) | | | 76,745 | | | | 3,787,366 | |
Waste Connections, Inc. | | | 74,807 | | | | 5,554,420 | |
| | | | | | | | |
| | | | | | | 9,341,786 | |
| | | | | | | | |
|
| Electrical Equipment—1.8% | |
AMETEK, Inc. | | | 66,257 | | | | 4,485,599 | |
| | | | | | | | |
|
| Electronic Equipment, Instruments & Components—4.0% | |
Cognex Corp. | | | 67,241 | | | | 2,600,210 | |
Keysight Technologies, Inc. (a) | | | 43,215 | | | | 2,682,787 | |
TE Connectivity Ltd. | | | 30,521 | | | | 2,308,303 | |
Trimble, Inc. (a) | | | 72,897 | | | | 2,399,040 | |
| | | | | | | | |
| | | | | | | 9,990,340 | |
| | | | | | | | |
| | |
| Entertainment—5.4% | | | | | | | | |
Spotify Technology S.A. (a) | | | 20,977 | | | | 2,380,890 | |
Take-Two Interactive Software, Inc. (a) | | | 69,810 | | | | 7,186,241 | |
Zynga, Inc., Class A (a) | | | 956,776 | | | | 3,760,130 | |
| | | | | | | | |
| | | | | | | 13,327,261 | |
| | | | | | | | |
|
| Healthcare Equipment & Supplies—13.1% | |
Cooper Cos., Inc. | | | 12,495 | | | | 3,179,977 | |
DexCom, Inc. (a) | | | 60,602 | | | | 7,260,120 | |
Edwards Lifesciences Corp. (a) | | | 51,098 | | | | 7,826,681 | |
Globus Medical, Inc., Class A (a) | | | 56,252 | | | | 2,434,587 | |
Haemonetics Corp. (a) | | | 41,443 | | | | 4,146,372 | |
IDEXX Laboratories, Inc. (a) | | | 29,670 | | | | 5,519,213 | |
Novocure Ltd. (a) | | | 59,436 | | | | 1,989,917 | |
| | | | | | | | |
| | | | | | | 32,356,867 | |
| | | | | | | | |
|
| Healthcare Providers & Services—2.0% | |
WellCare Health Plans, Inc. (a) | | | 20,875 | | | | 4,928,379 | |
| | | | | | | | |
|
| Hotels, Restaurants & Leisure—4.3% | |
Chipotle Mexican Grill, Inc. (a) | | | 8,135 | | | | 3,512,611 | |
MGM Resorts International | | | 121,718 | | | | 2,952,879 | |
Royal Caribbean Cruises Ltd. | | | 41,233 | | | | 4,032,175 | |
| | | | | | | | |
| | | | | | | 10,497,665 | |
| | | | | | | | |
| | |
| Insurance—1.6% | | | | | | | | |
Arthur J Gallagher & Co. | | | 53,020 | | | | 3,907,574 | |
| | | | | | | | |
| | | | | | | | |
| | | Shares | | | Value | |
| | |
| IT Services—8.9% | | | | | | | | |
EPAM Systems, Inc. (a) | | | 47,923 | | | $ | 5,559,547 | |
Twilio, Inc., Class A (a) | | | 29,595 | | | | 2,642,833 | |
WEX, Inc. (a) | | | 31,428 | | | | 4,401,806 | |
Wix.com Ltd. (a) | | | 28,059 | | | | 2,534,850 | |
Worldpay, Inc., Class A (a) | | | 90,495 | | | | 6,916,533 | |
| | | | | | | | |
| | | | | | | 22,055,569 | |
| | | | | | | | |
|
| Life Sciences Tools & Services—3.2% | |
Agilent Technologies, Inc. | | | 76,319 | | | | 5,148,480 | |
Bruker Corp. | | | 94,306 | | | | 2,807,489 | |
| | | | | | | | |
| | | | | | | 7,955,969 | |
| | | | | | | | |
| | |
| Multi-Line Retail—2.0% | | | | | | | | |
Dollar Tree, Inc. (a) | | | 55,977 | | | | 5,055,843 | |
| | | | | | | | |
|
| Oil, Gas & Consumable Fuels—2.7% | |
Marathon Oil Corp. | | | 172,623 | | | | 2,475,414 | |
Parsley Energy, Inc., Class A (a) | | | 122,543 | | | | 1,958,237 | |
PBF Energy, Inc., Class A | | | 70,895 | | | | 2,316,140 | |
| | | | | | | | |
| | | | | | | 6,749,791 | |
| | | | | | | | |
| | |
| Pharmaceuticals—1.5% | | | | | | | | |
Catalent, Inc. (a) | | | 116,397 | | | | 3,629,258 | |
| | | | | | | | |
|
| Professional Services—3.6% | |
Equifax, Inc. | | | 31,293 | | | | 2,914,317 | |
Verisk Analytics, Inc. (a) | | | 55,163 | | | | 6,014,974 | |
| | | | | | | | |
| | | | | | | 8,929,291 | |
| | | | | | | | |
|
| Real Estate Management & Development—1.3% | |
CBRE Group, Inc., Class A (a) | | | 80,661 | | | | 3,229,666 | |
| | | | | | | | |
|
| Semiconductors & Semiconductor Equipment—6.6% | |
Advanced Micro Devices, Inc. (a) | | | 236,365 | | | | 4,363,298 | |
Entegris, Inc. | | | 90,831 | | | | 2,533,731 | |
Monolithic Power Systems, Inc. | | | 23,719 | | | | 2,757,334 | |
Xilinx, Inc. | | | 76,975 | | | | 6,555,960 | |
| | | | | | | | |
| | | | | | | 16,210,323 | |
| | | | | | | | |
| | |
| Software—9.6% | | | | | | | | |
Ceridian HCM Holding, Inc. (a) | | | 87,790 | | | | 3,027,877 | |
Nutanix, Inc., Class A (a) | | | 40,385 | | | | 1,679,612 | |
PTC, Inc. (a) | | | 58,684 | | | | 4,864,904 | |
Splunk, Inc. (a) | | | 40,994 | | | | 4,298,221 | |
Trade Desk, Inc., Class A (a) | | | 22,833 | | | | 2,649,998 | |
Workday, Inc., Class A (a) | | | 45,844 | | | | 7,320,370 | |
| | | | | | | | |
| | | | | | | 23,840,982 | |
| | | | | | | | |
| | |
| Specialty Retail—4.5% | | | | | | | | |
Burlington Stores, Inc. (a) | | | 23,205 | | | | 3,774,757 | |
Floor & Decor Holdings, Inc., Class A (a) | | | 121,045 | | | | 3,135,066 | |
Ulta Salon Cosmetics & Fragrance, Inc. (a) | | | 17,554 | | | | 4,297,921 | |
| | | | | | | | |
| | | | | | | 11,207,744 | |
| | | | | | | | |
|
| Textiles, Apparel & Luxury Goods—4.1% | |
Lululemon Athletica, Inc. (a) | | | 41,635 | | | | 5,063,232 | |
VF Corp. | | | 70,750 | | | | 5,047,305 | |
| | | | | | | | |
| | | | | | | 10,110,537 | |
| | | | | | | | |
|
| Trading Companies & Distributors—1.6% | |
United Rentals, Inc. (a) | | | 38,139 | | | | 3,910,392 | |
| | | | | | | | |
| Total Common Stock (cost—$249,425,464) | | | | 248,789,601 | |
| | | | | | | | |
| | | | | | | | |
| | | Principal
Amount
(000s) | | | Value | |
|
| Repurchase Agreements—0.4% | |
State Street Bank and Trust Co., dated 12/31/18, 0.50%, due 1/2/19, proceeds $1,109,031; collateralized by U.S. Treasury Inflation Indexed Notes, 0.125%, due 7/15/26, valued at $1,132,293 including accrued interest | |
(cost—$1,109,000) | | | $1,109 | | | $ | 1,109,000 | |
| | | | | | | | |
| |
Total Investments
(cost—$250,534,464)—101.1% | | | | 249,898,601 | |
| | | | | | | | |
| |
| Liabilities in excess of other assets—(1.1)% | | | | (2,676,701 | ) |
| | | | | | | | |
| |
| Net Assets—100.0% | | | | $247,221,900 | |
| | | | | | | | |
Notes to Schedule of Investments:
(a) Non-income producing.
| | | | | | |
| 78 | | Semiannual Report | | | December 31, 2018 | | | See accompanying Notes to Financial Statements |
Schedule of Investments
December 31, 2018 (unaudited)
AllianzGI NFJ Dividend Value Fund
| | | | | | | | |
| | | Shares | | | Value | |
|
| Common Stock—100.3% | |
|
| Aerospace & Defense—4.0% | |
Lockheed Martin Corp. | | | 113,165 | | | | $29,631,123 | |
United Technologies Corp. | | | 265,845 | | | | 28,307,176 | |
| | | | | | | | |
| | | | | | | 57,938,299 | |
| | | | | | | | |
|
| Auto Components—0.0% | |
Garrett Motion, Inc. (a) | | | 23,717 | | | | 292,668 | |
| | | | | | | | |
| | |
| Automobiles—1.9% | | | | | | | | |
General Motors Co. | | | 837,575 | | | | 28,016,884 | |
| | | | | | | | |
| | |
| Banks—13.6% | | | | | | | | |
Bank of America Corp. | | | 1,190,310 | | | | 29,329,238 | |
Citigroup, Inc. | | | 520,170 | | | | 27,080,050 | |
Citizens Financial Group, Inc. | | | 930,135 | | | | 27,652,914 | |
Comerica, Inc. | | | 406,700 | | | | 27,936,223 | |
JPMorgan Chase & Co. | | | 587,640 | | | | 57,365,417 | |
U.S. Bancorp | | | 590,315 | | | | 26,977,395 | |
| | | | | | | | |
| | | | | | | 196,341,237 | |
| | | | | | | | |
| | |
| Biotechnology—2.1% | | | | | | | | |
Amgen, Inc. | | | 156,683 | | | | 30,501,480 | |
| | | | | | | | |
| |
| Building Products—0.1% | | | | | |
Resideo Technologies, Inc. (a) | | | 39,528 | | | | 812,300 | |
| | | | | | | | |
|
| Capital Markets—2.0% | |
Morgan Stanley | | | 745,445 | | | | 29,556,894 | |
| | | | | | | | |
| | |
| Chemicals—1.1% | | | | | | | | |
Celanese Corp. | | | 170,300 | | | | 15,321,891 | |
| | | | | | | | |
|
| Communications Equipment—2.0% | |
Cisco Systems, Inc. | | | 662,970 | | | | 28,726,490 | |
| | | | | | | | |
|
| Containers & Packaging—1.0% | |
International Paper Co. | | | 342,475 | | | | 13,822,291 | |
| | | | | | | | |
|
| Diversified Telecommunication Services—4.2% | |
AT&T, Inc. | | | 1,042,463 | | | | 29,751,894 | |
Verizon Communications, Inc. | | | 542,650 | | | | 30,507,783 | |
| | | | | | | | |
| | | | | | | 60,259,677 | |
| | | | | | | | |
|
| Electric Utilities—4.2% | |
Entergy Corp. | | | 358,115 | | | | 30,822,958 | |
Exelon Corp. | | | 671,158 | | | | 30,269,226 | |
| | | | | | | | |
| | | | | | | 61,092,184 | |
| | | | | | | | |
|
| Electrical Equipment—2.0% | |
Eaton Corp. PLC | | | 428,010 | | | | 29,387,167 | |
| | | | | | | | |
| | |
| Entertainment—2.1% | | | | | | | | |
Walt Disney Co. | | | 276,184 | | | | 30,283,576 | |
| | | | | | | | |
|
| Equity Real Estate Investment Trusts (REITs)—2.0% | |
Host Hotels & Resorts, Inc. | | | 1,723,357 | | | | 28,728,361 | |
| | | | | | | | |
|
| Food & Staples Retailing—2.1% | |
Walmart, Inc. | | | 322,550 | | | | 30,045,533 | |
| | | | | | | | |
| | |
| Food Products—3.4% | | | | | | | | |
Conagra Brands, Inc. | | | 955,747 | | | | 20,414,756 | |
Mondelez International, Inc., Class A | | | 735,200 | | | | 29,430,056 | |
| | | | | | | | |
| | | | | | | 49,844,812 | |
| | | | | | | | |
|
| Healthcare Equipment & Supplies—4.0% | |
Abbott Laboratories | | | 405,600 | | | | 29,337,048 | |
Medtronic PLC | | | 317,770 | | | | 28,904,359 | |
| | | | | | | | |
| | | | | | | 58,241,407 | |
| | | | | | | | |
| | | | | | | | |
| | | Shares | | | Value | |
|
| Healthcare Providers & Services—4.1% | |
Anthem, Inc. | | | 113,585 | | | $ | 29,830,829 | |
Quest Diagnostics, Inc. | | | 345,460 | | | | 28,766,454 | |
| | | | | | | | |
| | | | | | | 58,597,283 | |
| | | | | | | | |
|
| Industrial Conglomerates—2.0% | |
Honeywell International, Inc. | | | 221,070 | | | | 29,207,768 | |
| | | | | | | | |
| |
| Insurance—6.0% | | | | | |
Allstate Corp. | | | 349,375 | | | | 28,868,856 | |
MetLife, Inc. | | | 697,365 | | | | 28,633,807 | |
Reinsurance Group of America, Inc. | | | 209,025 | | | | 29,311,576 | |
| | | | | | | | |
| | | | | | | 86,814,239 | |
| | | | | | | | |
| |
| Media—2.0% | | | | | |
Comcast Corp., Class A | | | 862,200 | | | | 29,357,910 | |
| | | | | | | | |
|
| Multi-Line Retail—2.0% | |
Target Corp. | | | 445,314 | | | | 29,430,802 | |
| | | | | | | | |
| |
| Multi-Utilities—2.1% | | | | | |
Public Service Enterprise Group, Inc. | | | 581,230 | | | | 30,253,022 | |
| | | | | | | | |
|
| Oil, Gas & Consumable Fuels—12.1% | |
ConocoPhillips | | | 480,965 | | | | 29,988,168 | |
Occidental Petroleum Corp. | | | 478,900 | | | | 29,394,882 | |
Royal Dutch Shell PLC, Class A ADR | | | 991,535 | | | | 57,776,744 | |
Total S.A. ADR | | | 555,600 | | | | 28,991,208 | |
Valero Energy Corp. | | | 393,500 | | | | 29,500,695 | |
| | | | | | | | |
| | | | | | | 175,651,697 | |
| | | | | | | | |
|
| Pharmaceuticals—8.2% | |
Eli Lilly & Co. | | | 259,676 | | | | 30,049,707 | |
Johnson & Johnson | | | 224,180 | | | | 28,930,429 | |
Merck & Co., Inc. | | | 393,549 | | | | 30,071,079 | |
Pfizer, Inc. | | | 682,285 | | | | 29,781,740 | |
| | | | | | | | |
| | | | | | | 118,832,955 | |
| | | | | | | | |
| | |
| Road & Rail—2.0% | | | | | | | | |
Kansas City Southern | | | 309,050 | | | | 29,498,823 | |
| | | | | | | | |
|
| Semiconductors & Semiconductor Equipment—3.1% | |
Intel Corp. | | | 621,744 | | | | 29,178,446 | |
QUALCOMM, Inc. | | | 277,174 | | | | 15,773,972 | |
| | | | | | | | |
| | | | | | | 44,952,418 | |
| | | | | | | | |
|
| Technology Hardware, Storage & Peripherals—3.9% | |
Apple, Inc. | | | 173,240 | | | | 27,326,877 | |
HP, Inc. | | | 1,420,180 | | | | 29,056,883 | |
| | | | | | | | |
| | | | | | | 56,383,760 | |
| | | | | | | | |
|
| Textiles, Apparel & Luxury Goods—1.0% | |
VF Corp. | | | 204,856 | | | | 14,614,427 | |
| | | | | | | | |
Total Common Stock (cost—$1,419,080,499) | | | | 1,452,808,255 | |
| | | | | | | | |
| | | | | | | | |
| | | | | | | | |
| | | Principal
Amount
(000s) | | | Value | |
|
| Repurchase Agreements—1.1% | |
State Street Bank and Trust Co., dated 12/31/18, 0.50%, due 1/2/19, proceeds $15,262,424; collateralized by U.S. Treasury Inflation Indexed Notes, 0.125%, due 7/15/26, valued at $15,570,262 including accrued interest | |
(cost—$15,262,000) | | | $15,262 | | | $ | 15,262,000 | |
| | | | | | | | |
| |
Total Investments
(cost—$1,434,342,499)—101.4% | | | | 1,468,070,255 | |
| | | | | | | | |
| |
| Liabilities in excess of other assets—(1.4)% | | | | (20,181,395 | ) |
| | | | | | | | |
| |
| Net Assets—100.0% | | | | $1,447,888,860 | |
| | | | | | | | |
Notes to Schedule of Investments:
(a) Non-income producing.
Glossary:
ADR—American Depositary Receipt
REIT—Real Estate Investment Trust
| | | | | | | | |
| See accompanying Notes to Financial Statements | | | December 31, 2018 | | | Semiannual Report | | | 79 | |
Schedule of Investments
December 31, 2018 (unaudited)
AllianzGI NFJ International Value Fund
| | | | | | | | |
| | | Shares | | | Value | |
|
| Common Stock—101.1% | |
| | |
| Australia—1.9% | | | | | | | | |
Macquarie Group Ltd. | | | 46,130 | | | | $3,533,371 | |
| | | | | | | | |
|
| Canada—11.0% | |
Bank of Montreal | | | 27,800 | | | | 1,816,730 | |
Canadian Pacific Railway Ltd. | | | 18,941 | | | | 3,364,300 | |
Enerplus Corp. | | | 191,400 | | | | 1,485,264 | |
Magna International, Inc. | | | 80,840 | | | | 3,674,178 | |
Manulife Financial Corp. | | | 121,268 | | | | 1,720,793 | |
Methanex Corp. | | | 15,950 | | | | 768,312 | |
Toronto-Dominion Bank | | | 110,340 | | | | 5,486,105 | |
TransCanada Corp. | | | 48,790 | | | | 1,741,803 | |
| | | | | | | | |
| | | | | | | 20,057,485 | |
| | | | | | | | |
|
| China—8.9% | |
Anhui Conch Cement Co., Ltd., Class H | | | 712,000 | | | | 3,443,069 | |
China Construction Bank Corp., Class H | | | 2,241,100 | | | | 1,835,132 | |
China Railway Signal & Communication Corp., Ltd., Class H (a) | | | 5,406,000 | | | | 3,786,449 | |
China Shenhua Energy Co., Ltd., Class H | | | 811,000 | | | | 1,768,746 | |
Kweichow Moutai Co., Ltd., Class A | | | 20,318 | | | | 1,755,043 | |
Longfor Group Holdings Ltd. | | | 636,500 | | | | 1,893,018 | |
Ping An Insurance Group Co of China Ltd., Class A | | | 217,217 | | | | 1,777,039 | |
| | | | | | | | |
| | | | | | | 16,258,496 | |
| | | | | | | | |
|
| France—5.9% | |
Capgemini SE | | | 32,723 | | | | 3,254,793 | |
Danone S.A. | | | 51,615 | | | | 3,637,960 | |
Euronext NV (a) | | | 32,593 | | | | 1,877,927 | |
Kering S.A. | | | 4,068 | | | | 1,905,728 | |
| | | | | | | | |
| | | | | | | 10,676,408 | |
| | | | | | | | |
|
| Germany—4.2% | |
BASF SE | | | 26,524 | | | | 1,847,492 | |
Muenchener Rueckversicherungs-Gesellschaft AG in Muenchen | | | 17,786 | | | | 3,879,102 | |
SAP SE | | | 18,637 | | | | 1,849,715 | |
| | | | | | | | |
| | | | | | | 7,576,309 | |
| | | | | | | | |
|
| Hong Kong—9.1% | |
AIA Group Ltd. | | | 226,800 | | | | 1,883,984 | |
BOC Hong Kong Holdings Ltd. | | | 958,100 | | | | 3,556,205 | |
CK Hutchison Holdings Ltd. | | | 388,000 | | | | 3,724,106 | |
CLP Holdings Ltd. | | | 327,000 | | | | 3,695,390 | |
Sands China Ltd. | | | 434,400 | | | | 1,894,424 | |
Xinyi Glass Holdings Ltd. | | | 1,544,000 | | | | 1,705,580 | |
| | | | | | | | |
| | | | | | | 16,459,689 | |
| | | | | | | | |
| | |
| India—0.6% | | | | | | | | |
Reliance Industries Ltd. GDR (a) | | | 34,949 | | | | 1,113,126 | |
| | | | | | | | |
| | |
| Indonesia—1.0% | | | | | | | | |
Bank Rakyat Indonesia Persero Tbk PT | | | 6,861,100 | | | | 1,747,921 | |
| | | | | | | | |
|
| Ireland—1.7% | |
Smurfit Kappa Group PLC | | | 112,732 | | | | 2,999,528 | |
| | | | | | | | |
| | |
| Israel—1.9% | | | | | | | | |
Bank Hapoalim BM | | | 554,222 | | | | 3,504,982 | |
| | | | | | | | |
| | | | | | | | |
| | | Shares | | | Value | |
| | |
| Italy—1.0% | | | | | | | | |
Terna Rete Elettrica Nazionale SpA | | | 317,283 | | | $ | 1,801,893 | |
| | | | | | | | |
|
| Japan—17.0% | |
Asahi Group Holdings Ltd. | | | 47,500 | | | | 1,840,806 | |
Astellas Pharma, Inc. | | | 138,500 | | | | 1,769,562 | |
Hitachi Ltd. | | | 69,240 | | | | 1,835,569 | |
Hoya Corp. | | | 31,600 | | | | 1,905,481 | |
Japan Exchange Group, Inc. | | | 227,600 | | | | 3,671,160 | |
Mitsubishi Corp. | | | 140,200 | | | | 3,843,800 | |
Nippon Telegraph & Telephone Corp. | | | 89,800 | | | | 3,663,778 | |
Shionogi & Co., Ltd. | | | 62,800 | | | | 3,584,338 | |
Sony Corp. | | | 105,000 | | | | 5,062,010 | |
Tokio Marine Holdings, Inc. | | | 80,600 | | | | 3,829,202 | |
| | | | | | | | |
| | | | | | | 31,005,706 | |
| | | | | | | | |
|
| Korea (Republic of)—3.8% | |
POSCO ADR | | | 33,360 | | | | 1,832,798 | |
Samsung Electronics Co., Ltd. | | | 106,541 | | | | 3,708,872 | |
SK Hynix, Inc. | | | 25,246 | | | | 1,376,323 | |
| | | | | | | | |
| | | | | | | 6,917,993 | |
| | | | | | | | |
| | |
| Mexico—0.9% | | | | | | | | |
Grupo Aeroportuario del Pacifico S.A.B de C.V., Class B | | | 210,000 | | | | 1,711,267 | |
| | | | | | | | |
|
| Netherlands—3.1% | |
Coca-Cola European Partners PLC | | | 81,282 | | | | 3,726,780 | |
Heineken NV | | | 20,780 | | | | 1,836,677 | |
| | | | | | | | |
| | | | | | | 5,563,457 | |
| | | | | | | | |
|
| Russian Federation—1.0% | |
LUKOIL PJSC ADR | | | 25,470 | | | | 1,817,030 | |
| | | | | | | | |
|
| Singapore—2.1% | |
DBS Group Holdings Ltd. | | | 220,500 | | | | 3,834,461 | |
| | | | | | | | |
| | |
| South Africa—1.0% | | | | | | | | |
Naspers Ltd., Class N | | | 9,198 | | | | 1,841,591 | |
| | | | | | | | |
| | |
| Sweden—1.0% | | | | | | | | |
Sandvik AB | | | 120,721 | | | | 1,729,723 | |
| | | | | | | | |
|
| Switzerland—2.0% | |
Roche Holding AG | | | 14,950 | | | | 3,711,470 | |
| | | | | | | | |
|
| Taiwan—2.0% | |
Taiwan Semiconductor Manufacturing Co., Ltd. ADR | | | 99,430 | | | | 3,669,961 | |
| | | | | | | | |
|
| United Kingdom—17.0% | |
3i Group PLC | | | 183,915 | | | | 1,814,729 | |
BAE Systems PLC ADR | | | 151,268 | | | | 3,542,696 | |
Carnival PLC | | | 72,015 | | | | 3,458,290 | |
Compass Group PLC | | | 88,650 | | | | 1,865,623 | |
GlaxoSmithKline PLC | | | 97,071 | | | | 1,849,981 | |
Howden Joinery Group PLC | | | 334,751 | | | | 1,857,367 | |
Imperial Brands PLC | | | 59,481 | | | | 1,805,350 | |
Legal & General Group PLC | | | 1,255,673 | | | | 3,699,676 | |
Rio Tinto PLC | | | 75,816 | | | | 3,631,009 | |
Royal Dutch Shell PLC, Class A ADR | | | 127,640 | | | | 7,437,583 | |
| | | | | | | | |
| | | | | | | 30,962,304 | |
| | | | | | | | |
| | | | | | | | |
| | | Shares | | | Value | |
| | |
| United States—3.0% | | | | | | | | |
Broadcom, Inc. | | | 7,400 | | | $ | 1,881,672 | |
Constellation Brands, Inc., Class A | | | 10,401 | | | | 1,672,689 | |
TE Connectivity Ltd. | | | 25,000 | | | | 1,890,750 | |
| | | | | | | | |
| | |
| | | | | | | 5,445,111 | |
| | | | | | | | |
Total Common Stock
(cost—$194,287,585) | | | | 183,939,282 | |
| | | | | | | | |
| | | | | | | | |
| | |
| | | Principal
Amount
(000s) | | | | |
|
| Repurchase Agreements—0.9% | |
State Street Bank and Trust Co., dated 12/31/18, 0.50%, due 1/2/19, proceeds $1,668,046; collateralized by U.S. Treasury Inflation Indexed Notes, 0.125%, due 7/15/26, valued at $1,705,856 including accrued interest | |
(cost—$1,668,000) | | | $1,668 | | | | 1,668,000 | |
| | | | | | | | |
| |
| Total Investments(cost—$195,955,585) (b)—102.0% | | | | 185,607,282 | |
| | | | | | | | |
| | |
| Liabilities in excess of other assets—(2.0)% | | | | | | | (3,565,432 | ) |
| | | | | | | | |
| | |
| Net Assets—100.0% | | | | | | | $182,041,850 | |
| | | | | | | | |
Notes to Schedule of Investments:
(a) 144A—Exempt from registration under Rule 144A of the Securities Act of 1933. These securities may be resold in transactions exempt from registration, typically only to qualified institutional buyers. Securities with an aggregate value of $6,777,502, representing 3.7% of net assets.
(b) Securities with an aggregate value of $133,585,445, representing 73.4% of net assets, were valued utilizing modeling tools provided by a third-party vendor. See Note 1(a) and Note 1(b) in the Notes to Financial Statements.
Glossary:
ADR—American Depositary Receipt
GDR—Global Depositary Receipt
| | | | | | |
| 80 | | Semiannual Report | | | December 31, 2018 | | | See accompanying Notes to Financial Statements |
Schedule of Investments
December 31, 2018 (unaudited)
The industry classification of portfolio holdings and liabilities in excess of other assets shown as a percentage of net assets were as follows:
| | | | |
Banks | | | 12.0% | |
Insurance | | | 9.2% | |
Oil, Gas & Consumable Fuels | | | 8.4% | |
Pharmaceuticals | | | 6.0% | |
Capital Markets | | | 6.0% | |
Beverages | | | 6.0% | |
Electronic Equipment, Instruments & Components | | | 4.1% | |
Hotels, Restaurants & Leisure | | | 4.0% | |
Semiconductors & Semiconductor Equipment | | | 3.8% | |
Trading Companies & Distributors | | | 3.1% | |
Electric Utilities | | | 3.0% | |
Metals & Mining | | | 3.0% | |
Auto Components | | | 3.0% | |
Household Durables | | | 2.8% | |
Industrial Conglomerates | | | 2.0% | |
Technology Hardware, Storage & Peripherals | | | 2.0% | |
Diversified Telecommunication Services | | | 2.0% | |
Food Products | | | 2.0% | |
Aerospace & Defense | | | 1.9% | |
Construction Materials | | | 1.9% | |
Road & Rail | | | 1.9% | |
IT Services | | | 1.8% | |
Containers & Packaging | | | 1.7% | |
Chemicals | | | 1.4% | |
Textiles, Apparel & Luxury Goods | | | 1.1% | |
Healthcare Equipment & Supplies | | | 1.1% | |
Real Estate Management & Development | | | 1.0% | |
Software | | | 1.0% | |
Media | | | 1.0% | |
Tobacco | | | 1.0% | |
Machinery | | | 1.0% | |
Transportation Infrastructure | | | 0.9% | |
Repurchase Agreements | | | 0.9% | |
Liabilities in excess of other assets | | | (2.0)% | |
| | | | |
| | | 100.0% | |
| | | | |
AllianzGI NFJ Large-Cap Value Fund
| | | | | | | | |
| | | Shares | | | Value | |
|
| Common Stock—97.3% | |
|
| Aerospace & Defense—2.6% | |
Lockheed Martin Corp. | | | 10,300 | | | | $2,696,952 | |
United Technologies Corp. | | | 53,666 | | | | 5,714,356 | |
| | | | | | | | |
| | | | | | | 8,411,308 | |
| | | | | | | | |
|
| Auto Components—0.0% | |
Garrett Motion, Inc. (a) | | | 4,810 | | | | 59,355 | |
| | | | | | | | |
| | |
| Banks—13.2% | | | | | | | | |
Bank of America Corp. | | | 379,300 | | | | 9,345,952 | |
Citigroup, Inc. | | | 109,900 | | | | 5,721,394 | |
Citizens Financial Group, Inc. | | | 88,465 | | | | 2,630,064 | |
Comerica, Inc. | | | 78,040 | | | | 5,360,568 | |
JPMorgan Chase & Co. | | | 127,600 | | | | 12,456,312 | |
U.S. Bancorp | | | 137,600 | | | | 6,288,320 | |
| | | | | | | | |
| | | | | | | 41,802,610 | |
| | | | | | | | |
|
| Beverages—1.2% | |
PepsiCo, Inc. | | | 34,000 | | | | 3,756,320 | |
| | | | | | | | |
|
| Biotechnology—1.1% | |
Amgen, Inc. | | | 18,149 | | | | 3,533,066 | |
| | | | | | | | |
|
| Building Products—0.0% | |
Resideo Technologies, Inc. (a) | | | 7,433 | | | | 152,748 | |
| | | | | | | | |
|
| Capital Markets—2.7% | |
Morgan Stanley | | | 147,400 | | | | 5,844,410 | |
T Rowe Price Group, Inc. | | | 28,242 | | | | 2,607,301 | |
| | | | | | | | |
| | | | | | | 8,451,711 | |
| | | | | | | | |
|
| Chemicals—2.0% | |
Air Products & Chemicals, Inc. | | | 21,122 | | | | 3,380,576 | |
Celanese Corp. | | | 33,200 | | | | 2,987,004 | |
| | | | | | | | |
| | | | | | | 6,367,580 | |
| | | | | | | | |
|
| Communications Equipment—2.2% | |
Cisco Systems, Inc. | | | 160,400 | | | | 6,950,132 | |
| | | | | | | | |
|
| Consumer Finance—1.9% | |
American Express Co. | | | 33,948 | | | | 3,235,923 | |
Discover Financial Services | | | 49,500 | | | | 2,919,510 | |
| | | | | | | | |
| | | | | | | 6,155,433 | |
| | | | | | | | |
|
| Containers & Packaging—1.0% | |
Sonoco Products Co. | | | 59,600 | | | | 3,166,548 | |
| | | | | | | | |
|
| Diversified Telecommunication Services—3.4% | |
AT&T, Inc. | | | 130,948 | | | | 3,737,256 | |
Verizon Communications, Inc. | | | 125,771 | | | | 7,070,846 | |
| | | | | | | | |
| | | | | | | 10,808,102 | |
| | | | | | | | |
|
| Electric Utilities—3.0% | |
Entergy Corp. | | | 72,800 | | | | 6,265,896 | |
Exelon Corp. | | | 68,992 | | | | 3,111,539 | |
| | | | | | | | |
| | | | | | | 9,377,435 | |
| | | | | | | | |
|
| Electrical Equipment—0.9% | |
Eaton Corp. PLC | | | 40,900 | | | | 2,808,194 | |
| | | | | | | | |
|
| Entertainment—1.0% | |
Walt Disney Co. | | | 30,100 | | | | 3,300,465 | |
| | | | | | | | |
|
| Equity Real Estate Investment Trusts (REITs)—1.9% | |
Host Hotels & Resorts, Inc. | | | 163,703 | | | | 2,728,929 | |
Omega Healthcare Investors, Inc. | | | 91,269 | | | | 3,208,105 | |
| | | | | | | | |
| | | | | | | 5,937,034 | |
| | | | | | | | |
| | | | | | | | |
| | | Shares | | | Value | |
|
| Food & Staples Retailing—2.4% | |
Sysco Corp. | | | 60,000 | | | $ | 3,759,600 | |
Walmart, Inc. | | | 40,000 | | | | 3,726,000 | |
| | | | | | | | |
| | | | | | | 7,485,600 | |
| | | | | | | | |
|
| Food Products—1.9% | |
Conagra Brands, Inc. | | | 113,800 | | | | 2,430,768 | |
Mondelez International, Inc., Class A | | | 89,600 | | | | 3,586,688 | |
| | | | | | | | |
| | | | | | | 6,017,456 | |
| | | | | | | | |
|
| Healthcare Equipment & Supplies—3.4% | |
Abbott Laboratories | | | 57,400 | | | | 4,151,742 | |
Baxter International, Inc. | | | 25,806 | | | | 1,698,551 | |
Medtronic PLC | | | 53,600 | | | | 4,875,456 | |
| | | | | | | | |
| | | | | | | 10,725,749 | |
| | | | | | | | |
|
| Healthcare Providers & Services—5.8% | |
Anthem, Inc. | | | 25,300 | | | | 6,644,539 | |
CVS Health Corp. | | | 44,768 | | | | 2,933,199 | |
Encompass Health Corp. | | | 45,700 | | | | 2,819,690 | |
HCA Healthcare, Inc. | | | 24,000 | | | | 2,986,800 | |
Quest Diagnostics, Inc. | | | 36,400 | | | | 3,031,028 | |
| | | | | | | | |
| | | | | | | 18,415,256 | |
| | | | | | | | |
|
| Hotels, Restaurants & Leisure—0.9% | |
Royal Caribbean Cruises Ltd. | | | 30,400 | | | | 2,972,816 | |
| | | | | | | | |
|
| Household Products—1.1% | |
Procter & Gamble Co. | | | 37,200 | | | | 3,419,424 | |
| | | | | | | | |
|
| Industrial Conglomerates—1.9% | |
Honeywell International, Inc. | | | 44,600 | | | | 5,892,552 | |
| | | | | | | | |
|
| Insurance—4.1% | |
Aflac, Inc. | | | 82,800 | | | | 3,772,368 | |
Allstate Corp. | | | 35,400 | | | | 2,925,102 | |
Progressive Corp. | | | 52,811 | | | | 3,186,088 | |
Reinsurance Group of America, Inc. | | | 23,400 | | | | 3,281,382 | |
| | | | | | | | |
| | | | | | | 13,164,940 | |
| | | | | | | | |
|
| Leisure Equipment & Products—0.7% | |
Brunswick Corp. | | | 48,100 | | | | 2,234,245 | |
| | | | | | | | |
| | |
| Machinery—1.0% | | | | | | | | |
Ingersoll-Rand PLC | | | 34,100 | | | | 3,110,943 | |
| | | | | | | | |
| | |
| Media—2.1% | | | | | | | | |
Comcast Corp., Class A | | | 198,600 | | | | 6,762,330 | |
| | | | | | | | |
| | |
| Metals & Mining—0.9% | | | | | | | | |
Steel Dynamics, Inc. | | | 90,200 | | | | 2,709,608 | |
| | | | | | | | |
| | |
| Multi-Line Retail—0.8% | | | | | | | | |
Target Corp. | | | 40,564 | | | | 2,680,875 | |
| | | | | | | | |
| | |
| Multi-Utilities—2.0% | | | | | | | | |
Public Service Enterprise Group, Inc. | | | 120,400 | | | | 6,266,820 | |
| | | | | | | | |
|
| Oil, Gas & Consumable Fuels—11.1% | |
ConocoPhillips | | | 109,300 | | | | 6,814,855 | |
EOG Resources, Inc. | | | 40,147 | | | | 3,501,220 | |
Equinor ASA ADR | | | 271,100 | | | | 5,739,187 | |
Marathon Oil Corp. | | | 210,825 | | | | 3,023,231 | |
Occidental Petroleum Corp. | | | 98,600 | | | | 6,052,068 | |
Royal Dutch Shell PLC, Class A ADR | | | 55,308 | | | | 3,222,797 | |
Total S.A. ADR | | | 56,800 | | | | 2,963,824 | |
Valero Energy Corp. | | | 50,528 | | | | 3,788,084 | |
| | | | | | | | |
| | | | | | | 35,105,266 | |
| | | | | | | | |
|
| Pharmaceuticals—7.1% | |
Eli Lilly & Co. | | | 65,300 | | | | 7,556,516 | |
Merck & Co., Inc. | | | 101,059 | | | | 7,721,918 | |
| | | | | | | | |
| See accompanying Notes to Financial Statements | | | December 31, 2018 | | | Semiannual Report | | | 81 | |
Schedule of Investments
December 31, 2018 (unaudited)
| | | | | | | | |
| | | Shares | | | Value | |
Pfizer, Inc. | | | 169,000 | | | $ | 7,376,850 | |
| | | | | | | | |
| | | | | | | 22,655,284 | |
| | | | | | | | |
| | |
| Road & Rail—1.7% | | | | | | | | |
Kansas City Southern | | | 27,700 | | | | 2,643,965 | |
Union Pacific Corp. | | | 19,100 | | | | 2,640,193 | |
| | | | | | | | |
| | | | | | | 5,284,158 | |
| | | | | | | | |
|
| Semiconductors & Semiconductor Equipment—3.7% | |
Broadcom, Inc. | | | 6,346 | | | | 1,613,661 | |
Intel Corp. | | | 148,500 | | | | 6,969,105 | |
QUALCOMM, Inc. | | | 53,416 | | | | 3,039,905 | |
| | | | | | | | |
| | | | | | | 11,622,671 | |
| | | | | | | | |
| | |
| Software—1.8% | | | | | | | | |
Microsoft Corp. | | | 56,674 | | | | 5,756,378 | |
| | | | | | | | |
| | |
| Specialty Retail—1.5% | | | | | | | | |
Best Buy Co., Inc. | | | 30,585 | | | | 1,619,782 | |
Lowe’s Cos., Inc. | | | 34,900 | | | | 3,223,364 | |
| | | | | | | | |
| | | | | | | 4,843,146 | |
| | | | | | | | |
|
| Technology Hardware, Storage & Peripherals—1.7% | |
Apple, Inc. | | | 15,500 | | | | 2,444,970 | |
HP, Inc. | | | 137,600 | | | | 2,815,296 | |
| | | | | | | | |
| | | | | | | 5,260,266 | |
| | | | | | | | |
|
| Textiles, Apparel & Luxury Goods—0.8% | |
VF Corp. | | | 35,009 | | | | 2,497,542 | |
| | | | | | | | |
| | |
| Tobacco—0.8% | | | | | | | | |
Philip Morris International, Inc. | | | 39,100 | | | | 2,610,316 | |
| | | | | | | | |
Total Common Stock
(cost—$335,240,812) | | | | | | | 308,531,682 | |
| | | | | | | | |
| | | | | | | | |
| | |
| | | Principal
Amount
(000s) | | | | |
|
| Repurchase Agreements—2.5% | |
State Street Bank and Trust Co., dated 12/31/18, 0.50%, due 1/2/19, proceeds $7,978,222; collateralized by U.S. Treasury Inflation Indexed Notes, 0.125%, due 7/15/26, valued at $8,138,663 including accrued interest | |
(cost—$7,978,000) | | | $7,978 | | | | 7,978,000 | |
| | | | | | | | |
| |
Total Investments
(cost—$343,218,812)—99.8% | | | | 316,509,682 | |
| | | | | | | | |
| | |
| Other assets less liabilities—0.2% | | | | | | | 748,928 | |
| | | | | | | | |
| | |
| Net Assets—100.0% | | | | | | | $317,258,610 | |
| | | | | | | | |
Notes to Schedule of Investments:
(a) Non-income producing.
Glossary:
ADR—American Depositary Receipt
REIT—Real Estate Investment Trust
AllianzGI NFJ Mid-Cap Value Fund
| | | | | | | | |
| | | Shares | | | Value | |
|
| Common Stock—98.4% | |
|
| Aerospace & Defense—4.0% | |
Harris Corp. | | | 75,630 | | | | $10,183,580 | |
Huntington Ingalls Industries, Inc. | | | 59,140 | | | | 11,254,933 | |
Northrop Grumman Corp. | | | 47,487 | | | | 11,629,566 | |
Spirit AeroSystems Holdings, Inc., Class A | | | 159,000 | | | | 11,462,310 | |
| | | | | | | | |
| | |
| | | | | | | 44,530,389 | |
| | | | | | | | |
|
| Air Freight & Logistics—0.8% | |
FedEx Corp. | | | 57,200 | | | | 9,228,076 | |
| | | | | | | | |
|
| Airlines—1.1% | |
Southwest Airlines Co. | | | 251,600 | | | | 11,694,368 | |
| | | | | | | | |
|
| Auto Components—2.1% | |
Lear Corp. | | | 94,600 | | | | 11,622,556 | |
Magna International, Inc. | | | 266,600 | | | | 12,116,970 | |
| | | | | | | | |
| | |
| | | | | | | 23,739,526 | |
| | | | | | | | |
|
| Banks—8.0% | |
BOK Financial Corp. | | | 152,000 | | | | 11,146,160 | |
Citizens Financial Group, Inc. | | | 372,790 | | | | 11,083,047 | |
Comerica, Inc. | | | 162,870 | | | | 11,187,540 | |
Fifth Third Bancorp | | | 481,700 | | | | 11,334,401 | |
KeyCorp | | | 740,000 | | | | 10,937,200 | |
M&T Bank Corp. | | | 81,287 | | | | 11,634,608 | |
Regions Financial Corp. | | | 827,900 | | | | 11,077,302 | |
SunTrust Banks, Inc. | | | 217,642 | | | | 10,977,863 | |
| | | | | | | | |
| | |
| | | | | | | 89,378,121 | |
| | | | | | | | |
|
| Beverages—1.8% | |
Coca-Cola European Partners PLC | | | 207,093 | | | | 9,495,214 | |
Constellation Brands, Inc., Class A | | | 64,200 | | | | 10,324,644 | |
| | | | | | | | |
| | |
| | | | | | | 19,819,858 | |
| | | | | | | | |
|
| Building Products—0.3% | |
Fortune Brands Home & Security, Inc. | | | 101,294 | | | | 3,848,159 | |
| | | | | | | | |
|
| Capital Markets—5.2% | |
Ameriprise Financial, Inc. | | | 96,900 | | | | 10,113,453 | |
Lazard Ltd., Class A | | | 314,828 | | | | 11,620,302 | |
Raymond James Financial, Inc. | | | 166,400 | | | | 12,381,824 | |
State Street Corp. | | | 182,720 | | | | 11,524,150 | |
TD Ameritrade Holding Corp. | | | 240,955 | | | | 11,797,157 | |
| | | | | | | | |
| | |
| | | | | | | 57,436,886 | |
| | | | | | | | |
|
| Chemicals—3.2% | |
Celanese Corp. | | | 132,900 | | | | 11,957,013 | |
Eastman Chemical Co. | | | 163,300 | | | | 11,938,863 | |
LyondellBasell Industries NV, Class A | | | 138,300 | | | | 11,501,028 | |
| | | | | | | | |
| | |
| | | | | | | 35,396,904 | |
| | | | | | | | |
|
| Commercial Services & Supplies—1.0% | |
KAR Auction Services, Inc. | | | 234,590 | | | | 11,194,635 | |
| | | | | | | | |
|
| Communications Equipment—1.0% | |
Motorola Solutions, Inc. | | | 98,030 | | | | 11,277,371 | |
| | | | | | | | |
|
| Construction & Engineering—1.2% | |
EMCOR Group, Inc. | | | 215,253 | | | | 12,848,452 | |
| | | | | | | | |
|
| Consumer Finance—0.8% | |
Discover Financial Services | | | 159,500 | | | | 9,407,310 | |
| | | | | | | | |
| | | | | | | | |
| | | Shares | | | Value | |
|
| Containers & Packaging—3.2% | |
International Paper Co. | | | 278,300 | | | $ | 11,232,188 | |
Packaging Corp. of America | | | 136,000 | | | | 11,350,560 | |
Sonoco Products Co. | | | 248,800 | | | | 13,218,744 | |
| | | | | | | | |
| | |
| | | | | | | 35,801,492 | |
| | | | | | | | |
|
| Distributors—1.2% | |
Genuine Parts Co. | | | 138,200 | | | | 13,269,964 | |
| | | | | | | | |
|
| Electric Utilities—4.0% | |
American Electric Power Co., Inc. | | | 148,920 | | | | 11,130,281 | |
Entergy Corp. | | | 133,060 | | | | 11,452,474 | |
Eversource Energy | | | 170,560 | | | | 11,093,222 | |
Southern Co. | | | 251,800 | | | | 11,059,056 | |
| | | | | | | | |
| | |
| | | | | | | 44,735,033 | |
| | | | | | | | |
|
| Electrical Equipment—2.1% | |
Eaton Corp. PLC | | | 173,600 | | | | 11,919,376 | |
Hubbell, Inc. | | | 118,000 | | | | 11,722,120 | |
| | | | | | | | |
| | |
| | | | | | | 23,641,496 | |
| | | | | | | | |
|
| Electronic Equipment, Instruments & Components—1.1% | |
TE Connectivity Ltd. | | | 167,500 | | | | 12,668,025 | |
| | | | | | | | |
|
| Energy Equipment & Services—0.5% | |
Halliburton Co. | | | 213,960 | | | | 5,687,057 | |
| | | | | | | | |
|
| Equity Real Estate Investment Trusts (REITs)—6.8% | |
American Tower Corp. | | | 38,846 | | | | 6,145,049 | |
Digital Realty Trust, Inc. | | | 102,600 | | | | 10,932,030 | |
Lamar Advertising Co., Class A | | | 185,700 | | | | 12,846,726 | |
Mid-America Apartment Communities, Inc. | | | 118,700 | | | | 11,359,590 | |
National Health Investors, Inc. | | | 186,900 | | | | 14,118,426 | |
Prologis, Inc. | | | 183,300 | | | | 10,763,376 | |
Weyerhaeuser Co. | | | 417,640 | | | | 9,129,610 | |
| | | | | | | | |
| | |
| | | | | | | 75,294,807 | |
| | | | | | | | |
|
| Food Products—3.2% | |
Archer-Daniels-Midland Co. | | | 280,400 | | | | 11,487,988 | |
Hershey Co. | | | 119,320 | | | | 12,788,718 | |
Ingredion, Inc. | | | 120,260 | | | | 10,991,764 | |
| | | | | | | | |
| | |
| | | | | | | 35,268,470 | |
| | | | | | | | |
|
| Gas Utilities—1.0% | |
UGI Corp. | | | 202,800 | | | | 10,819,380 | |
| | | | | | | | |
|
| Healthcare Equipment & Supplies—1.0% | |
STERIS PLC | | | 105,570 | | | | 11,280,154 | |
| | | | | | | | |
|
| Healthcare Providers & Services—2.5% | |
Encompass Health Corp. | | | 167,140 | | | | 10,312,538 | |
Fresenius Medical Care AG & Co. KGaA ADR | | | 154,170 | | | | 4,993,566 | |
Universal Health Services, Inc., Class B | | | 107,000 | | | | 12,471,920 | |
| | | | | | | | |
| | |
| | | | | | | 27,778,024 | |
| | | | | | | | |
|
| Hotels, Restaurants & Leisure—1.0% | |
Royal Caribbean Cruises Ltd. | | | 119,540 | | | | 11,689,817 | |
| | | | | | | | |
|
| Household Durables—1.0% | |
DR Horton, Inc. | | | 312,200 | | | | 10,820,852 | |
| | | | | | | | |
|
| Insurance—9.1% | |
Allstate Corp. | | | 141,280 | | | | 11,673,966 | |
American Financial Group, Inc. | | | 122,950 | | | | 11,130,664 | |
| | | | | | |
| 82 | | Semiannual Report | | | December 31, 2018 | | | See accompanying Notes to Financial Statements |
Schedule of Investments
December 31, 2018 (unaudited)
| | | | | | | | |
| | | Shares | | | Value | |
Aon PLC | | | 75,520 | | | $ | 10,977,587 | |
Everest Re Group Ltd. | | | 58,700 | | | | 12,782,512 | |
Hartford Financial Services Group, Inc. | | | 271,080 | | | | 12,049,506 | |
Lincoln National Corp. | | | 170,500 | | | | 8,748,355 | |
Principal Financial Group, Inc. | | | 265,270 | | | | 11,716,976 | |
Progressive Corp. | | | 215,900 | | | | 13,025,247 | |
Prudential Financial, Inc. | | | 110,700 | | | | 9,027,585 | |
| | | | | | | | |
| | |
| | | | | | | 101,132,398 | |
| | | | | | | | |
|
| IT Services—3.9% | |
Amdocs Ltd. | | | 184,110 | | | | 10,785,164 | |
Booz Allen Hamilton Holding Corp. | | | 267,400 | | | | 12,051,718 | |
DXC Technology Co. | | | 150,500 | | | | 8,002,085 | |
Fidelity National Information Services, Inc. | | | 119,000 | | | | 12,203,450 | |
| | | | | | | | |
| | |
| | | | | | | 43,042,417 | |
| | | | | | | | |
|
| Leisure Equipment & Products—1.0% | |
Brunswick Corp. | | | 250,660 | | | | 11,643,157 | |
| | | | | | | | |
|
| Life Sciences Tools & Services—2.0% | |
Agilent Technologies, Inc. | | | 189,221 | | | | 12,764,849 | |
Bruker Corp. | | | 316,799 | | | | 9,431,106 | |
| | | | | | | | |
| | |
| | | | | | | 22,195,955 | |
| | | | | | | | |
|
| Machinery—5.3% | |
Altra Industrial Motion Corp. | | | 306,850 | | | | 7,717,278 | |
Crane Co. | | | 151,740 | | | | 10,952,593 | |
Cummins, Inc. | | | 81,760 | | | | 10,926,406 | |
Illinois Tool Works, Inc. | | | 48,280 | | | | 6,116,593 | |
Ingersoll-Rand PLC | | | 121,790 | | | | 11,110,902 | |
PACCAR, Inc. | | | 220,400 | | | | 12,593,656 | |
| | | | | | | | |
| | |
| | | | | | | 59,417,428 | |
| | | | | | | | |
|
| Metals & Mining—1.0% | |
Nucor Corp. | | | 218,200 | | | | 11,304,942 | |
| | | | | | | | |
|
| Multi-Line Retail—1.2% | |
Dollar General Corp. | | | 124,600 | | | | 13,466,768 | |
| | | | | | | | |
|
| Multi-Utilities—0.9% | |
Public Service Enterprise Group, Inc. | | | 187,670 | | | | 9,768,223 | |
| | | | | | | | |
|
| Oil, Gas & Consumable Fuels—7.5% | |
ConocoPhillips | | | 190,475 | | | | 11,876,116 | |
Devon Energy Corp. | | | 387,350 | | | | 8,730,869 | |
EQM Midstream Partners L.P. | | | 218,800 | | | | 9,463,100 | |
Magellan Midstream Partners L.P. | | | 197,300 | | | | 11,257,938 | |
Marathon Oil Corp. | | | 538,240 | | | | 7,718,362 | |
Marathon Petroleum Corp. | | | 195,000 | | | | 11,506,950 | |
TransCanada Corp. | | | 315,600 | | | | 11,266,920 | |
Valero Energy Corp. | | | 160,800 | | | | 12,055,176 | |
| | | | | | | | |
| | |
| | | | | | | 83,875,431 | |
| | | | | | | | |
|
| Road & Rail—3.1% | |
JB Hunt Transport Services, Inc. | | | 118,900 | | | | 11,062,456 | |
Kansas City Southern | | | 128,810 | | | | 12,294,914 | |
Norfolk Southern Corp. | | | 75,490 | | | | 11,288,775 | |
| | | | | | | | |
| | |
| | | | | | | 34,646,145 | |
| | | | | | | | |
|
| Semiconductors & Semiconductor Equipment—1.3% | |
Applied Materials, Inc. | | | 187,900 | | | | 6,151,846 | |
Skyworks Solutions, Inc. | | | 124,050 | | | | 8,313,831 | |
| | | | | | | | |
| | |
| | | | | | | 14,465,677 | |
| | | | | | | | |
| | | | | | | | |
| | | Shares | | | Value | |
|
| Software—1.1% | |
Citrix Systems, Inc. | | | 60,275 | | | $ | 6,175,776 | |
SS&C Technologies Holdings, Inc. | | | 124,334 | | | | 5,608,707 | |
| | | | | | | | |
| | |
| | | | | | | 11,784,483 | |
| | | | | | | | |
|
| Specialty Retail—1.2% | |
Tractor Supply Co. | | | 160,150 | | | | 13,362,916 | |
| | | | | | | | |
|
| Textiles, Apparel & Luxury Goods—0.7% | |
Tapestry, Inc. | | | 225,856 | | | | 7,622,640 | |
| | | | | | | | |
Total Common Stock
(cost—$1,112,781,402) | | | | 1,096,283,206 | |
| | | | | | | | |
| | | | | | | | |
| | |
| | | Principal
Amount
(000s) | | | | |
|
| Repurchase Agreements—1.4% | |
State Street Bank and Trust Co., dated 12/31/18, 0.50%, due 1/2/19, proceeds $15,213,423; collateralized by U.S. Treasury Inflation Indexed Notes, 0.125%, due 7/15/26, valued at $15,520,817 including accrued interest | |
(cost—$15,213,000) | | | $15,213 | | | | 15,213,000 | |
| | | | | | | | |
| |
Total Investments
(cost—$1,127,994,402)—99.8% | | | | 1,111,496,206 | |
| | | | | | | | |
| | |
| Other assets less liabilities—0.2% | | | | | | | 1,728,548 | |
| | | | | | | | |
| | |
| Net Assets—100.0% | | | | | | | $1,113,224,754 | |
| | | | | | | | |
Glossary:
ADR—American Depositary Receipt
REIT—Real Estate Investment Trust
AllianzGI NFJ Small-Cap Value Fund
| | | | | | | | |
| | | Shares | | | Value | |
|
| Common Stock—100.2% | |
|
| Aerospace & Defense—2.2% | |
CAE, Inc. | | | 659,900 | | | | $12,109,165 | |
Curtiss-Wright Corp. | | | 146,200 | | | | 14,929,944 | |
| | | | | | | | |
| | | | | | | 27,039,109 | |
| | | | | | | | |
| | |
| Airlines—1.2% | | | | | | | | |
Hawaiian Holdings, Inc. | | | 542,500 | | | | 14,327,425 | |
| | | | | | | | |
| | |
| Banks—22.4% | | | | | | | | |
Associated Banc-Corp | | | 755,480 | | | | 14,950,949 | |
Berkshire Hills Bancorp, Inc. | | | 520,264 | | | | 14,031,520 | |
CenterState Bank Corp. | | | 702,773 | | | | 14,786,344 | |
East West Bancorp, Inc. | | | 190,590 | | | | 8,296,383 | |
Enterprise Financial Services Corp. | | | 389,150 | | | | 14,643,714 | |
First Bancorp | | | 454,429 | | | | 14,841,651 | |
First Hawaiian, Inc. | | | 663,800 | | | | 14,942,138 | |
First Horizon National Corp. | | | 1,136,800 | | | | 14,960,288 | |
First Interstate Bancsystem, Inc., Class A | | | 404,848 | | | | 14,801,243 | |
FNB Corp. | | | 1,481,255 | | | | 14,575,549 | |
Great Western Bancorp, Inc. | | | 478,415 | | | | 14,950,469 | |
Hope Bancorp, Inc. | | | 1,226,725 | | | | 14,548,959 | |
IBERIABANK Corp. | | | 229,458 | | | | 14,749,560 | |
International Bancshares Corp. | | | 345,600 | | | | 11,888,640 | |
Simmons First National Corp., Class A | | | 625,850 | | | | 15,101,760 | |
South State Corp. | | | 249,500 | | | | 14,957,525 | |
TCF Financial Corp. | | | 727,700 | | | | 14,182,873 | |
Towne Bank | | | 61,400 | | | | 1,470,530 | |
Umpqua Holdings Corp. | | | 855,540 | | | | 13,603,086 | |
United Community Banks, Inc. | | | 680,930 | | | | 14,612,758 | |
| | | | | | | | |
| | | | | | | 270,895,939 | |
| | | | | | | | |
| |
| Building Products—1.2% | | | | | |
Universal Forest Products, Inc. | | | 569,302 | | | | 14,779,080 | |
| | | | | | | | |
| |
| Capital Markets—4.5% | | | | | |
AllianceBernstein Holding L.P. | | | 445,212 | | | | 12,163,192 | |
BrightSphere Investment Group | | | 1,411,844 | | | | 15,078,494 | |
Houlihan Lokey, Inc. | | | 399,850 | | | | 14,714,480 | |
Stifel Financial Corp. | | | 292,490 | | | | 12,114,936 | |
| | | | | | | | |
| | | | | | | 54,071,102 | |
| | | | | | | | |
| | |
| Chemicals—4.9% | | | | | | | | |
Cabot Corp. | | | 356,500 | | | | 15,308,110 | |
Innophos Holdings, Inc. | | | 166,148 | | | | 4,075,610 | |
Methanex Corp. | | | 254,500 | | | | 12,259,265 | |
Orion Engineered Carbons S.A. | | | 611,365 | | | | 15,455,307 | |
Rentech Nitrogen Partners
L.P. (a)(b)(c) | | | 555,768 | | | | 56 | |
Stepan Co. | | | 165,958 | | | | 12,280,892 | |
| | | | | | | | |
| | | | | | | 59,379,240 | |
| | | | | | | | |
|
| Commercial Services & Supplies—2.0% | |
Ennis, Inc. | | | 616,801 | | | | 11,873,419 | |
Interface, Inc. | | | 899,858 | | | | 12,822,977 | |
| | | | | | | | |
| | | | | | | 24,696,396 | |
| | | | | | | | |
|
| Construction & Engineering—3.2% | |
Argan, Inc. | | | 303,463 | | | | 11,483,040 | |
EMCOR Group, Inc. | | | 242,729 | | | | 14,488,494 | |
KBR, Inc. | | | 799,110 | | | | 12,130,490 | |
| | | | | | | | |
| | | | | | | 38,102,024 | |
| | | | | | | | |
| | | | | | | | |
| See accompanying Notes to Financial Statements | | | December 31, 2018 | | | Semiannual Report | | | 83 | |
Schedule of Investments
December 31, 2018 (unaudited)
| | | | | | | | |
| | | Shares | | | Value | |
|
| Containers & Packaging—2.3% | |
Silgan Holdings, Inc. | | | 628,006 | | | $ | 14,833,502 | |
Sonoco Products Co. | | | 240,520 | | | | 12,778,827 | |
| | | | | | | | |
| | | | | | | 27,612,329 | |
| | | | | | | | |
|
| Electrical Equipment—2.4% | |
EnerSys | | | 194,131 | | | | 15,066,507 | |
Regal Beloit Corp. | | | 207,810 | | | | 14,557,090 | |
| | | | | | | | |
| | | | | | | 29,623,597 | |
| | | | | | | | |
|
| Electronic Equipment, Instruments & Components—2.4% | |
Methode Electronics, Inc. | | | 623,442 | | | | 14,519,964 | |
Vishay Intertechnology, Inc. | | | 812,010 | | | | 14,624,300 | |
| | | | | | | | |
| | | | | | | 29,144,264 | |
| | | | | | | | |
|
| Energy Equipment & Services—1.1% | |
Mammoth Energy Services, Inc. | | | 710,800 | | | | 12,780,184 | |
| | | | | | | | |
|
| Equity Real Estate Investment Trusts (REITs)—4.4% | |
CyrusOne, Inc. | | | 232,694 | | | | 12,304,859 | |
InfraREIT, Inc. | | | 365,520 | | | | 7,683,230 | |
Monmouth Real Estate Investment Corp. | | | 1,135,308 | | | | 14,077,819 | |
National Health Investors, Inc. | | | 170,520 | | | | 12,881,081 | |
PotlatchDeltic Corp. | | | 214,433 | | | | 6,784,660 | |
| | | | | | | | |
| | | | | | | 53,731,649 | |
| | | | | | | | |
| | |
| Food Products—1.2% | | | | | | | | |
Ingredion, Inc. | | | 159,660 | | | | 14,592,924 | |
| | | | | | | | |
| | |
| Gas Utilities—1.0% | | | | | | | | |
National Fuel Gas Co. | | | 229,090 | | | | 11,724,826 | |
| | | | | | | | |
|
| Healthcare Equipment & Supplies—1.1% | |
Hill-Rom Holdings, Inc. | | | 149,580 | | | | 13,245,309 | |
| | | | | | | | |
|
| Healthcare Providers & Services—1.1% | |
Encompass Health Corp. | | | 223,339 | | | | 13,780,016 | |
| | | | | | | | |
|
| Hotels, Restaurants & Leisure—2.4% | |
Extended Stay America, Inc. UNIT | | | 935,353 | | | | 14,497,971 | |
Ruth’s Hospitality Group, Inc. | | | 648,145 | | | | 14,732,336 | |
| | | | | | | | |
| | | | | | | 29,230,307 | |
| | | | | | | | |
|
| Household Durables—2.3% | |
La-Z-Boy, Inc. | | | 532,600 | | | | 14,758,346 | |
MDC Holdings, Inc. | | | 446,724 | | | | 12,557,412 | |
| | | | | | | | |
| | | | | | | 27,315,758 | |
| | | | | | | | |
| | |
| Insurance—4.6% | | | | | | | | |
American Financial Group, Inc. | | | 161,050 | | | | 14,579,856 | |
CNO Financial Group, Inc. | | | 976,860 | | | | 14,535,677 | |
First American Financial Corp. | | | 332,220 | | | | 14,830,301 | |
Old Republic International Corp. | | | 588,090 | | | | 12,097,011 | |
| | | | | | | | |
| | | | | | | 56,042,845 | |
| | | | | | | | |
| | |
| IT Services—1.0% | | | | | | | | |
Booz Allen Hamilton Holding Corp. | | | 268,480 | | | | 12,100,394 | |
| | | | | | | | |
|
| Leisure Equipment & Products—1.2% | |
Brunswick Corp. | | | 306,530 | | | | 14,238,319 | |
| | | | | | | | |
| | | | | | | | |
| | | Shares | | | Value | |
|
| Life Sciences Tools & Services—1.1% | |
Bruker Corp. | | | 454,500 | | | $ | 13,530,465 | |
| | | | | | | | |
| | |
| Machinery—4.8% | | | | | | | | |
Crane Co. | | | 207,040 | | | | 14,944,147 | |
Global Brass & Copper Holdings, Inc. | | | 548,152 | | | | 13,786,023 | |
ITT, Inc. | | | 307,195 | | | | 14,828,302 | |
Kennametal, Inc. | | | 443,810 | | | | 14,769,997 | |
| | | | | | | | |
| | | | | | | 58,328,469 | |
| | | | | | | | |
| | |
| Media—1.1% | | | | | | | | |
Meredith Corp. | | | 253,652 | | | | 13,174,685 | |
| | | | | | | | |
|
| Metals & Mining—1.0% | |
Steel Dynamics, Inc. | | | 402,480 | | | | 12,090,499 | |
| | | | | | | | |
|
| Multi-Utilities—1.0% | |
Black Hills Corp. | | | 187,760 | | | | 11,787,573 | |
| | | | | | | | |
|
| Oil, Gas & Consumable Fuels—7.2% | |
Alliance Resource Partners L.P. | | | 82,100 | | | | 1,423,614 | |
CNX Midstream Partners L.P. | | | 865,571 | | | | 14,091,496 | |
Delek Logistics Partners L.P. | | | 461,664 | | | | 13,503,672 | |
Enerplus Corp. | | | 1,554,300 | | | | 12,061,368 | |
EQM Midstream Partners L.P. | | | 331,146 | | | | 14,322,065 | |
Parkland Fuel Corp. | | | 252,000 | | | | 6,523,352 | |
SandRidge Permian Trust | | | 622,702 | | | | 1,176,907 | |
Ship Finance International Ltd. | | | 1,311,500 | | | | 13,810,095 | |
Valero Energy Partners L.P. | | | 255,626 | | | | 10,779,748 | |
| | | | | | | | |
| | | | | | | 87,692,317 | |
| | | | | | | | |
|
| Paper & Forest Products—2.9% | |
Neenah, Inc. | | | 237,023 | | | | 13,965,395 | |
Schweitzer-Mauduit International, Inc. | | | 359,004 | | | | 8,993,050 | |
Western Forest Products, Inc. | | | 8,390,956 | | | | 11,616,545 | |
| | | | | | | | |
| | | | | | | 34,574,990 | |
| | | | | | | | |
|
| Professional Services—1.1% | |
Korn/Ferry International | | | 326,462 | | | | 12,908,308 | |
| | | | | | | | |
| | |
| Road & Rail—1.2% | | | | | | | | |
Werner Enterprises, Inc. | | | 489,747 | | | | 14,467,126 | |
| | | | | | | | |
|
| Semiconductors & Semiconductor Equipment—2.2% | |
MKS Instruments, Inc. | | | 184,160 | | | | 11,898,578 | |
Versum Materials, Inc. | | | 527,446 | | | | 14,620,803 | |
| | | | | | | | |
| | | | | | | 26,519,381 | |
| | | | | | | | |
|
| Specialty Retail—1.8% | |
DSW, Inc., Class A | | | 617,650 | | | | 15,255,955 | |
Tailored Brands, Inc. | | | 453,467 | | | | 6,185,290 | |
| | | | | | | | |
| | | | | | | 21,441,245 | |
| | | | | | | | |
|
| Textiles, Apparel & Luxury Goods—1.2% | |
Carter’s, Inc. | | | 184,720 | | | | 15,076,846 | |
| | | | | | | | |
|
| Thrifts & Mortgage Finance—1.2% | |
Washington Federal, Inc. | | | 551,460 | | | | 14,729,497 | |
| | | | | | | | |
| | |
| Tobacco—1.1% | | | | | | | | |
Universal Corp. | | | 240,619 | | | | 13,029,519 | |
| | | | | | | | |
| | | | | | | | |
| | | Shares | | | Value | |
|
| Trading Companies & Distributors—1.2% | |
MSC Industrial Direct Co., Inc., Class A | | | 189,738 | | | $ | 14,594,647 | |
| | | | | | | | |
Total Common Stock
(cost—$1,275,179,788) | | | | 1,212,398,603 | |
| | | | | | | | |
| | | | | | | | |
| | |
| | | Principal
Amount
(000s) | | | | |
|
| Repurchase Agreements—0.2% | |
State Street Bank and Trust Co., dated 12/31/18, 0.50%, due 1/2/19, proceeds $2,055,057; collateralized by U.S. Treasury Inflation Indexed Notes, 0.125%, due 7/15/26, valued at $2,096,472 including accrued interest | |
(cost—$2,055,000) | | | $2,055 | | | | 2,055,000 | |
| | | | | | | | |
| |
Total Investments
(cost—$1,277,234,788)—100.4% | | | | 1,214,453,603 | |
| | | | | | | | |
| |
| Liabilities in excess of other assets—(0.4)% | | | | (4,847,018 | ) |
| | | | | | | | |
| | |
| Net Assets—100.0% | | | | | | | $1,209,606,585 | |
| | | | | | | | |
Notes to Schedule of Investments:
(a) Fair-Valued—Security with a value of $56, representing less than 0.05% of net assets. See Note 1(a) and Note 1(b) in the Notes to Financial Statements.
(b) Level 3 security. See Note 1(a) and Note 1(b) in the Notes to Financial Statements.
(c) Non-income producing.
Glossary:
REIT—Real Estate Investment Trust
UNIT—More than one class of securities traded together
| | | | | | |
| 84 | | Semiannual Report | | | December 31, 2018 | | | See accompanying Notes to Financial Statements |
Schedule of Investments
December 31, 2018 (unaudited)
AllianzGI Small-Cap Fund
| | | | | | | | |
| | | Shares | | | Value | |
|
| Common Stock—98.2% | |
|
| Aerospace & Defense—2.2% | |
AAR Corp. | | | 4,366 | | | | $163,026 | |
Axon Enterprise, Inc. (c) | | | 3,149 | | | | 137,769 | |
BWX Technologies, Inc. | | | 3,020 | | | | 115,455 | |
Engility Holdings, Inc. (c) | | | 13,500 | | | | 384,210 | |
HEICO Corp. | | | 1,060 | | | | 82,129 | |
Kratos Defense & Security Solutions, Inc. (c) | | | 22,871 | | | | 322,252 | |
Moog, Inc., Class A | | | 7,300 | | | | 565,604 | |
| | | | | | | | |
| | | | | | | 1,770,445 | |
| | | | | | | | |
|
| Air Freight & Logistics—0.0% | |
Echo Global Logistics, Inc. (c) | | | 1,548 | | | | 31,471 | |
| | | | | | | | |
|
| Auto Components—0.2% | |
Stoneridge, Inc. (c) | | | 7,480 | | | | 184,382 | |
| | | | | | | | |
|
| Banks—3.9% | |
Bancorp, Inc. (c) | | | 19,180 | | | | 152,673 | |
Carolina Financial Corp. | | | 1,282 | | | | 37,934 | |
CBTX, Inc. | | | 2,250 | | | | 66,150 | |
Equity Bancshares, Inc., Class A (c) | | | 1,519 | | | | 53,545 | |
First BanCorp | | | 69,100 | | | | 594,260 | |
First Financial Bankshares, Inc. | | | 12,575 | | | | 725,452 | |
First Foundation, Inc. (c) | | | 3,117 | | | | 40,084 | |
First Internet Bancorp | | | 1,143 | | | | 23,363 | |
First Merchants Corp. | | | 11,775 | | | | 403,529 | |
Franklin Financial Network, Inc. (c) | | | 1,295 | | | | 34,149 | |
Investors Bancorp, Inc. | | | 5,470 | | | | 56,888 | |
National Commerce Corp. (c) | | | 957 | | | | 34,452 | |
Preferred Bank | | | 817 | | | | 35,417 | |
RBB Bancorp | | | 3,745 | | | | 65,800 | |
Southern National Bancorp of Virginia, Inc. | | | 4,495 | | | | 59,424 | |
TCF Financial Corp. | | | 32,445 | | | | 632,353 | |
Triumph Bancorp, Inc. (c) | | | 1,221 | | | | 36,264 | |
Veritex Holdings, Inc. (c) | | | 2,000 | | | | 42,760 | |
| | | | | | | | |
| | | | | | | 3,094,497 | |
| | | | | | | | |
|
| Beverages—1.3% | |
Boston Beer Co., Inc., Class A (c) | | | 2,385 | | | | 574,403 | |
Craft Brew Alliance, Inc. (c) | | | 4,320 | | | | 61,819 | |
MGP Ingredients, Inc. | | | 1,829 | | | | 104,344 | |
Primo Water Corp. (c) | | | 20,247 | | | | 283,661 | |
| | | | | | | | |
| | | | | | | 1,024,227 | |
| | | | | | | | |
|
| Biotechnology—5.8% | |
Abeona Therapeutics, Inc. (c) | | | 1,384 | | | | 9,882 | |
Albireo Pharma, Inc. (c) | | | 465 | | | | 11,406 | |
Amicus Therapeutics, Inc. (c) | | | 5,330 | | | | 51,061 | |
Arena Pharmaceuticals, Inc. (c) | | | 2,010 | | | | 78,290 | |
Array BioPharma, Inc. (c) | | | 8,498 | | | | 121,096 | |
Arrowhead Pharmaceuticals, Inc. (c) | | | 7,630 | | | | 94,765 | |
Audentes Therapeutics, Inc. (c) | | | 795 | | | | 16,949 | |
BioCryst Pharmaceuticals, Inc. (c) | | | 3,510 | | | | 28,326 | |
Biohaven Pharmaceutical Holding Co., Ltd. (c) | | | 758 | | | | 28,031 | |
BioSpecifics Technologies Corp. (c) | | | 4,464 | | | | 270,518 | |
Blueprint Medicines Corp. (c) | | | 1,094 | | | | 58,978 | |
Cara Therapeutics, Inc. (c) | | | 1,266 | | | | 16,458 | |
Corbus Pharmaceuticals Holdings, Inc. (c) | | | 1,752 | | | | 10,232 | |
CRISPR Therapeutics AG (c) | | | 2,660 | | | | 75,996 | |
CytomX Therapeutics, Inc. (c) | | | 1,282 | | | | 19,358 | |
| | | | | | | | |
| | | Shares | | | Value | |
Dicerna Pharmaceuticals, Inc. (c) | | | 6,838 | | | $ | 73,098 | |
Editas Medicine, Inc. (c) | | | 3,226 | | | | 73,392 | |
Emergent Biosolutions, Inc. (c) | | | 11,085 | | | | 657,119 | |
Exelixis, Inc. (c) | | | 6,175 | | | | 121,462 | |
Fate Therapeutics, Inc. (c) | | | 1,821 | | | | 23,363 | |
FibroGen, Inc. (c) | | | 1,475 | | | | 68,263 | |
Flexion Therapeutics, Inc. (c) | | | 1,682 | | | | 19,040 | |
Genomic Health, Inc. (c) | | | 14,320 | | | | 922,351 | |
Global Blood Therapeutics, Inc. (c) | | | 1,440 | | | | 59,112 | |
GlycoMimetics, Inc. (c) | | | 1,481 | | | | 14,025 | |
Heron Therapeutics, Inc. (c) | | | 2,222 | | | | 57,639 | |
Immunomedics, Inc. (c) | | | 3,930 | | | | 56,081 | |
Intellia Therapeutics, Inc. (c) | | | 6,639 | | | | 90,622 | |
Invitae Corp. (c) | | | 21,185 | | | | 234,306 | |
Iovance Biotherapeutics, Inc. (c) | | | 7,011 | | | | 62,047 | |
Karyopharm Therapeutics, Inc. (c) | | | 1,365 | | | | 12,790 | |
Kindred Biosciences, Inc. (c) | | | 3,090 | | | | 33,836 | |
Kura Oncology, Inc. (c) | | | 1,193 | | | | 16,750 | |
La Jolla Pharmaceutical Co. (c) | | | 1,036 | | | | 9,769 | |
Loxo Oncology, Inc. (c) | | | 576 | | | | 80,680 | |
MacroGenics, Inc. (c) | | | 1,251 | | | | 15,888 | |
Progenics Pharmaceuticals, Inc. (c) | | | 3,075 | | | | 12,915 | |
PTC Therapeutics, Inc. (c) | | | 13,745 | | | | 471,728 | |
Rigel Pharmaceuticals, Inc. (c) | | | 6,081 | | | | 13,986 | |
Sangamo Therapeutics, Inc. (c) | | | 2,022 | | | | 23,213 | |
T2 Biosystems, Inc. (c) | | | 6,214 | | | | 18,704 | |
uniQure NV (c) | | | 672 | | | | 19,367 | |
Vanda Pharmaceuticals, Inc. (c) | | | 1,791 | | | | 46,799 | |
Veracyte, Inc. (c) | | | 4,015 | | | | 50,509 | |
Verastem, Inc. (c) | | | 14,883 | | | | 50,007 | |
Vericel Corp. (c) | | | 17,554 | | | | 305,440 | |
Viking Therapeutics, Inc. (c) | | | 2,138 | | | | 16,356 | |
Voyager Therapeutics, Inc. (c) | | | 1,057 | | | | 9,936 | |
| | | | | | | | |
| | | | | | | 4,631,939 | |
| | | | | | | | |
|
| Building Products—0.1% | |
PGT Innovations, Inc. (c) | | | 2,381 | | | | 37,739 | |
| | | | | | | | |
|
| Capital Markets—0.2% | |
BlackRock TCP Capital Corp. | | | 3,895 | | | | 50,791 | |
Main Street Capital Corp. | | | 1,780 | | | | 60,182 | |
Prospect Capital Corp. | | | 9,926 | | | | 62,633 | |
| | | | | | | | |
| | | | | | | 173,606 | |
| | | | | | | | |
|
| Chemicals—0.7% | |
American Vanguard Corp. | | | 2,304 | | | | 34,998 | |
Balchem Corp. | | | 945 | | | | 74,041 | |
Ingevity Corp. (c) | | | 3,576 | | | | 299,275 | |
Trinseo S.A. | | | 3,605 | | | | 165,037 | |
| | | | | | | | |
| | | | | | | 573,351 | |
| | | | | | | | |
|
| Commercial Services & Supplies—3.4% | |
Brink’s Co. | | | 1,804 | | | | 116,629 | |
Essendant, Inc. | | | 40,425 | | | | 508,546 | |
Healthcare Services Group, Inc. | | | 4,270 | | | | 171,569 | |
Herman Miller, Inc. | | | 17,130 | | | | 518,182 | |
MSA Safety, Inc. | | | 7,620 | | | | 718,337 | |
Tetra Tech, Inc. | | | 12,375 | | | | 640,654 | |
| | | | | | | | |
| | | | | | | 2,673,917 | |
| | | | | | | | |
|
| Communications Equipment—0.5% | |
Ciena Corp. (c) | | | 1,615 | | | | 54,765 | |
EchoStar Corp., Class A (c) | | | 2,035 | | | | 74,725 | |
InterDigital, Inc. | | | 1,505 | | | | 99,977 | |
NetScout Systems, Inc. (c) | | | 1,985 | | | | 46,906 | |
Plantronics, Inc. | | | 1,115 | | | | 36,906 | |
Viavi Solutions, Inc. (c) | | | 7,625 | | | | 76,631 | |
| | | | | | | | |
| | | | | | | 389,910 | |
| | | | | | | | |
| | | | | | | | |
| | | Shares | | | Value | |
|
| Construction & Engineering—0.3% | |
NV5 Global, Inc. (c) | | | 1,232 | | | $ | 74,598 | |
Sterling Construction Co., Inc. (c) | | | 3,806 | | | | 41,447 | |
Willscot Corp. (c) | | | 12,784 | | | | 120,425 | |
| | | | | | | | |
| | | | | | | 236,470 | |
| | | | | | | | |
|
| Construction Materials—0.0% | |
U.S. Concrete, Inc. (c) | | | 977 | | | | 34,469 | |
| | | | | | | | |
|
| Consumer Finance—0.5% | |
Enova International, Inc. (c) | | | 7,670 | | | | 149,258 | |
Green Dot Corp., Class A (c) | | | 3,551 | | | | 282,376 | |
| | | | | | | | |
| | | | | | | 431,634 | |
| | | | | | | | |
|
| Containers & Packaging—0.3% | |
Greif, Inc., Class A | | | 4,390 | | | | 162,913 | |
Silgan Holdings, Inc. | | | 3,185 | | | | 75,230 | |
| | | | | | | | |
| | | | | | | 238,143 | |
| | | | | | | | |
|
| Diversified Consumer Services—1.3% | |
Bright Horizons Family Solutions, Inc. (c) | | | 2,595 | | | | 289,213 | |
Carriage Services, Inc. | | | 5,288 | | | | 81,964 | |
Chegg, Inc. (c) | | | 11,449 | | | | 325,381 | |
Graham Holdings Co., Class B | | | 125 | | | | 80,072 | |
Grand Canyon Education, Inc. (c) | | | 565 | | | | 54,319 | |
Strategic Education, Inc. | | | 1,521 | | | | 172,512 | |
| | | | | | | | |
| | | | | | | 1,003,461 | |
| | | | | | | | |
|
| Diversified Financial Services—0.2% | |
Compass Diversified Holdings | | | 13,030 | | | | 162,223 | |
| | | | | | | | |
|
| Diversified Telecommunication Services—0.1% | |
ORBCOMM, Inc. (c) | | | 5,301 | | | | 43,786 | |
| | | | | | | | |
| | |
| Electric Utilities—2.7% | | | | | | | | |
ALLETE, Inc. | | | 3,780 | | | | 288,112 | |
Hawaiian Electric Industries, Inc. | | | 10,220 | | | | 374,256 | |
IDACORP, Inc. | | | 2,530 | | | | 235,442 | |
Otter Tail Corp. | | | 1,345 | | | | 66,766 | |
PNM Resources, Inc. | | | 2,625 | | | | 107,861 | |
Portland General Electric Co. | | | 22,770 | | | | 1,044,004 | |
| | | | | | | | |
| | | | | | | 2,116,441 | |
| | | | | | | | |
|
| Electronic Equipment, Instruments & Components—0.3% | |
II-VI, Inc. (c) | | | 6,451 | | | | 209,399 | |
Mesa Laboratories, Inc. | | | 266 | | | | 55,432 | |
| | | | | | | | |
| | | | | | | 264,831 | |
| | | | | | | | |
|
| Energy Equipment & Services—0.6% | |
Newpark Resources, Inc. (c) | | | 36,187 | | | | 248,605 | |
ProPetro Holding Corp. (c) | | | 10,002 | | | | 123,225 | |
SEACOR Holdings, Inc. (c) | | | 1,625 | | | | 60,125 | |
USA Compression Partners L.P. | | | 4,840 | | | | 62,823 | |
| | | | | | | | |
| | | | | | | 494,778 | |
| | | | | | | | |
|
| Entertainment—1.3% | |
Liberty Media Corp-Liberty Braves, Class A (c) | | | 12,190 | | | | 304,019 | |
Liberty Media Corp-Liberty Braves, Class C (c) | | | 4,235 | | | | 105,409 | |
Madison Square Garden Co., Class A (c) | | | 490 | | | | 131,173 | |
Reading International, Inc., Class A (c) | | | 4,910 | | | | 71,391 | |
Rosetta Stone, Inc. (c) | | | 13,462 | | | | 220,777 | |
Zynga, Inc., Class A (c) | | | 53,570 | | | | 210,530 | |
| | | | | | | | |
| | | | | | | 1,043,299 | |
| | | | | | | | |
|
| Equity Real Estate Investment Trusts (REITs)—1.2% | |
Chatham Lodging Trust | | | 21,970 | | | | 388,430 | |
CorePoint Lodging, Inc. | | | 3,480 | | | | 42,630 | |
| | | | | | | | |
| See accompanying Notes to Financial Statements | | | December 31, 2018 | | | Semiannual Report | | | 85 | |
Schedule of Investments
December 31, 2018 (unaudited)
| | | | | | | | |
| | | Shares | | | Value | |
Equity Commonwealth | | | 10,830 | | | $ | 325,008 | |
Ryman Hospitality Properties, Inc. | | | 3,410 | | | | 227,413 | |
Winthrop Realty
Trust (a)(b)(c) | | | 12,960 | | | | 1,944 | |
| | | | | | | | |
| | | | | | | 985,425 | |
| | | | | | | | |
|
| Food & Staples Retailing—0.3% | |
Casey’s General Stores, Inc. | | | 620 | | | | 79,447 | |
Performance Food Group Co. (c) | | | 4,234 | | | | 136,631 | |
PriceSmart, Inc. | | | 835 | | | | 49,348 | |
| | | | | | | | |
| | | | | | | 265,426 | |
| | | | | | | | |
|
| Food Products—2.2% | |
Calavo Growers, Inc. | | | 2,956 | | | | 215,670 | |
Conagra Brands, Inc. | | | 2,487 | | | | 53,122 | |
Flowers Foods, Inc. | | | 5,700 | | | | 105,279 | |
J&J Snack Foods Corp. | | | 1,305 | | | | 188,690 | |
John B Sanfilippo & Son, Inc. | | | 755 | | | | 42,023 | |
Lancaster Colony Corp. | | | 4,045 | | | | 715,399 | |
Simply Good Foods Co. (c) | | | 14,871 | | | | 281,062 | |
Tootsie Roll Industries, Inc. | | | 5,365 | | | | 179,191 | |
| | | | | | | | |
| | | | | | | 1,780,436 | |
| | | | | | | | |
|
| Gas Utilities—0.2% | |
ONE Gas, Inc. | | | 720 | | | | 57,312 | |
Suburban Propane Partners L.P. | | | 6,100 | | | | 117,547 | |
| | | | | | | | |
| | | | | | | 174,859 | |
| | | | | | | | |
|
| Healthcare Equipment & Supplies—7.4% | |
Antares Pharma, Inc. (c) | | | 10,993 | | | | 29,901 | |
Avanos Medical, Inc. (c) | | | 1,350 | | | | 60,467 | |
AxoGen, Inc. (c) | | | 7,842 | | | | 160,212 | |
Cerus Corp. (c) | | | 6,792 | | | | 34,435 | |
CONMED Corp. | | | 845 | | | | 54,249 | |
CryoLife, Inc. (c) | | | 2,363 | | | | 67,062 | |
CryoPort, Inc. (c) | | | 21,362 | | | | 235,623 | |
CytoSorbents Corp. (c) | | | 4,196 | | | | 33,904 | |
Globus Medical, Inc., Class A (c) | | | 13,050 | | | | 564,804 | |
Haemonetics Corp. (c) | | | 5,320 | | | | 532,266 | |
Heska Corp. (c) | | | 391 | | | | 33,665 | |
Hill-Rom Holdings, Inc. | | | 3,880 | | | | 343,574 | |
ICU Medical, Inc. (c) | | | 275 | | | | 63,148 | |
Inogen, Inc. (c) | | | 2,793 | | | | 346,807 | |
Insulet Corp. (c) | | | 2,562 | | | | 203,218 | |
Integra LifeSciences Holdings Corp. (c) | | | 1,150 | | | | 51,865 | |
IntriCon Corp. (c) | | | 7,198 | | | | 189,883 | |
LeMaitre Vascular, Inc. | | | 2,253 | | | | 53,261 | |
LivaNova PLC (c) | | | 2,310 | | | | 211,296 | |
Masimo Corp. (c) | | | 8,140 | | | | 873,992 | |
Merit Medical Systems, Inc. (c) | | | 5,427 | | | | 302,881 | |
Neogen Corp. (c) | | | 1,040 | | | | 59,280 | |
Novocure Ltd. (c) | | | 6,395 | | | | 214,105 | |
OrthoPediatrics Corp. (c) | | | 1,702 | | | | 59,366 | |
RTI Surgical, Inc. (c) | | | 63,665 | | | | 235,560 | |
Senseonics Holdings, Inc. (c) | | | 71,792 | | | | 185,941 | |
Sientra, Inc. (c) | | | 2,182 | | | | 27,733 | |
Surmodics, Inc. (c) | | | 1,255 | | | | 59,311 | |
Tactile Systems Technology, Inc. (c) | | | 5,407 | | | | 246,289 | |
Utah Medical Products, Inc. | | | 2,210 | | | | 183,607 | |
ViewRay, Inc. (c) | | | 25,854 | | | | 156,934 | |
West Pharmaceutical Services, Inc. | | | 650 | | | | 63,719 | |
| | | | | | | | |
| | | | | | | 5,938,358 | |
| | | | | | | | |
|
| Healthcare Providers & Services—4.8% | |
Addus HomeCare Corp. (c) | | | 5,225 | | | | 354,673 | |
Amedisys, Inc. (c) | | | 6,100 | | | | 714,371 | |
BioTelemetry, Inc. (c) | | | 4,959 | | | | 296,152 | |
Chemed Corp. | | | 660 | | | | 186,965 | |
Encompass Health Corp. | | | 8,015 | | | | 494,526 | |
| | | | | | | | |
| | | Shares | | | Value | |
Ensign Group, Inc. | | | 1,305 | | | $ | 50,621 | |
HealthEquity, Inc. (c) | | | 3,186 | | | | 190,045 | |
LHC Group, Inc. (c) | | | 2,850 | | | | 267,558 | |
Molina Healthcare, Inc. (c) | | | 415 | | | | 48,231 | |
Premier, Inc., Class A (c) | | | 2,460 | | | | 91,881 | |
Providence Service Corp. (c) | | | 1,265 | | | | 75,925 | |
R1 RCM, Inc. (c) | | | 100,456 | | | | 798,625 | |
RadNet, Inc. (c) | | | 3,535 | | | | 35,951 | |
Tivity Health, Inc. (c) | | | 2,325 | | | | 57,683 | |
U.S. Physical Therapy, Inc. | | | 1,255 | | | | 128,449 | |
| | | | | | | | |
| | | | | | | 3,791,656 | |
| | | | | | | | |
|
| Healthcare Technology—2.2% | |
Medidata Solutions, Inc. (c) | | | 4,263 | | | | 287,411 | |
Omnicell, Inc. (c) | | | 4,641 | | | | 284,215 | |
Tabula Rasa HealthCare, Inc. (c) | | | 6,949 | | | | 443,068 | |
Teladoc, Inc. (c) | | | 5,962 | | | | 295,536 | |
Vocera Communications, Inc. (c) | | | 10,630 | | | | 418,291 | |
| | | | | | | | |
| | | | | | | 1,728,521 | |
| | | | | | | | |
|
| Hotels, Restaurants & Leisure—3.7% | |
Carrols Restaurant Group, Inc. (c) | | | 4,411 | | | | 43,404 | |
Cedar Fair L.P. | | | 1,340 | | | | 63,382 | |
Century Casinos, Inc. (c) | | | 5,208 | | | | 38,487 | |
Choice Hotels International, Inc. | | | 1,430 | | | | 102,360 | |
Churchill Downs, Inc. | | | 1,948 | | | | 475,195 | |
Dine Brands Global, Inc. | | | 3,982 | | | | 268,148 | |
Eldorado Resorts, Inc. (c) | | | 8,216 | | | | 297,502 | |
Extended Stay America, Inc. UNIT | | | 13,120 | | | | 203,360 | |
Golden Entertainment, Inc. (c) | | | 1,860 | | | | 29,797 | |
Hyatt Hotels Corp., Class A | | | 12,025 | | | | 812,890 | |
International Speedway Corp., Class A | | | 1,820 | | | | 79,825 | |
Jack in the Box, Inc. | | | 940 | | | | 72,972 | |
Lindblad Expeditions Holdings, Inc. (c) | | | 6,195 | | | | 83,385 | |
Texas Roadhouse, Inc. | | | 6,249 | | | | 373,065 | |
| | | | | | | | |
| | | | | | | 2,943,772 | |
| | | | | | | | |
|
| Household Durables—1.4% | |
Helen of Troy Ltd. (c) | | | 5,200 | | | | 682,136 | |
Lennar Corp., Class B | | | 11,035 | | | | 345,726 | |
LGI Homes, Inc. (c) | | | 803 | | | | 36,312 | |
Turtle Beach Corp. (c) | | | 1,433 | | | | 20,449 | |
| | | | | | | | |
| | | | | | | 1,084,623 | |
| | | | | | | | |
|
| Household Products—0.5% | |
Central Garden & Pet Co. (c) | | | 1,935 | | | | 66,661 | |
Central Garden & Pet Co., Class A (c) | | | 2,350 | | | | 73,438 | |
Energizer Holdings, Inc. | | | 1,155 | | | | 52,148 | |
WD-40 Co. | | | 1,155 | | | | 211,665 | |
| | | | | | | | |
| | | | | | | 403,912 | |
| | | | | | | | |
|
| Independent Power Producers & Energy Traders—0.5% | |
Clearway Energy, Inc., Class A | | | 17,800 | | | | 301,176 | |
TerraForm Power, Inc., Class A | | | 6,375 | | | | 71,527 | |
| | | | | | | | |
| | | | | | | 372,703 | |
| | | | | | | | |
|
| Insurance—3.3% | |
American Equity Investment Life Holding Co. | | | 19,480 | | | | 544,271 | |
American National Insurance Co. | | | 1,090 | | | | 138,692 | |
Argo Group International Holdings Ltd. | | | 1,452 | | | | 97,647 | |
Donegal Group, Inc., Class A | | | 5,925 | | | | 80,847 | |
| | | | | | | | |
| | | Shares | | | Value | |
Enstar Group Ltd. (c) | | | 440 | | | $ | 73,731 | |
FedNat Holding Co. | | | 11,915 | | | | 237,347 | |
Investors Title Co. | | | 380 | | | | 67,138 | |
Kemper Corp. | | | 4,445 | | | | 295,059 | |
Navigators Group, Inc. | | | 9,800 | | | | 681,002 | |
NI Holdings, Inc. (c) | | | 5,225 | | | | 82,189 | |
ProAssurance Corp. | | | 2,565 | | | | 104,037 | |
RLI Corp. | | | 1,160 | | | | 80,028 | |
Safety Insurance Group, Inc. | | | 925 | | | | 75,674 | |
Trupanion, Inc. (c) | | | 2,806 | | | | 71,441 | |
| | | | | | | | |
| | | | | | | 2,629,103 | |
| | | | | | | | |
|
| Interactive Media & Services—0.5% | |
QuinStreet, Inc. (c) | | | 15,594 | | | | 253,091 | |
Yelp, Inc. (c) | | | 4,704 | | | | 164,593 | |
| | | | | | | | |
| | | | | | | 417,684 | |
| | | | | | | | |
|
| Internet & Direct Marketing Retail—0.4% | |
Gaia, Inc., Class A (c) | | | 3,238 | | | | 33,546 | |
Liberty Expedia Holdings, Inc., Class A (c) | | | 1,820 | | | | 71,180 | |
Quotient Technology, Inc. (c) | | | 12,737 | | | | 136,031 | |
Shutterfly, Inc. (c) | | | 1,240 | | | | 49,922 | |
| | | | | | | | |
| | | | | | | 290,679 | |
| | | | | | | | |
|
| IT Services—1.9% | |
Brightcove, Inc. (c) | | | 4,463 | | | | 31,419 | |
Carbonite, Inc. (c) | | | 8,368 | | | | 211,376 | |
CoreLogic, Inc. (c) | | | 1,480 | | | | 49,462 | |
CSG Systems International, Inc. | | | 1,940 | | | | 61,634 | |
Hackett Group, Inc. | | | 2,734 | | | | 43,771 | |
ManTech International Corp., Class A | | | 13,750 | | | | 719,056 | |
MAXIMUS, Inc. | | | 1,370 | | | | 89,173 | |
Travelport Worldwide Ltd. | | | 20,285 | | | | 316,852 | |
| | | | | | | | |
| | | | | | | 1,522,743 | |
| | | | | | | | |
|
| Leisure Equipment & Products—2.6% | |
American Outdoor Brands Corp. (c) | | | 36,800 | | | | 473,248 | |
Callaway Golf Co. | | | 11,907 | | | | 182,177 | |
Clarus Corp. | | | 25,495 | | | | 258,009 | |
Malibu Boats, Inc., Class A (c) | | | 17,428 | | | | 606,495 | |
MasterCraft Boat Holdings, Inc. (c) | | | 27,574 | | | | 515,634 | |
Vista Outdoor, Inc. (c) | | | 4,575 | | | | 51,926 | |
| | | | | | | | |
| | | | | | | 2,087,489 | |
| | | | | | | | |
|
| Life Sciences Tools & Services—3.9% | |
Charles River Laboratories International, Inc. (c) | | | 7,140 | | | | 808,105 | |
Codexis, Inc. (c) | | | 2,076 | | | | 34,669 | |
Medpace Holdings, Inc. (c) | | | 19,545 | | | | 1,034,517 | |
NeoGenomics, Inc. (c) | | | 21,278 | | | | 268,315 | |
PRA Health Sciences, Inc. (c) | | | 10,310 | | | | 948,108 | |
| | | | | | | | |
| | | | | | | 3,093,714 | |
| | | | | | | | |
|
| Machinery—1.5% | |
Chart Industries, Inc. (c) | | | 4,621 | | | | 300,504 | |
Columbus McKinnon Corp. | | | 4,117 | | | | 124,086 | |
DMC Global, Inc. | | | 4,325 | | | | 151,894 | |
Kadant, Inc. | | | 710 | | | | 57,837 | |
Kornit Digital Ltd. (c) | | | 9,284 | | | | 173,796 | |
Park-Ohio Holdings Corp. | | | 12,120 | | | | 371,963 | |
| | | | | | | | |
| | | | | | | 1,180,080 | |
| | | | | | | | |
|
| Media—1.8% | |
Cable One, Inc. | | | 115 | | | | 94,312 | |
Cardlytics, Inc. (c) | | | 10,347 | | | | 112,058 | |
Gray Television, Inc. (c) | | | 33,400 | | | | 492,316 | |
Liberty Broadband Corp., Class A (c) | | | 1,635 | | | | 117,409 | |
Loral Space & Communications, Inc. (c) | | | 1,390 | | | | 51,778 | |
New Media Investment Group, Inc. | | | 4,525 | | | | 52,354 | |
| | | | | | |
| 86 | | Semiannual Report | | | December 31, 2018 | | | See accompanying Notes to Financial Statements |
Schedule of Investments
December 31, 2018 (unaudited)
| | | | | | | | |
| | | Shares | | | Value | |
New York Times Co., Class A | | | 2,010 | | | $ | 44,803 | |
News Corp., Class B | | | 9,850 | | | | 113,767 | |
Nexstar Media Group, Inc., Class A | | | 3,663 | | | | 288,058 | |
Scholastic Corp. | | | 2,365 | | | | 95,215 | |
| | | | | | | | |
| | | | | | | 1,462,070 | |
| | | | | | | | |
|
| Metals & Mining—0.1% | |
Allegheny Technologies, Inc. (c) | | | 4,923 | | | | 107,174 | |
| | | | | | | | |
|
Mortgage Real Estate Investment Trusts
(REITs)—3.0% | |
Apollo Commercial Real Estate Finance, Inc. | | | 21,245 | | | | 353,942 | |
ARMOUR Residential REIT, Inc. | | | 4,570 | | | | 93,685 | |
Blackstone Mortgage Trust, Inc., Class A | | | 13,160 | | | | 419,277 | |
Chimera Investment Corp. | | | 11,035 | | | | 196,644 | |
Exantas Capital Corp. | | | 17,600 | | | | 176,352 | |
Granite Point Mortgage Trust, Inc. | | | 4,035 | | | | 72,751 | |
Invesco Mortgage Capital, Inc. | | | 4,835 | | | | 70,011 | |
MFA Financial, Inc. | | | 65,310 | | | | 436,271 | |
Ready Capital Corp. | | | 3,705 | | | | 51,240 | |
TPG RE Finance Trust, Inc. | | | 22,055 | | | | 403,165 | |
Two Harbors Investment Corp. | | | 12,145 | | | | 155,942 | |
| | | | | | | | |
| | | | | | | 2,429,280 | |
| | | | | | | | |
|
| Multi-Utilities—1.1% | |
Black Hills Corp. | | | 7,335 | | | | 460,491 | |
NorthWestern Corp. | | | 4,580 | | | | 272,235 | |
Unitil Corp. | | | 3,415 | | | | 172,936 | |
| | | | | | | | |
| | | | | | | 905,662 | |
| | | | | | | | |
|
| Oil, Gas & Consumable Fuels—3.6% | |
Abraxas Petroleum Corp. (c) | | | 17,617 | | | | 19,203 | |
Alliance Resource Partners L.P. | | | 32,100 | | | | 556,614 | |
Antero Midstream Partners L.P. | | | 2,525 | | | | 54,010 | |
Black Stone Minerals L.P. | | | 6,345 | | | | 98,221 | |
Crestwood Equity Partners L.P. | | | 2,320 | | | | 64,751 | |
Delek U.S. Holdings, Inc. | | | 5,803 | | | | 188,656 | |
Dorchester Minerals L.P. | | | 3,255 | | | | 47,653 | |
Enviva Partners L.P. | | | 2,830 | | | | 78,532 | |
Evolution Petroleum Corp. | | | 5,282 | | | | 36,023 | |
Gran Tierra Energy, Inc. (c) | | | 154,645 | | | | 335,580 | |
Lonestar Resources U.S., Inc., Class A (c) | | | 5,087 | | | | 18,568 | |
Par Pacific Holdings, Inc. (c) | | | 3,770 | | | | 53,459 | |
PBF Energy, Inc., Class A | | | 12,805 | | | | 418,339 | |
PBF Logistics L.P. | | | 3,415 | | | | 68,641 | |
Peabody Energy Corp. | | | 2,240 | | | | 68,275 | |
Penn Virginia Corp. (c) | | | 787 | | | | 42,545 | |
Plains GP Holdings L.P., Class A (c) | | | 15,700 | | | | 315,570 | |
Ring Energy, Inc. (c) | | | 3,160 | | | | 16,053 | |
Ship Finance International Ltd. | | | 8,060 | | | | 84,872 | |
Sunoco L.P. | | | 3,405 | | | | 92,582 | |
Valero Energy Partners L.P. | | | 2,155 | | | | 90,876 | |
Viper Energy Partners L.P. | | | 1,930 | | | | 50,257 | |
WildHorse Resource Development Corp. (c) | | | 6,866 | | | | 96,879 | |
| | | | | | | | |
| | | | | | | 2,896,159 | |
| | | | | | | | |
|
| Paper & Forest Products—0.6% | |
Mercer International, Inc. | | | 21,475 | | | | 224,199 | |
Resolute Forest Products, Inc. | | | 36,885 | | | | 292,498 | |
| | | | | | | | |
| | | | | | | 516,697 | |
| | | | | | | | |
| | | | | | | | |
| | | Shares | | | Value | |
|
| Personal Products—0.3% | |
Inter Parfums, Inc. | | | 1,020 | | | $ | 66,882 | |
Nu Skin Enterprises, Inc., Class A | | | 1,610 | | | | 98,741 | |
USANA Health Sciences, Inc. (c) | | | 545 | | | | 64,163 | |
| | | | | | | | |
| | | | | | | 229,786 | |
| | | | | | | | |
|
| Pharmaceuticals—1.7% | |
Amphastar Pharmaceuticals, Inc. (c) | | | 2,095 | | | | 41,690 | |
ANI Pharmaceuticals, Inc. (c) | | | 795 | | | | 35,791 | |
Assembly Biosciences, Inc. (c) | | | 593 | | | | 13,414 | |
Catalent, Inc. (c) | | | 8,865 | | | | 276,411 | |
Cymabay Therapeutics, Inc. (c) | | | 9,113 | | | | 71,719 | |
Intersect ENT, Inc. (c) | | | 1,716 | | | | 48,357 | |
Omeros Corp. (c) | | | 1,203 | | | | 13,401 | |
Phibro Animal Health Corp., Class A | | | 16,925 | | | | 544,308 | |
Revance Therapeutics, Inc. (c) | | | 892 | | | | 17,956 | |
Supernus Pharmaceuticals, Inc. (c) | | | 4,321 | | | | 143,544 | |
WaVe Life Sciences Ltd. (c) | | | 2,840 | | | | 119,394 | |
| | | | | | | | |
| | | | | | | 1,325,985 | |
| | | | | | | | |
|
| Professional Services—2.4% | |
CRA International, Inc. | | | 1,039 | | | | 44,209 | |
FTI Consulting, Inc. (c) | | | 9,655 | | | | 643,409 | |
Heidrick & Struggles International, Inc. | | | 19,190 | | | | 598,536 | |
Kforce, Inc. | | | 1,692 | | | | 52,317 | |
Korn/Ferry International | | | 14,775 | | | | 584,204 | |
| | | | | | | | |
| | | | | | | 1,922,675 | |
| | | | | | | | |
|
| Real Estate Management & Development—0.1% | |
St Joe Co. (c) | | | 4,080 | | | | 53,734 | |
| | | | | | | | |
|
| Road & Rail—0.9% | |
Daseke, Inc. (c) | | | 4,565 | | | | 16,799 | |
Saia, Inc. (c) | | | 6,075 | | | | 339,107 | |
Universal Logistics Holdings, Inc. | | | 12,965 | | | | 234,537 | |
USA Truck, Inc. (c) | | | 7,490 | | | | 112,125 | |
| | | | | | | | |
| | | | | | | 702,568 | |
| | | | | | | | |
|
| Semiconductors & Semiconductor Equipment—0.2% | |
Axcelis Technologies, Inc. (c) | | | 1,680 | | | | 29,904 | |
AXT, Inc. (c) | | | 5,968 | | | | 25,961 | |
FormFactor, Inc. (c) | | | 3,289 | | | | 46,342 | |
Ichor Holdings Ltd. (c) | | | 1,788 | | | | 29,144 | |
| | | | | | | | |
| | | | | | | 131,351 | |
| | | | | | | | |
|
| Software—6.6% | |
2U, Inc. (c) | | | 3,301 | | | | 164,126 | |
Alteryx, Inc., Class A (c) | | | 4,626 | | | | 275,108 | |
Amber Road, Inc. (c) | | | 4,959 | | | | 40,813 | |
Aspen Technology, Inc. (c) | | | 3,950 | | | | 324,611 | |
Asure Software, Inc. (c) | | | 3,441 | | | | 17,480 | |
Blackline, Inc. (c) | | | 3,942 | | | | 161,425 | |
Box, Inc., Class A (c) | | | 7,516 | | | | 126,870 | |
Everbridge, Inc. (c) | | | 7,350 | | | | 417,186 | |
Five9, Inc. (c) | | | 7,907 | | | | 345,694 | |
Hortonworks, Inc. (c) | | | 10,935 | | | | 157,683 | |
Instructure, Inc. (c) | | | 6,045 | | | | 226,748 | |
LivePerson, Inc. (c) | | | 16,256 | | | | 306,588 | |
Model N, Inc. (c) | | | 30,504 | | | | 403,568 | |
PROS Holdings, Inc. (c) | | | 1,450 | | | | 45,530 | |
Q2 Holdings, Inc. (c) | | | 2,852 | | | | 141,317 | |
Rapid7, Inc. (c) | | | 7,468 | | | | 232,703 | |
RealPage, Inc. (c) | | | 4,490 | | | | 216,373 | |
SPS Commerce, Inc. (c) | | | 7,000 | | | | 576,660 | |
| | | | | | | | |
| | | Shares | | | Value | |
Upland Software, Inc. (c) | | | 2,019 | | | $ | 54,876 | |
Varonis Systems, Inc. (c) | | | 3,695 | | | | 195,465 | |
Verint Systems, Inc. (c) | | | 14,560 | | | | 616,034 | |
Yext, Inc. (c) | | | 16,154 | | | | 239,887 | |
| | | | | | | | |
| | |
| | | | | | | 5,286,745 | |
| | | | | | | | |
| | |
| Specialty Retail—1.9% | | | | | | | | |
Boot Barn Holdings, Inc. (c) | | | 25,900 | | | | 441,077 | |
Cato Corp., Class A | | | 11,310 | | | | 161,394 | |
Five Below, Inc. (c) | | | 550 | | | | 56,276 | |
Floor & Decor Holdings, Inc., Class A (c) | | | 3,902 | | | | 101,062 | |
Office Depot, Inc. | | | 213,500 | | | | 550,830 | |
Williams-Sonoma, Inc. | | | 3,745 | | | | 188,935 | |
| | | | | | | | |
| | |
| | | | | | | 1,499,574 | |
| | | | | | | | |
|
| Technology Hardware, Storage & Peripherals—0.2% | |
USA Technologies, Inc. (c) | | | 35,261 | | | | 137,165 | |
| | | | | | | | |
|
| Textiles, Apparel & Luxury Goods—3.8% | |
Columbia Sportswear Co. | | | 9,545 | | | | 802,639 | |
Crocs, Inc. (c) | | | 22,200 | | | | 576,756 | |
Deckers Outdoor Corp. (c) | | | 7,170 | | | | 917,401 | |
G-III Apparel Group Ltd. (c) | | | 26,011 | | | | 725,447 | |
Movado Group, Inc. | | | 1,540 | | | | 48,695 | |
| | | | | | | | |
| | |
| | | | | | | 3,070,938 | |
| | | | | | | | |
|
| Thrifts & Mortgage Finance—3.9% | |
America First Multifamily Investors L.P. | | | 18,595 | | | | 104,504 | |
BankFinancial Corp. | | | 4,250 | | | | 63,537 | |
Capitol Federal Financial, Inc. | | | 25,610 | | | | 327,040 | |
Essent Group Ltd. (c) | | | 5,234 | | | | 178,898 | |
First Defiance Financial Corp. | | | 1,880 | | | | 46,079 | |
Flagstar Bancorp, Inc. (c) | | | 2,395 | | | | 63,228 | |
Kearny Financial Corp. | | | 14,530 | | | | 186,275 | |
LendingTree, Inc. (c) | | | 1,050 | | | | 230,548 | |
Meridian Bancorp, Inc. | | | 7,598 | | | | 108,803 | |
MGIC Investment Corp. (c) | | | 56,100 | | | | 586,806 | |
Northwest Bancshares, Inc. | | | 4,590 | | | | 77,755 | |
OceanFirst Financial Corp. | | | 2,405 | | | | 54,136 | |
Oritani Financial Corp. | | | 14,040 | | | | 207,090 | |
PCSB Financial Corp. | | | 3,660 | | | | 71,590 | |
Radian Group, Inc. | | | 37,000 | | | | 605,320 | |
Territorial Bancorp, Inc. | | | 5,340 | | | | 138,733 | |
Waterstone Financial, Inc. | | | 5,230 | | | | 87,655 | |
| | | | | | | | |
| | |
| | | | | | | 3,137,997 | |
| | | | | | | | |
| | |
| Tobacco—0.7% | | | | | | | | |
Turning Point Brands, Inc. | | | 10,200 | | | | 277,644 | |
Universal Corp. | | | 1,995 | | | | 108,029 | |
Vector Group Ltd. | | | 18,048 | | | | 175,607 | |
| | | | | | | | |
| | |
| | | | | | | 561,280 | |
| | | | | | | | |
|
| Trading Companies & Distributors—0.3% | |
Rush Enterprises, Inc., Class B | | | 5,885 | | | | 209,506 | |
| | | | | | | | |
| | |
| Water Utilities—0.1% | | | | | | | | |
American States Water Co. | | | 1,005 | | | | 67,375 | |
SJW Group | | | 860 | | | | 47,833 | |
| | | | | | | | |
| | |
| | | | | | | 115,208 | |
| | | | | | | | |
|
| Wireless Telecommunication Services—0.5% | |
Boingo Wireless, Inc. (c) | | | 18,058 | | | | 371,453 | |
| | | | | | | | |
Total Common Stock
(cost—$78,003,699) | | | | | | | 78,419,209 | |
| | | | | | | | |
| | | | | | | | |
| See accompanying Notes to Financial Statements | | | December 31, 2018 | | | Semiannual Report | | | 87 | |
Schedule of Investments
December 31, 2018 (unaudited)
| | | | | | | | |
| | | Principal
Amount
(000s) | | | Value | |
|
| Repurchase Agreements—1.6% | |
State Street Bank and Trust Co., dated 12/31/18, 0.50%, due 1/2/19, proceeds $1,280,036; collateralized by U.S. Treasury Inflation Indexed Notes, 0.125%, due 7/15/26, valued at $1,310,295 including accrued interest | |
(cost—$1,280,000) | | | $1,280 | | | $ | 1,280,000 | |
| | | | | | | | |
| |
| Total Investments(cost—$79,283,699)—99.8% | | | | 79,699,209 | |
| | | | | | | | |
| |
Other assets less
liabilities—0.2% | | | | 163,960 | |
| | | | | | | | |
| |
| Net Assets—100.0% | | | | $79,863,169 | |
| | | | | | | | |
Notes to Schedule of Investments:
(a) Fair-Valued—Security with a value of $1,944, representing less than 0.05% of net assets. See Note 1(a) and Note 1(b) in the Notes to Financial Statements.
(b) Level 3 security. See Note 1(a) and Note 1(b) in the Notes to Financial Statements.
(c) Non-income producing.
Glossary:
REIT—Real Estate Investment Trust
UNIT—More than one class of securities traded together
AllianzGI Technology Fund
| | | | | | | | |
| | | Shares | | | Value | |
|
| Common Stock—90.0% | |
| | |
| Automobiles—0.7% | | | | | | | | |
Tesla, Inc. (d) | | | 30,745 | | | | $10,231,936 | |
| | | | | | | | |
|
| Communications Equipment—2.3% | |
Arista Networks, Inc. (d) | | | 44,165 | | | | 9,305,565 | |
Cisco Systems, Inc. | | | 100 | | | | 4,333 | |
Juniper Networks, Inc. | | | 100 | | | | 2,691 | |
Lumentum Holdings, Inc. (d) | | | 100 | | | | 4,201 | |
Motorola Solutions, Inc. | | | 100 | | | | 11,504 | |
Nokia Oyj ADR | | | 100 | | | | 582 | |
Palo Alto Networks, Inc. (d) | | | 115,985 | | | | 21,845,775 | |
| | | | | | | | |
| | | | | | | 31,174,651 | |
| | | | | | | | |
|
| Diversified Consumer Services—0.0% | |
New Oriental Education & Technology Group, Inc. ADR (d) | | | 100 | | | | 5,481 | |
| | | | | | | | |
|
| Diversified Telecommunication Services—0.0% | |
AT&T, Inc. | | | 100 | | | | 2,854 | |
Verizon Communications, Inc. | | | 100 | | | | 5,622 | |
| | | | | | | | |
| | | | | | | 8,476 | |
| | | | | | | | |
|
| Electrical Equipment—0.2% | |
Bloom Energy Corp., Class A (d) | | | 207,800 | | | | 2,073,844 | |
Nidec Corp. | | | 100 | | | | 11,315 | |
| | | | | | | | |
| | | | | | | 2,085,159 | |
| | | | | | | | |
|
| Electronic Equipment, Instruments & Components—0.2% | |
CDW Corp. | | | 100 | | | | 8,105 | |
Cognex Corp. | | | 100 | | | | 3,867 | |
IPG Photonics Corp. (d) | | | 100 | | | | 11,329 | |
Murata Manufacturing Co., Ltd. | | | 100 | | | | 13,475 | |
Samsung Electro-Mechanics Co., Ltd. | | | 170 | | | | 15,848 | |
Samsung SDI Co., Ltd. (d) | | | 13,890 | | | | 2,730,189 | |
| | | | | | | | |
| | | | | | | 2,782,813 | |
| | | | | | | | |
|
| Entertainment—2.2% | |
Activision Blizzard, Inc. | | | 100 | | | | 4,657 | |
Electronic Arts, Inc. (d) | | | 100 | | | | 7,891 | |
Netflix, Inc. (d) | | | 16,368 | | | | 4,381,059 | |
Nintendo Co., Ltd. | | | 100 | | | | 26,554 | |
Take-Two Interactive Software, Inc. (d) | | | 251,445 | | | | 25,883,748 | |
| | | | | | | | |
| | | | | | | 30,303,909 | |
| | | | | | | | |
|
| Healthcare Technology—0.1% | |
Veeva Systems, Inc., Class A (d) | | | 22,425 | | | | 2,003,001 | |
| | | | | | | | |
|
| Household Durables—0.0% | |
Garmin Ltd. | | | 100 | | | | 6,332 | |
| | | | | | | | |
|
| Interactive Media & Services—8.9% | |
58.com, Inc. ADR (d) | | | 100 | | | | 5,421 | |
Alphabet, Inc., Class A (c)(d) | | | 56,010 | | | | 58,528,209 | |
Alphabet, Inc., Class C (d) | | | 44,060 | | | | 45,628,977 | |
Baidu, Inc. ADR (d) | | | 100 | | | | 15,860 | |
Facebook, Inc., Class A (c)(d) | | | 149,225 | | | | 19,561,905 | |
NAVER Corp. | | | 500 | | | | 54,798 | |
Tencent Holdings Ltd. | | | 100 | | | | 4,008 | |
TripAdvisor, Inc. (d) | | | 100 | | | | 5,394 | |
Twitter, Inc. (d) | | | 100 | | | | 2,874 | |
Weibo Corp. ADR (d) | | | 20 | | | | 1,169 | |
Yandex NV, Class A (d) | | | 100 | | | | 2,735 | |
Yelp, Inc. (d) | | | 100 | | | | 3,499 | |
| | | | | | | | |
| | | Shares | | | Value | |
Zillow Group, Inc., Class A (d) | | | 100 | | | $ | 3,143 | |
| | | | | | | | |
| | | | | | | 123,817,992 | |
| | | | | | | | |
|
| Internet & Direct Marketing Retail—7.9% | |
Alibaba Group Holding Ltd. ADR (d) | | | 100 | | | | 13,707 | |
Amazon.com, Inc. (d) | | | 73,110 | | | | 109,809,027 | |
Ctrip.com International Ltd. ADR (d) | | | 100 | | | | 2,706 | |
eBay, Inc. (d) | | | 100 | | | | 2,807 | |
Expedia Group, Inc. | | | 100 | | | | 11,265 | |
GrubHub, Inc. (d) | | | 100 | | | | 7,681 | |
JD.com, Inc. ADR (d) | | | 100 | | | | 2,093 | |
| | | | | | | | |
| | | | | | | 109,849,286 | |
| | | | | | | | |
| | |
| IT Services—18.9% | | | | | | | | |
Accenture PLC, Class A | | | 100 | | | | 14,101 | |
Adyen NV (a)(d) | | | 100 | | | | 54,024 | |
Akamai Technologies, Inc. (d) | | | 100 | | | | 6,108 | |
Amadeus IT Group S.A. | | | 100 | | | | 6,958 | |
Automatic Data Processing, Inc. | | | 100 | | | | 13,112 | |
Cognizant Technology Solutions Corp., Class A | | | 29,950 | | | | 1,901,226 | |
DXC Technology Co. | | | 453,795 | | | | 24,128,280 | |
Fidelity National Information Services, Inc. | | | 100 | | | | 10,255 | |
First Data Corp., Class A (d) | | | 100 | | | | 1,691 | |
Global Payments, Inc. | | | 100 | | | | 10,313 | |
GoDaddy, Inc., Class A (d) | | | 100 | | | | 6,562 | |
Mastercard, Inc., Class A | | | 179,575 | | | | 33,876,824 | |
MongoDB, Inc. (d) | | | 242,920 | | | | 20,342,121 | |
Okta, Inc. (d) | | | 462,205 | | | | 29,488,679 | |
PayPal Holdings, Inc. (d) | | | 356,875 | | | | 30,009,619 | |
Perspecta, Inc. | | | 226,897 | | | | 3,907,166 | |
Sabre Corp. | | | 100 | | | | 2,164 | |
Shopify, Inc., Class A (d) | | | 100 | | | | 13,845 | |
Square, Inc. Class A (c)(d) | | | 745,805 | | | | 41,832,202 | |
Tata Consultancy Services Ltd. | | | 2,000 | | | | 54,278 | |
Total System Services, Inc. | | | 24,675 | | | | 2,005,831 | |
Twilio, Inc., Class A (d) | | | 423,285 | | | | 37,799,351 | |
Visa, Inc., Class A | | | 270,530 | | | | 35,693,728 | |
Worldpay, Inc., Class A (d) | | | 100 | | | | 7,643 | |
| | | | | | | | |
| | | | | | | 261,186,081 | |
| | | | | | | | |
| | |
| Media—0.0% | | | | | | | | |
Comcast Corp., Class A | | | 100 | | | | 3,405 | |
| | | | | | | | |
|
| Professional Services—0.0% | |
Verisk Analytics, Inc. (d) | | | 100 | | | | 10,904 | |
| | | | | | | | |
|
| Semiconductors & Semiconductor Equipment—7.1% | |
Advanced Micro Devices, Inc. (d) | | | 100 | | | | 1,846 | |
ams AG (d) | | | 100 | | | | 2,408 | |
Applied Materials, Inc. | | | 100 | | | | 3,274 | |
Broadcom, Inc. | | | 69,990 | | | | 17,797,057 | |
Cree, Inc. (d) | | | 184,290 | | | | 7,883,005 | |
Cypress Semiconductor Corp. | | | 100 | | | | 1,272 | |
Infineon Technologies AG | | | 100 | | | | 2,002 | |
Intel Corp. | | | 414,050 | | | | 19,431,366 | |
KLA-Tencor Corp. | | | 100 | | | | 8,949 | |
Lam Research Corp. | | | 100 | | | | 13,617 | |
Marvell Technology Group Ltd. | | | 100 | | | | 1,619 | |
Maxim Integrated Products, Inc. | | | 100 | | | | 5,085 | |
MediaTek, Inc. | | | 1,000 | | | | 7,443 | |
Microchip Technology, Inc. | | | 271,182 | | | | 19,503,409 | |
| | | | | | |
| 88 | | Semiannual Report | | | December 31, 2018 | | | See accompanying Notes to Financial Statements |
Schedule of Investments
December 31, 2018 (unaudited)
| | | | | | | | |
| | | Shares | | | Value | |
Micron Technology, Inc. (c)(d) | | | 100 | | | $ | 3,173 | |
NVIDIA Corp. | | | 100 | | | | 13,350 | |
ON Semiconductor Corp. (d) | | | 100 | | | | 1,651 | |
Qorvo, Inc. (d) | | | 100 | | | | 6,073 | |
QUALCOMM, Inc. | | | 72,385 | | | | 4,119,430 | |
SK Hynix, Inc. | | | 100 | | | | 5,452 | |
Skyworks Solutions, Inc. | | | 100 | | | | 6,702 | |
Taiwan Semiconductor Manufacturing Co., Ltd. ADR | | | 70,345 | | | | 2,596,434 | |
Teradyne, Inc. | | | 131,425 | | | | 4,124,117 | |
Texas Instruments, Inc. | | | 241,640 | | | | 22,834,980 | |
Tokyo Electron Ltd. | | | 800 | | | | 90,059 | |
Universal Display Corp. | | | 100 | | | | 9,357 | |
| | | | | | | | |
| | | | | | | 98,473,130 | |
| | | | | | | | |
| | |
| Software—34.7% | | | | | | | | |
Adobe, Inc. (d) | | | 31,440 | | | | 7,112,986 | |
Aspen Technology, Inc. (d) | | | 5,160 | | | | 424,049 | |
Atlassian Corp. PLC, Class A (d) | | | 124,975 | | | | 11,120,275 | |
Autodesk, Inc. (d) | | | 2,435 | | | | 313,165 | |
Aveva Group PLC | | | 388,845 | | | | 11,995,641 | |
Box, Inc., Class A (d) | | | 100 | | | | 1,688 | |
Cornerstone OnDemand, Inc. (d) | | | 100 | | | | 5,043 | |
Coupa Software, Inc. (d) | | | 100 | | | | 6,286 | |
CyberArk Software Ltd. (d) | | | 100 | | | | 7,414 | |
Dell Technologies, Inc. Class C (d) | | | 181 | | | | 8,829 | |
DocuSign, Inc. (d) | | | 100 | | | | 4,008 | |
Dropbox, Inc., Class A, Class A (d) | | | 100 | | | | 2,043 | |
Elastic NV (d) | | | 64,681 | | | | 4,623,398 | |
Fortinet, Inc. (d) | | | 100 | | | | 7,043 | |
HubSpot, Inc. (d) | | | 100 | | | | 12,573 | |
Intuit, Inc. | | | 100 | | | | 19,685 | |
Microsoft Corp. (c) | | | 1,234,046 | | | | 125,342,052 | |
Nutanix, Inc., Class A (d) | | | 494,090 | | | | 20,549,203 | |
Oracle Corp. | | | 189,485 | | | | 8,555,248 | |
Paycom Software, Inc. (d) | | | 507,259 | | | | 62,113,865 | |
Proofpoint, Inc. (d) | | | 157,550 | | | | 13,204,265 | |
RealPage, Inc. (d) | | | 100 | | | | 4,819 | |
Red Hat, Inc. (d) | | | 100 | | | | 17,564 | |
RingCentral, Inc., Class A (d) | | | 429,625 | | | | 35,418,285 | |
SailPoint Technologies Holding, Inc. (d) | | | 10,570 | | | | 248,289 | |
Salesforce.com, Inc. (d) | | | 319,796 | | | | 43,802,458 | |
SAP SE ADR | | | 100 | | | | 9,955 | |
ServiceNow, Inc. (d) | | | 397,180 | | | | 70,717,899 | |
Sophos Group PLC (a) | | | 100 | | | | 482 | |
Splunk, Inc. (d) | | | 100 | | | | 10,485 | |
Tableau Software, Inc., Class A (d) | | | 110,090 | | | | 13,210,800 | |
Temenos AG (d) | | | 3,285 | | | | 394,735 | |
VMware, Inc., Class A | | | 100 | | | | 13,713 | |
Workday, Inc., Class A (d) | | | 320,910 | | | | 51,242,909 | |
Zendesk, Inc. (d) | | | 100 | | | | 5,837 | |
Zscaler, Inc. (d) | | | 100 | | | | 3,921 | |
Zuora, Inc., Class A (d) | | | 100 | | | | 1,814 | |
| | | | | | | | |
| | | | | | | 480,532,724 | |
| | | | | | | | |
|
| Technology Hardware, Storage & Peripherals—6.8% | |
Apple, Inc. (c) | | | 240,860 | | | | 37,993,256 | |
Catcher Technology Co., Ltd. | | | 1,000 | | | | 7,322 | |
| | | | | | | | |
| | | Shares | | | Value | |
Hewlett Packard Enterprise Co. | | | 100 | | | $ | 1,321 | |
HP, Inc. | | | 100 | | | | 2,046 | |
NetApp, Inc. (c) | | | 937,750 | | | | 55,955,543 | |
Pure Storage, Inc., Class A (d) | | | 27,715 | | | | 445,657 | |
Samsung Electronics Co., Ltd. | | | 5,000 | | | | 174,058 | |
Western Digital Corp. | | | 100 | | | | 3,697 | |
| | | | | | | | |
| | | | | | | 94,582,900 | |
| | | | | | | | |
|
Wireless
Telecommunication
Services—0.0% | |
T-Mobile U.S., Inc. (d) | | | 100 | | | | 6,361 | |
| | | | | | | | |
Total Common Stock
(cost—$913,306,713) | | | | 1,247,064,541 | |
| | | | | | | | |
| | | | | | | | |
|
Exchange-
Traded
Funds—0.0% | |
iShares FTSE A50 China Index | | | 1,000 | | | | 1,454 | |
iShares MSCI Emerging Markets Index | | | 100 | | | | 3,906 | |
| | | | | | | | |
Total Exchange-
Traded Funds
(cost—$5,747) | | | | 5,360 | |
| | | | | | | | |
| | | | | | | | |
| | |
| | | Principal
Amount
(000s) | | | | |
|
Repurchase
Agreements—10.0% | |
State Street Bank and
Trust Co., dated
12/31/18, 0.50%,
due 1/2/19, proceeds
$138,163,838;
collateralized by
U.S. Treasury Inflation
Indexed Notes,
0.125%, due 7/15/26,
valued at $140,923,480
including accrued
interest | |
(cost—
$138,160,000) | | | $138,160 | | | | 138,160,000 | |
| | | | | | | | |
Total Options
Purchased—0.3% (cost
—
$2,293,183)
(d)(e)(f) | | | | 4,211,500 | |
| | | | | | | | |
| |
Total Investments, before
options written and securities
sold short
(cost—
$1,053,765,643)—100.3% | | | | 1,389,441,401 | |
| | | | | | | | |
| | | | | | | | |
| | |
| | | Shares | | | | |
|
| Securities Sold Short—(0.1)% | |
|
| Common Stock—(0.1)% | |
|
| IT Services—(0.0)% | |
International Business Machines Corp. | | | 1 | | | | (113 | ) |
| | | | | | | | |
|
| Semiconductors & Semiconductor Equipment—(0.1)% | |
STMicroelectronics NV | | | 75,210 | | | | (1,043,915 | ) |
| | | | | | | | |
Total Securities Sold Short
(proceeds received—$1,237,528) | | | | (1,044,028 | ) |
| | | | | | | | |
| Total Options Written—(0.1)% (premiums received—$2,097,012) (d)(e)(f) | | | | (1,121,800 | ) |
| | | | | | | | |
| | | | | | |
| | | | | Value | |
Total Investments, net of options written and securities sold short
(cost—$1,050,431,103) (b)—100.1% | | $ | 1,387,275,573 | |
| | | | | | |
| |
| Other liabilities in excess of other assets—(0.1)% | | | (2,004,074 | ) |
| | | | | | |
| |
| Net Assets—100.0% | | | $1,385,271,499 | |
| | | | | | |
Notes to Schedule of Investments:
(a) 144A—Exempt from registration under Rule 144A of the Securities Act of 1933. These securities may be resold in transactions exempt from registration, typically only to qualified institutional buyers. Securities with an aggregate value of $54,506, representing less than 0.05% of net assets.
(b) Securities (net of securities sold short) with an aggregate value of $15,652,503, representing 1.1% of net assets, were valued utilizing modeling tools provided by a third-party vendor. See Note 1(a) and Note 1(b) in the Notes to Financial Statements.
(c) All or partial amount segregated for the benefit of the counterparty as collateral for securities sold short and options written.
(d) Non-income producing.
(e) Exchange traded-Chicago Board Options Exchange.
| | | | | | | | |
| See accompanying Notes to Financial Statements | | | December 31, 2018 | | | Semiannual Report | | | 89 | |
Schedule of Investments
December 31, 2018 (unaudited)
(f) Exchange traded option contracts outstanding at December 31, 2018:
| | | | | | | | | | | | | | | | | | | | | | | | | | | | |
| | | |
| Options purchased contracts outstanding at December 31, 2018: | | | | | | | | | | |
| Description | | Exercise
Price | | | Expiration
Date | | | Number of
Contracts | | | Notional
Amount | | | Market
Value | | | Cost | | | Unrealized
Appreciation | |
Call options: | | | | | | | | | | | | | | | | | | | | | | | | | | | | |
Broadcom Ltd. | | | 260.00 USD | | | | 1/17/20 | | | | 620 | | | $ | 62,000 | | | $ | 1,937,500 | | | $ | 1,613,883 | | | $ | 323,617 | |
NetApp, Inc. | | | 50.00 USD | | | | 1/18/19 | | | | 2,400 | | | | 240,000 | | | | 2,274,000 | | | | 679,300 | | | | 1,594,700 | |
| | | | | | | | | | | | | | | | | | | | |
| Total options purchased contracts | | | $ | 4,211,500 | | | $ | 2,293,183 | | | $ | 1,918,317 | |
| | | | | | | | | | | | | | | | | | | | |
| | | | | | | | | | | | | | | | | | | | | | | | | | | | |
| Options written contracts outstanding at December 31, 2018: | | | | | | | | | | |
| Description | | Exercise
Price | | | Expiration
Date | | | Number of
Contracts | | | Notional
Amount | | | Market
Value | | | Premiums
Received | | | Unrealized
Appreciation | |
Put options: | | | | | | | | | | | | | | | | | | | | | | | | | | | | |
Broadcom Ltd. | | | 210.00 USD | | | | 1/17/20 | | | | 620 | | | $ | (62,000 | ) | | $ | (1,109,800 | ) | | $ | (1,384,328 | ) | | $ | 274,528 | |
NetApp, Inc. | | | 40.00 USD | | | | 1/18/19 | | | | 2,400 | | | | (240,000 | ) | | | (12,000 | ) | | | (712,684 | ) | | | 700,684 | |
| | | | | | | | | | | | | | | | | | | | |
| Total options written contracts | | | $ | (1,121,800 | ) | | $ | (2,097,012 | ) | | $ | 975,212 | |
| | | | | | | | | | | | | | | | | | | | |
Glossary:
ADR—American Depositary Receipt
FTSE—Financial Times Stock Exchange
MSCI—Morgan Stanley Capital International
| | | | | | |
| 90 | | Semiannual Report | | | December 31, 2018 | | | See accompanying Notes to Financial Statements |
(THIS PAGE INTENTIONALLY LEFT BLANK)
Statements of Assets and Liabilities
December 31, 2018 (unaudited)
| | | | | | | | | | | | | | | | |
| | | AllianzGI
Emerging
Markets
Opportunities | | | AllianzGI
Focused
Growth | | | AllianzGI
Global
Natural
Resources | | | AllianzGI
Global Small-Cap | |
| Assets: | | | | | | | | | | | | |
| Investments, at value | | $ | 308,366,280 | | | $ | 903,185,702 | | | $ | 12,991,365 | | | $ | 130,602,629 | |
| Repurchase agreements, at value | | | 5,055,000 | | | | 6,043,000 | | | | 110,000 | | | | 1,674,000 | |
| Cash | | | — | | | | — | | | | 10,791 | | | | — | |
| Foreign currency, at value | | | 2,856,933 | | | | — | | | | 174 | | | | 244,703 | |
| Dividends and interest receivable (net of foreign withholding taxes) | | | 744,466 | | | | 54,020 | | | | 22,182 | | | | 119,064 | |
| Receivable for Fund shares sold | | | 402,565 | | | | 7,915,605 | | | | 8,378 | | | | 28,913 | |
| Investments in Affiliated Funds — Trustees Deferred Compensation Plan (see Note 4) | | | 59,905 | | | | 215,636 | | | | 8,380 | | | | 47,399 | |
| Tax reclaims receivable | | | 51,230 | | | | — | | | | 11,601 | | | | 125,445 | |
| Receivable for investments sold | | | — | | | | — | | | | 6,609 | | | | 796,676 | |
| Prepaid expenses and other assets | | | — | | | | — | | | | — | | | | — | |
Total Assets | | | 317,536,379 | | | | 917,413,963 | | | | 13,169,480 | | | | 133,638,829 | |
| Liabilities: | | | | | | | | | | | | |
| Payable for Fund shares redeemed | | | 832,924 | | | | 9,675,787 | | | | 156,441 | | | | 980,571 | |
| Investment Advisory fees payable | | | 165,279 | | | | 260,690 | | | | 7,929 | | | | 103,674 | |
| Administration fees payable | | | 67,269 | | | | 264,945 | | | | 4,684 | | | | 45,852 | |
| Trustees Deferred Compensation Plan payable (see Note 4) | | | 59,905 | | | | 215,636 | | | | 8,380 | | | | 47,399 | |
| Servicing fees payable | | | 10,957 | | | | 115,814 | | | | 1,443 | | | | 11,331 | |
| Distribution fees payable | | | 2,363 | | | | 33,710 | | | | 851 | | | | 5,599 | |
| Payable to custodian for cash overdraft | | | 1,492 | | | | 32,056 | | | | — | | | | 2,382 | |
| Options written, at value | | | — | | | | — | | | | — | | | | — | |
| Payable for investments purchased | | | — | | | | — | | | | — | | | | 130,496 | |
| Line of credit payable | | | — | | | | — | | | | — | | | | — | |
| Accrued expenses and other liabilities | | | 337,412 | | | | — | | | | — | | | | — | |
Total Liabilities | | | 1,477,601 | | | | 10,598,638 | | | | 179,728 | | | | 1,327,304 | |
| Net Assets | | $ | 316,058,778 | | | $ | 906,815,325 | | | $ | 12,989,752 | | | $ | 132,311,525 | |
| Net Assets Consist of: | | | | | | | | | | | | |
| Paid-in-capital | | $ | 354,580,372 | | | $ | 648,713,687 | | | $ | 24,484,253 | | | $ | 133,877,698 | |
| Total distributable earnings | | | (38,521,594 | ) | | | 258,101,638 | | | | (11,494,501 | ) | | | (1,566,173 | ) |
| Net Assets | | $ | 316,058,778 | | | $ | 906,815,325 | | | $ | 12,989,752 | | | $ | 132,311,525 | |
| Cost of Investments | | $ | 316,640,191 | | | $ | 649,125,640 | | | $ | 13,814,546 | | | $ | 127,605,803 | |
| Cost of Repurchase Agreements | | $ | 5,055,000 | | | $ | 6,043,000 | | | $ | 110,000 | | | $ | 1,674,000 | |
| Cost of Foreign Currency | | $ | 2,851,173 | | | $ | — | | | $ | 174 | | | $ | 244,135 | |
| Premiums Received for Options Written | | $ | — | | | $ | — | | | $ | — | | | $ | — | |
| | | | | | |
| 92 | | Semiannual Report | | | December 31, 2018 | | | See accompanying Notes to Financial Statements |
| | | | | | | | | | | | | | | | | | | | | | |
| | | |
AllianzGI
Health
Sciences | | | AllianzGI
Income &
Growth | | | AllianzGI
Mid-Cap | | | AllianzGI NFJ
Dividend Value | | | AllianzGI NFJ
International
Value | |
| | | | | | | | | | | | | | | | | |
| | | | | $ | 140,561,691 | | | $ | 3,610,914,539 | | | $ | 248,789,601 | | | $ | 1,452,808,255 | | | $ | 183,939,282 | |
| | | | | | 885,000 | | | | 101,362,000 | | | | 1,109,000 | | | | 15,262,000 | | | | 1,668,000 | |
| | | | | | 44,450 | | | | — | | | | 30,710 | | | | — | | | | 107,387 | |
| | | | | | — | | | | — | | | | — | | | | — | | | | 52,296 | |
| | | | |
|
77,937 |
| | | 28,668,545 | | | | 77,591 | | | | 3,344,378 | | | | 133,839 | |
| | | | | | 113,247 | | | | 15,417,376 | | | | 207,868 | | | | 2,723,892 | | | | 240,978 | |
| | | | |
|
39,221 |
| | | 524,654 | | | | 57,089 | | | | 1,361,726 | | | | 276,778 | |
| | | | | | 126,849 | | | | 4,180 | | | | — | | | | 252,496 | | | | 339,939 | |
| | | | | | 3,167,700 | | | | 2,850,324 | | | | 603,131 | | | | 26,317,835 | | | | 3,402,194 | |
| | | | | | — | | | | 5,875 | | | | — | | | | — | | | | — | |
| | | | | 145,016,095 | | | | 3,759,747,493 | | | | 250,874,990 | | | | 1,502,070,582 | | | | 190,160,693 | |
| | | | | | | | | | | | | | | | | |
| | | | | | 256,004 | | | | 17,837,890 | | | | 2,054,199 | | | | 28,138,589 | | | | 4,277,791 | |
| | | | | | 93,150 | | | | 1,961,844 | | | | 94,755 | | | | 469,251 | | | | 85,735 | |
| | | | | | 46,372 | | | | 1,096,015 | | | | 78,345 | | | | 448,963 | | | | 70,216 | |
| | | | | | 39,221 | | | | 524,654 | | | | 57,089 | | | | 1,361,726 | | | | 276,778 | |
| | | | | | 28,604 | | | | 466,722 | | | | 42,859 | | | | 131,832 | | | | 19,547 | |
| | | | | | 2,447 | | | | 650,082 | | | | 17,100 | | | | 431,176 | | | | 36,385 | |
| | | | | | — | | | | 64,472 | | | | — | | | | 55,278 | | | | — | |
| | | | | | — | | | | 1,145,770 | | | | — | | | | — | | | | — | |
| | | | | | 1,406,704 | | | | 5,254,485 | | | | 1,308,743 | | | | — | | | | — | |
| | | | | | — | | | | — | | | | — | | | | 23,144,907 | | | | 3,352,391 | |
| | | | | | — | | | | — | | | | — | | | | — | | | | — | |
| | | | | | 1,872,502 | | | | 29,001,934 | | | | 3,653,090 | | | | 54,181,722 | | | | 8,118,843 | |
| | | | $ | 143,143,593 | | | $ | 3,730,745,559 | | | $ | 247,221,900 | | | $ | 1,447,888,860 | | | $ | 182,041,850 | |
| | | | | | | | | | | | | | | | | |
| | | | | $ | 134,256,966 | | | $ | 4,513,609,322 | | | $ | 248,799,897 | | | $ | 1,414,118,421 | | | $ | 647,106,755 | |
| | | | | | 8,886,627 | | | | (782,863,763 | ) | | | (1,577,997 | ) | | | 33,770,439 | | | | (465,064,905 | ) |
| | | | | $ | 143,143,593 | | | $ | 3,730,745,559 | | | $ | 247,221,900 | | | $ | 1,447,888,860 | | | $ | 182,041,850 | |
| | | | | $ | 132,573,445 | | | $ | 4,382,868,000 | | | $ | 249,425,464 | | | $ | 1,419,080,499 | | | $ | 194,287,585 | |
| | | | | $ | 885,000 | | | $ | 101,362,000 | | | $ | 1,109,000 | | | $ | 15,262,000 | | | $ | 1,668,000 | |
| | | | | $ | — | | | $ | — | | | $ | — | | | $ | — | | | $ | 52,243 | |
| | | | | $ | — | | | $ | 997,660 | | | $ | — | | | $ | — | | | $ | — | |
| | | | | | | | |
| See accompanying Notes to Financial Statements | | | December 31, 2018 | | | Semiannual Report | | | 93 | |
Statements of Assets and Liabilities (cont’d)
December 31, 2018 (unaudited)
| | | | | | | | | | | | | | | | |
| | | AllianzGI
Emerging
Markets
Opportunities | | | AllianzGI
Focused
Growth | | | AllianzGI
Global
Natural
Resources | | | AllianzGI
Global Small-Cap | |
| Net Assets: | | | | | | | | | | | | |
| Class A | | $ | 50,232,651 | | | $ | 496,501,090 | | | $ | 5,451,208 | | | $ | 44,610,053 | |
| Class C | | | 4,038,711 | | | | 47,572,599 | | | | 1,287,234 | | | | 8,891,144 | |
| Class R | | | — | | | | 19,671,378 | | | | — | | | | — | |
| Class P | | | 18,697,188 | | | | 84,259,638 | | | | 1,215,215 | | | | 9,643,810 | |
| Institutional Class | | | 221,716,956 | | | | 144,004,861 | | | | 5,036,095 | | | | 69,166,518 | |
| Class R6 | | | 21,373,272 | | | | 110,632,871 | | | | — | | | | — | |
| Administrative Class | | | — | | | | 4,172,888 | | | | — | | | | — | |
| Shares Issued and Outstanding: | | | | | | | | | | | | |
| Class A | | | 2,030,395 | | | | 11,334,644 | | | | 434,503 | | | | 1,332,342 | |
| Class C | | | 164,110 | | | | 1,676,186 | | | | 109,257 | | | | 314,619 | |
| Class R | | | — | | | | 613,022 | | | | — | | | | — | |
| Class P | | | 773,848 | | | | 2,573,121 | | | | 95,459 | | | | 267,070 | |
| Institutional Class | | | 8,962,051 | | | | 3,592,104 | | | | 391,659 | | | | 1,895,579 | |
| Class R6 | | | 868,555 | | | | 2,756,110 | | | | — | | | | — | |
| Administrative Class | | | — | | | | 112,054 | | | | — | | | | — | |
| Net Asset Value and Redemption Price Per Share:* | | | | | | | | | | | | |
| Class A | | $ | 24.74 | | | $ | 43.80 | | | $ | 12.55 | | | $ | 33.48 | |
| Class C | | | 24.61 | | | | 28.39 | | | | 11.78 | | | | 28.26 | |
| Class R | | | — | | | | 32.09 | | | | — | | | | — | |
| Class P | | | 24.16 | | | | 32.75 | | | | 12.73 | | | | 36.11 | |
| Institutional Class | | | 24.74 | | | | 40.09 | | | | 12.86 | | | | 36.49 | |
| Class R6 | | | 24.61 | | | | 40.14 | | | | — | | | | — | |
| Administrative Class | | | — | | | | 37.24 | | | | — | | | | — | |
| * | Net asset value and redemption price per share may not recalculate exactly due to rounding. |
| | | | | | |
| 94 | | Semiannual Report | | | December 31, 2018 | | | See accompanying Notes to Financial Statements |
| | | | | | | | | | | | | | | | | | | | | | |
| | | |
AllianzGI
Health
Sciences | | | AllianzGI
Income &
Growth | | | AllianzGI
Mid-Cap | | | AllianzGI NFJ
Dividend
Value | | | AllianzGI NFJ
International
Value | |
| | | | | | | | | | | | | | | | | |
| | | | | $ | 136,838,236 | | | $ | 1,226,886,469 | | | $ | 190,769,743 | | | $ | 464,536,993 | | | $ | 69,876,760 | |
| | | | | | 3,979,022 | | | | 1,053,921,110 | | | | 18,298,490 | | | | 91,366,486 | | | | 15,710,509 | |
| | | | | | — | | | | 3,815,109 | | | | 1,161,395 | | | | 75,277,190 | | | | 6,474,400 | |
| | | | | | — | | | | 919,250,542 | | | | 8,551,465 | | | | 384,037,275 | | | | 45,688,876 | |
| | | | | | 2,326,335 | | | | 526,872,329 | | | | 27,246,908 | | | | 304,537,281 | | | | 41,015,259 | |
| | | | | | — | | | | — | | | | — | | | | 71,665,309 | | | | 1,606,974 | |
| | | | | — | | | | — | | | | 1,193,899 | | | | 56,468,326 | | | | 1,669,072 | |
| | | | | | | | | | | | | | | | | |
| | | | | | 4,800,198 | | | | 121,154,148 | | | | 66,911,084 | | | | 43,387,554 | | | | 4,282,229 | |
| | | | | | 181,616 | | | | 113,263,541 | | | | 8,038,247 | | | | 8,388,842 | | | | 979,414 | |
| | | | | | — | | | | 376,740 | | | | 416,074 | | | | 7,031,542 | | | | 395,834 | |
| | | | | | — | | | | 88,560,961 | | | | 2,584,760 | | | | 35,555,702 | | | | 2,784,382 | |
| | | | | | 80,524 | | | | 50,273,552 | | | | 8,176,071 | | | | 28,234,982 | | | | 2,496,144 | |
| | | | | | — | | | | — | | | | — | | | | 6,669,544 | | | | 97,888 | |
| | | | | — | | | | — | | | | 392,043 | | | | 5,145,605 | | | | 101,961 | |
| | | | | | | | | | | | | | | | | |
| | | | | $ | 28.51 | | | $ | 10.13 | | | $ | 2.85 | | | $ | 10.71 | | | $ | 16.32 | |
| | | | | | 21.91 | | | | 9.31 | | | | 2.27 | | | | 10.89 | | | | 16.04 | |
| | | | | | — | | | | 10.13 | | | | 2.79 | | | | 10.71 | | | | 16.36 | |
| | | | | | — | | | | 10.38 | | | | 3.31 | | | | 10.80 | | | | 16.41 | |
| | | | | | 28.89 | | | | 10.48 | | | | 3.33 | | | | 10.79 | | | | 16.43 | |
| | | | | | — | | | | — | | | | — | | | | 10.75 | | | | 16.42 | |
| | | | | | — | | | | — | | | | 3.04 | | | | 10.97 | | | | 16.37 | |
| | | | | | | | |
| See accompanying Notes to Financial Statements | | | December 31, 2018 | | | Semiannual Report | | | 95 | |
Statements of Assets and Liabilities (cont’d)
December 31, 2018 (unaudited)
| | | | | | | | | | | | | | | | |
| | | AllianzGI
NFJ Large-Cap
Value | | | AllianzGI
NFJ Mid-Cap
Value | | | AllianzGI
NFJ Small-Cap
Value | | | AllianzGI
Small-Cap | |
| Assets: | | | | | | | | | | | | |
| Investments, at value | | $ | 308,531,682 | | | $ | 1,096,283,206 | | | $ | 1,212,398,603 | | | $ | 78,419,209 | |
| Repurchase agreements, at value | | | 7,978,000 | | | | 15,213,000 | | | | 2,055,000 | | | | 1,280,000 | |
| Cash | | | 12,377 | | | | 66,831 | | | | — | | | | 6,725 | |
| Foreign currency, at value | | | — | | | | — | | | | — | | | | — | |
| Dividends and interest receivable (net of foreign withholding taxes) | | | 630,526 | | | | 2,593,514 | | | | 1,778,834 | | | | 113,092 | |
| Receivable for investments sold | | | — | | | | 8,087,414 | | | | 14,670,676 | | | | 121,184 | |
| Receivable for Fund shares sold | | | 864,856 | | | | 4,341,413 | | | | 3,049,428 | | | | 155,640 | |
| Tax reclaims receivable | | | 20,097 | | | | 17,706 | | | | — | | | | — | |
| Investments in Affiliated Funds — Trustees Deferred Compensation Plan (see Note 4) | | | 167,260 | | | | 274,913 | | | | 1,116,875 | | | | 11,813 | |
| Prepaid expenses and other assets | | | — | | | | — | | | | 886 | | | | — | |
Total Assets | | | 318,204,798 | | | | 1,126,877,997 | | | | 1,235,070,302 | | | | 80,107,663 | |
| Liabilities: | | | | | | | | | | | | |
| Payable for investments purchased | | | — | | | | 8,170,087 | | | | 6,386,747 | | | | — | |
| Payable for Fund shares redeemed | | | 522,468 | | | | 4,409,220 | | | | 12,443,277 | | | | 156,058 | |
| Payable to custodian for cash overdraft | | | — | | | | — | | | | 77,184 | | | | — | |
| Securities sold short, at value | | | — | | | | — | | | | — | | | | — | |
| Options written, at value | | | — | | | | — | | | | — | | | | — | |
| Line of credit payable | | | — | | | | — | | | | 3,773,972 | | | | — | |
| Investment Advisory fees payable | | | 116,664 | | | | 505,564 | | | | 542,426 | | | | 39,277 | |
| Distribution fees payable | | | 8,735 | | | | 37,047 | | | | 655,803 | | | | 4,610 | |
| Servicing fees payable | | | 37,060 | | | | 123,537 | | | | 109,858 | | | | 13,594 | |
| Administration fees payable | | | 94,001 | | | | 132,875 | | | | 357,575 | | | | 19,142 | |
| Trustees Deferred Compensation Plan payable (see Note 4) | | | 167,260 | | | | 274,913 | | | | 1,116,875 | | | | 11,813 | |
Total Liabilities | | | 946,188 | | | | 13,653,243 | | | | 25,463,717 | | | | 244,494 | |
| Net Assets | | $ | 317,258,610 | | | $ | 1,113,224,754 | | | $ | 1,209,606,585 | | | $ | 79,863,169 | |
| Net Assets Consist of: | | | | | | | | | | | | |
| Paid-in-capital | | $ | 346,445,449 | | | $ | 1,121,054,552 | | | $ | 1,237,793,816 | | | $ | 80,298,752 | |
| Total distributable earnings | | | (29,186,839 | ) | | | (7,829,798 | ) | | | (28,187,231 | ) | | | (435,583 | ) |
| Net Assets | | $ | 317,258,610 | | | $ | 1,113,224,754 | | | $ | 1,209,606,585 | | | $ | 79,863,169 | |
| Cost of Investments | | $ | 335,240,812 | | | $ | 1,112,781,402 | | | $ | 1,275,179,788 | | | $ | 78,003,699 | |
| Cost of Repurchase Agreements | | $ | 7,978,000 | | | $ | 15,213,000 | | | $ | 2,055,000 | | | $ | 1,280,000 | |
| Cost of Foreign Currency | | $ | — | | | $ | — | | | $ | — | | | $ | — | |
| Proceeds Received on Securities Sold Short | | $ | — | | | $ | — | | | $ | — | | | $ | — | |
| Premiums Received for Options Written | | $ | — | | | $ | — | | | $ | — | | | $ | — | |
| | | | | | |
| 96 | | Semiannual Report | | | December 31, 2018 | | | See accompanying Notes to Financial Statements |
| | | | | | |
| | | | AllianzGI
Technology | |
| | | | | |
| | | | | $ | 1,251,281,401 | |
| | | | | | 138,160,000 | |
| | | | | | 17,863 | |
| | | | | | 4,202,529 | |
| | | | | | 99,747 | |
| | | | | | 1,237,528 | |
| | | | | | 3,376,712 | |
| | | | | | 12,191 | |
| | | | | | 335,309 | |
| | | | | | — | |
| | | | | 1,398,723,280 | |
| | | | | |
| | | | | | 4,972,092 | |
| | | | | | 4,446,873 | |
| | | | | | — | |
| | | | | | 1,044,028 | |
| | | | | | 1,121,800 | |
| | | | | | — | |
| | | | | | 1,008,527 | |
| | | | | | 29,459 | |
| | | | | | 111,694 | |
| | | | | | 381,999 | |
| | | | | | 335,309 | |
| | | | | | 13,451,781 | |
| | | | $ | 1,385,271,499 | |
| | | | | |
| | | | | $ | 1,029,168,893 | |
| | | | | | 356,102,606 | |
| | | | | $ | 1,385,271,499 | |
| | | | | $ | 915,605,643 | |
| | | | | $ | 138,160,000 | |
| | | | | $ | 4,016,872 | |
| | | | | $ | 1,237,528 | |
| | | | | $ | 2,097,012 | |
| | | | | | | | |
| See accompanying Notes to Financial Statements | | | December 31, 2018 | | | Semiannual Report | | | 97 | |
Statements of Assets and Liabilities (cont’d)
December 31, 2018 (unaudited)
| | | | | | | | | | | | | | | | |
| | | AllianzGI
NFJ Large-Cap
Value | | | AllianzGI
NFJ Mid-Cap
Value | | | AllianzGI
NFJ Small-Cap
Value | | | AllianzGI
Small-Cap | |
| Net Assets: | |
| Class A | | $ | 166,388,471 | | | $ | 530,370,556 | | | $ | 450,613,097 | | | $ | 58,647,646 | |
| Class C | | | 13,233,341 | | | | 43,228,468 | | | | 12,121,214 | | | | 7,772,283 | |
| Class R | | | 1,910,171 | | | | 16,485,010 | | | | 24,493,963 | | | | — | |
| Class P | | | 17,282,415 | | | | 158,915,038 | | | | 39,433,800 | | | | 7,375,902 | |
| Institutional Class | | | 117,347,516 | | | | 330,134,689 | | | | 377,181,299 | | | | 6,059,319 | |
| Class R6 | | | — | | | | 11,686,290 | | | | 184,555,660 | | | | 8,019 | |
| Administrative Class | | | 1,096,696 | | | | 22,404,703 | | | | 121,207,552 | | | | — | |
| Shares Issued and Outstanding: | | | | | | | | | | | | |
| Class A | | | 6,964,632 | | | | 20,468,362 | | | | 35,549,924 | | | | 3,536,370 | |
| Class C | | | 547,271 | | | | 2,020,166 | | | | 1,066,850 | | | | 487,916 | |
| Class R | | | 79,132 | | | | 742,854 | | | | 1,768,652 | | | | — | |
| Class P | | | 716,647 | | | | 7,607,282 | | | | 2,694,864 | | | | 439,673 | |
| Institutional Class | | | 4,935,173 | | | | 11,920,862 | | | | 25,542,606 | | | | 358,295 | |
| Class R6 | | | — | | | | 422,386 | | | | 12,575,218 | | | | 474 | |
| Administrative Class | | | 45,261 | | | | 838,651 | | | | 9,598,302 | | | | — | |
| Net Asset Value and Redemption Price Per Share:* | | | | | | | | | | | | |
| Class A | | $ | 23.89 | | | $ | 25.91 | | | $ | 12.68 | | | $ | 16.58 | |
| Class C | | | 24.18 | | | | 21.40 | | | | 11.36 | | | | 15.93 | |
| Class R | | | 24.14 | | | | 22.19 | | | | 13.85 | | | | — | |
| Class P | | | 24.12 | | | | 20.89 | | | | 14.63 | | | | 16.77 | |
| Institutional Class | | | 23.78 | | | | 27.69 | | | | 14.77 | | | | 16.91 | |
| Class R6 | | | — | | | | 27.67 | | | | 14.68 | | | | 16.91 | |
| Administrative Class | | | 24.23 | | | | 26.72 | | | | 12.63 | | | | — | |
| * | Net asset value and redemption price per share may not recalculate exactly due to rounding. |
| | | | | | |
| 98 | | Semiannual Report | | | December 31, 2018 | | | See accompanying Notes to Financial Statements |
| | | | | | |
| | | | AllianzGI
Technology | |
| | | | | |
| | | | | $ | 503,653,941 | |
| | | | | | 41,555,084 | |
| | | | | | — | |
| | | | | | 116,508,490 | |
| | | | | | 707,817,628 | |
| | | | | | — | |
| | | | | 15,736,356 | |
| | | | | |
| | | | | | 9,838,768 | |
| | | | | | 1,143,249 | |
| | | | | | — | |
| | | | | | 2,009,265 | |
| | | | | | 11,948,315 | |
| | | | | | — | |
| | | | | 286,274 | |
| | | | | |
| | | | | $ | 51.19 | |
| | | | | | 36.35 | |
| | | | | | — | |
| | | | | | 57.98 | |
| | | | | | 59.24 | |
| | | | | | — | |
| | | | | | 54.97 | |
| | | | | | | | |
| See accompanying Notes to Financial Statements | | | December 31, 2018 | | | Semiannual Report | | | 99 | |
Statements of Operations
Six Months ended December 31, 2018 (unaudited)
| | | | | | | | | | | | | | | | |
| | | AllianzGI
Emerging
Markets
Opportunities | | | AllianzGI
Focused
Growth | | | AllianzGI
Global
Natural
Resources | | | AllianzGI
Global
Small-Cap | |
| Investment Income: | | | | | | | | | | | | |
| Dividends, net of foreign withholding taxes* | | $ | 5,301,006 | | | $ | 4,740,265 | | | $ | 254,813 | | | $ | 781,479 | |
| Interest | | | 12,224 | | | | 13,576 | | | | 500 | | | | 11,527 | |
| Miscellaneous | | | 15 | | | | 47 | | | | 1 | | | | 8 | |
Total Investment Income | | | 5,313,245 | | | | 4,753,888 | | | | 255,314 | | | | 793,014 | |
| Expenses: | | | | | | | | | | | | |
| Investment advisory | | | 1,469,062 | | | | 2,427,041 | | | | 63,918 | | | | 813,958 | |
| Administration | | | 720,234 | | | | 1,970,576 | | | | 37,510 | | | | 360,346 | |
| Distribution — Class C | | | 22,728 | | | | 586,217 | | | | 7,020 | | | | 57,839 | |
| Distribution — Class R | | | — | | | | 29,533 | | | | — | | | | — | |
| Servicing — Class A | | | 78,498 | | | | 615,851 | | | | 8,864 | | | | 69,323 | |
| Servicing — Class C | | | 7,576 | | | | 195,406 | | | | 2,340 | | | | 19,280 | |
| Servicing — Class R | | | — | | | | 29,533 | | | | — | | | | — | |
| Distribution and/or servicing — Administrative Class | | | — | | | | 5,801 | | | | — | | | | — | |
| Trustees | | | 20,724 | | | | 62,649 | | | | 1,566 | | | | 11,273 | |
| Line of credit commitment | | | 4,645 | | | | 14,112 | | | | 240 | | | | 2,387 | |
| Legal | | | 118 | | | | 379 | | | | 6 | | | | 63 | |
| Interest expense | | | — | | | | — | | | | — | | | | — | |
| Securities sold short | | | — | | | | — | | | | 70 | | | | — | |
| Miscellaneous | | | 3,516 | | | | 6,444 | | | | 403 | | | | 1,377 | |
Total Expenses | | | 2,327,101 | | | | 5,943,542 | | | | 121,937 | | | | 1,335,846 | |
Less: Investment Advisory/Administration waived | | | (604,908 | ) | | | (588,611 | ) | | | — | | | | — | |
Net Expenses | | | 1,722,193 | | | | 5,354,931 | | | | 121,937 | | | | 1,335,846 | |
| Net Investment Income (Loss) | | | 3,591,052 | | | | (601,043 | ) | | | 133,377 | | | | (542,832 | ) |
| Realized and Change in Unrealized Gain (Loss): | | | | | | | | | | | | |
| Net realized gain (loss) on: | | | | | | | | | | | | | | | | |
Investments | | | (18,453,206 | ) | | | 78,201,421 | | | | (484,552 | ) | | | (1,524,889 | ) |
Options written | | | — | | | | — | | | | 1,475 | | | | — | |
Foreign currency transactions | | | (320,262 | ) | | | — | | | | (4,240 | ) | | | (29,868 | ) |
| Net change in unrealized appreciation/depreciation of: | | | | | | | | | | | | | | | | |
Investments | | | (27,006,552 | ) | | | (207,531,702 | ) | | | (3,360,057 | ) | | | (32,959,978 | ) |
Options written | | | — | | | | — | | | | — | | | | — | |
Foreign currency transactions | | | 54,413 | | | | — | | | | (60 | ) | | | 8,372 | |
| Net realized and change in unrealized gain (loss) | | | (45,725,607 | ) | | | (129,330,281 | ) | | | (3,847,434 | ) | | | (34,506,363 | ) |
| Net Increase (Decrease) in Net Assets Resulting from Investment Operations | | $ | (42,134,555 | ) | | $ | (129,931,324 | ) | | $ | (3,714,057 | ) | | $ | (35,049,195 | ) |
| * Foreign withholding taxes | | $ | 636,642 | | | $ | — | | | $ | 9,317 | | | $ | 37,580 | |
| | | | | | |
| 100 | | Semiannual Report | | | December 31, 2018 | | | See accompanying Notes to Financial Statements |
| | | | | | | | | | | | | | | | | | | | | | |
| | | |
AllianzGI
Health
Sciences | | | AllianzGI
Income &
Growth | | | AllianzGI
Mid-Cap | | | AllianzGI
NFJ Dividend
Value | | | AllianzGI
NFJ International
Value | |
| | | | | | | | | | | | | | | | | |
| | | | | $ | 937,909 | | | $ | 15,706,047 | | | $ | 821,115 | | | $ | 27,898,303 | | | $ | 3,005,958 | |
| | | | | | 6,591 | | | | 43,942,397 | | | | 2,345 | | | | 20,759 | | | | 2,098 | |
| | | | | | 7 | | | | 176 | | | | 13 | | | | 80 | | | | 11 | |
| | | | | 944,507 | | | | 59,648,620 | | | | 823,473 | | | | 27,919,142 | | | | 3,008,067 | |
| | | | | | | | | | | | | | | | | |
| | | | | | 630,392 | | | | 12,932,661 | | | | 702,904 | | | | 4,223,948 | | | | 752,024 | |
| | | | | | 313,772 | | | | 7,137,716 | | | | 581,549 | | | | 3,344,670 | | | | 596,534 | |
| | | | | | 25,192 | | | | 4,328,166 | | | | 340,740 | | | | 667,927 | | | | 102,263 | |
| | | | | | — | | | | 4,774 | | | | 1,810 | | | | 111,775 | | | | 10,333 | |
| | | | | | 185,041 | | | | 1,632,897 | | | | 203,984 | | | | 641,336 | | | | 105,352 | |
| | | | | | 8,397 | | | | 1,442,722 | | | | 113,580 | | | | 222,642 | | | | 34,088 | |
| | | | | | — | | | | 4,774 | | | | 1,810 | | | | 111,775 | | | | 10,333 | |
| | | | | | — | | | | — | | | | 1,807 | | | | 96,725 | | | | 5,342 | |
| | | | | | 9,383 | | | | 217,570 | | | | 18,019 | | | | 110,515 | | | | 16,438 | |
| | | | | | 2,088 | | | | 51,820 | | | | 3,919 | | | | 24,998 | | | | 3,306 | |
| | | | | | 54 | | | | 1,351 | | | | 105 | | | | 635 | | | | 88 | |
| | | | | | — | | | | — | | | | — | | | | 44,907 | | | | 2,391 | |
| | | | | | — | | | | — | | | | — | | | | — | | | | — | |
| | | | | | 1,040 | | | | 29,415 | | | | 2,926 | | | | 16,662 | | | | 5,318 | |
| | | | | | 1,175,359 | | | | 27,783,866 | | | | 1,973,153 | | | | 9,618,515 | | | | 1,643,810 | |
| | | | | | — | | | | (169,739 | ) | | | — | | | | (1,196,647 | ) | | | (94,003 | ) |
| | | | | | 1,175,359 | | | | 27,614,127 | | | | 1,973,153 | | | | 8,421,868 | | | | 1,549,807 | |
| | | | | | (230,852 | ) | | | 32,034,493 | | | | (1,149,680 | ) | | | 19,497,274 | | | | 1,458,260 | |
| | | | | | | | | | | | | | | | | |
| | | | | | | | | | | | | | | | | | | | | | |
| | | | | | 14,274,133 | | | | 99,429,328 | | | | 2,159,410 | | | | 90,745,360 | | | | 569,245 | |
| | | | | | — | | | | 3,369,386 | | | | — | | | | — | | | | — | |
| | | | | | (180 | ) | | | — | | | | (42 | ) | | | — | | | | (83,025 | ) |
| | | | | | | | | | | | | | | | | | | | | | |
| | | | | | (13,941,472 | ) | | | (423,912,660 | ) | | | (41,448,707 | ) | | | (255,690,097 | ) | | | (29,530,062 | ) |
| | | | | | — | | | | (824,172 | ) | | | — | | | | — | | | | — | |
| | | | | | 678 | | | | — | | | | — | | | | — | | | | 30,527 | |
| | | | | | 333,159 | | | | (321,938,118 | ) | | | (39,289,339 | ) | | | (164,944,737 | ) | | | (29,013,315 | ) |
| | | | | $ | 102,307 | | | $ | (289,903,625 | ) | | $ | (40,439,019 | ) | | $ | (145,447,463 | ) | | $ | (27,555,055 | ) |
| | | | | $ | 1,330 | | | $ | — | | | $ | 3,523 | | | $ | 454,547 | | | $ | 258,390 | |
| | | | | | | | |
| See accompanying Notes to Financial Statements | | | December 31, 2018 | | | Semiannual Report | | | 101 | |
Statements of Operations (cont’d)
Six Months ended December 31, 2018 (unaudited)
| | | | | | | | | | | | | | | | |
| | | AllianzGI
NFJ Large-Cap
Value | | | AllianzGI NFJ
Mid-Cap Value | | | AllianzGI
NFJ Small-Cap
Value | | | AllianzGI
Small-Cap | |
| Investment Income: | | | | | | | | | | | | |
| Interest | | $ | 10,228 | | | $ | 50,783 | | | $ | 45,286 | | | $ | 4,094 | |
| Dividends, net of foreign withholding taxes* | | | 4,532,804 | | | | 15,479,034 | | | | 28,185,590 | | | | 689,454 | |
| Non-cash income | | | — | | | | — | | | | — | | | | 140,048 | |
| Miscellaneous | | | 15 | | | | 56 | | | | 80 | | | | 4 | |
Total Investment Income | | | 4,543,047 | | | | 15,529,873 | | | | 28,230,956 | | | | 833,600 | |
| Expenses: | | | | | | | | | | | | |
| Investment advisory | | | 815,097 | | | | 3,553,244 | | | | 5,809,360 | | | | 289,532 | |
| Administration | | | 658,026 | | | | 2,354,076 | | | | 3,120,605 | | | | 186,875 | |
| Distribution — Class C | | | 154,945 | | | | 468,006 | | | | 244,645 | | | | 88,067 | |
| Distribution — Class R | | | 4,822 | | | | 21,871 | | | | 39,807 | | | | — | |
| Servicing — Class A | | | 205,298 | | | | 705,960 | | | | 814,343 | | | | 71,494 | |
| Servicing — Class C | | | 51,648 | | | | 156,002 | | | | 81,548 | | | | 29,356 | |
| Servicing — Class R | | | 4,822 | | | | 21,871 | | | | 39,807 | | | | — | |
| Distribution and/or servicing — Administrative Class | | | 1,569 | | | | 29,734 | | | | 217,855 | | | | — | |
| Legal | | | 123 | | | | 440 | | | | 652 | | | | 33 | |
| Dividends on securities sold short | | | — | | | | — | | | | — | | | | — | |
| Trustees | | | 21,020 | | | | 73,172 | | | | 124,525 | | | | 5,925 | |
| Interest expense | | | — | | | | — | | | | 23,972 | | | | — | |
| Securities sold short | | | — | | | | — | | | | — | | | | — | |
| Line of credit commitment | | | 4,768 | | | | 16,926 | | | | 26,461 | | | | 1,239 | |
| Miscellaneous | | | 2,247 | | | | 7,435 | | | | 40,168 | | | | 1,195 | |
Total Expenses | | | 1,924,385 | | | | 7,408,737 | | | | 10,583,748 | | | | 673,716 | |
Less: Investment Advisory/Administration waived | | | — | | | | (1,421,298 | ) | | | (612,648 | ) | | | (39,267 | ) |
Net Expenses | | | 1,924,385 | | | | 5,987,439 | | | | 9,971,100 | | | | 634,449 | |
| Net Investment Income (Loss) | | | 2,618,662 | | | | 9,542,434 | | | | 18,259,856 | | | | 199,151 | |
| Realized and Change in Unrealized Gain (Loss): | | | | | | | | | | | | |
| Net realized gain (loss) on: | | | | | | | | | | | | | | | | |
| Net realized loss on investments | | | (1,164,181 | ) | | | 9,071,054 | | | | 59,870,480 | | | | 226,625 | |
Securities sold short | | | — | | | | — | | | | — | | | | — | |
Options written | | | — | | | | — | | | | — | | | | — | |
Foreign currency transactions | | | — | | | | 1,682 | | | | 9,550 | | | | — | |
| Net change in unrealized appreciation/depreciation of: | | | | | | | | | | | | | | | | |
Investments | | | (27,573,774 | ) | | | (183,056,947 | ) | | | (421,152,080 | ) | | | (15,447,908 | ) |
Securities sold short | | | — | | | | — | | | | — | | | | — | |
Options written | | | — | | | | — | | | | — | | | | — | |
Foreign currency transactions | | | — | | | | (1,502 | ) | | | (6,290 | ) | | | — | |
| Net realized and change in unrealized loss | | | (28,737,955 | ) | | | (173,985,713 | ) | | | (361,278,340 | ) | | | (15,221,283 | ) |
| Net Decrease in Net Assets Resulting from Investment Operations | | $ | (26,119,293 | ) | | $ | (164,443,279 | ) | | $ | (343,018,484 | ) | | $ | (15,022,132 | ) |
| * Foreign withholding taxes | | $ | 54,488 | | | $ | 74,825 | | | $ | 158,713 | | | $ | 207 | |
| | | | | | |
| 102 | | Semiannual Report | | | December 31, 2018 | | | See accompanying Notes to Financial Statements |
| | | | | | |
| | | | AllianzGI
Technology | |
| | | | | |
| | | | | $ | 342,226 | |
| | | | | | 3,086,767 | |
| | | | | | — | |
| | | | | | 390 | |
| | | | | 3,429,383 | |
| | | | | |
| | | | | | 7,304,739 | |
| | | | | | 2,750,688 | |
| | | | | | 383,625 | |
| | | | | | — | |
| | | | | | 699,909 | |
| | | | | | 127,875 | |
| | | | | | — | |
| | | | | | 25,588 | |
| | | | | | 585 | |
| | | | | | 6,442 | |
| | | | | | 95,500 | |
| | | | | | — | |
| | | | | | 58,648 | |
| | | | | | 20,808 | |
| | | | | | 14,263 | |
| | | | | | 11,488,670 | |
| | | | | | (850,348 | ) |
| | | | | | 10,638,322 | |
| | | | | (7,208,939 | ) |
| | | | | |
| | | | | | |
| | | | | | 82,023,131 | |
| | | | | | (1,815 | ) |
| | | | | | (2,835,747 | ) |
| | | | | | (48,053 | ) |
| | | | | | |
| | | | | | (226,409,562 | ) |
| | | | | | 191,568 | |
| | | | | | (7,317,062 | ) |
| | | | | | (47,025 | ) |
| | | | | | (154,444,565 | ) |
| | | | | $ | (161,653,504 | ) |
| | | | | $ | (318 | ) |
| | | | | | | | |
| See accompanying Notes to Financial Statements | | | December 31, 2018 | | | Semiannual Report | | | 103 | |
Statements of Changes in Net Assets
| | | | | | | | | | | | | | | | | | | | |
| | | AllianzGI Emerging Markets
Opportunities | | | AllianzGI Focused Growth | | | | |
| | | | | | |
| | | Six Months ended
December 31, 2018
(unaudited) | | | Year ended June 30, 2018 | | | Six Months ended
December 31, 2018
(unaudited) | | | Year ended June 30, 2018 | | | | |
| Increase (Decrease) in Net Assets from: | | | | | | | | | | | | | | | |
| | | | | | |
Investment Operations: | | | | | | | | | | | | | | | | | | | | |
| Net investment income (loss) | | $ | 3,591,052 | | | $ | 5,119,377 | | | $ | (601,043 | ) | | $ | (765,369 | ) | | | | |
| Net realized gain (loss) | | | (18,773,468 | ) | | | (8,920,246 | ) | | | 78,201,421 | | | | 51,103,752 | | | | | |
| Net change in unrealized appreciation/depreciation | | | (26,952,139 | ) | | | 13,156,224 | | | | (207,531,702 | ) | | | 161,891,564 | | | | | |
| | | | | | |
Net increase (decrease) in net assets resulting from investment operations | | | (42,134,555 | ) | | | 9,355,355 | | | | (129,931,324 | ) | | | 212,229,947 | | | | | |
| Dividends and Distributions to Shareholders from: | | | | | | | | | | | | | | | |
| | | | | | |
| Net investment income: | | | | | | | | | | | | | | | | | | | | |
Class A | | | — | | | | (1,285,169 | ) | | | — | | | | (23,468 | ) | | | | |
Class C | | | — | | | | (25,141 | ) | | | — | | | | (879 | ) | | | | |
Class R | | | — | | | | — | | | | — | | | | (6 | ) | | | | |
Class P | | | — | | | | (448,520 | ) | | | — | | | | (113,936 | ) | | | | |
Institutional Class | | | — | | | | (2,113,250 | ) | | | — | | | | (203,158 | ) | | | | |
Class R6 | | | — | | | | (14,883 | ) | | | — | | | | (51,061 | ) | | | | |
Administrative Class | | | — | | | | — | | | | — | | | | (10 | ) | | | | |
| | | | | | |
| Net realized capital gains: | | | | | | | | | | | | | | | | | | | | |
Class A | | | — | | | | — | | | | — | | | | (5,392,582 | ) | | | | |
Class C | | | — | | | | — | | | | — | | | | (4,432,093 | ) | | | | |
Class R | | | — | | | | — | | | | — | | | | (398,509 | ) | | | | |
Class P | | | — | | | | — | | | | — | | | | (1,561,919 | ) | | | | |
Institutional Class | | | — | | | | — | | | | — | | | | (3,156,079 | ) | | | | |
Class R6 | | | — | | | | — | | | | — | | | | (586,284 | ) | | | | |
Administrative Class | | | — | | | | — | | | | — | | | | (71,082 | ) | | | | |
| | | | | | |
| Total distributions paid:* | | | | | | | | | | | | | | | | | | | | |
Class A | | | (969,272 | ) | | | — | | | | (59,884,757 | ) | | | — | | | | | |
Class C | | | (15,097 | ) | | | — | | | | (8,093,814 | ) | | | — | | | | | |
Class R | | | — | | | | — | | | | (3,051,304 | ) | | | — | | | | | |
Class P | | | (507,886 | ) | | | — | | | | (14,260,002 | ) | | | — | | | | | |
Institutional Class | | | (6,130,461 | ) | | | — | | | | (18,778,168 | ) | | | — | | | | | |
Class R6 | | | (591,467 | ) | | | — | | | | (13,248,091 | ) | | | — | | | | | |
Administrative Class | | | — | | | | — | | | | (568,572 | ) | | | — | | | | | |
| Total dividends and distributions to shareholders | | | (8,214,183 | ) | | | (3,886,963 | ) | | | (117,884,708 | ) | | | (15,991,066 | ) | | | | |
| Fund Share Transactions: | | | | | | | | | | | | | | | |
| Net proceeds from the sale of shares | | | 93,118,807 | | | | 251,387,461 | | | | 278,671,090 | | | | 216,700,595 | | | | | |
| Issued in reinvestment of dividends and distributions | | | 7,717,648 | | | | 3,503,546 | | | | 105,500,804 | | | | 14,454,671 | | | | | |
| Cost of shares redeemed | | | (102,520,890 | ) | | | (150,572,709 | ) | | | (313,168,435 | ) | | | (271,934,775 | ) | | | | |
| Net increase (decrease) from Fund share transactions | | | (1,684,435 | ) | | | 104,318,298 | | | | 71,003,459 | | | | (40,779,509 | ) | | | | |
| Total increase (decrease) in net assets | | | (52,033,173 | ) | | | 109,786,690 | | | | (176,812,573 | ) | | | 155,459,372 | | | | | |
| Net Assets: | | | | | | | | | | | | | | | |
| Beginning of period | | | 368,091,951 | | | | 258,305,261 | | | | 1,083,627,898 | | | | 928,168,526 | | | | | |
| End of period** | | $ | 316,058,778 | | | $ | 368,091,951 | | | $ | 906,815,325 | | | $ | 1,083,627,898 | | | | | |
| — | May reflect actual amounts rounding to less than $1. |
| * | Distributions from net investment income and net realized capital gains are combined for the period ended December 31, 2018. See Note 1 in the Notes to Financial Statements for more information regarding new accounting pronouncements. The dividends and distributions to shareholders for the year ended June 30, 2018 have not been reclassified to conform to the current year presentation. |
| ** | Net Assets — End of period includes undistributed (dividends in excess of) net investment income of $4,528,214 for AllianzGI Emerging Markets Opportunities, $(623,887) for AllianzGI Focused Growth, $203,172 for AllianzGI Global Natural Resources, $(671,237) AllianzGI Global Small-Cap and $799,028 for AllianzGI Health Sciences as of June 30, 2018. |
| | | | | | |
| 104 | | Semiannual Report | | | December 31, 2018 | | | See accompanying Notes to Financial Statements |
| | | | | | | | | | | | | | | | | | | | | | | | | | |
| | | | AllianzGI Global Natural
Resources | | | AllianzGI Global Small-Cap | | | AllianzGI Health Sciences | |
| | | | | | | |
| | | | Six Months ended
December 31, 2018
(unaudited) | | | Year ended
June 30, 2018 | | | Six Months ended
December 31, 2018
(unaudited) | | | Year ended
June 30, 2018 | | | Six Months ended
December 31, 2018
(unaudited) | | | Year ended
June 30, 2018 | |
| | | | | | | | | | | | | | | | | | | | |
| | | | | | | |
| | | | | | | | | | | | | | | | | | | | |
| | | | | $ | 133,377 | | | $ | 229,563 | | | $ | (542,832 | ) | | $ | (786,438 | ) | | $ | (230,852 | ) | | $ | (146,044 | ) |
| | | | | | (487,317 | ) | | | 1,099,614 | | | | (1,554,757 | ) | | | 36,877,430 | | | | 14,273,953 | | | | 12,896,013 | |
| | | | | | (3,360,117 | ) | | | 2,399,673 | | | | (32,951,606 | ) | | | (3,737,620 | ) | | | (13,940,794 | ) | | | (4,771,108 | ) |
| | | | | | | |
| | | | | (3,714,057 | ) | | | 3,728,850 | | | | (35,049,195 | ) | | | 32,353,372 | | | | 102,307 | | | | 7,978,861 | |
| | | | | | | | | | | | | | | | | | | | |
| | | | | | | |
| | | | | | | | | | | | | | | | | | | | | | | | | | |
| | | | | | — | | | | (22,600 | ) | | | — | | | | (104,607 | ) | | �� | — | | | | — | |
| | | | | | — | | | | (2 | ) | | | — | | | | (4 | ) | | | — | | | | — | |
| | | | | | — | | | | — | | | | — | | | | — | | | | — | | | | — | |
| | | | | | — | | | | (1 | ) | | | — | | | | (53,154 | ) | | | — | | | | — | |
| | | | | | — | | | | (33,505 | ) | | | — | | | | (363,320 | ) | | | — | | | | — | |
| | | | | | — | | | | — | | | | — | | | | — | | | | — | | | | — | |
| | | | | | — | | | | — | | | | — | | | | — | | | | — | | | | — | |
| | | | | | | |
| | | | | | | | | | | | | | | | | | | | | | | | | | |
| | | | | | — | | | | — | | | | — | | | | (4,831,503 | ) | | | — | | | | — | |
| | | | | | — | | | | — | | | | — | | | | (1,825,070 | ) | | | — | | | | — | |
| | | | | | — | | | | — | | | | — | | | | — | | | | — | | | | — | |
| | | | | | — | | | | — | | | | — | | | | (1,455,425 | ) | | | — | | | | — | |
| | | | | | — | | | | — | | | | — | | | | (7,466,205 | ) | | | — | | | | — | |
| | | | | | — | | | | — | | | | — | | | | — | | | | — | | | | — | |
| | | | | | — | | | | — | | | | — | | | | — | | | | — | | | | — | |
| | | | | | | |
| | | | | | | | | | | | | | | | | | | | | | | | | | |
| | | | | | (106,938 | ) | | | — | | | | (9,059,158 | ) | | | — | | | | (19,287,433 | ) | | | — | |
| | | | | | (13,875 | ) | | | — | | | | (2,028,346 | ) | | | — | | | | (661,505 | ) | | | — | |
| | | | | | — | | | | — | | | | — | | | | — | | | | — | | | | — | |
| | | | | | (42,272 | ) | | | — | | | | (2,305,369 | ) | | | — | | | | — | | | | — | |
| | | | | | (116,198 | ) | | | — | | | | (13,171,798 | ) | | | — | | | | (324,420 | ) | | | — | |
| | | | | | — | | | | — | | | | — | | | | — | | | | — | | | | — | |
| | | | | | — | | | | — | | | | — | | | | — | | | | — | | | | — | |
| | | | | | (279,283 | ) | | | (56,108 | ) | | | (26,564,671 | ) | | | (16,099,288 | ) | | | (20,273,358 | ) | | | — | |
| | | | | | | | | | | | | | | | | | | | |
| | | | | | 2,164,973 | | | | 6,932,416 | | | | 14,936,721 | | | | 18,628,082 | | | | 7,740,442 | | | | 4,201,145 | |
| | | | | | 256,399 | | | | 49,377 | | | | 24,879,822 | | | | 14,938,931 | | | | 19,582,484 | | | | — | |
| | | | | | (6,100,079 | ) | | | (16,062,072 | ) | | | (39,335,403 | ) | | | (70,931,193 | ) | | | (16,202,225 | ) | | | (24,792,002 | ) |
| | | | | | (3,678,707 | ) | | | (9,080,279 | ) | | | 481,140 | | | | (37,364,180 | ) | | | 11,120,701 | | | | (20,590,857 | ) |
| | | | | | (7,672,047 | ) | | | (5,407,537 | ) | | | (61,132,726 | ) | | | (21,110,096 | ) | | | (9,050,350 | ) | | | (12,611,996 | ) |
| | | | | | | | | | | | | | | | | | | | |
| | | | | | 20,661,799 | | | | 26,069,336 | | | | 193,444,251 | | | | 214,554,347 | | | | 152,193,943 | | | | 164,805,939 | |
| | | | | $ | 12,989,752 | | | $ | 20,661,799 | | | $ | 132,311,525 | | | $ | 193,444,251 | | | $ | 143,143,593 | | | $ | 152,193,943 | |
| | | | | | | | |
| See accompanying Notes to Financial Statements | | | December 31, 2018 | | | Semiannual Report | | | 105 | |
Statements of Changes in Net Assets (cont’d)
| | | | | | | | | | | | | | | | | | | | |
| | |
AllianzGI Income & Growth | | | AllianzGI Mid-Cap | | | | |
| | | | | | |
| | | Six Months ended
December 31, 2018
(unaudited) | | | Year ended
June 30, 2018 | | | Six Months ended
December 31, 2018
(unaudited) | | | Year ended
June 30, 2018 | | | | |
| Increase (Decrease) in Net Assets from: | | | | | | | | | | | | | | | |
| | | | | | |
Investment Operations: | | | | | | | | | | | | | | | | | | | | |
| Net investment income (loss) | | $ | 32,034,493 | | | $ | 63,804,793 | | | $ | (1,149,680 | ) | | $ | (2,449,712 | ) | | | | |
| Net realized gain (loss) | | | 102,798,714 | | | | 242,826,372 | | | | 2,159,368 | | | | 51,205,374 | | | | | |
| Net change in unrealized appreciation/depreciation | | | (424,736,832 | ) | | | (993,051 | ) | | | (41,448,707 | ) | | | (9,218,208 | ) | | | | |
| | | | | | |
Net increase (decrease) in net assets resulting from investment operations | | | (289,903,625 | ) | | | 305,638,114 | | | | (40,439,019 | ) | | | 39,537,454 | | | | | |
| Dividends and Distributions to Shareholders from: | | | | | | | | | | | | | | | |
| | | | | | |
| Net investment income: | | | | | | | | | | | | | | | | | | | | |
Class A | | | — | | | | (27,990,677 | ) | | | — | | | | — | | | | | |
Class C | | | — | | | | (20,598,689 | ) | | | — | | | | — | | | | | |
Class R | | | — | | | | (59,020 | ) | | | — | | | | — | | | | | |
Class P | | | — | | | | (19,970,577 | ) | | | — | | | | — | | | | | |
Institutional Class | | | — | | | | (10,121,944 | ) | | | — | | | | — | | | | | |
Class R6 | | | — | | | | — | | | | — | | | | — | | | | | |
Administrative Class | | | — | | | | — | | | | — | | | | — | | | | | |
| | | | | | |
| Net realized capital gains: | | | | | | | | | | | | | | | | | | | | |
Class A | | | — | | | | (69,579,945 | ) | | | — | | | | (10,987,891 | ) | | | | |
Class C | | | — | | | | (69,473,288 | ) | | | — | | | | (16,017,034 | ) | | | | |
Class R | | | — | | | | (168,277 | ) | | | — | | | | (266,285 | ) | | | | |
Class P | | | — | | | | (45,366,902 | ) | | | — | | | | (879,671 | ) | | | | |
Institutional Class | | | — | | | | (22,148,657 | ) | | | — | | | | (2,321,396 | ) | | | | |
Class R6 | | | — | | | | — | | | | — | | | | — | | | | | |
Administrative Class | | | — | | | | — | | | | — | | | | (121,353 | ) | | | | |
| | | | | | |
| Return of Capital: | | | | | | | | | | | | | | | | | | | | |
Class A | | | — | | | | — | | | | — | | | | — | | | | | |
Class C | | | — | | | | — | | | | — | | | | — | | | | | |
Class R | | | — | | | | — | | | | — | | | | — | | | | | |
Class P | | | — | | | | — | | | | — | | | | — | | | | | |
Institutional Class | | | — | | | | — | | | | — | | | | — | | | | | |
Class R6 | | | — | | | | — | | | | — | | | | — | | | | | |
Administrative Class | | | — | | | | — | | | | — | | | | — | | | | | |
| | | | | | |
| Total distributions paid:* | | | | | | | | | | | | | | | | | | | | |
Class A | | | (54,155,934 | ) | | | — | | | | (27,504,968 | ) | | | — | | | | | |
Class C | | | (47,969,520 | ) | | | — | | | | (3,284,654 | ) | | | — | | | | | |
Class R | | | (152,385 | ) | | | — | | | | (181,202 | ) | | | — | | | | | |
Class P | | | (40,884,072 | ) | | | — | | | | (1,137,529 | ) | | | — | | | | | |
Institutional Class | | | (22,460,182 | ) | | | — | | | | (3,398,339 | ) | | | — | | | | | |
Class R6 | | | — | | | | — | | | | — | | | | — | | | | | |
Administrative Class | | | — | | | | — | | | | (161,658 | ) | | | — | | | | | |
| Total dividends and distributions to shareholders | | | (165,622,093 | ) | | | (285,477,976 | ) | | | (35,668,350 | ) | | | (30,593,630 | ) | | | | |
| Fund Share Transactions: | | | | | | | | | | | | | | | |
| Net proceeds from the sale of shares | | | 884,730,775 | | | | 1,196,339,109 | | | | 136,764,136 | | | | 27,220,178 | | | | | |
| Issued in reinvestment of dividends and distributions | | | 147,292,753 | | | | 246,915,825 | | | | 31,730,631 | | | | 26,897,865 | | | | | |
| Cost of shares redeemed | | | (574,069,464 | ) | | | (952,452,588 | ) | | | (150,738,415 | ) | | | (51,312,655 | ) | | | | |
| Net increase (decrease) from Fund share transactions | | | 457,954,064 | | | | 490,802,346 | | | | 17,756,352 | | | | 2,805,388 | | | | | |
| Total increase (decrease) in net assets | | | 2,428,346 | | | | 510,962,484 | | | | (58,351,017 | ) | | | 11,749,212 | | | | | |
| Net Assets: | | | | | | | | | | | | | | | |
| Beginning of period | | | 3,728,317,213 | | | | 3,217,354,729 | | | | 305,572,917 | | | | 293,823,705 | | | | | |
End of period** | | $ | 3,730,745,559 | | | $ | 3,728,317,213 | | | $ | 247,221,900 | | | $ | 305,572,917 | | | | | |
| — | May reflect actual amounts rounding to less than $1. |
| * | Distributions from net investment income and net realized capital gains are combined for the period ended December 31, 2018. See Note 1 in the Notes to Financial Statements for more information regarding new accounting pronouncements. The dividends and distributions to shareholders for the year ended June 30, 2018 have not been reclassified to conform to the current year presentation. |
| ** | Net Assets — End of period includes undistributed (dividends in excess of) net investment income of $(21,395,422) for AllianzGI Income & Growth, $(1,717,007) for AllianzGI Mid-Cap, $1,989,444 for AllianzGI NFJ Dividend Value, $(522,383) for AllianzGI NFJ International Value and $121,757 for AllianzGI NFJ Large-Cap Value as of June 30, 2018. |
| | | | | | |
| 106 | | Semiannual Report | | | December 31, 2018 | | | See accompanying Notes to Financial Statements |
| | | | | | | | | | | | | | | | | | | | | | | | | | |
| | | | AllianzGI NFJ Dividend Value | | | AllianzGI NFJ International
Value | | | AllianzGI NFJ Large-Cap Value | |
| | | | | | | |
| | | | Six Months ended
December 31, 2018
(unaudited) | | | Year ended
June 30, 2018 | | | Six Months ended
December 31, 2018
(unaudited) | | | Year ended
June 30, 2018 | | | Six Months ended
December 31, 2018
(unaudited) | | | Year ended
June 30, 2018 | |
| | | | | | | | | | | | | | | | | | | | |
| | | | | | | |
| | | | | | | | | | | | | | | | | | | | |
| | | | | $ | 19,497,274 | | | $ | 42,245,052 | | | $ | 1,458,260 | | | $ | 6,644,356 | | | $ | 2,618,662 | | | $ | 5,763,663 | |
| | | | | | 90,745,360 | | | | 367,187,371 | | | | 486,220 | | | | 35,616,621 | | | | (1,164,181 | ) | | | 89,131,221 | |
| | | | | | (255,690,097 | ) | | | (147,665,772 | ) | | | (29,499,535 | ) | | | (18,041,126 | ) | | | (27,573,774 | ) | | | (61,826,574 | ) |
| | | | | | | |
| | | | | (145,447,463 | ) | | | 261,766,651 | | | | (27,555,055 | ) | | | 24,219,851 | | | | (26,119,293 | ) | | | 33,068,310 | |
| | | | | | | | | | | | | | | | | | | | |
| | | | | | | |
| | | | | | | | | | | | | | | | | | | | | | | | | | |
| | | | | | — | | | | (9,168,967 | ) | | | — | | | | (1,729,618 | ) | | | — | | | | (2,421,068 | ) |
| | | | | | — | | | | (2,386,455 | ) | | | — | | | | (468,542 | ) | | | — | | | | (556,867 | ) |
| | | | | | — | | | | (1,520,389 | ) | | | — | | | | (126,870 | ) | | | — | | | | (85,092 | ) |
| | | | | | — | | | | (11,863,238 | ) | | | — | | | | (2,064,885 | ) | | | — | | | | (357,030 | ) |
| | | | | | — | | | | (11,118,898 | ) | | | — | | | | (1,206,487 | ) | | | — | | | | (2,414,451 | ) |
| | | | | | — | | | | (1,926,654 | ) | | | — | | | | (44,765 | ) | | | — | | | | — | |
| | | | | | — | | | | (2,481,551 | ) | | | — | | | | (92,560 | ) | | | — | | | | (22,813 | ) |
| | | | | | | |
| | | | | | | | | | | | | | | | | | | | | | | | | | |
| | | | | | — | | | | (116,513,958 | ) | | | — | | | | — | | | | — | | | | — | |
| | | | | | — | | | | (55,513,493 | ) | | | — | | | | — | | | | — | | | | — | |
| | | | | | — | | | | (22,585,984 | ) | | | — | | | | — | | | | — | | | | — | |
| | | | | | — | | | | (132,640,140 | ) | | | — | | | | — | | | | — | | | | — | |
| | | | | | — | | | | (114,548,968 | ) | | | — | | | | — | | | | — | | | | — | |
| | | | | | — | | | | (18,541,699 | ) | | | — | | | | — | | | | — | | | | — | |
| | | | | | — | | | | (20,927,043 | ) | | | — | | | | — | | | | — | | | | — | |
| | | | | | | |
| | | | | | | | | | | | | | | | | | | | | | | | | | |
| | | | | | — | | | | — | | | | — | | | | (46,282 | ) | | | — | | | | — | |
| | | | | | — | | | | — | | | | — | | | | (19,274 | ) | | | — | | | | — | |
| | | | | | — | | | | — | | | | — | | | | (4,762 | ) | | | — | | | | — | |
| | | | | | — | | | | — | | | | — | | | | (46,555 | ) | | | — | | | | — | |
| | | | | | — | | | | — | | | | — | | | | (28,713 | ) | | | — | | | | — | |
| | | | | | — | | | | — | | | | — | | | | (933 | ) | | | — | | | | — | |
| | | | | | — | | | | — | | | | — | | | | (2,475 | ) | | | — | | | | — | |
| | | | | | | |
| | | | | | | | | | | | | | | | | | | | | | | | | | |
| | | | | | (98,702,938 | ) | | | — | | | | (449,584 | ) | | | — | | | | (1,274,849 | ) | | | — | |
| | | | | | (19,156,582 | ) | | | — | | | | (42,491 | ) | | | — | | | | (96,564 | ) | | | — | |
| | | | | | (14,984,642 | ) | | | — | | | | (32,672 | ) | | | — | | | | (21,004 | ) | | | — | |
| | | | | | (88,910,663 | ) | | | — | | | | (403,962 | ) | | | — | | | | (167,562 | ) | | | — | |
| | | | | | (68,326,738 | ) | | | — | | | | (336,809 | ) | | | — | | | | (1,237,803 | ) | | | — | |
| | | | | | (14,859,788 | ) | | | — | | | | (13,457 | ) | | | — | | | | — | | | | — | |
| | | | | | (12,656,436 | ) | | | — | | | | (24,475 | ) | | | — | | | | (9,517 | ) | | | — | |
| | | | | | (317,597,787 | ) | | | (521,737,437 | ) | | | (1,303,450 | ) | | | (5,882,703 | ) | | | (2,807,299 | ) | | | (5,857,321 | ) |
| | | | | | | | | | | | | | | | | | | | |
| | | | | | 226,559,060 | | | | 278,975,203 | | | | 22,328,933 | | | | 56,218,043 | | | | 62,066,449 | | | | 37,353,233 | |
| | | | | | 272,083,140 | | | | 445,389,136 | | | | 1,150,216 | | | | 5,200,274 | | | | 2,603,925 | | | | 5,362,953 | |
| | | | | | (552,957,865 | ) | | | (1,316,418,856 | ) | | | (98,570,382 | ) | | | (243,497,297 | ) | | | (80,548,199 | ) | | | (70,138,960 | ) |
| | | | | | (54,315,665 | ) | | | (592,054,517 | ) | | | (75,091,233 | ) | | | (182,078,980 | ) | | | (15,877,825 | ) | | | (27,422,774 | ) |
| | | | | (517,360,915 | ) | | | (852,025,303 | ) | | | (103,949,738 | ) | | | (163,741,832 | ) | | | (44,804,417 | ) | | | (211,785 | ) |
| | | | | | | | | | | | | | | | | | | | |
| | | | | | 1,965,249,775 | | | | 2,817,275,078 | | | | 285,991,588 | | | | 449,733,420 | | | | 362,063,027 | | | | 362,274,812 | |
| | | | | $ | 1,447,888,860 | | | $ | 1,965,249,775 | | | $ | 182,041,850 | | | $ | 285,991,588 | | | $ | 317,258,610 | | | $ | 362,063,027 | |
| | | | | | | | |
| See accompanying Notes to Financial Statements | | | December 31, 2018 | | | Semiannual Report | |
| 107
|
|
Statements of Changes in Net Assets (cont’d)
| | | | | | | | | | | | | | | | | | | | |
| | | AllianzGI NFJ Mid-Cap Value | | | AllianzGI NFJ Small-Cap Value | | | | |
| | | | | | |
| | | Six Months ended
December 31, 2018
(unaudited) | | | Year ended June 30, 2018 | | | Six Months ended
December 31, 2018
(unaudited) | | | Year ended June 30, 2018 | | | | |
| Increase (Decrease) in Net Assets from: | | | | | | | | | | | | | | | |
| | | | | | |
Investment Operations: | | | | | | | | | | | | | | | | | | | | |
| Net investment income (loss) | | $ | 9,542,434 | | | $ | 11,884,978 | | | $ | 18,259,856 | | | $ | 38,441,521 | | | | | |
| Net realized gain | | | 9,072,736 | | | | 11,068,507 | | | | 59,880,030 | | | | 344,066,391 | | | | | |
| Net change in unrealized appreciation/depreciation | | | (183,058,449 | ) | | | 4,697,184 | | | | (421,158,370 | ) | | | (185,882,457 | ) | | | | |
| | | | | | |
Net increase (decrease) in net assets resulting from investment operations | | | (164,443,279 | ) | | | 27,650,669 | | | | (343,018,484 | ) | | | 196,625,455 | | | | | |
| Dividends and Distributions to Shareholders from: | | | | | | | | | | | | | | | |
| | | | | | |
| Net investment income: | | | | | | | | | | | | | | | | | | | | |
Class A | | | — | | | | (4,171,641 | ) | | | — | | | | (3,377,555 | ) | | | | |
Class C | | | — | | | | (318,297 | ) | | | — | | | | (53 | ) | | | | |
Class R | | | — | | | | (77,400 | ) | | | — | | | | (63,699 | ) | | | | |
Class P | | | — | | | | (1,511,170 | ) | | | — | | | | (521,236 | ) | | | | |
Institutional Class | | | — | | | | (1,586,074 | ) | | | — | | | | (8,284,457 | ) | | | | |
Class R6 | | | — | | | | (2,590 | ) | | | — | | | | (3,628,782 | ) | | | | |
Administrative Class | | | — | | | | (103,493 | ) | | | — | | | | (1,623,000 | ) | | | | |
| | | | | | |
| Net realized capital gains: | | | | | | | | | | | | | | | | | | | | |
Class A | | | — | | | | (44,702,946 | ) | | | — | | | | (115,908,457 | ) | | | | |
Class C | | | — | | | | (17,643,815 | ) | | | — | | | | (22,666,813 | ) | | | | |
Class R | | | — | | | | (819,284 | ) | | | — | | | | (7,153,419 | ) | | | | |
Class P | | | — | | | | (10,998,117 | ) | | | — | | | | (10,801,192 | ) | | | | |
Institutional Class | | | — | | | | (11,199,186 | ) | | | — | | | | (158,591,956 | ) | | | | |
Class R6 | | | — | | | | (16,847 | ) | | | — | | | | (63,789,144 | ) | | | | |
Administrative Class | | | — | | | | (849,232 | ) | | | — | | | | (48,474,051 | ) | | | | |
| | | | | | |
| Total distributions paid:* | | | | | | | | | | | | | | | | | | | | |
Class A | | | (6,382,759 | ) | | | — | | | | (125,664,406 | ) | | | — | | | | | |
Class C | | | (3,067 | ) | | | — | | | | (3,447,097 | ) | | | — | | | | | |
Class R | | | (188,116 | ) | | | — | | | | (6,171,694 | ) | | | — | | | | | |
Class P | | | (2,852,418 | ) | | | — | | | | (11,101,354 | ) | | | — | | | | | |
Institutional Class | | | (4,615,174 | ) | | | — | | | | (94,888,377 | ) | | | — | | | | | |
Class R6 | | | (161,057 | ) | | | — | | | | (46,791,068 | ) | | | — | | | | | |
Administrative Class | | | (285,557 | ) | | | — | | | | (34,340,757 | ) | | | — | | | | | |
| Total dividends and distributions to shareholders | | | (14,488,148 | ) | | | (94,000,092 | ) | | | (322,404,753 | ) | | | (444,883,814 | ) | | | | |
| Fund Share Transactions: | | | | | | | | | | | | | | | |
| Net proceeds from the sale of shares | | | 384,283,261 | | | | 792,678,134 | | | | 212,249,968 | | | | 490,123,036 | | | | | |
| Issued in reinvestment of dividends and distributions | | | 12,930,868 | | | | 84,180,541 | | | | 294,059,205 | | | | 414,202,018 | | | | | |
| Cost of shares redeemed | | | (374,492,359 | ) | | | (306,899,043 | ) | | | (891,231,494 | ) | | | (1,487,596,822 | ) | | | | |
| Net increase (decrease) from Fund share transactions | | | 22,721,770 | | | | 569,959,632 | | | | (384,922,321 | ) | | | (583,271,768 | ) | | | | |
| Total increase (decrease) in net assets | | | (156,209,657 | ) | | | 503,610,209 | | | | (1,050,345,558 | ) | | | (831,530,127 | ) | | | | |
| Net Assets: | | | | | | | | | | | | | | | |
| Beginning of period | | | 1,269,434,411 | | | | 765,824,202 | | | | 2,259,952,143 | | | | 3,091,482,270 | | | | | |
| End of period** | | $ | 1,113,224,754 | | | $ | 1,269,434,411 | | | $ | 1,209,606,585 | | | $ | 2,259,952,143 | | | | | |
| — | May reflect actual amounts rounding to less than $1. |
| * | Distributions from net investment income and net realized capital gains are combined for the period ended December 31, 2018. See Note 1 in the Notes to Financial Statements for more information regarding new accounting pronouncements. The dividends and distributions to shareholders for the year ended June 30, 2018 have not been reclassified to conform to the current year presentation. |
| ** | Net Assets — End of period includes undistributed (dividends in excess of) net investment income of $106,049 for AllianzGI NFJ Mid-Cap Value, $444,830 for AllianzGI NFJ Small-Cap Value, $(240,398) for AllianzGI Small-Cap and $(7,056,692) for AllianzGI Technology as of June 30, 2018. |
| | | | | | |
| 108 | | Semiannual Report | | | December 31, 2018 | | | See accompanying Notes to Financial Statements |
| | | | | | | | | | | | | | | | | | |
| | | | AllianzGI Small-Cap | | | AllianzGI Technology | |
| | | | | |
| | | | Six Months ended
December 31, 2018
(unaudited) | | | Year ended
June 30, 2018 | | | Six Months ended
December 31, 2018
(unaudited) | | | Year ended June
30, 2018 | |
| | | | | | | | | | | | | | |
| | | | | |
| | | | | | | | | | | | | | |
| | | | | $ | 199,151 | | | $ | (296,987 | ) | | $ | (7,208,939 | ) | | $ | (12,249,945 | ) |
| | | | | | 226,625 | | | | 11,815,368 | | | | 79,137,516 | | | | 323,500,019 | |
| | | | | | (15,447,908 | ) | | | 3,812,594 | | | | (233,582,081 | ) | | | 166,330,893 | |
| | | | | |
| | | | | (15,022,132 | ) | | | 15,330,975 | | | | (161,653,504 | ) | | | 477,580,967 | |
| | | | | | | | | | | | | | |
| | | | | |
| | | | | | | | | | | | | | | | | | |
| | | | | | — | | | | — | | | | — | | | | — | |
| | | | | | — | | | | — | | | | — | | | | — | |
| | | | | | — | | | | — | | | | — | | | | — | |
| | | | | | — | | | | — | | | | — | | | | — | |
| | | | | | — | | | | — | | | | — | | | | — | |
| | | | | | — | | | | — | | | | — | | | | — | |
| | | | | | — | | | | — | | | | — | | | | — | |
| | | | | |
| | | | | | | | | | | | | | | | | | |
| | | | | | — | | | | (5,340,498 | ) | | | — | | | | (76,542,243 | ) |
| | | | | | — | | | | (4,343,421 | ) | | | — | | | | (23,797,863 | ) |
| | | | | | — | | | | — | | | | — | | | | — | |
| | | | | | — | | | | (550,506 | ) | | | — | | | | (9,980,800 | ) |
| | | | | | — | | | | (520,890 | ) | | | — | | | | (114,417,733 | ) |
| | | | | | — | | | | — | | | | — | | | | — | |
| | | | | | — | | | | — | | | | — | | | | (2,594,308 | ) |
| | | | | |
| | | | | | | | | | | | | | | | | | |
| | | | | | (5,294,854 | ) | | | — | | | | (103,779,540 | ) | | | — | |
| | | | | | (707,606 | ) | | | — | | | | (11,594,326 | ) | | | — | |
| | | | | | — | | | | — | | | | — | | | | — | |
| | | | | | (657,655 | ) | | | — | | | | (21,155,444 | ) | | | — | |
| | | | | | (538,178 | ) | | | — | | | | (126,878,404 | ) | | | — | |
| | | | | | (703 | ) | | | — | | | | — | | | | — | |
| | | | | | — | | | | — | | | | (3,019,512 | ) | | | — | |
| | | | | (7,198,996 | ) | | | (10,755,315 | ) | | | (266,427,226 | ) | | | (227,332,947 | ) |
| | | | | | | | | | | | | | |
| | | | | | 40,188,019 | | | | 17,254,774 | | | | 340,609,721 | | | | 420,037,569 | |
| | | | | | 6,657,652 | | | | 9,698,353 | | | | 252,764,380 | | | | 216,039,340 | |
| | | | | | (39,688,381 | ) | | | (15,374,400 | ) | | | (362,754,513 | ) | | | (679,635,733 | ) |
| | | | | | 7,157,290 | | | | 11,578,727 | | | | 230,619,588 | | | | (43,558,824 | ) |
| | | | | (15,063,838 | ) | | | 16,154,387 | | | | (197,461,142 | ) | | | 206,689,196 | |
| | | | | | | | | | | | | | |
| | | | | | 94,927,007 | | | | 78,772,620 | | | | 1,582,732,641 | | | | 1,376,043,445 | |
| | | | | $ | 79,863,169 | | | $ | 94,927,007 | | | $ | 1,385,271,499 | | | $ | 1,582,732,641 | |
| | | | | | | | |
| See accompanying Notes to Financial Statements | | | December 31, 2018 | | | Semiannual Report | | | 109 | |
Financial Highlights
For a Share Outstanding for the Period ended:^
| | | | | | | | | | | | | | | | | | | | | | | | | | | | |
| | | Net Asset
Value,
Beginning
of Period | | | Net
Investment
Income (a) | | |
Net Realized
and Change
in Unrealized
Gain (Loss) | | | Total from
Investment
Operations | | | Dividends
from Net
Investment
Income | | | Net Asset
Value, End
of Period | | | | |
| AllianzGI Emerging Markets Opportunities: | | | | | | | | | | | | | | | | | | | | | |
| Class A | | | | | | | | | | | | | | | | | | | | | | | | | | | | |
12/31/2018† | | $ | 28.53 | | | $ | 0.34 | | | $ | (3.65 | ) | | $ | (3.31 | ) | | $ | (0.48 | ) | | $ | 24.74 | | | | | |
6/30/2018 | | | 26.59 | | | | 0.41 | | | | 1.85 | | | | 2.26 | | | | (0.32 | ) | | | 28.53 | | | | | |
6/30/2017 | | | 22.60 | | | | 0.41 | | | | 3.98 | | | | 4.39 | | | | (0.40 | ) | | | 26.59 | | | | | |
6/30/2016 | | | 25.90 | | | | 0.34 | | | | (3.39 | ) | | | (3.05 | ) | | | (0.25 | ) | | | 22.60 | | | | | |
6/30/2015 | | | 27.00 | | | | 0.35 | | | | (1.10 | ) | | | (0.75 | ) | | | (0.35 | ) | | | 25.90 | | | | | |
6/30/2014 | | | 23.96 | | | | 0.30 | | | | 3.06 | | | | 3.36 | | | | (0.32 | ) | | | 27.00 | | | | | |
| Class C | | | | | | | | | | | | | | | | | | | | | | | | | | | | |
12/31/2018† | | $ | 28.05 | | | $ | 0.19 | | | $ | (3.53 | ) | | $ | (3.34 | ) | | $ | (0.10 | ) | | $ | 24.61 | | | | | |
6/30/2018 | | | 26.13 | | | | 0.16 | | | | 1.84 | | | | 2.00 | | | | (0.08 | ) | | | 28.05 | | | | | |
6/30/2017 | | | 22.09 | | | | 0.19 | | | | 3.96 | | | | 4.15 | | | | (0.11 | ) | | | 26.13 | | | | | |
6/30/2016 | | | 25.21 | | | | 0.22 | | | | (3.34 | ) | | | (3.12 | ) | | | — | | | | 22.09 | | | | | |
6/30/2015 | | | 26.25 | | | | 0.14 | | | | (1.07 | ) | | | (0.93 | ) | | | (0.11 | ) | | | 25.21 | | | | | |
6/30/2014 | | | 23.28 | | | | 0.11 | | | | 2.97 | | | | 3.08 | | | | (0.11 | ) | | | 26.25 | | | | | |
| Class P | | | | | | | | | | | | | | | | | | | | | | | | | | | | |
12/31/2018† | | $ | 28.02 | | | $ | 0.31 | | | $ | (3.53 | ) | | $ | (3.22 | ) | | $ | (0.64 | ) | | $ | 24.16 | | | | | |
6/30/2018 | | | 26.17 | | | | 0.46 | | | | 1.84 | | | | 2.30 | | | | (0.45 | ) | | | 28.02 | | | | | |
6/30/2017 | | | 22.23 | | | | 0.44 | | | | 3.94 | | | | 4.38 | | | | (0.44 | ) | | | 26.17 | | | | | |
6/30/2016 | | | 25.44 | | | | 0.46 | | | | (3.40 | ) | | | (2.94 | ) | | | (0.27 | ) | | | 22.23 | | | | | |
6/30/2015 | | | 26.63 | | | | 0.42 | | | | (1.11 | ) | | | (0.69 | ) | | | (0.50 | ) | | | 25.44 | | | | | |
6/30/2014 | | | 23.63 | | | | 0.38 | | | | 2.99 | | | | 3.37 | | | | (0.37 | ) | | | 26.63 | | | | | |
| Institutional Class | | | | | | | | | | | | | | | | | | | | | | | | | | | | |
12/31/2018† | | $ | 28.72 | | | $ | 0.26 | | | $ | (3.55 | ) | | $ | (3.29 | ) | | $ | (0.69 | ) | | $ | 24.74 | | | | | |
6/30/2018 | | | 26.83 | | | | 0.53 | | | | 1.85 | | | | 2.38 | | | | (0.49 | ) | | | 28.72 | | | | | |
6/30/2017 | | | 22.74 | | | | 0.49 | | | | 4.03 | | | | 4.52 | | | | (0.43 | ) | | | 26.83 | | | | | |
6/30/2016 | | | 25.95 | | | | 0.44 | | | | (3.42 | ) | | | (2.98 | ) | | | (0.23 | ) | | | 22.74 | | | | | |
6/30/2015 | | | 27.11 | | | | 0.43 | | | | (1.11 | ) | | | (0.68 | ) | | | (0.48 | ) | | | 25.95 | | | | | |
6/30/2014 | | | 24.10 | | | | 0.39 | | | | 3.07 | | | | 3.46 | | | | (0.45 | ) | | | 27.11 | | | | | |
| Class R6 | | | | | | | | | | | | | | | | | | | | | | | | | | | | |
12/31/2018† | | $ | 28.57 | | | $ | 0.30 | | | $ | (3.56 | ) | | $ | (3.26 | ) | | $ | (0.70 | ) | | $ | 24.61 | | | | | |
6/30/2018 | | | 26.69 | | | | 0.62 | | | | 1.76 | | | | 2.38 | | | | (0.50 | ) | | | 28.57 | | | | | |
6/30/2017 | | | 22.69 | | | | 0.60 | | | | 3.90 | | | | 4.50 | | | | (0.50 | ) | | | 26.69 | | | | | |
12/14/2015* - 6/30/2016 | | | 21.21 | | | | 0.31 | | | | 1.47 | | | | 1.78 | | | | (0.30 | ) | | | 22.69 | | | | | |
| ^ | A — may reflect actual amounts rounding to less than $0.01 or 0.01%. |
| * | Commencement of operations. |
| (a) | Calculated on average shares outstanding during the period. |
| (b) | Total return is calculated assuming a purchase of a share on the first day of the period and a sale of a share on the last day of each period reported. Dividends and distributions, if any, are assumed, for purposes of this calculation, to be reinvested. Total return does not reflect sales charges and includes the effect of fee waivers and reimbursements. Total return may reflect adjustments to conform to U.S. GAAP. Total return for a period of less than one year is not annualized. |
| (c) | Annualized, unless otherwise noted. |
| | | | | | |
| 110 | | Semiannual Report | | | December 31, 2018 | | | See accompanying Notes to Financial Statements |
| | | | | | | | | | | | | | | | | | | | | | | | | | |
| | | | Total Return (b) | | | Net Assets,
End of Period
(000s) | | | Ratio of
Expenses to
Average Net
Assets with
Fee Waiver/
Reimbursement | | | Ratio of
Expenses to
Average Net
Assets without
Fee Waiver/
Reimbursement | | | Ratio of Net
Investment
Income
to Average
Net Assets | | | Portfolio
Turnover Rate | |
| | | | | | | | | | | | | | | | | | | | |
| | | | | | | | | | | | | | | | | | | | | | | | | | |
| | | | | | (11.58 | )% | | $ | 50,233 | | | | 1.26 | %(c) | | | 1.60 | %(c) | | | 2.50 | %(c) | | | 45 | % |
| | | | | | 8.44 | | | | 108,279 | | | | 1.26 | | | | 1.61 | | | | 1.36 | | | | 88 | |
| | | | | | 19.76 | | | | 154,357 | | | | 1.42 | | | | 1.62 | | | | 1.69 | | | | 155 | |
| | | | | | (11.73 | ) | | | 143,677 | | | | 1.48 | | | | 1.62 | | | | 1.59 | | | | 85 | |
| | | | | | (2.76 | ) | | | 28,690 | | | | 1.67 | | | | 1.67 | | | | 1.30 | | | | 99 | |
| | | | | | 14.12 | | | | 29,361 | | | | 1.67 | | | | 1.67 | | | | 1.21 | | | | 120 | |
| | | | | | | | | | | | | | | | | | | | | | | | | | |
| | | | | | (11.92 | )% | | $ | 4,039 | | | | 2.01 | %(c) | | | 2.35 | %(c) | | | 1.38 | %(c) | | | 45 | % |
| | | | | | 7.63 | | | | 8,113 | | | | 2.01 | | | | 2.36 | | | | 0.55 | | | | 88 | |
| | | | | | 18.91 | | | | 8,982 | | | | 2.17 | | | | 2.37 | | | | 0.80 | | | | 155 | |
| | | | | | (12.38 | ) | | | 11,862 | | | | 2.27 | | | | 2.37 | | | | 1.02 | | | | 85 | |
| | | | | | (3.53 | ) | | | 15,069 | | | | 2.42 | | | | 2.42 | | | | 0.53 | | | | 99 | |
| | | | | | 13.26 | | | | 18,170 | | | | 2.42 | | | | 2.42 | | | | 0.44 | | | | 120 | |
| | | | | | | | | | | | | | | | | | | | | | | | | | |
| | | | | | (11.48 | )% | | $ | 18,697 | | | | 1.01 | %(c) | | | 1.35 | %(c) | | | 2.28 | %(c) | | | 45 | % |
| | | | | | 8.71 | | | | 29,887 | | | | 1.01 | | | | 1.36 | | | | 1.55 | | | | 88 | |
| | | | | | 20.11 | | | | 21,586 | | | | 1.17 | | | | 1.37 | | | | 1.86 | | | | 155 | |
| | | | | | (11.51 | ) | | | 20,262 | | | | 1.26 | | | | 1.37 | | | | 2.11 | | | | 85 | |
| | | | | | (2.53 | ) | | | 12,229 | | | | 1.42 | | | | 1.42 | | | | 1.63 | | | | 99 | |
| | | | | | 14.38 | | | | 2,066 | | | | 1.42 | | | | 1.42 | | | | 1.54 | | | | 120 | |
| | | | | | | | | | | | | | | | | | | | | | | | | | |
| | | | | | (11.42 | )% | | $ | 221,717 | | | | 0.91 | %(c) | | | 1.25 | %(c) | | | 1.95 | %(c) | | | 45 | % |
| | | | | | 8.79 | | | | 197,536 | | | | 0.91 | | | | 1.26 | | | | 1.74 | | | | 88 | |
| | | | | | 20.26 | | | | 72,688 | | | | 1.07 | | | | 1.27 | | | | 2.02 | | | | 155 | |
| | | | | | (11.41 | ) | | | 64,785 | | | | 1.17 | | | | 1.27 | | | | 2.00 | | | | 85 | |
| | | | | | (2.45 | ) | | | 62,339 | | | | 1.32 | | | | 1.32 | | | | 1.60 | | | | 99 | |
| | | | | | 14.51 | | | | 56,709 | | | | 1.32 | | | | 1.32 | | | | 1.53 | | | | 120 | |
| | | | | | | | | | | | | | | | | | | | | | | | | | |
| | | | | | (11.39 | )% | | $ | 21,373 | | | | 0.86 | %(c) | | | 1.20 | %(c) | | | 2.20 | %(c) | | | 45 | % |
| | | | | | 8.85 | | | | 24,277 | | | | 0.86 | | | | 1.21 | | | | 2.03 | | | | 88 | |
| | | | | | 20.27 | | | | 692 | | | | 1.02 | | | | 1.22 | | | | 2.46 | | | | 155 | |
| | | | | | 8.46 | | | | 21 | | | | 1.07 | (c) | | | 1.22 | (c) | | | 2.63 | (c) | | | 85 | |
| | | | | | | | |
| See accompanying Notes to Financial Statements | | | December 31, 2018 | | | Semiannual Report | | | 111 | |
Financial Highlights (cont’d)
For a Share Outstanding for the Period ended:^
| | | | | | | | | | | | | | | | | | | | | | | | | | | | |
| | | Net Asset
Value,
Beginning
of Period | | | Net
Investment
Income
(Loss) (a) | | |
Net Realized
and Change
in Unrealized
Gain (Loss) | | | Total from
Investment
Operations | | | Dividends
from Net
Investment
Income | | | Distributions
from Net
Realized Capital
Gains | | | | |
| AllianzGI Focused Growth: | | | | | | | | | | | | | | | | | | | | | |
| Class A | | | | | | | | | | | | | | | | | | | | | | | | | | | | |
12/31/2018† | | $ | 56.83 | | | $ | (0.03 | ) | | $ | (7.10 | ) | | $ | (7.13 | ) | | $ | — | | | $ | (5.90 | ) | | | | |
6/30/2018 | | | 46.62 | | | | — | | | | 10.92 | | | | 10.92 | | | | — | | | | (0.71 | ) | | | | |
6/30/2017 | | | 40.72 | | | | 0.06 | | | | 6.85 | | | | 6.91 | | | | — | | | | (1.01 | ) | | | | |
6/30/2016 | | | 42.73 | | | | 0.08 | | | | 0.62 | | | | 0.70 | | | | — | | | | (2.71 | ) | | | | |
6/30/2015 | | | 41.93 | | | | (0.03 | ) | | | 4.57 | | | | 4.54 | | | | (0.17 | ) | | | (3.57 | ) | | | | |
6/30/2014 | | | 34.82 | | | | 0.05 | | | | 10.40 | | | | 10.45 | | | | (0.02 | ) | | | (3.32 | ) | | | | |
| Class C | | | | | | | | | | | | | | | | | | | | | | | | | | | | |
12/31/2018† | | $ | 39.41 | | | $ | (0.19 | ) | | $ | (4.93 | ) | | $ | (5.12 | ) | | $ | — | | | $ | (5.90 | ) | | | | |
6/30/2018 | | | 32.76 | | | | (0.29 | ) | | | 7.65 | | | | 7.36 | | | | — | | | | (0.71 | ) | | | | |
6/30/2017 | | | 29.12 | | | | (0.19 | ) | | | 4.84 | | | | 4.65 | | | | — | | | | (1.01 | ) | | | | |
6/30/2016 | | | 31.53 | | | | (0.17 | ) | | | 0.47 | | | | 0.30 | | | | — | | | | (2.71 | ) | | | | |
6/30/2015 | | | 31.96 | | | | (0.25 | ) | | | 3.40 | | | | 3.15 | | | | (0.01 | ) | | | (3.57 | ) | | | | |
6/30/2014 | | | 27.38 | | | | (0.19 | ) | | | 8.09 | | | | 7.90 | | | | — | | | | (3.32 | ) | | | | |
| Class R | | | | | | | | | | | | | | | | | | | | | | | | | | | | |
12/31/2018† | | $ | 43.54 | | | $ | (0.08 | ) | | $ | (5.47 | ) | | $ | (5.55 | ) | | $ | — | | | $ | (5.90 | ) | | | | |
6/30/2018 | | | 35.95 | | | | (0.11 | ) | | | 8.41 | | | | 8.30 | | | | — | | | | (0.71 | ) | | | | |
6/30/2017 | | | 31.71 | | | | (0.04 | ) | | | 5.29 | | | | 5.25 | | | | — | | | | (1.01 | ) | | | | |
6/30/2016 | | | 33.93 | | | | (0.02 | ) | | | 0.51 | | | | 0.49 | | | | — | | | | (2.71 | ) | | | | |
6/30/2015 | | | 34.08 | | | | (0.11 | ) | | | 3.66 | | | | 3.55 | | | | (0.13 | ) | | | (3.57 | ) | | | | |
6/30/2014 | | | 28.89 | | | | (0.04 | ) | | | 8.56 | | | | 8.52 | | | | (0.01 | ) | | | (3.32 | ) | | | | |
| Class P | | | | | | | | | | | | | | | | | | | | | | | | | | | | |
12/31/2018† | | $ | 44.18 | | | $ | 0.03 | | | $ | (5.56 | ) | | $ | (5.53 | ) | | $ | — | | | $ | (5.90 | ) | | | | |
6/30/2018 | | | 36.33 | | | | 0.09 | | | | 8.52 | | | | 8.61 | | | | (0.05 | ) | | | (0.71 | ) | | | | |
6/30/2017 | | | 31.88 | | | | 0.14 | | | | 5.32 | | | | 5.46 | | | | — | | | | (1.01 | ) | | | | |
6/30/2016 | | | 33.94 | | | | 0.15 | | | | 0.50 | | | | 0.65 | | | | — | | | | (2.71 | ) | | | | |
6/30/2015 | | | 34.09 | | | | 0.06 | | | | 3.66 | | | | 3.72 | | | | (0.30 | ) | | | (3.57 | ) | | | | |
6/30/2014 | | | 28.86 | | | | 0.12 | | | | 8.56 | | | | 8.68 | | | | (0.13 | ) | | | (3.32 | ) | | | | |
| Institutional Class | | | | | | | | | | | | | | | | | | | | | | | | | | | | |
12/31/2018† | | $ | 52.51 | | | $ | 0.06 | | | $ | (6.58 | ) | | $ | (6.52 | ) | | $ | — | | | $ | (5.90 | ) | | | | |
6/30/2018 | | | 43.02 | | | | 0.16 | | | | 10.08 | | | | 10.24 | | | | (0.04 | ) | | | (0.71 | ) | | | | |
6/30/2017 | | | 37.53 | | | | 0.20 | | | | 6.30 | | | | 6.50 | | | | — | | | | (1.01 | ) | | | | |
6/30/2016 | | | 39.45 | | | | 0.21 | | | | 0.58 | | | | 0.79 | | | | — | | | | (2.71 | ) | | | | |
6/30/2015 | | | 39.01 | | | | 0.11 | | | | 4.23 | | | | 4.34 | | | | (0.33 | ) | | | (3.57 | ) | | | | |
6/30/2014 | | | 32.58 | | | | 0.17 | | | | 9.72 | | | | 9.89 | | | | (0.14 | ) | | | (3.32 | ) | | | | |
| Class R6 | | | | | | | | | | | | | | | | | | | | | | | | | | | | |
12/31/2018† | | $ | 52.56 | | | $ | 0.07 | | | $ | (6.59 | ) | | $ | (6.52 | ) | | $ | — | | | $ | (5.90 | ) | | | | |
6/30/2018 | | | 43.04 | | | | 0.19 | | | | 10.10 | | | | 10.29 | | | | (0.06 | ) | | | (0.71 | ) | | | | |
6/30/2017 | | | 37.53 | | | | 0.21 | | | | 6.31 | | | | 6.52 | | | | — | | | | (1.01 | ) | | | | |
12/14/2015* - 6/30/2016 | | | 37.51 | | | | 0.12 | | | | (0.10 | ) | | | 0.02 | | | | — | | | | — | | | | | |
| Administrative Class | | | | | | | | | | | | | | | | | | | | | | | | | | | | |
12/31/2018† | | $ | 49.33 | | | $ | (0.01 | ) | | $ | (6.18 | ) | | $ | (6.19 | ) | | $ | — | | | $ | (5.90 | ) | | | | |
6/30/2018 | | | 40.51 | | | | 0.03 | | | | 9.50 | | | | 9.53 | | | | — | | | | (0.71 | ) | | | | |
6/30/2017 | | | 35.48 | | | | 0.09 | | | | 5.95 | | | | 6.04 | | | | — | | | | (1.01 | ) | | | | |
6/30/2016 | | | 37.53 | | | | 0.11 | | | | 0.55 | | | | 0.66 | | | | — | | | | (2.71 | ) | | | | |
6/30/2015 | | | 37.31 | | | | 0.01 | | | | 4.02 | | | | 4.03 | | | | (0.24 | ) | | | (3.57 | ) | | | | |
6/30/2014 | | | 31.24 | | | | 0.08 | | | | 9.31 | | | | 9.39 | | | | — | | | | (3.32 | ) | | | | |
| ^ | A — may reflect actual amounts rounding to less than $0.01 or 0.01%. |
| * | Commencement of operations. |
| (a) | Calculated on average shares outstanding during the period. |
| (b) | Total return is calculated assuming a purchase of a share on the first day of the period and a sale of a share on the last day of each period reported. Dividends and distributions, if any, are assumed, for purposes of this calculation, to be reinvested. Total return does not reflect sales charges and includes the effect of fee waivers and reimbursements. Total return may reflect adjustments to conform to U.S. GAAP. Total return for a period of less than one year is not annualized. |
| (c) | Annualized, unless otherwise noted. |
| | | | | | |
| 112 | | Semiannual Report | | | December 31, 2018 | | | See accompanying Notes to Financial Statements |
| | | | | | | | | | | | | | | | | | | | | | | | | | | | | | | | | | |
| | | | Total
Dividends and
Distributions | | | Net Asset
Value, End
of Period | | | Total Return (b) | | | Net Assets,
End of Period
(000s) | | | Ratio of
Expenses to
Average Net
Assets with
Fee Waiver/
Reimbursement | | | Ratio of
Expenses to
Average Net
Assets without
Fee Waiver/
Reimbursement | | | Ratio of Net
Investment
Income (Loss)
to Average
Net Assets | | | Portfolio
Turnover Rate | |
| | | | | | | | | | | | | | | | | | | | | | | | | | |
| | | | | | | | | | | | | | | | | | | | | | | | | | | | | | | | | | |
| | | | | $ | (5.90 | ) | | $ | 43.80 | | | | (12.29 | )% | | $ | 496,501 | | | | 0.99 | %(c) | | | 1.11 | %(c) | | | (0.10 | )%(c) | | | 25 | % |
| | | | | | (0.71 | ) | | | 56.83 | | | | 23.53 | | | | 421,188 | | | | 0.99 | | | | 1.11 | | | | — | | | | 40 | |
| | | | | | (1.01 | ) | | | 46.62 | | | | 17.29 | | | | 373,359 | | | | 1.05 | | | | 1.11 | | | | 0.15 | | | | 46 | |
| | | | | | (2.71 | ) | | | 40.72 | | | | 1.54 | | | | 357,077 | | | | 1.11 | | | | 1.11 | | | | 0.20 | | | | 55 | |
| | | | | | (3.74 | ) | | | 42.73 | | | | 11.57 | | | | 297,572 | | | | 1.11 | | | | 1.11 | | | | (0.06 | ) | | | 58 | |
| | | | | | (3.34 | ) | | | 41.93 | | | | 30.97 | | | | 282,561 | | | | 1.11 | | | | 1.11 | | | | 0.13 | | | | 51 | |
| | | | | | | | | | | | | | | | | | | | | | | | | | | | | | | | | | |
| | | | | $ | (5.90 | ) | | $ | 28.39 | | | | (12.62 | )% | | $ | 47,573 | | | | 1.76 | %(c) | | | 1.86 | %(c) | | | (0.92 | )%(c) | | | 25 | % |
| | | | | | (0.71 | ) | | | 39.41 | | | | 22.59 | | | | 233,854 | | | | 1.76 | | | | 1.86 | | | | (0.77 | ) | | | 40 | |
| | | | | | (1.01 | ) | | | 32.76 | | | | 16.40 | | | | 217,685 | | | | 1.81 | | | | 1.86 | | | | (0.62 | ) | | | 46 | |
| | | | | | (2.71 | ) | | | 29.12 | | | | 0.79 | | | | 230,432 | | | | 1.86 | | | | 1.86 | | | | (0.56 | ) | | | 55 | |
| | | | | | (3.58 | ) | | | 31.53 | | | | 10.76 | | | | 227,519 | | | | 1.86 | | | | 1.86 | | | | (0.81 | ) | | | 58 | |
| | | | | | (3.32 | ) | | | 31.96 | | | | 29.99 | | | | 223,035 | | | | 1.86 | | | | 1.86 | | | | (0.62 | ) | | | 51 | |
| | | | | | | | | | | | | | | | | | | | | | | | | | | | | | | | | | |
| | | | | $ | (5.90 | ) | | $ | 32.09 | | | | (12.41 | )% | | $ | 19,671 | | | | 1.26 | %(c) | | | 1.36 | %(c) | | | (0.38 | )%(c) | | | 25 | % |
| | | | | | (0.71 | ) | | | 43.54 | | | | 23.21 | | | | 23,781 | | | | 1.26 | | | | 1.36 | | | | (0.27 | ) | | | 40 | |
| | | | | | (1.01 | ) | | | 35.95 | | | | 16.96 | | | | 20,635 | | | | 1.31 | | | | 1.36 | | | | (0.11 | ) | | | 46 | |
| | | | | | (2.71 | ) | | | 31.71 | | | | 1.31 | | | | 17,877 | | | | 1.36 | | | | 1.36 | | | | (0.05 | ) | | | 55 | |
| | | | | | (3.70 | ) | | | 33.93 | | | | 11.32 | | | | 14,751 | | | | 1.36 | | | | 1.36 | | | | (0.31 | ) | | | 58 | |
| | | | | | (3.33 | ) | | | 34.08 | | | | 30.62 | | | | 15,989 | | | | 1.36 | | | | 1.36 | | | | (0.12 | ) | | | 51 | |
| | | | | | | | | | | | | | | | | | | | | | | | | | | | | | | | | | |
| | | | | $ | (5.90 | ) | | $ | 32.75 | | | | (12.19 | )% | | $ | 84,260 | | | | 0.76 | %(c) | | | 0.86 | %(c) | | | 0.12 | %(c) | | | 25 | % |
| | | | | | (0.76 | ) | | | 44.18 | | | | 23.84 | | | | 109,456 | | | | 0.76 | | | | 0.86 | | | | 0.23 | | | | 40 | |
| | | | | | (1.01 | ) | | | 36.33 | | | | 17.54 | | | | 80,667 | | | | 0.81 | | | | 0.86 | | | | 0.41 | | | | 46 | |
| | | | | | (2.71 | ) | | | 31.88 | | | | 1.81 | | | | 35,025 | | | | 0.86 | | | | 0.86 | | | | 0.46 | | | | 55 | |
| | | | | | (3.87 | ) | | | 33.94 | | | | 11.88 | | | | 16,050 | | | | 0.86 | | | | 0.86 | | | | 0.19 | | | | 58 | |
| | | | | | (3.45 | ) | | | 34.09 | | | | 31.26 | | | | 14,774 | | | | 0.86 | | | | 0.86 | | | | 0.38 | | | | 51 | |
| | | | | | | | | | | | | | | | | | | | | | | | | | | | | | | | | | |
| | | | | $ | (5.90 | ) | | $ | 40.09 | | | | (12.14 | )% | | $ | 144,004 | | | | 0.66 | %(c) | | | 0.76 | %(c) | | | 0.22 | %(c) | | | 25 | % |
| | | | | | (0.75 | ) | | | 52.51 | | | | 23.93 | | | | 177,278 | | | | 0.66 | | | | 0.76 | | | | 0.33 | | | | 40 | |
| | | | | | (1.01 | ) | | | 43.02 | | | | 17.67 | | | | 195,161 | | | | 0.71 | | | | 0.76 | | | | 0.50 | | | | 46 | |
| | | | | | (2.71 | ) | | | 37.53 | | | | 1.92 | | | | 155,976 | | | | 0.76 | | | | 0.76 | | | | 0.55 | | | | 55 | |
| | | | | | (3.90 | ) | | | 39.45 | | | | 11.99 | | | | 122,979 | | | | 0.76 | | | | 0.76 | | | | 0.29 | | | | 58 | |
| | | | | | (3.46 | ) | | | 39.01 | | | | 31.39 | | | | 95,990 | | | | 0.76 | | | | 0.76 | | | | 0.47 | | | | 51 | |
| | | | | | | | | | | | | | | | | | | | | | | | | | | | | | | | | | |
| | | | | $ | (5.90 | ) | | $ | 40.14 | | | | (12.13 | )% | | $ | 110,633 | | | | 0.61 | %(c) | | | 0.71 | %(c) | | | 0.27 | %(c) | | | 25 | % |
| | | | | | (0.77 | ) | | | 52.56 | | | | 24.03 | | | | 114,054 | | | | 0.61 | | | | 0.71 | | | | 0.38 | | | | 40 | |
| | | | | | (1.01 | ) | | | 43.04 | | | | 17.72 | | | | 36,374 | | | | 0.66 | | | | 0.71 | | | | 0.53 | | | | 46 | |
| | | | | | — | | | | 37.53 | | | | 0.05 | | | | 11,564 | | | | 0.71 | (c) | | | 0.71 | (c) | | | 0.60 | (c) | | | 55 | |
| | | | | | | | | | | | | | | | | | | | | | | | | | | | | | | | | | |
| | | | | $ | (5.90 | ) | | $ | 37.24 | | | | (12.25 | )% | | $ | 4,173 | | | | 0.91 | %(c) | | | 1.01 | %(c) | | | (0.05 | )%(c) | | | 25 | % |
| | | | | | (0.71 | ) | | | 49.33 | | | | 23.63 | | | | 4,017 | | | | 0.91 | | | | 1.01 | | | | 0.07 | | | | 40 | |
| | | | | | (1.01 | ) | | | 40.51 | | | | 17.39 | | | | 4,288 | | | | 0.96 | | | | 1.01 | | | | 0.25 | | | | 46 | |
| | | | | | (2.71 | ) | | | 35.48 | | | | 1.65 | | | | 7,900 | | | | 1.01 | | | | 1.01 | | | | 0.29 | | | | 55 | |
| | | | | | (3.81 | ) | | | 37.53 | | | | 11.67 | | | | 6,439 | | | | 1.01 | | | | 1.01 | | | | 0.04 | | | | 58 | |
| | | | | | (3.32 | ) | | | 37.31 | | | | 31.07 | | | | 5,996 | | | | 1.01 | | | | 1.01 | | | | 0.22 | | | | 51 | |
| | | | | | | | |
| See accompanying Notes to Financial Statements | | | December 31, 2018 | | | Semiannual Report | | | 113 | |
Financial Highlights (cont’d)
For a Share Outstanding for the Period ended:^
| | | | | | | | | | | | | | | | | | | | | | | | | | | | |
| | | Net Asset
Value,
Beginning
of Period | | | Net
Investment
Income
(Loss) (a) | | |
Net Realized
and Change
in Unrealized
Gain (Loss) | | | Total from
Investment
Operations | | | Dividends
from Net
Investment
Income | | | Net Asset
Value, End
of Period | | | | |
| AllianzGI Global Natural Resources: | | | | | | | | | | | | | | | | | | | | | |
| Class A | | | | | | | | | | | | | | | | | | | | | | | | | | | | |
12/31/2018† | | $ | 15.95 | | | $ | 0.10 | | | $ | (3.26 | ) | | $ | (3.16 | ) | | $ | (0.24 | ) | | $ | 12.55 | | | | | |
6/30/2018 | | | 13.77 | | | | 0.13 | | | | 2.08 | | | | 2.21 | | | | (0.03 | ) | | | 15.95 | | | | | |
6/30/2017 | | | 14.67 | | | | 0.01 | | | | (0.78 | ) | | | (0.77 | ) | | | (0.13 | ) | | | 13.77 | | | | | |
6/30/2016 | | | 16.66 | | | | 0.05 | | | | (1.97 | ) | | | (1.92 | ) | | | (0.07 | ) | | | 14.67 | | | | | |
6/30/2015 | | | 20.71 | | | | 0.06 | | | | (4.11 | ) | | | (4.05 | ) | | | — | | | | 16.66 | | | | | |
6/30/2014 | | | 16.19 | | | | — | | | | 4.58 | | | | 4.58 | | | | (0.06 | ) | | | 20.71 | | | | | |
| Class C | | | | | | | | | | | | | | | | | | | | | | | | | | | | |
12/31/2018† | | $ | 14.90 | | | $ | 0.04 | | | $ | (3.04 | ) | | $ | (3.00 | ) | | $ | (0.12 | ) | | $ | 11.78 | | | | | |
6/30/2018 | | | 12.93 | | | | 0.02 | | | | 1.95 | | | | 1.97 | | | | — | | | | 14.90 | | | | | |
6/30/2017 | | | 13.77 | | | | (0.10 | ) | | | (0.74 | ) | | | (0.84 | ) | | | — | | | | 12.93 | | | | | |
6/30/2016 | | | 15.67 | | | | (0.06 | ) | | | (1.84 | ) | | | (1.90 | ) | | | — | | | | 13.77 | | | | | |
6/30/2015 | | | 19.63 | | | | (0.07 | ) | | | (3.89 | ) | | | (3.96 | ) | | | — | | | | 15.67 | | | | | |
6/30/2014 | | | 15.41 | | | | (0.13 | ) | | | 4.35 | | | | 4.22 | | | | — | | | | 19.63 | | | | | |
| Class P | | | | | | | | | | | | | | | | | | | | | | | | | | | | |
12/31/2018† | | $ | 16.25 | | | $ | 0.12 | | | $ | (3.33 | ) | | $ | (3.21 | ) | | $ | (0.31 | ) | | $ | 12.73 | | | | | |
6/30/2018 | | | 13.96 | | | | 0.18 | | | | 2.11 | | | | 2.29 | | | | — | | | | 16.25 | | | | | |
6/30/2017 | | | 14.86 | | | | 0.03 | | | | (0.78 | ) | | | (0.75 | ) | | | (0.15 | ) | | | 13.96 | | | | | |
6/30/2016 | | | 16.87 | | | | 0.09 | | | | (1.99 | ) | | | (1.90 | ) | | | (0.11 | ) | | | 14.86 | | | | | |
6/30/2015 | | | 20.98 | | | | 0.13 | | | | (4.20 | ) | | | (4.07 | ) | | | (0.04 | ) | | | 16.87 | | | | | |
6/30/2014 | | | 16.41 | | | | 0.05 | | | | 4.65 | | | | 4.70 | | | | (0.13 | ) | | | 20.98 | | | | | |
| Institutional Class | | | | | | | | | | | | | | | | | | | | | | | | | | | | |
12/31/2018† | | $ | 16.39 | | | $ | 0.13 | | | $ | (3.36 | ) | | $ | (3.23 | ) | | $ | (0.30 | ) | | $ | 12.86 | | | | | |
6/30/2018 | | | 14.12 | | | | 0.19 | | | | 2.14 | | | | 2.33 | | | | (0.06 | ) | | | 16.39 | | | | | |
6/30/2017 | | | 14.99 | | | | 0.07 | | | | (0.81 | ) | | | (0.74 | ) | | | (0.13 | ) | | | 14.12 | | | | | |
6/30/2016 | | | 17.00 | | | | 0.09 | | | | (1.99 | ) | | | (1.90 | ) | | | (0.11 | ) | | | 14.99 | | | | | |
6/30/2015 | | | 21.10 | | | | 0.12 | | | | (4.19 | ) | | | (4.07 | ) | | | (0.03 | ) | | | 17.00 | | | | | |
6/30/2014 | | | 16.49 | | | | 0.06 | | | | 4.68 | | | | 4.74 | | | | (0.13 | ) | | | 21.10 | | | | | |
| ^ | A — may reflect actual amounts rounding to less than $0.01 or 0.01%. |
| (a) | Calculated on average shares outstanding during the period. |
| (b) | Total return is calculated assuming a purchase of a share on the first day of the period and a sale of a share on the last day of each period reported. Dividends and distributions, if any, are assumed, for purposes of this calculation, to be reinvested. Total return does not reflect sales charges and includes the effect of fee waivers and reimbursements. Total return may reflect adjustments to conform to U.S. GAAP. Total return for a period of less than one year is not annualized. |
| (c) | Annualized, unless otherwise noted. |
| (d) | Does not include expenses of the investment companies in which the Fund invests. |
| | | | | | |
| 114 | | Semiannual Report | | | December 31, 2018 | | | See accompanying Notes to Financial Statements |
| | | | | | | | | | | | | | | | | | | | | | |
| | | | Total Return (b) | | | Net Assets,
End of Period
(000s) | | | Ratio of
Expenses
to Average
Net Assets | | | Ratio of Net
Investment
Income (Loss)
to Average
Net Assets | | | Portfolio
Turnover Rate | |
| | | | | | | | | | | | | | | | | |
| | | | | | | | | | | | | | | | | | | | | | |
| | | | | | (19.78 | )% | | $ | 5,451 | | | | 1.43 | %(c) | | | 1.39 | %(c) | | | 38 | % |
| | | | | | 16.05 | | | | 7,812 | | | | 1.43 | (d) | | | 0.84 | (d) | | | 113 | |
| | | | | | (5.37 | ) | | | 11,135 | | | | 1.42 | (d) | | | 0.08 | (d) | | | 108 | |
| | | | | | (11.44 | ) | | | 14,175 | | | | 1.42 | (d) | | | 0.34 | (d) | | | 177 | |
| | | | | | (19.56 | ) | | | 11,395 | | | | 1.41 | | | | 0.32 | | | | 107 | |
| | | | | | 28.36 | | | | 12,320 | | | | 1.41 | | | | — | | | | 93 | |
| | | | | | | | | | | | | | | | | | | | | | |
| | | | | | (20.14 | )% | | $ | 1,287 | | | | 2.18 | %(c) | | | 0.63 | %(c) | | | 38 | % |
| | | | | | 15.24 | | | | 2,102 | | | | 2.18 | (d) | | | 0.13 | (d) | | | 113 | |
| | | | | | (6.07 | ) | | | 2,896 | | | | 2.17 | (d) | | | (0.70 | )(d) | | | 108 | |
| | | | | | (12.13 | ) | | | 4,200 | | | | 2.17 | (d) | | | (0.43 | )(d) | | | 177 | |
| | | | | | (20.17 | ) | | | 4,579 | | | | 2.16 | | | | (0.42 | ) | | | 107 | |
| | | | | | 27.38 | | | | 4,002 | | | | 2.16 | | | | (0.77 | ) | | | 93 | |
| | | | | | | | | | | | | | | | | | | | | | |
| | | | | | (19.72 | )% | | $ | 1,215 | | | | 1.18 | %(c) | | | 1.61 | %(c) | | | 38 | % |
| | | | | | 16.40 | | | | 2,435 | | | | 1.18 | (d) | | | 1.20 | (d) | | | 113 | |
| | | | | | (5.18 | ) | | | 1,970 | | | | 1.17 | (d) | | | 0.19 | (d) | | | 108 | |
| | | | | | (11.20 | ) | | | 8,025 | | | | 1.17 | (d) | | | 0.61 | (d) | | | 177 | |
| | | | | | (19.38 | ) | | | 8,128 | | | | 1.16 | | | | 0.73 | | | | 107 | |
| | | | | | 28.73 | | | | 1,308 | | | | 1.16 | | | | 0.24 | | | | 93 | |
| | | | | | | | | | | | | | | | | | | | | | |
| | | | | | (19.66 | )% | | $ | 5,037 | | | | 1.08 | %(c) | | | 1.70 | %(c) | | | 38 | % |
| | | | | | 16.48 | | | | 8,313 | | | | 1.08 | (d) | | | 1.24 | (d) | | | 113 | |
| | | | | | (5.07 | ) | | | 10,068 | | | | 1.07 | (d) | | | 0.43 | (d) | | | 108 | |
| | | | | | (11.12 | ) | | | 17,671 | | | | 1.07 | (d) | | | 0.64 | (d) | | | 177 | |
| | | | | | (19.28 | ) | | | 30,751 | | | | 1.06 | | | | 0.67 | | | | 107 | |
| | | | | | 28.86 | | | | 31,709 | | | | 1.06 | | | | 0.34 | | | | 93 | |
| | | | | | | | |
| See accompanying Notes to Financial Statements | | | December 31, 2018 | | | Semiannual Report | | | 115 | |
Financial Highlights (cont’d)
For a Share Outstanding for the Period ended:^
| | | | | | | | | | | | | | | | | | | | | | | | | | | | |
| | | Net Asset
Value,
Beginning
of Period | | | Net
Investment
Income
(Loss) (a) | | |
Net Realized
and Change
in Unrealized
Gain (Loss) | | | Total from
Investment
Operations | | | Dividends
from Net
Investment
Income | | | Distributions
from Net
Realized Capital
Gains | | | | |
| AllianzGI Global Small-Cap: | | | | | | | | | | | | | | | | | | | | | |
| Class A | | | | | | | | | | | | | | | | | | | | | | | | | | | | |
12/31/2018† | | $ | 51.40 | | | $ | (0.18 | ) | | $ | (9.73 | ) | | $ | (9.91 | ) | | $ | — | | | $ | (8.01 | ) | | | | |
6/30/2018 | | | 47.75 | | | | (0.26 | ) | | | 8.28 | | | | 8.02 | | | | (0.10 | ) | | | (4.27 | ) | | | | |
6/30/2017 | | | 41.18 | | | | (0.14 | ) | | | 6.71 | | | | 6.57 | | | | — | | | | — | | | | | |
6/30/2016 | | | 45.05 | | | | (0.13 | ) | | | (3.74 | ) | | | (3.87 | ) | | | — | | | | — | | | | | |
6/30/2015 | | | 43.12 | | | | (0.19 | ) | | | 2.12 | | | | 1.93 | | | | — | | | | — | | | | | |
6/30/2014 | | | 34.59 | | | | (0.23 | ) | | | 8.76 | | | | 8.53 | | | | — | | | | — | | | | | |
| Class C | | | | | | | | | | | | | | | | | | | | | | | | | | | | |
12/31/2018† | | $ | 45.13 | | | $ | (0.32 | ) | | $ | (8.54 | ) | | $ | (8.86 | ) | | $ | — | | | $ | (8.01 | ) | | | | |
6/30/2018 | | | 42.62 | | | | (0.57 | ) | | | 7.35 | | | | 6.78 | | | | — | | | | (4.27 | ) | | | | |
6/30/2017 | | | 37.03 | | | | (0.42 | ) | | | 6.01 | | | | 5.59 | | | | — | | | | — | | | | | |
6/30/2016 | | | 40.81 | | | | (0.41 | ) | | | (3.37 | ) | | | (3.78 | ) | | | — | | | | — | | | | | |
6/30/2015 | | | 39.36 | | | | (0.46 | ) | | | 1.91 | | | | 1.45 | | | | — | | | | — | | | | | |
6/30/2014 | | | 31.81 | | | | (0.48 | ) | | | 8.03 | | | | 7.55 | | | | — | | | | — | | | | | |
| Class P | | | | | | | | | | | | | | | | | | | | | | | | | | | | |
12/31/2018† | | $ | 54.57 | | | $ | (0.13 | ) | | $ | (10.32 | ) | | $ | (10.45 | ) | | $ | — | | | $ | (8.01 | ) | | | | |
6/30/2018 | | | 50.40 | | | | (0.15 | ) | | | 8.75 | | | | 8.60 | | | | (0.16 | ) | | | (4.27 | ) | | | | |
6/30/2017 | | | 43.36 | | | | 0.02 | | | | 7.02 | | | | 7.04 | | | | — | | | | — | | | | | |
6/30/2016 | | | 47.30 | | | | (0.05 | ) | | | (3.89 | ) | | | (3.94 | ) | | | — | | | | — | | | | | |
6/30/2015 | | | 45.17 | | | | (0.06 | ) | | | 2.19 | | | | 2.13 | | | | — | | | | — | | | | | |
6/30/2014 | | | 36.14 | | | | (0.03 | ) | | | 9.06 | | | | 9.03 | | | | — | | | | — | | | | | |
| Institutional Class | | | | | | | | | | | | | | | | | | | | | | | | | | | | |
12/31/2018† | | $ | 55.01 | | | $ | (0.10 | ) | | $ | (10.41 | ) | | $ | (10.51 | ) | | $ | — | | | $ | (8.01 | ) | | | | |
6/30/2018 | | | 50.77 | | | | (0.09 | ) | | | 8.81 | | | | 8.72 | | | | (0.21 | ) | | | (4.27 | ) | | | | |
6/30/2017 | | | 43.63 | | | | 0.02 | | | | 7.12 | | | | 7.14 | | | | — | | | | — | | | | | |
6/30/2016 | | | 47.55 | | | | 0.02 | | | | (3.94 | ) | | | (3.92 | ) | | | — | | | | — | | | | | |
6/30/2015 | | | 45.37 | | | | (0.05 | ) | | | 2.23 | | | | 2.18 | | | | — | | | | — | | | | | |
6/30/2014 | | | 36.26 | | | | (0.09 | ) | | | 9.20 | | | | 9.11 | | | | — | | | | — | | | | | |
| ^ | A — may reflect actual amounts rounding to less than $0.01 or 0.01%. |
| (a) | Calculated on average shares outstanding during the period. |
| (b) | Total return is calculated assuming a purchase of a share on the first day of the period and a sale of a share on the last day of each period reported. Dividends and distributions, if any, are assumed, for purposes of this calculation, to be reinvested. Total return does not reflect sales charges and includes the effect of fee waivers and reimbursements. Total return may reflect adjustments to conform to U.S. GAAP. Total return for a period of less than one year is not annualized. |
| (c) | Annualized, unless otherwise noted. |
| (d) | Payments from Affiliates increased the end of period net asset value and total return by less than $0.01 and 0.01%, respectively. |
| | | | | | |
| 116 | | Semiannual Report | | | December 31, 2018 | | | See accompanying Notes to Financial Statements |
| | | | | | | | | | | | | | | | | | | | | | | | | | | | | | |
| | | | Total
Dividends and
Distributions | | | Net Asset
Value, End
of Period | | | Total Return (b) | | | Net Assets,
End of Period
(000s) | | | Ratio of
Expenses
to Average
Net Assets | | | Ratio of Net
Investment
Income (Loss)
to Average
Net Assets | | | Portfolio
Turnover Rate | |
| | | | | | | | | | | | | | | | | | | | | | | |
| | | | | | | | | | | | | | | | | | | | | | | | | | | | | | |
| | | | | $ | (8.01 | ) | | $ | 33.48 | (d) | | | (18.90 | )%(d) | | $ | 44,610 | | | | 1.62 | %(c) | | | (0.74 | )%(c) | | | 38 | % |
| | | | | | (4.37 | ) | | | 51.40 | (d) | | | 17.08 | (d) | | | 56,929 | | | | 1.62 | | | | (0.51 | ) | | | 77 | |
| | | | | | — | | | | 47.75 | (d) | | | 15.96 | (d) | | | 56,686 | | | | 1.61 | | | | (0.32 | ) | | | 80 | |
| | | | | | — | | | | 41.18 | | | | (8.59 | ) | | | 68,625 | | | | 1.61 | | | | (0.31 | ) | | | 87 | |
| | | | | | — | | | | 45.05 | | | | 4.48 | | | | 57,590 | | | | 1.61 | | | | (0.45 | ) | | | 64 | |
| | | | | | — | | | | 43.12 | | | | 24.66 | | | | 55,955 | | | | 1.61 | | | | (0.56 | ) | | | 73 | |
| | | | | | | | | | | | | | | | | | | | | | | | | | | | | | |
| | | | | $ | (8.01 | ) | | $ | 28.26 | (d) | | | (19.21 | )%(d) | | $ | 8,891 | | | | 2.37 | %(c) | | | (1.48 | )%(c) | | | 38 | % |
| | | | | | (4.27 | ) | | | 45.13 | (d) | | | 16.21 | (d) | | | 19,630 | | | | 2.37 | | | | (1.25 | ) | | | 77 | |
| | | | | | — | | | | 42.62 | (d) | | | 15.10 | (d) | | | 19,729 | | | | 2.36 | | | | (1.06 | ) | | | 80 | |
| | | | | | — | | | | 37.03 | | | | (9.26 | ) | | | 23,055 | | | | 2.36 | | | | (1.09 | ) | | | 87 | |
| | | | | | — | | | | 40.81 | | | | 3.69 | | | | 25,959 | | | | 2.36 | | | | (1.19 | ) | | | 64 | |
| | | | | | — | | | | 39.36 | | | | 23.73 | | | | 23,560 | | | | 2.36 | | | | (1.30 | ) | | | 73 | |
| | | | | | | | | | | | | | | | | | | | | | | | | | | | | | |
| | | | | $ | (8.01 | ) | | $ | 36.11 | (d) | | | (18.80 | )%(d) | | $ | 9,644 | | | | 1.37 | %(c) | | | (0.50 | )%(c) | | | 38 | % |
| | | | | | (4.43 | ) | | | 54.57 | (d) | | | 17.36 | (d) | | | 18,262 | | | | 1.37 | | | | (0.27 | ) | | | 77 | |
| | | | | | — | | | | 50.40 | (d) | | | 16.24 | (d) | | | 23,214 | | | | 1.36 | | | | 0.03 | | | | 80 | |
| | | | | | — | | | | 43.36 | | | | (8.33 | ) | | | 20,921 | | | | 1.36 | | | | (0.11 | ) | | | 87 | |
| | | | | | — | | | | 47.30 | | | | 4.72 | | | | 26,662 | | | | 1.36 | | | �� | (0.14 | ) | | | 64 | |
| | | | | | — | | | | 45.17 | | | | 24.99 | | | | 18,179 | | | | 1.36 | | | | (0.07 | ) | | | 73 | |
| | | | | | | | | | | | | | | | | | | | | | | | | | | | | | |
| | | | | $ | (8.01 | ) | | $ | 36.49 | (d) | | | (18.75 | )%(d) | | $ | 69,167 | | | | 1.27 | %(c) | | | (0.39 | )%(c) | | | 38 | % |
| | | | | | (4.48 | ) | | | 55.01 | (d) | | | 17.48 | (d) | | | 98,623 | | | | 1.27 | | | | (0.17 | ) | | | 77 | |
| | | | | | — | | | | 50.77 | (d) | | | 16.36 | (d) | | | 114,925 | | | | 1.26 | | | | 0.05 | | | | 80 | |
| | | | | | — | | | | 43.63 | | | | (8.25 | ) | | | 122,294 | | | | 1.26 | | | | 0.06 | | | | 87 | |
| | | | | | — | | | | 47.55 | | | | 4.80 | | | | 80,319 | | | | 1.26 | | | | (0.12 | ) | | | 64 | |
| | | | | | — | | | | 45.37 | | | | 25.12 | | | | 64,282 | | | | 1.26 | | | | (0.21 | ) | | | 73 | |
| | | | | | | | |
| See accompanying Notes to Financial Statements | | | December 31, 2018 | | | Semiannual Report | | | 117 | |
Financial Highlights (cont’d)
For a Share Outstanding for the Period ended:^
| | | | | | | | | | | | | | | | | | | | | | | | | | | | |
| | | Net Asset
Value,
Beginning
of Period | | | Net
Investment
Income
(Loss) (a) | | |
Net Realized
and Change
in Unrealized
Gain (Loss) | | | Total from
Investment
Operations | | | Dividends
from Net
Investment
Income | | | Distributions
from Net
Realized Capital
Gains | | | | |
| AllianzGI Health Sciences: | | | | | | | | | | | | | | | | | | | | | |
| Class A | | | | | | | | | | | | | | | | | | | | | | | | | | | | |
12/31/2018† | | $ | 33.27 | | | $ | (0.05 | ) | | $ | (0.12 | ) | | $ | (0.17 | ) | | $ | (0.31 | ) | | $ | (4.28 | ) | | | | |
6/30/2018 | | | 31.61 | | | | (0.02 | ) | | | 1.68 | | | | 1.66 | | | | — | | | | — | | | | | |
6/30/2017 | | | 27.77 | | | | (0.01 | ) | | | 3.85 | | | | 3.84 | | | | — | | | | — | | | | | |
6/30/2016 | | | 38.48 | | | | (0.02 | ) | | | (3.87 | ) | | | (3.89 | ) | | | — | | | | (6.82 | ) | | | | |
6/30/2015 | | | 33.91 | | | | (0.26 | ) | | | 9.79 | | | | 9.53 | | | | — | | | | (4.96 | ) | | | | |
6/30/2014 | | | 30.82 | | | | (0.17 | ) | | | 9.34 | | | | 9.17 | | | | — | | | | (6.08 | ) | | | | |
| Class C | | | | | | | | | | | | | | | | | | | | | | | | | | | | |
12/31/2018† | | $ | 26.43 | | | $ | (0.14 | ) | | $ | (0.10 | ) | | $ | (0.24 | ) | | $ | — | | | $ | (4.28 | ) | | | | |
6/30/2018 | | | 25.30 | | | | (0.21 | ) | | | 1.34 | | | | 1.13 | | | | — | | | | — | | | | | |
6/30/2017 | | | 22.40 | | | | (0.18 | ) | | | 3.08 | | | | 2.90 | | | | — | | | | — | | | | | |
6/30/2016 | | | 32.67 | | | | (0.28 | ) | | | (3.17 | ) | | | (3.45 | ) | | | — | | | | (6.82 | ) | | | | |
6/30/2015 | | | 29.66 | | | | (0.45 | ) | | | 8.42 | | | | 7.97 | | | | — | | | | (4.96 | ) | | | | |
6/30/2014 | | | 27.82 | | | | (0.37 | ) | | | 8.29 | | | | 7.92 | | | | — | | | | (6.08 | ) | | | | |
| Institutional Class | | | | | | | | | | | | | | | | | | | | | | | | | | | | |
12/31/2018† | | $ | 33.69 | | | $ | 0.02 | | | $ | (0.13 | ) | | $ | (0.11 | ) | | $ | (0.41 | ) | | $ | (4.28 | ) | | | | |
6/30/2018 | | | 31.90 | | | | 0.10 | | | | 1.69 | | | | 1.79 | | | | — | | | | — | | | | | |
6/30/2017 | | | 27.93 | | | | 0.09 | | | | 3.88 | | | | 3.97 | | | | — | | | | — | | | | | |
6/30/2016 | | | 38.53 | | | | 0.04 | | | | (3.82 | ) | | | (3.78 | ) | | | — | | | | (6.82 | ) | | | | |
12/22/2014* - 6/30/2015 | | | 33.09 | | | | (0.04 | ) | | | 5.48 | | | | 5.44 | | | | — | | | | — | | | | | |
| ^ | A — may reflect actual amounts rounding to less than $0.01 or 0.01%. |
| * | Commencement of operations. |
| (a) | Calculated on average shares outstanding during the period. |
| (b) | Total return is calculated assuming a purchase of a share on the first day of the period and a sale of a share on the last day of each period reported. Dividends and distributions, if any, are assumed, for purposes of this calculation, to be reinvested. Total return does not reflect sales charges and includes the effect of fee waivers and reimbursements. Total return may reflect adjustments to conform to U.S. GAAP. Total return for a period of less than one year is not annualized. |
| (c) | Annualized, unless otherwise noted. |
| | | | | | |
| 118 | | Semiannual Report | | | December 31, 2018 | | | See accompanying Notes to Financial Statements |
| | | | | | | | | | | | | | | | | | | | | | | | | | | | | | |
| | | | Total
Dividends and
Distributions | | | Net Asset
Value, End
of Period | | | Total Return (b) | | | Net Assets,
End of Period
(000s) | | | Ratio of
Expenses
to Average
Net Assets | | | Ratio of Net
Investment
Income (Loss)
to Average
Net Assets | | | Portfolio
Turnover Rate | |
| | | | | | | | | | | | | | | | | | | | | | | |
| | | | | | | | | | | | | | | | | | | | | | | | | | | | | | |
| | | | | $ | (4.59 | ) | | $ | 28.51 | | | | (0.05 | )% | | $ | 136,838 | | | | 1.46 | %(c) | | | (0.27 | )%(c) | | | 57 | % |
| | | | | | — | | | | 33.27 | | | | 5.25 | | | | 141,122 | | | | 1.47 | | | | (0.05 | ) | | | 55 | |
| | | | | | — | | | | 31.61 | | | | 13.83 | | | | 150,756 | | | | 1.46 | | | | (0.04 | ) | | | 82 | |
| | | | | | (6.82 | ) | | | 27.77 | | | | (10.82 | ) | | | 167,724 | | | | 1.47 | | | | (0.07 | ) | | | 113 | |
| | | | | | (4.96 | ) | | | 38.48 | | | | 30.53 | | | | 45,093 | | | | 1.46 | | | | (0.72 | ) | | | 76 | |
| | | | | | (6.08 | ) | | | 33.91 | | | | 34.03 | | | | 28,019 | | | | 1.46 | | | | (0.54 | ) | | | 119 | |
| | | | | | | | | | | | | | | | | | | | | | | | | | | | | | |
| | | | | $ | (4.28 | ) | | $ | 21.91 | | | | (0.39 | )% | | $ | 3,979 | | | | 2.21 | %(c) | | | (0.99 | )%(c) | | | 57 | % |
| | | | | | — | | | | 26.43 | | | | 4.47 | | | | 8,218 | | | | 2.22 | | | | (0.81 | ) | | | 55 | |
| | | | | | — | | | | 25.30 | | | | 12.95 | | | | 10,358 | | | | 2.21 | | | | (0.79 | ) | | | 82 | |
| | | | | | (6.82 | ) | | | 22.40 | | | | (11.48 | ) | | | 13,446 | | | | 2.22 | | | | (1.07 | ) | | | 113 | |
| | | | | | (4.96 | ) | | | 32.67 | | | | 29.57 | | | | 20,902 | | | | 2.21 | | | | (1.46 | ) | | | 76 | |
| | | | | | (6.08 | ) | | | 29.66 | | | | 33.05 | | | | 10,828 | | | | 2.21 | | | | (1.29 | ) | | | 119 | |
| | | | | | | | | | | | | | | | | | | | | | | | | | | | | | |
| | | | | $ | (4.69 | ) | | $ | 28.89 | | | | 0.13 | % | | $ | 2,327 | | | | 1.11 | %(c) | | | 0.09 | %(c) | | | 57 | % |
| | | | | | — | | | | 33.69 | | | | 5.61 | | | | 2,854 | | | | 1.12 | | | | 0.29 | | | | 55 | |
| | | | | | — | | | | 31.90 | | | | 14.21 | | | | 3,692 | | | | 1.11 | | | | 0.31 | | | | 82 | |
| | | | | | (6.82 | ) | | | 27.93 | | | | (10.49 | ) | | | 1,977 | | | | 1.12 | | | | 0.14 | | | | 113 | |
| | | | | | — | | | | 38.53 | | | | 16.44 | | | | 1,240 | | | | 1.10 | (c) | | | (0.21 | )(c) | | | 76 | |
| | | | | | | | |
| See accompanying Notes to Financial Statements | | | December 31, 2018 | | | Semiannual Report | | | 119 | |
Financial Highlights (cont’d)
For a Share Outstanding for the Period ended:^
| | | | | | | | | | | | | | | | | | | | | | | | | | | | |
| | | Net Asset
Value,
Beginning
of Period | | | Net
Investment
Income (a) | | |
Net Realized
and Change
in Unrealized
Gain (Loss) | | | Total from
Investment
Operations | | | Dividends
from Net
Investment
Income | | | Distributions
from Net
Realized Capital
Gains | | | | |
| AllianzGI Income & Growth: | | | | | | | | | | | | | | | | | | | | | |
| Class A | | | | | | | | | | | | | | | | | | | | | | | | | | | | |
12/31/2018† | | $ | 11.34 | | | $ | 0.10 | | | $ | (0.85 | ) | | $ | (0.75 | ) | | $ | (0.14 | ) | | $ | (0.32 | ) | | | | |
6/30/2018 | | | 11.24 | | | | 0.23 | | | | 0.82 | | | | 1.05 | | | | (0.28 | ) | | | (0.67 | ) | | | | |
6/30/2017 | | | 10.80 | | | | 0.27 | | | | 1.17 | | | | 1.44 | | | | (0.32 | ) | | | (0.68 | ) | | | | |
6/30/2016 | | | 12.12 | | | | 0.28 | | | | (0.55 | ) | | | (0.27 | ) | | | (0.37 | ) | | | (0.68 | ) | | | | |
6/30/2015 | | | 12.95 | | | | 0.27 | | | | (0.05 | ) | | | 0.22 | | | | (0.26 | ) | | | (0.79 | ) | | | | |
6/30/2014 | | | 12.02 | | | | 0.30 | | | | 1.68 | | | | 1.98 | | | | (0.26 | ) | | | (0.79 | ) | | | | |
| Class C | | | | | | | | | | | | | | | | | | | | | | | | | | | | |
12/31/2018† | | $ | 10.46 | | | $ | 0.05 | | | $ | (0.77 | ) | | $ | (0.72 | ) | | $ | (0.11 | ) | | $ | (0.32 | ) | | | | |
6/30/2018 | | | 10.44 | | | | 0.13 | | | | 0.76 | | | | 0.89 | | | | (0.20 | ) | | | (0.67 | ) | | | | |
6/30/2017 | | | 10.10 | | | | 0.18 | | | | 1.09 | | | | 1.27 | | | | (0.25 | ) | | | (0.68 | ) | | | | |
6/30/2016 | | | 11.46 | | | | 0.19 | | | | (0.53 | ) | | | (0.34 | ) | | | (0.34 | ) | | | (0.68 | ) | | | | |
6/30/2015 | | | 12.38 | | | | 0.17 | | | | (0.06 | ) | | | 0.11 | | | | (0.24 | ) | | | (0.79 | ) | | | | |
6/30/2014 | | | 11.59 | | | | 0.19 | | | | 1.63 | | | | 1.82 | | | | (0.24 | ) | | | (0.79 | ) | | | | |
| Class R | | | | | | | | | | | | | | | | | | | | | | | | | | | | |
12/31/2018† | | $ | 11.34 | | | $ | 0.08 | | | $ | (0.84 | ) | | $ | (0.76 | ) | | $ | (0.13 | ) | | $ | (0.32 | ) | | | | |
6/30/2018 | | | 11.24 | | | | 0.20 | | | | 0.82 | | | | 1.02 | | | | (0.25 | ) | | | (0.67 | ) | | | | |
6/30/2017 | | | 10.80 | | | | 0.25 | | | | 1.16 | | | | 1.41 | | | | (0.29 | ) | | | (0.68 | ) | | | | |
6/30/2016 | | | 12.14 | | | | 0.26 | | | | (0.56 | ) | | | (0.30 | ) | | | (0.36 | ) | | | (0.68 | ) | | | | |
6/30/2015 | | | 13.00 | | | | 0.24 | | | | (0.05 | ) | | | 0.19 | | | | (0.26 | ) | | | (0.79 | ) | | | | |
6/30/2014 | | | 12.08 | | | | 0.27 | | | | 1.70 | | | | 1.97 | | | | (0.26 | ) | | | (0.79 | ) | | | | |
| Class P | | | | | | | | | | | | | | | | | | | | | | | | | | | | |
12/31/2018† | | $ | 11.61 | | | $ | 0.11 | | | $ | (0.86 | ) | | $ | (0.75 | ) | | $ | (0.16 | ) | | $ | (0.32 | ) | | | | |
6/30/2018 | | | 11.48 | | | | 0.26 | | | | 0.84 | | | | 1.10 | | | | (0.30 | ) | | | (0.67 | ) | | | | |
6/30/2017 | | | 11.01 | | | | 0.31 | | | | 1.19 | | | | 1.50 | | | | (0.35 | ) | | | (0.68 | ) | | | | |
6/30/2016 | | | 12.32 | | | | 0.32 | | | | (0.57 | ) | | | (0.25 | ) | | | (0.38 | ) | | | (0.68 | ) | | | | |
6/30/2015 | | | 13.12 | | | | 0.31 | | | | (0.05 | ) | | | 0.26 | | | | (0.27 | ) | | | (0.79 | ) | | | | |
6/30/2014 | | | 12.15 | | | | 0.33 | | | | 1.70 | | | | 2.03 | | | | (0.27 | ) | | | (0.79 | ) | | | | |
| Institutional Class | | | | | | | | | | | | | | | | | | | | | | | | | | | | |
12/31/2018† | | $ | 11.72 | | | $ | 0.12 | | | $ | (0.88 | ) | | $ | (0.76 | ) | | $ | (0.16 | ) | | $ | (0.32 | ) | | | | |
6/30/2018 | | | 11.58 | | | | 0.28 | | | | 0.84 | | | | 1.12 | | | | (0.31 | ) | | | (0.67 | ) | | | | |
6/30/2017 | | | 11.09 | | | | 0.32 | | | | 1.21 | | | | 1.53 | | | | (0.36 | ) | | | (0.68 | ) | | | | |
6/30/2016 | | | 12.40 | | | | 0.33 | | | | (0.57 | ) | | | (0.24 | ) | | | (0.39 | ) | | | (0.68 | ) | | | | |
6/30/2015 | | | 13.19 | | | | 0.32 | | | | (0.05 | ) | | | 0.27 | | | | (0.27 | ) | | | (0.79 | ) | | | | |
6/30/2014 | | | 12.20 | | | | 0.35 | | | | 1.70 | | | | 2.05 | | | | (0.27 | ) | | | (0.79 | ) | | | | |
| ^ | A — may reflect actual amounts rounding to less than $0.01 or 0.01%. |
| (a) | Calculated on average shares outstanding during the period. |
| (b) | Total return is calculated assuming a purchase of a share on the first day of the period and a sale of a share on the last day of each period reported. Dividends and distributions, if any, are assumed, for purposes of this calculation, to be reinvested. Total return does not reflect sales charges and includes the effect of fee waivers and reimbursements. Total return may reflect adjustments to conform to U.S. GAAP. Total return for a period of less than one year is not annualized. |
| (c) | Annualized, unless otherwise noted. |
| (d) | Payments from Affiliates increased the end of period net asset value and total return by less than $0.01 and 0.01%, respectively. |
| | | | | | |
| 120 | | Semiannual Report | | | December 31, 2018 | | | See accompanying Notes to Financial Statements |
| | | | | | | | | | | | | | | | | | | | | | | | | | | | | | | | | | |
| | | | Total
Dividends and
Distributions | | | Net Asset
Value, End
of Period | | | Total Return (b) | | | Net Assets,
End of Period
(000s) | | | Ratio of
Expenses to
Average Net
Assets with
Fee Waiver/
Reimbursement | | | Ratio of
Expenses to
Average Net
Assets without
Fee Waiver/
Reimbursement | | | Ratio of Net
Investment
Income
to Average
Net Assets | | | Portfolio
Turnover Rate | |
| | | | | | | | | | | | | | | | | | | | | | | | | | |
| | | | | | | | | | | | | | | | | | | | | | | | | | | | | | | | | | |
| | | | | $ | (0.46 | ) | | $ | 10.13 | | | | (6.83 | )% | | $ | 1,226,886 | | | | 1.28 | %(c) | | | 1.29 | %(c) | | | 1.72 | %(c) | | | 25 | % |
| | | | | | (0.95 | ) | | | 11.34 | | | | 9.58 | | | | 1,250,639 | | | | 1.28 | | | | 1.29 | | | | 1.99 | | | | 102 | |
| | | | | | (1.00 | ) | | | 11.24 | | | | 13.88 | | | | 1,091,888 | | | | 1.29 | | | | 1.29 | | | | 2.45 | | | | 159 | |
| | | | | | (1.05 | ) | | | 10.80 | | | | (2.02 | ) | | | 1,009,542 | | | | 1.34 | | | | 1.34 | | | | 2.56 | | | | 94 | |
| | | | | | (1.05 | ) | | | 12.12 | | | | 1.80 | | | | 897,530 | | | | 1.32 | | | | 1.32 | | | | 2.16 | | | | 84 | |
| | | | | | (1.05 | ) | | | 12.95 | (d) | | | 17.03 | (d) | | | 863,378 | | | | 1.32 | | | | 1.32 | | | | 2.34 | | | | 114 | |
| | | | | | | | | | | | | | | | | | | | | | | | | | | | | | | | | | |
| | | | | $ | (0.43 | ) | | $ | 9.31 | | | | (7.16 | )% | | $ | 1,053,921 | | | | 2.03 | %(c) | | | 2.04 | %(c) | | | 0.97 | %(c) | | | 25 | % |
| | | | | | (0.87 | ) | | | 10.46 | | | | 8.78 | | | | 1,116,788 | | | | 2.03 | | | | 2.04 | | | | 1.24 | | | | 102 | |
| | | | | | (0.93 | ) | | | 10.44 | | | | 13.08 | | | | 1,090,887 | | | | 2.04 | | | | 2.04 | | | | 1.70 | | | | 159 | |
| | | | | | (1.02 | ) | | | 10.10 | | | | (2.79 | ) | | | 1,159,303 | | | | 2.09 | | | | 2.09 | | | | 1.81 | | | | 94 | |
| | | | | | (1.03 | ) | | | 11.46 | | | | 0.95 | | | | 1,195,391 | | | | 2.07 | | | | 2.07 | | | | 1.41 | | | | 84 | |
| | | | | | (1.03 | ) | | | 12.38 | (d) | | | 16.14 | (d) | | | 933,126 | | | | 2.07 | | | | 2.07 | | | | 1.59 | | | | 114 | |
| | | | | | | | | | | | | | | | | | | | | | | | | | | | | | | | | | |
| | | | | $ | (0.45 | ) | | $ | 10.13 | | | | (6.95 | )% | | $ | 3,815 | | | | 1.53 | %(c) | | | 1.54 | %(c) | | | 1.48 | %(c) | | | 25 | % |
| | | | | | (0.92 | ) | | | 11.34 | | | | 9.32 | | | | 3,150 | | | | 1.53 | | | | 1.54 | | | | 1.73 | | | | 102 | |
| | | | | | (0.97 | ) | | | 11.24 | | | | 13.59 | | | | 1,781 | | | | 1.54 | | | | 1.54 | | | | 2.20 | | | | 159 | |
| | | | | | (1.04 | ) | | | 10.80 | | | | (2.31 | ) | | | 2,261 | | | | 1.59 | | | | 1.59 | | | | 2.30 | | | | 94 | |
| | | | | | (1.05 | ) | | | 12.14 | | | | 1.49 | | | | 2,543 | | | | 1.57 | | | | 1.57 | | | | 1.89 | | | | 84 | |
| | | | | | (1.05 | ) | | | 13.00 | (d) | | | 16.71 | (d) | | | 3,733 | | | | 1.57 | | | | 1.57 | | | | 2.09 | | | | 114 | |
| | | | | | | | | | | | | | | | | | | | | | | | | | | | | | | | | | |
| | | | | $ | (0.48 | ) | | $ | 10.38 | | | | (6.74 | )% | | $ | 919,251 | | | | 1.03 | %(c) | | | 1.04 | %(c) | | | 1.97 | %(c) | | | 25 | % |
| | | | | | (0.97 | ) | | | 11.61 | | | | 9.90 | | | | 897,716 | | | | 1.03 | | | | 1.04 | | | | 2.24 | | | | 102 | |
| | | | | | (1.03 | ) | | | 11.48 | | | | 14.14 | | | | 690,147 | | | | 1.04 | | | | 1.04 | | | | 2.69 | | | | 159 | |
| | | | | | (1.06 | ) | | | 11.01 | | | | (1.81 | ) | | | 560,425 | | | | 1.09 | | | | 1.09 | | | | 2.81 | | | | 94 | |
| | | | | | (1.06 | ) | | | 12.32 | | | | 2.07 | | | | 676,865 | | | | 1.07 | | | | 1.07 | | | | 2.42 | | | | 84 | |
| | | | | | (1.06 | ) | | | 13.12 | (d) | | | 17.26 | (d) | | | 443,278 | | | | 1.07 | | | | 1.07 | | | | 2.59 | | | | 114 | |
| | | | | | | | | | | | | | | | | | | | | | | | | | | | | | | | | | |
| | | | | $ | (0.48 | ) | | $ | 10.48 | | | | (6.72 | )% | | $ | 526,873 | | | | 0.93 | %(c) | | | 0.94 | %(c) | | | 2.07 | %(c) | | | 25 | % |
| | | | | | (0.98 | ) | | | 11.72 | | | | 10.00 | | | | 460,024 | | | | 0.93 | | | | 0.94 | | | | 2.34 | | | | 102 | |
| | | | | | (1.04 | ) | | | 11.58 | | | | 14.33 | | | | 342,652 | | | | 0.94 | | | | 0.94 | | | | 2.76 | | | | 159 | |
| | | | | | (1.07 | ) | | | 11.09 | | | | (1.76 | ) | | | 181,890 | | | | 0.99 | | | | 0.99 | | | | 2.91 | | | | 94 | |
| | | | | | (1.06 | ) | | | 12.40 | | | | 2.17 | | | | 190,675 | | | | 0.97 | | | | 0.97 | | | | 2.51 | | | | 84 | |
| | | | | | (1.06 | ) | | | 13.19 | (d) | | | 17.38 | (d) | | | 163,155 | | | | 0.97 | | | | 0.97 | | | | 2.71 | | | | 114 | |
| | | | | | | | |
| See accompanying Notes to Financial Statements | | | December 31, 2018 | | | Semiannual Report | | | 121 | |
Financial Highlights (cont’d)
For a Share Outstanding for the Period ended:^
| | | | | | | | | | | | | | | | | | | | | | | | | | | | |
| | | Net Asset
Value,
Beginning
of Period | | | Net
Investment
Income
(Loss) (a) | | |
Net Realized
and Change
in Unrealized
Gain (Loss) | | | Total from
Investment
Operations | | | Distributions
from Net
Realized Capital
Gains | | | Net Asset
Value, End
of Period | | | | |
| AllianzGI Mid-Cap: | | | | | | | | | | | | �� | | | | | | | | | |
| Class A | | | | | | | | | | | | | | | | | | | | | | | | | | | | |
12/31/2018† | | $ | 3.88 | | | $ | (0.01 | ) | | $ | (0.54 | ) | | $ | (0.55 | ) | | $ | (0.48 | ) | | $ | 2.85 | | | | | |
6/30/2018 | | | 3.74 | | | | (0.02 | ) | | | 0.54 | | | | 0.52 | | | | (0.38 | ) | | | 3.88 | | | | | |
6/30/2017 | | | 3.40 | | | | (0.01 | ) | | | 0.62 | | | | 0.61 | | | | (0.27 | ) | | | 3.74 | | | | | |
6/30/2016 | | | 3.65 | | | | (0.01 | ) | | | (0.03 | ) | | | (0.04 | ) | | | (0.21 | ) | | | 3.40 | | | | | |
6/30/2015 | | | 3.92 | | | | (0.01 | ) | | | 0.28 | | | | 0.27 | | | | (0.54 | ) | | | 3.65 | | | | | |
6/30/2014 | | | 3.20 | | | | (0.01 | ) | | | 0.73 | | | | 0.72 | | | | — | | | | 3.92 | | | | | |
| Class C | | | | | | | | | | | | | | | | | | | | | | | | | | | | |
12/31/2018† | | $ | 3.23 | | | $ | (0.02 | ) | | $ | (0.46 | ) | | $ | (0.48 | ) | | $ | (0.48 | ) | | $ | 2.27 | | | | | |
6/30/2018 | | | 3.19 | | | | (0.04 | ) | | | 0.46 | | | | 0.42 | | | | (0.38 | ) | | | 3.23 | | | | | |
6/30/2017 | | | 2.96 | | | | (0.04 | ) | | | 0.54 | | | | 0.50 | | | | (0.27 | ) | | | 3.19 | | | | | |
6/30/2016 | | | 3.22 | | | | (0.03 | ) | | | (0.02 | ) | | | (0.05 | ) | | | (0.21 | ) | | | 2.96 | | | | | |
6/30/2015 | | | 3.55 | | | | (0.04 | ) | | | 0.25 | | | | 0.21 | | | | (0.54 | ) | | | 3.22 | | | | | |
6/30/2014 | | | 2.92 | | | | (0.03 | ) | | | 0.66 | | | | 0.63 | | | | — | | | | 3.55 | | | | | |
| Class R | | | | | | | | | | | | | | | | | | | | | | | | | | | | |
12/31/2018† | | $ | 3.82 | | | $ | (0.02 | ) | | $ | (0.53 | ) | | $ | (0.55 | ) | | $ | (0.48 | ) | | $ | 2.79 | | | | | |
6/30/2018 | | | 3.69 | | | | (0.03 | ) | | | 0.54 | | | | 0.51 | | | | (0.38 | ) | | | 3.82 | | | | | |
6/30/2017 | | | 3.37 | | | | (0.02 | ) | | | 0.61 | | | | 0.59 | | | | (0.27 | ) | | | 3.69 | | | | | |
6/30/2016 | | | 3.62 | | | | (0.02 | ) | | | (0.02 | ) | | | (0.04 | ) | | | (0.21 | ) | | | 3.37 | | | | | |
6/30/2015 | | | 3.91 | | | | (0.02 | ) | | | 0.27 | | | | 0.25 | | | | (0.54 | ) | | | 3.62 | | | | | |
6/30/2014 | | | 3.20 | | | | (0.02 | ) | | | 0.73 | | | | 0.71 | | | | — | | | | 3.91 | | | | | |
| Class P | | | | | | | | | | | | | | | | | | | | | | | | | | | | |
12/31/2018† | | $ | 4.41 | | | $ | (0.01 | ) | | $ | (0.61 | ) | | $ | (0.62 | ) | | $ | (0.48 | ) | | $ | 3.31 | | | | | |
6/30/2018 | | | 4.19 | | | | (0.01 | ) | | | 0.61 | | | | 0.60 | | | | (0.38 | ) | | | 4.41 | | | | | |
6/30/2017 | | | 3.77 | | | | (0.01 | ) | | | 0.70 | | | | 0.69 | | | | (0.27 | ) | | | 4.19 | | | | | |
6/30/2016 | | | 4.01 | | | | — | | | | (0.03 | ) | | | (0.03 | ) | | | (0.21 | ) | | | 3.77 | | | | | |
6/30/2015 | | | 4.24 | | | | — | | | | 0.31 | | | | 0.31 | | | | (0.54 | ) | | | 4.01 | | | | | |
6/30/2014 | | | 3.45 | | | | — | | | | 0.79 | | | | 0.79 | | | | — | | | | 4.24 | | | | | |
| Institutional Class | | | | | | | | | | | | | | | | | | | | | | | | | | | | |
12/31/2018† | | $ | 4.43 | | | $ | (0.01 | ) | | $ | (0.61 | ) | | $ | (0.62 | ) | | $ | (0.48 | ) | | $ | 3.33 | | | | | |
6/30/2018 | | | 4.21 | | | | (0.01 | ) | | | 0.61 | | | | 0.60 | | | | (0.38 | ) | | | 4.43 | | | | | |
6/30/2017 | | | 3.78 | | | | — | | | | 0.70 | | | | 0.70 | | | | (0.27 | ) | | | 4.21 | | | | | |
6/30/2016 | | | 4.02 | | | | — | | | | (0.03 | ) | | | (0.03 | ) | | | (0.21 | ) | | | 3.78 | | | | | |
6/30/2015 | | | 4.25 | | | | — | | | | 0.31 | | | | 0.31 | | | | (0.54 | ) | | | 4.02 | | | | | |
6/30/2014 | | | 3.46 | | | | 0.01 | | | | 0.78 | | | | 0.79 | | | | — | | | | 4.25 | | | | | |
| Administrative Class | | | | | | | | | | | | | | | | | | | | | | | | | | | | |
12/31/2018† | | $ | 4.11 | | | $ | (0.01 | ) | | $ | (0.58 | ) | | $ | (0.59 | ) | | $ | (0.48 | ) | | $ | 3.04 | | | | | |
6/30/2018 | | | 3.94 | | | | (0.02 | ) | | | 0.57 | | | | 0.55 | | | | (0.38 | ) | | | 4.11 | | | | | |
6/30/2017 | | | 3.56 | | | | (0.01 | ) | | | 0.66 | | | | 0.65 | | | | (0.27 | ) | | | 3.94 | | | | | |
6/30/2016 | | | 3.80 | | | | (0.01 | ) | | | (0.02 | ) | | | (0.03 | ) | | | (0.21 | ) | | | 3.56 | | | | | |
6/30/2015 | | | 4.06 | | | | (0.01 | ) | | | 0.29 | | | | 0.28 | | | | (0.54 | ) | | | 3.80 | | | | | |
6/30/2014 | | | 3.32 | | | | — | | | | 0.74 | | | | 0.74 | | | | — | | | | 4.06 | | | | | |
| ^ | A — may reflect actual amounts rounding to less than $0.01 or 0.01%. |
| (a) | Calculated on average shares outstanding during the period. |
| (b) | Total return is calculated assuming a purchase of a share on the first day of the period and a sale of a share on the last day of each period reported. Dividends and distributions, if any, are assumed, for purposes of this calculation, to be reinvested. Total return does not reflect sales charges and includes the effect of fee waivers and reimbursements. Total return may reflect adjustments to conform to U.S. GAAP. Total return for a period of less than one year is not annualized. |
| (c) | Annualized, unless otherwise noted. |
| | | | | | |
| 122 | | Semiannual Report | | | December 31, 2018 | | | See accompanying Notes to Financial Statements |
| | | | | | | | | | | | | | | | | | | | | | |
| | | | Total Return (b) | | | Net Assets,
End of Period
(000s) | | | Ratio of
Expenses
to Average
Net Assets | | | Ratio of Net
Investment
Income (Loss)
to Average
Net Assets | | | Portfolio
Turnover Rate | |
| | | | | | | | | | | | | | | | | |
| | | | | | | | | | | | | | | | | | | | | | |
| | | | | | (13.79 | )% | | $ | 190,771 | | | | 1.14 | %(c) | | | (0.60 | )%(c) | | | 35 | % |
| | | | | | 14.14 | | | | 116,673 | | | | 1.13 | | | | (0.48 | ) | | | 79 | |
| | | | | | 18.89 | | | | 112,947 | | | | 1.13 | | | | (0.40 | ) | | | 77 | |
| | | | | | (1.05 | ) | | | 86,224 | | | | 1.13 | | | | (0.26 | ) | | | 73 | |
| | | | | | 7.91 | | | | 98,253 | | | | 1.13 | | | | (0.38 | ) | | | 79 | |
| | | | | | 22.50 | | | | 106,116 | | | | 1.13 | | | | (0.18 | ) | | | 88 | |
| | | | | | | | | | | | | | | | | | | | | | |
| | | | | | (14.40 | )% | | $ | 18,298 | | | | 1.89 | %(c) | | | (1.31 | )%(c) | | | 35 | % |
| | | | | | 13.40 | | | | 142,931 | | | | 1.88 | | | | (1.23 | ) | | | 79 | |
| | | | | | 17.95 | | | | 142,565 | | | | 1.88 | | | | (1.15 | ) | | | 77 | |
| | | | | | (1.51 | ) | | | 162,104 | | | | 1.88 | | | | (1.01 | ) | | | 73 | |
| | | | | | 6.98 | | | | 183,765 | | | | 1.88 | | | | (1.13 | ) | | | 79 | |
| | | | | | 21.58 | | | | 193,481 | | | | 1.88 | | | | (0.93 | ) | | | 88 | |
| | | | | | | | | | | | | | | | | | | | | | |
| | | | | | (14.00 | )% | | $ | 1,161 | | | | 1.39 | %(c) | | | (0.84 | )%(c) | | | 35 | % |
| | | | | | 14.03 | | | | 1,463 | | | | 1.38 | | | | (0.72 | ) | | | 79 | |
| | | | | | 18.45 | | | | 2,345 | | | | 1.38 | | | | (0.65 | ) | | | 77 | |
| | | | | | (1.05 | ) | | | 2,195 | | | | 1.38 | | | | (0.51 | ) | | | 73 | |
| | | | | | 7.38 | | | | 2,867 | | | | 1.38 | | | | (0.63 | ) | | | 79 | |
| | | | | | 22.19 | | | | 2,795 | | | | 1.38 | | | | (0.44 | ) | | | 88 | |
| | | | | | | | | | | | | | | | | | | | | | |
| | | | | | (13.71 | )% | | $ | 8,551 | | | | 0.89 | %(c) | | | (0.34 | )%(c) | | | 35 | % |
| | | | | | 14.56 | | | | 11,189 | | | | 0.88 | | | | (0.23 | ) | | | 79 | |
| | | | | | 19.18 | | | | 8,604 | | | | 0.88 | | | | (0.15 | ) | | | 77 | |
| | | | | | (0.69 | ) | | | 2,009 | | | | 0.88 | | | | (0.01 | ) | | | 73 | |
| | | | | | 8.31 | | | | 2,010 | | | | 0.88 | | | | (0.12 | ) | | | 79 | |
| | | | | | 22.90 | | | | 1,339 | | | | 0.88 | | | | 0.07 | | | | 88 | |
| | | | | | | | | | | | | | | | | | | | | | |
| | | | | | (13.65 | )% | | $ | 27,247 | | | | 0.79 | %(c) | | | (0.24 | )%(c) | | | 35 | % |
| | | | | | 14.47 | | | | 31,876 | | | | 0.78 | | | | (0.13 | ) | | | 79 | |
| | | | | | 19.39 | | | | 26,788 | | | | 0.78 | | | | (0.05 | ) | | | 77 | |
| | | | | | (0.69 | ) | | | 29,092 | | | | 0.78 | | | | 0.11 | | | | 73 | |
| | | | | | 8.29 | | | | 24,130 | | | | 0.78 | | | | (0.04 | ) | | | 79 | |
| | | | | | 22.83 | | | | 34,540 | | | | 0.78 | | | | 0.16 | | | | 88 | |
| | | | | | | | | | | | | | | | | | | | | | |
| | | | | | (13.98 | )% | | $ | 1,194 | | | | 1.04 | %(c) | | | (0.49 | )%(c) | | | 35 | % |
| | | | | | 14.19 | | | | 1,441 | | | | 1.03 | | | | (0.40 | ) | | | 79 | |
| | | | | | 19.19 | | | | 575 | | | | 1.03 | | | | (0.30 | ) | | | 77 | |
| | | | | | (0.73 | ) | | | 488 | | | | 1.03 | | | | (0.16 | ) | | | 73 | |
| | | | | | 7.88 | | | | 532 | | | | 1.03 | | | | (0.28 | ) | | | 79 | |
| | | | | | 22.29 | | | | 494 | | | | 1.03 | | | | (0.09 | ) | | | 88 | |
| | | | | | | | |
| See accompanying Notes to Financial Statements | | | December 31, 2018 | | | Semiannual Report | | | 123 | |
Financial Highlights (cont’d)
For a Share Outstanding for the Period ended:^
| | | | | | | | | | | | | | | | | | | | | | | | | | | | |
| | | Net Asset
Value,
Beginning
of Period | | | Net
Investment
Income (a) | | | Net Realized
and Change
in Unrealized
Gain (Loss) | | | Total from
Investment
Operations | | | Dividends
from Net
Investment
Income | | |
Distributions
from Net
Realized Capital
Gains | | | | |
| AllianzGI NFJ Dividend Value: | | | | | | | | | | | | | | | | | | | | | |
| Class A | | | | | | | | | | | | | | | | | | | | | | | | | | | | |
12/31/2018† | | $ | 14.76 | | | $ | 0.15 | | | $ | (1.47 | ) | | $ | (1.32 | ) | | $ | (0.13 | ) | | $ | (2.60 | ) | | | | |
6/30/2018 | | | 17.20 | | | | 0.27 | | | | 1.45 | | | | 1.72 | | | | (0.28 | ) | | | (3.88 | ) | | | | |
6/30/2017 | | | 15.74 | | | | 0.34 | | | | 2.08 | | | | 2.42 | | | | (0.37 | ) | | | (0.59 | ) | | | | |
6/30/2016 | | | 16.68 | | | | 0.37 | | | | (0.92 | ) | | | (0.55 | ) | | | (0.39 | ) | | | — | | | | | |
6/30/2015 | | | 17.12 | | | | 0.33 | | | | (0.44 | ) | | | (0.11 | ) | | | (0.33 | ) | | | — | | | | | |
6/30/2014 | | | 14.14 | | | | 0.29 | | | | 3.01 | | | | 3.30 | | | | (0.32 | ) | | | — | | | | | |
| Class C | | | | | | | | | | | | | | | | | | | | | | | | | | | | |
12/31/2018† | | $ | 14.92 | | | $ | 0.10 | | | $ | (1.49 | ) | | $ | (1.39 | ) | | $ | (0.04 | ) | | $ | (2.60 | ) | | | | |
6/30/2018 | | | 17.34 | | | | 0.15 | | | | 1.46 | | | | 1.61 | | | | (0.15 | ) | | | (3.88 | ) | | | | |
6/30/2017 | | | 15.86 | | | | 0.21 | | | | 2.10 | | | | 2.31 | | | | (0.24 | ) | | | (0.59 | ) | | | | |
6/30/2016 | | | 16.83 | | | | 0.25 | | | | (0.93 | ) | | | (0.68 | ) | | | (0.29 | ) | | | — | | | | | |
6/30/2015 | | | 17.27 | | | | 0.20 | | | | (0.43 | ) | | | (0.23 | ) | | | (0.21 | ) | | | — | | | | | |
6/30/2014 | | | 14.27 | | | | 0.18 | | | | 3.02 | | | | 3.20 | | | | (0.20 | ) | | | — | | | | | |
| Class R | | | | | | | | | | | | | | | | | | | | | | | | | | | | |
12/31/2018† | | $ | 14.71 | | | $ | 0.13 | | | $ | (1.46 | ) | | $ | (1.33 | ) | | $ | (0.07 | ) | | $ | (2.60 | ) | | | | |
6/30/2018 | | | 17.15 | | | | 0.23 | | | | 1.45 | | | | 1.68 | | | | (0.24 | ) | | | (3.88 | ) | | | | |
6/30/2017 | | | 15.70 | | | | 0.29 | | | | 2.08 | | | | 2.37 | | | | (0.33 | ) | | | (0.59 | ) | | | | |
6/30/2016 | | | 16.65 | | | | 0.33 | | | | (0.92 | ) | | | (0.59 | ) | | | (0.36 | ) | | | — | | | | | |
6/30/2015 | | | 17.09 | | | | 0.28 | | | | (0.43 | ) | | | (0.15 | ) | | | (0.29 | ) | | | — | | | | | |
6/30/2014 | | | 14.12 | | | | 0.26 | | | | 2.99 | | | | 3.25 | | | | (0.28 | ) | | | — | | | | | |
| Class P | | | | | | | | | | | | | | | | | | | | | | | | | | | | |
12/31/2018† | | $ | 14.87 | | | $ | 0.17 | | | $ | (1.48 | ) | | $ | (1.31 | ) | | $ | (0.16 | ) | | $ | (2.60 | ) | | | | |
6/30/2018 | | | 17.30 | | | | 0.32 | | | | 1.45 | | | | 1.77 | | | | (0.32 | ) | | | (3.88 | ) | | | | |
6/30/2017 | | | 15.83 | | | | 0.38 | | | | 2.09 | | | | 2.47 | | | | (0.41 | ) | | | (0.59 | ) | | | | |
6/30/2016 | | | 16.77 | | | | 0.41 | | | | (0.93 | ) | | | (0.52 | ) | | | (0.42 | ) | | | — | | | | | |
6/30/2015 | | | 17.21 | | | | 0.37 | | | | (0.43 | ) | | | (0.06 | ) | | | (0.38 | ) | | | — | | | | | |
6/30/2014 | | | 14.21 | | | | 0.34 | | | | 3.01 | | | | 3.35 | | | | (0.35 | ) | | | — | | | | | |
| Institutional Class | | | | | | | | | | | | | | | | | | | | | | | | | | | | |
12/31/2018† | | $ | 14.87 | | | $ | 0.18 | | | $ | (1.48 | ) | | $ | (1.30 | ) | | $ | (0.18 | ) | | $ | (2.60 | ) | | | | |
6/30/2018 | | | 17.30 | | | | 0.34 | | | | 1.45 | | | | 1.79 | | | | (0.34 | ) | | | (3.88 | ) | | | | |
6/30/2017 | | | 15.82 | | | | 0.41 | | | | 2.08 | | | | 2.49 | | | | (0.42 | ) | | | (0.59 | ) | | | | |
6/30/2016 | | | 16.76 | | | | 0.42 | | | | (0.93 | ) | | | (0.51 | ) | | | (0.43 | ) | | | — | | | | | |
6/30/2015 | | | 17.20 | | | | 0.39 | | | | (0.43 | ) | | | (0.04 | ) | | | (0.40 | ) | | | — | | | | | |
6/30/2014 | | | 14.20 | | | | 0.35 | | | | 3.02 | | | | 3.37 | | | | (0.37 | ) | | | — | | | | | |
| Class R6 | | | | | | | | | | | | | | | | | | | | | | | | | | | | |
12/31/2018† | | $ | 14.83 | | | $ | 0.18 | | | $ | (1.47 | ) | | $ | (1.29 | ) | | $ | (0.19 | ) | | $ | (2.60 | ) | | | | |
6/30/2018 | | | 17.27 | | | | 0.34 | | | | 1.45 | | | | 1.79 | | | | (0.35 | ) | | | (3.88 | ) | | | | |
6/30/2017 | | | 15.80 | | | | 0.41 | | | | 2.09 | | | | 2.50 | | | | (0.44 | ) | | | (0.59 | ) | | | | |
6/30/2016 | | | 16.74 | | | | 0.42 | | | | (0.92 | ) | | | (0.50 | ) | | | (0.44 | ) | | | — | | | | | |
6/30/2015 | | | 17.19 | | | | 0.39 | | | | (0.42 | ) | | | (0.03 | ) | | | (0.42 | ) | | | — | | | | | |
12/19/2013* - 6/30/2014 | | | 15.62 | | | | 0.19 | | | | 1.56 | | | | 1.75 | | | | (0.18 | ) | | | — | | | | | |
| Administrative Class | | | | | | | | | | | | | | | | | | | | | | | | | | | | |
12/31/2018† | | $ | 15.04 | | | $ | 0.16 | | | $ | (1.50 | ) | | $ | (1.34 | ) | | $ | (0.13 | ) | | $ | (2.60 | ) | | | | |
6/30/2018 | | | 17.41 | | | | 0.32 | | | | 1.43 | | | | 1.75 | | | | (0.24 | ) | | | (3.88 | ) | | | | |
6/30/2017 | | | 15.92 | | | | 0.36 | | | | 2.11 | | | | 2.47 | | | | (0.39 | ) | | | (0.59 | ) | | | | |
6/30/2016 | | | 16.87 | | | | 0.39 | | | | (0.94 | ) | | | (0.55 | ) | | | (0.40 | ) | | | — | | | | | |
6/30/2015 | | | 17.31 | | | | 0.35 | | | | (0.44 | ) | | | (0.09 | ) | | | (0.35 | ) | | | — | | | | | |
6/30/2014 | | | 14.29 | | | | 0.31 | | | | 3.04 | | | | 3.35 | | | | (0.33 | ) | | | — | | | | | |
| ^ | A — may reflect actual amounts rounding to less than $0.01 or 0.01%. |
| * | Commencement of operations. |
| (a) | Calculated on average shares outstanding during the period. |
| (b) | Total return is calculated assuming a purchase of a share on the first day of the period and a sale of a share on the last day of each period reported. Dividends and distributions, if any, are assumed, for purposes of this calculation, to be reinvested. Total return does not reflect sales charges and includes the effect of fee waivers and reimbursements. Total return may reflect adjustments to conform to U.S. GAAP. Total return for a period of less than one year is not annualized. |
| (c) | Annualized, unless otherwise noted. |
| | | | | | |
| 124 | | Semiannual Report | | | December 31, 2018 | | | See accompanying Notes to Financial Statements |
| | | | | | | | | | | | | | | | | | | | | | | | | | | | | | | | | | |
| | | | Total
Dividends and
Distributions | | | Net Asset
Value, End
of Period | | | Total Return (b) | | | Net Assets,
End of Period
(000s) | | | Ratio of
Expenses to
Average Net
Assets with
Fee Waiver/
Reimbursement | | | Ratio of
Expenses to
Average Net
Assets without
Fee Waiver/
Reimbursement | | | Ratio of Net
Investment
Income
to Average
Net Assets | | | Portfolio
Turnover Rate | |
| | | | | | | | | | | | | | | | | | | | | | | | | | |
| | | | | | | | | | | | | | | | | | | | | | | | | | | | | | | | | | |
| | | | | $ | (2.73 | ) | | $ | 10.71 | | | | (8.69 | )% | | $ | 464,538 | | | | 0.98 | %(c) | | | 1.11 | %(c) | | | 1.99 | %(c) | | | 27 | % |
| | | | | | (4.16 | ) | | | 14.76 | | | | 9.55 | | | | 480,068 | | | | 0.95 | | | | 1.10 | | | | 1.66 | | | | 47 | |
| | | | | | (0.96 | ) | | | 17.20 | | | | 15.55 | | | | 599,510 | | | | 0.99 | | | | 1.09 | | | | 2.02 | | | | 41 | |
| | | | | | (0.39 | ) | | | 15.74 | | | | (3.25 | ) | | | 814,993 | | | | 1.07 | | | | 1.07 | | | | 2.34 | | | | 42 | |
| | | | | | (0.33 | ) | | | 16.68 | | | | (0.65 | ) | | | 1,363,171 | | | | 1.05 | | | | 1.05 | | | | 1.92 | | | | 44 | |
| | | | | | (0.32 | ) | | | 17.12 | | | | 23.50 | | | | 1,913,130 | | | | 1.05 | | | | 1.05 | | | | 1.89 | | | | 26 | |
| | | | | | | | | | | | | | | | | | | | | | | | | | | | | | | | | | |
| | | | | $ | (2.64 | ) | | $ | 10.89 | | | | (9.07 | )% | | $ | 91,366 | | | | 1.73 | %(c) | | | 1.86 | %(c) | | | 1.25 | %(c) | | | 27 | % |
| | | | | | (4.03 | ) | | | 14.92 | | | | 8.77 | | | | 231,933 | | | | 1.70 | | | | 1.85 | | | | 0.91 | | | | 47 | |
| | | | | | (0.83 | ) | | | 17.34 | | | | 14.67 | | | | 274,212 | | | | 1.74 | | | | 1.84 | | | | 1.28 | | | | 41 | |
| | | | | | (0.29 | ) | | | 15.86 | | | | (3.97 | ) | | | 347,825 | | | | 1.82 | | | | 1.82 | | | | 1.59 | | | | 42 | |
| | | | | | (0.21 | ) | | | 16.83 | | | | (1.38 | ) | | | 440,554 | | | | 1.80 | | | | 1.80 | | | | 1.18 | | | | 44 | |
| | | | | | (0.20 | ) | | | 17.27 | | | | 22.51 | | | | 497,725 | | | | 1.80 | | | | 1.80 | | | | 1.14 | | | | 26 | |
| | | | | | | | | | | | | | | | | | | | | | | | | | | | | | | | | | |
| | | | | $ | (2.67 | ) | | $ | 10.71 | | | | (8.78 | )% | | $ | 75,277 | | | | 1.23 | %(c) | | | 1.36 | %(c) | | | 1.75 | %(c) | | | 27 | % |
| | | | | | (4.12 | ) | | | 14.71 | | | | 9.30 | | | | 94,437 | | | | 1.20 | | | | 1.35 | | | | 1.41 | | | | 47 | |
| | | | | | (0.92 | ) | | | 17.15 | | | | 15.24 | | | | 130,630 | | | | 1.24 | | | | 1.34 | | | | 1.77 | | | | 41 | |
| | | | | | (0.36 | ) | | | 15.70 | | | | (3.50 | ) | | | 157,199 | | | | 1.32 | | | | 1.32 | | | | 2.09 | | | | 42 | |
| | | | | | (0.29 | ) | | | 16.65 | | | | (0.89 | ) | | | 226,101 | | | | 1.30 | | | | 1.30 | | | | 1.68 | | | | 44 | |
| | | | | | (0.28 | ) | | | 17.09 | | | | 23.16 | | | | 272,790 | | | | 1.30 | | | | 1.30 | | | | 1.65 | | | | 26 | |
| | | | | | | | | | | | | | | | | | | | | | | | | | | | | | | | | | |
| | | | | $ | (2.76 | ) | | $ | 10.80 | | | | (8.57 | )% | | $ | 384,037 | | | | 0.73 | %(c) | | | 0.86 | %(c) | | | 2.24 | %(c) | | | 27 | % |
| | | | | | (4.20 | ) | | | 14.87 | | | | 9.83 | | | | 551,096 | | | | 0.70 | | | | 0.85 | | | | 1.91 | | | | 47 | |
| | | | | | (1.00 | ) | | | 17.30 | | | | 15.79 | | | | 639,847 | | | | 0.74 | | | | 0.84 | | | | 2.27 | | | | 41 | |
| | | | | | (0.42 | ) | | | 15.83 | | | | (3.03 | ) | | | 1,057,863 | | | | 0.82 | | | | 0.82 | | | | 2.60 | | | | 42 | |
| | | | | | (0.38 | ) | | | 16.77 | | | | (0.38 | ) | | | 1,543,701 | | | | 0.80 | | | | 0.80 | | | | 2.18 | | | | 44 | |
| | | | | | (0.35 | ) | | | 17.21 | | | | 23.82 | | | | 1,446,734 | | | | 0.80 | | | | 0.80 | | | | 2.15 | | | | 26 | |
| | | | | | | | | | | | | | | | | | | | | | | | | | | | | | | | | | |
| | | | | $ | (2.78 | ) | | $ | 10.79 | | | | (8.51 | )% | | $ | 304,538 | | | | 0.63 | %(c) | | | 0.75 | %(c) | | | 2.34 | %(c) | | | 27 | % |
| | | | | | (4.22 | ) | | | 14.87 | | | | 9.94 | | | | 438,422 | | | | 0.60 | | | | 0.75 | | | | 2.03 | | | | 47 | |
| | | | | | (1.01 | ) | | | 17.30 | | | | 15.96 | | | | 731,788 | | | | 0.64 | | | | 0.74 | | | | 2.44 | | | | 41 | |
| | | | | | (0.43 | ) | | | 15.82 | | | | (2.95 | ) | | | 2,233,140 | | | | 0.72 | | | | 0.72 | | | | 2.69 | | | | 42 | |
| | | | | | (0.40 | ) | | | 16.76 | | | | (0.29 | ) | | | 3,402,951 | | | | 0.70 | | | | 0.70 | | | | 2.27 | | | | 44 | |
| | | | | | (0.37 | ) | | | 17.20 | | | | 23.96 | | | | 4,078,876 | | | | 0.70 | | | | 0.70 | | | | 2.24 | | | | 26 | |
| | | | | | | | | | | | | | | | | | | | | | | | | | | | | | | | | | |
| | | | | $ | (2.79 | ) | | $ | 10.75 | | | | (8.44 | )% | | $ | 71,665 | | | | 0.58 | %(c) | | | 0.71 | %(c) | | | 2.40 | %(c) | | | 27 | % |
| | | | | | (4.23 | ) | | | 14.83 | | | | 9.96 | | | | 85,285 | | | | 0.55 | | | | 0.70 | | | | 2.06 | | | | 47 | |
| | | | | | (1.03 | ) | | | 17.27 | | | | 16.01 | | | | 95,755 | | | | 0.59 | | | | 0.69 | | | | 2.44 | | | | 41 | |
| | | | | | (0.44 | ) | | | 15.80 | | | | (2.90 | ) | | | 128,994 | | | | 0.67 | | | | 0.67 | | | | 2.72 | | | | 42 | |
| | | | | | (0.42 | ) | | | 16.74 | | | | (0.22 | ) | | | 119,483 | | | | 0.65 | | | | 0.65 | | | | 2.30 | | | | 44 | |
| | | | | | (0.18 | ) | | | 17.19 | | | | 11.27 | | | | 968 | | | | 0.65 | (c) | | | 0.65 | (c) | | | 2.13 | (c) | | | 26 | |
| | | | | | | | | | | | | | | | | | | | | | | | | | | | | | | | | | |
| | | | | $ | (2.73 | ) | | $ | 10.97 | | | | (8.70 | )% | | $ | 56,468 | | | | 0.88 | %(c) | | | 1.01 | %(c) | | | 2.09 | %(c) | | | 27 | % |
| | | | | | (4.12 | ) | | | 15.04 | | | | 9.67 | | | | 84,009 | | | | 0.85 | | | | 1.00 | | | | 1.87 | | | | 47 | |
| | | | | | (0.98 | ) | | | 17.41 | | | | 15.68 | | | | 345,533 | | | | 0.89 | | | | 0.99 | | | | 2.11 | | | | 41 | |
| | | | | | (0.40 | ) | | | 15.92 | | | | (3.19 | ) | | | 387,993 | | | | 0.97 | | | | 0.97 | | | | 2.44 | | | | 42 | |
| | | | | | (0.35 | ) | | | 16.87 | | | | (0.55 | ) | | | 628,008 | | | | 0.95 | | | | 0.95 | | | | 2.03 | | | | 44 | |
| | | | | | (0.33 | ) | | | 17.31 | | | | 23.64 | | | | 871,543 | | | | 0.95 | | | | 0.95 | | | | 1.99 | | | | 26 | |
| | | | | | | | |
| See accompanying Notes to Financial Statements | | | December 31, 2018 | | | Semiannual Report | | | 125 | |
Financial Highlights (cont’d)
For a Share Outstanding for the Period ended:^
| | | | | | | | | | | | | | | | | | | | | | | | | | | | |
| | | Net Asset
Value,
Beginning
of Period | | | Net
Investment
Income (a) | | | Net Realized
and Change
in Unrealized
Gain (Loss) | | | Total from
Investment
Operations | | |
Dividends
from Net
Investment
Income | | | Distributions
from Return
of Capital | | | | |
| AllianzGI NFJ International Value: | | | | | | | | | | | | | | | | | | | | | |
| Class A | | | | | | | | | | | | | | | | | | | | | | | | | | | | |
12/31/2018† | | $ | 18.52 | | | $ | 0.10 | | | $ | (2.20 | ) | | $ | (2.10 | ) | | $ | (0.10 | ) | | $ | — | | | | | |
6/30/2018 | | | 18.13 | | | | 0.34 | | | | 0.38 | | | | 0.72 | | | | (0.32 | ) | | | (0.01 | ) | | | | |
6/30/2017 | | | 16.32 | | | | 0.34 | | | | 1.92 | | | | 2.26 | | | | (0.45 | ) | | | — | | | | | |
6/30/2016 | | | 21.61 | | | | 0.37 | | | | (5.15 | ) | | | (4.78 | ) | | | (0.51 | ) | | | — | | | | | |
6/30/2015 | | | 24.17 | | | | 0.41 | | | | (2.40 | ) | | | (1.99 | ) | | | (0.57 | ) | | | — | | | | | |
6/30/2014 | | | 20.80 | | | | 0.46 | | | | 3.32 | | | | 3.78 | | | | (0.41 | ) | | | — | | | | | |
| Class C | | | | | | | | | | | | | | | | | | | | | | | | | | | | |
12/31/2018† | | $ | 18.20 | | | $ | 0.04 | | | $ | (2.16 | ) | | $ | (2.12 | ) | | $ | (0.04 | ) | | $ | — | | | | | |
6/30/2018 | | | 17.86 | | | | 0.19 | | | | 0.37 | | | | 0.56 | | | | (0.21 | ) | | | (0.01 | ) | | | | |
6/30/2017 | | | 16.09 | | | | 0.23 | | | | 1.86 | | | | 2.09 | | | | (0.32 | ) | | | — | | | | | |
6/30/2016 | | | 21.37 | | | | 0.24 | | | | (5.08 | ) | | | (4.84 | ) | | | (0.44 | ) | | | — | | | | | |
6/30/2015 | | | 23.91 | | | | 0.24 | | | | (2.37 | ) | | | (2.13 | ) | | | (0.41 | ) | | | — | | | | | |
6/30/2014 | | | 20.62 | | | | 0.28 | | | | 3.29 | | | | 3.57 | | | | (0.28 | ) | | | — | | | | | |
| Class R | | | | | | | | | | | | | | | | | | | | | | | | | | | | |
12/31/2018† | | $ | 18.56 | | | $ | 0.08 | | | $ | (2.20 | ) | | $ | (2.12 | ) | | $ | (0.08 | ) | | $ | — | | | | | |
6/30/2018 | | | 18.15 | | | | 0.31 | | | | 0.35 | | | | 0.66 | | | | (0.24 | ) | | | (0.01 | ) | | | | |
6/30/2017 | | | 16.35 | | | | 0.33 | | | | 1.88 | | | | 2.21 | | | | (0.41 | ) | | | — | | | | | |
6/30/2016 | | | 21.66 | | | | 0.35 | | | | (5.17 | ) | | | (4.82 | ) | | | (0.49 | ) | | | — | | | | | |
6/30/2015 | | | 24.23 | | | | 0.37 | | | | (2.41 | ) | | | (2.04 | ) | | | (0.53 | ) | | | — | | | | | |
6/30/2014 | | | 20.87 | | | | 0.42 | | | | 3.31 | | | | 3.73 | | | | (0.37 | ) | | | — | | | | | |
| Class P | | | | | | | | | | | | | | | | | | | | | | | | | | | | |
12/31/2018† | | $ | 18.61 | | | $ | 0.13 | | | $ | (2.21 | ) | | $ | (2.08 | ) | | $ | (0.12 | ) | | $ | — | | | | | |
6/30/2018 | | | 18.21 | | | | 0.36 | | | | 0.41 | | | | 0.77 | | | | (0.36 | ) | | | (0.01 | ) | | | | |
6/30/2017 | | | 16.40 | | | | 0.40 | | | | 1.90 | | | | 2.30 | | | | (0.49 | ) | | | — | | | | | |
6/30/2016 | | | 21.70 | | | | 0.43 | | | | (5.18 | ) | | | (4.75 | ) | | | (0.55 | ) | | | — | | | | | |
6/30/2015 | | | 24.28 | | | | 0.48 | | | | (2.41 | ) | | | (1.93 | ) | | | (0.65 | ) | | | — | | | | | |
6/30/2014 | | | 20.88 | | | | 0.51 | | | | 3.34 | | | | 3.85 | | | | (0.45 | ) | | | — | | | | | |
| Institutional Class | | | | | | | | | | | | | | | | | | | | | | | | | | | | |
12/31/2018† | | $ | 18.64 | | | $ | 0.13 | | | $ | (2.21 | ) | | $ | (2.08 | ) | | $ | (0.13 | ) | | $ | — | | | | | |
6/30/2018 | | | 18.24 | | | | 0.42 | | | | 0.36 | | | | 0.78 | | | | (0.37 | ) | | | (0.01 | ) | | | | |
6/30/2017 | | | 16.42 | | | | 0.37 | | | | 1.95 | | | | 2.32 | | | | (0.50 | ) | | | — | | | | | |
6/30/2016 | | | 21.71 | | | | 0.40 | | | | (5.13 | ) | | | (4.73 | ) | | | (0.56 | ) | | | — | | | | | |
6/30/2015 | | | 24.29 | | | | 0.50 | | | | (2.42 | ) | | | (1.92 | ) | | | (0.66 | ) | | | — | | | | | |
6/30/2014 | | | 20.88 | | | | 0.52 | | | | 3.36 | | | | 3.88 | | | | (0.47 | ) | | | — | | | | | |
| Class R6 | | | | | | | | | | | | | | | | | | | | | | | | | | | | |
12/31/2018† | | $ | 18.63 | | | $ | 0.13 | | | $ | (2.20 | ) | | $ | (2.07 | ) | | $ | (0.14 | ) | | $ | — | | | | | |
6/30/2018 | | | 18.19 | | | | 0.29 | | | | 0.50 | | | | 0.79 | | | | (0.34 | ) | | | (0.01 | ) | | | | |
6/30/2017 | | | 16.38 | | | | 0.40 | | | | 1.93 | | | | 2.33 | | | | (0.52 | ) | | | — | | | | | |
6/30/2016 | | | 21.68 | | | | 0.48 | | | | (5.20 | ) | | | (4.72 | ) | | | (0.58 | ) | | | — | | | | | |
6/30/2015 | | | 24.28 | | | | 0.55 | | | | (2.46 | ) | | | (1.91 | ) | | | (0.69 | ) | | | — | | | | | |
12/19/2013* - 6/30/2014 | | | 22.59 | | | | 0.59 | | | | 1.30 | | | | 1.89 | | | | (0.20 | ) | | | — | | | | | |
| Administrative Class | | | | | | | | | | | | | | | | | | | | | | | | | | | | |
12/31/2018† | | $ | 18.56 | | | $ | 0.11 | | | $ | (2.19 | ) | | $ | (2.08 | ) | | $ | (0.11 | ) | | $ | — | | | | | |
6/30/2018 | | | 18.19 | | | | 0.38 | | | | 0.35 | | | | 0.73 | | | | (0.35 | ) | | | (0.01 | ) | | | | |
6/30/2017 | | | 16.37 | | | | 0.36 | | | | 1.92 | | | | 2.28 | | | | (0.46 | ) | | | — | | | | | |
6/30/2016 | | | 21.68 | | | | 0.42 | | | | (5.20 | ) | | | (4.78 | ) | | | (0.53 | ) | | | — | | | | | |
6/30/2015 | | | 24.25 | | | | 0.45 | | | | (2.41 | ) | | | (1.96 | ) | | | (0.61 | ) | | | — | | | | | |
6/30/2014 | | | 20.83 | | | | 0.46 | | | | 3.36 | | | | 3.82 | | | | (0.40 | ) | | | — | | | | | |
| ^ | A — may reflect actual amounts rounding to less than $0.01 or 0.01%. |
| * | Commencement of operations. |
| (a) | Calculated on average shares outstanding during the period. |
| (b) | Total return is calculated assuming a purchase of a share on the first day of the period and a sale of a share on the last day of each period reported. Dividends and distributions, if any, are assumed, for purposes of this calculation, to be reinvested. Total return does not reflect sales charges and includes the effect of fee waivers and reimbursements. Total return may reflect adjustments to conform to U.S. GAAP. Total return for a period of less than one year is not annualized. |
| (c) | Annualized, unless otherwise noted. |
| | | | | | |
| 126 | | Semiannual Report | | | December 31, 2018 | | | See accompanying Notes to Financial Statements |
| | | | | | | | | | | | | | | | | | | | | | | | | | | | | | | | | | |
| | | | Total
Dividends and
Distributions | | | Net Asset
Value, End
of Period | | | Total Return (b) | | | Net Assets,
End of Period
(000s) | | | Ratio of
Expenses to
Average Net
Assets with
Fee Waiver/
Reimbursement | | | Ratio of
Expenses to
Average Net
Assets without
Fee Waiver/
Reimbursement | | | Ratio of Net
Investment
Income
to Average
Net Assets | | | Portfolio
Turnover Rate | |
| | | | | | | | | | | | | | | | | | | | | | | | | | |
| | | | | | | | | | | | | | | | | | | | | | | | | | | | | | | | | | |
| | | | | $ | (0.10 | ) | | $ | 16.32 | | | | (11.35 | )% | | $ | 69,877 | | | | 1.30 | %(c) | | | 1.37 | %(c) | | | 1.06 | %(c) | | | 25 | % |
| | | | | | (0.33 | ) | | | 18.52 | | | | 3.95 | | | | 88,385 | | | | 1.29 | | | | 1.37 | | | | 1.76 | | | | 63 | |
| | | | | | (0.45 | ) | | | 18.13 | | | | 13.99 | | | | 127,642 | | | | 1.30 | | | | 1.35 | | | | 2.01 | | | | 63 | |
| | | | | | (0.51 | ) | | | 16.32 | | | | (22.28 | ) | | | 258,429 | | | | 1.29 | | | | 1.32 | | | | 2.04 | | | | 50 | |
| | | | | | (0.57 | ) | | | 21.61 | | | | (8.30 | ) | | | 466,262 | | | | 1.27 | | | | 1.30 | | | | 1.83 | | | | 54 | |
| | | | | | (0.41 | ) | | | 24.17 | | | | 18.25 | | | | 924,201 | | | | 1.24 | | | | 1.29 | | | | 2.01 | | | | 33 | |
| | | | | | | | | | | | | | | | | | | | | | | | | | | | | | | | | | |
| | | | | $ | (0.04 | ) | | $ | 16.04 | | | | (11.64 | )% | | $ | 15,711 | | | | 2.05 | %(c) | | | 2.12 | %(c) | | | 0.45 | %(c) | | | 25 | % |
| | | | | | (0.22 | ) | | | 18.20 | | | | 3.11 | | | | 36,184 | | | | 2.04 | | | | 2.12 | | | | 0.99 | | | | 63 | |
| | | | | | (0.32 | ) | | | 17.86 | | | | 13.10 | | | | 54,546 | | | | 2.05 | | | | 2.10 | | | | 1.37 | | | | 63 | |
| | | | | | (0.44 | ) | | | 16.09 | | | | (22.81 | ) | | | 83,722 | | | | 2.04 | | | | 2.07 | | | | 1.33 | | | | 50 | |
| | | | | | (0.41 | ) | | | 21.37 | | | | (8.99 | ) | | | 154,476 | | | | 2.02 | | | | 2.05 | | | | 1.09 | | | | 54 | |
| | | | | | (0.28 | ) | | | 23.91 | | | | 17.36 | | | | 203,445 | | | | 1.99 | | | | 2.04 | | | | 1.23 | | | | 33 | |
| | | | | | | | | | | | | | | | | | | | | | | | | | | | | | | | | | |
| | | | | $ | (0.08 | ) | | $ | 16.36 | | | | (11.43 | )% | | $ | 6,474 | | | | 1.55 | %(c) | | | 1.62 | %(c) | | | 0.87 | %(c) | | | 25 | % |
| | | | | | (0.25 | ) | | | 18.56 | | | | 3.64 | | | | 9,190 | | | | 1.54 | | | | 1.62 | | | | 1.58 | | | | 63 | |
| | | | | | (0.41 | ) | | | 18.15 | | | | 13.68 | | | | 11,300 | | | | 1.55 | | | | 1.60 | | | | 1.91 | | | | 63 | |
| | | | | | (0.49 | ) | | | 16.35 | | | | (22.43 | ) | | | 13,915 | | | | 1.54 | | | | 1.57 | | | | 1.89 | | | | 50 | |
| | | | | | (0.53 | ) | | | 21.66 | | | | (8.52 | ) | | | 22,511 | | | | 1.52 | | | | 1.55 | | | | 1.63 | | | | 54 | |
| | | | | | (0.37 | ) | | | 24.23 | | | | 17.95 | | | | 28,344 | | | | 1.49 | | | | 1.54 | | | | 1.85 | | | | 33 | |
| | | | | | | | | | | | | | | | | | | | | | | | | | | | | | | | | | |
| | | | | $ | (0.12 | ) | | $ | 16.41 | | | | (11.20 | )% | | $ | 45,689 | | | | 1.05 | %(c) | | | 1.12 | %(c) | | | 1.37 | %(c) | | | 25 | % |
| | | | | | (0.37 | ) | | | 18.61 | | | | 4.17 | | | | 89,644 | | | | 1.04 | | | | 1.12 | | | | 1.87 | | | | 63 | |
| | | | | | (0.49 | ) | | | 18.21 | | | | 14.20 | | | | 148,540 | | | | 1.05 | | | | 1.10 | | | | 2.34 | | | | 63 | |
| | | | | | (0.55 | ) | | | 16.40 | | | | (22.07 | ) | | | 350,745 | | | | 1.04 | | | | 1.07 | | | | 2.34 | | | | 50 | |
| | | | | | (0.65 | ) | | | 21.70 | | | | (8.04 | ) | | | 659,204 | | | | 1.02 | | | | 1.05 | | | | 2.15 | | | | 54 | |
| | | | | | (0.45 | ) | | | 24.28 | | | | 18.54 | | | | 500,111 | | | | 0.99 | | | | 1.04 | | | | 2.24 | | | | 33 | |
| | | | | | | | | | | | | | | | | | | | | | | | | | | | | | | | | | |
| | | | | $ | (0.13 | ) | | $ | 16.43 | | | | (11.17 | )% | | $ | 41,015 | | | | 0.95 | %(c) | | | 1.02 | %(c) | | | 1.45 | %(c) | | | 25 | % |
| | | | | | (0.38 | ) | | | 18.64 | | | | 4.27 | | | | 55,924 | | | | 0.94 | | | | 1.02 | | | | 2.14 | | | | 63 | |
| | | | | | (0.50 | ) | | | 18.24 | | | | 14.33 | | | | 74,272 | | | | 0.95 | | | | 1.00 | | | | 2.18 | | | | 63 | |
| | | | | | (0.56 | ) | | | 16.42 | | | | (21.97 | ) | | | 309,622 | | | | 0.94 | | | | 0.97 | | | | 2.17 | | | | 50 | |
| | | | | | (0.66 | ) | | | 21.71 | | | | (7.98 | ) | | | 1,095,977 | | | | 0.92 | | | | 0.95 | | | | 2.21 | | | | 54 | |
| | | | | | (0.47 | ) | | | 24.29 | | | | 18.68 | | | | 1,392,488 | | | | 0.89 | | | | 0.94 | | | | 2.29 | | | | 33 | |
| | | | | | | | | | | | | | | | | | | | | | | | | | | | | | | | | | |
| | | | | $ | (0.14 | ) | | $ | 16.42 | | | | (11.15 | )% | | $ | 1,607 | | | | 0.90 | %(c) | | | 0.97 | %(c) | | | 1.47 | %(c) | | | 25 | % |
| | | | | | (0.35 | ) | | | 18.63 | | | | 4.31 | | | | 1,836 | | | | 0.89 | | | | 0.97 | | | | 1.48 | | | | 63 | |
| | | | | | (0.52 | ) | | | 18.19 | | | | 14.42 | | | | 28,460 | | | | 0.90 | | | | 0.95 | | | | 2.33 | | | | 63 | |
| | | | | | (0.58 | ) | | | 16.38 | | | | (21.97 | ) | | | 55,751 | | | | 0.89 | | | | 0.92 | | | | 2.64 | | | | 50 | |
| | | | | | (0.69 | ) | | | 21.68 | | | | (7.94 | ) | | | 66,164 | | | | 0.87 | | | | 0.90 | | | | 2.51 | | | | 54 | |
| | | | | | (0.20 | ) | | | 24.28 | | | | 8.38 | | | | 1,441 | | | | 0.87 | (c) | | | 0.89 | (c) | | | 4.65 | (c) | | | 33 | |
| | | | | | | | | | | | | | | | | | | | | | | | | | | | | | | | | | |
| | | | | $ | (0.11 | ) | | $ | 16.37 | | | | (11.22 | )% | | $ | 1,669 | | | | 1.20 | %(c) | | | 1.27 | %(c) | | | 1.20 | %(c) | | | 25 | % |
| | | | | | (0.36 | ) | | | 18.56 | | | | 4.01 | | | | 4,829 | | | | 1.19 | | | | 1.27 | | | | 1.96 | | | | 63 | |
| | | | | | (0.46 | ) | | | 18.19 | | | | 14.09 | | | | 4,973 | | | | 1.20 | | | | 1.25 | | | | 2.08 | | | | 63 | |
| | | | | | (0.53 | ) | | | 16.37 | | | | (22.22 | ) | | | 14,487 | | | | 1.19 | | | | 1.22 | | | | 2.31 | | | | 50 | |
| | | | | | (0.61 | ) | | | 21.68 | | | | (8.18 | ) | | | 19,020 | | | | 1.17 | | | | 1.20 | | | | 2.00 | | | | 54 | |
| | | | | | (0.40 | ) | | | 24.25 | | | | 18.42 | | | | 20,604 | | | | 1.14 | | | | 1.19 | | | | 2.01 | | | | 33 | |
| | | | | | | | |
| See accompanying Notes to Financial Statements | | | December 31, 2018 | | | Semiannual Report | | | 127 | |
Financial Highlights (cont’d)
For a Share Outstanding for the Period ended:^
| | | | | | | | | | | | | | | | | | | | | | | | | | | | |
| | | Net Asset
Value,
Beginning
of Period | | | Net
Investment
Income (a) | | | Net Realized
and Change
in Unrealized
Gain (Loss) | | | Total from
Investment
Operations | | | Dividends
from Net
Investment
Income | | | Distributions
from Net
Realized Capital
Gains | | | | |
| AllianzGI NFJ Large-Cap Value: | | | | | | | | | | | | | | | | | | | | | |
| Class A | | | | | | | | | | | | | | | | | | | | | | | | | | | | |
12/31/2018† | | $ | 26.14 | | | $ | 0.19 | | | $ | (2.24) | | | $ | (2.05 | ) | | $ | (0.15 | ) | | $ | (0.05 | ) | | | | |
6/30/2018 | | | 24.31 | | | | 0.41 | | | | 1.83 | | | | 2.24 | | | | (0.41 | ) | | | — | | | | | |
6/30/2017 | | | 20.34 | | | | 0.36 | | | | 3.97 | (d) | | | 4.33 | | | | (0.36 | ) | | | — | | | | | |
6/30/2016 | | | 21.44 | | | | 0.37 | | | | (1.09 | ) | | | (0.72 | ) | | | (0.38 | ) | | | — | | | | | |
6/30/2015 | | | 21.13 | | | | 0.35 | | | | 0.30 | | | | 0.65 | | | | (0.34 | ) | | | — | | | | | |
6/30/2014 | | | 17.56 | | | | 0.32 | | | | 3.57 | | | | 3.89 | | | | (0.32 | ) | | | — | | | | | |
| Class C | | | | | | | | | | | | | | | | | | | | | | | | | | | | |
12/31/2018† | | $ | 26.44 | | | $ | 0.09 | | | $ | (2.27 | ) | | $ | (2.18 | ) | | $ | (0.03 | ) | | $ | (0.05 | ) | | | | |
6/30/2018 | | | 24.57 | | | | 0.22 | | | | 1.86 | | | | 2.08 | | | | (0.21 | ) | | | — | | | | | |
6/30/2017 | | | 20.50 | | | | 0.19 | | | | 4.01 | (d) | | | 4.20 | | | | (0.13 | ) | | | — | | | | | |
6/30/2016 | | | 21.57 | | | | 0.22 | | | | (1.09 | ) | | | (0.87 | ) | | | (0.20 | ) | | | — | | | | | |
6/30/2015 | | | 21.22 | | | | 0.19 | | | | 0.30 | | | | 0.49 | | | | (0.14 | ) | | | — | | | | | |
6/30/2014 | | | 17.64 | | | | 0.18 | | | | 3.57 | | | | 3.75 | | | | (0.17 | ) | | | — | | | | | |
| Class R | | | | | | | | | | | | | | | | | | | | | | | | | | | | |
12/31/2018† | | $ | 26.41 | | | $ | 0.16 | | | $ | (2.26 | ) | | $ | (2.10 | ) | | $ | (0.12 | ) | | $ | (0.05 | ) | | | | |
6/30/2018 | | | 24.55 | | | | 0.35 | | | | 1.85 | | | | 2.20 | | | | (0.34 | ) | | | — | | | | | |
6/30/2017 | | | 20.51 | | | | 0.30 | | | | 4.02 | (d) | | | 4.32 | | | | (0.28 | ) | | | — | | | | | |
6/30/2016 | | | 21.60 | | | | 0.32 | | | | (1.09 | ) | | | (0.77 | ) | | | (0.32 | ) | | | — | | | | | |
6/30/2015 | | | 21.26 | | | | 0.30 | | | | 0.30 | | | | 0.60 | | | | (0.26 | ) | | | — | | | | | |
6/30/2014 | | | 17.67 | | | | 0.27 | | | | 3.60 | | | | 3.87 | | | | (0.28 | ) | | | — | | | | | |
| Class P | | | | | | | | | | | | | | | | | | | | | | | | | | | | |
12/31/2018† | | $ | 26.38 | | | $ | 0.22 | | | $ | (2.24 | ) | | $ | (2.02 | ) | | $ | (0.19 | ) | | $ | (0.05 | ) | | | | |
6/30/2018 | | | 24.53 | | | | 0.47 | | | | 1.86 | | | | 2.33 | | | | (0.48 | ) | | | — | | | | | |
6/30/2017 | | | 20.56 | | | | 0.42 | | | | 4.01 | (d) | | | 4.43 | | | | (0.46 | ) | | | — | | | | | |
6/30/2016 | | | 21.68 | | | | 0.42 | | | | (1.09 | ) | | | (0.67 | ) | | | (0.45 | ) | | | — | | | | | |
6/30/2015 | | | 21.42 | | | | 0.41 | | | | 0.31 | | | | 0.72 | | | | (0.46 | ) | | | — | | | | | |
6/30/2014 | | | 17.80 | | | | 0.37 | | | | 3.62 | | | | 3.99 | | | | (0.37 | ) | | | — | | | | | |
| Institutional Class | | | | | | | | | �� | | | | | | | | | | | | | | | | | | | |
12/31/2018† | | $ | 26.02 | | | $ | 0.23 | | | $ | (2.22 | ) | | $ | (1.99 | ) | | $ | (0.20 | ) | | $ | (0.05 | ) | | | | |
6/30/2018 | | | 24.20 | | | | 0.49 | | | | 1.84 | | | | 2.33 | | | | (0.51 | ) | | | — | | | | | |
6/30/2017 | | | 20.27 | | | | 0.43 | | | | 3.97 | (d) | | | 4.40 | | | | (0.47 | ) | | | — | | | | | |
6/30/2016 | | | 21.39 | | | | 0.44 | | | | (1.09 | ) | | | (0.65 | ) | | | (0.47 | ) | | | — | | | | | |
6/30/2015 | | | 21.13 | | | | 0.42 | | | | 0.31 | | | | 0.73 | | | | (0.47 | ) | | | — | | | | | |
6/30/2014 | | | 17.56 | | | | 0.39 | | | | 3.57 | | | | 3.96 | | | | (0.39 | ) | | | — | | | | | |
| Administrative Class | | | | | | | | | | | | | | | | | | | | | | | | | | | | |
12/31/2018† | | $ | 26.51 | | | $ | 0.20 | | | $ | (2.27 | ) | | $ | (2.07 | ) | | $ | (0.16 | ) | | $ | (0.05 | ) | | | | |
6/30/2018 | | | 24.64 | | | | 0.43 | | | | 1.88 | | | | 2.31 | | | | (0.44 | ) | | | — | | | | | |
6/30/2017 | | | 20.61 | | | | 0.38 | | | | 4.04 | (d) | | | 4.42 | | | | (0.39 | ) | | | — | | | | | |
6/30/2016 | | | 21.73 | | | | 0.39 | | | | (1.10 | ) | | | (0.71 | ) | | | (0.41 | ) | | | — | | | | | |
6/30/2015 | | | 21.26 | | | | 0.39 | | | | 0.29 | | | | 0.68 | | | | (0.21 | ) | | | — | | | | | |
6/30/2014 | | | 17.67 | | | | 0.34 | | | | 3.59 | | | | 3.93 | | | | (0.34 | ) | | | — | | | | | |
| ^ | A — may reflect actual amounts rounding to less than $0.01 or 0.01%. |
| (a) | Calculated on average shares outstanding during the period. |
| (b) | Total return is calculated assuming a purchase of a share on the first day of the period and a sale of a share on the last day of each period reported. Dividends and distributions, if any, are assumed, for purposes of this calculation, to be reinvested. Total return does not reflect sales charges and includes the effect of fee waivers and reimbursements. Total return may reflect adjustments to conform to U.S. GAAP. Total return for a period of less than one year is not annualized. |
| (c) | Annualized, unless otherwise noted. |
| (d) | Payments from securities litigation increased net realized and change in unrealized gain (loss) and net asset value per share by approximately $0.65 for Class A; $0.68 for Class C; $0.71 for Class R; $0.75 for Class P; $0.57 for Institutional Class and $0.65 for Administrative Class. The increase in total return per class was approximately 3.24% for Class A; 3.33% for Class C; 3.50% for Class R; 3.72% for Class P; 2.87% for Institutional Class and 3.21% for Administrative Class. |
| | | | | | |
| 128 | | Semiannual Report | | | December 31, 2018 | | | See accompanying Notes to Financial Statements |
| | | | | | | | | | | | | | | | | | | | | | | | | | | | | | | | | | |
| | | | Total
Dividends and
Distributions | | | Net Asset
Value, End
of Period | | | Total Return (b) | | | Net Assets,
End of Period
(000s) | | | Ratio of
Expenses to
Average Net
Assets with
Fee Waiver/
Reimbursement | | | Ratio of
Expenses to
Average Net
Assets without
Fee Waiver/
Reimbursement | | | Ratio of Net
Investment
Income
to Average
Net Assets | | | Portfolio
Turnover Rate | |
| | | | | | | | | | | | | | | | | | | | | | | | | | |
| | | | | | | | | | | | | | | | | | | | | | | | | | | | | | | | | | |
| | | | | $ | (0.20 | ) | | $ | 23.89 | | | | (7.87 | )% | | $ | 166,389 | | | | 1.12 | %(c) | | | 1.12 | %(c) | | | 1.40 | %(c) | | | 34 | % |
| | | | | | (0.41 | ) | | | 26.14 | | | | 9.27 | | | | 145,338 | | | | 1.06 | | | | 1.11 | | | | 1.56 | | | | 110 | |
| | | | | | (0.36 | ) | | | 24.31 | (d) | | | 21.42 | (d) | | | 151,306 | | | | 1.02 | | | | 1.12 | | | | 1.60 | | | | 67 | |
| | | | | | (0.38 | ) | | | 20.34 | | | | (3.30 | ) | | | 150,436 | | | | 1.11 | | | | 1.11 | | | | 1.82 | | | | 51 | |
| | | | | | (0.34 | ) | | | 21.44 | | | | 3.06 | | | | 145,039 | | | | 1.11 | | | | 1.11 | | | | 1.63 | | | | 26 | |
| | | | | | (0.32 | ) | | | 21.13 | | | | 22.30 | | | | 172,182 | | | | 1.11 | | | | 1.11 | | | | 1.65 | | | | 22 | |
| | | | | | | | | | | | | | | | | | | | | | | | | | | | | | | | | | |
| | | | | $ | (0.08 | ) | | $ | 24.18 | | | | (8.26 | )% | | $ | 13,233 | | | | 1.87 | %(c) | | | 1.87 | %(c) | | | 0.62 | %(c) | | | 34 | % |
| | | | | | (0.21 | ) | | | 26.44 | | | | 8.49 | | | | 62,232 | | | | 1.81 | | | | 1.86 | | | | 0.82 | | | | 110 | |
| | | | | | (0.13 | ) | | | 24.57 | (d) | | | 20.52 | (d) | | | 70,159 | | | | 1.77 | | | | 1.87 | | | | 0.86 | | | | 67 | |
| | | | | | (0.20 | ) | | | 20.50 | | | | (4.04 | ) | | | 79,758 | | | | 1.86 | | | | 1.86 | | | | 1.06 | | | | 51 | |
| | | | | | (0.14 | ) | | | 21.57 | | | | 2.28 | | | | 94,367 | | | | 1.86 | | | | 1.86 | | | | 0.88 | | | | 26 | |
| | | | | | (0.17 | ) | | | 21.22 | | | | 21.35 | | | | 103,838 | | | | 1.86 | | | | 1.86 | | | | 0.90 | | | | 22 | |
| | | | | | | | | | | | | | | | | | | | | | | | | | | | | | | | | | |
| | | | | $ | (0.17 | ) | | $ | 24.14 | | | | (8.00 | )% | | $ | 1,910 | | | | 1.37 | %(c) | | | 1.37 | %(c) | | | 1.12 | %(c) | | | 34 | % |
| | | | | | (0.34 | ) | | | 26.41 | | | | 9.00 | | | | 5,200 | | | | 1.31 | | | | 1.36 | | | | 1.35 | | | | 110 | |
| | | | | | (0.28 | ) | | | 24.55 | (d) | | | 21.14 | (d) | | | 6,997 | | | | 1.27 | | | | 1.37 | | | | 1.35 | | | | 67 | |
| | | | | | (0.32 | ) | | | 20.51 | | | | (3.53 | ) | | | 7,200 | | | | 1.36 | | | | 1.36 | | | | 1.56 | | | | 51 | |
| | | | | | (0.26 | ) | | | 21.60 | | | | 2.80 | | | | 8,641 | | | | 1.36 | | | | 1.36 | | | | 1.39 | | | | 26 | |
| | | | | | (0.28 | ) | | | 21.26 | | | | 22.00 | | | | 11,546 | | | | 1.36 | | | | 1.36 | | | | 1.40 | | | | 22 | |
| | | | | | | | | | | | | | | | | | | | | | | | | | | | | | | | | | |
| | | | | $ | (0.24 | ) | | $ | 24.12 | | | | (7.72 | )% | | $ | 17,282 | | | | 0.87 | %(c) | | | 0.87 | %(c) | | | 1.64 | %(c) | | | 34 | % |
| | | | | | (0.48 | ) | | | 26.38 | | | | 9.54 | | | | 20,242 | | | | 0.81 | | | | 0.86 | | | | 1.80 | | | | 110 | |
| | | | | | (0.46 | ) | | | 24.53 | (d) | | | 21.71 | (d) | | | 18,164 | | | | 0.77 | | | | 0.87 | | | | 1.85 | | | | 67 | |
| | | | | | (0.45 | ) | | | 20.56 | | | | (3.06 | ) | | | 14,197 | | | | 0.86 | | | | 0.86 | | | | 2.06 | | | | 51 | |
| | | | | | (0.46 | ) | | | 21.68 | | | | 3.35 | | | | 17,699 | | | | 0.86 | | | | 0.86 | | | | 1.88 | | | | 26 | |
| | | | | | (0.37 | ) | | | 21.42 | | | | 22.57 | | | | 12,148 | | | | 0.86 | | | | 0.86 | | | | 1.90 | | | | 22 | |
| | | | | | | | | | | | | | | | | | | | | | | | | | | | | | | | | | |
| | | | | $ | (0.25 | ) | | $ | 23.78 | | | | (7.69 | )% | | $ | 117,348 | | | | 0.77 | %(c) | | | 0.77 | %(c) | | | 1.74 | %(c) | | | 34 | % |
| | | | | | (0.51 | ) | | | 26.02 | | | | 9.66 | | | | 127,728 | | | | 0.71 | | | | 0.76 | | | | 1.89 | | | | 110 | |
| | | | | | (0.47 | ) | | | 24.20 | (d) | | | 21.88 | (d) | | | 114,377 | | | | 0.67 | | | | 0.77 | | | | 1.95 | | | | 67 | |
| | | | | | (0.47 | ) | | | 20.27 | | | | (2.99 | ) | | | 150,909 | | | | 0.76 | | | | 0.76 | | | | 2.18 | | | | 51 | |
| | | | | | (0.47 | ) | | | 21.39 | | | | 3.44 | | | | 312,294 | | | | 0.76 | | | | 0.76 | | | | 1.97 | | | | 26 | |
| | | | | | (0.39 | ) | | | 21.13 | | | | 22.73 | | | | 431,318 | | | | 0.76 | | | | 0.76 | | | | 2.00 | | | | 22 | |
| | | | | | | | | | | | | | | | | | | | | | | | | | | | | | | | | | |
| | | | | $ | (0.21 | ) | | $ | 24.23 | | | | (7.84 | )% | | $ | 1,097 | | | | 1.02 | %(c) | | | 1.02 | %(c) | | | 1.49 | %(c) | | | 34 | % |
| | | | | | (0.44 | ) | | | 26.51 | | | | 9.40 | | | | 1,323 | | | | 0.96 | | | | 1.01 | | | | 1.64 | | | | 110 | |
| | | | | | (0.39 | ) | | | 24.64 | (d) | | | 21.58 | (d) | | | 1,272 | | | | 0.92 | | | | 1.02 | | | | 1.71 | | | | 67 | |
| | | | | | (0.41 | ) | | | 20.61 | | | | (3.23 | ) | | | 1,345 | | | | 1.01 | | | | 1.01 | | | | 1.91 | | | | 51 | |
| | | | | | (0.21 | ) | | | 21.73 | | | | 3.20 | | | | 1,655 | | | | 1.01 | | | | 1.01 | | | | 1.79 | | | | 26 | |
| | | | | | (0.34 | ) | | | 21.26 | | | | 22.38 | | | | 6,391 | | | | 1.01 | | | | 1.01 | | | | 1.76 | | | | 22 | |
| | | | | | | | |
| See accompanying Notes to Financial Statements | | | December 31, 2018 | | | Semiannual Report | | | 129 | |
Financial Highlights (cont’d)
For a Share Outstanding for the Period ended:^
| | | | | | | | | | | | | | | | | | | | | | | | | | | | |
| | | Net Asset
Value,
Beginning
of Period | | | Net
Investment
Income (a) | | | Net Realized
and Change
in Unrealized
Gain (Loss) | | | Total from
Investment
Operations | | | Dividends
from Net
Investment
Income | | | Distributions
from Net
Realized Capital
Gains | | | | |
| AllianzGI NFJ Mid-Cap Value: | | | | | | | | | | | | | | | | | | | | | |
| Class A | | | | | | | | | | | | | | | | | | | | | | | | | | | | |
12/31/2018† | | $ | 30.06 | | | $ | 0.22 | | | $ | (4.06 | ) | | $ | (3.84 | ) | | $ | (0.31 | ) | | $ | — | | | | | |
6/30/2018 | | | 31.41 | | | | 0.39 | | | | 1.27 | | | | 1.66 | | | | (0.26 | ) | | | (2.75 | ) | | | | |
6/30/2017 | | | 24.37 | | | | 0.36 | | | | 7.03 | (e) | | | 7.39 | | | | (0.33 | ) | | | (0.02 | ) | | | | |
6/30/2016 | | | 25.82 | | | | 0.45 | | | | (0.87 | ) | | | (0.42 | ) | | | (0.32 | ) | | | (0.71 | ) | | | | |
6/30/2015 | | | 25.52 | | | | 0.31 | | | | 0.36 | | | | 0.67 | | | | (0.37 | ) | | | — | | | | | |
6/30/2014 | | | 20.33 | | | | 0.29 | | | | 5.10 | | | | 5.39 | | | | (0.20 | ) | | | — | | | | | |
| Class C | | | | | | | | | | | | | | | | | | | | | | | | | | | | |
12/31/2018† | | $ | 24.62 | | | $ | 0.06 | | | $ | (3.28 | ) | | $ | (3.22 | ) | | $ | — | | | $ | — | | | | | |
6/30/2018 | | | 26.22 | | | | 0.12 | | | | 1.08 | | | | 1.20 | | | | (0.05 | ) | | | (2.75 | ) | | | | |
6/30/2017 | | | 20.43 | | | | 0.13 | | | | 5.87 | (e) | | | 6.00 | | | | (0.19 | ) | | | (0.02 | ) | | | | |
6/30/2016 | | | 21.83 | | | | 0.23 | | | | (0.73 | ) | | | (0.50 | ) | | | (0.19 | ) | | | (0.71 | ) | | | | |
6/30/2015 | | | 21.66 | | | | 0.10 | | | | 0.30 | | | | 0.40 | | | | (0.23 | ) | | | — | | | | | |
6/30/2014 | | | 17.30 | | | | 0.10 | | | | 4.34 | | | | 4.44 | | | | (0.08 | ) | | | — | | | | | |
| Class R | | | | | | | | | | | | | | | | | | | | | | | | | | | | |
12/31/2018† | | $ | 25.79 | | | $ | 0.15 | | | $ | (3.48 | ) | | $ | (3.33 | ) | | $ | (0.27 | ) | | $ | — | | | | | |
6/30/2018 | | | 27.40 | | | | 0.24 | | | | 1.17 | | | | 1.41 | | | | (0.27 | ) | | | (2.75 | ) | | | | |
6/30/2017 | | | 21.26 | | | | 0.26 | | | | 6.13 | (e) | | | 6.39 | | | | (0.23 | ) | | | (0.02 | ) | | | | |
6/30/2016 | | | 22.68 | | | | 0.34 | | | | (0.76 | ) | | | (0.42 | ) | | | (0.29 | ) | | | (0.71 | ) | | | | |
6/30/2015 | | | 22.48 | | | | 0.22 | | | | 0.32 | | | | 0.54 | | | | (0.34 | ) | | | — | | | | | |
6/30/2014 | | | 17.95 | | | | 0.21 | | | | 4.49 | | | | 4.70 | | | | (0.17 | ) | | | — | | | | | |
| Class P | | | | | | | | | | | | | | | | | | | | | | | | | | | | |
12/31/2018† | | $ | 24.35 | | | $ | 0.20 | | | $ | (3.28 | ) | | $ | (3.08 | ) | | $ | (0.38 | ) | | $ | — | | | | | |
6/30/2018 | | | 26.01 | | | | 0.37 | | | | 1.10 | | | | 1.47 | | | | (0.38 | ) | | | (2.75 | ) | | | | |
6/30/2017 | | | 20.27 | | | | 0.32 | | | | 5.87 | (e) | | | 6.19 | | | | (0.43 | ) | | | (0.02 | ) | | | | |
6/30/2016 | | | 21.70 | | | | 0.43 | | | | (0.74 | ) | | | (0.31 | ) | | | (0.41 | ) | | | (0.71 | ) | | | | |
6/30/2015 | | | 21.57 | | | | 0.33 | | | | 0.29 | | | | 0.62 | | | | (0.49 | ) | | | — | | | | | |
6/30/2014 | | | 17.23 | | | | 0.29 | | | | 4.32 | | | | 4.61 | | | | (0.27 | ) | | | — | | | | | |
| Institutional Class | | | | | | | | | | | | | | | | | | | | | | | | | | | | |
12/31/2018† | | $ | 32.15 | | | $ | 0.29 | | | $ | (4.35 | ) | | $ | (4.06 | ) | | $ | (0.40 | ) | | $ | — | | | | | |
6/30/2018 | | | 33.41 | | | | 0.51 | | | | 1.38 | | | | 1.89 | | | | (0.40 | ) | | | (2.75 | ) | | | | |
6/30/2017 | | | 25.88 | | | | 0.48 | | | | 7.47 | (e) | | | 7.95 | | | | (0.40 | ) | | | (0.02 | ) | | | | |
6/30/2016 | | | 27.33 | | | | 0.56 | | | | (0.90 | ) | | | (0.34 | ) | | | (0.40 | ) | | | (0.71 | ) | | | | |
6/30/2015 | | | 26.99 | | | | 0.43 | | | | 0.37 | | | | 0.80 | | | | (0.46 | ) | | | — | | | | | |
6/30/2014 | | | 21.49 | | | | 0.41 | | | | 5.38 | | | | 5.79 | | | | (0.29 | ) | | | — | | | | | |
| Class R6 | | | | | | | | | | | | | | | | | | | | | | | | | | | | |
12/31/2018† | | $ | 32.13 | | | $ | 0.36 | | | $ | (4.41 | ) | | $ | (4.05 | ) | | $ | (0.41 | ) | | $ | — | | | | | |
12/18/2017* - 6/30/2018 | | | 36.74 | | | | 0.18 | | | | (1.61 | ) | | | (1.43 | ) | | | (0.43 | ) | | | (2.75 | ) | | | | |
| Administrative Class | | | | | | | | | | | | | | | | | | | | | | | | | | | | |
12/31/2018† | | $ | 31.00 | | | $ | 0.24 | | | $ | (4.18 | ) | | $ | (3.94 | ) | | $ | (0.34 | ) | | $ | — | | | | | |
6/30/2018 | | | 32.35 | | | | 0.42 | | | | 1.32 | | | | 1.74 | | | | (0.34 | ) | | | (2.75 | ) | | | | |
6/30/2017 | | | 25.08 | | | | 0.40 | | | | 7.24 | (e) | | | 7.64 | | | | (0.35 | ) | | | (0.02 | ) | | | | |
6/30/2016 | | | 26.54 | | | | 0.49 | | | | (0.89 | ) | | | (0.40 | ) | | | (0.35 | ) | | | (0.71 | ) | | | | |
6/30/2015 | | | 26.23 | | | | 0.35 | | | | 0.37 | | | | 0.72 | | | | (0.41 | ) | | | — | | | | | |
6/30/2014 | | | 20.89 | | | | 0.32 | | | | 5.25 | | | | 5.57 | | | | (0.23 | ) | | | — | | | | | |
| ^ | A — may reflect actual amounts rounding to less than $0.01 or 0.01%. |
| * | Commencement of operations. |
| (a) | Calculated on average shares outstanding during the period. |
| (b) | Total return is calculated assuming a purchase of a share on the first day of the period and a sale of a share on the last day of each period reported. Dividends and distributions, if any, are assumed, for purposes of this calculation, to be reinvested. Total return does not reflect sales charges and includes the effect of fee waivers and reimbursements. Total return may reflect adjustments to conform to U.S. GAAP. Total return for a period of less than one year is not annualized. |
| (c) | Annualized, unless otherwise noted. |
| (d) | Does not include expenses of the investment companies in which the Fund invests. |
| (e) | Payments from securities litigation increased net realized and change in unrealized gain (loss) and net asset value per share by approximately $0.65 for Class A; $0.68 for Class C; $0.71 for Class R; $0.75 for Class P; $0.57 for Institutional Class and $0.65 for Administrative Class. The increase in total return per class was approximately 3.24% for Class A; 3.33% for Class C; 3.50% for Class R; 3.72% for Class P; 2.87% for Institutional Class and 3.21% for Administrative Class. |
| | | | | | |
| 130 | | Semiannual Report | | | December 31, 2018 | | | See accompanying Notes to Financial Statements |
| | | | | | | | | | | | | | | | | | | | | | | | | | | | | | | | | | |
| | | | Total
Dividends and
Distributions | | | Net Asset
Value, End
of Period | | | Total Return (b) | | | Net Assets,
End of Period
(000s) | | | Ratio of
Expenses to
Average Net
Assets with
Fee Waiver/
Reimbursement | | | Ratio of
Expenses to
Average Net
Assets without
Fee Waiver/
Reimbursement | | | Ratio of Net
Investment
Income
to Average
Net Assets | | | Portfolio
Turnover Rate | |
| | | | | | | | | | | | | | | | | | | | | | | | | | |
| | | | | | | | | | | | | | | | | | | | | | | | | | | | | | | | | | |
| | | | | $ | (0.31 | ) | | $ | 25.91 | | | | (12.77 | )% | | $ | 530,371 | | | | 0.99 | %(c) | | | 1.21 | %(c) | | | 1.45 | %(c) | | | 28 | % |
| | | | | | (3.01 | ) | | | 30.06 | | | | 4.88 | | | | 518,293 | | | | 1.04 | (d) | | | 1.21 | (d) | | | 1.22 | (d) | | | 31 | |
| | | | | | (0.35 | ) | | | 31.41 | (e) | | | 30.53 | (e) | | | 480,691 | | | | 1.21 | (d) | | | 1.21 | (d) | | | 1.30 | (d) | | | 45 | |
| | | | | | (1.03 | ) | | | 24.37 | | | | (1.46 | ) | | | 363,166 | | | | 1.23 | (d) | | | 1.23 | (d) | | | 1.88 | (d) | | | 50 | |
| | | | | | (0.37 | ) | | | 25.82 | | | | 2.66 | | | | 408,706 | | | | 1.26 | (d) | | | 1.26 | (d) | | | 1.23 | (d) | | | 48 | |
| | | | | | (0.20 | ) | | | 25.52 | | | | 26.63 | | | | 459,875 | | | | 1.26 | (d) | | | 1.26 | (d) | | | 1.28 | (d) | | | 40 | |
| | | | | | | | | | | | | | | | | | | | | | | | | | | | | | | | | | |
| | | | | $ | — | | | $ | 21.40 | | | | (13.07 | )% | | $ | 43,228 | | | | 1.74 | %(c) | | | 1.96 | %(c) | | | 0.45 | %(c) | | | 28 | % |
| | | | | | (2.80 | ) | | | 24.62 | | | | 4.10 | | | | 182,192 | | | | 1.79 | (d) | | | 1.96 | (d) | | | 0.46 | (d) | | | 31 | |
| | | | | | (0.21 | ) | | | 26.22 | (e) | | | 29.52 | (e) | | | 168,922 | | | | 1.96 | (d) | | | 1.96 | (d) | | | 0.59 | (d) | | | 45 | |
| | | | | | (0.90 | ) | | | 20.43 | | | | (2.16 | ) | | | 173,304 | | | | 1.98 | (d) | | | 1.98 | (d) | | | 1.13 | (d) | | | 50 | |
| | | | | | (0.23 | ) | | | 21.83 | | | | 1.88 | | | | 198,432 | | | | 2.01 | (d) | | | 2.01 | (d) | | | 0.48 | (d) | | | 48 | |
| | | | | | (0.08 | ) | | | 21.66 | | | | 25.72 | | | | 217,181 | | | | 2.01 | (d) | | | 2.01 | (d) | | | 0.53 | (d) | | | 40 | |
| | | | | | | | | | | | | | | | | | | | | | | | | | | | | | | | | | |
| | | | | $ | (0.27 | ) | | $ | 22.19 | | | | (12.88 | )% | | $ | 16,485 | | | | 1.24 | %(c) | | | 1.46 | %(c) | | | 1.18 | %(c) | | | 28 | % |
| | | | | | (3.02 | ) | | | 25.79 | | | | 4.65 | | | | 15,644 | | | | 1.27 | (d) | | | 1.46 | (d) | | | 0.90 | (d) | | | 31 | |
| | | | | | (0.25 | ) | | | 27.40 | (e) | | | 30.19 | (e) | | | 5,591 | | | | 1.46 | (d) | | | 1.46 | (d) | | | 1.09 | (d) | | | 45 | |
| | | | | | (1.00 | ) | | | 21.26 | | | | (1.70 | ) | | | 6,969 | | | | 1.48 | (d) | | | 1.48 | (d) | | | 1.58 | (d) | | | 50 | |
| | | | | | (0.34 | ) | | | 22.68 | | | | 2.43 | | | | 11,665 | | | | 1.51 | (d) | | | 1.51 | (d) | | | 0.96 | (d) | | | 48 | |
| | | | | | (0.17 | ) | | | 22.48 | | | | 26.29 | | | | 14,103 | | | | 1.51 | (d) | | | 1.51 | (d) | | | 1.01 | (d) | | | 40 | |
| | | | | | | | | | | | | | | | | | | | | | | | | | | | | | | | | | |
| | | | | $ | (0.38 | ) | | $ | 20.89 | | | | (12.64 | )% | | $ | 158,915 | | | | 0.74 | %(c) | | | 0.96 | %(c) | | | 1.65 | %(c) | | | 28 | % |
| | | | | | (3.13 | ) | | | 24.35 | | | | 5.17 | | | | 200,081 | | | | 0.77 | (d) | | | 0.96 | (d) | | | 1.46 | (d) | | | 31 | |
| | | | | | (0.45 | ) | | | 26.01 | (e) | | | 30.82 | (e) | | | 52,167 | | | | 0.96 | (d) | | | 0.96 | (d) | | | 1.39 | (d) | | | 45 | |
| | | | | | (1.12 | ) | | | 20.27 | | | | (1.19 | ) | | | 17,268 | | | | 0.98 | (d) | | | 0.98 | (d) | | | 2.14 | (d) | | | 50 | |
| | | | | | (0.49 | ) | | | 21.70 | | | | 2.93 | | | | 15,307 | | | | 1.01 | (d) | | | 1.01 | (d) | | | 1.55 | (d) | | | 48 | |
| | | | | | (0.27 | ) | | | 21.57 | | | | 26.92 | | | | 6,687 | | | | 1.01 | (d) | | | 1.01 | (d) | | | 1.50 | (d) | | | 40 | |
| | | | | | | | | | | | | | | | | | | | | | | | | | | | | | | | | | |
| | | | | $ | (0.40 | ) | | $ | 27.69 | | | | (12.62 | )% | | $ | 330,135 | | | | 0.64 | %(c) | | | 0.86 | %(c) | | | 1.78 | %(c) | | | 28 | % |
| | | | | | (3.15 | ) | | | 32.15 | | | | 5.26 | | | | 332,110 | | | | 0.66 | (d) | | | 0.86 | (d) | | | 1.53 | (d) | | | 31 | |
| | | | | | (0.42 | ) | | | 33.41 | (e) | | | 30.95 | (e) | | | 53,333 | | | | 0.86 | (d) | | | 0.86 | (d) | | | 1.66 | (d) | | | 45 | |
| | | | | | (1.11 | ) | | | 25.88 | | | | (1.08 | ) | | | 55,877 | | | | 0.88 | (d) | | | 0.88 | (d) | | | 2.16 | (d) | | | 50 | |
| | | | | | (0.46 | ) | | | 27.33 | | | | 3.01 | | | | 92,289 | | | | 0.91 | (d) | | | 0.91 | (d) | | | 1.60 | (d) | | | 48 | |
| | | | | | (0.29 | ) | | | 26.99 | | | | 27.09 | | | | 89,928 | | | | 0.91 | (d) | | | 0.91 | (d) | | | 1.66 | (d) | | | 40 | |
| | | | | | | | | | | | | | | | | | | | | | | | | | | | | | | | | | |
| | | | | $ | (0.41 | ) | | $ | 27.67 | | | | (12.57 | )% | | $ | 11,686 | | | | 0.59 | %(c) | | | 0.81 | %(c) | | | 2.33 | %(c) | | | 28 | % |
| | | | | | (3.18 | ) | | | 32.13 | | | | (4.25 | ) | | | 2,167 | | | | 0.59 | (c)(d) | | | 0.81 | (c)(d) | | | 1.04 | (c)(d) | | | 31 | |
| | | | | | | | | | | | | | | | | | | | | | | | | | | | | | | | | | |
| | | | | $ | (0.34 | ) | | $ | 26.72 | | | | (12.68 | )% | | $ | 22,405 | | | | 0.89 | %(c) | | | 1.11 | %(c) | | | 1.58 | %(c) | | | 28 | % |
| | | | | | (3.09 | ) | | | 31.00 | | | | 4.98 | | | | 18,947 | | | | 0.92 | (d) | | | 1.11 | (d) | | | 1.32 | (d) | | | 31 | |
| | | | | | (0.37 | ) | | | 32.35 | (e) | | | 30.66 | (e) | | | 5,120 | | | | 1.11 | (d) | | | 1.11 | (d) | | | 1.40 | (d) | | | 45 | |
| | | | | | (1.06 | ) | | | 25.08 | | | | (1.36 | ) | | | 3,792 | | | | 1.13 | (d) | | | 1.13 | (d) | | | 1.98 | (d) | | | 50 | |
| | | | | | (0.41 | ) | | | 26.54 | | | | 2.77 | | | | 4,698 | | | | 1.16 | (d) | | | 1.16 | (d) | | | 1.33 | (d) | | | 48 | |
| | | | | | (0.23 | ) | | | 26.23 | | | | 26.77 | | | | 4,961 | | | | 1.16 | (d) | | | 1.16 | (d) | | | 1.36 | (d) | | | 40 | |
| | | | | | | | |
| See accompanying Notes to Financial Statements | | | December 31, 2018 | | | Semiannual Report | | | 131 | |
Financial Highlights (cont’d)
For a Share Outstanding for the Period ended:^
| | | | | | | | | | | | | | | | | | | | | | | | | | | | |
| | | Net Asset Value, Beginning of Period | | | Net Investment Income (a) | | |
Net Realized and Change in Unrealized Gain (Loss) | | | Total from Investment Operations | | | Dividends from Net Investment Income | | | Distributions from Net Realized Capital Gains | | | | |
| AllianzGI NFJ Small-Cap Value: | | | | | | | | | | | | | | | | | | | | | |
| Class A | | | | | | | | | | | | | | | | | | | | | | | | | | | | |
12/31/2018† | | $ | 21.71 | | | $ | 0.18 | | | $ | (4.47 | ) | | $ | (4.29 | ) | | $ | (0.66 | ) | | $ | (4.08 | ) | | | | |
6/30/2018 | | | 24.36 | | | | 0.29 | | | | 1.44 | | | | 1.73 | | | | (0.12 | ) | | | (4.26 | ) | | | | |
6/30/2017 | | | 20.82 | | | | 0.30 | | | | 4.12 | | | | 4.42 | | | | (0.32 | ) | | | (0.56 | ) | | | | |
6/30/2016 | | | 25.91 | | | | 0.41 | | | | (1.92 | ) | | | (1.51 | ) | | | (0.35 | ) | | | (3.23 | ) | | | | |
6/30/2015 | | | 35.24 | | | | 0.41 | | | | (1.95 | ) | | | (1.54 | ) | | | (0.67 | ) | | | (7.12 | ) | | | | |
6/30/2014 | | | 31.96 | | | | 0.39 | | | | 6.96 | | | | 7.35 | | | | (0.35 | ) | | | (3.72 | ) | | | | |
| Class C | | | | | | | | | | | | | | | | | | | | | | | | | | | | |
12/31/2018† | | $ | 19.30 | | | $ | 0.09 | | | $ | (3.95 | ) | | $ | (3.86 | ) | | $ | — | | | $ | (4.08 | ) | | | | |
6/30/2018 | | | 22.14 | | | | 0.11 | | | | 1.31 | | | | 1.42 | | | | — | | | | (4.26 | ) | | | | |
6/30/2017 | | | 19.02 | | | | 0.12 | | | | 3.75 | | | | 3.87 | | | | (0.19 | ) | | | (0.56 | ) | | | | |
6/30/2016 | | | 23.99 | | | | 0.23 | | | | (1.78 | ) | | | (1.55 | ) | | | (0.19 | ) | | | (3.23 | ) | | | | |
6/30/2015 | | | 33.27 | | | | 0.17 | | | | (1.85 | ) | | | (1.68 | ) | | | (0.48 | ) | | | (7.12 | ) | | | | |
6/30/2014 | | | 30.40 | | | | 0.13 | | | | 6.59 | | | | 6.72 | | | | (0.13 | ) | | | (3.72 | ) | | | | |
| Class R | | | | | | | | | | | | | | | | | | | | | | | | | | | | |
12/31/2018† | | $ | 23.10 | | | $ | 0.16 | | | $ | (4.75 | ) | | $ | (4.59 | ) | | $ | (0.58 | ) | | $ | (4.08 | ) | | | | |
6/30/2018 | | | 25.64 | | | | 0.25 | | | | 1.51 | | | | 1.76 | | | | (0.04 | ) | | | (4.26 | ) | | | | |
6/30/2017 | | | 21.87 | | | | 0.25 | | | | 4.34 | | | | 4.59 | | | | (0.26 | ) | | | (0.56 | ) | | | | |
6/30/2016 | | | 26.99 | | | | 0.37 | | | | (1.99 | ) | | | (1.62 | ) | | | (0.27 | ) | | | (3.23 | ) | | | | |
6/30/2015 | | | 36.37 | | | | 0.34 | | | | (2.02 | ) | | | (1.68 | ) | | | (0.58 | ) | | | (7.12 | ) | | | | |
6/30/2014 | | | 32.87 | | | | 0.31 | | | | 7.17 | | | | 7.48 | | | | (0.26 | ) | | | (3.72 | ) | | | | |
| Class P | | | | | | | | | | | | | | | | | | | | | | | | | | | | |
12/31/2018† | | $ | 24.18 | | | $ | 0.23 | | | $ | (4.98 | ) | | $ | (4.75 | ) | | $ | (0.72 | ) | | $ | (4.08 | ) | | | | |
6/30/2018 | | | 26.69 | | | | 0.39 | | | | 1.56 | | | | 1.95 | | | | (0.20 | ) | | | (4.26 | ) | | | | |
6/30/2017 | | | 22.74 | | | | 0.36 | | | | 4.54 | | | | 4.90 | | | | (0.39 | ) | | | (0.56 | ) | | | | |
6/30/2016 | | | 27.92 | | | | 0.51 | | | | (2.06 | ) | | | (1.55 | ) | | | (0.40 | ) | | | (3.23 | ) | | | | |
6/30/2015 | | | 37.36 | | | | 0.51 | | | | (2.07 | ) | | | (1.56 | ) | | | (0.76 | ) | | | (7.12 | ) | | | | |
6/30/2014 | | | 33.59 | | | | 0.48 | | | | 7.37 | | | | 7.85 | | | | (0.36 | ) | | | (3.72 | ) | | | | |
| Institutional Class | | | | | | | | | | | | | | | | | | | | | | | | | | | | |
12/31/2018† | | $ | 24.34 | | | $ | 0.24 | | | $ | (5.01 | ) | | $ | (4.77 | ) | | $ | (0.72 | ) | | $ | (4.08 | ) | | | | |
6/30/2018 | | | 26.82 | | | | 0.42 | | | | 1.58 | | | | 2.00 | | | | (0.22 | ) | | | (4.26 | ) | | | | |
6/30/2017 | | | 22.84 | | | | 0.42 | | | | 4.53 | | | | 4.95 | | | | (0.41 | ) | | | (0.56 | ) | | | | |
6/30/2016 | | | 28.05 | | | | 0.55 | | | | (2.08 | ) | | | (1.53 | ) | | | (0.45 | ) | | | (3.23 | ) | | | | |
6/30/2015 | | | 37.46 | | | | 0.56 | | | | (2.07 | ) | | | (1.51 | ) | | | (0.78 | ) | | | (7.12 | ) | | | | |
6/30/2014 | | | 33.73 | | | | 0.56 | | | | 7.36 | | | | 7.92 | | | | (0.47 | ) | | | (3.72 | ) | | | | |
| Class R6 | | | | | | | | | | | | | | | | | | | | | | | | | | | | |
12/31/2018† | | $ | 24.25 | | | $ | 0.25 | | | $ | (5.00 | ) | | $ | (4.75 | ) | | $ | (0.74 | ) | | $ | (4.08 | ) | | | | |
6/30/2018 | | | 26.75 | | | | 0.44 | | | | 1.56 | | | | 2.00 | | | | (0.24 | ) | | | (4.26 | ) | | | | |
6/30/2017 | | | 22.79 | | | | 0.41 | | | | 4.55 | | | | 4.96 | | | | (0.44 | ) | | | (0.56 | ) | | | | |
6/30/2016 | | | 28.02 | | | | 0.56 | | | | (2.08 | ) | | | (1.52 | ) | | | (0.48 | ) | | | (3.23 | ) | | | | |
6/30/2015 | | | 37.47 | | | | 0.40 | | | | (1.90 | ) | | | (1.50 | ) | | | (0.83 | ) | | | (7.12 | ) | | | | |
12/19/2013* - 6/30/2014 | | | 34.19 | | | | 0.29 | | | | 2.99 | | | | 3.28 | | | | — | | | | — | | | | | |
| Administrative Class | | | | | | | | | | | | | | | | | | | | | | | | | | | | |
12/31/2018† | | $ | 21.65 | | | $ | 0.19 | | | $ | (4.47 | ) | | $ | (4.28 | ) | | $ | (0.66 | ) | | $ | (4.08 | ) | | | | |
6/30/2018 | | | 24.30 | | | | 0.32 | | | | 1.43 | | | | 1.75 | | | | (0.14 | ) | | | (4.26 | ) | | | | |
6/30/2017 | | | 20.78 | | | | 0.33 | | | | 4.11 | | | | 4.44 | | | | (0.36 | ) | | | (0.56 | ) | | | | |
6/30/2016 | | | 25.87 | | | | 0.45 | | | | (1.92 | ) | | | (1.47 | ) | | | (0.39 | ) | | | (3.23 | ) | | | | |
6/30/2015 | | | 35.19 | | | | 0.46 | | | | (1.96 | ) | | | (1.50 | ) | | | (0.70 | ) | | | (7.12 | ) | | | | |
6/30/2014 | | | 31.92 | | | | 0.44 | | | | 6.95 | | | | 7.39 | | | | (0.40 | ) | | | (3.72 | ) | | | | |
| ^ | A — may reflect actual amounts rounding to less than $0.01 or 0.01%. |
| * | Commencement of operations. |
| (a) | Calculated on average shares outstanding during the period. |
| (b) | Total return is calculated assuming a purchase of a share on the first day of the period and a sale of a share on the last day of each period reported. Dividends and distributions, if any, are assumed, for purposes of this calculation, to be reinvested. Total return does not reflect sales charges and includes the effect of fee waivers and reimbursements. Total return may reflect adjustments to conform to U.S. GAAP. Total return for a period of less than one year is not annualized. |
| (c) | Annualized, unless otherwise noted. |
| (d) | Does not include expenses of the investment companies in which the Fund invests. |
| (e) | Payments from Affiliates increased the end of period net asset value and total return by less than $0.01 and 0.00%, respectively. |
| | | | | | |
| 132 | | Semiannual Report | | | December 31, 2018 | | | See accompanying Notes to Financial Statements |
| | | | | | | | | | | | | | | | | | | | | | | | | | | | | | | | | | |
| | | | Total Dividends and Distributions | | | Net Asset Value, End of Period | | | Total Return (b) | | | Net Assets, End of Period (000s) | | | Ratio of Expenses to Average Net Assets with Fee Waiver/ Reimbursement | | | Ratio of Expenses to Average Net Assets without Fee Waiver/ Reimbursement | | | Ratio of Net
Investment Income to Average Net Assets | | | Portfolio Turnover Rate | |
| | | | | | | | | | | | | | | | | | | | | | | | | | |
| | | | | | | | | | | | | | | | | | | | | | | | | | | | | | | | | | |
| | | | | $ | (4.74 | ) | | $ | 12.68 | | | | (19.46 | )% | | $ | 450,613 | | | | 1.20 | %(c) | | | 1.26 | %(c) | | | 1.74 | %(c) | | | 17 | % |
| | | | | | (4.38 | ) | | | 21.71 | | | | 7.04 | | | | 718,104 | | | | 1.20 | | | | 1.25 | | | | 1.27 | | | | 24 | |
| | | | | | (0.88 | ) | | | 24.36 | | | | 21.38 | | | | 788,438 | | | | 1.20 | (d) | | | 1.24 | (d) | | | 1.31 | (d) | | | 30 | |
| | | | | | (3.58 | ) | | | 20.82 | | | | (5.31 | ) | | | 1,037,525 | | | | 1.22 | (d) | | | 1.23 | (d) | | | 1.88 | (d) | | | 48 | |
| | | | | | (7.79 | ) | | | 25.91 | (e) | | | (3.77 | )(e) | | | 1,592,000 | | | | 1.18 | | | | 1.21 | | | | 1.39 | | | | 42 | |
| | | | | | (4.07 | ) | | | 35.24 | | | | 24.36 | | | | 2,250,556 | | | | 1.17 | | | | 1.21 | | | | 1.15 | | | | 29 | |
| | | | | | | | | | | | | | | | | | | | | | | | | | | | | | | | | | |
| | | | | $ | (4.08 | ) | | $ | 11.36 | | | | (19.72 | )% | | $ | 12,121 | | | | 1.95 | %(c) | | | 2.01 | %(c) | | | 0.91 | %(c) | | | 17 | % |
| | | | | | (4.26 | ) | | | 19.30 | | | | 6.26 | | | | 106,052 | | | | 1.95 | | | | 2.00 | | | | 0.54 | | | | 24 | |
| | | | | | (0.75 | ) | | | 22.14 | | | | 20.45 | | | | 135,225 | | | | 1.95 | (d) | | | 1.99 | (d) | | | 0.56 | (d) | | | 30 | |
| | | | | | (3.42 | ) | | | 19.02 | | | | (5.99 | ) | | | 175,139 | | | | 1.97 | (d) | | | 1.98 | (d) | | | 1.14 | (d) | | | 48 | |
| | | | | | (7.60 | ) | | | 23.99 | (e) | | | (4.52 | )(e) | | | 259,629 | | | | 1.93 | | | | 1.96 | | | | 0.63 | | | | 42 | |
| | | | | | (3.85 | ) | | | 33.27 | | | | 23.43 | | | | 342,352 | | | | 1.92 | | | | 1.96 | | | | 0.40 | | | | 29 | |
| | | | | | | | | | | | | | | | | | | | | | | | | | | | | | | | | | |
| | | | | $ | (4.66 | ) | | $ | 13.85 | | | | (19.59 | )% | | $ | 24,494 | | | | 1.45 | %(c) | | | 1.51 | %(c) | | | 1.49 | %(c) | | | 17 | % |
| | | | | | (4.30 | ) | | | 23.10 | | | | 6.77 | | | | 37,655 | | | | 1.45 | | | | 1.50 | | | | 1.02 | | | | 24 | |
| | | | | | (0.82 | ) | | | 25.64 | | | | 21.09 | | | | 51,759 | | | | 1.45 | (d) | | | 1.49 | (d) | | | 1.04 | (d) | | | 30 | |
| | | | | | (3.50 | ) | | | 21.87 | | | | (5.52 | ) | | | 64,707 | | | | 1.47 | (d) | | | 1.48 | (d) | | | 1.62 | (d) | | | 48 | |
| | | | | | (7.70 | ) | | | 26.99 | (e) | | | (4.06 | )(e) | | | 97,345 | | | | 1.43 | | | | 1.46 | | | | 1.13 | | | | 42 | |
| | | | | | (3.98 | ) | | | 36.37 | | | | 24.06 | | | | 131,571 | | | | 1.42 | | | | 1.46 | | | | 0.90 | | | | 29 | |
| | | | | | | | | | | | | | | | | | | | | | | | | | | | | | | | | | |
| | | | | $ | (4.80 | ) | | $ | 14.63 | | | | (19.39 | )% | | $ | 39,434 | | | | 0.95 | %(c) | | | 1.01 | %(c) | | | 2.00 | %(c) | | | 17 | % |
| | | | | | (4.46 | ) | | | 24.18 | | | | 7.27 | | | | 65,466 | | | | 0.95 | | | | 1.00 | | | | 1.54 | | | | 24 | |
| | | | | | (0.95 | ) | | | 26.69 | | | | 21.66 | | | | 72,679 | | | | 0.95 | (d) | | | 0.99 | (d) | | | 1.42 | (d) | | | 30 | |
| | | | | | (3.63 | ) | | | 22.74 | | | | (5.01 | ) | | | 58,556 | | | | 0.97 | (d) | | | 0.98 | (d) | | | 2.13 | (d) | | | 48 | |
| | | | | | (7.88 | ) | | | 27.92 | (e) | | | (3.58 | )(e) | | | 106,077 | | | | 0.93 | | | | 0.96 | | | | 1.63 | | | | 42 | |
| | | | | | (4.08 | ) | | | 37.36 | | | | 24.68 | | | | 93,195 | | | | 0.92 | | | | 0.96 | | | | 1.34 | | | | 29 | |
| | | | | | | | | | | | | | | | | | | | | | | | | | | | | | | | | | |
| | | | | $ | (4.80 | ) | | $ | 14.77 | | | | (19.33 | )% | | $ | 377,181 | | | | 0.85 | %(c) | | | 0.91 | %(c) | | | 2.05 | %(c) | | | 17 | % |
| | | | | | (4.48 | ) | | | 24.34 | | | | 7.43 | | | | 778,547 | | | | 0.85 | | | | 0.90 | | | | 1.61 | | | | 24 | |
| | | | | | (0.97 | ) | | | 26.82 | | | | 21.82 | | | | 1,213,861 | | | | 0.83 | (d) | | | 0.89 | (d) | | | 1.68 | (d) | | | 30 | |
| | | | | | (3.68 | ) | | | 22.84 | | | | (4.93 | ) | | | 1,800,472 | | | | 0.82 | (d) | | | 0.88 | (d) | | | 2.28 | (d) | | | 48 | |
| | | | | | (7.90 | ) | | | 28.05 | (e) | | | (3.40 | )(e) | | | 2,866,196 | | | | 0.78 | | | | 0.86 | | | | 1.78 | | | | 42 | |
| | | | | | (4.19 | ) | | | 37.46 | | | | 24.85 | | | | 3,749,112 | | | | 0.77 | | | | 0.86 | | | | 1.55 | | | | 29 | |
| | | | | | | | | | | | | | | | | | | | | | | | | | | | | | | | | | |
| | | | | $ | (4.82 | ) | | $ | 14.68 | | | | (19.30 | )% | | $ | 184,556 | | | | 0.80 | %(c) | | | 0.86 | %(c) | | | 2.12 | %(c) | | | 17 | % |
| | | | | | (4.50 | ) | | | 24.25 | | | | 7.44 | | | | 347,379 | | | | 0.80 | | | | 0.85 | | | | 1.70 | | | | 24 | |
| | | | | | (1.00 | ) | | | 26.75 | | | | 21.90 | | | | 464,279 | | | | 0.79 | (d) | | | 0.84 | (d) | | | 1.60 | (d) | | | 30 | |
| | | | | | (3.71 | ) | | | 22.79 | | | | (4.86 | ) | | | 371,453 | | | | 0.77 | (d) | | | 0.83 | (d) | | | 2.39 | (d) | | | 48 | |
| | | | | | (7.95 | ) | | | 28.02 | (e) | | | (3.37 | )(e) | | | 235,613 | | | | 0.73 | | | | 0.81 | | | | 1.36 | | | | 42 | |
| | | | | | — | | | | 37.47 | | | | 9.59 | | | | 27,994 | | | | 0.72 | (c) | | | 0.81 | (c) | | | 1.49 | (c) | | | 29 | |
| | | | | | | | | | | | | | | | | | | | | | | | | | | | | | | | | | |
| | | | | $ | (4.74 | ) | | $ | 12.63 | | | | (19.44 | )% | | $ | 121,208 | | | | 1.10 | %(c) | | | 1.16 | %(c) | | | 1.82 | %(c) | | | 17 | % |
| | | | | | (4.40 | ) | | | 21.65 | | | | 7.14 | | | | 206,749 | | | | 1.10 | | | | 1.15 | | | | 1.38 | | | | 24 | |
| | | | | | (0.92 | ) | | | 24.30 | | | | 21.52 | | | | 365,241 | | | | 1.09 | (d) | | | 1.14 | (d) | | | 1.43 | (d) | | | 30 | |
| | | | | | (3.62 | ) | | | 20.78 | | | | (5.11 | ) | | | 494,621 | | | | 1.07 | (d) | | | 1.13 | (d) | | | 2.03 | (d) | | | 48 | |
| | | | | | (7.82 | ) | | | 25.87 | (e) | | | (3.62 | )(e) | | | 811,305 | | | | 1.03 | | | | 1.11 | | | | 1.54 | | | | 42 | |
| | | | | | (4.12 | ) | | | 35.19 | | | | 24.55 | | | | 1,220,261 | | | | 1.02 | | | | 1.11 | | | | 1.30 | | | | 29 | |
| | | | | | | | |
| See accompanying Notes to Financial Statements | | | December 31, 2018 | | | Semiannual Report | | | 133 | |
Financial Highlights (cont’d)
For a Share Outstanding for the Period ended:^
| | | | | | | | | | | | | | | | | | | | | | | | | | | | |
| | | Net Asset
Value,
Beginning
of Period | | | Net
Investment
Income
(Loss) (a) | | | Net Realized
and Change
in Unrealized
Gain (Loss) | | | Total from
Investment
Operations | | |
Dividends
from Net
Investment
Income | | | Distributions
from Net
Realized Capital
Gains | | | | |
| AllianzGI Small-Cap: | | | | | | | | | | | | | | | | | | | | | |
| Class A | | | | | | | | | | | | | | | | | | | | | | | | | | | | |
12/31/2018† | | $ | 21.61 | | | $ | 0.06 | | | $ | (3.46 | ) | | $ | (3.40 | ) | | $ | — | | | $ | (1.63 | ) | | | | |
6/30/2018 | | | 20.51 | | | | (0.02 | ) | | | 3.92 | | | | 3.90 | | | | — | | | | (2.80 | ) | | | | |
6/30/2017 | | | 16.71 | | | | 0.03 | | | | 3.79 | | | | 3.82 | | | | (0.01 | ) | | | (0.01 | ) | | | | |
6/30/2016 | | | 18.41 | | | | 0.03 | | | | (1.14 | ) | | | (1.11 | ) | | | (0.09 | ) | | | (0.50 | ) | | | | |
6/30/2015 | | | 18.28 | | | | 0.09 | | | | 0.93 | | | | 1.02 | | | | (0.05 | ) | | | (0.84 | ) | | | | |
7/2/2013* - 6/30/2014 | | | 15.00 | | | | 0.08 | | | | 3.38 | | | | 3.46 | | | | (0.06 | ) | | | (0.12 | ) | | | | |
| Class C | | | | | | | | | | | | | | | | | | | | | | | | | | | | |
12/31/2018† | | $ | 20.92 | | | $ | (0.03 | ) | | $ | (3.33 | ) | | $ | (3.36 | ) | | $ | — | | | $ | (1.63 | ) | | | | |
6/30/2018 | | | 20.07 | | | | (0.17 | ) | | | 3.82 | | | | 3.65 | | | | — | | | | (2.80 | ) | | | | |
6/30/2017 | | | 16.48 | | | | (0.11 | ) | | | 3.71 | | | | 3.60 | | | | — | | | | (0.01 | ) | | | | |
6/30/2016 | | | 18.20 | | | | (0.10 | ) | | | (1.12 | ) | | | (1.22 | ) | | | — | | | | (0.50 | ) | | | | |
6/30/2015 | | | 18.16 | | | | (0.05 | ) | | | 0.93 | | | | 0.88 | | | | — | | | | (0.84 | ) | | | | |
7/2/2013* - 6/30/2014 | | | 15.00 | | | | (0.07 | ) | | | 3.40 | | | | 3.33 | | | | (0.05 | ) | | | (0.12 | ) | | | | |
| Class P | | | | | | | | | | | | | | | | | | | | | | | | | | | | |
12/31/2018† | | $ | 21.81 | | | $ | 0.09 | | | $ | (3.50 | ) | | $ | (3.41 | ) | | $ | — | | | $ | (1.63 | ) | | | | |
6/30/2018 | | | 20.63 | | | | 0.03 | | | | 3.95 | | | | 3.98 | | | | — | | | | (2.80 | ) | | | | |
6/30/2017 | | | 16.77 | | | | 0.07 | | | | 3.81 | | | | 3.88 | | | | (0.01 | ) | | | (0.01 | ) | | | | |
6/30/2016 | | | 18.49 | | | | 0.07 | | | | (1.15 | ) | | | (1.08 | ) | | | (0.14 | ) | | | (0.50 | ) | | | | |
6/30/2015 | | | 18.33 | | | | 0.13 | | | | 0.95 | | | | 1.08 | | | | (0.08 | ) | | | (0.84 | ) | | | | |
7/2/2013* - 6/30/2014 | | | 15.00 | | | | 0.10 | | | | 3.41 | | | | 3.51 | | | | (0.06 | ) | | | (0.12 | ) | | | | |
| Institutional Class | | | | | | | | | | | | | | | | | | | | | | | | | | | | |
12/31/2018† | | $ | 21.96 | | | $ | 0.10 | | | $ | (3.52 | ) | | $ | (3.42 | ) | | $ | — | | | $ | (1.63 | ) | | | | |
6/30/2018 | | | 20.73 | | | | 0.05 | | | | 3.98 | | | | 4.03 | | | | — | | | | (2.80 | ) | | | | |
6/30/2017 | | | 16.84 | | | | 0.10 | | | | 3.81 | | | | 3.91 | | | | (0.01 | ) | | | (0.01 | ) | | | | |
6/30/2016 | | | 18.49 | | | | 0.08 | | | | (1.13 | ) | | | (1.05 | ) | | | (0.10 | ) | | | (0.50 | ) | | | | |
6/30/2015 | | | 18.34 | | | | 0.15 | | | | 0.94 | | | | 1.09 | | | | (0.10 | ) | | | (0.84 | ) | | | | |
7/2/2013* - 6/30/2014 | | | 15.00 | | | | 0.11 | | | | 3.42 | | | | 3.53 | | | | (0.07 | ) | | | (0.12 | ) | | | | |
| Class R6 | | | | | | | | | | | | | | | | | | | | | | | | | | | | |
8/22/2018*- 12/31/2018† | | $ | 23.16 | | | $ | 0.07 | | | $ | (4.69 | ) | | $ | (4.62 | ) | | $ | — | | | $ | (1.63 | ) | | | | |
| ^ | A — may reflect actual amounts rounding to less than $0.01 or 0.01%. |
| * | Commencement of operations. |
| (a) | Calculated on average shares outstanding during the period. |
| (b) | Total return is calculated assuming a purchase of a share on the first day of the period and a sale of a share on the last day of each period reported. Dividends and distributions, if any, are assumed, for purposes of this calculation, to be reinvested. Total return does not reflect sales charges and includes the effect of fee waivers and reimbursements. Total return may reflect adjustments to conform to U.S. GAAP. Total return for a period of less than one year is not annualized. |
| (c) | Annualized, unless otherwise noted. |
| (d) | Does not include expenses of the investment companies in which the Fund invests. |
| (e) | Payments from Affiliates increased the end of period net asset value and total return by less than $0.01 and 0.01%, respectively. |
| | | | | | |
| 134 | | Semiannual Report | | | December 31, 2018 | | | See accompanying Notes to Financial Statements |
| | | | | | | | | | | | | | | | | | | | | | | | | | | | | | | | | | |
| | | | Total
Dividends and
Distributions | | | Net Asset
Value, End
of Period | | | Total Return (b) | | | Net Assets,
End of Period
(000s) | | | Ratio of
Expenses to
Average Net
Assets with
Fee Waiver/
Reimbursement | | | Ratio of
Expenses to
Average Net
Assets without
Fee Waiver/
Reimbursement | | | Ratio of Net
Investment
Income (Loss)
to Average
Net Assets | | | Portfolio
Turnover Rate | |
| | | | | | | | | | | | | | | | | | | | | | | | | | |
| | | | | | | | | | | | | | | | | | | | | | | | | | | | | | | | | | |
| | | | | $ | (1.63 | ) | | $ | 16.58 | | | | (15.60 | )% | | $ | 58,648 | | | | 1.19 | %(c) | | | 1.27 | %(c) | | | 0.59 | %(c) | | | 39 | % |
| | | | | | (2.80 | ) | | | 21.61 | | | | 19.96 | | | | 44,860 | | | | 1.31 | (d) | | | 1.31 | (d) | | | (0.07 | )(d) | | | 126 | |
| | | | | | (0.02 | ) | | | 20.51 | (e) | | | 22.82 | (e) | | | 39,509 | | | | 1.31 | | | | 1.31 | | | | 0.15 | | | | 152 | |
| | | | | | (0.59 | ) | | | 16.71 | | | | (6.02 | ) | | | 32,660 | | | | 1.27 | | | | 1.31 | | | | 0.17 | | | | 139 | |
| | | | | | (0.89 | ) | | | 18.41 | | | | 6.01 | | | | 38,579 | | | | 1.24 | | | | 1.30 | | | | 0.47 | | | | 148 | |
| | | | | | (0.18 | ) | | | 18.28 | | | | 23.15 | | | | 103 | | | | 1.31 | (c) | | | 3.19 | (c) | | | 0.46 | (c) | | | 119 | |
| | | | | | | | | | | | | | | | | | | | | | | | | | | | | | | | | | |
| | | | | $ | (1.63 | ) | | $ | 15.93 | | | | (15.92 | )% | | $ | 7,772 | | | | 1.94 | %(c) | | | 2.02 | %(c) | | | (0.28 | )%(c) | | | 39 | % |
| | | | | | (2.80 | ) | | | 20.92 | | | | 19.10 | | | | 35,080 | | | | 2.06 | (d) | | | 2.06 | (d) | | | (0.82 | )(d) | | | 126 | |
| | | | | | (0.01 | ) | | | 20.07 | (e) | | | 21.82 | (e) | | | 32,802 | | | | 2.06 | | | | 2.06 | | | | (0.60 | ) | | | 152 | |
| | | | | | (0.50 | ) | | | 16.48 | | | | (6.72 | ) | | | 36,607 | | | | 2.02 | | | | 2.06 | | | | (0.58 | ) | | | 139 | |
| | | | | | (0.84 | ) | | | 18.20 | | | | 5.27 | | | | 44,067 | | | | 1.99 | | | | 2.05 | | | | (0.29 | ) | | | 148 | |
| | | | | | (0.17 | ) | | | 18.16 | | | | 22.28 | | | | 39 | | | | 2.06 | (c) | | | 3.99 | (c) | | | (0.38 | )(c) | | | 119 | |
| | | | | | | | | | | | | | | | | | | | | | | | | | | | | | | | | | |
| | | | | $ | (1.63 | ) | | $ | 16.77 | | | | (15.50 | )% | | $ | 7,376 | | | | 0.94 | %(c) | | | 1.02 | %(c) | | | 0.84 | %(c) | | | 39 | % |
| | | | | | (2.80 | ) | | | 21.81 | | | | 20.25 | | | | 6,883 | | | | 1.06 | (d) | | | 1.06 | (d) | | | 0.12 | (d) | | | 126 | |
| | | | | | (0.02 | ) | | | 20.63 | (e) | | | 23.12 | (e) | | | 3,425 | | | | 1.06 | | | | 1.06 | | | | 0.39 | | | | 152 | |
| | | | | | (0.64 | ) | | | 16.77 | | | | (5.82 | ) | | | 3,246 | | | | 1.02 | | | | 1.06 | | | | 0.43 | | | | 139 | |
| | | | | | (0.92 | ) | | | 18.49 | | | | 6.36 | | | | 2,143 | | | | 0.99 | | | | 1.05 | | | | 0.73 | | | | 148 | |
| | | | | | (0.18 | ) | | | 18.33 | | | | 23.43 | | | | 13 | | | | 1.06 | (c) | | | 3.40 | (c) | | | 0.56 | (c) | | | 119 | |
| | | | | | | | | | | | | | | | | | | | | | | | | | | | | | | | | | |
| | | | | $ | (1.63 | ) | | $ | 16.91 | | | | (15.44 | )% | | $ | 6,059 | | | | 0.84 | %(c) | | | 0.92 | %(c) | | | 0.90 | %(c) | | | 39 | % |
| | | | | | (2.80 | ) | | | 21.96 | | | | 20.40 | | | | 8,104 | | | | 0.96 | (d) | | | 0.96 | (d) | | | 0.21 | (d) | | | 126 | |
| | | | | | (0.02 | ) | | | 20.73 | (e) | | | 23.22 | (e) | | | 3,037 | | | | 0.96 | | | | 0.96 | | | | 0.52 | | | | 152 | |
| | | | | | (0.60 | ) | | | 16.84 | | | | (5.69 | ) | | | 2,738 | | | | 0.92 | | | | 0.96 | | | | 0.46 | | | | 139 | |
| | | | | | (0.94 | ) | | | 18.49 | | | | 6.41 | | | | 6,656 | | | | 0.93 | | | | 0.95 | | | | 0.86 | | | | 148 | |
| | | | | | (0.19 | ) | | | 18.34 | | | | 23.56 | | | | 6,277 | | | | 0.96 | (c) | | | 3.30 | (c) | | | 0.66 | (c) | | | 119 | |
| | | | | | | | | | | | | | | | | | | | | | | | | | | | | | | | | | |
| | | | | $ | (1.63 | ) | | $ | 16.91 | | | | (19.82 | )% | | $ | 8 | | | | 0.79 | %(c) | | | 0.87 | %(c) | | | 0.97 | %(c) | | | 39 | % |
| | | | | | | | |
| See accompanying Notes to Financial Statements | | | December 31, 2018 | | | Semiannual Report | | | 135 | |
Financial Highlights (cont’d)
For a Share Outstanding for the Period ended:^
| | | | | | | | | | | | | | | | | | | | | | | | | | | | |
| | | Net Asset
Value,
Beginning
of Period | | | Net
Investment
Income
(Loss) (a) | | |
Net Realized
and Change
in Unrealized
Gain (Loss) | | | Total from
Investment
Operations | | | Distributions
from Net
Realized Capital
Gains | | | Net Asset
Value, End
of Period | | | | |
| AllianzGI Technology: | | | | | | | | | | | | | | | | | | | | | |
| Class A | | | | | | | | | | | | | | | | | | | | | | | | | | | | |
12/31/2018† | | $ | 71.60 | | | $ | (0.37 | ) | | $ | (7.14 | ) | | $ | (7.51 | ) | | $ | (12.90 | ) | | $ | 51.19 | | | | | |
6/30/2018 | | | 60.82 | | | | (0.64 | ) | | | 22.58 | | | | 21.94 | | | | (11.16 | ) | | | 71.60 | | | | | |
6/30/2017 | | | 48.03 | | | | (0.17 | )(e) | | | 15.75 | | | | 15.58 | | | | (2.79 | ) | | | 60.82 | (e) | | | | |
6/30/2016 | | | 58.15 | | | | (0.38 | ) | | | (1.07 | ) | | | (1.45 | ) | | | (8.67 | ) | | | 48.03 | | | | | |
6/30/2015 | | | 63.49 | | | | (0.54 | ) | | | 6.49 | | | | 5.95 | | | | (11.29 | ) | | | 58.15 | | | | | |
6/30/2014 | | | 50.70 | | | | (0.54 | ) | | | 17.81 | | | | 17.27 | | | | (4.48 | ) | | | 63.49 | | | | | |
| Class C | | | | | | | | | | | | | | | | | | | | | | | | | | | | |
12/31/2018† | | $ | 55.32 | | | $ | (0.51 | ) | | $ | (5.56 | ) | | $ | (6.07 | ) | | $ | (12.90 | ) | | $ | 36.35 | | | | | |
6/30/2018 | | | 49.43 | | | | (0.91 | ) | | | 17.96 | | | | 17.05 | | | | (11.16 | ) | | | 55.32 | | | | | |
6/30/2017 | | | 39.80 | | | | (0.46 | )(e) | | | 12.88 | | | | 12.42 | | | | (2.79 | ) | | | 49.43 | (e) | | | | |
6/30/2016 | | | 49.98 | | | | (0.66 | ) | | | (0.85 | ) | | | (1.51 | ) | | | (8.67 | ) | | | 39.80 | | | | | |
6/30/2015 | | | 56.46 | | | | (0.87 | ) | | | 5.68 | | | | 4.81 | | | | (11.29 | ) | | | 49.98 | | | | | |
6/30/2014 | | | 45.82 | | | | (0.88 | ) | | | 16.00 | | | | 15.12 | | | | (4.48 | ) | | | 56.46 | | | | | |
| Class P | | | | | | | | | | | | | | | | | | | | | | | | | | | | |
12/31/2018† | | $ | 79.05 | | | $ | (0.31 | ) | | $ | (7.86 | ) | | $ | (8.17 | ) | | $ | (12.90 | ) | | $ | 57.98 | | | | | |
6/30/2018 | | | 66.03 | | | | (0.53 | ) | | | 24.71 | | | | 24.18 | | | | (11.16 | ) | | | 79.05 | | | | | |
6/30/2017 | | | 51.80 | | | | — | (e) | | | 17.02 | | | | 17.02 | | | | (2.79 | ) | | | 66.03 | (e) | | | | |
6/30/2016 | | | 61.90 | | | | (0.27 | ) | | | (1.16 | ) | | | (1.43 | ) | | | (8.67 | ) | | | 51.80 | | | | | |
6/30/2015 | | | 66.74 | | | | (0.42 | ) | | | 6.87 | | | | 6.45 | | | | (11.29 | ) | | | 61.90 | | | | | |
6/30/2014 | | | 52.97 | | | | (0.42 | ) | | | 18.67 | | | | 18.25 | | | | (4.48 | ) | | | 66.74 | | | | | |
| Institutional Class | | | | | | | | | | | | | | | | | | | | | | | | | | | | |
12/31/2018† | | $ | 80.40 | | | $ | (0.28 | ) | | $ | (7.98 | ) | | $ | (8.26 | ) | | $ | (12.90 | ) | | $ | 59.24 | | | | | |
6/30/2018 | | | 66.94 | | | | (0.45 | ) | | | 25.07 | | | | 24.62 | | | | (11.16 | ) | | | 80.40 | | | | | |
6/30/2017 | | | 52.43 | | | | 0.06 | (e) | | | 17.24 | | | | 17.30 | | | | (2.79 | ) | | | 66.94 | (e) | | | | |
6/30/2016 | | | 62.49 | | | | (0.24 | ) | | | (1.15 | ) | | | (1.39 | ) | | | (8.67 | ) | | | 52.43 | | | | | |
6/30/2015 | | | 67.21 | | | | (0.36 | ) | | | 6.93 | | | | 6.57 | | | | (11.29 | ) | | | 62.49 | | | | | |
6/30/2014 | | | 53.27 | | | | (0.36 | ) | | | 18.78 | | | | 18.42 | | | | (4.48 | ) | | | 67.21 | | | | | |
| Administrative Class | | | | | | | | | | | | | | | | | | | | | | | | | | | | |
12/31/2018† | | $ | 75.76 | | | $ | (0.36 | ) | | $ | (7.53 | ) | | $ | (7.89 | ) | | $ | (12.90 | ) | | $ | 54.97 | | | | | |
6/30/2018 | | | 63.76 | | | | (0.61 | ) | | | 23.77 | | | | 23.16 | | | | (11.16 | ) | | | 75.76 | | | | | |
6/30/2017 | | | 50.18 | | | | (0.23 | )(e) | | | 16.60 | | | | 16.37 | | | | (2.79 | ) | | | 63.76 | (e) | | | | |
6/30/2016 | | | 60.32 | | | | (0.36 | ) | | | (1.11 | ) | | | (1.47 | ) | | | (8.67 | ) | | | 50.18 | | | | | |
6/30/2015 | | | 65.40 | | | | (0.50 | ) | | | 6.71 | | | | 6.21 | | | | (11.29 | ) | | | 60.32 | | | | | |
6/30/2014 | | | 52.06 | | | | (0.50 | ) | | | 18.32 | | | | 17.82 | | | | (4.48 | ) | | | 65.40 | | | | | |
| ^ | A — may reflect actual amounts rounding to less than $0.01 or 0.01%. |
| (a) | Calculated on average shares outstanding during the period. |
| (b) | Total return is calculated assuming a purchase of a share on the first day of the period and a sale of a share on the last day of each period reported. Dividends and distributions, if any, are assumed, for purposes of this calculation, to be reinvested. Total return does not reflect sales charges and includes the effect of fee waivers and reimbursements. Total return may reflect adjustments to conform to U.S. GAAP. Total return for a period of less than one year is not annualized. |
| (c) | Annualized, unless otherwise noted. |
| (d) | Does not include expenses of the investment companies in which the Fund invests. |
| (e) | An out of period adjustment of $3,694,541, which is included in miscellaneous income, related to income earned in previous years, decreased net investment loss per share and increased net asset value per share by approximately $0.15 for Class A; $0.13 for Class C; $0.20 for Class P; $0.20 for Institutional Class and $0.04 for Administrative Class. The increase in total return and decrease in ratio of net investment loss to average net assets relating to this income for each share class was approximately 0.33% and 0.28% for Class A; 0.35% and 0.29% for Class C; 0.40% and 0.33% for Class P; 0.40% and 0.32% for Institutional Class; 0.09% and 0.08% for Administrative Class, respectively. |
| | | | | | |
| 136 | | Semiannual Report | | | December 31, 2018 | | | See accompanying Notes to Financial Statements |
| | | | | | | | | | | | | | | | | | | | | | | | | | |
| | | | Total Return (b) | | | Net Assets,
End of Period
(000s) | | | Ratio of
Expenses to
Average Net
Assets with
Fee Waiver/
Reimbursement | | | Ratio of
Expenses to
Average Net
Assets without
Fee Waiver/
Reimbursement | | | Ratio of Net
Investment
Income (Loss)
to Average
Net Assets | | | Portfolio
Turnover Rate | |
| | | | | | | | | | | | | | | | | | | | |
| | | | | | | | | | | | | | | | | | | | | | | | | | |
| | | | | | (9.98 | )% | | $ | 503,654 | | | | 1.46 | %(c) | | | 1.56 | %(c) | | | (1.04 | )%(c) | | | 47 | % |
| | | | | | 38.89 | | | | 530,127 | | | | 1.42 | | | | 1.57 | | | | (0.95 | ) | | | 104 | |
| | | | | | 33.69 | (e) | | | 452,039 | | | | 1.51 | (d) | | | 1.61 | (d) | | | (0.31 | )(d)(e) | | | 128 | |
| | | | | | (3.24 | ) | | | 417,305 | | | | 1.66 | (d) | | | 1.66 | (d) | | | (0.74 | )(d) | | | 171 | |
| | | | | | 10.33 | | | | 340,765 | | | | 1.61 | | | | 1.61 | | | | (0.90 | ) | | | 165 | |
| | | | | | 35.10 | | | | 330,421 | | | | 1.59 | | | | 1.59 | | | | (0.92 | ) | | | 152 | |
| | | | | | | | | | | | | | | | | | | | | | | | | | |
| | | | | | (10.31 | )% | | $ | 41,555 | | | | 2.21 | %(c) | | | 2.31 | %(c) | | | (1.77 | )%(c) | | | 47 | % |
| | | | | | 37.86 | | | | 138,589 | | | | 2.17 | | | | 2.32 | | | | (1.70 | ) | | | 104 | |
| | | | | | 32.69 | (e) | | | 113,411 | | | | 2.26 | (d) | | | 2.36 | (d) | | | (1.05 | )(d)(e) | | | 128 | |
| | | | | | (3.95 | ) | | | 112,423 | | | | 2.41 | (d) | | | 2.41 | (d) | | | (1.53 | )(d) | | | 171 | |
| | | | | | 9.51 | | | | 130,395 | | | | 2.36 | | | | 2.36 | | | | (1.65 | ) | | | 165 | |
| | | | | | 34.08 | | | | 127,243 | | | | 2.34 | | | | 2.34 | | | | (1.67 | ) | | | 152 | |
| | | | | | | | | | | | | | | | | | | | | | | | | | |
| | | | | | (9.87 | )% | | $ | 116,508 | | | | 1.21 | %(c) | | | 1.31 | %(c) | | | (0.80 | )%(c) | | | 47 | % |
| | | | | | 39.24 | | | | 100,560 | | | | 1.17 | | | | 1.32 | | | | (0.71 | ) | | | 104 | |
| | | | | | 34.03 | (e) | | | 59,369 | | | | 1.26 | (d) | | | 1.35 | (d) | | | (0.01 | )(d)(e) | | | 128 | |
| | | | | | (2.99 | ) | | | 44,881 | | | | 1.41 | (d) | | | 1.41 | (d) | | | (0.50 | )(d) | | | 171 | |
| | | | | | 10.62 | | | | 53,710 | | | | 1.36 | | | | 1.36 | | | | (0.66 | ) | | | 165 | |
| | | | | | 35.43 | | | | 45,425 | | | | 1.34 | | | | 1.34 | | | | (0.67 | ) | | | 152 | |
| | | | | | | | | | | | | | | | | | | | | | | | | | |
| | | | | | (9.81 | )% | | $ | 707,818 | | | | 1.11 | %(c) | | | 1.21 | %(c) | | | (0.69 | )%(c) | | | 47 | % |
| | | | | | 39.37 | | | | 789,922 | | | | 1.07 | | | | 1.22 | | | | (0.59 | ) | | | 104 | |
| | | | | | 34.16 | (e) | | | 736,162 | | | | 1.16 | (d) | | | 1.25 | (d) | | | 0.09 | (d)(e) | | | 128 | |
| | | | | | (2.89 | ) | | | 518,761 | | | | 1.31 | (d) | | | 1.31 | (d) | | | (0.43 | )(d) | | | 171 | |
| | | | | | 10.71 | | | | 617,315 | | | | 1.26 | | | | 1.26 | | | | (0.55 | ) | | | 165 | |
| | | | | | 35.56 | | | | 544,216 | | | | 1.24 | | | | 1.24 | | | | (0.57 | ) | | | 152 | |
| | | | | | | | | | | | | | | | | | | | | | | | | | |
| | | | | | (9.93 | )% | | $ | 15,736 | | | | 1.36 | %(c) | | | 1.46 | %(c) | | | (0.94 | )%(c) | | | 47 | % |
| | | | | | 39.02 | | | | 23,535 | | | | 1.32 | | | | 1.47 | | | | (0.85 | ) | | | 104 | |
| | | | | | 33.83 | (e) | | | 15,062 | | | | 1.44 | (d) | | | 1.52 | (d) | | | (0.41 | )(d)(e) | | | 128 | |
| | | | | | (3.15 | ) | | | 62,913 | | | | 1.56 | (d) | | | 1.56 | (d) | | | (0.68 | )(d) | | | 171 | |
| | | | | | 10.44 | | | | 72,947 | | | | 1.51 | | | | 1.51 | | | | (0.80 | ) | | | 165 | |
| | | | | | 35.25 | | | | 65,147 | | | | 1.49 | | | | 1.49 | | | | (0.82 | ) | | | 152 | |
| | | | | | | | |
| See accompanying Notes to Financial Statements | | | December 31, 2018 | | | Semiannual Report | | | 137 | |
Notes to Financial Statements
December 31, 2018 (unaudited)
| 1. | ORGANIZATION AND SIGNIFICANT ACCOUNTING POLICIES |
Allianz Funds (the “Trust”) is registered under the Investment Company Act of 1940, as amended, as an open-end management investment company organized as a Massachusetts business trust and accordingly, follows the investment company accounting and reporting guidance of the Financial Accounting Standards Board (“FASB”) Accounting Standards Codification (“ASC”) Topic 946 Financial Services—Investment Companies. As of December 31, 2018, the Trust consisted of fourteen separate investment funds (each a “Fund” and collectively the “Funds”). Allianz Global Investors U.S. LLC (“AllianzGI U.S.” or the “Investment Adviser”) serves as the Funds’ investment adviser. The Investment Adviser is an indirect wholly-owned subsidiary of Allianz Asset Management of America L.P. (“AAM”). AAM is an indirect, wholly-owned subsidiary of Allianz SE, a publicly traded European insurance and financial services company. Currently, the Trust may offer up to seven classes of shares to new and existing investors: A, C, R, P, Institutional, R6 and Administrative.
The following Fund sold and issued shares of beneficial interest to Allianz Fund Investments, Inc. (“AFI”), an indirect wholly-owned subsidiary of Allianz SE, during the six months ended December 31, 2018:
| | | | | | | | | | | | |
|
| AllianzGI Small Cap | |
| Class | | Date | | | Shares | | | Amount | |
R6 | | | 8/22/18 | | | | 432 | | | $ | 10,000 | |
The investment objective of AllianzGI Emerging Markets Opportunities is to seek maximum long-term capital appreciation. The investment objective of AllianzGI Focused Growth, AllianzGI Global Natural Resources, AllianzGI Global Small-Cap, AllianzGI Health Sciences, AllianzGI Mid-Cap, AllianzGI Small-Cap and AllianzGI Technology is to seek long-term capital appreciation. The investment objective of AllianzGI NFJ Dividend Value, AllianzGI NFJ International Value, AllianzGI NFJ Large-Cap Value, AllianzGI NFJ Mid-Cap Value and AllianzGI NFJ Small-Cap Value is to seek long-term growth of capital and income. The investment objective of AllianzGI Income & Growth is to seek total return comprised of current income, current gains and capital appreciation. There can be no assurance that the Funds will meet their stated objectives.
The preparation of the Funds’ financial statements in accordance with accounting principles generally accepted in the United States of America (“U.S. GAAP”) requires the Funds’ management to make estimates and assumptions that affect the reported amounts and disclosures in each Fund’s financial statements. Actual results could differ from those estimates.
Like many other companies, the Trust’s organizational documents provide that its officers (“Officers”) and the Board of Trustees (the “Board” or the “Trustees”) are indemnified against certain liabilities arising out of the performance of their duties to the Trust. In addition, both in some of its principal service contracts and in the normal course of its business, the Trust enters into contracts that provide indemnifications to other parties for certain types of losses or
liabilities. The Trust’s maximum exposure under these arrangements is unknown as this could involve future claims against the Trust.
The following is a summary of significant accounting policies consistently followed by the Funds:
(a) Valuation of Investments. Portfolio securities and other financial instruments for which market quotations are readily available are stated at market value. Market values for various types of securities and other instruments are determined on the basis of closing prices or last sales prices on an exchange or other market, or based on quotes or other market information obtained from quotation reporting systems, established market makers or pricing services. Investments in mutual funds are valued at the net asset value (“NAV”) as reported on each business day. The Funds’ investments are valued daily using prices supplied by an independent pricing service or broker/dealer quotations, or by using the last sale or settlement price on the exchange that is the primary market for such securities, or the mean between the last bid and ask quotations. The market value for NASDAQ Global Market and NASDAQ Capital Market securities may also be calculated using the NASDAQ Official Closing Price instead of the last reported sales price. Independent pricing services use information provided by market makers or estimates of market values obtained from yield data relating to investments or securities with similar characteristics.
The Board has adopted procedures for valuing portfolio securities and other financial instruments in circumstances where market quotations are not readily available (including in cases where available market quotations are deemed to be unreliable), and has delegated primary responsibility for applying the valuation methods to the Investment Adviser. The Trust’s Valuation Committee was established by the Board to oversee the implementation of the Funds’ valuation methods and to make fair value determinations on behalf of the Board, as instructed. The Investment Adviser monitors the continued appropriateness of methods applied and identifies circumstances and events that may require fair valuation. The Investment Adviser determines if adjustments should be made in light of market changes, events affecting the issuer or other factors. If the Investment Adviser determines that a valuation method may no longer be appropriate, another valuation method previously approved by the Trust’s Valuation Committee may be selected or the Trust’s Valuation Committee will be convened to consider the matter and take any appropriate action in accordance with procedures adopted by the Board. The Board shall review the appropriateness of the valuation methods and these methods may be amended or supplemented from time to time by the Trust’s Valuation Committee.
Short-term investments having a maturity of 60 days or less will be valued at amortized cost unless the Board or its Valuation Committee determines that particular circumstances dictate otherwise.
Investments initially valued in currencies other than the U.S. dollar are converted to the U.S. dollar using exchange rates obtained from pricing services. As a result, the NAV of each share class of a Fund may be affected by changes in the value of currencies in relation to the U.S. dollar. The value of securities traded in markets outside the United States or denominated in
| | | | | | |
| 138 | | December 31, 2018 | | | Semiannual Report | | |
currencies other than the U.S. dollar may be affected significantly on a day that the New York Stock Exchange (“NYSE”) is closed.
The prices used by the Funds to value investments may differ from the value that would be realized if the investments were sold, and these differences could be material to the Funds’ financial statements. The NAV of each share class of a Fund is normally determined as of the close of regular trading (normally, 4:00 p.m. Eastern Time) on the NYSE on each day the NYSE is open for business. In unusual circumstances, a Fund may in good faith determine its NAV as of 4:00 p.m., Eastern Time, notwithstanding an earlier, unscheduled close or halt of trading on the NYSE.
The prices of certain portfolio securities or financial instruments may be determined at a time prior to the close of regular trading on the NYSE. When fair-valuing the securities, the Funds may, among other things, consider significant events (which may be considered to include changes in the value of U.S. securities or securities indices) that occur after the close of the relevant market and before the time the NAV of each share class of a Fund is calculated. With respect to certain foreign securities, the Funds may fair-value securities using modeling tools provided by third-party vendors. The Funds have retained a statistical research service to assist in determining the fair value of foreign securities. This service utilizes statistics and programs based on historical performance of markets and other economic data to assist in making fair value estimates. Fair value estimates used by the Funds for foreign securities may differ from the value realized from the sale of those securities and the difference could be material to the financial statements. Fair value pricing may require subjective determinations about the value of a security or other assets, and fair values used to determine the NAV of each share class of a Fund may differ from quoted or published prices, or from prices that are used by others, for the same investments. In addition, the use of fair value pricing may not always result in adjustments to the prices of securities or other assets held by a Fund.
(b) Fair Value Measurements. Fair value is defined as the price that would be received to sell an asset or paid to transfer a liability (i.e., the “exit price”) in an orderly transaction between market participants. The three levels of the fair value hierarchy are described below:
| ∎ | | Level 1—quoted prices in active markets for identical investments that the Funds have the ability to access |
| ∎ | | Level 2—valuations based on other significant observable inputs, which may include, but are not limited to, quoted prices for similar assets or liabilities, interest rates, yield curves, volatilities, prepayment speeds, loss severities, credit risks and default rates or other market corroborated inputs |
| ∎ | | Level 3—valuations based on significant unobservable inputs (including the Investment Adviser’s or Valuation Committee’s own assumptions and securities whose price was determined by using a single broker’s quote) |
The valuation techniques used by the Funds to measure fair value during the six months ended December 31, 2018 were intended to maximize the use of observable inputs and to minimize the use of unobservable inputs.
An investment asset’s or liability’s level within the fair value hierarchy is based on the lowest level input, individually or in aggregate, that is significant to the fair value measurement. The objective of fair value measurement remains the same even when there is a significant decrease in the volume and level of activity for an asset or liability and regardless of the valuation techniques used.
The inputs or methodology used for valuing securities are not necessarily an indication of the risk associated with investing in those securities. The following are certain inputs and techniques that the Funds generally use to evaluate how to classify each major category of assets and liabilities within Level 2 and Level 3, in accordance with U.S. GAAP.
Equity Securities (Common and Preferred Stock and Warrants)—Equity securities traded in inactive markets and certain foreign equity securities are valued using inputs which include broker-dealer quotes, recently executed transactions adjusted for changes in the benchmark index, or evaluated price quotes received from independent pricing services that take into account the integrity of the market sector and issuer, the individual characteristics of the security, and information received from broker-dealers and other market sources pertaining to the issuer or security. To the extent that these inputs are observable, the values of equity securities are categorized as Level 2. To the extent that these inputs are unobservable, the values are categorized as Level 3.
Corporate Bonds & Notes—Corporate bonds & notes are generally comprised of two main categories: investment grade bonds and high yield bonds. Investment grade bonds are valued by independent pricing services using various inputs and techniques, which include broker-dealer quotations, live trading levels, recently executed transactions in securities of the issuer or comparable issuers, and option adjusted spread models that include base curve and spread curve inputs. Adjustments to individual bonds can be applied to recognize trading differences compared to other bonds issued by the same issuer. High yield bonds are valued by independent pricing services based primarily on broker-dealer quotations from relevant market makers and recently executed transactions in securities of the issuer or comparable issuers. The broker-dealer quotations received are supported by credit analysis of the issuer that takes into consideration credit quality assessments, daily trading activity, and the activity of the underlying equities, listed bonds and sector-specific trends. To the extent that these inputs are observable, the values of corporate bonds & notes are categorized as Level 2. To the extent that these inputs are unobservable, the values are categorized as Level 3.
Convertible Bonds & Notes—Convertible bonds & notes are valued by independent pricing services based on various inputs and techniques, which include broker-dealer quotations from relevant market makers and recently executed transactions in securities of the issuer or comparable issuers. The broker-dealer quotations received are supported by credit analysis of the issuer that takes into consideration credit quality assessments, daily trading activity, and the activity of the underlying equities, listed bonds and sector-specific trends. To the extent that these inputs are observable, the values of
| | | | | | |
| | Semiannual Report | | | December 31, 2018 | | 139 |
Notes to Financial Statements (cont’d)
December 31, 2018 (unaudited)
convertible bonds & notes are categorized as Level 2. To the extent that these inputs are unobservable, the values are categorized as Level 3.
Option Contracts—Option contracts traded over-the-counter (“OTC”) and FLexible EXchange (“FLEX”) options are valued by independent pricing services based on pricing models that incorporate various inputs such as interest rates, credit spreads, currency exchange rates and volatility measurements for in-the-money, at-the-money, and out-of-the-money contracts based on a given strike price. To the extent that these inputs are observable, the values of OTC and FLEX option contracts are categorized as Level 2. To the extent that these inputs are unobservable, the values are categorized as Level 3.
Forward Foreign Currency Contracts—Forward foreign currency contracts are valued by independent pricing services using various inputs and techniques, which include broker-dealer quotations, actual trading information and foreign currency exchange rates gathered from leading market makers and foreign currency exchange trading centers throughout the world. To the extent that these inputs are observable, the values of forward foreign currency contracts are categorized as Level 2. To the extent that these inputs are unobservable, the values are categorized as Level 3.
A summary of the inputs used at December 31, 2018 in valuing each Fund’s assets and liabilities is listed below (refer to the Schedules of Investments and Notes to Schedules of Investments for more detailed information on Investments in Securities and Other Financial Instruments):
| | | | | | | | | | | | | | | | |
|
| AllianzGI Emerging Markets Opportunities: | |
| Investments in Securities–Assets | | Level 1–
Quoted Prices | | | Level 2–
Other Significant
Observable Inputs | | | Level 3–
Significant
Unobservable Inputs | | | Value at
12/31/18 | |
Common Stock: | | | | | | | | | | | | | | | | |
Brazil | | $ | 2,532,832 | | | $ | 2,363,810 | | | | — | | | $ | 4,896,642 | |
China | | | 9,279,639 | | | | 85,375,716 | | | | — | | | | 94,655,355 | |
India | | | 4,226,472 | | | | 36,841,495 | | | | — | | | | 41,067,967 | |
Mexico | | | 4,511,970 | | | | — | | | | — | | | | 4,511,970 | |
Peru | | | 12,146,629 | | | | — | | | | — | | | | 12,146,629 | |
Russian Federation | | | 15,460,234 | | | | — | | | $ | 2,673,064 | | | | 18,133,298 | |
Thailand | | | — | | | | — | | | | 4,538,380 | | | | 4,538,380 | |
United States | | | 3,353,360 | | | | — | | | | — | | | | 3,353,360 | |
All Other | | | — | | | | 106,545,211 | | | | — | | | | 106,545,211 | |
Preferred Stock: | | | | | | | | | | | | | | | | |
Brazil | | | — | | | | 14,044,037 | | | | — | | | | 14,044,037 | |
Russian Federation | | | — | | | | — | | | | 4,473,431 | | | | 4,473,431 | |
Repurchase Agreements | | | — | | | | 5,055,000 | | | | — | | | | 5,055,000 | |
Totals | | $ | 51,511,136 | | | $ | 250,225,269 | | | $ | 11,684,875 | | | $ | 313,421,280 | |
| | | | | | | | | | | | | | | | |
|
| AllianzGI Focused Growth: | |
| Investments in Securities – Assets | | Level 1–
Quoted Prices | | | Level 2–
Other Significant
Observable Inputs | | | Level 3–
Significant
Unobservable Inputs | | | Value at
12/31/18 | |
Common Stock | | $ | 903,185,702 | | | | — | | | | — | | | $ | 903,185,702 | |
Repurchase Agreements | | | — | | | $ | 6,043,000 | | | | — | | | | 6,043,000 | |
Totals | | $ | 903,185,702 | | | $ | 6,043,000 | | | | — | | | $ | 909,228,702 | |
| | | | | | |
| 140 | | December 31, 2018 | | | Semiannual Report | | |
| | | | | | | | | | | | | | | | |
| | | | |
| AllianzGI Global Natural Resources: | | | | | | | | | | | | |
| Investments in Securities – Assets | | Level 1– Quoted Prices | | | Level 2–
Other Significant
Observable Inputs | | | Level 3–
Significant
Unobservable Inputs | | | Value at
12/31/18 | |
Common Stock: | | | | | | | | | | | | | | | | |
Australia | | | — | | | $ | 789,004 | | | | — | | | $ | 789,004 | |
Denmark | | | — | | | | 110,217 | | | | — | | | | 110,217 | |
France | | | — | | | | 822,831 | | | | — | | | | 822,831 | |
Germany | | | — | | | | 137,000 | | | | — | | | | 137,000 | |
Japan | | | — | | | | 107,566 | | | | — | | | | 107,566 | |
United Kingdom | | | — | | | | 2,031,310 | | | | — | | | | 2,031,310 | |
All Other | | $ | 8,770,305 | | | | — | | | | — | | | | 8,770,305 | |
Exchange-Traded Funds | | | 223,132 | | | | — | | | | — | | | | 223,132 | |
Repurchase Agreements | | | — | | | | 110,000 | | | | — | | | | 110,000 | |
Totals | | $ | 8,993,437 | | | $ | 4,107,928 | | | | — | | | $ | 13,101,365 | |
| | | | | | | | | | | | | | | | |
| | | | |
| AllianzGI Global Small-Cap: | | | | | | | | | | | | |
| Investments in Securities – Assets | | Level 1–
Quoted Prices | | | Level 2–
Other Significant
Observable Inputs | | | Level 3– Significant Unobservable Inputs | | | Value at
12/31/18 | |
Common Stock: | | | | | | | | | | | | | | | | |
Australia | | | — | | | $ | 2,853,381 | | | | — | | | $ | 2,853,381 | |
Austria | | | — | | | | 2,895,248 | | | | — | | | | 2,895,248 | |
China | | | — | | | | 516,212 | | | | — | | | | 516,212 | |
Denmark | | | — | | | | 3,196,586 | | | | — | | | | 3,196,586 | |
Finland | | | — | | | | 393,817 | | | | — | | | | 393,817 | |
France | | | — | | | | 3,204,461 | | | | — | | | | 3,204,461 | |
Germany | | | — | | | | 4,778,287 | | | | — | | | | 4,778,287 | |
Hong Kong | | | — | | | | 916,591 | | | | — | | | | 916,591 | |
Indonesia | | | — | | | | 355,810 | | | | — | | | | 355,810 | |
Italy | | | — | | | | 1,552,046 | | | | — | | | | 1,552,046 | |
Japan | | | — | | | | 17,322,556 | | | | — | | | | 17,322,556 | |
Korea (Republic of) | | | — | | | | 347,143 | | | | — | | | | 347,143 | |
Netherlands | | | — | | | | 852,236 | | | | — | | | | 852,236 | |
Norway | | | — | | | | 1,456,253 | | | | — | | | | 1,456,253 | |
Singapore | | | — | | | | 397,544 | | | | — | | | | 397,544 | |
Spain | | | — | | | | 716,508 | | | | — | | | | 716,508 | |
Sweden | | | — | | | | 932,599 | | | | — | | | | 932,599 | |
Switzerland | | | — | | | | 3,089,776 | | | | — | | | | 3,089,776 | |
Taiwan | | | — | | | | 382,932 | | | | — | | | | 382,932 | |
United Kingdom | | $ | 853,110 | | | | 5,564,535 | | | | — | | | | 6,417,645 | |
All Other | | | 77,391,845 | | | | — | | | | — | | | | 77,391,845 | |
Preferred Stock | | | — | | | | 633,153 | | | | — | | | | 633,153 | |
Repurchase Agreements | | | — | | | | 1,674,000 | | | | — | | | | 1,674,000 | |
Totals | | $ | 78,244,955 | | | $ | 54,031,674 | | | | — | | | $ | 132,276,629 | |
| | | | | | |
| | Semiannual Report | | | December 31, 2018 | | 141 |
Notes to Financial Statements (cont’d)
December 31, 2018 (unaudited)
| | | | | | | | | | | | | | | | |
|
| AllianzGI Health Sciences: | |
| Investments in Securities – Assets | | Level 1– Quoted Prices | | | Level 2–
Other Significant
Observable Inputs | | | Level 3– Significant Unobservable Inputs | | | Value at
12/31/18 | |
Common Stock: | | | | | | | | | | | | | | | | |
Pharmaceuticals | | $ | 52,464,634 | | | $ | 588,391 | | | | — | | | $ | 53,053,025 | |
All Other | | | 87,387,740 | | | | — | | | | — | | | | 87,387,740 | |
Warrants | | | — | | | | — | | | $ | 120,926 | | | | 120,926 | |
Repurchase Agreements | | | — | | | | 885,000 | | | | — | | | | 885,000 | |
Totals | | $ | 139,852,374 | | | $ | 1,473,391 | | | $ | 120,926 | | | $ | 141,446,691 | |
| | | | | | | | | | | | | | | | |
|
| AllianzGI Income & Growth: | |
| Investments in Securities – Assets | | Level 1– Quoted Prices | | | Level 2–
Other Significant
Observable Inputs | | | Level 3–
Significant
Unobservable Inputs | | | Value at
12/31/18 | |
Common Stock: | | | | | | | | | | | | | | | | |
Advertising | | | — | | | | — | | | $ | 906,597 | | | $ | 906,597 | |
Aerospace & Defense | | $ | 35,327,725 | | | | — | | | | 279,256 | | | | 35,606,981 | |
Apparel & Textiles | | | — | | | | — | | | | 47,677 | | | | 47,677 | |
Banks | | | 43,436,458 | | | | — | | | | 7 | | | | 43,436,465 | |
Commercial Services | | | — | | | | — | | | | 576,798 | | | | 576,798 | |
Media | | | 14,903,685 | | | | — | | | | 1,222,608 | | | | 16,126,293 | |
Oil, Gas & Consumable Fuels | | | 34,807,484 | | | | — | | | | 47,425 | | | | 34,854,909 | |
Semiconductors | | | — | | | | — | | | | 10,552 | | | | 10,552 | |
All Other | | | 1,078,504,050 | | | | — | | | | — | | | | 1,078,504,050 | |
Corporate Bonds & Notes: | | | | | | | | | | | | | | | | |
Commercial Services | | | — | | | $ | 55,374,934 | | | | 476,780 | | | | 55,851,714 | |
Diversified Financial Services | | | — | | | | 47,337,341 | | | | 4,971,639 | | | | 52,308,980 | |
Media | | | — | | | | 94,899,753 | | | | 153 | | | | 94,899,906 | |
Oil, Gas & Consumable Fuels | | | — | | | | 109,059,286 | | | | 645,120 | | | | 109,704,406 | |
All Other | | | — | | | | 892,750,842 | | | | — | | | | 892,750,842 | |
Convertible Bonds & Notes: | | | | | | | | | | | | | | | | |
Banks | | | — | | | | — | | | | 16,858,201 | | | | 16,858,201 | |
Energy-Alternate Sources | | | — | | | | 14,446,132 | | | | 571,500 | | | | 15,017,632 | |
All Other | | | — | | | | 989,558,238 | | | | — | | | | 989,558,238 | |
Convertible Preferred Stock: | | | | | | | | | | | | | | | | |
Computers | | | — | | | | 9,081,022 | | | | — | | | | 9,081,022 | |
Electronics | | | — | | | | 10,938,277 | | | | — | | | | 10,938,277 | |
Equity Real Estate Investment Trusts (REITs) | | | 5,055,473 | | | | 11,813,764 | | | | — | | | | 16,869,237 | |
Hand/Machine Tools | | | — | | | | 8,777,311 | | | | — | | | | 8,777,311 | |
Healthcare-Products | | | — | | | | 17,955,243 | | | | — | | | | 17,955,243 | |
All Other | | | 93,533,746 | | | | — | | | | — | | | | 93,533,746 | |
Preferred Stock | | | — | | | | — | | | | 16,591,384 | | | | 16,591,384 | |
Equity-Linked Security | | | 148,074 | | | | — | | | | — | | | | 148,074 | |
Warrants | | | — | | | | — | | | | 4 | | | | 4 | |
Repurchase Agreements | | | — | | | | 101,362,000 | | | | — | | | | 101,362,000 | |
| | | | 1,305,716,695 | | | | 2,363,354,143 | | | | 43,205,701 | | | | 3,712,276,539 | |
Investments in Securities – Liabilities | | | | | | | | | | | | | | | | |
Options Written: | | | | | | | | | | | | | | | | |
Market Price | | | (1,145,770 | ) | | | — | | | | — | | | | (1,145,770 | ) |
Totals | | $ | 1,304,570,925 | | | $
| 2,363,354,143
|
| | $
| 43,205,701
|
| | $ | 3,711,130,769 | |
| | | | | | |
| 142 | | December 31, 2018 | | | Semiannual Report | | |
| | | | | | | | | | | | | | | | |
|
| AllianzGI Mid-Cap: | |
| Investments in Securities – Assets | | Level 1– Quoted Prices | | | Level 2–
Other Significant
Observable Inputs | | | Level 3–
Significant
Unobservable Inputs | | | Value at
12/31/18 | |
Common Stock | | $ | 248,789,601 | | | | — | | | | — | | | $ | 248,789,601 | |
Repurchase Agreements | | | — | | | $ | 1,109,000 | | | | — | | | | 1,109,000 | |
Totals | | $ | 248,789,601 | | | $ | 1,109,000 | | | | — | | | $ | 249,898,601 | |
| | | | | | | | | | | | | | | | |
|
| AllianzGI NFJ Dividend Value: | |
| Investments in Securities – Assets | | Level 1– Quoted Prices | | | Level 2–
Other Significant
Observable Inputs | | | Level 3–
Significant
Unobservable Inputs | | | Value at
12/31/18 | |
Common Stock | | $ | 1,452,808,255 | | | | — | | | | — | | | $ | 1,452,808,255 | |
Repurchase Agreements | | | — | | | $ | 15,262,000 | | | | — | | | | 15,262,000 | |
Totals | | $ | 1,452,808,255 | | | $ | 15,262,000 | | | | — | | | $ | 1,468,070,255 | |
| | | | | | | | | | | | | | | | |
|
| AllianzGI NFJ International Value: | |
| Investments in Securities – Assets | | Level 1– Quoted Prices | | | Level 2–
Other Significant
Observable Inputs | | | Level 3–
Significant
Unobservable Inputs | | | Value at
12/31/18 | |
Common Stock: | | | | | | | | | | | | | | | | |
Canada | | $ | 20,057,485 | | | | — | | | | — | | | $ | 20,057,485 | |
India | | | 1,113,126 | | | | — | | | | — | | | | 1,113,126 | |
Korea (Republic of) | | | 1,832,798 | | | $ | 5,085,195 | | | | — | | | | 6,917,993 | |
Mexico | | | 1,711,267 | | | | — | | | | — | | | | 1,711,267 | |
Netherlands | | | 3,726,780 | | | | 1,836,677 | | | | — | | | | 5,563,457 | |
Russian Federation | | | 1,817,030 | | | | — | | | | — | | | | 1,817,030 | |
Taiwan | | | 3,669,961 | | | | — | | | | — | | | | 3,669,961 | |
United Kingdom | | | 10,980,279 | | | | 19,982,025 | | | | — | | | | 30,962,304 | |
United States | | | 5,445,111 | | | | — | | | | — | | | | 5,445,111 | |
All Other | | | — | | | | 106,681,548 | | | | — | | | | 106,681,548 | |
Repurchase Agreements | | | — | | | | 1,668,000 | | | | — | | | | 1,668,000 | |
Totals | | $ | 50,353,837 | | | $ | 135,253,445 | | | | — | | | $ | 185,607,282 | |
| | | | | | | | | | | | | | | | |
|
| AllianzGI NFJ Large-Cap Value: | |
| Investments in Securities – Assets | | Level 1– Quoted Prices | | | Level 2–
Other Significant
Observable Inputs | | | Level 3–
Significant
Unobservable Inputs | | | Value at
12/31/18 | |
Common Stock | | $ | 308,531,682 | | | | — | | | | — | | | $ | 308,531,682 | |
Repurchase Agreements | | | — | | | $ | 7,978,000 | | | | — | | | | 7,978,000 | |
Totals | | $ | 308,531,682 | | | $ | 7,978,000 | | | | — | | | $ | 316,509,682 | |
| | | | | | | | | | | | | | | | |
|
| AllianzGI NFJ Mid-Cap Value: | |
| Investments in Securities – Assets | | Level 1– Quoted Prices | | | Level 2–
Other Significant
Observable Inputs | | | Level 3–
Significant
Unobservable Inputs | | | Value at
12/31/18 | |
Common Stock | | $ | 1,096,283,206 | | | | — | | | | — | | | $ | 1,096,283,206 | |
Repurchase Agreements | | | — | | | $ | 15,213,000 | | | | — | | | | 15,213,000 | |
Totals | | $ | 1,096,283,206 | | | $ | 15,213,000 | | | | — | | | $ | 1,111,496,206 | |
| | | | | | | | | | | | | | | | |
| | | | | | |
| | Semiannual Report | | | December 31, 2018 | | 143 |
Notes to Financial Statements (cont’d)
December 31, 2018 (unaudited)
| | | | | | | | | | | | | | | | |
|
| AllianzGI NFJ Small-Cap Value: | |
| Investments in Securities – Assets | | Level 1– Quoted Prices | | | Level 2–
Other Significant
Observable Inputs | | | Level 3–
Significant
Unobservable Inputs | | | Value at
12/31/18 | |
Common Stock: | | | | | | | | | | | | | | | | |
Chemicals | | $ | 59,379,184 | | | | — | | | $ | 56 | | | $ | 59,379,240 | |
All Other | | | 1,153,019,363 | | | | — | | | | — | | | | 1,153,019,363 | |
Repurchase Agreements | | | — | | | $ | 2,055,000 | | | | — | | | | 2,055,000 | |
Totals | | $ | 1,212,398,547 | | | $ | 2,055,000 | | | $ | 56 | | | $ | 1,214,453,603 | |
| | | | | | | | | | | | | | | | |
|
| AllianzGI Small-Cap: | |
| Investments in Securities – Assets | | Level 1– Quoted Prices | | | Level 2–
Other Significant
Observable Inputs | | | Level 3–
Significant
Unobservable Inputs | | | Value at
12/31/18 | |
Common Stock: | | | | | | | | | | | | | | | | |
Equity Real Estate Investment Trusts (REITs) | | $ | 983,481 | | | | — | | | $ | 1,944 | | | $ | 985,425 | |
All Other | | | 77,433,784 | | | | — | | | | — | | | | 77,433,784 | |
Repurchase Agreements | | | — | | | $ | 1,280,000 | | | | — | | | | 1,280,000 | |
Totals | | $ | 78,417,265 | | | $ | 1,280,000 | | | $ | 1,944 | | | $ | 79,699,209 | |
| | | | | | | | | | | | | | | | |
|
| AllianzGI Technology: | |
| Investments in Securities – Assets | | Level 1– Quoted Prices | | | Level 2–
Other Significant
Observable Inputs | | | Level 3–
Significant
Unobservable Inputs | | | Value at
12/31/18 | |
Common Stock: | | | | | | | | | | | | | | | | |
Electrical Equipment | | $ | 2,073,844 | | | $ | 11,315 | | | | — | | | $ | 2,085,159 | |
Electronic Equipment, Instruments & Components | | | 23,301 | | | | 2,759,512 | | | | — | | | | 2,782,813 | |
Entertainment | | | 30,277,355 | | | | 26,554 | | | | — | | | | 30,303,909 | |
Interactive Media & Services | | | 123,753,792 | | | | 58,806 | | | | — | | | | 123,812,598 | |
IT Services | | | 261,070,821 | | | | 115,260 | | | | — | | | | 261,186,081 | |
Semiconductors & Semiconductor Equipment | | | 98,365,766 | | | | 107,364 | | | | — | | | | 98,473,130 | |
Software | | | 489,978,812 | | | | 12,390,858 | | | | — | | | | 502,369,670 | |
Technology Hardware, Storage & Peripherals | | | 94,410,349 | | | | 181,380 | | | | — | | | | 94,591,729 | |
All Other | | | 131,459,452 | | | | — | | | | — | | | | 131,459,452 | |
Exchange-Traded Funds: | | | | | | | | | | | | | | | | |
Exchange-Traded Funds | | | 3,906 | | | | 1,454 | | | | — | | | | 5,360 | |
Repurchase Agreements | | | — | | | | 138,160,000 | | | | — | | | | 138,160,000 | |
Options Purchased: | | | | | | | | | | | | | | | | |
Market Price | | | 4,211,500 | | | | — | | | | — | | | | 4,211,500 | |
| | | | 1,235,628,898 | | | | 153,812,503 | | | | — | | | | 1,389,441,401 | |
Investments in Securities – Liabilities | | | | | | | | | | | | | | | | |
Securities Sold Short, at value | | | (1,044,028 | ) | | | — | | | | — | | | | (1,044,028 | ) |
Options Written: | | | | | | | | | | | | | | | | |
Market Price | | | (1,121,800 | ) | | | — | | | | — | | | | (1,121,800 | ) |
| | | (2,165,828 | ) | | | — | | | | — | | | | (2,165,828 | ) |
Totals | | $ | 1,233,463,070 | | | $ | 153,812,503 | | | | — | | | $ | 1,387,275,573 | |
A roll forward of fair value measurements using significant unobservable inputs (Level 3) for the six months ended December 31, 2018, was as follows:
| | | | | | | | | | | | | | | | | | | | | | | | | | | | | | | | | | | | |
|
| AllianzGI Emerging Markets Opportunities: | |
| Investments in Securities – Assets | | Beginning
Balance
6/30/18 | | | Purchases | | | Sales | | | Accrued
Discount
(Premiums) | | | Net
Realized
Gain (Loss) | | | Net Change
in Unrealized
Appreciation/
Depreciation | | | Transfers into
Level 3 | | | Transfers out of Level 3 | | | Ending
Balance
12/31/18 | |
Common Stock: | | | | | | | | | | | | | | | | | | | | | | | | | | | | | | | | | | | | |
Russian Federation | | $ | 1,733,513 | | | $ | 3,082,407 | | | $ | (1,407,327 | ) | | | — | | | $ | (247,646 | ) | | $ | (487,883 | ) | | | — | | | | — | | | $ | 2,673,064 | |
Thailand | | | 13,378,021 | | | | 1,740,852 | | | | (9,937,696 | ) | | | — | | | | 207,560 | | | | (850,357 | ) | | | — | | | | — | | | | 4,538,380 | |
Preferred Stock | | | 2,322,012 | | | | 1,743,261 | | | | — | | | | — | | | | — | | | | 408,158 | | | | — | | | | — | | | | 4,473,431 | |
Totals | | $ | 17,433,546 | | | $ | 6,566,520 | | | $ | (11,345,023 | ) | | | — | | | $ | (40,086 | ) | | $ | (930,082 | ) | | | — | | | | — | | | $ | 11,684,875 | |
| | | | | | |
| 144 | | December 31, 2018 | | | Semiannual Report | | |
| | | | | | | | | | | | | | | | | | | | | | | | | | | | | | | | | | | | |
|
| AllianzGI Health Sciences: | |
| Investments in Securities – Assets | | Beginning
Balance
6/30/18 | | | Purchases | | | Sales | | | Accrued
Discount
(Premiums) | | | Net
Realized
Gain (Loss) | | | Net Change
in Unrealized
Appreciation/
Depreciation | | | Transfers into
Level 3 | | | Transfers out
of Level 3 | | | Ending
Balance
12/31/18 | |
Common Stock: | | | | | | | | | | | | | | | | | | | | | | | | | | | | | | | | | | | | |
Equity Real Estate Investment Trusts (REITs) | | $ | 75,826 | | | | — | | | | — | | | | — | | | | — | | | $ | 45,100 | | | | — | | | | — | | | $ | 120,926 | |
| | | | | | | | | | | | | | | | | | | | | | | | | | | | | | | | | | | | |
|
| AllianzGI Income & Growth: | |
| Investments in Securities – Assets | | Beginning
Balance
6/30/18 | | | Purchases | | | Sales | | | Accrued
Discount
(Premiums) | | | Net
Realized
Gain (Loss) | | | Net Change
in Unrealized Appreciation/ Depreciation | | | Transfers into
Level 3* | | | Transfers out of Level 3 | | | Ending
Balance
12/31/18 | |
Common Stock: | |
Advertising | | $ | 1,385,428 | | | | — | | | | — | | | | — | | | | — | | | $ | (478,831 | ) | | | — | | | | — | | | $ | 906,597 | |
Aerospace & Defense | | | 354,775 | | | | — | | | | — | | | | — | | | | — | | | | (75,519 | ) | | | — | | | | — | | | | 279,256 | |
Apparel & Textiles | | | 60,947 | | | | — | | | | — | | | | — | | | | — | | | | (13,270 | ) | | | — | | | | — | | | | 47,677 | |
Banks | | | — | | | | — | | | | — | | | | — | | | | — | | | | — | | | $ | 7 | | | | — | | | | 7 | |
Commercial Services | | | — | | | $ | 1,960,164 | †† | | | — | | | | — | | | | — | | | | (1,383,366 | ) | | | — | | | | — | | | | 576,798 | |
Media | | | 1,442,959 | | | | — | | | | — | | | | — | | | | — | | | | (220,351 | ) | | | — | | | | — | | | | 1,222,608 | |
Oil, Gas & Consumable Fuels | | | 322,716 | | | | — | | | $ | (218,790 | )† | | | — | | | | — | | | | (56,501 | ) | | | — | | | | — | | | | 47,425 | |
Semiconductors | | | 10,552 | | | | — | | | | — | | | | — | | | | — | | | | — | | | | — | | | | — | | | | 10,552 | |
Corporate Bonds & Notes: | |
Advertising | | | 993,836 | | | | 39,753 | | | | — | | | | — | | | | — | | | | (10,336 | ) | | | — | | | $ | (1,023,253 | )** | | | — | |
Commercial Services | | | — | | | | — | | | | — | | | | — | | | | — | | | | — | | | | 476,780 | | | | — | | | | 476,780 | |
Diversified Financial Services | | | — | | | | — | | | | — | | | | — | | | | — | | | | — | | | | 4,971,639 | | | | — | | | | 4,971,639 | |
Media | | | 153 | | | | — | | | | — | | | | — | | | | — | | | | — | | | | — | | | | — | | | | 153 | |
Oil, Gas & Consumable Fuels | | | — | | | | 5,748,245 | †† | | | — | | | | — | | | | — | | | | (5,103,125 | ) | | | — | | | | — | | | | 645,120 | |
Convertible Bonds & Notes: | |
Banks | | | 17,540,357 | | | | — | | | | — | | | | — | | | | — | | | | (682,156 | ) | | | — | | | | — | | | | 16,858,201 | |
Energy-Alternate Sources | | | 571,500 | | | | — | | | | — | | | | — | | | | — | | | | — | | | | — | | | | — | | | | 571,500 | |
Preferred Stock | | | 18,217,438 | | | | — | | | | — | | | | — | | | | — | | | | (1,626,054 | ) | | | — | | | | — | | | | 16,591,384 | |
Equity-Linked Securities: | |
Coal | | | 117,974 | | | | — | | | | — | | | | — | | | | — | | | | 30,100 | | | | — | | | | (148,074 | )*** | | | — | |
Oil, Gas & Consumable Fuels | | | 141 | | | | — | | | | — | | | | — | | | | — | | | | (141 | ) | | | — | | | | — | | | | — | |
Warrants: | |
Commercial Services | | | 76 | | | | — | | | | — | @ | | | — | | | $ | (237,932 | ) | | | 237,856 | | | | — | | | | — | | | | — | |
Media | | | 4 | | | | — | | | | — | | | | — | | | | — | | | | — | | | | — | | | | — | | | | 4 | |
Totals | | $ | 41,018,856 | | | $ | 7,748,162 | | | $ | (218,790 | ) | | | — | | | $ | (237,932 | ) | | $ | (9,381,694 | ) | | $ | 5,448,426 | | | $ | (1,171,327 | ) | | $ | 43,205,701 | |
The table for AllianzGI Income & Growth includes Level 3 investments that are valued by brokers and pricing services. The inputs for these investments are not readily available or cannot be reasonably estimated and are generally those inputs described in Note 1 (b).
| | | | | | | | | | | | | | | | | | | | | | | | | | | | | | | | | | | | |
|
| AllianzGI NFJ Small-Cap Value: | |
| Investments in Securities – Assets | | Beginning
Balance
6/30/18 | | | Purchases | | | Sales | | | Accrued
Discount
(Premiums) | | | Net
Realized
Gain (Loss) | | | Net Change
in Unrealized
Appreciation/
Depreciation | | | Transfers into
Level 3 | | | Transfers out
of Level 3 | | | Ending
Balance
12/31/18 | |
Common Stock: | |
Chemicals | | $ | 56 | | | | — | | | | — | | | | — | | | | — | | | | — | | | | — | | | | — | | | $ | 56 | |
| | | | | | |
| | Semiannual Report | | | December 31, 2018 | | 145 |
Notes to Financial Statements (cont’d)
December 31, 2018 (unaudited)
| | | | | | | | | | | | | | | | | | | | | | | | | | | | | | | | | | | | |
|
| AllianzGI Small-Cap: | |
| Investments in Securities – Assets | | Beginning
Balance
6/30/18 | | | Purchases | | | Sales | | | Accrued
Discount
(Premiums) | | | Net
Realized
Gain (Loss) | | | Net Change
in Unrealized
Appreciation/
Depreciation | | | Transfers into
Level 3 | | | Transfers out of Level 3 | | | Ending
Balance
12/31/18 | |
Common Stock: | |
Equity Real Estate Investment Trusts (REITs) | | $ | 7,258 | | | | — | | | $ | (5,184 | )††† | | | — | | | | — | | | $ | (130 | ) | | | — | | | | — | | | $ | 1,944 | |
The tables above may include Level 3 investments that are valued by brokers or independent pricing services.
The following table presents additional information about valuation techniques and inputs used for investments that are measured at fair value and categorized within Level 3 at December 31, 2018:
| | | | | | | | | | | | |
|
| AllianzGI Health Sciences: | |
| Investments in Securities – Assets | | Ending
Balance
at 12/31/18 | | | Valuation Technique Used | | Unobservable
Inputs | | Input Values | |
Common Stock | | $ | 120,926 | | | Black Scholes Model | | Volatility | | | 44.19% | |
| | | | | | | | | | | | |
|
| AllianzGI Income & Growth: | |
| Investments in Securities – Assets | | Ending
Balance
at 12/31/18 | | | Valuation Technique Used | | Unobservable
Inputs | | Input Values | |
Common Stock: | | | | | | | | | | | | |
| | $ | 634,422 | | | Market and Company Comparables | | EV Multiples | | | 4.96x (2.06x-9.36x) | |
| | | | | | | | | Illiquidity Discount | | | 20% | |
| | $ | 272,175 | | | Market and Company Comparables | | EV Multiples | | | 1.97x (1.08x-3.72x) | |
| | | | | | | | | Illiquidity Discount | | | 20% | |
| | $ | 279,256 | | | Market and Company Comparables | | EV Multiples | | | 0.60x (0.40x-0.76x) | |
| | | | | | | | M&A Transaction Multiples | | | 0.87x (0.32x-2.12x) | |
| | | | | | | | | Illiquidity Discount | | | 40% | |
| | $ | 47,677 | | | Market and Company Comparables | | EV Multiples | | | 0.65x (0.19x-1.11x) | |
| | | | | | | | | Illiquidity Discount | | | 20% | |
| | $ | 1,222,588 | | | Market and Company Comparables | | EV Multiples | | | 1.01x (0.00x-1.95x) | |
| | | | | | | | | Illiquidity Discount | | | 10% | |
| | $ | 47,407 | | | Market and Company Comparables | | EV Multiples | | | 2.32x (1.54x-2.86x) | |
| | | | | | | | | Illiquidity Discount | | | 40% | |
Preferred Stock: | | $ | 1,082,958 | | | Market and Company Comparables | | EV Multiples | | | 0.62x (0.17x-1.13x) | |
| | | | | | | | Applicable Liquidity Multiple | | | 1.60 | |
| | | | | | | | | Illiquidity Discount | | | 25% | |
| | $ | 15,508,346 | | | Market and Company Comparables | | EV Multiples | | | 0.62x (0.17x-1.13x) | |
| | | | | | | | | Illiquidity Discount | | | 25% | |
| | | | | | | | | | | | |
|
| AllianzGI Small-Cap: | |
| Investments in Securities – Assets | | Ending
Balance
at 12/31/18 | | | Valuation Technique Used | | Unobservable
Inputs | | Input Values | |
Common Stock | | $ | 1,944 | | | Net Assets Approach | | Estimated Movement of Proceeds | | | 7.18% | |
The tables above does not include Level 3 investments that are valued by brokers or independent pricing services.
| * | Transferred out of Level 2 and into Level 3 because current evaluated mean price was not available at December 31, 2018. |
| ** | Transferred out of Level 3 into Level 2 because an evaluated mean price was used at December 31, 2018, which was not available on June 30, 2018. |
| *** | Transferred out of Level 3 and into Level 1 because the last traded price was used at December 31, 2018, which was not available on June 30, 2018. |
| † | Reduction due to cash distribution from corporate action. |
| †† | Issued or removed via corporate action. |
| ††† | Reduced due to Return of Capital Payments. |
| @ | Removed from accounting records as worthless. |
| | | | | | |
| 146 | | December 31, 2018 | | | Semiannual Report | | |
The net change in unrealized appreciation/depreciation of Level 3 investments which the following Funds held at December 31, 2018 was:
| | | | |
AllianzGI Emerging Markets Opportunities | | $ | (447,350 | ) |
AllianzGI Health Sciences | | | 45,100 | |
AllianzGI Income & Growth | | | (8,957,017 | ) |
AllianzGI Small-Cap | | | (130 | ) |
Net realized gain (loss) and net change in unrealized appreciation/depreciation are reflected on the Statements of Operations.
(c) Investment Transactions and Investment Income. Investment transactions are accounted for on the trade date. Securities purchased and sold on a when-issued or delayed-delivery basis may be settled beyond a standard settlement period for the security after the trade date. Realized gains and losses on investments are determined on an identified cost basis. Estimated tax liabilities on certain foreign securities are recorded on an accrual basis and are reflected as a component of net change in unrealized appreciation (depreciation) of investments on the Statements of Operations. Tax liabilities realized as a result of such security sales are reflected as a component of net realized gain (loss) on investments on the Statements of Operations. Interest income adjusted for the accretion of discounts and amortization of premiums is recorded on an accrual basis. Discounts or premiums on debt securities purchased are accreted or amortized, respectively, to interest income. Conversion premium is not amortized. Dividend income is recorded on the ex-dividend date, except for certain dividends from foreign securities where the ex-dividend date may have passed, and then are recorded as soon after the ex-dividend date as the Funds, using reasonable diligence, become aware of such dividends. Dividend and interest income on the Statements of Operations are shown net of any foreign taxes withheld on income from foreign securities. Payments received from real estate investment trust securities may be comprised of dividends, realized gains and return of capital. The payment may initially be recorded as dividend income and may subsequently be reclassified as realized gains and/or return of capital upon receipt of information from the issuer. Payments considered return of capital reduce the cost basis of the respective security. Distributions, if any, in excess of the cost basis of a security are recognized as capital gains. Dividends from underlying funds are recorded as dividend income, while capital gain distributions are recorded as net capital gain distributions received from underlying funds on the Statements of Operations. Consent fees relating to corporate actions are recorded as miscellaneous income upon receipt. Expenses are recorded on an accrual basis and such expenses exclude those of the underlying funds. Expenses of the underlying funds are reflected in the net asset values of those funds.
(d) Federal Income Taxes. The Funds intend to distribute all of their taxable income and to comply with the other requirements of Subchapter M of the U.S. Internal Revenue Code of 1986, as amended, applicable to regulated investment companies. Accordingly, no provision for U.S. federal income taxes is required. The Funds may be subject to excise tax based on distributions to shareholders.
Accounting for uncertainty in income taxes establishes for all entities, including pass-through entities such as the Funds, a minimum threshold for financial statement recognition of the benefit of positions taken in filing tax returns (including whether an entity is taxable in a particular jurisdiction), and requires certain expanded tax disclosures. In accordance with provisions set forth under U.S. GAAP, the Investment Adviser has reviewed the Funds’ tax positions for all open tax years. As of December 31, 2018, the Funds have recorded no liability for net unrecognized tax benefits relating to uncertain income tax positions they have taken. The Funds’ U.S. federal income tax returns for the prior three years, as applicable, remain subject to examination by the Internal Revenue Service.
(e) Dividends and Distributions to Shareholders. Dividends from net investment income, if any, of each Fund (except AllianzGI Income & Growth, AllianzGI NFJ Dividend Value, AllianzGI NFJ International Value and AllianzGI NFJ Large-Cap Value), are declared and distributed to shareholders annually. Dividends from net investment income and/or distributions from short-term capital gains for AllianzGI Income & Growth, if any, are declared and distributed monthly. Dividends from net investment income, if any, for AllianzGI NFJ Dividend Value, AllianzGI NFJ International Value and AllianzGI NFJ Large-Cap Value are declared and distributed quarterly. Net realized capital gains, if any, earned by each Fund, will be distributed annually. The Funds record dividends and distributions to their respective shareholders on the ex-dividend date. The amount of dividends from net investment income and distributions from net realized capital gains is determined in accordance with federal income tax regulations, which may differ from U.S. GAAP. These “book-tax” differences are considered either temporary or permanent in nature. To the extent these differences are permanent in nature, such amounts are reclassified within the capital accounts based on their U.S. federal income tax treatment. Temporary differences do not require reclassification. To the extent dividends and/or distributions exceed current and accumulated earnings and profits for U.S. federal income tax purposes, they are reported as dividends and/or distributions to shareholders from return of capital.
(f) Multi-Class Operations. Each class offered by the Funds has equal rights as to assets and voting privileges (except that shareholders of a class have exclusive voting rights regarding any matter relating solely to that class of shares). Income, non-class specific expenses, and realized and unrealized capital gains and losses of each Fund are allocated daily to each class of shares based on the relative net assets of each class. Class specific expenses, where applicable, include administration, distribution and servicing fees.
(g) Foreign Currency Translation. The Funds’ accounting records are maintained in U.S. dollars as follows: (1) the foreign currency market values of investments and other assets and liabilities denominated in foreign currencies are translated at the prevailing exchange rate at the end of the period; and (2) purchases and sales, income and expenses are translated at the prevailing exchange rate on the respective dates of such transactions. The resulting net foreign currency gain (loss) is included in the Funds’ Statements of Operations.
| | | | | | |
| | Semiannual Report | | | December 31, 2018 | | 147 |
Notes to Financial Statements (cont’d)
December 31, 2018 (unaudited)
The Funds do not generally isolate that portion of the results of operations arising as a result of changes in foreign currency exchange rates from the fluctuations arising from changes in the market prices of securities. Accordingly, such foreign currency gain (loss) is included in net realized and unrealized gain (loss) on investments. However, the Funds do isolate the effect of fluctuations in foreign currency exchange rates when determining the gain (loss) upon the sale or maturity of foreign currency denominated debt obligations pursuant to U.S. federal income tax regulations; such amount is categorized as foreign currency gain (loss) for both financial reporting and income tax reporting purposes.
(h) Repurchase Agreements. The Funds are parties to Master Repurchase Agreements (“Master Repo Agreements”) with select counterparties. The Master Repo Agreements include provisions for the initiation of repurchase transactions, income payments, events of default, and maintenance of collateral.
The Funds enter into transactions, under the Master Repo Agreements, with their custodian bank or securities brokerage firms whereby they purchase securities under agreements (i.e., repurchase agreements) to resell such securities at an agreed upon price and date. The Funds, through their custodian, take possession of securities collateralizing the repurchase agreement. Such agreements are carried at the contract amount in the financial statements, which is considered to represent fair value. The collateral that is pledged (i.e. the securities received by the Funds), which consists primarily of U.S. government obligations and asset-backed securities, is held by the custodian bank for the benefit of the Funds until the maturity of the repurchase agreement. Provisions of the repurchase agreements and the procedures adopted by the Funds require that the market value of the collateral, including accrued interest thereon, be sufficient in the event of default by the counterparty. If the counterparty defaults under the Master Repo Agreements and the value of the collateral declines or if the counterparty enters an insolvency proceeding, realization of the collateral by the Funds may be delayed or limited. The gross values are included in the Funds’ Schedules of Investments. As of December 31, 2018, the value of the related collateral exceeded the value of the repurchase agreements for each Fund.
(i) Securities Sold Short. Certain Funds engage in short sales for investment and risk management purposes. Short sales are transactions in which a Fund sells a security or other instrument (such as an option, forward, future or other derivative contract) it does not own. When a Fund engages in a short sale, it must borrow the security sold short and deliver it to the counterparty. The Funds will ordinarily have to pay a fee or premium to borrow a security and be obligated to repay the lender of the security any dividend or interest that accrues on the security during the period of the loan. Until a short position is closed out, the net proceeds of the short sale will be retained by the lending broker to the extent necessary to meet margin requirements, together with any additional assets the broker requires as collateral. This collateral earns interest and the interest is used to pay each lender a fee for borrowed securities, to compensate the broker for its services, and to provide a rebate to the borrower (the Fund) for posting the collateral. The net proceeds from these transactions are shown as
miscellaneous income or miscellaneous expense on the Statement of Operations. A Fund is also required to designate, on its books or the books of its custodian, liquid assets (less any additional collateral held by the broker) to cover the short sale obligation, marked to market daily. Short sales expose the Funds to the risk that they will be required to cover the short position at a time when the security or other asset has appreciated in value, thus resulting in losses to the applicable Fund. A short sale is “against the box” if a Fund holds in its portfolio or has the right to acquire the security sold short at no additional cost. The Funds will be subject to additional risks to the extent that they engage in short sales that are not “against the box.” A Fund’s loss on a short sale could theoretically be unlimited in cases where the Fund is unable, for whatever reason, to close out its short position.
(j) Warrants. The Funds may receive warrants. Warrants are securities that are usually issued together with a debt security or preferred stock and that give the holder the right to buy a proportionate amount of common stock at a specified price. Warrants may be freely transferable and are often traded on major exchanges. Warrants normally have a life that is measured in years and entitle the holder to buy common stock of a company at a price that is usually higher than the market price at the time the warrant is issued. Warrants may entail greater risks than certain other types of investments. Generally, warrants do not carry the right to receive dividends or exercise voting rights with respect to the underlying securities, and they do not represent any rights in the assets of the issuer. In addition, their value does not necessarily change with the value of the underlying securities, and they cease to have value if they are not exercised on or before their expiration date. If the market price of the underlying stock does not exceed the exercise price during the life of the warrant, the warrant will expire worthless. Warrants may increase the potential profit or loss to be realized from the investment as compared with investing the same amount in the underlying securities. Similarly, the percentage increase or decrease in the value of an equity security warrant may be greater than the percentage increase or decrease in the value of the underlying common stock. Warrants may relate to the purchase of equity or debt securities. Debt obligations with warrants attached to purchase equity securities have many characteristics of convertible securities and their prices may, to some degree, reflect the performance of the underlying stock. Debt obligations also may be issued with warrants attached to purchase additional debt securities at the same coupon rate. A decline in interest rates would permit a Fund to sell such warrants at a profit. If interest rates rise, these warrants would generally expire with no value.
(k) Rights. The Funds may receive rights. A right is a privilege granted to existing shareholders of a corporation to subscribe for shares of a new issue of common stock before it is issued. Rights normally have a short life, usually two to four weeks, are freely transferable and entitle the holder to buy the new common stock at a lower price than the public offering price. Rights may entail greater risks than certain other types of investments. Generally, rights do not carry the right to receive dividends or exercise voting rights with respect to the underlying securities, and they do not represent any rights in the assets of the issuer. In addition, their value does not necessarily change with the
| | | | | | |
| 148 | | December 31, 2018 | | | Semiannual Report | | |
value of the underlying securities, and they cease to have value if they are not exercised on or before their expiration date. If the market price of the underlying stock does not exceed the exercise price during the life of the right, the right will expire worthless. Rights may increase the potential profit or loss to be realized from the investment as compared with investing the same amount in the underlying securities.
(l) Exchange-Traded Funds. Certain Funds may invest in exchange-traded-funds (“ETFs”), which typically are index-based investment companies that hold substantially all of their assets in securities representing their specific index, but may also be actively-managed investment companies. Shares of ETFs trade throughout the day on an exchange and represent an investment in a portfolio of securities and other assets. As a shareholder of another investment company, the Funds would bear their pro rata portion of the other investment company’s expenses, including advisory fees, in addition to the expenses the Funds bear directly in connection with their own operations.
(m) Convertible Securities. Certain Funds’ may invest a portion of their assets in convertible securities. Although convertible securities derive part of their value from that of the securities into which they are convertible, they are not considered derivative financial instruments. However, certain of the Funds’ investments in convertible securities include features which render them sensitive to price changes in their underlying securities. The value of structured/synthetic convertible securities can be affected by interest rate changes and credit risks of the issuer. Such securities may be structured in ways that limit their potential for capital appreciation and the entire value of the security may be at risk of loss depending on the performance of the underlying equity security. Consequently, the Funds are exposed to greater downside risk than traditional convertible securities, but typically still less than that of the underlying stock.
(n) Payment In-Kind Securities. The Funds may invest in payment in-kind securities, which are debt or preferred stock securities that require or permit payment of interest in the form of additional securities. Payment in-kind securities allow the issuer to avoid or delay the need to generate cash to meet current interest payments and, as a result, may involve greater risk than securities that pay interest currently or in cash.
(o) Loan Interest Expense. Loan interest expense relates to the amounts borrowed under the credit facility (See Note 11). Loan interest expense is recorded as it is incurred.
(p) Contingent Value Rights. A Fund may invest in contingent value rights (“CVRs”). A CVR gives the holder the right to receive an amount (which may be a fixed amount or determined by a formula) in the event that a specified corporate action, business milestone, or other trigger occurs (or does not occur) which is often subject to an expiration date. CVRs often are awarded to shareholders in the context of a corporate acquisition or major restructuring. For example, shareholders of an acquired company may receive a CVR that enables them to receive additional shares of the acquiring company in the event that the acquiring company’s share price falls below a certain level by a specified date. Risks associated with the use of CVRs are generally similar to risks associated with the use of options, such as the risk that the required
trigger does not (or does) occur prior to a CVR’s expiration, causing the CVR to expire with no value. CVRs also present illiquidity risk, as they may not be registered securities or may otherwise be non-transferable or difficult to transfer, as well as counterparty risk and credit risk. Further, because CVRs are valued based on the likelihood of the occurrence of a trigger, valuation often requires modeling and judgment, which increases the risk of mispricing or improper valuation.
(q) Restricted Securities. The Funds are permitted to invest in securities that are subject to legal or contractual restrictions on resale. These securities generally may be resold in transactions exempt from registration or to the public if the securities are registered. Disposal of these securities may involve time-consuming negotiations and expenses, and prompt sale at an acceptable price may be difficult.
(r) New Accounting Pronouncements. In March 2017, the FASB issued Accounting Standards Update (“ASU”) 2017-08 changed the amortization period for a callable debt security from the maturity date to the earliest call date. The ASU is effective for annual periods beginning after December 15, 2018, and interim periods within those annual periods. The ASU 2017-08 amendments are reflected in the Funds’ financial statements for the period ended December 31, 2018.
In August 2018, the FASB issued ASU 2018-13 which changes the fair value measurement disclosure requirements for investment companies. The ASU is effective for annual periods beginning after December 15, 2019, and interim periods within those annual periods. Management has reviewed ASU 2018-13 and resolved to adopt immediately certain aspects of the ASU related to the removal and modification of certain fair measurement disclosures.
On October 17, 2018, the U.S. Securities and Exchange Commission (“SEC”) adopted changes to Regulation S-X to simplify the reporting of information by registered investment companies in financial statements. The amendments require presentation of the total, rather than the components, of distributable earnings on the Statements of Assets and Liabilities and also require presentation of the total, rather than the components, of distributions to shareholders, except for tax return of capital distributions, if any, on the Statements of Changes in Net Assets. The amendments also removed the requirement for parenthetical disclosure of undistributed net investment income on the Statements of Changes in Net Assets. These Regulation S-X amendments are reflected in the Funds’ financial statements for the period ended December 31, 2018. The distributions to shareholders in the June 30, 2018 Statements of Changes in Net Assets presented herein have not been reclassified to conform to the current year presentation.
In the normal course of business, the Funds trade financial instruments and enter into financial transactions where risk of potential loss exists due to, among other things, changes in the market (market risk) or failure of the other party to a transaction to perform (counterparty risk). The Funds are also exposed to other risks such as, but not limited to, interest rate, foreign currency, credit and leverage risks.
| | | | | | |
| | Semiannual Report | | | December 31, 2018 | | 149 |
Notes to Financial Statements (cont’d)
December 31, 2018 (unaudited)
Interest rate risk is the risk that fixed income securities’ valuations will change because of changes in interest rates. During periods of rising nominal interest rates, the values of fixed income instruments are generally expected to decline. Conversely, during periods of declining nominal interest rates, the values of fixed income instruments are generally expected to rise. To the extent that a Fund effectively has short positions with respect to fixed income instruments, the values of such short positions would generally be expected to rise when nominal interest rates rise and to decline when nominal interest rates decline. A nominal interest rate can be described as the sum of a real interest rate and an expected inflation rate. Fixed income securities with longer durations tend to be more sensitive to changes in interest rates, usually making them more volatile than securities with shorter durations. Duration is used primarily as a measure of the sensitivity of a fixed income security’s market price to interest rate (i.e., yield) movements. Interest rate changes can be sudden and unpredictable, and the Funds may lose money as a result of movements in interest rates. High-yield or junk bonds are subject to greater levels of credit and liquidity risk, may be speculative and may decline in value due to an increase in interest rates or an issuer’s deterioration and/or default. The Funds may not be able to hedge against changes in interest rates or may choose not to do so for cost or other reasons. In addition, any hedges may not work as intended. The values of equity and other non-fixed income securities may also decline due to fluctuations in interest rates.
Variable and floating rate securities generally are less sensitive to interest rate changes but may decline in value if their interest rates do not rise as much, or as quickly, as interest rates in general. Conversely, floating rate securities will not generally increase in value if interest rates decline. Inverse floating rate securities may decrease in value if interest rates increase. Inverse floating rate securities may also exhibit greater price volatility than a fixed rate obligation with similar credit quality. When the Funds hold variable or floating rate securities, a decrease (or, in the case of inverse floating rate securities, an increase) in market interest rates will adversely affect the income received from such securities and the NAV of the Funds’ shares.
The Funds are exposed to credit risk, which is the risk of losing money if the issuer or guarantor of a fixed income security is unable or unwilling, or is perceived (whether by market participants, rating agencies, pricing services or otherwise) as unable or unwilling, to make timely principal and/or interest payments, or to otherwise honor its obligations. Securities are subject to varying degrees of credit risk, which are often reflected in credit ratings.
To the extent the Funds directly invest in foreign currencies or in securities that trade in, and receive revenues in, foreign currencies, or in derivatives that provide exposure to foreign currencies, they will be subject to the risk that those currencies will decline in value relative to the U.S. dollar, or, in the case of hedging positions, that the U.S. dollar will decline in value relative to the currency being hedged. Currency rates in foreign countries may fluctuate significantly over short periods of time for a number of reasons, including economic growth, inflation, changes in interest rates, intervention (or the failure to intervene) by U.S. or foreign governments, central banks or supranational entities
such as the International Monetary Fund, or the imposition of currency controls or other political developments in the United States or abroad. As a result, the Funds’ investments in foreign currency-denominated securities may reduce the returns of the Funds. The local emerging market currencies in which the Funds may be invested may experience substantially greater volatility against the U.S. dollar than the major convertible currencies in developed countries.
The Funds are subject to elements of risk not typically associated with investments in the U.S., due to concentrated investments in foreign issuers located in a specific country or region. Such concentrations will subject the Funds to additional risks resulting from future political or economic conditions in such country or region and the possible imposition of adverse governmental laws or currency exchange restrictions affecting such country or region, which could cause the securities and their markets to be less liquid and prices more volatile than those of comparable U.S. companies.
The market values of securities may decline due to general market conditions (market risk) which are not specifically related to a particular company, such as real or perceived adverse economic conditions, changes in the general outlook for corporate earnings, changes in interest or currency rates, adverse changes to credit markets or adverse investor sentiment. They may also decline due to factors that affect a particular industry or industries, such as labor shortages or increased production costs and competitive conditions within an industry. Equity securities and equity-related investments generally have greater market price volatility than fixed income securities, although under certain market conditions fixed income securities may have comparable or greater price volatility. Credit ratings downgrades may also negatively affect securities held by the Funds. Even when markets perform well, there is no assurance that the investments held by the Funds will increase in value along with the broader market. In addition, market risk includes the risk that geopolitical events will disrupt the economy on a national or global level.
The Funds are exposed to counterparty risk, or the risk that an institution or other entity with which the Funds have unsettled or open transactions will default. The potential loss to the Funds could exceed the value of the financial assets recorded in the Funds’ financial statements. Financial assets, which potentially expose the Funds to counterparty risk, consist principally of cash due from counterparties and investments. The Investment Adviser seeks to minimize the Funds’ counterparty risk by performing reviews of each counterparty and by minimizing concentration of counterparty risk by undertaking transactions with multiple customers and counterparties on recognized and reputable exchanges. Delivery of securities sold is only made once the Funds have received payment. Payment is made on a purchase once the securities have been delivered by the counterparty. The trade will fail if either party fails to meet its obligation.
The Funds are exposed to risks associated with leverage. Leverage may cause the value of the Funds’ shares to be more volatile than if the Funds did not use leverage. This is because leverage tends to exaggerate the effect of any increase or decrease in the value of the Funds’ portfolio securities. The Funds may engage in transactions or
| | | | | | |
| 150 | | December 31, 2018 | | | Semiannual Report | | |
purchase instruments that give rise to forms of leverage. In addition, to the extent the Funds employ leverage, dividend and interest costs on such leverage may not be recovered by any appreciation of the securities purchased with the leverage proceeds and could exceed the Funds’ investment returns, resulting in greater losses.
The Funds may hold defaulted securities that may involve special considerations including bankruptcy proceedings, other regulatory and legal restrictions affecting the Funds’ ability to trade, and the availability of prices from independent pricing services or dealer quotations. Defaulted securities are often illiquid and may not be actively traded. Sale of securities in bankrupt companies at an acceptable price may be difficult and differences compared to the value of the securities used by the Funds could be material. A Fund may incur additional expenses to the extent it is required to seek recovery upon a portfolio security’s default in the payment of principal or interest. In any bankruptcy proceeding relating to a defaulted investment, a Fund may lose its entire investment or may be required to accept cash or securities with a value substantially less than its original investment.
Short sales may be used by certain of the Funds. When a Fund engages in a short sale on a security, it must borrow the security sold short and deliver it to the counterparty. The Fund will ordinarily have to pay a fee or premium to borrow particular securities and be obligated to repay the lender of the security any dividends or interest that accrue on the security during the period of the loan. The amount of any gain from a short sale will be decreased, and the amount of any loss increased, by the amount of the premium, dividends, interest or expenses a Fund pays in connection with the short sale. Short sales expose a Fund to the risk that it will be required to cover its short position at a time when the securities have appreciated in value, thus resulting in a loss to the Fund.
Investments in senior loans and repurchase agreements also involve special risks. Although typically secured, senior loans may not be backed by sufficient collateral to satisfy their issuers’ obligations in the event of bankruptcy or similar scenarios. Senior loans may also be illiquid. Similarly, repurchase agreements may result in losses if the collateral associated with such positions is insufficient in the event of a counterparty default or similar scenario. Repurchase agreement positions may also be illiquid.
The considerations and factors surrounding the settlement of certain purchases and sales made on a delayed-delivery basis are governed by Master Securities Forward Transaction Agreements (“Master Forward Agreements”) between the Funds and select counterparties. The Master Forward Agreements maintain provisions for, among other things, initiation and confirmation, payment and transfer, events of default, termination, and maintenance of collateral.
The counterparty risk associated with certain contracts may be reduced by master netting arrangements to the extent that if an event of default occurs, all amounts with the counterparty are terminated and settled on a net basis. The Funds’ overall exposure to counterparty risk with respect to transactions subject to master netting arrangements can change substantially within a short period, as it is affected by each transaction subject to the arrangement.
The Funds may invest in other investment companies, including investment companies advised by the Investment Adviser or its affiliates. Investing in other investment companies involves certain additional expenses and tax results that would not be present in a
direct investment in such other investment companies. Each Fund’s NAV will fluctuate in response to changes in the NAVs of the other investment companies in which it invests. The extent to which the investment performance and risks associated with each Fund correlate to those of a particular investment company will depend upon the extent to which each Fund’s assets are allocated from time to time for investment in such investment company, which will vary. To the extent that a Fund invests a significant portion of its assets in another investment company, it will be particularly sensitive to the risks associated with that investment company.
| 3. | FINANCIAL DERIVATIVE INSTRUMENTS |
Disclosure about derivatives and hedging activities requires qualitative disclosure regarding objectives and strategies for using derivatives, quantitative disclosure about fair value amounts of gains and losses on derivatives, and disclosure about credit-risk-related contingent features in derivative agreements. The disclosure requirements distinguish between derivatives which are accounted for as “hedges”, and those that do not qualify for such accounting. Although the Funds at times use derivatives for hedging purposes, the Funds reflect derivatives at fair value and recognize changes in fair value through the Funds’ Statements of Operations, and such derivatives do not qualify for hedge accounting treatment.
Option Transactions. The Funds purchase put and call options on securities and indices for hedging purposes, risk management purposes or otherwise as part of their investment strategies. The risks associated with purchasing an option include the risk that the Funds pay a premium whether or not the option is exercised. Additionally, the Funds bear the risk of loss of premiums and changes in market value should the counterparty not perform under the contract. Put and call options purchased are accounted for in the same manner as portfolio securities. The cost of securities acquired through the exercise of call options is increased by the premiums paid. The proceeds from securities sold through the exercise of put options are decreased by the premiums paid.
The Funds may write (sell) put and call options on securities and indices to earn premiums, for hedging purposes, risk management purposes or otherwise as part of their investment strategies. When an option is written, the premium received is recorded as an asset with an equal liability that is subsequently marked to market to reflect the market value of the option written. These liabilities, if any, are reflected as options written in the Funds’ Statements of Assets and Liabilities. Premiums received from writing options which expire unexercised are recorded on the expiration date as a realized gain. The difference between the premium received and the amount paid on effecting a closing purchase transaction, including brokerage commissions, is also treated as a realized gain, or if the premium is less than the amount paid for the closing purchase transaction, as a realized loss. If a call option written is exercised, the premium is added to the proceeds from the sale of the underlying security in determining whether there has been a realized gain or loss. If a put option written is exercised, the premium reduces the cost basis of the security. In writing an option, the Funds bear the market risk of an unfavorable change in the price of the security underlying the written option. Exercise of a written option could result in the Funds purchasing a security at a price different from its current market value.
There are several risks associated with option transactions on securities. For example, there are significant differences between the securities and
| | | | | | |
| | Semiannual Report | | | December 31, 2018 | | 151 |
Notes to Financial Statements (cont’d)
December 31, 2018 (unaudited)
options markets that could result in an imperfect correlation between these markets, causing a given transaction not to achieve its objective. The Funds’ ability to use options successfully will depend on the Investment Manager’s ability to predict pertinent market movements, which cannot be assured. As the writer of a covered call option, a Fund foregoes, during the option’s life, the opportunity to profit from increases in the market value of the security covering the call option above the sum of the premium and the strike price of the call, but has retained the risk of loss should the price of the underlying security decline.
The following is a summary of the Funds’ derivatives categorized by risk exposure.
The effect of derivatives on the Statements of Assets and Liabilities at December 31, 2018:
| | | | |
|
| AllianzGI Income & Growth: | |
| Location | | Market
Price | |
Liability derivatives: | | | | |
Options written, at value | | $ | (1,145,770 | ) |
| | | | |
|
| AllianzGI Technology: | |
| Location | | Market
Price | |
Asset derivatives: | | | | |
Investments, at value (options purchased) | | $ | 4,211,500 | |
Liability derivatives: | | | | |
Options written, at value | | $ | (1,121,800 | ) |
The effect of derivatives on the Statements of Operations for the six months ended December 31, 2018:
| | | | |
|
| AllianzGI Global Natural Resources: | |
| Location | | Market
Price | |
Net realized gain on: | | | | |
Options written | | $ | 1,475 | |
| | | | |
| |
| AllianzGI Income & Growth: | | | |
| Location | | Market
Price | |
Net realized gain on: | | | | |
Options written | | $ | 3,369,386 | |
Net change in unrealized appreciation/depreciation of: | | | | |
Options written | | $ | (824,172 | ) |
| | | | |
|
| AllianzGI Technology: | |
| Location | | Market
Price | |
Net realized loss on: | | | | |
Investments (options purchased) | | $ | (4,526,862 | ) |
Options written | | | (2,835,747 | ) |
Total net realized loss | | $ | (7,362,609 | ) |
Net change in unrealized appreciation/depreciation of: | | | | |
Investments (options purchased) | | $ | (16,005,580 | ) |
Options written | | | (7,317,062 | ) |
Total net change in unrealized appreciation/depreciation | | $ | (23,322,642 | ) |
The average volume (based on the open positions at each month-end) of derivative activity during the six months ended December 31, 2018:
| | | | | | | | |
| | | Options
Purchased
Contracts(1) | | | Options
Written
Contracts(1) | |
AllianzGI Global Natural Resources | | | — | | | | 58 | |
AllianzGI Income & Growth | | | — | | | | 20,131 | |
AllianzGI Technology | | | 13,421 | | | | 21,113 | |
| 4. | INVESTMENT ADVISER/ADMINISTRATOR/DISTRIBUTOR FEES/ EXPENSES & DEFERRED COMPENSATION |
Investment Advisory Fee. AllianzGI U.S. serves as investment adviser to the Funds, pursuant to an investment advisory contract. AllianzGI U.S. receives a monthly fee (the “Investment Advisory Fee”) from each Fund at an annual rate based on the average daily net assets of each Fund.
Administration Fee. AllianzGI U.S. provides administrative services to the Funds and also bears the cost of most third-party administrative services required by the Funds, and in return it receives from each share class of each Fund a monthly administration fee based on each share class’ average daily net assets (the “Administration Fee”).
The Investment Advisory Fee and Administration Fee for all classes are charged at an annual rate as indicated in the following table:
| | | | | | | | | | | | | | | | | | | | | | | | | | | | | | | | | | | | | | | | | | | | | | | | |
| | | | | | |
| | | All Classes | | | Class A, C,
and R | | | Class P | | | Institutional Class | | | Class R6 | | | Administrative Class | |
| | | | | | | | | | | | |
| | | Investment
Advisory
Fee | | | Effective
Advisory
Fee | | | Administ-
ration
Fee | | | Effective
Administ-
ration Fee | | | Administ-
ration
Fee | | | Effective
Administ-
ration Fee | | | Administ-
ration
Fee | | | Effective
Administ-
ration Fee | | | Administ-
ration
Fee | | | Effective
Administ-
ration
Fee | | | Administ-
ration
Fee | | | Effective
Administ-
ration Fee | |
AllianzGI Emerging Markets(1) Opportunities | | | 0.85 | % | �� | | 0.65 | %(4) | | | 0.50 | % | | | 0.34 | %(5) | | | 0.50 | % | | | 0.34 | %(5) | | | 0.40 | % | | | 0.24 | %(5) | | | 0.35 | % | | | 0.19 | %(5) | | | N/A | | | | N/A | |
| | | | | | |
| 152 | | December 31, 2018 | | | Semiannual Report | | |
| | | | | | | | | | | | | | | | | | | | | | | | | | | | | | | | | | | | | | | | | | | | | | | | |
| | | | | | |
| | | All Classes | | | Class A, C,
and R | | | Class P | | | Institutional Class | | | Class R6 | | | Administrative Class | |
| | | | | | | | | | | | |
| | | Investment
Advisory
Fee | | | Effective
Advisory
Fee | | | Administ-
ration
Fee | | | Effective
Administ-
ration Fee | | | Administ-
ration
Fee | | | Effective
Administ-
ration Fee | | | Administ-
ration
Fee | | | Effective
Administ-
ration Fee | | | Administ-
ration
Fee | | | Effective
Administ-
ration
Fee | | | Administ-
ration
Fee | | | Effective
Administ-
ration Fee | |
AllianzGI Focused Growth(3) | | | 0.45 | % | | | 0.35 | %(6) | | | 0.40 | % | | | † | (7) | | | 0.40 | % | | | 0.40 | % | | | 0.30 | % | | | 0.30 | % | | | 0.25 | % | | | 0.25 | % | | | 0.30 | % | | | 0.30 | % |
AllianzGI Global Natural Resources(2) | | | 0.70 | | | | 0.70 | | | | 0.45 | | | | 0.45 | % | | | 0.45 | | | | 0.45 | | | | 0.35 | | | | 0.35 | | | | N/A | | | | N/A | | | | N/A | | | | N/A | |
AllianzGI GlobalSmall-Cap(2) | | | 0.90 | | | | 0.90 | | | | 0.45 | | | | 0.45 | | | | 0.45 | | | | 0.45 | | | | 0.35 | | | | 0.35 | | | | N/A | | | | N/A | | | | N/A | | | | N/A | |
AllianzGI Health Sciences(3) | | | 0.80 | | | | 0.80 | | | | 0.40 | | | | 0.40 | | | | N/A | | | | N/A | | | | 0.30 | | | | 0.30 | | | | N/A | | | | N/A | | | | N/A | | | | N/A | |
AllianzGI Income & Growth(3) | | | 0.65 | | | | 0.64 | (9) | | | 0.40 | | | | 0.37 | | | | 0.40 | | | | 0.37 | | | | 0.30 | | | | 0.27 | | | | N/A | | | | N/A | | | | N/A | | | | N/A | |
AllianzGI Mid-Cap(3) | | | 0.47 | | | | 0.47 | | | | 0.40 | | | | 0.40 | | | | 0.40 | | | | 0.40 | | | | 0.30 | | | | 0.30 | | | | N/A | | | | N/A | | | | 0.30 | | | | 0.30 | |
AllianzGI NFJ Dividend Value(3) | | | 0.45 | | | | 0.32 | (10) | | | 0.40 | | | | 0.39 | | | | 0.40 | | | | 0.39 | | | | 0.30 | | | | 0.29 | | | | 0.25 | | | | 0.24 | | | | 0.30 | | | | 0.29 | |
AllianzGI NFJ International Value(1) | | | 0.60 | | | | 0.55 | (11) | | | 0.50 | | | | 0.47 | (12) | | | 0.50 | | | | 0.47 | (12) | | | 0.40 | | | | 0.37 | (12) | | | 0.35 | | | | 0.32 | (12) | | | 0.40 | | | | 0.37 | (12) |
AllianzGI NFJ Large-Cap Value(3) | | | 0.45 | | | | 0.45 | | | | 0.40 | | | | 0.40 | | | | 0.40 | | | | 0.40 | | | | 0.30 | | | | 0.30 | | | | N/A | | | | N/A | | | | 0.30 | | | | 0.30 | |
AllianzGI NFJ Mid-Cap Value(3) | | | 0.55 | | | | 0.55 | | | | 0.40 | | | | 0.17 | (13) | | | 0.40 | | | | 0.17 | (13) | | | 0.30 | | | | 0.07 | (13) | | | 0.25 | | | | 0.03 | (13) | | | 0.30 | | | | 0.07 | (13) |
AllianzGI NFJ Small-Cap Value(3) | | | 0.60 | | | | 0.57 | (14) | | | 0.40 | | | | 0.35 | (15) | | | 0.40 | | | | 0.35 | (15) | | | 0.30 | | | | 0.25 | (15) | | | 0.25 | | | | 0.20 | (15) | | | 0.30 | | | | 0.25 | (15) |
AllianzGI Small-Cap(3) | | | 0.60 | | | | 0.61 | (16) | | | 0.40 | | | | 0.31 | (16) | | | 0.40 | | | | 0.32 | (16) | | | 0.30 | | | | 0.22 | (16) | | | 0.25 | | | | 0.15 | (16) | | | N/A | | | | N/A | |
AllianzGI Technology(3) | | | 0.90 | | | | 0.80 | (8) | | | 0.40 | | | | 0.39 | | | | 0.40 | | | | 0.39 | | | | 0.30 | | | | 0.29 | | | | N/A | | | | N/A | | | | 0.30 | | | | 0.29 | |
| (1) | The total Administration Fee rate for each class of shares shall be reduced according to the following schedule, each based on such Fund’s aggregate average daily net assets: by 0.025% per annum on assets in excess of $250 million, by an additional 0.025% per annum on assets in excess of $500 million, by an additional 0.025% per annum on assets in excess of $1 billion, by an additional 0.025% per annum on assets in excess of $2.5 billion, by an additional 0.025% per annum on assets in excess of $5 billion and by an additional 0.025% per annum on assets in excess of $7.5 billion. To the extent that any such reduction in the fee rate applies, the dollar amount of the fee reduction with respect to each share class is calculated and applied on a pro rata basis by reference to the percentage of the Fund’s average daily net assets attributable to that class. |
| (2) | The total Administration Fee rate for each class of shares shall be reduced according to the following schedule, each based on such Fund’s aggregate average daily net assets: by 0.025% per annum on assets in excess of $500 million, by an additional 0.025% per annum on assets in excess of $1 billion, by an additional 0.025% per annum on assets in excess of $2.5 billion, by an additional 0.025% per annum on assets in excess of $5 billion and by an additional 0.025% per annum on assets in excess of $7.5 billion. To the extent that any such reduction in the fee rate applies, the dollar amount of the fee reduction with respect to each share class is calculated and applied on a pro rata basis by reference to the percentage of the Fund’s average daily net assets attributable to that class. |
| (3) | The total Administration Fee rate for each class of shares shall be reduced according to the following schedule, each based on such Fund’s aggregate average daily net assets: by 0.025% per annum on assets in excess of $1 billion, by an additional 0.025% per annum on assets in excess of $2.5 billion, by an additional 0.025% per annum on assets in excess of $5 billion and by an additional 0.025% per annum on assets in excess of $7.5 billion. To the extent that any such reduction in the fee rate applies, the dollar amount of the fee reduction with respect to each share class is calculated and applied on a pro rata basis by reference to the percentage of the Fund’s average daily net assets attributable to that class. |
| (4) | The Adviser has contractually agreed to observe, through October 31, 2019, an irrevocable waiver of a portion of its Investment Advisory Fee currently in place, which reduces the 0.85% contractual fee rate by 0.20% to 0.65%. This waiver arrangement has been in effect since April 1, 2017. |
| (5) | The Administrator has contractually agreed to observe, through October 31, 2019, an irrevocable waiver of a portion of its Administration Fees, which reduces the contractual fee rate by 0.15%. This waiver has been in effect since before the beginning of the Fund’s most recent fiscal year. |
| (6) | The Adviser has contractually agreed to observe, through October 31, 2019, an irrevocable waiver of a portion of its Investment Advisory Fee currently in place, which reduces the 0.45% contractual fee rate by 0.10% to 0.35%. |
| (7) | The Administrator has contractually agreed to observe, through October 31, 2019, an irrevocable waiver of a portion of its Administration Fees for Class A shares currently in place, which reduces the contractual fee rate by 0.02%. |
| (8) | The Adviser had contractually agreed to observe, through October 31, 2018, an irrevocable waiver of a portion of the Investment Advisory Fee, which reduces the 0.90% contractual fee rate by 0.15% to 0.75%, and then an additional 0.01% on net assets in excess of $2 billion, by an additional 0.015% on net assets in excess of $3 billion and by an additional 0.025% on net assets in excess of $5 billion, each based on the Fund’s average daily net assets. This waiver arrangement had been in effect since November 1, 2016. |
| (9) | The Adviser has contractually agreed to observe, through October 31, 2019, an irrevocable waiver of a portion of the Investment Advisory Fee, which reduces the 0.65% contractual fee rate by 0.01% on net assets in excess of $2 billion, by an additional 0.015% on net assets in excess of $3 billion and by an additional 0.025% on net assets in excess of $5 billion, each based on the Fund’s average daily net assets. An identical waiver arrangement has been in effect since before the beginning of the Fund’s most recent fiscal year. |
| (10) | The Adviser has contractually agreed to observe, through October 31, 2018, an irrevocable waiver of a portion of its Investment Advisory Fee, which reduces the 0.45% contractual fee rate by 0.15% to 0.30%. Effective November 1, 2018 through October 31, 2019, the Adviser has contractually agreed to observe an irrevocable waiver of a portion of it’s Investment Advisory fee, which reduces the 0.45% contractual fee rate by 0.075% to 0.375%, and by an additional 0.025% on net assets in excess of $7.5 billion, and by an additional 0.025% on net assets in excess of $10 billion, each based on the Fund’s average daily net assets. |
| | | | | | |
| | Semiannual Report | | | December 31, 2018 | | 153 |
Notes to Financial Statements (cont’d)
December 31, 2018 (unaudited)
| (11) | The Adviser has contractually agreed to observe, through October 31, 2019, an irrevocable waiver of a portion of the Investment Advisory Fee, which reduces the 0.60% contractual fee rate by 0.05% to 0.55%, and an additional 0.01% on net assets in excess of $4 billion, by an additional 0.015% on net assets in excess of $5 billion and by an additional 0.025% on net assets in excess of $7.5 billion, each based on the Fund’s average daily net assets. An identical waiver arrangement has been in effect since before the beginning of the Fund’s most recent fiscal year. |
| (12) | The Administrator has contractually agreed to observe, through October 31, 2019, an irrevocable waiver of a portion of its Administration Fees, which reduces the contractual fee rate by 0.025%. This waiver has been in effect since before the beginning of the Fund’s most recent fiscal year. |
| (13) | The Administrator has contractually agreed to observe, through September 30, 2019, an irrevocable waiver of a portion of its Administration Fees for all classes, which reduces the contractual fee rate by 0.22%. This waiver has been in effect since September 22, 2017. |
| (14) | Effective November 1, 2018, the Adviser has contractually agreed to observe, through October 31, 2019, an irrevocable waiver of a portion of the Investment Advisory Fee, which reduces the 0.60% contractual fee rate by 0.10% to 0.50%, and then by an additional 0.025% on net assets in excess of $3 billion, by an additional 0.025% on net assets in excess of $4 billion and by an additional 0.025% on net assets in excess of $5 billion, each based on the Fund’s average daily net assets. From November 1, 2017 through October 31, 2018, the previously mentioned breakpoint was in place without the 0.10% irrevocable waiver of a portion of the Investment Advisory Fee. |
| (15) | The Administrator had contractually agreed to observe, through October 31, 2018, an irrevocable waiver of a portion of its Administration Fees which reduces the contractual fee rate by 0.05%. An identical fee waiver had been in effect since November 1, 2016. |
| (16) | Effective August 1, 2018, the Investment Advisory Fee was reduced by 0.05% from 0.65% to 0.60%. The Administrator has contractually agreed to observe, through August 31, 2020, an irrevocable waiver of a portion of its Administration Fees for all classes, which reduces the contractual fee rate by 0.10%. This waiver has been in effect since August 1, 2018. |
| † | The effective Administration Fee rate for Class A is 0.38%; for Class C and Class R is 0.40%, respectively. |
Distribution and Servicing Fees. Allianz Global Investors Distributors LLC (the “Distributor”), an affiliate of AllianzGI U.S., serves as the distributor of the Trust’s shares. The Funds are permitted to reimburse the Distributor on a quarterly basis, out of the Administrative Class assets of each Fund offering Administrative Class shares, in an amount up to 0.25% on an annual basis of the average daily net assets of that class, for payments made to financial intermediaries that provide services in connection with the distribution of shares or administration of plans or programs that use Fund shares as their funding medium. Unreimbursed costs may be carried forward for reimbursement for up to twelve months beyond the date in which they are incurred, subject always to the limit that not more than 0.25% of the average daily net assets attributable to the Administrative Class may be expensed.
Pursuant to the Distribution and Servicing Plans adopted by the A, C and R classes, the Distributor receives (i) in connection with the distribution of C and R class shares of the Trust, certain distribution fees from the Trust, and (ii) in connection with personal services rendered to A, C and R class shareholders of the Trust and the maintenance of shareholder accounts, certain servicing fees from the Trust.
The Funds paid the Distributor distribution and/or servicing fees at an effective rate as set forth below (calculated as a percentage of each Fund’s average daily net assets attributable to each class):
| | | | | | | | |
| |
| | | Allowable Rate | |
| | |
| | | Distribution Fee | | | Servicing Fee | |
Class A | | | | | | | | |
All Funds | | | — | | | | 0.25 | % |
Class C | | | | | | | | |
All Funds | | | 0.75 | % | | | 0.25 | |
Class R | | | | | | | | |
All Funds | | | 0.25 | | | | 0.25 | |
The Distributor also receives the proceeds of the initial sales charges paid by the shareholders upon the purchase of Class A shares and contingent deferred sales charges (“CDSC”) paid by the shareholders upon certain redemptions of Class A and C shares. For the six months
ended December 31, 2018, the Distributor received $650,447, representing commissions (sales charges) and CDSC from the Funds.
Expenses. The Trust is responsible for the following expenses: (i) salaries and other compensation of any of the Trust’s executive officers and employees who are not officers, directors, stockholders or employees of the Investment Adviser or its subsidiaries or affiliates; (ii) taxes and governmental fees; (iii) brokerage fees and commissions and other portfolio transaction expenses; (iv) the costs of borrowing money, including interest expense and bank overdraft charges; (v) fees and expenses of the Trustees who are not “interested persons” of the Investment Adviser or the Trust, and any counsel or other experts retained exclusively for their benefit; (vi) extraordinary expenses, including costs of litigation and indemnification expenses; (vii) organization expenses, if any and (viii) any expenses allocated or allocable to a specific class of shares, which include service fees payable with respect to the Administrative Class shares and may include certain other expenses as permitted by the Trust’s Amended and Restated Multi-Class Plan adopted pursuant to Rule 18f-3 under the Investment Company Act of 1940 and subject to review and approval by the Trustees. The Funds may invest in other investment companies, including investment companies advised or sub-advised by the Investment Adviser or its affiliates. Investing in other investment companies involves certain additional expenses and tax results that would not be present in a direct investment in such other investment companies. The ratio of expenses to average net assets per share class, as disclosed in the Financial Highlights, may differ from the estimated annual fund operating expenses per share class as disclosed in the Prospectus for the reasons set forth above.
Deferred Compensation. The Trustees do not currently receive any pension or retirement benefits from the Trust. In calendar year 2018 and certain prior periods, the Trust maintained a deferred compensation plan pursuant to which each Trustee who is not interested person of the Trust (“Independent Trustee”) had the opportunity to elect not to receive all or a portion of his or her fees from the Trust on a current basis, but instead to receive in a subsequent period chosen by the Trustee an amount equal to the value of such compensation if such compensation had been invested in one or more series of the Trust or Allianz Funds Multi-Strategy Trust selected by the Trustees from and after the normal payment dates for such
| | | | | | |
| 154 | | December 31, 2018 | | | Semiannual Report | | |
compensation. The deferred compensation program was closed to new deferrals effective January 1, 2019, and all Trustee fees earned with respect to service in calendar year 2019 and beyond have been or will be paid in cash, on a current basis, unless the Board reopens the program to new deferrals. The Trust still has obligations with respect to Trustee fees deferred in 2018 and in prior periods, and will continue to have such obligations until all deferred Trustee fees are paid out pursuant to the terms of the deferred compensation plan.
| 5. | INVESTMENTS IN SECURITIES |
For the six months ended December 31, 2018, purchases and sales of investments, other than short-term securities were:
| | | | | | | | |
| | |
| | | Purchases | | | Sales | |
AllianzGI Emerging Markets Opportunities | | $ | 153,492,794 | | | $ | 152,788,409 | |
AllianzGI Focused Growth | | | 263,181,017 | | | | 308,750,427 | |
AllianzGI Global Natural Resources | | | 6,843,989 | | | | 10,384,432 | |
AllianzGI Global Small-Cap | | | 65,013,087 | | | | 85,885,604 | |
AllianzGI Health Sciences | | | 86,440,160 | | | | 96,144,804 | |
AllianzGI Income & Growth | | | 1,264,601,079 | | | | 949,422,865 | |
| | | | | | | | |
| | |
| | | Purchases | | | Sales | |
AllianzGI Mid-Cap | | $ | 103,866,504 | | | $ | 121,283,117 | |
AllianzGI NFJ Dividend Value | | | 499,607,071 | | | | 864,126,896 | |
AllianzGI NFJ International Value | | | 60,762,030 | | | | 131,613,863 | |
AllianzGI NFJ Large-Cap Value | | | 118,330,954 | | | | 133,574,384 | |
AllianzGI NFJ Mid-Cap Value | | | 366,976,360 | | | | 344,442,733 | |
AllianzGI NFJ Small-Cap Value | | | 320,837,856 | | | | 998,920,260 | |
AllianzGI Small-Cap | | | 35,643,676 | | | | 35,623,994 | |
AllianzGI Technology* | | | 678,835,110 | | | | 676,584,604 | |
| * | Securities sold short of $1,237,366; covers on securities sold short of $49,423. |
At December 31, 2018, the aggregate cost basis and the net unrealized appreciation (depreciation) of investments in securities and other financial instruments for U.S. federal income tax purposes were:
| | | | | | | | | | | | | | | | |
| | | Federal Tax
Cost Basis | | | Unrealized
Appreciation | | | Unrealized
Depreciation | | | Net Unrealized
Appreciation
(Depreciation) | |
AllianzGI Emerging Markets Opportunities | | $ | 322,686,693 | | | $ | 15,462,220 | | | $ | 24,727,633 | | | $ | (9,265,413 | ) |
AllianzGI Focused Growth | | | 655,921,338 | | | | 313,123,183 | | | | 59,815,819 | | | | 253,307,364 | |
AllianzGI Global Natural Resources | | | 14,381,214 | | | | 494,409 | | | | 1,774,258 | | | | (1,279,849 | ) |
AllianzGI Global Small-Cap | | | 130,037,240 | | | | 14,975,814 | | | | 12,736,425 | | | | 2,239,389 | |
AllianzGI Health Sciences | | | 134,171,574 | | | | 16,113,713 | | | | 8,838,596 | | | | 7,275,117 | |
AllianzGI Income & Growth | | | 4,494,841,768 | | | | 18,594,755 | | | | 802,305,754 | | | | (783,710,999 | ) |
AllianzGI Mid-Cap | | | 251,086,510 | | | | 25,806,633 | | | | 26,994,542 | | | | (1,187,909 | ) |
AllianzGI NFJ Dividend Value | | | 1,449,176,238 | | | | 144,511,792 | | | | 125,617,775 | | | | 18,894,017 | |
AllianzGI NFJ International Value | | | 197,473,730 | | | | 7,008,837 | | | | 18,875,285 | | | | (11,866,448 | ) |
AllianzGI NFJ Large-Cap Value | | | 344,522,434 | | | | 10,010,086 | | | | 38,022,838 | | | | (28,012,752 | ) |
AllianzGI NFJ Mid-Cap Value | | | 1,128,572,623 | | | | 88,026,156 | | | | 105,102,573 | | | | (17,076,417 | ) |
AllianzGI NFJ Small-Cap Value | | | 1,279,504,369 | | | | 132,881,193 | | | | 197,931,959 | | | | (65,050,766 | ) |
AllianzGI Small-Cap | | | 79,469,752 | | | | 8,573,877 | | | | 8,344,420 | | | | 229,457 | |
AllianzGI Technology | | | 1,057,087,160 | | | | 343,123,513 | | | | 12,935,100 | | | | 330,188,413 | |
| (1) | Differences, if any, between book and tax cost basis are primarily attributable to wash sale loss deferrals and the differing treatment of bond premium amortization. |
| | | | | | |
| | Semiannual Report | | | December 31, 2018 | | 155 |
Notes to Financial Statements (cont’d)
December 31, 2018 (unaudited)
| 7. | SHARES OF BENEFICIAL INTEREST |
The Trust may issue an unlimited number of shares of beneficial interest with $0.0001 par value. Changes in shares of beneficial interest were as follows:
| | | | | | | | | | | | | | | | | | | | | | | | | | | | | | | | | | | | |
| | | AllianzGI Emerging Markets Opportunities | | | AllianzGI Focused Growth | | | | |
| | | | | |
| | | Six Months ended
December 31, 2018
(unaudited) | | | Year ended
June 30, 2018 | | | Six Months ended
December 31, 2018
(unaudited) | | | Year ended
June 30, 2018 | | | | |
| | | Shares | | | Amount | | | Shares | | | Amount | | | Shares | | | Amount | | | Shares | | | Amount | | | | |
Shares sold: | | | | | | | | | | | | | | | | | | | | | | | | | | | | | | | | | | | | |
Class A | | | 191,878 | | | $ | 5,168,439 | | | | 697,928 | | | $ | 20,810,440 | | | | 3,610,899 | | | $ | 213,348,617 | | | | 845,049 | | | $ | 45,026,886 | | | | | |
Class C | | | 13,144 | | | | 331,106 | | | | 33,859 | | | | 1,000,458 | | | | 161,771 | | | | 5,363,021 | | | | 199,107 | | | | 7,318,588 | | | | | |
Class R | | | — | | | | — | | | | — | | | | — | | | | 78,715 | | | | 3,278,090 | | | | 133,299 | | | | 5,479,120 | | | | | |
Class P | | | 149,097 | | | | 3,891,092 | | | | 563,064 | | | | 16,657,768 | | | | 453,008 | | | | 19,298,429 | | | | 839,524 | | | | 34,751,624 | | | | | |
Institutional Class | | | 2,919,472 | | | | 80,797,138 | | | | 5,829,537 | | | | 183,882,754 | | | | 308,931 | | | | 15,610,124 | | | | 897,756 | | | | 43,898,753 | | | | | |
Class R6 | | | 108,670 | | | | 2,931,032 | | | | 920,330 | | | | 29,036,041 | | | | 424,373 | | | | 20,087,480 | | | | 1,562,011 | | | | 79,373,546 | | | | | |
Administrative Class | | | — | | | | — | | | | — | | | | — | | | | 31,923 | | | | 1,685,329 | | | | 17,863 | | | | 852,078 | | | | | |
| | | | | | | |
Issued in reinvestment of dividends and distributions: | | | | | | | | | | | | | | | | | | | | | | | | | | | | | |
Class A | | | 37,330 | | | | 916,062 | | | | 41,566 | | | | 1,241,997 | | | | 1,264,995 | | | | 54,065,891 | | | | 86,993 | | | | 4,626,289 | | | | | |
Class C | | | 592 | | | | 14,456 | | | | 786 | | | | 23,182 | | | | 266,353 | | | | 7,377,992 | | | | 116,094 | | | | 4,297,789 | | | | | |
Class R | | | — | | | | — | | | | — | | | | — | | | | 83,352 | | | | 2,609,751 | | | | 8,375 | | | | 341,603 | | | | | |
Class P | | | 20,942 | | | | 501,782 | | | | 13,849 | | | | 405,788 | | | | 354,870 | | | | 11,338,112 | | | | 32,582 | | | | 1,344,967 | | | | | |
Institutional Class | | | 232,119 | | | | 5,693,881 | | | | 60,550 | | | | 1,817,696 | | | | 416,583 | | | | 16,292,546 | | | | 63,927 | | | | 3,135,604 | | | | | |
Class R6 | | | 24,240 | | | | 591,467 | | | | 498 | | | | 14,883 | | | | 338,307 | | | | 13,248,091 | | | | 12,985 | | | | 637,345 | | | | | |
Administrative Class | | | — | | | | — | | | | — | | | | — | | | | 15,646 | | | | 568,421 | | | | 1,540 | | | | 71,074 | | | | | |
| | | | | | | | | |
Cost of shares redeemed: | | | | | | | | | | | | | | | | | | | | | | | | | | | | | | | | | | | | |
Class A | | | (1,993,944 | ) | | | (55,663,483 | ) | | | (2,748,849 | ) | | | (80,949,799 | ) | | | (952,152 | ) | | | (50,912,234 | ) | | | (1,530,183 | ) | | | (81,276,063 | ) | | | | |
Class C | | | (138,833 | ) | | | (3,676,170 | ) | | | (89,122 | ) | | | (2,659,097 | ) | | | (4,685,990 | ) | | | (193,973,010 | ) | | | (1,026,181 | ) | | | (38,161,076 | ) | | | | |
Class R | | | — | | | | — | | | | — | | | | — | | | | (95,256 | ) | | | (4,189,552 | ) | | | (169,477 | ) | | | (6,978,684 | ) | | | | |
Class P | | | (462,789 | ) | | | (12,144,160 | ) | | | (335,061 | ) | | | (10,020,087 | ) | | | (712,466 | ) | | | (27,866,561 | ) | | | (614,723 | ) | | | (25,121,226 | ) | | | | |
Institutional Class | | | (1,066,611 | ) | | | (27,995,406 | ) | | | (1,722,594 | ) | | | (53,937,449 | ) | | | (509,308 | ) | | | (26,265,279 | ) | | | (2,122,703 | ) | | | (105,917,209 | ) | | | | |
Class R6 | | | (113,956 | ) | | | (3,041,671 | ) | | | (97,151 | ) | | | (3,006,277 | ) | | | (176,614 | ) | | | (9,099,771 | ) | | | (250,018 | ) | | | (12,412,457 | ) | | | | |
Administrative Class | | | — | | | | — | | | | — | | | | — | | | | (16,949 | ) | | | (862,028 | ) | | | (43,814 | ) | | | (2,068,060 | ) | | | | |
Net increase (decrease) resulting from Fund share transactions | | | (78,649 | ) | | $ | (1,684,435 | ) | | | 3,169,190 | | | $ | 104,318,298 | | | | 660,991 | | | $ | 71,003,459 | | | | (939,994 | ) | | $ | (40,779,509 | ) | | | | |
| — | May reflect actual amounts rounding to less than $1 or less than 1 share. |
| | | | | | |
| 156 | | December 31, 2018 | | | Semiannual Report | | |
| | | | | | | | | | | | | | | | | | | | | | | | | | | | | | | | | | | | | | | | | | | | | | | | | | |
| | | | AllianzGI Global Natural Resources | | | AllianzGI Global Small-Cap | | | AllianzGI Health Sciences | |
| | | | | | |
| | | | Six Months ended
December 31, 2018
(unaudited) | | | Year ended
June 30, 2018 | | | Six Months ended
December 31, 2018
(unaudited) | | | Year ended
June 30, 2018 | | | Six Months ended
December 31, 2018
(unaudited) | | | Year ended
June 30, 2018 | |
| | | | Shares | | | Amount | | | Shares | | | Amount | | | Shares | | | Amount | | | Shares | | | Amount | | | Shares | | | Amount | | | Shares | | | Amount | |
| | | | | | | | | | | | | | | | | | | | | | | | | | | | | | | | | | | | | | | | | | | | | | | | | | |
| | | | | | 50,640 | | | $ | 770,875 | | | | 105,939 | | | $ | 1,575,623 | | | | 148,016 | | | $ | 7,201,589 | | | | 83,184 | | | $ | 4,244,889 | | | | 197,472 | | | $ | 6,898,262 | | | | 86,357 | | | $ | 2,801,477 | |
| | | | | | 24,908 | | | | 375,251 | | | | 9,008 | | | | 125,928 | | | | 9,700 | | | | 374,283 | | | | 33,805 | | | | 1,531,603 | | | | 19,126 | | | | 486,686 | | | | 10,459 | | | | 271,090 | |
| | | | | | — | | | | — | | | | — | | | | — | | | | — | | | | — | | | | — | | | | — | | | | — | | | | — | | | | — | | | | — | |
| | | | | | 21,561 | | | | 308,952 | | | | 110,809 | | | | 1,737,713 | | | | 24,239 | | | | 1,121,312 | | | | 72,253 | | | | 3,943,050 | | | | — | | | | — | | | | — | | | | — | |
| | | | | | 46,131 | | | | 709,895 | | | | 226,220 | | | | 3,493,152 | | | | 118,867 | | | | 6,239,537 | | | | 162,556 | | | | 8,908,540 | | | | 10,198 | | | | 355,494 | | | | 34,004 | | | | 1,128,578 | |
| | | | | | — | | | | — | | | | — | | | | — | | | | — | | | | — | | | | — | | | | — | | | | — | | | | — | | | | — | | | | — | |
| | | | | | — | | | | — | | | | — | | | | — | | | | — | | | | — | | | | — | | | | — | | | | — | | | | — | | | | — | | | | — | |
| | | | | | | | | | | | |
| | | | | | | | | | | | | | | | | | | | | | | | | | | | | | | | | | | | | | | | | | | | | | | | | | |
| | | | | | 6,938 | | | | 85,340 | | | | 1,014 | | | | 15,872 | | | | 254,078 | | | | 8,310,892 | | | | 90,251 | | | | 4,491,798 | | | | 674,933 | | | | 18,634,889 | | | | — | | | | — | |
| | | | | | 1,122 | | | | 12,975 | | | | — | | | | 2 | | | | 69,797 | | | | 1,927,792 | | | | 40,033 | | | | 1,756,267 | | | | 29,367 | | | | 623,175 | | | | — | | | | — | |
| | | | | | — | | | | — | | | | — | | | | — | | | | — | | | | — | | | | — | | | | — | | | | — | | | | — | | | | — | | | | — | |
| | | | | | 3,357 | | | | 41,893 | | | | — | | | | — | | | | 41,648 | | | | 1,469,340 | | | | 17,947 | | | | 947,048 | | | | — | | | | — | | | | — | | | | — | |
| | | | | | 9,214 | | | | 116,191 | | | | 2,086 | | | | 33,503 | | | | 369,475 | | | | 13,171,798 | | | | 145,643 | | | | 7,743,818 | | | | 11,595 | | | | 324,420 | | | | — | | | | — | |
| | | | | | — | | | | — | | | | — | | | | — | | | | — | | | | — | | | | — | | | | — | | | | — | | | | — | | | | — | | | | — | |
| | | | | | — | | | | — | | | | — | | | | — | | | | — | | | | — | | | | — | | | | — | | | | — | | | | — | | | | — | | | | — | |
| | | | | | | | | | | | |
| | | | | | | | | | | | | | | | | | | | | | | | | | | | | | | | | | | | | | | | | | | | | | | | | | |
| | | | | | (112,807 | ) | | | (1,615,853 | ) | | | (425,769 | ) | | | (6,543,832 | ) | | | (177,314 | ) | | | (7,459,976 | ) | | | (252,928 | ) | | | (12,931,724 | ) | | | (313,832 | ) | | | (10,271,837 | ) | | | (614,264 | ) | | | (19,853,094 | ) |
| | | | | | (57,848 | ) | | | (811,316 | ) | | | (91,805 | ) | | | (1,284,764 | ) | | | (199,834 | ) | | | (8,644,993 | ) | | | (101,780 | ) | | | (4,592,282 | ) | | | (177,794 | ) | | | (5,016,362 | ) | | | (108,952 | ) | | | (2,809,024 | ) |
| | | | | | — | | | | — | | | | — | | | | — | | | | — | | | | — | | | | — | | | | — | | | | — | | | | — | | | | — | | | | — | |
| | | | | | (79,356 | ) | | | (1,075,188 | ) | | | (101,951 | ) | | | (1,533,966 | ) | | | (133,465 | ) | | | (5,593,675 | ) | | | (216,159 | ) | | | (11,519,088 | ) | | | — | | | | — | | | | — | | | | — | |
| | | | | | (170,980 | ) | | | (2,597,722 | ) | | | (434,005 | ) | | | (6,699,510 | ) | | | (385,590 | ) | | | (17,636,759 | ) | | | (779,135 | ) | | | (41,888,099 | ) | | | (25,986 | ) | | | (914,026 | ) | | | (65,031 | ) | | | (2,129,884 | ) |
| | | | | | — | | | | — | | | | — | | | | — | | | | — | | | | — | | | | — | | | | — | | | | — | | | | — | | | | — | | | | — | |
| | | | | | — | | | | — | | | | — | | | | — | | | | — | | | | — | | | | — | | | | — | | | | — | | | | — | | | | — | | | | — | |
|
|
| | | (257,120 | ) | | $ | (3,678,707 | ) | | | (598,454 | ) | | $ | (9,080,279 | ) | | | 139,617 | | | $ | 481,140 | | | | (704,330 | ) | | $ | (37,364,180 | ) | | | 425,079 | | | $ | 11,120,701 | | | | (657,427 | ) | | $ | (20,590,857 | ) |
| | | | | | |
| | Semiannual Report | | | December 31, 2018 | | 157 |
Notes to Financial Statements (cont’d)
December 31, 2018 (unaudited)
| | | | | | | | | | | | | | | | | | | | | | | | | | | | | | | | | | | | |
| | | AllianzGI Income & Growth | | | AllianzGI Mid-Cap | | | | |
| | | | | |
| | | Six Months ended
December 31, 2018
(unaudited) | | | Year ended
June 30, 2018 | | | Six Months ended
December 31, 2018
(unaudited) | | | Year ended
June 30, 2018 | | | | |
| | | Shares | | | Amount | | | Shares | | | Amount | | | Shares | | | Amount | | | Shares | | | Amount | | | | |
Shares sold: | | | | | | | | | | | | | | | | | | | | | | | | | | | | | | | | | | | | |
Class A | | | 20,611,774 | | | $ | 229,566,540 | | | | 33,772,645 | | | $ | 386,348,881 | | | | 33,227,716 | | | $ | 130,234,558 | | | | 2,593,888 | | | $ | 10,045,894 | | | | | |
Class C | | | 17,742,103 | | | | 182,910,381 | | | | 20,620,016 | | | | 218,600,150 | | | | 291,072 | | | | 801,985 | | | | 424,664 | | | | 1,380,308 | | | | | |
Class R | | | 104,005 | | | | 1,165,142 | | | | 171,240 | | | | 1,953,034 | | | | 52,119 | | | | 195,853 | | | | 297,665 | | | | 1,127,022 | | | | | |
Class P | | | 23,902,127 | | | | 272,234,845 | | | | 32,638,485 | | | | 382,338,888 | | | | 514,119 | | | | 2,082,916 | | | | 1,473,845 | | | | 6,481,066 | | | | | |
Institutional Class | | | 17,187,848 | | | | 198,853,867 | | | | 17,530,636 | | | | 207,098,156 | | | | 796,496 | | | | 3,400,862 | | | | 1,646,838 | | | | 7,270,598 | | | | | |
Class R6 | | | — | | | | — | | | | — | | | | — | | | | — | | | | — | | | | — | | | | — | | | | | |
Administrative Class | | | — | | | | — | | | | — | | | | — | | | | 11,758 | | | | 47,962 | | | | 212,388 | | | | 915,290 | | | | | |
| | | | | | | |
Issued in reinvestment of dividends and distributions: | | | | | | | | | | | | | | | | | | | | | | | | | | | | | |
Class A | | | 4,640,715 | | | | 51,060,503 | | | | 7,604,961 | | | | 86,778,417 | | | | 8,659,587 | | | | 23,813,865 | | | | 2,104,396 | | | | 7,912,529 | | | | | |
Class C | | | 4,270,437 | | | | 43,286,615 | | | | 7,548,126 | | | | 79,690,897 | | | | 1,428,502 | | | | 3,128,419 | | | | 5,010,740 | | | | 15,733,723 | | | | | |
Class R | | | 13,879 | | | | 152,385 | | | | 19,912 | | | | 227,297 | | | | 62,568 | | | | 168,308 | | | | 62,655 | | | | 232,450 | | | | | |
Class P | | | 2,695,815 | | | | 30,378,307 | | | | 4,117,228 | | | | 48,042,746 | | | | 332,466 | | | | 1,060,568 | | | | 135,406 | | | | 576,829 | | | | | |
Institutional Class | | | 1,973,435 | | | | 22,414,943 | | | | 2,734,032 | | | | 32,176,468 | | | | 1,058,509 | | | | 3,397,813 | | | | 541,021 | | | | 2,320,981 | | | | | |
Class R6 | | | — | | | | — | | | | — | | | | — | | | | — | | | | — | | | | — | | | | — | | | | | |
Administrative Class | | | — | | | | — | | | | — | | | | — | | | | 55,173 | | | | 161,658 | | | | 30,491 | | | | 121,353 | | | | | |
| | | | | | | | | |
Cost of shares redeemed: | | | | | | | | | | | | | | | | | | | | | | | | | | | | | | | | | | | | |
Class A | | | (14,369,654 | ) | | | (157,431,229 | ) | | | (28,283,166 | ) | | | (323,787,507 | ) | | | (5,013,291 | ) | | | (16,881,907 | ) | | | (4,835,052 | ) | | | (18,793,034 | ) | | | | |
Class C | | | (15,491,079 | ) | | | (156,300,305 | ) | | | (25,916,477 | ) | | | (274,222,576 | ) | | | (37,960,546 | ) | | | (126,615,551 | ) | | | (5,840,802 | ) | | | (19,118,611 | ) | | | | |
Class R | | | (18,915 | ) | | | (201,365 | ) | | | (71,876 | ) | | | (823,566 | ) | | | (81,672 | ) | | | (281,295 | ) | | | (612,039 | ) | | | (2,324,109 | ) | | | | |
Class P | | | (15,343,509 | ) | | | (169,815,929 | ) | | | (19,558,217 | ) | | | (228,922,268 | ) | | | (800,661 | ) | | | (3,222,338 | ) | | | (1,123,777 | ) | | | (4,948,975 | ) | | | | |
Institutional Class | | | (8,140,701 | ) | | | (90,320,636 | ) | | | (10,605,368 | ) | | | (124,696,671 | ) | | | (867,546 | ) | | | (3,641,714 | ) | | | (1,361,639 | ) | | | (5,972,622 | ) | | | | |
Class R6 | | | — | | | | — | | | | — | | | | — | | | | — | | | | — | | | | — | | | | — | | | | | |
Administrative Class | | | — | | | | — | | | | — | | | | — | | | | (25,639 | ) | | | (95,610 | ) | | | (38,280 | ) | | | (155,304 | ) | | | | |
Net increase (decrease) resulting from Fund share transactions | | | 39,778,280 | | | $ | 457,954,064 | | | | 42,322,177 | | | $ | 490,802,346 | | | | 1,740,730 | | | $ | 17,756,352 | | | | 722,408 | | | $ | 2,805,388 | | | | | |
| — | May reflect actual amounts rounding to less than $1 or less than 1 share. |
| | | | | | |
| 158 | | December 31, 2018 | | | Semiannual Report | | |
| | | | | | | | | | | | | | | | | | | | | | | | | | | | | | | | | | | | | | | | | | | | | | | | | | |
| | | | AllianzGI NFJ Dividend Value | | | AllianzGI NFJ International Value | | | AllianzGI NFJ Large-Cap Value | |
| | | | | | |
| | | | Six Months ended
December 31, 2018
(unaudited) | | | Year ended
June 30, 2018 | | | Six Months ended
December 31, 2018
(unaudited) | | | Year ended
June 30, 2018 | | | Six Months ended
December 31, 2018
(unaudited) | | | Year ended
June 30, 2018 | |
| | | | Shares | | | Amount | | | Shares | | | Amount | | | Shares | | | Amount | | | Shares | | | Amount | | | Shares | | | Amount | | | Shares | | | Amount | |
| | | | | | | | | | | | | | | | | | | | | | | | | | | | | | | | | | | | | | | | | | | | | | | | | | |
| | | | | | | | | | | | |
| | | | | | 9,218,820 | | | $ | 136,301,636 | | | | 2,887,835 | | | $ | 46,170,379 | | | | 860,097 | | | $ | 15,610,964 | | | | 672,137 | | | $ | 13,052,413 | | | | 1,896,490 | | | $ | 52,588,398 | | | | 268,456 | | | $ | 7,057,856 | |
| | | | | | 545,552 | | | | 6,602,295 | | | | 577,836 | | | | 9,243,294 | | | | 21,502 | | | | 362,491 | | | | 75,609 | | | | 1,451,967 | | | | 51,765 | | | | 1,319,206 | | | | 48,157 | | | | 1,289,667 | |
| | | | | | 295,967 | | | | 3,962,122 | | | | 448,571 | | | | 7,236,995 | | | | 41,878 | | | | 750,583 | | | | 97,061 | | | | 1,891,755 | | | | 9,457 | | | | 257,472 | | | | 35,122 | | | | 928,774 | |
| | | | | | 3,453,864 | | | | 42,909,494 | | | | 6,160,359 | | | | 98,362,137 | | | | 137,069 | | | | 2,442,839 | | | | 1,287,288 | | | | 24,898,377 | | | | 66,369 | | | | 1,761,686 | | | | 261,209 | | | | 6,970,343 | |
| | | | | | 1,987,029 | | | | 29,111,741 | | | | 4,691,958 | | | | 77,966,645 | | | | 154,778 | | | | 2,778,480 | | | | 595,344 | | | | 11,716,809 | | | | 227,862 | | | | 6,064,993 | | | | 798,491 | | | | 20,880,744 | |
| | | | | | 344,321 | | | | 5,083,255 | | | | 1,166,043 | | | | 19,609,108 | | | | 7,431 | | | | 131,085 | | | | 120,088 | | | | 2,389,745 | | | | — | | | | — | | | | — | | | | — | |
| | | | | | 170,902 | | | | 2,588,517 | | | | 1,182,779 | | | | 20,386,645 | | | | 14,102 | | | | 252,491 | | | | 41,662 | | | | 816,977 | | | | 2,780 | | | | 74,694 | | | | 8,554 | | | | 225,849 | |
| | | | | | | | | | | | |
| | | | | | | | | | | | | | | | | | | | | | | | | | | | | | | | | | | | | | | | | | | | | | | | | | |
| | | | | | 8,216,372 | | | | 87,143,973 | | | | 7,104,995 | | | | 108,288,914 | | | | 25,143 | | | | 420,418 | | | | 86,907 | | | | 1,641,914 | | | | 45,932 | | | | 1,146,819 | | | | 82,594 | | | | 2,130,259 | |
| | | | | | 1,511,384 | | | | 16,362,029 | | | | 3,417,871 | | | | 52,594,833 | | | | 2,330 | | | | 37,137 | | | | 23,940 | | | | 442,642 | | | | 3,365 | | | | 91,420 | | | | 20,592 | | | | 531,053 | |
| | | | | | 1,387,338 | | | | 14,725,016 | | | | 1,557,309 | | | | 23,651,696 | | | | 1,965 | | | | 32,672 | | | | 6,959 | | | | 131,632 | | | | 786 | | | | 20,717 | | | | 3,227 | | | | 83,705 | |
| | | | | | 6,201,541 | | | | 66,557,680 | | | | 6,885,804 | | | | 105,788,156 | | | | 16,695 | | | | 287,828 | | | | 84,932 | | | | 1,613,308 | | | | 6,134 | | | | 157,076 | | | | 11,565 | | | | 301,863 | |
| | | | | | 5,580,866 | | | | 59,778,581 | | | | 7,232,947 | | | | 111,189,140 | | | | 19,614 | | | | 334,229 | | | | 64,628 | | | | 1,230,045 | | | | 46,658 | | | | 1,178,376 | | | | 89,013 | | | | 2,293,260 | |
| | | | | | 1,392,781 | | | | 14,859,788 | | | | 1,335,037 | | | | 20,468,353 | | | | 791 | | | | 13,457 | | | | 2,394 | | | | 45,698 | | | | — | | | | — | | | | — | | | | — | |
| | | | | | 1,161,611 | | | | 12,656,073 | | | | 1,499,167 | | | | 23,408,044 | | | | 1,456 | | | | 24,475 | | | | 5,021 | | | | 95,035 | | | | 372 | | | | 9,517 | | | | 872 | | | | 22,813 | |
| | | | | | | | | | | | |
| | | | | | | | | | | | | | | | | | | | | | | | | | | | | | | | | | | | | | | | | | | | | | | | | | |
| | | | | | (6,580,558 | ) | | | (87,880,210 | ) | | | (12,322,123 | ) | | | (203,194,915 | ) | | | (1,376,492 | ) | | | (23,899,313 | ) | | | (3,025,449 | ) | | | (58,604,394 | ) | | | (537,538 | ) | | | (14,318,958 | ) | | | (1,016,387 | ) | | | (26,608,387 | ) |
| | | | | | (9,217,598 | ) | | | (141,048,126 | ) | | | (4,259,604 | ) | | | (70,024,894 | ) | | | (1,032,319 | ) | | | (18,416,801 | ) | | | (1,166,265 | ) | | | (22,270,887 | ) | | | (1,861,690 | ) | | | (52,488,795 | ) | | | (569,979 | ) | | | (15,070,758 | ) |
| | | | | | (1,072,807 | ) | | | (16,065,134 | ) | | | (3,201,945 | ) | | | (53,568,123 | ) | | | (143,137 | ) | | | (2,608,868 | ) | | | (231,634 | ) | | | (4,471,696 | ) | | | (128,010 | ) | | | (3,574,102 | ) | | | (126,484 | ) | | | (3,452,445 | ) |
| | | | | | (11,156,061 | ) | | | (145,815,705 | ) | | | (12,968,268 | ) | | | (210,551,432 | ) | | | (2,186,318 | ) | | | (38,215,478 | ) | | | (4,712,928 | ) | | | (92,817,017 | ) | | | (123,055 | ) | | | (3,355,710 | ) | | | (246,102 | ) | | | (6,540,742 | ) |
| | | | | | (8,821,222 | ) | | | (125,503,744 | ) | | | (24,742,226 | ) | | | (425,352,619 | ) | | | (677,875 | ) | | | (12,327,361 | ) | | | (1,732,226 | ) | | | (34,002,855 | ) | | | (248,111 | ) | | | (6,593,352 | ) | | | (705,510 | ) | | | (18,159,402 | ) |
| | | | | | (817,006 | ) | | | (12,268,577 | ) | | | (2,296,447 | ) | | | (39,348,087 | ) | | | (8,908 | ) | | | (156,850 | ) | | | (1,588,350 | ) | | | (30,157,473 | ) | | | — | | | | — | | | | — | | | | — | |
| | | | | | (1,773,948 | ) | | | (24,376,369 | ) | | | (16,944,762 | ) | | | (314,378,786 | ) | | | (173,720 | ) | | | (2,945,711 | ) | | | (59,964 | ) | | | (1,172,975 | ) | | | (7,812 | ) | | | (217,282 | ) | | | (11,127 | ) | | | (307,226 | ) |
| | | | | | | | | | | | | |
| | | | | | 2,029,148 | | | $ | (54,315,665 | ) | | | (30,586,864 | ) | | $ | (592,054,517 | ) | | | (4,293,918 | ) | | $ | (75,091,233 | ) | | | (9,352,846 | ) | | $ | (182,078,980 | ) | | | (548,246 | ) | | $ | (15,877,825 | ) | | | (1,047,737 | ) | | $ | (27,422,774 | ) |
| | | | | | |
| | Semiannual Report | | | December 31, 2018 | | 159 |
Notes to Financial Statements (cont’d)
December 31, 2018 (unaudited)
| | | | | | | | | | | | | | | | | | | | | | | | | | | | | | | | | | | | |
| | | AllianzGI NFJ Mid-Cap Value | | | AllianzGI NFJ Small-Cap Value | | | | |
| | | | | |
| | | Six Months ended
December 31, 2018
(unaudited) | | | Year ended
June 30, 2018 | | | Six Months ended
December 31, 2018
(unaudited) | | | Year ended
June 30, 2018 | | | | |
| | | Shares | | | Amount | | | Shares | | | Amount | | | Shares | | | Amount | | | Shares | | | Amount | | | | |
Shares sold: | | | | | | | | | | | | | | | | | | | | | | | | | | | | | | | | | | | | |
Class A | | | 5,770,910 | | | $ | 177,811,835 | | | | 5,474,465 | | | $ | 173,724,735 | | | | 5,628,898 | | | $ | 109,949,170 | | | | 8,002,039 | | | $ | 170,545,062 | | | | | |
Class C | | | 438,704 | | | | 10,664,576 | | | | 1,212,825 | | | | 31,570,305 | | | | 69,842 | | | | 892,216 | | | | 153,952 | | | | 3,165,825 | | | | | |
Class R | | | 241,518 | | | | 6,132,096 | | | | 514,498 | | | | 14,005,436 | | | | 109,573 | | | | 2,225,039 | | | | 185,326 | | | | 4,554,851 | | | | | |
Class P | | | 1,856,114 | | | | 44,837,112 | | | | 7,595,411 | | | | 195,683,218 | | | | 401,555 | | | | 8,084,078 | | | | 959,748 | | | | 24,310,328 | | | | | |
Institutional Class | | | 3,872,538 | | | | 122,268,046 | | | | 10,697,534 | | | | 358,873,216 | | | | 2,036,291 | | | | 42,472,726 | | | | 4,334,370 | | | | 110,523,206 | | | | | |
Class R6 | | | 371,078 | | | | 11,662,985 | | | | 72,675 | # | | | 2,393,103 | # | | | 2,002,774 | | | | 41,070,431 | | | | 5,901,430 | | | | 150,915,358 | | | | | |
Administrative Class | | | 345,597 | | | | 10,906,611 | | | | 503,048 | | | | 16,428,121 | | | | 401,141 | | | | 7,556,308 | | | | 1,142,638 | | | | 26,108,406 | | | | | |
| | | | | | | |
Issued in reinvestment of dividends and distributions: | | | | | | | | | | | | | | | | | | | | | | | | | | | | | |
Class A | | | 220,468 | | | | 5,643,972 | | | | 1,354,254 | | | | 42,523,329 | | | | 9,034,371 | | | | 112,929,635 | | | | 4,827,870 | | | | 105,247,566 | | | | | |
Class C | | | 135 | | | | 2,864 | | | | 681,614 | | | | 17,599,274 | | | | 258,108 | | | | 2,893,396 | | | | 1,101,049 | | | | 21,415,391 | | | | | |
Class R | | | 8,358 | | | | 183,296 | | | | 30,983 | | | | 835,615 | | | | 445,976 | | | | 6,092,035 | | | | 306,683 | | | | 7,121,185 | | | | | |
Class P | | | 115,235 | | | | 2,378,449 | | | | 416,454 | | | | 10,577,921 | | | | 584,374 | | | | 8,432,510 | | | | 348,613 | | | | 8,453,860 | | | | | |
Institutional Class | | | 157,191 | | | | 4,300,740 | | | | 348,217 | | | | 11,672,240 | | | | 6,135,775 | | | | 89,336,886 | | | | 6,448,975 | | | | 157,290,488 | | | | | |
Class R6 | | | 5,893 | | | | 161,057 | | | | 581 | # | | | 19,437 | # | | | 2,768,426 | | | | 40,059,127 | | | | 2,686,009 | | | | 65,270,025 | | | | | |
Administrative Class | | | 9,871 | | | | 260,490 | | | | 29,432 | | | | 952,725 | | | | 2,756,274 | | | | 34,315,616 | | | | 2,273,516 | | | | 49,403,503 | | | | | |
| | | | | | |
Cost of shares redeemed: | | | | | | | | | | | | | | | | | | | | | | | | | |
Class A | | | (2,766,661 | ) | | | (80,703,034 | ) | | | (4,891,003 | ) | | | (152,623,468 | ) | | | (12,193,461 | ) | | | (237,391,738 | ) | | | (12,111,632 | ) | | | (280,714,536 | ) | | | | |
Class C | | | (5,817,637 | ) | | | (147,376,538 | ) | | | (937,401 | ) | | | (24,452,518 | ) | | | (4,757,374 | ) | | | (89,980,716 | ) | | | (1,865,524 | ) | | | (38,724,388 | ) | | | | |
Class R | | | (113,711 | ) | | | (2,926,169 | ) | | | (142,851 | ) | | | (3,871,309 | ) | | | (417,331 | ) | | | (9,358,426 | ) | | | (880,383 | ) | | | (21,666,359 | ) | | | | |
Class P | | | (2,580,980 | ) | | | (61,191,928 | ) | | | (1,800,360 | ) | | | (46,108,843 | ) | | | (998,476 | ) | | | (19,786,923 | ) | | | (1,324,234 | ) | | | (33,475,597 | ) | | | | |
Institutional Class | | | (2,439,676 | ) | | | (77,712,161 | ) | | | (2,311,349 | ) | | | (77,076,555 | ) | | | (14,620,734 | ) | | | (323,379,871 | ) | | | (24,043,187 | ) | | | (617,520,460 | ) | | | | |
Class R6 | | | (22,032 | ) | | | (681,898 | ) | | | (5,809 | )# | | | (187,935 | )# | | | (6,522,073 | ) | | | (150,032,424 | ) | | | (11,619,999 | ) | | | (290,169,735 | ) | | | | |
Administrative Class | | | (127,930 | ) | | | (3,900,631 | ) | | | (79,644 | ) | | | (2,578,415 | ) | | | (3,110,550 | ) | | | (61,301,396 | ) | | | (8,895,129 | ) | | | (205,325,747 | ) | | | | |
Net increase (decrease) resulting from Fund share transactions | | | (455,017 | ) | | $ | 22,721,770 | | | | 18,763,574 | | | $ | 569,959,632 | | | | (9,986,621 | ) | | $ | (384,922,321 | ) | | | (22,067,870 | ) | | $ | (583,271,768 | ) | | | | |
| — | May reflect actual amounts rounding to less than $1 or less than 1 share. |
| # | For the period December 18, 2017 (commencement of share class) through June 30, 2018. “Shares sold” includes shares sold to AFI. |
| ## | For the period August 22, 2018 (commencement of share class) through December 31, 2018. “Shares sold” includes shares sold to AFI. |
| | | | | | |
| 160 | | December 31, 2018 | | | Semiannual Report | | |
| | | | | | | | | | | | | | | | | | | | | | | | | | | | | | | | | | |
| | | | AllianzGI Small-Cap | | | AllianzGI Technology | |
| | | | |
| | | | Six Months ended
December 31, 2018
(unaudited) | | | Year ended
June 30, 2018 | | | Six Months ended
December 31, 2018
(unaudited) | | | Year ended
June 30, 2018 | |
| | | | Shares | | | Amount | | | Shares | | | Amount | | | Shares | | | Amount | | | Shares | | | Amount | |
| | | | | | | | | | | | | | | | | | | | | | | | | | | | | | | | | | |
| | | | | | 1,521,650 | | | $ | 32,817,829 | | | | 273,818 | | | $ | 5,934,103 | | | | 1,980,759 | | | $ | 144,720,535 | | | | 1,478,124 | | | $ | 101,162,454 | |
| | | | | | 71,773 | | | | 1,361,326 | | | | 78,065 | | | | 1,577,299 | | | | 158,129 | | | | 8,345,036 | | | | 193,418 | | | | 10,375,838 | |
| | | | | | — | | | | — | | | | — | | | | — | | | | — | | | | — | | | | — | | | | — | |
| | | | | | 154,681 | | | | 3,366,578 | | | | 207,122 | | | | 4,396,841 | | | | 740,862 | | | | 57,758,099 | | | | 515,793 | | | | 39,908,557 | |
| | | | | | 121,927 | | | | 2,632,286 | | | | 251,379 | | | | 5,346,531 | | | | 1,603,254 | | | | 126,788,231 | | | | 3,418,373 | | | | 262,754,728 | |
| | | | | | 432 | ## | | | 10,000 | ## | | | — | | | | — | | | | — | | | | — | | | | — | | | | — | |
| | | | | | — | | | | — | | | | — | | | | — | | | | 38,751 | | | | 2,997,820 | | | | 79,796 | | | | 5,835,992 | |
| | | | | | | | |
| | | | | | | | | | | | | | | | | | | | | | | | | | | | | | | | | | |
| | | | | | 294,762 | | | | 4,795,779 | | | | 222,628 | | | | 4,506,000 | | | | 1,934,895 | | | | 96,280,395 | | | | 1,130,136 | | | | 70,158,803 | |
| | | | | | 44,410 | | | | 693,689 | | | | 217,696 | | | | 4,282,069 | | | | 300,556 | | | | 10,621,661 | | | | 474,556 | | | | 22,849,887 | |
| | | | | | — | | | | — | | | | — | | | | — | | | | — | | | | — | | | | — | | | | — | |
| | | | | | 38,255 | | | | 629,303 | | | | 19,088 | | | | 389,394 | | | | 332,385 | | | | 18,733,242 | | | | 128,482 | | | | 8,794,567 | |
| | | | | | 32,459 | | | | 538,178 | | | | 25,372 | | | | 520,890 | | | | 2,155,428 | | | | 124,109,570 | | | | 1,604,511 | | | | 111,641,922 | |
| | | | | | 42 | ## | | | 703 | ## | | | — | | | | — | | | | — | | | | — | | | | — | | | | — | |
| | | | | | — | | | | — | | | | — | | | | — | | | | 56,513 | | | | 3,019,512 | | | | 39,515 | | | | 2,594,161 | |
| | | | | | | | |
| | | | | | | | | | | | | | | | | | | | | | | | | | | | | | | | | | |
| | | | | | (356,060 | ) | | | (7,358,180 | ) | | | (346,997 | ) | | | (7,387,795 | ) | | | (1,480,795 | ) | | | (100,326,620 | ) | | | (2,636,487 | ) | | | (181,082,964 | ) |
| | | | | | (1,305,146 | ) | | | (27,345,118 | ) | | | (253,016 | ) | | | (5,202,287 | ) | | | (1,820,698 | ) | | | (104,203,742 | ) | | | (457,029 | ) | | | (24,550,804 | ) |
| | | | | | — | | | | — | | | | — | | | | — | | | | — | | | | — | | | | — | | | | — | |
| | | | | | (68,865 | ) | | | (1,428,006 | ) | | | (76,666 | ) | | | (1,643,999 | ) | | | (336,076 | ) | | | (24,305,872 | ) | | | (271,258 | ) | | | (20,102,726 | ) |
| | | | | | (165,143 | ) | | | (3,557,077 | ) | | | (54,207 | ) | | | (1,140,319 | ) | | | (1,635,023 | ) | | | (124,992,452 | ) | | | (6,195,191 | ) | | | (450,675,239 | ) |
| | | | | | — | ## | | | — | ## | | | — | | | | — | | | | — | | | | — | | | | — | | | | — | |
| | | | | | — | | | | — | | | | — | | | | — | | | | (119,640 | ) | | | (8,925,827 | ) | | | (44,893 | ) | | | (3,224,000 | ) |
| | | | | | | | | |
| | | | | | 385,177 | | | $ | 7,157,290 | | | | 564,282 | | | $ | 11,578,727 | | | | 3,909,300 | | | $ | 230,619,588 | | | | (542,154 | ) | | $ | (43,558,824 | ) |
| | | | | | |
| | Semiannual Report | | | December 31, 2018 | | 161 |
Notes to Financial Statements (cont’d)
December 31, 2018 (unaudited)
| 8. | SIGNIFICANT ACCOUNT HOLDERS |
From time to time, a Fund may have a concentration of shareholders, which may include the Investment Adviser or affiliates of the Investment Adviser, holding a significant percentage of shares outstanding. Investment activities of these shareholders could have a material impact to a Fund.
At December 31, 2018, the significant account-holders, owners of 5% or greater of each respective Fund’s outstanding shares were as follows:
| | | | | | | | |
| | | Unaffiliated | |
| | | Number of
Account
Holders | | | Approximate
Ownership | |
AllianzGI Emerging Markets Opportunities | | | 3 | | | | 73 | % |
AllianzGI Focused Growth | | | 6 | | | | 52 | % |
AllianzGI Global Natural Resources | | | 5 | | | | 58 | % |
AllianzGI Global Small-Cap | | | 5 | | | | 67 | % |
AllianzGI Health Sciences | | | 3 | | | | 57 | % |
AllianzGI Income & Growth | | | 9 | | | | 79 | % |
AllianzGI Mid-Cap | | | 7 | | | | 56 | % |
AllianzGI NFJ Dividend Value | | | 8 | | | | 43 | % |
AllianzGI NFJ International Value | | | 6 | | | | 56 | % |
AllianzGI NFJ Large-Cap Value | | | 9 | | | | 60 | % |
AllianzGI NFJ Mid-Cap Value | | | 7 | | | | 53 | % |
AllianzGI NFJ Small-Cap Value | | | 5 | | | | 54 | % |
AllianzGI Small-Cap | | | 6 | | | | 55 | % |
AllianzGI Technology | | | 3 | | | | 38 | % |
(a) New Share Class
Effective August 22, 2018, AllianzGI Small-Cap began offering Class R6 shares.
(b) Class Conversion.
As of September 30, 2018 (the “Class C Conversion Date”), all Class C shares of a Fund that were purchased ten years or more prior to the Class C Conversion Date automatically converted to Class A shares of the same Fund. After the Class C Conversion Date, all Class C shares of a Fund held in accounts directly with the Trust’s transfer agent will automatically convert to Class A shares of the same Fund on or about the first business day of the month following the ten-year anniversary of purchase. After the Class C Conversion Date, all Class C shares of a Fund held through a financial intermediary (subject to the exceptions noted below) will automatically convert to Class A shares of the same Fund following the ten-year anniversary of purchase.
Although the timing of this conversion may differ from the timing stated above, it is expected to occur during the month following the ten-year anniversary of purchase. Such conversions will be effected on the basis of the relative net asset values of the Class C and Class A shares involved in the conversion. When Class C shares convert, any other Class C shares that were acquired by the shareholder by the reinvestment of dividends or distributions will also convert to Class A shares on a pro rata basis. The Board’s approval of the conversion feature in the Trust’s Twelfth Amended and Restated Multi-Class Plan is subject to the limitation that if, after the Class C Conversion Date, the Class A shareholders of a Fund approve any material increase in expenses allocated to that class (including 12b-1 Fees) without the approval of the then-existing Class C shareholders, Class C shares will cease automatically converting into Class A shares.
Class C shares held through a financial intermediary in an omnibus account will be converted into Class A shares only if the intermediary can document that the shareholder has met the required holding period. It is the financial intermediary’s (and not the Funds’) responsibility to keep records and to ensure that the shareholder is credited with the proper holding period. Not all financial intermediaries are able to track purchases to credit individual shareholder’s holding periods. In particular, the Trust understands that group retirement plans held through third party intermediaries that hold Class C shares in an omnibus account in certain instances do not track participant level share lot aging. Please consult with your financial intermediary about your eligibility to exercise this conversion privilege.
| 10. | PAYMENTS FROM AFFILIATES |
During the year ended June 30, 2018, AllianzGI U.S. reimbursed AllianzGI Global Small-Cap $78,097 for realized losses resulting from a trading error.
There were no payments from affiliates for the six months ended December 31, 2018.
| | | | | | |
| 162 | | December 31, 2018 | | | Semiannual Report | | |
The Trust entered into a credit agreement (the “State Street Agreement”), among the Trust, AllianzGI Institutional Multi-Series Trust, Allianz Funds Multi-Strategy Trust and Premier Multi-Series VIT, as borrowers (collectively, the “AllianzGI Borrowers” and each series thereof, an “AllianzGI Borrower Fund”), and State Street Bank and Trust Company, as agent and lender, for a committed line of credit. The State Street Agreement permits the AllianzGI Borrowers to borrow up to $200 million in aggregate, subject to (i) a requirement that each AllianzGI Borrower Fund’s asset coverage with respect to senior securities representing indebtedness be 300% or higher, and (ii) certain other limitations and conditions. Each AllianzGI Borrower Fund must pay interest on any amounts borrowed under the facility at a rate per annum equal to 1.25% plus the higher of the then current federal funds overnight rate or the one-month LIBOR rate, subject to upward adjustment when any past due payments are outstanding. The AllianzGI Borrowers must also pay a usage fee at an annualized rate of 0.25% on undrawn amounts, allocated pro rata among the AllianzGI Borrower Funds on the basis of net assets. Amounts borrowed may be repaid and reborrowed on a revolving basis during the term of the facility. The State Street Agreement was extended by an additional 364-day period by an amendment effective October 25, 2018 with an expiration date of October 24, 2019 (the “Amendment”). The Amendment changed a 0.25% usage fee on undrawn amounts, which had previously applied, to an annualized rate of 0.20%, to be allocated pro rata among the AllianzGI Borrower Funds on the basis of net assets. Amounts borrowed may be repaid and reborrowed on a revolving basis during the term of the facility.
| | | | | | | | | | | | | | | | |
| | | Average
Amount
Borrowed
During the
Period | | | Average
Interest Rate | | | Number of
Days
Outstanding
During the
Period | | | Outstanding
Borrowings at
December 31,
2018 | |
AllianzGI NFJ Dividend Value | | $ | 35,833,333 | | | | 3.76 | % | | | 12 | | | $ | 23,100,000 | |
AllianzGI NFJ International Value | | | 3,810,000 | | | | 3.77 | % | | | 6 | | | | 3,350,000 | |
AllianzGI NFJ Small-Cap Value | | | 19,216,667 | | | | 3.75 | % | | | 12 | | | | 3,750,000 | |
Pursuant to an exemptive order issued by the SEC (the “Order”), the Funds are authorized to enter into a master interfund lending agreement (the “Interfund Program”) with each other and certain funds advised by the Investment Adviser (each a “Participating Fund”). The Interfund Program allows each Participating Fund, whose policies permit it to do so, to lend money directly to and borrow money directly from other Funds for temporary purposes. During the six months ended December 31, 2018, the Funds did not participate as a borrower or lender in the Interfund Program.
| 12. | RELATED PARTY TRANSACTIONS |
The Investment Adviser is a related party. Fees payable to this party are disclosed in Note 4 and the accrued related party fee amounts are disclosed on the Statements of Assets and Liabilities.
Certain Funds are permitted to purchase or sell securities from or to certain related affiliated funds under specified conditions outlined in procedures adopted by the Board. The procedures have been designed to ensure that any purchase or sale of securities by the Funds from or to another fund or portfolio that are, or could be, considered an affiliate by virtue of having a common investment adviser (or affiliated investment advisers), common Trustees and/or common officers comply with Rule 17a-7 of the 1940 Act. Further, as defined under the procedures, each transaction is effected at the current market price.
During the six months ended December 31, 2018, the Funds did not engage in any purchases and sales of securities pursuant to Rule 17a-7 of the 1940 Act.
In preparing these financial statements, the Funds’ management has evaluated events and transactions for potential recognition or disclosure through the date the financial statements were issued.
On January 17, 2019, AllianzGI Income & Growth declared per-share net investment income dividends and short-term capital gain distributions to shareholders, payable January 17, 2019 to shareholders of record on January 16, 2019 as follows:
| | | | | | | | |
| | |
| Share Class | | Dividend Rate | | | Short-term Capital Gains | |
Class A | | $ | 0.01778 | | | $ | 0.05972 | |
Class C | | | 0.01198 | | | | 0.05972 | |
Class R | | | 0.01535 | | | | 0.05972 | |
Class P | | | 0.01998 | | | | 0.05972 | |
Institutional Class | | | 0.02086 | | | | 0.05972 | |
On February 21, 2019, AllianzGI Income & Growth declared per-share net investment income dividends and short-term capital gain distribution to shareholders, payable February 21, 2019 to shareholders of record on February 20, 2019 as follows:
| | | | | | | | |
| | |
| Share Class | | Dividend Rate | | | Short-term Capital Gains | |
Class A | | $ | 0.01678 | | | $ | 0.06072 | |
Class C | | | 0.01150 | | | | 0.06072 | |
Class R | | | 0.01497 | | | | 0.06072 | |
Class P | | | 0.01879 | | | | 0.06072 | |
Institutional Class | | | 0.01960 | | | | 0.06072 | |
There were no other subsequent events identified that require recognition or disclosure.
| | | | | | |
| | Semiannual Report | | | December 31, 2018 | | 163 |
Unaudited
Changes to the Board of Trustees
Effective January 1, 2019, Alan Rappaport was appointed Chairman of the Board of Trustees of the Funds.
Effective January 1, 2019, Sarah E. Cogan became a Trustee of the Funds.
| | | | | | |
| 164 | | December 31, 2018 | | | Semiannual Report | | |
Unaudited
Privacy Policy
Please read this Policy carefully. It gives you important information about how Allianz Global Investors U.S. and its U.S. affiliates (“AllianzGI US,” “we” or “us”) handle non-public personal information (“Personal Information”) that we may receive about you. It applies to all of our past, present and future clients and shareholders of AllianzGI US and the funds and accounts it manages, advises, sub-advises, administers or distributes, and will continue to apply when you are no longer a client or shareholder. As used throughout this Policy, “AllianzGI US” means Allianz Global Investors U.S. LLC, Allianz Global Investors Distributors LLC, and the family of registered and unregistered funds managed by one or more of these firms. AllianzGI US is part of a global investment management group, and the privacy policies of other Allianz Global Investors entities outside of the United States may have provisions in their policies that differ from this Privacy Policy. Please refer to the website of the specific non-US Allianz Global Investors entity for its policy on privacy.
We Care about Your Privacy
We consider your privacy to be a fundamental aspect of our relationship with you, and we strive to maintain the confidentiality, integrity and security of your Personal Information. To ensure your privacy, we have developed policies that are designed to protect your Personal Information while allowing your needs to be served.
Information We May Collect
In the course of providing you with products and services, we may obtain Personal Information about you, which may come from sources such as account application and other forms, from other written, electronic, or verbal communications, from account transactions, from a brokerage or financial advisory firm, financial advisor or consultant, and/or from information you provide on our website.
You are not required to supply any of the Personal Information that we may request. However, failure to do so may result in us being unable to open and maintain your account, or to provide services to you.
How Your Information Is Shared
We do not disclose your Personal Information to anyone for marketing purposes. We disclose your Personal Information only to those service providers, affiliated and non-affiliated, who need the information for everyday business purposes, such as to respond to your inquiries, to perform services, and/or to service and maintain your account. This applies to all of the categories of Personal Information we collect about you. The affiliated and non-affiliated service providers who receive your Personal Information also may use it to process your transactions, provide you with materials (including preparing and mailing prospectuses and shareholder reports and gathering shareholder proxies), and provide you with account statements and other materials relating to your account. These service providers provide services at our direction, and under their agreements with us, are required to keep your Personal Information confidential and to use it only for providing the contractually required services. Our service providers may not use your Personal Information to market products and services to you except in conformance with applicable laws and regulations. We also may provide your Personal Information to your respective brokerage or financial advisory firm, custodian, and/or to your financial advisor or consultant.
In addition, we reserve the right to disclose or report Personal Information to non-affiliated third parties, in limited circumstances, where we believe in good faith that disclosure is required under law, to cooperate with regulators or law enforcement authorities or pursuant to other legal process, or to protect our rights or property, including to enforce our Privacy Policy or other agreements with you. Personal Information collected by us may also be transferred as part of a corporate sale, restructuring, bankruptcy, or other transfer of assets.
Security of Your Information
We maintain your Personal Information for as long as necessary for legitimate business purposes or otherwise as required by law. In maintaining this information, we have implemented appropriate procedures that are designed to restrict access to your Personal Information only to those who need to know that information in order to provide products and/or services to you. In addition, we have implemented physical, electronic and procedural safeguards to help protect your Personal Information.
Privacy and the Internet
The Personal Information that you provide through our website, as applicable, is handled in the same way as the Personal Information that you provide by any other means, as described above. This section of the Policy gives you additional information about the way in which Personal Information that is obtained online is handled.
| | ∎ | | Online Enrollment, Account Access and Transactions: When you visit our website, you can visit pages that are open to the general public, or, where available, log into protected pages to enroll online, access information about your account, or conduct certain transactions. Access to the secure pages of our website is permitted only after you have created a User ID and Password. The User ID and Password must be supplied each time |
| | | | | | |
| | Semiannual Report | | | December 31, 2018 | | 165 |
Unaudited
Privacy Policy (cont’d)
| | you want to access your account information online. This information serves to verify your identity. When you enter Personal Information into our website to enroll or access your account online, you will log into secure pages. By using our website, you consent to this Privacy Policy and to the use of your Personal Information in accordance with the practices described in this Policy. If you provide Personal Information to effect transactions, a record of the transactions you have performed while on the site is retained by us. For additional terms and conditions governing your use of our website, please refer to the Investor Mutual Fund Access — Disclaimer which is incorporated herein by reference and is available on our website. |
| | ∎ | | Cookies and Similar Technologies: Cookies are small text files stored in your computer’s hard drive when you visit certain web pages. Clear GIFs (also known as Web Beacons) are typically transparent very small graphic images (usually 1 pixel x 1 pixel) that are placed on a website that may be included on our services provided via our website and typically work in conjunction with cookies to identify our users and user behavior. We may use cookies and automatically collected information to: (i) personalize our website and the services provided via our website, such as remembering your information so that you will not have to re-enter it during your use of, or the next time you use, our website and the services provided via our website; (ii) provide customized advertisements, content, and information; (iii) monitor and analyze the effectiveness of our website and the services provided via our website and third-party marketing activities; (iv) monitor aggregate site usage metrics such as total number of visitors and pages viewed; and (v) track your entries, submissions, and status in any promotions or other activities offered through our website and the services provided via our website. Tracking technology also helps us manage and improve the usability of our website, (i) detecting whether there has been any contact between your computer and us in the past and (ii) to identify the most popular sections of our website. Because an industry-standard Do-Not-Track protocol is not yet established, our website will continue to operate as described in this Privacy Policy and will not be affected by any Do-Not-Track signals from any browser. |
| | ∎ | | Use of Social Media Plugins: Our website uses the following Social Media Plugins (“Plugins”): |
| | ∎ | | Facebook Share Button operated by Facebook Inc., 1601 S. California Ave, Palo Alto, CA 94304, USA |
| | ∎ | | Tweet Button operated by Twitter Inc., 795 Folsom St., Suite 600, San Francisco, CA 94107, USA |
| | ∎ | | LinkedIn Share Button operated by LinkedIn Corporation, 2029 Stierlin Court, Mountain View, CA 94043, USA |
All Plugins are marked with the brand of the respective operators Facebook, Twitter and LinkedIn (“Operators”). When you visit our website that contains a social plugin, your browser establishes a direct connection to the servers of the Operator. The Operator directly transfers the plugin content to your browser which embeds the latter into our website, enabling the Operator to receive information about you having accessed the respective page of our website. Thus, AllianzGI US has no influence on the data gathered by the plugin and we inform you according to our state of knowledge: The embedded plugins provide the Operator with the information that you have accessed the corresponding page of our website. If you do not wish to have such data transferred to the Operators, you need to log out of your respective account before visiting our website. Please see the Operators’ data privacy statements in order to get further information about purpose and scope of the data collection and the processing and use:
| | ∎ | | Facebook: https://de-de.facebook.com/about/privacy |
| | ∎ | | Twitter: https://twitter.com/privacy |
| | ∎ | | Linked In: https://www.linkedin.com/legal/privacy-policy |
Changes to Our Privacy Policy
We may modify this Privacy Policy from time-to-time to reflect changes in related practices and procedures, or applicable laws and regulations. If we make changes, we will notify you on our website and the revised Policy will become effective immediately upon posting to our website. We also will provide account owners with a copy of our Privacy Policy, annually if required. We encourage you to visit our website periodically to remain up to date on our Privacy Policy. You acknowledge that by using our website after we have posted changes to this Privacy Policy, you are agreeing to the terms of the Privacy Policy as modified.
Obtaining Additional Information
If you have any questions about this Privacy Policy or our privacy related practices in the United States, you may contact us via our dedicated email at PrivacyUS@allianzgi.com.
| | | | | | |
| 166 | | December 31, 2018 | | | Semiannual Report | | |
Unaudited
Matters Relating to the Trustees’ Consideration of the Investment Advisory Agreement
The Investment Company Act of 1940, as amended, requires that both the full Board of Trustees (the “Board” or the “Trustees”) and a majority of the Trustees who are not interested persons of the Trust (the “Independent Trustees”), voting separately, annually approve the continuation of the Trust’s Amended and Restated Investment Advisory Agreement (the “Agreement”) on behalf of each Fund (as defined below) with Allianz Global Investors U.S. LLC (the “Investment Adviser”).
The Independent Trustees met in executive session on October 3, 2018 to consider whether to approve the continuation of the Agreement for an additional year. The Contracts Committee of the Board of Trustees, which is comprised of all of the Independent Trustees, held a conference call on September 20, 2018 and met in-person October 3, 2018 (the “contract review meetings”) with independent counsel to discuss the materials provided by the Investment Adviser in response to the Independent Trustees’ written request for information regarding the annual renewal. Representatives from fund management attended portions of those meetings to, among other topics, review the comparative fee and expense information and comparative performance information prepared and provided by Broadridge Financial Solutions, Inc. (“Broadridge”), an independent third party, for each Fund using its respective Broadridge peer groups for performance and expense comparisons.
At their meeting held on October 3, 2018, the Board and the Independent Trustees unanimously approved the continuation of the Agreements for an additional one-year period commencing January 1, 2019 with respect to AllianzGI Emerging Markets Opportunities Fund, AllianzGI Focused Growth Fund, AllianzGI Global Natural Resources Fund, AllianzGI Global-Small-Cap Fund, AllianzGI Health Sciences Fund, AllianzGI Income & Growth Fund, AllianzGI Mid-Cap Fund, AllianzGI Small-Cap Fund, AllianzGI Technology Fund (each, a “Fund,” and together, the “AllianzGI Funds”); and, AllianzGI NFJ Dividend Value Fund, AllianzGI NFJ International Value Fund, AllianzGI NFJ Large-Cap Fund, AllianzGI NFJ Mid-Cap Value Fund, AllianzGI NFJ Small-Cap Value Fund (each, also a “Fund,” together, the “NFJ Funds,” and with the AllianzGI Funds, the “Funds”).
The material factors and conclusions that formed the basis of these approvals for the Funds are discussed below.
In connection with their deliberations regarding the approval of the Agreement, the Independent Trustees considered such information and factors as they believed, in light of the legal advice furnished to them and their own business judgment, to be relevant. As described below, the Independent Trustees considered the nature, quality and extent of the various investment management, administrative and other services to be performed by the Investment Adviser under the Agreement.
In connection with their contract review meetings, the Independent Trustees received and relied upon materials provided by the Investment
Adviser including, among other items: (i) information provided by Broadridge Financial Solutions, Inc. (“Broadridge”), an independent third party, for the Funds on the investment performance of a group of funds with investment classifications and/or objectives comparable to those of the Funds identified by Broadridge (the “Broadridge Performance Universe”), the performance of applicable benchmark indices and the total return investment performance (based on net assets) of the Funds for various time periods; (ii) information on the Funds’ advisory fees and other expenses and information compiled by Broadridge, as applicable, on the advisory fees and other expenses of comparable funds identified by Broadridge (the “Broadridge Expense Group”); (iii) to the extent applicable, information regarding the investment performance and fees for other mutual funds and separately managed accounts managed by the Investment Adviser or its affiliates with similar investment objective(s) and policies to those of the Funds, if any; (iv) an estimate of the profitability to the Investment Adviser from its relationship with the Funds for the twelve months ended December 31, 2017; (v) descriptions of various functions performed by the Investment Adviser for the Funds, such as portfolio management, compliance monitoring, portfolio trading practices and oversight of third party service providers; (vi) information regarding the overall organization and business functions of the Investment Adviser, including, without limitation, information regarding senior management, portfolio managers and other personnel providing or proposed to provide investment management, administrative and other services, and corporate ownership and business operations unrelated to the Funds; (vii) fact cards for each Renewal Fund including, among other information, performance comparisons between the Funds and their Broadridge Performance Universe, total return investment performance, investment objective, total net assets, annual fund operating expenses for each share class, portfolio managers, total expense ratio and management fee comparisons between each Renewal Fund and its Broadridge Expense Group and trends in profitability to the Investment Adviser of its advisory relationship with each Renewal Fund; and (viii) summaries assigning a quadrant placement to each Renewal Fund for an institutional and retail share class based on an average of certain measures of performance and fees/expenses versus peer group medians.
The Independent Trustees’ conclusions as to the approval of the Agreement were based on a comprehensive consideration of all information provided to the Independent Trustees and were not the result of any single factor. Individual Independent Trustees may have evaluated the information presented differently from one another, attributing different weights to various factors. The Independent Trustees recognized that the fee arrangements for the Funds are the result of review and discussion in the prior years between the Independent Trustees and the Investment Adviser, that certain aspects of such arrangements may receive greater scrutiny in some years than in others, and that the Independent Trustees’ conclusions may be based, in part, on their consideration of these same arrangements during the course of the year and in prior years. The Independent Trustees evaluated information available to them on a Fund-by-Fund basis, and their determinations
| | | | | | |
| | Semiannual Report | | | December 31, 2018 | | 167 |
Unaudited
Matters Relating to the Trustees’ Consideration of the Investment Advisory Agreement (cont’d)
were made separately in respect of each Renewal Fund. However, they also took into account the common interests of all series of the Trust in their review. The Independent Trustees also took into account that the Investment Adviser had proposed the continuation, modification, termination or adoption of certain advisory or administrative fee breakpoints, waivers or reductions for certain Funds. The Independent Trustees also considered the risk profiles of the Funds.
The Independent Trustees considered, among other matters, that the Investment Adviser provides or procures through third-party service providers most administrative services that are required by the Funds under a separate administration agreement (the “Administration Agreement”). These services include accounting, bookkeeping, tax, legal, audit, custody, transfer agency, sub-transfer agency, valuation and compliance services, preparation of prospectuses, shareholder reports and other regulatory filings, oversight and coordination of activities of third-party service providers and various shareholder services. The Independent Trustees took into account the “unitary” administrative fee structure applicable to the Funds, under which certain third-party services that are ordinarily the financial responsibility of a mutual fund (e.g., audit, custody, accounting, legal, transfer agency, sub-transfer agency and printing services) are, in the case of the Funds, paid for by the Investment Adviser out of its administrative fee. They also took into account that the Investment Adviser provides the Funds with office space, administrative services and personnel to serve as Fund officers, and that the Investment Adviser and its affiliates pay all of the compensation of the Funds’ interested Trustees and officers (in their capacities as employees of the Investment Adviser or such affiliates).
Performance Information
Fund-specific performance results for the Funds reviewed by the Independent Trustees are discussed below. The comparative performance information was prepared and provided by Broadridge and was not independently verified by the Independent Trustees. With respect to all Funds, the Independent Trustees reviewed, among other information, comparative information showing performance for Class A and Institutional Class shares of the Funds against their respective Broadridge Performance Universes for the one-, three-, five- and ten-year periods (to the extent each such Renewal Fund had been in existence), each ended June 30, 2018. Institutional Class performance relative to the median for each Renewal Fund’s Broadridge Performance Universe is described below, and for those Funds with performance that ranked below median for their respective Broadridge Performance Universes, the specific quintile rankings for Institutional Class shares are also noted below with respect to the relevant periods of underperformance.
For the AllianzGI Emerging Markets Opportunities Fund, performance was below median for the three- and ten-year periods (in the third and fourth quintiles, respectively) and above median for the one- and five-year periods. For the AllianzGI Focused Growth Fund,
performance was above median for the one-, three-, five-, and ten-year periods. For the AllianzGI Global Natural Resources Fund, performance was below median for the one- and three-year periods (in the third and fourth quintiles, respectively) and above median for the five- and ten-year periods. For the AllianzGI Global Small-Cap Fund, performance was below median for the three-year period (in the fourth quintile) and above median for the one-, five- and ten-year periods. For the AllianzGI Health Sciences Fund, performance was below median for the one- and three-year periods (in the fifth and third quintiles, respectively). The AllianzGI Health Sciences Fund’s Institutional Class shares have less than five years of history; its Class A shares’ performance was below median for the five- and ten-year periods (each in the fourth quintile). For the AllianzGI Income & Growth Fund, performance was above median for the one-, three-, five-, and ten-year periods. For the AllianzGI Mid-Cap Fund, performance was below median for the one- and five-year periods (in the fifth and third quintiles, respectively) and above median for the three- and ten-year periods. For the AllianzGI NFJ Dividend Value Fund, performance was above median for the one-year period and below median for the three-, five-, and ten-year periods (in the fourth quintile for the three- and five-year periods and in the fifth quintile for the ten-year period). For the AllianzGI NFJ International Value Fund, performance was below median for the three-, five-, and ten-year periods (in the fifth quintile for each period) and was above median for the one-year period. For the AllianzGI NFJ Large-Cap Value Fund, performance was above median for the one-, three-, and five-year periods and below median (in the fourth quintile) for the ten-year period. For the AllianzGI NFJ Mid-Cap Value Fund, performance was below median for the one-year period (in the fifth quintile) and above median for the three-, five-, and ten-year periods. For the AllianzGI NFJ Small-Cap Value Fund, performance was below median for theone-, three-, five-, and ten-year periods (in the fifth quintile for the one-year period and in the fourth quintile for the three-, five-, and ten-year periods). For the AllianzGI Small-Cap Fund, performance was above median for the one- and three-year periods. For the AllianzGI Technology Fund, performance was below median for the three-year period (in the third quintile) and above median for the one-,five-, and ten-year periods.
In addition, the Independent Trustees considered matters bearing on the Funds and their advisory arrangements at their meetings throughout the year, including a review of performance data at each regular meeting (either by the full Board or by the Performance Committee of the Board).
As part of their review, the Independent Trustees examined the ability of the Investment Adviser to provide high-quality investment management and other services to the Funds. Among other information, the Independent Trustees considered the investment philosophy and research and decision-making processes of the Investment Adviser, as well as the Investment Adviser’s broker selection process and trading operations; the experience of key advisory personnel of the Investment Adviser and its affiliates, as applicable, responsible for portfolio
| | | | | | |
| 168 | | December 31, 2018 | | | Semiannual Report | | |
management of the Funds; the ability of the Investment Adviser to attract and retain capable personnel; the background and capabilities of the senior management and staff of the Investment Adviser; employee compensation; and the operational infrastructure, including technology and systems, of the Investment Adviser. In addition, the Independent Trustees reviewed the extent and quality of the Investment Adviser’s services with respect to regulatory compliance and ability to comply with the investment policies of the Funds; the compliance programs and risk controls of the Investment Adviser; the specific contractual obligations of the Investment Adviser pursuant to the Agreement; the nature, extent and quality of certain administrative services the Investment Adviser is responsible for providing to the Funds; the Investment Adviser’s risk management function; and conditions that might affect the ability of the Investment Adviser to provide high quality services to the Funds in the future under the Agreement, including, but not limited to, the organization’s financial condition and operational stability. Based on the foregoing, the Independent Trustees concluded that the Investment Adviser’s investment processes, research capabilities and philosophy were well-suited to each Renewal Fund given its investment objective and policies, that the Investment Adviser would be able to continue to meet any reasonably foreseeable obligations under each Agreement, and that the Investment Adviser would otherwise be able to provide services to the Funds of sufficient extent and quality.
Fee and Expense Information
In assessing the reasonableness of the Funds’ fees and expenses under the Agreement, the Independent Trustees considered, among other information, each Renewal Fund’s advisory fee and the Renewal Fund’s total expense ratio as a percentage of average daily net assets and the advisory fees and total expense ratios in comparison to such Fund’s Broadridge Expense Group. The Independent Trustees also noted certain advisory or administrative fee breakpoints, waivers or reductions for certain Funds that had been proposed by the Investment Adviser for continuation, modification, termination or adoption, and also noted any such preexisting waivers that were not being continued. The Independent Trustees also considered, among other items: (i) that the Funds pay a unitary administrative fee for non-advisory services, which differentiates the Funds from many in the industry, and (ii) current Fund asset levels as compared to prior years.
The Independent Trustees also considered information showing the contractual advisory fees charged by the Investment Adviser to other funds and accounts, including institutional and separate accounts, with similar investment objective(s) and policies to those of the Funds, if any. In comparing these fees, the Independent Trustees considered information provided by the Investment Adviser as to the generally broader and more extensive services provided to the Funds in comparison to institutional or separate accounts; the higher demands placed on the Investment Adviser’s investment personnel and trading infrastructure as a result of the daily cash in-flows and out-flows of the Funds; the greater entrepreneurial risk in managing retail mutual funds; and the impact on the Investment Adviser and expenses
associated with the more extensive regulatory regime to which the Funds are subject in comparison to institutional or separate accounts.
The Independent Trustees considered and evaluated the unitary administrative fees paid by each Fund under the Administration Agreement, including in light of the total expenses of the Funds and the total expenses of competitor funds as reflected in the Broadridge materials. The Independent Trustees noted that, in connection with the contract review process in prior years, they had negotiated with the Investment Adviser to observe administrative fee breakpoints for each Fund and share class under the Administration Agreement, and to apply breakpoints based on the entire net assets of each Fund (rather than on net assets attributable to particular share classes).
The Trustees also considered, among other information, the Investment Adviser’s business model of providing advisory and administrative services as part of a comprehensive program wherein the services cannot readily be separated and the Investment Adviser’s indication that it would not be willing to outsource its provision of administrative services while continuing to provide advisory services. They also took into account disclosure in the Funds’ prospectuses regarding administrative fees.
The Independent Trustees reviewed, among other information, information provided by Broadridge comparing each Renewal Fund’s advisory fee, and ratios of total expenses to net assets (“Total Expense Ratios”) for two share classes (Class A and Institutional Class share classes) to the Funds’ respective Broadridge Expense Groups for the most recent fiscal year ended June 30, 2018. Class A shares of the applicable Broadridge-selected group of comparable funds are referred to below as the “retail expense group,” and Institutional Class are referred to as the “institutional expense group.” The Independent Trustees noted that the Broadridge data takes into account any fee reductions or expense limitations that were in effect during a Renewal Fund’s last fiscal year. The Fund-specific fee and expense results discussed below were prepared and provided by Broadridge and were not independently verified by the Independent Trustees. The Funds’ fee and expense rankings are discussed below relative to the median of the applicable Broadridge Expense Groups. A Renewal Fund whose fees and expenses were below median had fees and expenses that were less than the median fees and expenses of its peer group, while a Renewal Fund whose fees and expenses were above median had fees and expenses that were higher than the median fees and expenses of its peer group. For those Funds whose fees or expenses were higher than the median, the specific quintile rankings are also noted below with respect to the relevant above-median fee or expense categories (unless quintile rankings were not provided to the Independent Trustees by Broadridge, in which case fund rankings are provided). For the purposes of Broadridge Expense Group quintile rankings, higher fees and expenses result in a lower quintile ranking, with the first quintile corresponding to low fees and expenses the fifth quintile corresponding to high fees and expenses.
| | | | | | |
| | Semiannual Report | | | December 31, 2018 | | 169 |
Unaudited
Matters Relating to the Trustees’ Consideration of the Investment Advisory Agreement (cont’d)
For the AllianzGI Emerging Markets Opportunities Fund, AllianzGI Focused Growth Fund, AllianzGI Mid-Cap Fund, AllianzGI NFJ Dividend Value Fund, AllianzGI NFJ International Value Fund, AllianzGI NFJ Large-Cap Value Fund, AllianzGI NFJ Mid-Cap Value Fund, and AllianzGI NFJ Small-Cap Value Fund, both the advisory fees and total expense ratios (taking fee waivers and/or breakpoints into account) were below the median for both the retail and institutional expense groups. For the AllianzGI Global Natural Resources Fund, advisory fees were at the median for the retail expense group and above median for the institutional expense group (ranked 6/8) and total expense ratios were above median for both the retail and institutional expense groups (in the fourth and third quintiles, respectively) (taking fee waivers and/or breakpoints into account in each case). For the AllianzGI Global Small-Cap Fund, advisory fees were at the median for the retail expense group and above median for the institutional expense group (ranked 4/6), and total expense ratios were above median for both the retail (ranked 4/5) and institutional expense group (in the third quintile) (taking fee waivers and/or breakpoints into account in each case). For the AllianzGI Health Sciences Fund, advisory fees were below median for the retail expense group and at the median for the institutional expense group, and total expense ratios were at the median for both the retail and institutional expense groups (taking fee waivers and/or breakpoints into account in each case). For the AllianzGI Income & Growth Fund, advisory fees were below median for both the retail expense group and the institutional expense group and total expense ratios were above median for both the retail and institutional expense groups (in the fifth and fourth quintiles, respectively) (taking fee waivers and/or breakpoints into account in each case). For the AllianzGI Small-Cap Fund, advisory fees were above median for the retail expense group (ranked 10/16) and below median for the institutional expense group and total expense ratios were below median for both the retail and institutional expense groups (taking fee waivers and/or breakpoints into account in each case). For the AllianzGI Technology Fund, advisory fees were above median for both the retail (ranked 7/10) and institutional expense groups (ranked 6/9) and total expense ratios were above median for both the retail and institutional expense groups (each in the fifth quintile) (taking fee waivers and/or breakpoints into account in each case).
The Independent Trustees considered the extent to which the Investment Adviser may realize economies of scale or other efficiencies in managing and supporting the Funds. The Independent Trustees took into account that, as open-end investment companies, the Funds intend to raise additional assets, so that, as the assets of the Funds grow over time, certain economies of scale and other efficiencies may be realized through spreading certain fixed costs across a larger asset base or across a variety of products and services, while also taking into account the breakpoints and fee waiver and breakpoint arrangements observed by the Investment Adviser for applicable Funds. Additionally, the Independent Trustees considered so-called “fall-out benefits” to the Investment Adviser and its affiliates, such as reputational value derived from serving as Investment Adviser to the Funds. They also considered that the unitary administrative fee generally results in increased profitability benefits as the asset base of the Funds increases
and such benefits generally inure to the Investment Adviser, and that the Investment Adviser’s profitability likewise generally declines under the unitary administrative fee structure when Fund assets decline. The Independent Trustees considered that the unitary fee also insulates shareholders from increased expense ratios arising from declines in net assets. The Trustees considered it appropriate to consider breakpoints in the Funds’ administrative fee as a means of sharing any economies of scale or efficiencies concerning administration services with Fund shareholders. The Independent Trustees also took into account the entrepreneurial, legal, regulatory and business risks the Investment Adviser has undertaken as investment adviser and sponsor of the Funds. The Independent Trustees also took into account that the Investment Adviser agreed to advisory and/or administrative fee waivers and/or breakpoints for certain Funds that would be effective as of November 1, 2018 through at least October 31, 2019.
The Independent Trustees recognized that it is difficult to make comparisons of profitability from mutual fund advisory and administration contracts because comparative information is not generally available and is affected by numerous factors, including the structure of the particular adviser, the types of funds it manages, its business mix, numerous assumptions about allocations and the adviser’s capital structure and cost of capital. The Independent Trustees considered the overall profitability to the Adviser with respect to combined advisory and administrative fees, as well as profitability separately as to each of the advisory fees and administrative fees, each on a Fund-by-Fund basis. The Independent Trustees took into account, among other factors, that a revised methodology with respect to the allocation of the Adviser’s costs and expenses was used to estimate profitability from the Funds for the year ended December 31, 2017 from the methodology used to estimate profitability in prior years, as had been presented to and discussed with Committee during its meetings earlier in the year, which included input from the Funds’ independent auditors as to the reasonableness of the revised methodology. The Independent Trustees also reviewed estimates of the Funds’ profitability for the year ended December 31, 2016 using the new allocation methodology for comparative purposes. In addition, the Independent Trustees reviewed information regarding profitability of other investment advisers with publicly-traded parent companies. The Independent Trustees concluded that the Adviser’s estimated pre-tax profitability for advisory services was not excessive or unreasonable, although it was sizeable for certain Funds, and that estimated pre-tax profitability for advisory and administrative services combined, including when calculated on a net revenue basis regarding the administrative fee, was sizeable for certain Funds, but generally not unreasonable under the circumstances. The Independent Trustees determined that the estimated profitability to the Adviser with respect to its relationship with each Renewal Fund did not, in any case, appear to be excessive.
After reviewing these and other factors described herein, the Independent Trustees concluded, with respect to each Fund, within the context of their overall conclusions regarding the Agreement, that
| | | | | | |
| 170 | | December 31, 2018 | | | Semiannual Report | | |
they were satisfied with the Investment Adviser’s responses andon-going efforts relating to the investment performance of the Funds. The Independent Trustees also concluded that the fees payable under each Agreement represent reasonable compensation in light of the nature, extent and quality of services provided by the Investment Adviser and should be continued, taking into account the Investment Adviser’s agreement to observe waivers and/or breakpoints for certain Funds. Based on their evaluation of factors that they deemed to be material, including, but not limited to, those factors described above, the Independent Trustees unanimously concluded that the continuation of the Agreement with respect to the Funds were in the interests of the applicable Funds and their shareholders, and determined to recommend that the continuance of the Agreement be approved by the full Board.
The Independent Trustees also considered the proposed continuance of the Administration Agreement between the Trust and AllianzGI U.S. for the Funds and determined to recommend the same for approval by the full Board.
The Independent Trustees also discussed the distribution arrangements and plans for the Funds and determined that there is a reasonable likelihood that the arrangements will continue to benefit the Funds and their shareholders, and to recommend the continuance of the same for approval by the full Board.
| | | | | | |
| | Semiannual Report | | | December 31, 2018 | | 171 |
Allianz Funds
Trustees
Alan Rappaport
Chairman of the Board of Trustees
Sarah E. Cogan
Deborah A. DeCotis
F. Ford Drummond
A. Douglas Eu
Bradford K. Gallagher
Erick R. Holt
James A. Jacobson
Hans W. Kertess
James S. MacLeod
William B. Ogden, IV
Davey S. Scoon
Officers
Thomas J. Fuccillo
President and Chief Executive Officer
Scott Whisten
Treasurer, Principal Financial & Accounting Officer
Angela Borreggine
Chief Legal Officer & Secretary
Thomas L. Harter
Chief Compliance Officer
Richard J. Cochran
Assistant Treasurer
Orhan Dzemaili
Assistant Treasurer
Debra Rubano
Assistant Secretary
Craig A. Ruckman
Assistant Secretary
Investment Adviser
Allianz Global Investors U.S. LLC
1633 Broadway
New York, NY 10019
Distributor
Allianz Global Investors Distributors LLC
1633 Broadway
New York, NY 10019
Custodian & Accounting Agent
State Street Bank & Trust Co.
801 Pennsylvania Avenue
Kansas City, MO 64105
Shareholder Servicing and Transfer Agent
State Street Bank and Trust Company, which has delegated its obligations as transfer agent to: DST Asset Management Solutions, Inc.
(Class A, Class C and Class R shares)
P.O. Box 219723
Kansas City, MO 64121-9723
(Class P, Institutional Class, Class R6 and Administrative Class shares)
P.O. Box 219968
Kansas City, MO 64121
Independent Registered Public Accounting Firm
PricewaterhouseCoopers LLP
1100 Walnut Street, Suite 1300
Kansas City, MO 64105
Legal Counsel
Ropes & Gray LLP
Prudential Tower
800 Boylston Street
Boston, MA 02199
This report, including the financial information herein, is transmitted to the shareholders of the Trust for their information. It is not a prospectus, circular or representation intended for use in the purchase of shares of each Fund or any securities mentioned in this report.
The financial information included herein is taken from the records of the Funds without examination by an independent registered public accounting firm, who did not express an opinion herein.
For Account Information
Contact your financial adviser, or if you receive account statements directly from Allianz Global Investors, you can also call (800) 988-8380 for Class A, C and R shares or(800) 498-5413 for Class P, Institutional, R6 and Administrative shares. Telephone representatives are available Monday-Friday 8:30 am to 6:00 pm Eastern Time. Or visit our website, us.allianzgi.com.
About Allianz Global Investors
Allianz Global Investors is a leading active asset manager with over 730 investment professionals in 25 offices worldwide and managing $621 billion in assets for individuals, families and institutions.*
Active is the most important word in our vocabulary. Active is how we create and share value with clients. We believe in solving, not selling, and in adding value beyond pure economic gain. We invest for the long term, employing our innovative investment expertise and global resources. Our goal is to ensure a superior experience for our clients, wherever they are based and whatever their investment needs.
Active is: Allianz Global Investors
* Data as of September 30, 2018.
Investors should consider the investment objectives, risks, charges and expenses of the above mentioned Funds carefully before investing. This and other information is contained in the Funds’ prospectus, which may be obtained by contacting your financial advisor, by visiting us.allianzgi.com or by calling 1-800-988-8380 (retail classes: A, C and R) or 1-800-498-5413 (Class P, Class R6, Institutional and Administrative classes). Please read the prospectus carefully before you invest or send money.
Allianz Global Investors U.S. LLC serves as the investment manager for the Allianz Funds and the Allianz Multi-Strategy Funds. Allianz Funds and the Allianz Multi-Strategy Funds are distributed by Allianz Global Investors Distributors LLC.© 2019. For information about any product, contact your financial advisor.
us.allianzgi.com
Receive this report electronically and eliminate paper mailings.
To enroll, go to us.allianzgi.com/edelivery.
702390
| (a) | Not required in this filing. |
| ITEM 3. | AUDIT COMMITTEE FINANCIAL EXPERT |
Not required in this filing.
| ITEM 4. | PRINCIPAL ACCOUNTANT FEES AND SERVICES |
Not required in this filing.
| ITEM 5. | AUDIT COMMITTEE OF LISTED REGISTRANT |
Disclosure not required foropen-end management investment companies.
| ITEM 6. | SCHEDULE OF INVESTMENTS |
| (a) | Schedule of Investments is included as part of the report to shareholders filed under Item 1 of this form. |
| ITEM 7. | DISCLOSURE OF PROXY VOTING POLICIES AND PROCEDURES FORCLOSED-END MANAGEMENT INVESTMENT COMPANIES |
Disclosure not required foropen-end management investment companies.
| ITEM 8. | PORTFOLIO MANAGERS OFCLOSED-END MANAGEMENT INVESTMENT COMPANIES |
Disclosure not required foropen-end management investment companies.
| ITEM 9. | PURCHASES OF EQUITY SECURITIES BYCLOSED-END MANAGEMENT INVESTMENT COMPANY AND AFFILIATED COMPANIES. |
Disclosure not required foropen-end management investment companies.
| ITEM 10. | SUBMISSION OF MATTERS TO A VOTE OF SECURITY HOLDERS |
There were no material changes to the procedures by which shareholders may recommend nominees to the Trust’s Board of Trustees since the Trust’s last provided disclosure in response to this item.
| ITEM 11. | CONTROLS AND PROCEDURES |
| (a) | The registrant’s President & Chief Executive Officer and Treasurer, Principal Financial & Accounting Officer have concluded that the registrant’s disclosure controls and procedures (as defined in Rule30a-3(c) under the Investment Company Act of 1940 (the “1940 Act”) (17 CFR270.30a-3(c)), as amended) are effective based on their evaluation of these controls and procedures as of a date within 90 days of the filing date of this document. |
| (b) | There were no changes in the registrant’s internal control over financial reporting (as defined in Rule30a-3(d) under the 1940 Act (17 CFR270.30a-3(d))) that occurred during the second fiscal quarter of the period covered by this report that has materially affected, or is reasonably likely to materially affect, the registrant’s internal control over financial reporting. |
| ITEM 12. | DISCLOSURE OF SECURITIES LENDING ACTIVITIES FORCLOSED-END MANAGEMENT INVESTMENT COMPANIES. |
Disclosure not required foropen-end management investment companies.
(a)(1) Exhibit 99.CODE ETH – Code of Ethics
(a)(2) Exhibit 99_ CERT. – Certification pursuant to Section 302 of the Sarbanes-Oxley Act of 2002
(a)(3) Not applicable
(b) Exhibit 99.906 CERT. – Certification pursuant to Section 906 of the Sarbanes-Oxley Act of 2002
Signatures
Pursuant to the requirements of the Securities Exchange Act of 1934 and the Investment Company Act of 1940, the registrant has duly caused this report to be signed on its behalf by the undersigned, thereunto duly authorized.
| | |
| Allianz Funds |
| |
| By: | | /s/ Thomas J. Fuccillo |
| | Thomas J. Fuccillo |
| | President & Chief Executive Officer |
|
| Date: February 28, 2019 |
| |
| By: | | /s/ Scott Whisten |
| | Scott Whisten |
| | Treasurer, Principal Financial & Accounting Officer |
|
| Date: February 28, 2019 |
Pursuant to the requirements of the Securities Exchange Act of 1934 and the Investment Company Act of 1940, this report has been signed below by the following persons on behalf of the registrant and in the capacities and on the dates indicated.
| | |
| By: | | /s/ Thomas J. Fuccillo |
| | Thomas J. Fuccillo |
| | President & Chief Executive Officer |
|
| Date: February 28, 2019 |
| |
| By: | | /s/ Scott Whisten |
| | Scott Whisten |
| | Treasurer, Principal Financial & Accounting Officer |
|
| Date: February 28, 2019 |