Table of Contents
UNITED STATES
SECURITIES AND EXCHANGE COMMISSION
Washington, D.C. 20549
FORM N-CSR
CERTIFIED SHAREHOLDER REPORT OF REGISTERED
MANAGEMENT INVESTMENT COMPANIES
Investment Company Act file number 811-06161
Allianz Funds
(Exact name of registrant as specified in charter)
| 1633 Broadway, New York, New York | 10019 | |
| (Address of principal executive offices) | (Zip code) |
Scott Whisten
1633 Broadway,
New York, New York 10019
(Name and address of agent for service)
Registrant’s telephone number, including area code: 212-739-3367
Date of fiscal year end: June 30
Date of reporting period: June 30, 2020
Table of Contents
ITEM 1. REPORT TO SHAREHOLDERS

Allianz Funds
SHARE CLASSES A, C, R, P, INSTITUTIONAL, R6, ADMINISTRATIVE
Annual Report
June 30, 2020
AllianzGI Dividend Value Fund (formerly AllianzGI NFJ Dividend Value Fund)
AllianzGI Emerging Markets Opportunities Fund
AllianzGI Focused Growth Fund
AllianzGI Global Small- Cap Fund
AllianzGI Health Sciences Fund
AllianzGI Income & Growth Fund
AllianzGI International Value Fund (formerly AllianzGI NFJ International Value Fund)
AllianzGI Large-Cap Value Fund (formerly AllianzGI NFJ Large-Cap Value Fund)
AllianzGI Mid-Cap Fund
AllianzGI Mid-Cap Value Fund (formerly AllianzGI NFJ Mid-Cap Value Fund)
AllianzGI Small-Cap Fund
AllianzGI Small-Cap Value Fund (formerly AllianzGI NFJ Small-Cap Value Fund)
AllianzGI Technology Fund
This material is authorized for use only when preceded or accompanied by the current Allianz Funds prospectus. Investors should consider the investment objectives, risks, charges and expenses of each Fund carefully before investing. This and other information is contained in the Funds’ prospectus or summary prospectus. Please read the prospectus carefully before you invest or send money.
Beginning on January 1, 2021, as permitted by regulations adopted by the U.S. Securities and Exchange Commission, paper copies of shareholder reports will no longer be sent by mail, unless you specifically request paper copies of the reports. Instead, the reports will be made available on the Funds’ website (us.allianzgi.com), and you will be notified by mail each time a report is posted and provided with a website link to access the report.
If you already elected to receive shareholder reports electronically, you will not be affected by this change and you need not take any action. You may elect to receive shareholder reports and other communications from a Fund electronically anytime by contacting your financial intermediary (such as a broker-dealer or bank) or, if you are a direct investor, by enrolling at us.allianzgi.com/edelivery.
If you prefer to receive paper copies of your shareholder reports after January 1, 2021, direct investors may inform a Fund at any time. If you invest through a financial intermediary, you should contact your financial intermediary directly. Paper copies are provided free of charge and your election to receive reports in paper will apply to all funds held with the fund complex if you invest directly with a Fund or all funds held in your account if you invest through your financial intermediary.

Receive this report electronically and eliminate paper mailings.
To enroll, go to us.allianzgi.com/edelivery.
Table of Contents
A Word About Risk: A fund may be subject to various risks as described in its prospectus. Some of those risks may include, but are not limited to, the following: fixed-income risk, liquidity risk, derivatives risk, smaller company risk, non-US investment risk, focused investment risk and specific sector investment risks. Below investment grade securities involve a greater risk to principal than investment grade securities. Bond prices will normally decline as interest rates rise. The impact may be greater with longer-duration bonds. The market for certain securities may become illiquid, which could prevent a fund from purchasing or selling these securities at an advantageous time or price and possibly delay redemptions of fund shares. Use of derivative instruments may involve certain costs and risks such as liquidity risk, interest rate risk, market risk, credit and counterparty risk, management risk and the risk that a fund is unable to close out a position when it is most advantageous to do so. Portfolios investing in derivatives could lose more than the principal amount invested in those instruments. Investing in foreign securities may entail risk due to foreign economic and political developments; this risk may be enhanced when investing in emerging markets. Smaller companies may be more volatile than larger companies and may entail more risk. Concentrating investments in individual sectors may add additional risk and additional volatility compared to a diversified equity portfolio. The principal values of the funds are not guaranteed at any time. Please refer to the applicable fund’s current prospectus for complete details.
Table of Contents

Thomas J. Fuccillo
President & CEO
Dear Shareholder,
The COVID-19 pandemic severely impacted the global economy during the 12-month fiscal reporting period ended June 30, 2020. Economic growth in the US and overseas contracted as countries instituted lockdown orders in an attempt to contain the novel coronavirus. Over this period, global equities generated mixed results. Elsewhere, the overall US bond market posted positive results.
The 12-Month Fiscal Period in Review
For the 12-month period ended June 30, 2020, US stocks returned 7.51%, as measured by the S&P 500 Index. Two measures of stock performance in developed international and global markets produced mixed results, in dollar-denominated terms, with the MSCI EAFE (Europe, Australasia and Far East) Index returning -5.13% and the MSCI World Index gaining 2.84%. Elsewhere, the MSCI Emerging Markets Index returned -3.39% in dollar-denominated terms. With respect to bonds of US-domiciled issuers, the Bloomberg Barclays US Universal Bond Index rose 7.88% and the Bloomberg Barclays US Government Bond Index returned 8.74%, while the broader US bond market, as measured by the Bloomberg Barclays US Aggregate Bond Index, gained 8.74%.
Turning to the US economy, gross domestic product (“GDP”), the value of goods and services produced in the country, the broadest measure of economic activity and the principal indicator of economic performance, expanded at a revised 2.6% and 2.4% annual pace during the third and fourth quarters of 2019, respectively. The COVID-19 pandemic then started to take its toll on the economy during the first quarter of 2020, resulting in a precipitous decline in GDP growth, to -5.0%, which at that time was the sharpest quarterly decline since the fourth quarter of 2008. The US Department of Commerce’s initial estimate of second quarter annualized GDP growth of -32.9% — released after the end of the reporting period — was the steepest decline on record.
The US Federal Reserve (“Fed”) took a number of aggressive actions in an attempt to support the economy and keep the market functioning properly in the wake of the spreading novel coronavirus. Looking back, following the Fed’s meeting that concluded on July 31, 2019, the Fed lowered the federal funds rate by 0.25% to a range between 2.00% and 2.25%. This was the Fed’s first rate cut since 2008. During its meetings in September and October 2019, the Fed instituted two more 0.25% rate cuts, with the last reduction moving the federal funds rate to a range
| 2 | June 30, 2020 | | Annual Report |
Table of Contents
between 1.50% and 1.75%. After remaining on hold for several months, in March 2020, in response to the broad-based market downturn, the Fed took a number of unprecedented initiatives to support the economy and the orderly function of the financial markets. On March 3, 2020, the Fed lowered the federal funds rate to a range between 1.00% and 1.25%. Then, on March 15, the Fed further lowered the federal funds rate to a range between 0.00% and 0.25%. Finally, on March 23, the Fed said it was “…committed to using its full range of tools to support the US economy in this challenging time and thereby promote its maximum employment and price stability goals.” Among its actions, the Fed announced that it would make unlimited purchases of US Treasury and mortgage securities. Meanwhile, also in March 2020, the U.S. government passed a $2 trillion fiscal stimulus bill to aid the economy.
Economic growth outside the US was weak overall during the reporting period. Against this backdrop, in September 2019, the European Central Bank (“ECB”) cut its key interest rate and announced a new package of bond purchases. The Bank of England kept rates on hold, but indicated it would be flexible given the uncertainties related to Brexit. Meanwhile, the Bank of Japan maintained its accommodative monetary policy during the reporting period.
Outlook
Since the market low on March 23, 2020, risk assets have rebounded impressively. While this year’s US equity rally was mostly dominated by sectors well-positioned to capitalize on or be bolstered by certain of the circumstances caused by the COVID-19 pandemic (e.g., technology and healthcare), we have seen a broadening of leadership since mid-May: cyclical sectors such as industrials, financials and energy have performed well. We continue to believe in the reopening story broadly, and we see a slow march toward normalization in the US economy — perhaps punctuated by the arrival of a viable vaccine. Against this backdrop, we believe a “barbell” approach to risk would be prudent: focus on cyclical sectors during the reopening phase, while considering adding tactical exposure to secular growth themes over time. In our view, investors should expect natural periods of consolidation in the coming months and be mindful of looming risks — from a second wave of coronavirus infections to the outcome of the US presidential election in November. Finally, as we reemerge from this crisis, we believe it remains critical to make active bets and reposition for a post-COVID-19 world.
On behalf of Allianz Global Investors U.S. LLC, the Funds’ investment adviser, thank you for investing with us. We encourage you to consult with your financial advisor and to visit our website, us.allianzgi.com, for additional information. We remain dedicated to serving your investment needs.
Sincerely,

Thomas J. Fuccillo
President & CEO
Past performance is no guarantee of future results. Unless otherwise noted, index returns reflect the reinvestment of income dividends and capital gains, if any, but do not reflect fees, brokerage commissions or other expenses of investing. It is not possible to invest directly in an index.
Receive this report electronically and eliminate paper mailings.
To enroll, go to us.allianzgi.com/edelivery.
| Annual Report | | June 30, 2020 | 3 |
Table of Contents
Unaudited
AllianzGI Dividend Value Fund (formerly AllianzGI NFJ Dividend Value Fund)*
For the period July 1, 2019 through June 30, 2020, as provided by the Value Equity US team.
Fund Insights
For the twelve-month period ended June 30, 2020, the Class A shares at net asset value (“NAV”) of the AllianzGI Dividend Value Fund (the “Fund”) returned -8.54%, outperforming the Russell 1000 Value Index (the “benchmark”), which returned -8.84%.
Market Overview
US equities posted double-digit gains in the second half of 2019, closing the year with the strongest annual returns since 2013. Despite a notable set-back in August of 2019, major indices hit a series of fresh highs as risk appetite was boosted by lower interest rates and a “phase one” trade deal between the US and China. Corporate earnings also beat, albeit lowered, expectations. Growth stocks continued to outperform value ones. The investment landscape shifted quickly when the 11-year bull market in the US finally ended in the first quarter of 2020. After touching fresh highs in mid-February, US stocks subsequently plunged as the extraordinary measures employed to control COVID-19 raised fears of a severe global recession. The rapidly evolving crisis led to heightened volatility, with US stocks suffering two of the largest one-day falls since 1987 in March of 2020, along with the largest daily gain since 2008. Sentiment turned in the second quarter, with a sharp rally helping the S&P 500 Index record its strongest quarterly performance since 1998. At one point in June, US stocks had recouped all of their year-to-date losses, although stocks subsequently came off their best levels as a surge in new cases in southern and western states caused some re-opening measures to be rolled back towards quarter-end.
Portfolio Review
Relative performance results were due to positive stock selection, while sector allocation somewhat detracted over the reporting period. Selection across the real estate investment trusts (“REITs”) and industrials sectors boosted relative returns, and these gains were only partially offset by holdings in the consumer staples and utilities sectors, which failed to keep pace with benchmark shares. Within the benchmark index, just three of the index’s eleven GICS economic sectors—information technology, health care and consumer staples—delivered positive absolute returns. In contrast, the energy, financials, REITs and industrials sectors recorded double-digit negative returns over the trailing one-year period. The Fund’s overweight in energy and underweight in utilities detracted from relative returns, while an overweight in technology and underweight in financials contributed to performance results during the trailing twelve-month period.
Outlook
The US economy entered a recession during the second quarter of 2020. It may have already exited, according to the technical definition. The recovery may have started out looking like a “V”, but it has since flattened out below peak levels. Retail sales and industrial production, after falling by the most in at least 100 years, have bounced to still-unhealthy levels. There has been severe damage to employment, particularly among small businesses and concentrated in certain industries (leisure/hospitality, transportation, oil & gas), that may take a long time to recover from a workforce perspective. Policymakers, between the US Federal Reserve and Congress, have been aggressive and acted quickly. Going forward, people may remain hesitant to go out in large groups and risk aversion could remain high. Many doctors project a return of the virus in the fall, the uncertainty around which could also keep consumer and business spending in check. However, the extraordinary stimulus could become a tailwind once the peak has passed. In the longer term, we may find growth on an even lower trajectory than existed prior to the virus due to deglobalization of supply chains, which will likely slow down productivity growth and hurt corporate profitability.
Our team understands the importance of efficiently reacting to the ever-changing market in order to capitalize on opportunities and add strength and quality in our portfolios. We believe our focus on higher-quality companies that pay a dividend within an attractive price-value framework offers many compelling characteristics, from less volatility with income to the potential to protect against inflation via dividend growth. As active managers committed to researching fundamentals and evaluating a company’s prospects, we believe this approach will become critical in the current environment for clients seeking strong absolute returns and moderated volatility over the long term.
* Effective April 30, 2020, the Fund changed its name from “AllianzGI NFJ Dividend Value Fund” to “AllianzGI Dividend Value Fund”.
| 4 | June 30, 2020 | | Annual Report |
Table of Contents
Unaudited
AllianzGI Dividend Value Fund (formerly AllianzGI NFJ Dividend Value Fund) (cont’d)
Average Annual Total Return for the period ended June 30, 2020
| 1 Year | 5 Year | 10 Year | Since Inception† | |||||||||||||||
AllianzGI Dividend Value Fund Class A | –8.54% | 3.18% | 8.87% | 6.83% | ||||||||||||||
| AllianzGI Dividend Value Fund Class A (adjusted) | –13.56% | 2.02% | 8.25% | 6.53% | |||||||||||||
AllianzGI Dividend Value Fund Class C | –9.17% | 2.41% | 8.05% | 6.03% | ||||||||||||||
| AllianzGI Dividend Value Fund Class C (adjusted) | –9.97% | 2.41% | 8.05% | 6.03% | |||||||||||||
| AllianzGI Dividend Value Fund Class R | –8.70% | 2.92% | 8.59% | 6.56% | |||||||||||||
| AllianzGI Dividend Value Fund Class P | –8.23% | 3.44% | 9.14% | 7.14% | |||||||||||||
| AllianzGI Dividend Value Fund Institutional Class | –8.24% | 3.53% | 9.24% | 7.25% | |||||||||||||
| AllianzGI Dividend Value Fund Class R6 | –8.12% | 3.59% | 9.30% | 7.30% | |||||||||||||
AllianzGI Dividend Value Fund Administrative Class | –8.33% | 3.29% | 8.98% | 6.98% | ||||||||||||||
| Russell 1000 Value Index | –8.84% | 4.64% | 10.41% | 6.12% | |||||||||||||
Lipper Equity Income Funds Average | –5.32% | 5.47% | 9.98% | 6.09% | ||||||||||||||
† The Fund began operations on 5/8/00. Benchmark comparisons began on the fund inception date. Lipper comparisons began on 4/30/00.
Performance quoted represents past performance and is no guarantee of future results. Current performance may be lower or higher than performance shown. For performance current to the most recent month-end, visit our website at us.allianzgi.com. Investment return and the principal value will fluctuate. Shares may be worth more or less than original cost when redeemed. The adjusted returns take into account the maximum sales charge of 5.50% on Class A shares and 1% contingent deferred sales charge (CDSC) on Class C shares, which may apply to shares redeemed during the first year of ownership. Returns do not reflect deduction of taxes that a shareholder would pay on fund distributions or redemption of fund shares. Please see pages 56-58 for more information. The Fund’s gross expense ratios are 1.11% for Class A shares, 1.86% for Class C shares, 1.36% for Class R shares, 0.86% for Class P shares, 0.76% for Institutional Class shares, 0.71% for Class R6 shares and 1.01% for Administrative Class shares. Theses ratios do not include an expense reduction, contractually agreed through at least August 31, 2020. The Fund’s expense ratios net of this reduction are 1.04% for Class A shares, 1.79% for Class C shares, 1.29% for Class R shares, 0.79% for Class P shares, 0.69% for Institutional Class shares, 0.64% for Class R6 shares and 0.94% for Administrative Class shares. Expense ratio information is as of the Fund’s current prospectus dated August 28, 2019, as further revised or supplemented from time to time.
Cumulative Returns Through June 30, 2020
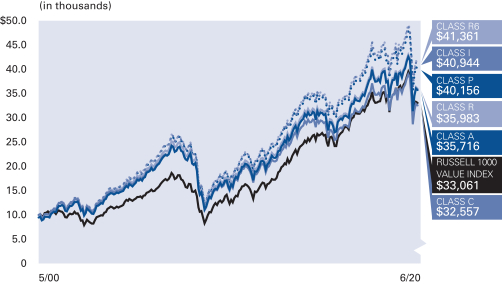
The Fund began operations on 5/8/00. Benchmark comparisons began on the fund inception date.
Industry/Sectors (as of June 30, 2020)
| Banks | 7.6% | |||
| Equity Real Estate Investment Trusts (REITS) | 6.5% | |||
| Insurance | 6.0% | |||
| Capital Markets | 5.8% | |||
| Semiconductors & Semiconductor Equipment | 5.6% | |||
| Pharmaceuticals | 5.6% | |||
| Electric Utilities | 4.7% | |||
| Oil, Gas & Consumable Fuels | 4.1% | |||
| Other | 53.1% | |||
| Cash & Equivalents — Net | 1.0% | |||
| Annual Report | | June 30, 2020 | 5 |
Table of Contents
Unaudited
AllianzGI Dividend Value Fund (formerly AllianzGI NFJ Dividend Value Fund) (cont’d)
| Shareholder Expense Example | Actual Performance | |||||||||||||
| Class A | Class C | Class R | Class P | Institutional Class | Class R6 | Administrative Class | ||||||||
| Beginning Account Value (1/1/20) | $1,000.00 | $1,000.00 | $1,000.00 | $1,000.00 | $1,000.00 | $1,000.00 | $1,000.00 | |||||||
| Ending Account Value (6/30/20) | $838.80 | $835.80 | $837.60 | $839.80 | $839.90 | $840.50 | $839.60 | |||||||
| Expenses Paid During Period | $4.75 | $8.17 | $5.89 | $3.61 | $3.16 | $2.93 | $4.30 | |||||||
| Hypothetical Performance | ||||||||||||||
| (5% return before expenses) | ||||||||||||||
| Class A | Class C | Class R | Class P | Institutional Class | Class R6 | Administrative Class | ||||||||
| Beginning Account Value (1/1/20) | $1,000.00 | $1,000.00 | $1,000.00 | $1,000.00 | $1,000.00 | $1,000.00 | $1,000.00 | |||||||
| Ending Account Value (6/30/20) | $1,019.69 | $1,015.96 | $1,018.45 | $1,020.93 | $1,021.43 | $1,021.68 | $1,020.19 | |||||||
| Expenses Paid During Period | $5.22 | $8.97 | $6.47 | $3.97 | $3.47 | $3.22 | $4.72 | |||||||
For each class of the Fund, expenses (net of fee waivers) are equal to the annualized expense ratio for the class (1.04% for Class A, 1.79% for Class C, 1.29% for Class R, 0.79% for Class P, 0.69% for Institutional Class, 0.64% for class R6 and 0.94% for Administrative Class), multiplied by the average account value over the period, multiplied by 182/366.
| 6 | June 30, 2020 | | Annual Report |
Table of Contents
(THIS PAGE INTENTIONALLY LEFT BLANK)
| Annual Report | | June 30, 2020 | 7 |
Table of Contents
Unaudited
AllianzGI Emerging Markets Opportunities Fund
For the period of July 1, 2019 through June 30, 2020, as provided by Lu Yu, CFA, CIPM, Portfolio Manager.
Fund Insights
For the twelve-month period ended June 30, 2020, the Class A shares at net asset value (“NAV”) of the AllianzGI Emerging Markets Opportunities Fund (the “Fund”) returned -2.45%, outperforming the MSCI Emerging Markets Index (the “benchmark”), which returned -3.39%.
Market Overview
Emerging market equities were influenced by rapidly shifting macroeconomic conditions during the annual reporting period in light of moderating global growth expectations and impact from the coronavirus (COVID-19).
Emerging markets equities initially declined in July and August 2019 due to concerns of slowing global demand, the strength of the US dollar and reescalation of the US/China trade war. The asset class advanced in September and October 2019 amid signs of easing trade tensions as well as via interest rate cuts from central banks in both developed and developing economies. After a flat performance in November 2019, the positive asset class performance accelerated in December 2019 thanks in part to the agreement of a “phase one” trade deal between the US and China coupled with a rebound in global growth expectations. The economic outlook then shifted suddenly as emerging market equities declined meaningfully in the January to March 2020 period, crippled by the spread COVID-19 and global economic growth ground to a standstill. The market decline reversed in April as the prior draconian measures which were employed to curtail the novel coronavirus were gradually lifted. After flat returns in May 2020, results in June 2020 were lifted amid optimism that the COVID-19 concerns which plagued the asset class were subsiding after unprecedented government and central bank support buoyed stocks, helping investors overcome fears of a second wave of infections.
Asian equities were the top performers with a 4.9% advance. Taiwan was the standout country in the region with a 21.9% gain thanks primarily to strength in the technology sector. Chinese equities were higher by 13.1% as the country was the first to be hit by the COVID-19 slowdown and subsequently the first to rebound once concerns were lessened. South Korea was modestly positive for the annual period while on the flip side Thailand and Indonesia were each down more than 23%. Emerging European stocks were collectively down 17.1%. Turkey was the best relative performer down 7.4%, while Russian shares were lower by 13% due primarily to lackluster energy demand. Higher risk countries, including Poland and Greece, declined 29.8% and 33.6% respectively. Latin American shares were broadly lower, down 32.5% for the annual period. Colombia dropped 40.7% and Chile declined 35.2%, as growth expectations slowed. Regional heavyweight Brazil was down 33.4% as falling commodity prices, slower global trade and the impact from COVID-19 depressed the country’s economic outlook.
Sector performance for the benchmark index was divergent, with 4 out of 11 sectors advancing. Health care was by far the top performer, advancing nearly 35% due to increased attention related to the search for tests, treatments and vaccines to tackle COVID-19. Information technology was up 25.1% due to resilient demand trends, followed by low double-digit gains in communication services and consumer discretionary sectors. Alternatively, cyclically-oriented sectors were the hardest hit, including financials which declined 25%. Energy, utilities, real estate, industrials and materials each declined double-digits during the annual reporting period.
Portfolio Review
The Fund seeks to deliver outperformance over time by investing in emerging market companies that are benefiting from change not yet fully reflected in the market, via the team’s behavioral finance-focused investment process. Results outpaced the benchmark thanks to bottom-up stock selection and a modest reduction in index-relative risk, which helped counteract the volatile environment for the asset class.
From a sector standpoint, strong bottom-up stockpicking in materials led results, thanks to selections in metals & mining and chemicals industries, followed by stock selection in communication services and consumer staples. An underweight to energy and financials aided relative performance results more modestly. Conversely, more conservative stock selection in consumer discretionary and information technology offset results for the annual period. From a country perspective, South Africa led returns thanks in part to positive results in gold stocks, with Russia, Malaysia and Thailand also among the outperformers. Alternatively, stock selection in South Korea, India and China detracted from performance during the annual reporting period.
Outlook
The combination of central bank easing, fiscal stimulus and business re-openings has seemingly shifted markets to a “risk on” mode in the near-term. Incremental buying activity from retail investors has furthered this impact, which has tended to emphasize lower quality and higher volatility stocks. We continue to believe that market sentiment will be heavily data-driven based upon COVID-19 news and the corresponding responses from governments globally. At present, the market optimism is positively influenced by expectations of a vaccine and slowing spread of COVID-19, leading to a resumption of global growth and a rebound in consumer spending. These expectations could change precipitously should sentiment shift in light of a spike in COVID-19 cases or should a prolonged low-growth environment become the norm.
We continue to construct the Fund’s portfolio on a bottom-up basis with conviction at the stock level. In addition, we apply a dual risk-budget, targeting a tracking error of 4-5% and lower forecast risk than the benchmark, which may help protect capital during down market periods and provide our clients with a greater level of return consistency. We believe investment results will be supported by earnings growth and our behavioral finance-focused investment process and focus on higher quality securities with attractive company fundamentals will be a driver of returns for the coming quarters.
| 8 | June 30, 2020 | | Annual Report |
Table of Contents
Unaudited
AllianzGI Emerging Markets Opportunities Fund (cont’d)
Average Annual Total Return for the period ended June 30, 2020
1 Year | 5 Year | 10 Year | Since Inception† | |||||||||||||||
AllianzGI Emerging Markets Opportunities Fund Class A | –2.45% | 1.58% | 3.60% | 7.77% | ||||||||||||||
| AllianzGI Emerging Markets Opportunities Fund Class A (adjusted) | –7.81% | 0.44% | 3.02% | 7.39% | |||||||||||||
AllianzGI Emerging Markets Opportunities Fund Class C | –3.16% | 0.83% | 2.83% | 6.96% | ||||||||||||||
| AllianzGI Emerging Markets Opportunities Fund Class C (adjusted) | –4.12% | 0.83% | 2.83% | 6.96% | |||||||||||||
| AllianzGI Emerging Markets Opportunities Fund Class P | –2.23% | 1.83% | 3.86% | 8.05% | |||||||||||||
| AllianzGI Emerging Markets Opportunities Fund Institutional Class | –2.11% | 1.94% | 3.93% | 8.18% | |||||||||||||
| AllianzGI Emerging Markets Opportunities Fund Class R6 | –2.04% | 2.00% | 3.99% | 8.23% | |||||||||||||
| MSCI Emerging Markets Index | –3.39% | 2.86% | 3.27% | 7.85% | |||||||||||||
Lipper Emerging Markets Funds Average | –2.52% | 2.71% | 3.42% | 7.64% | ||||||||||||||
† The Fund began operations on 5/27/04. Benchmark comparisons began on the fund inception date. Lipper comparisons began on 5/31/04.
Performance quoted represents past performance and is no guarantee of future results. Current performance may be lower or higher than performance shown. For performance current to the most recent month-end, visit our website at us.allianzgi.com. Investment return and the principal value will fluctuate. Shares may be worth more or less than original cost when redeemed. The adjusted returns take into account the maximum sales charge of 5.50% on Class A shares and 1% contingent deferred sales charge (CDSC) on Class C shares, which may apply to shares redeemed during the first year of ownership. Returns do not reflect deduction of taxes that a shareholder would pay on fund distributions or redemption of fund shares. Please see pages 56-58 for more information. The Fund’s gross expense ratios are 1.61% for Class A shares, 2.36% for Class C shares, 1.36% for Class P shares, 1.26% for Institutional Class and 1.21% for Class R6 shares. These ratios do not include an expense reduction, contractually agreed through at least August 31, 2020. The Fund’s expense ratios net of these reductions and waivers are 1.26% for Class A shares, 2.01% for Class C shares, 1.01% for Class P shares, 0.91% for Institutional Class shares and 0.86% for Class R6 shares. Expense ratio information is as of the Fund’s current prospectus dated August 28, 2019, as further revised or supplemented from time to time.
Cumulative Returns Through June 30, 2020
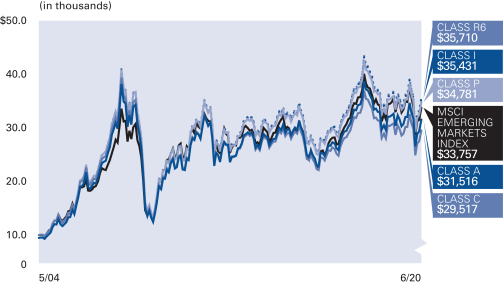
The Fund began operations on 5/27/04. Benchmark comparisons began on the fund inception date.
Country/Location Allocation (as of June 30, 2020)
| China | 44.4% | |||
| Taiwan | 16.7% | |||
| Korea (Republic of) | 11.3% | |||
| India | 7.9% | |||
| Russian Federation | 4.8% | |||
| Thailand | 3.0% | |||
| South Africa | 2.7% | |||
| Brazil | 2.3% | |||
| Other | 6.1% | |||
| Cash & Equivalents — Net | 0.8% | |||
| Annual Report | | June 30, 2020 | 9 |
Table of Contents
Unaudited
AllianzGI Emerging Markets Opportunities Fund (cont’d)
| Shareholder Expense Example | Actual Performance | |||||||||
| Class A | Class C | Class P | Institutional Class | Class R6 | ||||||
| Beginning Account Value (1/1/20) | $1,000.00 | $1,000.00 | $1,000.00 | $1,000.00 | $1,000.00 | |||||
| Ending Account Value (6/30/20) | $910.30 | $906.80 | $911.00 | $911.40 | $911.90 | |||||
| Expenses Paid During Period | $6.08 | $9.62 | $4.89 | $4.42 | $4.18 | |||||
| Hypothetical Performance | ||||||||||
| (5% return before expenses) | ||||||||||
| Class A | Class C | Class P | Institutional Class | Class R6 | ||||||
| Beginning Account Value (1/1/20) | $1,000.00 | $1,000.00 | $1,000.00 | $1,000.00 | $1,000.00 | |||||
| Ending Account Value (6/30/20) | $1,018.50 | $1,014.77 | $1,019.74 | $1,020.24 | $1,020.49 | |||||
| Expenses Paid During Period | $6.42 | $10.17 | $5.17 | $4.67 | $4.42 | |||||
For each class of the Fund, expenses (net of fee waivers) are equal to the annualized expense ratio for the class (1.28% for Class A, 2.03% for Class C, 1.03% for Class P, 0.93% for Institutional Class and 0.88% for Class R6), multiplied by the average account value over the period, multiplied by 182/366. These expenses do not include the expenses of the investment companies in which the Fund invests, which are indirectly borne by Fund shareholders.
| 10 | June 30, 2020 | | Annual Report |
Table of Contents
(THIS PAGE INTENTIONALLY LEFT BLANK)
| Annual Report | | June 30, 2020 | 11 |
Table of Contents
Unaudited
AllianzGI Focused Growth Fund
For the period of July 1, 2019 through June 30, 2020, as provided by Karen Hiatt, CFA, Lead Portfolio Manager.
Fund Insights
For the twelve-month period ended June 30, 2020, the Class A shares at net asset value (“NAV”) of the AllianzGI Focused Growth Fund (the “Fund”) returned 24.76%, outperforming the Russell 1000 Growth Index (the “benchmark”), which returned 23.28%.
Market Overview
Despite the abrupt sell-off in the first quarter of 2020, sparked by the COVID-19 pandemic, US equities delivered solid gains over the full period. After a strong finish to 2019 and touching fresh highs in mid-February, US stocks subsequently plunged as the extraordinary measures employed to control COVID-19 raised fears of a severe global recession. The rapidly evolving crisis led to heightened volatility, with US stocks suffering two of the largest one-day falls since 1987 in March 2020, along with the largest daily gain since 2008. Sentiment turned in the second quarter, with a sharp rally helping the S&P 500 Index record its strongest quarterly performance since 1998. At one point in June, US stocks had recouped all of their year-to-date losses, although stocks subsequently came off their best levels as a surge in new cases in southern and western states caused some re-opening measures to be rolled back towards quarter-end.
Portfolio Review
The Fund’s relative performance was helped by overweight positions in health care stocks such as Dexcom, Horizon Therapeutics, and Tandem Diabetes Care. These companies are benefiting from secular tailwinds despite the challenging economic backdrop. Other top relative contributors included an underweight position to Boeing and not owning Cisco Systems.
Conversely, relative performance was negatively impacted by overweights to General Electric and Broadcom, as both companies saw significant declines due to the adverse economic conditions caused by the COVID-19 pandemic. In addition, the Fund’s underweight to Apple weighed on relative performance. Apple is the second largest position in the Fund, though it remains underweight versus the benchmark’s large position. Other detractors included overweight positions to Anthem and L3Harris Technologies.
From a sector allocation perspective, underweight positions in the consumer staples and consumer discretionary sectors helped relative performance. Conversely, overweight positions in the health care and financials sectors hurt relative performance.
Outlook
While equity markets have rallied off the lows, significant uncertainty remains over the months ahead. With quarantine measures being lifted or relaxed around the world, we believe that the pace of the economic recovery will depend on how quickly businesses can ramp back up and how consumers will respond. Unfortunately, the growth of new COVID-19 cases is accelerating in several states across the US, which will likely slow the pace of an economic recovery.
Central banks around the world have reduced interest rates and increased asset purchases in hopes of softening the economic impact. Additionally, massive fiscal stimulus packages are being implemented to help consumers and businesses weather the downturn. While it is too early to predict the ultimate economic impact of the virus outbreak, we believe these stimulus measures should boost business and consumer spending over the long term, which should benefit equity markets.
From a stock perspective, we believe there will be winners and losers as business and consumer behavior changes. As we evaluate investment opportunities, we believe it is critical to be highly selective in these times to ensure that growth and balance sheet strength are sustainable. Our focus continues to be on applying rigorous fundamental research to identify companies with strong balance sheets, under-appreciated growth prospects, and attractive risk-reward characteristics.
| 12 | June 30, 2020 | | Annual Report |
Table of Contents
Unaudited
AllianzGI Focused Growth Fund (cont’d)
Average Annual Total Return for the period ended June 30, 2020
| 1 Year | 5 Year | 10 Year | Since Inception† | |||||||||||||||
AllianzGI Focused Growth Fund Class A | 24.76% | 14.41% | 16.43% | 11.65% | ||||||||||||||
| AllianzGI Focused Growth Fund Class A (adjusted) | 17.89% | 13.12% | 15.77% | 11.47% | |||||||||||||
AllianzGI Focused Growth Fund Class C | 23.79% | 13.53% | 15.54% | 10.81% | ||||||||||||||
| AllianzGI Focused Growth Fund Class C (adjusted) | 22.79% | 13.53% | 15.54% | 10.81% | |||||||||||||
| AllianzGI Focused Growth Fund Class R | 24.43% | 14.10% | 16.13% | 11.30% | |||||||||||||
| AllianzGI Focused Growth Fund Class P | 25.03% | 14.67% | 16.71% | 11.95% | |||||||||||||
| AllianzGI Focused Growth Fund Institutional Class | 25.15% | 14.79% | 16.82% | 12.06% | |||||||||||||
| AllianzGI Focused Growth Fund Class R6 | 25.22% | 14.84% | 16.88% | 12.12% | |||||||||||||
AllianzGI Focused Growth Fund Administrative Class | 24.87% | 14.50% | 16.54% | 11.78% | ||||||||||||||
| Russell 1000 Growth Index | 23.28% | 15.89% | 17.23% | 11.45% | |||||||||||||
Lipper Large-Cap Growth Funds Average | 20.82% | 14.32% | 15.87% | 7.98% | ||||||||||||||
† The Fund began operations on 2/24/84. Benchmark and Lipper performance comparisons began on 2/29/84.
Performance quoted represents past performance and is no guarantee of future results. Current performance may be lower or higher than performance shown. For performance current to the most recent month-end, visit our website at us.allianzgi.com. Investment return and the principal value will fluctuate. Shares may be worth more or less than original cost when redeemed. The adjusted returns take into account the maximum sales charge of 5.50% on Class A shares and 1% contingent deferred sales charge (CDSC) on Class C shares, which may apply to shares redeemed during the first year of ownership. Returns do not reflect deduction of taxes that a shareholder would pay on fund distributions or redemption of fund shares. Please see pages 56-58 for more information. The Fund’s gross expense ratios are 1.12% for Class A shares, 1.87% for Class C shares, 1.37% for Class R shares, 0.87% for Class P shares, 0.77% for Institutional Class, 0.72% for Class R6 shares, and 1.02% for Administrative Class shares. These ratios do not include an expense reduction, contractually agreed through at least August 31, 2020. The Fund’s expense ratios net of this reduction are 1.00% for Class A shares, 1.77% for Class C shares, 1.27% for Class R shares, 0.77% for Class P shares, 0.67% for Institutional Class shares, 0.62% for Class R6 shares, and 0.92% for Administrative Class shares. Expense ratio information is as of the Fund’s current prospectus dated August 28, 2019, as further revised or supplemented from time to time.
Cumulative Returns Through June 30, 2020
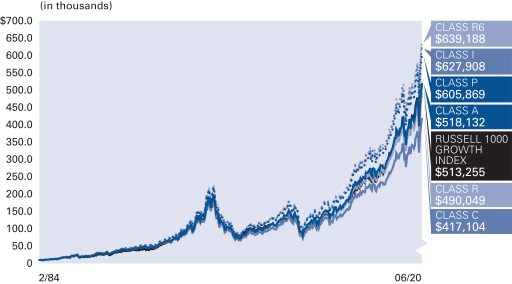
The Fund began operations on 2/24/84. Benchmark performance comparisons began on 2/29/84.
Country/Location Allocation (as of June 30, 2020)
| IT Services | 16.0% | |||
| Software | 14.6% | |||
| Technology Hardware, Storage & Peripherals | 8.5% | |||
| Pharmaceuticals | 7.4% | |||
| Interactive Media & Services | 7.2% | |||
| Internet & Direct Marketing Retail | 7.2% | |||
| Semiconductors & Semiconductor Equipment | 5.7% | |||
| Specialty Retail | 5.1% | |||
| Other | 27.6% | |||
| Cash & Equivalents — Net | 0.7% | |||
| Annual Report | | June 30, 2020 | 13 |
Table of Contents
Unaudited
AllianzGI Focused Growth Fund (cont’d)
| Shareholder Expense Example | Actual Performance | |||||||||||||
| Class A | Class C | Class R | Class P | Institutional Class | Class R6 | Administrative Class | ||||||||
| Beginning Account Value (1/1/20) | $1,000.00 | $1,000.00 | $1,000.00 | $1,000.00 | $1,000.00 | $1,000.00 | $1,000.00 | |||||||
| Ending Account Value (6/30/20) | $1,134.90 | $1,130.40 | $1,133.20 | $1,136.10 | $1,136.60 | $1,136.90 | $1,135.10 | |||||||
| Expenses Paid During Period | $5.26 | $9.33 | $6.69 | $4.05 | $3.52 | $3.25 | $4.84 | |||||||
| Hypothetical Performance | ||||||||||||||
| (5% return before expenses) | ||||||||||||||
| Class A | Class C | Class R | Class P | Institutional Class | Class R6 | Administrative Class | ||||||||
| Beginning Account Value (1/1/20) | $1,000.00 | $1,000.00 | $1,000.00 | $1,000.00 | $1,000.00 | $1,000.00 | $1,000.00 | |||||||
| Ending Account Value (6/30/20) | $1,019.94 | $1,016.10 | $1,018.59 | $1,021.07 | $1,021.57 | $1,021.83 | $1,020.33 | |||||||
| Expenses Paid During Period | $4.98 | $8.83 | $6.33 | $3.83 | $3.33 | $3.07 | $4.58 | |||||||
For each class of the Fund, expenses (net of fee waivers) are equal to the annualized expense ratio for the class (0.99% for Class A, 1.76% for Class C, 1.26% for Class R, 0.76% for Class P, 0.66% for Institutional Class, 0.61% for Class R6 and 0.91% for Administrative Class), multiplied by the average account value over the period, multiplied by 182/366.
| 14 | June 30, 2020 | | Annual Report |
Table of Contents
(THIS PAGE INTENTIONALLY LEFT BLANK)
| Annual Report | | June 30, 2020 | 15 |
Table of Contents
Unaudited
AllianzGI Global Small-Cap Fund
For the period of July 1, 2019 through June 30, 2020, as provided by Andrew Neville, Lead Portfolio Manager.
Fund Insights
For the twelve-month period ended June 30, 2020, the Class A shares at net asset value (“NAV”) of the AllianzGI Global Small-Cap Fund (the “Fund”) returned -2.20%, outperforming the MSCI World Small-Cap Index (the “benchmark”), which returned -5.18%.
Market Overview
Global equities overcame a sharp set-back in August 2019 to deliver robust gains over the second half of 2019. In the first quarter of 2020 global equities suffered when the COVID-19 pandemic spread worldwide. After suffering their worst quarter since the 2008 financial crisis, global stocks rebounded strongly in the second quarter, helped by growing optimism over economic recovery as well as unprecedented government and central bank support.
Portfolio Review
The Fund represents the highest conviction names from four underlying regional small cap strategies: US, Europe, Japan, and Asia ex-Japan. Stock selection is the key driver of relative returns as the regional allocation of the fund is neutral to the benchmark and there are risk controls to ensure sector deviations do not become too large.
In absolute terms, three of four small cap markets showed losses. US small caps registered the strongest losses followed by small caps from the Asia ex Japan and finally Europe. Japanese small caps closed with gains. In relative terms, all portfolios were able to outperform their local markets with outperformance strongest in the Asia ex Japan sleeve portfolio, followed by the US, Japan and finally Europe.
The Fund’s outperformance was driven by both stock selection and sector allocation, with the latter particularly due to the strategy’s strong underweight of energy and financials, and overweight to the information technology (“IT”) and health care sectors. On the other hand, the overweight in communication services and the underweight in materials and utilities were a light drag on relative performance. Strongest contributions came from stock selection within IT, financials, and communication services. Selection within the materials, industrials, and consumer discretionary was mostly negative.
The largest contributors to performance were Horizon Therapeutics and Teladoc (both US) particularly positively impacted performance. Horizon Therapeutics is an established biopharmaceutical company that focuses on orphan, rheumatology and inflammation treatments. The stock was higher, as Horizon’s Krystexxa (gout treatment) and Tepezza (thyroid eye disease treatment) demonstrated strong growth trajectories and adoption. Teladoc provides health care telemedicine services on-demand. The company’s already strong telemedicine presence was further bolstered by today’s COVID-19 environment.
The largest detractors to performance were Merit Medical (US) a global healthcare company. Management executed poorly in launching new products and the company’s attempt to bolster margins through vertically integrating product parts did not work. We sold the holding in the third quarter of 2019. Another detractor was Chart Industries (US). The company operates as a global manufacturer of equipment used in the production, storage, and end-use of hydrocarbon and industrial gases. The company reported an unconvincing outlook in April. We sold the holding in the second quarter of 2020.
Outlook
Even though the global economy is currently experiencing a deep recession, the outlook for equity investments has recently improved. In particular, several leading indicators have recovered considerably. Moreover, financial conditions have improved as central banks have flooded the markets with liquidity and governments have provided financial support. The full impact of the crisis on growth and corporate profits will not be felt until sometime during the coming months. We believe that small cap performance globally will be influenced by both the economic conditions and stimulus measures and the resulting balance between the two. The Fund will continue to focus on high quality growth stocks (stock selection) that aim to deliver outperformance above the benchmark.
| 16 | June 30, 2020 | | Annual Report |
Table of Contents
Unaudited
AllianzGI Global Small-Cap Fund (cont’d)
Average Annual Total Return for the period ended June 30, 2020
| 1 Year | 5 Year | 10 Year | Since Inception† | |||||||||||||||
| AllianzGI Global Small-Cap Fund Class A | –2.20% | 2.97% | 10.64% | 9.19% | ||||||||||||||
| AllianzGI Global Small-Cap Fund Class A (adjusted) | –7.58% | 1.81% | 10.01% | 8.93% | |||||||||||||
| AllianzGI Global Small-Cap Fund Class C | –2.92% | 2.20% | 9.81% | 8.39% | ||||||||||||||
| AllianzGI Global Small-Cap Fund Class C (adjusted) | –3.81% | 2.20% | 9.81% | 8.39% | |||||||||||||
| AllianzGI Global Small-Cap Fund Class P | –1.96% | 3.23% | 10.91% | 9.50% | |||||||||||||
| AllianzGI Global Small-Cap Fund Institutional Class | –1.84% | 3.33% | 11.02% | 9.61% | |||||||||||||
| MSCI World Small-Cap Index | –5.18% | 4.26% | 9.45% | 7.33% | |||||||||||||
| Lipper Global Small-/Mid-Cap Funds Average | 0.20% | 5.33% | 9.43% | 7.54% | ||||||||||||||
† The Fund began operations on 12/31/96. Benchmark and Lipper comparisons began on the fund inception date.
Performance quoted represents past performance and is no guarantee of future results. Current performance may be lower or higher than performance shown. For performance current to the most recent month-end, visit our website at us.allianzgi.com. Investment return and the principal value will fluctuate. Shares may be worth more or less than original cost when redeemed. The adjusted returns take into account the maximum sales charge of 5.50% on Class A shares and 1% contingent deferred sales charge (CDSC) on Class C shares, which may apply to shares redeemed during the first year of ownership. Returns do not reflect deduction of taxes that a shareholder would pay on fund distributions or redemption of fund shares. Please see pages 56-58 for more information. The Fund’s expense ratios are 1.62% for Class A shares, 2.37% for Class C shares, 1.37% for Class P shares and 1.27% for Institutional Class shares. Expense ratio information is as of the Fund’s current prospectus dated August 28, 2019, as further revised or supplemented from time to time.
Cumulative Returns Through June 30, 2020
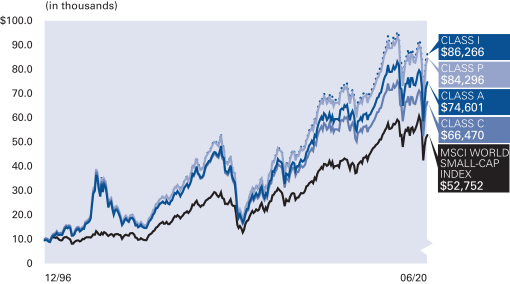
The Fund began operations on 12/31/96. Benchmark comparisons began on the fund inception date.
Country/Location Allocation (as of June 30, 2020)
| United States | 58.2% | |||
| Japan | 12.4% | |||
| United Kingdom | 6.9% | |||
| Germany | 4.1% | |||
| Switzerland | 2.6% | |||
| Australia | 2.5% | |||
| France | 2.1% | |||
| Netherlands | 1.3% | |||
| Other | 8.6% | |||
| Cash & Equivalents — Net | 1.3% | |||
| Annual Report | | June 30, 2020 | 17 |
Table of Contents
Unaudited
AllianzGI Global Small-Cap Fund (cont’d)
| Shareholder Expense Example | Actual Performance | |||||||
| Class A | Class C | Class P | Institutional Class | |||||
| Beginning Account Value (1/1/20) | $1,000.00 | $1,000.00 | $1,000.00 | $1,000.00 | ||||
| Ending Account Value (6/30/20) | $ 938.30 | $ 934.70 | $ 939.40 | $ 939.90 | ||||
| Expenses Paid During Period | $ 7.81 | $ 11.40 | $ 6.61 | $ 6.13 | ||||
| Hypothetical Performance | ||||||||
| (5% return before expenses) | ||||||||
| Class A | Class C | Class P | Institutional Class | |||||
| Beginning Account Value (1/1/20) | $1,000.00 | $1,000.00 | $1,000.00 | $1,000.00 | ||||
| Ending Account Value (6/30/20) | $1,016.81 | $1,013.08 | $1,018.05 | $1,018.55 | ||||
| Expenses Paid During Period | $ 8.12 | $ 11.86 | $ 6.87 | $ 6.37 | ||||
For each class of the Fund, expenses are equal to the annualized expense ratio for the class (1.62% for Class A, 2.37% for Class C, 1.37% for Class P and 1.27% for Institutional Class), multiplied by the average account value over the period, multiplied by 182/366.
| 18 | June 30, 2020 | | Annual Report |
Table of Contents
(THIS PAGE INTENTIONALLY LEFT BLANK)
| Annual Report | | June 30, 2020 | 19 |
Table of Contents
Unaudited
AllianzGI Health Sciences Fund
For the period of July 1, 2019 through June 30, 2020, as provided by Peter Pirsch, CFA, Lead Portfolio Manager.
Fund Insights
Performance Overview
For the twelve-month period ended June 30, 2020, the Class A shares at net asset value (“NAV”) of the AllianzGI Health Sciences Fund (the “Fund”) returned 13.37%, underperforming the MSCI World Health Care Index (the “benchmark”), which returned 13.87%.
Market Overview
Equities globally were influenced by rapidly shifting macroeconomic conditions during the annual reporting period in light of moderating global growth expectations and impact from the coronavirus (COVID-19).
Initially, the benchmark posted flat to slightly negative returns in the July to September 2019 time frame as the strength of the US dollar, a seasonal slowdown in summer trading activity and tensions between the US and China impacted equity prices. Sentiment was lifted in the October to December 2019 period by a plethora of interest rate cuts across the developed and emerging markets, better-than-expected corporate earnings and optimism over a “phase one” trade deal between the US and China, leading to three consecutive months of mid-single-digit gains. The global economic outlook then shifted suddenly as equities declined meaningfully in the January to March 2020 period, crippled by the spread of COVID-19, and global economic growth ground to a standstill. Health care stocks were relative beneficiaries during this period as investors sought safety and potential beneficiaries of the COVID-19 pandemic. The market decline reversed in April as the prior draconian measures which were employed to curtail the virus were gradually lifted. After positive results in May 2020, the benchmark declined in June 2020 as investors sought pro-cyclical stocks due to optimism that the COVID-19 concerns which plagued markets globally were subsiding thanks to unprecedented government and central bank support buoying stocks and helping investors overcome fears of a second wave of infections.
Results for the benchmark were higher across the board with all six industries posting gains. Health care technology and biotechnology were the top performers, each advancing in excess of 30% during the reporting period. Conversely, health care equipment saw a relative decline in demand due to the focus on COVID-19 testing, therapeutics and vaccines, and managed to post a 9.4% gain. Pharmaceuticals, the biggest weight in the benchmark, were higher by 11.0%.
Portfolio Review
The Fund seeks to deliver outperformance over time via a conviction portfolio via the implementation of a top-down and bottom-up investment process focused on rigorous fundamental analysis.
During the annual performance period, the Fund’s performance slightly trailed the benchmark due primarily to allocation decisions. From an industry standpoint, strong bottom-up stockpicking in pharmaceuticals contributed to results as did stock selection in health care provider & services and health care equipment & supplies. Conversely, a modest underweight and more conservative selection in biotechnology detracted from results. The underweight to life sciences tools and health care technology, the benchmark’s top industry performer, offset performance more moderately. Country results were aided by stock selection in the United States, followed by bottom-up selections in the United Kingdom and Canada. Meanwhile, Switzerland and Japan were the primary laggards due to more conservative stock selection.
The top performer during the reporting period was Horizon Therapeutics Plc, a developer and acquirer of late-stage biopharmaceutical therapies for the treatment of pain and inflammation as well as specialty and orphan diseases. Shares advanced thanks in part to the company meaningfully increasing forecasts for its ongoing drug launch used to combat thyroid eye disease. Continuous glucose monitoring device company DexCom Inc. and clinical stage immuno-oncology company Forty Seven Inc. were also among the top performers thanks to positive stock selection. Meanwhile, a relative underweight allocation to Eli Lilly & Co. offset results, due in part to positive earnings results and the potential benefit from breast cancer and Alzheimer solutions. An overweight allocation to medical device maker Boston Scientific and stock selection in respiratory device maker Vapotherm Inc. also detracted from performance results during the annual reporting period.
Outlook
Looking forward, we are optimistic about the opportunities in health care over the next year thanks to a combination of improving investor demand and the sector’s defensive-growth nature. Health care stocks have been key beneficiaries of the COVID-19 pandemic as investors are seeking solutions in terms of testing, therapeutics and vaccines. The ongoing pandemic will likely have multiple waves of severity and prevalence before we see an effective, safe and mass produced vaccine or herd immunity. As such, we will tactically shift the portfolio as we see risk reward ebb and flow with these waves of outbreak. With respect to the US election, we continue to believe that regardless of whether Donald Trump or Joe Biden is chosen as President, the most logical outcome post the 2020 US election is “status quo” with respect to “Medicare for all” or even a modest expansion of “Obamacare”, which would be viewed positively for the sector. Longer-term, our focus continues to be on what we believe are the significant durable growth drivers for health care which are largely driven by drug and cost-containment innovation.
| 20 | June 30, 2020 | | Annual Report |
Table of Contents
Unaudited
AllianzGI Health Sciences Fund (cont’d)
Average Annual Total Return for the period ended June 30, 2020
| 1 Year | 5 Year | 10 Year | Since Inception† | |||||||||||||||
AllianzGI Health Sciences Fund Class A | 13.37% | 6.50% | 14.64% | 11.70% | ||||||||||||||
| AllianzGI Health Sciences Fund Class A (adjusted) | 7.14% | 5.30% | 13.99% | 11.44% | |||||||||||||
AllianzGI Health Sciences Fund Class C | 12.52% | 5.71% | 13.79% | 10.87% | ||||||||||||||
| AllianzGI Health Sciences Fund Class C (adjusted) | 11.52% | 5.71% | 13.79% | 10.87% | |||||||||||||
| AllianzGI Health Sciences Fund Institutional Class | 13.76% | 6.88% | 15.04% | 12.12% | |||||||||||||
| MSCI World Health Care Index | 13.87% | 6.76% | 13.59% | 8.78% | |||||||||||||
Lipper Health/Biotechnology Funds Average | 16.99% | 6.54% | 16.49% | 10.66% | ||||||||||||||
† The Fund began operations on 12/31/96. Benchmark and Lipper comparisons began on the fund inception date.
Performance quoted represents past performance and is no guarantee of future results. Current performance may be lower or higher than performance shown. For performance current to the most recent month-end, visit our website at us.allianzgi.com. Investment return and the principal value will fluctuate. Shares may be worth more or less than original cost when redeemed. The adjusted returns take into account the maximum sales charge of 5.50% on Class A shares and 1% contingent deferred sales charge (CDSC) on Class C shares, which may apply to shares redeemed during the first year of ownership. Returns do not reflect deduction of taxes that a shareholder would pay on fund distributions or redemption of fund shares. Please see pages 56-58 for more information. The Fund’s expense ratios are 1.47% for Class A shares, 2.22% for Class C shares and 1.12% for Institutional Class shares. Expense ratio information is as of the Fund’s current prospectus dated August 28, 2019, as further revised or supplemented from time to time.
Cumulative Returns Through June 30, 2020
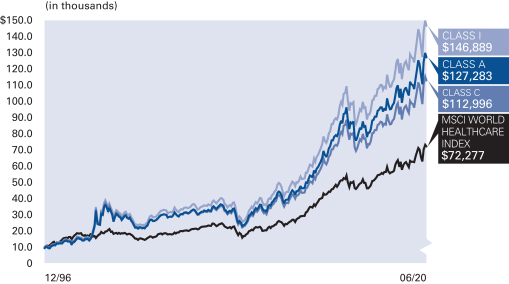
The Fund began operations on 12/31/96. Benchmark comparisons began on the fund inception date.
Industry/Sectors (as of June 30, 2020)
| Pharmaceuticals | 45.7% | |||
| HealthCare Equipment & Supplies | 17.7% | |||
| Biotechnology | 16.0% | |||
| HealthCare Providers & Services | 12.7% | |||
| Life Sciences Tools & Services | 3.7% | |||
| Cash & Equivalents — Net | 4.2% | |||
| Annual Report | | June 30, 2020 | 21 |
Table of Contents
Unaudited
AllianzGI Health Sciences Fund (cont’d)
| Shareholder Expense Example | Actual Performance | |||||||||
| Class A | Class C | Institutional Class | ||||||||
| Beginning Account Value (1/1/20) | $1,000.00 | $1,000.00 | $1,000.00 | |||||||
| Ending Account Value (6/30/20) | $1,013.60 | $1,009.90 | $1,015.50 | |||||||
| Expenses Paid During Period | $7.31 | $11.04 | $5.56 | |||||||
| Hypothetical Performance | ||||||||||
| (5% return before expenses) | ||||||||||
| Class A | Class C | Institutional Class | ||||||||
| Beginning Account Value (1/1/20) | $1,000.00 | $1,000.00 | $1,000.00 | |||||||
| Ending Account Value (6/30/20) | $1,017.60 | $1,013.87 | $1,019.34 | |||||||
| Expenses Paid During Period | $7.32 | $11.07 | $5.57 | |||||||
For each class of the Fund, expenses are equal to the annualized expense ratio for the class (1.46% for Class A, 2.21% for Class C and 1.11% for Institutional Class ), multiplied by the average account value over the period, multiplied by 182/366.
| 22 | June 30, 2020 | | Annual Report |
Table of Contents
(THIS PAGE INTENTIONALLY LEFT BLANK)
| Annual Report | | June 30, 2020 | 23 |
Table of Contents
Unaudited
AllianzGI Income & Growth Fund
For the period of July 1, 2019 through June 30, 2020, as provided by Douglas G. Forsyth, CFA, Portfolio Manager.
Fund Insights
For the twelve-month period ended June 30, 2020, the Class A shares at net asset value (“NAV”) of the AllianzGI Income & Growth Fund (the “Fund”) returned 7.08%. During the same period, the S&P 500 Index increased 7.51% and the overall U.S. bond market, as measured by the Bloomberg Barclays U.S. Aggregate Bond Index, rose 8.74%. The convertible universe returned 15.34%, as measured by the ICE BofA US Convertible Index; and high yield bonds, as measured by the ICE BofA US High Yield Master II Index, declined -1.10%. Lastly, the Russell 1000 Growth Index gained 23.28%.
Market Overview
Risk assets gained throughout 2019 and into early 2020 before selling off aggressively in late February and throughout much of March as the COVID-19 outbreak intensified and the short-term trajectory of the global economy and corporate profitability became highly uncertain. Coinciding with unprecedented monetary and fiscal policy responses, equities, convertible securities and high-yield bonds rebounded into reporting period-end. Stabilizing Investor confidence, improving economic data and vaccine hopes were also market supportive.
The US Federal Reserve’s (“Fed”) response was designed to ensure the normal functioning and stabilization of US credit markets and also extraordinary in terms of its swiftness, scope, and willingness to do more. Fed Chairman Jerome Powell communicated the Fed’s commitment to using its full range of tools, including keeping rates near zero until the end of 2022 at the earliest and buying US Treasuries and mortgage-backed securities at its current pace at a minimum, to ensure as strong an economic recovery as possible.
The fiscal response was also immediate with President Trump signing into law several bills including the $2.2 trillion Coronavirus Aid, Relief & Security Act. To further support the economy, the administration was in the process of weighing additional measures including bill extensions, a second stimulus package and an infrastructure spending plan.
As anticipated, the economy decelerated and the unemployment rate surged. However, economic data released throughout the second quarter improved as lock-downs, travel restrictions and social-distancing measures eased. Payrolls, jobless claims, housing-related statistics, retail sales, consumer sentiment and manufacturing data all signaled economic stabilization.
The first-quarter earnings season was weak and management outlooks provided limited visibility into the business climate for the second quarter. Most companies remained focused on cash management, cost controls and liquidity.
Portfolio Review
The Fund provided consistent income—the primary goal of the strategy—and a positive total return over the twelve-month reporting period. Equity holdings had the greatest positive impact on the Fund’s performance followed by convertible securities exposure, while high-yield bond positions on balance weighed on performance.
Information technology, consumer discretionary and health care were the top-contributing sectors among equities. Conversely, the industrials, energy and consumer staples sectors detracted.
Outperforming convertible exposure included technology, consumer discretionary and health care, while energy, materials and utilities underperformed.
Among high-yield holdings, industries exhibiting strength included cable & satellite TV technology & electronics and media content. In contrast, aerospace/defense, theaters & entertainment and chemicals were sources of weakness.
Over the reporting period, many option positions expired below strike and the portfolio was able to retain the set premiums. The number of equities with a covered call structure fluctuated over the trailing twelve months concurrent with changes in realized volatility.
Outlook
While uncertainty remains elevated, visibility around the macro outlook and corporate profitability improved throughout the quarter.
Extraordinary monetary and fiscal policy measures instituted by the Fed and the US government have begun to stabilize the US economy and financial markets. Furthermore, Chairman Powell and US Treasury Secretary Mnuchin have pledged additional support to accelerate the recovery.
In our view, ongoing monetary and fiscal stimulus in conjunction with a healthy US consumer, the easing of pandemic-related restrictions and the reopening of America should lead to a resumption of expanded economic activity.
With economic progress, we believe corporate profits should trough and begin to recover over the second half of the year and into 2021. In our view, US companies are not only positioned to benefit from direct Fed programs and US government fiscal support but also from a significant boost in operating leverage as strengthening demand is met with productivity gains.
Against this backdrop, a number of risks need to be monitored, including geopolitical tensions, US elections and localized shutdowns due to virus waves and public health concerns.
| 24 | June 30, 2020 | | Annual Report |
Table of Contents
Unaudited
AllianzGI Income & Growth Fund (cont’d)
Average Annual Total Return for the period ended June 30, 2020
1 Year | 5 Year | 10 Year | Since Inception† | |||||||||||||||
AllianzGI Income & Growth Fund Class A | 7.08% | 6.64% | 8.79% | 6.87% | ||||||||||||||
| AllianzGI Income & Growth Fund Class A (adjusted) | 1.19% | 5.44% | 8.18% | 6.42% | |||||||||||||
AllianzGI Income & Growth Fund Class C | 6.31% | 5.87% | 7.98% | 6.07% | ||||||||||||||
| AllianzGI Income & Growth Fund Class C (adjusted) | 5.33% | 5.87% | 7.98% | 6.07% | |||||||||||||
| AllianzGI Income & Growth Fund Class R | 6.81% | 6.39% | 8.52% | 6.61% | |||||||||||||
| AllianzGI Income & Growth Fund Class P | 7.32% | 6.91% | 9.07% | 7.15% | |||||||||||||
| AllianzGI Income & Growth Fund Institutional Class | 7.44% | 7.01% | 9.17% | 7.25% | |||||||||||||
| S&P 500 Index | 7.51% | 10.73% | 13.99% | 8.36% | |||||||||||||
| Bloomberg Barclays U.S. Aggregate Bond Index | 8.74% | 4.30% | 3.82% | 4.51% | |||||||||||||
Lipper Flexible Portfolio Funds Average | –1.05% | 3.27% | 6.18% | 4.29% | ||||||||||||||
† The Fund began operations on 2/28/07. Benchmark and Lipper comparisons began on the fund inception date.
Performance quoted represents past performance and is no guarantee of future results. Current performance may be lower or higher than performance shown. For performance current to the most recent month-end, visit our website at us.allianzgi.com. Investment return and the principal value will fluctuate. Shares may be worth more or less than original cost when redeemed. The adjusted returns take into account the maximum sales charge of 5.50% on Class A shares and 1% contingent deferred sales charge (CDSC) on Class C shares, which may apply to shares redeemed during the first year of ownership. Returns do not reflect deduction of taxes that a shareholder would pay on fund distributions or redemption of fund shares. Please see pages 56-58 for more information. The Fund’s gross expense ratios are 1.29% for Class A shares, 2.04% for Class C shares, 1.54% for Class R shares, 1.04% for Class P shares and 0.94% for Institutional Class shares. These ratios do not include an expense reduction, contractually agreed through at least August 31, 2020. The Fund’s expense ratios net of this reduction are 1.28% for Class A shares, 2.03% for Class C shares, 1.53% for Class R shares, 1.03% for Class P shares and 0.93% for Institutional Class shares. Expense ratio information is as of the Fund’s current prospectus dated August 28, 2019, as further revised or supplemented from time to time.
Cumulative Returns Through June 30, 2020
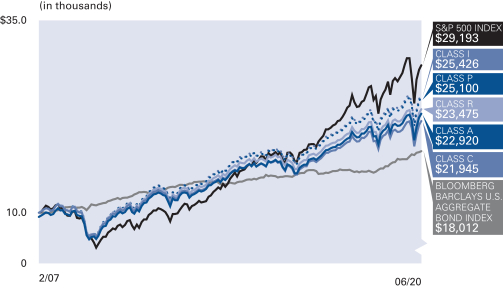
The Fund began operations on 2/28/07. Benchmark comparisons began on the fund inception date.
Industry/Sectors (as of June 30, 2020)
Software | 11.4% | |||
Internet | 4.8% | |||
Media | 4.7% | |||
Pharmaceuticals | 3.8% | |||
Semiconductors & Semiconductor Equipment | 3.3% | |||
Semiconductors | 3.2% | |||
IT Services | 3.2% | |||
Telecommunications | 3.1% | |||
Other | 58.7% | |||
Cash & Equivalents — Net | 3.8% | |||
S&P Ratings* (as of June 30, 2020)
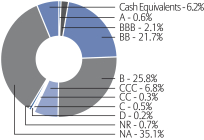
| * | As a percentage of fixed-income investments. Bond ratings refer to the underlying holdings of the Fund and are categorized from highest to lowest credit quality using ratings provided by S&P Global Ratings (“S&P”). S&P’s ratings have been selected for several reasons, including the portfolio managers’ usage of S&P ratings methodology among other credit quality information in managing the Fund, access to background information and other materials provided by S&P, as well as the Fund’s consideration of industry practice. The Fund also displays S&P credit ratings information in materials provided in client presentations. See “Important Information” for more detail on the selection of S&P for the Fund’s ratings presentation. Securities not rated by S&P and bonds that do not currently have a rating available are designated in the chart above as “NR” and “NA”, respectively. |
| Annual Report | | June 30, 2020 | 25 |
Table of Contents
Unaudited
AllianzGI Income & Growth Fund (cont’d)
| Shareholder Expense Example | Actual Performance | |||||||||
Class A | Class C | Class R | Class P | Institutional | ||||||
Beginning Account Value (1/1/20) | $1,000.00 | $1,000.00 | $1,000.00 | $1,000.00 | $1,000.00 | |||||
Ending Account Value (6/30/20) | $1,011.30 | $1,008.00 | $1,010.00 | $1,012.20 | $1,012.50 | |||||
Expenses Paid During Period | $6.35 | $10.08 | $7.60 | $5.10 | $4.60 | |||||
| Hypothetical Performance | ||||||||||
| (5% return before expenses) | ||||||||||
Class A | Class C | Class R | Class P | Institutional | ||||||
Beginning Account Value (1/1/20) | $1,000.00 | $1,000.00 | $1,000.00 | $1,000.00 | $1,000.00 | |||||
Ending Account Value (6/30/20) | $1,018.55 | $1,014.82 | $1,017.30 | $1,019.79 | $1,020.29 | |||||
Expenses Paid During Period | $6.37 | $10.12 | $7.62 | $5.12 | $4.62 | |||||
For each class of the Fund, expenses (net of fee waivers) are equal to the annualized expense ratio for the class (1.27% for Class A, 2.02% for Class C, 1.52% for Class R, 1.02% for Class P and 0.92% for Institutional Class), multiplied by the average account value over the period, multiplied by 182/366.
| 26 | June 30, 2020 | | Annual Report |
Table of Contents
(THIS PAGE INTENTIONALLY LEFT BLANK)
| Annual Report | | June 30, 2020 | 27 |
Table of Contents
Unaudited
AllianzGI International Value Fund (formerly AllianzGI NFJ International Value Fund)*
For the period July 1, 2019 through June 30, 2020, as provided by the Value Equity US team.
Fund Insights
For the twelve-month period ended June 30, 2020, the Class A shares at net asset value (“NAV”) of the AllianzGI International Value Fund (the “Fund”) returned -6.66%, underperforming the MSCI AC World Index ex USA (the “benchmark”), which returned -4.80%.
Market overview
International equities overcame a sharp set-back in August of 2019 to deliver robust gains over the second half of 2019. The rally meant many equity markets recorded their strongest annual gains in several years, with many markets closing the year at or near fresh/multi-month highs. Sentiment was lifted by a plethora of interest rate cuts across the developed and developing world, better-than-expected corporate earnings and optimism over a “phase one” trade deal between the US and China. In contrast, the first six months of 2020 were volatile for international equities. After a steady start to 2020, global stocks changed direction in mid-February as the COVID-19 outbreak started to spread beyond China. The sell-off gathered pace in March of 2020 as the draconian measures employed to curtail the virus caused the global economy to ground to a standstill, triggering fears of a severe global recession. After suffering their worst quarter since the 2008 financial crisis, global stocks rebounded in the second quarter, helped by growing optimism over economic recovery as well as unprecedented government and central bank support. However, while the second-quarter rally shrunk the size of year-to-date losses, most markets still closed the six-month period lower.
Portfolio review
Relative performance results over the reporting period were due to negative sector and country allocations, which were only partially offset by positive stock selection. Selection across the real estate investment trusts (“REITs”) and materials sectors boosted relative returns. These gains were only modestly dampened by holdings in the technology and consumer discretionary sectors, which failed to keep pace with benchmark shares. The Fund’s overweight in financials detracted from relative returns while an overweight in technology contributed to performance during the trailing twelve-month period. By country, selection was positive across Hong Kong and Singapore, while the Fund realized negative selection from holdings based in the UK and the Netherlands. Overweight exposures across the UK and Singapore detracted over the reporting period. In contrast, overweight positions in China and Ireland boosted relative performance.
Outlook
Emerging markets surged toward the end of the reporting period, and while this region may be disproportionately hit by the COVID-19 pandemic, over the longer term our team believes that the emerging markets space remains a source for attractive investment opportunities—with the caveat that investors have to differentiate between countries more than ever. The US Federal Reserve has pledged to keep rates low for longer, and China’s central bank is working with lowered reserve requirements. In particular, China’s economy has resumed economic growth, appearing to have the COVID-19 virus under control. And while its exporters may still suffer from reduced demand from the US recession, the IMF now projects China’s economy to grow in 2020 for the full year—one of the only major economies expected to do so.
Undoubtedly, there is volatility attached to trading in today’s markets. However, we believe a focus on quality and valuations can uncover buying opportunities. To this end, our team is focused on companies with strong fundamentals and industry leaders with clean balance sheets that are effectively “on sale,” trading at discounts to where we could have bought them before the coronavirus pandemic. Furthermore, with interest rates likely to remain low for an extended period, dividend payers and companies that can grow their dividends could offer additional strength.
* Effective April 30, 2020, the Fund changed its name from “AllianzGI NFJ international Value Fund” to “AllianzGI international Value Fund”.
| 28 | June 30, 2020 | | Annual Report |
Table of Contents
Unaudited
AllianzGI International Value Fund (formerly AllianzGI NFJ International Value Fund) (cont’d)
Average Annual Total Return for the period ended June 30, 2020
| 1 Year | 5 Year | 10 Year | Since Inception† | |||||||||||||||
AllianzGI International Value Fund Class A | –6.66% | –2.70% | 2.07% | 7.25% | ||||||||||||||
| AllianzGI International Value Fund Class A (adjusted) | –11.79% | –3.80% | 1.50% | 6.90% | |||||||||||||
AllianzGI International Value Fund Class C | –7.33% | –3.41% | 1.32% | 6.46% | ||||||||||||||
| AllianzGI International Value Fund Class C (adjusted) | –8.25% | –3.41% | 1.32% | 6.46% | |||||||||||||
| AllianzGI International Value Fund Class R | –6.89% | –2.94% | 1.83% | 7.00% | |||||||||||||
| AllianzGI International Value Fund Class P | –6.45% | –2.47% | 2.33% | 7.54% | |||||||||||||
| AllianzGI International Value Fund Institutional Class | –6.33% | –2.36% | 2.43% | 7.64% | |||||||||||||
| AllianzGI International Value Fund Class R6 | –6.28% | –2.32% | 2.48% | 7.69% | |||||||||||||
AllianzGI International Value Fund Administrative Class | –6.58% | –2.60% | 2.19% | 7.38% | ||||||||||||||
| MSCI AC World Index ex USA | –4.80% | 2.26% | 4.97% | 7.25% | |||||||||||||
Lipper International Large-Cap Core Funds Average | –5.47% | 0.40% | 4.65% | 6.60% | ||||||||||||||
† The Fund began operations on 1/31/03. Benchmark comparisons began on the fund inception date. Lipper comparisons began on 1/31/03.
Performance quoted represents past performance and is no guarantee of future results. Current performance may be lower or higher than performance shown. For performance current to the most recent month-end, visit our website at us.allianzgi.com. Investment return and the principal value will fluctuate. Shares may be worth more or less than original cost when redeemed. The adjusted returns take into account the maximum sales charge of 5.50% on Class A shares and 1% contingent deferred sales charge (CDSC) on Class C shares, which may apply to shares redeemed during the first year of ownership. Returns do not reflect deduction of taxes that a shareholder would pay on fund distributions or redemption of fund shares. Please see pages 56-58 for more information. The Fund’s gross expense ratios are 1.38% for Class A shares, 2.13% for Class C shares, 1.63% for Class R shares, 1.13% for Class P shares, 1.03% for Institutional Class shares, 0.98% for Class R6 shares and 1.28% for Administrative Class shares. Theses ratios do not include an expense reduction, contractually agreed through at least August 31, 2020. The Fund’s expense ratios net of this reduction are 1.31% for Class A shares, 2.06% for Class C shares, 1.56% for Class R shares, 1.06% for Class P shares, 0.96% for Institutional Class shares, 0.91% for Class R6 shares and 1.21% for Administrative Class shares. Expense ratio information is as of the Fund’s current prospectus dated August 28, 2019, as further revised or supplemented from time to time.
Cumulative Returns Through June 30, 2020
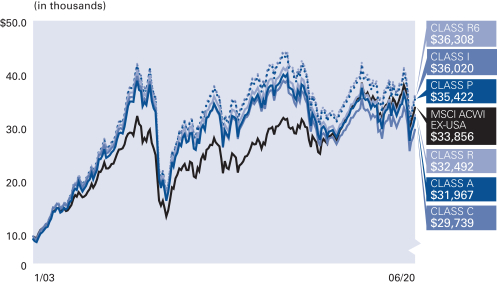
The Fund began operations on 1/31/03. Benchmark comparisons began on the fund inception date.
Country/Location Allocation (as of June 30, 2020)
| China | 15.6% | |||
| Japan | 10.0% | |||
| France | 9.2% | |||
| United Kingdom | 8.3% | |||
| Canada | 7.6% | |||
| Switzerland | 6.9% | |||
| United States | 6.8% | |||
| Germany | 5.2% | |||
| Other | 28.0% | |||
| Cash & Equivalents — Net | 2.4% | |||
| Annual Report | | June 30, 2020 | 29 |
Table of Contents
Unaudited
AllianzGI International Value Fund (formerly AllianzGI NFJ International Value Fund) (cont’d)
| Shareholder Expense Example | Actual Performance | |||||||||||||
| Class A | Class C | Class R | Class P | Institutional Class | Class R6 | Administrative Class | ||||||||
| Beginning Account Value (1/1/20) | $1,000.00 | $1,000.00 | $1,000.00 | $1,000.00 | $1,000.00 | $1,000.00 | $1,000.00 | |||||||
| Ending Account Value (6/30/20) | $879.20 | $876.00 | $878.30 | $880.00 | $880.70 | $880.90 | $879.80 | |||||||
| Expenses Paid During Period | $6.03 | $9.52 | $7.19 | $4.86 | $4.40 | $4.16 | $5.56 | |||||||
| Hypothetical Performance | ||||||||||||||
| (5% return before expenses) | ||||||||||||||
| Class A | Class C | Class R | Class P | Institutional Class | Class R6 | Administrative Class | ||||||||
| Beginning Account Value (1/1/20) | $1,000.00 | $1,000.00 | $1,000.00 | $1,000.00 | $1,000.00 | $1,000.00 | $1,000.00 | |||||||
| Ending Account Value (6/30/20) | $1,018.45 | $1,014.72 | $1,017.21 | $1,019.69 | $1,020.19 | $1,020.44 | $1,018.95 | |||||||
| Expenses Paid During Period | $6.47 | $10.22 | $7.72 | $5.22 | $4.72 | $4.47 | $5.97 | |||||||
For each class of the Fund, expenses (net of fee waiver) are equal to the annualized expense ratio for the class (1.29% for Class A, 2.04% for Class C, 1.54% for Class R, 1.04% for Class P, 0.94% for Institutional Class , 0.89% for Class R6 and 1.19% for Administrative Class), multiplied by the average account value over the period, multiplied by 182/366.
| 30 | June 30, 2020 | | Annual Report |
Table of Contents
(THIS PAGE INTENTIONALLY LEFT BLANK)
| Annual Report | | June 30, 2020 | 31 |
Table of Contents
Unaudited
AllianzGI Large-Cap Value Fund (formerly AllianzGI NFJ Large-Cap Value Fund)*
For the period July 1, 2019 through June 30, 2020, as provided by the Value Equity US team.
Fund Insights
For the twelve-month period ended June 30, 2020, the Class A shares at net asset value (“NAV”) of the AllianzGI Large-Cap Value Fund (the “Fund”) returned -5.71%, outperforming the Russell 1000 Value Index (the “benchmark”), which returned -8.84%.
Market overview
US equities posted double-digit gains in the second half of 2019, closing the year with the strongest annual returns since 2013. Despite a notable set-back in August of 2019, major indices hit a series of fresh highs as risk appetite was boosted by lower interest rates and a “phase one” trade deal between the US and China. Corporate earnings also beat, albeit lowered, expectations. Growth stocks continued to outperform value ones. The investment landscape shifted quickly when the 11-year bull market in the US finally ended in the first quarter of 2020. After touching fresh highs in mid-February, US stocks subsequently plunged as the extraordinary measures employed to control COVID-19 raised fears of a severe global recession. The rapidly evolving crisis led to heightened volatility, with US stocks suffering two of the largest one-day falls since 1987 in March of 2020, along with the largest daily gain since 2008. Sentiment turned in the second quarter, with a sharp rally helping the S&P 500 Index record its strongest quarterly performance since 1998. At one point in June 2020, US stocks had recouped all of their year-to-date losses, although stocks subsequently came off their best levels as a surge in new cases in southern and western states caused some re-opening measures to be rolled back towards quarter-end.
Portfolio review
Relative performance results were due to positive stock selection, while sector allocation modestly detracted over the reporting period. Selection across the technology and consumer discretionary sectors boosted relative returns, and these gains were only partially offset by holdings in the consumer staples and health care sectors, which failed to keep pace with benchmark shares. Within the benchmark index, just three of the index’s eleven GICS economic sectors—information technology, health care and consumer staples—delivered positive absolute returns. In contrast, the energy, financials, real estate investment trusts (“REITs”) and industrials sectors recorded double-digit negative returns over the trailing one-year period. The Fund’s overweight in energy and underweight in utilities detracted from relative returns, while an overweight in technology and underweight in financials contributed to performance results during the trailing twelve-month period.
Outlook
The US economy entered a recession during the second quarter. It may have already exited, according to the technical definition. The recovery may have started out looking like a “V”, but it has since flattened out below peak levels. Retail sales and industrial production, after falling by the most in at least 100 years, have bounced to still-unhealthy levels. There has been severe damage to employment, particularly among small businesses and concentrated in certain industries (leisure/hospitality, transportation, oil & gas), that may take a long time to recover from a workforce perspective. Policymakers, between the Fed and Congress, have been aggressive and acted quickly. Going forward, people may remain hesitant to go out in large groups and risk aversion could remain high. Many doctors project a return of the virus in the fall, the uncertainty around which could also keep consumer and business spending in check. However, the extraordinary stimulus could become a tailwind once the peak has passed. In the longer term, we may find growth on an even lower trajectory than existed prior to the virus due to deglobalization of supply chains, which will likely slow down productivity growth and hurt corporate profitability.
Our team understands the importance of efficiently reacting to the ever-changing market in order to capitalize on opportunities and add strength and quality in our portfolios. We believe our focus on higher-quality companies that pay a dividend within an attractive price-value framework offers many compelling characteristics, from less volatility with income to the potential to protect against inflation via dividend growth. As active managers committed to researching fundamentals and evaluating a company’s prospects, we believe this approach will become critical in the current environment for clients seeking strong absolute returns and moderated volatility over the long term.
* Effective April 30, 2020, the Fund changed its name from “AllianzGI NFJ Large-Cap Value Fund” to “AllianzGI Large-Cap Value Fund”.
| 32 | June 30, 2020 | | Annual Report |
Table of Contents
Unaudited
AllianzGI Large-Cap Value Fund (formerly AllianzGI NFJ Large-Cap Value Fund) (cont’d)
Average Annual Total Return for the period ended June 30, 2020
1 Year | 5 Year | 10 Year | Since Inception† | |||||||||||||||
AllianzGI Large-Cap Value Fund Class A | –5.71% | 4.83% | 9.93% | 6.71% | ||||||||||||||
| AllianzGI Large-Cap Value Fund Class A (adjusted) | –10.90% | 3.65% | 9.31% | 6.41% | |||||||||||||
AllianzGI Large-Cap Value Fund Class C | –6.41% | 4.04% | 9.10% | 5.92% | ||||||||||||||
| AllianzGI Large-Cap Value Fund Class C (adjusted) | –7.32% | 4.04% | 9.10% | 5.92% | |||||||||||||
| AllianzGI Large-Cap Value Fund Class R | –5.92% | 4.58% | 9.65% | 6.47% | |||||||||||||
| AllianzGI Large-Cap Value Fund Class P | –5.45% | 5.10% | 10.20% | 7.03% | |||||||||||||
| AllianzGI Large-Cap Value Fund Institutional Class | –5.36% | 5.20% | 10.32% | 7.14% | |||||||||||||
AllianzGI Large-Cap Value Fund Administrative Class | –5.62% | 4.93% | 10.04% | 6.86% | ||||||||||||||
| Russell 1000 Value Index | –8.84% | 4.64% | 10.41% | 6.12% | |||||||||||||
Lipper Large-Cap Value Funds Average | –6.99% | 4.60% | 9.92% | 5.73% | ||||||||||||||
† The Fund began operations on 5/8/00. Benchmark comparisons began on the fund inception date. Lipper comparisons began on 4/30/00.
Performance quoted represents past performance and is no guarantee of future results. Current performance may be lower or higher than performance shown. For performance current to the most recent month-end, visit our website at us.allianzgi.com. Investment return and the principal value will fluctuate. Shares may be worth more or less than original cost when redeemed. The adjusted returns take into account the maximum sales charge of 5.50% on Class A shares and 1% contingent deferred sales charge (CDSC) on Class C shares, which may apply to shares redeemed during the first year of ownership. Returns do not reflect deduction of taxes that a shareholder would pay on fund distributions or redemption of fund shares. Please see pages 56-58 for more information. The Fund’s expense ratios are 1.12% for Class A shares, 1.87% for Class C shares, 1.37% for Class R shares, 0.87% for Class P shares, 0.77% for Institutional Class shares and 1.02% for Administrative Class shares. Expense ratio information is as of the Fund’s current prospectus dated August 28, 2019, as further revised or supplemented from time to time.
Cumulative Returns Through June 30, 2020
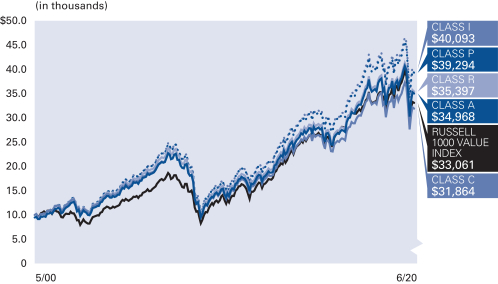
The Fund began operations on 5/8/00. Benchmark comparisons began on the fund inception date.
Industry/Sectors (as of June 30, 2020)
Banks | 9.4% | |||
Equity Real Estate Investment Trusts (REITs) | 5.4% | |||
Capital Markets | 5.2% | |||
Semiconductors & Semiconductor Equipment | 4.9% | |||
Insurance | 4.7% | |||
Pharmaceuticals | 4.5% | |||
Oil, Gas & Consumable Fuels | 4.5% | |||
Software | 4.3% | |||
Other | 55.3% | |||
Cash & Equivalents — Net | 1.8% | |||
| Annual Report | | June 30, 2020 | 33 |
Table of Contents
Unaudited
AllianzGI Large-Cap Value Fund (formerly AllianzGI NFJ Large-Cap Value Fund) (cont’d)
| Shareholder Expense Example | Actual Performance | |||||||||||
Class A | Class C | Class R | Class P | Institutional | Administrative | |||||||
Beginning Account Value (1/1/20) | $1,000.00 | $1,000.00 | $1,000.00 | $1,000.00 | $1,000.00 | $1,000.00 | ||||||
Ending Account Value (6/30/20) | $859.70 | $856.40 | $858.70 | $860.80 | $861.30 | $860.10 | ||||||
Expenses Paid During Period | $5.13 | $8.59 | $6.29 | $3.98 | $3.52 | $4.67 | ||||||
| Hypothetical Performance | ||||||||||||
| (5% return before expenses) | ||||||||||||
| Class A | Class C | Class R | Class P | Institutional Class | Administrative Class | |||||||
Beginning Account Value (1/1/20) | $1,000.00 | $1,000.00 | $1,000.00 | $1,000.00 | $1,000.00 | $1,000.00 | ||||||
Ending Account Value (6/30/20) | $1,019.34 | $1,015.61 | $1,018.10 | $1,020.59 | $1,021.08 | $1,019.84 | ||||||
Expenses Paid During Period | $5.57 | $9.32 | $6.82 | $4.32 | $3.82 | $5.07 | ||||||
For each class of the Fund, expenses are equal to the annualized expense ratio for the class (1.11% for Class A, 1.86 % for Class C, 1.36% for Class R, 0.86% for Class P, 0.76% for Institutional Class and 1.01% for Administrative Class), multiplied by the average account value over the period, multiplied by 182/366.
| 34 | June 30, 2020 | | Annual Report |
Table of Contents
(THIS PAGE INTENTIONALLY LEFT BLANK)
| Annual Report | | June 30, 2020 | 35 |
Table of Contents
Unaudited
AllianzGI Mid-Cap Fund
For the period July 1, 2019 through June 30, 2020, as provided by Steven Klopukh, CFA, Lead Portfolio Manager.
Fund Insights
For the twelve-month period ended June 30, 2020, the Class A shares at net asset value (“NAV”) of the AllianzGI Mid-Cap Fund (the “Fund”) returned 20.15%, outperforming the Russell Midcap Growth Index (the “benchmark”), which returned 11.91%.
Market Overview
The 11-year bull market in the US finally ended in the first quarter of 2020. After touching fresh highs in mid-February, US stocks subsequently plunged as the extraordinary measures employed to control COVID-19 raised fears of a severe global recession. Sentiment turned in the second quarter, with a sharp rally helping the S&P 500 Index record its strongest quarterly performance since 1998. Against this backdrop, the Russell Midcap Index returned -2.2%, underperforming the Russell 1000 Index’s return of 7.5%. Within the mid cap universe, growth stocks outperformed value stocks by 23.7%.
Portfolio Review
Positive security selection was the primary driver of outperformance and sector allocation had a marginally positive effect. Stock picking in information technology was the primary contributor, followed by the health care and communication services sectors. This is balanced by weaker security selections in the real estate, consumer discretionary and energy sectors. The underweight to the energy sector contributed from returns. This was partially offset by an underweight to information technology.
A top contributor to relative returns was DexCom, Inc., which is a medical device company that specializes in continuous glucose monitoring (CGM) systems with smart device connectivity. The stock benefited from quarterly earnings results and guidance that exceeded consensus expectations. DexCom continues to see strong adoption, as patients shift away from traditional finger prick methods. With low penetration in a large addressable market and strong product offerings, DexCom’s growth trajectory remains robust.
The top detractor to relative returns was Workday, Inc., which provides cloud based enterprise software for applications that include finance and human resources. Shares underperformed as management’s forward guidance was below investor expectations. Although the company is exposed to an ongoing enterprise shift from legacy software to modern cloud based systems, we exited the position given other opportunities with more attractive growth drivers.
As of June 30, 2020, the largest sector overweight was in industrials, followed by materials and financials. Health care was the largest underweight position in the Fund, followed by the information technology and consumer staples sectors.
Outlook
The advent of COVID-19 significantly changed the growth trajectory of the US economy, from slow growth to contractionary conditions. To bridge the gap between the ongoing shelter-at-home orders and the full reopening of the economy, government institutions around the globe launched significant waves of fiscal and monetary stimulus. Consequently, we expect the markets will be willing to look through the next couple of quarters’ results, which will likely be significantly impacted by COVID-19. We believe that investors should place heavy emphasis on the trajectory and pace of earnings recovery over the next several quarters. Further, certain industries could take years in order to recover to pre-COVID levels due to structural disruptions, while others could emerge from a reopened economy with strong growth runways. Our research efforts focus on discovering these companies with underappreciated growth potential.
As always, we continue to focus on stock selection, seeking to invest in high quality mid cap companies with superior growth prospects that are attractively valued. The portfolio emphasizes free cash flow yield and responsible capital allocation.
| 36 | June 30, 2020 | | Annual Report |
Table of Contents
Unaudited
AllianzGI Mid-Cap Fund (cont’d)
Average Annual Total Return for the period ended June 30, 2020
| 1 Year | 5 Year | 10 Year | Since Inception† | |||||||||||||||
AllianzGI Mid-Cap Fund Class A | 20.15% | 12.88% | 14.00% | 13.05% | ||||||||||||||
| AllianzGI Mid-Cap Fund Class A (adjusted) | 13.54% | 11.61% | 13.36% | 12.89% | |||||||||||||
AllianzGI Mid-Cap Fund Class C | 19.29% | 12.08% | 13.16% | 12.27% | ||||||||||||||
| AllianzGI Mid-Cap Fund Class C (adjusted) | 18.29% | 12.08% | 13.16% | 12.27% | |||||||||||||
| AllianzGI Mid-Cap Fund Class R | 20.09% | 12.64% | 13.74% | 12.85% | |||||||||||||
| AllianzGI Mid-Cap Fund Class P | 20.56% | 13.21% | 14.35% | 13.49% | |||||||||||||
| AllianzGI Mid-Cap Fund Institutional Class | 20.64% | 13.29% | 14.43% | 13.60% | |||||||||||||
AllianzGI Mid-Cap Fund Administrative Class | 20.34% | 13.06% | 14.13% | 13.30% | ||||||||||||||
| Russell Midcap Growth Index | 11.91% | 11.60% | 15.09% | 12.39% | |||||||||||||
Lipper Mid-Cap Growth Funds Average | 12.20% | 11.09% | 14.21% | 9.40% | ||||||||||||||
Lipper Multi-Cap Growth Funds Average | 17.46% | 12.26% | 14.82% | —% | ||||||||||||||
† The Fund began operations on 11/6/79. Benchmark and primary Lipper performance comparisons began on 10/31/79; secondary Lipper performance is available for trailing 10 years.
Performance quoted represents past performance and is no guarantee of future results. Current performance may be lower or higher than performance shown. For performance current to the most recent month-end, visit our website at us.allianzgi.com. Investment return and the principal value will fluctuate. Shares may be worth more or less than original cost when redeemed. The adjusted returns take into account the maximum sales charge of 5.50% on Class A shares and 1% contingent deferred sales charge (CDSC) on Class C shares, which may apply to shares redeemed during the first year of ownership. Returns do not reflect deduction of taxes that a shareholder would pay on fund distributions or redemption of fund shares. Please see pages 56-58 for more information. The Fund’s expense ratios are 1.14% for Class A shares, 1.89% for Class C shares, 1.39% for Class R shares, 0.89% for Class P shares, 0.79% for Institutional Class shares and 1.04% for Administrative Class shares. Expense ratio information is as of the Fund’s current prospectus dated August 28, 2019, as further revised or supplemented from time to time.
Cumulative Returns Through June 30, 2020
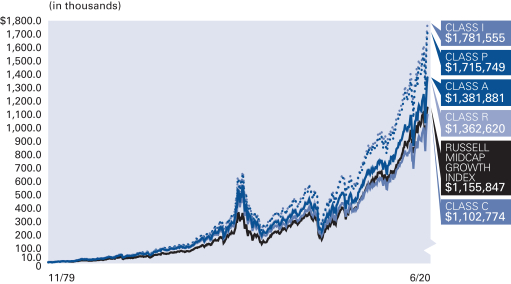
The Fund began operations on 11/6/79. Benchmark performance comparisons began on 10/31/79.
Industry/Sectors (as of June 30, 2020)
IT Services | 12.7% | |||
Software | 11.3% | |||
Health Care Equipment & Supplies | 11.0% | |||
Semiconductors & Semiconductor Equipment | 6.5% | |||
Pharmaceuticals | 5.4% | |||
Entertainment | 5.0% | |||
Commercial Services & Supplies | 4.8% | |||
Electronic Equipment, Instruments & Components | 4.5% | |||
Other | 39.0% | |||
Cash & Equivalents — Net | –0.2% | |||
| Annual Report | | June 30, 2020 | 37 |
Table of Contents
Unaudited
AllianzGI Mid-Cap Fund (cont’d)
Shareholder Expense Example | Actual Performance | |||||||||||
Class A | Class C | Class R | Class P | Institutional | Administrative | |||||||
Beginning Account Value (1/1/20) | $1,000.00 | $1,000.00 | $1,000.00 | $1,000.00 | $1,000.00 | $1,000.00 | ||||||
Ending Account Value (6/30/20) | $1,122.70 | $1,116.70 | $1,120.30 | $1,124.70 | $1,123.60 | $1,124.10 | ||||||
Expenses Paid During Period | $ 5.96 | $ 9.89 | $ 7.28 | $ 4.65 | $ 4.12 | $ 5.44 | ||||||
| Hypothetical Performance | ||||||||||||
(5% return before expenses) | ||||||||||||
Class A | Class C | Class R | Class P | Institutional | Administrative | |||||||
Beginning Account Value (1/1/20) | $1,000.00 | $1,000.00 | $1,000.00 | $1,000.00 | $1,000.00 | $1,000.00 | ||||||
Ending Account Value (6/30/20) | $1,019.24 | $1,015.51 | $1,018.00 | $1,020.49 | $1,020.98 | $1,019.74 | ||||||
Expenses Paid During Period | $ 5.67 | $ 9.42 | $ 6.92 | $ 4.42 | $ 3.92 | $ 5.17 | ||||||
For each class of the Fund, expenses are equal to the annualized expense ratio for the class (1.13% for Class A, 1.88% for Class C, 1.38% for Class R, 0.88% for Class P, 0.78% for Institutional Class and 1.03% for Administrative Class), multiplied by the average account value over the period, multiplied by 182/366.
| 38 | June 30, 2020 | | Annual Report |
Table of Contents
(THIS PAGE INTENTIONALLY LEFT BLANK)
| Annual Report | | June 30, 2020 | 39 |
Table of Contents
Unaudited
AllianzGI Mid-Cap Value Fund (formerly AllianzGI NFJ Mid-Cap Value Fund)*
For the period July 1, 2019 through June 30, 2020, as provided by the Value Equity US team.
Fund Insights
For the twelve-month period ended June 30, 2020, the Class A shares at net asset value (“NAV”) of the AllianzGI Mid-Cap Value Fund (the “Fund”) returned -8.93%, outperforming the Russell MidCap Value Index (the “benchmark”), which returned -11.81%.
Market overview
US equities posted double-digit gains in the second half of 2019, closing the year with the strongest annual returns since 2013. Despite a notable set-back in August of 2019, major indices hit a series of fresh highs as risk appetite was boosted by lower interest rates and a “phase one” trade deal between the US and China. Corporate earnings also beat, albeit lowered, expectations. Growth stocks continued to outperform value ones. The investment landscape shifted quickly when the 11-year bull market in the US finally ended in the first quarter of 2020. After touching fresh highs in mid-February, US stocks subsequently plunged as the extraordinary measures employed to control COVID-19 raised fears of a severe global recession. The rapidly evolving crisis led to heightened volatility, with US stocks suffering two of the largest one-day falls since 1987 in March of 2020, along with the largest daily gain since 2008. Sentiment turned in the second quarter, with a sharp rally helping the S&P 500 Index record its strongest quarterly performance since 1998. At one point in June 2020, US stocks had recouped all of their year-to-date losses, although stocks subsequently came off their best levels as a surge in new cases in southern and western states caused some re-opening measures to be rolled back towards quarter-end.
Portfolio review
Relative performance results were due to positive stock selection, while sector allocation was net neutral over the reporting period. Selection across the real estate investment trusts (“REITs”) and consumer discretionary sectors boosted relative returns, and these gains were only partially offset by holdings in the financials and consumer staples sectors, which failed to keep pace with benchmark shares. Within the benchmark index, just three of the index’s eleven GICS economic sectors—consumer staples, information technology and health care—delivered positive absolute returns. In contrast, the energy, financials, REITs and consumer discretionary sectors recorded double-digit negative returns over the trailing one-year period. The Fund’s overweight in consumer discretionary and underweight in communication services detracted from relative returns, while an overweight in technology and underweight in consumer staples contributed to performance results during the trailing twelve-month period.
Outlook
The US economy entered a recession during the second quarter. It may have already exited, according to the technical definition. The recovery may have started out looking like a “V”, but it has since flattened out below peak levels. Retail sales and industrial production, after falling by the most in at least 100 years, have bounced to still-unhealthy levels. There has been severe damage to employment, particularly among small businesses and concentrated in certain industries (leisure/hospitality, transportation, oil & gas), that may take a long time to recover from a workforce perspective. Policymakers, between the Fed and Congress, have been aggressive and acted quickly. Going forward, people may remain hesitant to go out in large groups and risk aversion could remain high. Many doctors project a return of the virus in the fall, the uncertainty around which could also keep consumer and business spending in check. However, the extraordinary stimulus could become a tailwind once the peak has passed. In the longer term, we may find growth on an even lower trajectory than existed prior to the virus due to deglobalization of supply chains, which will likely slow down productivity growth and hurt corporate profitability.
Our team understands the importance of efficiently reacting to the ever-changing market in order to capitalize on opportunities and add strength and quality in our portfolios. We believe our focus on higher-quality companies that pay a dividend within an attractive price-value bolstered by framework offers many compelling characteristics, from less volatility with income to the potential to protect against inflation via dividend growth. As active managers committed to researching fundamentals and evaluating a company’s prospects, we believe this approach will become critical in the current environment for clients seeking strong absolute returns and moderated volatility over the long term.
* Effective April 30, 2020, the Fund changed its name from “AllianzGI NFJ Mid-Cap Value Fund” to “AllianzGI Mid-Cap Value Fund”.
| 40 | June 30, 2020 | | Annual Report |
Table of Contents
Unaudited
AllianzGI Mid-Cap Value Fund (formerly AllianzGI NFJ Mid-Cap Value Fund) (cont’d)
Average Annual Total Return for the period ended June 30, 2020
1 Year | 5 Year | 10 Year | Since Inception† | |||||||||||||||
AllianzGI Mid-Cap Value Fund Class A | –8.93% | 4.91% | 10.03% | 10.35% | ||||||||||||||
| AllianzGI Mid-Cap Value Fund Class A (adjusted) | –13.94% | 3.73% | 9.41% | 10.16% | |||||||||||||
AllianzGI Mid-Cap Value Fund Class C | –9.64% | 4.13% | 9.21% | 9.53% | ||||||||||||||
| AllianzGI Mid-Cap Value Fund Class C (adjusted) | –10.47% | 4.13% | 9.21% | 9.53% | |||||||||||||
| AllianzGI Mid-Cap Value Fund Class R | –9.17% | 4.66% | 9.75% | 10.02% | |||||||||||||
| AllianzGI Mid-Cap Value Fund Class P | –8.72% | 5.18% | 10.31% | 10.64% | |||||||||||||
| AllianzGI Mid-Cap Value Fund Institutional Class | –8.62% | 5.28% | 10.42% | 10.75% | |||||||||||||
| AllianzGI Mid-Cap Value Fund Class R6 | –8.57% | 5.35% | 10.47% | 10.81% | |||||||||||||
AllianzGI Mid-Cap Value Fund Administrative Class | –8.85% | 5.02% | 10.14% | 10.50% | ||||||||||||||
| Russell Midcap Value Index | –11.81% | 3.32% | 10.29% | 10.76% | |||||||||||||
Lipper Multi-Cap Value Funds Average | –10.51% | 3.06% | 8.87% | 6.61% | ||||||||||||||
† The Fund began operations on 4/18/88. Benchmark and Lipper performance comparisons began on 4/30/88.
Performance quoted represents past performance and is no guarantee of future results. Current performance may be lower or higher than performance shown. For performance current to the most recent month-end, visit our website at us.allianzgi.com. Investment return and the principal value will fluctuate. Shares may be worth more or less than original cost when redeemed. The adjusted returns take into account the maximum sales charge of 5.50% on Class A shares and 1% contingent deferred sales charge (CDSC) on Class C shares, which may apply to shares redeemed during the first year of ownership. Returns do not reflect deduction of taxes that a shareholder would pay on fund distributions or redemption of fund shares. Please see pages 56-58 for more information. The Fund’s gross expense ratios are 1.21% for Class A shares, 1.96% for Class C shares, 1.46% for Class R shares, 0.96% for Class P shares, 0.86% for Institutional Class shares, 0.81% for Class R6 shares and 1.11% for Administrative Class shares. These ratios do not include an expense reduction, contractually agree through at least August 31, 2020. The Fund’s expense ratios net of this reduction are 0.99% for Class A shares, 1.74% for Class C shares, 1.24% for Class R shares, 0.74% for Class P shares, 0.64% for Institutional Class shares, 0.59% for Class R6 shares and 0.89% for Administrative Class shares. Expense ratio information is as of the Fund’s current prospectus dated August 28, 2019, as further revised or supplemented from time to time.
Cumulative Returns Through June 30, 2020
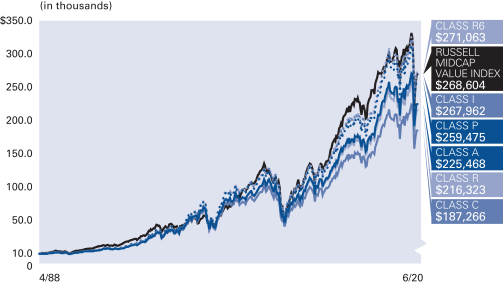
The Fund began operations on 4/18/88. Benchmark performance comparisons began on 4/30/88.
Industry/Sectors (as of June 30, 2020)
Equity Real Estate Investment Trusts (REITs) | 13.9% | |||
Insurance | 11.2% | |||
Multi-Utilities | 5.3% | |||
Capital Markets | 5.2% | |||
Electric Utilities | 5.0% | |||
IT Services | 4.2% | |||
Health Care Equipment & Supplies | 3.8% | |||
Semiconductors & Semiconductor Equipment | 3.3% | |||
Other | 47.7% | |||
Cash & Equivalents — Net | 0.4% | |||
| Annual Report | | June 30, 2020 | 41 |
Table of Contents
Unaudited
AllianzGI Mid-Cap Value Fund (formerly AllianzGI NFJ Mid-Cap Value Fund) (cont’d)
| Shareholder Expense Example | Actual Performance | |||||||||||||
Class A | Class C | Class R | Class P | Institutional | Class R6 | Administrative | ||||||||
Beginning Account Value (1/1/20) | $1,000.00 | $1,000.00 | $1,000.00 | $1,000.00 | $1,000.00 | $1,000.00 | $1,000.00 | |||||||
Ending Account Value (6/30/20) | $ 837.50 | $ 834.30 | $ 836.60 | $ 838.80 | $ 838.90 | $ 839.30 | $ 838.00 | |||||||
Expenses Paid During Period | $ 4.52 | $ 7.94 | $ 5.66 | $ 3.38 | $ 2.93 | $ 2.70 | $ 4.07 | |||||||
| Hypothetical Performance | ||||||||||||||
| (5% return before expenses) | ||||||||||||||
Class A | Class C | Class R | Class P | Institutional | Class R6 | Administrative | ||||||||
Beginning Account Value (1/1/20) | $1,000.00 | $1,000.00 | $1,000.00 | $1,000.00 | $1,000.00 | $1,000.00 | $1,000.00 | |||||||
Ending Account Value (6/30/20) | $1,019.94 | $1,016.21 | $1,018.70 | $1,021.18 | $1,021.68 | $1,021.93 | $1,020.44 | |||||||
Expenses Paid During Period | $ 4.97 | $ 8.72 | $ 6.22 | $ 3.72 | $ 3.22 | $ 2.97 | $ 4.47 | |||||||
For each class of the Fund, expenses ( net of fee waiver) are equal to the annualized expense ratio for the class (0.99% for Class A, 1.74% for Class C, 1.24% for Class R, 0.74% for Class P, 0.64% for Institutional Class, 0.59% for Class R6 and 0.89% for Administrative Class), multiplied by the average account value over the period, multiplied by 182/366.
| 42 | June 30, 2020 | | Annual Report |
Table of Contents
(THIS PAGE INTENTIONALLY LEFT BLANK)
| Annual Report | | June 30, 2020 | 43 |
Table of Contents
Unaudited
AllianzGI Small-Cap Fund
For the period of July 1, 2019 through June 30, 2020, as provided by Kunal Ghosh, Lead Portfolio Manager.
Fund Insights
For the twelve-month period ended June 30, 2020, the Class A shares at net asset value (“NAV”) of the AllianzGI Small-Cap Fund (the “Fund”) returned -9.95%, underperforming the Russell 2000 Index (the “benchmark”), which returned -6.63%.
Market Overview
The 11-year bull market in the US finally ended in the first quarter of 2020. After touching fresh highs in mid-February, US stocks subsequently plunged as the extraordinary measures employed to control COVID-19 raised fears of a severe global recession. Sentiment turned in the second quarter, with a sharp rally helping the S&P 500 Index record its strongest quarterly performance since 1998. The Russell 2000, which is representative of US small caps, underperformed the Russell 1000 large cap index by 14.1%.
Portfolio Review
The Fund combines three unique small-cap strategies in a single investment solution. Results trailed the benchmark due to outperformance of the highest volatility category of the index, which the Fund is generally underweight. From an attribution perspective, security selection detracted from performance, while positive sector allocation was modestly offsetting. Stock picking was most negative in health care. The real estate and financials sectors were also detractors. Positive selections in the communication services, information technology and energy sectors were partially offsetting.
A top contributor, Model N, Inc. is a cloud software company with a focus on revenue management solutions for the life sciences industry. The stock rallied after the company reported better-than-expected earnings and raised guidance. The largest relative detractor was Performance Food Group, which is a food product distributor for restaurants and various institutions. Shares fell as investors anticipated steep sales declines with shelter-in-place orders negatively impacting foodservice operations.
At the end of the period, the Fund was positioned with overweight allocations to the consumer staples, health care and consumer discretionary sectors. Real estate was the largest underweight position in the Fund, followed by the financials and industrials sectors.
Outlook
The advent of COVID-19 significantly changed the growth trajectory of the US economy, from slow growth to contractionary conditions. To bridge the gap between the ongoing shelter-at-home orders and the full reopening of the economy, government institutions around the globe launched significant waves of fiscal and monetary stimulus. Consequently, equity markets experienced strong recovery rallies that favored the most volatile category of stocks. However, it is important to highlight that these risk-driven regimes tend to be short-lived and equity market conditions eventually return to normalcy, as the intensity of the recent market environment will, in our view, undoubtedly have a finite life. In the lens of normalized conditions, the highest volatility stocks tend to underperform. As markets normalize, we believe it should favor our three sleeve Fund construct.
The Fund combines three unique small-cap strategies in one investment, including a quantitative core, a fundamental growth and a managed volatility sleeve. Each individual small-cap sleeve is managed independently as a standalone portfolio by its respective portfolio management team, providing investors with access to a wide range of small-cap strategies in a single investment. We remain confident that the Fund will provide diversification benefits and may help reduce overall portfolio volatility through the combination of three separately managed small-cap portfolios.
| 44 | June 30, 2020 | | Annual Report |
Table of Contents
Unaudited
AllianzGI Small-Cap Fund (cont’d)
Average Annual Total Return for the period ended June 30, 2020
1 Year | 5 Year | Since Inception† | ||||||||||||
AllianzGI Small-Cap Fund Class A | –9.95% | 4.38% | 7.12% | |||||||||||
| AllianzGI Small-Cap Fund Class A (adjusted) | –14.91% | 3.21% | 6.25% | ||||||||||
AllianzGI Small-Cap Fund Class C | –10.60% | 3.59% | 6.32% | |||||||||||
| AllianzGI Small-Cap Fund Class C (adjusted) | –11.49% | 3.59% | 6.32% | ||||||||||
| AllianzGI Small-Cap Fund Class P | –9.74% | 4.64% | 7.38% | ||||||||||
| AllianzGI Small-Cap Fund Institutional Class | –9.62% | 4.75% | 7.49% | ||||||||||
| AllianzGI Small-Cap Fund Class R6 | –9.55% | 4.80% | 7.55% | ||||||||||
| Russell 2000 Index | –6.63% | 4.29% | 6.98% | ||||||||||
Lipper Small-Cap Core Funds Average | –12.24% | 2.01% | 5.13% | |||||||||||
† The Fund began operations on 7/1/13. Benchmark performance comparison began on 7/1/13. Lipper performance comparisons began on 6/30/13.
Performance quoted represents past performance and is no guarantee of future results. Current performance may be lower or higher than performance shown. For performance current to the most recent month-end, visit our website at us.allianzgi.com. Investment return and the principal value will fluctuate. Shares may be worth more or less than original cost when redeemed. The adjusted returns take into account the maximum sales charge of 5.50% on Class A shares and 1% contingent deferred sales charge (CDSC) on Class C shares, which may apply to shares redeemed during the first year of ownership. Returns do not reflect deduction of taxes that a shareholder would pay on fund distributions or redemption of fund shares. Please see pages 56-58 for more information. The Fund’s expense ratios are 1.29% for Class A shares, 2.04% for Class C shares, 1.04% for Class P shares, 0.94% for Institutional Class shares and 0.89% for Class R6 shares. Theses ratios do not include an expense reduction, contractually agreed through at least August 31, 2020. The Fund’s expense ratios net of this reduction are 1.19% for Class A shares, 1.94% for Class C shares, 0.94% for Class P shares, 0.84% for Institutional Class shares and 0.79% for Class R6 shares. Expense ratio information is as of the Fund’s current prospectus dated August 28, 2019, as further revised or supplemented from time to time.
Cumulative Returns Through June 30, 2020
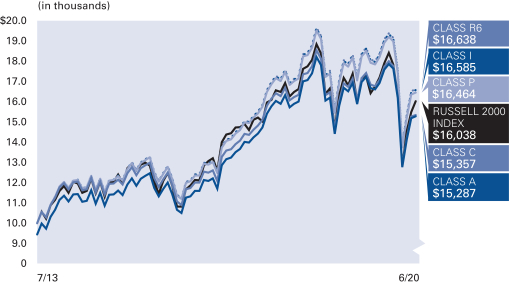
The Fund began operations on 7/1/13. Benchmark performance comparisons began on 7/1/13.
Industry/Sectors (as of June 30, 2020)
Biotechnology | 8.2% | |||
Software | 6.8% | |||
Healthcare Equipment & Supplies | 4.7% | |||
Food Products | 4.2% | |||
Life Sciences Tools & Services | 3.9% | |||
Household Durables | 3.8% | |||
Specialty Retail | 3.7% | |||
HealthCare Providers & Services | 3.7% | |||
Other | 59.1% | |||
Cash & Equivalents — Net | 1.9% | |||
| Annual Report | | June 30, 2020 | 45 |
Table of Contents
Unaudited
AllianzGI Small-Cap Fund (cont’d)
| Shareholder Expense Example | Actual Performance | |||||||||
Class A | Class C | Class P | Institutional | Class R6 | ||||||
Beginning Account Value (1/1/20) | $1,000.00 | $1,000.00 | $1,000.00 | $1,000.00 | $1,000.00 | |||||
Ending Account Value (6/30/20) | $855.70 | $852.50 | $856.70 | $857.00 | $857.90 | |||||
Expenses Paid During Period | $5.40 | $8.84 | $4.25 | $3.79 | $3.56 | |||||
| Hypothetical Performance | ||||||||||
| (5% return before expenses) | ||||||||||
| Class A | Class C | Class P | Institutional Class | Class R6 | ||||||
Beginning Account Value (1/1/20) | $1,000.00 | $1,000.00 | $1,000.00 | $1,000.00 | $1,000.00 | |||||
Ending Account Value (6/30/20) | $1,019.05 | $1,015.32 | $1,020.29 | $1,020.79 | $1,021.03 | |||||
Expenses Paid During Period | $5.87 | $9.62 | $4.62 | $4.12 | $3.87 | |||||
For each class of the Fund, expenses (net of fee waiver) are equal to the annualized expense ratio for the class (1.17% for Class A, 1.92% for Class C, 0.92% for Class P, 0.82% for Institutional Class and 0.76% for Class R6), multiplied by the average account value over the period, multiplied by 182/366. These expenses do not include the expenses of the investment companies in which the Fund invests, which are indirectly borne by Fund shareholders.
| 46 | June 30, 2020 | | Annual Report |
Table of Contents
(THIS PAGE INTENTIONALLY LEFT BLANK)
| Annual Report | | June 30, 2020 | 47 |
Table of Contents
Unaudited
AllianzGI Small-Cap Value Fund (formerly AllianzGI NFJ Small-Cap Value Fund)*
For the period July 1, 2019 through June 30, 2020, as provided by the Value Equity US team.
Fund Insights
For the twelve-month period ended June 30, 2020, the Class A shares at net asset value (“NAV”) of the AllianzGI Small-Cap Value Fund (the “Fund”) returned -16.62%, outperforming the Russell 2000 Value Index (the “benchmark”), which returned -17.48%.
Market overview
US equities posted double-digit gains in the second half of 2019, closing the year with the strongest annual returns since 2013. Despite a notable set-back in August of 2019, major indices hit a series of fresh highs as risk appetite was boosted by lower interest rates and a “phase one” trade deal between the US and China. Corporate earnings also beat, albeit lowered, expectations. Growth stocks continued to outperform value ones. The investment landscape shifted quickly when the 11-year bull market in the US finally ended in the first quarter of 2020. After touching fresh highs in mid-February, US stocks subsequently plunged as the extraordinary measures employed to control COVID-19 raised fears of a severe global recession. The rapidly evolving crisis led to heightened volatility, with US stocks suffering two of the largest one-day falls since 1987 in March of 2020, along with the largest daily gain since 2008. Sentiment turned in the second quarter, with a sharp rally helping the S&P 500 Index record its strongest quarterly performance since 1998. At one point in June, US stocks had recouped all of their year-to-date losses, although stocks subsequently came off their best levels as a surge in new cases in southern and western states caused some re-opening measures to be rolled back towards quarter-end.
Portfolio review
Relative performance results were due to positive stock selection, while sector allocation modestly detracted over the reporting period. Selection across the energy and real estate investment trusts (“REITs”) sectors boosted relative returns, and these gains were only partially offset by holdings in the consumer staples and utilities sectors, which failed to keep pace with benchmark shares. Within the benchmark index, just three of the index’s eleven GICS economic sectors—information technology, consumer staples and health care—delivered positive absolute returns. In contrast, the energy, communication services, financials and REITs sectors recorded the weakest double-digit negative returns over the trailing one-year period. The Fund’s underweight exposures in consumer discretionary and health care detracted from relative returns, while underweight positions in communication services and energy contributed to performance results during the trailing twelve-month period.
Outlook
The US economy entered a recession during the second quarter. It may have already exited, according to the technical definition. The recovery may have started out looking like a “V”, but it has since flattened out below peak levels. Retail sales and industrial production, after falling by the most in at least 100 years, have bounced to still-unhealthy levels. There has been severe damage to employment, particularly among small businesses and concentrated in certain industries (leisure/hospitality, transportation, oil & gas), that may take a long time to recover from a workforce perspective. Policymakers, between the Fed and Congress, have been aggressive and acted quickly. Going forward, people may remain hesitant to go out in large groups and risk aversion could remain high. Many doctors project a return of the virus in the fall, the uncertainty around which could also keep consumer and business spending in check. However, the extraordinary stimulus could become a tailwind once the peak has passed. In the longer term, we may find growth on an even lower trajectory than existed prior to the virus due to deglobalization of supply chains, which will likely slow down productivity growth and hurt corporate profitability.
Our team understands the importance of efficiently reacting to the ever-changing market in order to capitalize on opportunities and add strength and quality in our portfolios. We believe our focus on higher-quality companies that pay a dividend within an attractive price-value framework offers many compelling characteristics, from less volatility with income to the potential to protect against inflation via dividend growth. As active managers committed to researching fundamentals and evaluating a company’s prospects, we believe this approach will become critical in the current environment for clients seeking strong absolute returns and moderated volatility over the long term.
* Effective April 30, 2020, the Fund changed its name from “AllianzGI NFJ Small-Cap Value Fund” to “AllianzGI Small-Cap Value Fund”.
| 48 | June 30, 2020 | | Annual Report |
Table of Contents
Unaudited
AllianzGI Small-Cap Value Fund (formerly AllianzGI NFJ Small-Cap Value Fund) (cont’d)
Average Annual Total Return for the period ended June 30, 2020
1 Year | 5 Year | 10 Year | Since Inception† | |||||||||||||||
AllianzGI Small-Cap Value Fund Class A | –16.62% | –1.09% | 5.86% | 9.38% | ||||||||||||||
| AllianzGI Small-Cap Value Fund Class A (adjusted) | –21.21% | –2.20% | 5.26% | 9.17% | |||||||||||||
AllianzGI Small-Cap Value Fund Class C | –17.26% | –1.82% | 5.07% | 8.57% | ||||||||||||||
| AllianzGI Small-Cap Value Fund Class C (adjusted) | –18.01% | –1.82% | 5.07% | 8.57% | |||||||||||||
| AllianzGI Small-Cap Value Fund Class R | –16.80% | –1.33% | 5.60% | 9.07% | |||||||||||||
| AllianzGI Small-Cap Value Fund Class P | –16.39% | –0.84% | 6.12% | 9.70% | |||||||||||||
| AllianzGI Small-Cap Value Fund Institutional Class | –16.31% | –0.73% | 6.26% | 9.82% | |||||||||||||
| AllianzGI Small-Cap Value Fund Class R6 | –16.25% | –0.68% | 6.32% | 9.88% | |||||||||||||
AllianzGI Small-Cap Value Fund Administrative Class | –16.58% | –0.98% | 5.99% | 9.51% | ||||||||||||||
| Russell 2000 Value Index | –17.48% | 1.26% | 7.82% | 9.60% | |||||||||||||
Lipper Small-Cap Core Funds Average | –12.24% | 2.01% | 8.80% | 8.06% | ||||||||||||||
† The Fund began operations on 10/1/91. Benchmark comparisons began on the fund inception date. Lipper comparisons began on 9/30/91.
Performance quoted represents past performance and is no guarantee of future results. Current performance may be lower or higher than performance shown. For performance current to the most recent month-end, visit our website at us.allianzgi.com. Investment return and the principal value will fluctuate. Shares may be worth more or less than original cost when redeemed. The adjusted returns take into account the maximum sales charge of 5.50% on Class A shares and 1% contingent deferred sales charge (CDSC) on Class C shares, which may apply to shares redeemed during the first year of ownership. Returns do not reflect deduction of taxes that a shareholder would pay on fund distributions or redemption of fund shares. Please see pages 56-58 for more information. The Fund’s gross expense ratios are 1.27% for Class A shares, 2.02% for Class C shares, 1.52% for Class R shares, 1.02% for Class P shares, 0.92% for Institutional Class shares, 0.87% for Class R6 shares and 1.17% for Administrative Class Shares. These ratios do not include an expense reduction, contractually agreed through at least August 31, 2020. The Fund’s expense ratios net of this reduction are 1.17% for Class A shares, 1.92% for Class C shares, 1.42% for Class R shares, 0.92% for Class P shares, 0.82% for Institutional Class shares, 0.77% for Class R6 shares and 1.07% for Administrative Class Shares. Expense ratio information is as of the Fund’s current prospectus dated August 28, 2019, as further revised or supplement from time to time.
Cumulative Returns Through June 30, 2020
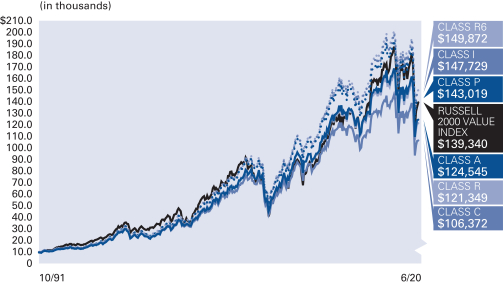
The Fund began operations on 10/1/91. Benchmark comparisons began on the fund inception date.
Industry/Sectors (as of June 30, 2020)
Banks | 12.0% | |||
Equity Real Estate Investment Trusts (REITs) | 8.9% | |||
Insurance | 7.0% | |||
IT Services | 4.7% | |||
Electric Utilities | 4.4% | |||
Thrifts & Mortgage Finance | 4.1% | |||
Mortgage Real Estate Investment Trusts (REITs) | 3.1% | |||
Commercial Services & Supplies | 3.0% | |||
Other | 52.1% | |||
Cash & Equivalents — Net | 0.7% | |||
| Annual Report | | June 30, 2020 | 49 |
Table of Contents
Unaudited
AllianzGI Small-Cap Value Fund (formerly AllianzGI NFJ Small-Cap Value Fund) (cont’d)
| Shareholder Expense Example | Actual Performance | |||||||||||||
Class A | Class C | Class R | Class P | Institutional | Class R6 | Administrative | ||||||||
Beginning Account Value (1/1/20) | $1,000.00 | $1,000.00 | $1,000.00 | $1,000.00 | $1,000.00 | $1,000.00 | $1,000.00 | |||||||
Ending Account Value (6/30/20) | $768.70 | $765.70 | $767.60 | $769.70 | $769.60 | $770.00 | $768.50 | |||||||
Expenses Paid During Period | $5.10 | $8.39 | $6.20 | $4.00 | $3.56 | $3.34 | $4.66 | |||||||
| Hypothetical Performance | ||||||||||||||
| (5% return before expenses) | ||||||||||||||
| Class A | Class C | Class R | Class P | Institutional Class | Class R6 | Administrative Class | ||||||||
Beginning Account Value (1/1/20) | $1,000.00 | $1,000.00 | $1,000.00 | $1,000.00 | $1,000.00 | $1,000.00 | $1,000.00 | |||||||
Ending Account Value (6/30/20) | $1,019.10 | $1,015.37 | $1,017.85 | $1,020.34 | $1,020.84 | $1,021.08 | $1,019.59 | |||||||
Expenses Paid During Period | $5.82 | $9.57 | $7.07 | $4.57 | $4.07 | $3.82 | $5.32 | |||||||
For each class of the Fund, expenses (net of fee waiver) are equal to the annualized expense ratio for the class (1.16% for Class A, 1.91% for Class C, 1.41% for Class R, 0.91% for Class P, 0.81% for Institutional Class , 0.76% for Class R6 and 1.06% for Administrative Class), multiplied by the average account value over the period, multiplied by 182/366. These expenses do not include the expenses of the investment companies in which the Fund invests,which are indirectly borne by Fund shareholders.
| 50 | June 30, 2020 | | Annual Report |
Table of Contents
(THIS PAGE INTENTIONALLY LEFT BLANK)
| Annual Report | | June 30, 2020 | 51 |
Table of Contents
Unaudited
AllianzGI Technology Fund
For the period of July 1, 2019 to June 30, 2020, as provided by Huachen Chen, CFA and Walter C. Price, Jr., CFA, Senior Portfolio Managers.
Fund Insights
For the twelve-month period ended June 30, 2020, the Class A shares at net asset value (“NAV”) of the AllianzGI Technology Fund (the “Fund”) returned 28.34%, underperforming the S&P North American Technology Sector Index (the “benchmark”), which returned 30.70%.
Market Overview
Technology companies continued to demonstrate strong earnings growth and delivered stronger stock returns relative to the broad market. The period included sharp market rotations in the second half of 2019 and much higher market volatility amid the COVID-19 crisis in early 2020. While there is elevated economic uncertainty ahead, businesses and consumers continue to turn to innovative technologies to improve productivity and reduce costs.
Portfolio Review
The Fund has benefited from strong performance among several mid-sized, high-growth software companies including RingCentral, Crowdstrike, and Zscaler. All of these companies continue to see increasing demand for innovative software services as the move to cloud computing and Software-as-a-Service solutions continues to accelerate. Additionally, an underweight position in Cisco Systems and an overweight position in Advanced Micro Devices helped relative performance.
However, the Fund underperformed the benchmark primarily due to the underweight position in Apple, the benchmark’s second largest position. The stock rose more than 86% in the period while earnings grew less than 5%. The Fund’s overweight positions in DXC Technologies and Samsung detracted from relative performance, as hardware and semiconductor stocks struggled during the market downturn in early 2020. Lastly, an underweight position in Amazon and an overweight position in Paycom Software also weighed on relative performance.
The core of our investment process is the identification of major themes impacting the technology sector and investing in the primary beneficiaries/drivers of these trends. We maintain our conviction in the core secular growth names in our portfolio, but we are also attentive to present market conditions and valuations.
Outlook
In our view, the technology sector continues to benefit from strong tailwinds which should continue to drive attractive long term appreciation. There is no question in our minds that the present events around the COVID-19 crisis will spur the use of technology and change how we live and work in the future. As companies adjust budgets due to supply and/or demand disruptions, we believe the need for companies to reduce costs should accelerate the move to cheaper and more productive solutions such as cloud, software-as-a-service, artificial intelligence, cyber security, etc. We are in a period of rapid change, where the importance of technology is key to the prosperity of most industries. In our view, this environment is likely to provide attractive growth opportunities in many technology stocks over the next several years.
We continue to believe the technology sector can provide some of the best absolute and relative return opportunities in the equity markets—especially for bottom-up stock pickers.
| 52 | June 30, 2020 | | Annual Report |
Table of Contents
Unaudited
AllianzGI Technology Fund (cont’d)
Average Annual Total Return for the period ended June 30, 2020
| 1 Year | 5 Year | 10 Year | Since Inception† | |||||||||||||||
AllianzGI Technology Fund Class A | 28.34% | 20.98% | 19.49% | 14.78% | ||||||||||||||
| AllianzGI Technology Fund Class A (adjusted) | 21.28% | 19.62% | 18.81% | 14.51% | |||||||||||||
AllianzGI Technology Fund Class C | 27.37% | 20.08% | 18.60% | 13.92% | ||||||||||||||
| AllianzGI Technology Fund Class C (adjusted) | 26.40% | 20.08% | 18.60% | 13.92% | |||||||||||||
| AllianzGI Technology Fund Class P | 28.67% | 21.29% | 19.78% | 15.15% | |||||||||||||
| AllianzGI Technology Fund Institutional Class | 28.78% | 21.41% | 19.90% | 15.26% | |||||||||||||
AllianzGI Technology Fund Administrative Class | 28.46% | 21.10% | 19.60% | 14.98% | ||||||||||||||
| S&P North American Technology Sector Index | 30.70% | 23.28% | 20.56% | 11.94% | |||||||||||||
| NASDAQ Composite Index | 26.94% | 16.36% | 18.25% | 10.40% | |||||||||||||
Lipper Global Science & Technology Funds Average | 25.62% | 18.29% | 17.34% | 9.80% | ||||||||||||||
† The Fund began operations on 12/27/95. Benchmark and Lipper performance comparisons began on 12/31/95.
Performance quoted represents past performance and is no guarantee of future results. Current performance may be lower or higher than performance shown. For performance current to the most recent month-end, visit our website at us.allianzgi.com. Investment return and the principal value will fluctuate. Shares may be worth more or less than original cost when redeemed. The adjusted returns take into account the maximum sales charge of 5.50% on Class A shares and 1% contingent deferred sales charge (CDSC) on Class C shares, which may apply to shares redeemed during the first year of ownership. Returns do not reflect deduction of taxes that a shareholder would pay on fund distributions or redemption of fund shares. Please see pages 56-58 for more information. The Fund’s gross expense ratios are 1.56% for Class A shares, 2.31% for Class C shares, 1.31% for Class P shares, 1.21% for Institutional Class shares and 1.46% for Administrative Class shares. Expense ratio information is as of the Fund’s current prospectus dated August 28, 2019, as further revised or supplemented from time to time.
Cumulative Returns Through June 30, 2020
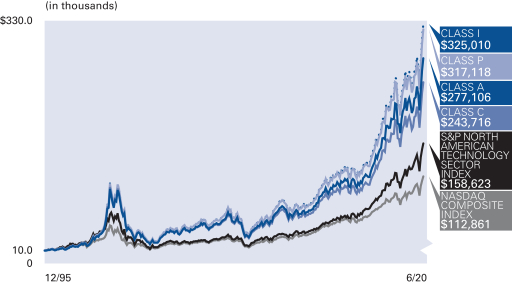
The Fund began operations on 12/27/95. Benchmark and Lipper performance comparisons began on 12/31/95.
Industry/Sectors (as of June 30, 2020)
| Software | 30.1% | |||
| IT Services | 18.5% | |||
| Semiconductors & Semiconductor Equipment | 13.4% | |||
| Technology Hardware, Storage & Peripherals | 11.5% | |||
| Interactive Media & Services | 6.8% | |||
| Internet & Direct Marketing Retail | 4.6% | |||
| Entertainment | 3.5% | |||
| Other | 2.8% | |||
| Securities Sold Short* | 0.0% | |||
| Cash & Equivalents — Net | 8.8% | |||
| * | Table below details the industry allocation for securities sold short |
Industry/Sectors - Securities Sold Short
| IT Services | 0.0% | |||
| Annual Report | | June 30, 2020 | 53 |
Table of Contents
Unaudited
AllianzGI Technology Fund (cont’d)
| Shareholder Expense Example | Actual Performance | |||||||||
| Class A | Class C | Class P | Institutional Class | Administrative Class | ||||||
| Beginning Account Value (1/1/20) | $1,000.00 | $1,000.00 | $1,000.00 | $1,000.00 | $1,000.00 | |||||
| Ending Account Value (6/30/20) | $1,243.60 | $1,238.80 | $1,245.00 | $1,245.70 | $1,244.00 | |||||
| Expenses Paid During Period | $8.70 | $12.86 | $7.31 | $6.76 | $8.15 | |||||
| Hypothetical Performance | ||||||||||
| (5% return before expenses) | ||||||||||
| Class A | Class C | Class P | Institutional Class | Administrative Class | ||||||
| Beginning Account Value (1/1/20) | $1,000.00 | $1,000.00 | $1,000.00 | $1,000.00 | $1,000.00 | |||||
| Ending Account Value (6/30/20) | $1,017.11 | $1,013.38 | $1,018.35 | $1,018.85 | $1,017.60 | |||||
| Expenses Paid During Period | $7.82 | $11.56 | $6.57 | $6.07 | $7.32 | |||||
For each class of the Fund, expenses are equal to the annualized expense ratio for the class (1.56% for Class A, 2.31% for Class C, 1.31% for Class P, 1.21% for Institutional Class and 1.46% for Administrative Class), multiplied by the average account value over the period, multiplied by 182/366. These expenses do not include the expenses of the investment companies in which the Fund invests, which are indirectly borne by Fund shareholders.
| 54 | June 30, 2020 | | Annual Report |
Table of Contents
(THIS PAGE INTENTIONALLY LEFT BLANK)
| Annual Report | | June 30, 2020 | 55 |
Table of Contents
Unaudited
Share Class (A/C)
The inception date on each Fund Summary page is the inception date of the Fund’s oldest share class or classes. The oldest share class for the following Funds is the Institutional share class, and the Class A and/or C shares were first offered in the month/year indicated in parentheses after each Fund name: AllianzGI Dividend Value (10/01), AllianzGI Large-Cap Value (7/02), AllianzGI Small-Cap Value (1/97), AllianzGI Mid-Cap (2/02), AllianzGI Emerging Markets Opportunities (8/06), AllianzGI Global Small-Cap (2/02) and AllianzGI Technology (2/02). The oldest share class for the following Funds is C, and the A shares were first offered in the month/year indicated in parentheses after each Fund name: AllianzGI Mid-Cap Value (2/91) and AllianzGI Focused Growth (10/90). The oldest share class for AllianzGI Health Sciences was the D share class, and the A and C shares were first offered in 2/02. For AllianzGI International Value the oldest share class is the Institutional share class and A and C shares were first offered in 4/05. For AllianzGI Small-Cap, A and C shares were each first offered in 7/13. For the AllianzGI Income & Growth Fund, Class A and Class C shares were first offered simultaneously with Institutional shares in 2/07.
Class A shares are subject to an initial sales charge. Class C shares are subject to a 1% CDSC for shares redeemed in the first year.
Share Class (R)
The inception date on each Fund Summary page is the inception date of the Fund’s oldest share class or classes. The oldest share classes are (Fund/share class): AllianzGI Dividend Value/Institutional and Administrative, AllianzGI Mid-Cap Value/C, AllianzGI Small-Cap Value/Institutional, AllianzGI Focused Growth/C and AllianzGI Mid-Cap/Institutional. Class R shares for these Funds were first offered in 12/02. The oldest share class for AllianzGI Large-Cap Value is the Institutional share class and it first offered Class R shares in 11/09. The oldest share class for AllianzGI International Value is the Institutional share class and the Fund first offered Class R shares in 11/09. The oldest share classes for AllianzGI Income & Growth are the Institutional, Class A and Class C share classes and the Fund first offered Class R shares in 2/11.
Share Class (P)
Class P shares were launched in July 2008, except for Class P shares of AllianzGI Mid-Cap Value Fund, which were launched February 28, 2011, Class P shares of AllianzGI Mid-Cap Fund, which were launched April 2, 2012, and Class P shares of AllianzGI Small-Cap, which were launched July 1, 2013.
Share Class (Institutional/Administrative)
The inception date on each Fund Summary page is the inception date of the Fund’s oldest share class or classes. Unless otherwise indicated, the noted Institutional or Administrative share class is one of the Fund’s oldest share classes. The oldest share class for the following Funds is the C shares, and the Institutional and Administrative shares were first offered in the month/year indicated in parentheses after each Fund name: AllianzGI Mid-Cap Value (4/88) and AllianzGI Focused Growth (3/99). The oldest share class for the AllianzGI Health
Sciences Fund was the D share class, and the Institutional share class was first offered in 12/14. The oldest share class for the following Funds is the Institutional class and the Administrative shares were first offered in the month/year indicated in parentheses after each Fund name: AllianzGI International Value (5/10), AllianzGI Large-Cap Value (9/06), AllianzGI Small-Cap Value (11/95), AllianzGI Technology (3/05) and AllianzGI Mid-Cap (2/02).
Share Class (R6)
The inception date on each Fund Summary page is the inception date of the Fund’s oldest share class or classes. The oldest share class for the following funds is the Institutional class and Class R6 shares were first offered in the month/year indicated in parentheses after each Fund name: AllianzGI Emerging Markets Opportunities (12/15), AllianzGI Dividend Value (12/13), AllianzGI International Value (12/13), AllianzGI Small-Cap Value (12/13), AllianzGI Mid Cap Value (12/17) and AllianzGI Small-Cap (8/18). For AllianzGI Focused Growth, Class C is the oldest share class and Class R6 shares were first offered in 12/15.
Returns shown in the “Fund Summaries” section of this report measure performance from the inception of the oldest share class to the present; therefore some returns predate the inception of the noted share class. Those returns are calculated by adjusting the returns of the oldest share class to reflect the fees and expenses paid by the newer class. Total return performance assumes that all dividend and capital gain distributions were reinvested on the payable date.
The Lipper Averages are calculated by Lipper, Inc. (“Lipper”). They are based on the total return performance, with distributions reinvested and operating expenses deducted, of funds included by Lipper in the stated category. Lipper does not take into account sales charges.
The Average Annual Total Return tables for each Fund assume the initial investment was made on the first day of the Fund’s initial fiscal year. The tables reflect any sales load that would have applied at the time of purchase or any CDSC that would have applied if a full redemption occurred on the last business day of the most recent fiscal year. Results assume that all dividend and capital gain distributions were reinvested. They do not take into account the effect of taxes. The benchmark index cumulative return began on the last day of the month of the respective Fund’s inception date, unless otherwise noted.
“Cash & Equivalents — Net” in the Allocation Summaries may be comprised of cash, repurchase agreements, U.S. Treasury Bills, options purchased, options written and other assets net of other liabilities including net unrealized appreciation (depreciation) on futures contracts, forward foreign currency contracts and swap agreements, as applicable.
Proxy Voting
Allianz Global Investors U.S. LLC (the “Investment Adviser”) has adopted written proxy voting policies and procedures (the “Proxy
| 56 | June 30, 2020 | | Annual Report |
Table of Contents
Policy”) as required by Rule 206(4)-6 under the Investment Advisers Act of 1940. The Proxy Policy has been adopted by the Trust as the policies and procedures that the Investment Adviser will use when voting proxies on behalf of the Funds. Copies of the written Proxy Policy, the factors that the Investment Adviser may consider in determining how to vote proxies for each Fund and information about how each Fund voted proxies relating to portfolio securities held during the most recent twelve-month period ended June 30, are provided without charge, upon request, by calling the Trust at 1-800-988-8380 (Class A, Class C and Class R) or 1-800-498-5413 (Class P, Class R6, Institutional and Administrative classes), on the Allianz Global Investors Distributors LLC website at us.allianzgi.com, and on the Securities and Exchange Commission (the “SEC”) Website at http://www.sec.gov.
Form N-PORT
The Trust files complete schedules of each Fund’s portfolio holdings with the SEC on Form N-PORT for the first and third quarters of the fiscal year; such filings are available on the SEC’s website at http://www.sec.gov. A copy of the Trust’s Form N-PORT, when available, will be provided without charge, upon request, by calling 1-800-988-8380 (Class A, Class C and Class R) or 1-800-498-5413 (Class P, Class R6, Institutional and Administrative classes). A description of the Trust’s policies and procedures with respect to the disclosure of each Fund’s portfolio holdings is available in the Trust’s Statement of Additional Information. The Investment Adviser will post each Fund’s holdings information on the Fund’s website at us.allianzgi.com. Each Fund’s website will contain a complete schedule of portfolio holdings as of the relevant month end. The information will be posted on the website approximately thirty (30) calendar days after the relevant month’s end. Portfolio holdings information for each Fund will remain accessible on its website until the Trust files its Form N-CSR, or Form N-PORT (for the last month of the Fund’s first or third fiscal quarters), with the SEC for the period that includes the date as of which the website information is current. The Trust’s policies with respect to the disclosure of the portfolio holdings are subject to change without notice.
The following disclosure provides important information regarding each Fund’s Shareholder Expense Example, which appears on each Fund Summary page in this Annual Report. Please refer to this information when reviewing the Shareholder Expense Example for a Fund.
Shareholder Expense Example
Shareholders of the Funds incur two types of costs: (1) transaction costs; and (2) ongoing costs, including investment advisory and administration fees; distribution and/or service (12b-1) fees and other Fund expenses. The Shareholder Expense Example is intended to help you understand your ongoing costs (in dollars) of investing in each Fund and to compare these costs with the ongoing costs of investing in other mutual funds. The Shareholder Expense Example is based on $1,000.00 invested at the beginning and held for the entire period of January 1, 2020 through June 30, 2020.
Actual Expenses
The information in the table under the heading “Actual Performance” provides information about actual account values and actual expenses. You may use the information in these columns, together with the amount you invested, to estimate the expenses that you paid over the period. Simply divide your account value by $1,000.00 (for example, an $8,600.00 account value divided by $1,000.00 = 8.6), then multiply the result by the number in the appropriate column for your share class, in the row entitled “Expenses Paid During Period”, to estimate the expenses you paid on your account during this period.
Hypothetical Example for Comparison Purposes
The information in the table under the heading “Hypothetical Performance (5% return before expenses)” provides information about hypothetical account values and hypothetical expenses based on a Fund’s actual expense ratio and an assumed rate of return of 5% per year before expenses, which is not a Fund’s actual return. The hypothetical account values and expenses may not be used to estimate the actual ending account balance or expenses you paid for the period. You may use this information to compare the ongoing costs of investing in the Fund and other funds. To do so, compare this 5% hypothetical example with the 5% hypothetical examples that appear in the shareholder reports of the other funds.
Please note that the expenses shown in the table are meant to highlight your ongoing costs only and do not reflect any transactional costs, such as sales charges. Therefore, the information under the heading “Hypothetical Performance (5% return before expenses)” is useful in comparing ongoing costs only, and will not help you determine the relative total costs of owning different funds. In addition, if these transactional costs were included, your costs may have been higher.
Expense ratios may vary from period to period because of various factors such as increases in expenses not covered by advisory and administration fees (for example, expenses of the Trustees and their counsel or litigation expenses) and/or because of reductions in the administration fees resulting from the size of the fund.
Credit Ratings
Bond ratings apply to the underlying holdings of a Fund and not the Fund itself and are divided into categories ranging from highest to lowest credit quality. Presentations of credit ratings information in this report use ratings provided by S&P Global Ratings (“S&P”), because of among other reasons, the access to background information and other materials provided by S&P, as well as the Funds’ considerations of industry practice. Bonds not rated by S&P, or bonds that do not have a rating available from S&P, or bonds that had a rating withdrawn by S&P are designated as “NR” or “NA”, respectively. Credit quality ratings assigned by a rating agency are subjective opinions, not statements of fact, and are subject to change periodically, even as frequently as daily.
| Annual Report | | June 30, 2020 | 57 |
Table of Contents
Unaudited
Important Information (cont’d)
Ratings assigned by S&P or another rating agency are not absolute standards of credit quality and do not evaluate market risk. Rating agencies may fail to make timely changes in credit ratings, and an issuer’s current financial condition may be better or worse than a rating indicates. In formulating investment decisions for the applicable Funds, the Investment Adviser develops its own analysis of the credit quality and risks associated with individual debt instruments, rather than relying exclusively on rating agencies or third-party research.
All of the information on the Fund Summary pages, including Fund Insights, Average Annual Total Return tables and Cumulative Returns charts, Shareholder Expense Examples and Allocation/Credit Ratings Summaries are unaudited.
Allianz Global Investors Distributors LLC, 1633 Broadway, New York, NY, 10019, us.allianzgi.com, 1-800-988-8380 (retail classes: A, C & R) or 1-800-498-5413 (Class P, Class R6, Institutional and Administrative classes).
| 58 | June 30, 2020 | | Annual Report |
Table of Contents
Unaudited
Unless otherwise noted, index returns reflect the reinvestment of income dividends and capital gains, if any, but do not reflect fees, brokerage commissions or other expenses of investing. It is not possible to invest directly in an index.
Prior to November 1, 2006, performance data for the MSCI Indices was calculated gross of dividend tax withholding. Performance data presently shown for the Indices is net of dividend tax withholding. This recalculation results in lower performance for the Indices.
| Index | Description | |
| Bloomberg Barclays US Aggregate Bond Index | The Bloomberg Barclays US Aggregate Bond Index represents securities that are SEC-registered, taxable, and US dollar denominated. The index covers the US investment grade fixed rate bond market, with index components for government and corporate securities, mortgage pass-through securities, and asset-backed securities. | |
| Bloomberg Barclays US Credit Index | The Bloomberg Barclays US Credit Index is the credit component of the US Government/Credit Index. It includes publicly issued US corporate and specified foreign debentures and secured notes that meet the specified maturity, liquidity, and quality requirements. To qualify, bonds must be SEC-registered. | |
| Bloomberg Barclays US Government Bond Index | The Bloomberg Barclays US Government Bond Index is the US Government component of the US Government/Credit Index. It includes US Dollar-denominated, fixed-rate, nominal US Treasuries and US agency debentures (securities issued by US government owned or government sponsored entities) and debt explicitly guaranteed by the US government. | |
| Bloomberg Barclays Global High Yield Index | The Bloomberg Barclays Global High Yield Index is a multi-currency flagship measure of the global high yield debt market. The index represents the union of the US High Yield, the Pan-European High Yield and Emerging Markets (EM) Hard Currency High Yield Indices. | |
| ICE BofA US Convertible Index | The ICE BofA US Convertible Index is a widely used, unmanaged index that measures the performance of U.S. dollar-denominated convertible securities not currently in bankruptcy with a total market value greater than $50 million at issuance. | |
| ICE BofA US High Yield Master II Index | The ICE BofA US High Yield Master II Index is an unmanaged index consisting of US dollar denominated bonds that are issued in countries having a BBB3 or higher debt rating with at least one year remaining until maturity. All bonds must have a credit rating below investment grade but not in default. | |
| Chicago Board Options Exchange (CBOE) Volatility Index (VIX) | The Chicago Board Options Exchange (CBOE) Volatility Index (VIX) is a key measure of market expectations of near-term volatility conveyed by S&P 500 stock index option prices. | |
| MSCI AC World Index ex USA (Also known as MSCI ACWI ex USA Index) | The MSCI AC World Index ex USA Index captures large and mid cap representation across Developed Markets countries (excluding the US) and Emerging Markets countries. The index covers approximately 85% of the global equity opportunity set outside the US. | |
| MSCI EAFE Index | The MSCI EAFE Index is an equity index which captures large and mid cap representation across the Developed Markets countries around the world, excluding the US and Canada. | |
| MSCI Emerging Markets Index | The MSCI Emerging Markets Index captures large and mid cap representation across Emerging Markets countries. The index covers approximately 85% of the free float-adjusted market capitalization in each country. | |
| MSCI World Energy Index | The MSCI World Energy Index is designed to capture the large and mid-cap segments across Developed Markets countries. All securities in the index are classified in the Energy sector as per the Global Industry Classification Standard. | |
| MSCI World Health Care Index | The MSCI World Health Care Index is designed to capture the large and mid cap segments across Developed Markets countries. All securities in the index are classified in the Health Care sector as per the Global Industry Classification Standard. | |
| MSCI World Index | The MSCI World Index captures large and mid cap representation across Developed Markets countries. The index covers approximately 85% of the free float-adjusted market capitalization in each country. | |
| MSCI World Materials Index | The MSCI World Materials Index is designed to capture the large and mid cap segments across Developed Markets countries. All securities in the index are classified in the Materials sector as per the Global Industry Classification Standard. | |
| Annual Report | | June 30, 2020 | 59 |
Table of Contents
Unaudited
Benchmark Descriptions (cont’d)
| Index | Description | |
| MSCI World Small-Cap Index | The MSCI World Small-Cap Index captures small-cap representation across Developed Markets countries. The index covers approximately 14% of the free float-adjusted market capitalization in each country. | |
| NASDAQ Composite Index | The NASDAQ Composite Index is an unmanaged market-value weighted index of all common stocks listed on the NASDAQ Stock Market. | |
| Russell 1000 Growth Index | The Russell 1000 Growth Index is an unmanaged index that measures the performance of the large-cap growth segment of the US equity universe. It includes those Russell 1000 companies with higher price-to-book ratios and higher forecasted growth values. The Russell 1000 Index measures the performance of the 1,000 largest companies in the Russell 3000® Index, which consists of the 3,000 largest US companies based on total market capitalization. | |
| Russell 1000 Index | The Russell 1000 Index is an unmanaged index that consists of the 1,000 largest companies in the Russell 3000 Index and represents approximately 90% of the total market capitalization of the Russell 3000 Index. It is highly correlated with the S&P 500 Index. | |
| Russell 1000 Value Index | The Russell 1000 Value Index is an unmanaged index that measures the performance of the large-cap value segment of the US equity universe. It includes those Russell 1000 companies with lower price-to-book ratios and lower expected growth values. | |
| Russell 2000 Index | The Russell 2000 Index measures the performance of the small-cap segment of the US equity universe. The Russell 2000 is a subset of the Russell 3000 Index representing approximately 10% of the total market capitalization of that index. It includes approximately 2000 of the smallest securities based on a combination of their market cap and current index membership. | |
| Russell 2000 Value Index | The Russell 2000 Value Index is an unmanaged index that measures the performance of the small-cap value segment of the US equity universe. It includes those Russell 2000 Index companies with lower price-to-book ratios and lower forecasted growth values. | |
| Russell Midcap Growth Index | The Russell Midcap Growth Index is an unmanaged index that measures the performance of the mid-cap growth segment of the US equity universe. It includes those Russell Midcap Index companies with higher price-to-book ratios and higher forecasted growth values. | |
| Russell Midcap Index | The Russell Midcap Index is an unmanaged index that measures the performance of the mid-cap segment of the U.S. equity universe. The Russell Midcap Index is a subset of the Russell 1000 Index. It includes approximately 800 of the smallest securities based on a combination of their market cap and current index membership. | |
| Russell Midcap Value Index | The Russell Midcap Value Index is an unmanaged index that measures the performance of the mid-cap value segment of the US equity universe represented by stocks in the largest 200 by market cap that exhibit value characteristics. It includes Russell Midcap companies with lower price-to-book ratios and lower forecasted growth values. | |
| S&P 500 Index | The S&P 500 Index is an unmanaged index of large capitalization common stocks. | |
| S&P North American Technology Sector Index | The S&P North American Technology Sector Index is a modified capitalization-weighted index of selected technology and internet-related stocks. | |
| 60 | June 30, 2020 | | Annual Report |
Table of Contents
June 30, 2020
AllianzGI Dividend Value Fund (formerly AllianzGI NFJ Dividend Value Fund)†
| Shares | Value | |||||||
| Common Stock—99.0% |
| |||||||
| Aerospace & Defense—2.8% |
| |||||||
L3Harris Technologies, Inc. | 41,636 | $7,064,380 | ||||||
Lockheed Martin Corp. | 34,213 | 12,485,008 | ||||||
Raytheon Technologies Corp. | 63,488 | 3,912,131 | ||||||
|
| |||||||
| 23,461,519 | ||||||||
|
| |||||||
| Banks—7.6% |
| |||||||
Bank of America Corp. | 467,304 | 11,098,470 | ||||||
Citigroup, Inc. | 245,295 | 12,534,575 | ||||||
JPMorgan Chase & Co. | 385,630 | 36,272,358 | ||||||
PNC Financial Services Group, Inc. | 40,707 | 4,282,783 | ||||||
|
| |||||||
| 64,188,186 | ||||||||
|
| |||||||
| Beverages—1.0% |
| |||||||
Coca-Cola Co. | 188,779 | 8,434,646 | ||||||
|
| |||||||
| Biotechnology—1.5% |
| |||||||
Amgen, Inc. | 52,975 | 12,494,683 | ||||||
|
| |||||||
| Capital Markets—5.8% |
| |||||||
Ameriprise Financial, Inc. | 71,539 | 10,733,712 | ||||||
Blackstone Group, Inc., Class A | 94,625 | 5,361,452 | ||||||
CME Group, Inc. | 47,450 | 7,712,523 | ||||||
Intercontinental Exchange, Inc. | 120,367 | 11,025,617 | ||||||
Morgan Stanley | 289,389 | 13,977,489 | ||||||
|
| |||||||
| 48,810,793 | ||||||||
|
| |||||||
| Chemicals—3.0% |
| |||||||
Celanese Corp. | 122,277 | 10,557,396 | ||||||
Linde PLC | 69,171 | 14,671,861 | ||||||
|
| |||||||
| 25,229,257 | ||||||||
|
| |||||||
| Commercial Services & Supplies—0.5% |
| |||||||
Waste Management, Inc. | 38,416 | 4,068,639 | ||||||
|
| |||||||
| Communications Equipment—1.8% |
| |||||||
Cisco Systems, Inc. | 231,290 | 10,787,365 | ||||||
Motorola Solutions, Inc. | 29,976 | 4,200,537 | ||||||
|
| |||||||
| 14,987,902 | ||||||||
|
| |||||||
| Containers & Packaging—0.8% |
| |||||||
Avery Dennison Corp. | 57,821 | 6,596,798 | ||||||
|
| |||||||
| Diversified Telecommunication Services—3.5% |
| |||||||
AT&T, Inc. | 484,708 | 14,652,723 | ||||||
Verizon Communications, Inc. | 265,980 | 14,663,477 | ||||||
|
| |||||||
| 29,316,200 | ||||||||
|
| |||||||
| Electric Utilities—4.7% |
| |||||||
American Electric Power Co., Inc. | 204,366 | 16,275,708 | ||||||
NextEra Energy, Inc. | 98,123 | 23,566,201 | ||||||
|
| |||||||
| 39,841,909 | ||||||||
|
| |||||||
| Equity Real Estate Investment Trusts (REITs)—6.5% |
| |||||||
Alexandria Real Estate Equities, Inc. | 29,108 | 4,722,773 | ||||||
American Tower Corp. | 21,452 | 5,546,200 | ||||||
CoreSite Realty Corp. | 89,551 | 10,841,044 | ||||||
Essex Property Trust, Inc. | 17,972 | 4,118,644 | ||||||
Medical Properties Trust, Inc. | 247,039 | 4,644,333 | ||||||
Prologis, Inc. | 133,900 | 12,496,887 | ||||||
Public Storage | 22,181 | 4,256,312 | ||||||
Sun Communities, Inc. | 62,191 | 8,438,075 | ||||||
|
| |||||||
| 55,064,268 | ||||||||
|
| |||||||
| Shares | Value | |||||||
| Food & Staples Retailing—1.0% |
| |||||||
Walmart, Inc. | 69,828 | $ | 8,363,998 | |||||
|
| |||||||
| Food Products—0.9% |
| |||||||
Mondelez International, Inc., Class A | 150,173 | 7,678,345 | ||||||
|
| |||||||
| Gas Utilities—1.0% |
| |||||||
Atmos Energy Corp. | 85,621 | 8,526,139 | ||||||
|
| |||||||
| Healthcare Equipment & Supplies—3.3% |
| |||||||
Abbott Laboratories | 118,595 | 10,843,141 | ||||||
Medtronic PLC | 190,655 | 17,483,063 | ||||||
|
| |||||||
| 28,326,204 | ||||||||
|
| |||||||
| Healthcare Providers & Services—2.2% |
| |||||||
Anthem, Inc. | 41,522 | 10,919,456 | ||||||
Chemed Corp. | 18,021 | 8,128,732 | ||||||
|
| |||||||
| 19,048,188 | ||||||||
|
| |||||||
| Hotels, Restaurants & Leisure—2.0% |
| |||||||
McDonald’s Corp. | 92,270 | 17,021,047 | ||||||
|
| |||||||
| Household Durables—1.2% |
| |||||||
Garmin Ltd. | 103,533 | 10,094,468 | ||||||
|
| |||||||
| Household Products—3.8% |
| |||||||
Church & Dwight Co., Inc. | 84,375 | 6,522,187 | ||||||
Procter & Gamble Co. | 217,901 | 26,054,423 | ||||||
|
| |||||||
| 32,576,610 | ||||||||
|
| |||||||
| Industrial Conglomerates—3.2% |
| |||||||
Honeywell International, Inc. | 118,850 | 17,184,521 | ||||||
Roper Technologies, Inc. | 25,145 | 9,762,798 | ||||||
|
| |||||||
| 26,947,319 | ||||||||
|
| |||||||
| Insurance—6.0% |
| |||||||
Allstate Corp. | 86,256 | 8,365,969 | ||||||
Cincinnati Financial Corp. | 181,214 | 11,603,132 | ||||||
Fidelity National Financial, Inc. | 266,805 | 8,180,241 | ||||||
Hartford Financial Services Group, Inc. | 118,863 | 4,582,169 | ||||||
Marsh & McLennan Cos., Inc. | 80,099 | 8,600,230 | ||||||
MetLife, Inc. | 119,057 | 4,347,962 | ||||||
Primerica, Inc. | 44,537 | 5,193,014 | ||||||
|
| |||||||
| 50,872,717 | ||||||||
|
| |||||||
| IT Services—3.2% |
| |||||||
Accenture PLC, Class A | 39,882 | 8,563,463 | ||||||
Automatic Data Processing, Inc. | 60,253 | 8,971,069 | ||||||
Broadridge Financial Solutions, Inc. | 40,871 | 5,157,512 | ||||||
Mastercard, Inc., Class A | 14,560 | 4,305,392 | ||||||
|
| |||||||
| 26,997,436 | ||||||||
|
| |||||||
| Life Sciences Tools & Services—1.0% |
| |||||||
Agilent Technologies, Inc. | 100,460 | 8,877,650 | ||||||
|
| |||||||
| Machinery—1.5% |
| |||||||
Dover Corp. | 45,150 | 4,359,684 | ||||||
Toro Co. | 126,488 | 8,391,214 | ||||||
|
| |||||||
| 12,750,898 | ||||||||
|
| |||||||
| Metals & Mining—0.6% |
| |||||||
Royal Gold, Inc. | 39,726 | 4,938,736 | ||||||
|
| |||||||
| Mortgage Real Estate Investment Trusts (REITs)—0.5% |
| |||||||
Blackstone Mortgage Trust, Inc., Class A | 164,709 | 3,967,840 | ||||||
|
| |||||||
| Shares | Value | |||||||
| Multi-Utilities—3.4% |
| |||||||
DTE Energy Co. | 120,852 | $ | 12,991,590 | |||||
Public Service Enterprise Group, Inc. | 164,403 | 8,082,051 | ||||||
Sempra Energy | 66,669 | 7,815,607 | ||||||
|
| |||||||
| 28,889,248 | ||||||||
|
| |||||||
| Oil, Gas & Consumable Fuels—4.1% |
| |||||||
Chevron Corp. | 91,861 | 8,196,757 | ||||||
ConocoPhillips | 198,793 | 8,353,282 | ||||||
Exxon Mobil Corp. | 188,016 | 8,408,075 | ||||||
ONEOK, Inc. | 134,335 | 4,462,609 | ||||||
Valero Energy Corp. | 97,224 | 5,718,716 | ||||||
|
| |||||||
| 35,139,439 | ||||||||
|
| |||||||
| Pharmaceuticals—5.6% |
| |||||||
Johnson & Johnson | 202,201 | 28,435,527 | ||||||
Merck & Co., Inc. | 243,006 | 18,791,654 | ||||||
|
| |||||||
| 47,227,181 | ||||||||
|
| |||||||
| Professional Services—1.0% |
| |||||||
TransUnion | 96,107 | 8,365,153 | ||||||
|
| |||||||
| Road & Rail—1.5% |
| |||||||
Norfolk Southern Corp. | 71,073 | 12,478,287 | ||||||
|
| |||||||
| Semiconductors & Semiconductor Equipment—5.6% |
| |||||||
Broadcom, Inc. | 54,523 | 17,208,004 | ||||||
Intel Corp. | 348,721 | 20,863,977 | ||||||
KLA Corp. | 50,053 | 9,734,308 | ||||||
|
| |||||||
| 47,806,289 | ||||||||
|
| |||||||
| Software—2.0% |
| |||||||
Microsoft Corp. | 83,999 | 17,094,636 | ||||||
|
| |||||||
| Specialty Retail—3.0% |
| |||||||
Best Buy Co., Inc. | 96,894 | 8,455,939 | ||||||
Home Depot, Inc. | 68,462 | 17,150,416 | ||||||
|
| |||||||
| 25,606,355 | ||||||||
|
| |||||||
| Technology Hardware, Storage & Peripherals—1.0% |
| |||||||
Apple, Inc. | 23,389 | 8,532,307 | ||||||
|
| |||||||
| Tobacco—0.9% |
| |||||||
Philip Morris International, Inc. | 108,265 | 7,585,046 | ||||||
|
| |||||||
| Total Common Stock (cost—$788,540,503) |
| 838,206,336 | ||||||
|
| |||||||
| Principal Amount (000s) | ||||||||
| Repurchase Agreements—0.9% |
| |||||||
State Street Bank and Trust Co., |
| |||||||
(cost—$7,571,000) | $7,571 | 7,571,000 | ||||||
|
| |||||||
| Total Investments (cost—$796,111,503)—99.9% |
| 845,777,336 | ||||||
|
| |||||||
| Other assets less liabilities—0.1% | 423,424 | |||||||
|
| |||||||
| Net Assets—100.0% | $846,200,760 | |||||||
|
| |||||||
| See accompanying Notes to Financial Statements | | June 30, 2020 | | Annual Report | 61 |
Table of Contents
Schedule of Investments
June 30, 2020
Notes to Schedule of Investments:
† Effective April 30, 2020, the AllianzGI NFJ Dividend Value Fund changed its name to AllianzGI Dividend Value Fund. See Note 9(a).
Glossary:
REIT—Real Estate Investment Trust
AllianzGI Emerging Markets Opportunities Fund
| Shares | Value | |||||||
| Common Stock—98.2% |
| |||||||
| Brazil—1.3% |
| |||||||
Banco do Brasil S.A. | 113,000 | $668,055 | ||||||
Hypera S.A. | 438,700 | 2,686,363 | ||||||
|
| |||||||
| 3,354,418 | ||||||||
|
| |||||||
| China—44.4% |
| |||||||
Alibaba Group Holding Ltd. (e) | 231,600 | 6,249,445 | ||||||
Alibaba Group Holding Ltd. ADR (e) | 54,500 | 11,755,650 | ||||||
Anhui Conch Cement Co., Ltd., Class H | 924,500 | 6,264,547 | ||||||
China Merchants Bank Co., Ltd., Class H | 1,268,500 | 5,878,408 | ||||||
China National Building Material Co., Ltd., Class H | 1,634,000 | 1,752,634 | ||||||
Henan Shuanghui Investment & Development Co., Ltd., Class A | 817,300 | 5,345,395 | ||||||
Industrial & Commercial Bank of China Ltd., Class H | 3,023,000 | 1,827,608 | ||||||
KWG Group Holdings Ltd. (e) | 1,580,000 | 2,684,513 | ||||||
Lepu Medical Technology Beijing Co., Ltd., Class A | 330,442 | 1,707,280 | ||||||
Meituan Dianping, Class B (e) | 206,100 | 4,605,584 | ||||||
NetEase, Inc. | 76,600 | 1,320,400 | ||||||
NetEase, Inc. ADR | 21,400 | 9,188,732 | ||||||
New Oriental Education & Technology Group, Inc. ADR (e) | 47,600 | 6,198,948 | ||||||
Ping An Insurance Group Co. of China Ltd., Class H | 173,000 | 1,724,635 | ||||||
RiseSun Real Estate Development Co., Ltd., Class A | 998,352 | 1,148,018 | ||||||
Shandong Weigao Group Medical Polymer Co., Ltd., Class H | 552,000 | 1,232,532 | ||||||
Tencent Holdings Ltd. | 334,700 | 21,446,862 | ||||||
Tianneng Power International Ltd. | 558,000 | 956,963 | ||||||
Tsingtao Brewery Co., Ltd., Class A | 457,564 | 4,965,910 | ||||||
Weichai Power Co., Ltd., Class H | 2,131,000 | 4,015,078 | ||||||
Wuhu Sanqi Interactive Entertainment Network Technology Group Co., Ltd., Class A | 1,078,500 | 7,159,701 | ||||||
Wuliangye Yibin Co., Ltd., Class A | 110,779 | 2,691,590 | ||||||
Zoomlion Heavy Industry Science and Technology Co., Ltd., Class H | 3,080,600 | 2,385,142 | ||||||
|
| |||||||
| 112,505,575 | ||||||||
|
| |||||||
| Hong Kong—1.0% |
| |||||||
WH Group Ltd. (a) | 3,035,500 | 2,623,260 | ||||||
|
| |||||||
| Hungary—0.3% |
| |||||||
OTP Bank Nyrt (e) | 24,268 | 853,149 | ||||||
|
| |||||||
| Shares | Value | |||||||
| India—7.9% |
| |||||||
Ambuja Cements Ltd. | 516,550 | $ | 1,324,297 | |||||
Bajaj Auto Ltd. | 26,593 | 994,814 | ||||||
Divi’s Laboratories Ltd. | 42,774 | 1,291,932 | ||||||
HDFC Bank Ltd. ADR | 115,800 | 5,264,268 | ||||||
Hindustan Petroleum Corp., Ltd. (e) | 262,269 | 754,908 | ||||||
Hindustan Unilever Ltd. | 44,827 | 1,295,983 | ||||||
Indiabulls Housing Finance Ltd. | 948,751 | 2,601,702 | ||||||
Infosys Ltd. | 341,829 | 3,322,819 | ||||||
NTPC Ltd. | 790,724 | 1,005,998 | ||||||
REC Ltd. | 989,982 | 1,421,379 | ||||||
Tata Chemicals Ltd. | 190,166 | 783,851 | ||||||
|
| |||||||
| 20,061,951 | ||||||||
|
| |||||||
| Indonesia—0.9% |
| |||||||
Bank Central Asia Tbk PT | 1,146,000 | 2,292,918 | ||||||
|
| |||||||
| Korea (Republic of)—11.3% |
| |||||||
CJ CheilJedang Corp. | 17,565 | 4,796,037 | ||||||
Hana Financial Group, Inc. | 146,900 | 3,340,852 | ||||||
Kia Motors Corp. | 79,219 | 2,140,700 | ||||||
LG Electronics, Inc. | 33,378 | 1,768,890 | ||||||
Samsung Electronics Co., Ltd. | 221,222 | 9,792,974 | ||||||
SK Hynix, Inc. | 95,688 | 6,831,977 | ||||||
|
| |||||||
| 28,671,430 | ||||||||
|
| |||||||
| Malaysia—1.6% |
| |||||||
Top Glove Corp., Bhd | 1,052,600 | 3,972,431 | ||||||
|
| |||||||
| Poland—0.9% |
| |||||||
CD Projekt S.A. (e) | 23,146 | 2,332,501 | ||||||
|
| |||||||
| Russian Federation—4.8% |
| |||||||
Lukoil PJSC ADR | 89,000 | 6,615,736 | ||||||
MMC Norilsk Nickel PJSC ADR | 162,593 | 4,249,947 | ||||||
VTB Bank PJSC GDR | 1,302,252 | 1,215,323 | ||||||
|
| |||||||
| 12,081,006 | ||||||||
|
| |||||||
| South Africa—2.7% |
| |||||||
AngloGold Ashanti Ltd. ADR | 89,200 | 2,630,508 | ||||||
Aspen Pharmacare Holdings Ltd. (e) | 92,205 | 765,881 | ||||||
Gold Fields Ltd. ADR | 300,200 | 2,821,880 | ||||||
Nedbank Group Ltd. | 105,368 | 617,814 | ||||||
|
| |||||||
| 6,836,083 | ||||||||
|
| |||||||
| Taiwan—16.7% |
| |||||||
Cathay Financial Holding Co., Ltd. | 561,000 | 798,015 | ||||||
Compeq Manufacturing Co., Ltd. | 1,785,000 | 2,913,469 | ||||||
CTBC Financial Holding Co., Ltd. | 1,064,000 | 737,392 | ||||||
Hon Hai Precision Industry Co., Ltd. | 1,804,000 | 5,296,822 | ||||||
Radiant Opto-Electronics Corp. | 812,000 | 3,287,835 | ||||||
Sino-American Silicon Products, Inc. | 481,000 | 1,559,849 | ||||||
Taiwan Semiconductor Manufacturing Co., Ltd. | 1,874,000 | 20,013,405 | ||||||
Uni-President Enterprises Corp. | 637,000 | 1,543,327 | ||||||
United Microelectronics Corp. | 6,890,000 | 3,725,012 | ||||||
Zhen Ding Technology Holding Ltd. | 561,000 | 2,461,938 | ||||||
|
| |||||||
| 42,337,064 | ||||||||
|
| |||||||
| 62 | Annual Report | | June 30, 2020 | | See accompanying Notes to Financial Statements |
Table of Contents
Schedule of Investments
June 30, 2020
| Shares | Value | |||||||
| Thailand—3.0% |
| |||||||
Charoen Pokphand Foods PCL (c)(d) | 7,373,900 | $ | 7,604,987 | |||||
|
| |||||||
| Turkey—0.8% |
| |||||||
KOC Holding AS | 233,104 | 613,099 | ||||||
Vestel Elektronik Sanayi ve Ticaret AS (e) | 584,565 | 1,384,035 | ||||||
|
| |||||||
| 1,997,134 | ||||||||
|
| |||||||
| United States—0.6% |
| |||||||
AutoZone, Inc. (e) | 1,300 | 1,466,556 | ||||||
|
| |||||||
| Total Common Stock (cost—$206,224,854) |
| 248,990,463 | ||||||
|
| |||||||
| Preferred Stock—1.0% |
| |||||||
| Brazil—1.0% |
| |||||||
Cia Paranaense de Energia | 221,800 | 2,480,623 | ||||||
|
| |||||||
| Total Investments (cost—$207,989,990) (b)—99.2% |
| 251,471,086 | ||||||
|
| |||||||
| Other assets less liabilities—0.8% |
| 2,056,308 | ||||||
|
| |||||||
| Net Assets—100.0% |
| $253,527,394 | ||||||
|
| |||||||
Notes to Schedule of Investments:
(a) 144A—Exempt from registration under Rule 144A of the Securities Act of 1933. These securities may be resold in transactions exempt from registration, typically only to qualified institutional buyers. Security with a value of $2,623,260, representing 1.0% of net assets.
(b) Securities with an aggregate value of $197,384,116, representing 77.9% of net assets, were valued utilizing modeling tools provided by a third-party vendor. See Note 1(a) and Note 1(b) in the Notes to Financial Statements.
(c) Fair-Valued—Security with a value of $7,604,987, representing 3.0% of net assets. See Note 1(a) and Note 1(b) in the Notes to Financial Statements.
(d) Level 3 security. See Note 1(a) and Note 1(b) in the Notes to Financial Statements.
(e) Non-income producing.
Glossary:
ADR—American Depositary Receipt
GDR—Global Depository Receipt
The industry classification of portfolio holdings and other assets less liabilities shown as a percentage of net assets were as follows:
Semiconductors & Semiconductor Equipment | 14.0% | |||
Banks | 9.0% | |||
Internet & Direct Marketing Retail | 8.9% | |||
Food Products | 8.6% | |||
Interactive Media & Services | 8.5% | |||
Entertainment | 7.9% | |||
Electronic Equipment, Instruments & Components | 4.2% | |||
Technology Hardware, Storage & Peripherals | 3.9% | |||
Metals & Mining | 3.8% | |||
Construction Materials | 3.7% | |||
Beverages | 3.0% | |||
Oil, Gas & Consumable Fuels | 2.9% | |||
Healthcare Equipment & Supplies | 2.7% | |||
Machinery | 2.5% | |||
Diversified Consumer Services | 2.5% | |||
Real Estate Management & Development | 1.5% | |||
IT Services | 1.3% | |||
Household Durables | 1.2% | |||
Automobiles | 1.2% | |||
Personal Products | 1.1% | |||
Thrifts & Mortgage Finance | 1.0% | |||
Insurance | 1.0% | |||
Electric Utilities | 1.0% | |||
Specialty Retail | 0.6% | |||
Diversified Financial Services | 0.6% | |||
Household Products | 0.5% | |||
Life Sciences Tools & Services | 0.5% | |||
Independent Power Producers & Energy Traders | 0.4% | |||
Auto Components | 0.4% | |||
Chemicals | 0.3% | |||
Pharmaceuticals | 0.3% | |||
Industrial Conglomerates | 0.2% | |||
Other assets less liabilities | 0.8% | |||
|
| |||
| 100.0% | ||||
|
|
AllianzGI Focused Growth Fund
| Shares | Value | |||||||
| Common Stock—99.3% |
| |||||||
| Aerospace & Defense—2.4% |
| |||||||
L3Harris Technologies, Inc. | 90,445 | $15,345,803 | ||||||
Lockheed Martin Corp. | 29,527 | 10,774,993 | ||||||
|
| |||||||
| 26,120,796 | ||||||||
|
| |||||||
| Airlines—1.8% |
| |||||||
Southwest Airlines Co. | 554,590 | 18,955,886 | ||||||
|
| |||||||
| Automobiles—3.1% |
| |||||||
Tesla, Inc. | 31,110 | 33,592,889 | ||||||
|
| |||||||
| Biotechnology—3.1% |
| |||||||
Exact Sciences Corp. (b) | 114,030 | 9,913,768 | ||||||
Immunomedics, Inc. (b) | 332,590 | 11,786,990 | ||||||
Vertex Pharmaceuticals, Inc. (b) | 40,930 | 11,882,388 | ||||||
|
| |||||||
| 33,583,146 | ||||||||
|
| |||||||
| Capital Markets—5.0% |
| |||||||
Morgan Stanley | 194,105 | 9,375,271 | ||||||
MSCI, Inc. | 60,645 | 20,244,514 | ||||||
S&P Global, Inc. | 74,350 | 24,496,838 | ||||||
|
| |||||||
| 54,116,623 | ||||||||
|
| |||||||
| Diversified Consumer Services—0.6% |
| |||||||
Bright Horizons Family Solutions, Inc. (b) | 57,125 | 6,695,050 | ||||||
|
| |||||||
| Healthcare Equipment & Supplies—2.0% |
| |||||||
DexCom, Inc. (b) | 19,945 | 8,085,703 | ||||||
Tandem Diabetes Care, Inc. (b) | 134,650 | 13,319,578 | ||||||
|
| |||||||
| 21,405,281 | ||||||||
|
| |||||||
| Healthcare Providers & Services—1.3% |
| |||||||
Anthem, Inc. | 51,945 | 13,660,496 | ||||||
|
| |||||||
| Hotels, Restaurants & Leisure—2.3% |
| |||||||
Chipotle Mexican Grill, Inc. (b) | 10,880 | 11,449,677 | ||||||
Las Vegas Sands Corp. | 278,260 | 12,671,960 | ||||||
|
| |||||||
| 24,121,637 | ||||||||
|
| |||||||
| Interactive Media & Services—7.2% |
| |||||||
Alphabet, Inc., Class A (b) | 11,940 | 16,931,517 | ||||||
Facebook, Inc., Class A (b) | 203,350 | 46,174,685 | ||||||
Tencent Holdings Ltd. ADR | 225,575 | 14,436,800 | ||||||
|
| |||||||
| 77,543,002 | ||||||||
|
| |||||||
| Internet & Direct Marketing Retail—7.2% |
| |||||||
Amazon.com, Inc. (b) | 27,952 | 77,114,537 | ||||||
|
| |||||||
| IT Services—16.0% |
| |||||||
EPAM Systems, Inc. (b) | 96,365 | 24,284,944 | ||||||
Mastercard, Inc., Class A | 115,920 | 34,277,544 | ||||||
Okta, Inc. (b) | 70,140 | 14,044,132 | ||||||
PayPal Holdings, Inc. (b) | 212,160 | 36,964,637 | ||||||
Repay Holdings Corp. (b) | 318,470 | 7,843,916 | ||||||
Square, Inc., Class A (b) | 98,190 | 10,304,059 | ||||||
Visa, Inc., Class A | 230,080 | 44,444,553 | ||||||
|
| |||||||
| 172,163,785 | ||||||||
|
| |||||||
| Life Sciences Tools & Services—0.8% |
| |||||||
Agilent Technologies, Inc. | 93,785 | 8,287,780 | ||||||
|
| |||||||
| Multi-Line Retail—2.3% |
| |||||||
Dollar General Corp. | 131,130 | 24,981,576 | ||||||
|
| |||||||
| Personal Products—0.9% |
| |||||||
Estee Lauder Cos., Inc., Class A | 52,155 | 9,840,605 | ||||||
|
| |||||||
| See accompanying Notes to Financial Statements | | June 30, 2020 | | Annual Report | 63 |
Table of Contents
Schedule of Investments
June 30, 2020
| Shares | Value | |||||||
| Pharmaceuticals—7.4% |
| |||||||
AstraZeneca PLC ADR | 409,405 | $ | 21,653,431 | |||||
Bristol-Myers Squibb Co. | 185,000 | 10,878,000 | ||||||
Horizon Therapeutics PLC (b) | 448,865 | 24,947,917 | ||||||
Zoetis, Inc. | 160,860 | 22,044,254 | ||||||
|
| |||||||
| 79,523,602 | ||||||||
|
| |||||||
| Road & Rail—2.0% |
| |||||||
Union Pacific Corp. | 129,925 | 21,966,420 | ||||||
|
| |||||||
| Semiconductors & Semiconductor Equipment—5.7% |
| |||||||
Lam Research Corp. | 88,200 | 28,529,172 | ||||||
Micron Technology, Inc. (b) | 236,055 | 12,161,553 | ||||||
NVIDIA Corp. | 52,825 | 20,068,746 | ||||||
|
| |||||||
| 60,759,471 | ||||||||
|
| |||||||
| Software—14.6% |
| |||||||
Microsoft Corp. | 596,775 | 121,449,680 | ||||||
Salesforce.com, Inc. (b) | 121,360 | 22,734,369 | ||||||
ServiceNow, Inc. (b) | 32,060 | 12,986,224 | ||||||
|
| |||||||
| 157,170,273 | ||||||||
|
| |||||||
| Shares | Value | |||||||
| Specialty Retail—5.1% |
| |||||||
Burlington Stores, Inc. (b) | 97,215 | $ | 19,144,550 | |||||
Lowe’s Cos., Inc. | 151,895 | 20,524,053 | ||||||
O’Reilly Automotive, Inc. (b) | 36,145 | 15,241,262 | ||||||
|
| |||||||
| 54,909,865 | ||||||||
|
| |||||||
| Technology Hardware, Storage & Peripherals—8.5% |
| |||||||
Apple, Inc. (a) | 251,810 | 91,860,288 | ||||||
|
| |||||||
| Total Common Stock (cost—$586,573,405) |
| 1,068,373,008 | ||||||
|
| |||||||
| Principal Amount (000s) | ||||||||
| Repurchase Agreements—1.1% |
| |||||||
State Street Bank and Trust Co., |
| |||||||
(cost—$12,301,000) | $12,301 | 12,301,000 | ||||||
|
| |||||||
| Principal Amount (000s) | Value | |||||
Total Investments, before options written (cost—$598,874,405)—100.4% | $ | 1,080,674,008 | ||||
|
| |||||
| Total Options Written—(0.0)% (premiums received—$574,213) (b)(c)(d) | (35,375 | ) | ||||
|
| |||||
| Total Investments, net of options written (cost—$598,300,192)—100.4% | 1,080,638,633 | |||||
|
| |||||
| Other liabilities in excess of other assets—(0.4)% | (4,285,473 | ) | ||||
|
| |||||
| Net Assets—100.0% | $1,076,353,160 | |||||
|
| |||||
Notes to Schedule of Investments:
(a) All or partial amount segregated for the benefit of the counterparty as collateral for option written.
(b) Non-income producing.
(c) Exchange traded-Chicago Board Options Exchange.
(d) Exchange traded option contracts outstanding at June 30, 2020:
| Options written contracts outstanding at June 30, 2020: | ||||||||||||||||||||||||||||
| Description | Exercise Price | Expiration Date | Number of Contracts | Notional Amount | Market Value | Premiums Received | Unrealized Appreciation | |||||||||||||||||||||
Put options: | ||||||||||||||||||||||||||||
Tesla, Inc. | 500.00 USD | 9/18/20 | (50 | ) | $ | (5,000 | ) | $ | (35,375 | ) | $ | (574,213 | ) | $ | 538,838 | |||||||||||||
|
| |||||||||||||||||||||||||||
Glossary:
ADR—American Depositary Receipt
| 64 | Annual Report | | June 30, 2020 | | See accompanying Notes to Financial Statements |
Table of Contents
Schedule of Investments
June 30, 2020
AllianzGI Global Small-Cap Fund
| Shares | Value | |||||||
| Common Stock—98.0% |
| |||||||
| Australia—2.5% |
| |||||||
Ansell Ltd. | 4,777 | $121,431 | ||||||
Austal Ltd. | 109,017 | 245,729 | ||||||
Bapcor Ltd. | 29,003 | 119,615 | ||||||
Cleanaway Waste Management Ltd. | 158,184 | 242,872 | ||||||
JB Hi-Fi Ltd. | 2,189 | 65,494 | ||||||
NEXTDC Ltd. (c) | 36,100 | 248,304 | ||||||
Northern Star Resources Ltd. | 22,100 | 208,425 | ||||||
Paradigm Biopharmaceuticals Ltd. (c) | 14,171 | 31,431 | ||||||
Pro Medicus Ltd. | 7,800 | 143,631 | ||||||
Seven Group Holdings Ltd. | 16,500 | 198,459 | ||||||
Starpharma Holdings Ltd. (c) | 104,609 | 81,589 | ||||||
Worley Ltd. | 19,650 | 120,235 | ||||||
|
| |||||||
| 1,827,215 | ||||||||
|
| |||||||
| Austria—0.6% |
| |||||||
Wienerberger AG (c) | 19,091 | 415,891 | ||||||
|
| |||||||
| Denmark—1.2% |
| |||||||
Ambu A/S, Class B | 14,315 | 452,530 | ||||||
SimCorp A/S | 4,270 | 461,810 | ||||||
|
| |||||||
| 914,340 | ||||||||
|
| |||||||
| Finland—0.5% |
| |||||||
Huhtamaki Oyj (c) | 9,284 | 367,283 | ||||||
|
| |||||||
| France—2.1% |
| |||||||
Korian S.A. | 11,794 | 432,877 | ||||||
Nexity S.A. | 9,943 | 323,422 | ||||||
SCOR SE (c) | 15,636 | 431,839 | ||||||
SPIE S.A. | 25,876 | 388,815 | ||||||
|
| |||||||
| 1,576,953 | ||||||||
|
| |||||||
| Germany—3.4% |
| |||||||
alstria office REIT-AG (c) | 25,981 | 386,680 | ||||||
Bechtle AG | 2,555 | 452,850 | ||||||
CANCOM SE | 7,381 | 393,471 | ||||||
Hella GmbH & Co. KGaA | 10,695 | 439,338 | ||||||
Scout24 AG (a) | 5,898 | 456,315 | ||||||
Siltronic AG (c) | 4,296 | 440,528 | ||||||
|
| |||||||
| 2,569,182 | ||||||||
|
| |||||||
| Hong Kong—0.9% |
| |||||||
Alphamab Oncology (a)(c) | 31,000 | 72,150 | ||||||
Hutchison China MediTech Ltd. ADR (c) | 7,100 | 195,818 | ||||||
Nissin Foods Co., Ltd. | 316,000 | 255,102 | ||||||
Techtronic Industries Co., Ltd. | 16,500 | 163,260 | ||||||
|
| |||||||
| 686,330 | ||||||||
|
| |||||||
| Indonesia—0.1% |
| |||||||
Jasa Marga Persero Tbk PT (c) | 145,700 | 45,034 | ||||||
|
| |||||||
| Ireland—0.4% |
| |||||||
Dalata Hotel Group PLC | 96,941 | 311,180 | ||||||
|
| |||||||
| Italy—1.0% |
| |||||||
Buzzi Unicem SpA | 20,995 | 453,654 | ||||||
ERG SpA | 12,911 | 278,987 | ||||||
|
| |||||||
| 732,641 | ||||||||
|
| |||||||
| Japan—12.4% |
| |||||||
Anritsu Corp. | 27,500 | 653,323 | ||||||
Azbil Corp. | 17,500 | 534,879 | ||||||
CKD Corp. | 33,300 | 592,617 | ||||||
COMSYS Holdings Corp. | 10,400 | 308,412 | ||||||
Fuji Electric Co., Ltd. | 15,600 | 429,374 | ||||||
Fuji Oil Holdings, Inc. | 12,100 | 311,339 | ||||||
Glory Ltd. | 12,200 | 278,288 | ||||||
GLP J-Reit REIT | 107 | 154,620 | ||||||
Heiwa Real Estate Co., Ltd. | 14,600 | 418,288 | ||||||
HOLON Co., Ltd. | 2,100 | 94,489 | ||||||
| Shares | Value | |||||||
Itochu Techno-Solutions Corp. | 22,100 | $ | 831,110 | |||||
Jeol Ltd. | 19,200 | 533,309 | ||||||
Marui Group Co., Ltd. | 31,300 | 566,195 | ||||||
Mitsubishi UFJ Lease & Finance Co., Ltd. | 98,700 | 470,981 | ||||||
Nihon M&A Center, Inc. | 2,400 | 109,147 | ||||||
Nihon Unisys Ltd. | 18,200 | 572,230 | ||||||
PALTAC Corp. | 2,200 | 101,493 | ||||||
Penta-Ocean Construction Co., Ltd. | 114,000 | 615,645 | ||||||
Ryohin Keikaku Co., Ltd. | 7,400 | 105,254 | ||||||
T&D Holdings, Inc. | 11,100 | 95,340 | ||||||
Taiyo Yuden Co., Ltd. | 4,600 | 143,844 | ||||||
TechnoPro Holdings, Inc. | 7,100 | 409,880 | ||||||
Tokyu Fudosan Holdings Corp. | 84,100 | 395,646 | ||||||
Yaoko Co., Ltd. | 3,200 | 229,052 | ||||||
Zenkoku Hosho Co., Ltd. | 8,500 | 321,112 | ||||||
|
| |||||||
| 9,275,867 | ||||||||
|
| |||||||
| Korea (Republic of)—0.3% |
| |||||||
Koh Young Technology, Inc. | 2,660 | 222,318 | ||||||
|
| |||||||
| Netherlands—1.3% |
| |||||||
ASM International NV | 3,261 | 502,019 | ||||||
ASR Nederland NV | 14,632 | 450,188 | ||||||
|
| |||||||
| 952,207 | ||||||||
|
| |||||||
| Norway—1.0% |
| |||||||
Elkem ASA (a) | 166,848 | 343,876 | ||||||
Storebrand ASA (c) | 80,317 | 418,551 | ||||||
|
| |||||||
| 762,427 | ||||||||
|
| |||||||
| Singapore—0.7% |
| |||||||
Mapletree Commercial Trust REIT | 132,688 | 185,658 | ||||||
Mapletree Industrial Trust REIT | 162,500 | 338,036 | ||||||
|
| |||||||
| 523,694 | ||||||||
|
| |||||||
| Sweden—1.1% |
| |||||||
AAK AB (c) | 24,785 | 427,792 | ||||||
Elekta AB, Class B | 41,425 | 385,889 | ||||||
|
| |||||||
| 813,681 | ||||||||
|
| |||||||
| Switzerland—2.6% |
| |||||||
Galenica AG (a) | 5,592 | 400,920 | ||||||
Georg Fischer AG | 527 | 454,327 | ||||||
Interroll Holding AG | 217 | 439,007 | ||||||
OC Oerlikon Corp. AG | 45,905 | 376,568 | ||||||
Quotient Ltd. (c) | 38,091 | 281,873 | ||||||
|
| |||||||
| 1,952,695 | ||||||||
|
| |||||||
| Taiwan—0.8% |
| |||||||
ASMedia Technology, Inc. | 2,000 | 97,944 | ||||||
Taiwan Surface Mounting Technology Corp. | 52,000 | 231,216 | ||||||
Win Semiconductors Corp. | 14,000 | 142,941 | ||||||
Yageo Corp. | 8,000 | 104,223 | ||||||
|
| |||||||
| 576,324 | ||||||||
|
| |||||||
| United Kingdom—6.9% |
| |||||||
ASOS PLC (c) | 11,131 | 473,095 | ||||||
Auto Trader Group PLC (a) | 68,372 | 445,153 | ||||||
Crest Nicholson Holdings PLC | 96,808 | 236,648 | ||||||
Derwent London PLC REIT | 10,312 | 354,721 | ||||||
Genus PLC | 9,674 | 423,482 | ||||||
HomeServe PLC | 28,076 | 453,904 | ||||||
Howden Joinery Group PLC | 54,175 | 370,891 | ||||||
Intermediate Capital Group PLC | 26,650 | 425,169 | ||||||
Mimecast Ltd. (c) | 9,303 | 387,563 | ||||||
Moneysupermarket.com Group PLC | 108,618 | 435,710 | ||||||
| Shares | Value | |||||||
Rotork PLC | 108,927 | $ | 376,997 | |||||
Spectris PLC | 12,003 | 374,885 | ||||||
Wizz Air Holdings PLC (a)(c) | 8,879 | 366,854 | ||||||
|
| |||||||
| 5,125,072 | ||||||||
|
| |||||||
| United States—58.2% |
| |||||||
ACADIA Pharmaceuticals, Inc. (c) | 8,117 | 393,431 | ||||||
Adaptive Biotechnologies Corp. (c) | 11,227 | 543,162 | ||||||
Agree Realty Corp. REIT | 10,601 | 696,592 | ||||||
Americold Realty Trust REIT | 19,909 | 722,697 | ||||||
Axon Enterprise, Inc. (c) | 7,779 | 763,353 | ||||||
Blackline, Inc. (c) | 6,496 | 538,583 | ||||||
Bright Horizons Family Solutions, Inc. (c) | 3,695 | 433,054 | ||||||
Cerence, Inc. (c) | 11,450 | 467,618 | ||||||
Chegg, Inc. (c) | 15,031 | 1,010,985 | ||||||
Chemours Co. | 42,865 | 657,978 | ||||||
Churchill Downs, Inc. | 4,030 | 536,595 | ||||||
Clean Harbors, Inc. (c) | 11,852 | 710,883 | ||||||
Everbridge, Inc. (c) | 2,182 | 301,902 | ||||||
EverQuote, Inc., Class A (c) | 11,408 | 663,489 | ||||||
Fastly, Inc., Class A (c) | 7,883 | 671,080 | ||||||
Floor & Decor Holdings, Inc., Class A (c) | 10,261 | 591,547 | ||||||
FormFactor, Inc. (c) | 7,455 | 218,655 | ||||||
Freshpet, Inc. (c) | 8,762 | 733,029 | ||||||
Grocery Outlet Holding Corp. (c) | 19,660 | 802,128 | ||||||
Haemonetics Corp. (c) | 6,652 | 595,753 | ||||||
Health Catalyst, Inc. (c) | 15,088 | 440,117 | ||||||
Horizon Therapeutics PLC (c) | 23,705 | 1,317,524 | ||||||
HubSpot, Inc. (c) | 3,557 | 798,013 | ||||||
IAA, Inc. (c) | 16,986 | 655,150 | ||||||
ICF International, Inc. | 7,907 | 512,611 | ||||||
II-VI, Inc. (c) | 11,813 | 557,810 | ||||||
Immunomedics, Inc. (c) | 15,695 | 556,231 | ||||||
Intersect ENT, Inc. (c) | 17,515 | 237,153 | ||||||
ITT, Inc. | 8,779 | 515,678 | ||||||
Kinsale Capital Group, Inc. | 4,202 | 652,192 | ||||||
Kratos Defense & Security Solutions, Inc. (c) | 34,365 | 537,125 | ||||||
LHC Group, Inc. (c) | 4,500 | 784,440 | ||||||
LPL Financial Holdings, Inc. | 8,930 | 700,112 | ||||||
Materion Corp. | 7,513 | 461,974 | ||||||
Mercury Systems, Inc. (c) | 9,514 | 748,371 | ||||||
MKS Instruments, Inc. | 5,434 | 615,346 | ||||||
Monolithic Power Systems, Inc. | 2,410 | 571,170 | ||||||
NanoString Technologies, Inc. (c) | 9,743 | 285,957 | ||||||
Nevro Corp. (c) | 3,301 | 394,371 | ||||||
nLight, Inc. (c) | 14,236 | 316,893 | ||||||
Norwegian Cruise Line Holdings Ltd. (c) | 26,889 | 441,786 | ||||||
Novocure Ltd. (c) | 5,076 | 301,007 | ||||||
Ollie’s Bargain Outlet Holdings, Inc. (c) | 5,988 | 584,728 | ||||||
Onto Innovation, Inc. (c) | 12,696 | 432,172 | ||||||
Palomar Holdings, Inc. (c) | 10,672 | 915,231 | ||||||
Paylocity Holding Corp. (c) | 4,140 | 603,985 | ||||||
Pebblebrook Hotel Trust REIT | 42,018 | 573,966 | ||||||
Penn National Gaming, Inc. (c) | 13,255 | 404,808 | ||||||
Perficient, Inc. (c) | 17,248 | 617,133 | ||||||
PetIQ, Inc. (c) | 22,192 | 773,169 | ||||||
Pinnacle Financial Partners, Inc. | 16,663 | 699,679 | ||||||
Planet Fitness, Inc., Class A (c) | 10,681 | 646,948 | ||||||
Pool Corp. | 2,760 | 750,361 | ||||||
Power Integrations, Inc. | 1,942 | 229,408 | ||||||
Q2 Holdings, Inc. (c) | 5,915 | 507,448 | ||||||
| See accompanying Notes to Financial Statements | | June 30, 2020 | | Annual Report | 65 |
Table of Contents
Schedule of Investments
June 30, 2020
| Shares | Value | |||||||
QTS Realty Trust, Inc., Class A REIT | 10,295 | $ | 659,807 | |||||
Qualys, Inc. (c) | 3,762 | 391,323 | ||||||
Repay Holdings Corp. (c) | 34,019 | 837,888 | ||||||
Saia, Inc. (c) | 5,244 | 583,028 | ||||||
Shockwave Medical, Inc. (c) | 7,779 | 368,491 | ||||||
Silk Road Medical, Inc. (c) | 4,658 | 195,124 | ||||||
Spirit AeroSystems Holdings, Inc., Class A | 15,820 | 378,731 | ||||||
Summit Materials, Inc., Class A (c) | 39,030 | 627,602 | ||||||
Tandem Diabetes Care, Inc. (c) | 9,934 | 982,671 | ||||||
TechTarget, Inc. (c) | 13,631 | 409,339 | ||||||
Terreno Realty Corp. REIT | 15,115 | 795,654 | ||||||
Trex Co., Inc. (c) | 5,066 | 658,935 | ||||||
Twist Bioscience Corp. (c) | 6,009 | 272,208 | ||||||
Veracyte, Inc. (c) | 15,917 | 412,250 | ||||||
Visteon Corp. (c) | 6,434 | 440,729 | ||||||
Wendy’s Co. | 29,231 | 636,651 | ||||||
Western Alliance Bancorp | 18,915 | 716,311 | ||||||
YETI Holdings, Inc. (c) | 17,694 | 756,065 | ||||||
Zynga, Inc., Class A (c) | 111,636 | 1,065,007 | ||||||
|
| |||||||
| 43,380,395 | ||||||||
|
| |||||||
| Total Common Stock (cost—$61,220,896) |
| 73,030,729 | ||||||
|
| |||||||
| Shares | Value | |||||||
| Preferred Stock—0.7% |
| |||||||
| Germany—0.7% |
| |||||||
Jungheinrich AG (c) | 22,179 | $ | 521,470 | |||||
|
| |||||||
| Principal Amount (000s) | ||||||||
| Repurchase Agreements—1.1% |
| |||||||
State Street Bank and Trust Co., |
| |||||||
(cost—$834,000) | $834 | 834,000 | ||||||
|
| |||||||
| Total Investments (cost-$62,661,158) (b)—99.8% |
| 74,386,199 | ||||||
|
| |||||||
| Other assets less liabilities (d)—0.2% |
| 167,660 | ||||||
|
| |||||||
| Net Assets—100.0% |
| $74,553,859 | ||||||
|
| |||||||
Notes to Schedule of Investments:
(a) 144A—Exempt from registration under Rule 144A of the Securities Act of 1933. These securities may be resold in transactions exempt from registration, typically only to qualified institutional buyers. Securities with an aggregate value of $2,085,268, representing 2.8% of net assets.
(b) Securities with an aggregate value of $28,890,659, representing 38.8% of net assets, were valued utilizing modeling tools provided by a third-party vendor. See Note 1(a) and Note 1(b) in the Notes to Financial Statements.
(c) Non-income producing.
(d) Includes net unrealized depreciation of other financial instruments as follows:
| Forward foreign currency contracts outstanding at June 30, 2020: | ||||||||||||||||
| Description | Counterparty | U.S.$ Value on Origination Date | U.S.$ Value June 30, 2020 | Unrealized Depreciation | ||||||||||||
Purchased: | ||||||||||||||||
9,852 Singapore Dollar settling 7/2/20 | State Street Bank London | $ | 7,099 | $ | 7,070 | $ | (29 | ) | ||||||||
|
| |||||||||||||||
Glossary:
ADR—American Depositary Receipt
REIT—Real Estate Investment Trust
| 66 | Annual Report | | June 30, 2020 | | See accompanying Notes to Financial Statements |
Table of Contents
Schedule of Investments
June 30, 2020
The industry classification of portfolio holdings and other assets less liabilities shown as a percentage of net assets were as follows:
Equity Real Estate Investment Trusts (REITs) | 6.5% | |||
IT Services | 6.2% | |||
Healthcare Equipment & Supplies | 6.2% | |||
Software | 6.0% | |||
Semiconductors & Semiconductor Equipment | 5.1% | |||
Machinery | 5.0% | |||
Hotels, Restaurants & Leisure | 4.0% | |||
Insurance | 4.0% | |||
Electronic Equipment, Instruments & Components | 3.6% | |||
Aerospace & Defense | 3.6% | |||
Commercial Services & Supplies | 3.3% | |||
Healthcare Providers & Services | 3.2% | |||
Biotechnology | 2.9% | |||
Pharmaceuticals | 2.4% | |||
Food Products | 2.3% | |||
Interactive Media & Services | 2.1% | |||
Construction Materials | 2.0% | |||
Diversified Consumer Services | 1.9% | |||
Banks | 1.9% | |||
Multi-Line Retail | 1.7% | |||
Capital Markets | 1.5% | |||
Entertainment | 1.4% | |||
Professional Services | 1.4% | |||
Food & Staples Retailing | 1.4% | |||
Chemicals | 1.3% | |||
Distributors | 1.3% | |||
Construction & Engineering | 1.2% | |||
Internet & Direct Marketing Retail | 1.2% | |||
Auto Components | 1.2% | |||
Life Sciences Tools & Services | 1.1% | |||
Diversified Financial Services | 1.1% | |||
Leisure Equipment & Products | 1.0% | |||
Real Estate Management & Development | 1.0% | |||
Metals & Mining | 0.9% | |||
Building Products | 0.9% | |||
Specialty Retail | 0.9% | |||
Healthcare Technology | 0.8% | |||
Road & Rail | 0.8% | |||
Trading Companies & Distributors | 0.8% | |||
Electrical Equipment | 0.6% | |||
Real Estate | 0.5% | |||
Media | 0.5% | |||
Containers & Packaging | 0.5% | |||
Airlines | 0.5% | |||
Independent Power Producers & Energy Traders | 0.4% | |||
Household Durables | 0.3% | |||
Energy Equipment & Services | 0.2% | |||
Transportation Infrastructure | 0.1% | |||
Repurchase Agreements | 1.1% | |||
Other assets less liabilities | 0.2% | |||
|
| |||
| 100.0% | ||||
|
|
AllianzGI Health Sciences Fund
| Shares | Value | |||||||
| Common Stock—95.7% |
| |||||||
| Biotechnology—16.0% |
| |||||||
AbbVie, Inc. | 53,520 | $5,254,593 | ||||||
ACADIA Pharmaceuticals, Inc. (d) | 17,995 | 872,218 | ||||||
Amgen, Inc. | 8,945 | 2,109,768 | ||||||
Arena Pharmaceuticals, Inc. (d) | 10,615 | 668,214 | ||||||
Aurinia Pharmaceuticals, Inc. (d) | 25,560 | 415,350 | ||||||
BioMarin Pharmaceutical, Inc. (d) | 18,165 | 2,240,471 | ||||||
BioNTech SE ADR (d) | 6,420 | 428,471 | ||||||
Deciphera Pharmaceuticals, Inc. (d) | 9,040 | 539,869 | ||||||
Epizyme, Inc. (d) | 34,770 | 558,406 | ||||||
Exact Sciences Corp. (d) | 17,410 | 1,513,625 | ||||||
Gilead Sciences, Inc. | 19,595 | 1,507,639 | ||||||
ImmunoGen, Inc. (d) | 86,940 | 399,924 | ||||||
Immunomedics, Inc. (d) | 41,830 | 1,482,455 | ||||||
Iovance Biotherapeutics, Inc. (d) | 22,435 | 615,841 | ||||||
Karyopharm Therapeutics, Inc. (d) | 17,005 | 322,075 | ||||||
Mersana Therapeutics, Inc. (d) | 19,060 | 446,004 | ||||||
Momenta Pharmaceuticals, Inc. (d) | 22,385 | 744,749 | ||||||
Regeneron Pharmaceuticals, Inc. (d) | 1,965 | 1,225,472 | ||||||
Translate Bio, Inc. (d) | 9,000 | 161,280 | ||||||
Turning Point Therapeutics, Inc. (d) | 6,115 | 394,968 | ||||||
Twist Bioscience Corp. (d) | 14,860 | 673,158 | ||||||
Vertex Pharmaceuticals, Inc. (d) | 12,690 | 3,684,034 | ||||||
|
| |||||||
| 26,258,584 | ||||||||
|
| |||||||
| Healthcare Equipment & Supplies—17.7% |
| |||||||
Abbott Laboratories | 18,423 | 1,684,415 | ||||||
Axonics Modulation Technologies, Inc. (d) | 24,700 | 867,217 | ||||||
Baxter International, Inc. | 14,290 | 1,230,369 | ||||||
Becton Dickinson and Co. | 12,885 | 3,082,994 | ||||||
Boston Scientific Corp. (d) | 81,982 | 2,878,388 | ||||||
CONMED Corp. | 16,160 | 1,163,358 | ||||||
Cooper Cos., Inc. | 6,950 | 1,971,298 | ||||||
DexCom, Inc. (d) | 5,200 | 2,108,080 | ||||||
GenMark Diagnostics, Inc. (d) | 68,530 | 1,008,076 | ||||||
Haemonetics Corp. (d) | 7,345 | 657,818 | ||||||
Hill-Rom Holdings, Inc. | 16,910 | 1,856,380 | ||||||
Hologic, Inc. (d) | 23,145 | 1,319,265 | ||||||
Itamar Medical Ltd. ADR (d) | 57,555 | 1,070,523 | ||||||
Medtronic PLC | 27,995 | 2,567,142 | ||||||
Meridian Bioscience, Inc. (d) | 27,590 | 642,571 | ||||||
Nevro Corp. (d) | 5,575 | 666,045 | ||||||
Quidel Corp. (d) | 3,240 | 724,918 | ||||||
Quotient Ltd. (d) | 171,919 | 1,272,201 | ||||||
Shockwave Medical, Inc. (d) | 12,920 | 612,020 | ||||||
Tandem Diabetes Care, Inc. (d) | 8,255 | 816,585 | ||||||
Zimmer Biomet Holdings, Inc. | 5,975 | 713,176 | ||||||
|
| |||||||
| 28,912,839 | ||||||||
|
| |||||||
| Healthcare Providers & Services—12.7% |
| |||||||
Anthem, Inc. | 13,865 | 3,646,218 | ||||||
Centene Corp. (d) | 66,380 | 4,218,449 | ||||||
Cigna Corp. (d) | 16,170 | 3,034,301 | ||||||
CVS Health Corp. | 22,900 | 1,487,813 | ||||||
Humana, Inc. | 5,270 | 2,043,443 | ||||||
LHC Group, Inc. (d) | 3,525 | 614,478 | ||||||
Tenet Healthcare Corp. (d) | 39,330 | 712,266 | ||||||
UnitedHealth Group, Inc. | 16,871 | 4,976,101 | ||||||
|
| |||||||
| 20,733,069 | ||||||||
|
| |||||||
| Shares | Value | |||||||
| Life Sciences Tools & Services—3.7% |
| |||||||
Agilent Technologies, Inc. | 22,700 | $ | 2,005,999 | |||||
Bio-Rad Laboratories, Inc., Class A (d) | 3,210 | 1,449,283 | ||||||
NanoString Technologies, Inc. (d) | 15,665 | 459,768 | ||||||
PRA Health Sciences, Inc. (d) | 7,560 | 735,512 | ||||||
Thermo Fisher Scientific, Inc. | 4,030 | 1,460,230 | ||||||
|
| |||||||
| 6,110,792 | ||||||||
|
| |||||||
| Pharmaceuticals—45.6% |
| |||||||
Astellas Pharma, Inc. | 148,100 | 2,473,205 | ||||||
AstraZeneca PLC ADR | 168,460 | 8,909,849 | ||||||
Bristol-Myers Squibb Co. | 113,320 | 6,663,216 | ||||||
Catalent, Inc. (d) | 33,205 | 2,433,927 | ||||||
Daiichi Sankyo Co., Ltd. | 28,600 | 2,339,240 | ||||||
Eli Lilly & Co. | 22,210 | 3,646,438 | ||||||
GlaxoSmithKline PLC ADR | 28,595 | 1,166,390 | ||||||
Horizon Therapeutics PLC (d) | 99,335 | 5,521,039 | ||||||
Johnson & Johnson | 40,957 | 5,759,783 | ||||||
Merck & Co., Inc. | 59,527 | 4,603,223 | ||||||
MyoKardia, Inc. (d) | 6,320 | 610,638 | ||||||
Novartis AG ADR | 92,208 | 8,053,447 | ||||||
Pfizer, Inc. | 162,299 | 5,307,177 | ||||||
Roche Holding AG ADR | 208,860 | 9,060,347 | ||||||
Sanofi ADR | 101,860 | 5,199,953 | ||||||
Zoetis, Inc. | 20,560 | 2,817,542 | ||||||
|
| |||||||
| 74,565,414 | ||||||||
|
| |||||||
| Total Common Stock (cost—$132,838,292) |
| 156,580,698 | ||||||
|
| |||||||
| Units | ||||||||
| Warrants—0.1% |
| |||||||
| Pharmaceuticals—0.1% |
| |||||||
AIT Therapeutics, Inc., exercise price $4.25, expires 2/14/21 (b)(c)(d) | 123,899 | 262,666 | ||||||
|
| |||||||
| Shares | ||||||||
| Rights—0.0% |
| |||||||
| Pharmaceuticals—0.0% |
| |||||||
Elanco Animal Health, Inc. CVR (b)(c)(d) | 38,000 | 957 | ||||||
|
| |||||||
| Principal Amount (000s) | ||||||||
| Repurchase Agreements—4.4% |
| |||||||
State Street Bank and Trust Co., |
| |||||||
(cost—$7,167,000) | $7,167 | 7,167,000 | ||||||
|
| |||||||
| Total Investments (cost—$140,007,488) (a)—100.2% |
| 164,011,321 | ||||||
|
| |||||||
| Liabilities in excess of other assets—(0.2)% |
| (385,061 | ) | |||||
|
| |||||||
| Net Assets—100.0% |
| $163,626,260 | ||||||
|
| |||||||
| See accompanying Notes to Financial Statements | | June 30, 2020 | | Annual Report | 67 |
Table of Contents
Schedule of Investments
June 30, 2020
Notes to Schedule of Investments:
(a) Securities with an aggregate value of $4,812,445, representing 2.9% of net assets, were valued utilizing modeling tools provided by a third-party vendor. See Note 1(a) and Note 1(b) in the Notes to Financial Statements.
(b) Fair-Valued—Securities with an aggregate value of $263,623, representing 0.2% of net assets. See Note 1(a) and Note 1(b) in the Notes to Financial Statements.
(c) Level 3 security. See Note 1(a) and Note 1(b) in the Notes to Financial Statements.
(d) Non-income producing.
Glossary:
ADR—American Depositary Receipt
CVR—Contingent Value Rights
AllianzGI Income & Growth Fund
| Shares | Value | |||||||
| Common Stock—34.3% |
| |||||||
| Advertising—0.0% |
| |||||||
Mood Media Corp. (e)(g)(m) | 286,500 | $157,575 | ||||||
|
| |||||||
| Aerospace & Defense—0.3% |
| |||||||
Boeing Co. | 65,500 | 12,006,150 | ||||||
Erickson, Inc. (e)(g)(m) | 10,866 | 183,201 | ||||||
|
| |||||||
| 12,189,351 | ||||||||
|
| |||||||
| Apparel & Textiles—0.0% |
| |||||||
Quiksilver, Inc. (e)(g)(m) | 2,328 | 28,890 | ||||||
|
| |||||||
| Automobiles—0.2% |
| |||||||
Ford Motor Co. | 1,199,700 | 7,294,176 | ||||||
|
| |||||||
| Banks—0.3% |
| |||||||
CCF Holdings LLC Class A (cost—$0; purchased 12/18/18) (e)(g)(k)(m) | 31,304 | 3 | ||||||
CCF Holdings LLC Class B (cost—$0; purchased 12/12/18) (e)(g)(j)(k)(m) | 42,857 | 4 | ||||||
JPMorgan Chase & Co. | 180,000 | 16,930,800 | ||||||
|
| |||||||
| 16,930,807 | ||||||||
|
| |||||||
| Beverages—0.3% |
| |||||||
PepsiCo, Inc. (h) | 104,000 | 13,755,040 | ||||||
|
| |||||||
| Biotechnology—1.5% |
| |||||||
AbbVie, Inc. | 301,842 | 29,634,847 | ||||||
Biogen, Inc. (m) | 29,700 | 7,946,235 | ||||||
BioMarin Pharmaceutical, Inc. (m) | 3,926 | 484,233 | ||||||
Gilead Sciences, Inc. | 163,350 | 12,568,149 | ||||||
Vertex Pharmaceuticals, Inc. (h)(m) | 84,100 | 24,415,071 | ||||||
|
| |||||||
| 75,048,535 | ||||||||
|
| |||||||
| Building Products—0.2% |
| |||||||
Johnson Controls International PLC | 335,482 | 11,453,356 | ||||||
|
| |||||||
| Capital Markets—0.7% |
| |||||||
Charles Schwab Corp. | 380,500 | 12,838,070 | ||||||
S&P Global, Inc. (h) | 61,000 | 20,098,280 | ||||||
|
| |||||||
| 32,936,350 | ||||||||
|
| |||||||
| Chemicals—0.2% |
| |||||||
Chemours Co. | 238,400 | 3,659,440 | ||||||
Corteva, Inc. (m) | 59,533 | 1,594,889 | ||||||
Dow, Inc. (m) | 59,533 | 2,426,565 | ||||||
DuPont de Nemours, Inc. | 59,533 | 3,162,988 | ||||||
|
| |||||||
| 10,843,882 | ||||||||
|
| |||||||
| Commercial Services—0.0% |
| |||||||
Cenveo Corp. (e)(g)(j)(m) | 19,074 | 576,798 | ||||||
|
| |||||||
| Commercial Services & Supplies—0.1% |
| |||||||
Stericycle, Inc. (m) | 66,843 | 3,741,871 | ||||||
|
| |||||||
| Communications Equipment—0.3% |
| |||||||
Cisco Systems, Inc. | 278,700 | 12,998,568 | ||||||
|
| |||||||
| Construction & Engineering—0.1% |
| |||||||
Fluor Corp. | 209,800 | 2,534,384 | ||||||
|
| |||||||
| Diversified Telecommunication Services—0.0% |
| |||||||
Frontier Communications Corp. (m) | 210,781 | 20,551 | ||||||
|
| |||||||
| Shares | Value | |||||||
| Electronic Equipment, Instruments & Components—0.1% |
| |||||||
Belden, Inc. | 125,172 | $ | 4,074,349 | |||||
|
| |||||||
| Energy Equipment & Services—0.1% |
| |||||||
Bristow Group, Inc. (m) | 2,838 | 39,533 | ||||||
National Oilwell Varco, Inc. | 145,600 | 1,783,600 | ||||||
Schlumberger Ltd. | 172,400 | 3,170,436 | ||||||
|
| |||||||
| 4,993,569 | ||||||||
|
| |||||||
| Entertainment—0.9% |
| |||||||
Activision Blizzard, Inc. (h) | 102,800 | 7,802,520 | ||||||
Netflix, Inc. (h)(m) | 84,800 | 38,587,392 | ||||||
|
| |||||||
| 46,389,912 | ||||||||
|
| |||||||
| Equity Real Estate Investment Trusts (REITs)—0.7% |
| |||||||
American Tower Corp. (h) | 83,000 | 21,458,820 | ||||||
Crown Castle International Corp. | 70,400 | 11,781,440 | ||||||
|
| |||||||
| 33,240,260 | ||||||||
|
| |||||||
| Food & Staples Retailing—0.6% |
| |||||||
Costco Wholesale Corp. (h) | 72,300 | 21,922,083 | ||||||
Walgreens Boots Alliance, Inc. | 154,600 | 6,553,494 | ||||||
|
| |||||||
| 28,475,577 | ||||||||
|
| |||||||
| Food Products—0.1% |
| |||||||
Archer-Daniels-Midland Co. | 159,650 | 6,370,035 | ||||||
|
| |||||||
| Healthcare Equipment & Supplies—1.3% |
| |||||||
Align Technology, Inc. (m) | 90,000 | 24,699,600 | ||||||
Boston Scientific Corp. (m) | 505,000 | 17,730,550 | ||||||
Intuitive Surgical, Inc. (h)(m) | 34,500 | 19,659,135 | ||||||
|
| |||||||
| 62,089,285 | ||||||||
|
| |||||||
| Healthcare Providers & Services—1.2% |
| |||||||
McKesson Corp. | 114,300 | 17,535,906 | ||||||
UnitedHealth Group, Inc. (h) | 143,800 | 42,413,810 | ||||||
|
| |||||||
| 59,949,716 | ||||||||
|
| |||||||
| Hotels, Restaurants & Leisure—0.9% |
| |||||||
McDonald’s Corp. | 112,000 | 20,660,640 | ||||||
Starbucks Corp. | 214,000 | 15,748,260 | ||||||
Wynn Resorts Ltd. | 114,200 | 8,506,758 | ||||||
|
| |||||||
| 44,915,658 | ||||||||
|
| |||||||
| Household Durables—0.4% |
| |||||||
DR Horton, Inc. (h) | 347,200 | 19,252,240 | ||||||
|
| |||||||
| Independent Power Producers & Energy Traders—0.1% |
| |||||||
Vistra Energy Corp. | 144,101 | 2,683,161 | ||||||
|
| |||||||
| Industrial Conglomerates—0.4% |
| |||||||
General Electric Co. | 326,200 | 2,227,946 | ||||||
Honeywell International, Inc. | 131,500 | 19,013,585 | ||||||
|
| |||||||
| 21,241,531 | ||||||||
|
| |||||||
| Insurance—0.1% |
| |||||||
Aon PLC, Class A | 8,900 | 1,714,140 | ||||||
Progressive Corp. (h) | 53,800 | 4,309,918 | ||||||
|
| |||||||
| 6,024,058 | ||||||||
|
| |||||||
| Interactive Media & Services—2.7% |
| |||||||
Alphabet, Inc., Class A (m) | 51,400 | 72,887,770 | ||||||
Facebook, Inc., Class A (m) | 252,200 | 57,267,054 | ||||||
|
| |||||||
| 130,154,824 | ||||||||
|
| |||||||
| 68 | Annual Report | | June 30, 2020 | | See accompanying Notes to Financial Statements |
Table of Contents
Schedule of Investments
June 30, 2020
| Shares | Value | |||||||
| Internet & Direct Marketing Retail—1.7% |
| |||||||
Alibaba Group Holding Ltd. ADR (h)(m) | 50,000 | $ | 10,785,000 | |||||
Amazon.com, Inc. (m) | 25,600 | 70,625,792 | ||||||
|
| |||||||
| 81,410,792 | ||||||||
|
| |||||||
| IT Services—3.2% |
| |||||||
Fiserv, Inc. (m) | 191,000 | 18,645,420 | ||||||
International Business Machines Corp. | 92,200 | 11,134,994 | ||||||
Mastercard, Inc., Class A (h) | 126,250 | 37,332,125 | ||||||
PayPal Holdings, Inc. (h)(m) | 228,200 | 39,759,286 | ||||||
Visa, Inc., Class A | 262,000 | 50,610,540 | ||||||
|
| |||||||
| 157,482,365 | ||||||||
|
| |||||||
| Life Sciences Tools & Services—0.6% |
| |||||||
Thermo Fisher Scientific, Inc. | 85,350 | 30,925,719 | ||||||
|
| |||||||
| Machinery—0.6% |
| |||||||
Caterpillar, Inc. | 172,200 | 21,783,300 | ||||||
Deere & Co. (h) | 56,900 | 8,941,835 | ||||||
|
| |||||||
| 30,725,135 | ||||||||
|
| |||||||
| Media—0.0% |
| |||||||
LiveStyle, | 202,319 | 20 | ||||||
Postmedia Network Canada Corp. (e)(g)(m) | 1,018,823 | 784,494 | ||||||
|
| |||||||
| 784,514 | ||||||||
|
| |||||||
| Metals & Mining—0.1% |
| |||||||
ArcelorMittal S.A. (m) | 180,611 | 1,937,956 | ||||||
Freeport-McMoRan, Inc. | 113,100 | 1,308,567 | ||||||
|
| |||||||
| 3,246,523 | ||||||||
|
| |||||||
| Multi-Line Retail—0.9% |
| |||||||
Dollar General Corp. (h) | 134,100 | 25,547,391 | ||||||
Target Corp. (h) | 163,700 | 19,632,541 | ||||||
|
| |||||||
| 45,179,932 | ||||||||
|
| |||||||
| Oil, Gas & Consumable Fuels—0.4% |
| |||||||
Arch Resources, Inc. | 1,858 | 52,786 | ||||||
Chesapeake Energy Corp. (m) | 6,253 | 30,640 | ||||||
Hercules Offshore, Inc. (e)(g)(m) | 174,935 | 17 | ||||||
Kinder Morgan, Inc. | 187,778 | 2,848,592 | ||||||
Occidental Petroleum Corp. | 229,700 | 4,203,510 | ||||||
Riviera Resources, Inc. | 25,527 | 45,821 | ||||||
Southwestern Energy Co. (m) | 508,010 | 1,300,506 | ||||||
Talos Energy, Inc. (m) | 98,625 | 907,350 | ||||||
Valero Energy Corp. | 171,200 | 10,069,984 | ||||||
|
| |||||||
| 19,459,206 | ||||||||
|
| |||||||
| Pharmaceuticals—1.2% |
| |||||||
Amryt Pharma PLC ADR (m) | 243,958 | 2,373,809 | ||||||
Bristol-Myers Squibb Co. | 419,400 | 24,660,720 | ||||||
Merck & Co., Inc. | 120,700 | 9,333,731 | ||||||
Teva Pharmaceutical Industries Ltd. ADR (m) | 248,006 | 3,057,914 | ||||||
Zoetis, Inc. (h) | 153,000 | 20,967,120 | ||||||
|
| |||||||
| 60,393,294 | ||||||||
|
| |||||||
| Road & Rail—0.3% |
| |||||||
Union Pacific Corp. (h) | 75,800 | 12,815,506 | ||||||
|
| |||||||
| Shares | Value | |||||||
| Semiconductors—0.0% |
| |||||||
GT Advanced Technologies, | 537 | $ | — | † | ||||
|
| |||||||
| Semiconductors & Semiconductor Equipment—3.3% |
| |||||||
Advanced Micro Devices, Inc. (h)(m) | 430,900 | 22,669,649 | ||||||
Broadcom, Inc. (h) | 68,300 | 21,556,163 | ||||||
Lam Research Corp. | 74,300 | 24,033,078 | ||||||
Marvell Technology Group Ltd. (h) | 589,800 | 20,678,388 | ||||||
Micron Technology, | 374,200 | 19,278,784 | ||||||
NVIDIA Corp. (h) | 80,700 | 30,658,737 | ||||||
QUALCOMM, Inc. (h) | 185,700 | 16,937,697 | ||||||
Texas Instruments, | 33,800 | 4,291,586 | ||||||
|
| |||||||
| 160,104,082 | ||||||||
|
| |||||||
| Software—5.1% |
| |||||||
Adobe, Inc. (h)(m) | 70,100 | 30,515,231 | ||||||
Atlassian Corp. PLC, | 58,800 | 10,599,876 | ||||||
Crowdstrike Holdings, Inc., Class A (m) | 153,600 | 15,404,544 | ||||||
Intuit, Inc. | 76,100 | 22,540,059 | ||||||
Microsoft Corp. | 427,400 | 86,980,174 | ||||||
Salesforce.com, | 189,000 | 35,405,370 | ||||||
ServiceNow, Inc. (h)(m) | 48,700 | 19,726,422 | ||||||
Workday, Inc., | 119,100 | 22,314,576 | ||||||
Zoom Video Communications, | 28,100 | 7,124,474 | ||||||
|
| |||||||
| 250,610,726 | ||||||||
|
| |||||||
| Specialty Retail—0.8% |
| |||||||
Home Depot, Inc. (h) | 160,400 | 40,181,804 | ||||||
|
| |||||||
| Technology Hardware, Storage & Peripherals—1.8% |
| |||||||
Apple, Inc. | 234,150 | 85,417,920 | ||||||
NetApp, Inc. | 99,600 | 4,419,252 | ||||||
Western Digital Corp. | 1,953 | 86,225 | ||||||
|
| |||||||
| 89,923,397 | ||||||||
|
| |||||||
| Textiles, Apparel & Luxury Goods—0.5% |
| |||||||
NIKE, Inc., Class B (h) | 255,200 | 25,022,360 | ||||||
|
| |||||||
| Trading Companies & Distributors—0.0% |
| |||||||
WESCO International, | 54,455 | 1,911,915 | ||||||
|
| |||||||
| Total Common Stock (cost—$1,980,638,240) |
| 1,680,541,579 | ||||||
|
| |||||||
| Principal Amount (000s) | ||||||||
| Corporate Bonds & Notes—28.6% |
| |||||||
| Advertising—0.2% |
| |||||||
Mood Media Borrower LLC (a)(b), |
| |||||||
0.302%, 12/31/23 | $1,260 | 1,026,942 | ||||||
National CineMedia LLC (a)(b), |
| |||||||
5.875%, 4/15/28 | 8,220 | 6,925,350 | ||||||
|
| |||||||
| 7,952,292 | ||||||||
|
| |||||||
| Aerospace & Defense—0.8% |
| |||||||
Kratos Defense & Security Solutions, |
| |||||||
6.50%, 11/30/25 | 4,910 | 5,112,022 | ||||||
| Principal Amount (000s) | Value | |||||||
TransDigm, Inc., |
| |||||||
5.50%, 11/15/27 | $ | 15,130 | $ | 13,249,568 | ||||
6.50%, 7/15/24 | 1,425 | 1,374,975 | ||||||
6.50%, 5/15/25 | 10,895 | 10,216,187 | ||||||
Triumph Group, Inc. (a)(b), |
| |||||||
6.25%, 9/15/24 | 10,815 | 9,214,164 | ||||||
|
| |||||||
| 39,166,916 | ||||||||
|
| |||||||
| Auto Components—0.8% |
| |||||||
Adient U.S. LLC (a)(b), |
| |||||||
7.00%, 5/15/26 | 10,770 | 11,281,575 | ||||||
American Axle & Manufacturing, Inc., |
| |||||||
6.25%, 4/1/25 | 8,000 | 7,877,640 | ||||||
Clarios Global LP (a)(b), |
| |||||||
8.50%, 5/15/27 | 12,895 | 12,991,390 | ||||||
Goodyear Tire & Rubber Co., |
| |||||||
5.00%, 5/31/26 | 9,955 | 9,307,975 | ||||||
|
| |||||||
| 41,458,580 | ||||||||
|
| |||||||
| Auto Manufacturers—0.9% |
| |||||||
Ford Motor Co., |
| |||||||
9.00%, 4/22/25 | 5,170 | 5,599,756 | ||||||
9.625%, 4/22/30 | 11,060 | 13,119,096 | ||||||
Ford Motor Credit Co LLC, |
| |||||||
5.125%, 6/16/25 | 4,465 | 4,467,791 | ||||||
Navistar International Corp. (a)(b), |
| |||||||
6.625%, 11/1/25 | 9,295 | 8,831,226 | ||||||
Tesla, Inc. (a)(b), |
| |||||||
5.30%, 8/15/25 | 9,850 | 9,851,034 | ||||||
|
| |||||||
| 41,868,903 | ||||||||
|
| |||||||
| Building Materials—0.2% |
| |||||||
Builders FirstSource, Inc. (a)(b), |
| |||||||
5.00%, 3/1/30 | 11,100 | 10,460,030 | ||||||
|
| |||||||
| Chemicals—0.8% |
| |||||||
Chemours Co., |
| |||||||
6.625%, 5/15/23 | 7,000 | 6,738,235 | ||||||
7.00%, 5/15/25 | 3,395 | 3,251,799 | ||||||
Kraton Polymers LLC (a)(b), |
| |||||||
7.00%, 4/15/25 | 5,325 | 5,370,316 | ||||||
Olin Corp., |
| |||||||
5.00%, 2/1/30 | 6,460 | 5,732,055 | ||||||
PQ Corp. (a)(b), |
| |||||||
5.75%, 12/15/25 | 2,635 | 2,664,367 | ||||||
Trinseo Materials Operating SCA (a)(b), |
| |||||||
5.375%, 9/1/25 | 5,645 | 5,366,278 | ||||||
Tronox Finance PLC (a)(b), |
| |||||||
5.75%, 10/1/25 | 5,510 | 5,116,834 | ||||||
Tronox, Inc. (a)(b), |
| |||||||
6.50%, 4/15/26 | 7,370 | 6,908,638 | ||||||
|
| |||||||
| 41,148,522 | ||||||||
|
| |||||||
| Commercial Services—1.1% |
| |||||||
Cenveo Corp. (d)(e)(g), |
| |||||||
6.00%, 5/15/24 (a)(b) | 8,116 | 148,766 | ||||||
8.50%, 9/15/22 (k) | 1,520 | 30,400 | ||||||
Herc Holdings, Inc. (a)(b), |
| |||||||
5.50%, 7/15/27 | 11,005 | 11,056,503 | ||||||
Hertz Corp. (a)(b)(d), |
| |||||||
6.00%, 1/15/28 | 12,195 | 3,846,425 | ||||||
7.125%, 8/1/26 | 3,750 | 1,184,044 | ||||||
Laureate Education, Inc. (a)(b), |
| |||||||
8.25%, 5/1/25 | 11,610 | 12,277,575 | ||||||
RR Donnelley & Sons Co., |
| |||||||
6.00%, 4/1/24 | 3,195 | 2,943,058 | ||||||
7.00%, 2/15/22 | 6,110 | 5,948,177 | ||||||
United Rentals North America, Inc., |
| |||||||
5.25%, 1/15/30 | 9,695 | 10,032,531 | ||||||
5.50%, 7/15/25 | 6,930 | 7,119,917 | ||||||
|
| |||||||
| 54,587,396 | ||||||||
|
| |||||||
| See accompanying Notes to Financial Statements | | June 30, 2020 | | Annual Report | 69 |
Table of Contents
Schedule of Investments
June 30, 2020
| Principal Amount (000s) | Value | |||||||
| Computers—0.3% |
| |||||||
Dell International LLC (a)(b), |
| |||||||
7.125%, 6/15/24 | $ | 9,275 | $ | 9,617,595 | ||||
Monitronics International, Inc. (e)(g), |
| |||||||
9.125%, 4/1/20 | 6,450 | 65 | ||||||
Vericast Corp. (a)(b), |
| |||||||
9.25%, 3/1/21 | 7,165 | 7,214,259 | ||||||
|
| |||||||
| 16,831,919 | ||||||||
|
| |||||||
| Containers & Packaging—0.7% |
| |||||||
Berry Global, Inc. (a)(b), |
| |||||||
5.625%, 7/15/27 | 11,590 | 11,945,292 | ||||||
Owens-Brockway Glass Container, Inc. (a)(b), |
| |||||||
6.625%, 5/13/27 | 10,135 | 10,559,403 | ||||||
Trivium Packaging Finance BV (a)(b), |
| |||||||
8.50%, 8/15/27 | 8,745 | 9,366,463 | ||||||
|
| |||||||
| 31,871,158 | ||||||||
|
| |||||||
| Distribution/Wholesale—0.5% |
| |||||||
H&E Equipment Services, Inc., |
| |||||||
5.625%, 9/1/25 | 9,845 | 9,967,029 | ||||||
Performance Food Group, Inc. (a)(b), |
| |||||||
5.50%, 10/15/27 | 13,570 | 13,119,883 | ||||||
|
| |||||||
| 23,086,912 | ||||||||
|
| |||||||
| Diversified Financial Services—1.1% |
| |||||||
CCF Holdings LLC, PIK 10.75% (a)(b)(e)(g), |
| |||||||
10.75%, 12/15/23 | 11,948 | 3,301,117 | ||||||
Community Choice Financial Issuer LLC (cost—$12,000,000; |
| |||||||
9.00%, 6/15/23 | 12,000 | 12,018,780 | ||||||
Navient Corp., |
| |||||||
5.00%, 3/15/27 | 11,555 | 9,731,563 | ||||||
6.75%, 6/15/26 | 11,105 | 10,353,358 | ||||||
Springleaf Finance Corp., |
| |||||||
6.625%, 1/15/28 | 10,165 | 10,080,529 | ||||||
8.25%, 10/1/23 | 8,730 | 9,372,921 | ||||||
|
| |||||||
| 54,858,268 | ||||||||
|
| |||||||
| Electric Utilities—0.3% |
| |||||||
NRG Energy, Inc., |
| |||||||
5.75%, 1/15/28 | 11,135 | 11,773,203 | ||||||
Talen Energy Supply LLC, |
| |||||||
6.50%, 6/1/25 | 3,365 | 2,277,987 | ||||||
|
| |||||||
| 14,051,190 | ||||||||
|
| |||||||
| Electrical Equipment—0.3% |
| |||||||
Energizer Holdings, Inc. (a)(b), |
| |||||||
7.75%, 1/15/27 | 10,295 | 11,001,082 | ||||||
WESCO Distribution, Inc. (a)(b), |
| |||||||
7.25%, 6/15/28 | 5,310 | 5,613,042 | ||||||
|
| |||||||
| 16,614,124 | ||||||||
|
| |||||||
| Engineering & Construction—0.3% |
| |||||||
AECOM, | ||||||||
5.875%, 10/15/24 | 7,245 | 7,843,473 | ||||||
Tutor Perini Corp. (a)(b), |
| |||||||
6.875%, 5/1/25 | 7,095 | 6,780,160 | ||||||
|
| |||||||
| 14,623,633 | ||||||||
|
| |||||||
| Entertainment—1.6% |
| |||||||
AMC Entertainment Holdings, Inc., |
| |||||||
6.125%, 5/15/27 | 13,610 | 4,321,175 | ||||||
10.50%, 4/15/25 (a)(b) | 4,970 | 4,050,923 | ||||||
Cedar Fair L.P., | ||||||||
5.375%, 6/1/24 | 5,550 | 5,275,414 | ||||||
5.375%, 4/15/27 | 2,700 | 2,424,344 | ||||||
Colt Merger Sub, Inc. (a)(b)(c), |
| |||||||
6.25%, 7/1/25 | 5,585 | 5,555,399 | ||||||
8.125%, 7/1/27 | 6,515 | 6,352,125 | ||||||
International Game Technology PLC (a)(b), |
| |||||||
6.25%, 1/15/27 | 8,350 | 8,536,330 | ||||||
6.50%, 2/15/25 | 4,175 | 4,281,984 | ||||||
| Principal Amount (000s) | Value | |||||||
Lions Gate Capital Holdings LLC (a)(b), |
| |||||||
6.375%, 2/1/24 | $ | 11,370 | $ | 11,121,168 | ||||
Live Nation Entertainment, Inc. (a)(b), |
| |||||||
5.625%, 3/15/26 | 4,145 | 3,786,706 | ||||||
Scientific Games International, Inc. (a)(b), |
| |||||||
5.00%, 10/15/25 | 8,365 | 7,752,515 | ||||||
8.25%, 3/15/26 | 7,810 | 6,944,691 | ||||||
Stars Group Holdings BV (a)(b), |
| |||||||
7.00%, 7/15/26 | 8,005 | 8,456,762 | ||||||
|
| |||||||
| 78,859,536 | ||||||||
|
| |||||||
| Equity Real Estate Investment Trusts (REITs)—0.2% |
| |||||||
Uniti Group L.P., | ||||||||
7.125%, 12/15/24 (a)(b) | 2,500 | 2,295,287 | ||||||
8.25%, 10/15/23 | 6,445 | 6,078,441 | ||||||
|
| |||||||
| 8,373,728 | ||||||||
|
| |||||||
| Food & Beverage—1.0% |
| |||||||
Albertsons Cos., Inc. (a)(b), |
| |||||||
4.875%, 2/15/30 | 9,920 | 10,159,370 | ||||||
7.50%, 3/15/26 | 4,535 | 4,923,196 | ||||||
Kraft Heinz Foods Co., | ||||||||
6.50%, 2/9/40 | 10,090 | 12,171,510 | ||||||
Post Holdings, Inc. (a)(b), |
| |||||||
5.75%, 3/1/27 | 10,700 | 11,105,583 | ||||||
U.S. Foods, Inc. (a)(b), | ||||||||
6.25%, 4/15/25 | 8,055 | 8,231,203 | ||||||
|
| |||||||
| 46,590,862 | ||||||||
|
| |||||||
| Food Service—0.2% |
| |||||||
Aramark Services, Inc. (a)(b), |
| |||||||
5.00%, 2/1/28 | 10,730 | 10,218,125 | ||||||
|
| |||||||
| Hand/Machine Tools—0.1% |
| |||||||
Colfax Corp. (a)(b), | ||||||||
6.375%, 2/15/26 | 6,655 | 6,964,890 | ||||||
|
| |||||||
| Healthcare-Products—0.2% |
| |||||||
Avantor, Inc. (a)(b), | ||||||||
9.00%, 10/1/25 | 9,555 | 10,307,456 | ||||||
|
| |||||||
| Healthcare-Services—1.5% |
| |||||||
Centene Corp., | ||||||||
4.625%, 12/15/29 | 3,135 | 3,315,262 | ||||||
5.375%, 6/1/26 (a)(b) | 6,975 | 7,274,332 | ||||||
Charles River Laboratories International, Inc. (a)(b), |
| |||||||
5.50%, 4/1/26 | 4,745 | 4,948,584 | ||||||
Community Health Systems, Inc., |
| |||||||
6.875%, 2/1/22 | 2,500 | 2,007,813 | ||||||
DaVita, Inc., | ||||||||
5.125%, 7/15/24 | 3,100 | 3,157,350 | ||||||
Encompass Health Corp., | ||||||||
4.50%, 2/1/28 | 2,095 | 2,012,897 | ||||||
4.75%, 2/1/30 | 6,595 | 6,309,371 | ||||||
HCA, Inc., | ||||||||
5.375%, 9/1/26 | 3,515 | 3,835,568 | ||||||
5.625%, 9/1/28 | 2,420 | 2,704,882 | ||||||
IQVIA, Inc. (a)(b), | ||||||||
5.00%, 5/15/27 | 5,445 | 5,582,323 | ||||||
Select Medical Corp. (a)(b), |
| |||||||
6.25%, 8/15/26 | 7,115 | 7,208,776 | ||||||
Tenet Healthcare Corp., | ||||||||
6.25%, 2/1/27 (a)(b) | 12,810 | 12,753,892 | ||||||
7.00%, 8/1/25 | 6,000 | 5,896,170 | ||||||
8.125%, 4/1/22 | 6,030 | 6,342,354 | ||||||
|
| |||||||
| 73,349,574 | ||||||||
|
| |||||||
| Home Builders—0.4% |
| |||||||
Beazer Homes USA, Inc., | ||||||||
5.875%, 10/15/27 | 1,885 | 1,806,122 | ||||||
KB Home, | ||||||||
4.80%, 11/15/29 | 2,935 | 2,892,810 | ||||||
Picasso Finance Sub, Inc. (a)(b), |
| |||||||
6.125%, 6/15/25 | 7,605 | 7,766,606 | ||||||
| Principal Amount (000s) | Value | |||||||
Taylor Morrison Communities, Inc. (a)(b), |
| |||||||
5.75%, 1/15/28 | $ | 5,975 | $ | 6,175,521 | ||||
|
| |||||||
| 18,641,059 | ||||||||
|
| |||||||
| Household Products/Wares—0.2% |
| |||||||
Prestige Brands, Inc. (a)(b), |
| |||||||
5.125%, 1/15/28 | 5,645 | 5,715,563 | ||||||
Spectrum Brands, Inc., | ||||||||
5.75%, 7/15/25 | 4,725 | 4,863,844 | ||||||
|
| |||||||
| 10,579,407 | ||||||||
|
| |||||||
| Internet—0.7% |
| |||||||
Go Daddy Operating Co. LLC (a)(b), |
| |||||||
5.25%, 12/1/27 | 6,500 | 6,628,797 | ||||||
Match Group, Inc. (a)(b), |
| |||||||
5.00%, 12/15/27 | 10,860 | 11,339,035 | ||||||
Netflix, Inc. (a)(b), | ||||||||
5.375%, 11/15/29 | 10,230 | 11,250,136 | ||||||
NortonLifeLock, Inc. (a)(b), |
| |||||||
5.00%, 4/15/25 | 5,390 | 5,497,800 | ||||||
|
| |||||||
| 34,715,768 | ||||||||
|
| |||||||
| Iron/Steel—0.2% |
| |||||||
Cleveland-Cliffs, Inc., | ||||||||
5.875%, 6/1/27 | 6,670 | 5,522,360 | ||||||
United States Steel Corp., | ||||||||
6.875%, 8/15/25 | 8,595 | 5,866,990 | ||||||
|
| |||||||
| 11,389,350 | ||||||||
|
| |||||||
| Leisure—0.2% |
| |||||||
Royal Caribbean Cruises Ltd. (a)(b), |
| |||||||
11.50%, 6/1/25 | 7,375 | 7,693,859 | ||||||
|
| |||||||
| Lodging—0.5% |
| |||||||
Boyd Gaming Corp. (a)(b), |
| |||||||
8.625%, 6/1/25 | 6,375 | 6,673,828 | ||||||
MGM Resorts International, |
| |||||||
6.75%, 5/1/25 | 620 | 616,562 | ||||||
5.50%, 4/15/27 | 4,747 | 4,596,164 | ||||||
Wyndham Hotels & Resorts, Inc. (a)(b), |
| |||||||
5.375%, 4/15/26 | 7,110 | 6,864,029 | ||||||
Wynn Las Vegas LLC (a)(b), |
| |||||||
5.50%, 3/1/25 | 7,275 | 6,679,869 | ||||||
|
| |||||||
| 25,430,452 | ||||||||
|
| |||||||
| Machinery-Construction & Mining—0.1% |
| |||||||
Terex Corp. (a)(b), | ||||||||
5.625%, 2/1/25 | 7,370 | 6,743,550 | ||||||
|
| |||||||
| Media—2.8% |
| |||||||
CCO Holdings LLC (a)(b), |
| |||||||
5.125%, 5/1/27 | 7,455 | 7,723,753 | ||||||
5.375%, 6/1/29 | 7,780 | 8,216,769 | ||||||
5.50%, 5/1/26 | 4,130 | 4,289,397 | ||||||
Clear Channel Worldwide Holdings, Inc., |
| |||||||
9.25%, 2/15/24 | 10,204 | 9,492,118 | ||||||
CSC Holdings LLC (a)(b), |
| |||||||
7.50%, 4/1/28 | 9,860 | 10,788,368 | ||||||
7.75%, 7/15/25 | 6,160 | 6,424,942 | ||||||
10.875%, 10/15/25 | 5,645 | 6,081,613 | ||||||
Diamond Sports Group LLC (a)(b), |
| |||||||
6.625%, 8/15/27 | 13,005 | 7,003,583 | ||||||
DISH DBS Corp., | ||||||||
5.875%, 7/15/22 | 4,335 | 4,417,473 | ||||||
5.875%, 11/15/24 | 10,820 | 10,774,394 | ||||||
6.75%, 6/1/21 | 9,250 | 9,438,700 | ||||||
7.375%, 7/1/28 (a)(b) | 2,875 | 2,871,406 | ||||||
Gray Television, Inc. (a)(b), |
| |||||||
5.875%, 7/15/26 | 14,550 | 14,529,121 | ||||||
LiveStyle, Inc. |
| |||||||
9.625%, 2/1/19 | 7,628 | 8 | ||||||
Meredith Corp., | ||||||||
6.875%, 2/1/26 | 12,250 | 10,199,717 | ||||||
| 70 | Annual Report | | June 30, 2020 | | See accompanying Notes to Financial Statements |
Table of Contents
Schedule of Investments
June 30, 2020
| Principal Amount (000s) | Value | |||||||
Nexstar Broadcasting, Inc. (a)(b), |
| |||||||
5.625%, 7/15/27 | $ | 11,905 | $ | 11,935,120 | ||||
Sirius XM Radio, Inc. (a)(b), |
| |||||||
5.00%, 8/1/27 | 6,715 | 6,898,219 | ||||||
Virgin Media Secured Finance PLC (a)(b), |
| |||||||
5.50%, 5/15/29 | 6,995 | 7,384,586 | ||||||
|
| |||||||
| 138,469,287 | ||||||||
|
| |||||||
| Metal Fabricate/Hardware—0.2% |
| |||||||
Park-Ohio Industries, Inc., |
| |||||||
6.625%, 4/15/27 | 11,165 | 9,195,047 | ||||||
|
| |||||||
| Mining—0.9% |
| |||||||
Alcoa Nederland Holding BV (a)(b), |
| |||||||
6.75%, 9/30/24 | 9,815 | 10,054,142 | ||||||
Constellium SE (a)(b), | ||||||||
6.625%, 3/1/25 | 9,605 | 9,743,168 | ||||||
Freeport-McMoRan, Inc., | ||||||||
5.25%, 9/1/29 | 10,940 | 11,236,912 | ||||||
Hudbay Minerals, Inc. (a)(b), |
| |||||||
7.625%, 1/15/25 | 4,965 | 4,766,921 | ||||||
Joseph T. Ryerson & Son, Inc. (a)(b), |
| |||||||
11.00%, 5/15/22 | 9,000 | 9,219,465 | ||||||
|
| |||||||
| 45,020,608 | ||||||||
|
| |||||||
| Miscellaneous Manufacturing—0.2% |
| |||||||
Koppers, Inc. (a)(b), |
| |||||||
6.00%, 2/15/25 | 9,700 | 9,463,417 | ||||||
|
| |||||||
| Oil, Gas & Consumable Fuels—1.9% |
| |||||||
Callon Petroleum Co., |
| |||||||
6.125%, 10/1/24 | 6,110 | 2,096,494 | ||||||
6.25%, 4/15/23 | 9,725 | 3,713,832 | ||||||
Chesapeake Energy Corp. (d), |
| |||||||
8.00%, 1/15/25 | 7,730 | 251,225 | ||||||
8.00%, 3/15/26 | 6,301 | 141,772 | ||||||
CNX Resources Corp. (a)(b), |
| |||||||
7.25%, 3/14/27 | 7,310 | 6,734,484 | ||||||
Cobalt International Energy, Inc. (d), |
| |||||||
7.75%, 12/1/23 | 9,216 | 284,866 | ||||||
Continental Resources, Inc., |
| |||||||
4.375%, 1/15/28 | 4,035 | 3,558,910 | ||||||
EP Energy LLC (d), | ||||||||
9.375%, 5/1/20 | 8,765 | 14,594 | ||||||
EQT Corp., | ||||||||
7.00%, 2/1/30 | 4,005 | 4,130,637 | ||||||
Nabors Industries, Inc., | ||||||||
5.75%, 2/1/25 | 1,910 | 780,512 | ||||||
Noble Holding International Ltd., |
| |||||||
7.75%, 1/15/24 | 6,955 | 164,451 | ||||||
Oasis Petroleum, Inc., | ||||||||
6.875%, 3/15/22 | 8,460 | 1,543,950 | ||||||
Occidental Petroleum Corp., |
| |||||||
5.55%, 3/15/26 | 11,185 | 10,231,423 | ||||||
3.50%, 6/15/25 | 3,250 | 2,762,500 | ||||||
PBF Holding Co. LLC (a)(b), |
| |||||||
6.00%, 2/15/28 | 10,735 | 8,936,887 | ||||||
PDC Energy, Inc., | ||||||||
5.75%, 5/15/26 | 1,185 | 1,082,089 | ||||||
Range Resources Corp., | ||||||||
4.875%, 5/15/25 | 8,965 | 6,754,903 | ||||||
Sable Permian Resources Land LLC |
| |||||||
7.375%, 11/1/21 | 5,000 | 375,000 | ||||||
Sanchez Energy Corp. (d), |
| |||||||
6.125%, 1/15/23 | 6,240 | 31,200 | ||||||
SM Energy Co., | ||||||||
6.625%, 1/15/27 | 11,360 | 5,599,401 | ||||||
Sunoco L.P., | ||||||||
5.50%, 2/15/26 | 4,605 | 4,558,950 | ||||||
5.875%, 3/15/28 | 6,830 | 6,804,183 | ||||||
Talos Production LLC, | ||||||||
11.00%, 4/3/22 | 1,168 | 1,103,696 | ||||||
| Principal Amount (000s) | Value | |||||||
Transocean, Inc. (a)(b), | ||||||||
7.50%, 1/15/26 | $ | 12,010 | $ | 6,665,550 | ||||
8.00%, 2/1/27 | 2,745 | 1,554,356 | ||||||
USA Compression Partners L.P., |
| |||||||
6.875%, 9/1/27 | 10,045 | 9,643,200 | ||||||
Valaris PLC, | ||||||||
5.20%, 3/15/25 | 1,295 | 116,485 | ||||||
7.75%, 2/1/26 | 6,640 | 518,949 | ||||||
Weatherford International Ltd. (a)(b), |
| |||||||
11.00%, 12/1/24 | 605 | 423,500 | ||||||
WPX Energy, Inc., | ||||||||
5.75%, 6/1/26 | 2,180 | 2,120,933 | ||||||
|
| |||||||
| 92,698,932 | ||||||||
|
| |||||||
| Paper & Forest Products—0.3% |
| |||||||
Mercer International, Inc., |
| |||||||
5.50%, 1/15/26 | 5,280 | 4,979,858 | ||||||
7.375%, 1/15/25 | 7,325 | 7,310,497 | ||||||
|
| |||||||
| 12,290,355 | ||||||||
|
| |||||||
| Personal Products—0.1% |
| |||||||
Edgewell Personal Care Co. (a)(b), |
| |||||||
5.50%, 6/1/28 | 3,605 | 3,715,403 | ||||||
|
| |||||||
| Pharmaceuticals—0.8% |
| |||||||
Bausch Health Americas, Inc. (a)(b), |
| |||||||
8.50%, 1/31/27 | 8,610 | 9,154,367 | ||||||
Bausch Health Cos., Inc. (a)(b), |
| |||||||
5.25%, 1/30/30 | 9,710 | 9,223,238 | ||||||
7.25%, 5/30/29 | 10,120 | 10,634,248 | ||||||
Horizon Therapeutics USA, Inc. (a)(b), |
| |||||||
5.50%, 8/1/27 | 9,515 | 9,915,201 | ||||||
Mallinckrodt International Finance S.A. (a)(b), |
| |||||||
5.75%, 8/1/22 | 6,055 | 1,528,887 | ||||||
|
| |||||||
| 40,455,941 | ||||||||
|
| |||||||
| Pipelines—1.2% |
| |||||||
Cheniere Energy Partners L.P., |
| |||||||
5.625%, 10/1/26 | 9,510 | 9,533,775 | ||||||
Crestwood Midstream Partners L.P., |
| |||||||
5.75%, 4/1/25 | 11,755 | 10,190,233 | ||||||
DCP Midstream Operating L.P., |
| |||||||
5.125%, 5/15/29 | 7,470 | 7,146,474 | ||||||
EQM Midstream Partners LP (a)(b), |
| |||||||
6.50%, 7/1/27 | 6,620 | 6,797,615 | ||||||
NGL Energy Partners L.P., | ||||||||
7.50%, 4/15/26 | 10,875 | 8,290,447 | ||||||
Targa Resources Partners L.P., |
| |||||||
6.50%, 7/15/27 | 7,170 | 7,331,325 | ||||||
6.875%, 1/15/29 | 10,670 | 11,210,169 | ||||||
|
| |||||||
| 60,500,038 | ||||||||
|
| |||||||
| Real Estate—0.5% |
| |||||||
Iron Mountain, Inc. (a)(b), |
| |||||||
4.875%, 9/15/27 | 10,625 | 10,381,634 | ||||||
Kennedy-Wilson, Inc., | ||||||||
5.875%, 4/1/24 | 12,423 | 12,399,583 | ||||||
|
| |||||||
| 22,781,217 | ||||||||
|
| |||||||
| Retail—0.7% |
| |||||||
1011778 BC ULC (a)(b), |
| |||||||
5.00%, 10/15/25 | 9,990 | 9,956,983 | ||||||
Asbury Automotive Group, Inc. (a)(b), |
| |||||||
4.75%, 3/1/30 | 6,155 | 6,016,512 | ||||||
Conn’s, Inc., | ||||||||
7.25%, 7/15/22 | 13,070 | 10,436,591 | ||||||
Neiman Marcus Group Ltd. LLC (a)(b)(d), |
| |||||||
8.00%, 10/15/21 | 6,810 | 3,975,338 | ||||||
Party City Holdings, Inc. (a)(b), |
| |||||||
6.625%, 8/1/26 | 11,755 | 2,644,875 | ||||||
Yum! Brands, Inc. (a)(b), |
| |||||||
4.75%, 1/15/30 | 1,525 | 1,552,015 | ||||||
|
| |||||||
| 34,582,314 | ||||||||
|
| |||||||
| Principal Amount (000s) | Value | |||||||
| Semiconductors—0.2% |
| |||||||
Amkor Technology, Inc. (a)(b), |
| |||||||
6.625%, 9/15/27 | $ | 9,410 | $ | 10,093,966 | ||||
|
| |||||||
| Software—0.6% |
| |||||||
j2 Cloud Services LLC (a)(b), |
| |||||||
6.00%, 7/15/25 | 9,810 | 10,007,230 | ||||||
Rackspace Hosting, Inc. (a)(b), |
| |||||||
8.625%, 11/15/24 | 9,620 | 9,802,780 | ||||||
SS&C Technologies, Inc. (a)(b), |
| |||||||
5.50%, 9/30/27 | 8,305 | 8,495,558 | ||||||
|
| |||||||
| 28,305,568 | ||||||||
|
| |||||||
| Telecommunications—2.6% |
| |||||||
CenturyLink, Inc., | ||||||||
5.125%, 12/15/26 (a)(b) | 9,215 | 9,206,292 | ||||||
7.50%, 4/1/24, Ser. Y | 4,785 | 5,266,658 | ||||||
Cincinnati Bell, Inc. (a)(b), |
| |||||||
7.00%, 7/15/24 | 7,265 | 7,432,930 | ||||||
CommScope Technologies LLC (a)(b), |
| |||||||
5.00%, 3/15/27 | 4,460 | 4,030,547 | ||||||
6.00%, 6/15/25 | 13,065 | 12,650,840 | ||||||
Consolidated Communications, Inc., |
| |||||||
6.50%, 10/1/22 | 9,435 | 8,721,478 | ||||||
Frontier Communications Corp. (d), |
| |||||||
10.50%, 9/15/22 | 9,315 | 3,246,417 | ||||||
GTT Communications, Inc. (a)(b), |
| |||||||
7.875%, 12/31/24 | 10,045 | 5,305,016 | ||||||
Hughes Satellite Systems Corp., |
| |||||||
6.625%, 8/1/26 | 9,080 | 9,456,275 | ||||||
7.625%, 6/15/21 | 7,440 | 7,680,126 | ||||||
Intelsat Connect Finance S.A. (a)(b)(d), |
| |||||||
9.50%, 2/15/23 | 3,195 | 808,734 | ||||||
Intelsat Jackson Holdings S.A. (d), |
| |||||||
5.50%, 8/1/23 | 10,370 | 5,933,973 | ||||||
9.75%, 7/15/25 (a)(b) | 6,940 | 4,274,346 | ||||||
Level 3 Financing, Inc., | ||||||||
5.15%, 5/1/25 | 2,420 | 2,477,729 | ||||||
Sprint Communications, Inc., |
| |||||||
11.50%, 11/15/21 | 7,890 | 8,756,125 | ||||||
Sprint Corp., | ||||||||
7.125%, 6/15/24 | 6,860 | 7,758,248 | ||||||
7.625%, 3/1/26 | 9,595 | 11,347,863 | ||||||
T-Mobile USA, Inc., | ||||||||
6.50%, 1/15/26 | 9,940 | 10,399,079 | ||||||
Windstream Services LLC |
| |||||||
6.375%, 8/1/23 | 7,464 | 410,520 | ||||||
|
| |||||||
| 125,163,196 | ||||||||
|
| |||||||
| Toys/Games/Hobbies—0.1% |
| |||||||
Mattel, Inc. (a)(b), |
| |||||||
5.875%, 12/15/27 | 2,915 | 3,033,349 | ||||||
|
| |||||||
| Transportation—0.1% |
| |||||||
XPO Logistics, Inc. (a)(b), |
| |||||||
6.125%, 9/1/23 | 2,705 | 2,745,859 | ||||||
6.50%, 6/15/22 | 3,184 | 3,195,064 | ||||||
|
| |||||||
| 5,940,923 | ||||||||
|
| |||||||
| Total Corporate Bonds & Notes (cost—$1,617,610,614) |
| 1,400,147,020 | ||||||
|
| |||||||
| Convertible Bonds & Notes—26.3% |
| |||||||
| Airlines—0.4% |
| |||||||
American Airlines Group, Inc., |
| |||||||
6.50%, 7/1/25 | 5,475 | 5,174,718 | ||||||
Southwest Airlines Co., |
| |||||||
1.25%, 5/1/25 | 13,225 | 15,949,760 | ||||||
|
| |||||||
| 21,124,478 | ||||||||
|
| |||||||
| See accompanying Notes to Financial Statements | | June 30, 2020 | | Annual Report | 71 |
Table of Contents
Schedule of Investments
June 30, 2020
| Principal Amount (000s) | Value | |||||||
| Apparel & Textiles—0.0% |
| |||||||
Iconix Brand Group, Inc., | ||||||||
5.75%, 8/15/23 | $ | 4,185 | $ | 2,197,125 | ||||
|
| |||||||
| Auto Components—0.2% |
| |||||||
Meritor, Inc., | ||||||||
3.25%, 10/15/37 | 8,095 | 8,084,119 | ||||||
|
| |||||||
| Auto Manufacturers—1.2% |
| |||||||
Tesla, Inc., | ||||||||
1.25%, 3/1/21 | 17,905 | 53,692,783 | ||||||
2.00%, 5/15/24 | 2,015 | 7,074,999 | ||||||
|
| |||||||
| 60,767,782 | ||||||||
|
| |||||||
| Banks—0.3% |
| |||||||
BofA Finance LLC, | ||||||||
0.125%, 9/1/22 | 7,885 | 8,220,113 | ||||||
JPMorgan Chase Bank N.A. (a)(b), |
| |||||||
0.125%, 1/1/23 | 7,480 | 7,928,800 | ||||||
|
| |||||||
| 16,148,913 | ||||||||
|
| |||||||
| Beverages—0.0% |
| |||||||
Luckin Coffee, Inc. (a)(b), |
| |||||||
0.75%, 1/15/25 | 640 | 168,000 | ||||||
|
| |||||||
| Biotechnology—1.5% |
| |||||||
BioMarin Pharmaceutical, Inc., |
| |||||||
0.599%, 8/1/24 | 1,825 | 2,234,820 | ||||||
1.25%, 5/15/27 (a)(b) | 8,115 | 9,484,585 | ||||||
Exact Sciences Corp., | ||||||||
0.375%, 3/15/27 | 19,190 | 19,975,867 | ||||||
0.375%, 3/1/28 | 4,525 | 4,347,403 | ||||||
Gossamer Bio, Inc., | ||||||||
5.00%, 6/1/27 | 6,625 | 6,698,637 | ||||||
Halozyme Therapeutics, Inc. (a)(b), |
| |||||||
1.25%, 12/1/24 | 7,720 | 9,799,768 | ||||||
Illumina, Inc., | ||||||||
0.50%, 6/15/21 | 715 | 1,067,151 | ||||||
Insmed, Inc., | ||||||||
1.75%, 1/15/25 | 4,050 | 3,956,344 | ||||||
Intercept Pharmaceuticals, Inc., |
| |||||||
3.25%, 7/1/23 | 3,870 | 2,931,613 | ||||||
Ligand Pharmaceuticals, Inc., |
| |||||||
0.75%, 5/15/23 | 5,750 | 5,057,329 | ||||||
Livongo Health, Inc. (a)(b), |
| |||||||
0.875%, 6/1/25 | 5,755 | 6,875,349 | ||||||
|
| |||||||
| 72,428,866 | ||||||||
|
| |||||||
| Commercial Services—1.1% |
| |||||||
Chegg, Inc., | ||||||||
0.125%, 3/15/25 | 11,890 | 16,873,694 | ||||||
Macquarie Infrastructure Corp., |
| |||||||
2.00%, 10/1/23 | 6,270 | 5,438,808 | ||||||
Square, Inc., | ||||||||
0.125%, 3/1/25 (a)(b) | 6,100 | 6,940,777 | ||||||
0.50%, 5/15/23 | 17,405 | 25,930,091 | ||||||
|
| |||||||
| 55,183,370 | ||||||||
|
| |||||||
| Computers—1.2% |
| |||||||
Lumentum Holdings, Inc., | ||||||||
0.25%, 3/15/24 | 1,820 | 2,657,200 | ||||||
0.50%, 12/15/26 (a)(b) | 15,355 | 16,199,525 | ||||||
Pure Storage, Inc., | ||||||||
0.125%, 4/15/23 | 10,020 | 9,875,712 | ||||||
Western Digital Corp., | ||||||||
1.50%, 2/1/24 | 16,060 | 15,177,247 | ||||||
Zscaler, Inc. (a)(b), | ||||||||
0.125%, 7/1/25 | 12,905 | 13,245,827 | ||||||
|
| |||||||
| 57,155,511 | ||||||||
|
| |||||||
| Diversified Financial Services—0.1% |
| |||||||
LendingTree, Inc., |
| |||||||
0.625%, 6/1/22 | 3,550 | 5,337,720 | ||||||
|
| |||||||
| Principal Amount (000s) | Value | |||||||
| Electronics—0.2% |
| |||||||
Fortive Corp., |
| |||||||
0.875%, 2/15/22 | $ | 3,885 | $ | 3,835,257 | ||||
II-VI, Inc., | ||||||||
0.25%, 9/1/22 | 4,145 | 4,923,588 | ||||||
Vishay Intertechnology, Inc., |
| |||||||
2.25%, 6/15/25 | 2,355 | 2,202,128 | ||||||
|
| |||||||
| 10,960,973 | ||||||||
|
| |||||||
| Energy-Alternate Sources—0.0% |
| |||||||
Enphase Energy, Inc. (a)(b), |
| |||||||
0.25%, 3/1/25 | 1,700 | 1,551,709 | ||||||
|
| |||||||
| Engineering & Construction—0.1% |
| |||||||
KBR, Inc., |
| |||||||
2.50%, 11/1/23 | 5,985 | 6,752,607 | ||||||
|
| |||||||
| Entertainment—0.3% |
| |||||||
Live Nation Entertainment, Inc., |
| |||||||
2.00%, 2/15/25 (a)(b) | 3,360 | 2,891,700 | ||||||
2.50%, 3/15/23 | 10,095 | 10,265,353 | ||||||
|
| |||||||
| 13,157,053 | ||||||||
|
| |||||||
| Healthcare-Products—0.9% |
| |||||||
CONMED Corp., |
| |||||||
2.625%, 2/1/24 | 2,870 | 3,018,038 | ||||||
Glaukos Corp. (a)(b), | ||||||||
2.75%, 6/15/27 | 11,740 | 11,309,758 | ||||||
Insulet Corp. (a)(b), | ||||||||
0.375%, 9/1/26 | 19,875 | 21,801,551 | ||||||
NuVasive, Inc., | ||||||||
0.375%, 3/15/25 (a)(b) | 4,545 | 3,990,735 | ||||||
2.25%, 3/15/21 | 4,355 | 4,793,548 | ||||||
|
| |||||||
| 44,913,630 | ||||||||
|
| |||||||
| Healthcare-Services—0.6% |
| |||||||
Anthem, Inc., |
| |||||||
2.75%, 10/15/42 | 3,165 | 11,593,313 | ||||||
Teladoc Health, Inc. (a)(b), |
| |||||||
1.25%, 6/1/27 | 17,285 | 19,183,954 | ||||||
|
| |||||||
| 30,777,267 | ||||||||
|
| |||||||
| Internet—4.1% |
| |||||||
Boingo Wireless, Inc., |
| |||||||
1.00%, 10/1/23 | 3,435 | 3,065,738 | ||||||
Booking Holdings, Inc. (a)(b), |
| |||||||
0.75%, 5/1/25 | 3,405 | 4,223,279 | ||||||
Etsy, Inc. (a)(b), | ||||||||
0.125%, 10/1/26 | 14,515 | 19,864,294 | ||||||
FireEye, Inc., | ||||||||
0.875%, 6/1/24 | 8,185 | 7,444,569 | ||||||
IAC FinanceCo 2, Inc. (a)(b), |
| |||||||
0.875%, 6/15/26 | 9,480 | 11,691,988 | ||||||
IAC FinanceCo 3, Inc. (a)(b), |
| |||||||
2.00%, 1/15/30 | 6,310 | 8,193,627 | ||||||
Momo, Inc., | ||||||||
1.25%, 7/1/25 | 3,990 | 3,093,712 | ||||||
Okta, Inc. (a)(b), | ||||||||
0.125%, 9/1/25 | 12,190 | 15,129,719 | ||||||
0.375%, 6/15/26 | 5,975 | 6,479,761 | ||||||
Palo Alto Networks, Inc., | ||||||||
0.375%, 6/1/25 (a)(b) | 10,260 | 10,265,089 | ||||||
0.75%, 7/1/23 | 4,660 | 4,993,083 | ||||||
Proofpoint, Inc. (a)(b), | ||||||||
0.25%, 8/15/24 | 13,715 | 13,500,839 | ||||||
Snap, Inc. (a)(b), | ||||||||
0.75%, 8/1/26 | 18,700 | 23,433,437 | ||||||
Twitter, Inc., | ||||||||
0.25%, 6/15/24 | 11,070 | 10,456,093 | ||||||
Wayfair, Inc., | ||||||||
1.00%, 8/15/26 (a)(b) | 9,155 | 13,366,738 | ||||||
1.125%, 11/1/24 | 2,810 | 5,024,364 | ||||||
Weibo Corp., | ||||||||
1.25%, 11/15/22 | 6,215 | 5,810,686 | ||||||
| Principal Amount (000s) | Value | |||||||
Zendesk, Inc. (a)(b), | ||||||||
0.625%, 6/15/25 | $ | 12,220 | $ | 13,096,462 | ||||
Zillow Group, Inc., | ||||||||
1.50%, 7/1/23 | 2,240 | 2,332,947 | ||||||
2.00%, 12/1/21 | 10,015 | 12,405,270 | ||||||
2.75%, 5/15/25 | 4,465 | 5,213,825 | ||||||
|
| |||||||
| 199,085,520 | ||||||||
|
| |||||||
| Investment Companies—0.1% |
| |||||||
Prospect Capital Corp., |
| |||||||
6.375%, 3/1/25 | 5,000 | 4,923,274 | ||||||
| Iron/Steel—0.1% |
| |||||||
Allegheny Technologies, Inc. (a)(b), |
| |||||||
3.50%, 6/15/25 | 1,200 | 1,161,537 | ||||||
Cleveland-Cliffs, Inc., | ||||||||
1.50%, 1/15/25 | 2,875 | 2,631,666 | ||||||
|
| |||||||
| 3,793,203 | ||||||||
|
| |||||||
| Leisure—0.5% |
| |||||||
NCL Corp. Ltd. (a)(b), |
| |||||||
6.00%, 5/15/24 | 2,545 | 3,401,082 | ||||||
Royal Caribbean Cruises Ltd. (a)(b), |
| |||||||
4.25%, 6/15/23 | 20,045 | 18,742,075 | ||||||
|
| |||||||
| 22,143,157 | ||||||||
|
| |||||||
| Media—1.6% |
| |||||||
DISH Network Corp., |
| |||||||
2.375%, 3/15/24 | 14,960 | 13,443,004 | ||||||
3.375%, 8/15/26 | 17,910 | 16,497,163 | ||||||
Liberty Interactive LLC (a)(b), |
| |||||||
1.75%, 9/30/46 | 4,860 | 7,359,687 | ||||||
Liberty Media Corp., | ||||||||
1.00%, 1/30/23 | 6,570 | 7,156,955 | ||||||
1.375%, 10/15/23 | 12,255 | 12,921,672 | ||||||
2.25%, 9/30/46 | 2,580 | 1,238,572 | ||||||
2.75%, 12/1/49 (a)(b) | 13,410 | 12,604,771 | ||||||
World Wrestling Entertainment, Inc., |
| |||||||
3.375%, 12/15/23 | 2,520 | 4,710,825 | ||||||
|
| |||||||
| 75,932,649 | ||||||||
|
| |||||||
| Oil, Gas & Consumable Fuels—0.6% |
| |||||||
Bristow Group, Inc., |
| |||||||
4.50%, 6/1/23 | 1,625 | 97,703 | ||||||
Chesapeake Energy Corp. (d), |
| |||||||
5.50%, 9/15/26 | 17,205 | 688,200 | ||||||
CNX Resources Corp. (a)(b), |
| |||||||
2.25%, 5/1/26 | 940 | 867,306 | ||||||
Ensco Jersey Finance Ltd., | ||||||||
3.00%, 1/31/24 | 9,245 | 1,247,231 | ||||||
EQT Corp. (a)(b), | ||||||||
1.75%, 5/1/26 | 6,435 | 6,688,139 | ||||||
Nabors Industries, Inc., | ||||||||
0.75%, 1/15/24 | 8,145 | 3,017,559 | ||||||
Oasis Petroleum, Inc., | ||||||||
2.625%, 9/15/23 | 9,190 | 1,494,294 | ||||||
Oil States International, Inc., |
| |||||||
1.50%, 2/15/23 | 2,450 | 1,235,586 | ||||||
Pioneer Natural Resources Co. (a)(b), |
| |||||||
0.25%, 5/15/25 | 10,385 | 12,304,011 | ||||||
Transocean, Inc., | ||||||||
0.50%, 1/30/23 | 9,755 | 4,071,343 | ||||||
|
| |||||||
| 31,711,372 | ||||||||
|
| |||||||
| Pharmaceuticals—1.5% |
| |||||||
Clovis Oncology, Inc., |
| |||||||
1.25%, 5/1/25 | 4,440 | 2,754,811 | ||||||
DexCom, Inc., | ||||||||
0.25%, 11/15/25 (a)(b) | 28,275 | 29,087,602 | ||||||
0.75%, 12/1/23 | 315 | 782,202 | ||||||
Flexion Therapeutics, Inc., | ||||||||
3.375%, 5/1/24 | 3,510 | 2,941,819 | ||||||
GSK Finance No 3 PLC (a)(b), |
| |||||||
zero coupon, 6/22/23 | 1,845 | 2,007,952 | ||||||
| 72 | Annual Report | | June 30, 2020 | | See accompanying Notes to Financial Statements |
Table of Contents
Schedule of Investments
June 30, 2020
| Principal Amount (000s) | Value | |||||||
Jazz Investments I Ltd. (a)(b), |
| |||||||
2.00%, 6/15/26 | $ | 4,050 | $ | 4,102,229 | ||||
Neurocrine Biosciences, Inc., |
| |||||||
2.25%, 5/15/24 | 8,270 | 13,833,452 | ||||||
Sarepta Therapeutics, Inc., |
| |||||||
1.50%, 11/15/24 | 4,645 | 10,671,887 | ||||||
Teva Pharmaceutical Finance Co. LLC, Ser. C, |
| |||||||
0.25%, 2/1/26 | 7,285 | 7,127,688 | ||||||
Tilray, Inc., | ||||||||
5.00%, 10/1/23 | 2,975 | 1,375,937 | ||||||
|
| |||||||
| 74,685,579 | ||||||||
|
| |||||||
| Pipelines—0.2% |
| |||||||
Cheniere Energy, Inc., |
| |||||||
4.25%, 3/15/45 | 15,605 | 10,101,679 | ||||||
|
| |||||||
| Retail—0.6% |
| |||||||
Burlington Stores, Inc. (a)(b), |
| |||||||
2.25%, 4/15/25 | 4,505 | 5,142,232 | ||||||
Dick’s Sporting Goods, Inc. (a)(b), |
| |||||||
3.25%, 4/15/25 | 6,000 | 8,334,988 | ||||||
RH, | ||||||||
zero coupon, 6/15/23 | 10,010 | 14,029,606 | ||||||
|
| |||||||
| 27,506,826 | ||||||||
|
| |||||||
| Semiconductors—2.4% |
| |||||||
Advanced Micro Devices, Inc., |
| |||||||
2.125%, 9/1/26 | 580 | 3,785,041 | ||||||
Cree, Inc., | ||||||||
0.875%, 9/1/23 | 9,590 | 11,300,225 | ||||||
Inphi Corp. (a)(b), | ||||||||
0.75%, 4/15/25 | 12,645 | 15,238,152 | ||||||
Microchip Technology, Inc., | ||||||||
1.625%, 2/15/27 | 30,825 | 45,545,387 | ||||||
2.25%, 2/15/37 | 2,500 | 3,648,808 | ||||||
Micron Technology, Inc., Ser. D, |
| |||||||
3.125%, 5/1/32 | 1,020 | 5,217,519 | ||||||
ON Semiconductor Corp., | ||||||||
1.00%, 12/1/20 | 2,475 | 2,889,334 | ||||||
1.625%, 10/15/23 | 14,005 | 17,030,220 | ||||||
Teradyne, Inc., | ||||||||
1.25%, 12/15/23 | 2,765 | 7,425,274 | ||||||
Veeco Instruments, Inc. (a)(b), |
| |||||||
3.75%, 6/1/27 | 6,130 | 7,095,475 | ||||||
|
| |||||||
| 119,175,435 | ||||||||
|
| |||||||
| Software—5.7% |
| |||||||
Akamai Technologies, Inc., |
| |||||||
0.125%, 5/1/25 | 19,460 | 24,330,882 | ||||||
Alteryx, Inc. (a)(b), | ||||||||
0.50%, 8/1/24 | 5,740 | 6,502,629 | ||||||
1.00%, 8/1/26 | 9,285 | 10,632,877 | ||||||
Avaya Holdings Corp., | ||||||||
2.25%, 6/15/23 | 1,580 | 1,307,641 | ||||||
Cloudflare, Inc. (a)(b), |
| |||||||
0.75%, 5/15/25 | 3,975 | 4,809,750 | ||||||
Coupa Software, Inc. (a)(b), |
| |||||||
0.375%, 6/15/26 | 19,525 | 22,644,327 | ||||||
Datadog, Inc. (a)(b), | ||||||||
0.125%, 6/15/25 | 10,015 | 11,873,314 | ||||||
DocuSign, Inc., | ||||||||
0.50%, 9/15/23 | 4,160 | 10,132,948 | ||||||
Everbridge, Inc. (a)(b), | ||||||||
0.125%, 12/15/24 | 6,370 | 8,671,815 | ||||||
Evolent Health, Inc., |
| |||||||
1.50%, 10/15/25 | 3,470 | 2,199,113 | ||||||
2.00%, 12/1/21 | 1,400 | 1,225,875 | ||||||
Five9, Inc. (a)(b), | ||||||||
0.50%, 6/1/25 | 10,285 | 11,062,803 | ||||||
HubSpot, Inc. (a)(b), | ||||||||
0.375%, 6/1/25 | 7,450 | 7,990,125 | ||||||
j2 Global, Inc. (a)(b), | ||||||||
1.75%, 11/1/26 | 12,040 | 10,185,744 | ||||||
| Principal Amount (000s) | Value | |||||||
MongoDB, Inc. (a)(b), |
| |||||||
0.25%, 1/15/26 | $ | 15,915 | $ | 20,116,633 | ||||
New Relic, Inc., | ||||||||
0.50%, 5/1/23 | 8,635 | 8,365,116 | ||||||
Nutanix, Inc., | ||||||||
zero coupon, 1/15/23 | 11,110 | 9,864,667 | ||||||
Pegasystems, Inc. (a)(b), |
| |||||||
0.75%, 3/1/25 | 6,815 | 6,992,610 | ||||||
Pluralsight, Inc., | ||||||||
0.375%, 3/1/24 | 8,705 | 7,728,603 | ||||||
RealPage, Inc., | ||||||||
1.50%, 5/15/25 | 2,345 | 2,533,120 | ||||||
RingCentral, Inc. (a)(b), |
| |||||||
zero coupon, 3/1/25 | 16,020 | 17,232,569 | ||||||
Sea Ltd. (a)(b), | ||||||||
2.375%, 12/1/25 | 4,495 | 6,250,055 | ||||||
Slack Technologies, Inc. (a)(b), |
| |||||||
0.50%, 4/15/25 | 8,570 | 10,594,662 | ||||||
Splunk, Inc. (a)(b), | ||||||||
1.125%, 6/15/27 | 25,675 | 27,481,359 | ||||||
Tabula Rasa HealthCare, Inc. (a)(b), |
| |||||||
1.75%, 2/15/26 | 4,510 | 4,637,915 | ||||||
Workday, Inc., | ||||||||
0.25%, 10/1/22 | 11,455 | 15,802,015 | ||||||
Zynga, Inc., | ||||||||
0.25%, 6/1/24 | 5,235 | 6,791,010 | ||||||
|
| |||||||
| 277,960,177 | ||||||||
|
| |||||||
| Telecommunications—0.5% |
| |||||||
CalAmp Corp., |
| |||||||
2.00%, 8/1/25 | 2,330 | 1,819,818 | ||||||
Infinera Corp., | ||||||||
2.125%, 9/1/24 | 7,705 | 6,573,651 | ||||||
Viavi Solutions, Inc., | ||||||||
1.00%, 3/1/24 | 2,685 | 3,096,905 | ||||||
1.75%, 6/1/23 | 7,478 | 8,367,861 | ||||||
Vonage Holdings Corp., | ||||||||
1.75%, 6/1/24 | 5,275 | 4,946,576 | ||||||
|
| |||||||
| 24,804,811 | ||||||||
|
| |||||||
| Transportation—0.3% |
| |||||||
Atlas Air Worldwide Holdings, Inc., |
| |||||||
1.875%, 6/1/24 | 1,400 | 1,353,401 | ||||||
2.25%, 6/1/22 | 6,445 | 6,152,060 | ||||||
Greenbrier Cos., Inc., | ||||||||
2.875%, 2/1/24 | 4,515 | 3,732,650 | ||||||
Teekay Corp., | ||||||||
5.00%, 1/15/23 | 1,625 | 1,336,764 | ||||||
|
| |||||||
| 12,574,875 | ||||||||
|
| |||||||
| Total Convertible Bonds & Notes (cost—$1,293,862,472) |
| 1,291,107,680 | ||||||
|
| |||||||
| Shares | ||||||||
| Convertible Preferred Stock—6.5% |
| |||||||
| Auto Components—0.3% |
| |||||||
Aptiv PLC, Ser. A, |
| |||||||
5.50%, 6/15/23 | 164,090 | 16,865,170 | ||||||
|
| |||||||
| Banks—0.9% |
| |||||||
Bank of America Corp., Ser. L (f), |
| |||||||
7.25% | 11,840 | 15,891,648 | ||||||
Wells Fargo & Co., Ser. L (f), |
| |||||||
7.50% | 22,405 | 29,059,285 | ||||||
|
| |||||||
| 44,950,933 | ||||||||
|
| |||||||
| Chemicals—0.3% |
| |||||||
International Flavors & Fragrances, Inc., |
| |||||||
6.00%, 9/15/21 | 289,890 | 12,842,127 | ||||||
|
| |||||||
| Computers—0.2% |
| |||||||
NCR Corp., Ser. A, PIK 5.50% (f), |
| |||||||
5.50% | 9,505 | 8,543,094 | ||||||
|
| |||||||
| Shares | Value | |||||||
| Diversified Financial Services—0.2% |
| |||||||
2020 Mandatory Exchangeable Trust (a)(b), |
| |||||||
6.50%, 5/16/23 | 4,665 | $ | 5,210,222 | |||||
AMG Capital Trust II, |
| |||||||
5.15%, 10/15/37 | 112,490 | 4,473,554 | ||||||
|
| |||||||
| 9,683,776 | ||||||||
|
| |||||||
| Electric Utilities—0.6% |
| |||||||
NextEra Energy, Inc., |
| |||||||
5.279%, 3/1/23 | 315,590 | 13,396,796 | ||||||
Sempra Energy, Ser. A, |
| |||||||
6.00%, 1/15/21 | 133,900 | 13,086,047 | ||||||
Southern Co., Ser. 2019, |
| |||||||
6.75%, 8/1/22 | 84,000 | 3,701,040 | ||||||
|
| |||||||
| 30,183,883 | ||||||||
|
| |||||||
| Electronics—0.3% |
| |||||||
Fortive Corp., Ser. A, |
| |||||||
5.00%, 7/1/21 | 19,890 | 17,129,467 | ||||||
|
| |||||||
| Environmental Services—0.2% |
| |||||||
GFL Environmental Inc., |
| |||||||
6.00%, 3/15/23 | 184,575 | 8,994,340 | ||||||
|
| |||||||
| Equity Real Estate Investment Trusts (REITs)—0.5% |
| |||||||
Crown Castle International Corp., Ser. A, |
| |||||||
6.875%, 8/1/20 | 15,710 | 23,333,906 | ||||||
|
| |||||||
| Financial Services—0.4% |
| |||||||
2020 Cash Mandatory Exchangeable Trust (a)(b), |
| |||||||
5.25%, 6/1/23 | 18,600 | 19,019,430 | ||||||
|
| |||||||
| Hand/Machine Tools—0.1% |
| |||||||
Stanley Black & Decker, Inc., |
| |||||||
5.25%, 11/15/22 | 35,325 | 3,160,881 | ||||||
|
| |||||||
| Healthcare Equipment & Supplies—0.8% |
| |||||||
Danaher Corp., Ser. B, |
| |||||||
5.00%, 4/15/23 | 34,260 | 36,782,564 | ||||||
|
| |||||||
| Healthcare-Products—0.5% |
| |||||||
Avantor, Inc., Ser. A, |
| |||||||
6.25%, 5/15/22 | 231,890 | 13,310,486 | ||||||
Boston Scientific Corp., Ser. A, |
| |||||||
5.50%, 6/1/23 | 116,605 | 12,207,377 | ||||||
|
| |||||||
| 25,517,863 | ||||||||
|
| |||||||
| Insurance—0.1% |
| |||||||
Assurant, Inc., Ser. D, |
| |||||||
6.50%, 3/15/21 | 66,120 | 6,879,125 | ||||||
|
| |||||||
| Oil, Gas & Consumable Fuels—0.0% |
| |||||||
Nabors Industries Ltd., Ser. A, |
| |||||||
6.00%, 5/1/21 | 53,040 | 344,760 | ||||||
|
| |||||||
| Pharmaceuticals—0.3% |
| |||||||
Becton Dickinson and Co., Ser. B, |
| |||||||
6.00%, 6/1/23 | 169,710 | 9,028,572 | ||||||
Elanco Animal Health, Inc., |
| |||||||
5.00%, 2/1/23 | 155,550 | 5,979,342 | ||||||
|
| |||||||
| 15,007,914 | ||||||||
|
| |||||||
| Semiconductors—0.6% |
| |||||||
Broadcom, Inc., Ser. A, |
| |||||||
8.00%, 9/30/22 | 28,535 | 31,797,977 | ||||||
|
| |||||||
| Utilities—0.2% |
| |||||||
PG&E Corp., | ||||||||
5.50%, 8/16/23 | 102,465 | 9,836,640 | ||||||
|
| |||||||
| Total Convertible Preferred Stock (cost—$335,350,054) |
| 320,873,850 | ||||||
|
| |||||||
| See accompanying Notes to Financial Statements | | June 30, 2020 | | Annual Report | 73 |
Table of Contents
Schedule of Investments
June 30, 2020
| Shares | Value | |||||||
| Preferred Stock (a)(e)(g)(m)(n)—0.3% |
| |||||||
| Media—0.3% |
| |||||||
LiveStyle, Inc., Ser. A | 7,960 | $ | 1,190,020 | |||||
LiveStyle, Inc., Ser. B (j) | 171,344 | 15,040,576 | ||||||
LiveStyle, Inc., Ser. B (j) | 8,000 | 80 | ||||||
|
| |||||||
| Total Preferred Stock (cost—$25,578,848) |
| 16,230,676 | ||||||
|
| |||||||
| Mutual Fund—0.2% |
| |||||||
AllianzGI High Yield | 1,206,558 | 9,447,349 | ||||||
|
| |||||||
| Units | ||||||||
| Warrants (e)(g)(m)—0.0% |
| |||||||
| Advertising—0.0% |
| |||||||
Affinion Group Holdings, Inc., |
| |||||||
exercise price $67.12, | 7,203 | 4,610 | ||||||
|
| |||||||
| Iron/Steel—0.0% |
| |||||||
Arch Resources, Inc., |
| |||||||
exercise price $54.65, | 4,002 | 11,658 | ||||||
|
| |||||||
| Media—0.0% |
| |||||||
LiveStyle, Inc., Ser. C, | 43,500 | 4 | ||||||
|
| |||||||
| Total Warrants (cost—$1,422,156) |
| 16,272 | ||||||
|
| |||||||
| Principal Amount (000s) | Value | |||||||
| Repurchase Agreements—3.6% |
| |||||||
State Street Bank and Trust Co., |
| |||||||
(cost— | $178,891 | $ | 178,891,000 | |||||
|
| |||||||
| Total Investments, before options written (cost—$5,443,539,265)—99.8% |
| 4,897,255,426 | ||||||
|
| |||||||
| Total Options Written—(0.0)% (premiums received—$1,226,008) (m)(o)(p) |
| (1,204,673 | ) | |||||
|
| |||||||
| Total Investments, net of options written (cost—$5,442,313,257)—99.8% |
| 4,896,050,753 | ||||||
|
| |||||||
| Other assets less other liabilities—0.2% | 8,531,162 | |||||||
|
| |||||||
| Net Assets—100.0% | $4,904,581,915 | |||||||
|
| |||||||
Notes to Schedule of Investments:
† Actual amount rounds to less than $1.
(a) Private Placement—Restricted as to resale and may not have a readily available market. Securities with an aggregate value of $1,459,977,934, representing 29.8% of net assets.
(b) 144A—Exempt from registration under Rule 144A of the Securities Act of 1933. These securities may be resold in transactions exempt from registration, typically only to qualified institutional buyers. Securities with an aggregate value of $1,443,747,238, representing 29.4% of net assets.
(c) When-issued or delayed-delivery. To be settled/delivered after June 30, 2020.
(d) In default.
(e) Fair-Valued—Securities with an aggregate value of $21,458,306, representing 0.4% of net assets. See Note 1(a) and Note 1(b) in the Notes to Financial Statements.
(f) Perpetual maturity. The date shown, if any, is the next call date.
(g) Level 3 security. See Note 1(a) and Note 1(b) in the Notes to Financial Statements.
(h) All or partial amount segregated for the benefit of the counterparty as collateral for options written.
(i) Affiliated fund.
(j) Affiliated security.
(k) Restricted. The aggregate cost of such securities is $33,523,461. The aggregate value is $12,839,325, representing 0.3% of net assets.
(l) Institutional Class share.
(m) Non-income producing.
(n) A member of the Fund’s portfolio management team is a member of the board of directors of LiveStyle, Inc. The Fund’s aggregate value of investments in LiveStyle, Inc. represents 0.3% of net assets.
(o) Exchange traded-Chicago Board Options Exchange.
(p) Exchange traded option contracts outstanding at June 30, 2020:
| Options written contracts outstanding at June 30, 2020: | ||||||||||||||||||||||||||||
| Description | Exercise Price | Expiration Date | Number of Contracts | Notional Amount | Market Value | Premiums Received | Unrealized Appreciation (Depreciation) | |||||||||||||||||||||
Call options: | ||||||||||||||||||||||||||||
Activision Blizzard, Inc. | 82.50 USD | 7/17/20 | (360 | ) | $ | (36,000 | ) | $ | (8,460 | ) | $ | (10,617 | ) | $ | 2,157 | |||||||||||||
Adobe, Inc. | 455.00 USD | 7/17/20 | (350 | ) | (35,000 | ) | (121,800 | ) | (73,992 | ) | (47,808 | ) | ||||||||||||||||
Advanced Micro Devices, Inc. | 60.00 USD | 7/17/20 | (2,155 | ) | (215,500 | ) | (90,510 | ) | (90,769 | ) | 259 | |||||||||||||||||
Alibaba Group Holding Ltd. | 250.00 USD | 7/17/20 | (310 | ) | (31,000 | ) | (4,185 | ) | (28,572 | ) | 24,387 | |||||||||||||||||
American Tower Corp. | 280.00 USD | 7/17/20 | (130 | ) | (13,000 | ) | (8,450 | ) | (7,872 | ) | (578 | ) | ||||||||||||||||
Atlassian Corp. | 210.00 USD | 7/17/20 | (295 | ) | (29,500 | ) | (9,587 | ) | (44,216 | ) | 34,629 | |||||||||||||||||
Broadcom, Inc. | 340.00 USD | 7/17/20 | (345 | ) | (34,500 | ) | (31,913 | ) | (32,289 | ) | 376 | |||||||||||||||||
Costco Wholesale Corp. | 322.50 USD | 7/17/20 | (80 | ) | (8,000 | ) | (3,400 | ) | (4,963 | ) | 1,563 | |||||||||||||||||
Deere & Co. | 175.00 USD | 7/17/20 | (285 | ) | (28,500 | ) | (14,107 | ) | (10,704 | ) | (3,403 | ) | ||||||||||||||||
Dollar General Corp. | 207.50 USD | 7/17/20 | (335 | ) | (33,500 | ) | (5,025 | ) | (11,387 | ) | 6,362 | |||||||||||||||||
Dr Horton, Inc. | 60.00 USD | 7/17/20 | (870 | ) | (87,000 | ) | (33,930 | ) | (26,257 | ) | (7,673 | ) | ||||||||||||||||
| 74 | Annual Report | | June 30, 2020 | | See accompanying Notes to Financial Statements |
Table of Contents
Schedule of Investments
June 30, 2020
| Options written contracts outstanding at June 30, 2020 (continued): | ||||||||||||||||||||||||||||
| Description | Exercise Price | Expiration Date | Number of Contracts | Notional Amount | Market Value | Premiums Received | Unrealized Appreciation (Depreciation) | |||||||||||||||||||||
Call options (continued): | ||||||||||||||||||||||||||||
Home Depot, Inc. | 267.50 USD | 7/17/20 | (715 | ) | $ | (71,500 | ) | $ | (42,900 | ) | $ | (52,802 | ) | $ | 9,902 | |||||||||||||
Intuitive Surgical, Inc. | 610.00 USD | 7/17/20 | (140 | ) | (14,000 | ) | (44,800 | ) | (34,574 | ) | (10,226 | ) | ||||||||||||||||
Marvell Technology Group Ltd. | 39.00 USD | 7/17/20 | (1,160 | ) | (116,000 | ) | (34,220 | ) | (29,059 | ) | (5,161 | ) | ||||||||||||||||
Mastercard, Inc. | 320.00 USD | 7/17/20 | (630 | ) | (63,000 | ) | (36,225 | ) | (42,071 | ) | 5,846 | |||||||||||||||||
Micron Technology, Inc. | 60.00 USD | 7/17/20 | (1,870 | ) | (187,000 | ) | (20,570 | ) | (58,999 | ) | 38,429 | |||||||||||||||||
Netflix, Inc. | 525.00 USD | 7/17/20 | (335 | ) | (33,500 | ) | (69,178 | ) | (105,439 | ) | 36,261 | |||||||||||||||||
Nike, Inc. | 110.00 USD | 8/21/20 | (665 | ) | (66,500 | ) | (54,198 | ) | (43,259 | ) | (10,939 | ) | ||||||||||||||||
Nvidia Corp. | 415.00 USD | 7/17/20 | (405 | ) | (40,500 | ) | (88,290 | ) | (45,825 | ) | (42,465 | ) | ||||||||||||||||
Paypal Holdings, Inc. | 195.00 USD | 7/17/20 | (685 | ) | (68,500 | ) | (40,758 | ) | (33,744 | ) | (7,014 | ) | ||||||||||||||||
Pepsico, Inc. | 140.00 USD | 7/17/20 | (415 | ) | (41,500 | ) | (15,977 | ) | (15,106 | ) | (871 | ) | ||||||||||||||||
Progressive Corp. | 85.00 USD | 7/17/20 | (270 | ) | (27,000 | ) | (13,500 | ) | (12,849 | ) | (651 | ) | ||||||||||||||||
Qualcomm, Inc. | 95.00 USD | 7/17/20 | (930 | ) | (93,000 | ) | (117,180 | ) | (63,193 | ) | (53,987 | ) | ||||||||||||||||
S & P Global, Inc. | 360.00 USD | 7/17/20 | (155 | ) | (15,500 | ) | (8,525 | ) | (15,822 | ) | 7,297 | |||||||||||||||||
Salesforce.Com, Inc. | 210.00 USD | 7/17/20 | (755 | ) | (75,500 | ) | (27,180 | ) | (49,845 | ) | 22,665 | |||||||||||||||||
Servicenow, Inc. | 440.00 USD | 7/17/20 | (195 | ) | (19,500 | ) | (56,550 | ) | (33,538 | ) | (23,012 | ) | ||||||||||||||||
Target Corp. | 135.00 USD | 7/17/20 | (820 | ) | (82,000 | ) | (6,970 | ) | (26,749 | ) | 19,779 | |||||||||||||||||
Texas Instruments, Inc. | 133.00 USD | 7/17/20 | (205 | ) | (20,500 | ) | (21,525 | ) | (19,143 | ) | (2,382 | ) | ||||||||||||||||
Union Pacific Corp. | 180.00 USD | 7/17/20 | (380 | ) | (38,000 | ) | (32,490 | ) | (27,086 | ) | (5,404 | ) | ||||||||||||||||
Unitedhealth Group, Inc | 320.00 USD | 7/17/20 | (430 | ) | (43,000 | ) | (58,695 | ) | (47,274 | ) | (11,421 | ) | ||||||||||||||||
Vertex Pharmaceuticals, Inc. | 320.00 USD | 7/17/20 | (210 | ) | (21,000 | ) | (22,575 | ) | (25,088 | ) | 2,513 | |||||||||||||||||
Workday, Inc. | 210.00 USD | 7/17/20 | (595 | ) | (59,500 | ) | (32,725 | ) | (44,422 | ) | 11,697 | |||||||||||||||||
Zoetis, Inc. | 145.00 USD | 7/17/20 | (215 | ) | (21,500 | ) | (11,825 | ) | (7,962 | ) | (3,863 | ) | ||||||||||||||||
Zoom Video Communications, Inc. | 300.00 USD | 7/17/20 | (140 | ) | (14,000 | ) | (16,450 | ) | (50,521 | ) | 34,071 | |||||||||||||||||
|
| |||||||||||||||||||||||||||
| Total options written contracts |
| $ | (1,204,673 | ) | $ | (1,226,008 | ) | $ | 21,335 | |||||||||||||||||||
|
| |||||||||||||||||||||||||||
Glossary:
ADR—American Depositary Receipt
PIK—Payment-in-Kind
REIT—Real Estate Investment Trust
| See accompanying Notes to Financial Statements | | June 30, 2020 | | Annual Report | 75 |
Table of Contents
Schedule of Investments
June 30, 2020
AllianzGI International Value Fund (formerly AllianzGI NFJ International Value Fund)†
| Shares | Value | |||||||
| Common Stock—96.2% |
| |||||||
| Australia—1.3% |
| |||||||
Goodman Group REIT | 31,225 | $322,186 | ||||||
Macquarie Group Ltd. | 15,654 | 1,299,159 | ||||||
|
| |||||||
| 1,621,345 | ||||||||
|
| |||||||
| Canada—7.6% |
| |||||||
Bank of Montreal | 22,200 | 1,177,710 | ||||||
Canadian Apartment Properties REIT | 23,552 | 842,952 | ||||||
Canadian Pacific Railway Ltd. | 2,383 | 608,475 | ||||||
Constellation Software, Inc. | 509 | 574,721 | ||||||
goeasy Ltd. | 11,957 | 481,592 | ||||||
Magna International, Inc. | 27,256 | 1,213,710 | ||||||
Manulife Financial Corp. | 61,168 | 833,108 | ||||||
Royal Bank of Canada | 18,100 | 1,227,180 | ||||||
TC Energy Corp. | 39,360 | 1,686,970 | ||||||
Toronto-Dominion Bank | 26,440 | 1,179,488 | ||||||
|
| |||||||
| 9,825,906 | ||||||||
|
| |||||||
| China—15.6% |
| |||||||
Anhui Conch Cement Co., Ltd., Class H | 139,000 | 941,884 | ||||||
China Construction Bank Corp., Class H | 1,358,100 | 1,104,655 | ||||||
China Merchants Bank Co., Ltd., Class H | 1,116,000 | 5,171,702 | ||||||
ENN Energy Holdings Ltd. | 106,000 | 1,197,851 | ||||||
Gree Electric Appliances, Inc. of Zhuhai, Class A | 75,400 | 605,578 | ||||||
Henan Shuanghui Investment & Development Co., Ltd., Class A | 108,400 | 708,970 | ||||||
Longfor Group Holdings Ltd. (a) | 272,500 | 1,304,412 | ||||||
NetEase, Inc. ADR | 2,969 | 1,274,829 | ||||||
Ping An Insurance Group Co of China Ltd., Class A | 221,617 | 2,242,986 | ||||||
Shenzhen Expressway Co., Ltd., Class H | 968,000 | 983,645 | ||||||
Tencent Holdings Ltd. | 56,000 | 3,588,361 | ||||||
Wuliangye Yibin Co., Ltd., Class A | 17,200 | 417,907 | ||||||
Yealink Network Technology Corp., Ltd., Class A | 72,350 | 701,884 | ||||||
|
| |||||||
| 20,244,664 | ||||||||
|
| |||||||
| France—9.2% |
| |||||||
Air Liquide S.A. | 8,951 | 1,294,196 | ||||||
BNP Paribas S.A. (c) | 17,549 | 701,153 | ||||||
Capgemini SE | 22,802 | 2,631,384 | ||||||
Euronext NV (a) | 10,481 | 1,054,956 | ||||||
Kering S.A. | 2,169 | 1,185,833 | ||||||
L’Oreal S.A. | 4,825 | 1,557,251 | ||||||
Sanofi | 33,934 | 3,460,744 | ||||||
|
| |||||||
| 11,885,517 | ||||||||
|
| |||||||
| Germany—3.8% |
| |||||||
Bayer AG | 15,624 | 1,158,105 | ||||||
Deutsche Boerse AG | 7,193 | 1,301,766 | ||||||
Muenchener Rueckversicherungs-Gesellschaft AG in Muenchen | 4,970 | 1,294,162 | ||||||
SAP SE | 7,910 | 1,105,734 | ||||||
|
| |||||||
| 4,859,767 | ||||||||
|
| |||||||
| Shares | Value | |||||||
| Hong Kong—3.8% |
| |||||||
AIA Group Ltd. | 134,400 | $ | 1,257,662 | |||||
Hong Kong Exchanges & Clearing Ltd. | 7,900 | 336,474 | ||||||
SITC International Holdings Co., Ltd. | 569,000 | 609,251 | ||||||
Techtronic Industries Co., Ltd. | 268,500 | 2,656,686 | ||||||
|
| |||||||
| 4,860,073 | ||||||||
|
| |||||||
| India—0.8% |
| |||||||
HDFC Bank Ltd. ADR | 7,200 | 327,312 | ||||||
Reliance Industries Ltd. GDR (a) | 14,771 | 682,742 | ||||||
|
| |||||||
| 1,010,054 | ||||||||
|
| |||||||
| Israel—1.2% |
| |||||||
Bank Hapoalim BM | 266,698 | 1,594,362 | ||||||
|
| |||||||
| Italy—1.9% |
| |||||||
Enel SpA | 170,494 | 1,474,507 | ||||||
Terna Rete Elettrica Nazionale SpA | 149,864 | 1,033,695 | ||||||
|
| |||||||
| 2,508,202 | ||||||||
|
| |||||||
| Japan—10.0% |
| |||||||
Astellas Pharma, Inc. | 73,000 | 1,219,068 | ||||||
Capcom Co., Ltd. | 17,500 | 640,564 | ||||||
Chubu Electric Power Co., Inc. | 19,500 | 244,568 | ||||||
Daiwa House Industry Co., Ltd. | 33,900 | 800,544 | ||||||
Hitachi Ltd. | 27,340 | 868,997 | ||||||
KDDI Corp. | 30,100 | 898,098 | ||||||
Mitsubishi Corp. | 45,800 | 967,833 | ||||||
Sony Corp. | 53,000 | 3,658,596 | ||||||
Tokio Marine Holdings, Inc. | 54,200 | 2,372,497 | ||||||
Tokyo Electron Ltd. | 5,200 | 1,283,068 | ||||||
|
| |||||||
| 12,953,833 | ||||||||
|
| |||||||
| Korea (Republic of)—4.4% |
| |||||||
Samsung Electronics Co., Ltd. | 129,050 | 5,712,738 | ||||||
|
| |||||||
| Netherlands—2.4% |
| |||||||
Unilever NV | 35,611 | 1,898,697 | ||||||
Wolters Kluwer NV | 15,083 | 1,178,068 | ||||||
|
| |||||||
| 3,076,765 | ||||||||
|
| |||||||
| Russian Federation—2.0% |
| |||||||
Lukoil PJSC ADR | 34,770 | 2,580,629 | ||||||
|
| |||||||
| Singapore—4.0% |
| |||||||
Ascendas Real Estate Investment Trust REIT | 368,500 | 845,490 | ||||||
DBS Group Holdings Ltd. | 122,900 | 1,849,254 | ||||||
Keppel DC REIT | 656,300 | 1,201,899 | ||||||
Mapletree Industrial Trust REIT | 632,600 | 1,315,948 | ||||||
|
| |||||||
| 5,212,591 | ||||||||
|
| |||||||
| Spain—2.0% |
| |||||||
Grifols S.A. ADR | 33,853 | 617,479 | ||||||
Iberdrola S.A. | 170,660 | 1,992,401 | ||||||
|
| |||||||
| 2,609,880 | ||||||||
|
| |||||||
| Sweden—0.3% |
| |||||||
Swedish Match AB | 4,608 | 325,120 | ||||||
|
| |||||||
| Switzerland—6.9% |
| |||||||
Nestle S.A. | 20,384 | 2,259,987 | ||||||
Roche Holding AG | 8,215 | 2,846,083 | ||||||
| Shares | Value | |||||||
Zurich Insurance Group AG | 10,897 | $ | 3,861,137 | |||||
|
| |||||||
| 8,967,207 | ||||||||
|
| |||||||
| Taiwan—3.9% |
| |||||||
Getac Technology Corp. | 454,000 | 670,316 | ||||||
Micro-Star International Co., Ltd. | 234,000 | 856,663 | ||||||
Taiwan Semiconductor Manufacturing Co., Ltd. ADR | 42,176 | 2,394,331 | ||||||
Uni-President Enterprises Corp. | 232,000 | 562,091 | ||||||
Unimicron Technology Corp. | 335,000 | 574,174 | ||||||
|
| |||||||
| 5,057,575 | ||||||||
|
| |||||||
| United Kingdom—8.3% |
| |||||||
3i Group PLC | 79,012 | 813,586 | ||||||
Aon PLC, Class A | 6,400 | 1,232,640 | ||||||
BAE Systems PLC ADR | 72,368 | 1,736,832 | ||||||
Coca-Cola HBC AG (c) | 32,408 | 811,273 | ||||||
Diageo PLC ADR | 7,236 | 972,446 | ||||||
GlaxoSmithKline PLC | 99,100 | 2,001,789 | ||||||
London Stock Exchange Group PLC | 2,603 | 270,699 | ||||||
Rio Tinto PLC | 22,524 | 1,267,573 | ||||||
Smith & Nephew PLC ADR | 44,703 | 1,704,078 | ||||||
|
| |||||||
| 10,810,916 | ||||||||
|
| |||||||
| United States—6.8% |
| |||||||
Broadcom, Inc. | 18,175 | 5,736,212 | ||||||
Equinix, Inc. REIT | 500 | 351,150 | ||||||
Garmin Ltd. | 12,300 | 1,199,250 | ||||||
Mastercard, Inc., Class A | 500 | 147,850 | ||||||
Royal Gold, Inc. | 11,200 | 1,392,384 | ||||||
|
| |||||||
| 8,826,846 | ||||||||
|
| |||||||
| Total Common Stock (cost—$112,746,610) | 124,543,990 | |||||||
|
| |||||||
| Preferred Stock—1.4% |
| |||||||
| Germany—1.4% |
| |||||||
Porsche Automobil Holding SE (cost—$2,058,295) | 29,419 | 1,703,910 | ||||||
|
| |||||||
| Principal Amount (000s) | ||||||||
| Repurchase Agreements—0.8% |
| |||||||
State Street Bank and Trust Co., |
| |||||||
(cost—$1,090,000) | $1,090 | 1,090,000 | ||||||
|
| |||||||
| Total Investments (cost—$115,894,905) (b)—98.4% |
| 127,337,900 | ||||||
|
| |||||||
| Other assets less liabilities—1.6% | 2,126,854 | |||||||
|
| |||||||
| Net Assets—100.0% | $129,464,754 | |||||||
|
| |||||||
| 76 | Annual Report | | June 30, 2020 | | See accompanying Notes to Financial Statements |
Table of Contents
Schedule of Investments
June 30, 2020
Notes to Schedule of Investments:
† Effective April 30, 2020, AllianzGI NFJ International Value Fund changed its name to AllianzGI International Value Fund. See Note 9(a).
(a) 144A—Exempt from registration under Rule 144A of the Securities Act of 1933. These securities may be resold in transactions exempt from registration, typically only to qualified institutional buyers. Securities with an aggregate value of $3,042,110, representing 2.3% of net assets.
(b) Securities with an aggregate value of $93,576,504, representing 72.3% of net assets, were valued utilizing modeling tools provided by a third-party vendor. See Note 1(a) and Note 1(b) in the Notes to Financial Statements.
(c) Non-income producing.
Glossary:
ADR—American Depositary Receipt
GDR—Global Depositary Receipt
REIT—Real Estate Investment Trust
The industry classification of portfolio holdings and other assets less liabilities shown as a percentage of net assets were as follows:
Banks | 11.1% | |||
Insurance | 10.1% | |||
Pharmaceuticals | 8.3% | |||
Semiconductors & Semiconductor Equipment | 7.3% | |||
Technology Hardware, Storage & Peripherals | 5.6% | |||
Household Durables | 4.2% | |||
Capital Markets | 3.9% | |||
Oil, Gas & Consumable Fuels | 3.8% | |||
Equity Real Estate Investment Trusts (REITs) | 3.8% | |||
Electric Utilities | 3.7% | |||
Interactive Media & Services | 2.8% | |||
Food Products | 2.7% | |||
Personal Products | 2.7% | |||
IT Services | 2.1% | |||
Metals & Mining | 2.1% | |||
Machinery | 2.1% | |||
Beverages | 1.7% | |||
Real Estate Management & Development | 1.6% | |||
Entertainment | 1.5% | |||
Aerospace & Defense | 1.3% | |||
Healthcare Equipment & Supplies | 1.3% | |||
Automobiles | 1.3% | |||
Software | 1.3% | |||
Electronic Equipment, Instruments & Components | 1.1% | |||
Chemicals | 1.0% | |||
Auto Components | 0.9% | |||
Gas Utilities | 0.9% | |||
Textiles, Apparel & Luxury Goods | 0.9% | |||
Professional Services | 0.9% | |||
Transportation Infrastructure | 0.8% | |||
Trading Companies & Distributors | 0.7% | |||
Construction Materials | 0.7% | |||
Wireless Telecommunication Services | 0.7% | |||
Communications Equipment | 0.5% | |||
Biotechnology | 0.5% | |||
Marine | 0.5% | |||
Road & Rail | 0.5% | |||
Consumer Finance | 0.4% | |||
Tobacco | 0.3% | |||
Repurchase Agreements | 0.8% | |||
Other assets less liabilities | 1.6% | |||
|
| |||
| 100.0% | ||||
|
|
AllianzGI Large-Cap Value Fund (formerly AllianzGI NFJ Large-Cap Value Fund)†
| Shares | Value | |||||||
| Common Stock—98.2% |
| |||||||
| Aerospace & Defense—2.7% |
| |||||||
L3Harris Technologies, Inc. | 17,292 | $2,933,933 | ||||||
Lockheed Martin Corp. | 8,612 | 3,142,691 | ||||||
Raytheon Technologies Corp. | 19,490 | 1,200,974 | ||||||
|
| |||||||
| 7,277,598 | ||||||||
|
| |||||||
| Banks—9.4% |
| |||||||
Bank of America Corp. | 220,023 | 5,225,546 | ||||||
Citigroup, Inc. | 97,378 | 4,976,016 | ||||||
Fifth Third Bancorp | 68,186 | 1,314,626 | ||||||
JPMorgan Chase & Co. | 120,471 | 11,331,502 | ||||||
PNC Financial Services Group, Inc. | 21,378 | 2,249,180 | ||||||
|
| |||||||
| 25,096,870 | ||||||||
|
| |||||||
| Beverages—1.7% |
| |||||||
Brown-Forman Corp., Class B | 19,003 | 1,209,731 | ||||||
Coca-Cola Co. | 77,345 | 3,455,775 | ||||||
|
| |||||||
| 4,665,506 | ||||||||
|
| |||||||
| Biotechnology—1.4% |
| |||||||
Amgen, Inc. | 15,967 | 3,765,977 | ||||||
|
| |||||||
| Capital Markets—5.2% |
| |||||||
Ameriprise Financial, Inc. | 19,764 | 2,965,390 | ||||||
CME Group, Inc. | 14,877 | 2,418,107 | ||||||
Intercontinental Exchange, Inc. | 33,436 | 3,062,738 | ||||||
Morgan Stanley | 116,512 | 5,627,530 | ||||||
|
| |||||||
| 14,073,765 | ||||||||
|
| |||||||
| Chemicals—3.1% |
| |||||||
Air Products & Chemicals, Inc. | 5,849 | 1,412,300 | ||||||
Celanese Corp. | 30,058 | 2,595,208 | ||||||
Linde PLC | 13,472 | 2,857,546 | ||||||
Sherwin-Williams Co. | 2,477 | 1,431,334 | ||||||
|
| |||||||
| 8,296,388 | ||||||||
|
| |||||||
| Commercial Services & Supplies—1.0% |
| |||||||
Cintas Corp. | 4,921 | 1,310,758 | ||||||
Waste Management, Inc. | 13,010 | 1,377,889 | ||||||
|
| |||||||
| 2,688,647 | ||||||||
|
| |||||||
| Communications Equipment—1.5% |
| |||||||
Cisco Systems, Inc. | 55,448 | 2,586,095 | ||||||
Motorola Solutions, Inc. | 9,407 | 1,318,203 | ||||||
|
| |||||||
| 3,904,298 | ||||||||
|
| |||||||
| Consumer Finance—0.6% |
| |||||||
Discover Financial Services | 32,588 | 1,632,333 | ||||||
|
| |||||||
| Containers & Packaging—0.5% |
| |||||||
Avery Dennison Corp. | 11,181 | 1,275,640 | ||||||
|
| |||||||
| Diversified Telecommunication Services—2.5% |
| |||||||
AT&T, Inc. | 87,401 | 2,642,132 | ||||||
Verizon Communications, Inc. | 72,819 | 4,014,512 | ||||||
|
| |||||||
| 6,656,644 | ||||||||
|
| |||||||
| Electric Utilities—2.9% |
| |||||||
American Electric Power Co., Inc. | 14,602 | 1,162,903 | ||||||
NextEra Energy, Inc. | 27,581 | 6,624,129 | ||||||
|
| |||||||
| 7,787,032 | ||||||||
|
| |||||||
| Electrical Equipment—0.5% |
| |||||||
AMETEK, Inc. | 16,059 | 1,435,193 | ||||||
|
| |||||||
| See accompanying Notes to Financial Statements | | June 30, 2020 | | Annual Report | 77 |
Table of Contents
Schedule of Investments
June 30, 2020
| Shares | Value | |||||||
| Entertainment—1.0% |
| |||||||
Walt Disney Co. | 23,242 | $ | 2,591,715 | |||||
|
| |||||||
| Equity Real Estate Investment Trusts (REITs)—5.4% |
| |||||||
American Tower Corp. | 4,737 | 1,224,704 | ||||||
CoreSite Realty Corp. | 22,285 | 2,697,822 | ||||||
Douglas Emmett, Inc. | 90,665 | 2,779,789 | ||||||
Essex Property Trust, Inc. | 16,135 | 3,697,658 | ||||||
Prologis, Inc. | 30,270 | 2,825,099 | ||||||
Sun Communities, Inc. | 9,319 | 1,264,402 | ||||||
|
| |||||||
| 14,489,474 | ||||||||
|
| |||||||
| Food & Staples Retailing—0.9% |
| |||||||
Costco Wholesale Corp. | 4,122 | 1,249,832 | ||||||
Walmart, Inc. | 9,067 | 1,086,045 | ||||||
|
| |||||||
| 2,335,877 | ||||||||
|
| |||||||
| Food Products—0.9% |
| |||||||
Mondelez International, Inc., Class A | 46,298 | 2,367,217 | ||||||
|
| |||||||
| Gas Utilities—0.9% |
| |||||||
Atmos Energy Corp. | 24,030 | 2,392,907 | ||||||
|
| |||||||
| Healthcare Equipment & Supplies—3.1% |
| |||||||
Abbott Laboratories | 38,822 | 3,549,495 | ||||||
Hill-Rom Holdings, Inc. | 12,991 | 1,426,152 | ||||||
Medtronic PLC | 36,854 | 3,379,512 | ||||||
|
| |||||||
| 8,355,159 | ||||||||
|
| |||||||
| Healthcare Providers & Services—2.1% |
| |||||||
Anthem, Inc. | 9,116 | 2,397,326 | ||||||
Chemed Corp. | 2,822 | 1,272,919 | ||||||
CVS Health Corp. | 20,881 | 1,356,639 | ||||||
HCA Healthcare, Inc. | 6,947 | 674,276 | ||||||
|
| |||||||
| 5,701,160 | ||||||||
|
| |||||||
| Hotels, Restaurants & Leisure—2.4% |
| |||||||
Dunkin’ Brands Group, Inc. | 20,433 | 1,332,845 | ||||||
McDonald’s Corp. | 21,049 | 3,882,909 | ||||||
Starbucks Corp. | 17,406 | 1,280,907 | ||||||
|
| |||||||
| 6,496,661 | ||||||||
|
| |||||||
| Household Durables—0.5% |
| |||||||
Garmin Ltd. | 14,757 | 1,438,807 | ||||||
|
| |||||||
| Household Products—2.3% |
| |||||||
Church & Dwight Co., Inc. | 17,534 | 1,355,378 | ||||||
Procter & Gamble Co. | 41,461 | 4,957,492 | ||||||
|
| |||||||
| 6,312,870 | ||||||||
|
| |||||||
| Industrial Conglomerates—3.0% |
| |||||||
Honeywell International, Inc. | 27,787 | 4,017,722 | ||||||
Roper Technologies, Inc. | 10,336 | 4,013,056 | ||||||
|
| |||||||
| 8,030,778 | ||||||||
|
| |||||||
| Insurance—4.7% |
| |||||||
Allstate Corp. | 24,615 | 2,387,409 | ||||||
Cincinnati Financial Corp. | 29,638 | 1,897,721 | ||||||
Fidelity National Financial, Inc. | 43,339 | 1,328,774 | ||||||
Hartford Financial Services Group, Inc. | 35,627 | 1,373,421 | ||||||
Marsh & McLennan Cos., Inc. | 13,313 | 1,429,417 | ||||||
MetLife, Inc. | 37,704 | 1,376,950 | ||||||
Primerica, Inc. | 25,169 | 2,934,705 | ||||||
|
| |||||||
| 12,728,397 | ||||||||
|
| |||||||
| IT Services—3.8% |
| |||||||
Accenture PLC, Class A | 13,621 | 2,924,701 | ||||||
Automatic Data Processing, Inc. | 17,406 | 2,591,580 | ||||||
Fiserv, Inc. (a) | 11,626 | 1,134,930 | ||||||
Mastercard, Inc., Class A | 4,549 | 1,345,139 | ||||||
Visa, Inc., Class A | 10,724 | 2,071,555 | ||||||
|
| |||||||
| 10,067,905 | ||||||||
|
| |||||||
| Shares | Value | |||||||
| Life Sciences Tools & Services—1.5% |
| |||||||
Agilent Technologies, Inc. | 22,645 | $ | 2,001,138 | |||||
Thermo Fisher Scientific, Inc. | 5,911 | 2,141,792 | ||||||
|
| |||||||
| 4,142,930 | ||||||||
|
| |||||||
| Machinery—2.2% |
| |||||||
Deere & Co. | 4,339 | 681,874 | ||||||
Dover Corp. | 13,130 | 1,267,833 | ||||||
ITT, Inc. | 25,965 | 1,525,184 | ||||||
Toro Co. | 35,362 | 2,345,915 | ||||||
|
| |||||||
| 5,820,806 | ||||||||
|
| |||||||
| Media—0.5% |
| |||||||
Comcast Corp., Class A | 31,338 | 1,221,555 | ||||||
|
| |||||||
| Metals & Mining—0.6% |
| |||||||
Royal Gold, Inc. | 12,334 | 1,533,363 | ||||||
|
| |||||||
| Multi-Line Retail—0.5% |
| |||||||
Dollar General Corp. | 6,906 | 1,315,662 | ||||||
|
| |||||||
| Multi-Utilities—2.8% |
| |||||||
DTE Energy Co. | 36,870 | 3,963,525 | ||||||
Public Service Enterprise Group, Inc. | 48,304 | 2,374,625 | ||||||
Sempra Energy | 9,549 | 1,119,429 | ||||||
|
| |||||||
| 7,457,579 | ||||||||
|
| |||||||
| Oil, Gas & Consumable Fuels—4.5% |
| |||||||
Chevron Corp. | 45,521 | 4,061,839 | ||||||
ConocoPhillips | 30,856 | 1,296,569 | ||||||
EOG Resources, Inc. | 29,140 | 1,476,232 | ||||||
Exxon Mobil Corp. | 47,113 | 2,106,893 | ||||||
ONEOK, Inc. | 40,035 | 1,329,963 | ||||||
Valero Energy Corp. | 29,952 | 1,761,777 | ||||||
|
| |||||||
| 12,033,273 | ||||||||
|
| |||||||
| Personal Products—0.4% |
| |||||||
Estee Lauder Cos., Inc., Class A | 6,136 | 1,157,740 | ||||||
|
| |||||||
| Pharmaceuticals—4.5% |
| |||||||
Bristol-Myers Squibb Co. | 34,298 | 2,016,722 | ||||||
Johnson & Johnson | 38,841 | 5,462,210 | ||||||
Merck & Co., Inc. | 59,435 | 4,596,109 | ||||||
|
| |||||||
| 12,075,041 | ||||||||
|
| |||||||
| Professional Services—0.5% |
| |||||||
TransUnion | 15,155 | 1,319,091 | ||||||
|
| |||||||
| Road & Rail—1.8% |
| |||||||
CSX Corp. | 9,635 | 671,945 | ||||||
Norfolk Southern Corp. | 23,448 | 4,116,765 | ||||||
|
| |||||||
| 4,788,710 | ||||||||
|
| |||||||
| Semiconductors & Semiconductor Equipment—4.9% |
| |||||||
Broadcom, Inc. | 9,123 | 2,879,310 | ||||||
Intel Corp. | 95,479 | 5,712,509 | ||||||
KLA Corp. | 23,003 | 4,473,623 | ||||||
|
| |||||||
| 13,065,442 | ||||||||
|
| |||||||
| Software—4.3% |
| |||||||
Intuit, Inc. | 8,721 | 2,583,073 | ||||||
Microsoft Corp. | 43,823 | 8,918,419 | ||||||
|
| |||||||
| 11,501,492 | ||||||||
|
| |||||||
| Specialty Retail—3.1% |
| |||||||
Best Buy Co., Inc. | 34,564 | 3,016,400 | ||||||
Home Depot, Inc. | 20,705 | 5,186,810 | ||||||
|
| |||||||
| 8,203,210 | ||||||||
|
| |||||||
| Technology Hardware, Storage & Peripherals—1.1% |
| |||||||
Apple, Inc. | 8,110 | 2,958,528 | ||||||
|
| |||||||
| Shares | Value | |||||||
| Textiles, Apparel & Luxury Goods—1.0% |
| |||||||
NIKE, Inc., Class B | 26,768 | $ | 2,624,602 | |||||
|
| |||||||
| Total Common Stock (cost—$263,418,865) |
| 263,083,842 | ||||||
|
| |||||||
| Principal Amount (000s) | ||||||||
| Repurchase Agreements—1.5% |
| |||||||
State Street Bank and Trust Co., |
| |||||||
(cost—$4,096,000) | $4,096 | 4,096,000 | ||||||
|
| |||||||
| Total Investments (cost—$267,514,865)—99.7% |
| 267,179,842 | ||||||
|
| |||||||
| Other assets less liabilities—0.3% | 841,518 | |||||||
|
| |||||||
| Net Assets—100.0% | $268,021,360 | |||||||
|
| |||||||
Notes to Schedule of Investments:
† Effective April 30, 2020, the AllianzGI NFJ Large-Cap Value Fund changed its name to AllianzGI Large-Cap Value Fund. See Note 9(a).
(a) Non-income producing.
Glossary:
REIT—Real Estate Investment Trust
| 78 | Annual Report | | June 30, 2020 | | See accompanying Notes to Financial Statements |
Table of Contents
Schedule of Investments
June 30, 2020
AllianzGI Mid-Cap Fund
| Shares | Value | |||||||
| Common Stock—100.0% |
| |||||||
| Aerospace & Defense—1.8% |
| |||||||
Mercury Systems, Inc. (a) | 34,780 | $2,735,795 | ||||||
TransDigm Group, Inc. | 7,650 | 3,381,682 | ||||||
|
| |||||||
| 6,117,477 | ||||||||
|
| |||||||
| Air Freight & Logistics—1.4% |
| |||||||
XPO Logistics, Inc. (a) | 61,269 | 4,733,030 | ||||||
|
| |||||||
| Biotechnology—1.5% |
| |||||||
Immunomedics, Inc. (a) | 147,835 | 5,239,272 | ||||||
|
| |||||||
| Capital Markets—1.8% |
| |||||||
Tradeweb Markets, Inc., Class A | 106,365 | 6,184,061 | ||||||
|
| |||||||
| Chemicals—1.5% |
| |||||||
FMC Corp. | 51,935 | 5,173,765 | ||||||
|
| |||||||
| Commercial Services & Supplies—4.8% |
| |||||||
Clean Harbors, Inc. (a) | 100,525 | 6,029,489 | ||||||
IAA, Inc. (a) | 128,450 | 4,954,317 | ||||||
Waste Connections, Inc. | 63,027 | 5,911,302 | ||||||
|
| |||||||
| 16,895,108 | ||||||||
|
| |||||||
| Consumer Finance—1.1% |
| |||||||
Discover Financial Services | 77,115 | 3,862,690 | ||||||
|
| |||||||
| Containers & Packaging—1.9% |
| |||||||
Crown Holdings, Inc. (a) | 103,655 | 6,751,050 | ||||||
|
| |||||||
| Electrical Equipment—1.4% |
| |||||||
AMETEK, Inc. | 56,607 | 5,058,968 | ||||||
|
| |||||||
| Electronic Equipment, Instruments & Components—4.5% |
| |||||||
IPG Photonics Corp. (a) | 16,345 | 2,621,575 | ||||||
Keysight Technologies, Inc. (a) | 42,390 | 4,272,064 | ||||||
TE Connectivity Ltd. | 61,506 | 5,015,814 | ||||||
Trimble, Inc. (a) | 93,012 | 4,017,188 | ||||||
|
| |||||||
| 15,926,641 | ||||||||
|
| |||||||
| Entertainment—5.0% |
| |||||||
Take-Two Interactive Software, Inc. (a) | 57,840 | 8,072,729 | ||||||
Zynga, Inc., Class A (a) | 1,000,831 | 9,547,928 | ||||||
|
| |||||||
| 17,620,657 | ||||||||
|
| |||||||
| Equity Real Estate Investment Trusts (REITs)—0.9% |
| |||||||
Terreno Realty Corp. | 62,705 | 3,300,791 | ||||||
|
| |||||||
| Food & Staples Retailing—1.7% |
| |||||||
Grocery Outlet Holding Corp. (a) | 148,140 | 6,044,112 | ||||||
|
| |||||||
| Food Products—1.9% |
| |||||||
Freshpet, Inc. (a) | 80,170 | 6,707,022 | ||||||
|
| |||||||
| Healthcare Equipment & Supplies—11.0% |
| |||||||
Align Technology, Inc. (a) | 30,820 | 8,458,241 | ||||||
Cooper Cos., Inc. | 15,565 | 4,414,856 | ||||||
DexCom, Inc. (a) | 26,402 | 10,703,371 | ||||||
Edwards Lifesciences Corp. (a) | 64,734 | 4,473,767 | ||||||
Haemonetics Corp. (a) | 45,353 | 4,061,815 | ||||||
IDEXX Laboratories, Inc. (a) | 19,600 | 6,471,136 | ||||||
|
| |||||||
| 38,583,186 | ||||||||
|
| |||||||
| Healthcare Providers & Services—1.1% |
| |||||||
Molina Healthcare, Inc. (a) | 22,435 | 3,992,981 | ||||||
|
| |||||||
| Hotels, Restaurants & Leisure—4.4% |
| |||||||
Chipotle Mexican Grill, Inc. (a) | 8,250 | 8,681,970 | ||||||
| Shares | Value | |||||||
Hyatt Hotels Corp., Class A | 58,925 | $ | 2,963,338 | |||||
Royal Caribbean Cruises Ltd. | 74,153 | 3,729,896 | ||||||
|
| |||||||
| 15,375,204 | ||||||||
|
| |||||||
| Insurance—1.8% |
| |||||||
James River Group Holdings Ltd. | 139,635 | 6,283,575 | ||||||
|
| |||||||
| IT Services—12.7% |
| |||||||
Booz Allen Hamilton Holding Corp. | 84,665 | 6,586,090 | ||||||
EPAM Systems, Inc. (a) | 41,568 | 10,475,551 | ||||||
Fidelity National Information Services, Inc. | 64,609 | 8,663,421 | ||||||
Repay Holdings Corp. (a) | 291,660 | 7,183,586 | ||||||
Square, Inc., Class A (a) | 50,055 | 5,252,772 | ||||||
Wix.com Ltd. (a) | 25,299 | 6,482,110 | ||||||
|
| |||||||
| 44,643,530 | ||||||||
|
| |||||||
| Life Sciences Tools & Services—1.0% |
| |||||||
Agilent Technologies, Inc. | 39,784 | 3,515,712 | ||||||
|
| |||||||
| Multi-Line Retail—1.5% |
| |||||||
Dollar Tree, Inc. (a) | 56,097 | 5,199,070 | ||||||
|
| |||||||
| Pharmaceuticals—5.4% |
| |||||||
Catalent, Inc. (a) | 94,397 | 6,919,300 | ||||||
Elanco Animal Health, Inc. (a) | 165,220 | 3,543,969 | ||||||
Horizon Therapeutics PLC (a) | 152,885 | 8,497,349 | ||||||
|
| |||||||
| 18,960,618 | ||||||||
|
| |||||||
| Professional Services—3.3% |
| |||||||
Clarivate Analytics PLC (a) | 178,280 | 3,980,992 | ||||||
Equifax, Inc. | 43,428 | 7,464,405 | ||||||
|
| |||||||
| 11,445,397 | ||||||||
|
| |||||||
| Real Estate Management & Development—1.1% |
| |||||||
CBRE Group, Inc., Class A (a) | 86,616 | 3,916,776 | ||||||
|
| |||||||
| Road & Rail—1.4% |
| |||||||
Kansas City Southern | 32,575 | 4,863,122 | ||||||
|
| |||||||
| Semiconductors & Semiconductor Equipment—6.5% |
| |||||||
Advanced Micro Devices, Inc. (a) | 100,915 | 5,309,138 | ||||||
Entegris, Inc. | 78,121 | 4,613,045 | ||||||
Lam Research Corp. | 19,600 | 6,339,816 | ||||||
Monolithic Power Systems, Inc. | 27,564 | 6,532,668 | ||||||
|
| |||||||
| 22,794,667 | ||||||||
|
| |||||||
| Software—11.3% |
| |||||||
Atlassian Corp. PLC, Class A (a) | 33,730 | 6,080,507 | ||||||
Ceridian HCM Holding, Inc. (a) | 76,390 | 6,055,435 | ||||||
Slack Technologies, Inc., Class A (a) | 157,770 | 4,905,069 | ||||||
Splunk, Inc. (a) | 51,504 | 10,233,845 | ||||||
Trade Desk, Inc., Class A (a) | 15,413 | 6,265,385 | ||||||
Zscaler, Inc. (a) | 56,330 | 6,168,135 | ||||||
|
| |||||||
| 39,708,376 | ||||||||
|
| |||||||
| Specialty Retail—1.4% |
| |||||||
Floor & Decor Holdings, Inc., Class A (a) | 85,585 | 4,933,975 | ||||||
|
| |||||||
| Textiles, Apparel & Luxury Goods—3.6% |
| |||||||
Lululemon Athletica, Inc. (a) | 29,475 | 9,196,495 | ||||||
VF Corp. | 57,705 | 3,516,543 | ||||||
|
| |||||||
| 12,713,038 | ||||||||
|
| |||||||
| Shares | Value | |||||||
| Trading Companies & Distributors—1.3% |
| |||||||
United Rentals, Inc. (a) | 30,314 | $ | 4,517,999 | |||||
|
| |||||||
| Total Common Stock (cost—$248,262,398) |
| 351,061,870 | ||||||
|
| |||||||
| Principal Amount (000s) | ||||||||
| Repurchase Agreements—0.2% |
| |||||||
State Street Bank and Trust Co., dated 6/30/20, 0.00%, due 7/1/20, proceeds $557,000; collateralized by U.S. Treasury Notes, 3.00%, due 10/31/25, valued at $568,241 including accrued interest |
| |||||||
(cost—$557,000) | $557 | 557,000 | ||||||
|
| |||||||
| Total Investments (cost—$248,819,398)—100.2% |
| 351,618,870 | ||||||
|
| |||||||
| Liabilities in excess of other assets—(0.2)% |
| (848,648 | ) | |||||
|
| |||||||
| Net Assets—100.0% |
| $350,770,222 | ||||||
|
| |||||||
Notes to Schedule of Investments:
(a) Non-income producing.
Glossary:
REIT—Real Estate Investment Trust
| See accompanying Notes to Financial Statements | | June 30, 2020 | | Annual Report | 79 |
Table of Contents
Schedule of Investments
June 30, 2020
AllianzGI Mid-Cap Value Fund (formerly AllianzGI NFJ Mid-Cap Value Fund)†
| Shares | Value | |||||||
| Common Stock—99.6% |
| |||||||
| Aerospace & Defense—1.7% |
| |||||||
L3Harris Technologies, Inc. | 53,770 | $9,123,156 | ||||||
Northrop Grumman Corp. | 37,603 | 11,560,666 | ||||||
|
| |||||||
| 20,683,822 | ||||||||
|
| |||||||
| Auto Components—0.5% |
| |||||||
Gentex Corp. | 235,784 | 6,076,154 | ||||||
|
| |||||||
| Banks—2.4% |
| |||||||
First Republic Bank | 57,241 | 6,066,974 | ||||||
M&T Bank Corp. | 168,027 | 17,469,767 | ||||||
Western Alliance Bancorp | 145,863 | 5,523,832 | ||||||
|
| |||||||
| 29,060,573 | ||||||||
|
| |||||||
| Beverages—0.2% |
| |||||||
Brown-Forman Corp., Class B | 43,850 | 2,791,491 | ||||||
|
| |||||||
| Biotechnology—0.9% |
| |||||||
Grifols S.A. ADR | 623,930 | 11,380,483 | ||||||
|
| |||||||
| Capital Markets—5.2% |
| |||||||
Ameriprise Financial, Inc. | 78,786 | 11,821,052 | ||||||
Cboe Global Markets, Inc. | 105,401 | 9,831,805 | ||||||
CME Group, Inc. | 27,320 | 4,440,593 | ||||||
Intercontinental Exchange, Inc. | 173,579 | 15,899,836 | ||||||
LPL Financial Holdings, Inc. | 78,476 | 6,152,518 | ||||||
Nasdaq, Inc. | 46,290 | 5,530,266 | ||||||
Northern Trust Corp. | 70,599 | 5,601,325 | ||||||
State Street Corp. | 72,972 | 4,637,371 | ||||||
|
| |||||||
| 63,914,766 | ||||||||
|
| |||||||
| Chemicals—2.1% |
| |||||||
Celanese Corp. | 207,958 | 17,955,094 | ||||||
Ecolab, Inc. | 10,128 | 2,014,965 | ||||||
FMC Corp. | 57,547 | 5,732,832 | ||||||
|
| |||||||
| 25,702,891 | ||||||||
|
| |||||||
| Commercial Services & Supplies—1.1% |
| |||||||
Cintas Corp. | 6,701 | 1,784,878 | ||||||
Republic Services, Inc. | 93,230 | 7,649,522 | ||||||
Tetra Tech, Inc. | 53,244 | 4,212,665 | ||||||
|
| |||||||
| 13,647,065 | ||||||||
|
| |||||||
| Communications Equipment—1.3% |
| |||||||
Motorola Solutions, Inc. | 110,982 | 15,551,908 | ||||||
|
| |||||||
| Construction & Engineering—1.0% |
| |||||||
EMCOR Group, Inc. | 183,046 | 12,106,662 | ||||||
|
| |||||||
| Containers & Packaging—1.4% |
| |||||||
Avery Dennison Corp. | 64,227 | 7,327,659 | ||||||
Sonoco Products Co. | 178,049 | 9,310,182 | ||||||
|
| |||||||
| 16,637,841 | ||||||||
|
| |||||||
| Diversified Consumer Services—0.6% |
| |||||||
Service Corp. International | 195,003 | 7,583,667 | ||||||
|
| |||||||
| Diversified Telecommunication Services—0.4% |
| |||||||
Cogent Communications Holdings, Inc. | 65,593 | 5,074,274 | ||||||
|
| |||||||
| Electric Utilities—5.0% |
| |||||||
Alliant Energy Corp. | 264,938 | 12,674,634 | ||||||
American Electric Power Co., Inc. | 111,990 | 8,918,884 | ||||||
Eversource Energy | 296,151 | 24,660,494 | ||||||
Xcel Energy, Inc. | 234,145 | 14,634,062 | ||||||
|
| |||||||
| 60,888,074 | ||||||||
|
| |||||||
| Shares | Value | |||||||
| Electrical Equipment—1.0% |
| |||||||
AMETEK, Inc. | 91,245 | $ | 8,154,566 | |||||
Eaton Corp. PLC | 39,300 | 3,437,964 | ||||||
|
| |||||||
| 11,592,530 | ||||||||
|
| |||||||
| Electronic Equipment, Instruments & Components—0.8% |
| |||||||
Jabil, Inc. | 183,147 | 5,875,356 | ||||||
Keysight Technologies, Inc. (a) | 42,637 | 4,296,957 | ||||||
|
| |||||||
| 10,172,313 | ||||||||
|
| |||||||
| Entertainment—0.4% |
| |||||||
Activision Blizzard, Inc. | 69,196 | 5,251,976 | ||||||
|
| |||||||
| Equity Real Estate Investment Trusts (REITs)—13.9% |
| |||||||
Alexandria Real Estate Equities, Inc. | 66,676 | 10,818,181 | ||||||
Americold Realty Trust | 283,212 | 10,280,596 | ||||||
AvalonBay Communities, Inc. | 103,990 | 16,081,014 | ||||||
CoreSite Realty Corp. | 54,900 | 6,646,194 | ||||||
Crown Castle International Corp. | 19,424 | 3,250,606 | ||||||
CyrusOne, Inc. | 88,893 | 6,466,966 | ||||||
Douglas Emmett, Inc. | 371,165 | 11,379,919 | ||||||
Equity Residential | 257,546 | 15,148,856 | ||||||
Essex Property Trust, Inc. | 60,296 | 13,818,034 | ||||||
Extra Space Storage, Inc. | 62,350 | 5,759,269 | ||||||
Medical Properties Trust, Inc. | 303,380 | 5,703,544 | ||||||
National Health Investors, Inc. | 192,350 | 11,679,492 | ||||||
Prologis, Inc. | 104,460 | 9,749,252 | ||||||
Public Storage | 22,364 | 4,291,428 | ||||||
Realty Income Corp. | 147,304 | 8,764,588 | ||||||
Rexford Industrial Realty, Inc. | 201,009 | 8,327,803 | ||||||
Sun Communities, Inc. | 74,998 | 10,175,729 | ||||||
UDR, Inc. | 330,296 | 12,346,464 | ||||||
|
| |||||||
| 170,687,935 | ||||||||
|
| |||||||
| Food & Staples Retailing—0.7% |
| |||||||
Kroger Co. | 241,244 | 8,166,109 | ||||||
|
| |||||||
| Food Products—1.5% |
| |||||||
Archer-Daniels-Midland Co. | 77,241 | 3,081,916 | ||||||
Hershey Co. | 35,249 | 4,568,976 | ||||||
Lamb Weston Holdings, Inc. | 63,600 | 4,065,948 | ||||||
Tyson Foods, Inc., Class A | 119,085 | 7,110,565 | ||||||
|
| |||||||
| 18,827,405 | ||||||||
|
| |||||||
| Gas Utilities—2.2% |
| |||||||
Atmos Energy Corp. | 222,107 | 22,117,415 | ||||||
ONE Gas, Inc. | 66,956 | 5,158,960 | ||||||
|
| |||||||
| 27,276,375 | ||||||||
|
| |||||||
| Healthcare Equipment & Supplies—3.8% |
| |||||||
Cooper Cos., Inc. | 30,425 | 8,629,747 | ||||||
Hill-Rom Holdings, Inc. | 231,518 | 25,416,046 | ||||||
STERIS PLC | 57,310 | 8,793,646 | ||||||
Zimmer Biomet Holdings, Inc. | 33,710 | 4,023,626 | ||||||
|
| |||||||
| 46,863,065 | ||||||||
|
| |||||||
| Healthcare Providers & Services—1.9% |
| |||||||
Cardinal Health, Inc. | 63,703 | 3,324,659 | ||||||
Chemed Corp. | 19,813 | 8,937,050 | ||||||
Humana, Inc. | 16,212 | 6,286,203 | ||||||
Quest Diagnostics, Inc. | 44,781 | 5,103,243 | ||||||
|
| |||||||
| 23,651,155 | ||||||||
|
| |||||||
| Shares | Value | |||||||
| Hotels, Restaurants & Leisure—0.7% |
| |||||||
Dunkin’ Brands Group, Inc. | 139,257 | $ | 9,083,734 | |||||
|
| |||||||
| Household Durables—2.0% |
| |||||||
Garmin Ltd. | 66,282 | 6,462,495 | ||||||
PulteGroup, Inc. | 526,319 | 17,910,636 | ||||||
|
| |||||||
| 24,373,131 | ||||||||
|
| |||||||
| Household Products—2.0% |
| |||||||
Church & Dwight Co., Inc. | 217,848 | 16,839,650 | ||||||
Kimberly-Clark Corp. | 50,799 | 7,180,439 | ||||||
|
| |||||||
| 24,020,089 | ||||||||
|
| |||||||
| Independent Power Producers & Energy Traders—1.3% |
| |||||||
AES Corp. | 1,072,572 | 15,541,568 | ||||||
|
| |||||||
| Industrial Conglomerates—0.7% |
| |||||||
Roper Technologies, Inc. | 23,002 | 8,930,757 | ||||||
|
| |||||||
| Insurance—11.2% |
| |||||||
Allstate Corp. | 119,091 | 11,550,636 | ||||||
American Financial Group, Inc. | 291,427 | 18,493,957 | ||||||
Aon PLC, Class A | 78,499 | 15,118,907 | ||||||
Cincinnati Financial Corp. | 292,957 | 18,758,037 | ||||||
Fidelity National Financial, Inc. | 308,784 | 9,467,317 | ||||||
Globe Life, Inc. | 95,342 | 7,077,237 | ||||||
Hanover Insurance Group, Inc. | 86,287 | 8,743,462 | ||||||
Hartford Financial Services Group, Inc. | 316,539 | 12,202,579 | ||||||
Lincoln National Corp. | 92,320 | 3,396,453 | ||||||
Marsh & McLennan Cos., Inc. | 51,220 | 5,499,491 | ||||||
Primerica, Inc. | 46,834 | 5,460,844 | ||||||
Progressive Corp. | 116,487 | 9,331,774 | ||||||
Reinsurance Group of America, Inc. | 149,893 | 11,757,607 | ||||||
|
| |||||||
| 136,858,301 | ||||||||
|
| |||||||
| IT Services—4.2% |
| |||||||
Amdocs Ltd. | 133,464 | 8,125,288 | ||||||
Broadridge Financial Solutions, Inc. | 53,221 | 6,715,958 | ||||||
Fiserv, Inc. (a) | 117,350 | 11,455,707 | ||||||
Leidos Holdings, Inc. | 70,468 | 6,600,738 | ||||||
Paychex, Inc. | 73,951 | 5,601,788 | ||||||
Science Applications International Corp. | 59,723 | 4,639,283 | ||||||
VeriSign, Inc. (a) | 36,977 | 7,647,953 | ||||||
|
| |||||||
| 50,786,715 | ||||||||
|
| |||||||
| Life Sciences Tools & Services—2.7% |
| |||||||
Agilent Technologies, Inc. | 147,668 | 13,049,421 | ||||||
IQVIA Holdings, Inc. (a) | 54,055 | 7,669,324 | ||||||
PerkinElmer, Inc. | 71,346 | 6,998,329 | ||||||
PRA Health Sciences, Inc. (a) | 49,979 | 4,862,457 | ||||||
|
| |||||||
| 32,579,531 | ||||||||
|
| |||||||
| Machinery—1.9% |
| |||||||
Cummins, Inc. | 42,287 | 7,326,645 | ||||||
Stanley Black & Decker, Inc. | 72,865 | 10,155,924 | ||||||
Toro Co. | 89,444 | 5,933,715 | ||||||
|
| |||||||
| 23,416,284 | ||||||||
|
| |||||||
| 80 | Annual Report | | June 30, 2020 | | See accompanying Notes to Financial Statements |
Table of Contents
Schedule of Investments
June 30, 2020
| Shares | Value | |||||||
| Media—0.2% |
| |||||||
FOX Corp., Class B | 81,955 | $ | 2,199,672 | |||||
|
| |||||||
| Metals & Mining—2.3% |
| |||||||
Reliance Steel & Aluminum Co. | 22,070 | 2,095,105 | ||||||
Royal Gold, Inc. | 173,523 | 21,572,379 | ||||||
Steel Dynamics, Inc. | 172,484 | 4,500,108 | ||||||
|
| |||||||
| 28,167,592 | ||||||||
|
| |||||||
| Mortgage Real Estate Investment Trusts (REITs)—0.6% |
| |||||||
AGNC Investment Corp. | 318,679 | 4,110,959 | ||||||
Annaly Capital Management, Inc. | 468,913 | 3,076,069 | ||||||
|
| |||||||
| 7,187,028 | ||||||||
|
| |||||||
| Multi-Line Retail—1.1% |
| |||||||
Dollar General Corp. | 68,398 | 13,030,503 | ||||||
|
| |||||||
| Multi-Utilities—5.3% |
| |||||||
DTE Energy Co. | 91,318 | 9,816,685 | ||||||
NiSource, Inc. | 367,715 | 8,361,839 | ||||||
Sempra Energy | 237,166 | 27,802,970 | ||||||
WEC Energy Group, Inc. | 221,355 | 19,401,766 | ||||||
|
| |||||||
| 65,383,260 | ||||||||
|
| |||||||
| Oil, Gas & Consumable Fuels—1.2% |
| |||||||
Marathon Petroleum Corp. | 135,753 | 5,074,447 | ||||||
ONEOK, Inc. | 135,128 | 4,488,952 | ||||||
Williams Cos., Inc. | 246,494 | 4,688,316 | ||||||
|
| |||||||
| 14,251,715 | ||||||||
|
| |||||||
| Personal Products—0.1% |
| |||||||
Estee Lauder Cos., Inc., Class A | 9,053 | 1,708,120 | ||||||
|
| |||||||
| Professional Services—2.5% |
| |||||||
FTI Consulting, Inc. (a) | 114,789 | 13,149,080 | ||||||
IHS Markit Ltd. | 170,581 | 12,878,865 | ||||||
TransUnion | 58,691 | 5,108,465 | ||||||
|
| |||||||
| 31,136,410 | ||||||||
|
| |||||||
| Road & Rail—1.0% |
| |||||||
Kansas City Southern | 55,402 | 8,270,965 | ||||||
Norfolk Southern Corp. | 24,544 | 4,309,190 | ||||||
|
| |||||||
| 12,580,155 | ||||||||
|
| |||||||
| Semiconductors & Semiconductor Equipment—3.3% |
| |||||||
Broadcom, Inc. | 33,240 | 10,490,876 | ||||||
KLA Corp. | 41,719 | 8,113,511 | ||||||
Lam Research Corp. | 68,971 | 22,309,360 | ||||||
|
| |||||||
| 40,913,747 | ||||||||
|
| |||||||
| Software—0.8% |
| |||||||
Cadence Design Systems, Inc. (a) | 52,485 | 5,036,460 | ||||||
Intuit, Inc. | 15,751 | 4,665,289 | ||||||
|
| |||||||
| 9,701,749 | ||||||||
|
| |||||||
| Specialty Retail—2.4% |
| |||||||
Best Buy Co., Inc. | 159,168 | 13,890,591 | ||||||
Lowe’s Cos., Inc. | 70,858 | 9,574,333 | ||||||
O’Reilly Automotive, Inc. (a) | 12,527 | 5,282,260 | ||||||
|
| |||||||
| 28,747,184 | ||||||||
|
| |||||||
| Thrifts & Mortgage Finance—0.4% |
| |||||||
Premier Financial Corp. | 261,524 | 4,621,129 | ||||||
|
| |||||||
| Water Utilities—1.7% |
| |||||||
American Water Works Co., Inc. | 163,071 | 20,980,715 | ||||||
|
| |||||||
| Total Common Stock (cost—$1,157,254,953) |
| 1,219,787,623 | ||||||
|
| |||||||
| Principal Amount (000s) | Value | |||||||
| Repurchase Agreements—0.5% |
| |||||||
State Street Bank and Trust Co., dated 6/30/20, 0.00%, due 7/1/20, proceeds $6,159,000; collateralized by U.S. Treasury Notes, 3.00%, due 10/31/25, valued at $6,282,286 including accrued interest |
| |||||||
(cost—$6,159,000) | $6,159 | $ | 6,159,000 | |||||
|
| |||||||
| Total Investments (cost—$1,163,413,953)—100.1% |
| 1,225,946,623 | ||||||
|
| |||||||
| Liabilities in excess of other assets—(0.1)% | (619,763 | ) | ||||||
|
| |||||||
| Net Assets—100.0% | $1,225,326,860 | |||||||
|
| |||||||
Notes to Schedule of Investments:
† Effective April 30, 2020, the AllianzGI NFJ Mid-Cap Value Fund changed its name to AllianzGI Mid-Cap Value Fund. See Note 9(a).
(a) Non-income producing.
Glossary:
ADR—American Depositary Receipt
REIT—Real Estate Investment Trust
AllianzGI Small-Cap Fund
| Shares | Value | |||||||
| Common Stock—97.9% |
| |||||||
| Aerospace & Defense—2.0% |
| |||||||
Axon Enterprise, Inc. (c) | 5,822 | $571,313 | ||||||
BWX Technologies, Inc. | 3,265 | 184,930 | ||||||
HEICO Corp. | 1,025 | 102,141 | ||||||
Kratos Defense & Security Solutions, Inc. (c) | 21,840 | 341,359 | ||||||
Mercury Systems, Inc. (c) | 5,667 | 445,766 | ||||||
Spirit AeroSystems Holdings, Inc., Class A | 8,070 | 193,196 | ||||||
Vectrus, Inc. (c) | 7,820 | 384,197 | ||||||
|
| |||||||
| 2,222,902 | ||||||||
|
| |||||||
| Air Freight & Logistics—0.3% |
| |||||||
XPO Logistics, Inc. (c) | 3,765 | 290,846 | ||||||
|
| |||||||
| Banks—2.6% |
| |||||||
BankFinancial Corp. | 5,200 | 43,680 | ||||||
Central Pacific Financial Corp. | 12,100 | 193,963 | ||||||
First Financial Bankshares, Inc. | 13,765 | 397,671 | ||||||
First Foundation, Inc. | 3,609 | 58,971 | ||||||
Glacier Bancorp, Inc. | 6,400 | 225,856 | ||||||
HarborOne Bancorp, Inc. (c) | 6,846 | 58,465 | ||||||
Hilltop Holdings, Inc. | 12,565 | 231,824 | ||||||
Hope Bancorp, Inc. | 39,800 | 366,956 | ||||||
Investors Bancorp, Inc. | 40,045 | 340,382 | ||||||
Preferred Bank | 1,053 | 45,121 | ||||||
South State Corp. | 5,370 | 255,934 | ||||||
Tristate Capital Holdings, Inc. (c) | 2,122 | 33,337 | ||||||
United Bankshares, Inc. | 7,300 | 201,918 | ||||||
Valley National Bancorp | 51,173 | 400,173 | ||||||
|
| |||||||
| 2,854,251 | ||||||||
|
| |||||||
| Beverages—0.2% |
| |||||||
Boston Beer Co., Inc., Class A (c) | 300 | 160,995 | ||||||
Coca-Cola Consolidated, Inc. | 290 | 66,465 | ||||||
|
| |||||||
| 227,460 | ||||||||
|
| |||||||
| Biotechnology—8.2% |
| |||||||
ACADIA Pharmaceuticals, Inc. (c) | 8,948 | 433,709 | ||||||
Adverum Biotechnologies, Inc. (c) | 8,009 | 167,228 | ||||||
Arena Pharmaceuticals, Inc. (c) | 3,254 | 204,839 | ||||||
Arrowhead Pharmaceuticals, Inc. (c) | 3,700 | 159,803 | ||||||
Avrobio, Inc. (c) | 1,077 | 18,794 | ||||||
BioCryst Pharmaceuticals, Inc. (c) | 6,800 | 32,402 | ||||||
BioSpecifics Technologies Corp. (c) | 763 | 46,757 | ||||||
Castle Biosciences, Inc. (c) | 982 | 37,012 | ||||||
ChemoCentryx, Inc. (c) | 1,570 | 90,338 | ||||||
Cytokinetics, Inc. (c) | 1,380 | 32,527 | ||||||
Deciphera Pharmaceuticals, Inc. (c) | 800 | 47,776 | ||||||
Dicerna Pharmaceuticals, Inc. (c) | 2,290 | 58,166 | ||||||
Dynavax Technologies Corp. (c) | 3,635 | 32,242 | ||||||
Eagle Pharmaceuticals, Inc. (c) | 5,135 | 246,377 | ||||||
Emergent Biosolutions, Inc. (c) | 9,020 | 713,302 | ||||||
Epizyme, Inc. (c) | 5,260 | 84,476 | ||||||
Fate Therapeutics, Inc. (c) | 1,317 | 45,186 | ||||||
Global Blood Therapeutics, Inc. (c) | 3,000 | 189,390 | ||||||
| See accompanying Notes to Financial Statements | | June 30, 2020 | | Annual Report | 81 |
Table of Contents
Schedule of Investments
June 30, 2020
| Shares | Value | |||||||
Halozyme Therapeutics, Inc. (c) | 17,190 | $ | 460,864 | |||||
Homology Medicines, Inc. (c) | 1,394 | 21,175 | ||||||
Immunomedics, Inc. (c) | 21,680 | 768,339 | ||||||
Inovio Pharmaceuticals, Inc. (c) | 4,100 | 110,495 | ||||||
Intellia Therapeutics, Inc. (c) | 2,621 | 55,093 | ||||||
Invitae Corp. (c) | 2,148 | 65,063 | ||||||
Iovance Biotherapeutics, Inc. (c) | 7,991 | 219,353 | ||||||
Kadmon Holdings, Inc. (c) | 7,984 | 40,878 | ||||||
Karuna Therapeutics, Inc. (c) | 1,315 | 146,570 | ||||||
Karyopharm Therapeutics, Inc. (c) | 8,752 | 165,763 | ||||||
Kindred Biosciences, Inc. (c) | 3,744 | 16,810 | ||||||
Kodiak Sciences, Inc. (c) | 2,915 | 157,760 | ||||||
Krystal Biotech, Inc. (c) | 538 | 22,284 | ||||||
Kura Oncology, Inc. (c) | 1,976 | 32,209 | ||||||
MannKind Corp. (c) | 10,200 | 17,850 | ||||||
MeiraGTx Holdings PLC (c) | 1,024 | 12,820 | ||||||
Momenta Pharmaceuticals, Inc. (c) | 12,480 | 415,210 | ||||||
Natera, Inc. (c) | 1,453 | 72,447 | ||||||
Precision BioSciences, Inc. (c) | 1,675 | 13,953 | ||||||
Principia Biopharma, Inc. (c) | 2,364 | 141,343 | ||||||
PTC Therapeutics, Inc. (c) | 7,467 | 378,876 | ||||||
Replimune Group, Inc. (c) | 5,060 | 125,741 | ||||||
Retrophin, Inc. (c) | 13,100 | 267,371 | ||||||
Rocket Pharmaceuticals, Inc. (c) | 1,272 | 26,623 | ||||||
TG Therapeutics, Inc. (c) | 3,418 | 66,583 | ||||||
Translate Bio, Inc. (c) | 1,400 | 25,088 | ||||||
Twist Bioscience Corp. (c) | 8,159 | 369,603 | ||||||
Ultragenyx Pharmaceutical, Inc. (c) | 4,100 | 320,702 | ||||||
uniQure NV (c) | 1,719 | 77,458 | ||||||
United Therapeutics Corp. (c) | 5,470 | 661,870 | ||||||
Vanda Pharmaceuticals, Inc. (c) | 2,052 | 23,475 | ||||||
Veracyte, Inc. (c) | 12,676 | 328,308 | ||||||
Vericel Corp. (c) | 3,048 | 42,123 | ||||||
Viking Therapeutics, Inc. (c) | 3,202 | 23,086 | ||||||
Voyager Therapeutics, Inc. (c) | 1,433 | 18,084 | ||||||
Xencor, Inc. (c) | 18,070 | 585,287 | ||||||
Y-mAbs Therapeutics, Inc. (c) | 900 | 38,880 | ||||||
ZIOPHARM Oncology, Inc. (c) | 8,036 | 26,358 | ||||||
|
| |||||||
| 9,002,119 | ||||||||
|
| |||||||
| Building Products—0.6% |
| |||||||
CSW Industrials, Inc. | 600 | 41,466 | ||||||
PGT Innovations, Inc. (c) | 2,436 | 38,197 | ||||||
Trex Co., Inc. (c) | 3,978 | 517,418 | ||||||
|
| |||||||
| 597,081 | ||||||||
|
| |||||||
| Capital Markets—2.8% |
| |||||||
Artisan Partners Asset Management, Inc., Class A | 29,540 | 960,050 | ||||||
Barings BDC, Inc. | 15,995 | 127,000 | ||||||
Freedom Holding Corp. (c) | 20,280 | 379,033 | ||||||
Golub Capital BDC, Inc. | 17,930 | 208,885 | ||||||
Hercules Capital, Inc. | 4,320 | 45,230 | ||||||
Main Street Capital Corp. | 2,223 | 69,202 | ||||||
PJT Partners, Inc., Class A | 19,000 | 975,460 | ||||||
Virtus Investment Partners, Inc. | 2,495 | 290,144 | ||||||
|
| |||||||
| 3,055,004 | ||||||||
|
| |||||||
| Chemicals—0.7% |
| |||||||
Balchem Corp. | 7,925 | 751,766 | ||||||
Westlake Chemical Partners L.P. | 2,265 | 42,899 | ||||||
|
| |||||||
| 794,665 | ||||||||
|
| |||||||
| Shares | Value | |||||||
| Commercial Services & Supplies—1.3% |
| |||||||
Casella Waste Systems, Inc., Class A (c) | 4,505 | $ | 234,801 | |||||
Clean Harbors, Inc. (c) | 7,015 | 420,760 | ||||||
IAA, Inc. (c) | 10,080 | 388,785 | ||||||
MSA Safety, Inc. | 2,215 | 253,484 | ||||||
Tetra Tech, Inc. | 2,105 | 166,548 | ||||||
|
| |||||||
| 1,464,378 | ||||||||
|
| |||||||
| Communications Equipment—0.4% |
| |||||||
Calix, Inc. (c) | 26,300 | 391,870 | ||||||
EchoStar Corp., Class A (c) | 2,475 | 69,201 | ||||||
|
| |||||||
| 461,071 | ||||||||
|
| |||||||
| Construction & Engineering—1.2% |
| |||||||
Construction Partners, Inc., Class A (c) | 2,851 | 50,634 | ||||||
EMCOR Group, Inc. | 7,775 | 514,238 | ||||||
MasTec, Inc. (c) | 14,610 | 655,551 | ||||||
NV5 Global, Inc. (c) | 1,476 | 75,025 | ||||||
Sterling Construction Co., Inc. (c) | 4,391 | 45,974 | ||||||
|
| |||||||
| 1,341,422 | ||||||||
|
| |||||||
| Construction Materials—0.3% |
| |||||||
Summit Materials, Inc., Class A (c) | 18,470 | 296,998 | ||||||
U.S. Concrete, Inc. (c) | 948 | 23,510 | ||||||
|
| |||||||
| 320,508 | ||||||||
|
| |||||||
| Containers & Packaging—0.1% |
| |||||||
Silgan Holdings, Inc. | 4,335 | 140,411 | ||||||
|
| |||||||
| Diversified Consumer Services—1.8% |
| |||||||
Aspen Group, Inc. (c) | 4,743 | 42,924 | ||||||
Bright Horizons Family Solutions, Inc. (c) | 2,940 | 344,568 | ||||||
Carriage Services, Inc. | 5,714 | 103,538 | ||||||
Chegg, Inc. (c) | 9,702 | 652,557 | ||||||
Grand Canyon Education, Inc. (c) | 4,325 | 391,542 | ||||||
Strategic Education, Inc. | 2,850 | 437,902 | ||||||
|
| |||||||
| 1,973,031 | ||||||||
|
| |||||||
| Diversified Telecommunication Services—1.0% |
| |||||||
Bandwidth, Inc., Class A (c) | 5,205 | 661,035 | ||||||
Cogent Communications Holdings, Inc. | 6,150 | 475,764 | ||||||
|
| |||||||
| 1,136,799 | ||||||||
|
| |||||||
| Electric Utilities—1.2% |
| |||||||
ALLETE, Inc. | 3,490 | 190,589 | ||||||
Hawaiian Electric Industries, Inc. | 12,045 | 434,343 | ||||||
IDACORP, Inc. | 1,995 | 174,303 | ||||||
Otter Tail Corp. | 1,615 | 62,646 | ||||||
PNM Resources, Inc. | 3,540 | 136,077 | ||||||
Portland General Electric Co. | 8,780 | 367,092 | ||||||
|
| |||||||
| 1,365,050 | ||||||||
|
| |||||||
| Electrical Equipment—0.6% |
| |||||||
Allied Motion Technologies, Inc. | 1,096 | 38,689 | ||||||
Generac Holdings, Inc. (c) | 4,355 | 531,005 | ||||||
Plug Power, Inc. (c) | 11,800 | 96,878 | ||||||
|
| |||||||
| 666,572 | ||||||||
|
| |||||||
| Electronic Equipment, Instruments & Components—1.4% |
| |||||||
FARO Technologies, Inc. (c) | 700 | 37,520 | ||||||
II-VI, Inc. (c) | 8,790 | 415,064 | ||||||
Methode Electronics, Inc. | 11,530 | 360,428 | ||||||
Napco Security Technologies, Inc. (c) | 2,763 | 64,626 | ||||||
nLight, Inc. (c) | 13,220 | 294,277 | ||||||
| Shares | Value | |||||||
OSI Systems, Inc. (c) | 5,250 | $ | 391,860 | |||||
|
| |||||||
| 1,563,775 | ||||||||
|
| |||||||
| Energy Equipment & Services—0.4% |
| |||||||
DMC Global, Inc. | 402 | 11,095 | ||||||
Liberty Oilfield Services, Inc., Class A | 60,900 | 333,732 | ||||||
USA Compression Partners L.P. | 7,010 | 76,129 | ||||||
|
| |||||||
| 420,956 | ||||||||
|
| |||||||
| Engineering & Construction—0.1% |
| |||||||
Shyft Group, Inc. | 2,957 | 49,796 | ||||||
|
| |||||||
| Entertainment—1.7% |
| |||||||
Liberty Media Corp-Liberty Braves, Class A (c) | 9,080 | 182,326 | ||||||
Liberty Media Corp-Liberty Braves, Class C (c) | 9,095 | 179,535 | ||||||
Liberty Media Corp-Liberty Formula One, Class A (c) | 2,675 | 78,057 | ||||||
Madison Square Garden Entertainment Corp. (c) | 665 | 49,875 | ||||||
Madison Square Garden Sports C, Class A (c) | 665 | 97,682 | ||||||
Sciplay Corp., Class A (c) | 45,600 | 676,248 | ||||||
Zynga, Inc., Class A (c) | 64,139 | 611,886 | ||||||
|
| |||||||
| 1,875,609 | ||||||||
|
| |||||||
| Equity Real Estate Investment Trusts (REITs)—2.3% |
| |||||||
CareTrust REIT, Inc. | 9,250 | 158,730 | ||||||
Chatham Lodging Trust | 14,730 | 90,148 | ||||||
Industrial Logistics Properties Trust | 28,670 | 589,168 | ||||||
Innovative Industrial Properties, Inc. | 500 | 44,010 | ||||||
National Health Investors, Inc. | 6,245 | 379,196 | ||||||
Pebblebrook Hotel Trust | 18,125 | 247,588 | ||||||
Physicians Realty Trust | 24,600 | 430,992 | ||||||
Piedmont Office Realty Trust, Inc., Class A | 17,635 | 292,917 | ||||||
QTS Realty Trust, Inc., Class A | 5,385 | 345,125 | ||||||
|
| |||||||
| 2,577,874 | ||||||||
|
| |||||||
| Food & Staples Retailing—2.4% |
| |||||||
Casey’s General Stores, Inc. | 1,560 | 233,251 | ||||||
Grocery Outlet Holding Corp. (c) | 13,485 | 550,188 | ||||||
Ingles Markets, Inc., Class A | 4,995 | 215,135 | ||||||
Performance Food Group Co. (c) | 9,640 | 280,910 | ||||||
PriceSmart, Inc. | 1,200 | 72,396 | ||||||
Sprouts Farmers Market, Inc. (c) | 25,660 | 656,639 | ||||||
Weis Markets, Inc. | 12,080 | 605,449 | ||||||
|
| |||||||
| 2,613,968 | ||||||||
|
| |||||||
| Food Products—4.2% |
| |||||||
Alico, Inc. | 1,780 | 55,465 | ||||||
Cal-Maine Foods, Inc. (c) | 3,095 | 137,666 | ||||||
Calavo Growers, Inc. | 7,080 | 445,403 | ||||||
Flowers Foods, Inc. | 26,120 | 584,043 | ||||||
Freshpet, Inc. (c) | 6,408 | 536,093 | ||||||
Hain Celestial Group, Inc. (c) | 14,020 | 441,770 | ||||||
Hostess Brands, Inc. (c) | 26,225 | 320,469 | ||||||
J&J Snack Foods Corp. | 2,845 | 361,685 | ||||||
John B Sanfilippo & Son, Inc. | 7,178 | 612,499 | ||||||
Lancaster Colony Corp. | 3,425 | 530,841 | ||||||
Sanderson Farms, Inc. | 2,040 | 236,415 | ||||||
Tootsie Roll Industries, Inc. | 11,177 | 383,036 | ||||||
|
| |||||||
| 4,645,385 | ||||||||
|
| |||||||
| Gas Utilities—0.6% |
| |||||||
Chesapeake Utilities Corp. | 2,730 | 229,320 | ||||||
Northwest Natural Holding Co. | 1,040 | 58,022 | ||||||
| 82 | Annual Report | | June 30, 2020 | | See accompanying Notes to Financial Statements |
Table of Contents
Schedule of Investments
June 30, 2020
| Shares | Value | |||||||
ONE Gas, Inc. | 855 | $ | 65,878 | |||||
Spire, Inc. | 4,305 | 282,881 | ||||||
|
| |||||||
| 636,101 | ||||||||
|
| |||||||
| Healthcare Equipment & Supplies—4.7% |
| |||||||
Antares Pharma, Inc. (c) | 14,854 | 40,848 | ||||||
Axogen, Inc. (c) | 2,456 | 22,693 | ||||||
Axonics Modulation Technologies, Inc. (c) | 2,038 | 71,554 | ||||||
BioLife Solutions, Inc. (c) | 3,582 | 58,566 | ||||||
Cerus Corp. (c) | 9,842 | 64,957 | ||||||
CONMED Corp. | 7,235 | 520,848 | ||||||
CryoLife, Inc. (c) | 1,409 | 27,011 | ||||||
CryoPort, Inc. (c) | 4,128 | 124,872 | ||||||
GenMark Diagnostics, Inc. (c) | 2,000 | 29,420 | ||||||
Globus Medical, Inc., Class A (c) | 1,670 | 79,676 | ||||||
Haemonetics Corp. (c) | 4,056 | 363,255 | ||||||
Integer Holdings Corp. (c) | 3,670 | 268,093 | ||||||
Itamar Medical Ltd. ADR (c) | 3,675 | 68,355 | ||||||
Mesa Laboratories, Inc. | 280 | 60,704 | ||||||
Nevro Corp. (c) | 2,851 | 340,609 | ||||||
Novocure Ltd. (c) | 5,627 | 333,681 | ||||||
Ontrak, Inc. (c) | 2,121 | 52,474 | ||||||
OrthoPediatrics Corp. (c) | 1,931 | 84,501 | ||||||
Quotient Ltd. (c) | 30,360 | 224,664 | ||||||
Shockwave Medical, Inc. (c) | 6,480 | 306,958 | ||||||
Silk Road Medical, Inc. (c) | 2,810 | 117,711 | ||||||
Surmodics, Inc. (c) | 1,222 | 52,839 | ||||||
Tandem Diabetes Care, Inc. (c) | 7,165 | 708,762 | ||||||
Utah Medical Products, Inc. | 2,955 | 261,872 | ||||||
West Pharmaceutical Services, Inc. | 3,895 | 884,827 | ||||||
|
| |||||||
| 5,169,750 | ||||||||
|
| |||||||
| Healthcare Providers & Services—3.7% |
| |||||||
Addus HomeCare Corp. (c) | 2,147 | 198,726 | ||||||
BioTelemetry, Inc. (c) | 1,525 | 68,915 | ||||||
Chemed Corp. | 950 | 428,517 | ||||||
Encompass Health Corp. | 1,240 | 76,793 | ||||||
Joint Corp. (c) | 3,989 | 60,912 | ||||||
LHC Group, Inc. (c) | 7,598 | 1,324,483 | ||||||
Molina Healthcare, Inc. (c) | 1,935 | 344,391 | ||||||
National HealthCare Corp. | 2,030 | 128,783 | ||||||
PetIQ, Inc. (c) | 13,700 | 477,308 | ||||||
R1 RCM, Inc. (c) | 53,778 | 599,625 | ||||||
RadNet, Inc. (c) | 3,997 | 63,433 | ||||||
Select Medical Holdings Corp. (c) | 18,160 | 267,497 | ||||||
|
| |||||||
| 4,039,383 | ||||||||
|
| |||||||
| Healthcare Technology—0.6% |
| |||||||
Health Catalyst, Inc. (c) | 9,837 | 286,945 | ||||||
Simulations Plus, Inc. | 500 | 29,910 | ||||||
Teladoc Health, Inc. (c) | 1,750 | 333,970 | ||||||
Vocera Communications, Inc. (c) | 1,841 | 39,029 | ||||||
|
| |||||||
| 689,854 | ||||||||
|
| |||||||
| Hotels, Restaurants & Leisure—2.4% |
| |||||||
Churchill Downs, Inc. | 5,032 | 670,011 | ||||||
Kura Sushi USA, Inc., Class A (c) | 2,557 | 36,514 | ||||||
Norwegian Cruise Line Holdings Ltd. (c) | 16,660 | 273,724 | ||||||
Papa John’s International, Inc. | 8,900 | 706,749 | ||||||
Penn National Gaming, Inc. (c) | 8,590 | 262,338 | ||||||
Planet Fitness, Inc., Class A (c) | 4,810 | 291,342 | ||||||
Wendy’s Co. | 17,680 | 385,070 | ||||||
|
| |||||||
| 2,625,748 | ||||||||
|
| |||||||
| Household Durables—3.8% |
| |||||||
Helen of Troy Ltd. (c) | 5,470 | 1,031,423 | ||||||
| Shares | Value | |||||||
Installed Building Products, Inc. (c) | 6,900 | $ | 474,582 | |||||
La-Z-Boy, Inc. | 29,300 | 792,858 | ||||||
Lennar Corp., Class B | 15,180 | 699,646 | ||||||
LGI Homes, Inc. (c) | 833 | 73,329 | ||||||
Meritage Homes Corp. (c) | 15,000 | 1,141,800 | ||||||
|
| |||||||
| 4,213,638 | ||||||||
|
| |||||||
| Household Products—0.3% |
| |||||||
WD-40 Co. | 1,720 | 341,076 | ||||||
|
| |||||||
| Independent Power Producers & Energy Traders—0.5% |
| |||||||
Ormat Technologies, Inc. | 3,880 | 246,341 | ||||||
TerraForm Power, Inc., Class A | 18,370 | 338,743 | ||||||
|
| |||||||
| 585,084 | ||||||||
|
| |||||||
| Insurance—2.3% |
| |||||||
American National Insurance Co. | 1,475 | 106,303 | ||||||
AMERISAFE, Inc. | 3,825 | 233,937 | ||||||
Donegal Group, Inc., Class A | 7,165 | 101,886 | ||||||
Employers Holdings, Inc. | 1,805 | 54,421 | ||||||
Enstar Group Ltd. (c) | 570 | 87,079 | ||||||
Kemper Corp. | 6,075 | 440,559 | ||||||
National General Holdings Corp. | 19,600 | 423,556 | ||||||
NI Holdings, Inc. (c) | 4,600 | 67,942 | ||||||
Palomar Holdings, Inc. (c) | 8,075 | 692,512 | ||||||
RLI Corp. | 3,365 | 276,266 | ||||||
Safety Insurance Group, Inc. | 1,130 | 86,174 | ||||||
|
| |||||||
| 2,570,635 | ||||||||
|
| |||||||
| Interactive Media & Services—0.5% |
| |||||||
EverQuote, Inc., Class A (c) | 9,101 | 529,314 | ||||||
QuinStreet, Inc. (c) | 4,318 | 45,166 | ||||||
|
| |||||||
| 574,480 | ||||||||
|
| |||||||
| Internet & Direct Marketing Retail—0.6% |
| |||||||
PetMed Express, Inc. | 16,700 | 595,188 | ||||||
Rubicon Project, Inc. (c) | 7,845 | 52,326 | ||||||
|
| |||||||
| 647,514 | ||||||||
|
| |||||||
| IT Services—2.1% |
| |||||||
Brightcove, Inc. (c) | 6,378 | 50,259 | ||||||
Fastly, Inc., Class A (c) | 6,485 | 552,068 | ||||||
Hackett Group, Inc. | 3,089 | 41,825 | ||||||
ManTech International Corp., Class A | 4,670 | 319,848 | ||||||
Paysign, Inc. (c) | 3,980 | 38,646 | ||||||
Perficient, Inc. (c) | 1,484 | 53,098 | ||||||
Repay Holdings Corp. (c) | 38,755 | 954,536 | ||||||
Science Applications International Corp. | 2,115 | 164,293 | ||||||
Shift4 Payments, Inc., Class A (c) | 3,775 | 134,012 | ||||||
|
| |||||||
| 2,308,585 | ||||||||
|
| |||||||
| Leisure Equipment & Products—2.4% |
| |||||||
Acushnet Holdings Corp. | 16,505 | 574,209 | ||||||
Malibu Boats, Inc., Class A (c) | 6,960 | 361,572 | ||||||
YETI Holdings, Inc. (c) | 40,244 | 1,719,626 | ||||||
|
| |||||||
| 2,655,407 | ||||||||
|
| |||||||
| Life Sciences Tools & Services—3.9% |
| |||||||
Adaptive Biotechnologies Corp. (c) | 6,970 | 337,209 | ||||||
Charles River Laboratories International, Inc. (c) | 3,050 | 531,767 | ||||||
Codexis, Inc. (c) | 2,677 | 30,518 | ||||||
Medpace Holdings, Inc. (c) | 8,830 | 821,367 | ||||||
NanoString Technologies, Inc. (c) | 11,588 | 340,108 | ||||||
NeoGenomics, Inc. (c) | 15,676 | 485,642 | ||||||
PRA Health Sciences, Inc. (c) | 6,855 | 666,923 | ||||||
| Shares | Value | |||||||
Quanterix Corp. (c) | 3,039 | $ | 83,238 | |||||
Repligen Corp. (c) | 8,350 | 1,032,143 | ||||||
|
| |||||||
| 4,328,915 | ||||||||
|
| |||||||
| Machinery—1.3% |
| |||||||
Columbus McKinnon Corp. | 1,314 | 43,953 | ||||||
Douglas Dynamics, Inc. | 1,000 | 35,120 | ||||||
Kadant, Inc. | 671 | 66,872 | ||||||
Kornit Digital Ltd. (c) | 10,712 | 571,807 | ||||||
SPX Corp. (c) | 16,830 | 692,554 | ||||||
|
| |||||||
| 1,410,306 | ||||||||
|
| |||||||
| Media—1.5% |
| |||||||
Cable One, Inc. | 305 | 541,329 | ||||||
Cardlytics, Inc. (c) | 1,524 | 106,650 | ||||||
Liberty Broadband Corp., Class A (c) | 4,590 | 560,852 | ||||||
Loral Space & Communications, Inc. | 2,055 | 40,114 | ||||||
TechTarget, Inc. (c) | 11,547 | 346,756 | ||||||
|
| |||||||
| 1,595,701 | ||||||||
|
| |||||||
| Metals & Mining—0.1% |
| |||||||
Coeur Mining, Inc. (c) | 12,440 | 63,195 | ||||||
Hecla Mining Co. | 22,935 | 74,998 | ||||||
|
| |||||||
| 138,193 | ||||||||
|
| |||||||
| Mortgage Real Estate Investment Trusts (REITs)—0.9% |
| |||||||
AG Mortgage Investment Trust, Inc. | 75,500 | 240,845 | ||||||
Arbor Realty Trust, Inc. | 80,700 | 745,668 | ||||||
|
| |||||||
| 986,513 | ||||||||
|
| |||||||
| Multi-Utilities—1.1% |
| |||||||
Avista Corp. | 2,030 | 73,872 | ||||||
Black Hills Corp. | 11,950 | 677,087 | ||||||
NorthWestern Corp. | 6,130 | 334,208 | ||||||
Unitil Corp. | 3,810 | 170,764 | ||||||
|
| |||||||
| 1,255,931 | ||||||||
|
| |||||||
| Oil, Gas & Consumable Fuels—1.3% |
| |||||||
Black Stone Minerals L.P. | 7,860 | 51,090 | ||||||
Delek Logistics Partners L.P. | 4,790 | 109,835 | ||||||
Enviva Partners L.P. | 5,160 | 185,966 | ||||||
Hess Midstream L.P., Class A | 19,300 | 353,576 | ||||||
Holly Energy Partners L.P. | 3,045 | 44,427 | ||||||
NuStar Energy L.P. | 3,665 | 52,336 | ||||||
Par Pacific Holdings, Inc. (c) | 5,845 | 52,547 | ||||||
PBF Logistics L.P. | 7,395 | 72,101 | ||||||
Penn Virginia Corp. (c) | 23,100 | 220,143 | ||||||
Sunoco L.P. | 4,635 | 105,817 | ||||||
TC Pipelines L.P. | 4,185 | 129,986 | ||||||
World Fuel Services Corp. | 1,840 | 47,398 | ||||||
|
| |||||||
| 1,425,222 | ||||||||
|
| |||||||
| Paper & Forest Products—0.5% |
| |||||||
Boise Cascade Co. | 13,800 | 519,018 | ||||||
| Personal Products—0.4% |
| |||||||
BellRing Brands, Inc., Class A (c) | 13,195 | 263,109 | ||||||
Lifevantage Corp. (c) | 8,200 | 110,864 | ||||||
USANA Health Sciences, Inc. (c) | 1,210 | 88,850 | ||||||
|
| |||||||
| 462,823 | ||||||||
|
| |||||||
| Pharmaceuticals—3.0% |
| |||||||
Amphastar Pharmaceuticals, Inc. (c) | 2,433 | 54,645 | ||||||
ANI Pharmaceuticals, Inc. (c) | 901 | 29,138 | ||||||
Arvinas, Inc. (c) | 217 | 7,278 | ||||||
Axsome Therapeutics, Inc. (c) | 1,073 | 88,286 | ||||||
Cara Therapeutics, Inc. (c) | 1,555 | 26,591 | ||||||
Catalent, Inc. (c) | 16,445 | 1,205,418 | ||||||
Collegium Pharmaceutical, Inc. (c) | 2,578 | 45,115 | ||||||
| See accompanying Notes to Financial Statements | | June 30, 2020 | | Annual Report | 83 |
Table of Contents
Schedule of Investments
June 30, 2020
| Shares | Value | |||||||
Durect Corp. (c) | 27,730 | $ | 64,334 | |||||
Horizon Therapeutics PLC (c) | 13,694 | 761,113 | ||||||
Intersect ENT, Inc. (c) | 10,365 | 140,342 | ||||||
MyoKardia, Inc. (c) | 1,740 | 168,119 | ||||||
Omeros Corp. (c) | 1,502 | 22,109 | ||||||
Prestige Consumer Healthcare, Inc. (c) | 13,775 | 517,389 | ||||||
Provention Bio, Inc. (c) | 1,723 | 24,312 | ||||||
Reata Pharmaceuticals, Inc., Class A (c) | 881 | 137,454 | ||||||
Revance Therapeutics, Inc. (c) | 1,800 | 43,956 | ||||||
|
| |||||||
| 3,335,599 | ||||||||
|
| |||||||
| Professional Services—0.7% |
| |||||||
ASGN, Inc. (c) | 5,150 | 343,402 | ||||||
CRA International, Inc. | 1,197 | 47,281 | ||||||
Franklin Covey Co. (c) | 1,309 | 28,013 | ||||||
ICF International, Inc. | 4,080 | 264,506 | ||||||
Kforce, Inc. | 915 | 26,764 | ||||||
|
| |||||||
| 709,966 | ||||||||
|
| |||||||
| Road & Rail—0.3% |
| |||||||
Saia, Inc. (c) | 3,346 | 372,008 | ||||||
|
| |||||||
| Semiconductors & Semiconductor Equipment—3.4% |
| |||||||
ACM Research, Inc., Class A (c) | 673 | 41,968 | ||||||
Axcelis Technologies, Inc. (c) | 2,268 | 63,164 | ||||||
FormFactor, Inc. (c) | 29,524 | 865,939 | ||||||
Ichor Holdings Ltd. (c) | 24,393 | 648,366 | ||||||
Inphi Corp. (c) | 2,147 | 252,273 | ||||||
MKS Instruments, Inc. | 3,739 | 423,404 | ||||||
Onto Innovation, Inc. (c) | 9,435 | 321,167 | ||||||
Power Integrations, Inc. | 9,065 | 1,070,849 | ||||||
|
| |||||||
| 3,687,130 | ||||||||
|
| |||||||
| Software—6.8% |
| |||||||
ACI Worldwide, Inc. (c) | 10,180 | 274,758 | ||||||
Agilysys, Inc. (c) | 2,564 | 45,998 | ||||||
Blackline, Inc. (c) | 5,447 | 451,611 | ||||||
Cerence, Inc. (c) | 9,029 | 368,744 | ||||||
Digital Turbine, Inc. (c) | 12,481 | 156,886 | ||||||
Everbridge, Inc. (c) | 2,711 | 375,094 | ||||||
Globant S.A. (c) | 3,015 | 451,798 | ||||||
LivePerson, Inc. (c) | 12,806 | 530,553 | ||||||
Mimecast Ltd. (c) | 5,980 | 249,127 | ||||||
Model N, Inc. (c) | 26,699 | 928,057 | ||||||
Paylocity Holding Corp. (c) | 2,515 | 366,913 | ||||||
Pluralsight, Inc., Class A (c) | 13,500 | 243,675 | ||||||
Progress Software Corp. | 8,535 | 330,731 | ||||||
PROS Holdings, Inc. (c) | 555 | 24,659 | ||||||
Q2 Holdings, Inc. (c) | 4,265 | 365,894 | ||||||
Qualys, Inc. (c) | 2,905 | 302,178 | ||||||
Sapiens International Corp. NV | 2,795 | 78,204 | ||||||
SPS Commerce, Inc. (c) | 12,250 | 920,220 | ||||||
Tenable Holdings, Inc. (c) | 29,700 | 885,357 | ||||||
Upland Software, Inc. (c) | 2,330 | 80,991 | ||||||
Zix Corp. (c) | 8,584 | 59,230 | ||||||
|
| |||||||
| 7,490,678 | ||||||||
|
| |||||||
| Specialty Retail—3.7% |
| |||||||
Boot Barn Holdings, Inc. (c) | 1,500 | 32,340 | ||||||
Cato Corp., Class A | 15,660 | 128,099 | ||||||
Citi Trends, Inc. | 4,545 | 91,900 | ||||||
Floor & Decor Holdings, Inc., Class A (c) | 5,430 | 313,040 | ||||||
Genesco, Inc. (c) | 29,800 | 645,468 | ||||||
Lithia Motors, Inc., Class A | 3,065 | 463,826 | ||||||
Lumber Liquidators Holdings, Inc. (c) | 80,100 | 1,110,186 | ||||||
Murphy USA, Inc. (c) | 3,485 | 392,376 | ||||||
Rent-A-Center, Inc. | 20,600 | 573,092 | ||||||
| Shares | Value | |||||||
TravelCenters of America, Inc. (c) | 23,800 | $ | 366,520 | |||||
|
| |||||||
| 4,116,847 | ||||||||
|
| |||||||
| Textiles, Apparel & Luxury Goods—0.3% |
| |||||||
Deckers Outdoor Corp. (c) | 1,375 | 270,036 | ||||||
|
| |||||||
| Thrifts & Mortgage Finance—2.8% |
| |||||||
Capitol Federal Financial, Inc. | 35,945 | 395,754 | ||||||
ESSA Bancorp, Inc. | 5,480 | 76,282 | ||||||
Flagstar Bancorp, Inc. | 23,490 | 691,311 | ||||||
Kearny Financial Corp. | 20,485 | 167,567 | ||||||
Meridian Bancorp, Inc. | 3,078 | 35,705 | ||||||
OceanFirst Financial Corp. | 2,970 | 52,361 | ||||||
PCSB Financial Corp. | 8,935 | 113,296 | ||||||
PennyMac Financial Services, Inc. | 24,300 | 1,015,497 | ||||||
Pioneer Bancorp, Inc. (c) | 3,880 | 35,502 | ||||||
Premier Financial Corp. | 2,112 | 37,319 | ||||||
Territorial Bancorp, Inc. | 4,865 | 115,738 | ||||||
Waterstone Financial, Inc. | 24,560 | 364,225 | ||||||
|
| |||||||
| 3,100,557 | ||||||||
|
| |||||||
| Tobacco—0.1% |
| |||||||
Universal Corp. | 3,550 | 150,911 | ||||||
|
| |||||||
| Trading Companies & Distributors—1.3% |
| |||||||
BMC Stock Holdings, Inc. (c) | 31,050 | 780,597 | ||||||
MSC Industrial Direct Co., Inc., Class A | 8,900 | 648,009 | ||||||
WESCO International, Inc. (c) | 1,041 | 36,550 | ||||||
|
| |||||||
| 1,465,156 | ||||||||
|
| |||||||
| Transportation Infrastructure—0.3% |
| |||||||
Macquarie Infrastructure Corp. | 11,600 | 356,004 | ||||||
|
| |||||||
| Water Utilities—1.8% |
| |||||||
American States Water Co. | 11,705 | 920,364 | ||||||
California Water Service Group | 3,440 | 164,088 | ||||||
Middlesex Water Co. | 6,200 | 416,516 | ||||||
SJW Group | 6,800 | 422,348 | ||||||
|
| |||||||
| 1,923,316 | ||||||||
|
| |||||||
| Wireless Telecommunication Services—0.1% |
| |||||||
Boingo Wireless, Inc. (c) | 4,227 | 56,304 | ||||||
|
| |||||||
| Total Common Stock (cost—$94,235,637) |
| 107,875,322 | ||||||
|
| |||||||
| Mutual Fund—0.1% |
| |||||||
Principal Healthcare Innovators Index (cost—$122,571) | 3,000 | 133,950 | ||||||
|
| |||||||
| Preferred Stock—0.1% |
| |||||||
| Trading Companies & Distributors—0.1% |
| |||||||
WESCO International, Inc. (c) (cost—$69,050) | 2,761 | 73,222 | ||||||
|
| |||||||
| Rights—0.0% |
| |||||||
| Biotechnology—0.0% |
| |||||||
Stemline Therapeutics, Inc. CVR (a)(b)(c) (cost—$661) | 2,004 | — | † | |||||
|
| |||||||
| Principal Amount (000s) | Value | |||||||
| Repurchase Agreements—2.0% |
| |||||||
State Street Bank and Trust Co., dated 6/30/20, 0.00%, due 7/1/20, proceeds $2,225,000; collateralized by U.S. Treasury Notes, 3.00%, due 10/31/25, valued at $2,269,524 including accrued interest |
| |||||||
(cost—$2,225,000) | $2,225 | $ | 2,225,000 | |||||
|
| |||||||
| Total Investments (cost—$96,652,919)—100.1% |
| 110,307,494 | ||||||
|
| |||||||
| Liabilities in excess of other assets—(0.1)% |
| (105,028 | ) | |||||
|
| |||||||
| Net Assets—100.0% |
| $110,202,466 | ||||||
|
| |||||||
Notes to Schedule of Investments:
† Actual amount rounds to less than $1.
(a) Fair-Valued—Security with a value of $0, representing less than 0.05% of net assets. See Note 1(a) and Note 1(b) in the Notes to Financial Statements.
(b) Level 3 security. See Note 1(a) and Note 1(b) in the Notes to Financial Statements.
(c) Non-income producing.
Glossary:
ADR—American Depositary Receipt
CVR—Contingent Value Rights
REIT—Real Estate Investment Trust
| 84 | Annual Report | | June 30, 2020 | | See accompanying Notes to Financial Statements |
Table of Contents
Schedule of Investments
June 30, 2020
AllianzGI Small-Cap Value Fund (formerly NFJ AllianzGI Small-Cap Value Fund)†
| Shares | Value | |||||||
| Common Stock—98.9% |
| |||||||
| Aerospace & Defense—0.9% |
| |||||||
CAE, Inc. | 78,782 | $1,275,481 | ||||||
Curtiss-Wright Corp. | 39,880 | 3,560,486 | ||||||
|
| |||||||
| 4,835,967 | ||||||||
|
| |||||||
| Airlines—0.5% |
| |||||||
SkyWest, Inc. | 83,521 | 2,724,455 | ||||||
|
| |||||||
| Auto Components—2.1% |
| |||||||
Dana, Inc. | 219,557 | 2,676,400 | ||||||
Fox Factory Holding Corp. (a) | 37,226 | 3,075,240 | ||||||
Standard Motor Products, Inc. | 129,807 | 5,348,048 | ||||||
|
| |||||||
| 11,099,688 | ||||||||
|
| |||||||
| Banks—12.0% |
| |||||||
Ameris Bancorp | 75,440 | 1,779,630 | ||||||
Atlantic Union Bankshares Corp. | 168,373 | 3,899,519 | ||||||
BancFirst Corp. | 59,915 | 2,430,751 | ||||||
Bank of Hawaii Corp. | 69,220 | 4,250,800 | ||||||
Community Bank System, Inc. | 21,982 | 1,253,414 | ||||||
CVB Financial Corp. | 143,679 | 2,692,544 | ||||||
Enterprise Financial Services Corp. | 197,192 | 6,136,615 | ||||||
First Interstate Bancsystem, Inc., Class A | 8,525 | 263,934 | ||||||
First Merchants Corp. | 9,719 | 267,953 | ||||||
Glacier Bancorp, Inc. | 65,472 | 2,310,507 | ||||||
IBERIABANK Corp. | 5,739 | 261,354 | ||||||
Independent Bank Corp. | 39,312 | 2,637,442 | ||||||
Simmons First National Corp., Class A | 15,718 | 268,935 | ||||||
South State Corp. | 278,265 | 13,262,110 | ||||||
United Community Banks, Inc. | 321,559 | 6,469,767 | ||||||
Valley National Bancorp | 1,461,488 | 11,428,836 | ||||||
Western Alliance Bancorp | 99,817 | 3,780,070 | ||||||
|
| |||||||
| 63,394,181 | ||||||||
|
| |||||||
| Beverages—0.6% |
| |||||||
Coca-Cola Consolidated, Inc. | 14,363 | 3,291,856 | ||||||
|
| |||||||
| Building Products—0.6% |
| |||||||
UFP Industries, Inc. | 59,694 | 2,955,450 | ||||||
|
| |||||||
| Capital Markets—2.9% |
| |||||||
AllianceBernstein Holding L.P. | 222,065 | 6,049,051 | ||||||
Houlihan Lokey, Inc. | 64,877 | 3,609,756 | ||||||
Stifel Financial Corp. | 118,890 | 5,638,953 | ||||||
|
| |||||||
| 15,297,760 | ||||||||
|
| |||||||
| Chemicals—1.2% |
| |||||||
Cabot Corp. | 76,082 | 2,818,838 | ||||||
Innospec, Inc. | 28,142 | 2,173,969 | ||||||
Stepan Co. | 16,168 | 1,569,913 | ||||||
|
| |||||||
| 6,562,720 | ||||||||
|
| |||||||
| Commercial Services & Supplies—3.0% |
| |||||||
ABM Industries, Inc. | 125,352 | 4,550,277 | ||||||
Brady Corp., Class A | 62,555 | 2,928,825 | ||||||
Ennis, Inc. | 135,019 | 2,449,245 | ||||||
McGrath RentCorp | 75,874 | 4,097,955 | ||||||
Tetra Tech, Inc. | 24,966 | 1,975,310 | ||||||
|
| |||||||
| 16,001,612 | ||||||||
|
| |||||||
| Shares | Value | |||||||
| Communications Equipment—0.8% |
| |||||||
Lumentum Holdings, Inc. (a) | 53,925 | $ | 4,391,113 | |||||
|
| |||||||
| Construction & Engineering—1.2% |
| |||||||
EMCOR Group, Inc. | 38,309 | 2,533,757 | ||||||
Quanta Services, Inc. | 95,576 | 3,749,447 | ||||||
|
| |||||||
| 6,283,204 | ||||||||
|
| |||||||
| Containers & Packaging—1.9% |
| |||||||
Silgan Holdings, Inc. | 98,621 | 3,194,334 | ||||||
Sonoco Products Co. | 129,881 | 6,791,478 | ||||||
|
| |||||||
| 9,985,812 | ||||||||
|
| |||||||
| Diversified Consumer Services—1.3% |
| |||||||
Service Corp. International | 127,321 | 4,951,514 | ||||||
Strategic Education, Inc. | 11,783 | 1,810,458 | ||||||
|
| |||||||
| 6,761,972 | ||||||||
|
| |||||||
| Diversified Telecommunication Services—0.5% |
| |||||||
Cogent Communications Holdings, Inc. | 35,865 | 2,774,516 | ||||||
|
| |||||||
| Electric Utilities—4.4% |
| |||||||
IDACORP, Inc. | 98,321 | 8,590,306 | ||||||
PNM Resources, Inc. | 197,840 | 7,604,969 | ||||||
Portland General Electric Co. | 173,543 | 7,255,833 | ||||||
|
| |||||||
| 23,451,108 | ||||||||
|
| |||||||
| Electronic Equipment, Instruments & Components—1.8% |
| |||||||
Dolby Laboratories, Inc., Class A | 23,463 | 1,545,508 | ||||||
Jabil, Inc. | 81,518 | 2,615,097 | ||||||
Methode Electronics, Inc. | 177,050 | 5,534,583 | ||||||
|
| |||||||
| 9,695,188 | ||||||||
|
| |||||||
| Equity Real Estate Investment Trusts (REITs)—8.9% |
| |||||||
American Assets Trust, Inc. | 72,488 | 2,018,066 | ||||||
Americold Realty Trust | 179,957 | 6,532,439 | ||||||
CoreCivic, Inc. | 86,807 | 812,513 | ||||||
CoreSite Realty Corp. | 40,670 | 4,923,510 | ||||||
CyrusOne, Inc. | 22,273 | 1,620,361 | ||||||
Douglas Emmett, Inc. | 17,410 | 533,791 | ||||||
First Industrial Realty Trust, Inc. | 63,106 | 2,425,795 | ||||||
Hudson Pacific Properties, Inc. | 137,607 | 3,462,192 | ||||||
Life Storage, Inc. | 66,161 | 6,281,987 | ||||||
National Health Investors, Inc. | 99,654 | 6,050,991 | ||||||
Rexford Industrial Realty, Inc. | 134,822 | 5,585,675 | ||||||
STAG Industrial, Inc. | 148,347 | 4,349,534 | ||||||
Terreno Realty Corp. | 45,104 | 2,374,275 | ||||||
|
| |||||||
| 46,971,129 | ||||||||
|
| |||||||
| Food & Staples Retailing—0.5% |
| |||||||
Casey’s General Stores, Inc. | 16,521 | 2,470,220 | ||||||
|
| |||||||
| Food Products—2.5% |
| |||||||
Calavo Growers, Inc. | 25,839 | 1,625,531 | ||||||
Ingredion, Inc. | 63,917 | 5,305,111 | ||||||
Lamb Weston Holdings, Inc. | 30,562 | 1,953,829 | ||||||
Simply Good Foods Co. (a) | 227,923 | 4,234,809 | ||||||
|
| |||||||
| 13,119,280 | ||||||||
|
| |||||||
| Gas Utilities—2.8% |
| |||||||
ONE Gas, Inc. | 84,368 | 6,500,555 | ||||||
Spire, Inc. | 122,361 | 8,040,341 | ||||||
|
| |||||||
| 14,540,896 | ||||||||
|
| |||||||
| Shares | Value | |||||||
| Healthcare Equipment & Supplies—2.1% |
| |||||||
CONMED Corp. | 29,229 | $ | 2,104,196 | |||||
Hill-Rom Holdings, Inc. | 83,268 | 9,141,161 | ||||||
|
| |||||||
| 11,245,357 | ||||||||
|
| |||||||
| Healthcare Providers & Services—1.5% |
| |||||||
Chemed Corp. | 8,363 | 3,772,298 | ||||||
Ensign Group, Inc. | 96,955 | 4,057,567 | ||||||
|
| |||||||
| 7,829,865 | ||||||||
|
| |||||||
| Hotels, Restaurants & Leisure—2.3% |
| |||||||
Cracker Barrel Old Country Store, Inc. | 2,253 | 249,880 | ||||||
Dunkin’ Brands Group, Inc. | 42,329 | 2,761,121 | ||||||
Marriott Vacations Worldwide Corp. | 41,710 | 3,428,979 | ||||||
Wendy’s Co. | 254,295 | 5,538,545 | ||||||
|
| |||||||
| 11,978,525 | ||||||||
|
| |||||||
| Household Durables—2.0% |
| |||||||
KB Home | 85,341 | 2,618,262 | ||||||
MDC Holdings, Inc. | 214,549 | 7,659,399 | ||||||
|
| |||||||
| 10,277,661 | ||||||||
|
| |||||||
| Household Products—0.9% |
| |||||||
WD-40 Co. | 23,829 | 4,725,291 | ||||||
|
| |||||||
| Insurance—7.0% |
| |||||||
American Financial Group, Inc. | 132,263 | 8,393,410 | ||||||
CNO Financial Group, Inc. | 224,263 | 3,491,775 | ||||||
First American Financial Corp. | 147,819 | 7,098,269 | ||||||
Old Republic International Corp. | 377,004 | 6,148,935 | ||||||
Primerica, Inc. | 47,102 | 5,492,093 | ||||||
Selective Insurance Group, Inc. | 122,211 | 6,445,408 | ||||||
|
| |||||||
| 37,069,890 | ||||||||
|
| |||||||
| IT Services—4.7% |
| |||||||
ExlService Holdings, Inc. (a) | 34,950 | 2,215,830 | ||||||
Genpact Ltd. | 109,272 | 3,990,613 | ||||||
KBR, Inc. | 149,450 | 3,370,097 | ||||||
ManTech International Corp., Class A | 131,089 | 8,978,286 | ||||||
Perspecta, Inc. | 108,711 | 2,525,357 | ||||||
Science Applications International Corp. | 50,845 | 3,949,640 | ||||||
|
| |||||||
| 25,029,823 | ||||||||
|
| |||||||
| Leisure Equipment & Products—0.4% |
| |||||||
Acushnet Holdings Corp. | 64,497 | 2,243,851 | ||||||
|
| |||||||
| Life Sciences Tools & Services—1.5% |
| |||||||
Bruker Corp. | 88,814 | 3,612,953 | ||||||
PRA Health Sciences, Inc. (a) | 43,678 | 4,249,433 | ||||||
|
| |||||||
| 7,862,386 | ||||||||
|
| |||||||
| Machinery—2.6% |
| |||||||
Federal Signal Corp. | 84,892 | 2,523,839 | ||||||
Hillenbrand, Inc. | 149,207 | 4,039,034 | ||||||
ITT, Inc. | 47,218 | 2,773,585 | ||||||
Toro Co. | 34,627 | 2,297,155 | ||||||
Watts Water Technologies, Inc., Class A | 26,504 | 2,146,824 | ||||||
|
| |||||||
| 13,780,437 | ||||||||
|
| |||||||
| Media—0.7% |
| |||||||
TEGNA, Inc. | 346,335 | 3,858,172 | ||||||
|
| |||||||
| See accompanying Notes to Financial Statements | | June 30, 2020 | | Annual Report | 85 |
Table of Contents
Schedule of Investments
June 30, 2020
| Shares | Value | |||||||
| Metals & Mining—2.2% |
| |||||||
Commercial Metals Co. | 292,830 | $ | 5,973,732 | |||||
Kaiser Aluminum Corp. | 3,470 | 255,461 | ||||||
Royal Gold, Inc. | 42,000 | 5,221,440 | ||||||
|
| |||||||
| 11,450,633 | ||||||||
|
| |||||||
| Mortgage Real Estate Investment Trusts (REITs)—3.1% |
| |||||||
Apollo Commercial Real Estate Finance, Inc. | 324,041 | 3,178,842 | ||||||
Blackstone Mortgage Trust, Inc., Class A | 356,076 | 8,577,871 | ||||||
Hannon Armstrong Sustainable Infrastructure Capital, Inc. | 161,427 | 4,594,212 | ||||||
|
| |||||||
| 16,350,925 | ||||||||
|
| |||||||
| Multi-Utilities—1.9% |
| |||||||
Black Hills Corp. | 89,638 | 5,078,889 | ||||||
NorthWestern Corp. | 4,582 | 249,811 | ||||||
Unitil Corp. | 100,230 | 4,492,308 | ||||||
|
| |||||||
| 9,821,008 | ||||||||
|
| |||||||
| Oil, Gas & Consumable Fuels—1.7% |
| |||||||
Delek Logistics Partners L.P. | 110,277 | 2,528,651 | ||||||
SFL Corp. Ltd. | 570,979 | 5,304,395 | ||||||
World Fuel Services Corp. | 45,926 | 1,183,054 | ||||||
|
| |||||||
| 9,016,100 | ||||||||
|
| |||||||
| Personal Products—0.3% |
| |||||||
Inter Parfums, Inc. | 32,582 | 1,568,823 | ||||||
|
| |||||||
| Professional Services—1.4% |
| |||||||
FTI Consulting, Inc. (a) | 45,851 | 5,252,232 | ||||||
ICF International, Inc. | 21,573 | 1,398,578 | ||||||
TransUnion | 6,658 | 579,512 | ||||||
|
| |||||||
| 7,230,322 | ||||||||
|
| |||||||
| Road & Rail—0.7% |
| |||||||
Werner Enterprises, Inc. | 85,089 | 3,703,924 | ||||||
|
| |||||||
| Semiconductors & Semiconductor Equipment—2.7% |
| |||||||
Cabot Microelectronics Corp. | 57,560 | 8,031,922 | ||||||
Cirrus Logic, Inc. (a) | 55,016 | 3,398,889 | ||||||
FormFactor, Inc. (a) | 50,421 | 1,478,848 | ||||||
MKS Instruments, Inc. | 13,658 | 1,546,632 | ||||||
|
| |||||||
| 14,456,291 | ||||||||
|
| |||||||
| Software—1.4% |
| |||||||
Fair Isaac Corp. (a) | 6,596 | 2,757,392 | ||||||
Progress Software Corp. | 119,639 | 4,636,011 | ||||||
|
| |||||||
| 7,393,403 | ||||||||
|
| |||||||
| Specialty Retail—2.3% |
| |||||||
Aaron’s, Inc. | 107,912 | 4,899,205 | ||||||
Lithia Motors, Inc., Class A | 31,114 | 4,708,482 | ||||||
RH (a) | 10,569 | 2,630,624 | ||||||
|
| |||||||
| 12,238,311 | ||||||||
|
| |||||||
| Thrifts & Mortgage Finance—4.1% |
| |||||||
Essent Group Ltd. | 7,850 | 284,720 | ||||||
Premier Financial Corp. | 210,030 | 3,711,230 | ||||||
Radian Group, Inc. | 325,629 | 5,050,506 | ||||||
Walker & Dunlop, Inc. | 109,563 | 5,566,896 | ||||||
Washington Federal, Inc. | 171,166 | 4,594,095 | ||||||
WSFS Financial Corp. | 81,369 | 2,335,290 | ||||||
|
| |||||||
| 21,542,737 | ||||||||
|
| |||||||
| Shares | Value | |||||||
| Water Utilities—1.0% |
| |||||||
California Water Service Group | 113,057 | $ | 5,392,819 | |||||
|
| |||||||
| Total Common Stock (cost—$550,301,924) |
| 522,674,681 | ||||||
|
| |||||||
| Exchange-Traded Funds—0.4% |
| |||||||
iShares Russell 2000 Value (cost—$1,824,443) | 19,661 | 1,916,161 | ||||||
|
| |||||||
| Principal Amount (000s) | ||||||||
| Repurchase Agreements—0.9% |
| |||||||
State Street Bank and Trust Co., dated 6/30/20, 0.00%, due 7/1/20, proceeds $4,855,000; collateralized by U.S. Treasury Notes, 3.00%, due 10/31/25, valued at $4,952,188 including accrued interest |
| |||||||
(cost—$4,855,000) | $4,855 | 4,855,000 | ||||||
|
| |||||||
| Total Investments (cost—$556,981,367)—100.2% |
| 529,445,842 | ||||||
|
| |||||||
| Liabilities in excess of other assets—(0.2)% | (1,259,527 | ) | ||||||
|
| |||||||
| Net Assets—100.0% | $528,186,315 | |||||||
|
| |||||||
Notes to Schedule of Investments:
† Effective April 30, 2020, the AllianzGI NFJ Small-Cap Value Fund changed its name to AllianzGI Small-Cap Value Fund. See Note 9(a).
(a) Non-income producing.
Glossary:
REIT—Real Estate Investment Trust
AllianzGI Technology Fund
| Shares | Value | |||||||
| Common Stock—91.2% |
| |||||||
| Automobiles—1.4% |
| |||||||
Tesla, Inc. (d) | 24,140 | $26,066,613 | ||||||
|
| |||||||
| Communications Equipment—0.0% |
| |||||||
Arista Networks, Inc. (d) | 100 | 21,003 | ||||||
Cisco Systems, Inc. | 100 | 4,664 | ||||||
Lumentum Holdings, Inc. (d) | 95 | 7,736 | ||||||
Motorola Solutions, Inc. | 95 | 13,312 | ||||||
Nokia Oyj ADR | 95 | 418 | ||||||
|
| |||||||
| 47,133 | ||||||||
|
| |||||||
| Diversified Consumer Services—0.0% |
| |||||||
New Oriental Education & Technology Group, Inc. ADR (d) | 95 | 12,372 | ||||||
TAL Education Group ADR (d) | 100 | 6,838 | ||||||
|
| |||||||
| 19,210 | ||||||||
|
| |||||||
| Electrical Equipment—0.0% |
| |||||||
Bloom Energy Corp., Class A (d) | 13,100 | 142,528 | ||||||
|
| |||||||
| Electronic Equipment, Instruments & Components—0.5% |
| |||||||
CDW Corp. | 95 | 11,037 | ||||||
Cognex Corp. | 100 | 5,972 | ||||||
IPG Photonics Corp. (d) | 95 | 15,237 | ||||||
Murata Manufacturing Co., Ltd. | 300 | 17,684 | ||||||
Samsung Electro-Mechanics Co., Ltd. | 165 | 17,901 | ||||||
Samsung SDI Co., Ltd. | 32,120 | 9,821,062 | ||||||
|
| |||||||
| 9,888,893 | ||||||||
|
| |||||||
| Entertainment—3.5% |
| |||||||
Activision Blizzard, Inc. | 225,645 | 17,126,455 | ||||||
NetEase, Inc. ADR | 30,920 | 13,276,430 | ||||||
Netflix, Inc. (d) | 40,360 | 18,365,414 | ||||||
Nintendo Co., Ltd. | 100 | 44,707 | ||||||
Roku, Inc. (d) | 100 | 11,653 | ||||||
Zynga, Inc., Class A (d) | 1,788,205 | 17,059,476 | ||||||
|
| |||||||
| 65,884,135 | ||||||||
|
| |||||||
| Healthcare Technology—0.9% |
| |||||||
Veeva Systems, Inc., Class A (d) | 68,080 | 15,959,314 | ||||||
|
| |||||||
| Household Durables—0.0% |
| |||||||
Garmin Ltd. | 95 | 9,263 | ||||||
|
| |||||||
| Industrial Conglomerates—0.0% |
| |||||||
Roper Technologies, Inc. | 100 | 38,826 | ||||||
|
| |||||||
| Interactive Media & Services—6.8% |
| |||||||
58.com, Inc. ADR (d) | 95 | 5,124 | ||||||
Alphabet, Inc., Class C (d) | 8,780 | 12,411,496 | ||||||
Facebook, Inc., Class A (c)(d) | 473,985 | 107,627,774 | ||||||
NAVER Corp. | 475 | 106,867 | ||||||
Pinterest, Inc., Class A (d) | 16,580 | 367,578 | ||||||
Snap, Inc., Class A (d) | 305,730 | 7,181,598 | ||||||
Tencent Holdings Ltd. | 100 | 6,408 | ||||||
Twitter, Inc. (d) | 95 | 2,830 | ||||||
Yandex NV, Class A (d) | 95 | 4,752 | ||||||
Yelp, Inc. (d) | 95 | 2,197 | ||||||
Zillow Group, Inc., Class A (d) | 95 | 5,461 | ||||||
|
| |||||||
| 127,722,085 | ||||||||
|
| |||||||
| 86 | Annual Report | | June 30, 2020 | | See accompanying Notes to Financial Statements |
Table of Contents
Schedule of Investments
June 30, 2020
| Shares | Value | |||||||
| Internet & Direct Marketing Retail—4.6% |
| |||||||
Alibaba Group Holding Ltd. ADR (d) | 100 | $ | 21,570 | |||||
Amazon.com, Inc. (d) | 31,090 | 85,771,714 | ||||||
eBay, Inc. | 95 | 4,983 | ||||||
Expedia Group, Inc. | 95 | 7,809 | ||||||
GrubHub, Inc. (d) | 95 | 6,679 | ||||||
JD.com, Inc. ADR (d) | 100 | 6,018 | ||||||
Trip.com Group Ltd. ADR (d) | 95 | 2,462 | ||||||
|
| |||||||
| 85,821,235 | ||||||||
|
| |||||||
| IT Services—18.5% |
| |||||||
Accenture PLC, Class A | 95 | 20,398 | ||||||
Adyen NV (a)(d) | 95 | 138,272 | ||||||
Akamai Technologies, Inc. (d) | 100 | 10,709 | ||||||
Fidelity National Information Services, Inc. | 28,550 | 3,828,270 | ||||||
Fiserv, Inc. (d) | 46,255 | 4,515,413 | ||||||
Global Payments, Inc. | 18,914 | 3,208,193 | ||||||
GoDaddy, Inc., Class A (d) | 95 | 6,966 | ||||||
Mastercard, Inc., Class A | 113,305 | 33,504,288 | ||||||
MongoDB, Inc. (d) | 207,915 | 47,059,481 | ||||||
Okta, Inc. (d) | 353,200 | 70,721,236 | ||||||
PayPal Holdings, Inc. (d) | 402,580 | 70,141,513 | ||||||
Shopify, Inc., Class A (d) | 13,280 | 12,605,376 | ||||||
Square, Inc., Class A (c)(d) | 226,835 | 23,804,065 | ||||||
Tata Consultancy Services Ltd. | 2,000 | 55,055 | ||||||
Twilio, Inc., Class A (d) | 351,380 | 77,099,800 | ||||||
Visa, Inc., Class A | 3,510 | 678,027 | ||||||
|
| |||||||
| 347,397,062 | ||||||||
|
| |||||||
| Media—0.0% |
| |||||||
Comcast Corp., Class A | 95 | 3,703 | ||||||
|
| |||||||
| Professional Services—0.0% |
| |||||||
Verisk Analytics, Inc. | 95 | 16,169 | ||||||
|
| |||||||
| Road & Rail—0.0% |
| |||||||
Lyft, Inc., Class A (d) | 100 | 3,301 | ||||||
|
| |||||||
| Semiconductors & Semiconductor Equipment—13.4% |
| |||||||
Advanced Micro Devices, Inc. (c)(d) | 432,470 | 22,752,247 | ||||||
ams AG (d) | 95 | 1,416 | ||||||
Analog Devices, Inc. | 77,320 | 9,482,525 | ||||||
ASML Holding NV | 55,860 | 20,558,156 | ||||||
Cree, Inc. (d) | 33,840 | 2,002,990 | ||||||
Infineon Technologies AG | 10,630 | 249,084 | ||||||
KLA Corp. | 9,355 | 1,819,360 | ||||||
Lam Research Corp. | 37,600 | 12,162,096 | ||||||
Marvell Technology Group Ltd. | 230,235 | 8,072,039 | ||||||
Maxim Integrated Products, Inc. | 95 | 5,758 | ||||||
MediaTek, Inc. | 1,000 | 19,771 | ||||||
Microchip Technology, Inc. | 86,795 | 9,140,381 | ||||||
Micron Technology, Inc. (c)(d) | 769,795 | 39,659,838 | ||||||
NVIDIA Corp. | 122,140 | 46,402,207 | ||||||
NXP Semiconductors NV | 102,445 | 11,682,828 | ||||||
ON Semiconductor Corp. (d) | 100 | 1,982 | ||||||
Qorvo, Inc. (d) | 124,045 | 13,710,694 | ||||||
QUALCOMM, Inc. | 170,615 | 15,561,794 | ||||||
SK Hynix, Inc. | 100 | 7,140 | ||||||
Skyworks Solutions, Inc. | 157,535 | 20,142,425 | ||||||
STMicroelectronics NV | 158,175 | 4,335,577 | ||||||
| Shares | Value | |||||||
Taiwan Semiconductor Manufacturing Co., Ltd. ADR | 100 | $ | 5,677 | |||||
Teradyne, Inc. | 50,890 | 4,300,714 | ||||||
Texas Instruments, Inc. | 100 | 12,697 | ||||||
Tokyo Electron Ltd. | 38,600 | 9,524,310 | ||||||
Universal Display Corp. | 95 | 14,214 | ||||||
Xilinx, Inc. | 100 | 9,839 | ||||||
|
| |||||||
| 251,637,759 | ||||||||
|
| |||||||
| Software—30.1% |
| |||||||
Adobe, Inc. (d) | 12,695 | 5,526,260 | ||||||
Alteryx, Inc., Class A (d) | 194,300 | 31,919,604 | ||||||
Atlassian Corp. PLC, Class A (d) | 267,835 | 48,282,615 | ||||||
Cadence Design Systems, Inc. (d) | 6,650 | 638,134 | ||||||
Coupa Software, Inc. (d) | 100 | 27,704 | ||||||
Crowdstrike Holdings, Inc., Class A (d) | 750,300 | 75,247,587 | ||||||
Datadog, Inc., Class A (d) | 32,310 | 2,809,355 | ||||||
DocuSign, Inc. (d) | 109,550 | 18,865,606 | ||||||
Dropbox, Inc., Class A (d) | 95 | 2,068 | ||||||
Dynatrace, Inc. (d) | 100 | 4,060 | ||||||
Elastic NV (d) | 100 | 9,221 | ||||||
Fortinet, Inc. (d) | 41,445 | 5,689,155 | ||||||
HubSpot, Inc. (d) | 81,765 | 18,343,978 | ||||||
Intuit, Inc. | 95 | 28,138 | ||||||
Microsoft Corp. (c) | 738,636 | 150,319,812 | ||||||
Nutanix, Inc., Class A (d) | 100 | 2,371 | ||||||
Palo Alto Networks, Inc. (d) | 100 | 22,967 | ||||||
Paycom Software, Inc. (d) | 116,564 | 36,103,368 | ||||||
RealPage, Inc. (d) | 100 | 6,501 | ||||||
|
| |||||||
RingCentral, Inc., Class A (d) | 174,275 | 49,670,118 | ||||||
|
| |||||||
Salesforce.com, Inc. (d) | 100 | 18,733 | ||||||
ServiceNow, Inc. (d) | 100 | 40,506 | ||||||
Slack Technologies, Inc., Class A (d) | 274,365 | 8,530,008 | ||||||
Splunk, Inc. (d) | 96,350 | 19,144,745 | ||||||
Synopsys, Inc. (d) | 3,565 | 695,175 | ||||||
VMware, Inc., Class A (d) | 95 | 14,712 | ||||||
Zendesk, Inc. (d) | 100 | 8,853 | ||||||
Zoom Video Communications, Inc. (d) | 133,430 | 33,829,842 | ||||||
Zscaler, Inc. (d) | 546,825 | 59,877,337 | ||||||
|
| |||||||
| 565,678,533 | ||||||||
|
| |||||||
| Technology Hardware, Storage & Peripherals—11.5% |
| |||||||
Apple, Inc. (c) | 459,215 | 167,521,632 | ||||||
Catcher Technology Co., Ltd. | 1,000 | 7,578 | ||||||
Dell Technologies, Inc., Class C (d) | 175 | 9,615 | ||||||
Hewlett Packard Enterprise Co. | 95 | 924 | ||||||
HP, Inc. | 95 | 1,656 | ||||||
NetApp, Inc. | 100 | 4,437 | ||||||
Pure Storage, Inc., Class A (d) | 338,525 | 5,866,638 | ||||||
Samsung Electronics Co., Ltd. | 966,805 | 42,798,168 | ||||||
|
| |||||||
| 216,210,648 | ||||||||
|
| |||||||
| Total Common Stock (cost—$1,035,810,104) |
| 1,712,546,410 | ||||||
|
| |||||||
| Principal Amount (000s) | Value | |||||||
| Repurchase Agreements—7.5% |
| |||||||
State Street Bank and Trust Co., dated 6/30/20, 0.00%, due 7/1/20, proceeds $139,883,000; collateralized by U.S. Treasury Notes, 3.00%, due 10/31/25, valued at $142,680,677 including accrued interest |
| |||||||
(cost—$139,883,000) | $139,883 | $139,883,000 | ||||||
|
| |||||||
| Total Options Purchased—2.1% (cost—$15,032,291) (d)(e)(f) |
| 38,956,535 | ||||||
|
| |||||||
| Total Investments, before options written and securities sold short (cost—$1,190,725,395)—100.8% |
| 1,891,385,945 | ||||||
|
| |||||||
| Shares | ||||||||
| Securities Sold Short—(0.0)% |
| |||||||
| Mutual Funds—(0.0)% |
| |||||||
iShares Core S&P Small-Cap | 100 | (6,829 | ) | |||||
iShares Russell 2000 | 100 | (14,318 | ) | |||||
|
| |||||||
| Total Securities Sold Short (proceeds received—$17,596) |
| (21,147 | ) | |||||
|
| |||||||
| Total Options Written —(0.6)% (premiums received—$11,938,872) (d)(e)(f) |
| (11,133,735 | ) | |||||
|
| |||||||
| Total Investments, net of options written and securities sold short (cost—$1,178,768,927) (b)—100.2% |
| 1,880,231,063 | ||||||
|
| |||||||
| Other liabilities in excess of other assets—(0.2)% |
| (2,788,575 | ) | |||||
|
| |||||||
| Net Assets—100.0% |
| $1,877,442,488 | ||||||
|
| |||||||
Notes to Schedule of Investments:
(a) 144A—Exempt from registration under Rule 144A of the Securities Act of 1933. These securities may be resold in transactions exempt from registration, typically only to qualified institutional buyers. Security with a value of $138,272, representing less than 0.05% of net assets.
(b) Securities (net of securities sold short) with an aggregate value of $62,677,151, representing 3.3% of net assets, were valued utilizing modeling tools provided by a third-party vendor. See Note 1(a) and Note 1(b) in the Notes to Financial Statements.
(c) All or partial amount segregated for the benefit of the counterparty as collateral for securities sold short and options written.
(d) Non-income producing.
(e) Exchange traded-Chicago Board Options Exchange.
| See accompanying Notes to Financial Statements | | June 30, 2020 | | Annual Report | 87 |
Table of Contents
Schedule of Investments
June 30, 2020
(f) Exchange traded option contracts outstanding at June 30, 2020:
| Options purchased contracts outstanding at June 30, 2020: | ||||||||||||||||||||||||||||
| Description | Exercise Price | Expiration Date | Number of Contracts | Notional Amount | Market Value | Cost | Unrealized Appreciation (Depreciation) | |||||||||||||||||||||
Call options: | ||||||||||||||||||||||||||||
Amazon.com, Inc. | 2,070.00 USD | 1/15/21 | 250 | $ | 25,000 | $ | 18,787,500 | $ | 2,784,260 | $ | 16,003,240 | |||||||||||||||||
Amazon.com, Inc. | 2,000.00 USD | 6/18/21 | 150 | 15,000 | 12,918,000 | 2,505,306 | 10,412,694 | |||||||||||||||||||||
Fidelity National Information Services, Inc. | 155.00 USD | 1/21/22 | 1,446 | 144,600 | 1,796,655 | 1,947,818 | (151,163 | ) | ||||||||||||||||||||
Fiserv, Inc. | 120.00 USD | 1/21/22 | 1,980 | 198,000 | 2,069,100 | 2,855,237 | (786,137 | ) | ||||||||||||||||||||
Global Payments, Inc. | 210.00 USD | 6/18/21 | 1,512 | 151,200 | 1,610,280 | 2,929,282 | (1,319,002 | ) | ||||||||||||||||||||
Pure Storage, Inc. | 20.00 USD | 1/15/21 | 10,000 | 1,000,000 | 1,775,000 | 2,010,388 | (235,388 | ) | ||||||||||||||||||||
|
| |||||||||||||||||||||||||||
| Total options purchased contracts |
| $ | 38,956,535 | $ | 15,032,291 | $ | 23,924,244 | |||||||||||||||||||||
|
| |||||||||||||||||||||||||||
| Options written contracts outstanding at June 30, 2020: | ||||||||||||||||||||||||||||
| Description | Exercise Price | Expiration Date | Number of Contracts | Notional Amount | Market Value | Premiums Received | Unrealized Appreciation (Depreciation) | |||||||||||||||||||||
Call options: | ||||||||||||||||||||||||||||
NVIDIA Corp. | 380.00 USD | 8/21/20 | (400 | ) | $ | (40,000 | ) | $ | (1,083,000 | ) | $ | (1,120,000 | ) | $ | 37,000 | |||||||||||||
Put options: | ||||||||||||||||||||||||||||
Amazon.com, Inc. | 1,500.00 USD | 1/15/21 | (250 | ) | $ | (25,000 | ) | $ | (295,625 | ) | $ | (1,135,297 | ) | $ | 839,672 | |||||||||||||
Amazon.com, Inc. | 1,400.00 USD | 6/18/21 | (150 | ) | (15,000 | ) | (317,250 | ) | (2,159,646 | ) | 1,842,396 | |||||||||||||||||
Fidelity National Information Services, Inc. | 120.00 USD | 1/21/22 | (1,446 | ) | (144,600 | ) | (2,241,300 | ) | (1,768,363 | ) | (472,937 | ) | ||||||||||||||||
Fiserv, Inc. | 90.00 USD | 1/21/22 | (1,980 | ) | (198,000 | ) | (3,088,800 | ) | (2,030,368 | ) | (1,058,432 | ) | ||||||||||||||||
Global Payments, Inc. | 160.00 USD | 6/18/21 | (1,512 | ) | (151,200 | ) | (3,182,760 | ) | (2,472,112 | ) | (710,648 | ) | ||||||||||||||||
Pure Storage, Inc. | 12.50 USD | 1/15/21 | (10,000 | ) | (1,000,000 | ) | (925,000 | ) | (1,253,086 | ) | 328,086 | |||||||||||||||||
|
| |||||||||||||||||||||||||||
| Total put options |
| $ | (10,050,735 | ) | $ | (10,818,872 | ) | $ | 768,137 | |||||||||||||||||||
|
| |||||||||||||||||||||||||||
| Total options written contracts |
| $ | (11,133,735 | ) | $ | (11,938,872 | ) | $ | 805,137 | |||||||||||||||||||
|
| |||||||||||||||||||||||||||
Glossary:
ADR—American Depositary Receipt
| 88 | Annual Report | | June 30, 2020 | | See accompanying Notes to Financial Statements |
Table of Contents
(THIS PAGE INTENTIONALLY LEFT BLANK)
| See accompanying Notes to Financial Statements | | June 30, 2020 | | Annual Report | 89 |
Table of Contents
Statements of Assets and Liabilities
June 30, 2020
| AllianzGI Dividend Value | AllianzGI Emerging Markets Opportunities | AllianzGI Focused Growth | AllianzGI Global Small-Cap | |||||||||||||
| Assets: | ||||||||||||||||
| Investments, at value | $ | 845,777,336 | $ | 251,471,086 | $ | 1,080,674,008 | $ | 74,386,199 | ||||||||
| Investments in Affiliates, at value | — | — | — | — | ||||||||||||
| Cash | 92,126 | — | 843 | 678 | ||||||||||||
| Foreign currency, at value | — | 1,709,750 | — | 182,007 | ||||||||||||
| Receivable for investments sold | 6,437,962 | 1,231,335 | 1,642,253 | — | ||||||||||||
| Dividends and interest receivable (net of foreign withholding taxes) | 1,488,566 | 924,934 | 130,174 | 60,108 | ||||||||||||
| Investments in Affiliated Funds — Trustees Deferred Compensation Plan (see Note 4) | 1,446,628 | 66,908 | 237,206 | 52,020 | ||||||||||||
| Receivable for Fund shares sold | 651,420 | 737,409 | 1,526,826 | 2,189 | ||||||||||||
| Tax reclaims receivable | 286,955 | 47,370 | — | 149,997 | ||||||||||||
Total Assets | 856,180,993 | 256,188,792 | 1,084,211,310 | 74,833,198 | ||||||||||||
| Liabilities: | ||||||||||||||||
| Payable for investments purchased | 5,883,110 | 999,876 | 4,794,451 | 112,915 | ||||||||||||
| Payable for Fund shares redeemed | 1,630,550 | 381,373 | 2,013,927 | 23,823 | ||||||||||||
| Trustees Deferred Compensation Plan payable (see Note 4) | 1,446,628 | 66,908 | 237,206 | 52,020 | ||||||||||||
| Distribution fees payable | 385,819 | 1,256 | 33,219 | 2,566 | ||||||||||||
| Investment Advisory fees payable | 273,529 | 133,853 | 302,146 | 54,767 | ||||||||||||
| Administration fees payable | 271,742 | 54,634 | 304,337 | 24,965 | ||||||||||||
| Servicing fees payable | 88,855 | 7,386 | 137,489 | 8,254 | ||||||||||||
| Payable to custodian for cash overdraft | — | 1,016,112 | — | — | ||||||||||||
| Options written, at value | — | — | 35,375 | — | ||||||||||||
| Unrealized depreciation of forward foreign currency contracts | — | — | — | 29 | ||||||||||||
Total Liabilities | 9,980,233 | 2,661,398 | 7,858,150 | 279,339 | ||||||||||||
| Net Assets | $ | 846,200,760 | $ | 253,527,394 | $ | 1,076,353,160 | $ | 74,553,859 | ||||||||
| Net Assets Consist of: | ||||||||||||||||
| Paid-in-capital | $ | 875,201,400 | $ | 282,796,016 | $ | 535,007,736 | $ | 63,722,981 | ||||||||
| Total distributable earnings (loss) | (29,000,640 | ) | (29,268,622 | ) | 541,345,424 | 10,830,878 | ||||||||||
| Net Assets | $ | 846,200,760 | $ | 253,527,394 | $ | 1,076,353,160 | $ | 74,553,859 | ||||||||
| Cost of Investments | $ | 796,111,503 | $ | 207,989,990 | $ | 598,874,405 | $ | 62,661,158 | ||||||||
| Cost of Investments in Affiliates | $ | — | $ | — | $ | — | $ | — | ||||||||
| Cost of Foreign Currency | $ | — | $ | 1,701,486 | $ | — | $ | 180,469 | ||||||||
| Premiums Received for Options Written | $ | — | $ | — | $ | 574,213 | $ | — | ||||||||
| 90 | Annual Report | | June 30, 2020 | | See accompanying Notes to Financial Statements |
Table of Contents
| AllianzGI Health Sciences | AllianzGI Income & Growth | AllianzGI International Value | AllianzGI Large-Cap Value | AllianzGI Mid-Cap | ||||||||||||||||||
| $ | 164,011,321 | $ | 4,872,190,599 | $ | 127,337,900 | $ | 267,179,842 | $ | 351,618,870 | |||||||||||||
| — | 25,064,827 | — | — | — | ||||||||||||||||||
| 161,069 | 322,823 | 8 | 15,141 | 1,650,561 | ||||||||||||||||||
| — | — | 354,149 | — | — | ||||||||||||||||||
| 160,201 | 81,839,297 | 4,163,832 | — | 567,769 | ||||||||||||||||||
| 104,782 |
| 31,530,728 | 257,020 | 388,514 | 101,687 | ||||||||||||||||
| 43,120 |
| 601,778 | 298,028 | 176,052 | 64,185 | ||||||||||||||||
| 21,431 | 5,859,416 | 25,643 | 736,723 | 45,213 | ||||||||||||||||||
| 222,102 | — | 319,537 | 55,347 | — | ||||||||||||||||||
| 164,724,026 | 5,017,409,468 | 132,756,117 | 268,551,619 | 354,048,285 | ||||||||||||||||||
| 720,195 | 102,070,753 | 2,314,409 | — | 2,431,853 | ||||||||||||||||||
| 141,812 | 3,661,068 | 526,561 | 134,659 | 466,930 | ||||||||||||||||||
| 43,120 | 601,778 | 298,028 | 176,052 | 64,185 | ||||||||||||||||||
| 2,538 | 749,210 | 32,462 | 5,525 | 15,392 | ||||||||||||||||||
| 106,557 | 2,551,699 | 58,595 | 99,580 | 133,683 | ||||||||||||||||||
| 52,412 | 1,405,935 | 47,368 | 81,033 | 109,173 | ||||||||||||||||||
| 31,132 | 582,437 | 13,940 | 33,410 | 56,847 | ||||||||||||||||||
| — | — | — | — | — | ||||||||||||||||||
| — | 1,204,673 | — | — | — | ||||||||||||||||||
| — | — | — | — | — | ||||||||||||||||||
| 1,097,766 | 112,827,553 | 3,291,363 | 530,259 | 3,278,063 | ||||||||||||||||||
| $ | 163,626,260 | $ | 4,904,581,915 | $ | 129,464,754 | $ | 268,021,360 | $ | 350,770,222 | |||||||||||||
| $ | 127,675,265 | $ | 5,432,603,839 | $ | 586,430,226 | $ | 280,998,701 | $ | 225,477,325 | |||||||||||||
| 35,950,995 | (528,021,924 | ) | (456,965,472 | ) | (12,977,341 | ) | 125,292,897 | |||||||||||||||
| $ | 163,626,260 | $ | 4,904,581,915 | $ | 129,464,754 | $ | 268,021,360 | $ | 350,770,222 | |||||||||||||
| $ | 140,007,488 | $ | 5,406,594,785 | $ | 115,894,905 | $ | 267,514,865 | $ | 248,819,398 | |||||||||||||
| $ | — | $ | 36,944,480 | $ | — | $ | — | $ | — | |||||||||||||
| $ | — | $ | — | $ | 351,468 | $ | — | $ | — | |||||||||||||
| $ | — | $ | 1,226,008 | $ | — | $ | — | $ | — | |||||||||||||
| See accompanying Notes to Financial Statements | | June 30, 2020 | | Annual Report | 91 |
Table of Contents
Statements of Assets and Liabilities (cont’d)
June 30, 2020
| AllianzGI Dividend Value | AllianzGI Emerging Markets Opportunities | AllianzGI Focused Growth | AllianzGI Global Small-Cap | |||||||||||||
| Net Assets: | ||||||||||||||||
| Class A | $ | 329,828,152 | $ | 32,513,553 | $ | 618,301,384 | $ | 36,141,936 | ||||||||
| Class C | 38,900,036 | 2,021,516 | 45,877,942 | 4,119,503 | ||||||||||||
| Class R | 52,184,323 | — | 20,481,288 | — | ||||||||||||
| Class P | 221,249,665 | 12,813,849 | 84,929,129 | 4,443,523 | ||||||||||||
| Institutional Class | 117,754,002 | 186,596,570 | 165,726,454 | 29,848,897 | ||||||||||||
| Class R6 | 60,490,366 | 19,581,906 | 136,518,550 | — | ||||||||||||
| Administrative Class | 25,794,216 | — | 4,518,413 | — | ||||||||||||
| Shares Issued and Outstanding: | ||||||||||||||||
| Class A | 34,107,915 | 1,256,409 | 10,575,824 | 1,011,871 | ||||||||||||
| Class C | 3,937,426 | 78,685 | 1,326,649 | 140,309 | ||||||||||||
| Class R | 5,396,790 | — | 505,863 | — | ||||||||||||
| Class P | 22,649,647 | 506,566 | 2,030,283 | 114,260 | ||||||||||||
| Institutional Class | 12,073,718 | 7,200,449 | 3,120,479 | 757,814 | ||||||||||||
| Class R6 | 6,230,625 | 759,543 | 2,564,638 | — | ||||||||||||
| Administrative Class | 2,590,993 | — | 93,053 | — | ||||||||||||
| Net Asset Value and Redemption Price Per Share:* | ||||||||||||||||
| Class A | $ | 9.67 | $ | 25.88 | $ | 58.46 | $ | 35.72 | ||||||||
| Class C | 9.88 | 25.69 | 34.58 | 29.36 | ||||||||||||
| Class R | 9.67 | — | 40.49 | — | ||||||||||||
| Class P | 9.77 | 25.30 | 41.83 | 38.89 | ||||||||||||
| Institutional Class | 9.75 | 25.91 | 53.11 | 39.39 | ||||||||||||
| Class R6 | 9.71 | 25.78 | 53.23 | — | ||||||||||||
| Administrative Class | 9.96 | — | 48.56 | — | ||||||||||||
| * | Net asset value and redemption price per share may not recalculate exactly due to rounding. |
| 92 | Annual Report | | June 30, 2020 | | See accompanying Notes to Financial Statements |
Table of Contents
AllianzGI | AllianzGI Income & Growth | AllianzGI International Value | AllianzGI Large-Cap Value | AllianzGI Mid-Cap | ||||||||||||||||||
| $ | 148,223,416 | $ | 1,631,126,307 | $ | 55,297,702 | $ | 150,404,413 | $ | 263,361,704 | |||||||||||||
| 4,221,300 | 1,215,780,352 | 7,487,617 | 7,854,397 | 15,495,039 | ||||||||||||||||||
| — | 6,032,243 | 4,382,015 | 1,196,917 | 1,702,919 | ||||||||||||||||||
| — | 1,253,363,469 | 22,911,511 | 15,383,544 | 13,669,695 | ||||||||||||||||||
| 11,181,544 | 798,279,544 | 37,008,598 | 92,001,090 | 54,793,328 | ||||||||||||||||||
| — | — | 1,229,839 | — | — | ||||||||||||||||||
| — | — | 1,147,472 | 1,180,999 | 1,747,537 | ||||||||||||||||||
| 4,333,095 | 149,766,990 | 3,280,031 | 6,141,499 | 61,205,992 | ||||||||||||||||||
| 165,942 | 122,985,979 | 451,998 | 316,435 | 4,623,078 | ||||||||||||||||||
| — | 553,900 | 259,204 | 48,325 | 406,300 | ||||||||||||||||||
| — | 111,890,771 | 1,350,699 | 622,032 | 2,708,955 | ||||||||||||||||||
| 320,877 | 70,493,601 | 2,179,818 | 3,775,470 | 10,760,181 | ||||||||||||||||||
| — | — | 72,483 | — | — | ||||||||||||||||||
| — | — | 67,816 | 47,517 | 378,514 | ||||||||||||||||||
| $ | 34.21 | $ | 10.89 | $ | 16.86 | $ | 24.49 | $ | 4.30 | |||||||||||||
| 25.44 | 9.89 | 16.57 | 24.82 | 3.35 | ||||||||||||||||||
| — | 10.89 | 16.91 | 24.77 | 4.19 | ||||||||||||||||||
| — | 11.20 | 16.96 | 24.73 | 5.05 | ||||||||||||||||||
| 34.85 | 11.32 | 16.98 | 24.37 | 5.09 | ||||||||||||||||||
| — | — | 16.97 | — | — | ||||||||||||||||||
| — | — | 16.92 | 24.85 | 4.62 | ||||||||||||||||||
| See accompanying Notes to Financial Statements | | June 30, 2020 | | Annual Report | 93 |
Table of Contents
Statements of Assets and Liabilities (cont’d)
June 30, 2020
| AllianzGI Mid-Cap Value | AllianzGI Small-Cap | AllianzGI Small-Cap Value | AllianzGI Technology | |||||||||||||
| Assets: | ||||||||||||||||
| Investments, at value | $ | 1,225,946,623 | $ | 110,307,494 | $ | 529,445,842 | $ | 1,891,385,945 | ||||||||
| Cash | 200,203 | 20,021 | 839 | 919 | ||||||||||||
| Foreign currency, at value | — | — | — | 4,378,058 | ||||||||||||
| Dividends and interest receivable (net of foreign withholding taxes) | 2,863,343 | 65,475 | 1,207,308 | 77,221 | ||||||||||||
| Receivable for investments sold | — | — | — | 17,367,775 | ||||||||||||
| Receivable for Fund shares sold | 1,984,768 | 92,755 | 339,126 | 987,784 | ||||||||||||
| Tax reclaims receivable | 18,054 | — | — | 38,129 | ||||||||||||
| Investments in Affiliated Funds — Trustees Deferred Compensation Plan (see Note 4) | 295,728 | 13,836 | 1,203,547 | 365,861 | ||||||||||||
| Prepaid expenses and other assets | — | — | 888 | — | ||||||||||||
Total Assets | 1,231,308,719 | 110,499,581 | 532,197,550 | 1,914,601,692 | ||||||||||||
| Liabilities: | ||||||||||||||||
| Payable for investments purchased | — | 147,003 | — | 20,839,466 | ||||||||||||
| Payable for Fund shares redeemed | 4,845,027 | 43,634 | 1,657,337 | 2,780,134 | ||||||||||||
| Payable for securities sold short expenses | — | — | — | 4,279 | ||||||||||||
| Securities sold short, at value | — | — | — | 21,147 | ||||||||||||
| Options written, at value | — | — | — | 11,133,735 | ||||||||||||
| Investment Advisory fees payable | 559,387 | 53,493 | 220,847 | 1,338,702 | ||||||||||||
| Distribution fees payable | 35,840 | 2,597 | 716,182 | 32,280 | ||||||||||||
| Servicing fees payable | 110,388 | 12,616 | 59,128 | 142,010 | ||||||||||||
| Administration fees payable | 135,489 | 23,936 | 154,194 | 498,722 | ||||||||||||
| Trustees Deferred Compensation Plan payable (see Note 4) | 295,728 | 13,836 | 1,203,547 | 365,861 | ||||||||||||
| Accrued expenses and other liabilities | — | — | — | 2,868 | ||||||||||||
Total Liabilities | 5,981,859 | 297,115 | 4,011,235 | 37,159,204 | ||||||||||||
| Net Assets | $ | 1,225,326,860 | $ | 110,202,466 | $ | 528,186,315 | $ | 1,877,442,488 | ||||||||
| Net Assets Consist of: | ||||||||||||||||
| Paid-in-capital | $ | 1,272,545,747 | $ | 106,776,127 | $ | 586,100,497 | $ | 997,558,557 | ||||||||
| Total distributable earnings (loss) | (47,218,887 | ) | 3,426,339 | (57,914,182 | ) | 879,883,931 | ||||||||||
| Net Assets | $ | 1,225,326,860 | $ | 110,202,466 | $ | 528,186,315 | $ | 1,877,442,488 | ||||||||
| Cost of Investments | $ | 1,163,413,953 | $ | 96,652,919 | $ | 556,981,367 | $ | 1,190,725,395 | ||||||||
| Cost of Foreign Currency | $ | — | $ | — | $ | — | $ | 4,016,853 | ||||||||
| Proceeds Received on Securities Sold Short | $ | — | $ | — | $ | — | $ | 17,596 | ||||||||
| Premiums Received for Options Written | $ | — | $ | — | $ | — | $ | 11,938,872 | ||||||||
| 94 | Annual Report | | June 30, 2020 | | See accompanying Notes to Financial Statements |
Table of Contents
| AllianzGI Mid-Cap Value | AllianzGI Small-Cap | AllianzGI Small-Cap Value | AllianzGI Technology | |||||||||||||
| Net Assets: | ||||||||||||||||
| Class A | $ | 474,970,247 | $ | 58,062,096 | $ | 267,845,503 | $ | 664,832,715 | ||||||||
| Class C | 37,277,595 | 4,251,024 | 1,626,990 | 50,421,047 | ||||||||||||
| Class R | 16,267,522 | — | 14,257,615 | — | ||||||||||||
| Class P | 211,729,606 | 16,747,467 | 21,354,168 | 154,810,529 | ||||||||||||
| Institutional Class | 385,310,686 | 22,027,474 | 99,894,631 | 995,708,789 | ||||||||||||
| Class R6 | 66,260,229 | 9,114,405 | 88,884,624 | — | ||||||||||||
| Administrative Class | 33,510,975 | — | 34,322,784 | 11,669,408 | ||||||||||||
| Shares Issued and Outstanding: | ||||||||||||||||
| Class A | 18,467,141 | 3,307,869 | 24,204,521 | 9,768,706 | ||||||||||||
| Class C | 1,797,460 | 254,562 | 167,093 | 1,154,312 | ||||||||||||
| Class R | 751,435 | — | 1,170,098 | — | ||||||||||||
| Class P | 10,430,658 | 942,762 | 1,646,979 | 1,952,771 | ||||||||||||
| Institutional Class | 13,908,268 | 1,229,150 | 7,609,589 | 12,227,574 | ||||||||||||
| Class R6 | 2,393,725 | 508,427 | 6,829,076 | — | ||||||||||||
| Administrative Class | 1,260,218 | — | 3,113,240 | 157,184 | ||||||||||||
| Net Asset Value and Redemption Price Per Share:* | ||||||||||||||||
| Class A | $ | 25.72 | $ | 17.55 | $ | 11.07 | $ | 68.06 | ||||||||
| Class C | 20.74 | 16.70 | 9.74 | 43.68 | ||||||||||||
| Class R | 21.65 | — | 12.18 | — | ||||||||||||
| Class P | 20.30 | 17.76 | 12.97 | 79.28 | ||||||||||||
| Institutional Class | 27.70 | 17.92 | 13.13 | 81.43 | ||||||||||||
| Class R6 | 27.68 | 17.93 | 13.02 | — | ||||||||||||
| Administrative Class | 26.59 | — | 11.02 | 74.24 | ||||||||||||
| * | Net asset value and redemption price per share may not recalculate exactly due to rounding. |
| See accompanying Notes to Financial Statements | | June 30, 2020 | | Annual Report | 95 |
Table of Contents
Year ended June 30, 2020
| AllianzGI Dividend Value | AllianzGI Emerging Markets Opportunities | AllianzGI Focused Growth | AllianzGI Global Small-Cap | |||||||||||||
| Investment Income: | ||||||||||||||||
| Dividends, net of foreign withholding taxes* | $ | 31,369,621 | $ | 9,705,813 | $ | 8,101,655 | $ | 910,200 | ||||||||
| Interest | 24,344 | 8,004 | 23,019 | 6,610 | ||||||||||||
| Dividends from investments in Affiliates | — | — | — | — | ||||||||||||
| Miscellaneous | — | 9 | — | — | ||||||||||||
Total Investment Income | 31,393,965 | 9,713,826 | 8,124,674 | 916,810 | ||||||||||||
| Expenses: | ||||||||||||||||
| Investment advisory | 5,090,154 | 2,757,096 | 4,558,600 | 850,308 | ||||||||||||
| Administration | 4,151,984 | 1,327,356 | 3,682,043 | 384,355 | ||||||||||||
| Distribution — Class C | 404,115 | 20,546 | 332,079 | 40,677 | ||||||||||||
| Distribution — Class R | 162,945 | — | 50,979 | — | ||||||||||||
| Servicing — Class A | 1,011,873 | 102,990 | 1,429,434 | 100,510 | ||||||||||||
| Servicing — Class C | 134,705 | 6,849 | 110,693 | 13,559 | ||||||||||||
| Servicing — Class R | 162,945 | — | 50,979 | — | ||||||||||||
| Distribution and/or servicing — Administrative Class | 78,720 | — | 11,214 | — | ||||||||||||
| Trustees | 172,880 | 47,977 | 147,248 | 15,378 | ||||||||||||
| Line of credit commitment | 27,683 | 8,005 | 23,425 | 2,386 | ||||||||||||
| Legal | 2,007 | 600 | 1,664 | 230 | ||||||||||||
| Excise tax | — | 34,874 | — | — | ||||||||||||
| Securities sold short | — | — | 205 | — | ||||||||||||
| Miscellaneous | 27,497 | 23,027 | 12,427 | 6,649 | ||||||||||||
Total Expenses | 11,427,508 | 4,329,320 | 10,410,990 | 1,414,052 | ||||||||||||
Less: Investment Advisory/Administration waived | (848,359 | ) | (1,135,275 | ) | (1,127,377 | ) | — | |||||||||
Net Expenses | 10,579,149 | 3,194,045 | 9,283,613 | 1,414,052 | ||||||||||||
| Net Investment Income (Loss) | 20,814,816 | 6,519,781 | (1,158,939 | ) | (497,242 | ) | ||||||||||
| Realized and Change in Unrealized Gain (Loss): | ||||||||||||||||
| Net realized gain (loss) on: | ||||||||||||||||
Investments | 19,126,575 | (28,021,212 | ) | 140,943,698 | 6,096,764 | |||||||||||
Options written | — | — | 250,329 | — | ||||||||||||
Forward foreign currency contracts | — | — | — | 5,502 | ||||||||||||
Foreign currency transactions | (1,757 | ) | (876,519 | ) | — | (16,730 | ) | |||||||||
| Net change in unrealized appreciation/depreciation of: | ||||||||||||||||
Investments | (126,220,018 | ) | 9,548,504 | 83,933,617 | (8,601,868 | ) | ||||||||||
Investments in Affiliates | — | — | — | — | ||||||||||||
Options written | — | — | 538,838 | — | ||||||||||||
Forward foreign currency contracts | — | — | — | (29 | ) | |||||||||||
Foreign currency transactions | (413 | ) | (56,871 | ) | — | 1,700 | ||||||||||
| Net realized and change in unrealized gain (loss) | (107,095,613 | ) | (19,406,098 | ) | 225,666,482 | (2,514,661 | ) | |||||||||
| Net Increase (Decrease) in Net Assets Resulting from Investment Operations | $ | (86,280,797 | ) | $ | (12,886,317 | ) | $ | 224,507,543 | $ | (3,011,903 | ) | |||||
| * Foreign withholding taxes | $ | 206,470 | $ | 1,329,043 | $ | — | $ | 59,815 | ||||||||
| 96 | Annual Report | | June 30, 2020 | | See accompanying Notes to Financial Statements |
Table of Contents
| AllianzGI Health Sciences | AllianzGI Income & Growth | AllianzGI International Value | AllianzGI Large-Cap Value | AllianzGI Mid-Cap | ||||||||||||||||||
| $ | 2,489,698 | $ | 34,942,407 | $ | 5,115,503 | $ | 7,868,850 | $ | 1,525,458 | |||||||||||||
| 9,188 | 101,459,843 | 1,769 | 4,279 | 3,759 | ||||||||||||||||||
| — | 185,880 | — | — | — | ||||||||||||||||||
| — | 233,729 | — | — | — | ||||||||||||||||||
| 2,498,886 | 136,821,859 | 5,117,272 | 7,873,129 | 1,529,217 | ||||||||||||||||||
| 1,235,322 | 30,413,863 | 915,835 | 1,365,936 | 1,499,223 | ||||||||||||||||||
| 612,304 | 16,493,957 | 718,496 | 1,107,945 | 1,225,838 | ||||||||||||||||||
| 29,463 | 9,096,864 | 75,337 | 73,263 | 114,284 | ||||||||||||||||||
| — | 14,324 | 12,920 | 4,592 | 3,311 | ||||||||||||||||||
| 362,825 | 3,833,608 | 158,603 | 420,042 | 600,578 | ||||||||||||||||||
| 9,821 | 3,032,288 | 25,112 | 24,421 | 38,095 | ||||||||||||||||||
| — | 14,324 | 12,920 | 4,592 | 3,311 | ||||||||||||||||||
| — | — | 2,924 | 3,171 | 3,943 | ||||||||||||||||||
| 22,356 | 662,783 | 22,820 | 45,117 | 45,342 | ||||||||||||||||||
| 3,593 | 108,401 | 3,740 | 7,312 | 7,327 | ||||||||||||||||||
| 308 | 7,425 | 319 | 566 | 567 | ||||||||||||||||||
| — | — | — | — | — | ||||||||||||||||||
| — | — | — | — | — | ||||||||||||||||||
| 839 | 54,694 | 5,034 | 3,990 | 4,887 | ||||||||||||||||||
| 2,276,831 | 63,732,531 | 1,954,060 | 3,060,947 | 3,546,706 | ||||||||||||||||||
| — | (522,588 | ) | (114,479 | ) | — | — | ||||||||||||||||
| 2,276,831 | 63,209,943 | 1,839,581 | 3,060,947 | 3,546,706 | ||||||||||||||||||
| 222,055 | 73,611,916 | 3,277,691 | 4,812,182 | (2,017,489 | ) | |||||||||||||||||
| 16,596,962 | 320,906,237 | (19,853,428 | ) | 515,476 | 31,423,998 | |||||||||||||||||
| — | (1,046,363 | ) | — | — | — | |||||||||||||||||
| — | — | — | — | — | ||||||||||||||||||
| (2,511 | ) | — | (61,437 | ) | (102 | ) | (15 | ) | ||||||||||||||
| 2,454,287 | (95,271,456 | ) | 4,990,921 | (18,371,445 | ) | 30,674,691 | ||||||||||||||||
| — | (4,215,722 | ) | — | — | — | |||||||||||||||||
| — | 170,788 | — | — | — | ||||||||||||||||||
| — | — | — | — | — | ||||||||||||||||||
| (221 | ) | — | 6,488 | (54 | ) | — | ||||||||||||||||
| 19,048,517 | 220,543,484 | (14,917,456 | ) | (17,856,125 | ) | 62,098,674 | ||||||||||||||||
| $ | 19,270,572 | $ | 294,155,400 | $ | (11,639,765 | ) | $ | (13,043,943 | ) | $ | 60,081,185 | |||||||||||
| $ | 91,773 | $ | — | $ | 433,328 | $ | 23,029 | $ | 7,651 | |||||||||||||
| See accompanying Notes to Financial Statements | | June 30, 2020 | | Annual Report | 97 |
Table of Contents
Statements of Operations (cont’d)
Year ended June 30, 2020
| AllianzGI Mid-Cap Value | AllianzGI Small-Cap | AllianzGI Small-Cap Value | AllianzGI Technology | |||||||||||||
| Investment Income: | ||||||||||||||||
| Interest | $ | 25,976 | $ | 6,111 | $ | 17,863 | $ | 225,310 | ||||||||
| Dividends, net of foreign withholding taxes* | 30,254,611 | 1,577,919 | 18,856,237 | 6,767,536 | ||||||||||||
| Miscellaneous | — | — | 8,865 | 688 | ||||||||||||
Total Investment Income | 30,280,587 | 1,584,030 | 18,882,965 | 6,993,534 | ||||||||||||
| Expenses: | ||||||||||||||||
| Investment advisory | 7,210,407 | 680,938 | 4,493,561 | 14,222,241 | ||||||||||||
| Administration | 4,650,031 | 414,951 | 2,596,130 | 5,361,073 | ||||||||||||
| Distribution — Class C | 330,428 | 36,371 | 17,493 | 328,953 | ||||||||||||
| Distribution — Class R | 47,764 | — | 46,036 | — | ||||||||||||
| Servicing — Class A | 1,379,273 | 158,098 | 890,476 | 1,451,321 | ||||||||||||
| Servicing — Class C | 110,143 | 12,124 | 5,831 | 109,651 | ||||||||||||
| Servicing — Class R | 47,764 | — | 46,036 | — | ||||||||||||
| Distribution and/or servicing — Administrative Class | 76,705 | — | 184,681 | 26,305 | ||||||||||||
| Legal | 2,197 | 252 | 1,378 | 2,479 | ||||||||||||
| Dividends on securities sold short | — | — | — | 73 | ||||||||||||
| Trustees | 187,874 | 16,209 | 121,761 | 227,460 | ||||||||||||
| Securities sold short | — | — | — | 134,578 | ||||||||||||
| Line of credit commitment | 30,753 | 2,627 | 19,001 | 35,717 | ||||||||||||
| Miscellaneous | 14,670 | 3,011 | 17,203 | 13,912 | ||||||||||||
Total Expenses | 14,088,009 | 1,324,581 | 8,439,587 | 21,913,763 | ||||||||||||
Less: Investment Advisory/Administration waived | (2,884,163 | ) | (113,490 | ) | (748,927 | ) | — | |||||||||
Net Expenses | 11,203,846 | 1,211,091 | 7,690,660 | 21,913,763 | ||||||||||||
| Net Investment Income (Loss) | 19,076,741 | 372,939 | 11,192,305 | (14,920,229 | ) | |||||||||||
| Realized and Change in Unrealized Gain (Loss): | ||||||||||||||||
| Net realized gain (loss) on: | ||||||||||||||||
Investments | (50,733,934 | ) | (8,467,903 | ) | 15,548,650 | 315,313,114 | ||||||||||
Securities sold short | — | — | — | (5,407,154 | ) | |||||||||||
Options written | — | — | — | 3,892,440 | ||||||||||||
Forward foreign currency contracts | — | — | — | 22,540 | ||||||||||||
Foreign currency transactions | (510 | ) | — | 8,005 | (1,016,390 | ) | ||||||||||
| Payments from Affiliates (See Note 11) | — | 706 | — | 32,512 | ||||||||||||
| Net change in unrealized appreciation/depreciation of: | ||||||||||||||||
Investments | (94,080,092 | ) | (2,123,837 | ) | (133,221,874 | ) | 117,675,126 | |||||||||
Securities sold short | — | — | — | (3,575 | ) | |||||||||||
Options written | — | — | — | (1,625,944 | ) | |||||||||||
Foreign currency transactions | (208 | ) | — | (421 | ) | 217,293 | ||||||||||
| Net realized and change in unrealized gain (loss) | (144,814,744 | ) | (10,591,034 | ) | (117,665,640 | ) | 429,099,962 | |||||||||
| Net Increase (Decrease) in Net Assets Resulting from Investment Operations | $ | (125,738,003 | ) | $ | (10,218,095 | ) | $ | (106,473,335 | ) | $ | 414,179,733 | |||||
| *Foreign withholding taxes | $ | 9,044 | $ | 98 | $ | 52,030 | $ | 289,761 | ||||||||
| 98 | Annual Report | | June 30, 2020 | | See accompanying Notes to Financial Statements |
Table of Contents
(THIS PAGE INTENTIONALLY LEFT BLANK)
| See accompanying Notes to Financial Statements | | June 30, 2020 | | Annual Report | 99 |
Table of Contents
Statements of Changes in Net Assets
| AllianzGI Dividend Value | AllianzGI Emerging Markets Opportunities | |||||||||||||||||||
| Year ended June 30, 2020 | Year ended June 30, 2019 | Year ended June 30, 2020 | Year ended June 30, 2019 | |||||||||||||||||
| Increase (Decrease) in Net Assets from: | ||||||||||||||||||||
Investment Operations: | ||||||||||||||||||||
| Net investment income (loss) | $ | 20,814,816 | $ | 34,147,685 | $ | 6,519,781 | $ | 7,163,044 | ||||||||||||
| Net realized gain (loss) | 19,124,818 | 130,028,369 | (28,897,731 | ) | (34,340,091 | ) | ||||||||||||||
| Net change in unrealized appreciation/depreciation | (126,220,431 | ) | (113,531,589 | ) | 9,491,633 | 15,603,950 | ||||||||||||||
Net increase (decrease) in net assets resulting from investment operations | (86,280,797 | ) | 50,644,465 | (12,886,317 | ) | (11,573,097 | ) | |||||||||||||
| Distributions to Shareholders from: | ||||||||||||||||||||
| Distributable earnings: | ||||||||||||||||||||
Class A | (56,080,548 | ) | (103,972,637 | ) | (917,791 | ) | (969,272 | ) | ||||||||||||
Class C | (6,720,695 | ) | (19,705,892 | ) | (32,037 | ) | (15,097 | ) | ||||||||||||
Class R | (8,916,420 | ) | (15,736,853 | ) | — | — | ||||||||||||||
Class P | (43,500,474 | ) | (93,724,314 | ) | (381,714 | ) | (507,886 | ) | ||||||||||||
Institutional Class | (27,828,308 | ) | (71,655,918 | ) | (6,546,761 | ) | (6,130,461 | ) | ||||||||||||
Class R6 | (9,340,811 | ) | (15,698,988 | ) | (582,626 | ) | (591,467 | ) | ||||||||||||
Administrative Class | (4,094,685 | ) | (13,203,454 | ) | — | — | ||||||||||||||
| Total distributions to shareholders | (156,481,941 | ) | (333,698,056 | ) | (8,460,929 | ) | (8,214,183 | ) | ||||||||||||
| Fund Share Transactions: | ||||||||||||||||||||
| Net proceeds from the sale of shares | 140,656,577 | 301,776,596 | 64,881,545 | 169,185,889 | ||||||||||||||||
| Issued in reinvestment of distributions | 137,434,327 | 286,170,219 | 8,039,907 | 7,717,648 | ||||||||||||||||
| Cost of shares redeemed | (546,370,620 | ) | (912,899,785 | ) | (176,406,409 | ) | (146,848,611 | ) | ||||||||||||
| Net increase (decrease) from Fund share transactions | (268,279,716 | ) | (324,952,970 | ) | (103,484,957 | ) | 30,054,926 | |||||||||||||
| Total increase (decrease) in net assets | (511,042,454 | ) | (608,006,561 | ) | (124,832,203 | ) | 10,267,646 | |||||||||||||
| Net Assets: | ||||||||||||||||||||
| Beginning of year | 1,357,243,214 | 1,965,249,775 | 378,359,597 | 368,091,951 | ||||||||||||||||
| End of year | $ | 846,200,760 | $ | 1,357,243,214 | $ | 253,527,394 | $ | 378,359,597 | ||||||||||||
| — | May reflect actual amounts rounding to less than $1. |
| 100 | Annual Report | | June 30, 2020 | | See accompanying Notes to Financial Statements |
Table of Contents
AllianzGI Focused Growth | AllianzGI Global Small-Cap | AllianzGI Health Sciences | ||||||||||||||||||||||||
| Year ended June 30, 2020 | Year ended June 30, 2019 | Year ended June 30, 2020 | Year ended June 30, 2019 | Year ended June 30, 2020 | Year ended June 30, 2019 | |||||||||||||||||||||
| $ | (1,158,939 | ) | $ | (1,139,936 | ) | $ | (497,242 | ) | $ | (321,870 | ) | $ | 222,055 | $ | 56,912 | |||||||||||
| 141,194,027 | 129,030,700 | 6,085,536 | 3,514,942 | 16,594,451 | 18,936,286 | |||||||||||||||||||||
| 84,472,455 | (63,725,778 | ) | (8,600,197 | ) | (15,621,622 | ) | 2,454,066 | (372,630 | ) | |||||||||||||||||
| 224,507,543 | 64,164,986 | (3,011,903 | ) | (12,428,550 | ) | 19,270,572 | 18,620,568 | |||||||||||||||||||
| (71,954,089 | ) | (59,884,650 | ) | (3,176,268 | ) | (9,059,158 | ) | (10,065,053 | ) | (19,287,433 | ) | |||||||||||||||
| (8,748,772 | ) | (8,093,814 | ) | (499,188 | ) | (2,028,346 | ) | (345,656 | ) | (661,505 | ) | |||||||||||||||
| (3,434,752 | ) | (3,051,304 | ) | — | — | — | — | |||||||||||||||||||
| (14,030,851 | ) | (14,260,002 | ) | (646,423 | ) | (2,305,369 | ) | — | — | |||||||||||||||||
| (20,050,942 | ) | (18,778,168 | ) | (3,167,395 | ) | (13,171,798 | ) | (313,756 | ) | (324,420 | ) | |||||||||||||||
| (18,688,902 | ) | (13,248,091 | ) | — | — | — | — | |||||||||||||||||||
| (695,736 | ) | (568,572 | ) | — | — | — | — | |||||||||||||||||||
| (137,604,044 | ) | (117,884,601 | ) | (7,489,274 | ) | (26,564,671 | ) | (10,724,465 | ) | (20,273,358 | ) | |||||||||||||||
| 138,942,551 | 332,235,487 | 4,601,862 | 22,603,210 | 13,767,000 | 12,144,594 | |||||||||||||||||||||
| 123,886,800 | 105,500,697 | 6,996,507 | 24,879,822 | 10,356,965 | 19,582,484 | |||||||||||||||||||||
| (314,763,479 | ) | (426,260,678 | ) | (60,435,140 | ) | (68,042,255 | ) | (24,532,379 | ) | (26,779,664 | ) | |||||||||||||||
| (51,934,128 | ) | 11,475,506 | (48,836,771 | ) | (20,559,223 | ) | (408,414 | ) | 4,947,414 | |||||||||||||||||
| 34,969,371 | (42,244,109 | ) | (59,337,948 | ) | (59,552,444 | ) | 8,137,693 | 3,294,624 | ||||||||||||||||||
| 1,041,383,789 | 1,083,627,898 | 133,891,807 | 193,444,251 | 155,488,567 | 152,193,943 | |||||||||||||||||||||
| $ | 1,076,353,160 | $ | 1,041,383,789 | $ | 74,553,859 | $ | 133,891,807 | $ | 163,626,260 | $ | 155,488,567 | |||||||||||||||
| See accompanying Notes to Financial Statements | | June 30, 2020 | | Annual Report | 101 |
Table of Contents
Statements of Changes in Net Assets (cont’d)
| AllianzGI Income & Growth | AllianzGI International Value | |||||||||||||||||||
| Year ended June 30, 2020 | Year ended June 30, 2019 | Year ended June 30, 2020 | Year ended June 30, 2019 | |||||||||||||||||
| Increase (Decrease) in Net Assets from: | ||||||||||||||||||||
Investment Operations: | ||||||||||||||||||||
| Net investment income (loss) | $ | 73,611,916 | $ | 71,178,883 | $ | 3,277,691 | $ | 4,017,249 | ||||||||||||
| Net realized gain (loss) | 319,859,874 | 240,336,412 | (19,914,865 | ) | 6,397,576 | |||||||||||||||
| Net change in unrealized appreciation/depreciation | (99,316,390 | ) | (99,581,375 | ) | 4,997,409 | (12,701,695 | ) | |||||||||||||
Net increase (decrease) in net assets resulting from investment operations | 294,155,400 | 211,933,920 | (11,639,765 | ) | (2,286,870 | ) | ||||||||||||||
| Distributions to Shareholders from: | ||||||||||||||||||||
| Distributable earnings: | ||||||||||||||||||||
Class A | (119,931,728 | ) | (110,411,831 | ) | (1,405,157 | ) | (1,240,282 | ) | ||||||||||||
Class C | (95,475,297 | ) | (96,161,658 | ) | (148,309 | ) | (150,145 | ) | ||||||||||||
Class R | (430,317 | ) | (343,496 | ) | (100,179 | ) | (92,441 | ) | ||||||||||||
Class P | (91,904,739 | ) | (84,862,532 | ) | (709,355 | ) | (886,735 | ) | ||||||||||||
Institutional Class | (59,262,556 | ) | (47,989,045 | ) | (1,056,165 | ) | (914,475 | ) | ||||||||||||
Class R6 | — | — | (32,599 | ) | (28,658 | ) | ||||||||||||||
Administrative Class | — | — | (27,201 | ) | (40,736 | ) | ||||||||||||||
| Total distributions to shareholders | (367,004,637 | ) | (339,768,562 | ) | (3,478,965 | ) | (3,353,472 | ) | ||||||||||||
| Fund Share Transactions: | ||||||||||||||||||||
| Net proceeds from the sale of shares | 1,479,074,103 | 1,709,498,560 | 17,583,522 | 37,499,896 | ||||||||||||||||
| Issued in reinvestment of distributions | 331,618,076 | 303,320,720 | 3,176,764 | 2,985,084 | ||||||||||||||||
| Cost of shares redeemed | (1,356,266,581 | ) | (1,090,296,297 | ) | (55,982,371 | ) | (141,030,657 | ) | ||||||||||||
| Net increase (decrease) from Fund share transactions | 454,425,598 | 922,522,983 | (35,222,085 | ) | (100,545,677 | ) | ||||||||||||||
| Total increase (decrease) in net assets | 381,576,361 | 794,688,341 | (50,340,815 | ) | (106,186,019 | ) | ||||||||||||||
| Net Assets: | ||||||||||||||||||||
| Beginning of year | 4,523,005,554 | 3,728,317,213 | 179,805,569 | 285,991,588 | ||||||||||||||||
| End of year | $ | 4,904,581,915 | $ | 4,523,005,554 | $ | 129,464,754 | $ | 179,805,569 | ||||||||||||
| — | May reflect actual amounts rounding to less than $1. |
| 102 | Annual Report | | June 30, 2020 | | See accompanying Notes to Financial Statements |
Table of Contents
AllianzGI Large-Cap Value | AllianzGI Mid-Cap | AllianzGI Mid-Cap Value | ||||||||||||||||||||||||
| Year ended June 30, 2020 | Year ended June 30, 2019 | Year ended June 30, 2020 | Year ended June 30, 2019 | Year ended June 30, 2020 | Year ended June 30, 2019 | |||||||||||||||||||||
| $ | 4,812,182 | $ | 5,744,563 | $ | (2,017,489 | ) | $ | (2,168,597 | ) | $ | 19,076,741 | $ | 19,748,593 | |||||||||||||
| 515,374 | (5,989,507 | ) | 31,423,983 | 7,637,737 | (50,734,444 | ) | 34,862,826 | |||||||||||||||||||
| (18,371,499 | ) | 17,171,832 | 30,674,691 | 31,311,937 | (94,080,300 | ) | (9,947,114 | ) | ||||||||||||||||||
| (13,043,943 | ) | 16,926,888 | 60,081,185 | 36,781,077 | (125,738,003 | ) | 44,664,305 | |||||||||||||||||||
| (5,831,151 | ) | (2,878,118 | ) | (11,314,973 | ) | (27,816,569 | ) | (47,357,050 | ) | (8,958,098 | ) | |||||||||||||||
| (249,261 | ) | (156,046 | ) | (890,197 | ) | (3,319,825 | ) | (4,329,388 | ) | (259,371 | ) | |||||||||||||||
| (58,717 | ) | (37,054 | ) | (62,933 | ) | (183,135 | ) | (1,914,476 | ) | (286,719 | ) | |||||||||||||||
| (654,862 | ) | (361,691 | ) | (486,183 | ) | (1,150,131 | ) | (21,721,615 | ) | (3,913,377 | ) | |||||||||||||||
| (3,758,206 | ) | (2,637,372 | ) | (2,171,232 | ) | (3,438,770 | ) | (33,543,054 | ) | (6,182,427 | ) | |||||||||||||||
| — | — | — | — | (5,444,939 | ) | (220,071 | ) | |||||||||||||||||||
| (44,392 | ) | (22,170 | ) | (70,695 | ) | (163,523 | ) | (2,689,085 | ) | (393,619 | ) | |||||||||||||||
| (10,596,589 | ) | (6,092,451 | ) | (14,996,213 | ) | (36,071,953 | ) | (116,999,607 | ) | (20,213,682 | ) | |||||||||||||||
| 68,570,284 | 74,280,028 | 55,585,635 | 147,501,131 | 432,993,516 | 552,773,876 | |||||||||||||||||||||
| 9,937,244 | 5,653,505 | 13,532,766 | 32,092,605 | 104,673,910 | 18,064,016 | |||||||||||||||||||||
| (132,376,371 | ) | (107,300,262 | ) | (75,600,574 | ) | (173,708,354 | ) | (382,404,116 | ) | (551,921,766 | ) | |||||||||||||||
| (53,868,843 | ) | (27,366,729 | ) | (6,482,173 | ) | 5,885,382 | 155,263,310 | 18,916,126 | ||||||||||||||||||
| (77,509,375 | ) | (16,532,292 | ) | 38,602,799 | 6,594,506 | (87,474,300 | ) | 43,366,749 | ||||||||||||||||||
| (77,509,375) | (16,532,292) | 38,602,799 | 6,594,506 | (87,474,300) | 43,366,749 | |||||||||||||||||||||
| 345,530,735 | 362,063,027 | 312,167,423 | 305,572,917 | 1,312,801,160 | 1,269,434,411 | |||||||||||||||||||||
| $ | 268,021,360 | $ | 345,530,735 | $ | 350,770,222 | $ | 312,167,423 | $ | 1,225,326,860 | $ | 1,312,801,160 | |||||||||||||||
| See accompanying Notes to Financial Statements | | June 30, 2020 | | Annual Report | 103 |
Table of Contents
Statements of Changes in Net Assets (cont’d)
| AllianzGI Small-Cap | AllianzGI Small-Cap Value | |||||||||||||||||||
| Year ended June 30, 2020 | Year ended June 30, 2019 | Year ended June 30, 2020 | Year ended June 30, 2019 | |||||||||||||||||
| Increase (Decrease) in Net Assets from: | ||||||||||||||||||||
Investment Operations: | ||||||||||||||||||||
| Net investment income (loss) | $ | 372,939 | $ | 299,803 | $ | 11,192,305 | $ | 28,314,977 | ||||||||||||
| Net realized gain (loss) | (8,467,197 | ) | (971,773 | ) | 15,556,655 | 52,161,420 | ||||||||||||||
| Net change in unrealized appreciation/depreciation | (2,123,837 | ) | (85,006 | ) | (133,222,295 | ) | (252,683,722 | ) | ||||||||||||
Net increase (decrease) in net assets resulting from investment operations | (10,218,095 | ) | (756,976 | ) | (106,473,335 | ) | (172,207,325 | ) | ||||||||||||
| Distributions to Shareholders from: | ||||||||||||||||||||
| Distributable earnings: | ||||||||||||||||||||
Class A | (36,355 | ) | (5,374,154 | ) | (34,922,642 | ) | (125,664,406 | ) | ||||||||||||
Class C | (2 | ) | (708,974 | ) | (223,274 | ) | (3,447,097 | ) | ||||||||||||
Class R | — | — | (1,588,320 | ) | (6,171,694 | ) | ||||||||||||||
Class P | (54,723 | ) | (673,909 | ) | (2,577,066 | ) | (11,101,354 | ) | ||||||||||||
Institutional Class | (51,869 | ) | (553,729 | ) | (11,170,094 | ) | (94,888,377 | ) | ||||||||||||
Class R6 | (96,048 | ) | (43,874 | ) | (10,202,555 | ) | (46,791,068 | ) | ||||||||||||
Administrative Class | — | — | (9,276,658 | ) | (34,340,757 | ) | ||||||||||||||
| Total distributions to shareholders | (238,997 | ) | (7,354,640 | ) | (69,960,609 | ) | (322,404,753 | ) | ||||||||||||
| Fund Share Transactions: | ||||||||||||||||||||
| Net proceeds from the sale of shares | 58,465,117 | 64,704,067 | 79,233,991 | 283,770,753 | ||||||||||||||||
| Issued in reinvestment of distributions | 234,792 | 6,805,302 | 64,678,073 | 294,059,205 | ||||||||||||||||
| Cost of shares redeemed | (48,688,186 | ) | (47,676,925 | ) | (490,909,819 | ) | (1,291,552,009 | ) | ||||||||||||
| Net increase (decrease) from Fund share transactions | 10,011,723 | 23,832,444 | (346,997,755 | ) | (713,722,051 | ) | ||||||||||||||
| Total increase (decrease) in net assets | (445,369 | ) | 15,720,828 | (523,431,699 | ) | (1,208,334,129 | ) | |||||||||||||
| Net Assets: | ||||||||||||||||||||
| Beginning of year | 110,647,835 | 94,927,007 | 1,051,618,014 | 2,259,952,143 | ||||||||||||||||
| End of year | $ | 110,202,466 | $ | 110,647,835 | $ | 528,186,315 | $ | 1,051,618,014 | ||||||||||||
| — | May reflect actual amounts rounding to less than $1. |
| 104 | Annual Report | | June 30, 2020 | | See accompanying Notes to Financial Statements |
Table of Contents
| AllianzGI Technology | ||||||||||
| Year ended June 30, 2020 | Year ended June 30, 2019 | |||||||||
| $ | (14,920,229 | ) | $ | (14,093,871 | ) | |||||
| 312,837,062 | 180,784,054 | |||||||||
| 116,262,900 | 14,943,453 | |||||||||
| 414,179,733 | 181,633,636 | |||||||||
| (99,021,129 | ) | (103,779,572 | ) | |||||||
| (10,444,134 | ) | (11,594,326 | ) | |||||||
| — | — | |||||||||
| (20,909,955 | ) | (21,155,444 | ) | |||||||
| (115,521,538 | ) | (126,878,404 | ) | |||||||
| — | — | |||||||||
| (1,647,783 | ) | (3,019,512 | ) | |||||||
| (247,544,539 | ) | (266,427,258 | ) | |||||||
| 382,937,947 | 528,506,555 | |||||||||
| 236,616,587 | 252,764,407 | |||||||||
| (526,003,444 | ) | (661,953,777 | ) | |||||||
| 93,551,090 | 119,317,185 | |||||||||
| 260,186,284 | 34,523,563 | |||||||||
| 260,186,284 | 34,523,563 | |||||||||
| 1,617,256,204 | 1,582,732,641 | |||||||||
| $ | 1,877,442,488 | $ | 1,617,256,204 | |||||||
| See accompanying Notes to Financial Statements | | June 30, 2020 | | Annual Report | 105 |
Table of Contents
For a Share Outstanding for the Year ended:^
| Net Asset Value, Beginning of Year | Net Investment Income (a) | Net Realized | Total from Investment Operations | Dividends from Net Investment Income | Distributions from Net Realized Capital Gains | |||||||||||||||||||||||
| AllianzGI Dividend Value: | ||||||||||||||||||||||||||||
| Class A | ||||||||||||||||||||||||||||
6/30/2020 | $ | 12.11 | $ | 0.19 | $ | (1.01 | ) | $ | (0.82 | ) | $ | (0.20 | ) | $ | (1.42 | ) | ||||||||||||
6/30/2019 | 14.76 | 0.26 | (0.05 | ) | 0.21 | (0.26 | ) | (2.60 | ) | |||||||||||||||||||
6/30/2018 | 17.20 | 0.27 | 1.45 | 1.72 | (0.28 | ) | (3.88 | ) | ||||||||||||||||||||
6/30/2017 | 15.74 | 0.34 | 2.08 | 2.42 | (0.37 | ) | (0.59 | ) | ||||||||||||||||||||
6/30/2016 | 16.68 | 0.37 | (0.92 | ) | (0.55 | ) | (0.39 | ) | — | |||||||||||||||||||
| Class C | ||||||||||||||||||||||||||||
6/30/2020 | $ | 12.32 | $ | 0.11 | $ | (1.02 | ) | $ | (0.91 | ) | $ | (0.11 | ) | $ | (1.42 | ) | ||||||||||||
6/30/2019 | 14.92 | 0.17 | (0.05 | ) | 0.12 | (0.12 | ) | (2.60 | ) | |||||||||||||||||||
6/30/2018 | 17.34 | 0.15 | 1.46 | 1.61 | (0.15 | ) | (3.88 | ) | ||||||||||||||||||||
6/30/2017 | 15.86 | 0.21 | 2.10 | 2.31 | (0.24 | ) | (0.59 | ) | ||||||||||||||||||||
6/30/2016 | 16.83 | 0.25 | (0.93 | ) | (0.68 | ) | (0.29 | ) | — | |||||||||||||||||||
| Class R | ||||||||||||||||||||||||||||
6/30/2020 | $ | 12.10 | $ | 0.17 | $ | (1.01 | ) | $ | (0.84 | ) | $ | (0.17 | ) | $ | (1.42 | ) | ||||||||||||
6/30/2019 | 14.71 | 0.23 | (0.05 | ) | 0.18 | (0.19 | ) | (2.60 | ) | |||||||||||||||||||
6/30/2018 | 17.15 | 0.23 | 1.45 | 1.68 | (0.24 | ) | (3.88 | ) | ||||||||||||||||||||
6/30/2017 | 15.70 | 0.29 | 2.08 | 2.37 | (0.33 | ) | (0.59 | ) | ||||||||||||||||||||
6/30/2016 | 16.65 | 0.33 | (0.92 | ) | (0.59 | ) | (0.36 | ) | — | |||||||||||||||||||
| Class P | ||||||||||||||||||||||||||||
6/30/2020 | $ | 12.21 | $ | 0.23 | $ | (1.02 | ) | $ | (0.79 | ) | $ | (0.23 | ) | $ | (1.42 | ) | ||||||||||||
6/30/2019 | 14.87 | 0.30 | (0.05 | ) | 0.25 | (0.31 | ) | (2.60 | ) | |||||||||||||||||||
6/30/2018 | 17.30 | 0.32 | 1.45 | 1.77 | (0.32 | ) | (3.88 | ) | ||||||||||||||||||||
6/30/2017 | 15.83 | 0.38 | 2.09 | 2.47 | (0.41 | ) | (0.59 | ) | ||||||||||||||||||||
6/30/2016 | 16.77 | 0.41 | (0.93 | ) | (0.52 | ) | (0.42 | ) | — | |||||||||||||||||||
| Institutional Class | ||||||||||||||||||||||||||||
6/30/2020 | $ | 12.20 | $ | 0.24 | $ | (1.03 | ) | $ | (0.79 | ) | $ | (0.24 | ) | $ | (1.42 | ) | ||||||||||||
6/30/2019 | 14.87 | 0.31 | (0.05 | ) | 0.26 | (0.33 | ) | (2.60 | ) | |||||||||||||||||||
6/30/2018 | 17.30 | 0.34 | 1.45 | 1.79 | (0.34 | ) | (3.88 | ) | ||||||||||||||||||||
6/30/2017 | 15.82 | 0.41 | 2.08 | 2.49 | (0.42 | ) | (0.59 | ) | ||||||||||||||||||||
6/30/2016 | 16.76 | 0.42 | (0.93 | ) | (0.51 | ) | (0.43 | ) | — | |||||||||||||||||||
| Class R6 | ||||||||||||||||||||||||||||
6/30/2020 | $ | 12.15 | $ | 0.24 | $ | (1.02 | ) | $ | (0.78 | ) | $ | (0.24 | ) | $ | (1.42 | ) | ||||||||||||
6/30/2019 | 14.83 | 0.31 | (0.04 | ) | 0.27 | (0.35 | ) | (2.60 | ) | |||||||||||||||||||
6/30/2018 | 17.27 | 0.34 | 1.45 | 1.79 | (0.35 | ) | (3.88 | ) | ||||||||||||||||||||
6/30/2017 | 15.80 | 0.41 | 2.09 | 2.50 | (0.44 | ) | (0.59 | ) | ||||||||||||||||||||
6/30/2016 | 16.74 | 0.42 | (0.92 | ) | (0.50 | ) | (0.44 | ) | — | |||||||||||||||||||
| Administrative Class | ||||||||||||||||||||||||||||
6/30/2020 | $ | 12.41 | $ | 0.21 | $ | (1.03 | ) | $ | (0.82 | ) | $ | (0.21 | ) | $ | (1.42 | ) | ||||||||||||
6/30/2019 | 15.04 | 0.28 | (0.05 | ) | 0.23 | (0.26 | ) | (2.60 | ) | |||||||||||||||||||
6/30/2018 | 17.41 | 0.32 | 1.43 | 1.75 | (0.24 | ) | (3.88 | ) | ||||||||||||||||||||
6/30/2017 | 15.92 | 0.36 | 2.11 | 2.47 | (0.39 | ) | (0.59 | ) | ||||||||||||||||||||
6/30/2016 | 16.87 | 0.39 | (0.94 | ) | (0.55 | ) | (0.40 | ) | — | |||||||||||||||||||
| ^ | A “—” may reflect actual amounts rounding to less than $0.01 or 0.01%. |
| (a) | Calculated on average shares outstanding during the year. |
| (b) | Total return is calculated assuming a purchase of a share on the first day of the year and a sale of a share on the last day of each year reported. Dividends and distributions, if any, are assumed, for purposes of this calculation, to be reinvested. Total return does not reflect sales charges and includes the effect of fee waivers and reimbursements. Total return may reflect adjustments to conform to U.S. GAAP. |
| 106 | Annual Report | | June 30, 2020 | | See accompanying Notes to Financial Statements |
Table of Contents
| Total Dividends and Distributions | Net Asset Value, End of Year | Total Return (b) | Net Assets, End of Year (000s) | Ratio of Expenses to Average Net Assets with Fee Waiver/ Reimbursement | Ratio of Expenses to Average Net Assets without Fee Waiver/ Reimbursement | Ratio of Net Investment Income to Average Net Assets | Portfolio Turnover Rate | |||||||||||||||||||||||||||
| $ | (1.62 | ) | $ | 9.67 | (8.54 | )% | $ | 329,828 | 1.04 | % | 1.12 | % | 1.74 | % | 139 | % | ||||||||||||||||||
| (2.86 | ) | 12.11 | 4.39 | 453,255 | 1.01 | 1.11 | 1.97 | 52 | ||||||||||||||||||||||||||
| (4.16 | ) | 14.76 | 9.55 | 480,068 | 0.95 | 1.10 | 1.66 | 47 | ||||||||||||||||||||||||||
| (0.96 | ) | 17.20 | 15.55 | 599,510 | 0.99 | 1.09 | 2.02 | 41 | ||||||||||||||||||||||||||
| (0.39 | ) | 15.74 | (3.25 | ) | 814,993 | 1.07 | 1.07 | 2.34 | 42 | |||||||||||||||||||||||||
| $ | (1.53 | ) | $ | 9.88 | (9.17 | )% | $ | 38,900 | 1.79 | % | 1.87 | % | 0.98 | % | 139 | % | ||||||||||||||||||
| (2.72 | ) | 12.32 | 3.56 | 75,395 | 1.76 | 1.86 | 1.23 | 52 | ||||||||||||||||||||||||||
| (4.03 | ) | 14.92 | 8.77 | 231,933 | 1.70 | 1.85 | 0.91 | 47 | ||||||||||||||||||||||||||
| (0.83 | ) | 17.34 | 14.67 | 274,212 | 1.74 | 1.84 | 1.28 | 41 | ||||||||||||||||||||||||||
| (0.29 | ) | 15.86 | (3.97 | ) | 347,825 | 1.82 | 1.82 | 1.59 | 42 | |||||||||||||||||||||||||
| $ | (1.59 | ) | $ | 9.67 | (8.70 | )% | $ | 52,184 | 1.29 | % | 1.37 | % | 1.49 | % | 139 | % | ||||||||||||||||||
| (2.79 | ) | 12.10 | 4.07 | 73,610 | 1.26 | 1.36 | 1.72 | 52 | ||||||||||||||||||||||||||
| (4.12 | ) | 14.71 | 9.30 | 94,437 | 1.20 | 1.35 | 1.41 | 47 | ||||||||||||||||||||||||||
| (0.92 | ) | 17.15 | 15.24 | 130,630 | 1.24 | 1.34 | 1.77 | 41 | ||||||||||||||||||||||||||
| (0.36 | ) | 15.70 | (3.50 | ) | 157,199 | 1.32 | 1.32 | 2.09 | 42 | |||||||||||||||||||||||||
| $ | (1.65 | ) | $ | 9.77 | (8.23 | )% | $ | 221,250 | 0.79 | % | 0.87 | % | 1.98 | % | 139 | % | ||||||||||||||||||
| (2.91 | ) | 12.21 | 4.62 | 378,642 | 0.76 | 0.86 | 2.22 | 52 | ||||||||||||||||||||||||||
| (4.20 | ) | 14.87 | 9.83 | 551,096 | 0.70 | 0.85 | 1.91 | 47 | ||||||||||||||||||||||||||
| (1.00 | ) | 17.30 | 15.79 | 639,847 | 0.74 | 0.84 | 2.27 | 41 | ||||||||||||||||||||||||||
| (0.42 | ) | 15.83 | (3.03 | ) | 1,057,863 | 0.82 | 0.82 | 2.60 | 42 | |||||||||||||||||||||||||
| $ | (1.66 | ) | $ | 9.75 | (8.24 | )% | $ | 117,755 | 0.69 | % | 0.77 | % | 2.07 | % | 139 | % | ||||||||||||||||||
| (2.93 | ) | 12.20 | 4.75 | 263,357 | 0.66 | 0.76 | 2.32 | 52 | ||||||||||||||||||||||||||
| (4.22 | ) | 14.87 | 9.94 | 438,422 | 0.60 | 0.75 | 2.03 | 47 | ||||||||||||||||||||||||||
| (1.01 | ) | 17.30 | 15.96 | 731,788 | 0.64 | 0.74 | 2.44 | 41 | ||||||||||||||||||||||||||
| (0.43 | ) | 15.82 | (2.95 | ) | 2,233,140 | 0.72 | 0.72 | 2.69 | 42 | |||||||||||||||||||||||||
| $ | (1.66 | ) | $ | 9.71 | (8.12 | )% | $ | 60,490 | 0.64 | % | 0.72 | % | 2.15 | % | 139 | % | ||||||||||||||||||
| (2.95 | ) | 12.15 | 4.82 | 65,935 | 0.61 | 0.71 | 2.38 | 52 | ||||||||||||||||||||||||||
| (4.23 | ) | 14.83 | 9.96 | 85,285 | 0.55 | 0.70 | 2.06 | 47 | ||||||||||||||||||||||||||
| (1.03 | ) | 17.27 | 16.01 | 95,755 | 0.59 | 0.69 | 2.44 | 41 | ||||||||||||||||||||||||||
| (0.44 | ) | 15.80 | (2.90 | ) | 128,994 | 0.67 | 0.67 | 2.72 | 42 | |||||||||||||||||||||||||
| $ | (1.63 | ) | $ | 9.96 | (8.33 | )% | $ | 25,794 | 0.94 | % | 1.02 | % | 1.84 | % | 139 | % | ||||||||||||||||||
| (2.86 | ) | 12.41 | 4.42 | 47,049 | 0.91 | 1.01 | 2.07 | 52 | ||||||||||||||||||||||||||
| (4.12 | ) | 15.04 | 9.67 | 84,009 | 0.85 | 1.00 | 1.87 | 47 | ||||||||||||||||||||||||||
| (0.98 | ) | 17.41 | 15.68 | 345,533 | 0.89 | 0.99 | 2.11 | 41 | ||||||||||||||||||||||||||
| (0.40 | ) | 15.92 | (3.19 | ) | 387,993 | 0.97 | 0.97 | 2.44 | 42 | |||||||||||||||||||||||||
| See accompanying Notes to Financial Statements | | June 30, 2020 | | Annual Report | 107 |
Table of Contents
Financial Highlights (cont’d)
For a Share Outstanding for the Period ended:^
Beginning | Net Investment Income (a) | Net Realized and Change in Unrealized Gain (Loss) | Total from Investment Operations | Dividends from Net Investment Income | Net Asset Value, End of Period | |||||||||||||||||||||||
| AllianzGI Emerging Markets Opportunities: | ||||||||||||||||||||||||||||
| Class A | ||||||||||||||||||||||||||||
6/30/2020 | $ | 27.06 | $ | 0.46 | $ | (1.08 | ) | $ | (0.62 | ) | $ | (0.56 | ) | $ | 25.88 | |||||||||||||
6/30/2019 | 28.53 | 0.56 | (1.55 | ) | (0.99 | ) | (0.48 | ) | 27.06 | |||||||||||||||||||
6/30/2018 | 26.59 | 0.41 | 1.85 | 2.26 | (0.32 | ) | 28.53 | |||||||||||||||||||||
6/30/2017 | 22.60 | 0.41 | 3.98 | 4.39 | (0.40 | ) | 26.59 | |||||||||||||||||||||
6/30/2016 | 25.90 | 0.34 | (3.39 | ) | (3.05 | ) | (0.25 | ) | 22.60 | |||||||||||||||||||
| Class C | ||||||||||||||||||||||||||||
6/30/2020 | $ | 26.81 | $ | 0.28 | $ | (1.10 | ) | $ | (0.82 | ) | $ | (0.30 | ) | $ | 25.69 | |||||||||||||
6/30/2019 | 28.05 | 0.31 | (1.45 | ) | (1.14 | ) | (0.10 | ) | 26.81 | |||||||||||||||||||
6/30/2018 | 26.13 | 0.16 | 1.84 | 2.00 | (0.08 | ) | 28.05 | |||||||||||||||||||||
6/30/2017 | 22.09 | 0.19 | 3.96 | 4.15 | (0.11 | ) | 26.13 | |||||||||||||||||||||
6/30/2016 | 25.21 | 0.22 | (3.34 | ) | (3.12 | ) | — | 22.09 | ||||||||||||||||||||
| Class P | ||||||||||||||||||||||||||||
6/30/2020 | $ | 26.46 | $ | 0.53 | $ | (1.06 | ) | $ | (0.53 | ) | $ | (0.63 | ) | $ | 25.30 | |||||||||||||
6/30/2019 | 28.02 | 0.55 | (1.47 | ) | (0.92 | ) | (0.64 | ) | 26.46 | |||||||||||||||||||
6/30/2018 | 26.17 | 0.46 | 1.84 | 2.30 | (0.45 | ) | 28.02 | |||||||||||||||||||||
6/30/2017 | 22.23 | 0.44 | 3.94 | 4.38 | (0.44 | ) | 26.17 | |||||||||||||||||||||
6/30/2016 | 25.44 | 0.46 | (3.40 | ) | (2.94 | ) | (0.27 | ) | 22.23 | |||||||||||||||||||
| Institutional Class | ||||||||||||||||||||||||||||
6/30/2020 | $ | 27.10 | $ | 0.54 | $ | (1.06 | ) | $ | (0.52 | ) | $ | (0.67 | ) | $ | 25.91 | |||||||||||||
6/30/2019 | 28.72 | 0.54 | (1.47 | ) | (0.93 | ) | (0.69 | ) | 27.10 | |||||||||||||||||||
6/30/2018 | 26.83 | 0.53 | 1.85 | 2.38 | (0.49 | ) | 28.72 | |||||||||||||||||||||
6/30/2017 | 22.74 | 0.49 | 4.03 | 4.52 | (0.43 | ) | 26.83 | |||||||||||||||||||||
6/30/2016 | 25.95 | 0.44 | (3.42 | ) | (2.98 | ) | (0.23 | ) | 22.74 | |||||||||||||||||||
| Class R6 | ||||||||||||||||||||||||||||
6/30/2020 | $ | 26.96 | $ | 0.54 | $ | (1.03 | ) | $ | (0.49 | ) | $ | (0.69 | ) | $ | 25.78 | |||||||||||||
6/30/2019 | 28.57 | 0.57 | (1.48 | ) | (0.91 | ) | (0.70 | ) | 26.96 | |||||||||||||||||||
6/30/2018 | 26.69 | 0.62 | 1.76 | 2.38 | (0.50 | ) | 28.57 | |||||||||||||||||||||
6/30/2017 | 22.69 | 0.60 | 3.90 | 4.50 | (0.50 | ) | 26.69 | |||||||||||||||||||||
12/14/2015* - 6/30/2016 | 21.21 | 0.31 | 1.47 | 1.78 | (0.30 | ) | 22.69 | |||||||||||||||||||||
| ^ | A “—” may reflect actual amounts rounding to less than $0.01 or 0.01%. |
| * | Commencement of operations. |
| (a) | Calculated on average shares outstanding during the period. |
| (b) | Total return is calculated assuming a purchase of a share on the first day of the period and a sale of a share on the last day of each period reported. Dividends and distributions, if any, are assumed, for purposes of this calculation, to be reinvested. Total return does not reflect sales charges and includes the effect of fee waivers and reimbursements. Total return may reflect adjustments to conform to U.S. GAAP. Total return for a period of less than one year is not annualized. |
| (c) | Annualized, unless otherwise noted. |
| 108 | Annual Report | | June 30, 2020 | | See accompanying Notes to Financial Statements |
Table of Contents
| Total Return (b) | Net Assets, End of Period (000s) | Ratio of Expenses to Average Net Assets with Fee Waiver/ Reimbursement | Ratio of Expenses to Average Net Assets without Fee Waiver/ Reimbursement | Ratio of Net Investment Income to Average Net Assets | Portfolio Turnover Rate | |||||||||||||||||||||
| (2.45 | )% | $ | 32,514 | 1.28 | % | 1.63 | % | 1.75 | % | 83 | % | |||||||||||||||
| (3.29 | ) | 48,388 | 1.26 | 1.61 | 2.08 | 101 | ||||||||||||||||||||
| 8.44 | 108,279 | 1.26 | 1.61 | 1.36 | 88 | |||||||||||||||||||||
| 19.76 | 154,357 | 1.42 | 1.62 | 1.69 | 155 | |||||||||||||||||||||
| (11.73 | ) | 143,677 | 1.48 | 1.62 | 1.59 | 85 | ||||||||||||||||||||
| (3.16 | )% | $ | 2,022 | 2.03 | % | 2.38 | % | 1.08 | % | 83 | % | |||||||||||||||
| (4.05 | ) | 3,675 | 2.01 | 2.36 | 1.15 | 101 | ||||||||||||||||||||
| 7.63 | 8,113 | 2.01 | 2.36 | 0.55 | 88 | |||||||||||||||||||||
| 18.91 | 8,982 | 2.17 | 2.37 | 0.80 | 155 | |||||||||||||||||||||
| (12.38 | ) | 11,862 | 2.27 | 2.37 | 1.02 | 85 | ||||||||||||||||||||
| (2.19 | )% | $ | 12,814 | 1.03 | % | 1.38 | % | 2.07 | % | 83 | % | |||||||||||||||
| (3.05 | ) | 20,454 | 1.01 | 1.36 | 2.08 | 101 | ||||||||||||||||||||
| 8.71 | 29,887 | 1.01 | 1.36 | 1.55 | 88 | |||||||||||||||||||||
| 20.11 | 21,586 | 1.17 | 1.37 | 1.86 | 155 | |||||||||||||||||||||
| (11.51 | ) | 20,262 | 1.26 | 1.37 | 2.11 | 85 | ||||||||||||||||||||
| (2.11 | )% | $ | 186,595 | 0.93 | % | 1.28 | % | 2.05 | % | 83 | % | |||||||||||||||
| (2.97 | ) | 282,196 | 0.91 | 1.26 | 2.03 | 101 | ||||||||||||||||||||
| 8.79 | 197,536 | 0.91 | 1.26 | 1.74 | 88 | |||||||||||||||||||||
| 20.26 | 72,688 | 1.07 | 1.27 | 2.02 | 155 | |||||||||||||||||||||
| (11.41 | ) | 64,785 | 1.17 | 1.27 | 2.00 | 85 | ||||||||||||||||||||
| (2.04 | )% | $ | 19,582 | 0.88 | % | 1.23 | % | 2.10 | % | 83 | % | |||||||||||||||
| (2.93 | ) | 23,647 | 0.86 | 1.21 | 2.13 | 101 | ||||||||||||||||||||
| 8.85 | 24,277 | 0.86 | 1.21 | 2.03 | 88 | |||||||||||||||||||||
| 20.27 | 692 | 1.02 | 1.22 | 2.46 | 155 | |||||||||||||||||||||
| 8.46 | 21 | 1.07 | (c) | 1.22 | (c) | 2.63 | (c) | 85 | ||||||||||||||||||
| See accompanying Notes to Financial Statements | | June 30, 2020 | | Annual Report | 109 |
Table of Contents
Financial Highlights (cont’d)
For a Share Outstanding for the Period ended:^
| Net Asset Value, Beginning of Period | Net | Net Realized and Change in Unrealized Gain (Loss) | Total from Investment Operations | Dividends from Net Investment Income | Distributions from Net Realized Capital Gains | |||||||||||||||||||||||
| AllianzGI Focused Growth: | ||||||||||||||||||||||||||||
| Class A | ||||||||||||||||||||||||||||
6/30/2020 | $ | 53.33 | $ | (0.10 | ) | $ | 12.28 | $ | 12.18 | $ | — | $ | (7.05 | ) | ||||||||||||||
6/30/2019 | 56.83 | (0.08 | ) | 2.48 | 2.40 | — | (5.90 | ) | ||||||||||||||||||||
6/30/2018 | 46.62 | — | 10.92 | 10.92 | — | (0.71 | ) | |||||||||||||||||||||
6/30/2017 | 40.72 | 0.06 | 6.85 | 6.91 | — | (1.01 | ) | |||||||||||||||||||||
6/30/2016 | 42.73 | 0.08 | 0.62 | 0.70 | — | (2.71 | ) | |||||||||||||||||||||
| Class C | ||||||||||||||||||||||||||||
6/30/2020 | $ | 34.42 | $ | (0.31 | ) | $ | 7.52 | $ | 7.21 | $ | — | $ | (7.05 | ) | ||||||||||||||
6/30/2019 | 39.41 | (0.36 | ) | 1.27 | 0.91 | — | (5.90 | ) | ||||||||||||||||||||
6/30/2018 | 32.76 | (0.29 | ) | 7.65 | 7.36 | — | (0.71 | ) | ||||||||||||||||||||
6/30/2017 | 29.12 | (0.19 | ) | 4.84 | 4.65 | — | (1.01 | ) | ||||||||||||||||||||
6/30/2016 | 31.53 | (0.17 | ) | 0.47 | 0.30 | — | (2.71 | ) | ||||||||||||||||||||
| Class R | ||||||||||||||||||||||||||||
6/30/2020 | $ | 39.02 | $ | (0.18 | ) | $ | 8.70 | $ | 8.52 | $ | — | $ | (7.05 | ) | ||||||||||||||
6/30/2019 | 43.54 | (0.16 | ) | 1.54 | 1.38 | — | (5.90 | ) | ||||||||||||||||||||
6/30/2018 | 35.95 | (0.11 | ) | 8.41 | 8.30 | — | (0.71 | ) | ||||||||||||||||||||
6/30/2017 | 31.71 | (0.04 | ) | 5.29 | 5.25 | — | (1.01 | ) | ||||||||||||||||||||
6/30/2016 | 33.93 | (0.02 | ) | 0.51 | 0.49 | — | (2.71 | ) | ||||||||||||||||||||
| Class P | ||||||||||||||||||||||||||||
6/30/2020 | $ | 39.91 | $ | 0.01 | $ | 8.96 | $ | 8.97 | $ | — | $ | (7.05 | ) | |||||||||||||||
6/30/2019 | 44.18 | 0.03 | 1.60 | 1.63 | — | (5.90 | ) | |||||||||||||||||||||
6/30/2018 | 36.33 | 0.09 | 8.52 | 8.61 | (0.05 | ) | (0.71 | ) | ||||||||||||||||||||
6/30/2017 | 31.88 | 0.14 | 5.32 | 5.46 | — | (1.01 | ) | |||||||||||||||||||||
6/30/2016 | 33.94 | 0.15 | 0.50 | 0.65 | — | (2.71 | ) | |||||||||||||||||||||
| Institutional Class | ||||||||||||||||||||||||||||
6/30/2020 | $ | 48.89 | $ | 0.06 | $ | 11.21 | $ | 11.27 | $ | — | $ | (7.05 | ) | |||||||||||||||
6/30/2019 | 52.51 | 0.09 | 2.19 | 2.28 | — | (5.90 | ) | |||||||||||||||||||||
6/30/2018 | 43.02 | 0.16 | 10.08 | 10.24 | (0.04 | ) | (0.71 | ) | ||||||||||||||||||||
6/30/2017 | 37.53 | 0.20 | 6.30 | 6.50 | — | (1.01 | ) | |||||||||||||||||||||
6/30/2016 | 39.45 | 0.21 | 0.58 | 0.79 | — | (2.71 | ) | |||||||||||||||||||||
| Class R6 | ||||||||||||||||||||||||||||
6/30/2020 | $ | 48.96 | $ | 0.09 | $ | 11.23 | $ | 11.32 | $ | — | $ | (7.05 | ) | |||||||||||||||
6/30/2019 | 52.56 | 0.11 | 2.19 | 2.30 | — | (5.90 | ) | |||||||||||||||||||||
6/30/2018 | 43.04 | 0.19 | 10.10 | 10.29 | (0.06 | ) | (0.71 | ) | ||||||||||||||||||||
6/30/2017 | 37.53 | 0.21 | 6.31 | 6.52 | — | (1.01 | ) | |||||||||||||||||||||
12/14/2015* - 6/30/2016 | 37.51 | 0.12 | (0.10 | ) | 0.02 | — | — | |||||||||||||||||||||
| Administrative Class | ||||||||||||||||||||||||||||
6/30/2020 | $ | 45.36 | $ | (0.05 | ) | $ | 10.30 | $ | 10.25 | $ | — | $ | (7.05 | ) | ||||||||||||||
6/30/2019 | 49.33 | (0.04 | ) | 1.97 | 1.93 | — | (5.90 | ) | ||||||||||||||||||||
6/30/2018 | 40.51 | 0.03 | 9.50 | 9.53 | — | (0.71 | ) | |||||||||||||||||||||
6/30/2017 | 35.48 | 0.09 | 5.95 | 6.04 | — | (1.01 | ) | |||||||||||||||||||||
6/30/2016 | 37.53 | 0.11 | 0.55 | 0.66 | — | (2.71 | ) | |||||||||||||||||||||
| ^ | A “—” may reflect actual amounts rounding to less than $0.01 or 0.01%. |
| * | Commencement of operations. |
| (a) | Calculated on average shares outstanding during the period. |
| (b) | Total return is calculated assuming a purchase of a share on the first day of the year and a sale of a share on the last day of each year reported. Dividends and distributions, if any, are assumed, for purposes of this calculation, to be reinvested. Total return does not reflect sales charges and includes the effect of fee waivers and reimbursements. Total return may reflect adjustments to conform to U.S. GAAP. Total return for a period of less than one year is not annualized. |
| (c) | Annualized, unless otherwise noted. |
| 110 | Annual Report | | June 30, 2020 | | See accompanying Notes to Financial Statements |
Table of Contents
| Total Dividends and Distributions | Net Asset Value, End of Period | Total Return (b) | Net Assets, End of Period (000s) | Ratio of Expenses to Average Net Assets with Fee Waiver/ Reimbursement | Ratio of Expenses to Average Net Assets without Fee Waiver/ Reimbursement | Ratio of Net Investment Income (Loss) to Average Net Assets | Portfolio Turnover Rate | |||||||||||||||||||||||||||
| $ | (7.05 | ) | $ | 58.46 | 24.74 | % | $ | 618,302 | 1.00 | % | 1.12 | % | (0.20 | )% | 63 | % | ||||||||||||||||||
| (5.90 | ) | 53.33 | 6.79 | 577,106 | 1.00 | 1.12 | (0.15 | ) | 50 | |||||||||||||||||||||||||
| (0.71 | ) | 56.83 | 23.53 | 421,188 | 0.99 | 1.11 | — | 40 | ||||||||||||||||||||||||||
| (1.01 | ) | 46.62 | 17.29 | 373,359 | 1.05 | 1.11 | 0.15 | 46 | ||||||||||||||||||||||||||
| (2.71 | ) | 40.72 | 1.54 | 357,077 | 1.11 | 1.11 | 0.20 | 55 | ||||||||||||||||||||||||||
| $ | (7.05 | ) | $ | 34.58 | 23.79 | % | $ | 45,878 | 1.77 | % | 1.87 | % | (0.97 | )% | 63 | % | ||||||||||||||||||
| (5.90 | ) | 34.42 | 5.93 | 48,706 | 1.77 | 1.87 | (0.93 | ) | 50 | |||||||||||||||||||||||||
| (0.71 | ) | 39.41 | 22.59 | 233,854 | 1.76 | 1.86 | (0.77 | ) | 40 | |||||||||||||||||||||||||
| (1.01 | ) | 32.76 | 16.40 | 217,685 | 1.81 | 1.86 | (0.62 | ) | 46 | |||||||||||||||||||||||||
| (2.71 | ) | 29.12 | 0.79 | 230,432 | 1.86 | 1.86 | (0.56 | ) | 55 | |||||||||||||||||||||||||
| $ | (7.05 | ) | $ | 40.49 | 24.40 | % | $ | 20,481 | 1.27 | % | 1.37 | % | (0.47 | )% | 63 | % | ||||||||||||||||||
| (5.90 | ) | 39.02 | 6.50 | 22,511 | 1.27 | 1.37 | (0.41 | ) | 50 | |||||||||||||||||||||||||
| (0.71 | ) | 43.54 | 23.21 | 23,781 | 1.26 | 1.36 | (0.27 | ) | 40 | |||||||||||||||||||||||||
| (1.01 | ) | 35.95 | 16.96 | 20,635 | 1.31 | 1.36 | (0.11 | ) | 46 | |||||||||||||||||||||||||
| (2.71 | ) | 31.71 | 1.31 | 17,877 | 1.36 | 1.36 | (0.05 | ) | 55 | |||||||||||||||||||||||||
| $ | (7.05 | ) | $ | 41.83 | 25.03 | % | $ | 84,929 | 0.77 | % | 0.87 | % | 0.03 | % | 63 | % | ||||||||||||||||||
| (5.90 | ) | 39.91 | 7.01 | 91,265 | 0.77 | 0.87 | 0.09 | 50 | ||||||||||||||||||||||||||
| (0.76 | ) | 44.18 | 23.84 | 109,456 | 0.76 | 0.86 | 0.23 | 40 | ||||||||||||||||||||||||||
| (1.01 | ) | 36.33 | 17.54 | 80,667 | 0.81 | 0.86 | 0.41 | 46 | ||||||||||||||||||||||||||
| (2.71 | ) | 31.88 | 1.81 | 35,025 | 0.86 | 0.86 | 0.46 | 55 | ||||||||||||||||||||||||||
| $ | (7.05 | ) | $ | 53.11 | 25.15 | % | $ | 165,726 | 0.67 | % | 0.77 | % | 0.13 | % | 63 | % | ||||||||||||||||||
| (5.90 | ) | 48.89 | 7.15 | 162,173 | 0.67 | 0.77 | 0.18 | 50 | ||||||||||||||||||||||||||
| (0.75 | ) | 52.51 | 23.93 | 177,278 | 0.66 | 0.76 | 0.33 | 40 | ||||||||||||||||||||||||||
| (1.01 | ) | 43.02 | 17.67 | 195,161 | 0.71 | 0.76 | 0.50 | 46 | ||||||||||||||||||||||||||
| (2.71 | ) | 37.53 | 1.92 | 155,976 | 0.76 | 0.76 | 0.55 | 55 | ||||||||||||||||||||||||||
| $ | (7.05 | ) | $ | 53.23 | 25.22 | % | $ | 136,519 | 0.62 | % | 0.72 | % | 0.19 | % | 63 | % | ||||||||||||||||||
| (5.90 | ) | 48.96 | 7.18 | 134,485 | 0.62 | 0.72 | 0.23 | 50 | ||||||||||||||||||||||||||
| (0.77 | ) | 52.56 | 24.03 | 114,054 | 0.61 | 0.71 | 0.38 | 40 | ||||||||||||||||||||||||||
| (1.01 | ) | 43.04 | 17.72 | 36,374 | 0.66 | 0.71 | 0.53 | 46 | ||||||||||||||||||||||||||
| — | 37.53 | 0.05 | 11,564 | 0.71 | (c) | 0.71 | (c) | 0.60 | (c) | 55 | ||||||||||||||||||||||||
| $ | (7.05 | ) | $ | 48.56 | 24.84 | % | $ | 4,518 | 0.92 | % | 1.02 | % | (0.11 | )% | 63 | % | ||||||||||||||||||
| (5.90 | ) | 45.36 | 6.88 | 5,138 | 0.92 | 1.02 | (0.08 | ) | 50 | |||||||||||||||||||||||||
| (0.71 | ) | 49.33 | 23.63 | 4,017 | 0.91 | 1.01 | 0.07 | 40 | ||||||||||||||||||||||||||
| (1.01 | ) | 40.51 | 17.39 | 4,288 | 0.96 | 1.01 | 0.25 | 46 | ||||||||||||||||||||||||||
| (2.71 | ) | 35.48 | 1.65 | 7,900 | 1.01 | 1.01 | 0.29 | 55 | ||||||||||||||||||||||||||
| See accompanying Notes to Financial Statements | | June 30, 2020 | | Annual Report | 111 |
Table of Contents
Financial Highlights (cont’d)
For a Share Outstanding for the Year ended:^
| Net Asset Value, Beginning of Year | Net Investment Income (Loss) (a) | Net Realized | Total from Investment Operations | Dividends from Net Investment Income | Distributions from Net Realized Capital Gains | |||||||||||||||||||||||
| AllianzGI Global Small-Cap: | ||||||||||||||||||||||||||||
| Class A | ||||||||||||||||||||||||||||
6/30/2020 | $ | 39.37 | $ | (0.23 | ) | $ | (0.47 | ) | $ | (0.70 | ) | $ | — | $ | (2.95 | ) | ||||||||||||
6/30/2019 | 51.40 | (0.14 | ) | (3.88 | ) | (4.02 | ) | — | (8.01 | ) | ||||||||||||||||||
6/30/2018 | 47.75 | (0.26 | ) | 8.28 | 8.02 | (0.10 | ) | (4.27 | ) | |||||||||||||||||||
6/30/2017 | 41.18 | (0.14 | ) | 6.71 | 6.57 | — | — | |||||||||||||||||||||
6/30/2016 | 45.05 | (0.13 | ) | (3.74 | ) | (3.87 | ) | — | — | |||||||||||||||||||
| Class C | ||||||||||||||||||||||||||||
6/30/2020 | $ | 33.10 | $ | (0.42 | ) | $ | (0.37 | ) | $ | (0.79 | ) | $ | — | $ | (2.95 | ) | ||||||||||||
6/30/2019 | 45.13 | (0.45 | ) | (3.57 | ) | (4.02 | ) | — | (8.01 | ) | ||||||||||||||||||
6/30/2018 | 42.62 | (0.57 | ) | 7.35 | 6.78 | — | (4.27 | ) | ||||||||||||||||||||
6/30/2017 | 37.03 | (0.42 | ) | 6.01 | 5.59 | — | — | |||||||||||||||||||||
6/30/2016 | 40.81 | (0.41 | ) | (3.37 | ) | (3.78 | ) | — | — | |||||||||||||||||||
| Class P | ||||||||||||||||||||||||||||
6/30/2020 | $ | 42.51 | $ | (0.18 | ) | $ | (0.49 | ) | $ | (0.67 | ) | $ | — | $ | (2.95 | ) | ||||||||||||
6/30/2019 | 54.57 | (0.06 | ) | (3.99 | ) | (4.05 | ) | — | (8.01 | ) | ||||||||||||||||||
6/30/2018 | 50.40 | (0.15 | ) | 8.75 | 8.60 | (0.16 | ) | (4.27 | ) | |||||||||||||||||||
6/30/2017 | 43.36 | 0.02 | 7.02 | 7.04 | — | — | ||||||||||||||||||||||
6/30/2016 | 47.30 | (0.05 | ) | (3.89 | ) | (3.94 | ) | — | — | |||||||||||||||||||
| Institutional Class | ||||||||||||||||||||||||||||
6/30/2020 | $ | 42.97 | $ | (0.13 | ) | $ | (0.50 | ) | $ | (0.63 | ) | $ | — | $ | (2.95 | ) | ||||||||||||
6/30/2019 | 55.01 | 0.01 | (4.04 | ) | (4.03 | ) | — | (8.01 | ) | |||||||||||||||||||
6/30/2018 | 50.77 | (0.09 | ) | 8.81 | 8.72 | (0.21 | ) | (4.27 | ) | |||||||||||||||||||
6/30/2017 | 43.63 | 0.02 | 7.12 | 7.14 | — | — | ||||||||||||||||||||||
6/30/2016 | 47.55 | 0.02 | (3.94 | ) | (3.92 | ) | — | — | ||||||||||||||||||||
| ^ | A “—” may reflect actual amounts rounding to less than $0.01 or 0.01%. |
| (a) | Calculated on average shares outstanding during the year. |
| (b) | Total return is calculated assuming a purchase of a share on the first day of the year and a sale of a share on the last day of each year reported. Dividends and distributions, if any, are assumed, for purposes of this calculation, to be reinvested. Total return does not reflect sales charges and includes the effect of fee waivers and reimbursements. Total return may reflect adjustments to conform to U.S. GAAP. |
| (c) | Payments from Affiliates increased the end of period net asset value and total return by less than $0.01 and 0.01%, respectively. |
| 112 | Annual Report | | June 30, 2020 | | See accompanying Notes to Financial Statements |
Table of Contents
| Total Dividends and Distributions | Net Asset Value, End of Year | Total Return (b) | Net Assets, End of Year (000s) | Ratio of Expenses to Average Net Assets | Ratio of Net Investment Income (Loss) to Average Net Assets | Portfolio Turnover Rate | ||||||||||||||||||||||||
| $ | (2.95 | ) | $ | 35.72 | (2.20 | )% | $ | 36,141 | 1.63 | % | (0.63 | )% | 93 | % | ||||||||||||||||
| (8.01 | ) | 39.37 | (4.64 | ) | 46,947 | 1.62 | (0.34 | ) | 85 | |||||||||||||||||||||
| (4.37 | ) | 51.40 | (c) | 17.08 | (c) | 56,929 | 1.62 | (0.51 | ) | 77 | ||||||||||||||||||||
| — | 47.75 | (c) | 15.96 | (c) | 56,686 | 1.61 | (0.32 | ) | 80 | |||||||||||||||||||||
| — | 41.18 | (8.59 | ) | 68,625 | 1.61 | (0.31 | ) | 87 | ||||||||||||||||||||||
| $ | (2.95 | ) | $ | 29.36 | (2.92 | )% | $ | 4,120 | 2.38 | % | (1.39 | )% | 93 | % | ||||||||||||||||
| (8.01 | ) | 33.10 | (5.37 | ) | 7,354 | 2.37 | (1.18 | ) | 85 | |||||||||||||||||||||
| (4.27 | ) | 45.13 | (c) | 16.21 | (c) | 19,630 | 2.37 | �� | (1.25 | ) | 77 | |||||||||||||||||||
| — | 42.62 | (c) | 15.10 | (c) | 19,729 | 2.36 | (1.06 | ) | 80 | |||||||||||||||||||||
| — | 37.03 | (9.26 | ) | 23,055 | 2.36 | (1.09 | ) | 87 | ||||||||||||||||||||||
| $ | (2.95 | ) | $ | 38.89 | (1.96 | )% | $ | 4,444 | 1.38 | % | (0.44 | )% | 93 | % | ||||||||||||||||
| (8.01 | ) | 42.51 | (4.40 | ) | 11,675 | 1.37 | (0.13 | ) | 85 | |||||||||||||||||||||
| (4.43 | ) | 54.57 | (c) | 17.36 | (c) | 18,262 | 1.37 | (0.27 | ) | 77 | ||||||||||||||||||||
| — | 50.40 | (c) | 16.24 | (c) | 23,214 | 1.36 | 0.03 | 80 | ||||||||||||||||||||||
| — | 43.36 | (8.33 | ) | 20,921 | 1.36 | (0.11 | ) | 87 | ||||||||||||||||||||||
| $ | (2.95 | ) | $ | 39.39 | (1.84 | )% | $ | 29,849 | 1.28 | % | (0.32 | )% | 93 | % | ||||||||||||||||
| (8.01 | ) | 42.97 | (4.32 | ) | 67,916 | 1.27 | 0.01 | 85 | ||||||||||||||||||||||
| (4.48 | ) | 55.01 | (c) | 17.48 | (c) | 98,623 | 1.27 | (0.17 | ) | 77 | ||||||||||||||||||||
| — | 50.77 | (c) | 16.36 | (c) | 114,925 | 1.26 | 0.05 | 80 | ||||||||||||||||||||||
| — | 43.63 | (8.25 | ) | 122,294 | 1.26 | 0.06 | 87 | |||||||||||||||||||||||
| See accompanying Notes to Financial Statements | | June 30, 2020 | | Annual Report | 113 |
Table of Contents
Financial Highlights (cont’d)
For a Share Outstanding for the Year ended:^
| Net Asset Value, Beginning of Year | Net Investment Income (Loss) (a) | Net Realized | Total from Investment Operations | Dividends from Net Investment Income | Distributions from Net Realized Capital Gains | |||||||||||||||||||||||
| AllianzGI Health Sciences: | ||||||||||||||||||||||||||||
| Class A | ||||||||||||||||||||||||||||
6/30/2020 | $ | 32.27 | $ | 0.05 | $ | 4.22 | $ | 4.27 | $ | (0.01 | ) | $ | (2.32 | ) | ||||||||||||||
6/30/2019 | 33.27 | 0.02 | 3.57 | 3.59 | (0.31 | ) | (4.28 | ) | ||||||||||||||||||||
6/30/2018 | 31.61 | (0.02 | ) | 1.68 | 1.66 | — | — | |||||||||||||||||||||
6/30/2017 | 27.77 | (0.01 | ) | 3.85 | 3.84 | — | — | |||||||||||||||||||||
6/30/2016 | 38.48 | (0.02 | ) | (3.87 | ) | (3.89 | ) | — | (6.82 | ) | ||||||||||||||||||
| Class C | ||||||||||||||||||||||||||||
6/30/2020 | $ | 24.71 | $ | (0.15 | ) | $ | 3.20 | $ | 3.05 | $ | — | $ | (2.32 | ) | ||||||||||||||
6/30/2019 | 26.43 | (0.19 | ) | 2.75 | 2.56 | — | (4.28 | ) | ||||||||||||||||||||
6/30/2018 | 25.30 | (0.21 | ) | 1.34 | 1.13 | — | — | |||||||||||||||||||||
6/30/2017 | 22.40 | (0.18 | ) | 3.08 | 2.90 | — | — | |||||||||||||||||||||
6/30/2016 | 32.67 | (0.28 | ) | (3.17 | ) | (3.45 | ) | — | (6.82 | ) | ||||||||||||||||||
| Institutional Class | ||||||||||||||||||||||||||||
6/30/2020 | $ | 32.76 | $ | 0.15 | $ | 4.30 | $ | 4.45 | $ | (0.04 | ) | $ | (2.32 | ) | ||||||||||||||
6/30/2019 | 33.69 | 0.13 | 3.63 | 3.76 | (0.41 | ) | (4.28 | ) | ||||||||||||||||||||
6/30/2018 | 31.90 | 0.10 | 1.69 | 1.79 | — | — | ||||||||||||||||||||||
6/30/2017 | 27.93 | 0.09 | 3.88 | 3.97 | — | — | ||||||||||||||||||||||
6/30/2016 | 38.53 | 0.04 | (3.82 | ) | (3.78 | ) | — | (6.82 | ) | |||||||||||||||||||
| ^ | A “—” may reflect actual amounts rounding to less than $0.01 or 0.01%. |
| (a) | Calculated on average shares outstanding during the year. |
| (b) | Total return is calculated assuming a purchase of a share on the first day of the year and a sale of a share on the last day of each year reported. Dividends and distributions, if any, are assumed, for purposes of this calculation, to be reinvested. Total return does not reflect sales charges and includes the effect of fee waivers and reimbursements. Total return may reflect adjustments to conform to U.S. GAAP. |
| 114 | Annual Report | | June 30, 2020 | | See accompanying Notes to Financial Statements |
Table of Contents
| Total Dividends and Distributions | Net Asset Value, End of Year | Total Return (b) | Net Assets, End of Year (000s) | Ratio of Expenses to Average Net Assets | Ratio of Net Investment Income (Loss) to Average Net Assets | Portfolio Turnover Rate | ||||||||||||||||||||||||
| $ | (2.33 | ) | $ | 34.21 | 13.37 | % | $ | 148,223 | 1.47 | % | 0.15 | % | 91 | % | ||||||||||||||||
| (4.59 | ) | 32.27 | 13.14 | 147,068 | 1.47 | 0.06 | 102 | |||||||||||||||||||||||
| — | 33.27 | 5.25 | 141,122 | 1.47 | (0.05 | ) | 55 | |||||||||||||||||||||||
| — | 31.61 | 13.83 | 150,756 | 1.46 | (0.04 | ) | 82 | |||||||||||||||||||||||
| (6.82 | ) | 27.77 | (10.82 | ) | 167,724 | 1.47 | (0.07 | ) | 113 | |||||||||||||||||||||
| $ | (2.32 | ) | $ | 25.44 | 12.52 | % | $ | 4,221 | 2.22 | % | (0.60 | )% | 91 | % | ||||||||||||||||
| (4.28 | ) | 24.71 | 12.34 | 4,131 | 2.22 | (0.75 | ) | 102 | ||||||||||||||||||||||
| — | 26.43 | 4.47 | 8,218 | 2.22 | (0.81 | ) | 55 | |||||||||||||||||||||||
| — | 25.30 | 12.95 | 10,358 | 2.21 | (0.79 | ) | 82 | |||||||||||||||||||||||
| (6.82 | ) | 22.40 | (11.48 | ) | 13,446 | 2.22 | (1.07 | ) | 113 | |||||||||||||||||||||
| $ | (2.36 | ) | $ | 34.85 | 13.76 | % | $ | 11,182 | 1.12 | % | 0.45 | % | 91 | % | ||||||||||||||||
| (4.69 | ) | 32.76 | 13.54 | 4,290 | 1.12 | 0.39 | 102 | |||||||||||||||||||||||
| — | 33.69 | 5.61 | 2,854 | 1.12 | 0.29 | 55 | ||||||||||||||||||||||||
| — | 31.90 | 14.21 | 3,692 | 1.11 | 0.31 | 82 | ||||||||||||||||||||||||
| (6.82 | ) | 27.93 | (10.49 | ) | 1,977 | 1.12 | 0.14 | 113 | ||||||||||||||||||||||
| See accompanying Notes to Financial Statements | | June 30, 2020 | | Annual Report | 115 |
Table of Contents
Financial Highlights (cont’d)
For a Share Outstanding for the Year ended:^
| Net Asset Value, Beginning of Year | Net Investment Income (a) | | Total from Investment Operations | Dividends from Net Investment Income | Distributions from Net Realized Capital Gains | |||||||||||||||||||||||
| AllianzGI Income & Growth: | ||||||||||||||||||||||||||||
| Class A | ||||||||||||||||||||||||||||
6/30/2020 | $ | 11.01 | $ | 0.18 | $ | 0.54 | $ | 0.72 | $ | (0.21 | ) | $ | (0.63 | ) | ||||||||||||||
6/30/2019 | 11.34 | 0.20 | 0.38 | 0.58 | (0.25 | ) | (0.66 | ) | ||||||||||||||||||||
6/30/2018 | 11.24 | 0.23 | 0.82 | 1.05 | (0.28 | ) | (0.67 | ) | ||||||||||||||||||||
6/30/2017 | 10.80 | 0.27 | 1.17 | 1.44 | (0.32 | ) | (0.68 | ) | ||||||||||||||||||||
6/30/2016 | 12.12 | 0.28 | (0.55 | ) | (0.27 | ) | (0.37 | ) | (0.68 | ) | ||||||||||||||||||
| Class C | ||||||||||||||||||||||||||||
6/30/2020 | $ | 10.07 | $ | 0.09 | $ | 0.50 | $ | 0.59 | $ | (0.14 | ) | $ | (0.63 | ) | ||||||||||||||
6/30/2019 | 10.46 | 0.11 | 0.34 | 0.45 | (0.18 | ) | (0.66 | ) | ||||||||||||||||||||
6/30/2018 | 10.44 | 0.13 | 0.76 | 0.89 | (0.20 | ) | (0.67 | ) | ||||||||||||||||||||
6/30/2017 | 10.10 | 0.18 | 1.09 | 1.27 | (0.25 | ) | (0.68 | ) | ||||||||||||||||||||
6/30/2016 | 11.46 | 0.19 | (0.53 | ) | (0.34 | ) | (0.34 | ) | (0.68 | ) | ||||||||||||||||||
| Class R | ||||||||||||||||||||||||||||
6/30/2020 | $ | 11.01 | $ | 0.15 | $ | 0.54 | $ | 0.69 | $ | (0.18 | ) | $ | (0.63 | ) | ||||||||||||||
6/30/2019 | 11.34 | 0.17 | 0.38 | 0.55 | (0.22 | ) | (0.66 | ) | ||||||||||||||||||||
6/30/2018 | 11.24 | 0.20 | 0.82 | 1.02 | (0.25 | ) | (0.67 | ) | ||||||||||||||||||||
6/30/2017 | 10.80 | 0.25 | 1.16 | 1.41 | (0.29 | ) | (0.68 | ) | ||||||||||||||||||||
6/30/2016 | 12.14 | 0.26 | (0.56 | ) | (0.30 | ) | (0.36 | ) | (0.68 | ) | ||||||||||||||||||
| Class P | ||||||||||||||||||||||||||||
6/30/2020 | $ | 11.29 | $ | 0.21 | $ | 0.57 | $ | 0.78 | $ | (0.24 | ) | $ | (0.63 | ) | ||||||||||||||
6/30/2019 | 11.61 | 0.23 | 0.38 | 0.61 | (0.27 | ) | (0.66 | ) | ||||||||||||||||||||
6/30/2018 | 11.48 | 0.26 | 0.84 | 1.10 | (0.30 | ) | (0.67 | ) | ||||||||||||||||||||
6/30/2017 | 11.01 | 0.31 | 1.19 | 1.50 | (0.35 | ) | (0.68 | ) | ||||||||||||||||||||
6/30/2016 | 12.32 | 0.32 | (0.57 | ) | (0.25 | ) | (0.38 | ) | (0.68 | ) | ||||||||||||||||||
| Institutional Class | ||||||||||||||||||||||||||||
6/30/2020 | $ | 11.41 | $ | 0.22 | $ | 0.57 | $ | 0.79 | $ | (0.25 | ) | $ | (0.63 | ) | ||||||||||||||
6/30/2019 | 11.72 | 0.25 | 0.38 | 0.63 | (0.28 | ) | (0.66 | ) | ||||||||||||||||||||
6/30/2018 | 11.58 | 0.28 | 0.84 | 1.12 | (0.31 | ) | (0.67 | ) | ||||||||||||||||||||
6/30/2017 | 11.09 | 0.32 | 1.21 | 1.53 | (0.36 | ) | (0.68 | ) | ||||||||||||||||||||
6/30/2016 | 12.40 | 0.33 | (0.57 | ) | (0.24 | ) | (0.39 | ) | (0.68 | ) | ||||||||||||||||||
| ^ | A “—” may reflect actual amounts rounding to less than $0.01 or 0.01%. |
| (a) | Calculated on average shares outstanding during the year. |
| (b) | Total return is calculated assuming a purchase of a share on the first day of the year and a sale of a share on the last day of each year reported. Dividends and distributions, if any, are assumed, for purposes of this calculation, to be reinvested. Total return does not reflect sales charges and includes the effect of fee waivers and reimbursements. Total return may reflect adjustments to conform to U.S. GAAP. |
| (c) | Does not include expenses of the investment companies in which the Fund invests. |
| (d) | Payments from Affiliates increased the end of period net asset value and total return by less than $0.01 and 0.01%, respectively. |
| 116 | Annual Report | | June 30, 2020 | | See accompanying Notes to Financial Statements |
Table of Contents
| Total Dividends and Distributions | Net Asset Value, End of Year | Total Return (b) | Net Assets, End of Year (000s) | Ratio of Expenses to Average Net Assets with Fee Waiver/ Reimbursement | Ratio of Expenses to Average Net Assets without Fee Waiver/ Reimbursement | Ratio of Net Investment Income to Average Net Assets | Portfolio Turnover Rate | |||||||||||||||||||||||||||
| $ | (0.84 | ) | $ | 10.89 | 6.98 | % | $ | 1,631,126 | 1.28 | %(c) | 1.29 | %(c) | 1.65 | %(c) | 93 | % | ||||||||||||||||||
| (0.91 | ) | 11.01 | (d) | 5.45 | (d) | 1,458,642 | 1.28 | 1.29 | 1.84 | 66 | ||||||||||||||||||||||||
| (0.95 | ) | 11.34 | 9.58 | 1,250,639 | 1.28 | 1.29 | 1.99 | 102 | ||||||||||||||||||||||||||
| (1.00 | ) | 11.24 | 13.88 | 1,091,888 | 1.29 | 1.29 | 2.45 | 159 | ||||||||||||||||||||||||||
| (1.05 | ) | 10.80 | (2.02 | ) | 1,009,542 | 1.34 | 1.34 | 2.56 | 94 | |||||||||||||||||||||||||
| $ | (0.77 | ) | $ | 9.89 | 6.31 | % | $ | 1,215,780 | 2.03 | %(c) | 2.04 | %(c) | 0.90 | %(c) | 93 | % | ||||||||||||||||||
| (0.84 | ) | 10.07 | (d) | 4.60 | (d) | 1,234,667 | 2.03 | 2.04 | 1.09 | 66 | ||||||||||||||||||||||||
| (0.87 | ) | 10.46 | 8.78 | 1,116,788 | 2.03 | 2.04 | 1.24 | 102 | ||||||||||||||||||||||||||
| (0.93 | ) | 10.44 | 13.08 | 1,090,887 | 2.04 | 2.04 | 1.70 | 159 | ||||||||||||||||||||||||||
| (1.02 | ) | 10.10 | (2.79 | ) | 1,159,303 | 2.09 | 2.09 | 1.81 | 94 | |||||||||||||||||||||||||
| $ | (0.81 | ) | $ | 10.89 | 6.72 | % | $ | 6,032 | 1.53 | %(c) | 1.54 | %(c) | 1.40 | %(c) | 93 | % | ||||||||||||||||||
| (0.88 | ) | 11.01 | (d) | 5.19 | (d) | 4,873 | 1.53 | 1.54 | 1.60 | 66 | ||||||||||||||||||||||||
| (0.92 | ) | 11.34 | 9.32 | 3,150 | 1.53 | 1.54 | 1.73 | 102 | ||||||||||||||||||||||||||
| (0.97 | ) | 11.24 | 13.59 | 1,781 | 1.54 | 1.54 | 2.20 | 159 | ||||||||||||||||||||||||||
| (1.04 | ) | 10.80 | (2.31 | ) | 2,261 | 1.59 | 1.59 | 2.30 | 94 | |||||||||||||||||||||||||
| $ | (0.87 | ) | $ | 11.20 | 7.32 | % | $ | 1,253,364 | 1.03 | %(c) | 1.04 | %(c) | 1.90 | %(c) | 93 | % | ||||||||||||||||||
| (0.93 | ) | 11.29 | (d) | 5.64 | (d) | 1,122,083 | 1.03 | 1.04 | 2.09 | 66 | ||||||||||||||||||||||||
| (0.97 | ) | 11.61 | 9.90 | 897,716 | 1.03 | 1.04 | 2.24 | 102 | ||||||||||||||||||||||||||
| (1.03 | ) | 11.48 | 14.14 | 690,147 | 1.04 | 1.04 | 2.69 | 159 | ||||||||||||||||||||||||||
| (1.06 | ) | 11.01 | (1.81 | ) | 560,425 | 1.09 | 1.09 | 2.81 | 94 | |||||||||||||||||||||||||
| $ | (0.88 | ) | $ | 11.32 | 7.35 | % | $ | 798,280 | 0.93 | %(c) | 0.94 | %(c) | 2.00 | %(c) | 93 | % | ||||||||||||||||||
| (0.94 | ) | 11.41 | (d) | 5.78 | (d) | 702,741 | 0.93 | 0.94 | 2.19 | 66 | ||||||||||||||||||||||||
| (0.98 | ) | 11.72 | 10.00 | 460,024 | 0.93 | 0.94 | 2.34 | 102 | ||||||||||||||||||||||||||
| (1.04 | ) | 11.58 | 14.33 | 342,652 | 0.94 | 0.94 | 2.76 | 159 | ||||||||||||||||||||||||||
| (1.07 | ) | 11.09 | (1.76 | ) | 181,890 | 0.99 | 0.99 | 2.91 | 94 | |||||||||||||||||||||||||
| See accompanying Notes to Financial Statements | | June 30, 2020 | | Annual Report | 117 |
Table of Contents
Financial Highlights (cont’d)
For a Share Outstanding for the Year ended:^
| Net Asset Value, Beginning of Year | Net Investment Income (a) | Net Realized | Total from Investment Operations | Dividends from Net Investment Income | Distributions from Return of Capital | |||||||||||||||||||||||
| AllianzGI International Value: | ||||||||||||||||||||||||||||
| Class A | ||||||||||||||||||||||||||||
6/30/2020 | $ | 18.47 | $ | 0.36 | $ | (1.58 | ) | $ | (1.22 | ) | $ | (0.39 | ) | $ | — | |||||||||||||
6/30/2019 | 18.52 | 0.33 | (0.08 | ) | 0.25 | (0.30 | ) | — | ||||||||||||||||||||
6/30/2018 | 18.13 | 0.34 | 0.38 | 0.72 | (0.32 | ) | (0.01 | ) | ||||||||||||||||||||
6/30/2017 | 16.32 | 0.34 | 1.92 | 2.26 | (0.45 | ) | — | |||||||||||||||||||||
6/30/2016 | 21.61 | 0.37 | (5.15 | ) | (4.78 | ) | (0.51 | ) | — | |||||||||||||||||||
| Class C | ||||||||||||||||||||||||||||
6/30/2020 | $ | 18.15 | $ | 0.22 | $ | (1.54 | ) | $ | (1.32 | ) | $ | (0.26 | ) | $ | — | |||||||||||||
6/30/2019 | 18.20 | 0.17 | (0.04 | ) | 0.13 | (0.18 | ) | — | ||||||||||||||||||||
6/30/2018 | 17.86 | 0.19 | 0.37 | 0.56 | (0.21 | ) | (0.01 | ) | ||||||||||||||||||||
6/30/2017 | 16.09 | 0.23 | 1.86 | 2.09 | (0.32 | ) | — | |||||||||||||||||||||
6/30/2016 | 21.37 | 0.24 | (5.08 | ) | (4.84 | ) | (0.44 | ) | — | |||||||||||||||||||
| Class R | ||||||||||||||||||||||||||||
6/30/2020 | $ | 18.52 | $ | 0.32 | $ | (1.58 | ) | $ | (1.26 | ) | $ | (0.35 | ) | $ | — | |||||||||||||
6/30/2019 | 18.56 | 0.29 | (0.07 | ) | 0.22 | (0.26 | ) | — | ||||||||||||||||||||
6/30/2018 | 18.15 | 0.31 | 0.35 | 0.66 | (0.24 | ) | (0.01 | ) | ||||||||||||||||||||
6/30/2017 | 16.35 | 0.33 | 1.88 | 2.21 | (0.41 | ) | — | |||||||||||||||||||||
6/30/2016 | 21.66 | 0.35 | (5.17 | ) | (4.82 | ) | (0.49 | ) | — | |||||||||||||||||||
| Class P | ||||||||||||||||||||||||||||
6/30/2020 | $ | 18.58 | $ | 0.41 | $ | (1.60 | ) | $ | (1.19 | ) | $ | (0.43 | ) | $ | — | |||||||||||||
6/30/2019 | 18.61 | 0.35 | (0.04 | ) | 0.31 | (0.34 | ) | — | ||||||||||||||||||||
6/30/2018 | 18.21 | 0.36 | 0.41 | 0.77 | (0.36 | ) | (0.01 | ) | ||||||||||||||||||||
6/30/2017 | 16.40 | 0.40 | 1.90 | 2.30 | (0.49 | ) | — | |||||||||||||||||||||
6/30/2016 | 21.70 | 0.43 | (5.18 | ) | (4.75 | ) | (0.55 | ) | — | |||||||||||||||||||
| Institutional Class | ||||||||||||||||||||||||||||
6/30/2020 | $ | 18.60 | $ | 0.43 | $ | (1.60 | ) | $ | (1.17 | ) | $ | (0.45 | ) | $ | — | |||||||||||||
6/30/2019 | 18.64 | 0.41 | (0.08 | ) | 0.33 | (0.37 | ) | — | ||||||||||||||||||||
6/30/2018 | 18.24 | 0.42 | 0.36 | 0.78 | (0.37 | ) | (0.01 | ) | ||||||||||||||||||||
6/30/2017 | 16.42 | 0.37 | 1.95 | 2.32 | (0.50 | ) | — | |||||||||||||||||||||
6/30/2016 | 21.71 | 0.40 | (5.13 | ) | (4.73 | ) | (0.56 | ) | — | |||||||||||||||||||
| Class R6 | ||||||||||||||||||||||||||||
6/30/2020 | $ | 18.59 | $ | 0.44 | $ | (1.60 | ) | $ | (1.16 | ) | $ | (0.46 | ) | $ | — | |||||||||||||
6/30/2019 | 18.63 | 0.37 | (0.04 | ) | 0.33 | (0.37 | ) | — | ||||||||||||||||||||
6/30/2018 | 18.19 | 0.29 | 0.50 | 0.79 | (0.34 | ) | (0.01 | ) | ||||||||||||||||||||
6/30/2017 | 16.38 | 0.40 | 1.93 | 2.33 | (0.52 | ) | — | |||||||||||||||||||||
6/30/2016 | 21.68 | 0.48 | (5.20 | ) | (4.72 | ) | (0.58 | ) | — | |||||||||||||||||||
| Administrative Class | ||||||||||||||||||||||||||||
6/30/2020 | $ | 18.54 | $ | 0.38 | $ | (1.59 | ) | $ | (1.21 | ) | $ | (0.41 | ) | $ | — | |||||||||||||
6/30/2019 | 18.56 | 0.29 | 0.01 | 0.30 | (0.32 | ) | — | |||||||||||||||||||||
6/30/2018 | 18.19 | 0.38 | 0.35 | 0.73 | (0.35 | ) | (0.01 | ) | ||||||||||||||||||||
6/30/2017 | 16.37 | 0.36 | 1.92 | 2.28 | (0.46 | ) | — | |||||||||||||||||||||
6/30/2016 | 21.68 | 0.42 | (5.20 | ) | (4.78 | ) | (0.53 | ) | — | |||||||||||||||||||
| ^ | A “—” may reflect actual amounts rounding to less than $0.01 or 0.01%. |
| (a) | Calculated on average shares outstanding during the year. |
| (b) | Total return is calculated assuming a purchase of a share on the first day of the year and a sale of a share on the last day of each year reported. Dividends and distributions, if any, are assumed, for purposes of this calculation, to be reinvested. Total return does not reflect sales charges and includes the effect of fee waivers and reimbursements. Total return may reflect adjustments to conform to U.S. GAAP. |
| 118 | Annual Report | | June 30, 2020 | | See accompanying Notes to Financial Statements |
Table of Contents
| Total Dividends and Distributions | Net Asset Value, End of Year | Total Return (b) | Net Assets, End of Year (000s) | Ratio of Expenses to Average Net Assets with Fee Waiver/ Reimbursement | Ratio of Expenses to Average Net Assets without Fee Waiver/ Reimbursement | Ratio of Net Investment Income to Average Net Assets | Portfolio Turnover Rate | |||||||||||||||||||||||||||
| $ | (0.39 | ) | $ | 16.86 | (6.66 | )% | $ | 55,297 | 1.30 | % | 1.37 | % | 2.06 | % | 91 | % | ||||||||||||||||||
| (0.30 | ) | 18.47 | 1.44 | 71,931 | 1.30 | 1.38 | 1.84 | 49 | ||||||||||||||||||||||||||
| (0.33 | ) | 18.52 | 3.95 | 88,385 | 1.29 | 1.37 | 1.76 | 63 | ||||||||||||||||||||||||||
| (0.45 | ) | 18.13 | 13.99 | 127,642 | 1.30 | 1.35 | 2.01 | 63 | ||||||||||||||||||||||||||
| (0.51 | ) | 16.32 | (22.28 | ) | 258,429 | 1.29 | 1.32 | 2.04 | 50 | |||||||||||||||||||||||||
| $ | (0.26 | ) | $ | 16.57 | (7.33 | )% | $ | 7,488 | 2.05 | % | 2.12 | % | 1.27 | % | 91 | % | ||||||||||||||||||
| (0.18 | ) | 18.15 | 0.76 | 13,926 | 2.05 | 2.13 | 0.98 | 49 | ||||||||||||||||||||||||||
| (0.22 | ) | 18.20 | 3.11 | 36,184 | 2.04 | 2.12 | 0.99 | 63 | ||||||||||||||||||||||||||
| (0.32 | ) | 17.86 | 13.10 | 54,546 | 2.05 | 2.10 | 1.37 | 63 | ||||||||||||||||||||||||||
| (0.44 | ) | 16.09 | (22.81 | ) | 83,722 | 2.04 | 2.07 | 1.33 | 50 | |||||||||||||||||||||||||
| $ | (0.35 | ) | $ | 16.91 | (6.89 | )% | $ | 4,382 | 1.55 | % | 1.62 | % | 1.82 | % | 91 | % | ||||||||||||||||||
| (0.26 | ) | 18.52 | 1.23 | 6,108 | 1.55 | 1.63 | 1.58 | 49 | ||||||||||||||||||||||||||
| (0.25 | ) | 18.56 | 3.64 | 9,190 | 1.54 | 1.62 | 1.58 | 63 | ||||||||||||||||||||||||||
| (0.41 | ) | 18.15 | 13.68 | 11,300 | 1.55 | 1.60 | 1.91 | 63 | ||||||||||||||||||||||||||
| (0.49 | ) | 16.35 | (22.43 | ) | 13,915 | 1.54 | 1.57 | 1.89 | 50 | |||||||||||||||||||||||||
| $ | (0.43 | ) | $ | 16.96 | (6.45 | )% | $ | 22,912 | 1.05 | % | 1.12 | % | 2.29 | % | 91 | % | ||||||||||||||||||
| (0.34 | ) | 18.58 | 1.76 | 38,655 | 1.05 | 1.13 | 1.93 | 49 | ||||||||||||||||||||||||||
| (0.37 | ) | 18.61 | 4.17 | 89,644 | 1.04 | 1.12 | 1.87 | 63 | ||||||||||||||||||||||||||
| (0.49 | ) | 18.21 | 14.20 | 148,540 | 1.05 | 1.10 | 2.34 | 63 | ||||||||||||||||||||||||||
| (0.55 | ) | 16.40 | (22.07 | ) | 350,745 | 1.04 | 1.07 | 2.34 | 50 | |||||||||||||||||||||||||
| $ | (0.45 | ) | $ | 16.98 | (6.33 | )% | $ | 37,009 | 0.95 | % | 1.02 | % | 2.41 | % | 91 | % | ||||||||||||||||||
| (0.37 | ) | 18.60 | 1.84 | 46,473 | 0.95 | 1.03 | 2.24 | 49 | ||||||||||||||||||||||||||
| (0.38 | ) | 18.64 | 4.27 | 55,924 | 0.94 | 1.02 | 2.14 | 63 | ||||||||||||||||||||||||||
| (0.50 | ) | 18.24 | 14.33 | 74,272 | 0.95 | 1.00 | 2.18 | 63 | ||||||||||||||||||||||||||
| (0.56 | ) | 16.42 | (21.97 | ) | 309,622 | 0.94 | 0.97 | 2.17 | 50 | |||||||||||||||||||||||||
| $ | (0.46 | ) | $ | 16.97 | (6.28 | )% | $ | 1,230 | 0.90 | % | 0.97 | % | 2.47 | % | 91 | % | ||||||||||||||||||
| (0.37 | ) | 18.59 | 1.88 | 1,277 | 0.90 | 0.98 | 2.07 | 49 | ||||||||||||||||||||||||||
| (0.35 | ) | 18.63 | 4.31 | 1,836 | 0.89 | 0.97 | 1.48 | 63 | ||||||||||||||||||||||||||
| (0.52 | ) | 18.19 | 14.42 | 28,460 | 0.90 | 0.95 | 2.33 | 63 | ||||||||||||||||||||||||||
| (0.58 | ) | 16.38 | (21.97 | ) | 55,751 | 0.89 | 0.92 | 2.64 | 50 | |||||||||||||||||||||||||
| $ | (0.41 | ) | $ | 16.92 | (6.58 | )% | $ | 1,147 | 1.20 | % | 1.27 | % | 2.17 | % | 91 | % | ||||||||||||||||||
| (0.32 | ) | 18.54 | 1.68 | 1,436 | 1.20 | 1.28 | 1.60 | 49 | ||||||||||||||||||||||||||
| (0.36 | ) | 18.56 | 4.01 | 4,829 | 1.19 | 1.27 | 1.96 | 63 | ||||||||||||||||||||||||||
| (0.46 | ) | 18.19 | 14.09 | 4,973 | 1.20 | 1.25 | 2.08 | 63 | ||||||||||||||||||||||||||
| (0.53 | ) | 16.37 | (22.22 | ) | 14,487 | 1.19 | 1.22 | 2.31 | 50 | |||||||||||||||||||||||||
| See accompanying Notes to Financial Statements | | June 30, 2020 | | Annual Report | 119 |
Table of Contents
Financial Highlights (cont’d)
For a Share Outstanding for the Year ended:^
| Net Asset Value, Beginning of Year | Net Investment Income (a) | Net Realized | Total from Investment Operations | Dividends from Net Investment Income | Distributions from Net Realized Capital Gains | |||||||||||||||||||||||
| AllianzGI Large-Cap Value: | ||||||||||||||||||||||||||||
| Class A | ||||||||||||||||||||||||||||
6/30/2020 | $ | 26.90 | $ | 0.39 | $ | (1.88 | ) | $ | (1.49 | ) | $ | (0.41 | ) | $ | (0.51 | ) | ||||||||||||
6/30/2019 | 26.14 | 0.41 | 0.79 | 1.20 | (0.39 | ) | (0.05 | ) | ||||||||||||||||||||
6/30/2018 | 24.31 | 0.41 | 1.83 | 2.24 | (0.41 | ) | — | |||||||||||||||||||||
6/30/2017 | 20.34 | 0.36 | 3.97 | (c) | 4.33 | (0.36 | ) | — | ||||||||||||||||||||
6/30/2016 | 21.44 | 0.37 | (1.09 | ) | (0.72 | ) | (0.38 | ) | — | |||||||||||||||||||
| Class C | ||||||||||||||||||||||||||||
6/30/2020 | $ | 27.23 | $ | 0.19 | $ | (1.88 | ) | $ | (1.69 | ) | $ | (0.21 | ) | $ | (0.51 | ) | ||||||||||||
6/30/2019 | 26.44 | 0.19 | 0.81 | 1.00 | (0.16 | ) | (0.05 | ) | ||||||||||||||||||||
6/30/2018 | 24.57 | 0.22 | 1.86 | 2.08 | (0.21 | ) | — | |||||||||||||||||||||
6/30/2017 | 20.50 | 0.19 | 4.01 | (c) | 4.20 | (0.13 | ) | — | ||||||||||||||||||||
6/30/2016 | 21.57 | 0.22 | (1.09 | ) | (0.87 | ) | (0.20 | ) | — | |||||||||||||||||||
| Class R | ||||||||||||||||||||||||||||
6/30/2020 | $ | 27.18 | $ | 0.33 | $ | (1.89 | ) | $ | (1.56 | ) | $ | (0.34 | ) | $ | (0.51 | ) | ||||||||||||
6/30/2019 | 26.41 | 0.34 | 0.80 | 1.14 | (0.32 | ) | (0.05 | ) | ||||||||||||||||||||
6/30/2018 | 24.55 | 0.35 | 1.85 | 2.20 | (0.34 | ) | — | |||||||||||||||||||||
6/30/2017 | 20.51 | 0.30 | 4.02 | (c) | 4.32 | (0.28 | ) | — | ||||||||||||||||||||
6/30/2016 | 21.60 | 0.32 | (1.09 | ) | (0.77 | ) | (0.32 | ) | — | |||||||||||||||||||
| Class P | ||||||||||||||||||||||||||||
6/30/2020 | $ | 27.16 | $ | 0.46 | $ | (1.90 | ) | $ | (1.44 | ) | $ | (0.48 | ) | $ | (0.51 | ) | ||||||||||||
6/30/2019 | 26.38 | 0.48 | 0.81 | 1.29 | (0.46 | ) | (0.05 | ) | ||||||||||||||||||||
6/30/2018 | 24.53 | 0.47 | 1.86 | 2.33 | (0.48 | ) | — | |||||||||||||||||||||
6/30/2017 | 20.56 | 0.42 | 4.01 | (c) | 4.43 | (0.46 | ) | — | ||||||||||||||||||||
6/30/2016 | 21.68 | 0.42 | (1.09 | ) | (0.67 | ) | (0.45 | ) | — | |||||||||||||||||||
| Institutional Class | ||||||||||||||||||||||||||||
6/30/2020 | $ | 26.77 | $ | 0.48 | $ | (1.87 | ) | $ | (1.39 | ) | $ | (0.50 | ) | $ | (0.51 | ) | ||||||||||||
6/30/2019 | 26.02 | 0.50 | 0.79 | 1.29 | (0.49 | ) | (0.05 | ) | ||||||||||||||||||||
6/30/2018 | 24.20 | 0.49 | 1.84 | 2.33 | (0.51 | ) | — | |||||||||||||||||||||
6/30/2017 | 20.27 | 0.43 | 3.97 | (c) | 4.40 | (0.47 | ) | — | ||||||||||||||||||||
6/30/2016 | 21.39 | 0.44 | (1.09 | ) | (0.65 | ) | (0.47 | ) | — | |||||||||||||||||||
| Administrative Class | ||||||||||||||||||||||||||||
6/30/2020 | $ | 27.29 | $ | 0.42 | $ | (1.91 | ) | $ | (1.49 | ) | $ | (0.44 | ) | $ | (0.51 | ) | ||||||||||||
6/30/2019 | 26.51 | 0.45 | 0.80 | 1.25 | (0.42 | ) | (0.05 | ) | ||||||||||||||||||||
6/30/2018 | 24.64 | 0.43 | 1.88 | 2.31 | (0.44 | ) | — | |||||||||||||||||||||
6/30/2017 | 20.61 | 0.38 | 4.04 | (c) | 4.42 | (0.39 | ) | — | ||||||||||||||||||||
6/30/2016 | 21.73 | 0.39 | (1.10 | ) | (0.71 | ) | (0.41 | ) | — | |||||||||||||||||||
| ^ | A “—” may reflect actual amounts rounding to less than $0.01 or 0.01%. |
| (a) | Calculated on average shares outstanding during the year. |
| (b) | Total return is calculated assuming a purchase of a share on the first day of the year and a sale of a share on the last day of each year reported. Dividends and distributions, if any, are assumed, for purposes of this calculation, to be reinvested. Total return does not reflect sales charges and includes the effect of fee waivers and reimbursements. Total return may reflect adjustments to conform to U.S. GAAP. |
| (c) | Payments from securities litigation increased net realized and change in unrealized gain (loss) and net asset value per share by approximately $0.65 for Class A; $0.68 for Class C; $0.71 for Class R; $0.75 for Class P; $0.57 for Institutional Class and $0.65 for Administrative Class. The increase in total return per class was approximately 3.24% for Class A; 3.33% for Class C; 3.50% for Class R; 3.72% for Class P; 2.87% for Institutional Class and 3.21% for Administrative Class. |
| 120 | Annual Report | | June 30, 2020 | | See accompanying Notes to Financial Statements |
Table of Contents
| Total Dividends and Distributions | Net Asset Value, End of Year | Total Return (b) | Net Assets, End of Year (000s) | Ratio of Expenses to Average Net Assets with Fee Waiver/ Reimbursement | Ratio of Expenses to Average Net Assets without Fee Waiver/ Reimbursement | Ratio of Net Investment Income to Average Net Assets | Portfolio Turnover Rate | |||||||||||||||||||||||||||
| $ | (0.92 | ) | $ | 24.49 | (5.71 | )% | $ | 150,404 | 1.12 | % | 1.12 | % | 1.48 | % | 114 | % | ||||||||||||||||||
| (0.44 | ) | 26.90 | 4.67 | 178,311 | 1.12 | 1.12 | 1.57 | 68 | ||||||||||||||||||||||||||
| (0.41 | ) | 26.14 | 9.27 | 145,338 | 1.06 | 1.11 | 1.56 | 110 | ||||||||||||||||||||||||||
| (0.36 | ) | 24.31 | (c) | 21.42 | (c) | 151,306 | 1.02 | 1.12 | 1.60 | 67 | ||||||||||||||||||||||||
| (0.38 | ) | 20.34 | (3.30 | ) | 150,436 | 1.11 | 1.11 | 1.82 | 51 | |||||||||||||||||||||||||
| $ | (0.72 | ) | $ | 24.82 | (6.41 | )% | $ | 7,854 | 1.87 | % | 1.87 | % | 0.73 | % | 114 | % | ||||||||||||||||||
| (0.21 | ) | 27.23 | 3.82 | 12,080 | 1.87 | 1.87 | 0.70 | 68 | ||||||||||||||||||||||||||
| (0.21 | ) | 26.44 | 8.49 | 62,232 | 1.81 | 1.86 | 0.82 | 110 | ||||||||||||||||||||||||||
| (0.13 | ) | 24.57 | (c) | 20.52 | (c) | 70,159 | 1.77 | 1.87 | 0.86 | 67 | ||||||||||||||||||||||||
| (0.20 | ) | 20.50 | (4.04 | ) | 79,758 | 1.86 | 1.86 | 1.06 | 51 | |||||||||||||||||||||||||
| $ | (0.85 | ) | $ | 24.77 | (5.92 | )% | $ | 1,197 | 1.37 | % | 1.37 | % | 1.24 | % | 114 | % | ||||||||||||||||||
| (0.37 | ) | 27.18 | 4.37 | 2,090 | 1.37 | 1.37 | 1.24 | 68 | ||||||||||||||||||||||||||
| (0.34 | ) | 26.41 | 9.00 | 5,200 | 1.31 | 1.36 | 1.35 | 110 | ||||||||||||||||||||||||||
| (0.28 | ) | 24.55 | (c) | 21.14 | (c) | 6,997 | 1.27 | 1.37 | 1.35 | 67 | ||||||||||||||||||||||||
| (0.32 | ) | 20.51 | (3.53 | ) | 7,200 | 1.36 | 1.36 | 1.56 | 51 | |||||||||||||||||||||||||
| $ | (0.99 | ) | $ | 24.73 | (5.49 | )% | $ | 15,384 | 0.87 | % | 0.87 | % | 1.73 | % | 114 | % | ||||||||||||||||||
| (0.51 | ) | 27.16 | 4.95 | 19,097 | 0.87 | 0.87 | 1.80 | 68 | ||||||||||||||||||||||||||
| (0.48 | ) | 26.38 | 9.54 | 20,242 | 0.81 | 0.86 | 1.80 | 110 | ||||||||||||||||||||||||||
| (0.46 | ) | 24.53 | (c) | 21.71 | (c) | 18,164 | 0.77 | 0.87 | 1.85 | 67 | ||||||||||||||||||||||||
| (0.45 | ) | 20.56 | (3.06 | ) | 14,197 | 0.86 | 0.86 | 2.06 | 51 | |||||||||||||||||||||||||
| $ | (1.01 | ) | $ | 24.37 | (5.36 | )% | $ | 92,001 | 0.77 | % | 0.77 | % | 1.81 | % | 114 | % | ||||||||||||||||||
| (0.54 | ) | 26.77 | 5.02 | 132,572 | 0.77 | 0.77 | 1.91 | 68 | ||||||||||||||||||||||||||
| (0.51 | ) | 26.02 | 9.66 | 127,728 | 0.71 | 0.76 | 1.89 | 110 | ||||||||||||||||||||||||||
| (0.47 | ) | 24.20 | (c) | 21.88 | (c) | 114,377 | 0.67 | 0.77 | 1.95 | 67 | ||||||||||||||||||||||||
| (0.47 | ) | 20.27 | (2.99 | ) | 150,909 | 0.76 | 0.76 | 2.18 | 51 | |||||||||||||||||||||||||
| $ | (0.95 | ) | $ | 24.85 | (5.65 | )% | $ | 1,181 | 1.02 | % | 1.02 | % | 1.58 | % | 114 | % | ||||||||||||||||||
| (0.47 | ) | 27.29 | 4.77 | 1,381 | 1.02 | 1.02 | 1.66 | 68 | ||||||||||||||||||||||||||
| (0.44 | ) | 26.51 | 9.40 | 1,323 | 0.96 | 1.01 | 1.64 | 110 | ||||||||||||||||||||||||||
| (0.39 | ) | 24.64 | (c) | 21.58 | (c) | 1,272 | 0.92 | 1.02 | 1.71 | 67 | ||||||||||||||||||||||||
| (0.41 | ) | 20.61 | (3.23 | ) | 1,345 | 1.01 | 1.01 | 1.91 | 51 | |||||||||||||||||||||||||
| See accompanying Notes to Financial Statements | | June 30, 2020 | | Annual Report | 121 |
Table of Contents
Financial Highlights (cont’d)
For a Share Outstanding for the Year ended:^
| Net Asset Value, Beginning of Year | Net Investment Income (Loss) (a) | Net Realized and Change in Unrealized Gain (Loss) | Total from Investment Operations | Distributions from Net Realized Capital Gains | Net Asset Value, End of Year | |||||||||||||||||||||||
| AllianzGI Mid-Cap: | ||||||||||||||||||||||||||||
| Class A | ||||||||||||||||||||||||||||
6/30/2020 | $ | 3.75 | $ | (0.02 | ) | $ | 0.75 | $ | 0.73 | $ | (0.18 | ) | $ | 4.30 | ||||||||||||||
6/30/2019 | 3.88 | (0.02 | ) | 0.37 | 0.35 | (0.48 | ) | 3.75 | ||||||||||||||||||||
6/30/2018 | 3.74 | (0.02 | ) | 0.54 | 0.52 | (0.38 | ) | 3.88 | ||||||||||||||||||||
6/30/2017 | 3.40 | (0.01 | ) | 0.62 | 0.61 | (0.27 | ) | 3.74 | ||||||||||||||||||||
6/30/2016 | 3.65 | (0.01 | ) | (0.03 | ) | (0.04 | ) | (0.21 | ) | 3.40 | ||||||||||||||||||
| Class C | ||||||||||||||||||||||||||||
6/30/2020 | $ | 2.98 | $ | (0.04 | ) | $ | 0.59 | $ | 0.55 | $ | (0.18 | ) | $ | 3.35 | ||||||||||||||
6/30/2019 | 3.23 | (0.04 | ) | 0.27 | 0.23 | (0.48 | ) | 2.98 | ||||||||||||||||||||
6/30/2018 | 3.19 | (0.04 | ) | 0.46 | 0.42 | (0.38 | ) | 3.23 | ||||||||||||||||||||
6/30/2017 | 2.96 | (0.04 | ) | 0.54 | 0.50 | (0.27 | ) | 3.19 | ||||||||||||||||||||
6/30/2016 | 3.22 | (0.03 | ) | (0.02 | ) | (0.05 | ) | (0.21 | ) | 2.96 | ||||||||||||||||||
| Class R | ||||||||||||||||||||||||||||
6/30/2020 | $ | 3.66 | $ | (0.03 | ) | $ | 0.74 | $ | 0.71 | $ | (0.18 | ) | $ | 4.19 | ||||||||||||||
6/30/2019 | 3.82 | (0.03 | ) | 0.35 | 0.32 | (0.48 | ) | 3.66 | ||||||||||||||||||||
6/30/2018 | 3.69 | (0.03 | ) | 0.54 | 0.51 | (0.38 | ) | 3.82 | ||||||||||||||||||||
6/30/2017 | 3.37 | (0.02 | ) | 0.61 | 0.59 | (0.27 | ) | 3.69 | ||||||||||||||||||||
6/30/2016 | 3.62 | (0.02 | ) | (0.02 | ) | (0.04 | ) | (0.21 | ) | 3.37 | ||||||||||||||||||
| Class P | ||||||||||||||||||||||||||||
6/30/2020 | $ | 4.36 | $ | (0.02 | ) | $ | 0.89 | $ | 0.87 | $ | (0.18 | ) | $ | 5.05 | ||||||||||||||
6/30/2019 | 4.41 | (0.02 | ) | 0.45 | 0.43 | (0.48 | ) | 4.36 | ||||||||||||||||||||
6/30/2018 | 4.19 | (0.01 | ) | 0.61 | 0.60 | (0.38 | ) | 4.41 | ||||||||||||||||||||
6/30/2017 | 3.77 | (0.01 | ) | 0.70 | 0.69 | (0.27 | ) | 4.19 | ||||||||||||||||||||
6/30/2016 | 4.01 | — | (0.03 | ) | (0.03 | ) | (0.21 | ) | 3.77 | |||||||||||||||||||
| Institutional Class | ||||||||||||||||||||||||||||
6/30/2020 | $ | 4.39 | $ | (0.01 | ) | $ | 0.89 | $ | 0.88 | $ | (0.18 | ) | $ | 5.09 | ||||||||||||||
6/30/2019 | 4.43 | (0.01 | ) | 0.45 | 0.44 | (0.48 | ) | 4.39 | ||||||||||||||||||||
6/30/2018 | 4.21 | (0.01 | ) | 0.61 | 0.60 | (0.38 | ) | 4.43 | ||||||||||||||||||||
6/30/2017 | 3.78 | — | 0.70 | 0.70 | (0.27 | ) | 4.21 | |||||||||||||||||||||
6/30/2016 | 4.02 | — | (0.03 | ) | (0.03 | ) | (0.21 | ) | 3.78 | |||||||||||||||||||
| Administrative Class | ||||||||||||||||||||||||||||
6/30/2020 | $ | 4.01 | $ | (0.02 | ) | $ | 0.81 | $ | 0.79 | $ | (0.18 | ) | $ | 4.62 | ||||||||||||||
6/30/2019 | 4.11 | (0.02 | ) | 0.40 | 0.38 | (0.48 | ) | 4.01 | ||||||||||||||||||||
6/30/2018 | 3.94 | (0.02 | ) | 0.57 | 0.55 | (0.38 | ) | 4.11 | ||||||||||||||||||||
6/30/2017 | 3.56 | (0.01 | ) | 0.66 | 0.65 | (0.27 | ) | 3.94 | ||||||||||||||||||||
6/30/2016 | 3.80 | (0.01 | ) | (0.02 | ) | (0.03 | ) | (0.21 | ) | 3.56 | ||||||||||||||||||
| ^ | A “—” may reflect actual amounts rounding to less than $0.01 or 0.01%. |
| (a) | Calculated on average shares outstanding during the year. |
| (b) | Total return is calculated assuming a purchase of a share on the first day of the year and a sale of a share on the last day of each year reported. Dividends and distributions, if any, are assumed, for purposes of this calculation, to be reinvested. Total return does not reflect sales charges and includes the effect of fee waivers and reimbursements. Total return may reflect adjustments to conform to U.S. GAAP. |
| 122 | Annual Report | | June 30, 2020 | | See accompanying Notes to Financial Statements |
Table of Contents
| Total Return (b) | Net Assets, End of Year (000s) | Ratio of Expenses to Average Net Assets | Ratio of Net Investment Income (Loss) to Average Net Assets | Portfolio Turnover Rate | ||||||||||||||||||
| 20.15 | % | $ | 263,361 | 1.14 | % | (0.66 | )% | 53 | % | |||||||||||||
| 13.58 | 240,017 | 1.14 | (0.66 | ) | 60 | |||||||||||||||||
| 14.14 | 116,673 | 1.13 | (0.48 | ) | 79 | |||||||||||||||||
| 18.89 | 112,947 | 1.13 | (0.40 | ) | 77 | |||||||||||||||||
| (1.05 | ) | 86,224 | 1.13 | (0.26 | ) | 73 | ||||||||||||||||
| 19.29 | % | $ | 15,495 | 1.89 | % | (1.41 | )% | 53 | % | |||||||||||||
| 12.56 | 21,251 | 1.89 | (1.34 | ) | 60 | |||||||||||||||||
| 13.40 | 142,931 | 1.88 | (1.23 | ) | 79 | |||||||||||||||||
| 17.95 | 142,565 | 1.88 | (1.15 | ) | 77 | |||||||||||||||||
| (1.51 | ) | 162,104 | 1.88 | (1.01 | ) | 73 | ||||||||||||||||
| 20.09 | % | $ | 1,703 | 1.39 | % | (0.91 | )% | 53 | % | |||||||||||||
| 12.97 | 1,384 | 1.39 | (0.89 | ) | 60 | |||||||||||||||||
| 14.03 | 1,463 | 1.38 | (0.72 | ) | 79 | |||||||||||||||||
| 18.45 | 2,345 | 1.38 | (0.65 | ) | 77 | |||||||||||||||||
| (1.05 | ) | 2,195 | 1.38 | (0.51 | ) | 73 | ||||||||||||||||
| 20.56 | % | $ | 13,670 | 0.89 | % | (0.41 | )% | 53 | % | |||||||||||||
| 13.79 | 11,617 | 0.89 | (0.39 | ) | 60 | |||||||||||||||||
| 14.56 | 11,189 | 0.88 | (0.23 | ) | 79 | |||||||||||||||||
| 19.18 | 8,604 | 0.88 | (0.15 | ) | 77 | |||||||||||||||||
| (0.69 | ) | 2,009 | 0.88 | (0.01 | ) | 73 | ||||||||||||||||
| 20.64 | % | $ | 54,793 | 0.79 | % | (0.31 | )% | 53 | % | |||||||||||||
| 13.97 | 36,373 | 0.79 | (0.29 | ) | 60 | |||||||||||||||||
| 14.47 | 31,876 | 0.78 | (0.13 | ) | 79 | |||||||||||||||||
| 19.39 | 26,788 | 0.78 | (0.05 | ) | 77 | |||||||||||||||||
| (0.69 | ) | 29,092 | 0.78 | 0.11 | 73 | |||||||||||||||||
| 20.34 | % | $ | 1,748 | 1.04 | % | (0.56 | )% | 53 | % | |||||||||||||
| 13.61 | 1,525 | 1.04 | (0.54 | ) | 60 | |||||||||||||||||
| 14.19 | 1,441 | 1.03 | (0.40 | ) | 79 | |||||||||||||||||
| 19.19 | 575 | 1.03 | (0.30 | ) | 77 | |||||||||||||||||
| (0.73 | ) | 488 | 1.03 | (0.16 | ) | 73 | ||||||||||||||||
| See accompanying Notes to Financial Statements | | June 30, 2020 | | Annual Report | 123 |
Table of Contents
Financial Highlights (cont’d)
For a Share Outstanding for the Period ended:^
| Net Asset Value, Beginning of Period | Net Investment Income (a) | Net Realized | Total from Investment Operations | Dividends from Net Investment Income | Distributions from Net Realized Capital Gains | |||||||||||||||||||||||
| AllianzGI Mid-Cap Value: | ||||||||||||||||||||||||||||
| Class A | ||||||||||||||||||||||||||||
6/30/2020 | $ | 30.60 | $ | 0.38 | $ | (2.72 | ) | $ | (2.34 | ) | $ | (0.33 | ) | $ | (2.21 | ) | ||||||||||||
6/30/2019 | 30.06 | 0.44 | 0.54 | 0.98 | (0.31 | ) | (0.13 | ) | ||||||||||||||||||||
6/30/2018 | 31.41 | 0.39 | 1.27 | 1.66 | (0.26 | ) | (2.75 | ) | ||||||||||||||||||||
6/30/2017 | 24.37 | 0.36 | 7.03 | (d) | 7.39 | (0.33 | ) | (0.02 | ) | |||||||||||||||||||
6/30/2016 | 25.82 | 0.45 | (0.87 | ) | (0.42 | ) | (0.32 | ) | (0.71 | ) | �� | |||||||||||||||||
| Class C | ||||||||||||||||||||||||||||
6/30/2020 | $ | 25.16 | $ | 0.13 | $ | (2.18 | ) | $ | (2.05 | ) | $ | (0.16 | ) | $ | (2.21 | ) | ||||||||||||
6/30/2019 | 24.62 | 0.13 | 0.54 | 0.67 | — | (0.13 | ) | |||||||||||||||||||||
6/30/2018 | 26.22 | 0.12 | 1.08 | 1.20 | (0.05 | ) | (2.75 | ) | ||||||||||||||||||||
6/30/2017 | 20.43 | 0.13 | 5.87 | (d) | 6.00 | (0.19 | ) | (0.02 | ) | |||||||||||||||||||
6/30/2016 | 21.83 | 0.23 | (0.73 | ) | (0.50 | ) | (0.19 | ) | (0.71 | ) | ||||||||||||||||||
| Class R | ||||||||||||||||||||||||||||
6/30/2020 | $ | 26.16 | $ | 0.26 | $ | (2.26 | ) | $ | (2.00 | ) | $ | (0.30 | ) | $ | (2.21 | ) | ||||||||||||
6/30/2019 | 25.79 | 0.31 | 0.46 | 0.77 | (0.27 | ) | (0.13 | ) | ||||||||||||||||||||
6/30/2018 | 27.40 | 0.24 | 1.17 | 1.41 | (0.27 | ) | (2.75 | ) | ||||||||||||||||||||
6/30/2017 | 21.26 | 0.26 | 6.13 | (d) | 6.39 | (0.23 | ) | (0.02 | ) | |||||||||||||||||||
6/30/2016 | 22.68 | 0.34 | (0.76 | ) | (0.42 | ) | (0.29 | ) | (0.71 | ) | ||||||||||||||||||
| Class P | ||||||||||||||||||||||||||||
6/30/2020 | $ | 24.68 | $ | 0.36 | $ | (2.10 | ) | $ | (1.74 | ) | $ | (0.43 | ) | $ | (2.21 | ) | ||||||||||||
6/30/2019 | 24.35 | 0.41 | 0.43 | 0.84 | (0.38 | ) | (0.13 | ) | ||||||||||||||||||||
6/30/2018 | 26.01 | 0.37 | 1.10 | 1.47 | (0.38 | ) | (2.75 | ) | ||||||||||||||||||||
6/30/2017 | 20.27 | 0.32 | 5.87 | (d) | 6.19 | (0.43 | ) | (0.02 | ) | |||||||||||||||||||
6/30/2016 | 21.70 | 0.43 | (0.74 | ) | (0.31 | ) | (0.41 | ) | (0.71 | ) | ||||||||||||||||||
| Institutional Class | ||||||||||||||||||||||||||||
6/30/2020 | $ | 32.77 | $ | 0.51 | $ | (2.92 | ) | $ | (2.41 | ) | $ | (0.45 | ) | $ | (2.21 | ) | ||||||||||||
6/30/2019 | 32.15 | 0.58 | 0.57 | 1.15 | (0.40 | ) | (0.13 | ) | ||||||||||||||||||||
6/30/2018 | 33.41 | 0.51 | 1.38 | 1.89 | (0.40 | ) | (2.75 | ) | ||||||||||||||||||||
6/30/2017 | 25.88 | 0.48 | 7.47 | (d) | 7.95 | (0.40 | ) | (0.02 | ) | |||||||||||||||||||
6/30/2016 | 27.33 | 0.56 | (0.90 | ) | (0.34 | ) | (0.40 | ) | (0.71 | ) | ||||||||||||||||||
| Class R6 | ||||||||||||||||||||||||||||
6/30/2020 | $ | 32.75 | $ | 0.56 | $ | (2.95 | ) | $ | (2.39 | ) | $ | (0.47 | ) | $ | (2.21 | ) | ||||||||||||
6/30/2019 | 32.13 | 0.63 | 0.53 | 1.16 | (0.41 | ) | (0.13 | ) | ||||||||||||||||||||
12/18/2017* - 6/30/2018 | 36.74 | 0.18 | (1.61 | ) | (1.43 | ) | (0.43 | ) | (2.75 | ) | ||||||||||||||||||
| Administrative Class | ||||||||||||||||||||||||||||
6/30/2020 | $ | 31.57 | $ | 0.42 | $ | (2.81 | ) | $ | (2.39 | ) | $ | (0.38 | ) | $ | (2.21 | ) | ||||||||||||
6/30/2019 | 31.00 | 0.48 | 0.56 | 1.04 | (0.34 | ) | (0.13 | ) | ||||||||||||||||||||
6/30/2018 | 32.35 | 0.42 | 1.32 | 1.74 | (0.34 | ) | (2.75 | ) | ||||||||||||||||||||
6/30/2017 | 25.08 | 0.40 | 7.24 | (d) | 7.64 | (0.35 | ) | (0.02 | ) | |||||||||||||||||||
6/30/2016 | 26.54 | 0.49 | (0.89 | ) | (0.40 | ) | (0.35 | ) | (0.71 | ) | ||||||||||||||||||
| ^ | A “—” may reflect actual amounts rounding to less than $0.01 or 0.01%. |
| * | Commencement of operations. |
| (a) | Calculated on average shares outstanding during the period. |
| (b) | Total return is calculated assuming a purchase of a share on the first day of the year and a sale of a share on the last day of each year reported. Dividends and distributions, if any, are assumed, for purposes of this calculation, to be reinvested. Total return does not reflect sales charges and includes the effect of fee waivers and reimbursements. Total return may reflect adjustments to conform to U.S. GAAP. Total return for a period of less than one year is not annualized. |
| (c) | Does not include expenses of the investment companies in which the Fund invests. |
| (d) | Payments from securities litigation increased net realized and change in unrealized gain (loss) and net asset value per share by approximately $1.41 for Class A; $1.23 for Class C; $1.13 for Class R; $1.93 for Class P; $1.19 for Institutional Class and $1.63 for Administrative Class. The increase in total return per class was approximately 5.86% for Class A; 6.08% for Class C; 5.37% for Class R; 9.70% for Class P; 4.66% for Institutional Class and 6.58% for Administrative Class. |
| (e) | Annualized, unless otherwise noted. |
| 124 | Annual Report | | June 30, 2020 | | See accompanying Notes to Financial Statements |
Table of Contents
| Total Dividends and Distributions | Net Asset Value, End of Period | Total Return (b) | Net Assets, End of Period (000s) | Ratio of Expenses to Average Net Assets with Fee Waiver/ Reimbursement | Ratio of Expenses to Average Net Assets without Fee Waiver/ Reimbursement | Ratio of Net Investment Income to Average Net Assets | Portfolio Turnover Rate | |||||||||||||||||||||||||||
| $ | (2.54 | ) | $ | 25.72 | (8.93 | )% | $ | 474,970 | 0.99 | % | 1.21 | % | 1.30 | % | 197 | % | ||||||||||||||||||
| (0.44 | ) | 30.60 | 3.46 | 595,707 | 0.99 | 1.21 | 1.48 | 81 | ||||||||||||||||||||||||||
| (3.01 | ) | 30.06 | 4.88 | 518,293 | 1.04 | (c) | 1.21 | (c) | 1.22 | (c) | 31 | |||||||||||||||||||||||
| (0.35 | ) | 31.41 | (d) | 30.53 | (d) | 480,691 | 1.21 | (c) | 1.21 | (c) | 1.30 | (c) | 45 | |||||||||||||||||||||
| (1.03 | ) | 24.37 | (1.46 | ) | 363,166 | 1.23 | (c) | 1.23 | (c) | 1.88 | (c) | 50 | ||||||||||||||||||||||
| $ | (2.37 | ) | $ | 20.74 | (9.64 | )% | $ | 37,278 | 1.74 | % | 1.96 | % | 0.55 | % | 197 | % | ||||||||||||||||||
| (0.13 | ) | 25.16 | 2.73 | 48,176 | 1.74 | 1.96 | 0.54 | 81 | ||||||||||||||||||||||||||
| (2.80 | ) | 24.62 | 4.10 | 182,192 | 1.79 | (c) | 1.96 | (c) | 0.46 | (c) | 31 | |||||||||||||||||||||||
| (0.21 | ) | 26.22 | (d) | 29.52 | (d) | 168,922 | 1.96 | (c) | 1.96 | (c) | 0.59 | (c) | 45 | |||||||||||||||||||||
| (0.90 | ) | 20.43 | (2.16 | ) | 173,304 | 1.98 | (c) | 1.98 | (c) | 1.13 | (c) | 50 | ||||||||||||||||||||||
| $ | (2.51 | ) | $ | 21.65 | (9.17 | )% | $ | 16,268 | 1.24 | % | 1.46 | % | 1.05 | % | 197 | % | ||||||||||||||||||
| (0.40 | ) | 26.16 | 3.21 | 20,087 | 1.24 | 1.46 | 1.22 | 81 | ||||||||||||||||||||||||||
| (3.02 | ) | 25.79 | 4.65 | 15,644 | 1.27 | (c) | 1.46 | (c) | 0.90 | (c) | 31 | |||||||||||||||||||||||
| (0.25 | ) | 27.40 | (d) | 30.19 | (d) | 5,591 | 1.46 | (c) | 1.46 | (c) | 1.09 | (c) | 45 | |||||||||||||||||||||
| (1.00 | ) | 21.26 | (1.70 | ) | 6,969 | 1.48 | (c) | 1.48 | (c) | 1.58 | (c) | 50 | ||||||||||||||||||||||
| $ | (2.64 | ) | $ | 20.30 | (8.72 | )% | $ | 211,729 | 0.74 | % | 0.96 | % | 1.57 | % | 197 | % | ||||||||||||||||||
| (0.51 | ) | 24.68 | 3.75 | 197,201 | 0.74 | 0.96 | 1.70 | 81 | ||||||||||||||||||||||||||
| (3.13 | ) | 24.35 | 5.17 | 200,081 | 0.77 | (c) | 0.96 | (c) | 1.46 | (c) | 31 | |||||||||||||||||||||||
| (0.45 | ) | 26.01 | (d) | 30.82 | (d) | 52,167 | 0.96 | (c) | 0.96 | (c) | 1.39 | (c) | 45 | |||||||||||||||||||||
| (1.12 | ) | 20.27 | (1.19 | ) | 17,268 | 0.98 | (c) | 0.98 | (c) | 2.14 | (c) | 50 | ||||||||||||||||||||||
| $ | (2.66 | ) | $ | 27.70 | (8.62 | )% | $ | 385,311 | 0.64 | % | 0.86 | % | 1.67 | % | 197 | % | ||||||||||||||||||
| (0.53 | ) | 32.77 | 3.83 | 406,173 | 0.64 | 0.86 | 1.82 | 81 | ||||||||||||||||||||||||||
| (3.15 | ) | 32.15 | 5.26 | 332,110 | 0.66 | (c) | 0.86 | (c) | 1.53 | (c) | 31 | |||||||||||||||||||||||
| (0.42 | ) | 33.41 | (d) | 30.95 | (d) | 53,333 | 0.86 | (c) | 0.86 | (c) | 1.66 | (c) | 45 | |||||||||||||||||||||
| (1.11 | ) | 25.88 | (1.08 | ) | 55,877 | 0.88 | (c) | 0.88 | (c) | 2.16 | (c) | 50 | ||||||||||||||||||||||
| $ | (2.68 | ) | $ | 27.68 | (8.57 | )% | $ | 66,260 | 0.59 | % | 0.81 | % | 1.86 | % | 197 | % | ||||||||||||||||||
| (0.54 | ) | 32.75 | 3.89 | 18,052 | 0.59 | 0.81 | 2.03 | 81 | ||||||||||||||||||||||||||
| (3.18 | ) | 32.13 | (4.25 | ) | 2,167 | 0.59 | (c)(e) | 0.81 | (c)(e) | 1.04 | (c)(e) | 31 | ||||||||||||||||||||||
| $ | (2.59 | ) | $ | 26.59 | (8.85 | )% | $ | 33,511 | 0.89 | % | 1.11 | % | 1.43 | % | 197 | % | ||||||||||||||||||
| (0.47 | ) | 31.57 | 3.60 | 27,405 | 0.89 | 1.11 | 1.58 | 81 | ||||||||||||||||||||||||||
| (3.09 | ) | 31.00 | 4.98 | 18,947 | 0.92 | (c) | 1.11 | (c) | 1.32 | (c) | 31 | |||||||||||||||||||||||
| (0.37 | ) | 32.35 | (d) | 30.66 | (d) | 5,120 | 1.11 | (c) | 1.11 | (c) | 1.40 | (c) | 45 | |||||||||||||||||||||
| (1.06 | ) | 25.08 | (1.36 | ) | 3,792 | 1.13 | (c) | 1.13 | (c) | 1.98 | (c) | 50 | ||||||||||||||||||||||
| See accompanying Notes to Financial Statements | | June 30, 2020 | | Annual Report | 125 |
Table of Contents
Financial Highlights (cont’d)
For a Share Outstanding for the Period ended:^
| Net Asset Value, Beginning of Period | Net Investment Income (Loss) (a) | Net Realized | Total from Investment Operations | Dividends from Net Investment Income | Distributions from Net Realized Capital Gains | |||||||||||||||||||||||
| AllianzGI Small-Cap: | ||||||||||||||||||||||||||||
| Class A | ||||||||||||||||||||||||||||
6/30/2020 | $ | 19.50 | $ | 0.04 | $ | (1.98 | ) | $ | (1.94 | ) | $ | (0.01 | ) | $ | — | |||||||||||||
6/30/2019 | 21.61 | 0.07 | (0.53 | ) | (0.46 | ) | (0.02 | ) | (1.63 | ) | ||||||||||||||||||
6/30/2018 | 20.51 | (0.02 | ) | 3.92 | 3.90 | — | (2.80 | ) | ||||||||||||||||||||
6/30/2017 | 16.71 | 0.03 | 3.79 | 3.82 | (0.01 | ) | (0.01 | ) | ||||||||||||||||||||
6/30/2016 | 18.41 | 0.03 | (1.14 | ) | (1.11 | ) | (0.09 | ) | (0.50 | ) | ||||||||||||||||||
| Class C | ||||||||||||||||||||||||||||
6/30/2020 | $ | 18.68 | $ | (0.09 | ) | $ | (1.89 | ) | $ | (1.98 | ) | $ | — | $ | — | |||||||||||||
6/30/2019 | 20.92 | (0.07 | ) | (0.54 | ) | (0.61 | ) | — | (1.63 | ) | ||||||||||||||||||
6/30/2018 | 20.07 | (0.17 | ) | 3.82 | 3.65 | — | (2.80 | ) | ||||||||||||||||||||
6/30/2017 | 16.48 | (0.11 | ) | 3.71 | 3.60 | — | (0.01 | ) | ||||||||||||||||||||
6/30/2016 | 18.20 | (0.10 | ) | (1.12 | ) | (1.22 | ) | — | (0.50 | ) | ||||||||||||||||||
| Class P | ||||||||||||||||||||||||||||
6/30/2020 | $ | 19.74 | $ | 0.08 | $ | (1.99 | ) | $ | (1.91 | ) | $ | (0.07 | ) | $ | — | |||||||||||||
6/30/2019 | 21.81 | 0.12 | (0.53 | ) | (0.41 | ) | (0.03 | ) | (1.63 | ) | ||||||||||||||||||
6/30/2018 | 20.63 | 0.03 | 3.95 | 3.98 | — | (2.80 | ) | |||||||||||||||||||||
6/30/2017 | 16.77 | 0.07 | 3.81 | 3.88 | (0.01 | ) | (0.01 | ) | ||||||||||||||||||||
6/30/2016 | 18.49 | 0.07 | (1.15 | ) | (1.08 | ) | (0.14 | ) | (0.50 | ) | ||||||||||||||||||
| Institutional Class | ||||||||||||||||||||||||||||
6/30/2020 | $ | 19.90 | $ | 0.09 | $ | (1.99 | ) | $ | (1.90 | ) | $ | (0.08 | ) | $ | — | |||||||||||||
6/30/2019 | 21.96 | 0.14 | (0.53 | ) | (0.39 | ) | (0.04 | ) | (1.63 | ) | ||||||||||||||||||
6/30/2018 | 20.73 | 0.05 | 3.98 | 4.03 | — | (2.80 | ) | |||||||||||||||||||||
6/30/2017 | 16.84 | 0.10 | 3.81 | 3.91 | (0.01 | ) | (0.01 | ) | ||||||||||||||||||||
6/30/2016 | 18.49 | 0.08 | (1.13 | ) | (1.05 | ) | (0.10 | ) | (0.50 | ) | ||||||||||||||||||
| Class R6 | ||||||||||||||||||||||||||||
6/30/2020 | $ | 19.90 | $ | 0.14 | $ | (2.03 | ) | $ | (1.89 | ) | $ | (0.08 | ) | $ | — | |||||||||||||
8/22/2018* - 6/30/2019 | 23.16 | 0.13 | (1.71 | ) | (1.58 | ) | (0.05 | ) | (1.63 | ) | ||||||||||||||||||
| ^ | A “—” may reflect actual amounts rounding to less than $0.01 or 0.01%. |
| * | Commencement of operations. |
| (a) | Calculated on average shares outstanding during the period. |
| (b) | Total return is calculated assuming a purchase of a share on the first day of the year and a sale of a share on the last day of each year reported. Dividends and distributions, if any, are assumed, for purposes of this calculation, to be reinvested. Total return does not reflect sales charges and includes the effect of fee waivers and reimbursements. Total return may reflect adjustments to conform to U.S. GAAP. Total return for a period of less than one year is not annualized. |
| (c) | Payments from Affiliates increased the end of period net asset value and total return by less than $0.01 and 0.01%, respectively. |
| (d) | Does not include expenses of the investment companies in which the Fund invests. |
| (e) | Annualized, unless otherwise noted. |
| 126 | Annual Report | | June 30, 2020 | | See accompanying Notes to Financial Statements |
Table of Contents
| Total Dividends and Distributions | Net Asset Value, End of Period | Total Return (b) | Net Assets, End of Period (000s) | Ratio of Expenses to Average Net Assets with Fee Waiver/ Reimbursement | Ratio of Expenses to Average Net Assets without Fee Waiver/ Reimbursement | Ratio of Net Investment Income (Loss) to Average Net Assets | Portfolio Turnover Rate | |||||||||||||||||||||||||||
| $ | (0.01 | ) | $ | 17.55 | (c) | (9.95 | )%(c) | $ | 58,062 | 1.17 | %(d) | 1.27 | %(d) | 0.23 | %(d) | 110 | % | |||||||||||||||||
| (1.65 | ) | 19.50 | (0.62 | ) | 66,269 | 1.18 | 1.27 | 0.35 | 78 | |||||||||||||||||||||||||
| (2.80 | ) | 21.61 | 19.96 | 44,860 | 1.31 | (d) | 1.31 | (d) | (0.07 | )(d) | 126 | |||||||||||||||||||||||
| (0.02 | ) | 20.51 | (c) | 22.82 | (c) | 39,509 | 1.31 | 1.31 | 0.15 | 152 | ||||||||||||||||||||||||
| (0.59 | ) | 16.71 | (6.02 | ) | 32,660 | 1.27 | 1.31 | 0.17 | 139 | |||||||||||||||||||||||||
| $ | — | $ | 16.70 | (c) | (10.60 | )%(c) | $ | 4,251 | 1.92 | %(d) | 2.02 | %(d) | (0.53 | )%(d) | 110 | % | ||||||||||||||||||
| (1.63 | ) | 18.68 | (1.39 | ) | 7,873 | 1.93 | 2.02 | (0.36 | ) | 78 | ||||||||||||||||||||||||
| (2.80 | ) | 20.92 | 19.10 | 35,080 | 2.06 | (d) | 2.0 | 6(d) | (0.82 | )(d) | 126 | |||||||||||||||||||||||
| (0.01 | ) | 20.07 | (c) | 21.82 | (c) | 32,802 | 2.06 | 2.06 | (0.60 | ) | 152 | |||||||||||||||||||||||
| (0.50 | ) | 16.48 | (6.72 | ) | 36,607 | 2.02 | 2.06 | (0.58 | ) | 139 | ||||||||||||||||||||||||
| $ | (0.07 | ) | $ | 17.76 | (c) | (9.74 | )%(c) | $ | 16,747 | 0.92 | %(d) | 1.02 | %(d) | 0.44 | %(d) | 110 | % | |||||||||||||||||
| (1.66 | ) | 19.74 | (0.36 | ) | 9,637 | 0.93 | 1.02 | 0.61 | 78 | |||||||||||||||||||||||||
| (2.80 | ) | 21.81 | 20.25 | 6,883 | 1.06 | (d) | 1.06 | (d) | 0.12 | (d) | 126 | |||||||||||||||||||||||
| (0.02 | ) | 20.63 | (c) | 23.12 | (c) | 3,425 | 1.06 | 1.06 | 0.39 | 152 | ||||||||||||||||||||||||
| (0.64 | ) | 16.77 | (5.82 | ) | 3,246 | 1.02 | 1.06 | 0.43 | 139 | |||||||||||||||||||||||||
| $ | (0.08 | ) | $ | 17.92 | (c) | (9.62 | )%(c) | $ | 22,028 | 0.82 | %(d) | 0.92 | %(d) | 0.49 | %(d) | 110 | % | |||||||||||||||||
| (1.67 | ) | 19.90 | (0.29 | ) | 9,077 | 0.83 | 0.92 | 0.70 | 78 | |||||||||||||||||||||||||
| (2.80 | ) | 21.96 | 20.40 | 8,104 | 0.96 | (d) | 0.96 | (d) | 0.21 | (d) | 126 | |||||||||||||||||||||||
| (0.02 | ) | 20.73 | (c) | 23.22 | (c) | 3,037 | 0.96 | 0.96 | 0.52 | 152 | ||||||||||||||||||||||||
| (0.60 | ) | 16.84 | (5.69 | ) | 2,738 | 0.92 | 0.96 | 0.46 | 139 | |||||||||||||||||||||||||
| $ | (0.08 | ) | $ | 17.93 | (c) | (9.55 | )%(c) | $ | 9,114 | 0.77 | %(d) | 0.87 | %(d) | 0.71 | %(d) | 110 | % | |||||||||||||||||
| (1.68 | ) | 19.90 | (5.42 | ) | 17,792 | 0.77 | (e) | 0.87 | (e) | 0.76 | (e) | 78 | ||||||||||||||||||||||
| See accompanying Notes to Financial Statements | | June 30, 2020 | | Annual Report | 127 |
Table of Contents
Financial Highlights (cont’d)
For a Share Outstanding for the Year ended:^
| Net Asset Value, Beginning of Year | Net Investment Income (a) | Net Realized | Total from Investment Operations | Dividends from Net Investment Income | Distributions from Net Realized Capital Gains | |||||||||||||||||||||||
| AllianzGI Small-Cap Value: | ||||||||||||||||||||||||||||
| Class A | ||||||||||||||||||||||||||||
6/30/2020 | $ | 14.53 | $ | 0.18 | $ | (2.28 | ) | $ | (2.10 | ) | $ | (0.06 | ) | $ | (1.30 | ) | ||||||||||||
6/30/2019 | 21.71 | 0.29 | (2.73 | ) | (2.44 | ) | (0.62 | ) | (4.12 | ) | ||||||||||||||||||
6/30/2018 | 24.36 | 0.29 | 1.44 | 1.73 | (0.12 | ) | (4.26 | ) | ||||||||||||||||||||
6/30/2017 | 20.82 | 0.30 | 4.12 | 4.42 | (0.32 | ) | (0.56 | ) | ||||||||||||||||||||
6/30/2016 | 25.91 | 0.41 | (1.92 | ) | (1.51 | ) | (0.35 | ) | (3.23 | ) | ||||||||||||||||||
| Class C | ||||||||||||||||||||||||||||
6/30/2020 | $ | 12.97 | $ | 0.07 | $ | (2.00 | ) | $ | (1.93 | ) | $ | — | $ | (1.30 | ) | |||||||||||||
6/30/2019 | 19.30 | 0.16 | (2.41 | ) | (2.25 | ) | — | (4.08 | )* | |||||||||||||||||||
6/30/2018 | 22.14 | 0.11 | 1.31 | 1.42 | — | (4.26 | ) | |||||||||||||||||||||
6/30/2017 | 19.02 | 0.12 | 3.75 | 3.87 | (0.19 | ) | (0.56 | ) | ||||||||||||||||||||
6/30/2016 | 23.99 | 0.23 | (1.78 | ) | (1.55 | ) | (0.19 | ) | (3.23 | ) | ||||||||||||||||||
| Class R | ||||||||||||||||||||||||||||
6/30/2020 | $ | 15.85 | $ | 0.16 | $ | (2.53 | ) | $ | (2.37 | ) | $ | — | $ | (1.30 | ) | |||||||||||||
6/30/2019 | 23.10 | 0.26 | (2.85 | ) | (2.59 | ) | (0.54 | ) | (4.12 | ) | ||||||||||||||||||
6/30/2018 | 25.64 | 0.25 | 1.51 | 1.76 | (0.04 | ) | (4.26 | ) | ||||||||||||||||||||
6/30/2017 | 21.87 | 0.25 | 4.34 | 4.59 | (0.26 | ) | (0.56 | ) | ||||||||||||||||||||
6/30/2016 | 26.99 | 0.37 | (1.99 | ) | (1.62 | ) | (0.27 | ) | (3.23 | ) | ||||||||||||||||||
| Class P | ||||||||||||||||||||||||||||
6/30/2020 | $ | 16.79 | $ | 0.25 | $ | (2.68 | ) | $ | (2.43 | ) | $ | (0.09 | ) | $ | (1.30 | ) | ||||||||||||
6/30/2019 | 24.18 | 0.38 | (2.97 | ) | (2.59 | ) | (0.68 | ) | (4.12 | ) | ||||||||||||||||||
6/30/2018 | 26.69 | 0.39 | 1.56 | 1.95 | (0.20 | ) | (4.26 | ) | ||||||||||||||||||||
6/30/2017 | 22.74 | 0.36 | 4.54 | 4.90 | (0.39 | ) | (0.56 | ) | ||||||||||||||||||||
6/30/2016 | 27.92 | 0.51 | (2.06 | ) | (1.55 | ) | (0.40 | ) | (3.23 | ) | ||||||||||||||||||
| Institutional Class | ||||||||||||||||||||||||||||
6/30/2020 | $ | 16.95 | $ | 0.27 | $ | (2.72 | ) | $ | (2.45 | ) | $ | (0.07 | ) | $ | (1.30 | ) | ||||||||||||
6/30/2019 | 24.34 | 0.41 | (3.00 | ) | (2.59 | ) | (0.68 | ) | (4.12 | ) | ||||||||||||||||||
6/30/2018 | 26.82 | 0.42 | 1.58 | 2.00 | (0.22 | ) | (4.26 | ) | ||||||||||||||||||||
6/30/2017 | 22.84 | 0.42 | 4.53 | 4.95 | (0.41 | ) | (0.56 | ) | ||||||||||||||||||||
6/30/2016 | 28.05 | 0.55 | (2.08 | ) | (1.53 | ) | (0.45 | ) | (3.23 | ) | ||||||||||||||||||
| Class R6 | ||||||||||||||||||||||||||||
6/30/2020 | $ | 16.85 | $ | 0.27 | $ | (2.68 | ) | $ | (2.41 | ) | $ | (0.12 | ) | $ | (1.30 | ) | ||||||||||||
6/30/2019 | 24.25 | 0.41 | (2.99 | ) | (2.58 | ) | (0.70 | ) | (4.12 | ) | ||||||||||||||||||
6/30/2018 | 26.75 | 0.44 | 1.56 | 2.00 | (0.24 | ) | (4.26 | ) | ||||||||||||||||||||
6/30/2017 | 22.79 | 0.41 | 4.55 | 4.96 | (0.44 | ) | (0.56 | ) | ||||||||||||||||||||
6/30/2016 | 28.02 | 0.56 | (2.08 | ) | (1.52 | ) | (0.48 | ) | (3.23 | ) | ||||||||||||||||||
| Administrative Class | ||||||||||||||||||||||||||||
6/30/2020 | $ | 14.48 | $ | 0.19 | $ | (2.27 | ) | $ | (2.08 | ) | $ | (0.08 | ) | $ | (1.30 | ) | ||||||||||||
6/30/2019 | 21.65 | 0.30 | (2.73 | ) | (2.43 | ) | (0.62 | ) | (4.12 | ) | ||||||||||||||||||
6/30/2018 | 24.30 | 0.32 | 1.43 | 1.75 | (0.14 | ) | (4.26 | ) | ||||||||||||||||||||
6/30/2017 | 20.78 | 0.33 | 4.11 | 4.44 | (0.36 | ) | (0.56 | ) | ||||||||||||||||||||
6/30/2016 | 25.87 | 0.45 | (1.92 | ) | (1.47 | ) | (0.39 | ) | (3.23 | ) | ||||||||||||||||||
| ^ | A “—” may reflect actual amounts rounding to less than $0.01 or 0.01%. |
| * | The character of a portion of the distribution was redesignated from net investment income to net realized capital gain for the year ended June 30, 2019. The per share amount for Class C differs fromother classes, as at the time the distribution was made, Class C had minimal distributable net investment income, therefore no redesignation for Class C was made. |
| (a) | Calculated on average shares outstanding during the year. |
| (b) | Total return is calculated assuming a purchase of a share on the first day of the year and a sale of a share on the last day of each year reported. Dividends and distributions, if any, are assumed, for purposes of this calculation, to be reinvested. Total return does not reflect sales charges and includes the effect of fee waivers and reimbursements. Total return may reflect adjustments to conform to U.S. GAAP. |
| (c) | Does not include expenses of the investment companies in which the Fund invests. |
| 128 | Annual Report | | June 30, 2020 | | See accompanying Notes to Financial Statements |
Table of Contents
| Total Dividends and Distributions | Net Asset Value, End of Year | Total Return (b) | Net Assets, End of Year (000s) | Ratio of Expenses to Average Net Assets with Fee Waiver/ Reimbursement | Ratio of Expenses to Average Net Assets without Fee Waiver/ Reimbursement | Ratio of Net Investment Income to Average Net Assets | Portfolio Turnover Rate | |||||||||||||||||||||||||||
| $ | (1.36 | ) | $ | 11.07 | (16.62 | )% | $ | 267,845 | 1.17 | %(c) | 1.27 | %(c) | 1.37 | %(c) | 126 | % | ||||||||||||||||||
| (4.74 | ) | 14.53 | (7.70 | ) | 439,710 | 1.18 | 1.26 | 1.65 | 47 | |||||||||||||||||||||||||
| (4.38 | ) | 21.71 | 7.04 | 718,104 | 1.20 | 1.25 | 1.27 | 24 | ||||||||||||||||||||||||||
| (0.88 | ) | 24.36 | 21.38 | 788,438 | 1.20 | (c) | 1.24 | (c) | 1.31 | (c) | 30 | |||||||||||||||||||||||
| (3.58 | ) | 20.82 | (5.31 | ) | 1,037,525 | 1.22 | (c) | 1.23 | (c) | 1.88 | (c) | 48 | ||||||||||||||||||||||
| $ | (1.30 | ) | $ | 9.74 | (17.26 | )% | $ | 1,627 | 1.92 | %(c) | 2.02 | %(c) | 0.58 | %(c) | 126 | % | ||||||||||||||||||
| (4.08 | ) | 12.97 | (8.35 | ) | 3,984 | 1.93 | 2.01 | 0.88 | 47 | |||||||||||||||||||||||||
| (4.26 | ) | 19.30 | 6.26 | 106,052 | 1.95 | 2.00 | 0.54 | 24 | ||||||||||||||||||||||||||
| (0.75 | ) | 22.14 | 20.45 | 135,225 | 1.95 | (c) | 1.99 | (c) | 0.56 | (c) | 30 | |||||||||||||||||||||||
| (3.42 | ) | 19.02 | (5.99 | ) | 175,139 | 1.97 | (c) | 1.98 | (c) | 1.14 | (c) | 48 | ||||||||||||||||||||||
| $ | (1.30 | ) | $ | 12.18 | (16.86 | )% | $ | 14,258 | 1.42 | %(c) | 1.52 | %(c) | 1.13 | %(c) | 126 | % | ||||||||||||||||||
| (4.66 | ) | 15.85 | (7.97 | ) | 22,153 | 1.43 | 1.51 | 1.41 | 47 | |||||||||||||||||||||||||
| (4.30 | ) | 23.10 | 6.77 | 37,655 | 1.45 | 1.50 | 1.02 | 24 | ||||||||||||||||||||||||||
| (0.82 | ) | 25.64 | 21.09 | 51,759 | 1.45 | (c) | 1.49 | (c) | 1.04 | (c) | 30 | |||||||||||||||||||||||
| (3.50 | ) | 21.87 | (5.52 | ) | 64,707 | 1.47 | (c) | 1.48 | (c) | 1.62 | (c) | 48 | ||||||||||||||||||||||
| $ | (1.39 | ) | $ | 12.97 | (16.39 | )% | $ | 21,354 | 0.92 | %(c) | 1.02 | %(c) | 1.62 | %(c) | 126 | % | ||||||||||||||||||
| (4.80 | ) | 16.79 | (7.49 | ) | 39,426 | 0.93 | 1.01 | 1.91 | 47 | |||||||||||||||||||||||||
| (4.46 | ) | 24.18 | 7.27 | 65,466 | 0.95 | 1.00 | 1.54 | 24 | ||||||||||||||||||||||||||
| (0.95 | ) | 26.69 | 21.66 | 72,679 | 0.95 | (c) | 0.99 | (c) | 1.42 | (c) | 30 | |||||||||||||||||||||||
| (3.63 | ) | 22.74 | (5.01 | ) | 58,556 | 0.97 | (c) | 0.98 | (c) | 2.13 | (c) | 48 | ||||||||||||||||||||||
| $ | (1.37 | ) | $ | 13.13 | (16.31 | )% | $ | 99,894 | 0.82 | %(c) | 0.92 | %(c) | 1.67 | %(c) | 126 | % | ||||||||||||||||||
| (4.80 | ) | 16.95 | (7.42 | ) | 288,309 | 0.83 | 0.91 | 1.98 | 47 | |||||||||||||||||||||||||
| (4.48 | ) | 24.34 | 7.43 | 778,547 | 0.85 | 0.90 | 1.61 | 24 | ||||||||||||||||||||||||||
| (0.97 | ) | 26.82 | 21.82 | 1,213,861 | 0.83 | (c) | 0.89 | (c) | 1.68 | (c) | 30 | |||||||||||||||||||||||
| (3.68 | ) | 22.84 | (4.93 | ) | 1,800,472 | 0.82 | (c) | 0.88 | (c) | 2.28 | (c) | 48 | ||||||||||||||||||||||
| $ | (1.42 | ) | $ | 13.02 | (16.25 | )% | $ | 88,885 | 0.77 | %(c) | 0.87 | %(c) | 1.76 | %(c) | 126 | % | ||||||||||||||||||
| (4.82 | ) | 16.85 | (7.37 | ) | 150,200 | 0.78 | 0.86 | 2.04 | 47 | |||||||||||||||||||||||||
| (4.50 | ) | 24.25 | 7.44 | 347,379 | 0.80 | 0.85 | 1.70 | 24 | ||||||||||||||||||||||||||
| (1.00 | ) | 26.75 | 21.90 | 464,279 | 0.79 | (c) | 0.84 | (c) | 1.60 | (c) | 30 | |||||||||||||||||||||||
| (3.71 | ) | 22.79 | (4.86 | ) | 371,453 | 0.77 | (c) | 0.83 | (c) | 2.39 | (c) | 48 | ||||||||||||||||||||||
| $ | (1.38 | ) | $ | 11.02 | (16.58 | )% | $ | 34,323 | 1.07 | %(c) | 1.17 | %(c) | 1.39 | %(c) | 126 | % | ||||||||||||||||||
| (4.74 | ) | 14.48 | (7.64 | ) | 107,836 | 1.08 | 1.16 | 1.74 | 47 | |||||||||||||||||||||||||
| (4.40 | ) | 21.65 | 7.14 | 206,749 | 1.10 | 1.15 | 1.38 | 24 | ||||||||||||||||||||||||||
| (0.92 | ) | 24.30 | 21.52 | 365,241 | 1.09 | (c) | 1.14 | (c) | 1.43 | (c) | 30 | |||||||||||||||||||||||
| (3.62 | ) | 20.78 | (5.11 | ) | 494,621 | 1.07 | (c) | 1.13 | (c) | 2.03 | (c) | 48 | ||||||||||||||||||||||
| See accompanying Notes to Financial Statements | | June 30, 2020 | | Annual Report | 129 |
Table of Contents
Financial Highlights (cont’d)
For a Share Outstanding for the Year ended:^
| Net Asset Value, Beginning of Year | Net Investment Income (Loss) (a) | Net Realized | Total from Investment Operations | Distributions from Net Realized Capital Gains | Net Asset Value, End of Year | |||||||||||||||||||||||
| AllianzGI Technology: | ||||||||||||||||||||||||||||
| Class A | ||||||||||||||||||||||||||||
6/30/2020 | $ | 63.92 | $ | (0.68 | ) | $ | 16.01 | $ | 15.33 | $ | (11.19 | ) | $ | 68.06 | (d) | |||||||||||||
6/30/2019 | 71.60 | (0.68 | ) | 5.90 | 5.22 | (12.90 | ) | 63.92 | ||||||||||||||||||||
6/30/2018 | 60.82 | (0.64 | ) | 22.58 | 21.94 | (11.16 | ) | 71.60 | ||||||||||||||||||||
6/30/2017 | 48.03 | (0.17 | )(e) | 15.75 | 15.58 | (2.79 | ) | 60.82 | (e) | |||||||||||||||||||
6/30/2016 | 58.15 | (0.38 | ) | (1.07 | ) | (1.45 | ) | (8.67 | ) | 48.03 | ||||||||||||||||||
| Class C | ||||||||||||||||||||||||||||
6/30/2020 | $ | 45.22 | $ | (0.76 | ) | $ | 10.41 | $ | 9.65 | $ | (11.19 | ) | $ | 43.68 | (d) | |||||||||||||
6/30/2019 | 55.32 | (0.92 | ) | 3.72 | 2.80 | (12.90 | ) | 45.22 | ||||||||||||||||||||
6/30/2018 | 49.43 | (0.91 | ) | 17.96 | 17.05 | (11.16 | ) | 55.32 | ||||||||||||||||||||
6/30/2017 | 39.80 | (0.46 | )(e) | 12.88 | 12.42 | (2.79 | ) | 49.43 | (e) | |||||||||||||||||||
6/30/2016 | 49.98 | (0.66 | ) | (0.85 | ) | (1.51 | ) | (8.67 | ) | 39.80 | ||||||||||||||||||
| Class P | ||||||||||||||||||||||||||||
6/30/2020 | $ | 72.49 | $ | (0.60 | ) | $ | 18.58 | $ | 17.98 | $ | (11.19 | ) | $ | 79.28 | (d) | |||||||||||||
6/30/2019 | 79.05 | (0.58 | ) | 6.92 | 6.34 | (12.90 | ) | 72.49 | ||||||||||||||||||||
6/30/2018 | 66.03 | (0.53 | ) | 24.71 | 24.18 | (11.16 | ) | 79.05 | ||||||||||||||||||||
6/30/2017 | 51.80 | — | (e) | 17.02 | 17.02 | (2.79 | ) | 66.03 | (e) | |||||||||||||||||||
6/30/2016 | 61.90 | (0.27 | ) | (1.16 | ) | (1.43 | ) | (8.67 | ) | 51.80 | ||||||||||||||||||
| Institutional Class | ||||||||||||||||||||||||||||
6/30/2020 | $ | 74.10 | $ | (0.55 | ) | $ | 19.07 | $ | 18.52 | $ | (11.19 | ) | $ | 81.43 | (d) | |||||||||||||
6/30/2019 | 80.40 | (0.52 | ) | 7.12 | 6.60 | (12.90 | ) | 74.10 | ||||||||||||||||||||
6/30/2018 | 66.94 | (0.45 | ) | 25.07 | 24.62 | (11.16 | ) | 80.40 | ||||||||||||||||||||
6/30/2017 | 52.43 | 0.06 | (e) | 17.24 | 17.30 | (2.79 | ) | 66.94 | (e) | |||||||||||||||||||
6/30/2016 | 62.49 | (0.24 | ) | (1.15 | ) | (1.39 | ) | (8.67 | ) | 52.43 | ||||||||||||||||||
| Administrative Class | ||||||||||||||||||||||||||||
6/30/2020 | $ | 68.67 | $ | (0.67 | ) | $ | 17.43 | $ | 16.76 | $ | (11.19 | ) | $ | 74.24 | (d) | |||||||||||||
6/30/2019 | 75.76 | (0.67 | ) | 6.48 | 5.81 | (12.90 | ) | 68.67 | ||||||||||||||||||||
6/30/2018 | 63.76 | (0.61 | ) | 23.77 | 23.16 | (11.16 | ) | 75.76 | ||||||||||||||||||||
6/30/2017 | 50.18 | (0.23 | )(e) | 16.60 | 16.37 | (2.79 | ) | 63.76 | (e) | |||||||||||||||||||
6/30/2016 | 60.32 | (0.36 | ) | (1.11 | ) | (1.47 | ) | (8.67 | ) | 50.18 | ||||||||||||||||||
| ^ | A “—” may reflect actual amounts rounding to less than $0.01 or 0.01%. |
| (a) | Calculated on average shares outstanding during the year. |
| (b) | Total return is calculated assuming a purchase of a share on the first day of the year and a sale of a share on the last day of each year reported. Dividends and distributions, if any, are assumed, for purposes of this calculation, to be reinvested. Total return does not reflect sales charges and includes the effect of fee waivers and reimbursements. Total return may reflect adjustments to conform to U.S. GAAP. |
| (c) | Does not include expenses of the investment companies in which the Fund invests. |
| (d) | Payments from Affiliates increased the end of period net asset value and total return by less than $0.01 and 0.01%, respectively. |
| (e) | An out of period adjustment of $3,694,541, which is included in miscellaneous income, related to income earned in previous years, decreased net investment loss per share and increased net asset value per share by approximately $0.15 for Class A; $0.13 for Class C; $0.20 for Class P; $0.20 for Institutional Class and $0.04 for Administrative Class. The increase in total return and decrease in ratio of net investment loss to average net assets relating to this income for each share class was approximately 0.33% and 0.28% for Class A; 0.35% and 0.29% for Class C; 0.40% and 0.33% for Class P; 0.40% and 0.32% for Institutional Class; 0.09% and 0.08% for Administrative Class, respectively. |
| 130 | Annual Report | | June 30, 2020 | | See accompanying Notes to Financial Statements |
Table of Contents
| Total Return (b) | Net Assets, End of Year (000s) | Ratio of Expenses to | Ratio of Expenses to Assets without Fee Waiver/ | Ratio of Net Investment Income (Loss) to Average Net Assets (c) | Portfolio Turnover Rate | |||||||||||||||||||||
| 28.34 | %(d) | $ | 664,833 | 1.57 | % | 1.57 | % | (1.12 | )% | 212 | % | |||||||||||||||
| 12.40 | 601,112 | 1.51 | 1.56 | (1.05 | ) | 109 | ||||||||||||||||||||
| 38.89 | 530,127 | 1.42 | 1.57 | (0.95 | ) | 104 | ||||||||||||||||||||
| 33.69 | (e) | 452,039 | 1.51 | 1.61 | (0.31 | )(e) | 128 | |||||||||||||||||||
| (3.24 | ) | 417,305 | 1.66 | 1.66 | (0.74 | ) | 171 | |||||||||||||||||||
| 27.37 | %(d) | $ | 50,421 | 2.32 | % | 2.32 | % | (1.87 | )% | 212 | % | |||||||||||||||
| 11.57 | 48,842 | 2.23 | 2.31 | (1.78 | ) | 109 | ||||||||||||||||||||
| 37.86 | 138,589 | 2.17 | 2.32 | (1.70 | ) | 104 | ||||||||||||||||||||
| 32.69 | (e) | 113,411 | 2.26 | 2.36 | (1.05 | )(e) | 128 | |||||||||||||||||||
| (3.95 | ) | 112,423 | 2.41 | 2.41 | (1.53 | ) | 171 | |||||||||||||||||||
| 28.67 | %(d) | $ | 154,810 | 1.32 | % | 1.32 | % | (0.87 | )% | 212 | % | |||||||||||||||
| 12.68 | 155,553 | 1.27 | 1.31 | (0.80 | ) | 109 | ||||||||||||||||||||
| 39.24 | 100,560 | 1.17 | 1.32 | (0.71 | ) | 104 | ||||||||||||||||||||
| 34.03 | (e) | 59,369 | 1.26 | 1.35 | (0.01 | )(e) | 128 | |||||||||||||||||||
| (2.99 | ) | 44,881 | 1.41 | 1.41 | (0.50 | ) | 171 | |||||||||||||||||||
| 28.78 | %(d) | $ | 995,709 | 1.22 | % | 1.22 | % | (0.78 | )% | 212 | % | |||||||||||||||
| 12.81 | 800,061 | 1.16 | 1.21 | (0.69 | ) | 109 | ||||||||||||||||||||
| 39.37 | 789,922 | 1.07 | 1.22 | (0.59 | ) | 104 | ||||||||||||||||||||
| 34.16 | (e) | 736,162 | 1.16 | 1.25 | 0.09 | (e) | 128 | |||||||||||||||||||
| (2.89 | ) | 518,761 | 1.31 | 1.31 | (0.43 | ) | 171 | |||||||||||||||||||
| 28.46 | %(d) | $ | 11,669 | 1.47 | % | 1.47 | % | (1.02 | )% | 212 | % | |||||||||||||||
| 12.52 | 11,688 | 1.40 | 1.46 | (0.95 | ) | 109 | ||||||||||||||||||||
| 39.02 | 23,535 | 1.32 | 1.47 | (0.85 | ) | 104 | ||||||||||||||||||||
| 33.83 | (e) | 15,062 | 1.44 | 1.52 | (0.41 | )(e) | 128 | |||||||||||||||||||
| (3.15 | ) | 62,913 | 1.56 | 1.56 | (0.68 | ) | 171 | |||||||||||||||||||
| See accompanying Notes to Financial Statements | | June 30, 2020 | | Annual Report | 131 |
Table of Contents
June 30, 2020
| 1. | ORGANIZATION AND SIGNIFICANT ACCOUNTING POLICIES |
Allianz Funds (the “Trust”) is registered under the Investment Company Act of 1940 (the “1940 Act”), as amended, as an open-end management investment company organized as a Massachusetts business trust and accordingly, follows the investment company accounting and reporting guidance of the Financial Accounting Standards Board (“FASB”) Accounting Standards Codification Topic 946 Financial Services—Investment Companies. As of June 30, 2020, the Trust consisted of thirteen separate investment series (each a “Fund” and collectively the “Funds”). Allianz Global Investors U.S. LLC (“AllianzGI U.S.” or the “Investment Adviser”) serves as the Funds’ investment adviser. AllianzGI U.S. is an indirect, wholly-owned subsidiary of PFP Holdings, Inc. and is a member of Munich based Allianz Group. Currently, the Trust offers up to seven classes of shares to new and existing investors: A, C, R, P, Institutional, R6 and Administrative. Class C shares of a Fund will automatically convert to Class A shares of the same Fund following the ten-year anniversary of purchase. Such conversions are subject to certain limitations.
The investment objective of each of AllianzGI Dividend Value (formerly known as AllianzGI NFJ Dividend Value), AllianzGI International Value (formerly known as AllianzGI NFJ International Value), AllianzGI Large-Cap Value (formerly known as AllianzGI NFJ Large-Cap Value), AllianzGI Mid-Cap Value (formerly known as AllianzGI NFJ Mid-Cap Value) and AllianzGI Small-Cap Value (formerly known as AllianzGI NFJ Small-Cap Value) is to seek long-term growth of capital and income. The investment objective of AllianzGI Emerging Markets Opportunities is to seek maximum long-term capital appreciation. The investment objective of each of AllianzGI Focused Growth, AllianzGI Global Small-Cap, AllianzGI Health Sciences, AllianzGI Mid-Cap, AllianzGI Small-Cap and AllianzGI Technology is to seek long-term capital appreciation. The investment objective of AllianzGI Income & Growth is to seek total return comprised of current income, current gains and capital appreciation. There can be no assurance that the Funds will meet their stated objectives.
The preparation of the Funds’ financial statements in accordance with accounting principles generally accepted in the United States of America (“U.S. GAAP”) requires the Funds’ management to make estimates and assumptions that affect the reported amounts and disclosures in each Fund’s financial statements. Actual results could differ from those estimates.
Like many other companies, the Trust’s organizational documents provide that its officers (“Officers”) and the Board of Trustees (the “Board” or the “Trustees”) are indemnified against certain liabilities arising out of the performance of their duties to the Trust. In addition, both in some of its principal service contracts and in the normal course of its business, the Trust enters into contracts that provide indemnifications to other parties for certain types of losses or liabilities. The Trust’s maximum exposure under these arrangements is unknown as this could involve future claims against the Trust.
The following is a summary of significant accounting policies consistently followed by the Funds:
(a) Valuation of Investments. Portfolio securities and other financial instruments for which market quotations are readily available are valued at market value. Market values for various types of securities and other instruments are determined on the basis of closing prices or last sales prices on an exchange or other market, based on quotes or other market information obtained from quotation reporting systems, established market makers or independent pricing services. Investments in mutual funds are valued at the net asset value (“NAV”) as reported on each business day, and under normal circumstances. Exchange-traded funds (“ETFs”) are valued at their current market trading price. The Funds’ investments are valued daily using prices supplied by an independent pricing service or broker/dealer quotations, or by using the last sale or settlement price on the exchange that is the primary market for such securities, or the mean between the last bid and ask quotations. The market value for NASDAQ Global Market and NASDAQ Capital Market securities may also be calculated using the NASDAQ Official Closing Price instead of the last reported sales price. Independent pricing services use information provided by market makers or estimates of market values obtained from yield data relating to investments or securities with similar characteristics.
The Board has adopted procedures for valuing portfolio securities and other financial derivative instruments in circumstances where market quotes are not readily available (including in cases where available market quotes are deemed to be unreliable), and has delegated primary responsibility for applying the valuation methods to the Investment Adviser. The Trust’s Valuation Committee was established by the Board to oversee the implementation of the Funds’ valuation methods and to make fair value determinations on behalf of the Board, as instructed. The Investment Adviser monitors the continued appropriateness of methods applied and identifies circumstances and events that may require fair valuation. The Investment Adviser determines if adjustments should be made in light of market changes, events affecting the issuer or other factors. If the Investment Adviser determines that a valuation method may no longer be appropriate, another valuation method previously approved by the Trust’s Valuation Committee may be selected or the Trust’s Valuation Committee will be convened to consider the matter and take any appropriate action in accordance with procedures set forth by the Board. The Board shall review and ratify the appropriateness of the valuation methods and these methods may be amended or supplemented from time to time by the Trust’s Valuation Committee.
Short-term debt investments having a remaining maturity of 60 days or less are valued at amortized cost unless the Board or its Valuation Committee determines that particular circumstances dictate otherwise.
Investments initially valued in currencies other than the U.S. dollar are converted to the U.S. dollar using exchange rates obtained from pricing services. As a result, the NAV of each share class of a Fund may
| 132 | June 30, 2020 | | Annual Report |
Table of Contents
be affected by changes in the value of currencies in relation to the U.S. dollar. The value of securities traded in markets outside the United States or denominated in currencies other than the U.S. dollar may be affected significantly on a day that the New York Stock Exchange (“NYSE”) is closed and the NAV of a Fund’s shares may change on days when an investor is not able to purchase or redeem or exchange shares.
The prices used by the Funds to value investments may differ from the value that would be realized if the investments were sold, and these differences could be material to the Funds’ financial statements. The NAV of each share class of a Fund is normally determined as of the close of regular trading (normally, 4:00 p.m., Eastern Time) on the NYSE on each day the NYSE is open for business. In unusual circumstances, the Board or the Valuation Committee may in good faith determine the NAV as of 4:00 p.m., Eastern Time, notwithstanding an earlier, unscheduled close or halt of trading on the NYSE.
The prices of certain portfolio securities or financial instruments may be determined at a time prior to the close of regular trading on the NYSE. In considering whether fair value pricing is required and in determining fair values, the Funds may, among other things, consider significant events (which may be considered to include changes in the value of U.S. securities or securities indices) that occur after the close of the relevant market and before the time the NAV of each share class of a Fund is calculated. With respect to certain foreign securities, the Funds may fair-value securities using modeling tools provided by third-party vendors, where appropriate. The Funds have retained a statistical research service to assist in determining the fair value of foreign securities. This service utilizes statistics and programs based on historical performance of markets and other economic data to assist in making fair value estimates. Fair value estimates used by the Funds for foreign securities may differ from the value realized from the sale of those securities and the difference could be material to the financial statements. Fair value pricing may require subjective determinations about the value of a security or other assets, and fair values used to determine the NAV of each share class of a Fund may differ from quoted or published prices, or from prices that are used by others, for the same investments. In addition, the use of fair value pricing may not always result in adjustments to the prices of securities or other assets held by a Fund.
(b) Fair Value Measurements. Fair value is defined as the price that would be received to sell an asset or paid to transfer a liability (i.e., the “exit price”) in an orderly transaction between market participants. The three levels of the fair value hierarchy are described below:
| ∎ | Level 1—quoted prices in active markets for identical investments that the Funds have the ability to access |
| ∎ | Level 2—valuations based on other significant observable inputs, which may include, but are not limited to, quoted prices for similar assets or liabilities, interest rates, yield curves, volatilities, prepayment speeds, loss severities, credit risks and default rates or other market corroborated inputs |
| ∎ | Level 3—valuations based on significant unobservable inputs (including the Investment Adviser’s or the Trust’s Valuation Committee’s own assumptions and securities whose price was determined by using a single broker’s quote) |
The valuation techniques used by the Funds to measure fair value during the year ended June 30, 2020 were intended to maximize the use of observable inputs and to minimize the use of unobservable inputs.
An investment asset’s or liability’s level within the fair value hierarchy is based on the lowest level input, individually or in aggregate, that is significant to the fair value measurement. The objective of fair value measurement remains the same even when there is a significant decrease in the volume and level of activity for an asset or liability and regardless of the valuation techniques used.
The inputs or methodology used for valuing securities are not necessarily an indication of the risk associated with investing in those securities. The following are certain inputs and techniques that the Funds generally use to evaluate how to classify each major category of assets and liabilities within Level 2 and Level 3, in accordance with U.S. GAAP.
An asset or liability for which market values cannot be measured using the methodologies described above is valued by methods deemed reasonable in good faith by the Valuation Committee, following the procedures established by the Board, to represent fair value. Under these procedures, the Funds generally use a market-based approach which may use related or comparable assets or liabilities, recent transactions, market multiples, book values and other relevant information. Fair value determinations involve the consideration of a number of subjective factors, an analysis of applicable facts and circumstances and the exercise of judgment. As a result, it is possible that the fair value for a security determined in good faith in accordance with the Funds’ valuation procedures may differ from valuations for the same security determined by other funds using their own valuation procedures. Although the Funds’ valuation procedures are designed to value a security at the price the Funds may reasonably expect to receive upon the security’s sale in an orderly transaction, there can be no assurance that any fair value determination thereunder would, in fact, approximate the amount that the Funds would actually realize upon the sale of the security or the price at which the security would trade if a reliable market price were readily available.
Equity Securities (Common and Preferred Stock and Warrants)—Equity securities traded in inactive markets and certain foreign equity securities are valued using inputs which include broker-dealer quotes, recently executed transactions adjusted for changes in the benchmark index, or evaluated price quotes received from independent pricing services that take into account the integrity of the market sector and issuer, the individual characteristics of the security, and information received from broker-dealers and other market sources pertaining to the issuer or security. To the extent that these inputs are observable, the values of equity securities are categorized as Level 2. To the extent that these inputs are unobservable, the values are categorized as Level 3.
| Annual Report | | June 30, 2020 | 133 |
Table of Contents
Notes to Financial Statements (cont’d)
June 30, 2020
Corporate Bonds & Notes—Corporate bonds & notes are generally comprised of two main categories: investment grade bonds and high yield bonds. Investment grade bonds are valued by independent pricing services using various inputs and techniques, which include broker-dealer quotations, live trading levels, recently executed transactions in securities of the issuer or comparable issuers, and option adjusted spread models that include base curve and spread curve inputs. Adjustments to individual bonds can be applied to recognize trading differences compared to other bonds issued by the same issuer. High yield bonds are valued by independent pricing services based primarily on broker-dealer quotations from relevant market makers and recently executed transactions in securities of the issuer or comparable issuers. The broker-dealer quotations received are supported by credit analysis of the issuer that takes into consideration credit quality assessments, daily trading activity, and the activity of the underlying equities, listed bonds and sector-specific trends. To the extent that these inputs are observable, the values of corporate bonds & notes are categorized as Level 2. To the extent that these inputs are unobservable, the values are categorized as Level 3.
Convertible Bonds & Notes—Convertible bonds & notes are valued by independent pricing services based on various inputs and techniques, which include broker-dealer quotations from relevant market makers and recently executed transactions in securities of the issuer or comparable issuers. The broker-dealer quotations received are supported by credit analysis of the issuer that takes into
consideration credit quality assessments, daily trading activity, and the activity of the underlying equities, listed bonds and sector-specific trends. To the extent that these inputs are observable, the values of convertible bonds & notes are categorized as Level 2. To the extent that these inputs are unobservable, the values are categorized as Level 3.
Option Contracts—Option contracts traded over-the-counter (“OTC”) and FLexible EXchange (“FLEX”) options are valued by independent pricing services based on pricing models that incorporate various inputs such as interest rates, credit spreads, currency exchange rates and volatility measurements for in-the-money, at-the-money, and out-of-the-money contracts based on a given strike price. To the extent that these inputs are observable, the values of OTC and FLEX option contracts are categorized as Level 2. To the extent that these inputs are unobservable, the values are categorized as Level 3.
Forward Foreign Currency Contracts—Forward foreign currency contracts are valued by independent pricing services using various inputs and techniques, which include broker-dealer quotations, actual trading information and foreign currency exchange rates gathered from leading market makers and foreign currency exchange trading centers throughout the world. To the extent that these inputs are observable, the values of forward foreign currency contracts are categorized as Level 2. To the extent that these inputs are unobservable, the values are categorized as Level 3.
A summary of the inputs used at June 30, 2020 in valuing each Fund’s assets and liabilities is listed below (refer to the Schedules of Investments and Notes to Schedules of Investments for more detailed information on Investments in Securities and Other Financial Instruments):
| AllianzGI Dividend Value: | ||||||||||||||||
| Investments in Securities – Assets | Level 1– Quoted Prices | Level 2– Other Significant Observable Inputs | Level 3– Significant Unobservable Inputs | Value at 6/30/20 | ||||||||||||
Common Stock | $ | 838,206,336 | — | — | $ | 838,206,336 | ||||||||||
Repurchase Agreements | — | $ | 7,571,000 | — | 7,571,000 | |||||||||||
Totals | $ | 838,206,336 | $ | 7,571,000 | — | $ | 845,777,336 | |||||||||
| AllianzGI Emerging Markets Opportunities: | ||||||||||||||||
| Investments in Securities – Assets | Level 1– Quoted Prices | Level 2– Other Significant Observable Inputs | Level 3– Significant Unobservable Inputs | Value at 6/30/20 | ||||||||||||
Common Stock: |
| |||||||||||||||
Brazil | $ | 3,354,418 | — | — | $ | 3,354,418 | ||||||||||
China | 28,463,730 | $ | 84,041,845 | — | 112,505,575 | |||||||||||
India | 5,264,268 | 14,797,683 | — | 20,061,951 | ||||||||||||
South Africa | 5,452,388 | 1,383,695 | — | 6,836,083 | ||||||||||||
Thailand | — | — | $ | 7,604,987 | 7,604,987 | |||||||||||
United States | 1,466,556 | — | — | 1,466,556 | ||||||||||||
All Other | — | 97,160,893 | — | 97,160,893 | ||||||||||||
Preferred Stock | 2,480,623 | — | — | 2,480,623 | ||||||||||||
Totals | $ | 46,481,983 | $ | 197,384,116 | $ | 7,604,987 | $ | 251,471,086 | ||||||||
| 134 | June 30, 2020 | | Annual Report |
Table of Contents
| AllianzGI Focused Growth: | ||||||||||||||||
| Investments in Securities – Assets | Level 1– Quoted Prices | Level 2– Other Significant Observable Inputs | Level 3– Significant Unobservable Inputs | Value at 6/30/20 | ||||||||||||
Common Stock | $ | 1,068,373,008 | — | — | $ | 1,068,373,008 | ||||||||||
Repurchase Agreements | — | $ | 12,301,000 | — | 12,301,000 | |||||||||||
| 1,068,373,008 | 12,301,000 | — | 1,080,674,008 | |||||||||||||
Investments in Securities – Liabilities |
| |||||||||||||||
Options Written: |
| |||||||||||||||
Market Price | (35,375 | ) | — | — | (35,375 | ) | ||||||||||
Totals | $ | 1,068,337,633 | $ | 12,301,000 | — | $ | 1,080,638,633 | |||||||||
| AllianzGI Global Small-Cap: | ||||||||||||||||
| Investments in Securities – Assets | Level 1– Quoted Prices | Level 2– Other Significant Observable Inputs | Level 3– Significant Unobservable Inputs | Value at 6/30/20 | ||||||||||||
Common Stock: |
| |||||||||||||||
Australia | — | $ | 1,827,215 | — | $ | 1,827,215 | ||||||||||
Denmark | — | 914,340 | — | 914,340 | ||||||||||||
Finland | — | 367,283 | — | 367,283 | ||||||||||||
France | — | 1,576,953 | — | 1,576,953 | ||||||||||||
Germany | — | 2,569,182 | — | 2,569,182 | ||||||||||||
Hong Kong | $ | 195,818 | 490,512 | — | 686,330 | |||||||||||
Indonesia | — | 45,034 | — | 45,034 | ||||||||||||
Ireland | — | 311,180 | — | 311,180 | ||||||||||||
Italy | — | 732,641 | — | 732,641 | ||||||||||||
Japan | — | 9,275,867 | — | 9,275,867 | ||||||||||||
Korea (Republic of) | — | 222,318 | — | 222,318 | ||||||||||||
Netherlands | — | 952,207 | — | 952,207 | ||||||||||||
Norway | — | 762,427 | — | 762,427 | ||||||||||||
Singapore | — | 523,694 | — | 523,694 | ||||||||||||
Sweden | — | 813,681 | — | 813,681 | ||||||||||||
Switzerland | 281,873 | 1,670,822 | — | 1,952,695 | ||||||||||||
Taiwan | — | 576,324 | — | 576,324 | ||||||||||||
United Kingdom | 387,563 | 4,737,509 | — | 5,125,072 | ||||||||||||
All Other | 43,796,286 | — | — | 43,796,286 | ||||||||||||
Preferred Stock | — | 521,470 | — | 521,470 | ||||||||||||
Repurchase Agreements | — | 834,000 | — | 834,000 | ||||||||||||
| 44,661,540 | 29,724,659 | — | 74,386,199 | |||||||||||||
Other Financial Instruments* – Liabilities |
| |||||||||||||||
Foreign Exchange Contracts | — | (29 | ) | — | (29 | ) | ||||||||||
Totals | $ | 44,661,540 | $ | 29,724,630 | — | $ | 74,386,170 | |||||||||
| AllianzGI Health Sciences: | ||||||||||||||||
| Investments in Securities – Assets | Level 1– Quoted Prices | Level 2– Other Significant Observable Inputs | Level 3– Significant Unobservable Inputs | Value at 6/30/20 | ||||||||||||
Common Stock: |
| |||||||||||||||
Pharmaceuticals | $ | 69,752,969 | $ | 4,812,445 | — | $ | 74,565,414 | |||||||||
All Other | 82,015,284 | — | — | 82,015,284 | ||||||||||||
Warrants | — | — | $ | 262,666 | 262,666 | |||||||||||
Rights | — | — | 957 | 957 | ||||||||||||
Repurchase Agreements | — | 7,167,000 | — | 7,167,000 | ||||||||||||
Totals | $ | 151,768,253 | $ | 11,979,445 | $ | 263,623 | $ | 164,011,321 | ||||||||
| Annual Report | | June 30, 2020 | 135 |
Table of Contents
Notes to Financial Statements (cont’d)
June 30, 2020
| AllianzGI Income & Growth: | ||||||||||||||||
| Investments in Securities – Assets | Level 1– Quoted Prices | Level 2– Other Significant Observable Inputs | Level 3– Significant Unobservable Inputs | Value at 6/30/20 | ||||||||||||
Common Stock: |
| |||||||||||||||
Advertising | — | — | $ | 157,575 | $ | 157,575 | ||||||||||
Aerospace & Defense | $ | 12,006,150 | — | 183,201 | 12,189,351 | |||||||||||
Apparel & Textiles | — | — | 28,890 | 28,890 | ||||||||||||
Banks | 16,930,800 | — | 7 | 16,930,807 | ||||||||||||
Commercial Services | — | — | 576,798 | 576,798 | ||||||||||||
Media | — | — | 784,514 | 784,514 | ||||||||||||
Oil, Gas & Consumable Fuels | 19,459,189 | — | 17 | 19,459,206 | ||||||||||||
Pharmaceuticals | 58,019,485 | $ | 2,373,809 | — | 60,393,294 | |||||||||||
All Other | 1,570,021,144 | — | — | 1,570,021,144 | ||||||||||||
Corporate Bonds & Notes: |
| |||||||||||||||
Commercial Services | — | 54,408,230 | 179,166 | 54,587,396 | ||||||||||||
Computers | — | 16,831,854 | 65 | 16,831,919 | ||||||||||||
Diversified Financial Services | — | 51,557,151 | 3,301,117 | 54,858,268 | ||||||||||||
Media | — | 138,469,279 | 8 | 138,469,287 | ||||||||||||
All Other | — | 1,135,400,150 | — | 1,135,400,150 | ||||||||||||
Convertible Bonds & Notes | — | 1,291,107,680 | — | 1,291,107,680 | ||||||||||||
Convertible Preferred Stock: |
| |||||||||||||||
Computers | — | 8,543,094 | — | 8,543,094 | ||||||||||||
Diversified Financial Services | — | 9,683,776 | — | 9,683,776 | ||||||||||||
All Other | 302,646,980 | — | — | 302,646,980 | ||||||||||||
Preferred Stock | — | — | 16,230,676 | 16,230,676 | ||||||||||||
Mutual Funds | 9,447,349 | — | — | 9,447,349 | ||||||||||||
Warrants | — | — | 16,272 | 16,272 | ||||||||||||
Repurchase Agreements | — | 178,891,000 | — | 178,891,000 | ||||||||||||
| 1,988,531,097 | 2,887,266,023 | 21,458,306 | 4,897,255,426 | |||||||||||||
Investments in Securities – Liabilities |
| |||||||||||||||
Options Written: |
| |||||||||||||||
Market Price | (1,204,673 | ) | — | — | (1,204,673 | ) | ||||||||||
Totals | $ | 1,987,326,424 | $ | 2,887,266,023 | $ | 21,458,306 | $ | 4,896,050,753 | ||||||||
| AllianzGI International Value: | ||||||||||||||||
| Investments in Securities – Assets | Level 1– Quoted Prices | Level 2– Other Significant Observable Inputs | Level 3– Significant Unobservable Inputs | Value at 6/30/20 | ||||||||||||
Common Stock: |
| |||||||||||||||
Canada | $ | 9,825,906 | — | — | $ | 9,825,906 | ||||||||||
China | 1,274,829 | $ | 18,969,835 | — | 20,244,664 | |||||||||||
India | 327,312 | 682,742 | — | 1,010,054 | ||||||||||||
Netherlands | 1,178,068 | 1,898,697 | — | 3,076,765 | ||||||||||||
Russian Federation | 2,580,629 | — | — | 2,580,629 | ||||||||||||
Spain | 617,479 | 1,992,401 | — | 2,609,880 | ||||||||||||
Taiwan | 2,394,331 | 2,663,244 | — | 5,057,575 | ||||||||||||
United Kingdom | 5,645,996 | 5,164,920 | — | 10,810,916 | ||||||||||||
United States | 8,826,846 | — | — | 8,826,846 | ||||||||||||
All Other | — | 60,500,755 | — | 60,500,755 | ||||||||||||
Preferred Stock | — | 1,703,910 | — | 1,703,910 | ||||||||||||
Repurchase Agreements | — | 1,090,000 | — | 1,090,000 | ||||||||||||
Totals | $ | 32,671,396 | $ | 94,666,504 | — | $ | 127,337,900 | |||||||||
| 136 | June 30, 2020 | | Annual Report |
Table of Contents
| AllianzGI Large-Cap Value: | ||||||||||||||||
| Investments in Securities – Assets | Level 1– Quoted Prices | Level 2– Other Significant Observable Inputs | Level 3– Significant Unobservable Inputs | Value at 6/30/20 | ||||||||||||
Common Stock | $ | 263,083,842 | — | — | $ | 263,083,842 | ||||||||||
Repurchase Agreements | — | $ | 4,096,000 | — | 4,096,000 | |||||||||||
Totals | $ | 263,083,842 | $ | 4,096,000 | — | $ | 267,179,842 | |||||||||
| AllianzGI Mid-Cap: | ||||||||||||||||
| Investments in Securities – Assets | Level 1– Quoted Prices | Level 2– Other Significant Observable Inputs | Level 3– Significant Unobservable Inputs | Value at 6/30/20 | ||||||||||||
Common Stock | $ | 351,061,870 | — | — | $ | 351,061,870 | ||||||||||
Repurchase Agreements | — | $ | 557,000 | — | 557,000 | |||||||||||
Totals | $ | 351,061,870 | $ | 557,000 | — | $ | 351,618,870 | |||||||||
| AllianzGI Mid-Cap Value: | ||||||||||||||||
| Investments in Securities – Assets | Level 1– Quoted Prices | Level 2– Other Significant Observable Inputs | Level 3– Significant Unobservable Inputs | Value at 6/30/20 | ||||||||||||
Common Stock | $ | 1,219,787,623 | — | — | $ | 1,219,787,623 | ||||||||||
Repurchase Agreements | — | $ | 6,159,000 | — | 6,159,000 | |||||||||||
Totals | $ | 1,219,787,623 | $ | 6,159,000 | — | $ | 1,225,946,623 | |||||||||
| AllianzGI Small-Cap: | ||||||||||||||||
| Investments in Securities – Assets | Level 1– Quoted Prices | Level 2– Other Significant Observable Inputs | Level 3– Significant Unobservable Inputs | Value at 6/30/20 | ||||||||||||
Common Stock | $ | 107,875,322 | — | — | $ | 107,875,322 | ||||||||||
Mutual Funds | 133,950 | — | — | 133,950 | ||||||||||||
Preferred Stock | 73,222 | — | — | 73,222 | ||||||||||||
Rights | — | — | — | † | — | † | ||||||||||
Repurchase Agreements | — | $ | 2,225,000 | — | 2,225,000 | |||||||||||
Totals | $ | 108,082,494 | $ | 2,225,000 | — | † | $ | 110,307,494 | ||||||||
| AllianzGI Small-Cap Value: | ||||||||||||||||
| Investments in Securities – Assets | Level 1– Quoted Prices | Level 2– Other Significant Observable Inputs | Level 3– Significant Unobservable Inputs | Value at 6/30/20 | ||||||||||||
Common Stock | $ | 522,674,681 | — | — | $ | 522,674,681 | ||||||||||
Exchange-Traded Funds | 1,916,161 | — | — | 1,916,161 | ||||||||||||
Repurchase Agreements | — | $ | 4,855,000 | — | 4,855,000 | |||||||||||
Totals | $ | 524,590,842 | $ | 4,855,000 | — | $ | 529,445,842 | |||||||||
| Annual Report | | June 30, 2020 | 137 |
Table of Contents
Notes to Financial Statements (cont’d)
June 30, 2020
| AllianzGI Technology: | ||||||||||||||||
| Investments in Securities – Assets | Level 1– Quoted Prices | Level 2– Other Significant Observable Inputs | Level 3– Significant Unobservable Inputs | Value at 6/30/20 | ||||||||||||
Common Stock: |
| |||||||||||||||
Electronic Equipment, Instruments & Components | $ | 32,246 | $ | 9,856,647 | — | $ | 9,888,893 | |||||||||
Entertainment | 65,839,428 | 44,707 | — | 65,884,135 | ||||||||||||
Interactive Media & Services | 127,608,810 | 113,275 | — | 127,722,085 | ||||||||||||
IT Services | 347,342,007 | 55,055 | — | 347,397,062 | ||||||||||||
Semiconductors & Semiconductor Equipment | 241,836,038 | 9,801,721 | — | 251,637,759 | ||||||||||||
Technology Hardware, Storage & Peripherals | 173,404,902 | 42,805,746 | — | 216,210,648 | ||||||||||||
All Other | 693,805,828 | — | — | 693,805,828 | ||||||||||||
Repurchase Agreements | — | 139,883,000 | — | 139,883,000 | ||||||||||||
Options Purchased: |
| |||||||||||||||
Market Price | 38,956,535 | — | — | 38,956,535 | ||||||||||||
| 1,688,825,794 | 202,560,151 | — | 1,891,385,945 | |||||||||||||
Investments in Securities – Liabilities |
| |||||||||||||||
Options Written: |
| |||||||||||||||
Market Price | (11,133,735 | ) | — | — | (11,133,735 | ) | ||||||||||
Securities Sold Short, at value | (21,147 | ) | — | — | (21,147 | ) | ||||||||||
| (11,154,882 | ) | — | — | (11,154,882 | ) | |||||||||||
Totals | $ | 1,677,670,912 | $ | 202,560,151 | — | $ | 1,880,231,063 | |||||||||
A roll forward of fair value measurements using significant unobservable inputs (Level 3) for the year ended June 30, 2020, was as follows:
| AllianzGI Emerging Markets Opportunities: | ||||||||||||||||||||||||||||||||||||
| Investments in Securities – Assets | Beginning Balance 6/30/19 | Purchases | Sales | Accrued Discount (Premiums) | Net Realized Gain (Loss) | Net Change in Unrealized Appreciation/ Depreciation | Transfers into Level 3 | Transfers out of Level 3 | Ending Balance 6/30/20 | |||||||||||||||||||||||||||
Common Stock: |
| |||||||||||||||||||||||||||||||||||
Russian Federation | $ | 3,377,025 | — | $ | (2,944,548 | ) | — | $ | (1,046,200 | ) | $ | 613,723 | — | — | — | |||||||||||||||||||||
Thailand | 7,596,712 | $ | 4,306,082 | (4,315,877 | ) | — | (604,693 | ) | 622,763 | — | — | $ | 7,604,987 | |||||||||||||||||||||||
Preferred Stock | 5,739,783 | — | (4,246,035 | ) | — | (401,688 | ) | (1,092,060 | ) | — | — | — | ||||||||||||||||||||||||
Totals | $ | 16,713,520 | $ | 4,306,082 | $ | (11,506,460 | ) | — | $ | (2,052,581 | ) | $ | 144,426 | — | — | $ | 7,604,987 | |||||||||||||||||||
| AllianzGI Global Small-Cap: | ||||||||||||||||||||||||||||||||||||
| Investments in Securities – Assets | Beginning Balance 6/30/19 | Purchases | Sales | Accrued Discount (Premiums) | Net Realized Gain (Loss) | Net Change in Unrealized Appreciation/ Depreciation | Transfers into Level 3 | Transfers out of Level 3 | Ending Balance 6/30/20 | |||||||||||||||||||||||||||
Common Stock: |
| |||||||||||||||||||||||||||||||||||
Australia | $ | 46,051 | — | $ | (44,355 | )†† | — | — | $ | (1,696 | ) | — | — | — | ||||||||||||||||||||||
Thailand | 257,201 | $ | 10,864 | (183,577 | ) | — | $ | (61,252 | ) | (23,236 | ) | — | — | — | ||||||||||||||||||||||
Totals | $ | 303,252 | $ | 10,864 | $ | (227,932 | ) | — | $ | (61,252 | ) | $ | (24,932 | ) | — | — | — | |||||||||||||||||||
| AllianzGI Health Sciences: | ||||||||||||||||||||||||||||||||||||
| Investments in Securities – Assets | Beginning Balance 6/30/19 | Purchases | Sales | Accrued Discount (Premiums) | Net Realized Gain (Loss) | Net Change in Unrealized Appreciation/ Depreciation | Transfers into Level 3 | Transfers out of Level 3 | Ending Balance 6/30/20 | |||||||||||||||||||||||||||
Warrants | $ | 184,981 | — | — | — | — | $ | 77,685 | — | — | $ | 262,666 | ||||||||||||||||||||||||
Rights | — | $ | 957 | †† | — | — | — | — | — | — | 957 | |||||||||||||||||||||||||
Totals | $ | 184,981 | $ | 957 | — | — | — | $ | 77,685 | — | — | $ | 263,623 | |||||||||||||||||||||||
| 138 | June 30, 2020 | | Annual Report |
Table of Contents
| AllianzGI Income & Growth: | ||||||||||||||||||||||||||||||||||||
| Investments in Securities – Assets | Beginning Balance 6/30/19 | Purchases | Sales | Accrued Discount (Premiums) | Net Realized Gain (Loss) | Net Change in Unrealized Appreciation/ Depreciation | Transfers into Level 3 | Transfers out of Level 3 | Ending Balance 6/30/20 | |||||||||||||||||||||||||||
Common Stock: |
| |||||||||||||||||||||||||||||||||||
Advertising | $ | 266,445 | — | — | — | — | $ | (108,870 | ) | — | — | $ | 157,575 | |||||||||||||||||||||||
Aerospace & Defense | 272,411 | — | — | — | — | (89,210 | ) | — | — | 183,201 | ||||||||||||||||||||||||||
Apparel & Textiles | 44,930 | — | — | — | — | (16,040 | ) | — | — | 28,890 | ||||||||||||||||||||||||||
Banks | 7 | — | — | — | — | — | — | — | 7 | |||||||||||||||||||||||||||
Commercial Services | 576,798 | — | — | — | — | — | — | — | 576,798 | |||||||||||||||||||||||||||
Media | 1,018,843 | — | — | — | — | (234,329 | ) | — | — | 784,514 | ||||||||||||||||||||||||||
Oil, Gas & Consumable Fuels | 18 | — | $ | (218,790 | ) | — | — | 218,789 | — | — | 17 | |||||||||||||||||||||||||
Corporate Bonds & Notes: |
| |||||||||||||||||||||||||||||||||||
Commercial Services | 476,780 | — | (118,132 | )†† | $ | 24 | — | (179,506 | ) | — | — | 179,166 | ||||||||||||||||||||||||
Computers | — | — | †† | — | — | — | 65 | — | — | 65 | ||||||||||||||||||||||||||
Diversified Financial Services | 3,683,024 | $ | 1,748,124 | ††† | — | 110,665 | — | (2,240,696 | ) | — | — | 3,301,117 | ||||||||||||||||||||||||
Media | 8 | — | — | — | — | — | — | — | 8 | |||||||||||||||||||||||||||
Convertible Bonds & Notes: |
| |||||||||||||||||||||||||||||||||||
Banks | 17,201,932 | — | (17,491,543 | ) | — | $ | (253,758 | ) | 543,369 | — | — | — | ||||||||||||||||||||||||
Semiconductors | — | — | (6,766 | ) | — | 6,766 | — | — | — | — | ||||||||||||||||||||||||||
Preferred Stock | 18,217,438 | — | — | — | — | (1,986,762 | ) | — | — | 16,230,676 | ||||||||||||||||||||||||||
Warrants: |
| |||||||||||||||||||||||||||||||||||
Advertising | 69,799 | — | — | — | — | (65,189 | ) | — | — | 4,610 | ||||||||||||||||||||||||||
Iron/Steel | — | — | — | — | — | 11,658 | — | — | 11,658 | |||||||||||||||||||||||||||
Media | 4 | — | — | — | — | — | — | — | 4 | |||||||||||||||||||||||||||
Totals | $ | 41,828,437 | $ | 1,748,124 | $ | (17,835,231 | ) | $ | 110,689 | $ | (246,992 | ) | $ | (4,146,721 | ) | — | — | $ | 21,458,306 | |||||||||||||||||
The table for AllianzGI Income & Growth includes Level 3 investments that are valued by brokers and independent pricing services. The inputs for these investments are not readily available or cannot be reasonably estimated and are generally those inputs described in Note 1(b).
| AllianzGI Small-Cap: | ||||||||||||||||||||||||||||||||||||
| Investments in Securities – Assets | Beginning Balance 6/30/19 | Purchases | Sales | Accrued Discount (Premiums) | Net Realized Gain (Loss) | Net Change in Unrealized Appreciation/ Depreciation | Transfers into Level 3 | Transfers out of Level 3 | Ending Balance 6/30/20 | |||||||||||||||||||||||||||
Common Stock: |
| |||||||||||||||||||||||||||||||||||
Equity Real Estate Investment Trusts (REITs) | $ | 2,074 | — | $ | (4,147 | ) | — | $ | (6,015 | ) | $ | 8,088 | — | — | — | |||||||||||||||||||||
Rights | — | $ | 661 | †† | — | — | — | (661 | ) | — | — | — | † | |||||||||||||||||||||||
Totals | $ | 2,074 | $ | 661 | $ | (4,147 | ) | — | $ | (6,015 | ) | $ | 7,427 | — | — | — | † | |||||||||||||||||||
| AllianzGI Small-Cap Value: | ||||||||||||||||||||||||||||||||||||
| Investments in Securities – Assets | Beginning Balance 6/30/19 | Purchases | Sales | Accrued Discount (Premiums) | Net Realized Gain (Loss) | Net Change in Unrealized Appreciation/ Depreciation | Transfers into Level 3 | Transfers out of Level 3 | Ending Balance 6/30/20 | |||||||||||||||||||||||||||
Common Stock: |
| |||||||||||||||||||||||||||||||||||
Chemicals | $ | 56 | — | — | †,†† | — | — | $ | (56 | ) | — | — | — | |||||||||||||||||||||||
The tables above may include Level 3 investments that are valued by brokers or independent pricing services. The inputs for these investments are not readily available or cannot be reasonably estimated and are generally those inputs described in Note 1(b).
| Annual Report | | June 30, 2020 | 139 |
Table of Contents
Notes to Financial Statements (cont’d)
June 30, 2020
The following tables present additional information about valuation techniques and inputs used for investments that are measured at fair value and categorized within Level 3 at June 30, 2020:
| AllianzGI Health Sciences: | ||||||||||||||||
| Investments in Securities –Assets | Ending Balance at 6/30/20 | Valuation Technique Used | Unobservable Inputs | Input Values | ||||||||||||
Warrants: | ||||||||||||||||
Pharmaceuticals | $ | 262,666 | Black Scholes Model | Implied Price | $ | 7.22 | ||||||||||
| Volatility | 43.58 | % | ||||||||||||||
| AllianzGI Income & Growth: | ||||||||||||||||
| Investments in Securities – Assets | Ending Balance at 6/30/20 | Valuation Technique Used | Unobservable Inputs | Input Values (Ranges) | ||||||||||||
Common Stock: | ||||||||||||||||
Advertising | $ | 157,575 | Market and Company Comparables | EV Multiples | 1.87x (1.07x-3.78x | ) | ||||||||||
| 7.68x (6.12x-10.07x) | ||||||||||||||||
| M&A Transaction Multiples | 1.90x (1.32x-2.50x | ) | ||||||||||||||
| Illiquidity Discount | 20 | % | ||||||||||||||
Aerospace & Defense | $ | 183,201 | Market and Company Comparables | EV Multiples | 0.48x (0.43x-0.53x | ) | ||||||||||
| 4.95x (3.23x-6.33x | ) | |||||||||||||||
| 0.46x (0.39x-0.53x | ) | |||||||||||||||
| M&A Transaction Multiples | 0.80x (0.38x-2.12x | ) | ||||||||||||||
| Illiquidity Discount | 40 | % | ||||||||||||||
Apparel & Textiles | $ | 28,890 | Market and Company Comparables | EV Multiples | 0.51x (0.19x-0.97x | ) | ||||||||||
| 9.66x (3.59x-22.96x | ) | |||||||||||||||
| 0.63x (0.22x-1.67x | ) | |||||||||||||||
| Illiquidity Discount | 20 | % | ||||||||||||||
Media | $ | 784,494 | Market and Company Comparables | EV Multiples | 0.84x (0.40x-3.60x | ) | ||||||||||
| 6.22x (4.99x-26.80x | ) | |||||||||||||||
| M&A Transaction Multiples | 8.52x (6.65x-10.11x | ) | ||||||||||||||
| Illiquidity Discount | 10 | % | ||||||||||||||
Corporate Bonds & Notes: | ||||||||||||||||
Diversified Financial Services | $ | 3,301,117 | Market and Company Comparables | EV Multiples | 1.03x (0.66x-1.73x | ) | ||||||||||
| 3.10x (1.02x-4.71x | ) | |||||||||||||||
| 0.63x (0.38x-0.78x | ) | |||||||||||||||
| Illiquidity Discount | 20 | % | ||||||||||||||
Preferred Stock: | ||||||||||||||||
Media | $ | 1,190,020 | Market and Company Comparables | EV Multiples | 0.60x (0.21x-0.95x | ) | ||||||||||
| Illiquidity Discount | 1%-30 | % | ||||||||||||||
| $ | 15,040,576 | Market and Company Comparables | EV Multiples | 0.60x (0.21x-0.95x | ) | |||||||||||
| Illiquidity Discount | 30 | % | ||||||||||||||
Warrants: | ||||||||||||||||
Iron/Steel | $ | 11,658 | Black-Scholes Model | Volatility | 43.07 | % | ||||||||||
| Implied Price | $ | 27.01 | ||||||||||||||
The tables above do not include Level 3 Investments that are valued by the brokers or independent pricing services.
| * | Other financial instruments are derivatives, such as forward foreign currency contracts which are valued at the unrealized appreciation (depreciation) of the instrument. |
| † | Actual amount rounds to less than $1. |
| †† | Issued or removed via corporate action. |
| ††† | Payment-in-Kind. |
The net change in unrealized appreciation/depreciation of Level 3 investments which the following Funds held at June 30, 2020 was:
AllianzGI Emerging Markets Opportunities | $ | 809,485 | ||
AllianzGI Health Sciences | 77,685 | |||
AllianzGI Income & Growth | (5,026,987 | ) |
| 140 | June 30, 2020 | | Annual Report |
Table of Contents
Net realized gain (loss) and net change in unrealized appreciation/depreciation are reflected on the Statements of Operations.
(c) Investment Transactions and Investment Income. Investment transactions are accounted for on the trade date. Securities purchased and sold on a when-issued or delayed-delivery basis may be settled beyond a standard settlement period for the security after the trade date. Realized gains and losses on investments are determined on an identified cost basis. Estimated tax liabilities on certain foreign securities are recorded on an accrual basis and are reflected as a component of net change in unrealized appreciation (depreciation) of investments on the Statements of Operations. Tax liabilities realized as a result of such security sales are reflected as a component of net realized gain (loss) on investments on the Statements of Operations. Interest income adjusted for the accretion of discounts and amortization of premiums is recorded on an accrual basis. Discounts or premiums on debt securities purchased are accreted or amortized, respectively, to interest income. Conversion premium is not amortized. Dividend income is recorded on the ex-dividend date, except for certain dividends from foreign securities where the ex-dividend date may have passed, and then are recorded as soon after the ex-dividend date as the Funds, using reasonable diligence, become aware of such dividends. Dividend and interest income on the Statements of Operations are shown net of any foreign taxes withheld on income from foreign securities. Payments received from real estate investment trust securities may be comprised of dividends, realized gains and return of capital. The payment may initially be recorded as dividend income and may subsequently be reclassified as realized gains and/or return of capital upon receipt of information from the issuer. Payments considered return of capital reduce the cost basis of the respective security. Distributions, if any, in excess of the cost basis of a security are recognized as capital gains. Dividends from underlying funds are recorded as dividend income, while capital gain distributions are recorded as net capital gain distributions received from underlying funds on the Statements of Operations. Consent fees relating to corporate actions are recorded as miscellaneous income upon receipt. Expenses are recorded on an accrual basis and such expenses exclude those of the underlying funds. Expenses of the underlying funds are reflected in the NAV of those funds.
(d) Federal Income Taxes. The Funds intend to distribute all of their taxable income and to comply with the other requirements of Subchapter M of the U.S. Internal Revenue Code of 1986, as amended, applicable to regulated investment companies. Accordingly, no provision for U.S. federal income taxes is required. The Funds may be subject to excise tax based on distributions to shareholders.
Accounting for uncertainty in income taxes establishes for all entities, including pass-through entities such as the Funds, a minimum threshold for financial statement recognition of the benefit of positions taken in filing tax returns (including whether an entity is taxable in a particular jurisdiction), and requires certain expanded tax disclosures. In accordance with provisions set forth under U.S. GAAP, the Investment Adviser has reviewed the Funds’ tax positions for all
open tax years. As of June 30, 2020, the Funds have recorded no liability for net unrecognized tax benefits relating to uncertain income tax positions they have taken. The Funds’ U.S. federal income tax returns for the prior three years, as applicable, remain subject to examination by the Internal Revenue Service.
(e) Dividends and Distributions to Shareholders. Dividends from net investment income, if any, of each Fund (except AllianzGI Dividend Value, AllianzGI Income & Growth, AllianzGI International Value and AllianzGI Large-Cap Value), are declared and distributed to shareholders annually. Dividends from net investment income, if any, for AllianzGI Dividend Value, AllianzGI International Value and AllianzGI Large-Cap Value are declared and distributed quarterly. Dividends from net investment income and/or distributions from short-term capital gains for AllianzGI Income & Growth, if any, are declared and distributed monthly. Net realized capital gains, if any, earned by each Fund, will be distributed annually. The Funds record dividends and distributions to their respective shareholders on the ex-dividend date. The amount of dividends from net investment income and distributions from net realized capital gains is determined in accordance with U.S. federal income tax regulations, which may differ from U.S. GAAP. These “book-tax” differences are considered either temporary or permanent in nature. To the extent these differences are permanent in nature, such amounts are reclassified within the capital accounts based on their U.S. federal income tax treatment. Temporary differences do not require reclassification. To the extent dividends and/or distributions exceed current and accumulated earnings and profits for U.S. federal income tax purposes, they are reported as dividends and/or distributions to shareholders from return of capital.
(f) Multi-Class Operations. Each class offered by the Funds has equal rights as to assets and voting privileges (except that shareholders of a class have exclusive voting rights regarding any matter relating solely to that class of shares). Income, non-class specific expenses, and realized and unrealized capital gains and losses of each Fund are allocated daily to each class of shares based on the relative net assets of each class. Class specific expenses, where applicable, include administration, distribution and servicing fees.
(g) Foreign Currency Translation. The Funds’ accounting records are maintained in U.S. dollars as follows: (1) the foreign currency market values of investments and other assets and liabilities denominated in foreign currencies are translated at the prevailing exchange rate at the end of the period; and (2) purchases and sales, income and expenses are translated at the prevailing exchange rate on the respective dates of such transactions. The resulting net foreign currency gain (loss) is included in the Funds’ Statements of Operations.
The Funds do not generally isolate that portion of the results of operations arising as a result of changes in foreign currency exchange rates from the fluctuations arising from changes in the market prices of securities. Accordingly, such foreign currency gain (loss) is included in net realized and unrealized gain (loss) on investments. However,
| Annual Report | | June 30, 2020 | 141 |
Table of Contents
Notes to Financial Statements (cont’d)
June 30, 2020
the Funds do isolate the effect of fluctuations in foreign currency exchange rates when determining the gain (loss) upon the sale or maturity of foreign currency denominated debt obligations pursuant to U.S. federal income tax regulations; such amount is categorized as foreign currency gain (loss) for both financial reporting and income tax reporting purposes.
(h) Repurchase Agreements. The Funds are parties to Master Repurchase Agreements (“Master Repo Agreements”) with select counterparties. The Master Repo Agreements include provisions for initiation of repurchase transactions, income payments, events of default, and maintenance of collateral.
The Funds enter into transactions, under the Master Repo Agreements, with their custodian bank or securities brokerage firms whereby they purchase securities under agreements (i.e., repurchase agreements) to resell such securities at an agreed upon price and date. The Funds, through their custodian, take possession of securities collateralizing the repurchase agreement. Such agreements are carried at the contract amount in the financial statements, which is considered to represent fair value. The collateral that is pledged (i.e. the securities received by the Funds), which consists primarily of U.S. government obligations and asset-backed securities, is held by the custodian bank for the benefit of the Funds until the maturity of the repurchase agreement. Provisions of the repurchase agreements and the procedures adopted by the Funds require that the market value of the collateral, including accrued interest thereon, be sufficient in the event of default by the counterparty. If the counterparty defaults under the Master Repo Agreements and the value of the collateral declines or if the counterparty enters an insolvency proceeding, realization of the collateral by the Funds may be delayed or limited. The gross values are included in the Funds’ Schedules of Investments. As of June 30, 2020, the value of the related collateral exceeded the value of the repurchase agreements for each Fund.
(i) Securities Sold Short. Certain Funds engage in short sales for investment and risk management purposes. Short sales are transactions in which a Fund sells a security or other instrument (such as an option, forward, future or other derivative contract) it does not own. When a Fund engages in a short sale, it must borrow the security sold short and deliver it to the counterparty. The Funds will ordinarily have to pay a fee or premium to borrow a security and be obligated to repay the lender of the security any dividend or interest that accrues on the security during the period of the loan. Until a short position is closed out, the net proceeds of the short sale will be retained by the lending broker to the extent necessary to meet margin requirements, together with any additional assets the broker requires as collateral. This collateral earns interest and the interest is used to pay each lender a fee for borrowed securities, to compensate the broker for its services, and to provide a rebate to the borrower (the Fund) for posting the collateral. The net proceeds from these transactions are shown as miscellaneous income or miscellaneous expense on the Statements of Operations. A Fund is also required to designate, on its books or the books of its custodian, liquid assets (less any additional collateral held by the broker) to cover the short sale obligation, marked
to market daily. Short sales expose the Funds to the risk that they will be required to cover the short position at a time when the security or other asset has appreciated in value, thus resulting in losses to the applicable Fund. A short sale is “against the box” if a Fund holds in its portfolio or has the right to acquire the security sold short at no additional cost. The Funds will be subject to additional risks to the extent that they engage in short sales that are not “against the box.” A Fund’s loss on a short sale could theoretically be unlimited in cases where the Fund is unable, for whatever reason, to close out its short position.
(j) Warrants. The Funds may receive warrants. Warrants are securities that are usually issued together with a debt security or preferred stock and that give the holder the right to buy a proportionate amount of common stock at a specified price. Warrants may be freely transferable and are often traded on major exchanges. Warrants normally have a life that is measured in years and entitle the holder to buy common stock of a company at a price that is usually higher than the market price at the time the warrant is issued. Warrants may entail greater risks than certain other types of investments. Generally, warrants do not carry the right to receive dividends or exercise voting rights with respect to the underlying securities, and they do not represent any rights in the assets of the issuer. In addition, their value does not necessarily change with the value of the underlying securities, and they cease to have value if they are not exercised on or before their expiration date. If the market price of the underlying stock does not exceed the exercise price during the life of the warrant, the warrant will expire worthless. Warrants may increase the potential profit or loss to be realized from the investment as compared with investing the same amount in the underlying securities. Similarly, the percentage increase or decrease in the value of an equity security warrant may be greater than the percentage increase or decrease in the value of the underlying common stock. Warrants may relate to the purchase of equity or debt securities. Debt obligations with warrants attached to purchase equity securities have many characteristics of convertible securities and their prices may, to some degree, reflect the performance of the underlying stock. Debt obligations also may be issued with warrants attached to purchase additional debt securities at the same coupon rate. A decline in interest rates would permit a Fund to sell such warrants at a profit. If interest rates rise, these warrants would generally expire with no value.
(k) Rights. The Funds may receive rights. A right is a privilege granted to existing shareholders of a corporation to subscribe for shares of a new issue of common stock before it is issued. Rights normally have a short life, usually two to four weeks, are freely transferable and entitle the holder to buy the new common stock at a lower price than the public offering price. Rights may entail greater risks than certain other types of investments. Generally, rights do not carry the right to receive dividends or exercise voting rights with respect to the underlying securities, and they do not represent any rights in the assets of the issuer. In addition, their value does not necessarily change with the value of the underlying securities, and
| 142 | June 30, 2020 | | Annual Report |
Table of Contents
they cease to have value if they are not exercised on or before their expiration date. If the market price of the underlying stock does not exceed the exercise price during the life of the right, the right will expire worthless. Rights may increase the potential profit or loss to be realized from the investment as compared with investing the same amount in the underlying securities.
(l) Exchange-Traded Funds. Certain Funds may invest in ETFs, which typically are index-based investment companies that hold substantially all of their assets in securities representing their specific index, but may also be actively-managed investment companies. Shares of ETFs trade throughout the day on an exchange and represent an investment in a portfolio of securities and other assets. As a shareholder of another investment company, the Funds would bear their pro rata portion of the other investment company’s expenses, including advisory fees, in addition to the expenses the Funds bear directly in connection with their own operations.
(m) Convertible Securities. Certain Funds may invest a portion of their assets in convertible securities. Although convertible securities derive part of their value from that of the securities into which they are convertible, they are not considered derivative financial instruments. However, certain of the Funds’ investments in convertible securities include features which render them sensitive to price changes in their underlying securities. The value of structured/synthetic convertible securities can be affected by interest rate changes and credit risks of the issuer. Such securities may be structured in ways that limit their potential for capital appreciation and the entire value of the security may be at risk of loss depending on the performance of the underlying equity security. Consequently, the Funds are exposed to greater downside risk than traditional convertible securities, but typically still less than that of the underlying stock.
(n) Payment In-Kind Securities. The Funds may invest in payment in-kind securities, which are debt or preferred stock securities that require or permit payment of interest in the form of additional securities. Payment in-kind securities allow the issuer to avoid or delay the need to generate cash to meet current interest payments and, as a result, may involve greater risk than securities that pay interest currently or in cash.
(o) Loan Interest Expense. Loan interest expense relates to the amounts borrowed under the credit facility (See Note 10). Loan interest expense is recorded as it is incurred.
(p) Contingent Value Rights. A Fund may invest in contingent value rights (“CVRs”). A CVR gives the holder the right to receive an amount (which may be a fixed amount or determined by a formula) in the event that a specified corporate action, business milestone, or other trigger occurs (or does not occur) which is often subject to an expiration date. CVRs often are awarded to shareholders in the context of a corporate acquisition or major restructuring. For example, shareholders of an acquired company may receive a CVR that enables them to receive additional shares of the acquiring company in the event that the acquiring company’s share price falls below a certain level by a specified date. Risks associated with the use of CVRs are
generally similar to risks associated with the use of options, such as the risk that the required trigger does not (or does) occur prior to a CVR’s expiration, causing the CVR to expire with no value. CVRs also present illiquidity risk, as they may not be registered securities or may otherwise be non-transferable or difficult to transfer, as well as counterparty risk and credit risk. Further, because CVRs are valued based on the likelihood of the occurrence of a trigger, valuation often requires modeling and judgment, which increases the risk of mispricing or improper valuation.
(q) Restricted Securities. The Funds are permitted to invest in securities that are subject to legal or contractual restrictions on resale. These securities generally may be resold in transactions exempt from registration or to the public if the securities are registered. Disposal of these securities may involve time-consuming negotiations and expenses, and prompt sale at an acceptable price may be difficult.
(r) New Accounting Pronouncements. In March 2020, the FASB issued Accounting Standards Update (“ASU”) 2020-04, which provides optional expedients and exceptions for contracts, hedging relationships and other transactions affected by reference rate reform if certain criteria are met. The adoption of the ASU is elective. At this time, management is evaluating the implications of these changes on the financial statements.
| 2. | PRINCIPAL RISKS |
In the normal course of business, the Funds trade financial instruments and enter into financial transactions where risk of potential loss exists due to, among other things, changes in the market (market risk) or failure of the other party to a transaction to perform (counterparty risk). The Funds are also exposed to other risks such as, but not limited to, interest rate, foreign currency, credit and leverage risks.
Interest rate risk is the risk that fixed income securities’ valuations will change because of changes in interest rates. During periods of rising nominal interest rates, the values of fixed income instruments are generally expected to decline. Conversely, during periods of declining nominal interest rates, the values of fixed income instruments are generally expected to rise. To the extent that a Fund effectively has short positions with respect to fixed income instruments, the values of such short positions would generally be expected to rise when nominal interest rates rise and to decline when nominal interest rates decline. A nominal interest rate can be described as the sum of a real interest rate and an expected inflation rate. Fixed income securities with longer durations tend to be more sensitive to changes in interest rates, usually making them more volatile than securities with shorter durations. Duration is used primarily as a measure of the sensitivity of a fixed income security’s market price to interest rate (i.e., yield) movements. Interest rate changes can be sudden and unpredictable, and the Funds may lose money as a result of movements in interest rates. High-yield or junk bonds are subject to greater levels of credit and liquidity risk, may be speculative and may decline in value due to increase in interest rates or an issuer’s deterioration and/or default. The Funds may not be able to hedge against changes in interest rates or may choose not to do so for cost or other reasons. In addition, any
| Annual Report | | June 30, 2020 | 143 |
Table of Contents
Notes to Financial Statements (cont’d)
June 30, 2020
hedges may not work as intended. The values of equity and other non-fixed income securities may also decline due to fluctuations in interest rates.
Variable and floating rate securities generally are less sensitive to interest rate changes but may decline in value if their interest rates do not rise as much, or as quickly, as interest rates in general. Conversely, floating rate securities will not generally increase in value if interest rates decline. Inverse floating rate securities may decrease in value if interest rates increase. Inverse floating rate securities may also exhibit greater price volatility than a fixed rate obligation with similar credit quality. When the Funds hold variable or floating rate securities, a decrease (or, in the case of inverse floating rate securities, an increase) in market interest rates will adversely affect the income received from such securities and the NAV of the Funds’ shares.
The Funds are exposed to credit risk, which is the risk of losing money if the issuer or guarantor of a fixed income security is unable or unwilling, or is perceived (whether by market participants, rating agencies, pricing services or otherwise) as unable or unwilling, to make timely principal and/or interest payments, or to otherwise honor its obligations. Securities are subject to varying degrees of credit risk, which are often reflected in credit ratings.
To the extent the Funds directly invest in foreign currencies or in securities that trade in, and receive revenues in, foreign currencies, or in derivatives that provide exposure to foreign currencies, they will be subject to the risk that those currencies will decline in value relative to the U.S. dollar, or, in the case of hedging positions, that the U.S. dollar will decline in value relative to the currency being hedged. Currency rates in foreign countries may fluctuate significantly over short periods of time for a number of reasons, including economic growth, inflation, changes in interest rates, intervention (or the failure to intervene) by U.S. or foreign governments, central banks or supranational entities such as the International Monetary Fund, or the imposition of currency controls or other political developments in the United States or abroad. As a result, the Funds’ investments in foreign currency-denominated securities may reduce the returns of the Funds. The local emerging market currencies in which the Funds may be invested may experience substantially greater volatility against the U.S. dollar than the major convertible currencies in developed countries.
The Funds are subject to elements of risk not typically associated with investments in the U.S., due to concentrated investments in foreign issuers located in a specific country or region. Such concentrations will subject the Funds to additional risks resulting from future political or economic conditions in such country or region and the possible imposition of adverse governmental laws or currency exchange restrictions affecting such country or region, which could cause the securities and their markets to be less liquid and prices more volatile than those of comparable U.S. companies.
Funds may be subject to increased risk to the extent they allocate assets among investment styles and certain styles under-perform relative to other investment styles.
The market values of securities may decline due to general market conditions (market risk) which are not specifically related to a particular company, such as real or perceived adverse economic conditions, changes in the general outlook for corporate earnings, changes in interest or currency rates, adverse changes to credit markets or adverse investor sentiment. They may also decline due to factors that affect a particular industry or industries, such as labor shortages or increased production costs and competitive conditions within an industry. Equity securities and equity-related investments generally have greater market price volatility than fixed income securities, although under certain market conditions fixed income securities may have comparable or greater price volatility. Credit ratings downgrades may also negatively affect securities held by the Funds. Even when markets perform well, there is no assurance that the investments held by the Funds will increase in value along with the broader market. In addition, market risk includes the risk that local, regional or global events, including geopolitical and other events, may disrupt the economy on a national or global level. For example, events such as war, acts of terrorism, the spread of infectious illness or other public health issues, recessions, or other events could have a significant impact on the economy or the markets for financial instruments and, as a result, could have a significant impact on a Fund and its investments. As a further example, an outbreak of respiratory disease caused by a novel coronavirus designated as COVID-19 was first detected in China in December 2019 and subsequently spread globally, being designated as a pandemic in early 2020. Associated disruptions could impair the Funds’ ability to maintain operational standards, disrupt the operations of the Funds’ service providers, adversely affect the value and liquidity of the Funds’ investments, and negatively impact the Funds’ performance and your investment in a Fund.
Certain of the Funds invest in ETFs. Shareholders will indirectly bear fees and expenses associated with the ETFs in which a Fund invests, in addition to a Fund’s direct fees and expenses. The cost of investing in a Fund, therefore, may be higher than the cost of investing in a mutual fund that invests directly in individual stocks and bonds. In addition, a Fund’s NAV will be subject to fluctuations in the market values of the ETFs in which it invests. A Fund is also subject to the risks associated with the securities or other investments in which the ETFs invest, and the ability of a Fund to meet its investment objective will directly depend on the ability of the ETFs to meet their investment objectives. An index based ETF’s performance may not match that of the index it seeks to track.
The Funds are exposed to counterparty risk, or the risk that an institution or other entity with which the Funds have unsettled or open transactions will default. The potential loss to the Funds could exceed the value of the financial assets recorded in the Funds’ financial statements. Financial assets, which potentially expose the Funds to counterparty risk, consist principally of cash due from counterparties and investments. The Investment Adviser seeks to minimize the Funds’ counterparty risk by performing reviews of each counterparty and by minimizing concentration of counterparty risk by undertaking transactions with multiple customers and counterparties on
| 144 | June 30, 2020 | | Annual Report |
Table of Contents
recognized and reputable exchanges. Delivery of securities sold is only made once the Funds have received payment. Payment is made on a purchase once the securities have been delivered by the counterparty. The trade will fail if either party fails to meet its obligation.
The Funds are exposed to risks associated with leverage. Leverage may cause the value of the Funds’ shares to be more volatile than if the Funds did not use leverage. This is because leverage tends to exaggerate the effect of any increase or decrease in the value of the Funds’ portfolio securities. The Funds may engage in transactions or purchase instruments that give rise to forms of leverage. In addition, to the extent the Funds employ leverage, dividend and interest costs on such leverage may not be recovered by any appreciation of the securities purchased with the leverage proceeds and could exceed the Funds’ investment returns, resulting in greater losses. As discussed further in Note 10, the Funds have entered into a credit agreement. In connection with their use of leverage as well as their investment activities, the Funds may have exposure to the London Interbank Offered Rate (“LIBOR”). LIBOR is an average interest rate, determined by the ICE Benchmark Administration, that banks charge one another for the use of short-term money. The United Kingdom’s Financial Conduct Authority, which regulates LIBOR, has announced plans to phase out the use of LIBOR by the end of 2021. There remains uncertainty regarding the future utilization of LIBOR and the nature of any replacement rate, and any potential effects of the transition away from LIBOR on a Fund or on certain instruments in which a Fund invests are not known.
The Funds may hold defaulted securities that may involve special considerations including bankruptcy proceedings, other regulatory and legal restrictions affecting the Funds’ ability to trade, and the availability of prices from independent pricing services or dealer quotations. Defaulted securities are often illiquid and may not be actively traded. Sale of securities in bankrupt companies at an acceptable price may be difficult and differences compared to the value of the securities used by the Funds could be material. A Fund may incur additional expenses to the extent it is required to seek recovery upon a portfolio security’s default in the payment of principal or interest. In any bankruptcy proceeding relating to a defaulted investment, a Fund may lose its entire investment or may be required to accept cash or securities with a value substantially less than its original investment.
Short sales may be used by certain Funds. When a Fund engages in a short sale on a security, it must borrow the security sold short and deliver it to the counterparty. The Fund will ordinarily have to pay a fee or premium to borrow particular securities and be obligated to repay the lender of the security any dividends or interest that accrue on the security during the period of the loan. The amount of any gain from a short sale will be decreased, and the amount of any loss increased, by the amount of the premium, dividends, interest or expenses a Fund pays in connection with the short sale. Short sales expose a Fund to the risk that it will be required to cover its short position at a time when the securities have appreciated in value, thus resulting in a loss to the Fund.
Investments in senior loans and repurchase agreements also involve special risks. Although typically secured, senior loans may not be backed by sufficient collateral to satisfy their issuers’ obligations in the event of bankruptcy or similar scenarios. Senior loans may also be illiquid. Similarly, repurchase agreements may result in losses if the collateral associated with such positions is insufficient in the event of a counterparty default or similar scenario. Repurchase agreement positions may also be illiquid.
The considerations and factors surrounding the settlement of certain purchases and sales made on a delayed-delivery basis are governed by Master Securities Forward Transaction Agreements (“Master Forward Agreements”) between the Funds and select counterparties. The Master Forward Agreements maintain provisions for, among other things, initiation and confirmation, payment and transfer, events of default, termination, and maintenance of collateral.
The counterparty risk associated with certain contracts may be reduced by master netting arrangements to the extent that if an event of default occurs, all amounts with the counterparty are terminated and settled on a net basis. The Funds’ overall exposure to counterparty risk with respect to transactions subject to master netting arrangements can change substantially within a short period, as it is affected by each transaction subject to the arrangement.
The Funds may invest in other investment companies, including investment companies advised by the Investment Adviser or its affiliates. Investing in other investment companies involves certain additional expenses and tax results that would not be present in a direct investment in such other investment companies. Each Fund’s NAV will fluctuate in response to changes in the NAVs of the other investment companies in which it invests. The extent to which the investment performance and risks associated with each Fund correlate to those of a particular investment company will depend upon the extent to which each Fund’s assets are allocated from time to time for investment in such investment company, which will vary. To the extent that a Fund invests a significant portion of its assets in another investment company, it will be particularly sensitive to the risks associated with that investment company.
| 3. | FINANCIAL DERIVATIVE INSTRUMENTS |
Disclosure about derivatives and hedging activities requires qualitative disclosure regarding objectives and strategies for using derivatives, quantitative disclosure about fair value amounts of gains and losses on derivatives, and disclosure about credit-risk-related contingent features in derivative agreements. The disclosure requirements distinguish between derivatives which are accounted for as “hedges”, and those that do not qualify for such accounting. Although the Funds at times use derivatives for hedging purposes, the Funds reflect derivatives at fair value and recognize changes in fair value through the Funds’ Statements of Operations, and such derivatives do not qualify for hedge accounting treatment.
Option Transactions. The Funds purchase put and call options on securities and indices for hedging purposes, risk management purposes or otherwise as part of their investment strategies. The risks
| Annual Report | | June 30, 2020 | 145 |
Table of Contents
Notes to Financial Statements (cont’d)
June 30, 2020
associated with purchasing an option include the risk that the Funds pay a premium whether or not the option is exercised. Additionally, the Funds bear the risk of loss of premiums and changes in market value should the counterparty not perform under the contract. Put and call options purchased are accounted for in the same manner as portfolio securities. The cost of securities acquired through the exercise of call options is increased by the premiums paid. The proceeds from securities sold through the exercise of put options are decreased by the premiums paid.
The Funds may write (sell) put and call options on securities and indices to earn premiums, for hedging purposes, risk management purposes or otherwise as part of their investment strategies. When an option is written, the premium received is recorded as an asset with an equal liability that is subsequently marked to market to reflect the market value of the option written. These liabilities, if any, are reflected as options written in the Funds’ Statements of Assets and Liabilities. Premiums received from writing options which expire unexercised are recorded on the expiration date as a realized gain. The difference between the premium received and the amount paid on effecting a closing purchase transaction, including brokerage commissions, is also treated as a realized gain, or if the premium is less than the amount paid for the closing purchase transaction, as a realized loss. If a call option written is exercised, the premium is added to the proceeds from the sale of the underlying security in determining whether there has been a realized gain or loss. If a put option written is exercised, the premium reduces the cost basis of the security. In writing an option, the Funds bear the market risk of an unfavorable change in the price of the security underlying the written option. Exercise of a written option could result in the Funds purchasing a security at a price different from its current market value.
There are several risks associated with option transactions on securities. For example, there are significant differences between the securities and options markets that could result in an imperfect correlation between these markets, causing a given transaction not to achieve its objective. The Funds’ ability to use options successfully will depend on the Investment Adviser’s ability to predict pertinent market movements, which cannot be assured. As the writer of a covered call option, a Fund foregoes, during the option’s life, the opportunity to profit from increases in the market value of the security covering the call option above the sum of the premium and the strike price of the call, but has retained the risk of loss should the price of the underlying security decline.
Forward Foreign Currency Contracts. A forward foreign currency contract is an agreement between two parties to buy and sell a currency at a set exchange rate on a future date. The Funds enter into forward foreign currency contracts for the purpose of hedging against foreign currency risk arising from the investment or anticipated investment in securities denominated in foreign currencies. The Funds also enter into these contracts for purposes of increasing exposure to a foreign currency or shifting exposure to foreign currency fluctuations from one country to another. The market value of a forward foreign currency contract fluctuates with changes in foreign currency
exchange rates. All commitments are marked to market daily at the applicable exchange rates and any resulting unrealized appreciation or depreciation is recorded. Realized gains or losses are recorded at the time the forward contract matures or by delivery of the currency. Risks may arise upon entering into these contracts from the potential inability of counterparties to meet the terms of their contracts and from unanticipated movements in the value of a foreign currency relative to the U.S. dollar. In addition, these contracts may involve market risk in excess of the unrealized appreciation (depreciation) reflected in the Funds’ Statements of Assets and Liabilities.
The following is a summary of the Funds’ derivatives categorized by risk exposure.
The effect of derivatives on the Statements of Assets and Liabilities at June 30, 2020:
| AllianzGI Focused Growth: | ||||
| Location | Market Price | |||
Liability derivatives: | ||||
Options written, at value | $ (35,375 | ) | ||
| AllianzGI Global Small-Cap: | ||||
| Location | Foreign Exchange Contracts | |||
Asset derivatives: | ||||
Unrealized depreciation of forward foreign currency contracts | $ (29 | ) | ||
| AllianzGI Income & Growth: | ||||
| Location | Market Price | |||
Liability derivatives: | ||||
Options written, at value | $ (1,204,673 | ) | ||
| AllianzGI Technology: | ||||
| Location | Market Price | |||
Asset derivatives: | ||||
Investments, at value (options purchased) | $ | 38,956,535 | ||
Liability derivatives: | ||||
Options written, at value | $ | (11,133,735 | ) | |
The effect of derivatives on the Statements of Operations for the year ended June 30, 2020:
| AllianzGI Focused Growth: | ||||
| Location | Market Price | |||
Net realized gain (loss) on: | ||||
Investments (options purchased) | $ | (266,193 | ) | |
Options written | 250,329 | |||
Total net realized loss | $ | (15,864 | ) | |
Net change in unrealized appreciation/depreciation of: | ||||
Options written | $ | 538,838 | ||
| 146 | June 30, 2020 | | Annual Report |
Table of Contents
| AllianzGI Global Small-Cap: | ||||
| Location | Foreign Exchange Contracts | |||
Net realized gain on: | ||||
Forward foreign currency contracts | $ | 5,502 | ||
Net change in unrealized appreciation/depreciation of: | ||||
Forward foreign currency contracts | $ | (29 | ) | |
| AllianzGI Income & Growth: | ||||
| Location | Market Price | |||
Net realized loss on: | ||||
Options written | $ | (1,046,363 | ) | |
Net change in unrealized appreciation/depreciation of: | ||||
Options written | $ | 170,788 | ||
| AllianzGI Technology: | ||||||||||||
| Location | Market Price | Foreign Exchange Contracts | Total | |||||||||
Net realized gain(loss) on: | ||||||||||||
Investments (options purchased) | $ | (4,945,360 | ) | — | $ | (4,945,360 | ) | |||||
Options written | 3,892,440 | — | 3,892,440 | |||||||||
Forward foreign currency contracts | — | $ | 22,540 | 22,540 | ||||||||
Total net realized gain(loss) | $ | (1,052,920 | ) | $ | 22,540 | $ | (1,030,380 | ) | ||||
Net change in unrealized appreciation/depreciation of: | ||||||||||||
Investments (options purchased) | 22,878,327 | — | 22,878,327 | |||||||||
Options written | (1,625,944 | ) | — | (1,625,944 | ) | |||||||
Total net change in unrealized appreciation/depreciation | $ | 21,252,383 | $ | — | $ | 21,252,383 | ||||||
The average volume (based on the open positions at each month-end) of derivative activity for the year ended June 30, 2020:
| Options Purchased | Options Written | Forward Foreign Currency Contracts(2) | ||||||||||||||
| Contracts(1) | Contracts(1) | Purchased | Sold | |||||||||||||
AllianzGI Focused Growth | — | † | (15 | ) | — | — | ||||||||||
AllianzGI Global Small-Cap | — | — | $ | 11,234 | $ | 27,792 | ||||||||||
AllianzGI Income & Growth | — | (16,010 | ) | — | — | |||||||||||
AllianzGI Technology | 9,610 | (10,906 | ) | 414,305 | — | |||||||||||
| † | Fund had derivative activity during the period but it did not have open positions at any month-end in the period. |
| (1) | Number of contracts |
| (2) | U.S. $ value on origination date |
The following table presents by counterparty, the Funds’ derivative assets and liabilities net of related collateral held by the Funds at June 30, 2020 which has not been offset in the Statements of Assets and Liabilities, but would be available for offset to the extent of a default by the counterparty to the transaction.
Financial Assets and Derivative Assets, and Collateral Received at June 30, 2020:
| AllianzGI Global Small-Cap: | ||||||||||||||||
| Gross Amounts Not Offset in the Statement of Assets and Liabilities | ||||||||||||||||
| Counterparty | Gross Liability Derivatives Presented in Statement of Assets and Liabilities | Financial Instrument/ Derivative Offset | Cash Collateral Received (Pledged) | Net Amount | ||||||||||||
Foreign Currency Exchange Contracts |
| |||||||||||||||
State Street Bank London | $ | 29 | — | — | $ | 29 | ||||||||||
| 4. | INVESTMENT ADVISER/ADMINISTRATOR/DISTRIBUTOR FEES/EXPENSES & DEFERRED COMPENSATION |
Investment Advisory Fee. AllianzGI U.S. serves as the investment adviser to the Funds, pursuant to an investment advisory contract. AllianzGI U.S. receives a monthly fee (the “Investment Advisory Fee”) from each Fund at an annual rate based on the average daily net assets of each Fund.
Administration Fee. AllianzGI U.S. (in its capacity as administrator, the “Administrator”) provides administrative services to the Funds and also bears the cost of most third-party administrative services required by the Funds, and in return it receives from each share class of each Fund a monthly administration fee based on each share class’ average daily net assets (the “Administration Fee”).
| Annual Report | | June 30, 2020 | 147 |
Table of Contents
Notes to Financial Statements (cont’d)
June 30, 2020
The Investment Advisory Fee and Administration Fee for all classes are charged at an annual rate as indicated in the following table:
| All Classes | Class A, C, and R* | Class P | Institutional Class | Class R6 | Administrative Class | |||||||||||||||||||||||||||||||||||||||||||
| Investment Advisory Fee | Effective Advisory Fee | Administ- ration Fee | Effective Administ- ration Fee | Administ- ration Fee | Effective Administ- ration Fee | Administ- ration Fee | Effective Administ- ration Fee | Administ- ration Fee | Effective Administ- ration Fee | Administ- ration Fee | Effective Administ- ration Fee | |||||||||||||||||||||||||||||||||||||
AllianzGI Dividend Value(3) | 0.45 | % | 0.37 | %(4) | 0.40 | % | 0.40 | % | 0.40 | % | 0.40 | % | 0.30 | % | 0.30 | % | 0.25 | % | 0.25 | % | 0.30 | % | 0.30 | % | ||||||||||||||||||||||||
AllianzGI Emerging Markets Opportunities(1) | 0.85 | 0.65 | (5) | 0.50 | 0.34 | (6) | 0.50 | 0.34 | (6) | 0.40 | 0.24 | (6) | 0.35 | 0.19 | (6) | N/A | N/A | |||||||||||||||||||||||||||||||
AllianzGI Focused Growth(3) | 0.45 | 0.35 | (7) | 0.40 | † | (8) | 0.40 | 0.40 | 0.30 | 0.30 | 0.25 | 0.25 | 0.30 | 0.30 | ||||||||||||||||||||||||||||||||||
AllianzGI Global Small-Cap(2) | 0.90 | 0.90 | 0.45 | 0.45 | 0.45 | 0.45 | 0.35 | 0.35 | N/A | N/A | N/A | N/A | ||||||||||||||||||||||||||||||||||||
AllianzGI Health Sciences(3) | 0.80 | 0.80 | 0.40 | 0.40 | N/A | N/A | 0.30 | 0.30 | N/A | N/A | N/A | N/A | ||||||||||||||||||||||||||||||||||||
AllianzGI Income & Growth(3) | 0.65 | 0.64 | (10) | 0.40 | 0.37 | 0.40 | 0.37 | 0.30 | 0.27 | N/A | N/A | N/A | N/A | |||||||||||||||||||||||||||||||||||
AllianzGI International Value(1) | 0.60 | 0.55 | (11) | 0.50 | 0.48 | (12) | 0.50 | 0.48 | (12) | 0.40 | 0.38 | (12) | 0.35 | 0.32 | (12) | 0.40 | 0.38 | (12) | ||||||||||||||||||||||||||||||
AllianzGI Large-Cap Value(3) | 0.45 | 0.45 | 0.40 | 0.40 | 0.40 | 0.40 | 0.30 | 0.30 | N/A | N/A | 0.30 | 0.30 | ||||||||||||||||||||||||||||||||||||
AllianzGI Mid-Cap(3) | 0.47 | 0.47 | 0.40 | 0.40 | 0.40 | 0.40 | 0.30 | 0.30 | N/A | N/A | 0.30 | 0.30 | ||||||||||||||||||||||||||||||||||||
AllianzGI Mid-Cap Value(3) | 0.55 | 0.55 | 0.40 | 0.17 | (13) | 0.40 | 0.17 | (13) | 0.30 | 0.07 | (13) | 0.25 | 0.02 | (13) | 0.30 | 0.07 | (13) | |||||||||||||||||||||||||||||||
AllianzGI Small-Cap(3) | 0.60 | 0.60 | 0.40 | 0.30 | (15) | 0.40 | 0.30 | (15) | 0.30 | 0.20 | (15) | 0.25 | 0.15 | (15) | N/A | N/A | ||||||||||||||||||||||||||||||||
AllianzGI Small-Cap Value(3) | 0.60 | 0.50 | (14) | 0.40 | 0.40 | 0.40 | 0.40 | 0.30 | 0.30 | 0.25 | 0.25 | 0.30 | 0.30 | |||||||||||||||||||||||||||||||||||
AllianzGI Technology(3) | 0.90 | 0.90 | (9) | 0.40 | 0.39 | 0.40 | 0.39 | 0.30 | 0.29 | N/A | N/A | 0.30 | 0.29 | |||||||||||||||||||||||||||||||||||
| (1) | The total Administration Fee rate for each class of shares shall be reduced according to the following schedule, each based on such Fund’s aggregate average daily net assets: by 0.025% per annum on assets in excess of $250 million, by an additional 0.025% per annum on assets in excess of $500 million, by an additional 0.025% per annum on assets in excess of $1 billion, by an additional 0.025% per annum on assets in excess of $2.5 billion, by an additional 0.025% per annum on assets in excess of $5 billion and by an additional 0.025% per annum on assets in excess of $7.5 billion. To the extent that any such reduction in the fee rate applies, the dollar amount of the fee reduction with respect to each share class is calculated and applied on a pro rata basis by reference to the percentage of the Fund’s average daily net assets attributable to that class. |
| (2) | The total Administration Fee rate for each class of shares shall be reduced according to the following schedule, each based on such Fund’s aggregate average daily net assets: by 0.025% per annum on assets in excess of $500 million, by an additional 0.025% per annum on assets in excess of $1 billion, by an additional 0.025% per annum on assets in excess of $2.5 billion, by an additional 0.025% per annum on assets in excess of $5 billion and by an additional 0.025% per annum on assets in excess of $7.5 billion. To the extent that any such reduction in the fee rate applies, the dollar amount of the fee reduction with respect to each share class is calculated and applied on a pro rata basis by reference to the percentage of the Fund’s average daily net assets attributable to that class. |
| (3) | The total Administration Fee rate for each class of shares shall be reduced according to the following schedule, each based on such Fund’s aggregate average daily net assets: by 0.025% per annum on assets in excess of $1 billion, by an additional 0.025% per annum on assets in excess of $2.5 billion, by an additional 0.025% per annum on assets in excess of $5 billion and by an additional 0.025% per annum on assets in excess of $7.5 billion. To the extent that any such reduction in the fee rate applies, the dollar amount of the fee reduction with respect to each share class is calculated and applied on a pro rata basis by reference to the percentage of the Fund’s average daily net assets attributable to that class. |
| (4) | The Investment Adviser has contractually agreed to observe, through August 31, 2020, an irrevocable waiver of a portion of its Investment Advisory fee, which reduces the 0.45% contractual fee rate by 0.075% to 0.375%, and by an additional 0.025% on net assets in excess of $7.5 billion, and by an additional 0.025% on net assets in excess of $10 billion, each based on the Fund’s average daily net assets. This waiver has been in effect since before the beginning of the Fund’s most recent fiscal year. |
| (5) | The Investment Adviser has contractually agreed to observe, through August 31, 2020, an irrevocable waiver of a portion of its Investment Advisory Fee, which reduces the 0.85% contractual fee rate by 0.20% to 0.65%. An identical waiver arrangement has been in effect since before the beginning of the Fund’s most recent fiscal year. |
| (6) | The Administrator has contractually agreed to observe, through August 31, 2020, an irrevocable waiver of a portion of its Administration Fees, which reduces the contractual fee rate by 0.15%. This waiver has been in effect since before the beginning of the Fund’s most recent fiscal year. |
| (7) | The Investment Adviser has contractually agreed to observe, through August 31, 2020, an irrevocable waiver of a portion of its Investment Advisory Fee, which reduces the 0.45% contractual fee rate by 0.10% to 0.35%. An identical waiver arrangement has been in effect since before the beginning of the Fund’s most recent fiscal year. |
| (8) | The Administrator has contractually agreed to observe, through August 31, 2020, an irrevocable waiver of a portion of its Administration Fees for Class A shares, which reduces the contractual fee rate by 0.02%. This waiver has been in effect since before the beginning of the Fund’s most recent fiscal year. |
| (9) | The Investment Adviser has contractually agreed to observe, through August 31, 2020, an irrevocable waiver of a portion of the Investment Advisory Fee, which reduces the 0.90% contractual fee rate by 0.01% on net assets in excess of $2 billion, by an additional 0.015% on net assets in excess of $3 billion and by an additional 0.025% on net assets in excess of $5 billion, each based on the Fund’s average daily net assets. An identical waiver arrangement has been in effect since before the beginning of the Fund’s most recent fiscal year. |
| 148 | June 30, 2020 | | Annual Report |
Table of Contents
| (10) | The Investment Adviser has contractually agreed to observe, through August 31, 2020, an irrevocable waiver of a portion of the Investment Advisory Fee, which reduces the 0.65% contractual fee rate by 0.01% on net assets in excess of $2 billion, by an additional 0.015% on net assets in excess of $3 billion and by an additional 0.025% on net assets in excess of $5 billion, each based on the Fund’s average daily net assets. An identical waiver arrangement has been in effect since before the beginning of the Fund’s most recent fiscal year. |
| (11) | The Investment Adviser has contractually agreed to observe, through August 31, 2020, an irrevocable waiver of a portion of the Investment Advisory Fee, which reduces the 0.60% contractual fee rate by 0.05% to 0.55%, and an additional 0.01% on net assets in excess of $4 billion, by an additional 0.015% on net assets in excess of $5 billion and by an additional 0.025% on net assets in excess of $7.5 billion, each based on the Fund’s average daily net assets. An identical waiver arrangement has been in effect since before the beginning of the Fund’s most recent fiscal year. |
| (12) | The Administrator has contractually agreed to observe, through August 31, 2020, an irrevocable waiver of a portion of its Administration Fees, which reduces the contractual fee rate by 0.025%. This waiver has been in effect since before the beginning of the Fund’s most recent fiscal year. |
| (13) | The Administrator has contractually agreed to observe through August 31, 2020, an irrevocable waiver of a portion of its Administration Fees, which reduces the contractual fee rate by 0.22%. This waiver has been in effect since before the beginning of the Fund’s most recent fiscal year. |
| (14) | The Investment Adviser has contractually agreed to observe, through August 31, 2020, an irrevocable waiver of a portion of the Investment Advisory Fee, which reduces the 0.60% contractual fee rate by 0.10% to 0.50%, and then by an additional 0.025% on net assets in excess of $3 billion, by an additional 0.025% on net assets in excess of $4 billion and by an additional 0.025% on net assets in excess of $5 billion, each based on the Fund’s average daily net assets. |
| (15) | The Administrator has contractually agreed to observe, through August 31, 2020, an irrevocable waiver of a portion of its Administration Fees, which reduces the contractual fee rate by 0.10%. This waiver has been in effect since before the beginning of the Fund’s most recent fiscal year. |
| † | The effective Administration Fee rate for Class A is 0.38%; for Class C and Class R is 0.40%, respectively. |
| * | Class R shares is not available for all Funds. |
Distribution and Servicing Fees. Allianz Global Investors Distributors LLC (the “Distributor”), an affiliate of AllianzGI U.S., serves as the distributor of the Trust’s shares. The Funds are permitted to reimburse the Distributor on a quarterly basis, out of the Administrative Class assets of each Fund offering Administrative Class shares, in an amount up to 0.25% on an annual basis of the average daily net assets of that class, for payments made to financial intermediaries that provide services in connection with the distribution of shares or administration of plans or programs that use Fund shares as their funding medium. Unreimbursed costs may be carried forward for reimbursement for up to twelve months beyond the date in which they are incurred, subject always to the limit that not more than 0.25% of the average daily net assets attributable to the Administrative Class may be expensed.
Pursuant to the Distribution and Servicing Plans adopted by the A, C and R classes, the Distributor receives (i) in connection with the distribution of C and R class shares of the Trust, certain distribution fees from the Trust, and (ii) in connection with personal services rendered to A, C and R class shareholders of the Trust and the maintenance of shareholder accounts, certain servicing fees from the Trust.
The Funds paid the Distributor distribution and/or servicing fees at an effective rate as set forth below (calculated as a percentage of each Fund’s average daily net assets attributable to each class):
| Allowable Rate | ||||||||
Distribution Fee | Servicing Fee | |||||||
Class A | ||||||||
All Funds | — | 0.25 | % | |||||
Class C | ||||||||
All Funds | 0.75 | % | 0.25 | |||||
Class R | ||||||||
All Funds | 0.25 | 0.25 | ||||||
The Distributor also receives the proceeds of the initial sales charges paid by the shareholders upon the purchase of Class A shares and
contingent deferred sales charges (“CDSC”) paid by the shareholders upon certain redemptions of Class A and C shares. For the year ended June 30, 2020, the Distributor received $1,804,095, representing commissions (sales charges) and CDSC from the Funds.
Expenses. The Trust is responsible for the following expenses: (i) salaries and other compensation of any of the Trust’s executive officers and employees who are not officers, directors, stockholders or employees of the Investment Adviser or its subsidiaries or affiliates; (ii) taxes and governmental fees; (iii) brokerage fees and commissions and other portfolio transaction expenses; (iv) the costs of borrowing money, including interest expense and bank overdraft charges; (v) fees and expenses of the Trustees who are not “interested persons” of the Investment Adviser or the Trust, and any counsel or other experts retained exclusively for their benefit; (vi) extraordinary expenses, including costs of litigation and indemnification expenses; (vii) organization expenses, if any and (viii) any expenses allocated or allocable to a specific class of shares, which include service fees payable with respect to the Administrative Class shares and may include certain other expenses as permitted by the Trust’s Amended and Restated Multi-Class Plan adopted pursuant to Rule 18f-3 under the 1940 Act and subject to review and approval by the Trustees. The Funds may invest in other investment companies, including investment companies advised or sub-advised by the Investment Adviser or its affiliates. Investing in other investment companies involves certain additional expenses and tax results that would not be present in a direct investment in such other investment companies. The ratio of expenses to average net assets per share class, as disclosed in the Financial Highlights, may differ from the estimated annual fund operating expenses per share class as disclosed in the Prospectus for the reasons set forth above.
Deferred Compensation. The Trustees do not currently receive any pension or retirement benefits from the Trust. In calendar year 2018 and certain prior periods, the Trust maintained a deferred compensation plan pursuant to which each Independent Trustee had the opportunity to elect not to receive all or a portion of his or her fees
| Annual Report | | June 30, 2020 | 149 |
Table of Contents
Notes to Financial Statements (cont’d)
June 30, 2020
from the Trust on a current basis, but instead to receive in a subsequent period chosen by the Trustee an amount equal to the value of such compensation if such compensation had been invested in one or more series of Allianz Funds Multi-Strategy Trust or the Trust selected by the Trustees from and after the normal payment dates for such compensation. The deferred compensation program was closed to new deferrals effective January 1, 2019, and all Trustee fees earned with respect to service in calendar year 2019 and beyond have been or will be paid in cash, on a current basis, unless the Board of Trustees of the Allianz-Sponsored Funds reopens the program to new deferrals. Allianz Funds Multi-Strategy Trust and the Trust still have obligations with respect to Trustee fees deferred in 2018 and in prior periods, and will continue to have such obligations until all deferred Trustee fees are paid out pursuant to the terms of the deferred compensation plan.
| 5. | INVESTMENTS IN SECURITIES |
For the year ended June 30, 2020, purchases and sales of investments, other than short-term securities were:
| Purchases | Sales | |||||||
AllianzGI Dividend Value | $ | 1,546,667,199 | $ | 1,936,032,794 | ||||
AllianzGI Emerging Markets Opportunities | 262,680,450 | 363,311,272 | ||||||
AllianzGI Focused Growth | 631,431,077 | 793,854,445 | ||||||
AllianzGI Global Small-Cap | 86,225,044 | 137,488,713 | ||||||
AllianzGI Health Sciences | 136,815,965 | 151,268,628 | ||||||
AllianzGI Income & Growth | 4,334,365,481 | 4,135,812,346 | ||||||
AllianzGI International Value | 137,021,085 | 174,693,759 | ||||||
AllianzGI Large-Cap Value | 340,423,807 | 403,437,957 | ||||||
AllianzGI Mid-Cap | 168,892,416 | 189,670,571 | ||||||
AllianzGI Mid-Cap Value | 2,614,388,360 | 2,553,765,702 | ||||||
AllianzGI Small-Cap | 133,284,870 | 122,194,756 | ||||||
AllianzGI Small-Cap Value | 941,322,111 | 1,356,589,813 | ||||||
AllianzGI Technology* | 3,127,049,788 | 3,280,955,644 | ||||||
| * | Securities sold short of $53,351,364; covers on securities sold short of $58,741,084. |
| 6. | INCOME TAX INFORMATION |
The tax character of dividends and distributions paid by the Funds was:
| Period or Year ended June 30, 2020 | Period or Year ended June 30, 2019 | |||||||||||||||||||||||
| Ordinary Income(1) | 20% Long-term Capital Gain | Return of Capital | Ordinary Income(1) | 15% Long-term Capital Gain | 25% Long-term Capital Gain | |||||||||||||||||||
AllianzGI Dividend Value | $ | 20,330,591 | $ | 136,151,350 | — | $ | 53,260,507 | $ | 280,436,188 | $ | 1,361 | |||||||||||||
AllianzGI Emerging Markets Opportunities | 8,460,929 | — | — | 8,214,183 | — | — | ||||||||||||||||||
AllianzGI Focused Growth | — | 137,604,044 | — | — | 117,884,601 | — | ||||||||||||||||||
AllianzGI Global Small-Cap | — | 7,489,274 | — | 3,913,582 | 22,639,586 | 11,503 | ||||||||||||||||||
AllianzGI Health Sciences | 2,842,959 | 7,881,506 | — | 2,479,547 | 17,793,811 | — | ||||||||||||||||||
AllianzGI Income & Growth | 361,010,215 | 5,994,423 | — | 334,655,872 | 5,082,690 | 30,000 | ||||||||||||||||||
AllianzGI International Value | 3,478,965 | — | — | 3,353,472 | — | — | ||||||||||||||||||
AllianzGI Large-Cap Value | 4,834,304 | 5,673,284 | $ | 89,001 | 5,431,742 | 660,709 | — | |||||||||||||||||
AllianzGI Mid-Cap | — | 14,996,213 | — | 6,580,701 | 29,491,252 | — | ||||||||||||||||||
AllianzGI Mid-Cap Value | 38,775,764 | 78,223,843 | — | 14,423,689 | 5,789,993 | — | ||||||||||||||||||
AllianzGI Small-Cap | 238,997 | — | — | 2,958,426 | 4,395,852 | 362 | ||||||||||||||||||
AllianzGI Small-Cap Value | 3,906,564 | 66,054,045 | — | 52,935,930 | 269,347,930 | 120,893 | ||||||||||||||||||
AllianzGI Technology | — | 247,544,540 | — | 42,412,898 | 224,014,360 | — | ||||||||||||||||||
| (1) | Includes short-term capital gains, if any. |
| 150 | June 30, 2020 | | Annual Report |
Table of Contents
At June 30, 2020, the components of distributable earnings were:
| Ordinary Income | Long-Term Capital Gain | Capital Loss Carryforwards(2) | Late Year Ordinary Loss(3) | |||||||||||||||||||||
| Post-October Capital Loss /(Gain)(4) | ||||||||||||||||||||||||
| Short-Term | Long-Term | |||||||||||||||||||||||
AllianzGI Dividend Value | $ | 138,822 | $ | 35,638 | — | — | $ | 77,051,426 | $ | (21,677,484 | ) | |||||||||||||
AllianzGI Emerging Markets Opportunities | 2,296,878 | — | $ | 54,226,904 | $ | 1,005,785 | 16,408,426 | 2,517,647 | ||||||||||||||||
AllianzGI Focused Growth | — | 60,060,999 | — | 441,687 | — | — | ||||||||||||||||||
AllianzGI Global Small-Cap | — | 2,799,647 | — | 172,785 | 2,786,031 | — | ||||||||||||||||||
AllianzGI Health Sciences | 4,719,188 | 8,006,805 | — | — | — | — | ||||||||||||||||||
AllianzGI Income & Growth | 23,676,177 | 13,875,610 | — | — | — | — | ||||||||||||||||||
AllianzGI International Value | 828,375 | — | 452,047,422 | — | 7,115,957 | 8,114,275 | ||||||||||||||||||
AllianzGI Large-Cap Value | — | — | — | — | 7,409,787 | 1,224,499 | ||||||||||||||||||
AllianzGI Mid-Cap | — | 26,766,014 | — | 1,000,778 | 2,332,861 | — | ||||||||||||||||||
AllianzGI Mid-Cap Value | 6,976,894 | 2,347,724 | — | — | 73,186,804 | (1,883,055 | ) | |||||||||||||||||
AllianzGI Small-Cap | 165,837 | — | 2,008,734 | — | 9,477,146 | (1,580,705 | ) | |||||||||||||||||
AllianzGI Small-Cap Value | 4,406,355 | 1,892,423 | — | — | 20,328,136 | (587,532 | ) | |||||||||||||||||
AllianzGI Technology | 4,501,091 | 235,056,351 | — | 8,981,148 | — | — | ||||||||||||||||||
| (2) | Capital loss carryforwards available as a reduction, to the extent provided in the regulations, of any future net realized gains. To the extent that these losses are used to offset future realized capital gains, such gains will not be disbursed. |
| (3) | Certain ordinary losses realized during the period November 1, 2019 through June 30, 2020, and/or other ordinary losses realized during the period January 1, 2020 through June 30, 2020, which the Funds elected to defer to the following taxable year pursuant to income tax regulations. |
| (4) | Capital losses realized during the period November 1, 2019 through June 30, 2020 which the Funds elected to defer to the following taxable year pursuant to income tax regulations. |
Under the Regulated Investment Company Modernization Act of 2010, the Funds are permitted to carry forward capital losses incurred in taxable years beginning after December 22, 2010, for an unlimited period. Post-enactment capital losses that are carried forward will retain their character as either short-term or long-term capital losses rather than being considered all short-term capital losses.
At June 30, 2020, capital loss carryforward amounts were:
| Short-Term | Long-Term | |||||||
AllianzGI Emerging Markets Opportunities | $ | 53,366,565 | $ | 860,339 | ||||
AllianzGI International Value | 263,734,941 | 188,312,481 | ||||||
AllianzGI Small-Cap | 2,008,734 | — | ||||||
For the year ended June 30, 2020, permanent “book-tax” adjustments were:
| Undistributed (Dividends in Excess of) Net Investment Income | Accumulated Net Realized Gain (Loss) | Paid-in-Capital | Appreciation/ Depreciation | |||||||||||||
AllianzGI Dividend Value (c)(f)(g) | $ | (2,845,634 | ) | $ | 3,162,779 | $ | — | $ | (317,145 | ) | ||||||
AllianzGI Emerging Markets Opportunities (b)(f)(k)(m) | (111,358 | ) | 146,232 | (34,874 | ) | — | ||||||||||
AllianzGI Focused Growth (d) | 1,267,510 | — | (1,267,510 | ) | — | |||||||||||
AllianzGI Global Small-Cap (b)(d)(f)(g) | 617,862 | (444,606 | ) | (201,386 | ) | 28,130 | ||||||||||
AllianzGI Health Sciences (f) | (2,511 | ) | 2,511 | — | — | |||||||||||
AllianzGI Income & Growth (g)(i)(j) | 6,860,069 | (6,837,499 | ) | — | (22,570 | ) | ||||||||||
AllianzGI International Value (b)(f) | 80,007 | (80,007 | ) | — | — | |||||||||||
AllianzGI Large-Cap Value (a)(c)(g)(l) | (135,984 | ) | 270,252 | (89,001 | ) | (45,267 | ) | |||||||||
AllianzGI Mid-Cap (d)(f)(g) | 2,056,227 | 15,438 | (2,071,665 | ) | — | |||||||||||
AllianzGI Mid-Cap Value (c)(e)(f)(g)(h) | 1,598,816 | (1,446,463 | ) | (8,307 | ) | (144,046 | ) | |||||||||
AllianzGI Small-Cap (b)(c)(g)(h) | (8,414 | ) | 2,873 | (17,584 | ) | 23,125 | ||||||||||
AllianzGI Small-Cap Value (e)(f)(g)(h) | 1,608,095 | (3,210,853 | ) | (565,132 | ) | 2,167,890 | ||||||||||
AllianzGI Technology (b)(d)(f) | 12,989,303 | (12,989,303 | ) | — | — | |||||||||||
| Annual Report | | June 30, 2020 | 151 |
Table of Contents
Notes to Financial Statements (cont’d)
June 30, 2020
These permanent “book-tax” differences were primarily attributable to:
| (a) | Reclassification of distributions. |
| (b) | Reclassification of gains from securities classified as Passive Foreign Investment Companies (“PFICs”) for tax purposes. |
| (c) | Reclassification from sales of securities with return of capital. |
| (d) | Net operating losses |
| (e) | Non-deductible costs due to sales of partnerships. |
| (f) | Reclassification of gains and losses from foreign currency transactions. |
| (g) | Reclassifications related to investments in Real Estate Investment Trusts (REITs). |
| (h) | Reclassifications related to investments in partnerships. |
| (i) | Section 305 sales adjustment. |
| (j) | Reclassification of contingent debt. |
| (k) | Non-deductible excise tax. |
| (l) | Return of Capital. |
| (m) | Foreign Capital Gains taxes. |
Net investment income, net realized gains or losses and net assets were not affected by these adjustments.
At June 30, 2020, the aggregate cost basis and the net unrealized appreciation (depreciation) of investments in securities and other financial instruments for federal income tax purposes were:
| Federal Tax Cost Basis(5) | Unrealized Appreciation | Unrealized Deprecation | Net Unrealized Appreciation (Depreciation) | |||||||||||||
AllianzGI Dividend Value | $ | 817,885,791 | $ | 59,542,726 | $ | 31,651,181 | $ | 27,891,545 | ||||||||
AllianzGI Emerging Markets Opportunities | 208,709,373 | 48,610,330 | 5,848,617 | 42,761,713 | ||||||||||||
AllianzGI Focused Growth | 598,675,315 | 489,195,988 | 7,232,670 | 481,963,318 | ||||||||||||
AllianzGI Global Small-Cap | 63,345,334 | 14,676,868 | 3,636,032 | 11,040,836 | ||||||||||||
AllianzGI Health Sciences | 140,745,300 | 26,045,326 | 2,779,305 | 23,266,021 | ||||||||||||
AllianzGI Income & Growth | 5,460,937,417 | 197,635,824 | 762,522,488 | (564,886,664 | ) | |||||||||||
AllianzGI International Value | 117,562,961 | 13,303,563 | 3,528,624 | 9,774,939 | ||||||||||||
AllianzGI Large-Cap Value | 271,346,842 | 16,853,910 | 21,020,910 | (4,167,000 | ) | |||||||||||
AllianzGI Mid-Cap | 249,694,165 | 106,965,671 | 5,040,966 | 101,924,705 | ||||||||||||
AllianzGI Mid-Cap Value | 1,210,780,774 | 57,956,263 | 42,790,414 | 15,165,849 | ||||||||||||
AllianzGI Small-Cap | 96,947,511 | 18,421,012 | 5,061,029 | 13,359,983 | ||||||||||||
AllianzGI Small-Cap Value | 568,549,146 | 35,030,682 | 74,133,986 | (39,103,304 | ) | |||||||||||
AllianzGI Technology | 1,230,913,076 | 654,932,910 | 5,614,923 | 649,317,987 | ||||||||||||
| (5) | Differences, if any, between book and tax cost basis are primarily attributable to wash sale loss deferrals, PFIC mark-to-market, differing treatment of bond premium amortization, basis adjustments from investments in partnerships, mark-to-market adjustments on section 1256 spot contracts, and Section 305 adjustments. |
| 152 | June 30, 2020 | | Annual Report |
Table of Contents
(THIS PAGE INTENTIONALLY LEFT BLANK)
| Annual Report | | June 30, 2020 | 153 |
Table of Contents
Notes to Financial Statements (cont’d)
June 30, 2020
7. SHARES OF BENEFICIAL INTEREST
The Trust may issue an unlimited number of shares of beneficial interest with $0.0001 par value. Changes in shares of beneficial interest were as follows:
| AllianzGI Dividend Value | AllianzGI Emerging Markets Opportunities | |||||||||||||||||||||||||||||||||||
| Year ended June 30, 2020 | Year ended June 30, 2019 | Year ended June 30, 2020 | Year ended June 30, 2019 | |||||||||||||||||||||||||||||||||
| Shares | Amount | Shares | Amount | Shares | Amount | Shares | Amount | |||||||||||||||||||||||||||||
Shares sold: | ||||||||||||||||||||||||||||||||||||
Class A | 4,193,025 | $ | 47,389,072 | 11,313,357 | $ | 160,679,320 | 144,055 | $ | 3,703,846 | 268,619 | $ | 7,217,505 | ||||||||||||||||||||||||
Class C | 257,662 | 2,841,264 | 631,855 | 7,621,144 | 5,013 | 128,107 | 16,147 | 410,475 | ||||||||||||||||||||||||||||
Class R | 681,674 | 6,533,384 | 527,472 | 6,693,820 | — | — | — | — | ||||||||||||||||||||||||||||
Class P | 3,193,349 | 34,512,983 | 5,601,788 | 67,818,148 | 106,554 | 2,612,820 | 352,083 | 9,091,300 | ||||||||||||||||||||||||||||
Institutional Class | 2,584,048 | 29,428,914 | 3,180,003 | 43,151,601 | 2,066,744 | 53,664,156 | 5,354,528 | 145,969,084 | ||||||||||||||||||||||||||||
Class R6 | 1,537,200 | 17,157,845 | 816,704 | 10,596,590 | 186,995 | 4,772,616 | 244,198 | 6,497,525 | ||||||||||||||||||||||||||||
Administrative Class | 257,509 | 2,793,115 | 389,033 | 5,215,973 | — | — | — | — | ||||||||||||||||||||||||||||
Issued in reinvestment of dividends and distributions: |
| |||||||||||||||||||||||||||||||||||
Class A | 4,393,336 | 49,683,548 | 8,603,057 | 91,771,627 | 30,762 | 867,174 | 37,329 | 916,062 | ||||||||||||||||||||||||||||
Class C | 491,446 | 5,713,397 | 1,550,267 | 16,835,328 | 1,087 | 30,545 | 592 | 14,456 | ||||||||||||||||||||||||||||
Class R | 777,315 | 8,811,540 | 1,449,485 | 15,468,682 | — | — | — | — | ||||||||||||||||||||||||||||
Class P | 2,855,246 | 32,589,267 | 6,500,134 | 70,165,546 | 13,671 | 376,224 | 20,942 | 501,782 | ||||||||||||||||||||||||||||
Institutional Class | 2,379,287 | 27,201,280 | 5,850,039 | 63,026,975 | 219,423 | 6,183,338 | 232,119 | 5,693,881 | ||||||||||||||||||||||||||||
Class R6 | 826,941 | 9,340,811 | 1,462,567 | 15,698,988 | 20,786 | 582,626 | 24,240 | 591,467 | ||||||||||||||||||||||||||||
Administrative Class | 352,465 | 4,094,484 | 1,206,182 | 13,203,073 | — | — | — | — | ||||||||||||||||||||||||||||
Cost of shares redeemed: |
| |||||||||||||||||||||||||||||||||||
Class A | (11,916,582 | ) | (131,786,612 | ) | (15,011,198 | ) | (186,349,526 | ) | (706,837 | ) | (18,162,330 | ) | (2,312,650 | ) | (64,223,641 | ) | ||||||||||||||||||||
Class C | (2,930,025 | ) | (33,954,543 | ) | (11,613,283 | ) | (169,595,677 | ) | (64,480 | ) | (1,628,445 | ) | (168,881 | ) | (4,468,000 | ) | ||||||||||||||||||||
Class R | (2,143,190 | ) | (23,044,308 | ) | (2,317,010 | ) | (30,660,555 | ) | — | — | — | — | ||||||||||||||||||||||||
Class P | (14,398,245 | ) | (157,888,751 | ) | (18,158,983 | ) | (228,744,792 | ) | (386,774 | ) | (9,560,905 | ) | (666,508 | ) | (17,465,149 | ) | ||||||||||||||||||||
Institutional Class | (14,479,995 | ) | (160,415,578 | ) | (16,927,973 | ) | (220,910,069 | ) | (5,497,930 | ) | (138,850,854 | ) | (2,051,506 | ) | (54,282,563 | ) | ||||||||||||||||||||
Class R6 | (1,559,699 | ) | (17,417,443 | ) | (2,602,536 | ) | (33,374,156 | ) | (325,206 | ) | (8,203,875 | ) | (241,071 | ) | (6,409,258 | ) | ||||||||||||||||||||
Administrative Class | (1,808,902 | ) | (21,863,385 | ) | (3,392,334 | ) | (43,265,010 | ) | — | — | — | — | ||||||||||||||||||||||||
Net increase (decrease) resulting from Fund share transactions | (24,456,135 | ) | $ | (268,279,716 | ) | (20,941,374 | ) | $ | (324,952,970 | ) | (4,186,137 | ) | $ | (103,484,957 | ) | 1,110,181 | $ | 30,054,926 | ||||||||||||||||||
| – | May reflect actual amounts rounding to less than $1 or less than 1 share. |
| 154 | June 30, 2020 | | Annual Report |
Table of Contents
| AllianzGI Focused Growth | AllianzGI Global Small-Cap | AllianzGI Health Sciences | ||||||||||||||||||||||||||||||||||||||||||||||||
| Year ended June 30, 2020 | Year ended June 30, 2019 | Year ended June 30, 2020 | Year ended June 30, 2019 | Year ended June 30, 2020 | Year ended June 30, 2019 | |||||||||||||||||||||||||||||||||||||||||||||
| Shares | Amount | Shares | Amount | Shares | Amount | Shares | Amount | Shares | Amount | Shares | Amount | |||||||||||||||||||||||||||||||||||||||
| 818,405 | $ | 42,300,013 | 3,957,145 | $ | 230,547,285 | 33,146 | $ | 1,240,087 | 182,657 | $ | 8,479,807 | 132,866 | $ | 4,363,069 | 246,715 | $ | 8,399,331 | |||||||||||||||||||||||||||||||||
| 157,378 | 4,983,252 | 237,512 | 7,807,792 | 5,111 | 157,999 | 13,645 | 500,947 | 28,035 | 681,121 | 28,328 | 702,965 | |||||||||||||||||||||||||||||||||||||||
| 82,857 | 3,050,935 | 130,920 | 5,187,343 | — | — | — | — | — | — | — | — | |||||||||||||||||||||||||||||||||||||||
| 481,192 | 18,475,308 | 684,624 | 27,975,772 | 15,037 | 597,144 | 91,215 | 3,811,875 | — | — | — | — | |||||||||||||||||||||||||||||||||||||||
| 821,950 | 38,685,091 | 589,652 | 28,467,542 | 65,653 | 2,606,632 | 205,859 | 9,810,581 | 258,720 | 8,722,810 | 95,913 | 3,042,298 | |||||||||||||||||||||||||||||||||||||||
| 640,224 | 30,508,020 | 648,134 | 30,278,729 | — | — | — | — | — | — | — | — | |||||||||||||||||||||||||||||||||||||||
| 20,522 | 939,932 | 38,603 | 1,971,024 | — | — | — | — | — | — | — | — | |||||||||||||||||||||||||||||||||||||||
| 1,281,065 | 65,462,399 | 1,264,993 | 54,065,784 | 78,232 | 2,957,958 | 254,078 | 8,310,892 | 290,557 | 9,736,819 | 674,933 | 18,634,889 | |||||||||||||||||||||||||||||||||||||||
| 263,084 | 7,984,592 | 266,353 | 7,377,992 | 14,869 | 463,904 | 69,797 | 1,927,792 | 12,951 | 324,031 | 29,367 | 623,175 | |||||||||||||||||||||||||||||||||||||||
| 89,301 | 3,164,830 | 83,352 | 2,609,751 | — | — | — | — | — | — | — | — | |||||||||||||||||||||||||||||||||||||||
| 302,105 | 11,032,878 | 354,870 | 11,338,112 | 9,904 | 407,250 | 41,648 | 1,469,340 | — | — | — | — | |||||||||||||||||||||||||||||||||||||||
| 363,782 | 16,857,643 | 416,583 | 16,292,546 | 76,103 | 3,167,395 | 369,475 | 13,171,798 | 8,689 | 296,115 | 11,595 | 324,420 | |||||||||||||||||||||||||||||||||||||||
| 402,518 | 18,688,902 | 338,307 | 13,248,091 | — | — | — | — | — | — | — | — | |||||||||||||||||||||||||||||||||||||||
| 16,397 | 695,556 | 15,646 | 568,421 | — | — | — | — | — | — | — | — | |||||||||||||||||||||||||||||||||||||||
| (2,345,077 | ) | (122,051,089 | ) | (1,811,609 | ) | (94,018,724 | ) | (292,098 | ) | (10,598,756 | ) | (351,706 | ) | (13,990,314 | ) | (647,674 | ) | (20,945,491 | ) | (605,927 | ) | (19,209,271 | ) | |||||||||||||||||||||||||||
| (508,764 | ) | (16,492,494 | ) | (5,022,966 | ) | (204,819,789 | ) | (101,822 | ) | (3,078,860 | ) | (296,247 | ) | (11,728,861 | ) | (42,205 | ) | (1,032,110 | ) | (201,451 | ) | (5,567,805 | ) | |||||||||||||||||||||||||||
| (243,281 | ) | (9,211,952 | ) | (183,497 | ) | (7,438,619 | ) | — | — | — | — | — | — | — | — | |||||||||||||||||||||||||||||||||||
| (1,039,638 | ) | (39,332,931 | ) | (1,230,579 | ) | (47,289,017 | ) | (185,344 | ) | (6,977,596 | ) | (192,848 | ) | (7,992,579 | ) | — | — | — | — | |||||||||||||||||||||||||||||||
| (1,382,539 | ) | (65,691,338 | ) | (1,064,847 | ) | (51,812,375 | ) | (964,324 | ) | (39,779,928 | ) | (787,779 | ) | (34,330,501 | ) | (77,490 | ) | (2,554,778 | ) | (61,267 | ) | (2,002,588 | ) | |||||||||||||||||||||||||||
| (1,224,791 | ) | (59,454,896 | ) | (409,798 | ) | (19,780,076 | ) | — | — | — | — | — | — | — | — | |||||||||||||||||||||||||||||||||||
| (57,136 | ) | (2,528,779 | ) | (22,413 | ) | (1,102,078 | ) | — | — | — | — | — | — | — | — | |||||||||||||||||||||||||||||||||||
| | (1,060,446 | ) | $ | (51,934,128 | ) | (719,015 | ) | $ | 11,475,506 | (1,245,533 | ) | $ | (48,836,771 | ) | (400,206 | ) | $ | (20,559,223 | ) | (35,551 | ) | $ | (408,414 | ) | 218,206 | $ | 4,947,414 | |||||||||||||||||||||||
| Annual Report | | June 30, 2020 | 155 |
Table of Contents
Notes to Financial Statements (cont’d)
June 30, 2020
| AllianzGI Income & Growth | AllianzGI International Value | |||||||||||||||||||||||||||||||||||
| Year ended June 30, 2020 | Year ended June 30, 2019 | Year ended June 30, 2020 | Year ended June 30, 2019 | |||||||||||||||||||||||||||||||||
| Shares | Amount | Shares | Amount | Shares | Amount | Shares | Amount | |||||||||||||||||||||||||||||
Shares sold: | ||||||||||||||||||||||||||||||||||||
Class A | 42,470,266 | $ | 458,307,364 | 41,382,233 | $ | 454,899,809 | 570,879 | $ | 9,917,509 | 1,209,396 | $ | 21,910,051 | ||||||||||||||||||||||||
Class C | 26,827,688 | 265,433,243 | 34,217,239 | 346,930,172 | 21,479 | 373,610 | 28,057 | 479,855 | ||||||||||||||||||||||||||||
Class R | 163,204 | 1,786,258 | 224,610 | 2,466,861 | 53,276 | 887,205 | 72,665 | 1,308,299 | ||||||||||||||||||||||||||||
Class P | 38,656,111 | 427,259,153 | 47,385,649 | 533,269,666 | 53,278 | 935,646 | 217,867 | 3,906,233 | ||||||||||||||||||||||||||||
Institutional Class | 29,285,040 | 326,288,085 | 32,549,042 | 371,932,052 | 281,304 | 4,831,385 | 493,776 | 8,984,985 | ||||||||||||||||||||||||||||
Class R6 | — | — | — | — | 23,498 | 376,509 | 29,903 | 547,843 | ||||||||||||||||||||||||||||
Administrative Class | — | — | — | — | 15,163 | 261,658 | 20,222 | 362,630 | ||||||||||||||||||||||||||||
Issued in reinvestment of dividends and distributions: |
| |||||||||||||||||||||||||||||||||||
Class A | 10,716,958 | 114,275,806 | 9,562,038 | 104,635,655 | 75,620 | 1,327,623 | 65,410 | 1,163,992 | ||||||||||||||||||||||||||||
Class C | 8,925,701 | 86,795,322 | 8,650,069 | 87,008,778 | 7,435 | 131,292 | 7,567 | 132,250 | ||||||||||||||||||||||||||||
Class R | 40,330 | 430,317 | 31,419 | 343,496 | 5,646 | 100,179 | 5,192 | 92,441 | ||||||||||||||||||||||||||||
Class P | 6,486,306 | 71,039,043 | 5,654,704 | 63,437,381 | 28,868 | 508,213 | 34,618 | 620,705 | ||||||||||||||||||||||||||||
Institutional Class | 5,335,005 | 59,077,588 | 4,232,229 | 47,895,410 | 59,937 | 1,049,657 | 50,379 | 906,302 | ||||||||||||||||||||||||||||
Class R6 | — | — | — | — | 1,865 | 32,599 | 1,609 | 28,658 | ||||||||||||||||||||||||||||
Administrative Class | — | — | — | — | 1,554 | 27,201 | 2,333 | 40,736 | ||||||||||||||||||||||||||||
Cost of shares redeemed: |
| |||||||||||||||||||||||||||||||||||
Class A | (35,958,214 | ) | (381,658,065 | ) | (28,677,604 | ) | (313,221,154 | ) | (1,260,019 | ) | (21,948,711 | ) | (2,154,736 | ) | (37,906,923 | ) | ||||||||||||||||||||
Class C | (35,348,794 | ) | (342,277,417 | ) | (27,028,004 | ) | (271,243,863 | ) | (344,021 | ) | (5,895,946 | ) | (1,256,420 | ) | (22,357,425 | ) | ||||||||||||||||||||
Class R | (92,452 | ) | (1,000,625 | ) | (90,982 | ) | (987,313 | ) | (129,498 | ) | (2,284,645 | ) | (243,205 | ) | (4,386,885 | ) | ||||||||||||||||||||
Class P | (32,610,163 | ) | (351,278,476 | ) | (30,988,364 | ) | (344,028,854 | ) | (811,469 | ) | (13,881,635 | ) | (2,989,399 | ) | (52,767,678 | ) | ||||||||||||||||||||
Institutional Class | (25,733,018 | ) | (280,051,998 | ) | (14,427,667 | ) | (160,815,113 | ) | (659,490 | ) | (11,111,521 | ) | (1,045,715 | ) | (18,990,289 | ) | ||||||||||||||||||||
Class R6 | — | — | — | — | (21,565 | ) | (384,682 | ) | (61,401 | ) | (1,100,132 | ) | ||||||||||||||||||||||||
Administrative Class | — | — | — | — | (26,372 | ) | (475,231 | ) | (205,207 | ) | (3,521,325 | ) | ||||||||||||||||||||||||
Net increase (decrease) resulting from Fund share transactions | 39,163,968 | $ | 454,425,598 | 82,676,611 | $ | 922,522,983 | (2,052,632 | ) | $ | (35,222,085 | ) | (5,717,089 | ) | $ | (100,545,677 | ) | ||||||||||||||||||||
| – | May reflect actual amounts rounding to less than $1 or less than 1 share. |
| 156 | June 30, 2020 | | Annual Report |
Table of Contents
| AllianzGI Large-Cap Value | AllianzGI Mid-Cap | AllianzGI Mid-Cap Value | ||||||||||||||||||||||||||||||||||||||||||||||||
| Year ended June 30, 2020 | Year ended June 30, 2019 | Year ended June 30, 2020 | Year ended June 30, 2019 | Year ended June 30, 2020 | Year ended June 30, 2019 | |||||||||||||||||||||||||||||||||||||||||||||
| Shares | Amount | Shares | Amount | Shares | Amount | Shares | Amount | Shares | Amount | Shares | Amount | |||||||||||||||||||||||||||||||||||||||
| 282,716 | $ | 7,207,163 | 2,041,454 | $ | 56,350,922 | 5,530,796 | $ | 21,292,287 | 34,421,548 | $ | 134,256,480 | 1,919,358 | $ | 55,370,753 | 6,698,495 | $ | 204,685,318 | |||||||||||||||||||||||||||||||||
| 36,209 | 912,343 | 84,599 | 2,188,878 | 245,383 | 723,159 | 650,165 | 1,783,093 | 343,814 | 8,057,851 | 630,222 | 15,246,842 | |||||||||||||||||||||||||||||||||||||||
| 14,639 | 368,652 | 11,595 | 314,013 | 213,581 | 807,257 | 121,412 | 433,020 | 240,521 | 5,949,639 | 358,914 | 9,057,683 | |||||||||||||||||||||||||||||||||||||||
| 56,962 | 1,522,918 | 126,157 | 3,352,016 | 639,541 | 2,828,821 | 905,697 | 3,633,083 | 5,431,382 | 119,319,213 | 4,293,177 | 101,871,414 | |||||||||||||||||||||||||||||||||||||||
| 2,388,884 | 58,419,448 | 449,862 | 11,791,096 | 6,763,364 | 29,602,379 | 1,762,730 | 7,253,419 | 5,184,884 | 153,606,350 | 5,936,147 | 186,319,815 | |||||||||||||||||||||||||||||||||||||||
| — | — | — | — | — | — | — | — | 2,161,892 | 70,723,536 | 560,276 | 17,538,456 | |||||||||||||||||||||||||||||||||||||||
| 5,498 | 139,760 | 10,773 | 283,103 | 83,579 | 331,732 | 37,587 | 142,036 | 687,991 | 19,966,174 | 594,563 | 18,054,348 | |||||||||||||||||||||||||||||||||||||||
| 201,929 | 5,280,956 | 100,269 | 2,601,467 | 2,610,485 | 9,919,842 | 8,735,577 | 24,085,907 | 1,366,776 | 41,672,996 | 296,346 | 7,931,688 | |||||||||||||||||||||||||||||||||||||||
| 8,027 | 215,851 | 5,291 | 143,588 | 285,007 | 846,472 | 1,440,361 | 3,162,218 | 160,184 | 3,954,936 | 9,718 | 240,700 | |||||||||||||||||||||||||||||||||||||||
| 2,217 | 58,598 | 1,366 | 36,380 | 15,966 | 59,233 | 63,092 | 170,148 | 74,035 | 1,902,697 | 12,096 | 279,668 | |||||||||||||||||||||||||||||||||||||||
| 23,340 | 614,039 | 12,869 | 339,075 | 104,605 | 465,493 | 335,351 | 1,072,570 | 749,548 | 18,019,137 | 151,593 | 3,261,952 | |||||||||||||||||||||||||||||||||||||||
| 142,551 | 3,723,408 | 96,666 | 2,510,825 | 483,526 | 2,171,031 | 1,068,157 | 3,438,239 | 945,832 | 31,013,835 | 202,468 | 5,761,385 | |||||||||||||||||||||||||||||||||||||||
| — | — | — | — | — | — | — | — | 166,258 | 5,444,939 | 7,723 | 220,071 | |||||||||||||||||||||||||||||||||||||||
| 1,677 | 44,392 | 838 | 22,170 | 17,327 | 70,695 | 55,660 | 163,523 | 84,588 | 2,665,370 | 13,345 | 368,552 | |||||||||||||||||||||||||||||||||||||||
| (971,846 | ) | (25,134,443 | ) | (1,072,771 | ) | (28,418,904 | ) | (10,968,495 | ) | (40,834,967 | ) | (9,160,991 | ) | (31,143,673 | ) | (4,284,821 | ) | (119,915,174 | ) | (4,772,658 | ) | (139,781,481 | ) | |||||||||||||||||||||||||||
| (171,378 | ) | (4,517,496 | ) | (2,000,144 | ) | (56,114,974 | ) | (3,037,545 | ) | (9,116,900 | ) | (39,239,512 | ) | (130,038,680 | ) | (621,647 | ) | (14,024,340 | ) | (6,123,795 | ) | (154,795,781 | ) | |||||||||||||||||||||||||||
| (45,404 | ) | (1,101,206 | ) | (132,987 | ) | (3,709,071 | ) | (201,060 | ) | (754,085 | ) | (189,750 | ) | (653,794 | ) | (331,033 | ) | (8,018,951 | ) | (209,787 | ) | (5,294,056 | ) | |||||||||||||||||||||||||||
| (161,500 | ) | (4,076,178 | ) | (202,995 | ) | (5,481,385 | ) | (702,403 | ) | (3,057,582 | ) | (1,112,672 | ) | (4,488,191 | ) | (3,741,443 | ) | (79,410,479 | ) | (4,670,512 | ) | (110,205,538 | ) | |||||||||||||||||||||||||||
| (3,707,915 | ) | (97,287,632 | ) | (503,342 | ) | (13,275,287 | ) | (4,772,890 | ) | (21,421,383 | ) | (1,733,318 | ) | (7,146,904 | ) | (4,615,848 | ) | (135,325,112 | ) | (4,076,024 | ) | (128,754,450 | ) | |||||||||||||||||||||||||||
| — | — | — | — | — | — | — | — | (485,632 | ) | (14,557,503 | ) | (84,239 | ) | (2,605,186 | ) | |||||||||||||||||||||||||||||||||||
| (10,272 | ) | (259,416 | ) | (10,918 | ) | (300,641 | ) | (103,157 | ) | (415,657 | ) | (63,233 | ) | (237,112 | ) | (380,386 | ) | (11,152,557 | ) | (350,996 | ) | (10,485,274 | ) | |||||||||||||||||||||||||||
| (1,903,666 | ) | $ | (53,868,843 | ) | (981,418 | ) | $ | (27,366,729 | ) | (2,792,390 | ) | $ | (6,482,173 | ) | (1,902,139 | ) | $ | 5,885,382 | 5,056,253 | $ | 155,263,310 | (522,928 | ) | $ | 18,916,126 | ||||||||||||||||||||||||
| Annual Report | | June 30, 2020 | 157 |
Table of Contents
Notes to Financial Statements (cont’d)
June 30, 2020
| AllianzGI Small-Cap | AllianzGI Small-Cap Value | |||||||||||||||||||||||||||||||||||
| Year ended June 30, 2020 | Year ended June 30, 2019 | Year ended June 30, 2020 | Year ended June 30, 2019 | |||||||||||||||||||||||||||||||||
| Shares | Amount | Shares | Amount | Shares | Amount | Shares | Amount | |||||||||||||||||||||||||||||
Shares sold: | ||||||||||||||||||||||||||||||||||||
Class A | 463,109 | $ | 8,626,005 | 1,600,232 | $ | 34,264,966 | 1,914,009 | $ | 23,590,458 | 7,098,648 | $ | 130,945,310 | ||||||||||||||||||||||||
Class C | 49,065 | 891,075 | 92,047 | 1,720,365 | 19,576 | 201,320 | 84,780 | 1,077,299 | ||||||||||||||||||||||||||||
Class R | — | — | — | — | 157,302 | 2,210,680 | 205,692 | 3,727,798 | ||||||||||||||||||||||||||||
Class P | 816,776 | 15,074,101 | 254,122 | 5,248,183 | 413,984 | 6,566,673 | 717,227 | 13,249,790 | ||||||||||||||||||||||||||||
Institutional Class | 1,312,314 | 24,014,426 | 288,688 | 5,869,487 | 1,191,633 | 17,523,857 | 3,242,577 | 62,341,662 | ||||||||||||||||||||||||||||
Class R6 | 524,773 | 9,859,510 | 891,912 | # | 17,601,066 | # | 1,353,058 | 20,719,065 | 3,019,919 | 57,555,186 | ||||||||||||||||||||||||||
Administrative Class | — | — | — | — | 606,485 | 8,421,938 | 911,459 | 14,873,708 | ||||||||||||||||||||||||||||
Issued in reinvestment of dividends and distributions: |
| |||||||||||||||||||||||||||||||||||
Class A | 1,632 | 33,389 | 298,477 | 4,867,765 | 2,205,554 | 31,782,029 | 9,034,371 | 112,929,635 | ||||||||||||||||||||||||||||
Class C | — | 3 | 44,482 | 695,030 | 16,900 | 215,135 | 258,108 | 2,893,396 | ||||||||||||||||||||||||||||
Class R | — | — | — | — | 99,180 | 1,575,974 | 445,976 | 6,092,035 | ||||||||||||||||||||||||||||
Class P | 2,586 | 53,483 | 39,051 | 644,904 | 107,314 | 1,809,314 | 584,374 | 8,432,510 | ||||||||||||||||||||||||||||
Institutional Class | 2,488 | 51,869 | 33,246 | 553,729 | 611,030 | 10,424,180 | 6,135,775 | 89,336,886 | ||||||||||||||||||||||||||||
Class R6 | 4,607 | 96,048 | 2,227 | # | 43,874 | # | 567,653 | 9,599,019 | 2,768,426 | 40,059,127 | ||||||||||||||||||||||||||
Administrative Class | — | — | — | — | 646,162 | 9,272,422 | 2,756,274 | 34,315,616 | ||||||||||||||||||||||||||||
Cost of shares redeemed: |
| |||||||||||||||||||||||||||||||||||
Class A | (555,248 | ) | (9,773,148 | ) | (576,351 | ) | (11,497,437 | ) | (10,181,232 | ) | (137,187,545 | ) | (18,946,945 | ) | (333,203,625 | ) | ||||||||||||||||||||
Class C | (215,989 | ) | (3,999,466 | ) | (1,391,922 | ) | (28,904,196 | ) | (176,644 | ) | (2,242,087 | ) | (5,531,901 | ) | (99,879,070 | ) | ||||||||||||||||||||
Class R | — | — | — | — | (483,683 | ) | (6,915,519 | ) | (884,803 | ) | (16,636,078 | ) | ||||||||||||||||||||||||
Class P | (364,824 | ) | (6,611,270 | ) | (120,551 | ) | (2,401,996 | ) | (1,222,145 | ) | (18,438,944 | ) | (1,661,186 | ) | (30,717,023 | ) | ||||||||||||||||||||
Institutional Class | (541,682 | ) | (9,409,714 | ) | (234,956 | ) | (4,873,058 | ) | (11,198,771 | ) | (185,648,350 | ) | (24,363,929 | ) | (484,952,787 | ) | ||||||||||||||||||||
Class R6 | (915,080 | ) | (18,894,588 | ) | (12 | )# | (238 | )# | (4,003,088 | ) | (62,474,690 | ) | (11,202,983 | ) | (227,278,706 | ) | ||||||||||||||||||||
Administrative Class | — | — | — | — | (5,586,028 | ) | (78,002,684 | ) | (5,772,549 | ) | (98,884,720 | ) | ||||||||||||||||||||||||
Net increase (decrease) resulting from Fund share transactions | 584,527 | $ | 10,011,723 | 1,220,692 | $ | 23,832,444 | (22,941,751 | ) | $ | (346,997,755 | ) | (31,100,690 | ) | $ | (713,722,051 | ) | ||||||||||||||||||||
| – | May reflect actual amounts rounding to less than $1 or less than 1 share. |
| # | For the period August 22, 2018 (commencement of share class) through June 30, 2019. “Shares sold” includes shares sold to AZOA. |
| 158 | June 30, 2020 | | Annual Report |
Table of Contents
| AllianzGI Technology | ||||||||||||||||||
| Year ended June 30, 2020 | Year ended June 30, 2019 | |||||||||||||||||
| Shares | Amount | Shares | Amount | |||||||||||||||
| 1,419,803 | $ | 83,096,454 | 2,550,443 | $ | 179,133,866 | |||||||||||||
| 245,503 | 9,558,130 | 257,142 | 12,544,036 | |||||||||||||||
| — | — | — | — | |||||||||||||||
| 494,730 | 33,680,157 | 1,128,423 | 84,211,489 | |||||||||||||||
| 3,625,923 | 250,396,596 | 3,351,624 | 247,227,588 | |||||||||||||||
| — | — | — | — | |||||||||||||||
| 98,762 | 6,206,610 | 75,889 | 5,389,576 | |||||||||||||||
| 1,717,063 | 93,597,114 | 1,934,896 | 96,280,422 | |||||||||||||||
| 271,884 | 9,548,573 | 300,556 | 10,621,661 | |||||||||||||||
| — | — | — | — | |||||||||||||||
| 293,746 | 18,626,410 | 332,385 | 18,733,242 | |||||||||||||||
| 1,738,813 | 113,196,707 | 2,155,428 | 124,109,570 | |||||||||||||||
| — | — | — | — | |||||||||||||||
| 27,726 | 1,647,783 | 56,513 | 3,019,512 | |||||||||||||||
| (2,772,609 | ) | (161,363,428 | ) | (2,484,799 | ) | (161,222,406 | ) | |||||||||||
| (443,259 | ) | (17,851,156 | ) | (1,982,776 | ) | (111,120,158 | ) | |||||||||||
| — | — | — | — | |||||||||||||||
| (981,508 | ) | (67,131,728 | ) | (587,099 | ) | (41,087,752 | ) | |||||||||||
| (3,934,639 | ) | (271,073,252 | ) | (4,534,231 | ) | (329,752,909 | ) | |||||||||||
| — | — | — | — | |||||||||||||||
| (139,509 | ) | (8,583,880 | ) | (272,847 | ) | (18,770,552 | ) | |||||||||||
| 1,662,429 |
| $ | 93,551,090 | 2,281,547 | $ | 119,317,185 | |||||||||||
| Annual Report | | June 30, 2020 | 159 |
Table of Contents
Notes to Financial Statements (cont’d)
June 30, 2020
| 8. | SIGNIFICANT ACCOUNT HOLDERS |
From time to time, a Fund may have a concentration of shareholders, which may include the Investment Adviser or affiliates of the Investment Adviser, holding a significant percentage of shares outstanding. Investment activities of these shareholders could have a material impact to a Fund.
At June 30, 2020, the significant account-holders, owners of 5% or greater of each respective Fund’s outstanding shares were as follows:
| Unaffiliated | ||||||||
| Number of Account Holders | Approximate Ownership | |||||||
AllianzGI Dividend Value | 7 | 64 | % | |||||
AllianzGI Emerging Markets Opportunities | 3 | 76 | % | |||||
AllianzGI Focused Growth | 5 | 50 | % | |||||
AllianzGI Global Small-Cap | 4 | 60 | % | |||||
AllianzGI Health Sciences | 3 | 58 | % | |||||
AllianzGI Income & Growth | 8 | 78 | % | |||||
AllianzGI International Value | 7 | 63 | % | |||||
AllianzGI Large-Cap Value | 9 | 70 | % | |||||
AllianzGI Mid-Cap | 7 | 60 | % | |||||
AllianzGI Mid-Cap Value | 6 | 50 | % | |||||
AllianzGI Small-Cap | 6 | 56 | % | |||||
AllianzGI Small-Cap Value | 4 | 49 | % | |||||
AllianzGI Technology | 3 | 45 | % | |||||
| 9. | FUND EVENTS |
(a) Name Changes
Effective April 30, 2020, AllianzGI NFJ Dividend Value Fund, AllianzGI NFJ International Value Fund, AllianzGI NFJ Large-Cap Value Fund, AllianzGI NFJ Mid-Cap Value Fund and AllianzGI NFJ Small-Cap Value Fund changed their names to AllianzGI Dividend Value Fund, AllianzGI International Value Fund, AllianzGI Large-Cap Value Fund, AllianzGI Mid-Cap Value Fund and AllianzGI Small-Cap Value Fund, respectively.
(b) Fund Liquidation
On June 11, 2020, AllianzGI Global Natural Resources Fund liquidated as a series of the Trust.
| 10. | BORROWINGS |
The Trust entered into a credit agreement (the “State Street Agreement”), among the Trust, AllianzGI Institutional Multi-Series Trust and Allianz Funds Multi-Strategy Trust, as borrowers (collectively, the “AllianzGI Borrowers” and each series thereof, an “AllianzGI Borrower Fund”), and State Street Bank and Trust Company, as agent and lender, for a committed line of credit. The State Street Agreement permits the AllianzGI Borrowers to borrow up to $200 million in aggregate, subject to (i) a requirement that each AllianzGI Borrower Fund’s asset coverage with respect to senior securities representing indebtedness be 300% or higher, and (ii) certain other limitations and conditions. Each AllianzGI Borrower Fund must pay interest on any amounts borrowed under the facility at a rate per annum equal to 1.25% plus the higher of the then-current federal funds overnight rate or the one-month LIBOR rate, subject to upward adjustment when any past due payments are outstanding. As discussed in Note 2 above, the Funds may face certain risks and
uncertainties insofar as they are exposed to LIBOR. The State Street Agreement has a term that runs through October 22, 2022. The Amendment includes a usage fee on undrawn amounts at an annualized rate of 0.20%, to be allocated pro rata among the AllianzGI Borrower Funds on the basis of net assets. Amounts borrowed may be repaid and reborrowed on a revolving basis during the term of the facility. The Funds did not utilize the line of credit during the year ended June 30, 2020.
Pursuant to an exemptive order issued by the SEC (the “Order”), the Funds are authorized to enter into a master interfund lending agreement (the “Interfund Program”) with each other and certain funds advised by the Investment Adviser (each a “Participating Fund”). The Interfund Program allows each Participating Fund, whose policies permit it to do so, to lend money directly to and borrow money directly from other Funds for temporary purposes through the Interfund Program. During the year ended June 30, 2020, the Funds did not participate as a borrower or lender in the Interfund Program.
| 11. | RELATED PARTY TRANSACTIONS |
The Investment Adviser and Distributor are related parties. Fees payable to and amounts due from these parties are disclosed in Note 4 and the accrued related party fee and receivable amounts are disclosed on the Statements of Assets and Liabilities.
Certain Funds are permitted to purchase or sell securities from or to certain related affiliated funds under specified conditions outlined in procedures adopted by the Board. The procedures have been designed to ensure that any purchase or sale of securities by the Funds from or to another fund or portfolio that are, or could be, considered an affiliate by virtue of having a common investment adviser (or
| 160 | June 30, 2020 | | Annual Report |
Table of Contents
affiliated investment advisers), common Trustees and/or common officers comply with Rule 17a-7 of the 1940 Act. Further, as defined under the procedures, each transaction is effected at the current market price.
During the year ended June 30, 2020, the Funds did not engage in any purchases or sales of securities pursuant to Rule 17a-7 of the 1940 Act.
(a) Payments from Affiliates
During the year ended June 30, 2019, AllianzGI U.S. reimbursed AllianzGI Income & Growth $2,600 for realized losses resulting from a trading error.
During the year ended June 30, 2020, AllianzGI U.S. reimbursed AllianzGI Small-Cap and AllianzGI Technology $706 and $32,512, respectively, for realized losses resulting from a trading error.
(b) Affiliated Transactions
An affiliate includes any company in which a Fund held 5% or more of a company’s outstanding voting securities at any point during the reporting period. The table below represents transactions in and earnings from these affiliated issuers during the year ended June 30, 2020:
| AllianzGI Income & Growth: | ||||||||||||||||||||||||||||||||||||
| Market Value 6/30/2019 | Purchases at Cost | Proceeds from Sales | Change in Unrealized Appreciation (Depreciation)* | Market Value 6/31/2020 | Dividend Income | Shares as of 6/30/2020 | Net Realized Gain (Loss) | Net Capital Gain Distributions Received | ||||||||||||||||||||||||||||
AllianzGI High Yield Bond | $ | — | $ | 10,185,881 | — | $ | (738,532 | ) | $ | 9,447,349 | $ | 185,880 | 1,206,558 | — | — | |||||||||||||||||||||
CCF Holdings LLC, Class B | 4 | — | — | — | 4 | — | 42,857 | — | — | |||||||||||||||||||||||||||
Cenveo Corp.† | 576,798 | — | — | — | 576,798 | — | 19,074 | — | — | |||||||||||||||||||||||||||
LiveStyle, Inc. | 20 | — | — | — | 20 | — | 202,319 | — | — | |||||||||||||||||||||||||||
LiveStyle, Inc., Ser. B | 17,134,400 | — | — | (2,093,824 | ) | 15,040,576 | — | 171,344 | — | — | ||||||||||||||||||||||||||
LiveStyle, Inc., Ser. B | 80 | — | — | — | 80 | — | 8,000 | — | — | |||||||||||||||||||||||||||
Totals | $ | 17,711,302 | $ | 10,185,881 | — | $ | (2,832,356 | ) | $ | 25,064,827 | $ | 185,880 | 1,650,152 | — | — | |||||||||||||||||||||
| † | Not affiliated at June 30, 2019. |
| * | Does not tie to Net change in unrealized appreciation/depreciation on the Statements of Operations as a result of previously unaffiliated securities moving to affiliated. |
| 12. | SUBSEQUENT EVENTS |
In preparing these financial statements, the Funds’ management has evaluated events and transactions for potential recognition or disclosure through the date the financial statements were issued.
On July 7, 2020, Allianz Global Investors U.S. LLC (“AllianzGI U.S.”) and Virtus Investment Partners, Inc. (“Virtus”) announced that they have entered into an agreement providing for a strategic alliance between the two parties. As part of this strategic alliance, wholly-owned subsidiaries of Virtus will become the investment adviser and administrator for the Funds and Virtus or an affiliate of Virtus will become the distributor for the Funds. With respect to all Funds other than the suite of value equity Funds, U.S. portfolio management teams will continue to be responsible for the day-to-day management of the Funds, through AllianzGI U.S. serving as sub-adviser to such Funds. With respect to the suite of value equity Funds managed by U.S. Dallas-based Value Equity US team (AllianzGI Dividend Value, AllianzGI International Value, AllianzGI Large-Cap Value, AllianzGI Mid-Cap Value and AllianzGI Small-Cap Value Funds), members of the Value Equity US team are expected to become employees of Virtus or an affiliate of
Virtus and continue their day-to-day management of those Funds. Certain of the new arrangements, including the new management agreements and sub-advisory agreements, must be approved by the Funds’ Board of Trustees and Fund shareholders in order to take effect.
Effective July 13, 2020, AllianzGI Health Sciences Fund began offering Class P shares.
On July 16, 2020, AllianzGI Income & Growth declared per-share net investment income dividends and short-term capital gain distributions to shareholders, payable July 16, 2020 to shareholders of record on July 15, 2020 as follows:
| Share Class | Dividend Rate | Short-Term Capital Gains | ||||||
Class A | $ | 0.01561 | $ | 0.05439 | ||||
Class C | $ | 0.00967 | $ | 0.05439 | ||||
Class R | $ | 0.01227 | $ | 0.05439 | ||||
Class P | $ | 0.01786 | $ | 0.05439 | ||||
Institutional Class | $ | 0.01878 | $ | 0.05439 | ||||
| Annual Report | | June 30, 2020 | 161 |
Table of Contents
Notes to Financial Statements (cont’d)
June 30, 2020
On August 20, 2020, AllianzGI Income & Growth declared per-share net investment income dividends and short-term capital gain distributions to shareholders, payable August 20, 2020 to shareholders of record on August 19, 2020 as follows:
| Share Class | Dividend Rate | Short-Term Capital Gains | ||||||
Class A | $ | 0.02482 | $ | 0.04518 | ||||
Class C | $ | 0.01905 | $ | 0.04518 | ||||
Class R | $ | 0.02263 | $ | 0.04518 | ||||
Class P | $ | 0.02701 | $ | 0.04518 | ||||
Institutional Class | $ | 0.02793 | $ | 0.04518 | ||||
There were no other subsequent events identified that require recognition or disclosure.
| 162 | June 30, 2020 | | Annual Report |
Table of Contents
Report of Independent Registered Public Accounting Firm
To the Board of Trustees of Allianz Funds and Shareholders of AllianzGI Dividend Value Fund, AllianzGI Emerging Markets Opportunities Fund, AllianzGI Focused Growth Fund, AllianzGI Global Small-Cap Fund, AllianzGI Health Sciences Fund, AllianzGI Income & Growth Fund, AllianzGI International Value Fund, AllianzGI Large-Cap Value Fund, AllianzGI Mid-Cap Fund, AllianzGI Mid-Cap Value Fund, AllianzGI Small-Cap Fund, AllianzGI Small-Cap Value Fund and AllianzGI Technology Fund
Opinions on the Financial Statements
We have audited the accompanying statements of assets and liabilities, including the schedules of investments, of AllianzGI Dividend Value Fund, AllianzGI Emerging Markets Opportunities Fund, AllianzGI Focused Growth Fund, AllianzGI Global Small-Cap Fund, AllianzGI Health Sciences Fund, AllianzGI Income & Growth Fund, AllianzGI International Value Fund, AllianzGI Large-Cap Value Fund, AllianzGI Mid-Cap Fund, AllianzGI Mid-Cap Value Fund, AllianzGI Small-Cap Fund, AllianzGI Small-Cap Value Fund and AllianzGI Technology Fund (constituting Allianz Funds, hereafter collectively referred to as the “Funds”) as of June 30, 2020, the related statements of operations for the year ended June 30, 2020, the statements of changes in net assets for each of the two years in the period ended June 30, 2020, including the related notes, and the financial highlights for each of the periods indicated therein (collectively referred to as the “financial statements”). In our opinion, the financial statements present fairly, in all material respects, the financial position of each of the Funds as of June 30, 2020, the results of each of their operations for the year then ended, the changes in each of their net assets for each of the two years in the period ended June 30, 2020 and each of the financial highlights for each of the periods indicated therein in conformity with accounting principles generally accepted in the United States of America.
Basis for Opinions
These financial statements are the responsibility of the Funds’ management. Our responsibility is to express an opinion on the Funds’ financial statements based on our audits. We are a public accounting firm registered with the Public Company Accounting Oversight Board (United States) (PCAOB) and are required to be independent with respect to the Funds in accordance with the U.S. federal securities laws and the applicable rules and regulations of the Securities and Exchange Commission and the PCAOB.
We conducted our audits of these financial statements in accordance with the standards of the PCAOB. Those standards require that we plan and perform the audit to obtain reasonable assurance about whether the financial statements are free of material misstatement, whether due to error or fraud.
Our audits included performing procedures to assess the risks of material misstatement of the financial statements, whether due to error or fraud, and performing procedures that respond to those risks. Such procedures included examining, on a test basis, evidence regarding the amounts and disclosures in the financial statements. Our audits also included evaluating the accounting principles used and significant estimates made by management, as well as evaluating the overall presentation of the financial statements. Our procedures included confirmation of securities owned as of June 30, 2020 by correspondence with the custodian, transfer agents and brokers; when replies were not received from transfer agents or brokers, we performed other auditing procedures. We believe that our audits provide a reasonable basis for our opinions.
PricewaterhouseCoopers LLP
New York, New York
August 20, 2020
We have served as the auditor of one or more investment companies in the Allianz Global Investors U.S. group of investment companies since at least 1995. We have not determined the specific year we began serving as auditor.
| Annual Report | | June 30, 2020 | 163 |
Table of Contents
Unaudited
Changes to the Board of Trustees/Liquidity Risk Management Program
Changes to the Board of Trustees:
Effective December 31, 20’19, Bradford K. Gallagher retired as an Independent Trustee of the Trust.
Liquidity Risk Management Program:
Consistent with Rule 22e-4 under the 1940 Act (the “Liquidity Rule”), the Funds have adopted a liquidity risk management program (the “Program”) on April 23, 2019. The Board appointed the Investment Adviser, acting principally through its US Risk Committee, to administer the Program (the “Program Administrator”). The Program governs the Funds’ approach to managing liquidity risk, and its principal objectives include assessing, managing and periodically reviewing each Fund’s liquidity risk, based on factors specific to the circumstances of the Fund. Liquidity risk is defined as the risk that a Fund could not meet redemption requests without significant dilution of remaining investors’ interests in the Fund.
During the period, the Board reviewed a report prepared by the Program Administrator regarding the operation and effectiveness of the Program for the period from June 1, 2019 through April 30, 2020 (the “Program Period”), the key conclusions of which are summarize as follows. During the Program Period, there were no liquidity events that materially affected the performance of any Fund or its ability to timely meet redemptions without dilution to remaining investors. The Funds maintained a high level of liquidity during the Program Period and primarily held assets that are defined under the Liquidity Rule as “Highly Liquid Investments,” which are defined to include securities a Fund expects to be convertible into cash in current market conditions in three business days without significantly changing their market value. The Funds that had previously established “Highly Liquid Investment Minimum” (HLIM) thresholds, as defined under the Liquidity Rule, operated significantly above their respective HLIM thresholds during the reporting period. The Program Administrator determined that, during the Program reporting period, the Program operated adequately and effectively to manage each Fund’s liquidity risk.
There can be no assurance that the Program will achieve its objectives under all circumstances in the future. Please refer to your Fund’s prospectus for more information regarding exposure to liquidity and other risks.
| 164 | June 30, 2020 | | Annual Report |
Table of Contents
Unaudited
Federal Income Tax Information
As required by the Internal Revenue Code, shareholders must be notified regarding certain tax attributes of distributions made by each fund.
During the year ended June 30, 2020, the following Funds distributed long-term capital gains in the amounts indicated (or the maximum amount allowable):
| 20% Long-Term Capital Gain | ||||
AllianzGI Dividend Value | $ | 136,151,350 | ||
AllianzGI Focused Growth | 137,604,044 | |||
AllianzGI Global Small-Cap | 7,489,274 | |||
AllianzGI Health Sciences | 7,881,506 | |||
AllianzGI Income & Growth | 5,994,423 | |||
AllianzGI Large-Cap Value | 5,673,284 | |||
AllianzGI Mid-Cap | 14,996,213 | |||
AllianzGI Mid-Cap Value | 78,223,843 | |||
AllianzGI Small-Cap Value | 66,054,045 | |||
AllianzGI Technology | 247,544,540 | |||
Under the Jobs and Growth Tax Relief Reconciliation Act of 2003, the following percentages of ordinary dividends paid during the fiscal year ended June 30, 2020, are designated as “qualified dividend income”:
AllianzGI Dividend Value | 100.00 | % | ||
AllianzGI Emerging Markets Opportunities | 84.90 | % | ||
AllianzGI Focused Growth | 0.00 | % | ||
AllianzGI Global Small-Cap | 0.00 | % | ||
AllianzGI Health Sciences | 67.87 | % | ||
AllianzGI Income & Growth | 8.49 | % | ||
AllianzGI International Value | 100.00 | % | ||
AllianzGI Large-Cap Value | 100.00 | % | ||
AllianzGI Mid-Cap | 0.00 | % | ||
AllianzGI Mid-Cap Value | 62.84 | % | ||
AllianzGI Small-Cap | 100.00 | % | ||
AllianzGI Small-Cap Value | 100.00 | % | ||
AllianzGI Technology | 0.00 | % |
Corporate shareholders are generally entitled to take the dividend received deduction on the portion of a Fund’s dividend distribution that qualifies under tax law. The percentage of the following Funds’ ordinary income dividends paid during the fiscal year ended June 30, 2020, that qualify for the corporate dividend received deduction is set forth below:
AllianzGI Dividend Value | 100.00 | % | ||
AllianzGI Emerging Markets Opportunities | 0.26 | % | ||
AllianzGI Focused Growth | 0.00 | % | ||
AllianzGI Global Small-Cap | 0.00 | % | ||
AllianzGI Health Sciences | 45.43 | % | ||
AllianzGI Income & Growth | 8.41 | % | ||
AllianzGI International Value | 3.83 | % | ||
AllianzGI Large-Cap Value | 100.00 | % | ||
AllianzGI Mid-Cap | 0.00 | % | ||
AllianzGI Mid-Cap Value | 63.69 | % | ||
AllianzGI Small-Cap | 100.00 | % | ||
AllianzGI Small-Cap Value | 100.00 | % | ||
AllianzGI Technology | 0.00 | % |
Foreign Tax Credit. The following Funds had elected to pass through the credit for tax paid in foreign countries. The foreign income and foreign tax per share outstanding on June 30, 2020 are as follows:
| Gross Foreign Dividends | Gross Foreign Dividends Per Share | Foreign Tax | Foreign Tax Per Share | |||||||||||||
AllianzGI Emerging Markets Opportunities | $ | 10,992,935 | $ | 1.121539 | $ | 1,328,797 | $ | 0.135569 | ||||||||
AllianzGI International Value | 5,378,106 | 0.701915 | 424,887 | 0.055453 | ||||||||||||
Since the Funds’ tax year is not the calendar year, another notification will be sent with respect to calendar year 2020. In January 2021, shareholders will be advised on IRS Form 1099-DIV as to the federal tax status of the dividends and distributions received during calendar year 2020. The amount that will be reported will be the amount to use on the shareholder’s 2020 federal income tax return and may differ from the amount which must be reported in connection with the Funds’ tax year ended June 30, 2020. Shareholders are advised to consult their tax advisers as to the federal, state and local tax status of the dividend income received from the Funds.
| Annual Report | | June 30, 2020 | 165 |
Table of Contents
Unaudited
Matters Relating to the Trustees’ Consideration of the Investment Advisory Agreements
The Investment Company Act of 1940, as amended (the “1940 Act”), requires that both the full Board of Trustees (the “Board” or the “Trustees”), including a majority of the Trustees who are not “interested persons” of the Trust, as that term is defined in the 1940 Act (the “Independent Trustees”), voting separately, annually approve the continuation of the Trust’s Amended and Restated Investment Advisory Agreement (the “Agreement”) on behalf of each Fund (as defined below) with Allianz Global Investors U.S. LLC (the “Investment Adviser”). Throughout the process, the Independent Trustees received separate legal advice from independent legal counsel that is experienced in 1940 Act matters and that is independent of the Investment Adviser (“Independent Counsel”), and with whom they met separately from the Investment Adviser during the contract review process.
The contract review process consisted of multiple meetings and discussions that included meetings of the Contracts Committee and meetings of the Independent Trustees and Independent Trustee Counsel leading up to the full Board’s consideration of the Agreement. Representatives from fund management participated in portions of those meetings and discussions to, among other topics, review the comparative fee and expense information and comparative performance information prepared and provided by Broadridge Financial Solutions, Inc. (“Broadridge”), an independent third party, for each Fund using its respective Broadridge peer groups for performance and expense comparisons. The Board’s review and approval process reflected developments through the second half of the Trust’s fiscal year ended June 30, 2020, but did not reflect subsequent events, including the strategic partnership announced on July 7, 2020, between the Investment Adviser and Virtus Investment Partners, Inc.
At their meeting held on June 25, 2020, the Board, including the Independent Trustees unanimously approved the continuation of the Agreement through June 30, 2021 with respect to AllianzGI Emerging Markets Opportunities Fund, AllianzGI Focused Growth Fund, AllianzGI Global Small-Cap Fund, AllianzGI Health Sciences Fund, AllianzGI Income & Growth Fund, AllianzGI Mid-Cap Fund, AllianzGI Small-Cap Fund, AllianzGI Technology Fund, AllianzGI Dividend Value Fund, AllianzGI International Value Fund, AllianzGI Large-Cap Value Fund, AllianzGI Mid-Cap Value Fund, AllianzGI Small-Cap Value Fund (each, a “Fund” and together, the “Funds”).1 The material factors and conclusions that formed the basis of these approvals for the Funds are discussed below.
In connection with their deliberations regarding the approval of the Agreement, the Independent Trustees considered such information and factors as they believed, in light of the legal advice furnished to them and their own business judgment, to be relevant. As described below, the Independent Trustees considered the nature, quality and extent of the various investment management, administrative, and other services to be performed by the Investment Adviser under the Agreement.
In evaluating the Agreement with respect to each Fund, the Board, including the Independent Trustees, reviewed extensive materials provided by the Investment Adviser in response to questions submitted by the Independent Trustees and Independent Counsel, and met with senior representatives of the Investment Adviser regarding its personnel, operations, and financial condition as they relate to the Funds. The Board also considered the broad range of information relevant to the annual contract review that is provided to the Board (including its various standing committees) at meetings throughout the year, including reports on investment performance, portfolio risk, and other portfolio information for each Fund, including the use of derivatives if used as part of the Fund’s principal investment strategy, as well as periodic reports on, among other matters, pricing and valuation; quality and cost of portfolio trade execution; compliance; and shareholder and other services provided by the Investment Adviser and its affiliates. To assist with their review, the Independent Trustees reviewed a summary for each Fund prepared by the Investment Adviser that includes, among other information, performance comparisons between the Funds and their Broadridge Performance Universe (as defined below), total return investment performance, investment objective, total net assets, annual fund operating expenses for each share class, portfolio managers, total expense ratio and management fee comparisons between each Fund and its Broadridge Expense Group (as defined below), and trends in the Investment Adviser’s profitability from its advisory relationship with each Fund. They also considered summaries assigning a quadrant placement to each Fund for an institutional and retail share class based on an average of certain measures of performance (including in relation to risk) and fees/expenses versus peer group medians. The Independent Trustees also considered the risk profiles of the Funds.
The Independent Trustees’ conclusions as to the approval of the Agreement were based on a comprehensive consideration of all information provided to the Independent Trustees and were not the result of any single factor. Individual Independent Trustees may have
1 The Board, including a majority of the Independent Trustees, determined to rely on the relief granted by an exemptive order issued by the U.S. Securities and Exchange Commission (the “SEC”) that permits mutual fund boards of directors to approve advisory contracts at a meeting held remotely rather than in-person in response to the impact of COVID-19 on investment advisers and funds. The Board determined that reliance on the exemptive order was necessary and appropriate due to circumstances related to current or potential effects of COVID-19, and prior to commencing the approval meeting, the Board confirmed that all Board members could hear each other simultaneously during the meeting. The Board noted that it would ratify any actions taken at this meeting pursuant to the SEC relief at its next in-person meeting.
| 166 | June 30, 2020 | | Annual Report |
Table of Contents
evaluated the information presented differently from one another, attributing different weights to various factors. The Independent Trustees recognized that the fee arrangements for the Funds are the result of review and discussion in the prior years between the Independent Trustees and the Investment Adviser, that certain aspects of such arrangements may receive greater scrutiny in some years than in others, and that the Independent Trustees’ conclusions may be based, in part, on their consideration of these same arrangements during the course of the year and in prior years. The Independent Trustees evaluated information available to them on a Fund-by-Fund basis, and their determinations were made separately in respect of each Fund. However, they also took into account the common interests of all series of the Trust in their review.
Performance Information
With respect to investment performance, the Independent Trustees considered information regarding each Fund’s short-, intermediate- and long-term performance, as applicable, net of the Fund’s fees and expenses, both on an absolute basis and relative to an appropriate benchmark index that does not deduct the fees or expenses of investing. The Independent Trustees also considered information provided by Broadridge for each Fund relative to the investment performance of a group of funds with investment classifications and/or objectives comparable to the Fund, as identified by Broadridge (the “Broadridge Performance Universe”). The Independent Trustees recognized that the performance information, including the Broadridge performance information, was as of March 31, 2020, and, as such, included the period of extreme market volatility resulting from COVID-19. The Independent Trustees also reviewed performance in relation to certain measures of the degree of investment risk undertaken by the portfolio managers.
For Funds that underperformed, the Board considered the magnitude and duration of that underperformance relative to the Broadridge Performance Universe and/or the benchmark (e.g., the amount by which a Fund underperformed, including, for example, whether the Fund slightly underperformed or significantly underperformed). To the extent that the Independent Trustees identified a Fund as having underperformed its benchmark indices and/or Broadridge Performance Universes to an extent, or over a period of time, that the Independent Trustees felt warranted additional inquiry, the Independent Trustees discussed with the Investment Adviser the Fund’s performance, potential reasons for the underperformance, and, if necessary, steps that the Investment Adviser had taken, or intended to take, to improve performance. The Independent Trustees also met with the portfolio managers of certain Funds during the 12 months prior to voting on the contract renewal to discuss the Funds’ performance. The Independent Trustees considered the Investment Adviser’s responsiveness with respect to the Funds that experienced lagging performance. In this regard, with respect to the group of Funds managed by the AllianzGI U.S. Value Equity team, they noted changes in leadership and recent additions to the portfolio
management and research personnel within the last couple of years. The Independent Trustees noted that performance is only one of the factors that it deems relevant to its consideration of the Agreements and that, after considering all relevant factors, it may be appropriate to approve the continuation of the Agreements notwithstanding a Fund’s relative performance.
Nature, Extent, and Quality of Services
As part of their review, the Independent Trustees received and considered descriptions of various functions performed by the Investment Adviser for the Funds, such as portfolio management, compliance monitoring, portfolio trading practices and oversight of third party service providers. They also considered information regarding the overall organization and business functions of the Investment Adviser, including, without limitation, information regarding senior management, portfolio managers and other personnel providing or proposed to provide investment management, administrative and other services, and corporate ownership and business operations unrelated to the Funds. They considered certain changes to the executive leadership and the organization of the governance structure, as well as the availability of research and other capabilities within the global organization. The Independent Trustees examined the ability of the Investment Adviser to provide high-quality investment management and other services to the Funds. Among other information, the Independent Trustees considered the investment philosophy and research and decision-making processes of the Investment Adviser, as well as the Investment Adviser’s broker selection process and trading operations; the experience of key advisory personnel of the Investment Adviser and its affiliates, as applicable, responsible for portfolio management of the Funds; the ability of the Investment Adviser to attract and retain capable personnel; the philosophy of employee compensation; and the operational infrastructure, including technology and systems, of the Investment Adviser. The Independent Trustees also considered actions taken by the Investment Adviser to manage the impact of the market volatility resulting from COVID-19 on the Funds and their portfolio holdings.
In addition, the Independent Trustees noted the extensive range of services that the Investment Adviser provides to the Funds beyond the investment management services. In this regard, the Independent Trustees reviewed the extent and quality of the Investment Adviser’s services with respect to regulatory compliance and ability to comply with the investment policies of the Funds; the compliance programs and risk controls of the Investment Adviser; the specific contractual obligations of the Investment Adviser pursuant to the Agreement; the nature, extent and quality of certain administrative services the Investment Adviser is responsible for providing to the Funds; the Investment Adviser’s risk management function; and conditions that might affect the ability of the Investment Adviser to provide high quality services to the Funds in the future under the Agreement, including, but not limited to, the organization’s financial condition and
| Annual Report | | June 30, 2020 | 167 |
Table of Contents
Unaudited
Matters Relating to the Trustees’ Consideration of the Investment Advisory Agreements (cont’d)
operational stability. The Independent Trustees also considered that the Investment Adviser assumes significant ongoing risks with respect to all Funds, including entrepreneurial, reputational, operational and business risks the Investment Adviser has undertaken in serving as investment manager and sponsor of the Funds. The Independent Trustees also noted the Investment Adviser’s activities under its contractual obligation to oversee the Funds’ various outside service providers, including its ongoing evaluation of the quality of the services provided, negotiation of certain service providers’ fees, and its evaluation of service providers’ cybersecurity programs, compliance programs, and business continuity programs, among other matters. It also considered the Investment Adviser’s ongoing development of its own infrastructure and information technology to support the Funds through, among other things, cybersecurity, business continuity planning, and risk management. The Independent Trustees also noted the Investment Adviser’s effective operation and implementation of its business continuity plan in response to COVID-19 and its oversight of the service providers’ business continuity plans during this period. The Independent Trustees considered, among other matters, that the Investment Adviser provides or procures through third-party service providers most administrative services that are required by the Funds under a separate Amended and Restated Administration Agreement (the “Administration Agreement”). These services include accounting, bookkeeping, tax, legal, audit, custody, transfer agency, sub-transfer agency, valuation and compliance services, preparation of prospectuses, shareholder reports and other regulatory filings, oversight and coordination of activities of third-party service providers and various shareholder services. The Independent Trustees took into account the “unitary” administrative fee structure applicable to the Funds, under which certain third-party services that are ordinarily the financial responsibility of a mutual fund (e.g., audit, custody, accounting, legal, transfer agency, sub-transfer agency and printing services) are, in the case of the Funds, paid for by the Investment Adviser out of its administrative fee. They also took into account that the Investment Adviser provides the Funds with office space, administrative services and personnel to serve as Fund officers, and that the Investment Adviser and its affiliates pay all of the compensation of the Funds’ interested Trustees and officers (in their capacities as employees of the Investment Adviser or such affiliates). Based on the foregoing, the Independent Trustees concluded that the Investment Adviser’s investment processes, research capabilities and philosophy were well-suited to each Fund given its investment objective and policies, that the Investment Adviser would be able to continue to meet any reasonably foreseeable obligations under the Agreement, and that the Investment Adviser would otherwise be able to provide services to the Funds of sufficient extent and quality.
Fee and Expense Information and Comparisons
In assessing the reasonableness of the Funds’ fees and expenses under the Agreement, the Independent Trustees considered, among other information, each Fund’s advisory fee and the Fund’s total
expense ratio as a percentage of average daily net assets and information regarding the advisory fees and other expenses of comparable funds identified by Broadridge (the “Broadridge Expense Group”). Where a Fund’s advisory fees or total expense ratios were higher than the Broadridge Expense Group median, the Independent Trustees considered whether specific factors, such as portfolio management, administration, or oversight needs contributed to the Fund’s advisory fees or total expense ratios. The Independent Trustees also noted certain advisory or administrative fee breakpoints, waivers or reductions for certain Funds that had been proposed by the Investment Adviser for continuation, or modification. With respect to certain Funds that underperformed for the one- and three-year periods relative to the median of the Broadridge Performance Universe, the Independent Trustees considered and discussed with the Investment Adviser whether any additional fee waivers were appropriate. The Independent Trustees also considered, among other items: (i) that the Funds pay a unitary administrative fee for non-advisory services, which differentiates the Funds from many in the industry, (ii) current Fund asset levels as compared to prior years, including recent or planned liquidations of some Funds in the complex, and (iii) the Funds’ “active share,” i.e., the percentage of stock holdings in a Fund that differ from its benchmark index and discussed with the Investment Adviser the reasons some Funds may have lower active share than others.
To the extent applicable, the Independent Trustees considered information regarding the investment performance and fees for other funds and/or separately managed accounts, including institutional accounts, managed by the Investment Adviser or its affiliates pursuing a similar investment strategy, if any (“similar accounts”). Specifically, the Independent Trustees reviewed information showing the net advisory fees charged by the Investment Adviser to the similar accounts. In comparing these fees, the Independent Trustees considered information provided by the Investment Adviser as to the generally broader and more extensive services provided to the Funds in comparison to institutional or separate accounts; the higher demands placed on the Investment Adviser to provide considerable shareholder services due to the volume of investors, including shareholder communications and client relation services and account administration services; investment personnel and trading infrastructure as a result of the daily cash in-flows and out-flows of the Funds; the greater entrepreneurial; enterprise, and reputational risk in managing retail mutual funds; and the impact on the Investment Adviser and expenses associated with the more extensive regulatory and compliance requirements to which the Funds are subject in comparison to institutional or separate accounts.
The Independent Trustees also considered and evaluated the unitary administrative fees paid by each Fund under the Administration Agreement, including in light of the total expenses of the Funds and the total expenses of competitor funds as reflected in the Broadridge materials. In considering the unitary administrative fees, the Trustees reviewed a summary from management describing which services fell
| 168 | June 30, 2020 | | Annual Report |
Table of Contents
within the unitary fee and which fell outside the unitary fee and were paid directly by the Funds. The Independent Trustees noted that, in connection with the contract review process in prior years, they had negotiated with the Investment Adviser to observe administrative fee breakpoints for each Fund and share class under the Administration Agreement, and to apply breakpoints based on the entire net assets of each Fund (rather than on net assets attributable to particular share classes).
The Trustees also considered, among other information, the Investment Adviser’s business model of providing advisory and administrative services as part of a comprehensive program wherein the services cannot readily be separated and the Investment Adviser’s indication that it would not be willing to outsource its provision of administrative services while continuing to provide advisory services. They also took into account disclosure in the Funds’ prospectuses regarding administrative fees.
Economies of Scale and “Fall-Out” Benefits
The Independent Trustees considered the extent to which the Investment Adviser may realize economies of scale or other efficiencies in managing and supporting the Funds. The Independent Trustees took into account that, as open-end investment companies, the Funds intend to raise additional assets, so that, as the assets of the Funds grow over time, certain economies of scale and other efficiencies may be realized through spreading certain fixed costs across a larger asset base or across a variety of products and services, while also taking into account the breakpoints and fee waiver and expense limitation arrangements observed by the Investment Adviser for applicable Funds. The Independent Trustees considered it appropriate to consider breakpoints in the Funds’ administrative fee as a means of sharing any economies of scale or efficiencies concerning administration services with Fund shareholders. The Independent Trustees also considered that the Investment Adviser shares the benefits of economies of scale with the Funds and their shareholders by adding and enhancing services to the Funds over time, including expenditures in staff, technology, and infrastructure.
Additionally, the Independent Trustees considered so-called “fall-out benefits” to the Investment Adviser and its affiliates, such as research it may receive from broker-dealers executing the Funds’ portfolio transactions on an agency basis or reputational value derived from serving as Investment Adviser to the Funds. They also considered that the unitary administrative fee generally results in increased profitability benefits as the asset base of the Funds increases and such benefits generally inure to the Investment Adviser, and that the Investment Adviser’s profitability likewise generally declines under the unitary administrative fee structure when Fund assets decline. The Independent Trustees considered that the unitary administrative fee also insulates shareholders from increased expense ratios arising from declines in net assets or from increases in the costs of third-party services, such as custodial, transfer agent or audit services.
Profitability
The Independent Trustees considered the overall estimated profitability to the Investment Adviser with respect to combined advisory and administrative fees, as well as profitability separately as to each of the advisory fees and administrative fees, each on a Fund-by-Fund basis for the twelve months ended December 31, 2019. They also reviewed the Investment Adviser’s aggregate profitability with respect to the Fund complex and the Investment Adviser’s overall profitability with respect to all products globally. As part of its considerations, the Board considered the cost allocation methodology that the Investment Adviser used in developing its estimated profitability figures. In this connection, the Independent Trustees considered that for certain Funds profitability had increased as a result of expense reduction efforts, although the Funds’ assets had declined over the last year. The Independent Trustees recognized that it is difficult to make comparisons of profitability from mutual fund advisory and administration contracts because comparative information is not generally available and is affected by numerous factors, including the structure of the particular adviser, the types of funds it manages, its business mix, numerous assumptions about allocations and the adviser’s capital structure and cost of capital. The Independent Trustees concluded that the Investment Adviser’s estimated pre-tax profitability for advisory services was not excessive or unreasonable, although it was sizeable for certain Funds, and that estimated pre-tax profitability for advisory and administrative services combined, including when calculated on a net revenue basis regarding the administrative fee, was sizeable for certain Funds, but generally not unreasonable under the circumstances. The Independent Trustees recognized that the Investment Adviser and its affiliates should be entitled to earn a reasonable level of profits for services they provide to each Fund and, based on their review, determined that the estimated profitability to the Investment Adviser with respect to its relationship with each Fund did not, in any case, appear to be excessive.
Fund-by-Fund Analysis
With regard to the investment performance of each Fund and the fees charged to each Fund, the Independent Trustees considered the following information. The comparative performance, fee, and expense information was prepared and provided by Broadridge and was not independently verified by the Independent Trustees.
With respect to all Funds, the Independent Trustees reviewed, among other information, comparative information showing performance for Class A and Institutional Class shares of the Funds against their respective Broadridge Performance Universes for the one-year, three-year, five-year and ten-year periods (to the extent each such Fund had been in existence), each ended March 31, 2020. Institutional Class performance relative to the median for each Fund’s Broadridge Performance Universe is described below, and for those Funds with performance that ranked below median for their respective
| Annual Report | | June 30, 2020 | 169 |
Table of Contents
Unaudited
Matters Relating to the Trustees’ Consideration of the Investment Advisory Agreements (cont’d)
Broadridge Performance Universes, the specific quintile rankings for Institutional Class shares are also noted below with respect to the relevant periods of underperformance. With respect to performance quintile rankings for a Fund compared to its Broadridge Performance Universe, the first quintile represents the highest (best) performance and the fifth quintile represents the lowest performance.
The Independent Trustees reviewed, among other information, data provided by Broadridge comparing each Fund’s advisory fee, and ratios of total expenses to net assets (“Total Expense Ratios”) for two share classes (Class A and Institutional Class) to the Funds’ respective Broadridge Expense Groups for the most recently reported fiscal year. Class A shares of the applicable Broadridge-selected group of comparable funds are referred to below as the “retail expense group,” and Institutional Class are referred to as the “institutional expense group.” The Independent Trustees noted that the Broadridge data takes into account any fee reductions or expense limitations that were in effect during a Fund’s last fiscal year. For those Funds whose fees or expenses were higher than the Broadridge Expense Group median, the specific quintile rankings are also noted below with respect to the relevant above-median fee or expense categories (unless quintile rankings were not provided to the Independent Trustees by Broadridge, in which case fund rankings are provided). For the purposes of Broadridge Expense Group quintile rankings, higher fees and expenses result in a lower quintile ranking, with the first quintile corresponding to low fees and expenses and the fifth quintile corresponding to high fees and expenses.
| ∎ | AllianzGI Emerging Markets Opportunities Fund: As compared to its Broadridge Performance Universe, the Fund’s performance was below the median for the five-year period (in the fourth quintile) and above the median for the one-, three- and ten-year periods. As compared to its Broadridge Expense Groups, the Fund’s advisory fees and total expense ratios were each below the median for both the retail and institutional expense groups (on a net basis). |
| ∎ | AllianzGI Focused Growth Fund: As compared to its Broadridge Performance Universe, the Fund’s performance was below the median for the three-year period (in the third quintile) and above the median for the one-, five- and ten-year periods. As compared to its Broadridge Expense Groups, the Fund’s advisory fees and total expense ratios were each below the median for both the retail and institutional expense groups (on a net basis). |
| ∎ | AllianzGI Global Natural Resources Fund: As compared to its Broadridge Performance Universe, the Fund’s performance was below the median for the three- and five-year periods (each in the third quintile) and above the median for the one- and ten-year periods. As compared to its Broadridge Expense Groups, the Fund’s advisory fees were below the median for the retail and institutional expense groups, and total expense ratios were above the median for both the retail and institutional expense groups (in the fifth and fourth quintiles, respectively) (on a net basis in each case). The Board noted this Fund would be liquidated as of June 11, 2020. |
| ∎ | AllianzGI Global Small-Cap Fund: As compared to its Broadridge Performance Universe, the Fund’s performance was below the median for the one-, three- and five-year periods (each in the fourth quintile) and above the median for the ten-year period. As compared to its Broadridge Expense Groups, the Fund’s advisory fees were above the median for the retail expense group (in the third quintile) and below the median for the institutional expense group, and total expense ratios were above the median for both the retail and institutional expense groups (in the fifth and third quintiles, respectively) (on a net basis in each case). |
| ∎ | AllianzGI Health Sciences Fund: As compared to its Broadridge Performance Universe, the Fund’s performance was above the median for the one-, three- and five-year periods. The Fund’s Institutional Class shares have less than ten years of history; its Class A shares’ performance was below the median for the ten-year period (in the fourth quintile) and above the median for the one-, three- and five-year periods. As compared to its Broadridge Expense Groups, the Fund’s advisory fees were above the median for the retail and institutional expense groups (in the third and fourth quintiles, respectively), and total expense ratios were at the median for the retail expense group and above the median for the institutional expense group (in the fourth quintile) (on a net basis in each case). |
| ∎ | AllianzGI Income & Growth Fund: As compared to its Broadridge Performance Universe, the Fund’s performance was above the median for the one-, three-, five- and ten-year periods. As compared to its Broadridge Expense Groups, the Fund’s advisory fees were below the median for the retail expense group and at median for the institutional expense group, and total expense ratios were above the median for both the retail and institutional expense groups (each in the fifth quintile) (on a net basis in each case). |
| ∎ | AllianzGI Mid-Cap Fund: As compared to its Broadridge Performance Universe, the Fund’s performance was below the median for the ten-year period (in the third quintile) and above the median for the one-, three- and five -year periods. As compared to its Broadridge Expense Groups, the Fund’s advisory fees and total expense ratios were each below the median for both the retail and institutional expense groups (on a net basis). |
| ∎ | AllianzGI Dividend Value Fund: As compared to its Broadridge Performance Universe, the Fund’s performance was below the median for the one-, three-, five- and ten-year periods (in the fourth quintile for the one-, five- and ten-year periods and in the third quintile for the three-year period). As compared to its Broadridge Expense Groups, the Fund’s advisory fees and total expense ratios were each below the median for both the retail and institutional expense groups (on a net basis). |
| ∎ | AllianzGI International Value Fund: As compared to its Broadridge Performance Universe, the Fund’s performance was below the median for the one-, five- and ten-year periods (in the fifth quintile for the five- and ten-year periods and in the third quintile for the one-year period), and was above the median for the three-year period. As compared to its Broadridge Expense Groups, the Fund’s advisory fees and total expense ratios were below the median for both the retail and institutional expense groups (on a net basis in each case). |
| 170 | June 30, 2020 | | Annual Report |
Table of Contents
| ∎ | AllianzGI Large-Cap Fund: As compared to its Broadridge Performance Universe, the Fund’s performance was above the median for the one-, three-, five- and ten-year periods. As compared to its Broadridge Expense Groups, the Fund’s advisory fees were below the median for both the retail and institutional expense groups, and total expense ratios were above the median for both the retail and institutional expense groups (each in the fourth quintile) (on a net basis in each case). |
| ∎ | AllianzGI Mid-Cap Value Fund: As compared to its Broadridge Performance Universe, the Fund’s performance was above the median for the one-, three-, five- and ten-year periods. As compared to its Broadridge Expense Groups, the Fund’s advisory fees and total expense ratios were each below the median for both the retail and institutional expense groups (on a net basis). |
| ∎ | AllianzGI Small-Cap Value Fund: As compared to its Broadridge Performance Universe, the Fund’s performance was below the median for the three-, five- and ten-year periods (in the fourth quintile for the three- and five-year periods and in the fifth quintile for the ten-year period) and above the median for the one-year period. As compared to its Broadridge Expense Groups, the Fund’s advisory fees and total expense ratios were each below the median for both the retail and institutional expense groups (on a net basis). |
| ∎ | AllianzGI Small-Cap Fund: As compared to its Broadridge Performance Universe, the Fund’s performance was above the median for the one-, three- and five-year periods. The Fund does not have ten years of history. As compared to its Broadridge Expense Groups, the Fund’s advisory fees were below the median for the retail expense group and at median for the institutional expense group, and total expense ratios were below the median for both the retail and institutional expense groups (on a net basis in each case). |
| ∎ | AllianzGI Technology Fund: As compared to its Broadridge Performance Universe, the Fund’s performance was below the median for the one-year period (in the third quintile) and above the median for the three-, five and ten-year periods. As compared to its Broadridge Expense Groups, the Fund’s advisory fees were above the median for both the retail and institutional expense groups (each in the fifth quintile), and total expense ratios were above the median for both the retail and institutional expense groups (each in the fifth quintile) (on a net basis in each case). |
Conclusions
After reviewing these and other factors described herein, the Independent Trustees concluded, with respect to each Fund, within the context of their overall conclusions regarding the Agreement and in their business judgment, that they were satisfied with the Investment Adviser’s responses and on-going efforts relating to the investment performance of the Funds, including efforts to improve performance for underperforming Funds. The Independent Trustees also concluded that the fees payable under the Agreement represent reasonable compensation in light of the nature, extent and quality of services provided by the Investment Adviser and should be continued, taking into account the Investment Adviser’s agreement to observe waivers and/or breakpoints for certain Funds. Based on their evaluation of factors that they deemed to be material, including, but not limited to, those factors described above, the Independent Trustees unanimously concluded that the continuation of the Agreement with respect to the Funds was in the interests of the applicable Funds and their shareholders, and determined to recommend that the continuance of the Agreement be approved by the full Board.
| Annual Report | | June 30, 2020 | 171 |
Table of Contents
Unaudited
Please read this Policy carefully. It gives you important information about how Allianz Global Investors U.S. and its U.S. affiliates (“AllianzGI US,” “we” or “us”) handle non-public personal information (“Personal Information”) that we may receive about you. It applies to all of our past, present and future clients and shareholders of AllianzGI US and the funds and accounts it manages, advises, administers or distributes, and will continue to apply when you are no longer a client or shareholder. As used throughout this Policy, “AllianzGI US” means Allianz Global Investors U.S. LLC, Allianz Global Investors Distributors LLC, and the family of registered and unregistered funds managed by one or more of these firms. AllianzGI US is part of a global investment management group, and the privacy policies of other Allianz Global Investors entities outside of the United States may have provisions in their policies that differ from this Privacy Policy. Please refer to the website of the specific non-US Allianz Global Investors entity for its policy on privacy.
We Care about Your Privacy
We consider your privacy to be a fundamental aspect of our relationship with you, and we strive to maintain the confidentiality, integrity and security of your Personal Information. To ensure your privacy, we have developed policies that are designed to protect your Personal Information while allowing your needs to be served.
Information We May Collect
In the course of providing you with products and services, we may obtain Personal Information about you, which may come from sources such as account application and other forms, from other written, electronic, or verbal communications, from account transactions, from a brokerage or financial advisory firm, financial advisor or consultant, and/or from information you provide on our website.
You are not required to supply any of the Personal Information that we may request. However, failure to do so may result in us being unable to open and maintain your account, or to provide services to you.
How Your Information Is Shared
We do not disclose your Personal Information to anyone for marketing purposes. We disclose your Personal Information only to those service providers, affiliated and non-affiliated, who need the information for everyday business purposes, such as to respond to your inquiries, to perform services, and/or to service and maintain your account. This applies to all of the categories of Personal Information we collect about you. The affiliated and non-affiliated service providers who receive your Personal Information also may use it to process your transactions, provide you with materials (including preparing and mailing prospectuses and shareholder reports and gathering shareholder proxies), and provide you with account statements and other materials relating to your account. These service providers provide services at our direction, and under their agreements with us, are required to keep your Personal Information confidential and to use it only for providing the contractually required services. Our service providers may not use your Personal Information to market products and services to you except in conformance with applicable laws and regulations. We also may provide your Personal Information to your respective brokerage or financial advisory firm, custodian, and/or to your financial advisor or consultant.
In addition, we reserve the right to disclose or report Personal Information to non-affiliated third parties, in limited circumstances, where we believe in good faith that disclosure is required under law, to cooperate with regulators or law enforcement authorities or pursuant to other legal process, or to protect our rights or property, including to enforce our Privacy Policy or other agreements with you. Personal Information collected by us may also be transferred as part of a corporate sale, restructuring, bankruptcy, or other transfer of assets.
Security of Your Information
We maintain your Personal Information for as long as necessary for legitimate business purposes or otherwise as required by law. In maintaining this information, we have implemented appropriate procedures that are designed to restrict access to your Personal Information only to those who need to know that information in order to provide products and/or services to you. In addition, we have implemented physical, electronic and procedural safeguards to help protect your Personal Information.
Privacy and the Internet
The Personal Information that you provide through our website, as applicable, is handled in the same way as the Personal Information that you provide by any other means, as described above. This section of the Policy gives you additional information about the way in which Personal Information that is obtained online is handled.
| ∎ | Online Enrollment, Account Access and Transactions: When you visit our website, you can visit pages that are open to the general public, or, where available, log into protected pages to enroll online, access information about your account, or conduct certain transactions. Access to these secure pages is permitted only after you have created a User ID and Password. The User ID and Password must be supplied each time you want to |
| 172 | June 30, 2020 | | Annual Report |
Table of Contents
access your account information online. This information serves to verify your identity. When you enter Personal Information into our website to enroll or access your account online, you will log into secure pages. By using our website, you consent to this Privacy Policy and to the use of your Personal Information in accordance with the practices described in this Policy. If you provide Personal Information to effect transactions, a record of the transactions you have performed while on the site is retained by us. For additional terms and conditions governing your use of our website, please refer to the Investor Mutual Fund Access—Disclaimer which is incorporated herein by reference and is available on our website. |
| ∎ | Cookies and Similar Technologies: Cookies are small text files stored in your computer’s hard drive when you visit certain web pages. Clear GIFs (also known as Web Beacons) are typically transparent very small graphic images (usually 1 pixel x 1 pixel) that are placed on a website that may be included on our services provided via our website and typically work in conjunction with cookies to identify our users and user behavior. We may use cookies and automatically collected information to: (i) personalize our website and the services provided via our website, such as remembering your information so that you will not have to re-enter it during your use of, or the next time you use, our website and the services provided via our website; (ii) provide customized advertisements, content, and information; (iii) monitor and analyze the effectiveness of our website and the services provided via our website and third-party marketing activities; (iv) monitor aggregate site usage metrics such as total number of visitors and pages viewed; and (v) track your entries, submissions, and status in any promotions or other activities offered through our website and the services provided via our website. Tracking technology also helps us manage and improve the usability of our website, (i) detecting whether there has been any contact between your computer and us in the past and (ii) to identify the most popular sections of our website. Because an industry-standard Do-Not-Track protocol is not yet established, our website will continue to operate as described in this Privacy Policy and will not be affected by any Do-Not-Track signals from any browser. |
| ∎ | Use of Social Media Plugins Our website uses the following Social Media Plugins (“Plugins”): |
| ∎ | Facebook Share Button operated by Facebook Inc., 1601 S. California Ave, Palo Alto, CA 94304, USA |
| ∎ | Tweet Button operated by Twitter Inc., 795 Folsom St., Suite 600, San Francisco, CA 94107, USA |
| ∎ | LinkedIn Share Button operated by LinkedIn Corporation, 2029 Stierlin Court, Mountain View, CA 94043, USA |
All Plugins are marked with the brand of the respective operators Facebook, Twitter and LinkedIn (“Operators”). When you visit our website that contains a social plugin, your browser establishes a direct connection to the servers of the Operator. The Operator directly transfers the plugin content to your browser which embeds the latter into our website, enabling the Operator to receive information about you having accessed the respective page of our website. Thus, AllianzGI US has no influence on the data gathered by the plugin and we inform you according to our state of knowledge: The embedded plugins provide the Operator with the information that you have accessed the corresponding page of our website. If you do not wish to have such data transferred to the Operators, you need to log out of your respective account before visiting our website. Please see the Operators’ data privacy statements in order to get further information about purpose and scope of the data collection and the processing and use:
| ∎ | Facebook: https://de-de.facebook.com/about/privacy |
| ∎ | Twitter: https://twitter.com/privacy |
| ∎ | Linked In: https://www.linkedin.com/legal/privacy-policy |
Changes to Our Privacy Policy
We may modify this Privacy Policy from time-to-time to reflect changes in related practices and procedures, or applicable laws and regulations. If we make changes, we will notify you on our website and the revised Policy will become effective immediately upon posting to our website. We also will provide account owners with a copy of our Privacy Policy, annually if required. We encourage you to visit our website periodically to remain up to date on our Privacy Policy. You acknowledge that by using our website after we have posted changes to this Privacy Policy, you are agreeing to the terms of the Privacy Policy as modified.
| Obtaining | Additional Information |
If you have any questions about this Privacy Policy or our privacy related practices in the United States, you may contact us via our dedicated email at PrivacyUS@allianzgi.com.
| Annual Report | | June 30, 2020 | 173 |
Table of Contents
Unaudited
Allianz Funds—Board of Trustees
The chart below identifies the Trustees and Officers of the Trust. The “interested” Trustees defined by the 1940 Act, are indicated below. Unless otherwise indicated, the correspondence address of all persons below is: 1633 Broadway, New York, New York 10019. The Funds’ Statement of Additional Information contains additional information about the Trustees. The Statement of Additional Information is available without charge, upon request, by calling 1-800-988-8380 (retail classes: A, C and R) or 1-800-498-5413 (Class P, Class R6, Institutional and Administrative classes).
Name, Year of Birth and Position Held with Trust | Term of Office and Length of Time Served | Principal Occupation(s) During Past 5 Years | Number of Funds in Fund Complex Overseen | Other Directorships Held by Trustee | ||||
| Interested Trustees | ||||||||
Erick R. Holt† 1952 | 12/2017 to present | Board Member, Global Chief Risk Officer, General Counsel and Chief Compliance Officer of Allianz Asset Management GmbH (2006-2018). | 55 | None | ||||
Thomas J. Fuccillo† 1968 | 3/2019 to present | Managing Director and Head of US Funds of Allianz Global Investors U.S. Holdings LLC; Managing Director of Allianz Global Investors Distributors LLC; Trustee, President and Chief Executive Officer of 55 funds in the Fund Complex; and President and Chief Executive Officer of The Korea Fund, Inc. and The Taiwan Fund, Inc. Formerly, Associate General Counsel, Head of US Funds and Retail Legal; Chief Legal Officer and Secretary of Allianz Global Investors Distributors LLC; Vice President, Secretary and Chief Legal Officer of numerous funds in the Fund Complex; and Secretary and Chief Legal Officer of The Korea Fund, Inc. | 55 | None | ||||
| Independent Trustees | ||||||||
Alan Rappaport 1953 Chairman of the Board of Trustees | 12/2014 to present | Adjunct Professor, New York University Stern School of Business (since 2011); Lecturer, Stanford University Graduate School of Business (since 2013); and Director, Victory Capital Holdings, Inc., an asset management firm (since 2013). Formerly, Trustee, American Museum of Natural History (2005-2015); Trustee and Member of Board of Overseers, NYU Langone Medical Center (2007-2015). and Advisory Director (formerly, Vice Chairman), Roundtable Investment Partners (2009-2018). | 55 | None. | ||||
Sarah E. Cogan 1956 | 1/2019 to present | Retired partner of Simpson Thacher & Bartlett LLP (“STB”)(law firm); Formerly, Partner, STB (1989-2018); Director, Girl Scouts of Greater New York (since 2016); and Trustee, Natural Resources Defense Council, Inc. (since 2013). | 83* | None. | ||||
Deborah A DeCotis 1952 | 6/2014 to present | Advisory Director, Morgan Stanley & Co., Inc. (since 1996); Member, Circle Financial Group (since 2009); Member, Council on Foreign Relations (since 2013); Trustee, Smith College (since 2017); and Director, Watford Re (Since 2017). Formerly, Co-Chair Special Projects Committee, Memorial Sloan Kettering (2005-2015); Trustee, Stanford University (2010-2015); and Principal, LaLoop LLC, a retail accessories company (1999-2014). | 83* | None. | ||||
F. Ford Drummond 1962 | 1/2006 to present | Owner/Operator, Drummond Ranch; and Director, Oklahoma Water Resources Board. Formerly, Director, The Cleveland Bank; and General Counsel, BMI-Health Plans (benefits administration). and Chairman, Oklahoma Water Resources Board. | 55 | Director, Bancfirst Corporation | ||||
| 174 | June 30, 2020 | | Annual Report |
Table of Contents
Name, Year of Birth and Position Held with Trust | Term of Office and Length of Time Served | Principal Occupation(s) During Past 5 Years | Number of Funds in Fund Complex Overseen | Other Directorships Held by Trustee | ||||
James A. Jacobson 1945 | 12/2014 to present | Retired. Trustee (since 2002) and Chairman of Investment Committee (since 2007), Ronald McDonald House of New York; and Trustee, New Jersey City University (since 2014). | 83* | Formerly, Trustee Alpine Mutual Funds Complex (consisting of 18 funds) (2009-2016). | ||||
Hans W. Kertess 1939 | 12/2014 to present | President, H. Kertess & Co., a financial advisory company; and Senior Adviser (formerly Managing Director), Royal Bank of Canada Capital Markets (since 2004). | 83* | None. | ||||
James S. MacLeod 1947 | 12/2014 to present | Non-Executive Chairman, CoastalSouth Bancshares, Inc. (since 2018); Director, Coastal States Bank; Director, Coastal States Mortgage, Inc.; Vice Chairman, MUSC Foundation; Chairman of the Board of Trustees, University of Tampa. Formerly, Chief Executive Officer of CoastalSouth Bancshares (2010-2018); President and Chief Operating Officer, Coastal States Bank (2007-2018); Managing Director and President, Homeowners Mortgage, a subsidiary of Coastal States Bank (2007-2018), Executive Vice President, Mortgage Guaranty Insurance Corporation (1984-2004). | 55 | Non-Executive Chairman & Director, Sykes Enterprises, Inc. | ||||
William B. Ogden, IV 1945 | 12/2014 to present | Retired. Formerly, Asset Management Industry Consultant; and Managing Director, Investment Banking Division of Citigroup Global Markets Inc. | 83* | None. | ||||
Davey S. Scoon 1946 | 1/2006 to present | Formerly Adjunct Professor, University of Wisconsin-Madison (2011-2019). | 55 | Director, Albireo Pharma, Inc. (since 2016); and Director, AMAG Pharmaceuticals, Inc. (since 2006). Formerly, Director, Biodel Inc. (2013-2016). | ||||
| * | Inclusive of 28 funds managed by Pacific Investment Management Company, LLC (“PIMCO”). |
| † | Each of Messrs. Holt and Fuccillo is an “Interested Person” of the Trust, as defined in Section 2(a)(19) of the 1940 Act, due to his affiliation with the Investment Adviser and its affiliates. |
| Annual Report | | June 30, 2020 | 175 |
Table of Contents
Unaudited
Allianz Funds—Officers
| Name, Address and Year of Birth and Position Held with Trust | Term of Office* and Length of Time Served | Principal Occupation(s) During Past 5 Years | ||
Thomas J. Fuccillo 1968 President and Chief Executive Officer | 4/2016 to present | Managing Director, and Head of US Funds of Allianz Global Investors U.S. Holdings LLC; Managing Director of Allianz Global Investors Distributors LLC; Trustee, President and Chief Executive Officer of 55 funds in the Fund Complex and President and Chief Executive Officer of The Korea Fund, Inc. Formerly, Associate General Counsel, Head of US Funds and Retail Legal; Chief Legal Officer and Secretary of Allianz Global Investors Distributors LLC; Vice President, Secretary and Chief Legal Officer of numerous funds in the Fund Complex (2004-2016); and Secretary and Chief Legal Officer of The Korea Fund, Inc. and The Taiwan Fund, Inc. | ||
Scott Whisten 1971 Treasurer, Principal Financial and Accounting Officer | 4/2018 to present | Director of Allianz Global Investors U.S. LLC; and Treasurer, Principal Financial and Accounting Officer of 55 funds in the Fund Complex. Formerly, Assistant Treasurer of numerous funds in the Fund Complex (2007-2018). | ||
Angela Borreggine 1964 Chief Legal Officer and Secretary | 4/2016 to present | Director and Senior Counsel of Allianz Global Investors U.S. Holdings LLC; Secretary and Chief Legal Officer of 55 funds in the Fund Complex; and Secretary and Chief Legal Officer of The Korea Fund, Inc. Formerly, Assistant Secretary of numerous funds in the Fund Complex (2015-2016). | ||
Thomas L. Harter, CFA 1975 Chief Compliance Officer | 4/2013 to present | Director, Senior Compliance Manager of Allianz Global Investors U.S. Holdings LLC; Director, Deputy Chief Compliance Officer of Allianz Global Investors U.S. LLC; and Chief Compliance Officer of 55 funds in the Fund Complex and of The Korea Fund, Inc. | ||
Richard J. Cochran 1961 Assistant Treasurer | 5/2008 to present | Vice President of Allianz Global Investors U.S. LLC and Assistant Treasurer of 55 funds in the Fund Complex and of The Korea Fund, Inc. | ||
Orhan Dzemaili 1974 Assistant Treasurer | 1/2011 to present | Director of Allianz Global Investors U.S. LLC; Treasurer, Principal Financial and Accounting Officer of The Korea Fund, Inc.; and Assistant Treasurer of 55 funds in the Fund Complex. Formerly, Assistant Treasurer of The Korea Fund, Inc. (2016-2018). | ||
Debra Rubano 1975 Assistant Secretary | 12/2015 to present | Director and Senior Counsel of Allianz Global Investors U.S. Holdings LLC; and Assistant Secretary of 55 funds in the Fund Complex. | ||
Craig A. Ruckman 1977 Assistant Secretary | 12/2017 to present | Director and Senior Counsel of Allianz Global Investors U.S. Holdings LLC; Chief Legal Officer of Allianz Global Investors Distributors LLC; and Assistant Secretary of 55 funds in the Fund Complex. Formerly, Associate of K&L Gates LLP (2012-2016). | ||
| * | The officers of the Trust are elected annually by the Board of Trustees. |
| 176 | June 30, 2020 | | Annual Report |
Table of Contents
Allianz Funds
Trustees
Alan Rappaport
Chairman of the Board of Trustees
Sarah E. Cogan
Deborah A. DeCotis
F. Ford Drummond
Thomas J. Fuccillo
Erick R. Holt
James A. Jacobson
Hans W. Kertess
James S. MacLeod
William B. Ogden, IV
Davey S. Scoon
Officers
Thomas J. Fuccillo
President and Chief Executive Officer
Scott Whisten
Treasurer, Principal Financial & Accounting Officer
Angela Borreggine
Chief Legal Officer & Secretary
Thomas L. Harter
Chief Compliance Officer
Richard J. Cochran
Assistant Treasurer
Orhan Dzemaili
Assistant Treasurer
Debra Rubano
Assistant Secretary
Craig A. Ruckman
Assistant Secretary
Investment Adviser
Allianz Global Investors U.S. LLC
1633 Broadway
New York, NY 10019
Distributor
Allianz Global Investors Distributors LLC
1633 Broadway
New York, NY 10019
Custodian & Accounting Agent
State Street Bank and Trust Co.
801 Pennsylvania Avenue
Kansas City, MO 64105
Shareholder Servicing and Transfer Agents
State Street Bank and Trust Company, which has delegated its obligations
as transfer agent to: DST Asset Management Solutions, Inc.
(Class A, Class C and Class R Shares)
P.O. Box 219723
Kansas City, MO 64121-9723
(Class P, Institutional Class, Class R6 and Administrative Class shares)
P.O. Box 219968
Kansas City, MO 64121-9968
Independent Registered Public Accounting Firm
PricewaterhouseCoopers LLP
300 Madison Ave
New York, NY 10017
Legal Counsel
Ropes & Gray LLP
Prudential Tower
800 Boylston Street
Boston, MA 02199
This report, including the financial information herein, is transmitted to the shareholders of the Trust for their information. It is not a prospectus, circular or representation intended for use in the purchase of shares of each Fund or any securities mentioned in this report.
For Account Information
Contact your financial adviser, or if you receive account statements directly from Allianz Global Investors, you can also call (800) 988-8380 for Class A, C and R shares or (800) 498-5413 for Class P, Institutional, R6 and Administrative shares. Telephone representatives are available Monday-Friday 8:30 am to 6:00 pm Eastern Time. Or visit our website, us.allianzgi.com.
Table of Contents
About Allianz Global Investors
Allianz Global Investors is a leading active asset manager with over 780 investment professionals in 25 offices worldwide and managing $590 billion in assets for individuals, families and institutions.*
Active is the most important word in our vocabulary. Active is how we create and share value with clients. We believe in solving, not selling, and in adding value beyond pure economic gain. We invest for the long term, employing our innovative investment expertise and global resources. Our goal is to ensure a superior experience for our clients, wherever they are based and whatever their investment needs.
Active is: Allianz Global Investors
* Data as of May 31, 2020.
Investors should consider the investment objectives, risks, charges and expenses of the above mentioned Funds carefully before investing. This and other information is contained in the Funds’ prospectus, which may be obtained by contacting your financial advisor, by visiting us.allianzgi.com or by calling 1-800-988-8380 (retail classes: A, C and R) or 1-800-498-5413 (Class P, Class R6, Institutional and Administrative classes). Please read the prospectus carefully before you invest or send money.
Allianz Global Investors U.S. LLC serves as the investment manager for the Allianz Funds and the Allianz Multi-Strategy Funds. Allianz Funds and the Allianz Multi-Strategy Funds are distributed by Allianz Global Investors Distributors LLC. © 2020. For information about any product, contact your financial advisor.
us.allianzgi.com
Receive this report electronically and eliminate paper mailings.
To enroll, go to us.allianzgi.com/edelivery.
AZ1005AR_063020 |
1221699
Table of Contents
| ITEM 2. | CODE OF ETHICS. |
| (a) | As of the end of the period covered by this report, the registrant has adopted a code of ethics (the “Section 406 Standards for Investment Companies – Ethical Standards for Principal Executive and Financial Officers”) that applies to the registrant’s President and Chief Executive Officer and Principal Financial Officer; the registrant’s Principal Financial Officer also serves as the Principal Accounting Officer. The registrant undertakes to provide a copy of such code of ethics to any person upon request, without charge, by calling 1-800-926-4456. The code of ethics are included as an Exhibit 99.CODE ETH hereto. |
| (b) | During the period covered by this report, there were not any amendments to a provision of the code of ethics adopted in 2(a) above. |
| (c) | During the period covered by this report, there were not any waivers or implicit waivers to a provision of the code of ethics adopted in 2(a) above. |
| ITEM 3. | AUDIT COMMITTEE FINANCIAL EXPERT. |
The Board of Trustees has determined that James A. Jacobson and Davey S. Scoon, both of whom serve on the Trust’s Audit Oversight Committee, qualify as “audit committee financial experts” and are “independent” for purposes of this Item.
| ITEM 4. | PRINCIPAL ACCOUNTANT FEES AND SERVICES. |
| a) | Audit fees. The aggregate fees billed for each of the last two fiscal years (the “Reporting Periods”) for professional services rendered by the Registrant’s principal accountant (the “Auditor”) for the audit of the Registrant’s annual financial statements, or services that are normally provided by the Auditor in connection with the statutory and regulatory filings or engagements for the Reporting Periods, were $565,959 in 2019 and $559,910 in 2020. |
| b) | Audit-Related Fees. The aggregate fees billed in the Reporting Periods for assurance and related services by the principal accountants that are reasonably related to the performance of the audit registrant’s financial statements and are not reported under paragraph (e) of this Item were $0 in 2019 and $0 in 2020. |
| c) | Tax Fees. The aggregate fees billed in the Reporting Periods for professional services rendered by the Auditor for tax compliance, tax service and tax planning (“Tax Services”) were $202,830 in 2019 and $155,000 in 2020. These services include review or preparation of U.S. federal, state, local, certain foreign tax returns, excise tax returns and the calculation of excise tax distributions. |
| d) | All Other Fees. The aggregate fees billed in the Reporting Periods for professional services, if any, billed for other products and services rendered by the principal account to the Trust were $0 in 2019 and $0 in 2020. |
| e) | 1. Audit Committee Pre-Approval Policies and Procedures. The Registrant’s Audit Oversight Committee has established policies and procedures for pre-approval of all audit and permissible non-audit services by the Auditor for the Registrant, as well as the Auditor’s engagements related directly to the operations and financial reporting of the Registrant. The Registrant’s policy is stated below. |
ALLIANZ FUNDS (The “Trust”)
AUDIT OVERSIGHT COMMITTEE POLICY
FOR
PRE-APPROVAL OF SERVICES PROVIDED BY THE INDEPENDENT ACCOUNTANTS
The Trust’s Audit Oversight Committee (“Committee”) is charged with the oversight of the Trust’s financial reporting policies and practices and their internal controls. As part of this responsibility, the Committee must pre-approve any independent accounting firm’s engagement to render audit and/or permissible non-audit services to the Trust as well as to the Trust’s investment adviser(1) or any entity controlling, controlled by or under common control with the investment adviser that provides ongoing services to the Trust (“Applicable Service Providers”), if the engagement relates directly to operations and financial reporting of the Trust. In evaluating a proposed engagement by the independent accountants, the Committee will assess the effect that the engagement might reasonably be expected to have on the accountant’s independence. The Committee’s evaluation will be based on:
a review of the nature of the professional services expected to be provided, the fees to be charged in connection with the services expected to be provided a review of the safeguards put into place by the accounting firm to safeguard independence, and periodic meetings with the accounting firm.
POLICY FOR PRE-APPROVAL OF AUDIT AND NON-AUDIT SERVICES TO BE PROVIDED TO THE TRUST
On an annual basis, the Committee of the Trust will review and if the Committee so determines, pre-approve the scope of the audits of the Trust and proposed audit fees, and permitted non-audit (including audit under related) services that are proposed to be performed by the Trust’s independent accountants for the Trust and its Applicable Service Providers (to the extent the services to be provided to the Applicable Service Providers relate directly to the operations and financial reporting of the Trust). The Committee may also pre-approve services at any other in-person or telephonic Committee meeting. At least annually, the Committee will receive a report of all audit and non-audit services that were rendered in the previous calendar year by the independent accountants for the Trust and its Applicable Service Providers pursuant to this Policy.
In addition to the Committee’s pre-approval of services pursuant to this Policy, the engagement of the independent accounting firm for any permitted non-audit service provided to the Trust with also require the separate written pre-approval of the President, Treasurer or Assistant Treasurer of the Trust, who may only grant such approval if he or she believes that the accounting firm’s engagement will not adversely affect the firm’s independence. All non-audit services performed by the independent accounting firm will be disclosed, as required, in filings with the Securities and Exchange Commission.
Table of Contents
AUDIT SERVICES
The categories of audit services and related fees to be reviewed and pre-approved annually by the Committee are:
Annual Trust financial statement audits
Seed audits (related to new product filings, as required)
SEC and regulatory filings and consents
Semiannual financial statement reviews
(1) For purposes of this requirement, the term “adviser” does not include sub-advisers that are not affiliated with a Trust’s investment adviser, are overseen by that investment adviser, and whose role is primarily portfolio management.
AUDIT-RELATED SERVICES
The following categories of audit-related services are considered to be consistent with the role of the Trust’s independent accountants and services falling under one of these categories will be pre-approved by the Committee on an annual basis if the Committee deems those services to be consistent with the accounting firm’s independence:
Accounting consultations
Fund merger support services
Agreed upon procedure reports
Other Attestation reports Comfort letters
Other internal control reports
Individual audit-related services that fall within one of these categories and are not presented to the Committee as part of the annual pre-approval process described above, may be pre-approved, if deemed consistent with the accounting firm’s independence, by the Committee Chair (or any other Committee member who is a disinterested trustee under the Investment Company to whom this responsibility has been delegated) so long as the estimated fee for those services does not exceed $500,000. Any pre-approval by a Committee member shall be reported to the full Committee at its next regularly scheduled meeting.
TAX SERVICES
The following categories of tax services are considered to be consistent with the role of the Trust’s independent accountants and services falling under one of these categories will be pre-approved by the Committee on an annual basis if the Committee deems those services to be consistent with the accounting firm’s independence:
Tax compliance services related to the filing or amendment of the following:
Federal, state and local income tax compliance; and, sales and use tax compliance
Timely RIC qualification reviews
Tax distribution analysis and planning
Tax authority examination services
Tax appeals support services
Accounting methods studies
Fund merger support services
Other tax consulting services and related projects
Individual tax services that fall within one of these categories and are not presented to the Committee as part of the annual pre-approval process described above, may be pre-approved, if deemed consistent with the accounting firm’s independence, by the Committee at any regular or special meeting. Such services may also be pre-approved by the Committee Chair (or any other Committee member who is a disinterested trustee under the Investment Company Act to whom this responsibility has been delegated) so long as the estimated fee for the particular service for which pre-approval is sought does not exceed $500,000. Any pre-approval by a Committee Member shall be reported to the full Committee at its next regularly scheduled meeting.
OTHER SERVICES
Services that are proposed to be provided to the Trust which are not audit, audit-related or tax services may be pre-approved, if deemed consistent with the accounting firm’s independence, by the Committee at any regular or special meeting. Such services may also be pre-approved by the Committee Chair (or any other Committee member who is a disinterested trustee under the Investment Company Act to whom this responsibility has been delegated) so long as the estimated fee for the particular service for which pre-approval is sought does not exceed the limit assigned within the Policy. Any pre-approval by a Committee member shall be reported to the full Committee at its next regularly scheduled meeting.
PROHIBITED SERVICES
The Trust’s independent accountants will not render services in the following categories of non-audit services:
Bookkeeping or other services related to the accounting records or financial statements of the Trust
Financial information systems design and implementation
Appraisal or valuation services, fairness opinions, or contribution-in-kind reports
Actuarial services
Internal audit outsourcing services
Table of Contents
Management functions or human resources
Broker or dealer, investment adviser or investment banking services
Legal services and expert services unrelated to the audit
Any other service that the Public Company Accounting Oversight Board determines, by regulation, is impermissible.
PRE-APPROVAL OF NON-AUDIT SERVICES PROVIDED TO OTHER ENTITIES WITHIN THE FUND COMPLEX
Rule 2-01(c)(7) of Regulation S-X provides that an accountant is not independent of the Trust unless the Trust’s Committee approves any permitted non-audit services to be provided to the Trust’s Applicable Service Providers, provided, in each case, that the engagement relates directly to the operations and financial reporting of the Trust.
Services to be provided to Applicable Service Providers that are required to be pre-approved, may be pre-approved, if deemed consistent with the accounting firm’s independence, by the Committee at a regular or special meeting or by the Committee Chair (or any other Committee member who is a disinterested trustee under the Investment Company Act to whom this responsibility has been delegated) so long as the estimated fee for those services does not exceed $500,000. If a service is approved by a Committee member, the full Committee is notified of such pre-approval at its next regularly scheduled meeting.
Although the Committee will not be required to pre-approve all services provided to Applicable Service Providers and their affiliates, the Committee will receive an annual report from the Trust’s independent accounting firm showing the aggregate fees for all services provided to Applicable Service Providers and their affiliates.
DE MINIMUS EXCEPTION TO REQUIREMENT OF PRE-APPROVAL OF NON-AUDIT SERVICES
With respect to the provision of permitted non-audit services to the Trust or Accounting Affiliates, the pre-approval requirement is waived if:
| (1) | The aggregate fees and costs of all non-audit services that, but for the limited exception provided by this section, would require pre-approval by the Committee constitutes no more than five percent of the total fees and costs paid by the Trust and Applicable Service Providers to the independent accountant during the fiscal year during which such non-audit services are provided; |
| (2) | At the time of the engagement for such services, the Trust did not recognize that the services were “non-audit services” that required preapproval; and |
| (3) | Each such service is brought promptly to the attention of the Committee and approved prior to the completion of the audit by the Committee, Committee Chair or any other Committee member who is a disinterested trustee under the Investment Company Act to whom this responsibility has been delegated. |
| e) | 2. No services were approved pursuant to the procedures contained in paragraph (C) (7) (i) (C) of Rule 2-01 of Registration S-X. |
| f) | Not applicable. |
| g) | Non-audit fees. The aggregate non-audit fees billed by the Auditor for services rendered to the Registrant, and rendered to the Adviser, for the 2019 Reporting Period was $1,479,044 and the 2020 Reporting Period was $1,738,597. |
| h) | Auditor Independence. The Registrant’s Audit Oversight Committee has considered whether the provision of non-audit services that were rendered to the Adviser which were not pre-approved is compatible with maintaining the Auditor’s independence. |
| ITEM 5. | AUDIT COMMITTEE OF LISTED REGISTRANTS. |
| (a) | Disclosure not required for open-end management investment companies. |
| (b) | Not applicable. |
| ITEM 6. | INVESTMENTS. |
| (a) | Schedule of Investments is included as part of the report to shareholders filed under Item 1 of this form. |
| (b) | Not applicable. |
| ITEM 7. | DISCLOSURE OF PROXY VOTING POLICIES AND PROCEDURES FOR CLOSED-END MANAGEMENT INVESTMENT COMPANIES. |
Disclosure not required for open-end management investment companies.
| ITEM 8. | PORTFOLIO MANAGERS OF CLOSED-END MANAGEMENT INVESTMENT COMPANIES. |
Disclosure not required for open-end management investment companies.
| ITEM 9. | PURCHASES OF EQUITY SECURITIES BY CLOSED-END MANAGEMENT INVESTMENT COMPANY AND AFFILIATED PURCHASERS. |
Disclosure not required for open-end management investment companies.
| ITEM 10. | SUBMISSION OF MATTERS TO A VOTE OF SECURITY HOLDERS. |
There have been no material changes to the procedures by which shareholders may recommend nominees to the Trust’s Board of Trustees since the Trust’s last provided disclosure in response to this item.
Table of Contents
| ITEM 11. | CONTROLS AND PROCEDURES. |
| (a) | The registrant’s President and Chief Executive Officer and Treasurer, Principal Financial & Accounting Officer have concluded that the registrant’s disclosure controls and procedures (as defined in Rule 30a-3(c) under the Act (17 CFR 270.30a-3(c))), are effective based on their evaluation of these controls and procedures as of a date within 90 days of the filing date of this document. |
| (b) | There were no changes in internal control over financial reporting (as defined in Rule 30a-3(d) under the Act (17 CFR 270.30a-3(d))) that occurred during the most recent semi-annual period covered by this report that has materially affected, or is reasonably likely to materially affect, the registrant’s internal control over financial reporting. |
| ITEM 12. | DISCLOSURE OF SECURITIES LENDING ACTIVITIES FOR CLOSED-END MANAGEMENT INVESTMENT COMPANIES. |
Disclosure not required for open-end management investment companies.
| ITEM 13. | EXHIBITS. |
(a)(1) Exhibit 99.CODE ETH – Code of Ethics
(a)(2) Exhibit 99.302CERT – Certification pursuant to Section 302 of the Sarbanes-Oxley Act of 2002
(a)(3) Not applicable
(a)(4) Not applicable
(b) Exhibit 99.906CERT – Certification pursuant to Section 906 of the Sarbanes-Oxley Act of 2002
Table of Contents
Signatures
Pursuant to the requirements of the Securities Exchange Act of 1934 and the Investment Company Act of 1940, the registrant has duly caused this report to be signed on its behalf by the undersigned, thereunto duly authorized.
Allianz Funds
By: | /s/ Thomas J. Fuccillo | |
| Thomas J. Fuccillo | ||
| President & Chief Executive Officer | ||
| Date: August 26, 2020 | ||
| By: | /s/ Scott Whisten | |
| Scott Whisten | ||
| Treasurer, Principal Financial & | ||
| Accounting Officer | ||
| Date: August 26, 2020 | ||
Pursuant to the requirements of the Securities Exchange Act of 1934 and the Investment Company Act of 1940, this report has been signed below by the following persons on behalf of the registrant and in the capacities and on the dates indicated.
| By: | /s/ Thomas J. Fuccillo | |
| Thomas J. Fuccillo | ||
| President & Chief Executive Officer | ||
| Date: August 26, 2020 | ||
| By: | /s/ Scott Whisten | |
| Scott Whisten | ||
| Treasurer, Principal Financial & | ||
| Accounting Officer | ||
| Date: August 26, 2020 | ||