UNITED STATES
SECURITIES AND EXCHANGE COMMISSION
Washington, D.C. 20549
FORM N-CSR
CERTIFIED SHAREHOLDER REPORT OF REGISTERED
MANAGEMENT INVESTMENT COMPANIES
Investment Company Act file number 811-06161
Virtus Investment Trust
(Exact name of registrant as specified in charter)
101 Munson Street
Greenfield, MA 01301-9683
(Address of principal executive offices) (Zip code)
Jennifer Fromm, Esq.
Vice President, Chief Legal Officer, Counsel and Secretary for Registrant
One Financial Plaza
Hartford, CT 06103-2608
(Name and address of agent for service)
Registrant’s telephone number, including area code: 800-243-1574
Date of fiscal year end: June 30
Date of reporting period: June 30, 2023
Form N-CSR is to be used by management investment companies to file reports with the Commission not later than 10 days after the transmission to stockholders of any report that is required to be transmitted to stockholders under Rule 30e-1 under the Investment Company Act of 1940 (17 CFR 270.30e-1). The Commission may use the information provided on Form N-CSR in its regulatory, disclosure review, inspection, and policymaking roles.
A registrant is required to disclose the information specified by Form N-CSR, and the Commission will make this information public. A registrant is not required to respond to the collection of information contained in Form N-CSR unless the Form displays a currently valid Office of Management and Budget (“OMB”) control number. Please direct comments concerning the accuracy of the information collection burden estimate and any suggestions for reducing the burden to Secretary, Securities and Exchange Commission, 450 Fifth Street, NW, Washington, DC 20549-0609. The OMB has reviewed this collection of information under the clearance requirements of 44 U.S.C. § 3507.
Item 1. Reports to Stockholders.
| | (a) | The Report to Shareholders is attached herewith. |
ANNUAL REPORT
VIRTUS INVESTMENT TRUST
| Virtus Emerging Markets Opportunities Fund |
| Virtus Income & Growth Fund |
| Virtus KAR Global Small-Cap Fund |
| Virtus KAR Health Sciences Fund |
| Virtus NFJ Dividend Value Fund |
| Virtus NFJ International Value Fund |
| Virtus NFJ Large-Cap Value Fund |
| Virtus NFJ Mid-Cap Value Fund |
| Virtus NFJ Small-Cap Value Fund |
| Virtus Silvant Focused Growth Fund |
| Virtus Silvant Mid-Cap Growth Fund |
| Virtus Small-Cap Fund |
| Virtus Zevenbergen Technology Fund |
Not FDIC Insured • No Bank Guarantee • May Lose Value
Table of Contents
| 1 |
| 2 |
| 6 |
| Fund | Fund
Summary | Schedule
of
Investments |
| 9 | 53 |
| 13 | 55 |
| 17 | 65 |
| 21 | 66 |
| 24 | 67 |
| 27 | 69 |
| 30 | 71 |
| 33 | 73 |
| 36 | 75 |
| 39 | 77 |
| 42 | 78 |
| 45 | 80 |
| 49 | 83 |
| 85 |
| 93 |
| 97 |
| 102 |
| 114 |
| 135 |
| 136 |
| 137 |
| 138 |
Proxy Voting Procedures and Voting Record (Form N-PX)
The subadvisers vote proxies, if any, relating to portfolio securities in accordance with procedures that have been approved by the Board of Trustees of the Trust (“Trustees”, or the “Board”). You may obtain a description of these procedures, along with information regarding how the Funds voted proxies during the most recent 12-month period ended June 30, free of charge, by calling toll-free 1-800-243-1574. This information is also available through the Securities and Exchange Commission’s (the “SEC”) website at https://www.sec.gov.
PORTFOLIO HOLDINGS INFORMATION
The Trust files a complete schedule of portfolio holdings for each Fund with the SEC for the first and third quarters of each fiscal year as an exhibit to its reports on Form N-PORT-P. Form N-PORT-P is available on the SEC’s website at https://www.sec.gov.
This report is not authorized for distribution to prospective investors in the Funds presented in this book unless preceded or accompanied by an effective prospectus which includes information concerning the sales charge, each Fund’s record and other pertinent information.
To Virtus Investment Trust Shareholders:
I am pleased to present this annual report, which reviews the performance of your Fund for the 12 months ended June 30, 2023.
The fiscal year was marked by volatility in the second half of 2022, followed by the beginning of a recovery in the first half of 2023. Investors dealt with continued inflation and rising interest rates, although the pace of both seemed to moderate during the period. Bank failures in March of 2023 caused additional concern, but by the end of the 12-month period, most markets were demonstrating more stability.
Domestic equity indexes moved higher during the 12 months ended June 30, 2023. U.S. large-capitalization stocks were up 19.59%, as measured by the S&P 500® Index, while small-cap stocks returned 12.31%, as measured by the Russell 2000® Index. International equities showed divergent performance, with developed markets, as measured by the MSCI EAFE® Index (net), returning 18.77%, while emerging markets, as measured by the MSCI Emerging Markets Index (net), were up only 1.75%.
Fixed income markets wrestled with continued interest rate hikes from the Federal Reserve (the Fed), although the central bank did not raise rates at its June 2023 meeting. The yield on the 10-year Treasury rose to 3.81% on June 30, 2023, from 2.98% on June 30, 2022. The broad U.S. fixed income market, as represented by the Bloomberg U.S. Aggregate Bond Index, was down 0.94% for the 12-month period, while non-investment grade bonds, as measured by the Bloomberg U.S. Corporate High Yield Bond Index, returned 9.06%.
While markets may be unpredictable in the short term, we believe most investors are best served by focusing on the long term. Please call our customer service team at 800-243-1574 if you have questions about your account or require assistance.
Sincerely,
George R. Aylward
President, Virtus Investment Trust
August 2023
Refer to the Fund Summary section for your Fund’s performance. Performance data quoted represents past results. Past performance is no guarantee of future results, and current performance may be higher or lower than the performance shown above. Investing involves risk, including the risk of loss of principal invested.
VIRTUS INVESTMENT TRUST
DISCLOSURE OF FUND EXPENSES (Unaudited)
FOR THE SIX-MONTH PERIOD OF January 1, 2023 TO June 30, 2023
We believe it is important for you to understand the impact of costs on your investment. All mutual funds have operating expenses. As a shareholder of a Virtus Investment Trust Fund (each, a “Fund”), you may incur two types of costs: (1) transaction costs, including sales charges on purchases of Class A shares and contingent deferred sales charges on Class C shares; and (2) ongoing costs, including investment advisory fees, distribution and service fees, and other expenses. Class P shares, Institutional Class shares, Class R6 shares and Administrative Class shares are sold without sales charges and do not incur distribution and service fees. Class R6 shares also do not incur shareholder servicing fees. For further information regarding applicable sales charges, see Note 1 in the Notes to Financial Statements. These examples are intended to help you understand your ongoing costs (in dollars) of investing in a Fund and to compare these costs with the ongoing costs of investing in other mutual funds. These examples are based on an investment of $1,000 invested at the beginning of the period and held for the entire six-month period. The Annualized Expense Ratios may be different from the expense ratios in the Financial Highlights which are for the fiscal year ended June 30, 2023.
Please note that the expenses shown in the accompanying tables are meant to highlight your ongoing costs only and do not reflect any transactional costs, such as sales charges or contingent deferred sales charges. Therefore, the accompanying tables are useful in comparing ongoing costs only, and will not help you determine the relative total costs of owning different funds. In addition, if these transactional costs were included, your costs would have been higher. The calculations assume no shares were bought or sold during the period. Your actual costs may have been higher or lower, depending on the amount of your investment and the timing of any purchases or redemptions.
Actual Expenses
The table below provides information about actual account values and actual expenses. You may use the information below, together with the amount you invested, to estimate the expenses that you paid over the period. Simply divide your account value by $1,000 (for example, an $8,600 account value divided by $1,000 = 8.6), then multiply the result by the number in the table under the heading entitled “Expenses Paid During Period” to estimate the expenses you paid on your account during this period.
| | | Beginning
Account Value
January 1, 2023 | | Ending
Account Value
June 30, 2023 | | Annualized
Expense
Ratio | | Expenses
Paid
During
Period* |
Emerging Markets Opportunities Fund
| | | | | | | | |
| | Class A | $ 1,000.00 | | $ 1,106.50 | | 1.29 % | | $ 6.74 |
| | Class C | 1,000.00 | | 1,102.10 | | 2.04 | | 10.63 |
| | Class P | 1,000.00 | | 1,107.80 | | 1.04 | | 5.44 |
| | Institutional Class | 1,000.00 | | 1,108.40 | | 0.94 | | 4.91 |
| | Class R6 | 1,000.00 | | 1,108.60 | | 0.89 | | 4.65 |
Income & Growth Fund
| | | | | | | | |
| | Class A | 1,000.00 | | 1,109.90 | | 1.13 | | 5.91 |
| | Class C | 1,000.00 | | 1,105.70 | | 1.88 | | 9.82 |
| | Class P | 1,000.00 | | 1,111.10 | | 0.88 | | 4.61 |
| | Institutional Class | 1,000.00 | | 1,111.60 | | 0.89 | | 4.66 |
KAR Global Small-Cap Fund
| | | | | | | | |
| | Class A | 1,000.00 | | 1,116.20 | | 1.63 | | 8.55 |
| | Class C | 1,000.00 | | 1,112.10 | | 2.38 | | 12.46 |
| | Class P | 1,000.00 | | 1,117.50 | | 1.38 | | 7.25 |
| | Institutional Class | 1,000.00 | | 1,117.90 | | 1.28 | | 6.72 |
KAR Health Sciences Fund
| | | | | | | | |
| | Class A | 1,000.00 | | 1,014.80 | | 1.39 | | 6.94 |
| | Class C | 1,000.00 | | 1,011.00 | | 2.14 | | 10.67 |
| | Class P | 1,000.00 | | 1,016.90 | | 1.03 | | 5.15 |
| | Institutional Class | 1,000.00 | | 1,016.50 | | 1.11 | | 5.55 |
NFJ Dividend Value Fund
| | | | | | | | |
| | Class A | 1,000.00 | | 1,067.60 | | 1.07 | | 5.49 |
| | Class C | 1,000.00 | | 1,064.10 | | 1.76 | | 9.01 |
| | Class P | 1,000.00 | | 1,069.50 | | 0.76 | | 3.90 |
| | Institutional Class | 1,000.00 | | 1,069.90 | | 0.70 | | 3.59 |
| | Class R6 | 1,000.00 | | 1,069.60 | | 0.66 | | 3.39 |
| | Administrative Class | 1,000.00 | | 1,079.50 | | 0.95 | | 4.90 |
NFJ International Value Fund
| | | | | | | | |
| | Class A | 1,000.00 | | 1,091.00 | | 1.30 | | 6.74 |
| | Class C | 1,000.00 | | 1,086.90 | | 2.05 | | 10.61 |
| | Class P | 1,000.00 | | 1,092.60 | | 1.07 | | 5.55 |
| | Institutional Class | 1,000.00 | | 1,092.60 | | 0.95 | | 4.93 |
| | Class R6 | 1,000.00 | | 1,093.00 | | 0.90 | | 4.67 |
| | Administrative Class | 1,000.00 | | 1,111.70 | | 1.20 | | 6.28 |
VIRTUS INVESTMENT TRUST
DISCLOSURE OF FUND EXPENSES (Unaudited) (Continued)
FOR THE SIX-MONTH PERIOD OF January 1, 2023 TO June 30, 2023
| | | Beginning
Account Value
January 1, 2023 | | Ending
Account Value
June 30, 2023 | | Annualized
Expense
Ratio | | Expenses
Paid
During
Period* |
NFJ Large-Cap Value Fund
| | | | | | | | |
| | Class A | $1,000.00 | | $1,083.90 | | 1.01% | | $ 5.22 |
| | Class C | 1,000.00 | | 1,080.00 | | 1.80 | | 9.28 |
| | Class P | 1,000.00 | | 1,085.40 | | 0.74 | | 3.83 |
| | Institutional Class | 1,000.00 | | 1,085.40 | | 0.76 | | 3.93 |
| | Class R6 | 1,000.00 | | 1,086.90 | | 0.52 | | 2.69 |
| | Administrative Class | 1,000.00 | | 1,084.70 | | 0.99 | | 5.12 |
NFJ Mid-Cap Value Fund
| | | | | | | | |
| | Class A | 1,000.00 | | 1,094.80 | | 1.00 | | 5.19 |
| | Class C | 1,000.00 | | 1,090.40 | | 1.75 | | 9.07 |
| | Class P | 1,000.00 | | 1,096.40 | | 0.75 | | 3.90 |
| | Institutional Class | 1,000.00 | | 1,096.60 | | 0.65 | | 3.38 |
| | Class R6 | 1,000.00 | | 1,096.80 | | 0.60 | | 3.12 |
| | Administrative Class | 1,000.00 | | 1,095.10 | | 0.90 | | 4.68 |
NFJ Small-Cap Value Fund
| | | | | | | | |
| | Class A | 1,000.00 | | 1,101.20 | | 1.18 | | 6.15 |
| | Class C | 1,000.00 | | 1,096.90 | | 1.92 | | 9.98 |
| | Class P | 1,000.00 | | 1,103.20 | | 0.90 | | 4.69 |
| | Institutional Class | 1,000.00 | | 1,103.00 | | 0.83 | | 4.33 |
| | Class R6 | 1,000.00 | | 1,103.50 | | 0.77 | | 4.02 |
| | Administrative Class | 1,000.00 | | 1,138.30 | | 1.08 | | 5.73 |
Silvant Focused Growth Fund
| | | | | | | | |
| | Class A | 1,000.00 | | 1,387.80 | | 0.94 | | 5.57 |
| | Class C | 1,000.00 | | 1,382.90 | | 1.70 | | 10.04 |
| | Class P | 1,000.00 | | 1,389.50 | | 0.67 | | 3.97 |
| | Institutional Class | 1,000.00 | | 1,389.60 | | 0.66 | | 3.91 |
| | Class R6 | 1,000.00 | | 1,390.10 | | 0.61 | | 3.61 |
| | Administrative Class | 1,000.00 | | 1,388.10 | | 0.91 | | 5.39 |
Silvant Mid-Cap Growth Fund
| | | | | | | | |
| | Class A | 1,000.00 | | 1,167.80 | | 0.99 | | 5.32 |
| | Class C | 1,000.00 | | 1,157.40 | | 1.76 | | 9.41 |
| | Class P | 1,000.00 | | 1,168.40 | | 0.70 | | 3.76 |
| | Institutional Class | 1,000.00 | | 1,168.80 | | 0.75 | | 4.03 |
| | Administrative Class | 1,000.00 | | 1,172.10 | | 1.03 | | 5.55 |
Small-Cap Fund
| | | | | | | | |
| | Class A | 1,000.00 | | 1,085.20 | | 1.16 | | 6.00 |
| | Class C | 1,000.00 | | 1,081.10 | | 1.92 | | 9.91 |
| | Class P | 1,000.00 | | 1,086.30 | | 0.92 | | 4.76 |
| | Institutional Class | 1,000.00 | | 1,087.20 | | 0.81 | | 4.19 |
| | Class R6 | 1,000.00 | | 1,087.20 | | 0.76 | | 3.93 |
Zevenbergen Technology Fund
| | | | | | | | |
| | Class A | 1,000.00 | | 1,484.50 | | 1.42 | | 8.75 |
| | Class C | 1,000.00 | | 1,479.10 | | 2.14 | | 13.15 |
| | Class P | 1,000.00 | | 1,486.80 | | 1.10 | | 6.78 |
| | Institutional Class | 1,000.00 | | 1,486.40 | | 1.15 | | 7.09 |
| | Administrative Class | 1,000.00 | | 1,484.20 | | 1.47 | | 9.05 |
| * | Expenses are equal to the relevant Fund’s annualized expense ratio, which is net of waived fees and reimbursed expenses, if applicable, multiplied by the average account value over the period, multiplied by the number of days (181) expenses were accrued in the most recent fiscal half-year, then divided by 365 to reflect the one-half year period. |
For Funds which may invest in other funds, the annualized expense ratios noted above do not reflect fees and expenses associated with any underlying funds. If such fees and expenses had been included, the expenses would have been higher.
You can find more information about a Fund’s expenses in the Financial Statements section that follows. For additional information on operating expenses and other shareholder costs, refer to that Fund’s prospectus.
VIRTUS INVESTMENT TRUST
DISCLOSURE OF FUND EXPENSES (Unaudited) (Continued)
FOR THE SIX-MONTH PERIOD OF January 1, 2023 TO June 30, 2023
Hypothetical Example for Comparison Purposes
The table below provides information about hypothetical account values and hypothetical expenses based on a Fund’s actual expense ratio and an assumed rate of return of 5% per year before expenses, which is not your Fund’s actual return. The hypothetical account values and expenses may not be used to estimate the actual ending account balance or expenses you paid for the period. You may use this information to compare the ongoing costs of investing in your Fund and other funds. To do so, compare these 5% hypothetical examples with the 5% hypothetical examples that appear in the shareholder reports of other mutual funds.
| | | Beginning
Account Value
January 1, 2023 | | Ending
Account Value
June 30, 2023 | | Annualized
Expense
Ratio | | Expenses
Paid
During
Period* |
Emerging Markets Opportunities Fund
| | | | | | | | |
| | Class A | $ 1,000.00 | | $ 1,018.40 | | 1.29 % | | $ 6.46 |
| | Class C | 1,000.00 | | 1,014.68 | | 2.04 | | 10.19 |
| | Class P | 1,000.00 | | 1,019.64 | | 1.04 | | 5.21 |
| | Institutional Class | 1,000.00 | | 1,020.13 | | 0.94 | | 4.71 |
| | Class R6 | 1,000.00 | | 1,020.38 | | 0.89 | | 4.46 |
Income & Growth Fund
| | | | | | | | |
| | Class A | 1,000.00 | | 1,019.19 | | 1.13 | | 5.66 |
| | Class C | 1,000.00 | | 1,015.47 | | 1.88 | | 9.39 |
| | Class P | 1,000.00 | | 1,020.43 | | 0.88 | | 4.41 |
| | Institutional Class | 1,000.00 | | 1,020.38 | | 0.89 | | 4.46 |
KAR Global Small-Cap Fund
| | | | | | | | |
| | Class A | 1,000.00 | | 1,016.71 | | 1.63 | | 8.15 |
| | Class C | 1,000.00 | | 1,012.99 | | 2.38 | | 11.88 |
| | Class P | 1,000.00 | | 1,017.95 | | 1.38 | | 6.90 |
| | Institutional Class | 1,000.00 | | 1,018.45 | | 1.28 | | 6.41 |
KAR Health Sciences Fund
| | | | | | | | |
| | Class A | 1,000.00 | | 1,017.90 | | 1.39 | | 6.95 |
| | Class C | 1,000.00 | | 1,014.18 | | 2.14 | | 10.69 |
| | Class P | 1,000.00 | | 1,019.69 | | 1.03 | | 5.16 |
| | Institutional Class | 1,000.00 | | 1,019.29 | | 1.11 | | 5.56 |
NFJ Dividend Value Fund
| | | | | | | | |
| | Class A | 1,000.00 | | 1,019.49 | | 1.07 | | 5.36 |
| | Class C | 1,000.00 | | 1,016.07 | | 1.76 | | 8.80 |
| | Class P | 1,000.00 | | 1,021.03 | | 0.76 | | 3.81 |
| | Institutional Class | 1,000.00 | | 1,021.32 | | 0.70 | | 3.51 |
| | Class R6 | 1,000.00 | | 1,021.52 | | 0.66 | | 3.31 |
| | Administrative Class | 1,000.00 | | 1,020.08 | | 0.95 | | 4.76 |
NFJ International Value Fund
| | | | | | | | |
| | Class A | 1,000.00 | | 1,018.35 | | 1.30 | | 6.51 |
| | Class C | 1,000.00 | | 1,014.63 | | 2.05 | | 10.24 |
| | Class P | 1,000.00 | | 1,019.49 | | 1.07 | | 5.36 |
| | Institutional Class | 1,000.00 | | 1,020.08 | | 0.95 | | 4.76 |
| | Class R6 | 1,000.00 | | 1,020.33 | | 0.90 | | 4.51 |
| | Administrative Class | 1,000.00 | | 1,018.84 | | 1.20 | | 6.01 |
NFJ Large-Cap Value Fund
| | | | | | | | |
| | Class A | 1,000.00 | | 1,019.79 | | 1.01 | | 5.06 |
| | Class C | 1,000.00 | | 1,015.87 | | 1.80 | | 9.00 |
| | Class P | 1,000.00 | | 1,021.12 | | 0.74 | | 3.71 |
| | Institutional Class | 1,000.00 | | 1,021.03 | | 0.76 | | 3.81 |
| | Class R6 | 1,000.00 | | 1,022.22 | | 0.52 | | 2.61 |
| | Administrative Class | 1,000.00 | | 1,019.89 | | 0.99 | | 4.96 |
NFJ Mid-Cap Value Fund
| | | | | | | | |
| | Class A | 1,000.00 | | 1,019.84 | | 1.00 | | 5.01 |
| | Class C | 1,000.00 | | 1,016.12 | | 1.75 | | 8.75 |
| | Class P | 1,000.00 | | 1,021.08 | | 0.75 | | 3.76 |
| | Institutional Class | 1,000.00 | | 1,021.57 | | 0.65 | | 3.26 |
| | Class R6 | 1,000.00 | | 1,021.82 | | 0.60 | | 3.01 |
| | Administrative Class | 1,000.00 | | 1,020.33 | | 0.90 | | 4.51 |
VIRTUS INVESTMENT TRUST
DISCLOSURE OF FUND EXPENSES (Unaudited) (Continued)
FOR THE SIX-MONTH PERIOD OF January 1, 2023 TO June 30, 2023
| | | Beginning
Account Value
January 1, 2023 | | Ending
Account Value
June 30, 2023 | | Annualized
Expense
Ratio | | Expenses
Paid
During
Period* |
NFJ Small-Cap Value Fund
| | | | | | | | |
| | Class A | $1,000.00 | | $1,018.94 | | 1.18% | | $ 5.91 |
| | Class C | 1,000.00 | | 1,015.27 | | 1.92 | | 9.59 |
| | Class P | 1,000.00 | | 1,020.33 | | 0.90 | | 4.51 |
| | Institutional Class | 1,000.00 | | 1,020.68 | | 0.83 | | 4.16 |
| | Class R6 | 1,000.00 | | 1,020.98 | | 0.77 | | 3.86 |
| | Administrative Class | 1,000.00 | | 1,019.44 | | 1.08 | | 5.41 |
Silvant Focused Growth Fund
| | | | | | | | |
| | Class A | 1,000.00 | | 1,020.13 | | 0.94 | | 4.71 |
| | Class C | 1,000.00 | | 1,016.36 | | 1.70 | | 8.50 |
| | Class P | 1,000.00 | | 1,021.47 | | 0.67 | | 3.36 |
| | Institutional Class | 1,000.00 | | 1,021.52 | | 0.66 | | 3.31 |
| | Class R6 | 1,000.00 | | 1,021.77 | | 0.61 | | 3.06 |
| | Administrative Class | 1,000.00 | | 1,020.28 | | 0.91 | | 4.56 |
Silvant Mid-Cap Growth Fund
| | | | | | | | |
| | Class A | 1,000.00 | | 1,019.89 | | 0.99 | | 4.96 |
| | Class C | 1,000.00 | | 1,016.07 | | 1.76 | | 8.80 |
| | Class P | 1,000.00 | | 1,021.32 | | 0.70 | | 3.51 |
| | Institutional Class | 1,000.00 | | 1,021.08 | | 0.75 | | 3.76 |
| | Administrative Class | 1,000.00 | | 1,019.69 | | 1.03 | | 5.16 |
Small-Cap Fund
| | | | | | | | |
| | Class A | 1,000.00 | | 1,019.04 | | 1.16 | | 5.81 |
| | Class C | 1,000.00 | | 1,015.27 | | 1.92 | | 9.59 |
| | Class P | 1,000.00 | | 1,020.23 | | 0.92 | | 4.61 |
| | Institutional Class | 1,000.00 | | 1,020.78 | | 0.81 | | 4.06 |
| | Class R6 | 1,000.00 | | 1,021.03 | | 0.76 | | 3.81 |
Zevenbergen Technology Fund
| | | | | | | | |
| | Class A | 1,000.00 | | 1,017.75 | | 1.42 | | 7.10 |
| | Class C | 1,000.00 | | 1,014.18 | | 2.14 | | 10.69 |
| | Class P | 1,000.00 | | 1,019.34 | | 1.10 | | 5.51 |
| | Institutional Class | 1,000.00 | | 1,019.09 | | 1.15 | | 5.76 |
| | Administrative Class | 1,000.00 | | 1,017.50 | | 1.47 | | 7.35 |
| * | Expenses are equal to the relevant Fund’s annualized expense ratio, which is net of waived fees and reimbursed expenses, if applicable, multiplied by the average account value over the period, multiplied by the number of days (181) expenses were accrued in the most recent fiscal half-year, then divided by 365 to reflect the one-half year period. |
For Funds which may invest in other funds, the annualized expense ratios noted above do not reflect fees and expenses associated with any underlying funds. If such fees and expenses had been included, the expenses would have been higher.
You can find more information about a Fund’s expenses in the Financial Statements section that follows. For additional information on operating expenses and other shareholder costs, refer to that Fund’s prospectus.
VIRTUS INVESTMENT TRUST
KEY INVESTMENT TERMS (Unaudited)
June 30, 2023
American Depositary Receipt (“ADR”)
Represents shares of foreign companies traded in U.S. dollars on U.S. exchanges that are held by a U.S. bank or a trust. Foreign companies use ADRs in order to make it easier for Americans to buy their shares.
Bloomberg U.S. Aggregate Bond Index
The Bloomberg U.S. Aggregate Bond Index measures the U.S. investment-grade, fixed-rate bond market. The index is calculated on a total return basis. The index is unmanaged, its returns do not reflect any fees, expenses, or sales charges, and it is not available for direct investment.
Bloomberg U.S. Corporate High Yield Bond Index
The Bloomberg U.S. Corporate High Yield Bond Index measures the U.S. dollar-denominated, high yield, fixed-rate corporate bond market. The index is calculated on a total return basis. The index is unmanaged, its returns do not reflect any fees, expenses, or sales charges, and it is not available for direct investment.
Exchange-Traded Fund (“ETF”)
An open-end fund that is traded on a stock exchange. Most ETFs have a portfolio of stocks or bonds that track a specific market index.
Federal Reserve (the “Fed”)
The central bank of the United States, responsible for controlling the money supply, interest rates and credit with the goal of keeping the U.S. economy and currency stable. Governed by a seven-member board, the system includes 12 regional Federal Reserve Banks, 25 branches and all national and state banks that are part of the system.
Gross Domestic Product (“GDP”)
The GDP represents the market value of all goods and services produced by the economy during the period measured, including personal consumption, government purchases, private inventories, paid-in construction costs, and the foreign trade balance.
Headline Inflation
Headline inflation is the total inflation in an economy, as measured by inflation in the prices of a basket of goods that includes commodities like food and energy.
ICE BofA US Convertibles Index
The ICE BofA US Convertibles Index is a widely used, unmanaged index that measures the performance of U.S. dollar-denominated convertible securities not currently in bankruptcy with a total market value greater than $50 million at issuance.
ICE BofA US High Yield Index
The ICE BofA US High Yield Cash Pay Index is a widely used, unmanaged index that measures the performance of US denominated, fixed-rate, coupon-bearing bonds rated BBB/Baa3 not currently in bankruptcy. The maturity range must be greater than or equal to one year with a total market value greater than $50 million at issuance.
Joint Stock Company (“JSC”)
A joint stock company is a business entity in which shares of the company’s stock can be bought and sold by shareholders. Each shareholder owns company stock in proportion, evidenced by their shares (certificates of ownership). Shareholders are able to transfer their shares to others without any effects to the continued existence of the company.
London Interbank Offered Rate (“LIBOR”)
A benchmark rate that some of the world’s leading banks charge each other for short-term loans and that serves as the first step to calculating interest rates on various loans throughout the world.
Master Limited Partnerships (“MLPs”)
Investment which combines the tax benefits of a limited partnership with the liquidity of publicly traded securities. To be classified as an MLP, a partnership must derive most of its cash flows from real estate, natural resources and commodities.
MSCI All Country World ex USA Index (net)
The MSCI All Country World ex USA Index (net) is a free float-adjusted market capitalization-weighted index that measures equity performance of developed and emerging markets, excluding the United States. The index is calculated on a total return basis with net dividends reinvested. The index is unmanaged, its returns do not reflect any fees, expenses, or sales charges, and is not available for direct investment.
MSCI All Country World Small-Cap Index (net)
The MSCI ACWI Small Cap Index (net) is a free float-adjusted market capitalization-weighted index that measures small cap equity performance of developed and emerging markets. The index is calculated on a total return basis with net dividends reinvested. The index is unmanaged, its returns do not reflect any fees, expenses, or sales charges, and is not available for direct investment.
VIRTUS INVESTMENT TRUST
KEY INVESTMENT TERMS (Unaudited) (Continued)
June 30, 2023
MSCI Brazil Index (net)
The MSCI Brazil Index (net) is a free float-adjusted market capitalization weighted index that measures large and mid cap equity performance across India. The index is calculated on a total return basis with net dividends reinvested. The index is unmanaged, its returns do not reflect any fees, expenses, or sales charges, and it is not available for direct investment.
MSCI China Index (net)
The MSCI China Index (net) is a free float-adjusted market capitalization weighted index that measures large and mid cap equity performance across China. The index is calculated on a total return basis with net dividends reinvested. The index is unmanaged, its returns do not reflect any fees, expenses, or sales charges, and it is not available for direct investment..
MSCI EAFE® Index (net)
The MSCI EAFE® (Europe, Australasia, Far East) Index (net) is a free float-adjusted market capitalization-weighted index that measures developed foreign market equity performance, excluding the U.S. and Canada. The index is calculated on a total return basis with net dividends reinvested. The index is unmanaged, its returns do not reflect any fees, expenses, or sales charges, and it is not available for direct investment.
MSCI Emerging Markets Index (net)
The MSCI Emerging Markets Index (net) is a free float-adjusted market capitalization-weighted index designed to measure equity market performance in the global emerging markets. The index is calculated on a total return basis with net dividends reinvested. The index is unmanaged, its returns do not reflect any fees, expenses, or sales charges, and it is not available for direct investment.
MSCI Hungary Index (net)
The MSCI Hungary Index (net) is a free float-adjusted market capitalization weighted index that measures large and mid cap equity performance across Hungary. The index is calculated on a total return basis with net dividends reinvested. The index is unmanaged, its returns do not reflect any fees, expenses, or sales charges, and it is not available for direct investment.
MSCI India Index (net)
The MSCI India Index (net) is a free float-adjusted market capitalization weighted index that measures large and mid cap equity performance across India. The index is calculated on a total return basis with net dividends reinvested. The index is unmanaged, its returns do not reflect any fees, expenses, or sales charges, and it is not available for direct investment.
MSCI Poland Index (net)
The MSCI Poland Index (net) is a free float-adjusted market capitalization weighted index that measures large and mid cap equity performance across Poland. The index is calculated on a total return basis with net dividends reinvested. The index is unmanaged, its returns do not reflect any fees, expenses, or sales charges, and it is not available for direct investment.
MSCI World Health Care Index (net)
The MSCI World Health Care Index is designed to capture the large- and mid-cap segments across Developed Markets countries. All securities in the index are classified in the Health Care sector as per the Global Industry Classification Standard. The index is calculated on a total return basis with net dividends reinvested. The index is unmanaged, its returns do not reflect any fees, expenses, or sales charges, and it is not available for direct investment.
MSCI World Small-Cap Index (net)
The MSCI World Small-Cap Index captures small-cap representation across Developed Markets countries. The index covers approximately 14% of the free float-adjusted market capitalization in each country. The index is calculated on a total return basis with net dividends reinvested. The index is unmanaged, its returns do not reflect any fees, expenses, or sales charges, and is not available for direct investment.
Nasdaq Composite® Index
The NASDAQ Composite Index is an unmanaged market-value weighted index of all common stocks listed on the NASDAQ Stock Market. The index is calculated on a total return basis with net dividends reinvested. The index is unmanaged, its returns do not reflect any fees, expenses, or sales charges, and it is not available for direct investment.
OPEC
The Organization of the Petroleum Exporting Countries (OPEC) coordinates and unifies the petroleum policies of its Member Countries and ensures the stabilization of oil markets in order to secure an efficient, economic and regular supply of petroleum to consumers, a steady income to producers and a fair return on capital for those investing in the petroleum industry.
Public Joint Stock Company (“PJSC”)
A public joint stock company is a method to allow thousands or millions of people to jointly own a business. The most important feature is limited liability. The most important function of a public joint stock company is that the investor can only lose their initial investment.
VIRTUS INVESTMENT TRUST
KEY INVESTMENT TERMS (Unaudited) (Continued)
June 30, 2023
Real Estate Investment Trust (“REIT”)
A publicly traded company that owns, develops and operates income-producing real estate such as apartments, office buildings, hotels, shopping centers and other commercial properties.
Risk Asset
A risk asset is generally any asset that has a significant degree of price volatility, such as equities, commodities, high-yield bonds, real estate, and currencies.
Russell 1000® Growth Index
The Russell 1000® Growth Index is a market capitalization-weighted index of growth-oriented stocks of the 1,000 largest companies in the Russell Universe, which comprises the 3,000 largest U.S. companies. The index is calculated on a total return basis with dividends reinvested. The index is unmanaged, its returns do not reflect any fees, expenses, or sales charges, and it is not available for direct investment.
Russell 1000® Value Index
The Russell 1000® Value Index is a market capitalization-weighted index of value-oriented stocks of the 1,000 largest companies in the Russell Universe, which comprises the 3,000 largest U.S. companies. The index is calculated on a total return basis with dividends reinvested. The index is unmanaged, its returns do not reflect any fees, expenses, or sales charges, and it is not available for direct investment.
Russell 2000® Index
The Russell 2000® Index is a market capitalization-weighted index of the 2,000 smallest companies in the Russell Universe, which comprises the 3,000 largest U.S. companies. The index is calculated on a total return basis with dividends reinvested. The index is unmanaged, its returns do not reflect any fees, expenses, or sales charges, and it is not available for direct investment.
Russell 2000® Value Index
The Russell 2000® Value Index is a market capitalization-weighted index of value-oriented stocks of the smallest 2,000 companies in the Russell Universe, which comprises the 3,000 largest U.S. companies. The index is calculated on a total return basis with dividends reinvested. The index is unmanaged, its returns do not reflect any fees, expenses, or sales charges, and it is not available for direct investment.
Russell Midcap® Growth Index
The Russell Midcap® Growth Index is a market capitalization-weighted index of medium-capitalization, growth-oriented stocks of U.S. companies. The index is calculated on a total return basis with dividends reinvested. The index is unmanaged, its returns do not reflect any fees, expenses, or sales charges, and it is not available for direct investment.
Russell Midcap® Value Index
The Russell Midcap Value Index is a market capitalization-weighted index of medium-capitalization, value-oriented stocks of U.S. companies. The index is calculated on a total return basis with dividends reinvested. The index is unmanaged, its returns do not reflect any fees, expenses, or sales charges, and it is not available for direct investment.
S&P 500® Index
The S&P 500® Index is a free-float market capitalization-weighted index of 500 of the largest U.S. companies. The index is calculated on a total return basis with dividends reinvested. The index is unmanaged, its returns do not reflect any fees, expenses, or sales charges, and it is not available for direct investment.
S&P North American Technology Sector Index
The S&P North American Technology Sector Index provides investors with a benchmark that represents U.S. securities classified under the Global Industry Classification Standard information technology sector as well as the internet and direct marketing retail, interactive home entertainment, and interactive media and services sub-industries. The index is calculated on a total return basis with net dividends reinvested. The index is unmanaged, its returns do not reflect any fees, expenses, or sales charges, and it is not available for direct investment.
Sponsored ADR
An ADR which is issued with the cooperation of the company whose stock will underlie the ADR. Sponsored ADRs generally carry the same rights normally given to stockholders, such as voting rights. ADRs must be sponsored to be able to trade on a major U.S. exchange such as the New York Stock Exchange (“NYSE”).
Yield Curve
A yield curve is a line that plots yields (interest rates) of bonds having equal credit quality but differing maturity dates. The slope of the yield curve gives an idea of future interest rate changes and economic activity.
| | Ticker Symbols: |
| | Class A : AOTAX |
| | Class C: AOTCX |
| | Class P: AEMPX |
| | Institutional Class: AOTIX |
| | Class R6: AEMOX |
Emerging Markets Opportunities Fund
Fund Summary (Unaudited)
Portfolio Manager Commentary by
Virtus Investment Advisers, Inc.
| ■ | The Fund is diversified and has an investment objective of seeking to maximize long-term capital appreciation. There is no guarantee that the Fund will meet its objective. |
| ■ | For the fiscal year ended June 30, 2023, the Fund’s Class A shares at NAV returned 4.22%†, Class C shares at NAV returned 3.41%†, Class P shares at NAV returned 4.49%†, Institutional Class shares at NAV returned 4.59%†, and Class R6 shares at NAV returned 4.62%†. For the same period, the MSCI Emerging Markets Index (net), the Fund’s style-specific benchmark appropriate for comparison, returned 1.75%. |
† See footnote 3 on page 12.
All performance figures assume reinvestment of distributions and exclude the effect of sales charges. Performance data quoted represents past results. Past performance is no guarantee of future results, and current performance may be higher or lower than the performance shown above. Investment return and principal value will fluctuate so your shares, when redeemed, may be worth more or less than their original cost. Please visit Virtus.com for performance data current to the most recent month-end.
How did the markets perform during the Fund’s fiscal year ended June 30, 2023?
Emerging market (EM) equities, as defined by the MSCI Emerging Markets Index (net), eked out a return of 1.75% for the fiscal year ended June 30, 2023. The fiscal year was marked by two distinct time periods: the Covid-era lockdowns in China, and the period after the lockdowns were relaxed.
October of 2022 marked a milestone in which President Xi Jinping was appointed as president/party chairman for a third term, breaking a precedent of two terms that had been followed by Chinese presidents for the prior three decades. The uncertainty of the political transition was coupled with a draconian lockdown in response to the Covid-19 virus. The result was a dramatic slowdown in economic activity in China as consumer activity came to a grinding halt in response to home confinement and lockdowns. The services sectors suffered, investments and capital formation slowed,
and exports, while anemic, were the only positive driver for this time period.
November of 2022 marked the turn of the political and economic environment in China. The new government under the third term of President Xi lifted all Covid-related restrictions, which led to a surge of economic activity and expectations for a recovery in the Chinese equity market. Since the market trough, reached on October 24, 2022, the MSCI Emerging Markets Index (net) and the MSCI China Index (net) did not disappoint, delivering returns of 19.5% and 26.1%, respectively, through June 30, 2023.
While developed economies (especially the U.S., the U.K., and the European Union) battled inflationary pressures, inflation was a muted problem in emerging economies. Much of the credit goes to the measured fiscal response by the governments of other EM countries in response to Covid, and to EM central banks, which were proactive about raising rates.
Having left Covid-related lockdowns and restrictions in economic activity behind, India and Brazil were some of the outstanding performers for the fiscal year ended June 30, 2023. The MSCI India Index (net) delivered a return of 14.2% for the period, while the MSCI Brazil Index (net) delivered a strong 29.8%. Brazilian elections, a smooth handover of power, and inflation that remained under control all helped bolster Brazilian markets. Eastern European countries were another pocket of strength. The Russian invasion of Ukraine made investors shy away from many of these countries. But the fiscal discipline, proactive central banks, and most importantly resilience and grit of the economies showed during this period. The MSCI Hungary Index (net) delivered a whopping 48.8% return for the year, and the MSCI Poland Index (net) posted a 36.4% increase for the same time period.
The energy sector was a strong performer as OPEC kept the oil supply glut in check. EM energy companies including PetroChina and Petrobras were the key contributors to the energy sector. Information technology was another strong performer with multiple tailwinds, the most important of which was the fervor around artificial intelligence (AI) and AI-related companies, which benefited several Taiwan technology stocks.
What factors affected the Fund’s performance during its fiscal year?
For the fiscal year ended June 30, 2023, the Fund outperformed its benchmark, the MSCI Emerging Markets Index (net). Stock selection was the key driver of outperformance. The Fund’s allocation to India was the top performer, aided by stock selection within the country. China was the second biggest contributor to the Fund, although the underweight in China hurt the Fund after the removal of the Covid lockdowns in November 2022. South Korea, a traditional bellwether of the global economy, detracted from Fund performance. The underperformance in South Korea was due to a combination of country allocation and stock selection. Higher levels of household debt in South Korea, as well as the slowdown in the housing market, hurt the performance of some of the banks and construction companies in that country.
Overall, the two largest contributors to Fund performance were Gigabyte Technology in Taiwan and PetroChina in Hong Kong. Gigabyte is a supplier of AI servers. Increased demand after the advent of ChatGPT helped the company’s pipeline and demand. The biggest detractor for the 12-month period was Daqo New Energy, a manufacturer of polysilicon solar cells. Headwinds for the company included the slowdown in China’s manufacturing, as well as efforts by western governments to shift the solar-related supply chain out of China. Postal Savings Bank in China was another detractor, reflecting the slowdown of the Chinese economy in the early part of the fiscal year when China was under Covid-related lockdowns.
Disclaimer:
As of July 2022, Virtus Investment Advisers (VIA) acquired the investment personnel and assets related to certain strategies from Allianz Global Investors U.S. LLC (AllianzGI), the Fund’s prior subadviser. All historical performance data, data analysis and other information provided for periods prior to July 25, 2022, were prepared by AllianzGI.
The preceding information is the opinion of portfolio management only through the end of the period stated on the cover. Any such opinions are subject to change at any time based upon market or other conditions and should not be relied upon as investment advice. Past performance is no guarantee
For information regarding the indexes and certain investment terms, see the Key Investment Terms starting on page 6.
Emerging Markets Opportunities Fund (Continued)
of future results, and there is no guarantee that market forecasts will be realized.
Market Volatility: The value of the securities in the portfolio may go up or down in response to the prospects of individual companies and/or general economic conditions. Local, regional, or global events such as war or military conflict, terrorism, pandemic, or recession could impact the portfolio, including hampering the ability of the portfolio’s manager(s) to invest its assets as intended.
Issuer Risk: The portfolio will be affected by factors specific to the issuers of securities and other instruments in which the portfolio invests, including actual or perceived changes in the financial condition or business prospects of such issuers.
Equity Securities: The market price of equity securities may be adversely affected by financial market, industry, or issuer-specific events. Focus on a particular style or on small or medium-sized companies may enhance that risk.
Foreign & Emerging Markets: Investing in foreign securities, especially in emerging markets, subjects the portfolio to additional risks such as increased volatility, currency fluctuations, less liquidity, and political, regulatory, economic, and market risk.
Focused Investments: To the extent the portfolio focuses its investments on a limited number of
issuers, sectors, industries or geographic regions, it may be subject to increased risk and volatility.
Prospectus: For additional information on risks, please see the Fund’s prospectus.
Asset Allocation
The following table presents asset allocation within certain industries as a percentage of total investments as of June 30, 2023.
| Banks | 19% |
| Technology Hardware, Storage & Peripherals | 12 |
| Semiconductors & Semiconductor Equipment | 10 |
| Oil, Gas & Consumable Fuels | 5 |
| Hotels, Restaurants & Leisure | 5 |
| Metals & Mining | 4 |
| Industrial Conglomerates | 4 |
| Construction & Engineering | 4 |
| Interactive Media & Services | 4 |
| Tobacco | 4 |
| Other | 29 |
| Total | 100% |
For information regarding the indexes and certain investment terms, see the Key Investment Terms starting on page 6.
Emerging Markets Opportunities Fund (Continued)
Average Annual Total Returns1 for periods ended 6/30/23
| | | 1 Year | 5 Years | 10 Years | Since
inception | Inception
date |
| Class A shares at NAV2 | | 4.22 % 3 | 1.27 % | 3.08 % | — % | — |
| Class A shares at POP4,5 | | -1.52 | 0.13 | 2.50 | — | — |
| Class C shares at NAV2 and with CDSC4 | | 3.41 3 | 0.51 | 2.31 | — | — |
| Class P shares at NAV2 | | 4.49 3 | 1.52 | 3.34 | — | — |
| Institutional Class shares at NAV2 | | 4.59 3 | 1.63 | 3.45 | — | — |
| Class R6 shares at NAV2 | | 4.62 3 | 1.66 | — | 5.91 | 12/14/15 |
| MSCI Emerging Markets Index (net) | | 1.75 | 0.93 | 2.95 | 5.89 6 | — |
| Fund Expense Ratios7: Class A shares: Gross 1.45%, Net 1.29%; Class C shares: Gross 2.21%, Net 2.04%; Class P shares: Gross 1.18%, Net 1.04%; Institutional Class shares: Gross 1.19%, Net 0.94%; Class R6 shares: Gross 1.07%, Net 0.89%. |
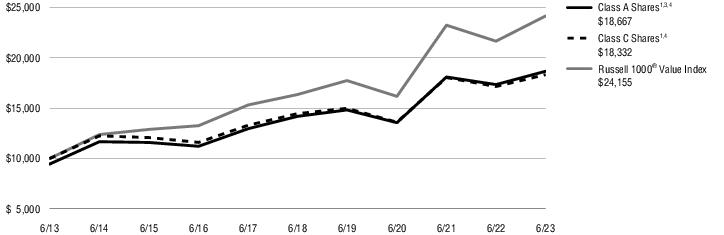
| All returns represent past performance which is no guarantee of future results. Current performance may be higher or lower than the performance shown. The investment return and principal value of an investment will fluctuate so that an investor’s shares, when redeemed, may be worth more or less than their original cost. The above table and graph below do not reflect the deduction of taxes that a shareholder would pay on fund distributions or the redemption of shares. Please visit Virtus.com for performance data current to the most recent month-end. |
Growth of $10,000 for periods ended 6/30
This chart assumes an initial investment of $10,000 made on June 30, 2013, for Class A shares and Class C shares including any applicable sales charges or fees. The performance of the other share class may be greater or less than that shown based on differences in inception dates, fees, and sales charges. Performance assumes reinvestment of dividends and capital gain distributions.
For information regarding the indexes and certain investment terms, see the Key Investment Terms starting on page 6.
Emerging Markets Opportunities Fund (Continued)
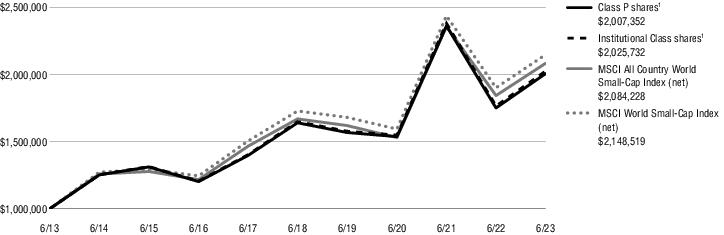
Growth of $1,000,000 for periods ended 6/30
This chart assumes an initial investment of $1,000,000 made on June 30, 2013, for Class P shares and Institutional Class shares. The performance of the other share class may be greater or less than that shown based on differences in inception dates, fees, and sales charges. Performance assumes reinvestment of dividends and capital gain distributions.

| 1 | Total returns are historical and include changes in share price and the reinvestment of both dividends and capital gain distributions. |
| 2 | “NAV” (Net Asset Value) total returns do not include the effect of any sales charge. |
| 3 | Total Return for the report period presented in the table differs from the return in the Financial Highlights. The total return presented in the above table is calculated based on the NAV at which shareholder transactions were processed. The total return presented in the Financial Highlights section of the report is calculated in the same manner, but also takes into account certain adjustments that are necessary under generally accepted accounting principles required in the annual report and semiannual report. |
| 4 | “POP” (Public Offering Price) total returns include the effect of the maximum front-end 5.50% sales charge. |
| 5 | “CDSC” (contingent deferred sales charge) is applied to redemptions of certain classes of shares that do not have a sales charge applied at the time of purchase. CDSC for certain redemptions of Class A shares made within 18 months of a finder’s fee being paid and all Class C shares are 1% within the first year and 0% thereafter. |
| 6 | The since inception index return is from the inception date of Class R6 shares. |
| 7 | The expense ratios of the Fund are set forth according to the prospectus for the Fund effective October 28, 2022, as supplemented and revised, and may differ from the expense ratios disclosed in the Financial Highlights tables in this report. See the Financial Highlights for more current expense ratios. Net Expense: Expenses reduced by a contractual expense limitation in effect through October 31, 2023. Gross Expense: Does not reflect the effect of the expense limitation. Expense ratios include fees and expenses associated with any underlying funds. |
The index is unmanaged and not available for direct investment; therefore, its performance does not reflect the expenses associated with active management of an actual portfolio.
For information regarding the indexes and certain investment terms, see the Key Investment Terms starting on page 6.
| | Ticker Symbols: |
| | Class A : AZNAX |
| | Class C: AZNCX |
| | Class P: AIGPX |
| | Institutional Class: AZNIX |
Income & Growth Fund
Fund Summary (Unaudited)
Portfolio Manager Commentary by
Voya Investment Management Co., LLC
| ■ | The Fund is diversified and has an investment objective of seeking total return comprised of current income, current gains and capital appreciation. There is no guarantee that the Fund will meet its objective. |
| ■ | For the fiscal year ended June 30, 2023, the Fund’s Class A shares at NAV returned 12.65%, Class C shares at NAV returned 11.83%, Class P shares at NAV returned 12.94%, and Institutional Class shares at NAV returned 12.96%. For the same period, the S&P 500® Index, the Fund’s style-specific benchmark appropriate for comparison, returned 19.59% and Bloomberg U.S. Aggregate Bond Index, a broad-based index, returned -0.94%. |
All performance figures assume reinvestment of distributions and exclude the effect of sales charges. Performance data quoted represents past results. Past performance is no guarantee of future results, and current performance may be higher or lower than the performance shown above. Investment return and principal value will fluctuate so your shares, when redeemed, may be worth more or less than their original cost. Please visit Virtus.com for performance data current to the most recent month-end.
How did the markets perform during the Fund’s fiscal year ended June 30, 2023?
Markets were volatile to start the fiscal year as they digested persistent inflation, rising interest rates, and the results of central bank tightening globally. During the fourth quarter of 2022, inflation slowed, reducing the odds of a higher-than-expected endpoint for central bank rate increases. In addition, the U.S. dollar and U.S. Treasury yields retreated from intra-quarter peak levels, which alleviated another perceived market challenge. These factors helped boost investor appetite for stocks and credit into year-end 2022.
This momentum carried into 2023, with risk assets advancing further on better-than-expected corporate earnings and economic data, waning inflation, and a pause in interest rate hikes. First-quarter 2023 earnings results topped forecasts, helped by corporate cost-cutting initiatives and improved operating efficiency. In addition, management
outlooks included fewer references to sales and profitability challenges. The unemployment rate remained low, consumer confidence improved substantially, gross domestic product (GDP) growth was revised higher, various housing statistics stabilized, and headline inflation trended lower. After softening its policy rate guidance in May, the U.S. Federal Reserve (the Fed) left interest rates unchanged in June – the first time in 11 meetings — at a range of 5% to 5.25%.
For the 12-month period ended June 30, 2023, equities, as measured by the S&P 500® Index, returned 19.59%. Convertible securities, as measured by the ICE BofA US Convertibles Index, returned 10.60%. And high yield bonds, as measured by the ICE BofA U.S. High Yield Cash Pay Index, returned 8.88%.
What factors affected the Fund’s performance during its fiscal year?
The Fund underperformed the S&P 500® Index and outperformed the Bloomberg U.S. Aggregate Bond Index for the 12 months ended June 30, 2023. The Fund delivered a high level of monthly income and a positive total return for the period. The Fund’s holdings benefited from the strength across risk assets.
Fund performance benefited from exposure to mega-cap stocks and technology companies. Better-than-expected earnings results, optimistic management guidance, and artificial intelligence (AI) optimism drove gains in many of the Fund’s top contributors. Other top contributors included positions in clean energy, travel services, semiconductors, and energy services.
Top detractors included a cellular tower real estate investment trust (REIT), an electronic components company, and a hydrogen fuel cells system developer whose earnings came in below analysts’ expectations. A telecom-wireline operator under new management also underperformed. Health care holdings with exposure to pharmaceuticals and diagnostics were also sources of weakness. Other laggards were exposures in cable and satellite TV, software, and power generation.
Additionally, many written options positions expired below the strike price, and the Fund was able to retain the set premiums.
Disclaimer:
As of July 2022, Voya Investment Management (Voya IM) acquired the investment personnel and assets related to certain strategies from Allianz Global Investors U.S. LLC (AllianzGI), the Fund’s prior subadviser. All historical performance data, data analysis and other information provided for periods prior to July 25, 2022, were prepared by AllianzGI.
The preceding information is the opinion of portfolio management only through the end of the period stated on the cover. Any such opinions are subject to change at any time based upon market or other conditions and should not be relied upon as investment advice. Past performance is no guarantee of future results, and there is no guarantee that market forecasts will be realized.
Market Volatility: The value of the securities in the portfolio may go up or down in response to the prospects of individual companies and/or general economic conditions. Local, regional, or global events such as war or military conflict, terrorism, pandemic, or recession could impact the portfolio, including hampering the ability of the portfolio’s manager(s) to invest its assets as intended.
Issuer Risk: The portfolio will be affected by factors specific to the issuers of securities and other instruments in which the portfolio invests, including actual or perceived changes in the financial condition or business prospects of such issuers.
High Yield Fixed Income Securities: There is a greater risk of issuer default, less liquidity, and increased price volatility related to high yield securities than investment grade securities.
Equity Securities: The market price of equity securities may be adversely affected by financial market, industry, or issuer-specific events. Focus on a particular style or on small or medium-sized companies may enhance that risk.
Unrated Fixed Income Securities: If the quality of an unrated fixed income security is not accurately assessed, the portfolio may invest in a security with greater risk than intended.
Debt Instruments: Debt instruments are subject to greater levels of credit and liquidity risk, may be speculative and may decline in value due to changes
For information regarding the indexes and certain investment terms, see the Key Investment Terms starting on page 6.
Income & Growth Fund (Continued)
in interest rates or an issuer’s or counterparty’s deterioration or default.
Derivatives: Investments in derivatives such as futures, options, forwards, and swaps may increase volatility or cause a loss greater than the principal investment.
Convertible Securities: A convertible security may be called for redemption at a time and price unfavorable to the portfolio.
Prospectus: For additional information on risks, please see the Fund’s prospectus.
Distribution Rate is calculated by summing all distributions over the preceding 12 months, and dividing the NAV on the last business date of the period.
Asset Allocation
The following table presents asset allocation within certain sectors as a percentage of total investments as of June 30, 2023.
| Common Stocks | | 38% |
| Software | 5% | |
| Interactive Media & Services | 3 | |
| Semiconductors & Semiconductor Equipment | 3 | |
| All other Common Stocks | 27 | |
| Corporate Bonds and Notes | | 32 |
| Media | 4 | |
| Oil, Gas & Consumable Fuels | 3 | |
| Telecommunications | 2 | |
| All other Corporate Bonds and Notes | 23 | |
| Convertible Bonds and Notes | | 24 |
| Internet | 5 | |
| Software | 5 | |
| Commercial Services | 2 | |
| All other Convertible Bonds and Notes | 12 | |
| Convertible Preferred Stocks | | 2 |
| Equity-Linked Warrants | | 2 |
| Short-Term Investment | | 1 |
| Equity-Linked Notes | | 1 |
| Total | | 100% |
For information regarding the indexes and certain investment terms, see the Key Investment Terms starting on page 6.
Income & Growth Fund (Continued)
Average Annual Total Returns1 for periods ended 6/30/23
| | | 1 Year | 5 Years | 10 Years |
| Class A shares at NAV2 | 12.65 % | 6.40% | 7.10% |
| Class A shares at POP3,4 | 6.46 | 5.20 | 6.50 |
| Class C shares at NAV2 and with CDSC4 | 11.83 | 5.61 | 6.30 |
| Class P shares at NAV2 | 12.94 | 6.66 | 7.36 |
| Institutional Class shares at NAV2 | 12.96 | 6.71 | 7.44 |
| Bloomberg U.S. Aggregate Bond Index | -0.94 | 0.77 | 1.52 |
| S&P 500® Index | 19.59 | 12.31 | 12.86 |
| Fund Expense Ratios5: Class A shares: 1.13%; Class C shares: 1.88%; Class P shares: 0.90%; Institutional Class shares: 0.89%. |
| All returns represent past performance which is no guarantee of future results. Current performance may be higher or lower than the performance shown. The investment return and principal value of an investment will fluctuate so that an investor’s shares, when redeemed, may be worth more or less than their original cost. The above table and graph below do not reflect the deduction of taxes that a shareholder would pay on fund distributions or the redemption of shares. Please visit Virtus.com for performance data current to the most recent month-end. |
Growth of $10,000 for periods ended 6/30
This chart assumes an initial investment of $10,000 made on June 30, 2013, for Class A shares and Class C shares including any applicable sales charges or fees. The performance of the other share class may be greater or less than that shown based on differences in inception dates, fees, and sales charges. Performance assumes reinvestment of dividends and capital gain distributions.
For information regarding the indexes and certain investment terms, see the Key Investment Terms starting on page 6.
Income & Growth Fund (Continued)
Growth of $1,000,000 for periods ended 6/30
This chart assumes an initial investment of $1,000,000 made on June 30, 2013, for Class P shares and Institutional Class shares. The performance of the other share class may be greater or less than that shown based on differences in inception dates, fees, and sales charges. Performance assumes reinvestment of dividends and capital gain distributions.

| 1 | Total returns are historical and include changes in share price and the reinvestment of both dividends and capital gain distributions. |
| 2 | “NAV” (Net Asset Value) total returns do not include the effect of any sales charge. |
| 3 | “POP” (Public Offering Price) total returns include the effect of the maximum front-end 5.50% sales charge. |
| 4 | “CDSC” (contingent deferred sales charge) is applied to redemptions of certain classes of shares that do not have a sales charge applied at the time of purchase. CDSC for certain redemptions of Class A shares made within 18 months of a finder’s fee being paid and all Class C shares are 1% within the first year and 0% thereafter. |
| 5 | The expense ratios of the Fund are set forth according to the prospectus for the Fund effective October 28, 2022, as supplemented and revised, and may differ from the expense ratios disclosed in the Financial Highlights tables in this report. See the Financial Highlights for more current expense ratios. Expense ratios include fees and expenses associated with any underlying funds. |
The indexes are unmanaged and not available for direct investment; therefore, their performance does not reflect the expenses associated with active management of an actual portfolio.
For information regarding the indexes and certain investment terms, see the Key Investment Terms starting on page 6.
| | Ticker Symbols: |
| | Class A : RGSAX |
| | Class C: RGSCX |
| | Class P: ARSPX |
| | Institutional Class: DGSCX |
KAR Global Small-Cap Fund
Fund Summary (Unaudited)
Portfolio Manager Commentary by
Kayne Anderson Rudnick Investment Management, LLC
| ■ | The Fund is diversified and has an investment objective of seeking long-term capital appreciation. There is no guarantee that the Fund will meet its objective. |
| ■ | For the fiscal year ended June 30, 2023, the Fund’s Class A shares at NAV returned 14.31%, Class C shares at NAV returned 13.49%, Class P shares at NAV returned 14.58%, and Institutional Class shares at NAV returned 14.71%. For the same period, the MSCI AC World Small-Cap Index (net), the Fund’s style-specific benchmark appropriate for comparison, returned 13.02%. |
All performance figures assume reinvestment of distributions and exclude the effect of sales charges. Performance data quoted represents past results. Past performance is no guarantee of future results, and current performance may be higher or lower than the performance shown above. Investment return and principal value will fluctuate so your shares, when redeemed, may be worth more or less than their original cost. Please visit Virtus.com for performance data current to the most recent month-end.
How did the markets perform during the Fund’s fiscal year ended June 30, 2023?
After experiencing historic double-digit losses for equities in 2022, and with inflation quickly escalating, markets remained volatile but began to trend upward in the fourth quarter of 2022. Stocks rallied in the first two quarters of 2023 despite continuing inflationary pressures. After 10 consecutive interest rate increases by the Federal Reserve (the Fed), which began its monetary tightening campaign in March of 2022, markets appeared to have digested the higher-for-longer rate narrative. The rally was aided by a strong labor market, higher employment wages, and low unemployment numbers, all of which fueled demand in the economy. Widespread concerns about a potential recession were replaced by inflation fears, and a recession had yet to materialize by the end of the fiscal year, with the macroeconomic environment for stocks proving more resilient than market participants expected.
The S&P 500® Index returned 19.59% for the fiscal year ended June 30, 2023, moving higher than small stocks, as measured by the Russell 2000® Index,
which returned 12.31%. Growth stocks, as measured by the Russell 1000® Growth Index, outpaced value stocks, with a positive return of 27.11% versus the 11.54% return of the Russell 1000® Value Index. International developed markets performed better than emerging markets, with the MSCI EAFE Index (net) posting a return of 18.77% versus the return of 1.75% for the MSCI Emerging Markets Index (net).
Kayne Anderson Rudnick Investment Management, LLC became the subadviser of the Fund effective July 25, 2022. Performance of the Fund prior thereto is that of the Fund’s former subadviser.
What factors affected the Fund’s performance during its fiscal year?
The Fund underperformed the MSCI All Country World Small Cap Index (net) for the 24-day period ended July 24, 2022.
From a sector perspective, both allocation decisions and security selection detracted from the Fund’s relative return. An overweight in utilities, the worst performing sector in the Index, was one of the top detractors, as was disappointing security selection in industrials. From a country perspective, security selection was the driver of the Fund’s underperformance. Security selection was most disappointing in the U.S., Sweden, and France.
What factors affected the Fund’s performance from July 25, 2022, through the fiscal year-end on June 30, 2023?
The Fund outperformed the MSCI All Country World Small Cap Index (net) from July 25, 2022, through the fiscal year-end on June 30, 2023. Industrials and information technology contributed the most to performance, while health care and real estate contributed the least.
From a country perspective, the U.S. and Brazil contributed the most to performance. The U.K. and Sweden detracted the most from performance during the period.
The biggest individual contributors to performance during the period were Primerica, Tegma Gestao Logistica, Simpson Manufacturing, Landstar System, and Baltic Classifieds.
The biggest individual detractors from performance during the period were Bank of Hawaii, Mortgage Advice Bureau, First Hawaiian, Rightmove, and Haw Par.
The preceding information is the opinion of portfolio management only through the end of the period stated on the cover. Any such opinions are subject to change at any time based upon market or other conditions and should not be relied upon as investment advice. Past performance is no guarantee of future results, and there is no guarantee that market forecasts will be realized.
Market Volatility: The value of the securities in the portfolio may go up or down in response to the prospects of individual companies and/or general economic conditions. Local, regional, or global events such as war or military conflict, terrorism, pandemic, or recession could impact the portfolio, including hampering the ability of the portfolio’s manager(s) to invest its assets as intended.
Issuer Risk: The portfolio will be affected by factors specific to the issuers of securities and other instruments in which the portfolio invests, including actual or perceived changes in the financial condition or business prospects of such issuers.
Equity Securities: The market price of equity securities may be adversely affected by financial market, industry, or issuer-specific events. Focus on a particular style or on small or medium-sized companies may enhance that risk.
Foreign & Emerging Markets: Investing in foreign securities subjects the portfolio to additional risks such as increased volatility, currency fluctuations, less liquidity, and political, regulatory, economic, and market risk.
Prospectus: For additional information on risks, please see the Fund’s prospectus.
For information regarding the indexes and certain investment terms, see the Key Investment Terms starting on page 6.
KAR Global Small-Cap Fund (Continued)
Asset Allocation
The following table presents asset allocation within certain sectors as a percentage of total investments as of June 30, 2023.
| Industrials | 32% |
| Financials | 26 |
| Communication Services | 19 |
| Information Technology | 11 |
| Consumer Discretionary | 4 |
| Materials | 3 |
| Health Care | 2 |
| Other | 3 |
| Total | 100% |
For information regarding the indexes and certain investment terms, see the Key Investment Terms starting on page 6.
KAR Global Small-Cap Fund (Continued)
Average Annual Total Returns1 for periods ended 6/30/23
| | | 1 Year | 5 Years | 10 Years |
| Class A shares at NAV2 | 14.31 % | 3.85% | 6.95% |
| Class A shares at POP3,4 | 8.02 | 2.68 | 6.35 |
| Class C shares at NAV2 and with CDSC4 | 13.49 | 3.07 | 6.15 |
| Class P shares at NAV2 | 14.58 | 4.11 | 7.22 |
| Institutional Class shares at NAV2 | 14.71 | 4.19 | 7.31 |
| MSCI All Country World Small-Cap Index (net)5 | 13.02 | 4.53 | 7.62 |
| MSCI World Small-Cap Index (net)5 | 12.94 | 4.44 | 7.95 |
| Fund Expense Ratios6: Class A shares: Gross 1.55%, Net 1.55%; Class C shares: Gross 2.32%, Net 2.32%; Class P shares: Gross 1.29%, Net 1.29%; Institutional Class shares: Gross 1.29%, Net 1.28%. |
| All returns represent past performance which is no guarantee of future results. Current performance may be higher or lower than the performance shown. The investment return and principal value of an investment will fluctuate so that an investor’s shares, when redeemed, may be worth more or less than their original cost. The above table and graph below do not reflect the deduction of taxes that a shareholder would pay on fund distributions or the redemption of shares. Please visit Virtus.com for performance data current to the most recent month-end. |
Growth of $10,000 for periods ended 6/30
This chart assumes an initial investment of $10,000 made on June 30, 2013, for Class A shares and Class C shares including any applicable sales charges or fees. The performance of the other share class may be greater or less than that shown based on differences in inception dates, fees, and sales charges. Performance assumes reinvestment of dividends and capital gain distributions.
For information regarding the indexes and certain investment terms, see the Key Investment Terms starting on page 6.
KAR Global Small-Cap Fund (Continued)
Growth of $1,000,000 for periods ended 6/30
This chart assumes an initial investment of $1,000,000 made on June 30, 2013, for Class P shares and Institutional Class shares. The performance of the other share class may be greater or less than that shown based on differences in inception dates, fees, and sales charges. Performance assumes reinvestment of dividends and capital gain distributions.
| 1 | Total returns are historical and include changes in share price and the reinvestment of both dividends and capital gain distributions. |
| 2 | “NAV” (Net Asset Value) total returns do not include the effect of any sales charge. |
| 3 | “POP” (Public Offering Price) total returns include the effect of the maximum front-end 5.50% sales charge. |
| 4 | “CDSC” (contingent deferred sales charge) is applied to redemptions of certain classes of shares that do not have a sales charge applied at the time of purchase. CDSC for certain redemptions of Class A shares made within 18 months of a finder’s fee being paid and all Class C shares are 1% within the first year and 0% thereafter. |
| 5 | The Fund changed its primary benchmark during the year to the MSCI All Country World Small-Cap Index (net) replacing the Fund’s previous primary benchmark, MSCI World Small-Cap Index (net). This change is being made to more closely match the Fund’s primary benchmark to its new principal investment strategy. |
| 6 | The expense ratios of the Fund are set forth according to the prospectus for the Fund effective October 28, 2022, as supplemented and revised, and may differ from the expense ratios disclosed in the Financial Highlights tables in this report. See the Financial Highlights for more current expense ratios. Net Expense: Expenses reduced by a contractual expense limitation in effect through October 31, 2023. Gross Expense: Does not reflect the effect of the expense limitation. Expense ratios include fees and expenses associated with any underlying funds. |
The indexes are unmanaged and not available for direct investment; therefore, their performance does not reflect the expenses associated with active management of an actual portfolio.
For information regarding the indexes and certain investment terms, see the Key Investment Terms starting on page 6.
| | Ticker Symbols: |
| | Class A : RAGHX |
| | Class C: RCGHX |
| | Class P: AAAEX |
| | Institutional Class: HLHIX |
KAR Health Sciences Fund
Fund Summary (Unaudited)
Portfolio Manager Commentary by
Kayne Anderson Rudnick Investment Management, LLC
| ■ | The Fund is diversified and has an investment objective of seeking long-term capital appreciation. There is no guarantee that the Fund will meet its objective. |
| ■ | For the fiscal year ended June 30, 2023, the Fund’s Class A shares at NAV returned 2.45%, Class C shares at NAV returned 1.66%, Class P shares at NAV returned 2.83%, and Institutional Class shares at NAV returned 2.75%. For the same period, the MSCI World Health Care Index (net), the Fund’s style-specific benchmark appropriate for comparison, returned 6.30%. |
All performance figures assume reinvestment of distributions and exclude the effect of sales charges. Performance data quoted represents past results. Past performance is no guarantee of future results, and current performance may be higher or lower than the performance shown above. Investment return and principal value will fluctuate so your shares, when redeemed, may be worth more or less than their original cost. Please visit Virtus.com for performance data current to the most recent month-end.
How did the markets perform during the Fund’s fiscal year ended June 30, 2023?
After experiencing historic double-digit losses for equities in 2022, and with inflation quickly escalating, markets remained volatile but began to trend upward in the fourth quarter of 2022. Stocks rallied in the first two quarters of 2023 despite continuing inflationary pressures. After 10 consecutive interest rate increases by the Federal Reserve (the Fed), which began its monetary tightening campaign in March of 2022, markets appeared to have digested the higher-for-longer rate narrative. The rally was aided by a strong labor market, higher employment wages, and low unemployment numbers, all of which fueled demand in the economy. Widespread concerns about a potential recession were replaced by inflation fears, and a recession had yet to materialize by the end of the fiscal year, with the macroeconomic environment for stocks proving more resilient than market participants expected.
The S&P 500® Index returned 19.59% for the fiscal year ended June 30, 2023, moving higher than small stocks, as measured by the Russell 2000® Index,
which returned 12.31%. Growth stocks, as measured by the Russell 1000® Growth Index, outpaced value stocks, with a positive return of 27.11% versus the 11.54% return of the Russell 1000® Value Index. International developed markets performed better than emerging markets, with the MSCI EAFE Index (net) posting a return of 18.77% versus the return of 1.75% for the MSCI Emerging Markets Index (net).
Kayne Anderson Rudnick Investment Management, LLC became the subadviser of the Fund effective July 25, 2022. Performance of the Fund prior thereto is that of the Fund’s former subadviser.
What factors affected the Fund’s performance during its fiscal year?
The Fund underperformed the MSCI World Health Care Index (net) for the 24-day period ended July 24, 2022.
From an industry perspective, security selection was a contributor to relative performance, while allocation decisions detracted overall. The primary detractor was in the life sciences tools & services industry, where both security selection and an underweight were detractors. On the other hand, security selection and an overweight to health care providers & services were both contributors.
What factors affected the Fund’s performance from July 25, 2022, through the fiscal year-end on June 30, 2023?
The Fund underperformed the MSCI World Health Care Index (net) from July 25, 2022, through the fiscal year-end on June 30, 2023. Pharmaceuticals and health care providers and services contributed the most to performance. Life sciences tools and services and biotechnology detracted from performance.
The biggest individual contributors to performance during the period were Eli Lilly, IDEXX Laboratories, Merck, McKesson, and Cooper Companies.
The biggest individual detractors from Fund performance during the period were STARR Surgical, Pfizer, Azenta, Waters Corp., and Silk Road Medical.
The preceding information is the opinion of portfolio management only through the end of the period stated on the cover. Any such opinions are subject to change at any time based upon market or other conditions and should not be relied upon as
investment advice. Past performance is no guarantee of future results, and there is no guarantee that market forecasts will be realized.
Market Volatility: The value of the securities in the portfolio may go up or down in response to the prospects of individual companies and/or general economic conditions. Local, regional, or global events such as war or military conflict, terrorism, pandemic, or recession could impact the portfolio, including hampering the ability of the portfolio’s manager(s) to invest its assets as intended.
Issuer Risk: The portfolio will be affected by factors specific to the issuers of securities and other instruments in which the portfolio invests, including actual or perceived changes in the financial condition or business prospects of such issuers.
Equity Securities: The market price of equity securities may be adversely affected by financial market, industry, or issuer-specific events. Focus on a particular style or on small or medium-sized companies may enhance that risk.
Focused Investments: To the extent the portfolio focuses its investments on a limited number of issuers, sectors, industries or geographic regions, it may be subject to increased risk and volatility.
Foreign Investing: Investing in foreign securities subjects the portfolio to additional risks such as increased volatility, currency fluctuations, less liquidity, and political, regulatory, economic, and market risk.
Prospectus: For additional information on risks, please see the Fund’s prospectus.
For information regarding the indexes and certain investment terms, see the Key Investment Terms starting on page 6.
KAR Health Sciences Fund (Continued)
Asset Allocation
The following table presents asset allocation within certain industries as a percentage of total investments as of June 30, 2023.
| Healthcare Equipment & Supplies | 30% |
| Pharmaceuticals | 22 |
| Life Sciences Tools & Services | 21 |
| Healthcare Providers & Services | 14 |
| Biotechnology | 13 |
| Total | 100% |
For information regarding the indexes and certain investment terms, see the Key Investment Terms starting on page 6.
KAR Health Sciences Fund (Continued)
Average Annual Total Returns1 for periods ended 6/30/23
| | | 1 Year | 5 Years | 10 Years | Since
inception | Inception
date |
| Class A shares at NAV2 | | 2.45 % | 10.05 % | 11.68 % | —% | — |
| Class A shares at POP3,4 | | -3.19 | 8.82 | 11.05 | — | — |
| Class C shares at NAV2 and with CDSC4 | | 1.66 | 9.24 | 10.85 | — | — |
| Class P shares at NAV2 | | 2.83 | — | — | 8.12 | 7/13/20 |
| Institutional Class shares at NAV2 | | 2.75 | 10.40 | — | 8.86 | 12/22/14 |
| MSCI World Health Care Index (net) | | 6.30 | 10.04 | 10.33 | — 5 | — |
| Fund Expense Ratios6: Class A shares: Gross 1.37%, Net 1.37%; Class C shares: Gross 2.13%, Net 2.13%; Class P shares: Gross 1.04%, Net 1.04%; Institutional Class shares: Gross 1.13%, Net 1.12%. |
| All returns represent past performance which is no guarantee of future results. Current performance may be higher or lower than the performance shown. The investment return and principal value of an investment will fluctuate so that an investor’s shares, when redeemed, may be worth more or less than their original cost. The above table and graph below do not reflect the deduction of taxes that a shareholder would pay on fund distributions or the redemption of shares. Please visit Virtus.com for performance data current to the most recent month-end. |
Growth of $10,000 for periods ended 6/30
This chart assumes an initial investment of $10,000 made on June 30, 2013, for Class A shares and Class C shares including any applicable sales charges or fees. The performance of the other share class may be greater or less than that shown based on differences in inception dates, fees, and sales charges. Performance assumes reinvestment of dividends and capital gain distributions.

| 1 | Total returns are historical and include changes in share price and the reinvestment of both dividends and capital gain distributions. |
| 2 | “NAV” (Net Asset Value) total returns do not include the effect of any sales charge. |
| 3 | “POP” (Public Offering Price) total returns include the effect of the maximum front-end 5.50% sales charge. |
| 4 | “CDSC” (contingent deferred sales charge) is applied to redemptions of certain classes of shares that do not have a sales charge applied at the time of purchase. CDSC for certain redemptions of Class A shares made within 18 months of a finder’s fee being paid and all Class C shares are 1% within the first year and 0% thereafter. |
| 5 | The since inception index returned 8.16% for the inception date of Class P shares and 7.90% for the inception date of Institutional Class shares. |
| 6 | The expense ratios of the Fund are set forth according to the prospectus for the Fund effective October 28, 2022, as supplemented and revised, and may differ from the expense ratios disclosed in the Financial Highlights tables in this report. See the Financial Highlights for more current expense ratios. Net Expense: Expenses reduced by a contractual expense limitation in effect through October 31, 2023. Gross Expense: Does not reflect the effect of the expense limitation. Expense ratios include fees and expenses associated with any underlying funds. |
The index is unmanaged and not available for direct investment; therefore, its performance does not reflect the expenses associated with active management of an actual portfolio.
For information regarding the indexes and certain investment terms, see the Key Investment Terms starting on page 6.
| | Ticker Symbols: |
| | Class A : PNEAX |
| | Class C: PNECX |
| | Class P: ADJPX |
| | Institutional Class: NFJEX |
| | Class R6: ANDVX |
| | Administrative Class: ANDAX |
NFJ Dividend Value Fund
Fund Summary (Unaudited)
Portfolio Manager Commentary by
NFJ Investment Group, LLC
| ■ | The Fund is diversified and has an investment objective of seeking long-term growth of capital and income. There is no guarantee that the Fund will meet its objective. |
| ■ | For the fiscal year ended June 30, 2023, the Fund’s Class A shares at NAV returned 7.62%, Class C shares at NAV returned 6.86%, Class P shares at NAV returned 7.95%, Institutional Class shares at NAV returned 8.01%, Class R6 shares at NAV returned 8.05%, and Administrative Class shares at NAV returned 8.90%. For the same period, the Russell 1000® Value Index, the Fund’s style-specific benchmark appropriate for comparison, returned 11.54%. |
All performance figures assume reinvestment of distributions and exclude the effect of sales charges. Performance data quoted represents past results. Past performance is no guarantee of future results, and current performance may be higher or lower than the performance shown above. Investment return and principal value will fluctuate so your shares, when redeemed, may be worth more or less than their original cost. Please visit Virtus.com for performance data current to the most recent month-end.
How did the markets perform during the Fund’s fiscal year ended June 30, 2023?
U.S. equities generally appreciated, particularly in the last three quarters of the annual period, despite the second and third largest bank failures on record and a Federal Reserve (Fed) that was committed to tightening monetary policy to combat lingering inflation. Coming off negative equity returns in calendar year 2022, market participants embraced
risk in the first half of 2023. Markets were buoyed in part by a debt ceiling and spending agreement, as well as enthusiasm for the benefits and applications of artificial intelligence (AI).
Within the Russell 1000® Value Index, more economically sensitive areas of the market, including industrials, consumer discretionary, energy, and information technology, led returns. Conversely, more defensive sectors such as utilities, real estate, and health care failed to keep pace over the 12-month period.
What factors affected the Fund’s performance during its fiscal year?
For the 12-month period ended June 30, 2023, the Fund underperformed its benchmark, the Russell 1000® Value Index.
Negative stock selection drove performance results over the reporting period. While selection was positive across the information technology, materials, and consumer discretionary sectors, these gains were overwhelmed by negative stock picking within the real estate, industrials, and communication services sectors.
Sector allocation contributed over the 12-month period, largely due to underweight positions in the utilities and health care sectors. Conversely, an overweight in real estate and an underweight in energy detracted from relative returns.
The preceding information is the opinion of portfolio management only through the end of the period stated on the cover. Any such opinions are subject to change at any time based upon market or other conditions and should not be relied upon as investment advice. Past performance is no guarantee
of future results, and there is no guarantee that market forecasts will be realized.
Market Volatility: The value of the securities in the portfolio may go up or down in response to the prospects of individual companies and/or general economic conditions. Local, regional, or global events such as war or military conflict, terrorism, pandemic, or recession could impact the portfolio, including hampering the ability of the portfolio’s manager(s) to invest its assets as intended.
Issuer Risk: The portfolio will be affected by factors specific to the issuers of securities and other instruments in which the portfolio invests, including actual or perceived changes in the financial condition or business prospects of such issuers.
Equity Securities: The market price of equity securities may be adversely affected by financial market, industry, or issuer-specific events. Focus on a particular style or on small or medium-sized companies may enhance that risk.
Prospectus: For additional information on risks, please see the Fund’s prospectus.
Asset Allocation
The following table presents asset allocation within certain sectors as a percentage of total investments as of June 30, 2023.
| Financials | 27% |
| Health Care | 14 |
| Industrials | 14 |
| Real Estate | 12 |
| Information Technology | 9 |
| Materials | 7 |
| Consumer Discretionary | 6 |
| Other | 11 |
| Total | 100% |
For information regarding the indexes and certain investment terms, see the Key Investment Terms starting on page 6.
NFJ Dividend Value Fund (Continued)
Average Annual Total Returns1 for periods ended 6/30/23
| | | 1 Year | 5 Years | 10 Years | Since
inception | Inception
date |
| Class A shares at NAV2 | | 7.62 % | 5.63 % | 7.04 % | — % | — |
| Class A shares at POP3,4 | | 1.70 | 4.45 | 6.44 | — | — |
| Class C shares at NAV2 and with CDSC4 | | 6.86 | 4.86 | 6.25 | — | — |
| Class P shares at NAV2 | | 7.95 | 5.90 | 7.32 | — | — |
| Institutional Class shares at NAV2 | | 8.01 | 5.98 | 7.41 | — | — |
| Class R6 shares at NAV2 | | 8.05 | 6.04 | — | 6.63 | 12/19/13 |
| Administrative Class shares at NAV2 | | 8.90 | 5.94 | 7.25 | — | |
| Russell 1000® Value Index | | 11.54 | 8.11 | 9.22 | 8.39 5 | — |
| Fund Expense Ratios6: Class A shares: Gross 1.01%, Net 1.01%; Class C shares: Gross 1.72%, Net 1.72%; Class P shares: Gross 0.72%, Net 0.72%; Institutional Class shares: Gross 0.75%, Net 0.70%; Class R6 shares: Gross 0.63%, Net 0.63%; Administrative Class shares: Gross 0.98%, Net 0.95%. |
| All returns represent past performance which is no guarantee of future results. Current performance may be higher or lower than the performance shown. The investment return and principal value of an investment will fluctuate so that an investor’s shares, when redeemed, may be worth more or less than their original cost. The above table and graph below do not reflect the deduction of taxes that a shareholder would pay on fund distributions or the redemption of shares. Please visit Virtus.com for performance data current to the most recent month-end. |
Growth of $10,000 for periods ended 6/30
This chart assumes an initial investment of $10,000 made on June 30, 2013, for Class A shares and Class C shares including any applicable sales charges or fees. The performance of the other share class may be greater or less than that shown based on differences in inception dates, fees, and sales charges. Performance assumes reinvestment of dividends and capital gain distributions.
For information regarding the indexes and certain investment terms, see the Key Investment Terms starting on page 6.
NFJ Dividend Value Fund (Continued)
Growth of $1,000,000 for periods ended 6/30
This chart assumes an initial investment of $1,000,000 made on June 30, 2013, for Class P shares, Institutional Class shares, and Administrative Class shares. The performance of the other share class may be greater or less than that shown based on differences in inception dates, fees, and sales charges. Performance assumes reinvestment of dividends and capital gain distributions.

| 1 | Total returns are historical and include changes in share price and the reinvestment of both dividends and capital gain distributions. |
| 2 | “NAV” (Net Asset Value) total returns do not include the effect of any sales charge. |
| 3 | “POP” (Public Offering Price) total returns include the effect of the maximum front-end 5.50% sales charge. |
| 4 | “CDSC” (contingent deferred sales charge) is applied to redemptions of certain classes of shares that do not have a sales charge applied at the time of purchase. CDSC for certain redemptions of Class A shares made within 18 months of a finder’s fee being paid and all Class C shares are 1% within the first year and 0% thereafter. |
| 5 | The since inception index return is from the inception date of Class R6 shares. |
| 6 | The expense ratios of the Fund are set forth according to the prospectus for the Fund effective October 28, 2022, as supplemented and revised, and may differ from the expense ratios disclosed in the Financial Highlights tables in this report. See the Financial Highlights for more current expense ratios. Net Expense: Expenses reduced by a contractual expense limitation in effect through October 31, 2023. Gross Expense: Does not reflect the effect of the expense limitation. Expense ratios include fees and expenses associated with any underlying funds. |
The index is unmanaged and not available for direct investment; therefore, its performance does not reflect the expenses associated with active management of an actual portfolio.
For information regarding the indexes and certain investment terms, see the Key Investment Terms starting on page 6.
| | Ticker Symbols: |
| | Class A : AFJAX |
| | Class C: AFJCX |
| | Class P: AFVPX |
| | Institutional Class: ANJIX |
| | Class R6: ANAVX |
| | Administrative Class: AIVAX |
NFJ International Value Fund
Fund Summary (Unaudited)
Portfolio Manager Commentary by
NFJ Investment Group, LLC
| ■ | The Fund is diversified and has an investment objective of seeking long-term growth of capital and income. There is no guarantee that the Fund will meet its objective. |
| ■ | For the fiscal year ended June 30, 2023, the Fund’s Class A shares at NAV returned 9.68%, Class C shares at NAV returned 8.86%, Class P shares at NAV returned 9.92%, Institutional Class shares at NAV returned 10.06%, Class R6 shares at NAV returned 10.08%, and Administration Class shares at NAV returned 11.74%†. For the same period, the MSCI AC World ex USA Index (net), the Fund’s style-specific benchmark appropriate for comparison, returned 12.72% and MSCI AC World ex USA Value Index (net), a broad-based index, returned 12.19%. |
† See footnote 5 on page 29.
All performance figures assume reinvestment of distributions and exclude the effect of sales charges. Performance data quoted represents past results. Past performance is no guarantee of future results, and current performance may be higher or lower than the performance shown above. Investment return and principal value will fluctuate so your shares, when redeemed, may be worth more or less than their original cost. Please visit Virtus.com for performance data current to the most recent month-end.
How did the markets perform during the Fund’s fiscal year ended June 30, 2023?
International equities generally appreciated, particularly in the last three quarters of the annual period, with developed markets largely outpacing emerging markets (EM). Though Europe ex-U.K. equities boasted the strongest returns, the region slipped into recession toward the end of the reporting period due in part to rising commodity prices. Weakness from the EM was largely due to China, which struggled with a sputtering reopening of its
economy, regulatory pressures, and negative investor sentiment.
Within the MSCI All Country World ex USA Index (net), Europe ex-U.K. led with a 25% gain, followed by strength from Japan, while the EM and Asia/Pacific ex-Japan regions registered the weakest returns over the period. The Index’s best performing sectors were industrials and information technology, both up over 24%, followed by strength from financials and consumer discretionary. Conversely, the real estate and communication services sectors slumped into negative territory, while health care and utilities underperformed on a relative basis.
What factors affected the Fund’s performance during its fiscal year?
For the 12-month period ended June 30, 2023, the Fund underperformed its benchmark, the MSCI All Country World ex USA Index (net).
Stock selection was negative over the reporting period as strong stock picking in the materials and information technology sectors was overwhelmed by negative selection in the consumer discretionary and industrials sectors.
Sector allocation contributed over the period, largely due to an overweight in information technology and an underweight in communication services. In contrast, overweight positions in the real estate and industrials sectors somewhat dampened relative returns.
By region, selection was strong across North America and the U.K., while selection within the EM and Europe ex-U.K. dampened relative returns. From an allocation standpoint, an overweight in Europe ex-U.K. contributed, while an overweight in the EM detracted over the 12-month period.
The preceding information is the opinion of portfolio management only through the end of the period stated on the cover. Any such opinions are subject to change at any time based upon market or other conditions and should not be relied upon as
investment advice. Past performance is no guarantee of future results, and there is no guarantee that market forecasts will be realized.
Market Volatility: The value of the securities in the portfolio may go up or down in response to the prospects of individual companies and/or general economic conditions. Local, regional, or global events such as war or military conflict, terrorism, pandemic, or recession could impact the portfolio, including hampering the ability of the portfolio’s manager(s) to invest its assets as intended.
Issuer Risk: The portfolio will be affected by factors specific to the issuers of securities and other instruments in which the portfolio invests, including actual or perceived changes in the financial condition or business prospects of such issuers.
Equity Securities: The market price of equity securities may be adversely affected by financial market, industry, or issuer-specific events. Focus on a particular style or on small or medium-sized companies may enhance that risk.
Foreign & Emerging Markets: Investing in foreign securities, especially in emerging markets, subjects the portfolio to additional risks such as increased volatility, currency fluctuations, less liquidity, and political, regulatory, economic, and market risk.
Prospectus: For additional information on risks, please see the Fund’s prospectus.
Asset Allocation
The following table presents asset allocation within certain sectors as a percentage of total investments as of June 30, 2023.
| Financials | 26% |
| Information Technology | 17 |
| Industrials | 16 |
| Consumer Discretionary | 12 |
| Health Care | 8 |
| Real Estate | 6 |
| Energy | 4 |
| Other | 11 |
| Total | 100% |
For information regarding the indexes and certain investment terms, see the Key Investment Terms starting on page 6.
NFJ International Value Fund (Continued)
Average Annual Total Returns1 for periods ended 6/30/23
| | | 1 Year | 5 Years | 10 Years | Since
inception | Inception
date |
| Class A shares at NAV2 | | 9.68 % | 2.64 % | 1.30 % | —% | — |
| Class A shares at POP3,4 | | 3.65 | 1.49 | 0.73 | — | — |
| Class C shares at NAV2 and with CDSC4 | | 8.86 | 1.90 | 0.55 | — | — |
| Class P shares at NAV2 | | 9.92 | 2.92 | 1.56 | — | — |
| Institutional Class shares at NAV2 | | 10.06 | 10.06 | 3.00 | — | — |
| Class R6 shares at NAV2 | | 10.08 | 3.05 | — | 0.81 | 12/19/13 |
| Administrative Class shares at NAV2 | | 11.74 5 | 3.13 | 1.59 | — | — |
| MSCI All Country World ex USA Index (net) | | 12.72 | 3.52 | 4.75 | 3.73 6 | — |
| MSCI All Country World ex USA Value Index (net) | | 12.19 | 2.65 | 3.70 | 2.51 6 | — |
| Fund Expense Ratios7: Class A shares: Gross 1.32%, Net 1.30%; Class C shares: Gross 2.02%, Net 2.02%; Class P shares: Gross 1.01%, Net 1.01%; Institutional Class shares: Gross 0.97%, Net 0.95%; Class R6 shares: Gross 0.92%, Net 0.90%; Administrative Class shares: Gross 1.50%, Net 1.20%. |
| All returns represent past performance which is no guarantee of future results. Current performance may be higher or lower than the performance shown. The investment return and principal value of an investment will fluctuate so that an investor’s shares, when redeemed, may be worth more or less than their original cost. The above table and graph below do not reflect the deduction of taxes that a shareholder would pay on fund distributions or the redemption of shares. Please visit Virtus.com for performance data current to the most recent month-end. |
Growth of $10,000 for periods ended 6/30
This chart assumes an initial investment of $10,000 made on June 30, 2013, for Class A shares and Class C shares including any applicable sales charges or fees. The performance of the other share class may be greater or less than that shown based on differences in inception dates, fees, and sales charges. Performance assumes reinvestment of dividends and capital gain distributions.
For information regarding the indexes and certain investment terms, see the Key Investment Terms starting on page 6.
NFJ International Value Fund (Continued)
Growth of $1,000,000 for periods ended 6/30
This chart assumes an initial investment of $1,000,000 made on June 30, 2013, for Class P shares, Institutional Class shares, and Administrative Class shares. The performance of the other share class may be greater or less than that shown based on differences in inception dates, fees, and sales charges. Performance assumes reinvestment of dividends and capital gain distributions.
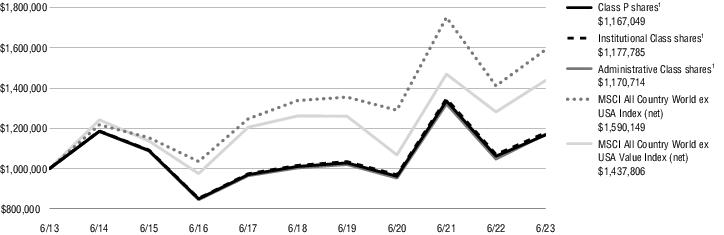
| 1 | Total returns are historical and include changes in share price and the reinvestment of both dividends and capital gain distributions. |
| 2 | “NAV” (Net Asset Value) total returns do not include the effect of any sales charge. |
| 3 | “POP” (Public Offering Price) total returns include the effect of the maximum front-end 5.50% sales charge. |
| 4 | “CDSC” (contingent deferred sales charge) is applied to redemptions of certain classes of shares that do not have a sales charge applied at the time of purchase. CDSC for certain redemptions of Class A shares made within 18 months of a finder’s fee being paid and all Class C shares are 1% within the first year and 0% thereafter. |
| 5 | Total Return for the report period presented in the table differs from the return in the Financial Highlights. The total return presented in the above table is calculated based on the NAV at which shareholder transactions were processed. The total return presented in the Financial Highlights section of the report is calculated in the same manner, but also takes into account certain adjustments that are necessary under generally accepted accounting principles required in the annual report and semiannual report. |
| 6 | The since inception index return is from the inception date of Class R6 shares. |
| 7 | The expense ratios of the Fund are set forth according to the prospectus for the Fund effective October 28, 2022, as supplemented and revised, and may differ from the expense ratios disclosed in the Financial Highlights tables in this report. See the Financial Highlights for more current expense ratios. Net Expense: Expenses reduced by a contractual expense limitation in effect through October 31, 2023. Gross Expense: Does not reflect the effect of the expense limitation. Expense ratios include fees and expenses associated with any underlying funds. |
The indexes are unmanaged and not available for direct investment; therefore, their performance does not reflect the expenses associated with active management of an actual portfolio.
For information regarding the indexes and certain investment terms, see the Key Investment Terms starting on page 6.
| | Ticker Symbols: |
| | Class A : PNBAX |
| | Class C: PNBCX |
| | Class P: ALCPX |
| | Institutional Class: ANVIX |
| | Class R6: VAAGX |
| | Administrative Class: ALNFX |
NFJ Large-Cap Value Fund
Fund Summary (Unaudited)
Portfolio Manager Commentary by
NFJ Investment Group, LLC
| ■ | The Fund is diversified and has an investment objective of seeking long-term growth of capital and income. There is no guarantee that the Fund will meet its objective. |
| ■ | For the fiscal year ended June 30, 2023, the Fund’s Class A shares at NAV returned 8.27%, Class C shares at NAV returned 7.42%, Class P shares at NAV returned 8.53%, Institutional Class shares at NAV returned 8.50%, and Administrative Class shares at NAV returned 8.38%, and Class R6 shares at NAV returned 8.75%. For the same period, the Russell 1000® Value Index, the Fund’s style-specific benchmark appropriate for comparison, returned 11.54%. |
All performance figures assume reinvestment of distributions and exclude the effect of sales charges. Performance data quoted represents past results. Past performance is no guarantee of future results, and current performance may be higher or lower than the performance shown above. Investment return and principal value will fluctuate so your shares, when redeemed, may be worth more or less than their original cost. Please visit Virtus.com for performance data current to the most recent month-end.
How did the markets perform during the Fund’s fiscal year ended June 30, 2023?
U.S. equities generally appreciated, particularly in the last three quarters of the annual period, despite the second and third largest bank failures on record and a Federal Reserve (Fed) that was committed to tightening monetary policy to combat lingering inflation. Coming off negative equity returns in
calendar year 2022, market participants embraced risk in the first half of 2023. Markets were buoyed in part by a debt ceiling and spending agreement, as well as enthusiasm for the benefits and applications of artificial intelligence (AI).
Within the Russell 1000® Value Index, more economically sensitive areas of the market, including industrials, consumer discretionary, energy, and information technology, led returns. Conversely, more defensive sectors such as utilities, real estate, and health care failed to keep pace over the 12-month period.
What factors affected the Fund’s performance during its fiscal year?
For the 12-month period ended June 30, 2023, the Fund underperformed its benchmark, the Russell 1000® Value Index.
Negative stock selection drove performance results over the reporting period. While selection was positive across the information technology, energy, and utilities sectors, these gains were overwhelmed by negative stock picking within the financials, real estate, and industrials sectors.
Sector allocation contributed over the 12-month period, largely due to underweight positions in the utilities and health care sectors. Conversely, an underweight in energy was the only detractor from an allocation perspective over the period.
The preceding information is the opinion of portfolio management only through the end of the period stated on the cover. Any such opinions are subject to change at any time based upon market or other conditions and should not be relied upon as investment advice. Past performance is no guarantee
of future results, and there is no guarantee that market forecasts will be realized.
Market Volatility: The value of the securities in the portfolio may go up or down in response to the prospects of individual companies and/or general economic conditions. Local, regional, or global events such as war or military conflict, terrorism, pandemic, or recession could impact the portfolio, including hampering the ability of the portfolio’s manager(s) to invest its assets as intended.
Issuer Risk: The portfolio will be affected by factors specific to the issuers of securities and other instruments in which the portfolio invests, including actual or perceived changes in the financial condition or business prospects of such issuers.
Equity Securities: The market price of equity securities may be adversely affected by financial market, industry, or issuer-specific events. Focus on a particular style or on small or medium-sized companies may enhance that risk.
Prospectus: For additional information on risks, please see the Fund’s prospectus.
Asset Allocation
The following table presents asset allocation within certain sectors as a percentage of total investments as of June 30, 2023.
| Financials | 22% |
| Industrials | 13 |
| Health Care | 13 |
| Information Technology | 12 |
| Real Estate | 10 |
| Consumer Discretionary | 9 |
| Communication Services | 7 |
| Other | 14 |
| Total | 100% |
For information regarding the indexes and certain investment terms, see the Key Investment Terms starting on page 6.
NFJ Large-Cap Value Fund (Continued)
Average Annual Total Returns1 for periods ended 6/30/23
| | | 1 Year | 5 Years | 10 Years | Since
inception | Inception
date |
| Class A shares at NAV2 | | 8.27 % | 6.38 % | 8.22 % | —% | — |
| Class A shares at POP3,4 | | 2.32 | 5.19 | 7.61 | — | — |
| Class C shares at NAV2 and with CDSC4 | | 7.42 | 5.57 | 7.41 | — | — |
| Class P shares at NAV2 | | 8.53 | 6.66 | 8.50 | — | — |
| Institutional Class shares at NAV2 | | 8.50 | 6.71 | 8.58 | — | — |
| Class R6 shares at NAV2 | | 8.75 | — | — | -3.03 | 10/29/21 |
| Administrative Class shares at NAV2 | | 8.38 | 6.47 | 8.33 | — | — |
| Russell 1000® Value Index | | 11.54 | 8.11 | 9.22 | -0.19 5 | — |
| Fund Expense Ratios6: Class A shares: Gross 1.00%, Net 1.00%; Class C shares: Gross 1.76%, Net 1.76%; Class P shares: Gross 0.75%, Net 0.75%; Institutional Class shares: Gross 0.74%, Net 0.74%; Class R6 shares: Gross 0.78%, Net 0.65%; Administrative Class shares: Gross 0.90%, Net 0.90%. |
| All returns represent past performance which is no guarantee of future results. Current performance may be higher or lower than the performance shown. The investment return and principal value of an investment will fluctuate so that an investor’s shares, when redeemed, may be worth more or less than their original cost. The above table and graph below do not reflect the deduction of taxes that a shareholder would pay on fund distributions or the redemption of shares. Please visit Virtus.com for performance data current to the most recent month-end. |
Growth of $10,000 for periods ended 6/30
This chart assumes an initial investment of $10,000 made on June 30, 2013, for Class A shares and Class C shares including any applicable sales charges or fees. The performance of the other share class may be greater or less than that shown based on differences in inception dates, fees, and sales charges. Performance assumes reinvestment of dividends and capital gain distributions.
For information regarding the indexes and certain investment terms, see the Key Investment Terms starting on page 6.
NFJ Large-Cap Value Fund (Continued)
Growth of $1,000,000 for periods ended 6/30
This chart assumes an initial investment of $1,000,000 made on June 30, 2013, for Class P shares, Institutional Class shares, and Administrative Class shares. The performance of the other share class may be greater or less than that shown based on differences in inception dates, fees, and sales charges. Performance assumes reinvestment of dividends and capital gain distributions.

| 1 | Total returns are historical and include changes in share price and the reinvestment of both dividends and capital gain distributions. |
| 2 | “NAV” (Net Asset Value) total returns do not include the effect of any sales charge. |
| 3 | “POP” (Public Offering Price) total returns include the effect of the maximum front-end 5.50% sales charge. |
| 4 | “CDSC” (contingent deferred sales charge) is applied to redemptions of certain classes of shares that do not have a sales charge applied at the time of purchase. CDSC for certain redemptions of Class A shares made within 18 months of a finder’s fee being paid and all Class C shares are 1% within the first year and 0% thereafter. |
| 5 | The since inception index return is from the inception date of Class R6 shares. |
| 6 | The expense ratios of the Fund are set forth according to the prospectus for the Fund effective October 28, 2022, as supplemented and revised, and may differ from the expense ratios disclosed in the Financial Highlights tables in this report. See the Financial Highlights for more current expense ratios. Net Expense: Expenses reduced by a contractual expense limitation in effect through October 31, 2023. Gross Expense: Does not reflect the effect of the expense limitation. Expense ratios include fees and expenses associated with any underlying funds. |
The index is unmanaged and not available for direct investment; therefore, its performance does not reflect the expenses associated with active management of an actual portfolio.
For information regarding the indexes and certain investment terms, see the Key Investment Terms starting on page 6.
| | Ticker Symbols: |
| | Class A : PQNAX |
| | Class C: PQNCX |
| | Class P: ANRPX |
| | Institutional Class: PRNIX |
| | Class R6: ANPRX |
| | Administrative Class: PRAAX |
NFJ Mid-Cap Value Fund
Fund Summary (Unaudited)
Portfolio Manager Commentary by
NFJ Investment Group, LLC
| ■ | The Fund is diversified and has an investment objective of seeking long-term growth of capital and income. There is no guarantee that the Fund will meet its objective. |
| ■ | For the fiscal year ended June 30, 2023, the Fund’s Class A shares at NAV returned 11.10%, Class C shares at NAV returned 10.23%, Class P shares at NAV returned 11.38%† , Institutional Class shares at NAV returned 11.48%, Class R6 shares at NAV returned 11.55%, and Administrative Class shares at NAV returned 11.20%. For the same period, the Russell Midcap® Value Index, the Fund’s style-specific benchmark appropriate for comparison, returned 10.50%. |
† See footnote 5 on page 35.
All performance figures assume reinvestment of distributions and exclude the effect of sales charges. Performance data quoted represents past results. Past performance is no guarantee of future results, and current performance may be higher or lower than the performance shown above. Investment return and principal value will fluctuate so your shares, when redeemed, may be worth more or less than their original cost. Please visit Virtus.com for performance data current to the most recent month-end.
How did the markets perform during the Fund’s fiscal year ended June 30, 2023?
U.S. equities generally appreciated, particularly in the last three quarters of the annual period, despite the second and third largest bank failures on record and a Federal Reserve (Fed) that was committed to tightening monetary policy to combat lingering inflation. Coming off negative equity returns in calendar year 2022, market participants embraced risk in the first half of 2023. Markets were buoyed in part by a debt ceiling and spending agreement, as
well as enthusiasm for the benefits and applications of artificial intelligence (AI).
Within the Russell Midcap® Value Index, more economically sensitive areas of the market, including industrials, consumer discretionary, information technology, and materials, led returns. Conversely, the real estate sector delivered negative returns, followed by relative weakness from communication services, financials, and utilities over the 12-month period.
What factors affected the Fund’s performance during its fiscal year?
For the 12-month period ended June 30, 2023, the Fund outperformed its benchmark, the Russell Midcap® Value Index.
Outperformance was driven by positive sector allocations, while stock selection somewhat detracted over the reporting period. Positive stock selection across the information technology, materials, and consumer discretionary sectors was overwhelmed by negative stock picking in real estate, financials, and industrials.
Sector allocations were positive across all 11 major market sectors over the 12-month period, led by gains from an overweight in the consumer discretionary sector and an underweight in the utilities sector.
The preceding information is the opinion of portfolio management only through the end of the period stated on the cover. Any such opinions are subject to change at any time based upon market or other conditions and should not be relied upon as investment advice. Past performance is no guarantee of future results, and there is no guarantee that market forecasts will be realized.
Market Volatility: The value of the securities in the portfolio may go up or down in response to the
prospects of individual companies and/or general economic conditions. Local, regional, or global events such as war or military conflict, terrorism, pandemic, or recession could impact the portfolio, including hampering the ability of the portfolio’s manager(s) to invest its assets as intended.
Issuer Risk: The portfolio will be affected by factors specific to the issuers of securities and other instruments in which the portfolio invests, including actual or perceived changes in the financial condition or business prospects of such issuers.
Equity Securities: The market price of equity securities may be adversely affected by financial market, industry, or issuer-specific events. Focus on a particular style or on small or medium-sized companies may enhance that risk.
Prospectus: For additional information on risks, please see the Fund’s prospectus.
Asset Allocation
The following table presents asset allocation within certain sectors as a percentage of total investments as of June 30, 2023.
| Financials | 24% |
| Real Estate | 13 |
| Health Care | 12 |
| Consumer Discretionary | 11 |
| Industrials | 11 |
| Materials | 8 |
| Information Technology | 7 |
| Other | 14 |
| Total | 100% |
For information regarding the indexes and certain investment terms, see the Key Investment Terms starting on page 6.
NFJ Mid-Cap Value Fund (Continued)
Average Annual Total Returns1 for periods ended 6/30/23
| | | 1 Year | 5 Years | 10 Years | Since
inception | Inception
date |
| Class A shares at NAV2 | | 11.10 % | 6.37 % | 9.09 % | —% | — |
| Class A shares at POP3,4 | | 4.99 | 5.17 | 8.48 | — | — |
| Class C shares at NAV2 and with CDSC4 | | 10.23 | 5.56 | 8.28 | — | — |
| Class P shares at NAV2 | | 11.38 5 | 6.64 | 9.37 | — | — |
| Institutional Class shares at NAV2 | | 11.48 | 6.74 | 9.48 | — | — |
| Class R6 shares at NAV2 | | 11.55 | 6.80 | — | 5.29 | 12/18/17 |
| Administrative Class shares at NAV2 | | 11.20 | 6.47 | 9.21 | — | — |
| Russell Midcap® Value Index | | 10.50 | 6.84 | 9.03 | 6.15 6 | — |
| Fund Expense Ratios7: Class A shares: Gross 1.09%, Net 1.00%; Class C shares: Gross 1.82%, Net 1.75%; Class P shares: Gross 0.82%, Net 0.75%; Institutional Class shares: Gross 0.80%, Net 0.65%; Class R6 shares: Gross 0.72%, Net 0.60%; Administrative Class shares: Gross 1.05%, Net 0.90%. |
| All returns represent past performance which is no guarantee of future results. Current performance may be higher or lower than the performance shown. The investment return and principal value of an investment will fluctuate so that an investor’s shares, when redeemed, may be worth more or less than their original cost. The above table and graph below do not reflect the deduction of taxes that a shareholder would pay on fund distributions or the redemption of shares. Please visit Virtus.com for performance data current to the most recent month-end. |
Growth of $10,000 for periods ended 6/30
This chart assumes an initial investment of $10,000 made on June 30, 2013, for Class A shares and Class C shares including any applicable sales charges or fees. The performance of the other share class may be greater or less than that shown based on differences in inception dates, fees, and sales charges. Performance assumes reinvestment of dividends and capital gain distributions.
For information regarding the indexes and certain investment terms, see the Key Investment Terms starting on page 6.
NFJ Mid-Cap Value Fund (Continued)
Growth of $1,000,000 for periods ended 6/30
This chart assumes an initial investment of $1,000,000 made on June 30, 2013, for Class P shares, Institutional Class shares, and Administrative Class shares. The performance of the other share class may be greater or less than that shown based on differences in inception dates, fees, and sales charges. Performance assumes reinvestment of dividends and capital gain distributions.

| 1 | Total returns are historical and include changes in share price and the reinvestment of both dividends and capital gain distributions. |
| 2 | “NAV” (Net Asset Value) total returns do not include the effect of any sales charge. |
| 3 | “POP” (Public Offering Price) total returns include the effect of the maximum front-end 5.50% sales charge. |
| 4 | “CDSC” (contingent deferred sales charge) is applied to redemptions of certain classes of shares that do not have a sales charge applied at the time of purchase. CDSC for certain redemptions of Class A shares made within 18 months of a finder’s fee being paid and all Class C shares are 1% within the first year and 0% thereafter. |
| 5 | Total Return for the report period presented in the table differs from the return in the Financial Highlights. The total return presented in the above table is calculated based on the NAV at which shareholder transactions were processed. The total return presented in the Financial Highlights section of the report is calculated in the same manner, but also takes into account certain adjustments that are necessary under generally accepted accounting principles required in the annual report and semiannual report. |
| 6 | The since inception index return is from the inception date of Class R6 shares. |
| 7 | The expense ratios of the Fund are set forth according to the prospectus for the Fund effective October 28, 2022, as supplemented and revised, and may differ from the expense ratios disclosed in the Financial Highlights tables in this report. See the Financial Highlights for more current expense ratios. Net Expense: Expenses reduced by a contractual expense limitation in effect through October 31, 2023. Gross Expense: Does not reflect the effect of the expense limitation. Expense ratios include fees and expenses associated with any underlying funds. |
The index is unmanaged and not available for direct investment; therefore, its performance does not reflect the expenses associated with active management of an actual portfolio.
For information regarding the indexes and certain investment terms, see the Key Investment Terms starting on page 6.
| | Ticker Symbols: |
| | Class A : PCVAX |
| | Class C: PCVCX |
| | Class P: ASVPX |
| | Institutional Class: PSVIX |
| | Class R6: ANFVX |
| | Administrative Class: PVADX |
NFJ Small-Cap Value Fund
Fund Summary (Unaudited)
Portfolio Manager Commentary by
NFJ Investment Group, LLC
| ■ | The Fund is diversified and has an investment objective of seeking long-term growth of capital and income. There is no guarantee that the Fund will meet its objective. |
| ■ | For the fiscal year ended June 30, 2023, the Fund’s Class A shares at NAV returned 10.64%, Class C shares at NAV returned 9.76%, Class P shares at NAV returned 10.85%, Institutional Class shares at NAV returned 10.93%, Class R6 shares at NAV returned 10.98%, and Administration Class shares at NAV returned 14.38%. For the same period, the Russell 2000® Value Index, the Fund’s style-specific benchmark appropriate for comparison, returned 6.01%. |
All performance figures assume reinvestment of distributions and exclude the effect of sales charges. Performance data quoted represents past results. Past performance is no guarantee of future results, and current performance may be higher or lower than the performance shown above. Investment return and principal value will fluctuate so your shares, when redeemed, may be worth more or less than their original cost. Please visit Virtus.com for performance data current to the most recent month-end.
How did the markets perform during the Fund’s fiscal year ended June 30, 2023?
U.S. equities generally appreciated, particularly in the last three quarters of the annual period, despite the second and third largest bank failures on record and a Federal Reserve (Fed) that was committed to tightening monetary policy to combat lingering inflation. Coming off negative equity returns in calendar year 2022, market participants embraced risk in the first half of 2023. Markets were buoyed in
part by a debt ceiling and spending agreement, as well as enthusiasm for the benefits and applications of artificial intelligence (AI).
Within the Russell 2000® Value Index, the information technology and energy sectors led returns with gains of 37% and 31%, respectively, followed by strength from more economically sensitive areas of the market, including consumer discretionary, industrials, and materials. Conversely, communication services, financials, consumer staples, and utilities slumped into negative territory over the 12-month period.
What factors affected the Fund’s performance during its fiscal year?
For the 12-month period ended June 30, 2023, the Fund outperformed its benchmark, the Russell 2000® Value Index.
Positive sector allocation and stock selection drove outperformance results. Stock selection was robust across the financials, health care, and communication services sectors. In contrast, selection was negative in the real estate, information technology, and energy sectors for the reporting period.
Sector allocations were positive across nine of the 11 major market sectors over the 12-month period, led by gains from overweight positions in the information technology and industrials sectors. Conversely, an underweight in the energy sector and an overweight in the consumer staples sector modestly detracted.
The preceding information is the opinion of portfolio management only through the end of the period stated on the cover. Any such opinions are subject to change at any time based upon market or other conditions and should not be relied upon as
investment advice. Past performance is no guarantee of future results, and there is no guarantee that market forecasts will be realized.
Market Volatility: The value of the securities in the portfolio may go up or down in response to the prospects of individual companies and/or general economic conditions. Local, regional, or global events such as war or military conflict, terrorism, pandemic, or recession could impact the portfolio, including hampering the ability of the portfolio’s manager(s) to invest its assets as intended.
Issuer Risk: The portfolio will be affected by factors specific to the issuers of securities and other instruments in which the portfolio invests, including actual or perceived changes in the financial condition or business prospects of such issuers.
Equity Securities: The market price of equity securities may be adversely affected by financial market, industry, or issuer-specific events. Focus on a particular style or on small or medium-sized companies may enhance that risk.
Prospectus: For additional information on risks, please see the Fund’s prospectus.
Asset Allocation
The following table presents asset allocation within certain sectors as a percentage of total investments as of June 30, 2023.
| Financials | 30% |
| Industrials | 16 |
| Consumer Discretionary | 12 |
| Information Technology | 9 |
| Materials | 8 |
| Health Care | 7 |
| Real Estate | 7 |
| Other | 11 |
| Total | 100% |
For information regarding the indexes and certain investment terms, see the Key Investment Terms starting on page 6.
NFJ Small-Cap Value Fund (Continued)
Average Annual Total Returns1 for periods ended 6/30/23
| | | 1 Year | 5 Years | 10 Years | Since
inception | Inception
date |
| Class A shares at NAV2 | | 10.64 % | 1.82 % | 4.89 % | — % | — |
| Class A shares at POP3,4 | | 4.55 | 0.68 | 4.29 | — | — |
| Class C shares at NAV2 and with CDSC4 | | 9.76 | 1.07 | 4.10 | — | — |
| Class P shares at NAV2 | | 10.85 | 2.09 | 5.15 | — | — |
| Institutional Class shares at NAV2 | | 10.93 | 2.17 | 5.26 | — | — |
| Class R6 shares at NAV2 | | 10.98 | 2.23 | — | 4.15 | 12/19/13 |
| Administrative Class shares at NAV2 | | 14.38 | 2.59 | 5.36 | — | |
| Russell 2000® Value Index | | 6.01 | 3.54 | 7.29 | 6.19 5 | — |
| Fund Expense Ratios6: Class A shares: Gross 1.20%, Net 1.17%; Class C shares: Gross 1.95%, Net 1.92%; Class P shares: Gross 0.89%, Net 0.89%; Institutional Class shares: Gross 0.87%, Net 0.82%; Class R6 shares: Gross 0.79%, Net 0.77%; Administrative Class shares: Gross 1.09%, Net 1.07%. |
| All returns represent past performance which is no guarantee of future results. Current performance may be higher or lower than the performance shown. The investment return and principal value of an investment will fluctuate so that an investor’s shares, when redeemed, may be worth more or less than their original cost. The above table and graph below do not reflect the deduction of taxes that a shareholder would pay on fund distributions or the redemption of shares. Please visit Virtus.com for performance data current to the most recent month-end. |
Growth of $10,000 for periods ended 6/30
This chart assumes an initial investment of $10,000 made on June 30, 2013, for Class A shares and Class C shares including any applicable sales charges or fees. The performance of the other share class may be greater or less than that shown based on differences in inception dates, fees, and sales charges. Performance assumes reinvestment of dividends and capital gain distributions.
For information regarding the indexes and certain investment terms, see the Key Investment Terms starting on page 6.
NFJ Small-Cap Value Fund (Continued)
Growth of $1,000,000 for periods ended 6/30
This chart assumes an initial investment of $1,000,000 made on June 30, 2013, for Class P shares, Institutional Class shares, and Administrative Class shares. The performance of the other share class may be greater or less than that shown based on differences in inception dates, fees, and sales charges. Performance assumes reinvestment of dividends and capital gain distributions.
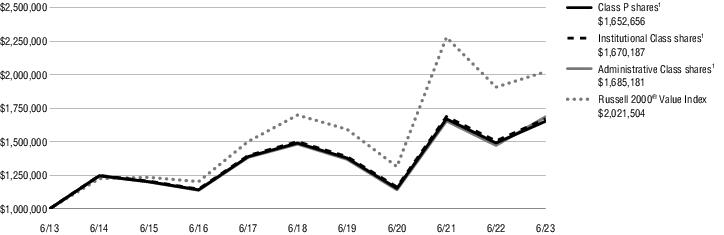
| 1 | Total returns are historical and include changes in share price and the reinvestment of both dividends and capital gain distributions. |
| 2 | “NAV” (Net Asset Value) total returns do not include the effect of any sales charge. |
| 3 | “POP” (Public Offering Price) total returns include the effect of the maximum front-end 5.50% sales charge. |
| 4 | “CDSC” (contingent deferred sales charge) is applied to redemptions of certain classes of shares that do not have a sales charge applied at the time of purchase. CDSC for certain redemptions of Class A shares made within 18 months of a finder’s fee being paid and all Class C shares are 1% within the first year and 0% thereafter. |
| 5 | The since inception index return is from the inception date of Class R6 shares. |
| 6 | The expense ratios of the Fund are set forth according to the prospectus for the Fund effective October 28, 2022, as supplemented and revised, and may differ from the expense ratios disclosed in the Financial Highlights tables in this report. See the Financial Highlights for more current expense ratios. Net Expense: Expenses reduced by a contractual expense limitation in effect through October 31, 2023. Gross Expense: Does not reflect the effect of the expense limitation. Expense ratios include fees and expenses associated with any underlying funds. |
The index is unmanaged and not available for direct investment; therefore, its performance does not reflect the expenses associated with active management of an actual portfolio.
For information regarding the indexes and certain investment terms, see the Key Investment Terms starting on page 6.
| | Ticker Symbols: |
| | Class A : PGWAX |
| | Class C: PGWCX |
| | Class P: AOGPX |
| | Institutional Class: PGFIX |
| | Class R6: AFGFX |
| | Administrative Class: PGFAX |
Silvant Focused Growth Fund
Fund Summary (Unaudited)
Portfolio Manager Commentary by
Silvant Capital Management LLC
| ■ | The Fund is non-diversified and has an investment objective of seeking long-term capital appreciation. There is no guarantee that the Fund will meet its objective. |
| ■ | For the fiscal year ended June 30, 2023, the Fund’s Class A shares at NAV returned 32.32%, Class C shares at NAV returned 31.31%, Class P shares at NAV returned 32.68%†, Institutional Class shares at NAV returned 32.70%, Class R6 shares at NAV returned 32.76%, and Administrative Class shares at NAV returned 32.34%. For the same period, the Russell 1000® Growth Index, the Fund’s style-specific benchmark appropriate for comparison, returned 27.11%. |
† See footnote 5 on page 41.
All performance figures assume reinvestment of distributions and exclude the effect of sales charges. Performance data quoted represents past results. Past performance is no guarantee of future results, and current performance may be higher or lower than the performance shown above. Investment return and principal value will fluctuate so your shares, when redeemed, may be worth more or less than their original cost. Please visit Virtus.com for performance data current to the most recent month-end.
How did the markets perform during the Fund’s fiscal year ended June 30, 2023?
After negative performance for both stocks and bonds in calendar year 2022, major U.S. equity markets rose nicely during the Fund’s fiscal 2023 year, primarily driven by robust returns in the third and fourth quarters of the fiscal year. The fiscal year was marked by unprecedented interest rate increases by the Federal Reserve (the Fed). As the yield curve inverted, meaning that the yields on longer-term investments dropped below the yields on shorter-term investments with the same risk profile, many investors and market pundits believed a recession was forthcoming.
However, the U.S. economy remained largely resilient, helping to soften worries about the risk of an imminent recession. Inflation continued to moderate into the Fund’s fourth fiscal quarter, allowing the Fed to pause its interest rate policy for the first time in the current tightening cycle. The job market remained robust, the U.S. debt ceiling standoff was resolved, and earnings were broadly
better-than-feared in the second half of the fiscal year. Furthermore, excitement around generative artificial intelligence (AI) continued to fuel a high degree of investor enthusiasm while increasing returns for select equities.
Against this backdrop, large-cap growth stocks, as measured by the Russell 1000® Growth Index, experience the largest gains (up 27.1%) among broad equity style categories, and significantly outperformed the large-cap value style as measured by the Russell 1000® Value Index, which gained 11.5%.
Silvant Capital Management LLC became the subadviser of the Fund effective July 25, 2022. Performance of the Fund prior thereto is that of the Fund’s former subadviser.
What factors affected the Fund’s performance during its fiscal year?
The Fund outperformed the Russell 1000® Growth Index for the 24-day period ended July 24, 2022.
From a sector perspective, both security selection and allocation decisions were contributors to relative performance. The sector that contributed the most to performance over this period was financials, where the Fund’s underweight relative to the Index was beneficial. An overweight to consumer discretionary was also a contributor over this period. The largest detractor over this period was security selection in health care. The Fund’s overweight to the sector hurt as well.
What factors affected the Fund’s performance from July 25, 2022, through the fiscal year-end on June 30, 2023?
The Fund outperformed its benchmark, the Russell 1000® Growth Index, for the 12-month period ended June 30, 2023. The Fund owned 10 stocks from four major economic sectors that gained more than 40% over this time period, showing broad diversification of returns. Furthermore, there was positive stock contribution to return within seven major economic sectors. The Fund’s consumer discretionary stocks lagged the benchmark, returning 13.90% while the Russell 1000® Growth Index’s consumer discretionary sector gained 15.98% over this period.
The best performing sector was information technology, where several stocks gained more than 45%, leading to a total return of 44.8% for the sector. The best performers were NVIDIA, Microsoft, and
Apple, while Tesla, Estee Lauder, and Amazon were among the bottom performers.
The preceding information is the opinion of portfolio management only through the end of the period stated on the cover. Any such opinions are subject to change at any time based upon market or other conditions and should not be relied upon as investment advice. Past performance is no guarantee of future results, and there is no guarantee that market forecasts will be realized.
Market Volatility: The value of the securities in the portfolio may go up or down in response to the prospects of individual companies and/or general economic conditions. Local, regional, or global events such as war or military conflict, terrorism, pandemic, or recession could impact the portfolio, including hampering the ability of the portfolio’s manager(s) to invest its assets as intended.
Issuer Risk: The portfolio will be affected by factors specific to the issuers of securities and other instruments in which the portfolio invests, including actual or perceived changes in the financial condition or business prospects of such issuers.
Equity Securities: The market price of equity securities may be adversely affected by financial market, industry, or issuer-specific events. Focus on a particular style or on small or medium-sized companies may enhance that risk.
Focused Investments: To the extent the portfolio focuses its investments on a limited number of issuers, sectors, industries or geographic regions, it may be subject to increased risk and volatility.
Prospectus: For additional information on risks, please see the Fund’s prospectus.
Asset Allocation
The following table presents asset allocation within certain sectors as a percentage of total investments as of June 30, 2023.
| Information Technology | 45% |
| Health Care | 15 |
| Consumer Discretionary | 13 |
| Communication Services | 11 |
| Industrials | 7 |
| Financials | 4 |
| Materials | 2 |
| Short-Term Investment | 3 |
| Total | 100% |
For information regarding the indexes and certain investment terms, see the Key Investment Terms starting on page 6.
Silvant Focused Growth Fund (Continued)
Average Annual Total Returns1 for periods ended 6/30/23
| | | 1 Year | 5 Years | 10 Years | Since
inception | Inception
date |
| Class A shares at NAV2 | | 32.32 % | 14.04 % | 15.28 % | —% | — |
| Class A shares at POP3,4 | | 25.04 | 12.76 | 14.63 | — | — |
| Class C shares at NAV2 and with CDSC5 | | 31.31 | 13.17 | 14.41 | — | — |
| Class P shares at NAV2 | | 32.68 5 | 14.31 | 15.56 | — | — |
| Institutional Class shares at NAV2 | | 32.70 | 14.39 | 15.66 | — | — |
| Class R6 shares at NAV2 | | 32.76 | 14.44 | — | 14.98 | 12/14/15 |
| Administrative Class shares at NAV2 | | 32.34 | 14.10 | 15.37 | — | — |
| Russell 1000® Growth Index | | 27.11 | 15.14 | 15.74 | 15.92 6 | — |
| Fund Expense Ratios7: Class A shares: Gross 0.93%, Net 0.93%; Class C shares: Gross 1.70%, Net 1.70%; Class P shares: Gross 0.71%, Net 0.71%; Institutional Class shares: Gross 0.70%, Net 0.67%; Class R6 shares: Gross 0.62%, Net 0.62%; Administrative Class shares: Gross 0.96%, Net 0.92%. |
| All returns represent past performance which is no guarantee of future results. Current performance may be higher or lower than the performance shown. The investment return and principal value of an investment will fluctuate so that an investor’s shares, when redeemed, may be worth more or less than their original cost. The above table and graph below do not reflect the deduction of taxes that a shareholder would pay on fund distributions or the redemption of shares. Please visit Virtus.com for performance data current to the most recent month-end. |
Growth of $10,000 for periods ended 6/30
This chart assumes an initial investment of $10,000 made on June 30, 2013, for Class A shares and Class C shares including any applicable sales charges or fees. The performance of the other share class may be greater or less than that shown based on differences in inception dates, fees, and sales charges. Performance assumes reinvestment of dividends and capital gain distributions.
For information regarding the indexes and certain investment terms, see the Key Investment Terms starting on page 6.
Silvant Focused Growth Fund (Continued)
Growth of $1,000,000 for periods ended 6/30
This chart assumes an initial investment of $1,000,000 made on June 30, 2013, for Class P shares, Institutional Class shares, and Administrative Class shares. The performance of the other share class may be greater or less than that shown based on differences in inception dates, fees, and sales charges. Performance assumes reinvestment of dividends and capital gain distributions.

| 1 | Total returns are historical and include changes in share price and the reinvestment of both dividends and capital gain distributions. |
| 2 | “NAV” (Net Asset Value) total returns do not include the effect of any sales charge. |
| 3 | “POP” (Public Offering Price) total returns include the effect of the maximum front-end 5.50% sales charge. |
| 4 | “CDSC” (contingent deferred sales charge) is applied to redemptions of certain classes of shares that do not have a sales charge applied at the time of purchase. CDSC for certain redemptions of Class A shares made within 18 months of a finder’s fee being paid and all Class C shares are 1% within the first year and 0% thereafter. |
| 5 | Total Return for the report period presented in the table differs from the return in the Financial Highlights. The total return presented in the above table is calculated based on the NAV at which shareholder transactions were processed. The total return presented in the Financial Highlights section of the report is calculated in the same manner, but also takes into account certain adjustments that are necessary under generally accepted accounting principles required in the annual report and semiannual report. |
| 6 | The since inception index return is from the inception date of Class R6 shares. |
| 7 | The expense ratios of the Fund are set forth according to the prospectus for the Fund effective October 28, 2022, as supplemented and revised, and may differ from the expense ratios disclosed in the Financial Highlights tables in this report. See the Financial Highlights for more current expense ratios. Net Expense: Expenses reduced by a contractual expense limitation in effect through October 31, 2023. Gross Expense: Does not reflect the effect of the expense limitation. Expense ratios include fees and expenses associated with any underlying funds. |
The index is unmanaged and not available for direct investment; therefore, its performance does not reflect the expenses associated with active management of an actual portfolio.
For information regarding the indexes and certain investment terms, see the Key Investment Terms starting on page 6.
| | Ticker Symbols: |
| | Class A : RMDAX |
| | Class C: RMDCX |
| | Class P: ARMPX |
| | Institutional Class: DRMCX |
| | Administrative Class: DRMAX |
Silvant Mid-Cap Growth Fund
Fund Summary (Unaudited)
Portfolio Manager Commentary by
Silvant Capital Management LLC
| ■ | The Fund is diversified and has an investment objective of seeking long-term capital appreciation. There is no guarantee that the Fund will meet its objective. |
| ■ | For the fiscal year ended June 30, 2023, the Fund’s Class A shares at NAV returned 22.84%, Class C shares at NAV returned 21.28%, Class P shares at NAV returned 22.89%, Institutional Class shares at NAV returned 22.85%, and Administrative Class at NAV returned 23.05%. For the same period, the Russell Midcap® Growth Index, the Fund’s style-specific benchmark appropriate for comparison, returned 23.13%. |
All performance figures assume reinvestment of distributions and exclude the effect of sales charges. Performance data quoted represents past results. Past performance is no guarantee of future results, and current performance may be higher or lower than the performance shown above. Investment return and principal value will fluctuate so your shares, when redeemed, may be worth more or less than their original cost. Please visit Virtus.com for performance data current to the most recent month-end.
How did the markets perform during the Fund’s fiscal year ended June 30, 2023?
After negative performance for both stocks and bonds in calendar year 2022, major U.S. equity markets rose nicely during the Fund’s fiscal 2023 year, primarily driven by robust returns in the third and fourth quarters of the fiscal year. The fiscal year was marked by unprecedented interest rate increases by the Federal Reserve (the Fed). As the yield curve inverted, meaning that the yields on longer-term investments dropped below the yields on shorter-term investments with the same risk profile, many investors and market pundits believed a recession was forthcoming.
However, the U.S. economy remained largely resilient, helping to soften worries about the risk of an imminent recession. Inflation continued to moderate into the Fund’s fourth fiscal quarter, allowing the Fed to pause its interest rate policy for the first time in the current tightening cycle. The job market remained robust, the U.S. debt ceiling standoff was resolved, and earnings were broadly
better-than-feared in the second half of the fiscal year. Furthermore, excitement around generative artificial intelligence (AI) continued to fuel a high degree of investor enthusiasm while increasing returns for select large equities.
Against this backdrop, large-cap growth stocks as measured by the Russell 1000® Growth Index experience the largest gains (up 27.1%), followed by mid-cap growth stocks as measured by the Russell Midcap® Growth Index (up 23.1%), while the S&P 500® Index, and most value-oriented indexes lagged.
Silvant Capital Management LLC became the subadviser of the Fund effective July 25, 2022. Performance of the Fund prior thereto is that of the Fund’s former subadviser.
What factors affected the Fund’s performance during its fiscal year?
The Fund underperformed the Russell Midcap® Growth Index for the 24-day period ended July 24, 2022.
From a sector perspective, security selection was a detractor from relative performance, while allocation decisions contributed overall. The sector that detracted the most from performance over this period was security selection in information technology. Security selection in health care was a detractor as well. The largest contributor was a lack of exposure to consumer staples, which lagged over this period.
What factors affected the Fund’s performance from July 25, 2022, through the fiscal year-end on June 30, 2023?
The Fund slightly underperformed its benchmark, the Russell Midcap® Growth Index, for the 12-month period ended June 30, 2023. The Fund owned 14 stocks from five major economic sectors that gained more than 40% over this time period, showing broad diversification of returns. Furthermore, there was positive stock contribution to return within six major economic sectors. Within the group of 10 largest stock detractors to return, five stocks declined by more than 30% over this period of time.
The best performing sectors were information technology and consumer discretionary. Among the better-performing stocks were Royal Caribbean,
Wingstop, and Palo Alto Networks. The Fund’s performance struggled within the financials and materials sectors. Among the holdings that lagged and declined in value were CF Industries Holdings, SVB Financial Group, and Catalent.
The preceding information is the opinion of portfolio management only through the end of the period stated on the cover. Any such opinions are subject to change at any time based upon market or other conditions and should not be relied upon as investment advice. Past performance is no guarantee of future results, and there is no guarantee that market forecasts will be realized.
Market Volatility: The value of the securities in the portfolio may go up or down in response to the prospects of individual companies and/or general economic conditions. Local, regional, or global events such as war or military conflict, terrorism, pandemic, or recession could impact the portfolio, including hampering the ability of the portfolio’s manager(s) to invest its assets as intended.
Issuer Risk: The portfolio will be affected by factors specific to the issuers of securities and other instruments in which the portfolio invests, including actual or perceived changes in the financial condition or business prospects of such issuers.
Equity Securities: The market price of equity securities may be adversely affected by financial market, industry, or issuer-specific events. Focus on a particular style or on small or medium-sized companies may enhance that risk.
Prospectus: For additional information on risks, please see the Fund’s prospectus.
Asset Allocation
The following table presents asset allocation within certain sectors as a percentage of total investments as of June 30, 2023.
| Information Technology | 28% |
| Health Care | 21 |
| Industrials | 20 |
| Consumer Discretionary | 17 |
| Financials | 7 |
| Communication Services | 4 |
| Energy | 2 |
| Other | 1 |
| Total | 100% |
For information regarding the indexes and certain investment terms, see the Key Investment Terms starting on page 6.
Silvant Mid-Cap Growth Fund (Continued)
Average Annual Total Returns1 for periods ended 6/30/23
| | | 1 Year | 5 Years | 10 Years |
| Class A shares at NAV2 | 22.84 % | 11.33% | 11.74% |
| Class A shares at POP3,4 | 16.08 | 10.08 | 11.11 |
| Class C shares at NAV2 and with CDSC4 | 21.28 | 10.37 | 10.87 |
| Class P shares at NAV2 | 22.89 | 11.53 | 12.03 |
| Institutional Class shares at NAV2 | 22.85 | 11.62 | 12.08 |
| Administrative Class shares at NAV2 | 23.05 | 11.38 | 11.82 |
| Russell Midcap® Growth Index | 23.13 | 9.71 | 11.53 |
| Fund Expense Ratios5: Class A shares: Gross 1.05%, Net 1.05%; Class C shares: Gross 1.81%, Net 1.81%; Class P shares: Gross 0.84%, Net 0.84%; Institutional Class shares: Gross 0.83%, Net 0.83%; Administrative Class shares: Gross 1.12%, Net 1.11%. |
| All returns represent past performance which is no guarantee of future results. Current performance may be higher or lower than the performance shown. The investment return and principal value of an investment will fluctuate so that an investor’s shares, when redeemed, may be worth more or less than their original cost. The above table and graph below do not reflect the deduction of taxes that a shareholder would pay on fund distributions or the redemption of shares. Please visit Virtus.com for performance data current to the most recent month-end. |
Growth of $10,000 for periods ended 6/30
This chart assumes an initial investment of $10,000 made on June 30, 2013, for Class A shares and Class C shares including any applicable sales charges or fees. The performance of the other share class may be greater or less than that shown based on differences in inception dates, fees, and sales charges. Performance assumes reinvestment of dividends and capital gain distributions.
For information regarding the indexes and certain investment terms, see the Key Investment Terms starting on page 6.
Silvant Mid-Cap Growth Fund (Continued)
Growth of $1,000,000 for periods ended 6/30
This chart assumes an initial investment of $1,000,000 made on June 30, 2013, for Class P shares, Institutional Class shares, and Administrative Class shares. The performance of the other share class may be greater or less than that shown based on differences in inception dates, fees, and sales charges. Performance assumes reinvestment of dividends and capital gain distributions.
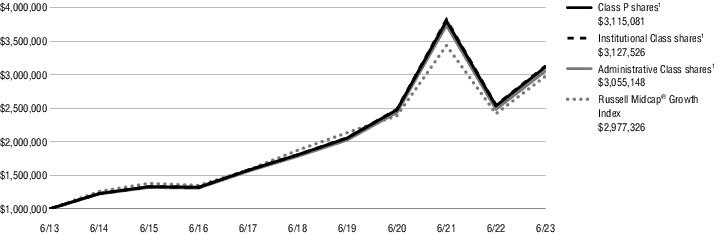
| 1 | Total returns are historical and include changes in share price and the reinvestment of both dividends and capital gain distributions. |
| 2 | “NAV” (Net Asset Value) total returns do not include the effect of any sales charge. |
| 3 | “POP” (Public Offering Price) total returns include the effect of the maximum front-end 5.50% sales charge. |
| 4 | “CDSC” (contingent deferred sales charge) is applied to redemptions of certain classes of shares that do not have a sales charge applied at the time of purchase. CDSC for certain redemptions of Class A shares made within 18 months of a finder’s fee being paid and all Class C shares are 1% within the first year and 0% thereafter. |
| 5 | The expense ratios of the Fund are set forth according to the prospectus for the Fund effective October 28, 2022, as supplemented and revised, and may differ from the expense ratios disclosed in the Financial Highlights tables in this report. See the Financial Highlights for more current expense ratios. Net Expense: Expenses reduced by a contractual expense limitation in effect through October 31, 2023. Gross Expense: Does not reflect the effect of the expense limitation. Expense ratios include fees and expenses associated with any underlying funds. |
The index is unmanaged and not available for direct investment; therefore, its performance does not reflect the expenses associated with active management of an actual portfolio.
For information regarding the indexes and certain investment terms, see the Key Investment Terms starting on page 6.
| | Ticker Symbols: |
| | Class A : AZBAX |
| | Class C: AZBCX |
| | Class P: AZBPX |
| | Institutional Class: AZBIX |
| | Class R6: ASCFX |
Small-Cap Fund
Fund Summary (Unaudited)
Portfolio Manager Commentary by
Virtus Investment Advisers, Inc.
| ■ | The Fund is diversified and has an investment objective of seeking long-term capital appreciation. There is no guarantee that the Fund will meet its objective. |
| ■ | For the fiscal year ended June 30, 2023, the Fund’s Class A shares at NAV returned 14.90%†, Class C shares at NAV returned 14.06%, Class P shares at NAV returned 15.16%†, Institutional Class shares at NAV returned 15.32%, and Class R6 at NAV returned 15.38%. For the same period, the Russell 2000® Index, the Fund’s style-specific benchmark appropriate for comparison, returned 12.31%. |
† See footnote 3 on page 48.
All performance figures assume reinvestment of distributions and exclude the effect of sales charges. Performance data quoted represents past results. Past performance is no guarantee of future results, and current performance may be higher or lower than the performance shown above. Investment return and principal value will fluctuate so your shares, when redeemed, may be worth more or less than their original cost. Please visit Virtus.com for performance data current to the most recent month-end.
How did the markets perform during the Fund’s fiscal year ended June 30, 2023?
U.S. small-cap equities delivered a total return of 12.31%, as measured by the Russell 2000® Index, for the fiscal year ended June 30, 2023, trailing the S&P 500® Index for the same period by approximately 7.3%. However, the positive return of small caps for the period does not accurately represent the volatility and the stress in the market. For the second half of 2022, the market was plagued by the highest inflation in 40 years and several interest rate increases from the U.S. Federal Reserve (the Fed). These conditions caused a selloff, especially in U.S. interest-rate-sensitive sectors. The fourth quarter of 2022 was marked by optimism from investors that the opening of China’s market would alleviate many of the inflationary pressures that had developed from the supply chain disruption. This resulted in a relatively healthy return of 5.8% for the fourth quarter of 2022 for the Russell 2000® Index.
The beginning of calendar year 2023 was marked by an irrational and premature belief that inflation was
coming under control. While that might have been true, small-cap banks faced an unforeseen crisis emanating from the Fed’s sharp hike of U.S. interest rates. Many of the regional banks that held their investments in U.S. Treasuries had to mark them to market with rising rates, which caused considerable accounting losses. These losses in turn caused a potential run on some banks, of which Silicon Valley Bank was the largest and most well-known. This then forced the Fed to pump more liquidity into the market by accepting many of the bank instruments and providing a window for emergency funding. That resulted in a liquidity rush in the market, with investors gravitating back to technology stocks to conclude the fiscal year ended June 30, 2023.
What factors affected the Fund’s performance during its fiscal year?
The Fund outperformed its benchmark, the Russell 2000® Index, for the 12 months ended June 30, 2023. Financials were the worst performing sector in the Index, driven by the crisis in regional banks precipitated by the Fed’s sharp rise in short-term interest rates. In contrast, information technology and industrials were the best performing sectors for the reporting period. The excitement and demand created by the advent of artificial intelligence (AI) and the associated hardware requirements helped the information technology sector, particularly the semiconductors that enable the computational intensity required by AI servers. The Inflation Reduction Act and associated onshoring helped the industrials sector.
The two best performers in the Fund were Axcelis Technologies and Rambus, both semiconductor companies that benefited from the semiconductor demand fueled by AI and its associated servers. These two companies also benefited from increased demand from many Chinese companies resulting from attempts to obtain products prior to the imposition of anticipated sanctions from the U.S. government on the Chinese semiconductor industry. The two biggest detractors for the fiscal year were health care companies Alignment Health and Avid Biosciences.
Dislaimer:
As of July 2022, Virtus Investment Advisers (VIA) acquired the investment personnel and assets related to certain strategies from Allianz Global Investors U.S. LLC (AllianzGI), the Fund’s prior subadviser. All
historical performance data, data analysis and other information provided for periods prior to July 25, 2022, were prepared by AllianzGI.
The preceding information is the opinion of portfolio management only through the end of the period stated on the cover. Any such opinions are subject to change at any time based upon market or other conditions and should not be relied upon as investment advice. Past performance is no guarantee of future results, and there is no guarantee that market forecasts will be realized.
Market Volatility: The value of the securities in the portfolio may go up or down in response to the prospects of individual companies and/or general economic conditions. Local, regional, or global events such as war or military conflict, terrorism, pandemic, or recession could impact the portfolio, including hampering the ability of the portfolio’s manager(s) to invest its assets as intended.
Issuer Risk: The portfolio will be affected by factors specific to the issuers of securities and other instruments in which the portfolio invests, including actual or perceived changes in the financial condition or business prospects of such issuers.
Equity Securities: The market price of equity securities may be adversely affected by financial market, industry, or issuer-specific events. Focus on a particular style or on small or medium-sized companies may enhance that risk.
Foreign Investing: Investing in foreign securities subjects the portfolio to additional risks such as increased volatility, currency fluctuations, less liquidity, and political, regulatory, economic, and market risk.
Prospectus: For additional information on risks, please see the Fund’s prospectus.
For information regarding the indexes and certain investment terms, see the Key Investment Terms starting on page 6.
Small-Cap Fund (Continued)
Asset Allocation
The following table presents asset allocation within certain industries as a percentage of total investments as of June 30, 2023.
| Biotechnology | 8% |
| Software | 7 |
| Trading Companies & Distributors | 6 |
| Healthcare Equipment & Supplies | 6 |
| Electronic Equipment, Instruments & Components | 5 |
| Hotels, Restaurants & Leisure | 5 |
| Semiconductors & Semiconductor Equipment | 5 |
| Pharmaceuticals | 4 |
| Insurance | 4 |
| Metals & Mining | 4 |
| Other | 46 |
| Total | 100% |
For information regarding the indexes and certain investment terms, see the Key Investment Terms starting on page 6.
Small-Cap Fund (Continued)
Average Annual Total Returns1 for periods ended 6/30/23
| | | 1 Year | 5 Years | Since
inception | Inception
date |
| Class A shares at NAV2 | | 14.90 % 3 | 5.11 % | 8.78 % | 7/1/13 |
| Class A shares at POP4,5 | | 8.58 | 3.93 | 8.16 | 7/1/13 |
| Class C shares at NAV2 and with CDSC4 | | 14.06 | 4.32 | 7.96 | 7/1/13 |
| Class P shares at NAV2 | | 15.16 3 | 5.37 | 9.05 | 7/1/13 |
| Institutional Class shares at NAV2 | | 15.32 | 5.48 | 9.16 | 7/1/13 |
| Class R6 shares at NAV2 | | 15.38 | — | 4.55 | 8/22/18 |
| Russell 2000® Index | | 12.31 | 4.21 | — 6 | — |
| Fund Expense Ratios7: Class A shares: Gross 1.24%, Net 1.24%; Class C shares: Gross 2.02%, Net 1.99%; Class P shares: Gross 0.99%, Net 0.99%; Institutional Class shares: Gross 0.99%, Net 0.89%; Class R6 shares: Gross 0.91%, Net 0.84%. |
| All returns represent past performance which is no guarantee of future results. Current performance may be higher or lower than the performance shown. The investment return and principal value of an investment will fluctuate so that an investor’s shares, when redeemed, may be worth more or less than their original cost. The above table and graph below do not reflect the deduction of taxes that a shareholder would pay on fund distributions or the redemption of shares. Please visit Virtus.com for performance data current to the most recent month-end. |
Growth of $10,000 for periods ended 6/30
This chart assumes an initial investment of $10,000 made on June 30, 2013, for Class A shares and Class C shares including any applicable sales charges or fees. The performance of the other share class may be greater or less than that shown based on differences in inception dates, fees, and sales charges. Performance assumes reinvestment of dividends and capital gain distributions.
For information regarding the indexes and certain investment terms, see the Key Investment Terms starting on page 6.
Small-Cap Fund (Continued)
Growth of $1,000,000 for periods ended 6/30
This chart assumes an initial investment of $1,000,000 made on June 30, 2013, for Class P shares and Institutional Class shares. The performance of the other share class may be greater or less than that shown based on differences in inception dates, fees, and sales charges. Performance assumes reinvestment of dividends and capital gain distributions.

| 1 | Total returns are historical and include changes in share price and the reinvestment of both dividends and capital gain distributions. |
| 2 | “NAV” (Net Asset Value) total returns do not include the effect of any sales charge. |
| 3 | Total Return for the report period presented in the table differs from the return in the Financial Highlights. The total return presented in the above table is calculated based on the NAV at which shareholder transactions were processed. The total return presented in the Financial Highlights section of the report is calculated in the same manner, but also takes into account certain adjustments that are necessary under generally accepted accounting principles required in the annual report and semiannual report. |
| 4 | “POP” (Public Offering Price) total returns include the effect of the maximum front-end 5.50% sales charge. |
| 5 | “CDSC” (contingent deferred sales charge) is applied to redemptions of certain classes of shares that do not have a sales charge applied at the time of purchase. CDSC for certain redemptions of Class A shares made within 18 months of a finder’s fee being paid and all Class C shares are 1% within the first year and 0% thereafter. |
| 6 | The since inception index returned 8.12% from the inception date of Class A shares, Class C shares, Class P shares, and Institutional Class shares and 3.30% from the inception date of Class R6 shares. |
| 7 | The expense ratios of the Fund are set forth according to the prospectus for the Fund effective October 28, 2022, as supplemented and revised, and may differ from the expense ratios disclosed in the Financial Highlights tables in this report. See the Financial Highlights for more current expense ratios. Net Expense: Expenses reduced by a contractual expense limitation in effect through October 31, 2023. Gross Expense: Does not reflect the effect of the expense limitation. Expense ratios include fees and expenses associated with any underlying funds. |
The index is unmanaged and not available for direct investment; therefore, its performance does not reflect the expenses associated with active management of an actual portfolio.
For information regarding the indexes and certain investment terms, see the Key Investment Terms starting on page 6.
| | Ticker Symbols: |
| | Class A : RAGTX |
| | Class C: RCGTX |
| | Class P: ARTPX |
| | Institutional Class: DRGTX |
| | Administrative Class: DGTAX |
Zevenbergen Technology Fund
Fund Summary (Unaudited)
Portfolio Manager Commentary by
Zevenbergen Capital Investments LLC
| ■ | The Fund is non-diversified and has an investment objective of seeking long-term capital appreciation. There is no guarantee that the Fund will meet its objective. |
| ■ | For the fiscal year ended June 30, 2023, the Fund’s Class A shares at NAV returned 32.14%, Class C shares at NAV returned 31.15%, Class P shares at NAV returned 32.52%, Institutional Class shares at NAV returned 32.48%, and Administrative Class shares at NAV returned 32.07%. For the same period, the S&P North American Technology Sector Index, the Fund’s style-specific benchmark appropriate for comparison, returned 33.71% and Nasdaq Composite® Index, a broad-based index, returned 26.14%. |
All performance figures assume reinvestment of distributions and exclude the effect of sales charges. Performance data quoted represents past results. Past performance is no guarantee of future results, and current performance may be higher or lower than the performance shown above. Investment return and principal value will fluctuate so your shares, when redeemed, may be worth more or less than their original cost. Please visit Virtus.com for performance data current to the most recent month-end.
How did the markets perform during the Fund’s fiscal year ended June 30, 2023?
Broad market indexes performed strongly during the fiscal year, with the Nasdaq Composite Index® gaining 26.1% and the S&P 500® Index returning 19.6%.
After a strong start to the fiscal year, continued inflationary pressures and economic uncertainty pressured markets downward as industry observers believed the weight of a potential recession and higher interest rates would be considerable. During the first six months of 2023, Wall Street strategists and economists described economic conditions as “resilient,” a marked improvement from the largely negative proclamations issued at the end of 2022. Better-than-feared economic and company data gave investors courage to increase their equity risk tolerance in the first six months of 2023. Further, markets appeared to grow increasingly comfortable with the potential of a pause or pivot in tightening
policy in late calendar 2023 or early 2024, after the quickest Federal Reserve (Fed) interest rate hiking cycle in 40 years.
Zevenbergen Capital Investments became the subadviser of the Fund effective July 25, 2022. Performance of the Fund prior thereto is that of the Fund’s former subadviser.
What factors affected the Fund’s performance during its fiscal year?
The Fund underperformed the S&P North American Technology Sector Index for the 24-day period ended July 24, 2022.
Industry allocation decisions were the primary driver of the Fund’s underperformance, although security selection also detracted from relative performance. An underweight in internet and direct marketing, the second-best performing industry in the Index, detracted the most, followed by an overweight in software. Security selection in software was another top detractor, as Fund holdings failed to keep pace with names in the Index.
What factors affected the Fund’s performance from July 25, 2022, through the fiscal year-end on June 30, 2023?
The Fund modestly outperformed its benchmark, the S&P North American Technology Sector Index, for the period. The Fund’s exposure to information technology (IT) was the largest absolute contributor for the period.
The share price whipsaw for IT companies reflected a positive turnabout in investor sentiment, as major economic concerns moderated and stocks across numerous industries within the sector adjusted to the rising likelihood of re-accelerating sales and earnings trends. In addition, enthusiasm for artificial intelligence (AI) software innovation compelled investors to revisit IT and adjacent areas, such as semiconductors, due to expectations that they would benefit from AI-related investment, productivity gains, and new market opportunities.
From a financial perspective, investors rewarded profitable growth over the period, boosting shares of companies that increased operating margins and free cash flow generation through headcount reductions and spending cuts on non-core segments.
From an individual stock perspective, the largest detractors from absolute returns included cybersecurity providers CrowdStrike Holdings, Zscaler, and Okta, as well as solar technology company Enphase Energy and small business payments provider BILL Holdings. The largest contributors to absolute returns were semiconductor company NVIDIA, e-commerce software provider Shopify, and mega-cap technology conglomerates Microsoft, Apple, and Meta Platforms.
The preceding information is the opinion of portfolio management only through the end of the period stated on the cover. Any such opinions are subject to change at any time based upon market or other conditions and should not be relied upon as investment advice. Past performance is no guarantee of future results, and there is no guarantee that market forecasts will be realized.
Market Volatility: The value of the securities in the portfolio may go up or down in response to the prospects of individual companies and/or general economic conditions. Local, regional, or global events such as war or military conflict, terrorism, pandemic, or recession could impact the portfolio, including hampering the ability of the portfolio’s manager(s) to invest its assets as intended.
Issuer Risk: The portfolio will be affected by factors specific to the issuers of securities and other instruments in which the portfolio invests, including actual or perceived changes in the financial condition or business prospects of such issuers.
Equity Securities: The market price of equity securities may be adversely affected by financial market, industry, or issuer-specific events. Focus on a particular style or on small or medium-sized companies may enhance that risk.
Focused Investments: To the extent the portfolio focuses its investments on a limited number of issuers, sectors, industries or geographic regions, it may be subject to increased risk and volatility.
Foreign Investing: Investing in foreign securities subjects the portfolio to additional risks such as increased volatility, currency fluctuations, less liquidity, and political, regulatory, economic, and market risk.
Prospectus: For additional information on risks, please see the Fund’s prospectus.
For information regarding the indexes and certain investment terms, see the Key Investment Terms starting on page 6.
Zevenbergen Technology Fund (Continued)
Asset Allocation
The following table presents asset allocation within certain industries as a percentage of total investments as of June 30, 2023.
| Software | 25% |
| Semiconductors & Semiconductor Equipment | 21 |
| Interactive Media & Services | 12 |
| Broadline Retail | 11 |
| Technology Hardware, Storage & Peripherals | 8 |
| IT Services | 6 |
| Automobiles | 5 |
| Media | 3 |
| Financial Services | 2 |
| Ground Transportation | 2 |
| Other | 5 |
| Total | 100% |
For information regarding the indexes and certain investment terms, see the Key Investment Terms starting on page 6.
Zevenbergen Technology Fund (Continued)
Average Annual Total Returns1 for periods ended 6/30/23
| | | 1 Year | 5 Years | 10 Years |
| Class A shares at NAV2 | 32.14 % | 13.44% | 17.54% |
| Class A shares at POP3,4 | 24.87 | 12.16 | 16.87 |
| Class C shares at NAV2 and with CDSC4 | 31.15 | 12.59 | 16.66 |
| Class P shares at NAV2 | 32.52 | 13.74 | 17.84 |
| Institutional Class shares at NAV2 | 32.48 | 13.79 | 17.92 |
| Administrative Class shares at NAV2 | 32.07 | 13.48 | 17.61 |
| Nasdaq Composite® Index | 26.14 | 13.93 | 16.21 |
| S&P North American Technology Index | 33.71 | 16.31 | 19.43 |
| Fund Expense Ratios5: Class A shares: Gross 1.42%, Net 1.42%; Class C shares: Gross 2.16%, Net 2.16%; Class P shares: Gross 1.17%, Net 1.17%; Institutional Class shares: Gross 1.16%, Net 1.16%; Administrative Class shares: Gross 1.71%, Net 1.47%. |
| All returns represent past performance which is no guarantee of future results. Current performance may be higher or lower than the performance shown. The investment return and principal value of an investment will fluctuate so that an investor’s shares, when redeemed, may be worth more or less than their original cost. The above table and graph below do not reflect the deduction of taxes that a shareholder would pay on fund distributions or the redemption of shares. Please visit Virtus.com for performance data current to the most recent month-end. |
Growth of $10,000 for periods ended 6/30
This chart assumes an initial investment of $10,000 made on June 30, 2013, for Class A shares and Class C shares including any applicable sales charges or fees. The performance of the other share class may be greater or less than that shown based on differences in inception dates, fees, and sales charges. Performance assumes reinvestment of dividends and capital gain distributions.
For information regarding the indexes and certain investment terms, see the Key Investment Terms starting on page 6.
Zevenbergen Technology Fund (Continued)
Growth of $1,000,000 for periods ended 6/30
This chart assumes an initial investment of $1,000,000 made on June 30, 2013, for Class P shares, Institutional Class shares, and Administrative Class shares. The performance of the other share class may be greater or less than that shown based on differences in inception dates, fees, and sales charges. Performance assumes reinvestment of dividends and capital gain distributions.

| 1 | Total returns are historical and include changes in share price and the reinvestment of both dividends and capital gain distributions. |
| 2 | “NAV” (Net Asset Value) total returns do not include the effect of any sales charge. |
| 3 | “POP” (Public Offering Price) total returns include the effect of the maximum front-end 5.50% sales charge. |
| 4 | “CDSC” (contingent deferred sales charge) is applied to redemptions of certain classes of shares that do not have a sales charge applied at the time of purchase. CDSC for certain redemptions of Class A shares made within 18 months of a finder’s fee being paid and all Class C shares are 1% within the first year and 0% thereafter. |
| 5 | The expense ratios of the Fund are set forth according to the prospectus for the Fund effective October 28, 2022, as supplemented and revised, and may differ from the expense ratios disclosed in the Financial Highlights tables in this report. See the Financial Highlights for more current expense ratios. Net Expense: Expenses reduced by a contractual expense limitation in effect through October 31, 2023. Gross Expense: Does not reflect the effect of the expense limitation. Expense ratios include fees and expenses associated with any underlying funds. |
The indexes are unmanaged and not available for direct investment; therefore, their performance does not reflect the expenses associated with active management of an actual portfolio.
For information regarding the indexes and certain investment terms, see the Key Investment Terms starting on page 6.
Emerging Markets Opportunities Fund
SCHEDULE OF INVESTMENTS
June 30, 2023
($ reported in thousands)
| | Shares | | Value |
| Preferred Stock—1.5% |
| Brazil—1.5% | | |
| Gerdau S.A., 13.100% | 361,815 | | $ 1,894 |
Total Preferred Stock
(Identified Cost $1,647) | | 1,894 |
| | | | |
| |
| | | | |
| |
| Common Stocks—94.3% |
| Bermuda—2.4% | | |
| Jardine Matheson Holdings Ltd. | 41,200 | | 2,089 |
| Kunlun Energy Co., Ltd. | 1,234,000 | | 972 |
| | | | 3,061 |
| | | | |
| |
| Brazil—6.9% | | |
| Ambev S.A. | 389,100 | | 1,253 |
| Banco do Brasil S.A. | 148,200 | | 1,532 |
| CPFL Energia S.A. | 447,700 | | 3,202 |
| Klabin S.A. | 346,500 | | 1,580 |
| Vale S.A. | 98,100 | | 1,318 |
| | | | 8,885 |
| | | | |
| |
| Cayman Islands—2.9% | | |
| iQIYI, Inc. ADR(1) | 440,683 | | 2,353 |
| Vipshop Holdings Ltd. ADR(1) | 85,538 | | 1,412 |
| | | | 3,765 |
| | | | |
| |
| China—22.4% | | |
| Alibaba Group Holding Ltd.(1) | 115,900 | | 1,206 |
| Bank of Jiangsu Co., Ltd. Class A(1) | 1,855,400 | | 1,881 |
| BYD Co., Ltd. Class H | 25,500 | | 818 |
| China Construction Bank Corp. Class H | 1,920,000 | | 1,243 |
| China Energy Engineering Corp., Ltd. Class A | 3,352,500 | | 1,081 |
| China Railway Group Ltd. Class A | 911,200 | | 953 |
| China Railway Signal & Communication Corp., Ltd. Class A | 981,064 | | 784 |
| China State Construction Engineering Corp., Ltd. Class A | 1,698,300 | | 1,343 |
| ENN Natural Gas Co., Ltd. Class A | 856,600 | | 2,240 |
| Industrial & Commercial Bank of China Ltd. Class H | 1,445,000 | | 772 |
| Lenovo Group Ltd. | 704,000 | | 738 |
| NetEase, Inc. | 49,100 | | 951 |
| People’s Insurance Co. Group of China Ltd. (The) Class H | 3,722,000 | | 1,352 |
| PetroChina Co., Ltd. Class H | 7,056,000 | | 4,899 |
| Postal Savings Bank of China Co., Ltd. Class H | 1,927,000 | | 1,188 |
| | Shares | | Value |
| | | | |
| China—continued | | |
| Sinopharm Group Co., Ltd. Class H | 463,600 | | $ 1,451 |
| Tencent Holdings Ltd. | 106,900 | | 4,533 |
| Yum China Holdings, Inc. | 22,090 | | 1,248 |
| | | | 28,681 |
| | | | |
| |
| Hong Kong—0.7% | | |
| CSPC Pharmaceutical Group Ltd. | 974,000 | | 848 |
| Hungary—1.3% | | |
| OTP Bank Nyrt | 46,055 | | 1,636 |
| India—14.0% | | |
| Axis Bank Ltd. | 83,220 | | 1,004 |
| Britannia Industries Ltd. | 22,897 | | 1,404 |
| GAIL India Ltd. | 489,305 | | 628 |
| HDFC Bank Ltd. | 45,633 | | 947 |
| ICICI Bank Ltd. Sponsored ADR | 63,194 | | 1,458 |
| ITC Ltd. | 814,758 | | 4,493 |
| Oil & Natural Gas Corp., Ltd. | 686,269 | | 1,343 |
| Power Finance Corp., Ltd. | 726,480 | | 1,917 |
| State Bank of India | 373,385 | | 2,615 |
| Tata Consultancy Services Ltd. | 13,400 | | 541 |
| Vedanta Ltd. | 469,035 | | 1,598 |
| | | | 17,948 |
| | | | |
| |
| Indonesia—2.7% | | |
| Astra International Tbk PT | 2,511,500 | | 1,139 |
| Bank Central Asia Tbk PT | 1,316,400 | | 808 |
| Bank Mandiri Persero Tbk PT | 4,247,700 | | 1,478 |
| | | | 3,425 |
| | | | |
| |
| Mexico—6.2% | | |
| America Movil SAB de C.V.(1) | 1,739,000 | | 1,888 |
| Coca-Cola Femsa SAB de C.V. | 144,380 | | 1,206 |
| Grupo Aeroportuario del Pacifico SAB de C.V. Class B | 120,100 | | 2,161 |
| Grupo Financiero Banorte SAB de C.V. Class O | 240,600 | | 1,979 |
| Kimberly-Clark de Mexico SAB de C.V. Class A | 312,200 | | 697 |
| | | | 7,931 |
| | | | |
| |
| Poland—0.7% | | |
| Powszechna Kasa Oszczednosci Bank Polski S.A. | 107,993 | | 960 |
| Russia—0.0% | | |
| Gazprom PJSC(1)(2)(3) | 1,323,341 | | 1 |
| | Shares | | Value |
| | | | |
| Russia—continued | | |
| LUKOIL PJSC Sponsored ADR(1)(2)(3) | 55,455 | | $ — (4) |
| | | | 1 |
| | | | |
| |
| Saudi Arabia—0.6% | | |
| Leejam Sports Co. JSC | 23,108 | | 795 |
| South Africa—1.4% | | |
| Absa Group Ltd. | 120,992 | | 1,079 |
| Sibanye Stillwater Ltd. ADR | 105,613 | | 659 |
| | | | 1,738 |
| | | | |
| |
| South Korea—10.3% | | |
| GS Engineering & Construction Corp. | 133,028 | | 1,895 |
| Hana Financial Group, Inc. | 22,746 | | 679 |
| Hanwha Aerospace Co., Ltd. | 15,471 | | 1,498 |
| Kia Corp. | 41,793 | | 2,815 |
| Samsung C&T Corp. | 11,503 | | 926 |
| Samsung Electronics Co., Ltd. | 96,531 | | 5,315 |
| | | | 13,128 |
| | | | |
| |
| Taiwan—17.2% | | |
| Asustek Computer, Inc. | 71,000 | | 719 |
| Compal Electronics, Inc. | 1,703,000 | | 1,602 |
| CTBC Financial Holding Co., Ltd. | 1,198,000 | | 958 |
| Gigabyte Technology Co., Ltd. | 329,000 | | 2,580 |
| Hon Hai Precision Industry Co., Ltd. | 268,000 | | 974 |
| Micro-Star International Co., Ltd. | 581,000 | | 3,304 |
| Novatek Microelectronics Corp. | 273,000 | | 3,748 |
| Taiwan Semiconductor Manufacturing Co., Ltd. | 439,000 | | 8,110 |
| | | | 21,995 |
| | | | |
| |
| Thailand—0.4% | | |
| Tipco Asphalt PCL Foreign Shares | 1,076,700 | | 568 |
| Turkey—1.0% | | |
| KOC Holding AS | 319,361 | | 1,273 |
| United Arab Emirates—0.4% | | |
| Emirates NBD Bank PJSC | 134,956 | | 546 |
See Notes to Financial Statements
Emerging Markets Opportunities Fund
SCHEDULE OF INVESTMENTS (Continued)
June 30, 2023
($ reported in thousands)
| | Shares | | Value |
| | | | |
| United States—2.8% | | |
| Starbucks Corp. | 35,620 | | $ 3,528 |
Total Common Stocks
(Identified Cost $109,368) | | 120,712 |
| | | | |
| |
| | | | |
| |
Total Long-Term Investments—95.8%
(Identified Cost $111,015) | | 122,606 |
| | | | |
| |
| | | | |
| |
TOTAL INVESTMENTS—95.8%
(Identified Cost $111,015) | | $122,606 |
| Other assets and liabilities, net—4.2% | | 5,353 |
| NET ASSETS—100.0% | | $127,959 |
| Abbreviations: |
| ADR | American Depositary Receipt |
| JSC | Joint Stock Company |
| PJSC | Public Joint Stock Company |
| Footnote Legend: |
| (1) | Non-income producing. |
| (2) | The value of this security was determined using significant unobservable inputs and is reported as a Level 3 security in the Fair Value Hierarchy table located after the Schedule of Investments. |
| (3) | The Fund is unable to trade and repatriate proceeds due to U.S. sanctions related to the Russia/Ukraine war. |
| (4) | Amount is less than $500 (not in thousands). |
| Country Weightings (Unaudited)† |
| China | 23% |
| Taiwan | 18 |
| India | 15 |
| South Korea | 11 |
| Brazil | 9 |
| Mexico | 6 |
| Cayman Islands | 3 |
| Other | 15 |
| Total | 100% |
| † % of total investments as of June 30, 2023. |
The following table summarizes the value of the Fund’s investments as of June 30, 2023, based on the inputs used to value them (See Security Valuation Note 2A in the Notes to Financial Statements):
| | Total
Value at
June 30, 2023 | | Level 1
Quoted Prices | | Level 2
Significant
Observable
Inputs | | Level 3
Significant
Unobservable
Inputs |
| Assets: | | | | | | | |
| Equity Securities: | | | | | | | |
| Common Stocks | $120,712 | | $33,763 | | $86,948 | | $ 1 |
| Preferred Stock | 1,894 | | 1,894 | | — | | — |
| Total Investments | $122,606 | | $35,657 | | $86,948 | | $ 1 |
There were no transfers into or out of Level 3 related to securities held at June 30, 2023.
Some of the Fund’s investments that were categorized as Level 3 may have been valued utilizing third party pricing information without adjustment. If applicable, such valuations are based on unobservable inputs. A significant change in third party information could result in a significantly lower or higher value of Level 3 investments.
Management has determined that the amount of Level 3 securities compared to total net assets is not material; therefore, the roll-forward of Level 3 securities and assumptions are not shown for the period ended June 30, 2023.
For information regarding the abbreviations, see the Key Investment Terms starting on page 6.
See Notes to Financial Statements
Income & Growth Fund
SCHEDULE OF INVESTMENTS
June 30, 2023
($ reported in thousands)
| | Par Value | | Value |
| Convertible Bonds and Notes—24.1% |
| Auto Manufacturers—0.4% | | |
Ford Motor Co.
0.000%, 3/15/26 | $ 6,700 | | $ 7,340 |
Lucid Group, Inc. 144A
1.250%, 12/15/26(1) | 17,880 | | 11,425 |
| | | | 18,765 |
| | | | |
| |
| Banks—0.5% | | |
BofA Finance LLC
0.600%, 5/25/27 | 22,120 | | 25,547 |
| Biotechnology—1.3% | | |
Alnylam Pharmaceuticals, Inc. 144A
1.000%, 9/15/27(1) | 12,410 | | 11,837 |
| BioMarin Pharmaceutical, Inc. | | | |
| 0.599%, 8/1/24 | 3,550 | | 3,487 |
| 1.250%, 5/15/27 | 8,620 | | 8,666 |
Bridgebio Pharma, Inc.
2.250%, 2/1/29 | 12,175 | | 7,474 |
Guardant Health, Inc.
0.000%, 11/15/27 | 10,085 | | 7,210 |
Halozyme Therapeutics, Inc.
0.250%, 3/1/27 | 19,055 | | 15,826 |
Insmed, Inc.
0.750%, 6/1/28 | 4,225 | | 3,544 |
Livongo Health, Inc.
0.875%, 6/1/25 | 6,900 | | 6,235 |
Sarepta Therapeutics, Inc. 144A
1.250%, 9/15/27(1) | 1,830 | | 1,980 |
| | | | 66,259 |
| | | | |
| |
| Commercial Services—1.5% | | |
Affirm Holdings, Inc.
0.000%, 11/15/26 | 17,000 | | 12,548 |
| Block, Inc. | | | |
| 0.125%, 3/1/25 | 5,735 | | 5,405 |
| 0.000%, 5/1/26 | 25,765 | | 21,282 |
| 0.250%, 11/1/27 | 2,860 | | 2,193 |
Chegg, Inc.
0.125%, 3/15/25 | 9,215 | | 8,119 |
Euronet Worldwide, Inc.
0.750%, 3/15/49 | 7,110 | | 6,901 |
| Shift4 Payments, Inc. | | | |
| 0.000%, 12/15/25 | 5,025 | | 5,457 |
| 0.500%, 8/1/27 | 16,220 | | 14,306 |
| | | | 76,211 |
| | | | |
| |
| Computers—0.7% | | |
| Lumentum Holdings, Inc. | | | |
| 0.500%, 12/15/26 | 14,475 | | 12,772 |
| 0.500%, 6/15/28 | 17,745 | | 13,954 |
Zscaler, Inc.
0.125%, 7/1/25 | 10,055 | | 11,719 |
| | | | 38,445 |
| | | | |
| |
| | Par Value | | Value |
| | | | |
| Electric Utilities—0.3% | | |
Southern Co. (The) 144A
3.875%, 12/15/25(1) | $ 17,910 | | $ 17,865 |
| Energy-Alternate Sources—0.7% | | |
| Enphase Energy, Inc. | | | |
| 0.000%, 3/1/26 | 10,400 | | 9,771 |
| 0.000%, 3/1/28 | 4,290 | | 4,033 |
SolarEdge Technologies, Inc.
0.000%, 9/15/25 | 4,665 | | 5,533 |
Sunnova Energy International, Inc. 144A
2.625%, 2/15/28(1) | 18,640 | | 15,166 |
| | | | 34,503 |
| | | | |
| |
| Entertainment—0.6% | | |
DraftKings Holdings, Inc.
0.000%, 3/15/28 | 17,990 | | 13,421 |
Live Nation Entertainment, Inc.
2.000%, 2/15/25 | 5,555 | | 5,897 |
Vail Resorts, Inc.
0.000%, 1/1/26 | 10,560 | | 9,431 |
| | | | 28,749 |
| | | | |
| |
| Financial Services—1.3% | | |
Coinbase Global, Inc.
0.500%, 6/1/26 | 21,960 | | 16,502 |
JPMorgan Chase Financial Co., LLC
0.500%, 6/15/27 | 21,000 | | 25,368 |
SoFi Technologies, Inc. 144A
0.000%, 10/15/26(1) | 21,245 | | 16,401 |
Upstart Holdings, Inc.
0.250%, 8/15/26 | 12,330 | | 8,415 |
| | | | 66,686 |
| | | | |
| |
| Health Care REITs—0.5% | | |
Welltower OP LLC 144A
2.750%, 5/15/28(1) | 23,235 | | 23,409 |
| Healthcare-Products—1.1% | | |
Envista Holdings Corp.
2.375%, 6/1/25 | 5,275 | | 8,837 |
| Exact Sciences Corp. | | | |
| 0.375%, 3/15/27 | 8,110 | | 8,713 |
| 0.375%, 3/1/28 | 20,895 | | 21,379 |
Novocure Ltd.
0.000%, 11/1/25 | 8,475 | | 7,289 |
Omnicell, Inc.
0.250%, 9/15/25 | 7,965 | | 8,057 |
| | | | 54,275 |
| | | | |
| |
| Healthcare-Services—0.2% | | |
Teladoc Health, Inc.
1.250%, 6/1/27 | 11,000 | | 8,745 |
| Hotel & Resort REITs—0.2% | | |
Pebblebrook Hotel Trust
1.750%, 12/15/26 | 12,180 | | 10,282 |
| | Par Value | | Value |
| | | | |
| Internet—5.0% | | |
| Etsy, Inc. | | | |
| 0.125%, 9/1/27 | $ 4,955 | | $ 4,130 |
| 0.250%, 6/15/28 | 24,535 | | 18,892 |
Expedia Group, Inc.
0.000%, 2/15/26 | 23,335 | | 20,390 |
Match Group Financeco 2, Inc. 144A
0.875%, 6/15/26(1) | 10,295 | | 9,226 |
Match Group Financeco 3, Inc. 144A
2.000%, 1/15/30(1) | 6,620 | | 5,941 |
| Okta, Inc. | | | |
| 0.125%, 9/1/25 | 2,000 | | 1,808 |
| 0.375%, 6/15/26 | 3,405 | | 2,906 |
Opendoor Technologies, Inc. 144A
0.250%, 8/15/26(1) | 7,375 | | 5,070 |
Palo Alto Networks, Inc.
0.375%, 6/1/25 | 14,840 | | 38,191 |
Sea Ltd.
0.250%, 9/15/26 | 24,825 | | 19,922 |
Shopify, Inc.
0.125%, 11/1/25 | 13,000 | | 11,778 |
| Snap, Inc. | | | |
| 0.750%, 8/1/26 | 7,500 | | 6,919 |
| 0.000%, 5/1/27 | 7,755 | | 5,739 |
| 0.125%, 3/1/28 | 30,440 | | 21,567 |
Spotify U.S.A., Inc.
0.000%, 3/15/26 | 18,205 | | 15,465 |
Uber Technologies, Inc.
0.000%, 12/15/25 | 20,775 | | 18,947 |
Wayfair, Inc.
0.625%, 10/1/25 | 18,685 | | 15,903 |
Wix.com Ltd.
0.000%, 8/15/25 | 12,510 | | 10,884 |
| Zillow Group, Inc. | | | |
| 2.750%, 5/15/25 | 13,715 | | 14,387 |
| 1.375%, 9/1/26 | 5,500 | | 6,916 |
| | | | 254,981 |
| | | | |
| |
| Leisure Time—0.5% | | |
NCL Corp., Ltd.
1.125%, 2/15/27 | 25,520 | | 23,518 |
| Machinery-Diversified—0.2% | | |
Middleby Corp. (The)
1.000%, 9/1/25 | 10,440 | | 12,961 |
| Media—1.1% | | |
| DISH Network Corp. | | | |
| 0.000%, 12/15/25 | 14,730 | | 7,789 |
| 3.375%, 8/15/26 | 7,890 | | 4,004 |
Liberty Broadband Corp. 144A
3.125%, 3/31/53(1) | 15,365 | | 14,989 |
| Liberty Media Corp. | | | |
| 1.375%, 10/15/23 | 7,310 | | 8,454 |
| 144A 0.500%, 12/1/50(1) | 19,030 | | 21,087 |
| | | | 56,323 |
| | | | |
| |
See Notes to Financial Statements
Income & Growth Fund
SCHEDULE OF INVESTMENTS (Continued)
June 30, 2023
($ reported in thousands)
| | Par Value | | Value |
| | | | |
| Mining—0.2% | | |
MP Materials Corp. 144A
0.250%, 4/1/26(1) | $ 12,250 | | $ 10,852 |
| Miscellaneous Manufacturing—0.4% | | |
Axon Enterprise, Inc. 144A
0.500%, 12/15/27(1) | 19,995 | | 21,285 |
| Passenger Airlines—0.3% | | |
Southwest Airlines Co.
1.250%, 5/1/25 | 15,740 | | 18,046 |
| Personal Care Product—0.1% | | |
Beauty Health Co. (The) 144A
1.250%, 10/1/26(1) | 8,140 | | 6,385 |
| Pharmaceuticals—1.2% | | |
Clovis Oncology, Inc.
1.250%, 5/1/25(2) | 4,440 | | 511 |
| Dexcom, Inc. | | | |
| 0.250%, 11/15/25 | 25,070 | | 26,762 |
| 144A 0.375%, 5/15/28(1) | 9,155 | | 9,333 |
Jazz Investments I Ltd.
2.000%, 6/15/26 | 23,155 | | 23,531 |
| | | | 60,137 |
| | | | |
| |
| Retail—0.2% | | |
Burlington Stores, Inc.
2.250%, 4/15/25 | 8,845 | | 9,149 |
| Semiconductors—1.1% | | |
Microchip Technology, Inc.
0.125%, 11/15/24 | 22,135 | | 25,040 |
ON Semiconductor Corp. 144A
0.500%, 3/1/29(1) | 15,465 | | 17,465 |
Wolfspeed, Inc.
0.250%, 2/15/28 | 18,530 | | 14,194 |
| | | | 56,699 |
| | | | |
| |
| Software—4.5% | | |
| Akamai Technologies, Inc. | | | |
| 0.125%, 5/1/25 | 12,050 | | 12,856 |
| 0.375%, 9/1/27 | 7,975 | | 7,702 |
| Bentley Systems, Inc. | | | |
| 0.125%, 1/15/26 | 775 | | 797 |
| 0.375%, 7/1/27 | 19,350 | | 17,473 |
BILL Holdings, Inc.
0.000%, 4/1/27 | 18,870 | | 15,474 |
BlackLine, Inc.
0.000%, 3/15/26 | 7,290 | | 6,169 |
Cloudflare, Inc.
0.000%, 8/15/26 | 15,450 | | 13,109 |
Confluent, Inc.
0.000%, 1/15/27 | 16,890 | | 14,023 |
Datadog, Inc.
0.125%, 6/15/25 | 8,930 | | 11,082 |
DigitalOcean Holdings, Inc.
0.000%, 12/1/26 | 17,485 | | 13,657 |
| MicroStrategy, Inc. | | | |
| 0.750%, 12/15/25 | 3,370 | | 3,644 |
| | Par Value | | Value |
| | | | |
| Software—continued | | |
| 0.000%, 2/15/27 | $ 12,620 | | $ 8,343 |
MongoDB, Inc.
0.250%, 1/15/26 | 7,780 | | 15,475 |
Nutanix, Inc.
0.250%, 10/1/27 | 9,495 | | 8,029 |
RingCentral, Inc.
0.000%, 3/1/25 | 16,565 | | 15,232 |
| Splunk, Inc. | | | |
| 1.125%, 9/15/25 | 25,000 | | 25,000 |
| 1.125%, 6/15/27 | 6,025 | | 5,197 |
Tyler Technologies, Inc.
0.250%, 3/15/26 | 14,910 | | 15,357 |
Unity Software, Inc.
0.000%, 11/15/26 | 28,435 | | 22,705 |
| | | | 231,324 |
| | | | |
| |
Total Convertible Bonds and Notes
(Identified Cost $1,428,818) | | 1,231,401 |
| | | | |
| |
| | | | |
| |
| Corporate Bonds and Notes—31.2% |
| Advertising—0.2% | | |
| Clear Channel Outdoor Holdings, Inc. | | | |
| 144A 7.750%, 4/15/28(1) | 5,410 | | 4,247 |
| 144A 7.500%, 6/1/29(1) | 7,810 | | 5,779 |
| | | | 10,026 |
| | | | |
| |
| Aerospace & Defense—0.4% | | |
Bombardier, Inc. 144A
7.500%, 2/1/29(1) | 13,020 | | 12,868 |
Spirit AeroSystems, Inc. 144A
9.375%, 11/30/29(1) | 900 | | 963 |
Triumph Group, Inc. 144A
9.000%, 3/15/28(1) | 8,445 | | 8,623 |
| | | | 22,454 |
| | | | |
| |
| Auto Manufacturers—0.8% | | |
| Ford Motor Co. | | | |
| 9.625%, 4/22/30 | 2,075 | | 2,414 |
| 7.450%, 7/16/31 | 9,690 | | 10,325 |
| 6.100%, 8/19/32 | 13,425 | | 13,011 |
| Ford Motor Credit Co. LLC | | | |
| 5.113%, 5/3/29 | 2,245 | | 2,082 |
| 4.000%, 11/13/30 | 14,895 | | 12,729 |
| | | | 40,561 |
| | | | |
| |
| Automobile Components—0.4% | | |
Goodyear Tire & Rubber Co. (The)
5.250%, 7/15/31 | 21,515 | | 18,691 |
| Automotive Parts & Equipment—0.6% | | |
| American Axle & Manufacturing, Inc. | | | |
| 6.500%, 4/1/27 | 6,070 | | 5,758 |
| 5.000%, 10/1/29 | 7,700 | | 6,419 |
| | Par Value | | Value |
| | | | |
Automotive Parts &
Equipment—continued | | |
| Clarios Global LP | | | |
| 144A 8.500%, 5/15/27(1) | $ 11,525 | | $ 11,544 |
| 144A 6.750%, 5/15/28(1) | 6,170 | | 6,148 |
| | | | 29,869 |
| | | | |
| |
| Building Materials—0.7% | | |
| Builders FirstSource, Inc. | | | |
| 144A 4.250%, 2/1/32(1) | 10,405 | | 9,054 |
| 144A 6.375%, 6/15/32(1) | 8,065 | | 8,012 |
Griffon Corp.
5.750%, 3/1/28 | 9,175 | | 8,578 |
Summit Materials LLC 144A
5.250%, 1/15/29(1) | 11,970 | | 11,309 |
| | | | 36,953 |
| | | | |
| |
| Chemicals—0.7% | | |
| Chemours Co. (The) | | | |
| 144A 5.750%, 11/15/28(1) | 6,355 | | 5,839 |
| 144A 4.625%, 11/15/29(1) | 13,120 | | 11,088 |
Tronox, Inc. 144A
4.625%, 3/15/29(1) | 10,895 | | 9,054 |
WR Grace Holdings LLC 144A
5.625%, 8/15/29(1) | 11,740 | | 9,619 |
| | | | 35,600 |
| | | | |
| |
| Commercial Services—1.5% | | |
ADT Security Corp. (The) 144A
4.125%, 8/1/29(1) | 15,625 | | 13,496 |
| Avis Budget Car Rental LLC | | | |
| 144A 5.750%, 7/15/27(1) | 6,905 | | 6,625 |
| 144A 5.375%, 3/1/29(1) | 5,680 | | 5,268 |
Deluxe Corp. 144A
8.000%, 6/1/29(1) | 5,540 | | 4,338 |
Herc Holdings, Inc. 144A
5.500%, 7/15/27(1) | 10,975 | | 10,516 |
Hertz Corp. (The) 144A
5.000%, 12/1/29(1) | 13,315 | | 11,007 |
Monitronics International Escrow
9.125%, 4/1/20(3) | 6,450 | | — |
NESCO Holdings II, Inc. 144A
5.500%, 4/15/29(1) | 12,150 | | 10,874 |
United Rentals North America, Inc.
5.250%, 1/15/30 | 11,630 | | 11,101 |
Williams Scotsman International, Inc. 144A
6.125%, 6/15/25(1) | 3,246 | | 3,222 |
| | | | 76,447 |
| | | | |
| |
See Notes to Financial Statements
Income & Growth Fund
SCHEDULE OF INVESTMENTS (Continued)
June 30, 2023
($ reported in thousands)
| | Par Value | | Value |
| | | | |
| Computers—0.8% | | |
McAfee Corp. 144A
7.375%, 2/15/30(1) | $ 11,960 | | $ 10,400 |
| NCR Corp. | | | |
| 144A 5.125%, 4/15/29(1) | 6,625 | | 5,865 |
| 144A 6.125%, 9/1/29(1) | 5,440 | | 5,445 |
Seagate HDD Cayman 144A
8.500%, 7/15/31(1) | 7,320 | | 7,676 |
Western Digital Corp.
4.750%, 2/15/26 | 10,985 | | 10,463 |
| | | | 39,849 |
| | | | |
| |
| Containers & Packaging—0.9% | | |
Berry Global, Inc. 144A
5.625%, 7/15/27(1) | 13,090 | | 12,812 |
Mauser Packaging Solutions Holding Co. 144A
7.875%, 8/15/26(1) | 10,755 | | 10,685 |
Owens-Brockway Glass Container, Inc. 144A
7.250%, 5/15/31(1) | 6,225 | | 6,303 |
Sealed Air Corp. 144A
5.000%, 4/15/29(1) | 2,300 | | 2,140 |
Trivium Packaging Finance B.V. 144A
8.500%, 8/15/27(1) | 12,770 | | 12,292 |
| | | | 44,232 |
| | | | |
| |
| Diversified REITS—0.7% | | |
Iron Mountain Information Management Services, Inc. 144A
5.000%, 7/15/32(1) | 7,535 | | 6,504 |
| Iron Mountain, Inc. | | | |
| 144A 7.000%, 2/15/29(1) | 13,125 | | 13,147 |
| 144A 5.250%, 7/15/30(1) | 10,050 | | 9,056 |
SBA Communications Corp.
3.125%, 2/1/29 | 11,135 | | 9,439 |
| | | | 38,146 |
| | | | |
| |
Electronic Equipment, Instruments &
Components—0.2% | | |
WESCO Distribution, Inc. 144A
7.250%, 6/15/28(1) | 11,220 | | 11,445 |
| Electronics—0.3% | | |
Coherent Corp. 144A
5.000%, 12/15/29(1) | 11,315 | | 10,213 |
Sensata Technologies B.V. 144A
5.875%, 9/1/30(1) | 2,895 | | 2,815 |
| | | | 13,028 |
| | | | |
| |
| | Par Value | | Value |
| | | | |
| Engineering & Construction—0.1% | | |
AECOM
5.125%, 3/15/27 | $ 4,625 | | $ 4,475 |
| Entertainment—1.5% | | |
AMC Entertainment Holdings, Inc. 144A
7.500%, 2/15/29(1) | 3,600 | | 2,531 |
| Caesars Entertainment, Inc. | | | |
| 144A 8.125%, 7/1/27(1) | 11,990 | | 12,271 |
| 144A 7.000%, 2/15/30(1) | 5,000 | | 5,021 |
CDI Escrow Issuer, Inc. 144A
5.750%, 4/1/30(1) | 10,035 | | 9,341 |
| International Game Technology plc | | | |
| 144A 4.125%, 4/15/26(1) | 7,305 | | 6,937 |
| 144A 6.250%, 1/15/27(1) | 3,200 | | 3,188 |
Lions Gate Capital Holdings LLC 144A
5.500%, 4/15/29(1) | 10,975 | | 7,948 |
| Live Nation Entertainment, Inc. | | | |
| 144A 6.500%, 5/15/27(1) | 2,065 | | 2,076 |
| 144A 4.750%, 10/15/27(1) | 14,410 | | 13,437 |
Scientific Games International, Inc. 144A
8.625%, 7/1/25(1) | 2,750 | | 2,809 |
SeaWorld Parks & Entertainment, Inc. 144A
5.250%, 8/15/29(1) | 13,460 | | 12,048 |
| | | | 77,607 |
| | | | |
| |
| Environmental Services—0.3% | | |
GFL Environmental, Inc. 144A
4.750%, 6/15/29(1) | 14,905 | | 13,617 |
Equity Real Estate Investment Trusts
(REITs)—0.2% | | |
Brookfield Property REIT, Inc. 144A
4.500%, 4/1/27(1) | 9,205 | | 7,752 |
| Financial Services—1.3% | | |
| Nationstar Mortgage Holdings, Inc. | | | |
| 144A 5.500%, 8/15/28(1) | 13,230 | | 11,589 |
| 144A 5.750%, 11/15/31(1) | 8,870 | | 7,286 |
| Navient Corp. | | | |
| 6.750%, 6/15/26 | 10,725 | | 10,341 |
| 5.000%, 3/15/27 | 12,315 | | 11,017 |
| 4.875%, 3/15/28 | 7,065 | | 6,050 |
| 9.375%, 7/25/30 | 1,000 | | 995 |
| OneMain Finance Corp. | | | |
| 6.625%, 1/15/28 | 9,655 | | 9,107 |
| 9.000%, 1/15/29 | 1,850 | | 1,866 |
| 5.375%, 11/15/29 | 7,480 | | 6,359 |
| | Par Value | | Value |
| | | | |
| Financial Services—continued | | |
PRA Group, Inc. 144A
8.375%, 2/1/28(1) | $ 3,755 | | $ 3,403 |
| | | | 68,013 |
| | | | |
| |
| Food & Beverage—0.9% | | |
Kraft Heinz Foods Co.
5.000%, 7/15/35 | 8,175 | | 8,053 |
| Performance Food Group, Inc. | | | |
| 144A 5.500%, 10/15/27(1) | 7,630 | | 7,352 |
| 144A 4.250%, 8/1/29(1) | 10,125 | | 9,014 |
| Post Holdings, Inc. | | | |
| 144A 5.500%, 12/15/29(1) | 3,660 | | 3,377 |
| 144A 4.500%, 9/15/31(1) | 9,420 | | 8,045 |
Simmons Foods, Inc. 144A
4.625%, 3/1/29(1) | 6,935 | | 5,557 |
US Foods, Inc. 144A
4.750%, 2/15/29(1) | 5,350 | | 4,898 |
| | | | 46,296 |
| | | | |
| |
| Food Service—0.2% | | |
Aramark Services, Inc. 144A
5.000%, 2/1/28(1) | 8,355 | | 7,875 |
| Healthcare-Products—0.3% | | |
Medline Borrower LP 144A
5.250%, 10/1/29(1) | 18,020 | | 15,636 |
| Healthcare-Services—1.1% | | |
Centene Corp.
4.625%, 12/15/29 | 2,490 | | 2,292 |
| Community Health Systems, Inc. | | | |
| 144A 5.625%, 3/15/27(1) | 6,495 | | 5,724 |
| 144A 6.875%, 4/15/29(1) | 9,715 | | 6,067 |
Select Medical Corp. 144A
6.250%, 8/15/26(1) | 11,245 | | 11,052 |
Tenet Healthcare Corp.
6.125%, 10/1/28 | 34,410 | | 33,126 |
| | | | 58,261 |
| | | | |
| |
| Home Builders—0.2% | | |
Taylor Morrison Communities, Inc. 144A
5.750%, 1/15/28(1) | 7,925 | | 7,663 |
| Hotel & Resort REITs—0.6% | | |
| Park Intermediate Holdings LLC | | | |
| 144A 5.875%, 10/1/28(1) | 8,830 | | 8,101 |
| 144A 4.875%, 5/15/29(1) | 9,060 | | 7,808 |
| Service Properties Trust | | | |
| 4.500%, 3/15/25 | 5,185 | | 4,898 |
| 7.500%, 9/15/25 | 5,355 | | 5,259 |
See Notes to Financial Statements
Income & Growth Fund
SCHEDULE OF INVESTMENTS (Continued)
June 30, 2023
($ reported in thousands)
| | Par Value | | Value |
| | | | |
| Hotel & Resort REITs—continued | | |
| 4.375%, 2/15/30 | $ 5,355 | | $ 4,005 |
| | | | 30,071 |
| | | | |
| |
| Household Products/Wares—0.1% | | |
Spectrum Brands, Inc. 144A
3.875%, 3/15/31(1) | 8,430 | | 6,913 |
| Housewares—0.0% | | |
Newell Brands, Inc.
6.625%, 9/15/29 | 1,165 | | 1,117 |
| Internet—0.5% | | |
Gen Digital, Inc. 144A
7.125%, 9/30/30(1) | 5,500 | | 5,509 |
| Uber Technologies, Inc. | | | |
| 144A 8.000%, 11/1/26(1) | 4,925 | | 5,019 |
| 144A 7.500%, 9/15/27(1) | 13,190 | | 13,492 |
| 144A 6.250%, 1/15/28(1) | 2,410 | | 2,398 |
| | | | 26,418 |
| | | | |
| |
| Investment Companies—0.3% | | |
| Compass Group Diversified Holdings LLC | | | |
| 144A 5.250%, 4/15/29(1) | 14,195 | | 12,442 |
| 144A 5.000%, 1/15/32(1) | 3,650 | | 2,946 |
| | | | 15,388 |
| | | | |
| |
| Iron & Steel—0.2% | | |
Cleveland-Cliffs, Inc. 144A
6.750%, 3/15/26(1) | 4,870 | | 4,921 |
United States Steel Corp.
6.875%, 3/1/29 | 7,210 | | 7,132 |
| | | | 12,053 |
| | | | |
| |
| Leisure Time—1.1% | | |
| Carnival Corp. | | | |
| 144A 10.500%, 2/1/26(1) | 7,675 | | 8,068 |
| 144A 5.750%, 3/1/27(1) | 8,455 | | 7,784 |
| 144A 6.000%, 5/1/29(1) | 10,775 | | 9,620 |
| 144A 10.500%, 6/1/30(1) | 5,405 | | 5,734 |
| NCL Corp., Ltd. | | | |
| 144A 5.875%, 3/15/26(1) | 12,550 | | 11,741 |
| 144A 7.750%, 2/15/29(1) | 2,280 | | 2,166 |
| Royal Caribbean Cruises Ltd. | | | |
| 144A 11.500%, 6/1/25(1) | 1,407 | | 1,493 |
| 144A 5.375%, 7/15/27(1) | 6,590 | | 6,162 |
| 144A 5.500%, 4/1/28(1) | 6,100 | | 5,688 |
| | | | 58,456 |
| | | | |
| |
| Lodging—0.6% | | |
Boyd Gaming Corp. 144A
4.750%, 6/15/31(1) | 6,045 | | 5,400 |
Hilton Domestic Operating Co., Inc. 144A
4.000%, 5/1/31(1) | 9,890 | | 8,589 |
| | Par Value | | Value |
| | | | |
| Lodging—continued | | |
Hilton Grand Vacations Borrower Escrow LLC 144A
5.000%, 6/1/29(1) | $ 8,230 | | $ 7,304 |
MGM Resorts International
4.750%, 10/15/28 | 7,595 | | 6,896 |
| | | | 28,189 |
| | | | |
| |
Machinery-Construction &
Mining—0.1% | | |
Terex Corp. 144A
5.000%, 5/15/29(1) | 7,100 | | 6,601 |
| Machinery-Diversified—0.2% | | |
Chart Industries, Inc. 144A
7.500%, 1/1/30(1) | 9,100 | | 9,284 |
| Media—3.6% | | |
| CCO Holdings LLC | | | |
| 4.500%, 5/1/32 | 6,375 | | 5,090 |
| 144A 5.375%, 6/1/29(1) | 14,405 | | 13,023 |
| 144A 6.375%, 9/1/29(1) | 12,135 | | 11,433 |
| 144A 7.375%, 3/1/31(1) | 2,400 | | 2,339 |
| CSC Holdings LLC | | | |
| 144A 7.500%, 4/1/28(1) | 14,490 | | 8,259 |
| 144A 5.750%, 1/15/30(1) | 3,000 | | 1,416 |
DirecTV Financing LLC 144A
5.875%, 8/15/27(1) | 15,910 | | 14,409 |
| DISH DBS Corp. | | | |
| 7.375%, 7/1/28 | 21,985 | | 11,762 |
| 144A 5.750%, 12/1/28(1) | 9,505 | | 7,070 |
DISH Network Corp. 144A
11.750%, 11/15/27(1) | 4,500 | | 4,392 |
Gray Escrow II, Inc. 144A
5.375%, 11/15/31(1) | 14,095 | | 9,342 |
| Gray Television, Inc. | | | |
| 144A 7.000%, 5/15/27(1) | 8,470 | | 7,226 |
| 144A 4.750%, 10/15/30(1) | 2,325 | | 1,577 |
iHeartCommunications, Inc.
8.375%, 5/1/27 | 11,905 | | 7,931 |
| Nexstar Media, Inc. | | | |
| 144A 5.625%, 7/15/27(1) | 13,405 | | 12,495 |
| 144A 4.750%, 11/1/28(1) | 5,800 | | 5,032 |
Scripps Escrow II, Inc. 144A
5.375%, 1/15/31(1) | 13,495 | | 9,511 |
| Sirius XM Radio, Inc. | | | |
| 144A 4.000%, 7/15/28(1) | 9,960 | | 8,654 |
| 144A 4.125%, 7/1/30(1) | 9,665 | | 7,892 |
TEGNA, Inc.
5.000%, 9/15/29 | 10,150 | | 8,757 |
Virgin Media Finance plc 144A
5.000%, 7/15/30(1) | 8,345 | | 6,643 |
| Virgin Media Secured Finance plc | | | |
| 144A 5.500%, 5/15/29(1) | 12,100 | | 10,945 |
| | Par Value | | Value |
| | | | |
| Media—continued | | |
| 144A 4.500%, 8/15/30(1) | $ 9,225 | | $ 7,733 |
| | | | 182,931 |
| | | | |
| |
| Mining—0.3% | | |
FMG Resources August 2006 Pty Ltd. 144A
4.375%, 4/1/31(1) | 4,130 | | 3,526 |
| Hudbay Minerals, Inc. | | | |
| 144A 4.500%, 4/1/26(1) | 9,720 | | 9,051 |
| 144A 6.125%, 4/1/29(1) | 5,375 | | 4,949 |
| | | | 17,526 |
| | | | |
| |
| Oil, Gas & Consumable Fuels—2.4% | | |
| Callon Petroleum Co. | | | |
| 144A 8.000%, 8/1/28(1) | 13,490 | | 13,340 |
| 144A 7.500%, 6/15/30(1) | 7,640 | | 7,211 |
CITGO Petroleum Corp. 144A
6.375%, 6/15/26(1) | 6,385 | | 6,145 |
Civitas Resources, Inc. 144A
8.750%, 7/1/31(1) | 11,905 | | 12,069 |
CNX Resources Corp. 144A
7.375%, 1/15/31(1) | 4,510 | | 4,388 |
Cobalt International Energy, Inc.
7.750%, 12/1/23(2)(3) | 9,216 | | — (4) |
| Comstock Resources, Inc. | | | |
| 144A 6.750%, 3/1/29(1) | 8,700 | | 7,960 |
| 144A 5.875%, 1/15/30(1) | 6,595 | | 5,726 |
Mesquite Energy, Inc.
0.000%, 1/15/23(3) | 6,240 | | 94 |
Northern Oil & Gas, Inc. 144A
8.750%, 6/15/31(1) | 6,295 | | 6,185 |
| Occidental Petroleum Corp. | | | |
| 8.875%, 7/15/30 | 6,600 | | 7,586 |
| 6.625%, 9/1/30 | 1,610 | | 1,673 |
| SM Energy Co. | | | |
| 6.625%, 1/15/27 | 7,980 | | 7,751 |
| 6.500%, 7/15/28 | 7,075 | | 6,792 |
| Southwestern Energy Co. | | | |
| 5.375%, 3/15/30 | 12,115 | | 11,306 |
| 4.750%, 2/1/32 | 4,720 | | 4,160 |
USA Compression Partners LP
6.875%, 9/1/27 | 12,545 | | 11,979 |
Weatherford International Ltd. 144A
8.625%, 4/30/30(1) | 8,565 | | 8,695 |
| | | | 123,060 |
| | | | |
| |
| Paper & Forest Products—0.2% | | |
Mercer International, Inc.
5.125%, 2/1/29 | 10,985 | | 8,549 |
See Notes to Financial Statements
Income & Growth Fund
SCHEDULE OF INVESTMENTS (Continued)
June 30, 2023
($ reported in thousands)
| | Par Value | | Value |
| | | | |
| Passenger Airlines—0.4% | | |
| American Airlines, Inc. | | | |
| 144A 11.750%, 7/15/25(1) | $ 3,875 | | $ 4,249 |
| 144A 5.750%, 4/20/29(1) | 14,125 | | 13,715 |
| | | | 17,964 |
| | | | |
| |
| Personal Care Product—0.2% | | |
Coty, Inc. 144A
6.500%, 4/15/26(1) | 11,185 | | 11,089 |
| Pharmaceuticals—0.9% | | |
Bausch Health Americas, Inc. 144A
8.500%, 1/31/27(1) | 32,710 | | 17,906 |
Jazz Securities DAC 144A
4.375%, 1/15/29(1) | 11,825 | | 10,550 |
Organon & Co. 144A
5.125%, 4/30/31(1) | 16,695 | | 13,774 |
Prestige Brands, Inc. 144A
5.125%, 1/15/28(1) | 5,645 | | 5,359 |
| | | | 47,589 |
| | | | |
| |
| Pipelines—0.9% | | |
Antero Midstream Partners LP 144A
5.375%, 6/15/29(1) | 8,185 | | 7,605 |
Crestwood Midstream Partners LP 144A
6.000%, 2/1/29(1) | 11,805 | | 11,023 |
EQM Midstream Partners LP 144A
6.500%, 7/1/27(1) | 4,470 | | 4,409 |
NGL Energy Operating LLC 144A
7.500%, 2/1/26(1) | 13,315 | | 13,114 |
NuStar Logistics LP
6.375%, 10/1/30 | 9,135 | | 8,715 |
| | | | 44,866 |
| | | | |
| |
| Real Estate—0.2% | | |
Kennedy-Wilson, Inc.
5.000%, 3/1/31 | 12,550 | | 9,392 |
| Retail—1.1% | | |
| Asbury Automotive Group, Inc. | | | |
| 4.750%, 3/1/30 | 6,155 | | 5,469 |
| 144A 5.000%, 2/15/32(1) | 4,280 | | 3,727 |
Bath & Body Works, Inc. 144A
6.625%, 10/1/30(1) | 14,795 | | 14,283 |
| Macy’s Retail Holdings LLC | | | |
| 144A 5.875%, 3/15/30(1) | 4,510 | | 4,019 |
| 144A 6.125%, 3/15/32(1) | 6,250 | | 5,468 |
Mariposa Borrower, Inc. Escrow
8.000%, 10/15/23(3) | 6,810 | | 2,202 |
| | Par Value | | Value |
| | | | |
| Retail—continued | | |
New Red Finance, Inc. 144A
4.000%, 10/15/30(1) | $ 12,185 | | $ 10,428 |
Yum! Brands, Inc.
4.625%, 1/31/32 | 9,655 | | 8,722 |
| | | | 54,318 |
| | | | |
| |
| Semiconductors—0.1% | | |
Amkor Technology, Inc. 144A
6.625%, 9/15/27(1) | 3,650 | | 3,657 |
| Software—0.7% | | |
Alteryx, Inc. 144A
8.750%, 3/15/28(1) | 6,870 | | 6,748 |
Clarivate Science Holdings Corp. 144A
4.875%, 7/1/29(1) | 10,575 | | 9,381 |
| Consensus Cloud Solutions, Inc. | | | |
| 144A 6.000%, 10/15/26(1) | 3,065 | | 2,782 |
| 144A 6.500%, 10/15/28(1) | 6,765 | | 5,784 |
SS&C Technologies, Inc. 144A
5.500%, 9/30/27(1) | 10,885 | | 10,421 |
| | | | 35,116 |
| | | | |
| |
| Telecommunications—1.8% | | |
CommScope Technologies LLC 144A
5.000%, 3/15/27(1) | 10,105 | | 7,034 |
CommScope, Inc. 144A
6.000%, 3/1/26(1) | 2,000 | | 1,864 |
| Frontier Communications Holdings LLC | | | |
| 144A 5.000%, 5/1/28(1) | 10,165 | | 8,771 |
| 144A 6.000%, 1/15/30(1) | 12,310 | | 9,055 |
| 144A 8.750%, 5/15/30(1) | 2,420 | | 2,365 |
Hughes Satellite Systems Corp.
6.625%, 8/1/26 | 13,080 | | 12,230 |
| Lumen Technologies, Inc. | | | |
| 144A 5.125%, 12/15/26(1) | 9,205 | | 6,379 |
| 144A 5.375%, 6/15/29(1) | 23,075 | | 11,557 |
| Sprint LLC | | | |
| 7.125%, 6/15/24 | 6,860 | | 6,921 |
| 7.625%, 3/1/26 | 7,435 | | 7,723 |
| T-Mobile USA, Inc. | | | |
| 4.750%, 2/1/28 | 450 | | 437 |
| 3.375%, 4/15/29 | 8,250 | | �� 7,450 |
| 3.500%, 4/15/31 | 14,160 | | 12,495 |
| | Par Value | | Value |
| | | | |
| Telecommunications—continued | | |
Windstream Services LLC 144A
6.375%, 8/1/23(1)(2)(3) | $ 7,464 | | $ — |
| | | | 94,281 |
| | | | |
| |
| Transportation—0.4% | | |
| Fortress Transportation & Infrastructure Investors LLC | | | |
| 144A 9.750%, 8/1/27(1) | 8,420 | | 8,696 |
| 144A 5.500%, 5/1/28(1) | 7,450 | | 6,817 |
XPO, Inc. 144A
7.125%, 6/1/31(1) | 5,365 | | 5,406 |
| | | | 20,919 |
| | | | |
| |
Total Corporate Bonds and Notes
(Identified Cost $1,844,539) | | 1,590,243 |
| | Shares | |
| Convertible Preferred Stocks—2.4% |
| Banks—1.3% | |
| Bank of America Corp. Series L, 7.250% | 21,900 | 25,663 |
| Wells Fargo & Co. Series L, 7.500% | 35,490 | 40,884 |
| | | 66,547 |
| | | |
| |
| Capital Markets—0.5% | |
| KKR & Co., Inc. Series C, 6.000% | 360,205 | 23,810 |
| Electric Utilities—0.5% | |
| NextEra Energy, Inc., 6.219% | 543,655 | 26,656 |
| Professional Services—0.1% | |
| Clarivate plc Series A, 5.250% | 140,520 | 5,768 |
Total Convertible Preferred Stocks
(Identified Cost $147,123) | 122,781 |
| | | |
| |
| | | |
| |
| Preferred Stock—0.1% |
| Entertainment—0.1% | |
| LiveStyle, Inc. Series B (3)(5)(6) | 27,523 | 2,227 |
Total Preferred Stock
(Identified Cost $2,698) | 2,227 |
| | | |
| |
| | | |
| |
See Notes to Financial Statements
Income & Growth Fund
SCHEDULE OF INVESTMENTS (Continued)
June 30, 2023
($ reported in thousands)
| | Shares | | Value |
| | | | |
| | | | |
| Common Stocks—37.1% |
| Aerospace & Defense—0.6% | | |
| Raytheon Technologies Corp. | 294,315 | | $ 28,831 |
| Air Freight & Logistics—0.6% | | |
| FedEx Corp. | 123,255 | | 30,555 |
| Automobile Components—0.3% | | |
| Aptiv plc(5) | 164,330 | | 16,777 |
| Automobiles—1.5% | | |
| Tesla, Inc.(5) | 287,883 | | 75,359 |
| Banks—1.3% | | |
| CCF Holdings LLC (3)(5) | 7,416,755 | | 4,969 |
| CCF Holdings LLC Class M(3)(5) | 1,759,917 | | 1,179 |
| JPMorgan Chase & Co.(7) | 211,475 | | 30,757 |
| Wells Fargo & Co. | 665,555 | | 28,406 |
| | | | 65,311 |
| | | | |
| |
| Biotechnology—0.4% | | |
| AbbVie, Inc. | 140,382 | | 18,914 |
| Broadline Retail—1.5% | | |
| Amazon.com, Inc.(5)(7) | 578,270 | | 75,383 |
| Capital Markets—1.0% | | |
| CME Group, Inc. Class A | 91,265 | | 16,911 |
| Moody’s Corp. | 100,300 | | 34,876 |
| | | | 51,787 |
| | | | |
| |
| Chemicals—0.9% | | |
| DuPont de Nemours, Inc. | 405,835 | | 28,993 |
| Sherwin-Williams Co. (The) | 62,925 | | 16,708 |
| | | | 45,701 |
| | | | |
| |
Commercial Services &
Supplies—0.3% | | |
| Waste Management, Inc. | 85,270 | | 14,788 |
| Communications Equipment—0.3% | | |
| Cisco Systems, Inc. | 299,340 | | 15,488 |
| Consumer Finance—0.5% | | |
| Capital One Financial Corp.(7) | 216,470 | | 23,675 |
| Erickson, Inc.(3)(5) | 10,866 | | 335 |
| | | | 24,010 |
| | | | |
| |
Consumer Staples Distribution &
Retail—0.7% | | |
| Costco Wholesale Corp.(7) | 57,075 | | 30,728 |
| Target Corp. | 54,415 | | 7,177 |
| | | | 37,905 |
| | | | |
| |
| Electric Utilities—0.9% | | |
| Exelon Corp. | 1,109,750 | | 45,211 |
| | Shares | | Value |
| | | | |
| Electrical Equipment—0.2% | | |
| Generac Holdings, Inc.(5) | 49,720 | | $ 7,415 |
| Plug Power, Inc.(5) | 437,288 | | 4,543 |
| | | | 11,958 |
| | | | |
| |
| Energy Equipment & Services—0.5% | | |
| Schlumberger N.V.(7) | 524,555 | | 25,766 |
| Entertainment—0.0% | | |
| LiveStyle, Inc. (3)(5)(6) | 202,319 | | — |
| Financial Services—1.1% | | |
| Mastercard, Inc. Class A(7) | 145,015 | | 57,034 |
| Ground Transportation—1.0% | | |
| Uber Technologies, Inc.(5)(7) | 341,745 | | 14,753 |
| Union Pacific Corp. | 188,945 | | 38,662 |
| | | | 53,415 |
| | | | |
| |
Healthcare Equipment &
Supplies—1.5% | | |
| Abbott Laboratories | 129,765 | | 14,147 |
| Align Technology, Inc.(5)(7) | 51,770 | | 18,308 |
| Boston Scientific Corp.(5) | 459,150 | | 24,835 |
| Intuitive Surgical, Inc.(5)(7) | 58,805 | | 20,108 |
| | | | 77,398 |
| | | | |
| |
Healthcare Providers &
Services—0.5% | | |
| UnitedHealth Group, Inc.(7) | 50,490 | | 24,268 |
| Hotels, Restaurants & Leisure—1.1% | | |
| Chipotle Mexican Grill, Inc. Class A(5) | 4,760 | | 10,182 |
| Las Vegas Sands Corp.(5)(7) | 423,715 | | 24,575 |
| Starbucks Corp.(7) | 146,670 | | 14,529 |
| Trip.com Group Ltd. ADR(5)(7) | 251,540 | | 8,804 |
| | | | 58,090 |
| | | | |
| |
| Insurance—0.2% | | |
| Aon plc Class A | 26,310 | | 9,082 |
| Interactive Media & Services—3.1% | | |
| Alphabet, Inc. Class A(5)(7) | 870,900 | | 104,247 |
| Alphabet, Inc. Class C(5)(7) | 78,505 | | 9,497 |
| Meta Platforms, Inc. Class A(5)(7) | 148,095 | | 42,500 |
| | | | 156,244 |
| | | | |
| |
| IT Services—0.7% | | |
| Accenture plc Class A(7) | 94,550 | | 29,176 |
| EPAM Systems, Inc.(5) | 20,020 | | 4,500 |
| GTT Communications, Inc.(5) | 8,647 | | 115 |
| | | | 33,791 |
| | | | |
| |
| Life Sciences Tools & Services—1.8% | | |
| Avantor, Inc.(5) | 280,592 | | 5,763 |
| Danaher Corp. | 118,914 | | 28,540 |
| | Shares | | Value |
| | | | |
Life Sciences Tools &
Services—continued | | |
| IQVIA Holdings, Inc.(5) | 118,460 | | $ 26,626 |
| Thermo Fisher Scientific, Inc. | 61,680 | | 32,182 |
| | | | 93,111 |
| | | | |
| |
| Machinery—0.4% | | |
| Deere & Co.(7) | 32,880 | | 13,323 |
| Stanley Black & Decker, Inc. | 82,623 | | 7,742 |
| | | | 21,065 |
| | | | |
| |
| Media—0.0% | | |
| Postmedia Network Canada Corp.(3)(5) | 1,018,823 | | 764 |
| Oil, Gas & Consumable Fuels—0.8% | | |
| ConocoPhillips | 218,150 | | 22,603 |
| Devon Energy Corp. | 426,520 | | 20,618 |
| Riviera Resources, Inc.(3)(5) | 25,527 | | — |
| | | | 43,221 |
| | | | |
| |
| Pharmaceuticals—1.1% | | |
| Elanco Animal Health, Inc.(5) | 358,695 | | 3,609 |
| Eli Lilly & Co.(7) | 40,495 | | 18,991 |
| Zoetis, Inc. Class A | 197,145 | | 33,950 |
| | | | 56,550 |
| | | | |
| |
Semiconductors & Semiconductor
Equipment—2.8% | | |
| Advanced Micro Devices, Inc.(5)(7) | 115,460 | | 13,152 |
| Lam Research Corp.(7) | 41,920 | | 26,949 |
| Marvell Technology, Inc.(7) | 376,990 | | 22,536 |
| Micron Technology, Inc.(7) | 389,325 | | 24,570 |
| NVIDIA Corp. | 98,400 | | 41,625 |
| Taiwan Semiconductor Manufacturing Co., Ltd. Sponsored ADR(7) | 146,300 | | 14,765 |
| | | | 143,597 |
| | | | |
| |
| Software—4.7% | | |
| Adobe, Inc. (5)(7) | 76,670 | | 37,491 |
| Atlassian Corp. Class A(5) | 55,805 | | 9,365 |
| Crowdstrike Holdings, Inc. Class A(5) | 123,360 | | 18,118 |
| Intuit, Inc.(7) | 48,695 | | 22,311 |
| Microsoft Corp. | 224,701 | | 76,520 |
| Salesforce, Inc.(5)(7) | 135,155 | | 28,553 |
| ServiceNow, Inc.(5)(7) | 81,780 | | 45,958 |
| Workday, Inc. Class A(5) | 4,974 | | 1,123 |
| | | | 239,439 |
| | | | |
| |
| Specialized REITs—0.4% | | |
| American Tower Corp. | 113,300 | | 21,973 |
| Specialty Retail—1.9% | | |
| AutoZone, Inc.(5)(7) | 10,955 | | 27,315 |
See Notes to Financial Statements
Income & Growth Fund
SCHEDULE OF INVESTMENTS (Continued)
June 30, 2023
($ reported in thousands)
| | Shares | | Value |
| | | | |
| Specialty Retail—continued | | |
| Chewy, Inc. Class A(5) | 245,667 | | $ 9,697 |
| Home Depot, Inc. (The)(7) | 100,200 | | 31,126 |
| TJX Cos., Inc. (The) | 322,270 | | 27,325 |
| | | | 95,463 |
| | | | |
| |
Technology Hardware, Storage &
Peripherals—2.0% | | |
| Apple, Inc.(7) | 514,960 | | 99,887 |
Textiles, Apparel & Luxury
Goods—0.5% | | |
| NIKE, Inc. Class B | 239,095 | | 26,389 |
| Quiksilver, Inc.(3)(5) | 2 | | — (4) |
| | | | 26,389 |
| | | | |
| |
Total Common Stocks
(Identified Cost $2,145,882) | | 1,894,525 |
| | | | |
| |
| | | | |
| |
| Warrants—0.0% |
| Banks—0.0% | | |
| CCF Holdings LLC, 4/1/24(3)(5) | 2,911,361 | | 1,165 |
| IT Services—0.0% | | |
| GTT Communications, Inc., 12/30/27(3)(5) | 27,745 | | — (4) |
| Media—0.0% | | |
| Tenerity, Inc., 4/1/24(3)(5)(6) | 7,203 | | — |
| Oil, Gas & Consumable Fuels—0.0% | | |
| Nabors Industries Ltd., 6/11/26(5) | 2,910 | | 33 |
Total Warrants
(Identified Cost $1,422) | | 1,198 |
| | | | |
| |
| | | | |
| |
| Equity-Linked Notes—1.0% |
| Banks—0.6% | | |
| JPMorgan Chase Bank N.A. 144A(1)(3) | 29,500 | | 29,500 |
| Financial Services—0.4% | | |
| Goldman Sachs Finance Corp. | 22,280,000 | | 20,884 |
Total Equity-Linked Notes
(Identified Cost $52,337) | | 50,384 |
| | | | |
| |
| | | | |
| |
| Equity-Linked Warrants—2.1% |
| Financial Services—2.1% | | |
| Barclays Bank plc 144A(1)(3) | 43,120 | | 37,002 |
| Merrill Lynch International & Co. CV(3) | 129,820 | | 36,801 |
| | Shares | | Value |
| | | | |
| Financial Services—continued | | |
| Merrill Lynch International & Co. CV Series 0001(3) | 252,920 | | $ 32,235 |
| | | | 106,038 |
| | | | |
| |
Total Equity-Linked Warrants
(Identified Cost $106,003) | | 106,038 |
| | | | |
| |
| | | | |
| |
Total Long-Term Investments—98.0%
(Identified Cost $5,728,822) | | 4,998,797 |
| | | | |
| |
| | | | |
| |
| Short-Term Investment—1.1% |
| Money Market Mutual Fund—1.1% |
| BlackRock Liquidity FedFund - Institutional Shares (seven-day effective yield 4.988%)(8) | 56,146,482 | | 56,146 |
Total Short-Term Investment
(Identified Cost $56,146) | | 56,146 |
| | | | |
| |
| | | | |
| |
TOTAL INVESTMENTS, BEFORE WRITTEN OPTIONS—99.1%
(Identified Cost $5,784,968) | | 5,054,943 |
| | | |
| Written Options—(0.0)% |
(See open written options
schedule) | | |
Total Written Options
(Premiums Received $1,566) | (1,828) |
| | | |
| |
| | | |
| |
TOTAL INVESTMENTS, NET OF WRITTEN OPTIONS—99.1%
(Identified Cost $5,783,402) | $5,053,115 |
| Other assets and liabilities, net—0.9% | 47,865 |
| NET ASSETS—100.0% | $5,100,980 |
| Abbreviations: |
| ADR | American Depositary Receipt |
| DAC | Designated Activity Company |
| EV | Enterprise Value |
| LLC | Limited Liability Company |
| LP | Limited Partnership |
| REIT | Real Estate Investment Trust |
| Footnote Legend: |
| (1) | Security exempt from registration under Rule 144A of the Securities Act of 1933. These securities may be resold in transactions exempt from registration, normally to qualified institutional buyers. At June 30, 2023, these securities amounted to a value of $1,467,277 or 28.8% of net assets. |
| (2) | Security in default; no interest payments are being received during the bankruptcy proceedings. |
| (3) | The value of this security was determined using significant unobservable inputs and is reported as a Level 3 security in the Fair Value Hierarchy table located after the Schedule of Investments. |
| (4) | Amount is less than $500 (not in thousands). |
| (5) | Non-income producing. |
| (6) | All or a portion of the security is restricted. |
| (7) | All or a portion of the security is segregated as collateral for written options. The value of securities segregated as collateral is $503,401. |
| (8) | Shares of this fund are publicly offered, and its prospectus and annual report are publicly available. |
| Country Weightings (Unaudited)† |
| United States | 91% |
| United Kingdom | 2 |
| Bermuda | 2 |
| Curaçao | 2 |
| Canada | 1 |
| Panama | 1 |
| Cayman Islands | 1 |
| Total | 100% |
| † % of total investments, net of written options, as of June 30, 2023. |
For information regarding the abbreviations, see the Key Investment Terms starting on page 6.
See Notes to Financial Statements
Income & Growth Fund
SCHEDULE OF INVESTMENTS (Continued)
June 30, 2023
($ reported in thousands)
| Open written options contracts as of June 30, 2023 were as follows: |
| Description of Options | Number of
Contracts | Contract
Notional
Amount | Strike
Price(1) | Expiration
Date | Value |
| Call Options(2) | | | | | |
| Accenture plc | (660) | $(22,770) | $ 345.00 | 07/21/23 | $ (3) |
| Adobe, Inc. | (383) | (21,065) | 550.00 | 07/21/23 | (33) |
| Advanced Micro Devices, Inc. | (577) | (7,501) | 130.00 | 07/21/23 | (36) |
| Align Technology, Inc. | (130) | (4,810) | 370.00 | 07/21/23 | (62) |
| Alphabet, Inc. | (4,355) | (60,970) | 140.00 | 07/21/23 | (35) |
| Alphabet, Inc. | (785) | (10,598) | 135.00 | 07/21/23 | (12) |
| Amazon.com, Inc. | (1,570) | (23,550) | 150.00 | 07/21/23 | (22) |
| Apple, Inc. | (2,575) | (51,500) | 200.00 | 07/21/23 | (227) |
| AutoZone, Inc. | (51) | (13,821) | 2,710.00 | 07/21/23 | (7) |
| Capital One Financial Corp. | (1,080) | (13,500) | 125.00 | 07/21/23 | (18) |
| Costco Wholesale Corp. | (400) | (22,200) | 555.00 | 07/21/23 | (60) |
| Deere & Co. | (230) | (10,120) | 440.00 | 07/21/23 | (12) |
| Eli Lilly & Co. | (404) | (19,796) | 490.00 | 07/21/23 | (93) |
| Home Depot, Inc. (The) | (501) | (17,034) | 340.00 | 07/21/23 | (6) |
| Intuit, Inc. | (243) | (12,636) | 520.00 | 07/21/23 | (12) |
| Intuitive Surgical, Inc. | (147) | (5,292) | 360.00 | 07/21/23 | (49) |
| JPMorgan Chase & Co. | (1,060) | (16,165) | 152.50 | 07/21/23 | (58) |
| Lam Research Corp. | (295) | (20,797) | 705.00 | 07/21/23 | (103) |
| Las Vegas Sands Corp. | (2,120) | (14,310) | 67.50 | 07/21/23 | (15) |
| Marvell Technology, Inc. | (1,885) | (12,818) | 68.00 | 07/21/23 | (41) |
| Mastercard, Inc. | (1,378) | (54,431) | 395.00 | 07/21/23 | (668) |
| Meta Platforms, Inc. | (370) | (12,025) | 325.00 | 07/21/23 | (19) |
| Micron Technology, Inc. | (1,315) | (10,126) | 77.00 | 07/21/23 | (4) |
| Salesforce, Inc. | (676) | (15,548) | 230.00 | 07/21/23 | (34) |
| Schlumberger N.V. | (1,311) | (7,211) | 55.00 | 07/21/23 | (30) |
| ServiceNow, Inc. | (575) | (35,937) | 625.00 | 07/21/23 | (81) |
| Starbucks Corp. | (1,027) | (11,297) | 110.00 | 07/21/23 | (5) |
| Taiwan Semiconductor Manufacturing Co. Ltd. | (1,025) | (11,992) | 117.00 | 07/21/23 | (22) |
| Trip.com Group Ltd. | (1,258) | (5,032) | 40.00 | 07/21/23 | (6) |
| Uber Technologies, Inc. | (840) | (3,780) | 45.00 | 07/21/23 | (53) |
| UnitedHealth Group, Inc. | (50) | (2,650) | 530.00 | 07/21/23 | (2) |
| Total Written Options | | $(1,828) |
| Footnote Legend: |
| (1) Strike price not reported in thousands. |
| (2) Exchange-traded options. |
See Notes to Financial Statements
Income & Growth Fund
SCHEDULE OF INVESTMENTS (Continued)
June 30, 2023
($ reported in thousands)
The following table summarizes the value of the Fund’s investments as of June 30, 2023, based on the inputs used to value them (See Security Valuation Note 2A in the Notes to Financial Statements):
| | Total
Value at
June 30, 2023 | | Level 1
Quoted Prices | | Level 2
Significant
Observable
Inputs | | Level 3
Significant
Unobservable
Inputs |
| Assets: | | | | | | | |
| Debt Instruments: | | | | | | | |
| Corporate Bonds and Notes | $1,590,243 | | $ — | | $1,587,947 | | $ 2,296(1) |
| Convertible Bonds and Notes | 1,231,401 | | — | | 1,231,401 | | — |
| Equity Securities: | | | | | | | |
| Common Stocks | 1,894,525 | | 1,887,163 | | 115 | | 7,247 (1) |
| Convertible Preferred Stocks | 122,781 | | 122,781 | | — | | — |
| Warrants | 1,198 | | 33 | | — | | 1,165 (1) |
| Preferred Stock | 2,227 | | — | | — | | 2,227 |
| Equity-Linked Notes | 50,384 | | — | | 20,884 | | 29,500 |
| Equity-Linked Warrants | 106,038 | | — | | — | | 106,038 |
| Money Market Mutual Fund | 56,146 | | 56,146 | | — | | — |
| Total Assets | 5,054,943 | | 2,066,123 | | 2,840,347 | | 148,473 |
| Liabilities: | | | | | | | |
| Other Financial Instruments: | | | | | | | |
| Written Options | (1,828) | | (1,761) | | (67) | | — |
| Total Investments, Net of Written Options | $5,053,115 | | $2,064,362 | | $2,840,280 | | $148,473 |
| (1) | Includes internally fair valued securities currently priced at zero ($0). |
There were no transfers into or out of Level 3 related to securities held at June 30, 2023.
Some of the Fund’s investments that were categorized as Level 3 were valued utilizing third party pricing information without adjustment. Such valuations are based on unobservable inputs. A significant change in third party information could result in a significantly lower or higher value of Level 3 investments.
The following is a reconciliation of assets of the Fund for Level 3 investments for which significant unobservable inputs were used to determine fair value.
| | Total | | Corporate
Bonds
And Notes | | Common
Stocks | | Preferred
Stocks | | Warrants | | Equity-Linked
Notes | | Equity-Linked
Warrants |
| Investments in Securities | | | | | | | | | | | | | |
| Balance as of June 30, 2022: | $ 11,751 | | $ 2,162(a) | | $ 3,651(a) | | $ 5,618(a) | | $ 320(a) | | $ — | | $ — |
| Net realized gain (loss) | (9,478) | | — | | (1,535) | | (7,944) | | 1 | | — | | — |
| Net change in unrealized appreciation (depreciation)(b) | 14,037 | | 163 | | 5,558 | | 7,437 | | 844 | | — | | 35 |
| Purchases | 139,812 | | 4,309 | | — | | — | | — (c) | | 29,500 | | 106,003 |
| Sales (d) | (7,649) | | (4,338) | | (427) | | (2,884) | | — | | — | | — |
| Balance as of June 30, 2023 | $ 148,473 | | $ 2,296(a) | | $ 7,247(a) | | $ 2,227 | | $ 1,165 (a) | | $ 29,500 | | $ 106,038 |
(a) Includes internally fair valued security currently priced at zero ($0).
(b) The net change in unrealized appreciation (depreciation) on investments still held at June 30, 2023, was $4,350.
(c) Amount is less than $500 (not in thousands).
(d) Includes paydowns on securities.
See Notes to Financial Statements
Income & Growth Fund
SCHEDULE OF INVESTMENTS (Continued)
June 30, 2023
($ reported in thousands)
The following table presents additional information about valuation techniques and inputs used for investments that are measured at fair value and categorized within Level 3 at June 30, 2023:
Investments in
Securities – Assets | | Ending
Balance
at June 30, 2023 | | Valuation Technique Used | | Unobservable
Inputs | | Input
Values |
| Preferred Stock: | | | | | | | | |
| LiveStyle, Inc. Series B | | $ 2,227 | | Discounted cash flows liquidation approach | | Discount rate | | 23.94% (23.37%-24.25%) |
| | | | | | | | | |
| | | | | | | | | |
| Common Stocks: | | | | | | | | |
| CCF Holdings LLC | | $ 4,969 | | Market and Company Comparables | | EV Multiples | | 1.12x (0.60x - 1.94x) |
| | | | | | | | | 5.39x (4.17x - 7.05x) |
| | | | | | | | | 0.52x (0.13x - 0.88x) |
| | | | | | | Illiquidity Discount | | 25% |
| | | | | | | | | |
| CCF Holdings LLC Class M | | $ 1,179 | | Market and Company Comparables | | EV Multiples | | 1.12x (0.60x - 1.94x) |
| | | | | | | | | 5.39x (4.17x - 7.05x) |
| | | | | | | | | 0.52x (0.13x - 0.88x) |
| | | | | | | Illiquidity Discount | | 25% |
| | | | | | | | | |
| | | | | | | | | |
| Erickson, Inc. | | $ 335 | | Market and Company Comparables | | EV Multiples | | 1.19x (0.66x - 3.09x) |
| | | | | | | | | 12.96x (10.89x - 14.92x) |
| | | | | | | | | 1.06x (0.51x - 1.86x) |
| | | | | | | M&A Transaction Multiples | | 0.96x (0.41x - 1.96x) |
| | | | | | | Illiquidity Discount | | 20% |
| | | | | | | | | |
| | | | | | | | | |
| LiveStyle, Inc. | | $ — (1) | | Discounted cash flows liquidation approach | | Discount rate | | 23.94% (23.37%-24.25%) |
| | | | | | | | | |
Postmedia Network
Canada Corp. | | $ 764 | | Market and Company Comparables | | EV Multiples | | 1.23x (0.48x - 2.61x) |
| | | | | | | | | 9.01x (2.80x - 18.73x) |
| | | | | | | Illiquidity Discount | | 10% |
| | | | | | | | | |
| | | | | | | | | |
| Quiksilver, Inc. | | $ — (2) | | Market and Company Comparables | | EV Multiples | | 0.65x (0.26x - 1.09x) |
| | | | | | | | | 0.82x (0.45x - 1.67x) |
| | | | | | | Illiquidity Discount | | 20% |
| | | | | | | | | |
| | | | | | | | | |
| Warrants: | | | | | | | | |
| CCF Holdings LLC | | $ 1,165 | | Market and Company Comparables | | EV Multiples | | 1.12x (0.60x - 1.94x) |
| | | | | | | | | 5.39x (4.17x - 7.05x) |
| | | | | | | | | 0.52x (0.13x - 0.88x) |
| | | | | | | Illiquidity Discount | | 25% |
| | | | | Black-Scholes Model | | Volatility | | 47.76% |
| | | | | | | | | |
| | | | | | | | | |
| | | | | | | | | |
| (1) Includes internally fair valued securities currently priced at zero ($0). | | | | | | | | |
| (2) Amount is less than $500 (not in thousands). | | | | | | | | |
See Notes to Financial Statements
KAR Global Small-Cap Fund
SCHEDULE OF INVESTMENTS
June 30, 2023
($ reported in thousands)
| | Shares | | Value |
| Common Stocks—99.3% |
| Brazil—5.8% | | |
| Tegma Gestao Logistica S.A. | 717,824 | | $ 3,291 |
| Canada—3.0% | | |
| CAE, Inc.(1) | 47,882 | | 1,072 |
| Pason Systems, Inc. | 74,884 | | 649 |
| | | | 1,721 |
| | | | |
| |
| China—2.7% | | |
| Haitian International Holdings Ltd. | 660,947 | | 1,550 |
| Finland—2.1% | | |
| Enento Group Oyj(1) | 51,762 | | 1,189 |
| France—1.8% | | |
| Alten S.A. | 6,404 | | 1,008 |
| Germany—1.2% | | |
| New Work SE | 5,190 | | 700 |
| Israel—0.5% | | |
| Max Stock Ltd. | 141,348 | | 291 |
| Italy—1.6% | | |
| Gruppo MutuiOnline SpA(1) | 26,115 | | 879 |
| Japan—6.3% | | |
| MarkLines Co., Ltd. | 89,744 | | 1,608 |
| Meitec Corp. | 54,977 | | 949 |
| Mercari, Inc.(1) | 44,378 | | 1,044 |
| | | | 3,601 |
| | | | |
| |
| Malaysia—1.8% | | |
| Heineken Malaysia Bhd | 178,815 | | 1,000 |
| Mexico—2.7% | | |
| Corp. Moctezuma SAB de C.V. | 436,121 | | 1,541 |
| | Shares | | Value |
| | | | |
| Norway—2.6% | | |
| Bouvet ASA | 246,239 | | $ 1,489 |
| Poland—2.1% | | |
| Grupa Pracuj S.A. | 85,244 | | 1,178 |
| Singapore—2.4% | | |
| Haw Par Corp., Ltd. | 193,217 | | 1,337 |
| South Korea—1.2% | | |
| S-1 Corp. | 16,427 | | 667 |
| Sweden—1.0% | | |
| BTS Group AB Class B | 24,479 | | 578 |
| United Kingdom—20.2% | | |
| AJ Bell plc | 317,093 | | 1,293 |
| Auto Trader Group plc | 327,459 | | 2,539 |
| Baltic Classifieds Group plc | 1,253,596 | | 2,929 |
| FDM Group Holdings plc | 196,277 | | 1,398 |
| Mortgage Advice Bureau Holdings Ltd. | 98,946 | | 741 |
| Rightmove plc | 386,271 | | 2,567 |
| | | | 11,467 |
| | | | |
| |
| United States—40.3% | | |
| Artisan Partners Asset Management, Inc. Class A | 18,892 | | 743 |
| First Hawaiian, Inc. | 45,106 | | 812 |
| Fox Factory Holding Corp.(1) | 10,292 | | 1,117 |
| FTI Consulting, Inc.(1) | 13,844 | | 2,633 |
| Landstar System, Inc. | 11,108 | | 2,139 |
| MediaAlpha, Inc. Class A(1) | 31,564 | | 325 |
| Moelis & Co. Class A | 39,857 | | 1,807 |
| Morningstar, Inc. | 3,215 | | 630 |
| nCino, Inc.(1) | 44,176 | | 1,331 |
| NVE Corp. | 9,725 | | 948 |
| Primerica, Inc. | 16,894 | | 3,341 |
| Ryan Specialty Holdings, Inc. Class A(1) | 94,176 | | 4,228 |
| | Shares | | Value |
| | | | |
| United States—continued | | |
| Simpson Manufacturing Co., Inc. | 20,112 | | $ 2,785 |
| | | | 22,839 |
| | | | |
| |
Total Common Stocks
(Identified Cost $51,539) | | 56,326 |
| | | | |
| |
| | | | |
| |
Total Long-Term Investments—99.3%
(Identified Cost $51,539) | | 56,326 |
| | | | |
| |
| | | | |
| |
TOTAL INVESTMENTS—99.3%
(Identified Cost $51,539) | | $56,326 |
| Other assets and liabilities, net—0.7% | | 408 |
| NET ASSETS—100.0% | | $56,734 |
| Footnote Legend: |
| (1) | Non-income producing. |
| Country Weightings (Unaudited)† |
| United States | 41% |
| United Kingdom | 20 |
| Japan | 6 |
| Brazil | 6 |
| Canada | 3 |
| China | 3 |
| Mexico | 3 |
| Other | 18 |
| Total | 100% |
| † % of total investments as of June 30, 2023. |
The following table summarizes the value of the Fund’s investments as of June 30, 2023, based on the inputs used to value them (See Security Valuation Note 2A in the Notes to Financial Statements):
| | Total
Value at
June 30, 2023 | | Level 1
Quoted Prices | | Level 2
Significant
Observable
Inputs |
| Assets: | | | | | |
| Equity Securities: | | | | | |
| Common Stocks | $56,326 | | $48,171 | | $8,155 |
| Total Investments | $56,326 | | $48,171 | | $8,155 |
There were no securities valued using significant unobservable inputs (Level 3) at June 30, 2023.
There were no transfers into or out of Level 3 related to securities held at June 30, 2023.
See Notes to Financial Statements
KAR Health Sciences Fund
SCHEDULE OF INVESTMENTS
June 30, 2023
($ reported in thousands)
| | Shares | | Value |
| Common Stocks—99.6% |
| Biotechnology—12.8% | | |
| AbbVie, Inc. | 45,547 | | $ 6,136 |
| Amgen, Inc. | 10,011 | | 2,223 |
| Moderna, Inc.(1) | 24,902 | | 3,026 |
| Regeneron Pharmaceuticals, Inc.(1) | 4,295 | | 3,086 |
| Vertex Pharmaceuticals, Inc.(1) | 14,854 | | 5,227 |
| | | | 19,698 |
| | | | |
| |
Healthcare Equipment &
Supplies—30.3% | | |
| Align Technology, Inc.(1) | 11,836 | | 4,186 |
| Cooper Cos., Inc. (The) | 18,640 | | 7,147 |
| Edwards Lifesciences Corp.(1) | 48,636 | | 4,588 |
| IDEXX Laboratories, Inc.(1) | 15,882 | | 7,976 |
| Insulet Corp.(1) | 13,051 | | 3,763 |
| Intuitive Surgical, Inc.(1) | 10,623 | | 3,633 |
| Silk Road Medical, Inc.(1) | 96,332 | | 3,130 |
| STAAR Surgical Co.(1) | 76,640 | | 4,029 |
| STERIS plc | 15,313 | | 3,445 |
| Teleflex, Inc. | 18,879 | | 4,569 |
| | | | 46,466 |
| | | | |
| |
| | Shares | | Value |
| | | | |
Healthcare Providers &
Services—14.3% | | |
| HealthEquity, Inc.(1) | 52,512 | | $ 3,316 |
| McKesson Corp. | 14,371 | | 6,141 |
| U.S. Physical Therapy, Inc. | 47,686 | | 5,788 |
| UnitedHealth Group, Inc. | 13,911 | | 6,686 |
| | | | 21,931 |
| | | | |
| |
| Life Sciences Tools & Services—20.5% | | |
| Azenta, Inc.(1) | 86,174 | | 4,023 |
| Charles River Laboratories International, Inc.(1) | 15,379 | | 3,234 |
| Danaher Corp. | 24,801 | | 5,952 |
| Mettler-Toledo International, Inc.(1) | 4,346 | | 5,700 |
| Thermo Fisher Scientific, Inc. | 10,241 | | 5,343 |
| West Pharmaceutical Services, Inc. | 18,597 | | 7,113 |
| | | | 31,365 |
| | | | |
| |
| Pharmaceuticals—21.7% | | |
| Bristol-Myers Squibb Co. | 68,093 | | 4,354 |
| Eli Lilly & Co. | 23,803 | | 11,163 |
| Merck & Co., Inc. | 55,990 | | 6,461 |
| Pfizer, Inc. | 131,642 | | 4,829 |
| | Shares | | Value |
| | | | |
| Pharmaceuticals—continued | | |
| Zoetis, Inc. Class A | 37,261 | | $ 6,417 |
| | | | 33,224 |
| | | | |
| |
Total Common Stocks
(Identified Cost $144,691) | | 152,684 |
| | | | |
| |
| | | | |
| |
Total Long-Term Investments—99.6%
(Identified Cost $144,691) | | 152,684 |
| | | | |
| |
| | | | |
| |
TOTAL INVESTMENTS—99.6%
(Identified Cost $144,691) | | $152,684 |
| Other assets and liabilities, net—0.4% | | 636 |
| NET ASSETS—100.0% | | $153,320 |
| Footnote Legend: |
| (1) | Non-income producing. |
The following table summarizes the value of the Fund’s investments as of June 30, 2023, based on the inputs used to value them (See Security Valuation Note 2A in the Notes to Financial Statements):
| | Total
Value at
June 30, 2023 | | Level 1
Quoted Prices |
| Assets: | | | |
| Equity Securities: | | | |
| Common Stocks | $152,684 | | $152,684 |
| Total Investments | $152,684 | | $152,684 |
There were no securities valued using significant observable inputs (Level 2) or significant unobservable inputs (Level 3) at June 30, 2023.
There were no transfers into or out of Level 3 related to securities held at June 30, 2023.
See Notes to Financial Statements
NFJ Dividend Value Fund
SCHEDULE OF INVESTMENTS
June 30, 2023
($ reported in thousands)
| | Shares | | Value |
| Common Stocks—96.7% |
| Communication Services—3.3% | | |
| Comcast Corp. Class A | 352,376 | | $ 14,641 |
| Electronic Arts, Inc. | 52,346 | | 6,789 |
| | | | 21,430 |
| | | | |
| |
| Consumer Discretionary—6.2% | | |
| Best Buy Co., Inc. | 76,672 | | 6,283 |
| Home Depot, Inc. (The) | 64,713 | | 20,103 |
| Ross Stores, Inc. | 82,246 | | 9,222 |
| Wendy’s Co. (The) | 202,842 | | 4,412 |
| | | | 40,020 |
| | | | |
| |
| Consumer Staples—1.3% | | |
| Tyson Foods, Inc. Class A | 162,838 | | 8,311 |
| Energy—4.8% | | |
| EOG Resources, Inc. | 56,639 | | 6,482 |
| ONEOK, Inc. | 92,873 | | 5,732 |
| Ovintiv, Inc. | 174,261 | | 6,634 |
| Phillips 66 | 60,767 | | 5,796 |
| Pioneer Natural Resources Co. | 31,807 | | 6,590 |
| | | | 31,234 |
| | | | |
| |
| Financials—25.6% | | |
| Bank of America Corp. | 903,789 | | 25,930 |
| BlackRock, Inc. Class A | 12,502 | | 8,641 |
| Blackstone Mortgage Trust, Inc. Class A | 268,613 | | 5,590 |
| Blackstone, Inc. | 58,270 | | 5,417 |
| Capital One Financial Corp. | 68,187 | | 7,458 |
| Citigroup, Inc. | 193,027 | | 8,887 |
| Fidelity National Financial, Inc. | 187,362 | | 6,745 |
| Global Payments, Inc. | 54,794 | | 5,398 |
| Intercontinental Exchange, Inc. | 65,754 | | 7,435 |
| Jack Henry & Associates, Inc. | 41,625 | | 6,965 |
| JPMorgan Chase & Co. | 47,185 | | 6,863 |
| Mastercard, Inc. Class A | 24,457 | | 9,619 |
| MetLife, Inc. | 119,283 | | 6,743 |
| | Shares | | Value |
| | | | |
| Financials—continued | | |
| Morgan Stanley | 142,241 | | $ 12,147 |
| MSCI, Inc. Class A | 26,680 | | 12,521 |
| PNC Financial Services Group, Inc. (The) | 109,540 | | 13,796 |
| U.S. Bancorp | 487,653 | | 16,112 |
| | | | 166,267 |
| | | | |
| |
| Health Care—13.4% | | |
| Abbott Laboratories | 114,346 | | 12,466 |
| Agilent Technologies, Inc. | 107,720 | | 12,953 |
| Baxter International, Inc. | 209,887 | | 9,563 |
| Medtronic plc | 77,642 | | 6,840 |
| Teleflex, Inc. | 53,805 | | 13,023 |
| Thermo Fisher Scientific, Inc. | 30,525 | | 15,926 |
| Zoetis, Inc. Class A | 93,320 | | 16,071 |
| | | | 86,842 |
| | | | |
| |
| Industrials—13.0% | | |
| Cummins, Inc. | 22,339 | | 5,477 |
| FedEx Corp. | 27,751 | | 6,879 |
| Genpact Ltd. | 167,907 | | 6,308 |
| L3Harris Technologies, Inc. | 32,919 | | 6,445 |
| Paycom Software, Inc. | 63,345 | | 20,349 |
| Stanley Black & Decker, Inc. | 135,965 | | 12,741 |
| TransUnion | 168,699 | | 13,214 |
| Union Pacific Corp. | 63,643 | | 13,023 |
| | | | 84,436 |
| | | | |
| |
| Information Technology—8.7% | | |
| Accenture plc Class A | 19,443 | | 6,000 |
| Apple, Inc. | 28,358 | | 5,501 |
| Cisco Systems, Inc. | 115,671 | | 5,985 |
| Intuit, Inc. | 54,945 | | 25,175 |
| Microsoft Corp. | 23,068 | | 7,855 |
| QUALCOMM, Inc. | 51,797 | | 6,166 |
| | | | 56,682 |
| | | | |
| |
| Materials—6.6% | | |
| Ball Corp. | 174,644 | | 10,166 |
| Celanese Corp. Class A | 176,069 | | 20,389 |
| | Shares | | Value |
| | | | |
| Materials—continued | | |
| LyondellBasell Industries N.V. Class A | 70,286 | | $ 6,454 |
| Pan American Silver Corp. | 373,896 | | 5,452 |
| | | | 42,461 |
| | | | |
| |
| Real Estate—11.9% | | |
| Alexandria Real Estate Equities, Inc. | 210,841 | | 23,928 |
| American Tower Corp. | 31,585 | | 6,126 |
| Digital Realty Trust, Inc. | 65,587 | | 7,468 |
| Invitation Homes, Inc. | 215,152 | | 7,401 |
| Rexford Industrial Realty, Inc. | 247,850 | | 12,943 |
| SBA Communications Corp. Class A | 57,228 | | 13,263 |
| Sun Communities, Inc. | 48,251 | | 6,295 |
| | | | 77,424 |
| | | | |
| |
| Utilities—1.9% | | |
| American Water Works Co., Inc. | 41,072 | | 5,863 |
| Eversource Energy | 89,596 | | 6,354 |
| | | | 12,217 |
| | | | |
| |
Total Common Stocks
(Identified Cost $586,822) | | 627,324 |
| | | | |
| |
| | | | |
| |
Total Long-Term Investments—96.7%
(Identified Cost $586,822) | | 627,324 |
| | | | |
| |
| | | | |
| |
TOTAL INVESTMENTS—96.7%
(Identified Cost $586,822) | | $627,324 |
| Other assets and liabilities, net—3.3% | | 21,485 |
| NET ASSETS—100.0% | | $648,809 |
| Abbreviation: |
| MSCI | Morgan Stanley Capital International |
For information regarding the abbreviations, see the Key Investment Terms starting on page 6.
See Notes to Financial Statements
NFJ Dividend Value Fund
SCHEDULE OF INVESTMENTS (Continued)
June 30, 2023
($ reported in thousands)
The following table summarizes the value of the Fund’s investments as of June 30, 2023, based on the inputs used to value them (See Security Valuation Note 2A in the Notes to Financial Statements):
| | Total
Value at
June 30, 2023 | | Level 1
Quoted Prices |
| Assets: | | | |
| Equity Securities: | | | |
| Common Stocks | $627,324 | | $627,324 |
| Total Investments | $627,324 | | $627,324 |
There were no securities valued using significant observable inputs (Level 2) or significant unobservable inputs (Level 3) at June 30, 2023.
There were no transfers into or out of Level 3 related to securities held at June 30, 2023.
See Notes to Financial Statements
NFJ International Value Fund
SCHEDULE OF INVESTMENTS
June 30, 2023
($ reported in thousands)
| | Shares | | Value |
| Common Stocks—96.3% |
| Austria—1.0% | | |
| Erste Group Bank AG | 28,298 | | $ 991 |
| Belgium—2.0% | | |
| KBC Group N.V. | 13,989 | | 976 |
| Umicore S.A. | 33,437 | | 933 |
| | | | 1,909 |
| | | | |
| |
| Canada—3.4% | | |
| Cogeco Communications, Inc. | 29,175 | | 1,557 |
| Pan American Silver Corp. | 45,110 | | 657 |
| RB Global, Inc. | 18,237 | | 1,094 |
| | | | 3,308 |
| | | | |
| |
| China—20.3% | | |
| Alibaba Group Holding Ltd.(1) | 231,900 | | 2,414 |
| ANTA Sports Products Ltd. | 59,400 | | 610 |
| China Merchants Bank Co., Ltd. Class A | 771,000 | | 3,486 |
| Contemporary Amperex Technology Co., Ltd. Class A | 27,900 | | 882 |
| ENN Energy Holdings Ltd. | 183,700 | | 2,298 |
| Inner Mongolia Yili Industrial Group Co., Ltd. Class A | 222,600 | | 869 |
| JD.com, Inc. Class A | 152,900 | | 2,608 |
| Li Ning Co., Ltd. | 167,500 | | 904 |
| Luxshare Precision Industry Co., Ltd. Class A | 497,375 | | 2,232 |
| NetEase, Inc. | 19,000 | | 368 |
| Ping An Bank Co., Ltd. Class A | 519,755 | | 806 |
| Ping An Insurance Group Co. of China Ltd. Class A | 96,400 | | 616 |
| Shenzhou International Group Holdings Ltd. | 76,800 | | 738 |
| Tencent Holdings Ltd. | 20,600 | | 873 |
| | | | 19,704 |
| | | | |
| |
| Finland—2.7% | | |
| Kesko Oyj Class B | 32,641 | | 614 |
| Neste Oyj | 31,213 | | 1,201 |
| Valmet Oyj | 27,539 | | 766 |
| | | | 2,581 |
| | | | |
| |
| France—10.2% | | |
| BioMerieux | 36,236 | | 3,801 |
| BNP Paribas S.A. | 14,909 | | 939 |
| Dassault Systemes SE | 35,535 | | 1,575 |
| Kering S.A. | 1,508 | | 832 |
| Sartorius Stedim Biotech | 3,530 | | 881 |
| Teleperformance | 11,166 | | 1,870 |
| | | | 9,898 |
| | | | |
| |
| Germany—5.9% | | |
| BASF SE | 16,855 | | 818 |
| | Shares | | Value |
| | | | |
| Germany—continued | | |
| Carl Zeiss Meditec AG | 8,450 | | $ 913 |
| Puma SE | 19,641 | | 1,181 |
| Sartorius AG | 3,474 | | 978 |
| Vonovia SE | 94,204 | | 1,840 |
| | | | 5,730 |
| | | | |
| |
| Hong Kong—2.9% | | |
| Techtronic Industries Co., Ltd. | 261,500 | | 2,860 |
| India—0.7% | | |
| HDFC Bank Ltd. ADR | 10,299 | | 718 |
| Ireland—0.9% | | |
| Kingspan Group plc | 12,916 | | 858 |
| Israel—9.8% | | |
| Bank Hapoalim BM | 174,384 | | 1,429 |
| Bank Leumi Le-Israel BM | 196,315 | | 1,461 |
| Israel Discount Bank Ltd. Class A | 302,232 | | 1,501 |
| Mizrahi Tefahot Bank Ltd. | 45,244 | | 1,505 |
| Nice Ltd.(1) | 17,790 | | 3,633 |
| | | | 9,529 |
| | | | |
| |
| Italy—1.9% | | |
| Amplifon SpA | 19,349 | | 709 |
| FinecoBank Banca Fineco SpA | 87,057 | | 1,170 |
| | | | 1,879 |
| | | | |
| |
| Japan—4.8% | | |
| MISUMI Group, Inc. | 36,300 | | 731 |
| MonotaRO Co., Ltd. | 257,100 | | 3,283 |
| Sony Group Corp. | 7,600 | | 686 |
| | | | 4,700 |
| | | | |
| |
| Luxembourg—1.2% | | |
| Globant S.A.(1) | 6,261 | | 1,125 |
| Netherlands—7.8% | | |
| ASML Holding N.V. | 5,100 | | 3,690 |
| Euronext N.V. | 28,219 | | 1,918 |
| IMCD N.V. | 6,777 | | 974 |
| NN Group N.V. | 26,744 | | 990 |
| | | | 7,572 |
| | | | |
| |
| Saudi Arabia—0.9% | | |
| Saudi Arabian Oil Co. | 105,055 | | 903 |
| South Africa—1.4% | | |
| Capitec Bank Holdings Ltd. | 16,048 | | 1,337 |
| Spain—0.6% | | |
| Industria de Diseno Textil S.A. | 14,150 | | 548 |
| Sweden—0.9% | | |
| Evolution AB | 6,595 | | 835 |
| | Shares | | Value |
| | | | |
| Switzerland—3.9% | | |
| Partners Group Holding AG | 4,003 | | $ 3,764 |
| Taiwan—1.0% | | |
| Taiwan Semiconductor Manufacturing Co., Ltd. | 53,000 | | 979 |
| United Kingdom—5.2% | | |
| London Stock Exchange Group plc | 6,893 | | 733 |
| Rio Tinto plc | 15,388 | | 974 |
| Segro plc | 373,407 | | 3,399 |
| | | | 5,106 |
| | | | |
| |
| United States—6.9% | | |
| Adobe, Inc. (1) | 1,984 | | 970 |
| Allegion plc | 8,785 | | 1,054 |
| Enphase Energy, Inc.(1) | 5,660 | | 948 |
| Fabrinet (1) | 7,462 | | 969 |
| Ovintiv, Inc. | 53,899 | | 2,052 |
| Stanley Black & Decker, Inc. | 7,506 | | 704 |
| | | | 6,697 |
| | | | |
| |
Total Common Stocks
(Identified Cost $95,657) | | 93,531 |
| | | | |
| |
| | | | |
| |
Total Long-Term Investments—96.3%
(Identified Cost $95,657) | | 93,531 |
| | | | |
| |
| | | | |
| |
TOTAL INVESTMENTS—96.3%
(Identified Cost $95,657) | | $93,531 |
| Other assets and liabilities, net—3.7% | | 3,593 |
| NET ASSETS—100.0% | | $97,124 |
| Abbreviation: |
| ADR | American Depositary Receipt |
| Footnote Legend: |
| (1) | Non-income producing. |
| Country Weightings (Unaudited)† |
| China | 21% |
| France | 11 |
| Israel | 10 |
| Netherlands | 8 |
| United States | 7 |
| Germany | 6 |
| United Kingdom | 5 |
| Other | 32 |
| Total | 100% |
| † % of total investments as of June 30, 2023. |
For information regarding the abbreviations, see the Key Investment Terms starting on page 6.
See Notes to Financial Statements
NFJ International Value Fund
SCHEDULE OF INVESTMENTS (Continued)
June 30, 2023
($ reported in thousands)
The following table summarizes the value of the Fund’s investments as of June 30, 2023, based on the inputs used to value them (See Security Valuation Note 2A in the Notes to Financial Statements):
| | Total
Value at
June 30, 2023 | | Level 1
Quoted Prices | | Level 2
Significant
Observable
Inputs |
| Assets: | | | | | |
| Equity Securities: | | | | | |
| Common Stocks | $93,531 | | $65,288 | | $28,243 |
| Total Investments | $93,531 | | $65,288 | | $28,243 |
There were no securities valued using significant observable inputs (Level 2) or significant unobservable inputs (Level 3) at June 30, 2023.
There were no transfers into or out of Level 3 related to securities held at June 30, 2023.
See Notes to Financial Statements
NFJ Large-Cap Value Fund
SCHEDULE OF INVESTMENTS
June 30, 2023
($ reported in thousands)
| | Shares | | Value |
| Common Stocks—97.5% |
| Communication Services—6.8% | | |
| Alphabet, Inc. Class A(1) | 10,664 | | $ 1,276 |
| Cable One, Inc. | 4,319 | | 2,838 |
| Comcast Corp. Class A | 136,210 | | 5,660 |
| Meta Platforms, Inc. Class A(1) | 10,229 | | 2,935 |
| Take-Two Interactive Software, Inc.(1) | 20,547 | | 3,024 |
| Walt Disney Co. (The)(1) | 39,434 | | 3,521 |
| | | | 19,254 |
| | | | |
| |
| Consumer Discretionary—8.4% | | |
| Best Buy Co., Inc. | 43,822 | | 3,591 |
| Domino’s Pizza, Inc. | 3,679 | | 1,240 |
| Home Depot, Inc. (The) | 17,779 | | 5,523 |
| Pool Corp. | 12,623 | | 4,729 |
| Puma SE Unsponsored ADR | 503,624 | | 3,002 |
| Ross Stores, Inc. | 21,430 | | 2,403 |
| TopBuild Corp.(1) | 11,441 | | 3,043 |
| | | | 23,531 |
| | | | |
| |
| Consumer Staples—0.9% | | |
| Tyson Foods, Inc. Class A | 50,524 | | 2,579 |
| Energy—5.0% | | |
| EOG Resources, Inc. | 26,673 | | 3,053 |
| ONEOK, Inc. | 28,797 | | 1,777 |
| Ovintiv, Inc. | 72,029 | | 2,742 |
| Phillips 66 | 22,248 | | 2,122 |
| Pioneer Natural Resources Co. | 21,113 | | 4,374 |
| | | | 14,068 |
| | | | |
| |
| Financials—21.6% | | |
| Bank of America Corp. | 237,722 | | 6,820 |
| BlackRock, Inc. Class A | 3,586 | | 2,478 |
| Capital One Financial Corp. | 28,321 | | 3,098 |
| Citigroup, Inc. | 66,442 | | 3,059 |
| CME Group, Inc. Class A | 14,015 | | 2,597 |
| Fidelity National Financial, Inc. | 37,836 | | 1,362 |
| First American Financial Corp. | 25,945 | | 1,479 |
| Fiserv, Inc.(1) | 11,504 | | 1,451 |
| Global Payments, Inc. | 23,697 | | 2,335 |
| Goldman Sachs Group, Inc. (The) | 8,332 | | 2,687 |
| Intercontinental Exchange, Inc. | 26,059 | | 2,947 |
| Jack Henry & Associates, Inc. | 17,311 | | 2,897 |
| JPMorgan Chase & Co. | 39,320 | | 5,719 |
| Morgan Stanley | 47,037 | | 4,017 |
| PNC Financial Services Group, Inc. (The) | 45,402 | | 5,718 |
| | Shares | | Value |
| | | | |
| Financials—continued | | |
| T. Rowe Price Group, Inc. | 22,861 | | $ 2,561 |
| Truist Financial Corp. | 177,984 | | 5,402 |
| U.S. Bancorp | 128,510 | | 4,246 |
| | | | 60,873 |
| | | | |
| |
| Health Care—12.7% | | |
| Abbott Laboratories | 24,614 | | 2,683 |
| Agilent Technologies, Inc. | 41,290 | | 4,965 |
| Amgen, Inc. | 6,829 | | 1,516 |
| Baxter International, Inc. | 90,615 | | 4,129 |
| Bristol-Myers Squibb Co. | 29,054 | | 1,858 |
| Edwards Lifesciences Corp.(1) | 15,534 | | 1,465 |
| Medtronic plc | 31,342 | | 2,761 |
| Teleflex, Inc. | 15,740 | | 3,810 |
| Thermo Fisher Scientific, Inc. | 7,141 | | 3,726 |
| Veeva Systems, Inc. Class A(1) | 15,638 | | 3,092 |
| Zoetis, Inc. Class A | 32,918 | | 5,669 |
| | | | 35,674 |
| | | | |
| |
| Industrials—12.9% | | |
| Carrier Global Corp. | 30,426 | | 1,512 |
| Cummins, Inc. | 10,626 | | 2,605 |
| Emerson Electric Co. | 14,983 | | 1,354 |
| FedEx Corp. | 12,283 | | 3,045 |
| Honeywell International, Inc. | 13,506 | | 2,803 |
| Leidos Holdings, Inc. | 27,882 | | 2,467 |
| Lennox International, Inc. | 4,972 | | 1,621 |
| Paycom Software, Inc. | 12,814 | | 4,116 |
| Paylocity Holding Corp.(1) | 14,214 | | 2,623 |
| Stanley Black & Decker, Inc. | 68,181 | | 6,389 |
| TransUnion | 72,841 | | 5,706 |
| Union Pacific Corp. | 10,033 | | 2,053 |
| | | | 36,294 |
| | | | |
| |
| Information Technology—11.9% | | |
| Adobe, Inc. (1) | 11,002 | | 5,380 |
| Apple, Inc. | 13,860 | | 2,688 |
| Cisco Systems, Inc. | 50,291 | | 2,602 |
| Globant S.A.(1) | 15,762 | | 2,833 |
| Intel Corp. | 59,510 | | 1,990 |
| Intuit, Inc. | 11,832 | | 5,421 |
| Microsoft Corp. | 14,822 | | 5,047 |
| QUALCOMM, Inc. | 20,923 | | 2,491 |
| Salesforce, Inc.(1) | 6,331 | | 1,338 |
| ServiceNow, Inc.(1) | 2,331 | | 1,310 |
| Teledyne Technologies, Inc.(1) | 5,803 | | 2,386 |
| | | | 33,486 |
| | | | |
| |
| Materials—6.7% | | |
| Avery Dennison Corp. | 9,017 | | 1,549 |
| | Shares | | Value |
| | | | |
| Materials—continued | | |
| Ball Corp. | 64,134 | | $ 3,733 |
| Celanese Corp. Class A | 72,085 | | 8,348 |
| LyondellBasell Industries N.V. Class A | 29,138 | | 2,676 |
| Pan American Silver Corp. | 166,742 | | 2,431 |
| | | | 18,737 |
| | | | |
| |
| Real Estate—9.3% | | |
| Alexandria Real Estate Equities, Inc. | 63,613 | | 7,220 |
| American Tower Corp. | 17,836 | | 3,459 |
| Digital Realty Trust, Inc. | 13,989 | | 1,593 |
| Invitation Homes, Inc. | 83,030 | | 2,856 |
| Medical Properties Trust, Inc. | 305,000 | | 2,824 |
| Rexford Industrial Realty, Inc. | 53,091 | | 2,772 |
| SBA Communications Corp. Class A | 18,384 | | 4,261 |
| Sun Communities, Inc. | 9,803 | | 1,279 |
| | | | 26,264 |
| | | | |
| |
| Utilities—1.3% | | |
| American Water Works Co., Inc. | 16,143 | | 2,304 |
| Eversource Energy | 19,468 | | 1,381 |
| | | | 3,685 |
| | | | |
| |
Total Common Stocks
(Identified Cost $256,971) | | 274,445 |
| | | | |
| |
| | | | |
| |
Total Long-Term Investments—97.5%
(Identified Cost $256,971) | | 274,445 |
| | | | |
| |
| | | | |
| |
TOTAL INVESTMENTS—97.5%
(Identified Cost $256,971) | | $274,445 |
| Other assets and liabilities, net—2.5% | | 7,011 |
| NET ASSETS—100.0% | | $281,456 |
| Abbreviation: |
| ADR | American Depositary Receipt |
| Footnote Legend: |
| (1) | Non-income producing. |
For information regarding the abbreviations, see the Key Investment Terms starting on page 6.
See Notes to Financial Statements
NFJ Large-Cap Value Fund
SCHEDULE OF INVESTMENTS (Continued)
June 30, 2023
($ reported in thousands)
The following table summarizes the value of the Fund’s investments as of June 30, 2023, based on the inputs used to value them (See Security Valuation Note 2A in the Notes to Financial Statements):
| | Total
Value at
June 30, 2023 | | Level 1
Quoted Prices |
| Assets: | | | |
| Equity Securities: | | | |
| Common Stocks | $274,445 | | $274,445 |
| Total Investments | $274,445 | | $274,445 |
There were no securities valued using significant observable inputs (Level 2) or significant unobservable inputs (Level 3) at June 30, 2023.
There were no transfers into or out of Level 3 related to securities held at June 30, 2023.
See Notes to Financial Statements
NFJ Mid-Cap Value Fund
SCHEDULE OF INVESTMENTS
June 30, 2023
($ reported in thousands)
| | Shares | | Value |
| Common Stocks—99.0% |
| Communication Services—4.1% | | |
| Cogeco Communications, Inc. | 379,969 | | $ 20,276 |
| Electronic Arts, Inc. | 68,015 | | 8,822 |
| Sirius XM Holdings, Inc. | 2,355,482 | | 10,670 |
| | | | 39,768 |
| | | | |
| |
| Consumer Discretionary—11.3% | | |
| Best Buy Co., Inc. | 121,921 | | 9,992 |
| Domino’s Pizza, Inc. | 31,073 | | 10,471 |
| Fox Factory Holding Corp.(1) | 80,196 | | 8,702 |
| Helen of Troy Ltd.(1) | 89,130 | | 9,628 |
| JD.com, Inc. ADR | 388,448 | | 13,258 |
| Lowe’s Cos., Inc. | 40,843 | | 9,218 |
| Lululemon Athletica, Inc.(1) | 24,759 | | 9,371 |
| Pool Corp. | 25,943 | | 9,719 |
| Puma SE Unsponsored ADR | 1,639,711 | | 9,773 |
| Whirlpool Corp. | 66,411 | | 9,881 |
| Winnebago Industries, Inc. | 141,674 | | 9,448 |
| | | | 109,461 |
| | | | |
| |
| Consumer Staples—1.9% | | |
| Tyson Foods, Inc. Class A | 358,700 | | 18,308 |
| Energy—3.0% | | |
| HF Sinclair Corp. | 216,723 | | 9,668 |
| Ovintiv, Inc. | 522,201 | | 19,880 |
| | | | 29,548 |
| | | | |
| |
| Financials—23.9% | | |
| Annaly Capital Management, Inc. | 466,928 | | 9,343 |
| Capital One Financial Corp. | 166,203 | | 18,178 |
| Citigroup, Inc. | 202,714 | | 9,333 |
| Citizens Financial Group, Inc. | 533,698 | | 13,919 |
| Commerce Bancshares, Inc. | 167,259 | | 8,145 |
| Erste Group Bank AG Sponsored ADR | 533,824 | | 9,330 |
| Fidelity National Financial, Inc. | 271,885 | | 9,788 |
| First Financial Bankshares, Inc. | 326,125 | | 9,291 |
| Global Payments, Inc. | 90,958 | | 8,961 |
| Hamilton Lane, Inc. Class A | 120,965 | | 9,675 |
| Jack Henry & Associates, Inc. | 59,213 | | 9,908 |
| Lakeland Financial Corp. | 179,184 | | 8,694 |
| MarketAxess Holdings, Inc. | 35,060 | | 9,165 |
| MSCI, Inc. Class A | 30,107 | | 14,129 |
| NN Group N.V. Unsponsored ADR | 507,956 | | 9,382 |
| PayPal Holdings, Inc.(1) | 147,305 | | 9,830 |
| PNC Financial Services Group, Inc. (The) | 148,687 | | 18,727 |
| T. Rowe Price Group, Inc. | 85,293 | | 9,555 |
| Truist Financial Corp. | 583,931 | | 17,722 |
| | Shares | | Value |
| | | | |
| Financials—continued | | |
| U.S. Bancorp | 572,507 | | $ 18,916 |
| | | | 231,991 |
| | | | |
| |
| Health Care—11.7% | | |
| Agilent Technologies, Inc. | 81,703 | | 9,825 |
| Bio-Rad Laboratories, Inc. Class A(1) | 21,961 | | 8,326 |
| Bio-Techne Corp. | 110,829 | | 9,047 |
| Charles River Laboratories International, Inc.(1) | 42,586 | | 8,954 |
| Edwards Lifesciences Corp.(1) | 103,991 | | 9,809 |
| IQVIA Holdings, Inc.(1) | 65,028 | | 14,616 |
| Teleflex, Inc. | 67,603 | | 16,362 |
| Veeva Systems, Inc. Class A(1) | 89,893 | | 17,775 |
| Waters Corp.(1) | 37,645 | | 10,034 |
| Zoetis, Inc. Class A | 50,981 | | 8,779 |
| | | | 113,527 |
| | | | |
| |
| Industrials—10.9% | | |
| Allegion plc | 80,395 | | 9,649 |
| Carrier Global Corp. | 193,861 | | 9,637 |
| Genpact Ltd. | 251,442 | | 9,447 |
| MonotaRO Co., Ltd. Unsponsored ADR | 637,093 | | 8,110 |
| Paycom Software, Inc. | 58,309 | | 18,731 |
| Paylocity Holding Corp.(1) | 101,357 | | 18,703 |
| Stanley Black & Decker, Inc. | 103,182 | | 9,669 |
| Toro Co. (The) | 78,953 | | 8,026 |
| TransUnion | 184,028 | | 14,415 |
| | | | 106,387 |
| | | | |
| |
| Information Technology—6.5% | | |
| Enphase Energy, Inc.(1) | 54,629 | | 9,149 |
| Globant S.A.(1) | 51,901 | | 9,328 |
| Keysight Technologies, Inc.(1) | 57,960 | | 9,705 |
| Nice Ltd. Sponsored ADR(1) | 83,836 | | 17,312 |
| Skyworks Solutions, Inc. | 80,773 | | 8,941 |
| Teledyne Technologies, Inc.(1) | 22,149 | | 9,106 |
| | | | 63,541 |
| | | | |
| |
| Materials—8.0% | | |
| Ball Corp. | 164,488 | | 9,575 |
| BASF SE Sponsored ADR | 718,430 | | 8,707 |
| Celanese Corp. Class A | 168,005 | | 19,455 |
| Eastman Chemical Co. | 114,384 | | 9,576 |
| Kaiser Aluminum Corp. | 149,154 | | 10,685 |
| Tronox Holdings plc | 783,444 | | 9,958 |
| Westrock Co. | 331,126 | | 9,626 |
| | | | 77,582 |
| | | | |
| |
| Real Estate—13.3% | | |
| Alexandria Real Estate Equities, Inc. | 157,880 | | 17,918 |
| | Shares | | Value |
| | | | |
| Real Estate—continued | | |
| Crown Castle, Inc. | 119,166 | | $ 13,578 |
| Digital Realty Trust, Inc. | 129,180 | | 14,710 |
| Douglas Emmett, Inc. | 622,037 | | 7,819 |
| Equity Residential | 143,637 | | 9,476 |
| Essex Property Trust, Inc. | 41,363 | | 9,691 |
| Invitation Homes, Inc. | 275,070 | | 9,462 |
| National Storage Affiliates Trust | 244,689 | | 8,523 |
| Rexford Industrial Realty, Inc. | 244,640 | | 12,775 |
| Sun Communities, Inc. | 69,731 | | 9,097 |
| Vonovia SE Unsponsored ADR | 1,680,784 | | 16,337 |
| | | | 129,386 |
| | | | |
| |
| Utilities—4.4% | | |
| Enel SpA Unsponsored ADR | 1,447,198 | | 9,682 |
| ENN Energy Holdings Ltd. Unsponsored ADR | 185,779 | | 9,313 |
| Eversource Energy | 204,145 | | 14,478 |
| UGI Corp. | 354,653 | | 9,565 |
| | | | 43,038 |
| | | | |
| |
Total Common Stocks
(Identified Cost $953,862) | | 962,537 |
| | | | |
| |
| | | | |
| |
Total Long-Term Investments—99.0%
(Identified Cost $953,862) | | 962,537 |
| | | | |
| |
| | | | |
| |
TOTAL INVESTMENTS—99.0%
(Identified Cost $953,862) | | $962,537 |
| Other assets and liabilities, net—1.0% | | 9,997 |
| NET ASSETS—100.0% | | $972,534 |
| Abbreviations: |
| ADR | American Depositary Receipt |
| MSCI | Morgan Stanley Capital International |
| Footnote Legend: |
| (1) | Non-income producing. |
| Country Weightings (Unaudited)† |
| United States | 81% |
| Germany | 4 |
| Canada | 3 |
| Bermuda | 2 |
| Israel | 2 |
| China | 1 |
| United Kingdom | 1 |
| Other | 6 |
| Total | 100% |
| † % of total investments as of June 30, 2023. |
For information regarding the abbreviations, see the Key Investment Terms starting on page 6.
See Notes to Financial Statements
NFJ Mid-Cap Value Fund
SCHEDULE OF INVESTMENTS (Continued)
June 30, 2023
($ reported in thousands)
The following table summarizes the value of the Fund’s investments as of June 30, 2023, based on the inputs used to value them (See Security Valuation Note 2A in the Notes to Financial Statements):
| | Total
Value at
June 30, 2023 | | Level 1
Quoted Prices |
| Assets: | | | |
| Equity Securities: | | | |
| Common Stocks | $962,537 | | $962,537 |
| Total Investments | $962,537 | | $962,537 |
There were no securities valued using significant observable inputs (Level 2) or significant unobservable inputs (Level 3) at June 30, 2023.
There were no transfers into or out of Level 3 related to securities held at June 30, 2023.
See Notes to Financial Statements
NFJ Small-Cap Value Fund
SCHEDULE OF INVESTMENTS
June 30, 2023
($ reported in thousands)
| | Shares | | Value |
| Common Stocks—98.8% |
| Communication Services—2.2% | | |
| Cogeco Communications, Inc. | 151,781 | | $ 8,099 |
| Consumer Discretionary—11.6% | | |
| Acushnet Holdings Corp. | 68,237 | | 3,731 |
| Fox Factory Holding Corp.(1) | 39,818 | | 4,321 |
| Helen of Troy Ltd.(1) | 32,898 | | 3,554 |
| La-Z-Boy, Inc. | 137,110 | | 3,927 |
| Leslie’s, Inc.(1) | 171,001 | | 1,606 |
| Malibu Boats, Inc. Class A(1) | 65,757 | | 3,857 |
| TopBuild Corp.(1) | 14,171 | | 3,770 |
| Wendy’s Co. (The) | 171,872 | | 3,738 |
| Whirlpool Corp. | 28,040 | | 4,172 |
| Winnebago Industries, Inc. | 55,689 | | 3,714 |
| Wolverine World Wide, Inc. | 215,934 | | 3,172 |
| YETI Holdings, Inc.(1) | 93,931 | | 3,648 |
| | | | 43,210 |
| | | | |
| |
| Consumer Staples—2.9% | | |
| Energizer Holdings, Inc. | 100,730 | | 3,383 |
| Herbalife Ltd.(1) | 152,666 | | 2,021 |
| Nomad Foods Ltd.(1) | 120,406 | | 2,109 |
| WD-40 Co. | 18,260 | | 3,445 |
| | | | 10,958 |
| | | | |
| |
| Energy—4.0% | | |
| Helmerich & Payne, Inc. | 78,995 | | 2,801 |
| HF Sinclair Corp. | 83,909 | | 3,743 |
| Matador Resources Co. | 80,159 | | 4,194 |
| Ovintiv, Inc. | 108,280 | | 4,122 |
| | | | 14,860 |
| | | | |
| |
| Financials—29.8% | | |
| Apollo Commercial Real Estate Finance, Inc. | 307,976 | | 3,486 |
| Arbor Realty Trust, Inc. | 238,827 | | 3,539 |
| Bank of Hawaii Corp. | 73,854 | | 3,045 |
| Blackstone Mortgage Trust, Inc. Class A | 209,119 | | 4,352 |
| Brighthouse Financial, Inc.(1) | 87,405 | | 4,139 |
| Cadence Bank | 180,018 | | 3,536 |
| Columbia Banking System, Inc. | 175,798 | | 3,565 |
| Commerce Bancshares, Inc. | 87,178 | | 4,246 |
| Community Bank System, Inc. | 114,208 | | 5,354 |
| Compass Diversified Holdings | 68,246 | | 1,480 |
| Enterprise Financial Services Corp. | 67,559 | | 2,642 |
| Essent Group Ltd. | 79,543 | | 3,723 |
| First Financial Bankshares, Inc. | 199,768 | | 5,691 |
| | Shares | | Value |
| | | | |
| Financials—continued | | |
| First Interstate BancSystem, Inc. Class A | 160,407 | | $ 3,824 |
| Glacier Bancorp, Inc. | 117,242 | | 3,654 |
| Hamilton Lane, Inc. Class A | 52,800 | | 4,223 |
| Hannon Armstrong Sustainable Infrastructure Capital, Inc. | 148,884 | | 3,722 |
| Houlihan Lokey, Inc. Class A | 39,305 | | 3,864 |
| Lakeland Financial Corp. | 73,281 | | 3,556 |
| MarketAxess Holdings, Inc. | 20,719 | | 5,416 |
| Nicolet Bankshares, Inc. | 54,851 | | 3,725 |
| Old National Bancorp | 260,742 | | 3,635 |
| Pathward Financial, Inc. | 78,066 | | 3,619 |
| Sandy Spring Bancorp, Inc. | 160,023 | | 3,629 |
| SouthState Corp. | 55,657 | | 3,662 |
| Stifel Financial Corp. | 61,370 | | 3,662 |
| UMB Financial Corp. | 63,645 | | 3,876 |
| Valley National Bancorp | 485,878 | | 3,766 |
| Walker & Dunlop, Inc. | 54,054 | | 4,275 |
| | | | 110,906 |
| | | | |
| |
| Health Care—7.5% | | |
| Addus HomeCare Corp.(1) | 42,630 | | 3,952 |
| Bio-Rad Laboratories, Inc. Class A(1) | 8,071 | | 3,060 |
| Bio-Techne Corp. | 45,638 | | 3,725 |
| Globus Medical, Inc. Class A(1) | 99,975 | | 5,953 |
| Medpace Holdings, Inc.(1) | 15,555 | | 3,736 |
| Teleflex, Inc. | 15,099 | | 3,654 |
| Waters Corp.(1) | 13,943 | | 3,716 |
| | | | 27,796 |
| | | | |
| |
| Industrials—15.5% | | |
| Allegion plc | 34,736 | | 4,169 |
| Armstrong World Industries, Inc. | 50,578 | | 3,715 |
| ASGN, Inc.(1) | 54,699 | | 4,137 |
| Douglas Dynamics, Inc. | 99,550 | | 2,975 |
| Exponent, Inc. | 38,091 | | 3,555 |
| Genpact Ltd. | 98,722 | | 3,709 |
| Gorman-Rupp Co. (The) | 139,240 | | 4,014 |
| ManpowerGroup, Inc. | 45,236 | | 3,592 |
| MSA Safety, Inc. | 17,126 | | 2,979 |
| Oshkosh Corp. | 47,140 | | 4,082 |
| Paylocity Holding Corp.(1) | 28,947 | | 5,342 |
| Stanley Black & Decker, Inc. | 39,641 | | 3,715 |
| Tetra Tech, Inc. | 23,226 | | 3,803 |
| Toro Co. (The) | 39,213 | | 3,986 |
| Watts Water Technologies, Inc. Class A | 20,669 | | 3,797 |
| | | | 57,570 |
| | | | |
| |
| Information Technology—8.6% | | |
| Cirrus Logic, Inc.(1) | 24,742 | | 2,004 |
| | Shares | | Value |
| | | | |
| Information Technology—continued | | |
| Diodes, Inc.(1) | 37,343 | | $ 3,454 |
| ePlus, Inc.(1) | 38,466 | | 2,166 |
| Fabrinet (1) | 28,951 | | 3,760 |
| Globant S.A.(1) | 19,753 | | 3,550 |
| MKS Instruments, Inc. | 34,641 | | 3,745 |
| RingCentral, Inc. Class A(1) | 116,973 | | 3,828 |
| Sapiens International Corp. N.V. | 223,005 | | 5,932 |
| SPS Commerce, Inc.(1) | 19,660 | | 3,776 |
| | | | 32,215 |
| | | | |
| |
| Materials—7.8% | | |
| Cia Siderurgica Nacional S.A. Sponsored ADR | 1,394,989 | | 3,613 |
| Kaiser Aluminum Corp. | 103,577 | | 7,420 |
| Kronos Worldwide, Inc. | 407,581 | | 3,558 |
| Quaker Chemical Corp. | 17,109 | | 3,335 |
| Sealed Air Corp. | 94,422 | | 3,777 |
| Stepan Co. | 39,115 | | 3,738 |
| Tronox Holdings plc | 293,895 | | 3,735 |
| | | | 29,176 |
| | | | |
| |
| Real Estate—6.9% | | |
| Douglas Emmett, Inc. | 237,052 | | 2,980 |
| Equity LifeStyle Properties, Inc. | 81,847 | | 5,475 |
| Jones Lang LaSalle, Inc.(1) | 25,243 | | 3,933 |
| National Storage Affiliates Trust | 107,764 | | 3,753 |
| STAG Industrial, Inc. | 110,565 | | 3,967 |
| Terreno Realty Corp. | 94,876 | | 5,702 |
| | | | 25,810 |
| | | | |
| |
| Utilities—2.0% | | |
| American States Water Co. | 43,795 | | 3,810 |
| UGI Corp. | 136,939 | | 3,693 |
| | | | 7,503 |
| | | | |
| |
Total Common Stocks
(Identified Cost $354,824) | | 368,103 |
| | | | |
| |
| | | | |
| |
Total Long-Term Investments—98.8%
(Identified Cost $354,824) | | 368,103 |
| | | | |
| |
| | | | |
| |
TOTAL INVESTMENTS—98.8%
(Identified Cost $354,824) | | $368,103 |
| Other assets and liabilities, net—1.2% | | 4,358 |
| NET ASSETS—100.0% | | $372,461 |
| Abbreviation: |
| ADR | American Depositary Receipt |
For information regarding the abbreviations, see the Key Investment Terms starting on page 6.
See Notes to Financial Statements
NFJ Small-Cap Value Fund
SCHEDULE OF INVESTMENTS (Continued)
June 30, 2023
($ reported in thousands)
| Footnote Legend: |
| (1) | Non-income producing. |
| Country Weightings (Unaudited)† |
| United States | 89% |
| Bermuda | 3 |
| Canada | 2 |
| Israel | 2 |
| United Kingdom | 1 |
| Brazil | 1 |
| Luxembourg | 1 |
| Other | 1 |
| Total | 100% |
| † % of total investments as of June 30, 2023. |
The following table summarizes the value of the Fund’s investments as of June 30, 2023, based on the inputs used to value them (See Security Valuation Note 2A in the Notes to Financial Statements):
| | Total
Value at
June 30, 2023 | | Level 1
Quoted Prices |
| Assets: | | | |
| Equity Securities: | | | |
| Common Stocks | $368,103 | | $368,103 |
| Total Investments | $368,103 | | $368,103 |
There were no securities valued using significant observable inputs (Level 2) or significant unobservable inputs (Level 3) at June 30, 2023.
There were no transfers into or out of Level 3 related to securities held at June 30, 2023.
See Notes to Financial Statements
Silvant Focused Growth Fund
SCHEDULE OF INVESTMENTS
June 30, 2023
($ reported in thousands)
| | Shares | | Value |
| Common Stocks—97.2% |
| Communication Services—11.3% | | |
| Alphabet, Inc. Class A(1) | 293,293 | | $ 35,107 |
| Alphabet, Inc. Class C(1) | 263,547 | | 31,881 |
| Meta Platforms, Inc. Class A(1) | 167,053 | | 47,941 |
| | | | 114,929 |
| | | | |
| |
| Consumer Discretionary—13.0% | | |
| Amazon.com, Inc.(1) | 542,456 | | 70,714 |
| Las Vegas Sands Corp.(1) | 307,683 | | 17,846 |
| Royal Caribbean Cruises Ltd.(1) | 235,480 | | 24,429 |
| Tesla, Inc.(1) | 73,565 | | 19,257 |
| | | | 132,246 |
| | | | |
| |
| Financials—4.4% | | |
| Visa, Inc. Class A | 191,256 | | 45,419 |
| Health Care—15.1% | | |
| Dexcom, Inc.(1) | 156,854 | | 20,157 |
| Edwards Lifesciences Corp.(1) | 292,837 | | 27,623 |
| Eli Lilly & Co. | 104,775 | | 49,138 |
| Intuitive Surgical, Inc.(1) | 67,054 | | 22,929 |
| UnitedHealth Group, Inc. | 70,475 | | 33,873 |
| | | | 153,720 |
| | | | |
| |
| | Shares | | Value |
| | | | |
| Industrials—6.7% | | |
| Boeing Co. (The)(1) | 103,296 | | $ 21,812 |
| Fair Isaac Corp.(1) | 34,915 | | 28,254 |
| Honeywell International, Inc. | 87,740 | | 18,206 |
| | | | 68,272 |
| | | | |
| |
| Information Technology—44.7% | | |
| Apple, Inc. | 747,754 | | 145,042 |
| Applied Materials, Inc. | 126,297 | | 18,255 |
| ASML Holding N.V. Registered Shares | 14,275 | | 10,346 |
| Autodesk, Inc.(1) | 84,511 | | 17,292 |
| Microsoft Corp. | 404,078 | | 137,604 |
| NVIDIA Corp. | 216,735 | | 91,683 |
| Salesforce, Inc.(1) | 105,288 | | 22,243 |
| Workday, Inc. Class A(1) | 55,730 | | 12,589 |
| | | | 455,054 |
| | | | |
| |
| Materials—2.0% | | |
| Vulcan Materials Co. | 89,122 | | 20,092 |
Total Common Stocks
(Identified Cost $477,391) | | 989,732 |
| | | | |
| |
| | | | |
| |
Total Long-Term Investments—97.2%
(Identified Cost $477,391) | | 989,732 |
| | | | |
| |
| | | | |
| |
| | Shares | | Value |
| | | | |
| | | | |
| Short-Term Investment—2.6% |
| Money Market Mutual Fund—2.6% |
| BlackRock Liquidity FedFund - Institutional Shares (seven-day effective yield 4.988%)(2) | 26,501,727 | | $ 26,502 |
Total Short-Term Investment
(Identified Cost $26,502) | | 26,502 |
| | | | |
| |
| | | | |
| |
TOTAL INVESTMENTS—99.8%
(Identified Cost $503,893) | | $1,016,234 |
| Other assets and liabilities, net—0.2% | | 1,851 |
| NET ASSETS—100.0% | | $1,018,085 |
| Footnote Legend: |
| (1) | Non-income producing. |
| (2) | Shares of this fund are publicly offered, and its prospectus and annual report are publicly available. |
The following table summarizes the value of the Fund’s investments as of June 30, 2023, based on the inputs used to value them (See Security Valuation Note 2A in the Notes to Financial Statements):
| | Total
Value at
June 30, 2023 | | Level 1
Quoted Prices |
| Assets: | | | |
| Equity Securities: | | | |
| Common Stocks | $ 989,732 | | $ 989,732 |
| Money Market Mutual Fund | 26,502 | | 26,502 |
| Total Investments | $1,016,234 | | $1,016,234 |
There were no securities valued using significant observable inputs (Level 2) or significant unobservable inputs (Level 3) at June 30, 2023.
There were no transfers into or out of Level 3 related to securities held at June 30, 2023.
See Notes to Financial Statements
Silvant Mid-Cap Growth Fund
SCHEDULE OF INVESTMENTS
June 30, 2023
($ reported in thousands)
| | Shares | | Value |
| Common Stocks—99.4% |
| Communication Services—4.0% | | |
| Spotify Technology S.A.(1) | 24,004 | | $ 3,854 |
| Trade Desk, Inc. (The) Class A(1) | 109,676 | | 8,469 |
| | | | 12,323 |
| | | | |
| |
| Consumer Discretionary—16.5% | | |
| Domino’s Pizza, Inc. | 5,961 | | 2,009 |
| DR Horton, Inc. | 41,701 | | 5,075 |
| DraftKings, Inc. Class A(1) | 48,067 | | 1,277 |
| Etsy, Inc.(1) | 32,415 | | 2,743 |
| Expedia Group, Inc.(1) | 51,466 | | 5,630 |
| Five Below, Inc.(1) | 12,011 | | 2,361 |
| Global-e Online Ltd.(1) | 33,208 | | 1,359 |
| Lululemon Athletica, Inc.(1) | 9,928 | | 3,758 |
| O’Reilly Automotive, Inc.(1) | 4,820 | | 4,604 |
| Pool Corp. | 11,586 | | 4,341 |
| Royal Caribbean Cruises Ltd.(1) | 47,918 | | 4,971 |
| Tractor Supply Co. | 20,563 | | 4,546 |
| Ulta Beauty, Inc.(1) | 7,041 | | 3,313 |
| Wingstop, Inc. | 15,629 | | 3,128 |
| Wynn Resorts Ltd. | 12,103 | | 1,278 |
| | | | 50,393 |
| | | | |
| |
| Energy—2.4% | | |
| Diamondback Energy, Inc. | 23,081 | | 3,032 |
| Valero Energy Corp. | 37,346 | | 4,381 |
| | | | 7,413 |
| | | | |
| |
| Financials—6.5% | | |
| Apollo Global Management, Inc. | 56,041 | | 4,304 |
| Gallagher (Arthur J.) & Co. | 31,548 | | 6,927 |
| LPL Financial Holdings, Inc. | 10,224 | | 2,223 |
| MSCI, Inc. Class A | 13,603 | | 6,384 |
| | | | 19,838 |
| | | | |
| |
| Health Care—21.1% | | |
| Alnylam Pharmaceuticals, Inc.(1) | 13,661 | | 2,595 |
| AmerisourceBergen Corp. | 50,854 | | 9,786 |
| Boston Scientific Corp.(1) | 77,512 | | 4,193 |
| Cooper Cos., Inc. (The) | 9,363 | | 3,590 |
| Dexcom, Inc.(1) | 73,993 | | 9,509 |
| IDEXX Laboratories, Inc.(1) | 15,529 | | 7,799 |
| | Shares | | Value |
| | | | |
| Health Care—continued | | |
| Inspire Medical Systems, Inc.(1) | 7,000 | | $ 2,272 |
| Insulet Corp.(1) | 13,223 | | 3,813 |
| Mettler-Toledo International, Inc.(1) | 1,918 | | 2,516 |
| Neurocrine Biosciences, Inc.(1) | 18,294 | | 1,725 |
| Sarepta Therapeutics, Inc.(1) | 15,838 | | 1,814 |
| Teleflex, Inc. | 6,489 | | 1,570 |
| Tenet Healthcare Corp.(1) | 62,943 | | 5,122 |
| Veeva Systems, Inc. Class A(1) | 10,373 | | 2,051 |
| West Pharmaceutical Services, Inc. | 10,893 | | 4,166 |
| Zimmer Biomet Holdings, Inc. | 12,378 | | 1,802 |
| | | | 64,323 |
| | | | |
| |
| Industrials—19.5% | | |
| AMETEK, Inc. | 38,637 | | 6,254 |
| Chart Industries, Inc.(1) | 18,068 | | 2,887 |
| Ferguson plc | 44,998 | | 7,079 |
| Hexcel Corp. | 108,232 | | 8,228 |
| Paycom Software, Inc. | 14,323 | | 4,601 |
| Quanta Services, Inc. | 53,750 | | 10,559 |
| Rockwell Automation, Inc. | 17,346 | | 5,715 |
| United Rentals, Inc. | 9,883 | | 4,402 |
| Vertiv Holdings Co. Class A | 39,762 | | 985 |
| Westinghouse Air Brake Technologies Corp. | 82,220 | | 9,017 |
| | | | 59,727 |
| | | | |
| |
| Information Technology—27.6% | | |
| Analog Devices, Inc. | 30,940 | | 6,028 |
| ANSYS, Inc.(1) | 8,083 | | 2,670 |
| Atlassian Corp. Class A(1) | 6,074 | | 1,019 |
| Belden, Inc. | 19,607 | | 1,875 |
| Bentley Systems, Inc. Class B | 34,084 | | 1,848 |
| Datadog, Inc. Class A(1) | 48,311 | | 4,753 |
| DoubleVerify Holdings, Inc.(1) | 46,068 | | 1,793 |
| Enphase Energy, Inc.(1) | 14,525 | | 2,433 |
| Entegris, Inc. | 47,834 | | 5,301 |
| Five9, Inc.(1) | 22,332 | | 1,841 |
| HubSpot, Inc.(1) | 7,593 | | 4,040 |
| Keysight Technologies, Inc.(1) | 38,036 | | 6,369 |
| Lam Research Corp. | 9,945 | | 6,393 |
| Lattice Semiconductor Corp.(1) | 39,294 | | 3,775 |
| Marvell Technology, Inc. | 63,016 | | 3,767 |
| | Shares | | Value |
| | | | |
| Information Technology—continued | | |
| Monolithic Power Systems, Inc. | 12,814 | | $ 6,923 |
| Palo Alto Networks, Inc.(1) | 42,574 | | 10,878 |
| TE Connectivity Ltd. | 48,403 | | 6,784 |
| Zscaler, Inc.(1) | 38,969 | | 5,701 |
| | | | 84,191 |
| | | | |
| |
| Materials—0.3% | | |
| Albemarle Corp. | 3,855 | | 860 |
| Real Estate—1.5% | | |
| Terreno Realty Corp. | 51,056 | | 3,069 |
| Zillow Group, Inc. Class A(1) | 31,509 | | 1,550 |
| | | | 4,619 |
| | | | |
| |
Total Common Stocks
(Identified Cost $241,807) | | 303,687 |
| | | | |
| |
| | | | |
| |
Total Long-Term Investments—99.4%
(Identified Cost $241,807) | | 303,687 |
| | | | |
| |
| | | | |
| |
TOTAL INVESTMENTS—99.4%
(Identified Cost $241,807) | | $303,687 |
| Other assets and liabilities, net—0.6% | | 1,784 |
| NET ASSETS—100.0% | | $305,471 |
| Abbreviation: |
| MSCI | Morgan Stanley Capital International |
| Footnote Legend: |
| (1) | Non-income producing. |
| Country Weightings (Unaudited)† |
| United States | 93% |
| Jersey | 2 |
| Switzerland | 2 |
| Luxembourg | 1 |
| Canada | 1 |
| Israel | 1 |
| Total | 100% |
| † % of total investments as of June 30, 2023. |
For information regarding the abbreviations, see the Key Investment Terms starting on page 6.
See Notes to Financial Statements
Silvant Mid-Cap Growth Fund
SCHEDULE OF INVESTMENTS (Continued)
June 30, 2023
($ reported in thousands)
The following table summarizes the value of the Fund’s investments as of June 30, 2023, based on the inputs used to value them (See Security Valuation Note 2A in the Notes to Financial Statements):
| | Total
Value at
June 30, 2023 | | Level 1
Quoted Prices |
| Assets: | | | |
| Equity Securities: | | | |
| Common Stocks | $303,687 | | $303,687 |
| Total Investments | $303,687 | | $303,687 |
There were no securities valued using significant observable inputs (Level 2) or significant unobservable inputs (Level 3) at June 30, 2023.
There were no transfers into or out of Level 3 related to securities held at June 30, 2023.
See Notes to Financial Statements
Small-Cap Fund
SCHEDULE OF INVESTMENTS
June 30, 2023
($ reported in thousands)
| | Shares | | Value |
| Common Stocks—97.2% |
| Aerospace & Defense—0.3% | | |
| HEICO Corp. | 1,788 | | $ 316 |
| Automobile Components—0.3% | | |
| LCI Industries | 2,004 | | 253 |
| Banks—1.9% | | |
| Byline Bancorp, Inc. | 18,180 | | 329 |
| Carter Bankshares, Inc.(1) | 26,472 | | 392 |
| Cathay General Bancorp | 14,116 | | 454 |
| Central Pacific Financial Corp. | 18,476 | | 290 |
| Preferred Bank | 7,638 | | 420 |
| | | | 1,885 |
| | | | |
| |
| Beverages—1.7% | | |
| Coca-Cola Consolidated, Inc. | 2,720 | | 1,730 |
| Biotechnology—7.8% | | |
| ADMA Biologics, Inc.(1) | 60,433 | | 223 |
| Alkermes plc(1) | 51,343 | | 1,607 |
| Anika Therapeutics, Inc.(1) | 45,579 | | 1,184 |
| Arrowhead Pharmaceuticals, Inc.(1) | 5,433 | | 194 |
| Avid Bioservices, Inc.(1) | 60,469 | | 845 |
| Beam Therapeutics, Inc.(1) | 3,049 | | 97 |
| Blueprint Medicines Corp.(1) | 1,947 | | 123 |
| Catalyst Pharmaceuticals, Inc.(1) | 6,713 | | 90 |
| Cytokinetics, Inc.(1) | 7,944 | | 259 |
| Eagle Pharmaceuticals, Inc.(1) | 21,865 | | 425 |
| Halozyme Therapeutics, Inc.(1) | 8,579 | | 309 |
| Intercept Pharmaceuticals, Inc.(1) | 9,297 | | 103 |
| Ironwood Pharmaceuticals, Inc. Class A(1) | 21,173 | | 225 |
| Keros Therapeutics, Inc.(1) | 2,953 | | 119 |
| Natera, Inc.(1) | 10,758 | | 524 |
| Sutro Biopharma, Inc.(1) | 28,274 | | 131 |
| Twist Bioscience Corp.(1) | 11,744 | | 240 |
| Vaxcyte, Inc.(1) | 3,178 | | 159 |
| VectivBio Holding AG(1) | 12,566 | | 212 |
| Veracyte, Inc.(1) | 12,864 | | 328 |
| Vericel Corp.(1) | 4,760 | | 179 |
| Xencor, Inc.(1) | 7,596 | | 190 |
| | | | 7,766 |
| | | | |
| |
| Capital Markets—1.6% | | |
| Federated Hermes, Inc. Class B | 7,549 | | 271 |
| Goldman Sachs BDC, Inc.(2) | 33,506 | | 464 |
| Golub Capital BDC, Inc. | 31,186 | | 421 |
| Hercules Capital, Inc.(2) | 12,197 | | 180 |
| Main Street Capital Corp.(2) | 5,094 | | 204 |
| | | | 1,540 |
| | | | |
| |
| Chemicals—0.3% | | |
| HB Fuller Co. | 4,496 | | 321 |
Commercial Services &
Supplies—0.7% | | |
| Tetra Tech, Inc. | 4,086 | | 669 |
| | Shares | | Value |
| | | | |
| Construction & Engineering—1.2% | | |
| Comfort Systems USA, Inc. | 3,773 | | $ 619 |
| EMCOR Group, Inc. | 2,974 | | 550 |
| | | | 1,169 |
| | | | |
| |
Consumer Staples Distribution &
Retail—1.3% | | |
| BJ’s Wholesale Club Holdings, Inc.(1) | 5,220 | | 329 |
| Casey’s General Stores, Inc. | 1,967 | | 480 |
| Ingles Markets, Inc. Class A | 2,699 | | 223 |
| Weis Markets, Inc. | 4,022 | | 258 |
| | | | 1,290 |
| | | | |
| |
| Containers & Packaging—2.5% | | |
| Graphic Packaging Holding Co. | 34,278 | | 824 |
| O-I Glass, Inc.(1) | 48,391 | | 1,032 |
| Silgan Holdings, Inc. | 12,889 | | 604 |
| | | | 2,460 |
| | | | |
| |
| Diversified Consumer Services—1.5% | | |
| 2U, Inc.(1) | 36,000 | | 145 |
| Bright Horizons Family Solutions, Inc.(1) | 2,413 | | 223 |
| Carriage Services, Inc. Class A | 3,684 | | 120 |
| Grand Canyon Education, Inc.(1) | 3,396 | | 350 |
| Perdoceo Education Corp.(1) | 25,404 | | 312 |
| Vitru Ltd.(1) | 17,829 | | 286 |
| | | | 1,436 |
| | | | |
| |
| Diversified REIT—0.3% | | |
| Armada Hoffler Properties, Inc. | 28,864 | | 337 |
Diversified Telecommunication
Services—0.2% | | |
| Cogent Communications Holdings, Inc. | 2,682 | | 180 |
| Electric Utilities—1.9% | | |
| ALLETE, Inc. | 7,596 | | 440 |
| Hawaiian Electric Industries, Inc. | 7,684 | | 278 |
| IDACORP, Inc. | 5,005 | | 514 |
| Otter Tail Corp. | 8,490 | | 670 |
| | | | 1,902 |
| | | | |
| |
| Electrical Equipment—2.9% | | |
| Atkore, Inc.(1) | 10,969 | | 1,711 |
| Thermon Group Holdings, Inc.(1) | 45,151 | | 1,201 |
| | | | 2,912 |
| | | | |
| |
Electronic Equipment, Instruments &
Components—4.9% | | |
| Belden, Inc. | 19,544 | | 1,869 |
| CTS Corp. | 5,061 | | 216 |
| Fabrinet (1) | 3,616 | | 470 |
| Novanta, Inc.(1) | 927 | | 171 |
| | Shares | | Value |
| | | | |
Electronic Equipment, Instruments &
Components—continued | | |
| OSI Systems, Inc.(1) | 1,796 | | $ 211 |
| Sanmina Corp.(1) | 23,988 | | 1,446 |
| Vishay Intertechnology, Inc. | 17,183 | | 505 |
| | | | 4,888 |
| | | | |
| |
| Energy Equipment & Services—1.8% | | |
| ProPetro Holding Corp.(1) | 90,810 | | 748 |
| RPC, Inc. | 18,365 | | 131 |
| Select Water Solutions, Inc. Class A | 27,132 | | 220 |
| U.S. Silica Holdings, Inc.(1) | 54,662 | | 663 |
| | | | 1,762 |
| | | | |
| |
| Entertainment—1.2% | | |
| Liberty Media Corp-Liberty Formula One Class A(1) | 8,722 | | 590 |
| Madison Square Garden Sports Corp. | 2,592 | | 487 |
| Sciplay Corp. Class A(1) | 6,390 | | 126 |
| | | | 1,203 |
| | | | |
| |
| Financial Services—0.3% | | |
| I3 Verticals, Inc. Class A(1) | 15,177 | | 347 |
| Food Products—3.3% | | |
| Cal-Maine Foods, Inc. | 4,407 | | 198 |
| Flowers Foods, Inc. | 19,748 | | 491 |
| Hostess Brands, Inc. Class A(1) | 25,736 | | 652 |
| J & J Snack Foods Corp. | 3,218 | | 510 |
| John B Sanfilippo & Son, Inc. | 5,968 | | 700 |
| Lancaster Colony Corp. | 2,950 | | 593 |
| Tootsie Roll Industries, Inc. | 3,407 | | 121 |
| | | | 3,265 |
| | | | |
| |
| Gas Utilities—0.6% | | |
| ONE Gas, Inc. | 7,707 | | 592 |
| Ground Transportation—1.5% | | |
| Ryder System, Inc. | 13,608 | | 1,154 |
| Saia, Inc.(1) | 892 | | 305 |
| | | | 1,459 |
| | | | |
| |
Healthcare Equipment &
Supplies—5.6% | | |
| Axonics, Inc.(1) | 2,371 | | 120 |
| Establishment Labs Holdings, Inc.(1)(2) | 2,529 | | 174 |
| Globus Medical, Inc. Class A(1) | 4,022 | | 239 |
| Haemonetics Corp.(1) | 13,662 | | 1,163 |
| Inari Medical, Inc.(1) | 5,598 | | 325 |
| Inspire Medical Systems, Inc.(1) | 1,803 | | 585 |
| Merit Medical Systems, Inc.(1) | 12,739 | | 1,066 |
| Nevro Corp.(1) | 12,500 | | 318 |
| Penumbra, Inc.(1) | 2,212 | | 761 |
See Notes to Financial Statements
Small-Cap Fund
SCHEDULE OF INVESTMENTS (Continued)
June 30, 2023
($ reported in thousands)
| | Shares | | Value |
| | | | |
Healthcare Equipment &
Supplies—continued | | |
| Shockwave Medical, Inc.(1) | 2,752 | | $ 785 |
| | | | 5,536 |
| | | | |
| |
Healthcare Providers &
Services—1.6% | | |
| Chemed Corp. | 895 | | 485 |
| Encompass Health Corp. | 3,901 | | 264 |
| Ensign Group, Inc. (The) | 2,110 | | 201 |
| Tenet Healthcare Corp.(1) | 7,910 | | 644 |
| | | | 1,594 |
| | | | |
| |
| Healthcare Technology—1.1% | | |
| HealthStream, Inc. | 5,015 | | 123 |
| NextGen Healthcare, Inc.(1) | 61,929 | | 1,005 |
| | | | 1,128 |
| | | | |
| |
| Hotels, Restaurants & Leisure—4.7% | | |
| Arcos Dorados Holdings, Inc. Class A | 73,348 | | 752 |
| Boyd Gaming Corp. | 15,966 | | 1,107 |
| Dave & Buster’s Entertainment, Inc.(1) | 3,833 | | 171 |
| Everi Holdings, Inc.(1) | 23,156 | | 335 |
| Hilton Grand Vacations, Inc.(1) | 17,467 | | 794 |
| PlayAGS, Inc.(1) | 25,567 | | 144 |
| Red Rock Resorts, Inc. Class A | 29,057 | | 1,359 |
| | | | 4,662 |
| | | | |
| |
Independent Power and Renewable
Electricity Producers—0.4% | | |
| TransAlta Corp. | 37,205 | | 348 |
| Insurance—4.0% | | |
| AMERISAFE, Inc. | 5,898 | | 315 |
| Donegal Group, Inc. Class A | 22,965 | | 331 |
| Employers Holdings, Inc. | 5,988 | | 224 |
| Enstar Group Ltd.(1) | 1,074 | | 262 |
| Genworth Financial, Inc. Class A(1) | 135,376 | | 677 |
| RLI Corp. | 3,933 | | 537 |
| Safety Insurance Group, Inc. | 6,345 | | 455 |
| Unum Group | 24,327 | | 1,160 |
| | | | 3,961 |
| | | | |
| |
| Interactive Media & Services—0.1% | | |
| Travelzoo (1) | 9,076 | | 72 |
| Leisure Products—0.4% | | |
| Acushnet Holdings Corp. | 6,970 | | 381 |
| Life Sciences Tools & Services—0.8% | | |
| Medpace Holdings, Inc.(1) | 895 | | 215 |
| | Shares | | Value |
| | | | |
Life Sciences Tools &
Services—continued | | |
| West Pharmaceutical Services, Inc. | 1,383 | | $ 529 |
| | | | 744 |
| | | | |
| |
| Machinery—1.4% | | |
| Franklin Electric Co., Inc. | 5,236 | | 539 |
| Terex Corp. | 5,439 | | 325 |
| Wabash National Corp. | 19,488 | | 500 |
| | | | 1,364 |
| | | | |
| |
| Metals & Mining—3.9% | | |
| Commercial Metals Co. | 28,487 | | 1,500 |
| Ryerson Holding Corp. | 20,985 | | 910 |
| United States Steel Corp. | 16,530 | | 414 |
| Warrior Met Coal, Inc. | 25,334 | | 987 |
| | | | 3,811 |
| | | | |
| |
Mortgage Real Estate Investment Trusts
(REITs)—0.3% | | |
| Invesco Mortgage Capital, Inc. | 24,085 | | 276 |
| Multi-Utilities—0.7% | | |
| Avista Corp. | 12,779 | | 502 |
| Unitil Corp. | 4,737 | | 240 |
| | | | 742 |
| | | | |
| |
| Oil, Gas & Consumable Fuels—2.9% | | |
| Baytex Energy Corp.(1) | 87,520 | | 285 |
| Gulfport Energy Corp.(1) | 10,569 | | 1,111 |
| Magnolia Oil & Gas Corp. Class A | 27,306 | | 571 |
| Plains GP Holdings LP Class A(1) | 63,597 | | 943 |
| | | | 2,910 |
| | | | |
| |
| Paper & Forest Products—0.6% | | |
| UFP Industries, Inc. | 6,467 | | 628 |
| Pharmaceuticals—4.2% | | |
| Amneal Pharmaceuticals, Inc.(1) | 44,480 | | 138 |
| Amphastar Pharmaceuticals, Inc.(1) | 6,109 | | 351 |
| Innoviva, Inc.(1) | 32,458 | | 413 |
| Perrigo Co. plc | 13,064 | | 444 |
| Phibro Animal Health Corp. Class A | 16,544 | | 227 |
| Prestige Consumer Healthcare, Inc.(1) | 29,515 | | 1,754 |
| Supernus Pharmaceuticals, Inc.(1) | 29,148 | | 876 |
| | | | 4,203 |
| | | | |
| |
| Professional Services—2.7% | | |
| Barrett Business Services, Inc. | 14,207 | | 1,239 |
| | Shares | | Value |
| | | | |
| Professional Services—continued | | |
| ExlService Holdings, Inc.(1) | 4,653 | | $ 703 |
| Kforce, Inc. | 7,238 | | 454 |
| Science Applications International Corp. | 2,430 | | 273 |
| | | | 2,669 |
| | | | |
| |
Real Estate Management &
Development—0.4% | | |
| Redfin Corp.(1) | 28,585 | | 355 |
Semiconductors & Semiconductor
Equipment—4.7% | | |
| Axcelis Technologies, Inc.(1) | 12,856 | | 2,357 |
| Diodes, Inc.(1) | 3,885 | | 359 |
| MACOM Technology Solutions Holdings, Inc.(1) | 2,703 | | 177 |
| Rambus, Inc.(1) | 18,125 | | 1,163 |
| Tower Semiconductor Ltd.(1) | 15,419 | | 579 |
| | | | 4,635 |
| | | | |
| |
| Software—6.3% | | |
| Agilysys, Inc.(1) | 3,102 | | 213 |
| BlackLine, Inc.(1) | 13,747 | | 740 |
| Box, Inc. Class A(1) | 23,784 | | 699 |
| CommVault Systems, Inc.(1) | 3,886 | | 282 |
| Everbridge, Inc.(1) | 5,470 | | 147 |
| Intapp, Inc.(1) | 30,954 | | 1,297 |
| Manhattan Associates, Inc.(1) | 3,998 | | 799 |
| New Relic, Inc.(1) | 2,866 | | 188 |
| Pegasystems, Inc. | 3,836 | | 189 |
| Progress Software Corp. | 11,330 | | 658 |
| RADCOM Ltd.(1) | 21,604 | | 205 |
| Smartsheet, Inc. Class A(1) | 5,694 | | 218 |
| Zeta Global Holdings Corp. Class A(1) | 75,677 | | 646 |
| | | | 6,281 |
| | | | |
| |
| Specialty Retail—1.2% | | |
| Asbury Automotive Group, Inc.(1) | 2,604 | | 626 |
| Dick’s Sporting Goods, Inc. | 4,181 | | 553 |
| | | | 1,179 |
| | | | |
| |
Technology Hardware, Storage &
Peripherals—0.1% | | |
| Pure Storage, Inc. Class A(1) | 3,685 | | 136 |
Textiles, Apparel & Luxury
Goods—0.8% | | |
| Oxford Industries, Inc. | 7,611 | | 749 |
Trading Companies &
Distributors—6.3% | | |
| Applied Industrial Technologies, Inc. | 14,236 | | 2,062 |
| Boise Cascade Co. | 12,761 | | 1,153 |
| GMS, Inc.(1) | 14,469 | | 1,001 |
See Notes to Financial Statements
Small-Cap Fund
SCHEDULE OF INVESTMENTS (Continued)
June 30, 2023
($ reported in thousands)
| | Shares | | Value |
| | | | |
Trading Companies &
Distributors—continued | | |
| Rush Enterprises, Inc. Class A | 20,194 | | $ 1,227 |
| WESCO International, Inc. | 4,179 | | 748 |
| | | | 6,191 |
| | | | |
| |
| Water Utilities—2.0% | | |
| American States Water Co. | 6,703 | | 583 |
| Consolidated Water Co., Ltd. | 36,114 | | 875 |
| SJW Group | 6,970 | | 489 |
| | | | 1,947 |
| | | | |
| |
Total Common Stocks
(Identified Cost $82,615) | | 96,184 |
| | | | |
| |
| | | | |
| |
Master Limited Partnerships and Related
Companies—0.4% |
| Downstream/Other—0.4% | | |
| Global Partners LP | 6,045 | | 186 |
| | Shares | | Value |
| | | | |
| Downstream/Other—continued | | |
| Sunoco LP | 4,380 | | $ 191 |
| | | | 377 |
| | | | |
| |
Total Master Limited Partnerships and Related Companies
(Identified Cost $297) | | 377 |
| | | | |
| |
| | | | |
| |
Total Long-Term Investments—97.6%
(Identified Cost $82,912) | | 96,561 |
| | | | |
| |
| | | | |
| |
| Securities Lending Collateral—0.9% |
| Dreyfus Government Cash Management Fund - Institutional Shares (seven-day effective yield 4.997%)(3)(4) | 913,126 | | 913 |
Total Securities Lending Collateral
(Identified Cost $913) | | 913 |
| | | | |
| |
| | | | |
| |
TOTAL INVESTMENTS—98.5%
(Identified Cost $83,825) | | $97,474 |
| Other assets and liabilities, net—1.5% | | 1,454 |
| NET ASSETS—100.0% | | $98,928 |
| Abbreviations: |
| LP | Limited Partnership |
| REIT | Real Estate Investment Trust |
| Footnote Legend: |
| (1) | Non-income producing. |
| (2) | All or a portion of security is on loan. |
| (3) | Shares of this fund are publicly offered, and its prospectus and annual report are publicly available. |
| (4) | Represents security purchased with cash collateral received for securities on loan. |
| Country Weightings (Unaudited)† |
| United States | 94% |
| Ireland | 2 |
| Cayman Islands | 1 |
| Virgin Islands (British) | 1 |
| Canada | 1 |
| Israel | 1 |
| Total | 100% |
| † % of total investments as of June 30, 2023. |
The following table summarizes the value of the Fund’s investments as of June 30, 2023, based on the inputs used to value them (See Security Valuation Note 2A in the Notes to Financial Statements):
| | Total
Value at
June 30, 2023 | | Level 1
Quoted Prices |
| Assets: | | | |
| Equity Securities: | | | |
| Common Stocks | $96,184 | | $96,184 |
| Master Limited Partnerships and Related Companies | 377 | | 377 |
| Securities Lending Collateral | 913 | | 913 |
| Total Investments | $97,474 | | $97,474 |
There were no securities valued using significant observable inputs (Level 2) or significant unobservable inputs (Level 3) at June 30, 2023.
There were no transfers into or out of Level 3 related to securities held at June 30, 2023.
For information regarding the abbreviations, see the Key Investment Terms starting on page 6.
See Notes to Financial Statements
Zevenbergen Technology Fund
SCHEDULE OF INVESTMENTS
June 30, 2023
($ reported in thousands)
| | Shares | | Value |
| Common Stocks—99.8% |
| Aerospace & Defense—0.8% | | |
| Axon Enterprise, Inc.(1) | 50,000 | | $ 9,756 |
| Automobiles—5.1% | | |
| Tesla, Inc.(1) | 250,000 | | 65,442 |
| Broadline Retail—10.7% | | |
| Amazon.com, Inc.(1) | 830,000 | | 108,199 |
| Global-e Online Ltd.(1) | 250,000 | | 10,235 |
| MercadoLibre, Inc.(1) | 17,000 | | 20,138 |
| | | | 138,572 |
| | | | |
| |
| Capital Markets—0.3% | | |
| Broadridge Financial Solutions, Inc. | 19,500 | | 3,230 |
| Communications Equipment—1.2% | | |
| Arista Networks, Inc.(1) | 49,300 | | 7,989 |
| Cisco Systems, Inc. | 140,000 | | 7,244 |
| | | | 15,233 |
| | | | |
| |
| Electrical Equipment—0.3% | | |
| Shoals Technologies Group, Inc. Class A(1) | 150,000 | | 3,834 |
Electronic Equipment, Instruments &
Components—1.6% | | |
| Amphenol Corp. Class A | 150,000 | | 12,743 |
| CDW Corp. | 40,000 | | 7,340 |
| | | | 20,083 |
| | | | |
| |
| Financial Services—2.3% | | |
| Block, Inc. Class A(1) | 10,000 | | 666 |
| Mastercard, Inc. Class A | 30,000 | | 11,799 |
| Visa, Inc. Class A | 75,000 | | 17,811 |
| | | | 30,276 |
| | | | |
| |
| Ground Transportation—1.8% | | |
| Uber Technologies, Inc.(1) | 550,000 | | 23,744 |
| Hotels, Restaurants & Leisure—0.8% | | |
| Airbnb, Inc. Class A(1) | 20,000 | | 2,563 |
| Booking Holdings, Inc.(1) | 3,000 | | 8,101 |
| | | | 10,664 |
| | | | |
| |
| Interactive Media & Services—12.4% | | |
| Alphabet, Inc. Class C(1) | 850,000 | | 102,824 |
| | Shares | | Value |
| | | | |
Interactive Media &
Services—continued | | |
| Meta Platforms, Inc. Class A(1) | 200,000 | | $ 57,396 |
| | | | 160,220 |
| | | | |
| |
| IT Services—5.8% | | |
| MongoDB, Inc. Class A(1) | 65,000 | | 26,714 |
| Shopify, Inc. Class A(1) | 450,000 | | 29,070 |
| Snowflake, Inc. Class A(1) | 110,000 | | 19,358 |
| | | | 75,142 |
| | | | |
| |
| Media—2.5% | | |
| Trade Desk, Inc. (The) Class A(1) | 425,000 | | 32,818 |
| Professional Services—0.2% | | |
| Paycom Software, Inc. | 5,000 | | 1,606 |
| Paylocity Holding Corp.(1) | 5,000 | | 923 |
| | | | 2,529 |
| | | | |
| |
Real Estate Management &
Development—0.2% | | |
| DigitalBridge Group, Inc. | 213,000 | | 3,133 |
Semiconductors & Semiconductor
Equipment—21.5% | | |
| Advanced Micro Devices, Inc.(1) | 325,000 | | 37,021 |
| Applied Materials, Inc. | 67,000 | | 9,684 |
| ASML Holding N.V. Registered Shares | 19,000 | | 13,770 |
| Enphase Energy, Inc.(1) | 75,000 | | 12,561 |
| First Solar, Inc.(1) | 55,000 | | 10,455 |
| Impinj, Inc.(1) | 30,000 | | 2,690 |
| KLA Corp. | 20,000 | | 9,700 |
| Micron Technology, Inc. | 250,000 | | 15,778 |
| Monolithic Power Systems, Inc. | 38,100 | | 20,583 |
| NVIDIA Corp. | 215,000 | | 90,949 |
| NXP Semiconductors N.V. | 91,000 | | 18,626 |
| ON Semiconductor Corp.(1) | 375,000 | | 35,467 |
| | | | 277,284 |
| | | | |
| |
| Software—24.5% | | |
| Adobe, Inc. (1) | 65,000 | | 31,784 |
| BILL Holdings, Inc.(1) | 15,000 | | 1,753 |
| Cadence Design Systems, Inc.(1) | 50,000 | | 11,726 |
| | Shares | | Value |
| | | | |
| Software—continued | | |
| Crowdstrike Holdings, Inc. Class A(1) | 85,000 | | $ 12,484 |
| Datadog, Inc. Class A(1) | 35,000 | | 3,443 |
| DoubleVerify Holdings, Inc.(1) | 250,000 | | 9,730 |
| Fortinet, Inc.(1) | 250,000 | | 18,898 |
| HubSpot, Inc.(1) | 7,000 | | 3,725 |
| Intuit, Inc. | 18,000 | | 8,247 |
| Microsoft Corp. | 325,000 | | 110,676 |
| Oracle Corp. | 200,000 | | 23,818 |
| Palo Alto Networks, Inc.(1) | 170,000 | | 43,437 |
| ServiceNow, Inc.(1) | 52,000 | | 29,222 |
| Zscaler, Inc.(1) | 50,000 | | 7,315 |
| | | | 316,258 |
| | | | |
| |
Technology Hardware, Storage &
Peripherals—7.8% | | |
| Apple, Inc. | 520,000 | | 100,864 |
Total Common Stocks
(Identified Cost $778,440) | | 1,289,082 |
| | | | |
| |
| | | | |
| |
Total Long-Term Investments—99.8%
(Identified Cost $778,440) | | 1,289,082 |
| | | | |
| |
| | | | |
| |
TOTAL INVESTMENTS—99.8%
(Identified Cost $778,440) | | $1,289,082 |
| Other assets and liabilities, net—0.2% | | 3,156 |
| NET ASSETS—100.0% | | $1,292,238 |
| Footnote Legend: |
| (1) | Non-income producing. |
| Country Weightings (Unaudited)† |
| United States | 95% |
| Netherlands | 2 |
| Uruguay | 2 |
| Israel | 1 |
| Total | 100% |
| † % of total investments as of June 30, 2023. |
See Notes to Financial Statements
Zevenbergen Technology Fund
SCHEDULE OF INVESTMENTS (Continued)
June 30, 2023
($ reported in thousands)
The following table summarizes the value of the Fund’s investments as of June 30, 2023, based on the inputs used to value them (See Security Valuation Note 2A in the Notes to Financial Statements):
| | Total
Value at
June 30, 2023 | | Level 1
Quoted Prices |
| Assets: | | | |
| Equity Securities: | | | |
| Common Stocks | $1,289,082 | | $1,289,082 |
| Total Investments | $1,289,082 | | $1,289,082 |
There were no securities valued using significant observable inputs (Level 2) or significant unobservable inputs (Level 3) at June 30, 2023.
There were no transfers into or out of Level 3 related to securities held at June 30, 2023.
See Notes to Financial Statements
VIRTUS INVESTMENT TRUST
STATEMENTS OF ASSETS AND LIABILITIES
June 30, 2023
(Reported in thousands except shares and per share amounts)
| | Emerging Markets Opportunities Fund | | Income & Growth Fund | | KAR Global Small-Cap Fund | | KAR Health Sciences Fund |
| Assets | | | | | | | |
Investment in securities at value(1)
| $ 122,606 | | $ 5,054,943 | | $ 56,326 | | $ 152,684 |
Foreign currency at value(2)
| 772 | | — | | 68 | | — |
Cash
| 5,776 | | 80,264 | | 264 | | 488 |
Cash pledged as collateral for written options
| — | | 915 | | — | | — |
| Receivables | | | | | | | |
Investment securities sold
| 1,604 | | 12,650 | | — | | 3,081 |
Fund shares sold
| 11 | | 4,858 | | 16 | | 5 |
Dividends and interest
| 791 | | 34,105 | | 63 | | 59 |
Tax reclaims
| 50 | | — | | 131 | | 323 |
Prepaid Trustees’ retainer
| 3 | | 100 | | 1 | | 3 |
Prepaid expenses
| 30 | | 5 | | 20 | | 22 |
Other assets
| 69 | | 726 | | 51 | | 46 |
Total assets
| 131,712 | | 5,188,566 | | 56,940 | | 156,711 |
| Liabilities | | | | | | | |
Written options at value(3)
| — | | 1,828 | | — | | — |
| Payables | | | | | | | |
Fund shares repurchased
| 111 | | 5,193 | | 60 | | 46 |
Investment securities purchased
| 3,050 | | 74,479 | | — | | 3,081 |
Foreign capital gains tax
| 375 | | — | | — | | — |
Investment advisory fees
| 55 | | 2,704 | | 24 | | 98 |
Distribution and service fees
| 5 | | 1,180 | | 7 | | 30 |
Administration and accounting fees
| 11 | | 423 | | 5 | | 13 |
Transfer agent and sub-transfer agent fees and expenses
| 30 | | 828 | | 14 | | 30 |
Professional fees
| 36 | | 45 | | 30 | | 35 |
Trustee deferred compensation plan
| 69 | | 726 | | 51 | | 46 |
Interest expense and/or commitment fees
| — (a) | | 10 | | — | | — (a) |
Other accrued expenses
| 11 | | 170 | | 15 | | 12 |
Total liabilities
| 3,753 | | 87,586 | | 206 | | 3,391 |
Net Assets
| $ 127,959 | | $ 5,100,980 | | $ 56,734 | | $ 153,320 |
| Net Assets Consist of: | | | | | | | |
Capital paid in on shares of beneficial interest
| $ 140,443 | | $ 5,859,091 | | $ 52,438 | | $ 151,338 |
Accumulated earnings (loss)
| (12,484) | | (758,111) | | 4,296 | | 1,982 |
Net Assets
| $ 127,959 | | $ 5,100,980 | | $ 56,734 | | $ 153,320 |
| Net Assets: | | | | | | | |
Class A
| $ 19,339 | | $ 1,955,600 | | $ 32,690 | | $ 138,726 |
Class C
| $ 735 | | $ 954,260 | | $ 529 | | $ 2,820 |
Class P
| $ 5,292 | | $ 1,072,972 | | $ 1,764 | | $ 1,179 |
Institutional Class
| $ 70,273 | | $ 1,118,148 | | $ 21,751 | | $ 10,595 |
Class R6
| $ 32,320 | | $ — | | $ — | | $ — |
| Shares Outstanding (unlimited number of shares authorized, no par value): | | | | | | | |
Class A
| 700,263 | | 184,631,129 | | 1,040,400 | | 4,948,752 |
Class C
| 26,530 | | 102,159,498 | | 23,500 | | 170,830 |
Class P
| 196,724 | | 97,695,377 | | 49,204 | | 40,768 |
Institutional Class
| 2,536,588 | | 100,450,549 | | 594,466 | | 366,034 |
Class R6
| 1,182,197 | | — | | — | | — |
See Notes to Financial Statements
VIRTUS INVESTMENT TRUST
STATEMENTS OF ASSETS AND LIABILITIES (Continued)
June 30, 2023
(Reported in thousands except shares and per share amounts)
| | Emerging Markets Opportunities Fund | | Income & Growth Fund | | KAR Global Small-Cap Fund | | KAR Health Sciences Fund |
| Net Asset Value and Redemption Price Per Share:* | | | | | | | |
Class A
| $ 27.62 | | $ 10.59 | | $ 31.42 | | $ 28.03 |
Class C
| $ 27.72 | | $ 9.34 | | $ 22.52 | | $ 16.51 |
Class P
| $ 26.90 | | $ 10.98 | | $ 35.85 | | $ 28.93 |
Institutional Class
| $ 27.70 | | $ 11.13 | | $ 36.59 | | $ 28.95 |
Class R6
| $ 27.34 | | $ — | | $ — | | $ — |
| Maximum Offering Price Per Share (NAV/(1-Maximum Sales Charge)): | | | | | | | |
Class A
| $ 29.23 | | $ 11.21 | | $ 33.25 | | $ 29.66 |
Maximum Sales Charge - Class A
| 5.50% | | 5.50% | | 5.50% | | 5.50% |
(1) Investment in securities at cost
| $ 111,015 | | $ 5,784,968 | | $ 51,539 | | $ 144,691 |
(2) Foreign currency at cost
| $ 768 | | $ — | | $ 68 | | $ — |
(3) Written options premiums received
| $ — | | $ 1,566 | | $ — | | $ — |
| (a) | Amount is less than $500 (not in thousands). |
| * | Net Asset Value and Redemption Price Per Share are calculated using unrounded net assets. |
See Notes to Financial Statements
VIRTUS INVESTMENT TRUST
STATEMENTS OF ASSETS AND LIABILITIES (Continued)
June 30, 2023
(Reported in thousands except shares and per share amounts)
| | NFJ Dividend Value Fund | | NFJ International Value Fund | | NFJ Large-Cap Value Fund | | NFJ Mid-Cap Value Fund |
| Assets | | | | | | | |
Investment in securities at value(1)
| $ 627,324 | | $ 93,531 | | $ 274,445 | | $ 962,537 |
Foreign currency at value(2)
| — | | 36 | | — | | — |
Cash
| 3,594 | | 2,694 | | 7,428 | | 4,379 |
| Receivables | | | | | | | |
Investment securities sold
| 17,663 | | 1,992 | | 2,063 | | 20,153 |
Fund shares sold
| 107 | | 8 | | 319 | | 355 |
Dividends and interest
| 1,135 | | 86 | | 417 | | 2,138 |
Tax reclaims
| 7 | | 482 | | 44 | | 169 |
Prepaid Trustees’ retainer
| 13 | | 2 | | 5 | | 19 |
Prepaid expenses
| 37 | | 30 | | 36 | | 41 |
Other assets
| 1,486 | | 318 | | 187 | | 312 |
Total assets
| 651,366 | | 99,179 | | 284,944 | | 990,103 |
| Liabilities | | | | | | | |
| Payables | | | | | | | |
Fund shares repurchased
| 486 | | 228 | | 175 | | 1,127 |
Investment securities purchased
| — | | 1,384 | | 2,855 | | 15,291 |
Investment advisory fees
| 232 | | 28 | | 104 | | 326 |
Distribution and service fees
| 81 | | 11 | | 32 | | 120 |
Administration and accounting fees
| 54 | | 9 | | 24 | | 80 |
Transfer agent and sub-transfer agent fees and expenses
| 150 | | 27 | | 59 | | 224 |
Professional fees
| 32 | | 34 | | 31 | | 34 |
Trustee deferred compensation plan
| 1,486 | | 318 | | 187 | | 312 |
Interest expense and/or commitment fees
| 1 | | — (a) | | — (a) | | 2 |
Other accrued expenses
| 35 | | 16 | | 21 | | 53 |
Total liabilities
| 2,557 | | 2,055 | | 3,488 | | 17,569 |
Net Assets
| $ 648,809 | | $ 97,124 | | $ 281,456 | | $ 972,534 |
| Net Assets Consist of: | | | | | | | |
Capital paid in on shares of beneficial interest
| $ 583,556 | | $ 534,958 | | $ 257,518 | | $ 948,915 |
Accumulated earnings (loss)
| 65,253 | | (437,834) | | 23,938 | | 23,619 |
Net Assets
| $ 648,809 | | $ 97,124 | | $ 281,456 | | $ 972,534 |
| Net Assets: | | | | | | | |
Class A
| $ 333,660 | | $ 48,363 | | $ 151,469 | | $ 476,789 |
Class C
| $ 8,040 | | $ 1,126 | | $ 2,041 | | $ 19,749 |
Class P
| $ 129,853 | | $ 14,861 | | $ 14,461 | | $ 81,136 |
Institutional Class
| $ 75,806 | | $ 28,557 | | $ 110,871 | | $ 282,625 |
Class R6
| $ 68,554 | | $ 2,756 | | $ 2,172 | | $ 78,020 |
Administrative Class
| $ 32,896 | | $ 1,461 | | $ 442 | | $ 34,215 |
| Shares Outstanding (unlimited number of shares authorized, no par value): | | | | | | | |
Class A
| 32,271,950 | | 2,522,160 | | 5,784,906 | | 18,852,666 |
Class C
| 752,707 | | 60,008 | | 76,786 | | 1,090,929 |
Class P
| 12,387,054 | | 769,297 | | 545,011 | | 4,693,826 |
Institutional Class
| 7,244,749 | | 1,477,316 | | 4,261,855 | | 10,036,047 |
Class R6
| 6,597,025 | | 142,712 | | 83,583 | | 2,776,648 |
Administrative Class
| 3,032,191 | | 74,380 | | 16,524 | | 1,286,224 |
See Notes to Financial Statements
VIRTUS INVESTMENT TRUST
STATEMENTS OF ASSETS AND LIABILITIES (Continued)
June 30, 2023
(Reported in thousands except shares and per share amounts)
| | NFJ Dividend Value Fund | | NFJ International Value Fund | | NFJ Large-Cap Value Fund | | NFJ Mid-Cap Value Fund |
| Net Asset Value and Redemption Price Per Share:* | | | | | | | |
Class A
| $ 10.34 | | $ 19.18 | | $ 26.18 | | $ 25.29 |
Class C
| $ 10.68 | | $ 18.76 | | $ 26.58 | | $ 18.10 |
Class P
| $ 10.48 | | $ 19.32 | | $ 26.53 | | $ 17.29 |
Institutional Class
| $ 10.46 | | $ 19.33 | | $ 26.01 | | $ 28.16 |
Class R6
| $ 10.39 | | $ 19.31 | | $ 25.99 | | $ 28.10 |
Administrative Class
| $ 10.85 | | $ 19.64 | | $ 26.75 | | $ 26.60 |
| Maximum Offering Price Per Share (NAV/(1-Maximum Sales Charge)): | | | | | | | |
Class A
| $ 10.94 | | $ 20.30 | | $ 27.70 | | $ 26.76 |
Maximum Sales Charge - Class A
| 5.50% | | 5.50% | | 5.50% | | 5.50% |
(1) Investment in securities at cost
| $ 586,822 | | $ 95,657 | | $ 256,971 | | $ 953,862 |
(2) Foreign currency at cost
| $ — | | $ 36 | | $ — | | $ — |
| (a) | Amount is less than $500 (not in thousands). |
| * | Net Asset Value and Redemption Price Per Share are calculated using unrounded net assets. |
See Notes to Financial Statements
VIRTUS INVESTMENT TRUST
STATEMENTS OF ASSETS AND LIABILITIES (Continued)
June 30, 2023
(Reported in thousands except shares and per share amounts)
| | NFJ Small-Cap Value Fund | | Silvant Focused Growth Fund | | Silvant Mid-Cap Growth Fund | | Small-Cap Fund |
| Assets | | | | | | | |
Investment in securities at value(1)(2)
| $ 368,103 | | $ 1,016,234 | | $ 303,687 | | $ 97,474 |
Cash
| 2,379 | | 20,083 | | 598 | | 1,904 |
| Receivables | | | | | | | |
Investment securities sold
| 16,455 | | 31,211 | | 8,251 | | 2,368 |
Fund shares sold
| 38 | | 244 | | 26 | | 58 |
Dividends and interest
| 633 | | 97 | | 98 | | 49 |
Tax reclaims
| 11 | | — | | — | | 1 |
Prepaid Trustees’ retainer
| 7 | | 18 | | 6 | | 2 |
Prepaid expenses
| 42 | | 36 | | 26 | | 30 |
Other assets
| 1,231 | | 259 | | 71 | | 16 |
Total assets
| 388,899 | | 1,068,182 | | 312,763 | | 101,902 |
| Liabilities | | | | | | | |
| Payables | | | | | | | |
Fund shares repurchased
| 458 | | 1,706 | | 171 | | 49 |
Investment securities purchased
| 14,303 | | 47,383 | | 6,744 | | 1,872 |
Collateral on securities loaned
| — | | — | | — | | 913 |
Investment advisory fees
| 183 | | 374 | | 114 | | 37 |
Distribution and service fees
| 51 | | 145 | | 52 | | 15 |
Administration and accounting fees
| 31 | | 84 | | 25 | | 9 |
Transfer agent and sub-transfer agent fees and expenses
| 128 | | 58 | | 58 | | 21 |
Professional fees
| 31 | | 36 | | 30 | | 30 |
Trustee deferred compensation plan
| 1,231 | | 259 | | 71 | | 16 |
Interest expense and/or commitment fees
| 1 | | 2 | | 1 | | — (a) |
Other accrued expenses
| 21 | | 50 | | 26 | | 12 |
Total liabilities
| 16,438 | | 50,097 | | 7,292 | | 2,974 |
Net Assets
| $ 372,461 | | $ 1,018,085 | | $ 305,471 | | $ 98,928 |
| Net Assets Consist of: | | | | | | | |
Capital paid in on shares of beneficial interest
| $ 347,357 | | $ 485,848 | | $ 261,737 | | $ 84,183 |
Accumulated earnings (loss)
| 25,104 | | 532,237 | | 43,734 | | 14,745 |
Net Assets
| $ 372,461 | | $ 1,018,085 | | $ 305,471 | | $ 98,928 |
| Net Assets: | | | | | | | |
Class A
| $ 225,530 | | $ 625,184 | | $ 242,677 | | $ 62,610 |
Class C
| $ 1,062 | | $ 22,534 | | $ 5,204 | | $ 3,415 |
Class P
| $ 24,940 | | $ 45,858 | | $ 6,421 | | $ 7,089 |
Institutional Class
| $ 52,013 | | $ 151,338 | | $ 50,028 | | $ 20,456 |
Class R6
| $ 46,194 | | $ 165,550 | | $ — | | $ 5,358 |
Administrative Class
| $ 22,722 | | $ 7,621 | | $ 1,141 | | $ — |
| Shares Outstanding (unlimited number of shares authorized, no par value): | | | | | | | |
Class A
| 19,021,877 | | 10,222,057 | | 68,448,174 | | 2,996,183 |
Class C
| 106,624 | | 875,120 | | 2,277,922 | | 176,588 |
Class P
| 1,702,810 | | 1,225,559 | | 1,423,295 | | 331,071 |
Institutional Class
| 3,494,548 | | 2,804,563 | | 10,942,584 | | 948,921 |
Class R6
| 3,140,794 | | 3,052,455 | | — | | 248,534 |
Administrative Class
| 1,853,273 | | 162,524 | | 288,375 | | — |
See Notes to Financial Statements
VIRTUS INVESTMENT TRUST
STATEMENTS OF ASSETS AND LIABILITIES (Continued)
June 30, 2023
(Reported in thousands except shares and per share amounts)
| | NFJ Small-Cap Value Fund | | Silvant Focused Growth Fund | | Silvant Mid-Cap Growth Fund | | Small-Cap Fund |
| Net Asset Value and Redemption Price Per Share:* | | | | | | | |
Class A
| $ 11.86 | | $ 61.16 | | $ 3.55 | | $ 20.90 |
Class C
| $ 9.96 | | $ 25.75 | | $ 2.28 | | $ 19.34 |
Class P
| $ 14.65 | | $ 37.42 | | $ 4.51 | | $ 21.41 |
Institutional Class
| $ 14.88 | | $ 53.96 | | $ 4.57 | | $ 21.56 |
Class R6
| $ 14.71 | | $ 54.24 | | $ — | | $ 21.56 |
Administrative Class
| $ 12.26 | | $ 46.89 | | $ 3.95 | | $ — |
| Maximum Offering Price Per Share (NAV/(1-Maximum Sales Charge)): | | | | | | | |
Class A
| $ 12.55 | | $ 64.72 | | $ 3.76 | | $ 22.12 |
Maximum Sales Charge - Class A
| 5.50% | | 5.50% | | 5.50% | | 5.50% |
(1) Investment in securities at cost
| $ 354,824 | | $ 503,893 | | $ 241,807 | | $ 83,825 |
(2) Market value of securities on loan
| $ — | | $ — | | $ — | | $ 888 |
| (a) | Amount is less than $500 (not in thousands). |
| * | Net Asset Value and Redemption Price Per Share are calculated using unrounded net assets. |
See Notes to Financial Statements
VIRTUS INVESTMENT TRUST
STATEMENTS OF ASSETS AND LIABILITIES (Continued)
June 30, 2023
(Reported in thousands except shares and per share amounts)
| | Zevenbergen Technology Fund |
| Assets | |
Investment in securities at value(1)
| $ 1,289,082 |
Cash
| 3,784 |
Due from broker for options contracts
| 11 |
| Receivables | |
Fund shares sold
| 1,007 |
Dividends and interest
| 218 |
Tax reclaims
| 108 |
Prepaid Trustees’ retainer
| 23 |
Prepaid expenses
| 29 |
Other assets
| 395 |
Total assets
| 1,294,657 |
| Liabilities | |
| Payables | |
Fund shares repurchased
| 459 |
Investment advisory fees
| 954 |
Distribution and service fees
| 128 |
Administration and accounting fees
| 109 |
Transfer agent and sub-transfer agent fees and expenses
| 268 |
Professional fees
| 38 |
Trustee deferred compensation plan
| 395 |
Interest expense and/or commitment fees
| 2 |
Other accrued expenses
| 66 |
Total liabilities
| 2,419 |
Net Assets
| $ 1,292,238 |
| Net Assets Consist of: | |
Capital paid in on shares of beneficial interest
| $ 1,066,771 |
Accumulated earnings (loss)
| 225,467 |
Net Assets
| $ 1,292,238 |
| Net Assets: | |
Class A
| $ 538,324 |
Class C
| $ 23,633 |
Class P
| $ 51,800 |
Institutional Class
| $ 670,734 |
Administrative Class
| $ 7,747 |
| Shares Outstanding (unlimited number of shares authorized, no par value): | |
Class A
| 12,928,746 |
Class C
| 2,568,213 |
Class P
| 910,864 |
Institutional Class
| 11,226,746 |
Administrative Class
| 155,898 |
| Net Asset Value and Redemption Price Per Share:* | |
Class A
| $ 41.64 |
Class C
| $ 9.20 |
Class P
| $ 56.87 |
Institutional Class
| $ 59.74 |
Administrative Class
| $ 49.69 |
See Notes to Financial Statements
VIRTUS INVESTMENT TRUST
STATEMENTS OF ASSETS AND LIABILITIES (Continued)
June 30, 2023
(Reported in thousands except shares and per share amounts)
| | Zevenbergen Technology Fund |
| Maximum Offering Price Per Share (NAV/(1-Maximum Sales Charge)): | |
Class A
| $ 44.06 |
Maximum Sales Charge - Class A
| 5.50% |
(1) Investment in securities at cost
| $ 778,440 |
| * | Net Asset Value and Redemption Price Per Share are calculated using unrounded net assets. |
See Notes to Financial Statements
VIRTUS INVESTMENT TRUST
STATEMENTS OF OPERATIONS
YEAR ENDED June 30, 2023
($ reported in thousands)
| | Emerging Markets Opportunities Fund | | Income & Growth Fund | | KAR Global Small-Cap Fund | | KAR Health Sciences Fund | | NFJ Dividend Value Fund |
| Investment Income | | | | | | | | | |
Dividends
| $ 5,986 | | $ 41,021 | | $1,453 | | $1,620 | | $18,679 |
Interest
| — | | 123,470 | | — | | — | | — |
Securities lending, net of fees
| — | | — | | — (1) | | — | | — |
Foreign taxes withheld
| (715) | | (13) | | (97) | | — (1) | | (40) |
Total investment income
| 5,271 | | 164,478 | | 1,356 | | 1,620 | | 18,639 |
| Expenses | | | | | | | | | |
Investment advisory fees
| 1,035 | | 34,011 | | 522 | | 1,311 | | 3,123 |
Distribution and service fees, Class A
| 48 | | 4,870 | | 79 | | 359 | | 869 |
Distribution and service fees, Class C
| 7 | | 10,162 | | 10 | | 31 | | 103 |
Distribution and service fees, Administrative Class
| — | | — | | — | | — | | 84 |
Administration and accounting fees
| 132 | | 5,320 | | 66 | | 174 | | 712 |
Transfer agent fees and expenses
| 55 | | 2,221 | | 27 | | 77 | | 309 |
Sub-transfer agent fees and expenses, Class A
| 22 | | 1,323 | | 32 | | 136 | | 440 |
Sub-transfer agent fees and expenses, Class C
| 1 | | 715 | | 1 | | 3 | | 7 |
Sub-transfer agent fees and expenses, Class P
| 5 | | 823 | | 2 | | — | | 113 |
Sub-transfer agent fees and expenses, Institutional Class
| 86 | | 981 | | 23 | | 16 | | 67 |
Sub-transfer agent fees and expenses, Administrative Class
| — | | — | | — | | — | | 23 |
State and Local Taxes
| — | | 42 | | — | | — | | — |
Custodian fees
| 10 | | 13 | | 5 | | 4 | | 4 |
Printing fees and expenses
| 10 | | 263 | | 7 | | 13 | | 52 |
Professional fees
| 49 | | 114 | | 38 | | 36 | | 227 |
Interest expense and/or commitment fees
| 23 | | 36 | | 2 | | 1 | | 11 |
Registration fees
| 65 | | 160 | | 60 | | 58 | | 91 |
Trustees’ fees and expenses
| 10 | | 392 | | 4 | | 12 | | 53 |
Miscellaneous expenses
| 27 | | 372 | | 24 | | 23 | | 47 |
Total expenses
| 1,585 | | 61,818 | | 902 | | 2,254 | | 6,335 |
Less net expenses reimbursed and/or waived by investment adviser and/or administrator(2)
| (352) | | — | | (38) | | (3) | | (57) |
Less low balance account fees
| — (1) | | — (1) | | — (1) | | — (1) | | — (1) |
Plus net expenses recaptured(2)
| — | | 2 | | — | | — | | — |
Net expenses
| 1,233 | | 61,820 | | 864 | | 2,251 | | 6,278 |
Net investment income (loss)
| 4,038 | | 102,658 | | 492 | | (631) | | 12,361 |
| Net Realized and Unrealized Gain (Loss) on Investments | | | | | | | | | |
| Net realized gain (loss) from: | | | | | | | | | |
Investments
| (10,349) | | 123,716 | | (321) | | 653 | | 46,514 |
Investment in affiliates
| — | | (7,943) | | — | | — | | — |
Foreign currency transactions
| (181) | | — | | (22) | | — (1) | | — |
Foreign capital gains tax
| (27) | | — | | — | | — | | — |
Written options
| — | | 9,113 | | — | | — | | — |
Net increase from payment by affiliate(3)
| — | | — | | 108 | | 28 | | — |
| Net change in unrealized appreciation (depreciation) on: | | | | | | | | | |
Investments
| 12,357 | | 378,670 | | 7,476 | | 3,614 | | (8,351) |
Investment in affiliates
| — | | 7,908 | | — | | — | | — |
Foreign currency transactions
| 40 | | — | | 7 | | — (1) | | — |
Foreign capital gains tax
| (375) | | — | | — | | — | | — |
Written options
| — | | (255) | | — | | — | | — |
Net realized and unrealized gain (loss) on investments
| 1,465 | | 511,209 | | 7,248 | | 4,295 | | 38,163 |
See Notes to Financial Statements
VIRTUS INVESTMENT TRUST
STATEMENTS OF OPERATIONS (Continued)
YEAR ENDED June 30, 2023
($ reported in thousands)
| | Emerging Markets Opportunities Fund | | Income & Growth Fund | | KAR Global Small-Cap Fund | | KAR Health Sciences Fund | | NFJ Dividend Value Fund |
Net increase (decrease) in net assets resulting from operations
| $ 5,503 | | $613,867 | | $7,740 | | $3,664 | | $50,524 |
| (1) | Amount is less than $500 (not in thousands). |
| (2) | See Note 4D in Notes to Financial Statements. |
| (3) | See Note 4G in Notes to Financial Statements. |
See Notes to Financial Statements
VIRTUS INVESTMENT TRUST
STATEMENTS OF OPERATIONS (Continued)
YEAR ENDED June 30, 2023
($ reported in thousands)
| | NFJ International Value Fund | | NFJ Large-Cap Value Fund | | NFJ Mid-Cap Value Fund | | NFJ Small-Cap Value Fund | | Silvant Focused Growth Fund |
| Investment Income | | | | | | | | | |
Dividends
| $ 3,451 | | $ 6,218 | | $ 22,710 | | $ 8,834 | | $ 5,193 |
Foreign taxes withheld
| (351) | | (4) | | (630) | | (133) | | (7) |
Total investment income
| 3,100 | | 6,214 | | 22,080 | | 8,701 | | 5,186 |
| Expenses | | | | | | | | | |
Investment advisory fees
| 594 | | 1,218 | | 5,791 | | 2,301 | | 3,955 |
Distribution and service fees, Class A
| 121 | | 382 | | 1,217 | | 575 | | 1,337 |
Distribution and service fees, Class C
| 14 | | 24 | | 250 | | 13 | | 217 |
Distribution and service fees, Administrative Class
| 4 | | 1 | | 86 | | 63 | | 16 |
Administration and accounting fees
| 108 | | 282 | | 1,076 | | 397 | | 901 |
Transfer agent fees and expenses
| 48 | | 127 | | 479 | | 173 | | 399 |
Sub-transfer agent fees and expenses, Class A
| 67 | | 141 | | 581 | | 336 | | 391 |
Sub-transfer agent fees and expenses, Class C
| 1 | | 2 | | 21 | | 1 | | 15 |
Sub-transfer agent fees and expenses, Class P
| 14 | | 13 | | 75 | | 14 | | 27 |
Sub-transfer agent fees and expenses, Institutional Class
| 14 | | 102 | | 254 | | 47 | | 84 |
Sub-transfer agent fees and expenses, Administrative Class
| 1 | | — (1) | | 39 | | — | | 6 |
State and Local Taxes
| — | | — | | — | | 9 | | — |
Custodian fees
| 9 | | 4 | | 6 | | 5 | | 5 |
Printing fees and expenses
| 14 | | 20 | | 69 | | 30 | | 39 |
Professional fees
| 104 | | 36 | | 44 | | 36 | | 41 |
Interest expense and/or commitment fees
| 2 | | 5 | | 13 | | 3 | | 7 |
Registration fees
| 69 | | 64 | | 99 | | 89 | | 100 |
Trustees’ fees and expenses
| 7 | | 20 | | 81 | | 29 | | 65 |
Miscellaneous expenses
| 18 | | 32 | | 213 | | 116 | | 81 |
Total expenses
| 1,209 | | 2,473 | | 10,394 | | 4,237 | | 7,686 |
Less net expenses reimbursed and/or waived by investment adviser and/or administrator(2)
| (65) | | — | | (1,423) | | (211) | | (59) |
Less low balance account fees
| — (1) | | — (1) | | — (1) | | — (1) | | (1) |
Net expenses
| 1,144 | | 2,473 | | 8,971 | | 4,026 | | 7,626 |
Net investment income (loss)
| 1,956 | | 3,741 | | 13,109 | | 4,675 | | (2,440) |
| Net Realized and Unrealized Gain (Loss) on Investments | | | | | | | | | |
| Net realized gain (loss) from: | | | | | | | | | |
Investments
| (5,634) | | 10,131 | | 88,974 | | 33,626 | | 71,120 |
Foreign currency transactions
| (84) | | — | | (6) | | (2) | | — |
Net increase from payment by affiliate(3)
| — | | — | | — | | — | | 69 |
| Net change in unrealized appreciation (depreciation) on: | | | | | | | | | |
Investments
| 12,937 | | 7,065 | | 6,331 | | (992) | | 181,075 |
Foreign currency transactions
| 27 | | — | | — | | — (1) | | — |
Net realized and unrealized gain (loss) on investments
| 7,246 | | 17,196 | | 95,299 | | 32,632 | | 252,264 |
Net increase (decrease) in net assets resulting from operations
| $ 9,202 | | $20,937 | | $108,408 | | $37,307 | | $249,824 |
| (1) | Amount is less than $500 (not in thousands). |
| (2) | See Note 4D in Notes to Financial Statements. |
| (3) | See Note 4G in Notes to Financial Statements. |
See Notes to Financial Statements
VIRTUS INVESTMENT TRUST
STATEMENTS OF OPERATIONS (Continued)
YEAR ENDED June 30, 2023
($ reported in thousands)
| | Silvant Mid-Cap Growth Fund | | Small-Cap Fund | | Zevenbergen Technology Fund |
| Investment Income | | | | | |
Dividends
| $ 1,988 | | $ 1,626 | | $ 4,649 |
Securities lending, net of fees
| — | | 4 | | — |
Foreign taxes withheld
| — | | (1) | | (84) |
Total investment income
| 1,988 | | 1,629 | | 4,565 |
| Expenses | | | | | |
Investment advisory fees
| 1,368 | | 668 | | 10,597 |
Distribution and service fees, Class A
| 576 | | 162 | | 1,146 |
Distribution and service fees, Class C
| 57 | | 34 | | 224 |
Distribution and service fees, Administrative Class
| 3 | | — | | 15 |
Administration and accounting fees
| 303 | | 121 | | 1,205 |
Transfer agent fees and expenses
| 142 | | 53 | | 531 |
Sub-transfer agent fees and expenses, Class A
| 146 | | 52 | | 463 |
Sub-transfer agent fees and expenses, Class C
| 4 | | 3 | | 19 |
Sub-transfer agent fees and expenses, Class P
| 4 | | 7 | | 31 |
Sub-transfer agent fees and expenses, Institutional Class
| 43 | | 23 | | 582 |
Sub-transfer agent fees and expenses, Administrative Class
| 1 | | — | | — (1) |
State and Local Taxes
| — | | — | | 4 |
Custodian fees
| 4 | | 4 | | 3 |
Printing fees and expenses
| 18 | | 9 | | 59 |
Professional fees
| 31 | | 30 | | 50 |
Interest expense and/or commitment fees
| 2 | | 2 | | 21 |
Registration fees
| 77 | | 65 | | 111 |
Trustees’ fees and expenses
| 22 | | 9 | | 89 |
Miscellaneous expenses
| 44 | | 22 | | 118 |
Total expenses
| 2,845 | | 1,264 | | 15,268 |
Less net expenses reimbursed and/or waived by investment adviser and/or administrator(2)
| — (1) | | (80) | | — |
Less low balance account fees
| (1) | | — (1) | | (1) |
Plus net expenses recaptured(2)
| — | | — | | 7 |
Net expenses
| 2,844 | | 1,184 | | 15,274 |
Net investment income (loss)
| (856) | | 445 | | (10,709) |
| Net Realized and Unrealized Gain (Loss) on Investments | | | | | |
| Net realized gain (loss) from: | | | | | |
Investments
| (6,050) | | 1,423 | | (53,828) |
Foreign currency transactions
| — | | — | | 248 |
Net increase from payment by affiliate(3)
| — | | 15 | | 110 |
| Net change in unrealized appreciation (depreciation) on: | | | | | |
Investments
| 66,756 | | 13,616 | | 387,959 |
Foreign currency transactions
| — | | — | | (326) |
Net realized and unrealized gain (loss) on investments
| 60,706 | | 15,054 | | 334,163 |
Net increase (decrease) in net assets resulting from operations
| $59,850 | | $15,499 | | $323,454 |
| (1) | Amount is less than $500 (not in thousands). |
| (2) | See Note 4D in Notes to Financial Statements. |
| (3) | See Note 4G in Notes to Financial Statements. |
See Notes to Financial Statements
VIRTUS INVESTMENT TRUST
STATEMENTS OF CHANGES IN NET ASSETS
($ reported in thousands)
| | Emerging Markets Opportunities Fund | | Income & Growth Fund | | KAR Global Small-Cap Fund |
| | Year Ended
June 30,
2023 | | Year Ended
June 30,
2022 | | Year Ended
June 30,
2023 | | Year Ended
June 30,
2022 | | Year Ended
June 30,
2023 | | Year Ended
June 30,
2022 |
| Increase (Decrease) in Net Assets Resulting from Operations | | | | | | | | | | | |
Net investment income (loss)
| $ 4,038 | | $ 6,435 | | $ 102,658 | | $ 84,377 | | $ 492 | | $ 46 |
Net realized gain (loss)
| (10,557) | | (6,735) | | 124,886 | | 215,059 | | (343) | | 2,854 |
Net increase from payment by affiliate(1)
| — | | — | | — | | — | | 108 | | — |
Net change in unrealized appreciation (depreciation)
| 12,022 | | (79,770) | | 386,323 | | (1,544,524) | | 7,483 | | (25,133) |
Increase (decrease) in net assets resulting from operations
| 5,503 | | (80,070) | | 613,867 | | (1,245,088) | | 7,740 | | (22,233) |
| Dividends and Distributions to Shareholders | | | | | | | | | | | |
| Net Investment Income and Net Realized Gains: | | | | | | | | | | | |
Class A
| (603) | | (397) | | (93,901) | | (159,641) | | (913) | | (12,359) |
Class C
| (14) | | — | | (52,772) | | (95,276) | | (37) | | (853) |
Class P
| (158) | | (163) | | (50,458) | | (109,170) | | (47) | | (726) |
Institutional Class
| (2,098) | | (4,023) | | (55,127) | | (97,525) | | (611) | | (8,802) |
Class R6
| (977) | | (727) | | — | | — | | — | | — |
| Return of Capital: | | | | | | | | | | | |
Class A
| — | | — | | (64,672) | | — | | — | | — |
Class C
| — | | — | | (33,734) | | — | | — | | — |
Class P
| — | | — | | (35,576) | | — | | — | | — |
Institutional Class
| — | | — | | (39,718) | | — | | — | | — |
Total dividends and distributions to shareholders
| (3,850) | | (5,310) | | (425,958) | | (461,612) | | (1,608) | | (22,740) |
| Change in Net Assets from Capital Transactions (See Note 6): | | | | | | | | | | | |
Class A
| (1,145) | | (4,768) | | (79,920) | | 153,524 | | (2,817) | | 5,131 |
Class C
| (36) | | (622) | | (167,901) | | (17,195) | | (976) | | (478) |
Class P
| (1,295) | | 1,288 | | (146,112) | | (272,790) | | (497) | | (84) |
Institutional Class
| (3,260) | | (71,138) | | (166,021) | | 307,064 | | (6,314) | | 2,972 |
Class R6
| 2,346 | | 9,813 | | — | | — | | — | | — |
Increase (decrease) in net assets from capital transactions
| (3,390) | | (65,427) | | (559,954) | | 170,603 | | (10,604) | | 7,541 |
Net increase (decrease) in net assets
| (1,737) | | (150,807) | | (372,045) | | (1,536,097) | | (4,472) | | (37,432) |
| Net Assets | | | | | | | | | | | |
Beginning of period
| 129,696 | | 280,503 | | 5,473,025 | | 7,009,122 | | 61,206 | | 98,638 |
End of Period
| $ 127,959 | | $ 129,696 | | $ 5,100,980 | | $ 5,473,025 | | $ 56,734 | | $ 61,206 |
| (1) | See Note 4G in Notes to Financial Statements. |
See Notes to Financial Statements
VIRTUS INVESTMENT TRUST
STATEMENTS OF CHANGES IN NET ASSETS (Continued)
($ reported in thousands)
| | KAR Health Sciences Fund | | NFJ Dividend Value Fund | | NFJ International Value Fund |
| | Year Ended
June 30,
2023 | | Year Ended
June 30,
2022 | | Year Ended
June 30,
2023 | | Year Ended
June 30,
2022 | | Year Ended
June 30,
2023 | | Year Ended
June 30,
2022 |
| Increase (Decrease) in Net Assets Resulting from Operations | | | | | | | | | | | |
Net investment income (loss)
| $ (631) | | $ (130) | | $ 12,361 | | $ 12,959 | | $ 1,956 | | $ 2,858 |
Net realized gain (loss)
| 653 | | 21,774 | | 46,514 | | 127,450 | | (5,718) | | 9,900 |
Net increase from payment by affiliate(1)
| 28 | | — | | — | | — | | — | | — |
Net change in unrealized appreciation (depreciation)
| 3,614 | | (28,282) | | (8,351) | | (166,182) | | 12,964 | | (42,809) |
Increase (decrease) in net assets resulting from operations
| 3,664 | | (6,638) | | 50,524 | | (25,773) | | 9,202 | | (30,051) |
| Dividends and Distributions to Shareholders | | | | | | | | | | | |
| Net Investment Income and Net Realized Gains: | | | | | | | | | | | |
Class A
| (12,697) | | (32,177) | | (55,380) | | (27,364) | | (900) | | (1,231) |
Class C
| (448) | | (981) | | (1,450) | | (907) | | (17) | | (39) |
Class P
| (117) | | (179) | | (22,898) | | (12,521) | | (313) | | (513) |
Institutional Class
| (1,278) | | (4,284) | | (13,896) | | (7,072) | | (601) | | (1,021) |
Class R6
| — | | — | | (12,691) | | (5,785) | | (63) | | (61) |
Administrative Class
| — | | — | | (5,187) | | (2,231) | | (27) | | (30) |
Total dividends and distributions to shareholders
| (14,540) | | (37,621) | | (111,502) | | (55,880) | | (1,921) | | (2,895) |
| Change in Net Assets from Capital Transactions (See Note 6): | | | | | | | | | | | |
Class A
| (1,137) | | 17,203 | | (1,515) | | (15,519) | | (5,551) | | (7,951) |
Class C
| (254) | | 866 | | (3,619) | | (5,103) | | (672) | | (1,244) |
Class P
| (875) | | 1,666 | | (10,554) | | (40,573) | | (3,436) | | (4,145) |
Institutional Class
| (11,812) | | 7,461 | | (8,732) | | (21,044) | | (11,758) | | 879 |
Class R6
| — | | — | | 2,923 | | (1,837) | | (1,012) | | 1,570 |
Administrative Class
| — | | — | | 2,127 | | 3,460 | | (198) | | 656 |
Increase (decrease) in net assets from capital transactions
| (14,078) | | 27,196 | | (19,370) | | (80,616) | | (22,627) | | (10,235) |
Net increase (decrease) in net assets
| (24,954) | | (17,063) | | (80,348) | | (162,269) | | (15,346) | | (43,181) |
| Net Assets | | | | | | | | | | | |
Beginning of period
| 178,274 | | 195,337 | | 729,157 | | 891,426 | | 112,470 | | 155,651 |
End of Period
| $ 153,320 | | $ 178,274 | | $ 648,809 | | $ 729,157 | | $ 97,124 | | $ 112,470 |
| (1) | See Note 4G in Notes to Financial Statements. |
See Notes to Financial Statements
VIRTUS INVESTMENT TRUST
STATEMENTS OF CHANGES IN NET ASSETS (Continued)
($ reported in thousands)
| | NFJ Large-Cap Value Fund | | NFJ Mid-Cap Value Fund | | NFJ Small-Cap Value Fund |
| | Year Ended
June 30,
2023 | | Year Ended
June 30,
2022 | | Year Ended
June 30,
2023 | | Year Ended
June 30,
2022 | | Year Ended
June 30,
2023 | | Year Ended
June 30,
2022 |
| Increase (Decrease) in Net Assets Resulting from Operations | | | | | | | | | | | |
Net investment income (loss)
| $ 3,741 | | $ 2,695 | | $ 13,109 | | $ 11,695 | | $ 4,675 | | $ 4,083 |
Net realized gain (loss)
| 10,131 | | 46,181 | | 88,968 | | 214,751 | | 33,624 | | 59,882 |
Net change in unrealized appreciation (depreciation)
| 7,065 | | (67,038) | | 6,331 | | (299,346) | | (992) | | (113,054) |
Increase (decrease) in net assets resulting from operations
| 20,937 | | (18,162) | | 108,408 | | (72,900) | | 37,307 | | (49,089) |
| Dividends and Distributions to Shareholders | | | | | | | | | | | |
| Net Investment Income and Net Realized Gains: | | | | | | | | | | | |
Class A
| (25,815) | | (11,330) | | (108,865) | | (66,580) | | (36,541) | | (25,065) |
Class C
| (385) | | (192) | | (7,318) | | (5,140) | | (234) | | (140) |
Class P
| (2,613) | | (1,169) | | (26,361) | | (30,390) | | (1,799) | | (1,457) |
Institutional Class
| (13,823) | | (7,866) | | (70,315) | | (51,577) | | (7,210) | | (5,349) |
Class R6
| (14) | | (6) | | (18,071) | | (8,923) | | (6,852) | | (5,537) |
Administrative Class
| (75) | | (32) | | (7,470) | | (4,770) | | (3,845) | | (3,012) |
Total dividends and distributions to shareholders
| (42,725) | | (20,595) | | (238,400) | | (167,380) | | (56,481) | | (40,560) |
| Change in Net Assets from Capital Transactions (See Note 6): | | | | | | | | | | | |
Class A
| 6,301 | | (4,142) | | 39,926 | | 1,124 | | 2,427 | | (33,996) |
Class C
| (517) | | (905) | | (3,725) | | (3,666) | | (151) | | 53 |
Class P
| 663 | | (3,215) | | (725) | | (104,458) | | 10,944 | | (6,610) |
Institutional Class
| 3,787 | | (945) | | (63,039) | | (4,658) | | (4,955) | | (23,666) |
Class R6
| 2,034 | | 100 | | (579) | | 16,625 | | (14,450) | | (13,538) |
Administrative Class
| 22 | | 1 | | 3,552 | | (7,987) | | (5,656) | | (1,513) |
Increase (decrease) in net assets from capital transactions
| 12,290 | | (9,106) | | (24,590) | | (103,020) | | (11,841) | | (79,270) |
Net increase (decrease) in net assets
| (9,498) | | (47,863) | | (154,582) | | (343,300) | | (31,015) | | (168,919) |
| Net Assets | | | | | | | | | | | |
Beginning of period
| 290,954 | | 338,817 | | 1,127,116 | | 1,470,416 | | 403,476 | | 572,395 |
End of Period
| $ 281,456 | | $ 290,954 | | $ 972,534 | | $ 1,127,116 | | $ 372,461 | | $ 403,476 |
See Notes to Financial Statements
VIRTUS INVESTMENT TRUST
STATEMENTS OF CHANGES IN NET ASSETS (Continued)
($ reported in thousands)
| | Silvant Focused Growth Fund | | Silvant Mid-Cap Growth Fund |
| | Year Ended
June 30,
2023 | | Year Ended
June 30,
2022 | | Year Ended
June 30,
2023 | | Year Ended
June 30,
2022 |
| Increase (Decrease) in Net Assets Resulting from Operations | | | | | | | |
Net investment income (loss)
| $ (2,440) | | $ (4,902) | | $ (856) | | $ (2,046) |
Net realized gain (loss)
| 71,120 | | 73,379 | | (6,050) | | 9,567 |
Net increase from payment by affiliate(1)
| 69 | | — | | — | | — |
Net change in unrealized appreciation (depreciation)
| 181,075 | | (390,971) | | 66,756 | | (158,309) |
Increase (decrease) in net assets resulting from operations
| 249,824 | | (322,494) | | 59,850 | | (150,788) |
| Dividends and Distributions to Shareholders | | | | | | | |
| Net Investment Income and Net Realized Gains: | | | | | | | |
Class A
| (28,856) | | (141,631) | | — | | (98,558) |
Class C
| (2,554) | | (12,875) | | — | | (4,311) |
Class P
| (3,163) | | (23,010) | | — | | (4,010) |
Institutional Class
| (7,589) | | (40,132) | | — | | (17,067) |
Class R6
| (9,912) | | (36,559) | | — | | — |
Administrative Class
| (426) | | (1,643) | | — | | (664) |
Total dividends and distributions to shareholders
| (52,500) | | (255,850) | | — | | (124,610) |
| Change in Net Assets from Capital Transactions (See Note 6): | | | | | | | |
Class A
| (38,279) | | 6,578 | | (28,356) | | 61,552 |
Class C
| (4,990) | | (2,532) | | (2,274) | | (948) |
Class P
| (7,098) | | (18,166) | | (1,047) | | (16,368) |
Institutional Class
| (2,897) | | 4,628 | | (7,781) | | 27,608 |
Class R6
| (37,061) | | 67,282 | | — | | — |
Administrative Class
| 411 | | 2,780 | | (782) | | 387 |
Increase (decrease) in net assets from capital transactions
| (89,914) | | 60,570 | | (40,240) | | 72,231 |
Net increase (decrease) in net assets
| 107,410 | | (517,774) | | 19,610 | | (203,167) |
| Net Assets | | | | | | | |
Beginning of period
| 910,675 | | 1,428,449 | | 285,861 | | 489,028 |
End of Period
| $ 1,018,085 | | $ 910,675 | | $ 305,471 | | $ 285,861 |
| (1) | See Note 4G in Notes to Financial Statements. |
See Notes to Financial Statements
VIRTUS INVESTMENT TRUST
STATEMENTS OF CHANGES IN NET ASSETS (Continued)
($ reported in thousands)
| | Small-Cap Fund | | Zevenbergen Technology Fund |
| | Year Ended
June 30,
2023 | | Year Ended
June 30,
2022 | | Year Ended
June 30,
2023 | | Year Ended
June 30,
2022 |
| Increase (Decrease) in Net Assets Resulting from Operations | | | | | | | |
Net investment income (loss)
| $ 445 | | $ 626 | | $ (10,709) | | $ (19,368) |
Net realized gain (loss)
| 1,423 | | 6,855 | | (53,580) | | 62,991 |
Net increase from payment by affiliate(1)
| 15 | | — | | 110 | | — |
Net change in unrealized appreciation (depreciation)
| 13,616 | | (43,808) | | 387,633 | | (698,576) |
Increase (decrease) in net assets resulting from operations
| 15,499 | | (36,327) | | 323,454 | | (654,953) |
| Dividends and Distributions to Shareholders | | | | | | | |
| Net Investment Income and Net Realized Gains: | | | | | | | |
Class A
| (3,120) | | (10,641) | | (82,847) | | (225,190) |
Class C
| (156) | | (633) | | (10,677) | | (25,330) |
Class P
| (380) | | (3,156) | | (5,489) | | (29,704) |
Institutional Class
| (1,170) | | (6,896) | | (84,604) | | (306,251) |
Class R6
| (241) | | (1,124) | | — | | — |
Administrative Class
| — | | — | | (953) | | (4,115) |
Total dividends and distributions to shareholders
| (5,067) | | (22,450) | | (184,570) | | (590,590) |
| Change in Net Assets from Capital Transactions (See Note 6): | | | | | | | |
Class A
| (7,723) | | 4,473 | | 14,750 | | 120,881 |
Class C
| (278) | | 44 | | 2,714 | | 11,085 |
Class P
| (7,029) | | (8,470) | | (4,837) | | (90,576) |
Institutional Class
| (29,008) | | 29,872 | | (190,054) | | 73,175 |
Class R6
| (2,703) | | 1,739 | | — | | — |
Administrative Class
| — | | — | | 770 | | (73,817) |
Increase (decrease) in net assets from capital transactions
| (46,741) | | 27,658 | | (176,657) | | 40,748 |
Net increase (decrease) in net assets
| (36,309) | | (31,119) | | (37,773) | | (1,204,795) |
| Net Assets | | | | | | | |
Beginning of period
| 135,237 | | 166,356 | | 1,330,011 | | 2,534,806 |
End of Period
| $ 98,928 | | $ 135,237 | | $ 1,292,238 | | $ 1,330,011 |
| (1) | See Note 4G in Notes to Financial Statements. |
See Notes to Financial Statements
VIRTUS INVESTMENT TRUST
FINANCIAL HIGHLIGHTS
SELECTED PER SHARE DATA AND RATIOS FOR A SHARE OUTSTANDING
THROUGHOUT EACH PERIOD
| | | Net Asset Value,
Beginning of Period | Net Investment Income (Loss)(1) | Net Realized and
Unrealized Gain (Loss) | Total from Investment Operations | Dividends from
Net Investment Income | Return of Capital | Distributions from
Net Realized Gains | Total Distributions | Payment from Affiliate | Change in Net Asset Value | Net Asset Value, End of Period | Total Return(2)(3) | Net Assets, End of Period
(in thousands) | Ratio of Net Expenses to
Average Net Assets(4)(5) | Ratio of Gross Expenses
to Average Net Assets(4)(5) | Ratio of Net Investment Income (Loss)
to Average Net Assets(4) | Portfolio Turnover Rate(2) |
| | | | | | | | | | | | | | | | | | | |
| Emerging Markets Opportunities Fund | | | | | | | | | | | | | | | | | | |
| Class A | | | | | | | | | | | | | | | | | | |
| 7/1/22 to 6/30/23 | | $ 27.39 | 0.79 | 0.27 | 1.06 | (0.83) | — | — | (0.83) | — | 0.23 | $ 27.62 | 4.18 % | $ 19,339 | 1.31 % (6) | 1.54 % | 3.01 % | 109 % |
| 7/1/21 to 6/30/22 | | 37.61 | 0.75 | (10.52) | (9.77) | (0.45) | — | — | (0.45) | — | (10.22) | 27.39 | (26.17) | 20,341 | 1.29 | 1.45 | 2.28 | 112 |
| 7/1/20 to 6/30/21 | | 25.88 | 0.33 | 11.71 | 12.04 | (0.31) | — | — | (0.31) | — | 11.73 | 37.61 | 46.70 | 33,740 | 1.28 (7) | 1.57 | 0.98 | 80 |
| 7/1/19 to 6/30/20 | | 27.06 | 0.46 | (1.08) | (0.62) | (0.56) | — | — | (0.56) | — | (1.18) | 25.88 | (2.45) | 32,514 | 1.28 | 1.63 | 1.75 | 83 |
| 7/1/18 to 6/30/19 | | 28.53 | 0.56 | (1.55) | (0.99) | (0.48) | — | — | (0.48) | — | (1.47) | 27.06 | (3.29) | 48,388 | 1.26 | 1.61 | 2.08 | 101 |
| Class C | | | | | | | | | | | | | | | | | | |
| 7/1/22 to 6/30/23 | | $ 27.42 | 0.60 | 0.27 | 0.87 | (0.57) | — | — | (0.57) | — | 0.30 | $ 27.72 | 3.37 % | $ 735 | 2.06 % (6) | 2.33 % | 2.27 % | 109 % |
| 7/1/21 to 6/30/22 | | 37.41 | 0.53 | (10.52) | (9.99) | — | — | — | — | — | (9.99) | 27.42 | (26.70) | 770 | 2.04 | 2.21 | 1.61 | 112 |
| 7/1/20 to 6/30/21 | | 25.69 | 0.07 | 11.65 | 11.72 | — (8) | — | — | — | — | 11.72 | 37.41 | 45.62 | 1,713 | 2.03 (7) | 2.30 | 0.22 | 80 |
| 7/1/19 to 6/30/20 | | 26.81 | 0.28 | (1.10) | (0.82) | (0.30) | — | — | (0.30) | — | (1.12) | 25.69 | (3.16) | 2,022 | 2.03 | 2.38 | 1.08 | 83 |
| 7/1/18 to 6/30/19 | | 28.05 | 0.31 | (1.45) | (1.14) | (0.10) | — | — | (0.10) | — | (1.24) | 26.81 | (4.05) | 3,675 | 2.01 | 2.36 | 1.15 | 101 |
| Class P | | | | | | | | | | | | | | | | | | |
| 7/1/22 to 6/30/23 | | $ 26.65 | 0.86 | 0.23 | 1.09 | (0.84) | — | — | (0.84) | — | 0.25 | $ 26.90 | 4.41 % | $ 5,292 | 1.06 % (6) | 1.25 % | 3.37 % | 109 % |
| 7/1/21 to 6/30/22 | | 36.71 | 0.79 | (10.24) | (9.45) | (0.61) | — | — | (0.61) | — | (10.06) | 26.65 | (26.00) | 6,578 | 1.04 | 1.18 | 2.48 | 112 |
| 7/1/20 to 6/30/21 | | 25.30 | 0.33 | 11.53 | 11.86 | (0.45) | — | — | (0.45) | — | 11.41 | 36.71 | 47.12 | 7,945 | 1.02 (7) | 1.32 | 1.05 | 80 |
| 7/1/19 to 6/30/20 | | 26.46 | 0.53 | (1.06) | (0.53) | (0.63) | — | — | (0.63) | — | (1.16) | 25.30 | (2.19) | 12,814 | 1.03 | 1.38 | 2.07 | 83 |
| 7/1/18 to 6/30/19 | | 28.02 | 0.55 | (1.47) | (0.92) | (0.64) | — | — | (0.64) | — | (1.56) | 26.46 | (3.05) | 20,454 | 1.01 | 1.36 | 2.08 | 101 |
| Institutional Class | | | | | | | | | | | | | | | | | | |
| 7/1/22 to 6/30/23 | | $ 27.33 | 0.88 | 0.28 | 1.16 | (0.79) | — | — | (0.79) | — | 0.37 | $ 27.70 | 4.52 % | $ 70,273 | 0.96 % (6) | 1.28 % | 3.36 % | 109 % |
| 7/1/21 to 6/30/22 | | 37.62 | 0.78 | (10.43) | (9.65) | (0.64) | — | — | (0.64) | — | (10.29) | 27.33 | (25.92) | 72,307 | 0.94 | 1.19 | 2.37 | 112 |
| 7/1/20 to 6/30/21 | | 25.91 | 0.48 | 11.70 | 12.18 | (0.47) | — | — | (0.47) | — | 11.71 | 37.62 | 47.27 | 206,383 | 0.93 (7) | 1.26 | 1.43 | 80 |
| 7/1/19 to 6/30/20 | | 27.10 | 0.54 | (1.06) | (0.52) | (0.67) | — | — | (0.67) | — | (1.19) | 25.91 | (2.11) | 186,595 | 0.93 | 1.28 | 2.05 | 83 |
| 7/1/18 to 6/30/19 | | 28.72 | 0.54 | (1.47) | (0.93) | (0.69) | — | — | (0.69) | — | (1.62) | 27.10 | (2.97) | 282,196 | 0.91 | 1.26 | 2.03 | 101 |
| Class R6 | | | | | | | | | | | | | | | | | | |
| 7/1/22 to 6/30/23 | | $ 27.15 | 0.90 | 0.25 | 1.15 | (0.96) | — | — | (0.96) | — | 0.19 | $ 27.34 | 4.58 % | $ 32,320 | 0.91 % (6) | 1.16 % | 3.44 % | 109 % |
| 7/1/21 to 6/30/22 | | 37.40 | 0.86 | (10.43) | (9.57) | (0.68) | — | — | (0.68) | — | (10.25) | 27.15 | (25.89) | 29,700 | 0.89 | 1.08 | 2.64 | 112 |
| 7/1/20 to 6/30/21 | | 25.78 | 0.49 | 11.64 | 12.13 | (0.51) | — | — | (0.51) | — | 11.62 | 37.40 | 47.34 | 30,722 | 0.88 (7) | 1.18 | 1.47 | 80 |
| 7/1/19 to 6/30/20 | | 26.96 | 0.54 | (1.03) | (0.49) | (0.69) | — | — | (0.69) | — | (1.18) | 25.78 | (2.04) | 19,582 | 0.88 | 1.23 | 2.10 | 83 |
| 7/1/18 to 6/30/19 | | 28.57 | 0.57 | (1.48) | (0.91) | (0.70) | — | — | (0.70) | — | (1.61) | 26.96 | (2.93) | 23,647 | 0.86 | 1.21 | 2.13 | 101 |
| | | | | | | | | | | | | | | | | | | |
| Income & Growth Fund | | | | | | | | | | | | | | | | | | |
| Class A | | | | | | | | | | | | | | | | | | |
| 7/1/22 to 6/30/23 | | $ 10.20 | 0.21 | 1.02 | 1.23 | (0.24) | (0.34) | (0.26) | (0.84) | — | 0.39 | $ 10.59 | 12.65 % | $1,955,600 | 1.14 % (9) | 1.14 % | 2.00 % | 42 % |
| 7/1/21 to 6/30/22 | | 13.26 | 0.16 | (2.38) | (2.22) | (0.19) | — | (0.65) | (0.84) | — | (3.06) | 10.20 | (17.65) | 1,963,340 | 1.14 (9) | 1.14 | 1.28 | 70 |
| 7/1/20 to 6/30/21 | | 10.89 | 0.14 | 3.07 | 3.21 | (0.19) | — | (0.65) | (0.84) | — | 2.37 | 13.26 | 30.29 | 2,403,182 | 1.19 (7)(9) | 1.22 | 1.11 | 83 |
| 7/1/19 to 6/30/20 | | 11.01 | 0.18 | 0.54 | 0.72 | (0.21) | — | (0.63) | (0.84) | — | (0.12) | 10.89 | 6.98 | 1,631,126 | 1.28 | 1.29 | 1.65 | 93 |
| 7/1/18 to 6/30/19 | | 11.34 | 0.20 | 0.38 | 0.58 | (0.25)��� | — | (0.66) | (0.91) | — | (0.33) | 11.01 (10) | 5.45 (10) | 1,458,642 | 1.28 | 1.29 | 1.84 | 66 |
The footnote legend is at the end of the financial highlights.
See Notes to Financial Statements
VIRTUS INVESTMENT TRUST
FINANCIAL HIGHLIGHTS (Continued)
SELECTED PER SHARE DATA AND RATIOS FOR A SHARE OUTSTANDING
THROUGHOUT EACH PERIOD
| | | Net Asset Value,
Beginning of Period | Net Investment Income (Loss)(1) | Net Realized and
Unrealized Gain (Loss) | Total from Investment Operations | Dividends from
Net Investment Income | Return of Capital | Distributions from
Net Realized Gains | Total Distributions | Payment from Affiliate | Change in Net Asset Value | Net Asset Value, End of Period | Total Return(2)(3) | Net Assets, End of Period
(in thousands) | Ratio of Net Expenses to
Average Net Assets(4)(5) | Ratio of Gross Expenses
to Average Net Assets(4)(5) | Ratio of Net Investment Income (Loss)
to Average Net Assets(4) | Portfolio Turnover Rate(2) |
| Income & Growth Fund (Continued) | | | | | | | | | | | | | | | | | | |
| Class C | | | | | | | | | | | | | | | | | | |
| 7/1/22 to 6/30/23 | | $ 9.10 | 0.11 | 0.92 | 1.03 | (0.19) | (0.30) | (0.30) | (0.79) | — | 0.24 | $ 9.34 | 11.83 % | $ 954,260 | 1.89 % (9) | 1.89 % | 1.25 % | 42 % |
| 7/1/21 to 6/30/22 | | 11.94 | 0.06 | (2.14) | (2.08) | (0.11) | — | (0.65) | (0.76) | — | (2.84) | 9.10 | (18.31) | 1,096,937 | 1.90 (9) | 1.90 | 0.51 | 70 |
| 7/1/20 to 6/30/21 | | 9.89 | 0.04 | 2.78 | 2.82 | (0.12) | — | (0.65) | (0.77) | — | 2.05 | 11.94 | 29.31 | 1,467,948 | 1.95 (7)(9) | 1.98 | 0.36 | 83 |
| 7/1/19 to 6/30/20 | | 10.07 | 0.09 | 0.50 | 0.59 | (0.14) | — | (0.63) | (0.77) | — | (0.18) | 9.89 | 6.31 | 1,215,780 | 2.03 | 2.04 | 0.90 | 93 |
| 7/1/18 to 6/30/19 | | 10.46 | 0.11 | 0.34 | 0.45 | (0.18) | — | (0.66) | (0.84) | — | (0.39) | 10.07 (10) | 4.60 (10) | 1,234,667 | 2.03 | 2.04 | 1.09 | 66 |
| Class P | | | | | | | | | | | | | | | | | | |
| 7/1/22 to 6/30/23 | | $ 10.54 | 0.24 | 1.06 | 1.30 | (0.26) | (0.35) | (0.25) | (0.86) | — | 0.44 | $ 10.98 | 12.94 % | $1,072,972 | 0.90 % (9) | 0.90 % | 2.24 % | 42 % |
| 7/1/21 to 6/30/22 | | 13.67 | 0.19 | (2.46) | (2.27) | (0.21) | — | (0.65) | (0.86) | — | (3.13) | 10.54 | (17.47) | 1,176,186 | 0.91 (9) | 0.91 | 1.49 | 70 |
| 7/1/20 to 6/30/21 | | 11.20 | 0.17 | 3.17 | 3.34 | (0.22) | — | (0.65) | (0.87) | — | 2.47 | 13.67 | 30.61 | 1,822,852 | 0.95 (7)(9) | 0.98 | 1.35 | 83 |
| 7/1/19 to 6/30/20 | | 11.29 | 0.21 | 0.57 | 0.78 | (0.24) | — | (0.63) | (0.87) | — | (0.09) | 11.20 | 7.32 | 1,253,364 | 1.03 | 1.04 | 1.90 | 93 |
| 7/1/18 to 6/30/19 | | 11.61 | 0.23 | 0.38 | 0.61 | (0.27) | — | (0.66) | (0.93) | — | (0.32) | 11.29 (10) | 5.64 (10) | 1,122,083 | 1.03 | 1.04 | 2.09 | 66 |
| Institutional Class | | | | | | | | | | | | | | | | | | |
| 7/1/22 to 6/30/23 | | $ 10.67 | 0.24 | 1.08 | 1.32 | (0.26) | (0.36) | (0.24) | (0.86) | — | 0.46 | $ 11.13 | 12.96 % | $1,118,148 | 0.90 % (9) | 0.90 % | 2.24 % | 42 % |
| 7/1/21 to 6/30/22 | | 13.83 | 0.20 | (2.50) | (2.30) | (0.21) | — | (0.65) | (0.86) | — | (3.16) | 10.67 | (17.48) | 1,236,562 | 0.92 (9) | 0.92 | 1.51 | 70 |
| 7/1/20 to 6/30/21 | | 11.32 | 0.18 | 3.20 | 3.38 | (0.22) | — | (0.65) | (0.87) | — | 2.51 | 13.83 | 30.71 | 1,315,140 | 0.90 (7) | 0.93 | 1.40 | 83 |
| 7/1/19 to 6/30/20 | | 11.41 | 0.22 | 0.57 | 0.79 | (0.25) | — | (0.63) | (0.88) | — | (0.09) | 11.32 | 7.35 | 798,280 | 0.93 | 0.94 | 2.00 | 93 |
| 7/1/18 to 6/30/19 | | 11.72 | 0.25 | 0.38 | 0.63 | (0.28) | — | (0.66) | (0.94) | — | (0.31) | 11.41 (10) | 5.78 (10) | 702,741 | 0.93 | 0.94 | 2.19 | 66 |
| | | | | | | | | | | | | | | | | | | |
| KAR Global Small-Cap Fund | | | | | | | | | | | | | | | | | | |
| Class A | | | | | | | | | | | | | | | | | | |
| 7/1/22 to 6/30/23 | | $ 28.33 | 0.21 | 3.70 | 3.91 | — | — | (0.87) | (0.87) | 0.05 | 3.09 | $ 31.42 | 14.31 % (11) | $ 32,690 | 1.63 % | 1.66 % | 0.73 % | 129 % |
| 7/1/21 to 6/30/22 | | 52.31 | (0.02) | (10.43) | (10.45) | — | — | (13.53) | (13.53) | — | (23.98) | 28.33 | (26.07) | 32,248 | 1.56 (9)(12) | 1.55 | (0.04) | 90 |
| 7/1/20 to 6/30/21 | | 35.72 | (0.25) | 19.01 | 18.76 | — | — | (2.17) | (2.17) | — | 16.59 | 52.31 | 53.24 | 51,169 | 1.60 (9) | 1.60 | (0.54) | 106 |
| 7/1/19 to 6/30/20 | | 39.37 | (0.23) | (0.47) | (0.70) | — | — | (2.95) | (2.95) | — | (3.65) | 35.72 | (2.20) | 36,141 | 1.63 | 1.63 | (0.63) | 93 |
| 7/1/18 to 6/30/19 | | 51.40 | (0.14) | (3.88) | (4.02) | — | — | (8.01) | (8.01) | — | (12.03) | 39.37 | (4.64) | 46,947 | 1.62 | 1.62 | (0.34) | 85 |
| Class C | | | | | | | | | | | | | | | | | | |
| 7/1/22 to 6/30/23 | | $ 20.69 | (0.02) | 2.68 | 2.66 | — | — | (0.87) | (0.87) | 0.04 | 1.83 | $ 22.52 | 13.49 % (11) | $ 529 | 2.38 % | 2.43 % | (0.08) % | 129 % |
| 7/1/21 to 6/30/22 | | 42.24 | (0.29) | (7.73) | (8.02) | — | — | (13.53) | (13.53) | — | (21.55) | 20.69 | (26.64) | 1,438 | 2.32 (9) | 2.32 | (0.90) | 90 |
| 7/1/20 to 6/30/21 | | 29.36 | (0.50) | 15.55 | 15.05 | — | — | (2.17) | (2.17) | — | 12.88 | 42.24 | 52.11 | 3,374 | 2.35 (9) | 2.35 | (1.34) | 106 |
| 7/1/19 to 6/30/20 | | 33.10 | (0.42) | (0.37) | (0.79) | — | — | (2.95) | (2.95) | — | (3.74) | 29.36 | (2.92) | 4,120 | 2.38 | 2.38 | (1.39) | 93 |
| 7/1/18 to 6/30/19 | | 45.13 | (0.45) | (3.57) | (4.02) | — | — | (8.01) | (8.01) | — | (12.03) | 33.10 | (5.37) | 7,354 | 2.37 | 2.37 | (1.18) | 85 |
| Class P | | | | | | | | | | | | | | | | | | |
| 7/1/22 to 6/30/23 | | $ 32.13 | 0.32 | 4.21 | 4.53 | — | — | (0.87) | (0.87) | 0.06 | 3.72 | $ 35.85 | 14.58 % (11) | $ 1,764 | 1.38 % | 1.39 % | 0.97 % | 129 % |
| 7/1/21 to 6/30/22 | | 57.32 | 0.09 | (11.75) | (11.66) | — | — | (13.53) | (13.53) | — | (25.19) | 32.13 | (25.87) | 2,067 | 1.30 (9) | 1.30 | 0.20 | 90 |
| 7/1/20 to 6/30/21 | | 38.89 | (0.19) | 20.79 | 20.60 | — | — | (2.17) | (2.17) | — | 18.43 | 57.32 | 53.64 | 3,609 | 1.35 (9) | 1.35 | (0.38) | 106 |
| 7/1/19 to 6/30/20 | | 42.51 | (0.18) | (0.49) | (0.67) | — | — | (2.95) | (2.95) | — | (3.62) | 38.89 | (1.96) | 4,444 | 1.37 | 1.37 | (0.44) | 93 |
| 7/1/18 to 6/30/19 | | 54.57 | (0.06) | (3.99) | (4.05) | — | — | (8.01) | (8.01) | — | (12.06) | 42.51 | (4.40) | 11,675 | 1.37 | 1.37 | (0.13) | 85 |
The footnote legend is at the end of the financial highlights.
See Notes to Financial Statements
VIRTUS INVESTMENT TRUST
FINANCIAL HIGHLIGHTS (Continued)
SELECTED PER SHARE DATA AND RATIOS FOR A SHARE OUTSTANDING
THROUGHOUT EACH PERIOD
| | | Net Asset Value,
Beginning of Period | Net Investment Income (Loss)(1) | Net Realized and
Unrealized Gain (Loss) | Total from Investment Operations | Dividends from
Net Investment Income | Return of Capital | Distributions from
Net Realized Gains | Total Distributions | Payment from Affiliate | Change in Net Asset Value | Net Asset Value, End of Period | Total Return(2)(3) | Net Assets, End of Period
(in thousands) | Ratio of Net Expenses to
Average Net Assets(4)(5) | Ratio of Gross Expenses
to Average Net Assets(4)(5) | Ratio of Net Investment Income (Loss)
to Average Net Assets(4) | Portfolio Turnover Rate(2) |
| KAR Global Small-Cap Fund (Continued) | | | | | | | | | | | | | | | | | | |
| Institutional Class | | | | | | | | | | | | | | | | | | |
| 7/1/22 to 6/30/23 | | $ 32.74 | 0.35 | 4.31 | 4.66 | — | — | (0.87) | (0.87) | 0.06 | 3.85 | $ 36.59 | 14.71 % (11) | $ 21,751 | 1.28 % | 1.40 % | 1.04 % | 129 % |
| 7/1/21 to 6/30/22 | | 58.13 | 0.11 | (11.97) | (11.86) | — | — | (13.53) | (13.53) | — | (25.39) | 32.74 | (25.86) | 25,453 | 1.28 | 1.29 | 0.23 | 90 |
| 7/1/20 to 6/30/21 | | 39.39 | (0.10) | 21.01 | 20.91 | — | — | (2.17) | (2.17) | — | 18.74 | 58.13 | 53.75 | 40,486 | 1.27 (7) | 1.30 | (0.20) | 106 |
| 7/1/19 to 6/30/20 | | 42.97 | (0.13) | (0.50) | (0.63) | — | — | (2.95) | (2.95) | — | (3.58) | 39.39 | (1.84) | 29,849 | 1.27 | 1.27 | (0.32) | 93 |
| 7/1/18 to 6/30/19 | | 55.01 | 0.01 | (4.04) | (4.03) | — | — | (8.01) | (8.01) | — | (12.04) | 42.97 | (4.32) | 67,916 | 1.27 | 1.27 | 0.01 | 85 |
| | | | | | | | | | | | | | | | | | | |
| KAR Health Sciences Fund | | | | | | | | | | | | | | | | | | |
| Class A | | | | | | | | | | | | | | | | | | |
| 7/1/22 to 6/30/23 | | $ 29.94 | (0.11) | 0.83 | 0.72 | — | — | (2.63) | (2.63) | — (8) | (1.91) | $ 28.03 | 2.45 % (13) | $ 138,726 | 1.39 % (9) | 1.39 % | (0.40) % | 75 % |
| 7/1/21 to 6/30/22 | | 38.11 | (0.03) | (0.65) | (0.68) | — | — | (7.49) | (7.49) | — | (8.17) | 29.94 | (3.75) | 149,236 | 1.37 (9) | 1.37 | (0.08) | 114 |
| 7/1/20 to 6/30/21 | | 34.21 | (0.01) | 8.76 | 8.75 | (0.03) | — | (4.82) | (4.85) | — | 3.90 | 38.11 | 27.66 | 169,577 | 1.43 (9) | 1.43 | (0.04) | 102 |
| 7/1/19 to 6/30/20 | | 32.27 | 0.05 | 4.22 | 4.27 | (0.01) | — | (2.32) | (2.33) | — | 1.94 | 34.21 | 13.37 | 148,223 | 1.47 | 1.47 | 0.15 | 91 |
| 7/1/18 to 6/30/19 | | 33.27 | 0.02 | 3.57 | 3.59 | (0.31) | — | (4.28) | (4.59) | — | (1.00) | 32.27 | 13.14 | 147,068 | 1.47 | 1.47 | 0.06 | 102 |
| Class C | | | | | | | | | | | | | | | | | | |
| 7/1/22 to 6/30/23 | | $ 18.83 | (0.20) | 0.51 | 0.31 | — | — | (2.63) | (2.63) | — (8) | (2.32) | $ 16.51 | 1.66 % (13) | $ 2,820 | 2.14 % (9) | 2.14 % | (1.15) % | 75 % |
| 7/1/21 to 6/30/22 | | 26.74 | (0.19) | (0.23) | (0.42) | — | — | (7.49) | (7.49) | — | (7.91) | 18.83 | (4.47) | 3,469 | 2.13 (9) | 2.13 | (0.82) | 114 |
| 7/1/20 to 6/30/21 | | 25.44 | (0.21) | 6.33 | 6.12 | — (8) | — | (4.82) | (4.82) | — | 1.30 | 26.74 | 26.73 | 3,758 | 2.18 (9) | 2.18 | (0.80) | 102 |
| 7/1/19 to 6/30/20 | | 24.71 | (0.15) | 3.20 | 3.05 | — | — | (2.32) | (2.32) | — | 0.73 | 25.44 | 12.52 | 4,221 | 2.22 | 2.22 | (0.60) | 91 |
| 7/1/18 to 6/30/19 | | 26.43 | (0.19) | 2.75 | 2.56 | — | — | (4.28) | (4.28) | — | (1.72) | 24.71 | 12.34 | 4,131 | 2.22 | 2.22 | (0.75) | 102 |
| Class P | | | | | | | | | | | | | | | | | | |
| 7/1/22 to 6/30/23 | | $ 30.71 | (0.01) | 0.86 | 0.85 | — | — | (2.63) | (2.63) | — (8) | (1.78) | $ 28.93 | 2.83 % (13) | $ 1,179 | 1.03 % (9) | 1.03 % | (0.05) % | 75 % |
| 7/1/21 to 6/30/22 | | 38.79 | 0.13 | (0.72) | (0.59) | — | — | (7.49) | (7.49) | — | (8.08) | 30.71 | (3.42) | 2,125 | 1.04 (9) | 1.04 | 0.39 | 114 |
| 7/13/20 (14) to 6/30/21 | | 35.14 | 0.09 | 8.62 | 8.71 | (0.24) | — | (4.82) | (5.06) | — | 3.65 | 38.79 | 26.91 | 880 | 1.13 (9) | 1.13 | 0.25 | 102 (15) |
| Institutional Class | | | | | | | | | | | | | | | | | | |
| 7/1/22 to 6/30/23 | | $ 30.75 | (0.04) | 0.87 | 0.83 | — | — | (2.63) | (2.63) | — (8) | (1.80) | $ 28.95 | 2.75 % (13) | $ 10,595 | 1.12 % | 1.14 % | (0.14) % | 75 % |
| 7/1/21 to 6/30/22 | | 38.87 | 0.04 | (0.67) | (0.63) | — | — | (7.49) | (7.49) | — | (8.12) | 30.75 | (3.53) | 23,444 | 1.12 | 1.14 | 0.11 | 114 |
| 7/1/20 to 6/30/21 | | 34.85 | 0.10 | 8.94 | 9.04 | (0.20) | — | (4.82) | (5.02) | — | 4.02 | 38.87 | 28.07 | 21,122 | 1.12 | 1.14 | 0.28 | 102 |
| 7/1/19 to 6/30/20 | | 32.76 | 0.15 | 4.30 | 4.45 | (0.04) | — | (2.32) | (2.36) | — | 2.09 | 34.85 | 13.76 | 11,182 | 1.12 | 1.12 | 0.45 | 91 |
| 7/1/18 to 6/30/19 | | 33.69 | 0.13 | 3.63 | 3.76 | (0.41) | — | (4.28) | (4.69) | — | (0.93) | 32.76 | 13.54 | 4,290 | 1.12 | 1.12 | 0.39 | 102 |
| | | | | | | | | | | | | | | | | | | |
| NFJ Dividend Value Fund | | | | | | | | | | | | | | | | | | |
| Class A | | | | | | | | | | | | | | | | | | |
| 7/1/22 to 6/30/23 | | $ 11.44 | 0.18 | 0.56 | 0.74 | (0.19) | — | (1.65) | (1.84) | — | (1.10) | $ 10.34 | 7.62 % | $ 333,660 | 1.04 % (9) | 1.04 % | 1.64 % | 72 % |
| 7/1/21 to 6/30/22 | | 12.73 | 0.18 | (0.61) | (0.43) | (0.18) | — | (0.68) | (0.86) | — | (1.29) | 11.44 | (4.16) | 365,634 | 1.01 (9) | 1.01 | 1.40 | 65 |
| 7/1/20 to 6/30/21 | | 9.67 | 0.15 | 3.07 | 3.22 | (0.16) | — | — (8) | (0.16) | — | 3.06 | 12.73 | 33.47 | 422,719 | 1.02 (7)(9) | 1.06 | 1.36 | 67 |
| 7/1/19 to 6/30/20 | | 12.11 | 0.19 | (1.01) | (0.82) | (0.20) | — | (1.42) | (1.62) | — | (2.44) | 9.67 | (8.54) | 329,828 | 1.04 | 1.12 | 1.74 | 139 |
| 7/1/18 to 6/30/19 | | 14.76 | 0.26 | (0.05) | 0.21 | (0.26) | — | (2.60) | (2.86) | — | (2.65) | 12.11 | 4.39 | 453,255 | 1.01 | 1.11 | 1.97 | 52 |
The footnote legend is at the end of the financial highlights.
See Notes to Financial Statements
VIRTUS INVESTMENT TRUST
FINANCIAL HIGHLIGHTS (Continued)
SELECTED PER SHARE DATA AND RATIOS FOR A SHARE OUTSTANDING
THROUGHOUT EACH PERIOD
| | | Net Asset Value,
Beginning of Period | Net Investment Income (Loss)(1) | Net Realized and
Unrealized Gain (Loss) | Total from Investment Operations | Dividends from
Net Investment Income | Return of Capital | Distributions from
Net Realized Gains | Total Distributions | Payment from Affiliate | Change in Net Asset Value | Net Asset Value, End of Period | Total Return(2)(3) | Net Assets, End of Period
(in thousands) | Ratio of Net Expenses to
Average Net Assets(4)(5) | Ratio of Gross Expenses
to Average Net Assets(4)(5) | Ratio of Net Investment Income (Loss)
to Average Net Assets(4) | Portfolio Turnover Rate(2) |
| NFJ Dividend Value Fund (Continued) | | | | | | | | | | | | | | | | | | |
| Class C | | | | | | | | | | | | | | | | | | |
| 7/1/22 to 6/30/23 | | $ 11.74 | 0.10 | 0.59 | 0.69 | (0.10) | — | (1.65) | (1.75) | — | (1.06) | $ 10.68 | 6.86 % | $ 8,040 | 1.75 % (9) | 1.75 % | 0.94 % | 72 % |
| 7/1/21 to 6/30/22 | | 13.04 | 0.09 | (0.64) | (0.55) | (0.07) | — | (0.68) | (0.75) | — | (1.30) | 11.74 | (4.91) | 12,496 | 1.72 (9) | 1.72 | 0.68 | 65 |
| 7/1/20 to 6/30/21 | | 9.88 | 0.07 | 3.14 | 3.21 | (0.05) | — | — (8) | (0.05) | — | 3.16 | 13.04 | 32.53 | 18,956 | 1.77 (7)(9) | 1.82 | 0.59 | 67 |
| 7/1/19 to 6/30/20 | | 12.32 | 0.11 | (1.02) | (0.91) | (0.11) | — | (1.42) | (1.53) | — | (2.44) | 9.88 | (9.17) | 38,900 | 1.79 | 1.87 | 0.98 | 139 |
| 7/1/18 to 6/30/19 | | 14.92 | 0.17 | (0.05) | 0.12 | (0.12) | — | (2.60) | (2.72) | — | (2.60) | 12.32 | 3.56 | 75,395 | 1.76 | 1.86 | 1.23 | 52 |
| Class P | | | | | | | | | | | | | | | | | | |
| 7/1/22 to 6/30/23 | | $ 11.57 | 0.21 | 0.57 | 0.78 | (0.22) | — | (1.65) | (1.87) | — | (1.09) | $ 10.48 | 7.95 % | $ 129,853 | 0.74 % (9) | 0.74 % | 1.94 % | 72 % |
| 7/1/21 to 6/30/22 | | 12.87 | 0.22 | (0.63) | (0.41) | (0.21) | — | (0.68) | (0.89) | — | (1.30) | 11.57 | (3.93) | 153,578 | 0.72 (9) | 0.72 | 1.68 | 65 |
| 7/1/20 to 6/30/21 | | 9.77 | 0.18 | 3.10 | 3.28 | (0.18) | — | — (8) | (0.18) | — | 3.10 | 12.87 | 33.79 | 210,888 | 0.76 (7)(9) | 0.81 | 1.60 | 67 |
| 7/1/19 to 6/30/20 | | 12.21 | 0.23 | (1.02) | (0.79) | (0.23) | — | (1.42) | (1.65) | — | (2.44) | 9.77 | (8.23) | 221,250 | 0.79 | 0.87 | 1.98 | 139 |
| 7/1/18 to 6/30/19 | | 14.87 | 0.30 | (0.05) | 0.25 | (0.31) | — | (2.60) | (2.91) | — | (2.66) | 12.21 | 4.62 | 378,642 | 0.76 | 0.86 | 2.22 | 52 |
| Institutional Class | | | | | | | | | | | | | | | | | | |
| 7/1/22 to 6/30/23 | | $ 11.55 | 0.22 | 0.56 | 0.78 | (0.22) | — | (1.65) | (1.87) | — | (1.09) | $ 10.46 | 8.01 % | $ 75,806 | 0.70 % | 0.74 % | 1.98 % | 72 % |
| 7/1/21 to 6/30/22 | | 12.85 | 0.22 | (0.63) | (0.41) | (0.21) | — | (0.68) | (0.89) | — | (1.30) | 11.55 | (3.95) | 91,990 | 0.70 | 0.75 | 1.71 | 65 |
| 7/1/20 to 6/30/21 | | 9.75 | 0.19 | 3.10 | 3.29 | (0.19) | — | — (8) | (0.19) | — | 3.10 | 12.85 | 33.95 | 122,996 | 0.70 | 0.75 | 1.67 | 67 |
| 7/1/19 to 6/30/20 | | 12.20 | 0.24 | (1.03) | (0.79) | (0.24) | — | (1.42) | (1.66) | — | (2.45) | 9.75 | (8.24) | 117,755 | 0.69 | 0.77 | 2.07 | 139 |
| 7/1/18 to 6/30/19 | | 14.87 | 0.31 | (0.05) | 0.26 | (0.33) | — | (2.60) | (2.93) | — | (2.67) | 12.20 | 4.75 | 263,357 | 0.66 | 0.76 | 2.32 | 52 |
| Class R6 | | | | | | | | | | | | | | | | | | |
| 7/1/22 to 6/30/23 | | $ 11.49 | 0.22 | 0.56 | 0.78 | (0.23) | — | (1.65) | (1.88) | — | (1.10) | $ 10.39 | 8.05 % | $ 68,554 | 0.65 % | 0.67 % | 2.04 % | 72 % |
| 7/1/21 to 6/30/22 | | 12.79 | 0.23 | (0.63) | (0.40) | (0.22) | — | (0.68) | (0.90) | — | (1.30) | 11.49 | (3.85) | 72,399 | 0.63 (9) | 0.63 | 1.78 | 65 |
| 7/1/20 to 6/30/21 | | 9.71 | 0.19 | 3.08 | 3.27 | (0.19) | — | — (8) | (0.19) | — | 3.08 | 12.79 | 33.98 | 82,578 | 0.64 (7) | 0.69 | 1.72 | 67 |
| 7/1/19 to 6/30/20 | | 12.15 | 0.24 | (1.02) | (0.78) | (0.24) | — | (1.42) | (1.66) | — | (2.44) | 9.71 | (8.12) | 60,490 | 0.64 | 0.72 | 2.15 | 139 |
| 7/1/18 to 6/30/19 | | 14.83 | 0.31 | (0.04) | 0.27 | (0.35) | — | (2.60) | (2.95) | — | (2.68) | 12.15 | 4.82 | 65,935 | 0.61 | 0.71 | 2.38 | 52 |
| Administrative Class | | | | | | | | | | | | | | | | | | |
| 7/1/22 to 6/30/23 | | $ 11.80 | 0.19 | 0.70 (16) | 0.89 | (0.19) | — | (1.65) | (1.84) | — | (0.95) | $ 10.85 | 8.90 % | $ 32,896 | 0.95 % | 0.98 % | 1.74 % | 72 % |
| 7/1/21 to 6/30/22 | | 13.12 | 0.19 | (0.64) | (0.45) | (0.19) | — | (0.68) | (0.87) | — | (1.32) | 11.80 | (4.20) | 33,060 | 0.95 | 0.99 | 1.46 | 65 |
| 7/1/20 to 6/30/21 | | 9.96 | 0.17 | 3.15 | 3.32 | (0.16) | — | — (8) | (0.16) | — | 3.16 | 13.12 | 33.55 | 33,289 | 0.94 (7) | 0.98 | 1.44 | 67 |
| 7/1/19 to 6/30/20 | | 12.41 | 0.21 | (1.03) | (0.82) | (0.21) | — | (1.42) | (1.63) | — | (2.45) | 9.96 | (8.33) | 25,794 | 0.94 | 1.02 | 1.84 | 139 |
| 7/1/18 to 6/30/19 | | 15.04 | 0.28 | (0.05) | 0.23 | (0.26) | — | (2.60) | (2.86) | — | (2.63) | 12.41 | 4.42 | 47,049 | 0.91 | 1.01 | 2.07 | 52 |
| | | | | | | | | | | | | | | | | | | |
| NFJ International Value Fund | | | | | | | | | | | | | | | | | | |
| Class A | | | | | | | | | | | | | | | | | | |
| 7/1/22 to 6/30/23 | | $ 17.83 | 0.33 | 1.36 | 1.69 | (0.34) | — | — | (0.34) | — | 1.35 | $ 19.18 | 9.68 % | $ 48,363 | 1.30 % | 1.38 % | 1.83 % | 104 % |
| 7/1/21 to 6/30/22 | | 22.93 | 0.40 | (5.10) | (4.70) | (0.40) | — | — | (0.40) | — | (5.10) | 17.83 | (20.78) | 50,307 | 1.30 | 1.33 | 1.90 | 66 |
| 7/1/20 to 6/30/21 | | 16.86 | 0.28 | 6.15 | 6.43 | (0.36) | — | — | (0.36) | — | 6.07 | 22.93 | 38.47 | 73,311 | 1.30 (7)(9) | 1.34 | 1.38 | 116 |
| 7/1/19 to 6/30/20 | | 18.47 | 0.36 | (1.58) | (1.22) | (0.39) | — | — | (0.39) | — | (1.61) | 16.86 | (6.66) | 55,297 | 1.30 | 1.37 | 2.06 | 91 |
| 7/1/18 to 6/30/19 | | 18.52 | 0.33 | (0.08) | 0.25 | (0.30) | — | — | (0.30) | — | (0.05) | 18.47 | 1.44 | 71,931 | 1.30 | 1.38 | 1.84 | 49 |
The footnote legend is at the end of the financial highlights.
See Notes to Financial Statements
VIRTUS INVESTMENT TRUST
FINANCIAL HIGHLIGHTS (Continued)
SELECTED PER SHARE DATA AND RATIOS FOR A SHARE OUTSTANDING
THROUGHOUT EACH PERIOD
| | | Net Asset Value,
Beginning of Period | Net Investment Income (Loss)(1) | Net Realized and
Unrealized Gain (Loss) | Total from Investment Operations | Dividends from
Net Investment Income | Return of Capital | Distributions from
Net Realized Gains | Total Distributions | Payment from Affiliate | Change in Net Asset Value | Net Asset Value, End of Period | Total Return(2)(3) | Net Assets, End of Period
(in thousands) | Ratio of Net Expenses to
Average Net Assets(4)(5) | Ratio of Gross Expenses
to Average Net Assets(4)(5) | Ratio of Net Investment Income (Loss)
to Average Net Assets(4) | Portfolio Turnover Rate(2) |
| NFJ International Value Fund (Continued) | | | | | | | | | | | | | | | | | | |
| Class C | | | | | | | | | | | | | | | | | | |
| 7/1/22 to 6/30/23 | | $ 17.47 | 0.19 | 1.33 | 1.52 | (0.23) | — | — | (0.23) | — | 1.29 | $ 18.76 | 8.86 % | $ 1,126 | 2.05 % | 2.10 % | 1.06 % | 104 % |
| 7/1/21 to 6/30/22 | | 22.51 | 0.25 | (5.00) | (4.75) | (0.29) | — | — | (0.29) | — | (5.04) | 17.47 | (21.32) | 1,724 | 2.02 (9) | 2.02 | 1.21 | 66 |
| 7/1/20 to 6/30/21 | | 16.57 | 0.11 | 6.04 | 6.15 | (0.21) | — | — | (0.21) | — | 5.94 | 22.51 | 37.40 | 3,576 | 2.02 (9) | 2.07 | 0.56 | 116 |
| 7/1/19 to 6/30/20 | | 18.15 | 0.22 | (1.54) | (1.32) | (0.26) | — | — | (0.26) | — | (1.58) | 16.57 | (7.33) | 7,488 | 2.05 | 2.12 | 1.27 | 91 |
| 7/1/18 to 6/30/19 | | 18.20 | 0.17 | (0.04) | 0.13 | (0.18) | — | — | (0.18) | — | (0.05) | 18.15 | 0.76 | 13,926 | 2.05 | 2.13 | 0.98 | 49 |
| Class P | | | | | | | | | | | | | | | | | | |
| 7/1/22 to 6/30/23 | | $ 17.96 | 0.38 | 1.36 | 1.74 | (0.38) | — | — | (0.38) | — | 1.36 | $ 19.32 | 9.92 % | $ 14,861 | 1.05 % | 1.07 % | 2.08 % | 104 % |
| 7/1/21 to 6/30/22 | | 23.09 | 0.47 | (5.13) | (4.66) | (0.47) | — | — | (0.47) | — | (5.13) | 17.96 | (20.52) | 17,205 | 1.01 (9) | 1.01 | 2.20 | 66 |
| 7/1/20 to 6/30/21 | | 16.96 | 0.34 | 6.19 | 6.53 | (0.40) | — | — | (0.40) | — | 6.13 | 23.09 | 38.86 | 26,708 | 1.03 (7)(9) | 1.07 | 1.65 | 116 |
| 7/1/19 to 6/30/20 | | 18.58 | 0.41 | (1.60) | (1.19) | (0.43) | — | — | (0.43) | — | (1.62) | 16.96 | (6.45) | 22,912 | 1.05 | 1.12 | 2.29 | 91 |
| 7/1/18 to 6/30/19 | | 18.61 | 0.35 | (0.04) | 0.31 | (0.34) | — | — | (0.34) | — | (0.03) | 18.58 | 1.76 | 38,655 | 1.05 | 1.13 | 1.93 | 49 |
| Institutional Class | | | | | | | | | | | | | | | | | | |
| 7/1/22 to 6/30/23 | | $ 17.96 | 0.40 | 1.36 | 1.76 | (0.39) | — | — | (0.39) | — | 1.37 | $ 19.33 | 10.06 % | $ 28,557 | 0.95 % | 1.02 % | 2.19 % | 104 % |
| 7/1/21 to 6/30/22 | | 23.11 | 0.48 | (5.14) | (4.66) | (0.49) | — | — | (0.49) | — | (5.15) | 17.96 | (20.52) | 38,243 | 0.95 | 0.98 | 2.25 | 66 |
| 7/1/20 to 6/30/21 | | 16.98 | 0.36 | 6.19 | 6.55 | (0.42) | — | — | (0.42) | — | 6.13 | 23.11 | 38.95 | 48,096 | 0.95 | 1.00 | 1.76 | 116 |
| 7/1/19 to 6/30/20 | | 18.60 | 0.43 | (1.60) | (1.17) | (0.45) | — | — | (0.45) | — | (1.62) | 16.98 | (6.33) | 37,009 | 0.95 | 1.02 | 2.41 | 91 |
| 7/1/18 to 6/30/19 | | 18.64 | 0.41 | (0.08) | 0.33 | (0.37) | — | — | (0.37) | — | (0.04) | 18.60 | 1.84 | 46,473 | 0.95 | 1.03 | 2.24 | 49 |
| Class R6 | | | | | | | | | | | | | | | | | | |
| 7/1/22 to 6/30/23 | | $ 17.95 | 0.40 | 1.36 | 1.76 | (0.40) | — | — | (0.40) | — | 1.36 | $ 19.31 | 10.08 % | $ 2,756 | 0.90 % | 0.98 % | 2.21���% | 104 % |
| 7/1/21 to 6/30/22 | | 23.08 | 0.51 | (5.15) | (4.64) | (0.49) | — | — | (0.49) | — | (5.13) | 17.95 | (20.42) | 3,477 | 0.90 | 0.93 | 2.40 | 66 |
| 7/1/20 to 6/30/21 | | 16.97 | 0.41 | 6.13 | 6.54 | (0.43) | — | — | (0.43) | — | 6.11 | 23.08 | 38.97 | 2,741 | 0.90 | 0.95 | 1.96 | 116 |
| 7/1/19 to 6/30/20 | | 18.59 | 0.44 | (1.60) | (1.16) | (0.46) | — | — | (0.46) | — | (1.62) | 16.97 | (6.28) | 1,230 | 0.90 | 0.97 | 2.47 | 91 |
| 7/1/18 to 6/30/19 | | 18.63 | 0.37 | (0.04) | 0.33 | (0.37) | — | — | (0.37) | — | (0.04) | 18.59 | 1.88 | 1,277 | 0.90 | 0.98 | 2.07 | 49 |
| Administrative Class | | | | | | | | | | | | | | | | | | |
| 7/1/22 to 6/30/23 | | $ 17.94 | 0.35 | 1.70 (16) | 2.05 | (0.35) | — | — | (0.35) | — | 1.70 | $ 19.64 | 11.68 % | $ 1,461 | 1.20 % | 1.29 % | 1.94 % | 104 % |
| 7/1/21 to 6/30/22 | | 23.06 | 0.41 | (5.11) | (4.70) | (0.42) | — | — | (0.42) | — | (5.12) | 17.94 | (20.69) | 1,514 | 1.20 | 1.50 | 1.91 | 66 |
| 7/1/20 to 6/30/21 | | 16.92 | 0.11 | 6.35 | 6.46 | (0.32) | — | — | (0.32) | — | 6.14 | 23.06 | 38.57 | 1,219 | 1.20 | 1.28 | 0.57 | 116 |
| 7/1/19 to 6/30/20 | | 18.54 | 0.38 | (1.59) | (1.21) | (0.41) | — | — | (0.41) | — | (1.62) | 16.92 | (6.58) | 1,147 | 1.20 | 1.27 | 2.17 | 91 |
| 7/1/18 to 6/30/19 | | 18.56 | 0.29 | 0.01 | 0.30 | (0.32) | — | — | (0.32) | — | (0.02) | 18.54 | 1.68 | 1,436 | 1.20 | 1.28 | 1.60 | 49 |
| | | | | | | | | | | | | | | | | | | |
| NFJ Large-Cap Value Fund | | | | | | | | | | | | | | | | | | |
| Class A | | | | | | | | | | | | | | | | | | |
| 7/1/22 to 6/30/23 | | $ 29.16 | 0.35 | 1.60 | 1.95 | (0.34) | — | (4.59) | (4.93) | — | (2.98) | $ 26.18 | 8.27 % | $ 151,469 | 1.01 % (9) | 1.01 % | 1.29 % | 67 % |
| 7/1/21 to 6/30/22 | | 33.12 | 0.24 | (2.09) | (1.85) | (0.20) | — | (1.91) | (2.11) | — | (3.96) | 29.16 | (6.36) | 159,063 | 1.00 (9) | 1.00 | 0.71 | 45 |
| 7/1/20 to 6/30/21 | | 24.49 | 0.23 | 8.62 | 8.85 | (0.22) | — | — | (0.22) | — | 8.63 | 33.12 | 36.24 | 184,745 | 1.06 (9) | 1.06 | 0.79 | 69 |
| 7/1/19 to 6/30/20 | | 26.90 | 0.39 | (1.88) | (1.49) | (0.41) | — | (0.51) | (0.92) | — | (2.41) | 24.49 | (5.71) | 150,404 | 1.12 | 1.12 | 1.48 | 114 |
| 7/1/18 to 6/30/19 | | 26.14 | 0.41 | 0.79 | 1.20 | (0.39) | — | (0.05) | (0.44) | — | 0.76 | 26.90 | 4.67 | 178,311 | 1.12 | 1.12 | 1.57 | 68 |
The footnote legend is at the end of the financial highlights.
See Notes to Financial Statements
VIRTUS INVESTMENT TRUST
FINANCIAL HIGHLIGHTS (Continued)
SELECTED PER SHARE DATA AND RATIOS FOR A SHARE OUTSTANDING
THROUGHOUT EACH PERIOD
| | | Net Asset Value,
Beginning of Period | Net Investment Income (Loss)(1) | Net Realized and
Unrealized Gain (Loss) | Total from Investment Operations | Dividends from
Net Investment Income | Return of Capital | Distributions from
Net Realized Gains | Total Distributions | Payment from Affiliate | Change in Net Asset Value | Net Asset Value, End of Period | Total Return(2)(3) | Net Assets, End of Period
(in thousands) | Ratio of Net Expenses to
Average Net Assets(4)(5) | Ratio of Gross Expenses
to Average Net Assets(4)(5) | Ratio of Net Investment Income (Loss)
to Average Net Assets(4) | Portfolio Turnover Rate(2) |
| NFJ Large-Cap Value Fund (Continued) | | | | | | | | | | | | | | | | | | |
| Class C | | | | | | | | | | | | | | | | | | |
| 7/1/22 to 6/30/23 | | $ 29.51 | 0.14 | 1.62 | 1.76 | (0.10) | — | (4.59) | (4.69) | — | (2.93) | $ 26.58 | 7.42 % | $ 2,041 | 1.79 % (9) | 1.79 % | 0.50 % | 67 % |
| 7/1/21 to 6/30/22 | | 33.54 | (0.02) | (2.09) | (2.11) | (0.01) | — | (1.91) | (1.92) | — | (4.03) | 29.51 | (7.05) | 2,775 | 1.76 (9) | 1.76 | (0.05) | 45 |
| 7/1/20 to 6/30/21 | | 24.82 | 0.02 | 8.73 | 8.75 | (0.03) | — | — | (0.03) | — | 8.72 | 33.54 | 35.24 | 4,056 | 1.81 (9) | 1.81 | 0.06 | 69 |
| 7/1/19 to 6/30/20 | | 27.23 | 0.19 | (1.88) | (1.69) | (0.21) | — | (0.51) | (0.72) | — | (2.41) | 24.82 | (6.41) | 7,854 | 1.87 | 1.87 | 0.73 | 114 |
| 7/1/18 to 6/30/19 | | 26.44 | 0.19 | 0.81 | 1.00 | (0.16) | — | (0.05) | (0.21) | — | 0.79 | 27.23 | 3.82 | 12,080 | 1.87 | 1.87 | 0.70 | 68 |
| Class P | | | | | | | | | | | | | | | | | | |
| 7/1/22 to 6/30/23 | | $ 29.49 | 0.43 | 1.60 | 2.03 | (0.40) | — | (4.59) | (4.99) | — | (2.96) | $ 26.53 | 8.53 % | $ 14,461 | 0.75 % (9) | 0.75 % | 1.55 % | 67 % |
| 7/1/21 to 6/30/22 | | 33.46 | 0.32 | (2.11) | (1.79) | (0.27) | — | (1.91) | (2.18) | — | (3.97) | 29.49 | (6.10) | 15,206 | 0.75 (9) | 0.75 | 0.95 | 45 |
| 7/1/20 to 6/30/21 | | 24.73 | 0.30 | 8.71 | 9.01 | (0.28) | — | — | (0.28) | — | 8.73 | 33.46 | 36.60 | 20,413 | 0.81 (9) | 0.81 | 1.04 | 69 |
| 7/1/19 to 6/30/20 | | 27.16 | 0.46 | (1.90) | (1.44) | (0.48) | — | (0.51) | (0.99) | — | (2.43) | 24.73 | (5.49) | 15,384 | 0.87 | 0.87 | 1.73 | 114 |
| 7/1/18 to 6/30/19 | | 26.38 | 0.48 | 0.81 | 1.29 | (0.46) | — | (0.05) | (0.51) | — | 0.78 | 27.16 | 4.95 | 19,097 | 0.87 | 0.87 | 1.80 | 68 |
| Institutional Class | | | | | | | | | | | | | | | | | | |
| 7/1/22 to 6/30/23 | | $ 29.01 | 0.41 | 1.58 | 1.99 | (0.40) | — | (4.59) | (4.99) | — | (3.00) | $ 26.01 | 8.50 % | $ 110,871 | 0.77 % | 0.77 % | 1.52 % | 67 % |
| 7/1/21 to 6/30/22 | | 32.96 | 0.32 | (2.07) | (1.75) | (0.29) | — | (1.91) | (2.20) | — | (3.95) | 29.01 | (6.09) | 113,368 | 0.74 | 0.74 | 0.98 | 45 |
| 7/1/20 to 6/30/21 | | 24.37 | 0.31 | 8.58 | 8.89 | (0.30) | — | — | (0.30) | — | 8.59 | 32.96 | 36.66 | 129,083 | 0.75 (9) | 0.75 | 1.09 | 69 |
| 7/1/19 to 6/30/20 | | 26.77 | 0.48 | (1.87) | (1.39) | (0.50) | — | (0.51) | (1.01) | — | (2.40) | 24.37 | (5.36) | 92,001 | 0.77 | 0.77 | 1.81 | 114 |
| 7/1/18 to 6/30/19 | | 26.02 | 0.50 | 0.79 | 1.29 | (0.49) | — | (0.05) | (0.54) | — | 0.75 | 26.77 | 5.02 | 132,572 | 0.77 | 0.77 | 1.91 | 68 |
| Class R6 | | | | | | | | | | | | | | | | | | |
| 7/1/22 to 6/30/23 | | $ 28.99 | 0.64 | 1.41 | 2.05 | (0.46) | — | (4.59) | (5.05) | — | (3.00) | $ 25.99 | 8.75 % | $ 2,172 | 0.57 % (9) | 0.57 % | 2.42 % | 67 % |
| 10/29/21 (14) to 6/30/22 | | 35.37 | 0.25 | (4.47) | (4.22) | (0.25) | — | (1.91) | (2.16) | — | (6.38) | 28.99 | (12.65) | 82 | 0.65 | 0.78 | 1.15 | 45 (15) |
| Administrative Class | | | | | | | | | | | | | | | | | | |
| 7/1/22 to 6/30/23 | | $ 29.67 | 0.37 | 1.64 | 2.01 | (0.34) | — | (4.59) | (4.93) | — | (2.92) | $ 26.75 | 8.38 % | $ 442 | 0.97 % (9) | 0.97 % | 1.33 % | 67 % |
| 7/1/21 to 6/30/22 | | 33.66 | 0.27 | (2.13) | (1.86) | (0.22) | — | (1.91) | (2.13) | — | (3.99) | 29.67 | (6.28) | 460 | 0.93 (9)(12) | 0.91 | 0.79 | 45 |
| 7/1/20 to 6/30/21 | | 24.85 | 0.25 | 8.75 | 9.00 | (0.19) | — | — | (0.19) | — | 8.81 | 33.66 | 36.33 | 520 | 1.01 (7) | 1.02 | 0.89 | 69 |
| 7/1/19 to 6/30/20 | | 27.29 | 0.42 | (1.91) | (1.49) | (0.44) | — | (0.51) | (0.95) | — | (2.44) | 24.85 | (5.65) | 1,181 | 1.02 | 1.02 | 1.58 | 114 |
| 7/1/18 to 6/30/19 | | 26.51 | 0.45 | 0.80 | 1.25 | (0.42) | — | (0.05) | (0.47) | — | 0.78 | 27.29 | 4.77 | 1,381 | 1.02 | 1.02 | 1.66 | 68 |
| | | | | | | | | | | | | | | | | | | |
| NFJ Mid-Cap Value Fund | | | | | | | | | | | | | | | | | | |
| Class A | | | | | | | | | | | | | | | | | | |
| 7/1/22 to 6/30/23 | | $ 29.43 | 0.30 | 2.33 | 2.63 | (0.39) | — | (6.38) | (6.77) | — | (4.14) | $ 25.29 | 11.10 % | $ 476,789 | 1.00 % | 1.12 % | 1.11 % | 105 % |
| 7/1/21 to 6/30/22 | | 35.54 | 0.24 | (2.18) | (1.94) | (0.25) | — | (3.92) | (4.17) | — | (6.11) | 29.43 | (6.83) | 495,612 | 1.00 | 1.10 | 0.70 | 76 |
| 7/1/20 to 6/30/21 | | 25.72 | 0.30 | 9.83 | 10.13 | (0.26) | — | (0.05) | (0.31) | — | 9.82 | 35.54 | 39.60 | 596,144 | 1.00 | 1.16 | 0.98 | 96 |
| 7/1/19 to 6/30/20 | | 30.60 | 0.38 | (2.72) | (2.34) | (0.33) | — | (2.21) | (2.54) | — | (4.88) | 25.72 | (8.93) | 474,970 | 0.99 | 1.21 | 1.30 | 197 |
| 7/1/18 to 6/30/19 | | 30.06 | 0.44 | 0.54 | 0.98 | (0.31) | — | (0.13) | (0.44) | — | 0.54 | 30.60 | 3.46 | 595,707 | 0.99 | 1.21 | 1.48 | 81 |
The footnote legend is at the end of the financial highlights.
See Notes to Financial Statements
VIRTUS INVESTMENT TRUST
FINANCIAL HIGHLIGHTS (Continued)
SELECTED PER SHARE DATA AND RATIOS FOR A SHARE OUTSTANDING
THROUGHOUT EACH PERIOD
| | | Net Asset Value,
Beginning of Period | Net Investment Income (Loss)(1) | Net Realized and
Unrealized Gain (Loss) | Total from Investment Operations | Dividends from
Net Investment Income | Return of Capital | Distributions from
Net Realized Gains | Total Distributions | Payment from Affiliate | Change in Net Asset Value | Net Asset Value, End of Period | Total Return(2)(3) | Net Assets, End of Period
(in thousands) | Ratio of Net Expenses to
Average Net Assets(4)(5) | Ratio of Gross Expenses
to Average Net Assets(4)(5) | Ratio of Net Investment Income (Loss)
to Average Net Assets(4) | Portfolio Turnover Rate(2) |
| NFJ Mid-Cap Value Fund (Continued) | | | | | | | | | | | | | | | | | | |
| Class C | | | | | | | | | | | | | | | | | | |
| 7/1/22 to 6/30/23 | | $ 22.96 | 0.06 | 1.70 | 1.76 | (0.24) | — | (6.38) | (6.62) | — | (4.86) | $ 18.10 | 10.23 % | $ 19,749 | 1.75 % | 1.83 % | 0.31 % | 105 % |
| 7/1/21 to 6/30/22 | | 28.63 | (0.01) | (1.65) | (1.66) | (0.09) | — | (3.92) | (4.01) | — | (5.67) | 22.96 | (7.48) | 28,379 | 1.75 | 1.82 | (0.05) | 76 |
| 7/1/20 to 6/30/21 | | 20.74 | 0.05 | 7.93 | 7.98 | (0.04) | — | (0.05) | (0.09) | — | 7.89 | 28.63 | 38.53 | 39,321 | 1.74 (7) | 1.90 | 0.21 | 96 |
| 7/1/19 to 6/30/20 | | 25.16 | 0.13 | (2.18) | (2.05) | (0.16) | — | (2.21) | (2.37) | — | (4.42) | 20.74 | (9.64) | 37,278 | 1.74 | 1.96 | 0.55 | 197 |
| 7/1/18 to 6/30/19 | | 24.62 | 0.13 | 0.54 | 0.67 | — | — | (0.13) | (0.13) | — | 0.54 | 25.16 | 2.73 | 48,176 | 1.74 | 1.96 | 0.54 | 81 |
| Class P | | | | | | | | | | | | | | | | | | |
| 7/1/22 to 6/30/23 | | $ 22.26 | 0.26 | 1.63 | 1.89 | (0.48) | — | (6.38) | (6.86) | — | (4.97) | $ 17.29 | 11.43 % | $ 81,136 | 0.75 % | 0.84 % | 1.33 % | 105 % |
| 7/1/21 to 6/30/22 | | 27.90 | 0.24 | (1.58) | (1.34) | (0.38) | — | (3.92) | (4.30) | — | (5.64) | 22.26 | (6.60) | 99,992 | 0.75 | 0.83 | 0.90 | 76 |
| 7/1/20 to 6/30/21 | | 20.30 | 0.29 | 7.74 | 8.03 | (0.38) | — | (0.05) | (0.43) | — | 7.60 | 27.90 | 39.93 | 239,250 | 0.75 | 0.90 | 1.23 | 96 |
| 7/1/19 to 6/30/20 | | 24.68 | 0.36 | (2.10) | (1.74) | (0.43) | — | (2.21) | (2.64) | — | (4.38) | 20.30 | (8.72) | 211,729 | 0.74 | 0.96 | 1.57 | 197 |
| 7/1/18 to 6/30/19 | | 24.35 | 0.41 | 0.43 | 0.84 | (0.38) | — | (0.13) | (0.51) | — | 0.33 | 24.68 | 3.75 | 197,201 | 0.74 | 0.96 | 1.70 | 81 |
| Institutional Class | | | | | | | | | | | | | | | | | | |
| 7/1/22 to 6/30/23 | | $ 31.99 | 0.43 | 2.59 | 3.02 | (0.47) | — | (6.38) | (6.85) | — | (3.83) | $ 28.16 | 11.48 % | $ 282,625 | 0.65 % | 0.82 % | 1.43 % | 105 % |
| 7/1/21 to 6/30/22 | | 38.28 | 0.39 | (2.38) | (1.99) | (0.38) | — | (3.92) | (4.30) | — | (6.29) | 31.99 | (6.49) | 381,239 | 0.65 | 0.81 | 1.06 | 76 |
| 7/1/20 to 6/30/21 | | 27.70 | 0.44 | 10.59 | 11.03 | (0.40) | — | (0.05) | (0.45) | — | 10.58 | 38.28 | 40.11 | 460,452 | 0.65 | 0.84 | 1.33 | 96 |
| 7/1/19 to 6/30/20 | | 32.77 | 0.51 | (2.92) | (2.41) | (0.45) | — | (2.21) | (2.66) | — | (5.07) | 27.70 | (8.62) | 385,311 | 0.64 | 0.86 | 1.67 | 197 |
| 7/1/18 to 6/30/19 | | 32.15 | 0.58 | 0.57 | 1.15 | (0.40) | — | (0.13) | (0.53) | — | 0.62 | 32.77 | 3.83 | 406,173 | 0.64 | 0.86 | 1.82 | 81 |
| Class R6 | | | | | | | | | | | | | | | | | | |
| 7/1/22 to 6/30/23 | | $ 31.97 | 0.44 | 2.59 | 3.03 | (0.52) | — | (6.38) | (6.90) | — | (3.87) | $ 28.10 | 11.55 % | $ 78,020 | 0.60 % | 0.74 % | 1.50 % | 105 % |
| 7/1/21 to 6/30/22 | | 38.24 | 0.41 | (2.38) | (1.97) | (0.38) | — | (3.92) | (4.30) | — | (6.27) | 31.97 | (6.45) | 87,682 | 0.60 | 0.72 | 1.12 | 76 |
| 7/1/20 to 6/30/21 | | 27.68 | 0.45 | 10.59 | 11.04 | (0.43) | — | (0.05) | (0.48) | — | 10.56 | 38.24 | 40.17 | 85,969 | 0.60 | 0.78 | 1.37 | 96 |
| 7/1/19 to 6/30/20 | | 32.75 | 0.56 | (2.95) | (2.39) | (0.47) | — | (2.21) | (2.68) | — | (5.07) | 27.68 | (8.57) | 66,260 | 0.59 | 0.81 | 1.86 | 197 |
| 7/1/18 to 6/30/19 | | 32.13 | 0.63 | 0.53 | 1.16 | (0.41) | — | (0.13) | (0.54) | — | 0.62 | 32.75 | 3.89 | 18,052 | 0.59 | 0.81 | 2.03 | 81 |
| Administrative Class | | | | | | | | | | | | | | | | | | |
| 7/1/22 to 6/30/23 | | $ 30.61 | 0.34 | 2.45 | 2.79 | (0.42) | — | (6.38) | (6.80) | — | (4.01) | $ 26.60 | 11.20 % | $ 34,215 | 0.90 % | 1.12 % | 1.22 % | 105 % |
| 7/1/21 to 6/30/22 | | 36.77 | 0.28 | (2.26) | (1.98) | (0.26) | — | (3.92) | (4.18) | — | (6.16) | 30.61 | (6.70) | 34,212 | 0.90 | 1.06 | 0.80 | 76 |
| 7/1/20 to 6/30/21 | | 26.59 | 0.34 | 10.17 | 10.51 | (0.28) | — | (0.05) | (0.33) | — | 10.18 | 36.77 | 39.73 | 49,280 | 0.90 | 1.08 | 1.06 | 96 |
| 7/1/19 to 6/30/20 | | 31.57 | 0.42 | (2.81) | (2.39) | (0.38) | — | (2.21) | (2.59) | — | (4.98) | 26.59 | (8.85) | 33,511 | 0.89 | 1.11 | 1.43 | 197 |
| 7/1/18 to 6/30/19 | | 31.00 | 0.48 | 0.56 | 1.04 | (0.34) | — | (0.13) | (0.47) | — | 0.57 | 31.57 | 3.60 | 27,405 | 0.89 | 1.11 | 1.58 | 81 |
| | | | | | | | | | | | | | | | | | | |
| NFJ Small-Cap Value Fund | | | | | | | | | | | | | | | | | | |
| Class A | | | | | | | | | | | | | | | | | | |
| 7/1/22 to 6/30/23 | | $ 12.80 | 0.13 | 1.03 | 1.16 | (0.14) | — | (1.96) | (2.10) | — | (0.94) | $ 11.86 | 10.64 % | $ 225,530 | 1.17 % | 1.23 % | 1.10 % | 79 % |
| 7/1/21 to 6/30/22 | | 15.67 | 0.10 | (1.66) | (1.56) | (0.17) | — | (1.14) | (1.31) | — | (2.87) | 12.80 | (11.08) | 236,990 | 1.17 | 1.21 | 0.68 | 52 |
| 7/1/20 to 6/30/21 | | 11.07 | 0.18 | 4.71 | 4.89 | (0.24) | — | (0.05) | (0.29) | — | 4.60 | 15.67 | 44.57 | 325,048 | 1.18 (7)(9) | 1.23 | 1.34 | 65 |
| 7/1/19 to 6/30/20 | | 14.53 | 0.18 | (2.28) | (2.10) | (0.06) | — | (1.30) | (1.36) | — | (3.46) | 11.07 | (16.62) | 267,845 | 1.17 | 1.27 | 1.37 | 126 |
| 7/1/18 to 6/30/19 | | 21.71 | 0.29 | (2.73) | (2.44) | (0.62) | — | (4.12) | (4.74) | — | (7.18) | 14.53 | (7.70) | 439,710 | 1.18 | 1.26 | 1.65 | 47 |
The footnote legend is at the end of the financial highlights.
See Notes to Financial Statements
VIRTUS INVESTMENT TRUST
FINANCIAL HIGHLIGHTS (Continued)
SELECTED PER SHARE DATA AND RATIOS FOR A SHARE OUTSTANDING
THROUGHOUT EACH PERIOD
| | | Net Asset Value,
Beginning of Period | Net Investment Income (Loss)(1) | Net Realized and
Unrealized Gain (Loss) | Total from Investment Operations | Dividends from
Net Investment Income | Return of Capital | Distributions from
Net Realized Gains | Total Distributions | Payment from Affiliate | Change in Net Asset Value | Net Asset Value, End of Period | Total Return(2)(3) | Net Assets, End of Period
(in thousands) | Ratio of Net Expenses to
Average Net Assets(4)(5) | Ratio of Gross Expenses
to Average Net Assets(4)(5) | Ratio of Net Investment Income (Loss)
to Average Net Assets(4) | Portfolio Turnover Rate(2) |
| NFJ Small-Cap Value Fund (Continued) | | | | | | | | | | | | | | | | | | |
| Class C | | | | | | | | | | | | | | | | | | |
| 7/1/22 to 6/30/23 | | $ 11.10 | 0.04 | 0.85 | 0.89 | (0.07) | — | (1.96) | (2.03) | — | (1.14) | $ 9.96 | 9.76 % | $ 1,062 | 1.92 % | 1.97 % | 0.34 % | 79 % |
| 7/1/21 to 6/30/22 | | 13.78 | (0.01) | (1.43) | (1.44) | (0.10) | — | (1.14) | (1.24) | — | (2.68) | 11.10 | (11.72) | 1,347 | 1.92 | 1.95 | (0.06) | 52 |
| 7/1/20 to 6/30/21 | | 9.74 | 0.07 | 4.14 | 4.21 | (0.12) | — | (0.05) | (0.17) | — | 4.04 | 13.78 | 43.52 | 1,606 | 1.91 (9) | 1.97 | 0.60 | 65 |
| 7/1/19 to 6/30/20 | | 12.97 | 0.07 | (2.00) | (1.93) | — | — | (1.30) | (1.30) | — | (3.23) | 9.74 | (17.26) | 1,627 | 1.92 | 2.02 | 0.58 | 126 |
| 7/1/18 to 6/30/19 | | 19.30 | 0.16 | (2.41) | (2.25) | — | — | (4.08) (17) | (4.08) | — | (6.33) | 12.97 | (8.35) | 3,984 | 1.93 | 2.01 | 0.88 | 47 |
| Class P | | | | | | | | | | | | | | | | | | |
| 7/1/22 to 6/30/23 | | $ 15.30 | 0.21 | 1.24 | 1.45 | (0.14) | — | (1.96) | (2.10) | — | (0.65) | $ 14.65 | 10.85 % | $ 24,940 | 0.91 % (9) | 0.91 % | 1.42 % | 79 % |
| 7/1/21 to 6/30/22 | | 18.42 | 0.17 | (1.97) | (1.80) | (0.18) | — | (1.14) | (1.32) | — | (3.12) | 15.30 | (10.73) | 14,358 | 0.89 (9) | 0.89 | 0.95 | 52 |
| 7/1/20 to 6/30/21 | | 12.97 | 0.25 | 5.52 | 5.77 | (0.27) | — | (0.05) | (0.32) | — | 5.45 | 18.42 | 44.88 | 24,149 | 0.91 (9) | 0.96 | 1.61 | 65 |
| 7/1/19 to 6/30/20 | | 16.79 | 0.25 | (2.68) | (2.43) | (0.09) | — | (1.30) | (1.39) | — | (3.82) | 12.97 | (16.39) | 21,354 | 0.92 | 1.02 | 1.62 | 126 |
| 7/1/18 to 6/30/19 | | 24.18 | 0.38 | (2.97) | (2.59) | (0.68) | — | (4.12) | (4.80) | — | (7.39) | 16.79 | (7.49) | 39,426 | 0.93 | 1.01 | 1.91 | 47 |
| Institutional Class | | | | | | | | | | | | | | | | | | |
| 7/1/22 to 6/30/23 | | $ 15.51 | 0.22 | 1.27 | 1.49 | (0.16) | — | (1.96) | (2.12) | — | (0.63) | $ 14.88 | 10.93 % | $ 52,013 | 0.82 % | 0.92 % | 1.44 % | 79 % |
| 7/1/21 to 6/30/22 | | 18.66 | 0.19 | (2.01) | (1.82) | (0.19) | — | (1.14) | (1.33) | — | (3.15) | 15.51 | (10.72) | 58,704 | 0.82 | 0.88 | 1.03 | 52 |
| 7/1/20 to 6/30/21 | | 13.13 | 0.27 | 5.59 | 5.86 | (0.28) | — | (0.05) | (0.33) | — | 5.53 | 18.66 | 45.07 | 94,847 | 0.82 | 0.89 | 1.69 | 65 |
| 7/1/19 to 6/30/20 | | 16.95 | 0.27 | (2.72) | (2.45) | (0.07) | — | (1.30) | (1.37) | — | (3.82) | 13.13 | (16.31) | 99,894 | 0.82 | 0.92 | 1.67 | 126 |
| 7/1/18 to 6/30/19 | | 24.34 | 0.41 | (3.00) | (2.59) | (0.68) | — | (4.12) | (4.80) | — | (7.39) | 16.95 | (7.42) | 288,309 | 0.83 | 0.91 | 1.98 | 47 |
| Class R6 | | | | | | | | | | | | | | | | | | |
| 7/1/22 to 6/30/23 | | $ 15.35 | 0.22 | 1.26 | 1.48 | (0.16) | — | (1.96) | (2.12) | — | (0.64) | $ 14.71 | 10.98 % | $ 46,194 | 0.77 % | 0.83 % | 1.48 % | 79 % |
| 7/1/21 to 6/30/22 | | 18.49 | 0.19 | (1.97) | (1.78) | (0.22) | — | (1.14) | (1.36) | — | (3.14) | 15.35 | (10.63) | 62,552 | 0.77 | 0.79 | 1.07 | 52 |
| 7/1/20 to 6/30/21 | | 13.02 | 0.27 | 5.55 | 5.82 | (0.30) | — | (0.05) | (0.35) | — | 5.47 | 18.49 | 45.09 | 88,986 | 0.77 | 0.84 | 1.73 | 65 |
| 7/1/19 to 6/30/20 | | 16.85 | 0.27 | (2.68) | (2.41) | (0.12) | — | (1.30) | (1.42) | — | (3.83) | 13.02 | (16.25) | 88,885 | 0.77 | 0.87 | 1.76 | 126 |
| 7/1/18 to 6/30/19 | | 24.25 | 0.41 | (2.99) | (2.58) | (0.70) | — | (4.12) | (4.82) | — | (7.40) | 16.85 | (7.37) | 150,200 | 0.78 | 0.86 | 2.04 | 47 |
| Administrative Class | | | | | | | | | | | | | | | | | | |
| 7/1/22 to 6/30/23 | | $ 12.79 | 0.14 | 1.42 (16) | 1.56 | (0.13) | — | (1.96) | (2.09) | — | (0.53) | $ 12.26 | 14.38 % | $ 22,722 | 1.07 % | 1.08 % | 1.17 % | 79 % |
| 7/1/21 to 6/30/22 | | 15.66 | 0.12 | (1.65) | (1.53) | (0.20) | — | (1.14) | (1.34) | — | (2.87) | 12.79 | (10.95) | 29,525 | 1.07 | 1.09 | 0.78 | 52 |
| 7/1/20 to 6/30/21 | | 11.02 | 0.20 | 4.70 | 4.90 | (0.21) | — | (0.05) | (0.26) | — | 4.64 | 15.66 | 44.81 | 37,759 | 1.07 | 1.32 | 1.45 | 65 |
| 7/1/19 to 6/30/20 | | 14.48 | 0.19 | (2.27) | (2.08) | (0.08) | — | (1.30) | (1.38) | — | (3.46) | 11.02 | (16.58) | 34,323 | 1.07 | 1.17 | 1.39 | 126 |
| 7/1/18 to 6/30/19 | | 21.65 | 0.30 | (2.73) | (2.43) | (0.62) | — | (4.12) | (4.74) | — | (7.17) | 14.48 | (7.64) | 107,836 | 1.08 | 1.16 | 1.74 | 47 |
| | | | | | | | | | | | | | | | | | | |
| Silvant Focused Growth Fund | | | | | | | | | | | | | | | | | | |
| Class A | | | | | | | | | | | | | | | | | | |
| 7/1/22 to 6/30/23 | | $ 49.11 | (0.19) | 15.07 | 14.88 | — | — | (2.83) | (2.83) | — (8) | 12.05 | $ 61.16 | 32.32 % (13) | $ 625,184 | 0.96 % (9) | 0.96 % | (0.37) % | 65 % |
| 7/1/21 to 6/30/22 | | 79.25 | (0.32) | (16.15) | (16.47) | — | — | (13.67) | (13.67) | — | (30.14) | 49.11 | (25.81) | 537,276 | 0.94 (9) | 0.94 | (0.45) | 22 |
| 7/1/20 to 6/30/21 | | 58.46 | (0.35) | 27.26 | 26.91 | — | — | (6.12) | (6.12) | — | 20.79 | 79.25 | 47.50 | 860,373 | 0.97 (7) | 1.04 | (0.50) | 50 |
| 7/1/19 to 6/30/20 | | 53.33 | (0.10) | 12.28 | 12.18 | — | — | (7.05) | (7.05) | — | 5.13 | 58.46 | 24.74 | 618,302 | 1.00 | 1.12 | (0.20) | 63 |
| 7/1/18 to 6/30/19 | | 56.83 | (0.08) | 2.48 | 2.40 | — | — | (5.90) | (5.90) | — | (3.50) | 53.33 | 6.79 | 577,106 | 1.00 | 1.12 | (0.15) | 50 |
The footnote legend is at the end of the financial highlights.
See Notes to Financial Statements
VIRTUS INVESTMENT TRUST
FINANCIAL HIGHLIGHTS (Continued)
SELECTED PER SHARE DATA AND RATIOS FOR A SHARE OUTSTANDING
THROUGHOUT EACH PERIOD
| | | Net Asset Value,
Beginning of Period | Net Investment Income (Loss)(1) | Net Realized and
Unrealized Gain (Loss) | Total from Investment Operations | Dividends from
Net Investment Income | Return of Capital | Distributions from
Net Realized Gains | Total Distributions | Payment from Affiliate | Change in Net Asset Value | Net Asset Value, End of Period | Total Return(2)(3) | Net Assets, End of Period
(in thousands) | Ratio of Net Expenses to
Average Net Assets(4)(5) | Ratio of Gross Expenses
to Average Net Assets(4)(5) | Ratio of Net Investment Income (Loss)
to Average Net Assets(4) | Portfolio Turnover Rate(2) |
| Silvant Focused Growth Fund (Continued) | | | | | | | | | | | | | | | | | | |
| Class C | | | | | | | | | | | | | | | | | | |
| 7/1/22 to 6/30/23 | | $ 22.51 | (0.25) | 6.32 | 6.07 | — | — | (2.83) | (2.83) | — (8) | 3.24 | $ 25.75 | 31.31 % (13) | $ 22,534 | 1.72 % (9) | 1.72 % | (1.13) % | 65 % |
| 7/1/21 to 6/30/22 | | 43.67 | (0.43) | (7.06) | (7.49) | — | — | (13.67) | (13.67) | — | (21.16) | 22.51 | (26.37) | 24,361 | 1.70 (9) | 1.70 | (1.22) | 22 |
| 7/1/20 to 6/30/21 | | 34.58 | (0.50) | 15.71 | 15.21 | — | — | (6.12) | (6.12) | — | 9.09 | 43.67 | 46.39 | 48,650 | 1.73 (9) | 1.79 | (1.25) | 50 |
| 7/1/19 to 6/30/20 | | 34.42 | (0.31) | 7.52 | 7.21 | — | — | (7.05) | (7.05) | — | 0.16 | 34.58 | 23.79 | 45,878 | 1.77 | 1.87 | (0.97) | 63 |
| 7/1/18 to 6/30/19 | | 39.41 | (0.36) | 1.27 | 0.91 | — | — | (5.90) | (5.90) | — | (4.99) | 34.42 | 5.93 | 48,706 | 1.77 | 1.87 | (0.93) | 50 |
| Class P | | | | | | | | | | | | | | | | | | |
| 7/1/22 to 6/30/23 | | $ 31.10 | (0.04) | 9.19 | 9.15 | — | — | (2.83) | (2.83) | — (8) | 6.32 | $ 37.42 | 32.63 % (13) | $ 45,858 | 0.71 % (9) | 0.71 % | (0.12) % | 65 % |
| 7/1/21 to 6/30/22 | | 54.85 | (0.11) | (9.97) | (10.08) | — | — | (13.67) | (13.67) | — | (23.75) | 31.10 | (25.62) | 45,888 | 0.71 (9) | 0.71 | (0.23) | 22 |
| 7/1/20 to 6/30/21 | | 41.83 | (0.13) | 19.27 | 19.14 | — | — | (6.12) | (6.12) | — | 13.02 | 54.85 | 47.83 | 105,688 | 0.73 (9) | 0.80 | (0.26) | 50 |
| 7/1/19 to 6/30/20 | | 39.91 | 0.01 | 8.96 | 8.97 | — | — | (7.05) | (7.05) | — | 1.92 | 41.83 | 25.03 | 84,929 | 0.77 | 0.87 | 0.03 | 63 |
| 7/1/18 to 6/30/19 | | 44.18 | 0.03 | 1.60 | 1.63 | — | — | (5.90) | (5.90) | — | (4.27) | 39.91 | 7.01 | 91,265 | 0.77 | 0.87 | 0.09 | 50 |
| Institutional Class | | | | | | | | | | | | | | | | | | |
| 7/1/22 to 6/30/23 | | $ 43.55 | (0.04) | 13.28 | 13.24 | — | — | (2.83) | (2.83) | — (8) | 10.41 | $ 53.96 | 32.70 % (13) | $ 151,338 | 0.67 % | 0.70 % | (0.08) % | 65 % |
| 7/1/21 to 6/30/22 | | 71.58 | (0.12) | (14.24) | (14.36) | — | — | (13.67) | (13.67) | — | (28.03) | 43.55 | (25.61) | 127,274 | 0.67 | 0.70 | (0.19) | 22 |
| 7/1/20 to 6/30/21 | | 53.11 | (0.12) | 24.71 | 24.59 | — | — | (6.12) | (6.12) | — | 18.47 | 71.58 | 47.94 | 209,066 | 0.67 | 0.74 | (0.19) | 50 |
| 7/1/19 to 6/30/20 | | 48.89 | 0.06 | 11.21 | 11.27 | — | — | (7.05) | (7.05) | — | 4.22 | 53.11 | 25.15 | 165,726 | 0.67 | 0.77 | 0.13 | 63 |
| 7/1/18 to 6/30/19 | | 52.51 | 0.09 | 2.19 | 2.28 | — | — | (5.90) | (5.90) | — | (3.62) | 48.89 | 7.15 | 162,173 | 0.67 | 0.77 | 0.18 | 50 |
| Class R6 | | | | | | | | | | | | | | | | | | |
| 7/1/22 to 6/30/23 | | $ 43.74 | (0.02) | 13.35 | 13.33 | — | — | (2.83) | (2.83) | — (8) | 10.50 | $ 54.24 | 32.76 % (13) | $ 165,550 | 0.62 % | 0.63 % | (0.04) % | 65 % |
| 7/1/21 to 6/30/22 | | 71.80 | (0.08) | (14.31) | (14.39) | — | — | (13.67) | (13.67) | — | (28.06) | 43.74 | (25.57) | 170,153 | 0.62 | 0.63 | (0.14) | 22 |
| 7/1/20 to 6/30/21 | | 53.23 | (0.10) | 24.79 | 24.69 | — | — | (6.12) | (6.12) | — | 18.57 | 71.80 | 48.02 | 198,031 | 0.62 | 0.68 | (0.15) | 50 |
| 7/1/19 to 6/30/20 | | 48.96 | 0.09 | 11.23 | 11.32 | — | — | (7.05) | (7.05) | — | 4.27 | 53.23 | 25.22 | 136,519 | 0.62 | 0.72 | 0.19 | 63 |
| 7/1/18 to 6/30/19 | | 52.56 | 0.11 | 2.19 | 2.30 | — | — | (5.90) | (5.90) | — | (3.60) | 48.96 | 7.18 | 134,485 | 0.62 | 0.72 | 0.23 | 50 |
| Administrative Class | | | | | | | | | | | | | | | | | | |
| 7/1/22 to 6/30/23 | | $ 38.32 | (0.13) | 11.53 | 11.40 | — | — | (2.83) | (2.83) | — (8) | 8.57 | $ 46.89 | 32.34 % (13) | $ 7,621 | 0.92 % | 0.97 % | (0.33) % | 65 % |
| 7/1/21 to 6/30/22 | | 64.69 | (0.24) | (12.46) | (12.70) | — | — | (13.67) | (13.67) | — | (26.37) | 38.32 | (25.79) | 5,723 | 0.92 | 0.97 | (0.44) | 22 |
| 7/1/20 to 6/30/21 | | 48.56 | (0.26) | 22.51 | 22.25 | — | — | (6.12) | (6.12) | — | 16.13 | 64.69 | 47.60 | 6,641 | 0.92 | 1.00 | (0.44) | 50 |
| 7/1/19 to 6/30/20 | | 45.36 | (0.05) | 10.30 | 10.25 | — | — | (7.05) | (7.05) | — | 3.20 | 48.56 | 24.84 | 4,518 | 0.92 | 1.02 | (0.11) | 63 |
| 7/1/18 to 6/30/19 | | 49.33 | (0.04) | 1.97 | 1.93 | — | — | (5.90) | (5.90) | — | (3.97) | 45.36 | 6.88 | 5,138 | 0.92 | 1.02 | (0.08) | 50 |
| | | | | | | | | | | | | | | | | | | |
| Silvant Mid-Cap Growth Fund | | | | | | | | | | | | | | | | | | |
| Class A | | | | | | | | | | | | | | | | | | |
| 7/1/22 to 6/30/23 | | $ 2.89 | (0.01) | 0.67 | 0.66 | — | — | — | — | — | 0.66 | $ 3.55 | 22.84 % | $ 242,677 | 1.00 % (9) | 1.01 % | (0.32) % | 34 % |
| 7/1/21 to 6/30/22 | | 5.94 | (0.02) | (1.44) | (1.46) | — | — | (1.59) | (1.59) | — | (3.05) | 2.89 | (33.42) | 223,611 | 0.98 (9) | 0.98 | (0.49) | 65 |
| 7/1/20 to 6/30/21 | | 4.30 | (0.04) | 2.26 | 2.22 | — | — | (0.58) | (0.58) | — (8) | 1.64 | 5.94 | 53.25 (13) | 376,649 | 1.06 (9) | 1.06 | (0.76) | 85 |
| 7/1/19 to 6/30/20 | | 3.75 | (0.02) | 0.75 | 0.73 | — | — | (0.18) | (0.18) | — | 0.55 | 4.30 | 20.15 | 263,361 | 1.14 | 1.14 | (0.66) | 53 |
| 7/1/18 to 6/30/19 | | 3.88 | (0.02) | 0.37 | 0.35 | — | — | (0.48) | (0.48) | — | (0.13) | 3.75 | 13.58 | 240,017 | 1.14 | 1.14 | (0.66) | 60 |
The footnote legend is at the end of the financial highlights.
See Notes to Financial Statements
VIRTUS INVESTMENT TRUST
FINANCIAL HIGHLIGHTS (Continued)
SELECTED PER SHARE DATA AND RATIOS FOR A SHARE OUTSTANDING
THROUGHOUT EACH PERIOD
| | | Net Asset Value,
Beginning of Period | Net Investment Income (Loss)(1) | Net Realized and
Unrealized Gain (Loss) | Total from Investment Operations | Dividends from
Net Investment Income | Return of Capital | Distributions from
Net Realized Gains | Total Distributions | Payment from Affiliate | Change in Net Asset Value | Net Asset Value, End of Period | Total Return(2)(3) | Net Assets, End of Period
(in thousands) | Ratio of Net Expenses to
Average Net Assets(4)(5) | Ratio of Gross Expenses
to Average Net Assets(4)(5) | Ratio of Net Investment Income (Loss)
to Average Net Assets(4) | Portfolio Turnover Rate(2) |
| Silvant Mid-Cap Growth Fund (Continued) | | | | | | | | | | | | | | | | | | |
| Class C | | | | | | | | | | | | | | | | | | |
| 7/1/22 to 6/30/23 | | $ 1.88 | (0.02) | 0.42 | 0.40 | — | — | — | — | — | 0.40 | $ 2.28 | 21.28 % | $ 5,204 | 1.78 % (9) | 1.78 % | (1.09) % | 34 % |
| 7/1/21 to 6/30/22 | | 4.45 | (0.04) | (0.94) | (0.98) | — | — | (1.59) | (1.59) | — | (2.57) | 1.88 | (33.91) | 6,350 | 1.74 (9) | 1.74 | (1.26) | 65 |
| 7/1/20 to 6/30/21 | | 3.35 | (0.06) | 1.74 | 1.68 | — | — | (0.58) | (0.58) | — (8) | 1.10 | 4.45 | 52.17 (13) | 15,282 | 1.82 (9) | 1.82 | (1.52) | 85 |
| 7/1/19 to 6/30/20 | | 2.98 | (0.04) | 0.59 | 0.55 | — | — | (0.18) | (0.18) | — | 0.37 | 3.35 | 19.29 | 15,495 | 1.89 | 1.89 | (1.41) | 53 |
| 7/1/18 to 6/30/19 | | 3.23 | (0.04) | 0.27 | 0.23 | — | — | (0.48) | (0.48) | — | (0.25) | 2.98 | 12.56 | 21,251 | 1.89 | 1.89 | (1.34) | 60 |
| Class P | | | | | | | | | | | | | | | | | | |
| 7/1/22 to 6/30/23 | | $ 3.67 | — (8) | 0.84 | 0.84 | — | — | — | — | — | 0.84 | $ 4.51 | 22.89 % | $ 6,421 | 0.76 % (9) | 0.76 % | (0.08) % | 34 % |
| 7/1/21 to 6/30/22 | | 7.10 | (0.02) | (1.82) | (1.84) | — | — | (1.59) | (1.59) | — | (3.43) | 3.67 | (33.30) | 6,195 | 0.78 (9) | 0.78 | (0.34) | 65 |
| 7/1/20 to 6/30/21 | | 5.05 | (0.03) | 2.66 | 2.63 | — | — | (0.58) | (0.58) | — (8) | 2.05 | 7.10 | 53.49 (13) | 30,526 | 0.81 (9) | 0.81 | (0.50) | 85 |
| 7/1/19 to 6/30/20 | | 4.36 | (0.02) | 0.89 | 0.87 | — | — | (0.18) | (0.18) | — | 0.69 | 5.05 | 20.56 | 13,670 | 0.89 | 0.89 | (0.41) | 53 |
| 7/1/18 to 6/30/19 | | 4.41 | (0.02) | 0.45 | 0.43 | — | — | (0.48) | (0.48) | — | (0.05) | 4.36 | 13.79 | 11,617 | 0.89 | 0.89 | (0.39) | 60 |
| Institutional Class | | | | | | | | | | | | | | | | | | |
| 7/1/22 to 6/30/23 | | $ 3.72 | — (8) | 0.85 | 0.85 | — | — | — | — | — | 0.85 | $ 4.57 | 22.85 % | $ 50,028 | 0.77 % (9) | 0.77 % | (0.09) % | 34 % |
| 7/1/21 to 6/30/22 | | 7.18 | (0.01) | (1.86) | (1.87) | — | — | (1.59) | (1.59) | — | (3.46) | 3.72 | (33.33) | 47,978 | 0.76 (9) | 0.76 | (0.25) | 65 |
| 7/1/20 to 6/30/21 | | 5.09 | (0.03) | 2.70 | 2.67 | — | — | (0.58) | (0.58) | — (8) | 2.09 | 7.18 | 53.86 (13) | 63,690 | 0.78 (9) | 0.78 | (0.48) | 85 |
| 7/1/19 to 6/30/20 | | 4.39 | (0.01) | 0.89 | 0.88 | — | — | (0.18) | (0.18) | — | 0.70 | 5.09 | 20.64 | 54,793 | 0.79 | 0.79 | (0.31) | 53 |
| 7/1/18 to 6/30/19 | | 4.43 | (0.01) | 0.45 | 0.44 | — | — | (0.48) | (0.48) | — | (0.04) | 4.39 | 13.97 | 36,373 | 0.79 | 0.79 | (0.29) | 60 |
| Administrative Class | | | | | | | | | | | | | | | | | | |
| 7/1/22 to 6/30/23 | | $ 3.21 | (0.01) | 0.75 (16) | 0.74 | — | — | — | — | — | 0.74 | $ 3.95 | 23.05 % | $ 1,141 | 1.04 % (9) | 1.04 % | (0.34) % | 34 % |
| 7/1/21 to 6/30/22 | | 6.43 | (0.03) | (1.60) | (1.63) | — | — | (1.59) | (1.59) | — | (3.22) | 3.21 | (33.52) | 1,727 | 1.04 | 1.05 | (0.55) | 65 |
| 7/1/20 to 6/30/21 | | 4.62 | (0.04) | 2.43 | 2.39 | — | — | (0.58) | (0.58) | — (8) | 1.81 | 6.43 | 53.26 (13) | 2,881 | 0.99 (9) | 0.99 | (0.69) | 85 |
| 7/1/19 to 6/30/20 | | 4.01 | (0.02) | 0.81 | 0.79 | — | — | (0.18) | (0.18) | — | 0.61 | 4.62 | 20.34 | 1,748 | 1.04 | 1.04 | (0.56) | 53 |
| 7/1/18 to 6/30/19 | | 4.11 | (0.02) | 0.40 | 0.38 | — | — | (0.48) | (0.48) | — | (0.10) | 4.01 | 13.61 | 1,525 | 1.04 | 1.04 | (0.54) | 60 |
| | | | | | | | | | | | | | | | | | | |
| Small-Cap Fund | | | | | | | | | | | | | | | | | | |
| Class A | | | | | | | | | | | | | | | | | | |
| 7/1/22 to 6/30/23 | | $ 19.10 | 0.06 | 2.73 | 2.79 | (0.11) | — | (0.88) | (0.99) | — (8) | 1.80 | $ 20.90 | 14.96 % (13) | $ 62,610 | 1.17 % | 1.22 % | 0.29 % | 82 % |
| 7/1/21 to 6/30/22 | | 27.49 | 0.06 | (5.02) | (4.96) | (0.02) | — | (3.41) | (3.43) | — | (8.39) | 19.10 | (20.45) | 64,567 | 1.17 | 1.17 | 0.23 | 69 |
| 7/1/20 to 6/30/21 | | 17.55 | (0.04) | 10.00 | 9.96 | (0.02) | — | — | (0.02) | — | 9.94 | 27.49 | 56.80 | 87,605 | 1.17 | 1.23 | (0.17) | 88 |
| 7/1/19 to 6/30/20 | | 19.50 | 0.04 | (1.98) | (1.94) | (0.01) | — | — | (0.01) | — | (1.95) | 17.55 (10) | (9.95) (10) | 58,062 | 1.17 | 1.27 | 0.23 | 110 |
| 7/1/18 to 6/30/19 | | 21.61 | 0.07 | (0.53) | (0.46) | (0.02) | — | (1.63) | (1.65) | — | (2.11) | 19.50 | (0.62) | 66,269 | 1.18 | 1.27 | 0.35 | 78 |
| Class C | | | | | | | | | | | | | | | | | | |
| 7/1/22 to 6/30/23 | | $ 17.78 | (0.09) | 2.53 | 2.44 | — | — | (0.88) | (0.88) | — (8) | 1.56 | $ 19.34 | 14.06 % (13) | $ 3,415 | 1.92 % | 1.99 % | (0.46) % | 82 % |
| 7/1/21 to 6/30/22 | | 25.99 | (0.12) | (4.68) | (4.80) | — | — | (3.41) | (3.41) | — | (8.21) | 17.78 | (21.04) | 3,405 | 1.92 | 1.95 | (0.52) | 69 |
| 7/1/20 to 6/30/21 | | 16.70 | (0.20) | 9.49 | 9.29 | — (8) | — | — | — | — | 9.29 | 25.99 | 55.63 | 4,940 | 1.92 | 1.99 | (0.92) | 88 |
| 7/1/19 to 6/30/20 | | 18.68 | (0.09) | (1.89) | (1.98) | — | — | — | — | — | (1.98) | 16.70 (10) | (10.60) (10) | 4,251 | 1.92 | 2.02 | (0.53) | 110 |
| 7/1/18 to 6/30/19 | | 20.92 | (0.07) | (0.54) | (0.61) | — | — | (1.63) | (1.63) | — | (2.24) | 18.68 | (1.39) | 7,873 | 1.93 | 2.02 | (0.36) | 78 |
The footnote legend is at the end of the financial highlights.
See Notes to Financial Statements
VIRTUS INVESTMENT TRUST
FINANCIAL HIGHLIGHTS (Continued)
SELECTED PER SHARE DATA AND RATIOS FOR A SHARE OUTSTANDING
THROUGHOUT EACH PERIOD
| | | Net Asset Value,
Beginning of Period | Net Investment Income (Loss)(1) | Net Realized and
Unrealized Gain (Loss) | Total from Investment Operations | Dividends from
Net Investment Income | Return of Capital | Distributions from
Net Realized Gains | Total Distributions | Payment from Affiliate | Change in Net Asset Value | Net Asset Value, End of Period | Total Return(2)(3) | Net Assets, End of Period
(in thousands) | Ratio of Net Expenses to
Average Net Assets(4)(5) | Ratio of Gross Expenses
to Average Net Assets(4)(5) | Ratio of Net Investment Income (Loss)
to Average Net Assets(4) | Portfolio Turnover Rate(2) |
| Small-Cap Fund (Continued) | | | | | | | | | | | | | | | | | | |
| Class P | | | | | | | | | | | | | | | | | | |
| 7/1/22 to 6/30/23 | | $ 19.42 | 0.11 | 2.78 | 2.89 | (0.02) | — | (0.88) | (0.90) | — (8) | 1.99 | $ 21.41 | 15.22 % (13) | $ 7,089 | 0.92 % | 0.96 % | 0.53 % | 82 % |
| 7/1/21 to 6/30/22 | | 27.82 | 0.10 | (5.07) | (4.97) | (0.02) | — | (3.41) | (3.43) | — | (8.40) | 19.42 | (20.24) | 13,287 | 0.92 (9)(12) | 0.92 | 0.41 | 69 |
| 7/1/20 to 6/30/21 | | 17.76 | 0.02 | 10.12 | 10.14 | (0.08) | — | — | (0.08) | — | 10.06 | 27.82 | 57.18 | 28,986 | 0.92 | 1.02 | 0.08 | 88 |
| 7/1/19 to 6/30/20 | | 19.74 | 0.08 | (1.99) | (1.91) | (0.07) | — | — | (0.07) | — | (1.98) | 17.76 (10) | (9.74) (10) | 16,747 | 0.92 | 1.02 | 0.44 | 110 |
| 7/1/18 to 6/30/19 | | 21.81 | 0.12 | (0.53) | (0.41) | (0.03) | — | (1.63) | (1.66) | — | (2.07) | 19.74 | (0.36) | 9,637 | 0.93 | 1.02 | 0.61 | 78 |
| Institutional Class | | | | | | | | | | | | | | | | | | |
| 7/1/22 to 6/30/23 | | $ 19.58 | 0.14 | 2.79 | 2.93 | (0.07) | — | (0.88) | (0.95) | — (8) | 1.98 | $ 21.56 | 15.32 % (13) | $ 20,456 | 0.82 % | 0.95 % | 0.66 % | 82 % |
| 7/1/21 to 6/30/22 | | 28.07 | 0.15 | (5.13) | (4.98) | (0.10) | — | (3.41) | (3.51) | — | (8.49) | 19.58 | (20.14) | 46,605 | 0.82 | 0.92 | 0.62 | 69 |
| 7/1/20 to 6/30/21 | | 17.92 | 0.04 | 10.22 | 10.26 | (0.11) | — | — | (0.11) | — | 10.15 | 28.07 | 57.35 | 36,211 | 0.82 | 0.96 | 0.19 | 88 |
| 7/1/19 to 6/30/20 | | 19.90 | 0.09 | (1.99) | (1.90) | (0.08) | — | — | (0.08) | — | (1.98) | 17.92 (10) | (9.62) (10) | 22,028 | 0.82 | 0.92 | 0.49 | 110 |
| 7/1/18 to 6/30/19 | | 21.96 | 0.14 | (0.53) | (0.39) | (0.04) | — | (1.63) | (1.67) | — | (2.06) | 19.90 | (0.29) | 9,077 | 0.83 | 0.92 | 0.70 | 78 |
| Class R6 | | | | | | | | | | | | | | | | | | |
| 7/1/22 to 6/30/23 | | $ 19.63 | 0.14 | 2.80 | 2.94 | (0.13) | — | (0.88) | (1.01) | — (8) | 1.93 | $ 21.56 | 15.38 % (13) | $ 5,358 | 0.77 % | 0.88 % | 0.68 % | 82 % |
| 7/1/21 to 6/30/22 | | 28.10 | 0.16 | (5.14) | (4.98) | (0.08) | — | (3.41) | (3.49) | — | (8.47) | 19.63 | (20.10) | 7,373 | 0.77 | 0.84 | 0.64 | 69 |
| 7/1/20 to 6/30/21 | | 17.93 | 0.06 | 10.21 | 10.27 | (0.10) | — | — | (0.10) | — | 10.17 | 28.10 | 57.37 | 8,614 | 0.77 | 0.87 | 0.24 | 88 |
| 7/1/19 to 6/30/20 | | 19.90 | 0.14 | (2.03) | (1.89) | (0.08) | — | — | (0.08) | — | (1.97) | 17.93 (10) | (9.55) (10) | 9,114 | 0.77 | 0.87 | 0.71 | 110 |
| 8/22/18 (14) to 6/30/19 | | 23.16 | 0.13 | (1.71) | (1.58) | (0.05) | — | (1.63) | (1.68) | — | (3.26) | 19.90 | (5.42) | 17,792 | 0.77 | 0.87 | 0.76 | 78 (15) |
| | | | | | | | | | | | | | | | | | | |
| Zevenbergen Technology Fund | | | | | | | | | | | | | | | | | | |
| Class A | | | | | | | | | | | | | | | | | | |
| 7/1/22 to 6/30/23 | | $ 39.74 | (0.39) | 9.87 | 9.48 | — | — | (7.58) | (7.58) | — (8) | 1.90 | $ 41.64 | 32.14 % (13) | $ 538,324 | 1.44 % (9) | 1.44 % | (1.05) % | 55 % |
| 7/1/21 to 6/30/22 | | 81.59 | (0.68) | (17.72) | (18.40) | — | — | (23.45) | (23.45) | — | (41.85) | 39.74 | (32.06) | 475,065 | 1.42 (9) | 1.42 | (1.05) | 126 |
| 7/1/20 to 6/30/21 | | 68.06 | (0.88) | 30.38 | 29.50 | — | — | (15.97) | (15.97) | — | 13.53 | 81.59 | 45.06 | 812,373 | 1.49 (9) | 1.50 | (1.12) | 150 |
| 7/1/19 to 6/30/20 | | 63.92 | (0.68) | 16.01 | 15.33 | — | — | (11.19) | (11.19) | — | 4.14 | 68.06 (10) | 28.34 (10) | 664,833 | 1.57 | 1.57 | (1.12) | 212 |
| 7/1/18 to 6/30/19 | | 71.60 | (0.68) | 5.90 | 5.22 | — | — | (12.90) | (12.90) | — | (7.68) | 63.92 | 12.40 | 601,112 | 1.51 | 1.56 | (1.05) | 109 |
| Class C | | | | | | | | | | | | | | | | | | |
| 7/1/22 to 6/30/23 | | $ 15.27 | (0.18) | 1.69 | 1.51 | — | — | (7.58) | (7.58) | — (8) | (6.07) | $ 9.20 | 31.15 % (13) | $ 23,633 | 2.18 % (9) | 2.18 % | (1.79) % | 55 % |
| 7/1/21 to 6/30/22 | | 45.83 | (0.52) | (6.59) | (7.11) | — | — | (23.45) | (23.45) | — | (30.56) | 15.27 | (32.58) | 25,961 | 2.17 (9) | 2.17 | (1.80) | 126 |
| 7/1/20 to 6/30/21 | | 43.68 | (0.87) | 18.99 | 18.12 | — | — | (15.97) | (15.97) | — | 2.15 | 45.83 | 44.01 | 53,742 | 2.24 (9) | 2.25 | (1.88) | 150 |
| 7/1/19 to 6/30/20 | | 45.22 | (0.76) | 10.41 | 9.65 | — | — | (11.19) | (11.19) | — | (1.54) | 43.68 (10) | 27.37 (10) | 50,421 | 2.32 | 2.32 | (1.87) | 212 |
| 7/1/18 to 6/30/19 | | 55.32 | (0.92) | 3.72 | 2.80 | — | — | (12.90) | (12.90) | — | (10.10) | 45.22 | 11.57 | 48,842 | 2.23 | 2.31 | (1.78) | 109 |
| Class P | | | | | | | | | | | | | | | | | | |
| 7/1/22 to 6/30/23 | | $ 51.13 | (0.38) | 13.70 | 13.32 | — | — | (7.58) | (7.58) | — (8) | 5.74 | $ 56.87 | 32.52 % (13) | $ 51,800 | 1.16 % (9) | 1.16 % | (0.77) % | 55 % |
| 7/1/21 to 6/30/22 | | 98.14 | (0.71) | (22.85) | (23.56) | — | — | (23.45) | (23.45) | — | (47.01) | 51.13 | (31.89) | 50,775 | 1.17 (9) | 1.17 | (0.83) | 126 |
| 7/1/20 to 6/30/21 | | 79.28 | (0.81) | 35.64 | 34.83 | — | — | (15.97) | (15.97) | — | 18.86 | 98.14 | 45.44 | 194,925 | 1.24 (9) | 1.25 | (0.87) | 150 |
| 7/1/19 to 6/30/20 | | 72.49 | (0.60) | 18.58 | 17.98 | — | — | (11.19) | (11.19) | — | 6.79 | 79.28 (10) | 28.67 (10) | 154,810 | 1.32 | 1.32 | (0.87) | 212 |
| 7/1/18 to 6/30/19 | | 79.05 | (0.58) | 6.92 | 6.34 | — | — | (12.90) | (12.90) | — | (6.56) | 72.49 | 12.68 | 155,553 | 1.27 | 1.31 | (0.80) | 109 |
The footnote legend is at the end of the financial highlights.
See Notes to Financial Statements
VIRTUS INVESTMENT TRUST
FINANCIAL HIGHLIGHTS (Continued)
SELECTED PER SHARE DATA AND RATIOS FOR A SHARE OUTSTANDING
THROUGHOUT EACH PERIOD
| | | Net Asset Value,
Beginning of Period | Net Investment Income (Loss)(1) | Net Realized and
Unrealized Gain (Loss) | Total from Investment Operations | Dividends from
Net Investment Income | Return of Capital | Distributions from
Net Realized Gains | Total Distributions | Payment from Affiliate | Change in Net Asset Value | Net Asset Value, End of Period | Total Return(2)(3) | Net Assets, End of Period
(in thousands) | Ratio of Net Expenses to
Average Net Assets(4)(5) | Ratio of Gross Expenses
to Average Net Assets(4)(5) | Ratio of Net Investment Income (Loss)
to Average Net Assets(4) | Portfolio Turnover Rate(2) |
| Zevenbergen Technology Fund (Continued) | | | | | | | | | | | | | | | | | | |
| Institutional Class | | | | | | | | | | | | | | | | | | |
| 7/1/22 to 6/30/23 | | $ 53.31 | (0.41) | 14.42 | 14.01 | — | — | (7.58) | (7.58) | — (8) | 6.43 | $ 59.74 | 32.48 % (13) | $ 670,734 | 1.17 % (9) | 1.17 % | (0.78) % | 55 % |
| 7/1/21 to 6/30/22 | | 101.34 | (0.67) | (23.91) | (24.58) | — | — | (23.45) | (23.45) | — | (48.03) | 53.31 | (31.89) | 772,161 | 1.16 (9) | 1.16 | (0.79) | 126 |
| 7/1/20 to 6/30/21 | | 81.43 | (0.77) | 36.65 | 35.88 | — | — | (15.97) | (15.97) | — | 19.91 | 101.34 | 45.53 | 1,386,911 | 1.17 (9) | 1.18 | (0.80) | 150 |
| 7/1/19 to 6/30/20 | | 74.10 | (0.55) | 19.07 | 18.52 | — | — | (11.19) | (11.19) | — | 7.33 | 81.43 (10) | 28.78 (10) | 995,709 | 1.22 | 1.22 | (0.78) | 212 |
| 7/1/18 to 6/30/19 | | 80.40 | (0.52) | 7.12 | 6.60 | — | — | (12.90) | (12.90) | — | (6.30) | 74.10 | 12.81 | 800,061 | 1.16 | 1.21 | (0.69) | 109 |
| Administrative Class | | | | | | | | | | | | | | | | | | |
| 7/1/22 to 6/30/23 | | $ 45.85 | (0.47) | 11.89 | 11.42 | — | — | (7.58) | (7.58) | — (8) | 3.84 | $ 49.69 | 32.07 % (13) | $ 7,747 | 1.47 % (12) | 1.37 % | (1.09) % | 55 % |
| 7/1/21 to 6/30/22 | | 90.62 | (0.85) | (20.47) | (21.32) | — | — | (23.45) | (23.45) | — | (44.77) | 45.85 | (32.09) | 6,049 | 1.47 | 1.72 | (1.10) | 126 |
| 7/1/20 to 6/30/21 | | 74.24 | (0.91) | 33.26 | 32.35 | — | — | (15.97) | (15.97) | — | 16.38 | 90.62 | 45.15 | 86,855 | 1.43 (9) | 1.44 | (1.05) | 150 |
| 7/1/19 to 6/30/20 | | 68.67 | (0.67) | 17.43 | 16.76 | — | — | (11.19) | (11.19) | — | 5.57 | 74.24 (10) | 28.46 (10) | 11,669 | 1.47 | 1.47 | (1.02) | 212 |
| 7/1/18 to 6/30/19 | | 75.76 | (0.67) | 6.48 | 5.81 | — | — | (12.90) | (12.90) | — | (7.09) | 68.67 | 12.52 | 11,688 | 1.40 | 1.46 | (0.95) | 109 |
| Footnote Legend: |
| (1) | Calculated using average shares outstanding. |
| (2) | Not annualized for periods less than one year. |
| (3) | Sales charges, where applicable, are not reflected in the total return calculation. |
| (4) | Annualized for periods less than one year. |
| (5) | The Funds will also indirectly bear their prorated share of expenses of any underlying funds in which they invest. Such expenses are not included in the calculation of this ratio. |
| (6) | Ratio of total expenses excluding interest expense on borrowings for the year ended June 30, 2023 were 1.29% (Class A), 2.04% (Class C), 1.04% (Class P), 0.94% (Class I) and 0.89% (Class R6). |
| (7) | Due to a change in expense cap, the ratio shown is a blended expense ratio. |
| (8) | Amount is less than $0.005 per share. |
| (9) | The share class is currently under its expense limitation. |
| (10) | Payments from affiliates increased the end of period net asset value and total return by less than $0.01 and 0.01%, respectively. |
| (11) | Total return would have been lower without the payment from affiliate. |
| (12) | See Note 4D in the Notes to Financial Statements for information on recapture of expenses previously reimbursed. |
| (13) | Payment from affiliate had no impact on total return. |
| (14) | Inception date. |
| (15) | Portfolio turnover is representative of the Fund for the entire period. |
| (16) | Includes reversal of previously accrued liabilities. |
| (17) | The character of a portion of the distribution was redesignated from net investment income to net realized capital gain for the year ended June 30, 2019. The per share amount for Class C differs from other classes, as at the time the distribution was made, Class C had minimal distributable net investment income, therefore no redesignation for Class C was made. |
See Notes to Financial Statements
VIRTUS INVESTMENT TRUST
NOTES TO FINANCIAL STATEMENTS
June 30, 2023
Note 1. Organization
Virtus Investment Trust (the “Trust”) is organized as a Massachusetts business trust and is registered under the Investment Company Act of 1940, as amended (the “1940 Act”), as an open-end management investment company.
As of the date of this report, the Trust is comprised of 13 funds (each a “Fund” or collectively, the “Funds”), each reported in this annual report. Each Fund’s investment objective is outlined in its respective Fund Summary page. There is no guarantee that a Fund will achieve its objective(s).
The Emerging Markets Opportunities Fund and Small-Cap Fund offer Class A shares, Class C shares, Class P shares, Institutional Class shares, and Class R6 shares. The KAR Global Small-Cap Fund, KAR Health Sciences Fund, and Income & Growth Fund offer Class A shares, Class C shares, Class P shares, and Institutional Class shares. The NFJ Dividend Value Fund, NFJ International Value Fund, NFJ Large-Cap Value Fund, NFJ Mid-Cap Value Fund, NFJ Small-Cap Value Fund, and Silvant Focused Growth Fund offer Class A shares, Class C shares, Class P shares, Institutional Class shares, Class R6 shares, and Administrative Class shares. The Silvant Mid-Cap Growth Fund and Zevenbergen Technology Fund offer Class A shares, Class C shares, Class P shares, Institutional Class shares and Administrative Class shares.
Class A shares of the Funds are sold with a front-end sales charge of up to 5.50% with some exceptions. Generally, Class A shares are not subject to any charges by the Funds when redeemed; however, a 0.50% – 1% contingent deferred sales charge (“CDSC”) may be imposed on certain redemptions made within a certain period following purchases on which a finder’s fee has been paid. The period for which such CDSC applies for the Funds is 18 months. The CDSC period begins on the last day of the month preceding the month in which the purchase was made.
On May 21, 2021, all Class R shares for the Income & Growth Fund, NFJ Dividend Value Fund, NFJ International Value Fund, NFJ Large-Cap Value Fund, NFJ Mid-Cap Value Fund, NFJ Small-Cap Value Fund, Silvant Focused Growth Fund, and Silvant Mid-Cap Growth Fund were converted into Class A shares of the respective Fund.
Class C shares are generally sold with a 1% CDSC, applicable if redeemed within one year of purchase. Class C shares and any reinvested dividends and other distributions paid on such shares, will be automatically converted to Class A shares of the same Fund following a required holding period, which as of March 1, 2021, was eight years. Effective February 26, 2021, if an investor intends to purchase greater than $999,999 of Class C shares, and the purchase would qualify for Class A shares with no load, then the purchase will automatically be made into a purchase of Class A shares, thus reducing expenses. Class P shares, Institutional Class shares, Class R6 shares, and Administrative Class shares are sold without a front-end sales charge or CDSC.
Class P shares are offered primarily through certain asset allocation, wrap fee and other similar programs offered by broker-dealers and other intermediaries (“service agents”) that have established a shareholder servicing relationship with the Trust on behalf of their customers. Such programs established with broker-dealers or financial intermediaries may purchase shares only if the program for which the shares are being acquired will maintain an omnibus or pooled account for each fund. Class P shares may also be offered for direct investment by other investors such as pension and profit sharing plans, employee benefit trusts and plan alliances, endowments, foundations and corporations.
Institutional Class shares are offered primarily to clients of financial intermediaries that (i) charge such clients an ongoing fee for advisory, investment, consulting, or similar services; or (ii) have entered into an agreement with the Funds’ distributor or transfer agent to offer Institutional Class shares through a no-load network or platform. Such clients may include pension and profit sharing plans, other employee benefit trusts, endowments, foundations and corporations. Institutional Class shares are also offered to private and institutional clients of, or referred by, the adviser, a subadviser or their affiliates, and to Trustees of the Funds and trustees/directors of affiliated open- and closed-end funds, and directors, officers and employees of Virtus and its affiliates. If you are eligible to purchase and do purchase Institutional Class shares, you will pay no sales charge at any time. There are no distribution and service fees applicable to Institutional Class shares.
Class R6 shares are offered without a minimum initial investment to the following investors in plan level or omnibus accounts only (provided that they do not require or receive any compensation, administrative payments, sub-transfer agency payments or service payments with respect to Class R6 shares): (i) qualified retirement plans, including, but not limited to, 401(k) plans, 457 plans, employer-sponsored 403(b) plans, and defined benefit plans; (ii) banks and trust companies; (iii) insurance companies; (iv) financial intermediaries utilizing such shares in fee-based investment advisory programs; (v) registered investment companies; and (vi) non-qualified deferred compensation plans. Other institutional investors may be permitted to purchase Class R6 shares subject to the applicable Fund’s determination of eligibility and may be subject to a $2,500,000 minimum initial investment requirement. In addition, without a minimum initial investment requirement, Class R6 shares are available to any Trustee of the Virtus Funds and trustees/directors of affiliated open- and closed-end funds, directors, officers and employees of Virtus and its affiliates, and a spouse or domestic partner, child or minor grandchild of any such qualifying individual (in each case either individually or jointly with other investors), provided in each case that those shares are held directly with the Transfer Agent or in an eligible account. Class R6 shares do not carry sales commissions or pay Rule 12b-1 fees. No compensation, administrative payments, sub-transfer agency payments or service payments are paid to brokers or other entities from Fund assets or the Funds’ distributor’s or an affiliate’s resources on sales of or investments in Class R6 shares.
Administrative Class shares are offered primarily through employee benefit plan alliances, broker-dealers, and other intermediaries, and each Fund pays service or distribution fees to such entities for services they provide to Administrative Class shareholders.
The Funds may impose an annual fee on accounts having balances of less than $2,500. The small account fee may be waived in certain circumstances, as disclosed in the prospectuses and/or statement of additional information. The fees collected will be used to offset certain expenses of the Funds. These fees are reflected as “Less low balance account fees” in each Fund’s Statement of Operations for the period, as applicable.
Each class of shares has identical voting, dividend, liquidation and other rights and the same terms and conditions, except that each class bears any expenses attributable specifically to that class (“class-specific expenses”) and has exclusive voting rights with respect to any Rule 12b-1 and/or shareholder service plan (“12b-1 Plan”) approved by the Board. Class P shares, Institutional Class shares, Class R6 shares, and Administrative Class
VIRTUS INVESTMENT TRUST
NOTES TO FINANCIAL STATEMENTS (Continued)
June 30, 2023
shares are not subject to a 12b-1 Plan. Class-specific expenses may include shareholder servicing fees, sub-transfer agency fees, and fees under a 12b-1 Plan, as well as certain other expenses as designated by the Funds’ Treasurer and approved by the Board. Investment income, common operating expenses and realized and unrealized gains and losses of each Fund are borne pro-rata by the holders of each class of shares.
Note 2. Significant Accounting Policies
The Trust is an investment company that follows the accounting and reporting guidance of the Financial Accounting Standards Board (“FASB”) Accounting Standards Codification Topic 946 Financial Services – Investment Companies. The following is a summary of significant accounting policies consistently followed by the Funds in the preparation of their financial statements and for derivatives, included in Note 3 below. The preparation of financial statements in conformity with U.S. generally accepted accounting principles (“U.S. GAAP”) requires management to make estimates and assumptions that affect the reported amounts of assets and liabilities, disclosure of contingent assets and liabilities at the date of the financial statements, and the reported amounts of increases and decreases in net assets from operations during the reporting period. Actual results could differ from those estimates and those differences could be significant.
| A. | Security Valuation |
| | The Trustees have designated the Investment Adviser as the valuation designee to perform fair valuations pursuant to Rule 2a-5 under the Investment Company Act of 1940. Each Fund utilizes a fair value hierarchy which prioritizes the inputs to valuation techniques used to measure fair value into three broad levels. The Funds’ policy is to recognize transfers into or out of Level 3 at the end of the reporting period. Each Fund utilizes a fair value hierarchy which prioritizes the inputs to valuation techniques used to measure fair value into three broad levels. The Funds’ policy is to recognize transfers into or out of Level 3 at the end of the reporting period. |
• Level 1 – quoted prices in active markets for identical securities (security types generally include listed equities).
• Level 2 – prices determined using other significant observable inputs (including quoted prices for similar securities, interest rates, prepayment speeds, credit risk, etc.).
• Level 3 – prices determined using significant unobservable inputs (including the Investment Adviser’s Valuation Committee’s own assumptions in determining the fair value of investments).
A description of the valuation techniques applied to a Fund’s major categories of assets and liabilities measured at fair value on a recurring basis is as follows:
Equity securities are valued at the official closing price (typically last sale) on the exchange on which the securities are primarily traded or, if no closing price is available, at the last bid price and are categorized as Level 1 in the hierarchy. Illiquid, restricted equity securities and illiquid private placements are internally fair valued by the Investment Adviser’s Valuation Committee, and are generally categorized as Level 3 in the hierarchy.
Certain non-U.S. securities may be fair valued in cases where closing prices are not readily available or are deemed not reflective of readily available market prices. For example, significant events (such as movement in the U.S. securities market, or other regional and local developments) may occur between the time that non-U.S. markets close (where the security is principally traded) and the time that a Fund calculates its net asset value (“NAV”) at the close of regular trading on the NYSE (generally 4 p.m. Eastern time) that may impact the value of securities traded in these non-U.S. markets. In such cases, the Funds fair value non-U.S. securities using an independent pricing service which considers the correlation of the trading patterns of the non-U.S. security to the intraday trading in the U.S. markets for investments such as ADRs, financial futures, ETFs, and certain indexes, as well as prices for similar securities. Such fair valuations are categorized as Level 2 in the hierarchy. Because the frequency of significant events is not predictable, fair valuation of certain non-U.S. common stocks may occur on a frequent basis.
Debt instruments, including convertible bonds, and restricted securities, are valued based on evaluated quotations received from independent pricing services or from dealers who make markets in such securities. For most bond types, the pricing service utilizes matrix pricing that considers one or more of the following factors: yield or price of bonds of comparable quality, coupon, maturity, current cash flows, type, activity of the underlying equities, and current day trade information, as well as dealer supplied prices. These valuations are generally categorized as Level 2 in the hierarchy. Structured debt instruments, such as mortgage-backed and asset-backed securities may also incorporate collateral analysis and utilize cash flow models for valuation and are generally categorized as Level 2 in the hierarchy. Pricing services do not provide pricing for all securities and therefore indicative bids from dealers are utilized which are based on pricing models used by market makers in the security and are generally categorized as Level 2 in the hierarchy. Debt instruments that are internally fair valued by the Investment Adviser’s Valuation Committee are generally categorized as Level 3 in the hierarchy.
Listed derivatives, such as options, that are actively traded are valued at the last posted settlement price from the exchange where they are principally traded and are categorized as Level 1 in the hierarchy. Over-the-counter (“OTC”) derivative contracts, which include forward currency contracts and equity-linked instruments, do not require material subjectivity as pricing inputs are observed from actively quoted markets and are categorized as Level 2 in the hierarchy.
Investments in open-end mutual funds are valued at NAV. Investments in closed-end funds and ETFs are valued as of the close of regular trading on the NYSE each business day. Each is categorized as Level 1 in the hierarchy.
A summary of the inputs used to value a Fund’s net assets by each major security type is disclosed at the end of the Schedule of Investments for each Fund. The inputs or methodologies used for valuing securities are not necessarily an indication of the risk associated with investing in those securities.
VIRTUS INVESTMENT TRUST
NOTES TO FINANCIAL STATEMENTS (Continued)
June 30, 2023
| B. | Security Transactions and Investment Income |
| | Security transactions are recorded on the trade date. Realized gains and losses from the sale of securities are determined on the identified cost basis. Dividend income and capital gain distributions are recognized on the ex-dividend date or, in the case of certain foreign securities, as soon as a Fund is notified. Interest income is recorded on the accrual basis. Each Fund amortizes premiums and accretes discounts using the effective interest method. Premiums on callable debt instruments are amortized to interest income to the earliest call date using the effective interest method. Conversion premium is not amortized. Any distributions from underlying funds are recorded in accordance with the character of the distributions as designated by the underlying funds. |
| | Dividend income from REIT and MLP investments is recorded using management’s estimate of the percentage of income included in distributions received from such investments based on historical information and other industry sources. The return of capital portion of the estimate is a reduction to investment income and a reduction in the cost basis of each investment which increases net realized gain (loss) and net change in unrealized appreciation (depreciation). If the return of capital distributions exceed their cost basis, the distributions are treated as realized gains. A Fund may invest in MLPs that make distributions that are primarily attributable to return of capital. The actual amounts of income, return of capital, and capital gains are only determined by each REIT and MLP after its fiscal year-end, and may differ from the estimated amounts. |
| C. | Income Taxes |
| | Each Fund is treated as a separate taxable entity. It is the intention of each Fund to comply with the requirements of Subchapter M of the Internal Revenue Code of 1986, as amended (the “Code”) and to distribute substantially all of its taxable income to its shareholders. Therefore, no provision for federal income taxes or excise taxes has been made. |
| | Certain Funds may be subject to foreign taxes on income, gains on investments or currency repatriation, a portion of which may be recoverable. Each Fund will accrue such taxes and recoveries as applicable based upon current interpretations of the tax rules and regulations that exist in the markets in which it invests. |
| | Management of the Funds has concluded that there are no significant uncertain tax positions that would require recognition in the financial statements. Each Fund’s U.S. federal income tax return is generally subject to examination by the Internal Revenue Service for a period of three years after it is filed. State, local and/or non-U.S. tax returns and/or other filings may be subject to examination for different periods, depending upon the tax rules of each applicable jurisdiction. |
| D. | Distributions to Shareholders |
| | Distributions are recorded by each Fund on the ex-dividend date. Income and capital gain distributions are determined in accordance with income tax regulations which may differ from U.S. GAAP. |
| E. | Expenses |
| | Expenses incurred together by a Fund and other affiliated mutual funds are allocated in proportion to the net assets of each such fund, except where allocation of direct expenses to each Fund and each such other fund, or an alternative allocation method, can be more appropriately used. |
| | In addition to the net annual operating expenses that a Fund bears directly, the shareholders of a Fund indirectly bear the pro-rata expenses of any underlying mutual funds in which the Fund invests. |
| F. | Foreign Currency Transactions |
| | Non-U.S. investment securities and other assets and liabilities denominated in foreign currencies are translated into U.S. dollar amounts at the foreign currency exchange rate effective at the end of the reporting period. Cost of investments is translated at the currency exchange rate effective at the trade date. The gain or loss resulting from a change in currency exchange rates between the trade and settlement date of a portfolio transaction is treated as a gain or loss on foreign currency. Likewise, the gain or loss resulting from a change in currency exchange rates between the date income is accrued and the date it is paid is treated as a gain or loss on foreign currency. For fixed income instruments, the Funds bifurcate that portion of the results of operations arising from changes in foreign exchange rates on investments from the fluctuations arising from changes in the market prices of securities held and such fluctuations are included with the net realized and unrealized gain or loss on foreign currency transactions. For equity securities, the Funds do not isolate that portion of the results of operations arising from changes in foreign exchange rates on investments from the fluctuations arising from changes in the market prices of securities held and such fluctuations are included with the net realized and unrealized gain or loss on investments. |
| G. | Convertible Securities |
| | Certain Funds may invest a portion of their assets in convertible securities. Although convertible securities derive part of their value from that of the securities into which they are convertible, they are not considered derivative financial instruments. However, certain of the Funds’ investments in convertible securities include features which render them sensitive to price changes in their underlying securities. The value of structured/synthetic convertible securities can be affected by interest rate changes and credit risks of the issuer. Such securities may be structured in ways that limit their potential for capital appreciation, and the entire value of the security may be at risk of loss depending on the performance of the underlying equity security. Consequently, the Funds are exposed to greater downside risk than traditional convertible securities, but typically still less than that of the underlying stock. |
| H. | When-issued Purchases and Forward Commitments (Delayed Delivery) |
| | Certain Funds may engage in when-issued or forward commitment transactions. Securities purchased on a when-issued or forward commitment basis are also known as delayed delivery transactions. Delayed delivery transactions involve a commitment by a Fund to purchase or sell a security at a future date (ordinarily up to 90 days later). When-issued or forward commitments enable the Funds to lock in what is believed to be an |
VIRTUS INVESTMENT TRUST
NOTES TO FINANCIAL STATEMENTS (Continued)
June 30, 2023
| | attractive price or yield on a particular security for a period of time, regardless of future changes in interest rates. Each Fund records when-issued and forward commitment securities on the trade date. Each Fund maintains collateral for the securities purchased. Securities purchased on a when-issued or forward commitment basis begin earning interest on the settlement date. |
| I. | Leveraged Loans |
| | Certain Funds may invest in direct debt instruments which are interests in amounts owed by a corporate, governmental, or other borrower to lenders or lending syndicates. Leveraged loans are generally non-investment grade and often involve borrowers that are highly leveraged. The Funds may invest in obligations of borrowers who are in bankruptcy proceedings. Leveraged loans are typically senior in the corporate capital structure of the borrower. A loan is often administered by a bank or other financial institution (the “lender”) that acts as agent for all holders. The agent administers the terms of the loan, as specified in the leveraged loan. A Fund’s investments in loans may be in the form of participations in loans or assignments of all or a portion of loans from third parties. When investing in loan participations, a Fund has the right to receive payments of principal, interest and any fees to which it is entitled only from the lender selling the loan participation and only upon receipt by the lender of payments from the borrower. A Fund generally has no right to enforce compliance with the terms of the leveraged loan with the borrower. As a result, a Fund may be subject to the credit risk of both the borrower and the lender that is selling the leveraged loan. When a Fund purchases assignments from lenders it acquires direct rights against the borrower on the loan. |
| | A Fund may invest in multiple series or tranches of a loan, which may have varying terms and carry different associated risks. Leveraged loans may involve foreign borrowers and investments may be denominated in foreign currencies. Direct indebtedness of emerging countries involves a risk that the government entities responsible for the repayment of the debt may be unable, or unwilling, to pay the principal and interest when due. |
| | The leveraged loans have floating rate loan interests which generally pay interest at rates that are periodically determined by reference to a base lending rate plus a premium. The base lending rates are generally LIBOR, SOFR, the prime rate offered by one or more U.S. banks or the certificate of deposit rate. When a leveraged loan is purchased a Fund may pay an assignment fee. On an ongoing basis, a Fund may receive a commitment fee based on the undrawn portion of the underlying line of credit portion of a leveraged loan. Prepayment penalty fees are received upon the prepayment of a leveraged loan by a borrower. Prepayment penalty, facility, commitment, consent and amendment fees are recorded to income as earned or paid. |
| | A Fund may invest in both secured loans and “covenant lite” loans which have few or no financial maintenance covenants that would require a borrower to maintain certain financial metrics. The lack of financial maintenance covenants in covenant lite loans increases the risk that the applicable Fund will experience difficulty or delays in enforcing its rights on its holdings of such loans, which may result in losses, especially during a downturn in the credit cycle. |
| J. | Warrants |
| | The Funds may receive warrants. Warrants are securities that are usually issued together with a debt instrument or preferred stock and that give the holder the right to buy a proportionate amount of common stock at a specified price. Warrants may be freely transferable and are often traded on major exchanges. Warrants normally have a life that is measured in years and entitle the holder to buy common stock of a company at a price that is usually higher than the market price at the time the warrant is issued. Warrants may entail greater risks than certain other types of investments. Generally, warrants do not carry the right to receive dividends or exercise voting rights with respect to the underlying securities, and they do not represent any rights in the assets of the issuer. In addition, their value does not necessarily change with the value of the underlying securities, and they cease to have value if they are not exercised on or before their expiration date. If the market price of the underlying stock does not exceed the exercise price during the life of the warrant, the warrant will expire worthless. Warrants may increase the potential profit or loss to be realized from the investment as compared with investing the same amount in the underlying securities. Similarly, the percentage increase or decrease in the value of an equity security warrant may be greater than the percentage increase or decrease in the value of the underlying common stock. Warrants may relate to the purchase of equity or debt instruments. Debt obligations with warrants attached to purchase equity securities have many characteristics of convertible securities and their prices may, to some degree, reflect the performance of the underlying stock. Debt obligations also may be issued with warrants attached to purchase additional debt instruments at the same coupon rate. A decline in interest rates would permit a Fund to sell such warrants at a profit. If interest rates rise, these warrants would generally expire with no value. |
| K. | Securities Lending |
| | The Funds may loan securities to qualified brokers through a securities lending agency agreement with The Bank of New York Mellon (“BNYM”). Under the securities lending policy, when lending securities a Fund is required to maintain collateral with a market value not less than 100% of the market value of loaned securities. Collateral is adjusted daily in connection with changes in the market value of securities on loan bringing the collateral market value in line with the required percent. Due to timing of collateral adjustments, the market value of collateral held with respect to a loaned security, may be more or less than the value of the security on loan. |
| | Collateral may consist of cash and securities issued by the U.S. government or its agencies. Cash collateral is invested in a short-term money market fund. Dividends earned on the collateral and premiums paid by the broker are recorded as income by the Fund net of fees and rebates charged/paid by BNYM for its services as securities lending agent and in connection with this securities lending program. Lending portfolio securities involves a risk of delay in the recovery of the loaned securities or in the declining value of the collateral. |
| | Securities lending transactions are entered into by each Fund under a Master Securities Lending Agreement (“MSLA”) which permits the Fund, under certain circumstances including an event of default (such as bankruptcy or insolvency), to offset amounts payable by the Fund to the same counterparty against amounts to be received and create one single net payment due to or from the Fund. |
VIRTUS INVESTMENT TRUST
NOTES TO FINANCIAL STATEMENTS (Continued)
June 30, 2023
| | As of June 30, 2023, the securities loaned were subject to a MSLA on a net payment basis as follows: |
| Fund | | Value of
Securities
on Loan | | Cash
Collateral
Received(1) | | Net
Amount(2) |
Small-Cap Fund
| | $ 888 | | $ 888 | | $ — |
| (1) | Collateral received in excess of the value of securities on loan is not presented in this table. The cash collateral received in connection with securities lending transactions has been used for the purchase of securities as disclosed in the Fund’s Schedule of Investments. |
| (2) | Net amount represents the net amount receivable due from the counterparty in the event of default. |
The following table reflects a breakdown of investments made from cash collateral received from lending activities and the remaining contractual maturity of those transactions as of June 30, 2023 for the Fund:
| Fund | | Investment of
Cash Collateral | | Overnight
and
Continuous |
Small-Cap Fund
| | Money Market Mutual Fund | | $913 |
Note 3. Derivative Financial Instruments and Transactions
($ reported in thousands)
Disclosures about derivative instruments and hedging activities are intended to enable investors to understand how and why a Fund uses derivatives, how derivatives are accounted for, and how derivative instruments affect a Fund’s results of operations and financial position. Summarized below are such disclosures and accounting policies for each specific type of derivative instrument used by certain Funds.
| A. | Forward Foreign Currency Exchange Contracts |
| | A forward foreign currency exchange contract is an agreement between two parties to buy and sell a currency at a set exchange rate on a future date. Forward foreign currency exchange contracts, when used by a Fund, help to manage the overall exposure to the currencies in which some of the investments held by the Fund are denominated. The contract is marked-to-market daily and the change in market value is recorded by the Fund as an unrealized appreciation or depreciation. When the contract is closed, the Fund records a realized gain or loss equal to the difference between the value at the time it was opened and the value at the time it was closed. The use of forward foreign currency exchange contracts involves the risk that the value of the contract changes unfavorably due to movements in the value of the referenced foreign currencies. Non-deliverable forward foreign currency exchange contracts are settled with the counterparty in U.S. dollars without the delivery of foreign currency. |
| | During the fiscal year (“the period”) ended June 30, 2023, none of the Funds entered into forward foreign currency exchange contracts. |
| B. | Options Contracts |
| | An options contract provides the purchaser with the right, but not the obligation, to buy (call option) or sell (put option) a financial instrument at an agreed upon price. Certain Funds may purchase or write both put and call options on portfolio securities. A Fund doing so is subject to equity price risk and/or foreign currency risk in the normal course of pursuing its investment objectives. |
| | When a Fund purchases an option, it pays a premium and an amount equal to that premium is recorded as an asset. When a Fund writes an option, it receives a premium and an amount equal to that premium is recorded as a liability. The asset or liability is adjusted daily to reflect the current market value of the option. Holdings of the Fund designated to cover outstanding written options are noted in the Schedules of Investments. Purchased options are reported as an asset within “Investment in securities at value” in the Statements of Assets and Liabilities. Written options are reported as a liability within “Written options at value.” Changes in value of the purchased option are included in “Net change in unrealized appreciation (depreciation) from investments” in the Statements of Operations. Changes in value of written options are included in “Net change in unrealized appreciation (depreciation) from written options” in the Statements of Operations. |
| | If an option expires unexercised, the Fund realizes a gain or loss to the extent of the premium received or paid. If an option is exercised, the
premium received or paid is recorded as an adjustment to the proceeds from the sale or the cost basis of the purchase. The difference between the premium and the amount received or paid on effecting a closing purchase or sale transaction is also treated as a realized gain or loss. Gain or loss on purchased options is included in “Net realized gain (loss) on investments” in the Statements of Operations. Gain or loss on written options is presented separately as “Net realized gain (loss) from written options” in the Statements of Operations. |
| | The risk in writing call options is that the Fund gives up the opportunity for profit if the market price/foreign currency rate of the referenced
security/currency increases and the option is exercised. The risk in writing put options is that the Fund may incur a loss if the market price/foreign currency rate of the referenced security/currency decreases and the option is exercised. The risk in buying options is that the Fund pays a premium whether or not the option is exercised. The use of such instruments may involve certain additional risks as a result of unanticipated movements in the market. Writers (sellers) of options are subject to unlimited risk of loss, as the seller will be obligated to deliver or take delivery of the security at a predetermined price which may, upon exercise of the option, be significantly different from the then-market value. |
| | During the year ended June 30, 2023, the Income & Growth Fund invested in written covered call options contracts in an attempt to manage equity price risk and with the purpose of generating realized gains. |
VIRTUS INVESTMENT TRUST
NOTES TO FINANCIAL STATEMENTS (Continued)
June 30, 2023
| | The following is a summary of derivative instruments categorized by primary risk exposure, and location as presented in the Statements of Assets and Liabilities at June 30, 2023: |
| Statement Line Description | | Primary Risk | Income & Growth Fund |
| Liability Derivatives |
| Written options at value | | Equity contracts | $(1,828) | |
| Total Liabilities | | | $(1,828) | |
The following is a summary of derivative instruments categorized by primary risk exposure, and location as presented in the Statements of Operations for the year ended June 30, 2023:
| Statement Line Description | | Primary Risk | Income & Growth Fund |
| Net Realized Gain (Loss) from |
| Written options | | Equity contracts | $9,113 | |
| Total | | | $9,113 | |
| Net Change in Unrealized Appreciation (Depreciation) on |
| Written options | | Equity contracts | $ (255) | |
| Total | | | $ (255) | |
The table below shows the quarterly average volume (unless otherwise specified) of the derivatives held by the applicable Fund for the year ended June 30, 2023:
| | Income & Growth
Fund |
Written Options(1)
| $1,457 |
| (1) Average premium amount. |
| C. | Derivative Risks |
| | A derivative contract may suffer a mark-to-market loss if the value of the contract decreases due to an unfavorable change in the market rates or values of the underlying instrument. Losses can also occur if the counterparty does not perform under the contract. |
| | A Fund’s risk of loss from counterparty credit risk on derivatives bought or sold OTC, rather than traded on a securities exchange, is generally limited to the aggregate unrealized gain netted against any collateral held by such Fund. For OTC purchased options, each Fund bears the risk of loss of the amount of the premiums paid plus the positive change in market values net of any collateral held by such Fund should the counterparty fail to perform under the contracts. Options written by a Fund do not typically give rise to counterparty credit risk, as options written generally obligate the Fund, and not the counterparty to perform. |
| | With exchange traded purchased options and futures and centrally cleared swaps generally speaking, there is less counterparty credit risk to the Fund since the exchange or clearinghouse, as counterparty to such instruments, guarantees against a possible default. The clearinghouse stands between the buyer and the seller of the contract; therefore, credit risk is limited to failure of the clearinghouse. While offset rights may exist under applicable law, a Fund does not have a contractual right of offset against a clearing broker or clearinghouse in the event of a default (including the bankruptcy or insolvency) of the clearing broker or clearinghouse. Additionally, credit risk exists in exchange traded futures and centrally cleared swaps with respect to initial and variation margin that is held in a clearing broker’s customer accounts. While clearing brokers are required to segregate customer margin from their own assets, in the event that a clearing broker becomes insolvent or goes into bankruptcy and at that time there is a shortfall in the aggregate amount of margin held by the clearing broker for all its clients, typically the shortfall would be allocated on a pro-rata basis across all the clearing broker’s customers, potentially resulting in losses to the Fund. |
| | In order to better define its contractual rights and to secure rights that will help a Fund mitigate its counterparty risk, each Fund may enter into an International Swaps and Derivatives Association, Inc. Master Agreement (“ISDA Master Agreement”) or similar agreement with its derivative contract counterparties. An ISDA Master Agreement is a bilateral agreement between a Fund and a counterparty that governs certain OTC derivatives and typically contains, among other things, collateral posting terms and netting provisions in the event of a default and/or termination event. Under an ISDA Master Agreement, a Fund may, under certain circumstances, offset with the counterparty certain derivative financial instruments’ payables and/or receivables with collateral held and/or posted and create one single net payment. The provisions of the ISDA Master Agreement typically permit a single net payment in the event of default including the bankruptcy or insolvency of the counterparty. However, bankruptcy or insolvency laws of a particular jurisdiction may impose restrictions on or prohibitions against the right of offset in bankruptcy, insolvency or other events. In addition, certain ISDA Master Agreements allow counterparties to OTC derivatives to terminate derivative contracts prior to maturity in the event a Fund’s net assets decline by a stated percentage or the Fund fails to meet the terms of its ISDA Master Agreements, which would cause the Fund to accelerate payment of any net liability owed to the counterparty. |
VIRTUS INVESTMENT TRUST
NOTES TO FINANCIAL STATEMENTS (Continued)
June 30, 2023
| D. | Collateral Requirements and Master Netting Agreements (“MNA”) |
| | For derivatives traded under an ISDA Master Agreement, the collateral requirements are typically calculated by netting the mark-to-market amount for each transaction under such agreement and comparing that amount to the value of any collateral currently pledged by the Funds and the counterparty. |
| | Cash collateral that has been pledged to cover obligations of a Fund and cash collateral received from the counterparty, if any, is reported separately on the Statements of Assets and Liabilities as cash pledged as collateral and cash received as collateral, respectively. Non-cash collateral pledged by a Fund, if any, is noted in the Schedules of Investments. Typically, the Funds and counterparties are not permitted to sell, re-pledge or use the collateral they receive. To the extent amounts due to a Fund from its counterparties are not fully collateralized, contractually or otherwise, the Fund bears the risk of loss from counterparty non-performance. The Funds attempt to mitigate counterparty risk by only entering into agreements with counterparties that they believe have the financial resources to honor their obligations and by monitoring the financial stability of those counterparties. |
| | For financial reporting purposes, the Funds do not offset derivative assets and derivative liabilities that are subject to netting arrangements in the Statements of Assets and Liabilities. |
| | The following table presents the Income & Growth Fund’s derivative assets and liabilities by counterparty net of amounts available for offset under a MNA and net of the related collateral received/pledged by the Funds as of June 30, 2023: |
| At June 30, 2023, the Fund’s derivative assets and liabilities (by type) are as follows: | | |
| | Income & Growth Fund | |
| | Assets | Liabilities | |
Derivative Financial
Instruments: | | | |
| Written options | $— | $ 1,828 | |
| Total derivative assets and liabilities in the Statements of Assets and Liabilities | $— | $ 1,828 | |
Derivatives not subject to a MNA
or similar agreement | — | (1,828) | |
Total assets and liabilities
subject to a MNA | $— | $ — | |
Note 4. Investment Advisory Fees and Related Party Transactions
($ reported in thousands)
| A. | Investment Adviser |
| | Virtus Investment Advisers, Inc. (the “Adviser”), an indirect, wholly-owned subsidiary of Virtus Investment Partners, Inc. (“Virtus”), is the investment adviser to the Funds. The Adviser manages the Funds’ investment programs and general operations of the Funds, including oversight of the Funds’ subadvisers. |
| | As compensation for its services to the Funds, the Adviser is entitled to a fee, which is calculated daily and paid monthly based upon the following annual rates as a percentage of the average daily net assets of each Fund: |
| Fund | | Advisory Fee |
Emerging Markets Opportunities Fund
| | 0.85% |
Income & Growth Fund
| | 0.65 |
KAR Global Small-Cap Fund
| | 0.90 |
KAR Health Sciences Fund
| | 0.80 |
NFJ Dividend Value Fund
| | 0.45 |
NFJ International Value Fund
| | 0.60 |
NFJ Large-Cap Value Fund
| | 0.45 |
NFJ Mid-Cap Value Fund
| | 0.55 |
NFJ Small-Cap Value Fund
| | 0.60 |
Silvant Focused Growth Fund
| | 0.45 |
Silvant Mid-Cap Growth Fund
| | 0.47 |
Small-Cap Fund
| | 0.60 |
Zevenbergen Technology Fund
| | 0.90 |
VIRTUS INVESTMENT TRUST
NOTES TO FINANCIAL STATEMENTS (Continued)
June 30, 2023
| B. | Subadvisers |
| | The subadvisers manage the investments of each Fund for which they are paid a fee by the Adviser. A list of the subadvisers and the Funds they serve as of the end of the year is as follows: |
| Fund | | Subadviser (1) |
Emerging Markets Opportunities Fund
| | N/A |
Income & Growth Fund
| | Voya IM(2) |
KAR Global Small-Cap Fund
| | KAR (3) |
KAR Health Sciences Fund
| | KAR (3) |
NFJ Dividend Value Fund
| | NFJ (4) |
NFJ International Value Fund
| | NFJ (4) |
NFJ Large-Cap Value Fund
| | NFJ (4) |
NFJ Mid-Cap Value Fund
| | NFJ (4) |
NFJ Small-Cap Value Fund
| | NFJ (4) |
Silvant Focused Growth Fund
| | Silvant (5) |
Silvant Mid-Cap Growth Fund
| | Silvant (5) |
Small-Cap Fund
| | N/A |
Zevenbergen Technology Fund
| | Zevenbergen (6) |
| (1) | Effective July 25, 2022, Allianz Global Investors U.S. LLC (“AllianzGI U.S.”) was removed as subadviser to each of the Funds other than NFJ Dividend Value Fund, NFJ International Value Fund, NFJ Large-Cap Value Fund, NFJ Mid-Cap Value Fund and NFJ Small-Cap Value Fund. The Emerging Markets Opportunities Fund and Small-Cap Fund are managed directly by the Adviser. |
| (2) | Effective July 25, 2022, Voya Investment Management Co. LLC (“Voya IM”) replaced AllianzGI U.S. as subadviser of the Fund. |
| (3) | Effective July 25, 2022, Kayne Anderson Rudnick Investment Management, LLC (“KAR”), an indirect, wholly-owned subsidiary of Virtus replaced AllianzGI U.S. as subadviser of the Fund. |
| (4) | NFJ Investment Group, LLC (“NFJ”), an indirect, wholly-owned subsidiary of Virtus. |
| (5) | Effective July 25, 2022, Silvant Capital Management LLC (“Silvant”), an indirect, wholly-owned subsidiary of Virtus, replaced AllianzGI U.S. as subadviser of the Fund. |
| (6) | Effective July 25, 2022, Zevenbergen Capital Investments LLC (“Zevenbergen”), a minority-owned affiliate of Virtus, replaced AllianzGI U.S. as subadviser of the Fund. |
| C. | Expense Limitations |
| | The Adviser has contractually agreed to limit each Fund’s annual total operating expenses, subject to the exceptions listed below, so that such expenses do not exceed, on an annualized basis, the following respective percentages of average daily net assets through October 31, 2023. Following the contractual period, the Adviser may discontinue these expense limitation arrangements at any time. The waivers and reimbursements are accrued daily and received monthly. |
| Fund | | Class A | | Class C | | Class P | | Institutional Class | | Class R6 | | Administrative
Class |
Emerging Markets Opportunities Fund
| | 1.29% | | 2.04% | | 1.04 % | | 0.94 % | | 0.89% | | N/A |
Income & Growth Fund
| | 1.28 | | 2.03 | | 1.03 | | 0.93 | | N/A | | N/A |
KAR Global Small-Cap Fund
| | 1.63 | | 2.38 | | 1.38 | | 1.28 | | N/A | | N/A |
KAR Health Sciences Fund
| | 1.47 | | 2.22 | | 1.22 | | 1.12 | | N/A | | N/A |
NFJ Dividend Value Fund
| | 1.05 | | 1.80 | | 0.80 | | 0.70 | | 0.65 | | 0.95 % |
NFJ International Value Fund
| | 1.30 | | 2.05 | | 1.05 | | 0.95 | | 0.90 | | 1.20 |
NFJ Large-Cap Value Fund
| | 1.12 | | 1.87 | | 0.87 | | 0.77 | | 0.65 | | 1.02 |
NFJ Mid-Cap Value Fund
| | 1.00 | | 1.75 | | 0.75 | | 0.65 | | 0.60 | | 0.90 |
NFJ Small-Cap Value Fund
| | 1.17 | | 1.92 | | 0.92 | | 0.82 | | 0.77 | | 1.07 |
Silvant Focused Growth Fund
| | 1.00 | | 1.77 | | 0.77 | | 0.67 | | 0.62 | | 0.92 |
Silvant Mid-Cap Growth Fund
| | 1.14 | | 1.89 | | 0.89 | | 0.79 | | N/A | | 1.04 |
Small-Cap Fund
| | 1.17 | | 1.92 | | 0.92 | | 0.82 | | 0.77 | | N/A |
Zevenbergen Technology Fund
| | 1.57 | | 2.32 | | 1.32 | | 1.22 | | N/A | | 1.47 |
The exclusions include front-end or contingent deferred sales charges, taxes, leverage and borrowing expenses (such as commitment, amendment and renewal expenses on credit or redemption facilities), interest, brokerage commissions, expenses incurred in connection with any merger or reorganization, unusual or infrequently occurring expenses (such as litigation), acquired fund fees and expenses, and dividend expenses, if any.
| D. | Expense Recapture |
| | Under certain conditions, the Adviser may recapture operating expenses reimbursed or fees waived under these arrangements within three years after the date on which such amounts were incurred or waived. A Fund must pay its ordinary operating expenses before the Adviser is entitled to |
VIRTUS INVESTMENT TRUST
NOTES TO FINANCIAL STATEMENTS (Continued)
June 30, 2023
| | any reimbursement and must remain in compliance with any applicable expense limitations or, if none, the expense limitation in effect at the time of the waiver or reimbursement. All or a portion of the following Adviser reimbursed expenses may be recaptured by the year ending June 30: |
| | | Expiration | | |
| Fund | | 2024 | | 2025 | | 2026 | | Total |
| Emerging Markets Opportunities Fund | | | | | | | | |
Class A
| | $ 32 | | $ 46 | | $ 44 | | $ 122 |
Class C
| | 1 | | 2 | | 2 | | 5 |
Class P
| | 7 | | 11 | | 10 | | 28 |
Institutional Class
| | 235 | | 494 | | 226 | | 955 |
Class R6
| | 31 | | 62 | | 70 | | 163 |
| KAR Global Small-Cap Fund | | | | | | | | |
Class A
| | — | | — | | 10 | | 10 |
Class C
| | — | | — (1) | | 1 | | 1 |
Class P
| | — | | — | | — (1) | | — (1) |
Institutional Class
| | 3 | | 12 | | 27 | | 42 |
| KAR Health Sciences Fund | | | | | | | | |
Institutional Class
| | — | | 4 | | 3 | | 7 |
| NFJ Dividend Value Fund | | | | | | | | |
Institutional Class
| | — | | 64 | | 36 | | 100 |
Class R6
| | — | | — | | 11 | | 11 |
Administrative Class
| | — | | 12 | | 11 | | 23 |
| NFJ International Value Fund | | | | | | | | |
Class A
| | — | | 14 | | 37 | | 51 |
Class C
| | — | | — | | 1 | | 1 |
Class P
| | — | | — | | 3 | | 3 |
Institutional Class
| | 3 | | 12 | | 21 | | 36 |
Class R6
| | — (1) | | 1 | | 2 | | 3 |
Administrative Class
| | — | | 5 | | 2 | | 7 |
| NFJ Large-Cap Value Fund | | | | | | | | |
Class R6
| | — | | — (1) | | — (1) | | — (1) |
| NFJ Mid-Cap Value Fund | | | | | | | | |
Class A
| | 186 | | 539 | | 570 | | 1,295 |
Class C
| | 10 | | 24 | | 21 | | 55 |
Class P
| | 62 | | 147 | | 76 | | 285 |
Institutional Class
| | 298 | | 681 | | 563 | | 1,542 |
Class R6
| | 51 | | 102 | | 119 | | 272 |
Administrative Class
| | 26 | | 66 | | 74 | | 166 |
| NFJ Small-Cap Value Fund | | | | | | | | |
Class A
| | — | | 96 | | 131 | | 227 |
Class C
| | — | | — | | 1 | | 1 |
Institutional Class
| | 16 | | 40 | | 51 | | 107 |
Class R6
| | 10 | | 15 | | 30 | | 55 |
Administrative Class
| | 30 | | 42 | | 6 | | 78 |
| Silvant Focused Growth Fund | | | | | | | | |
Institutional Class
| | 13 | | 59 | | 45 | | 117 |
Class R6
| | — | | 10 | | 19 | | 29 |
Administrative Class
| | 1 | | 4 | | 3 | | 8 |
| Silvant Mid-Cap Growth Fund | | | | | | | | |
Administrative Class
| | — | | — | | — (1) | | — (1) |
| Small-Cap Fund | | | | | | | | |
Class A
| | 2 | | 6 | | 31 | | 39 |
Class C
| | 1 | | 1 | | 2 | | 4 |
Class P
| | — (1) | | 9 | | 4 | | 13 |
Institutional Class
| | 28 | | 46 | | 37 | | 111 |
Class R6
| | 4 | | 6 | | 6 | | 16 |
| Zevenbergen Technology Fund | | | | | | | | |
Administrative Class
| | — | | 32 | | — (1) | | 32 |
| (1) | Amount is less than $500 (not in thousands). |
VIRTUS INVESTMENT TRUST
NOTES TO FINANCIAL STATEMENTS (Continued)
June 30, 2023
During the year ended June 30, 2023, the Adviser recaptured expenses previously waived for the following Funds:
| Fund | | Class A | | Class C | | Class P | | Institutional Class | | Class R6 | | Administrative Class | | Total |
Income & Growth Fund
| | $— | | $— | | $— | | $— (1) | | $— | | $— | | $— (1) |
KAR Global Small-Cap Fund
| | 1 | | — | | — (1) | | — | | — | | — | | 1 |
KAR Health Sciences Fund
| | — | | — | | — | | 1 | | — | | — | | 1 |
NFJ Dividend Value Fund
| | 1 | | — | | — | | — | | — (1) | | — (1) | | 1 |
NFJ International Value Fund
| | — | | — (1) | | — (1) | | — | | — | | — (1) | | — (1) |
NFJ Large-Cap Value Fund
| | — | | — | | — | | 7 | | — (1) | | — | | 7 |
NFJ Small-Cap Value Fund
| | 2 | | — | | 1 | | — | | — | | 6 | | 9 |
Silvant Focused Growth Fund
| | — (1) | | — | | — | | 7 | | 2 | | — (1) | | 9 |
Silvant Mid-Cap Growth Fund
| | — | | — | | — | | — (1) | | — | | — (1) | | — (1) |
Zevenbergen Technology Fund
| | — | | — | | — | | — | | — | | 7 | | 7 |
| (1) | Amount is less than $500 (not in thousands). |
| E. | Distributor |
| | VP Distributors, LLC (“VP Distributors”), an indirect, wholly-owned subsidiary of Virtus, serves as the distributor of each Fund’s shares. VP Distributors has advised the Funds that for the year ended June 30, 2023, it retained net commissions of $514 for Class A shares and CDSC of $18 and $94 for Class A shares and Class C shares, respectively. |
| | In addition, each Fund pays VP Distributors 12b-1 fees under a 12b-1 Plan as a percentage of the average daily net assets of each respective class at the annual rates of 0.25% for Class A shares and 1.00% for Class C shares. Administrative Class shares pay a 0.25% Administrative Distribution fee. Class P shares, Institutional Class shares, and Class R6 shares, are not subject to a 12b-1 Plan. |
| | Under certain circumstances, shares of certain Virtus Funds may be exchanged for shares of the same class of certain other Virtus Funds on the basis of the relative NAV per share at the time of the exchange. On exchanges with share classes that carry a CDSC, the CDSC schedule of the original shares purchased continues to apply. |
| F. | Administrator and Transfer Agent |
| | Virtus Fund Services, LLC, an indirect, wholly-owned subsidiary of Virtus, serves as the administrator and transfer agent to the Funds. |
| | For the year ended June 30, 2023, the Funds incurred administration fees totaling $9,937 which are included in the Statements of Operations within the line item “Administration and accounting fees.” The fees are calculated daily and paid monthly. |
| | For the year ended June 30, 2023, the Funds incurred transfer agent fees totaling $4,449 which are included in the Statements of Operations within the line item “Transfer agent fees and expenses.” The fees are calculated daily and paid monthly. |
| G. | Payment from Affiliates |
| | During the year ended June 30, 2023, the former subadviser, AllianzGI U.S., reimbursed KAR Global Small-Cap Fund, KAR Health Sciences Fund, Silvant Focused Growth Fund, Small-Cap Fund and Zevenbergen Technology Fund for trading costs associated with subadviser changes. These amounts are included in “Net increase from payment by affiliates” in the Statements of Operations. With the exception of KAR Global Small-Cap Fund, there was no impact on the total return. |
| H. | Investments with Affiliates |
| | The Funds are permitted to purchase assets from or sell assets to certain related affiliates under specified conditions outlined in procedures adopted by the Board. The procedures have been designed to ensure that any purchase or sale of assets by the Funds from or to another fund or portfolio that are, or could be, considered an affiliate by virtue of having a common investment adviser (or affiliated investment advisers), common Trustees and/or common officers comply with Rule 17a-7 under the 1940 Act. Further, as defined under the procedures, each transaction is effected at the current market price. |
| | During the year ended June 30, 2023, the Funds did not engage in any transactions pursuant to Rule 17a-7 under the 1940 Act. |
| | Outside of Rule 17a-7 transactions, other investments with affiliated issuers are separately reported in this Note. An affiliated issuer includes any company in which the Fund held 5% or more of a company’s outstanding voting shares at any point during the period, as well as other circumstances where an investment adviser or subadviser to the Fund is deemed to exercise, directly or indirectly, a certain level of control over the company. |
VIRTUS INVESTMENT TRUST
NOTES TO FINANCIAL STATEMENTS (Continued)
June 30, 2023
A summary of the Funds’ total long-term and short-term purchases and sales of the respective shares of the affiliated investments during the year ended June 30, 2023, is as follows:
| | Value,
beginning
of period | | Purchases | | Sales
proceeds | | Net
realized
gain
(loss)
on
affiliated
securities | | Net
change in
unrealized
appreciation
(depreciation)
on affiliated
securities | | Value,
end of
period | | Shares | | Dividend
income | | Distributions
of realized
gains |
| Income & Growth Fund |
| Preferred Stocks—0.0% |
LiveStyle, Inc. Series B (1)
| $5,618 | | $— | | $2,884 | | $ 57 | | $ (92) | | $— | | — | | $— | | $— |
LiveStyle, Inc. Series B (1)
| — | | — | | — | | (8,000) | | 8,000 | | — | | — | | — | | — |
| | 5,618 | | — | | 2,884 | | (7,943) | | 7,908 | | — | | | | — | | — |
| Common Stocks—0.0% |
| LiveStyle, Inc.(1) | — (2) | | — | | — | | — | | — | | — | | — | | — | | — |
| Total | $5,618 | | $— | | $2,884 | | $(7,943) | | $7,908 | | $— | | | | $— | | $— |
| (1) | Issuer is not an affiliated investment of the Fund at June 30, 2023. |
| (2) | Amount is less than $500 (not in thousands). |
| I. | Trustee Deferred Compensation Plan |
| | The Trust provides a deferred compensation plan for its Trustees who receive compensation from the Trust. Under the deferred compensation plan, Trustees may elect to defer all or a portion of their compensation. Amounts deferred are retained by the Trust, and then, to the extent permitted by the 1940 Act, in turn, may be invested in the shares of affiliated or unaffiliated mutual funds selected by the participating Trustees. Investments in such instruments are included in “Other assets” in the Statements of Assets and Liabilities at June 30, 2023. |
| | In calendar year 2018 and certain other periods prior to January 1, 2020, the Funds maintained a different deferred compensation plan pursuant to which each Trustee who was not affiliated with AllianzGI U.S. had the opportunity to elect not to receive all or a portion of his or her fees from the respective Fund on a current basis, but instead to receive in a subsequent period chosen by the Trustee an amount equal to the value of such compensation if such compensation had been invested in one or more series of Virtus Investment Trust (then known as Allianz Funds) and Virtus Strategy Trust (then known as Allianz Funds Multi-Strategy Trust) selected by such Trustee from and after the normal payment dates for such compensation. The deferred compensation program was closed to new deferrals effective January 1, 2020, and all Trustee fees earned with respect to service in calendar year 2020 were paid in cash, on a current basis. The Trustees do not currently receive any pension or retirement benefits from the Funds. |
| | In addition to the Trustee fees deferred in the current period, the Funds still have obligations with respect to Trustee fees deferred in 2018 and in other periods prior to January 1, 2020, and will continue to have such obligations until all deferred Trustee fees are paid out pursuant to the terms of the applicable deferred compensation plan. |
Note 5. Purchases and Sales of Securities
($ reported in thousands)
Purchases and sales of securities (excluding U.S. government and agency securities, forward currency contracts, written options, and short-term securities) during the year ended June 30, 2023, were as follows:
| | Purchases | | Sales |
Emerging Markets Opportunities Fund
| $ 127,488 | | $ 131,184 |
Income & Growth Fund
| 2,115,377 | | 2,941,044 |
KAR Global Small-Cap Fund
| 73,020 | | 83,176 |
KAR Health Sciences Fund
| 120,368 | | 149,591 |
NFJ Dividend Value Fund
| 496,113 | | 626,148 |
NFJ International Value Fund
| 99,690 | | 123,071 |
NFJ Large-Cap Value Fund
| 179,244 | | 206,689 |
NFJ Mid-Cap Value Fund
| 1,094,514 | | 1,338,930 |
NFJ Small-Cap Value Fund
| 299,181 | | 365,266 |
Silvant Focused Growth Fund
| 565,192 | | 731,987 |
VIRTUS INVESTMENT TRUST
NOTES TO FINANCIAL STATEMENTS (Continued)
June 30, 2023
| | Purchases | | Sales |
Silvant Mid-Cap Growth Fund
| $ 97,364 | | $ 135,259 |
Small-Cap Fund
| 89,745 | | 142,274 |
Zevenbergen Technology Fund
| 632,386 | | 869,080 |
There were no purchases or sales of long-term U.S. government and agency securities during the year ended June 30, 2023.
Note 6. Capital Share Transactions
(reported in thousands)
Transactions in shares of capital stock, during the years ended as indicated below, were as follows:
| | Emerging Markets Opportunities Fund | | Income & Growth Fund |
| | Year Ended
June 30, 2023 | | Year Ended
June 30, 2022 | | Year Ended
June 30, 2023 | | Year Ended
June 30, 2022 |
| | SHARES | | AMOUNT | | SHARES | | AMOUNT | | SHARES | | AMOUNT | | SHARES | | AMOUNT |
| Class A | | | | | | | | | | | | | | | |
| Shares sold | 71 | | $ 1,847 | | 80 | | $ 2,711 | | 23,065 | | $ 238,190 | | 34,842 | | $ 440,020 |
| Reinvestment of distributions | 22 | | 565 | | 12 | | 373 | | 14,608 | | 149,814 | | 12,258 | | 150,344 |
| Shares repurchased | (135) | | (3,557) | | (246) | | (7,852) | | (45,554) | | (467,924) | | (35,815) | | (436,840) |
| Net Increase / (Decrease) | (42) | | $ (1,145) | | (154) | | $ (4,768) | | (7,881) | | $ (79,920) | | 11,285 | | $ 153,524 |
| Class C | | | | | | | | | | | | | | | |
| Shares sold | 7 | | $ 190 | | 1 | | $ 47 | | 6,854 | | $ 62,789 | | 18,782 | | $ 216,138 |
| Reinvestment of distributions | 1 | | 14 | | — | | — | | 9,118 | | 82,970 | | 8,276 | | 91,065 |
| Shares repurchased | (10) | | (240) | | (19) | | (669) | | (34,364) | | (313,660) | | (29,502) | | (324,398) |
| Net Increase / (Decrease) | (2) | | $ (36) | | (18) | | $ (622) | | (18,392) | | $ (167,901) | | (2,444) | | $ (17,195) |
| Class P | | | | | | | | | | | | | | | |
| Shares sold | 25 | | $ 647 | | 133 | | $ 4,377 | | 20,596 | | $ 220,297 | | 30,102 | | $ 395,436 |
| Reinvestment of distributions | 6 | | 155 | | 5 | | 161 | | 6,194 | | 65,791 | | 6,599 | | 84,089 |
| Shares repurchased | (81) | | (2,097) | | (108) | | (3,250) | | (40,677) | | (432,200) | | (58,458) | | (752,315) |
| Net Increase / (Decrease) | (50) | | $ (1,295) | | 30 | | $ 1,288 | | (13,887) | | $ (146,112) | | (21,757) | | $ (272,790) |
| Institutional Class | | | | | | | | | | | | | | | |
| Shares sold | 573 | | $ 14,746 | | 2,120 | | $ 71,408 | | 19,389 | | $ 209,296 | | 48,591 | | $ 653,466 |
| Reinvestment of distributions | 83 | | 2,086 | | 102 | | 3,324 | | 8,808 | | 94,717 | | 7,616 | | 97,397 |
| Shares repurchased | (765) | | (20,092) | | (5,063) | | (145,870) | | (43,626) | | (470,034) | | (35,413) | | (443,799) |
| Net Increase / (Decrease) | (109) | | $ (3,260) | | (2,841) | | $ (71,138) | | (15,429) | | $ (166,021) | | 20,794 | | $ 307,064 |
| Class R6 | | | | | | | | | | | | | | | |
| Shares sold | 389 | | $ 10,187 | | 595 | | $ 20,278 | | — | | $ — | | — | | $ — |
| Reinvestment of distributions | 39 | | 977 | | 22 | | 727 | | — | | — | | — | | — |
| Shares repurchased | (340) | | (8,818) | | (345) | | (11,192) | | — | | — | | — | | — |
| Net Increase / (Decrease) | 88 | | $ 2,346 | | 272 | | $ 9,813 | | — | | $ — | | — | | $ — |
| | KAR Global Small-Cap Fund | | KAR Health Sciences Fund |
| | Year Ended
June 30, 2023 | | Year Ended
June 30, 2022 | | Year Ended
June 30, 2023 | | Year Ended
June 30, 2022 |
| | SHARES | | AMOUNT | | SHARES | | AMOUNT | | SHARES | | AMOUNT | | SHARES | | AMOUNT |
| Class A | | | | | | | | | | | | | | | |
| Shares sold | 52 | | $ 1,519 | | 46 | | $ 1,877 | | 110 | | $ 3,156 | | 144 | | $ 4,971 |
| Reinvestment of distributions | 31 | | 867 | | 315 | | 11,665 | | 441 | | 12,301 | | 935 | | 31,093 |
| Shares repurchased | (181) | | (5,203) | | (201) | | (8,411) | | (586) | | (16,594) | | (544) | | (18,861) |
| Net Increase / (Decrease) | (98) | | $ (2,817) | | 160 | | $ 5,131 | | (35) | | $ (1,137) | | 535 | | $ 17,203 |
VIRTUS INVESTMENT TRUST
NOTES TO FINANCIAL STATEMENTS (Continued)
June 30, 2023
| | KAR Global Small-Cap Fund | | KAR Health Sciences Fund |
| | Year Ended
June 30, 2023 | | Year Ended
June 30, 2022 | | Year Ended
June 30, 2023 | | Year Ended
June 30, 2022 |
| | SHARES | | AMOUNT | | SHARES | | AMOUNT | | SHARES | | AMOUNT | | SHARES | | AMOUNT |
| Class C | | | | | | | | | | | | | | | |
| Shares sold | 4 | | $ 88 | | 3 | | $ 103 | | 29 | | $ 503 | | 43 | | $ 938 |
| Reinvestment of distributions | 2 | | 37 | | 31 | | 847 | | 27 | | 447 | | 47 | | 981 |
| Shares repurchased | (52) | | (1,101) | | (45) | | (1,428) | | (69) | | (1,204) | | (46) | | (1,053) |
| Net Increase / (Decrease) | (46) | | $ (976) | | (11) | | $ (478) | | (13) | | $ (254) | | 44 | | $ 866 |
| Class P | | | | | | | | | | | | | | | |
| Shares sold | 2 | | $ 67 | | 2 | | $ 98 | | 44 | | $ 1,256 | | 99 | | $ 3,343 |
| Reinvestment of distributions | 1 | | 44 | | 16 | | 682 | | 4 | | 108 | | 5 | | 179 |
| Shares repurchased | (19) | | (608) | | (17) | | (864) | | (76) | | (2,239) | | (58) | | (1,856) |
| Net Increase / (Decrease) | (16) | | $ (497) | | 1 | | $ (84) | | (28) | | $ (875) | | 46 | | $ 1,666 |
| Institutional Class | | | | | | | | | | | | | | | |
| Shares sold | 44 | | $ 1,495 | | 75 | | $ 3,439 | | 141 | | $ 4,304 | | 571 | | $ 19,966 |
| Reinvestment of distributions | 19 | | 611 | | 206 | | 8,802 | | 44 | | 1,258 | | 124 | | 4,230 |
| Shares repurchased | (246) | | (8,420) | | (200) | | (9,269) | | (581) | | (17,374) | | (476) | | (16,735) |
| Net Increase / (Decrease) | (183) | | $ (6,314) | | 81 | | $ 2,972 | | (396) | | $ (11,812) | | 219 | | $ 7,461 |
| | NFJ Dividend Value Fund | | NFJ International Value Fund |
| | Year Ended
June 30, 2023 | | Year Ended
June 30, 2022 | | Year Ended
June 30, 2023 | | Year Ended
June 30, 2022 |
| | SHARES | | AMOUNT | | SHARES | | AMOUNT | | SHARES | | AMOUNT | | SHARES | | AMOUNT |
| Class A | | | | | | | | | | | | | | | |
| Shares sold | 2,486 | | $ 26,004 | | 3,288 | | $ 42,101 | | 213 | | $ 3,796 | | 277 | | $ 5,858 |
| Reinvestment of distributions | 5,148 | | 50,100 | | 1,902 | | 24,662 | | 50 | | 856 | | 54 | | 1,168 |
| Shares repurchased | (7,336) | | (77,619) | | (6,414) | | (82,282) | | (562) | | (10,203) | | (707) | | (14,977) |
| Net Increase / (Decrease) | 298 | | $ (1,515) | | (1,224) | | $ (15,519) | | (299) | | $ (5,551) | | (376) | | $ (7,951) |
| Class C | | | | | | | | | | | | | | | |
| Shares sold | 192 | | $ 2,101 | | 99 | | $ 1,276 | | 5 | | $ 93 | | 9 | | $ 200 |
| Reinvestment of distributions | 141 | | 1,409 | | 67 | | 902 | | 1 | | 17 | | 2 | | 39 |
| Shares repurchased | (645) | | (7,129) | | (556) | | (7,281) | | (45) | | (782) | | (71) | | (1,483) |
| Net Increase / (Decrease) | (312) | | $ (3,619) | | (390) | | $ (5,103) | | (39) | | $ (672) | | (60) | | $ (1,244) |
| Class P | | | | | | | | | | | | | | | |
| Shares sold | 1,647 | | $ 17,224 | | 1,060 | | $ 13,724 | | 40 | | $ 719 | | 44 | | $ 982 |
| Reinvestment of distributions | 1,771 | | 17,476 | | 737 | | 9,666 | | 11 | | 191 | | 16 | | 347 |
| Shares repurchased | (4,304) | | (45,254) | | (4,906) | | (63,963) | | (240) | | (4,346) | | (259) | | (5,474) |
| Net Increase / (Decrease) | (886) | | $ (10,554) | | (3,109) | | $ (40,573) | | (189) | | $ (3,436) | | (199) | | $ (4,145) |
| Institutional Class | | | | | | | | | | | | | | | |
| Shares sold | 853 | | $ 9,128 | | 1,333 | | $ 17,543 | | 331 | | $ 6,295 | | 363 | | $ 7,453 |
| Reinvestment of distributions | 1,394 | | 13,723 | | 520 | | 6,799 | | 34 | | 591 | | 47 | | 1,011 |
| Shares repurchased | (2,965) | | (31,583) | | (3,460) | | (45,386) | | (1,016) | | (18,644) | | (363) | | (7,585) |
| Net Increase / (Decrease) | (718) | | $ (8,732) | | (1,607) | | $ (21,044) | | (651) | | $ (11,758) | | 47 | | $ 879 |
| Class R6 | | | | | | | | | | | | | | | |
| Shares sold | 1,457 | | $ 16,193 | | 916 | | $ 11,974 | | 96 | | $ 1,686 | | 108 | | $ 2,266 |
| Reinvestment of distributions | 1,296 | | 12,691 | | 445 | | 5,785 | | 4 | | 63 | | 3 | | 61 |
| Shares repurchased | (2,458) | | (25,961) | | (1,516) | | (19,596) | | (151) | | (2,761) | | (36) | | (757) |
| Net Increase / (Decrease) | 295 | | $ 2,923 | | (155) | | $ (1,837) | | (51) | | $ (1,012) | | 75 | | $ 1,570 |
VIRTUS INVESTMENT TRUST
NOTES TO FINANCIAL STATEMENTS (Continued)
June 30, 2023
| | NFJ Dividend Value Fund | | NFJ International Value Fund |
| | Year Ended
June 30, 2023 | | Year Ended
June 30, 2022 | | Year Ended
June 30, 2023 | | Year Ended
June 30, 2022 |
| | SHARES | | AMOUNT | | SHARES | | AMOUNT | | SHARES | | AMOUNT | | SHARES | | AMOUNT |
| Administrative Class | | | | | | | | | | | | | | | |
| Shares sold | 774 | | $ 8,674 | | 605 | | $ 7,964 | | 25 | | $ 440 | | 77 | | $ 1,576 |
| Reinvestment of distributions | 513 | | 5,187 | | 167 | | 2,231 | | 2 | | 27 | | 1 | | 30 |
| Shares repurchased | (1,056) | | (11,734) | | (509) | | (6,735) | | (37) | | (665) | | (47) | | (950) |
| Net Increase / (Decrease) | 231 | | $ 2,127 | | 263 | | $ 3,460 | | (10) | | $ (198) | | 31 | | $ 656 |
| | NFJ Large-Cap Value Fund | | NFJ Mid-Cap Value Fund |
| | Year Ended
June 30, 2023 | | Year Ended
June 30, 2022 | | Year Ended
June 30, 2023 | | Year Ended
June 30, 2022 |
| | SHARES | | AMOUNT | | SHARES | | AMOUNT | | SHARES | | AMOUNT | | SHARES | | AMOUNT |
| Class A | | | | | | | | | | | | | | | |
| Shares sold | 228 | | $ 6,088 | | 243 | | $ 8,002 | | 1,242 | | $ 31,993 | | 844 | | $ 28,415 |
| Reinvestment of distributions | 978 | | 23,626 | | 308 | | 10,293 | | 4,199 | | 97,163 | | 1,757 | | 58,654 |
| Shares repurchased | (875) | | (23,413) | | (675) | | (22,437) | | (3,428) | | (89,230) | | (2,537) | | (85,945) |
| Net Increase / (Decrease) | 331 | | $ 6,301 | | (124) | | $ (4,142) | | 2,013 | | $ 39,926 | | 64 | | $ 1,124 |
| Class C | | | | | | | | | | | | | | | |
| Shares sold | 20 | | $ 530 | | 18 | | $ 591 | | 78 | | $ 1,573 | | 96 | | $ 2,577 |
| Reinvestment of distributions | 16 | | 385 | | 6 | | 190 | | 424 | | 7,059 | | 188 | | 4,923 |
| Shares repurchased | (53) | | (1,432) | | (51) | | (1,686) | | (647) | | (12,357) | | (421) | | (11,166) |
| Net Increase / (Decrease) | (17) | | $ (517) | | (27) | | $ (905) | | (145) | | $ (3,725) | | (137) | | $ (3,666) |
| Class P | | | | | | | | | | | | | | | |
| Shares sold | 66 | | $ 1,811 | | 163 | | $ 5,404 | | 1,871 | | $ 32,867 | | 1,203 | | $ 31,462 |
| Reinvestment of distributions | 100 | | 2,437 | | 32 | | 1,094 | | 1,244 | | 19,660 | | 995 | | 25,098 |
| Shares repurchased | (137) | | (3,585) | | (290) | | (9,713) | | (2,912) | | (53,252) | | (6,282) | | (161,018) |
| Net Increase / (Decrease) | 29 | | $ 663 | | (95) | | $ (3,215) | | 203 | | $ (725) | | (4,084) | | $ (104,458) |
| Institutional Class | | | | | | | | | | | | | | | |
| Shares sold | 1,677 | | $ 42,528 | | 775 | | $ 25,434 | | 1,809 | | $ 52,742 | | 3,656 | | $ 132,433 |
| Reinvestment of distributions | 571 | | 13,737 | | 236 | | 7,824 | | 2,505 | | 64,436 | | 1,315 | | 47,629 |
| Shares repurchased | (1,895) | | (52,478) | | (1,019) | | (34,203) | | (6,196) | | (180,217) | | (5,083) | | (184,720) |
| Net Increase / (Decrease) | 353 | | $ 3,787 | | (8) | | $ (945) | | (1,882) | | $ (63,039) | | (112) | | $ (4,658) |
| Class R6 | | | | | | | | | | | | | | | |
| Shares sold | 81 | | $ 2,042 | | 3 | | $ 100 | | 471 | | $ 14,414 | | 820 | | $ 29,076 |
| Reinvestment of distributions | — (1) | | — (2) | | — | | — | | 704 | | 18,071 | | 247 | | 8,923 |
| Shares repurchased | (—) (1) | | (8) | | — | | — | | (1,141) | | (33,064) | | (573) | | (21,374) |
| Net Increase / (Decrease) | 81 | | $ 2,034 | | 3 | | $ 100 | | 34 | | $ (579) | | 494 | | $ 16,625 |
| Administrative Class | | | | | | | | | | | | | | | |
| Shares sold | — (1) | | $ —(2) | | — (1) | | $ 19 | | 230 | | $ 6,365 | | 144 | | $ 5,141 |
| Reinvestment of distributions | 3 | | 75 | | 1 | | 32 | | 307 | | 7,470 | | 138 | | 4,770 |
| Shares repurchased | (2) | | (53) | | (1) | | (50) | | (369) | | (10,283) | | (504) | | (17,898) |
| Net Increase / (Decrease) | 1 | | $ 22 | | — (1) | | $ 1 | | 168 | | $ 3,552 | | (222) | | $ (7,987) |
VIRTUS INVESTMENT TRUST
NOTES TO FINANCIAL STATEMENTS (Continued)
June 30, 2023
| | NFJ Small-Cap Value Fund | | Silvant Focused Growth Fund |
| | Year Ended
June 30, 2023 | | Year Ended
June 30, 2022 | | Year Ended
June 30, 2023 | | Year Ended
June 30, 2022 |
| | SHARES | | AMOUNT | | SHARES | | AMOUNT | | SHARES | | AMOUNT | | SHARES | | AMOUNT |
| Class A | | | | | | | | | | | | | | | |
| Shares sold | 809 | | $ 9,516 | | 885 | | $ 13,314 | | 428 | | $ 22,097 | | 550 | | $ 38,758 |
| Reinvestment of distributions | 3,132 | | 33,918 | | 1,563 | | 23,166 | | 587 | | 26,569 | | 1,892 | | 131,234 |
| Shares repurchased | (3,427) | | (41,007) | | (4,689) | | (70,476) | | (1,732) | | (86,945) | | (2,360) | | (163,414) |
| Net Increase / (Decrease) | 514 | | $ 2,427 | | (2,241) | | $ (33,996) | | (717) | | $ (38,279) | | 82 | | $ 6,578 |
| Class C | | | | | | | | | | | | | | | |
| Shares sold | 19 | | $ 205 | | 18 | | $ 228 | | 104 | | $ 2,365 | | 108 | | $ 3,603 |
| Reinvestment of distributions | 25 | | 233 | | 11 | | 139 | | 132 | | 2,528 | | 393 | | 12,557 |
| Shares repurchased | (59) | | (589) | | (24) | | (314) | | (443) | | (9,883) | | (533) | | (18,692) |
| Net Increase / (Decrease) | (15) | | $ (151) | | 5 | | $ 53 | | (207) | | $ (4,990) | | (32) | | $ (2,532) |
| Class P | | | | | | | | | | | | | | | |
| Shares sold | 925 | | $ 13,436 | | 118 | | $ 2,106 | | 397 | | $ 13,328 | | 476 | | $ 23,193 |
| Reinvestment of distributions | 100 | | 1,338 | | 62 | | 1,102 | | 86 | | 2,367 | | 430 | | 18,881 |
| Shares repurchased | (261) | | (3,830) | | (553) | | (9,818) | | (733) | | (22,793) | | (1,357) | | (60,240) |
| Net Increase / (Decrease) | 764 | | $ 10,944 | | (373) | | $ (6,610) | | (250) | | $ (7,098) | | (451) | | $ (18,166) |
| Institutional Class | | | | | | | | | | | | | | | |
| Shares sold | 204 | | $ 3,050 | | 500 | | $ 8,993 | | 731 | | $ 34,358 | | 824 | | $ 54,682 |
| Reinvestment of distributions | 518 | | 7,030 | | 289 | | 5,167 | | 168 | | 6,711 | | 585 | | 35,936 |
| Shares repurchased | (1,012) | | (15,035) | | (2,087) | | (37,826) | | (1,017) | | (43,966) | | (1,407) | | (85,990) |
| Net Increase / (Decrease) | (290) | | $ (4,955) | | (1,298) | | $ (23,666) | | (118) | | $ (2,897) | | 2 | | $ 4,628 |
| Class R6 | | | | | | | | | | | | | | | |
| Shares sold | 460 | | $ 6,956 | | 447 | | $ 8,054 | | 399 | | $ 18,305 | | 1,240 | | $ 74,596 |
| Reinvestment of distributions | 492 | | 6,598 | | 303 | | 5,378 | | 248 | | 9,912 | | 593 | | 36,560 |
| Shares repurchased | (1,888) | | (28,004) | | (1,486) | | (26,970) | | (1,485) | | (65,278) | | (701) | | (43,874) |
| Net Increase / (Decrease) | (936) | | $ (14,450) | | (736) | | $ (13,538) | | (838) | | $ (37,061) | | 1,132 | | $ 67,282 |
| Administrative Class | | | | | | | | | | | | | | | |
| Shares sold | 358 | | $ 4,546 | | 186 | | $ 2,778 | | 14 | | $ 539 | | 32 | | $ 2,060 |
| Reinvestment of distributions | 355 | | 3,845 | | 203 | | 3,012 | | 12 | | 426 | | 30 | | 1,642 |
| Shares repurchased | (1,168) | | (14,047) | | (492) | | (7,303) | | (13) | | (554) | | (16) | | (922) |
| Net Increase / (Decrease) | (455) | | $ (5,656) | | (103) | | $ (1,513) | | 13 | | $ 411 | | 46 | | $ 2,780 |
| | Silvant Mid-Cap Growth Fund | | Small-Cap Fund |
| | Year Ended
June 30, 2023 | | Year Ended
June 30, 2022 | | Year Ended
June 30, 2023 | | Year Ended
June 30, 2022 |
| | SHARES | | AMOUNT | | SHARES | | AMOUNT | | SHARES | | AMOUNT | | SHARES | | AMOUNT |
| Class A | | | | | | | | | | | | | | | |
| Shares sold | 1,506 | | $ 4,736 | | 6,034 | | $ 28,674 | | 89 | | $ 1,768 | | 203 | | $ 5,057 |
| Reinvestment of distributions | — | | — | | 20,186 | | 87,202 | | 150 | | 2,916 | | 420 | | 9,935 |
| Shares repurchased | (10,469) | | (33,092) | | (12,167) | | (54,324) | | (622) | | (12,407) | | (430) | | (10,519) |
| Net Increase / (Decrease) | (8,963) | | $ (28,356) | | 14,053 | | $ 61,552 | | (383) | | $ (7,723) | | 193 | | $ 4,473 |
| Class C | | | | | | | | | | | | | | | |
| Shares sold | 60 | | $ 124 | | 312 | | $ 913 | | 8 | | $ 157 | | 20 | | $ 482 |
| Reinvestment of distributions | — | | — | | 1,506 | | 4,248 | | 9 | | 156 | | 29 | | 633 |
| Shares repurchased | (1,167) | | (2,398) | | (1,869) | | (6,109) | | (32) | | (591) | | (48) | | (1,071) |
| Net Increase / (Decrease) | (1,107) | | $ (2,274) | | (51) | | $ (948) | | (15) | | $ (278) | | 1 | | $ 44 |
VIRTUS INVESTMENT TRUST
NOTES TO FINANCIAL STATEMENTS (Continued)
June 30, 2023
| | Silvant Mid-Cap Growth Fund | | Small-Cap Fund |
| | Year Ended
June 30, 2023 | | Year Ended
June 30, 2022 | | Year Ended
June 30, 2023 | | Year Ended
June 30, 2022 |
| | SHARES | | AMOUNT | | SHARES | | AMOUNT | | SHARES | | AMOUNT | | SHARES | | AMOUNT |
| Class P | | | | | | | | | | | | | | | |
| Shares sold | 457 | | $ 1,870 | | 589 | | $ 3,464 | | 13 | | $ 273 | | 994 | | $ 26,315 |
| Reinvestment of distributions | — | | — | | 706 | | 3,866 | | 18 | | 364 | | 129 | | 3,094 |
| Shares repurchased | (723) | | (2,917) | | (3,904) | | (23,698) | | (384) | | (7,666) | | (1,481) | | (37,879) |
| Net Increase / (Decrease) | (266) | | $ (1,047) | | (2,609) | | $ (16,368) | | (353) | | $ (7,029) | | (358) | | $ (8,470) |
| Institutional Class | | | | | | | | | | | | | | | |
| Shares sold | 1,652 | | $ 6,837 | | 3,694 | | $ 24,641 | | 143 | | $ 2,942 | | 1,691 | | $ 42,970 |
| Reinvestment of distributions | — | | — | | 3,075 | | 17,065 | | 58 | | 1,170 | | 285 | | 6,896 |
| Shares repurchased | (3,620) | | (14,618) | | (2,734) | | (14,098) | | (1,633) | | (33,120) | | (885) | | (19,994) |
| Net Increase / (Decrease) | (1,968) | | $ (7,781) | | 4,035 | | $ 27,608 | | (1,432) | | $ (29,008) | | 1,091 | | $ 29,872 |
| Class R6 | | | | | | | | | | | | | | | |
| Shares sold | — | | $ — | | — | | $ — | | 45 | | $ 913 | | 95 | | $ 2,395 |
| Reinvestment of distributions | — | | — | | — | | — | | 12 | | 242 | | 46 | | 1,124 |
| Shares repurchased | — | | — | | — | | — | | (184) | | (3,858) | | (72) | | (1,780) |
| Net Increase / (Decrease) | — | | $ — | | — | | $ — | | (127) | | $ (2,703) | | 69 | | $ 1,739 |
| Administrative Class | | | | | | | | | | | | | | | |
| Shares sold | 29 | | $ 101 | | 27 | | $ 126 | | — | | $ — | | — | | $ — |
| Reinvestment of distributions | — | | — | | 138 | | 664 | | — | | — | | — | | — |
| Shares repurchased | (279) | | (883) | | (74) | | (403) | | — | | — | | — | | — |
| Net Increase / (Decrease) | (250) | | $ (782) | | 91 | | $ 387 | | — | | $ — | | — | | $ — |
| | Zevenbergen Technology Fund |
| | Year Ended
June 30, 2023 | | Year Ended
June 30, 2022 |
| | SHARES | | AMOUNT | | SHARES | | AMOUNT |
| Class A | | | | | | | |
| Shares sold | 790 | | $ 28,066 | | 812 | | $ 49,880 |
| Reinvestment of distributions | 2,693 | | 78,172 | | 3,585 | | 212,887 |
| Shares repurchased | (2,510) | | (91,488) | | (2,398) | | (141,886) |
| Net Increase / (Decrease) | 973 | | $ 14,750 | | 1,999 | | $ 120,881 |
| Class C | | | | | | | |
| Shares sold | 293 | | $ 2,450 | | 99 | | $ 2,609 |
| Reinvestment of distributions | 1,618 | | 10,423 | | 1,073 | | 24,592 |
| Shares repurchased | (1,043) | | (10,159) | | (645) | | (16,116) |
| Net Increase / (Decrease) | 868 | | $ 2,714 | | 527 | | $ 11,085 |
| Class P | | | | | | | |
| Shares sold | 339 | | $ 16,785 | | 155 | | $ 12,532 |
| Reinvestment of distributions | 119 | | 4,718 | | 339 | | 25,889 |
| Shares repurchased | (540) | | (26,340) | | (1,487) | | (128,997) |
| Net Increase / (Decrease) | (82) | | $ (4,837) | | (993) | | $ (90,576) |
| Institutional Class | | | | | | | |
| Shares sold | 1,856 | | $ 95,486 | | 2,725 | | $ 235,136 |
| Reinvestment of distributions | 2,005 | | 83,404 | | 3,770 | | 299,998 |
| Shares repurchased | (7,120) | | (368,944) | | (5,696) | | (461,959) |
| Net Increase / (Decrease) | (3,259) | | $ (190,054) | | 799 | | $ 73,175 |
VIRTUS INVESTMENT TRUST
NOTES TO FINANCIAL STATEMENTS (Continued)
June 30, 2023
| | Zevenbergen Technology Fund |
| | Year Ended
June 30, 2023 | | Year Ended
June 30, 2022 |
| | SHARES | | AMOUNT | | SHARES | | AMOUNT |
| Administrative Class | | | | | | | |
| Shares sold | 10 | | $ 407 | | 14 | | $ 1,035 |
| Reinvestment of distributions | 27 | | 953 | | 60 | | 4,114 |
| Shares repurchased | (13) | | (590) | | (900) | | (78,966) |
| Net Increase / (Decrease) | 24 | | $ 770 | | (826) | | $ (73,817) |
| (1) | Amount is less than 500 shares (not in thousands). |
| (2) | Amount is less than $500 (not in thousands). |
Note 7. 10% Shareholders
As of June 30, 2023, certain Funds had individual shareholder account(s) and/or omnibus shareholder account(s) (comprised of a group of individual shareholders), which individually amounted to more than 10% of the total shares outstanding of such Fund as detailed below:
| | % of Shares
Outstanding | | Number of
Accounts* |
Emerging Markets Opportunities Fund
| 57 % | | 2 |
KAR Global Small-Cap Fund
| 46 | | 3 |
KAR Health Sciences Fund
| 45 | | 2 |
NFJ International Value Fund
| 14 | | 1 |
NFJ Large-Cap Value Fund
| 23 | | 1 |
NFJ Small-Cap Value Fund
| 20 | | 1 |
Silvant Focused Growth Fund
| 11 | | 1 |
Silvant Mid-Cap Growth Fund
| 12 | | 1 |
Small-Cap Fund
| 12 | | 1 |
Zevenbergen Technology Fund
| 24 | | 2 |
| * | None of the accounts are affiliated. |
Note 8. Credit and Market Risk and Asset Concentration
In July 2017, the head of the United Kingdom Financial Conduct Authority (“FCA”) announced the intention to phase out the use of LIBOR by the end of 2021. However, after subsequent announcements by the FCA, the LIBOR administrator and other regulators, certain of the most widely used LIBORs are expected to continue until June 30, 2023. The ICE Benchmark Administration Limited, which is regulated and authorized by FCA, and the administrator of LIBOR, ceased publishing certain LIBOR settings on December 31, 2021. On April 3, 2023, the FCA announced its decision to require LIBOR’s administrator to continue to publish the 1-month, 3-month, and 6-month U.S. dollar settings under an unrepresentative synthetic methodology until September 30, 2024. On March 15, 2022, the Adjustable Interest Act (LIBOR) Act (the “LIBOR Act”) was enacted into law which directs the Federal Reserve Board, as a fallback mechanism, to identify benchmark rates based on SOFR that will replace LIBOR in certain financial contracts after June 30, 2023. On December 16, 2022, the Federal Reserve adopted regulations implementing the LIBOR Act. The Funds may be exposed to financial instruments tied to LIBOR to determine payment obligations, financing terms, hedging strategies or investment value. The expected discontinuation of LIBOR could have a significant impact on the financial markets and may present a material risk for certain market participants, including the Funds. Abandonment of or modifications to LIBOR could lead to significant short- and long-term uncertainty and market instability. The risks associated with this discontinuation and transition may be exacerbated if the work necessary to effect an orderly transition to an alternative reference rate is not completed in a timely manner. It remains uncertain the effects such changes will have on the Funds, issuers of instruments in which the Funds invest, and the financial markets generally.
Local, regional or global events such as war or military conflict, acts of terrorism, the spread of infectious illness or other public health issue, recessions, or other events could have a significant impact on a Fund and its investments, including hampering the ability of each Fund’s portfolio manager(s) to invest each Fund’s assets as intended.
Emerging market countries typically have economic and political systems that are less fully developed, and can be expected to be less stable than those of more developed countries. For example, the economies of such countries can be subject to rapid and unpredictable rates of inflation or deflation. Since these markets are often small, they may be more likely to suffer sharp and frequent price changes or long-term price depression because of adverse publicity, investor perceptions or the actions of a few large investors. They may also have policies that restrict investment by foreigners, or that prevent foreign investors from withdrawing their money at will.
Certain emerging markets may also face other significant internal or external risks, including the risk of war and civil unrest. Each of these factors can affect the value and liquidity of the assets of a Fund. Failure to generate adequate earnings from foreign trade would make it difficult for an emerging
VIRTUS INVESTMENT TRUST
NOTES TO FINANCIAL STATEMENTS (Continued)
June 30, 2023
market country to service foreign debt. Disruptions resulting from social and political factors may cause the securities markets of emerging market countries to close. If this were to occur, the liquidity and value of a Fund’s assets invested in corporate debt obligations of emerging market companies would decline.
The imposition of sanctions, exchange controls (including repatriation restrictions), confiscation of assets and property, trade restrictions (including tariffs) and other government restrictions by the U.S. or other governments, or from problems in registration, settlement or custody, may also result in losses. The type and severity of sanctions and other similar measures, including counter sanctions and other retaliatory actions, that may be imposed could vary broadly in scope, and their impact is impossible to predict. For example, the imposition of sanctions and other similar measures could, among other things, cause a decline in the value and/or liquidity of securities issued by the sanctioned country or companies located in or economically tied to the sanctioned country and increase market volatility and disruption in the sanctioned country and throughout the world. Sanctions and other similar measures could limit or prevent a Fund from buying and selling securities (in the sanctioned country and other markets), significantly delay or prevent the settlement of securities transactions, and significantly impact a Fund’s liquidity and performance.
Sanctions threatened or imposed may result in a decline in the value and liquidity of a Fund’s assets. The securities of a Fund may be deemed to have a zero value. A Fund may make investments that are illiquid or that may become less liquid in response to market developments or adverse investor perceptions. Illiquid investments may be more difficult to value. Liquidity risk may also refer to the risk that a Fund will not be able to pay redemption proceeds within the allowable time period or without significant dilution to remaining investors’ interests because of unusual market conditions, an unusually high volume of redemption requests, or other reasons. To meet redemption requests, a Fund may be forced to sell investments at an unfavorable time and/or under unfavorable conditions. If a Fund is forced to sell securities at an unfavorable time and/or under unfavorable conditions, such sales may adversely affect a Fund’s NAV and dilute remaining investors’ interests. Liquidity risk may be the result of, among other things, the reduced number and capacity of traditional market participants to make a market in fixed income securities or the lack of an active market. The potential for liquidity risk may be magnified by a rising interest rate environment or other circumstances where investor redemptions from fixed income funds may be higher than normal, potentially causing increased supply in the market due to selling activity. These risks may be more pronounced in connection with a Fund’s investments in securities of issuers located in emerging market countries. Redemptions by large shareholders may have a negative impact on a Fund’s liquidity.
For all these reasons, investments in emerging markets may be considered speculative. To the extent that a Fund invests a significant portion of its assets in a particular emerging market, the Fund will be more vulnerable to financial, economic, political and other developments in that country, and conditions that negatively impact that country will have a greater impact on the Fund as compared with a fund that does not have its holdings concentrated in a particular country.
Certain Funds may invest a high percentage of their assets in specific sectors of the market in the pursuit of their investment objectives. Fluctuations in these sectors of concentration may have a greater impact on a Fund, positive or negative, than if the Fund did not concentrate its investments in such sectors.
At June 30, 2023, the following Funds held securities issued by various companies in specific sectors and industries as detailed below:
| Fund | | Sector
/Industry | | Percentage of
Total Investments |
KAR Global Small-Cap Fund
| | Industrials | | 32% |
KAR Global Small-Cap Fund
| | Financials | | 26 |
KAR Health Sciences Fund
| | Healthcare Equipment & Supplies | | 30 |
NFJ Dividend Value Fund
| | Financials | | 27 |
NFJ International Value Fund
| | Financials | | 26 |
NFJ Small-Cap Value Fund
| | Financials | | 30 |
Silvant Focused Growth Fund
| | Information Technology | | 45 |
Silvant Mid-Cap Growth Fund
| | Information Technology | | 28 |
Zevenbergen Technology Fund
| | Software | | 25 |
Note 9. Indemnifications
Under the Trust’s organizational documents and in separate agreements between each Trustee and the Trust, its Trustees and officers are indemnified against certain liabilities arising out of the performance of their duties to the Trust and its funds. In addition, in the normal course of business, the Trust and the Funds enter into contracts that provide a variety of indemnifications to other parties. The Trust’s and/or the Funds’ maximum exposure under these arrangements is unknown, as this would involve future claims that may be made against the Trust or the Funds and that have not occurred. However, neither the Trust nor the Funds have had prior claims or losses pursuant to these arrangements, and they expect the risk of loss to be remote.
Note 10. Restricted Securities
($ reported in thousands)
Restricted securities are not registered under the Securities Act of 1933, as amended (the “1933 Act”). Generally, 144A securities are excluded from this category. Each Fund will bear any costs, including those involved in registration under the 1933 Act, in connection with the disposition of such securities. The following Fund held securities that were considered to be restricted at June 30, 2023:
VIRTUS INVESTMENT TRUST
NOTES TO FINANCIAL STATEMENTS (Continued)
June 30, 2023
| Fund | | Investment | | Date of
Acquisition | | Cost | | Value | | Percentage of
Net Assets |
Income & Growth Fund
| | LiveStyle, Inc. | | 12/1/2016 | | $ — | | $ — | | 0.0% |
| | | LiveStyle, Inc. Series B | | 3/1/2016 | | 2,698 | | 2,227 | | 0.1 |
| | | Tenerity, Inc. | | 11/4/2015 | | 1,422 | | — | | 0.0 |
Note 11. Redemption Facility
($ reported in thousands)
On June 14, 2021, the Funds and certain other affiliated funds entered into an $250,000 unsecured line of credit (“Credit Agreement”). This Credit Agreement, as amended, is with a commercial bank that allows the Funds to borrow cash from the bank to manage large unexpected redemptions and trade fails, up to a limit of one-third or one-fifth, as applicable, of each Fund’s total net assets in accordance with the terms of the agreement. This Credit Agreement had a term of 364 days and was extended to July 7, 2023. Subsequent to the reporting period, the Credit Agreement was renewed for a term of 364 days for a period up to July 6, 2024. Effective March 10, 2022, interest is charged at the higher of the SOFR or the Federal Funds rate plus an additional percentage rate on the amount borrowed. Commitment fees are charged on the undrawn balance. Total commitment fees paid for the year ended June 30, 2023, are included in the “Interest expense and/or commitment fees” line on the Statements of Operations. The Funds and other affiliated funds that are parties are individually, and not jointly, liable for their particular advances, if any, under the Credit Agreement. The lending bank has the ability to require repayment of outstanding borrowings under this Credit Agreement upon certain circumstances such as an event of default.
The following Funds had outstanding loans during the year. The borrowings were valued at cost, which approximates fair value.
| Fund | | Interest
Incurred on
Borrowing | | Average
Borrowing | | Weighted Average
Interest Rate | | Days
Outstanding |
Emerging Markets Opportunities Fund
| | $ 8 | | $2,709 | | 2.88% | | 35 |
KAR Global Small-Cap Fund
| | 2 | | 3,100 | | 5.65 | | 4 |
KAR Health Sciences Fund
| | — (1) | | 800 | | 2.63 | | 2 |
NFJ Dividend Value Fund
| | 6 | | 7,700 | | 5.40 | | 5 |
NFJ International Value Fund
| | 2 | | 5,500 | | 3.38 | | 3 |
NFJ Large-Cap Value Fund
| | 3 | | 6,725 | | 4.15 | | 4 |
NFJ Mid-Cap Value Fund
| | 5 | | 6,820 | | 5.68 | | 5 |
Silvant Focused Growth Fund
| | 1 | | 4,850 | | 4.60 | | 2 |
Small-Cap Fund
| | 1 | | 4,600 | | 3.71 | | 2 |
Zevenbergen Technology Fund
| | 16 | | 6,122 | | 5.25 | | 18 |
| (1) | Amount is less than $500 (not in thousands). |
Note 12. Federal Income Tax Information
($ reported in thousands)
At June 30, 2023, the approximate aggregate cost basis and the unrealized appreciation (depreciation) of investments and other financial instruments for federal income tax purposes were as follows:
| Fund | | Federal
Tax Cost | | Unrealized
Appreciation | | Unrealized
(Depreciation) | | Net Unrealized
Appreciation
(Depreciation) |
Emerging Markets Opportunities Fund
| | $ 112,763 | | $ 22,488 | | $ (12,645) | | $ 9,843 |
Income & Growth Fund
| | 5,810,510 | | 74,372 | | (829,939) | | (755,567) |
Income & Growth Fund (Written options)
| | (1,566) | | 589 | | (851) | | (262) |
KAR Global Small-Cap Fund
| | 51,610 | | 7,882 | | (3,166) | | 4,716 |
KAR Health Sciences Fund
| | 145,157 | | 17,649 | | (10,122) | | 7,527 |
NFJ Dividend Value Fund
| | 592,048 | | 65,726 | | (30,450) | | 35,276 |
NFJ International Value Fund
| | 97,255 | | 7,106 | | (10,830) | | (3,724) |
NFJ Large-Cap Value Fund
| | 258,428 | | 32,301 | | (16,284) | | 16,017 |
NFJ Mid-Cap Value Fund
| | 969,300 | | 74,462 | | (81,225) | | (6,763) |
NFJ Small-Cap Value Fund
| | 358,450 | | 37,322 | | (27,669) | | 9,653 |
Silvant Focused Growth Fund
| | 504,378 | | 515,158 | | (3,302) | | 511,856 |
Silvant Mid-Cap Growth Fund
| | 241,942 | | 70,004 | | (8,259) | | 61,745 |
Small-Cap Fund
| | 84,427 | | 17,059 | | (4,012) | | 13,047 |
Zevenbergen Technology Fund
| | 817,987 | | 517,778 | | (46,683) | | 471,095 |
VIRTUS INVESTMENT TRUST
NOTES TO FINANCIAL STATEMENTS (Continued)
June 30, 2023
Certain Funds have capital loss carryforwards available to offset future realized capital gains, if any, to the extent permitted by the Code. Net capital losses are carried forward without expiration and generally retain their short-term and/or long-term tax character, as applicable. For the year ended June 30, 2023, the Funds’ capital loss carryovers were as follows:
| Fund | | Short-Term | | Long-Term |
Emerging Markets Opportunities Fund
| | $ 19,429 | | $ — |
KAR Global Small-Cap Fund
| | 666 | | — |
KAR Health Sciences Fund
| | 4,559 | | — |
NFJ International Value Fund
| | 249,048 | | 183,078 |
Silvant Mid-Cap Growth Fund
| | 8,707 | | — |
Zevenbergen Technology Fund
| | 212,900 | | — |
The components of distributable earnings on a tax basis and certain tax attributes for the Funds consist of the following:
| Fund | | Undistributed
Ordinary
Income | | Undistributed
Long-Term
Capital Gains | | Late Year
Ordinary Losses
Deferred | | Post-October
Capital Loss
Deferred | | Capital Loss
Deferred |
Emerging Markets Opportunities Fund
| | $ 2,017 | | $ — | | $ — | | $ 4,436 | | $ 19,429 |
Income & Growth Fund
| | — | | — | | — | | 1,557 | | — |
KAR Global Small-Cap Fund
| | 299 | | — | | — | | — | | 666 |
KAR Health Sciences Fund
| | — | | — | | 263 | | 675 | | 4,559 |
NFJ Dividend Value Fund
| | 361 | | 31,104 | | — | | — | | — |
NFJ International Value Fund
| | 850 | | — | | — | | 2,516 | | 432,126 |
NFJ Large-Cap Value Fund
| | 643 | | 7,464 | | — | | — | | — |
NFJ Mid-Cap Value Fund
| | 18,381 | | 12,315 | | — | | — | | — |
NFJ Small-Cap Value Fund
| | 4,972 | | 11,710 | | — | | — | | — |
Silvant Focused Growth Fund
| | — | | 21,750 | | 1,103 | | — | | — |
Silvant Mid-Cap Growth Fund
| | — | | — | | 443 | | 8,789 | | 8,707 |
Small-Cap Fund
| | 188 | | 1,540 | | — | | — | | — |
Zevenbergen Technology Fund
| | — | | — | | 5,066 | | 27,256 | | 212,900 |
The differences between the book and tax basis of distributable earnings relate principally to the timing of recognition of income and gains for federal income tax purposes. Short-term gain distributions, if any, are reported as ordinary income for federal tax purposes. Distributions are determined on a tax basis and may differ from net investment income and realized capital gains for financial reporting purposes.
The tax character of dividends and distributions paid during the years ended June 30, 2023 and 2022 was as follows:
| | Ordinary
Income | | Long-Term
Capital Gains | | Return of
Capital | | Total |
Emerging Markets Opportunities Fund
| | | | | | | |
6/30/23
| $ 3,850 | | $ — | | $ — | | $ 3,850 |
6/30/22
| 5,310 | | — | | — | | 5,310 |
Income & Growth Fund
| | | | | | | |
6/30/23
| 237,003 | | 15,255 | | 173,700 | | 425,958 |
6/30/22
| 461,612 | | — | | — | | 461,612 |
KAR Global Small-Cap Fund
| | | | | | | |
6/30/23
| 1 | | 1,607 | | — | | 1,608 |
6/30/22
| 12,623 | | 10,117 | | — | | 22,740 |
KAR Health Sciences Fund
| | | | | | | |
6/30/23
| — | | 14,540 | | — | | 14,540 |
6/30/22
| 17,411 | | 20,210 | | — | | 37,621 |
NFJ Dividend Value Fund
| | | | | | | |
6/30/23
| 20,452 | | 91,050 | | — | | 111,502 |
6/30/22
| 17,960 | | 37,920 | | — | | 55,880 |
NFJ International Value Fund
| | | | | | | |
6/30/23
| 1,921 | | — | | — | | 1,921 |
6/30/22
| 2,895 | | — | | — | | 2,895 |
VIRTUS INVESTMENT TRUST
NOTES TO FINANCIAL STATEMENTS (Continued)
June 30, 2023
| | Ordinary
Income | | Long-Term
Capital Gains | | Return of
Capital | | Total |
NFJ Large-Cap Value Fund
| | | | | | | |
6/30/23
| $ 6,945 | | $ 35,780 | | $ — | | $ 42,725 |
6/30/22
| 10,795 | | 9,800 | | — | | 20,595 |
NFJ Mid-Cap Value Fund
| | | | | | | |
6/30/23
| 60,200 | | 178,200 | | — | | 238,400 |
6/30/22
| 76,780 | | 90,600 | | — | | 167,380 |
NFJ Small-Cap Value Fund
| | | | | | | |
6/30/23
| 8,131 | | 48,350 | | — | | 56,481 |
6/30/22
| 16,430 | | 24,130 | | — | | 40,560 |
Silvant Focused Growth Fund
| | | | | | | |
6/30/23
| — | | 52,500 | | — | | 52,500 |
6/30/22
| 35,850 | | 220,000 | | — | | 255,850 |
Silvant Mid-Cap Growth Fund
| | | | | | | |
6/30/22
| 27,480 | | 97,130 | | — | | 124,610 |
Small-Cap Fund
| | | | | | | |
6/30/23
| 433 | | 4,634 | | — | | 5,067 |
6/30/22
| 6,120 | | 16,330 | | — | | 22,450 |
Zevenbergen Technology Fund
| | | | | | | |
6/30/23
| — | | 184,570 | | — | | 184,570 |
6/30/22
| 300,890 | | 289,700 | | — | | 590,590 |
Certain capital accounts in the financial statements are periodically adjusted for permanent differences in order to reflect their tax character. Permanent reclassifications can arise from differing treatment of certain income and gain transactions and nondeductible current year net operating losses. These adjustments have no impact on net assets or net asset value per share of the Funds. Temporary differences that arise from recognizing certain items of income, expense, gain or loss in different periods for financial statement and tax purposes will likely reverse at some time in the future.
Note 13. Regulatory Matters and Litigation
From time to time, the Trust, the Funds, the Adviser and/or subadvisers and/or their affiliates may be involved in litigation and arbitration as well as examinations and investigations by various regulatory bodies, including the SEC, involving compliance with, among other things, securities laws, client investment guidelines, laws governing the activities of broker-dealers and other laws and regulations affecting their activities. At this time, the Adviser believes that the outcomes of such matters are not likely, either individually or in aggregate, to be material to these financial statements.
Note 14. Recent Accounting Pronouncement
In March 2020, the FASB issued Accounting Standards Update (“ASU”) No. 2020-04 (“ASU 2020-04”), Reference Rate Reform (Topic 848) – Facilitation of the Effects of Reference Rate Reform on Financial Reporting. The amendments in ASU 2020-04 provide optional temporary financial reporting relief from the effect of certain types of contract modifications due to the planned discontinuation of the LIBOR and other interbank-offered reference rates as of the end of 2021. In March 2021, the administrator for LIBOR announced the extension of the publication of a majority of the USD LIBOR settings to June 30, 2023. On December 21, 2022, the FASB issued ASU 2022-06 to defer the sunset date of ASC 848 until December 31, 2024. ASU 2020-04 is effective for certain reference rate-related contract modifications that occur during the period March 12, 2020 through December 31, 2024. Management is currently evaluating ASU 2020-04 and ASU 2020-06, but does not believe there will be a material impact.
Note 15. New Regulatory Pronouncement
In October 2022, the SEC adopted a rule and form amendments relating to tailored shareholder reports for mutual funds and ETFs; and fee information in investment company advertisements. The rule and form amendments will require mutual funds and ETFs to transmit streamlined shareholder reports that highlight key information to investors. The rule amendments will require that certain more in-depth information be made available online and available for delivery free of charge to investors on request. The amendments became effective in January 2023 and there is an 18-month transition period after the effective date of the amendment with a compliance date of July 2024.
Note 16. Subsequent Events
Management has evaluated the impact of all subsequent events on the Funds through the date the financial statements were available for issuance, and has determined that there are no subsequent events requiring recognition or disclosure in these financial statements.
Report of Independent Registered Public Accounting Firm
To the Board of Trustees of Virtus Investment Trust and Shareholders of Virtus Emerging Markets Opportunities Fund, Virtus Income & Growth Fund, Virtus KAR Global Small-Cap Fund, Virtus KAR Health Sciences Fund, Virtus NFJ Dividend Value Fund, Virtus NFJ International Value Fund, Virtus NFJ Large-Cap Value Fund, Virtus NFJ Mid-Cap Value Fund, Virtus NFJ Small-Cap Value Fund, Virtus Silvant Focused Growth Fund, Virtus Silvant Mid-Cap Growth Fund, Virtus Small-Cap Fund, and Virtus Zevenbergen Technology Fund
Opinions on the Financial Statements
We have audited the accompanying statements of assets and liabilities, including the schedules of investments, of Virtus Emerging Markets Opportunities Fund, Virtus Income & Growth Fund, Virtus KAR Global Small-Cap Fund, Virtus KAR Health Sciences Fund, Virtus NFJ Dividend Value Fund, Virtus NFJ International Value Fund, Virtus NFJ Large-Cap Value Fund, Virtus NFJ Mid-Cap Value Fund, Virtus NFJ Small-Cap Value Fund, Virtus Silvant Focused Growth Fund, Virtus Silvant Mid-Cap Growth Fund, Virtus Small-Cap Fund, and Virtus Zevenbergen Technology Fund (constituting Virtus Investment Trust, hereafter collectively referred to as the “Funds”) as of June 30, 2023, the related statements of operations for the year ended June 30, 2023, the statements of changes in net assets for each of the two years in the period ended June 30, 2023, including the related notes, and the financial highlights for each of the periods indicated therein (collectively referred to as the “financial statements”). In our opinion, the financial statements present fairly, in all material respects, the financial position of each of the Funds as of June 30, 2023, the results of each of their operations for the year then ended, the changes in each of their net assets for each of the two years in the period ended June 30, 2023, and each of the financial highlights for each of the periods indicated therein in conformity with accounting principles generally accepted in the United States of America.
Basis for Opinions
These financial statements are the responsibility of the Funds’ management. Our responsibility is to express an opinion on the Funds’ financial statements based on our audits. We are a public accounting firm registered with the Public Company Accounting Oversight Board (United States) (PCAOB) and are required to be independent with respect to the Funds in accordance with the U.S. federal securities laws and the applicable rules and regulations of the Securities and Exchange Commission and the PCAOB.
We conducted our audits of these financial statements in accordance with the standards of the PCAOB. Those standards require that we plan and perform the audit to obtain reasonable assurance about whether the financial statements are free of material misstatement, whether due to error or fraud.
Our audits included performing procedures to assess the risks of material misstatement of the financial statements, whether due to error or fraud, and performing procedures that respond to those risks. Such procedures included examining, on a test basis, evidence regarding the amounts and disclosures in the financial statements. Our audits also included evaluating the accounting principles used and significant estimates made by management, as well as evaluating the overall presentation of the financial statements. Our procedures included confirmation of securities owned as of June 30, 2023 by correspondence with the custodian, transfer agents, and brokers. When replies were not received from brokers, we performed other auditing procedures. We believe that our audits provide a reasonable basis for our opinions.
/s/PricewaterhouseCoopers LLP
Philadelphia, PA
August 23, 2023
We have served as the auditor of one or more investment companies in Virtus Mutual Funds’ since at least 1977. We have not been able to determine the specific year we began serving as auditor.
VIRTUS INVESTMENT TRUST
TAX INFORMATION NOTICE (Unaudited)
June 30, 2023
The following information ($ reported in thousands) is being provided in order to meet reporting requirements set forth by the Code and/or to meet state specific requirements. In early 2024, the Funds will notify applicable shareholders of amounts for use in preparing 2023 U.S. federal income tax forms. Shareholders should consult their tax advisors.
With respect to distributions paid during the fiscal year ended June 30, 2023, the Funds designate the following amounts (or, if subsequently determined to be different, the maximum amount allowable):
| Fund | | Qualified
Dividend
Income %
(non-corporate
shareholder) | | Dividend
Received
Deduction %
(corporate
shareholders) | | Long-Term
Capital Gain
Distributions ($) |
Emerging Markets Opportunities Fund
| | 83.59 % | | 1.63 % | | $ — |
Income & Growth Fund
| | 16.24 | | 14.96 | | 15,255 |
KAR Global Small-Cap Fund
| | 100.00 | | 100.00 | | — |
KAR Health Sciences Fund
| | — | | — | | — |
NFJ Dividend Value Fund
| | 100.00 | | 100.00 | | 43,688 |
NFJ International Value Fund
| | 100.00 | | 4.21 | | — |
NFJ Large-Cap Value Fund
| | 100.00 | | 100.00 | | 10,762 |
NFJ Mid-Cap Value Fund
| | 58.88 | | 51.20 | | 67,683 |
NFJ Small-Cap Value Fund
| | 100.00 | | 96.96 | | 28,806 |
Silvant Focused Growth Fund
| | — | | — | | 41,620 |
Silvant Mid-Cap Growth Fund
| | — | | — | | — |
Small-Cap Fund
| | 100.00 | | 100.00 | | 1,540 |
Zevenbergen Technology Fund
| | — | | — | | — |
For the fiscal year ended June 30, 2023, certain Funds are disclosing the following information pursuant to notice requirements of Section 853(a) and 855(d) of the Code, and the Treasury Regulations thereunder.
| | Foreign Source
Income
Recognized | | Foreign Taxes
Paid on
Foreign
Source
Income |
Emerging Markets Opportunities Fund
| $ 5,787 | | $ 742 |
KAR Global Small-Cap Fund
| 1,011 | | 97 |
NFJ International Value Fund
| 3,282 | | 351 |
STATEMENT REGARDING LIQUIDITY RISK MANAGEMENT PROGRAM (UNAUDITED)
Pursuant to Rule 22e-4 under the 1940 Act, the Funds have adopted a liquidity risk management program (the “Program”) to govern the Funds’ approach to managing liquidity risk, which is the risk that a Fund would not be able to meet redemption requests without significant dilution of remaining investors’ interests in the Fund. The Program is overseen by the Adviser as the Funds’ Liquidity Risk Management Program Administrator (the “Program Administrator”), and the Program’s principal objectives include assessing, managing and periodically reviewing each Fund’s liquidity risk, based on factors specific to the circumstances of the Funds. Assessment and management of a Fund’s liquidity risk under the Program take into consideration certain factors, such as the Fund’s investment strategy and the liquidity of its portfolio investments during normal and reasonably foreseeable stressed conditions, its short- and long-term cash-flow projections during both normal and reasonably foreseeable stressed conditions, and its cash and cash-equivalent holdings and access to other funding sources. As required by the rule, the Program includes policies and procedures for classification of Fund portfolio holdings in four liquidity categories, maintaining certain levels of highly liquid investments, and limiting holdings of illiquid investments.
At a meeting of the Board held on May 22-24, 2023, the Board received a report from the Program Administrator addressing the operation and management of the Program for calendar year 2022 (the “Review Period”). The Program Administrator’s report noted that for the Review Period, the Program Administrator believed that the Program was implemented and operated effectively in all material respects and that existing procedures, controls and safeguards were appropriately designed to enable the Program Administrator to administer the Program in compliance with Rule 22e-4. The Program Administrator’s report noted that during the Review Period, there were no events that created liquidity related concerns for the Funds. The Program Administrator’s report further noted that while changes to the Program had been made during the Review Period and reported to the Board, no material changes were made to the Program as a result of the Program Administrator’s annual review.
There can be no assurance that the Program will achieve its objectives in the future. Please refer to a Fund’s prospectus for more information regarding the Fund’s exposure to liquidity risk and other principal risks to which an investment in that Fund may be subject.
FUND MANAGEMENT TABLES (Unaudited)
Information pertaining to the Trustees and officers of the Trust as of the date of issuance of this report, is set forth below. The statement of additional information (SAI) includes additional information about the Trustees and is available without charge, upon request, by calling (800) 243-4361.
The address of each individual, unless otherwise noted, is c/o Virtus Investment Trust, One Financial Plaza, Hartford, CT 06103. There is no stated term of office for Trustees or officers of the Trust.
Independent Trustees
Name, Year of Birth,
Length of Time Served
and Number of
Portfolios in Fund
Complex Overseen by
Trustee | Principal Occupation(s) During Past 5 Years | Other Directorships Held by Trustee During Past 5 Years |
Burke, Donald C.
YOB: 1960
Served Since: 2021
107 Portfolios | Private investor (since 2009). Formerly, President and Chief Executive Officer, BlackRock U.S. Funds (2007 to 2009); Managing Director, BlackRock, Inc. (2006 to 2009); and Managing Director, Merrill Lynch Investment Managers (1990 to 2006). | Trustee (since May 2023) and Advisory Board Member (May 2023), Virtus Artificial Intelligence & Technology Opportunities Fund, Virtus Dividend, Interest & Premium Strategy Fund and Virtus Equity & Convertible Income Fund; Advisory Board Member (since May 2023), Virtus Convertible & Income 2024 Target Term Fund, Virtus Convertible & Income Fund, Virtus Convertible & Income Fund II and Virtus Diversified Income & Convertible Fund; Trustee (since 2022), Virtus Stone Harbor Emerging Markets Income Fund and Virtus Stone Harbor Emerging Markets Total Income Fund; Trustee (since 2021), The Merger Fund®, The Merger Fund® VL, Virtus Event Opportunities Trust (2 portfolios), Virtus Investment Trust (13 portfolios) and Virtus Strategy Trust (8 portfolios); Director (2020 to 2021), Duff & Phelps Select MLP and Midstream Energy Fund Inc.; Director (since 2020), Virtus Total Return Fund Inc.; Trustee (since 2020), Virtus Global Multi-Sector Income Fund; Trustee (since 2016), Virtus Mutual Fund Family (56 portfolios), Virtus Variable Insurance Trust (8 portfolios) and Virtus Alternative Solutions Trust (4 portfolios); Director (since 2014), closed-end funds managed by Duff & Phelps Investment Management Co. (3 funds); Director, Avista Corp. (energy company) (since 2011); Trustee, Goldman Sachs Fund Complex (2010 to 2014); and Director, BlackRock Luxembourg and Cayman Funds (2006 to 2010). |
Cogan, Sarah E.
YOB: 1956
Served Since: 2019
104 Portfolios | Retired Partner, Simpson Thacher & Bartlett LLP (“STB”) (law firm) (since 2019); Director, Girl Scouts of Greater New York (since 2016); Trustee, Natural Resources Defense Council, Inc. (since 2013); and formerly, Partner, STB (1989 to 2018). | Trustee (since 2022) and Advisory Board Member (2021 to 2022), Virtus Alternative Solutions Trust (4 portfolios), Virtus Mutual Fund Family (56 portfolios) and Virtus Variable Insurance Trust (8 portfolios); Trustee (since 2022), Virtus Stone Harbor Emerging Markets Income Fund and Virtus Stone Harbor Emerging Markets Total Income Fund; Trustee (since 2022), PIMCO Access Income Fund and PIMCO California Flexible Municipal Income Fund; Trustee (since 2021), PIMCO Flexible Emerging Markets Income Fund; Trustee (since 2021), The Merger Fund®, The Merger Fund® VL, Virtus Event Opportunities Trust (2 portfolios), and Virtus Global Multi-Sector Income Fund; Advisory Board Member (February 2021 to June 2021), Duff & Phelps Select MLP and Midstream Energy Fund Inc.; Director (since 2021), Virtus Total Return Fund Inc.; Trustee (since 2019), Virtus Investment Trust (13 portfolios) and Virtus Strategy Trust (8 portfolios); Trustee (since 2019), Virtus Artificial Intelligence & Technology Opportunities Fund, Virtus Convertible & Income 2024 Target Term Fund, Virtus Convertible & Income Fund, Virtus Convertible & Income Fund II, Virtus Diversified Income & Convertible Fund, Virtus Equity & Convertible Income Fund, and Virtus Dividend, Interest & Premium Strategy Fund; Trustee (since 2019), PIMCO California Municipal Income Fund, PIMCO California Municipal Income Fund II, PIMCO California Municipal Income Fund III, PIMCO Municipal Income Fund, PIMCO Municipal Income Fund II, PIMCO Municipal Income Fund III, PIMCO New York Municipal Income Fund, PIMCO New York Municipal Income Fund II, PIMCO New York Municipal Income Fund III, PIMCO Energy and Tactical Credit Opportunities Fund, PCM Fund, Inc, PIMCO Corporate & Income Strategy Fund, PIMCO Corporate & Income Opportunity Fund, PIMCO Dynamic Income Fund, PIMCO Global StocksPLUS® & Income Fund, PIMCO High Income Fund, PIMCO Income Strategy Fund, PIMCO Income Strategy Fund II, PIMCO Strategic Income Fund, Inc., PIMCO Flexible Credit Income Fund and PIMCO Flexible Municipal Income Fund; Trustee (since 2019), PIMCO Managed Accounts Trust (5 portfolios); and Trustee (2019 to 2021), PIMCO Dynamic Credit and Mortgage Income Fund and PIMCO Income Opportunity Fund. |
FUND MANAGEMENT TABLES (Unaudited) (Continued)
Name, Year of Birth,
Length of Time Served
and Number of
Portfolios in Fund
Complex Overseen by
Trustee | Principal Occupation(s) During Past 5 Years | Other Directorships Held by Trustee During Past 5 Years |
DeCotis, Deborah A.
YOB: 1952
Served Since: 2014
104 Portfolios | Director, Cadre Holdings Inc. (since 2022); Advisory Director, Morgan Stanley & Co., Inc. (since 1996); Member, Circle Financial Group (since 2009); Member, Council on Foreign Relations (since 2013); and Trustee, Smith College (since 2017). Formerly, Director, Watford Re (2017 to 2021); Co-Chair Special Projects Committee, Memorial Sloan Kettering (2005 to 2015); and Trustee, Stanford University (2010 to 2015). | Trustee (since 2022) and Advisory Board Member (2021 to 2022), Virtus Alternative Solutions Trust (4 portfolios), Virtus Mutual Fund Family (56 portfolios) and Virtus Variable Insurance Trust (8 portfolios); Trustee (since 2022), Virtus Stone Harbor Emerging Markets Income Fund and Virtus Stone Harbor Emerging Markets Total Income Fund; Trustee (since 2022), PIMCO Access Income Fund and PIMCO California Flexible Municipal Income Fund; Trustee (since 2021), PIMCO Flexible Emerging Markets Income Fund; Trustee (since 2021), The Merger Fund®, The Merger Fund® VL, Virtus Event Opportunities Trust (2 portfolios), and Virtus Global Multi-Sector Income Fund; Advisory Board Member (February 2021 to June 2021), Duff & Phelps Select MLP and Midstream Energy Fund Inc.; Director (since 2021), Virtus Total Return Fund Inc.; Trustee (since 2020), PIMCO Dynamic Income Opportunities Fund; Trustee (since 2019), PIMCO Energy and Tactical Credit Opportunities Fund and Virtus Artificial Intelligence & Technology Opportunities Fund; Trustee (since 2018), PIMCO Flexible Municipal Income Fund; Trustee (since 2017), PIMCO Flexible Credit Income Fund and Virtus Convertible & Income 2024 Target Term Fund; Trustee (since 2015), Virtus Diversified Income & Convertible Fund; Trustee (since 2014), Virtus Investment Trust (13 portfolios); Trustee (2013 to 2021), PIMCO Dynamic Credit and Mortgage Income Fund; Trustee (since 2012), PIMCO Dynamic Income Fund; Trustee (since 2011), Virtus Strategy Trust (8 portfolios); Trustee (since 2011), PIMCO California Municipal Income Fund II, PIMCO California Municipal Income Fund III, PIMCO Municipal Income Fund, PIMCO Municipal Income Fund II, PIMCO Municipal Income Fund III, PIMCO New York Municipal Income Fund, PIMCO New York Municipal Income Fund II, PIMCO New York Municipal Income Fund III, PCM Fund, Inc., PIMCO Corporate & Income Strategy Fund, PIMCO Corporate & Income Opportunity Fund, PIMCO Global StocksPLUS® & Income Fund, PIMCO High Income Fund, PIMCO Income Strategy Fund, PIMCO Income Strategy Fund II, PIMCO Strategic Income Fund, Inc., and PIMCO Managed Accounts Trust (5 portfolios); Trustee (since 2011), Virtus Convertible & Income Fund, Virtus Convertible & Income Fund II, Virtus Equity & Convertible Income Fund, and Virtus Dividend, Interest & Premium Strategy Fund; and Trustee (2011 to 2021), PIMCO Income Opportunity Fund. |
Drummond, F. Ford
YOB: 1962
Served Since: 2006
104 Portfolios | President (since 1998), F.G. Drummond Ranches, Inc.; and Director (since 2015), Texas and Southwestern Cattle Raisers Association. Formerly Chairman, Oklahoma Nature Conservancy (2019 to 2020); Board Member (2006 to 2020) and Chairman (2016 to 2018), Oklahoma Water Resources Board; Trustee (since 2014), Frank Phillips Foundation; Director (1998 to 2008), The Cleveland Bank; and General Counsel (1998 to 2008), BMIHealth Plans (benefits administration). | Trustee (since 2022) and Advisory Board Member (2021 to 2022), Virtus Alternative Solutions Trust (4 portfolios), Virtus Mutual Fund Family (56 portfolios), and Virtus Variable Insurance Trust (8 portfolios); Trustee (since 2022), Virtus Stone Harbor Emerging Markets Income Fund and Virtus Stone Harbor Emerging Markets Total Income Fund; Trustee (since 2021), The Merger Fund®, The Merger Fund® VL, and Virtus Event Opportunities Trust (2 portfolios); Advisory Board Member (February 2021 to June 2021), Duff & Phelps Select MLP and Midstream Energy Fund Inc.; Trustee (since 2021), Virtus Global Multi-Sector Income Fund; Director (since 2021), Virtus Total Return Fund Inc.; Trustee (since 2019), Virtus Artificial Intelligence & Technology Opportunities Fund; Trustee (since 2017), Virtus Convertible & Income 2024 Target Term Fund; Trustee (since 2015), Virtus Convertible & Income Fund, Virtus Convertible & Income Fund II, Virtus Diversified Income & Convertible Fund, Virtus Dividend, Interest & Premium Strategy Fund and Virtus Equity & Convertible Income Fund; Trustee (since 2014), Virtus Strategy Trust (8 portfolios); Director (since 2011), Bancfirst Corporation; and Trustee (since 2006), Virtus Investment Trust (13 portfolios). |
FUND MANAGEMENT TABLES (Unaudited) (Continued)
Name, Year of Birth,
Length of Time Served
and Number of
Portfolios in Fund
Complex Overseen by
Trustee | Principal Occupation(s) During Past 5 Years | Other Directorships Held by Trustee During Past 5 Years |
Harris, Sidney E.
YOB: 1949
Served Since: 2021
97 Portfolios | Private Investor (since 2021); Dean Emeritus (since 2015), Professor (2015 to 2021 and 1997 to 2014), and Dean (1997 to 2004), J. Mack Robinson College of Business, Georgia State University. | Trustee (since 2022), Virtus Stone Harbor Emerging Markets Income Fund and Virtus Stone Harbor Emerging Markets Total Income Fund; Trustee (since 2021), The Merger Fund®, The Merger Fund® VL, Virtus Event Opportunities Trust (2 portfolios), Virtus Investment Trust (13 portfolios) and Virtus Strategy Trust (8 portfolios); Director (2020 to 2021), Duff & Phelps Select MLP and Midstream Energy Fund Inc.; Director (since 2020), Virtus Total Return Fund Inc.; Trustee (since 2020), Virtus Global Multi-Sector Income Fund; Trustee (since 2019), Mutual Fund Directors Forum; Trustee (since 2017), Virtus Mutual Fund Family (56 portfolios), Virtus Variable Insurance Trust (8 portfolios), and Virtus Alternative Solutions Trust (4 portfolios); Trustee (2013 to 2020) and Honorary Trustee (since 2020), KIPP Metro Atlanta; Director (1999 to 2019), Total System Services, Inc.; Trustee (2004 to 2017), RidgeWorth Funds; Chairman (2012 to 2017), International University of the Grand Bassam Foundation; Trustee (since 2012), International University of the Grand Bassam Foundation; and Trustee (2011 to 2015), Genspring Family Offices, LLC. |
Mallin, John R.
YOB: 1950
Served Since: 2021
97 Portfolios | Partner/Attorney (since 2003), McCarter & English LLP (law firm) Real Property Practice Group; and Member (2014 to 2022), Counselors of Real Estate. | Trustee (since 2022), Virtus Stone Harbor Emerging Markets Income Fund and Virtus Stone Harbor Emerging Markets Total Income Fund; Trustee (since 2021), The Merger Fund®, The Merger Fund® VL, Virtus Event Opportunities Trust (2 portfolios), Virtus Investment Trust (13 portfolios) and Virtus Strategy Trust (8 portfolios); Director (2020 to 2021), Duff & Phelps Select MLP and Midstream Energy Fund Inc.; Director (since 2020), Virtus Total Return Fund Inc.; Trustee (since 2020), Virtus Global Multi-Sector Income Fund; Trustee (since 2016), Virtus Mutual Fund Family (56 portfolios) and Virtus Alternative Solutions Trust (4 portfolios); Director (since 2019), 1892 Club, Inc. (non-profit); Director (2013 to 2020), Horizons, Inc. (non-profit); and Trustee (since 1999), Virtus Variable Insurance Trust (8 portfolios). |
McDaniel, Connie D.
YOB: 1958
Served Since: 2021
104 Portfolios | Retired (since 2013). Vice President, Chief of Internal Audit, Corporate Audit Department (2009 to 2013); Vice President, Global Finance Transformation (2007 to 2009); and Vice President and Controller (1999 to 2007), The Coca-Cola Company. | Trustee (since May 2023) and Advisory Board Member (May 2023), Virtus Artificial Intelligence & Technology Opportunities Fund, Virtus Convertible & Income 2024 Target Term Fund, Virtus Convertible & Income Fund, Virtus Convertible & Income Fund II, Virtus Diversified Income & Convertible Fund, Virtus Dividend, Interest & Premium Strategy Fund and Virtus Equity & Convertible Income Fund; Trustee (since 2022), Virtus Stone Harbor Emerging Markets Income Fund and Virtus Stone Harbor Emerging Markets Total Income Fund; Trustee (since 2021), The Merger Fund®, The Merger Fund® VL, Virtus Event Opportunities Trust (2 portfolios), Virtus Investment Trust (13 portfolios) and Virtus Strategy Trust (8 portfolios); Director (2020 to 2021), Duff & Phelps Select MLP and Midstream Energy Fund Inc.; Director (since 2020), Virtus Total Return Fund Inc.; Trustee (since 2020), Virtus Global Multi-Sector Income Fund; Director (since 2019), Global Payments Inc.; Chairperson (since 2021), Governance & Nominating Committee, Global Payments Inc; Trustee (since 2017), Virtus Mutual Fund Family (56 portfolios), Virtus Variable Insurance Trust (8 portfolios), and Virtus Alternative Solutions Trust (4 portfolios); Director (since 2021), North Florida Land Trust; Director (2014 to 2019), Total System Services, Inc.; Member (2011 to 2022) and Chair (2014 to 2016), Georgia State University, Robinson College of Business Board of Advisors; and Trustee (2005 to 2017), RidgeWorth Funds. |
FUND MANAGEMENT TABLES (Unaudited) (Continued)
Name, Year of Birth,
Length of Time Served
and Number of
Portfolios in Fund
Complex Overseen by
Trustee | Principal Occupation(s) During Past 5 Years | Other Directorships Held by Trustee During Past 5 Years |
McLoughlin, Philip
YOB: 1946
Served Since: 2021
107 Portfolios | Private investor since 2010. | Trustee and Chairman (since 2022), Virtus Stone Harbor Emerging Markets Income Fund and Virtus Stone Harbor Emerging Markets Total Income Fund; Trustee (since 2021), The Merger Fund®, The Merger Fund® VL, Virtus Event Opportunities Trust (2 portfolios), Virtus Investment Trust (13 portfolios) and Virtus Strategy Trust (8 portfolios); Chairman (since 2023) and Trustee (since 2021), Virtus Artificial Intelligence & Technology Opportunities Fund, Virtus Convertible & Income Fund II, Virtus Diversified Income & Convertible Fund, Virtus Equity & Convertible Income Fund and Virtus Dividend, Interest & Premium Strategy Fund; Chairman (since 2023), Trustee (since 2022) and Advisory Board Member (2021), Virtus Convertible & Income 2024 Target Term Fund and Virtus Convertible & Income Fund; Director and Chairman (since 2016), Virtus Total Return Fund Inc.; Director and Chairman (2016 to 2019), the former Virtus Total Return Fund Inc.; Director and Chairman (2014 to 2021), Duff & Phelps Select MLP and Midstream Energy Fund Inc.; Trustee and Chairman (since 2013), Virtus Alternative Solutions Trust (4 portfolios); Trustee and Chairman (since 2011), Virtus Global Multi-Sector Income Fund; Chairman and Trustee (since 2003), Virtus Variable Insurance Trust (8 portfolios); Director (since 1995), closed-end funds managed by Duff & Phelps Investment Management Co. (3 funds); Director (1991 to 2019) and Chairman (2010 to 2019), Lazard World Trust Fund (closed-end investment firm in Luxembourg); and Trustee (since 1989) and Chairman (since 2002), Virtus Mutual Fund Family (56 portfolios). |
McNamara, Geraldine M.
YOB: 1951
Served Since: 2021
107 Portfolios | Private investor (since 2006); and Managing Director, U.S. Trust Company of New York (1982 to 2006). | Trustee (since May 2023) and Advisory Board Member (January 2023 to May 2023), Virtus Convertible & Income Fund, Virtus Convertible & Income Fund II, Virtus Diversified Income & Convertible Fund and Virtus Dividend, Interest & Premium Strategy Fund; Trustee (since 2023), Virtus Artificial Intelligence & Technology Opportunities Fund and Virtus Equity & Convertible Income Fund; Advisory Board Member (since 2023), Virtus Convertible & Income 2024 Target Term Fund; Trustee (since 2022), Virtus Stone Harbor Emerging Markets Income Fund and Virtus Stone Harbor Emerging Markets Total Income Fund; Trustee (since 2021), The Merger Fund®, The Merger Fund® VL, Virtus Event Opportunities Trust (2 portfolios), Virtus Investment Trust (13 portfolios) and Virtus Strategy Trust (8 portfolios); Director (2020 to 2021), Duff & Phelps Select MLP and Midstream Energy Fund Inc.; Director (since 2020), Virtus Total Return Fund Inc.; Trustee (since 2020), Virtus Global Multi-Sector Income Fund; Trustee (since 2016) Virtus Alternative Solutions Trust (4 portfolios); Trustee (since 2015), Virtus Variable Insurance Trust (8 portfolios); Director (since 2003), closed-end funds managed by Duff & Phelps Investment Management Co. (3 funds); and Trustee (since 2001), Virtus Mutual Fund Family (56 portfolios). |
Walton, R. Keith
YOB: 1964
Served Since: 2021
104 Portfolios | Senior Adviser (since 2022), Brightwood Capital LLC; Venture and Operating Partner (since 2020), Plexo Capital, LLC; Venture Partner (since 2019) and Senior Adviser (2018 to 2019), Plexo, LLC; and Partner (since 2006), Global Infrastructure Partners. Formerly, Managing Director (2020 to 2021), Lafayette Square Holding Company LLC; Senior Adviser (2018 to 2019), Vatic Labs, LLC; Executive Vice President, Strategy (2017 to 2019), Zero Mass Water, LLC; and Vice President, Strategy (2013 to 2017), Arizona State University. | Trustee (since May 2023) and Advisory Board Member (2022 to May 2023), Virtus Convertible & Income Fund II and Virtus Dividend, Interest & Premium Strategy Fund; Trustee (since 2022) and Advisory Board Member (January 2022 to July 2022), Virtus Artificial Intelligence & Technology Opportunities Fund, Virtus Convertible & Income Fund and Virtus Equity & Convertible Income Fund; Trustee (since 2022), Virtus Stone Harbor Emerging Markets Income Fund and Virtus Stone Harbor Emerging Markets Total Income Fund; Trustee (since 2022), Virtus Diversified Income & Convertible Fund; Advisory Board Member (since 2022), Virtus Convertible & Income 2024 Target Term Fund; Trustee (since 2021), The Merger Fund®, The Merger Fund® VL, Virtus Event Opportunities Trust (2 portfolios), Virtus Investment Trust (13 portfolios) and Virtus Strategy Trust (8 portfolios); Trustee (since 2020) Virtus Alternative Solutions Trust (4 portfolios), Virtus Variable Insurance Trust (8 portfolios) and Virtus Mutual Fund Family (56 portfolios); Director (since 2017), certain funds advised by Bessemer Investment Management LLC; Director (2016 to 2021), Duff & Phelps Select MLP and Midstream Energy Fund Inc.; Trustee (since 2016), Virtus Global Multi-Sector Income Fund; Director (2006 to 2019), Systematica Investments Limited Funds; Director (2006 to 2017), BlueCrest Capital Management Funds; Trustee (2014 to 2017), AZ Service; Director (since 2004), Virtus Total Return Fund Inc.; and Director (2004 to 2019), the former Virtus Total Return Fund Inc. |
FUND MANAGEMENT TABLES (Unaudited) (Continued)
Name, Year of Birth,
Length of Time Served
and Number of
Portfolios in Fund
Complex Overseen by
Trustee | Principal Occupation(s) During Past 5 Years | Other Directorships Held by Trustee During Past 5 Years |
Zino, Brian T.
YOB: 1952
Served Since: 2021
104 Portfolios | Retired. Various roles (1982 to 2009), J. & W. Seligman & Co. Incorporated, including President (1994 to 2009). | Trustee (since 2022), Virtus Stone Harbor Emerging Markets Income Fund and Virtus Stone Harbor Emerging Markets Total Income Fund; Trustee (since 2021), The Merger Fund®, The Merger Fund® VL, Virtus Event Opportunities Trust (2 portfolios), Virtus Investment Trust (13 portfolios) and Virtus Strategy Trust (8 portfolios); Trustee (since 2022) and Advisory Board Member (2021), Virtus Artificial Intelligence & Technology Opportunities Fund, Virtus Convertible & Income 2024 Target Term Fund, Virtus Convertible & Income Fund, Virtus Convertible & Income Fund II, Virtus Diversified Income & Convertible Fund, Virtus Equity & Convertible Income Fund, and Virtus Dividend, Interest & Premium Strategy Fund; Trustee (since 2020) Virtus Alternative Solutions Trust (4 portfolios), Virtus Variable Insurance Trust (8 portfolios) and Virtus Mutual Fund Family (56 portfolios); Director (2016 to 2021), Duff & Phelps Select MLP and Midstream Energy Fund Inc.; Trustee (since 2016), Virtus Global Multi-Sector Income Fund; Director (since 2014), Virtus Total Return Fund Inc.; Director (2014 to 2019), the former Virtus Total Return Fund Inc.; Trustee (since 2011), Bentley University; Director (1986 to 2009) and President (1994 to 2009), J&W Seligman Co. Inc.; Director (1998 to 2009), Chairman (2002 to 2004) and Vice Chairman (2000 to 2002), ICI Mutual Insurance Company; Member, Board of Governors of ICI (1998 to 2008). |
FUND MANAGEMENT TABLES (Unaudited) (Continued)
Interested Trustee
Name, Year of Birth,
Length of Time Served
and Number of
Funds Overseen | Principal Occupation(s) During Past
5 Years | Principal Occupation(s) During Past 5 Years and
Other Directorships Held by Trustee |
Aylward, George R.*
Trustee and President
YOB: 1964
Served Since: 2021
110 Portfolios | Director, President and Chief Executive Officer (since 2008), Virtus Investment Partners, Inc. and/or certain of its subsidiaries, and various senior officer positions with Virtus affiliates (since 2005). | Trustee, President and Chief Executive Officer (since 2022), Virtus Stone Harbor Emerging Markets Income Fund and Virtus Stone Harbor Emerging Markets Total Income Fund; Member, Board of Governors of the Investment Company Institute (since 2021); Trustee and President (since 2021), The Merger Fund®, The Merger Fund® VL, Virtus Event Opportunities Trust (2 portfolios), Virtus Investment Trust (13 portfolios) and Virtus Strategy Trust (8 portfolios); Trustee, President and Chief Executive Officer (since 2021), Virtus Artificial Intelligence & Technology Opportunities Fund, Virtus Convertible & Income 2024 Target Term Fund, Virtus Convertible & Income Fund, Virtus Convertible & Income Fund II, Virtus Diversified Income & Convertible Fund, Virtus Equity & Convertible Income Fund, and Virtus Dividend, Interest & Premium Strategy Fund; Chairman and Trustee (since 2015), Virtus ETF Trust II (6 portfolios); Director, President and Chief Executive Officer (2014 to 2021), Duff & Phelps Select MLP and Midstream Energy Fund Inc.; Trustee and President (since 2013), Virtus Alternative Solutions Trust (4 portfolios); Director (since 2013), Virtus Global Funds, PLC (5 portfolios); Trustee (since 2012) and President (since 2010), Virtus Variable Insurance Trust (8 portfolios); Trustee, President and Chief Executive Officer (since 2011), Virtus Global Multi-Sector Income Fund; Trustee and President (since 2006) and Executive Vice President (2004 to 2006), Virtus Mutual Fund Family (56 portfolios); Director, President and Chief Executive Officer (since 2006), Virtus Total Return Fund Inc.; and Director, President and Chief Executive Officer (2006 to 2019), the former Virtus Total Return Fund Inc. |
*Mr. Aylward is an “interested person,” as defined in the 1940 Act, by reason of his position as President and Chief Executive Officer of Virtus Investment Partners, Inc. (“Virtus”), the ultimate parent company of the Adviser, and various positions with its affiliates, including the Adviser.
Officers of the Trust Who Are Not Trustees
Name, Address and
Year of Birth | Position(s) Held
with Trust and
Length of
Time Served | Principal Occupation(s) During Past 5 Years |
Batchelar, Peter J.
YOB: 1970 | Senior Vice President (since 2021). | Senior Vice President, Product Development (since 2017), Vice President, Product Development (2008 to 2017), and various officer positions (since 2008), Virtus Investment Partners, Inc. and/or certain of its subsidiaries; various officer positions (since 2008) of various registered funds advised by subsidiaries of Virtus Investment Partners, Inc. |
Bradley, W. Patrick
YOB: 1972 | Executive Vice President, Chief Financial Officer and Treasurer (since 2021). | Executive Vice President, Fund Services (since 2016), Senior Vice President, Fund Services (2010 to 2016) and various officer positions (since 2004), Virtus Investment Partners, Inc. and/or certain of its subsidiaries; various officer positions (since 2006) of various registered funds advised by subsidiaries of Virtus Investment Partners, Inc.; Member (since 2022), BNY Mellon Asset Servicing Client Advisory Board. |
Branigan, Timothy
YOB: 1976 | Vice President and Fund Chief Compliance Officer (since 2022); Assistant Vice President and Deputy Fund Chief Compliance Officer (March to May 2022); and Assistant Vice President and Assistant Chief Compliance Officer (2021 to 2022). | Various officer positions (since 2019) of various registered funds advised by subsidiaries of Virtus Investment Partners, Inc. |
Chisolm, Daphne
YOB: 1969 | Vice President, Counsel and Assistant Secretary (since 2023). | Vice President and Senior Counsel (since 2023), Virtus Investment Partners, Inc.; Attorney at Law engaged in private practice as a solo practitioner (2018 to 2023); and various officer positions (since 2023) of various registered funds advised by subsidiaries of Virtus Investment Partners, Inc. |
Fromm, Jennifer
YOB: 1973 | Vice President, Chief Legal Officer, Counsel and Secretary (since 2021). | Vice President (since 2016) and Senior Counsel, Legal (since 2007) and various officer positions (since 2008), Virtus Investment Partners, Inc. and/or certain of its subsidiaries; various officer positions (since 2008) of various registered funds advised by subsidiaries of Virtus Investment Partners, Inc. |
FUND MANAGEMENT TABLES (Unaudited) (Continued)
Name, Address and
Year of Birth | Position(s) Held
with Trust and
Length of
Time Served | Principal Occupation(s) During Past 5 Years |
Griswold, Heidi
YOB: 1973 | Vice President (since 2021). | Vice President, Head of Transfer Agent & Servicing, Mutual Fund Services (since 2018), Virtus Investment Partners, Inc. and/or certain of its subsidiaries; and Vice President (since 2016) of various registered funds advised by subsidiaries of Virtus Investment Partners, Inc. |
Hackett, Amy
YOB: 1968 | Vice President and Assistant Treasurer (since 2021). | Vice President (since 2010) and Assistant Vice President (2007 to 2010), Fund Services, Virtus Investment Partners, Inc. and/or certain of its subsidiaries; and various officer positions (since 2007) of various registered funds advised by subsidiaries of Virtus Investment Partners, Inc. |
Krishnan, Suneeta
YOB: 1965 | Vice President and Assistant Treasurer (since 2021). | Vice President (since 2017) and Assistant Treasurer (since 2007), Mutual Fund Administration, Virtus Investment Partners, Inc. and/or certain of its subsidiaries; and various officer positions (since 2009) of various registered funds advised by subsidiaries of Virtus Investment Partners, Inc. |
Lowe, Benjamin
YOB: 1978 | Vice President, Controller and Assistant Treasurer (since 2021). | Vice President, Fund Services (since 2017), Virtus Investment Partners, Inc. and/or certain of its subsidiaries; and various officer positions (since 2018) of various registered funds advised by subsidiaries of Virtus Investment Partners, Inc. |
Martin, David
YOB: 1959 | Anti-Money Laundering Compliance Officer (since 2021). | Vice President, Compliance – Broker/Dealer (since 2009), Virtus Investment Partners, Inc.; and Vice President and Chief Compliance Officer of certain Virtus subsidiaries (since 2004). |
Rahman, Mahmood
YOB: 1967 | Assistant Vice President (since 2021). | Vice President (since 2023), Tax Director (since 2020) and Assistant Vice President (2020 to 2023), Fund Administration, Virtus Investment Partners, Inc.; Assistant Vice President (since 2021) of various registered funds advised by subsidiaries of Virtus Investment Partners, Inc.; and Assistant Treasurer and Tax Director, Grantham, Mayo, Van Otterloo & Co. LLC (2007 to 2019). |
Short, Julia R.
YOB: 1972 | Senior Vice President (since 2021). | Senior Vice President, Product Development (since 2017), Virtus Investment Partners, Inc. and/or certain of its subsidiaries; Senior Vice President (since 2017) of various registered funds advised by subsidiaries of Virtus Investment Partners, Inc.; and Managing Director, Product Manager, RidgeWorth Investments (2004 to 2017). |
Smirl, Richard W.
YOB: 1967 | Executive Vice President (since 2021). | Chief Operating Officer (since 2021), Virtus Investment Partners, Inc.; Executive Vice President (since 2021), Virtus Investment Partners, Inc. and/or certain of its subsidiaries; Executive Vice President (since 2021) of various registered funds advised by subsidiaries of Virtus Investment Partners, Inc.; Chief Operating Officer (2018 to 2021), Russell Investments; Executive Director (Jan. to July 2018), State of Wisconsin Investment Board; and Partner and Chief Operating Officer (2004 to 2018), William Blair Investment Management. |
Suss, Amanda
YOB: 1969 | Vice President, Controller and Assistant Treasurer (since 2022). | Vice President and Controller (since 2022), Mutual Fund Administration and Financial Reporting, Virtus Investment Partners, Inc.; Vice President, Controller and Assistant Treasurer (since 2022) of various registered funds advised by subsidiaries of Virtus Investment Partners, Inc.; and Senior Finance Associate (2011 to 2022), Stone Harbor Investment Partners LP. |
VIRTUS INVESTMENT TRUST
101 Munson Street
Greenfield, MA 01301-9668
Trustees
Philip R. McLoughlin, Chairman
George R. Aylward
Donald C. Burke
Deborah A. DeCotis
F. Ford Drummond
Sidney E. Harris
John R. Mallin
Connie D. McDaniel
Geraldine M. McNamara
R. Keith Walton
Brian T. Zino
Officers
George R. Aylward, President
Peter Batchelar, Senior Vice President
W. Patrick Bradley, Executive Vice President, Chief Financial Officer and Treasurer
Timothy Branigan, Vice President and Fund Chief Compliance Officer
Jennifer Fromm, Vice President, Chief Legal Officer, Counsel and Secretary
Julia R. Short, Senior Vice President
Richard W. Smirl, Executive Vice President
Investment Adviser
Virtus Investment Advisers, Inc.
One Financial Plaza
Hartford, CT 06103-2608
Principal Underwriter
VP Distributors, LLC
One Financial Plaza
Hartford, CT 06103-2608
Administrator and Transfer Agent
Virtus Fund Services, LLC
One Financial Plaza
Hartford, CT 06103-2608
Custodian
The Bank of New York Mellon
240 Greenwich Street
New York, NY 10286-1048
Independent Registered Public
Accounting Firm
PricewaterhouseCoopers LLP
2001 Market Street
Philadelphia, PA 19103-7042
How to Contact Us
| Mutual Fund Services | 1-800-243-1574 |
| Adviser Consulting Group | 1-800-243-4361 |
Important Notice to Shareholders
The Securities and Exchange Commission has modified mailing regulations for semiannual and annual shareholder fund reports to allow mutual fund companies to send a single copy of these reports to shareholders who share the same mailing address. If you would like additional copies, please call Mutual Fund Services at 1-800-243-1574.
P.O. Box 534470
Pittsburgh, PA 15253-4470
For more information about Virtus Funds,
please contact us at 1-800-243-1574, or visit Virtus.com.
Item 2. Code of Ethics.
| | (a) | The registrant, as of the end of the period covered by this report, has adopted a code of ethics that applies to the registrant’s principal executive officer, principal financial officer, principal accounting officer or controller, or persons performing similar functions, regardless of whether these individuals are employed by the registrant or a third party. |
| | (c) | Other than certain non-substantive changes, there have been no amendments during the period covered by this report, to a provision of the code of ethics that applies to the registrant’s principal executive officer, principal financial officer, principal accounting officer or controller, or persons performing similar functions, regardless of whether these individuals are employed by the registrant or a third party, and that relates to any element of the code of ethics described in Item 2(b) of the instructions for completion of Form N-CSR. A copy of the currently applicable code is included as an exhibit. |
| | (d) | The registrant has not granted any waivers, during the period covered by this report, including an implicit waiver, from a provision of the code of ethics that applies to the registrant’s principal executive officer, principal financial officer, principal accounting officer or controller, or persons performing similar functions, regardless of whether these individuals are employed by the registrant or a third party, that relates to one or more of the items set forth in paragraph (b) of the instructions for completion of this Item. |
Item 3. Audit Committee Financial Expert.
| (a)(1) | The Registrant’s Board of Trustees has determined that the Registrant has an “audit committee financial expert” serving on its Audit Committee. |
| (a)(2) | The Registrant’s Board of Trustees has determined that each of Donald C. Burke, Connie D. McDaniel and Brian T. Zino possesses the technical attributes identified in Instruction 2(b) of Item 3 to Form N-CSR to qualify as an “audit committee financial expert.” Each such individual is an “independent” trustee pursuant to paragraph (a)(2) of Item 3 to Form N-CSR. |
Item 4. Principal Accountant Fees and Services.
Audit Fees
| | (a) | The aggregate fees billed for each of the last two fiscal years for professional services rendered by the principal accountant for the audit of the registrant’s annual financial statements or services that are normally provided by the accountant in connection with statutory and regulatory filings or engagements for those fiscal years are $335,882 for 2023 and $327,690 for 2022. |
Audit-Related Fees
| | (b) | The aggregate fees billed in each of the last two fiscal years for assurance and related services by the principal accountant that are reasonably related to the performance of the audit of the registrant’s financial statements and are not reported under paragraph (a) of this Item are $31,085 for 2023 and $37,836 for 2022. |
Tax Fees
| | (c) | The aggregate fees billed in each of the last two fiscal years for professional services rendered by the principal accountant for tax compliance, tax advice, and tax planning are $43,164 for 2023 and $81,605 for 2022. |
“Tax Fees” are those primarily associated with review of the Trust’s tax provision and qualification as a regulated investment company (RIC) in connection with audits of the Trust’s financial statement, review of year-end distributions by the Fund to avoid excise tax for the Trust, periodic discussion with management on tax issues affecting the Trust, and reviewing and signing the Fund’s federal income tax returns.
All Other Fees
| | (d) | The aggregate fees billed in each of the last two fiscal years for products and services provided by the principal accountant, other than the services reported in paragraphs (a) through (c) of this Item are $263,461 for 2023 and $0 for 2022. |
2023 fees are related to tax reclaim services.
| | (e)(1) | Disclose the audit committee’s pre-approval policies and procedures described in paragraph (c)(7) of Rule 2-01 of Regulation S-X. |
The Board of Trustees of Virtus Investment Trust (the “Fund”) has adopted policies and procedures with regard to the pre-approval of services provided by its independent auditors. Audit, audit-related and tax compliance services provided to the Fund on an annual basis require specific pre-approval by the Audit Committee. The Audit Committee must also approve other non-audit services provided to the Fund and those non-audit services provided to the Fund’s Affiliated Service Providers that relate directly to the operations and financial reporting of the Fund. Certain of these non-audit services that the Audit Committee believes are a) consistent with the SEC’s auditor independence rules and b) routine and recurring services that will not impair the independence of the independent auditors may be approved by the Audit Committee without consideration on a specific case-by-case basis (“general pre-approval”).
The Audit Committee has determined that the Chair of the Audit Committee may provide pre-approval for such services that meet the above requirements in the event such approval is sought between regularly scheduled meetings. In any event, the Audit Committee is informed of each service approved subject to general pre-approval at the next regularly scheduled in-person Audit Committee meeting.
| | (e)(2) | The percentage of services described in each of paragraphs (b) through (d) of this Item that were approved by the audit committee pursuant to paragraph (c)(7)(i)(C) of Rule 2-01 of Regulation S-X are as follows: |
(b) 0%
(c) 0%
(d) N/A
| | (f) | The percentage of hours expended on the principal accountant’s engagement to audit the registrant’s financial statements for the most recent fiscal year that were attributed to work performed by persons other than the principal accountant’s full-time, permanent employees was less than fifty percent. |
| | (g) | The aggregate non-audit fees billed by the registrant’s accountant for services rendered to the registrant, and rendered to the registrant’s investment adviser (not including any sub-adviser whose role is primarily portfolio management and is subcontracted with or overseen by another investment adviser), and any entity controlling, controlled by, or under common control with the adviser that provides ongoing services to the registrant for each of the last two fiscal years of the registrant was $337,710 for 2023 and $81,605 for 2022. |
| | (h) | The registrant’s audit committee of the board of directors has considered whether the provision of non-audit services that were rendered to the registrant’s investment adviser (not including any sub-adviser whose role is primarily portfolio management and is subcontracted with or overseen by another investment adviser), and any entity controlling, controlled by, or under common control with the investment adviser that provides ongoing services to the registrant that were not pre-approved pursuant to paragraph (c)(7)(ii) of Rule 2-01 of Regulation S-X is compatible with maintaining the principal accountant’s independence. |
Item 5. Audit Committee of Listed Registrants.
Disclosure not required for open-end management investment companies.
Item 6. Investments.
| | (a) | Schedule of Investments in securities of unaffiliated issuers as of the close of the reporting period is included as part of the report to shareholders filed under Item 1(a) of this form. |
Item 7. Disclosure of Proxy Voting Policies and Procedures for Closed-End Management Investment Companies.
Disclosure not required for open-end management investment companies.
Item 8. Portfolio Managers of Closed-End Management Investment Companies.
Disclosure not required for open-end management investment companies.
Item 9. Purchases of Equity Securities by Closed-End Management Investment Company and Affiliated Purchasers.
Disclosure not required for open-end management investment companies.
Item 10. Submission of Matters to a Vote of Security Holders.
There have been no material changes to the procedures by which the shareholders may recommend nominees to the registrant’s board of trustees, where those changes were implemented after the registrant last provided disclosure in response to the requirements of Item 407(c)(2)(iv) of Regulation S-K (17 CFR 229.407) (as required by Item 22(b)(15) of Schedule 14A (17 CFR 240.14a-101)), or this Item.
Item 11. Controls and Procedures.
| | (a) | The registrant’s principal executive officer and principal financial officer have concluded that the registrant’s disclosure controls and procedures (as defined in Rule 30a-3(c) under the Investment Company Act of 1940 (the “1940 Act”)) are effective, based on an evaluation of those controls and procedures made as of a date within 90 days of the filing date of this report as required by Rule 30a-3(b) under the 1940 Act and Rule 13a-15(b) under the Exchange Act. |
| | (b) | There has been no change in the registrant’s internal control over financial reporting (as defined in Rule 30a-3(d) under the 1940 Act) that occurred during the period covered by this report that has materially affected, or is reasonably likely to materially affect, the registrant’s internal control over financial reporting. |
Item 12. Disclosure of Securities Lending Activities for Closed-End Management Investment Companies.
Disclosure not required for open-end management investment companies.
Item 13. Exhibits.
SIGNATURES
Pursuant to the requirements of the Securities Exchange Act of 1934 and the Investment Company Act of 1940, the registrant has duly caused this report to be signed on its behalf by the undersigned, thereunto duly authorized.
(Registrant) Virtus Investment Trust
| | | | |
| By (Signature and Title)* | | /s/ George R. Aylward | | |
| | George R. Aylward, President and Chief Executive Officer
(principal executive officer) | | |
Date 8/31/2023
Pursuant to the requirements of the Securities Exchange Act of 1934 and the Investment Company Act of 1940, this report has been signed below by the following persons on behalf of the registrant and in the capacities and on the dates indicated.
| | | | |
| By (Signature and Title)* | | /s/ George R. Aylward | | |
| | George R. Aylward, President and Chief Executive Officer
(principal executive officer) | | |
Date 8/31/2023
| | | | |
| By (Signature and Title)* | | /s/ W. Patrick Bradley | | |
| | W. Patrick Bradley, Executive Vice President, | | |
| | Chief Financial Officer, and Treasurer | | |
| | (principal financial officer) | | |
Date 8/31/2023
| * | Print the name and title of each signing officer under his or her signature. |