Note 1. Organization
Virtus Investment Trust (the “Trust”) is organized as a Massachusetts business trust and is registered under the Investment Company Act of 1940, as amended (the “1940 Act”), as an open-end management investment company.
As of the date of this report, the Trust is comprised of 13 funds (each a “Fund” or collectively, the “Funds”), each reported in this annual report. Each Fund’s investment objective is outlined in its respective Fund Summary page. There is no guarantee that a Fund will achieve its objective(s).
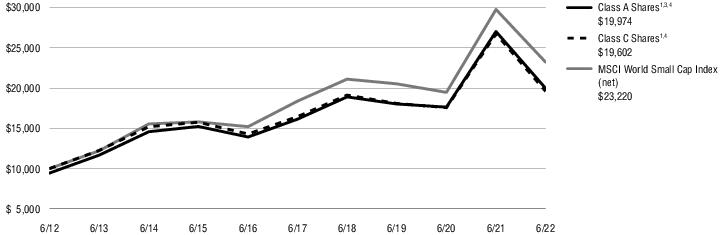
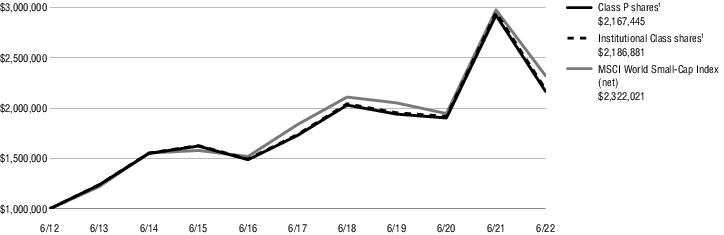
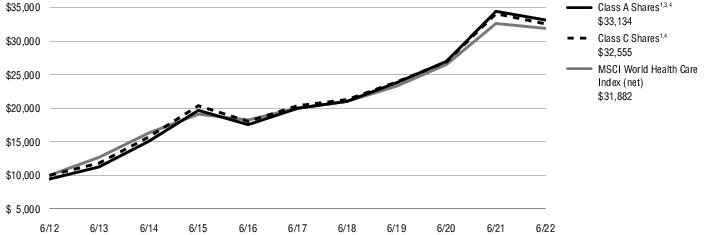
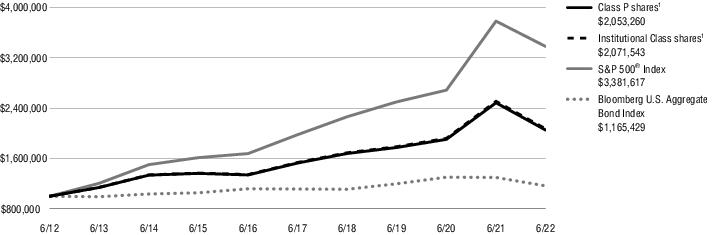
The Focused Growth Fund, NFJ Dividend Value Fund, NFJ International Value Fund, NFJ Large-Cap Value Fund, NFJ Mid-Cap Value Fund, and NFJ Small-Cap Value Fund offer Class A shares, Class C shares, Class P shares, Institutional Class shares, Class R6 shares, and Administrative Class shares. The Emerging Markets Opportunities Fund and Small-Cap Fund offer Class A shares, Class C shares, Class P shares, Institutional Class shares, and Class R6 shares. The Mid-Cap Growth Fund and Technology Fund offer Class A shares, Class C shares, Class P shares, Institutional Class shares and Administrative Class shares. The Global Small-Cap Fund, Health Sciences Fund, and Income & Growth Fund offer Class A shares, Class C shares, Class P shares, and Institutional Class shares.
Class A shares of the Funds are sold with a front-end sales charge of up to 5.50% with some exceptions. Generally, Class A shares are not subject to any charges by the Funds when redeemed; however, a 0.50% – 1% contingent deferred sales charge (“CDSC”) may be imposed on certain redemptions made within a certain period following purchases on which a finder’s fee has been paid. The period for which such CDSC applies for the Funds is 18 months. The CDSC period begins on the last day of the month preceding the month in which the purchase was made.
On May 21, 2021, all Class R shares for the Focused Growth Fund, Income & Growth Fund, Mid-Cap Growth Fund, NFJ Dividend Value Fund, NFJ International Value Fund, NFJ Large-Cap Value Fund, NFJ Mid-Cap Value Fund, and NFJ Small-Cap Value Fund were converted into Class A shares of the respective Fund.
Class C shares are generally sold with a 1% CDSC, applicable if redeemed within one year of purchase. Class C shares and any reinvested dividends and other distributions paid on such shares, will be automatically converted to Class A shares of the same Fund following a required holding period, which as of March 1, 2021, was eight years. Effective February 26, 2021, if an investor intends to purchase greater than $999,999 of Class C shares, and the purchase would qualify for Class A shares with no load, then the purchase will automatically be made into a purchase of Class A shares, thus reducing expenses. Class P shares, Institutional Class shares, Class R6 shares, and Administrative Class shares are sold without a front-end sales charge or CDSC.
Class P shares are offered primarily through certain asset allocation, wrap fee and other similar programs offered by broker-dealers and other intermediaries (“service agents”) that have established a shareholder servicing relationship with the Trust on behalf of their customers. Such programs established with broker-dealers or financial intermediaries may purchase shares only if the program for which the shares are being acquired will maintain an omnibus or pooled account for each fund. Class P shares may also be offered for direct investment by other investors such as pension and profit sharing plans, employee benefit trusts and plan alliances, endowments, foundations and corporations.
Institutional Class shares are offered primarily to clients of financial intermediaries that (i) charge such clients an ongoing fee for advisory, investment, consulting, or similar services; or (ii) have entered into an agreement with the Funds’ distributor or transfer agent to offer Institutional Class shares through a no-load network or platform. Such clients may include pension and profit sharing plans, other employee benefit trusts, endowments, foundations and corporations. Institutional Class shares are also offered to private and institutional clients of, or referred by, the adviser, a subadviser or their affiliates, and to Trustees of the Funds and trustees/directors of affiliated open- and closed-end funds, and directors, officers and employees of Virtus and its affiliates. If you are eligible to purchase and do purchase Institutional Class shares, you will pay no sales charge at any time. There are no distribution and service fees applicable to Institutional Class shares.
Class R6 shares are offered without a minimum initial investment to the following investors in plan level or omnibus accounts only (provided that they do not require or receive any compensation, administrative payments, sub-transfer agency payments or service payments with respect to Class R6 shares): (i) qualified retirement plans, including, but not limited to, 401(k) plans, 457 plans, employer-sponsored 403(b) plans, and defined benefit plans; (ii) banks and trust companies; (iii) insurance companies; (iv) financial intermediaries utilizing such shares in fee-based investment advisory programs; (v) registered investment companies; and (vi) non-qualified deferred compensation plans. Other institutional investors may be permitted to purchase Class R6 shares subject to the applicable Fund’s determination of eligibility and may be subject to a $2,500,000 minimum initial investment requirement. In addition, without a minimum initial investment requirement, Class R6 shares are available to any Trustee of the Virtus Funds and trustees/directors of affiliated open- and closed-end funds, directors, officers and employees of Virtus and its affiliates, and a spouse or domestic partner, child or minor grandchild of any such qualifying individual (in each case either individually or jointly with other investors), provided in each case that those shares are held directly with the Transfer Agent or in an eligible account. Class R6 shares do not carry sales commissions or pay Rule 12b-1 fees. No compensation, administrative payments, sub-transfer agency payments or service payments are paid to brokers or other entities from Fund assets or the Funds’ distributor’s or an affiliate’s resources on sales of or investments in Class R6 shares.
Administrative Class shares are offered primarily through employee benefit plan alliances, broker-dealers, and other intermediaries, and each Fund pays service or distribution fees to such entities for services they provide to Administrative Class shareholders.
The Funds may impose an annual fee on accounts having balances of less than $2,500. The small account fee may be waived in certain circumstances, as disclosed in the prospectuses and/or statement of additional information. The fees collected will be used to offset certain expenses of the Funds. These fees are reflected as “Less low balance account fees” in each Fund’s Statement of Operations for the period, as applicable.
Each class of shares has identical voting, dividend, liquidation and other rights and the same terms and conditions, except that each class bears any expenses attributable specifically to that class (“class-specific expenses”) and has exclusive voting rights with respect to any Rule 12b-1 and/or shareholder service plan (“12b-1 Plan”) approved by the Board. Class P shares, Institutional Class shares, Class R6 shares, and Administrative Class