UNITED STATES
SECURITIES AND EXCHANGE COMMISSION
Washington, D.C. 20549
FORM N-CSR
CERTIFIED SHAREHOLDER REPORT OF REGISTERED
MANAGEMENT INVESTMENT COMPANIES
Investment Company Act file number: 811-06260
Quaker Investment Trust
(Exact name of registrant as specified in charter)
| | |
309 Technology Drive
Malvern, PA 19355 |
| (Address of principle executive offices) | | (Zip Code) |
Jeffry H. King, Sr.
Quaker Investment Trust
309 Technology Drive
Malvern, PA 19355
(Name and address of agent for service)
| | |
Registrant’s telephone number, including area code: | | (800) 220-8888 |
| |
Date of fiscal year end: | | June 30, 2012 |
| |
Date of reporting period: | | June 30, 2012 |
Form N-CSR is to be used by management investment companies to file reports with the Commission not later than 10 days after the transmission to stockholders of any report that is required to be transmitted to stockholders under Rule 30e-1 under the Investment Company Act of 1940 (17 CFR 270.30e-1). The Commission may use the information provided on Form N-CSR in its regulatory, disclosure review, inspection, and policymaking roles.
A registrant is required to disclose the information specified by Form N-CSR, and the Commission will make this information public. A registrant is not required to respond to the collection of information contained in Form N-CSR unless the Form displays a currently valid Office of Management and Budget (“OMB”) control number. Please direct comments concerning the accuracy of the information collection burden estimate and any suggestions for reducing the burden to Secretary, Securities and Exchange Commission, 450 Fifth Street, NW, Washington, DC 20549-0609. The OMB has reviewed this collection of information under the clearance requirements of 44 U.S.C. § 3507.
Item 1. Report to Shareholders.
ANNUAL REPORT
2012
QUAKER EVENT ARBITRAGE FUND
QUAKER GLOBAL TACTICAL ALLOCATION FUND
QUAKER MID-CAP VALUE FUND
QUAKER SMALL-CAP GROWTH TACTICAL ALLOCATION FUND
QUAKER SMALL-CAP VALUE FUND
QUAKER STRATEGIC GROWTH FUND

MUTUAL FUND INVESTING INVOLVES RISK. PRINCIPAL LOSS IS POSSIBLE.
Investing in the Quaker Funds may involve special risk including, but not limited to, investments in smaller companies, non-diversification, short sales, foreign securities, special situations, debt securities and value growth investing. Please refer to the prospectus for more complete information.
This report must be preceded or accompanied by a current prospectus.
The opinions expressed are those of the adviser and sub-advisers through the end of the period for this report, are subject to change, are not a guarantee, and should not be considered investment advice.
Fund holdings are subject to change and should not be considered a recommendation to buy or sell any security. Current and future holdings are subject to risk.
Chairman’s Letter to the Shareholders
June 30, 2012
Dear Fellow Shareholder,
The premise on which Quaker Funds, Inc. was founded was the desire to afford everyday investors access to the same tactical allocation used by professional money managers to augment traditional investing strategies within a holistic asset allocation mix. Our commitment to this principle is still as strong today as it was the day we opened our doors.
Our management team continually strives to provide our shareholders with innovative investment alternatives and advisers that constantly seek superior returns. Thank you for your trust and investment in the Quaker Funds.
Sincerely,
Jeffry King
Chairman & CEO
Quaker Investment Trust
Performance Update
Quaker Event Arbitrage Fund (QEAAX, QEACX, QEAIX)
OBJECTIVES AND PRINCIPAL STRATEGIES
The Quaker Event Arbitrage Fund (“Fund”) seeks to provide long-term growth of capital. The Fund generally invests in the securities of publicly traded companies involved in mergers, takeovers, tender offers, leveraged buyouts, spin-offs, liquidations or similar events.
PERFORMANCE REVIEW AND MARKET OUTLOOK
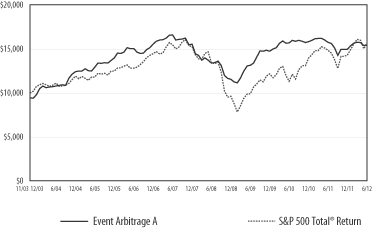
For the fiscal year ended June 30, 2012, the Fund returned -2.31%, whereas the total return of the S&P 500 Total Return Index (“S&P 500”) was 5.45%. While the equity market gyrated over the last year, the Fund’s daily volatility was roughly 59% lower than that of the S&P 500.
The past twelve months proved challenging for event-driven investing. This is evident, as the HFRI Event-Driven Total Index (“HFRI Index”) return was -3.92%. The HFRI Index is a good barometer for the asset class as it aggregates many hedge funds into one index that represents event-driven investing. Some causes for the negative returns that impacted the fund and the asset class in general could be traced to a pullback in corporate risk-taking, which had a negative impact on mergers and acquisition activity. The decrease in corporate risk-taking also negatively impacted activist/proxy fight investing as companies were not particularly interested in acquiring competing corporations.
Looking forward, the portfolio management team sees opportunities in merger arbitrage, mostly in event-driven mergers, which are bidding wars, hostile transactions, or other mergers that are deemed to have a higher level of uncertainty with significant upside potential. These opportunities have the potential to provide attractive rewards given the level of risk taken.
Also, the Fund’s distressed securities holdings, which lie mostly in distressed mortgage-backed securities, have delivered very strong cash flows relative to their low prices. The portfolio management team considers these risk/return profiles very appealing, and believe this profile will continue throughout the year. In contrast, few opportunities during the last year have presented themselves in distressed corporate bonds as corporate bankruptcies remain low.
Finally, we believe the outlook is very positive for proxy fight investing as activist investors are pushing underperforming companies to sell themselves. In addition, many potential acquirers have large amounts of cash available and continue to generate significant cash flows. Similarly, once companies are in play, competitive bidders can quickly enter the fray. All of this should bode well for the proxy fight sub-strategy.
I wish all investors a prosperous year and thank you for your continued support.
Sincerely,
Thomas Kirchner, Portfolio Manager
Quaker Funds, Inc.
|
| ADVISER: |
| Quaker Funds, Inc. |
| |
TOTAL NET ASSETS: AS OF JUNE 30, 2012 |
| $55,211,709 |
| | | | |
| Top Ten Holdings ** (% of net assets) | |
SurModics, Inc. | | | 2.40% | |
Progress Software Corp. | | | 2.32% | |
Lennar Corp. | | | 2.22% | |
Goodrich Corp. | | | 1.91% | |
Sycamore Networks, Inc. | | | 1.89% | |
Novell, Inc. | | | 1.77% | |
Seachange International, Inc. | | | 1.71% | |
Monster Worldwide, Inc. | | | 1.65% | |
Countrywide Home Equity Loan Trust | | | 1.64% | |
Tyco International Ltd. | | | 1.63% | |
% Fund Total | | | 19.14% | |
| ** | Excludes Short-Term Investments |

|
* The benchmark since inception returns are calculated for the period November 21, 2003 through June 30, 2012. |
Quaker Event Arbitrage Fund
Growth of a Hypothetical $10,000 Investment
June 30, 2012
| | | | | | | | | | | | | | | | | | | | | | | | | | | | | | | | | | | | |
| Average Annualized Total Return | |
| | | Expense
Ratio | | | Inception
Date | | | One Year | | | Five Year | | | Ten Year | | Commencement
of operations
through 6/30/2012 | |
| | | | | | | | | with
sales
charge | | | without
sales
charge | | | with
sales
charge | | | without
sales
charge | | | with
sales
charge | | without
sales
charge | | with
sales
charge | | | without
sales
charge | |
Class A | | | 1.99% | | | | 11/21/2003 | | | | -7.68% | | | | -2.31% | | | | -2.59% | | | | -1.48% | | | N/A | | N/A | | | 5.15% | | | | 5.84% | |
Class C | | | 2.74% | | | | 6/7/2010 | | | | -3.13% | | | | -3.13% | | | | N/A | | | | N/A | | | N/A | | N/A | | | -0.88% | | | | -0.88% | |
Institutional Class | | | 1.74% | | | | 6/7/2010 | | | | -2.14% | | | | -2.14% | | | | N/A | | | | N/A | | | N/A | | N/A | | | 0.04% | | | | 0.04% | |
S&P 500 Total Return Index* | | | | 5.45% | | | | 5.45% | | | | 0.22% | | | | 0.22% | | | N/A | | N/A | | | 5.36% | | | | 5.36% | |
Performance data quoted represents past performance and is no guarantee of future results. Investment return and principal value will fluctuate so that shares, when redeemed, may be worth more or less than their original cost. Current performance may be lower or higher than performance data quoted. Performance data current to the most recent month end is available at www.quakerfunds.com or by calling us toll free at 800-220-8888. Total return includes reinvestment of dividends and capital gains.
Class A shares of the Fund have a maximum sales charge of 5.50%.
The line graph and performance table do not reflect the deduction of taxes that a shareholder might pay on fund distributions or the redemption of fund shares. Total return calculations reflect expense reimbursements and fee waivers in the applicable periods. See financial highlights for periods where fees were waived or reimbursed.
The Fund’s portfolio holdings may differ significantly from the securities held in the index and, unlike a mutual fund, an unmanaged index assumes no transaction costs, taxes, management fees or other expenses. You cannot invest directly in an index.
The S&P 500 Total Return Index (“Index”) is a widely recognized, unmanaged index consisting of the approximately 500 largest companies in the United States as measured by market capitalization. The Index assumes reinvestment of all dividends and distributions.
Performance Update
Quaker Global Tactical Allocation Fund (QTRAX, QTRCX, QTRIX)
OBJECTIVES AND PRINCIPAL STRATEGIES
The Quaker Global Tactical Allocation Fund (“Fund”) seeks to provide long-term growth of capital. The Fund invests in common stocks of U.S. companies and American Depository Receipts (“ADRs”) of foreign companies without regard to market capitalization. Under normal circumstances, the Fund will invest at least 40% of its total assets in common stocks and ADRs of foreign companies.
PERFORMANCE REVIEW AND MARKET OUTLOOK
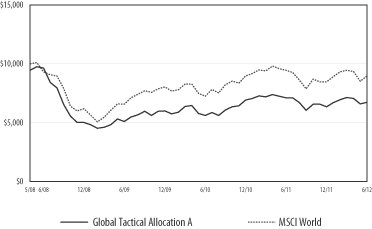
For the fiscal year ended June 30, 2012, the MSCI World Index (“MSCI World”) fell -4.98% while the Fund finished the fiscal year with a loss of -5.19%. For the first half of the 2012 calendar year, the MSCI World rose 5.91% while the Fund gained 6.11%.
During the fiscal year, the valuation of the majority of stock markets in emerging countries fell to decade lows. This largely reflected the economic slowdown in the emerging world and was also due to the onset of the recession in the Eurozone which is a large export market for those emerging economies. Another related factor was the negative flow of capital from countries like India and Brazil as hedge funds pulled back overseas investments and permanent capital flows in the form of direct investments slowed, the latter mainly due to domestic economic policies that were seen as hostile to such capital.
In the developed world, the slowdown in the Eurozone accelerated as policy makers implemented austerity programs in the southern countries of the zone as a condition of obtaining financial help from the northern euro countries and the European Central Bank. Unfortunately, conditions were not conducive for a quick resolution of the problems that the countries in the Eurozone faced: high debt levels on the sovereign and private level, high and stubborn unemployment rates in countries like Greece and Spain and limited hope of any fiscal stimulus due to the aforementioned high debt levels. Most forecasts now call for negative economic growth in euro countries like Italy, Spain, Portugal and Greece for the next two years.
Shifting to a longer term horizon, demographics continue to favor the emerging countries over the developed world due to the former’s younger populations. For example, in Israel, the Philippines and South Africa, the prime spending age group of 35 to 54 years does not peak until 2050. For India, Columbia, Mexico, Peru and Malaysia, the peak for this group does not occur until 2043 to 2045. The next group is Egypt, Brazil and Turkey which do not peak until the period 2030-2035. In contrast, Japan peaked in 1990, the U.S. in 2001, and Germany peaked in 2006. From an investment perspective, this fact should continue to benefit global companies that provide goods and services to populations in the emerging countries that have this “demographic dividend.”
Sectors posted mixed results for the year with the tech and consumer staples sectors (both overweights in the portfolio) advancing the most and energy, materials (both relative overweights) and financials (an underweight) trailing most other sectors and ending in negative territory. During the last twelve months, the portfolio was helped by stock picks in the consumer staples and financial sectors and hurt by stock picks in energy and materials.
Looking ahead, we believe the likelihood of a global recession has greatly increased from the spring of this calendar year when it seemed that the growth trajectory of the world economies was accelerating. In such a slow growth or “start and stop” environment (in that growth cycles seem to be truncated to very short periods), the Fund will continue to emphasize large multinational companies with good balance sheets and cash flows that cater to the expanding middle class in the emerging countries and companies that have secular growth ahead of them due to shifting technology trends. At the same time, the Fund will continue to seek to take advantage of its mandate of protecting capital by tactically raising cash and using its short-selling capabilities.
Respectfully,
Manu P. Daftary, Portfolio Manager
DG Capital Management
|
| SUB-ADVISER: |
| DG Capital Management, Inc. |
| |
TOTAL NET ASSETS: AS OF JUNE 30, 2012 |
| $9,763,433 |
| | | | |
| Top Ten Holdings ** (% of net assets) | |
Apple, Inc. | | | 4.03% | |
Mastercard, Inc. | | | 3.04% | |
Mead Johnson Nutrition Co. | | | 2.89% | |
Anheuser-Busch InBev NV | | | 2.72% | |
ACE Ltd. | | | 2.59% | |
Verisk Analytics, Inc. | | | 2.55% | |
Coca-Cola Co. | | | 2.54% | |
Capital One Financial Corp. | | | 2.52% | |
Monsanto Co. | | | 2.38% | |
Visa, Inc. | | | 2.28% | |
% Fund Total | | | 27.54% | |
| ** | Excludes Short-Term Investments |

| | | | | | |
| Country Allocation (% of net assets) |
 | | | 95.31% | | | Common Stocks |
| | | 2.72% | | | Belgium |
| | | 3.59% | | | Bermuda |
| | | 1.77% | | | Canada |
| | | 2.22% | | | Denmark |
| | | 2.09% | | | France |
| | | 2.48% | | | Germany |
| | | 4.47% | | | Ireland |
| | | 1.98% | | | Mexico |
| | | 3.30% | | | Netherlands |
| | | 1.94% | | | Panama |
| | | 4.83% | | | Switzerland |
| | | 6.01% | | | United Kingdom |
| | | 57.91% | | | United States |
 | | | 3.97% | | | Short-Term Investments |
| | | 99.28% | | | Total Market Value of Investments |
 | | | 0.72% | | | Other Assets in Excess of Liabilities, Net |
| | | 100.00% | | | Total Net Assets |
|
* The benchmark since inception returns are calculated since commencement of May 1, 2008 through June 30, 2012. |
Quaker Global Tactical Allocation Fund
Growth of a Hypothetical $10,000 Investment
June 30, 2012
| | | | | | | | | | | | | | | | | | | | | | | | | | | | | | | | |
| Average Annualized Total Return | |
| | | Expense
Ratio | | | Inception
Date | | | One Year | | | Five Year | | Ten Year | | Commencement
of operations
through 6/30/2012 | |
| | | | | | | | | with
sales
charge | | | without
sales
charge | | | with
sales
charge | | without
sales
charge | | with
sales
charge | | without
sales
charge | | with
sales
charge | | | without
sales
charge | |
Class A | | | 2.39% | | | | 5/1/2008 | | | | -10.41% | | | | -5.19% | | | N/A | | N/A | | N/A | | N/A | | | -9.07% | | | | -7.83% | |
Class C | | | 3.14% | | | | 5/1/2008 | | | | -5.99% | | | | -5.99% | | | N/A | | N/A | | N/A | | N/A | | | -8.52% | | | | -8.52% | |
Institutional Class | | | 2.14% | | | | 7/23/2008 | | | | -5.03% | | | | -5.03% | | | N/A | | N/A | | N/A | | N/A | | | -5.15% | | | | -5.15% | |
MSCI World Index* | | | | -4.98% | | | | -4.98% | | | N/A | | N/A | | N/A | | N/A | | | -2.60% | | | | -2.60% | |
Performance data quoted represents past performance and is no guarantee of future results. Investment return and principal value will fluctuate so that shares, when redeemed, may be worth more or less than their original cost. Current performance may be lower or higher than performance data quoted. Performance data current to the most recent month end is available at www.quakerfunds.com or by calling us toll free at 800-220-8888. Total return includes reinvestment of dividends and capital gains.
Class A shares of the Fund have a maximum sales charge of 5.50%.
The line graph and performance table do not reflect the deduction of taxes that a shareholder might pay on fund distributions or the redemption of fund shares. Total return calculations reflect expense reimbursements and fee waivers in the applicable periods. See financial highlights for periods where fees were waived or reimbursed.
The Fund’s portfolio holdings may differ significantly from the securities held in the index and, unlike a mutual fund, an unmanaged index assumes no transaction costs, taxes, management fees or other expenses. You cannot invest directly in an index.
The Morgan Stanley Capital International World Index (“MSCI World Index”) measures developed-market equity performance throughout the world. The MSCI World Index assumes reinvestment of all dividends and distributions.
Performance Update
Quaker Mid-Cap Value Fund (QMCVX, QMCCX, QMVIX)
OBJECTIVES AND PRINCIPAL STRATEGIES
The Quaker Mid-Cap Value Fund (“Fund”) seeks to provide long-term growth of capital. Current income is not a significant investment consideration and any such income realized will be considered incidental to the Fund’s investment objective. The Fund invests primarily in common stocks comparable to the companies included in the Russell Midcap Value Index (“Russell Index”).
PERFORMANCE REVIEW AND MARKET OUTLOOK
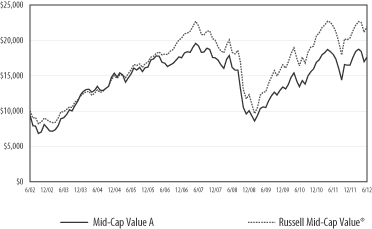
For the period from July 1, 2011 through June 30, 2012, the Fund generated a modest gain of 0.10% (gross of fees) and -1.87% (net of fees) versus a loss of -0.37% for the Russell Index. Despite both the Fund and the benchmark being essentially unchanged, there was significant variability in performance by sector. Energy and Industrials posted the largest declines in both the Fund and the Russell Index while utilities and consumer staples posted positive returns. The Fund’s relative performance was driven entirely by positive stock selection, particularly in materials and technology.
The financial crisis in Europe has likely put the Eurozone economy in recession, and the fear of this contagion spreading to the U.S. economy was clearly evidenced by the out performance of the defensive Utility and Consumer staples sectors over the last twelve months. Despite increasing levels of macroeconomic uncertainty, we believe we are still seeing attractive investment opportunities, as measured by the number of companies generating strong returns on capital invested at reasonable valuations. We believe these companies will create long-term value for shareholders.
Sincerely,
Frank Latuda, Jr. CFA
Chief Investment Officer & Portfolio Manager
Kennedy Capital Management, Inc.
|
| SUB-ADVISER: |
| Kennedy Capital Management, Inc. |
| |
TOTAL NET ASSETS: AS OF JUNE 30, 2012 |
| $8,415,236 |
| | | | |
| Top Ten Holdings ** (% of net assets) | |
Gildan Activewear, Inc. | | | 2.94% | |
Torchmark Corp. | | | 2.75% | |
Huntington Bancshares, Inc. | | | 2.61% | |
Hormel Foods Corp. | | | 2.56% | |
Ameriprise Financial, Inc. | | | 2.50% | |
Ultra Petroleum Corp. | | | 2.48% | |
AGCO Corp. | | | 2.45% | |
Zimmer Holdings, Inc. | | | 2.41% | |
Regal-Beloit Corp. | | | 2.34% | |
Harman International Industries, Inc. | | | 2.26% | |
% Fund Total | | | 25.30% | |
| ** | Excludes Short-Term Investments |

| | | | | | |
| Sectors (% of net assets) |
| | | 93.63% | | | Common Stocks |
| | | 6.14% | | | Basic Materials |
| | | 10.78% | | | Consumer Cyclical |
| | | 3.90% | | | Consumer Non-cyclical |
| | | 9.14% | | | Energy |
| | | 22.46% | | | Financial |
| | | 8.34% | | | Healthcare |
| | | 10.61% | | | Industrial |
| | | 9.11% | | | Technology |
| | | 13.15% | | | Utilities |
| | | 4.74% | | | Real Estate Investment Trusts |
| | | 4.06% | | | Short-Term Investments |
| | | 102.43% | | | Total Market Value of Investments |
 | | | (2.43)% | | | Liabilities in Excess of Other Assets, Net |
| | | 100.00% | | | Total Net Assets |
|
* The benchmark since inception returns are calculated since commencement of December 31,1997 through June 30, 2012. |
Quaker Mid-Cap Value Fund
Growth of a Hypothetical $10,000 Investment
June 30, 2012
| | | | | | | | | | | | | | | | | | | | | | | | | | | | | | | | | | | | | | | | |
| Average Annualized Total Return | |
| | | Expense
Ratio | | | Inception
Date | | | One Year | | | Five Year | | | Ten Year | | | Commencement
of operations
through 6/30/2012 | |
| | | | | | | | | with
sales
charge | | | without
sales
charge | | | with
sales
charge | | | without
sales
charge | | | with
sales
charge | | | without
sales
charge | | | with
sales
charge | | | without
sales
charge | |
Class A | | | 2.13% | | | | 12/31/1997 | | | | -7.27% | | | | -1.87% | | | | - 2.82% | | | | -1.71% | | | | 5.84% | | | | 6.44% | | | | 5.59% | | | | 6.01% | |
Class C | | | 2.88% | | | | 7/31/2000 | | | | -2.56% | | | | -2.56% | | | | - 2.43% | | | | -2.43% | | | | 5.65% | | | | 5.65% | | | | 6.26% | | | | 6.26% | |
Institutional Class | | | 1.88% | | | | 11/21/2000 | | | | -1.62% | | | | -1.62% | | | | - 1.46% | | | | -1.46% | | | | 6.72% | | | | 6.72% | | | | 7.54% | | | | 7.54% | |
Russell Mid-Cap Value Index* | | | | - 0.37% | | | | -0.37% | | | | -0.13% | | | | -0.13% | | | | 8.17% | | | | 8.17% | | | | 7.59% | | | | 7.59% | |
Performance data quoted represents past performance and is no guarantee of future results. Investment return and principal value will fluctuate so that shares, when redeemed, may be worth more or less than their original cost. Current performance may be lower or higher than performance data quoted. Performance data current to the most recent month end is available at www.quakerfunds.com or by calling us toll free at 800-220-8888. Total return includes reinvestment of dividends and capital gains.
Class A shares of the Fund have a maximum sales charge of 5.50%.
The line graph and performance table do not reflect the deduction of taxes that a shareholder might pay on fund distributions or the redemption of fund shares. Total return calculations reflect expense reimbursements and fee waivers in the applicable periods. See financial highlights for periods where fees were waived or reimbursed.
The Fund’s portfolio holdings may differ significantly from the securities held in the index and, unlike a mutual fund, an unmanaged index assumes no transaction costs, taxes, management fees or other expenses. You cannot invest directly in an index.
The Russell Midcap Value® Index is a widely recognized, unmanaged index of companies included in the Russell 1000 Index with current market capitalizations between $829 million and $12.2 billion. The Russell Midcap Value Index assumes reinvestment of all dividends.
Performance Update
Quaker Small-Cap Growth Tactical Allocation Fund (QGASX, QGCSX, QGISX)
OBJECTIVES AND PRINCIPAL STRATEGIES
The Quaker Small-Cap Growth Tactical Allocation Fund (“Fund”) seeks to provide long-term growth of capital. The Fund invests at least 80% of its total assets in common stocks, American Depository Receipts (“ADRs”) and foreign securities traded on U.S. stock exchanges with market capitalizations within the range of companies included in the Russell 2000® Growth Index (“Russell 2000 Index”).
PERFORMANCE REVIEW AND MARKET OUTLOOK
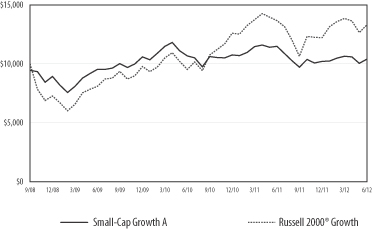
The fiscal year ended June 30, 2012 witnessed the same volatility that has been present in the micro cap/small cap marketplace since 2008. In fact, the fiscal year began with a decline in the Russell 2000 Index that nearly matched its decline in the fourth quarter of 2008. The Russell 2000 Index declined -28.10% from its peak in early July 2011 to its trough in October 2011; the Fund fell significantly less: -17.87%. This is consistent with the Fund’s effort to manage risk, significant drawdowns, and volatility.
During the fiscal year ended June 30, 2012, the Fund’s performance decreased -9.51% while the Russell 2000 Index decreased -2.71%.
The purpose of the Fund is to allow investors to participate in a perceived risky marketplace of micro cap and small cap growth stocks, while seeking to avoid the volatility (and significant losses) associated with them. Since inception, the Fund has had an absolute return strategy that involves a very disciplined buying strategy that defaults to cash when appropriate investments are not available. Additionally, to modulate the volatility and to avoid downside risk, the Fund will sell the Russell 2000 Index short against its equity holdings.
The general underperformance of the Fund can be described by two factors, namely the size of the market capitalization of companies in the Russell 2000 Index versus the Fund and the performance difference among the companies as measured by their respective market capitalization.
As was true in the calendar year for the Russell 2000 Index, this past fiscal year saw all positive gains in the Russell 2000 Index derive from the largest quintile (or 20%) of the companies in the Russell 2000 Index. Generally speaking, these are companies whose market capitalization exceeded $1.3 billion. Furthermore, companies of that size comprised nearly one-half of the market cap weight of the Russell 2000 Index. So, the largest weights had the only positive result, which amounted to nearly half of the Russell 2000 Index. By contrast, the smallest quintile (or smallest 20%) of stocks in the Russell 2000 Index declined by 51.13%. Fortunately for owners of the Russell 2000 Index, these comprised less than 4% of the weight of the Index. The Fund’s largest quintile of companies also had positive results but only represented 17.81% of its portfolio weighting. Alternatively, the Fund had roughly five times the amount of companies in the smallest quintile. Although these significantly outperformed the Russell 2000 Index stocks of the same cap size, they still declined, on average, by approximately 34.42%. The strategy of the Fund has historically been to always hold smaller companies because they provide the best long term returns. So, it is a combination of much higher market capitalization companies and the generally better performance of these larger companies that lead to the outperformance of the Russell 2000 Index as compared to the Fund.
We believe that this performance differential is an indication of the dramatic degree of risk aversion that continues to exist through the market and the economy.
The Fund will continue to seek positive returns and to avoid significant losses no matter the market environment. It will maintain its disciplined buying, selling, and shorting strategy to avoid significant declines like we witnessed from July 2011 through October 2011. As a result, the Fund will strive to exhibit a ‘margin of safety’ when compared to all active small cap growth managers.
Stephen Shipman, Portfolio Manager
Century Management, Inc.
|
| SUB-ADVISER: |
| Century Management, Inc. |
| |
TOTAL NET ASSETS: AS OF JUNE 30, 2012 |
$6,304,898 |
| | | | |
| Top Ten Holdings ** (% of net assets) | |
Direxion Daily Small Cap Bear 3X | | | | |
Shares | | | 4.30% | |
Comstock Mining, Inc. | | | 4.14% | |
Titan Machinery, Inc. | | | 3.85% | |
Blucora, Inc. | | | 3.44% | |
Multimedia Games Holding Co., Inc. | | | 3.31% | |
BancorpSouth, Inc. | | | 3.04% | |
Hanmi Financial Corp. | | | 2.83% | |
Wilshire Bancorp, Inc. | | | 2.78% | |
Ellie Mae, Inc. | | | 2.77% | |
Arctic Cat, Inc. | | | 2.73% | |
% Fund Total | | | 33.19% | |
| ** | Excludes Short-Term Investments |

| | | | | | |
| Sectors (% of net assets) |
| | | 66.89% | | | Domestic Common Stocks |
| | | 7.74% | | | Basic Materials |
| | | 8.54% | | | Communications |
| | | 14.68% | | | Consumer Cyclical |
| | | 5.51% | | | Energy |
| | | 17.60% | | | Financial |
| | | 5.86% | | | Healthcare |
| | | 6.96% | | | Industrial |
 | | | 14.34% | | | Foreign Common Stocks |
 | | | 4.30% | | | Exchange-Traded Fund |
| | | 31.06% | | | Short-Term Investments |
| | | 116.59% | | | Total Market Value of Investments |
| | | (16.59)% | | | Liabilities in Excess of Other Assets, Net |
| | | 100.00% | | | Total Net Assets |
|
* The benchmark since inception
returns are calculated since commencement of September 30, 2008 through June 30, 2012. |
Quaker Small-Cap Growth Tactical Allocation Fund
Growth of a Hypothetical $10,000 Investment
June 30, 2012
| | | | | | | | | | | | | | | | | | | | | | | | | | | | | | | | | | | | | | | | |
| Average Annualized Total Return | |
| | | Expense
Ratio | | | Inception
Date | | | One Year | | | Five Year | | | Ten Year | | | Commencement
of operations
through 6/30/2012 | |
| | | | | | | | | with
sales
charge | | | without
sales
charge | | | with
sales
charge | | | without
sales
charge | | | with
sales
charge | | | without
sales
charge | | | with
sales
charge | | | without
sales
charge | |
Class A | | | 2.03% | | | | 9/30/2008 | | | | -14.49% | | | | -9.51% | | | | N/A | | | | N/A | | | | N/A | | | | N/A | | | | 1.03% | | | | 2.57% | |
Class C | | | 2.78% | | | | 9/30/2008 | | | | -10.23% | | | | -10.23% | | | | N/A | | | | N/A | | | | N/A | | | | N/A | | | | 1.80% | | | | 1.80% | |
Institutional Class | | | 1.78% | | | | 9/30/2008 | | | | -9.33% | | | | -9.33% | | | | N/A | | | | N/A | | | | N/A | | | | N/A | | | | 2.83% | | | | 2.83% | |
Russell 2000 Growth Index* | | | | -2.71% | | | | -2.71% | | | | N/A | | | | N/A | | | | N/A | | | | N/A | | | | 7.91% | | | | 7.91% | |
Performance data quoted represents past performance and is no guarantee of future results. Investment return and principal value will fluctuate so that shares, when redeemed, may be worth more or less than their original cost. Current performance may be lower or higher than performance data quoted. Performance data current to the most recent month end is available at www.quakerfunds.com or by calling us toll free at 800-220-8888. Total return includes reinvestment of dividends and capital gains.
Class A shares of the Fund have a maximum sales charge of 5.50%.
The line graph and performance table do not reflect the deduction of taxes that a shareholder might pay on fund distributions or the redemption of fund shares. Total return calculations reflect expense reimbursements and fee waivers in the applicable periods. See financial highlights for periods where fees were waived or reimbursed.
The Fund’s portfolio holdings may differ significantly from the securities held in the index and, unlike a mutual fund, an unmanaged index assumes no transaction costs, taxes, management fees or other expenses. You cannot invest directly in an index.
The Russell 2000® Growth Index is an unmanaged index that measures the performance of the small-cap growth segment of the U.S. equity universe. It includes the Russell 2000 companies with higher price-to-value ratios and higher forecasted growth values. The Index assumes reinvestment of all dividends and distributions.
Performance Update
Quaker Small-Cap Value Fund (QUSVX, QSVCX, QSVIX)
OBJECTIVES AND PRINCIPAL STRATEGIES
The Quaker Small-Cap Value Fund (the “Fund”) seeks to provide long-term growth of capital. Current income is not a significant investment consideration, and any such income realized will be considered incidental to the Fund’s investment objective. The Fund invests primarily in common stocks of U.S. companies with market capitalizations similar to the market capitalizations of companies included in the Russell 2000® Index and Russell 2500® Index. The Fund invests in companies considered by the Fund’s sub-adviser to have consistent earnings and above-average core assets, selling at relatively low market valuations, with attractive growth and momentum characteristics.
PERFORMANCE REVIEW AND MARKET OUTLOOK
For the fiscal year ended June 30, 2012, the Fund’s performance was -4.11%, while the Fund’s benchmark, the Russell 2000® Index (a broad-based cross-section of the entire U.S. small-cap market) decreased by -2.08%. Working from the bottom up, we evaluate companies relative to their industry peers using three broad categories of attractiveness: value, management, and momentum. Value to us means fairly traditional ratios of price to fundamental value; management measures seek evidence that company management has produced and will continue to produce earnings power; and gauges of momentum help us determine when stocks might be expected to begin their ascent toward full valuation.
Our shortfall over the fiscal year was attributable to poor performance from our stock selection within the strategy’s three largest sectors: financial, technology, and healthcare. In financials, we can further zero-in on our holdings in the insurance and real estate industries as the culprits — they were heavily tilted toward positive momentum, a measure that was rewarded at the broad portfolio level but not in these two particular financial industries. Within the technology sector, our struggles in the semiconductor industry were mainly attributable to our deeper-than-benchmark value orientation. Although rewarding in its contribution to the bottom line over most of the last twelve months in healthcare stocks, that same value-orientation reversed for the quarter ended June 30, 2012.
We remain firm in our conviction that superior results can be achieved through a consistent, systematic approach that focuses on low-priced companies with proven management and earnings power.
The Portfolio Management Team
Aronson Johnson Ortiz
|
| SUB-ADVISER: |
| Aronson Johnson Ortiz, LP. |
| |
TOTAL NET ASSETS: AS OF JUNE 30, 2012 |
| $30,238,464 |
| | | | |
| Top Ten Holdings ** (% of net assets) | |
Community Health Systems, Inc. | | | 1.48% | |
Unisys Corp. | | | 1.39% | |
Tesoro Corp. | | | 1.35% | |
Montpelier Re Holdings Ltd. | | | 1.35% | |
CACI International, Inc. | | | 1.29% | |
Schweitzer-Mauduit International, Inc. | | | 1.28% | |
Huntington Bancshares, Inc. | | | 1.27% | |
AGCO Corp. | | | 1.27% | |
Interpublic Group of Cos, Inc. | | | 1.25% | |
Arctic Cat, Inc. | | | 1.22% | |
% Fund Total | | | 13.15% | |
| ** | Excludes Short-Term Investments |

| | | | | | |
| Sectors (% of net assets) |
| | | 94.62% | | | Common Stocks |
| | | 6.65% | | | Basic Materials |
| | | 7.52% | | | Communications |
| | | 15.42% | | | Consumer Cyclical |
| | | 9.46% | | | Consumer Non-cyclical |
| | | 6.23% | | | Energy |
| | | 15.32% | | | Financial |
| | | 12.59% | | | Healthcare |
| | | 9.04% | | | Industrial |
| | | 8.61% | | | Technology |
| | | 3.78% | | | Utilities |
| | | 5.13% | | | Real Estate Investment Trusts |
| | | 6.58% | | | Short-Term Investments |
| | | 106.33% | | | Total Market Value of Investments |
| | | (6.33)% | | | Liabilities in Excess of Other Assets, Net |
| | | 100.00% | | | Total Net Assets |
|
* The benchmark since inception
returns are calculated since commencement of
November 25, 1996 through June 30, 2012. |
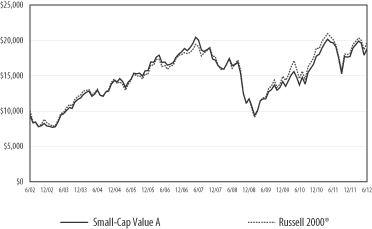
Quaker Small-Cap Value Fund
Growth of a Hypothetical $10,000 Investment
June 30, 2012
| | | | | | | | | | | | | | | | | | | | | | | | | | | | | | | | | | | | | | | | |
| Average Annualized Total Return | |
| | | Expense
Ratio | | | Inception
Date | | | One Year | | | Five Year | | | Ten Year | | | Commencement
of operations
through 6/30/2012 | |
| | | | | | | | | with
sales
charge | | | without
sales
charge | | | with
sales
charge | | | without
sales
charge | | | with
sales
charge | | | without
sales
charge | | | with
sales
charge | | | without
sales
charge | |
Class A | | | 1.98% | | | | 11/25/1996 | | | | -9.39% | | | | -4.11% | | | | - 2.36% | | | | -1.25% | | | | 6.52% | | | | 7.13% | | | | 8.73% | | | | 9.12% | |
Class C | | | 2.73% | | | | 7/28/2000 | | | | -4.80% | | | | -4.80% | | | | - 2.00% | | | | -2.00% | | | | 6.34% | | | | 6.34% | | | | 7.46% | | | | 7.46% | |
Institutional Class | | | 1.73% | | | | 9/12/2000 | | | | -3.79% | | | | -3.79% | | | | - 1.00% | | | | -1.00% | | | | 7.39% | | | | 7.39% | | | | 7.59% | | | | 7.59% | |
Russell 2000 Index* | | | | -2.08% | | | | -2.08% | | | | 0.54% | | | | 0.54% | | | | 7.00% | | | | 7.00% | | | | 6.77% | | | | 6.77% | |
Performance data quoted represents past performance and is no guarantee of future results. Investment return and principal value will fluctuate so that shares, when redeemed, may be worth more or less than their original cost. Current performance may be lower or higher than performance data quoted. Performance data current to the most recent month end is available at www.quakerfunds.com or by calling us toll free at 800-220-8888. Total return includes reinvestment of dividends and capital gains.
Class A shares of the Fund have a maximum sales charge of 5.50%.
The line graph and performance table do not reflect the deduction of taxes that a shareholder might pay on fund distributions or the redemption of fund shares. Total return calculations reflect expense reimbursements and fee waivers in the applicable periods. See financial highlights for periods where fees were waived or reimbursed.
The Fund’s portfolio holdings may differ significantly from the securities held in the index and, unlike a mutual fund, an unmanaged index assumes no transaction costs, taxes, management fees or other expenses. You cannot invest directly in an index.
The Russell 2000® Index is a widely recognized, unmanaged index comprised of the smallest 2000 companies represented in the Russell 3000® Index. The Russell 2000 Index currently represents approximately 8% of the market capitalization of the Russell 3000® Index.
Performance Update
Quaker Strategic Growth Fund (QUAGX, QAGCX, QAGIX)
OBJECTIVES AND PRINCIPAL STRATEGIES
The Quaker Strategic Growth Fund (the “Fund”) seeks to provide long-term growth of capital. Current income is not a significant investment consideration. The Fund invests primarily in equity securities of domestic U.S. companies which the Fund’s sub-adviser believes show a high probability for superior growth.
PERFORMANCE REVIEW AND MARKET OUTLOOK
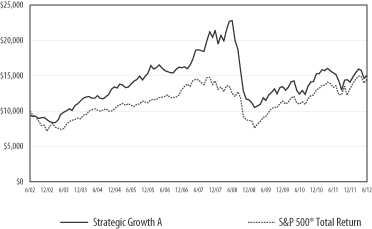
For the fiscal year ended June 30, 2012, the S&P 500 Total Return Index (the “S&P 500”) (a broad based market proxy) gained 5.45% while the Class A shares of the Fund finished the fiscal year with a total return of -2.42%. For the first half of calendar year 2012, the S&P 500 gained 9.49% while the Fund rose 6.68%.
Over the course of the last twelve months, macroeconomic and political machinations continued to dominate market movements as high correlations and volatility largely marginalized the influence of stock specific fundamentals. From a fundamental standpoint, valuations continued to be attractively low and did not seem to reflect the value and earnings growth that corporations have generated. This may have been due to investor skepticism over the sustainability of that earnings growth in light of the major risks facing the world economy including an EU recession and mediocre growth and rising taxes in the U.S. Taking a closer look at some of these influences, however brightens the picture somewhat. While 20.9% of domestic exports go to the EU, exports only make up 13.9% of the overall domestic economy — thus EU exports are only 2.8% of GDP and those exports will likely not go to zero. Also, the housing market, which typically averages about 5% of GDP (though it reached 7% in 2006), has now fallen to 2.5% of GDP. Thus continued weakness (which is expected through 2014) will have a smaller effect on domestic growth than in the past. The bright spot in domestic markets occurred in the first quarter of 2012, which saw a fall-off in volatility and sustained upward move in equity prices. In the current environment, no news is good news! However troubles in Europe shattered the placid façade pushing markets sharply lower in the most recent quarter. Many international markets continue to be attractive in spite of the high volatility and double digit losses that occurred in many of these markets in 2011. In the long run, demographics continue to favor the emerging markets over the developed markets due to their younger populations.
Sectors posted mixed results for the year with the telecom and utilities sectors (both underweights in the portfolio) advancing the most and energy, materials (both relative overweights) and financials (an underweight) trailing most other sectors. During the last twelve months the portfolio was helped by stock picks in the consumer staples and financial sectors and hurt by stock picks in energy healthcare and consumer discretionaries, as well as cash drag.
Although fundamentals still mattered to a degree, sector performance was largely driven by political events and macroeconomic factors. Case in point, in the first quarter of this year, signs of economic stability and political responsibility pushed cyclical sectors higher, while a breakdown in these factors punished the same sectors in the second quarter. Top-down perceptions (mainly political and international) largely drove market performance generating a difficult environment for any strategy to consistently navigate. Although monetary policy continues to be very accommodative, the market is expecting black swan events and will only appreciate in the absence of them; but it will also harshly punish equity prices when they occur.
Looking ahead, we believe the world economy will continue to be weak, even as corporate profitability continues to be strong. Thus, we believe corporate efficiency, rather than economic cyclically, will drive earnings results, which may enhance their sustainability and eventually provide an environment for multiple expansion. In order to capitalize on this we will continue to emphasize high quality companies with high levels of available cash, strong free cash flows and reasonable valuations. Currently, our favored areas to overweight include large multinational consumer staples and discretionary companies catering to the expanding middle class in emerging market countries, large-cap technology companies providing efficiency (and profit) enhancing IT products to their clients.
Respectfully,
Manu P. Daftary, Portfolio Manager
DG Capital Management
|
| SUB-ADVISER: |
| DG Capital Management, Inc. |
| |
TOTAL NET ASSETS: AS OF JUNE 30, 2012 |
| $179,167,411 |
| | | | |
| Top Ten Holdings ** (% of net assets) | |
Apple, Inc. | | | 4.01% | |
Mastercard, Inc. | | | 3.00% | |
Mead Johnson Nutrition Co. | | | 2.86% | |
Anheuser-Busch InBev NV | | | 2.70% | |
Verisk Analytics, Inc. | | | 2.53% | |
Coca-Cola Co. | | | 2.52% | |
ACE Ltd. | | | 2.52% | |
Capital One Financial Corp. | | | 2.46% | |
Monsanto Co. | | | 2.36% | |
Visa, Inc. | | | 2.27% | |
% Fund Total | | | 27.23% | |
| ** | Excludes Short-Term Investments |

| | | | | | |
| Sectors (% of net assets) |
| | | 69.88% | | | Domestic Common Stocks |
| | | 3.34% | | | Basic Materials |
| | | 7.65% | | | Communications |
| | | 10.57% | | | Consumer Cyclical |
| | | 15.97% | | | Consumer Non-cyclical |
| | | 3.60% | | | Energy |
| | | 6.05% | | | Financial |
| | | 9.86% | | | Healthcare |
| | | 4.02% | | | Industrial |
| | | 8.82% | | | Technology |
| | | 20.29% | | | Foreign Common Stocks |
| | | 6.42% | | | Short-Term Investments |
| | | 96.59% | | | Total Market Value of Investments |
| | | 3.41% | | | Other Assets in Excess of Liabilities, Net |
| | | 100.00% | | | Total Net Assets |
|
* The benchmark since inception returns are calculated since commencement of November 25, 1996 through June 30, 2012 |
Quaker Strategic Growth Fund
Growth of a Hypothetical $10,000 Investment
June 30, 2012
| | | | | | | | | | | | | | | | | | | | | | | | | | | | | | | | | | | | | | | | |
| Average Annualized Total Return | |
| | | Expense
Ratio | | | Inception
Date | | | One Year | | | Five Year | | | Ten Year | | | Commencement
of operations
through 6/30/2012 | |
| | | | | | | | | with
sales
charge | | | without
sales
charge | | | with
sales
charge | | | without
sales
charge | | | with
sales
charge | | | without
sales
charge | | | with
sales
charge | | | without
sales
charge | |
Class A | | | 2.21% | | | | 11/25/1996 | | | | -7.79% | | | | -2.42% | | | | -5.30% | | | | -4.23% | | | | 4.16% | | | | 4.75% | | | | 10.19% | | | | 10.59% | |
Class C | | | 2.96% | | | | 7/11/2000 | | | | -3.15% | | | | -3.15% | | | | -4.94% | | | | -4.94% | | | | 3.98% | | | | 3.98% | | | | 1.38% | | | | 1.38% | |
Institutional Class | | | 1.96% | | | | 7/20/2000 | | | | -2.17% | | | | -2.17% | | | | -3.95% | | | | -3.95% | | | | 5.01% | | | | 5.01% | | | | 2.27% | | | | 2.27% | |
S&P 500® Total Return Index* | | | | 5.45% | | | | 5.45% | | | | 0.22% | | | | 0.22% | | | | 5.33% | | | | 5.33% | | | | 5.71% | | | | 5.71% | |
Performance data quoted represents past performance and is no guarantee of future results. Investment return and principal value will fluctuate so that shares, when redeemed, may be worth more or less than their original cost. Current performance may be lower or higher than performance data quoted. Performance data current to the most recent month end is available at www.quakerfunds.com or by calling us toll free at 800-220-8888. Total return includes reinvestment of dividends and capital gains.
Class A shares of the Fund have a maximum sales charge of 5.50%.
The line graph and performance table do not reflect the deduction of taxes that a shareholder might pay on fund distributions or the redemption of fund shares. Total return calculations reflect expense reimbursements and fee waivers in the applicable periods. See financial highlights for periods where fees were waived or reimbursed.
The Fund’s portfolio holdings may differ significantly from the securities held in the index and, unlike a mutual fund, an unmanaged index assumes no transaction costs, taxes, management fees or other expenses. You cannot invest directly in an index.
The S&P 500 Total Return Index (“Index”) is a widely recognized, unmanaged index consisting of the approximately 500 largest companies in the United States as measured by market capitalization. The index assumes reinvestment of all dividends and distributions.
Expense Information
As a shareholder of the Fund, you incur two types of costs: (1) transaction costs, including applicable sales charges and redemption fees; and (2) ongoing costs, including management fees, distribution (12b-1) fees and other Fund expenses. This example is intended to help you understand your ongoing costs (in dollars) of investing in the Fund and to compare these costs with the ongoing costs of investing in other funds. The example is based on an investment of $1,000 invested at the beginning of the (six-month) period and held for the entire period January 1, 2012 through June 30, 2012.
ACTUAL EXPENSES
The first section of each table below provides information about actual account values and actual expenses for each of the Funds. You may use this information, together with the amount you invested, to estimate the expenses that you paid over the period. Simply divide your account value by $1,000 (for example, an $8,600 account value divided by $1,000 = 8.6), then multiply the result by the number in the applicable line under the heading entitled “Expenses Paid During the Period” to estimate the expenses you paid on your account during this period.
HYPOTHETICAL EXAMPLE FOR COMPARISON PURPOSES
The second section of each table below provides information about hypothetical account values and hypothetical expenses based on the Fund’s actual expense ratio and an assumed rate of return of 5% per year before expenses, which is not the Fund’s actual return. The hypothetical account values and expenses may not be used to estimate the actual ending account balance or expenses you paid for the period. You may use this information to compare the ongoing costs of investing in the Fund to other funds. To do so, compare this 5% hypothetical example with the 5% hypothetical examples that appear in the shareholder reports of the other funds. Please note that the expenses shown in the table are meant to highlight your ongoing costs only and do not reflect any transactional costs, such as sales charges (loads), redemption fees or exchange fees. Therefore, the second section of the table is useful in comparing ongoing costs only, and will not help you determine the relative total costs of owning different funds. In addition, if these transactional costs were included, your costs would have been higher.
| | | | | | | | | | | | | | | | | | | | |
| | | | | | Beginning Account
Value 01/01/12 | | | Annualized Expense
Ratio For the Period | | | Ending Account
Value 6/30/2012 | | | Expenses Paid
During Period* | |
| Event Arbitrage | |
| Actual return based on actual return of: | |
Class A | | | 2.93 | % | | $ | 1,000.00 | | | | 1.99 | % | | $ | 1,029.30 | | | $ | 10.04 | |
Class C | | | 2.43 | % | | | 1,000.00 | | | | 2.74 | % | | | 1,024.30 | | | | 13.79 | |
Institutional Class | | | 2.92 | % | | | 1,000.00 | | | | 1.74 | % | | | 1,029.20 | | | | 8.78 | |
| Hypothetical return based on assumed 5% return: | |
Class A | | | | | | | 1,000.00 | | | | 1.99 | % | | | 1,014.97 | | | | 9.97 | |
Class C | | | | | | | 1,000.00 | | | | 2.74 | % | | | 1,011.24 | | | | 13.70 | |
Institutional Class | | | | | | | 1,000.00 | | | | 1.74 | % | | | 1,016.21 | | | | 8.72 | |
| Global Tactical Allocation | |
| Actual return based on actual return of: | |
Class A | | | 6.11 | % | | | 1,000.00 | | | | 2.89 | % | | | 1,061.10 | | | | 14.81 | |
Class C | | | 5.67 | % | | | 1,000.00 | | | | 3.64 | % | | | 1,056.70 | | | | 18.61 | |
Institutional Class | | | 6.14 | % | | | 1,000.00 | | | | 2.63 | % | | | 1,061.40 | | | | 13.48 | |
| Hypothetical return based on assumed 5% return: | |
Class A | | | | | | | 1,000.00 | | | | 2.89 | % | | | 1,010.49 | | | | 14.45 | |
Class C | | | | | | | 1,000.00 | | | | 3.64 | % | | | 1,006.76 | | | | 18.16 | |
Institutional Class | | | | | | | 1,000.00 | | | | 2.63 | % | | | 1,011.79 | | | | 13.16 | |
| Mid-Cap Value | |
| Actual return based on actual return of: | |
Class A | | | 6.93 | % | | | 1,000.00 | | | | 2.18 | % | | | 1,069.30 | | | | 11.22 | |
Class C | | | 6.57 | % | | | 1,000.00 | | | | 2.93 | % | | | 1,065.70 | | | | 15.05 | |
Institutional Class | | | 7.12 | % | | | 1,000.00 | | | | 1.93 | % | | | 1,071.20 | | | | 9.94 | |
| Hypothetical return based on assumed 5% return: | |
Class A | | | | | | | 1,000.00 | | | | 2.18 | % | | | 1,014.02 | | | | 10.92 | |
Class C | | | | | | | 1,000.00 | | | | 2.93 | % | | | 1,010.29 | | | | 14.64 | |
Institutional Class | | | | | | | 1,000.00 | | | | 1.93 | % | | | 1,015.27 | | | | 9.67 | |
| Small-Cap Growth Tactical Allocation | |
| Actual return based on actual return of: | |
Class A | | | 1.83 | % | | | 1,000.00 | | | | 2.14 | % | | | 1,018.30 | | | | 10.74 | |
Class C | | | 1.53 | % | | | 1,000.00 | | | | 2.86 | % | | | 1,015.30 | | | | 14.33 | |
Institutional Class | | | 1.93 | % | | | 1,000.00 | | | | 1.89 | % | | | 1,019.30 | | | | 9.49 | |
| Hypothetical return based on assumed 5% return: | |
Class A | | | | | | | 1,000.00 | | | | 2.14 | % | | | 1,014.22 | | | | 10.72 | |
Class C | | | | | | | 1,000.00 | | | | 2.86 | % | | | 1,010.64 | | | | 14.30 | |
Institutional Class | | | | | | | 1,000.00 | | | | 1.89 | % | | | 1,015.47 | | | | 9.47 | |
| | | | | | | | | | | | | | | | | | | | |
| | | | | | Beginning Account
Value 01/01/12 | | | Annualized Expense
Ratio For the Period | | | Ending Account
Value 6/30/2012 | | | Expenses Paid
During Period* | |
| Small-Cap Value | |
| Actual return based on actual return of: | |
Class A | | | 6.02 | % | | $ | 1,000.00 | | | | 1.81 | % | | $ | 1,060.20 | | | $ | 9.27 | |
Class C | | | 5.64 | % | | | 1,000.00 | | | | 2.56 | % | | | 1,056.40 | | | | 13.09 | |
Institutional Class | | | 6.18 | % | | | 1,000.00 | | | | 1.59 | % | | | 1,061.80 | | | | 8.15 | |
| Hypothetical return based on assumed 5% return: | |
Class A | | | | | | | 1,000.00 | | | | 1.81 | % | | | 1,015.86 | | | | 9.07 | |
Class C | | | | | | | 1,000.00 | | | | 2.56 | % | | | 1,012.13 | | | | 12.81 | |
Institutional Class | | | | | | | 1,000.00 | | | | 1.59 | % | | | 1,016.96 | | | | 7.97 | |
| Strategic Growth | |
| Actual return based on actual return of: | |
Class A | | | 6.68 | % | | | 1,000.00 | | | | 2.11 | % | | | 1,066.80 | | | | 10.84 | |
Class C | | | 6.32 | % | | | 1,000.00 | | | | 2.86 | % | | | 1,063.20 | | | | 14.67 | |
Institutional Class | | | 6.79 | % | | | 1,000.00 | | | | 1.88 | % | | | 1,067.90 | | | | 9.67 | |
| Hypothetical return based on assumed 5% return: | |
Class A | | | | | | | 1,000.00 | | | | 2.11 | % | | | 1,014.37 | | | | 10.57 | |
Class C | | | | | | | 1,000.00 | | | | 2.86 | % | | | 1,010.64 | | | | 14.30 | |
Institutional Class | | | | | | | 1,000.00 | | | | 1.88 | % | | | 1,015.51 | | | | 9.42 | |
| * | Expenses are equal to the Funds’ annualized six-month expense ratios (excluding reimbursements) multiplied by the average account value over the period muliplied by the number of days in the most recent fiscal half year (182) divided by 366 to reflect the one-half year period. |
Schedule of Investments
Quaker Event Arbitrage Fund
June 30, 2012
| | | | | | | | |
| | | Number of Shares | | | Fair
Value | |
| Domestic Common Stocks — 54.98% | |
| Basic Materials — 0.04% | | | | | |
| Forest Products & Paper — 0.04% | | | | | |
Wausau Paper Corp. | | | 2,500 | | | $ | 24,325 | |
Total Basic Materials (Cost: $24,138) | | | | 24,325 | |
| Communications — 12.21% | | | | | | | | |
| Internet — 3.78% | | | | | | | | |
30DC, Inc.(a)(b) | | | 50,000 | | | | 3,485 | |
AboveNet, Inc.(b) | | | 6,000 | | | | 504,000 | |
ModusLink Global Solutions, Inc.(b)(g) | | | 300,262 | | | | 897,783 | |
Selectica, Inc.(b) | | | 23,600 | | | | 92,512 | |
Unwired Planet, Inc.(b)(g) | | | 256,625 | | | | 590,238 | |
| | | | | | | | 2,088,018 | |
| Media — 1.21% | | | | | | | | |
Liberty Media Corp. Class A(b)(g) | | | 7,600 | | | | 668,116 | |
| Telecommunications — 7.22% | | | | | | | | |
Anaren, Inc.(b) | | | 25,000 | | | | 490,000 | |
Comverse Technology, Inc.(b)(g) | | | 100,000 | | | | 582,000 | |
Extreme Networks(b)(g) | | | 235,290 | | | | 809,397 | |
InterDigital, Inc. | | | 30,000 | | | | 885,300 | |
Sycamore Networks, Inc.(b) | | | 72,000 | | | | 1,045,440 | |
Telephone & Data Systems, Inc. | | | 8,131 | | | | 173,109 | |
| | | | | | | | 3,985,246 | |
Total Communications (Cost: $7,366,323) | | | | | | | 6,741,380 | |
| Consumer Cyclical — 9.68% | | | | | | | | |
| Entertainment — 0.64% | | | | | | | | |
EDCI Holdings, Inc.(b) | | | 74,000 | | | | 351,500 | |
| Home Builders — 2.22% | | | | | | | | |
Lennar Corp. Class B(g) | | | 51,000 | | | | 1,225,530 | |
| Leisure Time — 1.30% | | | | | | | | |
Ambassadors Group, Inc. | | | 131,900 | | | | 717,536 | |
| Lodging — 0.00% | | | | | | | | |
Trump Entertainment Resorts, Inc.(a)(b)(c) | | | 8,949 | | | | 0 | |
Trump Entertainment Resorts, Inc.(a)(b)(c) | | | 135 | | | | 409 | |
| | | | | | | | 409 | |
| Retail — 3.98% | | | | | | | | |
Abercrombie & Fitch Co. Class A | | | 14,300 | | | | 488,202 | |
Regis Corp. | | | 26,000 | | | | 466,960 | |
Syms Corp.(b) | | | 61,450 | | | | 406,185 | |
The Pantry, Inc.(b) | | | 57,000 | | | | 837,900 | |
| | | | | | | | 2,199,247 | |
| Toys/Games/Hobbies — 1.54% | | | | | | | | |
Jakks Pacific, Inc. | | | 53,000 | | | | 848,530 | |
Total Consumer Cyclical (Cost: $4,680,666) | | | | | | | 5,342,752 | |
| Consumer Non-cyclical — 5.68% | | | | | | | | |
| Commercial Services — 3.03% | | | | | | | | |
Corrections Corp. | | | 26,000 | | | | 765,700 | |
Monster Worldwide, Inc.(b) | | | 107,000 | | | | 909,500 | |
| | | | | | | | 1,675,200 | |
| Cosmetics & Personal Care — 1.06% | | | | | | | | |
CCA Industries, Inc. | | | 149,792 | | | | 584,189 | |
| | | | | | | | |
| | | Number of Shares | | | Fair
Value | |
| Domestic Common Stocks (Continued) | |
| Consumer Non-cyclical (Continued) | | | | | | | | |
| Food — 1.59% | | | | | | | | |
Dole Food Co., Inc.(b) | | | 100,000 | | | $ | 878,000 | |
Total Consumer Non-cyclical (Cost: $3,376,594) | | | | | | | 3,137,389 | |
| Diversified — 0.00% | | | | | | | | |
| Holding Companies-Diversified — 0.00% | | | | | | | | |
Stoneleigh Partners Acquisition Corp.(a)(b)(c) | | | 400 | | | | 0 | |
Total Diversified (Cost: $0) | | | | | | | 0 | |
| Energy — 0.49% | | | | | | | | |
| Oil & Gas — 0.49% | | | | | | | | |
Marathon Petroleum Corp. | | | 6,000 | | | | 269,520 | |
Total Energy (Cost: $250,890) | | | | | | | 269,520 | |
| Financial — 6.79% | | | | | | | | |
| Banks — 2.73% | | | | | | | | |
Alliance Bancorp, Inc. | | | 53,286 | | | | 658,082 | |
Franklin Financial Corp.(b) | | | 7,600 | | | | 125,020 | |
Standard Financial Corp. | | | 45,000 | | | | 724,500 | |
| | | | | | | | 1,507,602 | |
| Savings & Loans — 4.06% | | | | | | | | |
Colonial Financial Services, Inc.(b) | | | 46,700 | | | | 607,567 | |
FedFirst Financial Corp. | | | 25,000 | | | | 357,250 | |
Home Federal Bancorp, Inc. | | | 23,000 | | | | 333,615 | |
SI Financial Group, Inc. | | | 20,000 | | | | 230,000 | |
SP Bancorp, Inc.(b) | | | 33,500 | | | | 427,460 | |
Wolverine Bancorp, Inc.(b) | | | 17,300 | | | | 285,450 | |
| | | | | | | | 2,241,342 | |
Total Financial (Cost: $3,459,486) | | | | | | | 3,748,944 | |
| Healthcare — 6.06% | | | | | | | | |
| Biotechnology — 1.76% | | | | | | | | |
Cadus Corp.(b) | | | 194,229 | | | | 266,094 | |
Maxygen, Inc.(b) | | | 118,000 | | | | 703,280 | |
| | | | | | | | 969,374 | |
| Healthcare-Products — 2.40% | | | | | | | | |
SurModics, Inc.(b)(g) | | | 76,743 | | | | 1,327,654 | |
| Healthcare-Services — 1.21% | | | | | | | | |
InSight Health Services Holdings Corp.(b) | | | 10,221 | | | | 668,265 | |
| Pharmaceuticals — 0.69% | | | | | | | | |
INYX, Inc.(a)(b) | | | 167,850 | | | | 252 | |
Nabi Biopharmaceuticals(b) | | | 239,805 | | | | 378,892 | |
| | | | | | | | 379,144 | |
Total Healthcare (Cost: $3,194,691) | | | | | | | 3,344,437 | |
| Industrial — 2.39% | | | | | | | | |
| Aerospace & Defense — 2.17% | | | | | | | | |
API Technologies Corp.(b) | | | 40,000 | | | | 147,200 | |
Goodrich Corp. | | | 8,300 | | | | 1,053,270 | |
| | | | | | | | 1,200,470 | |
| Building Materials — 0.20% | | | | | | | | |
U.S. Concrete, Inc.(b) | | | 21,880 | | | | 108,197 | |
| | | | | | | | |
| | | Number of Shares | | | Fair
Value | |
| Domestic Common Stocks (Continued) | |
| Industrial (Continued) | | | | | | | | |
| Environmental Control — 0.02% | | | | | | | | |
Strategic Enviromental & Energy Resources, Inc.(a)(b) | | | 43,000 | | | $ | 12,977 | |
Total Industrial (Cost: $1,425,086) | | | | | | | 1,321,644 | |
| Technology — 11.64% | | | | | | | | |
| Computers — 0.01% | | | | | | | | |
Computer Horizons Corp.(b) | | | 65,000 | | | | 3,412 | |
| Semiconductors — 2.83% | | | | | | | | |
DSP Group, Inc.(b)(g) | | | 136,522 | | | | 865,549 | |
Integrated Device Technology, Inc.(b) | | | 124,000 | | | | 696,880 | |
| | | | | | | | 1,562,429 | |
| Software — 8.80% | | | | | | | | |
BMC Software, Inc.(b) | | | 20,000 | | | | 853,600 | |
Contra Softbrands, Inc.(a)(b)(c) | | | 5,000 | | | | 0 | |
Network-1 Security Solutions, Inc.(b) | | | 235,000 | | | | 303,150 | |
Novell, Inc. (a)(b) | | | 160,000 | | | | 976,000 | |
Official Payments Holdings, Inc. Class B(b) | | | 127,876 | | | | 498,717 | |
Progress Software Corp.(b) | | | 61,500 | | | | 1,283,505 | |
Seachange International, Inc.(b)(g) | | | 115,005 | | | | 946,491 | |
| | | | | | | | 4,861,463 | |
Total Technology (Cost: $6,728,853) | | | | | | | 6,427,304 | |
Total Domestic Common Stocks
(Cost $30,506,727) | | | | | | | 30,357,695 | |
| | | | | | | | |
| Foreign Common Stocks — 5.85% | | | | | | | | |
| Australia — 0.97% | | | | | | | | |
| Machinery-Construction & Mining — 0.97% | | | | | | | | |
Ludowici Ltd.(a) | | | 50,000 | | | | 534,319 | |
Total Australia (Cost: $525,049) | | | | 534,319 | |
| Canada — 0.40% | | | | | | | | |
| Mining — 0.02% | | | | | | | | |
Sacre-Coeur Minerals Ltd.(a)(b) | | | 109,000 | | | | 9,636 | |
Sacre-Coeur Minerals Ltd.(b) | | | 444 | | | | 39 | |
| | | | | 9,675 | |
| Oil & Gas — 0.38% | | | | | | | | |
PetroMagdalena Energy Corp.(b) | | | 9,200 | | | | 14,278 | |
Progress Energy Resources Corp.(b)(g) | | | 10,000 | | | | 197,142 | |
| | | | | 211,420 | |
Total Canada (Cost: $273,455) | | | | 221,095 | |
| Germany — 0.81% | | | | | | | | |
| Healthcare-Services — 0.80% | | | | | | | | |
Rhoen Klinikum AG | | | 20,000 | | | | 442,942 | |
| Holding Companies-Diversified — 0.01% | | | | | | | | |
KHD Humboldt Wedag International AG(b) | | | 1,014 | | | | 6,314 | |
Total Germany (Cost: $569,958) | | | | 449,256 | |
| Ireland — 1.30% | | | | | | | | |
| Pharmaceuticals — 1.30% | | | | | | | | |
Warner Chilcott PLC Class A(b) | | | 40,000 | | | | 716,800 | |
Total Ireland (Cost: $740,600) | | | | 716,800 | |
| | | | | | | | |
| | | Number of Shares | | | Fair
Value | |
| Foreign Common Stocks (Continued) | | | | | | | | |
| Spain — 0.23% | | | | | | | | |
| Media — 0.23% | | | | | | | | |
Promotora de Informaciones S.A. Class B ADR | | | 45,000 | | | $ | 129,150 | |
Total Spain (Cost: $425,693) | | | | 129,150 | |
| Switzerland — 2.14% | | | | | | | | |
| Banks — 0.51% | | | | | | | | |
Bank Sarasin & Cie AG(b) | | | 10,000 | | | | 281,334 | |
| Electronics — 1.63% | | | | | | | | |
Tyco International Ltd. | | | 17,000 | | | | 898,450 | |
Total Switzerland (Cost: $1,208,535) | | | | | | | 1,179,784 | |
Total Foreign Common Stocks
(Cost $3,743,290) | | | | | | | 3,230,404 | |
| | | | | | | | |
| Preferred Stocks — 1.13% | | | | | | | | |
| United States — 1.13% | | | | | | | | |
Ally Financial, Inc. 144A , 7.00% | | | 700 | | | | 623,635 | |
GeoMet, Inc. , 8.00%(b) | | | 3 | | | | 12 | |
| | | | | | | | 623,647 | |
Total United States (Cost $649,531) | | | | | | | 623,647 | |
Total Preferred Stocks
(Cost $649,531) | | | | | | | 623,647 | |
| | |
| | | Par
Value | | | | |
| Corporate Bonds — 1.47% | | | | | | | | |
| Basic Materials — 0.04% | | | | | | | | |
| Forest Products & Paper — 0.04% | | | | | | | | |
Catalyst Paper Corp. 7.38%, 03/01/2014(d) | | $ | 750,000 | | | | 13,125 | |
NewPage Corp. 10.00%, 05/01/2012(d) | | | 300,000 | | | | 12,000 | |
| | | | | | | | 25,125 | |
Total Basic Materials (Cost: $821,113) | | | | | | | 25,125 | |
| Financial — 1.24% | | | | | | | | |
| Diversified Financial Services — 1.24% | | | | | | | | |
Credit Suisse Securities USA LLC 11.00%, 09/05/2013 | | | 20,000 | | | | 19,906 | |
Credit Suisse Securities USA LLC 11.10%, 01/23/2013 | | | 500,000 | | | | 501,900 | |
Lehman Brothers Holdings, Inc. 0.00%, 07/08/2014(d) | | | 110,000 | | | | 24,750 | |
Lehman Brothers Holdings, Inc. 0.00%, 02/17/2015(d) | | | 130,000 | | | | 28,275 | |
Lehman Brothers Holdings, Inc. 0.00%, 01/28/2020(d) | | | 100,000 | | | | 21,750 | |
Lehman Brothers Holdings, Inc. 0.00%, 09/23/2020(a)(d) | | | 100,000 | | | | 21,880 | |
Lehman Brothers Holdings, Inc. 0.00%, 02/14/2023(d) | | | 200,000 | | | | 43,500 | |
Lehman Brothers Holdings, Inc. 5.50%, 02/27/2020(d) | | | 100,000 | | | | 21,750 | |
| | | | | | | | 683,711 | |
| Venture Capital — 0.00% | | | | | | | | |
Infinity Capital Group 7.00%, 12/31/2049(a)(c) | | | 25,000 | | | | 0 | |
Total Financial (Cost: $709,643) | | | | | | | 683,711 | |
| Industrial — 0.19% | | | | | | | | |
| Building Materials — 0.19% | | | | | | | | |
U.S. Concrete, Inc. 9.50%, 08/31/2015 | | | 100,000 | | | | 105,375 | |
Total Industrial (Cost: $100,000) | | | | | | | 105,375 | |
| Utilities — 0.0% | | | | | | | | |
| Electric — 0.0% | | | | | | | | |
Mirant Corp. 0.03%, 06/15/2021(a)(c) | | | 20,000 | | | | 0 | |
Total Utilities (Cost: $0) | | | | 0 | |
Total Corporate Bonds
(Cost $1,630,756) | | | | | | | 814,211 | |
Schedule of Investments
Quaker Event Arbitrage Fund
June 30, 2012
| | | | | | | | |
| | |
| | | Number
of Shares | | | Fair
Value | |
| Warrant — 0.00% | | | | | | | | |
Sacre-Coeur Minerals Ltd. Expiration:(a)(b)(c)
March, 2013 | | | 54,500 | | | $ | 0 | |
Total Warrant
(Cost $0) | | | | | | | 0 | |
| | |
| | | Par Value | | | | |
| Asset Backed Securities — 11.20% | | | | | | | | |
| United States — 11.20% | | | | | | | | |
AFC Home Equity Loan Trust
Class 1A Series 2000- 2 0.64%, 06/25/2030(e) | | | 17,622 | | | | 10,766 | |
Citigroup Mortgage Loan Trust, Inc.
Class A Series 2007-SHL1 0.65%, 11/25/2046(e) | | | 598,685 | | | | 289,739 | |
Countrywide Alternative Loan Trust
Class 2A2A Series 2006-OC5 0.42%, 06/25/2036(e) | | | 127,601 | | | | 70,895 | |
Countrywide Alternative Loan Trust
Class A3 Series 2007-OA7 0.55%, 05/25/2047(e) | | | 410,730 | | | | 33,738 | |
Countrywide Asset-Backed Certificates
Class A2 Series 2006-IM1 0.49%, 04/25/2036(e) | | | 985,443 | | | | 471,975 | |
Countrywide Asset-Backed Certificates
Class M1 Series 2006-23 0.50%, 05/25/2037(e) | | | 1,800,000 | | | | 112,669 | |
Countrywide Asset-Backed Certificates
Class M1 Series 2006-BC4 0.54%, 11/25/2036(e) | | | 3,000,000 | | | | 135,699 | |
Countrywide Asset-Backed Certificates
Class 2M2 Series 2007-11 0.57%, 06/25/2047(e) | | | 2,200,000 | | | | 39,488 | |
Countrywide Asset-Backed Certificates
Class A3 Series 2006-S8 5.56%, 04/25/2036(e) | | | 155,960 | | | | 110,836 | |
Countrywide Home Equity Loan Trust
Class 2A Series 2006-E 0.38%, 07/15/2036(e) | | | 445,402 | | | | 277,967 | |
Countrywide Home Equity Loan Trust
Class 2A Series 2006-G 0.39%, 10/15/2036(e) | | | 196,544 | | | | 121,756 | |
Countrywide Home Equity Loan Trust
Class A Series 2007-E 0.39%, 06/15/2037(e) | | | 761,219 | | | | 475,539 | |
Countrywide Home Equity Loan Trust
Class 2A Series 2005-A 0.48%, 04/15/2035(e) | | | 51,786 | | | | 33,010 | |
Credit-Based Asset Servicing & Securitization LLC
Class AF4 Series 2007-CB1 5.27%, 01/25/2037 | | | 961,804 | | | | 358,533 | |
GSAMP Trust
Class A1B Series 2007-H1 0.45%, 01/25/2047(e) | | | 500,000 | | | | 271,360 | |
HSI Asset Securitization Corp. Trust
Class 2A5 Series 2006-OPT4 0%, 03/25/2036 | | | 500,000 | | | | 390,886 | |
Morgan Stanley ABS Capital I
Class A2C Series 2006-HE6 0.40%, 09/25/2036(e) | | | 1,800,000 | | | | 553,887 | |
Novastar Home Equity Loan
Class A2B Series 2006- 6 0.35%, 01/25/2037(e) | | | 672,578 | | | | 341,560 | |
Option One Mortgage Loan Trust
Class 2A2 Series 2006-3 0.35%, 02/25/2037(e) | | | 822,827 | | | | 431,333 | |
Provident Bank Home Equity Loan Trust
Class A2 Series 2000-2 0.79%, 08/25/2031(e) | | | 507,824 | | | | 244,808 | |
Provident Bank Home Equity Loan Trust
Class A1 Series 2000-2 0.79%, 08/25/2031(e) | | | 148,236 | | | | 83,884 | |
Residential Funding Mortgage Securities II Home Loan Trust
Class AII Series 2007-HSA3 0.39%, 06/25/2037(e) | | | 875,334 | | | | 576,973 | |
Structured Asset Investment Loan Trust
Class M1 Series 2003-BC9 1.30%, 08/25/2033(e) | | | 892,128 | | | | 745,852 | |
| | | | | | | | 6,183,153 | |
Total United States (Cost $6,969,660) | | | | | | | 6,183,153 | |
Total Asset Backed Securities
(Cost $6,969,660) | | | | | | | 6,183,153 | |
| | | | | | | | |
| | |
| | | Number
of Shares | | | Fair
Value | |
| Rights — 0.10% | | | | | | | | |
| France — 0.10% | | | | | | | | |
Sanofi(b) | | | 37,500 | | | $ | 52,875 | |
Total France (Cost $54,095) | | | | | | | 52,875 | |
| United States — 0.00% | | | | | | | | |
Lev Pharmaceuticals, Inc. ESCROW(a)(b)(c) | | | 15,000 | | | | 0 | |
Petrocorp, Inc. ESCROW(a)(b)(c) | | | 200 | | | | 0 | |
| | | | | | | | 0 | |
Total United States (Cost $0) | | | | | | | 0 | |
Total Rights
(Cost $54,095) | | | | | | | 52,875 | |
| | |
| | | Number
of Contracts | | | | |
| Options — 0.11% | | | | | | | | |
Collective Brands, Inc. Expiration: December, 2012
Exercise Price: $19.00 | | | 75 | | | | 750 | |
Lennar Corp. Expiration: August, 2012
Exercise Price: $29.00 | | | 510 | | | | 61,200 | |
| | | | | | | | 61,950 | |
Total United States (Cost $237,881) | | | | | | | 61,950 | |
Total Options
(Cost $237,881) | | | | | | | 61,950 | |
| | |
| | | Number
of Shares | | | | |
| Short-Term Investment — 12.13% | | | | | | | | |
| Time Deposit — 12.13% | | | | | | | | |
Citibank 0.03%, 07/02/2012(f) | | | 6,694,675 | | | | 6,694,675 | |
Total Short-Term Investment
(Cost $6,694,675) | | | | | | | 6,694,675 | |
Total Investments
(Cost $50,486,615) — 86.97% | | | | | | | 48,018,610 | |
Other Assets in Excess of Liabilities, Net — 13.03% | | | | | | | 7,193,099 | |
Total Net Assets — 100.00% | | | | | | $ | 55,211,709 | |
| Schedule of Securities Sold Short | | | | | | |
| Common Stocks — 0.99% | | | | | | | | |
| Collective Brands, Inc.(b) | | | 12,000 | | | | 257,040 | |
InterDigital, Inc. | | | 200 | | | | 5,902 | |
Sirius XM Radio, Inc.(b) | | | 152,000 | | | | 281,200 | |
Total Common Stocks | | | | | | | 544,142 | |
Total Securities Sold Short (Proceeds: $593,645) | | | | | | | 544,142 | |
| | |
| | | Number
of Contracts | | | | |
| Call Options Written — 3.11% | | | | | | | | |
Abercrombie & Fitch Co. Expiration: July, 2012
Exercise Price: $33.00 | | | 143 | | | | 29,744 | |
Ambassadors Group, Inc. Expiration: July, 2012
Exercise Price: $5.00 | | | 1,319 | | | | 56,057 | |
| | | | | | | | |
| | | Number
of Contracts | | | Fair
Value | |
| Call Options Written (Continued) | | | | | | | | |
Anaren, inc. Expiration: July, 2012
Exercise Price: $20.00 | | | 150 | | | $ | 6,375 | |
Ancestry.Com, Inc. Expiration: July, 2012
Exercise Price: $22.50 | | | 300 | | | | 3,000 | |
BMC Software, Inc. Expiration: July, 2012
Exercise Price: $38.00 | | | 200 | | | | 89,000 | |
Corrections Corp. Expiration: July, 2012
Exercise Price: $25.00 | | | 100 | | | | 45,000 | |
Dole Food Co., Inc. Expiration: July, 2012
Exercise Price: $7.50 | | | 1,000 | | | | 130,000 | |
DSP Group, Inc. Expiration: July, 2012
Exercise Price: $5.00 | | | 1,000 | | | | 5,000 | |
InterDigital, Inc. Expiration: July, 2012
Exercise Price: $22.50 | | | 298 | | | | 207,110 | |
Iron Mountain, Inc. Expiration: July, 2012
Exercise Price: $30.00 | | | 250 | | | | 3,750 | |
Jakks Pacific, Inc. Expiration: July, 2012
Exercise Price: $15.00 | | | 230 | | | | 25,300 | |
Lennar Corp. Expiration: August, 2012
Exercise Price: $29.00 | | | 510 | | | | 153,000 | |
Monster Worldwide, Inc. Expiration: July, 2012
Exercise Price: $7.00 | | | 1,070 | | | | 139,100 | |
| | | | | | | | |
| | | Number
of Contracts | | | Fair
Value | |
| Call Options Written (Continued) | | | | | | | | |
Progress Software Corp. Expiration: July, 2012
Exercise Price: $17.50 | | | 220 | | | $ | 74,800 | |
Regis Corp. Expiration: July, 2012
Exercise Price: $17.50 | | | 230 | | | | 16,100 | |
Seachange International, Inc. Expiration: July, 2012
Exercise Price: $7.50 | | | 500 | | | | 32,500 | |
SurModics, Inc. Expiration: July, 2012
Exercise Price: $12.50 | | | 400 | | | | 190,000 | |
SurModics, Inc. Expiration: July, 2012
Exercise Price: $15.00 | | | 180 | | | | 40,950 | |
Sycamore Networks, Inc. Expiration: July, 2012
Exercise Price: $12.50 | | | 320 | | | | 64,800 | |
The Pantry, Inc. Expiration: July, 2012
Exercise Price: $12.50 | | | 570 | | | | 123,975 | |
Tyco International Ltd. Expiration: July, 2012
Exercise Price: $44.00 | | | 170 | | | | 149,175 | |
Warner Chilcott PLC Expiration: July, 2012
Exercise Price: $15.00 | | | 400 | | | | 131,000 | |
Total Options Written
(Premiums Received $1,274,680) | | | | | | $ | 1,715,736 | |
| | | | | | | | | | | | | | | | | | | | | | | | | | | | | | | | |
| Forward Currency Contracts | |
| Buy | | Counterparty | | | Principal
Covered
by contract | | | Settlement
month | | | Sell | | | Contract
Amount | | | Unrealized
Appreciation | | | Unrealized
Depreciation | | | Net
Unrealized
Appreciation/
(Depreciation) | |
| AUD | | | Brown Brothers Harriman & Co. | | | | 562,250 | | | | Jul-12 | | | | USD | | | | 555,278 | | | | 19,798 | | | | — | | | | 19,798 | |
| EUR | | | Brown Brothers Harriman & Co. | | | | 372,675 | | | | Jul-12 | | | | USD | | | | 465,934 | | | | 5,730 | | | | — | | | | 5,730 | |
| USD | | | Brown Brothers Harriman & Co. | | | | 542,131 | | | | Jul-12 | | | | EUR | | | | 430,000 | | | | — | | | | (2,117 | ) | | | (2,117 | ) |
| | | | | | | | | | | | | | | | | | | | | | | $ | 25,528 | | | $ | (2,117 | ) | | $ | 23,411 | |
Currency Abbreviations
| ADR | American Depositary Receipt |
| (a) | Indicates an illiquid security. Total market value for illiquid securities is $1,558,959, representing 2.82% of net assets. |
| (b) | Non-income producing security. |
| (c) | Indicates a fair valued security. Total market value for fair valued securities is $1,644,674 representing 2.98% of net assets. |
| (e) | The coupon rate shown on floating or adjustable rate securities represents the rate at period end. |
| (f) | The rate shown is the annualized seven-day yield at period end. |
| (g) | Held as collateral for short sales. |
The accompanying notes are an integral part of the financial statements.
Schedule of Investments
Quaker Global Tactical Allocation Fund
June 30, 2012
| | | | | | | | |
| | | Number
of Shares | | | Fair
Value | |
| Common Stocks — 95.31% | | | | | | | | |
| Belgium — 2.72% | | | | | | | | |
Anheuser-Busch InBev NV ADR | | | 3,330 | | | $ | 265,234 | |
Total Belgium (Cost $194,891) | | | | | | | 265,234 | |
| Bermuda — 3.59% | | | | | | | | |
Arch Capital Group Ltd.(a) | | | 4,000 | | | | 158,760 | |
Seadrill Ltd. | | | 5,400 | | | | 191,808 | |
| | | | | | | | 350,568 | |
Total Bermuda (Cost $329,039) | | | | | | | 350,568 | |
| Canada — 1.77% | | | | | | | | |
Cenovus Energy, Inc. | | | 5,430 | | | | 172,674 | |
Total Canada (Cost $171,384) | | | | | | | 172,674 | |
| Denmark — 2.22% | | | | | | | | |
Novo Nordisk ADR | | | 1,490 | | | | 216,557 | |
Total Denmark (Cost $216,759) | | | | | | | 216,557 | |
| France — 2.09% | | | | | | | | |
Sanofi ADR | | | 5,400 | | | | 204,012 | |
Total France (Cost $199,013) | | | | | | | 204,012 | |
| Germany — 2.48% | | | | | | | | |
Adidas AG ADR(b) | | | 4,000 | | | | 143,440 | |
Daimler AG ADR | | | 2,200 | | | | 98,441 | |
| | | | | | | | 241,881 | |
Total Germany (Cost $233,142) | | | | | | | 241,881 | |
| Ireland — 4.47% | | | | | | | | |
Accenture PLC | | | 3,630 | | | | 218,127 | |
Amarin Corp. PLC ADR(a) | | | 15,100 | | | | 218,346 | |
| | | | | | | | 436,473 | |
Total Ireland (Cost $402,136) | | | | | | | 436,473 | |
| Mexico — 1.98% | | | | | | | | |
Fomento Economico Mexicano SAB de CV ADR | | | 2,170 | | | | 193,673 | |
Total Mexico (Cost $172,453) | | | | | | | 193,673 | |
| Netherlands — 3.30% | | | | | | | | |
CNH Global NV(a) | | | 4,340 | | | | 168,652 | |
Unilever NV | | | 4,600 | | | | 153,410 | |
| | | | | | | | 322,062 | |
Total Netherlands (Cost $315,763) | | | | | | | 322,062 | |
| Panama — 1.94% | | | | | | | | |
Copa Holdings S.A. | | | 2,300 | | | | 189,704 | |
Total Panama (Cost $190,529) | | | | | | | 189,704 | |
| Switzerland — 4.83% | | | | | | | | |
ACE Ltd. | | | 3,410 | | | | 252,783 | |
Syngenta AG ADR | | | 3,200 | | | | 219,008 | |
| | | | | | | | 471,791 | |
Total Switzerland (Cost $442,090) | | | | | | | 471,791 | |
| United Kingdom — 6.01% | | | | | | | | |
Diageo PLC ADR | | | 1,930 | | | | 198,925 | |
GlaxoSmithKline PLC ADR | | | 4,130 | | | | 188,204 | |
Intercontinental Hotels Group PLC ADR | | | 8,300 | | | | 200,030 | |
| | | | | | | | 587,159 | |
Total United Kingdom (Cost $568,475) | | | | | | | 587,159 | |
| | | | | | | | |
| | | Number
of Shares | | | Fair
Value | |
| Common Stocks (Continued) | | | | | | | | |
| United States — 57.91% | | | | | | | | |
Abbott Laboratories | | | 1,900 | | | $ | 122,493 | |
Allergan, Inc. | | | 2,370 | | | | 219,391 | |
American Express Co. | | | 3,450 | | | | 200,824 | |
Apple, Inc.(a) | | | 674 | | | | 393,616 | |
Capital One Financial Corp. | | | 4,510 | | | | 246,517 | |
Chevron Corp. | | | 1,800 | | | | 189,900 | |
Citrix Systems, Inc.(a) | | | 2,030 | | | | 170,398 | |
Coca-Cola Co. | | | 3,170 | | | | 247,862 | |
Dunkin’ Brands Group, Inc. | | | 5,460 | | | | 187,496 | |
eBay, Inc.(a) | | | 4,770 | | | | 200,388 | |
EMC Corp.(a) | | | 4,700 | | | | 120,461 | |
FedEx Corp. | | | 1,840 | | | | 168,562 | |
Google, Inc.(a) | | | 170 | | | | 98,612 | |
Home Depot, Inc. | | | 3,240 | | | | 171,688 | |
Las Vegas Sands Corp. | | | 4,460 | | | | 193,965 | |
LinkedIn Corp.(a) | | | 1,430 | | | | 151,966 | |
Mastercard, Inc. | | | 690 | | | | 296,776 | |
Mead Johnson Nutrition Co. | | | 3,510 | | | | 282,590 | |
Monsanto Co. | | | 2,810 | | | | 232,612 | |
Nike, Inc. | | | 1,470 | | | | 129,037 | |
Occidental Petroleum Corp. | | | 2,250 | | | | 192,983 | |
Philip Morris International, Inc. | | | 2,200 | | | | 191,972 | |
priceline.com, Inc.(a) | | | 300 | | | | 199,356 | |
Salesforce.com, Inc.(a) | | | 910 | | | | 125,817 | |
Starbucks Corp. | | | 2,790 | | | | 148,763 | |
Vantiv, Inc.(a) | | | 6,660 | | | | 155,111 | |
Verisk Analytics, Inc.(a) | | | 5,060 | | | | 249,256 | |
Visa, Inc. | | | 1,800 | | | | 222,534 | |
Yum! Brands, Inc. | | | 2,220 | | | | 143,012 | |
| | | | | | | | 5,653,958 | |
Total United States (Cost $5,491,213) | | | | | | | 5,653,958 | |
Total Common Stocks
(Cost $8,926,887) | | | | | | | 9,305,746 | |
| | | | | | | | |
| Short-Term Investments — 3.97% | | | | | | | | |
| Investment Trust — 1.68% | | | | | | | | |
Invesco Liquid Assets Portfolio, 0.16%(c)(d) | | | 163,800 | | | | 163,800 | |
| Time Deposit — 2.29% | | | | | | | | |
Citibank 0.03%, 07/02/2012(d) | | | 224,043 | | | | 224,043 | |
Total Short-Term Investments
(Cost $387,843) | | | | | | | 387,843 | |
Total Investments
(Cost $9,314,730) — 99.28% | | | | | | | 9,693,589 | |
Other Assets in Excess of Liabilities, Net — 0.72% | | | | | | | 69,844 | |
Total Net Assets — 100.00% | | | | | | $ | 9,763,433 | |
| | |
| Schedule of Securities Sold Short | | | | | | |
| Exchange-Traded Funds — 2.99% | | | | | | | | |
iShares MSCI Brazil Index Fund | | | 1,900 | | | | 98,420 | |
iShares MSCI Hong Kong Index Fund | | | 11,800 | | | | 193,520 | |
Total Exchange-Traded Funds | | | | | | | 291,940 | |
Total Securities Sold Short (Proceeds: $277,826) | | | | | | | 291,940 | |
| | | | | | | | |
| | | Number
of Contracts | | | Fair
Value | |
| Call Options Written — 0.02% | |
Capital One Financial Corp. Expiration: July, 2012
Exercise Price: $55.00 | | | 10 | | | $ | 1,220 | |
Dunkin’ Brands Group, Inc. Expiration: August, 2012
Exercise Price: $40.00 | | | 13 | | | | 260 | |
Total Options Written
(Premiums Received $1,373) | | | | | | $ | 1,480 | |
| ADR | American Depositary Receipt |
| (a) | Non-income producing security. |
| (b) | All or a portion of the security out on loan. |
| (c) | Represents investment of collateral received from securities lending transactions. |
| (d) | The rate shown is the annualized seven-day yield at period end. |
The accompanying notes are an integral part of the financial statements.
Schedule of Investments
Quaker Mid-Cap Value Fund
June 30, 2012
| | | | | | | | |
| | | Number
of Shares | | | Fair
Value | |
| Common Stocks — 93.63% | |
| Basic Materials — 6.14% | | | | | | | | |
| Chemicals — 4.59% | | | | | |
CF Industries Holdings, Inc. | | | 616 | | | $ | 119,344 | |
FMC Corp. | | | 2,156 | | | | 115,303 | |
Methanex Corp. | | | 5,430 | | | | 151,171 | |
| | | | | | | | 385,818 | |
| Iron & Steel Production — 1.55% | | | | | | | | |
Steel Dynamics, Inc. | | | 11,098 | | | | 130,402 | |
Total Basic Materials (Cost: $397,261) | | | | | | | 516,220 | |
| Consumer, Cyclical — 10.78% | | | | | | | | |
| Apparel — 2.94% | | | | | | | | |
Gildan Activewear, Inc. | | | 8,983 | | | | 247,212 | |
| Distribution & Wholesale — 2.09% | | | | | | | | |
Fossil, Inc.(a) | | | 2,298 | | | | 175,889 | |
| Home Furnishings — 2.26% | | | | | | | | |
Harman International Industries, Inc. | | | 4,816 | | | | 190,713 | |
| Leisure Time — 1.88% | | | | | | | | |
WMS Industries, Inc.(a) | | | 7,922 | | | | 158,044 | |
| Retail — 1.61% | | | | | | | | |
Darden Restaurants, Inc. | | | 2,674 | | | | 135,385 | |
Total Consumer, Cyclical (Cost: $853,745) | | | | | | | 907,243 | |
| Consumer, Non-cyclical — 3.90% | | | | | | | | |
| Agriculture — 1.34% | | | | | | | | |
Bunge Ltd. | | | 1,804 | | | | 113,183 | |
| Food — 2.56% | | | | | | | | |
Hormel Foods Corp. | | | 7,072 | | | | 215,130 | |
Total Consumer, Non-cyclical (Cost: $237,714) | | | | | | | 328,313 | |
| Energy — 9.14% | | | | | | | | |
| Oil & Gas — 7.37% | | | | | | | | |
Atwood Oceanics, Inc.(a) | | | 3,976 | | | | 150,452 | |
Ultra Petroleum Corp.(a)(b) | | | 9,045 | | | | 208,668 | |
Valero Energy Corp. | | | 6,835 | | | | 165,065 | |
Whiting Petroleum Corp.(a) | | | 2,336 | | | | 96,056 | |
| | | | | | | | 620,241 | |
| Oil Equipment & Services — 1.77% | | | | | | | | |
Oil States International, Inc.(a) | | | 2,243 | | | | 148,487 | |
Total Energy (Cost: $708,430) | | | | | | | 768,728 | |
| Financial — 22.46% | | | | | | | | |
| Banks — 10.49% | | | | | | | | |
Comerica, Inc. | | | 5,617 | | | | 172,498 | |
Huntington Bancshares, Inc. | | | 34,290 | | | | 219,456 | |
Keycorp | | | 21,270 | | | | 164,630 | |
Regions Financial Corp. | | | 27,523 | | | | 185,780 | |
Zions Bancorporation | | | 7,218 | | | | 140,174 | |
| | | | | | | | 882,538 | |
| Diversified Financial Services — 3.93% | | | | | | | | |
Ameriprise Financial, Inc. | | | 4,029 | | | | 210,556 | |
Invesco Ltd. | | | 5,312 | | | | 120,051 | |
| | | | | | | | 330,607 | |
| | | | | | | | |
| | | Number
of Shares | | | Fair
Value | |
| Common Stocks (Continued) | |
| Financial (Continued) | |
| Insurance — 8.04% | | | | | | | | |
Allied World Assurance Co. Holdings Ltd. | | | 2,181 | | | $ | 173,324 | |
Genworth Financial, Inc. Class A(a) | | | 19,198 | | | | 108,661 | |
Reinsurance Group of America, Inc. Class A | | | 3,066 | | | | 163,142 | |
Torchmark Corp. | | | 4,579 | | | | 231,468 | |
| | | | | | | | 676,595 | |
Total Financial (Cost: $1,530,803) | | | | | | | 1,889,740 | |
| Healthcare — 8.34% | | | | | | | | |
| Healthcare-Products — 6.46% | | | | | | | | |
Hospira, Inc.(a) | | | 4,904 | | | | 171,542 | |
St. Jude Medical, Inc. | | | 4,238 | | | | 169,138 | |
Zimmer Holdings, Inc. | | | 3,153 | | | | 202,927 | |
| | | | | | | | 543,607 | |
| Pharmaceuticals — 1.88% | | | | | | | | |
Forest Laboratories, Inc.(a) | | | 4,530 | | | | 158,505 | |
Total Healthcare (Cost: $578,417) | | | | | | | 702,112 | |
| Industrial— 10.61% | | | | | | | | |
| Aerospace & Defense — 1.11% | | | | | | | | |
L-3 Communications Holdings, Inc. | | | 1,263 | | | | 93,475 | |
| Electronics — 1.08% | | | | | | | | |
Waters Corp.(a) | | | 1,138 | | | | 90,437 | |
| Hand & Machine Tools — 5.97% | | | | | | | | |
Kennametal, Inc. | | | 4,538 | | | | 150,435 | |
Lincoln Electric Holdings, Inc. | | | 3,532 | | | | 154,666 | |
Regal-Beloit Corp. | | | 3,168 | | | | 197,240 | |
| | | | | | | | 502,341 | |
| Machinery-Diversified — 2.45% | | | | | | | | |
AGCO Corp.(a) | | | 4,517 | | | | 206,562 | |
Total Industrial (Cost: $776,166) | | | | | | | 892,815 | |
| Technology — 9.11% | | | | | | | | |
| Computers — 2.04% | | | | | | | | |
NetApp, Inc.(a) | | | 5,390 | | | | 171,510 | |
| Semiconductors — 7.07% | | | | | | | | |
Applied Materials, Inc. | | | 13,162 | | | | 150,836 | |
Marvell Technology Group Ltd. | | | 7,801 | | | | 87,995 | |
ON Semiconductor Corp.(a) | | | 24,948 | | | | 177,131 | |
Skyworks Solutions, Inc.(a) | | | 6,556 | | | | 179,438 | |
| | | | | | | | 595,400 | |
Total Technology (Cost: $757,656) | | | | | | | 766,910 | |
| Utilities — 13.15% | | | | | | | | |
| Electric — 5.79% | | | | | | | | |
Northeast Utilities | | | 4,254 | | | | 165,098 | |
Westar Energy, Inc. | | | 5,458 | | | | 163,467 | |
Xcel Energy, Inc. | | | 5,590 | | | | 158,812 | |
| | | | | | | | 487,377 | |
| Gas — 7.36% | | | | | | | | |
Centerpoint Energy, Inc. | | | 7,668 | | | | 158,497 | |
Energen Corp. | | | 2,978 | | | | 134,397 | |
Questar Corp. | | | 7,693 | | | | 160,476 | |
| | | | | | | | |
| | | Number
of Shares | | | Fair
Value | |
| Common Stocks (Continued) | |
| Utilities (Continued) | | | | | | | | |
| Gas (Continued) | | | | | | | | |
UGI Corp. | | | 5,646 | | | $ | 166,162 | |
| | | | | | | | 619,532 | |
Total Utilities (Cost: $903,025) | | | | | | | 1,106,909 | |
Total Common Stocks
(Cost $6,743,217) | | | | | | | 7,878,990 | |
| | | | | | | | |
| Real Estate Investment Trusts — 4.74% | | | | | | | | |
Boston Properties, Inc. | | | 806 | | | | 87,346 | |
Camden Property Trust | | | 1,251 | | | | 84,655 | |
Health Care REIT, Inc. | | | 1,712 | | | | 99,810 | |
Host Hotels & Resorts, Inc. | | | 8,039 | | | | 127,177 | |
| | | | | | | | 398,988 | |
Total Real Estate Investment Trusts
(Cost $238,419) | | | | | | | 398,988 | |
| | | | | | | | |
| Short-Term Investments — 4.06% | | | | | | | | |
| Investment Trust — 2.48% | | | | | | | | |
Invesco Liquid Assets Portfolio, 0.16%(c)(d) | | | 208,181 | | | | 208,181 | |
| Time Deposit — 1.58% | | | | | | | | |
Bank of America, 0.03%, 07/02/2012(d) | | | 133,169 | | | | 133,169 | |
Total Short-Term Investments
(Cost $341,350) | | | | | | | 341,350 | |
Total Investments
(Cost $7,322,986) — 102.43% | | | | | | | 8,619,328 | |
Liabilities in Excess of Other Assets, Net (2.43)% | | | | | | | (204,092 | ) |
Total Net Assets — 100.00% | | | | | | $ | 8,415,236 | |
| REIT | Real Estate Investment Trust |
| (a) | Non-income producing security. |
| (b) | All or a portion of the security out on loan. |
| (c) | Represents investment of collateral received from securities lending transactions. |
| (d) | The rate shown is the annualized seven-day yield at period end. |
The accompanying notes are an integral part of the financial statements.
Schedule of Investments
Quaker Small-Cap Growth Tactical Allocation Fund
June 30, 2012
| | | | | | | | |
| | | Number
of Shares | | | Fair
Value | |
| Domestic Common Stocks — 66.89% | | | | | | | | |
| Basic Materials — 7.74% | | | | | | | | |
| Chemicals — 2.40% | | | | | | | | |
NewMarket Corp. | | | 700 | | | $ | 151,620 | |
| Mining — 5.34% | | | | | | | | |
Comstock Mining, Inc.(a) | | | 105,700 | | | | 261,079 | |
Gold Resource Corp.(b) | | | 2,900 | | | | 75,371 | |
| | | | | | | | 336,450 | |
Total Basic Materials (Cost: $423,200) | | | | | | | 488,070 | |
| Communications — 8.54% | | | | | | | | |
| Internet — 5.47% | | | | | | | | |
Blucora, Inc.(a) | | | 17,600 | | | | 216,832 | |
Liquidity Services, Inc. a) | | | 2,500 | | | | 127,975 | |
| | | | | | | | 344,807 | |
| Media — 2.14% | | | | | | | | |
Belo Corp. Class A | | | 21,000 | | | | 135,240 | |
| Telecommunications — 0.93% | | | | | | | | |
CalAmp Corp.(a) | | | 8,000 | | | | 58,640 | |
Total Communications (Cost: $518,503) | | | | | | | 538,687 | |
| Consumer, Cyclical — 14.68% | | | | | | | | |
| Distribution & Wholesale — 4.62% | | | | | | | | |
Core-Mark Holding Co., Inc. | | | 1,000 | | | | 48,140 | |
Titan Machinery, Inc.(a) | | | 8,000 | | | | 242,960 | |
| | | | | | | | 291,100 | |
| Entertainment — 3.31% | | | | | | | | |
Multimedia Games Holding Co., Inc.(a) | | | 14,900 | | | | 208,600 | |
| Leisure Time — 2.73% | | | | | | | | |
Arctic Cat, Inc.(a) | | | 4,700 | | | | 171,832 | |
| Retail — 1.42% | | | | | | | | |
Gaiam, Inc. Class A(a) | | | 23,000 | | | | 89,700 | |
| Toys/Games/Hobbies — 2.60% | | | | | | | | |
Leapfrog Enterprises, Inc. Class A(a) | | | 16,000 | | | | 164,160 | |
Total Consumer, Cyclical (Cost: $883,190) | | | | | | | 925,392 | |
| Energy — 5.51% | | | | | | | | |
| Oil & Gas — 1.76% | | | | | | | | |
Synergy Resources Corp.(a)(b) | | | 36,000 | | | | 110,880 | |
| Oil & Gas Services — 3.75% | | | | | | | | |
Mitcham Industries, Inc.(a) | | | 8,800 | | | | 149,336 | |
TGC Industries, Inc.(a) | | | 9,000 | | | | 87,390 | |
| | | | | | | | 236,726 | |
Total Energy (Cost: $359,714) | | | | | | | 347,606 | |
| Financial — 17.60% | | | | | | | | |
| Banks — 8.65% | | | | | | | | |
BancorpSouth, Inc. | | | 13,200 | | | | 191,664 | |
Hanmi Financial Corp.(a) | | | 17,000 | | | | 178,160 | |
Wilshire Bancorp, Inc.(a) | | | 32,000 | | | | 175,360 | |
| | | | | | | | 545,184 | |
| Diversified Financial Services — 7.00% | | | | | | | | |
Ellie Mae, Inc.(a) | | | 9,700 | | | | 174,600 | |
Ellington Financial LLC | | | 7,700 | | | | 162,932 | |
| | | | | | | | |
| | | Number
of Shares | | | Fair
Value | |
| Domestic Common Stocks (Continued) | | | | | | | | |
| Financial (Continued) | | | | | | | | |
| Diversified Financial Services (Continued) | | | | | | | | |
WisdomTree Investments, Inc.(a) | | | 15,800 | | | $ | 103,806 | |
| | | | | | | | 441,338 | |
| Insurance — 1.95% | | | | | | | | |
Homeowners Choice, Inc. | | | 7,000 | | | | 123,200 | |
Total Financial (Cost: $1,062,866) | | | | | | | 1,109,722 | |
| Healthcare — 5.86% | | | | | | | | |
| Pharmaceuticals — 5.86% | | | | | | | | |
Dusa Pharmaceuticals, Inc.(a) | | | 18,900 | | | | 98,658 | |
Lifevantage Corp.(a)(b) | | | 39,185 | | | | 110,894 | |
Questcor Pharmaceuticals, Inc.(a)(b) | | | 3,000 | | | | 159,720 | |
| | | | | | | | 369,272 | |
Total Healthcare (Cost: $267,269) | | | | | | | 369,272 | |
| Industrial — 6.96% | | | | | | | | |
| Building Materials — 1.62% | | | | | | | | |
Trex Co., Inc.(a) | | | 3,400 | | | | 102,306 | |
| Machinery-Diversified — 2.64% | | | | | | | | |
Flow International Corp.(a) | | | 52,700 | | | | 166,005 | |
| Miscellaneous Manufacturing — 2.70% | | | | | | | | |
Lydall, Inc.(a) | | | 12,600 | | | | 170,352 | |
Total Industrial (Cost: $441,984) | | | | | | | 438,663 | |
Total Domestic Common Stocks
(Cost $3,956,726) | | | | | | | 4,217,412 | |
| | | | | | | | |
| Foreign Common Stocks — 14.34% | | | | | | | | |
| Canada — 1.88% | | | | | | | | |
| Mining — 1.88% | | | | | | | | |
Rubicon Minerals Corp.(a) | | | 20,000 | | | | 60,800 | |
Seabridge Gold, Inc.(a)(b) | | | 4,000 | | | | 57,960 | |
| | | | | | | | 118,760 | |
Total Canada (Cost: $136,961) | | | | | | | 118,760 | |
| Cayman Islands — 2.58% | | | | | | | | |
| Insurance — 2.58% | | | | | | | | |
Greenlight Capital Re Ltd. Class A(a) | | | 6,400 | | | | 162,688 | |
Total Cayman Islands (Cost: $159,163) | | | | | | | 162,688 | |
| China — 5.92% | | | | | | | | |
| Internet — 2.58% | | | | | | | | |
21Vianet Group, Inc. ADR(a)(b) | | | 14,200 | | | | 162,590 | |
| Software — 1.17% | | | | | | | | |
NQ Mobile, Inc. ADR(a)(b) | | | 9,000 | | | | 73,710 | |
| Telecommunications — 2.17% | | | | | | | | |
KongZhong Corp. ADR(a) | | | 17,000 | | | | 136,680 | |
Total China (Cost: $332,376) | | | | | | | 372,980 | |
| Ireland — 2.18% | | | | | | | | |
| Software — 2.18% | | | | | | | | |
Velti PLC(a)(b) | | | 21,100 | | | | 137,150 | |
Total Ireland (Cost: $238,005) | | | | | | | 137,150 | |
| | | | | | | | |
| | | Number
of Shares | | | Fair
Value | |
| Foreign Common Stocks (Continued) | | | | | | | | |
| Taiwan — 1.78% | | | | | | | | |
| Semiconductors — 1.78% | | | | | | | | |
Himax Technologies, Inc. ADR | | | 60,000 | | | $ | 112,500 | |
Total Taiwan (Cost: $110,561) | | | | | | | 112,500 | |
Total Foreign Common Stocks
(Cost $977,066) | | | | | | | 904,078 | |
| | | | | | | | |
| Exchange-Traded Fund — 4.30% | | | | | | | | |
Direxion Daily Small Cap Bear 3X Shares(a)(b) | | | 15,000 | | | | 271,050 | |
Total Exchange-Traded Fund
(Cost $341,380) | | | | | | | 271,050 | |
| | | | | | | | |
| Short-Term Investments — 31.06% | | | | | | | | |
| Investment Trust — 16.42% | | | | | | | | |
Invesco Liquid Assets Portfolio, 0.16%(c)(d) | | | 1,034,904 | | | | 1,034,904 | |
| Time Deposit — 14.64% | | | | | | | | |
HSBC Bank USA, Grand Cayman 0.03%, 07/02/2012(d) | | | 923,332 | | | | 923,332 | |
Total Short-Term Investments
(Cost $1,958,236) | | | | | | | 1,958,236 | |
Total Investments
(Cost $7,233,408) — 116.59% | | | | | | | 7,350,776 | |
Liabilities in Excess of Other Assets, Net (16.59)% | | | | | | | (1,045,878 | ) |
Total Net Assets — 100.00% | | | | | | $ | 6,304,898 | |
| ADR | American Depositary Receipt |
| (a) | Non-income producing security. |
| (b) | All or a portion of the security out on loan. |
| (c) | Represents investment of collateral received from securities lending transactions. |
| (d) | The rate shown is the annualized seven-day yield at period end. |
The accompanying notes are an integral part of the financial statements.
Schedule of Investments
Quaker Small-Cap Value Fund
June 30, 2012
| | | | | | | | |
| | | Number
of Shares | | | Fair
Value | |
| Common Stocks — 94.62% | | | | | | | | |
| Basic Materials — 6.65% | | | | | | | | |
| Chemicals — 2.49% | | | | | | | | |
Airgas, Inc. | | | 1,800 | | | $ | 151,218 | |
Georgia Gulf Corp. | | | 4,600 | | | | 118,082 | |
Huntsman Corp. | | | 15,000 | | | | 194,100 | |
Stepan Co. | | | 1,400 | | | | 131,852 | |
Valspar Corp. | | | 3,000 | | | | 157,470 | |
| | | | | | | | 752,722 | |
| Forest Products & Paper — 3.86% | | | | | | | | |
Boise, Inc. | | | 19,300 | | | | 126,994 | |
Domtar Corp. | | | 3,300 | | | | 253,143 | |
PH Glatfelter Co. | | | 15,400 | | | | 252,098 | |
Schweitzer-Mauduit International, Inc. | | | 5,700 | | | | 388,398 | |
Wausau Paper Corp. | | | 15,200 | | | | 147,896 | |
| | | | | | | | 1,168,529 | |
| Mining — 0.30% | | | | | | | | |
Coeur d’ Alene Mines Corp.(a) | | | 5,100 | | | | 89,556 | |
Total Basic Materials (Cost: $2,086,025) | | | | | | | 2,010,807 | |
| Communications — 7.52% | | | | | | | | |
| Advertising — 1.25% | | | | | | | | |
Interpublic Group of Cos, Inc. | | | 34,700 | | | | 376,495 | |
| Internet — 2.11% | | | | | | | | |
Ancestry.com, Inc.(a)(b) | | | 5,400 | | | | 148,662 | |
Dice Holdings, Inc.(a) | | | 21,500 | | | | 201,885 | |
United Online, Inc. | | | 68,400 | | | | 288,648 | |
| | | | | | | | 639,195 | |
| Telecommunications — 4.16% | | | | | | | | |
Amdocs Ltd. | | | 12,000 | | | | 356,640 | |
Arris Group, Inc.(a) | | | 9,800 | | | | 136,318 | |
Cbeyond, Inc.(a) | | | 33,900 | | | | 229,503 | |
NeuStar, Inc. Class A(a) | | | 8,800 | | | | 293,920 | |
Neutral Tandem, Inc.(a) | | | 18,400 | | | | 242,512 | |
| | | | | | | | 1,258,893 | |
Total Communications (Cost: $2,252,413) | | | | | | | 2,274,583 | |
| Consumer, Cyclical — 15.42% | | | | | | | | |
| Airlines — 0.99% | | | | | | | | |
Alaska Air Group, Inc.(a) | | | 4,300 | | | | 154,370 | |
US Airways Group, Inc.(a) | | | 10,900 | | | | 145,297 | |
| | | | | | | | 299,667 | |
| Apparel — 0.87% | | | | | | | | |
Carter’s, Inc.(a) | | | 2,400 | | | | 126,240 | |
Oxford Industries, Inc. | | | 3,100 | | | | 138,570 | |
| | | | | | | | 264,810 | |
| Auto Manufacturers — 0.75% | | | | | | | | |
Oshkosh Corp.(a) | | | 10,800 | | | | 226,260 | |
| Auto Parts & Equipment — 1.13% | | | | | | | | |
Lear Corp. | | | 2,900 | | | | 109,417 | |
Meritor, Inc.(a) | | | 23,100 | | | | 120,582 | |
WABCO Holdings, Inc.(a) | | | 2,100 | | | | 111,153 | |
| | | | | | | | 341,152 | |
| | | | | | | | |
| | | Number
of Shares | | | Fair
Value | |
| Common Stocks (Continued) | | | | | | | | |
| Consumer, Cyclical (Continued) | | | | | | | | |
| Distribution & Wholesale — 1.46% | | | | | | | | |
Ingram Micro, Inc. Class A(a) | | | 6,800 | | | $ | 118,796 | |
Tech Data Corp.(a)(b) | | | 6,700 | | | | 322,739 | |
| | | | | | | | 441,535 | |
| Home Furnishings — 0.73% | | | | | | | | |
Whirlpool Corp. | | | 3,600 | | | | 220,176 | |
| Housewares — 0.44% | | | | | | | | |
Toro Co. | | | 1,800 | | | | 131,922 | |
| Leisure Time — 1.22% | | | | | | | | |
Arctic Cat, Inc.(a) | | | 10,100 | | | | 369,256 | |
| Lodging — 0.37% | | | | | | | | |
Ameristar Casinos, Inc. | | | 6,300 | | | | 111,951 | |
| Office Furnishings — 0.40% | | | | | | | | |
Steelcase, Inc. Class A | | | 13,600 | | | | 122,808 | |
| Retail — 6.64% | | | | | | | | |
Aeropostale, Inc.(a) | | | 7,700 | | | | 137,291 | |
American Eagle Outfitters, Inc. | | | 8,800 | | | | 173,624 | |
ANN, Inc.(a) | | | 7,400 | | | | 188,626 | |
Asbury Automotive Group, Inc.(a) | | | 6,300 | | | | 149,247 | |
Coinstar, Inc.(a)(b) | | | 2,900 | | | | 199,114 | |
Copart, Inc.(a) | | | 5,400 | | | | 127,926 | |
Destination Maternity Corp. | | | 9,800 | | | | 211,680 | |
First Cash Financial Services, Inc.(a) | | | 2,900 | | | | 116,493 | |
Foot Locker, Inc. | | | 4,200 | | | | 128,436 | |
HOT Topic, Inc. | | | 13,300 | | | | 128,877 | |
Lithia Motors, Inc. Class A | | | 7,100 | | | | 163,655 | |
PetMed Express, Inc. | | | 23,300 | | | | 283,328 | |
| | | | | | | | 2,008,297 | |
| Toys/Games/Hobbies — 0.42% | | | | | | | | |
Leapfrog Enterprises, Inc. Class A(a) | | | 12,300 | | | | 126,198 | |
Total Consumer, Cyclical (Cost: $4,581,138) | | | | | | | 4,664,032 | |
| Consumer, Non-cyclical — 9.46% | | | | | | | | |
| Commercial Services — 8.35% | | | | | | | | |
Aaron’s, Inc. | | | 9,300 | | | | 263,283 | |
Aegean Marine Petroleum Network, Inc.(b) | | | 26,200 | | | | 140,170 | |
Apollo Group, Inc. Class A(a) | | | 8,800 | | | | 318,472 | |
Capella Education Co.(a) | | | 4,000 | | | | 139,040 | |
Grand Canyon Education, Inc.(a) | | | 7,800 | | | | 163,332 | |
H&E Equipment Services, Inc.(a) | | | 6,500 | | | | 97,695 | |
ITT Educational Services, Inc.(a)(b) | | | 4,100 | | | | 249,075 | |
Lender Processing Services, Inc. | | | 8,600 | | | | 217,408 | |
Medifast, Inc.(a) | | | 6,100 | | | | 120,048 | |
Net 1 UEPS Technologies, Inc.(a) | | | 18,300 | | | | 153,171 | |
PHH Corp.(a) | | | 6,900 | | | | 120,612 | |
Resources Connection, Inc. | | | 9,900 | | | | 121,770 | |
SAIC, Inc. | | | 25,300 | | | | 306,636 | |
TNS, Inc.(a) | | | 6,300 | | | | 113,022 | |
| | | | | | | | 2,523,734 | |
| | | | | | | | |
| | | Number
of Shares | | | Fair
Value | |
| Common Stocks (Continued) | | | | | | | | |
| Consumer, Non-cyclical (Continued) | | | | | | | | |
| Food — 1.11% | | | | | | | | |
Cal-Maine Foods, Inc.(b) | | | 3,300 | | | $ | 129,030 | |
Dean Foods Co.(a) | | | 12,100 | | | | 206,063 | |
| | | | | | | | 335,093 | |
Total Consumer, Non-cyclical (Cost: $2,965,422) | | | | 2,858,827 | |
| Energy — 6.23% | | | | | | | | |
| Oil & Gas — 5.01% | | | | | | | | |
Energy Partners Ltd.(a) | | | 7,300 | | | | 123,370 | |
Gran Tierra Energy, Inc.(a) | | | 32,600 | | | | 160,066 | |
Sunoco, Inc. | | | 7,500 | | | | 356,250 | |
Tesoro Corp.(a) | | | 16,400 | | | | 409,344 | |
Vaalco Energy, Inc.(a) | | | 25,900 | | | | 223,517 | |
Western Refining, Inc. | | | 10,900 | | | | 242,743 | |
| | | | | 1,515,290 | |
| Oil & Gas Services — 1.22% | | | | | | | | |
Helix Energy Solutions Group, Inc.(a) | | | 6,500 | | | | 106,665 | |
Matrix Service Co.(a) | | | 11,700 | | | | 132,795 | |
Oceaneering International, Inc. | | | 2,700 | | | | 129,222 | |
| | | | | | | | 368,682 | |
Total Energy (Cost: $1,722,330) | | | | 1,883,972 | |
| Financial — 15.32% | | | | | | | | |
| Banks — 5.91% | | | | | | | | |
Banco Latinoamericano de Exportaciones S.A. Class E | | | 12,300 | | | | 263,589 | |
East West Bancorp, Inc. | | | 7,400 | | | | 173,604 | |
First Citizens BancShares, Inc. Class A | | | 800 | | | | 133,320 | |
Huntington Bancshares, Inc. | | | 60,200 | | | | 385,280 | |
International Bancshares Corp. | | | 5,900 | | | | 115,168 | |
PacWest Bancorp | | | 14,700 | | | | 347,949 | |
Umpqua Holdings Corp. | | | 17,100 | | | | 225,036 | |
Wilshire Bancorp, Inc.(a) | | | 26,500 | | | | 145,220 | |
| | | | | 1,789,166 | |
| Diversified Financial Services — 1.23% | | | | | | | | |
Calamos Asset Management, Inc. Class A | | | 9,300 | | | | 106,485 | |
Duff & Phelps Corp. Class A | | | 8,700 | | | | 126,150 | |
Netspend Holdings, Inc.(a) | | | 15,200 | | | | 139,688 | |
| | | | | | | | 372,323 | |
| Insurance — 5.95% | | | | | | | | |
Allied World Assurance Co. Holdings Ltd. | | | 2,300 | | | | 182,781 | |
Assurant, Inc. | | | 8,600 | | | | 299,624 | |
Everest Re Group Ltd. | | | 2,900 | | | | 300,121 | |
Montpelier Re Holdings Ltd. | | | 19,200 | | | | 408,768 | |
ProAssurance Corp. | | | 3,400 | | | | 302,906 | |
RenaissanceRe Holdings Ltd. | | | 4,000 | | | | 304,040 | |
| | | | | 1,798,240 | |
| Real Estate — 1.46% | | | | | | | | |
HFF, Inc. Class A(a) | | | 8,400 | | | | 117,096 | |
Jones Lang LaSalle, Inc. | | | 4,600 | | | | 323,702 | |
| | | | | 440,798 | |
| Savings & Loans — 0.77% | | | | | | | | |
Washington Federal, Inc. | | | 13,800 | | | | 233,082 | |
Total Financial (Cost: $4,578,325) | | | | 4,633,609 | |
| | | | | | | | |
| | | Number
of Shares | | | Fair
Value | |
| Common Stocks (Continued) | | | | | | | | |
| Healthcare — 12.59% | | | | | | | | |
| Biotechnology — 4.22% | | | | | | | | |
AMAG Pharmaceuticals, Inc.(a) | | | 7,000 | | | $ | 107,800 | |
Emergent Biosolutions, Inc.(a) | | | 8,300 | | | | 125,745 | |
Myriad Genetics, Inc.(a) | | | 13,600 | | | | 323,272 | |
PDL BioPharma, Inc.(b) | | | 55,500 | | | | 367,965 | |
United Therapeutics Corp.(a) | | | 7,100 | | | | 350,598 | |
| | | | | | | | 1,275,380 | |
| Healthcare-Products — 2.13% | | | | | | | | |
Cyberonics, Inc.(a) | | | 5,700 | | | | 256,158 | |
Hill-Rom Holdings, Inc. | | | 5,000 | | | | 154,250 | |
Thoratec Corp.(a) | | | 7,000 | | | | 235,060 | |
| | | | | 645,468 | |
| Healthcare-Services — 4.53% | | | | | | | | |
Amedisys, Inc.(a) | | | 9,100 | | | | 113,295 | |
Community Health Systems, Inc.(a) | | | 16,000 | | | | 448,480 | |
Gentiva Health Services, Inc.(a) | | | 16,600 | | | | 115,038 | |
Health Net, Inc.(a) | | | 10,100 | | | | 245,127 | |
Sun Healthcare Group, Inc.(a) | | | 40,200 | | | | 336,474 | |
WellCare Health Plans, Inc.(a) | | | 2,100 | | | | 111,300 | |
| | | | | 1,369,714 | |
| Pharmaceuticals — 1.71% | | | | | | | | |
Herbalife Ltd. | | | 4,900 | | | | 236,817 | |
Warner Chilcott PLC Class A(a) | | | 15,600 | | | | 279,552 | |
| | | | | | | | 516,369 | |
Total Healthcare (Cost: $3,313,592) | | | | 3,806,931 | |
| Industrial — 9.04% | | | | | | | | |
| Aerospace & Defense — 0.84% | | | | | | | | |
Alliant Techsystems, Inc. | | | 2,600 | | | | 131,482 | |
GenCorp, Inc.(a) | | | 18,700 | | | | 121,737 | |
| | | | | 253,219 | |
| Building Materials — 1.06% | | | | | | | | |
Lennox International, Inc. | | | 4,000 | | | | 186,520 | |
Universal Forest Products, Inc. | | | 3,400 | | | | 132,532 | |
| | | | | 319,052 | |
| Electrical Components & Equipment — 0.78% | | | | | | | | |
Advanced Energy Industries, Inc.(a) | | | 10,400 | | | | 139,568 | |
Lihua International, Inc.(b) | | | 17,800 | | | | 97,544 | |
| | | | | 237,112 | |
| Engineering & Construction — 1.33% | | | | | | | | |
Dycom Industries, Inc.(a) | | | 5,900 | | | | 109,799 | |
Foster Wheeler AG(a) | | | 10,600 | | | | 183,698 | |
URS Corp. | | | 3,100 | | | | 108,128 | |
| | | | | 401,625 | |
| Machinery-Diversified — 2.33% | | | | | | | | |
AGCO Corp.(a) | | | 8,400 | | | | 384,132 | |
Applied Industrial Technologies, Inc. | | | 4,000 | | | | 147,400 | |
NACCO Industries, Inc. Class A | | | 1,500 | | | | 174,375 | |
| | | | | 705,907 | |
Schedule of Investments
Quaker Small-Cap Value Fund
June 30, 2012
| | | | | | | | |
| | | Number
of Shares | | | Fair
Value | |
| Common Stocks (Continued) | | | | | | | | |
| Industrial (Continued) | | | | | | | | |
| Metal Fabricate & Hardware — 0.89% | | | | | | | | |
Timken Co. | | | 5,900 | | | $ | 270,161 | |
| Miscellaneous Manufacturing — 0.42% | | | | | | | | |
Smith & Wesson Holding Corp.(a) | | | 15,100 | | | | 125,481 | |
| Transportation — 0.50% | | | | | | | | |
RailAmerica, Inc.(a) | | | 6,200 | | | | 150,040 | |
| Trucking & Leasing — 0.89% | | | | | | | | |
Amerco, Inc. | | | 3,000 | | | | 269,910 | |
Total Industrial (Cost: $2,733,633) | | | | 2,732,507 | |
| Technology — 8.61% | | | | | | | | |
| Computers — 4.45% | | | | | | | | |
Brocade Communications Systems, Inc.(a) | | | 22,800 | | | | 112,404 | |
CACI International, Inc. Class A(a)(b) | | | 7,100 | | | | 390,642 | |
Mentor Graphics Corp.(a) | | | 11,200 | | | | 168,000 | |
Unisys Corp.(a) | | | 21,500 | | | | 420,325 | |
Xyratex Ltd. | | | 22,400 | | | | 253,344 | |
| | | | | 1,344,715 | |
| Semiconductors — 2.24% | | | | | | | | |
Amkor Technology, Inc.(a)(b) | | | 24,800 | | | | 121,024 | |
Kulicke & Soffa Industries, Inc.(a) | | | 11,400 | | | | 101,688 | |
LSI Corp.(a) | | | 47,900 | | | | 305,123 | |
Monolithic Power Systems, Inc.(a) | | | 7,500 | | | | 149,025 | |
| | | | | | | | 676,860 | |
| Software — 1.92% | | | | | | | | |
Actuate Corp.(a) | | | 22,100 | | | | 153,153 | |
Ebix, Inc.(b) | | | 7,100 | | | | 141,645 | |
Fair Isaac Corp. | | | 3,600 | | | | 152,208 | |
Quest Software, Inc.(a) | | | 4,800 | | | | 133,680 | |
| | | | | | | | 580,686 | |
Total Technology (Cost: $2,538,202) | | | | | | | 2,602,261 | |
| Utilities — 3.78% | | | | | | | | |
| Electric — 3.78% | | | | | | | | |
Alliant Energy Corp. | | | 5,200 | | | | 236,964 | |
NV Energy, Inc. | | | 19,500 | | | | 342,810 | |
Pinnacle West Capital Corp. | | | 2,600 | | | | 134,524 | |
PNM Resources, Inc. | | | 8,300 | | | | 162,182 | |
Portland General Electric Co. | | | 10,000 | | | | 266,600 | |
| | | | | | | | 1,143,080 | |
Total Utilities (Cost: $942,626) | | | | | | | 1,143,080 | |
Total Common Stocks
(Cost $27,713,706) | | | | | | | 28,610,609 | |
| | | | | | | | |
| Real Estate Investment Trusts — 5.13% | | | | | | | | |
CapitalSource, Inc. | | | 31,200 | | | | 209,664 | |
CommonWealth REIT | | | 12,900 | | | | 246,648 | |
Coresite Realty Corp. | | | 4,900 | | | | 126,518 | |
Hospitality Properties Trust | | | 10,600 | | | | 262,562 | |
National Health Investors, Inc. | | | 6,700 | | | | 341,164 | |
PS Business Parks, Inc. | | | 3,000 | | | | 203,160 | |
Sunstone Hotel Investors, Inc.(a) | | | 14,700 | | | | 161,553 | |
| | | | | | | | 1,551,269 | |
Total Real Estate Investment Trusts
(Cost $1,395,259) | | | | | | | 1,551,269 | |
| | | | | | | | |
| | | Number
of Shares | | | Fair
Value | |
| Short-Term Investments — 6.58% | | | | | | | | |
| Investment Trust — 5.25% | | | | | | | | |
Invesco Liquid Assets Portfolio, 0.16%(c)(d) | | | 1,588,041 | | | $ | 1,588,041 | |
| Time Deposit — 1.33% | | | | | | | | |
JPMorgan Chase & Co., 0.03%, 07/02/2012(d) | | | 401,169 | | | | 401,169 | |
Total Short-Term Investments
(Cost $1,989,210) | | | | | | | 1,989,210 | |
Total Investments
(Cost $31,098,175) — 106.33% | | | | | | | 32,151,088 | |
Liabilities in Excess of Other Assets, Net (6.33)% | | | | | | | (1,912,624 | ) |
Total Net Assets — 100.00% | | | | | | $ | 30,238,464 | |
| REIT | Real Estate Investment Trust |
| (a) | Non-income producing security. |
| (b) | All or a portion of the security out on loan. |
| (c) | Represents investment of collateral received from securities lending transactions. |
| (d) | The rate shown is the annualized seven-day yield at period end. |
The accompanying notes are an integral part of the financial statements.
Schedule of Investments
Quaker Strategic Growth Fund
June 30, 2012
| | | | | | | | |
| | | Number
of Shares | | | Fair
Value | |
| Domestic Common Stocks — 69.88% | | | | | | | | |
| Basic Materials — 3.34% | | | | | | | | |
| Chemicals — 3.34% | | | | | | | | |
Chemtura Corp.(a) | | | 121,240 | | | $ | 1,757,980 | |
Monsanto Co. | | | 51,050 | | | | 4,225,919 | |
| | | | | | | | 5,983,899 | |
Total Basic Materials (Cost: $5,680,699) | | | | | | | 5,983,899 | |
| Communications — 7.65% | | | | | | | | |
| Internet — 6.63% | | | | | | | | |
eBay, Inc. (a) | | | 86,630 | | | | 3,639,326 | |
Google, Inc. Class A (a) | | | 3,140 | | | | 1,821,420 | |
LinkedIn Corp. Class A (a)(b) | | | 26,060 | | | | 2,769,396 | |
priceline.com, Inc.(a) | | | 5,490 | | | | 3,648,215 | |
| | | | | | | | 11,878,357 | |
| Telecommunications — 1.02% | | | | | | | | |
Qualcomm, Inc. | | | 32,780 | | | | 1,825,190 | |
Total Communications (Cost: $13,655,863) | | | | | | | 13,703,547 | |
| Consumer, Cyclical — 10.57% | | | | | | | | |
| Airlines — 0.60% | | | | | | | | |
JetBlue Airways Corp.(a) | | | 203,600 | | | | 1,079,080 | |
| Apparel — 1.31% | | | | | | | | |
Nike, Inc. Class B | | | 26,717 | | | | 2,345,218 | |
| Lodging — 1.98% | | | | | | | | |
Las Vegas Sands Corp. | | | 81,684 | | | | 3,552,437 | |
| Retail — 6.68% | | | | | | | | |
Dunkin’ Brands Group, Inc. | | | 98,330 | | | | 3,376,652 | |
Home Depot, Inc. | | | 60,410 | | | | 3,201,126 | |
Starbucks Corp. | | | 51,040 | | | | 2,721,453 | |
Yum! Brands, Inc. | | | 41,300 | | | | 2,660,546 | |
| | | | | | | | 11,959,777 | |
Total Consumer, Cyclical (Cost: $18,287,988) | | | | | | | 18,936,512 | |
| Consumer, Non-cyclical — 15.97% | | | | | | | | |
| Agriculture — 1.96% | | | | | | | | |
Philip Morris International, Inc. | | | 40,300 | | | | 3,516,578 | |
| Beverages — 2.52% | | | | | | | | |
Coca-Cola Co. | | | 57,770 | | | | 4,517,036 | |
| Commercial Services — 9.40% | | | | | | | | |
Mastercard, Inc. Class A | | | 12,520 | | | | 5,384,977 | |
Vantiv, Inc. Class A (a) | | | 122,850 | | | | 2,861,177 | |
Verisk Analytics, Inc. Class A (a) | | | 91,960 | | | | 4,529,950 | |
Visa, Inc. Class A | | | 32,840 | | | | 4,060,009 | |
| | | | | | | | 16,836,113 | |
| Cosmetics & Personal Care — 2.09% | | | | | | | | |
Colgate-Palmolive Co. | | | 35,900 | | | | 3,737,190 | |
Total Consumer, Non-cyclical (Cost: $24,827,383) | | | | | | | 28,606,917 | |
| Energy — 3.60% | | | | | | | | |
| Oil & Gas — 3.60% | | | | | | | | |
Anadarko Petroleum Corp. | | | 48,510 | | | | 3,211,362 | |
Occidental Petroleum Corp. | | | 37,730 | | | | 3,236,102 | |
| | | | | | | | 6,447,464 | |
Total Energy (Cost: $6,860,390) | | | | | | | 6,447,464 | |
| | | | | | | | |
| | | Number
of Shares | | | Fair
Value | |
| Domestic Common Stocks (Continued) | | | | | | | | |
| Financial — 6.05% | | | | | | | | |
| Banks — 2.46% | | | | | | | | |
Capital One Financial Corp. | | | 80,530 | | | $ | 4,401,770 | |
| Diversified Financial Services — 2.04% | | | | | | | | |
American Express Co. | | | 62,950 | | | | 3,664,319 | |
| Insurance — 1.55% | | | | | | | | |
Marsh & McLennan Cos., Inc. | | | 86,200 | | | | 2,778,226 | |
Total Financial (Cost: $10,296,260) | | | | | | | 10,844,315 | |
| Healthcare — 9.86% | | | | | | | | |
| Biotechnology — 0.51% | | | | | | | | |
Celgene Corp.(a) | | | 14,330 | | | | 919,413 | |
| Healthcare-Services — 1.46% | | | | | | | | |
Cigna Corp. | | | 59,370 | | | | 2,612,280 | |
| Pharmaceuticals — 7.89% | | | | | | | | |
Abbott Laboratories | | | 35,740 | | | | 2,304,158 | |
Allergan, Inc. | | | 42,350 | | | | 3,920,340 | |
Johnson & Johnson | | | 41,240 | | | | 2,786,174 | |
Mead Johnson Nutrition Co. Class A | | | 63,620 | | | | 5,122,046 | |
| | | | | | | | 14,132,718 | |
Total Healthcare (Cost: $15,753,710) | | | | | | | 17,664,411 | |
| Industrial — 4.02% | | | | | | | | |
| Machinery-Diversified — 2.30% | | | | | | | | |
Cummins, Inc. | | | 9,320 | | | | 903,201 | |
Deere & Co. | | | 39,780 | | | | 3,217,009 | |
| | | | | | | | 4,120,210 | |
| Transportation — 1.72% | | | | | | | | |
FedEx Corp. | | | 33,580 | | | | 3,076,264 | |
Total Industrial (Cost: $7,249,717) | | | | | | | 7,196,474 | |
| Technology — 8.82% | | | | | | | | |
| Computers — 5.25% | | | | | | | | |
Apple, Inc.(a) | | | 12,310 | | | | 7,189,040 | |
EMC Corp.(a) | | | 86,400 | | | | 2,214,432 | |
| | | | | | | | 9,403,472 | |
| Software — 3.57% | | | | | | | | |
Citrix Systems, Inc.(a) | | | 37,970 | | | | 3,187,202 | |
QLIK Technologies, Inc.(a) | | | 42,070 | | | | 930,588 | |
Salesforce.com, Inc.(a) | | | 16,580 | | | | 2,292,351 | |
| | | | | | | | 6,410,141 | |
Total Technology (Cost: $15,766,691) | | | | | | | 15,813,613 | |
Total Domestic Common Stocks
(Cost $118,378,701) | | | | | | | 125,197,152 | |
| | | | | | | | |
| Foreign Common Stocks — 20.29% | | | | | | | | |
| Belgium — 2.70% | | | | | | | | |
| Beverages — 2.70% | | | | | | | | |
Anheuser-Busch InBev NV ADR | | | 60,800 | | | | 4,842,720 | |
Total Belgium (Cost: $3,339,014) | | | | | | | 4,842,720 | |
Schedule of Investments
Quaker Strategic Growth Fund
June 30, 2012
| | | | | | | | |
| | | Number
of Shares | | | Fair
Value | |
| Foreign Common Stocks (Continued) | | | | | | | | |
| Bermuda — 1.76% | | | | | | | | |
| Insurance —1.76% | | | | | | | | |
Arch Capital Group Ltd. (a) | | | 79,400 | | | $ | 3,151,386 | |
Total Bermuda (Cost: $2,701,144) | | | | | | | 3,151,386 | |
| Canada — 1.76% | | | | | | | | |
| Oil & Gas — 1.76% | | | | | | | | |
Cenovus Energy, Inc. | | | 99,220 | | | | 3,155,196 | |
Total Canada (Cost: $3,425,172) | | | | | | | 3,155,196 | |
| France — 2.05% | | | | | | | | |
| Pharmaceuticals — 2.05% | | | | | | | | |
Sanofi ADR | | | 97,020 | | | | 3,665,415 | |
Total France (Cost: $3,679,845) | | | | | | | 3,665,415 | |
| Germany — 1.45% | | | | | | | | |
| Apparel — 1.45% | | | | | | | | |
Adidas AG ADR(b) | | | 72,510 | | | | 2,600,209 | |
Total Germany (Cost: $2,372,650) | | | | | | | 2,600,209 | |
| Ireland — 2.22% | | | | | | | | |
| Computers — 2.22% | | | | | | | | |
Accenture PLC Class A | | | 66,310 | | | | 3,984,568 | |
Total Ireland (Cost: $3,146,593) | | | | | | | 3,984,568 | |
| Israel — 0.78% | | | | | | | | |
| Software — 0.78% | | | | | | | | |
Check Point Software Technologies(a) | | | 27,970 | | | | 1,387,032 | |
Total Israel (Cost: $1,566,447) | | | | | | | 1,387,032 | |
| Netherlands — 1.56% | | | | | | | | |
| Food — 1.56% | | | | | | | | |
Unilever NV Class NY | | | 83,800 | | | | 2,794,730 | |
Total Netherlands (Cost: $2,769,762) | | | | | | | 2,794,730 | |
| Switzerland — 2.52% | | | | | | | | |
| Insurance — 2.52% | | | | | | | | |
ACE Ltd. | | | 60,930 | | | | 4,516,741 | |
Total Switzerland (Cost: $3,749,887) | | | | | | | 4,516,741 | |
| United Kingdom — 3.49% | | | | | | | | |
| Beverages — 1.53% | | | | | | | | |
Diageo PLC ADR | | | 26,600 | | | | 2,741,662 | |
| Pharmaceuticals — 1.96% | | | | | | | | |
GlaxoSmithKline PLC ADR | | | 77,160 | | | | 3,516,181 | |
Total United Kingdom (Cost: $5,764,549) | | | | | | | 6,257,843 | |
Total Foreign Common Stocks
(Cost $32,515,063) | | | | | | | 36,355,840 | |
| | | | | | | | |
| | | Number
of Shares | | | Fair
Value | |
| Short-Term Investments — 6.42% | | | | | | | | |
| Investment Trust —1.27% | | | | | | | | |
Invesco Liquid Assets Portfolio, 0.16%(c)(d) | | | 2,270,726 | | | $ | 2,270,726 | |
| Time Deposit — 5.15% | | | | | | | | |
Citibank 0.03%, 07/02/2012(d) | | $ | 9,232,586 | | | | 9,232,586 | |
Total Short-Term Investments (Cost $11,503,312) | | | | | | | 11,503,312 | |
Total Investments
(Cost $162,397,076) — 96.59% | | | | | | | 173,056,304 | |
Other Assets in Excess of Liabilities, Net — 3.41% | | | | 6,111,107 | |
Total Net Assets —100.00% | | | | | | $ | 179,167,411 | |
| | | | | | | | |
| Call Options Written — 0.01% | | | | | | | | |
Capital One Financial Corp. Expiration: July, 2012
Exercise Price: $55.00 | | | 172 | | | | 20,984 | |
Dunkin’ Brands Group, Inc. Expiration: August, 2012
Exercise Price: $40.00 | | | 228 | | | | 4,560 | |
Total Options Written
(Premiums Received $23,839) | | | | | | $ | 25,544 | |
| ADR | American Depositary Receipt |
| (a) | Non-income producing security. |
| (b) | All or a portion of the security out on loan. |
| (c) | Represents investment of collateral received from securities lending transactions. |
| (d) | The rate shown is the annualized seven-day yield at period end. |
The accompanying notes are an integral part of the financial statements.
Statements of Assets and Liabilities
June 30, 2012
| | | | | | | | | | | | | | | | | | | | | | | | |
| | | Quaker Event
Arbitrage Fund | | | Quaker Global
Tactical Allocation Fund | | | Quaker
Mid-Cap
Value Fund | | | Quaker Small-Cap
Growth Tactical
Allocation Fund | | | Quaker Small-Cap
Value Fund | | | Quaker Strategic
Growth Fund | |
| ASSETS: | | | | | | | | | | | | | | | | | | | | | | | | |
Investments, at value | | $ | 48,018,610 | | | $ | 9,693,589 | | | $ | 8,619,328 | | | $ | 7,350,776 | | | $ | 32,151,088 | | | $ | 173,056,304 | |
Foreign currency deposits | | | 616,108 | | | | — | | | | — | | | | — | | | | — | | | | — | |
Deposits with brokers for securities sold short | | | 7,903,790 | | | | 976,255 | | | | — | | | | — | | | | — | | | | 5,870,849 | |
Receivables: | | | | | | | | | | | | | | | | | | | | | | | | |
Dividends and interest | | | 38,555 | | | | 8,667 | | | | 14,401 | | | | 657 | | | | 23,419 | | | | 191,483 | |
Capital shares sold | | | 131,676 | | | | 100 | | | | 13,792 | | | | — | | | | 264 | | | | 627,463 | |
Investment securities sold | | | 1,835,139 | | | | 1,822,425 | | | | — | | | | 30,456 | | | | — | | | | 6,587,566 | |
Receivable for open forward currency contracts | | | 1,588,871 | | | | — | | | | — | | | | — | | | | — | | | | — | |
Securities lending income | | | — | | | | 28 | | | | 22 | | | | 4,690 | | | | 4,287 | | | | 1,095 | |
Prepaid expenses and other assets | | | 55,622 | | | | 7,375 | | | | 7,269 | | | | 7,386 | | | | 26,749 | | | | 122,450 | |
Total assets | | | 60,188,371 | | | | 12,508,439 | | | | 8,654,812 | | | | 7,393,965 | | | | 32,205,807 | | | | 186,457,210 | |
| | | | | | | | | | | | | | | | | | | | | | | | |
| LIABILITIES: | | | | | | | | | | | | | | | | | | | | | | | | |
Call Options Written, at value | | | 1,715,736 | | | | 1,480 | | | | — | | | | — | | | | — | | | | 25,544 | |
Securities sold short, at value | | | 544,142 | | | | 291,940 | | | | — | | | | — | | | | — | | | | — | |
Payables: | | | | | | | | | | | | | | | | | | | | | | | | |
Due to Advisor (Note 3) | | | 32,955 | | | | 10,702 | | | | 6,988 | | | | 5,151 | | | | 31,955 | | | | 86,556 | |
Capital shares redeemed | | | 182,392 | | | | 29,334 | | | | 2,062 | | | | 24,165 | | | | 152,767 | | | | 532,854 | |
Upon return of securities loaned | | | — | | | | 163,800 | | | | 208,181 | | | | 1,034,904 | | | | 1,588,041 | | | | 2,270,726 | |
Investment securities purchased | | | 835,971 | | | | 2,210,602 | | | | — | | | | — | | | | 116,961 | | | | 4,014,986 | |
Payable for open forward currency contracts | | | 1,565,460 | | | | — | | | | — | | | | — | | | | — | | | | — | |
Dividends on securities sold short | | | — | | | | 531 | | | | — | | | | — | | | | — | | | | — | |
Distributions fees | | | 12,987 | | | | 3,793 | | | | 2,751 | | | | 2,103 | | | | 3,108 | | | | 44,784 | |
Trustee expenses | | | 4,068 | | | | 844 | | | | 671 | | | | 671 | | | | 3,117 | | | | 14,706 | |
Chief compliance officer fees | | | 2,664 | | | | 495 | | | | 404 | | | | 358 | | | | 1,826 | | | | 8,780 | |
Accrued expenses | | | 80,287 | | | | 31,485 | | | | 18,519 | | | | 21,715 | | | | 69,568 | | | | 290,863 | |
Total liabilities | | | 4,976,662 | | | | 2,745,006 | | | | 239,576 | | | | 1,089,067 | | | | 1,967,343 | | | | 7,289,799 | |
NET ASSETS | | $ | 55,211,709 | | | $ | 9,763,433 | | | $ | 8,415,236 | | | $ | 6,304,898 | | | $ | 30,238,464 | | | $ | 179,167,411 | |
| | | | | | | | | | | | | | | | | | | | | | | | |
| NET ASSETS CONSIST OF: | | | | | | | | | | | | | | | | | | | | | | | | |
Paid-in capital | | $ | 58,800,814 | | | $ | 23,182,462 | | | $ | 16,398,422 | | | $ | 7,782,147 | | | $ | 38,427,566 | | | $ | 615,018,620 | |
Accumulated net realized loss on investments | | | (833,424 | ) | | | (13,703,513 | ) | | | (9,246,000 | ) | | | (1,533,278 | ) | | | (9,209,164 | ) | | | (445,853,852 | ) |
Accumulated net investment gain (loss) | | | 76,874 | | | | (80,154 | ) | | | (33,528 | ) | | | (61,339 | ) | | | (32,850 | ) | | | (654,882 | ) |
Net unrealized appreciation (depreciation) on investments | | | (2,832,555 | ) | | | 364,638 | | | | 1,296,342 | | | | 117,368 | | | | 1,052,912 | | | | 10,657,525 | |
Total Net Assets | | $ | 55,211,709 | | | $ | 9,763,433 | | | $ | 8,415,236 | | | $ | 6,304,898 | | | $ | 30,238,464 | | | $ | 179,167,411 | |
Total Investments, at Cost | | $ | 50,486,615 | | | $ | 9,314,730 | | | $ | 7,322,986 | | | $ | 7,233,408 | | | $ | 31,098,175 | | | $ | 162,397,076 | |
Foreign Currency, at Cost | | $ | 611,077 | | | $ | — | | | $ | — | | | $ | — | | | $ | — | | | $ | — | |
Proceeds from Securities Sold Short | | | 593,645 | | | | 277,826 | | | | — | | | | — | | | | — | | | | — | |
Premiums on options | | | 1,274,680 | | | | 1,373 | | | | — | | | | — | | | | — | | | | 23,839 | |
Market value of securities loaned | | | — | | | | 159,643 | | | | 202,719 | | | | 1,000,391 | | | | 1,540,736 | | | | 2,221,822 | |
Class A Shares: | | | | | | | | | | | | | | | | | | | | | | | | |
Net Assets | | $ | 34,725,268 | | | $ | 5,707,042 | | | $ | 6,113,935 | | | $ | 2,506,906 | | | $ | 8,347,166 | | | $ | 111,777,678 | |
Shares of Beneficial interest outstanding(1) | | | 2,911,921 | | | | 801,996 | | | | 388,614 | | | | 282,305 | | | | 526,678 | | | | 6,927,955 | |
Net Asset Value per share and redemption price per share | | $ | 11.93 | | | $ | 7.12 | | | $ | 15.73 | | | $ | 8.88 | | | $ | 15.85 | | | $ | 16.13 | |
Offering price per share (100 ÷ 94.50 × net asset value per share) | | $ | 12.62 | | | $ | 7.53 | | | $ | 16.65 | | | $ | 9.40 | | | $ | 16.77 | | | $ | 17.07 | |
Class C Shares: | | | | | | | | | | | | | | | | | | | | | | | | |
Net Assets | | $ | 7,194,577 | | | $ | 3,157,883 | | | $ | 1,950,097 | | | $ | 1,900,435 | | | $ | 1,863,236 | | | $ | 27,101,905 | |
Shares of Beneficial interest outstanding(1) | | | 610,634 | | | | 457,958 | | | | 138,211 | | | | 220,817 | | | | 138,112 | | | | 1,872,785 | |
Net Asset Value per share and redemption price per share | | $ | 11.78 | | | $ | 6.90 | | | $ | 14.11 | | | $ | 8.61 | | | $ | 13.49 | | | $ | 14.47 | |
Institutional Class Shares: | | | | | | | | | | | | | | | | | | | | | | | | |
Net Assets | | $ | 13,291,864 | | | $ | 898,508 | | | $ | 351,204 | | | $ | 1,897,557 | | | $ | 20,028,062 | | | $ | 40,287,828 | |
Shares of Beneficial interest outstanding(1) | | | 1,110,251 | | | | 110,714 | | | | 21,431 | | | | 211,294 | | | | 1,214,181 | | | | 2,418,131 | |
Net Asset Value per share and redemption price per share | | $ | 11.97 | | | $ | 8.12 | | | $ | 16.39 | | | $ | 8.98 | | | $ | 16.50 | | | $ | 16.66 | |
| (1) | Unlimited number of shares of beneficial interest with a $0.01 par value authorized. |
The accompanying notes are an integral part of the financial statements.
Statements of Operations
For the Fiscal Year Ended June 30, 2012
| | | | | | | | | | | | | | | | | | | | | | | | |
| | | Quaker
Event
Arbitrage Fund | | | Quaker
Global Tactical
Allocation Fund | | | Quaker
Mid-Cap
Value Fund | | | Quaker Small-Cap
Growth Tactical
Allocation Fund | | | Quaker
Small-Cap
Value Fund | | | Quaker
Strategic
Growth Fund | |
| INVESTMENT INCOME | | | | | | | | | | | | | | | | | | | | | | | | |
Income: | | | | | | | | | | | | | | | | | | | | | | | | |
Dividends (net of foreign withholding taxes) | | $ | 464,158 | | | $ | 175,944 | | | $ | 131,517 | | | $ | 37,208 | | | $ | 526,783 | | | $ | 2,621,562 | |
Interest | | | 1,004,655 | | | | 86 | | | | — | | | | 472 | | | | 200 | | | | 2,495 | |
Securities lending income | | | — | | | | 2,488 | | | | 55 | | | | 47,520 | | | | 39,197 | | | | 25,160 | |
Total Income | | | 1,468,813 | | | | 178,518 | | | | 131,572 | | | | 85,200 | | | | 566,180 | | | | 2,649,217 | |
| | | | | | |
Expenses: | | | | | | | | | | | | | | | | | | | | | | | | |
Investment advisory fees (Note 3) | | | 658,708 | | | | 174,674 | | | | 91,231 | | | | 119,231 | | | | 389,369 | | | | 2,701,407 | |
Fund administration fees | | | 37,333 | | | | 10,377 | | | | 6,524 | | | | 8,803 | | | | 28,529 | | | | 146,686 | |
Accounting fees | | | 57,901 | | | | 22,992 | | | | 12,873 | | | | 16,117 | | | | 38,353 | | | | 163,885 | |
Transfer agent fees | | | 115,782 | | | | 31,125 | | | | 20,906 | | | | 25,554 | | | | 54,137 | | | | 491,032 | |
Custody fees | | | 31,748 | | | | 36,909 | | | | 9,675 | | | | 15,142 | | | | 25,360 | | | | 52,854 | |
Trustee fees and meeting expenses | | | 19,238 | | | | 5,070 | | | | 3,169 | | | | 4,642 | | | | 13,514 | | | | 73,490 | |
Legal fees | | | 10,406 | | | | 1,461 | | | | 992 | | | | 1,262 | | | | 4,434 | | | | 23,624 | |
Audit fees | | | 30,002 | | | | 7,869 | | | | 3,986 | | | | 6,418 | | | | 19,072 | | | | 102,597 | |
Distribution Fee — Class A | | | 76,488 | | | | 20,479 | | | | 15,569 | | | | 12,986 | | | | 24,967 | | | | 346,282 | |
Distribution Fee — Class C | | | 60,612 | | | | 45,732 | | | | 21,075 | | | | 33,485 | | | | 20,263 | | | | 324,887 | |
Officers’ compensation fees | | | 27,196 | | | | 7,216 | | | | 4,577 | | | | 6,104 | | | | 20,836 | | | | 107,911 | |
Registration and filing expenses | | | 34,190 | | | | 16,064 | | | | 8,138 | | | | 18,091 | | | | 40,845 | | | | 208,053 | |
Printing expenses | | | 28,519 | | | | 10,811 | | | | 4,261 | | | | 8,755 | | | | 16,759 | | | | 106,693 | |
Dividends and Interest on securities sold short | | | 7,401 | | | | 9,106 | | | | — | | | | — | | | | — | | | | — | |
Other operating expenses | | | 10,579 | | | | 6,323 | | | | 4,237 | | | | 6,471 | | | | 13,814 | | | | 67,775 | |
Total expenses | | | 1,206,103 | | | | 406,208 | | | | 207,213 | | | | 283,061 | | | | 710,252 | | | | 4,917,176 | |
Less: | | | | | | | | | | | | | | | | | | | | | | | | |
Investment advisory fees waived & reimbursed (Note 3) | | | (187,347 | ) | | | — | | | | — | | | | — | | | | — | | | | (100,595 | ) |
Net expenses | | | 1,018,756 | | | | 406,208 | | | | 207,213 | | | | 283,061 | | | | 710,252 | | | | 4,816,581 | |
Net investment income (loss) | | | 450,057 | | | | (227,690 | ) | | | (75,641 | ) | | | (197,861 | ) | | | (144,072 | ) | | | (2,167,364 | ) |
| | | | | | | | | | | | | | | | | | | | | | | | |
REALIZED AND UNREALIZED GAIN (LOSS) ON INVESTMENTS
AND FOREIGN CURRENCY | | | | | | | | | | | | | | | | | | | | | | | | |
Net realized gain (loss) from investments,
(excluding short securities) | | | (6,273,170 | ) | | | (192,890 | ) | | | 1,089,211 | | | | (1,416,646 | ) | |
|
1,825,142 |
| | | 16,298,547 | |
Net realized gain on in-kind redemption | | | — | | | | — | | | | — | | | | — | | | | 96,419 | | | | — | |
Net realized loss from short securities | | | (1,172,110 | ) | | | (179,231 | ) | | | — | | | | — | | | | — | | | | — | |
Net realized gain from written options | | | 6,432,693 | | | | 7,403 | | | | — | | | | — | | | | — | | | | 114,480 | |
Net realized gain from foreign currency transactions | | | 152,206 | | | | — | | | | — | | | | — | | | | — | | | | — | |
Net change in unrealized depreciation on investments
(excluding short securities) | | | (801,516 | ) | | | (620,939 | ) | | | (1,343,438 | ) | | | (391,574 | ) | | | (4,746,214 | ) | | | (24,080,055 | ) |
Net change in unrealized appreciation (depreciation) on short securities | | | 282,226 | | | | (14,114 | ) | | | — | | | | — | | | | — | | | | — | |
Net change in unrealized appreciation (depreciation) on written options | | | (507,771 | ) | | | 502 | | | | — | | | | — | | | | — | | | | 6,008 | |
Net change in unrealized appreciation on forward currency | | | 26,951 | | | | — | | | | — | | | | — | | | | — | | | | — | |
Net realized and unrealized loss on investments
and foreign currency transactions | | | (1,860,491 | ) | | | (999,269 | ) | | | (254,227 | ) | | | (1,808,220 | ) | | | (2,824,653 | ) | | | (7,661,020 | ) |
Net decrease in net assets resulting from operations | | $ | (1,410,434 | ) | | $ | (1,226,959 | ) | | $ | (329,868 | ) | | $ | (2,006,081 | ) | | $ | (2,968,725 | ) | | $ | (9,828,384 | ) |
Foreign withholding taxes on dividends | | $ | 13,069 | | | $ | (9,935 | ) | | $ | (504 | ) | | $ | (49 | ) | | $ | (353 | ) | | $ | (87,509 | ) |
The accompanying notes are an integral part of the financial statements.
Statements of Changes in Net Assets
For the Fiscal Year Ended June 30, 2012
| | | | | | | | | | | | | | | | | | | | | | | | |
| | | Quaker
Event
Arbitrage Fund | | | Quaker
Global Tactical
Allocation Fund | | | Quaker
Mid-Cap
Value Fund | | | Quaker Small-Cap
Growth Tactical
Allocation Fund | | | Quaker
Small-Cap
Value Fund | | | Quaker
Strategic
Growth Fund | |
| INCREASE (DECREASE) IN NET ASSETS | | | | | | | | | | | | | | | | | | | | | | | | |
Operations | | | | | | | | | | | | | | | | | | | | | | | | |
Net investment income (loss) | | $ | 450,057 | | | $ | (227,690 | ) | | $ | (75,641 | ) | | $ | (197,861 | ) | | $ | (144,072 | ) | | $ | (2,167,364 | ) |
Net realized gain (loss) from investment transactions and foreign currency transactions | | | 311,729 | | | | (185,487 | ) | | | 1,089,211 | | | | (1,416,646 | ) | | | 1,921,561 | | | | 16,413,027 | |
Net realized loss from securities sold short | | | (1,172,110 | ) | | | (179,231 | ) | | | — | | | | — | | | | — | | | | — | |
Change in net unrealized depreciation on investments and foreign currency | | | (1,282,336 | ) | | | (620,437 | ) | | | (1,343,438 | ) | | | (391,574 | ) | | | (4,746,214 | ) | | | (24,074,047 | ) |
Change in net unrealized appreciation (depreciation) on securities sold short | | | 282,226 | | | | (14,114 | ) | | | — | | | | — | | | | — | | | | — | |
Net decrease in net assets resulting from operations | | | (1,410,434 | ) | | | (1,226,959 | ) | | | (329,868 | ) | | | (2,006,081 | ) | | | (2,968,725 | ) | | | (9,828,384 | ) |
Distributions to shareholders from | | | | | | | | | | | | | | | | | | | | | | | | |
Net realized capital gain — Class A | | | (681,915 | ) | | | — | | | | — | | | | (260,397 | ) | | | — | | | | — | |
Net realized capital gain — Class C | | | (136,929 | ) | | | — | | | | — | | | | (141,918 | ) | | | — | | | | — | |
Net realized capital gain — Institutional Class | | | (285,061 | ) | | | — | | | | — | | | | (146,266 | ) | | | — | | | | — | |
Total Distributions | | | (1,103,905 | ) | | | — | | | | — | | | | (548,581 | ) | | | — | | | | — | |
Capital share transactions | | | | | | | | | | | | | | | | | | | | | | | | |
| | | | | | |
Increase (Decrease) in net assets from fund share transactions (Note 9) | | | 8,003,003 | | | | (8,585,104 | ) | | | (1,493,862 | ) | | | (11,205,264 | ) | | | (6,558,501 | ) | | | (82,128,768 | ) |
Total increase (decrease) in net assets | | | 5,488,664 | | | | (9,812,063 | ) | | | (1,823,730 | ) | | | (13,759,926 | ) | | | (9,527,226 | ) | | | (91,957,152 | ) |
| | | | | | | | | | | | | | | | | | | | | | | | |
| NET ASSETS | | | | | | | | | | | | | | | | | | | | | | | | |
Beginning of period | | | 49,723,045 | | | | 19,575,496 | | | | 10,238,966 | | | | 20,064,824 | | | | 39,765,690 | | | | 271,124,563 | |
End of period | | $ | 55,211,709 | | | $ | 9,763,433 | | | $ | 8,415,236 | | | $ | 6,304,898 | | | $ | 30,238,464 | | | $ | 179,167,411 | |
Accumulated net investment income (loss), at end of period | | $ | 76,874 | | | $ | (80,154 | ) | | $ | (33,528 | ) | | $ | (61,339 | ) | | $ | (32,850 | ) | | $ | (654,882 | ) |
| For the Fiscal Year Ended June 30, 2011 | | | | | | | | | | | | | | | | | | | | | | | | |
| INCREASE (DECREASE) IN NET ASSETS | | | | | | | | | | | | | | | | | | | | | | | | |
Operations | | | | | | | | | | | | | | | | | | | | | | | | |
Net investment income (loss) | | $ | 41,180 | | | $ | (355,018 | ) | | $ | (109,680 | ) | | $ | (490,185 | ) | | $ | (115,833 | ) | | $ | (3,467,817 | ) |
Net realized gain from investment transactions and foreign currency transactions | | | 1,195,637 | | | | 4,365,594 | | | | 1,368,433 | | | | 1,225,918 | | | | 13,897,375 | | | | 39,986,447 | |
Net realized gain (loss) from securities sold short | | | (471,623 | ) | | | 20,507 | | | | — | | | | — | | | | — | | | | (17,672 | ) |
Change in net unrealized appreciation (depreciation) | | | (1,307,167 | ) | | | 1,317,442 | | | | 1,665,169 | | | | 848,564 | | | | 6,411,019 | | | | 42,940,214 | |
Net increase (decrease) in net assets resulting from operations | | | (541,973 | ) | | | 5,348,525 | | | | 2,923,922 | | | | 1,584,297 | | | | 20,192,561 | | | | 79,441,172 | |
Distributions to shareholders from | | | | | | | | | | | | | | | | | | | | | | | | |
Net investment income Class A | | | (83,661 | ) | | | — | | | | — | | | | — | | | | — | | | | — | |
Net investment income Class C | | | (4,905 | ) | | | — | | | | — | | | | — | | | | — | | | | — | |
Net investment income Institutional Class | | | (28,257 | ) | | | — | | | | — | | | | — | | | | — | | | | — | |
Net realized capital gain — Class A | | | (46,008 | ) | | | — | | | | — | | | | (316,211 | ) | | | — | | | | — | |
Net realized capital gain — Class C | | | (4,938 | ) | | | — | | | | — | | | | (211,202 | ) | | | — | | | | — | |
Net realized capital gain — Institutional Class | | | (13,204 | ) | | | — | | | | — | | | | (116,906 | ) | | | — | | | | — | |
Total Distributions | | | (180,973 | ) | | | — | | | | — | | | | (644,319 | ) | | | — | | | | — | |
Capital share transactions | | | | | | | | | | | | | | | | | | | | | | | | |
| | | | | | |
Increase (Decrease) in net assets from fund share transactions (Note 9) | | | 45,188,855 | | | | (9,050,472 | ) | | | (2,153,124 | ) | | | (7,835,404 | ) | | | (62,914,069 | ) | | | (198,196,928 | ) |
Total increase (decrease) in net assets | | | 44,465,909 | | | | (3,701,947 | ) | | | 770,798 | | | | (6,895,426 | ) | | | (42,721,508 | ) | | | (118,755,756 | ) |
| | | | | | | | | | | | | | | | | | | | | | | | |
| NET ASSETS | | | | | | | | | | | | | | | | | | | | | | | | |
Beginning of period | | | 5,257,136 | | | | 23,277,443 | | | | 9,468,168 | | | | 26,960,250 | | | | 82,487,198 | | | | 389,880,319 | |
End of period | | $ | 49,723,045 | | | $ | 19,575,496 | | | $ | 10,238,966 | | | $ | 20,064,824 | | | $ | 39,765,690 | | | $ | 271,124,563 | |
Accumulated net investment income (loss), at end of period | | $ | 171,167 | | | $ | (355,018 | ) | | $ | (107,755 | ) | | $ | (490,185 | ) | | $ | (104,894 | ) | | $ | (3,467,817 | ) |
The accompanying notes are an integral part of the financial statements.
Financial Highlights
Quaker Event Arbitrage Fund
(For a Share Outstanding Throughout the Period)
| | | | | | | | | | | | | | | | | | | | | | | | |
| | | Class A | |
| | | Year Ended
June 30, 2012 | | | Year Ended
June 30, 2011 | | | For the Period
January 1, 2010
to June 30, 2010 | | | Year Ended
December 31, 2009 | | | Year Ended December 31, 2008 | | | Year Ended
December 31, 2007 | |
| Net asset value, beginning of period | | $ | 12.50 | | | $ | 12.54 | | | $ | 11.80 | | | $ | 9.23 | | | $ | 12.43 | | | $ | 13.20 | |
| Income from investment operations | | | | | | | | | | | | | | | | | | | | | | | | |
Net investment income (loss)(1) | | | 0.11 | | | | — | | | | 0.34 | | | | (0.05 | ) | | | (0.01 | ) | | | 0.15 | |
Net realized and unrealized gain (loss) on investments | | | (0.41 | ) | | | 0.06 | | | | 0.40 | | | | 2.62 | | | | (3.19 | ) | | | (0.15 | ) |
Total from investment operations | | | (0.30 | ) | | | 0.06 | | | | 0.74 | | | | 2.57 | | | | (3.20 | ) | | | — | |
| Distributions to shareholders from: | | | | | | | | | | | | | | | | | | | | | | | | |
Net investment income | | | — | | | | (0.06 | ) | | | — | | | | — | | | | — | | | | (0.08 | ) |
Net realized capital gain | | | (0.27 | ) | | | (0.04 | ) | | | — | | | | — | | | | — | | | | (0.55 | ) |
Return of capital | | | — | | | | — | | | | — | | | | — | | | | — | | | | (0.14 | ) |
Total distributions | | | (0.27 | ) | | | (0.10 | ) | | | — | | | | — | | | | — | | | | (0.77 | ) |
| Net asset value, end of period | | $ | 11.93 | | | $ | 12.50 | | | $ | 12.54 | | | $ | 11.80 | | | $ | 9.23 | | | $ | 12.43 | |
| Total Return(2) | | | (2.31 | )% | | | 0.47 | % | | | 6.27 | %* | | | 27.84 | % | | | (25.74 | )% | | | (0.03 | )% |
| | | | | | |
| Ratios/supplemental data | | | | | | | | | | | | | | | | | | | | | | | | |
Net assets, end of period (000’s omitted) | | $ | 34,725 | | | $ | 25,413 | | | $ | 4,283 | | | $ | 2,918 | | | $ | 1,847 | | | $ | 3,503 | |
Ratio of expenses to average net assets: | | | | | | | | | | | | | | | | | | | | | | | | |
Expenses before reductions | | | 2.37 | % | | | 2.30 | % | | | 3.25 | %** | | | 3.86 | % | | | 3.51 | % | | | 2.10 | % |
Expenses net of fee waivers, if any | | | 1.99 | % | | | 1.99 | % | | | 2.44 | %** | | | 1.91 | % | | | 2.00 | % | | | 1.50 | % |
Expenses before reductions (excluding dividend and
interest expense for securities sold short) | | | 2.35 | % | | | 2.24 | % | | | 2.56 | %** | | | 3.46 | % | | | 3.02 | % | | | 2.09 | % |
Expenses net of all reductions (excluding dividend and interest expense for securities sold short) | | | 1.98 | % | | | 1.93 | % | | | 1.76 | %** | | | 1.50 | % | | | 1.50 | % | | | 1.50 | % |
Ratio of net investment income (loss) to average net assets*** | | | — | | | | — | | | | 5.59 | %** | | | (0.47 | )% | | | (0.13 | )% | | | 0.57 | % |
Before waiver and expense reimbursement(3) | | | 0.55 | % | | | (0.28 | )% | | | — | | | | — | | | | — | | | | — | |
After waiver and expense reimbursement(3) | | | 0.92 | % | | | 0.04 | % | | | — | | | | — | | | | — | | | | — | |
| Portfolio turnover rate | | | 156.57 | % | | | 98.65 | % | | | 138.58 | %* | | | 226.00 | % | | | 224.66 | % | | | 249.36 | % |
| (1) | The average shares outstanding method has been applied for per share information. |
| (2) | Total investment return is based on the change in net asset value of a share during the period, assumes reinvestment of dividends and distributions at net asset value and does not reflect the impact of a sales charge. |
| (3) | Expenses waived or reimbursed reflect reductions to total expenses, as discussed in the notes to the financial statements. These amounts would increase the net investment loss ratio or decrease the net investment income ratio, as applicable, had such reductions not occurred. |
| | *** | The net investment income (loss) ratios include dividends on short positions. |
The accompanying notes are an integral part of the financial statements.
| | | | | | | | | | | | |
| | | Class C | |
| | | Year Ended
June 30, 2012 | | | Year Ended
June 30, 2011 | | | For the Period
June 7, 2010
(commencement of operations)
to June 30, 2010 | |
| Net asset value, beginning of period | | $ | 12.45 | | | $ | 12.55 | | | $ | 12.35 | |
| Income from investment operations | | | | | | | | | | | | |
Net investment income (loss)(1) | | | 0.02 | | | | (0.07 | ) | | | (0.21 | ) |
Net realized and unrealized gain (loss) on investments | | | (0.42 | ) | | | 0.04 | | | | 0.41 | |
Total from investment operations | | | (0.40 | ) | | | (0.03 | ) | | | 0.20 | |
| Distributions to shareholders from: | | | | | | | | | | | | |
Net investment income | | | — | | | | (0.03 | ) | | | — | |
Net realized capital gain | | | (0.27 | ) | | | (0.04 | ) | | | — | |
Total distributions | | | (0.27 | ) | | | (0.07 | ) | | | — | |
| Net asset value, end of period | | $ | 11.78 | | | $ | 12.45 | | | $ | 12.55 | |
| Total Return(2) | | | (3.13 | )% | | | (0.24 | )% | | | 1.62 | %†* |
| | | |
| Ratios/supplemental data | | | | | | | | | | | | |
Net assets, end of period (000’s omitted) | | $ | 7,195 | | | $ | 4,369 | | | $ | 231 | |
Ratio of expenses to average net assets: | | | | | | | | | | | | |
Expenses before reductions | | | 3.12 | % | | | 3.08 | % | | | 2.74 | %** |
Expenses net of fee waivers, if any | | | 2.74 | % | | | 2.74 | % | | | 2.74 | %** |
Expenses before reductions (excluding dividend and interest expense for securities sold short) | | | 3.10 | % | | | 3.02 | % | | | 2.52 | %** |
Expenses net of all reductions (excluding dividend and interest expense for securities sold short) | | | 2.73 | % | | | 2.68 | % | | | 2.52 | %** |
Ratio of net investment income (loss) to average net assets:*** | | | — | | | | — | | | | (29.65 | )%** |
Before waiver and expense reimbursement(4) | | | (0.17 | )% | | | (0.91 | )% | | | — | |
After waiver and expense reimbursement(4) | | | 0.21 | % | | | (0.57 | )% | | | — | |
| Portfolio turnover rate | | | 156.57 | % | | | 98.65 | % | | | 138.58 | %(3)* |
| (1) | The average shares outstanding method has been applied for per share information. |
| (2) | Total investment return is based on the change in net asset value of a share during the period, assumes reinvestment of dividends and distributions at net asset value and does not reflect the impact of a sales charge. |
| (3) | Portfolio turnover for this class is for the period January 1, 2010 to June 30, 2010. |
| (4) | Expenses waived or reimbursed reflect reductions to total expenses, as discussed in the notes to the financial statements. These amounts would increase the net investment loss ratio or decrease the net investment income ratio, as applicable, had such reductions not occurred. |
| | † | The returns shown represent performance for a period of less than one year. |
| | *** | The net investment (loss) ratios include dividends on short positions. |
The accompanying notes are an integral part of the financial statements.
Financial Highlights
Quaker Event Arbitrage Fund
(For a Share Outstanding Throughout the Period)
| | | | | | | | | | | | |
| | | Institutional Class | |
| | | Year Ended
June 30, 2012 | | | Year Ended
June 30, 2011 | | | For the Period June 7, 2010
(commencement of operations)
to June 30, 2010 | |
| Net asset value, beginning of period | | $ | 12.52 | | | $ | 12.54 | | | $ | 12.35 | |
| Income from investment operations | | | | | | | | | | | | |
Net investment income (loss)(1) | | | 0.13 | | | | 0.08 | | | | (0.03 | ) |
Net realized and unrealized gain (loss) on investments | | | (0.41 | ) | | | 0.02 | | | | 0.22 | |
Total from investment operations | | | (0.28 | ) | | | 0.10 | | | | 0.19 | |
| Distributions to shareholders from: | | | | | | | | | | | | |
Net investment income | | | — | | | | (0.08 | ) | | | — | |
Net realized capital gain | | | (0.27 | ) | | | (0.04 | ) | | | — | |
Total distributions | | | (0.27 | ) | | | (0.12 | ) | | | — | |
| Net asset value, end of period | | $ | 11.97 | | | $ | 12.52 | | | $ | 12.54 | |
| Total Return(2) | | | (2.14 | )% | | | 0.72 | % | | | 1.54 | %†* |
| | | |
| Ratios/supplemental data | | | | | | | | | | | | |
Net assets, end of period (000’s omitted) | | $ | 13,292 | | | $ | 19,941 | | | $ | 743 | |
Ratio of expenses to average net assets: | | | | | | | | | | | | |
Expenses before reductions | | | 2.09 | % | | | 2.11 | % | | | 3.00 | %** |
Expenses net of fee waivers, if any | | | 1.74 | % | | | 1.74 | % | | | 3.00 | %** |
Expenses before reductions (excluding dividend and interest expense for securities sold short) | | | 2.08 | % | | | 2.06 | % | | | 2.88 | %** |
Expenses net of all reductions (excluding dividend and interest expense for securities sold short) | | | 1.73 | % | | | 1.70 | % | | | 2.88 | %** |
Ratio of net investment income (loss) to average net assets*** | | | — | | | | — | | | | (3.81 | )%** |
Before waiver and expense reimbursement(4) | | | 0.75 | % | | | 0.26 | % | | | — | |
After waiver and expense reimbursement(4) | | | 1.11 | % | | | 0.62 | % | | | — | |
| Portfolio turnover rate | | | 156.57 | % | | | 98.65 | % | | | 138.58 | %(3)* |
| (1) | The average shares outstanding method has been applied for per share information. |
| (2) | Total investment return is based on the change in net asset value of a share during the period, assumes reinvestment of dividends and distributions at net asset value and does not reflect the impact of a sales charge. |
| (3) | Portfolio turnover for this class is for the period January 1, 2010 to June 30, 2010. |
| (4) | Expenses waived or reimbursed reflect reductions to total expenses, as discussed in the notes to the financial statements. These amounts would increase the net investment loss ratio or decrease the net investment income ratio, as applicable, had such reductions not occurred. |
| | † | The returns shown represent performance for a period of less than one year. |
| | *** | The net investment (loss) ratios include dividends on short positions. |
The accompanying notes are an integral part of the financial statements.
Financial Highlights
Quaker Global Tactical Allocation Fund
(For a Share Outstanding Throughout the Period)
| | | | | | | | | | | | | | | | | | | | |
| | | Class A | |
| | | Year Ended
June 30, 2012 | | | Year Ended
June 30, 2011 | | | Year Ended June 30, 2010 | | | Year Ended
June 30, 2009 | | | For the Period
May 1, 2008
(commencement of operations)
to June 30, 2008 | |
| Net asset value, beginning of period | | $ | 7.51 | | | $ | 5.92 | | | $ | 5.37 | | | $ | 10.19 | | | $ | 10.00 | |
| Income from investment operations | | | | | | | | | | | | | | | | | | | | |
Net investment loss(1) | | | (0.10 | ) | | | (0.09 | ) | | | (0.07 | ) | | | (0.05 | ) | | | (0.02 | ) |
Net realized and unrealized gain (loss) on investments | | | (0.29 | ) | | | 1.68 | | | | 0.62 | | | | (4.77 | ) | | | 0.21 | |
Total from investment operations | | | (0.39 | ) | | | 1.59 | | | | 0.55 | | | | (4.82 | ) | | | 0.19 | |
| Net asset value, end of period | | $ | 7.12 | | | $ | 7.51 | | | $ | 5.92 | | | $ | 5.37 | | | $ | 10.19 | |
| Total Return(2) | | | (5.19 | )% | | | 26.86 | % | | | 10.24 | % | | | (47.30 | )% | | | 1.90 | %†* |
| | | | | |
| Ratios/supplemental data | | | | | | | | | | | | | | | | | | | | |
Net assets, end of period (000’s omitted) | | $ | 5,707 | | | $ | 11,708 | | | $ | 12,889 | | | $ | 16,380 | | | $ | 27,109 | |
Ratio of expenses to average net assets | | | 2.68 | % | | | 2.41 | % | | | 2.32 | % | | | 2.38 | % | | | 2.01 | %** |
Ratio of net investment income (loss) to average net assets | | | (1.41 | )% | | | (1.30 | )% | | | (1.12 | )% | | | (0.85 | )% | | | (1.20 | )%** |
| Portfolio turnover rate | | | 879.75 | % | | | 732.27 | % | | | 1212.89 | % | | | 760.99 | % | | | 29.39 | %* |
| | | | | | | | | | | | | | | | | | | | |
| | | Class C | |
| | | Year Ended June 30, 2012 | | | Year Ended June 30, 2011 | | | Year Ended June 30, 2010 | | | Year Ended
June 30, 2009 | | | For the Period
May 1, 2008
(commencement of operations)
to June 30, 2008 | |
| Net asset value, beginning of period | | $ | 7.34 | | | $ | 5.82 | | | $ | 5.32 | | | $ | 10.17 | | | $ | 10.00 | |
| Income from investment operations | | | | | | | | | | | | | | | | | | | | |
Net investment loss(1) | | | (0.15 | ) | | | (0.14 | ) | | | (0.11 | ) | | | (0.09 | ) | | | (0.03 | ) |
Net realized and unrealized gain (loss) on investments | | | (0.29 | ) | | | 1.66 | | | | 0.61 | | | | (4.76 | ) | | | 0.20 | |
Total from investment operations | | | (0.44 | ) | | | 1.52 | | | | 0.50 | | | | (4.85 | ) | | | 0.17 | |
| Net asset value, end of period | | $ | 6.90 | | | $ | 7.34 | | | $ | 5.82 | | | $ | 5.32 | | | $ | 10.17 | |
| Total Return(2) | | | (5.99 | )% | | | 26.12 | % | | | 9.40 | % | | | (47.69 | )% | | | 1.70 | %†* |
| | | | | |
| Ratios/supplemental data | | | | | | | | | | | | | | | | | | | | |
Net assets, end of period (000’s omitted) | | $ | 3,158 | | | $ | 6,880 | | | $ | 9,512 | | | $ | 11,386 | | | $ | 14,002 | |
Ratio of expenses to average net assets | | | 3.43 | % | | | 3.16 | % | | | 3.07 | % | | | 3.13 | % | | | 2.76 | %** |
Ratio of net investment income (loss) to average net assets | | | (2.15 | )% | | | (2.07 | )% | | | (1.87 | )% | | | (1.60 | )% | | | (1.95 | )%** |
| Portfolio turnover rate | | | 879.75 | % | | | 732.27 | % | | | 1212.89 | % | | | 760.99 | % | | | 29.39 | %* |
| (1) | The average shares outstanding method has been applied for per share information. |
| (2) | Total investment return is based on the change in net asset value of a share during the period, assumes reinvestment of dividends and distributions at net asset value and does not reflect the impact of a sales charge. |
| | † | The returns shown represent a period of less than one year. |
The accompanying notes are an integral part of the financial statements.
Financial Highlights
Quaker Global Tactical Allocation Fund
(For a Share Outstanding Throughout the Period)
| | | | | | | | | | | | | | | | |
| | | Institutional Class | |
| | | Year Ended June 30, 2012 | | | Year Ended June 30, 2011 | | | Year Ended June 30, 2010 | | | For the Period July 23, 2008
(commencement of operations)
to June 30, 2009 | |
| Net asset value, beginning of period | | $ | 8.55 | | | $ | 6.71 | | | $ | 6.08 | | | $ | 10.00 | |
| Income from investment operations | | | | | | | | | | | | | | | | |
Net investment loss(1) | | | (0.09 | ) | | | (0.08 | ) | | | (0.05 | ) | | | (0.05 | ) |
Net realized and unrealized gain (loss) on investments | | | (0.34 | ) | | | 1.92 | | | | 0.68 | | | | (3.87 | ) |
Total from investment operations | | | (0.43 | ) | | | 1.84 | | | | 0.63 | | | | (3.92 | ) |
| Net asset value, end of period | | $ | 8.12 | | | $ | 8.55 | | | $ | 6.71 | | | $ | 6.08 | |
| Total Return(2) | | | (5.03 | )% | | | 27.42 | % | | | 10.36 | % | | | (39.20 | )%†* |
| | | | |
| Ratios/supplemental data | | | | | | | | | | | | | | | | |
Net assets, end of period (000’s omitted) | | $ | 899 | | | $ | 987 | | | $ | 877 | | | $ | 226 | |
Ratio of expenses to average net assets | | | 2.47 | % | | | 2.16 | % | | | 1.86 | % | | | 2.23 | %** |
Ratio of net investment income (loss) to average net assets | | | (1.12 | )% | | | (1.05 | )% | | | (0.70 | )% | | | (0.74 | )%** |
| Portfolio turnover rate | | | 879.75 | % | | | 732.27 | % | | | 1212.89 | % | | | 760.99 | %* |
| (1) | The average shares outstanding method has been applied for per share information. |
| (2) | Total investment return is based on the change in net asset value of a share during the period, assumes reinvestment of dividends and distributions at net asset value and does not reflect the impact of a sales charge. |
| | † | The returns shown represent a period of less than one year. |
The accompanying notes are an integral part of the financial statements.
Financial Highlights
Quaker Mid-Cap Value Fund
(For a Share Outstanding Throughout the Period)
| | | | | | | | | | | | | | | | | | | | |
| | | Class A | |
| | | Year Ended
June 30, 2012 | | | Year Ended
June 30, 2011 | | | Year Ended
June 30, 2010 | | | Year Ended
June 30, 2009 | | | Year Ended
June 30, 2008 | |
| Net asset value, beginning of period | | $ | 16.03 | | | $ | 11.99 | | | $ | 9.39 | | | $ | 14.42 | | | $ | 17.84 | |
| Income from investment operations | | | | | | | | | | | | | | | | | | | | |
Net investment income (loss)(1) | | | (0.11 | ) | | | (0.13 | ) | | | (0.05 | ) | | | 0.01 | | | | (0.06 | ) |
Net realized and unrealized gain (loss) on investments | | | (0.19 | ) | | | 4.17 | | | | 2.65 | | | | (5.04 | ) | | | (2.74 | ) |
Total from investment operations | | | (0.30 | ) | | | 4.04 | | | | 2.60 | | | | (5.03 | ) | | | (2.80 | ) |
| Distributions to shareholders from: | | | | | | | | | | | | | | | | | | | | |
Net realized capital gain | | | — | | | | — | | | | — | | | | — | | | | (0.62 | ) |
Total distributions | | | — | | | | — | | | | — | | | | — | | | | (0.62 | ) |
| Net asset value, end of period | | $ | 15.73 | | | $ | 16.03 | | | $ | 11.99 | | | $ | 9.39 | | | $ | 14.42 | |
| Total Return(2) | | | (1.87 | )% | | | 33.69 | % | | | 27.69 | % | | | (34.88 | )% | | | (15.92 | )% |
| | | | | |
| Ratios/supplemental data | | | | | | | | | | | | | | | | | | | | |
Net assets, end of period (000’s omitted) | | $ | 6,114 | | | $ | 7,229 | | | $ | 6,796 | | | $ | 6,967 | | | $ | 17,118 | |
Ratio of expenses to average net assets: | | | | | | | | | | | | | | | | | | | | |
Before expense reimbursements and waived fees | | | 2.21 | % | | | 2.13 | % | | | 2.09 | % | | | 1.96 | % | | | 1.64 | % |
After expense reimbursement and waived fees | | | 2.21 | % | | | 2.13 | % | | | 2.09 | % | | | 1.94 | % | | | 1.58 | % |
Ratio of net investment income (loss) to average net assets | | | (0.70 | )% | | | (0.88 | )% | | | (0.41 | )% | | | 0.11 | % | | | (0.36 | )% |
| Portfolio turnover rate | | | 41.70 | % | | | 27.10 | % | | | 50.53 | % | | | 184.80 | % | | | 221.17 | % |
| | | | | | | | | | | | | | | | | | | | |
| | | Class C | |
| | | Year Ended
June 30, 2012 | | | Year Ended
June 30, 2011 | | | Year Ended
June 30, 2010 | | | Year Ended
June 30, 2009 | | | Year Ended
June 30, 2008 | |
| Net asset value, beginning of period | | $ | 14.48 | | | $ | 10.92 | | | $ | 8.61 | | | $ | 13.32 | | | $ | 16.65 | |
| Income from investment operations | | | | | | | | | | | | | | | | | | | | |
Net investment loss(1) | | | (0.20 | ) | | | (0.22 | ) | | | (0.12 | ) | | | (0.06 | ) | | | (0.19 | ) |
Net realized and unrealized gain (loss) on investments | | | (0.17 | ) | | | 3.78 | | | | 2.43 | | | | (4.65 | ) | | | (2.52 | ) |
Total from investment operations | | | (0.37 | ) | | | 3.56 | | | | 2.31 | | | | (4.71 | ) | | | (2.71 | ) |
| Distributions to shareholders from: | | | | | | | | | | | | | | | | | | | | |
Net realized capital gain | | | — | | | | — | | | | — | | | | — | | | | (0.62 | ) |
Total distributions | | | — | | | | — | | | | — | | | | — | | | | (0.62 | ) |
| Net asset value, end of period | | $ | 14.11 | | | $ | 14.48 | | | $ | 10.92 | | | $ | 8.61 | | | $ | 13.32 | |
| Total Return(2) | | | (2.56 | )% | | | 32.60 | % | | | 26.83 | % | | | (35.36 | )% | | | (16.53 | )% |
| | | | | |
| Ratios/supplemental data | | | | | | | | | | | | | | | | | | | | |
Net assets, end of period (000’s omitted) | | $ | 1,950 | | | $ | 2,577 | | | $ | 2,427 | | | $ | 2,629 | | | $ | 5,801 | |
Ratio of expenses to average net assets: | | | | | | | | | | | | | | | | | | | | |
Before expense reimbursements and waived fees | | | 2.96 | % | | | 2.88 | % | | | 2.83 | % | | | 2.71 | % | | | 2.57 | % |
After expense reimbursement and waived fees | | | 2.96 | % | | | 2.88 | % | | | 2.83 | % | | | 2.69 | % | | | 2.52 | % |
Ratio of net investment income (loss) to average net assets | | | (1.45 | )% | | | (1.63 | )% | | | (1.16 | )% | | | (0.62 | )% | | | (1.27 | )% |
| Portfolio turnover rate | | | 41.70 | % | | | 27.10 | % | | | 50.53 | % | | | 184.80 | % | | | 221.17 | % |
| (1) | The average shares outstanding method has been applied for per share information. |
| (2) | Total investment return is based on the change in net asset value of a share during the period, assumes reinvestment of dividends and distributions at net asset value and does not reflect the impact of a sales charge. |
The accompanying notes are an integral part of the financial statements.
Financial Highlights
Quaker Mid-Cap Value Fund
(For a Share Outstanding Throughout the Period)
| | | | | | | | | | | | | | | | | | | | |
| | | Institutional Class | |
| | | Year Ended
June 30, 2012 | | | Year Ended
June 30, 2011 | | | Year Ended
June 30, 2010 | | | Year Ended
June 30, 2009 | | | Year Ended
June 30, 2008 | |
| Net asset value, beginning of period | | $ | 16.66 | | | $ | 12.43 | | | $ | 9.70 | | | $ | 14.87 | | | $ | 18.33 | |
| Income from investment operations | | | | | | | | | | | | | | | | | | | | |
Net investment income (loss)(1) | | | (0.07 | ) | | | (0.10 | ) | | | (0.02 | ) | | | 0.04 | | | | (0.05 | ) |
Net realized and unrealized gain (loss) on investments | | | (0.20 | ) | | | 4.33 | | | | 2.75 | | | | (5.21 | ) | | | (2.79 | ) |
Total from investment operations | | | (0.27 | ) | | | 4.23 | | | | 2.73 | | | | (5.17 | ) | | | (2.84 | ) |
| Distributions to shareholders from: | | | | | | | | | | | | | | | | | | | | |
Net realized capital gain | | | — | | | | — | | | | — | | | | — | | | | (0.62 | ) |
Total distributions | | | — | | | | — | | | | — | | | | — | | | | (0.62 | ) |
| Net asset value, end of period | | $ | 16.39 | | | $ | 16.66 | | | $ | 12.43 | | | $ | 9.70 | | | $ | 14.87 | |
| Total Return(2) | | | (1.62 | )% | | | 34.03 | % | | | 28.14 | % | | | (34.77 | )% | | | (15.70 | )% |
| | | | | |
| Ratios/supplemental data | | | | | | | | | | | | | | | | | | | | |
Net assets, end of period (000’s omitted) | | $ | 351 | | | $ | 433 | | | $ | 245 | | | $ | 227 | | | $ | 511 | |
Ratio of expenses to average net assets: | | | | | | | | | | | | | | | | | | | | |
Before expense reimbursements and waived fees | | | 1.96 | % | | | 1.87 | % | | | 1.84 | % | | | 1.70 | % | | | 1.63 | % |
After expense reimbursement and waived fees | | | 1.96 | % | | | 1.87 | % | | | 1.84 | % | | | 1.68 | % | | | 1.58 | % |
Ratio of net investment income (loss) to average net assets | | | (0.45 | )% | | | (0.62 | )% | | | (0.19 | )% | | | 0.36 | % | | | (0.30 | )% |
| Portfolio turnover rate | | | 41.70 | % | | | 27.10 | % | | | 50.53 | % | | | 184.80 | % | | | 221.17 | % |
| (1) | The average shares outstanding method has been applied for per share information. |
| (2) | Total investment return is based on the change in net asset value of a share during the period, assumes reinvestment of dividends and distributions at net asset value and does not reflect the impact of a sales charge. |
The accompanying notes are an integral part of the financial statements.
Financial Highlights
Quaker Small-Cap Growth Tactical Allocation Fund
(For a Share Outstanding Throughout the Period)
| | | | | | | | | | | | | | | | |
| | | Class A | |
| | | Year Ended
June 30, 2012 | | | Year Ended
June 30, 2011 | | | Year Ended
June 30, 2010 | | | For the Period
September 30, 2008
(commencement of operations)
to June 30, 2009 | |
| Net asset value, beginning of period | | $ | 10.28 | | | $ | 9.77 | | | $ | 10.09 | | | $ | 10.00 | |
| Income from investment operations | | | | | | | | | | | | | | | | |
Net investment loss(1) | | | (0.14 | ) | | | (0.16 | ) | | | (0.16 | ) | | | (0.15 | ) |
Net realized and unrealized gain (loss) on investments | | | (0.84 | ) | | | 0.90 | | | | 1.29 | | | | 0.24 | |
Total from investment operations | | | (0.98 | ) | | | 0.74 | | | | 1.13 | | | | 0.09 | |
| Distributions to shareholders from: | | | | | | | | | | | | | | | | |
Net realized capital gain | | | (0.42 | ) | | | (0.23 | ) | | | (1.45 | ) | | | — | |
| Net asset value, end of period | | $ | 8.88 | | | $ | 10.28 | | | $ | 9.77 | | | $ | 10.09 | |
| Total Return(2) | | | (9.51 | )% | | | 7.79 | % | | | 11.75 | % | | | 0.90 | %†* |
| | | | |
| Ratios/supplemental data | | | | | | | | | | | | | | | | |
Net assets, end of period (000’s omitted) | | $ | 2,507 | | | $ | 9,082 | | | $ | 13,281 | | | $ | 3,728 | |
Ratio of expenses to average net assets | | | 2.24 | % | | | 2.02 | % | | | 1.89 | % | | | 2.64 | %** |
Ratio of net investment income (loss) to average net assets | | | (1.54 | )% | | | (1.70 | )% | | | (1.61 | )% | | | (2.15 | )%** |
| Portfolio turnover rate | | | 625.61 | % | | | 879.32 | % | | | 991.29 | % | | | 714.79 | %* |
| | | | | | | | | | | | | | | | |
| | | Class C | |
| | | Year Ended
June 30, 2012 | | | Year Ended
June 30, 2011 | | | Year Ended
June 30, 2010 | | | For the Period
September 30, 2008
(commencement of operations)
to June 30, 2009 | |
| Net asset value, beginning of period | | $ | 10.06 | | | $ | 9.64 | | | $ | 10.04 | | | $ | 10.00 | |
| Income from investment operations | | | | | | | | | | | | | | | | |
Net investment loss(1) | | | (0.20 | ) | | | (0.23 | ) | | | (0.24 | ) | | | (0.19 | ) |
Net realized and unrealized gain (loss) on investments | | | (0.83 | ) | | | 0.88 | | | | 1.29 | | | | 0.23 | |
Total from investment operations | | | (1.03 | ) | | | 0.65 | | | | 1.05 | | | | 0.04 | |
| Distributions to shareholders from: | | | | | | | | | | | | | | | | |
Net realized capital gain | | | (0.42 | ) | | | (0.23 | ) | | | (1.45 | ) | | | — | |
| Net asset value, end of period | | $ | 8.61 | | | $ | 10.06 | | | $ | 9.64 | | | $ | 10.04 | |
| Total Return(2) | | | (10.23 | )% | | | 6.95 | % | | | 10.94 | % | | | 0.40 | %†* |
| | | | |
| Ratios/supplemental data | | | | | | | | | | | | | | | | |
Net assets, end of period (000’s omitted) | | $ | 1,900 | | | $ | 5,896 | | | $ | 9,180 | | | $ | 5,081 | |
Ratio of expenses to average net assets: | | | 2.97 | % | | | 2.78 | % | | | 2.65 | % | | | 3.33 | %** |
Ratio of net investment income (loss) to average net assets | | | (2.25 | )% | | | (2.45 | )% | | | (2.35 | )% | | | (2.80 | )%** |
| Portfolio turnover rate | | | 625.61 | % | | | 879.32 | % | | | 991.29 | % | | | 714.79 | %* |
| (1) | The average shares outstanding method has been applied for per share information. |
| (2) | Total investment return is based on the change in net asset value of a share during the period, assumes reinvestment of dividends and distributions at net asset value and does not reflect the impact of a sales charge. |
| | † | The returns shown represent performance for a period of less than one year. |
The accompanying notes are an integral part of the financial statements.
Financial Highlights
Quaker Small-Cap Growth Tactical Allocation Fund
(For a Share Outstanding Throughout the Period)
| | | | | | | | | | | | | | | | |
| | | Institutional Class | |
| | | Year Ended June 30, 2012 | | | Year Ended June 30, 2011 | | | Year Ended June 30, 2010 | | | For the Period
September 30, 2008
(commencement of operations) to June 30, 2009 | |
| Net asset value, beginning of period | | $ | 10.37 | | | $ | 9.84 | | | $ | 10.13 | | | $ | 10.00 | |
| Income from investment operations | | | | | | | | | | | | | | | | |
Net investment loss(1) | | | (0.12 | ) | | | (0.14 | ) | | | (0.14 | ) | | | (0.12 | ) |
Net realized and unrealized gain (loss) on investments | | | (0.85 | ) | | | 0.90 | | | | 1.30 | | | | 0.25 | |
Total from investment operations | | | (0.97 | ) | | | 0.76 | | | | 1.16 | | | | 0.13 | |
| Distributions to shareholders from: | | | | | | | | | | | | | | | | |
Net realized capital gain | | | (0.42 | ) | | | (0.23 | ) | | | (1.45 | ) | | | — | |
| Net asset value, end of period | | $ | 8.98 | | | $ | 10.37 | | | $ | 9.84 | | | $ | 10.13 | |
| Total Return(2) | | | (9.33 | )% | | | 7.93 | % | | | 12.01 | % | | | 1.30 | %†* |
| | | | |
| Ratios/supplemental data | | | | | | | | | | | | | | | | |
Net assets, end of period (000’s omitted) | | $ | 1,898 | | | $ | 5,087 | | | $ | 4,499 | | | $ | 721 | |
Ratio of expenses to average net assets: | | | 1.99 | % | | | 1.81 | % | | | 1.65 | % | | | 2.30 | %** |
Ratio of net investment income (loss) to average net assets | | | (1.26 | )% | | | (1.47 | )% | | | (1.37 | )% | | | (1.76 | )%** |
| Portfolio turnover rate | | | 625.61 | % | | | 879.32 | % | | | 991.29 | % | | | 714.79 | %* |
| (1) | The average shares outstanding method has been applied for per share information. |
| (2) | Total investment return is based on the change in net asset value of a share during the period, assumes reinvestment of dividends and distributions at net asset value and does not reflect the impact of a sales charge. |
| | † | The returns shown represent performance for a period of less than one year. |
The accompanying notes are an integral part of the financial statements.
Financial Highlights
Quaker Small-Cap Value Fund
(For a Share Outstanding Throughout the Period)
| | | | | | | | | | | | | | | | | | | | |
| | | Class A | |
| | | Year Ended
June 30, 2012 | | | Year Ended
June 30, 2011 | | | Year Ended
June 30, 2010 | | | Year Ended
June 30, 2009 | | | Year Ended
June 30, 2008 | |
| Net asset value, beginning of period | | $ | 16.53 | | | $ | 11.54 | | | $ | 9.90 | | | $ | 13.88 | | | $ | 20.71 | |
| Income from investment operations | | | | | | | | | | | | | | | | | | | | |
Net investment loss(1) | | | (0.08 | ) | | | (0.05 | ) | | | (0.07 | ) | | | (0.01 | ) | | | (0.07 | ) |
Net realized and unrealized gain (loss) on investments | | | (0.60 | ) | | | 5.04 | | | | 1.71 | | | | (3.96 | ) | | | (3.51 | ) |
Total from investment operations | | | (0.68 | ) | | | 4.99 | | | | 1.64 | | | | (3.97 | ) | | | (3.58 | ) |
| Distributions to shareholders from: | | | | | | | | | | | | | | | | | | | | |
Net realized capital gain | | | — | | | | — | | | | — | | | | (0.01 | ) | | | (3.25 | ) |
Total distributions | | | — | | | | — | | | | — | | | | (0.01 | ) | | | (3.25 | ) |
| Net asset value, end of period | | $ | 15.85 | | | $ | 16.53 | | | $ | 11.54 | | | $ | 9.90 | | | $ | 13.88 | |
| Total Return(2) | | | (4.11 | )% | | | 43.24 | % | | | 16.57 | % | | | (28.61 | )% | | | (17.86 | )% |
| | | | | |
| Ratios/supplemental data | | | | | | | | | | | | | | | | | | | | |
Net assets, end of period (000’s omitted) | | $ | 8,347 | | | $ | 14,168 | | | $ | 19,398 | | | $ | 20,210 | | | $ | 27,722 | |
Ratio of expenses to average net assets: | | | | | | | | | | | | | | | | | | | | |
Before expense reimbursements and waived fees | | | 1.96 | % | | | 1.98 | % | | | 1.89 | % | | | 1.83 | % | | | 1.78 | % |
After expense reimbursement and waived fees | | | 1.96 | % | | | 1.98 | % | | | 1.83 | % | | | 1.74 | % | | | 1.70 | % |
Ratio of net investment income (loss) to average net assets | | | (0.52 | )% | | | (0.35 | )% | | | (0.60 | )% | | | (0.09 | )% | | | (0.44 | )% |
| Portfolio turnover rate | | | 157.77 | % | | | 130.60 | % | | | 112.61 | % | | | 122.83 | % | | | 129.58 | % |
| | | | | | | | | | | | | | | | | | | | |
| | | Class C | |
| | | Year Ended
June 30, 2012 | | | Year Ended
June 30, 2011 | | | Year Ended
June 30, 2010 | | | Year Ended
June 30, 2009 | | | Year Ended
June 30, 2008 | |
| Net asset value, beginning of period | | $ | 14.17 | | | $ | 9.98 | | | $ | 8.62 | | | $ | 12.18 | | | $ | 18.77 | |
| Income from investment operations | | | | | | | | | | | | | | | | | | | | |
Net investment loss(1) | | | (0.16 | ) | | | (0.14 | ) | | | (0.14 | ) | | | (0.08 | ) | | | (0.18 | ) |
Net realized and unrealized gain (loss) on investments | | | (0.52 | ) | | | 4.33 | | | | 1.50 | | | | (3.47 | ) | | | (3.16 | ) |
Total from investment operations | | | (0.68 | ) | | | 4.19 | | | | 1.36 | | | | (3.55 | ) | | | (3.34 | ) |
| Distributions to shareholders from: | | | | | | | | | | | | | | | | | | | | |
Net realized capital gain | | | — | | | | — | | | | — | | | | (0.01 | ) | | | (3.25 | ) |
Total distributions | | | — | | | | — | | | | — | | | | (0.01 | ) | | | (3.25 | ) |
| Net asset value, end of period | | $ | 13.49 | | | $ | 14.17 | | | $ | 9.98 | | | $ | 8.62 | | | $ | 12.18 | |
| Total Return(2) | | | (4.80 | )% | | | 41.98 | % | | | 15.78 | % | | | (29.16 | )% | | | (18.49 | )% |
| | | | | |
| Ratios/supplemental data | | | | | | | | | | | | | | | | | | | | |
Net assets, end of period (000’s omitted) | | $ | 1,863 | | | $ | 2,524 | | | $ | 2,085 | | | $ | 2,688 | | | $ | 4,711 | |
Ratio of expenses to average net assets: | | | | | | | | | | | | | | | | | | | | |
Before expense reimbursements and waived fees | | | 2.70 | % | | | 2.73 | % | | | 2.63 | % | | | 2.58 | % | | | 2.52 | % |
After expense reimbursement and waived fees | | | 2.70 | % | | | 2.73 | % | | | 2.57 | % | | | 2.49 | % | | | 2.44 | % |
Ratio of net investment income (loss) to average net assets | | | (1.25 | )% | | | (1.15 | )% | | | (1.36 | )% | | | (0.86 | )% | | | (1.17 | )% |
| Portfolio turnover rate | | | 157.77 | % | | | 130.60 | % | | | 112.61 | % | | | 122.83 | % | | | 129.58 | % |
| (1) | The average shares outstanding method has been applied for per share information. |
| (2) | Total investment return is based on the change in net asset value of a share during the period, assumes reinvestment of dividends and distributions at net asset value and does not reflect the impact of a sales charge. |
The accompanying notes are an integral part of the financial statements.
Financial Highlights
Quaker Small-Cap Value Fund
(For a Share Outstanding Throughout the Period)
| | | | | | | | | | | | | | | | | | | | |
| | | Institutional Class | |
| | | Year Ended
June 30, 2012 | | | Year Ended
June 30, 2011 | | | Year Ended
June 30, 2010 | | | Year Ended
June 30, 2009 | | | Year Ended
June 30, 2008 | |
| Net asset value, beginning of period | | $ | 17.15 | | | $ | 11.96 | | | $ | 10.24 | | | $ | 14.32 | | | $ | 21.19 | |
| Income from investment operations | | | | | | | | | | | | | | | | | | | | |
Net investment loss(1) | | | (0.04 | ) | | | (0.01 | ) | | | (0.04 | ) | | | 0.02 | | | | (0.03 | ) |
Net realized and unrealized gain (loss) on investments | | | (0.61 | ) | | | 5.20 | | | | 1.77 | | | | (4.09 | ) | | | (3.59 | ) |
Total from investment operations | | | (0.65 | ) | | | 5.19 | | | | 1.73 | | | | (4.07 | ) | | | (3.62 | ) |
| Distributions to shareholders from: | | | | | | | | | | | | | | | | | | | | |
Net investment income | | | — | | | | — | | | | (0.01 | ) | | | — | | | | — | |
Net realized capital gain | | | — | | | | — | | | | — | | | | (0.01 | ) | | | (3.25 | ) |
Total distributions | | | — | | | | — | | | | (0.01 | ) | | | (0.01 | ) | | | (3.25 | ) |
| Net asset value, end of period | | $ | 16.50 | | | $ | 17.15 | | | $ | 11.96 | | | $ | 10.24 | | | $ | 14.32 | |
| Total Return(2) | | | (3.79 | )% | | | 43.39 | % | | | 16.90 | % | | | (28.43 | )% | | | (17.62 | )% |
| | | | | |
| Ratios/supplemental data | | | | | | | | | | | | | | | | | | | | |
Net assets, end of period (000’s omitted) | | $ | 20,028 | | | $ | 23,073 | | | $ | 61,004 | | | $ | 60,675 | | | $ | 23,528 | |
Ratio of expenses to average net assets: | | | | | | | | | | | | | | | | | | | | |
Before expense reimbursements and waived fees | | | 1.71 | % | | | 1.73 | % | | | 1.64 | % | | | 1.59 | % | | | 1.54 | % |
After expense reimbursement and waived fees | | | 1.71 | % | | | 1.73 | % | | | 1.58 | % | | | 1.50 | % | | | 1.46 | % |
Ratio of net investment income (loss) to average net assets | | | (0.25 | )% | | | (0.07 | )% | | | (0.35 | )% | | | 0.19 | % | | | (0.20 | )% |
| Portfolio turnover rate | | | 157.77 | % | | | 130.60 | % | | | 112.61 | % | | | 122.83 | % | | | 129.58 | % |
| (1) | The average shares outstanding method has been applied for per share information. |
| (2) | Total investment return is based on the change in net asset value of a share during the period, assumes reinvestment of dividends and distributions at net asset value and does not reflect the impact of a sales charge. |
The accompanying notes are an integral part of the financial statements.
Financial Highlights
Quaker Strategic Growth Fund
(For a Share Outstanding Throughout the Period)
| | | | | | | | | | | | | | | | | | | | |
| | | Class A | |
| | | Year Ended
June 30, 2012 | | | Year Ended
June 30, 2011 | | | Year Ended
June 30, 2010 | | | Year Ended
June 30, 2009 | | | Year Ended
June 30, 2008 | |
| Net asset value, beginning of period | | $ | 16.53 | | | $ | 13.33 | | | $ | 12.33 | | | $ | 28.45 | | | $ | 25.69 | |
| Income from investment operations | | | | | | | | | | | | | | | | | | | | |
Net investment loss(1) | | | (0.15 | ) | | | (0.14 | ) | | | (0.10 | ) | | | (0.07 | ) | | | (0.09 | ) |
Net realized and unrealized gain (loss) on investments | | | (0.25 | ) | | | 3.34 | | | | 1.10 | | | | (14.08 | ) | | | 5.50 | |
Total from investment operations | | | (0.40 | ) | | | 3.20 | | | | 1.00 | | | | (14.15 | ) | | | 5.41 | |
| Distributions to shareholders from: | | | | | | | | | | | | | | | | | | | | |
Net investment income | | | — | | | | — | | | | — | | | | — | | | | — | |
Net realized capital gain | | | — | | | | — | | | | — | | | | (1.97 | ) | | | (2.65 | ) |
Total distributions | | | — | | | | — | | | | — | | | | (1.97 | ) | | | (2.65 | ) |
| Net asset value, end of period | | $ | 16.13 | | | $ | 16.53 | | | $ | 13.33 | | | $ | 12.33 | | | $ | 28.45 | |
| Total Return(2) | | | (2.42 | )% | | | 24.01 | % | | | 8.11 | % | | | (49.61 | )% | | | 22.22 | % |
| | | | | |
| Ratios/supplemental data | | | | | | | | | | | | | | | | | | | | |
Net assets, end of period (000’s omitted) | | $ | 111,778 | | | $ | 186,877 | | | $ | 306,523 | | | $ | 436,015 | | | $ | 1,244,922 | |
Ratio of expenses to average net assets: | | | | | | | | | | | | | | | | | | | | |
Before expense reimbursements and waived fees | | | 2.30 | % | | | 2.21 | % | | | 1.99 | % | | | 1.89 | % | | | 1.80 | % |
After expense reimbursements and waived fees | | | 2.24 | % | | | 1.99 | % | | | 1.99 | % | | | 1.89 | % | | | 1.80 | % |
Ratio of net investment income (loss) to average net assets: | | | — | | | | — | | | | (0.69 | )% | | | (0.45 | )% | | | (0.34 | )% |
Before expense reimbursements and waived fees(3) | | | (1.03 | )% | | | (1.14 | )% | | | — | | | | — | | | | — | |
After expense reimbursements and waived fees(3) | | | (0.98 | )% | | | (0.92 | )% | | | — | | | | — | | | | — | |
| Portfolio turnover rate | | | 178.23 | % | | | 136.18 | % | | | 276.31 | % | | | 468.72 | % | | | 168.61 | % |
| | | | | | | | | | | | | | | | | | | | |
| | | Class C | |
| | | Year Ended
June 30, 2012 | | | Year Ended
June 30, 2011 | | | Year Ended
June 30, 2010 | | | Year Ended
June 30, 2009 | | | Year Ended
June 30, 2008 | |
| Net asset value, beginning of period | | $ | 14.94 | | | $ | 12.14 | | | $ | 11.31 | | | $ | 26.61 | | | $ | 24.36 | |
| Income from investment operations | | | | | | | | | | | | | | | | | | | | |
Net investment loss(1) | | | (0.24 | ) | | | (0.23 | ) | | | (0.19 | ) | | | (0.17 | ) | | | (0.27 | ) |
Net realized and unrealized gain (loss) on investments | | | (0.23 | ) | | | 3.03 | | | | 1.02 | | | | (13.16 | ) | | | 5.17 | |
Total from investment operations | | | (0.47 | ) | | | 2.80 | | | | 0.83 | | | | (13.33 | ) | | | 4.90 | |
| Distributions to shareholders from: | | | | | | | | | | | | | | | | | | | | |
Net realized capital gain | | | — | | | | — | | | | — | | | | (1.97 | ) | | | (2.65 | ) |
Total distributions | | | — | | | | — | | | | — | | | | (1.97 | ) | | | (2.65 | ) |
| Net asset value, end of period | | $ | 14.47 | | | $ | 14.94 | | | $ | 12.14 | | | $ | 11.31 | | | $ | 26.61 | |
| Total Return(2) | | | (3.15 | )% | | | 23.06 | % | | | 7.34 | % | | | (49.99 | )% | | | 21.29 | % |
| | | | | |
| Ratios/supplemental data | | | | | | | | | | | | | | | | | | | | |
Net assets, end of period (000’s omitted) | | $ | 27,102 | | | $ | 42,729 | | | $ | 63,002 | | | $ | 92,152 | | | $ | 213,194 | |
Ratio of expenses to average net assets: | | | | | | | | | | | | | | | | | | | | |
Before expense reimbursements and waived fees | | | 3.04 | % | | | 2.96 | % | | | 2.74 | % | | | 2.64 | % | | | 2.55 | % |
After expense reimbursements and waived fees | | | 2.99 | % | | | 2.74 | % | | | 2.74 | % | | | 2.64 | % | | | 2.55 | % |
Ratio of net investment income (loss) to average net assets: | | | — | | | | — | | | | (1.44 | )% | | | (1.21 | )% | | | (1.09 | )% |
Before expense reimbursements and waived fees(3) | | | (1.77 | )% | | | (1.90 | )% | | | — | | | | — | | | | — | |
After expense reimbursements and waived fees(3) | | | (1.72 | )% | | | (1.68 | )% | | | — | | | | — | | | | — | |
| Portfolio turnover rate | | | 178.23 | % | | | 136.18 | % | | | 276.31 | % | | | 468.72 | % | | | 168.61 | % |
| (1) | The average shares outstanding method has been applied for per share information. |
| (2) | Total investment return is based on the change in net asset value of a share during the period, assumes reinvestment of dividends and distributions at net asset value and does not reflect the impact of a sales charge. |
| (3) | Expenses waived or reimbursed reflect reductions to total expenses, as discussed in the notes to the financial statements. These amounts would increase the net investment loss ratio or decrease the net investment income ratio, as applicable, had such reductions not occurred. |
The accompanying notes are an integral part of the financial statements.
Financial Highlights
Quaker Strategic Growth Fund
(For a Share Outstanding Throughout the Period)
| | | | | | | | | | | | | | | | | | | | |
| | | Institutional Class | |
| | | Year Ended
June 30, 2012 | | | Year Ended
June 30, 2011 | | | Year Ended
June 30, 2010 | | | Year Ended
June 30, 2009 | | | Year Ended
June 30, 2008 | |
| Net asset value, beginning of period | | $ | 17.03 | | | $ | 13.71 | | | $ | 12.65 | | | $ | 29.03 | | | $ | 26.09 | |
| Income from investment operations | | | | | | | | | | | | | | | | | | | | |
Net investment loss(1) | | | (0.11 | ) | | | (0.11 | ) | | | (0.07 | ) | | | (0.04 | ) | | | (0.03 | ) |
Net realized and unrealized gain (loss) on investments | | | (0.26 | ) | | | 3.43 | | | | 1.13 | | | | (14.37 | ) | | | 5.62 | |
Total from investment operations | | | (0.37 | ) | | | 3.32 | | | | 1.06 | | | | (14.41 | ) | | | 5.59 | |
| Distributions to shareholders from: | | | | | | | | | | | | | | | | | | | | |
Net investment income | | | — | | | | — | | | | — | | | | — | | | | — | |
Net realized capital gain | | | — | | | | — | | | | — | | | | (1.97 | ) | | | (2.65 | ) |
Total distributions | | | — | | | | — | | | | — | | | | (1.97 | ) | | | (2.65 | ) |
| Net asset value, end of period | | $ | 16.66 | | | $ | 17.03 | | | $ | 13.71 | | | $ | 12.65 | | | $ | 29.03 | |
| Total Return(2) | | | (2.17 | )% | | | 24.22 | % | | | 8.38 | % | | | (49.51 | )% | | | 22.58 | % |
| | | | | |
| Ratios/supplemental data | | | | | | | | | | | | | | | | | | | | |
Net assets, end of period (000’s omitted) | | $ | 40,288 | | | $ | 41,519 | | | $ | 20,355 | | | $ | 46,136 | | | $ | 126,637 | |
Ratio of expenses to average net assets: | | | | | | | | | | | | | | | | | | | | |
Before expense reimbursements and waived fees | | | 2.03 | % | | | 1.97 | % | | | 1.75 | % | | | 1.64 | % | | | 1.54 | % |
After expense reimbursements and waived fees | | | 1.99 | % | | | 1.74 | % | | | 1.75 | % | | | 1.64 | % | | | 1.54 | % |
Ratio of net investment income (loss) to average net assets: | | | — | | | | — | | | | (0.46 | )% | | | (0.23 | )% | | | (0.09 | )% |
Before expense reimbursements and waived fees(3) | | | (0.72 | )% | | | (0.89 | )% | | | — | | | | — | | | | — | |
After expense reimbursements and waived fees(3) | | | (0.68 | )% | | | (0.66 | )% | | | — | | | | — | | | | — | |
| Portfolio turnover rate | | | 178.23 | % | | | 136.18 | % | | | 276.31 | % | | | 468.72 | % | | | 168.61 | % |
| (1) | The average shares outstanding method has been applied for per share information. |
| (2) | Total investment return is based on the change in net asset value of a share during the period, assumes reinvestment of dividends and distributions at net asset value and does not reflect the impact of a sales charge. |
| (3) | Expenses waived or reimbursed reflect reductions to total expenses, as discussed in the notes to the financial statements. These amounts would increase the net investment loss ratio or decrease the net investment income ratio, as applicable, had such reductions not occurred. |
The accompanying notes are an integral part of the financial statements.
Notes to the Financial Statements
Note 1 — Organization
The Quaker Investment Trust (“Trust”), a diversified, open-end management investment company, was organized as a Massachusetts business trust on October 24, 1990, and is registered under the Investment Company Act of 1940, as amended (“1940 Act”). The Trust’s Amended and Restated Declaration of Trust permits the Trustees to issue an unlimited number of shares of beneficial interest. The Trust currently has eight series: Quaker Akros Absolute Return Fund (formerly, Quaker Akros Absolute Strategies Fund) (“Akros Absolute Return”), Quaker Capital Opportunities Fund (“Capital Opportunities”), Quaker Event Arbitrage Fund (“Event Arbitrage”) Quaker Global Tactical Allocation Fund (“Global Tactical Allocation”), Quaker Mid-Cap Value Fund (“Mid-Cap Value”), Quaker Small-Cap Growth Tactical Allocation Fund (“Small-Cap Growth Tactical Allocation”), Quaker Small-Cap Value Fund (“Small-Cap Value”) and Quaker Strategic Growth Fund (“Strategic Growth”) (each a “Fund” and collectively, “Funds”). All Funds are diversified with the exception of Akros Absolute Return, Capital Opportunities and Event Arbitrage. The investment objectives of each Fund, except for Akros Absolute Return and Capital Opportunities, are set forth below.
Strategic Growth and Small-Cap Value commenced operations on November 25, 1996. Mid-Cap Value commenced operations on December 31, 1997. Global Tactical Allocation commenced operations on May 1, 2008. Small-Cap Growth Tactical Allocation commenced operations on September 30, 2008. Event Arbitrage commenced operations on June 7, 2010 in conjunction with the reorganization of the Pennsylvania Avenue Event Driven Fund (“Event Driven Fund”). The predecessor Event Driven Fund commenced operations on September 19, 2002. The investment objective of these Funds is to seek long-term growth of capital. The investment objective of these funds is non-fundamental in that this objective may be changed by the Board of Trustees (“Board” or “Trustees”) without shareholder approval.
The Funds currently offer three classes of shares (Class A, Class C and Institutional Class Shares). Class A Shares are charged a front-end sales charge and a distribution and servicing fee; Class C shares are charged a distribution fee, but bear no front-end sales charge or contingent deferred sales charge (“CDSC”); and Institutional Class Shares bear no front-end sales charge or CDSC, but have higher minimum investment thresholds. Quaker Funds, Inc. (“QFI”), the investment adviser to each of the Funds, has the ability to waive the minimum investment for Institutional Class shares at its discretion.
Note 2 — Summary of Significant Accounting Policies and Other Information
The following is a summary of significant accounting policies consistently followed by the Funds in the preparation of their financial statements. The policies are in conformity with accounting principles generally accepted in the United States of America (“GAAP”).
A. Security Valuation. The Funds’ investments in securities are carried at market value. Securities listed on an exchange or quoted on a national market system are generally valued at the last quoted sales price at the time of valuation. Other securities traded in the over-the-counter market and listed securities for which no sale was reported on that date are valued at the most recent bid price. Each security reported on the NASDAQ National Market System is valued at the NASDAQ Official Closing Price.
Debt and other fixed-income securities (other than short-term obligations) are valued at the last quoted bid price and/or by using a combination of daily quotes and matrix evaluations provided by an independent pricing service (which reflect such factors as security prices, yields, maturities, ratings, and dealer and exchange quotations), the use of which has been approved by the Board.
Short-term investments are valued at amortized cost, which approximates fair market value.
The Funds enter into forward foreign currency contracts to lock in the U.S. dollar cost of purchase and sale transactions or to defend the portfolio against currency fluctuations. A forward foreign currency contract is a commitment to purchase or sell a foreign currency at a future date at a negotiated rate. These contracts are valued daily, and the Fund’s net equity therein, representing unrealized gain or loss on the contracts as measured by the difference between the forward foreign exchange rates at the dates of entry into the contracts and the forward rates at the reporting, is included in the Statement of Assets and Liabilities. Realized and unrealized gains and losses are included in the Statement of Operations. Risks may arise upon entering into these contracts from the potential inability of counterparties to meet the terms of the contract and from unanticipated movements in the value of foreign currencies relative to the U.S. dollar.
The Funds have adopted fair valuation procedures to value securities at fair market value in certain circumstances, and the Trust has established a Valuation Committee responsible for determining when fair valuing a security is necessary and appropriate. The Funds will value securities at fair market value when market quotations are not readily available or when securities cannot be accurately valued within established pricing procedures. The Valuation Committee may also fair value foreign securities whose prices may have been affected by events occurring after the close of trading in their respective markets but prior to the time the Fund holding the foreign securities calculates its net asset value. The Funds’ fair valuation procedures are designed to help ensure that prices at which Fund shares are purchased and redeemed are fair and do not result in dilution of shareholder interest or other harm to shareholders.
The Fund is required to disclose information regarding the fair value measurements of the Fund’s assets and liabilities. Fair value is defined as the price that the Fund would receive upon selling an investment in an orderly transaction to an independent buyer in the principal or most advantageous market for the investment. The disclosure requirements utilize a three-tier hierarchy to maximize the use of observable market data, minimize the use of unobservable inputs and establish classification of fair value measurements for disclosure purposes. A financial instrument’s level within the fair value hierarchy is based on the lowest level that is significant to the fair value measurement. Inputs refer broadly to the assumptions that market participants would use in pricing the asset or liability, including assumptions about risk, for example, the risk inherent in a particular valuation technique used to measure fair value including such a pricing model and/or the risk inherent in the inputs to the valuation technique. Inputs may be observable or unobservable.
Observable inputs are inputs that reflect the assumptions market participants would use in pricing the asset or liability, which are based on market data obtained from sources independent of the reporting entity. Unobservable inputs are inputs that reflect the reporting entity’s own assumptions about the assumptions market participants would use in pricing the asset or liability developed based on the best information available in the circumstances.
The significant unobservable inputs used in the fair value measurement of the reporting entity’s private equity holdings are audited financial statements, expenses occurred from the partnership, interim financial statements, capital call, distributions and publicly traded securities. Significant increases (decreases) in any of those inputs in isolation would result in a significantly lower (higher) fair value measurement.
Various inputs may be used to determine the value of each Fund’s investments. These inputs are summarized in three broad levels for financial statement purposes. The inputs or methodologies used to value securities are not necessarily an indication of the risk associated with investing in those securities.
Level I — Quoted prices in active markets for identical securities.
Notes to the Financial Statements
Note 2 — Summary of Significant Accounting Policies and Other Information (Continued)
Level II — Prices determined using significant other observable inputs (including quoted prices for similar securities, interest rates, prepayment speeds, credit risk, etc.) Municipal securities, long-term U.S. Government obligations and corporate debt securities are valued in accordance with the evaluated price supplied by the pricing service and generally categorized as Level 2 in the hierarchy. Other securities that are categorized as Level 2 in the hierarchy include, but are not limited to, warrants that do not trade on an exchange, OTC options and international equity securities valued by an independent third party in order to adjust for stale pricing and foreign market holidays.
Level III — Prices determined using significant unobservable inputs (including the Fund’s own assumptions). For restricted equity securities where observable inputs are limited, assumptions about market activity and risk are used in determining fair value. These are categorized as Level 3 in the hierarchy.
The value of a foreign security is generally determined as of the close of trading on the foreign stock exchange on which the security is primarily traded, or as of the close of trading on the New York Stock Exchange (“NYSE”), if earlier. The value is
then converted into its U.S. dollar equivalent at the foreign exchange rate in effect at the close of the NYSE (generally 4:00 p.m. Eastern time) on the day that the value of the foreign security is determined. If no sale is reported at that time, the foreign security will be valued within the range of the most recent quoted bid and ask prices. If market quotations are not readily available for a foreign security or an event has occurred that caused a quotation to be unavailable or unreliable, the Valuation Committee will fair value foreign securities using the procedures described below.
The Trust has adopted fair valuation procedures to value securities at fair market value when independent prices are unavailable or unreliable, and the Trust has established a Valuation Committee that is responsible for determining when fair valuing a security is necessary and appropriate. Securities and assets for which market quotations are not readily available may be valued based upon valuation methods that include: (i) multiple of earnings; (ii) yield to maturity with respect to debt issues; (iii) discounts from market prices of similar freely traded securities; or (iv) a combination of these methods. Securities may also be priced using fair value pricing methods when their closing prices do not reflect their market values at the time the Fund calculates its net asset value (“NAV”) because an event had occurred since the closing prices were established on the domestic or foreign exchange or market but before the Fund’s NAV calculation.
The following is a summary of the fair valuations according to the inputs used as of June 30, 2012 in valuing the Fund’s assets and liabilities:
| | | | | | | | | | | | | | | | | | |
| Category | | Event Arbitrage | | Quoted Prices
in Active Markets for
Identical Investments
(Level 1) | | | Significant Other
Observable Inputs
(Level 2) | | | Significant
Unobservable Inputs
(Level 3) | | | Fair
Value at
6/30/2012 | |
Asset Backed Securities | | | | | | | | | | | | | | | | | | |
United States | | | | | | | | | | | | | | | | | | |
Asset Backed Securities | | | | $ | 0 | | | $ | 6,078,520 | | | $ | 0 | | | $ | 6,078,520 | |
Mortgage Securities | | | | | 0 | | | | 104,633 | | | | 0 | | | | 104,633 | |
Domestic Common Stocks | | | | | | | | | | | | | | | | | | |
United States | | | | | | | | | | | | | | | | | | |
Basic Materials | | | | | 24,325 | | | | 0 | | | | 0 | | | | 24,325 | |
Communications | | | | | 6,737,895 | | | | 3,485 | | | | 0 | | | | 6,741,380 | |
Consumer Cyclical | | | | | 5,342,343 | | | | 0 | | | | 409 | | | | 5,342,752 | |
Consumer Non-cyclical | | | | | 3,137,389 | | | | 0 | | | | 0 | | | | 3,137,389 | |
Diversified | | | | | 0 | | | | 0 | | | | 0 | | | | 0 | |
Energy | | | | | 269,520 | | | | 0 | | | | 0 | | | | 269,520 | |
Financial | | | | | 3,748,944 | | | | 0 | | | | 0 | | | | 3,748,944 | |
Healthcare | | | | | 2,676,172 | | | | 0 | | | | 668,265 | | | | 3,344,437 | |
Industrial | | | | | 1,308,667 | | | | 12,977 | | | | 0 | | | | 1,321,644 | |
Technology | | | | | 5,451,304 | | | | 0 | | | | 976,000 | | | | 6,427,304 | |
Preferred Stocks | | | | | | | | | | | | | | | | | | |
United States | | | | | | | | | | | | | | | | | | |
Energy | | | | | 12 | | | | 0 | | | | 0 | | | | 12 | |
Financial | | | | | 623,635 | | | | 0 | | | | 0 | | | | 623,635 | |
Corporate Bonds | | | | | | | | | | | | | | | | | | |
Canada | | | | | | | | | | | | | | | | | | |
Basic Materials | | | | | 0 | | | | 13,125 | | | | 0 | | | | 13,125 | |
United States | | | | | | | | | | | | | | | | | | |
Basic Materials | | | | | 0 | | | | 12,000 | | | | 0 | | | | 12,000 | |
Financial | | | | | 0 | | | | 683,711 | | | | 0 | | | | 683,711 | |
Industrial | | | | | 0 | | | | 105,375 | | | | 0 | | | | 105,375 | |
Foreign Common Stocks | | | | | | | | | | | | | | | | | | |
Australia | | | | | | | | | | | | | | | | | | |
Industrial | | | | | 534,319 | | | | 0 | | | | 0 | | | | 534,319 | |
Note 2 — Summary of Significant Accounting Policies and Other Information (Continued)
| | | | | | | | | | | | | | | | | | |
| Category | | Event Arbitrage (Continued) | | Quoted Prices
in Active Markets for
Identical Investments
(Level 1) | | | Significant Other
Observable Inputs
(Level 2) | | | Significant
Unobservable Inputs
(Level 3) | | | Fair
Value at
6/30/2012 | |
Canada | | | | | | | | | | | | | | | | | | |
Basic Materials | | | | | 9,675 | | | | 0 | | | | 0 | | | | 9,675 | |
Energy | | | | | 211,420 | | | | 0 | | | | 0 | | | | 211,420 | |
Germany | | | | | | | | | | | | | | | | | | |
Diversified | | | | | 6,314 | | | | 0 | | | | 0 | | | | 6,314 | |
Healthcare | | | | | 442,942 | | | | 0 | | | | 0 | | | | 442,942 | |
Ireland | | | | | | | | | | | | | | | | | | |
Healthcare | | | | | 716,800 | | | | 0 | | | | 0 | | | | 716,800 | |
Spain | | | | | | | | | | | | | | | | | | |
Communications | | | | | 129,150 | | | | 0 | | | | 0 | | | | 129,150 | |
Switzerland | | | | | | | | | | | | | | | | | | |
Financial | | | | | 281,334 | | | | 0 | | | | 0 | | | | 281,334 | |
Industrial | | | | | 898,450 | | | | 0 | | | | 0 | | | | 898,450 | |
Rights | | | | | | | | | | | | | | | | | | |
France | | | | | | | | | | | | | | | | | | |
Healthcare | | | | | 52,875 | | | | 0 | | | | 0 | | | | 52,875 | |
United States | | | | | | | | | | | | | | | | | | |
Energy | | | | | 0 | | | | 0 | | | | 0 | | | | 0 | |
Healthcare | | | | | 0 | | | | 0 | | | | 0 | | | | 0 | |
Utilities | | | | | 0 | | | | 0 | | | | 0 | | | | 0 | |
Warrant | | | | | | | | | | | | | | | | | | |
Canada | | | | | | | | | | | | | | | | | | |
Basic Materials | | | | | 0 | | | | 0 | | | | 0 | | | | 0 | |
Options | | | | | 61,950 | | | | 0 | | | | 0 | | | | 61,950 | |
United States | | | | | | | | | | | | | | | | | | |
Short-Term Investment | | | | | 6,694,675 | | | | 0 | | | | 0 | | | | 6,694,675 | |
| | | | | | 39,360,110 | | | | 7,013,826 | | | | 1,644,674 | | | | 48,018,610 | |
Call Options - Written | | | | | (1,715,736 | ) | | | 0 | | | | 0 | | | | (1,715,736 | ) |
Securities Sold Short | | | | | (544,142 | ) | | | 0 | | | | 0 | | | | (544,142 | ) |
Forwards | | | | | 23,411 | | | | 0 | | | | 0 | | | | 23,411 | |
Total | | | | $ | 37,123,643 | | | $ | 7,013,826 | | | $ | 1,644,674 | | | $ | 45,782,143 | |
| | | | | | | | | | | | | | | | | | |
| Category | | Global Tactical Allocation | | Quoted Prices
in Active Markets for
Identical Investments
(Level 1) | | | Significant Other
Observable Inputs
(Level 2) | | | Significant
Unobservable Inputs
(Level 3) | | | Fair
Value at
6/30/2012 | |
Domestic Common Stocks | | | | | | | | | | | | | | | | | | |
United States | | | | | | | | | | | | | | | | | | |
Basic Materials | | | | $ | 232,612 | | | $ | 0 | | | $ | 0 | | | $ | 232,612 | |
Communications | | | | | 650,322 | | | | 0 | | | | 0 | | | | 650,322 | |
Consumer, Cyclical | | | | | 973,961 | | | | 0 | | | | 0 | | | | 973,961 | |
Consumer, Non-cyclical | | | | | 1,363,511 | | | | 0 | | | | 0 | | | | 1,363,511 | |
Energy | | | | | 382,883 | | | | 0 | | | | 0 | | | | 382,883 | |
Financial | | | | | 447,341 | | | | 0 | | | | 0 | | | | 447,341 | |
Healthcare | | | | | 624,474 | | | | 0 | | | | 0 | | | | 624,474 | |
Industrial | | | | | 168,562 | | | | 0 | | | | 0 | | | | 168,562 | |
Technology | | | | | 810,292 | | | | 0 | | | | 0 | | | | 810,292 | |
Foreign Common Stocks | | | | | | | | | | | | | | | | | | |
Belgium | | | | | | | | | | | | | | | | | | |
Consumer, Non-cyclical | | | | | 265,234 | | | | 0 | | | | 0 | | | | 265,234 | |
Notes to the Financial Statements
Note 2 — Summary of Significant Accounting Policies and Other Information (Continued)
| | | | | | | | | | | | | | | | | | |
| Category | | Global Tactical Allocation (Continued) | | Quoted Prices
in Active Markets for
Identical Investments
(Level 1) | | | Significant Other
Observable Inputs
(Level 2) | | | Significant
Unobservable Inputs
(Level 3) | | | Fair
Value at
6/30/2012 | |
Bermuda | | | | | | | | | | | | | | | | | | |
Energy | | | | | 191,808 | | | | 0 | | | | 0 | | | | 191,808 | |
Financial | | | | | 158,760 | | | | 0 | | | | 0 | | | | 158,760 | |
Canada | | | | | | | | | | | | | | | | | | |
Energy | | | | | 172,674 | | | | 0 | | | | 0 | | | | 172,674 | |
Denmark | | | | | | | | | | | | | | | | | | |
Healthcare | | | | | 216,557 | | | | 0 | | | | 0 | | | | 216,557 | |
France | | | | | | | | | | | | | | | | | | |
Healthcare | | | | | 204,012 | | | | 0 | | | | 0 | | | | 204,012 | |
Germany | | | | | | | | | | | | | | | | | | |
Consumer, Cyclical | | | | | 241,881 | | | | 0 | | | | 0 | | | | 241,881 | |
Ireland | | | | | | | | | | | | | | | | | | |
Healthcare | | | | | 218,346 | | | | 0 | | | | 0 | | | | 218,346 | |
Technology | | | | | 218,127 | | | | 0 | | | | 0 | | | | 218,127 | |
Mexico | | | | | | | | | | | | | | | | | | |
Consumer, Non-cyclical | | | | | 193,673 | | | | 0 | | | | 0 | | | | 193,673 | |
Netherlands | | | | | | | | | | | | | | | | | | |
Consumer, Non-cyclical | | | | | 153,410 | | | | 0 | | | | 0 | | | | 153,410 | |
Industrial | | | | | 168,652 | | | | 0 | | | | 0 | | | | 168,652 | |
Panama | | | | | | | | | | | | | | | | | | |
Consumer, Cyclical | | | | | 189,704 | | | | 0 | | | | 0 | | | | 189,704 | |
Switzerland | | | | | | | | | | | | | | | | | | |
Basic Materials | | | | | 219,008 | | | | 0 | | | | 0 | | | | 219,008 | |
Financial | | | | | 252,783 | | | | 0 | | | | 0 | | | | 252,783 | |
United Kingdom | | | | | | | | | | | | | | | | | | |
Consumer, Cyclical | | | | | 200,030 | | | | 0 | | | | 0 | | | | 200,030 | |
Consumer, Non-cyclical | | | | | 198,925 | | | | 0 | | | | 0 | | | | 198,925 | |
Healthcare | | | | | 188,204 | | | | 0 | | | | 0 | | | | 188,204 | |
Short-Term Investments | | | | | 387,843 | | | | 0 | | | | 0 | | | | 387,843 | |
| | | | | | 9,693,589 | | | | 0 | | | | 0 | | | | 9,693,589 | |
Call Options - Written | | | | | (1,480 | ) | | | 0 | | | | 0 | | | | (1,480 | ) |
Securities Sold Short | | | | | (291,940 | ) | | | 0 | | | | 0 | | | | (291,940 | ) |
Total | | | | $ | 9,400,169 | | | $ | 0 | | | $ | 0 | | | $ | 9,400,169 | |
| | | | | | | | | | | | | | | | | | |
| Category | | Mid-Cap Value | | Quoted Prices
in Active Markets for
Identical Investments
(Level 1) | | | Significant Other
Observable Inputs
(Level 2) | | | Significant
Unobservable Inputs
(Level 3) | | | Fair
Value at
6/30/2012 | |
Common Stocks | | | | | | | | | | | | | | | | | | |
Basic Materials | | | | $ | 516,220 | | | $ | 0 | | | $ | 0 | | | $ | 516,220 | |
Consumer, Cyclical | | | | | 907,243 | | | | 0 | | | | 0 | | | | 907,243 | |
Consumer, Non-cyclical | | | | | 328,313 | | | | 0 | | | | 0 | | | | 328,313 | |
Energy | | | | | 768,728 | | | | 0 | | | | 0 | | | | 768,728 | |
Financial | | | | | 1,889,740 | | | | 0 | | | | 0 | | | | 1,889,740 | |
Healthcare | | | | | 702,112 | | | | 0 | | | | 0 | | | | 702,112 | |
Industrial | | | | | 892,815 | | | | 0 | | | | 0 | | | | 892,815 | |
Technology | | | | | 766,910 | | | | 0 | | | | 0 | | | | 766,910 | |
Utilities | | | | | 1,106,909 | | | | 0 | | | | 0 | | | | 1,106,909 | |
Real Estate Investment Trusts | | | | | | | | | | | | | | | | | | |
Financial | | | | | 398,988 | | | | 0 | | | | 0 | | | | 398,988 | |
Short-Term Investments | | | | | 341,350 | | | | 0 | | | | 0 | | | | 341,350 | |
Total | | | | $ | 8,619,328 | | | $ | 0 | | | $ | 0 | | | $ | 8,619,328 | |
Note 2 — Summary of Significant Accounting Policies and Other Information (Continued)
| | | | | | | | | | | | | | | | | | |
| Category | | Small-Cap Growth Tactical Allocation | | Quoted Prices in
Active Markets for
Identical Investments
(Level 1) | | | Significant Other
Observable Inputs
(Level 2) | | | Significant
Unobservable Inputs
(Level 3) | | | Fair
Value at
6/30/2012 | |
Domestic Common Stocks | | | | | | | | | | | | | | | | | | |
United States | | | | | | | | | | | | | | | | | | |
Basic Materials | | | | $ | 488,070 | | | $ | 0 | | | $ | 0 | | | $ | 488,070 | |
Communications | | | | | 538,687 | | | | 0 | | | | 0 | | | | 538,687 | |
Consumer, Cyclical | | | | | 925,392 | | | | 0 | | | | 0 | | | | 925,392 | |
Energy | | | | | 347,606 | | | | 0 | | | | 0 | | | | 347,606 | |
Financial | | | | | 1,109,722 | | | | 0 | | | | 0 | | | | 1,109,722 | |
Healthcare | | | | | 369,272 | | | | 0 | | | | 0 | | | | 369,272 | |
Industrial | | | | | 438,663 | | | | 0 | | | | 0 | | | | 438,663 | |
Exchange-Traded Fund | | | | | | | | | | | | | | | | | | |
United States | | | | | | | | | | | | | | | | | | |
Exchange-Traded Funds | | | | | 271,050 | | | | 0 | | | | 0 | | | | 271,050 | |
Foreign Common Stocks | | | | | | | | | | | | | | | | | | |
Canada | | | | | | | | | | | | | | | | | | |
Basic Materials | | | | | 118,760 | | | | 0 | | | | 0 | | | | 118,760 | |
Cayman Islands | | | | | | | | | | | | | | | | | | |
Financial | | | | | 162,688 | | | | 0 | | | | 0 | | | | 162,688 | |
China | | | | | | | | | | | | | | | | | | |
Communications | | | | | 299,270 | | | | 0 | | | | 0 | | | | 299,270 | |
Technology | | | | | 73,710 | | | | 0 | | | | 0 | | | | 73,710 | |
Ireland | | | | | | | | | | | | | | | | | | |
Technology | | | | | 137,150 | | | | 0 | | | | 0 | | | | 137,150 | |
Taiwan | | | | | | | | | | | | | | | | | | |
Technology | | | | | 112,500 | | | | 0 | | | | 0 | | | | 112,500 | |
Short-Term Investments | | | | | 1,958,236 | | | | 0 | | | | 0 | | | | 1,958,236 | |
Total | | | | $ | 7,350,776 | | | $ | 0 | | | $ | 0 | | | $ | 7,350,776 | |
| | | | | | | | | | | | | | | | | | |
| Category | | Small-Cap Value | | Quoted Prices in
Active Markets for
Identical Investments
(Level 1) | | | Significant Other
Observable Inputs
(Level 2) | | | Significant
Unobservable Inputs
(Level 3) | | | Fair
Value at
6/30/2012 | |
Common Stocks | | | | | | | | | | | | | | | | | | |
Basic Materials | | | | $ | 2,010,807 | | | $ | 0 | | | $ | 0 | | | $ | 2,010,807 | |
Communications | | | | | 2,274,583 | | | | 0 | | | | 0 | | | | 2,274,583 | |
Consumer, Cyclical | | | | | 4,664,032 | | | | 0 | | | | 0 | | | | 4,664,032 | |
Consumer, Non-cyclical | | | | | 2,858,827 | | | | 0 | | | | 0 | | | | 2,858,827 | |
Energy | | | | | 1,883,972 | | | | 0 | | | | 0 | | | | 1,883,972 | |
Financial | | | | | 4,633,609 | | | | 0 | | | | 0 | | | | 4,633,609 | |
Healthcare | | | | | 3,806,931 | | | | 0 | | | | 0 | | | | 3,806,931 | |
Industrial | | | | | 2,732,507 | | | | 0 | | | | 0 | | | | 2,732,507 | |
Technology | | | | | 2,602,261 | | | | 0 | | | | 0 | | | | 2,602,261 | |
Utilities | | | | | 1,143,080 | | | | 0 | | | | 0 | | | | 1,143,080 | |
Real Estate Investment Trusts | | | | | | | | | | | | | | | | | | |
Financial | | | | | 1,551,269 | | | | 0 | | | | 0 | | | | 1,551,269 | |
Short-Term Investments | | | | | 1,989,210 | | | | 0 | | | | 0 | | | | 1,989,210 | |
Total | | | | $ | 32,151,088 | | | $ | 0 | | | $ | 0 | | | $ | 32,151,088 | |
Notes to the Financial Statements
Note 2 — Summary of Significant Accounting Policies and Other Information (Continued)
| | | | | | | | | | | | | | | | | | |
| Category | | Strategic Growth | | Quoted Prices in
Active Markets for
Identical Investments
(Level 1) | | | Significant Other
Observable Inputs
(Level 2) | | | Significant
Unobservable Inputs
(Level 3) | | | Fair
Value at
6/30/2012 | |
Domestic Common Stocks | | | | | | | | | | | | | | | | | | |
United States | | | | | | | | | | | | | | | | | | |
Basic Materials | | | | $ | 5,983,899 | | | $ | 0 | | | $ | 0 | | | $ | 5,983,899 | |
Communications | | | | | 13,703,547 | | | | 0 | | | | 0 | | | | 13,703,547 | |
Consumer, Cyclical | | | | | 18,936,512 | | | | 0 | | | | 0 | | | | 18,936,512 | |
Consumer, Non-cyclical | | | | | 28,606,917 | | | | 0 | | | | 0 | | | | 28,606,917 | |
Energy | | | | | 6,447,464 | | | | 0 | | | | 0 | | | | 6,447,464 | |
Financial | | | | | 10,844,315 | | | | 0 | | | | 0 | | | | 10,844,315 | |
Healthcare | | | | | 17,664,411 | | | | 0 | | | | 0 | | | | 17,664,411 | |
Industrial | | | | | 7,196,474 | | | | 0 | | | | 0 | | | | 7,196,474 | |
Technology | | | | | 15,813,613 | | | | 0 | | | | 0 | | | | 15,813,613 | |
Foreign Common Stocks | | | | | | | | | | | | | | | | | | |
Belgium | | | | | | | | | | | | | | | | | | |
Consumer, Non-cyclical | | | | | 4,842,720 | | | | 0 | | | | 0 | | | | 4,842,720 | |
Bermuda | | | | | | | | | | | | | | | | | | |
Financial | | | | | 3,151,386 | | | | 0 | | | | 0 | | | | 3,151,386 | |
Canada | | | | | | | | | | | | | | | | | | |
Energy | | | | | 3,155,196 | | | | 0 | | | | 0 | | | | 3,155,196 | |
France | | | | | | | | | | | | | | | | | | |
Healthcare | | | | | 3,665,415 | | | | 0 | | | | 0 | | | | 3,665,415 | |
Germany | | | | | | | | | | | | | | | | | | |
Consumer, Cyclical | | | | | 2,600,209 | | | | 0 | | | | 0 | | | | 2,600,209 | |
Ireland | | | | | | | | | | | | | | | | | | |
Technology | | | | | 3,984,568 | | | | 0 | | | | 0 | | | | 3,984,568 | |
Israel | | | | | | | | | | | | | | | | | | |
Technology | | | | | 1,387,032 | | | | 0 | | | | 0 | | | | 1,387,032 | |
Netherlands | | | | | | | | | | | | | | | | | | |
Consumer, Non-cyclical | | | | | 2,794,730 | | | | 0 | | | | 0 | | | | 2,794,730 | |
Switzerland | | | | | | | | | | | | | | | | | | |
Financial | | | | | 4,516,741 | | | | 0 | | | | 0 | | | | 4,516,741 | |
United Kingdom | | | | | | | | | | | | | | | | | | |
Consumer, Non-cyclical | | | | | 2,741,662 | | | | 0 | | | | 0 | | | | 2,741,662 | |
Healthcare | | | | | 3,516,181 | | | | 0 | | | | 0 | | | | 3,516,181 | |
Short-Term Investments | | | | | 11,503,312 | | | | 0 | | | | 0 | | | | 11,503,312 | |
| | | | | | 173,056,304 | | | | 0 | | | | 0 | | | | 173,056,304 | |
Call Options - Written | | | | | (25,544 | ) | | | 0 | | | | 0 | | | | (25,544 | ) |
Total | | | | $ | 173,030,760 | | | $ | 0 | | | $ | 0 | | | $ | 173,030,760 | |
There have been no transfers in and out of Level 1 and Level 2 fair value measurements during the year ended June 30, 2012 for all of the Funds.
Transfers are recognized at the end of the reporting period.
Note 2 — Summary of Significant Accounting Policies and Other Information (Continued)
The following is a reconciliation of assets for which significant unobservable inputs (Level 3) were used in determining fair value during the period from July 1, 2011 through June 30, 2012.
| | | | | | | | | | | | | | | | | | | | | | | | | | | | | | | | | | | | | | |
| Category | | Event Arbitrage | | Balance as of
6/30/2011 | | | Purchases | | | Sales | | | Realized
gain (loss) | | | Net unrealized
appreciation
(depreciation) | | | Amortized
discounts/
premiums | | | Transfers in
to Level 3 | | | Transfers out
of Level 3 | | | Balance as of
6/30/2012 | |
Domestic Common Stocks | | | | | | | | | | | | | | | | | | | | | | | | | | | | | | | | | |
United States | | | | | | | | | | | | | | | | | | | | | | | | | | | | | | | | | | | | |
Consumer Cyclical | | $ | 410 | | | $ | — | | | $ | — | | | $ | — | | | $ | (1 | ) | | $ | — | | | $ | — | | | $ | — | | | $ | 409 | |
Energy | | | | | 25,338 | | | | — | | | | (50,590 | ) | | | 50,590 | | | | (25,338 | ) | | | — | | | | — | | | | — | | | | — | |
Financial | | | | | 5,780 | | | | — | | | | — | | | | — | | | | (5,780 | ) | | | — | | | | — | | | | — | | | | — | |
Healthcare | | | | | 802,162 | | | | — | | | | (179,536 | ) | | | 26,541 | | | | 19,098 | | | | — | | | | — | | | | — | | | | 668,265 | |
Industrial | | | | | 21,676 | | | | — | | | | — | | | | — | | | | (8,699 | ) | | | — | | | | — | | | | (12,977 | ) | | | — | |
Technology | | | | | 978,503 | | | | — | | | | — | | | | — | | | | 910 | | | | — | | | | — | | | | (3,413 | ) | | | 976,000 | |
Rights | | | | | | | | | | | | | | | | | | | | | | | | | | | | | | | | | | | | | | |
United States | | | | | | | — | | | | — | | | | — | | | | — | | | | — | | | | — | | | | — | | | | — | |
Healthcare | | | | | 3,900 | | | | — | | | | — | | | | — | | | | (3,900 | ) | | | — | | | | — | | | | — | | | | — | |
Foreign Common Stock | | | | | | | | | | | | | | | | | | | | | | | | | | | | | | | | | | | | |
Germany | | | | | | | | | | | | | | | | | | | | | | | | | | | | | | | | | | | | | | |
Industrial | | | | | 571,512 | | | | — | | | | (571,238 | ) | | | (21,914 | ) | | | 21,640 | | | | — | | | | — | | | | — | | | | — | |
| | | | | $ | 2,409,281 | | | $ | — | | | $ | (801,364 | ) | | $ | 55,217 | | | $ | (2,070 | ) | | $ | — | | | $ | — | | | $ | (16,390 | ) | | $ | 1,644,674 | |
Net change in unrealized appreciation (depreciation) from Level 3 investments still held as of June 30, 2012 | | | | | | | | | | | | | | | | | | | $ | (2,070 | ) |
B. Federal Income Taxes. It is the Funds’ policy to comply with the requirements of Subchapter M of the Internal Revenue Code and to distribute substantially all of their taxable income to shareholders. Therefore, no federal income tax provision is required.
In accordance with Financial Accounting Standards Board (“FASB”) Interpretation ASC 740, (“ASC 740”), each Fund recognizes a tax benefit from an uncertain position only if it is more likely than not that the position is sustainable, based solely on its technical merits and consideration of the relevant taxing authority’s widely understood administrative practices and precedents. If this threshold is met, a Fund measures the tax benefit as the largest amount of benefit that is greater than fifty percent likely of being realized upon ultimate settlement. Management has reviewed the tax positions for each of the four open tax years as of June 30, 2012 and has determined that the implementation of ASC 740 does not have a material impact on the Funds’ financial statements. Each Fund’s federal tax returns for the prior three fiscal years remains subject to examination by the Internal Revenue Service.
Net investment income or loss and net realized gains or losses may differ for financial statement and income tax purposes primarily due to investments that have a different basis for financial statement and income tax purposes. The character of distributions made during the year from net investment income or net realized gains may differ from their ultimate characterization for federal income tax purposes. Also, due to the timing of dividend distributions, the fiscal year in which amounts are distributed may differ from the year that the income or realized gains were recorded by each Fund. Permanent differences in the recognition of earnings are reclassified to additional paid-in capital. Distributions in excess of tax-basis earnings are recorded as a return of capital.
C. Security Transactions and Investment Income. Security transactions are recorded on the trade date. Realized gains and losses are determined using the specific identification cost method. Interest income on debt securities is recorded daily on the accrual basis. Discounts and premiums on debt securities are
amortized over their respective lives. Dividend income is recorded on the ex-dividend date, or as soon as information is available to the Fund.
Certain Funds may make short sales of investments, which are transactions in which a Fund sells a security it does not own in anticipation of a decline in the fair value of that security. To complete such a transaction, the Fund must borrow the security to make delivery to the buyer. The Fund is then obligated to replace the security borrowed by purchasing it at the market price at the time of replacement. The broker retains the proceeds of short sales to the extent necessary to meet margin requirements until the short position is closed out.
If a security pays a dividend while the Fund holds it short, the Fund will need to pay the dividend to the original owner of the security. Since the Fund borrowed the shares and sold them to a third party, the third party will receive the dividend from the security and the Fund will pay the original owner the dividend directly. The Fund is not entitled to the dividend because it does not own the shares. A gain, limited to the price at which the Fund sold the security short, or a loss, unlimited in size, will be recognized upon the termination of a short sale.
D. Options Contracts Written. Certain Funds may write options to manage exposure to certain changes in the market. When a Fund writes an option, an amount equal to the premium received by the Fund is recorded as a liability, which is marked-to-market daily to reflect the current market value of the option written. If the option expires, the Fund realizes a gain from investments equal to the amount of the premium received. When a written call option is exercised, the difference between the premium and the amount for effecting a closing purchase transaction, including brokerage commission, is also treated as a realized gain or loss. When a written put option is exercised, the amount of the premium received reduces the cost of the security purchased by the Fund.
A risk in writing a covered call option is that the Fund may forego the opportunity of profit if the market price of the underlying security increases and the option is exercised. The risk in writing a put option is that the Fund may incur a loss if the market price of the underlying security decreases and the option is exercised.
Notes to the Financial Statements
Note 2 — Summary of Significant Accounting Policies and Other Information (Continued)
In addition, there is the risk that the Fund may not be able to enter into a closing transaction because of an illiquid secondary market.
E. Purchased Options. Certain Funds may purchase call options in anticipation of an increase in the market value of securities of the type in which they may invest. The purchase of a call option will entitle a Fund, in return for the premium paid, to purchase specified securities at a specified price during the option period. A Fund will ordinarily realize a gain if, during the option period, the value of such securities exceeded the sum of the exercise price, the premium paid and transaction costs; otherwise, the Fund will realize either no gain or a loss on the purchase of the call option. A Fund will normally purchase put options in anticipation of a decline in the market value of securities in its portfolio (“protective puts”) or in securities in which it may invest. The purchase of a put option will entitle the Fund, in exchange for the premium paid, to sell specified securities at a specified price during the option period. The purchase of protective puts is designed to offset or hedge against a decline in the market value of the Fund’s securities. Put options may also be purchased by a Fund for the purpose of affirmatively benefiting from a decline in the price of securities which it does not own. The Fund will ordinarily realize a gain if, during the option period, the value of the underlying securities decreased below the exercise price sufficiently to more than cover the premium and transaction costs; otherwise the Fund will realize either no gain or a loss on the purchase of the put option. Gains and losses on the purchase of protective put options would tend to be offset by countervailing changes in the value of the underlying portfolio securities.
F. Futures Contracts. Certain Funds may enter into financial futures contracts, to the extent permitted by their investment policies and objectives, for bona fide hedging and other permissible risk management purposes including protecting against anticipated changes in the value of securities a Fund intends to purchase. Upon entering into a financial futures contract, a Fund is required to deposit cash or securities as initial margin. Additional securities are also segregated as collateral up to the current market value of the financial futures contracts. Subsequent payments, known as variation margin, are made or received by the Fund, depending on the fluctuation in the value of the underlying financial instruments. The Fund recognizes an unrealized gain or loss equal to the variation margin. When the financial futures contracts are closed, a realized gain or loss is recognized equal to the difference between the proceeds from (or cost of) the closing transactions and the Fund’s basis in the contracts. The risks associated with entering into financial futures contracts include the possibility that a change in the value of the contract may not correlate with the changes in the value of the underlying instruments. In addition, investing in financial futures contracts involves the risk that the Fund could lose more than the original margin deposit and subsequent payments required for a futures transaction. Risks may also arise upon entering into these contracts from the potential inability of the counterparties to meet the terms of their contracts.
G. Foreign Currency Transactions. Securities and other assets and liabilities denominated in foreign currencies are converted each business day into U.S. dollars based on the prevailing rates of exchange. Purchases and sales of portfolio securities and income and expenses are converted into U.S. dollars on the respective dates of such transactions.
Gains and losses resulting from changes in exchange rates applicable to foreign securities are not reported separately from gains and losses arising from movements in securities prices.
Net realized foreign exchange gains and losses include gains and losses from sales and maturities of foreign currency exchange contracts, gains and losses realized between the trade and settlement dates of foreign securities transactions,
and the difference between the amount of dividends, interest and foreign withholding taxes on the Funds’ books and the U.S. dollar equivalent of the amounts actually received. Net unrealized foreign exchange gains and losses include gains and losses from changes in the fair value of assets and liabilities denominated in foreign currencies other than portfolio securities, resulting from changes in exchange rates.
H. Forward Foreign Currency Contracts. Certain Funds may enter into forward foreign currency contracts to hedge against foreign currency exchange rate risk on their non-U.S. dollar denominated securities or to facilitate settlement of foreign currency denominated portfolio transactions. A forward foreign currency contract is an agreement between two parties to buy and sell a currency at a set price on a future date. The contract is marked-to-market daily and the change in value is recorded by a Fund as an unrealized gain or loss. When a forward foreign currency contract is extinguished, through either delivery or offset by entering into another forward foreign currency contract, the Fund records a realized gain or loss equal to the difference between the value of the contract at the time it was opened and the value of the contract at the time it was extinguished.
Forward foreign currency contracts involve elements of market risk in excess of the amounts reflected in the Statements of Assets and Liabilities. The Fund bears the risk of an unfavorable change in the foreign exchange rate underlying the forward foreign currency contract. Risks may also arise upon entering into these contracts from the potential inability of the counterparties to meet the terms of their contracts.
I. Portfolio Investment Risks. Investments in securities of foreign issuers carry certain risks not ordinarily associated with investments in securities of U.S. issuers. These risks include future disruptive political and economic developments and the possible imposition of exchange controls or other unfavorable foreign government laws and restrictions. In addition, investments in certain countries may carry risks of expropriation of assets, confiscatory taxation, political or social instability, or diplomatic developments that adversely affect investments in those countries. Certain countries may also impose substantial restrictions on investments in their capital markets by foreign entities, including restrictions on investments in issuers in industries deemed sensitive to relevant national interests. These factors may limit the investment opportunities available and result in a lack of liquidity and high price volatility with respect to securities of issuers from developing countries.
Event Arbitrage is not a “diversified” Fund, which means that the Fund may allocate its investments to a relatively small number of issuers or to a single industry, making the Fund more susceptible to adverse developments of a single user or industry. As a result, investing in the Fund is potentially more risky than investing in a diversified fund that is other wise similar to the Fund.
J. Multiple Class Allocations. Each class of shares has equal rights as to earnings and assets except that each class bears different distribution and shareholder servicing expenses. Each class of shares has exclusive voting rights with respect to matters that affect just that class. Income, expenses (other than expenses attributable to a specific class) and realized and unrealized gains or losses on investments are allocated to each class of shares based on its relative net assets.
K. Expense Allocations. Expenses that are not series (Fund) specific are allocated to each series based upon its relative proportion of net assets to the Trust’s total net assets.
L. Distributions to Shareholders. Each Fund generally declares dividends at least annually, payable in December, on a date selected by the Board. In addition, distributions may be made annually in December out of net realized gains through October 31 of that calendar year. Distributions to shareholders are recorded on the ex-dividend date. Each Fund may make a supplemental distribution subsequent to the end of its fiscal year ending June 30.
Note 2 — Summary of Significant Accounting Policies and Other Information (Continued)
M. Use of Estimates. The preparation of financial statements in conformity with GAAP requires management to make estimates and assumptions that affect the reported amounts of assets and liabilities and the disclosure of contingent assets and liabilities at the date of the financial statements, and the reported amounts of revenue and expenses during the reporting period. Actual results could differ from those estimates, and those differences could be significant.
N. Security Loans. The Funds receive compensation in the form of fees, or retain a portion of interest on the investment of any cash received as collateral. The Funds also continue to receive interest or dividends on the securities loaned. The loans are secured by collateral at least equal, at all times, to 102% of the market value of the loaned securities. Gain or loss in the fair value of the securities loaned that may occur during the term of the loan will be for the account of the Funds. The Funds have the right under the lending agreement to recover the securities from the borrower on demand.
O. Derivative Instruments. Effective June 30, 2009, the Funds have adopted amendments to authoritative guidance on disclosures about derivative instruments and hedging activities which require that the Funds disclose: a) how and why an entity uses derivative instruments; and b) how derivative instruments and related hedged items affect an entity’s financial position, financial performance and cash flows. The adoption of the additional disclosure requirements did not materially impact the Funds’ financial statements.
The Funds traded financial instruments where they are considered to be a seller of credit derivatives in accordance with authoritative guidance under GAAP on derivatives and hedging.
The fair value of derivative instruments and whose primary underlying risk exposure is equity price risk at June 30, 2012 was as follows:
Event Arbitrage
| | | | | | | | |
| | | Fair Value | |
| Derivative | | Asset Derivatives(1) | | | Liability Derivatives(2) | |
Written Options | | $ | — | | | $ | 1,715,736 | |
Purchased Options | | | 61,950 | | | | — | |
Forward Currency Contracts | | | 1,588,871 | | | | 1,565,460 | |
Global Tactical Allocation
| | | | | | | | |
| | | Fair Value | |
| Derivative | | Asset Derivatives(1) | | | Liability Derivatives(2) | |
Written Options | | $ | — | | | $ | 1,480 | |
Strategic Growth
| | | | | | | | |
| | | Fair Value | |
| Derivative | | Asset Derivatives(1) | | | Liability Derivatives(2) | |
Written Options | | $ | — | | | $ | 25,544 | |
| (1) | Statement of Assets and Liabilities location: Investments, at value and Receivable for open forward contracts. |
| (2) | Statement of Assets and Liabilities location: Call Options Written, at value and Payable for open forward currency contracts. |
The effect of derivative instruments on the Statement of Operations and whose primary underlying risk exposure is equity price risk for the period ended June 30, 2012 was as follows:
Event Arbitrage
| | | | | | | | |
| | | | |
| Derivative | | Realized Gain (Loss)
on Derivatives
Recognized in
Income(1) | | | Change in Unrealized
Appreciation
(Depreciation) on
Derivatives Recognized
in Income(2) | |
Written Options | | $ | 6,432,693 | | | $ | (507,771 | ) |
Purchased Options | | | (219,203 | ) | | | (43,394 | ) |
Forward Currency Contracts | | | 143,331 | | | | 23,411 | |
Global Tactical Allocation
| | | | | | | | |
| | | | |
| Derivative | | Realized Gain (Loss)
on Derivatives
Recognized in
Income(1) | | | Change in Unrealized
Appreciation
(Depreciation) on
Derivatives Recognized
in Income(2) | |
Written Options | | $ | 7,403 | | | $ | 502 | |
Strategic Growth
| | | | | | | | |
| | | | |
| Derivative | | Realized Gain (Loss)
on Derivatives
Recognized in
Income(1) | | | Change in Unrealized
Appreciation
(Depreciation) on
Derivatives Recognized
in Income(2) | |
Written Options | | $ | 114,480 | | | $ | 6,008 | |
| (1) | Statement of Operations location: Net realized gain (loss) from written options, net realized gain (loss) from investments and net realized gain (loss) from forward currency contracts. |
| (2) | Statement of Operations location: Net unrealized appreciation (depreciation) on written options, net unrealized appreciation (depreciation) on investments and net unrealized appreciation (depreciation) on forward currency contracts. |
The average notional amounts of written options, purchased options and forward currency contracts outstanding during the period ended June 30, 2012 were approximately as follows:
| | | | | | | | | | | | |
| Fund | | Written
Options | | | Purchased
Options | | | Forward
Currency
Contracts | |
Event Arbitrage | | $ | 1,333,937 | | | $ | 531,063 | | | $ | 1,430,323 | |
Global Tactical Allocation | | | 918 | | | | — | | | | — | |
Strategic Growth | | | 11,265 | | | | — | | | | — | |
Note 3 — Investment Advisory Fee and Other Related Party Transactions
QFI serves as investment adviser to each Fund. Pursuant to separate investment subadvisory agreements, QFI has selected the following investment advisory firms to serve as sub-advisers:
| | |
| Fund | | Sub-adviser |
| Event Arbitrage | | N/A |
| Global Tactical Allocation Inc. | | DG Capital Management, Inc. |
| Mid-Cap Value Management, Inc. | | Kennedy Capital |
| Small-Cap Growth Tactical Allocation | | Century Management, Inc. |
| Small-Cap Value | | Aronson Johnson Ortiz, L.P. |
| Strategic Growth | | DG Capital Management, Inc. |
QFI or the sub-advisers provide each Fund with a continuous program of supervision of the Fund’s assets, including the composition of its portfolio, and furnish advice and recommendations with respect to investments, investment policies and the purchase and sale of securities.
Notes to the Financial Statements
Note 3 — Investment Advisory Fee and Other Related Party Transactions (Continued)
Each Fund paid QFI aggregate fees shown in the table below for the fiscal year ending June 30, 2012. Amounts are expressed as an annualized percentage of average net assets.
| | | | | | | | | | | | |
| Fund | | Aggregate
advisory fee
paid to QFI | | | Subadvisory
fee paid by QFI
to the sub-adviser | | | Advisory &
subadvisory
fees waived &
reimbursed | |
Event Arbitrage | | | 1.30% | | | | N/A | | | | 0.37% | |
Global Tactical Allocation | | | 1.25% | | | | 0.75% | | | | N/A | |
Mid-Cap Value | | | 1.05% | | | | 0.75% | | | | N/A | |
Small-Cap Growth Tactical Allocation | | | 1.00% | | | | 0.50% | | | | N/A | |
Small-Cap Value | | | 1.00% | | | | 0.70% | | | | N/A | |
Strategic Growth | | | 1.30% | | | | 0.75% | | | | 0.05% | |
For the fiscal year ending June 30, 2012, QFI and the sub-advisers earned and reimbursed fees as follows:
| | | | | | | | | | | | |
| Fund | | Aggregate
advisory fee
paid to QFI | | | Subadvisory
fee paid by QFI
to the sub-adviser | | | Advisory &
subadvisory
fees waived &
reimbursed | |
Event Arbitrage | | $ | 658,708 | | | | N/A | | | $ | 187,347 | |
Global Tactical Allocation | | | 174,674 | | | | 104,804 | | | | N/A | |
Mid-Cap Value | | | 91,231 | | | | 65,164 | | | | N/A | |
Small Cap Growth Tactical Allocation | | | 119,231 | | | | 59,615 | | | | N/A | |
Small-Cap Value | | | 389,369 | | | | 272,558 | | | | N/A | |
Strategic Growth | | | 2,701,407 | | | | 1,558,504 | | | | 100,595 | |
QFI voluntarily agreed to waive its management fee to the extent that the total operating expenses of Event Arbitrage (exclusive of interest, taxes, brokerage commissions and other costs incurred in connection with the purchase or sale of portfolio securities, and extraordinary items) exceed the annual rate of 1.99% for Class A shares, 2.74% for Class C shares, and 1.74% for Institutional Class shares of the average net assets of each class, respectively. QFI currently has no intention to terminate this arrangement; however, it may do so at any time in its sole discretion. If, at any time, the annualized expenses of Event Arbitrage were less than the annualized expense ratio, the Trust, on behalf of Event Arbitrage, would reimburse QFI for any fees previously waived and/or expenses previously assumed; provided, however, that repayment would be payable only to the extent that it (a) can be made during the three (3) years following the time at which the adviser waived fees or assumed expenses for Event Arbitrage, and (b) can be repaid without causing the expenses of Event Arbitrage to exceed the annualized expense ratio. This fee waiver agreement shall continue in effect from October 28, 2011 until October 28, 2012. This agreement shall automatically terminate upon termination of the advisory agreement between QFI and the Trust or, with respect to Event Arbitrage, in the event of its merger or liquidation.
Additionally, QFI voluntarily agreed to waive its management fee to the extent that the total operating expenses of Small-Cap Value (exclusive of interest, taxes, brokerage commissions and other costs incurred in connection with the purchase or sale of portfolio securities, and extraordinary items) exceed the annual rate of 2.60% for Class A shares, 3.35% for Class C shares, and 2.35% for Institutional Class shares of the average net assets of each class, respectively. QFI currently has no intention to terminate this arrangement; however, it may do so at any time in its sole discretion.
Additionally, QFI voluntarily agreed to waive its management fee to the extent that the total operating expenses of Strategic Growth (exclusive of interest, taxes, brokerage commissions and other costs incurred in connection with the purchase
or sale of portfolio securities, and extraordinary items) exceed the annual rate of 2.24% for Class A shares, 2.99% for Class C shares, and 1.99% for Institutional Class shares of the average net assets of each class, respectively. QFI currently has no intention to terminate this arrangement; however, it may do so at any time in its sole discretion.
At June 30, 2012, the cumulative unreimbursed amount paid and/or waived by the Advisor on behalf of Event Arbitrage and Strategic Growth that may be recouped was $288,555, and $851,720, respectively. The Advisor may recapture portions of the above amount no later than the dates stated below:
| | | | | | | | | | | | |
| | | June 30,
2013 | | | June 30,
2014 | | | June 30,
2015 | |
Event Arbitrage | | $ | 16,059 | | | $ | 85,149 | | | $ | 187,347 | |
Strategic Growth | | | —* | | | | 751,125 | | | | 100,595 | |
| * | Prior to June 30, 2011, Strategic Growth did not waive sub-advisory fees. |
US Bancorp Fund Services, LLC (“USB”), serves as the Trust’s transfer, dividend paying, and shareholder servicing agent (“Transfer Agent”). The Transfer Agent maintains the records of each shareholder’s account, answers shareholder inquiries concerning accounts, processes purchases and redemptions of Fund shares, acts as dividend and distribution disbursing agent and performs other shareholder functions. As compensation for its services, the Transfer Agent receives a fee at the annual rate ranging between $8 and $11 dollars per shareholder account.
Brown Brothers Harriman & Co. serves as fund accountant and administrator (“Administrator”) for the Trust pursuant to a written agreement with the Trust. The Administrator provides fund accounting services and administrative services to each Fund. As compensation for its services, the Administrator receives a fee at the annual rate of 0.025% for accounting and 0.030% for administration of the aggregate of the Trust’s first $2 billion of average daily net assets and 0.020% for accounting and 0.025% for administration for over $2 billion of average daily net assets.
The Trust will incur an annual account minimum if, on an annual basis, the asset charges do not exceed the account minimum charges.
Foreside Fund Services, LLC (“Distributor”) serves as principal underwriter for the Trust. The Trust has adopted distribution and shareholder servicing plans pursuant to Rule 12b-1 of the 1940 Act for Class A and Class C Shares described below. There is no Rule 12b-1 distribution plan for Institutional Class Shares of the Funds. The Class A Plan provides that each Fund may pay a servicing or Rule 12b-1 fee at an annual rate of 0.25% of the Class A average net assets on a monthly basis to persons or institutions for performing certain servicing functions for the Class A shareholders. The Class A Plan also allows the Fund to pay or reimburse expenditures in connection with sales and promotional services related to distribution of the Fund’s shares, including personal services provided to prospective and existing shareholders. The Class C Plan provides that each Fund may compensate QFI and others for services provided and expenses incurred in the distribution of shares at an annual rate of 1.00% of the average net assets of each class on a monthly basis.
For the fiscal year ending June 30, 2012, the Distributor received underwriter concessions from the sale of Funds shares as follows:
| | | | |
| Fund | | Amount | |
Event Arbitrage | | $ | 13,409 | |
Global Tactical Allocation | | | 151 | |
Mid-Cap Value | | | 60 | |
Small-Cap Growth Tactical Allocation | | | 10 | |
Small-Cap Value | | | 545 | |
Strategic Growth | | | 3,644 | |
Note 3 — Investment Advisory Fee and Other Related Party Transactions (Continued)
Except for the Trust’s Chief Compliance Officer (“CCO”), employees and Officers of QFI do not receive any compensation from the Trust. The CCO of the Trust also serves as general counsel to QFI. For the fiscal year ending June 30, 2012, the Funds compensated the CCO as follows:
| | | | |
| Fund | | Amount | |
Event Arbitrage | | $ | 25,653 | |
Global Tactical Allocation | | | 7,408 | |
Mid-Cap Value | | | 4,498 | |
Small-Cap Growth Tactical Allocation | | | 6,458 | |
Small-Cap Value | | | 20,537 | |
Strategic Growth | | | 108,782 | |
Long-Short Tactical (Liquidated, See Note 12) | | | 354 | |
Note 4 — Purchases and Sales of Investments
For the fiscal year ending June 30, 2012, aggregate purchases and sales of investment securities (excluding short-term investments) for each Fund were as follows:
| | | | | | | | |
| Fund | | Purchases | | | Sales | |
Event Arbitrage | | $ | 105,695,816 | | | $ | 61,904,349 | |
Global Tactical Allocation | | | 115,082,398 | | | | 123,844,020 | |
Mid-Cap Value | | | 3,620,118 | | | | 5,004,265 | |
Small-Cap Growth Tactical Allocation | | | 70,944,851 | | | | 65,687,100 | |
Small-Cap Value | | | 61,515,547 | | | | 60,050,789 | |
Strategic Growth | | | 347,153,141 | | | | 438,376,121 | |
Note 5 — Options Written
A summary of option contracts written by the Trust during the fiscal year ended June 30, 2012 is as follows:
| | | | | | | | |
| | | Event Arbitrage | |
| | | Number of Contracts | | | Option Premiums | |
Options outstanding at beginning of period | | | 3,556 | | | $ | 412,815 | |
Options written | | | 61,018 | | | | 10,325,909 | |
Options closed | | | (14,425 | ) | | | (3,350,687 | ) |
Options exercised | | | (25,153 | ) | | | (5,329,679 | ) |
Options expired | | | (15,436 | ) | | | (783,678 | ) |
Options outstanding at end of period | | | 9,560 | | | $ | 1,274,680 | |
| | | | | | | | |
| | | Global Tactical Allocation | |
| | | Number of Contracts | | | Option Premiums | |
Options outstanding at beginning of period | | | 3 | | | $ | 306 | |
Options written | | | 96 | | | | 15,676 | |
Options closed | | | (76 | ) | | | (14,609 | ) |
Options exercised | | | — | | | | — | |
Options expired | | | — | | | | — | |
Options outstanding at end of period | | | 23 | | | $ | 1,373 | |
| | | | | | | | |
| | | Strategic Growth | |
| | | Number of Contracts | | | Option Premiums | |
Options outstanding at beginning of period | | | 38 | | | $ | 3,878 | |
Options written | | | 1,455 | | | | 236,937 | |
Options closed | | | (1,093 | ) | | | (216,976 | ) |
Options exercised | | | — | | | | — | |
Options expired | | | — | | | | — | |
Options outstanding at end of period | | | 400 | | | $ | 23,839 | |
Note 6 — Tax Matters
For U.S. federal income tax purposes, the cost of securities owned, gross appreciation, gross depreciation, and net unrealized appreciation (depreciation) of investments at June 30, 2012 for each Fund were as follows:
| | | | | | | | | | | | | | | | |
| Fund | | Cost | | | Gross
Appreciation | | | Gross
Depreciation | | | Net Appreciation (Depreciation) | |
Event Arbitrage | | $ | 50,906,676 | | | $ | 2,022,929 | | | $ | (4,910,995 | ) | | $ | (2,888,066 | ) |
Global Tactical Allocation | | | 9,720,268 | | | | 449,761 | | | | (476,440 | ) | | | (26,679 | ) |
Mid-Cap Value | | | 7,413,489 | | | | 1,731,491 | | | | (525,652 | ) | | | 1,205,839 | |
Small Cap Growth Tactical Allocation | | | 7,457,323 | | | | 410,406 | | | | (516,953 | ) | | | (106,547 | ) |
Small-Cap Value | | | 31,196,112 | | | | 2,279,267 | | | | (1,324,291 | ) | | | 954,976 | |
Strategic Growth | | | 163,920,692 | | | | 13,309,597 | | | | (4,173,985 | ) | | | 9,135,612 | |
As of June 30, 2012, the components of distributable earnings on a tax basis were as follows:
| | | | | | | | | | | | | | | | | | | | | | | | |
| Fund | | Unrealized
Appreciation
(Depreciation) | | | Undistributed
Ordinary Income | | | Undistributed
Capital Gain | | | Capital Loss
Carryforward | | | Late Year
Loss | | | Total
Distributable
Earnings | |
Event Arbitrage | | $ | (3,276,027 | ) | | $ | 100,285 | | | $ | — | | | $ | — | | | $ | (413,363 | ) | | $ | (3,589,105 | ) |
Global Tactical Allocation | | | (40,900 | ) | | | — | | | | — | | | | (13,297,975 | ) | | | (80,154 | ) | | | (13,419,029 | ) |
Mid-Cap Value | | | 1,205,839 | | | | — | | | | — | | | | (9,146,683 | ) | | | (42,342 | ) | | | (7,983,186 | ) |
Small Cap Growth Tactical Allocation | | | (106,547 | ) | | | — | | | | — | | | | (1,309,364 | ) | | | (61,338 | ) | | | (1,477,249 | ) |
Small-Cap Value | | | 954,974 | | | | — | | | | — | | | | (9,101,305 | ) | | | (42,771 | ) | | | (8,189,102 | ) |
Strategic Growth | | | 9,133,907 | | | | — | | | | — | | | | (444,330,236 | ) | | | (654,882 | ) | | | (435,851,209 | ) |
The difference between book basis and tax basis unrealized appreciation (depreciation) is attributable primarily to the tax deferral of losses on wash sales and straddles from options, the differing book/tax treatment of unrealized appreciation/depreciation on forward foreign currency contracts, and outstanding REIT and Partnership adjustments.
Notes to the Financial Statements
Note 6 — Tax Matters (Continued)
The undistributed ordinary income, capital gains and carryforward losses shown above differ from the corresponding accumulated net investment income and accumulated net realized gain (loss) figures reported in the statements of assets and liabilities due to differing book/tax treatment of short-term capital gains, and certain temporary book/tax differences such as the deferral of realized losses on wash sales, straddles from options and net losses realized after October 31.
Under current tax law, foreign currency and net capital losses realized after October 31 may be deferred and treated as occurring on the first day of the following fiscal year. The Funds elected to defer net capital and currency losses as indicated in the chart below.
At June 30, 2012, the capital loss carryovers for the Funds were as follows:
| | | | | | | | | | | | | | | | | | | | | | | | | | | | |
Fund | | Post December 31, 2010
Capital Losses
No Expiration | | | Capital Loss
Carryovers Expiring | | | Capital Loss
Carryovers Expiring | | | Capital Loss
Carryovers Expiring | | | Post-October Capital Loss | |
| | Short-term | | | Long-term | | | 2018 | | | 2017 | | | 2016 | | | Deferred | | | Utilized | |
Event Arbitrage | | $ | — | | | $ | — | | | $ | — | | | $ | — | | | $ | — | | | $ | — | | | $ | 236,408 | |
Global Tactical Allocation | | | 302,389 | | | | — | | | | 2,718,683 | | | | 10,276,903 | | | | — | | | | — | | | | — | |
Mid-Cap Value | | | — | | | | — | | | | 1,170,572 | | | | 7,976,111 | | | | — | | | | — | | | | — | |
Small Cap Growth Tactical Allocation | | | 1,309,364 | | | | — | | | | — | | | | — | | | | — | | | | — | | | | — | |
Small-Cap Value | | | — | | | | — | | | | 9,101,305 | | | | — | | | | — | | | | — | | | | — | |
Strategic Growth | | | — | | | | — | | | | 164,714,297 | | | | 279,615,939 | | | | — | | | | — | | | | — | |
Under the Regulated Investment Company Modernization Act of 2010 (“Act”), net capital losses may be carried forward indefinitely, and their character is retained as short term and/or long-term losses. Previously, net capital losses were carried forward for eight years and treated as short term losses. As a transition rule, the Act requires that postenactment net capital losses be used before pre-enactment net capital losses. As a result of this ordering rule, pre-enactment capital loss carryforwards may expire unused, whereas under the previous rules these losses may have been utilized.
Note 7 — Reclassification of Capital Accounts
In accordance with the accounting pronouncements, each Fund has recorded reclassifications in the capital accounts. These reclassifications have no impact on the net asset value of the Funds and are designed generally to present undistributed income and realized gains on a tax basis which is considered to be more informative to shareholders. As of June 30, 2012, the Funds recorded the following reclassification to increase (decrease) the accounts listed below:
| | | | | | | | | | | | |
| Beneficial Fund | | Accumulated Net Investment Income | | | Accumulated Net Realized Gain (Loss) | | | Capital Shares of Interest | |
Event Arbitrage | | $ | (373,183 | ) | | $ | 373,183 | | | $ | — | |
Global Tactical Allocation | | | 147,536 | | | | | | | | (147,536 | ) |
Mid-Cap Value | | | 35,293 | | | | 4,777 | | | | (40,070 | ) |
Small Cap Growth Tactical Allocation | | | 136,522 | | | | 604 | | | | (137,126 | ) |
Small-Cap Value | | | 102,107 | | | | (91,080 | ) | | | (11,027 | ) |
Strategic Growth | | | 1,512,483 | | | | | | | | (1,512,483 | ) |
During the year ended June 30, 2012, the Quaker Small Cap Value Fund realized $96,419 of net capital gains resulting from an in-kind redemption. Shareholders exchanged fund shares for securities held by the Fund rather than cash. Net capital gains or losses resulting from in-kind redemptions are excluded from the Fund’s taxable gains and are not distributed to shareholders. Because such gains are not taxable to the Fund, and are not distributed to shareholders, they have been reclassified from accumulated net realized gains and losses to paid-in-capital. Such reclassification has no effect on the Fund’s net assets.
Note 8 — Distributions to Shareholders
Income and long-term capital gain distributions are determined in accordance with federal income tax regulations, which may differ from GAAP. The information set forth below is for each Fund’s fiscal year as required by federal securities laws.
The tax character of dividends and distributions paid during the fiscal years of 2012 and 2011 were as follows:
| | | | | | | | | | | | | | | | | | | | | | | | |
| | | Ordinary Income | | | Long-Term Capital Gain | | | Return of Capital | |
| Fund | | 2012 | | | 2011 | | | 2012 | | | 2011 | | | 2012 | | | 2011 | |
Event Arbitrage | | $ | 1,103,905 | | | $ | 116,827 | | | $ | — | | | $ | 64,146 | | | $ | — | | | $ | — | |
Global Tactical Allocation | | | — | | | | — | | | | — | | | | — | | | | — | | | | — | |
Mid-Cap Value | | | — | | | | — | | | | — | | | | — | | | | — | | | | — | |
Small Cap Growth Tactical Allocation | | | 548,581 | | | | 644,319 | | | | — | | | | — | | | | — | | | | — | |
Small-Cap Value | | | — | | | | — | | | | — | | | | — | | | | — | | | | — | |
Strategic Growth | | | — | | | | — | | | | — | | | | — | | | | — | | | | — | |
Note 9 — Fund Share Transactions
At June 30, 2012, there were an unlimited number of shares of beneficial interest with a $0.01 par value authorized.
The following table summarizes the activity in shares of each Fund:
| | | | | | | | | | | | | | | | | | | | | | | | | | | | | | | | |
| Event Arbitrage | |
| | | For the Fiscal Year Ended June 30, 2012 | | | For the Fiscal Year Ended June 30, 2011 | |
| | | Sold | | | Redeemed | | | Reinvested | | | End Shares | | | Sold | | | Redeemed | | | Reinvested | | | End Shares | |
Class A | | | | | | | | | | | | | | | | | | | | | | | | | | | | | | | | |
Shares | | | 1,735,073 | | | | (912,029 | ) | | | 56,537 | | | | 2,911,921 | | | | 2,575,353 | | | | (893,723 | ) | | | 9,090 | | | | 2,032,340 | |
Value | | $ | 20,758,217 | | | $ | (10,911,336 | ) | | $ | 653,570 | | | | | | | $ | 32,680,895 | | | $ | (11,332,113 | ) | | $ | 114,175 | | | | | |
Class C | | | | | | | | | | | | | | | | | | | | | | | | | | | | | | | | |
Shares | | | 354,371 | | | | (105,426 | ) | | | 10,799 | | | | 610,634 | | | | 372,244 | | | | (40,491 | ) | | | 725 | | | | 350,890 | |
Value | | $ | 4,227,492 | | | $ | (1,248,161 | ) | | $ | 123,866 | | | | | | | $ | 4,719,300 | | | $ | (513,878 | ) | | $ | 9,104 | | | | | |
Institutional Class | | | | | | | | | | | | | | | | | | | | | | | | | | | | | | | | |
Shares | | | 413,029 | | | | (915,671 | ) | | | 20,573 | | | | 1,110,251 | | | | 1,669,821 | | | | (139,739 | ) | | | 3,003 | | | | 1,592,320 | |
Value | | $ | 4,887,392 | | | $ | (10,726,682 | ) | | $ | 238,645 | | | | | | | $ | 21,254,814 | | | $ | (1,781,161 | ) | | $ | 37,719 | | | | | |
| | | | | | | | | | | | | | | | | | | | | | | | | | | | | | | | |
| Global Tactical Allocation | |
| | | For the Fiscal Year Ended June 30, 2012 | | | For the Fiscal Year Ended June 30, 2011 | |
| | | Sold | | | Redeemed | | | Reinvested | | | End Shares | | | Sold | | | Redeemed | | | Reinvested | | | End Shares | |
Class A | | | | | | | | | | | | | | | | | | | | | | | | | | | | | | | | |
Shares | | | 103,452 | | | | (859,470 | ) | | | — | | | | 801,996 | | | | 209,770 | | | | (830,100 | ) | | | — | | | | 1,558,014 | |
Value | | $ | 721,380 | | | $ | (5,963,328 | ) | | $ | — | | | | | | | $ | 1,571,128 | | | $ | 5,744,811 | | | $ | — | | | | | |
Class C | | | | | | | | | | | | | | | | | | | | | | | | | | | | | | | | |
Shares | | | 46,415 | | | | (526,527 | ) | | | — | | | | 457,958 | | | | 66,805 | | | | (763,464 | ) | | | — | | | | 938,070 | |
Value | | $ | 315,078 | | | $ | (3,600,623 | ) | | $ | — | | | | | | | $ | 467,312 | | | $ | (5,226,851 | ) | | $ | — | | | | | |
Institutional Class | | | | | | | | | | | | | | | | | | | | | | | | | | | | | | | | |
Shares | | | 59,881 | | | | (64,634 | ) | | | — | | | | 110,714 | | | | 9,736 | | | | (24,851 | ) | | | — | | | | 115,467 | |
Value | | $ | 500,000 | | | $ | (557,611 | ) | | $ | — | | | | | | | $ | 83,272 | | | $ | (200,522 | ) | | $ | — | | | | | |
| | | | | | | | | | | | | | | | | | | | | | | | | | | | | | | | |
| Mid-Cap Value | |
| | | For the Fiscal Year Ended June 30, 2012 | | | For the Fiscal Year Ended June 30, 2011 | |
| | | Sold | | | Redeemed | | | Reinvested | | | End Shares | | | Sold | | | Redeemed | | | Reinvested | | | End Shares | |
Class A | | | | | | | | | | | | | | | | | | | | | | | | | | | | | | | | |
Shares | | | 28,760 | | | | (91,030 | ) | | | — | | | | 388,614 | | | | 38,471 | | | | (154,161 | ) | | | — | | | | 450,884 | |
Value | | $ | 440,252 | | | $ | (1,362,926 | ) | | $ | — | | | | | | | $ | 590,197 | | | $ | (2,250,912 | ) | | $ | — | | | | | |
Class C | | | | | | | | | | | | | | | | | | | | | | | | | | | | | | | | |
Shares | | | 12,078 | | | | (51,770 | ) | | | — | | | | 138,211 | | | | 16,395 | | | | (60,807 | ) | | | — | | | | 177,903 | |
Value | | $ | 169,204 | | | $ | (671,636 | ) | | $ | — | | | | | | | $ | 220,315 | | | $ | (808,831 | ) | | $ | — | | | | | |
Institutional Class | | | | | | | | | | | | | | | | | | | | | | | | | | | | | | | | |
Shares | | | — | | | | (4,565 | ) | | | — | | | | 21,431 | | | | 11,979 | | | | (5,707 | ) | | | — | | | | 25,996 | |
Value | | $ | — | | | $ | (68,756 | ) | | $ | — | | | | | | | $ | 178,097 | | | $ | (81,990 | ) | | $ | — | | | | | |
| | | | | | | | | | | | | | | | | | | | | | | | | | | | | | | | |
Notes to the Financial Statements
Note 9 — Fund Share Transactions (Continued)
| | | | | | | | | | | | | | | | | | | | | | | | | | | | | | | | |
| Small-Cap Growth Tactical Allocation | |
| | | For the Fiscal Year Ended June 30, 2012 | | | For the Fiscal Year Ended June 30, 2011 | |
| | | Sold | | | Redeemed | | | Reinvested | | | End Shares | | | Sold | | | Redeemed | | | Reinvested | | | End Shares | |
Class A | | | | | | | | | | | | | | | | | | | | | | | | | | | | | | | | |
Shares | | | 12,860 | | | | (642,623 | ) | | | 28,363 | | | | 282,305 | | | | 573,751 | | | | (1,080,333 | ) | | | 30,681 | | | | 883,705 | |
Value | | $ | 124,477 | | | $ | (5,865,299 | ) | | $ | 247,896 | | | | | | | $ | 5,589,956 | | | $ | (10,418,007 | ) | | $ | 294,848 | | | | | |
Class C | | | | | | | | | | | | | | | | | | | | | | | | | | | | | | | | |
Shares | | | 18,513 | | | | (397,263 | ) | | | 13,446 | | | | 220,817 | | | | 198,320 | | | | (583,564 | ) | | | 18,932 | | | | 586,121 | |
Value | | $ | 175,362 | | | $ | (3,508,730 | ) | | $ | 114,426 | | | | | | | $ | 1,860,624 | | | $ | (5,660,707 | ) | | $ | 178,714 | | | | | |
Institutional Class | | | | | | | | | | | | | | | | | | | | | | | | | | | | | | | | |
Shares | | | 26,663 | | | | (314,969 | ) | | | 9,224 | | | | 211,294 | | | | 365,903 | | | | (338,092 | ) | | | 5,245 | | | | 490,376 | |
Value | | $ | 247,767 | | | $ | (2,822,614 | ) | | $ | 81,451 | | | | | | | $ | 3,574,721 | | | $ | (3,306,375 | ) | | $ | 50,822 | | | | | |
| | | | | | | | | | | | | | | | | | | | | | | | | | | | | | | | |
| Small-Cap Value | |
| | | For the Fiscal Year Ended June 30, 2012 | | | For the Fiscal Year Ended June 30, 2011 | |
| | | Sold | | | Redeemed | | | Reinvested | | | End Shares | | | Sold | | | Redeemed | | | Reinvested | | | End Shares | |
Class A | | | | | | | | | | | | | | | | | | | | | | | | | | | | | | | | |
Shares | | | 42,586 | | | | (373,217 | ) | | | — | | | | 526,678 | | | | 226,282 | | | | (1,049,170 | ) | | | — | | | | 857,309 | |
Value | | $ | 638,657 | | | $ | (5,492,383 | ) | | $ | — | | | | | | | $ | 3,074,213 | | | $ | (14,912,990 | ) | | $ | — | | | | | |
Class C | | | | | | | | | | | | | | | | | | | | | | | | | | | | | | | | |
Shares | | | 559 | | | | (40,550 | ) | | | — | | | | 138,112 | | | | 7,368 | | | | (38,302 | ) | | | — | | | | 178,103 | |
Value | | $ | 7,340 | | | $ | (509,287 | ) | | $ | — | | | | | | | $ | 91,224 | | | $ | (469,366 | ) | | $ | — | | | | | |
Institutional Class | | | | | | | | | | | | | | | | | | | | | | | | | | | | | | | | |
Shares | | | 552,441 | | | | (683,273 | ) | | | — | | | | 1,214,181 | | | | 115,713 | | | | (3,871,069 | ) | | | — | | | | 1,345,013 | |
Value | | $ | 9,566,836 | | | $ | (10,769,664 | ) | | $ | — | | | | | | | $ | 1,605,138 | | | $ | (52,302,288 | ) | | $ | — | | | | | |
| | | | | | | | | | | | | | | | | | | | | | | | | | | | | | | | | | |
| Strategic Growth | |
| | | For the Fiscal Year Ended June 30, 2012 | | | | | For the Fiscal Year Ended June 30, 2011 | |
| | | Sold | | | Redeemed | | | Reinvested | | | End Shares | | | | | Sold | | | Redeemed | | | Reinvested | | | End Shares | |
Class A | | | | | | | | | | | | | | | | | | | | | | | | | | | | | | | | | | |
Shares | | | 500,426 | | | | (4,878,197 | ) | | | — | | | | 6,927,955 | | | | | | 1,714,977 | | | | (13,406,019 | ) | | | — | | | | 11,305,726 | |
Value | | $ | 7,925,123 | | | $ | (76,172,869 | ) | | $ | — | | | | | | | | | $ | 26,601,682 | | | $ | (208,173,296 | ) | | $ | — | | | | | |
Class C | | | | | | | | | | | | | | | | | | | | | | | | | | | | | | | | | | |
Shares | | | 55,875 | | | | (1,043,606 | ) | | | — | | | | 1,872,785 | | | | | | 99,273 | | | | (2,429,003 | ) | | | — | | | | 2,860,516 | |
Value | | $ | 791,844 | | | $ | (14,712,803 | ) | | $ | — | | | | | | | | | $ | 1,391,735 | | | $ | (33,776,263 | ) | | $ | — | | | | | |
Institutional Class | | | | | | | | | | | | | | | | | | | | | | | | | | | | | | | | | | |
Shares | | | 932,946 | | | | (952,784 | ) | | | — | | | | 2,418,131 | | | | | | 1,840,158 | | | | (886,496 | ) | | | — | | | | 2,437,969 | |
Value | | $ | 15,225,608 | | | $ | (15,185,671 | ) | | $ | — | | | | | | | | | $ | 29,964,155 | | | $ | (14,204,941 | ) | | $ | — | | | | | |
Note 10 — 5% Shareholders
At June 30, 2012, certain unaffiliated shareholders of record, specifically omnibus accounts, individually or collectively held greater than 5% of the outstanding shares of the following Funds: Event Arbitrage — three own 25.03%; Global Tactical Allocation — one owns 8.98%; Mid-Cap Value — two own 14.47%; Small-Cap Growth Tactical Allocation — three own 27.99%; Strategic Growth — two own 27.21%.
Transactions by these shareholders may have a material impact upon the Funds.
Note 11 — Indemnifications
Under the Trust’s organizational documents, its officers and Trustees are indemnified against certain liabilities arising out of the performance of their duties to the Funds. In addition, in the normal course of business, the Trust enters into contracts with its vendors and others that provide for general indemnifications.
The Trust’s maximum exposure under these arrangements is dependant on future claims that may be made against the Trust, and, therefore, cannot be estimated; however, based on experience, risk of loss from such claims is considered remote.
Note 12 — Fund Liquidations
On September 19, 2011, the Board, including all of the Trustees who are not “interested persons” (as that term is defined in the 1940 Act) approved the liquidation and dissolution of the Quaker Long-Short Tactical Allocation Fund. The liquidation and dissolution was approved by the Board and a majority of shareholders of the Fund in accordance with the requirements of the 1940 Act, the Securities Exchange Act of 1934, as amended (“1934 Act”) and the Trust’s Amended and Restated Declaration of Trust. The liquidation and dissolution of the Fund was approved on October 24, 2011, by more than 50% of the outstanding voting securities entitled to vote. The result of the vote is shown below:
| | | | | | | | | | | | |
| Long-Short Tactical Allocation Fund | | % vote for | | | % vote
against | | | % vote
abstain | |
Proposal: Approval of the liquidation and dissolution of the Fund, a series of the Trust, pursuant to the Plan of Liquidation and Dissolution. | | | 59.37 | % | | | 0.00 | % | | | 0.47 | % |
Note 13 — Securities Lending
At June 30, 2012, these securities or a portion of these securities are out on loan. The aggregate market value of these loaned securities and the value of the cash collateral the Funds received is as follows:
| | | | | | | | | | | | |
| Fund | | Loaned Securities
Market Value | | | Value of Cash Collateral | | | % of
Net Assets | |
Event Arbitrage | | $ | — | | | $ | — | | | | — | |
Global Tactical Allocation | | $ | 159,643 | | | $ | 163,800 | | | | 1.64 | % |
Mid-Cap Value | | $ | 202,719 | | | $ | 208,181 | | | | 2.41 | % |
Small-Cap Growth Tactical Allocation | | $ | 1,000,391 | | | $ | 1,034,904 | | | | 15.87 | % |
Small-Cap Value | | $ | 1,540,736 | | | $ | 1,588,041 | | | | 5.10 | % |
Strategic Growth | | $ | 2,221,822 | | | $ | 2,270,726 | | | | 1.24 | % |
REPORT OF INDEPENDENT REGISTERED PUBLIC ACCOUNTING FIRM
To the Shareholders and Board of Trustees of Quaker Investment Trust
We have audited the accompanying statements of assets and liabilities of Quaker Event Arbitrage Fund, Quaker Global Tactical Allocation Fund, Quaker Mid-Cap Value Fund, Quaker Small-Cap Growth Tactical Allocation Fund, Quaker Small-Cap Value Fund, and Quaker Strategic Growth Fund, (the “Funds”) each a series of Quaker Investment Trust (the “Trust”), including the schedules of investments, as of June 30, 2012, the related statements of operations, the statements of changes in net assets and the financial highlights for the year then ended. These financial statements and financial highlights are the responsibility of the Funds’ management. Our responsibility is to express an opinion on these financial statements and financial highlights based on our audits. The statements of changes in net assets for the year ended June 30, 2011 and the financial highlights for each of the four years in the period then ended were audited by other auditors, whose report dated August 29, 2011 expressed an unqualified opinion on such statements and financial highlights.
We conducted our audits in accordance with the standards of the Public Company Accounting Oversight Board (United States). Those standards require that we plan and perform the audits to obtain reasonable assurance about whether the financial statements and financial highlights are free of material misstatement. The Funds are not required to have, nor were we engaged to perform, an audit of their internal control over financial reporting. Our audits included consideration of internal control over financial reporting as a basis for designing audit procedures that are appropriate in the circumstances, but not for the purpose of expressing an opinion on the effectiveness of the Funds’ internal control over financial reporting. Accordingly, we express no such opinion. An audit includes examining, on a test basis, evidence supporting the amounts and disclosures in the financial statements. Our procedures included confirmation of securities owned as of June 30, 2012, by correspondence with the custodian and brokers or through other appropriate procedures where replies from brokers were unable to be obtained. An audit also includes assessing the accounting principles used and significant estimates made by management, as well as evaluating the overall financial statement presentation. We believe that our audits provide a reasonable basis for our opinion.
In our opinion, the financial statements and financial highlights referred to above present fairly, in all material respects, the financial position of Quaker Event Arbitrage Fund, Quaker Global Tactical Allocation Fund, Quaker Mid-Cap Value Fund, Quaker Small-Cap Growth Tactical Allocation Fund, Quaker Small-Cap Value Fund, and Quaker Strategic Growth Fund, as of June 30, 2012, the results of their operations, the changes in their net assets and the financial highlights for the year then ended, in conformity with accounting principles generally accepted in the United States of America.
Tait, Weller & Baker LLP
Philadelphia, Pennsylvania
August 29, 2012
Trustees and Officers
June 30, 2012
The Board has overall responsibility for conduct of the Trust’s affairs. The day-to-day operations of the Trust are managed by QFI subject to the Bylaws of
the Trust and review by the Board. The Trustees, including those Trustees who are also officers, are listed below:
| | | | | | | | | | |
| Name, Address and Age | | Position(s) Held with the Trust | | Serving as an Officer or Trustee of
the Trust | | Principal Occupation(s) During Past 5 Years | | Portfolios Overseen by Trustee | | Directorships
Held by
Trustee(1) |
Jeffry H. King, Sr.(2)(3)
309 Technology Drive
Malvern, PA 19355
Age 69 | | Chairman of the Board and Chief Executive Officer | | Since
Nov. 1996 | | Chairman of Board of Directors and Chief Executive Officer, Quaker Funds, Inc. (1996–present). | | 8 | | None |
Laurie Keyes(3)(4)
309 Technology Drive
Malvern, PA 19355
Age 62 | | Treasurer and Trustee | | Since
Nov. 1996 | | Chief Financial Officer, Quaker Funds, Inc. (1996–present). | | 8 | | None |
Justin Brundage(5)
309 Technology Drive
Malvern, PA 19355
Age 42 | | Secretary | | Since
Nov. 2006 | | President, Quaker Funds, Inc. (2007–present); Chief Operating Officer, Quaker Funds, Inc. (2005–present). | | None | | None |
Timothy E. Richards
309 Technology Drive
Malvern, PA 19355
Age 47 | | Chief Compliance Officer | | Since
March 2004 | | General Counsel to Quaker Funds, Inc. (2003–present); Chief Compliance Officer for the Quaker Investment Trust (2004–present). | | None | | None |
James R. Brinton
309 Technology Drive
Malvern, PA 19355
Age 58 | | Trustee Lead Independent Trustee | | Since
Feb. 2002
Since
Aug. 2007 | | President, Robert J. McAllister Agency, Inc. (commercial insurance brokerage firm) (1979–present). | | 8 | | Director, ACP Funds Trust |
Gary Edward Shugrue
309 Technology Drive
Malvern, PA 19335
Age 58 | | Trustee | | Since
July 2008 | | President and Chief Investment Officer, Ascendant Capital Partners. | | 8 | | Director, BHR Institutional Funds; Director, ACP Funds Trust |
Warren West
309 Technology Drive
Malvern, PA 19355
Age 55 | | Trustee | | Since
Nov. 2003 | | President and owner, Greentree Brokerage Services, Inc. (1998–present). | | 8 | | None |
Everett T. Keech
309 Technology
Drive Malvern, PA 19355
Age 72 | | Trustee Interested Trustee, Vice Chairman of the Board, President, Treasurer Trustee | | Since
Nov. 2005
Nov., 1996 –Jan., 2005 Nov., 1996 –
Feb., 2002 | | Chairman-Executive Committee, Technology Development Corp., (1997–Present) technology development and manufacturing firm (1997–present); Affiliated Faculty, University of Pennsylvania (1998–present). | | 8 | | Director, Technology Development Corp.; Director, Advanced Training Systems International, Inc.; Director, Phoenix Data Systems, Inc. |
| (1) | Directorship of companies required to report to the SEC under the Securities and Exchange Act of 1934, as amended (the “Exchange Act”) (i.e., “public companies”) and investment companies registered under the 1940 Act. |
| (2) | Mr. King is considered to be “interested person” of the Trust for purposes of the 1940 Act because he is the Chief Executive Officer and a controlling shareholder of Quaker Funds, Inc., the investment adviser to the Funds. |
| (3) | Mr. King and Ms. Keyes are husband and wife. |
| (4) | Ms. Keyes is considered to be an “interested person” of the Trust for purposes of the 1940 Act because she is the Trust’s Treasurer and a controlling shareholder of Quaker Funds, Inc. |
| (5) | Mr. Brundage is Ms. Keyes’ son. |
The Statement of Additional Information for the Trust includes additional information about the Trustees and Officers and is available, without charge, upon request by calling (800) 220-8888.
Board Consideration of the Investment Advisory and Sub-Advisory Agreements
At a meeting held on April 26, 2012, the Independent Trustees of the Board of the Trust considered the continuation of the Investment Advisory Agreement between the Trust and QFI, and each of the respective Sub-Advisory Agreements between QFI and Aronson Johnson Ortiz, LP, Century Management, Inc., DG Capital Management and Kennedy Capital Management, Inc. (collectively, “Agreements”) with regard to each Fund. At the meeting, the Independent Trustees reported to the full Board their considerations with respect to the Agreements, and the Board, including a majority of Independent Trustees, considered and approved the renewal of the Agreements. Each of the Agreements was approved for a one year period.
In arriving at their decision to renew the Agreements, the Board, including the Independent Trustees, considered a variety of information concerning QFI and each sub-adviser. In considering the continuation of the Agreements, the Board, including the Independent Trustees, considered the nature and quality of the services provided by QFI and each of the sub-advisers, the proposed fee structures, the level of fee waivers, each Fund’s past and anticipated expense ratios, possible economies of scale resulting from increases in the size of the Funds and other possible benefits QFI and each of the sub-advisers derived from their relationships with the Funds. The Board, including the Independent Trustees, carefully analyzed the information provided to them by QFI and each of the sub-advisers, focusing particularly on the level of advisory fees and expenses of each Fund compared with information for similar funds, and the performance of each Fund compared to funds with similar investment objectives. The Board, including the Independent Trustees, also considered other information that it had received from QFI and each of the sub-advisers at other meetings throughout the year.
In examining the nature, extent and quality of the services to be provided by QFI, the Board, including the Independent Trustees, considered the portfolio management, administrative and supervisory services provided by QFI. The Board, including the Independent Trustees, acknowledged the value of QFI’s historical performance of services for the Funds. The Independent Trustees were satisfied with the nature, extent and quality of the services provided by QFI to each of the Funds. The Board’s view was based upon factors such as the background and experience of management personnel involved in the Funds’ operation, the quality and thoroughness of the monitoring of each Fund’s investment performance conducted by QFI, reports furnished by QFI as to adherence with various compliance and procedural matters, the monitoring of various service providers to the Funds, and QFI’s success in obtaining meaningful information on a timely basis from each of the Fund’s sub-advisers. The Board, including the Independent Trustees, noted QFI’s commitment to servicing the Funds as its only client, QFI’s efforts during the past year to reduce Fund expenses, and the nature of the non-investment advisory services provided to the Funds, such as the supervision of the Funds’ other third-party service providers by QFI.
With respect to the nature, extent and quality of the services provided to the Funds by each sub-adviser, the Board, including the Independent Trustees, considered the quality of the portfolio management services that each sub-adviser provided to the Funds, the depth, and experience and demonstrated consistency in investment approach of each of the sub-advisers’ portfolio management teams. Particular attention was given to analysis involved in the review of sub-adviser performance for each Fund. The nature of the services of the sub-advisers to each Fund was considered primarily in respect to the investment performance of the Funds. The Board was, however, satisfied with the adherence by each sub-adviser with the investment policies and restrictions of the Funds advised, as well as their adherence to various compliance and other procedures based on personnel presentations made by sub-advisers’ portfolio managers and QFI’s reports of its discussions with the sub-advisers, as well as certifications and materials furnished at Board meetings.
With respect to the Funds’ investment performance, the Board, including the Independent Trustees, reviewed each Fund’s performance compared to both its peer group and relative benchmark indices over one-year, three-year, five-year and since inception periods, as applicable. The Board, including the Independent Trustees, considered factors, including but not limited to the sub-advisers’ management style, peer group performance and overall market conditions that have affected the performance of each Fund relative to its peer group and benchmarks.
With respect to the costs of the services to be provided and profits to be realized by QFI from its relationship with the Trust, the Board, including the Independent Trustees, considered QFI’s and sub-advisers’ willingness to waive fees. The Board, including the Independent Trustees, also considered that QFI and the sub-advisers might be able to recover some of its waived fees in the future. Because QFI has no other advisory accounts, the Board, including the Independent Trustees, did not consider the relationship between QFI’s advisory fees compared to other accounts that QFI advises. The Board, including the Independent Trustees, also discussed efforts being taken by QFI to reduce Fund expenses. In light of such considerations and factors and taking into account the nature of the Funds’ operations and overall performance, the Board, including the Independent Trustees, found the expenses of each Fund to be acceptable.
The Board, including the Independent Trustees, considered whether there are any ancillary benefits that may accrue to QFI or a sub-adviser resulting from their relationship with the Funds. Based on the information provided, the Board, including the Independent Trustees, noted that there did not appear to be any significant benefits in this regard.
Based on the totality of the information considered, the Board, including the Independent Trustees, concluded that the Funds were likely to benefit from the nature, extent and quality of QFI’s and each of the sub-adviser’s services, as applicable, and that QFI and each of the sub-advisers have the ability to continue to provide these services based on their respective experience, operations and resources.
After evaluation of the comparative performance, fee and expense information and the profitability, ancillary benefits and other considerations as described above, and in light of the nature, extent and quality of services to be provided by QFI and each of the sub-advisers, the Board, including the Independent Trustees, concluded that the level of fees to be paid to QFI and each of the sub-advisers was reasonable.
In voting unanimously to approve the Agreements based on the various considerations discussed above, the Board, including the Independent Trustees, determined that the approval of the Agreements was in the best interests of the Funds. As a result, the Board, including a majority of the Independent Trustees, approved the Agreements.
General Information (Unaudited)
Form N-Q Filing and Proxy Voting Policies and Procedures
Each Fund files its complete schedule of portfolio holdings with the Securities and Exchange Commission (“SEC”) for the first and third quarters of each fiscal year on Form N-Q. Each Fund’s Forms N-Q, as well as a description of the policies and procedures that each Fund uses to determine how to vote proxies (if any) relating to portfolio securities is available without charge: (i) upon request, by calling (800) 220-8888; and (ii) on the SEC’s web-site at http://www.sec.gov. Each Fund’s Forms N-Q may be reviewed and copied at the SEC’s Public Reference Room in Washington, DC; information on the operation of the Public Reference Room may be obtained by calling 1-800-SEC-0330.
Information (if any) regarding how the Funds voted proxies relating to portfolio securities during the most recently disclosed 12-month period ended June 30 is available: (i) without charge, upon request, by calling (800) 220-8888; and (ii) on the SEC’s web-site at http://www.sec.gov.
Tax Information
We are required to advise you within 60 days of the Funds’ fiscal year-end regarding the federal tax status of certain distributions received by shareholders during such fiscal year. The information below is provided for the fiscal year ending June 30, 2012. During the fiscal year ended June 30, 2012, the following Funds paid long-term capital distributions:
| | | | | | | | |
| Fund | | Long-Term
Capital Gains | | | Per
Share | |
Event Arbitrage | | $ | — | | | $ | — | |
Global Tactical Allocation | | | — | | | | — | |
Mid-Cap Value | | | — | | | | — | |
Small-Cap Growth Tactical Allocation | | | — | | | | — | |
Small-Cap Value | | | — | | | | — | |
Strategic Growth | | | — | | | | — | |
Individual shareholders are eligible for reduced tax rates on the following percentages of qualified dividend income. For the purposes of computing the dividends eligible for reduced taxes, the following amounts of the dividends paid by the Fund from ordinary income earned during the fiscal year are considered qualified dividend income.
| | | | | | | | |
Fund | | Amount | | | Percentage | |
Event Arbitrage | | $ | 233,476 | | | | 21.15 | % |
Global Tactical Allocation | | | — | | | | — | |
Mid-Cap Value | | | — | | | | — | |
Small-Cap Growth Tactical Allocation | | | 21,614 | | | | 3.95 | % |
Small-Cap Value | | | — | | | | — | |
Strategic Growth | | | — | | | | — | |
Corporate shareholders may exclude up to the following percentages of qualifying dividends. For the purposes of computing this exclusion, the following amounts of the dividends paid by the Funds from ordinary income earned during the fiscal year represents qualifying dividends.
| | | | | | | | |
| Fund | | Amount | | | Percentage | |
Event Arbitrage | | $ | 236,898 | | | | 21.46 | % |
Global Tactical Allocation | | | — | | | | — | |
Mid-Cap Value | | | — | | | | — | |
Small-Cap Growth Tactical Allocation | | | 30,227 | | | | 5.51 | % |
Small-Cap Value | | | — | | | | — | |
Strategic Growth | | | — | | | | — | |
Dividends and distributions received by retirement plans such as IRAs, Keogh type plans and 403(b) plans need not be reported as taxable income. However, many retirement plan trusts may need this information for their annual information reporting. Since the information above is reported for the Funds’ fiscal year and not the calendar year, shareholders should refer to their Form 1099-DIV or other tax information which will be mailed in January 2013 to determine the calendar year amounts to be included on their 2012 tax returns. Shareholders should consult their tax advisers.
The Quaker Funds are distributed by
Foreside Fund Services, LLC.
Contact us:
Quaker Funds, Inc.
c/o U.S. Bancorp Fund Services, LLC.
PO Box 701
Milwaukee, WI 53201-0701
800-220-8888
www.quakerfunds.com
©2012 Quaker® Investment Trust
QKAR 062012
ANNUAL REPORT
2012
QUAKER AKROS ABSOLUTE RETURN FUND

MUTUAL FUND INVESTING INVOLVES RISK. PRINCIPAL LOSS IS POSSIBLE.
Investing in the Quaker Funds may involve special risk including, but not limited to, investments in smaller companies, non-diversification, short sales, foreign securities, special situations, debt securities and value growth investing. Please refer to the prospectus for more complete information.
This report must be preceded or accompanied by a current prospectus.
The opinions expressed are those of the sub-adviser through the end of the period for this report, are subject to change, are not a guarantee, and should not be considered investment advice.
Fund holdings are subject to change and should not be considered a recommendation to buy or sell any security. Current and future holdings are subject to risk.
Chairman’s Letter to the Shareholders
June 30, 2012
Dear Fellow Shareholder,
The premise on which Quaker Funds, Inc. was founded was the desire to afford everyday investors access to the same tactical allocation used by professional money managers to augment traditional investing strategies within a holistic asset allocation mix. Our commitment to this principle is still as strong today as it was the day we opened our doors.
Our management team continually strives to provide our shareholders with innovative investment alternatives and advisers that constantly seek superior returns. Thank you for your trust and investment in the Quaker Funds.
Sincerely,
Jeffry King
Chairman & CEO
Quaker Investment Trust
Table of Contents
Performance Update
Quaker Akros Absolute Return Fund (AARFX, QASDX, QASIX)
Objectives and Principal Strategies
The Quaker Akros Absolute Return Fund (“Fund”) seeks to provide long-term capital appreciation and income, while seeking to protect principal during unfavorable market conditions.
Performance Review and Market Outlook
For the fiscal year ended June 30, 2012, the Fund fell -6.22%, while the S&P 500® Total Return Index (“S&P 500”) gained 5.45%. For the six months ended June 30, 2012, the Fund was down -2.47%, while the S&P 500 returned 9.49%.
Although this was clearly disappointing relative performance for the Fund, we did manage to keep its day-to-day fluctuations comparatively low as we positioned the Fund for the investment environment that we believe will eventually unfold. The Fund is currently positioned with a defensive, market-neutral posture, which reflects our assessments of the many crosscurrents that are prevalent today.
The biggest contributor to the Fund’s underperformance during the past year was the manner in which the Fund was structured to reflect a negative viewpoint on the U.S. stock market. The quarter ending March 31, 2012 was particularly painful as the S&P 500 was up over 12%, while the Fund was up just 1.5%. The Fund spent most of that quarter being net short between 5% and 10%, and was net short as much as 17% during the year ended June 30, 2012. The Fund adopted a very defensive position for the entire year, which obviously hurt the Fund’s performance relative to the S&P 500.
In addition, the Fund’s unhedged exposure to financial stocks during the first six months of the year ended June 30, 2012 was an important contributor to the Fund’s underperformance on the security selection side. Citigroup, Inc. was one of the Fund’s largest holdings and performed particularly poorly. We still believe that Citigroup, Inc. is well capitalized, properly positioned to capture market share in Europe over the next several years and that its stock is very cheap compared to most of its peers. Nonetheless, our attraction to value plays has not helped the Fund as growth stocks carried the day during the year ended June 30, 2012. In addition to Citigroup, Inc., individual securities that hurt performance include InterMune, Inc. and Ventrus Biosciences, Inc.
Our relative-value trades—where we went long several stocks that we felt were attractively priced and went short stocks with highly correlated characteristics that were expensive according to our discipline – worked well on an absolute and risk-adjusted basis for the Fund. Our top-down outlook and our decisions regarding when to add and remove market hedges (mostly through futures contracts and ETFs) were also effective overall in generating positive returns and reducing volatility. In addition, we moved out of certain technology stocks on a timely basis that helped preserve some of our gains.
The Fund currently has a near market-neutral posture. We intend to remain defensive, and we may turn even more bearish by increasing our short positions if stocks rally in the near term. Based on concerns regarding the on-going European fiscal situation, the slowing domestic economy and the upcoming U.S. presidential election, we believe there will be a lid on stock prices until after the elections in November. Over the next several months, we anticipate that the stock market will be in a trading range between this year’s high of about 1420 and last October’s low of around 1075 on the S&P 500. When the market is near the upper end of this range, we expect to be more defensive. One catalyst for higher stock prices later this year could be an extension of the Bush tax cuts. But even with the potential for this extension, our 2013 outlook – based on the continued softness in the economy and the current overall valuation of the stock market – is so negative that we believe prudent investors should stay relatively defensive. We think that the Federal Reserve is running out of ammunition and when this becomes apparent to a broader group of investors, the exit door for the equity markets will be a crowed space.
Probably more so than at any time since we started the Fund, we are trying to find relative-value trades where we can buy attractively priced stocks while being short similar stocks in the same or a highly correlated industry that aren’t so attractively priced. We believe we have the Fund situated to make money whether the stock market goes up or down, provided that our long positions outperform our short positions.
As always, we will be vigilant in analyzing the markets and we reserve the right to alter our stance if circumstances unexpectedly change. Generally, over the long run, markets tend to move toward fair value. And while the effects of price manipulation can linger for quite some time, they’re usually temporary nonetheless. Currently, we strongly believe that the Fund is well-positioned for a challenging investment environment.
Brady T. Lipp, Portfolio Manager
Akros Capital, LLC
SUB-ADVISER:
Akros Capital LLC
TOTAL NET ASSETS:
AS OF JUNE 30, 2012
$6,747,181
| | | | |
Top Ten Holdings ** (% of net assets) | | | |
Morgan Stanley | | | 5.96 | % |
Prime Acquisition Corp. | | | 2.20 | % |
Total S.A. | | | 2.13 | % |
Investment Technology Group, Inc. | | | 1.91 | % |
Citigroup, Inc. | | | 1.89 | % |
Laboratory Corp. of America | | | | |
Holdings | | | 1.78 | % |
Exelon Corp. | | | 1.67 | % |
FibroGen, Inc. | | | 1.55 | % |
Thermo Fisher Scientific, Inc. | | | 1.46 | % |
Nautilus Marine Acquisition Corp. | | | 1.46 | % |
| | | | |
% Fund Total | | | 22.01 | % |
| | | | |
| ** | Excludes Short-Term Investments |
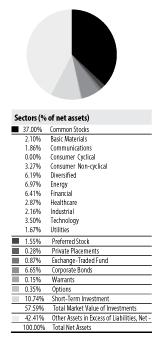
2012 ANNUAL REPORT | 2
Performance Update
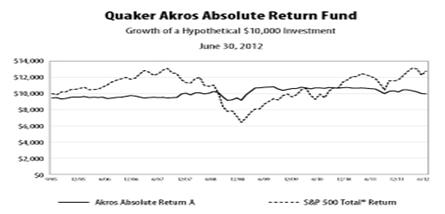
Average Annualized Total Return
| | | | | | | | | | | | | | | | | | | | | | | | | | | | | | | | | | | | | | | | |
| | | Expense
Ratio | | | Inception
Date | | | One
Year | | | Five
Year | | | Ten
Year | | | Commencement
of Operations
Through
6/30/2012 | |
| | | | | with
sales
charge | | | without
sales
charge | | | with
sales
charge | | | without
sales
charge | | | with
sales
charge | | | without
sales
charge | | | with
sales
charge | | | without
sales
charge | |
Class A | | | 1.99 | % | | | 09/30/2005 | | | | -11.38 | % | | | -6.22 | % | | | -0.22 | % | | | 0.91 | % | | | N/A | | | | N/A | | | | -0.08 | % | | | 0.76 | % |
Class C | | | 2.74 | % | | | 10/04/2010 | | | | -6.83 | % | | | -6.83 | % | | | N/A | | | | N/A | | | | N/A | | | | N/A | | | | -5.11 | % | | | -5.11 | % |
Institutional Class | | | 1.74 | % | | | 10/04/2010 | | | | -5.98 | % | | | -5.98 | % | | | N/A | | | | N/A | | | | N/A | | | | N/A | | | | -4.11 | % | | | -4.11 | % |
S&P 500 Total Return Index* | | | | | | | | | | | 5.45 | % | | | 5.45 | % | | | 0.22 | % | | | 0.22 | % | | | N/A | | | | N/A | | | | 3.70 | % | | | 3.70 | % |
| * | The benchmark since inception returns are calculated for the period September 30, 2005 through June 30, 2012. |
Performance data quoted represents past performance and is no guarantee of future results. Investment return and principal value will fluctuate so that shares, when redeemed, may be worth more or less than their original cost. Current performance may be lower or higher than performance data quoted. Performance data current to the most recent month end is available at www.quakerfunds.com or by calling us toll free at 800-220-8888. Total return includes reinvestment of dividends and capital gains.
Class A shares of the Fund have a maximum sales charge of 5.50%.
The performance table does not reflect the deduction of taxes that a shareholder might pay on fund distributions or the redemption of fund shares. Total return calculations reflect expense reimbursements and fee waivers in the applicable periods. See financial highlights for periods where fees were waived or reimbursed.
The Fund’s portfolio holdings may differ significantly from the securities held in the index and, unlike a mutual fund, an unmanaged index assumes no transaction costs, taxes, management fees or other expenses. You cannot invest directly in an index.
The S&P 500® Total Return Index (“Index”) is a widely recognized, unmanaged index consisting of the approximately 500 largest companies in the United States as measured by market capitalization. The Index assumes reinvestment of all dividends and distributions.
| | |
| The accompanying notes are an integral part of the financial statements. | | 2012 ANNUAL REPORT | 3 |
Expense Information
As a shareholder of the Fund, you incur two types of costs: (1) transaction costs, including applicable sales charges and redemption fees; and (2) ongoing costs, including management fees, distribution (12b-1) fees and other Fund expenses. This example is intended to help you understand your ongoing costs (in dollars) of investing in the Fund and to compare these costs with the ongoing costs of investing in other funds. The example is based on an investment of $1,000 invested at the beginning of the (six-month) period and held for the entire period January 1, 2012 through June 30, 2012.
Actual Expenses
The first section of each table below provides information about actual account values and actual expenses for each of the Funds. You may use this information, together with the amount you invested, to estimate the expenses that you paid over the period. Simply divide your account value by $1,000 (for example, an $8,600 account value divided by $1,000 = 8.6), then multiply the result by the number in the applicable line under the heading entitled “Expenses Paid During the Period” to estimate the expenses you paid on your account during this period.
Hypothetical Example For Comparison Purposes
The second section of each table below provides information about hypothetical account values and hypothetical expenses based on the Fund’s actual expense ratio and an assumed rate of return of 5% per year before expenses, which is not the Fund’s actual return. The hypothetical account values and expenses may not be used to estimate the actual ending account balance or expenses you paid for the period. You may use this information to compare the ongoing costs of investing in the Fund to other funds. To do so, compare this 5% hypothetical example with the 5% hypothetical examples that appear in the shareholder reports of the other funds. Please note that the expenses shown in the table are meant to highlight your ongoing costs only and do not reflect any transactional costs, such as sales charges (loads), redemption fees or exchange fees. Therefore, the second section of the table is useful in comparing ongoing costs only, and will not help you determine the relative total costs of owning different funds. In addition, if these transactional costs were included, your costs would have been higher.
| | | | | | | | | | | | | | | | | | | | |
| | | | | | Beginning Account
Value 01/01/12 | | | Annualized Expense
Ratio For the Period | | | Ending Account
Value 6/30/2012 | | | Expenses Paid
During Period* | |
Akros Absolute Return | | | | | | | | | | | | | | | | | | | | |
Actual return based on actual return of: | | | | | | | | | | | | | | | | | | | | |
Class A | | | (2.47 | )% | | $ | 1,000.00 | | | | 1.99 | % | | $ | 975.30 | | | $ | 9.77 | |
Class C | | | (2.73 | )% | | | 1,000.00 | | | | 2.74 | % | | | 972.70 | | | | 13.44 | |
Institutional Class | | | (2.34 | )% | | | 1,000.00 | | | | 1.74 | % | | | 976.60 | | | | 8.55 | |
Hypothetical return based on assumed 5% return: | | | | | | | | | | | | | | | | | | | | |
Class A | | | | | | | 1,000.00 | | | | 1.99 | % | | | 1,014.97 | | | | 9.97 | |
Class C | | | | | | | 1,000.00 | | | | 2.74 | % | | | 1,011.24 | | | | 13.70 | |
Institutional Class | | | | | | | 1,000.00 | | | | 1.74 | % | | | 1,016.21 | | | | 8.72 | |
| * | Expenses are equal to the Funds’ annualized six-month expense ratios (excluding reimbursements) multiplied by the average account value over the period muliplied by the number of days in the most recent fiscal half year (182) divided by 366 to reflect the one-half year period. |
2012 ANNUAL REPORT | 4
Schedule of Investments
Quaker Akros Absolute Return Fund
June 30, 2012
| | | | | | | | |
| | | Number
of Shares | | | Fair Value | |
Common Stocks—37.00% | | | | | | | | |
Basic Materials—2.10% | | | | | | | | |
Chemicals—0.81% | | | | | | | | |
The Mosaic Co. | | | 1,000 | | | $ | 54,760 | |
| | | | | | | | |
| | |
Mining—1.29% | | | | | | | | |
Polymet Mining Corp. (a) | | | 40,000 | | | | 33,600 | |
Taseko Mines Ltd. (a) | | | 20,000 | | | | 53,200 | |
| | | | | | | | |
| | | | | | | 86,800 | |
| | | | | | | | |
Total Basic Materials
(Cost: $239,537) | | | | | | | 141,560 | |
| | | | | | | | |
Communications—1.86% | | | | | | | | |
Internet—0.69% | | | | | | | | |
Google, Inc. Class A (a) | | | 80 | | | | 46,406 | |
| | | | | | | | |
| | |
Telecommunications—1.17% | | | | | | | | |
CenturyLink, Inc. | | | 1,000 | | | | 39,490 | |
Nokia OYJ ADR | | | 19,000 | | | | 39,330 | |
| | | | | | | | |
| | | | | | | 78,820 | |
| | | | | | | | |
Total Communications
(Cost: $225,148) | | | | | | | 125,226 | |
| | | | | | | | |
Consumer, Cyclical—0.00% | | | | | | | | |
Leisure Time—0.00% | | | | | | | | |
TableMAX Corp. (a)(b)(c)(d) | | | 13,911 | | | | 8 | |
| | | | | | | | |
Total Consumer, Cyclical
(Cost: $24,344) | | | | | | | 8 | |
| | | | | | | | |
Consumer, Non-cyclical—3.27% | | | | | | | | |
Commercial Services—1.00% | | | | | | | | |
Western Union Co. | | | 4,000 | | | | 67,360 | |
Food—2.27% | | | | | | | | |
Nash Finch Co. | | | 4,000 | | | | 85,920 | |
SUPERVALU, Inc. | | | 13,000 | | | | 67,340 | |
| | | | | | | | |
| | | | | | | 153,260 | |
| | | | | | | | |
Total Consumer, Non-cyclical
(Cost: $261,142) | | | | | | | 220,620 | |
| | | | | | | | |
Diversified—6.19% | | | | | | | | |
Holding Companies-Diversified—6.19% | | | | | | | | |
Cazador Acquisition Corp. Ltd. (a)(b)(d) | | | 9,000 | | | | 90,180 | |
Nautilus Marine Acquisition Corp. (a) | | | 10,000 | | | | 98,200 | |
Prime Acquisition Corp. (a)(b)(d) | | | 15,000 | | | | 148,650 | |
Selway Capital Acquisition Corp. Class U (a)(b)(d) | | | 8,000 | | | | 80,400 | |
| | | | | | | | |
| | | | | | | 417,430 | |
| | | | | | | | |
Total Diversified (Cost: $416,577) | | | | | | | 417,430 | |
| | | | | | | | |
Energy—6.97% | | | | | | | | |
Coal—0.51% | | | | | | | | |
Peabody Energy Corp. | | | 1,400 | | | | 34,328 | |
| | | | | | | | |
| | |
Oil & Gas—4.44% | | | | | | | | |
Birchcliff Energy Ltd. (a) | | | 4,000 | | | | 22,040 | |
Devon Energy Corp. | | | 1,000 | | | | 57,990 | |
EnCana Corp. | | | 2,000 | | | | 41,660 | |
Precision Drilling Corp. (a) | | | 5,000 | | | | 34,100 | |
Total S.A. ADR | | | 3,200 | | | | 143,840 | |
| | | | | | | | |
| | | | | | | 299,630 | |
| | | | | | | | |
Oil & Gas Services—2.02% | | | | | | | | |
Baker Hughes, Inc. | | | 1,250 | | | | 51,375 | |
Halliburton Co. | | | 3,000 | | | | 85,170 | |
| | | | | | | | |
| | | | | | | 136,545 | |
| | | | | | | | |
Total Energy (Cost: $558,841) | | | | | | | 470,503 | |
| | | | | | | | |
Financial—6.41% | | | | | | | | |
Banks—1.89% | | | | | | | | |
Citigroup, Inc. | | | 4,650 | | | | 127,457 | |
| | | | | | | | |
Diversified Financial Services—3.16% | | | | | | | | |
Investment Technology Group, Inc. (a) | | | 14,000 | | | | 128,800 | |
| | | | | | | | |
| | | Number
of Shares | | | Fair Value | |
Common Stocks—(continued) | | | | | | | | |
Knight Capital Group, Inc. Class A (a) | | | 7,100 | | | | 84,774 | |
| | | | | | | | |
| | | | | | | 213,574 | |
| | | | | | | | |
Savings & Loans—1.36% | | | | | | | | |
First Bancorp of Indiana, Inc. | | | 1,259 | | | | 13,648 | |
HF Financial Corp. | | | 3,000 | | | | 36,420 | |
HopFed Bancorp, Inc. | | | 5,900 | | | | 41,683 | |
| | | | | | | | |
| | | | | | | 91,751 | |
| | | | | | | | |
Total Financial (Cost: $611,124) | | | | | | | 432,782 | |
| | | | | | | | |
Healthcare—2.87% | | | | | | | | |
Biotechnology—0.71% | | | | | | | | |
InterMune, Inc. (a) | | | 4,000 | | | | 47,800 | |
| | | | | | | | |
| | |
Healthcare-Services—1.78% | | | | | | | | |
Laboratory Corp. of America Holdings (a) | | | 1,300 | | | | 120,393 | |
| | | | | | | | |
| | |
Pharmaceuticals—0.38% | | | | | | | | |
Ventrus Biosciences, Inc. (a) | | | 6,000 | | | | 25,620 | |
| | | | | | | | |
| | |
Total Healthcare (Cost: $318,875) | | | | | | | 193,813 | |
| | | | | | | | |
Industrial—2.16% | | | | | | | | |
Electronics—2.16% | | | | | | | | |
FLIR Systems, Inc. | | | 2,400 | | | | 46,800 | |
Thermo Fisher Scientific, Inc. | | | 1,900 | | | | 98,629 | |
| | | | | | | | |
| | | | | | | 145,429 | |
| | | | | | | | |
Total Industrial (Cost: $153,518) | | | | | | | 145,429 | |
| | | | | | | | |
Technology—3.50% | | | | | | | | |
Computers—0.12% | | | | | | | | |
Force 10 Networks, Inc. (a)(b)(c)(d) | | | 1 | | | | 8,112 | |
| | | | | | | | |
| | |
Semiconductors—2.47% | | | | | | | | |
Lam Research Corp. (a) | | | 2,000 | | | | 75,480 | |
Marvell Technology Group Ltd. | | | 8,100 | | | | 91,368 | |
| | | | | | | | |
| | | | | | | 166,848 | |
| | | | | | | | |
Software—0.91% | | | | | | | | |
Microsoft Corp. | | | 2,000 | | | | 61,180 | |
| | | | | | | | |
Total Technology (Cost: $269,167) | | | | | | | 236,140 | |
| | | | | | | | |
Utilities—1.67% | | | | | | | | |
Electric—1.67% | | | | | | | | |
Exelon Corp. | | | 3,000 | | | | 112,860 | |
| | | | | | | | |
| | |
Total Utilities (Cost: $126,013) | | | | | | | 112,860 | |
| | | | | | | | |
Total Common Stocks
(Cost $3,204,286) | | | | | | | 2,496,371 | |
| | | | | | | | |
Preferred Stock—1.55% | | | | | | | | |
United States—1.55% | | | | | | | | |
FibroGen, Inc. (a)(b)(c)(d) | | | 15,000 | | | | 105,000 | |
| | | | | | | | |
Total United States
(Cost $67,350) | | | | | | | 105,000 | |
| | | | | | | | |
Total Preferred Stock
(Cost $67,350) | | | | | | | 105,000 | |
Private Placements—0.28% | | | | | | | | |
United States—0.28% | | | | | | | | |
Alien Technology (a)(b)(c)(d) | | | 64 | | | | 253 | |
Alien Technology Series A (a)(b)(c)(d) | | | 4,688 | | | | 18,517 | |
| | | | | | | | |
| | | | | | | 18,770 | |
| | | | | | | | |
Total United States (Cost $123,609) | | | | | | | 18,770 | |
| | | | | | | | |
Total Private Placements
(Cost $123,609) | | | | | | | 18,770 | |
| | | | | | | | |
| | |
| The accompanying notes are an integral part of the financial statements. | | 2012 ANNUAL REPORT | 5 |
Schedule of Investments
Quaker Akros Absolute Return Fund
June 30, 2012
| | | | | | | | |
Exchange-Traded Fund—0.87% | | | | | | | | |
ProShares Short 20+ Year Treasury(a) | | | 2,000 | | | | 58,560 | |
| | | | | | | | |
Total Exchange-Traded Fund (Cost $73,166) | | | | | | | 58,560 | |
| | | | | | | | |
| | |
| | | Number
of Shares | | | Fair
Value | |
Warrants—0.15% | | | | | | | | |
Alien Technology Warrants Expiration: | | | | | | | | |
December, 2049(a)(b)(c)(d) | | | 5 | | | | 0 | |
Bionovo Warrants Expiration: | | | | | | | | |
October, 2014(a)(b)(c)(d) | | | 3,000 | | | | 0 | |
Cazador Acquisition Corp. Ltd. Warrants Expiration: | | | | | | | | |
October, 2015(a) | | | 18,000 | | | | 2,700 | |
FlatWorld Acquisition Corp. Warrants Expiration: | | | | | | | | |
September, 2012(a) | | | 35,000 | | | | 6,650 | |
Nautilus Marine Acquisition Corp. Warrants Expiration: | | | | | | | | |
July, 2016(a)(b)(d) | | | 10,000 | | | | 1,100 | |
| | | | | | | | |
Total Warrants (Cost $19,800) | | | | | | | 10,450 | |
| | | | | | | | |
| | |
| | | Par Value | | | Fair
Value | |
Corporate Bonds—6.65% | | | | | | | | |
Energy—0.69% | | | | | | | | |
Oil & Gas—0.69% | | | | | | | | |
ATP Oil & Gas Corp. 11.87%, 05/01/2015 | | | 100,000 | | | | 46,500 | |
| | | | | | | | |
Total Energy (Cost: $102,142) | | | | | | | 46,500 | |
| | | | | | | | |
Financial—5.96% | | | | | | | | |
Banks—5.96% | | | | | | | | |
Morgan Stanley 4.50%, 02/11/2020(e) | | | 450,000 | | | | 402,129 | |
| | | | | | | | |
Total Financial (Cost: $448,093) | | | | | | | 402,129 | |
| | | | | | | | |
Total Corporate Bonds (Cost $550,235) | | | | | | | 448,629 | |
| | | | | | | | |
| | |
| | | Number
of Contracts | | | Fair
Value | |
Options—0.35% | | | | | | | | |
SUPERVALU, Inc. Expiration: July, 2012 | | | | | | | | |
Exercise Price: $8.00 | | | 140 | | | | 280 | |
Ventrus Biosciences, Inc. Expiration: September, 2012 | | | | | | | | |
Exercise Price: $12.50 | | | 10 | | | | 150 | |
Ventrus Biosciences, Inc. Expiration: September, 2012 | | | | | | | | |
Exercise Price: $10.00 | | | 40 | | | | 23,200 | |
| | | | | | | | |
| | | | | | | 23,630 | |
| | | | | | | | |
Total United States (Cost $20,053) | | | | | | | 23,630 | |
| | | | | | | | |
Total Options (Cost $20,053) | | | | | | | 23,630 | |
| | | | | | | | |
Short-Term Investment—10.74% | | | | | | | | |
Time Deposit—10.74% | | | | | | | | |
Citibank, 0.03%, 07/02/2012(f) | | $ | 724,609 | | | | 724,609 | |
| | | | | | | | |
Total Short-Term Investment (Cost $724,609) | | | | | | | 724,609 | |
| | | | | | | | |
Total Investments (Cost $4,783,108)—57.59% | | | | | | | 3,886,019 | |
| | | | | | | | |
Other Assets in Excess of Liabilities, Net—42.41% | | | | | | | 2,861,162 | |
| | | | | | | | |
Total Net Assets—100.00% | | | | | | $ | 6,747,181 | |
| | |
| Schedule of Securities Sold Short | | Number of
Shares | | | Fair Value | |
Common Stocks—13.66% | | | | | | | | |
Amazon.com, Inc. (a) | | | 220 | | | $ | 50,237 | |
Boston Beer Co., Inc. Class A (a) | | | 600 | | | | 72,600 | |
Canadian Pacific Railway Ltd. | | | 700 | | | | 51,282 | |
Estee Lauder Companies Class A | | | 1,600 | | | | 86,592 | |
PerkinElmer, Inc. | | | 1,800 | | | | 46,440 | |
Quest Diagnostics, Inc. | | | 2,000 | | | | 119,800 | |
Sherwin-Williams Co. | | | 1,000 | | | | 132,350 | |
SPDR S&P Oil & Gas Equipment & Services ETF | | | 2,950 | | | | 90,595 | |
Taylor Capital Group, Inc. (a) | | | 4,000 | | | | 65,560 | |
Toro Co. | | | 700 | | | | 51,303 | |
Verizon Communications, Inc. | | | 3,000 | | | | 133,320 | |
| | | | | | | | |
| | | Number
of Shares | | | Fair Value | |
Common Stocks—(continued) | | | | | | | | |
Waters Corp. (a) | | | 275 | | | | 21,854 | |
| | | | | | | | |
Total Common Stocks | | | | | | | 921,933 | |
| | | | | | | | |
Exchange-Traded Funds—7.99% | | | | | | | | |
iShares Dow Jones US Aerospace & Defense Index Fund | | | 800 | | | | 51,200 | |
Market Vectors Agribusiness ETF | | | 500 | | | | 24,790 | |
PowerShares Water Resources Portfolio | | | 2,000 | | | | 36,300 | |
SPDR S&P Homebuilders ETF | | | 4,000 | | | | 85,400 | |
SPDR S&P Regional Banking ETF | | | 6,000 | | | | 164,280 | |
SPDR S&P Retail ETF | | | 3,000 | | | | 177,090 | |
| | | | | | | | |
Total Exchange-Traded Funds | | | | | | | 539,060 | |
| | | | | | | | |
Total Securities Sold Short (Proceeds: $1,320,957) | | | | | | $ | 1,460,993 | |
| | | | | | | | |
| | |
| | | Number
of Contracts | | | Fair Value | |
Call Options Written—0.05% | | | | | | | | |
SUPERVALU, Inc. Expiration: July, 2012 | | | | | | | | |
Exercise Price: $5.00 | | | 105 | | | $ | 2,100 | |
Ventrus Biosciences, Inc. Expiration: September, 2012 | | | | | | | | |
Exercise Price: $15.00 | | | 25 | | | | 125 | |
Ventrus Biosciences, Inc. Expiration: September, 2012 | | | | | | | | |
Exercise Price: $5.00 | | | 10 | | | | 1,250 | |
| | | | | | | | |
Total Options Written (Premiums Received $9,698) | | | | | | $ | 3,475 | |
| | | | | | | | |
| | | | | | | | | | | | |
| | | Number of
Contracts Sold | | | Settlement Month | | | Unrealized
Appreciation/
(Depreciation) | |
Futures | | | | | | | | | | | | |
RUSSELL 2000 MINI September Futures | | | 6 | | | | September, 2012 | | | | (18,730 | ) |
S&P 500 EMINI FUT September Futures | | | 6 | | | | September, 2012 | | | | (8,625 | ) |
| | | | | | | | | | | | |
Total Futures Contracts Sold | | | | | | | | | | | (27,355 | ) |
| | | | | | | | | | | | |
ADR—American Depositary Receipt
ETF—Exchange-Traded Fund
| (a) | Non-income producing security. |
| (b) | Indicates an illiquid security. Total market value for illiquid securities is $452,220, representing 6.70% of net assets. |
| (c) | Indicates a fair valued security. Total market value for fair valued securities is $131,890, representing 1.95% of net assets. |
| (d) | Restricted security that may be sold to “qualified institutional buyers” pursuant to the conditions of Rule 144A under the Securities Act of 1933, as amended. |
| (e) | The coupon rate shown on floating or adjustable rate securities represents the rate at period end. |
| (f) | The rate shown is the annualized seven-day yield at period end. |
| | |
| The accompanying notes are an integral part of the financial statements. | | 2012 ANNUAL REPORT | 6 |
Statement of Assets and Liabilities
June 30, 2012
| | | | |
| | | Quaker Akros Absolute Return Fund | |
ASSETS: | | | | |
Investments, at value | | $ | 3,886,019 | |
Cash | | | 748,125 | |
Deposits with brokers for securities and options sold short and futures held Receivables: | | | 3,549,740 | |
Dividends and interest | | | 7,935 | |
Capital shares sold | | | 16,826 | |
Investment securities sold | | | 50,464 | |
Prepaid expenses and other assets | | | 4,030 | |
| | | | |
Total assets | | | 8,263,139 | |
| | | | |
LIABILITIES: | | | | |
Call Options Written, at value | | | 3,475 | |
Securities sold short, at value | | | 1,460,993 | |
Futures held | | | 27,355 | |
Payables: | | | | |
Due to Advisor (Note 3) | | | 7,131 | |
Dividends on securites sold short | | | 589 | |
Distributions fees | | | 1,339 | |
Trustee expenses | | | 548 | |
Chief compliance officer fees | | | 353 | |
Accrued expenses | | | 14,175 | |
| | | | |
Total liabilities | | | 1,515,958 | |
| | | | |
NET ASSETS | | $ | 6,747,181 | |
NET ASSETS CONSIST OF: | | | | |
Paid-in capital | | $ | 7,872,070 | |
Accumulated net realized loss on investments | | | (16,899 | ) |
Accumulated net investment loss | | | (49,734 | ) |
Net unrealized depreciation on investments | | | (1,058,256 | ) |
| | | | |
| |
Total Net Assets | | $ | 6,747,181 | |
| | | | |
Total Investments, at Cost | | $ | 4,783,108 | |
| | | | |
Proceeds from Securities Sold Short | | | 1,320,957 | |
| | | | |
Premiums on options | | | 9,698 | |
| | | | |
Class A Shares: | | | | |
Net Assets | | $ | 4,696,671 | |
Shares of Beneficial interest outstanding(1) | | | 566,265 | |
Net Asset Value per share and redemption price per share | | $ | 8.29 | |
| | | | |
Offering price per share (100 ÷ 94.50 × net asset value per share) | | $ | 8.77 | |
| | | | |
Class C Shares: | | | | |
Net Assets | | $ | 380,929 | |
Shares of Beneficial interest outstanding(1) | | | 46,570 | |
Net Asset Value per share and redemption price per share | | $ | 8.18 | |
| | | | |
Institutional Class Shares: | | | | |
Net Assets | | $ | 1,669,581 | |
Shares of Beneficial interest outstanding(1) | | | 200,342 | |
Net Asset Value per share and redemption price per share | | $ | 8.33 | |
| | | | |
| (1) | Unlimited number of shares of beneficial interest with a $0.01 par value, authorized. |
| | |
| The accompanying notes are an integral part of the financial statements. | | 2012 ANNUAL REPORT | 7 |
Statement of Operations
For the Fiscal Year Ended June 30, 2012
| | | | |
| | | Quaker Akros Absolute Return Fund | |
INVESTMENT INCOME | | | | |
Income: | | | | |
Dividends (net of foreign withholding taxes) | | $ | 24,714 | |
Interest | | | 53,386 | |
| | | | |
Total Income | | | 78,100 | |
| | | | |
Expenses: | | | | |
Investment advisory fees (Note 3) | | | 101,671 | |
Fund administration fees | | | 4,194 | |
Fund accounting fees | | | 17,583 | |
Transfer agent fees | | | 19,225 | |
Custody fees | | | 8,722 | |
Trustee fees and meeting expenses | | | 3,081 | |
Legal fees | | | 938 | |
Audit fees | | | 4,895 | |
Distribution Fee—Class A | | | 14,377 | |
Distribution Fee—Class C | | | 4,126 | |
Officers’ compensation fees | | | 4,262 | |
Registration and filing expenses | | | 13,958 | |
Printing expenses | | | 4,278 | |
Dividends and Interest on securities sold short | | | 9,290 | |
Other operating expenses | | | 4,664 | |
| | | | |
Total expenses | | | 215,264 | |
| | | | |
Less: | | | | |
Investment advisory fees waived & reimbursed (Note 3) | | | (55,214 | ) |
Net expenses | | | 160,050 | |
| | | | |
Net investment loss | | | (81,950 | ) |
| | | | |
REALIZED AND UNREALIZED GAIN (LOSS) ON INVESTMENTS AND FOREIGN CURRENCY TRANSACTIONS | | | | |
| |
Net realized loss from investments, (excluding short securities) | | | (144,883 | ) |
Net realized gain from short securities | | | 30,522 | |
Net realized gain from written options | | | 112,962 | |
Net realized gain on futures | | | 104,293 | |
| |
Net change in unrealized depreciation on investments (excluding short securities) | | | (639,447 | ) |
Net change in unrealized appreciation on short securities | | | 130,091 | |
Net change in unrealized appreciation on written options | | | 1,633 | |
Net change in unrealized loss on futures | | | (27,355 | ) |
| | | | |
Net realized and unrealized loss on investments and foreign currency transactions | | | (432,184 | ) |
| | | | |
Net decrease in net assets resulting from operations | | $ | (514,134 | ) |
| | | | |
Foreign withholding taxes on dividends | | $ | (2,409 | ) |
| | | | |
Statements of Changes in Net Assets
For the Fiscal Year Ended June 30, 2012
| | | | |
| | | Quaker Akros Absolute Return Fund | |
For the Fiscal Year Ended June 30, 2012 | | | | |
INCREASE (DECREASE) IN NET ASSETS | | | | |
Operations | | | | |
Net investment loss | | $ | (81,950 | ) |
| |
Net realized gain from investment transactions and foreign currency transactions | | | 72,372 | |
Net realized gain from securities sold short | | | 30,522 | |
Change in net unrealized depreciation on investments | | | (665,169 | ) |
Change in net unrealized depreciation on short securities | | | 130,091 | |
| | | | |
Net decrease in net assets resulting from operations | | | (514,134 | ) |
| | | | |
Capital share transactions | | | | |
Decrease in net assets from fund share transactions (Note 9) | | | (5,261,426 | ) |
| | | | |
Total decrease in net assets | | | (5,775,560 | ) |
| | | | |
| |
NET ASSETS | | | | |
Beginning of period | | | 12,522,741 | |
| | | | |
End of period | | $ | 6,747,181 | |
| | | | |
Accumulated net investment loss, at end of period | | $ | (49,734 | ) |
| | | | |
| |
For the Period Ended June 30, 2011* | | | | |
INCREASE (DECREASE) IN NET ASSETS | | | | |
Operations | | | | |
Net investment loss | | $ | (131,388 | ) |
| |
Net realized gain from investment transactions and foreign currency transactions | | | 381,613 | |
Net realized loss from securities sold short | | | (316,429 | ) |
Change in net unrealized depreciation on investments | | | (753 | ) |
| | | | |
Net decrease in net assets resulting from operations | | | (66,957 | ) |
| | | | |
Distributions to shareholders from | | | | |
Net realized capital gain—Class A | | | (244,675 | ) |
Net realized capital gain—Class C | | | (614 | ) |
Net realized capital gain—Class I | | | (44,331 | ) |
Return of Capital—Class A | | | (43,829 | ) |
Return of Capital—Class C | | | (110 | ) |
Return of Capital—Class I | | | (7,941 | ) |
| | | | |
Total Distributions | | | (341,500 | ) |
| | | | |
Capital share transactions | | | | |
Increase in net assets from fund share transactions (Note 9) | | | 2,948,106 | |
| | | | |
Total increase in net assets | | | 2,539,649 | |
| | | | |
| |
NET ASSETS | | | | |
Beginning of period | | | 9,983,092 | |
| | | | |
End of period | | $ | 12,522,741 | |
| | | | |
Accumulated net investment loss, at end of period | | $ | (131,388 | ) |
| | | | |
| * | Financial Statement data for this Fund reflects the period September 1, 2010 to June 30, 2011. |
| | |
| The accompanying notes are an integral part of the financial statements. | | 2012 ANNUAL REPORT | 9 |
Statements of Changes in Net Assets
The following Statement of Changes in Net Assets is for the prior year fiscal year period of the Quaker Akros Absolute Return Fund, while the Fund was still operating as the Akros Absolute Return Fund. To comply with proper reporting requirements, we have included this statement to disclose a full year of activity for the Statement of Changes in Net Assets. Due to the change in the Fund’s fiscal year end from August 31 to June 30, the information provided in the previous statements included a partial period from September 1, 2010 to June 30, 2011, requiring us to further disclose the following statement.
| | | | |
| | | Year Ended August 31, 2010 | |
From Operations | | | | |
Net investment loss | | $ | (100,115 | ) |
| | | | |
Net Realized Gain on: | | | | |
Investments | | | 205,277 | |
Purchased Options | | | — | |
Short Transactions | | | 60,631 | |
Foreign Currency Translation | | | — | |
Option Contracts Expired or Closed | | | 66,440 | |
Futures Contracts Closed | | | 73,469 | |
Change in Net Unrealized Appreciation (Depreciation) on: | | | | |
Investments | | | (374,777 | ) |
Short Transactions | | | (57,311 | ) |
Options Contracts | | | (231 | ) |
Futures Contracts | | | 50,876 | |
| | | | |
Net Decrease in Net Assets from Operations | | | (75,741 | ) |
| | | | |
From Distributions | | | | |
Net Investment Income | | | — | |
Net Realized Gain on Investments | | | (265,719 | ) |
| | | | |
Net Decrease in Net Assets Resulting from Distributions Paid | | | (265,719 | ) |
| | | | |
From Capital Share Transactions | | | | |
Proceeds from Shares Sold | | | 6,812,301 | |
Net Asset Value of Shares Issued in Reinvestment of Distributions to Shareholders | | | 181,130 | |
Payments for Shares Redeemed * | | | (733,027 | ) |
Net Increase in Net Assets from Capital Share Transactions | | | 6,260,404 | |
| | | | |
Total increase in net assets | | | 5,918,944 | |
| | | | |
| |
NET ASSETS | | | | |
Beginning of period | | | 4,064,148 | |
| | | | |
End of period | | $ | 9,983,092 | |
| | | | |
Undistributed Net Investment Income | | $ | — | |
| | | | |
* Net of redemption fees of | | $ | 717 | |
| | |
| The accompanying notes are an integral part of the financial statements. | | 2012 ANNUAL REPORT | 10 |
Financial Highlights
Quaker Akros Absolute Return Fund
(For a Share Outstanding Throughout the Period)
| | | | | | | | | | | | |
| | | Quaker Akros Absolute Return Fund | |
| | | Year Ended June 30,
2012 | | | Class A
For the period
September 1, 2010 to
June 30, 2011 | | | Year Ended August 31,
2010 | |
Net asset value, beginning of period | | $ | 8.84 | | | $ | 9.16 | | | $ | 9.84 | |
| | | | | | | | | | | | |
Income from investment operations | | | | | | | | | | | | |
Net investment loss(1) | | | (0.09) | | | | (0.11) | | | | (0.09) | |
Net realized and unrealized gain (loss) on investments | | | (0.46) | | | | 0.08 | | | | (0.06) | |
| | | | | | | | | | | | |
Total from investment operations | | | (0.55) | | | | (0.03) | | | | (0.15) | |
| | | | | | | | | | | | |
Distributions to shareholders from: | | | | | | | | | | | | |
Net investment income | | | — | | | | — | | | | — | |
Net realized capital gain | | | — | | | | (0.25) | | | | (0.53) | |
Return of capital | | | — | | | | (0.04) | | | | — | |
| | | | | | | | | | | | |
Total distributions | | | | | | | (0.29) | | | | (0.53) | |
| | | | | | | | | | | | |
Paid-in capital from redemption fees | | | — | | | | — | | | | 0.00‡ | |
| | | | | | | | | | | | |
Net asset value, end of period | | $ | 8.29 | | | $ | 8.84 | | | $ | 9.16 | |
| | | | | | | | | | | | |
Total Return(2) | | | (6.22)% | | | | (0.39)%†* | | | | (1.45)% | |
Ratios/supplemental data | | | | | | | | | | | | |
Net asssets, end of period (000’s omitted) | | $ | 4,697 | | | $ | 9,809 | | | $ | 9,983 | |
Ratio of expenses to average net assets: | | | | | | | | | | | | |
Expenses before reductions | | | 2.67% | | | | 3.27%** | | | | 4.77% | |
Expenses net of fee waivers, if any | | | 1.99% | | | | 1.99%** | | | | 2.28% | |
Expenses before reductions (excluding dividend and interest expense for securities sold short) | | | 2.56% | | | | 2.97%** | | | | 4.48% | |
Expenses net of all reductions (excluding dividend and interest expense for securities sold short) | | | 1.88% | | | | 1.69%** | | | | 1.99% | |
Ratio of net investment income (loss) to average net assets*** | | | | | | | | | | | | |
Before waiver and expense reimbursement(3) | | | (1.71)% | | | | (2.72)%** | | | | (4.12)% | |
After waiver and expense reimbursement(3) | | | (1.03)% | | | | (1.44)%** | | | | (1.63)% | |
Portfolio turnover rate | | | 103.42% | | | | 136.57%* | | | | 373.76% | |
| |
| | | Quaker Akros Absolute Return Fund | |
| | | Year Ended August 31,
2009 | | | Class A
Year Ended August 31,
2008 | | | Year Ended August 31,
2007 | |
Net asset value, beginning of period | | $ | 9.68 | | | $ | 9.46 | | | $ | 10.07 | |
| | | | | | | | | | | | |
Income from investment operations | | | | | | | | | | | | |
Net investment income (loss)(1) | | | (0.06) | | | | 0.07 | | | | 0.17 | |
Net realized and unrealized gain (loss) on investments | | | 0.51 | | | | 0.64 | | | | (0.21) | |
| | | | | | | | | | | | |
Total from investment operations | | | 0.45 | | | | 0.71 | | | | (0.04) | |
| | | | | | | | | | | | |
Distributions to shareholders from: | | | | | | | | | | | | |
Net investment income | | | (0.07) | | | | (0.16) | | | | (0.11) | |
Net realized capital gain | | | (0.22) | | | | (0.33) | | | | (0.46) | |
Return of capital | | | — | | | | — | | | | — | |
| | | | | | | | | | | | |
Total distributions | | | (0.29) | | | | (0.49) | | | | (0.57) | |
| | | | | | | | | | | | |
Paid-in capital from redemption fees | | | — | | | | — | | | | — | |
| | | | | | | | | | | | |
Net asset value, end of period | | $ | 9.84 | | | $ | 9.68 | | | $ | 9.46 | |
| | | | | | | | | | | | |
Total Return(2) | | | 5.30 | % | | | 7.95 | % | | | (0.47 | )% |
Ratios/supplemental data | | | | | | | | | | | | |
Net asssets, end of period (000’s omitted) | | $ | 4,064 | | | $ | 2,733 | | | $ | 2,362 | |
Ratio of expenses to average net assets: | | | | | | | | | | | | |
Expenses before reductions(3) | | | 7.52% | | | | 8.91% | | | | 8.88% | |
Expenses net of fee waivers, if any(3) | | | 2.03% | | | | 2.18% | | | | 2.45% | |
Expenses before reductions (excluding dividend and interest expense for securities sold short)(3) | | | 7.48% | | | | 8.72% | | | | 8.42% | |
Expenses net of all reductions (excluding dividend and interest expense for securities sold short)(3) | | | 1.99% | | | | 1.99% | | | | 1.99% | |
| | |
| The accompanying notes are an integral part of the financial statements. | | 2012 ANNUAL REPORT | 11 |
Financial Highlights
Quaker Akros Absolute Return Fund
(For a Share Outstanding Throughout the Period)
| | | | | | | | | | | | |
| | | Quaker Akros Absolute Return Fund | |
| | | Class A | |
| | | Year Ended August 31,
2009 | | | Year Ended August 31,
2008 | | | Year Ended August 31,
2007 | |
Ratio of net investment income (loss) to average net assets*** | | | | | | | | | | | | |
Before waiver and expense reimbursement (3) | | | (6.25)% | | | | (5.90)% | | | | (4.64)% | |
After waiver and expense reimbursement(3) | | | (0.77)% | | | | 0.83% | | | | 1.79% | |
Portfolio turnover rate | | | 456.41% | | | | 249.85% | | | | 301.09% | |
| (1) | The average shares outstanding method has been applied for per share information. |
| (2) | Total investment return is based on the change in net asset value of a share during the period, assumes reinvestment of dividends and distributions at net asset value and does not reflect the impact of a sales charge. |
| (3) | Expenses waived or reimbursed reflect reductions to total expenses, as discussed in the notes to the financial statements. These amounts would increase the net investment loss ratio or decrease the net investment income ratio, as applicable, had such reductions not occurred. |
| *** | The net investment income (loss) ratios include dividends on short positions. |
| ‡ | Less than 0.5 cent per share. |
| † | The retuns shown represent performance for a period of less than one year. |
| | |
| The accompanying notes are an integral part of the financial statements. | | 2012 ANNUAL REPORT | 12 |
Financial Highlights
Quaker Akros Absolute Return Fund
(For a Share Outstanding Throughout the Period)
| | | | | | | | |
| | | Quaker Akros Absolute Return Fund Class C | |
| | | Year Ended June 30,
2012 | | | For the period October
4, 2010
(commencement of
operations) to June 30,
2011 | |
Net asset value, beginning of period | | $ | 8.78 | | | $ | 9.25 | |
| | | | | | | | |
Income from investment operations | | | | | | | | |
Net investment loss(1) | | | (0.16 | ) | | | (0.12 | ) |
Net realized and unrealized loss on investments | | | (0.44 | ) | | | (0.06 | ) |
| | | | | | | | |
Total from investment operations | | | (0.60 | ) | | | (0.18 | ) |
| | | | | | | | |
Distributions to shareholders from: | | | | | | | | |
Net realized capital gain | | | — | | | | (0.25 | ) |
Return of capital | | | — | | | | (0.04 | ) |
| | | | | | | | |
Total distributions | | | — | | | | (0.29 | ) |
| | | | | | | | |
Net asset value, end of period | | $ | 8.18 | | | $ | 8.78 | |
| | | | | | | | |
Total Return(2) | | | (6.83 | )% | | | (2.02 | )%†** |
Ratios/supplemental data | | | | | | | | |
Net asssets, end of period (000’s omitted) | | $ | 381 | | | $ | 296 | |
Ratio of expenses to average net assets: | | | | | | | | |
Expenses before reductions(3) | | | 3.42 | % | | | 3.94 | %*** |
Expenses net of fee waivers, if any(3) | | | 2.74 | % | | | 2.74 | %*** |
Expenses before reductions (excluding dividend and interest expense for securities sold short)(3) | | | 3.29 | % | | | 3.84 | %*** |
Expenses net of all reductions (excluding dividend and interest expense for securities sold short)(3) | | | 2.61 | % | | | 2.65 | %*** |
Ratio of net investment loss to average net assets* | | | | | | | | |
Before waiver and expense reimbursement(3) | | | (2.52 | )% | | | (3.05 | )%*** |
After waiver and expense reimbursement(3) | | | (1.84 | )% | | | (1.86 | )%*** |
Portfolio turnover rate | | | 103.42 | % | | | 136.57 | %** |
| (1) | The average shares outstanding method has been applied for per share information. |
| (2) | Total investment return is based on the change in net asset value of a share during the period, assumes reinvestment of dividends and distributions at net asset value and does not reflect the impact of a sales charge. |
| (3) | Expenses waived or reimbursed reflect reductions to total expenses, as discussed in the notes to the financial statements. These amounts would increase the net investment loss ratio or decrease the net investment income ratio, as applicable, had such reductions not occurred. |
| * | The net investment income (loss) ratios include dividends on short positions. |
| † | The returns shown represent performance for a period of less than one year. |
| | |
| The accompanying notes are an integral part of the financial statements. | | 2012 ANNUAL REPORT | 13 |
Financial Highlights
Quaker Akros Absolute Return Fund
(For a Share Outstanding Throughout the Period)
| | | | | | | | |
| | | Quaker Akros Absolute Return Fund
Institutional Class | |
| | | Year Ended June 30,
2012 | | | For the period October
4, 2010
(commencement of
operations) to June 30,
2011 | |
Net asset value, beginning of period | | $ | 8.86 | | | $ | 9.25 | |
Income from investment operations | | | | | | | | |
Net investment loss(1) | | | (0.06 | ) | | | (0.07 | ) |
Net realized and unrealized loss on investments | | | (0.47 | ) | | | (0.03 | ) |
| | | | | | | | |
Total from investment operations | | | (0.53 | ) | | | (0.10 | ) |
| | | | | | | | |
Distributions to shareholders from: | | | | | | | | |
Net realized capital gain | | | — | | | | (0.25 | ) |
Return of capital | | | — | | | | (0.04 | ) |
| | | | | | | | |
Total distributions | | | — | | | | (0.29 | ) |
| | | | | | | | |
Net asset value, end of period | | $ | 8.33 | | | $ | 8.86 | |
| | | | | | | | |
Total Return(2) | | | (5.98 | )% | | | (1.14 | )%†** |
Ratios/supplemental data | | | | | | | | |
Net asssets, end of period (000’s omitted) | | $ | 1,670 | | | $ | 2,418 | |
Ratio of expenses to average net assets: | | | | | | | | |
Expenses before reductions(3) | | | 2.42 | % | | | 2.93 | %*** |
Expenses net of fee waivers, if any(3) | | | 1.74 | % | |
| 1.74
| %
*** |
Expenses before reductions (excluding dividend and interest expense for securities sold short)(3) | | | 2.31 | % | | | 2.62 | %*** |
Expenses net of all reductions (excluding dividend and interest expense for securities sold short)(3) | | | 1.63 | % | | | 1.44 | %*** |
Ratio of net investment loss to average net assets* | | | | | | | | |
Before waiver and expense reimbursement(3) | | | (1.44 | )% | | | (2.17 | )%*** |
After waiver and expense reimbursement(3) | | | (0.76 | )% | | | (0.99 | )%*** |
Portfolio turnover rate | | | 103.42 | % | | | 136.57 | %** |
| (1) | The average shares outstanding method has been applied for per share information. |
| (2) | Total investment return is based on the change in net asset value of a share during the period, assumes reinvestment of dividends and distributions at net asset value and does not reflect the impact of a sales charge. |
| (3) | Expenses waived or reimbursed reflect reductions to total expenses, as discussed in the notes to the financial statements. These amounts would increase the net investment loss ratio or decrease the net investment income ratio, as applicable, had such reductions not occurred. |
| * | The net investment income (loss) ratios include dividends on short positions. |
| † | The returns shown represent performance for a period of less than one year. |
| | |
| The accompanying notes are an integral part of the financial statements. | | 2012 ANNUAL REPORT | 14 |
Notes to the Financial Statements
Note 1—Organization
The Quaker Investment Trust (“Trust”), a diversified, open-end management investment company was organized as a Massachusetts business trust on October 24, 1990, and is registered under the Investment Company Act of 1940, as amended (the “1940 Act”). The Trust’s Amended and Restated Declaration of Trust permits the Trustees to issue an unlimited number of shares of beneficial interest. The Trust currently has eight series: Quaker Akros Absolute Return Fund (formerly, Quaker Akros Absolute Strategies Fund) (“Akros Absolute Return”), Quaker Capital Opportunities Fund (“Capital Opportunities”), Quaker Event Arbitrage Fund (“Event Arbitrage”) Quaker Global Tactical Allocation Fund (“Global Tactical Allocation”), Quaker Mid-Cap Value Fund (“Mid-Cap Value”), Quaker Small-Cap Growth Tactical Allocation Fund (“Small-Cap Growth Tactical Allocation”), Quaker Small-Cap Value Fund (“Small-Cap Value”) and Quaker Strategic Growth Fund (“Strategic Growth”) (each a “Fund” and collectively, “Funds”). All Funds are diversified with the exception of Akros Absolute Return, Capital Opportunities and Event Arbitrage. The investment objectives of the Akros Absolute Return is set forth below.
Akros Absolute Return commenced operations on October 4, 2010 in conjunction with the reorganization of the Akros Absolute Return Fund (“Absolute Return Fund”). The predecessor Absolute Return Fund commenced operations on September 30, 2005. The investment objective of this Fund is to seek long-term growth of capital. The investment objective of the Fund is non-fundamental in that this objective may be changed by the Board of Trustees (“Board” or “Trustees”) without shareholder approval.
Effective March 25, 2011, the Board approved changing the name of the Quaker Akros Absolute Strategies Fund to the Quaker Akros Absolute Return Fund. There have been no changes to the investment objective or strategies of the Fund.
The Fund currently offers three classes of shares (Class A, Class C and Institutional Class Shares). Class A Shares are charged a front-end sales charge and a distribution and servicing fee; Class C shares are charged a distribution fee, but bear no front-end sales charge or contingent deferred sales charge (“CDSC”); and Institutional Class Shares bear no front-end sales charge or CDSC, but have higher minimum investment thresholds.
Quaker Funds, Inc. (“QFI”), the investment adviser to the Fund, has the ability to waive the minimum investment for Institutional Class shares at its discretion.
Note 2—Summary of Significant Accounting Policies and Other Information
The following is a summary of significant accounting policies consistently followed by the Fund in the preparation of its financial statements. The policies are in conformity with accounting principles generally accepted in the United States of America (“GAAP”).
A. Security Valuation. The Fund’s investments in securities are carried at market value. Securities listed on an exchange or quoted on a national market system are generally valued at the last quoted sales price at the time of valuation. Other securities traded in the over-the-counter market and listed securities for which no sale was reported on that date are valued at the most recent bid price. Each security reported on the NASDAQ National Market System is valued at the NASDAQ Official Closing Price.
Debt and other fixed-income securities (other than short-term obligations) are valued at the last quoted bid price and/or by using a combination of daily quotes and matrix evaluations provided by an independent pricing service (which reflect such factors as security prices, yields, maturities, ratings, and dealer and exchange quotations), the use of which has been approved by the Board.
Short-term investments are valued at amortized cost, which approximates fair market value.
The Fund has adopted fair valuation procedures to value securities at fair market value in certain circumstances and the Trust has established a Valuation Committee responsible for determining when fair valuing a security is necessary and appropriate. The Fund will value securities at fair market value when market quotations are not readily available or when securities cannot be accurately valued within established pricing procedures. The Valuation Committee may also fair value foreign securities whose prices may have been affected by events occurring after the close of trading in their respective markets but prior to the time the Fund holding the foreign securities calculates its net asset value. The Fund’s fair valuation procedures are designed to help ensure that prices at which Fund shares are purchased and redeemed are fair and do not result in dilution of shareholder interest or other harm to shareholders.
The Fund is required to disclose information regarding the fair value measurements of the Fund’s assets and liabilities. Fair value is defined as the price that the Fund would receive upon selling an investment in an orderly transaction to an independent buyer in the principal or most advantageous market for the investment. The disclosure requirements utilize a three-tier hierarchy to maximize the use of observable market data, minimize the use of unobservable inputs and establish classification of fair value measurements for disclosure purposes. A financial instrument’s level within the fair value hierarchy is based on the lowest level that is significant to the fair value measurement. Inputs refer broadly to the assumptions that market participants would use in pricing the asset or liability, including assumptions about risk, for example, the risk inherent in a particular valuation technique used to measure fair value including such a pricing model and/or the risk inherent in the inputs to the valuation technique. Inputs may be observable or unobservable.
2012 ANNUAL REPORT | 15
Notes to the Financial Statements
Observable inputs are inputs that reflect the assumptions market participants would use in pricing the asset or liability, which are based on market data obtained from sources independent of the reporting entity. Unobservable inputs are inputs that reflect the reporting entity’s own assumptions about the assumptions market participants would use in pricing the asset or liability developed based on the best information available in the circumstances.
The significant unobservable inputs used in the fair value measurement of the reporting entity’s private equity holdings are audited financial statements, expenses occurred from the partnership, interim financial statements, capital call, distributions and publicly traded securities. Significant increases (decreases) in any of those inputs in isolation would result in a significantly lower (higher) fair value measurement.
Various inputs may be used to determine the value of each Fund’s investments. These inputs are summarized in three broad levels for financial statement purposes. The inputs or methodologies used to value securities are not necessarily an indication of the risk associated with investing in those securities.
Level I—Quoted prices in active markets for identical securities.
Level II—Prices determined using significant other observable inputs (including quoted prices for similar securities, interest rates, prepayment speeds, credit risk, etc.) Municipal securities, long-term U.S. Government obligations and corporate debt securities are valued in accordance with the evaluated price supplied by the pricing service and generally categorized as Level 2 in the hierarchy. Other securities that are categorized as Level 2 in the hierarchy include, but are not limited to, warrants that do not trade on an exchange, and international equity securities valued by an independent third party in order to adjust for stale pricing and foreign market holidays.
Level III—Prices determined using significant unobservable inputs (including the Fund’s own assumptions). For restricted equity securities where observable inputs are limited, assumptions about market activity and risk are used in determining fair value. These are categorized as Level 3 in the hierarchy.
Equity and option securities, for which market quotations are readily available, are valued at the last reported sale price and are categorized as Level 1. Investments in open-end mutual funds, exchange traded funds (“ETF’s”) and futures are valued at their closing net asset value each business day and are categorized as Level 1. Short-term securities with remaining maturities of sixty days or less are valued at amortized cost, which approximates fair market value and are categorized as Level 1.
For international equity securities traded on a foreign exchange or market which closes prior to the Fund’s Valuation Time, in order to adjust for events which occur between the close of the foreign exchange they are traded on and the close of the New York Stock Exchange, a fair valuation model is used, and these securities are categorized as Level 2.
The Fund also holds securities, some of which are classified as Level 3 investments (as defined below). Level 3 investments have significant unobservable inputs, as they trade infrequently. In determining the fair value of these investments, management uses the market approach which includes as the primary input the capital balance reported; however, adjustments to the reported capital balance may be made based on various factors, including, but not limited to, the attributes of the interest held, including the rights and obligations, and any restrictions or illiquidity of such interests, and the fair value of these securities.
The value of a foreign security is generally determined as of the close of trading on the foreign stock exchange on which the security is primarily traded, or as of the close of trading on the New York Stock Exchange (“NYSE”), if earlier. The value is then converted into its U.S. dollar equivalent at the foreign exchange rate in effect at the close of the NYSE (generally 4:00 p.m. Eastern time) on the day that the value of the foreign security is determined. If no sale is reported at that time, the foreign security will be valued within the range of the most recent quoted bid and ask prices. If market quotations are not readily available for a foreign security or an event has occurred that caused a quotation to be unavailable or unreliable, the Valuation Committee will fair value foreign securities using the procedures described below.
The Trust has adopted fair valuation procedures to value securities at fair market value when independent prices are unavailable or unreliable, and the Trust has established a Valuation Committee that is responsible for determining when fair valuing a security is necessary and appropriate. Securities and assets for which market quotations are not readily available may be valued based upon valuation methods that include: (i) multiple of earnings; (ii) yield to maturity with respect to debt issues; (iii) discounts from market prices of similar freely traded securities; or (iv) a combination of these methods. Securities may also be priced using fair value pricing methods when their closing prices do not reflect their market values at the time the Fund calculates its net asset value (“NAV”) because an event had occurred since the closing prices were established on the domestic or foreign exchange or market but before the Fund’s NAV calculation.
2012 ANNUAL REPORT | 16
Notes to the Financial Statements
The following is a summary of the fair valuations according to the inputs used as of June 30, 2012 in valuing the Fund’s assets and liabilities:
| | | | | | | | | | | | | | | | | | |
Category | | Akros Absolute Return | | Quoted Prices
in Active Markets
for Identical
Investments
(Level 1) | | | Significant Other
Observable
Inputs
(Level 2) | | | Significant
Unobservable
Inputs
(Level 3) | | | Fair
Value at
6/30/2012 | |
Corporate Bonds | | | | | | | | | | | | | | | | | | |
Energy | | | | $ | 0 | | | $ | 46,500 | | | $ | 0 | | | $ | 46,500 | |
Financial | | | | | 0 | | | | 402,129 | | | | 0 | | | | 402,129 | |
Common Stocks | | | | | | | | | | | | | | | | | | |
Basic Materials | | | | | 141,560 | | | | 0 | | | | 0 | | | | 141,560 | |
Communications | | | | | 125,226 | | | | 0 | | | | 0 | | | | 125,226 | |
Consumer, Cyclical | | | | | 0 | | | | 0 | | | | 8 | | | | 8 | |
Consumer, Non-cyclical | | | | | 220,620 | | | | 0 | | | | 0 | | | | 220,620 | |
Diversified | | | | | 417,430 | | | | 0 | | | | 0 | | | | 417,430 | |
Energy | | | | | 470,503 | | | | 0 | | | | 0 | | | | 470,503 | |
Financial | | | | | 432,782 | | | | 0 | | | | 0 | | | | 432,782 | |
Healthcare | | | | | 193,813 | | | | 0 | | | | 0 | | | | 193,813 | |
Industrial | | | | | 145,429 | | | | 0 | | | | 0 | | | | 145,429 | |
Technology | | | | | 228,028 | | | | 0 | | | | 8,112 | | | | 236,140 | |
Utilities | | | | | 112,860 | | | | 0 | | | | 0 | | | | 112,860 | |
Exchange-Traded Fund | | | | | | | | | | | | | | | | | | |
Funds | | | | | 58,560 | | | | 0 | | | | 0 | | | | 58,560 | |
Warrants | | | | | | | | | | | | | | | | | | |
Technology | | | | | 10,450 | | | | 0 | | | | 0 | | | | 10,450 | |
Private Placements | | | | | | | | | | | | | | | | | | |
Technology | | | | | 0 | | | | 0 | | | | 18,770 | | | | 18,770 | |
Preferred Stock | | | | | | | | | | | | | | | | | | |
Healthcare | | | | | 0 | | | | 0 | | | | 105,000 | | | | 105,000 | |
Options | | | | | 23,630 | | | | 0 | | | | 0 | | | | 23,630 | |
Short-Term Investment | | | | | 724,609 | | | | 0 | | | | 0 | | | | 724,609 | |
| | | | | | | | | | | | | | | | | | |
| | | | $ | 3,305,500 | | | $ | 448,629 | | | $ | 131,890 | | | $ | 3,886,019 | |
| | | | | | | | | | | | | | | | | | |
Call Options—Written | | | | $ | (3,475 | ) | | $ | 0 | | | $ | 0 | | | $ | (3,475 | ) |
Securities Sold Short | | | | $ | (1,460,993 | ) | | $ | 0 | | | $ | 0 | | | $ | (1,460,993 | ) |
Futures | | | | $ | (27,355 | ) | | $ | 0 | | | $ | 0 | | | $ | (27,355 | ) |
| | | | | | | | | | | | | | | | | | |
Total | | | | $ | 1,813,677 | | | $ | 448,629 | | | $ | 131,890 | | | $ | 2,394,196 | |
| | | | | | | | | | | | | | | | | | |
There have been no transfers in and out of Level 1 and Level 2 fair value measurements during the year ended June 30, 2012.
The following is a reconciliation of assets for which significant unobservable inputs (Level 3) were used in determining fair value during the period July 1, 2011, through June 30, 2012.
2012 ANNUAL REPORT | 17
Notes to the Financial Statements
| | | | | | | | | | | | | | | | | | | | | | | | | | | | | | | | | | | | | | |
| Category | | Akros Absolute Return | | Balance as
of
6/30/2011 | | | Purchases | | | Sales | | | Realized
gain
(loss) | | | Net unrealized
appreciation(depreciation) | | | Amortized
discounts/
premiums | | | Transfers
in to
Level 3 | | | Transfers
out of
Level 3 | | | Balance as
of
6/30/2012 | |
Common Stock | | | | | | | | | | | | | | | | | | | | | | | | | | | | | | | | | | | | | | |
Consumer, Cyclical | | | | $ | 170 | | | $ | — | | | $ | — | | | $ | — | | | $ | (162) | | | $ | — | | | $ | — | | | $ | — | | | $ | 8 | |
Financial | | | | | 13,219 | | | | — | | | | — | | | | — | | | | 429 | | | | — | | | | — | | | | (13,648) | | | | — | |
Technology | | | | | — | | | | — | | | | — | | | | — | | | | 8,112 | | | | — | | | | — | | | | — | | | | 8,112 | |
Preferred Stock | | | | | | | | | | | | | | | | | | | | | | | | | | | | | | | | | | | | | | |
Healthcare | | | | | 105,000 | | | | — | | | | — | | | | — | | | | — | | | | — | | | | — | | | | — | | | | 105,000 | |
Private Placement | | | | | | | | | | | | | | | | | | | | | | | | | | | | | | | | | | | | | | |
Technology | | | | | 58,315 | | | | — | | | | (54,673) | | | | 291 | | | | 14,837 | | | | — | | | | — | | | | — | | | | 18,770 | |
Warrant | | | | | | | | | | | | | | | | | | | | | | | | | | | | | | | | | | | | | | |
Technology | | | | | 26 | | | | — | | | | — | | | | — | | | | (26) | | | | — | | | | — | | | | — | | | | — | |
| | | | | | | | | | | | | | | | | | | | | | | | | | | | | | | | | | | | | | |
| | | | $ | 176,730 | | | $ | — | | | $ | (54,673) | | | $ | 291 | | | $ | 23,190 | | | $ | — | | | $ | — | | | $ | (13,648) | | | $ | 131,890 | |
| | | | | | | | | | | | | | | | | | | | | | | | | | | | | | | | | | | | | | |
Net change in unrealized appreciation (depreciation) from investments still held as of June 30, 2012 $23,190.
B. Federal Income Taxes. It is the Fund’s policy to comply with the requirements of Subchapter M of the Internal Revenue Code and to distribute substantially all of their taxable income to shareholders. Therefore, no federal income tax provision is required.
In accordance with Financial Accounting Standards Board (“FASB”) Interpretation ASC 740, (“ASC 740”), each Fund recognizes a tax benefit from an uncertain position only if it is more likely than not that the position is sustainable, based solely on its technical merits and consideration of the relevant taxing authority’s widely understood administrative practices and precedents. If this threshold is met, a Fund measures the tax benefit as the largest amount of benefit that is greater than fifty percent likely of being realized upon ultimate settlement. Management has reviewed the tax positions for each of the four open tax years as of June 30, 2012 and has determined that the implementation of ASC 740 does not have a material impact on the Funds’ financial statements. The Fund’s federal tax returns for the prior three fiscal years remains subject to examination by the Internal Revenue Service.
Net investment income or loss and net realized gains or losses may differ for financial statement and income tax purposes primarily due to investments that have a different basis for financial statement and income tax purposes. The character of distributions made during the year from net investment income or net realized gains may differ from their ultimate characterization for federal income tax purposes. Also, due to the timing of dividend distributions, the fiscal year in which amounts are distributed may differ from the year that the income or realized gains were recorded by the Fund. Permanent differences in the recognition of earnings are reclassified to additional paid-in capital. Distributions in excess of tax-basis earnings are recorded as a return of capital.
C. Security Transactions and Investment Income. Security transactions are recorded on the trade date. Realized gains and losses are determined using the specific identification cost method. Interest income on debt securities is recorded daily on the accrual basis. Discounts and premiums on debt securities are amortized over their respective lives. Dividend income is recorded on the ex-dividend date, or as soon as information is available to the Fund.
The Fund may make short sales of investments, which are transactions in which the Fund sells a security it does not own in anticipation of a decline in the fair value of that security. To complete such a transaction, the Fund must borrow the security to make delivery to the buyer. The Fund is then obligated to replace the security borrowed by purchasing it at the market price at the time of replacement. The broker retains the proceeds of short sales to the extent necessary to meet margin requirements until the short position is closed out.
If a security pays a dividend while the Fund holds it short, the Fund will need to pay the dividend to the original owner of the security. Since the Fund borrowed the shares and sold them to a third party, the third party will receive the dividend from the security and the Fund will pay the original owner the dividend directly. The Fund is not entitled to the dividend because it does not own the shares. A gain, limited to the price at which the Fund sold the security short, or a loss, unlimited in size, will be recognized upon the termination of a short sale.
2012 ANNUAL REPORT | 18
Notes to the Financial Statements
D. Options Contracts Written. The Fund may write options to manage exposure to certain changes in the market. When the Fund writes an option, an amount equal to the premium received by the Fund is recorded as a liability, which is marked-to-market daily to reflect the current market value of the option written. If the option expires, the Fund realizes a gain from investments equal to the amount of the premium received. When a written call option is exercised, the difference between the premium and the amount for effecting a closing purchase transaction, including brokerage commission, is also treated as a realized gain or loss. When a written put option is exercised, the amount of the premium received reduces the cost of the security purchased by the Fund.
A risk in writing a covered call option is that the Fund may forego the opportunity of profit if the market price of the underlying security increases and the option is exercised. The risk in writing a put option is that the Fund may incur a loss if the market price of the underlying security decreases and the option is exercised. In addition, there is the risk that the Fund may not be able to enter into a closing transaction because of an illiquid secondary market.
E. Purchased Options. The Fund may purchase call options in anticipation of an increase in the market value of securities of the type in which they may invest. The purchase of a call option will entitle the Fund, in return for the premium paid, to purchase specified securities at a specified price during the option period. The Fund will ordinarily realize a gain if, during the option period, the value of such securities exceeded the sum of the exercise price, the premium paid and transaction costs; otherwise, the Fund will realize either no gain or a loss on the purchase of the call option. The Fund will normally purchase put options in anticipation of a decline in the market value of securities in its portfolio (“protective puts”) or in securities in which it may invest. The purchase of a put option will entitle the Fund, in exchange for the premium paid, to sell specified securities at a specified price during the option period. The purchase of protective puts is designed to offset or hedge against a decline in the market value of the Fund’s securities. Put options may also be purchased by the Fund for the purpose of affirmatively benefiting from a decline in the price of securities which it does not own. The Fund will ordinarily realize a gain if, during the option period, the value of the underlying securities decreased below the exercise price sufficiently to more than cover the premium and transaction costs; otherwise the Fund will realize either no gain or a loss on the purchase of the put option. Gains and losses on the purchase of protective put options would tend to be offset by countervailing changes in the value of the underlying portfolio securities.
F. Futures Contracts. The Fund may enter into financial futures contracts, to the extent permitted by their investment policies and objectives, for bona fide hedging and other permissible risk management purposes including protecting against anticipated changes in the value of securities the Fund intends to purchase. Upon entering into a financial futures contract, the Fund is required to deposit cash or securities as initial margin. Additional securities are also segregated as collateral up to the current market value of the financial futures contracts. Subsequent payments, known as variation margin, are made or received by the Fund, depending on the fluctuation in the value of the underlying financial instruments. The Fund recognizes an unrealized gain or loss equal to the variation margin. When the financial futures contracts are closed, a realized gain or loss is recognized equal to the difference between the proceeds from (or cost of) the closing transactions and the Fund’s basis in the contracts. The risks associated with entering into financial futures contracts include the possibility that a change in the value of the contract may not correlate with the changes in the value of the underlying instruments. In addition, investing in financial futures contracts involves the risk that the Fund could lose more than the original margin deposit and subsequent payments required for a futures transaction. Risks may also arise upon entering into these contracts from the potential inability of the counterparties to meet the terms of their contracts.
G. Foreign Currency Transactions. Securities and other assets and liabilities denominated in foreign currencies are converted each business day into U.S. dollars based on the prevailing rates of exchange. Purchases and sales of portfolio securities and income and expenses are converted into U.S. dollars on the respective dates of such transactions.
Gains and losses resulting from changes in exchange rates applicable to foreign securities are not reported separately from gains and losses arising from movements in securities prices.
Net realized foreign exchange gains and losses include gains and losses from sales and maturities of foreign currency exchange contracts, gains and losses realized between the trade and settlement dates of foreign securities transactions, and the difference between the amount of dividends, interest and foreign withholding taxes on the Fund’s books and the U.S. dollar equivalent of the amounts actually received. Net unrealized foreign exchange gains and losses include gains and losses from changes in the fair value of assets and liabilities denominated in foreign currencies other than portfolio securities, resulting from changes in exchange rates.
H. Forward Foreign Currency Contracts. The Fund may enter into forward foreign currency contracts to hedge against foreign currency exchange rate risk on their non-U.S. dollar denominated securities or to facilitate settlement of foreign currency denominated portfolio transactions. A forward foreign currency contract is an agreement between two parties to buy and sell a currency at a set price on a future date. The contract is marked-to-market daily and the change in value is recorded by the Fund as an unrealized gain or loss. When a forward foreign currency contract is extinguished, through either delivery or offset by entering into another forward foreign currency contract, the Fund records a realized gain or loss equal to the difference between the value of the contract at the time it was opened and the value of the contract at the time it was extinguished.
2012 ANNUAL REPORT | 19
Notes to the Financial Statements
Forward foreign currency contracts involve elements of market risk in excess of the amounts reflected in the Statements of Assets and Liabilities. The Fund bears the risk of an unfavorable change in the foreign exchange rate underlying the forward foreign currency contract. Risks may also arise upon entering into these contracts from the potential inability of the counterparties to meet the terms of their contracts.
I. Portfolio Investment Risks. Investments in securities of foreign issuers carry certain risks not ordinarily associated with investments in securities of U.S. issuers. These risks include future disruptive political and economic developments and the possible imposition of exchange controls or other unfavorable foreign government laws and restrictions. In addition, investments in certain countries may carry risks of expropriation of assets, confiscatory taxation, political or social instability, or diplomatic developments that adversely affect investments in those countries. Certain countries may also impose substantial restrictions on investments in their capital markets by foreign entities, including restrictions on investments in issuers in industries deemed sensitive to relevant national interests. These factors may limit the investment opportunities available and result in a lack of liquidity and high price volatility with respect to securities of issuers from developing countries.
The Akros Absolute Return Fund is not a “diversified” Fund, which means that the Fund may allocate their investments to a relatively small number of issuers or to a single industry, making the Fund more susceptible to adverse developments of a single user or industry. As a result, investing in the Fund is potentially more risky than investing in a diversified fund that is otherwise similar to the Fund.
J. Multiple Class Allocations. Each class of shares has equal rights as to earnings and assets except that each class bears different distribution and shareholder servicing expenses. Each class of shares has exclusive voting rights with respect to matters that affect just that class. Income, expenses (other than expenses attributable to a specific class) and realized and unrealized gains or losses on investments are allocated to each class of shares based on its relative net assets.
K. Expense Allocations. Expenses that are not series (Fund) specific are allocated to each series based upon its relative proportion of net assets to the Trust’s total net assets.
L. Distributions to Shareholders. The Fund generally declares dividends at least annually, payable in December, on a date selected by the Board. In addition, distributions may be made annually in December out of net realized gains through October 31 of that calendar year. Distributions to shareholders are recorded on the ex-dividend date. The Fund may make a supplemental distribution subsequent to the end of its fiscal year ending June 30.
M. Use of Estimates. The preparation of financial statements in conformity with GAAP requires management to make estimates and assumptions that affect the reported amounts of assets and liabilities and the disclosure of contingent assets and liabilities at the date of the financial statements, and the reported amounts of revenue and expenses during the reporting period. Actual results could differ from those estimates, and those differences could be significant.
N. Security Loans. The Fund receives compensation in the form of fees, or retain a portion of interest on the investment of any cash received as collateral. The Fund also continues to receive interest or dividends on the securities loaned. The loans are secured by collateral at least equal, at all times, to 102% of the market value of the loaned securities. Gain or loss in the fair value of the securities loaned that may occur during the term of the loan will be for the account of the Fund. The Fund has the right under the lending agreement to recover the securities from the borrower on demand.
O. Derivative Instruments. Effective June 30, 2009, the Fund has adopted amendments to authoritative guidance on disclosures about derivative instruments and hedging activities which require that the Fund disclose: a) how and why an entity uses derivative instruments; and b) how derivative instruments and related hedged items affect an entity’s financial position, financial performance and cash flows. The adoption of the additional disclosure requirements did not materially impact the Funds’ financial statements.
The Fund traded financial instruments where they are considered to be a seller of credit derivatives in accordance with authoritative guidance under GAAP on derivatives and hedging.
The fair value of derivative instruments and whose primary underlying risk exposure is equity price risk at June 30, 2012 was as follows:
Akros Absolute Return
| | | | | | | | |
| | | Fair Value | |
| Derivative | | Asset Derivatives(1) | | | Liability Derivatives(2) | |
Written Options | | $ | — | | | $ | 3,475 | |
Futures | | | — | | | | 27,355 | |
Purchased Options | | | 23,630 | | | | — | |
| (1) | Statement of Assets and Liabilities location: Investments, at value. |
| (2) | Statement of Assets and Liabilities location: Call Options Written, at value and Futures held. |
2012 ANNUAL REPORT | 20
Notes to the Financial Statements
The effect of derivative instruments on the Statement of Operations and whose primary underlying risk exposure is equity price risk for the period ended June 30, 2012 was as follows:
Akros Absolute Return
| | | | | | | | |
Derivative | | Realized gain (Loss) on Derivatives
Recognized in Income(1) | | | Change in Unrealized appreciation
(Depreciation) on Derivatives
Recognized in Income(2) | |
Written Options | | $ | 112,962 | | | $ | 1,633 | |
Futures | | | 104,293 | | | | (27,355 | ) |
Purchased Options | | | (15,122 | ) | | | 3,577 | |
| (1) | Statement of Operations location: Net realized gain (loss) from written options, net realized gain (loss) from investments and net realized gain (loss) on futures. |
| (2) | Statement of Operations location: Net unrealized appreciation (depreciation) on written options, net unrealized appreciation (depreciation) on investments and net unrealized appreciation (depreciation) on futures. |
The average notional amounts of written options, purchased options and futures contracts outstanding during the period ended June 30, 2012 were approximately as follows:
| | | | | | | | | | | | |
Fund | | Written Options | | | Purchased Options | | | Futures | |
Akros Absolute Return | | $ | 8,651 | | | $ | 4,631 | | | $ | 1,001,826 | |
Note 3—Investment Advisory Fee and Other Related Party Transactions
QFI serves as investment adviser to the Fund. Pursuant to separate investment subadvisory agreements, QFI has selected the following investment advisory firm to serve as sub-adviser:
| | |
Fund | | Sub-adviser |
| Akros Absolute Return | | Akros Capital, LLC |
QFI or the sub-adviser provide the Fund with a continuous program of supervision of the Fund’s assets, including the composition of its portfolio, and furnish advice and recommendations with respect to investments, investment policies and the purchase and sale of securities.
The Fund paid QFI aggregate fees shown in the table below for the fiscal year ending June 30, 2012. Amounts are expressed as an annualized percentage of average net assets.
| | | | | | | | | | | | |
Fund | | Aggregate
advisory fee
paid to QFI | | | Subadvisory
fee paid by QFI
to the sub-adviser | | | Advisory &
subadvisory
fees waived &
reimbursed | |
Akros Absolute Return | | | 1.25 | % | | | 0.75 | % | | | 0.68 | % |
For the fiscal year ending June 30, 2012, QFI and the sub-adviser earned and reimbursed fees as follows:
| | | | | | | | | | | | |
| | | Aggregate
advisory fee
paid to QFI | | | Subadvisory
fee paid by QFI
to the Sub-Advisor | | | Advisory &
subadvisory
fees waived &
reimbursed | |
Akros Absolute Return | | $ | 101,671 | | | $ | 61,002 | | | $ | 55,214 | |
Akros Capital, LLC, the sub-adviser to Akros Absolute Return has waived a portion of its subadvisory fee to the extent that the total operating expenses of Akros Absolute Return (exclusive of 12b-1 fees) exceeded the annual rate of 1.99% for Class A shares, 2.74% for Class C shares, and 1.74% for Institutional Class shares of the average net assets of each class, respectively. If, at any time,
2012 ANNUAL REPORT | 21
Notes to the Financial Statements
the annualized expenses of Akros Absolute Return were less than the annualized expense ratio, the Trust, on behalf of Akros Absolute Return, would reimburse QFI for any fees previously waived and/or expenses previously assumed; provided, however, that repayment would be payable only to the extent that it (a) can be made during the three (3) years following the time at which the adviser waived fees or assumed expenses for Akros Absolute Return, and (b) can be repaid without causing the expenses of Akros Absolute Return to exceed the annualized expense ratio. This fee waiver agreement shall continue in effect from October 28, 2011 until October 28, 2012. This agreement shall automatically terminate upon termination of the advisory agreement between QFI and the Trust or, with respect to the Akros Absolute Return Fund, in the event of its merger or liquidation.
At June 30, 2012, the cumulative unreimbursed amount paid and/or waived by the Advisor on behalf of the Fund that may be recouped was $328,357. The Advisor may recapture portions of the above amount no later than the dates stated below:
| | | | | | | | | | | | |
| | | August 30,
2013 | | | June 30,
2014 | | | June 30,
2015 | |
Akros Absolute Return | | $ | 152,600 | | | $ | 120,543 | | | $ | 55,214 | |
US Bancorp Fund Services, LLC (“USB”), serves as the Trust’s transfer, dividend paying, and shareholder servicing agent (“Transfer Agent”). The Transfer Agent maintains the records of each shareholder’s account, answers shareholder inquiries concerning accounts, processes purchases and redemptions of Fund shares, acts as dividend and distribution disbursing agent and performs other shareholder functions. As compensation for its services, the Transfer Agent receives a fee at the annual rate ranging between $8 and $11 dollars per shareholder account.
Brown Brothers Harriman & Co. serves as fund accountant and administrator (“Administrator”) for the Trust pursuant to a written agreement with the Trust. The Administrator provides fund accounting services and administrative services to each Fund. As compensation for its services, the Administrator receives a fee at the annual rate of 0.025% for accounting and 0.030% for administration of the aggregate of the Trust’s first $2 billion of average daily net assets and 0.020% for accounting and 0.025% for administration for over $2 billion of average daily net assets.
The Trust will incur an annual account minimum if, on an annual basis, the asset charges do not exceed the account minimum charges.
Foreside Fund Services, LLC (“Distributor”) serves as principal underwriter for the Trust. The Trust has adopted distribution and shareholder servicing plans pursuant to Rule 12b-1 of the 1940 Act for Class A and Class C Shares described below. There is no Rule 12b-1 distribution plan for Institutional Class Shares of the Funds. The Class A Plan provides that the Fund may pay a servicing or Rule 12b-1 fee at an annual rate of 0.25% of the Class A average net assets on a monthly basis to persons or institutions for performing certain servicing functions for the Class A shareholders. The Class A Plan also allows the Fund to pay or reimburse expenditures in connection with sales and promotional services related to distribution of the Fund’s shares, including personal services provided to prospective and existing shareholders. The Class C Plan provides that the Fund may compensate QFI and others for services provided and expenses incurred in the distribution of shares at an annual rate of 1.00% of the average net assets of each class on a monthly basis.
For the fiscal year ending June 30, 2012, the Distributor received $399 in underwriter concessions from the sale of Funds shares.
Except for the Trust’s Chief Compliance Officer (“CCO”), employees and Officers of QFI do not receive any compensation from the Trust. The CCO of the Trust also serves as general counsel to QFI. For the fiscal year ending June 30, 2012, the Fund was allocated $4,311 of the CCO’s fees for compensation.
Note 4—Purchases and Sales of Investments
For the fiscal year ending June 30, 2012, aggregate purchases and sales of investment securities (excluding short-term investments) for each Fund were as follows:
| | | | | | | | |
Fund | | Purchases | | | Sales | |
Akros Absolute Return | | $ | 5,163,545 | | | $ | 9,665,955 | |
| | | | | | | | |
2012 ANNUAL REPORT | 22
Notes to the Financial Statements
Note 5—Options Written
A summary of option contracts written by the Fund during the fiscal year ended June 30, 2012 is as follows:
| | | | | | | | |
| | | Akros Absolute Return | |
| | | Number of
Contracts | | | Option
Premiums | |
Options outstanding at beginning of period | | | 311 | | | $ | 13,046 | |
Options written | | | 2,998 | | | | 117,273 | |
Options exercised | | | (638 | ) | | | (45,389 | ) |
Options expired | | | (2,531 | ) | | | (75,232 | ) |
| | | | | | | | |
Options outstanding at end of period | | | 140 | | | $ | 9,698 | |
Note 6—Tax Matters
For U.S. federal income tax purposes, the cost of securities owned, gross appreciation, gross depreciation, and net unrealized appreciation (depreciation) of investments at June 30, 2012 for the Fund was as follows:
| | | | | | | | | | | | | | | | |
| Fund | | Cost | | | Gross
Appreciation | | | Net
Gross
Depreciation | | | Appreciation
(Depreciation) | |
Akros Absolute Return | | $ | 4,807,972 | | | $ | 88,643 | | | $ | (1,010,596 | ) | | $ | (921,953 | ) |
As of June 30, 2012, the components of distributable earnings on a tax basis were as follows:
| | | | | | | | | | | | | | | | | | | | | | | | |
| Fund | | Unrealized
Appreciation
(Depreciation) | | | Undistributed
Ordinary
Income | | | Undistributed
Capital Loss | | | Capital Loss
Carryforward | | | Late Year
Losses | | | Total
Distributable
Earnings | |
Akros Absolute Return | | $ | (1,075,155 | ) | | $ | – | | | $ | — | | | $ | — | | | $ | (49,734 | ) | | $ | (1,124,889 | ) |
The difference between book basis and tax basis unrealized appreciation (depreciation) is attributable primarily to the tax deferral of losses on wash sales and straddles from options and the differing book/tax treatment of unrealized appreciation/depreciation on futures contracts.
The undistributed ordinary income, capital gains and carryforward losses shown above differ from the corresponding accumulated net investment income and accumulated net realized gain (loss) figures reported in the statements of assets and liabilities due to differing book/tax treatment of short-term capital gains, and certain temporary book/tax differences such as the deferral of realized losses on wash sales, straddles from options and net losses realized after October 31.
Under current tax law, foreign currency and net capital losses realized after October 31 may be deferred and treated as occurring on the first day of the following fiscal year.
Under the Regulated Investment Company Modernization Act of 2010 (“Act”), net capital losses may be carried forward indefinitely, and their character is retained as short term and/or long-term losses. Previously, net capital losses were carried forward for eight years and treated as short term losses. As a transition rule, the Act requires that postenactment net capital losses be used before pre-enactment net capital losses. As a result of this ordering rule, pre-enactment capital loss carryforwards may expire unused, whereas under the previous rules these losses may have been utilized.
2012 ANNUAL REPORT | 23
Notes to the Financial Statements
Note 7—Reclassification of Capital Accounts
In accordance with the accounting pronouncements, the Fund has recorded reclassifications in the capital accounts. These reclassifications have no impact on the net asset value of the Fund and are designed generally to present undistributed income and realized gains on a tax basis which is considered to be more informative to shareholders. As of June 30, 2012, the Fund recorded the following reclassification to increase (decrease) the accounts listed below:
| | | | | | | | | | | | |
Fund | | Accumulated
Net Investment
Income (loss) | | | Accumulated
Net Realized
Gain (Loss) | | | Capital Paid in on
Shares of Beneficial
Interest | |
Akros Absolute Return | | $ | 34,616 | | | $ | (28,545 | ) | | $ | (6,071 | ) |
Note 8—Distributions to Shareholders
Income and long-term capital gain distributions are determined in accordance with federal income tax regulations, which may differ from GAAP. The information set forth below is for the Fund’s fiscal year as required by federal securities laws.
The tax character of dividends and distributions paid during the fiscal years of 2012 and 2011 were as follows:
| | | | | | | | | | | | | | | | | | | | | | | | |
| | | Ordinary Income | | | Long-Term Capital Gain | | | Return of Capital | |
Fund | | 2012 | | | 2011 | | | 2012 | | | 2011 | | | 2012 | | | 2011 | |
Akros Absolute Return | | $ | — | | | $ | 341,500 | | | $ | — | | | $ | — | | | $ | — | | | $ | (51,880 | ) |
Note 9—Fund Share Transactions
At June 30, 2012, there were an unlimited number of shares of beneficial interest with a $0.01 par value authorized. The following table summarizes the activity in shares of the Fund:
| | | | | | | | | | | | | | | | | | | | | | | | | | | | | | | | |
| | | Akros Absolute Return | |
| | | For the Fiscal Year Ended June 30, 2012 | | | For the nine-month period September 1, 2010 through June 30, 2011 | |
| | | Sold | | | Redeemed | | | Reinvested | | | End Shares | | | Sold | | | Redeemed | | | Reinvested | | | End Shares | |
Class A | | | | | | | | | | | | | | | | | | | | | | | | | | | | | | | | |
Shares | | | 123,496 | | | | (667,212 | ) | | | — | | | | 566,265 | | | | 689,900 | | | | (699,040 | ) | | | 29,261 | | | | 1,109,981 | |
Value | | $ | 1,057,720 | | | $ | (5,813,173 | ) | | $ | — | | | | | | | $ | 6,281,813 | | | $ | (6,386,662 | ) | | $ | 261,597 | | | | | |
Class C | | | | | | | | | | | | | | | | | | | | | | | | | | | | | | | | |
Shares | | | 38,600 | | | | (25,713 | ) | | | — | | | | 46,570 | | | | 33,614 | | | | (12 | ) | | | 81 | | | | 33,683 | |
Value | | $ | 323,952 | | | $ | (216,198 | ) | | $ | — | | | | | | | $ | 297,968 | | | $ | (115 | ) | | $ | 724 | | | | | |
Institutional Class | | | | | | | | | | | | | | | | | | | | | | | | | | | | | | | | |
Shares | | | 41,220 | | | | (113,833 | ) | | | — | | | | 200,342 | | | | 273,787 | | | | (6,668 | ) | | | 5,837 | | | | 272,956 | |
Value | | $ | 356,147 | | | $ | (969,874 | ) | | $ | — | | | | | | | $ | 2,500,479 | | | $ | (59,881 | ) | | $ | 52,183 | | | | | |
Note 10—5% Shareholders
At June 30, 2012, three unaffiliated shareholders of record, specifically omnibus accounts, individually or collectively held 46.83% of the outstanding shares of the Fund. Transactions by these shareholders may have a material impact upon the Fund.
Note 11—Indemnifications
Under the Trust’s organizational documents, its officers and Trustees are indemnified against certain liabilities arising out of the performance of their duties to the Fund. In addition, in the normal course of business, the Trust enters into contracts with its vendors and others that provide for general indemnifications. The Trust’s maximum exposure under these arrangements is dependant on future claims that may be made against the Trust, and, therefore, cannot be estimated; however, based on experience, risk of loss from such claims is considered remote.
Note 12—Securities Lending
At June 30, 2012 the Fund had no securities out on loan.
2012 ANNUAL REPORT | 24
REPORT OF INDEPENDENT REGISTERED PUBLIC ACCOUNTING FIRM
To the Shareholders and
The Board of Trustees of
Quaker Investment Trust
We have audited the accompanying statement of assets and liabilities of Quaker Akros Absolute Return Fund, (the “Fund”) a series of Quaker Investment Trust (the “Trust”), including the schedule of investments, as of June 30, 2012, the related statement of operations, the statement of changes in net assets and the financial highlights for the year then ended. These financial statements and financial highlights are the responsibility of the Fund’s management. Our responsibility is to express an opinion on these financial statements and financial highlights based on our audit. The statement of changes in net assets for the year ended June 30, 2011 and the financial highlights for each of the four years in the period then ended were audited by other auditors, whose report dated August 29, 2011 expressed an unqualified opinion on such statement and financial highlights.
We conducted our audit in accordance with the standards of the Public Company Accounting Oversight Board (United States). Those standards require that we plan and perform the audit to obtain reasonable assurance about whether the financial statements and financial highlights are free of material misstatement. The Fund is not required to have, nor were we engaged to perform, an audit of its internal control over financial reporting. Our audit included consideration of internal control over financial reporting as a basis for designing audit procedures that are appropriate in the circumstances, but not for the purpose of expressing an opinion on the effectiveness of the Fund’s internal control over financial reporting. Accordingly, we express no such opinion. An audit includes examining, on a test basis, evidence supporting the amounts and disclosures in the financial statements. Our procedures included confirmation of securities owned as of June 30, 2012, by correspondence with the custodian and brokers. An audit also includes assessing the accounting principles used and significant estimates made by management, as well as evaluating the overall financial statement presentation. We believe that our audit provides a reasonable basis for our opinion.
In our opinion, the financial statements and financial highlights referred to above present fairly, in all material respects, the financial position of Quaker Akros Absolute Return Fund, as of June 30, 2012, the results of its operations, the changes in its net assets and the financial highlights for the year then ended, in conformity with accounting principles generally accepted in the United States of America.
TAIT, WELLER & BAKER LLP
Philadelphia, Pennsylvania
August 29, 2012
2012 ANNUAL REPORT | 25
Trustees and Officers
June 30, 2012
The Board has overall responsibility for conduct of the Trust’s affairs. The day-to-day operations of the Trust are managed by QFI, subject to the Bylaws of the Trust and review by the Board. The Trustees of the Trust, including those Trustees who are also officers, are listed below:
| | | | | | | | | | |
Name, Address and Age | | Position(s) Held
with the Trust | | Serving as an Officer or Trustee
of the Trust | | Principal Occupation(s) During Past 5 Years | | Portfolios
Overseen by
Trustee | | Directorships
Held by
Trustee(1) |
Jeffry H. King, Sr.(2)(3) 309 Technology Drive Malvern, PA 19355 Age 69 | | Chairman of the Board and Chief Executive Officer | | Since Nov. 1996 | | Chairman of Board of Directors and Chief Executive Officer, Quaker Funds, Inc. (1996–present). | | 8 | | None |
| | | | | |
Laurie Keyes (3), (4) 309 Technology Drive Malvern, PA 19355 Age 62 | | Treasurer and Trustee | | Since Nov. 1996 | | Chief Financial Officer, Quaker Funds, Inc. (1996–present). | | 8 | | None |
| | | | | |
Justin Brundage (5) 309 Technology Drive Malvern, PA 19355 Age 42 | | Secretary | | Since Nov. 2006 | | President, Quaker Funds, Inc. (2007–present); Chief Operating Officer, Quaker Funds, Inc. (2005–present). | | None | | None |
| | | | | |
Timothy E. Richards 309 Technology Drive Malvern, PA 19355 Age 47 | | Chief Compliance Officer | | Since March 2004 | | General Counsel to Quaker Funds, Inc. (2003–present); Chief Compliance Officer for the Quaker Investment Trust (2004–present). | | None | | None |
| | | | | |
James R. Brinton 309 Technology Drive Malvern, PA 19355 Age 58 | | Trustee Lead Independent Trustee | | Since Feb. 2002 Since Aug. 2007 | | President, Robert J. McAllister Agency, Inc. (commercial insurance brokerage firm) (1979–present). | | 8 | | Director, ACP Funds Trust |
| | | | | |
Gary Edward Shugrue 309 Technology Drive Malvern, PA 19335 Age 58 | | Trustee | | Since July 2008 | | President and Chief Investment Officer, Ascendant Capital Partners. | | 8 | | Director, BHR Institutional Funds; Director, ACP Funds Trust |
| | | | | |
Warren West 309 Technology Drive Malvern, PA 19355 Age 55 | | Trustee | | Since Nov. 2003 | | President and owner, Greentree Brokerage Services, Inc. (1998–present). | | 8 | | None |
| | | | | |
Everett T. Keech 309 Technology Drive Malvern, PA 19355 Age 72 | | Trustee Interested Trustee, Vice Chairman of the Board, President, Treasurer | | Since Nov. 2005 Nov., 1996—Jan., 2005 | | Chairman-Executive Committee, Technology Development Corp., (1997—Present) technology development and manufacturing firm (1997–present); Affiliated Faculty, University of Pennsylvania (1998–present). | | 8 | | Director, Technology Development Corp.; Director, Advanced Training Systems International, Inc.; Director, Phoenix Data Systems, Inc. |
| | Trustee | | Nov., 1996—Feb., 2002 | | | | | |
2012 ANNUAL REPORT | 26
Trustees and Officers
| (1) | Directorship of companies required to report to the SEC under the Securities and Exchange Act of 1934, as amended (“Exchange Act”) (i.e., “public companies”) and investment companies registered under the 1940 Act. |
| (2) | Mr. King is considered to be “interested person” of the Trust for purposes of the 1940 Act because he is the Chief Executive Officer and a controlling shareholder of Quaker Funds, Inc., the investment adviser to the Funds. |
| (3) | Mr. King and Ms. Keyes are husband and wife. |
| (4) | Ms. Keyes is considered to be an “interested person” of the Trust for purposes of the 1940 Act because she is the Trust’s Treasurer and a controlling shareholder of Quaker Funds, Inc. |
| (5) | Mr. Brundage is Ms. Keyes’ son. |
The Statement of Additional Information for the Trust includes additional information about the Trustees and Officers and is available, without charge, upon request by calling (800) 220-8888.
2012 ANNUAL REPORT | 27
Board consideration of the Investment Advisory and Sub-Advisory Agreements
At a meeting held on April 26, 2012, the Independent Trustees of the Board of the Trust considered the continuation of the Investment Advisory Agreement between the Trust and QFI, and the Sub-Advisory Agreement between QFI and Akros Capital LLC (collectively,“Agreements”) with regard to the Fund. At the meeting, the Independent Trustees reported to the full Board their considerations with respect to the Agreements, and the Board, including a majority of Independent Trustees, considered and approved the renewal of the Agreements. Each of the Agreements was approved for a one year period.
In arriving at their decision to renew the Agreements, the Board, including the Independent Trustees, considered a variety of information concerning QFI and the sub-adviser. In considering the continuation of the Agreements, the Board, including the Independent Trustees, considered the nature and quality of the services provided by QFI and the sub-adviser, the proposed fee structures, the level of fee waivers, the Fund’s past and anticipated expense ratios, possible economies of scale resulting from increases in the size of the Fund and other possible benefits QFI and the sub-adviser derived from their relationships with the Fund. The Board, including the Independent Trustees, carefully analyzed the information provided to them by QFI and the sub-adviser, focusing particularly on the level of advisory fees and expenses of the Fund compared with information for similar funds, and the performance of the Fund compared to funds with similar investment objectives. The Board, including the Independent Trustees, also considered other information that it had received from QFI and the sub-adviser at other meetings throughout the year.
In examining the nature, extent and quality of the services to be provided by QFI, the Board, including the Independent Trustees, considered the portfolio management, administrative and supervisory services provided by QFI. The Board, including the Independent Trustees, acknowledged the value of QFI’s historical performance of services for the Fund. The Independent Trustees were satisfied with the nature, extent and quality of the services provided by QFI to the Fund. The Board’s view was based upon factors such as the background and experience of management personnel involved in the Fund’s operations, the quality and thoroughness of the monitoring of the Fund’s investment performance conducted by QFI, reports furnished by QFI as to adherence with various compliance and procedural matters, the monitoring of various service providers to the Fund, and QFI’s success in obtaining meaningful information on a timely basis from the Fund’s sub-adviser. The Board, including the Independent Trustees, noted QFI’s commitment to servicing the Funds as its only client, QFI’s efforts during the past year to reduce Fund expenses, and the nature of the non-investment advisory services provided to the Funds, such as the supervision of the Funds’ other third-party service providers by QFI.
With respect to the nature, extent and quality of the services provided to the Fund by the sub-adviser, the Board, including the Independent Trustees, considered the quality of the portfolio management services that the sub-adviser provided to the Fund, the depth, and experience and demonstrated consistency in investment approach of the sub-adviser’s portfolio management teams. Particular attention was given to analysis involved in the review of sub-adviser performance for the Fund. The nature of the services of the sub-adviser to the Fund was considered primarily in respect to the investment performance of the Fund. The Board was, however, satisfied with the adherence by the sub-adviser with the investment policies and restrictions of the Fund advised, as well as its adherence to various compliance and other procedures based on personnel presentations made by sub-adviser’s portfolio managers and QFI’s reports of its discussions with the sub-adviser, as well as certifications and materials furnished at Board meetings.
With respect to the Fund’s investment performance, the Board, including the Independent Trustees, reviewed the Fund’s performance compared to both its peer group and relative benchmark indices over one-year, three-year, five-year and since inception periods, as applicable. The Board, including the Independent Trustees, considered factors, including but not limited to the sub-adviser’s management style, peer group performance and overall market conditions that have affected the performance of the Fund relative to its peer group and benchmarks.
With respect to the costs of the services to be provided and profits to be realized by QFI from its relationship with the Trust, the Board, including the Independent Trustees, considered QFI’s and the subadviser’s willingness to waive fees. The Board, including the Independent Trustees, also considered that QFI and the sub-adviser might be able to recover some of its waived fees in the future. Because QFI has no other advisory accounts, the Board, including the Independent Trustees, did not consider the relationship between QFI’s advisory fees compared to other accounts that QFI advises. The Board, including the Independent Trustees, also discussed efforts being taken by QFI to reduce Fund expenses. In light of such considerations and factors and taking into account the nature of the Fund’s operations and overall performance, the Board, including the Independent Trustees, found the expenses of the Fund to be acceptable.
The Board, including the Independent Trustees, considered whether there are any ancillary benefits that may accrue to QFI or a sub-adviser resulting from their relationship with the Funds. Based on the information provided, the Board, including the Independent Trustees, noted that there did not appear to be any significant benefits in this regard.
2012 ANNUAL REPORT | 28
Board consideration of the Investment Advisory and Sub-Advisory Agreements
Based on the totality of the information considered, the Board, including the Independent Trustees, concluded that the Fund was likely to benefit from the nature, extent and quality of QFI’s and the sub-adviser’s services, as applicable, and that QFI and the sub-adviser have the ability to continue to provide these services based on their respective experience, operations and resources.
After evaluation of the comparative performance, fee and expense information and the profitability, ancillary benefits and other considerations as described above, and in light of the nature, extent and quality of services to be provided by QFI and the sub-adviser, the Board, including the Independent Trustees, concluded that the level of fees to be paid to QFI and the sub-adviser was reasonable.
In voting unanimously to approve the Agreements based on the various considerations discussed above, the Board, including the Independent Trustees, determined that the approval of the Agreements was in the best interests of the Fund. As a result, the Board, including a majority of the Independent Trustees, approved the Agreements.
2012 ANNUAL REPORT | 29
General Information (Unaudited)
Form N-Q Filing and Proxy Voting Policies and Procedures
Each Fund files its complete schedule of portfolio holdings with the Securities and Exchange Commission (“SEC”) for the first and third quarters of each fiscal year on Form N-Q. Each Fund’s Forms N-Q, as well as a description of the policies and procedures that each Fund uses to determine how to vote proxies (if any) relating to portfolio securities is available without charge: (i) upon request, by calling (800) 220-8888; and (ii) on the SEC’s web-site at http://www.sec.gov. Each Fund’s Forms N-Q may be reviewed and copied at the SEC’s Public Reference Room in Washington, DC; information on the operation of the Public Reference Room may be obtained by calling 1-800-SEC-0330.
Information (if any) regarding how the Funds voted proxies relating to portfolio securities during the most recently disclosed 12-month period ended June 30 is available: (i) without charge, upon request, by calling (800) 220-8888; and (ii) on the SEC’s web-site at http://www.sec.gov.
Tax Information
We are required to advise you within 60 days of the Funds’ fiscal year-end regarding the federal tax status of certain distributions received by shareholders during such fiscal year. The information below is provided for the fiscal year ending June 30, 2012. During the fiscal year ended June 30, 2012, the Fund did not distribute long-term capital gains.
Individual shareholders are eligible for reduced tax rates on the following percentages of qualified dividend income. For the purposes of computing the dividends eligible for reduced taxes, the following amounts of the dividends paid by the Fund from ordinary income earned during the fiscal year is considered qualified dividend income.
| | | | | | | | |
Fund | | Amount | | | Percentage | |
Akros Absolute Return | | | — | | | | — | |
Corporate shareholders may exclude up to the following percentages of qualifying dividends. For the purposes of computing this exclusion, the following amounts of the dividends paid by the Fund from ordinary income earned during the fiscal year represents qualifying dividends.
| | | | | | | | |
Fund | | Amount | | | Percentage | |
Akros Absolute Return | | | — | | | | — | |
Dividends and distributions received by retirement plans such as IRAs, Keogh type plans and 403(b) plans need not be reported as taxable income. However, many retirement plan trusts may need this information for their annual information reporting. Since the information above is reported for the Fund’s fiscal year and not the calendar year, shareholders should refer to their Form 1099-DIV or other tax information which will be mailed in January 2013 to determine the calendar year amounts to be included on their 2012 tax returns. Shareholders should consult their tax advisers.
2012 ANNUAL REPORT | 30
The Quaker Funds are distributed by
Foreside Fund Services, LLC.
Contact us:
Quaker Funds, Inc.
c/o U.S. Bancorp Fund Services, LLC.
PO Box 701
Milwaukee, WI 53201-0701
800-220-8888
www.quakerfunds.com
©2012 Quaker® Investment Trust
| | |
| | QKARAK 062012 |
ANNUAL REPORT
2012
QUAKER CAPITAL OPPORTUNITIES FUND
MUTUAL FUND INVESTING INVOLVES RISK. PRINCIPAL LOSS IS POSSIBLE.
Investing in the Quaker Funds may involve special risk including, but not limited to, investments in smaller companies, non-diversification, short sales, foreign securities, special situations, debt securities and value growth investing. Please refer to the prospectus for more complete information.
This report must be preceded or accompanied by a current prospectus.
The opinions expressed are those of the sub-adviser through the end of the period for this report, are subject to change, are not a guarantee, and should not be considered investment advice.
Fund holdings are subject to change and should not be considered a recommendation to buy or sell any security. Current and future holdings are subject to risk.
Chairman’s Letter to the Shareholders
June 30, 2012
Dear Fellow Shareholder,
The premise on which Quaker Funds, Inc. was founded was the desire to afford everyday investors access to the same tactical allocation used by professional money managers to augment traditional investing strategies within a holistic asset allocation mix. Our commitment to this principle is still as strong today as it was the day we opened our doors.
Our management team continually strives to provide our shareholders with innovative investment alternatives and advisers that constantly seek superior returns. Thank you for your trust and investment in the Quaker Funds.
Sincerely,
Jeffry King
Chairman & CEO
Quaker Investment Trust
Table of Contents
Performance Update
Quaker Capital Opportunities Fund (QUKTX, QCOCX, QCOIX)
Objectives and Principal Strategies
The Quaker Capital Opportunities Fund (“Fund”) seeks to provide long-term growth of capital. Current income is not a significant investment consideration and any such income realized will be considered incidental to the Fund’s investment objective. The Fund invests primarily in a limited number of securities which the Fund’s sub-adviser believes shows a high probability for superior growth.
Performance Review and Market Outlook
The Fund underperformed the S&P 500 Total Return Index (“S&P 500”) for the fiscal year ending June 30, 2012, as world financial markets remained in varied states of uncertainty. For the year ended June 30, 2012, the S&P 500 returned 5.45% while the Fund returned -7.70%. Returns were adversely impacted as the Fund transitioned management styles to a multi-strategy/multi-disciplined approach. This process included allocations to large cap value, international American Depository Receipts securities, which were the key drivers of underperformance in a marketplace that was marked by both increased volatility and a decided growth bias. Throughout the second half of 2011, the equity markets focused on the U.S. deficit, lowering of the U.S. debt rating, slow down in U.S. GDP and the expiration or extension of the so-called Bush era tax cuts. Critical focus then shifted to the 17 countries in the Eurozone, where volatility seemed likely to continue as Greece, Spain, Italy and other countries attempted to resolve their budget issues.
Investors entered 2012 in much the same manner as they entered 2011 – with high expectations. The first half of 2012 was a tale of two quarters. The first quarter was very strong with the S&P 500 up 12.59%. There seemed to be a sense that Europe may work out its issues concerning austerity and debt levels. There were also signs of stronger economic data in the U.S. The second quarter of 2012, however, gave back many of the gains of the first quarter by the end of May. Investors’ concerns escalated about the future of the European currency union, slowing global growth, discouraging data on unemployment in the U.S. and renewed focus on the capitalization of some banks in Europe and the U.S. China and India also experienced slowdowns in growth, which put downward pressure on the prices of oil, other commodities and stocks in general. However, the equity markets were strong in the month of June amidst signs of the European situation stabilizing.
Although there are clear indications that the remainder of 2012 will continue to be volatile, there are a number of events which could impact the equity markets, including U.S. economic data and the U.S. presidential election, the Eurozone debt crisis and a slowdown in emerging market economies, primarily China.
Mindful of the risks associated with investing in stocks, we employ a multi-strategy/multi-disciplined approach which allows us to take the emotion out of the investment process while addressing the concerns of each investor from a number of observation and vantage points. We are cognizant of the many challenges that investors face both at home and around the world and believe that it remains important for us to continue to take a long-term perspective in the design of the Fund’s investment portfolio. By combining the selective disciplines of relative ranking quantitative analysis with fundamental/macro research and technical analytics, we strive to identify and invest in the appropriate capital opportunities.
Respectively,
Quantitative Strategies Group
ICC Capital Management, Inc.
SUB-ADVISER:
ICC Capital Management, Inc.
TOTAL NET ASSETS:
AS OF JUNE 30, 2012
$3,968,013
| | | | |
Top Ten Holdings ** (% of net assets) | | | |
AT&T, Inc. | | | 2.90 | % |
CBS Corp. | | | 2.40 | % |
Home Depot, Inc. | | | 1.74 | % |
US Bancorp | | | 1.66 | % |
Pfizer, Inc. | | | 1.64 | % |
Chevron Corp. | | | 1.60 | % |
Intel Corp. | | | 1.53 | % |
Wells Fargo & Co. | | | 1.52 | % |
Abbott Laboratories | | | 1.50 | % |
Apple, Inc. | | | 1.47 | % |
| | | | |
% Fund Total | | | 17.96 | % |
| | | | |
| ** | Excludes Short-Term Investments |
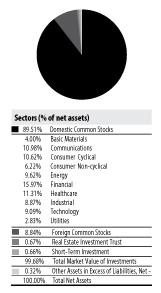
2012 ANNUAL REPORT | 2
Performance Update
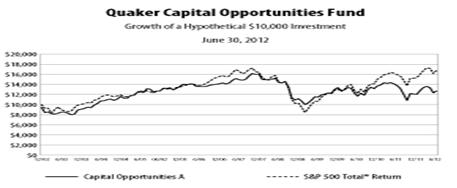
| | | | | | | | | | | | | | | | | | | | | | | | | | | | | | | | | | | | | | | | |
| | | Average Annualized Total Return | |
| | | Expense
Ratio | | | Inception
Date | | | One Year | | | Five Year | | | Ten Year | | | Commencement
of Operations
through
6/30/2012 | |
| | | | | with
sales
charge | | | without
sales
charge | | | with
sales
charge | | | without
sales
charge | | | with
sales
charge | | | without
sales
charge | | | with
sales
charge | | | without
sales
charge | |
Class A | | | 1.81 | % | | | 1/31/2002 | | | | -12.78 | % | | | -7.70 | % | | | -4.25 | % | | | -3.16 | % | | | 2.42 | % | | | 3.01 | % | | | 1.75 | % | | | 2.31 | % |
Class C | | | 2.56 | % | | | 5/2/2002 | | | | -8.30 | % | | | -8.30 | % | | | -3.87 | % | | | -3.87 | % | | | 2.25 | % | | | 2.25 | % | | | 1.69 | % | | | 1.69 | % |
Institutional Class | | | 1.56 | % | | | 5/5/2009 | | | | -7.46 | % | | | -7.46 | % | | | N/A | | | | N/A | | | | N/A | | | | N/A | | | | 4.44 | % | | | 4.44 | % |
S&P 500 Total Return Index* | | | | 5.45 | % | | | 5.45 | % | | | 0.22 | % | | | 0.22 | % | | | 5.33 | % | | | 5.33 | % | | | 3.85 | % | | | 3.85 | % |
| * | The benchmark since inception returns are calculated since commencement of January 31, 2002 through June 30, 2012. |
Performance data quoted represents past performance and is no guarantee of future results. Investment return and principal value will fluctuate so that shares, when redeemed, may be worth more or less than their original cost. Current performance may be lower or higher than performance data quoted. Performance data current to the most recent month end is available at www.quakerfunds.com or by calling us toll free at 800-220-8888. Total return includes reinvestment of dividends and capital gains.
Class A shares of the Fund have a maximum sales charge of 5.50%.
The performance table does not reflect the deduction of taxes that a shareholder might pay on fund distributions or the redemption of fund shares. Total return calculations reflect expense reimbursements and fee waivers in the applicable periods. See financial highlights for periods where fees were waived or reimbursed.
The Fund’s portfolio holdings may differ significantly from the securities held in the index and, unlike a mutual fund, an unmanaged index assumes no transaction costs, taxes, management fees or other expenses. You cannot invest directly in an index.
The S&P 500® Total Return Index (“Index”) is a widely recognized, unmanaged index consisting of the approximately 500 largest companies in the United States as measured by market capitalization. The Index assumes reinvestment of all dividends and distributions.
2012 ANNUAL REPORT | 3
Expense Information
As a shareholder of the Fund, you incur two types of costs: (1) transaction costs, including applicable sales charges and redemption fees; and (2) ongoing costs, including management fees, distribution (12b-1) fees and other Fund expenses. This example is intended to help you understand your ongoing costs (in dollars) of investing in the Fund and to compare these costs with the ongoing costs of investing in other funds. The example is based on an investment of $1,000 invested at the beginning of the (six-month) period and held for the entire period January 1, 2012 through June 30, 2012.
Actual Expenses
The first section of each table below provides information about actual account values and actual expenses for each of the Funds. You may use this information, together with the amount you invested, to estimate the expenses that you paid over the period. Simply divide your account value by $1,000 (for example, an $8,600 account value divided by $1,000 = 8.6), then multiply the result by the number in the applicable line under the heading entitled “Expenses Paid During the Period” to estimate the expenses you paid on your account during this period.
Hypothetical Example For Comparison Purposes
The second section of each table below provides information about hypothetical account values and hypothetical expenses based on the Fund’s actual expense ratio and an assumed rate of return of 5% per year before expenses, which is not the Fund’s actual return. The hypothetical account values and expenses may not be used to estimate the actual ending account balance or expenses you paid for the period. You may use this information to compare the ongoing costs of investing in the Fund to other funds. To do so, compare this 5% hypothetical example with the 5% hypothetical examples that appear in the shareholder reports of the other funds. Please note that the expenses shown in the table are meant to highlight your ongoing costs only and do not reflect any transactional costs, such as sales charges (loads), redemption fees or exchange fees. Therefore, the second section of the table is useful in comparing ongoing costs only, and will not help you determine the relative total costs of owning different funds. In addition, if these transactional costs were included, your costs would have been higher.
| | | | | | | | | | | | | | | | | | | | |
| | | | | | Beginning Account Value 01/01/12 | | | Annualized Expense Ratio For the Period | | | Ending Account Value
6/30/2012 | | | Expenses Paid During Period* | |
Capital Opportunities | | | | | | | | | | | | | | | | | | | | |
Actual return based on actual return of: | | | | | | | | | | | | | | | | | | | | |
Class A | | | 5.58 | % | | $ | 1,000.00 | | | | 2.95 | % | | $ | 1,055.80 | | | $ | 15.08 | |
Class C | | | 50.14 | % | | | 1,000.00 | | | | 3.69 | % | | | 1,051.40 | | | | 18.82 | |
Institutional Class | | | 5.70 | % | | | 1,000.00 | | | | 2.61 | % | | | 1,057.00 | | | | 13.35 | |
Hypothetical return based on assumed 5% return: | | | | | | | | | | | | | | | | | | | | |
Class A | | | | | | | 1,000.00 | | | | 2.95 | % | | | 1,010.19 | | | | 14.74 | |
Class C | | | | | | | 1,000.00 | | | | 3.69 | % | | | 1,006.51 | | | | 18.41 | |
Institutional Class | | | | | | | 1,000.00 | | | | 2.61 | % | | | 1,011.88 | | | | 13.06 | |
| * | Expenses are equal to the Funds' annualized six-month expense ratios (excluding reimbursements) multiplied by the average account value over the period muliplied by the number of days in the most recent fiscal half year (182) divided by 366 to reflect the one-half year period. |
2012 ANNUAL REPORT | 4
Schedule of Investments
Quaker Capital Opportunities Fund
June 30, 2012
| | | | | | | | |
| | | Number
of Shares | | | Fair Value | |
Domestic Common Stocks—89.51% | | | | | | | | |
Basic Materials—4.00% | | | | | | | | |
Chemicals—2.84% | | | | | | | | |
Albemarle Corp. | | | 575 | | | $ | 34,293 | |
Dow Chemical Co. | | | 475 | | | | 14,963 | |
EI du Pont de Nemours & Co. | | | 475 | | | | 24,021 | |
Monsanto Co. | | | 125 | | | | 10,347 | |
PPG Industries, Inc. | | | 275 | | | | 29,183 | |
| | | | | | | | |
| | | | | | | 112,807 | |
| | | | | | | | |
Mining—1.16% | | | | | | | | |
Freeport-McMoRan Copper & Gold, Inc. | | | 775 | | | | 26,404 | |
Newmont Mining Corp. | | | 400 | | | | 19,404 | |
| | | | | | | | |
| | | | | | | 45,808 | |
| | | | | | | | |
Total Basic Materials
(Cost: $163,570) | | | | | | | 158,615 | |
| | | | | | | | |
Communications—10.98% | | | | | | | | |
Internet—1.37% | | | | | | | | |
Google, Inc. Class A (a) | | | 50 | | | | 29,004 | |
Symantec Corp. (a) | | | 1,725 | | | | 25,202 | |
| | | | | | | | |
| | | | | | | 54,206 | |
| | | | | | | | |
Media—4.26% | | | | | | | | |
CBS Corp. Class B | | | 2,900 | | | | 95,062 | |
Comcast Corp. Class A | | | 850 | | | | 27,174 | |
News Corp. Class B | | | 1,225 | | | | 27,587 | |
Walt Disney Co. | | | 400 | | | | 19,400 | |
| | | | | | | | |
| | | | | | | 169,223 | |
| | | | | | | | |
Telecommunications—5.35% | | | | | | | | |
AT&T, Inc. | | | 3,225 | | | | 115,003 | |
CenturyLink, Inc. | | | 675 | | | | 26,656 | |
Cisco Systems, Inc. | | | 1,400 | | | | 24,038 | |
Qualcomm, Inc. | | | 200 | | | | 11,136 | |
Verizon Communications, Inc. | | | 800 | | | | 35,552 | |
| | | | | | | | |
| | | | | | | 212,385 | |
| | | | | | | | |
Total Communications
(Cost: $416,733) | | | | | | | 435,814 | |
| | | | | | | | |
Consumer, Cyclical—10.62% | | | | | | | | |
Airlines—0.75% | | | | | | | | |
Delta Air Lines, Inc. (a) | | | 425 | | | | 4,654 | |
Southwest Airlines Co. | | | 2,725 | | | | 25,124 | |
| | | | | | | | |
| | | | | | | 29,778 | |
| | | | | | | | |
Auto Manufacturers—1.46% | | | | | | | | |
Ford Motor Co. | | | 6,050 | | | | 58,020 | |
| | | | | | | | |
Auto Parts & Equipment—0.54% | | | | | | | | |
Johnson Controls, Inc. | | | 775 | | | | 21,475 | |
| | | | | | | | |
Home Builders—2.06% | | | | | | | | |
DR Horton, Inc. | | | 1,650 | | | | 30,327 | |
KB Home (b) | | | 2,175 | | | | 21,315 | |
Pulte Group, Inc. (a) | | | 2,825 | | | | 30,228 | |
| | | | | | | | |
| | | | | | | 81,870 | |
| | | | | | | | |
Leisure Time—0.60% | | | | | | | | |
Harley-Davidson, Inc. | | | 275 | | | | 12,576 | |
Royal Caribbean Cruises Ltd. | | | 425 | | | | 11,062 | |
| | | | | | | | |
| | | | | | | 23,638 | |
| | | | | | | | |
Retail—4.44% | | | | | | | | |
Brinker International, Inc. | | | 350 | | | | 11,154 | |
Foot Locker, Inc. | | | 500 | | | | 15,290 | |
Home Depot, Inc. | | | 1,300 | | | | 68,887 | |
Macy’s, Inc. | | | 500 | | | | 17,175 | |
McDonald’s Corp. | | | 275 | | | | 24,346 | |
Starbucks Corp. | | | 425 | | | | 22,661 | |
Tractor Supply Co. | | | 200 | | | | 16,612 | |
| | | | | | | | |
| | | | | | | 176,125 | |
| | | | | | | | |
US Bancorp | | | 2,050 | | | | 65,928 | |
Wells Fargo & Co. | | | 1,800 | | | | 60,192 | |
| | | | | | | | |
| | | | | | | 414,265 | |
| | | | | | | | |
| | | | | | | | |
| | | Number
of Shares | | | Fair Value | |
Domestic Common Stocks (continued) | | | | | | | | |
Consumer, Cyclical (continued) | | | | | | | | |
Toys/Games/Hobbies—0.77% | | | | | | | | |
Hasbro, Inc. | | | 900 | | | $ | 30,483 | |
| | | | | | | | |
Total Consumer, Cyclical
(Cost: $415,916) | | | | | | | 421,389 | |
| | | | | | | | |
Consumer, Non-cyclical—6.22% | | | | | | | | |
Agriculture—0.55% | | | | | | | | |
Philip Morris International, Inc. | | | 250 | | | | 21,815 | |
| | | | | | | | |
Beverages—0.39% | | | | | | | | |
Coca-Cola Co. | | | 200 | | | | 15,638 | |
| | | | | | | | |
Cosmetics & Personal Care—0.54% | | | | | | | | |
Procter & Gamble Co. | | | 350 | | | | 21,437 | |
| | | | | | | | |
Food—4.04% | | | | | | | | |
ConAgra Foods, Inc. | | | 1,175 | | | | 30,468 | |
General Mills, Inc. | | | 775 | | | | 29,868 | |
HJ Heinz Co. | | | 600 | | | | 32,628 | |
Ingredion, Inc. | | | 250 | | | | 12,380 | |
Kraft Foods, Inc. Class A | | | 1,425 | | | | 55,034 | |
| | | | | | | | |
| | | | | | | 160,378 | |
| | | | | | | | |
Household Products—0.70% | | | | | | | | |
Church & Dwight Co., Inc. | | | 500 | | | | 27,735 | |
| | | | | | | | |
Total Consumer, Non-cyclical (Cost: $244,754) | | | | | | | 247,003 | |
| | | | | | | | |
Energy—9.62% | | | | | | | | |
Coal—0.42% | | | | | | | | |
Walter Energy, Inc. | | | 375 | | | | 16,560 | |
| | | | | | | | |
Oil & Gas—7.78% | | | | | | | | |
Apache Corp. | | | 400 | | | | 35,156 | |
Atwood Oceanics, Inc. (a) | | | 325 | | | | 12,298 | |
Chevron Corp. | | | 600 | | | | 63,300 | |
Concho Resources, Inc. (a) | | | 50 | | | | 4,256 | |
ConocoPhillips | | | 250 | | | | 13,970 | |
Exxon Mobil Corp. | | | 525 | | | | 44,924 | |
Hess Corp. | | | 1,175 | | | | 51,054 | |
Marathon Oil Corp. | | | 1,550 | | | | 39,633 | |
Phillips 66 (a) | | | 375 | | | | 12,465 | |
Valero Energy Corp. | | | 925 | | | | 22,339 | |
Whiting Petroleum Corp. (a) | | | 225 | | | | 9,252 | |
| | | | | | | | |
| | | | | | | 308,647 | |
| | | | | | | | |
Oil & Gas Services—0.19% | | | | | | | | |
CARBO Ceramics, Inc. (b) | | | 100 | | | | 7,673 | |
| | | | | | | | |
Pipelines—1.23% | | | | | | | | |
Oneok, Inc. | | | 1,150 | | | | 48,657 | |
| | | | | | | | |
Total Energy (Cost: $426,889) | | | | | | | 381,537 | |
| | | | | | | | |
Financial—15.97% | | | | | | | | |
Banks—10.44% | | | | | | | | |
Bank of America Corp. | | | 6,250 | | | | 51,125 | |
Bank of New York Mellon Corp. | | | 1,550 | | | | 34,023 | |
Citigroup, Inc. | | | 800 | | | | 21,928 | |
Fifth Third Bancorp | | | 2,375 | | | | 31,825 | |
First Republic Bank (a) | | | 775 | | | | 26,040 | |
Fulton Financial Corp. | | | 1,950 | | | | 19,481 | |
Goldman Sachs Group, Inc. | | | 325 | | | | 31,154 | |
JPMorgan Chase & Co. | | | 1,625 | | | | 58,061 | |
State Street Corp. | | | 325 | | | | 14,508 | |
Miscellaneous Manufacturing—2.16% | | | | | | | | |
Donaldson Co., Inc. | | | 1,050 | | | | 35,038 | |
Eaton Corp. | | | 600 | | | | 23,778 | |
General Electric Co. | | | 1,300 | | | | 27,092 | |
| | | | | | | | |
| | | | | | | 85,908 | |
| | | | | | | | |
| | |
| The accompanying notes are an integral part of the financial statements. | | 2012 ANNUAL REPORT | 5 |
Schedule of Investments
Quaker Capital Opportunities Fund
June 30, 2012
| | | | | | | | |
| | | Number
of Shares | | | Fair Value | |
Domestic Common Stocks (continued) | | | | | | | | |
Financial (continued) | | | | | | | | |
Diversified Financial Services—3.90% | | | | | | | | |
Affiliated Managers Group, Inc. (a) | | | 350 | | | $ | 38,308 | |
American Express Co. | | | 550 | | | | 32,016 | |
BlackRock, Inc. Class A | | | 175 | | | | 29,718 | |
Discover Financial Services | | | 1,025 | | | | 35,444 | |
Invesco Ltd. | | | 850 | | | | 19,210 | |
| | | | | | | | |
| | | | | | | 154,696 | |
| | | | | | | | |
Insurance—1.63% | | | | | | | | |
Allstate Corp. | | | 475 | | | | 16,668 | |
Lincoln National Corp. | | | 1,250 | | | | 27,337 | |
MetLife, Inc. | | | 675 | | | | 20,824 | |
| | | | | | | | |
| | | | | | | 64,829 | |
| | | | | | | | |
Total Financial (Cost: $629,369) | | | | | | | 633,790 | |
| | | | | | | | |
Healthcare—11.31% | | | | | | | | |
Healthcare-Products—1.80% | | | | | | | | |
Baxter International, Inc. | | | 550 | | | | 29,233 | |
Becton Dickinson & Co. | | | 325 | | | | 24,294 | |
St. Jude Medical, Inc. | | | 450 | | | | 17,959 | |
| | | | | | | | |
| | | | | | | 71,486 | |
| | | | | | | | |
Healthcare-Services—2.23% | | | | | | | | |
Aetna, Inc. | | | 525 | | | | 20,354 | |
Cigna Corp. | | | 950 | | | | 41,800 | |
UnitedHealth Group, Inc. | | | 450 | | | | 26,325 | |
| | | | | | | | |
| | | | | | | 88,479 | |
| | | | | | | | |
Pharmaceuticals—7.28% | | | | | | | | |
Abbott Laboratories | | | 925 | | | | 59,635 | |
AmerisourceBergen Corp. Class A | | | 825 | | | | 32,464 | |
Cardinal Health, Inc. | | | 700 | | | | 29,400 | |
Eli Lilly & Co. | | | 1,275 | | | | 54,710 | |
McKesson Corp. | | | 275 | | | | 25,781 | |
Merck & Co., Inc. | | | 525 | | | | 21,919 | |
Pfizer, Inc. | | | 2,825 | | | | 64,975 | |
| | | | | | | | |
| | | | | | | 288,884 | |
| | | | | | | | |
Total Healthcare (Cost: $442,822) | | | | | | | 448,849 | |
| | | | | | | | |
Industrial—8.87% | | | | | | | | |
Aerospace & Defense—0.52% | | | | | | | | |
United Technologies Corp. | | | 275 | | | | 20,771 | |
| | | | | | | | |
Electrical Components & Equipment—0.72% | | | | | | | | |
Emerson Electric Co. | | | 350 | | | | 16,303 | |
GrafTech International Ltd. (a) | | | 1,275 | | | | 12,304 | |
| | | | | | | | |
| | | | | | | 28,607 | |
| | | | | | | | |
Electronics—0.79% | | | | | | | | |
Gentex Corp. | | | 975 | | | | 20,348 | |
| | | | | | | | |
Koninklijke Philips Electronics NV ADR Class NY | | | 550 | | | | 10,819 | |
| | | | | | | | |
| | | | | | | 31,167 | |
| | | | | | | | |
Hand & Machine Tools—0.97% | | | | | | | | |
Lincoln Electric Holdings, Inc. | | | 875 | | | | 38,316 | |
| | | | | | | | |
Machinery-Construction & Mining—0.16% | | | | | | | | |
Caterpillar, Inc. | | | 75 | | | | 6,368 | |
| | | | | | | | |
Machinery-Diversified—1.29% | | | | | | | | |
Cummins, Inc. | | | 175 | | | | 16,959 | |
IDEX Corp. | | | 875 | | | | 34,108 | |
| | | | | | | | |
| | | | | | | 51,067 | |
| | | | | | | | |
| | | | | | | | |
| | | Number
of Shares | | | Fair Value | |
Domestic Common Stocks (continued) | | | | | | | | |
Industrial (continued) | | | | | | | | |
Packaging & Containers—0.38% | | | | | | | | |
Rock-Tenn Co. Class A | | | 275 | | | $ | 15,001 | |
| | | | | | | | |
Transportation—1.88% | | | | | | | | |
Kansas City Southern | | | 300 | | | | 20,868 | |
Norfolk Southern Corp. | | | 375 | | | | 26,914 | |
Union Pacific Corp. | | | 225 | | | | 26,845 | |
| | | | | | | | |
| | | | | | | 74,627 | |
| | | | | | | | |
Total Industrial (Cost: $374,608) | | | | | | | 351,832 | |
| | | | | | | | |
Technology—9.09% | | | | | | | | |
Computers—4.78% | | | | | | | | |
Apple, Inc. (a) | | | 100 | | | | 58,400 | |
International Business Machines Corp. | | | 275 | | | | 53,785 | |
Mentor Graphics Corp. (a) | | | 1,500 | | | | 22,500 | |
Microsoft Corp. | | | 1,800 | | | | 55,062 | |
| | | | | | | | |
| | | | | | | 189,747 | |
| | | | | | | | |
Semiconductors—3.81% | | | | | | | | |
Applied Materials, Inc. | | | 2,425 | | | | 27,790 | |
Intel Corp. | | | 2,275 | | | | 60,629 | |
KLA-Tencor Corp. | | | 375 | | | | 18,469 | |
Micron Technology, Inc. (a) | | | 7,000 | | | | 44,170 | |
| | | | | | | | |
| | | | | | | 151,058 | |
| | | | | | | | |
Software—0.50% | | | | | | | | |
Fiserv, Inc. (a) | | | 275 | | | | 19,860 | |
| | | | | | | | |
Total Technology (Cost: $345,710) | | | | | | | 360,665 | |
| | | | | | | | |
Utilities—2.83% | | | | | | | | |
Electric—2.14% | | | | | | | | |
American Electric Power Co., Inc. | | | 925 | | | | 36,908 | |
NextEra Energy, Inc. | | | 500 | | | | 34,405 | |
Progress Energy, Inc. | | | 225 | | | | 13,538 | |
| | | | | | | | |
| | | | | | | 84,851 | |
| | | | | | | | |
Gas—0.69% | | | | | | | | |
Sempra Energy | | | 400 | | | | 27,552 | |
| | | | | | | | |
Total Utilities (Cost: $107,424) | | | | | | | 112,403 | |
| | | | | | | | |
Total Domestic Common Stocks
(Cost $3,567,795) | | | | | | | 3,551,897 | |
Foreign Common Stocks—8.84% | | | | | | | | |
Belgium—0.40% | | | | | | | | |
Beverages—0.40% | | | | | | | | |
Anheuser-Busch InBev NV ADR | | | 200 | | | | 15,930 | |
| | | | | | | | |
Total Belgium (Cost: $11,530) | | | | | | | 15,930 | |
| | | | | | | | |
Brazil—0.24% | | | | | | | | |
Oil & Gas—0.24% | | | | | | | | |
Petroleo Brasileiro S.A. ADR | | | 500 | | | | 9,385 | |
| | | | | | | | |
Total Brazil (Cost: $13,809) | | | | | | | 9,385 | |
| | | | | | | | |
| | |
| The accompanying notes are an integral part of the financial statements. | | 2012 ANNUAL REPORT | 6 |
Schedule of Investments
Quaker Capital Opportunities Fund
June 30, 2012
| | | | | | | | |
Canada—0.83% | | | | | | | | |
Mining—0.83% | | | | | | | | |
Barrick Gold Corp. | | | 875 | | | | 32,874 | |
| | | | | | | | |
Total Canada (Cost: $34,188) | | | | | | | 32,874 | |
| | | | | | | | |
France—0.05% | | | | | | | | |
Telecommunications—0.05% | | | | | | | | |
Alcatel-Lucent ADR(a) | | | 1,300 | | | | 2,119 | |
| | | | | | | | |
Total France (Cost: $7,348) | | | | | | | 2,119 | |
| | | | | | | | |
| | |
| | | Number
of Shares | | | Fair
Value | |
Foreign Common Stocks (continued) | | | | | | | | |
Germany—1.14% | | | | | | | | |
Auto Manufacturers—0.23% | | | | | | | | |
Daimler AG Registered Shares Class REGISTERED | | | 200 | | | $ | 8,958 | |
| | | | | | | | |
Miscellaneous Manufacturing—0.42% | | | | | | | | |
Siemens AG ADR | | | 200 | | | | 16,814 | |
| | | | | | | | |
Software—0.49% | | | | | | | | |
SAP AG ADR | | | 325 | | | | 19,292 | |
| | | | | | | | |
Total Germany (Cost: $60,826) | | | | | | | 45,064 | |
| | | | | | | | |
Ireland—0.12% | | | | | | | | |
Insurance—0.12% | | | | | | | | |
XL Group PLC Class A | | | 225 | | | | 4,734 | |
| | | | | | | | |
Total Ireland (Cost: $4,906) | | | | | | | 4,734 | |
| | | | | | | | |
Japan—1.82% | | | | | | | | |
Auto Manufacturers—0.54% | | | | | | | | |
Honda Motor Co. Ltd. ADR | | | 625 | | | | 21,663 | |
| | | | | | | | |
Electrical Components & Equipment—0.62% | | | | | | | | |
Hitachi Ltd. ADR | | | 400 | | | | 24,560 | |
| | | | | | | | |
Electronics—0.32% | | | | | | | | |
Kyocera Corp. ADR | | | 150 | | | | 12,810 | |
| | | | | | | | |
Home Furnishings—0.21% | | | | | | | | |
Sony Corp. ADR | | | 575 | | | | 8,188 | |
| | | | | | | | |
Telecommunications—0.13% | | | | | | | | |
Nippon Telegraph & Telephone Corp. ADR | | | 225 | | | | 5,206 | |
| | | | | | | | |
Total Japan (Cost: $83,152) | | | | | | | 72,427 | |
| | | | | | | | |
Luxembourg—0.31% | | | | | | | | |
Metal Fabricate & Hardware—0.31% | | | | | | | | |
Tenaris S.A. ADR | | | 350 | | | | 12,239 | |
| | | | | | | | |
Total Luxembourg (Cost: $15,757) | | | | | | | 12,239 | |
| | | | | | | | |
Netherlands—1.22% | | | | | | | | |
Chemicals—0.23% | | | | | | | | |
Akzo Nobel NV ADR | | | 575 | | | | 9,005 | |
| | | | | | | | |
Engineering & Construction—0.19% | | | | | | | | |
Chicago Bridge & Iron Co. NV | | | 200 | | | | 7,592 | |
| | | | | | | | |
Food—0.71% | | | | | | | | |
Unilever NV Class NY | | | 850 | | | | 28,347 | |
| | | | | | | | |
| | | | | | | | |
Insurance—0.09% | | | | | | | | |
ING Groep NV ADR(a) | | | 525 | | | | 3,507 | |
| | | | | | | | |
Total Netherlands (Cost: $54,037) | | | | | | | 48,451 | |
| | | | | | | | |
Switzerland—0.27% | | | | | | | | |
Semiconductors—0.27% | | | | | | | | |
STMicroelectronics NV Class NY | | | 2,000 | | | | 10,880 | |
| | | | | | | | |
Total Switzerland (Cost: $19,914) | | | | | | | 10,880 | |
| | | | | | | | |
United Kingdom—2.44% | | | | | | | | |
Beverages—0.65% | | | | | | | | |
Diageo PLC ADR | | | 250 | | | | 25,767 | |
| | | | | | | | |
| | |
| | | Number
of Shares | | | Fair Value | |
Foreign Common Stocks (continued) | | | | | | | | |
United Kingdom (continued) | | | | | | | | |
Lodging—0.27% | | | | | | | | |
Intercontinental Hotels Group PLC ADR | | | 450 | | | $ | 10,845 | |
| | | | | | | | |
Oil & Gas—0.23% | | | | | | | | |
BP PLC ADR | | | 225 | | | | 9,122 | |
| | | | | | | | |
Pharmaceuticals—0.58% | | | | | | | | |
GlaxoSmithKline PLC ADR | | | 500 | | | | 22,785 | |
| | | | | | | | |
Telecommunications—0.71% | | | | | | | | |
BT Group PLC ADR | | | 425 | | | | 14,101 | |
Vodafone Group PLC ADR | | | 500 | | | | 14,090 | |
| | | | | | | 28,191 | |
| | | | | | | | |
Total United Kingdom (Cost: $88,952) | | | | | | | 96,710 | |
| | | | | | | | |
Total Foreign Common Stocks
(Cost $394,419) | | | | | | | 350,813 | |
| | | | | | | | |
Real Estate Investment Trust—0.67% | | | | | | | | |
Kimco Realty Corp. | | | 1,400 | | | | 26,642 | |
| | | | | | | | |
Total Real Estate Investment Trust
(Cost $25,687) | | | | | | | 26,642 | |
| | | | | | | | |
Short-Term Investment—0.66% | | | | | | | | |
Investment Trust—0.66% | | | | | | | | |
Invesco Liquid Assets Portfolio, 0.16%(c)(d) | | | 26,082 | | | | 26,082 | |
| | | | | | | | |
Total Short-Term Investment
(Cost $26,082) | | | | | | | 26,082 | |
| | | | | | | | |
Total Investments
(Cost $4,013,983)—99.68% | | | | | | | 3,955,434 | |
| | | | | | | | |
Other Assets in Excess of Liabilities, Net—0.32% | | | | | | | 12,579 | |
| | | | | | | | |
Total Net Assets—100.00% | | | | | | $ | 3,968,013 | |
| | | | | | | | |
ADR—American Depositary Receipt
| (a) | Non-income producing security. |
| (b) | All or a portion of the security out on loan. |
| (c) | Represents investment of collateral received from securities lending transactions. |
| (d) | The rate shown is the annualized seven-day yield at period end. |
| | |
| The accompanying notes are an integral part of the financial statements. | | 2012 ANNUAL REPORT | 7 |
Statement of Assets and Liabilities
June 30, 2012
| | | | |
| | | Quaker Capital Opportunities Fund | |
ASSETS: | | | | |
Investments, at value | | $ | 3,955,434 | |
Receivables: | | | | |
Dividends and interest | | | 6,055 | |
Capital shares sold | | | 97 | |
Investment securities sold | | | 56,462 | |
Securities lending income | | | 75 | |
Prepaid expenses and other assets | | | 3,641 | |
| | | | |
Total assets | | | 4,021,764 | |
| | | | |
LIABILITIES: | | | | |
Cash Overdraft | | | 5,346 | |
Payables: | | | | |
Due to Advisor (Note 3) | | | 3,020 | |
Capital shares redeemed | | | 113 | |
Upon return of securities loaned | | | 26,082 | |
Distributions fees | | | 1,250 | |
Trustee expenses | | | 376 | |
Chief compliance officer fee | | | 216 | |
Accrued expenses | | | 17,348 | |
| | | | |
Total liabilities | | | 53,751 | |
| | | | |
NET ASSETS | | $ | 3,968,013 | |
| | | | |
NET ASSETS CONSIST OF: | | | | |
Paid-in capital | | $ | 4,463,050 | |
Accumulated net realized loss on investments | | | (413,175 | ) |
Accumulated net investment loss | | | (23,313 | ) |
Net unrealized depreciation on investments | | | (58,549 | ) |
| | | | |
Total Net Assets | | $ | 3,968,013 | |
| | | | |
Total Investments, at Cost | | $ | 4,013,983 | |
| | | | |
Market Value of securities loaned | | | 25,506 | |
Class A Shares: | | | | |
Net Assets | | $ | 2,201,162 | |
| | | | |
Shares of Beneficial interest outstanding(1) | | | 290,698 | |
| | | | |
Net Asset Value per share and redemption price per share | | $ | 7.57 | |
| | | | |
Offering price per share (100 ÷ 94.50 × net asset value per share) | | $ | 8.01 | |
| | | | |
Class C Shares: | | | | |
Net Assets | | $ | 986,659 | |
Shares of Beneficial interest outstanding(1) | | | 141,764 | |
| | | | |
Net Asset Value per share and redemption price per share | | $ | 6.96 | |
| | | | |
Institutional Class Shares: | | | | |
Net Assets | | $ | 780,192 | |
Shares of Beneficial interest outstanding(1) | | | 102,645 | |
| | | | |
Net Asset Value per share and redemption price per share | | $ | 7.60 | |
| | | | |
| (1) | Unlimited number of shares of beneficial interest with a $0.01 par value, authorized. |
| | |
| The accompanying notes are an integral part of the financial statements. | | 2012 ANNUAL REPORT | 8 |
Statement of Operations
For the Fiscal Year Ended June 30, 2012
| | | | |
| | | Quaker Capital Opportunities Fund | |
INVESTMENT INCOME | | | | |
Income: | | | | |
Dividends (net of foreign withholding taxes) | | $ | 101,822 | |
Interest | | | 20 | |
Securities lending income | | | 296 | |
| | | | |
Total Income | | | 102,138 | |
| | | | |
Expenses: | | | | |
Investment advisory fees (Note 3) | | | 47,077 | |
Fund accounting fees | | | 16,090 | |
Transfer agent fees | | | 9,145 | |
Fund administration fees | | | 3,538 | |
Custody fees | | | 24,643 | |
Trustee fees and meeting expenses | | | 1,597 | |
Legal fees | | | 1,829 | |
Audit fees | | | 2,092 | |
Distribution Fee—Class A | | | 7,047 | |
Distribution Fee—Class C | | | 12,543 | |
Officers’ compensation fees | | | 2,709 | |
Registration and filing expenses | | | 11,920 | |
Printing expenses | | | 2,250 | |
Dividends and Interest on securities sold short | | | — | |
Other operating expenses | | | 6,519 | |
| | | | |
Total expenses | | | 148,999 | |
| | | | |
Less: | | | | |
Investment advisory fees waived & reimbursed (Note 3) | | | — | |
Net expenses | | | 148,999 | |
| | | | |
Net investment loss | | | (46,861 | ) |
| | | | |
REALIZED AND UNREALIZED GAIN (LOSS) ON INVESTMENTS AND FOREIGN CURRENCY TRANSACTIONS | | | | |
Net realized loss from investments, (excluding short securities) | | | (276,976 | ) |
Net realized gain from short securities | | | 6,634 | |
Net change in unrealized depreciation on investments (excluding short securities) | | | (258,804 | ) |
| | | | |
Net realized and unrealized loss on investments and foreign currency transactions | | | (529,146 | ) |
| | | | |
Net decrease in net assets resulting from operations | | $ | (576,007 | ) |
| | | | |
Foreign withholding taxes on dividends | | $ | (1,308 | ) |
| | | | |
| | |
| The accompanying notes are an integral part of the financial statements. | | 2012 ANNUAL REPORT | 9 |
Statements of Changes in Net Assets
For the Fiscal Year Ended June 30, 2012
| | | | |
| | | Quaker Capital Opportunities Fund | |
INCREASE (DECREASE) IN NET ASSETS | | | | |
Operations | | | | |
Net investment loss | | $ | (46,861 | ) |
Net realized loss from investment transactions and foreign currency transactions | | | (276,976 | ) |
Net realized gain from securities sold short | | | 6,634 | |
Change in net unrealized depreciation on investments | | | (258,804 | ) |
| | | | |
Net decrease in net assets resulting from operations | | | (576,007 | ) |
| | | | |
Distributions to shareholders from | | | | |
Net realized capital gain—Class A | | | (186,406 | ) |
Net realized capital gain—Class C | | | (92,231 | ) |
Net realized capital gain—Institutional Class | | | (54,499 | ) |
| | | | |
Total Distributions | | | (333,136 | ) |
| | | | |
Capital share transactions | | | | |
Decrease in net assets from fund share transactions (Note 8) | | | (2,371,770 | ) |
| | | | |
Total decrease in net assets | | | (3,280,913 | ) |
| | | | |
NET ASSETS | | | | |
Beginning of period | | | 7,248,926 | |
End of period | | $ | 3,968,013 | |
| | | | |
Accumulated net investment loss, at end of period | | $ | (23,313 | ) |
| | | | |
For the Fiscal Year Ended June 30, 2011 INCREASE (DECREASE) IN NET ASSETS | | | | |
Operations | | | | |
Net investment loss | | $ | (56,311 | ) |
Net realized gain from investment transactions and foreign currency transactions | | | 1,447,843 | |
Net realized gain from securities sold short | | | — | |
Change in net unrealized appreciation on investments | | | 1,484,830 | |
| | | | |
Net increase in net assets resulting from operations | | | 2,876,362 | |
| | | | |
Capital share transactions | | | | |
Decrease in net assets from fund share transactions (Note 8) | | | (14,115,546 | ) |
| | | | |
Total decrease in net assets | | | (11,239,184 | ) |
| | | | |
NET ASSETS | | | | |
Beginning of period | | | 18,488,110 | |
| | | | |
End of period | | $ | 7,248,926 | |
| | | | |
Accumulated net investment loss, at end of period | | $ | (56,311 | ) |
| | | | |
| | |
| The accompanying notes are an integral part of the financial statements. | | 2012 ANNUAL REPORT | 10 |
Financial Highlights
Quaker Capital Opportunities Fund
(For a Share Outstanding Throughout the Period)
| | | | | | | | | | | | |
| | | Quaker Capital Opportunities Fund | |
| | | Year Ended June 30,
2012 | | | Class A
Year Ended June 30,
2011 | | | Year Ended June 30,
2010 | |
Net asset value, beginning of period | | $ | 8.84 | | | $ | 7.49 | | | $ | 7.37 | |
| | | | | | | | | | | | |
Income from investment operations | | | | | | | | | | | | |
Net investment loss(1) | | | (0.06 | ) | | | (0.03 | ) | | | (0.02 | ) |
Net realized and unrealized gain (loss) on investments | | | (0.65 | ) | | | 1.38 | | | | 0.14 | |
| | | | | | | | | | | | |
Total from investment operations | | | (0.71 | ) | | | 1.35 | | | | 0.12 | |
| | | | | | | | | | | | |
Distributions to shareholders from: | | | | | | | | | | | | |
Net realized capital gain | | | (0.56 | ) | | | — | | | | — | |
Return of capital | | | — | | | | — | | | | — | |
| | | | | | | | | | | | |
Total distributions | | | (0.56 | ) | | | — | | | | — | |
| | | | | | | | | | | | |
Net asset value, end of period | | $ | 7.57 | | | $ | 8.84 | | | $ | 7.49 | |
| | | | | | | | | | | | |
Total Return(2) | | | (7.70 | )% | | | 18.02 | % | | | 1.63 | % |
Ratios/supplemental data | | | | | | | | | | | | |
Net asssets, end of period (000’s omitted) | | $ | 2,201 | | | $ | 4,196 | | | $ | 7,766 | |
Ratio of expenses to average net assets: | | | 2.79 | % | | | 1.80 | % | | | 1.75 | % |
Ratio of net investment income (loss) to average net assets | | | (0.79 | )% | | | (0.30 | )% | | | (0.30 | )% |
Portfolio turnover rate | | | 226.47 | % | | | 60.09 | % | | | 139.57 | % |
| | | | | | | | |
| | | Quaker Capital Opportunities Fund Class A | |
| | | Year Ended June 30,
2009 | | | Year Ended June 30,
2008 | |
Net asset value, beginning of period | | $ | 9.24 | | | $ | 11.30 | |
| | | | | | | | |
Income from investment operations | | | | | | | | |
Net investment income(1) | | | 0.02 | | | | 0.02 | |
Net realized and unrealized gain (loss) on investments | | | (1.88 | ) | | | (0.26 | ) |
| | | | | | | | |
Total from investment operations | | | (1.86 | ) | | | (0.24 | ) |
| | | | | | | | |
Distributions to shareholders from | | | | | | | | |
Net realized capital gain | | | (0.01 | ) | | | (1.75 | ) |
Return of capital | | | — | | | | (0.07 | ) |
| | | | | | | | |
Total distributions | | | (0.01 | ) | | | (1.82 | ) |
| | | | | | | | |
Net asset value, end of period | | $ | 7.37 | | | $ | 9 .24 | |
| | | | | | | | |
Total Return(2) | | | (20.18 | )% | | | (3.63 | )% |
| | | | | | | | |
Ratios/supplemental data | | | | | | | | |
Net asssets, end of period (000’s omitted) | | $ | 7,979 | | | $ | 7,007 | |
Ratio of expenses to average net assets | | | 1.88 | % | | | 1.59 | % |
Ratio of net investment income to average net assets | | | 0.22 | % | | | 0.15 | % |
Portfolio turnover rate | | | 104.43 | % | | | 75.18 | % |
| (1) | The average shares outstanding method has been applied for per share information. |
| (2) | Total investment return is based on the change in net asset value of a share during the period, assumes reinvestment of dividends and distributions at net asset value and does not reflect the impact of a sales charge. |
| | |
| The accompanying notes are an integral part of the financial statements. | | 2012 ANNUAL REPORT | 11 |
Financial Highlights
Quaker Capital Opportunities Fund
(For a Share Outstanding Throughout the Period)
| | | | | | | | | | | | |
| | | Quaker Capital Opportunities Fund | |
| | | Year Ended June 30,
2012 | | | Class C
Year Ended June 30,
2011 | | | Year Ended June 30,
2010 | |
Net asset value, beginning of period | | $ | 8.23 | | | $ | 7.03 | | | $ | 6.97 | |
| | | | | | | | | | | | |
Income from investment operations | | | | | | | | | | | | |
Net investment loss(1) | | | (0.11 | ) | | | (0.09 | ) | | | (0.08 | ) |
Net realized and unrealized gain (loss) on investments | | | (0.60 | ) | | | 1.29 | | | | 0.14 | |
| | | | | | | | | | | | |
Total from investment operations | | | (0.71 | ) | | | 1.20 | | | | 0.06 | |
| | | | | | | | | | | | |
Distributions to shareholders from: | | | | | | | | | | | | |
Net realized capital gain | | | (0.56 | ) | | | — | | | | — | |
Return of capital | | | — | | | | — | | | | — | |
| | | | | | | | | | | | |
Total distributions | | | (0.56 | ) | | | — | | | | — | |
| | | | | | | | | | | | |
Net asset value, end of period | | $ | 6.96 | | | $ | 8.23 | | | $ | 7.03 | |
| | | | | | | | | | | | |
Total Return(2) | | | (8.30 | )% | | | 17.07 | % | | | 0.86 | % |
Ratios/supplemental data | | | | | | | | | | | | |
Net asssets, end of period (000’s omitted) | | $ | 987 | | | $ | 2,260 | | | $ | 3,428 | |
Ratio of expenses to average net assets: | | | 3.54 | % | | | 2.55 | % | | | 2.49 | % |
Ratio of net investment income (loss) to average net assets | | | (1.54 | )% | | | (1.08 | )% | | | (1.05 | )% |
Portfolio turnover rate | | | 226.47 | % | | | 60.09 | % | | | 139.57 | % |
| | | | | | | | |
| | | Quaker Capital Opportunities Fund | |
| | | Year Ended June 30,
2009 | | | Class C
Year Ended June 30,
2008 | |
Net asset value, beginning of period | | $ | 8.80 | | | $ | 10.92 | |
| | | | | | | | |
Income from investment operations | | | | | | | | |
Net investment loss(1) | | | (0.04 | ) | | | (0.10 | ) |
Net realized and unrealized gain (loss) on investments | | | (1.78 | ) | | | (0.20 | ) |
| | | | | | | | |
Total from investment operations | | | (1.82 | ) | | | (0.30 | ) |
| | | | | | | | |
Distributions to shareholders from: | | | | | | | | |
Net realized capital gain | | | (0.01 | ) | | | (1.75 | ) |
Return of capital | | | — | | | | (0.07 | ) |
| | | | | | | | |
Total distributions | | | (0.01 | ) | | | (1.82 | ) |
| | | | | | | | |
Net asset value, end of period | | $ | 6.97 | | | $ | 8.80 | |
| | | | | | | | |
Total Return(2) | | | (20.74 | )% | | | (4.38 | )% |
Ratios/supplemental data | | | | | | | | |
Net asssets, end of period (000’s omitted) | | $ | 4,060 | | | $ | 5,322 | |
Ratio of expenses to average net assets: | | | 2.60 | % | | | 2.34 | % |
Ratio of net investment loss to average net assets | | | (0.53 | )% | | | (1.01 | )% |
Portfolio turnover rate | | | 104.43 | % | | | 75.18 | % |
| (1) | The average shares outstanding method has been applied for per share information. |
| (2) | Total investment return is based on the change in net asset value of a share during the period, assumes reinvestment of dividends and distributions at net asset value and does not reflect the impact of a sales charge. |
| | |
| The accompanying notes are an integral part of the financial statements. | | 2012 ANNUAL REPORT | 12 |
Financial Highlights
Quaker Capital Opportunities Fund
(For a Share Outstanding Throughout the Period)
| | | | | | | | | | | | |
| | | Quaker Capital Opportunities Fund | |
| | | Year Ended June 30,
2012 | | | Institutional Class
Year Ended June 30,
2011 | | | Year Ended June 30,
2010 | |
Net asset value, beginning of period | | $ | 8.85 | | | $ | 7.51 | | | $ | 7.37 | |
| | | | | | | | | | | | |
Income from investment operations | | | | | | | | | | | | |
Net investment loss(1) | | | (0.04 | ) | | | (0.01 | ) | | | (0.01 | ) |
Net realized and unrealized gain (loss) on investments | | | (0.65 | ) | | | 1.35 | | | | 0.15 | |
| | | | | | | | | | | | |
Total from investment operations | | | (0.69 | ) | | | 1.34 | | | | 0.14 | |
| | | | | | | | | | | | |
Distributions to shareholders from: | | | | | | | | | | | | |
Net investment income | | | — | | | | — | | | | — | |
Net realized capital gain | | | (0.56 | ) | | | — | | | | — | |
Return of capital | | | — | | | | — | | | | — | |
| | | | | | | | | | | | |
Total distributions | | | (0.56 | ) | | | — | | | | — | |
| | | | | | | | | | | | |
Net asset value, end of period | | $ | 7.60 | | | $ | 8.85 | | | $ | 7.51 | |
| | | | | | | | | | | | |
Total Return(2) | | | (7.46 | )% | | | 17.84 | % | | | 1.90 | % |
Ratios/supplemental data | | | | | | | | | | | | |
Net asssets, end of period (000’s omitted) | | $ | 780 | | | $ | 793 | | | $ | 7,294 | |
Ratio of expenses to average net assets: | | | 2.55 | % | | | 1.54 | % | | | 1.52 | % |
Ratio of net investment income (loss) to average net assets | | | (0.51 | )% | | | (0.07 | )% | | | (0.06 | )% |
Portfolio turnover rate | | | 226.47 | % | | | 60.09 | % | | | 139.57 | % |
| | | | |
| | | Quaker Capital Opportunities Fund
Institutional Class | |
| | | For the period May 5,
2009 (commencement
of operations) to June
30, 2009 | |
Net asset value, beginning of period | | $ | 7.14 | |
| | | | |
Income from investment operations | | | | |
Net investment income(1) | | | 0.01 | |
Net realized and unrealized gain on investments | | | 0.22 | |
| | | | |
Total from investment operations | | | 0.23 | |
| | | | |
Net asset value, end of period | | $ | 7.37 | |
| | | | |
Total Return(2) | | | 3.22 | %†* |
Ratios/supplemental data | | | | |
Net asssets, end of period (000’s omitted) | | $ | 9 | |
Ratio of expenses to average net assets: | | | 1.92 | %** |
Ratio of net investment income to average net assets | | | 0.71 | %** |
Portfolio turnover rate | | | 104.43 | %* |
| (1) | The average shares outstanding method has been applied for per share information. |
| (2) | Total investment return is based on the change in net asset value of a share during the period, assumes reinvestment of dividends and distributions at net asset value and does not reflect the impact of a sales charge. |
| † | The returns shown represent performance for a period of less than one year. |
| | |
| The accompanying notes are an integral part of the financial statements. | | 2012 ANNUAL REPORT | 13 |
Notes to the Financial Statements
Note 1—Organization
The Quaker Investment Trust (“Trust”), a diversified, open-end management investment company was organized as a Massachusetts business trust on October 24, 1990, and is registered under the Investment Company Act of 1940, as amended (“1940 Act”). The Trust’s Amended and Restated Declaration of Trust permits the Trustees to issue an unlimited number of shares of beneficial interest. The Trust currently has eight series: Quaker Akros Absolute Return Fund (formerly, Quaker Akros Absolute Strategies Fund) (“Akros Absolute Return”), Quaker Capital Opportunities Fund (“Capital Opportunities”), Quaker Event Arbitrage Fund (“Event Arbitrage”) Quaker Global Tactical Allocation Fund (“Global Tactical Allocation”), Quaker Mid-Cap Value Fund (“Mid-Cap Value”), Quaker Small-Cap Growth Tactical Allocation Fund (“Small-Cap Growth Tactical Allocation”), Quaker Small-Cap Value Fund (“Small-Cap Value”) and Quaker Strategic Growth Fund (“Strategic Growth”) (each a “Fund” and collectively,“Funds”). All Funds are diversified with the exception of Akros Absolute Return, Capital Opportunities and Event Arbitrage. The investment objective of Capital Opportunities is set forth below.
Capital Opportunities commenced operations on January 31, 2002. The investment objective of the Fund is to seek long-term growth of capital. The investment objective of this Fund is non-fundamental in that this objective may be changed by the Board of Trustees (“Board” or “Trustees”) without shareholder approval.
The Fund currently offers three classes of shares (Class A, Class C and Institutional Class Shares). Class A Shares are charged a front-end sales charge and a distribution and servicing fee; Class C shares are charged a distribution fee, but bear no front end sales charge or contingent deferred sales charge (“CDSC”) and Institutional Class Shares bear no front-end sales charge or CDSC, but have higher minimum investment thresholds.
Quaker Funds, Inc. (“QFI”), the investment adviser to the Fund, has the ability to waive the minimum investment for Institutional Class shares at its discretion.
Note 2—Summary of Significant Accounting Policies and Other Information
The following is a summary of significant accounting policies consistently followed by the Fund in the preparation of its financial statements. The policies are in conformity with accounting principles generally accepted in the United States of America.
A. Security Valuation. The Fund’s investments in securities are carried at market value. Securities listed on an exchange or quoted on a national market system are generally valued at the last quoted sales price at the time of valuation. Other securities traded in the over-the-counter market and listed securities for which no sale was reported on that date are valued at the most recent bid price. Each security reported on the NASDAQ National Market System is valued at the NASDAQ Official Closing Price.
Debt and other fixed-income securities (other than short-term obligations) are valued at the last quoted bid price and/or by using a combination of daily quotes and matrix evaluations provided by an independent pricing service (which reflect such factors as security prices, yields, maturities, ratings, and dealer and exchange quotations), the use of which has been approved by the Board.
Short-term investments are valued at amortized cost, which approximates fair market value.
The Fund has adopted fair valuation procedures to value securities at fair market value in certain circumstances, and the Trust has established a Valuation Committee responsible for determining when fair valuing a security is necessary and appropriate. The Fund will value securities at fair market value when market quotations are not readily available or when securities cannot be accurately valued within established pricing procedures. The Valuation Committee may also fair value foreign securities whose prices may have been affected by events occurring after the close of trading in their respective markets but prior to the time the Fund holding the foreign securities calculates its net asset value. The Fund’s fair valuation procedures are designed to help ensure that prices at which Fund shares are purchased and redeemed are fair and do not result in dilution of shareholder interest or other harm to shareholders.
The Fund is required to disclose information regarding the fair value measurements of the Fund’s assets and liabilities. Fair value is defined as the price that the Fund would receive upon selling an investment in an orderly transaction to an independent buyer in the principal or most advantageous market for the investment. The disclosure requirements utilize a three-tier hierarchy to maximize the use of observable market data, minimize the use of unobservable inputs and establish classification of fair value measurements for disclosure purposes. A financial instrument’s level within the fair value hierarchy is based on the lowest level that is significant to the fair value measurement. Inputs refer broadly to the assumptions that market participants would use in pricing the asset or liability, including assumptions about risk, for example, the risk inherent in a particular valuation technique used to measure fair value including such a pricing model and/or the risk inherent in the inputs to the valuation technique. Inputs may be observable or unobservable.
2012 ANNUAL REPORT | 14
Notes to the Financial Statements
Observable inputs are inputs that reflect the assumptions market participants would use in pricing the asset or liability, which are based on market data obtained from sources independent of the reporting entity. Unobservable inputs are inputs that reflect the reporting entity’s own assumptions about the assumptions market participants would use in pricing the asset or liability developed based on the best information available in the circumstances.
The significant unobservable inputs used in the fair value measurement of the reporting entity’s private equity holdings are audited financial statements, expenses occurred from the partnership, interim financial statements, capital call, distributions and publicly traded securities. Significant increases (decreases) in any of those inputs in isolation would result in a significantly lower (higher) fair value measurement.
Various inputs may be used to determine the value of the Fund’s investments. These inputs are summarized in three broad levels for financial statement purposes. The inputs or methodologies used to value securities are not necessarily an indication of the risk associated with investing in those securities.
Level I—Quoted prices in active markets for identical securities.
Level II—Prices determined using significant other observable inputs (including quoted prices for similar investments, interest rates, prepayment speeds, credit risk, etc.) Municipal securities, long-term U.S. Government obligations and corporate debt securities are valued in accordance with the evaluated price supplied by the pricing service and generally categorized as Level 2 in the hierarchy. Other securities that are categorized as Level 2 in the hierarchy include, but are not limited to, warrants that do not trade on an exchange, OTC options and international equity securities valued by an independent third party in order to adjust for stale pricing and foreign market holidays.
Level III—Prices determined using significant unobservable inputs (including the Fund’s own assumptions). For restricted equity securities where observable inputs are limited, assumptions about market activity and risk are used in determining fair value. These are categorized as Level 3 in the hierarchy.
The value of a foreign security is generally determined as of the close of trading on the foreign stock exchange on which the security is primarily traded, or as of the close of trading on the New York Stock Exchange (“NYSE”), if earlier. The value is then converted into its U.S. dollar equivalent at the foreign exchange rate in effect at the close of the NYSE (generally 4:00 p.m. Eastern time) on the day that the value of the foreign security is determined. If no sale is reported at that time, the foreign security will be valued within the range of the most recent quoted bid and ask prices. If market quotations are not readily available for a foreign security or an event has occurred that caused a quotation to be unavailable or unreliable, the Valuation Committee will fair value foreign securities using the procedures described below.
The Trust has adopted fair valuation procedures to value securities at fair market value when independent prices are unavailable or unreliable, and the Trust has established a Valuation Committee that is responsible for determining when fair valuing a security is necessary and appropriate. Securities and assets for which market quotations are not readily available may be valued based upon valuation methods that include: (i) multiple of earnings; (ii) yield to maturity with respect to debt issues; (iii) discounts from market prices of similar freely traded securities; or (iv)a combination of these methods. Securities may also be priced using fair value pricing methods when their closing prices do not reflect their market values at the time the Fund calculates its net asset value (“NAV”) because an event had occurred since the closing prices were established on the domestic or foreign exchange or market but before the Fund’s NAV calculation.
The following is a summary of the fair valuations according to the inputs used as of June 30, 2012 in valuing the Fund’s assets and liabilities:
| | | | | | | | | | | | | | | | |
Category | | Quoted Prices
in Active Markets
for Identical
Investments
(Level 1) | | | Significant Other
Observable
Inputs
(Level 2) | | | Significant
Unobservable
Inputs
(Level 3) | | | Fair
Value at
6/30/2012 | |
Domestic Common Stocks | | | | | | | | | | | | | | | | |
United States | | | | | | | | | | | | | | | | |
Basic Materials | | $ | 158,615 | | | $ | 0 | | | $ | 0 | | | $ | 158,615 | |
Communications | | | 435,814 | | | | 0 | | | | 0 | | | | 435,814 | |
Consumer, Cyclical | | | 421,389 | | | | 0 | | | | 0 | | | | 421,389 | |
Consumer, Non-cyclical | | | 247,003 | | | | 0 | | | | 0 | | | | 247,003 | |
Energy | | | 381,537 | | | | 0 | | | | 0 | | | | 381,537 | |
Financial | | | 633,790 | | | | 0 | | | | 0 | | | | 633,790 | |
Healthcare | | | 448,849 | | | | 0 | | | | 0 | | | | 448,849 | |
2012 ANNUAL REPORT | 15
Notes to the Financial Statements
| | | | | | | | | | | | | | | | |
Industrial | | | 351,832 | | | | 0 | | | | 0 | | | | 351,832 | |
Technology | | | 360,665 | | | | 0 | | | | 0 | | | | 360,665 | |
Utilities | | | 112,403 | | | | 0 | | | | 0 | | | | 112,403 | |
Foreign Common Stocks | | | | | | | | | | | | | | | | |
Belgium | | | | | | | | | | | | | | | | |
Consumer, Non-cyclical | | | 15,930 | | | | 0 | | | | 0 | | | | 15,930 | |
Brazil | | | | | | | | | | | | | | | | |
Energy | | | 9,385 | | | | 0 | | | | 0 | | | | 9,385 | |
Canada | | | | | | | | | | | | | | | | |
Basic Materials | | | 32,874 | | | | 0 | | | | 0 | | | | 32,874 | |
France | | | | | | | | | | | | | | | | |
Communications | | | 2,119 | | | | 0 | | | | 0 | | | | 2,119 | |
Germany | | | | | | | | | | | | | | | | |
Consumer, Cyclical | | | 8,958 | | | | 0 | | | | 0 | | | | 8,958 | |
Industrial | | | 16,814 | | | | 0 | | | | 0 | | | | 16,814 | |
Technology | | | 19,292 | | | | 0 | | | | 0 | | | | 19,292 | |
Ireland | | | | | | | | | | | | | | | | |
Financial | | | 4,734 | | | | 0 | | | | 0 | | | | 4,734 | |
Japan | | | | | | | | | | | | | | | | |
Communications | | | 5,206 | | | | 0 | | | | 0 | | | | 5,206 | |
Consumer, Cyclical | | | 29,851 | | | | 0 | | | | 0 | | | | 29,851 | |
Industrial | | | 37,370 | | | | 0 | | | | 0 | | | | 37,370 | |
Luxembourg | | | | | | | | | | | | | | | | |
Industrial | | | 12,239 | | | | 0 | | | | 0 | | | | 12,239 | |
Netherlands | | | | | | | | | | | | | | | | |
Basic Materials | | | 9,005 | | | | 0 | | | | 0 | | | | 9,005 | |
Consumer, Non-cyclical | | | 28,347 | | | | 0 | | | | 0 | | | | 28,347 | |
Financial | | | 3,507 | | | | 0 | | | | 0 | | | | 3,507 | |
Industrial | | | 7,592 | | | | 0 | | | | 0 | | | | 7,592 | |
Switzerland | | | | | | | | | | | | | | | | |
Technology | | | 10,880 | | | | 0 | | | | 0 | | | | 10,880 | |
United Kingdom | | | | | | | | | | | | | | | | |
Communications | | | 28,191 | | | | 0 | | | | 0 | | | | 28,191 | |
Consumer, Cyclical | | | 10,845 | | | | 0 | | | | 0 | | | | 10,845 | |
Consumer, Non-cyclical | | | 25,767 | | | | 0 | | | | 0 | | | | 25,767 | |
Energy | | | 9,122 | | | | 0 | | | | 0 | | | | 9,122 | |
Healthcare | | | 22,785 | | | | 0 | | | | 0 | | | | 22,785 | |
Real Estate Investment Trust- | | | | | | | | | | | | | | | | |
United States | | | | | | | | | | | | | | | | |
Financial | | | 26,642 | | | | 0 | | | | 0 | | | | 26,642 | |
Short-Term Investment- | | | 26,082 | | | | 0 | | | | 0 | | | | 26,082 | |
| | | | | | | | | | | | | | | | |
Total | | $ | 3,955,434 | | | $ | 0 | | | $ | 0 | | | $ | 3,955,434 | |
| | | | | | | | | | | | | | | | |
There were no transfers in and out of Level 1 and Level 2 fair value measurements during the year ended June 30, 2012.
B. Federal Income Taxes. It is the Fund’s policy to comply with the requirements of Subchapter M of the Internal Revenue Code and to distribute substantially all of its taxable income to shareholders. Therefore, no federal income tax provision is required.
In accordance with Financial Accounting Standards Board (“FASB”) Interpretation ASC 740, (“ASC 740”), the Fund recognizes a tax benefit from an uncertain position only if it is more likely than not that the position is sustainable, based solely on its technical merits and consideration of the relevant taxing authority’s widely understood administrative practices and precedents. If this threshold is met, the Fund measures the tax benefit as the largest amount of benefit that is greater than fifty percent likely of being realized upon ultimate settlement. Management has reviewed the tax positions for each of the four open tax years as of June 30, 2012 and has determined that the implementation of ASC 740 does not have a material impact on the Fund’s financial statements. The Fund’s federal tax returns for the prior three fiscal years remains subject to examination by the Internal Revenue Service.
Net investment income or loss and net realized gains or losses may differ for financial statement and income tax purposes primarily due to investments that have a different basis for financial statement and income tax purposes. The character of distributions made during the year from net investment income or net realized gains may differ from their ultimate characterization for federal income tax purposes. Also, due to the timing of dividend distributions, the fiscal year in which amounts are distributed may differ from the year that the income or realized gains were recorded by the Fund. Permanent differences in the recognition of earnings are reclassified to additional paid-in capital. Distributions in excess of tax-basis earnings are recorded as a return of capital.
C. Security Transactions and Investment Income. Security transactions are recorded on the trade date. Realized gains and losses are determined using the specific identification cost method. Interest income on debt securities is recorded daily on the accrual basis. Discounts and premiums on debt securities are amortized over their respective lives. Dividend income is recorded on the ex-dividend date, or as soon as information is available to the Fund.
2012 ANNUAL REPORT | 16
Notes to the Financial Statements
Certain Funds may make short sales of investments, which are transactions in which a Fund sells a security it does not own in anticipation of a decline in the fair value of that security. To complete such a transaction, the Fund must borrow the security to make delivery to the buyer. The Fund is then obligated to replace the security borrowed by purchasing it at the market price at the time of replacement. The broker retains the proceeds of short sales to the extent necessary to meet margin requirements until the short position is closed out.
If a security pays a dividend while the Fund holds it short, the Fund will need to pay the dividend to the original owner of the security. Since the Fund borrowed the shares and sold them to a third party, the third party will receive the dividend from the security and the Fund will pay the original owner the dividend directly. The Fund is not entitled to the dividend because it does not own the shares. A gain, limited to the price at which the Fund sold the security short, or a loss, unlimited in size, will be recognized upon the termination of a short sale.
D. Options Contracts Written. The Fund may write options to manage exposure to certain changes in the market. When the Fund writes an option, an amount equal to the premium received by the Fund is recorded as a liability, which is marked-to-market daily to reflect the current market value of the option written. If the option expires, the Fund realizes a gain from investments equal to the amount of the premium received. When a written call option is exercised, the difference between the premium and the amount for effecting a closing purchase transaction, including brokerage commission, is also treated as a realized gain or loss. When a written put option is exercised, the amount of the premium received reduces the cost of the security purchased by the Fund.
A risk in writing a covered call option is that the Fund may forego the opportunity of profit if the market price of the underlying security increases and the option is exercised. The risk in writing a put option is that the Fund may incur a loss if the market price of the underlying security decreases and the option is exercised. In addition, there is the risk that the Fund may not be able to enter into a closing transaction because of an illiquid secondary market.
E. Purchased Options. The Fund may purchase call options in anticipation of an increase in the market value of securities of the type in which they may invest. The purchase of a call option will entitle the Fund, in return for the premium paid, to purchase specified securities at a specified price during the option period. The Fund will ordinarily realize a gain if, during the option period, the value of such securities exceeded the sum of the exercise price, the premium paid and transaction costs; otherwise, the Fund will realize either no gain or a loss on the purchase of the call option. The Fund will normally purchase put options in anticipation of a decline in the market value of securities in its portfolio (“protective puts”) or in securities in which it may invest. The purchase of a put option will entitle the Fund, in exchange for the premium paid, to sell specified securities at a specified price during the option period. The purchase of protective puts is designed to offset or hedge against a decline in the market value of the Fund’s securities. Put options may also be purchased by a Fund for the purpose of affirmatively benefiting from a decline in the price of securities which it does not own. The Fund will ordinarily realize a gain if, during the option period, the value of the underlying securities decreased below the exercise price sufficiently to more than cover the premium and transaction costs; otherwise the Fund will realize either no gain or a loss on the purchase of the put option. Gains and losses on the purchase of protective put options would tend to be offset by countervailing changes in the value of the underlying portfolio securities.
F. Futures Contracts. The Fund may enter into financial futures contracts, to the extent permitted by their investment policies and objectives, for bona fide hedging and other permissible risk management purposes including protecting against anticipated changes in the value of securities the Fund intends to purchase. Upon entering into a financial futures contract, a Fund is required to deposit cash or securities as initial margin. Additional securities are also segregated as collateral up to the current market value of the financial futures contracts. Subsequent payments, known as variation margin, are made or received by the Fund, depending on the fluctuation in the value of the underlying financial instruments. The Fund recognizes an unrealized gain or loss equal to the variation margin. When the financial futures contracts are closed, a realized gain or loss is recognized equal to the difference between the proceeds from (or cost of) the closing transactions and the Fund’s basis in the contracts. The risks associated with entering into financial futures contracts include the possibility that a change in the value of the contract may not correlate with the changes in the value of the underlying instruments. In addition, investing in financial futures contracts involves the risk that the Fund could lose more than the original margin deposit and subsequent payments required for a futures transaction. Risks may also arise upon entering into these contracts from the potential inability of the counterparties to meet the terms of their contracts.
G. Foreign Currency Transactions. Securities and other assets and liabilities denominated in foreign currencies are converted each business day into U.S. dollars based on the prevailing rates of exchange. Purchases and sales of portfolio securities and income and expenses are converted into U.S. dollars on the respective dates of such transactions.
2012 ANNUAL REPORT | 17
Notes to the Financial Statements
Gains and losses resulting from changes in exchange rates applicable to foreign securities are not reported separately from gains and losses arising from movements in securities prices.
Net realized foreign exchange gains and losses include gains and losses from sales and maturities of foreign currency exchange contracts, gains and losses realized between the trade and settlement dates of foreign securities transactions, and the difference between the amount of dividends, interest and foreign withholding taxes on the Fund’s books and the U.S. dollar equivalent of the amounts actually received. Net unrealized foreign exchange gains and losses include gains and losses from changes in the fair value of assets and liabilities denominated in foreign currencies other than portfolio securities, resulting from changes in exchange rates.
H. Forward Foreign Currency Contracts. The Fund may enter into forward foreign currency contracts to hedge against foreign currency exchange rate risk on their non-U.S. dollar denominated securities or to facilitate settlement of foreign currency denominated portfolio transactions. A forward foreign currency contract is an agreement between two parties to buy and sell a currency at a set price on a future date. The contract is marked-to-market daily and the change in value is recorded by the Fund as an unrealized gain or loss. When a forward foreign currency contract is extinguished, through either delivery or offset by entering into another forward foreign currency contract, the Fund records a realized gain or loss equal to the difference between the value of the contract at the time it was opened and the value of the contract at the time it was extinguished.
Forward foreign currency contracts involve elements of market risk in excess of the amounts reflected in the Statements of Assets and Liabilities. The Fund bears the risk of an unfavorable change in the foreign exchange rate underlying the forward foreign currency contract. Risks may also arise upon entering into these contracts from the potential inability of the counterparties to meet the terms of their contracts.
I. Portfolio Investment Risks. Investments in securities of foreign issuers carry certain risks not ordinarily associated with investments in securities of U.S. issuers. These risks include future disruptive political and economic developments and the possible imposition of exchange controls or other unfavorable foreign government laws and restrictions. In addition, investments in certain countries may carry risks of expropriation of assets, confiscatory taxation, political or social instability, or diplomatic developments that adversely affect investments in those countries. Certain countries may also impose substantial restrictions on investments in their capital markets by foreign entities, including restrictions on investments in issuers in industries deemed sensitive to relevant national interests. These factors may limit the investment opportunities available and result in a lack of liquidity and high price volatility with respect to securities of issuers from developing countries.
Capital Opportunities is not a “diversified” Fund, which means that the Fund may allocate its investments to a relatively small number of issuers or to a single industry, making the Funds more susceptible to adverse developments of a single user or industry. As a result, investing in the Fund is potentially more risky than investing in a diversified fund that is otherwise similar to the Fund.
J. Multiple Class Allocations. Each class of shares has equal rights as to earnings and assets except that each class bears different distribution and shareholder servicing expenses. Each class of shares has exclusive voting rights with respect to matters that affect just that class. Income, expenses (other than expenses attributable to a specific class) and realized and unrealized gains or losses on investments are allocated to each class of shares based on its relative net assets.
K. Expense Allocations. Expenses that are not series (Fund) specific are allocated to each series based upon its relative proportion of net assets to the Trust’s total net assets.
L. Distributions to Shareholders. The Fund generally declares dividends at least annually, payable in December, on a date selected by the Board. In addition, distributions may be made annually in December out of net realized gains through October 31 of that calendar year. Distributions to shareholders are recorded on the ex-dividend date. The Fund may make a supplemental distribution subsequent to the end of its fiscal year ending June 30.
M. Use of Estimates. The preparation of financial statements in conformity with GAAP requires management to make estimates and assumptions that affect the reported amounts of assets and liabilities and the disclosure of contingent assets and liabilities at the date of the financial statements, and the reported amounts of revenue and expenses during the reporting period. Actual results could differ from those estimates, and those differences could be significant.
N. Security Loans. The Fund receives compensation in the form of fees, or retain a portion of interest on the investment of any cash received as collateral. The Fund continues to receive interest or dividends on the securities loaned. The loans are secured by collateral at least equal, at all times, to 102% of the market value of the loaned securities. Gain or loss in the fair value of the securities loaned that may occur during the term of the loan will be for the account of the Fund. The Fund has the right under the lending agreement to recover the securities from the borrower on demand.
O. Derivative Instruments. Effective June 30, 2009, the Fund adopted amendments to authoritative guidance on disclosures about derivative instruments and hedging activities which require that the Funds disclose: a) how and why an entity uses derivative instruments; and b) how derivative instruments and related hedged items affect an entity’s financial position, financial performance and cash flows. The adoption of the additional disclosure requirements did not materially impact the Fund’s financial statements.
2012 ANNUAL REPORT | 18
Notes to the Financial Statements
Note 3—Investment Advisory Fee and Other Related Party Transactions
QFI serves as investment adviser to the Fund. Pursuant to separate investment subadvisory agreements, QFI has selected the following investment advisory firm to serve as sub-adviser:
| | |
Fund | | Sub-adviser |
Capital Opportunities | | ICC Capital Management, Inc. |
QFI or the sub-advisers provide the Fund with a continuous program of supervision of the Fund’s assets, including the composition of its portfolio, and furnish advice and recommendations with respect to investments, investment policies and the purchase and sale of securities.
The Fund paid QFI aggregate fees shown in the table below for the fiscal year ending June 30, 2012. Amounts are expressed as an annualized percentage of average net assets.
| | | | | | | | | | | | |
| | | | | | | | | Advisory & | |
| Fund | | Aggregate
advisory fee
paid to QFI | | | Subadvisory
fee paid by QFI
to the sub-adviser | | | subadvisory
fees waived &
reimbursed | |
Capital Opportunities | | | 0.925 | % | | | 0.625 | % | | | N/A | |
For the fiscal year ending June 30, 2012, QFI and the sub-advisers earned and reimbursed fees as follows:
| | | | | | | | | | | | |
| | | | | | | | | Advisory & | |
| | | Aggregate
advisory fee
paid to QFI | | | Subadvisory
fee paid by QFI
to the sub-advisor | | | subadvisory
fee waived &
reimbursed | |
Capital Opportunities | | $ | 47,077 | | | $ | 31,809 | | | $ | — | |
US Bancorp Fund Services, LLC (“USB”), serves as the Trust’s transfer, dividend paying, and shareholder servicing agent (“Transfer Agent”). The Transfer Agent maintains the records of each shareholder’s account, answers shareholder inquiries concerning accounts, processes purchases and redemptions of Fund shares, acts as dividend and distribution disbursing agent and performs other shareholder functions. As compensation for its services, the Transfer Agent receives a fee at the annual rate ranging between $8 and $11 dollars per shareholder account.
Brown Brothers Harriman & Co. serves as fund accountant and administrator (“Administrator”) for the Trust pursuant to a written agreement with the Trust. The Administrator provides fund accounting services and administrative services to the Fund. As compensation for its services, the Administrator receives a fee at the annual rate of 0.025% for accounting and 0.030% for administration of the aggregate of the Trust’s first $2 billion of average daily net assets and 0.020% for accounting and 0.025% for administration for over $2 billion of average daily net assets.
The Trust will incur an annual account minimum if, on an annual basis, the asset charges do not exceed the account minimum charges.
Foreside Fund Services, LLC (“Distributor”) serves as principal underwriter for the Trust. The Trust has adopted distribution and shareholder servicing plans pursuant to Rule 12b-1 of the 1940 Act for Class A and Class C Shares described below. There is no Rule 12b-1 distribution plan for Institutional Class Shares of the Funds. The Class A Plan provides that the Fund may pay a servicing or Rule 12b-1 fee at an annual rate of 0.25% of the Class A average net assets on a monthly basis to persons or institutions for performing certain servicing functions for the Class A shareholders. The Class A Plan also allows the Fund to pay or reimburse expenditures in connection with sales and promotional services related to distribution of the Fund’s shares, including personal services provided to prospective and existing shareholders. The Class C Plan provides that the Fund may compensate QFI and others for services provided and expenses incurred in the distribution of shares at an annual rate of 1.00% of the average net assets of each class on a monthly basis.
For the fiscal year ending June 30, 2012, the Distributor received $12 in underwriter concessions from the sale of Fund shares.
2012 ANNUAL REPORT | 19
Notes to the Financial Statements
Except for the Trust’s Chief Compliance Officer (“CCO”), employees and Officers of QFI do not receive any compensation from the Trust. The CCO of the Trust also serves as general counsel to QFI. For the fiscal year ending June 30, 2012, the Fund was allocated $3,127 of the CCO’s fees for compensation.
Note 4—Purchases and Sales of Investments
For the fiscal year ending June 30, 2012, aggregate purchases and sales of investment securities for the Fund were as follows:
| | | | | | | | |
Fund | | Purchases | | | Sales | |
Capital Opportunities | | $ | 11,651,629 | | | $ | 14,429,879 | |
Note 5—Tax Matters
For U.S. federal income tax purposes, the cost of securities owned (including proceeds for securities sold short), gross appreciation, gross depreciation, and net unrealized appreciation (depreciation) of investments at June 30, 2012 for each Fund were as follows:
| | | | | | | | | | | | | | |
Fund | | Cost | | | Gross
Appreciation | | | Gross
Depreciation | | | Net
Appreciation
(Depreciation) |
Capital Opportunities | | $ | 4,079,339 | | | $ | 208,465 | | | $ | (332,370 | ) | | $(123,905) |
As of June 30, 2012, the components of distributable earnings on a tax basis were as follows:
| | | | | | | | | | | | | | | | | | | | | | |
Fund | | Unrealized
Appreciation
(Depreciation) | | | Undistributed
Ordinary Income | | | Late Year
Losses | | | Capital Loss
Carryforward | | | Post October
Losses | | | Total
Distributable
Earnings |
Capital Opportunities | | $ | (123,905 | ) | | $ | — | | | $ | (23,491 | ) | | $ | (123,252 | ) | | $ | (224,389 | ) | | $(495,037) |
The difference between book basis and tax basis unrealized appreciation (depreciation) is attributable primarily to the tax deferral of losses on wash sales and REIT basis adjustments.
The undistributed ordinary income, capital gains and carryforward losses shown above differ from the corresponding accumulated net investment income and accumulated net realized gain (loss) figures reported in the statements of assets and liabilities due to differing book/tax treatment of short-term capital gains, and certain temporary book/tax differences such as the deferral of realized losses on wash sales, straddles from options and net losses realized after October 31.
Under current tax law, foreign currency and net capital losses realized after October 31 may be deferred and treated as occurring on the first day of the following fiscal year. The Fund elected to defer net capital and currency losses as indicated in the chart below.
At June 30, 2012, the capital loss carryovers for the Fund were as follows:
| | | | | | | | | | | | | | | | | | | | | | | | | | | | |
| | | Post December 31,
2010
Capital losses
No expiration | | | Capital Loss
Carryovers
Expiring | | | Capital Loss
Carryovers
Expiring | | | Capital Loss
Carryovers
Expiring | | | Post-October
Capital Loss | | | | |
Fund | | Short-Term | | | Long-Term | | | 2018 | | | 2017 | | | 2016 | | | Deferred | | | Utilized | |
Capital Opportunities | | $ | 83,460 | | | $ | 39,792 | | | $ | — | | | $ | — | | | | — | | | $ | 224,389 | | | $ | — | |
2012 ANNUAL REPORT | 20
Notes to the Financial Statements
Under the Regulated Investment Company Modernization Act of 2010 (“Act”), net capital losses may be carried forward indefinitely, and their character is retained as short term and/or long-term losses. Previously, net capital losses were carried forward for eight years and treated as short term losses. As a transition rule, the Act requires that postenactment net capital losses be used before pre-enactment net capital losses. As a result of this ordering rule, pre-enactment capital loss carryforwards may expire unused, whereas under the previous rules these losses may have been utilized. This change is effective for fiscal years beginning after the date of enactment.
Note 6—Reclassification of Capital Accounts
In accordance with the accounting pronouncements, the Fund has recorded reclassifications in the capital accounts. These reclassifications have no impact on the net asset value of the Fund and are designed generally to present undistributed income and realized gains on a tax basis which is considered to be more informative to shareholders. As of June 30, 2012, the Fund recorded the following reclassification to increase (decrease) the accounts listed below:
| | | | | | | | | | | | |
in on Beneficial Fund | | Accumulated
Net Investment
Income | | | Accumulated
Net Realized
Gain (Loss) | | | Capital Paid
Shares of
Interest | |
Capital Opportunities | | $ | 23,548 | | | $ | 49 | | | $ | (23,597 | ) |
Note 7—Distributions to Shareholders
Income and long-term capital gain distributions are determined in accordance with federal income tax regulations, which may differ from GAAP. The information set forth below is for the Fund’s fiscal year as required by federal securities laws.
The tax character of dividends and distributions paid during the fiscal years of 2012 and 2011 were as follows:
| | | | | | | | | | | | | | | | | | | | | | | | |
| | | Ordinary Income | | | Long-Term Capital Gain | | | Return of Capital | |
Fund | | 2012 | | | 2011 | | | 2012 | | | 2011 | | | 2012 | | | 2011 | |
Capital Opportunities | | | — | | | | — | | | $ | 333,136 | | | | — | | | | — | | | | — | |
2012 ANNUAL REPORT | 21
Notes to the Financial Statements
Note 8—Fund Share Transactions
At June 30, 2012, there were an unlimited number of shares of beneficial interest with a $0.01 par value authorized. The following table summarizes the activity in shares of the Fund:
| | | | | | | | | | | | | | | | | | | | | | | | | | | | | | | | |
| | | Capital Opportunities | |
| | | For the Fiscal Year Ended June 30, 2012 | | | | | | For the Fiscal Year Ended June 30, 2011 | | | | |
| | | Sold | | | Redeemed | | | Reinvested | | | End Shares | | | Sold | | | Redeemed | | | Reinvested | | | End Shares | |
Class A | | | | | | | | | | | | | | | | | | | | | | | | | | | | | | | | |
Shares | | | 21,190 | | | | (230,566 | ) | | | 25,234 | | | | 290,698 | | | | 28,875 | | | | (590,894 | ) | | | — | | | | 474,840 | |
Value | | $ | 162,241 | | | $ | (1,781,293 | ) | | $ | 181,429 | | | | | | | $ | 242,527 | | | $ | (4,995,758 | ) | | $ | — | | | | | |
Class C | | | | | | | | | | | | | | | | | | | | | | | | | | | | | | | | |
Shares | | | 2,388 | | | | (147,866 | ) | | | 12,710 | | | | 141,764 | | | | 11,159 | | | | (224,137 | ) | | | — | | | | 274,532 | |
Value | | $ | 16,675 | | | $ | (1,101,488 | ) | | $ | 84,394 | | | | | | | $ | 84,740 | | | $ | (1,782,230 | ) | | $ | — | | | | | |
Institutional Class | | | | | | | | | | | | | | | | | | | | | | | | | | | | | | | | |
Shares | | | 186,672 | | | | (180,646 | ) | | | 7,010 | | | | 102,645 | | | | 849,358 | | | | (1,730,529 | ) | | | — | | | | 89,609 | |
Value | | $ | 1,442,137 | | | $ | (1,426,410 | ) | | $ | 50,545 | | | | | | | $ | 7,342,388 | | | $ | (15,007,213 | ) | | $ | — | | | | | |
Note 9—5% Shareholders
At June 30, 2012, three unaffiliated shareholders of record, specifically omnibus accounts, individually or collectively held 28.36% of the outstanding shares of the Fund. Transactions by these shareholders may have a material impact upon the Fund.
Note 10—Indemnifications
Under the Trust’s organizational documents, its officers and Trustees are indemnified against certain liabilities arising out of the performance of their duties to the Fund. In addition, in the normal course of business, the Trust enters into contracts with its vendors and others that provide for general indemnifications. The Trust’s maximum exposure under these arrangements is dependant on future claims that may be made against the Trust, and, therefore, cannot be estimated; however, based on experience, risk of loss from such claims is considered remote.
Note 11—Securities Lending
At June 30, 2012, these securities or a portion of these securities are out on loan. The aggregate market value of these loaned securities and the value of the cash collateral the Fund received is as follows:
| | | | | | | | | | | | |
Fund | | Loaned Securities
Market Value | | | Value of
Cash Collateral | | | % of
Net Assets | |
Capital Opportunities | | $ | 25,506 | | | $ | 26,082 | | | | 0.64 | % |
2012 ANNUAL REPORT | 22
REPORT OF INDEPENDENT REGISTERED PUBLIC ACCOUNTING FIRM
To the Shareholders and
The Board of Trustees of
Quaker Investment Trust
We have audited the accompanying statement of assets and liabilities of Quaker Capital Opportunities Fund, (the “Fund”) a series of Quaker Investment Trust (the “Trust”), including the schedule of investments, as of June 30, 2012, the related statement of operations, the statement of changes in net assets and the financial highlights for the year then ended. These financial statements and financial highlights are the responsibility of the Fund’s management. Our responsibility is to express an opinion on these financial statements and financial highlights based on our audit. The statement of changes in net assets for the year ended June 30, 2011 and the financial highlights for each of the four years in the period then ended were audited by other auditors, whose report dated August 29, 2011 expressed an unqualified opinion on such statement and financial highlights.
We conducted our audit in accordance with the standards of the Public Company Accounting Oversight Board (United States). Those standards require that we plan and perform the audit to obtain reasonable assurance about whether the financial statements and financial highlights are free of material misstatement. The Fund is not required to have, nor were we engaged to perform, an audit of its internal control over financial reporting. Our audit included consideration of internal control over financial reporting as a basis for designing audit procedures that are appropriate in the circumstances, but not for the purpose of expressing an opinion on the effectiveness of the Fund’s internal control over financial reporting. Accordingly, we express no such opinion. An audit includes examining, on a test basis, evidence supporting the amounts and disclosures in the financial statements. Our procedures included confirmation of securities owned as of June 30, 2012, by correspondence with the custodian. An audit also includes assessing the accounting principles used and significant estimates made by management, as well as evaluating the overall financial statement presentation. We believe that our audit provides a reasonable basis for our opinion.
In our opinion, the financial statements and financial highlights referred to above present fairly, in all material respects, the financial position of Quaker Capital Opportunities Fund, as of June 30, 2012, the results of its operations, the changes in its net assets and the financial highlights for the year then ended, in conformity with accounting principles generally accepted in the United States of America.
TAIT, WELLER & BAKER LLP
Philadelphia, Pennsylvania
August 29, 2012
2012 ANNUAL REPORT | 23
Trustees and Officers
June 30, 2012
The Board has overall responsibility for conduct of the Trust’s affairs. The day-to-day operations of the Trust are managed by QFI, subject to the Bylaws of the Trust and review by the Board. The Trustees of the Trust, including those Trustees who are also officers, are listed below:
| | | | | | | | | | |
Name, Address and Age | | Position(s) Held
with the Trust | | Serving as an
Officer or Trustee
of the Trust | | Principal Occupation(s) During Past
5 Years | | Portfolios
Overseen by
Trustee | | Directorships
Held by
Trustee(1) |
Jeffry H. King, Sr.(2)(3) 309 Technology Drive Malvern, PA 19355 Age 69 | | Chairman of the Board Since and Chief Executive Officer | | Since Nov. 1996 | | Chairman of Board of Directors and Chief Executive, Officer, Quaker Funds, Inc. (1996–present). | | 8 | | None |
| | | | | |
Laurie Keyes (3)(4) 309 Technology Drive Malvern, PA 19355 Age 62 | | Treasurer and Trustee | | Since Nov. 1996 | | Chief Financial Officer, Quaker Funds, Inc. (1996–present). | | 8 | | None |
| | | | | |
Justin Brundage (5) 309 Technology Drive Malvern, PA 19355 Age 42 | | Secretary | | Since Nov. 2006 | | President, Quaker Funds, Inc. (2007–present); Chief Operating Officer, Quaker Funds, Inc. (2005–present). | | None | | None |
| | | | | |
Timothy E. Richards 309 Technology Drive Malvern, PA 19355 Age 47 | | Chief Compliance Officer | | Since March 2004 | | General Counsel to Quaker Funds, Inc. (2003–present); Chief Compliance Officer for the Quaker Investment Trust (2004–present). | | None | | None |
| | | | | |
James R. Brinton 309 Technology Drive Malvern, PA 19355 Age 58 | | Trustee Lead Independent Trustee | | Since Feb. 2002 Since Aug. 2007 | | President, Robert J. McAllister Agency, Inc. (commercial insurance brokerage firm) (1979–present). | | 8 | | Director, ACP Funds Trust |
| | | | | |
Gary Edward Shugrue 309 Technology Drive Malvern, PA 19335 Age 58 | | Trustee | | Since July 2008 | | President and Chief Investment Officer, Ascendant Capital Partners. | | 8 | | Director, BHR Institutional Funds; Director, ACP Funds Trust |
| | | | | |
Warren West 309 Technology Drive Malvern, PA 19355 Age 56 | | Trustee | | Since Nov. 2003 | | President and owner, Greentree Brokerage Services, Inc. (1998–present). | | 8 | | None |
| | | | | |
Everett T. Keech 309 Technology Drive Malvern, PA 19355 Age 72 | | Trustee Interested Trustee, Vice Chairman of the Board, President, Treasurer Trustee | | Since Nov. 2005 Nov., 1996—Jan., 2005 Nov., 1996—Feb., 2002 | | Chairman-Executive Committee, Technology Development Corp., (1997—Present) technology development and manufacturing firm (1997–present); Affiliated Faculty, Faculty, University of Pennsylvania (1998–present). | | 8 | | Director, Technology Development Corp.; Director, Advanced Training Systems International, Inc.; Director, Phoenix Data Systems, Inc. |
2012 ANNUAL REPORT | 24
Trustees and Officers
| (1) | Directorship of companies required to report to the SEC under the Securities and Exchange Act of 1934, as amended (“Exchange Act”) (i.e., “public companies”) and investment companies registered under the 1940 Act. |
| (2) | Mr. King is considered to be “interested person” of the Trust for purposes of the 1940 Act because he is the Chief Executive Officer and a controlling shareholder of Quaker Funds, Inc., the investment adviser to the Funds. |
| (3) | Mr. King and Ms. Keyes are husband and wife. |
| (4) | Ms. Keyes is considered to be an “interested person” of the Trust for purposes of the 1940 Act because she is the Trust’s Treasurer and a controlling shareholder of Quaker Funds, Inc. |
| (5) | Mr. Brundage is Ms. Keyes’ son. |
The Statement of Additional Information for the Trust includes additional information about the Trustees and Officers and is available, without charge, upon request by calling (800) 220-8888.
2012 ANNUAL REPORT | 25
Board consideration of the Investment Advisory and Sub-Advisory Agreements
At a meeting held on September 8, 2011, the Independent Trustees of the Board of the Trust considered the approval of the Sub-Advisory Agreement between QFI and ICC Capital Management, Inc. (“Sub-Advisory Agreement”) with regard to the Fund. At a meeting held on April, 26, 2012, the Independent Trustees of the Board of the Trust considered the continuation of the Investment Advisory Agreement between the Trust and QFI (“Advisory Agreement”) with regard to the Fund. The Advisory Agreement and Sub-Advisory Agreement are collectively “Agreements.” At the meetings, the Independent Trustees reported to the full Board their considerations with respect to the Agreements, and the Board, including a majority of Independent Trustees, considered and approved the Agreements. The Sub-Advisory Agreement was approved for a two year period, and the Advisory Agreement was approved for a one year period.
In arriving at their decision to approve the Agreements, the Board, including the Independent Trustees, considered a variety of information concerning QFI and the sub-adviser. In considering the continuation of the Agreements, the Board, including the Independent Trustees, considered the nature and quality of the services provided by QFI and the sub-adviser, the proposed fee structures, the level of fee waivers, the Fund’s past and anticipated expense ratios, possible economies of scale resulting from increases in the size of the Fund and other possible benefits QFI and the sub-adviser derived from their relationships with the Fund. The Board, including the Independent Trustees, carefully analyzed the information provided to them by QFI and the sub-adviser, focusing particularly on the level of advisory fees and expenses of the Fund compared with information for similar funds, and the performance of the Fund compared to funds with similar investment objectives. The Board, including the Independent Trustees, also considered other information that it had received from QFI and the sub-adviser at other meetings throughout the year.
In examining the nature, extent and quality of the services to be provided by QFI, the Board, including the Independent Trustees, considered the portfolio management, administrative and supervisory services provided by QFI. The Board, including the Independent Trustees, acknowledged the value of QFI’s historical performance of services for the Fund. The Independent Trustees were satisfied with the nature, extent and quality of the services provided by QFI to the Fund. The Board’s view was based upon factors such as the background and experience of management personnel involved in the Fund’s operations, the quality and thoroughness of the monitoring of the Fund’s investment performance conducted by QFI, reports furnished by QFI as to adherence with various compliance and procedural matters, the monitoring of various service providers to the Fund, and QFI’s success in obtaining meaningful information on a timely basis from the Fund’s sub-adviser. The Board, including the Independent Trustees, noted QFI’s commitment to servicing the Funds as its only client, QFI’s efforts during the past year to reduce Fund expenses, and the nature of the non-investment advisory services provided to the Funds, such as the supervision of the Funds’ other third-party service providers by QFI.
With respect to the nature, extent and quality of the services provided to the Fund by the sub-adviser, the Board, including the Independent Trustees, considered the quality of the portfolio management services that the sub-adviser provided to the Fund, the depth, experience and demonstrated consistency in investment approach of the sub-adviser’s portfolio management teams. Particular attention was given to analysis involved in the review of sub-adviser performance for the Fund. The nature of the services of the sub-adviser to the Fund was considered primarily in respect to the investment performance of the Fund. The Board was, however, satisfied with the adherence by the sub-adviser with the investment policies and restrictions of the Fund advised, as well as its adherence to various compliance and other procedures based on personnel presentations made by sub-adviser’s portfolio managers and QFI’s reports of its discussions with the sub-adviser, as well as certifications and materials furnished at Board meetings.
With respect to the Fund’s investment performance, the Board, including the Independent Trustees, reviewed the Fund’s performance compared to both its peer group and relative benchmark indices over one-year, three-year, five-year and since inception periods, as applicable. The Board, including the Independent Trustees, considered factors, including but not limited to the sub-adviser’s management style, peer group performance and overall market conditions that have affected the performance of the Fund relative to its peer group and benchmarks.
With respect to the costs of the services to be provided and profits to be realized by QFI from its relationship with the Trust, the Board, including the Independent Trustees, considered QFI’s and the sub-adviser’s willingness to waive fees. The Board, including the Independent Trustees, also considered that QFI and the sub-adviser might be able to recover some of its waived fees in the future. Because QFI has no other advisory accounts, the Board, including the Independent Trustees, did not consider the relationship between QFI’s advisory fees compared to other accounts that QFI advises. The Board, including the Independent Trustees, also discussed efforts being taken by QFI to reduce Fund expenses. In light of such considerations and factors and taking into account the nature of the Fund’s operations and overall performance, the Board, including the Independent Trustees, found the expenses of the Fund to be acceptable.
2012 ANNUAL REPORT | 26
Board consideration of the Investment Advisory and Sub-Advisory Agreements
The Board, including the Independent Trustees, considered whether there are any ancillary benefits that may accrue to QFI or a sub-adviser resulting from their relationship with the Funds. Based on the information provided, the Board, including the Independent Trustees, noted that there did not appear to be any significant benefits in this regard.
Based on the totality of the information considered, the Board, including the Independent Trustees, concluded that the Fund was likely to benefit from the nature, extent and quality of QFI’s and the sub-adviser’s services, as applicable, and that QFI and the sub-adviser have the ability to continue to provide these services based on their respective experience, operations and resources.
After evaluation of the comparative performance, fee and expense information and the profitability, ancillary benefits and other considerations as described above, and in light of the nature, extent and quality of services to be provided by QFI and the sub-adviser, the Board, including the Independent Trustees, concluded that the level of fees to be paid to QFI and the sub-adviser was reasonable.
In voting unanimously to approve the Agreements based on the various considerations discussed above, the Board, including the Independent Trustees, determined that the approval of the Agreements was in the best interests of the Fund. As a result, the Board, including a majority of the Independent Trustees, approved the Agreements.
2012 ANNUAL REPORT | 27
General Information (Unaudited)
Form N-Q Filing and Proxy Voting Policies and Procedures
Each Fund files its complete schedule of portfolio holdings with the Securities and Exchange Commission (“SEC”) for the first and third quarters of each fiscal year on Form N-Q. Each Fund’s Forms N-Q, as well as a description of the policies and procedures that each Fund uses to determine how to vote proxies (if any) relating to portfolio securities is available without charge: (i) upon request, by calling (800) 220-8888; and (ii) on the SEC’s web-site at http://www.sec.gov. Each Fund’s Forms N-Q may be reviewed and copied at the SEC’s Public Reference Room in Washington, DC; information on the operation of the Public Reference Room may be obtained by calling 1-800-SEC-0330.
Information (if any) regarding how the Funds voted proxies relating to portfolio securities during the most recently disclosed 12-month period ended June 30 is available: (i) without charge, upon request, by calling (800) 220-8888; and (ii) on the SEC’s web-site at http://www.sec.gov.
Tax Information
We are required to advise you within 60 days of the Funds’ fiscal year-end regarding the federal tax status of certain distributions received by shareholders during such fiscal year. The information below is provided for the fiscal year ending June 30, 2012. During the fiscal year ended June 30, 2012, the Fund distributed the following long-term capital gains.
| | | | | | | | |
Fund | | Amount | | | Per share | |
Capital Opportunities | | $ | 333,136 | | | $ | 0.55968 | |
Individual shareholders are eligible for reduced tax rates on the following percentages of qualified dividend income. For the purposes of computing the dividends eligible for reduced taxes, the following amounts of the dividends paid by the Fund from ordinary income earned during the fiscal year is considered qualified dividend income.
| | | | | | | | |
Fund | | Amount | | | Percentage | |
Capital Opportunities | | | — | | | | — | |
Corporate shareholders may exclude up to the following percentages of qualifying dividends. For the purposes of computing this exclusion, the following amounts of the dividends paid by the Fund from ordinary income earned during the fiscal year represents qualifying dividends.
| | | | | | | | |
Fund | | Amount | | | Percentage | |
Capital Opportunities | | | — | | | | — | |
Dividends and distributions received by retirement plans such as IRAs, Keogh type plans and 403(b) plans need not be reported as taxable income. However, many retirement plan trusts may need this information for their annual information reporting. Since the information above is reported for the Fund’s fiscal year and not the calendar year, shareholders should refer to their Form 1099-DIV or other tax information which will be mailed in January 2013 to determine the calendar year amounts to be included on their 2012 tax returns. Shareholders should consult their tax advisers.
2012 ANNUAL REPORT | 28
The Quaker Funds are distributed by
Foreside Fund Services, LLC.
Contact us:
Quaker Funds, Inc.
c/o U.S. Bancorp Fund Services, LLC.
PO Box 701
Milwaukee, WI 53201-0701
800-220-8888
www.quakerfunds.com
©2012 Quaker® Investment Trust
| | |
| | QKARCO 062012 |
Item 2. Code of Ethics.
As of the period ended June 30, 2012 (the “Reporting Period”), the Registrant has adopted a code of ethics that applies to the Registrant’s Principal Executive Officer and Principal Financial Officer. During the Reporting Period, there have been no changes to, amendments to, or waivers from, any provision of the code of ethics. A copy of this code of ethics, dated June 30, 2007, is filed as an Exhibit to this Form N-CSR pursuant to Item 12(a)(1).
Item 3. Audit Committee Financial Expert.
The Registrant’s Board of Trustees (the “Board”) has determined that the Registrant has one audit committee financial expert serving on its audit committee. The Board has designated Everett T. Keech audit committee financial expert serving on the registrant’s audit committee, and determined that Everett T. Keech is independent within the meaning of paragraph (a)(2) of Item 3 of Form N-CSR.
Item 4. Principal Accountant Fees and Services.
| | (a) | Audit Fees: The aggregate fees billed for each of the last two fiscal years for professional services rendered to the Registrant by the principal accountant for the audit of the Registrant’s annual financial statements or services that are normally provided by the accountant in connection with statutory and regulatory filings or engagements for those fiscal years are $100,000 for 2012 and $174,750 for 2011. |
| | (b) | Audit-Related Fees: The aggregate fees billed in each of the last two fiscal years for assurance and related services rendered to the Registrant by the principal accountant that are reasonably related to the performance of the audit of the Registrant’s financial statements and are not reported under paragraph (a) of this Item are $0 for 2012 and $1,500 for 2011. |
| | (c) | Tax Fees: The aggregate fees billed in each of the last two fiscal years for professional services rendered to the Registrant by the principal accountant for tax compliance, tax advice, and tax planning are $20,000 for 2012 and $34,315 for 2011. The services for each of the fiscal years ended June 30, 2012 and June 30, 2011 consisted of: (i) review or preparation of U.S. federal, state, local and excise tax returns; (ii) U.S. federal, state and local tax planning, advice and assistance regarding statutory, regulatory or administrative developments; and (iii) tax advice regarding tax qualification. |
| | (d) | All Other Fees: The aggregate fees billed in each of the last two fiscal years for products and services provided by the principal accountant, other than the services reported in paragraphs (a) through (c) of this Item are $0 for 2012 and $0 for 2011. |
| | (e) | The Audit Committee of the Board of Trustees (the “Audit Committee”) has not adopted pre-approval policies and procedures. Instead, pursuant to the registrant’s Audit Committee Charter that has been adopted by the Audit Committee, the Audit Committee shall approve, prior to appointment, the engagement of the auditor to provide audit services to the registrant and non-audit services to the registrant, its investment adviser or any entity controlling, controlled by or under common control with the investment adviser that provides on-going services to the registrant if the engagement relates directly to the operations and financial reporting of the Registrant. |
| | (f) | All of the principal accountant’s hours spent on auditing the Registrant’s financial statements were attributed to work performed by full time permanent employees of the principal accountant. |
| | (g) | The aggregate non-audit fees billed by the Registrant’s accountant for services rendered to the Registrant and to the Registrant’s investment adviser (not including any sub-adviser whose role is primarily portfolio management and whose activities are overseen by the Registrant’s investment adviser) and any entity controlling, controlled by, or under common control with the investment adviser that provides ongoing services to the Registrant, for each of the Registrant’s last two fiscal years are $0 for 2012 and $0 for 2011. |
| | (h) | The Audit Committee has considered whether the provision of non-audit services that were rendered to the Registrant’s investment adviser is compatible with maintaining the principal accountant’s independence. The Audit Committee has concluded that the provision of such non-audit services by the accountant has not compromised the accountant’s independence. |
Item 5. Audit Committee of Listed Registrants.
Not Applicable.
Item 6. Investments.
| | (a) | A Schedule of Investments in securities of unaffiliated issuers as of the close of the reporting period is included as part of the report to shareholders filed under Item 1, Report to Shareholders, of this Form N-CSR. |
Item 7. Disclosure of Proxy Voting Policies and Procedures for Closed-End Management Investment Companies.
Not Applicable.
Item 8. Portfolio Managers of Closed-End Management Investment Companies.
Not Applicable.
Item 9. Purchases of Equity Securities by Closed-End Management Investment Company and Affiliated Purchasers.
Not Applicable.
Item 10. Submission of Matters to a Vote of Security Holders.
There have been no material changes to the procedures by which shareholders may recommend nominees to the registrant’s Board of Trustees, where those changes were implemented after the Registrant last provided disclosure in response to the requirements of Item 407(c)(2)(iv) of Regulation S-K (as required by Item 22(b)(15) of Schedule 14A (17 CFR 240.14a-101)), or this Item.
Item 11. Controls and Procedures.
| | (a) | The Registrant’s Principal Executive Officer and Principal Financial Officer, or persons performing similar functions, have concluded that the Registrant’s disclosure controls and procedures (as defined in Rule 30a-3(c) under the Investment Company Act of 1940, as amended (the “1940 Act”)(17 CFR 270.30a-3(c))) were effective, as of a date within 90 days of the filing date of this report, based on their evaluation of the effectiveness of the Registrant’s disclosure controls and procedures as required by Rule 30a-3(b) under the 1940 Act (17 CFR 270.30a-3(b)) and Rules 13a-15(b) or 15d-15(b) under the Securities Exchange Act of 1934, as amended (17 CFR 240.13a-15(b) or 240.15d-15(b)). |
| | (b) | There were no changes in the Registrant’s internal control over financial reporting (as defined in Rule 30a-3(d) under the 1940 Act (17 CFR 270.30a-3(d)) that occurred during the Registrant’s second fiscal quarter of the period covered by this report that have materially affected, or are reasonably likely to materially affect, the Registrant’s internal control over financial reporting. |
Item 12. Exhibits.
| | (a) (1) | Registrant’s Code of Ethics for Senior Officers pursuant to the Sarbanes-Oxley Act of 2002 is filed as Exhibit 12(a)(1) to this Form N-CSR. |
| | (a) (2) | Certifications required by Rule 30a-2(a) under the 1940 Act and Section 302 of the Sarbanes-Oxley Act of 2002 are filed as Exhibit 12(a)(2) to this Form N-CSR. |
| | (b) | Certifications required by Rule 30a-2(b) under the 1940 Act and Section 906 of the Sarbanes-Oxley Act of 2002 are furnished as Exhibit 12(b) to this Form N-CSR. |
SIGNATURES
Pursuant to the requirements of the Securities Exchange Act of 1934 and the Investment Company Act of 1940, the registrant has duly caused this report to be signed on its behalf by the undersigned, thereunto duly authorized.
| | | | |
| (Registrant) | | Quaker Investment Trust |
| | |
| By (signature and title) | | | | /s/ Jeffry H. King, Sr. |
| | | | Jeffry H. King, Sr. |
| | | | Chief Executive Officer |
| | |
| Date | | | | September 6, 2012 |
Pursuant to the requirements of the Securities Exchange Act of 1934 and the Investment Company Act of 1940, this report has been signed below by the following persons on behalf of the registrant and in the capacities and on the dates indicated.
| | | | |
| | |
| By (signature and title) | | | | /s/ Jeffry H. King, Sr. |
| | | | Jeffry H. King, Sr. |
| | | | Chief Executive Officer |
| | |
| Date | | | | September 6, 2012 |
| | |
| By (signature and title) | | | | /s/ Laurie Keyes |
| | | | Laurie Keyes |
| | | | Treasurer |
| | |
| Date | | | | September 6, 2012 |

