UNITED STATES
SECURITIES AND EXCHANGE COMMISSION
Washington, D.C. 20549
FORM N-CSR
CERTIFIED SHAREHOLDER REPORT OF REGISTERED
MANAGEMENT INVESTMENT COMPANIES
Investment Company Act file number (811-06260)
Quaker Investment Trust
(Exact name of registrant as specified in charter)
309 Technology Drive
Malvern, PA 19355
(Address of principal executive offices) (Zip code)
Jeffry H. King, Sr.
Quaker Investment Trust
309 Technology Drive
Malvern, PA 19355
(Name and address of agent for service)
(800) 220-8888
Registrant’s telephone number, including area code
Date of fiscal year end: June 30, 2013
Date of reporting period: June 30, 2013
Item 1. Report to Stockholders.
Quaker Akros Absolute Return Fund
Quaker Event Arbitrage Fund
Quaker Global Tactical Allocation Fund
Quaker Mid-Cap Value Fund
Quaker Small-Cap Growth Tactical Allocation Fund
Quaker Small-Cap Value Fund
Quaker Strategic Growth Fund

Mutual fund investing involves risk. Principal loss is possible. Investing in the Quaker Funds may involve special risk including, but not limited to, investments in smaller companies, non-diversification, short sales, foreign securities, special situations, debt securities and value growth investing. Please refer to the prospectus for more complete information. This report must be preceded or accompanied by a current prospectus. The opinions expressed are those of the sub-adviser through the end of the period for this report, are subject to change, are not a guarantee, and should not be considered investment advice. Fund holdings are subject to change and should not be considered a recommendation to buy or sell any security. Current and future holdings are subject to risk. |
Chairman’s Letter to the Shareholders (Unaudited)
June 30, 2013
Dear Fellow Shareholder,
The premise on which Quaker Funds, Inc. was founded was the desire to afford everyday investors access to the same tactical allocation used by professional money managers to augment traditional investing strategies within a holistic asset allocation mix. Our commitment to this principle is still as strong today as it was the day we opened our doors.
Our management team continually strives to provide our shareholders with innovative investment alternatives and advisers that constantly seek superior returns. Thank you for your trust and investment in the Quaker Funds.
Sincerely,
Jeffry King
Chairman & CEO
Quaker Investment Trust
Performance Update (Unaudited)
Quaker Akros Absolute Return Fund (AARFX, QASDX, QASIX)
INVESTMENT OBJECTIVE AND PRINCIPAL INVESTMENT STRATEGIES
The Quaker Akros Absolute Return Fund (“Fund”) seeks to provide long-term capital appreciation and income, while seeking to protect principal during unfavorable market conditions.
PERFORMANCE REVIEW AND MARKET OUTLOOK
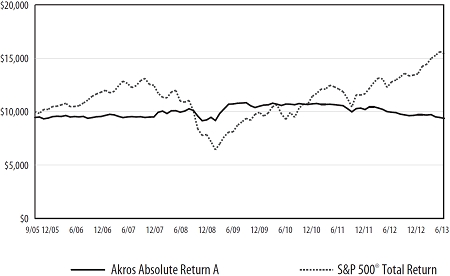
For the fiscal year ended June 30, 2013, the Fund was down -5.82% while the S&P 500 Total Return Index (S&P 500) gained 20.60%. For the six months ended June 30, 2013, the Fund was down -3.50% while the S&P 500 returned 13.82%
The performance of AARFX for the twelve months ending June 30th, 2013 was the most disappointing twelve month period we have had since starting the Fund almost eight years ago. Our bearish stance on the market was the biggest contributor to the Fund’s underperformance. In particular, betting against the American consumer and home builders in the face of falling interest rates hurt us the most. We still have strong convictions that these segments of the market will be very vulnerable in the face of higher interest rates which, we believe have finally arrived. We continue to hold short positions in these expensive segments of the market.
On the long side, the biggest detractors from performance were Knight Capital Group, Inc. (KCG), SuperValu, Inc. (SVU), Professional Diversity Network, Inc. (IPDN) and ATP Oil & Gas Corp. bonds. We have since sold our position in KCG and SVU but continue to hold IPDN as we believe there is huge upside potential considering their recent strategic partnership with LinkedIn. On the short side, the biggest detractors from performance were positions in Sherwin-Williams Co. (SHW) and Canadian Pacific Railway Ltd. (CP).
Stocks having the biggest positive impact on our fund were: Citigroup, Inc. (C), Nokia Corp. (NOK), Cooper Tire & Rubber Co. (CTB), Synergy Pharmaceuticals, Inc. (SGYP), Total, S.A. (TOT) and Kips Bay Medical, Inc. (KIPS). We have sold all those stocks with the exception of SGYP which we believe has significant long term upside potential as they are entering Phase III trials with a chronic constipation drug that could be a blockbuster drug if it gets approved. The Phase IIb results were so impressive that I believe there is a chance the company could be an acquisition target for larger cap pharmaceutical firms. Short positions that helped us included Chipotle Mexican Grill, Inc. (CMG) and Salesforce.com, Inc. (CRM).
Looking ahead, we may become more trading oriented, as we believe we could be nearing an inflection point this fall. With that said, we have tempered our bearishness to the point that we have limited our losses, and we anticipate making up for our past mistakes with solid performance going forward. We continue to respect the fact that the stock market can continue to move higher in the near term due to its tremendous momentum and push from the world’s central banks. We will be watching interest rates, credit growth, and economic indicators as key gauges in making our asset allocation decisions for the remainder of the year. If interest rates rise much higher, we believe that such higher rates will exacerbate an already leveraged financial system. If the economy begins to deteriorate from an already anemic condition, despite the massive monetary stimulus being thrown at it, we believe that the end of this four-year recovery could be around the corner. The proverbial, “pushing on a string” liquidity trap that has embraced Japan for the past twenty-four years could be upon us. If credit growth begins to slow due to higher interest rates or fickleness on the part of investors, we believe the storm will have arrived. In such an environment, we believe that being short highly leveraged companies, while being long solid, reasonably priced growth companies with clean balance sheets will be a good strategy in such an environment.
We remain slightly net short the market on a beta adjusted basis and expect to remain slightly short at these stock market levels. There are stocks that interest us at lower levels and we may add to long positions in select stocks on weakness. For the foreseeable future, we would expect to be market neutral, plus or minus 25% depending on the opportunity sets. Most of our long positions will be special situations or trading situations in companies that have gotten too cheap.
Brady T. Lipp, Portfolio Manager
Akros Capital, LLC
| | SUB-ADVISER: |
| | Akros Capital, LLC |
| | |
| | TOTAL NET ASSETS:
AS OF JUNE 30, 2013
$4,202,223 |
| | |
| Top 10 Holdings ** (% of net assets) |
| | |
| Apple, Inc. | 2.83% |
| FibroGen, Inc. | 2.68% |
| Marvell Technology Group Ltd. | 2.26% |
| Barrick Gold Corp. | 2.25% |
| Synergy Pharmaceuticals, Inc. | 2.06% |
| Professional Diversity Network | 1.78% |
| Nuance Communications, Inc. | 1.75% |
| Encana Corp. | 1.61% |
| Agnico Eagle Mines Ltd | 1.31% |
| Devon Energy Corp. | 1.23% |
| | |
| % Fund Total | 19.76% |
| ** | Excludes Short-Term Investments |
| Sectors (% of net assets) |
| | | |
| n | 19.02% | Domestic Common Stocks |
| | 0.71% | Basic Materials |
| | 0.18% | Communications |
| | 1.78% | Consumer Staple |
| | 0.00% | Consumer, Cyclical |
| | 1.27% | Consumer, Non-cyclical |
| | 0.53% | Diversified |
| | 2.54% | Energy |
| | 1.41% | Financial |
| | 6.02% | Health Care |
| | 4.58% | Technology |
| n | 12.01% | Foreign Common Stocks |
| n | 2.68% | Preferred Stocks |
| n | 0.45% | Domestic Private Placements |
| n | 0.00% | Rights |
| n | 1.11% | Warrants |
| n | 0.03% | Corporate Bonds |
| n | 0.01% | Purchased Options |
| n | 22.75% | Short-Term Investments |
| n | 6.71% | Investments Purchased with Proceeds from Securities Lending |
| | 64.77% | Total Market Value of Investments |
| | 35.23% | Other Assets in Excess of Liabilities, Net |
| | 100.00% | Total Net Assets |
2 | 2 0 1 3 A N N U A L R E P O R T
| | |
| * | The benchmark since inception
returns are calculated for the period
September 30, 2005 through
June 30, 2013. |
| | |
Quaker Akros Absolute Return Fund
Growth of a Hypothetical $10,000 Investment
June 30, 2013
| Average Annualized Total Return |
| | | Expense
Ratio | | Inception
Date | | One Year | | Five Year | | Ten Year | | Commencement
of operations
through 6/30/2013 |
| | | | | | | with
sales
charge | | without
sales
charge | | with
sales
charge | | without
sales
charge | | with
sales
charge | | without
sales
charge | | with
sales
charge | | without
sales
charge |
| Class A | | 1.99 | % | | 09/30/2005 | | -10.98 | % | | -5.82 | % | | -2.32 | % | | -1.21 | % | | N/A | | N/A | | -0.84 | % | | -0.11 | % |
| Class C | | 2.74 | % | | 10/04/2010 | | -6.64 | % | | -6.64 | % | | N/A | | | N/A | | | N/A | | N/A | | -5.67 | % | | -5.67 | % |
| Institutional Class | | 1.74 | % | | 10/04/2010 | | -5.56 | % | | -5.56 | % | | N/A | | | N/A | | | N/A | | N/A | | -4.65 | % | | -4.65 | % |
| S&P 500® Total Return Index* | | 20.60 | % | | 20.60 | % | | 7.01 | % | | 7.01 | % | | N/A | | N/A | | 5.74 | % | | 5.74 | % |
Performance data quoted represents past performance and is no guarantee of future results. Investment return and principal value will fluctuate so that shares, when redeemed, may be worth more or less than their original cost. Current performance may be lower or higher than performance data quoted. Performance data current to the most recent month end is available at www.quakerfunds.com or by calling us toll free at 800-220-8888. Total return includes reinvestment of dividends and capital gains.
Class A shares of the Fund have a maximum sales charge of 5.50%.
The line graph and performance table do not reflect the deduction of taxes that a shareholder might pay on fund distributions or the redemption of fund shares. Total return calculations reflect expense reimbursements and fee waivers in the applicable periods. See financial highlights for periods where fees were waived or reimbursed.
The Fund’s portfolio holdings may differ significantly from the securities held in the index and, unlike a mutual fund, an unmanaged index assumes no transaction costs, taxes, management fees or other expenses. You cannot invest directly in an index.
The S&P 500® Total Return Index (“Index”) is a widely recognized, unmanaged index consisting of the approximately 500 largest companies in the United States as measured by market capitalization. The index assumes reinvestment of all dividends and distributions.
2 0 1 3 A N N U A L R E P O R T | 3
Performance Update (Unaudited)
Quaker Event Arbitrage Fund (QEAAX, QEACX, QEAIX)
OBJECTIVES AND PRINCIPAL STRATEGIES
The Quaker Event Arbitrage Fund (“Fund”) seeks to provide long-term growth of capital. The Fund generally invest in the securities of publicly traded companies involved in mergers, takeovers, tender offers, leveraged buyouts, spin-offs, liquidations or similar events.
PERFORMANCE REVIEW AND MARKET OUTLOOK
Over the last year the Fund returned 8.70%, whereas the total return of the S&P 500 was 20.60%. While the equity market gyrated over the last year, the Fund’s daily volatility was roughly 61% lower than that of the S&P 500.
The past 12 months proved more favorable for event driven investing than prior years. This is evident, as the HFRI Event Driven (Total) Index return was 12.43%. The HFRI Event Driven (Total) Index is a good barometer for the asset class as it aggregates many hedge funds into one index that represents Event Driven investing. Nevertheless, monetary policy has been more advantageous to direct market exposure than to other investment strategies like event-driven investment.
Looking forward, the portfolio management team sees opportunities in proxy fights, where activist investors are pushing underperforming companies to sell themselves. These investments have multiple ways to generate returns for the funds: first, activist investors prepare companies for a sale by eliminating governance problems that hold the firms back; second, they divest non-core assets and allow management to focus on the core business; third, they help the companies implement operational changes; and finally, the sale of the company occurs with a control premium.
This year, the Fund has found more opportunities in distressed securities of corporate issues. While most of the distress in recent years was found to lie mostly in distressed mortgage-backed securities, opportunities in this space can now be found in corporate distress. The Fund exited most of its mortgage backed securities holdings during the year as the risk/reward profile became less attractive when prices recovered closer to pre-crisis levels.
Finally, merger arbitrage remains a small portion of the portfolio. With interest rates remaining near historic lows this strategy in general generates unattractive returns, in particular in light of the risks incurred. Nevertheless, opportunities appear from time to time and the investment team invests on such occasions.
I wish all investors a prosperous year and thank you for your continued support.
Sincerely,
Thomas Kirchner, Portfolio Manager
Quaker Funds, Inc.
| | ADVISER: |
| | Quaker Funds, Inc. |
| | |
| | TOTAL NET ASSETS:
AS OF JUNE 30, 2013
$66,114,800 |
| | |
| Top 10 Holdings ** (% of net assets) |
| | |
| Regis Corp. | 2.01% |
| Integrated Device Technology, Inc. | 1.75% |
| Whitewave Foods Co. Class A | 1.75% |
| Vodafone Group PLC | 1.74% |
| Seachange International, Inc. | 1.53% |
| API Technologies Corp. | 1.49% |
| Fairpoint Communications, Inc. | 1.43% |
| NetApp, Inc. | 1.41% |
| Nuance Communications, Inc. | 1.40% |
| Long Beach Mortgage Loan Trust | 1.37% |
| | |
| % Fund Total | 15.88% |
| ** | Excludes Short-Term Investments |

| Sectors (% of net assets) |
| | |
| n | 49.90% | Domestic Common Stocks |
| | 0.88% | Basic Materials |
| | 10.60% | Communications |
| | 7.99% | Consumer, Cyclical |
| | 8.11% | Consumer, Non-cyclical |
| | 0.00% | Diversified |
| | 2.01% | Energy |
| | 1.14% | Healthcare |
| | 4.31% | Industrial |
| | 14.51% | Technology |
| | 0.35% | Utilities |
| n | 5.90% | Foreign Common Stocks |
| n | 0.93% | Preferred Stocks |
| n | 1.54% | Real Estate Investment Trusts |
| n | 0.00% | Rights |
| n | 0.75% | Warrants |
| n | 4.54% | Asset Backed Securities |
| n | 1.00% | Convertible Bonds |
| n | 3.13% | Corporate Bonds |
| n | 2.84% | Mortgage Backed Securities |
| n | 1.45% | Municipal Bonds |
| n | 0.77% | Term Loan |
| n | 2.15% | Purchased Options |
| n | 12.89% | Short-Term Investments |
| n | 6.46% | Investments Purchased with Proceeds from Securities Lending |
| | 94.25% | Total Market Value of Investments |
| | 5.75% | Other Assets in Excess of Liabilities, Net |
| | 100.00% | Total Net Assets |
4 | 2 0 1 3 A N N U A L R E P O R T
| | |
| * | The benchmark since inception
returns are calculated for the period
November 21, 2003 through
June 30, 2013. |
| | |
Quaker Event Arbitrage Fund
Growth of a Hypothetical $10,000 Investment
June 30, 2013

| Average Annualized Total Return |
| | | Expense
Ratio | | Inception
Date | | One Year | | Five Year | | Ten Year | | Commencement
of operations
through 6/30/2013 |
| | | | | | | with
sales
charge | | without
sales
charge | | with
sales
charge | | without
sales
charge | | with
sales
charge | | without
sales
charge | | with
sales
charge | | without
sales
charge |
| Class A | | 1.99 | % | | 11/21/2003 | | 2.75 | % | | 8.70 | % | | 3.34 | % | | 4.51 | % | | N/A | | N/A | | 5.52 | % | | 6.14 | % |
| Class C | | 2.74 | % | | 6/7/2010 | | 7.91 | % | | 7.91 | % | | N/A | | | N/A | | | N/A | | N/A | | 1.91 | % | | 1.91 | % |
| Institutional Class | | 1.74 | % | | 6/7/2010 | | 9.04 | % | | 9.04 | % | | N/A | | | N/A | | | N/A | | N/A | | 2.89 | % | | 2.89 | % |
| S&P 500 Total Return Index* | | 20.60 | % | | 20.60 | % | | 7.01 | % | | 7.01 | % | | N/A | | N/A | | 6.85 | % | | 6.85 | % |
Performance data quoted represents past performance and is no guarantee of future results. Investment return and principal value will fluctuate so that shares, when redeemed, may be worth more or less than their original cost. Current performance may be lower or higher than performance data quoted. Performance data current to the most recent month end is available at www.quakerfunds.com or by calling us toll free at 800-220-8888. Total return includes reinvestment of dividends and capital gains.
Class A shares of the Fund have a maximum sales charge of 5.50%.
The line graph and performance table do not reflect the deduction of taxes that a shareholder might pay on fund distributions or the redemption of fund shares. Total return calculations reflect expense reimbursements and fee waivers in the applicable periods. See financial highlights for periods where fees were waived or reimbursed.
The Fund’s portfolio holdings may differ significantly from the securities held in the index and, unlike a mutual fund, an unmanaged index assumes no transaction costs, taxes, management fees or other expenses. You cannot invest directly in an index.
The S&P 500® Total Return Index (“Index”) is a widely recognized, unmanaged index consisting of the approximately 500 largest companies in the United States as measured by market capitalization. The Index assumes reinvestment of all dividends and distributions.
2 0 1 3 A N N U A L R E P O R T | 5
Performance Update (Unaudited)
Quaker Global Tactical Allocation Fund (QTRAX, QTRCX, QTRIX)
OBJECTIVES AND PRINCIPAL STRATEGIES
The Fund seeks to provide long-term growth of capital. The Fund invests in common stocks of U.S. companies and American Depository Receipts (“ADRs”) of foreign companies without regard to market capitalization. Under normal circumstances, the Fund will invest at least 40% of its total assets in common stocks and ADRs of foreign companies.
PERFORMANCE REVIEW AND MARKET OUTLOOK
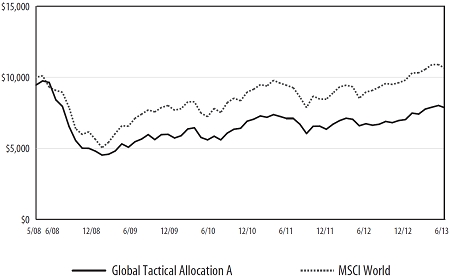
For the fiscal year ended June 30, 2013, the MSCI World Index (“MSCI World”) (a global market proxy) gained 18.58% while the Quaker Global Tactical Allocation Fund finished the fiscal year with a gain of 16.57%. For the first half of the 2013 calendar year, the MSCI World rose 8.43% while the Quaker Global Tactical Allocation Fund gained 11.71%.
In spite of a host of headwinds, markets exhibited robust advances over the last year, with all global sectors gaining ground. One of the biggest surprises for domestic markets in the first half of 2013 was the lack of damage from the fiscal cliff tax increases (which reduced personal income without impacting consumer spending) and sequestration spending cuts (which took effect in early March) lopping off 2% from overall government expenditures. Another surprise from Washington was the bipartisan debt ceiling compromise that allowed it to avoid a repeat of the showdown that ultimately led to a downgrade in federal debt in 2011. Along with sustained consumer spending and reduced political uncertainty, the housing rebound has also begun to provide a lift to the economy. Since so many potential problems were already “on the calendar,” bad news was already priced into equity prices, helping the slate of positive news provide upward momentum for domestic markets.
As we look back over the last couple years, it is undeniable that the Fed and other central banks have been the primary driver of stock market performance as anticipation of central bank moves have left a clear mark on the trajectory of equity prices. While changing expectations and shifts in fundamentals still have an effect, in the U.S., the Fed’s flood of liquidity largely overshadowed the ability of fundamental earnings analysis to determine proper valuation creating a difficult environment for stock picking. While the Bank of Japan continues to stimulate, this trend seems to finally be reversing itself domestically. The reversal began when the Fed added clarity to its liquidity program by setting definitive unemployment and inflation targets for continued Fed intervention in hopes of lessening the risk-on/risk-off market movements that characterized Fed announcements cycles. The trend continued with the taper announcement which, after a short “taper tantrum” sell-off, continued to add clarity to Fed intentions and stability to domestic markets. Time will tell if the Bank of Japan or the European Central bank follow suit.
Domestically, in addition to the clarity provided by the Fed, there continues to be bullish signs. While many are skeptical of future earnings growth since profit margins are at historic highs, it is difficult to fathom that corporate profitability is peaking while the developed world’s economy is in such a depressed state. If growth picks up (and the corporate cash hoard is put to work) profits will continue to have the ability to surprise on the upside. The flip side of earnings skepticism is the continued modest valuation of the S&P500, which at a 15x forward P/E multiple stands below the historical average valuation band. If economic conditions improve, there is plenty of room for multiple expansion.
Foreign economies looked much more dire for most of the year. Early this year, the Cypriot crisis reinforced the perception that the European crisis is far from over, with continued recession affecting much of the continent. The European slowdown also affected export markets in many emerging economies, which also had many homegrown issues including: wage pressure and weak manufacturing growth in China, rising inflation in Brazil and weakening natural gas prices in Russia (not to mention the periodic pounding of war-drums on the Korean peninsula). That said the global outlook is improving with growth in China beginning to stabilize and European recession showing indications that it may be at an end.
All sectors gained ground for the year with consumer discretionaries, healthcare (both overweights) and financials advancing the most and materials, utilities (both relative underweights) and technology trailing most other sectors. During the last 12 months the portfolio was helped by stock picks in the healthcare (Celgene and Biogen) and technology (Apple and Visa) sectors and hurt by stock picks in consumer staples (Mead Johnson) and financials (Capital One and Royal Bank of Scotland), as well as cash drag.
Over the last year, we concentrated our stock picking efforts on seeking out companies that have a definitive competitive advantage and access to consumer growth patterns, both domestically, but also in emerging markets. Areas fitting this pattern (which we called the three M’s) continue to be themes in the portfolio.
Media: which has enormous potential growth internationally through several channels and provides margin protection due to intellectual property rights (IP). The landscape has rapidly changed in this arena as content has gone digital allowing streaming video and audio services. As they are rolled out into areas with existing broadband infrastructure, services are highly scalable with little additional fixed cost, boosting margins dramatically.
Molecular Biology: which encompasses both drug companies and biotech. These firms again have protections from competition through IP and have an expanding customer base as their inroads into emerging markets become more profitable as those countries grow richer and can afford more sophisticated treatments and (to a lessor extent) as Obamacare broadens the population with healthcare coverage domestically. A slew of M&A deals have also pushed up prices in this sector recently.
Mobile: as more content migrates onto mobile platforms and more cell phones and smart phones are sold into emerging markets, companies that can leverage, capitalize and monetize their mobile presence will outmaneuver their competition.
| | SUB-ADVISER: |
| | DG Capital Management, Inc. |
| | |
| | TOTAL NET ASSETS:
AS OF JUNE 30, 2013
$6,605,687 |
| | |
| Top 10 Holdings ** (% of net assets) |
| | |
| Biogen Idec, Inc. | 3.80% |
| Gilead Sciences, Inc. | 3.15% |
| Google, Inc. Class A | 2.64% |
| American International Group, Inc. | 2.59% |
| CBS Corp. | 2.57% |
| Mastercard, Inc. Class A | 2.57% |
| Citigroup, Inc. | 2.54% |
| Adidas AG - ADR | 2.48% |
| ACE Ltd. | 2.48% |
| Allied World Assurance Co. Holdings AG | 2.45% |
| | |
| % Fund Total | 27.27% |
| ** | Excludes Short-Term Investments |
| Country Allocation (% of net assets) |
| | |
| n | 99.01% | Common Stocks |
| | 1.51% | Belgium |
| | 2.42% | Bermuda |
| | 1.31% | Denmark |
| | 2.25% | France |
| | 6.62% | Germany |
| | 1.94% | Ireland |
| | 1.44% | Japan |
| | 1.63% | Mexico |
| | 3.74% | Netherlands |
| | 11.12% | Switzerland |
| | 4.95% | United Kingdom |
| | 60.08% | United States |
| n | 0.40% | Short-Term Investments |
| n | 23.55% | Investments Purchased with Proceeds from Securities Lending |
| | 122.96% | Total Market Value of Investments |
| | (22.96)% | Liabilities in Excess of Other Assets, Net |
| | 100.00% | Total Net Assets |
6 | 2 0 1 3 A N N U A L R E P O R T
| | |
| * | The benchmark since inception
returns are calculated since
commencement of May 1, 2008
through June 30, 2013. |
| | |
More recently we have also increased our allocation to industrials which should benefit from the infrastructure build out needed to exploit fracking technology. Cheap energy costs in the U.S. along with slow growing labor costs and improving productivity have also begun to encourage the on shoring of some industrial production back in the U.S. (especially in light of fast growing wages in China, and rising transport costs) which will help further boost the sector.
We will continue to seek opportunities both domestically and worldwide that meet our investment criteria in an effort to provide a good risk adjusted return for our clients going forward, and at the same time the Fund will continue to take advantage of its mandate to protect capital by tactically raising cash and use its short-selling capabilities when we believe it is warranted. Thank you for your continued support.
Respectfully,
Manu P. Daftary, Portfolio Manager
DG Capital Management
Quaker Global Tactical Allocation Fund
Growth of a Hypothetical $10,000 Investment
June 30, 2013
| Average Annualized Total Return |
| | | Expense
Ratio | | Inception
Date | | One Year | | Five Year | | Ten Year | | Commencement
of operations
through 6/30/2013 |
| | | | | | | | with
sales
charge | | without
sales
charge | | with
sales
charge | | without
sales
charge | | with
sales
charge | without
sales
charge | with
sales
charge | | without
sales
charge |
| Class A | | 2.68 | % | | 5/1/2008 | | 10.23 | % | | 16.57 | % | | -5.09 | % | | -4.02 | % | | N/A | | N/A | | -4.59 | % | | -3.54 | % |
| Class C | | 3.43 | % | | 5/1/2008 | | 15.65 | % | | 15.65 | % | | -4.73 | % | | -4.73 | % | | N/A | | N/A | | -4.28 | % | | -4.28 | % |
| Institutional Class | | 2.43 | % | | 7/23/2008 | | 16.87 | % | | 16.87 | % | | N/A | | | N/A | | | N/A | | N/A | | -1.05 | % | | -1.05 | % |
| MSCI World Index* | | 18.58 | % | | 18.58 | % | | 2.70 | % | | 2.70 | % | | N/A | | N/A | | 1.18 | % | | 1.18 | % |
Performance data quoted represents past performance and is no guarantee of future results. Investment return and principal value will fluctuate so that shares, when redeemed, may be worth more or less than their original cost. Current performance may be lower or higher than performance data quoted. Performance data current to the most recent month end is available at www.quakerfunds.com or by calling us toll free at 800-220-8888. Total return includes reinvestment of dividends and capital gains.
Class A shares of the Fund have a maximum sales charge of 5.50%.
The line graph and performance table do not reflect the deduction of taxes that a shareholder might pay on fund distributions or the redemption of fund shares. Total return calculations reflect expense reimbursements and fee waivers in the applicable periods. See financial highlights for periods where fees were waived or reimbursed.
The Fund’s portfolio holdings may differ significantly from the securities held in the index and, unlike a mutual fund, an unmanaged index assumes no transaction costs, taxes, management fees or other expenses. You cannot invest directly in an index.
The Morgan Stanley Capital International World Index (“MSCI World Index”) measures developed-market equity performance throughout the world. The MSCI World Index assumes reinvestment of all dividends and distributions.
2 0 1 3 A N N U A L R E P O R T | 7
Performance Update (Unaudited)
Quaker Mid-Cap Value Fund (QMCVX, QMCCX, QMVIX)
OBJECTIVES AND PRINCIPAL STRATEGIES
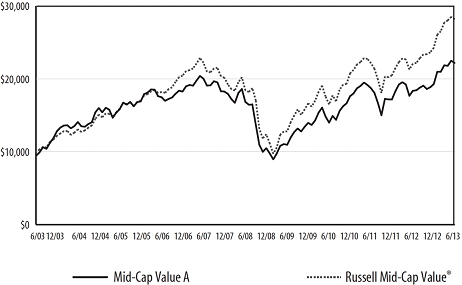
The Quaker Mid-Cap Value Fund (“Fund”) seeks to provide long-term growth of capital. Current income is not a significant investment consideration and any such income realized will be considered incidental to the Fund’s investment objective. The Fund invests primarily in common stocks comparable to the companies included in the Russell Midcap® Value Index.
PERFORMANCE REVIEW AND MARKET OUTLOOK
For the period from July 1, 2012 through June 30, 2013, the Fund generated a gain of 20.72% (before sales charges) and 14.05% (after sales charges) versus a gain of 27.65% for the Russell Midcap® Value Index. Every sector in the benchmark was up double-digits. The same was true for the Fund, except for the Information Technology and Telecommunication sectors (the fund has no exposure in telecommunication), the Information Technology sector only increased 6% due to poor performance from stocks that were either tied to the slowdown at bell weather Apple, Inc., or to the slower than expected recovery in semiconductor equipment capital spending. The Fund’s best relative performance came from the Materials sector, which increased 24% versus an increase of 14% in the benchmark. We believe our stocks did well and we avoided the worst performing industries and stocks in the sector.
In our opinion, a significant portion of the rally in equities over the past year can be attributed to the massive quantitative easing program implemented by the Federal Reserve. For the most part, the Federal Reserve’s liquidity injection had held rates on 10 year treasuries below 2 percent for the last 2 years, with rates reaching a low of 1.4% last July. With the interest rate shock to over 2.5% recently, the pace of outflows from bond funds accelerated towards the end of the second quarter, reaching $60 billion in June according to ICI. However, this still only represents less than 2% of the nearly $3.8 trillion total invested in bond funds, and additional asset reallocation could provide an increasing source of stimulus to equity markets.
Ultimately, we believe corporate performance will need to replace federal stimulus for equities to continue to perform well. Overall, returns remain high by historical standards, but growth opportunities continue to pose a challenge for management teams in the current slow growth environment. We believe our investment approach is well suited to such an environment, as we continue to focus our investments in companies with stable or improving returns on invested capital and a demonstrated ability to reinvest in the businesses.
Sincerely,
Frank Latuda, Jr. CFA
Chief Investment Officer & Portfolio Manager
Kennedy Capital Management, Inc.
| | SUB-ADVISER: |
| | Kennedy Capital Management, Inc. |
| | |
| | TOTAL NET ASSETS: |
| | AS OF JUNE 30, 2013 |
| | $8,904,312 |
| | |
| | |
| Top 10 Holdings ** (% of net assets) |
| | | |
| Torchmark Corp. | | 2.51% |
| Huntington Bancshares, Inc. | | 2.50% |
| Timken Co. | | 2.46% |
| Regions Financial Corp. | | 2.43% |
| Hospira, Inc. | | 2.30% |
| Harman International Industries, Inc. | | 2.23% |
| Keycorp | | 2.17% |
| Protective Life Corp. | | 2.12% |
| Dana Holding Corp. | | 2.10% |
| Reinsurance Group of America, Inc., Class A | | 2.10% |
| | | |
| % Fund Total | | 22.92% |
| ** | Excludes Short-Term Investments |

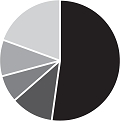
| Sectors (% of net assets) |
| ¢ | 83.59% | Domestic Common Stocks |
| | 4.56% | Basic Materials |
| | 10.69% | Consumer, Cyclical |
| | 9.76% | Consumer, Non-cyclical |
| | 8.95% | Energy |
| | 15.69% | Financial |
| | 17.27% | Industrial |
| | 8.80% | Technology |
| | 7.87% | Utilities |
| ¢ | 5.46% | Foreign Common Stocks |
| ¢ | 4.73% | Real Estate Investment Trusts |
| ¢ | 5.22% | Short-Term Investments |
| ¢ | 26.90% | Investments Purchased with Proceeds from Securities Lending |
| | 125.90% | Total Market Value of Investments |
| | (25.90)% | Liabilities in Excess of Other Assets, Net |
| | 100.00% | Total Net Assets |
8 | 2 0 1 3 A N N U A L R E P O R T
| | |
| * | The benchmark since inception returns are calculated since commencement of December 31, 1997 through June 30, 2013. |
| | |
Quaker Mid-Cap Value Fund
Growth of a Hypothetical $10,000 Investment
June 30, 2013
| Average Annualized Total Return |
| | | | | | | | | | | | | | | | | | | | | | | | | | Commencement | |
| | | Expense | | Inception | | | | | | | | | | | of operations | |
| | | Ratio | | Date | | One Year | | Five Year | | Ten Year | | through 6/30/2013 | |
| | | | | | | | with | | without | | with | | without | | with | | without | | with | | without | |
| | | | | | | | sales | | sales | | sales | | sales | | sales | | sales | | sales | | sales | |
| | | | | | | | charge | | charge | | charge | | charge | | charge | | charge | | charge | | charge | |
| Class A | | | 2.21 | % | | 12/31/1997 | | | 14.05 | % | | | 20.72 | | | | 4.47 | % | | | 5.66 | % | | | 8.29 | % | | | 8.91 | % | | | 6.52 | % | | | 6.90 | % | |
| Class C | | | 2.96 | % | | 7/31/2000 | | | 19.84 | % | | | 19.84 | % | | | 4.89 | % | | | 4.89 | % | | | 8.11 | % | | | 8.11 | % | | | 7.26 | % | | | 7.26 | % | |
| Institutional Class | | | 1.96 | % | | 11/21/2000 | | | 20.99 | % | | | 20.99 | % | | | 5.93 | % | | | 5.93 | % | | | 9.19 | % | | | 9.19 | % | | | 8.55 | % | | | 8.55 | % | |
| Russell Mid-Cap Value Index* | | | 27.65 | % | | | 27.65 | % | | | 8.87 | % | | | 8.87 | % | | | 10.92 | % | | | 10.92 | % | | | 8.79 | % | | | 8.79 | % | |
Performance data quoted represents past performance and is no guarantee of future results. Investment return and principal value will fluctuate so that shares, when redeemed, may be worth more or less than their original cost. Current performance may be lower or higher than performance data quoted. Performance data current to the most recent month end is available at www.quakerfunds.com or by calling us toll free at 800-220-8888. Total return includes reinvestment of dividends and capital gains.
Class A shares of the Fund have a maximum sales charge of 5.50%.
The line graph and performance table do not reflect the deduction of taxes that a shareholder might pay on fund distributions or the redemption of fund shares. Total return calculations reflect expense reimbursements and fee waivers in the applicable periods. See financial highlights for periods where fees were waived or reimbursed.
The Fund’s portfolio holdings may differ significantly from the securities held in the index and, unlike a mutual fund, an unmanaged index assumes no transaction costs, taxes, management fees or other expenses. You cannot invest directly in an index.
The Russell Midcap Value® Index is a widely recognized, unmanaged index of companies included in the Russell 1000 Index with current market capitalizations between $829 million and $12.2 billion. The Russell Midcap Value Index assumes reinvestment of all dividends.
2 0 1 3 A N N U A L R E P O R T | 9
Performance Update (Unaudited)
Quaker Small-Cap Growth Tactical Allocation Fund (QGASX, QGCSX, QGISX)
PERFORMANCE REVIEW AND MARKET OUTLOOK
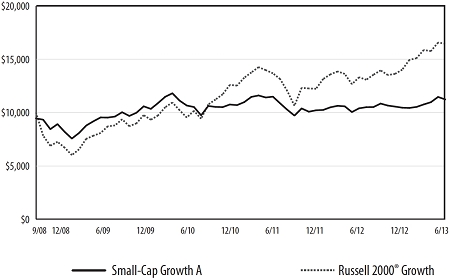
The Quaker Small-Cap Growth Tactical Allocation Fund (“The Fund”) increased 8.00% for the year ending June 30, 2013. The Russell 2000 Growth Index (“The Index”) increased 23.67% for the year. It is the benchmark against which the Fund is compared. As an absolute return strategy, the Fund will own stocks, hold cash, and sell short the Index against its equity positions. The objective of the strategy is to enable its shareholders to make money in all markets, owning small cap and microcap growth stocks only when we believe they measure a considerable margin of safety.
The equities of the Fund increased 15.77% for the fiscal year. The fund had a net equity invested position of 59.27% during the year. The average cash position was 15.35% and the average ‘short’ position was 25.38%. Importantly, the cash position and the ‘shorts’ are not derived from a macro- economic ‘top down’ view or from an assessment of the overall market’s valuation. The equities are held and owned regardless of the economic or market environment as long as they meet three strict criteria that comprise our assessment of the appropriate ‘margin of safety:’ These companies have to have a price/earnings ratio less than their anticipated growth rate of earnings; the companies must have a debt to market capitalization ratio of less than twenty five percent; and the companies must have a market price that exceeds their one-hundred and fifty day moving average price. If there are not enough equities that meet these criteria, the Fund defaults to own cash until other opportunities arise.
The decision to sell short the Index and to cover the shorts is mechanical and depends solely upon two measures of sentiment. The short position is activated when the number of advancing stocks over a ten day period exceeds the number of declining stocks by at least thirty percent. Oppositely, the position is ‘covered’ when the number of advancing stocks is at least thirty percent less than the declining stocks over the same ten day period. Generally, the strategy employs the short selling on a fairly short term basis and is effective to help preserve gains from the equities in the portfolio. It did so until the end of November of 2012 and the Fund was outperforming the Index. However, from the bottom of that market, the ten day moving average discipline triggered the short selling position but never really triggered an action to ‘cover’ those shorts. As a result, the portfolio of the Fund declined - 5.36% more than it would have if the shorts were not used. Like many other hedged strategies that seek absolute returns, the past few years’ performance of the Fund have been very disappointing, mostly because of the short position of the portfolio.
The most aggravating equity in the Fund this past year was Velti PLC. A new media advertising company, it provides advanced insights and analysis for companies wanting to advertise on the proliferating mobile devices. During the year they changed their strategy and reorganized a very successful, fast growing business. Unfortunately, their revamp was going to cost them some money, but, more importantly, time to recover their profitability. The company declined considerably in price and cost the portfolio -5.25%.
By any measure, the Fund had a disappointing year whose potential return was diminished by a large cash position, a large short position, and a large loss in a single company. It did achieve its objective by limiting downside risk to the extent that it barely dipped below par during the most difficult months of the early part of the fiscal year, especially in July and then, again, in November when the Index became untracked and declined over ten percent from its previous high. The Fund continues to maintain its hallmark profile of very low volatility of price when compared to the Index.
Stephen W. Shipman, CFA
Portfolio Manager
| | SUB-ADVISER: |
| | Century Management, Inc. |
| | |
| | TOTAL NET ASSETS: |
| | AS OF JUNE 30, 2013 |
| | $3,443,885 |
| | |
| | |
| Top 10 Holdings ** (% of net assets) |
| | | |
| WMS Industries, Inc. | | 5.48% |
| Arbitron, Inc. | | 5.13% |
| Direxion Daily Small Cap Bear 3X Shares | | 4.72% |
| ProShares UltraPro Short Russell 2000 | | 4.66% |
| Comstock Mining, Inc. | | 3.59% |
| Core-Mark Holding Co., Inc. | | 3.32% |
| Tangoe, Inc. | | 3.18% |
| Mitcham Industries, Inc. | | 2.92% |
| PowerSecure International, Inc. | | 2.84% |
| RF Micro Devices, Inc. | | 2.73% |
| | | |
| % Fund Total | | 38.57% |
| ** | Excludes Short-Term Investments |
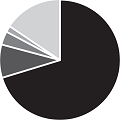
| Sectors (% of net assets) |
| | | |
| ¢ | 66.34% | Domestic Common Stocks |
| | 4.91% | Basic Materials |
| | 6.11% | Communications |
| | 11.97% | Consumer, Cyclical |
| | 8.58% | Consumer, Non-cyclical |
| | 4.05% | Energy |
| | 3.29% | Financial |
| | 11.02% | Industrial |
| | 16.41% | Technology |
| ¢ | 14.27% | Foreign Common Stocks |
| ¢ | 9.38% | Exchange Traded Funds |
| ¢ | 12.35% | Short-Term Investments |
| ¢ | 24.32% | Investments Purchased with Proceeds from Securities Lending |
| | 126.66% | Total Market Value of Investments |
| | (26.66)% | Liabilities in Excess of Other Assets, Net |
| | 100.00% | Total Net Assets |
10 | 2 0 1 3 A N N U A L R E P O R T
| | |
| * | The benchmark since inception returns are calculated since commencement of September 30, 2008 through June 30, 2013. |
| | |
Quaker Small-Cap Growth Tactical Allocation Fund
Growth of a Hypothetical $10,000 Investment
June 30, 2013
| Average Annualized Total Return |
| | | | | | | | | | | | | | | | | | | Commencement | |
| | | Expense | | Inception | | | | | | | | | | | | | | of operations | |
| | | Ratio | | Date | | One Year | | Five Year | | Ten Year | | through 6/30/2013 | |
| | | | | | | with | | without | | with | | without | | with | | without | | with | | without | |
| | | | | | | sales | | sales | | sales | | sales | | sales | | sales | | sales | | sales | |
| | | | | | | charge | | charge | | charge | | charge | | charge | | charge | | charge | | charge | |
| Class A | | | 2.28 | % | | 9/30/2008 | | | 2.02 | % | | | 8.00 | % | | | N/A | | | | N/A | | | | N/A | | | | N/A | | | | 2.46 | % | | | 3.69 | % | |
| Class C | | | 3.03 | % | | 9/30/2008 | | | 7.08 | % | | | 7.08 | % | | | N/A | | | | N/A | | | | N/A | | | | N/A | | | | 2.89 | % | | | 2.89 | % | |
| Institutional Class | | | 2.03 | % | | 9/30/2008 | | | 8.24 | % | | | 8.24 | % | | | N/A | | | | N/A | | | | N/A | | | | N/A | | | | 3.95 | % | | | 3.95 | % | |
| Russell 2000 Growth Index* | | | 23.67 | % | | | 23.67 | % | | | N/A | | | | N/A | | | | N/A | | | | N/A | | | | 11.06 | % | | | 11.06 | % | |
Performance data quoted represents past performance and is no guarantee of future results. Investment return and principal value will fluctuate so that shares, when redeemed, may be worth more or less than their original cost. Current performance may be lower or higher than performance data quoted. Performance data current to the most recent month end is available at www.quakerfunds.com or by calling us toll free at 800-220-8888. Total return includes reinvestment of dividends and capital gains.
Class A shares of the Fund have a maximum sales charge of 5.50%.
The line graph and performance table do not reflect the deduction of taxes that a shareholder might pay on fund distributions or the redemption of fund shares. Total return calculations reflect expense reimbursements and fee waivers in the applicable periods. See financial highlights for periods where fees were waived or reimbursed.
The Fund’s portfolio holdings may differ significantly from the securities held in the index and, unlike a mutual fund, an unmanaged index assumes no transaction costs, taxes, management fees or other expenses. You cannot invest directly in an index.
The Russell 2000® Growth Index is an unmanaged index that measures the performance of the small-cap growth segment of the U.S. equity universe. It includes the Russell 2000 companies with higher price-to-value ratios and higher forecasted growth values. The Index assumes reinvestment of all dividends and distributions.
2 0 1 3 A N N U A L R E P O R T | 11
Performance Update (Unaudited)
Quaker Small-Cap Value Fund (QUSVX, QSVCX, QSVIX)
OBJECTIVES AND PRINCIPAL STRATEGIES
The Fund seeks to provide long-term growth of capital. Current income is not a significant investment consideration, and any such income realized will be considered incidental to the Fund’s investment objective. The Fund invests primarily in common stocks of U.S. companies with market capitalizations similar to the market capitalizations of companies included in the Russell 2000® Index and Russell 2500® Index. The Fund invests in companies considered by the Fund’s sub-adviser to have consistent earnings and above-average core assets, selling at relatively low market valuations, with attractive growth and momentum characteristics.
PERFORMANCE REVIEW AND MARKET OUTLOOK
For the fiscal year ended June 30, 2013, the Fund’s performance was 23.17%, while the Fund’s benchmark, the Russell 2000® Index (a broad-based cross-section of the entire U.S. small-cap market) returned 24.21%. Working from the bottom up, we evaluate companies relative to their industry peers using three broad categories of attractiveness: value, management, and momentum. Value to us means fairly traditional ratios of price to fundamental value; management measures seek evidence that company management has produced and will continue to produce earnings power; and gauges of momentum help us determine when stocks might be expected to begin their ascent toward full valuation.
Our shortfall over the fiscal year can be attributed to one of the three broad categories of attractiveness we use to pick stocks —management — and was almost entirely due to the emphasis we place on earnings quality. This was most evident in the consumer discretionary sector as stocks with strong management scores, such as Apollo Group (APOL) underperformed. The Fund’s market-cap distribution also held back performance: Aronson Johnson Ortiz overweights the small-cap names in its universe and implements a corresponding underweight to the most microcap names, contrary to market preference this period. On the other hand, both value and momentum were positive influences, particularly across the Fund’s holdings in the energy, healthcare, and industrial sectors where nearly all factors worked to our advantage. Examples include Tesoro (TSO) and Alliant Techsystems (ATK).
We remain firm in our conviction that superior results can be achieved through a consistent, systematic approach that focuses on low-priced companies with proven management and earnings power.
The Portfolio Management Team
Aronson Johnson Ortiz
| | SUB-ADVISER: |
| | Aronson Johnson Ortiz, LP. |
| | |
| | TOTAL NET ASSETS: |
| | AS OF JUNE 30, 2013 |
| | $32,745,259 |
| | |
| | |
| Top 10 Holdings ** (% of net assets) |
| | |
| GameStop Corp. | 1.33% |
| Huntington Bancshares, Inc. | 1.32% |
| CBOE Holdings, Inc. | 1.31% |
| Alliant Techsystems, Inc. | 1.31% |
| Exelis, Inc. | 1.26% |
| NV Energy, Inc. | 1.25% |
| Packaging Corp. of America | 1.24% |
| Myriad Genetics, Inc. | 1.23% |
| EMCOR Group, Inc. | 1.22% |
| Manhattan Associates, Inc. | 1.20% |
| | |
| % Fund Total | 12.67% |
| ** | Excludes Short-Term Investments |
| Sectors (% of net assets) |
| | | |
| ¢ | 84.48% | Domestic Common Stocks |
| | 3.07% | Basic Materials |
| | 6.47% | Communications |
| | 11.41% | Consumer, Cyclical |
| | 17.57% | Consumer, Non-cyclical |
| | 4.98% | Energy |
| | 14.86% | Financial |
| | 16.34% | Industrial |
| | 6.18% | Technology |
| | 3.60% | Utilities |
| ¢ | 10.65% | Foreign Common Stocks |
| ¢ | 4.23% | Real Estate Investment Trusts |
| ¢ | 2.22% | Short-Term Investments |
| ¢ | 18.42% | Investments Purchased with Proceeds from Securities Lending |
| | 120.00% | Total Market Value of Investments |
| | (20.00)% | Liabilities in Excess of Other Assets, Net |
| | 100.00% | Total Net Assets |
12 | 2 0 1 3 A N N U A L R E P O R T
| | |
| * | The benchmark since inception returns are calculated since commencement of November 25, 1996 through June 30, 2013. |
| | |
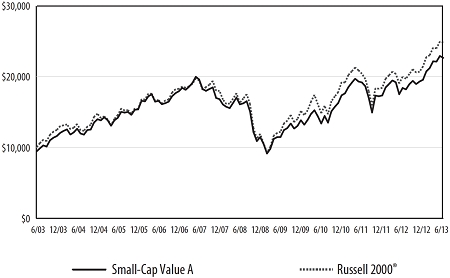
Quaker Small-Cap Value Fund
Growth of a Hypothetical $10,000 Investment
June 30, 2013
| Average Annualized Total Return |
| | | | | | | | | | | | | | | | | | | Commencement | |
| | | Expense | | Inception | | | | | | | | of operations | |
| | | Ratio | | Date | | One Year | | Five Year | | Ten Year | | through 6/30/2013 | |
| | | | | | | with | | without | | with | | without | | with | | without | | with | | without | |
| | | | | | | sales | | sales | | sales | | sales | | sales | | sales | | sales | | sales | |
| | | | | | | charge | | charge | | charge | | charge | | charge | | charge | | charge | | charge | |
| Class A | | 1.96% | | 11/25/1996 | | | 16.41 | % | | | 23.17 | % | | | 5.87 | % | | | 7.08 | % | | | 8.53 | % | | | 9.14 | % | | | 9.56 | % | | | 9.93 | % | |
| Class C | | 2.71% | | 7/28/2000 | | | 22.24 | % | | | 22.24 | % | | | 6.27 | % | | | 6.27 | % | | | 8.34 | % | | | 8.34 | % | | | 8.54 | % | | | 8.54 | % | |
| Institutional Class | | 1.71% | | | | 9/12/2000 | | | 23.44 | % | | | 23.44 | % | | | 7.34 | % | | | 7.34 | % | | | 9.41 | % | | | 9.41 | % | | | 8.76 | % | | | 8.76 | % | |
| Russell 2000® Index* | | | 24.21 | % | | | 24.21 | % | | | 8.77 | % | | | 8.77 | % | | | 9.53 | % | | | 9.53 | % | | | 7.75 | % | | | 7.75 | % | |
Performance data quoted represents past performance and is no guarantee of future results. Investment return and principal value will fluctuate so that shares, when redeemed, may be worth more or less than their original cost. Current performance may be lower or higher than performance data quoted. Performance data current to the most recent month end is available at www.quakerfunds.com or by calling us toll free at 800-220-8888. Total return includes reinvestment of dividends and capital gains.
Class A shares of the Fund have a maximum sales charge of 5.50%.
The line graph and performance table do not reflect the deduction of taxes that a shareholder might pay on fund distributions or the redemption of fund shares. Total return calculations reflect expense reimbursements and fee waivers in the applicable periods. See financial highlights for periods where fees were waived or reimbursed.
The Fund’s portfolio holdings may differ significantly from the securities held in the index and, unlike a mutual fund, an unmanaged index assumes no transaction costs, taxes, management fees or other expenses. You cannot invest directly in an index.
The Russell 2000® Index is a widely recognized, unmanaged index comprised of the smallest 2000 companies represented in the Russell 3000® Index. The Russell 2000 Index currently represents approximately 8% of the market capitalization of the Russell 3000® Index.
2 0 1 3 A N N U A L R E P O R T | 13
Performance Update (Unaudited)
Quaker Strategic Growth Fund (QUAGX, QAGCX, QAGIX)
OBJECTIVES AND PRINCIPAL STRATEGIES
The Fund seeks to provide long-term growth of capital. Current income is not a significant investment consideration. The Fund invests primarily in equity securities of domestic U.S. companies which the Fund’s sub-adviser believes show a high probability for superior growth.
PERFORMANCE REVIEW AND MARKET OUTLOOK
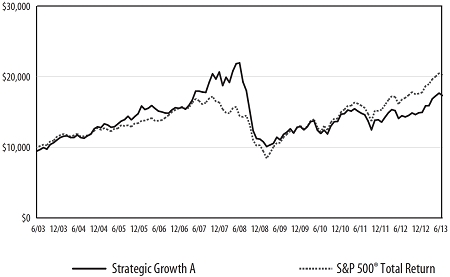
For the fiscal year ended June 30, 2013, the S&P 500 Total Return Index (the “S&P 500®”) (a broad based market proxy) gained 20.60% while the Class A shares of the Quaker Strategic Growth Fund finished the fiscal year with a total return of 19.71%. For the first half of calendar year 2013, the S&P 500® gained 13.82% while the Quaker Strategic Growth Fund rose 15.84%.
In spite of a host of headwinds, markets exhibited robust advances over the last year, with all domestic sectors gaining ground. One of the biggest surprises for the first half of 2013 was the lack of damage from the fiscal cliff tax increases, which reduced personal income without significantly impacting consumer spending. Sequestration spending cuts also took effect in early March lopping off 2% from overall government expenditures, which comprise upward of 20-25% of U.S. GDP (however much of this will be implemented over time). The real upside surprise from Washington was the bipartisan debt ceiling compromise that allowed it to avoid a repeat of the showdown that ultimately led to a downgrade in federal debt in 2011. Along with sustained consumer spending and reduced political uncertainty, the housing rebound has also begun to provide a lift to the economy. Increasing prices and a declining supply of houses has spurred new housing construction to such an extent that it has actually added to, rather than subtracted from, economic growth for the first time in six years.
All sectors gained ground for the year with consumer discretionaries, healthcare (both overweights) and financials advancing the most and tech, telecom and utilities (all relative underweights) trailing most other sectors. During the last 12 months the portfolio was helped by stock picks in the healthcare (Vertex and Celgene) and technology sectors and hurt by stock picks in consumer staples (Mead Johnson) and financials (Capital One), as well as cash drag.
Looking at the portfolio sector by sector, over the last year we concentrated our stock picking efforts on seeking out companies that have a definitive competitive advantage and a runway to consumer growth patterns, both domestically, but also in emerging markets. Areas fitting this pattern we called the three M’s, all of which continue to be themes in the portfolio.
Media: which has enormous potential growth internationally through several channels (including streaming video and audio – which is very scalable) and provides margin protection due to intellectual property rights (IP).
Molecular Biology: which encompasses both drug companies and biotech. These firms again have protections from competition through IP and have an expanding customer base as their inroads into emerging markets become more profitable as those countries grow richer and can afford more sophisticated treatments.
Mobile: as more content migrates onto mobile platforms and more cell phones and smart phones are sold into emerging markets, companies that can leverage, capitalize and monetize their mobile presence will outmaneuver their competition.
More recently we have also increased our allocation to industrials which should benefit from the infrastructure build out needed to exploit fracking technology. Cheap energy costs in the U.S. along with slow growing labor costs and improving productivity have also begun to encourage the on shoring of some industrial production back to the U.S. (especially in light of fast growing wages in China, and rising transport costs) which will help further boost the sector. We have largely avoided the utilities and telecom sectors whose bond-like characteristics and high dividend rates have driven up valuations as investors bid them up in a desperate search for yields. These same characteristics will likely work against them as interest rates begin to rise.
Going forward, earnings should play an increasingly positive role in equity markets. While profitability is high by historical standards, earnings peaks are generally associated with strong, vibrant economic activity. Given the recession in Europe, slowdown in China, emerging market doldrums and high unemployment in the U.S., it is difficult to fathom that economic activity, and the resultant earnings, have peaked.
We will continue to seek opportunities both domestically and worldwide that meet our investment criteria in an effort to provide a good risk adjusted return for our shareholders going forward, and at the same time the Fund will continue to take advantage of its mandate to protect capital by tactically raising cash and use its short-selling capabilities when we believe it is warranted. Thank you for your continued support.
Respectfully,
Manu P. Daftary, Portfolio Manager
DG Capital Management
| | SUB-ADVISER: |
| | DG Capital Management, Inc. |
| | |
| | TOTAL NET ASSETS: |
| | AS OF JUNE 30, 2013 |
| | $157,789,693 |
| | |
| | |
| Top 10 Holdings ** (% of net assets) |
| | | |
| Biogen Idec, Inc. | | 3.71% |
| Gilead Sciences, Inc. | | 3.09% |
| American International Group, Inc. | | 2.52% |
| CBS Corp. | | 2.51% |
| Mastercard, Inc. Class A | | 2.47% |
| Citigroup, Inc. | | 2.46% |
| ACE Ltd. | | 2.34% |
| Google, Inc. Class A | | 2.33% |
| Novartis AG - ADR | | 2.26% |
| AbbVie, Inc. | | 2.20% |
| % Fund Total | | 25.89% |
| ** | Excludes Short-Term Investments |
| Sectors (% of net assets) |
| | | |
| ¢ | 76.28% | Domestic Common Stocks |
| | 1.24% | Basic Materials |
| | 16.48% | Communications |
| | 11.26% | Consumer, Cyclical |
| | 25.94% | Consumer, Non-cyclical |
| | 3.94% | Energy |
| | 10.51% | Financial |
| | 3.07% | Industrial |
| | 3.84% | Technology |
| ¢ | 19.35% | Foreign Common Stocks |
| ¢ | 4.49% | Short-Term Investments |
| ¢ | 18.97% | Investments Purchased with Proceeds from Securities Lending |
| | 119.09% | Total Market Value of Investments |
| | (19.09)% | Liabilities in Excess of Other Assets, Net |
| | 100.00% | Total Net Assets |
14 | 2 0 1 3 A N N U A L R E P O R T
| | |
| * | The benchmark since inception returns are calculated since commencement of November 25, 1996 through June 30, 2013. |
| | |
Quaker Strategic Growth Fund
Growth of a Hypothetical $10,000 Investment
June 30, 2013
| Average Annualized Total Return |
| | | | | | | | | | | | | | | | | | | Commencement | |
| | | Expense | | Inception | | | | | | | �� | of operations | |
| | | Ratio | | Date | | One Year | | Five Year | | Ten Year | | through 6/30/2013 | |
| | | | | | | with | | without | | with | | without | | with | | without | | with | | without | |
| | | | | | | sales | | sales | | sales | | sales | | sales | | sales | | sales | | sales | |
| | | | | | | charge | | charge | | charge | | charge | | charge | | charge | | charge | | charge | |
| Class A | | | 2.30 | % | | 11/25/1996 | | | 13.12 | % | | | 19.71 | % | | | -5.70 | % | | | -4.63 | % | | | 5.64 | % | | | 6.24 | % | | | 10.75 | % | | | 11.13 | % | |
| Class C | | | 3.05 | % | | 7/11/2000 | | | 18.80 | % | | | 18.80 | % | | | -5.34 | % | | | -5.34 | % | | | 5.45 | % | | | 5.45 | % | | | 2.63 | % | | | 2.63 | % | |
| Institutional Class | | | 2.05 | % | | 7/20/2000 | | | 19.99 | % | | | 19.99 | % | | | -4.42 | % | | | -4.42 | % | | | 6.50 | % | | | 6.50 | % | | | 3.54 | % | | | 3.54 | % | |
| S&P 500® Total Return Index* | | | 20.60 | % | | | 20.60 | % | | | 7.01 | % | | | 7.01 | % | | | 7.30 | % | | | 7.30 | % | | | 6.56 | % | | | 6.56 | % | |
Performance data quoted represents past performance and is no guarantee of future results. Investment return and principal value will fluctuate so that shares, when redeemed, may be worth more or less than their original cost. Current performance may be lower or higher than performance data quoted. Performance data current to the most recent month end is available at www.quakerfunds.com or by calling us toll free at 800-220-8888. Total return includes reinvestment of dividends and capital gains.
Class A shares of the Fund have a maximum sales charge of 5.50%.
The line graph and performance table do not reflect the deduction of taxes that a shareholder might pay on fund distributions or the redemption of fund shares. Total return calculations reflect expense reimbursements and fee waivers in the applicable periods. See financial highlights for periods where fees were waived or reimbursed.
The Fund’s portfolio holdings may differ significantly from the securities held in the index and, unlike a mutual fund, an unmanaged index assumes no transaction costs, taxes, management fees or other expenses. You cannot invest directly in an index.
The S&P 500® Total Return Index (“Index”) is a widely recognized, unmanaged index consisting of the approximately 500 largest companies in the United States as measured by market capitalization. The index assumes reinvestment of all dividends and distributions.
2 0 1 3 A N N U A L R E P O R T | 15
Expense Information (Unaudited)
As a shareholder of the Fund, you incur two types of costs: (1) transaction costs, including applicable sales charges and redemption fees; and (2) ongoing costs, including management fees, distribution (12b-1) fees and other Fund expenses. This example is intended to help you understand you ongoing costs (in dollars) of investing in the Fund and to compare these costs with the ongoing costs of investing in other funds. The example is based on an investment of $1,000 invested at the beginning of the (six-month) period and held for the entire period January 1, 2013 through June 30, 2013.
ACTUAL EXPENSES
The first section of each table below provides information about actual account values and actual expenses for each of the Funds. You may use this information, together with the amount you invested, to estimate the expenses that you paid over the period. Simply divide your account value by $1,000 (for example, an $8,600 account value divided by $1,000 = 8.6), then multiply the result by the number in the applicable line under the heading entitled “Expenses Paid During the Period” to estimate the expenses you paid on your account during this period.
HYPOTHETICAL EXAMPLE FOR COMPARISON PURPOSES
The second section of each table below provides information about hypothetical account values and hypothetical expenses based on the Fund’s actual expense ratio and an assumed rate of return of 5% per year before expenses, which is not the Fund’s actual return. The hypothetical account values and expenses may not be used to estimate the actual ending account balance or expenses you paid for the period. You may use this information to compare the ongoing costs of investing in the Fund to other funds. To do so, compare this 5% hypothetical example with the 5% hypothetical examples that appear in the shareholder reports of the other funds. Please note that the expenses shown in the table are meant to highlight your ongoing costs only and do not reflect any transactional costs, such as sales charges (loads), redemption fees or exchange fees. Therefore, the second section of the table is useful in comparing ongoing costs only, and will not help you determine the relative total costs of owning different funds. In addition, if these transactional costs were included, your costs would have been higher.
16 | 2 0 1 3 A N N U A L R E P O R T
| | | | | Beginning Account
Value (01/01/2013) | | Annualized Expense
Ratio for the Period | | Ending Account
Value (06/30/2013) | | Expenses Paid
During Period* |
| | | | | | | | | | | | | | | | | | | | | | | | | |
| Akros Absolute Return | | | | | | | | | | | | | | | | | | | | | | | | |
| | | | | | | | | | | | | | | | | | | | | | | | | |
| Actual return based on actual return of: | | | | | | | | | | | | | | | | | |
| Class A | | | -3.50 | % | | | $ | 1,000.00 | | | | | 1.99 | % | | | $ | 965.00 | | | | $ | 9.70 | |
| Class C | | | -3.82 | % | | | | 1,000.00 | | | | | 2.74 | % | | | | 961.80 | | | | | 13.33 | |
| Institutional Class | | | -3.23 | % | | | | 1,000.00 | | | | | 1.74 | % | | | | 967.70 | | | | | 8.49 | |
| | | | | | | | | | | | | | | | | | | | | | | | | |
| Hypothetical return based on assumed 5% return: | | | | | | | | | | | | | | | | |
| Class A | | | | | | | | 1,000.00 | | | | | 1.99 | % | | | | 1,014.93 | | | | | 9.94 | |
| Class C | | | | | | | | 1,000.00 | | | | | 2.74 | % | | | | 1,011.21 | | | | | 13.66 | |
| Institutional Class | | | | | | | | 1,000.00 | | | | | 1.74 | % | | | | 1,016.17 | | | | | 8.70 | |
| | | | | | | | | | | | | | | | | | | | | | | | | |
| Event Arbitrage | | | | | | | | | | | | | | | | | | | | | | | | |
| | | | | | | | | | | | | | | | | | | | | | | | | |
| Actual return based on actual return of: | | | | | | | | | | | | | | | | | |
| Class A | | | 5.69 | % | | | | 1,000.00 | | | | | 1.99 | % | | | | 1,056.90 | | | | | 10.15 | |
| Class C | | | 5.28 | % | | | | 1,000.00 | | | | | 2.74 | % | | | | 1,052.80 | | | | | 13.95 | |
| Institutional Class | | | 5.84 | % | | | | 1,000.00 | | | | | 1.74 | % | | | | 1,058.40 | | | | | 8.88 | |
| | | | | | | | | | | | | | | | | | | | | | | | | |
| Hypothetical return based on assumed 5% return: | | | | | | | | | | | | | | | | |
| Class A | | | | | | | | 1,000.00 | | | | | 1.99 | % | | | | 1,014.93 | | | | | 9.94 | |
| Class C | | | | | | | | 1,000.00 | | | | | 2.74 | % | | | | 1,011.21 | | | | | 13.66 | |
| Institutional Class | | | | | | | | 1,000.00 | | | | | 1.74 | % | | | | 1,016.17 | | | | | 8.70 | |
| | | | | | | | | | | | | | | | | | | | | | | | | |
| Global Tactical Allocation | | | | | | | | | | | | | | | | | |
| | | | | | | | | | | | | | | | | | | | | | | | | |
| Actual return based on actual return of: | | | | | | | | | | | | | | | | | |
| Class A | | | 11.71 | % | | | | 1,000.00 | | | | | 2.69 | % | | | | 1,117.10 | | | | | 14.12 | |
| Class C | | | 11.30 | % | | | | 1,000.00 | | | | | 3.44 | % | | | | 1,113.00 | | | | | 18.02 | |
| Institutional Class | | | 11.91 | % | | | | 1,000.00 | | | | | 2.44 | % | | | | 1,119.10 | | | | | 12.82 | |
| | | | | | | | | | | | | | | | | | | | | | | | | |
| Hypothetical return based on assumed 5% return: | | | | | | | | | | | | | | | | |
| Class A | | | | | | | | 1,000.00 | | | | | 2.69 | % | | | | 1,011.46 | | | | | 13.42 | |
| Class C | | | | | | | | 1,000.00 | | | | | 3.44 | % | | | | 1,007.74 | | | | | 17.12 | |
| Institutional Class | | | | | | | | 1,000.00 | | | | | 2.44 | % | | | | 1,012.69 | | | | | 12.18 | |
| | | | | | | | | | | | | | | | | | | | | | | | | |
| Mid-Cap Value | | | | | | | | | | | | | | | | | | | | | | | | |
| | | | | | | | | | | | | | | | | | | | | | | | | |
| Actual return based on actual return of: | | | | | | | | | | | | | | | | | |
| Class A | | | 14.95 | % | | | | 1,000.00 | | | | | 2.11 | % | | | | 1,149.50 | | | | | 11.25 | |
| Class C | | | 14.57 | % | | | | 1,000.00 | | | | | 2.86 | % | | | | 1,145.70 | | | | | 15.22 | |
| Institutional Class | | | 15.09 | % | | | | 1,000.00 | | | | | 1.86 | % | | | | 1,150.90 | | | | | 9.92 | |
| | | | | | | | | | | | | | | | | | | | | | | | | |
| Hypothetical return based on assumed 5% return: | | | | | | | | | | | | | | | | |
| Class A | | | | | | | | 1,000.00 | | | | | 2.11 | % | | | | 1,014.33 | | | | | 10.54 | |
| Class C | | | | | | | | 1,000.00 | | | | | 2.86 | % | | | | 1,010.61 | | | | | 14.26 | |
| Institutional Class | | | | | | | | 1,000.00 | | | | | 1.86 | % | | | | 1,015.57 | | | | | 9.30 | |
| | | | | | | | | | | | | | | | | | | | | | | | | |
| Small-Cap Growth Tactical Allocation | | | | | | | | | | | | | | | | | |
| | | | | | | | | | | | | | | | | | | | | | | | | |
| Actual return based on actual return of: | | | | | | | | | | | | | | | | | |
| Class A | | | 7.39 | % | | | | 1,000.00 | | | | | 2.44 | % | | | | 1,073.90 | | | | | 12.55 | |
| Class C | | | 6.96 | % | | | | 1,000.00 | | | | | 3.19 | % | | | | 1,069.60 | | | | | 16.37 | |
| Institutional Class | | | 7.52 | % | | | | 1,000.00 | | | | | 2.19 | % | | | | 1,075.20 | | | | | 11.27 | |
| | | | | | | | | | | | | | | | | | | | | | | | | |
| Hypothetical return based on assumed 5% return: | | | | | | | | | | | | | | | | |
| Class A | | | | | | | | 1,000.00 | | | | | 2.44 | % | | | | 1,012.69 | | | | | 12.18 | |
| Class C | | | | | | | | 1,000.00 | | | | | 3.19 | % | | | | 1,008.98 | | | | | 15.89 | |
| Institutional Class | | | | | | | | 1,000.00 | | | | | 2.19 | % | | | | 1,013.93 | | | | | 10.94 | |
| | | | | | | | | | | | | | | | | | | | | | | | | |
| Small-Cap Value | | | | | | | | | | | | | | | | | | | | | | | | |
| | | | | | | | | | | | | | | | | | | | | | | | | |
| Actual return based on actual return of: | | | | | | | | | | | | | | | | | |
| Class A | | | 15.86 | % | | | | 1,000.00 | | | | | 1.88 | % | | | | 1,158.60 | | | | | 10.06 | |
| Class C | | | 15.40 | % | | | | 1,000.00 | | | | | 2.63 | % | | | | 1,154.00 | | | | | 14.05 | |
| Institutional Class | | | 16.01 | % | | | | 1,000.00 | | | | | 1.63 | % | | | | 1,160.10 | | | | | 8.73 | |
| | | | | | | | | | | | | | | | | | | | | | | | | |
| Hypothetical return based on assumed 5% return: | | | | | | | | | | | | | | | | |
| Class A | | | | | | | | 1,000.00 | | | | | 1.88 | % | | | | 1,015.47 | | | | | 9.39 | |
| Class C | | | | | | | | 1,000.00 | | | | | 2.63 | % | | | | 1,011.75 | | | | | 13.12 | |
| Institutional Class | | | | | | | | 1,000.00 | | | | | 1.63 | % | | | | 1,016.71 | | | | | 8.15 | |
| | | | | | | | | | | | | | | | | | | | | | | | | |
| Strategic Growth | | | | | | | | | | | | | | | | | | | | | | | | |
| | | | | | | | | | | | | | | | | | | | | | | | | |
| Actual return based on actual return of: | | | | | | | | | | | | | | | | | |
| Class A | | | 15.84 | % | | | | 1,000.00 | | | | | 2.04 | % | | | | 1,158.40 | | | | | 10.92 | |
| Class C | | | 15.37 | % | | | | 1,000.00 | | | | | 2.79 | % | | | | 1,153.70 | | | | | 14.90 | |
| Institutional Class | | | 15.95 | % | | | | 1,000.00 | | | | | 1.79 | % | | | | 1,159.50 | | | | | 9.58 | |
| | | | | | | | | | | | | | | | | | | | | | | | | |
| Hypothetical return based on assumed 5% return: | | | | | | | | | | | | | | | | |
| Class A | | | | | | | | 1,000.00 | | | | | 2.04 | % | | | | 1,014.68 | | | | | 10.19 | |
| Class C | | | | | | | | 1,000.00 | | | | | 2.79 | % | | | | 1,010.96 | | | | | 13.91 | |
| Institutional Class | | | | | | | | 1,000.00 | | | | | 1.79 | % | | | | 1,015.92 | | | | | 8.95 | |
| * | Expenses are equal to the Funds’ annualized six-month expense ratios (excluding reimbursements) multiplied by the average account value over the period multiplied by the number of days in the most recent fiscal half year (181) divided by 365 to reflect the one-half year period. |
2 0 1 3 A N N U A L R E P O R T | 17
Schedule of Investments
Quaker Akros Absolute Return Fund
June 30, 2013
| | | Number
of Shares | | | Fair
Value | |
| Domestic Common Stocks — 19.02% | | | | | | | | |
| | | | | | | | | |
| Basic Materials — 0.71% | | | | | | | | |
| Mining — 0.71% | | | | | | | | |
| Newmont Mining Corp. | | | 1,000 | | | $ | 29,950 | |
| Total Basic Materials (Cost: $43,106) | | | | | | | 29,950 | |
| | | | | | | | | |
| Communications — 0.18% | | | | | | | | |
| Internet — 0.18% | | | | | | | | |
| IZEA, Inc. (a) • | | | 24,500 | | | | 7,619 | |
| Total Communications (Cost: $13,121) | | | | | | | 7,619 | |
| | | | | | | | | |
| Consumer Staple — 1.78% | | | | | | | | |
| Commercial Services — 1.78% | | | | | | | | |
| Professional Diversity Network, Inc. (a)(b) | | | 19,000 | | | | 74,670 | |
| Total Consumer Staple (Cost: $118,991) | | | | | | | 74,670 | |
| | | | | | | | | |
| Consumer, Cyclical — 0.00% | | | | | | | | |
| Leisure Time — 0.00% | | | | | | | | |
| TableMAX Corp. ^*(a) | | | 13,911 | | | | 8 | |
| Total Consumer, Cyclical (Cost: $24,344) | | | | | | | 8 | |
| | | | | | | | | |
| Consumer, Non-cyclical — 1.27% | | | | | | | | |
| Beverages — 0.56% | | | | | | | | |
| Pulse Beverage Corp. (a) | | | 30,000 | | | | 23,700 | |
| | | | | | | | | |
| Pharmaceuticals — 0.71% | | | | | | | | |
| Echo Therapeutics, Inc. (a) | | | 12,000 | | | | 29,880 | |
| Total Consumer, Non-cyclical (Cost: $70,613) | | | | | | | 53,580 | |
| | | | | | | | | |
| Diversified — 0.53% | | | | | | | | |
| Holding Companies-Diversified — 0.53% | | | | | | | | |
| Universal Business Payment Solutions Acquisition Corp. (a) • | | | 7,000 | | | | 22,400 | |
| Total Diversified (Cost: $34,273) | | | | | | | 22,400 | |
| | | | | | | | | |
| Energy — 2.54% | | | | | | | | |
| Coal — 0.49% | | | | | | | | |
| Peabody Energy Corp. | | | 1,400 | | | | 20,496 | |
| | | | | | | | | |
| Oil & Gas — 2.05% | | | | | | | | |
| Devon Energy Corp. | | | 1,000 | | | | 51,880 | |
| Marathon Oil Corp. | | | 1,000 | | | | 34,580 | |
| | | | | | | | 86,460 | |
| Total Energy (Cost: $136,523) | | | | | | | 106,956 | |
| | | | | | | | | |
| Financial — 1.41% | | | | | | | | |
| Savings & Loans — 1.41% | | | | | | | | |
| First Pactrust Bancorp, Inc. | | | 2,500 | | | | 33,950 | |
| HF Financial Corp. | | | 1,934 | | | | 25,181 | |
| | | | | | | | 59,131 | |
| Total Financial (Cost: $58,073) | | | | | | | 59,131 | |
| | | | | | | | | |
| Health Care — 6.02% | | | | | | | | |
| Biotechnology — 2.20% | | | | | | | | |
| InterMune, Inc. (a)(b) | | | 4,000 | | | | 38,480 | |
| Omeros Corp. (a)(b) | | | 4,000 | | | | 20,160 | |
| Venaxis, Inc. (a)(b) | | | 28,000 | | | | 33,600 | |
| | | | | | | | 92,240 | |
| | | | | | | | | |
| Pharmaceuticals — 3.82% | | | | | | | | |
| Anthera Pharmaceuticals, Inc. (a) | | | 40,000 | | | | 18,524 | |
| Medivation, Inc. (a) | | | 1,000 | | | | 49,200 | |
| Northwest Biotherapeutics, Inc. (a)(b) | | | 500 | | | | 1,670 | |
| Synergy Pharmaceuticals, Inc. (a)(b) | | | 20,000 | | | | 86,400 | |
| Ventrus Biosciences, Inc. (a) | | | 2,000 | | | | 4,800 | |
| | | | | | | | 160,594 | |
| Total Health Care (Cost: $403,056) | | | | | | | 252,834 | |
| | | Number
of Shares | | | Fair
Value | |
| Domestic Common Stocks (Continued) | | | | | | | | |
| | | | | | | | | |
| Technology — 4.58% | | | | | | | | |
| Computers — 2.83% | | | | | | | | |
| Apple, Inc. | | | 300 | | | $ | 118,824 | |
| | | | | | | | | |
| Software — 1.75% | | | | | | | | |
| Nuance Communications, Inc. (a) | | | 4,000 | | | | 73,520 | |
| Total Technology (Cost: $206,412) | | | | | | | 192,344 | |
Total Domestic Common Stocks
(Cost $1,108,512) | | | | | | | 799,492 | |
| | | | | | | | | |
| Foreign Common Stocks — 12.01% | | | | | | | | |
| | | | | | | | | |
| Bermuda — 3.01% | | | | | | | | |
| Semiconductors — 2.25% | | | | | | | | |
| Marvell Technology Group Ltd. | | | 8,100 | | | | 94,851 | |
| | | | | | | | | |
| Transportation — 0.76% | | | | | | | | |
| Golar LNG, Ltd. | | | 1,000 | | | | 31,890 | |
| Total Bermuda (Cost: $151,730) | | | | | | | 126,741 | |
| | | | | | | | | |
| Canada — 5.74% | | | | | | | | |
| Mining — 4.13% | | | | | | | | |
| Agnico Eagle Mines, Ltd. (b) | | | 2,000 | | | | 55,080 | |
| Barrick Gold Corp. (b) | | | 6,000 | | | | 94,440 | |
| Polymet Mining Corp. (a)(b) | | | 34,000 | | | | 23,800 | |
| | | | | | | | 173,320 | |
| | | | | | | | | |
| Oil & Gas — 1.61% | | | | | | | | |
| Encana Corp. | | | 4,000 | | | | 67,760 | |
| Total Canada (Cost: $325,990) | | | | | | | 241,080 | |
| | | | | | | | | |
| Israel — 2.28% | | | | | | | | |
| Biotechnology — 0.21% | | | | | | | | |
| Rosetta Genomics, Ltd. (a) | | | 2,522 | | | | 8,550 | |
| | | | | | | | | |
| Mining — 1.14% | | | | | | | | |
| Alcobra. Ltd. (a) | | | 7,000 | | | | 47,950 | |
| | | | | | | | | |
| Pharmaceuticals — 0.93% | | | | | | | | |
| Teva Pharmaceutical Industries Ltd.- ADR | | | 1,000 | | | | 39,200 | |
| Total Israel (Cost: $110,558) | | | | | | | 95,700 | |
| | | | | | | | | |
| Norway — 0.98% | | | | | | | | |
| Oil & Gas — 0.98% | | | | | | | | |
| Statoil ASA - ADR | | | 2,000 | | | | 41,380 | |
| Total Norway (Cost: $42,506) | | | | | | | 41,380 | |
Total Foreign Common Stocks
(Cost $630,784) | | | | | | | 504,901 | |
| | | | | | | | | |
| Preferred Stocks — 2.68% | | | | | | | | |
| | | | | | | | | |
| United States — 2.68% | | | | | | | | |
| FibroGen, Inc. ^*(a) | | | 15,000 | | | | 112,500 | |
| Total United States (Cost: $67,350) | | | | | | | 112,500 | |
Total Preferred Stocks
(Cost $67,350) | | | | | | | 112,500 | |
The accompanying notes are an integral part of the financial statements.
18 | 2 0 1 3 A N N U A L R E P O R T
Schedule of Investments
Quaker Akros Absolute Return Fund
June 30, 2013
| | | | Number
of Shares | | | | Fair
Value | |
| Domestic Private Placements — 0.45% | | | | | | | | |
| | | | | | | | | |
| Technology — 0.45% | | | | | | | | |
| Alien Technology ^*(a) | | | 64 | | | $ | 253 | |
| Alient Technology Series A ^*(a) | | | 4,688 | | | | 18,518 | |
| Total Technology (Cost: $123,609) | | | | | | | 18,771 | |
Total Domestic Private Placements
(Cost $123,609) | | | | | | | 18,771 | |
| | | | | | | | | |
| Rights — 0.00% | | | | | | | | |
| | | | | | | | | |
| United States — 0.00% | | | | | | | | |
| Polymet Mining Corp. (a) | | | 4,000 | | | | 92 | |
| Total United States (Cost: $1,065) | | | | | | | 92 | |
Total Rights
(Cost $1,065) | | | | | | | 92 | |
| | | | | | | | | |
| Warrants — 1.11% | | | | | | | | |
| | | | | | | | | |
| Alien Technology, Expiration: December, 2049 ^*(a) | | | 5 | | | | 0 | |
| Synergy Pharmaceuticals, Inc., Expiration: December, 2016 (a) | | | 22,815 | | | | 41,979 | |
| Venaxis, Inc., Expiration: May, 2018 (a) ^ | | | 30,000 | | | | 4,889 | |
Total Warrants
(Cost $54,425) | | | | | | | 46,868 | |
| | | Par
Value | | | Fair
Value | |
| Corporate Bonds — 0.03% | | | | | | | | |
| | | | | | | | | |
| Energy — 0.03% | | | | | | | | |
| Oil & Gas — 0.03% | | | | | | | | |
| ATP Oil & Gas Corp., 11.88%, 05/01/2015 •+ | | $ | 100,000 | | | | 1,250 | |
| Total Energy (Cost: $102,431) | | | | | | | 1,250 | |
Total Corporate Bond
(Cost $102,431) | | | | | | | 1,250 | |
| | | Number
of Contracts | | | Fair
Value | |
| Purchased Options — 0.01% | | | | | | | | |
| | | | | | | | | |
| Put Options | | | | | | | | |
| United States — 0.01% | | | | | | | | |
| Barrick Gold Corp., Expiration: July, 2013 | | | | | | | | |
| Exercise Price: $14.00 | | | 20 | | | | 180 | |
| Newmont Mining Corp., Expiration: July, 2013 | | | | | | | | |
| Exercise Price: $27.00 | | | 10 | | | | 60 | |
| Total United States (Cost: $314) | | | | | | | 240 | |
Total Purchased Options
(Cost $314) | | | | | | | 240 | |
| | | Par
Value | | | Fair
Value | |
| Short Term Investments — 22.75% | | | | | | | | |
| | | | | | | | | |
| U.S. Treasury Bills — 17.79% | | | | | | | | |
| | | | | | | | | |
| U.S. Treasury Bills, 0.05%, 02/16/2014 • | | $ | 748,000 | | | $ | 747,623 | |
Total Treasury Bills
(Cost $747,452) | | | | | | | 747,623 | |
| | | Number
of Shares | | | Fair
Value | |
| Money Market Funds — 4.96% | | | | | | | | |
| | | | | | | | | |
Fidelity Institutional Money Market Portfolio,
0.07% (c) | | | 208,277 | | | | 208,277 | |
Total Money Market Funds
(Cost $208,277) | | | | | | | 208,277 | |
Total Short Term Investments
(Cost $955,729) | | | | | | | 955,900 | |
| | | | | | | | | |
| Investments Purchased with Proceeds from Securities Lending — 6.71% | | | | | | | | |
| | | | | | | | | |
| Money Market Funds — 6.71% | | | | | | | | |
| Mount Vernon Securities Lending Trust Prime Portfolio, 0.19% (c)(d) | | | 281,860 | | | | 281,860 | |
| Total Investments Purchased with Proceeds from Securities Lending (Cost $281,860) | | | | | | | 281,860 | |
Total Investments
(Cost $3,326,079) — 64.77% | | | | | | | 2,721,874 | |
| Other Assets in Excess of Liabilities, Net 35.23% | | | | | | | 1,480,349 | |
| Total Net Assets — 100.00% | | | | | | $ | 4,202,223 | |
| | | | | | | | | |
| Schedule of Securities Sold Short (e) | | | | | | | | |
| Common Stocks — 16.85% | | | | | | | | |
| | | | | | | | | |
| Blackrock, Inc. | | | 200 | | | | 51,370 | |
| Canadian Pacific Railway Ltd. | | | 500 | | | | 60,690 | |
| Cincinnati Financial Corp. | | | 2,150 | | | | 98,685 | |
| Estee Lauder Companies, Inc. | | | 1,600 | | | | 105,232 | |
| Evercore Partners, Inc. | | | 2,000 | | | | 78,560 | |
| Morgan Stanley | | | 3,000 | | | | 73,290 | |
| Sherwin-Williams Co. | | | 1,000 | | | | 176,600 | |
| Toro Co. | | | 1,400 | | | | 63,574 | |
| Total Common Stocks | | | | | | | 708,001 | |
| | | | | | | | | |
| Exchange-Traded Funds — 10.87% | | | | | | | | |
| | | | | | | | | |
| iShares Dow Jones U.S. Healthcare Providers Index Fund | | | 2,000 | | | | 167,980 | |
| SPDR S&P Homebuilders | | | 2,000 | | | | 58,840 | |
| SPDR S&P Retail | | | 3,000 | | | | 229,830 | |
| Total Exchange-Traded Funds | | | | | | | 456,650 | |
| Total Securities Sold Short (Proceeds $777,255) | | | | | | $ | 1,164,651 | |
The accompanying notes are an integral part of the financial statements.
2 0 1 3 A N N U A L R E P O R T | 19
Schedule of Investments
Quaker Akros Absolute Return Fund
June 30, 2013
| | | Number
of Contracts | | | Fair
Value | |
| Written Options — 0.13% | | | | | | | | |
| | | | | | | | | |
| Call Options | | | | | | | | |
| Medivation Inc., Expiration: July, 2013 | | | | | | | | |
| Exercise Price: $55.00 | | | 10 | | | $ | 1,850 | |
| Newmont Mining Corp., Expiration: July, 2013 | | | | | | | | |
| Exercise Price: $36.00 | | | 10 | | | | 50 | |
| Total Call Options (Premiums Received: $2,324) | | | | | | | 1,900 | |
| | | | | | | | | |
| Put Options | | | | | | | | |
| Agnico Eagle Mines Ltd, Expiration: July, 2013 | | | | | | | | |
| Exercise Price: $22.50 | | | 20 | | | | 240 | |
| Barrick Gold Corp., Expiration: July, 2013 | | | | | | | | |
| Exercise Price: $14.00 | | | 20 | | | | 500 | |
| Canadian Pacific Railway Ltd, Expiration: July, 2013 | | | | | | | | |
| Exercise Price: $115.00 | | | 2 | | | | 210 | |
| Evercore Partners, Inc., Expiration: July, 2013 | | | | | | | | |
| Exercise Price: $35.00 • | | | 10 | | | | 150 | |
| Ironwood Pharmaceuticals, Inc., Expiration: July, 2013 | | | | | | | | |
| Exercise Price: $10.00 | | | 20 | | | | 1,300 | |
| Newmont Mining Corp., Expiration: July, 2013 | | | | | | | | |
| Exercise Price: $27.00 | | | 10 | | | | 300 | |
| Peabody Energy Corp., Expiration: July, 2013 | | | | | | | | |
| Exercise Price: $14.00 | | | 20 | | | | 720 | |
| SPDR S&P Homebuilders ETF, Expiration: July, 2013 | | | | | | | | |
| Exercise Price: $26.00 • | | | 20 | | | | 110 | |
| Total Put Options (Premiums Received: $4,411) | | | | | | | 3,530 | |
| Total Written Options (Premiums Received $6,735) | | | | | | $ | 5,430 | |
ADR- American Depositary Receipt
| (a) | Non-income producing security. |
| (b) | All or a portion of the security out on loan. |
| (c) | The rate shown is the annualized seven-day effective yield at period end. |
| (d) | Represents investments of collateral received from securities lending transactions. |
| (e) | Securities sold short are non-income producing. |
| ^ | Indicates a fair valued security. Total market value for fair valued securities is $136,168, representing 3.24% of net assets and Level 3 securities. |
| * | Indicates an illiquid security. Total market value for illiquid securities is $131,279, representing 3.12% of net assets. |
| + | Defaulted bond |
| • | Level 2 securities. |
The accompanying notes are an integral part of the financial statements.
20 | 2 0 1 3 A N N U A L R E P O R T
Schedule of Investments
Quaker Event Arbitrage Fund
June 30, 2013
| | | Number
of Shares | | | Fair
Value | |
| Domestic Common Stocks — 49.90% | | | | | | |
| | | | | | | |
| Basic Materials — 0.88% | | | | | | |
| Forest Products & Paper — 0.88% | | | | | | |
| Wausau Paper Corp. | | | 51,000 | | | $ | 581,400 | |
| Total Basic Materials (Cost: $429,158) | | | | | | | 581,400 | |
| | | | | | | | | |
| Communications — 10.60% | | | | | | | | |
| Internet — 2.16% | | | | | | | | |
| 30DC, Inc. (a) • | | | 50,000 | | | | 3,750 | |
| Equinix, Inc. (a) | | | 1,700 | | | | 314,024 | |
| Keynote Systems, Inc. | | | 30,000 | | | | 592,800 | |
| Unwired Planet, Inc. (a) | | | 266,125 | | | | 518,944 | |
| | | | | | | | 1,429,518 | |
| | | | | | | | | |
| Media — 1.50% | | | | | | | | |
| News Corp. Class A (a) | | | 46,000 | | | | 703,800 | |
| Tribune Co. Class A (a) | | | 5,000 | | | | 284,500 | |
| | | | | | | | 988,300 | |
| | | | | | | | | |
| Telecommunications — 6.94% | | | | | | | | |
| Anaren, Inc. (a) | | | 31,200 | | | | 715,728 | |
| Comverse, Inc. (a)(b) | | | 22,000 | | | | 654,720 | |
| Extreme Networks, Inc. (a) | | | 215,820 | | | | 744,579 | |
| Fairpoint Communications, Inc. (a)(b) | | | 113,300 | | | | 946,055 | |
| Telephone & Data Systems, Inc. | | | 26,000 | | | | 640,900 | |
| tw telecom Inc. (a) | | | 31,500 | | | | 886,410 | |
| | | | | | | | 4,588,392 | |
| Total Communications (Cost: $6,868,348) | | | | | | | 7,006,210 | |
| | | | | | | | | |
| Consumer, Cyclical — 7.99% | | | | | | | | |
| Apparel — 1.05% | | | | | | | | |
| True Religion Apparel, Inc. | | | 22,000 | | | | 696,520 | |
| | | | | | | | | |
| Entertainment — 0.36% | | | | | | | | |
| EDCI Holdings, Inc.• | | | 75,500 | | | | 239,713 | |
| | | | | | | | | |
| Home Builders — 0.86% | | | | | | | | |
| Lennar Corp. Class B | | | 20,000 | | | | 567,000 | |
| | | | | | | | | |
| Lodging — 1.08% | | | | | | | | |
| Ameristar Casinos, Inc. | | | 27,107 | | | | 712,643 | |
| Trump Entertainment Resorts, Inc. ^*(a) | | | 8,949 | | | | 0 | |
| Trump Entertainment Resorts, Inc. ^*(a) | | | 135 | | | | 409 | |
| | | | | | | | 713,052 | |
| | | | | | | | | |
| Retail — 4.64% | | | | | | | | |
| CST Brands, Inc. (a)(b) | | | 23,300 | | | | 717,873 | |
| DSW, Inc. Class A | | | 3,300 | | | | 242,451 | |
| Regis Corp. (b) | | | 81,000 | | | | 1,330,020 | |
| The Wet Seal, Inc. (a) | | | 164,500 | | | | 774,795 | |
| | | | | | | | 3,065,139 | |
| Total Consumer, Cyclical (Cost: $4,836,554) | | | | | | | 5,281,424 | |
| | | | | | | | | |
| Consumer, Non-cyclical — 8.11% | | | | | | | | |
| Biotechnology — 1.68% | | | | | | | | |
| Cadus Corp. (a) | | | 214,729 | | | | 300,621 | |
| Life Technologies Corp. (a) | | | 8,700 | | | | 643,887 | |
| Maxygen, Inc. | | | 68,000 | | | | 168,640 | |
| | | | | | | | 1,113,148 | |
| | | | | | | | | |
| Commercial Services — 0.81% | | | | | | | | |
| The Brink’s Co. | | | 9,400 | | | | 239,794 | |
| SAIC, Inc. (b) | | | 21,000 | | | | 292,530 | |
| | | | | | | | 532,324 | |
| | | Number
of Shares | | | Fair
Value | |
| Domestic Common Stocks (Continued) | | | | | | |
| | | | | | | |
| Cosmetics & Personal Care — 1.21% | | | | | | | | |
| CCA Industries, Inc. | | | 104,402 | | | $ | 334,087 | |
| Physicians Formula Holdings, Inc. ^* | | | 95,600 | | | | 468,439 | |
| | | | | | | | 802,526 | |
| | | | | | | | | |
| Food — 4.37% | | | | | | | | |
| Dean Foods Co. (a) | | | 40,000 | | | | 400,800 | |
| Mondelez International, Inc. | | | 25,800 | | | | 736,074 | |
| Whitewave Foods Co. Class A (a)(b) | | | 71,017 | | | | 1,154,026 | |
| Whitewave Foods Co. Class B (a) | | | 39,552 | | | | 601,190 | |
| | | | | | | | 2,892,090 | |
| | | | | | | | | |
| Healthcare-Products — 0.04% | | | | | | | | |
| Synovis Life Technologies, Inc. ^(a) | | | 43,000 | | | | 22,730 | |
| | | | | | | | | |
| Pharmaceuticals — 0.00% | | | | | | | | |
| INYX, Inc. (a) | | | 167,850 | | | | 269 | |
| Total Consumer, Non-cyclical (Cost: $5,705,768) | | | | | | | 5,363,087 | |
| | | | | | | | | |
| Diversified — 0.00% | | | | | | | | |
| Holding Companies-Diversified — 0.00% | | | | | | | | |
| Stoneleigh Partners Acquisition Corp. ^*(a) | | | 400 | | | | 0 | |
| Total Diversified (Cost: $0) | | | | | | | 0 | |
| | | | | | | | | |
| Energy — 2.01% | | | | | | | | |
| Coal — 0.79% | | | | | | | | |
| CONSOL Energy, Inc. (b) | | | 19,300 | | | | 523,030 | |
| Oil & Gas — 0.62% | | | | | | | | |
| Hess Corp. | | | 6,200 | | | | 412,238 | |
| | | | | | | | | |
| Oil & Gas Services — 0.60% | | | | | | | | |
| Lufkin Industries, Inc. | | | 4,469 | | | | 395,372 | |
| Total Energy (Cost: $1,385,308) | | | | | | | 1,330,640 | |
| | | | | | | | | |
| Healthcare — 1.14% | | | | | | | | |
| Healthcare-Services — 1.14% | | | | | | | | |
| Diagnostic Services Holdings, Inc. ^(a) | | | 10,221 | | | | 756,438 | |
| Total Healthcare (Cost: $735,000) | | | | | | | 756,438 | |
| | | | | | | | | |
| Industrial — 4.31% | | | | | | | | |
| Aerospace & Defense — 1.49% | | | | | | | | |
| API Technologies Corp. (a)(b) | | | 351,505 | | | | 984,214 | |
| | | | | | | | | |
| Environmental Control — 1.18% | | | | | | | | |
| Calgon Carbon Corp. (a)(b) | | | 47,000 | | | | 783,960 | |
| | | | | | | | | |
| Machinery-Diversified — 0.80% | | | | | | | | |
| Gardner Denver, Inc. | | | 7,000 | | | | 526,260 | |
| | | | | | | | | |
| Miscellaneous Manufacturing — 0.84% | | | | | | | | |
| SPX Corp. | | | 7,700 | | | | 554,246 | |
| Total Industrial (Cost: $2,938,522) | | | | | | | 2,848,680 | |
| | | | | | | | | |
| Technology — 14.51% | | | | | | | | |
| Computers — 3.71% | | | | | | | | |
| CACI International, Inc. (a) | | | 12,300 | | | | 780,927 | |
| Computer Horizons Corp. ^* | | | 65,000 | | | | 0 | |
| NetApp, Inc. (a) | | | 24,700 | | | | 933,166 | |
| STEC, Inc. (a) | | | 110,000 | | | | 739,200 | |
| | | | | | | | 2,453,293 | |
The accompanying notes are an integral part of the financial statements.
2 0 1 3 A N N U A L R E P O R T | 21
Schedule of Investments
Quaker Event Arbitrage Fund
June 30, 2013
| | | Number
of Shares | | | Fair
Value | |
| Domestic Common Stocks (Continued) | | | |
| | | | | | | | | |
| Semiconductors — 4.48% | | | | | | | | |
| DSP Group, Inc. (a) | | | 81,522 | | | $ | 677,448 | |
| Emulex Corp. (a) | | | 100,000 | | | | 652,000 | |
| Integrated Device Technology, Inc. (a) | | | 146,000 | | | | 1,159,240 | |
| Tessera Technologies, Inc. | | | 5,000 | | | | 104,000 | |
| TriQuint Semiconductor, Inc. (a)(b) | | | 53,000 | | | | 367,290 | |
| | | | | | | | 2,959,978 | |
| | | | | | | | | |
| Software — 6.32% | | | | | | | | |
| Allscripts Healthcare Solutions, Inc. (a) | | | 55,000 | | | | 711,700 | |
| Compuware Corp. (a) | | | 25,000 | | | | 258,750 | |
| Contra Softbrands, Inc. ^*(a) | | | 5,000 | | | | 0 | |
| Network-1 Security Solutions, Inc. (a) | | | 235,000 | | | | 423,000 | |
| Nuance Communications, Inc. (a) | | | 50,500 | | | | 928,190 | |
| Seachange International, Inc. (a) | | | 86,105 | | | | 1,008,290 | |
| VMware, Inc. (a)(b) | | | 12,700 | | | | 850,773 | |
| | | | | | | | 4,180,703 | |
| Total Technology (Cost: $9,026,101) | | | | | | | 9,593,974 | |
| | | | | | | | | |
| Utilities — 0.35% | | | | | | | | |
| Electric — 0.35% | | | | | | | | |
| National Fuel Gas Co. | | | 4,000 | | | | 231,800 | |
| Total Utilities (Cost: $234,060) | | | | | | | 231,800 | |
Total Domestic Common Stocks
(Cost $32,158,819) | | | | | | | 32,993,653 | |
| | | | | | | | | |
| Foreign Common Stocks — 5.90% | | | | | |
| | | | | | | | | |
| Australia — 0.71% | | | | | | | | |
| Agriculture — 0.71% | | | | | | | | |
| GrainCorp Ltd. | | | 41,000 | | | | 471,333 | |
| Total Australia (Cost: $522,823) | | | | | | | 471,333 | |
| | | | | | | | | |
| Bermuda — 0.37% | | | | | | | | |
| Real Estate — 0.37% | | | | | | | | |
| Brookfield Property Partners LP (b) | | | 12,000 | | | $ | 243,600 | |
| Total Bermuda (Cost: $257,080) | | | | | | | 243,600 | |
| | | | | | | | | |
| Canada — 0.49% | | | | | | | | |
| Mining — 0.02% | | | | | | | | |
| Sacre-Coeur Minerals Ltd. (a) • | | | 109,444 | | | | 13,008 | |
| | | | | | | | | |
| Retail — 0.47% | | | | | | | | |
| RONA, Inc. (a) | | | 30,000 | | | | 310,069 | |
| Total Canada (Cost: $370,933) | | | | | | | 323,077 | |
| | | | | | | | | |
| Germany — 1.17% | | | | | | | | |
| Holding Companies-Diversified — 0.01% | | | | | |
| KHD Humboldt Wedag International AG | | | 1,014 | | | | 6,100 | |
| | | | | | | | | |
| Media — 1.16% | | | | | | | | |
| Kabel Deutschland Holding AG | | | 7,000 | | | | 768,828 | |
| Total Germany (Cost: $787,639) | | | | | | | 774,928 | |
| | | | | | | | | |
| United Kingdom — 3.16% | | | | | | | | |
| Media — 1.42% | | | | | | | | |
| Liberty Global PLC Series A (a) | | | 3,092 | | | | 229,032 | |
| Liberty Global PLC Series C (a) | | | 10,449 | | | | 709,355 | |
| | | | | | | | 938,387 | |
| | | Number
of Shares | | Fair
Value |
| Foreign Common Stocks (Continued) | |
| | | | | | | | | |
| Telecommunications — 1.74% | | | | | | | | |
| Vodafone Group PLC - ADR | | | 40,000 | | | $ | 1,149,600 | |
| Total United Kingdom (Cost: $1,965,440) | | | | | | | 2,087,987 | |
Total Foreign Common Stocks
(Cost $3,903,915) | | | | | | | 3,900,925 | |
| | | | | | | | | |
| Preferred Stocks — 0.93% | | | | | | | | |
| | | | | | | | | |
| United States — 0.93% | | | | | | | | |
| Diagnostic Services Holdings, Inc. ^*(a) | | | 613 | | | | 613,000 | |
| GeoMet, Inc., 9.60% (a)• | | | 3 | | | | 23 | |
| | | | | | | | 613,023 | |
| Total United States (Cost: $613,030) | | | | | | | 613,023 | |
Total Preferred Stocks
(Cost $613,030) | | | | | | | 613,023 | |
| | | | | | | | | |
| Real Estate Investment Trusts — 1.54% | | | | | | | | |
| | | | | | | | | |
| United States — 1.54% | | | | | | | | |
| CommonWealth | | | 22,000 | | | | 508,640 | |
| MPG Office Trust, Inc. (a) | | | 20,000 | | | | 507,800 | |
| | | | | | | | 1,016,440 | |
| Total United States (Cost: $1,087,651) | | | | | | | 1,016,440 | |
Total Real Estate Investment Trusts
(Cost $1,087,651) | | | | | | | 1,016,440 | |
| | | | | | | | | |
| Rights — 0.00% | | | | | | | | |
| | | | | | | | | |
| United States — 0.00% | | | | | | | | |
| Petrocorp, Inc. Escrow ^*(a) | | | 200 | | | | 0 | |
| Total United States (Cost: $0) | | | | | | | 0 | |
Total Rights
(Cost $0) | | | | | | | 0 | |
| | | | | | | | | |
| Warrants — 0.75% | | | | | | | | |
| | | | | | | | | |
| Barclays Bank PLC, Expiration: December, 2014 (a) • | | | 37,853 | | | | 492,846 | |
Total Warrants
(Cost $430,010) | | | | | | | 492,846 | |
| | | Par
Value | | Fair
Value |
| Asset Backed Securities — 4.54% | | | | | |
| | | | | | | | | |
| United States — 4.54% | | | | | | | | |
AFC Home Equity Loan Trust
Class 1A, Series 2000-2, 0.98%, 06/25/2030 ▲• | | $ | 15,392 | | | | 13,621 | |
Citigroup Mortgage Loan Trust, Inc.
Class M3, Series 2005-OPT1, 0.90%, 02/25/2035 ▲• | | | 631,228 | | | | 572,685 | |
Countrywide Alternative Loan Trust
Class 2A2A, Series 2006-OC5, 0.36%, 06/25/2046 ▲• | | | 98,250 | | | | 74,652 | |
Countrywide Asset-Backed Certificates
Class A6, Series 2006-S6, 5.66%, 03/25/2034 ▲• | | | 90,519 | | | | 100,713 | |
Countrywide Asset-Backed Certificates
Class M1, Series 2006-BC4, 0.48%, 11/25/2036 ^*▲ | | | 3,000,000 | | | | 240,000 | |
The accompanying notes are an integral part of the financial statements.
22 | 2 0 1 3 A N N U A L R E P O R T
Schedule of Investments
Quaker Event Arbitrage Fund
June 30, 2013
| | | Par
Value | | Fair
Value |
| Asset Backed Securities (Continued) | | | | | | | | |
| | | | | | | | | |
| United States (Continued) | | | | | | | | |
Countrywide Asset-Backed Certificates
Class M1, Series 2006-23, 0.44%, 05/25/2037 ▲• | | $ | 1,800,000 | | | $ | 32,778 | |
Countrywide Asset-Backed Certificates
Class 2M2, Series 2007-11, 0.51%, 09/25/2037 ▲• | | | 1,812,361 | | | | 5,923 | |
Countrywide Home Equity Loan Trust
Class 2A, Series 2005-A, 0.43%, 04/15/2035 ▲• | | | 41,906 | | | | 33,470 | |
Countrywide Home Equity Loan Trust
Class 2A, Series 2006-G, 0.34%, 10/15/2036 ▲• | | | 155,286 | | | | 112,558 | |
Long Beach Mortgage Loan Trust
Class 2M1, Series 2002-1, 1.32%, 05/25/2032 ▲• | | | 979,657 | | | | 904,555 | |
Structured Asset Investment Loan Trust
Class M1, Series 2003-BC9, 1.24%, 08/25/2033 ▲• | | | 574,426 | | | | 523,311 | |
Structured Asset Securities Corp.
Class M6, Series 2005-WF2, 0.85%, 05/25/2035 ▲• | | | 479,000 | | | | 388,142 | |
| | | | | | | | 3,002,408 | |
| Total United States (Cost: $3,653,779) | | | | | | | 3,002,408 | |
Total Asset Backed Securities
(Cost $3,653,779) | | | | | | | 3,002,408 | |
| | | | | | | | | |
| Convertible Bonds — 1.00% | | | | | | | | |
| | | | | | | | | |
| United States — 1.00% | | | | | | | | |
| Frontline Bermuda Ltd. 4.50%, 04/14/2015 ^* | | | 1,000,000 | | | | 503,750 | |
| U.S. Concrete, Inc. 9.50%, 08/31/2015 #• | | | 100,000 | | | | 156,688 | |
| | | | | | | | 660,438 | |
| Total United States (Cost: $647,424) | | | | | | | 660,438 | |
Total Convertible Bonds
(Cost $647,424) | | | | | | | 660,438 | |
| | | | | | | | | |
| Corporate Bonds — 3.13% | | | | | | | | |
| | | | | | | | | |
| Basic Materials — 0.00% | | | | | | | | |
| Forest Products & Paper — 0.00% | | | | | | | | |
| NewPage Corp.10.00%, 05/01/2012 ^*+• | | | 300,000 | | | | 0 | |
| Total Basic Materials (Cost: $198,770) | | | | | | | 0 | |
| | | | | | | | | |
| Consumer, Cyclical — 0.92% | | | | | | | | |
| Auto Parts & Equipment — 0.92% | | | | | | | | |
| Exide Technologies 8.625%, 02/01/2018 +• | | | 1,000,000 | | | | 610,000 | |
| Total Consumer, Cyclical (Cost: $583,750) | | | | | | | 610,000 | |
| | | | | | | | | |
| Energy — 0.48% | | | | | | | | |
| Oil, Gas & Coal — 0.48% | | | | | | | | |
| OGX Petroleo e Gas Participacoes SA 8.50%, 06/01/2018 • | | | 1,000,000 | | | | 315,000 | |
| Total Energy (Cost: $377,964) | | | | | | | 315,000 | |
| | | | | | | | | |
| Financial — 1.73% | | | | | | | | |
| Diversified Financial Services — 1.73% | | | | | | | | |
| Credit Suisse Securities USA LLC 10.00%, 07/31/2014 • | | | 500,000 | | | | 488,300 | |
| Credit Suisse Securities USA LLC 10.50%, 09/05/2014 • | | | 500,000 | | | | 486,250 | |
| Lehman Brothers Holdings, Inc. 4.55%, 07/08/2014 +• | | | 110,000 | | | | 26,675 | |
| Lehman Brothers Holdings, Inc. 5.32%, 02/17/2015 +• | | | 130,000 | | | | 29,738 | |
| Lehman Brothers Holdings, Inc. 5.50%, 02/27/2020 +• | | | 100,000 | | | | 22,875 | |
| Lehman Brothers Holdings, Inc. 7.00%, 01/28/2020 +• | | | 100,000 | | | | 22,875 | |
| Lehman Brothers Holdings, Inc. 8.25%, 09/23/2020 +• | | | 100,000 | | | | 20,630 | |
| Lehman Brothers Holdings, Inc. 8.75%, 02/14/2023 +• | | | 200,000 | | | | 45,750 | |
| | | | | | | | 1,143,093 | |
| | | Par
Value | | Fair
Value |
| Corporate Bonds (Continued) | | | | |
| | | | | |
| Venture Capital — 0.00% | | | | |
| Infinity Capital Group 7.00%, 12/31/2049 ^*• | | $ | 25,000 | | | $ | 0 | |
| Total Financial (Cost: $1,150,451) | | | | | | | 1,143,093 | |
| | | | | | | | | |
| Utilities — 0.00% | | | | | | | | |
| Electric — 0.00% | | | | | | | | |
| Mirant Corp. 2.50%, 06/15/2021 ^*+• | | | 20,000 | | | | 0 | |
| Total Utilities (Cost: $0) | | | | | | | 0 | |
Total Corporate Bonds
(Cost $2,310,935) | | | | | | | 2,068,093 | |
| | | | | | | | | |
| Mortgage Backed Securities — 2.84% | | | | | | | | |
| | | | | | | | | |
| United States — 2.84% | | | | | | | | |
GSR Mortgage Loan Trust
Class B2, Series 2005-5F, 5.76%, 06/25/2035 ▲• | | | 629,075 | | | | 413,903 | |
LB-UBS Commercial Mortgage Trust
Class C, Series 2006-C3, 5.70%, 03/15/2039 *▲• | | | 750,000 | | | | 618,092 | |
Morgan Stanley Capital I Trust
Class B, Series 2007-T25, 5.61%, 11/12/2049 #▲• | | | 500,000 | | | | 350,296 | |
Wachovia Bank Commercial Mortgage Trust
Class E, Series 2003-C9, 5.29%, 12/15/2035 ▲• | | | 500,000 | | | | 496,941 | |
| | | | | | | | 1,879,232 | |
| Total United States (Cost: $1,987,527) | | | | | | | 1,879,232 | |
Total Mortgage Backed Securities
(Cost $1,987,527) | | | | | | | 1,879,232 | |
| | | | | | | | | |
| Municipal Bonds — 1.45% | | | | | | | | |
| | | | | | | | | |
| United States — 1.45% | | | | | | | | |
| City of Detroit MI Water Supply System Revenue, Second Lien, Series C, 4.50%, 07/01/2029 • | | | 205,000 | | | | 193,372 | |
| City of Detroit MI Water Supply System Revenue, Senior Lien, Series A, 5.00%, 07/01/2034 • | | | 500,000 | | | | 482,975 | |
| City of Detroit MI Water Supply System Revenue, Senior Lien, Series A, 5.00%, 07/01/2036 • | | | 200,000 | | | | 191,822 | |
| City of Detroit MI Water Supply System Revenue, Senior Lien, Series C, 5.00%, 07/01/2041 • | | | 95,000 | | | | 87,872 | |
| | | | | | | | 956,041 | |
| Total United States (Cost: $972,788) | | | | | | | 956,041 | |
Total Municipal Bonds
(Cost $972,788) | | | | | | | 956,041 | |
| | | | | | | | | |
| Term Loan — 0.77% | | | | | | | | |
| | | | | | | | | |
| United States — 0.77% | | | | | | | | |
| Diagnostic Services Holdings, Inc. 14.50%, 05/05/2016 ^* | | | 511,054 | | | | 511,054 | |
| Total United States (Cost: $511,054) | | | | | | | 511,054 | |
Total Term Loan
(Cost $511,054) | | | | | | | 511,054 | |
The accompanying notes are an integral part of the financial statements.
2 0 1 3 A N N U A L R E P O R T | 23
Schedule of Investments
Quaker Event Arbitrage Fund
June 30, 2013
| | | Number
of Contracts | | Fair
Value |
| Purchased Options — 2.15% | | | | | |
| | | | | | | | | |
| Call Options — 1.74% | | | | | | | | |
American Tower Corp., Expiration: January, 2014
Exercise Price: $77.50 | | | 385 | | | $ | 157,850 | |
The Brink’s Co., Expiration: December, 2013
Exercise Price: $27.00 ^ | | | 94 | | | | 17,578 | |
Calgon Carbon Corp., Expiration: December, 2013
Exercise Price: $17.35 ^ | | | 470 | | | | 55,460 | |
Chesapeake Energy Corp., Expiration: January, 2014
Exercise Price: $18.00 | | | 550 | | | | 199,100 | |
DSW, Inc., Expiration: December, 2013
Exercise Price: $70.00 ^ | | | 33 | | | | 25,179 | |
Emulex Corp., Expiration: December, 2013
Exercise Price: $6.20 ^ | | | 500 | | | | 41,500 | |
Fairpoint Communications, Inc., Expiration: December, 2013
Exercise Price: $7.85 ^ | | | 800 | | | | 120,800 | |
Integrated Device Technology, Inc., Expiration: December, 2013
Exercise Price: $7.00 ^ | | | 490 | | | | 72,030 | |
InterMune, Inc., Expiration: January, 2014
Exercise Price: $11.00 • | | | 1,220 | | | | 168,970 | |
Regis Corp., Expiration: December, 2013
Exercise Price: $18.50 ^ | | | 285 | | | | 19,950 | |
SAIC, Inc., Expiration: December, 2013
Exercise Price: $14.00 ^ | | | 210 | | | | 17,640 | |
Wausau Paper Corp., Expiration: December, 2013
Exercise Price: $10.75 ^ | | | 510 | | | | 62,220 | |
The Wet Seal, Inc., Expiration: December, 2013
Exercise Price: $3.75 ^ | | | 1,645 | | | | 194,110 | |
| Total Call Options (Cost: $1,068,571) | | | | | | | 1,152,387 | |
| | | | | | | | | |
| Put Options — 0.41% | | | | | | | | |
Lennar Corp., Expiration: November, 2013
Exercise Price: $42.00 • | | | 200 | | | | 152,500 | |
Liberty Global, Inc., Expiration: July, 2013
Exercise Price: $75.00 | | | 129 | | | | 30,960 | |
Verizon Communications, Inc., Expiration: October, 2013
Exercise Price: $55.00 • | | | 140 | | | | 84,700 | |
WhiteWave Foods Co., Expiration: July, 2013
Exercise Price: $15.00 • | | | 324 | | | | 4,050 | |
| Total Put Options (Cost: $389,058) | | | | | | | 272,210 | |
Total Purchased Options
(Cost $1,457,629) | | | | | | | 1,424,597 | |
| | | | Number
of Shares | | | | Fair
Value | |
| Short-Term Investments — 12.89% | | | | | |
| Money Market Funds — 12.89% | | | | | | | | |
| | | | | | | | | |
| Fidelity Institutional Money Market Portfolio, 0.07% (c) | | | 8,521,553 | | | | 8,521,553 | |
Total Short-Term Investments
(Cost $8,521,553) | | | | | | | 8,521,553 | |
| | | Number
of Shares | | Fair
Value |
| Investments Purchased with Proceeds from Securities Lending — 6.46% | | | | |
| | | | | |
| Money Market Funds — 6.46% | | | | |
| Mount Vernon Securities Lending Trust Prime Portfolio, 0.19% (c)(d) | | | 4,272,213 | | | $ | 4,272,213 | |
Total Investments Purchased with Proceeds from
Securities Lending (Cost $4,272,213) | | | | | | | 4,272,213 | |
Total Investments
(Cost $62,528,327) — 94.25% | | | | | | | 62,312,516 | |
| Other Assets in Excess of Liabilities, Net 5.75% | | | | | | | 3,802,284 | |
| Total Net Assets — 100.00% | | | | | | $ | 66,114,800 | |
| | | | | | | | | |
| Schedule of Securities Sold Short (e) | | | | | | | | |
| Common Stocks — 1.91% | | | | | | | | |
| | | | | | | | | |
| Intermec, Inc. | | | 80,000 | | | | 786,400 | |
| NetSpend Holdings, Inc. | | | 30,000 | | | | 479,100 | |
Total Common Stocks
(Proceeds $1,260,016) | | | | | | $ | 1,265,500 | |
| | | Number
of Contracts | | Fair
Value |
| Written Options — 2.70% | | | | |
| | | | | |
| Call Options — 2.60% | | | | | | | | |
Allscripts Healthcare Solutions, Inc., Expiration: July, 2013
Exercise Price: $13.00 | | | 550 | | | | 19,250 | |
American Tower Corp., Expiration: January, 2014
Exercise Price: $85.00 | | | 385 | | | | 74,112 | |
The Brink’s Co., Expiration: December, 2013
Exercise Price: $30.00 • | | | 188 | | | | 14,570 | |
CACI International, Inc., Expiration: July, 2013
Exercise Price: $57.50 • | | | 50 | | | | 31,000 | |
CACI International, Inc., Expiration: August, 2013
Exercise Price: $55.00 • | | | 73 | | | | 65,700 | |
Calgon Carbon Corp., Expiration: December, 2013
Exercise Price: $19.00 ^ | | | 940 | | | | 61,100 | |
Chesapeake Energy Corp., Expiration: January, 2014
Exercise Price: $25.00 | | | 550 | | | | 37,950 | |
Comverse, Inc., Expiration: July, 2013
Exercise Price: $28.25 ^ | | | 220 | | | | 44,880 | |
CST Brands, Inc., Expiration: July, 2013
Exercise Price: $30.00 • | | | 233 | | | | 30,873 | |
DSW, Inc., Expiration: December, 2013
Exercise Price: $73.00 ^ | | | 66 | | | | 39,666 | |
Emulex Corp., Expiration: December, 2013
Exercise Price: $7.00 ^ | | | 1,000 | | | | 47,000 | |
Fairpoint Communications, Inc., Expiration: December, 2013
Exercise Price: $9.25 ^ | | | 1,600 | | | | 163,200 | |
Fairpoint Communications, Inc., Expiration: July, 2013
Exercise Price: $7.50 • | | | 333 | | | | 28,305 | |
Integrated Device Technology, Inc., Expiration: December, 2013
Exercise Price: $7.80 ^ | | | 980 | | | | 97,020 | |
InterMune, Inc., Expiration: January, 2014
Exercise Price: $14.00 • | | | 1,220 | | | | 83,570 | |
Lennar Corp., Expiration: November, 2013
Exercise Price: $42.00 • | | | 200 | | | | 33,000 | |
The accompanying notes are an integral part of the financial statements.
24 | 2 0 1 3 A N N U A L R E P O R T
Schedule of Investments
Quaker Event Arbitrage Fund
June 30, 2013
| | | Number
of Contracts | | Fair
Value |
| Written Options (Continued) | | | | | | | | |
| | | | | | | | | |
Liberty Global, Inc., Expiration: July, 2013
Exercise Price: $75.00 | | | 129 | | | $ | 16,770 | |
NetApp, Inc., Expiration: July, 2013
Exercise Price: $34.00 • | | | 247 | | | | 95,095 | |
Nuance Communications, Inc., Expiration: July, 2013
Exercise Price: $18.00 | | | 200 | | | | 18,000 | |
Regis Corp., Expiration: December, 2013
Exercise Price: $20.50 ^ | | | 570 | | | | 18,810 | |
SAIC, Inc., Expiration: December, 2013
Exercise Price: $15.00 ^ | | | 420 | | | | 19,320 | |
SPX Corp., Expiration: July, 2013
Exercise Price: $65.00 • | | | 77 | | | | 56,595 | |
Telephone & Data Systems, Inc., Expiration: July, 2013
Exercise Price: $22.50 • | | | 260 | | | | 57,850 | |
tw telecom Inc., Expiration: July, 2013
Exercise Price: $26.00 ^ | | | 135 | | | | 32,265 | |
tw telecom Inc., Expiration: July, 2013
Exercise Price: $28.30 ^ | | | 180 | | | | 14,220 | |
Verizon Communications, Inc., Expiration: October, 2013
Exercise Price: $55.00 | | | 140 | | | | 6,440 | |
VMware, Inc., Expiration: July, 2013
Exercise Price: $60.00 • | | | 67 | | | | 49,580 | |
Wausau Paper Corp., Expiration: December, 2013
Exercise Price: $11.60 ^ | | | 1,020 | | | | 81,600 | |
The Wet Seal, Inc., Expiration: December, 2013
Exercise Price: $4.25 ^ | | | 3,290 | | | | 276,360 | |
WhiteWave Foods Co., Expiration: July, 2013
Exercise Price: $15.00 • | | | 840 | | | | 105,000 | |
| Total Call Options (Premiums Received $1,584,143) | | | | | | | 1,719,101 | |
| | | Number
of Contracts | | Fair
Value |
| Written Options (Continued) | | | | | | | | |
| | | | | | | | | |
| Put Options — 0.10% | | | | | | | | |
Health Management Associates, Inc., Expiration: July, 2013
Exercise Price: $11.00 • | | | 636 | | | $ | 1,590 | |
Hess Corp., Expiration: July, 2013
Exercise Price: $57.50 • | | | 60 | | | | 870 | |
Iron Mountain Incorporated, Expiration: July, 2013
Exercise Price: $26.50 ^ | | | 226 | | | | 14,238 | |
Mondelez International, Inc., Expiration: July, 2013
Exercise Price: $26.00 | | | 288 | | | | 1,440 | |
Nabors Industries Ltd., Expiration: July, 2013
Exercise Price: $14.00 | | | 357 | | | | 3,927 | |
Noble Corp., Expiration: July, 2013
Exercise Price: $35.00 | | | 230 | | | | 7,360 | |
NRG Energy, Inc., Expiration: July, 2013
Exercise Price: $26.00 | | | 230 | | | | 6,900 | |
SAIC, Inc., Expiration: August, 2013
Exercise Price: $13.00 | | | 250 | | | | 4,000 | |
SPX Corp., Expiration: July, 2013
Exercise Price: $70.00 | | | 57 | | | | 4,845 | |
Tessera Technologies, Inc., Expiration: July, 2013
Exercise Price: $19.70 | | | 200 | | | | 4,000 | |
Time Warner, Inc,, Expiration: July, 2013
Exercise Price: $56.30 ^ | | | 124 | | | | 6,944 | |
The Timken Co., Expiration: August, 2013
Exercise Price: $50.00 | | | 120 | | | | 7,200 | |
| Total Put Options (Premiums Received $83,577) | | | | | | | 63,314 | |
| Total Written Options (Premiums Received $1,667,720) | | | | | | $ | 1,782,415 | |
| Forward Currency Contracts |
| Settlement Date | | Counterparty | | Currency to be Delivered | | U.S. $ Value on
June 30, 2013 of
Currency to be
Delivered | | Currency to be Received | | U.S. $ Value on
June 30, 2013 of
Currency to be
Received | | Unrealized Depreciation |
| 7/31/2013 | | Brown Brother Harriman & Co. | | 596,054 Euro | | $ | 775,958 | | | 775,538 U.S. Dollar | | $ | 775,538 | | | | $(420 | ) |
ADR - American Depositary Receipt
| (a) | Non-income producing security. |
| (b) | All or a portion of the security out on loan. |
| (c) | Rate shown is the annualized seven-day effective yield at period end. |
| (d) | Represents investments of collateral received from securities lending transactions. |
| (e) | Securities sold short are non-income producing. |
| ^ | Indicates a fair valued security. Total market value for fair valued securities is $2,825,664, representing 4.27% of net assets and Level 3 securities. |
| * | Indicates an illiquid security. Total market value for illiquid securities is $2,954,744, representing 4.47% of net assets. |
| + | Defaulted Bond |
| # | Restricted security that may be sold to “qualified institutional buyers” pursuant to the conditions of Rule 144A under the Securities Act of 1933, as amended. |
| ▲ | The coupon rate shown on floating or adjustable rate securities represents the rate at period end. |
| • | Level 2 securities. |
The accompanying notes are an integral part of the financial statements.
2 0 1 3 A N N U A L R E P O R T | 25
Schedule of Investments
Quaker Global Tactical Allocation Fund
June 30, 2013
| | | Number
of Shares | | | Fair
Value | |
| Common Stocks — 99.01% | | | | | | |
| | | | | | | |
| Belgium — 1.51% | | | | | | |
| Anheuser-Busch InBev NV - ADR | | | 1,105 | | | $ | 99,737 | |
| Total Belgium (Cost $82,478) | | | | | | | 99,737 | |
| | | | | | | | | |
| Bermuda — 2.42% | | | | | | | | |
| Arch Capital Group Ltd. (a)(b) | | | 3,110 | | | | 159,885 | |
| Total Bermuda (Cost $122,263) | | | | | | | 159,885 | |
| | | | | | | | | |
| Denmark — 1.31% | | | | | | | | |
| Novo Nordisk - ADR | | | 560 | | | | 86,783 | |
| Total Denmark (Cost $92,449) | | | | | | | 86,783 | |
| | | | | | | | | |
| France — 2.25% | | | | | | | | |
| Sanofi - ADR | | | 2,890 | | | | 148,864 | |
| Total France (Cost $131,939) | | | | | | | 148,864 | |
| | | | | | | | | |
| Germany — 6.62% | | | | | | | | |
| Adidas AG - ADR (b) | | | 3,030 | | | | 164,044 | |
| Bayerische Motoren Werke AG - ADR (b) | | | 4,710 | | | | 137,202 | |
| SAP AG - ADR (b) | | | 1,870 | | | | 136,192 | |
| | | | | | | | 437,438 | |
| Total Germany (Cost $367,167) | | | | | | | 437,438 | |
| | | | | | | | | |
| Ireland — 1.94% | | | | | | | | |
| Ryanair Holdings PLC - ADR | | | 2,480 | | | | 127,794 | |
| Total Ireland (Cost $105,007) | | | | | | | 127,794 | |
| | | | | | | | | |
| Japan — 1.44% | | | | | | | | |
| Toyota Motor Corp. - ADR | | | 790 | | | | 95,321 | |
| Total Japan (Cost $96,822) | | | | | | | 95,321 | |
| | | | | | | | | |
| Mexico — 1.63% | | | | | | | | |
| Fomento Economico Mexicano SAB de CV - ADR | | | 1,045 | | | | 107,834 | |
| Total Mexico (Cost $94,207) | | | | | | | 107,834 | |
| | | | | | | | | |
| Netherlands — 3.74% | | | | | | | | |
| Koninklijke Philips NV - ADR (b) | | | 5,385 | | | | 146,418 | |
| Unilever NV - ADR (b) | | | 2,555 | | | | 100,437 | |
| | | | | | | | 246,855 | |
| Total Netherlands (Cost $235,002) | | | | | | | 246,855 | |
| | | | | | | | | |
| Switzerland — 11.12% | | | | | | | | |
| ACE Ltd. | | | 1,830 | | | | 163,748 | |
| Allied World Assurance Co. Holdings AG (b) | | | 1,770 | | | | 161,973 | |
| Novartis AG - ADR (b) | | | 2,165 | | | | 153,087 | |
| Roche Holdings, Ltd. - ADR (b) | | | 1,890 | | | | 116,925 | |
| Syngenta AG - ADR | | | 1,780 | | | | 138,591 | |
| | | | | | | | 734,324 | |
| Total Switzerland (Cost $658,623) | | | | | | | 734,324 | |
| | | | | | | | | |
| United Kingdom — 4.95% | | | | | | | | |
| Diageo PLC - ADR | | | 730 | | | | 83,913 | |
| GlaxoSmithKline PLC - ADR | | | 2,180 | | | | 108,935 | |
| InterContinental Hotels Group PLC - ADR | | | 4,882 | | | | 134,109 | |
| | | | | | | | 326,957 | |
| Total United Kingdom (Cost $312,076) | | | | | | | 326,957 | |
| | | | Number
of Shares | | | | Fair
Value | |
| Common Stocks (Continued) | | |
| | | | | | | | | |
| United States — 60.08% | | | | | | | | |
| AbbVie, Inc. | | | 3,640 | | | $ | 150,478 | |
| Akamai Technologies, Inc. (a) | | | 1,270 | | | | 54,039 | |
| Amazon.com, Inc. (a) | | | 485 | | | | 134,680 | |
| American International Group, Inc. (a) | | | 3,825 | | | | 170,978 | |
| Anadarko Petroleum Corp. | | | 1,610 | | | | 138,347 | |
| Best Buy, Inc. (b) | | | 4,900 | | | | 133,917 | |
| Biogen Idec, Inc. (a) | | | 1,165 | | | | 250,708 | |
| CBS Corp. | | | 3,480 | | | | 170,068 | |
| Celgene Corp. (a) | | | 1,170 | | | | 136,785 | |
| Citigroup, Inc. | | | 3,495 | | | | 167,655 | |
| Delta Air Lines, Inc. (a) | | | 7,530 | | | | 140,886 | |
| eBay, Inc. (a) | | | 2,010 | | | | 103,957 | |
| Gilead Sciences, Inc. (a)(b) | | | 4,065 | | | | 208,169 | |
| Google, Inc. Class A (a) | | | 198 | | | | 174,313 | |
| Intel Corp. | | | 4,200 | | | | 101,724 | |
| Las Vegas Sands Corp. | | | 2,630 | | | | 139,206 | |
| Marathon Oil Corp. | | | 3,780 | | | | 130,712 | |
| Mastercard, Inc. Class A | | | 295 | | | | 169,477 | |
| Mead Johnson Nutrition Co. | | | 1,745 | | | | 138,256 | |
| Mondelez International, Inc. | | | 3,500 | | | | 99,855 | |
| Monsanto Co. | | | 845 | | | | 83,486 | |
| News Corp. | | | 4,300 | | | | 140,180 | |
| Onyx Pharmaceuticals, Inc. (a)(b) | | | 1,225 | | | | 106,355 | |
| Time Warner, Inc. (b) | | | 2,340 | | | | 135,299 | |
| United Continental Holdings, Inc. (a)(b) | | | 4,380 | | | | 137,050 | |
| Vertex Pharmaceuticals, Inc. (a) | | | 1,300 | | | | 103,831 | |
| Viacom, Inc. | | | 2,040 | | | | 138,822 | |
| Visa, Inc. (b) | | | 755 | | | | 137,976 | |
| Walgreen Co. | | | 1,170 | | | | 51,714 | |
| Waters Corp. (a) | | | 195 | | | | 19,510 | |
| | | | | | | | 3,968,433 | |
| Total United States (Cost $3,579,268) | | | | | | | 3,968,433 | |
Total Common Stocks
Cost ($5,877,301) | | | | | | | 6,540,225 | |
| | | | | | | | | |
| Short-Term Investments — 0.40% | | | | | | | | |
| Money Market Funds — 0.40% | | | | | | | | |
| Fidelity Institutional Money Market Portfolio, 0.07% (c) | | | 26,765 | | | | 26,765 | |
Total Short-Term Investments
Cost ($26,765) | | | | | | | 26,765 | |
| |
Investments Purchased with Proceeds from Securities
Lending — 23.55% |
| Money Market Funds — 23.55% | | | | | | | | |
| Mount Vernon Securities Lending Trust Prime Portfolio, 0.19% (c)(d) | | | 1,555,375 | | | | 1,555,375 | |
Total Investments Purchased with Proceeds from Securities Lending
(Cost $1,555,375) | | 1,555,375 | |
Total Investments
(Cost $7,459,441) — 122.96% | | | | | | | 8,122,365 | |
| Liabilities in Excess of Other Assets, Net (22.96)% | | | | | | | (1,516,678 | ) |
| Total Net Assets — 100.00% | | | | | | $ | 6,605,687 | |
The accompanying notes are an integral part of the financial statements.
26 | 2 0 1 3 A N N U A L R E P O R T
Schedule of Investments
Quaker Global Tactical Allocation Fund
June 30, 2013
| Schedule of Securities Sold Short (e) | | Number
of Shares | | | Fair
Value | |
| Exchange-Traded Funds — 3.23% |
| | | | | | | | | |
| CurrencyShares Australian Dollar Trust | | | 2,330 | | | $ | 213,428 | |
| Total Exchange-Traded Funds | | | | | | | 213,428 | |
| Total Securities Sold Short (Proceeds: $235,453) | | | | | | $ | 213,428 | |
ADR - American Depositary Receipt
| (a) | Non-income producing security. |
| (b) | All or a portion of the security out on loan. |
| (c) | The rate shown is the annualized seven-day effective yield at period end. |
| (d) | Represents investments of collateral received from securities lending transactions. |
| (e) | Securities sold short are non-income producing. |
The accompanying notes are an integral part of the financial statements.
2 0 1 3 A N N U A L R E P O R T | 27
Schedule of Investments
Quaker Mid-Cap Value Fund
June 30, 2013
| | | Number
of Shares | | | Fair
Value | |
| Domestic Common Stocks — 83.59% | | | |
| | | | | | | | | |
| Basic Materials — 4.56% | | | | | | | | |
| Chemicals — 2.67% | | | | | | | | |
| Axiall Corp. | | | 3,045 | | | $ | 129,656 | |
| FMC Corp. (b) | | | 1,779 | | | | 108,626 | |
| | | | | | | | 238,282 | |
| | | | | | | | | |
| Iron & Steel Production — 1.89% | | | | | | | | |
| Steel Dynamics, Inc. (b) | | | 11,268 | | | | 168,006 | |
| Total Basic Materials (Cost: $296,751) | | | | | | | 406,288 | |
| | | | | | | | | |
| Consumer, Cyclical — 10.69% | | | | | | | | |
| Airlines — 1.87% | | | | | | | | |
| Southwest Airlines Co. | | | 12,920 | | | | 166,539 | |
| | | | | | | | | |
| Auto Parts & Equipment — 2.10% | | | | | | | | |
| Dana Holding Corp. (b) | | | 9,731 | | | | 187,419 | |
| | | | | | | | | |
| Distribution & Wholesale — 1.32% | | | | | | | | |
| Fossil Group, Inc. (a) | | | 1,134 | | | | 117,154 | |
| | | | | | | | | |
| Home Furnishings — 2.23% | | | | | | | | |
| Harman International Industries, Inc. | | | 3,664 | | | | 198,589 | |
| | | | | | | | | |
| Retail — 3.17% | | | | | | | | |
| Darden Restaurants, Inc. | | | 2,203 | | | | 111,207 | |
| Kohl’s Corp. | | | 3,381 | | | | 170,774 | |
| | | | | | | | 281,981 | |
| Total Consumer, Cyclical (Cost: $797,655) | | | | | | | 951,682 | |
| | | | | | | | | |
| Consumer, Non-cyclical — 9.76% | | | | | | | | |
| Food — 2.01% | | | | | | | | |
| Tyson Foods, Inc. (b) | | | 6,970 | | | | 178,990 | |
| | | | | | | | | |
| Healthcare-Products — 6.03% | | | | | | | | |
| Hospira, Inc. (a)(b) | | | 5,338 | | | | 204,499 | |
| St. Jude Medical, Inc. (b) | | | 3,494 | | | | 159,431 | |
| Zimmer Holdings, Inc. | | | 2,304 | | | | 172,662 | |
| | | | | | | | 536,592 | |
| | | | | | | | | |
| Pharmaceuticals — 1.72% | | | | | | | | |
| Forest Laboratories, Inc. (a) | | | 3,735 | | | | 153,135 | |
| Total Consumer, Non-cyclical (Cost: $675,746) | | | | | | | 868,717 | |
| | | | | | | | | |
| Energy — 8.95% | | | | | | | | |
| Oil & Gas — 7.57% | | | | | | | | |
| Atwood Oceanics, Inc. (a) | | | 3,275 | | | | 170,464 | |
| Denbury Resources, Inc. (a) | | | 8,647 | | | | 149,766 | |
| Energen Corp. (b) | | | 2,205 | | | | 115,233 | |
| Helmerich & Payne, Inc. (b) | | | 2,402 | | | | 150,005 | |
| Whiting Petroleum Corp. (a) | | | 1,925 | | | | 88,723 | |
| | | | | | | | 674,191 | |
| | | | | | |
| Oil Equipment & Services — 1.38% | | | | | |
| Oil States International, Inc. (a) | | | 1,323 | | | | 122,563 | |
| Total Energy (Cost: $619,680) | | | | | | | 796,754 | |
| | | | | | | | | |
| Financial — 15.69% | | | | | | | | |
| Banks — 8.96% | | | | | | | | |
| First Horizon National Corp. (b) | | | 14,765 | | | | 165,368 | |
| Huntington Bancshares, Inc. (b) | | | 28,266 | | | | 222,736 | |
| Keycorp (b) | | | 17,533 | | | | 193,564 | |
| Regions Financial Corp. | | | 22,688 | | | | 216,217 | |
| | | | | | | | 797,885 | |
| | | Number
of Shares | | | Fair
Value | |
| Domestic Common Stocks (Continued) |
| | | | | | | | | |
| Insurance — 6.73% | | | | | | | | |
| Protective Life Corp. | | | 4,910 | | | $ | 188,593 | |
| Reinsurance Group of America, Inc., Class A | | | 2,711 | | | | 187,357 | |
| Torchmark Corp. | | | 3,435 | | | | 223,756 | |
| | | | | | | | 599,706 | |
| Total Financial (Cost: $977,616) | | | | | | | 1,397,591 | |
| | | | | | | | | |
| Industrial — 17.27% | | | | | | | | |
| Electronics — 3.71% | | | | | | | | |
| Jabil Circuit, Inc. | | | 8,293 | | | | 169,011 | |
| Woodward, Inc. | | | 4,036 | | | | 161,440 | |
| | | | | | | | 330,451 | |
| | | | | | | | | |
| Hand & Machine Tools — 1.49% | | | | | | | | |
| Regal-Beloit Corp. | | | 2,045 | | | | 132,598 | |
| | | | | | | | | |
| Machinery-Diversified — 4.09% | | | | | | | | |
| AGCO Corp. | | | 3,731 | | | | 187,259 | |
| Roper Industries, Inc. | | | 1,426 | | | | 177,138 | |
| | | | | | | | 364,397 | |
| | | | | | | | | |
| Metal Fabricate & Hardware — 4.22% | | | | | | | | |
| Timken Co. | | | 3,889 | | | | 218,873 | |
| Valmont Industries, Inc. | | | 1,098 | | | | 157,113 | |
| | | | | | | | 375,986 | |
| | | | | | | | | |
| Miscellaneous Manufacturing — 3.76% | | | | | | | | |
| Parker Hannifin Corp. (b) | | | 1,877 | | | | 179,066 | |
| Trinity Industries, Inc. | | | 4,045 | | | | 155,490 | |
| | | | | | | | 334,556 | |
| Total Industrial (Cost: $1,367,688) | | | | | | | 1,537,988 | |
| | | | | | | | | |
| Technology — 8.80% | | | | | | | | |
| Computers — 1.88% | | | | | | | | |
| NetApp, Inc. (a) | | | 4,441 | | | | 167,781 | |
| | | | | | | | | |
| Semiconductors — 6.92% | | | | | | | | |
| KLA-Tencor Corp. | | | 2,751 | | | | 153,313 | |
| ON Semiconductor Corp. (a)(b) | | | 20,563 | | | | 166,149 | |
| Skyworks Solutions, Inc. (a) | | | 6,602 | | | | 144,518 | |
| Teradyne, Inc. (a)(b) | | | 8,669 | | | | 152,314 | |
| | | | | | | | 616,294 | |
| Total Technology (Cost: $695,994) | | | | | | | 784,075 | |
| | | | | | | | | |
| Utilities — 7.87% | | | | | | | | |
| Electric — 4.35% | | | | | | | | |
| Northeast Utilities | | | 2,686 | | | | 112,866 | |
| Westar Energy, Inc. (b) | | | 4,497 | | | | 143,724 | |
| Xcel Energy, Inc. | | | 4,608 | | | | 130,591 | |
| | | | | | | | 387,181 | |
| | | | | | | | | |
| Gas — 3.52% | | | | | | | | |
| Centerpoint Energy, Inc. | | | 6,321 | | | | 148,480 | |
| Questar Corp. | | | 3,404 | | | | 81,185 | |
| UGI Corp. | | | 2,137 | | | | 83,578 | |
| | | | | | | | 313,243 | |
| Total Utilities (Cost: $502,217) | | | | | | | 700,424 | |
Total Domestic Common Stocks
Cost ($5,933,347) | | | | | | | 7,443,519 | |
The accompanying notes are an integral part of the financial statements.
28 | 2 0 1 3 A N N U A L R E P O R T
Schedule of Investments
Quaker Mid-Cap Value Fund
June 30, 2013
| | | Number
of Shares | | | Fair
Value | |
| Foreign Common Stocks — 5.46% |
| | | | | | | |
| Bermuda — 1.57% | | | | | | |
| Diversified Financial Services — 1.57% | | | | | | |
| Invesco Ltd . | | | 4,379 | | | $ | 139,252 | |
| Total Bermuda (Cost: $59,854) | | | | | | | 139,252 | |
| | | | | | | | | |
| Canada — 3.89% | | | | | | | | |
| Apparel — 1.89% | | | | | | | | |
| Gildan Activewear, Inc., Class A | | | 4,161 | | | | 168,562 | |
| Oil & Gas — 2.00% | | | | | | | | |
| Ultra Petroleum Corp. (a)(b) | | | 8,983 | | | | 178,043 | |
| Total Canada (Cost: $303,079) | | | | | | | 346,605 | |
Total Foreign Common Stocks
Cost ($362,933) | | | | | | | 485,857 | |
| | | | | | | | | |
| Real Estate Investment Trusts — 4.73% | | | | | | | | |
|
| BioMed Realty Trust Inc. | | | 8,884 | | | | 179,723 | |
| Camden Property Trust | | | 1,167 | | | | 80,686 | |
| Host Hotels & Resorts, Inc. | | | 9,517 | | | | 160,552 | |
| | | | | | | | 420,961 | |
Total Real Estate Investment Trusts
Cost ($318,155) | | | | | | | 420,961 | |
| | | | | | | | | |
| Short-Term Investments — 5.22% | | | | | | | | |
| | | | | | | | | |
| Money Market Funds — 5.22% | | | | | | | | |
| Fidelity Institutional Money Market Portfolio, 0.07% (c) | | | 465,061 | | | | 465,061 | |
Total Short-Term Investments
Cost ($465,061) | | | | | | | 465,061 | |
| |
Investments Purchased with Proceeds from Securities
Lending — 26.90% |
| | | | | | | | | |
| Money Market Funds — 26.90% | | | | | | | | |
| Mount Vernon Securities Lending Trust Prime Portfolio, 0.19% (c)(d) | | | 2,395,433 | | | | 2,395,433 | |
Total Investments Purchased with Proceeds from Securities Lending
(Cost $2,395,433) | 2,395,433 | |
Total Investments
(Cost $9,474,929) — 125.90% | | | | | | | 11,210,831 | |
| Liabilities in Excess of Other Assets, Net (25.90)% | | | | | | | (2,306,519 | ) |
| Total Net Assets — 100.00% | | | | | | $ | 8,904,312 | |
| (a) | Non-income producing security. |
| (b) | All or a portion of the security out on loan. |
| (c) | The rate shown is the annualized seven-day effective yield at period end. |
| (d) | Represents investments of collateral received from securities lending transactions. |
The accompanying notes are an integral part of the financial statements.
2 0 1 3 A N N U A L R E P O R T | 29
Schedule of Investments
Quaker Small-Cap Growth Tactical Allocation Fund
June 30, 2013
| | | | Number
of Shares | | | | Fair
Value | |
| Domestic Common Stocks — 66.34% | | | |
| | | | | | | | | |
| Basic Materials — 4.91% | | | | | | | | |
| Iron/Steel — 1.32% | | | | | | | | |
| Sutor Technology Group Ltd. (a) | | | 30,000 | | | $ | 45,600 | |
| | | | | | | | | |
| Mining — 3.59% | | | | | | | | |
| Comstock Mining, Inc. (a)(b) | | | 75,000 | | | | 123,750 | |
| Total Basic Materials (Cost: $200,511) | | | | | | | 169,350 | |
| | | | | | | | | |
| Communications — 6.11% | | | | | | | | |
| Internet — 3.38% | | | | | | | | |
| AOL, Inc. (b) | | | 1,000 | | | | 36,480 | |
| Blucora, Inc. (a)(b) | | | 4,300 | | | | 79,722 | |
| | | | | | | | 116,202 | |
| | | | | | | | | |
| Telecommunications — 2.73% | | | | | | | | |
| RF Micro Devices, Inc. (a) | | | 17,600 | | | | 94,160 | |
| Total Communications (Cost: $207,322) | | | | | | | 210,362 | |
| | | | | | | | | |
| Consumer, Cyclical — 11.97% | | | | | | | | |
| Apparel — 0.95% | | | | | | | | |
| Joes Jeans, Inc. (a) | | | 20,000 | | | | 32,800 | |
| | | | | | | | | |
| Auto Parts & Equipment — 2.22% | | | | | | | | |
| Cooper Tire & Rubber Co. | | | 2,300 | | | | 76,291 | |
| | | | | | | | | |
| Distribution & Wholesale — 3.32% | | | | | | | | |
| Core-Mark Holding Co., Inc. (b) | | | 1,800 | | | | 114,300 | |
| | | | | | | | | |
| Leisure Time — 5.48% | | | | | | | | |
| WMS Industries, Inc. (a) | | | 7,400 | | | | 188,774 | |
| Total Consumer, Cyclical (Cost: $366,162) | | | | | | | 412,165 | |
| | | | | | | | | |
| Consumer, Non-cyclical — 8.58% | | | | | | | | |
| Commercial Services — 5.12% | | | | | | | | |
| Arbitron, Inc. | | | 3,800 | | | | 176,510 | |
| | | | | | | | | |
| Pharmaceuticals — 3.46% | | | | | | | | |
| Santarus, Inc. (a) | | | 3,500 | | | | 73,675 | |
| SIGA Technologies, Inc. (a)(b) | | | 16,000 | | | | 45,440 | |
| | | | | | | | 119,115 | |
| Total Consumer, Non-cyclical (Cost: $311,743) | | | | | | | 295,625 | |
| | | | | | | | | |
| Energy — 4.05% | | | | | | | | |
| Energy-Alternate Sources — 1.13% | | | | | | | | |
| Renewable Energy Group, Inc. (a) | | | 2,725 | | | | 38,777 | |
| | | | | | | | | |
| Oil & Gas Services — 2.92% | | | | | | | | |
| Mitcham Industries, Inc. (a)(b) | | | 6,000 | | | | 100,680 | |
| Total Energy (Cost: $114,575) | | | | | | | 139,457 | |
| | | | | | | | | |
| Financial — 3.29% | | | | | | | | |
| Diversified Financial Services — 1.59% | | | | | | | | |
| Gain Capital Holdings, Inc. | | | 8,700 | | | | 54,897 | |
| | | | | | | | | |
| Insurance — 1.70% | | | | | | | | |
| HCI Group, Inc. | | | 1,900 | | | | 58,368 | |
| Total Financial (Cost: $110,818) | | | | | | | 113,265 | |
| | | | | | | | | |
| Industrial — 11.02% | | | | | | | | |
| Building Materials — 2.48% | | | | | | | | |
| Trex Co., Inc. (a) | | | 1,800 | | | | 85,482 | |
| | | | | | | | | |
| Electrical Components & Equipment — 6.61% | | | | | | | | |
| Active Power, Inc. (a) | | | 14,000 | | | | 58,520 | |
| American Electric Technologies, Inc. (a) | | | 10,000 | | | | 71,300 | |
| PowerSecure International, Inc. (a) | | | 6,500 | | | | 97,695 | |
| | | | | | | | 227,515 | |
| | | Number
of Shares | | | Fair
Value | |
| Domestic Common Stocks (Continued) |
| | | | | | | |
| Hand & Machine Tools — 1.93% | | | | | | |
| Hardinge, Inc. | | | 4,500 | | | $ | 66,510 | |
| Total Industrial (Cost: $358,764) | | | | | | | 379,507 | |
| | | | | | | | | |
| Technology — 16.41% | | | | | | | | |
| Computers — 8.47% | | | | | | | | |
| CIBER, Inc. (a) | | | 14,000 | | | | 46,760 | |
| The KEYW Holding Corp. (a) | | | 2,700 | | | | 35,775 | |
| Maxwell Technologies, Inc. (a)(b) | | | 12,000 | | | | 85,800 | |
| Synaptics, Inc. (a) | | | 1,900 | | | | 73,264 | |
| Uni-Pixel, Inc. (a)(b) | | | 3,400 | | | | 50,014 | |
| | | | | | | | 291,613 | |
| | | | | | | | | |
| Semiconductors — 4.76% | | | | | | | | |
| Diodes, Inc. (a) | | | 2,400 | | | | 62,328 | |
| IXYS Corp. | | | 4,100 | | | | 45,346 | |
| MoSys, Inc. (a) | | | 14,000 | | | | 56,280 | |
| | | | | | | | 163,954 | |
| | | | | | | | | |
| Software — 3.18% | | | | | | | | |
| Tangoe, Inc. (a)(b) | | | 7,100 | | | | 109,553 | |
| Total Technology (Cost: $592,509) | | | | | | | 565,120 | |
Total Domestic Common Stocks
(Cost $2,262,404) | | | | | | | 2,284,851 | |
| | | | | | | | | |
| Foreign Common Stocks — 14.27% | | | | | | | | |
| | | | | | | | | |
| Canada — 2.00% | | | | | | | | |
| Mining — 2.00% | | | | | | | | |
| Seabridge Gold, Inc. (a)(b) | | | 7,300 | | | | 68,839 | |
| Total Canada (Cost: $76,151) | | | | | | | 68,839 | |
| | | | | | | | | |
| Cayman Islands — 4.41% | | | | | | | | |
| Insurance — 2.14% | | | | | | | | |
| Greenlight Capital Re Ltd. (a) | | | 3,000 | | | | 73,590 | |
| | | | | | | | | |
| Semiconductors — 2.27% | | | | | | | | |
| Himax Technologies, Inc. – ADR | | | 15,000 | | | | 78,300 | |
| Total Cayman Islands (Cost: $172,199) | | | | | | | 151,890 | |
| | | | | | | | | |
| Israel — 6.32% | | | | | | | | |
| Electronics — 2.67% | | | | | | | | |
| Orbotech Ltd. (a) | | | 7,400 | | | | 92,056 | |
| Internet — 2.23% | | | | | | | | |
| Perion Network Ltd. (a)(b) | | | 6,700 | | | | 76,715 | |
| Telecommunications — 1.42% | | | | | | | | |
| AudioCodes Ltd. (a) | | | 11,000 | | | | 48,730 | |
| Total Israel (Cost: $199,123) | | | | | | | 217,501 | |
| | | | | | | | | |
| Jersey — 1.54% | | | | | | | | |
| Software — 1.54% | | | | | | | | |
| Velti PLC (a)(b) | | | 38,000 | | | | 53,200 | |
| Total Jersey (Cost: $299,292) | | | | | | | 53,200 | |
Total Foreign Common Stocks
(Cost $746,765) | | | | | | | 491,430 | |
| Exchange-Traded Funds — 9.38% | | | | | | | | |
| | | | | | | | | |
| Direxion Daily Small Cap Bear 3X Shares (a)(b) | | | 5,100 | | | | 162,486 | |
| ProShares UltraPro Short Russell 2000 (a)(b) | | | 8,100 | | | | 160,542 | |
Total Exchange-Traded Funds
(Cost $429,180) | | | | | | | 323,028 | |
The accompanying notes are an integral part of the financial statements.
30 | 2 0 1 3 A N N U A L R E P O R T
Schedule of Investments
Quaker Small-Cap Growth Tactical Allocation Fund
June 30, 2013
| | | Number
of Shares | | | Fair
Value | |
| Short-Term Investments — 12.35% |
| Money Market Funds — 12.35% | |
| Fidelity Institutional Money Market Portfolio, 0.07% (c) | | | 425,228 | | | $ | 425,228 | |
Total Short-Term Investments
(Cost $425,228) | 425,228 | |
| | | |
Investments Purchased with Proceeds from Securities
Lending — 24.32% | |
| Money Market Funds — 24.32% | | |
| Mount Vernon Securities Lending Trust Prime Portfolio, 0.19% (c)(d) | | | 837,630 | | | | 837,630 | |
Total Investments Purchased with Proceeds from Securities Lending
(Cost $837,630) | 837,630 | |
Total Investments
(Cost $4,701,207) — 126.66% | 4,362,167 | |
| Liabilities in Excess of Other Assets, Net (26.66)% | | (918,282 | ) |
| Total Net Assets — 100.00% | | | | | | $ | 3,443,885 | |
ADR - American Depositary Receipt
| (a) | Non-income producing security. |
| (b) | All or a portion of the security out on loan. |
| (c) | The rate shown is the annualized seven-day effective yield at period end. |
| (d) | Represents investments of collateral received from securities lending transactions. |
The accompanying notes are an integral part of the financial statements.
2 0 1 3 A N N U A L R E P O R T | 31
Schedule of Investments
Quaker Small-Cap Value Fund
June 30, 2013
| | | Number
of Shares | | | Fair
Value | |
| Domestic Common Stocks — 84.48% | | | | | | | | |
| | | | | | | | | |
| Basic Materials — 3.07% | | | | | | | | |
| Chemicals — 1.23% | | | | | | | | |
| Ferro Corp. (a)(b) | | | 36,600 | | | $ | 254,370 | |
| Minerals Technologies, Inc. | | | 3,600 | | | | 148,824 | |
| | | | | | | | 403,194 | |
| | | | | | | | | |
| Forest Products & Paper — 1.84% | | | | | | | | |
| Boise, Inc. | | | 7,600 | | | | 64,904 | |
| Domtar Corp. | | | 2,100 | | | | 139,650 | |
| PH Glatfelter Co. (b) | | | 7,600 | | | | 190,760 | |
| Resolute Forest Products, Inc. (a) | | | 15,800 | | | | 208,086 | |
| | | | | | | | 603,400 | |
| Total Basic Materials (Cost: $1,006,810) | | | | | | | 1,006,594 | |
| | | | | | | | | |
| Communications — 6.47% | | | | | | | | |
| Internet — 4.04% | | | | | | | | |
| Blue Nile, Inc. (a) | | | 3,900 | | | | 147,342 | |
| IAC/InterActiveCorp. | | | 2,700 | | | | 128,412 | |
| Nutrisystem, Inc. | | | 19,600 | | | | 230,888 | |
| QuinStreet, Inc. (a) | | | 9,900 | | | | 85,437 | |
| Stamps.com, Inc. (a) | | | 3,900 | | | | 153,621 | |
| United Online, Inc. | | | 39,500 | | | | 299,410 | |
| ValueClick, Inc. (a)(b) | | | 11,200 | | | | 276,416 | |
| | | | | | | | 1,321,526 | |
| | | | | | | | | |
| Media — 0.72% | | | | | | | | |
| CTC Media, Inc. | | | 21,300 | | | | 236,856 | |
| | | | | | | | | |
| Telecommunications — 1.71% | | | | | | | | |
| Cbeyond, Inc. (a) | | | 28,000 | | | | 219,520 | |
| NeuStar, Inc. Class A (a)(b) | | | 4,000 | | | | 194,720 | |
| Neutral Tandem, Inc. | | | 25,400 | | | | 146,050 | |
| | | | | | | | 560,290 | |
| Total Communications (Cost: $1,822,845) | | | | | | | 2,118,672 | |
| | | | | | | | | |
| Consumer, Cyclical — 11.41% | | | | | | | | |
| Airlines — 0.55% | | | | | | | | |
| Alaska Air Group, Inc. (a) | | | 1,200 | | | | 62,400 | |
| Allegiant Travel Co. | | | 1,100 | | | | 116,589 | |
| | | | | | | | 178,989 | |
| | | | | | | | | |
| Apparel — 0.37% | | | | | | | | |
| Deckers Outdoor Corp. (a) | | | 2,400 | | | | 121,224 | |
| | | | | | | | | |
| Auto Manufacturers — 0.60% | | | | | | | | |
| Oshkosh Corp. (a) | | | 5,200 | | | | 197,444 | |
| | | | | | | | | |
| Auto Parts & Equipment — 1.08% | | | | | | | | |
| Lear Corp. | | | 1,800 | | | | 108,828 | |
| Modine Manufacturing Co. (a)(b) | | | 14,100 | | | | 153,408 | |
| Tenneco, Inc. (a) | | | 2,000 | | | | 90,560 | |
| | | | | | | | 352,796 | |
| | | | | | | | | |
| Distribution & Wholesale — 0.85% | | | | | | | | |
| Core-Mark Holding Co., Inc. | | | 1,200 | | | | 76,200 | |
| Fossil Group, Inc. (a) | | | 700 | | | | 72,317 | |
| Ingram Micro, Inc. Class A (a) | | | 6,800 | | | | 129,132 | |
| | | | | | | | 277,649 | |
| | | | | | | | | |
| Entertainment — 0.24% | | | | | | | | |
| Marriott Vacations Worldwide Corp. (a) | | | 1,800 | | | | 77,832 | |
| | | | | | | | | |
| Home Builders — 0.40% | | | | | | | | |
| The Ryland Group, Inc. (b) | | | 3,300 | | | | 132,330 | |
| | | Number
of Shares | | | Fair
Value | |
| Domestic Common Stocks (Continued) | | | | | | |
| | | | | | | |
| Housewares — 0.42% | | | | | | |
| Newell Rubbermaid, Inc. | | | 5,300 | | | $ | 139,125 | |
| | | | | | | | | |
| Leisure Time — 0.40% | | | | | | | | |
| Nautilus, Inc. (a) | | | 15,000 | | | | 130,350 | |
| | | | | | | | | |
| Retail — 5.89% | | | | | | | | |
| CEC Entertainment, Inc. (b) | | | 3,900 | | | | 160,056 | |
| Destination Maternity Corp. | | | 5,300 | | | | 130,380 | |
| Dillard’s, Inc. (b) | | | 3,800 | | | | 311,486 | |
| Domino’s Pizza, Inc. | | | 2,300 | | | | 133,745 | |
| GameStop Corp. (b) | | | 10,400 | | | | 437,112 | |
| Kirkland’s, Inc. (a) | | | 13,900 | | | | 239,775 | |
| Nu Skin Enterprises, Inc. | | | 1,600 | | | | 97,792 | |
| PetMed Express, Inc. | | | 24,700 | | | | 311,220 | |
| The Wet Seal, Inc. (a) | | | 22,500 | | | | 105,975 | |
| | | | | | | | 1,927,541 | |
| | | | | | | | | |
| Textiles — 0.61% | | | | | | | | |
| UniFirst Corp. | | | 2,200 | | | | 200,750 | |
Total Consumer, Cyclical
(Cost: $3,367,426) | | | | | | | 3,736,030 | |
| | | | | | | | | |
| Consumer, Non-cyclical — 17.57% | | | | | | | | |
| Biotechnology — 3.57% | | | | | | | | |
| Myriad Genetics, Inc. (a) | | | 15,000 | | | | 403,050 | |
| PDL BioPharma, Inc. (b) | | | 48,700 | | | | 375,964 | |
| United Therapeutics Corp. (a)(b) | | | 5,900 | | | | 388,338 | |
| | | | | | | | 1,167,352 | |
| | | | | | | | | |
| Commercial Services — 6.37% | | | | | | | | |
| Aaron’s, Inc. | | | 9,300 | | | | 260,493 | |
| Capella Education Co. (a) | | | 3,300 | | | | 137,445 | |
| Consolidated Graphics, Inc. (a) | | | 5,400 | | | | 253,854 | |
| CoreLogic, Inc. (a) | | | 6,800 | | | | 157,556 | |
| H&R Block, Inc. | | | 5,700 | | | | 158,175 | |
| Medifast, Inc. (a)(b) | | | 5,300 | | | | 136,528 | |
| Monster Worldwide, Inc. (a)(b) | | | 44,100 | | | | 216,531 | |
| PAREXEL International Corp. (a)(b) | | | 5,400 | | | | 248,076 | |
| The Providence Services Corp. (a) | | | 9,800 | | | | 285,082 | |
| RPX Corp. (a) | | | 8,500 | | | | 142,800 | |
| United Rentals, Inc. (a) | | | 1,800 | | | | 89,838 | |
| | | | | | | | 2,086,378 | |
| | | | | | | | | |
| Food — 1.67% | | | | | | | | |
| Ingredion, Inc. | | | 1,800 | | | | 118,116 | |
| J&J Snack Foods Corp. | | | 900 | | | | 70,020 | |
| Sanderson Farms, Inc. | | | 2,600 | | | | 172,692 | |
| The Hillshire Brands Co. | | | 5,600 | | | | 185,248 | |
| | | | | | | | 546,076 | |
| | | | | | | | | |
| Healthcare-Services — 3.00% | | | | | | | | |
| Addus HomeCare Corp. (a) | | | 7,300 | | | | 144,102 | |
| Community Health Systems, Inc. | | | 1,900 | | | | 89,072 | |
| Covance, Inc. (a) | | | 3,000 | | | | 228,420 | |
| Health Net, Inc. (a) | | | 8,800 | | | | 280,016 | |
| LHC Group, Inc. (a) | | | 12,300 | | | | 240,834 | |
| | | | | | | | 982,444 | |
| | | | | | | | | |
| Household Products & Wares — 0.66% | | | | | | | | |
| Jarden Corp. (a) | | | 1,600 | | | | 70,000 | |
| Tupperware Brands Corp. | | | 1,900 | | | | 147,611 | |
| | | | | | | | 217,611 | |
The accompanying notes are an integral part of the financial statements.
32 | 2 0 1 3 A N N U A L R E P O R T
Schedule of Investments
Quaker Small-Cap Value Fund
June 30, 2013
| | | Number
of Shares | | | Fair
Value | |
| Domestic Common Stocks (Continued) | | | | | | | | |
| | | | | | | | | |
| Pharmaceuticals — 2.30% | | | | | | | | |
| PharMerica Corp. (a) | | | 23,700 | | | $ | 328,482 | |
| Questcor Pharmaceuticals, Inc. | | | 2,000 | | | | 90,920 | |
| Sciclone Pharmaceuticals, Inc. (a) | | | 27,900 | | | | 138,384 | |
| USANA Health Sciences, Inc. (a)(b) | | | 2,700 | | | | 195,426 | |
| | | | | | | | 753,212 | |
| Total Consumer, Non-cyclical (Cost: $5,032,573) | | | | | | | 5,753,073 | |
| | | | | | | | | |
| Energy — 4.98% | | | | | | | | |
| Oil & Gas — 3.41% | | | | | | | | |
| CVR Energy, Inc. | | | 4,600 | | | | 218,040 | |
| Delek US Holdings, Inc. (b) | | | 3,700 | | | | 106,486 | |
| EPL Oil & Gas, Inc. (a) | | | 7,300 | | | | 214,328 | |
| Helmerich & Payne, Inc. (b) | | | 2,000 | | | | 124,900 | |
| Patterson-UTI Energy, Inc. | | | 10,800 | | | | 209,034 | |
| VAALCO Energy, Inc. (a) | | | 42,700 | | | | 244,244 | |
| | | | | | | | 1,117,032 | |
| | | | | | | | | |
| Oil & Gas Services — 1.57% | | | | | | | | |
| Newpark Resources, Inc. (a)(b) | | | 32,400 | | | | 356,076 | |
| Superior Energy Services, Inc. (a) | | | 6,100 | | | | 158,234 | |
| | | | | | | | 514,310 | |
| Total Energy (Cost: $1,699,252) | | | | | | | 1,631,342 | |
| | | | | | | | | |
| Financial — 14.86% | | | | | | | | |
| Banks — 5.64% | | | | | | | | |
| Banner Corp. | | | 7,400 | | | | 250,046 | |
| CapitalSource Inc. | | | 6,900 | | | | 64,722 | |
| Central Pacific Financial Corp. (a) | | | 4,000 | | | | 72,000 | |
| East West Bancorp, Inc. | | | 4,500 | | | | 123,750 | |
| First Merchants Corp. | | | 5,300 | | | | 90,895 | |
| Hanmi Financial Corp. (a) | | | 9,600 | | | | 169,632 | |
| Huntington Bancshares, Inc. (b) | | | 54,900 | | | | 432,612 | |
| SVB Financial Group (a) | | | 2,300 | | | | 191,636 | |
| Umpqua Holdings Corp. (b) | | | 11,200 | | | | 168,112 | |
| Wilshire Bancorp, Inc. (a) | | | 42,700 | | | | 282,674 | |
| | | | | | | | 1,846,079 | |
| | | | | | | | | |
| Diversified Financial Services — 5.33% | | | | | | | | |
| CBOE Holdings, Inc. | | | 9,200 | | | | 429,088 | |
| Manning & Napier, Inc. | | | 20,000 | | | | 355,200 | |
| MarketAxess Holdings, Inc. | | | 3,300 | | | | 154,275 | |
| Portfolio Recovery Associates, Inc. (a) | | | 800 | | | | 122,904 | |
| Waddell & Reed Financial, Inc. | | | 8,500 | | | | 369,750 | |
| World Acceptance Corp. (a)(b) | | | 3,600 | | | | 312,984 | |
| | | | | | | | 1,744,201 | |
| | | | | | | | | |
| Insurance — 2.05% | | | | | | | | |
| American Financial Group, Inc. | | | 4,600 | | | | 224,986 | |
| Assurant, Inc. | | | 5,900 | | | | 300,369 | |
| Unum Group | | | 5,000 | | | | 146,850 | |
| | | | | | | | 672,205 | |
| | | | | | | | | |
| Investment Companies — 0.34% | | | | | | | | |
| TCP Cap Corp. | | | 6,700 | | | | 112,359 | |
| | | | | | | | | |
| Real Estate — 1.50% | | | | | | | | |
| Jones Lang LaSalle, Inc. | | | 3,900 | | | | 355,446 | |
| Realogy Holdings Corp. (a) | | | 2,800 | | | | 134,512 | |
| | | | | | | | 489,958 | |
| Total Financial (Cost: $4,244,551) | | | | | | | 4,864,802 | |
| | | Number
of Shares | | | Fair
Value | |
| Domestic Common Stocks (Continued) | | | | | | | | |
| | | | | | | | | |
| Industrial — 16.34% | | | | | | | | |
| Aerospace & Defense — 3.06% | | | | | | | | |
| AAR Corp. | | | 7,300 | | | $ | 160,454 | |
| Alliant Techsystems, Inc. | | | 5,200 | | | | 428,116 | |
| Exelis, Inc. | | | 29,900 | | | | 412,321 | |
| | | | | | | | 1,000,891 | |
| | | | | | | | | |
| Building Materials — 1.01% | | | | | | | | |
| Comfort Systems U.S.A., Inc. | | | 11,400 | | | | 170,088 | |
| Louisiana-Pacific Corp. (a) | | | 10,900 | | | | 161,211 | |
| | | | | | | | 331,299 | |
| | | | | | | | | |
| Electrical Components & Equipment — 1.05% | | | | | | | | |
| Advanced Energy Industries, Inc. (a) | | | 10,400 | | | | 181,064 | |
| Coleman Cable, Inc. | | | 9,000 | | | | 162,540 | |
| | | | | | | | 343,604 | |
| | | | | | | | | |
| Electronics — 1.55% | | | | | | | | |
| Benchmark Electronics, Inc. (a) | | | 7,400 | | | | 148,740 | |
| Vishay Intertechnology, Inc. (a)(b) | | | 25,900 | | | | 359,751 | |
| | | | | | | | 508,491 | |
| | | | | | | | | |
| Engineering & Construction — 3.31% | | | | | | | | |
| AECOM Technology Corp. (a) | | | 4,500 | | | | 143,055 | |
| EMCOR Group, Inc. (b) | | | 9,800 | | | | 398,370 | |
| MasTec, Inc. (a)(b) | | | 3,700 | | | | 121,730 | |
| Tutor Perini Corp. (a)(b) | | | 7,600 | | | | 137,484 | |
| URS Corp. | | | 6,000 | | | | 283,320 | |
| | | | | | | | 1,083,959 | |
| | | | | | | | | |
| Machinery-Construction & Mining — 0.17% | | | | | | | | |
| Hyster Yale Materials Handling, Inc. | | | 900 | | | | 56,511 | |
| | | | | | | | | |
| Machinery-Diversified — 0.38% | | | | | | | | |
| AGCO Corp. | | | 2,500 | | | | 125,475 | |
| | | | | | | | | |
| Metal Fabricate & Hardware — 0.53% | | | | | | | | |
| Mueller Industrial, Inc. | | | 3,400 | | | | 171,462 | |
| | | | | | | | | |
| Miscellaneous Manufacturing — 1.38% | | | | | | | | |
| Smith & Wesson Holding Corp. (a) | | | 7,300 | | | | 72,854 | |
| Sturm, Ruger & Company, Inc. (b) | | | 7,900 | | | | 379,516 | |
| | | | | | | | 452,370 | |
| | | | | | | | | |
| Packaging & Containers — 2.00% | | | | | | | | |
| Packaging Corp. of America | | | 8,300 | | | | 406,368 | |
| Rock Tenn Co. | | | 2,500 | | | | 249,700 | |
| | | | | | | | 656,068 | |
| | | | | | | | | |
| Shipbuilding — 0.86% | | | | | | | | |
| Huntington Ingalls Industries, Inc. | | | 5,000 | | | | 282,400 | |
| | | | | | | | | |
| Transportation — 1.04% | | | | | | | | |
| Heartland Express, Inc. | | | 14,400 | | | | 199,728 | |
| Ryder System, Inc. | | | 2,300 | | | | 139,817 | |
| | | | | | | | 339,545 | |
| Total Industrial (Cost: $4,845,145) | | | | | | | 5,352,075 | |
| | | | | | | | | |
| Technology — 6.18% | | | | | | | | |
| Computers — 3.10% | | | | | | | | |
| CACI International, Inc. Class A (a) | | | 2,300 | | | | 146,027 | |
| Lexmark International, Inc. (b) | | | 5,200 | | | | 158,964 | |
| Manhattan Associates, Inc. (a) | | | 5,100 | | | | 393,516 | |
| NetScout Systems, Inc. (a) | | | 7,900 | | | | 184,386 | |
| Synaptics, Inc. (a) | | | 3,400 | | | | 131,104 | |
| | | | | | | | 1,013,997 | |
The accompanying notes are an integral part of the financial statements.
2 0 1 3 A N N U A L R E P O R T | 33
Schedule of Investments
Quaker Small-Cap Value Fund
June 30, 2013
| | | Number
of Shares | | | Fair
Value | |
| Domestic Common Stocks (Continued) | | | | | | | | |
| | | | | | | | | |
| Semiconductors — 1.65% | | | | | | | | |
| First Solar, Inc. (a)(b) | | | 1,800 | | | $ | 80,514 | |
| Kulicke & Soffa Industries, Inc. (a) | | | 7,800 | | | | 86,268 | |
| LSI Corp. (a) | | | 15,600 | | | | 111,384 | |
| PMC-Sierra, Inc. (a) | | | 28,100 | | | | 178,435 | |
| Silicon Image, Inc. (a) | | | 14,500 | | | | 84,825 | |
| | | | | | | | 541,426 | |
| | | | | | | | | |
| Software — 1.43% | | | | | | | | |
| Aspen Technology, Inc. (a) | | | 7,900 | | | | 227,441 | |
| Solera Holdings, Inc. | | | 4,300 | | | | 239,295 | |
| | | | | | | | 466,736 | |
| Total Technology (Cost: $1,964,333) | | | | | | | 2,022,159 | |
| | | | | | | | | |
| Utilities — 3.60% | | | | | | | | |
| Electric — 3.60% | | | | | | | | |
| El Paso Electric Co. | | | 10,800 | | | | 381,348 | |
| NV Energy, Inc. | | | 17,400 | | | | 408,204 | |
| Pinnacle West Capital Corp. | | | 2,600 | | | | 144,222 | |
| Portland General Electric Co. (b) | | | 8,000 | | | | 244,720 | |
| | | | | | | | 1,178,494 | |
| Total Utilities (Cost: $874,897) | | | | | | | 1,178,494 | |
Total Domestic Common Stocks
(Cost $24,857,832) | | | | | | | 27,663,241 | |
| | | | | | | | | |
| Foreign Common Stocks — 10.65% | | | | | | | | |
| | | | | | | | | |
| Bermuda — 4.83% | | | | | | | | |
| Computers — 0.39% | | | | | | | | |
| Xyratex Ltd. | | | 12,500 | | | | 125,750 | |
| | | | | | | | | |
| Diversified Financial Services — 0.49% | | | | | | | | |
| Aircastle Ltd. (b) | | | 10,100 | | | | 161,499 | |
| | | | | | | | | |
| Food — 0.36% | | | | | | | | |
| Cosan Ltd. | | | 7,300 | | | | 117,968 | |
| | | | | | | | | |
| Insurance — 3.19% | | | | | | | | |
| Axis Capital Holdings Ltd. (b) | | | 7,100 | | | | 325,038 | |
| Everest Re Group, Ltd. | | | 2,900 | | | | 371,954 | |
| RenaissanceRe Holdings, Ltd. | | | 4,000 | | | | 347,160 | |
| | | | | | | | 1,044,152 | |
| | | | | | | | | |
| Semiconductors — 0.40% | | | | | | | | |
| Marvell Technology Group Ltd. (b) | | | 11,200 | | | | 131,152 | |
| Total Bermuda (Cost: $1,386,898) | | | | | | | 1,580,521 | |
| | | | | | | | | |
| Canada — 0.87% | | | | | | | | |
| Apparel — 0.43% | | | | | | | | |
| Gildan Activewear, Inc., Class A | | | 3,500 | | | | 141,785 | |
| | | | | | | | | |
| Electronics — 0.44% | | | | | | | | |
| Celestica, Inc. (a) | | | 15,300 | | | | 144,585 | |
| Total Canada (Cost: $256,779) | | | | | | | 286,370 | |
| | | | | | | | | |
| Guernsey — 1.14% | | | | | | | | |
| Telecommunications — 1.14% | | | | | | | | |
| Amdocs Ltd. | | | 10,100 | | | | 374,609 | |
| Total Guernsey (Cost: $297,999) | | | | | | | 374,609 | |
| | | | | | | | | |
| Ireland — 1.40% | | | | | | | | |
| Healthcare-Services — 0.48% | | | | | | | | |
| ICON PLC (a) | | | 4,400 | | | | 155,892 | |
| | | Number
of Shares | | | Fair
Value | |
| Foreign Common Stocks (Continued) | | | | | | | | |
| | | | | | | | | |
| Pharmaceuticals — 0.92% | | | | | | | | |
| Warner Chilcott PLC Class A | | | 15,200 | | | $ | 302,176 | |
| Total Ireland (Cost: $319,465) | | | | | | | 458,068 | |
| | | | | | | | | |
| Israel — 0.59% | | | | | | | | |
| Building Materials — 0.26% | | | | | | | | |
| Caesarstone Sdot-Yam Ltd. (a) | | | 3,100 | | | | 84,413 | |
| | | | | | | | | |
| Software — 0.33% | | | | | | | | |
| Cimatron Ltd. (b) | | | 18,000 | | | | 108,360 | |
| Total Israel (Cost: $194,415) | | | | | | | 192,773 | |
| | | | | | | | | |
| Netherlands — 1.18% | | | | | | | | |
| Diversified Financial Services — 1.18% | | | | | | | | |
| AerCap Holdings N.V. (a) | | | 22,100 | | | | 385,866 | |
| Total Netherlands (Cost: $354,093) | | | | | | | 385,866 | |
| | | | | | | | | |
| Switzerland — 0.64% | | | | | | | | |
| Insurance — 0.64% | | | | | | | | |
| Allied World Assurance Co. Holdings AG | | | 2,300 | | | | 210,473 | |
| Total Switzerland (Cost: $174,631) | | | | | | | 210,473 | |
Total Foreign Common Stocks
(Cost $2,984,280) | | | | | | | 3,488,680 | |
| | | | | | | | | |
| Real Estate Investment Trusts — 4.23% | | | | | | | | |
| | | | | | | | | |
| Ashford Hospitality Trust, Inc. | | | 10,800 | | | | 123,660 | |
| BioMed Realty Trust, Inc. | | | 3,200 | | | | 64,736 | |
| Brandywine Realty Trust | | | 11,300 | | | | 152,776 | |
| CoreSite Realty Corp. (b) | | | 8,900 | | | | 283,109 | |
| Equity Lifestyle Properties, Inc. | | | 4,600 | | | | 361,514 | |
| Sabra Health Care REIT, Inc. | | | 3,500 | | | | 91,385 | |
| Taubman Centers, Inc. | | | 4,100 | | | | 308,115 | |
| | | | | | | | 1,385,295 | |
Total Real Estate Investment Trusts
(Cost $1,341,069) | | | | | | | 1,385,295 | |
| | | | | | | | | |
| Short-Term Investments — 2.22% | | | | | | | | |
| | | | | | | | | |
| Money Market Funds — 2.22% | | | | | | | | |
| Fidelity Institutional Money Market Portfolio, 0.07% (c) | | | 726,545 | | | | 726,545 | |
Total Short-Term Investments
(Cost $726,545) | | | | | | | 726,545 | |
| | | | | | | | | |
| Investments Purchased with Proceeds from Securities Lending — 18.42% | | | | | | | | |
| | | | | | | | | |
| Money Market Funds — 18.42% | | | | | | | | |
| Mount Vernon Securities Lending Trust Prime Portfolio, 0.19% (c)(d) | | | 6,030,392 | | | | 6,030,392 | |
Total Investments Purchased with Proceeds from Securities Lending
(Cost $6,030,392) | | | | | | | 6,030,392 | |
Total Investments
(Cost $35,940,118) — 120.00% | | | | | | | 39,294,153 | |
| Liabilities in Excess of Other Assets, Net (20.00)% | | | | | | | (6,548,894 | ) |
| Total Net Assets — 100.00% | | | | | | $ | 32,745,259 | |
REIT - Real Estate Investment Trust
| (a) | Non-income producing security. |
| (b) | All or a portion of the security out on loan. |
| (c) | The rate shown is the annualized seven-day effective yield at period end. |
| (d) | Represents investments of collateral received from securities lending transactions. |
The accompanying notes are an integral part of the financial statements.
34 | 2 0 1 3 A N N U A L R E P O R T
Schedule of Investments
Quaker Strategic Growth Fund
June 30, 2013
| | | Number | | | Fair | |
| | | of Shares | | | Value | |
| Domestic Common Stocks — 76.28% | | | | | | | | |
| | | | | | | | | |
| Basic Materials — 1.24% | | | | | | | | |
| Chemicals — 1.24% | | | | | | | | |
| Monsanto Co. | | | 19,730 | | | $ | 1,949,324 | |
| Total Basic Materials (Cost: $1,807,766) | | | | | | | 1,949,324 | |
| | | | | | | | | |
| Communications — 16.48% | | | | | | | | |
| Internet — 5.84% | | | | | | | | |
| Amazon.com, Inc. (a) | | | 11,340 | | | | 3,149,005 | |
| eBay, Inc. (a) | | | 46,265 | | | | 2,392,826 | |
| Google, Inc. Class A (a) | | | 4,180 | | | | 3,679,947 | |
| | | | | | | | 9,221,778 | |
| | | | | | | | | |
| Media — 8.64% | | | | | | | | |
| CBS Corp. | | | 81,135 | | | | 3,965,067 | |
| News Corp. | | | 100,160 | | | | 3,265,216 | |
| Time Warner, Inc. (b) | | | 54,620 | | | | 3,158,128 | |
| Viacom, Inc. | | | 47,560 | | | | 3,236,458 | |
| | | | | | | | 13,624,869 | |
| | | | | | | | | |
| Telecommunications — 2.00% | | | | | | | | |
| Cisco Systems, Inc. | | | 129,810 | | | | 3,155,681 | |
| Total Communications (Cost: $22,470,171) | | | | | | | 26,002,328 | |
| | | | | | | | | |
| Consumer, Cyclical — 11.26% | | | | | | | | |
| Airlines — 5.41% | | | | | | | | |
| Delta Air Lines, Inc. (a) | | | 179,480 | | | | 3,358,071 | |
| United Continental Holdings, Inc. (a)(b) | | | 101,640 | | | | 3,180,316 | |
| U.S. Airways Group, Inc. (a)(b) | | | 121,440 | | | | 1,994,045 | |
| | | | | | | | 8,532,432 | |
| | | | | | | | | |
| Lodging — 2.03% | | | | | | | | |
| Las Vegas Sands Corp. | | | 60,574 | | | | 3,206,182 | |
| | | | | | | | | |
| Retail — 3.82% | | | | | | | | |
| Best Buy Co., Inc. (b) | | | 113,255 | | | | 3,095,259 | |
| Dunkin’ Brands Group, Inc. | | | 41,525 | | | | 1,778,100 | |
| Walgreen Co. | | | 26,230 | | | | 1,159,366 | |
| | | | | | | | 6,032,725 | |
| Total Consumer, Cyclical (Cost: $15,514,022) | | | | | | | 17,771,339 | |
| | | | | | | | | |
| Consumer, Non-cyclical — 25.94% | | | | | | | | |
| Biotechnology — 11.60% | | | | | | | | |
| Amgen, Inc. | | | 19,460 | | | | 1,919,924 | |
| Biogen Idec, Inc. (a)(b) | | | 27,170 | | | | 5,846,984 | |
| Celgene Corp. (a) | | | 27,300 | | | | 3,191,643 | |
| Gilead Sciences, Inc. (a)(b) | | | 95,265 | | | | 4,878,521 | |
| Vertex Pharmaceuticals, Inc. (a)(b) | | | 30,915 | | | | 2,469,181 | |
| | | | | | | | 18,306,253 | |
| | | | | | | | | |
| Commercial Services — 3.96% | | | | | | | | |
| Mastercard, Inc. Class A | | | 6,790 | | | | 3,900,855 | |
| Verisk Analytics, Inc. Class A (a) | | | 39,290 | | | | 2,345,613 | |
| | | | | | | | 6,246,468 | |
| | | | | | | | | |
| Food — 1.48% | | | | | | | | |
| Mondelez International, Inc. | | | 81,945 | | | | 2,337,891 | |
| | | | | | | | | |
| Healthcare-Services — 1.52% | | | | | | | | |
| Cigna Corporation | | | 33,075 | | | | 2,397,607 | |
��
| | | Number | | | Fair | |
| | | of Shares | | | Value | |
| Domestic Common Stocks (Continued) | | | | | | | | |
| | | | | | | | | |
| Pharmaceuticals — 7.38% | | | | | | | | |
| AbbVie, Inc. | | | 84,120 | | | $ | 3,477,521 | |
| Eli Lilly & Company | | | 48,475 | | | | 2,381,092 | |
| Mead Johnson Nutrition Co. | | | 41,690 | | | | 3,303,099 | |
| Onyx Pharmaceuticals, Inc. (a)(b) | | | 28,555 | | | | 2,479,145 | |
| | | | | | | | 11,640,857 | |
| Total Consumer, Non-cyclical (Cost: $35,152,310) | | | | | | | 40,929,076 | |
| | | | | | | | | |
| Energy — 3.94% | | | | | | | | |
| Oil & Gas — 3.94% | | | | | | | | |
| Anadarko Petroleum Corp. | | | 37,035 | | | | 3,182,418 | |
| Marathon Oil Corp. (b) | | | 87,920 | | | | 3,040,274 | |
| | | | | | | | 6,222,692 | |
| Total Energy (Cost: $5,511,042) | | | | | | | 6,222,692 | |
| | | | | | | | | |
| Financial — 10.51% | | | | | | | | |
| Banks — 4.37% | | | | | | | | |
| Citigroup, Inc. | | | 81,065 | | | | 3,888,688 | |
| Morgan Stanley (b) | | | 123,400 | | | | 3,014,662 | |
| | | | | | | | 6,903,350 | |
| | | | | | | | | |
| Diversified Financial Services — 2.04% | | | | | | | | |
| Visa, Inc. Class A (b) | | | 17,600 | | | | 3,216,400 | |
| | | | | | | | | |
| Insurance — 4.10% | | | | | | | | |
| American International Group, Inc. (a)(b) | | | 88,890 | | | | 3,973,383 | |
| Marsh & McLennan Cos., Inc. | | | 62,388 | | | | 2,490,529 | |
| | | | | | | | 6,463,912 | |
| Total Financial (Cost: $15,028,963) | | | | | | | 16,583,662 | |
| | | | | | | | | |
| Industrial — 3.07% | | | | | | | | |
| Electronics — 1.56% | | | | | | | | |
| Waters Corp. (a) | | | 24,505 | | | | 2,451,725 | |
| | | | | | | | | |
| Hand & Machine Tools — 1.51% | | | | | | | | |
| Stanley Black & Decker, Inc. (b) | | | 30,885 | | | | 2,387,410 | |
| Total Industrial (Cost: $4,435,050) | | | | | | | 4,839,135 | |
| | | | | | | | | |
| Technology — 3.84% | | | | | | | | |
| Semiconductors — 1.51% | | | | | | | | |
| Intel Corp. | | | 98,850 | | | | 2,394,147 | |
| | | | | | | | | |
| Software — 2.33% | | | | | | | | |
| Akamai Technologies, Inc. (a)(b) | | | 29,210 | | | | 1,242,885 | |
| Microsoft Corp. | | | 70,370 | | | | 2,429,876 | |
| | | | | | | | 3,672,761 | |
| Total Technology (Cost: $6,079,607) | | | | | | | 6,066,908 | |
Total Domestic Common Stocks
(Cost $105,998,931) | | | | | | | 120,364,464 | |
| | | | | | | | | |
| Foreign Common Stocks — 19.35% | | | | | | | | |
| | | | | | | | | |
| Belgium — 1.47% | | | | | | | | |
| Beverages — 1.47% | | | | | | | | |
| Anheuser-Busch InBev NV - ADR (b) | | | 25,735 | | | | 2,322,841 | |
| Total Belgium (Cost: $1,796,307) | | | | | | | 2,322,841 | |
| | | | | | | | | |
| Bermuda — 2.04% | | | | | | | | |
| Insurance — 2.04% | | | | | | | | |
| Arch Capital Group Ltd. (a) | | | 62,650 | | | | 3,220,835 | |
| Total Bermuda (Cost: $2,303,326) | | | | | | | 3,220,835 | |
The accompanying notes are an integral part of the financial statements.
2 0 1 3 A N N U A L R E P O R T | 35
Schedule of Investments
Quaker Strategic Growth Fund
June 30, 2013
| | | Number | | | Fair | |
| | | of Shares | | | Value | |
| Foreign Common Stocks (Continued) | | | | | | | | |
| | | | | | | | | |
| Denmark — 1.27% | | | | | | | | |
| Pharmaceuticals — 1.27% | | | | | | | | |
| Novo Nordisk - ADR (b) | | | 12,965 | | | $ | 2,009,186 | |
| Total Denmark (Cost: $2,142,962) | | | | | | | 2,009,186 | |
| | | | | | | | | |
| France — 2.03% | | | | | | | | |
| Pharmaceuticals — 2.03% | | | | | | | | |
| Sanofi - ADR | | | 62,190 | | | | 3,203,407 | |
| Total France (Cost: $2,869,082) | | | | | | | 3,203,407 | |
| | | | | | | | | |
| Germany — 1.74% | | | | | | | | |
| Apparel — 1.74% | | | | | | | | |
| Adidas AG - ADR | | | 50,550 | | | | 2,736,777 | |
| Total Germany (Cost: $1,754,008) | | | | | | | 2,736,777 | |
| | | | | | | | | |
| Netherlands — 1.50% | | | | | | | | |
| Food — 1.50% | | | | | | | | |
| Unilever NV Class NY - ADR (b) | | | 60,080 | | | | 2,361,745 | |
| Total Netherlands (Cost: $2,052,968) | | | | | | | 2,361,745 | |
| | | | | | | | | |
| Switzerland — 6.61% | | | | | | | | |
| Insurance — 4.35% | | | | | | | | |
| ACE Ltd. | | | 41,270 | | | | 3,692,840 | |
| Allied World Assurance Co. Holdings AG | | | 34,710 | | | | 3,176,312 | |
| | | | | | | | 6,869,152 | |
| | | | | | | | | |
| Pharmaceuticals — 2.26% | | | | | | | | |
| Novartis AG - ADR (b) | | | 50,375 | | | | 3,562,016 | |
| Total Switzerland (Cost: $9,068,276) | | | | | | | 10,431,168 | |
| | | | | | | | | |
| United Kingdom — 2.69% | | | | | | | | |
| Beverages — 1.23% | | | | | | | | |
| Diageo PLC - ADR | | | 16,860 | | | | 1,938,057 | |
| | | | | | | | | |
| Pharmaceuticals — 1.46% | | | | | | | | |
| GlaxoSmithKline PLC - ADR | | | 46,160 | | | | 2,306,615 | |
| Total United Kingdom (Cost: $3,962,025) | | | | | | | 4,244,672 | |
Total Foreign Common Stocks
(Cost $25,948,954) | | | | | | | 30,530,631 | |
| | | | | | | | | |
| Short-Term Investments — 4.49% | | | | | | | | |
| | | | | | | | | |
| Money Market Funds — 4.49% | | | | | | | | |
| Fidelity Institutional Money Market Portfolio, 0.07% (c) | | | 7,088,348 | | | | 7,088,348 | |
Total Short-Term Investments
(Cost $7,088,348) | | | | | | | 7,088,348 | |
| |
| Investments Purchased with Proceeds from Securities Lending — 18.97% |
| | | | | | | | | |
| Money Market Funds — 18.97% | | | | | | | | |
| Mount Vernon Securities Lending Trust Prime Portfolio, 0.19% (c)(d) | | | 29,936,988 | | | | 29,936,988 | |
Total Investments Purchased with Proceeds from Securities Lending
(Cost $29,936,988) | | 29,936,988 | |
Total Investments
(Cost $168,973,221) — 119.09% | | 187,920,431 | |
| Liabilities in Excess of Other Assets, Net (19.09)% | | (30,130,738 | ) |
| Total Net Assets — 100.00% | | | | | | $ | 157,789,693 | |
ADR - American Depositary Receipt
(a) Non-income producing security.
(b) All or a portion of the security out on loan.
(c) The rate shown is the annualized seven-day effective yield at period end.
(d) Represents investments of collateral received from securities lending transactions.
The accompanying notes are an integral part of the financial statements.
36 | 2 0 1 3 A N N U A L R E P O R T
Statements of Assets and Liabilities
June 30, 2013
| | | Quaker
Akros Absolute
Return Fund | | | Quaker Event
Arbitrage Fund | | | Quaker Global
Tactical
Allocation Fund | | | Quaker Mid-
Cap Value
Fund | | | Quaker Small-Cap
Growth Tactical
Allocation Fund | | | Quaker Small-
Cap Value
Fund | | | Quaker
Strategic
Growth Fund | |
| ASSETS: | | | | | | | | | | | | | | | | | | | | | | | | | | | | |
| Investments, at value (Note 11) | | $ | 2,721,874 | | | $ | 62,312,516 | | | $ | 8,122,365 | | | $ | 11,210,831 | | | $ | 4,362,167 | | | $ | 39,294,153 | | | $ | 187,920,431 | |
| Cash | | | 300 | | | | 922,099 | | | | — | | | | — | | | | — | | | | 1,120 | | | | 568,303 | |
| Cash held at brokers | | | 3,002,369 | | | | 10,329,038 | | | | 493,560 | | | | — | | | | — | | | | — | | | | — | |
| Receivables: | | | | | | | | | | | | | | | | | | | | | | | | | | | | |
| Dividends and interest | | | 504 | | | | 118,345 | | | | 9,156 | | | | 13,654 | | | | 296 | | | | 32,588 | | | | 164,699 | |
| Due from advisor | | | 9,271 | | | | — | | | | — | | | | — | | | | — | | | | — | | | | 31,387 | |
| Capital shares sold | | | 10,000 | | | | 578,012 | | | | — | | | | 101,028 | | | | — | | | | 5,678 | | | | 310,632 | |
| Investment securities sold | | | 68,833 | | | | 203,429 | | | | 83,733 | | | | 166,094 | | | | 56,640 | | | | 93,156 | | | | 3,676,819 | |
| Prepaid expenses and other assets | | | 4,101 | | | | 65,209 | | | | 6,972 | | | | 8,840 | | | | 2,480 | | | | 31,577 | | | | 86,587 | |
| Total assets | | | 5,817,252 | | | | 74,528,648 | | | | 8,715,786 | | | | 11,500,447 | | | | 4,421,583 | | | | 39,458,272 | | | | 192,758,858 | |
| | | | | | | | | | | | | | | | | | | | | | | | | | | | | |
| LIABILITIES: | | | | | | | | | | | | | | | | | | | | | | | | | | | | |
| Call options written, at value | | $ | 5,430 | | | $ | 1,782,415 | | | $ | — | | | $ | — | | | $ | — | | | $ | — | | | $ | — | |
| Securities sold short, at value | | | 1,164,651 | | | | 1,265,500 | | | | 213,428 | | | | — | | | | — | | | | — | | | | — | |
| Payables: | | | | | | | | | | | | | | | | | | | | | | | | | | | | |
| Foreign currency | | | — | | | | 205,405 | | | | — | | | | — | | | | — | | | | — | | | | — | |
| Due to advisor (Note 3) | | | — | | | | 55,553 | | | | 7,065 | | | | 7,444 | | | | 2,969 | | | | 27,021 | | | | — | |
| Capital shares redeemed | | | 1,786 | | | | 287,953 | | | | 165,163 | | | | 155 | | | | 100,293 | | | | 20,283 | | | | 286,327 | |
| Upon return of securities loaned | | | 281,860 | | | | 4,272,213 | | | | 1,555,375 | | | | 2,395,433 | | | | 837,630 | | | | 6,030,392 | | | | 29,936,988 | |
| Investment securities purchased | | | 126,096 | | | | 455,629 | | | | 140,913 | | | | 176,954 | | | | 24,511 | | | | 593,462 | | | | 4,474,836 | |
| Open forward currency contracts | | | — | | | | 420 | | | | — | | | | — | | | | — | | | | — | | | | — | |
| Dividends on securities sold short | | | 2,080 | | | | — | | | | — | | | | — | | | | — | | | | — | | | | — | |
| Distributions fees | | | 667 | | | | 12,281 | | | | 2,609 | | | | 2,679 | | | | 1,212 | | | | 2,945 | | | | 38,288 | |
| Trustee expenses | | | 483 | | | | 5,265 | | | | 736 | | | | 742 | | | | 548 | | | | 2,959 | | | | 14,602 | |
| Chief compliance officer fees | | | 436 | | | | 3,116 | | | | 483 | | | | 441 | | | | 811 | | | | 1,798 | | | | 8,727 | |
| Accrued expenses | | | 31,540 | | | | 68,098 | | | | 24,327 | | | | 12,287 | | | | 9,724 | | | | 34,153 | | | | 209,397 | |
| Total liabilities | | | 1,615,029 | | | | 8,413,848 | | | | 2,110,099 | | | | 2,596,135 | | | | 977,698 | | | | 6,713,013 | | | | 34,969,165 | |
| Net Assets | | $ | 4,202,223 | | | $ | 66,114,800 | | | $ | 6,605,687 | | | $ | 8,904,312 | | | $ | 3,443,885 | | | $ | 32,745,259 | | | $ | 157,789,693 | |
| | | | | | | | | | | | | | | | | | | | | | | | | | | | | |
| NET ASSETS CONSIST OF: | | | | | | | | | | | | | | | | | | | | | | | | | | | | |
| Paid-in capital | | $ | 5,563,698 | | | $ | 65,661,676 | | | $ | 18,614,943 | | | $ | 15,321,090 | | | $ | 4,508,283 | | | $ | 34,500,136 | | | $ | 563,027,226 | |
| Accumulated net investment income (loss) | | | — | | | | 1,855,341 | | | | (46,337 | ) | | | (34,658 | ) | | | (11,931 | ) | | | 75,167 | | | | (574,287 | ) |
| Accumulated net realized loss on investments | | | (371,179 | ) | | | (1,061,601 | ) | | | (12,647,868 | ) | | | (8,118,022 | ) | | | (713,427 | ) | | | (5,184,079 | ) | | | (423,610,456 | ) |
| Net unrealized appreciation (depreciation) on investments: | | | | | | | | | | | | | | | | | | | | | | | | | | | | |
| Investments | | | (604,205 | ) | | | (215,811 | ) | | | 662,924 | | | | 1,735,902 | | | | (339,040 | ) | | | 3,354,035 | | | | 18,947,210 | |
| Securities sold short | | | (387,396 | ) | | | (5,484 | ) | | | 22,025 | | | | — | | | | — | | | | — | | | | — | |
| Written option contracts | | | 1,305 | | | | (114,695 | ) | | | — | | | | — | | | | — | | | | — | | | | — | |
| Forward currency contracts | | | — | | | | (420 | ) | | | — | | | | — | | | | — | | | | — | | | | — | |
| Foreign currency transactions | | | — | | | | (4,206 | ) | | | — | | | | — | | | | — | | | | — | | | | — | |
| Total net assets | | $ | 4,202,223 | | | $ | 66,114,800 | | | $ | 6,605,687 | | | $ | 8,904,312 | | | $ | 3,443,885 | | | $ | 32,745,259 | | | $ | 157,789,693 | |
| Total investments, at cost | | $ | 3,326,079 | | | $ | 62,528,327 | | | $ | 7,459,441 | | | $ | 9,474,929 | | | $ | 4,701,207 | | | $ | 35,940,118 | | | $ | 168,973,221 | |
| Total foreign currency, at cost | | | — | | | | 201,344 | | | | — | | | | — | | | | — | | | | — | | | | — | |
| Proceeds from securities sold short | | | 777,255 | | | | 1,260,016 | | | | 235,453 | | | | — | | | | — | | | | — | | | | — | |
| Premiums on options | | | 6,735 | | | | 1,667,720 | | | | — | | | | — | | | | — | | | | — | | | | — | |
| Class A shares: | | | | | | | | | | | | | | | | | | | | | | | | | | | | |
| Net Assets | | $ | 2,444,984 | | | $ | 35,231,669 | | | $ | 3,855,751 | | | $ | 6,029,110 | | | $ | 1,593,770 | | | $ | 7,727,313 | | | $ | 88,969,884 | |
| Shares of beneficial interest outstanding(1) | | | 316,191 | | | | 2,750,981 | | | | 464,592 | | | | 317,431 | | | | 166,184 | | | | 396,367 | | | | 4,607,225 | |
| Net assets value per share and redemption price per share | | $ | 7.73 | | | $ | 12.81 | | | $ | 8.30 | | | $ | 18.99 | | | $ | 9.59 | | | $ | 19.50 | | | $ | 19.31 | |
| Offering price per share (100/94.50 x net assets value per share) | | $ | 8.18 | | | $ | 13.56 | | | $ | 8.78 | | | $ | 20.10 | | | $ | 10.15 | | | $ | 20.63 | | | $ | 20.43 | |
| Class C shares: | | | | | | | | | | | | | | | | | | | | | | | | | | | | |
| Net Assets | | $ | 155,239 | | | $ | 5,953,830 | | | $ | 2,124,744 | | | $ | 1,815,203 | | | $ | 1,027,260 | | | $ | 1,625,270 | | | $ | 22,968,471 | |
| Shares of beneficial interest outstanding(1) | | | 20,521 | | | | 473,641 | | | | 266,186 | | | | 107,369 | | | | 111,363 | | | | 98,568 | | | | 1,336,049 | |
| Net assets value per share and redemption price per share | | $ | 7.56 | | | $ | 12.57 | | | $ | 7.98 | | | $ | 16.91 | | | $ | 9.22 | | | $ | 16.49 | | | $ | 17.19 | |
| Institutional Class Shares: | | | | | | | | | | | | | | | | | | | | | | | | | | | | |
| Net Assets | | $ | 1,602,000 | | | $ | 24,929,301 | | | $ | 625,192 | | | $ | 1,059,999 | | | $ | 822,855 | | | $ | 23,392,676 | | | $ | 45,851,338 | |
| Shares of beneficial interest outstanding (1) | | | 205,691 | | | | 1,939,002 | | | | 65,868 | | | | 53,443 | | | | 84,634 | | | | 1,153,136 | | | | 2,294,134 | |
| Net assets value per share and redemption price per share | | $ | 7.79 | | | $ | 12.86 | | | $ | 9.49 | | | $ | 19.83 | | | $ | 9.72 | | | $ | 20.29 | | | $ | 19.99 | |
| (1) | Unlimited number of shares of beneficial interest with a 0.01 par value authorized. |
The accompanying notes are an integral part of the financial statements.
2 0 1 3 A N N U A L R E P O R T | 37
Statements of Operations
For the Fiscal Year Ended June 30, 2013
| | | Quaker | | | | | | Quaker Global | | | Quaker Mid- | | | Quaker Small-Cap | | | Quaker Small- | | | Quaker | |
| | | Akros Absolute | | | Quaker Event | | | Tactical | | | Cap Value | | | Growth Tactical | | | Cap Value | | | Strategic | |
| | | Return Fund | | | Arbitrage Fund | | | Allocation Fund | | | Fund | | | Allocation Fund | | | Fund | | | Growth Fund | |
| INVESTMENT INCOME: | | | | | | | | | | | | | | | | | | | | | | | | | | | | |
| Dividends (net of foreign withholding taxes) | | $ | 23,631 | | | $ | 317,868 | | | $ | 134,741 | | | $ | 110,991 | | | $ | 32,358 | | | $ | 734,734 | | | $ | 2,276,859 | |
| Interest | | | 12,460 | | | | 2,546,345 | | | | 5 | | | | 102 | | | | 264 | | | | 148 | | | | 3,123 | |
| Securities Lending Income | | | 415 | | | | 627 | | | | — | | | | 730 | | | | 26,797 | | | | 17,468 | | | | 3,485 | |
| Total Income | | | 36,506 | | | | 2,864,840 | | | | 134,746 | | | | 111,823 | | | | 59,419 | | | | 752,350 | | | | 2,283,467 | |
| | | | | | | | | | | | | | | | | | | | | | | | | | | | | |
| Expenses: | | | | | | | | | | | | | | | | | | | | | | | | | | | | |
| Investment advisory fees (Note 3) | | | 68,424 | | | | 743,459 | | | | 104,346 | | | | 84,710 | | | | 49,009 | | | | 311,002 | | | | 2,150,357 | |
| Funds administration and accounting fees | | | 62,378 | | | | 100,497 | | | | 20,395 | | | | 15,547 | | | | 10,589 | | | | 51,639 | | | | 245,848 | |
| Transfer agent fees | | | 14,770 | | | | 137,608 | | | | 19,368 | | | | 21,573 | | | | 13,352 | | | | 38,392 | | | | 444,174 | |
| Custody fees | | | 13,536 | | | | 29,691 | | | | 39,680 | | | | 6,560 | | | | 8,320 | | | | 17,717 | | | | 59,165 | |
| Trustee fees and meeting expenses | | | 1,954 | | | | 21,056 | | | | 2,982 | | | | 2,927 | | | | 1,746 | | | | 10,789 | | | | 58,667 | |
| Legal fees | | | 1,023 | | | | 13,264 | | | | 1,536 | | | | 1,459 | | | | 906 | | | | 5,668 | | | | 29,976 | |
| Audit fees | | | 15,057 | | | | 20,219 | | | | 3,392 | | | | 2,925 | | | | 3,564 | | | | 11,171 | | | | 60,275 | |
| Distribution fee — Class A | | | 9,045 | | | | 83,214 | | | | 12,268 | | | | 13,926 | | | | 5,125 | | | | 19,813 | | | | 246,571 | |
| Distribution fee — Class C | | | 2,733 | | | | 66,695 | | | | 26,546 | | | | 18,403 | | | | 14,499 | | | | 17,005 | | | | 248,238 | |
| Insurance | | | 2,517 | | | | 19,313 | | | | 3,504 | | | | 3,035 | | | | 2,825 | | | | 12,888 | | | | 66,162 | |
| Officers’ compensation fees | | | 4,354 | | | | 36,627 | | | | 5,486 | | | | 5,190 | | | | 3,727 | | | | 19,766 | | | | 106,717 | |
| Registration and filing expenses | | | 19,273 | | | | 44,503 | | | | 8,520 | | | | 6,719 | | | | 8,068 | | | | 26,672 | | | | 203,537 | |
| Printing expenses | | | 5,358 | | | | 25,421 | | | | 4,690 | | | | 4,148 | | | | 3,408 | | | | 13,437 | | | | 73,875 | |
| Dividends and Interest on securities sold short | | | 19,561 | | | | 19,413 | | | | 377 | | | | — | | | | — | | | | — | | | | — | |
| Other operating expenses | | | 1,756 | | | | 2,512 | | | | 1,297 | | | | 1,624 | | | | 2,181 | | | | 1,866 | | | | 5,638 | |
| Total expenses | | | 241,739 | | | | 1,363,492 | | | | 254,387 | | | | 188,746 | | | | 127,319 | | | | 557,825 | | | | 3,999,200 | |
| Less: | | | | | | | | | | | | | | | | | | | | | | | | | | | | |
| Investment advisory fees waived & reimbursed (Note 3) | | | (134,759 | ) | | | (218,279 | ) | | | — | | | | — | | | | — | | | | — | | | | (204,586 | ) |
| Net expenses | | | 106,980 | | | | 1,145,213 | | | | 254,387 | | | | 188,746 | | | | 127,319 | | | | 557,825 | | | | 3,794,614 | |
| Net investment income (loss) | | | (70,474 | ) | | | 1,719,627 | | | | (119,641 | ) | | | (76,923 | ) | | | (67,900 | ) | | | 194,525 | | | | (1,511,147 | ) |
| | | | | | | | | | | | | | | | | | | | | | | | | | | | | |
| REALIZED AND UNREALIZED GAIN (LOSS) ON INVESTMENTS AND FOREIGN CURRENCY TRANSACTIONS | | | | | | | | | | | | | | | | | | | | | | | | | | | | |
| Net realized gain (loss) from investments | | | (293,537 | ) | | | (4,811,477 | ) | | | 1,133,487 | | | | 1,127,978 | | | | 851,143 | | | | 4,025,085 | | | | 22,222,065 | |
| Net realized gain (loss) from securities sold short | | | (26,885 | ) | | | (915,912 | ) | | | (79,072 | ) | | | — | | | | — | | | | — | | | | — | |
| Net realized gain (loss) from written options | | | 63,051 | | | | 6,102,873 | | | | 1,230 | | | | — | | | | — | | | | — | | | | 21,331 | |
| Net realized gain (loss) from foreign currency transactions | | | (2 | ) | | | 64,001 | | | | — | | | | — | | | | — | | | | — | | | | — | |
| Net realized gain (loss) from forwards | | | — | | | | 91,691 | | | | — | | | | — | | | | — | | | | — | | | | — | |
| Net realized gain (loss) on futures | | | (66,028 | ) | | | — | | | | — | | | | — | | | | — | | | | — | | | | — | |
| Net change in unrealized appreciation (depreciation) on investments | | | 292,884 | | | | 2,252,194 | | | | 284,065 | | | | 439,560 | | | | (456,408 | ) | | | 2,301,123 | | | | 8,287,981 | |
| Net change in unrealized appreciation (depreciation) on securities sold short | | | (247,360 | ) | | | (54,987 | ) | | | 36,139 | | | | — | | | | — | | | | — | | | | — | |
| Net change in unrealized appreciation (depreciation) on written options | | | (4,918 | ) | | | 326,361 | | | | 107 | | | | — | | | | — | | | | — | | | | 1,704 | |
| Net change in unrealized appreciation (depreciation) on foreign currency transactions | | | — | | | | (7,798 | ) | | | — | | | | — | | | | — | | | | — | | | | — | |
| Net change in unrealized appreciation (depreciation) on forwards | | | — | | | | (23,831 | ) | | | — | | | | — | | | | — | | | | — | | | | — | |
| Net change in unrealized appreciation (depreciation) on futures | | | 27,354 | | | | — | | | | — | | | | — | | | | — | | | | — | | | | — | |
| Net realized and unrealized gain on investments and foreign currency transactions | | | (255,441 | ) | | | 3,023,115 | | | | 1,375,956 | | | | 1,567,538 | | | | 394,735 | | | | 6,326,208 | | | | 30,533,081 | |
| Net increase in net assets resulting from operations | | | (325,915 | ) | | $ | 4,742,742 | | | $ | 1,256,315 | | | $ | 1,490,615 | | | $ | 326,835 | | | $ | 6,520,733 | | | $ | 29,021,934 | |
| (Foreign withholding taxes on dividends)/tax reclaims | | | 768 | | | | 1,443 | | | $ | (6,624 | ) | | $ | (783 | ) | | $ | (128 | ) | | $ | (269 | ) | | $ | (78,383 | ) |
The accompanying notes are an integral part of the financial statements.
38 | 2 0 1 3 A N N U A L R E P O R T
Statements of Changes in Net Assets
For the Fiscal Year Ended June 30, 2013
| | | | | | | | | | | | | | | Quaker | | | | | | | |
| | | Quaker | | | | | | Quaker | | | Quaker Mid- | | | Small-Cap | | | Quaker Small- | | | Quaker | |
| | | Akros Absolute | | | Quaker Event | | | Global Tactical | | | Cap Value | | | Growth Tactical | | | Cap Value | | | Strategic | |
| | | Return Fund | | | Arbitrage Fund | | | Allocation Fund | | | Fund | | | Allocation Fund | | | Fund | | | Growth Fund | |
| INCREASE (DECREASE) IN NET ASSETS | | | | | | | | | | | | | | | | | | | | | | | | | | | | |
| Operations: | | | | | | | | | | | | | | | | | | | | | | | | | | | | |
| Net investment income (loss) | | $ | (70,474 | ) | | $ | 1,719,627 | | | $ | (119,641 | ) | | $ | (76,923 | ) | | $ | (67,900 | ) | | $ | 194,525 | | | $ | (1,511,147 | ) |
| Net realized gain (loss) from investment transactions | | | (293,537 | ) | | | (4,811,477 | ) | | | 1,133,487 | | | | 1,127,978 | | | | 851,143 | | | | 4,025,085 | | | | 22,222,065 | |
| Net realized gain (loss) from foreign currency transactions | | | (2 | ) | | | 64,001 | | | | — | | | | — | | | | — | | | | — | | | | — | |
| Net realized gain (loss) from written options | | | 63,051 | | | | 6,102,873 | | | | 1,230 | | | | — | | | | — | | | | — | | | | 21,331 | |
| Net realized gain (loss) from securities sold short | | | (26,885 | ) | | | (915,912 | ) | | | (79,072 | ) | | | — | | | | — | | | | — | | | | — | |
| Net realized gain (loss) from forwards | | | | | | | 91,691 | | | | — | | | | — | | | | — | | | | — | | | | — | |
| Net realized gain (loss) on futures | | | (66,028 | ) | | | — | | | | — | | | | — | | | | — | | | | — | | | | — | |
| Change in net unrealized appreciation (depreciation) on investments | | | 292,884 | | | | 2,252,194 | | | | 284,065 | | | | 439,560 | | | | (456,408 | ) | | | 2,301,123 | | | | 8,287,981 | |
| Change in net unrealized appreciation (depreciation) on securities sold short | | | (247,360 | ) | | | (54,987 | ) | | | 36,139 | | | | — | | | | — | | | | — | | | | — | |
| Change in net unrealized appreciation (depreciation) on written options | | | (4,918 | ) | | | 326,361 | | | | 107 | | | | — | | | | — | | | | — | | | | 1,704 | |
| Change in net unrealized appreciation (depreciation) on foreign currency transactions | | | — | | | | (7,798 | ) | | | — | | | | — | | | | — | | | | — | | | | — | |
| Change in net unrealized appreciation (depreciation) on forwards | | | — | | | | (23,831 | ) | | | — | | | | — | | | | — | | | | — | | | | — | |
| Change in net unrealized appreciation (depreciation) on futures | | | 27,354 | | | | — | | | | — | | | | — | | | | — | | | | — | | | | — | |
| Net increase (decrease) in net assets resulting from operations | | | (325,915 | ) | | | 4,742,742 | | | | 1,256,315 | | | | 1,490,615 | | | | 326,835 | | | | 6,520,733 | | | | 29,021,934 | |
| | | | | | | | | | | | | | | | | | | | | | | | | | | | | |
| Distributions to shareholders from | | | | | | | | | | | | | | | | | | | | | | | | | | | | |
| Net investment income — Class A | | | — | | | | (39,234 | ) | | | — | | | | — | | | | — | | | | (8,724 | ) | | | — | |
| Net investment income — Institutional Class | | | — | | | | (61,271 | ) | | | — | | | | — | | | | — | | | | (77,784 | ) | | | — | |
| Net realized capital gain — Class A | | | (32,569 | ) | | | (351,265 | ) | | | — | | | | — | | | | — | | | | — | | | | — | |
| Net realized capital gain — Class C | | | (2,967 | ) | | | (74,102 | ) | | | — | | | | — | | | | — | | | | — | | | | — | |
| Net realized capital gain — Institutional Class | | | (14,505 | ) | | | (174,648 | ) | | | — | | | | — | | | | — | | | | — | | | | — | |
| Total distributions | | | (50,041 | ) | | | (700,520 | ) | | | — | | | | — | | | | — | | | | (86,508 | ) | | | — | |
| | | | | | | | | | | | | | | | | | | | | | | | | | | | | |
| Capital share transactions | | | | | | | | | | | | | | | | | | | | | | | | | | | | |
| Increase (decrease) in net assets from fund share transactions (Note 9) | | | (2,169,002 | ) | | | 6,860,869 | | | | (4,414,061 | ) | | | (1,001,539 | ) | | | (3,187,848 | ) | | | (3,927,430 | ) | | | (50,399,652 | ) |
| Total increase (decrease) in net assets | | | (2,544,958 | ) | | | 10,903,091 | | | | (3,157,746 | ) | | | 489,076 | | | | (2,861,013 | ) | | | 2,506,795 | | | | (21,377,718 | ) |
| | | | | | | | | | | | | | | | | | | | | | | | | | | | | |
| NET ASSETS | | | | | | | | | | | | | | | | | | | | | | | | | | | | |
| Beginning of period | | | 6,747,181 | | | | 55,211,709 | | | | 9,763,433 | | | | 8,415,236 | | | | 6,304,898 | | | | 30,238,464 | | | | 179,167,411 | |
| End of period | | | 4,202,223 | | | | 66,114,800 | | | $ | 6,605,687 | | | $ | 8,904,312 | | | $ | 3,443,885 | | | $ | 32,745,259 | | | $ | 157,789,693 | |
| Undistributed (Accumulated) net investment income (loss), at end of period | | | — | | | $ | 1,855,341 | | | $ | (46,337 | ) | | $ | (34,658 | ) | | $ | (11,931 | ) | | $ | 75,167 | | | $ | (574,287 | ) |
For the Fiscal Year Ended June 30, 2012
| | | | | | | | | | | | | | | Quaker | | | | | | | |
| | | Quaker | | | | | | Quaker | | | Quaker Mid- | | | Small-Cap | | | Quaker Small- | | | Quaker | |
| | | Akros Absolute | | | Quaker Event | | | Global Tactical | | | Cap Value | | | Growth Tactical | | | Cap Value | | | Strategic | |
| | | Return Fund | | | Arbitrage Fund | | | Allocation Fund | | | Fund | | | Allocation Fund | | | Fund | | | Growth Fund | |
| INCREASE (DECREASE) IN NET ASSETS | | | | | | | | | | | | | | | | | | | | | | | | | | | | |
| Operations | | | | | | | | | | | | | | | | | | | | | | | | | | | | |
| Net investment income (loss) | | $ | (81,950 | ) | | $ | 450,057 | | | $ | (227,690 | ) | | $ | (75,641 | ) | | $ | (197,861 | ) | | $ | (144,072 | ) | | $ | (2,167,364 | ) |
| Net realized gain (loss) from investment transactions and foreign currency transactions | | | 72,372 | | | | 311,729 | | | | (185,487 | ) | | | 1,089,211 | | | | (1,416,646 | ) | | | 1,921,561 | | | | 16,413,027 | |
| Net realized gain (loss) from securities sold short | | | 30,522 | | | | (1,172,110 | ) | | | (179,231 | ) | | | — | | | | — | | | | — | | | | — | |
| Change in net unrealized appreciation (depreciation) on investments and foreign currency transactions | | | (665,169 | ) | | | (1,282,336 | ) | | | (620,437 | ) | | | (1,343,438 | ) | | | (391,574 | ) | | | (4,746,214 | ) | | | (24,074,047 | ) |
| Change in net unrealized appreciation (depreciation) on securities sold short | | | 130,091 | | | | 282,226 | | | | (14,114 | ) | | | — | | | | — | | | | — | | | | — | |
| Net increase (decrease) in net assets resulting from operations | | | (514,134 | ) | | | (1,410,434 | ) | | | (1,226,959 | ) | | | (329,868 | ) | | | (2,006,081 | ) | | | (2,968,725 | ) | | | (9,828,384 | ) |
| | | | | | | | | | | | | | | | | | | | | | | | | | | | | |
| Distributions to shareholders from | | | | | | | | | | | | | | | | | | | | | | | | | | | | |
| Net realized capital gain — Class A | | | — | | | | (681,915 | ) | | | — | | | | — | | | | (260,397 | ) | | | — | | | | — | |
| Net realized capital gain — Class C | | | — | | | | (136,929 | ) | | | — | | | | — | | | | (141,918 | ) | | | — | | | | — | |
| Net realized capital gain — Institutional Class | | | — | | | | (285,061 | ) | | | — | | | | — | | | | (146,266 | ) | | | — | | | | — | |
| Total distributions | | | — | | | | (1,103,905 | ) | | | — | | | | — | | | | (548,581 | ) | | | — | | | | — | |
| | | | | | | | | | | | | | | | | | | | | | | | | | | | | |
| Capital share transactions | | | | | | | | | | | | | | | | | | | | | | | | | | | | |
Increase (decrease) in net assets from fund share transactions
(Note 9) | | $ | (5,261,426 | ) | | | 8,003,003 | | | | (8,585,104 | ) | | | (1,493,862 | ) | | | (11,205,264 | ) | | | (6,558,501 | ) | | | (82,128,768 | ) |
| Total increase (decrease) in net assets | | | (5,775,560 | ) | | | 5,488,664 | | | | (9,812,063 | ) | | | (1,823,730 | ) | | | (13,759,926 | ) | | | (9,527,226 | ) | | | (91,957,152 | ) |
| | | | | | | | | | | | | | | | | | | | | | | | | | | | | |
| NET ASSETS | | | | | | | | | | | | | | | | | | | | | | | | | | | | |
| Beginning of period | | | 12,522,741 | | | | 49,723,045 | | | | 19,575,496 | | | | 10,238,966 | | | | 20,064,824 | | | | 39,765,690 | | | | 271,124,563 | |
| End of period | | $ | 6,747,181 | | | $ | 55,211,709 | | | $ | 9,763,433 | | | $ | 8,415,236 | | | $ | 6,304,898 | | | $ | 30,238,464 | | | $ | 179,167,411 | |
| Undistributed (Accumulated) net investment income (loss), at end of period | | $ | (49,734 | ) | | $ | 76,874 | | | $ | (80,154 | ) | | $ | (33,528 | ) | | $ | (61,339 | ) | | $ | (32,850 | ) | | $ | (654,882 | ) |
The accompanying notes are an integral part of the financial statements.
2 0 1 3 A N N U A L R E P O R T | 39
Financial Highlights
Quaker Akros Absolute Return
(For a Share Outstanding Throughout the Period)
| | | Class A |
| | | | | | | | | For the Period | | | | | | | | | |
| | | | | | | | | September 1, | | Year Ended | | Year Ended | | Year Ended |
| | | Year Ended | | | Year Ended | | 2010 to June 30, | | August 31, | | August 31, | | August 31, |
| | | June 30, 2013 | | | June 30, 2012 | | 2011 | | 2010 | | 2009 | | 2008 |
| Net asset value, beginning of period | | | $8.29 | | | | $8.84 | | | | $9.16 | | | | $9.84 | | | | $9.68 | | | | $9.46 | |
| | | | | | | | | | | | | | | | | | | | | | | | | |
| Income from investment operations: | | | | | | | | | | | | | | | | | | | | | | | | |
| Net investment loss(1) | | | (0.11 | ) | | | (0.09 | ) | | | (0.11 | ) | | | (0.09 | ) | | | (0.06 | ) | | | 0.07 | |
| Net realized and unrealized gain/(loss) on investments | | | (0.37 | ) | | | (0.46 | ) | | | 0.08 | | | | (0.06 | ) | | | 0.51 | | | | 0.64 | |
| Total from investment operations | | | (0.48 | ) | | | (0.55 | ) | | | (0.03 | ) | | | (0.15 | ) | | | 0.45 | | | | 0.71 | |
| | | | | | | | | | | | | | | | | | | | | | | | | |
| Distributions to shareholders from: | | | | | | | | | | | | | | | | | | | | | | | | |
| Net investment income | | | — | | | | — | | | | — | | | | — | | | | (0.07 | ) | | | (0.16 | ) |
| Net realized capital gain | | | (0.08 | ) | | | — | | | | (0.25 | ) | | | (0.53 | ) | | | (0.22 | ) | | | (0.33 | ) |
| Return of Capital | | | — | | | | — | | | | (0.04 | ) | | | — | | | | — | | | | — | |
| Total distributions | | | (0.08 | ) | | | — | | | | (0.29 | ) | | | (0.53 | ) | | | (0.29 | ) | | | (0.49 | ) |
| Paid-in capital from redemption fees | | | — | | | | — | | | | — | | | | 0.00± | | | | — | | | | — | |
| Net asset value, end of period | | | $7.73 | | | | $8.29 | | | | $8.84 | | | | $9.16 | | | | $9.84 | | | | $9.68 | |
| Total Return(2) | | | (5.82 | )% | | | (6.22 | )% | | | (0.39 | )%*+ | | | (1.45 | )% | | | 5.30 | % | | | 7.95 | % |
| | | | | | | | | | | | | | | | | | | | | | | | | |
| Ratios/supplemental data: | | | | | | | | | | | | | | | | | | | | | | | | |
| Net assets, end of period (000’ omitted) | | | $2,445 | | | | $4,697 | | | | $9,809 | | | | $9,983 | | | | $4,064 | | | | $2,733 | |
| Ratio of expenses to average net assets: | | | | | | | | | | | | | | | | | | | | | | | | |
| Expenses before reductions(3) | | | 4.45 | % | | | 2.67 | % | | | 3.27 | %** | | | 4.77 | % | | | 7.52 | % | | | 8.91 | % |
| Expenses net of fee waivers, if any(3) | | | 1.99 | % | | | 1.99 | % | | | 1.99 | %** | | | 2.28 | % | | | 2.03 | % | | | 2.18 | % |
| Expenses before reductions (excluding dividend and interest expense for securities sold short)(3) | | | 4.09 | % | | | 2.56 | % | | | 2.97 | %** | | | 4.48 | % | | | 7.48 | % | | | 8.72 | % |
| Expenses net of all reductions (excluding dividend and interest expense for securities sold short)(3) | | | 1.63 | % | | | 1.88 | % | | | 1.69 | %** | | | 1.99 | % | | | 1.99 | % | | | 1.99 | % |
| Ratio of net investment income (loss) to average net assets *** | | | | | | | | | | | | | | | | | | | | | | | | |
| Before waiver and expense reimbursement(3) | | | (3.78 | )% | | | (1.71 | )% | | | (2.72 | )%** | | | (4.12 | )% | | | (6.25 | )% | | | (5.90 | )% |
| After waiver and expense reimbursement(3) | | | (1.32 | )% | | | (1.03 | )% | | | (1.44 | )%** | | | (1.63 | )% | | | (0.77 | )% | | | 0.83 | % |
| Portfolio turnover rate | | | 215.38 | % | | | 103.42 | % | | | 136.57 | %* | | | 373.76 | % | | | 456.41 | % | | | 249.85 | % |
| (1) | The average shares outstanding method has been applied for per share information. |
| | |
| (2) | Total investment return is based on the change in net asset value of a share during the period, assumes reinvestment of dividends and distributions at net asset value and does not reflect the impact of a sales charge. |
| | |
| (3) | Expense waived or reimbursed reflect reductions to total expenses, as discussed in the notes to the financial statements. These amounts would increase the net investment loss ratio or decrease the net investment income ratio, as applicable, had such reductions not occurred. |
| | |
| * | Not annualized. |
| | |
| ** | Annualized. |
| | |
| *** | The net investment income (loss) ratios include dividends on short positions. |
| | |
| ± | Less than 0.5 cent per share. |
| | |
| + | The return shown represents performance for a period of less than one year. |
The accompanying notes are an integral part of the financial statements.
40 | 2 0 1 3 A N N U A L R E P O R T
Financial Highlights
Quaker Akros Absolute Return
(For a Share Outstanding Throughout the Period)
| | | Class C |
| | | | | | | | | For the Period |
| | | | | | | | | October 4, 2010 |
| | | | | | | | | (commencement |
| | | Year Ended | | Year Ended | | of operations) to |
| | | June 30, 2013 | | June 30, 2012 | | June 30, 2011 |
| Net asset value, beginning of period | | | $8.18 | | | | $8.78 | | | | $9.25 | |
| | | | | | | | | | | | | |
| Income from investment operations: | | | | | | | | | | | | |
| Net investment loss(1) | | | (0.16 | ) | | | (0.16 | ) | | | (0.12 | ) |
| Net realized and unrealized loss on investments | | | (0.38 | ) | | | (0.44 | ) | | | (0.06 | ) |
| Total from investment operations | | | (0.54 | ) | | | (0.60 | ) | | | (0.18 | ) |
| | | | | | | | | | | | | |
| Distributions to shareholders from: | | | | | | | | | | | | |
| Net investment income | | | — | | | | — | | | | — | |
| Net realized capital gain | | | (0.08 | ) | | | — | | | | (0.25 | ) |
| Return of Capital | | | — | | | | — | | | | (0.04 | ) |
| Total distributions | | | (0.08 | ) | | | — | | | | (0.29 | ) |
| Net asset value, end of period | | | $7.56 | | | | $8.18 | | | | $8.78 | |
| Total Return(2) | | | (6.64 | )% | | | (6.83 | )% | | | (2.02 | )%*+ |
| | | | | | | | | | | | | |
| Ratios/supplemental data: | | | | | | | | | | | | |
| Net assets, end of period (000’ omitted) | | | $155 | | | | $381 | | | | $296 | |
| Ratio of expenses to average net assets: | | | | | | | | | | | | |
| Expenses before reductions(3) | | | 5.20 | % | | | 3.42 | % | | | 3.94 | %** |
| Expenses net of fee waivers, if any(3) | | | 2.74 | % | | | 2.74 | % | | | 2.74 | %** |
| Expenses before reductions (excluding dividend and interest expense for securities sold short)(3) | | | 4.84 | % | | | 3.29 | % | | | 3.84 | %** |
| Expenses net of all reductions (excluding dividend and interest expense for securities sold short)(3) | | | 2.38 | % | | | 2.61 | % | | | 2.65 | %** |
| Ratio of net investment income (loss) to average net assets *** | | | | | | | | | | | | |
| Before waiver and expense reimbursement(3) | | | (4.53 | )% | | | (2.52 | )% | | | (3.05 | )%** |
| After waiver and expense reimbursement(3) | | | (2.07 | )% | | | (1.84 | )% | | | (1.86 | )%** |
| Portfolio turnover rate | | | 215.38 | % | | | 103.42 | % | | | 136.57 | %* |
| (1) | The average shares outstanding method has been applied for per share information. |
| | |
| (2) | Total investment return is based on the change in net asset value of a share during the period, assumes reinvestment of dividends and distributions at net asset value and does not reflect the impact of a sales charge. |
| | |
| (3) | Expense waived or reimbursed reflect reductions to total expenses, as discussed in the notes to the financial statements. These amounts would increase the net investment loss ratio or decrease the net investment income ratio, as applicable, had such reductions not occurred. |
| | |
| * | Not annualized. |
| | |
| ** | Annualized. |
| | |
| *** | The net investment income (loss) ratios include dividends on short positions. |
| | |
| + | The return shown represents performance for a period of less than one year. |
The accompanying notes are an integral part of the financial statements.
2 0 1 3 A N N U A L R E P O R T | 41
Financial Highlights
Quaker Akros Absolute Return
(For a Share Outstanding Throughout the Period)
| | | Institutional Class |
| | | | | | | | | For the Period |
| | | | | | | | | October 4, 2010 |
| | | | | | | | | (commencement |
| | | Year Ended | | Year Ended | | of operations) to |
| | | June 30, 2013 | | June 30, 2012 | | June 30, 2011 |
| Net asset value, beginning of period | | | $8.33 | | | | $8.86 | | | | $9.25 | |
| | | | | | | | | | | | | |
| Income from investment operations: | | | | | | | | | | | | |
| Net investment loss(1) | | | (0.09 | ) | | | (0.06 | ) | | | (0.07 | ) |
| Net realized and unrealized loss on investments | | | (0.37 | ) | | | (0.47 | ) | | | (0.03 | ) |
| Total from investment operations | | | (0.46 | ) | | | (0.53 | ) | | | (0.10 | ) |
| | | | | | | | | | | | | |
| Distributions to shareholders from: | | | | | | | | | | | | |
| Net investment income | | | — | | | | — | | | | — | |
| Net realized capital gain | | | (0.08 | ) | | | — | | | | (0.25 | ) |
| Return of Capital | | | — | | | | — | | | | (0.04 | ) |
| Total distributions | | | (0.08 | ) | | | — | | | | (0.29 | ) |
| Net asset value, end of period | | | $7.79 | | | | $8.33 | | | | $8.86 | |
| Total Return(2) | | | (5.56 | )% | | | (5.98 | )% | | | (1.14 | )%*+ |
| | | | | | | | | | | | | |
| Ratios/supplemental data: | | | | | | | | | | | | |
| Net assets, end of period (000’ omitted) | | | $1,602 | | | | $1,670 | | | | $2,418 | |
| Ratio of expenses to average net assets: | | | | | | | | | | | | |
| Expenses before reductions(3) | | | 4.20 | % | | | 2.42 | % | | | 2.93 | %** |
| Expenses net of fee waivers, if any(3) | | | 1.74 | % | | | 1.74 | % | | | 1.74 | %** |
| Expenses before reductions (excluding dividend and interest expense for securities sold short)(3) | | | 3.84 | % | | | 2.31 | % | | | 2.62 | %** |
| Expenses net of all reductions (excluding dividend and interest expense for securities sold short)(3) | | | 1.38 | % | | | 1.63 | % | | | 1.44 | %** |
| Ratio of net investment income (loss) to average net assets *** | | | | | | | | | | | | |
| Before waiver and expense reimbursement(3) | | | (3.53 | )% | | | (1.44 | )% | | | (2.17 | )%** |
| After waiver and expense reimbursement(3) | | | (1.07 | )% | | | (0.76 | )% | | | (0.99 | )%** |
| Portfolio turnover rate | | | 215.38 | % | | | 103.42 | % | | | 136.57 | %* |
| (1) | The average shares outstanding method has been applied for per share information. |
| | |
| (2) | Total investment return is based on the change in net asset value of a share during the period, assumes reinvestment of dividends and distributions at net asset value and does not reflect the impact of a sales charge. |
| | |
| (3) | Expense waived or reimbursed reflect reductions to total expenses, as discussed in the notes to the financial statements. These amounts would increase the net investment loss ratio or decrease the net investment income ratio, as applicable, had such reductions not occurred. |
| | |
| * | Not annualized. |
| | |
| ** | Annualized. |
| | |
| *** | The net investment income (loss) ratios include dividends on short positions. |
| | |
| + | The return shown represents performance for a period of less than one year. |
The accompanying notes are an integral part of the financial statements.
42 | 2 0 1 3 A N N U A L R E P O R T
Financial Highlights
Quaker Event Arbitrage
(For a Share Outstanding Throughout the Period)
| | | Class A |
| | | Years Ended June 30, | | For the Period
January 1, 2010 to | | Years Ended December 31, |
| | | 2013 | | 2012 | | 2011 | | June 30, 2010 | | 2009 | | 2008 |
| Net asset value, beginning of period | | $11.93 | | | $12.50 | | | $12.54 | | | $11.80 | | | $9.23 | | | $12.43 | |
| | | | | | | | | | | | | | | | | | | |
| Income from investment operations: | | | | | | | | | | | | | | | | | | |
| Net investment income (loss)(1) | | 0.37 | | | 0.11 | | | — | | | 0.34 | | | (0.05 | ) | | (0.01 | ) |
| Net realized and unrealized gain/(loss) on investments | | 0.65 | | | (0.41 | ) | | 0.06 | | | 0.40 | | | 2.62 | | | (3.19 | ) |
| Total from investment operations | | 1.02 | | | (0.30 | ) | | 0.06 | | | 0.74 | | | 2.57 | | | (3.20 | ) |
| | | | | | | | | | | | | | | | | | | |
| Distributions to shareholders from: | | | | | | | | | | | | | | | | | | |
| Net investment income | | (0.01 | ) | | — | | | (0.06 | ) | | — | | | — | | | — | |
| Net realized capital gains | | (0.13 | ) | | (0.27 | ) | | (0.04 | ) | | — | | | — | | | — | |
| Total distributions | | (0.14 | ) | | (0.27 | ) | | (0.10 | ) | | — | | | — | | | — | |
| Net asset value, end of period | | $12.81 | | | $11.93 | | | $12.50 | | | $12.54 | | | $11.80 | | | $9.23 | |
| Total Return(2) | | 8.70 | % | | (2.31 | )% | | 0.47 | % | | 6.27 | %+ | | 27.84 | % | | (25.74 | )% |
| | | | | | | | | | | | | | | | | | | |
| Ratios/supplemental data: | | | | | | | | | | | | | | | | | | |
| Net assets, end of period (000’ omitted) | | $35,232 | | | $34,725 | | | $25,413 | | | $4,283 | | | $2,918 | | | $1,847 | |
| Ratio of expenses to average net assets: | | | | | | | | | | | | | | | | | | |
| Expense before reductions(3) | | 2.37 | % | | 2.37 | % | | 2.30 | % | | 3.25 | %** | | 3.86 | % | | 3.51 | % |
| Expense net of fee waivers, if any(3) | | 1.99 | % | | 1.99 | % | | 1.99 | % | | 2.44 | %** | | 1.91 | % | | 2.00 | % |
| Expense before reductions (excluding dividend and interest expense for securities sold short)(3) | | 2.34 | % | | 2.35 | % | | 2.24 | % | | 2.56 | %** | | 3.46 | % | | 3.02 | % |
| Expenses net of all reductions (excluding dividend and interest expenses for securities sold short)(3) | | 1.96 | % | | 1.98 | % | | 1.93 | % | | 1.76 | %** | | 1.50 | % | | 1.50 | % |
| Ratio of net investment income (loss) to average net assets *** | | — | | | — | | | — | | | 5.59 | %** | | (0.47 | )% | | (0.13 | )% |
| Before waiver and expense reimbursement(3) | | 2.64 | % | | 0.55 | % | | (0.28 | )% | | — | | | — | | | — | |
| After waiver and expense reimbursement(3) | | 3.02 | % | | 0.92 | % | | 0.04 | % | | — | | | — | | | — | |
| Portfolio turnover rate | | 186.15 | % | | 156.57 | % | | 98.65 | % | | 138.58 | %* | | 226.00 | % | | 224.66 | % |
| (1) | The average shares outstanding method has been applied for per share information. |
| (2) | Total investment return is based on the change in net asset value of a share during the period, assumes reinvestment of dividends and distributions at net asset value and does not reflect the impact of a sales charge. |
| (3) | Expense waived or reimbursed reflect reductions to total expenses, as discussed in the notes to the financial statements. These amounts would increase the net investment loss ratio or decrease the net investment income ratio, as applicable, had such reductions not occurred. |
| * | Not annualized. |
| ** | Annualized. |
| *** | The net investment income (loss) ratios include dividends on short positions. |
| + | The return shown represents performance for a period of less than one year. |
The accompanying notes are an integral part of the financial statements.
2 0 1 3 A N N U A L R E P O R T | 43
Financial Highlights
Quaker Event Arbitrage
(For a Share Outstanding Throughout the Period)
| | | Class C |
| | | | | For the Period
June 7, 2010
(commencement |
| | | Years Ended June 30, | | of operations) to |
| | | 2013 | | 2012 | | 2011 | | June 30, 2010 |
| Net asset value, beginning of period | | $11.78 | | | $12.45 | | | $12.55 | | | $12.35 | |
| | | | | | | | | | | | | |
| Income from investment operations: | | | | | | | | | | | | |
| Net investment income (loss)(1) | | 0.28 | | | 0.02 | | | (0.07 | ) | | (0.21 | ) |
| Net realized and unrealized gain (loss) on investments | | 0.64 | | | (0.42 | ) | | 0.04 | | | 0.41 | |
| Total from investment operations | | 0.92 | | | (0.40 | ) | | (0.03 | ) | | 0.20 | |
| | | | | | | | | | | | | |
| Distributions to shareholders from: | | | | | | | | | | | | |
| Net investment income | | — | | | — | | | (0.03 | ) | | — | |
| Net realized capital gain | | (0.13 | ) | | (0.27 | ) | | (0.04 | ) | | — | |
| Total distributions | | (0.13 | ) | | (0.27 | ) | | (0.07 | ) | | — | |
| Net asset value, end of period | | $12.57 | | | $11.78 | | | $12.45 | | | $12.55 | |
| Total Return(2) | | 7.91 | % | | (3.13 | )% | | (0.24 | )% | | 1.62 | %†* |
| | | | | | | | | | | | | |
| Ratios/supplemental data: | | | | | | | | | | | | |
| Net assets, end of period (000’ omitted) | | $5,954 | | | $7,195 | | | $4,369 | | | $231 | |
| Ratio of expenses to average net assets: | | | | | | | | | | | | |
| Expense before reductions(4) | | 3.12 | % | | 3.12 | % | | 3.08 | % | | 2.74 | %** |
| Expense net of fee waivers, if any(4) | | 2.74 | % | | 2.74 | % | | 2.74 | % | | 2.74 | %** |
| Expense before reductions (excluding dividend and interest expense for securities sold short)(4) | | 3.09 | % | | 3.10 | % | | 3.02 | % | | 2.52 | %** |
| Expenses net of all reductions (excluding dividend and interest expenses for securities sold short)(4) | | 2.71 | % | | 2.73 | % | | 2.68 | % | | 2.52 | %** |
| Ratio of net investment income (loss) to average net assets *** | | — | | | — | | | — | | | (29.65 | )%** |
| Before waiver and expense reimbursement(4) | | 1.89 | % | | (0.17 | )% | | (0.91 | )% | | — | |
| After waiver and expense reimbursement(4) | | 2.27 | % | | 0.21 | % | | (0.57 | )% | | — | |
| Portfolio turnover rate | | 186.15 | % | | 156.57 | % | | 98.65 | % | | 138.58 | %(3)* |
| (1) | The average shares outstanding method has been applied for per share information. |
| (2) | Total investment return is based on the change in net asset value of a share during the period, assumes reinvestment of dividends and distributions at net asset value and does not reflect the impact of a sales charge. |
| (3) | Portfolio turnover for this class is for the period January 1, 2010 to June 30, 2010. |
| (4) | Expense waived or reimbursed reflect reductions to total expenses, as discussed in the notes to the financial statements. These amounts would increase the net investment loss ratio or decrease the net investment income ratio, as applicable, had such reductions not occurred. |
| † | The return shown represents performance for a period of less than one year. |
| * | Not annualized. |
| ** | Annualized. |
| *** | The net investment income (loss) ratios include dividends on short positions. |
The accompanying notes are an integral part of the financial statements.
44 | 2 0 1 3 A N N U A L R E P O R T
Financial Highlights
Quaker Event Arbitrage
(For a Share Outstanding Throughout the Period)
| | | Institutional Class |
| | | | | For the Period
June 7, 2010
(commencement |
| | | Years Ended June 30, | | of operations) to |
| | | 2013 | | | 2012 | | | 2011 | | | June 30, 2010 |
| Net asset value, beginning of period | | $11.97 | | | $12.52 | | | $12.54 | | | $12.35 | |
| | | | | | | | | | | | | |
| Income from investment operations: | | | | | | | | | | | | |
| Net investment income (loss)(1) | | 0.40 | | | 0.13 | | | 0.08 | | | (0.03 | ) |
| Net realized and unrealized gain (loss) on investments | | 0.67 | | | (0.41 | ) | | 0.02 | | | 0.22 | |
| Total from investment operations | | 1.07 | | | (0.28 | ) | | 0.10 | | | 0.19 | |
| | | | | | | | | | | | | |
| Distributions to shareholders from: | | | | | | | | | | | | |
| Net investment income | | (0.05 | ) | | — | | | (0.08 | ) | | — | |
| Net realized capital gain | | (0.13 | ) | | (0.27 | ) | | (0.04 | ) | | — | |
| Total distributions | | (0.18 | ) | | (0.27 | ) | | (0.12 | ) | | — | |
| Net asset value, end of period | | $12.86 | | | $11.97 | | | $12.52 | | | $12.54 | |
| Total Return(2) | | 9.04 | % | | (2.14 | )% | | 0.72 | % | | 1.54 | %†* |
| | | | | | | | | | | | | |
| Ratios/supplemental data: | | | | | | | | | | | | |
| Net assets, end of period (000’ omitted) | | $24,929 | | | $13,292 | | | $19,941 | | | $743 | |
| Ratio of expenses to average net assets: | | | | | | | | | | | | |
| Expense before reductions(4) | | 2.12 | % | | 2.09 | % | | 2.11 | % | | 3.00 | %** |
| Expense net of fee waivers, if any(4) | | 1.74 | % | | 1.74 | % | | 1.74 | % | | 3.00 | %** |
| Expense before reductions (excluding dividend and interest expense for securities sold short)(4) | | 2.09 | % | | 2.08 | % | | 2.06 | % | | 2.88 | %** |
| Expenses net of all reductions (excluding dividend and interest expenses for securities sold short)(4) | | 1.71 | % | | 1.73 | % | | 1.70 | % | | 2.88 | %** |
| Ratio of net investment income (loss) to average net assets *** | | — | | | — | | | — | | | (3.81 | )** |
| Before waiver and expense reimbursement(4) | | 2.89 | % | | 0.75 | % | | 0.26 | % | | — | |
| After waiver and expense reimbursement(4) | | 3.27 | % | | 1.11 | % | | 0.62 | % | | — | |
| Portfolio turnover rate | | 186.15 | % | | 156.57 | % | | 98.65 | % | | 138.58 | %(3)* |
| (1) | The average shares outstanding method has been applied for per share information. |
| (2) | Total investment return is based on the change in net asset value of a share during the period, assumes reinvestment of dividends and distributions at net asset value and does not reflect the impact of a sales charge. |
| (3) | Portfolio turnover for this class is for the period January 1, 2010 to June 30, 2010. |
| (4) | Expense waived or reimbursed reflect reductions to total expenses, as discussed in the notes to the financial statements. These amounts would increase the net investment loss ratio or decrease the net investment income ratio, as applicable, had such reductions not occurred. |
| † | The return shown represents performance for a period of less than one year. |
| * | Not annualized. |
| ** | Annualized. |
| *** | The net investment income (loss) ratios include dividends on short positions. |
The accompanying notes are an integral part of the financial statements.
2 0 1 3 A N N U A L R E P O R T | 45
Financial Highlights
Quaker Global Tactical Allocation Fund
(For a Share Outstanding Throughout the Period)
| | | Class A |
| | | Years Ended June 30, |
| | | 2013 | | 2012 | | 2011 | | 2010 | | 2009 |
| Net asset value, beginning of period | | $7.12 | | | $7.51 | | | $5.92 | | | $5.37 | | | $10.19 | |
| | | | | | | | | | | | | | | | |
| Income from investment operations: | | | | | | | | | | | | | | | |
| Net investment loss(1) | | (0.09 | ) | | (0.10 | ) | | (0.09 | ) | | (0.07 | ) | | (0.05 | ) |
| Net realized and unrealized gain (loss) on investments | | 1.27 | | | (0.29 | ) | | 1.68 | | | 0.62 | | | (4.77 | ) |
| Total from investment operations | | 1.18 | | | (0.39 | ) | | 1.59 | | | 0.55 | | | (4.82 | ) |
| | | | | | | | | | | | | | | | |
| Distributions to shareholders from: | | | | | | | | | | | | | | | |
| Net investment income | | — | | | — | | | — | | | — | | | — | |
| Net realized capital gain | | — | | | — | | | — | | | — | | | — | |
| Total distributions | | — | | | — | | | — | | | — | | | — | |
| Net asset value, end of period | | $8.30 | | | $7.12 | | | $7.51 | | | $5.92 | | | $5.37 | |
| Total Return(2) | | 16.57 | % | | (5.19 | )% | | 26.86 | % | | 10.24 | % | | (47.30 | )% |
| | | | | | | | | | | | | | | | |
| Ratios/supplemental data: | | | | | | | | | | | | | | | |
| Net assets, end of period (000’ omitted) | | $3,856 | | | $5,707 | | | $11,708 | | | $12,889 | | | $16,380 | |
| Ratio of expenses to average net assets | | 2.83 | % | | 2.68 | % | | 2.41 | % | | 2.32 | % | | 2.38 | % |
| Ratio of expenses to average net assets (excluding dividend and interest expense for securities sold short) | | 2.83 | % | | — | | | — | | | — | | | — | |
| Ratio of net investment income (loss) to average net assets | | (1.22 | )% | | (1.41 | )% | | (1.30 | )% | | (1.12 | )% | | (0.85 | )% |
| Portfolio turnover rate | | 484.31 | % | | 879.75 | % | | 732.27 | % | | 1212.89 | % | | 760.99 | % |
| | | Class C |
| | | Years Ended June 30, |
| | | 2013 | | 2012 | | 2011 | | 2010 | | 2009 |
| Net asset value, beginning of period | | $6.90 | | | $7.34 | | | $5.82 | | | $5.32 | | | $10.17 | |
| | | | | | | | | | | | | | | | |
| Income from investment operations | | | | | | | | | | | | | | | |
| Net investment loss(1) | | (0.14 | ) | | (0.15 | ) | | (0.14 | ) | | (0.11 | ) | | (0.09 | ) |
| Net realized and unrealized gain (loss) on investments | | 1.22 | | | (0.29 | ) | | 1.66 | | | 0.61 | | | (4.76 | ) |
| Total from investment operations | | 1.08 | | | (0.44 | ) | | 1.52 | | | 0.50 | | | (4.85 | ) |
| | | | | | | | | | | | | | | | |
| Distributions to shareholders from: | | | | | | | | | | | | | | | |
| Net investment income | | — | | | — | | | — | | | — | | | — | |
| Net realized capital gain | | — | | | — | | | — | | | — | | | — | |
| Total distributions | | — | | | — | | | — | | | — | | | — | |
| Net asset value, end of period | | $7.98 | | | $6.90 | | | $7.34 | | | $5.82 | | | $5.32 | |
| Total Return(2) | | 15.65 | % | | (5.99 | )% | | 26.12 | % | | 9.40 | % | | (47.69 | )% |
| | | | | | | | | | | | | | | | |
| Ratios/supplemental data | | | | | | | | | | | | | | | |
| Net assets, end of period (000’ omitted) | | $2,124 | | | $3,158 | | | $6,880 | | | $9,512 | | | $11,386 | |
| Ratio of expenses to average net assets | | 3.58 | % | | 3.43 | % | | 3.16 | % | | 3.07 | % | | 3.13 | % |
| Ratio of expenses to average net assets (excluding dividend and interest expense for securities sold short) | | 3.58 | % | | — | | | — | | | — | | | — | |
| Ratio of net investment income (loss) to average net assets | | (1.97 | )% | | (2.15 | )% | | (2.07 | )% | | (1.87 | )% | | (1.60 | )% |
| Portfolio turnover rate | | 484.31 | % | | 879.75 | % | | 732.27 | % | | 1212.89 | % | | 760.99 | % |
| (1) | The average shares outstanding method has been applied for per share information. |
| (2) | Total investment return is based on the change in net asset value of a share during the period, assumes reinvestment of dividends and distributions at net asset value and does not reflect the impact of a sales charge. |
The accompanying notes are an integral part of the financial statements.
46 | 2 0 1 3 A N N U A L R E P O R T
Financial Highlights
Quaker Global Tactical Allocation Fund
(For a Share Outstanding Throughout the Period)
| | | Institutional Class |
| | | | | For the Period
July 23, 2008
(commencement |
| | | Years Ended June 30, | | of operations) |
| | | 2013 | | 2012 | | 2011 | | 2010 | | to June 30, 2009 |
| Net asset value, beginning of period | | $8.12 | | | $8.55 | | | $6.71 | | | $6.08 | | | $10.00 | |
| | | | | | | | | | | | | | | | |
| Income from investment operations: | | | | | | | | | | | | | | | |
| Net investment loss(1) | | (0.08 | ) | | (0.09 | ) | | (0.08 | ) | | (0.05 | ) | | (0.05 | ) |
| Net realized and unrealized gain (loss) on investments | | 1.45 | | | (0.34 | ) | | 1.92 | | | 0.68 | | | (3.87 | ) |
| Total from investment operations | | 1.37 | | | (0.43 | ) | | 1.84 | | | 0.63 | | | (3.92 | ) |
| | | | | | | | | | | | | | | | |
| Distributions to shareholders from: | | | | | | | | | | | | | | | |
| Net investment income | | — | | | — | | | — | | | — | | | — | |
| Net realized capital gain | | — | | | — | | | — | | | — | | | — | |
| Total distributions | | — | | | — | | | — | | | — | | | — | |
| Net asset value, end of period | | $9.49 | | | $8.12 | | | $8.55 | | | $6.71 | | | $6.08 | |
| Total Return(2) | | 16.87 | % | | (5.03 | )% | | 27.42 | % | | 10.36 | % | | (39.20 | )%†* |
| | | | | | | | | | | | | | | | |
| Ratios/supplemental data: | | | | | | | | | | | | | | | |
| Net assets, end of period (000’ omitted) | | $625 | | | $899 | | | $987 | | | $877 | | | $226 | |
| Ratio of expenses to average net assets | | 2.58 | % | | 2.47 | % | | 2.16 | % | | 1.86 | % | | 2.23 | %** |
| Ratio of expenses to average net assets (excluding dividend and interest expense for securities sold short) | | 2.58 | % | | — | | | — | | | — | | | — | |
| Ratio of net investment income (loss) to average net assets: | | (0.97 | )% | | (1.12 | )% | | (1.05 | )% | | (0.70 | )% | | (0.74 | )%** |
| Portfolio turnover rate | | 484.31 | % | | 879.75 | % | | 732.27 | % | | 1212.89 | % | | 760.99 | % |
| (1) | The average shares outstanding method has been applied for per share information. |
| (2) | Total investment return is based on the change in net asset value of a share during the period, assumes reinvestment of dividends and distributions at net asset value and does not reflect the impact of a sales charge. |
| † | The return represent a period of less than one year. |
| * | Not annualized. |
| ** | Annualized. |
The accompanying notes are an integral part of the financial statements.
2 0 1 3 A N N U A L R E P O R T | 47
Financial Highlights
Quaker Mid Cap Value Fund
(For a Share Outstanding Throughout the Period)
| | | Class A |
| | | Years Ended June 30, |
| | | 2013 | | 2012 | | 2011 | | 2010 | | 2009 |
| Net asset value, beginning of period | | $15.73 | | | $16.03 | | | $11.99 | | | $9.39 | | | $14.42 | |
| | | | | | | | | | | | | | | | |
| Income from investment operations: | | | | | | | | | | | | | | | |
| Net investment income (loss)(1) | | (0.14 | ) | | (0.11 | ) | | (0.13 | ) | | (0.05 | ) | | 0.01 | |
| Net realized and unrealized gain (loss) on investments | | 3.40 | | | (0.19 | ) | | 4.17 | | | 2.65 | | | (5.04 | ) |
| Total from investment operations | | 3.26 | | | (0.30 | ) | | 4.04 | | | 2.60 | | | (5.03 | ) |
| | | | | | | | | | | | | | | | |
| Distributions to shareholders from: | | | | | | | | | | | | | | | |
| Net investment income | | — | | | — | | | — | | | — | | | — | |
| Net realized capital gain | | — | | | — | | | — | | | — | | | — | |
| Total distributions | | — | | | — | | | — | | | — | | | — | |
| Net asset value, end of period | | $18.99 | | | $15.73 | | | $16.03 | | | $11.99 | | | $9.39 | |
| Total Return(2) | | 20.72 | % | | (1.87 | )% | | 33.69 | % | | 27.69 | % | | (34.88 | )% |
| | | | | | | | | | | | | | | | |
| Ratios/supplemental data: | | | | | | | | | | | | | | | |
| Net assets, end of period (000’ omitted) | | $6,029 | | | $6,114 | | | $7,229 | | | $6,796 | | | $6,967 | |
| Ratio of expenses to average net assets: | | | | | | | | | | | | | | | |
| Before expense reimbursements and waived fees | | 2.19 | % | | 2.21 | % | | 2.13 | % | | 2.09 | % | | 1.96 | % |
| After expense reimbursements and waived fees | | 2.19 | % | | 2.21 | % | | 2.13 | % | | 2.09 | % | | 1.94 | % |
| Ratio of net investment income (loss) to average net assets | | (0.80 | )% | | (0.70 | )% | | (0.88 | )% | | (0.41 | )% | | 0.11 | % |
| Portfolio turnover rate | | 46.91 | % | | 41.70 | % | | 27.10 | % | | 50.53 | % | | 184.80 | % |
| | | Class C |
| | | Years Ended June 30, |
| | | 2013 | | 2012 | | 2011 | | 2010 | | 2009 |
| Net asset value, beginning of period | | $14.11 | | | $14.48 | | | $10.92 | | | $8.61 | | | $13.32 | |
| | | | | | | | | | | | | | | | |
| Income from investment operations | | | | | | | | | | | | | | | |
| Net investment loss(1) | | (0.24 | ) | | (0.20 | ) | | (0.22 | ) | | (0.12 | ) | | (0.06 | ) |
| Net realized and unrealized gain (loss) on investments | | 3.04 | | | (0.17 | ) | | 3.78 | | | 2.43 | | | (4.65 | ) |
| Total from investment operations | | 2.80 | | | (0.37 | ) | | 3.56 | | | 2.31 | | | (4.71 | ) |
| | | | | | | | | | | | | | | | |
| Distributions to shareholders from: | | | | | | | | | | | | | | | |
| Net investment income | | — | | | — | | | — | | | — | | | — | |
| Net realized capital gains | | — | | | — | | | — | | | — | | | — | |
| Total distributions | | — | | | — | | | — | | | — | | | — | |
| Net asset value, end of period | | $16.91 | | | $14.11 | | | $14.48 | | | $10.92 | | | $8.61 | |
| Total Return(2) | | 19.84 | % | | (2.56 | )% | | 32.60 | % | | 26.83 | % | | (35.36 | )% |
| | | | | | | | | | | | | | | | |
| Ratios/supplemental data | | | | | | | | | | | | | | | |
| Net assets, end of period (000’ omitted) | | $1,815 | | | $1,950 | | | $2,577 | | | $2,427 | | | $2,629 | |
| Ratio of expenses to average net assets: | | | | | | | | | | | | | | | |
| Before expense reimbursements and waived fees | | 2.94 | % | | 2.96 | % | | 2.88 | % | | 2.83 | % | | 2.71 | % |
| After expense reimbursements and waived fees | | 2.94 | % | | 2.96 | % | | 2.88 | % | | 2.83 | % | | 2.69 | % |
| Ratio of net investment income (loss) to average net assets: | | (1.55 | )% | | (1.45 | )% | | (1.63 | )% | | (1.16 | )% | | (0.62 | )% |
| Portfolio turnover rate | | 46.91 | % | | 41.70 | % | | 27.10 | % | | 50.53 | % | | 184.80 | % |
| (1) | The average shares outstanding method has been applied for per share information. |
| (2) | Total investment return is based on the change in net asset value of a share during the period, assumes reinvestment of dividends and distributions at net asset value and does not reflect the impact of a sales charge. |
The accompanying notes are an integral part of the financial statements.
48 | 2 0 1 3 A N N U A L R E P O R T
Financial Highlights
Quaker Mid Cap Value Fund
(For a Share Outstanding Throughout the Period)
| | | Institutional Class |
| | | Years Ended June 30, |
| | | 2013 | | 2012 | | 2011 | | 2010 | | 2009 |
| Net asset value, beginning of period | | $16.39 | | | $16.66 | | | $12.43 | | | $9.70 | | | $14.87 | |
| | | | | | | | | | | | | | | | |
| Income from investment operations: | | | | | | | | | | | | | | | |
| Net investment income (loss)(1) | | (0.10 | ) | | (0.07 | ) | | (0.10 | ) | | (0.02 | ) | | 0.04 | |
| Net realized and unrealized gain (loss) on investments | | 3.54 | | | (0.20 | ) | | 4.33 | | | 2.75 | | | (5.21 | ) |
| Total from investment operations | | 3.44 | | | (0.27 | ) | | 4.23 | | | 2.73 | | | (5.17 | ) |
| | | | | | | | | | | | | | | | |
| Distributions to shareholders from: | | | | | | | | | | | | | | | |
| Net investment income | | — | | | — | | | — | | | — | | | — | |
| Net realized capital gain | | — | | | — | | | — | | | — | | | — | |
| Total distributions | | — | | | — | | | — | | | — | | | — | |
| Net asset value, end of period | | $19.83 | | | $16.39 | | | $16.66 | | | $12.43 | | | $9.70 | |
| Total Return(2) | | 20.99 | % | | (1.62 | )% | | 34.03 | % | | 28.14 | % | | (34.77 | )% |
| | | | | | | | | | | | | | | | |
| Ratios/supplemental data: | | | | | | | | | | | | | | | |
| Net assets, end of period (000’ omitted) | | $1,060 | | | $351 | | | $433 | | | $245 | | | $227 | |
| Ratio of expenses to average net assets: | | | | | | | | | | | | | | | |
| Before expense reimbursements and waived fees | | 1.94 | % | | 1.96 | % | | 1.87 | % | | 1.84 | % | | 1.70 | % |
| After expense reimbursements and waived fees | | 1.94 | % | | 1.96 | % | | 1.87 | % | | 1.84 | % | | 1.68 | % |
| Ratio of net investment income (loss) to average net assets: | | (0.55 | )% | | (0.45 | )% | | (0.62 | )% | | (0.19 | )% | | 0.36 | % |
| Portfolio turnover rate | | 46.91 | % | | 41.70 | % | | 27.10 | % | | 50.53 | % | | 184.80 | % |
| (1) | The average shares outstanding method has been applied for per share information. |
| (2) | Total investment return is based on the change in net asset value of a share during the period, assumes reinvestment of dividends and distributions at net asset value and does not reflect the impact of a sales charge. |
The accompanying notes are an integral part of the financial statements.
2 0 1 3 A N N U A L R E P O R T | 49
Financial Highlights
Quaker Small-Cap Growth Tactical Allocation Fund
(For a Share Outstanding Throughout the Period)
| | | Class A |
| | | | | | | | | | | For the Period
September 30, 2008
(commencement |
| | | Years Ended June 30, | | of operations) |
| | | 2013 | | 2012 | | 2011 | | 2010 | | to June 30, 2009 |
| Net asset value, beginning of period | | $8.88 | | | $10.28 | | | $9.77 | | | $10.09 | | | $10.00 | |
| Income from investment operations: | | | | | | | | | | | | | | | |
| Net investment loss(1) | | (0.11 | ) | | (0.14 | ) | | (0.16 | ) | | (0.16 | ) | | (0.15 | ) |
| Net realized and unrealized gain (loss) on investments | | 0.82 | | | (0.84 | ) | | 0.90 | | | 1.29 | | | 0.24 | |
| Total from investment operations | | 0.71 | | | (0.98 | ) | | 0.74 | | | 1.13 | | | 0.09 | |
| Distributions to shareholders from: | | | | | | | | | | | | | | | |
| Net investment income | | — | | | — | | | — | | | — | | | — | |
| Net realized capital gain | | — | | | (0.42 | ) | | (0.23 | ) | | (1.45 | ) | | — | |
| Total distributions | | — | | | (0.42 | ) | | (0.23 | ) | | (1.45 | ) | | — | |
| Net asset value, end of period | | $9.59 | | | $8.88 | | | $10.28 | | | $9.77 | | | $10.09 | |
| Total Return(2) | | 8.00 | % | | (9.51 | )% | | 7.79 | % | | 11.75 | % | | 0.90 | %†* |
| Ratios/supplemental data: | | | | | | | | | | | | | | | |
| Net assets, end of period (000’ omitted) | | $1,594 | | | $2,507 | | | $9,082 | | | $13,281 | | | $3,728 | |
| Ratio of expenses to average net assets | | 2.45 | % | | 2.24 | % | | 2.02 | % | | 1.89 | % | | 2.64 | %** |
| Ratio of net investment income (loss) to average net assets | | (1.24 | )% | | (1.54 | )% | | (1.70 | )% | | (1.61 | )% | | (2.15 | )%** |
| Portfolio turnover rate | | 441.74 | % | | 625.61 | % | | 879.32 | % | | 991.29 | % | | 714.79 | %* |
| | | Class C |
| | | | | | | | | | | For the Period
September 30, 2008
(commencement |
| | | Years Ended June 30, | | of operations) |
| | | 2013 | | 2012 | | 2011 | | 2010 | | to June 30, 2009 |
| Net asset value, beginning of period | | $8.61 | | | $10.06 | | | $9.64 | | | $10.04 | | | $10.00 | |
| Income from investment operations: | | | | | | | | | | | | | | | |
| Net investment loss(1) | | (0.18 | ) | | (0.20 | ) | | (0.23 | ) | | (0.24 | ) | | (0.19 | ) |
| Net realized and unrealized gain (loss) on investments | | 0.79 | | | (0.83 | ) | | 0.88 | | | 1.29 | | | 0.23 | |
| Total from investment operations | | 0.61 | | | (1.03 | ) | | 0.65 | | | 1.05 | | | 0.04 | |
| Distributions to shareholders from: | | | | | | | | | | | | | | | |
| Net investment income | | — | | | — | | | — | | | — | | | — | |
| Net realized capital gains | | — | | | (0.42 | ) | | (0.23 | ) | | (1.45 | ) | | — | |
| Total distributions | | — | | | (0.42 | ) | | (0.23 | ) | | (1.45 | ) | | — | |
| Net asset value, end of period | | $9.22 | | | $8.61 | | | $10.06 | | | $9.64 | | | $10.04 | |
| Total Return(2) | | 7.08 | % | | (10.23 | )% | | 6.95 | % | | 10.94 | % | | 0.40 | %†* |
| Ratios/supplemental data: | | | | | | | | | | | | | | | |
| Net assets, end of period (000’ omitted) | | $1,027 | | | $1,900 | | | $5,896 | | | $9,180 | | | $5,081 | |
| Ratio of expenses to average net assets | | 3.20 | % | | 2.97 | % | | 2.78 | % | | 2.65 | % | | 3.33 | %** |
| Ratio of net investment income (loss) to average net assets | | (1.99 | )% | | (2.25 | )% | | (2.45 | )% | | (2.35 | )% | | (2.80 | )%** |
| Portfolio turnover rate | | 441.74 | % | | 625.61 | % | | 879.32 | % | | 991.29 | % | | 714.79 | %* |
| (1) | The average shares outstanding method has been applied for per share information. |
| | |
| (2) | Total investment returns is based on the change in net asset value of a share during the period, assumes reinvestment of dividends and distributions at net asset value and does not reflect the impact of a sales charge. |
| | |
| † | The returns shown represent performance for a period of less than one year. |
| | |
| * | Not annualized. |
| | |
| ** | Annualized. |
The accompanying notes are an integral part of the financial statements.
50 | 2 0 1 3 A N N U A L R E P O R T
Financial Highlights
Quaker Small-Cap Growth Tactical Allocation Fund
(For a Share Outstanding Throughout the Period)
| | | Institutional Class |
| | | | | | | | | | | For the Period September 30, 2008 (commencement |
| | | Years Ended June 30, | | of operations) |
| | | 2013 | | 2012 | | 2011 | | 2010 | | to June 30, 2009 |
| Net asset value, beginning of period | | $8.98 | | | $10.37 | | | $9.84 | | | $10.13 | | | $10.00 | |
| Income from investment operations: | | | | | | | | | | | | | | | |
| Net investment loss(1) | | (0.09 | ) | | (0.12 | ) | | (0.14 | ) | | (0.14 | ) | | (0.12 | ) |
| Net realized and unrealized gain (loss) on investments | | 0.83 | | | (0.85 | ) | | 0.90 | | | 1.30 | | | 0.25 | |
| Total from investment operations | | 0.74 | | | (0.97 | ) | | 0.76 | | | 1.16 | | | 0.13 | |
| Distributions to shareholders from: | | | | | | | | | | | | | | | |
| Net investment income | | — | | | — | | | — | | | — | | | — | |
| Net realized capital gain | | — | | | (0.42 | ) | | (0.23 | ) | | (1.45 | ) | | — | |
| Total distributions | | — | | | (0.42 | ) | | (0.23 | ) | | (1.45 | ) | | — | |
| Net asset value, end of period | | $9.72 | | | $8.98 | | | $10.37 | | | $9.84 | | | $10.13 | |
| Total Return(2) | | 8.24 | % | | (9.33 | )% | | 7.93 | % | | 12.01 | % | | 1.30 | %†* |
| Ratios/supplemental data: | | | | | | | | | | | | | | | |
| Net assets, end of period (000’ omitted) | | $823 | | | $1,898 | | | $5,087 | | | $4,499 | | | $721 | |
| Ratio of expenses to average net assets | | 2.20 | % | | 1.99 | % | | 1.81 | % | | 1.65 | % | | 2.30 | %** |
| Ratio of net investment income (loss) to average net assets: | | (0.99 | )% | | (1.26 | )% | | (1.47 | )% | | (1.37 | )% | | (1.76 | )%** |
| Portfolio turnover rate | | 441.74 | % | | 625.61 | % | | 879.32 | % | | 991.29 | % | | 714.79 | %* |
| (1) | The average shares outstanding method has been applied for per share information. |
| | |
| (2) | Total investment return is based on the change in net asset value of a share during the period, assumes reinvestment of dividends and distributions at net asset value and does not reflect the impact of a sales charge. |
| | |
| † | The return shown represent performance for a period of less than one year. |
| | |
| * | Not annualized. |
| | |
| ** | Annualized. |
The accompanying notes are an integral part of the financial statements.
2 0 1 3 A N N U A L R E P O R T | 51
Financial Highlights
Quaker Small-Cap Value Fund
(For a Share Outstanding Throughout the Period)
| | | Class A |
| | | Years Ended June 30, |
| | | 2013 | | 2012 | | 2011 | | 2010 | | 2009 |
| Net asset value, beginning of period | | $15.85 | | | $16.53 | | | $11.54 | | | $9.90 | | | $13.88 | |
| Income from investment operations: | | | | | | | | | | | | | | | |
| Net investment income (loss)(1) | | 0.09 | | | (0.08 | ) | | (0.05 | ) | | (0.07 | ) | | (0.01 | ) |
| Net realized and unrealized gain (loss) on investments | | 3.58 | | | (0.60 | ) | | 5.04 | | | 1.71 | | | (3.96 | ) |
| Total from investment operations | | 3.67 | | | (0.68 | ) | | 4.99 | | | 1.64 | | | (3.97 | ) |
| Distributions to shareholders from: | | | | | | | | | | | | | | | |
| Net investment income | | (0.02 | ) | | — | | | — | | | — | | | — | |
| Net realized capital gain | | — | | | — | | | — | | | — | | | (0.01 | ) |
| Total distributions | | (0.02 | ) | | — | | | — | | | — | | | (0.01 | ) |
| Net asset value, end of period | | $19.50 | | | $15.85 | | | $16.53 | | | $11.54 | | | $9.90 | |
| Total Return(2) | | 23.17 | % | | (4.11 | )% | | 43.24 | % | | 16.57 | % | | (28.61 | )% |
| Ratios/supplemental data: | | | | | | | | | | | | | | | |
| Net assets, end of period (000’ omitted) | | $7,727 | | | $8,347 | | | $14,168 | | | $19,398 | | | $20,210 | |
| Ratio of expenses to average net assets: | | | | | | | | | | | | | | | |
| Before expense reimbursements and waived fees | | 1.93 | % | | 1.96 | % | | 1.98 | % | | 1.89 | % | | 1.83 | % |
| After expense reimbursements and waived fees | | 1.93 | % | | 1.96 | % | | 1.98 | % | | 1.83 | % | | 1.74 | % |
| Ratio of net investment income (loss) to average net assets | | 0.49 | % | | (0.52 | )% | | (0.35 | )% | | (0.60 | )% | | (0.09 | )% |
| Portfolio turnover rate | | 142.27 | % | | 157.77 | % | | 130.60 | % | | 112.61 | % | | 122.83 | % |
|
| | | Class C |
| | | Years Ended June 30, |
| | | 2013 | | 2012 | | 2011 | | 2010 | | 2009 |
| Net asset value, beginning of period | | $13.49 | | | $14.17 | | | $9.98 | | | $8.62 | | | $12.18 | |
| Income from investment operations: | | | | | | | | | | | | | | | |
| Net investment loss(1) | | (0.04 | ) | | (0.16 | ) | | (0.14 | ) | | (0.14 | ) | | (0.08 | ) |
| Net realized and unrealized gain (loss) on investments | | 3.04 | | | (0.52 | ) | | 4.33 | | | 1.50 | | | (3.47 | ) |
| Total from investment operations | | 3.00 | | | (0.68 | ) | | 4.19 | | | 1.36 | | | (3.55 | ) |
| Distributions to shareholders from: | | | | | | | | | | | | | | | |
| Net investment income | | — | | | — | | | — | | | — | | | — | |
| Net realized capital gains | | — | | | — | | | — | | | — | | | (0.01 | ) |
| Total distributions | | — | | | — | | | — | | | — | | | (0.01 | ) |
| Net asset value, end of period | | $16.49 | | | $13.49 | | | $14.17 | | | $9.98 | | | $8.62 | |
| Total Return(2) | | 22.24 | % | | (4.80 | )% | | 41.98 | % | | 15.78 | % | | (29.16 | )% |
| Ratios/supplemental data: | | | | | | | | | | | | | | | |
| Net assets, end of period (000’ omitted) | | $1,625 | | | $1,863 | | | $2,524 | | | $2,085 | | | $2,688 | |
| Ratio of expenses to average net assets: | | | | | | | | | | | | | | | |
| Before expense reimbursements and waived fees | | 2.68 | % | | 2.70 | % | | 2.73 | % | | 2.63 | % | | 2.58 | % |
| After expense reimbursements and waived fees | | 2.68 | % | | 2.70 | % | | 2.73 | % | | 2.57 | % | | 2.49 | % |
| Ratio of net investment income (loss) to average net assets | | (0.26 | )% | | (1.25 | )% | | (1.15 | )% | | (1.36 | )% | | (0.86 | )% |
| Portfolio turnover rate | | 142.27 | % | | 157.77 | % | | 130.60 | % | | 112.61 | % | | 122.83 | % |
| (1) | The average shares outstanding method has been applied for per share information. |
| | |
| (2) | Total investment return is based on the change in net asset value of a share during the period, assumes reinvestment of dividends and distributions at net asset value and does not reflect the impact of a sales charge. |
The accompanying notes are an integral part of the financial statements.
52 | 2 0 1 3 A N N U A L R E P O R T
Financial Highlights
Quaker Small-Cap Value Fund
(For a Share Outstanding Throughout the Period)
| | | Institutional Class |
| | | Years Ended June 30, |
| | | 2013 | | 2012 | | 2011 | | 2010 | | 2009 |
| Net asset value, beginning of period | | $16.50 | | | $17.15 | | | $11.96 | | | $10.24 | | | $14.32 | |
| Income from investment operations: | | | | | | | | | | | | | | | |
| Net investment income (loss)(1) | | 0.13 | | | (0.04 | ) | | (0.01 | ) | | (0.04 | ) | | 0.02 | |
| Net realized and unrealized gain (loss) on investments | | 3.73 | | | (0.61 | ) | | 5.20 | | | 1.77 | | | (4.09 | ) |
| Total from investment operations | | 3.86 | | | (0.65 | ) | | 5.19 | | | 1.73 | | | (4.07 | ) |
| Distributions to shareholders from: | | | | | | | | | | | | | | | |
| Net investment income | | (0.07 | ) | | — | | | — | | | (0.01 | ) | | — | |
| Net realized capital gain | | — | | | — | | | — | | | — | | | (0.01 | ) |
| Total distributions | | (0.07 | ) | | — | | | — | | | (0.01 | ) | | (0.01 | ) |
| Net asset value, end of period | | $20.29 | | | $16.50 | | | $17.15 | | | $11.96 | | | $10.24 | |
| Total Return(2) | | 23.44 | % | | (3.79 | )% | | 43.39 | % | | 16.90 | % | | (28.43 | )% |
| Ratios/supplemental data: | | | | | | | | | | | | | | | |
| Net assets, end of period (000’ omitted) | | $23,393 | | | $20,028 | | | $23,073 | | | $61,004 | | | $60,675 | |
| Ratio of expenses to average net assets: | | | | | | | | | | | | | | | |
| Before expense reimbursements and waived fees | | 1.68 | % | | 1.71 | % | | 1.73 | % | | 1.64 | % | | 1.59 | % |
| After expense reimbursements and waived fees | | 1.68 | % | | 1.71 | % | | 1.73 | % | | 1.58 | % | | 1.50 | % |
| Ratio of net investment income (loss) to average net assets | | 0.74 | % | | (0.25 | )% | | (0.07 | )% | | (0.35 | )% | | 0.19 | % |
| Portfolio turnover rate | | 142.27 | % | | 157.77 | % | | 130.60 | % | | 112.61 | % | | 122.83 | % |
| (1) | The average shares outstanding method has been applied for per share information. |
| | |
| (2) | Total investment return is based on the change in net asset value of a share during the period, assumes reinvestment of dividends and distributions at net asset value and does not reflect the impact of a sales charge. |
The accompanying notes are an integral part of the financial statements.
2 0 1 3 A N N U A L R E P O R T | 53
Financial Highlights
Quaker Strategic Growth Fund
(For a Share Outstanding Throughout the Period)
| | | Class A |
| | | Years Ended June 30, |
| | | 2013 | | 2012 | | 2011 | | 2010 | | 2009 |
| Net asset value, beginning of period | | $16.13 | | | $16.53 | | | $13.33 | | | $12.33 | | | $28.45 | |
|
| Income from investment operations: | | | | | | | | | | | | | | | |
| Net investment loss(1) | | (0.15 | ) | | (0.15 | ) | | (0.14 | ) | | (0.10 | ) | | (0.07 | ) |
| Net realized and unrealized gain (loss) on investments | | 3.33 | | | (0.25 | ) | | 3.34 | | | 1.10 | | | (14.08 | ) |
| Total from investment operations | | 3.18 | | | (0.40 | ) | | 3.20 | | | 1.00 | | | (14.15 | ) |
|
| Distributions to shareholders from: | | | | | | | | | | | | | | | |
| Net investment income | | — | | | — | | | — | | | — | | | — | |
| Net realized capital gain | | — | | | — | | | — | | | — | | | (1.97 | ) |
| Total distributions | | — | | | — | | | — | | | — | | | (1.97 | ) |
| Net asset value, end of period | | $19.31 | | | $16.13 | | | $16.53 | | | $13.33 | | | $12.33 | |
| Total Return(2) | | 19.71 | % | | (2.42 | )% | | 24.01 | % | | 8.11 | % | | (49.61 | )% |
| Ratios/supplemental data: | | | | | | | | | | | | | | | |
| Net assets, end of period (000’ omitted) | | $88,970 | | | $111,778 | | | $186,877 | | | $306,523 | | | $436,015 | |
| Ratio of expenses to average net assets: | | | | | | | | | | | | | | | |
| Before expense reimbursements and waived fees | | 2.36 | % | | 2.30 | % | | 2.21 | % | | 1.99 | % | | 1.89 | % |
| After expense reimbursements and waived fees | | 2.24 | % | | 2.24 | % | | 1.99 | % | | 1.99 | % | | 1.89 | % |
| Ratio of net investment income (loss) to average net assets: | | | | | — | | | — | | | (0.69 | )% | | 0.45 | % |
| Before expense reimbursement and waived fees(3) | | (0.98 | )% | | 1.03 | % | | (1.14 | )% | | — | | | — | |
| After expense reimbursement and waived fees(3) | | (0.86 | )% | | (0.98 | )% | | (0.92 | )% | | — | | | — | |
| Portfolio turnover rate | | 294.35 | % | | 178.23 | % | | 136.18 | % | | 276.31 | % | | 468.72 | % |
|
|
| | | Class C |
| | | Years Ended June 30, |
| | | 2013 | | 2012 | | 2011 | | 2010 | | 2009 |
| Net asset value, beginning of period | | $14.47 | | | $14.94 | | | $12.14 | | | $11.31 | | | $26.61 | |
|
| Income from investment operations: | | | | | | | | | | | | | | | |
| Net investment loss(1) | | (0.25 | ) | | (0.24 | ) | | (0.23 | ) | | (0.19 | ) | | (0.17 | ) |
| Net realized and unrealized gain (loss) on investments | | 2.97 | | | (0.23 | ) | | 3.03 | | | 1.02 | | | (13.16 | ) |
| Total from investment operations | | 2.72 | | | (0.47 | ) | | 2.80 | | | 0.83 | | | (13.33 | ) |
|
| Distributions to shareholders from: | | | | | | | | | | | | | | | |
| Net investment income | | — | | | — | | | — | | | — | | | — | |
| Net realized capital gain | | — | | | — | | | — | | | — | | | (1.97 | ) |
| Total distributions | | — | | | — | | | — | | | — | | | (1.97 | ) |
| Net asset value, end of period | | $17.19 | | | $14.47 | | | $14.94 | | | $12.14 | | | $11.31 | |
| Total Return(2) | | 18.80 | % | | (3.15 | )% | | 23.06 | % | | 7.34 | % | | (49.99 | )% |
| Ratios/supplemental data: | | | | | | | | | | | | | | | |
| Net assets, end of period (000’ omitted) | | $22,968 | | | $27,102 | | | $42,729 | | | $63,002 | | | $92,152 | |
| Ratio of expenses to average net assets: | | | | | | | | | | | | | | | |
| Before expense reimbursements and waived fees | | 3.11 | % | | 3.04 | % | | 2.96 | % | | 2.74 | % | | 2.64 | % |
| After expense reimbursements and waived fees | | 2.99 | % | | 2.99 | % | | 2.74 | % | | 2.74 | % | | 2.64 | % |
| Ratio of net investment income (loss) to average net assets: | | | | | — | | | — | | | (1.44 | )% | | (1.21 | )% |
| Before expense reimbursement and waived fees(3) | | (1.74 | )% | | (1.77 | )% | | (1.90 | )% | | — | | | — | |
| After expense reimbursement and waived fees(3) | | (1.62 | )% | | (1.72 | )% | | (1.68 | )% | | — | | | — | |
| Portfolio turnover rate | | 294.35 | % | | 178.23 | % | | 136.18 | % | | 276.31 | % | | 468.72 | % |
| (1) | The average shares outstanding method has been applied for per share information. |
| | |
| (2) | Total investment return is based on the change in net asset value of a share during the period, assumes reinvestment of dividends and distributions at net asset value and does not reflect the impact of a sales charge. |
| | |
| (3) | Expense waived or reimbursed reflect reductions to total expenses, as discussed in the notes to the financial statements. These amounts would increase the net investment loss ratio or decrease the net investment income ratio, as applicable, had such reductions not occurred. |
The accompanying notes are an integral part of the financial statements.
54 | 2 0 1 3 A N N U A L R E P O R T
Financial Highlights
Quaker Strategic Growth Fund
(For a Share Outstanding Throughout the Period)
| | | Institutional Class |
| | | Years Ended June 30, |
| | | 2013 | | 2012 | | 2011 | | 2010 | | 2009 |
| Net asset value, beginning of period | | $16.66 | | | $17.03 | | | $13.71 | | | $12.65 | | | $29.03 | |
| Income from investment operations: | | | | | | | | | | | | | | | |
| Net investment loss(1) | | (0.11 | ) | | (0.11 | ) | | (0.11 | ) | | (0.07 | ) | | (0.04 | ) |
| Net realized and unrealized gain (loss) on investments | | 3.44 | | | (0.26 | ) | | 3.43 | | | 1.13 | | | (14.37 | ) |
| Total from investment operations | | 3.33 | | | (0.37 | ) | | 3.32 | | | 1.06 | | | (14.41 | ) |
| Distributions to shareholders from: | | | | | | | | | | | | | | | |
| Net investment income | | — | | | — | | | — | | | — | | | — | |
| Net realized capital gain | | — | | | — | | | — | | | — | | | (1.97 | ) |
| Total distributions | | — | | | — | | | — | | | — | | | (1.97 | ) |
| Net asset value, end of period | | $19.99 | | | $16.66 | | | $17.03 | | | $13.71 | | | $12.65 | |
| Total Return(2) | | 19.99 | % | | (2.17 | )% | | 24.22 | % | | 8.38 | % | | (49.51 | )% |
| Ratios/supplemental data: | | | | | | | | | | | | | | | |
| Net assets, end of period (000’ omitted) | | $45,851 | | | $40,288 | | | $41,519 | | | $20,355 | | | $46,136 | |
| Ratio of expenses to average net assets: | | | | | | | | | | | | | | | |
| Before expense reimbursements and waived fees | | 2.11 | % | | 2.03 | % | | 1.97 | % | | 1.75 | % | | 1.64 | % |
| After expense reimbursements and waived fees | | 1.99 | % | | 1.99 | % | | 1.74 | % | | 1.75 | % | | 1.64 | % |
| Ratio of net investment income (loss) to average net assets: | | | | | — | | | — | | | (0.46 | )% | | (0.23 | )% |
| Before expense reimbursement and waived fees(3) | | (0.74 | )% | | (0.72 | )% | | (0.89 | )% | | — | | | — | |
| After expense reimbursement and waived fees(3) | | (0.62 | )% | | (0.68 | )% | | (0.66 | )% | | — | | | — | |
| Portfolio turnover rate | | 294.35 | % | | 178.23 | % | | 136.18 | % | | 276.31 | % | | 468.72 | % |
| (1) | The average shares outstanding method has been applied for per share information. |
| | |
| (2) | Total investment return is based on the change in net asset value of a share during the period, assumes reinvestment of dividends and distributions at net asset value and does not reflect the impact of a sales charge. |
| | |
| (3) | Expense waived or reimbursed reflect reductions to total expenses, as discussed in the notes to the financial statements. These amounts would increase the net investment loss ratio or decrease the net investment income ratio, as applicable, had such reductions not occurred. |
The accompanying notes are an integral part of the financial statements.
2 0 1 3 A N N U A L R E P O R T | 55
Notes to the Financial Statements
Note 1 — Organization
The Quaker Investment Trust (“Trust”), a diversified, open-end management investment company, was organized as a Massachusetts business trust on October 24, 1990, and is registered under the Investment Company Act of 1940, as amended (“1940 Act”). The Trust’s Amended and Restated Declaration of Trust permits the Trustees to issue an unlimited number of shares of beneficial interest. The Trust currently has seven series: Quaker Akros Absolute Return Fund (formerly, Quaker Akros Absolute Strategies Fund) (“Akros Absolute Return”), Quaker Event Arbitrage Fund (“Event Arbitrage”), Quaker Global Tactical Allocation Fund (“Global Tactical Allocation”), Quaker Mid-Cap Value Fund (“Mid-Cap Value”), Quaker Small-Cap Growth Tactical Allocation Fund (“Small-Cap Growth Tactical Allocation”), Quaker Small-Cap Value Fund (“Small-Cap Value”) and Quaker Strategic Growth Fund (“Strategic Growth”) (each a “Fund” and collectively, “Funds”). All Funds are diversified with the exception of Akros Absolute Return and Event Arbitrage. The investment objectives of each Fund are set forth below.
Akros Absolute Return commenced operations on October 4, 2010 in conjunction with the reorganization of the Akros Absolute Return Fund. The predecessor Absolute Return Fund commenced operations on September 30, 2005. Strategic Growth and Small-Cap Value commenced operations on November 25, 1996. Mid-Cap Value commenced operations on December 31, 1997. Global Tactical Allocation commenced operations on May 1, 2008. Small-Cap Growth Tactical Allocation commenced operations on September 30, 2008. Event Arbitrage commenced operations on June 7, 2010 in conjunction with the reorganization of the Pennsylvania Avenue Event Driven Fund (“Event Driven Fund”). The predecessor Event Driven Fund commenced operations on September 19, 2002. The investment objective of these Funds is to seek long-term growth of capital. The investment objective of these funds is non-fundamental in that this objective may be changed by the Board of Trustees (“Board” or “Trustees”) without shareholder approval.
The Funds currently offer three classes of shares (Class A, Class C and Institutional Class Shares). Class A Shares are charged a front-end sales charge and a distribution and servicing fee; Class C shares are charged a distribution fee, but bear no front-end sales charge or contingent deferred sales charge (“CDSC”); and Institutional Class Shares bear no front-end sales charge or CDSC, but have higher minimum investment thresholds. Quaker Funds, Inc. (“QFI”), the investment adviser to each of the Funds, has the ability to waive the minimum investment for Institutional Class shares at its discretion.
Note 2 — Summary of Significant Accounting Policies and Other Information
The following is a summary of significant accounting policies consistently followed by the Funds in the preparation of their financial statements. The policies are in conformity with accounting principles generally accepted in the United States of America (“GAAP”).
A. Security Valuation. The Funds’ investments in securities are carried at market value. Securities listed on an exchange or quoted on a national market system are generally valued at the last quoted sales price at the time of valuation. Other securities traded in the over-the-counter market and listed securities for which no sale was reported on that date are valued at the most recent bid price. Each security reported on the NASDAQ National Market System is valued at the NASDAQ Official Closing Price.
Debt and other fixed-income securities (other than short-term obligations) are valued at the last quoted bid price and/or by using a combination of daily quotes and matrix evaluations provided by an independent pricing service (which reflect such factors as security prices, yields, maturities, ratings, and dealer and exchange quotations), the use of which has been approved by the Board.
Short-term investments are valued at amortized cost, which approximates fair market value.
The Funds enter into forward foreign currency contracts to lock in the U.S. dollar cost of purchase and sale transactions or to defend the portfolio against currency fluctuations. A forward foreign currency contract is a commitment to purchase or sell a foreign currency at a future date at a negotiated rate. These contracts are valued daily, and the Fund’s net equity therein, representing unrealized gain or loss on the contracts as measured by the difference between the forward foreign exchange rates at the dates of entry into the contracts and the forward rates at the reporting, is included in the Statements of Assets and Liabilities. Realized and unrealized gains and losses are included in the Statements of Operations. Risks may arise upon entering into these contracts from the potential inability of counterparties to meet the terms of the contract and from unanticipated movements in the value of foreign currencies relative to the U.S. dollar.
The Funds have adopted fair valuation procedures to value securities at fair market value in certain circumstances, and the Trust has established a Valuation Committee responsible for determining when fair valuing a security is necessary and appropriate. The Funds will value securities at fair market value when market quotations are not readily available or when securities cannot be accurately valued within established pricing procedures. The Valuation Committee may also fair value foreign securities whose prices may have been affected by events occurring after the close of trading in their respective markets but prior to the time the Fund holding the foreign securities calculates its net asset value. The Funds’ fair valuation procedures are designed to help ensure that prices at which Fund shares are purchased and redeemed are fair and do not result in dilution of shareholder interest or other harm to shareholders.
The Fund is required to disclose information regarding the fair value measurements of the Fund’s assets and liabilities. Fair value is defined as the price that the Fund would receive upon selling an investment in an orderly transaction to an independent buyer in the principal or most advantageous market for the investment. The disclosure requirements utilize a three-tier hierarchy to maximize the use of observable market data, minimize the use of unobservable inputs and establish classification of fair value measurements for disclosure purposes. A financial instrument’s level within the fair value hierarchy is based on the lowest level that is significant to the fair value measurement. Inputs refer broadly to the assumptions that market participants would use in pricing the asset or liability, including assumptions about risk, for example, the risk inherent in a particular valuation technique used to measure fair value including the pricing model used and/or the risk inherent in the inputs to the valuation technique. Inputs may be observable or unobservable.
Observable inputs are inputs that reflect the assumptions market participants would use in pricing the asset or liability, which are based on market data obtained from sources independent of the reporting entity. Unobservable inputs are inputs that reflect the reporting entity’s own assumptions about the assumptions market participants would use in pricing the asset or liability developed based on the best information available in the circumstances.
The significant unobservable inputs used in the fair value measurement of the reporting entity’s private equity holdings are the cost of prior transactions in the secondary market, prior stock repurchase offers from the company, single broker quotes and discounts applied for a lack of marketability. Significant increases (decreases) in any of those inputs in isolation could result in a significantly lower (higher) fair value measurement.
Various inputs may be used to determine the value of each Fund’s investments. These inputs are summarized in three broad levels for financial statement purposes. The inputs or methodologies used to value securities are not necessarily an indication of the risk associated with investing in those securities.
Level I — Quoted prices in active markets for identical securities.
Level II — Prices determined using significant other observable inputs (including quoted prices for similar securities, interest rates, prepayment speeds, credit risk, etc.) Municipal securities, long-term U.S. Government obligations and corporate debt securities
56 | 2 0 1 3 A N N U A L R E P O R T
Note 2 — Summary of Significant Accounting Policies and Other Information (Continued)
are valued in accordance with the evaluated price supplied by the pricing service and generally categorized as Level 2 in the hierarchy. Other securities that are categorized as Level 2 in the hierarchy include, but are not limited to, warrants that do not trade on an exchange, OTC options and international equity securities valued by an independent third party in order to adjust for stale pricing and foreign market holidays.
Level III — Prices determined using significant unobservable inputs (including the Fund’s own assumptions). For restricted equity securities where observable inputs are limited, assumptions about market activity and risk are used in determining fair value. These are categorized as Level 3 in the hierarchy.
For international equity securities traded on a foreign exchange or market which closes prior to a Fund’s Valuation Time, in order to adjust for events which occur between the close of the foreign exchange they are traded on and the close of the New York Stock Exchange, a fair valuation model is used, and these securities are categorized as Level 2.
A Fund may hold securities, some of which are classified as Level 3 investments (as defined below). Level 3 investments have significant unobservable inputs, as they trade infrequently. In determining the fair value of these investments, management uses the market approach which includes as the primary input the capital balance reported; however, adjustments to the reported capital balance may be made based on various factors, including, but not limited to, the attributes of the interest held, including the
rights and obligations, and any restrictions or illiquidity of such interests, and the fair value of these securities.
The value of a foreign security is generally determined as of the close of trading on the foreign stock exchange on which the security is primarily traded, or as of the close of trading on the New York Stock Exchange (“NYSE”), if earlier. The value is then converted into its U.S. dollar equivalent at the foreign exchange rate in effect at the close of the NYSE (generally 4:00 p.m. Eastern time) on the day that the value of the foreign security is determined. If no sale is reported at that time, the foreign security will be valued within the range of the most recent quoted bid and ask prices. If market quotations are not readily available for a foreign security or an event has occurred that caused a quotation to be unavailable or unreliable, the Valuation Committee will fair value foreign securities using the procedures described below.
The Trust has adopted fair valuation procedures to value securities at fair market value when independent prices are unavailable or unreliable, and the Trust has established a Valuation Committee that is responsible for determining when fair valuing a security is necessary and appropriate. Securities and assets for which market quotations are not readily available may be valued based upon valuation methods that include: (i) multiple of earnings; (ii) yield to maturity with respect to debt issues; (iii) discounts from market prices of similar freely traded securities; or (iv) a combination of these methods. Securities may also be priced using fair value pricing methods when their closing prices do not reflect their market values at the time the Fund calculates its net asset value (“NAV”) because an event had occurred since the closing prices were established on the domestic or foreign exchange or market but before the Fund’s NAV calculation.
The following is a summary of the fair valuations according to the inputs used as of June 30, 2013 in valuing the Fund’s assets and liabilities:
| Description | | AKROS ABSOLUTE RETURN | | Level 1 | | | Level 2 | | | Level 3 | | | Total | |
| Domestic Common Stocks | | | | $ | 769,465 | | | $ | 30,019 | | | $ | 8 | | | $ | 799,492 | |
| Foreign Common Stocks | | | | $ | 504,901 | | | | — | | | | — | | | | 504,901 | |
| Preferred Stocks | | | | | — | | | | — | | | | 112,500 | | | | 112,500 | |
| Domestic Private Placements | | | | | — | | | | — | | | | 18,771 | | | | 18,771 | |
| Rights | | | | | 92 | | | | — | | | | — | | | | 92 | |
| Warrants | | | | | 41,979 | | | | — | | | | 4,889 | | | | 46,868 | |
| Corporate Bonds | | | | | — | | | | 1,250 | | | | — | | | | 1,250 | |
| Purchased Options | | | | | 240 | | | | — | | | | — | | | | 240 | |
| Short-Term Investments | | | | | 208,277 | | | | 747,623 | | | | — | | | | 955,900 | |
| Investments Purchased with Proceeds from Security Lending | | | | | 281,860 | | | | — | | | | — | | | | 281,860 | |
| Total Investments in Securities | | | | $ | 1,806,814 | | | $ | 778,892 | | | $ | 136,168 | | | $ | 2,721,874 | |
| Common Stocks sold short | | | | | (708,001 | ) | | | — | | | | — | | | | (708,001 | ) |
| Exchange-Traded Funds | | | | | (456,650 | ) | | | — | | | | — | | | | (456,650 | ) |
| Written Options | | | | | (5,170 | ) | | | (260 | ) | | | — | | | | (5,430 | ) |
| Total Investments in Securities sold short | | | | $ | (1,169,821 | ) | | $ | (260 | ) | | $ | — | | | $ | (1,170,081 | ) |
| Description | | EVENT ARBITRAGE | | Level 1 | | | Level 2 | | | Level 3 | | | Total | |
| Domestic Common Stocks | | | | $ | 31,502,174 | | | $ | 243,463 | | | $ | 1,248,016 | | | $ | 32,993,653 | |
| Foreign Common Stocks | | | | | 3,887,917 | | | | 13,008 | | | | — | | | | 3,900,925 | |
| Preferred Stocks | | | | | — | | | | 23 | | | | 613,000 | | | | 613,023 | |
| Real Estate Investment Trusts | | | | | 1,016,440 | | | | — | | | | — | | | | 1,016,440 | |
| Rights | | | | | — | | | | — | | | | — | | | | — | |
| Warrants | | | | | — | | | | 492,846 | | | | — | | | | 492,846 | |
| Asset Backed Securities | | | | | — | | | | 2,762,408 | | | | 240,000 | | | | 3,002,408 | |
| Convertible Bonds | | | | | — | | | | 156,688 | | | | 503,750 | | | | 660,438 | |
| Corporate Bonds | | | | | — | | | | 2,068,093 | | | | — | | | | 2,068,093 | |
| Mortgage Backed Securities | | | | | — | | | | 1,879,232 | | | | — | | | | 1,879,232 | |
| Municipal Bonds | | | | | — | | | | 956,041 | | | | — | | | | 956,041 | |
| Term Loan | | | | | — | | | | — | | | | 511,054 | | | | 511,054 | |
| Purchased Options | | | | | 387,910 | | | | 410,220 | | | | 626,467 | | | | 1,424,597 | |
| Short-Term Investments | | | | | 8,521,553 | | | | — | | | | — | | | | 8,521,553 | |
| Investments Purchased with Proceeds from Security Lending | | | | | 4,272,213 | | | | — | | | | — | | | | 4,272,213 | |
| Total Investments in Securities | | | | | 49,588,207 | | | | 8,982,022 | | | | 3,742,287 | | | | 62,312,516 | |
| Common Stocks sold short | | | | | (1,265,500 | ) | | | — | | | | — | | | | (1,265,500 | ) |
| Written Options | | | | | (212,194 | ) | | | (653,598 | ) | | | (916,623 | ) | | | (1,782,415 | ) |
| Forwards | | | | | (420 | ) | | | — | | | | — | | | | (420 | ) |
| Total | | | | $ | (1,478,114 | ) | | $ | (653,598 | ) | | $ | (916,623 | ) | | $ | (3,048,335 | ) |
2 0 1 3 A N N U A L R E P O R T | 57
Notes to the Financial Statements
Note 2 — Summary of Significant Accounting Policies and Other Information (Continued)
| Description | | GLOBAL TACTICAL ALLOCATION | | Level 1 | | | Level 2 | | | Level 3 | | | Total | |
| Common Stocks | | | | $ | 6,540,225 | | | $ | — | | | $ | — | | | $ | 6,540,225 | |
| Short-Term Investments | | | | | 26,765 | | | | — | | | | — | | | | 26,765 | |
| Investments Purchased with Proceeds from Security Lending | | | | | 1,555,375 | | | | — | | | | — | | | | 1,555,375 | |
| Total Investments in Securities | | | | $ | 8,122,365 | | | $ | — | | | $ | — | | | $ | 8,122,365 | |
| Exchange-Traded Funds - Sold short | | | | | 213,428 | | | | — | | | | — | | | | 213,428 | |
| Total Investments in Securities sold short | | | | $ | 213,428 | | | $ | — | | | $ | — | | | $ | 213,428 | |
| Description | | MID-CAP VALUE | | Level 1 | | | Level 2 | | | Level 3 | | | Total | |
| Domestic Common Stocks | | | | $ | 7,443,519 | | | $ | — | | | $ | — | | | $ | 7,443,519 | |
| Foreign Common Stocks | | | | | 485,857 | | | | — | | | | — | | | | 485,857 | |
| Real Estate Investment Trusts | | | | | 420,961 | | | | — | | | | — | | | | 420,961 | |
| Short-Term Investments | | | | | 465,061 | | | | — | | | | — | | | | 465,061 | |
| Investments Purchased with Proceeds from Security Lending | | | | | 2,395,433 | | | | — | | | | — | | | | 2,395,433 | |
| Total Investments in Securities | | | | $ | 11,210,831 | | | $ | — | | | $ | — | | | $ | 11,210,831 | |
| Description | | SMALL-CAP GROWTH TACTICAL ALLOCATION | | Level 1 | | | Level 2 | | | Level 3 | | | Total | |
| Domestic Common Stocks | | | | $ | 2,284,851 | | | $ | — | | | $ | — | | | $ | 2,284,851 | |
| Foreign Common Stocks | | | | | 491,430 | | | | — | | | | — | | | | 491,430 | |
| Exchange-Traded Funds | | | | | 323,028 | | | | — | | | | — | | | | 323,028 | |
| Short-Term Investments | | | | | 425,228 | | | | — | | | | — | | | | 425,228 | |
| Investments Purchased with Proceeds from Security Lending | | | | | 837,630 | | | | — | | | | — | | | | 837,630 | |
| Total Investments in Securities | | | | $ | 4,362,167 | | | $ | — | | | $ | — | | | $ | 4,362,167 | |
| Description | | SMALL-CAP VALUE | | Level 1 | | | Level 2 | | | Level 3 | | | Total | |
| Domestic Common Stocks | | | | $ | 27,663,241 | | | $ | — | | | $ | — | | | $ | 27,663,241 | |
| Foreign Common Stocks | | | | | 3,488,680 | | | | — | | | | — | | | | 3,488,680 | |
| Real Estate Investment Trusts | | | | | 1,385,295 | | | | — | | | | — | | | | 1,385,295 | |
| Short-Term Investments | | | | | 726,545 | | | | — | | | | — | | | | 726,545 | |
| Investments Purchased with Proceeds from Security Lending | | | | | 6,030,392 | | | | — | | | | — | | | | 6,030,392 | |
| Total Investments in Securities | | | | $ | 39,294,153 | | | $ | — | | | $ | — | | | $ | 39,294,153 | |
| Description | | STRATEGIC GROWTH | | Level 1 | | | Level 2 | | | Level 3 | | | Total | |
| Common Stocks | | | | $ | 120,364,464 | | | $ | — | | | $ | — | | | $ | 120,364,464 | |
| Foreign Common Stocks | | | | | 30,530,631 | | | | — | | | | — | | | | 30,530,631 | |
| Short-Term Investments | | | | | 7,088,348 | | | | — | | | | — | | | | 7,088,348 | |
| Investments Purchased with Proceeds from Security Lending | | | | | 29,936,988 | | | | — | | | | — | | | | 29,936,988 | |
| Total Investments in Securities | | | | $ | 187,920,431 | | | $ | — | | | $ | — | | | $ | 187,920,431 | |
Refer to the Fund’s Schedules of Investments for industry classifications.
There have been no transfers in and out of Level 1 and Level 2 fair value measurements as of June 30, 2013 for all of the Funds.
Transfers are recognized at the end of the reporting period.
Level 3 Reconciliation
The following is a reconciliation of Akros Absolute Return’s and Event Arbitrage’s Level 3 investments for which significant unobservable inputs were used in determining value.
See the schedules of investments for industry breakout:
| AKROS ABSOLUTE RETURN | | Balance as of
June 30, 2012 | | | Purchases | | Sales | | Realized
gain (loss) | | Net Unrealized
appreciation
(depreciation) | | Amortized
discounts/
premiums | | Transfers in
to Level 3 | | Transfers out
of Level 3 | | Balance as of
6/30/2013 |
| Common Stocks & Warrants | | $ | 8,120 | | | | $ | 300 | | | | $ | (7,577 | ) | | | $ | 7,577 | | | $ | (3,523 | ) | | $ | — | | | $ | — | | | $ | — | | | $ | 4,897 | |
| Preferred Stocks | | | 105,000 | | | | | — | | | | | — | | | | | — | | | | 7,500 | | | | — | | | | — | | | | — | | | | 112,500 | |
| Private Placements | | | 18,770 | | | | | — | | | | | — | | | | | — | | | | 1 | | | | — | | | | — | | | | — | | | $ | 18,771 | |
| | | $ | 131,890 | | | | $ | 300 | | | | $ | (7,577 | ) | | | $ | 7,577 | | | $ | 3,978 | | | $ | — | | | $ | — | | | $ | — | | | $ | 136,168 | |
| Net change in unrealized appreciation (depreciation) for Level 3 investments still held as of June 30, 2013 | | | | | | | $ | 12,090 | |
| EVENT ARBITRAGE | | Balance as of
June 30, 2012 | | Purchases | | Sales | | Realized
gain (loss) | | Net Unrealized
appreciation
(depreciation) | | Amortized
discounts/
premiums | | Transfers in
to Level 3 | | Transfers out
of Level 3 | | Balance as of
6/30/2013 |
| Common Stocks | | $ | 1,644,674 | | | $ | 458,662 | | | | $ | (1,082,672 | ) | | | $ | 120,997 | | | $ | 83,625 | | | | $ | — | | | $ | 22,730 | | | $ | — | | | $ | 1,248,016 | |
| Preferred Stocks | | | — | | | | 613,000 | | | | | — | | | | | — | | | | — | | | | | — | | | | — | | | | — | | | | 613,000 | |
| Asset Backed Securities | | | — | | | | — | | | | | — | | | | | — | | | | — | | | | | — | | | | 240,000 | | | | — | | | | 240,000 | |
| Convertible Bonds | | | — | | | | 505,000 | | | | | — | | | | | — | | | | (1,250 | ) | | | | — | | | | — | | | | — | | | | 503,750 | |
| Term Loan | | | — | | | | 511,054 | | | | | — | | | | | — | | | | — | | | | | — | | | | — | | | | — | | | | 511,054 | |
| Purchased Options | | | — | | | | 538,298 | | | | | — | | | | | — | | | | 88,169 | | | | | — | | | | — | | | | — | | | | 626,467 | |
| | | $ | 1,644,674 | | | $ | 2,626,014 | | | | $ | (1,082,672 | ) | | | $ | 120,997 | | | $ | 170,544 | | | | $ | — | | | $ | 262,730 | | | $ | — | | | $ | 3,742,287 | |
| Written Options | | $ | — | | | $ | (605,918 | ) | | | $ | — | | | | $ | — | | | $ | (310,705 | ) | | | $ | — | | | $ | — | | | $ | — | | | $ | (916,623 | ) |
| Net change in unrealized appreciation (depreciation) for Level 3 investments still held as of June 30, 2013 | | | | | | $ | (125,836 | ) |
58 | 2 0 1 3 A N N U A L R E P O R T
Note 2 — Summary of Significant Accounting Policies and Other Information (Continued)
The following presents information about significant unobservable inputs related to Level 3 investments at June 30, 2013
| | | Fair Value at | | Evaluation | | Unobservable |
| AKROS ABSOLUTE RETURN | June 30, 2013 | | Technique | | Input |
| Common Stocks | | $ | 8 | | | Qualitative assessment | | Discount for lack of marketability |
| Preferred Stocks | | | 112,500 | | | Qualitative assessment | | Prior transaction cost |
| Private Placements | | | 18,771 | | | Qualitative assessment | | Prior transaction cost |
| Warrants | | | 4,889 | | | Options pricing model | | Volatility, risk free interest rate |
| | | | | | | |
| | | Fair Value at | | Evaluation | | Unobservable |
| EVENT ARBITRAGE | | June 30, 2013 | | Technique | | Input |
| Common Stocks | | $ | 756,847 | | | Qualitative assessment | | Prior transaction cost |
| Common Stocks | | | 468,439 | | | Qualitative assessment | | Prior stock repurchase offer |
| Common Stocks | | | 22,730 | | | Qualitative assessment | | Discount for lack of marketability |
| Preferred Stocks | | | 613,000 | | | Qualitative assessment | | Prior transaction cost |
| Asset Backed Securities | | | 240,000 | | | Qualitative assessment | | Single broker quote |
| Convertible Bonds | | | 503,750 | | | Qualitative assessment | | Prior transaction cost |
| Term Loan | | | 511,054 | | | Qualitative assessment | | Prior transaction cost |
| Purchased Options | | | 626,467 | | | Options pricing model | | Volatility, risk free interest rate |
| Written Options | | | (916,623 | ) | | Options pricing model | | Volatility, risk free interest rate |
B. Federal Income Taxes. It is the Funds’ policy to comply with the requirements of Subchapter M of the Internal Revenue Code and to distribute substantially all of their taxable income to shareholders. Therefore, no federal income tax provision is required.
In accordance with Financial Accounting Standards Board (“FASB”) Interpretation ASC 740, (“ASC 740”), each Fund recognizes a tax benefit from an uncertain position only if it is more likely than not that the position is sustainable, based solely on its technical merits and consideration of the relevant taxing authority’s widely understood administrative practices and precedents. If this threshold is met, a Fund measures the tax benefit as the largest amount of benefit that is greater than fifty percent likely of being realized upon ultimate settlement. Management has reviewed the tax positions for each of the four open tax years as of June 30, 2013 and has determined that the implementation of ASC 740 does not have a material impact on the Funds’ financial statements. Each Fund’s federal tax returns for the prior three fiscal years remains subject to examination by the Internal Revenue Service.
Net investment income or loss and net realized gains or losses may differ for financial statement and income tax purposes primarily due to investments that have a different basis for financial statement and income tax purposes. The character of distributions made during the year from net investment income or net realized gains may differ from their ultimate characterization for federal income tax purposes. Also, due to the timing of dividend distributions, the fiscal year in which amounts are distributed may differ from the year that the income or realized gains were recorded by each Fund. Permanent differences in the recognition of earnings are reclassified to additional paid-in capital. Distributions in excess of tax-basis earnings are recorded as a return of capital.
C. Security Transactions and Investment Income. Security transactions are recorded on the trade date. Realized gains and losses are determined using the specific identification cost method. Interest income on debt securities is recorded daily on the accrual basis. Discounts and premiums on debt securities are amortized over their respective lives. Dividend income is recorded on the ex-dividend date, or as soon as information is available to the Fund.
Certain Funds may make short sales of investments, which are transactions in which a Fund sells a security it does not own in anticipation of a decline in the fair value of that security. To complete such a transaction, the Fund must borrow the security to make delivery to the buyer. The Fund is then obligated to replace the security borrowed by
purchasing it at the market price at the time of replacement. The broker retains the proceeds of short sales to the extent necessary to meet margin requirements until the short position is closed out.
If a security pays a dividend while the Fund holds it short, the Fund will need to pay the dividend to the original owner of the security. Since the Fund borrowed the shares and sold them to a third party, the third party will receive the dividend from the security and the Fund will pay the original owner the dividend directly. The Fund is not entitled to the dividend because it does not own the shares. A gain, limited to the price at which the Fund sold the security short, or a loss, unlimited in size, will be recognized upon the termination of a short sale.
D. Options Contracts Written. Certain Funds may write options to manage exposure to certain changes in the market. When a Fund writes an option, an amount equal to the premium received by the Fund is recorded as a liability, which is marked-to-market daily to reflect the current market value of the option written. If the option expires, the Fund realizes a gain from investments equal to the amount of the premium received. When a written call option is exercised, the difference between the premium and the amount for effecting a closing purchase transaction, including brokerage commission, is also treated as a realized gain or loss. When a written put option is exercised, the amount of the premium received reduces the cost of the security purchased by the Fund.
A risk in writing a covered call option is that the Fund may forego the opportunity of profit if the market price of the underlying security increases and the option is exercised. The risk in writing a put option is that the Fund may incur a loss if the market price of the underlying security decreases and the option is exercised.
In addition, there is the risk that the Fund may not be able to enter into a closing transaction because of an illiquid secondary market.
E. Purchased Options. Certain Funds may purchase call options in anticipation of an increase in the market value of securities of the type in which they may invest. The purchase of a call option will entitle a Fund, in return for the premium paid, to purchase specified securities at a specified price during the option period. A Fund will ordinarily realize a gain if, during the option period, the value of such securities exceeded the sum of the exercise price, the premium paid and transaction costs; otherwise, the Fund will realize either no gain or a loss on the purchase of the call option. A Fund will normally purchase put options in anticipation of a decline in the market value of securities in its portfolio (“protective puts”) or in securities in which it may invest. The purchase of a put option will entitle the Fund, in exchange for the premium paid, to sell specified securities at a specified price during the option period. The purchase of protective puts is designed to offset or hedge against a decline in the market value of the Fund’s securities. Put options may also be purchased by a Fund for the purpose of affirmatively benefiting from a decline in the price of securities which it does not own. The Fund will ordinarily realize a gain if, during the option period, the value of the underlying securities decreased below the exercise price sufficiently to more than cover the premium and transaction costs; otherwise the Fund will realize either no gain or a loss on the purchase of the put option. Gains and losses on the purchase of protective put options would tend to be offset by countervailing changes in the value of the underlying portfolio securities.
F. Futures Contracts. Certain Funds may enter into financial futures contracts, to the extent permitted by their investment policies and objectives, for bona fide hedging and other permissible risk management purposes including protecting against anticipated changes in the value of securities a Fund intends to purchase. Upon entering into a financial futures contract, a Fund is required to deposit cash or securities as initial margin.
Additional securities are also segregated as collateral up to the current market value of the financial futures contracts. Subsequent payments, known as variation margin, are made or received by the Fund, depending on the fluctuation in the value of the underlying financial instruments. The Fund recognizes an unrealized gain or loss equal to the variation
2 0 1 3 A N N U A L R E P O R T | 59
Notes to the Financial Statements
Note 2 — Summary of Significant Accounting Policies and Other Information (Continued)
margin. When the financial futures contracts are closed, a realized gain or loss is recognized equal to the difference between the proceeds from (or cost of) the closing transactions and the Fund’s basis in the contracts. The risks associated with entering into financial futures contracts include the possibility that a change in the value of the contract may not correlate with the changes in the value of the underlying instruments. In addition, investing in financial futures contracts involves the risk that the Fund could lose more than the original margin deposit and subsequent payments required for a futures transaction. Risks may also arise upon entering into these contracts from the potential inability of the counterparties to meet the terms of their contracts.
G. Foreign Currency Transactions. Securities and other assets and liabilities denominated in foreign currencies are converted each business day into U.S. dollars based on the prevailing rates of exchange. Purchases and sales of portfolio securities and income and expenses are converted into U.S. dollars on the respective dates of such transactions.
Gains and losses resulting from changes in exchange rates applicable to foreign securities are not reported separately from gains and losses arising from movements in securities prices.
Net realized foreign exchange gains and losses include gains and losses from sales and maturities of foreign currency exchange contracts, gains and losses realized between the trade and settlement dates of foreign securities transactions, and the difference between the amount of dividends, interest and foreign withholding taxes on the Funds’ books and the U.S. dollar equivalent of the amounts actually received. Net unrealized foreign exchange gains and losses include gains and losses from changes in the fair value of assets and liabilities denominated in foreign currencies other than portfolio securities, resulting from changes in exchange rates.
H. Forward Foreign Currency Contracts. Certain Funds may enter into forward foreign currency contracts to hedge against foreign currency exchange rate risk on their non-U.S. dollar denominated securities or to facilitate settlement of foreign currency denominated portfolio transactions. A forward foreign currency contract is an agreement between two parties to buy and sell a currency at a set price on a future date. The contract is marked-to-market daily and the change in value is recorded by a Fund as an unrealized gain or loss. When a forward foreign currency contract is extinguished, through either delivery or offset by entering into another forward foreign currency contract, the Fund records a realized gain or loss equal to the difference between the value of the contract at the time it was opened and the value of the contract at the time it was extinguished.
Forward foreign currency contracts involve elements of market risk in excess of the amounts reflected in the Statements of Assets and Liabilities. The Fund bears the risk of an unfavorable change in the foreign exchange rate underlying the forward foreign currency contract. Risks may also arise upon entering into these contracts from the potential inability of the counterparties to meet the terms of their contracts.
I. Portfolio Investment Risks. Investments in securities of foreign issuers carry certain risks not ordinarily associated with investments in securities of U.S. issuers. These risks include future disruptive political and economic developments and the possible imposition of exchange controls or other unfavorable foreign government laws and restrictions. In addition, investments in certain countries may carry risks of expropriation of assets, confiscatory taxation, political or social instability, or diplomatic developments that adversely affect investments in those countries. Certain countries may also impose substantial restrictions on investments in their capital markets by foreign entities, including restrictions on investments in issuers in industries deemed sensitive to relevant national interests. These factors may limit the investment opportunities available and result in a lack of liquidity and high price volatility with respect to securities of issuers from developing countries.
Akros Absolute Return and Event Arbitrage are not “diversified” Funds, which means that each of these Fund’s may allocate their investments to a relatively small number of issuers or to a single industry, making the Fund’s more susceptible to adverse developments of a single user or industry. As a result, investing in these Fund’s is potentially more risky than investing in a diversified fund that is otherwise similar to these Fund’s.
J. Multiple Class Allocations. Each class of shares has equal rights as to earnings and assets except that each class bears different distribution and shareholder servicing expenses. Each class of shares has exclusive voting rights with respect to matters that affect just that class. Income, expenses (other than expenses attributable to a specific class) and realized and unrealized gains or losses on investments are allocated to each class of shares based on its relative net assets.
K. Expense Allocations. Expenses that are not series (Fund) specific are allocated to each series based upon its relative proportion of net assets to the Trust’s total net assets.
L. Distributions to Shareholders. Each Fund generally declares dividends at least annually, payable in December, on a date selected by the Board. In addition, distributions may be made annually in December out of net realized gains through October 31 of that calendar year. Distributions to shareholders are recorded on the ex-dividend date. Each Fund may make a supplemental distribution subsequent to the end of its fiscal year ending June 30.
M. Use of Estimates. The preparation of financial statements in conformity with GAAP requires management to make estimates and assumptions that affect the reported amounts of assets and liabilities and the disclosure of contingent assets and liabilities at the date of the financial statements, and the reported amounts of revenue and expenses during the reporting period. Actual results could differ from those estimates, and those differences could be significant.
N. Security Loans. The Funds receive compensation in the form of fees, or retain a portion of interest on the investment of any cash received as collateral. The Funds also continue to receive interest or dividends on the securities loaned. The loans are secured by collateral at least equal, at all times, to 102% of the market value of the loaned securities. Gain or loss in the fair value of the securities loaned that may occur during the term of the loan will be for the account of the Funds. The Funds have the right under the lending agreement to recover the securities from the borrower on demand.
O. Derivative Instruments. The Funds have adopted amendments to authoritative guidance on disclosures about derivative instruments and hedging activities which require that the Funds disclose: a) how and why an entity uses derivative instruments; and b) how derivative instruments and related hedged items affect an entity’s financial position, financial performance and cash flows.
The Funds traded financial instruments where they are considered to be a seller of credit derivatives in accordance with authoritative guidance under GAAP on derivatives and hedging.
The fair value of derivative instruments and whose primary underlying risk exposure is equity price risk at June 30, 2013 was as follows:
Akros Absolute Return
| | | Fair Value |
| Derivative | | Asset Derivatives(1) | | Liability Derivatives(2) |
| Written Options | | | $— | | | $ | 5,430 | |
| Purchased Options | | | 240 | | | | — | |
| Warrants | | | 46,868 | | | | — | |
60 | 2 0 1 3 A N N U A L R E P O R T
Note 2 — Summary of Significant Accounting Policies and Other Information (Continued)
Event Arbitrage
| | | Fair Value |
| Derivative | | Asset Derivatives(1) | | Liability Derivatives(2) |
| Written Options | | $ | — | | | $ | 1,782,415 | |
| Purchased Options | | | 1,424,597 | | | | — | |
| Forward Currency Contracts | | | — | | | | 420 | |
| Warrants | | | 492,846 | | | | — | |
| (1) | Statements of Assets and Liabilities location: Investments, at value. |
| (2) | Statements of Assets and Liabilities location: Call Options Written, at value and Payable for open forward currency contracts. |
The effect of derivative instruments on the Statements of Operations and whose underlying risk exposure is equity price risk for the period ended June 30, 2013 was as follows:
| Akros Absolute Return | | | | |
| | | | | Change in Unrealized |
| | | Realized Gain(Loss) | | Appreciation |
| | | on Derivatives | | (Depreciation) on |
| | | Recognized in | | Derivatives Recognized |
| Derivative | | Income(1) | | in Income(2) |
| Written Options | | | 63,051 | | | | (4,918 | ) |
| Purchased Options | | | (26,684 | ) | | | (3,651 | ) |
| Futures | | | (66,028 | ) | | | 27,354 | |
| Warrants | | | 25,429 | | | | (7,557 | ) |
| | | | | | | | | |
| Event Arbitrage | | | | | | | | |
| | | | | | | | | |
| | | | | Change in Unrealized |
| | | Realized Gain(Loss) | | Appreciation |
| | | on Derivatives | | (Depreciation) on |
| | | Recognized in | | Derivatives Recognized |
| Derivative | | Income(1) | | in Income(2) |
| Written Options | | | 6,102,873 | | | | 326,361 | |
| Purchased Options | | | (737,614 | ) | | | 142,899 | |
| Forward Currency Contracts | | | 91,691 | | | | (23,831 | ) |
| Warrants | | | — | | | | (62,836 | ) |
| | | | | | | | | |
| Global Tactical | | | | | | | | |
| | | | | |
| | | | | Change in Unrealized |
| | | Realized Gain(Loss) | | Appreciation |
| | | on Derivatives | | (Depreciation) on |
| | | Recognized in | | Derivatives Recognized |
| Derivative | | Income(1) | | in Income(2) |
| Written Options | | | 1,230 | | | | 107 | |
| | | | | | | | | |
| Strategic Growth | | | | | | | | |
| | | | | |
| | | | | Change in Unrealized |
| | | Realized Gain(Loss) | | Appreciation |
| | | on Derivatives | | (Depreciation) on |
| | | Recognized in | | Derivatives Recognized |
| Derivative | | Income(1) | | in Income(2) |
| Written Options | | | 21,331 | | | | 1,704 | |
| (1) | Statements of Operations location: Net realized gain (loss) from written options, net realized gain (loss) from investments and net realized gain (loss) from futures and forward currency contracts. |
| (2) | Statements of Operations location: Net unrealized appreciation (depreciation) on written options, net unrealized appreciation (depreciation) on investments and net unrealized appreciation (depreciation) on futures and forward currency contracts. |
The average notional amounts of written options, purchased options, futures and forward currency contracts outstanding during the period ended June 30, 2013 were approximately as follows:
| | | | | | | | | Forward |
| | | Written | | Purchased | | | | Currency |
| | | Options | | Options | | Futures | | Contracts |
| Akros Absolute Return | | $ | 3,778 | | | $ | 4,831 | | | $ | 350,234 | | | $ | — | |
| Event Arbitrage | | | 1,476,997 | | | | 563,453 | | | | | | | | 618,701 | |
| Global Tactical Allocation | | | 296 | | | | — | | | | — | | | | — | |
| Strategic Growth | | | 5,108 | | | | — | | | | — | | | | — | |
Note 3 — Investment Advisory Fee and Other Related Party Transactions
QFI serves as investment adviser to each Fund. Pursuant to separate investment sub-advisory agreements, QFI has selected the following investment advisory firms to serve as sub-advisers:
| Fund | | Sub-adviser |
| Akros Absolute Return | | Akros Capital, LLC |
| Event Arbitrage | | N/A |
| Global Tactical Allocation Inc. | | DG Capital Management, Inc. |
| Mid-Cap Value Fund | | Kennedy Capital Management, Inc. |
| Small-Cap Growth Tactical Allocation | | Century Management, Inc. |
| Small-Cap Value | | Aronson Johnson Ortiz, L.P. |
| Strategic Growth | | DG Capital Management, Inc. |
QFI or the sub-advisers provide each Fund with a continuous program of supervision of the Fund’s assets, including the composition of its portfolio, and furnish advice and recommendations with respect to investments, investment policies and the purchase and sale of securities.
Each Fund paid QFI aggregate fees shown in the table below for the fiscal year ending June 30, 2013. Amounts are expressed as an annualized percentage of average net assets.
| | | | | | | Advisory & |
| | | Aggregate | | Subadvisory | | subadvisory |
| | | advisory fee | | fee paid by QFI | | fees waived & |
| Fund | | paid to QFI | | to the sub-adviser | | reimbursed |
| Akros Absolute Return | | | 1.25% | | | | 0.75% | | | | 2.46% | |
| Event Arbitrage | | | 1.30% | | | | N/A | | | | 0.38% | |
| Global Tactical Allocation | | | 1.25% | | | | 0.75% | | | | N/A | |
| Mid-Cap Value | | | 1.05% | | | | 0.75% | | | | N/A | |
| Small-Cap Growth Tactical Allocation | | | 1.00% | | | | 0.50% | | | | N/A | |
| Small-Cap Value | | | 1.00% | | | | 0.65% | | | | N/A | |
| Strategic Growth | | | 1.30% | | | | 0.75% | | | | 0.12% | |
For the fiscal year ending June 30, 2013, QFI and the sub-advisers earned and reimbursed fees as follows:
| | | | | | | Advisory & |
| | | Aggregate | | Subadvisory | | subadvisory |
| | | advisory fee | | fee paid by QFI | | fees waived & |
| | | paid to QFI | | to the sub-adviser | | reimbursed |
| Akros Absolute Return | | $ | 68,424 | | | $ | 41,055 | | | $ | 134,759 | |
| Event Arbitrage | | | 743,459 | | | | N/A | | | | 218,279 | |
| Global Tactical Allocation | | | 104,346 | | | | 62,608 | | | | N/A | |
| Mid-Cap Value | | | 84,710 | | | | 60,507 | | | | N/A | |
| Small-Cap Growth Tactical Allocation | | | 49,009 | | | | 24,504 | | | | N/A | |
| Small-Cap Value | | | 311,002 | | | | 202,151 | | | | N/A | |
| Strategic Growth | | | 2,150,357 | | | | 1,240,590 | | | | 204,586 | |
Akros Capital, LLC the sub-adviser to Akros Absolute Return has waived a portion of its sub-advisory fee to the extent that the total operating expenses of Akros Absolute Return (exclusive of 12b-1 fees) exceeded the annual rate of 1.99% for Class A shares, 2.74% for Class C shares, and 1.74% for Institutional Class shares of the average net assets of each class, respectively. If, at any time, the annualized expenses of Akros Absolute Return were less than the annualized expense ratio, the Trust, on behalf of Akros Absolute Return, would reimburse QFI for any fees previously waived and/or expenses previously assumed; provided, however, that repayment would be payable only to the extent that it (a) can be made during the three (3) years following the time at which the adviser waived fees or assumed expenses for Akros Absolute Return, and (b) can be repaid without causing the expenses of Akros Absolute Return to exceed the annualized expense ratio. This fee waiver agreement shall continue in effect from October 28, 2012 until October 28, 2013. This agreement shall automatically terminate upon termination of the advisory agreement between QFI and the Trust or, with respect to the Akros Absolute Return Fund, in the event of its merger or liquidation.
2 0 1 3 A N N U A L R E P O R T | 61
Notes to the Financial Statements
Note 3 — Investment Advisory Fee and Other Related Party Transactions (Continued)
QFI voluntarily agreed to waive its management fee to the extent that the total operating expenses of Event Arbitrage (exclusive of interest, taxes, brokerage commissions and other costs incurred in connection with the purchase or sale of portfolio securities, and extraordinary items) exceed the annual rate of 1.99% for Class A shares, 2.74% for Class C shares, and 1.74% for Institutional Class shares of the average net assets of each class, respectively. QFI currently has no intention to terminate this arrangement; however, it may do so at any time in its sole discretion. If, at any time, the annualized expenses of Event Arbitrage were less than the annualized expense ratio, the Trust, on behalf of Event Arbitrage, would reimburse QFI for any fees previously waived and/or expenses previously assumed; provided, however, that repayment would be payable only to the extent that it (a) can be made during the three (3) years following the time at which the adviser waived fees or assumed expenses for Event Arbitrage, and (b) can be repaid without causing the expenses of Event Arbitrage to exceed the annualized expense ratio. This fee waiver agreement shall continue in effect from October 28, 2012 until October 28, 2013. This agreement shall automatically terminate upon termination of the advisory agreement between QFI and the Trust or, with respect to Event Arbitrage, in the event of its merger or liquidation.
Additionally, QFI voluntarily agreed to waive its management fee to the extent that the total operating expenses of Small-Cap Value (exclusive of interest, taxes, brokerage commissions and other costs incurred in connection with the purchase or sale of portfolio securities, and extraordinary items) exceed the annual rate of 2.60% for Class A shares, 3.35% for Class C shares, and 2.35% for Institutional Class shares of the average net assets of each class, respectively. QFI currently has no intention to terminate this arrangement; however, it may do so at any time in its sole discretion.
Additionally, QFI voluntarily agreed to waive its management fee to the extent that the total operating expenses of Strategic Growth (exclusive of interest, taxes, brokerage commissions and other costs incurred in connection with the purchase or sale of portfolio securities, and extraordinary items) exceed the annual rate of 2.24% for Class A shares, 2.99% for Class C shares, and 1.99% for Institutional Class shares of the average net assets of each class, respectively. QFI currently has no intention to terminate this arrangement; however, it may do so at any time in its sole discretion.
At June 30, 2013, the cumulative unreimbursed amount paid and/or waived by the Advisor on behalf of Akros Absolute Return, Event Arbitrage and Strategic Growth that may be recouped was $463,116, $490,775 and $1,056,306, respectively. The Advisor may recapture portions of the above amount no later than the dates stated below:
| | | August 31, | | June 30, | | June 30, | | June 30, |
| | | 2013 | | 2014 | | 2015 | | 2016 |
| Akros Absolute Return | | $ | 152,600 | | | $ | 120,543 | | | $ | 55,214 | | | $ | 134,759 | |
| Event Arbitrage | | | — | | | | 85,149 | | | | 187,347 | | | | 218,279 | |
| Strategic Growth | | | — | | | | 751,125 | | | | 100,595 | | | | 204,586 | |
Foreside Fund Services, LLC (“Distributor”) serves as principal underwriter for the Trust. The Trust has adopted distribution and shareholder servicing plans pursuant to Rule 12b-1 of the 1940 Act for Class A and Class C shares described below. There is no Rule 12b-1 distribution plan for Institutional Class shares of the Funds. The Class A Plan provides that each Fund may pay a servicing or Rule 12b-1 fee at an annual rate of 0.25% of the Class A average net assets on a monthly basis to persons or institutions for performing certain servicing functions for the Class A shareholders. The Class A Plan also allows the Fund to pay or reimburse expenditures in connection with sales and promotional services related to distribution of the Fund’s shares, including personal services provided to prospective and existing shareholders. The Class C Plan provides that each Fund may compensate QFI and others for services provided and expenses
incurred in the distribution of shares at an annual rate of 1.00% of the average net assets of each class on a monthly basis.
For the fiscal year ending June 30, 2013, the Distributor received underwriter concessions from the sale of Funds shares as follows:
| Fund | | Amount | |
| Akros Absolute Return | | $ | 406 | | |
| Event Arbitrage | | | 7,739 | | |
| Global Tactical Allocation | | | 246 | | |
| Mid-Cap Value | | | 527 | | |
| Small-Cap Growth Tactical Allocation | | | 172 | | |
| Small-Cap Value | | | 275 | | |
| Strategic Growth | | | 5,806 | | |
Except for the Trust’s Chief Compliance Officer (“CCO”), employees and Officers of QFI do not receive any compensation from the Trust. The CCO of the Trust also serves as general counsel to QFI. For the fiscal year ending June 30, 2013, the Funds compensated the CCO as follows:
| Fund | | Amount | |
| Akros Absolute Return | | $ | 4,354 | | |
| Event Arbitrage | | | 36,627 | | |
| Global Tactical Allocation | | | 5,486 | | |
| Mid-Cap Value | | | 5,190 | | |
| Small-Cap Growth Tactical Allocation | | | 3,727 | | |
| Small-Cap Value | | | 19,766 | | |
| Strategic Growth | | | 106,717 | | |
Note 4 — Purchases and Sales of Investments
For the fiscal year ending June 30, 2013 aggregate purchases and sales of investment securities (excluding short-term investments) for each Fund were as follows:
| | | Purchases | | Sales | |
| Akros Absolute Return | | $ | 4,716,037 | | | $ | 6,305,433 | | |
| Event Arbitrage | | | 113,115,479 | | | | 82,781,429 | | |
| Global Tactical Allocation | | | 38,708,330 | | | | 42,873,809 | | |
| Mid-Cap Value | | | 3,721,202 | | | | 5,201,689 | | |
| Small-Cap Growth Tactical Allocation | | | 18,987,235 | | | | 21,097,617 | | |
| Small-Cap Value | | | 43,758,475 | | | | 47,049,994 | | |
| Strategic Growth | | | 454,274,108 | | | | 494,805,590 | | |
Note 5 — Options Written
A summary of option contracts written by the Trust during the fiscal year ended June 30, 2013 are as follows:
| | | Akros Absolute Return |
| | | Number of | | Option |
| | | Contracts | | Premiums |
| Options outstanding at beginning of period | | | 140 | | | $ | 9,698 | |
| Options written | | | 1,926 | | | | 69,400 | |
| Options closed | | | (237 | ) | | | (12,398 | ) |
| Options exercised | | | (422 | ) | | | (14,014 | ) |
| Options expired | | | (1,265 | ) | | | (45,951 | ) |
| Options outstanding at end of period | | | 142 | | | | 6,735 | |
| | | |
| | | Event Arbitrage |
| | | Number of | | Option |
| | | Contracts | | Premiums |
| Options outstanding at beginning of period | | | 9,560 | | | $ | 1,274,680 | |
| Options written | | | 99,152 | | | | 14,249,829 | |
| Options closed | | | (43,830 | ) | | | (6,854,766 | ) |
| Options exercised | | | (27,139 | ) | | | (6,069,635 | ) |
| Options expired | | | (18,802 | ) | | | (932,388 | ) |
| Options outstanding at end of period | | | 18,941 | | | | 1,667,720 | |
62 | 2 0 1 3 A N N U A L R E P O R T
Note 5 — Options Written (Continued)
| | | Global Tactical Allocation |
| | | | Number of
Contracts | | Option
Premiums | |
| Options outstanding at beginning of period | | | | 23 | | | $ | 1,373 | | |
| Options written | | | | — | | | | — | | |
| Options closed | | | | (13 | ) | | | (663 | ) | |
| Options exercised | | | | (10 | ) | | | (710 | ) | |
| Options expired | | | | — | | | | — | | |
| Options outstanding at end of period | | | | — | | | | — | | |
| | | Strategic Growth |
| | | | Number of
Contracts | | | Option
Premiums | | |
| Options outstanding at beginning of period | | | 400 | | | $ | 23,839 | | |
| Options written | | | — | | | | — | | |
| Options closed | | | (228 | ) | | | (11,628 | ) | |
| Options exercised | | | (172 | ) | | | (12,211 | ) | |
| Options expired | | | — | | | | — | | |
| Options outstanding at end of period | | | — | | | | — | | |
Note 6 — Tax Matters
For U.S. federal income tax purposes, the cost of securities owned, gross appreciation, gross depreciation, and net unrealized appreciation (depreciation) of investments at June 30, 2013 for each Fund were as follows:
| Fund | | Cost | | | Gross
Appreciation | | | Gross
Depreciation | | Net Appreciation
(Depreciation) | |
| Akros Absolute Return | | $ | 3,332,135 | | | $ | 70,147 | | | $ | (680,408 | ) | | $ | (610,261 | ) | |
| Event Arbitrage | | | 62,833,934 | | | | 3,024,122 | | | | (3,545,540 | ) | | | (521,418 | ) | |
| Global Tactical Allocation | | | 7,522,847 | | | | 666,693 | | | | (67,175 | ) | | | 599,518 | | |
| Mid-Cap Value | | | 9,531,618 | | | | 1,797,124 | | | | (117,911 | ) | | | 1,679,213 | | |
| Small Cap Growth Tactical Allocation | | | 4,991,050 | | | | 197,033 | | | | (825,916 | ) | | | (628,883 | ) | |
| Small-Cap Value | | | 36,000,490 | | | | 4,056,510 | | | | (762,847 | ) | | | 3,293,663 | | |
| Strategic Growth | | | 170,082,162 | | | | 19,067,108 | | | | (1,228,839 | ) | | | 17,838,269 | | |
As of June 30, 2013, the components of distributable earnings on a tax basis were as follows:
| Fund | | Unrealized
Appreciation
(Depreciation) | | Undistributed
Ordinary Income | | Undistributed
Capital Gain | | | Capital Loss
Carryforward | | Late Year
Loss | | | | Total
Distributable
Earnings/(Loss) | |
| Akros Absolute Return | | $ | (996,352 | ) | | $ | — | | | $ | — | | | $ | (92,213 | ) | | $ | (272,910 | ) | | $ | (1,361,475 | ) | |
| Event Arbitrage | | | (645,803 | ) | | | 1,854,920 | | | | — | | | | — | | | | (755,993 | ) | | | 453,124 | | |
| Global Tactical Allocation | | | 621,543 | | | | — | | | | — | | | | (12,584,462 | ) | | | (46,337 | ) | | | (12,009,256 | ) | |
| Mid-Cap Value | | | 1,679,213 | | | | — | | | | — | | | | (8,061,333 | ) | | | (34,658 | ) | | | (6,416,778 | ) | |
| Small Cap Growth Tactical Allocation | | | (628,883 | ) | | | — | | | | — | | | | (423,584 | ) | | | (11,931 | ) | | | (1,064,398 | ) | |
| Small-Cap Value | | | 3,293,663 | | | | 117,065 | | | | — | | | | (5,165,605 | ) | | | — | | | | (1,754,877 | ) | |
| Strategic Growth | | | 17,838,269 | | | | — | | | | — | | | | (422,501,515 | ) | | | (574,287 | ) | | | (405,237,533 | ) | |
The difference between book basis and tax basis unrealized appreciation (depreciation) is attributable primarily to the tax deferral of losses on wash sales and straddles from options, the differing book/tax treatment of unrealized appreciation/depreciation on forward foreign currency contracts, and outstanding PFIC adjustments.
The undistributed ordinary income, capital gains and carryforward losses shown above differ from the corresponding accumulated net investment income and accumulated net realized gain (loss) figures reported in the statements of assets and liabilities due to differing book/tax treatment of short-term capital gains, and certain temporary book/tax differences such as the deferral of realized losses on wash sales, straddles from options and net losses realized after October 31 and from ordinary losses incurred after December 31.
Under current tax law, foreign currency and net capital losses realized after October 31 may be deferred and treated as occurring on the first day of the following fiscal year. The Funds elected to defer net capital and currency losses as indicated in the chart below.
At June 30, 2013, the capital loss carryovers for the Funds were as follows:
| | | Post December 31, 2010
Capital Losses
No Expiration | | | Capital Loss Carryovers Expiring | | Post-October Capital Loss | |
| Fund | | Short-Term | | | Long-Term | | | 2018 | | | 2017 | | | 2016 | | | Deferred | | | Utilized | | |
| Akros Absolute Return | | $ | — | | | | $92,213 | | | $ | — | | | $ | — | | | | $— | | | $ | 272,910 | | | $ | — | | |
| Event Arbitrage | | | — | | | | — | | | | — | | | | — | | | | — | | | | 755,993 | | | | (413,363 | ) | |
| Global Tactical Allocation | | | — | | | | — | | | | 2,718,683 | | | | 9,865,779 | | | | — | | | | — | | | | — | | |
| Mid-Cap Value | | | — | | | | — | | | | 1,170,572 | | | | 6,890,761 | | | | — | | | | — | | | | — | | |
| Small-Cap Growth Tactical Allocation | | | 423,584 | | | | — | | | | — | | | | — | | | | — | | | | — | | | | — | | |
| Small-Cap Value | | | — | | | | — | | | | 5,165,605 | | | | — | | | | — | | | | — | | | | — | | |
| Strategic Growth | | | — | | | | — | | | | 164,714,298 | | | | 257,787,217 | | | | — | | | | — | | | | — | | |
2 0 1 3 A N N U A L R E P O R T | 63
Notes to the Financial Statements
Note 7 — Reclassification of Capital Accounts
In accordance with the accounting pronouncements, each Fund has recorded reclassifications in the capital accounts. These reclassifications have no impact on the net asset value of the Funds and are designed generally to present undistributed income and realized gains on a tax basis which is considered to be more informative to shareholders. As of June 30, 2013, the Funds recorded the following reclassification to increase (decrease) the accounts listed below:
| | | Accumulated | | Accumulated | | | | |
| | | Net Investment | | Net Realized | | Paid-in | | |
| Beneficial Fund | | Income (Loss) | | Gain (Loss) | | Capital | | |
| Akros Absolute Return | | | 120,208 | | | | 19,162 | | | | (139,370 | ) | |
| Event Arbitrage | | | 159,345 | | | | (159,338 | ) | | | (7 | ) | |
| Global Tactical Allocation | | | 153,458 | | | | — | | | | (153,458 | ) | |
| Mid-Cap Value | | | 75,793 | | | | — | | | | (75,793 | ) | |
| Small Cap Growth Tactical Allocation | | | 117,308 | | | | (31,292 | ) | | | (86,016 | ) | |
| Small-Cap Value | | | — | | | | — | | | | — | | |
| Strategic Growth | | | 1,591,742 | | | | — | | | | (1,591,742 | ) | |
Note 8 — Distributions to Shareholders
Income and long-term capital gain distributions are determined in accordance with federal income tax regulations, which may differ from GAAP. The information set forth below is for each Fund’s fiscal year as required by federal securities laws.
The tax character of dividends and distributions paid during the fiscal years of 2013 and 2012 were as follows:
| | | Ordinary Income | | | Long-Term Capital Gain | | | Return of Capital | | |
| Fund | | 2013 | | | 2012 | | | 2013 | | | 2012 | | | 2013 | | | 2012 | | |
| Akros Absolute Return | | $ | 50,041 | | | $ | — | | | $ | — | | | $ | — | | | $ | — | | | $ | — | | |
| Event Arbitrage | | | 700,520 | | | | 1,103,905 | | | | — | | | | — | | | | — | | | | — | | |
| Global Tactical Allocation | | | — | | | | — | | | | — | | | | — | | | | — | | | | — | | |
| Mid-Cap Value | | | — | | | | — | | | | — | | | | — | | | | — | | | | — | | |
| Small Cap Growth Tactical Allocation | | | — | | | | 548,581 | | | | — | | | | — | | | | — | | | | — | | |
| Small-Cap Value | | | 86,508 | | | | — | | | | — | | | | — | | | | — | | | | — | | |
| Strategic Growth | | | — | | | | — | | | | — | | | | — | | | | — | | | | — | | |
Note 9 — Fund Share Transactions
At June 30, 2013, there were an unlimited number of shares of beneficial interest with a $0.01 par value authorized. The following table summarizes the activity in shares of each Fund:
| Akros Absolute Return | |
| | | For the Fiscal Year Ended June 30, 2013 | | | For the Fiscal Year Ended June 30, 2012 | | |
| | | Sold | | | Redeemed | | | Reinvested | | | End Shares | | | Sold | | | Redeemed | | | Reinvested | | | End Shares | | |
| Class A | | | | | | | | | | | | | | | | | | | | | | | | | | | | | | | | | |
| Shares | | | 125,350 | | | | (379,152 | ) | | | 3,728 | | | | 316,191 | | | | 123,496 | | | | (667,212 | ) | | | — | | | | 566,265 | | |
| Value | | $ | 1,015,336 | | | $ | (3,052,660 | ) | | $ | 29,822 | | | | | | | | $1,057,720 | | | $ | (5,813,173 | ) | | $ | — | | | | | | |
| Class C | | | | | | | | | | | | | | | | | | | | | | | | | | | | | | | | | |
| Shares | | | 8,538 | | | | (34,965 | ) | | | 378 | | | | 20,521 | | | | 38,600 | | | | (25,713 | ) | | | — | | | | 46,570 | | |
| Value | | $ | 67,264 | | | $ | (275,232 | ) | | $ | 2,967 | | | | | | | | $323,952 | | | $ | (216,198 | ) | | $ | — | | | | | | |
| Institutional Class | | | | | | | | | | | | | | | | | | | | | | | | | | | | | | | | | |
| Shares | | | 38,131 | | | | (34,584 | ) | | | 1,802 | | | | 205,691 | | | | 41,220 | | | | (113,883 | ) | | | — | | | | 200,342 | | |
| Value | | $ | 306,528 | | | $ | (277,532 | ) | | $ | 14,505 | | | | | | | | $356,147 | | | $ | (969,874 | ) | | $ | — | | | | | | |
| | | | | | | | | | | | | | | | | | | | | | | | | | | | | | | | | | |
| Event Arbitrage | |
| | | For the Fiscal Year Ended June 30, 2013 | | | For the Fiscal Year Ended June 30, 2012 | | |
| | | Sold | | | Redeemed | | | Reinvested | | | End Shares | | | Sold | | | Redeemed | | | Reinvested | | | End Shares | | |
| Class A | | | | | | | | | | | | | | | | | | | | | | | | | | | | | | | | | |
| Shares | | | 1,020,896 | | | | (1,212,671 | ) | | | 30,835 | | | | 2,750,981 | | | | 1,735,073 | | | | (912,029 | ) | | | 56,537 | | | | 2,911,921 | | |
| Value | | $ | 12,620,599 | | | $ | (14,814,872 | ) | | $ | 371,562 | | | | | | | $ | 20,758,217 | | | $ | (10,911,336 | ) | | $ | 653,570 | | | | | | |
| Class C | | | | | | | | | | | | | | | | | | | | | | | | | | | | | | | | | |
| Shares | | | 113,780 | | | | (256,519 | ) | | | 5,746 | | | | 473,641 | | | | 354,371 | | | | (105,426 | ) | | | 10,799 | | | | 610,634 | | |
| Value | | | $1,388,619 | | | | $(3,121,760 | ) | | $ | 68,205 | | | | | | | $ | 4,227,492 | | | $ | (1,248,161 | ) | | $ | 123,866 | | | | | | |
| Institutional Class | | | | | | | | | | | | | | | | | | | | | | | | | | | | | | | | | |
| Shares | | | 1,161,683 | | | | (349,132 | ) | | | 16,200 | | | | 1,939,002 | | | | 413,029 | | | | (915,671 | ) | | | 20,573 | | | | 1,110,251 | | |
| Value | | $ | 14,462,851 | | | $ | (4,310,034 | ) | | $ | 195,699 | | | | | | | $ | 4,887,392 | | | $ | (10,726,682 | ) | | $ | 238,645 | | | | | | |
64 | 2 0 1 3 A N N U A L R E P O R T
Note 9 — Fund Share Transactions (Continued)
| Global Tactical Allocation |
| | | For the Fiscal Year Ended June 30, 2013 | | | For the Fiscal Year Ended June 30, 2012 |
| | | Sold | | | Redeemed | | | Reinvested | | | End Shares | | | Sold | | | Redeemed | | | Reinvested | | | End Shares | | |
| Class A | | | | | | | | | | | | | | | | | | | | | | | | | | | | | | | | | | | |
| Shares | | | 41,787 | | | | (379,191 | ) | | | | — | | | | 464,592 | | | | 103,452 | | | | (859,470 | ) | | | | — | | | | 801,996 | | |
| Value | | | $309,689 | | | | $(2,905,906 | ) | | | $ | — | | | | | | | $ | 721,380 | | | $ | (5,963,328 | ) | | | $ | — | | | | | | |
| Class C | | | | | | | | | | | | | | | | | | | | | | | | | | | | | | | | | | | |
| Shares | | | 2,199 | | | | (193,971 | ) | | | | — | | | | 266,186 | | | | 46,415 | | | | (526,527 | ) | | | | — | | | | 457,958 | | |
| Value | | | $15,378 | | | | $(1,436,277 | ) | | | $ | — | | | | | | | $ | 315,078 | | | $ | (3,600,623 | ) | | | $ | — | | | | | | |
| Institutional Class | | | | | | | | | | | | | | | | | | | | | | | | | | | | | | | | | | | |
| Shares | | | 1,318 | | | | (46,164 | ) | | | | — | | | | 65,868 | | | | 59,881 | | | | (64,634 | ) | | | | — | | | | 110,714 | | |
| Value | | | $12,075 | | | | $(409,020 | ) | | | $ | — | | | | | | | $ | 500,000 | | | $ | (557,611 | ) | | | $ | — | | | | | | |
| | | | | | | | | | | | | | | | | | | | | | | | | | | | | | | | | | | | |
| Mid-Cap Value |
| | | For the Fiscal Year Ended June 30, 2013 | | | For the Fiscal Year Ended June 30, 2012 |
| | | Sold | | | Redeemed | | | Reinvested | | End Shares | | | Sold | | | Redeemed | | | Reinvested | | | End Shares | | |
| Class A | | | | | | | | | | | | | | | | | | | | | | | | | | | | | | | | | | | |
| Shares | | | 74,459 | | | | (145,642 | ) | | | | — | | | | 317,431 | | | | 28,760 | | | | (91,030 | ) | | | | — | | | | 388,614 | | |
| Value | | | $1,379,496 | | | | $(2,506,200 | ) | | | $ | — | | | | | | | $ | 440,252 | | | $ | (1,362,926 | ) | | | $ | — | | | | �� | | |
| Class C | | | | | | | | | | | | | | | | | | | | | | | | | | | | | | | | | | | |
| Shares | | | 3,057 | | | | (33,899 | ) | | | | — | | | | 107,369 | | | | 12,078 | | | | (51,770 | ) | | | | — | | | | 138,211 | | |
| Value | | | $46,032 | | | | $(520,042 | ) | | | $ | — | | | | | | | $ | 169,204 | | | $ | (671,636 | ) | | | $ | — | | | | | | |
| Institutional Class | | | | | | | | | | | | | | | | | | | | | | | | | | | | | | | | | | | |
| Shares | | | 48,215 | | | | (16,203 | ) | | | | — | | | | 53,443 | | | | — | | | | (4,565 | ) | | | | — | | | | 21,431 | | |
| Value | | | $907,883 | | | | $(308,708 | ) | | | $ | — | | | | | | | $ | — | | | $ | (68,756 | ) | | | $ | — | | | | | | |
| | | | | | | | | | | | | | | | | | | | | | | | | | | | | | | | | | | | |
| Small-Cap Growth Tactical Allocation |
| | | For the Fiscal Year Ended June 30, 2013 | | | For the Fiscal Year Ended June 30, 2012 | | |
| | | | Sold | | | | Redeemed | | | Reinvested | | | | End Shares | | | | Sold | | | | Redeemed | | | Reinvested | | | | End Shares | | |
| Class A | | | | | | | | | | | | | | | | | | | | | | | | | | | | | | | | | | | |
| Shares | | | 4,676 | | | | (120,797 | ) | | | | — | | | | 166,184 | | | | 12,860 | | | | (642,623 | ) | | | | 28,363 | | | | 282,305 | | |
| Value | | | $42,664 | | | | $(1,103,618 | ) | | | $ | — | | | | | | | $ | 124,477 | | | $ | (5,865,299 | ) | | | | $247,896 | | | | | | |
| Class C | | | | | | | | | | | | | | | | | | | | | | | | | | | | | | | | | | | |
| Shares | | | 229 | | | | (109,683 | ) | | | | — | | | | 111,363 | | | | 18,513 | | | | (397,263 | ) | | | | 13,446 | | | | 220,817 | | |
| Value | | | $2,000 | | | | $(964,669 | ) | | | $ | — | | | | | | | $ | 175,362 | | | $ | (3,508,730 | ) | | | | $114,426 | | | | | | |
| Institutional Class | | | | | | | | | | | | | | | | | | | | | | | | | | | | | | | | | | | |
| Shares | | | 9,010 | | | | (135,670 | ) | | | | — | | | | 84,634 | | | | 26,663 | | | | (314,969 | ) | | | | 9,224 | | | | 211,294 | | |
| Value | | | $83,566 | | | | $(1,247,791 | ) | | | $ | — | | | | | | | $ | 247,767 | | | $ | (2,822,614 | ) | | | | $81,451 | | | | | | |
| | | | | | | | | | | | | | | | | | | | | | | | | | | | | | | | | | | | |
| Small-Cap Value |
| | | For the Fiscal Year Ended June 30, 2013 | | | For the Fiscal Year Ended June 30, 2012 | | |
| | | | Sold | | | | Redeemed | | | Reinvested | | | | End Shares | | | | Sold | | | | Redeemed | | | Reinvested | | | | End Shares | | |
| Class A | | | | | | | | | | | | | | | | | | | | | | | | | | | | | | | | | | | |
| Shares | | | 17,706 | | | | (148,506 | ) | | | | 489 | | | | 396,367 | | | | 42,586 | | | | (373,217 | ) | | | | — | | | | 526,678 | | |
| Value | | | $302,337 | | | | $(2,558,282 | ) | | | $ | 8,059 | | | | | | | $ | 638,657 | | | $ | 5,492,383 | | | | $ | — | | | | | | |
| Class C | | | | | | | | | | | | | | | | | | | | | | | | | | | | | | | | | | | |
| Shares | | | 2,096 | | | | (41,640 | ) | | | | — | | | | 98,568 | | | | 559 | | | | (40,550 | ) | | | | — | | | | 138,112 | | |
| Value | | | $31,188 | | | | $(617,552 | ) | | | $ | — | | | | | | | $ | 7,340 | | | $ | (509,287 | ) | | | $ | — | | | | | | |
| Institutional Class | | | | | | | | | | | | | | | | | | | | | | | | | | | | | | | | | | | |
| Shares | | | 64,487 | | | | (128,787 | ) | | | | 3,255 | | | | 1,153,136 | | | | 552,441 | | | | (683,273 | ) | | | | — | | | | 1,214,181 | | |
| Value | | | $1,183,195 | | | | $(2,332,157 | ) | | | $ | 55,782 | | | | | | | $ | 9,566,836 | | | $ | (10,769,664 | ) | | | $ | — | | | | | | |
| | | | | | | | | | | | | | | | | | | | | | | | | | | | | | | | | | | | |
| Strategic Growth |
| | | For the Fiscal Year Ended June 30, 2013 | | | For the Fiscal Year Ended June 30, 2012 | | |
| | | Sold | | | Redeemed | | Reinvested | | | End Shares | | | Sold | | | Redeemed | | | Reinvested | | | End Shares | | |
| Class A | | | | | | | | | | | | | | | | | | | | | | | | | | | | | | | | | | | |
| Shares | | | 530,779 | | | | (2,851,509 | ) | | | | — | | | | 4,607,225 | | | | 500,426 | | | | (4,878,197 | ) | | | | — | | | | 6,927,955 | | |
| Value | | $ | 9,819,661 | | | $ | (50,010,445 | ) | | | $ | — | | | | | | | $ | 7,925,123 | | | $ | (76,172,869 | ) | | | $ | — | | | | | | |
| Class C | | | | | | | | | | | | | | | | | | | | | | | | | | | | | | | | | | | |
| Shares | | | 23,191 | | | | (559,927 | ) | | | | — | | | | 1,336,049 | | | | 55,875 | | | | (1,043,606 | ) | | | | — | | | | 1,872,785 | | |
| Value | | $ | 364,184 | | | $ | (8,702,474 | ) | | | $ | — | | | | | | | $ | 791,844 | | | $ | (14,712,803 | ) | | | $ | — | | | | | | |
| Institutional Class | | | | | | | | | | | | | | | | | | | | | | | | | | | | | | | | | | | |
| Shares | | | 931,177 | | | | (1,055,174 | ) | | | | — | | | | 2,294,134 | | | | 932,946 | | | | (952,784 | ) | | | | — | | | | 2,418,131 | | |
| Value | | $ | 16,754,902 | | | $ | (18,625,480 | ) | | | $ | — | | | | | | | $ | 15,225,608 | | | $ | (15,185,671 | ) | | | $ | — | | | | | | |
2 0 1 3 A N N U A L R E P O R T | 65
Notes to the Financial Statements
Note 10 — Indemnifications
Under the Trust’s organizational documents, its officers and Trustees are indemnified against certain liabilities arising out of the performance of their duties to the Funds. In addition, in the normal course of business, the Trust enters into contracts with its vendors and others that provide for general indemnifications.
The Trust’s maximum exposure under these arrangements is dependant on future claims that may be made against the Trust, and, therefore, cannot be estimated; however, based on experience, risk of loss from such claims is considered remote.
Note 11 — Securities Lending
The Funds hold the Mount Vernon Securities Lending Trust Prime Portfolio as cash collateral, which is a registered money market fund whose main objective is to maximize current income to the extent consistent with the preservation of capital and liquidity. It primarily invests in Certificates of Deposits, Asset Backed and Financial Company Commercial Paper, and Repurchase Agreements.
At June 30, 2013, the aggregate market value of loaned securities and the value of the cash collateral the Funds received is as follows:
| | | Loaned Securities
Market Value | | Value of
Cash Collateral | | % of
Net Assets |
| Akros Absolute Return | | $ | 250,365 | | | $ | 281,860 | | | | 6.71 | % |
| Event Arbitrage | | | 4,084,057 | | | | 4,272,213 | | | | 6.46 | % |
| Global Tactical Allocation | | | 1,506,032 | | | | 1,555,375 | | | | 23.55 | % |
| Mid-Cap Value | | | 2,288,363 | | | | 2,395,433 | | | | 26.90 | % |
| Small-Cap Growth Tactical Allocation | | | 764,032 | | | | 837,630 | | | | 24.32 | % |
| Small-Cap Value | | | 5,785,366 | | | | 6,030,392 | | | | 18.42 | % |
| Strategic Growth | | | 29,052,495 | | | | 29,936,988 | | | | 18.97 | % |
REPORT OF INDEPENDENT REGISTERED PUBLIC ACCOUNTING FIRM
To the Shareholders and Board of Trustees of Quaker Investment Trust
We have audited the accompanying statements of assets and liabilities of Quaker Akros Absolute Return Fund, Quaker Event Arbitrage Fund, Quaker Global Tactical Allocation Fund, Quaker Mid-Cap Value Fund, Quaker Small-Cap Growth Tactical Allocation Fund, Quaker Small-Cap Value Fund, and Quaker Strategic Growth Fund, (the “Funds”) each a series of Quaker Investment Trust (the “Trust”), including the schedules of investments, as of June 30, 2013, and the related statements of operations for the year then ended, and the statements of changes in net assets and the financial highlights for each of the two years in the period then ended. These financial statements and financial highlights are the responsibility of the Funds’ management. Our responsibility is to express an opinion on these financial statements and financial highlights based on our audits. The financial highlights for each of the three years in the period then ended were audited by other auditors, whose report dated August 29, 2011 expressed an unqualified opinion on such statements and financial highlights.
We conducted our audits in accordance with the standards of the Public Company Accounting Oversight Board (United States). Those standards require that we plan and perform the audits to obtain reasonable assurance about whether the financial statements and financial highlights are free of material misstatement. The Funds are not required to have, nor were we engaged to perform, an audit of their internal control over financial reporting. Our audits included consideration of internal control over financial reporting as a basis for designing audit procedures that are appropriate in the circumstances, but not for the purpose of expressing an opinion on the effectiveness of the Funds’ internal control over financial reporting. Accordingly, we express no such opinion. An audit includes examining, on a test basis, evidence supporting the amounts and disclosures in the financial statements. Our procedures included confirmation of securities owned as of June 30, 2013, by correspondence with the custodian and brokers or through other appropriate procedures where replies from brokers were unable to be obtained. An audit also includes assessing the accounting principles used and significant estimates made by management, as well as evaluating the overall financial statement presentation. We believe that our audits provide a reasonable basis for our opinion.
In our opinion, the financial statements and financial highlights referred to above present fairly, in all material respects, the financial position of Quaker Akros Absolute Return Fund, Quaker Event Arbitrage Fund, Quaker Global Tactical Allocation Fund, Quaker Mid-Cap Value Fund, Quaker Small-Cap Growth Tactical Allocation Fund, Quaker Small-Cap Value Fund, and Quaker Strategic Growth Fund, as of June 30, 2013, the results of their operations for the year then ended, and the changes in their net assets and the financial highlights for each of the two years in the period then ended, in conformity with accounting principles generally accepted in the United States of America.
Tait, Weller & Baker LLP
Philadelphia, Pennsylvania
August 29, 2013
66 | 2 0 1 3 A N N U A L R E P O R T
Trustees and Officers (Unaudited)
June 30, 2013
The Board has overall responsibility for conduct of the Trust’s affairs. The day-to-day operations of the Trust are managed by QFI subject to the Bylaws of
the Trust and review by the Board. The Trustees, including those Trustees who are also officers, are listed below:
| Name, Address and Age | | Position(s) Held
with the Trust | | Serving as
an Officer
or Trustee of
the Trust | | Principal Occupation(s) During Past 5 Years | | Portfolios
Overseen by
Trustee | | Directorships
Held by
Trustee(1) | |
Jeffry H. King, Sr.(2)(3)
309 Technology Drive
Malvern, PA 19355
Age 70 | | Chairman of the Board
and Chief Executive
Officer | | Since
Nov. 1996 | | Chairman of Board of Directors and Chief Executive Officer, Quaker Funds, Inc. (1996–present). | | 7 | | None | |
Laurie Keyes(3)(4)
309 Technology Drive
Malvern, PA 19355
Age 63 | | Treasurer and Trustee | | Since
Nov. 1996 | | Chief Financial Officer, Quaker Funds, Inc. (1996–present). | | 7 | | None | |
Justin Brundage(5)
309 Technology Drive
Malvern, PA 19355
Age 43 | | Secretary | | Since
Nov. 2006 | | President, Quaker Funds, Inc. (2007–present); Chief Operating Officer, Quaker Funds, Inc. (2005–present). | | N/A | | N/A | |
Timothy E. Richards
309 Technology Drive
Malvern, PA 19355
Age 48 | | Chief Compliance
Officer |
| Since
March 2004 | | General Counsel to Quaker Funds, Inc. (2003–present); Chief Compliance Officer for the Quaker Investment Trust (2004–present). | | N/A | | N/A | |
James R. Brinton
309 Technology Drive
Malvern, PA 19355
Age 59 | | Trustee
Lead Independent Trustee | | Since
Feb. 2002
Since
Aug. 2007 | | President, Robert J. McAllister Agency, Inc. (commercial insurance brokerage firm) (1979–present). | | 7 | | Director, ACP Funds Trust | |
Gary Edward Shugrue
309 Technology Drive
Malvern, PA 19335
Age 59 | | Trustee | | Since
July 2008 | | President and Chief Investment Officer, Ascendant Capital Partners. | | 7 | | Director, BHR
Institutional
Funds; Director,
ACP Funds Trust | |
Warren West
309 Technology Drive
Malvern, PA 19355
Age 56 | | Trustee | | Since
Nov. 2003 | | President and owner, Greentree Brokerage Services, Inc. (1998–present). | | 7 | | None | |
Everett T. Keech
309 Technology
Drive Malvern, PA 19355
Age 73 | | Trustee
Interested Trustee,
Vice Chairman of the
Board, President,
Treasurer
Trustee | | Since
Nov. 2005
Nov., 1996 –
Jan., 2005
Nov., 1996 –
Feb., 2002 | | Chairman-Executive Committee, Technology Development Corp., (1997–Present) technology development and manufacturing firm (1997–present); Affiliated Faculty, University of Pennsylvania (1998–present). | | 7 | | Director,
Technology
Development
Corp.; Director,
Advanced
Training Systems
International,
Inc.; Director,
Phoenix Data
Systems, Inc. | |
| (1) | Directorship of companies required to report to the SEC under the Securities and Exchange Act of 1934, as amended (the “Exchange Act”) (i.e., “public companies”) and investment companies registered under the 1940 Act. |
| (2) | Mr. King is considered to be “interested person” of the Trust for purposes of the 1940 Act because he is the Chief Executive Officer and a controlling shareholder of Quaker Funds, Inc., the investment adviser to the Funds. |
| (3) | Mr. King and Ms. Keyes are husband and wife. |
| (4) | Ms. Keyes is considered to be an “interested person” of the Trust for purposes of the 1940 Act because she is the Trust’s Treasurer and a controlling shareholder of Quaker Funds, Inc. |
| (5) | Mr. Brundage is Ms. Keyes’ son. |
The Statement of Additional Information for the Trust includes additional information about the Trustees and Officers and is available, without charge, upon request by calling (800) 220-8888.
Form N-Q Filing and Proxy Voting Policies and Procedures
Each Fund files its complete schedule of portfolio holdings with the Securities and Exchange Commission (“SEC”) for the first and third quarters of each fiscal year on Form N-Q. Each Fund’s Forms N-Q, as well as a description of the policies and procedures that each Fund uses to determine how to vote proxies (if any) relating to portfolio securities is available without charge: (i) upon request, by calling (800) 220-8888; and (ii) on the SEC’s web-site at http://www.sec.gov. Each Fund’s Forms N-Q may be reviewed and
copied at the SEC’s Public Reference Room in Washington, DC; information on the operation of the Public Reference Room may be obtained by calling 1-800-SEC-0330.
Information (if any) regarding how the Funds voted proxies relating to portfolio securities during the most recently disclosed 12-month period ended June 30 is available: (i) without charge, upon request, by calling (800) 220-8888; and (ii) on the SEC’s web-site at http://www.sec.gov.
2 0 1 3 A N N U A L R E P O R T | 67
Board Consideration of the Investment Advisory and
Sub-Advisory Agreements (Unaudited)
At a meeting held on March 14, 2013, the Independent Trustees of the Board of the Trust (“Trustees” or “Board”) considered the continuation of the Investment Advisory Agreement between the Trust and Quaker Funds, Inc. (“Adviser”) and each of the respective Sub-Advisory Agreements between the Adviser and Akros Capital, LLC, Aronson Johnson Ortiz, LP, Century Management, Inc., DG Capital Management and Kennedy Capital Management, Inc. (collectively, “Agreements”) with regard to each Fund. At the meeting, the Independent Trustees reported to the full Board their considerations with respect to the Agreements, and the Board, including a majority of Independent Trustees, considered and approved the renewal of the Agreements. Each of the Agreements was approved for a one year period, except for the Quaker Small Cap Growth Tactical Allocation Fund and the Quaker Akros Absolute Return Fund, which were approved for a six-month period.
In considering the continuation of the advisory and sub-advisory agreements, the Trustees considered the nature and quality of the services provided by the Adviser and each of the sub-advisers, the fee structures, the level of fee waivers, each Fund’s past and anticipated expense ratios, possible economies of scale resulting from increases in the size of the Funds and other possible benefits the Adviser and each of the sub-advisers derived from their relationships with the Funds. The Trustees carefully analyzed the information provided to them by the Adviser and each of the sub-advisers, focusing particularly on the level of advisory fees and expenses of each Fund and the performance of each Fund compared to funds with similar investment objectives.
The Board considered the services provided by the Adviser and the sub-advisers to the Funds and their shareholders. In reviewing the nature, extent and quality of services, the Board considered reports furnished to it throughout the year, which covered matters such as the relative performance of each Fund, compliance of portfolio managers with the investment policies, strategies and restrictions for each Fund, compliance by the personnel at the Adviser and sub-advisers with the Trust’s Code of Ethics, as well as the Codes of Ethics applicable to their firms, and adherence to fair value pricing procedures as established by the Board. The Board was pleased with the current staffing of the sub-advisers and the emphasis placed on research in the investment process as evidenced by reports provided during the course of the year. The Board gave favorable consideration to the Adviser’s efforts to control expenses as the Trust’s assets decreased while maintaining service levels committed to Fund matters. The Trustees considered the quality of the portfolio management services that each sub-adviser provided to the Funds; the depth, experience and demonstrated consistency in investment approach of each of the sub-advisers’ portfolio management teams. The Board noted that during the prior year, the Adviser had implemented measures to reduce overall costs, including by working with the Board to reduce the costs of the Funds’ third-party service providers. The Board noted the benefits provided to Fund shareholders through each shareholder’s ability to exchange investments between Funds and to reinvest Fund dividends into additional shares of a Fund. The Independent Trustees also acknowledged the Adviser’s commitment to servicing the Funds as its only client and the nature of the non-investment advisory services provided to the Funds, such as the supervision of the Funds’ other third-party services providers by the Adviser. The Board was satisfied with the nature, extent and quality of the overall services provided by the Adviser and the sub-advisers.
With respect to the Funds’ investment performance, the Trustees reviewed each Fund’s performance compared to both its Morningstar peer group and relative benchmark indices over one-year, three-year, five-year and since inception periods, as applicable. The Trustees considered factors, including but not limited to the sub-advisers’ management style and overall market conditions that had affected the performance of each Fund relative to its benchmark. The Trustees noted the continued improvement in the performance of the Quaker Strategic Growth Fund and Quaker Global Tactical Allocation Fund on an absolute basis and against their benchmarks. The Board concluded that the Quaker Small Cap Value Fund, Quaker Mid Cap Value Fund, and Quaker Event Arbitrage Fund had performed in line with expectations in light of market conditions over the past several years. With respect to the Quaker Small Cap Growth Tactical Allocation Fund and the Quaker Akros Absolute Return Fund, the Trustees noted their continued underperformance for the 1-year, 3-year and since inception periods and concluded that it was not satisfied with each of the Fund’s performance.
The Trustees considered the costs of the services provided to the Trust and the profits realized by the Adviser from its relationship with the Trust, including the Adviser’s and sub-advisers’ willingness to waive fees. The Board also considered that the Adviser and sub-advisers might be able to recover some of its waived fees in the future. The Board noted the Adviser’s efforts to improve services provided to Fund shareholders and to meet additional regulatory and compliance requirements resulting from recent industry-wide regulatory initiatives. The Trustees noted that the Adviser continued to subsidize the operation of the Funds and that such subsidies had materially affected its profitability. Because the Adviser has no other advisory accounts, the Trustees did not consider the relationship between the Adviser’s advisory fees compared to other accounts that the Adviser advises.
The Trustees considered whether there are any “fall out” or ancillary benefits that may accrue to the Adviser or a sub-adviser as a result of their relationship with the Funds. Based on the information provided, the Trustees noted that there did not appear to be any significant benefits in this regard.
Based on the totality of the information considered, the Trustees concluded that with the exception of the Quaker Small Cap Growth Tactical Allocation Fund and the Quaker Akros Absolute Return Fund, the Funds were likely to benefit from the nature, extent and quality of the Adviser’s and each of the sub-advisers’ services, as applicable, and that the Adviser and each of the sub-advisers have the ability to continue to provide these services based on their respective experience, operations and resources. With respect to the Quaker Small Cap Growth Tactical Allocation Fund and the Quaker Akros Absolute Return Fund, the Trustees directed the Adviser to evaluate the Fund’s short and longer-term performance and provide a recommendation to the Trustees for future action.
After evaluation of the performance, fee and expense information and the profitability, ancillary benefits and other considerations as described above, and in light of the nature, extent and quality of services to be provided by the Adviser and each of the sub-advisers, the Trustees determined the level of fees to be paid to the Adviser and each of the sub-advisers to be reasonable.
The Board discussed in detail the content of the information provided by the Adviser and each of the sub-advisers and raised specific questions they had from their individual reviews. In voting unanimously to approve the Advisory Agreement and Sub-advisory Agreements, based on the various considerations discussed above, the Trustees, including a majority of the Independent Trustees, determined that the approval of each of the Advisory Agreement and Sub-Advisory Agreements was in the best interests of the Funds. With respect to the Quaker Small Cap Growth Tactical Allocation Fund and the Quaker Absolute Return Fund, the Trustees concluded that due to the continued underperformance of the Fund’s sub-adviser, it was appropriate to renew the sub-advisory agreement for less than the traditional full-year period. Accordingly, these sub-advisory agreements would only be renewed for a six-month period.
68 | 2 0 1 3 A N N U A L R E P O R T
General Information (Unaudited)
Tax Information
We are required to advise you within 60 days of the Funds’ fiscal year-end regarding the federal tax status of certain distributions received by shareholders during such fiscal year. The information below is provided for the fiscal year ending June 30, 2013. During the fiscal year ended June 30, 2013, the following Funds paid long-term capital distributions:
| Fund | | Long-Term
Capital Gains | | Per
Share | |
| Akros Absolute Return | | | $ | — | | | | $ | — | | |
| Event Arbitrage | | | | — | | | | | — | | |
| Global Tactical Allocation | | | | — | | | | | — | | |
| Mid-Cap Value | | | | — | | | | | — | | |
| Small-Cap Growth Tactical Allocation | | | | — | | | | | — | | |
| Small-Cap Value | | | | — | | | | | — | | |
| Strategic Growth | | | | — | | | | | — | | |
Individual shareholders are eligible for reduced tax rates on the following percentages of qualified dividend income. For the purposes of computing the dividends eligible for reduced taxes, the following amounts of the dividends paid by the Fund from ordinary income earned during the fiscal year are considered qualified dividend income.
| Fund | | Amount | | Percentage | |
| Akros Absolute Return | | | $ | — | | | | | — | % | |
| Event Arbitrage | | | | 88,336 | | | | | 12.61 | % | |
| Global Tactical Allocation | | | | — | | | | | — | | |
| Mid-Cap Value | | | | — | | | | | — | | |
| Small-Cap Growth Tactical Allocation | | | | — | | | | | — | | |
| Small-Cap Value | | | | 86,508 | | | | | 100.00 | % | |
| Strategic Growth | | | | — | | | | | — | | |
Corporate shareholders may exclude up to the following percentages of qualifying dividends. For the purposes of computing this exclusion, the following amounts of the dividends paid by the Funds from ordinary income earned during the fiscal year represents qualifying dividends.
| Fund | | Amount | | Percentage | |
| Akros Absolute Return | | | $ | — | | | | | — | % | |
| Event Arbitrage | | | | 79,579 | | | | | 11.36 | % | |
| Global Tactical Allocation | | | | — | | | | | — | | |
| Mid-Cap Value | | | | — | | | | | — | | |
| Small-Cap Growth Tactical Allocation | | | | — | | | | | — | | |
| Small-Cap Value | | | | 86,508 | | | | | 100.00 | % | |
| Strategic Growth | | | | — | | | | | — | | |
Dividends and distributions received by retirement plans such as IRAs, Keogh type plans and 403(b) plans need not be reported as taxable income. However, many retirement plan trusts may need this information for their annual information reporting. Since the information above is reported for the Funds’ fiscal year and not the calendar year, shareholders should refer to their Form 1099-DIV or other tax information which will be mailed in January 2014 to determine the calendar year amounts to be included on their 2013 tax returns. Shareholders should consult their tax advisers.
Privacy Policy
Your personal privacy is important. At Quaker Investment Trust, including its subsidiaries and affiliated entities, we recognize that whether you are an existing customer or are considering a relationship with us, you have an interest in how we collect, retain and use information about you and your relationship with us.
We are committed to protecting your confidential information. We do this by maintaining standards and procedures designed to prevent the accidental disclosure of such information and/or its misuse. Our Customer Privacy Policy, which outlines how we accomplish the protection of your information, is set forth below.
I. INFORMATION COLLECTION
We may collect “non-public personal information” about you from the following sources:
| • | Information we receive from you on account applications and other account forms you provide to us; |
| | |
| • | Information about your transactions with us, our affiliates, and other entities; |
| | |
| • | Information we receive from third parties, such as credit bureaus, the IRS, and others. “Non-public personal information” is non-public information about you that we obtain in connection with providing a financial product or service to you. For example, non-public personal information includes information regarding your account balance, shares held, which funds you own, your investment history, etc. |
II. INFORMATION USE & SHARING WITH THIRD PARTIES
We are permitted under law to share information about our experiences or transactions with you or your account (such as your account balance, shares owned, and investment history) with affiliates. We may also share additional information about you or your account (such as information we receive from account applications and other correspondence) with our affiliates. We do not disclose information to our affiliates that does not directly relate to our or our affiliates’, experiences or transactions with your account.
We are also permitted under law to disclose non-public information about you to “non-affiliated third parties” in certain circumstances. We may share certain kinds of customer information with these third parties solely to facilitate the offering, administration, collection and delivery of our services to you, and only under strictly controlled circumstances designed to protect the privacy of your information. We require any non-affiliated third party with whom we share such information to execute our Confidentiality and Consumer Privacy Protection Agreement. Under that agreement, those parties are not allowed to release, use for their own purposes, or sell, transfer or provide any customer information we share with them to any other party.
You should be aware that there may be occasions where we are legally required to disclose information about you, such as in response to a governmental or court order.
If you decide to close your account with us, we will continue to adhere to these privacy policies. Lastly, we do not sell customer lists or individual customer information.
III. SECURITY STANDARDS
At Quaker Investment Trust and our affiliates, employee access to customer information is authorized for business purposes only and only for employees who need to know such information.
We regularly train our employees on privacy and privacy security, and we have established and continuously maintain standards and procedures to protect the privacy of your information.
When you use our on-line (Internet) products and services, we may collect information about you to personalize our services to you, but we do not share any such information or your email information to anyone other than our affiliates, unless compelled to do so under law.
IV. ACCURACY
We continually strive to maintain complete and accurate information about you and your accounts. Should you ever believe that our records are inaccurate or incomplete, please call us immediately at 800-220-8888. We will investigate your concerns and correct any inaccuracies. We will also confirm to you the actions we have taken concerning your account. You may also write to us at the Quaker Investment Trust, c/o U.S. Bancorp Fund Services, LLC 615 E. Michigan St., 3rd Floor, Milwaukee, Wisconsin 53202-52007.
2 0 1 3 A N N U A L R E P O R T | 69
The Quaker Funds are distributed by
Foreside Fund Services, LLC.
Contact us:
Quaker Funds, Inc.
c/o U.S. Bancorp Fund Services, LLC.
PO Box 701
Milwaukee, WI 53201-0701
800-220-8888
www.quakerfunds.com
©2013 Quaker® Investment Trust
 | QKAR 062013 |
Item 2. Code of Ethics.
As of the period ended June 30, 2013 (the “Reporting Period”), the Registrant has adopted a code of ethics that applies to the Registrant’s Principal Executive Officer and Principal Financial Officer. During the Reporting Period, there have been no changes to, amendments to, or waivers from, any provision of the code of ethics. A copy of this code of ethics, dated June 30, 2007, is filed as an Exhibit to this Form N-CSR pursuant to Item 12(a)(1).
Item 3. Audit Committee Financial Expert.
The Registrant’s Board of Trustees (the “Board”) has determined that the Registrant has one audit committee financial expert serving on its audit committee. The Board has designated Everett T. Keech audit committee financial expert serving on the registrant’s audit committee, and determined that Everett T. Keech is independent within the meaning of paragraph (a)(2) of Item 3 of Form N-CSR.
Item 4. Principal Accountant Fees and Services.
| (a) | Audit Fees: The aggregate fees billed for each of the last two fiscal years for professional services rendered to the Registrant by the principal accountant for the audit of the Registrant’s annual financial statements or services that are normally provided by the accountant in connection with statutory and regulatory filings or engagements for those fiscal years are $87,500 for 2013 and $100,000 for 2012. |
| (b) | Audit-Related Fees: The aggregate fees billed in each of the last two fiscal years for assurance and related services rendered to the Registrant by the principal accountant that are reasonably related to the performance of the audit of the Registrant’s financial statements and are not reported under paragraph (a) of this Item are $0 for 2013 and $0 for 2012. |
| (c) | Tax Fees: The aggregate fees billed in each of the last two fiscal years for professional services rendered to the Registrant by the principal accountant for tax compliance, tax advice, and tax planning are $17,500 for 2013 and $20,000 for 2012. The services for each of the fiscal years ended June 30, 2013 and June 30, 2012 consisted of: (i) review or preparation of U.S. federal, state, local and excise tax returns; (ii) U.S. federal, state and local tax planning, advice and assistance regarding statutory, regulatory or administrative developments; and (iii) tax advice regarding tax qualification. |
| (d) | All Other Fees: The aggregate fees billed in each of the last two fiscal years for products and services provided by the principal accountant, other than the services reported in paragraphs (a) through (c) of this Item are $0 for 2013 and $0 for 2012. |
| (e) | The Audit Committee of the Board of Trustees (the “Audit Committee”) has not adopted pre-approval policies and procedures. Instead, pursuant to the registrant’s Audit Committee Charter that has been adopted by the Audit Committee, the Audit Committee shall approve, prior to appointment, the engagement of the auditor to provide audit services to the registrant and non-audit services to the registrant, its investment adviser or any entity controlling, controlled by or under common control with the investment |
| | | adviser that provides on-going services to the registrant if the engagement relates directly to the operations and financial reporting of the Registrant. |
| (f) | All of the principal accountant’s hours spent on auditing the Registrant’s financial statements were attributed to work performed by full time permanent employees of the principal accountant. |
| (g) | The aggregate non-audit fees billed by the Registrant’s accountant for services rendered to the Registrant and to the Registrant’s investment adviser (not including any sub-adviser whose role is primarily portfolio management and whose activities are overseen by the Registrant’s investment adviser) and any entity controlling, controlled by, or under common control with the investment adviser that provides ongoing services to the Registrant, for each of the Registrant’s last two fiscal years are $0 for 2013 and $0 for 2012. |
| (h) | The Audit Committee has considered whether the provision of non-audit services that were rendered to the Registrant’s investment adviser is compatible with maintaining the principal accountant’s independence. The Audit Committee has concluded that the provision of such non-audit services by the accountant has not compromised the accountant’s independence. |
Item 5. Audit Committee of Listed Registrants.
Not Applicable.
Item 6. Schedule of Investments.
| (a) | A Schedule of Investments in securities of unaffiliated issuers as of the close of the reporting period is included as part of the report to shareholders filed under Item 1, Report to Shareholders, of this Form N-CSR. |
| (b) | Not Applicable. |
Item 7. Disclosure of Proxy Voting Policies and Procedures for Closed-End Management Investment Companies.
Not Applicable.
Item 8. Portfolio Managers of Closed-End Management Investment Companies.
Not Applicable.
Item 9. Purchases of Equity Securities by Closed-End Management Investment Company and Affiliated Purchasers.
Not Applicable.
Item 10. Submission of Matters to a Vote of Security Holders.
There have been no material changes to the procedures by which shareholders may recommend nominees to the registrant’s Board of Trustees, where those changes were implemented after the Registrant last provided disclosure in response to the requirements of Item 407(c)(2)(iv) of Regulation S-K (as required by Item 22(b)(15) of Schedule 14A (17 CFR 240.14a-101)), or this Item.
Item 11. Controls and Procedures.
| (a) | The Registrant’s Principal Executive Officer and Principal Financial Officer, or persons performing similar functions, have reviewed the Registrant’s disclosure controls and procedures (as defined in Rule 30a-3(c) under the Investment Company Act of 1940, as amended (the “Act”)) as of a date within 90 days of the filing of this report, as required by Rule 30a-3(b) under the Act and Rules 13a-15(b) or 15d-15(b) under the Securities Exchange Act of 1934. Based on their review, such officers have concluded that the disclosure controls and procedures are effective in ensuring that information required to be disclosed in this report is appropriately recorded, processed, summarized and reported and made known to them by others within the Registrant and by the Registrant’s service provider. |
| (b) | There were no changes in the Registrant’s internal control over financial reporting (as defined in Rule 30a-3(d) under the Act) that occurred during the second fiscal quarter of the period covered by this report that has materially affected, or is reasonably likely to materially affect, the Registrant’s internal control over financial reporting. |
Item 12. Exhibits.
| (a) | (1) | Any code of ethics or amendment thereto, that is subject of the disclosure required by Item 2, to the extent that the registrant intends to satisfy Item 2 requirements through filing an exhibit. Filed herewith. |
| | | |
| (a) | (2) | Certifications pursuant to Section 302 of the Sarbanes-Oxley Act of 2002. Filed herewith. |
| | | |
| (a) | (3) | Any written solicitation to purchase securities under Rule 23c-1 under the Act sent or given during the period covered by the report by or on behalf of the registrant to 10 or more persons. Not applicable to open-end investment companies. |
| | |
| (b) | Certification pursuant to Section 906 of the Sarbanes-Oxley Act of 2002. Filed herewith. |
SIGNATURES
Pursuant to the requirements of the Securities Exchange Act of 1934 and the Investment Company Act of 1940, the registrant has duly caused this report to be signed on its behalf by the undersigned, thereunto duly authorized.
| (Registrant) Quaker Investment Trust | |
| | | |
| By (Signature and Title) | /s/ Jeffry H. King, Sr. | |
| | Jeffry H. King, Sr., | |
| | Chief Executive Officer | |
| | | |
| Date | 09/05/2013 | | |
Pursuant to the requirements of the Securities Exchange Act of 1934 and the Investment Company Act of 1940, this report has been signed below by the following persons on behalf of the registrant and in the capacities and on the dates indicated.
| By (Signature and Title) | /s/ Jeffry H. King, Sr. | |
| | Jeffry H. King, Sr., | |
| | Chief Executive Officer | |
| | | |
| Date | 09/05/2013 | | |
| | | |
| By (Signature and Title) | /s/ Laurie Keyes | |
| | Laurie Keyes, | |
| | Treasurer | |
| | | |
| Date | 09/05/2013 | | |