ANNUAL REPORT
JUNE 30, 2016
QUAKER EVENT ARBITRAGE FUND
QUAKER GLOBAL TACTICAL ALLOCATION FUND
QUAKER MID-CAP VALUE FUND
QUAKER SMALL-CAP VALUE FUND
QUAKER STRATEGIC GROWTH FUND
| | | |
| | Mutual fund investing involves risk. Principal loss is possible. | |
| | Investing in the Quaker Funds may involve special risk including, but not limited to, investments in smaller companies, short sales, foreign securities, special situations, debt securities and value growth investing. Please refer to the prospectus for more complete information. | |
| | This report must be preceded or accompanied by a current prospectus. | |
| | The opinions expressed are those of the adviser or sub-advisers through the end of the period for this report, are subject to change, are not a guarantee, and should not be considered investment advice. | |
| | Fund holdings are subject to change and should not be considered a recommendation to buy or sell any security. Current and future holdings are subject to risk. | |
| | | |
Chairman’s Letter to the Shareholders (unaudited)
June 30, 2016
Dear Fellow Shareholder:
The premise upon which Quaker Funds, Inc. was founded was the desire to afford everyday investors access to the same tactical and allocation strategies used by professional money managers to augment traditional investing strategies within a holistic asset allocation mix. Our commitment to this principle is still as strong today as it was the day we opened our doors.
Our management team continually strives to provide our shareholders with innovative investment alternatives and advisers that constantly seek superior returns. Thank you for your trust and investment in the Quaker Funds.
Sincerely,
Jeffry H. King, Sr.
Chairman & CEO
Quaker Investment Trust
| | | | | |
| | | Table of Contents | | |
| | | | Page | |
| | | Chairman’s Letter to the Shareholders | 1 | |
| | | Performance Update: | | |
| | | Quaker Event Arbitrage Fund | 2 | |
| | | Quaker Global Tactical Allocation Fund | 5 | |
| | | Quaker Mid-Cap Value Fund | 9 | |
| | | Quaker Small-Cap Value Fund | 12 | |
| | | Quaker Strategic Growth Fund | 15 | |
| | | Expense Information | 19 | |
| | | Schedule of Investments | 21 | |
| | | Statements of Assets and Liabilities | 38 | |
| | | Statements of Operations | 40 | |
| | | Statements of Changes in Net Assets | 42 | |
| | | Financial Highlights | 44 | |
| | | Notes to the Financial Statements | 59 | |
| | | Report of Independent Registered Public | | |
| | | Accounting Firm | 78 | |
| | | Trustees and Officers | 79 | |
| | | Approval of Advisory and | | |
| | | Sub-Advisory Agreements | 81 | |
| | | General Information | 83 | |
| | | | | |
Performance Update (unaudited)
Quaker Event Arbitrage Fund (QEAAX, QEACX, QEAIX)
OBJECTIVES AND PRINCIPAL STRATEGIES
The Quaker Event Arbitrage Fund (“Fund”) seeks to provide long-term growth of capital. The Fund generally invest in the securities of publicly traded companies involved in mergers, takeovers, tender offers, leveraged buyouts, spin-offs, liquidations or similar events.
PERFORMANCE REVIEW AND MARKET OUTLOOK
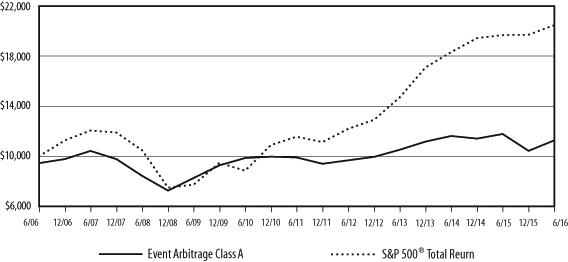
Over the last year the Fund returned -4.33%, whereas the total return of the S&P 500 was 3.99%. While the equity market gyrated over the last year, the Fund’s daily volatility was roughly 11% lower than that of the S&P 500.
The past 12 months have seen an uncharacteristically variable environment for event driven investing. After weak performance during fall and winter the strategy experienced a snap back after reaching lows in February. The principal driver of the sharp pull back seems to have been driven by forced selling by hedge funds, which impacted many event driven positions. Forced liquidations by hedge funds began in early 2015 in many distressed securities and spread to other sub-strategies in which the Fund invests later in the year. In particular, activist investments suffered sharp pull backs as many hedge funds that specialize in these strategies experienced investor redemptions and had to liquidate positions to meet redemption requests. Throughout this period the Fund held its portfolio in line with where it had been prior to the selloff, while the weighting of some positions that, in the opinion of the portfolio managers looked more attractive at lower prices, were increased.
Looking forward, the portfolio management team believes there may be opportunities in activist investments, distressed investments and special situations such as spin-offs. Over the last year, the Fund’s investments in distressed securities represented both weakness during the selloff but excellent performers once hedge fund liquidations abated. Distressed energy companies have provided attractive distressed investment candidates. In activist investments, despite the turmoil that some activist investors experienced that fund has had some successes, for example, when a lesser known activist had its portfolio investments sold at a large premium. We believe that classic merger arbitrage has provided mostly inadequate risk/return profiles throughout the year and therefore had small allocations, which were frequently as low as zero. We also believe that event-driven merger arbitrage has provided better risk/return profiles.
I wish all investors a prosperous year and thank you for your continued support.
Sincerely,
Thomas Kirchner, Portfolio Manager
Quaker Funds, Inc.
2016 ANNUAL REPORT
Performance Update (unaudited) (continued)
Quaker Event Arbitrage Fund (QEAAX, QEACX, QEAIX)
ADVISER:
Quaker Funds, Inc.
TOTAL NET ASSETS:
AS OF JUNE 30, 2016
$33,891,588
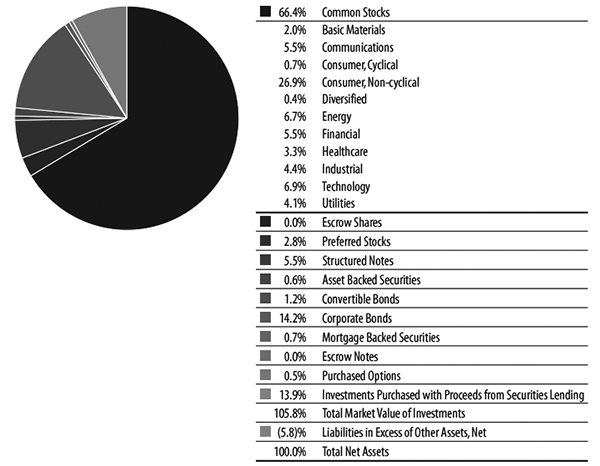
| Top 10 Holdings* (% of net assets) | | |
| Pfizer Inc. | 4.5% | |
| AGL Resources Inc. | 4.1% | |
| Mondelez International Inc. | 3.7% | |
| Diagnostic Services Holdings Inc. | 3.3% | |
| AbbVie Inc. | 3.3% | |
| Kosmos Energy Ltd., 7.875%, 08/01/2021 | 2.8% | |
| Ryanair Holdings PLC Structured Note, | | |
| Expiration: 08/10/2016 | 2.8% | |
| Bank of America Corp. Structured Note, | | |
| Expiration: 02/14/2017 | 2.7% | |
| QUALCOMM Inc. | 2.7% | |
| Anheuser-Busch InBev NV - ADR | 2.7% | |
| % Fund Total | 32.6% | |
* Includes Long-Term Investments only.
| Sectors (% of net assets) |
2016 ANNUAL REPORT
Performance Update (unaudited) (continued)
Quaker Event Arbitrage Fund (QEAAX, QEACX, QEAIX)
Growth of a Hypothetical $10,000 Investment
June 30, 2016
| Average Annualized Total Return |
| | | | | | | | | | Commencement |
| | | | | | | | | | of operations |
| | Expense | Inception | | | | | | | through |
| | Ratio* | Date | One Year | Five Year | Ten Year | 6/30/2016 |
| | | | with | without | with | without | with | without | with | without |
| | | | sales | sales | sales | sales | sales | sales | sales | sales |
| | | | charge | charge | charge | charge | charge | charge | charge | charge |
| Class A | 1.99% | 11/21/03 | -9.60% | -4.33% | 1.46% | 2.61% | 1.20% | 1.77% | 4.75% | 5.22% |
| Class C | 2.74% | 6/7/10 | -5.03% | -5.03% | 1.83% | 1.83% | N/A | N/A | 1.73% | 1.73% |
| Institutional Class | 1.74% | 6/7/10 | -4.15% | -4.15% | 2.86% | 2.86% | N/A | N/A | 2.73% | 2.73% |
S&P 500® Total Return Index** | | 3.99% | 3.99% | 12.10% | 12.10% | 7.42% | 7.42% | 7.97% | 7.97% |
| * | As stated in the Prospectus dated October 28, 2015. Net Expense Ratio shown. Gross Expense Ratio: A:2.17%, C:2.92%, I:1.92%. The net expense ratio reflects a contractual commitment by the Fund’s investment adviser to waive fees and reimburse expenses through October 28, 2016. Absent the waiver and reimbursement, performance would have been less favorable. |
| ** | The benchmark since inception returns are calculated since commencement of November 21, 2003 through June 30, 2016. |
Performance data quoted represents past performance and is no guarantee of future results. Investment return and principal value will fluctuate so that shares, when redeemed, may be worth more or less than their original cost. Current performance may be lower or higher than performance data quoted. Performance data current to the most recent month end is available at www.quakerfunds.com or by calling us toll free at 800-220-8888. Total return includes reinvestment of dividends and capital gains.
Class A shares of the Fund have a maximum sales charge of 5.50%.
The performance table does not reflect the deduction of taxes that a shareholder might pay on fund distributions or the redemption of fund shares. Total return calculations reflect expense reimbursements and fee waivers in the applicable periods. See financial highlights for periods where fees were waived or reimbursed.
The Fund’s portfolio holdings may differ significantly from the securities held in the index and, unlike a mutual fund, an unmanaged index assumes no transaction costs, taxes, management fees or other expenses. You cannot invest directly in an index.
The S&P 500® Total Return Index (“S&P 500® Index”) is a widely recognized, unmanaged index consisting of the approximately 500 largest companies in the United States as measured by market capitalization. The S&P 500® Index assumes reinvestment of all dividends and distributions.
2016 ANNUAL REPORT
Performance Update (unaudited)
Quaker Global Tactical Allocation Fund (QTRAX, QTRCX, QTRIX)
OBJECTIVES AND PRINCIPAL STRATEGIES
The Fund seeks to provide long-term growth of capital. The Fund invests in common stocks of U.S. companies and American Depository Receipts (“ADRs”) of foreign companies without regard to market capitalization. Under normal circumstances, the Fund will invest at least 40% of its total assets in common stocks and ADRs of foreign companies.
PERFORMANCE REVIEW AND MARKET OUTLOOK
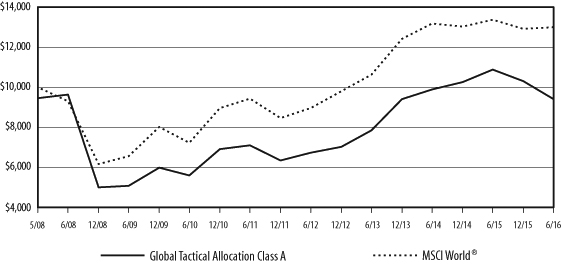
For the fiscal year ended June 30, 2016, the MSCI World Index (“MSCI World”, a global market proxy) fell 2.78% while the Quaker Global Tactical Allocation Fund finished the fiscal year with a loss of 13.55%. For the first half of the 2016 calendar year, the MSCI World rose 0.66% while the Quaker Global Tactical Allocation Fund fell 8.72%.
After a relatively serene winter and spring, the summer of 2015 brought heightened volatility to domestic and international markets with the VIX (known as the fear index) spiking to levels not seen since the 20% sell-off in 2011. A combination of weakening oil prices, subdued economic activity and uncertainty surrounding the first Fed tightening in just short of a decade, all weighed on markets both domestic and abroad. A fourth quarter rebound ultimately proved to be quite narrow, led by a select group of mega-cap stocks. Companies with low visibility in their earnings growth prospects (like those in the energy and industrial space) also failed to rally, hampered by weak commodity prices and the strong dollar.
International markets also waited with anticipation for the Fed’s interest rate decision, which in tightening is diverging from the ongoing easing efforts in Europe, Japan and China. While divergent paths should favor international markets, geopolitical risks still abound. Globally, weakened commodity prices have been particularly damaging for emerging market economies (since it has also been coupled with lower demand).
The first half of 2016 continued to be tumultuous for both domestic and global markets. Domestic markets kicked off the year with a record breaking sell-off in the first six weeks, which was followed by a similarly dramatic rally, taking the S&P back into positive territory by the end of the first quarter. The market was spooked by a continued steep slide in both energy and commodity prices, continued weak global growth and uncertainty surrounding the timing and impact of the Fed’s rate hike. The second quarter was rather subdued up until the surprise Brexit vote at quarter-end which sent the S&P on another week-long 5% crash and recovery round trip.
International markets were also volatile in the first half. Slow growth and falling oil prices pushed the Eurozone into deflation in February prompting the ECB to announce an expansion of its stimulus program in March. China also acknowledged that its growth rate is slowing by lowering its growth target to the 6.5% -7.0% range. In emerging markets, bottoming oil and commodity prices and central bank easing led markets to rally. However, slowing growth in China is expected to be a negative going forward for many developing countries that face credit downgrades, slowing global growth and a stronger dollar (which makes their dollar denominated debt more expensive to service). The Brexit vote also pushed down European markets, which quickly recovered. European currencies, however, also took a hit but stayed down on the long term prospect of the United Kingdom exiting the European Union.
Sector gains were mixed over the last year with utilities, telecom and consumer staples (all underweights) the biggest winners and materials, energy and financials (also all underweights) the biggest losers. During the last 12 months the portfolio was helped by underweights in materials, and financials as well as stock selection in consumer discretionaries. Relative performance was hurt by stock picks in most other sectors, particularly biotech, as well as an underweight in consumer staples and a heavy overweight in healthcare.
2016 ANNUAL REPORT
Performance Update (unaudited) (continued)
Going forward, we expect to continue to favor growth themes which allow companies to produce strong earnings growth in a variety of economic and interest rate environments. In our view, market valuations continue to be reasonable in an environment of low interest rates. Economic activity has also perked up in housing and consumer spending which are two areas that could benefit the broader economy. Looking ahead, weakening currencies, lower input costs and future dovish central bank activity abroad could help boost the reflation and recovery of many economies (both emerging and developed) through increased exports and higher consumer demand. The lower valuations in many international markets will also make them attractive, relative to domestic equities, once growth returns in earnest.
Our biggest overweight currently is in technology focusing on companies that provide productivity solutions via enhancing data analytics, cloud based services, electronic payments and online retail. We also have an overweight in the consumer discretionary sector focusing on millennial trends in both media and retail and on dominant franchises that are gaining market share. We expect to continue to have an overweight in the healthcare sector concentrating on global biotech and pharmaceutical companies. While this area has become a political hotcake in this election year, technological advances continue to bring new, important products to market and M&A activity also continues to add support to valuations. In addition to following these themes, we also expect to continue to concentrate on foreign names with a substantial end-market in the U.S. (like biotech/pharma) or other higher growth areas (like India and China).
Our underweights continue to be in the more cyclical areas of industrials, materials and consumer staples as we find more appealing value elsewhere. We continue to underweight energy names since we feel the recent oil rally has overshot fundamentals and is due for a pull-back.
We continue to strive to provide a good risk adjusted return for our shareholders through intensive stock selection, evaluating opportunities both domestic and worldwide. At the same time, the Fund will continue to take advantage of its mandate to protect capital by tactically raising cash and by utilizing short-selling strategies.
Respectfully,
Manu P. Daftary,
Portfolio Manager
DG Capital Management, Inc.
2016 ANNUAL REPORT
Performance Update (unaudited) (continued)
Quaker Global Tactical Allocation Fund (QTRAX, QTRCX, QTRIX)
SUB-ADVISER:
DG Capital Management, Inc.
TOTAL NET ASSETS:
AS OF JUNE 30, 2016
$6,738,920
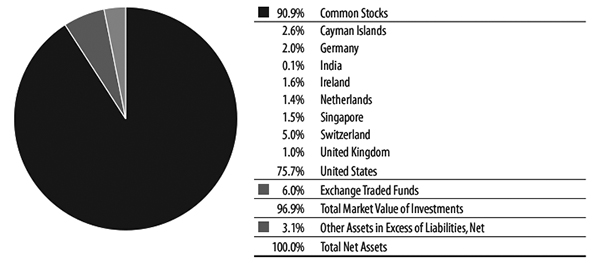
| Top 10 Holdings* (% of net assets) | | |
| WisdomTree Europe Hedged Equity Fund - ETF | 4.8% | |
| Amazon.com Inc. | 4.6% | |
| Alphabet Inc. Cl A & C | 4.2% | |
| Visa Inc. Cl A | 3.3% | |
| Mastercard Inc. Cl A | 3.2% | |
| Facebook Inc. Cl A | 3.1% | |
| Roche Holding AG - ADR | 2.8% | |
| The TJX Cos. Inc. | 2.7% | |
| Adobe Systems Inc. | 2.6% | |
| Amgen Inc. | 2.6% | |
| % Fund Total | 33.9% | |
* Includes Long-Term Investments only.
| Country Allocation (% of net assets) |
Performance Update (unaudited) (continued)
Quaker Global Tactical Allocation Fund (QTRAX, QTRCX, QTRIX)
Growth of a Hypothetical $10,000 Investment
June 30, 2016
| Average Annualized Total Return |
| | | | | | | | | | Commencement |
| | | | | | | | | | of operations |
| | Expense | Inception | | | | | | | through |
| | Ratio* | Date | One Year | Five Year | Ten Year | 6/30/2016 |
| | | | with | without | with | without | with | without | with | without |
| | | | sales | sales | sales | sales | sales | sales | sales | sales |
| | | | charge | charge | charge | charge | charge | charge | charge | charge |
| Class A | 2.29% | 5/1/08 | -18.31% | -13.55% | 4.59% | 5.79% | N/A | N/A | -0.75% | -0.06% |
| Class C | 3.04% | 5/1/08 | -14.21% | -14.21% | 4.98% | 4.98% | N/A | N/A | -0.81% | -0.81% |
| Institutional Class | 2.04% | 7/23/08 | -13.30% | -13.30% | 6.05% | 6.05% | N/A | N/A | 1.74% | 1.74% |
| MSCI World® Index** | | | -2.78% | -2.78% | 6.63% | 6.63% | N/A | N/A | 3.26% | 3.26% |
| * | As stated in the Prospectus dated October 28, 2015. |
| ** | The benchmark since inception returns are calculated since commencement of May 1, 2008 through June 30, 2016. |
Performance data quoted represents past performance and is no guarantee of future results. Investment return and principal value will fluctuate so that shares, when redeemed, may be worth more or less than their original cost. Current performance may be lower or higher than performance data quoted. Performance data current to the most recent month end is available at www.quakerfunds.com or by calling us toll free at 800-220-8888. Total return includes reinvestment of dividends and capital gains.
Class A shares of the Fund have a maximum sales charge of 5.50%.
The performance table does not reflect the deduction of taxes that a shareholder might pay on fund distributions or the redemption of fund shares. Total return calculations reflect expense reimbursements and fee waivers in the applicable periods. See financial highlights for periods where fees were waived or reimbursed.
The Fund’s portfolio holdings may differ significantly from the securities held in the index and, unlike a mutual fund, an unmanaged index assumes no transaction costs, taxes, management fees or other expenses. You cannot invest directly in an index.
The Morgan Stanley Capital International World Index (“MSCI World® Index”) measures developed-market equity performance throughout the world. The MSCI World® Index assumes reinvestment of all dividends and distributions.
2016 ANNUAL REPORT
Performance Update (unaudited)
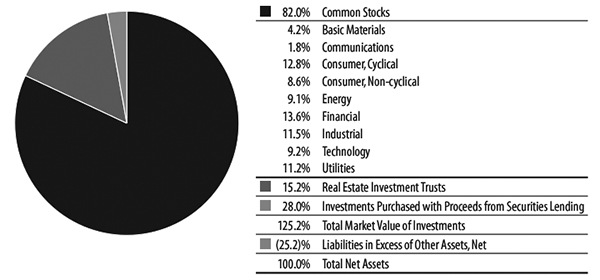
Quaker Mid-Cap Value Fund (QMCVX, QMCCX, QMVIX)
OBJECTIVES AND PRINCIPAL STRATEGIES
The Quaker Mid-Cap Value Fund (the “Fund”) seeks to provide long-term growth of capital. Current income is not a significant investment consideration and any such income realized will be considered incidental to the Fund’s investment objective. The Fund invests primarily in common stocks comparable to the companies included in the Russell Midcap® Value Index.
PERFORMANCE REVIEW AND MARKET OUTLOOK
For the fiscal year ended June 30, 2016, the Fund declined 4.84% versus a gain of 3.25% for the Russell Midcap® Value Index. Sector performance within the index was highlighted by strong performance from utilities and consumer staples, up 33% and 24%, respectively. Our holdings in those sectors did even better, with returns of 41% and 55%, respectively. But that strength was overshadowed by weakness from our holdings in the information technology and consumer discretionary sectors, which declined -11% and -20%, respectively, and were the biggest detractors from relative performance. The energy sector continued to grab most of the attention with another year as the worst performing sector in both the Fund and the benchmark, posting declines of -34% and -19%, respectively.
Looking forward, we continue to expect modest growth for the U.S. economy for the balance of the year. Housing starts, auto sales, strong consumer confidence, and low unemployment continue to indicate growth in the domestic economy. The recent increase in oil prices has also started to stir some new activity in the energy sector which could provide some stimulus to the still admittedly lagging industrial sector.
Our outlook for equities also remains unchanged with expectations for modest returns overall. While uncertainty abounds regarding the path for the United Kingdom to separate from the European Union, we believe that this new element of uncertainty will most likely extend the period of ultra-low interest rates around the globe. In the past, we have highlighted our thoughts on the “pull-forward” effect of near-zero global interest rates on equity returns, and we are now witnessing interest rates actually turn negative for sovereign debt for most European and Asian nations, potentially creating a new stimulus for equity returns.
We acknowledge that our bottom up focus on stock selection has led us to underestimate the macro driven impact of lower interest rates on levered, yield-generating equities such as REITS and utilities. In hindsight, we should have weighted such sectors more heavily, as the near-zero interest rate environment has magnified gains for these equities. We do not know how long this unprecedented period of negative interest rates will last; however, we do believe stock selection will become increasingly important as rates ultimately begin to normalize.
Sincerely,
Frank Latuda, Jr. CFA
Chief Investment Officer & Portfolio Manager
Kennedy Capital Management, Inc.
2016 ANNUAL REPORT
Performance Update (unaudited) (continued)
Quaker Mid-Cap Value Fund (QMCVX, QMCCX, QMVIX)
SUB-ADVISER:
Kennedy Capital Management, Inc.
TOTAL NET ASSETS:
AS OF JUNE 30, 2016
$6,904,935
| Top 10 Holdings* (% of net assets) | | |
| Reinsurance Group of America Inc. Cl A | 2.7% | |
| Concho Resources Inc. | 2.7% | |
| Sun Communities Inc. | 2.5% | |
| Reliance Steel & Aluminum Co. | 2.5% | |
| Xcel Energy Inc. | 2.5% | |
| DTE Energy Co. | 2.5% | |
| Helmerich & Payne Inc. | 2.4% | |
| UGI Corp. | 2.3% | |
| Alexandria Real Estate Equities Inc. | 2.2% | |
| Torchmark Corp. | 2.2% | |
| % Fund Total | 24.5% | |
* Includes Long-Term Investments only.
| Sectors (% of net assets) |
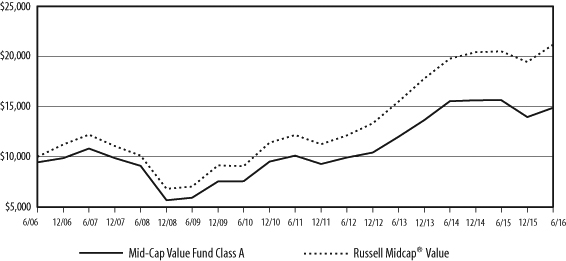
Performance Update (unaudited) (continued)
Quaker Mid-Cap Value Fund (QMCVX, QMCCX, QMVIX)
Growth of a Hypothetical $10,000 Investment
June 30, 2016
| Average Annualized Total Return |
| | | | | | | | | | Commencement |
| | | | | | | | | | of operations |
| | Expense | Inception | | | | | | | through |
| | Ratio* | Date | One Year | Five Year | Ten Year | 6/30/2016 |
| | | | with | without | with | without | with | without | with | without |
| | | | sales | sales | sales | sales | sales | sales | sales | sales |
| | | | charge | charge | charge | charge | charge | charge | charge | charge |
| Class A | 1.98% | 12/31/97 | -10.07% | -4.84% | 6.81% | 8.02% | 4.06% | 4.64% | 6.67% | 7.00% |
| Class C | 2.73% | 7/31/00 | -5.57% | -5.57% | 7.22% | 7.22% | 3.87% | 3.87% | 7.15% | 7.15% |
| Institutional Class | 1.73% | 11/21/00 | -4.61% | -4.61% | 8.29% | 8.29% | 4.91% | 4.91% | 8.40% | 8.40% |
Russell Midcap® Value Index** | | | 3.25% | 3.25% | 11.70% | 11.70% | 7.79% | 7.79% | 9.14% | 9.14% |
| * | As stated in the Prospectus dated October 28, 2015. |
| ** | The benchmark since inception returns are calculated since commencement of December 31,1997 through June 30, 2016. |
Performance data quoted represents past performance and is no guarantee of future results. Investment return and principal value will fluctuate so that shares, when redeemed, may be worth more or less than their original cost. Current performance may be lower or higher than performance data quoted. Performance data current to the most recent month end is available at www.quakerfunds.com or by calling us toll free at 800-220-8888. Total return includes reinvestment of dividends and capital gains.
Class A shares of the Fund have a maximum sales charge of 5.50%.
The performance table does not reflect the deduction of taxes that a shareholder might pay on fund distributions or the redemption of fund shares. Total return calculations reflect expense reimbursements and fee waivers in the applicable periods. See financial highlights for periods where fees were waived or reimbursed.
The Fund’s portfolio holdings may differ significantly from the securities held in the index and, unlike a mutual fund, an unmanaged index assumes no transaction costs, taxes, management fees or other expenses. You cannot invest directly in an index.
The Russell Midcap® Value Index is a widely recognized, unmanaged index of companies included in the Russell 1000 Index with current market capitalizations between $2.4 billion to $28.7 billion. The Russell Midcap® Value index assumes reinvestment of all dividends.
2016 ANNUAL REPORT
Performance Update (unaudited)
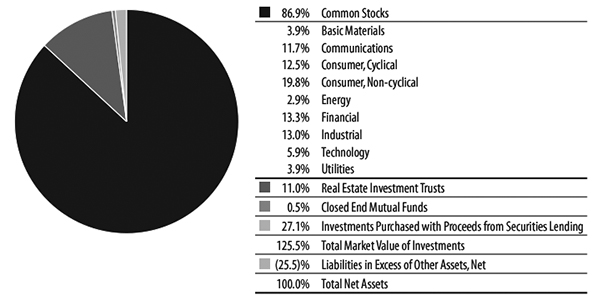
Quaker Small-Cap Value Fund (QUSVX, QSVCX, QSVIX)
OBJECTIVES AND PRINCIPAL STRATEGIES
The Fund seeks to provide long-term growth of capital. Current income is not a significant investment consideration, and any such income realized will be considered incidental to the Fund’s investment objective. The Fund invests primarily in common stocks of U.S. companies with market capitalizations similar to the market capitalizations of companies included in the Russell 2000® Index and Russell 2500® Index. The Fund invests in companies considered by the Fund’s sub-adviser to have consistent earnings and above-average core assets, selling at relatively low market valuations, with attractive growth and momentum characteristics.
PERFORMANCE REVIEW AND MARKET OUTLOOK
For the fiscal year ended June 30, 2016, the Fund’s performance was -9.93%, while the Fund’s benchmark, the Russell 2000® Index (a broad-based cross-section of the entire U.S. small-cap market), returned -6.73%. Working from the bottom up, we evaluate companies relative to their industry peers using four broad categories of attractiveness: value, management, momentum, and sentiment. Value to us means fairly traditional ratios of price to fundamental value; management measures seek evidence that company management has produced and will continue to produce earnings power; momentum helps us determine when stocks might be expected to begin their ascent toward full valuation; and sentiment provides another level of understanding of the buying and selling behavior of key investor segments.
It was an erratic year, with a noticeable shift in volatility and capitalization preference across the equity markets which presented a headwind to our work. For example, in our small-cap universe, the quintile return spread between high- and low-vol stocks was -42% — in favor of low-vol names and against our (unintended) positioning. Similarly, within the small-cap universe, the larger-cap stocks outperformed the smaller-cap stocks.
The bulk of our underperformance arose from poor stock selection in the financials, consumer discretionary, and information technology sectors where several of our factors failed to distinguish the winners from losers. Our information technology picks were most impacted by an environment where measures of earnings and price momentum were ignored in the market’s quest for lower risk. Among consumer discretionary stocks, small-cap retailers trading at attractive valuations lagged their less-volatile peers. And within financials, the highest dividend payers (i.e., REITs) topped our better valued, more efficiently managed portfolio holdings.
On a positive note, our health care holdings benefitted from our evaluation of management — notably, our preference for companies that repurchase their own shares and use assets efficiently. And in the more stable consumer staples sector, momentum contributed modestly, just not enough to overcome our shortfall.
We remain firm in our conviction that superior results can be achieved through a consistent, systematic approach that focuses on low-priced companies with proven management, earnings power, and favorable investor sentiment.
The Portfolio Management Team
Aronson Johnson Ortiz, LP
2016 ANNUAL REPORT
Performance Update (unaudited) (continued)
Quaker Small-Cap Value Fund (QUSVX, QSVCX, QSVIX)
SUB-ADVISER:
Aronson Johnson Ortiz, LP
TOTAL NET ASSETS:
AS OF JUNE 30, 2016
$32,550,214
| Top 10 Holdings* (% of net assets) | |
| Take-Two Interactive Software Inc. | 1.4% |
| Kaiser Aluminum Corp. | 1.4% |
| Reinsurance Group of America Inc. Cl A | 1.4% |
| Huntington Ingalls Industries Inc. | 1.4% |
| Hospitality Properties Trust | 1.3% |
| UGI Corp. | 1.3% |
| Flagstar Bancorp Inc. | 1.3% |
| Aspen Technology Inc. | 1.3% |
| Aegion Corp. | 1.3% |
| Orthofix International NV | 1.2% |
| % Fund Total | 13.3% |
* Includes Long-Term Investments only.
| Sectors (% of net assets) |
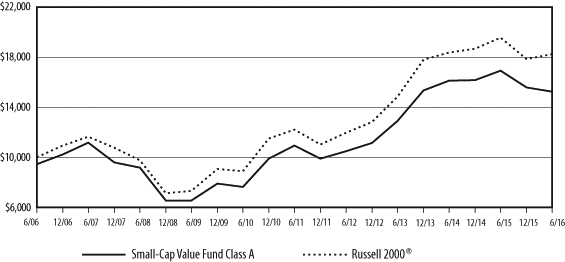
Performance Update (unaudited) (continued)
Quaker Small-Cap Value Fund (QUSVX, QSVCX, QSVIX)
Growth of a Hypothetical $10,000 Investment
June 30, 2016
| Average Annualized Total Return |
| | | | | | | | | | Commencement |
| | | | | | | | | | of operations |
| | Expense | Inception | | | | | | | through |
| | Ratio* | Date | One Year | Five Year | Ten Year | 6/30/2016 |
| | | | with | without | with | without | with | without | with | without |
| | | | sales | sales | sales | sales | sales | sales | sales | sales |
| | | | charge | charge | charge | charge | charge | charge | charge | charge |
| Class A | 1.79% | 11/25/96 | -14.90% | -9.93% | 5.66% | 6.86% | 4.30% | 4.90% | 8.95% | 9.27% |
| Class C | 2.54% | 7/28/00 | -10.59% | -10.59% | 6.08% | 6.08% | 4.11% | 4.11% | 7.84% | 7.84% |
| Institutional Class | 1.54% | 9/12/00 | -9.71% | -9.71% | 7.14% | 7.14% | 5.15% | 5.15% | 8.22% | 8.22% |
Russell 2000® Index** | | | -6.73% | -6.73% | 8.35% | 8.35% | 6.20% | 6.20% | 7.65% | 7.65% |
| * | As stated in the Prospectus dated October 28, 2015. |
| ** | The benchmark since inception returns are calculated since commencement of November 25, 1996 through June 30, 2016. |
Performance data quoted represents past performance and is no guarantee of future results. Investment return and principal value will fluctuate so that shares, when redeemed, may be worth more or less than their original cost. Current performance may be lower or higher than performance data quoted. Performance data current to the most recent month end is available at www.quakerfunds.com or by calling us toll free at 800-220-8888. Total return includes reinvestment of dividends and capital gains.
Class A shares of the Fund have a maximum sales charge of 5.50%.
The performance table does not reflect the deduction of taxes that a shareholder might pay on fund distributions or the redemption of fund shares. Total return calculations reflect expense reimbursements and fee waivers in the applicable periods. See financial highlights for periods where fees were waived or reimbursed.
The Fund’s portfolio holdings may differ significantly from the securities held in the index and, unlike a mutual fund, an unmanaged index assumes no transaction costs, taxes, management fees or other expenses. You cannot invest directly in an index.
The Russell 2000® Index is a widely recognized, unmanaged index comprised of the smallest 2000 companies represented in the Russell 3000® Index. The Russell 2000® Index currently represents approximately 8% of the market capitalization of the Russell 3000® Index.
2016 ANNUAL REPORT
Performance Update (unaudited)
Quaker Strategic Growth Fund (QUAGX, QAGCX, QAGIX)
OBJECTIVES AND PRINCIPAL STRATEGIES
The Fund seeks to provide long-term growth of capital. Current income is not a significant investment consideration. The Fund invests primarily in equity securities of domestic U.S. companies which the Fund’s sub-adviser believes show a high probability for superior growth.
PERFORMANCE REVIEW AND MARKET OUTLOOK
For the fiscal year ended June 30, 2016, the S&P 500 Total Return Index (the “S&P 500®”, a broad based market proxy) gained 3.99% while the Class A shares of the Quaker Strategic Growth Fund finished the fiscal year with a total return loss of 10.36%. For the first half of calendar year 2016, the S&P 500® gained 3.84% while the Quaker Strategic Growth Fund fell 7.28%.
After a relatively serene winter and spring, the summer of 2015 brought heightened volatility to domestic and international markets with the VIX (known as the fear index) spiking to levels not seen since the 20% sell-off in 2011. A combination of weakening oil prices, subdued economic activity and uncertainty surrounding the first Fed tightening in just short of a decade, all weighed on markets both domestic and abroad. The underperformance in mid and smaller cap names was likely due to rising risk aversion as concerns over weakened economic activity in China continued and the date of the anticipated FOMC rate hike neared. Companies with low visibility in their earnings growth prospects (like those in the energy and industrial space) also failed to rally, hampered by weak commodity prices and the strong dollar.
2016 began with another tumultuous quarter. The year kicked off with a record breaking sell-off in the first six weeks, which was followed by a similarly dramatic rally, taking the S&P back into positive territory by quarter-end. The market was again spooked by falling commodity prices, falling energy prices, weak global growth and uncertainty surrounding the timing and impact of U.S. interest rate increases by the Fed. Fears abated as an uptick in factory activity, a boost in pending home sales and healthy jobs growth restored confidence in the domestic economy. The second quarter was rather subdued up until the surprise Brexit vote at quarter-end sent the S&P on another week-long 5% crash and recovery round trip.
Sector gains were mixed over the last year with utilities, telecom and consumer staples (all underweights) the biggest winners and materials, energy and financials (also all underweights) the biggest losers. During the last 12 months the portfolio was helped by underweights in materials, energy and financials as well as stock selection in consumer discretionaries. Relative performance was hurt by stock picks in most other sectors, particularly biotech, as well as underweights in consumer staples and utilities.
Going forward, we expect to continue to favor growth themes which allow companies to produce strong earnings growth in a variety of economic and interest rate environments. In our view, the indiscriminate selling of high-growth companies in the first quarter has led to a decline in valuations for firms with no material deterioration in their business fundamentals. As such, we have taken the opportunity to upgrade our portfolio with companies that we believe are exhibiting strong earnings growth potential, dominant franchises, and strong execution of their business plans.
Our biggest overweight currently is in technology focusing on companies that provide productivity solutions via enhancing data analytics, cloud based services, electronic payments and online retail. We also have an overweight in the consumer discretionary sector focusing on millennial trends in both media and retail and on
2016 ANNUAL REPORT
Performance Update (unaudited) (continued)
dominant franchises that are gaining market share. We expect to continue to have an overweight in the healthcare sector concentrating on global biotech and pharmaceutical companies. While this area has become a political hotcake in this election year, technological advances continue to bring new, important products to market and M&A activity also continues to add support to valuations. After the political fracas inevitably dies down, we anticipate that we will look to add back to positions where we see compelling growth drivers.
We anticipate that our underweights will continue to be in the more cyclical areas of industrials, materials and consumer staples as we find more appealing value elsewhere. We continue to underweight energy names since we feel the recent oil rally has overshot fundamentals and are due for a pull-back.
We continue to strive to provide a good risk adjusted return for our shareholders through intensive stock selection, evaluating opportunities both domestic and worldwide. At the same time, the Fund will continue to take advantage of its mandate to protect capital by tactically raising cash and by utilizing short-selling strategies.
Respectfully,
Manu P. Daftary,
Portfolio Manager
DG Capital Management, Inc.
2016 ANNUAL REPORT
Performance Update (unaudited) (continued)
Quaker Strategic Growth Fund (QUAGX, QAGCX, QAGIX)
SUB-ADVISER:
DG Capital Management, Inc.
TOTAL NET ASSETS:
AS OF JUNE 30, 2016
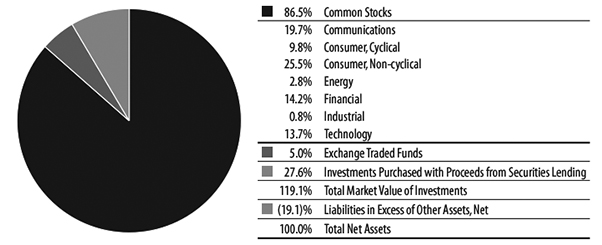
$85,990,653
| Top 10 Holdings* (% of net assets) | |
| SPDR S&P 500 ETF Trust | 5.0% |
| Amazon.com Inc. | 4.6% |
| Alphabet Inc. Cl A & C | 4.1% |
| Visa Inc. Cl A | 3.2% |
| Mastercard Inc. Cl A | 3.1% |
| Facebook Inc. Cl A | 3.0% |
| The TJX Cos. Inc. | 2.6% |
| Adobe Systems Inc. | 2.6% |
| Amgen Inc. | 2.5% |
| Eli Lilly & Co. | 2.4% |
| % Fund Total | 33.1% |
* Includes Long-Term Investments only.
| Sectors (% of net assets) |
2016 ANNUAL REPORT
Performance Update (unaudited) (continued)
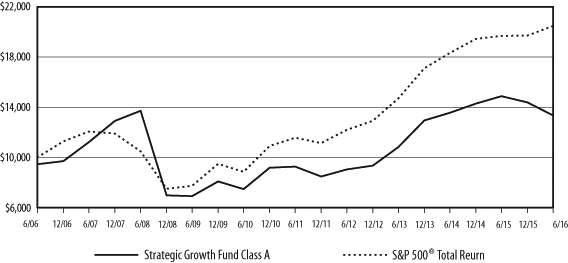
Quaker Strategic Growth Fund (QUAGX, QAGCX, QAGIX)
Growth of a Hypothetical $10,000 Investment
June 30, 2016
| Average Annualized Total Return |
| | | | | | | | | | Commencement |
| | | | | | | | | | of operations |
| | Expense | Inception | | | | | | | through |
| | Ratio* | Date | One Year | Five Year | Ten Year | 6/30/2016 |
| | | | with | without | with | without | with | without | with | without |
| | | | sales | sales | sales | sales | sales | sales | sales | sales |
| | | | charge | charge | charge | charge | charge | charge | charge | charge |
| Class A | 2.24% | 11/25/96 | -15.30% | -10.36% | 6.35% | 7.56% | 2.92% | 3.50% | 10.20% | 10.52% |
| Class C | 2.99% | 7/11/00 | -11.00% | -11.00% | 6.76% | 6.76% | 2.73% | 2.73% | 3.33% | 3.33% |
| Institutional Class | 1.99% | 7/20/00 | -10.14% | -10.14% | 7.82% | 7.82% | 3.75% | 3.75% | 4.27% | 4.27% |
| S&P 500® Total Return Index** | | | 3.99% | 3.99% | 12.10% | 12.10% | 7.42% | 7.42% | 7.33% | 7.33% |
| * | As stated in the Prospectus dated October 28, 2015. |
| ** | The benchmark since inception returns are calculated since commencement of November 25, 1996 through June 30, 2016. |
Performance data quoted represents past performance and is no guarantee of future results. Investment return and principal value will fluctuate so that shares, when redeemed, may be worth more or less than their original cost. Current performance may be lower or higher than performance data quoted. Performance data current to the most recent month end is available at www.quakerfunds.com or by calling us toll free at 800-220-8888. Total return includes reinvestment of dividends and capital gains.
Class A shares of the Fund have a maximum sales charge of 5.50%.
The performance table does not reflect the deduction of taxes that a shareholder might pay on fund distributions or the redemption of fund shares. Total return calculations reflect expense reimbursements and fee waivers in the applicable periods. See financial highlights for periods where fees were waived or reimbursed.
The Fund’s portfolio holdings may differ significantly from the securities held in the index and, unlike a mutual fund, an unmanaged index assumes no transaction costs, taxes, management fees or other expenses. You cannot invest directly in an index.
The S&P 500® Total Return Index (“S&P 500® Index”) is a widely recognized, unmanaged index consisting of the approximately 500 largest companies in the United States as measured by market capitalization. The S&P 500® Index assumes reinvestment of all dividends and distributions.
2016 ANNUAL REPORT
Expense Information (unaudited)
As a shareholder of the Fund, you incur two types of costs: (1) transaction costs, including applicable sales charges and redemption fees; and (2) ongoing costs, including management fees, distribution (12b-1) fees and other Fund expenses. This example is intended to help you understand your ongoing costs (in dollars) of investing in the Fund and to compare these costs with the ongoing costs of investing in other funds. The example is based on an investment of $1,000 invested at the beginning of the (six-month) period and held for the entire period January 1, 2016 through June 30, 2016.
ACTUAL EXPENSES
The first section of each table below provides information about actual account values and actual expenses for each of the Funds. You may use this information, together with the amount you invested, to estimate the expenses that you paid over the period. Simply divide your account value by $1,000 (for example, an $8,600 account value divided by $1,000 = 8.6), then multiply the result by the number in the applicable line under the heading entitled “Expenses Paid During the Period” to estimate the expenses you paid on your account during this period.
HYPOTHETICAL EXAMPLE FOR COMPARISON PURPOSES
The second section of each table below provides information about hypothetical account values and hypothetical expenses based on the Fund’s actual expense ratio and an assumed rate of return of 5% per year before expenses, which is not the Fund’s actual return. The hypothetical account values and expenses may not be used to estimate the actual ending account balance or expenses you paid for the period. You may use this information to compare the ongoing costs of investing in the Fund to other funds. To do so, compare this 5% hypothetical example with the 5% hypothetical examples that appear in the shareholder reports of the other funds. Please note that the expenses shown in the table are meant to highlight your ongoing costs only and do not reflect any transactional costs, such as sales charges (loads), redemption fees or exchange fees. Therefore, the second section of the table is useful in comparing ongoing costs only, and will not help you determine the relative total costs of owning different funds. In addition, if these transactional costs were included, your costs would have been higher.
| | | Beginning | Annualized | Ending | |
| | | Account Value | Expense Ratio | Account Value | Expenses Paid |
| | | (1/1/2016) | for the Period | (6/30/2016) | During Period* |
| Event Arbitrage | | | | | |
| Example based on actual return of: | | | | | |
| Class A | 8.03% | $1,000.00 | 1.99% | $1,080.30 | $10.29 |
| Class C | 7.55% | 1,000.00 | 2.74% | 1,075.50 | 14.14 |
| Institutional Class | 8.06% | 1,000.00 | 1.74% | 1,080.60 | 9.00 |
| Hypothetical example based on assumed 5% return: | | | |
| Class A | | 1,000.00 | 1.99% | 1,014.97 | 9.97 |
| Class C | | 1,000.00 | 2.74% | 1,011.24 | 13.70 |
| Institutional Class | | 1,000.00 | 1.74% | 1,016.21 | 8.72 |
2016 ANNUAL REPORT
Expense Information (unaudited) (continued)
| | | Beginning | Annualized | Ending | |
| | | Account Value | Expense Ratio | Account Value | Expenses Paid |
| | | (1/1/2016) | for the Period | (6/30/2016) | During Period* |
| Global Tactical Allocation | | | | | |
| Example based on actual return of: | | | | | |
| Class A | -8.72% | $1,000.00 | 2.60% | $ 912.80 | 12.37 |
| Class C | -8.95% | 1,000.00 | 3.35% | 910.50 | 15.91 |
| Institutional Class | -8.53% | 1,000.00 | 2.35% | 914.70 | 11.19 |
| Hypothetical example based on assumed 5% return: | | | |
| Class A | | 1,000.00 | 2.60% | 1,011.93 | 13.01 |
| Class C | | 1,000.00 | 3.35% | 1,008.20 | 16.73 |
| Institutional Class | | 1,000.00 | 2.35% | 1,013.18 | 11.76 |
| Mid-Cap Value | | | | | |
| Example based on actual return of: | | | | | |
| Class A | 6.60% | 1,000.00 | 2.31% | 1,066.00 | 11.87 |
| Class C | 6.21% | 1,000.00 | 3.06% | 1,062.10 | 15.69 |
| Institutional Class | 6.71% | 1,000.00 | 2.06% | 1,067.10 | 10.59 |
| Hypothetical example based on assumed 5% return: | | | |
| Class A | | 1,000.00 | 2.31% | 1,013.38 | 11.56 |
| Class C | | 1,000.00 | 3.06% | 1,009.65 | 15.29 |
| Institutional Class | | 1,000.00 | 2.06% | 1,014.62 | 10.32 |
| Small-Cap Value | | | | | |
| Example based on actual return of: | | | | | |
| Class A | -2.19% | 1,000.00 | 2.04% | 978.10 | 10.03 |
| Class C | -2.53% | 1,000.00 | 2.79% | 974.70 | 13.70 |
| Institutional Class | -2.08% | 1,000.00 | 1.79% | 979.20 | 8.81 |
| Hypothetical example based on assumed 5% return: | | | |
| Class A | | 1,000.00 | 2.04% | 1,014.72 | 10.22 |
| Class C | | 1,000.00 | 2.79% | 1,010.99 | 13.95 |
| Institutional Class | | 1,000.00 | 1.79% | 1,015.96 | 8.97 |
| Strategic Growth | | | | | |
| Example based on actual return of: | | | | | |
| Class A | -7.28% | 1,000.00 | 2.24% | 927.20 | 10.73 |
| Class C | -7.62% | 1,000.00 | 2.99% | 923.80 | 14.30 |
| Institutional Class | -7.18% | 1,000.00 | 1.99% | 928.20 | 9.54 |
| Hypothetical example based on assumed 5% return: | | | |
| Class A | | 1,000.00 | 2.24% | 1,013.72 | 11.22 |
| Class C | | 1,000.00 | 2.99% | 1,010.00 | 14.94 |
| Institutional Class | | 1,000.00 | 1.99% | 1,014.97 | 9.97 |
| * | Expenses are equal to the Funds’ annualized six-month expense ratios multiplied by the average account value over the period multiplied by the number of days in the most recent fiscal half year (182) divided by 366 to reflect the one-half year period. |
Schedule of Investments
Quaker Event Arbitrage Fund
June 30, 2016
| | | Number | | | Fair | |
| | | of Shares | | | Value | |
| Long-Term Investments — 91.4% | | | | | | |
| Common Stocks — 66.4% | | | | | | |
| Basic Materials — 2.0% | | | | | | |
| Chemicals — 2.0% | | | | | | |
MPM Holdings Inc. (a)(b)• | | | 34,576 | | | $ | 330,201 | |
| Platform Specialty | | | | | | | | |
| Products Corp. (a)(b) | | | 39,400 | | | | 349,872 | |
| | | | | | | | 680,073 | |
| Mining — 0.0% | | | | | | | | |
| Sacre-Coeur Minerals Ltd. (a)*^ | | | 109,444 | | | | 0 | |
| Total Basic Materials | | | | | | | | |
| (Cost $1,692,913) | | | | | | | 680,073 | |
| Communications — 5.5% | | | | | | | | |
| Internet — 1.8% | | | | | | | | |
30DC Inc. (a)• | | | 50,000 | | | | 1,733 | |
| FTD Cos. Inc. (a)(b) | | | 25,000 | | | | 624,000 | |
| | | | | | | | 625,733 | |
| Media — 2.0% | | | | | | | | |
| Tribune Media Co. Cl A (b)** | | | 17,340 | | | | 679,381 | |
| Telecommunications — 1.7% | | | | | | | | |
| NII Holdings Inc. (a)(b) | | | 89,529 | | | | 284,702 | |
Vodafone Group PLC - ADR (b)f | | | 9,020 | | | | 278,628 | |
| | | | | | | | 563,330 | |
| Total Communications | | | | | | | | |
| (Cost $3,185,705) | | | | | | | 1,868,444 | |
| Consumer, Cyclical — 0.7% | | | | | | | | |
| Auto Parts & Equipment — 0.0% | | | | | | | | |
| Exide Technologies (a)*^ | | | 5,926 | | | | 15,000 | |
| Distribution/Wholesale — 0.5% | | | | | | | | |
Medion AG f | | | 8,011 | | | | 152,468 | |
| Lodging — 0.0% | | | | | | | | |
| Trump Entertainment | | | | | | | | |
| Resorts Inc. (a)*^ | | | 8,949 | | | | 0 | |
| Trump Entertainment | | | | | | | | |
| Resorts Inc. (a)*^ | | | 135 | | | | 0 | |
| | | | | | | | 0 | |
| Retail — 0.2% | | | | | | | | |
Punch Taverns PLC (a)f | | | 60,336 | | | | 74,298 | |
| Total Consumer, Cyclical | | | | | | | | |
| (Cost $880,958) | | | | | | | 241,766 | |
| Consumer, Non-cyclical — 26.9% | | | | | | | | |
| Beverages — 3.4% | | | | | | | | |
Anheuser-Busch InBev NV - ADR f | | | 6,880 | | | | 905,959 | |
| PepsiCo Inc. | | | 2,200 | | | | 233,068 | |
| | | | | | | | 1,139,027 | |
| Commercial Services — 5.5% | | | | | | | | |
| Electro Rent Corp. | | | 6,000 | | | | 92,460 | |
| Hertz Global Holdings Inc. (a) | | | 48,370 | | | | 535,456 | |
| PayPal Holdings Inc. (a)** | | | 16,950 | | | | 618,844 | |
| Sotheby’s (b) | | | 22,820 | | | | 625,268 | |
| | | | | | | | 1,872,028 | |
| Food — 3.7% | | | | | | | | |
| Mondelez International Inc. ** | | | 27,840 | | | | 1,266,998 | |
| Healthcare-Products — 0.1% | | | | | | | | |
| Synovis Life Technologies Inc. (a)^ | | | 43,000 | | | | 18,572 | |
| Healthcare-Services — 1.4% | | | | | | | | |
| Brookdale Senior Living Inc. (a) | | | 29,650 | | | | 457,796 | |
| Pharmaceuticals — 12.8% | | | | | | | | |
| AbbVie Inc. ** | | | 18,030 | | | | 1,116,237 | |
Celesio AG f | | | 11,796 | | | | 332,503 | |
GlaxoSmithKline PLC - ADR f | | | 13,850 | | | | 600,259 | |
INYX Inc. (a)• | | | 167,850 | | | | 369 | |
| Pfizer Inc. ** | | | 43,060 | | | | 1,516,143 | |
| Zoetis Inc. ** | | | 16,500 | | | | 783,090 | |
| | | | | | | | 4,348,601 | |
| Total Consumer, Non-cyclical | | | | | | | | |
| (Cost $9,426,880) | | | | | | | 9,103,022 | |
| Diversified — 0.4% | | | | | | | | |
| Holding Companies-Diversified — 0.4% | | | | | | | | |
CF Corp. (a)(b) f | | | 11,400 | | | | 113,088 | |
| Stoneleigh Partners | | | | | | | | |
| Acquisition Corp. (a)*^ | | | 400 | | | | 0 | |
| | | | | | | | 113,088 | |
| Total Diversified | | | | | | | | |
| (Cost $114,000) | | | | | | | 113,088 | |
| Energy — 6.7% | | | | | | | | |
| Energy-Alternate Sources — 0.5% | | | | | | | | |
| TerraForm Global Inc. | | | 20,000 | | | | 65,200 | |
| TerraForm Power Inc. | | | 9,000 | | | | 98,100 | |
| | | | | | | | 163,300 | |
The accompanying notes are an integral part of the financial statements.
2016 ANNUAL REPORT
Schedule of Investments (continued)
Quaker Event Arbitrage Fund
June 30, 2016
| | | Number | | | Fair | |
| | | of Shares | | | Value | |
| Common Stocks (Continued) | | | | | | |
| Oil & Gas — 2.4% | | | | | | |
| Hess Corp. (b) | | | 13,300 | | | $ | 799,330 | |
| OGX Austria Petroleo e | | | | | | | | |
Gas SA-SP-ADR f • | | | 55,075 | | | | 24,068 | |
| | | | | | | | 823,398 | |
| Oil & Gas Services — 2.7% | | | | | | | | |
| Halliburton Co. | | | 20,000 | | | | 905,800 | |
| Pipelines — 1.1% | | | | | | | | |
| The Williams Cos. Inc. | | | 17,240 | | | | 372,901 | |
| Total Energy | | | | | | | | |
| (Cost $2,639,675) | | | | | | | 2,265,399 | |
| Financial — 5.5% | | | | | | | | |
| Diversified Financial Services — 0.3% | | | | | | | | |
Guoco Group Ltd. f | | | 10,000 | | | | 105,696 | |
| Insurance — 0.6% | | | | | | | | |
| Ambac Financial Group Inc. (a)** | | | 13,100 | | | | 215,626 | |
| Real Estate — 4.6% | | | | | | | | |
CA Immobilien Anlagen AG f | | | 38,800 | | | | 646,308 | |
Conwert Immobilien Invest SE f | | | 55,000 | | | | 883,503 | |
| Safeway Casa Ley CVR (a)*^ | | | 47,000 | | | | 10,575 | |
| Safeway Property Development | | | | | | | | |
| Center LLC CVR (a)*^ | | | 47,000 | | | | 10,575 | |
| | | | | | | | 1,550,961 | |
| Total Financial | | | | | | | | |
| (Cost $1,824,516) | | | | | | | 1,872,283 | |
| Healthcare — 3.3% | | | | | | | | |
| Healthcare-Services — 3.3% | | | | | | | | |
| Diagnostic Services | | | | | | | | |
| Holdings Inc. (a)^ | | | 10,221 | | | | 1,120,608 | |
| Total Healthcare | | | | | | | | |
| (Cost $735,000) | | | | | | | 1,120,608 | |
| Industrial — 4.4% | | | | | | | | |
| Aerospace & Defense — 1.7% | | | | | | | | |
| B/E Aerospace Inc. (b) | | | 12,600 | | | | 581,805 | |
| Electronics — 2.7% | | | | | | | | |
| IEC Electronics Corp. (a) | | | 217,656 | | | | 903,273 | |
| Miscellaneous Manufacturing — 0.0% | | | | | | | | |
Pentair PLC f | | | 70 | | | | 4,080 | |
| Total Industrial | | | | | | | | |
| (Cost $1,648,703) | | | | | | | 1,489,158 | |
| Technology — 6.9% | | | | | | | | |
| Computers — 0.0% | | | | | | | | |
| Computer Horizons Corp. (a)*^ | | | 65,000 | | | | 0 | |
| Semiconductors — 2.7% | | | | | | | | |
| QUALCOMM Inc. | | | 16,980 | | | | 909,618 | |
| Software — 4.2% | | | | | | | | |
| Contra Softbrands Inc. (a)*^ | | | 5,000 | | | | 0 | |
| Microsoft Corp. ** | | | 15,270 | | | | 781,366 | |
| VMware Inc. (a)** | | | 11,500 | | | | 658,030 | |
| | | | | | | | 1,439,396 | |
| Total Technology | | | | | | | | |
| (Cost $2,342,049) | | | | | | | 2,349,014 | |
| Utilities — 4.1% | | | | | | | | |
| Gas — 4.1% | | | | | | | | |
| AGL Resources Inc. | | | 21,080 | | | | 1,390,648 | |
| Total Utilities | | | | | | | | |
| (Cost $1,289,565) | | | | | | | 1,390,648 | |
| Escrow Shares — 0.0% | | | | | | | | |
| Exide Technologies (a)*+^ | | | 1,777 | | | | 0 | |
| Petrocorp Inc. (a)*+^ | | | 200 | | | | 0 | |
| | | | | | | | 0 | |
| Total Escrow Shares | | | | | | | | |
| (Cost $1,686) | | | | | | | 0 | |
| Total Common Stocks | | | | | | | | |
| (Cost $25,781,650) | | | | | | | 22,493,503 | |
| Preferred Stocks — 2.8% | | | | | | | | |
| Energy — 0.0% | | | | | | | | |
| Oil & Gas — 0.0% | | | | | | | | |
| GeoMet Inc., 12.50% - | | | | | | | | |
Convertible Series A• | | | 3 | | | | 5 | |
| Total Energy | | | | | | | | |
| (Cost $22) | | | | | | | 5 | |
| Financial — 1.0% | | | | | | | | |
| Insurance — 0.2% | | | | | | | | |
| MBIA Insurance Corp., | | | | | | | | |
| 4.71% (a)*#^ | | | 10 | | | | 80,000 | |
| Mortgage Agencies — 0.8% | | | | | | | | |
| Federal Home Loan Mortgage Corp., | | | | | | | | |
0.00%, Series G (a) | | | 3,000 | | | | 18,450 | |
| Federal Home Loan Mortgage Corp., | | | | | | | | |
| 0.00%, Series M (a) | | | 9,500 | | | | 58,425 | |
The accompanying notes are an integral part of the financial statements.
Schedule of Investments (continued)
Quaker Event Arbitrage Fund
June 30, 2016
| | | Number | | | Fair | |
| | | of Shares | | | Value | |
| Preferred Stocks (Continued) | | | | | | |
| Mortgage Agencies (Continued) | | | | | | |
| Federal Home Loan Mortgage Corp., | | | | | | |
0.00%, Series Q (a)• | | | 1,000 | | | $ | 6,040 | |
| Federal Home Loan Mortgage Corp., | | | | | | | | |
0.00%, Series S (a) | | | 25,000 | | | | 158,000 | |
| Federal Home Loan Mortgage Corp., | | | | | | | | |
| 5.00%, Series F (a) | | | 4,500 | | | | 27,000 | |
| | | | | | | | 267,915 | |
| Total Financial | | | | | | | | |
| (Cost $1,051,290) | | | | | | | 347,915 | |
| Healthcare — 1.8% | | | | | | | | |
| Healthcare-Services — 1.8% | | | | | | | | |
| Diagnostic Services Holdings Inc., | | | | | | | | |
| 0.00% (a)*^ | | | 613 | | | | 613,000 | |
| Total Healthcare | | | | | | | | |
| (Cost $613,000) | | | | | | | 613,000 | |
| Industrial — 0.0% | | | | | | | | |
| Aerospace & Defense — 0.0% | | | | | | | | |
| Rolls-Royce Holdings PLC, | | | | | | | | |
0.00% (a) f *^ | | | 2,122,900 | | | | 2,826 | |
| Total Industrial | | | | | | | | |
| (Cost $3,102) | | | | | | | 2,826 | |
| Total Preferred Stocks | | | | | | | | |
| (Cost $1,667,414) | | | | | | | 963,746 | |
| Structured Notes — 5.5% | | | | | | | | |
| Bank of America Corp. Structured | | | | | | | | |
Note, Expiration: 02/14/2017 (a)• | | | 9,000 | | | | 915,120 | |
| Ryanair Holdings PLC Structured | | | | | | | | |
Note, Expiration: 08/17/2016 (a)• | | | 22,040 | | | | 931,388 | |
| | | | | | | | 1,846,508 | |
| Total Structured Notes | | | | | | | | |
| (Cost $1,796,589) | | | | | | | 1,846,508 | |
| | | | | | | | | |
| | | Par | | | | | |
| | | Value | | | | | |
| Asset Backed Securities — 0.6% | | | | | | | | |
| AFC Home Equity Loan Trust | | | | | | | | |
| Class 1A, Series 2000-2, | | | | | | | | |
1.24%, 06/25/2030• | | $ | 8,632 | | | | 7,738 | |
| Citigroup Mortgage Loan Trust Inc. | | | | | | | | |
| Class M3, Series 2005-OPT1, | | | | | | | | |
1.15%, 02/25/2035• | | | 209,943 | | | | 169,233 | |
| Countrywide Home Equity Loan Trust | | | | | | | | |
| Class 2A, Series 2005-A, | | | | | | | | |
0.68%, 04/15/2035• | | | 20,982 | | | | 18,124 | |
| | | | | | | | 195,095 | |
| Total Asset Backed Securities | | | | | | | | |
| (Cost $210,931) | | | | | | | 195,095 | |
| Convertible Bonds — 1.2% | | | | | | | | |
| Basic Materials — 0.0% | | | | | | | | |
| Mining — 0.0% | | | | | | | | |
| Talvivaara Mining Co. PLC, | | | | | | | | |
4.00%, 12/16/2015 f *+^ | | € | 12,900,000 | | | | 0 | |
| Total Basic Materials | | | | | | | | |
| (Cost $1,141,281) | | | | | | | 0 | |
| Consumer, Cyclical — 0.2% | | | | | | | | |
| Auto Parts & Equipment — 0.2% | | | | | | | | |
| Exide Technologies, | | | | | | | | |
7.00%, 04/30/2025*• | | $ | 159,623 | | | | 71,830 | |
| Total Consumer, Cyclical | | | | | | | | |
| (Cost $152,762) | | | | | | | 71,830 | |
| Financial — 1.0% | | | | | | | | |
| Banks — 1.0% | | | | | | | | |
| BNP Paribas Fortis SA, | | | | | | | | |
1.74%, 12/29/2049 f• | | € | 500,000 | | | | 332,927 | |
| Total Financial | | | | | | | | |
| (Cost $555,517) | | | | | | | 332,927 | |
| Total Convertible Bonds | | | | | | | | |
| (Cost $1,849,560) | | | | | | | 404,757 | |
| Corporate Bonds — 14.2% | | | | | | | | |
| Consumer, Cyclical — 1.0% | | | | | | | | |
| Auto Parts & Equipment — 1.0% | | | | | | | | |
| Exide Technologies, | | | | | | | | |
| 8.625%, 02/12/2018 *+^ | | $ | 1,000,000 | | | | 0 | |
| Exide Technologies, | | | | | | | | |
11.00%, 04/30/2020• | | | 421,633 | | | | 333,090 | |
| | | | | | | | 333,090 | |
| Total Consumer, Cyclical | | | | | | | | |
| (Cost $405,688) | | | | | | | 333,090 | |
The accompanying notes are an integral part of the financial statements.
2016 ANNUAL REPORT
Schedule of Investments (continued)
Quaker Event Arbitrage Fund
June 30, 2016
| | | Par | | | Fair | |
| | | Value | | | Value | |
| Corporate Bonds (Continued) | | | | | | |
| Energy — 11.4% | | | | | | |
| Oil & Gas — 11.4% | | | | | | |
| Gastar Exploration Inc., | | | | | | |
8.625%, 05/15/2018 • | | $ | 1,000,000 | | | $ | 837,500 | |
| Halcon Resources Corp., | | | | | | | | |
12.00%, 02/15/2022 #• | | | 390,000 | | | | 356,850 | |
| Ithaca Energy Inc., | | | | | | | | |
8.125%, 07/01/2019 f+#• | | | 1,000,000 | | | | 885,000 | |
| Kosmos Energy Ltd., | | | | | | | | |
7.875%, 08/01/2021 (b)f#• | | | 1,000,000 | | | | 965,000 | |
| OGX Austria GMBH, | | | | | | | | |
8.50%, 06/01/2018 f *+• | | | 3,500,000 | | | | 35 | |
| Tullow Oil PLC, | | | | | | | | |
6.00%, 11/01/2020 f#• | | | 1,000,000 | | | | 807,500 | |
| | | | | | | | 3,851,885 | |
| Total Energy | | | | | | | | |
| (Cost $4,223,166) | | | | | | | 3,851,885 | |
| Financial — 1.8% | | | | | | | | |
| Diversified Financial Services — 1.3% | | | | | | | | |
| Hellas Telecommunications | | | | | | | | |
| Luxembourg II SCA, | | | | | | | | |
0.00%, 01/15/2015 f *#+^ | | | 5,000,000 | | | | 50,000 | |
| Lehman Brothers Holdings Inc., | | | | | | | | |
4.55%, 07/08/2014 +• | | | 110,000 | | | | 7,425 | |
| Lehman Brothers Holdings Inc., | | | | | | | | |
5.32%, 02/17/2015 +• | | | 130,000 | | | | 8,612 | |
| Lehman Brothers Holdings Inc., | | | | | | | | |
5.50%, 02/27/2020 +• | | | 100,000 | | | | 6,625 | |
| Lehman Brothers Holdings Inc., | | | | | | | | |
7.00%, 01/28/2020 +• | | | 100,000 | | | | 6,625 | |
| Lehman Brothers Holdings Inc., | | | | | | | | |
8.25%, 09/23/2020 +• | | | 100,000 | | | | 6,625 | |
| Lehman Brothers Holdings Inc., | | | | | | | | |
8.75%, 02/14/2023 +• | | | 200,000 | | | | 13,250 | |
| Twin Reefs Pass-Through Trust, | | | | | | | | |
| 0.01%, 12/29/2049 +^ | | | 1,000,000 | | | | 340,000 | |
| | | | | | | | 439,162 | |
| Insurance — 0.5% | | | | | | | | |
| Ambac Assurance Corp., | | | | | | | | |
| 5.10%, 06/07/2020 +#^ | | | 221,329 | | | | 191,627 | |
| Venture Capital — 0.0% | | | | | | | | |
| Infinity Capital Group, | | | | | | | | |
| 7.00%, 12/31/2049 *+^ | | | 25,000 | | | | 0 | |
| Total Financial | | | | | | | | |
| (Cost $822,150) | | | | | | | 630,789 | |
| Total Corporate Bonds | | | | | | | | |
| (Cost $5,451,004) | | | | | | | 4,815,764 | |
| Mortgage Backed Securities — 0.7% | | | | | | | | |
| GSR Mortgage Loan Trust | | | | | | | | |
| Class B2, Series 2005-5F, | | | | | | | | |
5.74%, 06/25/2035• | | | 628,584 | | | | 237,488 | |
| | | | | | | | 237,488 | |
| Total Mortgage Backed Securities | | | | | | | | |
| (Cost $544,147) | | | | | | | 237,488 | |
| Escrow Notes — 0.0% | | | | | | | | |
| Mirant Corp. (a)*^ | | | 20,000 | | | | 0 | |
| NewPage Corp. (a)*^ | | | 300,000 | | | | 0 | |
| | | | | | | | 0 | |
| Total Escrow Notes | | | | | | | | |
| (Cost $198,770) | | | | | | | 0 | |
| Total Long-Term Investments | | | | | | | | |
| (Cost $37,500,065) | | | | | | | 30,956,861 | |
| | | | | | | | | |
| | | Number | | | | | |
| | | of Contracts | | | | | |
| | | (100 Shares | | | | | |
| | | Per Contract) | | | | | |
| Purchased Options — 0.5% | | | | | | | | |
| Call Options — 0.2% | | | | | | | | |
| Perrigo Co. PLC, | | | | | | | | |
| Expiration: November, 2016 | | | | | | | | |
Exercise Price: $110.00 • | | | 50 | | | | 13,875 | |
| Tenet Healthcare Corp., | | | | | | | | |
| Expiration: August, 2016 | | | | | | | | |
Exercise Price: $35.00 • | | | 270 | | | | 6,750 | |
| Valeant Pharmaceuticals | | | | | | | | |
| International Inc., | | | | | | | | |
| Expiration: January, 2018 | | | | | | | | |
| Exercise Price: $30.00 | | | 100 | | | | 49,400 | |
| Total Call Options | | | | | | | | |
| (Cost $186,188) | | | | | | | 70,025 | |
The accompanying notes are an integral part of the financial statements.
2016 ANNUAL REPORT
Schedule of Investments (continued)
Quaker Event Arbitrage Fund
June 30, 2016
| | | Number | | | | |
| | | of Contracts | | | | |
| | | (100 Shares | | | Fair | |
| | | Per Contract) | | | Value | |
| Purchased Options (Continued) | | | | | | |
| Put Options — 0.3% | | | | | | |
| CurrencyShares Euro Trust, | | | | | | |
| Expiration: September, 2016 | | | | | | |
| Exercise Price: $110.00 | | | 372 | | | $ | 108,996 | |
| Total Put Options | | | | | | | | |
| (Cost $85,560) | | | | | | | 108,996 | |
| Total Purchased Options | | | | | | | | |
| (Cost $271,748) | | | | | | | 179,021 | |
| | | | | | | | | |
| | | Number | | | | | |
| | | of Shares | | | | | |
| Investments Purchased with Proceeds | | | | | | | | |
| from Securities Lending — 13.9% | | | | | | | | |
| Money Market Funds — 13.9% | | | | | | | | |
| Mount Vernon Securities | | | | | | | | |
| Lending Trust Prime Portfolio, | | | | | | | | |
| 0.56% (c)(d) | | | 4,709,849 | | | | 4,709,849 | |
| (Cost $4,709,849) | | | | | | | 4,709,849 | |
| Total Investments | | | | | | | | |
| (Cost $42,481,662) — 105.8% | | | | | | | 35,845,731 | |
| Other Liabilities in Excess | | | | | | | | |
| of Assets, Net (5.8)% | | | | | | | (1,954,143 | ) |
| Total Net Assets — 100.0% | | | | | | $ | 33,891,588 | |
| | | | | | | | | |
| | | Number | | | | | |
| | | of Contracts | | | | | |
| | | (100 Shares | | | | | |
| | | Per Contract) | | | | | |
| Written Options | | | | | | | | |
| Call Options | | | | | | | | |
| Ambac Financial Group Inc., | | | | | | | | |
| Expiration: July, 2016 | | | | | | | | |
Exercise Price: $17.50 • | | | 131 | | | | 3,930 | |
| CurrencyShares Euro Trust, | | | | | | | | |
| Expiration: September, 2016 | | | | | | | | |
| Exercise Price: $110.00 | | | 372 | | | | 40,548 | |
| FTD Cos. Inc., Expiration: July, 2016 | | | | | | | | |
Exercise Price: $25.00 • | | | 250 | | | | 15,625 | |
| Halliburton Co., Expiration: July, 2016 | | | | | | | | |
Exercise Price: $40.00 • | | | 200 | | | | 98,000 | |
| PepsiCo Inc., Expiration: July, 2016 | | | | | | | | |
| Exercise Price: $104.00 | | | 22 | | | | 5,544 | |
| Perrigo Co. PLC, | | | | | | | | |
| Expiration: November, 2016 | | | | | | | | |
Exercise Price: $130.00 • | | | 50 | | | | 6,125 | |
| Tenet Healthcare Corp., | | | | | | | | |
| Expiration: August, 2016 | | | | | | | | |
Exercise Price: $40.00 • | | | 270 | | | | 3,375 | |
| Valeant Pharmaceuticals | | | | | | | | |
| International Inc., | | | | | | | | |
| Expiration: January, 2018 | | | | | | | | |
| Exercise Price: $40.00 | | | 100 | | | | 31,500 | |
| VMware Inc., Expiration: July, 2016 | | | | | | | | |
| Exercise Price: $60.00 | | | 115 | | | | 6,900 | |
| Total Call Options | | | | | | | | |
| (Premiums Received $342,341) | | | | | | | 211,547 | |
| Total Written Options | | | | | | | | |
| (Premiums Received $342,341) | | | | | | $ | 211,547 | |
ADR - American Depositary Receipt
CVR - Contingent Value Rights
€ - Euro
| (a) | Non-income producing security. |
| (b) | All or a portion of the security is out on loan. The total market value of securities on loan was $4,682,746. The remaining contractual maturity of all of the securities lending transactions is overnight and continuous. |
| (c) | Rate shown is the annualized seven-day effective yield at period end. |
| (d) | Represents investments of collateral received from securities lending transactions. |
| f | Foreign issued security. |
| * | Indicates an illiquid security. Total market value for illiquid securities is $853,841, representing 2.5% of net assets. |
| ** | All or a portion of the shares have been committed as collateral for open securities sold short or written options. |
| + | Defaulted bonds. |
| # | Restricted security that may be sold to “qualified institutional buyers” pursuant to the conditions of Rule 144A under the Securities Act of 1933, as amended. |
| | The coupon rate shown on floating or adjustable rate securities represents the rate at period end. |
| • | Level 2 securities. |
| ^ | Indicates a fair valued security. Total market value for fair valued securities is $2,452,783 representing 7.2% of net assets and Level 3 securities. |
The accompanying notes are an integral part of the financial statements.
2016 ANNUAL REPORT
Schedule of Investments
Quaker Global Tactical Allocation Fund
June 30, 2016
| | | Number | | | Fair | |
| | | of Shares | | | Value | |
| Long-Term Investments — 96.9% | | | | | | |
| Common Stocks — 90.9% | | | | | | |
| Communications — 21.2% | | | | | | |
| Internet — 17.8% | | | | | | |
| Alibaba Group Holding Ltd. - ADR | | | | | | |
| (Cayman Islands) (a) | | | 1,060 | | | $ | 84,302 | |
| Alphabet Inc. Cl A (a) | | | 208 | | | | 146,334 | |
| Alphabet Inc. Cl C (a) | | | 198 | | | | 137,036 | |
| Amazon.com Inc. (a) | | | 436 | | | | 312,010 | |
| Expedia Inc. | | | 810 | | | | 86,103 | |
| Facebook Inc. Cl A (a) | | | 1,843 | | | | 210,618 | |
| GoDaddy Inc. (a) | | | 1,605 | | | | 50,060 | |
| Netflix Inc. (a) | | | 727 | | | | 66,506 | |
| Wayfair Inc. (a) | | | 2,805 | | | | 109,395 | |
| | | | | | | | 1,202,364 | |
| Media — 3.4% | | | | | | | | |
| Liberty Global PLC LiLAC Cl C | | | | | | | | |
| (United Kingdom) (a) | | | 436 | | | | 14,168 | |
| Liberty Global PLC Series C | | | | | | | | |
| (United Kingdom) (a) | | | 1,900 | | | | 54,435 | |
| Time Warner Inc. | | | 2,155 | | | | 158,479 | |
| | | | | | | | 227,082 | |
| Sub-Total Communications — | | | | | | | | |
| Foreign (Cost $163,452) | | | | | | | 152,905 | |
| Sub-Total Communications — | | | | | | | | |
| United States (Cost $1,226,729) | | | | | | | 1,276,541 | |
| Total Communications (Cost $1,390,181) | | | | | | | 1,429,446 | |
| Consumer, Cyclical — 11.9% | | | | | | | | |
| Airlines — 0.2% | | | | | | | | |
| AMR Corp. Escrow (a) *^ | | | 7,600 | | | | 11,020 | |
| Apparel — 0.4% | | | | | | | | |
| Adidas AG - ADR (Germany) | | | 340 | | | | 24,374 | |
| Auto Manufacturers — 1.7% | | | | | | | | |
| Bayerische Motoren Werke | | | | | | | | |
| AG - ADR (Germany) | | | 4,590 | | | | 112,639 | |
| Tata Motors Ltd. - ADR (India) (a) | | | 130 | | | | 4,523 | |
| | | | | | | | 117,162 | |
| Distribution & Wholesale — 0.8% | | | | | | | | |
| HD Supply Holdings Inc. (a) | | | 1,485 | | | | 51,708 | |
| Retail — 8.8% | | | | | | | | |
| Costco Wholesale Corp. | | | 950 | | | | 149,188 | |
| McDonald’s Corp. | | | 285 | | | | 34,297 | |
| Panera Bread Co. (a) | | | 330 | | | | 69,940 | |
| The TJX Cos. Inc. | | | 2,355 | | | | 181,877 | |
| Ulta Salon Cosmetics & | | | | | | | | |
| Fragrance Inc. (a) | | | 440 | | | | 107,202 | |
| Walgreens Boots Alliance Inc. | | | 630 | | | | 52,460 | |
| | | | | | | | 594,964 | |
| Sub-Total Consumer, Cyclical — | | | | | | | | |
| Foreign (Cost $167,923) | | | | | | | 141,536 | |
| Sub-Total Consumer, Cyclical — | | | | | | | | |
| United States (Cost $600,288) | | | | | | | 657,692 | |
| Total Consumer, Cyclical (Cost $768,211) | | | | | | | 799,228 | |
| Consumer, Non-cyclical — 26.7% | | | | | | | | |
| Biotechnology — 4.6% | | | | | | | | |
| Amgen Inc. | | | 1,141 | | | | 173,603 | |
| BioMarin Pharmaceutical Inc. (a) | | | 635 | | | | 49,403 | |
| Gilead Sciences Inc. | | | 410 | | | | 34,202 | |
| Vertex Pharmaceuticals Inc. (a) | | | 600 | | | | 51,612 | |
| | | | | | | | 308,820 | |
| Commercial Services — 3.8% | | | | | | | | |
| FleetCor Technologies Inc. (a) | | | 590 | | | | 84,447 | |
| PayPal Holdings Inc. (a) | | | 1,845 | | | | 67,361 | |
| Sabre Corp. | | | 3,915 | | | | 104,883 | |
| | | | | | | | 256,691 | |
| Cosmetics & Personal Care — 1.4% | | | | | | | | |
| Unilever NV - | | | | | | | | |
| NY Shares (Netherlands) | | | 2,065 | | | | 96,931 | |
| Food — 1.4% | | | | | | | | |
| Mondelez International Inc. | | | 2,005 | | | | 91,248 | |
| Healthcare-Products — 3.1% | | | | | | | | |
| Edwards Lifesciences Corp. (a) | | | 860 | | | | 85,768 | |
| Intuitive Surgical Inc. (a) | | | 190 | | | | 125,668 | |
| | | | | | | | 211,436 | |
| Healthcare-Services — 1.2% | | | | | | | | |
| UnitedHealth Group Inc. | | | 590 | | | | 83,308 | |
| Household Products & Wares — 1.1% | | | | | | | | |
| Avery Dennison Corp. | | | 970 | | | | 72,507 | |
| Pharmaceuticals — 10.1% | | | | | | | | |
| AbbVie Inc. | | | 881 | | | | 54,543 | |
| Allergan PLC (Ireland) (a) | | | 450 | | | | 103,990 | |
| Bristol-Myers Squibb Co. | | | 2,230 | | | | 164,016 | |
| Eli Lilly & Co. | | | 2,136 | | | | 168,210 | |
The accompanying notes are an integral part of the financial statements.
2016 ANNUAL REPORT
Schedule of Investments (continued)
Quaker Global Tactical Allocation Fund
June 30, 2016
| | | Number | | | Fair | |
| | | of Shares | | | Value | |
| Common Stocks (Continued) | | | | | | |
| Pharmaceuticals (Continued) | | | | | | |
| Roche Holding AG - ADR | | | | | | |
| (Switzerland) | | | 5,785 | | | $ | 190,616 | |
| | | | | | | | 681,375 | |
| Sub-Total Consumer, Non-cyclical — | | | | | | | | |
| Foreign (Cost $396,982) | | | | | | | 391,537 | |
| Sub-Total Consumer, Non-cyclical — | | | | | | | | |
| United States (Cost $1,381,346) | | | | | | | 1,410,779 | |
| Total Consumer, Non-cyclical (Cost $1,778,328) | | | | | | | 1,802,316 | |
| Energy — 2.8% | | | | | | | | |
| Oil & Gas — 2.8% | | | | | | | | |
| Hess Corp. | | | 1,185 | | | | 71,219 | |
| Marathon Oil Corp. | | | 3,415 | | | | 51,259 | |
| Pioneer Natural Resources Co. | | | 445 | | | | 67,288 | |
| | | | | | | | 189,766 | |
| Sub-Total Energy — | | | | | | | | |
| United States (Cost $189,951) | | | | | | | 189,766 | |
| Total Energy (Cost $189,951) | | | | | | | 189,766 | |
| Financial — 13.4% | | | | | | | | |
| Banks — 1.9% | | | | | | | | |
| Bank of America Corp. | | | 4,080 | | | | 54,142 | |
| JPMorgan Chase & Co. | | | 1,165 | | | | 72,393 | |
| | | | | | | | 126,535 | |
| Diversified Financial Services — 9.3% | | | | | | | | |
| Discover Financial Services | | | 1,328 | | | | 71,168 | |
| Ellie Mae Inc. (a) | | | 1,310 | | | | 120,061 | |
| Mastercard Inc. Cl A | | | 2,430 | | | | 213,986 | |
| Visa Inc. Cl A | | | 2,963 | | | | 219,766 | |
| | | | | | | | 624,981 | |
| Insurance — 2.2% | | | | | | | | |
| Chubb Ltd. (Switzerland) | | | 1,155 | | | | 150,970 | |
| Sub-Total Financial — | | | | | | | | |
| Foreign (Cost $130,124) | | | | | | | 150,970 | |
| Sub-Total Financial — | | | | | | | | |
| United States (Cost $736,916) | | | | | | | 751,516 | |
| Total Financial (Cost $867,040) | | | | | | | 902,486 | |
| Industrial — 0.9% | | | | | | | | |
| Electronics — 0.9% | | | | | | | | |
| Honeywell International Inc. | | | 500 | | | | 58,160 | |
| Sub-Total Industrial — | | | | | | | | |
| United States (Cost $53,020) | | | | | | | 58,160 | |
| Total Industrial (Cost $53,020) | | | | | | | 58,160 | |
| Technology — 14.0% | | | | | | | | |
| Semiconductors — 2.8% | | | | | | | | |
| Applied Materials Inc. | | | 3,770 | | | | 90,367 | |
| Broadcom Ltd. (Singapore) | | | 655 | | | | 101,787 | |
| | | | | | | | 192,154 | |
| Software — 11.2% | | | | | | | | |
| Activision Blizzard Inc. | | | 2,105 | | | | 83,421 | |
| Adobe Systems Inc. (a) | | | 1,850 | | | | 177,211 | |
| Intuit Inc. | | | 645 | | | | 71,988 | |
| NetEase Inc. - ADR (Cayman Islands) | | | 455 | | | | 87,915 | |
| salesforce.com Inc. (a) | | | 1,530 | | | | 121,497 | |
| ServiceNow Inc. (a) | | | 1,430 | | | | 94,952 | |
| Workday Inc. Cl A (a) | | | 1,560 | | | | 116,485 | |
| | | | | | | | 753,469 | |
| Sub-Total Technology — | | | | | | | | |
| Foreign (Cost $166,814) | | | | | | | 189,702 | |
| Sub-Total Technology — | | | | | | | | |
| United States (Cost $710,219) | | | | | | | 755,921 | |
| Total Technology (Cost $877,033) | | | | | | | 945,623 | |
| Total Common Stocks | | | | | | | | |
| (Cost $5,923,764) | | | | | | | 6,127,025 | |
| Exchange Traded Funds — 6.0% | | | | | | | | |
| ProShares UltraShort Euro (a) | | | 3,390 | | | | 82,445 | |
| WisdomTree Europe | | | | | | | | |
| Hedged Equity Fund | | | 6,340 | | | | 320,360 | |
| | | | | | | | 402,805 | |
| Sub-Total Exchange Traded Funds — | | | | | | | | |
| United States (Cost $424,756) | | | | | | | 402,805 | |
| Total Exchange Traded Funds | | | | | | | | |
| Cost ($424,756) | | | | | | | 402,805 | |
| Total Long-Term Investments | | | | | | | | |
| Cost ($6,348,520) | | | | | | | 6,529,830 | |
| Total Investments | | | | | | | | |
| (Cost $6,348,520) — 96.9% | | | | | | | 6,529,830 | |
| Other Assets in Excess | | | | | | | | |
| of Liabilities, Net 3.1% | | | | | | | 209,090 | |
| Total Net Assets — 100.0% | | | | | | $ | 6,738,920 | |
ADR - American Depositary Receipt
| (a) | Non-income producing security. |
| * | Indicates an illiquid security. Total market value for illiquid securities is $11,020, representing 0.2% of net assets. |
| ^ | Indicates a fair valued security. Total market value for fair valued securities is $11,020, representing 0.2% of net assets and Level 3 securities. |
The accompanying notes are an integral part of the financial statements.
Schedule of Investments
Quaker Mid-Cap Value Fund
June 30, 2016
| | | Number | | | Fair | |
| | | of Shares | | | Value | |
| Long-Term Investments — 97.2% | | | | | | |
| Common Stocks — 82.0% | | | | | | |
| Basic Materials — 4.2% | | | | | | |
| Chemicals — 1.7% | | | | | | |
| Westlake Chemical Corp. | | | 2,741 | | | $ | 117,644 | |
| Iron & Steel — 2.5% | | | | | | | | |
| Reliance Steel & Aluminum Co. | | | 2,277 | | | | 175,101 | |
| Total Basic Materials | | | | | | | | |
| (Cost $282,762) | | | | | | | 292,745 | |
| Communications — 1.8% | | | | | | | | |
| Internet — 1.8% | | | | | | | | |
| F5 Networks Inc. (a) | | | 1,083 | | | | 123,289 | |
| Total Communications | | | | | | | | |
| (Cost $122,816) | | | | | | | 123,289 | |
| Consumer, Cyclical — 12.8% | | | | | | | | |
| Auto Manufacturers — 1.4% | | | | | | | | |
| PACCAR Inc. (b) | | | 1,870 | | | | 96,997 | |
| Auto Parts & Equipment — 0.9% | | | | | | | | |
| The Goodyear Tire & Rubber Co. | | | 2,316 | | | | 59,429 | |
| Home Furnishings — 2.9% | | | | | | | | |
| Harman International Industries Inc. | | | 1,675 | | | | 120,299 | |
| Whirlpool Corp. (b) | | | 499 | | | | 83,153 | |
| | | | | | | | 203,452 | |
| Leisure Time — 2.7% | | | | | | | | |
| Brunswick Corp. (b) | | | 2,965 | | | | 134,374 | |
| Norwegian Cruise Line | | | | | | | | |
Holdings Ltd. (a)(b) f | | | 1,310 | | | | 52,190 | |
| | | | | | | | 186,564 | |
| Retail — 2.0% | | | | | | | | |
| Best Buy Co. Inc. (b) | | | 2,266 | | | | 69,340 | |
| Nordstrom Inc. | | | 1,835 | | | | 69,822 | |
| | | | | | | | 139,162 | |
| Textiles — 1.0% | | | | | | | | |
| Mohawk Industries Inc. (a)(b) | | | 358 | | | | 67,934 | |
| Toys/Games & Hobbies — 1.9% | | | | | | | | |
| Hasbro Inc. | | | 1,571 | | | | 131,948 | |
| Total Consumer, Cyclical | | | | | | | | |
| (Cost $876,693) | | | | | | | 885,486 | |
| Consumer, Non-cyclical — 8.6% | | | | | | | | |
| Food — 3.6% | | | | | | | | |
| Flowers Foods Inc. | | | 5,481 | | | | 102,769 | |
| Ingredion Inc. (b) | | | 1,118 | | | | 144,680 | |
| | | | | | | | 247,449 | |
| Healthcare-Products — 1.6% | | | | | | | | |
| Zimmer Biomet Holdings Inc. (b) | | | 935 | | | | 112,555 | |
| Healthcare-Services — 1.3% | | | | | | | | |
| Brookdale Senior Living Inc. (a) | | | 5,876 | | | | 90,725 | |
| Pharmaceuticals — 2.1% | | | | | | | | |
Mylan NV (a)(b) f | | | 3,346 | | | | 144,681 | |
| Total Consumer, Non-cyclical | | | | | | | | |
| (Cost $584,692) | | | | | | | 595,410 | |
| Energy — 9.1% | | | | | | | | |
| Oil & Gas — 9.1% | | | | | | | | |
| Concho Resources Inc. (a)(b) | | | 1,545 | | | | 184,272 | |
| Diamond Offshore Drilling Inc. (b) | | | 2,463 | | | | 59,925 | |
| Helmerich & Payne Inc. (b) | | | 2,432 | | | | 163,260 | |
| Newfield Exploration Co. (a) | | | 2,658 | | | | 117,430 | |
| Tesoro Corp. | | | 1,412 | | | | 105,787 | |
| | | | | | | | 630,674 | |
| Total Energy | | | | | | | | |
| (Cost $592,125) | | | | | | | 630,674 | |
| Financial — 13.6% | | | | | | | | |
| Banks — 7.2% | | | | | | | | |
| East West Bancorp Inc. | | | 3,837 | | | | 131,149 | |
| Huntington Bancshares Inc. (b) | | | 14,411 | | | | 128,834 | |
| PacWest Bancorp | | | 2,380 | | | | 94,676 | |
| Zions Bancorporation (b) | | | 5,509 | | | | 138,441 | |
| | | | | | | | 493,100 | |
| Insurance — 6.4% | | | | | | | | |
| Lincoln National Corp. | | | 2,719 | | | | 105,416 | |
| Reinsurance Group of America Inc. Cl A | | | 1,934 | | | | 187,579 | |
| Torchmark Corp. (b) | | | 2,445 | | | | 151,150 | |
| | | | | | | | 444,145 | |
| Total Financial | | | | | | | | |
| (Cost $825,480) | | | | | | | 937,245 | |
| Industrial — 11.5% | | | | | | | | |
| Aerospace & Defense — 1.0% | | | | | | | | |
| Teledyne Technologies Inc. (a) | | | 708 | | | | 70,127 | |
| Electronics — 4.4% | | | | | | | | |
| Jabil Circuit Inc. | | | 5,493 | | | | 101,456 | |
| Trimble Navigation Ltd. (a) | | | 4,016 | | | | 97,830 | |
| Woodward Inc. | | | 1,865 | | | | 107,499 | |
| | | | | | | | 306,785 | |
| Machinery-Diversified — 2.8% | | | | | | | | |
| Roper Technologies Inc. (b) | | | 697 | | | | 118,880 | |
The accompanying notes are an integral part of the financial statements.
2016 ANNUAL REPORT
Schedule of Investments (continued)
Quaker Mid-Cap Value Fund
June 30, 2016
| | | Number | | | Fair | |
| | | of Shares | | | Value | |
| Common Stocks (Continued) | | | | | | |
| Machinery-Diversified (Continued) | | | | | | |
| Zebra Technologies Corp. (a)(b) | | | 1,520 | | | $ | 76,152 | |
| | | | | | | | 195,032 | |
| Miscellaneous Manufacturing — 1.6% | | | | | | | | |
| Carlisle Cos. Inc. | | | 1,011 | | | | 106,842 | |
| Transportation — 1.7% | | | | | | | | |
| Old Dominion Freight Line Inc. (a) | | | 1,936 | | | | 116,760 | |
| Total Industrial | | | | | | | | |
| (Cost $753,336) | | | | | | | 795,546 | |
| Technology — 9.2% | | | | | | | | |
| Computers — 5.7% | | | | | | | | |
| CSRA Inc. | | | 3,831 | | | | 89,760 | |
| MAXIMUS Inc. (b) | | | 2,313 | | | | 128,071 | |
| Synopsys Inc. (a) | | | 2,072 | | | | 112,054 | |
| Western Digital Corp. (b) | | | 1,311 | | | | 61,958 | |
| | | | | | | | 391,843 | |
| Semiconductors — 3.5% | | | | | | | | |
| NVIDIA Corp. (b) | | | 2,087 | | | | 98,110 | |
| ON Semiconductor Corp. (a) | | | 16,036 | | | | 141,438 | |
| | | | | | | | 239,548 | |
| Total Technology | | | | | | | | |
| (Cost $635,925) | | | | | | | 631,391 | |
| Utilities — 11.2% | | | | | | | | |
| Electric — 7.1% | | | | | | | | |
| DTE Energy Co. | | | 1,717 | | | | 170,189 | |
| OGE Energy Corp. | | | 4,445 | | | | 145,574 | |
| Xcel Energy Inc. | | | 3,870 | | | | 173,299 | |
| | | | | | | | 489,062 | |
| Gas — 4.1% | | | | | | | | |
| CenterPoint Energy Inc. | | | 5,232 | | | | 125,568 | |
| UGI Corp. | | | 3,457 | | | | 156,429 | |
| | | | | | | | 281,997 | |
| Total Utilities | | | | | | | | |
| (Cost $576,997) | | | | | | | 771,059 | |
| Total Common Stocks | | | | | | | | |
| (Cost $5,250,826) | | | | | | | 5,662,845 | |
| Real Estate Investment Trusts — 15.2% | | | | | | | | |
| Alexandria Real Estate Equities Inc. | | | 1,467 | | | | 151,864 | |
| AvalonBay Communities Inc. (b) | | | 358 | | | | 64,580 | |
| Brixmor Property Group Inc. | | | 5,319 | | | | 140,741 | |
| DDR Corp. | | | 3,900 | | | | 70,746 | |
| Duke Realty Corp. (b) | | | 3,389 | | | | 90,351 | |
| Gaming and Leisure Properties Inc. | | | 4,145 | | | | 142,919 | |
| Sun Communities Inc. | | | 2,297 | | | | 176,042 | |
| Taubman Centers Inc. | | | 1,728 | | | | 128,217 | |
| Ventas Inc. (b) | | | 1,195 | | | | 87,020 | |
| | | | | | | | 1,052,480 | |
| Total Real Estate Investment Trusts | | | | | | | | |
| (Cost $922,201) | | | | | | | 1,052,480 | |
| Total Long-Term Investments | | | | | | | | |
| (Cost $6,173,027) | | | | | | | 6,715,325 | |
| Investments Purchased with Proceeds | | | | | | | | |
| from Securities Lending — 28.0% | | | | | | | | |
| Money Market Funds — 28.0% | | | | | | | | |
| Mount Vernon Securities | | | | | | | | |
| Lending Trust Prime Portfolio, | | | | | | | | |
| 0.56% (c)(d) | | | 1,930,487 | | | | 1,930,487 | |
| Total Investments Purchased with | | | | | | | | |
| Proceeds from Securities Lending | | | | | | | | |
| (Cost $1,930,487) | | | | | | | 1,930,487 | |
| Total Investments | | | | | | | | |
| (Cost $8,103,514) — 125.2% | | | | | | | 8,645,812 | |
| Liabilities in Excess | | | | | | | | |
| of Other Assets, Net (25.2%) | | | | | | | (1,740,877 | ) |
| Total Net Assets — 100.0% | | | | | | $ | 6,904,935 | |
| (a) | Non-income producing security. |
| (b) | All or a portion of the security is out on loan. The total market value of securities on loan was $1,930,029. The remaining contractual maturity of all of the securities lending transactions is overnight and continuous. |
| (c) | The rate shown is the annualized seven-day effective yield at period end. |
| (d) | Represents investments of collateral received from securities lending transactions. |
| f | Foreign issued security. |
The accompanying notes are an integral part of the financial statements.
Schedule of Investments
Quaker Small-Cap Value Fund
June 30, 2016
| | | Number | | | Fair | |
| | | of Shares | | | Value | |
| Long-Term Investments — 98.4% | | | | | | |
| Common Stocks — 86.9% | | | | | | |
| Basic Materials — 3.9% | | | | | | |
| Chemicals — 0.4% | | | | | | |
| Cabot Corp. | | | 857 | | | $ | 39,131 | |
| OMNOVA Solutions Inc. (a) | | | 10,629 | | | | 77,060 | |
| | | | | | | | 116,191 | |
| Forest Products & Paper — 0.5% | | | | | | | | |
| Clearwater Paper Corp. (a) | | | 1,537 | | | | 100,474 | |
| Mercer International Inc. | | | 7,312 | | | | 58,350 | |
| | | | | | | | 158,824 | |
| Iron & Steel — 1.4% | | | | | | | | |
| Reliance Steel & Aluminum Co. | | | 4,856 | | | | 373,426 | |
| Ryerson Holding Corp. (a)(b) | | | 5,110 | | | | 89,425 | |
| | | | | | | | 462,851 | |
| Mining — 1.6% | | | | | | | | |
Dominion Diamond Corp. f | | | 3,854 | | | | 34,069 | |
| Kaiser Aluminum Corp. | | | 4,893 | | | | 442,376 | |
Nevsun Resources Ltd. f | | | 16,927 | | | | 49,765 | |
| | | | | | | | 526,210 | |
| Total Basic Materials | | | | | | | | |
| (Cost $1,163,100) | | | | | | | 1,264,076 | |
| Communications — 11.7% | | | | | | | | |
| Internet — 6.3% | | | | | | | | |
| Autobytel Inc. (a) | | | 2,287 | | | | 31,721 | |
AVG Technologies NV (a) f | | | 17,582 | | | | 333,882 | |
| Blue Nile Inc. | | | 2,997 | | | | 82,058 | |
| DHI Group Inc. (a) | | | 27,942 | | | | 174,079 | |
| IAC/InterActive Corp. | | | 5,807 | | | | 326,934 | |
| Internap Corp. (a) | | | 27,437 | | | | 56,520 | |
magicJack VocalTec Ltd. (a)(b) f | | | 9,340 | | | | 58,749 | |
| New Media Investment Group Inc. | | | 19,151 | | | | 346,059 | |
| RetailMeNot Inc. (a) | | | 31,097 | | | | 239,758 | |
| Web.com Group Inc. (a) | | | 21,760 | | | | 395,597 | |
| | | | | | | | 2,045,357 | |
| Media — 2.4% | | | | | | | | |
| Gannett Co. Inc. | | | 10,867 | | | | 150,073 | |
| MSG Networks Inc. (a) | | | 16,823 | | | | 258,065 | |
| Time Inc. | | | 22,755 | | | | 374,547 | |
| | | | | | | | 782,685 | |
| Telecommunications — 3.0% | | | | | | | | |
| Black Box Corp. | | | 4,001 | | | | 52,333 | |
| EarthLink Holdings Corp. | | | 60,878 | | | | 389,619 | |
| Extreme Networks Inc. (a) | | | 45,574 | | | | 154,496 | |
| FairPoint Communications Inc. (a) | | | 13,427 | | | | 197,108 | |
| NeuStar Inc. (a)(b) | | | 8,338 | | | | 196,026 | |
| | | | | | | | 989,582 | |
| Total Communications | | | | | | | | |
| (Cost $4,083,864) | | | | | | | 3,817,624 | |
| Consumer, Cyclical — 12.5% | | | | | | | | |
| Airlines — 1.5% | | | | | | | | |
| Hawaiian Holdings Inc. (a) | | | 7,307 | | | | 277,374 | |
| SkyWest Inc. | | | 7,693 | | | | 203,557 | |
| | | | | | | | 480,931 | |
| Apparel — 0.1% | | | | | | | | |
| Perry Ellis International Inc. (a) | | | 1,586 | | | | 31,910 | |
| Auto Manufacturers — 1.2% | | | | | | | | |
| Wabash National Corp. (a)(b) | | | 30,867 | | | | 392,011 | |
| Auto Parts & Equipment — 2.7% | | | | | | | | |
| Cooper Tire & Rubber Co. | | | 9,766 | | | | 291,222 | |
| Dana Holding Corp. (b) | | | 11,157 | | | | 117,818 | |
| Lear Corp. | | | 1,842 | | | | 187,442 | |
| Meritor Inc. (a)(b) | | | 6,774 | | | | 48,773 | |
| Tenneco Inc. (a)(b) | | | 1,728 | | | | 80,542 | |
| Visteon Corp. (b) | | | 2,332 | | | | 153,469 | |
| | | | | | | | 879,266 | |
| Distribution & Wholesale — 0.5% | | | | | | | | |
| Veritiv Corp. (a) | | | 1,950 | | | | 73,281 | |
| WESCO International Inc. (a)(b) | | | 1,923 | | | | 99,015 | |
| | | | | | | | 172,296 | |
| Entertainment — 0.1% | | | | | | | | |
| Eldorado Resorts Inc. (a) | | | 1,523 | | | | 23,142 | |
| Home Builders — 0.1% | | | | | | | | |
| NVR Inc. (a)(b) | | | 17 | | | | 30,266 | |
| Home Furnishings — 1.2% | | | | | | | | |
| Ethan Allen Interiors Inc. (b) | | | 9,812 | | | | 324,188 | |
| La-Z-Boy Inc. | | | 2,812 | | | | 78,230 | |
| | | | | | | | 402,418 | |
| Office Furnishings — 0.5% | | | | | | | | |
| Herman Miller Inc. (b) | | | 5,760 | | | | 172,166 | |
The accompanying notes are an integral part of the financial statements.
Schedule of Investments (continued)
Quaker Small-Cap Value Fund
June 30, 2016
| | | Number | | | Fair | |
| | | of Shares | | | Value | |
| Common Stocks (Continued) | | | | | | |
| Retail — 4.4% | | | | | | |
| American Eagle Outfitters Inc. (b) | | | 3,141 | | | $ | 50,036 | |
| Big Lots Inc. (b) | | | 7,027 | | | | 352,123 | |
| Bloomin’ Brands Inc. | | | 4,261 | | | | 76,144 | |
| Bob Evans Farms Inc. (b) | | | 1,683 | | | | 63,870 | |
| Bravo Brio Restaurant | | | | | | | | |
| Group Inc. (a)(b) | | | 16,737 | | | | 137,076 | |
| Carrols Restaurant Group Inc. (a) | | | 6,297 | | | | 74,934 | |
| Francesca’s Holdings Corp. (a) | | | 13,651 | | | | 150,844 | |
| Movado Group Inc. | | | 9,027 | | | | 195,705 | |
| Nu Skin Enterprises Inc. (b) | | | 2,775 | | | | 128,177 | |
| Potbelly Corp. (a)(b) | | | 9,657 | | | | 121,099 | |
| Tailored Brands Inc. | | | 2,272 | | | | 28,764 | |
| Vitamin Shoppe Inc. (a)(b) | | | 1,624 | | | | 49,646 | |
| | | | | | | | 1,428,418 | |
| Toys/Games & Hobbies — 0.2% | | | | | | | | |
| JAKKS Pacific Inc. (a)(b) | | | 7,878 | | | | 62,315 | |
| Total Consumer, Cyclical | | | | | | | | |
| (Cost $4,038,988) | | | | | | | 4,075,139 | |
| Consumer, Non-cyclical — 19.8% | | | | | | | | |
| Biotechnology — 5.5% | | | | | | | | |
| Acorda Therapeutics Inc. (a)(b) | | | 8,567 | | | | 218,501 | |
| AMAG Pharmaceuticals Inc. (a)(b) | | | 1,799 | | | | 43,032 | |
| Applied Genetic | | | | | | | | |
| Technologies Corp. (a) | | | 6,642 | | | | 93,851 | |
| Emergent BioSolutions Inc. (a)(b) | | | 11,427 | | | | 321,327 | |
| Five Prime Therapeutics Inc. (a)(b) | | | 6,513 | | | | 269,313 | |
| Lexicon Pharmaceuticals Inc. (a)(b) | | | 9,252 | | | | 132,766 | |
| Ligand Pharmaceuticals Inc. (a)(b) | | | 3,148 | | | | 375,462 | |
| United Therapeutics Corp. (a)(b) | | | 3,066 | | | | 324,751 | |
| | | | | | | | 1,779,003 | |
| Commercial Services — 4.5% | | | | | | | | |
| Aaron’s Inc. | | | 4,409 | | | | 96,513 | |
| American Public Education Inc. (a) | | | 2,104 | | | | 59,122 | |
| The Brink’s Co. | | | 8,987 | | | | 256,040 | |
| Capella Education Co. (b) | | | 738 | | | | 38,848 | |
| Hertz Global Holdings Inc. (a) | | | 4,166 | | | | 46,118 | |
| INC Research Holdings Inc. (a) | | | 762 | | | | 29,055 | |
| Insperity Inc. | | | 595 | | | | 45,952 | |
| Medifast Inc. | | | 5,094 | | | | 169,477 | |
| Quanta Services Inc. (a)(b) | | | 10,890 | | | | 251,777 | |
| Rent-A-Center Inc. | | | 14,208 | | | | 174,474 | |
| Strayer Education Inc. (a) | | | 1,764 | | | | 86,665 | |
| Vectrus Inc. (a) | | | 7,038 | | | | 200,513 | |
| | | | | | | | 1,454,554 | |
| Cosmetics & Personal Care — 0.2% | | | | | | | | |
| Avon Products Inc. | | | 14,444 | | | | 54,598 | |
| Food — 1.4% | | | | | | | | |
| Dean Foods Co. (b) | | | 21,473 | | | | 388,447 | |
| Sanderson Farms Inc. (b) | | | 783 | | | | 67,839 | |
| | | | | | | | 456,286 | |
| Healthcare-Products — 3.1% | | | | | | | | |
| BioTelemetry Inc. (a) | | | 6,716 | | | | 109,471 | |
| Genomic Health Inc. (a) | | | 1,550 | | | | 40,137 | |
| Luminex Corp. (a) | | | 14,558 | | | | 294,508 | |
Orthofix International NV (a) f | | | 9,537 | | | | 404,369 | |
| Repligen Corp. (a) | | | 6,295 | | | | 172,231 | |
| | | | | | | | 1,020,716 | |
| Healthcare-Services — 2.3% | | | | | | | | |
| Air Methods Corp. (a)(b) | | | 7,283 | | | | 260,950 | |
| Amedisys Inc. (a)(b) | | | 3,970 | | | | 200,406 | |
| Magellan Health Inc. (a) | | | 4,300 | | | | 282,811 | |
| | | | | | | | 744,167 | |
| Household Products & Wares — 0.6% | | | | | | | | |
| ACCO Brands Corp. (a) | | | 14,881 | | | | 153,721 | |
| Central Garden & Pet Co. (a) | | | 2,119 | | | | 46,003 | |
| | | | | | | | 199,724 | |
| Pharmaceuticals — 2.2% | | | | | | | | |
| Anika Therapeutics Inc. (a) | | | 3,420 | | | | 183,483 | |
| BioDelivery Sciences | | | | | | | | |
| International Inc. (a)(b) | | | 17,146 | | | | 40,465 | |
| Enanta Pharmaceuticals Inc. (a)(b) | | | 7,074 | | | | 155,982 | |
Herbalife Ltd. (a) f | | | 749 | | | | 43,839 | |
| Omega Protein Corp. (a) | | | 7,627 | | | | 152,464 | |
| Vanda Pharmaceuticals Inc. (a) | | | 13,159 | | | | 147,249 | |
| | | | | | | | 723,482 | |
| Total Consumer, Non-cyclical | | | | | | | | |
| (Cost $6,352,499) | | | | | | | 6,432,530 | |
| Energy — 2.9% | | | | | | | | |
| Coal — 0.1% | | | | | | | | |
| SunCoke Energy Inc. | | | 4,491 | | | | 26,138 | |
The accompanying notes are an integral part of the financial statements.
2016 ANNUAL REPORT
Schedule of Investments (continued)
Quaker Small-Cap Value Fund
June 30, 2016
| | | Number | | | Fair | |
| | | of Shares | | | Value | |
| Common Stocks (Continued) | | | | | | |
| Energy-Alternate Sources — 0.4% | | | | | | |
| REX American Resources Corp. (a) | | | 1,989 | | | $ | 119,002 | |
| Oil & Gas — 2.4% | | | | | | | | |
| Atwood Oceanics Inc. (b) | | | 19,628 | | | | 245,743 | |
| Bill Barrett Corp. (a) | | | 6,186 | | | | 39,529 | |
Ensco PLC (b) f | | | 12,254 | | | | 118,986 | |
Rowan Cos. PLC (b) f | | | 21,507 | | | | 379,814 | |
| | | | | | | | 784,072 | |
| Total Energy | | | | | | | | |
| (Cost $893,398) | | | | | | | 929,212 | |
| Financial — 13.3% | | | | | | | | |
| Banks — 2.6% | | | | | | | | |
| Central Pacific Financial Corp. | | | 14,175 | | | | 334,530 | |
| First NBC Bank Holding Co. (a) | | | 3,852 | | | | 64,675 | |
| Great Western Bancorp Inc. | | | 8,946 | | | | 282,157 | |
| Walker & Dunlop Inc. (a) | | | 6,925 | | | | 157,751 | |
| | | | | | | | 839,113 | |
| Diversified Financial Services — 1.7% | | | | | | | | |
| Altisource Portfolio | | | | | | | | |
Solutions SA (a)(b) f | | | 6,889 | | | | 191,790 | |
| Encore Capital Group Inc. (a)(b) | | | 1,930 | | | | 45,413 | |
| Evercore Partners Inc. | | | 2,943 | | | | 130,051 | |
| Federal Agricultural Mortgage Corp. | | | 3,450 | | | | 120,129 | |
| KCG Holdings Inc. (a) | | | 2,804 | | | | 37,293 | |
| Navient Corp. (b) | | | 1,813 | | | | 21,665 | |
| | | | | | | | 546,341 | |
| Insurance — 7.5% | | | | | | | | |
Aspen Insurance Holdings Ltd. f | | | 8,668 | | | | 402,022 | |
Assured Guaranty Ltd. f | | | 15,246 | | | | 386,791 | |
Everest Re Group Ltd. f | | | 939 | | | | 171,527 | |
| Federated National Holding Co. | | | 1,961 | | | | 37,337 | |
| Genworth Financial Inc. (a) | | | 42,862 | | | | 110,584 | |
| HCI Group Inc. | | | 3,746 | | | | 102,191 | |
| Reinsurance Group of America Inc. Cl A | | | 4,548 | | | | 441,111 | |
| United Insurance Holdings Corp. | | | 2,309 | | | | 37,821 | |
| Universal Insurance Holdings Inc. | | | 6,834 | | | | 126,976 | |
Validus Holdings Ltd. f | | | 7,934 | | | | 385,513 | |
| Voya Financial Inc. | | | 10,308 | | | | 255,226 | |
| | | | | | | | 2,457,099 | |
| Real Estate — 0.2% | | | | | | | | |
FirstService Corp. f | | | 1,408 | | | | 64,529 | |
| Savings & Loans — 1.3% | | | | | | | | |
| Flagstar Bancorp Inc. (a) | | | 17,529 | | | | 427,883 | |
| Total Financial | | | | | | | | |
| (Cost $4,084,281) | | | | | | | 4,334,965 | |
| Industrial — 13.0% | | | | | | | | |
| Aerospace & Defense — 0.7% | | | | | | | | |
| Spirit AeroSystems Holdings Inc. (a) | | | 5,385 | | | | 231,555 | |
| Building Materials — 0.6% | | | | | | | | |
| Boise Cascade Co. (a) | | | 2,229 | | | | 51,156 | |
| Continental Building Products Inc. (a) | | | 1,418 | | | | 31,522 | |
| Owens Corning | | | 2,498 | | | | 128,697 | |
| | | | | | | | 211,375 | |
| Electronics — 2.8% | | | | | | | | |
Celestica Inc. (a)(b) f | | | 29,509 | | | | 274,434 | |
Flextronics International Ltd. (a) f | | | 12,831 | | | | 151,406 | |
| Sanmina Corp. (a) | | | 4,188 | | | | 112,280 | |
| Vishay Intertechnology Inc. (b) | | | 27,444 | | | | 340,031 | |
| Vishay Precision Group Inc. (a) | | | 2,347 | | | | 31,497 | |
| | | | | | | | 909,648 | |
| Engineering & Construction — 3.9% | | | | | | | | |
| Aegion Corp. (a) | | | 21,117 | | | | 411,993 | |
| Comfort Systems U.S.A. Inc. | | | 5,900 | | | | 192,163 | |
| EMCOR Group Inc. (b) | | | 7,820 | | | | 385,213 | |
| MYR Group Inc. (a) | | | 11,094 | | | | 267,143 | |
| | | | | | | | 1,256,512 | |
| Machinery-Diversified — 0.7% | | | | | | | | |
| BWX Technologies Inc. | | | 6,151 | | | | 220,021 | |
| Metal Fabricate & Hardware — 0.5% | | | | | | | | |
| Global Brass & Copper Holdings Inc. | | | 4,794 | | | | 130,828 | |
| Olympic Steel Inc. | | | 1,406 | | | | 38,398 | |
| | | | | | | | 169,226 | |
| Miscellaneous Manufacturing — 1.2% | | | | | | | | |
| Myers Industries Inc. | | | 5,812 | | | | 83,693 | |
Trinseo SA (a) f | | | 7,558 | | | | 324,465 | |
| | | | | | | | 408,158 | |
| Shipbuilding — 1.4% | | | | | | | | |
| Huntington Ingalls Industries Inc. | | | 2,625 | | | | 441,079 | |
| Transportation — 1.2% | | | | | | | | |
| Atlas Air Worldwide Holdings Inc. (a)(b) | | | 730 | | | | 30,237 | |
DHT Holdings Inc. f | | | 38,013 | | | | 191,205 | |
The accompanying notes are an integral part of the financial statements.
2016 ANNUAL REPORT
Schedule of Investments (continued)
Quaker Small-Cap Value Fund
June 30, 2016
| | | Number | | | Fair | |
| | | of Shares | | | Value | |
| Common Stocks (Continued) | | | | | | |
| Transportation (Continued) | | | | | | |
Euronav NV f | | | 16,904 | | | $ | 155,010 | |
| | | | | | | | 376,452 | |
| Total Industrial | | | | | | | | |
| (Cost $3,761,640) | | | | | | | 4,224,026 | |
| Technology — 5.9% | | | | | | | | |
| Computers — 1.0% | | | | | | | | |
| Cadence Design Systems Inc. (a)(b) | | | 3,363 | | | | 81,721 | |
| Convergys Corp. (b) | | | 2,163 | | | | 54,075 | |
| Insight Enterprises Inc. (a) | | | 3,749 | | | | 97,474 | |
| Teradata Corp. (a) | | | 3,114 | | | | 78,068 | |
| | | | | | | | 311,338 | |
| Semiconductors — 1.6% | | | | | | | | |
Alpha & Omega Semiconductor Ltd. (a) f | | | 7,894 | | | | 109,963 | |
| Kulicke & Soffa Industries Inc. (a) | | | 21,025 | | | | 255,874 | |
| ON Semiconductor Corp. (a) | | | 2,850 | | | | 25,137 | |
| Teradyne Inc. | | | 7,190 | | | | 141,571 | |
| | | | | | | | 532,545 | |
| Software — 3.3% | | | | | | | | |
| Aspen Technology Inc. (a)(b) | | | 10,318 | | | | 415,196 | |
| MicroStrategy Inc. (a) | | | 620 | | | | 108,512 | |
| Rackspace Hosting Inc. (a) | | | 4,799 | | | | 100,107 | |
| Take-Two Interactive | | | | | | | | |
| Software Inc. (a)(b) | | | 11,995 | | | | 454,850 | |
| | | | | | | | 1,078,665 | |
| Total Technology | | | | | | | | |
| (Cost $1,762,709) | | | | | | | 1,922,548 | |
| Utilities — 3.9% | | | | | | | | |
| Electric — 2.3% | | | | | | | | |
| El Paso Electric Co. | | | 2,350 | | | | 111,084 | |
| Great Plains Energy Inc. | | | 12,322 | | | | 374,589 | |
| NRG Energy Inc. | | | 11,511 | | | | 172,550 | |
| Portland General Electric Co. (b) | | | 1,722 | | | | 75,975 | |
| | | | | | | | 734,198 | |
| Gas — 1.6% | | | | | | | | |
| Just Energy Group Inc. f | | | 4,547 | | | | 27,646 | |
| Southwest Gas Corp. | | | 1,022 | | | | 80,442 | |
| UGI Corp. | | | 9,518 | | | | 430,689 | |
| | | | | | | | 538,777 | |
| Total Utilities | | | | | | | | |
| (Cost $1,076,391) | | | | | | | 1,272,975 | |
| Total Common Stocks | | | | | | | | |
| (Cost $27,216,870) | | | | | | | 28,273,095 | |
| Real Estate Investment Trusts — 11.0% | | | | | | | | |
| Ashford Hospitality Trust Inc. | | | 67,025 | | | | 359,924 | |
| Care Capital Properties Inc. | | | 1,569 | | | | 41,123 | |
| CBL & Associates Properties Inc. | | | 26,670 | | | | 248,298 | |
| CoreSite Realty Corp. (b) | | | 3,709 | | | | 328,951 | |
| First Potomac Realty Trust | | | 5,446 | | | | 50,103 | |
| Gaming and Leisure Properties Inc. | | | 1,741 | | | | 60,030 | |
| Hersha Hospitality Trust | | | 13,799 | | | | 236,653 | |
| Hospitality Properties Trust | | | 15,000 | | | | 432,000 | |
| Mack-Cali Realty Corp. (b) | | | 11,800 | | | | 318,600 | |
| National Storage Affiliates Trust | | | 19,045 | | | | 396,517 | |
| Ryman Hospitality Properties Inc. (b) | | | 6,964 | | | | 352,727 | |
| Summit Hotel Properties Inc. | | | 14,636 | | | | 193,781 | |
| Taubman Centers Inc. | | | 4,565 | | | | 338,723 | |
| WP Glimcher Inc. | | | 19,734 | | | | 220,823 | |
| | | | | | | | 3,578,253 | |
| Total Real Estate Investment Trusts | | | | | | | | |
| (Cost $3,746,647) | | | | | | | 3,578,253 | |
| Closed End Mutual Funds — 0.5% | | | | | | | | |
| THL Credit Inc. | | | 15,733 | | | | 175,108 | |
| Total Closed End Mutual Funds | | | | | | | | |
| (Cost $194,488) | | | | | | | 175,108 | |
| Total Long-Term Investments | | | | | | | | |
| (Cost $31,158,005) | | | | | | | 32,026,456 | |
The accompanying notes are an integral part of the financial statements.
2016 ANNUAL REPORT
Schedule of Investments (continued)
Quaker Small-Cap Value Fund
June 30, 2016
| | | Number | | | Fair | |
| | | of Shares | | | Value | |
| Investments Purchased with Proceeds | | | | | | |
| from Securities Lending — 27.1% | | | | | | |
| Money Market Funds — 27.1% | | | | | | |
| Mount Vernon Securities | | | | | | |
| Lending Trust Prime Portfolio, | | | | | | |
| 0.56% (c)(d) | | | 8,824,306 | | | $ | 8,824,306 | |
| Total Investments Purchased with | | | | | | | | |
| Proceeds from Securities Lending | | | | | | | | |
| (Cost $8,824,306) | | | | | | | 8,824,306 | |
| Total Investments | | | | | | | | |
| (Cost $39,982,311) — 125.5% | | | | | | | 40,850,762 | |
| Liabilities in Excess of | | | | | | | | |
| Other Assets, Net (25.5)% | | | | | | | (8,300,548 | ) |
| Total Net Assets — 100.0% | | | | | | $ | 32,550,214 | |
| (a) | Non-income producing security. |
| (b) | All or a portion of the security is out on loan. The total market value of securities on loan was $8,760,189. The remaining contractual maturity of all of the securities lending transactions is overnight and continuous. |
| (c) | The rate shown is the annualized seven-day effective yield at period end. |
| (d) | Represents investments of collateral received from securities lending transactions. |
| f | Foreign issued security. |
The accompanying notes are an integral part of the financial statements.
2016 ANNUAL REPORT
Schedule of Investments
Quaker Strategic Growth Fund
June 30, 2016
| | | Number | | | Fair | |
| | | of Shares | | | Value | |
| Long-Term Investments — 91.5% | | | | | | |
| Common Stocks — 86.5% | | | | | | |
| Communications — 19.7% | | | | | | |
| Internet — 17.4% | | | | | | |
| Alibaba Group Holding | | | | | | |
Ltd. - ADR (a)(b) f | | | 13,483 | | | $ | 1,072,303 | |
| Alphabet Inc. Cl A (a) | | | 2,500 | | | | 1,758,825 | |
| Alphabet Inc. Cl C (a) | | | 2,508 | | | | 1,735,787 | |
| Amazon.com Inc. (a) | | | 5,492 | | | | 3,930,185 | |
| Expedia Inc. (b) | | | 10,030 | | | | 1,066,189 | |
| Facebook Inc. Cl A (a) | | | 22,835 | | | | 2,609,584 | |
| GoDaddy Inc. (a)(b) | | | 19,905 | | | | 620,837 | |
| Netflix Inc. (a)(b) | | | 9,059 | | | | 828,717 | |
| Wayfair Inc. (a)(b) | | | 35,060 | | | | 1,367,340 | |
| | | | | | | | 14,989,767 | |
| Media — 2.3% | | | | | | | | |
| Time Warner Inc. | | | 26,675 | | | | 1,961,679 | |
| Total Communications | | | | | | | | |
| (Cost $16,385,279) | | | | | | | 16,951,446 | |
| Consumer, Cyclical — 9.8% | | | | | | | | |
| Airlines — 0.4% | | | | | | | | |
| AMR Corp. Escrow (a)*^ | | | 211,235 | | | | 306,291 | |
| Distribution & Wholesale — 0.7% | | | | | | | | |
| HD Supply Holdings Inc. (a)(b) | | | 18,405 | | | | 640,862 | |
| Retail — 8.7% | | | | | | | | |
| Costco Wholesale Corp. (b) | | | 12,070 | | | | 1,895,473 | |
| McDonald’s Corp. | | | 3,580 | | | | 430,817 | |
| Panera Bread Co. (a)(b) | | | 4,117 | | | | 872,557 | |
| The TJX Cos. Inc. | | | 29,270 | | | | 2,260,522 | |
| Ulta Salon Cosmetics & | | | | | | | | |
| Fragrance Inc. (a)(b) | | | 5,465 | | | | 1,331,493 | |
| Walgreens Boots Alliance Inc. | | | 7,850 | | | | 653,669 | |
| | | | | | | | 7,444,531 | |
| Total Consumer, Cyclical | | | | | | | | |
| (Cost $7,565,735) | | | | | | | 8,391,684 | |
| Consumer, Non-cyclical — 25.5% | | | | | | | | |
| Biotechnology — 4.5% | | | | | | | | |
| Amgen Inc. | | | 14,195 | | | | 2,159,769 | |
| BioMarin Pharmaceutical Inc. (a) | | | 7,885 | | | | 613,453 | |
| Gilead Sciences Inc. | | | 5,213 | | | | 434,868 | |
| Vertex Pharmaceuticals Inc. (a) | | | 7,434 | | | | 639,473 | |
| | | | | | | | 3,847,563 | |
| Commercial Services — 3.7% | | | | | | | | |
| FleetCor Technologies Inc. (a) | | | 7,485 | | | | 1,071,328 | |
| PayPal Holdings Inc. (a) | | | 23,450 | | | | 856,159 | |
| Sabre Corp. | | | 48,125 | | | | 1,289,269 | |
| | | | | | | | 3,216,756 | |
| Cosmetics & Personal Care— 1.4% | | | | | | | | |
Unilever NV - NY Shares f | | | 25,025 | | | | 1,174,674 | |
| Food — 1.3% | | | | | | | | |
| Mondelez International Inc. | | | 24,885 | | | | 1,132,516 | |
| Healthcare-Products — 3.1% | | | | | | | | |
| Edwards Lifesciences Corp. (a) | | | 10,885 | | | | 1,085,561 | |
| Intuitive Surgical Inc. (a) | | | 2,340 | | | | 1,547,700 | |
| | | | | | | | 2,633,261 | |
| Healthcare-Services — 1.2% | | | | | | | | |
| UnitedHealth Group Inc. | | | 7,480 | | | | 1,056,176 | |
| Household Products & Wares — 1.0% | | | | | | | | |
| Avery Dennison Corp. (b) | | | 11,420 | | | | 853,645 | |
| Pharmaceuticals — 9.3% | | | | | | | | |
| AbbVie Inc. | | | 10,978 | | | | 679,648 | |
Allergan PLC (a) f | | | 5,581 | | | | 1,289,713 | |
| Bristol-Myers Squibb Co. (b) | | | 27,951 | | | | 2,055,796 | |
| Eli Lilly & Co. | | | 26,426 | | | | 2,081,048 | |
Roche Holding AG - ADR f | | | 58,415 | | | | 1,924,774 | |
| | | | | | | | 8,030,979 | |
| Total Consumer, Non-cyclical | | | | | | | | |
| (Cost $21,842,889) | | | | | | | 21,945,570 | |
| Energy — 2.8% | | | | | | | | |
| Oil & Gas — 2.8% | | | | | | | | |
| Hess Corp. (b) | | | 14,670 | | | | 881,667 | |
| Marathon Oil Corp. (b) | | | 43,370 | | | | 650,984 | |
| Pioneer Natural Resources Co. (b) | | | 5,520 | | | | 834,679 | |
| | | | | | | | 2,367,330 | |
| Total Energy | | | | | | | | |
| (Cost $2,367,803) | | | | | | | 2,367,330 | |
| Financial — 14.2% | | | | | | | | |
| Banks — 1.9% | | | | | | | | |
| Bank of America Corp. | | | 51,160 | | | | 678,893 | |
| JPMorgan Chase & Co. (b) | | | 14,606 | | | | 907,617 | |
| | | | | | | | 1,586,510 | |
The accompanying notes are an integral part of the financial statements.
2016 ANNUAL REPORT
Schedule of Investments (continued)
Quaker Strategic Growth Fund
June 30, 2016
| | | Number | | | Fair | |
| | | of Shares | | | Value | |
| Common Stocks (Continued) | | | | | | |
| Diversified Financial Services — 9.1% | | | | | | |
| Discover Financial Services | | | 16,635 | | | $ | 891,470 | |
| Ellie Mae Inc. (a)(b) | | | 16,631 | | | | 1,524,231 | |
| Mastercard Inc. Cl A | | | 30,185 | | | | 2,658,091 | |
| Visa Inc. Cl A (b) | | | 36,820 | | | | 2,730,939 | |
| | | | | | | | 7,804,731 | |
| Insurance — 3.2% | | | | | | | | |
Chubb Ltd. f | | | 14,235 | | | | 1,860,657 | |
| Marsh & McLennan Cos. Inc. (b) | | | 13,543 | | | | 927,154 | |
| | | | | | | | 2,787,811 | |
| Total Financial | | | | | | | | |
| (Cost $11,221,476) | | | | | | | 12,179,052 | |
| Industrial — 0.8% | | | | | | | | |
| Electronics — 0.8% | | | | | | | | |
| Honeywell International Inc. | | | 6,046 | | | | 703,271 | |
| Total Industrial | | | | | | | | |
| (Cost $640,072) | | | | | | | 703,271 | |
| Technology — 13.7% | | | | | | | | |
| Semiconductors — 2.8% | | | | | | | | |
| Applied Materials Inc. | | | 46,635 | | | | 1,117,841 | |
Broadcom Ltd. f | | | 8,350 | | | | 1,297,590 | |
| | | | | | | | 2,415,431 | |
| Software — 10.9% | | | | | | | | |
| Activision Blizzard Inc. | | | 26,745 | | | | 1,059,904 | |
| Adobe Systems Inc. (a) | | | 22,919 | | | | 2,195,411 | |
| Intuit Inc. | | | 7,975 | | | | 890,090 | |
NetEase Inc. - ADR (b) f | | | 5,770 | | | | 1,114,880 | |
| salesforce.com Inc. (a)(b) | | | 18,995 | | | | 1,508,393 | |
| ServiceNow Inc. (a)(b) | | | 17,725 | | | | 1,176,940 | |
| Workday Inc. Cl A (a)(b) | | | 19,345 | | | | 1,444,491 | |
| | | | | | | | 9,390,109 | |
| Total Technology | | | | | | | | |
| (Cost $10,800,816) | | | | | | | 11,805,540 | |
| Total Common Stocks | | | | | | | | |
| (Cost $70,824,070) | | | | | | | 74,343,893 | |
| Exchange Traded Funds — 5.0% | | | | | | | | |
| SPDR S&P 500 ETF Trust (b) | | | 20,595 | | | | 4,315,270 | |
| Total Exchange Traded Funds | | | | | | | | |
| (Cost $4,296,168) | | | | | | | 4,315,270 | |
| Total Long-Term Investments | | | | | | | | |
| (Cost $75,120,238) | | | | | | | 78,659,163 | |
| Investments Purchased with Proceeds | | | | | | | | |
| from Securities Lending — 27.6% | | | | | | | | |
| Money Market Funds — 27.6% | | | | | | | | |
| Mount Vernon Securities | | | | | | | | |
| Lending Trust Prime Portfolio, | | | | | | | | |
| 0.56% (c)(d) | | | 23,725,114 | | | | 23,725,114 | |
| Total Investments Purchased with | | | | | | | | |
| Proceeds from Securities Lending | | | | | | | | |
| (Cost $23,725,114) | | | | | | | 23,725,114 | |
| Total Investments | | | | | | | | |
| (Cost $98,845,352) — 119.1% | | | | | | | 102,384,277 | |
| Liabilities in Excess of | | | | | | | | |
| Other Assets, Net (19.1%) | | | | | | | (16,393,624 | ) |
| Total Net Assets — 100.0% | | | | | | $ | 85,990,653 | |
ADR - American Depositary Receipt
| (a) | Non-income producing security. |
| (b) | All or a portion of the security is out on loan. The total market value of securities on loan was $23,423,295. The remaining contractual maturity of all of the securities lending transactions is overnight and continuous. |
| (c) | The rate shown is the annualized seven-day effective yield at period end. |
| (d) | Represents investments of collateral received from securities lending transactions. |
| f | Foreign issued security. |
| * | Indicates an illiquid security. Total market value for illiquid securities is $306,291, representing 0.4% of net assets. |
| ^ | Indicates a fair valued security. Total market value for fair valued securities is $306,291, representing 0.4.% of net assets and Level 3 securities. |
The accompanying notes are an integral part of the financial statements.
2016 ANNUAL REPORT
(This Page Intentionally Left Blank.)
2016 ANNUAL REPORT
Statements of Assets and Liabilities
June 30, 2016
| | | | | | Quaker Global | | | Quaker | | | Quaker | | | Quaker | |
| | | Quaker Event | | | Tactical | | | Mid-Cap | | | Small-Cap | | | Strategic | |
| | | Arbitrage Fund | | | Allocation Fund | | | Value Fund | | | Value Fund | | | Growth Fund | |
| ASSETS: | | | | | | | | | | | | | | | |
| Investments, at value (Note 12) | | $ | 35,845,731 | | | $ | 6,529,830 | | | $ | 8,645,812 | | | $ | 40,850,762 | | | $ | 102,384,277 | |
| Cash | | | 1,090,240 | | | | 356,480 | | | | 194,143 | | | | 370,776 | | | | 8,630,037 | |
| Foreign currency, at value | | | 155,431 | | | | — | | | | — | | | | 374 | | | | — | |
| Cash held at brokers for short sales | | | 125,683 | | | | — | | | | — | | | | — | | | | — | |
| Receivables: | | | | | | | | | | | | | | | | | | | | |
| Dividends and interest | | | 157,510 | | | | 6,546 | | | | 11,522 | | | | 40,806 | | | | 72,680 | |
| Capital shares sold | | | 132,017 | | | | — | | | | 140 | | | | 12,771 | | | | 1,687 | |
| Investment securities sold | | | 2,785,265 | | | | 30,449 | | | | — | | | | 1,075,337 | | | | 446,234 | |
| Miscellaneous | | | 41,092 | | | | — | | | | — | | | | — | | | | — | |
| Securities lending income | | | 1,766 | | | | — | | | | 374 | | | | 2,203 | | | | 6,864 | |
| Prepaid expenses and other assets | | | 61,156 | | | | 11,231 | | | | 9,927 | | | | 46,402 | | | | 133,468 | |
| Total assets | | | 40,395,891 | | | | 6,934,536 | | | | 8,861,918 | | | | 42,399,431 | | | | 111,675,247 | |
| | | | | | | | | | | | | | | | | | | | | |
| LIABILITIES: | | | | | | | | | | | | | | | | | | | | |
| Written options, at value | | $ | 211,547 | | | $ | — | | | $ | — | | | $ | — | | | $ | — | |
| Payables: | | | | | | | | | | | | | | | | | | | | |
| Due to advisor (Note 3) | | | 32,957 | | | | 7,193 | | | | 5,993 | | | | 26,937 | | | | 77,639 | |
| Capital shares redeemed | | | 183,061 | | | | 60,114 | | | | 5,724 | | | | 3,403 | | | | 170,696 | |
| Upon return of securities loaned | | | 4,709,849 | | | | — | | | | 1,930,487 | | | | 8,824,306 | | | | 23,725,114 | |
| Investment securities purchased | | | 1,278,241 | | | | 109,876 | | | | — | | | | 948,722 | | | | 1,531,306 | |
| Distribution fees | | | 12,662 | | | | 4,559 | | | | 3,781 | | | | 2,643 | | | | 39,715 | |
| Trustee expenses | | | 7,488 | | | | 904 | | | | 770 | | | | 3,528 | | | | 12,310 | |
| Chief compliance officer fees | | | 3,177 | | | | 636 | | | | 610 | | | | 2,874 | | | | 7,797 | |
| Accrued expenses | | | 65,321 | | | | 12,334 | | | | 9,618 | | | | 36,804 | | | | 120,017 | |
| Total liabilities | | | 6,504,303 | | | | 195,616 | | | | 1,956,983 | | | | 9,849,217 | | | | 25,684,594 | |
| Net assets | | $ | 33,891,588 | | | $ | 6,738,920 | | | $ | 6,904,935 | | | $ | 32,550,214 | | | $ | 85,990,653 | |
The accompanying notes are an integral part of the financial statements.
2016 ANNUAL REPORT
Statements of Assets and Liabilities (continued)
June 30, 2016
| | | | | | Quaker Global | | | Quaker | | | Quaker | | | Quaker | |
| | | Quaker Event | | | Tactical | | | Mid-Cap | | | Small-Cap | | | Strategic | |
| | | Arbitrage Fund | | | Allocation Fund | | | Value Fund | | | Value Fund | | | Growth Fund | |
| NET ASSETS CONSIST OF: | | | | | | | | | | | | | | | |
| Paid-in capital | | $ | 48,230,460 | | | $ | 17,479,376 | | | $ | 11,288,961 | | | $ | 32,659,282 | | | $ | 445,649,540 | |
| Accumulated net investment income (loss) | | | (2,437 | ) | | | (57,345 | ) | | | (15,879 | ) | | | (51,144 | ) | | | (513,707 | ) |
| Accumulated net realized | | | | | | | | | | | | | | | | | | | | |
| gain (loss) on investments | | | (7,830,909 | ) | | | (10,864,421 | ) | | | (4,910,445 | ) | | | (926,377 | ) | | | (362,684,105 | ) |
| Net unrealized appreciation (depreciation) | | | | | | | | | | | | | | | | | | | | |
| on investments: | | | | | | | | | | | | | | | | | | | | |
| Securities | | | (6,635,931 | ) | | | 181,310 | | | | 542,298 | | | | 868,451 | | | | 3,538,925 | |
| Securities sold short | | | — | | | | — | | | | — | | | | — | | | | — | |
| Written option contracts | | | 130,794 | | | | — | | | | — | | | | — | | | | — | |
| Foreign currency transactions | | | (389 | ) | | | — | | | | — | | | | 2 | | | | — | |
| Total net assets | | $ | 33,891,588 | | | $ | 6,738,920 | | | $ | 6,904,935 | | | $ | 32,550,214 | | | $ | 85,990,653 | |
| Total investments, at cost | | $ | 42,481,662 | | | $ | 6,348,520 | | | $ | 8,103,514 | | | $ | 39,982,311 | | | $ | 98,845,352 | |
| Includes loaned securities | | | | | | | | | | | | | | | | | | | | |
| with a market value of | | $ | 4,682,746 | | | $ | — | | | $ | 1,930,029 | | | $ | 8,760,189 | | | $ | 23,423,295 | |
| Total foreign currency, at cost | | $ | 153,487 | | | $ | — | | | $ | — | | | $ | 372 | | | $ | — | |
| Premiums on written options | | | 342,341 | | | | — | | | | — | | | | — | | | | — | |
| Class A shares: | | | | | | | | | | | | | | | | | | | | |
| Net assets | | $ | 14,362,993 | | | $ | 3,183,354 | | | $ | 4,056,704 | | | $ | 6,430,816 | | | $ | 57,159,195 | |
Shares of beneficial interest outstanding(1) | | | 1,227,026 | | | | 319,795 | | | | 172,030 | | | | 320,039 | | | | 2,401,223 | |
| Net asset value per share and | | | | | | | | | | | | | | | | | | | | |
| redemption price per share | | $ | 11.71 | | | $ | 9.95 | | | $ | 23.58 | | | $ | 20.09 | | | $ | 23.80 | |
| Offering price per share | | | | | | | | | | | | | | | | | | | | |
| (100/94.50 x net asset value per share) | | $ | 12.39 | | | $ | 10.53 | | | $ | 24.95 | | | $ | 21.26 | | | $ | 25.19 | |
| Class C shares: | | | | | | | | | | | | | | | | | | | | |
| Net assets | | $ | 4,575,369 | | | $ | 1,497,263 | | | $ | 1,565,000 | | | $ | 1,477,552 | | | $ | 15,374,910 | |
Shares of beneficial interest outstanding(1) | | | 406,312 | | | | 159,958 | | | | 76,256 | | | | 91,273 | | | | 742,033 | |
| Net asset value per share and | | | | | | | | | | | | | | | | | | | | |
| redemption price per share | | $ | 11.26 | | | $ | 9.36 | | | $ | 20.52 | | | $ | 16.19 | | | $ | 20.72 | |
| Institutional Class Shares: | | | | | | | | | | | | | | | | | | | | |
| Net assets | | $ | 14,953,226 | | | $ | 2,058,303 | | | $ | 1,283,231 | | | $ | 24,641,846 | | | $ | 13,456,548 | |
Shares of beneficial interest outstanding(1) | | | 1,266,957 | | | | 179,385 | | | | 51,719 | | | | 1,163,774 | | | | 542,100 | |
| Net asset value per share and | | | | | | | | | | | | | | | | | | | | |
| redemption price per share | | $ | 11.80 | | | $ | 11.47 | | | $ | 24.81 | | | $ | 21.17 | | | $ | 24.82 | |
(1) Unlimited number of shares of beneficial interest with a 0.01 par value authorized.
The accompanying notes are an integral part of the financial statements.
2016 ANNUAL REPORT
Statements of Operations
For the Fiscal Year Ended June 30, 2016
| | | | | | Quaker Global | | | Quaker | | | Quaker | | | Quaker | |
| | | Quaker Event | | | Tactical | | | Mid-Cap | | | Small-Cap | | | Strategic | |
| | | Arbitrage Fund | | | Allocation Fund | | | Value Fund | | | Value Fund | | | Growth Fund | |
| INVESTMENT INCOME (LOSS) | | | | | | | | | | | | | | | |
| Income: | | | | | | | | | | | | | | | |
| Dividends (net of foreign withholding taxes) | | $ | 762,816 | | | $ | 92,726 | | | $ | 136,640 | | | $ | 501,850 | | | $ | 1,085,825 | |
| Interest | | | 563,119 | | | | — | | | | 40 | | | | — | | | | — | |
| Securities lending income, net | | | 25,715 | | | | 4,322 | | | | 6,016 | | | | 29,492 | | | | 52,994 | |
| Other Income | | | 15,528 | | | | 44 | | | | — | | | | 177 | | | | — | |
| Total Income | | | 1,367,178 | | | | 97,092 | | | | 142,696 | | | | 531,519 | | | | 1,138,819 | |
| Expenses: | | | | | | | | | | | | | | | | | | | | |
| Investment advisory fees (Note 3) | | | 929,280 | | | | 108,733 | | | | 78,082 | | | | 340,820 | | | | 1,537,363 | |
| Funds administration and accounting fees | | | 93,556 | | | | 15,567 | | | | 12,748 | | | | 53,386 | | | | 144,467 | |
| Transfer agent fees | | | 203,116 | | | | 23,209 | | | | 20,924 | | | | 54,891 | | | | 300,177 | |
| Custody fees | | | 22,877 | | | | 9,689 | | | | 2,544 | | | | 11,473 | | | | 17,172 | |
| Trustee fees and meeting expenses | | | 32,481 | | | | 3,259 | | | | 2,799 | | | | 12,620 | | | | 48,841 | |
| Legal fees | | | 31,342 | | | | 1,703 | | | | 1,437 | | | | 6,691 | | | | 22,552 | |
| Audit fees | | | 22,443 | | | | 2,722 | | | | 2,307 | | | | 10,594 | | | | 36,935 | |
| Distribution fee — Class A | | | 54,248 | | | | 11,063 | | | | 11,197 | | | | 17,310 | | | | 166,152 | |
| Distribution fee — Class C | | | 54,053 | | | | 18,487 | | | | 16,501 | | | | 15,954 | | | | 177,702 | |
| Insurance | | | 49,317 | | | | 4,049 | | | | 4,166 | | | | 17,197 | | | | 72,267 | |
| Officers’ compensation fees | | | 51,118 | | | | 6,988 | | | | 5,899 | | | | 27,260 | | | | 89,863 | |
| Registration and filing expenses | | | 78,175 | | | | 5,818 | | | | 6,197 | | | | 25,659 | | | | 111,634 | |
| Printing expenses | | | 19,701 | | | | 4,152 | | | | 4,171 | | | | 8,692 | | | | 32,200 | |
| Dividends and interest on securities sold short | | | 7,326 | | | | 630 | | | | — | | | | — | | | | 7,673 | |
| Other operating expenses | | | 2,055 | | | | 1,926 | | | | 1,815 | | | | 1,864 | | | | 2,111 | |
| Total expenses | | | 1,651,088 | | | | 217,995 | | | | 170,787 | | | | 604,411 | | | | 2,767,109 | |
| Investment advisory fees | | | | | | | | | | | | | | | | | | | | |
| reimbursed (Note 3) | | | (298,982 | ) | | | — | | | | — | | | | — | | | | (70,047 | ) |
| Net expenses | | | 1,352,106 | | | | 217,995 | | | | 170,787 | | | | 604,411 | | | | 2,697,062 | |
| Net investment income (loss) | | | 15,072 | | | | (120,903 | ) | | | (28,091 | ) | | | (72,892 | ) | | | (1,558,243 | ) |
The accompanying notes are an integral part of the financial statements.
2016 ANNUAL REPORT
Statements of Operations (continued)
For the Fiscal Year Ended June 30, 2016
| | | | | | Quaker Global | | | Quaker | | | Quaker | | | Quaker | |
| | | Quaker Event | | | Tactical | | | Mid-Cap | | | Small-Cap | | | Strategic | |
| | | Arbitrage Fund | | | Allocation Fund | | | Value Fund | | | Value Fund | | | Growth Fund | |
| REALIZED AND UNREALIZED GAIN (LOSS) ON INVESTMENTS | | | | | | | | | | | | | |
| Net realized gain (loss) on investments: | | | | | | | | | | | | | | | |
| Securities | | $ | (7,728,438 | ) | | $ | (551,302 | ) | | $ | (39,028 | ) | | $ | (902,423 | ) | | $ | (562,424 | ) |
| Securities sold short | | | (117,016 | ) | | | (14,810 | ) | | | — | | | | — | | | | (173,758 | ) |
| Written options | | | 316,179 | | | | — | | | | — | | | | — | | | | — | |
| Foreign currency transactions | | | (20,296 | ) | | | 15 | | | | — | | | | (6 | ) | | | — | |
| Net realized gain (loss) on investments | | | (7,549,571 | ) | | | (566,097 | ) | | | (39,028 | ) | | | (902,429 | ) | | | (736,182 | ) |
| Capital gain distributions from | | | | | | | | | | | | | | | | | | | | |
| regulated investments companies | | | — | | | | 9,574 | | | | — | | | | — | | | | — | |
| Net change in unrealized appreciation | | | | | | | | | | | | | | | | | | | | |
| (depreciation) of investments: | | | | | | | | | | | | | | | | | | | | |
| Securities | | | (4,096,077 | ) | | | (749,693 | ) | | | (441,921 | ) | | | (2,691,298 | ) | | | (10,304,539 | ) |
| Securities sold short | | | 11,942 | | | | — | | | | — | | | | — | | | | — | |
| Written options | | | 92,613 | | | | — | | | | — | | | | — | | | | — | |
| Foreign currency transactions | | | (3,994 | ) | | | — | | | | — | | | | 2 | | | | — | |
| Net change in unrealized appreciation | | | | | | | | | | | | | | | | | | | | |
| (depreciation) of investments | | | (3,995,516 | ) | | | (749,693 | ) | | | (441,921 | ) | | | (2,691,296 | ) | | | (10,304,539 | ) |
| Net realized and unrealized | | | | | | | | | | | | | | | | | | | | |
| gain (loss) on investments | | | (11,545,087 | ) | | | (1,306,216 | ) | | | (480,949 | ) | | | (3,593,725 | ) | | | (11,040,721 | ) |
| Net increase (decrease) in net assets | | | | | | | | | | | | | | | | | | | | |
| resulting from operations | | $ | (11,530,015 | ) | | $ | (1,427,119 | ) | | $ | (509,040 | ) | | $ | (3,666,617 | ) | | $ | (12,598,964 | ) |
| (Foreign withholding taxes on | | | | | | | | | | | | | | | | | | | | |
| dividends/tax reclaims/interest) | | $ | (22,247 | ) | | $ | (2,398 | ) | | $ | (94 | ) | | $ | (1,625 | ) | | $ | (24,615 | ) |
The accompanying notes are an integral part of the financial statements.
2016 ANNUAL REPORT
Statements of Changes in Net Assets
For the Fiscal Year Ended June 30, 2016
| | | | | | Quaker Global | | | Quaker | | | Quaker | | | Quaker | |
| | | Quaker Event | | | Tactical | | | Mid-Cap | | | Small-Cap | | | Strategic | |
| | | Arbitrage Fund | | | Allocation Fund | | | Value Fund | | | Value Fund | | | Growth Fund | |
| INCREASE (DECREASE) IN NET ASSETS | | | | | | | | | | | | | | | |
| Operations: | | | | | | | | | | | | | | | |
| Net investment income (loss) | | $ | 15,072 | | | $ | (120,903 | ) | | $ | (28,091 | ) | | $ | (72,892 | ) | | $ | (1,558,243 | ) |
| Net realized gain (loss) | | | | | | | | | | | | | | | | | | | | |
| on investment transactions: | | | | | | | | | | | | | | | | | | | | |
| Securities | | | (7,728,438 | ) | | | (551,302 | ) | | | (39,028 | ) | | | (902,423 | ) | | | (562,424 | ) |
| Securities sold short | | | (117,016 | ) | | | (14,810 | ) | | | — | | | | — | | | | (173,758 | ) |
| Written options | | | 316,179 | | | | — | | | | — | | | | — | | | | — | |
| Foreign currency transactions | | | (20,296 | ) | | | 15 | | | | — | | | | (6 | ) | | | — | |
| Capital gain distributions from | | | | | | | | | | | | | | | | | | | | |
| regulated investment companies | | | — | | | | 9,574 | | | | — | | | | — | | | | — | |
| Net change in unrealized appreciation | | | | | | | | | | | | | | | | | | | | |
| (depreciation) of investment transactions: | | | | | | | | | | | | | | | | | | | | |
| Securities | | | (4,096,077 | ) | | | (749,693 | ) | | | (441,921 | ) | | | (2,691,298 | ) | | | (10,304,539 | ) |
| Securities sold short | | | 11,942 | | | | — | | | | — | | | | — | | | | — | |
| Written options | | | 92,613 | | | | — | | | | — | | | | — | | | | — | |
| Foreign currency transactions | | | (3,994 | ) | | | — | | | | — | | | | 2 | | | | — | |
| Net increase (decrease) in | | | | | | | | | | | | | | | | | | | | |
| net assets resulting from operations | | | (11,530,015 | ) | | | (1,427,119 | ) | | | (509,040 | ) | | | (3,666,617 | ) | | | (12,598,964 | ) |
| Distributions to shareholders from: | | | | | | | | | | | | | | | | | | | | |
| Net realized capital gain — Class A | | | (1,695,347 | ) | | | — | | | | — | | | | (539,696 | ) | | | — | |
| Net realized capital gain — Class C | | | (467,044 | ) | | | — | | | | — | | | | (156,220 | ) | | | — | |
| Net realized capital gain — Institutional Class | | | (3,193,513 | ) | | | — | | | | — | | | | (1,869,051 | ) | | | — | |
| Total distributions | | | (5,355,904 | ) | | | — | | | | — | | | | (2,564,967 | ) | | | — | |
| Capital share transactions: | | | | | | | | | | | | | | | | | | | | |
| Increase (decrease) in net assets | | | | | | | | | | | | | | | | | | | | |
| from fund share transactions (Note 9) | | | (63,054,301 | ) | | | (864,896 | ) | | | (1,553,878 | ) | | | 781,008 | | | | (65,259,779 | ) |
| Total increase (decrease) in net assets | | | (79,940,220 | ) | | | (2,292,015 | ) | | | (2,062,918 | ) | | | (5,450,576 | ) | | | (77,858,743 | ) |
| | | | | | | | | | | | | | | | | | | | | |
| NET ASSETS | | | | | | | | | | | | | | | | | | | | |
| Beginning of year | | | 113,831,808 | | | | 9,030,935 | | | | 8,967,853 | | | | 38,000,790 | | | | 163,849,396 | |
| End of year | | $ | 33,891,588 | | | $ | 6,738,920 | | | $ | 6,904,935 | | | $ | 32,550,214 | | | $ | 85,990,653 | |
| Undistributed (Accumulated) net investment | | | | | | | | | | | | | | | | | | | | |
| income (loss), at end of year | | $ | (2,437 | ) | | $ | (57,345 | ) | | $ | (15,879 | ) | | $ | (51,144 | ) | | $ | (513,707 | ) |
The accompanying notes are an integral part of the financial statements.
2016 ANNUAL REPORT
Statements of Changes in Net Assets (continued)
For the Fiscal Year Ended June 30, 2015
| | | | | | Quaker Global | | | Quaker | | | Quaker | | | Quaker | |
| | | Quaker Event | | | Tactical | | | Mid-Cap | | | Small-Cap | | | Strategic | |
| | | Arbitrage Fund | | | Allocation Fund | | | Value Fund | | | Value Fund | | | Growth Fund | |
| INCREASE (DECREASE) IN NET ASSETS | | | | | | | | | | | | | | | |
| Operations: | | | | | | | | | | | | | | | |
| Net investment income (loss) | | $ | (207,986 | ) | | $ | (94,156 | ) | | $ | (48,045 | ) | | $ | (39,328 | ) | | $ | (1,959,026 | ) |
| Net realized gain (loss) on | | | | | | | | | | | | | | | | | | | | |
| investment transactions: | | | | | | | | | | | | | | | | | | | | |
| Securities | | | 3,901,091 | | | | 1,157,680 | | | | 1,496,645 | | | | 3,153,654 | | | | 25,961,573 | |
| Securities sold short | | | 99,814 | | | | 41,962 | | | | — | | | | — | | | | — | |
| Written options | | | 2,578,054 | | | | — | | | | — | | | | — | | | | — | |
| Foreign currency transactions | | | (115,622 | ) | | | 1 | | | | — | | | | — | | | | — | |
| Net change in unrealized appreciation | | | | | | | | | | | | | | | | | | | | |
| (depreciation) of investment transactions: | | | | | | | | | | | | | | | | | | | | |
| Securities | | | (5,541,358 | ) | | | (334,971 | ) | | | (1,409,699 | ) | | | (1,282,781 | ) | | | (8,663,583 | ) |
| Securities sold short | | | 221,999 | | | | (10,087 | ) | | | — | | | | — | | | | — | |
| Written options | | | 74,248 | | | | — | | | | — | | | | — | | | | — | |
| Foreign currency transactions | | | (13,869 | ) | | | — | | | | — | | | | — | | | | — | |
| Net increase (decrease) in | | | | | | | | | | | | | | | | | | | | |
| net assets resulting from operations | | | 996,371 | | | | 760,429 | | | | 38,901 | | | | 1,831,545 | | | | 15,338,964 | |
| Distributions to shareholders from: | | | | | | | | | | | | | | | | | | | | |
| Net investment income — Class A | | | (306,809 | ) | | | — | | | | — | | | | — | | | | — | |
| Net investment income — Class C | | | (11,982 | ) | | | — | | | | — | | | | — | | | | — | |
| Net investment income — Institutional Class | | | (812,515 | ) | | | — | | | | — | | | | — | | | | — | |
| Net realized capital gain — Class A | | | (1,997,309 | ) | | | — | | | | — | | | | (414,711 | ) | | | — | |
| Net realized capital gain — Class C | | | (340,345 | ) | | | — | | | | — | | | | (107,437 | ) | | | — | |
| Net realized capital gain — Institutional Class | | | (3,851,430 | ) | | | — | | | | — | | | | (1,402,902 | ) | | | — | |
| Total distributions | | | (7,320,390 | ) | | | — | | | | — | | | | (1,925,050 | ) | | | — | |
| Capital share transactions: | | | | | | | | | | | | | | | | | | | | |
| Increase (decrease) in net assets | | | | | | | | | | | | | | | | | | | | |
| from fund share transactions (Note 9) | | | 1,091,370 | | | | 945,368 | | | | (1,096,913 | ) | | | (92,858 | ) | | | (20,472,584 | ) |
| Total increase (decrease) in net assets | | | (5,232,649 | ) | | | 1,705,797 | | | | (1,058,012 | ) | | | (186,363 | ) | | | (5,133,620 | ) |
| | | | | | | | | | | | | | | | | | | | | |
| NET ASSETS | | | | | | | | | | | | | | | | | | | | |
| Beginning of year | | | 119,064,457 | | | | 7,325,138 | | | | 10,025,865 | | | | 38,187,153 | | | | 168,983,016 | |
| End of year | | $ | 113,831,808 | | | $ | 9,030,935 | | | $ | 8,967,853 | | | $ | 38,000,790 | | | $ | 163,849,396 | |
| Undistributed (Accumulated) net investment | | | | | | | | | | | | | | | | | | | | |
| income (loss), at end of year | | $ | (59,894 | ) | | $ | (44,190 | ) | | $ | (18,527 | ) | | $ | (106 | ) | | $ | (824,307 | ) |
The accompanying notes are an integral part of the financial statements.
2016 ANNUAL REPORT
Financial Highlights
Quaker Event Arbitrage Fund
(For a Share Outstanding Throughout the Year)
| | | Class A | |
| | | Years Ended June 30, | |
| | | 2016 | | | 2015 | | | 2014 | | | 2013 | | | 2012 | |
| Net asset value, beginning of year | | $ | 13.39 | | | $ | 14.07 | | | $ | 12.81 | | | $ | 11.93 | | | $ | 12.50 | |
| Income from investment operations: | | | | | | | | | | | | | | | | | | | | |
Net investment income (loss)(1) | | | (0.01 | ) | | | (0.04 | ) | | | 0.41 | | | | 0.37 | | | | 0.11 | |
| Net realized and unrealized | | | | | | | | | | | | | | | | | | | | |
| gain (loss) on investments | | | (0.65 | ) | | | 0.21 | | | | 0.93 | | | | 0.65 | | | | (0.41 | ) |
| Total from investment operations | | | (0.66 | ) | | | 0.17 | | | | 1.34 | | | | 1.02 | | | | (0.30 | ) |
| Distributions to shareholders from: | | | | | | | | | | | | | | | | | | | | |
| Net investment income | | | — | | | | (0.11 | ) | | | (0.01 | ) | | | (0.01 | ) | | | — | |
| Net realized capital gain | | | (1.02 | ) | | | (0.74 | ) | | | (0.07 | ) | | | (0.13 | ) | | | (0.27 | ) |
| Total distributions | | | (1.02 | ) | | | (0.85 | ) | | | (0.08 | ) | | | (0.14 | ) | | | (0.27 | ) |
| Net asset value, end of year | | $ | 11.71 | | | $ | 13.39 | | | $ | 14.07 | | | $ | 12.81 | | | $ | 11.93 | |
Total Return(2) | | | (4.33 | )% | | | 1.38 | % | | | 10.47 | % | | | 8.70 | % | | | (2.31 | )% |
| Ratios/supplemental data: | | | | | | | | | | | | | | | | | | | | |
| Net assets, end of year (000’ omitted) | | $ | 14,363 | | | $ | 31,817 | | | $ | 53,035 | | | $ | 35,232 | | | $ | 34,725 | |
| Ratio of expenses to average net assets: | | | | | | | | | | | | | | | | | | | | |
Expense before reductions(3)(4) | | | 2.41 | % | | | 2.17 | % | | | 2.15 | % | | | 2.37 | % | | | 2.37 | % |
Expense net of fee waivers, if any(3)(5) | | | 1.99 | % | | | 1.99 | % | | | 1.99 | % | | | 1.99 | % | | | 1.99 | % |
| Ratio of net investment income (loss) | | | | | | | | | | | | | | | | | | | | |
| to average net assets*: | | | | | | | | | | | | | | | | | | | | |
Before waiver and expense reimbursement(3) | | | (0.50 | )% | | | (0.47 | %) | | | 2.85 | % | | | 2.64 | % | | | 0.55 | % |
After waiver and expense reimbursement(3) | | | (0.08 | )% | | | (0.29 | %) | | | 3.01 | % | | | 3.02 | % | | | 0.92 | % |
| Portfolio turnover rate | | | 160 | % | | | 237 | % | | | 280 | % | | | 186 | % | | | 157 | % |
| (1) | The average shares outstanding method has been applied for per share information. |
| (2) | Total investment return is based on the change in net asset value of a share during the year, assumes reinvestment of dividends and distributions at net asset value and does not reflect the impact of a sales charge. |
| (3) | Expense waived or reimbursed reflect reductions to total expenses, as discussed in the notes to the financial statements. These amounts would increase the net investment loss ratio or decrease the net investment income ratio, as applicable, had such reductions not occurred. |
| (4) | Expenses before reductions (excluding dividend and interest expense for securities sold short) were 2.40%, 2.16%, 2.14%, 2.34% and 2.35% for the years ended June 30, 2016, 2015, 2014, 2013 and 2012, respectively. |
| (5) | Expenses net of all reductions (excluding dividend and interest expense for securities sold short) were 1.98%, 1.98%, 1.98%, 1.96% and 1.98% for the years ended June 30, 2016, 2015, 2014, 2013 and 2012, respectively. |
| * | The net investment income (loss) ratios include dividends on short positions. |
The accompanying notes are an integral part of the financial statements.
2016 ANNUAL REPORT
Financial Highlights
Quaker Event Arbitrage Fund
(For a Share Outstanding Throughout the Year)
| | | Class C | |
| | | Years Ended June 30, | |
| | | 2016 | | | 2015 | | | 2014 | | | 2013 | | | 2012 | |
| Net asset value, beginning of year | | $ | 13.01 | | | $ | 13.72 | | | $ | 12.57 | | | $ | 11.78 | | | $ | 12.45 | |
| Income from investment operations: | | | | | | | | | | | | | | | | | | | | |
Net investment income (loss)(1) | | | (0.09 | ) | | | (0.14 | ) | | | 0.30 | | | | 0.28 | | | | 0.02 | |
| Net realized and unrealized | | | | | | | | | | | | | | | | | | | | |
| gain (loss) on investments | | | (0.64 | ) | | | 0.20 | | | | 0.92 | | | | 0.64 | | | | (0.42 | ) |
| Total from investment operations | | | (0.73 | ) | | | 0.06 | | | | 1.22 | | | | 0.92 | | | | (0.40 | ) |
| Distributions to shareholders from: | | | | | | | | | | | | | | | | | | | | |
| Net investment income | | | — | | | | (0.03 | ) | | | — | | | | — | | | | — | |
| Net realized capital gain | | | (1.02 | ) | | | (0.74 | ) | | | (0.07 | ) | | | (0.13 | ) | | | (0.27 | ) |
| Total distributions | | | (1.02 | ) | | | (0.77 | ) | | | (0.07 | ) | | | (0.13 | ) | | | (0.27 | ) |
| Net asset value, end of year | | $ | 11.26 | | | $ | 13.01 | | | $ | 13.72 | | | $ | 12.57 | | | $ | 11.78 | |
Total Return(2) | | | (5.03 | )% | | | 0.52 | % | | | 9.72 | % | | | 7.91 | % | | | (3.13 | )% |
| Ratios/supplemental data: | | | | | | | | | | | | | | | | | | | | |
| Net assets, end of year (000’ omitted) | | $ | 4,576 | | | $ | 6,595 | | | $ | 6,555 | | | $ | 5,954 | | | $ | 7,195 | |
| Ratio of expenses to average net assets: | | | | | | | | | | | | | | | | | | | | |
Expense before reductions(3)(4) | | | 3.16 | % | | | 2.92 | % | | | 2.90 | % | | | 3.12 | % | | | 3.12 | % |
Expense net of fee waivers, if any(3)(5) | | | 2.74 | % | | | 2.74 | % | | | 2.74 | % | | | 2.74 | % | | | 2.74 | % |
| Ratio of net investment income (loss) | | | | | | | | | | | | | | | | | | | | |
| to average net assets*: | | | | | | | | | | | | | | | | | | | | |
Before waiver and expense reimbursement(3) | | | (1.25 | )% | | | (1.22 | )% | | | 2.10 | % | | | 1.89 | % | | | (0.17 | )% |
After waiver and expense reimbursement(3) | | | (0.83 | )% | | | (1.04 | )% | | | 2.26 | % | | | 2.27 | % | | | 0.21 | % |
| Portfolio turnover rate | | | 160 | % | | | 237 | % | | | 280 | % | | | 186 | % | | | 157 | % |
| (1) | The average shares outstanding method has been applied for per share information. |
| (2) | Total investment return is based on the change in net asset value of a share during the year, assumes reinvestment of dividends and distributions at net asset value and does not reflect the impact of a sales charge. |
| (3) | Expense waived or reimbursed reflect reductions to total expenses, as discussed in the notes to the financial statements. These amounts would increase the net investment loss ratio or decrease the net investment income ratio, as applicable, had such reductions not occurred. |
| (4) | Expenses before reductions (excluding dividend and interest expense for securities sold short) were 3.15%, 2.91%, 2.89%, 3.09% and 3.10% for the years ended June 30, 2016, 2015, 2014, 2013 and 2012, respectively. |
| (5) | Expenses net of all reductions (excluding dividend and interest expense for securities sold short) were 2.73%, 2.73%, 2.73%, 2.71% and 2.73% for the years ended June 30, 2016, 2015, 2014, 2013 and 2012, respectively. |
| * | The net investment income (loss) ratios include dividends on short positions. |
The accompanying notes are an integral part of the financial statements.
2016 ANNUAL REPORT
Financial Highlights
Quaker Event Arbitrage Fund
(For a Share Outstanding Throughout the Year)
| | | Institutional Class | |
| | | Years Ended June 30, | |
| | | 2016 | | | 2015 | | | 2014 | | | 2013 | | | 2012 | |
| Net asset value, beginning of year | | $ | 13.46 | | | $ | 14.15 | | | $ | 12.86 | | | $ | 11.97 | | | $ | 12.52 | |
| Income from investment operations: | | | | | | | | | | | | | | | | | | | | |
Net investment income (loss)(1) | | | 0.02 | | | | (0.01 | ) | | | 0.44 | | | | 0.40 | | | | 0.13 | |
| Net realized and unrealized | | | | | | | | | | | | | | | | | | | | |
| gain (loss) on investments | | | (0.66 | ) | | | 0.21 | | | | 0.94 | | | | 0.67 | | | | (0.41 | ) |
| Total from investment operations | | | (0.64 | ) | | | 0.20 | | | | 1.38 | | | | 1.07 | | | | (0.28 | ) |
| Distributions to shareholders from: | | | | | | | | | | | | | | | | | | | | |
| Net investment income | | | — | | | | (0.15 | ) | | | (0.02 | ) | | | (0.05 | ) | | | — | |
| Net realized capital gain | | | (1.02 | ) | | | (0.74 | ) | | | (0.07 | ) | | | (0.13 | ) | | | (0.27 | ) |
| Total distributions | | | (1.02 | ) | | | (0.89 | ) | | | (0.09 | ) | | | (0.18 | ) | | | (0.27 | ) |
| Net asset value, end of year | | $ | 11.80 | | | $ | 13.46 | | | $ | 14.15 | | | $ | 12.86 | | | $ | 11.97 | |
Total Return(2) | | | (4.15 | )% | | | 1.61 | % | | | 10.77 | % | | | 9.04 | % | | | (2.14 | )% |
| Ratios/supplemental data: | | | | | | | | | | | | | | | | | | | | |
| Net assets, end of year (000’ omitted) | | $ | 14,953 | | | $ | 75,420 | | | $ | 59,474 | | | $ | 24,929 | | | $ | 13,292 | |
| Ratio of expenses to average net assets: | | | | | | | | | | | | | | | | | | | | |
Expense before reductions(3)(4) | | | 2.16 | % | | | 1.92 | % | | | 1.90 | % | | | 2.12 | % | | | 2.09 | % |
Expense net of fee waivers, if any(3)(5) | | | 1.74 | % | | | 1.74 | % | | | 1.74 | % | | | 1.74 | % | | | 1.74 | % |
| Ratio of net investment income (loss) | | | | | | | | | | | | | | | | | | | | |
| to average net assets*: | | | | | | | | | | | | | | | | | | | | |
Before waiver and expense reimbursement(3) | | | (0.25 | )% | | | (0.22 | )% | | | 3.10 | % | | | 2.89 | % | | | 0.75 | % |
After waiver and expense reimbursement(3) | | | 0.17 | % | | | (0.04 | )% | | | 3.26 | % | | | 3.27 | % | | | 1.11 | % |
| Portfolio turnover rate | | | 160 | % | | | 237 | % | | | 280 | % | | | 186 | % | | | 157 | % |
| (1) | The average shares outstanding method has been applied for per share information. |
| (2) | Total investment return is based on the change in net asset value of a share during the year, assumes reinvestment of dividends and distributions at net asset value and does not reflect the impact of a sales charge. |
| (3) | Expense waived or reimbursed reflect reductions to total expenses, as discussed in the notes to the financial statements. These amounts would increase the net investment loss ratio or decrease the net investment income ratio, as applicable, had such reductions not occurred. |
| (4) | Expenses before reductions (excluding dividend and interest expense for securities sold short) were 2.15%, 1.91%, 1.89%, 2.09% and 2.08% for the years ended June 30, 2016, 2015, 2014, 2013 and 2012, respectively. |
| (5) | Expenses net of all reductions (excluding dividend and interest expense for securities sold short) were 1.73%, 1.73%, 1.73%, 1.71% and 1.73% for the years ended June 30, 2016, 2015, 2014, 2013 and 2012, respectively. |
| * | The net investment income (loss) ratios include dividends on short positions. |
The accompanying notes are an integral part of the financial statements.
2016 ANNUAL REPORT
Financial Highlights
Quaker Global Tactical Allocation Fund
(For a Share Outstanding Throughout the Year)
| | | Class A | |
| | | Years Ended June 30, | |
| | | 2016 | | | 2015 | | | 2014 | | | 2013 | | | 2012 | |
| Net asset value, beginning of year | | $ | 11.51 | | | $ | 10.46 | | | $ | 8.30 | | | $ | 7.12 | | | $ | 7.51 | |
| Income from investment operations: | | | | | | | | | | | | | | | | | | | | |
Net investment income (loss)(1) | | | (0.14 | ) | | | (0.11 | ) | | | (0.08 | ) | | | (0.09 | ) | | | (0.10 | ) |
| Net realized and unrealized | | | | | | | | | | | | | | | | | | | | |
| gain (loss) on investments | | | (1.42 | ) | | | 1.16 | | | | 2.24 | | | | 1.27 | | | | (0.29 | ) |
| Total from investment operations | | | (1.56 | ) | | | 1.05 | | | | 2.16 | | | | 1.18 | | | | (0.39 | ) |
| Distributions to shareholders from: | | | | | | | | | | | | | | | | | | | | |
| Net investment income | | | — | | | | — | | | | — | | | | — | | | | — | |
| Net realized capital gain | | | — | | | | — | | | | — | | | | — | | | | — | |
| Total distributions | | | — | | | | — | | | | — | | | | — | | | | — | |
| Net asset value, end of year | | $ | 9.95 | | | $ | 11.51 | | | $ | 10.46 | | | $ | 8.30 | | | $ | 7.12 | |
Total Return(2) | | | (13.55 | )% | | | 10.04 | % | | | 26.02 | % | | | 16.57 | % | | | (5.19 | )% |
| Ratios/supplemental data: | | | | | | | | | | | | | | | | | | | | |
| Net assets, end of year (000’ omitted) | | $ | 3,184 | | | $ | 5,707 | | | $ | 3,992 | | | $ | 3,856 | | | $ | 5,707 | |
Ratio of expenses to average net assets(3) | | | 2.42 | % | | | 2.27 | % | | | 2.19 | % | | | 2.83 | % | | | 2.68 | % |
| Ratio of net investment income (loss) | | | | | | | | | | | | | | | | | | | | |
| to average net assets* | | | (1.30 | )% | | | (1.03 | )% | | | (0.80 | )% | | | (1.22 | )% | | | (1.41 | )% |
| Portfolio turnover rate | | | 211 | % | | | 125 | % | | | 130 | % | | | 484 | % | | | 880 | % |
| (1) | The average shares outstanding method has been applied for per share information. |
| (2) | Total investment return is based on the change in net asset value of a share during the year, assumes reinvestment of dividends and distributions at net asset value and does not reflect the impact of a sales charge. |
| (3) | Ratio of expenses (excluding dividend and interest expense for securities sold short) were 2.41%, 2.25%, 2.15% and 2.83% for the years ended June 30, 2016, 2015, 2014 and 2013, respectively. |
| * | The net investment income (loss) ratios include dividends on short positions. |
The accompanying notes are an integral part of the financial statements.
2016 ANNUAL REPORT
Financial Highlights
Quaker Global Tactical Allocation Fund
(For a Share Outstanding Throughout the Year)
| | | Class C | |
| | | Years Ended June 30, | |
| | | 2016 | | | 2015 | | | 2014 | | | 2013 | | | 2012 | |
| Net asset value, beginning of year | | $ | 10.91 | | | $ | 9.99 | | | $ | 7.98 | | | $ | 6.90 | | | $ | 7.34 | |
| Income from investment operations: | | | | | | | | | | | | | | | | | | | | |
Net investment income (loss)(1) | | | (0.20 | ) | | | (0.19 | ) | | | (0.14 | ) | | | (0.14 | ) | | | (0.15 | ) |
| Net realized and unrealized | | | | | | | | | | | | | | | | | | | | |
| gain (loss) on investments | | | (1.35 | ) | | | 1.11 | | | | 2.15 | | | | 1.22 | | | | (0.29 | ) |
| Total from investment operations | | | (1.55 | ) | | | 0.92 | | | | 2.01 | | | | 1.08 | | | | (0.44 | ) |
| Distributions to shareholders from: | | | | | | | | | | | | | | | | | | | | |
| Net investment income | | | — | | | | — | | | | — | | | | — | | | | — | |
| Net realized capital gain | | | — | | | | — | | | | — | | | | — | | | | — | |
| Total distributions | | | — | | | | — | | | | — | | | | — | | | | — | |
| Net asset value, end of year | | $ | 9.36 | | | $ | 10.91 | | | $ | 9.99 | | | $ | 7.98 | | | $ | 6.90 | |
Total Return(2) | | | (14.21 | )% | | | 9.21 | % | | | 25.19 | % | | | 15.65 | % | | | (5.99 | )% |
| Ratios/supplemental data: | | | | | | | | | | | | | | | | | | | | |
| Net assets, end of year (000’ omitted) | | $ | 1,497 | | | $ | 1,851 | | | $ | 2,093 | | | $ | 2,124 | | | $ | 3,158 | |
Ratio of expenses to average net assets(3) | | | 3.17 | % | | | 3.02 | % | | | 2.94 | % | | | 3.58 | % | | | 3.43 | % |
| Ratio of net investment income (loss) | | | | | | | | | | | | | | | | | | | | |
| to average net assets* | | | (2.05 | )% | | | (1.78 | )% | | | (1.55 | )% | | | (1.97 | )% | | | (2.15 | )% |
| Portfolio turnover rate | | | 211 | % | | | 125 | % | | | 130 | % | | | 484 | % | | | 880 | % |
| (1) | The average shares outstanding method has been applied for per share information. |
| (2) | Total investment return is based on the change in net asset value of a share during the year, assumes reinvestment of dividends and distributions at net asset value and does not reflect the impact of a sales charge. |
| (3) | Ratio of expenses (excluding dividend and interest expense for securities sold short) were 3.16%, 3.00%, 2.90% and 3.58% for the years ended June 30, 2016, 2015, 2014 and 2013, respectively. |
| * | The net investment income (loss) ratios include dividends on short positions. |
The accompanying notes are an integral part of the financial statements.
2016 ANNUAL REPORT
Financial Highlights
Quaker Global Tactical Allocation Fund
(For a Share Outstanding Throughout the Year)
| | | Institutional Class | |
| | | Years Ended June 30, | |
| | | 2016 | | | 2015 | | | 2014 | | | 2013 | | | 2012 | |
| Net asset value, beginning of year | | $ | 13.23 | | | $ | 12.00 | | | $ | 9.49 | | | $ | 8.12 | | | $ | 8.55 | |
| Income from investment operations: | | | | | | | | | | | | | | | | | | | | |
Net investment income (loss)(1) | | | (0.13 | ) | | | (0.10 | ) | | | (0.06 | ) | | | (0.08 | ) | | | (0.09 | ) |
| Net realized and unrealized | | | | | | | | | | | | | | | | | | | | |
| gain (loss) on investments | | | (1.63 | ) | | | 1.33 | | | | 2.57 | | | | 1.45 | | | | (0.34 | ) |
| Total from investment operations | | | (1.76 | ) | | | 1.23 | | | | 2.51 | | | | 1.37 | | | | (0.43 | ) |
| Distributions to shareholders from: | | | | | | | | | | | | | | | | | | | | |
| Net investment income | | | — | | | | — | | | | — | | | | — | | | | — | |
| Net realized capital gain | | | — | | | | — | | | | — | | | | — | | | | — | |
| Total distributions | | | — | | | | — | | | | — | | | | — | | | | — | |
| Net asset value, end of year | | $ | 11.47 | | | $ | 13.23 | | | $ | 12.00 | | | $ | 9.49 | | | $ | 8.12 | |
Total Return(2) | | | (13.30 | )% | | | 10.25 | % | | | 26.45 | % | | | 16.87 | % | | | (5.03 | )% |
| Ratios/supplemental data: | | | | | | | | | | | | | | | | | | | | |
| Net assets, end of year (000’ omitted) | | $ | 2,058 | | | $ | 1,474 | | | $ | 1,240 | | | $ | 625 | | | $ | 899 | |
Ratio of expenses to average net assets(3) | | | 2.17 | % | | | 2.02 | % | | | 1.94 | % | | | 2.58 | % | | | 2.47 | % |
| Ratio of net investment income (loss) | | | | | | | | | | | | | | | | | | | | |
| to average net assets* | | | (1.05 | )% | | | (0.78 | )% | | | (0.55 | )% | | | (0.97 | )% | | | (1.12 | )% |
| Portfolio turnover rate | | | 211 | % | | | 125 | % | | | 130 | % | | | 484 | % | | | 880 | % |
| (1) | The average shares outstanding method has been applied for per share information. |
| (2) | Total investment return is based on the change in net asset value of a share during the year, assumes reinvestment of dividends and distributions at net asset value and does not reflect the impact of a sales charge. |
| (3) | Ratio of expenses (excluding dividend and interest expense for securities sold short) were 2.16%, 2.00%, 1.90% and 2.58% for the years ended June 30, 2016, 2015, 2014 and 2013, respectively. |
| * | The net investment income (loss) ratios include dividends on short positions. |
The accompanying notes are an integral part of the financial statements.
2016 ANNUAL REPORT
Financial Highlights
Quaker Mid-Cap Value Fund
(For a Share Outstanding Throughout the Year)
| | | Class A | |
| | | Years Ended June 30, | |
| | | 2016 | | | 2015 | | | 2014 | | | 2013 | | | 2012 | |
| Net asset value, beginning of year | | $ | 24.78 | | | $ | 24.62 | | | $ | 18.99 | | | $ | 15.73 | | | $ | 16.03 | |
| Income from investment operations: | | | | | | | | | | | | | | | | | | | | |
Net investment income (loss)(1) | | | (0.06 | ) | | | (0.10 | ) | | | (0.09 | ) | | | (0.14 | ) | | | (0.11 | ) |
| Net realized and unrealized | | | | | | | | | | | | | | | | | | | | |
| gain (loss) on investments | | | (1.14 | ) | | | 0.26 | | | | 5.72 | | | | 3.40 | | | | (0.19 | ) |
| Total from investment operations | | | (1.20 | ) | | | 0.16 | | | | 5.63 | | | | 3.26 | | | | (0.30 | ) |
| Distributions to shareholders from: | | | | | | | | | | | | | | | | | | | | |
| Net investment income | | | — | | | | — | | | | — | | | | — | | | | — | |
| Net realized capital gain | | | — | | | | — | | | | — | | | | — | | | | — | |
| Total distributions | | | — | | | | — | | | | — | | | | — | | | | — | |
| Net asset value, end of year | | $ | 23.58 | | | $ | 24.78 | | | $ | 24.62 | | | $ | 18.99 | | | $ | 15.73 | |
Total Return(2) | | | (4.84 | )% | | | 0.65 | % | | | 29.65 | % | | | 20.72 | % | | | (1.87 | )% |
| Ratios/supplemental data: | | | | | | | | | | | | | | | | | | | | |
| Net assets, end of year (000’ omitted) | | $ | 4,057 | | | $ | 5,520 | | | $ | 5,724 | | | $ | 6,029 | | | $ | 6,114 | |
| Ratio of expenses to average net assets | | | 2.17 | % | | | 1.98 | % | | | 2.03 | % | | | 2.19 | % | | | 2.21 | % |
| Ratio of net investment income (loss) | | | | | | | | | | | | | | | | | | | | |
| to average net assets | | | (0.26 | )% | | | (0.39 | )% | | | (0.42 | )% | | | (0.80 | )% | | | (0.70 | )% |
| Portfolio turnover rate | | | 71 | % | | | 49 | % | | | 62 | % | | | 47 | % | | | 42 | % |
| (1) | The average shares outstanding method has been applied for per share information. |
| (2) | Total investment return is based on the change in net asset value of a share during the year, assumes reinvestment of dividends and distributions at net asset value and does not reflect the impact of a sales charge. |
The accompanying notes are an integral part of the financial statements.
2016 ANNUAL REPORT
Financial Highlights
Quaker Mid-Cap Value Fund
(For a Share Outstanding Throughout the Year)
| | | Class C | |
| | | Years Ended June 30, | |
| | | 2016 | | | 2015 | | | 2014 | | | 2013 | | | 2012 | |
| Net asset value, beginning of year | | $ | 21.73 | | | $ | 21.75 | | | $ | 16.91 | | | $ | 14.11 | | | $ | 14.48 | |
| Income from investment operations: | | | | | | | | | | | | | | | | | | | | |
Net investment income (loss)(1) | | | (0.20 | ) | | | (0.25 | ) | | | (0.22 | ) | | | (0.24 | ) | | | (0.20 | ) |
| Net realized and unrealized | | | | | | | | | | | | | | | | | | | | |
| gain (loss) on investments | | | (1.01 | ) | | | 0.23 | | | | 5.06 | | | | 3.04 | | | | (0.17 | ) |
| Total from investment operations | | | (1.21 | ) | | | (0.02 | ) | | | 4.84 | | | | 2.80 | | | | (0.37 | ) |
| Distributions to shareholders from: | | | | | | | | | | | | | | | | | | | | |
| Net investment income | | | — | | | | — | | | | — | | | | — | | | | — | |
| Net realized capital gain | | | — | | | | — | | | | — | | | | — | | | | — | |
| Total distributions | | | — | | | | — | | | | — | | | | — | | | | — | |
| Net asset value, end of year | | $ | 20.52 | | | $ | 21.73 | | | $ | 21.75 | | | $ | 16.91 | | | $ | 14.11 | |
Total Return(2) | | | (5.57 | )% | | | (0.09 | )% | | | 28.62 | % | | | 19.84 | % | | | (2.56 | )% |
| Ratios/supplemental data: | | | | | | | | | | | | | | | | | | | | |
| Net assets, end of year (000’ omitted) | | $ | 1,565 | | | $ | 1,944 | | | $ | 2,086 | | | $ | 1,815 | | | $ | 1,950 | |
| Ratio of expenses to average net assets | | | 2.92 | % | | | 2.73 | % | | | 2.78 | % | | | 2.94 | % | | | 2.96 | % |
| Ratio of net investment income (loss) | | | | | | | | | | | | | | | | | | | | |
| to average net assets | | | (1.01 | )% | | | (1.14 | )% | | | (1.17 | )% | | | (1.55 | )% | | | (1.45 | )% |
| Portfolio turnover rate | | | 71 | % | | | 49 | % | | | 62 | % | | | 47 | % | | | 42 | % |
| (1) | The average shares outstanding method has been applied for per share information. |
| (2) | Total investment return is based on the change in net asset value of a share during the year, assumes reinvestment of dividends and distributions at net asset value and does not reflect the impact of a sales charge. |
The accompanying notes are an integral part of the financial statements.
2016 ANNUAL REPORT
Financial Highlights
Quaker Mid-Cap Value Fund
(For a Share Outstanding Throughout the Year)
| | | Institutional Class | |
| | | Years Ended June 30, | |
| | | 2016 | | | 2015 | | | 2014 | | | 2013 | | | 2012 | |
| Net asset value, beginning of year | | $ | 26.01 | | | $ | 25.77 | | | $ | 19.83 | | | $ | 16.39 | | | $ | 16.66 | |
| Income from investment operations: | | | | | | | | | | | | | | | | | | | | |
Net investment income (loss)(1) | | (0.00 | )^ | | | (0.04 | ) | | | (0.04 | ) | | | (0.10 | ) | | | (0.07 | ) |
| Net realized and unrealized | | | | | | | | | | | | | | | | | | | | |
| gain (loss) on investments | | | (1.20 | ) | | | 0.28 | | | | 5.98 | | | | 3.54 | | | | (0.20 | ) |
| Total from investment operations | | | (1.20 | ) | | | 0.24 | | | | 5.94 | | | | 3.44 | | | | (0.27 | ) |
| Distributions to shareholders from: | | | | | | | | | | | | | | | | | | | | |
| Net investment income | | | — | | | | — | | | | — | | | | — | | | | — | |
| Net realized capital gain | | | — | | | | — | | | | — | | | | — | | | | — | |
| Total distributions | | | — | | | | — | | | | — | | | | — | | | | — | |
| Net asset value, end of year | | $ | 24.81 | | | $ | 26.01 | | | $ | 25.77 | | | $ | 19.83 | | | $ | 16.39 | |
Total Return(2) | | | (4.61 | )% | | | 0.93 | % | | | 29.95 | % | | | 20.99 | % | | | (1.62 | )% |
| Ratios/supplemental data: | | | | | | | | | | | | | | | | | | | | |
| Net assets, end of year (000’ omitted) | | $ | 1,283 | | | $ | 1,504 | | | $ | 2,216 | | | $ | 1,060 | | | $ | 351 | |
| Ratio of expenses to average net assets | | | 1.92 | % | | | 1.73 | % | | | 1.78 | % | | | 1.94 | % | | | 1.96 | % |
| Ratio of net investment income (loss) | | | | | | | | | | | | | | | | | | | | |
| to average net assets | | | (0.01 | )% | | | (0.14 | )% | | | (0.17 | )% | | | (0.55 | )% | | | (0.45 | )% |
| Portfolio turnover rate | | | 71 | % | | | 49 | % | | | 62 | % | | | 47 | % | | | 42 | % |
| (1) | The average shares outstanding method has been applied for per share information. |
| (2) | Total investment return is based on the change in net asset value of a share during the year, assumes reinvestment of dividends and distributions at net asset value and does not reflect the impact of a sales charge. |
| ^ | Amount is less than 0.005 per share. |
The accompanying notes are an integral part of the financial statements.
2016 ANNUAL REPORT
Financial Highlights
Quaker Small-Cap Value Fund
(For a Share Outstanding Throughout the Year)
| | | Class A | |
| | | Years Ended June 30, | |
| | | 2016 | | | 2015 | | | 2014 | | | 2013 | | | 2012 | |
| Net asset value, beginning of year | | $ | 24.15 | | | $ | 24.28 | | | $ | 19.50 | | | $ | 15.85 | | | $ | 16.53 | |
| Income from investment operations: | | | | | | | | | | | | | | | | | | | | |
Net investment income (loss)(1) | | | (0.08 | ) | | | (0.06 | ) | | | (0.11 | ) | | | 0.09 | | | | (0.08 | ) |
| Net realized and unrealized | | | | | | | | | | | | | | | | | | | | |
| gain (loss) on investments | | | (2.26 | ) | | | 1.22 | | | | 4.95 | | | | 3.58 | | | | (0.60 | ) |
| Total from investment operations | | | (2.34 | ) | | | 1.16 | | | | 4.84 | | | | 3.67 | | | | (0.68 | ) |
| Distributions to shareholders from: | | | | | | | | | | | | | | | | | | | | |
| Net investment income | | | — | | | | — | | | | (0.06 | ) | | | (0.02 | ) | | | — | |
| Net realized capital gain | | | (1.72 | ) | | | (1.29 | ) | | | — | | | | — | | | | — | |
| Total distributions | | | (1.72 | ) | | | (1.29 | ) | | | (0.06 | ) | | | (0.02 | ) | | | — | |
| Net asset value, end of year | | $ | 20.09 | | | $ | 24.15 | | | $ | 24.28 | | | $ | 19.50 | | | $ | 15.85 | |
Total Return(2) | | | (9.93 | )% | | | 4.96 | % | | | 24.83 | % | | | 23.17 | % | | | (4.11 | )% |
| Ratios/supplemental data: | | | | | | | | | | | | | | | | | | | | |
| Net assets, end of year (000’ omitted) | | $ | 6,431 | | | $ | 7,790 | | | $ | 8,512 | | | $ | 7,727 | | | $ | 8,347 | |
| Ratio of expenses to average net assets | | | 1.93 | % | | | 1.78 | % | | | 1.83 | % | | | 1.93 | % | | | 1.96 | % |
| Ratio of net investment income (loss) | | | | | | | | | | | | | | | | | | | | |
| to average net assets | | | (0.37 | )% | | | (0.26 | )% | | | (0.47 | )% | | | 0.49 | % | | | (0.52 | )% |
| Portfolio turnover rate | | | 119 | % | | | 128 | % | | | 176 | % | | | 142 | % | | | 158 | % |
| (1) | The average shares outstanding method has been applied for per share information. |
| (2) | Total investment return is based on the change in net asset value of a share during the year, assumes reinvestment of dividends and distributions at net asset value and does not reflect the impact of a sales charge. |
The accompanying notes are an integral part of the financial statements.
2016 ANNUAL REPORT
Financial Highlights
Quaker Small-Cap Value Fund
(For a Share Outstanding Throughout the Year)
| | | Class C | |
| | | Years Ended June 30, | |
| | | 2016 | | | 2015 | | | 2014 | | | 2013 | | | 2012 | |
| Net asset value, beginning of year | | $ | 19.96 | | | $ | 20.43 | | | $ | 16.49 | | | $ | 13.49 | | | $ | 14.17 | |
| Income from investment operations: | | | | | | | | | | | | | | | | | | | | |
Net investment income (loss)(1) | | | (0.19 | ) | | | (0.20 | ) | | | (0.23 | ) | | | (0.04 | ) | | | (0.16 | ) |
| Net realized and unrealized | | | | | | | | | | | | | | | | | | | | |
| gain (loss) on investments | | | (1.86 | ) | | | 1.02 | | | | 4.17 | | | | 3.04 | | | | (0.52 | ) |
| Total from investment operations | | | (2.05 | ) | | | 0.82 | | | | 3.94 | | | | 3.00 | | | | (0.68 | ) |
| Distributions to shareholders from: | | | | | | | | | | | | | | | | | | | | |
| Net investment income | | | — | | | | — | | | | — | | | | — | | | | — | |
| Net realized capital gain | | | (1.72 | ) | | | (1.29 | ) | | | — | | | | — | | | | — | |
| Total distributions | | | (1.72 | ) | | | (1.29 | ) | | | — | | | | — | | | | — | |
| Net asset value, end of year | | $ | 16.19 | | | $ | 19.96 | | | $ | 20.43 | | | $ | 16.49 | | | $ | 13.49 | |
Total Return(2) | | | (10.59 | )% | | | 4.20 | % | | | 23.89 | % | | | 22.24 | % | | | (4.80 | )% |
| Ratios/supplemental data: | | | | | | | | | | | | | | | | | | | | |
| Net assets, end of year (000’ omitted) | | $ | 1,477 | | | $ | 1,684 | | | $ | 1,806 | | | $ | 1,625 | | | $ | 1,863 | |
| Ratio of expenses to average net assets | | | 2.68 | % | | | 2.53 | % | | | 2.58 | % | | | 2.68 | % | | | 2.70 | % |
| Ratio of net investment income (loss) | | | | | | | | | | | | | | | | | | | | |
| to average net assets | | | (1.12 | )% | | | (1.01 | )% | | | (1.22 | )% | | | (0.26 | )% | | | (1.25 | )% |
| Portfolio turnover rate | | | 119 | % | | | 128 | % | | | 176 | % | | | 142 | % | | | 158 | % |
| (1) | The average shares outstanding method has been applied for per share information. |
| (2) | Total investment return is based on the change in net asset value of a share during the year, assumes reinvestment of dividends and distributions at net asset value and does not reflect the impact of a sales charge. |
The accompanying notes are an integral part of the financial statements.
2016 ANNUAL REPORT
Financial Highlights
Quaker Small-Cap Value Fund
(For a Share Outstanding Throughout the Year)
| | | Institutional Class | |
| | | Years Ended June 30, | |
| | | 2016 | | | 2015 | | | 2014 | | | 2013 | | | 2012 | |
| Net asset value, beginning of year | | $ | 25.29 | | | $ | 25.30 | | | $ | 20.29 | | | $ | 16.50 | | | $ | 17.15 | |
| Income from investment operations: | | | | | | | | | | | | | | | | | | | | |
Net investment income (loss)(1) | | | (0.03 | ) | | (0.00 | )^ | | | (0.05 | ) | | | 0.13 | | | | (0.04 | ) |
| Net realized and unrealized | | | | | | | | | | | | | | | | | | | | |
| gain (loss) on investments | | | (2.37 | ) | | | 1.28 | | | | 5.14 | | | | 3.73 | | | | (0.61 | ) |
| Total from investment operations | | | (2.40 | ) | | | 1.28 | | | | 5.09 | | | | 3.86 | | | | (0.65 | ) |
| Distributions to shareholders from: | | | | | | | | | | | | | | | | | | | | |
| Net investment income | | | — | | | | — | | | | (0.08 | ) | | | (0.07 | ) | | | — | |
| Net realized capital gain | | | (1.72 | ) | | | (1.29 | ) | | | — | | | | — | | | | — | |
| Total distributions | | | (1.72 | ) | | | (1.29 | ) | | | (0.08 | ) | | | (0.07 | ) | | | — | |
| Net asset value, end of year | | $ | 21.17 | | | $ | 25.29 | | | $ | 25.30 | | | $ | 20.29 | | | $ | 16.50 | |
Total Return(2) | | | (9.71 | )% | | | 5.24 | % | | | 25.13 | % | | | 23.44 | % | | | (3.79 | )% |
| Ratios/supplemental data: | | | | | | | | | | | | | | | | | | | | |
| Net assets, end of year (000’ omitted) | | $ | 24,642 | | | $ | 28,528 | | | $ | 27,868 | | | $ | 23,393 | | | $ | 20,028 | |
| Ratio of expenses to average net assets | | | 1.68 | % | | | 1.53 | % | | | 1.58 | % | | | 1.68 | % | | | 1.71 | % |
| Ratio of net investment income (loss) | | | | | | | | | | | | | | | | | | | | |
| to average net assets | | | (0.12 | )% | | | (0.01 | )% | | | (0.22 | )% | | | 0.74 | % | | | (0.25 | )% |
| Portfolio turnover rate | | | 119 | % | | | 128 | % | | | 176 | % | | | 142 | % | | | 158 | % |
| (1) | The average shares outstanding method has been applied for per share information. |
| (2) | Total investment return is based on the change in net asset value of a share during the year, assumes reinvestment of dividends and distributions at net asset value and does not reflect the impact of a sales charge. |
| ^ | Amount is less than 0.005 per share. |
The accompanying notes are an integral part of the financial statements.
2016 ANNUAL REPORT
Financial Highlights
Quaker Strategic Growth Fund
(For a Share Outstanding Throughout the Year)
| | | Class A | |
| | | Years Ended June 30, | |
| | | 2016 | | | 2015 | | | 2014 | | | 2013 | | | 2012 | |
| Net asset value, beginning of year | | $ | 26.55 | | | $ | 24.19 | | | $ | 19.31 | | | $ | 16.13 | | | $ | 16.53 | |
| Income from investment operations: | | | | | | | | | | | | | | | | | | | | |
Net investment income (loss)(1) | | | (0.32 | ) | | | (0.30 | ) | | | (0.26 | ) | | | (0.15 | ) | | | (0.15 | ) |
| Net realized and unrealized | | | | | | | | | | | | | | | | | | | | |
| gain (loss) on investments | | | (2.43 | ) | | | 2.66 | | | | 5.14 | | | | 3.33 | | �� | | (0.25 | ) |
| Total from investment operations | | | (2.75 | ) | | | 2.36 | | | | 4.88 | | | | 3.18 | | | | (0.40 | ) |
| Distributions to shareholders from: | | | | | | | | | | | | | | | | | | | | |
| Net investment income | | | — | | | | — | | | | — | | | | — | | | | — | |
| Net realized capital gain | | | — | | | | — | | | | — | | | | — | | | | — | |
| Total distributions | | | — | | | | — | | | | — | | | | — | | | | — | |
| Net asset value, end of year | | $ | 23.80 | | | $ | 26.55 | | | $ | 24.19 | | | $ | 19.31 | | | $ | 16.13 | |
Total Return(2) | | | (10.36 | )% | | | 9.76 | % | | | 25.27 | % | | | 19.71 | % | | | (2.42 | )% |
| Ratios/supplemental data: | | | | | | | | | | | | | | | | | | | | |
| Net assets, end of year (000’ omitted) | | $ | 57,159 | | | $ | 77,188 | | | $ | 87,053 | | | $ | 88,970 | | | $ | 111,778 | |
| Ratio of expenses to average net assets: | | | | | | | | | | | | | | | | | | | | |
Before expense reimbursements or recoveries(3)(4) | | | 2.30 | % | | | 2.12 | % | | | 2.15 | % | | | 2.36 | % | | | 2.30 | % |
After expense reimbursements or recoveries(3)(5) | | | 2.24 | % | | | 2.24 | % | | | 2.24 | % | | | 2.24 | % | | | 2.24 | % |
| Ratio of net investment income (loss) | | | | | | | | | | | | | | | | | | | | |
| to average net assets*: | | | | | | | | | | | | | | | | | | | | |
Before expense reimbursements or recoveries(3) | | | (1.34 | )% | | | (1.06 | )% | | | (1.06 | )% | | | (0.98 | )% | | | (1.03 | )% |
After expense reimbursements or recoveries(3) | | | (1.28 | )% | | | (1.18 | )% | | | (1.15 | )% | | | (0.86 | )% | | | (0.98 | )% |
| Portfolio turnover rate | | | 211 | % | | | 149 | % | | | 170 | % | | | 294 | % | | | 178 | % |
| (1) | The average shares outstanding method has been applied for per share information. |
| (2) | Total investment return is based on the change in net asset value of a share during the year, assumes reinvestment of dividends and distributions at net asset value and does not reflect the impact of a sales charge. |
| (3) | Expense waived or reimbursed reflect reductions to total expenses, as discussed in the notes to the financial statements. These reimbursed amounts would increase the net investment loss ratio or decrease the net investment income ratio and recovered amounts would decrease the net investment loss ratio or increase the net investment income ratio, as applicable, had such reductions or increases not occurred. |
| (4) | Expenses before reductions (excluding dividend and interest expense for securities sold short) were 2.29% for the year ended June 30, 2016. |
| (5) | Expenses net of all reductions (excluding dividend and interest expense for securities sold short) were 2.23% for the year ended June 30, 2016. |
| * | The net investment income (loss) ratios include dividends on short positions. |
The accompanying notes are an integral part of the financial statements.
2016 ANNUAL REPORT
Financial Highlights
Quaker Strategic Growth Fund
(For a Share Outstanding Throughout the Year)
| | | Class C | |
| | | Years Ended June 30, | |
| | | 2016 | | | 2015 | | | 2014 | | | 2013 | | | 2012 | |
| Net asset value, beginning of year | | $ | 23.28 | | | $ | 21.37 | | | $ | 17.19 | | | $ | 14.47 | | | $ | 14.94 | |
| Income from investment operations: | | | | | | | | | | | | | | | | | | | | |
Net investment income (loss)(1) | | | (0.44 | ) | | | (0.43 | ) | | | (0.37 | ) | | | (0.25 | ) | | | (0.24 | ) |
| Net realized and unrealized | | | | | | | | | | | | | | | | | | | | |
| gain (loss) on investments | | | (2.12 | ) | | | 2.34 | | | | 4.55 | | | | 2.97 | | | | (0.23 | ) |
| Total from investment operations | | | (2.56 | ) | | | 1.91 | | | | 4.18 | | | | 2.72 | | | | (0.47 | ) |
| Distributions to shareholders from: | | | | | | | | | | | | | | | | | | | | |
| Net investment income | | | — | | | | — | | | | — | | | | — | | | | — | |
| Net realized capital gain | | | — | | | | — | | | | — | | | | — | | | | — | |
| Total distributions | | | — | | | | — | | | | — | | | | — | | | | — | |
| Net asset value, end of year | | $ | 20.72 | | | $ | 23.28 | | | $ | 21.37 | | | $ | 17.19 | | | $ | 14.47 | |
Total Return(2) | | | (11.00 | )% | | | 8.94 | % | | | 24.32 | % | | | 18.80 | % | | | (3.15 | )% |
| Ratios/supplemental data: | | | | | | | | | | | | | | | | | | | | |
| Net assets, end of year (000’ omitted) | | $ | 15,375 | | | $ | 20,140 | | | $ | 22,931 | | | $ | 22,968 | | | $ | 27,102 | |
| Ratio of expenses to average net assets: | | | | | | | | | | | | | | | | | | | | |
Before expense reimbursements or recoveries(3)(4) | | | 3.05 | % | | | 2.87 | % | | | 2.90 | % | | | 3.11 | % | | | 3.04 | % |
After expense reimbursements or recoveries(3)(5) | | | 2.99 | % | | | 2.99 | % | | | 2.99 | % | | | 2.99 | % | | | 2.99 | % |
| Ratio of net investment income (loss) | | | | | | | | | | | | | | | | | | | | |
| to average net assets*: | | | | | | | | | | | | | | | | | | | | |
Before expense reimbursements or recoveries(3) | | | (2.09 | )% | | | (1.81 | )% | | | (1.81 | )% | | | (1.74 | )% | | | (1.77 | )% |
After expense reimbursements or recoveries(3) | | | (2.03 | )% | | | (1.93 | )% | | | (1.90 | )% | | | (1.62 | )% | | | (1.72 | )% |
| Portfolio turnover rate | | | 211 | % | | | 149 | % | | | 170 | % | | | 294 | % | | | 178 | % |
| (1) | The average shares outstanding method has been applied for per share information. |
| (2) | Total investment return is based on the change in net asset value of a share during the year, assumes reinvestment of dividends and distributions at net asset value and does not reflect the impact of a sales charge. |
| (3) | Expense waived or reimbursed reflect reductions to total expenses, as discussed in the notes to the financial statements. These reimbursed amounts would increase the net investment loss ratio or decrease the net investment income ratio and recovered amounts would decrease the net investment loss ratio or increase the net investment income ratio, as applicable, had such reductions or increases not occurred. |
| (4) | Expenses before reductions (excluding dividend and interest expense for securities sold short) were 3.04% for the year ended June 30, 2016. |
| (5) | Expenses net of all reductions (excluding dividend and interest expense for securities sold short) were 2.98% for the year ended June 30, 2016. |
| * | The net investment income (loss) ratios include dividends on short positions. |
The accompanying notes are an integral part of the financial statements.
2016 ANNUAL REPORT
Financial Highlights
Quaker Strategic Growth Fund
(For a Share Outstanding Throughout the Year)
| | | Institutional Class | |
| | | Years Ended June 30, | |
| | | 2016 | | | 2015 | | | 2014 | | | 2013 | | | 2012 | |
| Net asset value, beginning of year | | $ | 27.62 | | | $ | 25.10 | | | $ | 19.99 | | | $ | 16.66 | | | $ | 17.03 | |
| Income from investment operations: | | | | | | | | | | | | | | | | | | | | |
Net investment income (loss)(1) | | | (0.27 | ) | | | (0.25 | ) | | | (0.21 | ) | | | (0.11 | ) | | | (0.11 | ) |
| Net realized and unrealized | | | | | | | | | | | | | | | | | | | | |
| gain (loss) on investments | | | (2.53 | ) | | | 2.77 | | | | 5.32 | | | | 3.44 | | | | (0.26 | ) |
| Total from investment operations | | | (2.80 | ) | | | 2.52 | | | | 5.11 | | | | 3.33 | | | | (0.37 | ) |
| Distributions to shareholders from: | | | | | | | | | | | | | | | | | | | | |
| Net investment income | | | — | | | | — | | | | — | | | | — | | | | — | |
| Net realized capital gain | | | — | | | | — | | | | — | | | | — | | | | — | |
| Total distributions | | | — | | | | — | | | | — | | | | — | | | | — | |
| Net asset value, end of year | | $ | 24.82 | | | $ | 27.62 | | | $ | 25.10 | | | $ | 19.99 | | | $ | 16.66 | |
Total Return(2) | | | (10.14 | )% | | | 10.04 | % | | | 25.56 | % | | | 19.99 | % | | | (2.17 | )% |
| Ratios/supplemental data: | | | | | | | | | | | | | | | | | | | | |
| Net assets, end of year (000’ omitted) | | $ | 13,457 | | | $ | 66,521 | | | $ | 58,999 | | | $ | 45,851 | | | $ | 40,288 | |
| Ratio of expenses to average net assets: | | | | | | | | | | | | | | | | | | | | |
Before expense reimbursements or recoveries(3)(4) | | | 2.05 | % | | | 1.87 | % | | | 1.90 | % | | | 2.11 | % | | | 2.03 | % |
After expense reimbursements or recoveries(3)(5) | | | 1.99 | % | | | 1.99 | % | | | 1.99 | % | | | 1.99 | % | | | 1.99 | % |
| Ratio of net investment income (loss) | | | | | | | | | | | | | | | | | | | | |
| to average net assets*: | | | | | | | | | | | | | | | | | | | | |
Before expense reimbursements or recoveries(3) | | | (1.09 | )% | | | (0.81 | )% | | | (0.81 | )% | | | (0.74 | )% | | | (0.72 | )% |
After expense reimbursements or recoveries(3) | | | (1.03 | )% | | | (0.93 | )% | | | (0.90 | )% | | | (0.62 | )% | | | (0.68 | )% |
| Portfolio turnover rate | | | 211 | % | | | 149 | % | | | 170 | % | | | 294 | % | | | 178 | % |
| (1) | The average shares outstanding method has been applied for per share information. |
| (2) | Total investment return is based on the change in net asset value of a share during the year, assumes reinvestment of dividends and distributions at net asset value and does not reflect the impact of a sales charge. |
| (3) | Expense waived or reimbursed reflect reductions to total expenses, as discussed in the notes to the financial statements. These reimbursed amounts would increase the net investment loss ratio or decrease the net investment income ratio and recovered amounts would decrease the net investment loss ratio or increase the net investment income ratio, as applicable, had such reductions or increases not occurred. |
| (4) | Expenses before reductions (excluding dividend and interest expense for securities sold short) were 2.04% for the year ended June 30, 2016. |
| (5) | Expenses net of all reductions (excluding dividend and interest expense for securities sold short) were 1.98% for the year ended June 30, 2016. |
| * | The net investment income (loss) ratios include dividends on short positions. |
The accompanying notes are an integral part of the financial statements.
2016 ANNUAL REPORT
Notes to the Financial Statements
Note 1 — Organization
The Quaker Investment Trust (“Trust”), a diversified, open-end management investment company, was organized as a Massachusetts business trust on October 24, 1990, and is registered under the Investment Company Act of 1940, as amended (“1940 Act”). The Trust’s Amended and Restated Declaration of Trust permits the Trustees to issue an unlimited number of shares of beneficial interest. The Trust currently has five series: Quaker Event Arbitrage Fund (“Event Arbitrage”), Quaker Global Tactical Allocation Fund (“Global Tactical Allocation”), Quaker Mid-Cap Value Fund (“Mid-Cap Value”), Quaker Small-Cap Value Fund (“Small-Cap Value”) and Quaker Strategic Growth Fund (“Strategic Growth”) (each a “Fund” and collectively, “Funds”). All Funds are diversified. The investment objectives of each Fund are set forth below.
Strategic Growth and Small-Cap Value commenced operations on November 25, 1996. Mid-Cap Value commenced operations on December 31, 1997. Global Tactical Allocation commenced operations on May 1, 2008. Event Arbitrage commenced operations on June 7, 2010 in conjunction with the reorganization of the Pennsylvania Avenue Event Driven Fund (“Event Driven Fund”). The predecessor to the Event Driven Fund, the Pennsylvania Avenue Fund, commenced operations on September 19, 2002. The investment objective of these Funds is to seek long-term growth of capital. The investment objective of these funds is non-fundamental in that this objective may be changed by the Board of Trustees (“Board” or “Trustees”) without shareholder approval. Each Fund is an investment company and accordingly follows the investment company accounting and reporting guidance of the Financial Accounting Standards Board (“FASB”) Accounting Standards Codification Topic 946 “Financial Services – Investment Companies.”
The Funds currently offer three classes of shares (Class A, Class C and Institutional Class shares). Class A shares are charged a front-end sales charge and a distribution and servicing fee; Class C shares are charged a distribution fee, but bear no front-end sales charge or contingent deferred sales charge (“CDSC”); and Institutional Class shares bear no front-end sales charge or CDSC, but have higher minimum investment thresholds. Quaker Funds, Inc. (“QFI”), the investment adviser to each of the Funds, has the ability to waive the minimum investment for Institutional Class shares at its discretion.
Note 2 — Summary of Significant Accounting Policies and Other Information
The following is a summary of significant accounting policies consistently followed by the Funds in the preparation of their financial statements. The policies are in conformity with accounting principles generally accepted in the United States of America (“GAAP”).
A. Security Valuation. The Funds’ investments in securities are carried at market value. Securities listed on an exchange or quoted on a national market system are generally valued at the last quoted sales price at the time of valuation. Other securities traded in the over-the-counter market and listed securities for which no sale was reported on that date are valued at the most recent bid price. Each security reported on the NASDAQ National Market System is valued at the NASDAQ Official Closing Price.
Debt and other fixed-income securities (other than short-term obligations) are valued at the last quoted bid price and/or by using a combination of daily quotes and matrix evaluations provided by an independent pricing service (which reflect such factors as security prices, yields, maturities, ratings, and dealer and exchange quotations), the use of which has been approved by the Board.
Short-term investments are valued at amortized cost, which approximates fair market value.
2016 ANNUAL REPORT
Notes to the Financial Statements (continued)
Note 2 — Summary of Significant Accounting Policies and Other Information (Continued)
The Funds may enter into forward foreign currency contracts to lock in the U.S. dollar cost of purchase and sale transactions or to defend the portfolio against currency fluctuations. A forward foreign currency contract is a commitment to purchase or sell a foreign currency at a future date at a negotiated rate. These contracts are valued daily, and the Fund’s net equity therein, representing unrealized gain or loss on the contracts as measured by the difference between the forward foreign exchange rates at the dates of entry into the contracts and the forward rates at the end of the reporting period, is included in the Statements of Assets and Liabilities. Realized and unrealized gains and losses are included in the Statements of Operations. Risks may arise upon entering into these contracts from the potential inability of counterparties to meet the terms of the contract and from unanticipated movements in the value of foreign currencies relative to the U.S. dollar.
For financial reporting purposes, investment transactions are recorded on the trade date; however, for purposes of executing shareholder transactions, the Funds record changes in holdings of portfolio securities no later than the first business day after the trade date in accordance with Rule 2a-4 of the 1940 Act. Accordingly, certain differences between net asset value for financial reporting and for executing shareholder transactions may arise.
The Funds have adopted fair valuation procedures to value securities at fair market value in certain circumstances, and the Trust has established a Valuation Committee responsible for determining when fair valuing a security is necessary and appropriate. The Funds will value securities at fair market value when market quotations are not readily available or when securities cannot be accurately valued within established pricing procedures. The Valuation Committee may also fair value foreign securities whose prices may have been affected by events occurring after the close of trading in their respective markets but prior to the time the Fund holding the foreign securities calculates its net asset value. The Funds’ fair valuation procedures are designed to help ensure that prices at which Fund shares are purchased and redeemed are fair and do not result in dilution of shareholder interest or other harm to shareholders.
The Fund is required to disclose information regarding the fair value measurements of the Fund’s assets and liabilities. Fair value is defined as the price that the Fund may receive upon selling an investment in an orderly transaction to an independent buyer in the principal or most advantageous market for the investment. The disclosure requirements utilize a three-tier hierarchy to maximize the use of observable market data, minimize the use of unobservable inputs and establish classification of fair value measurements for disclosure purposes. A financial instrument’s level within the fair value hierarchy is based on the lowest level that is significant to the fair value measurement. Inputs refer broadly to the assumptions that market participants would use in pricing the asset or liability, including assumptions about risk, for example, the risk inherent in a particular valuation technique used to measure fair value including the pricing model used and/or the risk inherent in the inputs to the valuation technique. Inputs may be observable or unobservable.
Observable inputs are inputs that reflect the assumptions market participants would use in pricing the asset or liability, which are based on market data obtained from sources independent of the reporting entity. Unobservable inputs are inputs that reflect the reporting entity’s own assumptions about the assumptions market participants would use in pricing the asset or liability developed based on the best information available in the circumstances.
The significant unobservable inputs used in the fair value measurement of the reporting entity’s private equity holdings are, the last traded price, the cost of prior transactions, single broker quotes, uncertainty of future payout, pricing service price adjusted for recent payout distribution, last trade price on pre-conversion bond
2016 ANNUAL REPORT
Notes to the Financial Statements (continued)
Note 2 — Summary of Significant Accounting Policies and Other Information (Continued)
and discounts applied for lack of marketability. Significant increases (decreases) in any of those inputs in isolation could result in a significantly lower (higher) fair value measurement.
Various inputs may be used to determine the value of each Fund’s investments. These inputs are summarized in three broad levels for financial statement purposes. The inputs or methodologies used to value securities are not necessarily an indication of the risk associated with investing in those securities.
Level 1 — Quoted prices in active markets for identical securities.
Level 2 — Prices determined using significant other observable inputs (including quoted prices for similar securities, interest rates, prepayment speeds, credit risk, etc.) municipal securities, long-term U.S. Government obligations and corporate debt securities are valued in accordance with the evaluated price supplied by the pricing service and generally categorized as Level 2 in the hierarchy. Other securities that are categorized as Level 2 in the hierarchy include, but are not limited to, warrants and structured notes that do not trade on an exchange, OTC options and international equity securities valued by an independent third party in order to adjust for stale pricing and foreign market holidays.
Level 3 — Prices determined using significant unobservable inputs (including the Fund’s own assumptions). For restricted equity securities where observable inputs are limited, assumptions about market activity and risk are used in determining fair value. These are categorized as Level 3 in the hierarchy.
For international equity securities traded on a foreign exchange or market which closes prior to a Fund’s Valuation Time, in order to adjust for events which occur between the close of the foreign exchange they are traded on and the close of the New York Stock Exchange, a fair valuation model is used, and these securities are categorized as Level 2.
A Fund may hold securities, some of which are classified as Level 3 investments (as defined below). Level 3 investments have significant unobservable inputs, as they trade infrequently. In determining the fair value of these investments, management uses the market approach which includes as the primary input the capital balance reported; however, adjustments to the reported capital balance may be made based on various factors, including, but not limited to, the attributes of the interest held, including the rights and obligations, and any restrictions or illiquidity of such interests, and the fair value of these securities.
The value of a foreign security is generally determined as of the close of trading on the foreign stock exchange on which the security is primarily traded, or as of the close of trading on the New York Stock Exchange (“NYSE”), if earlier. The value is then converted into its U.S. dollar equivalent at the foreign exchange rate in effect at the close of the NYSE (generally 4:00 p.m. Eastern time) on the day that the value of the foreign security is determined. If no sale is reported at that time, the foreign security will be valued within the range of the most recent quoted bid and ask prices. If market quotations are not readily available for a foreign security or an event has occurred that caused a quotation to be unavailable or unreliable, the Valuation Committee will fair value foreign securities using the procedures described below.
The Trust has adopted fair valuation procedures to value securities at fair market value when independent prices are unavailable or unreliable, and the Trust has established a Valuation Committee that is responsible for determining when fair valuing a security is necessary and appropriate. Securities and assets for which market quotations are not readily available may be valued based upon valuation methods that include: (i) multiple of
2016 ANNUAL REPORT
Notes to the Financial Statements (continued)
Note 2 — Summary of Significant Accounting Policies and Other Information (Continued)
earnings; (ii) yield to maturity with respect to debt issues; (iii) discounts from market prices of similar freely traded securities; or (iv) a combination of these or other methods. Securities may also be priced using fair value pricing methods when their closing prices do not reflect their market values at the time the Fund calculates its net asset value (“NAV”) because an event had occurred since the closing prices were established on the domestic or foreign exchange or market but before the Fund’s NAV calculation.
The following is a summary of the fair valuations according to the inputs used as of June 30, 2016 in valuing the Fund’s assets and liabilities:
| Description | EVENT ARBITRAGE FUND | | Level 1 | | | Level 2 | | | Level 3 | | | Total | |
| Common Stocks | | $ | 20,961,802 | | | $ | 356,371 | | | $ | 1,175,330 | | | $ | 22,493,503 | |
| Preferred Stocks | | | 261,875 | | | | 6,045 | | | | 695,826 | | | | 963,746 | |
| Structured Notes | | | — | | | | 1,846,508 | | | | — | | | | 1,846,508 | |
| Asset Backed Securities | | | — | | | | 195,095 | | | | — | | | | 195,095 | |
| Convertible Bonds | | | — | | | | 404,757 | | | | 0 | | | | 404,757 | |
| Corporate Bonds | | | — | | | | 4,234,137 | | | | 581,627 | | | | 4,815,764 | |
| Mortgage Backed Securities | | | — | | | | 237,488 | | | | — | | | | 237,488 | |
| Escrow Notes | | | — | | | | — | | | | 0 | | | | 0 | |
| Purchased Options | | | 158,396 | | | | 20,625 | | | | — | | | | 179,021 | |
| Investments Purchased with | | | | | | | | | | | | | | | | |
| Proceeds from Securities Lending | | | 4,709,849 | | | | — | | | | — | | | | 4,709,849 | |
| Total Investments in Securities | | $ | 26,091,922 | | | $ | 7,301,026 | | | $ | 2,452,783 | | | $ | 35,845,731 | |
| Written Options | | | 84,492 | | | | 127,055 | | | | — | | | | 211,547 | |
| Total Investments in Securities sold short | | $ | 84,492 | | | $ | 127,055 | | | $ | — | | | $ | 211,547 | |
| | | | | | | | | | | | | | |
| Description | GLOBAL TACTICAL ALLOCATION FUND | | Level 1 | | | Level 2 | | | Level 3 | | | Total | |
| Common Stocks | | $ | 6,116,005 | | | $ | — | | | $ | 11,020 | | | $ | 6,127,025 | |
| Exchange Traded Funds | | | 402,805 | | | | — | | | | — | | | | 402,805 | |
| Total Investments in Securities | | $ | 6,518,810 | | | $ | — | | | $ | 11,020 | | | $ | 6,529,830 | |
| | | | | | | | | | | | | | |
| Description | MID-CAP VALUE FUND | | Level 1 | | | Level 2 | | | Level 3 | | | Total | |
| Common Stocks | | $ | 5,662,845 | | | $ | — | | | $ | — | | | $ | 5,662,845 | |
| Real Estate Investment Trusts | | | 1,052,480 | | | | — | | | | — | | | | 1,052,480 | |
| Investments Purchased with | | | | | | | | | | | | | | | | |
| Proceeds from Securities Lending | | | 1,930,487 | | | | — | | | | — | | | | 1,930,487 | |
| Total Investments in Securities | | $ | 8,645,812 | | | $ | — | | | $ | — | | | $ | 8,645,812 | |
| | | | | | | | | | | | | | |
| Description | SMALL-CAP VALUE FUND | | Level 1 | | | Level 2 | | | Level 3 | | | Total | |
| Common Stocks | | $ | 28,273,095 | | | $ | — | | | $ | — | | | $ | 28,273,095 | |
| Real Estate Investment Trusts | | | 3,578,253 | | | | — | | | | — | | | | 3,578,253 | |
| Closed End Mutual Funds | | | 175,108 | | | | — | | | | — | | | | 175,108 | |
| Investments Purchased with | | | | | | | | | | | | | | | | |
| Proceeds from Securities Lending | | | 8,824,306 | | | | — | | | | — | | | | 8,824,306 | |
| Total Investments in Securities | | $ | 40,850,762 | | | $ | — | | | $ | — | | | $ | 40,850,762 | |
2016 ANNUAL REPORT
Notes to the Financial Statements (continued)
Note 2 — Summary of Significant Accounting Policies and Other Information (Continued)
| Description | STRATEGIC GROWTH FUND | | Level 1 | | | Level 2 | | | Level 3 | | | Total | |
| Common Stocks | | $ | 74,037,602 | | | $ | — | | | $ | 306,291 | | | $ | 74,343,893 | |
| Exchange Traded Funds | | | 4,315,270 | | | | — | | | | — | | | | 4,315,270 | |
| Investments Purchased with | | | | | | | | | | | | | | | | |
| Proceeds from Securities Lending | | | 23,725,114 | | | | — | | | | — | | | | 23,725,114 | |
| Total Investments in Securities | | $ | 102,077,986 | | | $ | — | | | $ | 306,291 | | | $ | 102,384,277 | |
Refer to the Fund’s Schedules of Investments for industry classifications.
Level 3 Reconciliation
The following is a reconciliation of Event Arbitrage’s, Global Tactical Allocation’s and Strategic Growth’s Level 3 investments for which significant unobservable inputs were used in determining value. See Schedules of Investments for industry breakouts:
EVENT ARBITRAGE FUND
| | | Balance | | | | | | | | | | | | Net | | | | | | | | | | | | Balance | |
| | | as of | | | | | | | | | | | | Unrealized | | | Amortized | | | Transfers | | | Transfers | | | as of | |
| | | June 30, | | | | | | | | | Realized | | | appreciation/ | | | discounts/ | | | in to | | | out of | | | June 30, | |
| | | 2015 | | | Purchases | | | Sales | | | gain (loss) | | | (depreciation) | | | premiums | | | Level 3 | | | Level 3 | | | 2016 | |
| Common Stocks | | $ | 2,360,386 | | | $ | 755,586 | | | $ | (7,162 | ) | | $ | (4,877 | ) | | $ | (1,643,901 | ) | | $ | — | | | $ | — | | | $ | (284,702 | ) | | $ | 1,175,330 | |
| Preferred Stocks | | | 813,000 | | | | 3,102 | | | | — | | | | — | | | | (120,276 | ) | | | — | | | | — | | | | — | | | | 695,826 | |
| Convertible Bonds | | | 277,047 | | | | 11,012 | | | | (100,000 | ) | | | — | | | | (116,799 | ) | | | 570 | | | | — | | | | (71,830 | ) | | | 0 | |
| Corporate Bonds | | | 738,396 | | | | — | | | | (583,750 | ) | | | — | | | | 425,076 | | | | 1,940 | | | | — | | | | (35 | ) | | | 581,627 | |
| Term Loan | | | 511,054 | | | | — | | | | (511,054 | ) | | | — | | | | — | | | | — | | | | — | | | | — | | | | 0 | |
| Escrow Notes | | | 0 | | | | — | | | | — | | | | — | | | | — | | | | — | | | | — | | | | — | | | | 0 | |
| | | $ | 4,699,883 | | | $ | 769,700 | | | $ | (1,201,966 | ) | | $ | (4,877 | ) | | $ | (1,455,900 | ) | | $ | 2,510 | | | $ | — | | | $ | (356,567 | ) | | $ | 2,452,783 | |
| Written Options | | $ | (21,420 | ) | | $ | — | | | $ | — | | | $ | 47,735 | | | $ | (26,315 | ) | | $ | — | | | $ | — | | | $ | — | | | $ | — | |
| Net change in unrealized appreciation (depreciation) for Level 3 investments still held as of June 30, 2016 | | | | | | | $ | (987,221 | ) |
| | | | | | | | | | | | | | | | | | | | | | | | | | | | | | | | | | | | | |
| GLOBAL TACTICAL ALLOCATION FUND | | | | | | | | | | | | | | | | | | | | | | | | | |
| | | Balance | | | | | | | | | | | | | | | Net | | | | | | | | | | | | | | | Balance | |
| | | as of | | | | | | | | | | | | | | | Unrealized | | | Amortized | | | Transfers | | | Transfers | | | as of | |
| | | June 30, | | | | | | | | | | | Realized | | | appreciation/ | | | discounts/ | | | in to | | | out of | | | June 30, | |
| | | 2015 | | | Purchases | | | Sales | | | gain (loss) | | | (depreciation) | | | premiums | | | Level 3 | | | Level 3 | | | 2016 | |
| Common Stocks | | $ | 13,756 | | | $ | — | | | $ | — | | | $ | — | | | $ | (2,736 | ) | | $ | — | | | $ | — | | | $ | — | | | $ | 11,020 | |
| | | $ | 13,756 | | | $ | — | | | $ | — | | | $ | — | | | $ | (2,736 | ) | | $ | — | | | $ | — | | | $ | — | | | $ | 11,020 | |
| Net change in unrealized appreciation (depreciation) for Level 3 investments still held as of June 30, 2016 | | | | | | | $ | (2,736 | ) |
| | | | | | | | | | | | | | | | | | | | | | | | | | | | | | | | | | | | | |
| STRATEGIC GROWTH FUND | | | | | | | | | | | | | | | | | | | | | | | | | | | | | |
| | | Balance | | | | | | | | | | | | | | | Net | | | | | | | | | | | | | | | Balance | |
| | | as of | | | | | | | | | | | | | | | Unrealized | | | Amortized | | | Transfers | | | Transfers | | | as of | |
| | | June 30, | | | | | | | | | | | Realized | | | appreciation/ | | | discounts/ | | | in to | | | out of | | | June 30, | |
| | | 2015 | | | Purchases | | | Sales | | | gain (loss) | | | (depreciation) | | | premiums | | | Level 3 | | | Level 3 | | | 2016 | |
| Common Stocks | | $ | 382,335 | | | $ | — | | | $ | — | | | $ | — | | | $ | (76,044 | ) | | $ | — | | | $ | — | | | $ | — | | | $ | 306,291 | |
| | | $ | 382,335 | | | $ | — | | | $ | — | | | $ | — | | | $ | (76,044 | ) | | $ | — | | | $ | — | | | $ | — | | | $ | 306,291 | |
| Net change in unrealized appreciation (depreciation) for Level 3 investments still held as of June 30, 2016 | | | | | | | $ | (76,044 | ) |
2016 ANNUAL REPORT
Notes to the Financial Statements (continued)
Note 2 — Summary of Significant Accounting Policies and Other Information (Continued)
Transfers are recognized at the end of the reporting period.
There have been no transfers in and out of Level 1 and Level 2 fair value measurements as of June 30, 2016, except for the Quaker Event Arbitrage Fund listed below:
| Transfers out of Level 1 into Level 2 | $ 369 | | Due to a decrease of market activity. |
| Transfers out of Level 3 into Level 2 | $ 71,865 | | Due to an increase of market activity. |
| Transfers out of Level 3 into Level 1 | $284,702 | | Due to an increase of market activity. |
The following presents information about significant unobservable inputs related to Level 3 investments at June 30, 2016:
EVENT ARBITRAGE FUND
| Asset | | Fair Value at | | Valuation | Unobservable | | Input | | Increase in Inputs |
| Categories | | June 30, 2016 | | Techniques | Input | | Values | | Impact on Valuation* |
| Common Stocks | | | | | | | | | |
| Auto Parts & | | $ | 15,000 | | Market approach | Last traded price of | | $ | 1.50 | | Increase |
| Equipment | | | | | | pre-conversion bonds | | | | | |
| Computers | | | 0 | | Profitability expected | Uncertainty of any | | $ | 0.00 | | Increase |
| | | | | | return method | additional future payout | | | | | |
| Escrow Shares | | | 0 | | Profitability expected | Uncertainty of any | | $ | 0.00 | | Increase |
| | | | | | return method | additional future payout | | | | | |
| Healthcare-Products | | | 18,572 | | Market approach | Liquidity discount | | | -21.00 | % | Decrease |
| Healthcare-Services | | | 1,120,608 | | Market approach | Percentage change in index | | | 0.74 | % | Increase |
| Holding Companies- | | | 0 | | Profitability expected | Uncertainty of any | | $ | 0.00 | | Increase |
| Diversified | | | | | return method | additional future payout | | | | | |
| Lodging | | | 0 | | Profitability expected | Uncertainty of any | | $ | 0.00 | | Increase |
| | | | | | return method | additional future payout | | | | | |
| Mining | | | 0 | | Profitability expected | Uncertainty of any | | $ | 0.00 | | Increase |
| | | | | | return method | additional future payout | | | | | |
| Real Estate | | | 21,150 | | Vendor pricing | Single broker quote | | $ | 0.23 | | Increase |
| Software | | | 0 | | Profitability expected | Uncertainty of any | | $ | 0.00 | | Increase |
| | | | | | return method | additional future payout | | | | | |
| Convertible Bonds | | | | | | | | | | | |
| Mining | | | 0 | | Profitability expected | Uncertainty of any | | $ | 0.00 | | Increase |
| | | | | | return method | additional future payout | | | | | |
| Corporate Bonds | | | | | | | | | | | |
| Auto Parts & | | | 0 | | Profitability expected | Uncertainty of any | | $ | 0.00 | | Increase |
| Equipment | | | | | return method | additional future payout | | | | | |
| Diversified Financial | | | 50,000 | | Vendor pricing | Single broker quote | | $ | 1.00 | | Increase |
| Services | | | | | | | | | | | |
| Diversified Financial | | | 340,000 | | Vendor pricing | Single broker quote | | $ | 34.00 | | Increase |
| Services | | | | | | | | | | | |
| Insurance | | | 191,627 | | Market approach | Haircut based on pro-forma | | | -22.87 | % | Decrease |
| | | | | | | calculation of expected | | | | | |
| | | | | | | final distribution amount | | | | | |
| Venture Capital | | | 0 | | Profitability expected | Uncertainty of any | | $ | 0.00 | | Increase |
| | | | | | return method | additional future payout | | | | | |
| Escrow Notes | | | 0 | | Profitability expected | Uncertainty of any | | $ | 0.00 | | Increase |
| | | | | | return method | additional future payout | | | | | |
| Preferred stocks | | | | | | | | | | | |
| Aerospace & | | | 2,826 | | Market approach | Prior transaction cost | | $ | 0.00 | | Increase |
| Defense | | | | | | | | | | | |
| Healthcare-Services | | | 613,000 | | Market approach | Prior transaction cost | | $ | 1,000.00 | | Increase |
| Insurance | | | 80,000 | | Vendor pricing | Single broker quote | | $ | 8,000.00 | | Increase |
2016 ANNUAL REPORT
Notes to the Financial Statements (continued)
Note 2 — Summary of Significant Accounting Policies and Other Information (Continued)
GLOBAL TACTICAL ALLOCATION FUND
| Asset | | Fair Value at | | Valuation | Unobservable | | Input | | Increase in Inputs |
| Categories | | June 30, 2016 | | Techniques | Input | | Values | | Impact on Valuation* |
| Common Stocks | | | | | | | | | |
| Airlines | | $ | 11,020 | | Market approach | Projected final distribution, | | | -10.00 | % | Decrease |
| | | | | | | discounted for lack of marketability | | | | | |
| STRATEGIC GROWTH FUND | | | | | | | | |
| Common Stocks | | | | | | | | | | | |
| Airlines | | | 306,291 | | Market approach | Projected final distribution, | | | -10.00 | % | Decrease |
| | | | | | | discounted for lack of marketability | | | | | |
* An impact to Valuation from a decrease in input would produce the opposite effect of an increase.
B. Federal Income Taxes. It is the Funds’ policy to comply with the requirements of Subchapter M of the Internal Revenue Code and to distribute substantially all of their taxable income to shareholders. Therefore, no federal income tax provision is required.
In accordance with Financial Accounting Standards Board (“FASB”) Interpretation ASC 740, (“ASC 740”), each Fund recognizes a tax benefit from an uncertain position only if it is more likely than not that the position is sustainable, based solely on its technical merits and consideration of the relevant taxing authority’s widely understood administrative practices and precedents. If this threshold is met, a Fund measures the tax benefit as the largest amount of benefit that is greater than fifty percent likely of being realized upon ultimate settlement. Management has reviewed the tax positions for each of the three open tax years as of June 30, 2016 and has determined that the implementation of ASC 740 does not have a material impact on the Funds’ financial statements. Each Fund’s federal tax returns for the prior three fiscal years remains subject to examination by the Internal Revenue Service.
Net investment income or loss and net realized gains or losses may differ for financial statement and income tax purposes primarily due to investments that have a different basis for financial statement and income tax purposes. The character of distributions made during the year from net investment income or net realized gains may differ from their ultimate characterization for federal income tax purposes. Also, due to the timing of dividend distributions, the fiscal year in which amounts are distributed may differ from the year that the income or realized gains were recorded by each Fund. Permanent differences in the recognition of earnings are reclassified to additional paid-in capital. Distributions in excess of tax-basis earnings are recorded as a return of capital.
C. Security Transactions and Investment Income. Security transactions are recorded on the trade date. Realized gains and losses are determined using the specific identification cost method. Interest income on debt securities is recorded daily on the accrual basis. Discounts and premiums on debt securities are amortized over their respective lives. Dividend income is recorded on the ex-dividend date, or as soon as information is available to the Fund.
D. Short Sales of Investments. Certain Funds may make short sales of investments, which are transactions in which a Fund sells a security it does not own in anticipation of a decline in the fair value of that security. To complete such a transaction, the Fund must borrow the security to make delivery to the buyer. The Fund is then obligated to replace the security borrowed by purchasing it at the market price at the time of replacement. The broker retains the proceeds of short sales to the extent necessary to meet margin requirements until the short position is closed out.
2016 ANNUAL REPORT
Notes to the Financial Statements (continued)
Note 2 — Summary of Significant Accounting Policies and Other Information (Continued)
If a security pays a dividend while the Fund holds it short, the Fund will need to pay the dividend to the original owner of the security. Since the Fund borrowed the shares and sold them to a third party, the third party will receive the dividend from the security and the Fund will pay the original owner the dividend directly. The Fund is not entitled to the dividend because it does not own the shares. A gain, limited to the price at which the Fund sold the security short, or a loss, unlimited in size, will be recognized upon the termination of a short sale.
E. Written Options Contracts. Certain Funds may write options to manage exposure to certain changes in the market. When a Fund writes an option, an amount equal to the premium received by the Fund is recorded as a liability, which is marked-to-market daily to reflect the current market value of the option written. If the option expires, the Fund realizes a gain from investments equal to the amount of the premium received. When a written call option is exercised, the difference between the premium and the amount for effecting a closing purchase transaction, including brokerage commission, is also treated as a realized gain or loss. When a written put option is exercised, the amount of the premium received reduces the cost of the security purchased by the Fund.
A risk in writing a covered call option is that the Fund may forego the opportunity of profit if the market price of the underlying security increases and the option is exercised. The risk in writing a put option is that the Fund may incur a loss if the market price of the underlying security decreases and the option is exercised.
In addition, there is the risk that the Fund may not be able to enter into a closing transaction because of an illiquid secondary market.
F. Purchased Options. Certain Funds may purchase call options in anticipation of an increase in the market value of securities of the type in which they may invest. The purchase of a call option will entitle a Fund, in return for the premium paid, to purchase specified securities at a specified price during the option period. A Fund will ordinarily realize a gain if, during the option period, the value of such securities exceeded the sum of the exercise price, the premium paid and transaction costs; otherwise, the Fund will realize either no gain or a loss on the purchase of the call option. A Fund will normally purchase put options in anticipation of a decline in the market value of securities in its portfolio (“protective puts”) or in securities in which it may invest. The purchase of a put option will entitle the Fund, in exchange for the premium paid, to sell specified securities at a specified price during the option period. The purchase of protective puts is designed to offset or hedge against a decline in the market value of the Fund’s securities. Put options may also be purchased by a Fund for the purpose of affirmatively benefiting from a decline in the price of securities which it does not own. The Fund will ordinarily realize a gain if, during the option period, the value of the underlying securities decreased below the exercise price sufficiently to more than cover the premium and transaction costs; otherwise the Fund will realize either no gain or a loss on the purchase of the put option. Gains and losses on the purchase of protective put options would tend to be offset by countervailing changes in the value of the underlying portfolio securities.
G. Futures Contracts. Certain Funds may enter into financial futures contracts, to the extent permitted by their investment policies and objectives, for bona fide hedging and other permissible risk management purposes including protecting against anticipated changes in the value of securities a Fund intends to purchase. Upon entering into a financial futures contract, a Fund is required to deposit cash or securities as initial margin.
Additional securities are also segregated as collateral up to the current market value of the financial futures contracts. Subsequent payments, known as variation margin, are made or received by the Fund, depending on the fluctuation in the value of the underlying financial instruments. The Fund recognizes an unrealized gain or loss equal to the variation margin. When the financial futures contracts are closed, a realized gain or loss is recognized equal to the difference between the proceeds from (or cost of) the closing transactions and the Fund’s basis in the contracts. The risks associated with entering into financial futures contracts include the possibility that a
2016 ANNUAL REPORT
Notes to the Financial Statements (continued)
Note 2 — Summary of Significant Accounting Policies and Other Information (Continued)
change in the value of the contract may not correlate with the changes in the value of the underlying instruments. In addition, investing in financial futures contracts involves the risk that the Fund could lose more than the original margin deposit and subsequent payments required for a futures transaction. Risks may also arise upon entering into these contracts from the potential inability of the counterparties to meet the terms of their contracts.
H. Foreign Currency Transactions. Securities and other assets and liabilities denominated in foreign currencies are converted each business day into U.S. dollars based on the prevailing rates of exchange. Purchases and sales of portfolio securities and income and expenses are converted into U.S. dollars on the respective dates of such transactions.
Gains and losses resulting from changes in exchange rates applicable to foreign securities are not reported separately from gains and losses arising from movements in securities prices.
Net realized foreign exchange gains and losses include gains and losses from sales and maturities of foreign currency exchange contracts, gains and losses realized between the trade and settlement dates of foreign securities transactions, and the difference between the amount of dividends, interest and foreign withholding taxes on the Funds’ books and the U.S. dollar equivalent of the amounts actually received. Net unrealized foreign exchange gains and losses include gains and losses from changes in the fair value of assets and liabilities denominated in foreign currencies other than portfolio securities, resulting from changes in exchange rates.
I. Forward Foreign Currency Contracts. Certain Funds may enter into forward foreign currency contracts to hedge against foreign currency exchange rate risk on their non-U.S. dollar denominated securities or to facilitate settlement of foreign currency denominated portfolio transactions. A forward foreign currency contract is an agreement between two parties to buy and sell a currency at a set price on a future date. The contract is marked-to-market daily and the change in value is recorded by a Fund as an unrealized gain or loss. When a forward foreign currency contract is extinguished, through either delivery or offset by entering into another forward foreign currency contract, the Fund records a realized gain or loss equal to the difference between the value of the contract at the time it was opened and the value of the contract at the time it was extinguished.
Forward foreign currency contracts involve elements of market risk in excess of the amounts reflected in the Statements of Assets and Liabilities. The Fund bears the risk of an unfavorable change in the foreign exchange rate underlying the forward foreign currency contract. Risks may also arise upon entering into these contracts from the potential inability of the counterparties to meet the terms of their contracts.
J. Portfolio Investment Risks. Investments in securities of foreign issuers carry certain risks not ordinarily associated with investments in securities of U.S. issuers. These risks include future disruptive political and economic developments and the possible imposition of exchange controls or other unfavorable foreign government laws and restrictions. In addition, investments in certain countries may carry risks of expropriation of assets, confiscatory taxation, political or social instability, or diplomatic developments that adversely affect investments in those countries. Certain countries may also impose substantial restrictions on investments in their capital markets by foreign entities, including restrictions on investments in issuers in industries deemed sensitive to relevant national interests. These factors may limit the investment opportunities available and result in a lack of liquidity and high price volatility with respect to securities of issuers from developing countries.
K. Multiple Class Allocations. Each class of shares has equal rights as to earnings and assets except that each class bears different distribution and shareholder servicing expenses. Each class of shares has exclusive voting rights with respect to matters that affect just that class. Income, expenses (other than expenses attributable to a specific class) and realized and unrealized gains or losses on investments are allocated to each class of shares based on its relative net assets.
2016 ANNUAL REPORT
Notes to the Financial Statements (continued)
Note 2 — Summary of Significant Accounting Policies and Other Information (Continued)
L. Expense Allocations. Expenses are allocated to each series based upon its relative proportion of net assets to the Trust’s total net assets.
M. Distributions to Shareholders. Each Fund generally declares dividends at least annually, payable in December, on a date selected by the Board. In addition, distributions may be made annually in December out of net realized gains through October 31 of that calendar year. Distributions to shareholders are recorded on the ex-dividend date. Each Fund may make a supplemental distribution subsequent to the end of its fiscal year ending June 30.
N. Use of Estimates. The preparation of financial statements in conformity with GAAP requires management to make estimates and assumptions that affect the reported amounts of assets and liabilities and the disclosure of contingent assets and liabilities at the date of the financial statements, and the reported amounts of revenue and expenses during the reporting period. Actual results could differ from those estimates, and those differences could be significant.
O. Security Loans. The Funds receive compensation in the form of fees, or retain a portion of interest on the investment of any cash received as collateral. The Funds also continue to receive interest or dividends on the securities loaned. The loans are secured by collateral at least equal to 102% of the prior days market value of the loaned securities. Gain or loss in the fair value of the securities loaned that may occur during the term of the loan will be for the account of the Funds. The Funds have the right under the lending agreement to recover the securities from the borrower on demand.
P. Derivative Instruments. The Funds have adopted amendments to authoritative guidance on disclosures about derivative instruments and hedging activities which require that the Funds disclose: a) how and why an entity uses derivative instruments; and b) how derivative instruments and related hedged items affect an entity’s financial position, financial performance and cash flows.
The Funds may trade financial instruments where they are considered to be a seller of credit derivatives in accordance with authoritative guidance under GAAP on derivatives and hedging.
The fair value of derivative instruments whose primary underlying risk exposure is equity price risk at June 30, 2016 were as follows:
EVENT ARBITRAGE
| | | Fair Value | |
| Derivative | Asset Derivatives(1) | | Liability Derivatives(2) |
| Written Options | | $ | — | | | | $ | 211,547 | |
| Purchased Options | | | 179,021 | | | | | — | |
| (1) | Statement of Assets and Liabilities location: Investments, at value. |
| (2) | Statement of Assets and Liabilities location: Written options, at value. |
The effect of derivative instruments on the Statement of Operations whose underlying risk exposure is equity price risk for the period ended June 30, 2016 were as follows:
EVENT ARBITRAGE
| | | Change in Unrealized Appreciation |
| | Realized Gain (Loss) on Derivatives | (Depreciation) on Derivatives |
| Derivative | Recognized in Income(1) | Recognized in Income(2) |
| Written Options | $ 316,179 | $ 92,613 |
| Purchased Options | (1,042,784) | 219,856 |
| (1) | Statement of Operations location: Net realized gain (loss) from written options and net realized gain (loss) from securities. |
| (2) | Statement of Operations location: Net unrealized appreciation (depreciation) on written options and net unrealized appreciation (depreciation) on securities. |
2016 ANNUAL REPORT
Notes to the Financial Statements (continued)
Note 2 — Summary of Significant Accounting Policies and Other Information (Continued)
For the period ending June 30, 2016, the Event Arbitrage Fund had: long option contracts (12,687 contracts) were purchased and $2,928,029 in premiums were paid, written option contracts (32,844 contracts) were opened and $3,981,320 in premiums were received.
Note 3 — Investment Advisory Fee and Other Related Party Transactions
QFI serves as investment adviser to each Fund. Pursuant to separate investment sub-advisory agreements, QFI has selected the following investment advisory firms to serve as sub-advisers:
| Fund | Sub-adviser |
| Event Arbitrage | N/A |
| Global Tactical Allocation | DG Capital Management, Inc. |
| Mid-Cap Value | Kennedy Capital Management, Inc. |
| Small-Cap Value | Aronson Johnson Ortiz, LP |
| Strategic Growth | DG Capital Management, Inc. |
QFI or the sub-advisers provide each Fund with a continuous program of supervision of the Fund’s assets, including the composition of its portfolio, and furnish advice and recommendations with respect to investments, investment policies and the purchase and sale of securities.
Each Fund paid QFI aggregate fees shown in the table below for the fiscal year ending June 30, 2016. Amounts are expressed as an annualized percentage of average net assets.
| | | | Advisory & |
| | Aggregate | Subadvisory | subadvisory |
| | advisory fee | fee paid by QFI | (reimbursed)/ |
| | paid to QFI | to the sub-adviser | recovered |
| Event Arbitrage | 1.30% | N/A | (0.42)% |
| Global Tactical Allocation | 1.25% | 0.75% | N/A |
| Mid-Cap Value | 1.05% | 0.75% | N/A |
| Small-Cap Value | 1.00% | 0.65% | N/A |
| Strategic Growth | 1.30% | 0.75% | (0.06)% |
For the fiscal year ending June 30, 2016, QFI and the sub-advisers earned and reimbursed fees as follows:
| | | | Advisory & |
| | Aggregate | Subadvisory | subadvisory |
| | advisory fee | fee paid by QFI | (reimbursed)/ |
| | paid to QFI | to the sub-adviser | recovered |
| Event Arbitrage | $929,280 | N/A | $(298,982) |
| Global Tactical Allocation | 43,493 | 65,240 | N/A |
| Mid-Cap Value | 22,309 | 55,773 | N/A |
| Small-Cap Value | 119,287 | 221,533 | N/A |
| Strategic Growth | 650,423 | 886,940 | (70,047) |
QFI contractually agreed to waive its management fee to the extent that the total operating expenses of Event Arbitrage (exclusive of interest, taxes, brokerage commissions and other costs incurred in connection with the purchase or sale of portfolio securities, and extraordinary items) exceed the annual rate of 1.99% for Class A shares, 2.74% for Class C shares, and 1.74% for Institutional Class shares of the average net assets of each class, respectively. QFI currently has no intention to terminate this arrangement; however, it may do so at any time in its sole discretion.
2016 ANNUAL REPORT
Notes to the Financial Statements (continued)
Note 3 — Investment Advisory Fee and Other Related Party Transactions (Continued)
If, at any time, the annualized expenses of Event Arbitrage were less than the annualized expense ratio, the Trust, on behalf of Event Arbitrage, would reimburse QFI for any fees previously waived and/or expenses previously assumed; provided, however, that repayment would be payable only to the extent that it (a) can be made during the three (3) years following the time at which the adviser waived fees or assumed expenses for Event Arbitrage, and (b) can be repaid without causing the expenses of Event Arbitrage to exceed the annualized expense ratio. This fee waiver agreement shall continue in effect from October 28, 2015 until October 28, 2016. This agreement shall automatically terminate upon termination of the advisory agreement between QFI and the Trust or, with respect to Event Arbitrage, in the event of its merger or liquidation.
Additionally, QFI contractually agreed to waive its management fee to the extent that the total operating expenses of Strategic Growth (exclusive of interest, taxes, brokerage commissions and other costs incurred in connection with the purchase or sale of portfolio securities, and extraordinary items) exceed the annual rate of 2.24% for Class A shares, 2.99% for Class C shares, and 1.99% for Institutional Class shares of the average net assets of each class, respectively. QFI has agreed to pass these waivers onto the shareholders. QFI currently has no intention to terminate this arrangement; however, it may do so at any time in its sole discretion.
If, at any time, the annualized expenses of Strategic Growth were less than the annualized expense ratio, the Trust, on behalf of Strategic Growth, would reimburse the sub-adviser for any fees previously waived and/or expenses previously assumed, provided, however, that the repayment shall be payable only to the extent that it: (a) can be made during the three (3) years following the time at which the sub-adviser waived fees or assumed expenses for Strategic Growth, and (b) can be repaid without causing the expenses of Strategic Growth to exceed the annualized expense ratio. This fee waiver agreement shall continue in effect from October 28, 2015 until October 28, 2016. This agreement shall automatically terminate upon termination of the advisory agreement, sub-advisory agreement or, with respect to Strategic Growth, in the event of its merger or liquidation.
At June 30, 2016, the cumulative unreimbursed amount paid and/or waived by the Adviser on behalf of Event Arbitrage and Strategic Growth that may be recovered are $648,997 and $70,047, respectively. The Adviser may recapture portions of the above amounts no later than the dates stated below.
| | June 30, | June 30, | June 30, |
| | 2017 | 2018 | 2019 |
| Event Arbitrage | $143,771 | $206,244 | $298,982 |
| Strategic Growth | — | — | 70,047 |
Foreside Fund Services, LLC (“Distributor”) serves as principal underwriter for the Trust. The Trust has adopted distribution and shareholder servicing plans pursuant to Rule 12b-1 of the 1940 Act for Class A and Class C shares described below. There is no Rule 12b-1 distribution plan for Institutional Class shares of the Funds. The Class A Plan provides that each Fund may pay a servicing or Rule 12b-1 fee at an annual rate of 0.25% of the Class A average net assets on a monthly basis to persons or institutions for performing certain servicing functions for the Class A shareholders. The Class A Plan also allows the Fund to pay or reimburse expenditures in connection with sales and promotional services related to distribution of the Fund’s shares, including personal services provided to prospective and existing shareholders. The Class C Plan provides that each Fund may compensate QFI and others for services provided and expenses incurred in the distribution of shares at an annual rate of 1.00% of the average net assets of each class on a monthly basis.
2016 ANNUAL REPORT
Notes to the Financial Statements (continued)
Note 3 — Investment Advisory Fee and Other Related Party Transactions (Continued)
For the fiscal year ending June 30, 2016, the Distributor received underwriter concessions from the sale of Funds shares as follows:
| Fund | | Amount | |
| Event Arbitrage | | $ | 1,300 | |
| Global Tactical Allocation | | | 1,795 | |
| Mid-Cap Value | | | 62 | |
| Small-Cap Value | | | 93 | |
| Strategic Growth | | | 2,188 | |
Except for the Trust’s Chief Compliance Officer (“CCO”), employees and Officers of QFI do not receive any compensation from the Trust. The CCO of the Trust also serves as general counsel to QFI. For fiscal year ending June 30, 2016, the Funds compensated the CCO as follows:
| Fund | | Amount | |
| Event Arbitrage | | $ | 51,118 | |
| Global Tactical Allocation | | | 6,988 | |
| Mid-Cap Value | | | 5,899 | |
| Small-Cap Value | | | 27,260 | |
| Strategic Growth | | | 89,863 | |
Note 4 — Purchases and Sales of Investments
For the fiscal year ending June 30, 2016 aggregate purchases and sales of investment securities (excluding short-term investments) for each Fund were as follows:
| | | Purchases | | | Sales | |
| Event Arbitrage | | $ | 90,464,668 | | | $ | 139,634,272 | |
| Global Tactical Allocation | | | 17,421,036 | | | | 18,376,178 | |
| Mid-Cap Value | | | 5,189,585 | | | | 6,758,770 | |
| Small-Cap Value | | | 40,389,498 | | | | 42,309,325 | |
| Strategic Growth | | | 229,865,288 | | | | 291,641,046 | |
Note 5 — Options Written
A summary of option contracts written by the Trust during the fiscal year ended June 30, 2016 are as follows:
| | | Event Arbitrage | |
| | | Number of | | | Option | |
| | | Contracts | | | Premiums | |
| Options outstanding at beginning of year | | | 7,732 | | | $ | 1,306,276 | |
| Options written | | | 32,844 | | | | 3,981,320 | |
| Options closed | | | (15,201 | ) | | | (2,217,984 | ) |
| Options exercised | | | (7,722 | ) | | | (1,387,473 | ) |
| Options expired | | | (16,143 | ) | | | (1,339,798 | ) |
| Options outstanding at end of year | | | 1,510 | | | $ | 342,341 | |
Note 6 — Tax Matters
For U.S. federal income tax purposes, the cost of securities owned, gross appreciation, gross depreciation, and net unrealized appreciation (depreciation) of investments at June 30, 2016 for each Fund were as follows:
2016 ANNUAL REPORT
Notes to the Financial Statements (continued)
Note 6 — Tax Matters (Continued)
| | | | | | Gross | | | Gross | | | Net Appreciation | |
| Fund | | Cost | | | Appreciation | | | Depreciation | | | (Depreciation) | |
| Event Arbitrage | | $ | 42,556,338 | | | $ | 2,078,115 | | | $ | (8,788,722 | ) | | $ | (6,710,607 | ) |
| Global Tactical Allocation | | | 6,534,244 | | | | 373,787 | | | | (378,201 | ) | | | (4,414 | ) |
| Mid-Cap Value | | | 8,115,488 | | | | 903,570 | | | | (373,246 | ) | | | 530,324 | |
| Small-Cap Value | | | 40,008,937 | | | | 3,143,266 | | | | (2,301,441 | ) | | | 841,825 | |
| Strategic Growth | | | 100,600,386 | | | | 5,086,370 | | | | (3,302,479 | ) | | | 1,783,891 | |
As of June 30, 2016, the components of distributable earnings on a tax basis were as follows:
| | | | | | | | | | | | | | | | | | | | | | | | Total | |
| | | | | | Undis- | | | Undis- | | | Other | | | Capital | | | | | | Post- | | | Distribu- | |
| | | Unrealized | | | tributed | | | tributed | | | Accum- | | | Loss | | | Late | | | October | | | table | |
| | | Appreciation | | | Ordinary | | | Capital | | | ulated | | | Carry- | | | Year | | | Capital | | | Earnings/ | |
| Fund | | (Depreciation) | | | Income | | | Gain | | | Gain | | | forward | | | Loss | | | Loss | | | (Loss) | |
| Event Arbitrage | | $ | (6,710,607 | ) | | $ | — | | | $ | — | | | $ | 130,405 | | | $ | (240,752 | ) | | $ | (2,437 | ) | | $ | (7,515,481 | ) | | $ | (14,338,872 | ) |
| Global Tactical Allocation | | | (4,414 | ) | | | — | | | | — | | | | — | | | | (10,128,327 | ) | | | (57,345 | ) | | | (550,370 | ) | | | (10,740,456 | ) |
| Mid-Cap Value | | | 530,324 | | | | — | | | | — | | | | — | | | | (4,759,171 | ) | | | (15,879 | ) | | | (139,300 | ) | | | (4,384,026 | ) |
| Small-Cap Value | | | 841,825 | | | | — | | | | — | | | | 2 | | | | — | | | | (51,144 | ) | | | (899,751 | ) | | | (109,068 | ) |
| Strategic Growth | | | 1,783,891 | | | | — | | | | — | | | | — | | | | (357,918,875 | ) | | | (513,707 | ) | | | (3,010,196 | ) | | | (359,658,887 | ) |
The difference between book basis and tax basis unrealized appreciation (depreciation) is attributable primarily to the tax deferral of losses on wash sales and straddles from options, and the differing book/tax treatment of unrealized appreciation/depreciation on partnership adjustments.
The undistributed ordinary income, capital gains and carryforward losses shown above differ from the corresponding accumulated net investment income and accumulated net realized gain (loss) figures reported in the statements of assets and liabilities due to differing book/tax treatment of short-term capital gains, and certain temporary book/tax differences such as the deferral of realized losses on wash sales, PFIC mark to market, partnership adjustments, straddles from options and net losses realized after October 31 and from ordinary losses incurred after December 31.
Under current tax law, foreign currency and net capital losses realized after October 31 may be deferred and treated as occurring on the first day of the following fiscal year. The Funds elected to defer net capital and currency losses as indicated in the chart below.
At June 30, 2016, the capital loss carryovers, late year losses, post-October capital loss and the capital loss utilized for the Funds were as follows:
| | | | | | | | | | | | | | | | | | | |
| | | Capital Loss Carryovers Expiring | | | Late Year | | | Post-October | | | Capital Loss | |
| Fund | | Indefinite | | | 2018 | | | 2017 | | | Loss | | | Capital Loss | | | Utilized | |
| Event Arbitrage | | $ | 240,752 | | | $ | — | | | $ | — | | | $ | 2,437 | | | $ | 7,515,481 | | | $ | — | |
| Global Tactical Allocation | | | — | | | | 2,718,683 | | | | 7,409,644 | | | | 57,345 | | | | 550,370 | | | | 149,387 | |
| Mid-Cap Value | | | — | | | | 1,170,572 | | | | 3,588,599 | | | | 15,879 | | | | 139,300 | | | | 70,991 | |
| Small-Cap Value | | | — | | | | — | | | | — | | | | 51,144 | | | | 899,751 | | | | — | |
| Strategic Growth | | | — | | | | 164,714,297 | | | | 193,204,578 | | | | 513,707 | | | | 3,010,196 | | | | 3,019,714 | |
Note 7 — Reclassification of Capital Accounts
In accordance with the accounting pronouncements, each Fund has recorded reclassifications in the capital accounts. These reclassifications have no impact on the net asset value of the Funds and are designed generally to present undistributed income and realized gains on a tax basis which is considered to be more informative
2016 ANNUAL REPORT
Notes to the Financial Statements (continued)
Note 7 — Reclassification of Capital Accounts (Continued)
to shareholders. As of June 30, 2016, the Funds recorded the following reclassification to increase (decrease) the accounts listed below:
| | | Accumulated | | | Accumulated | | | | |
| | | Net Investment | | | Net Realized | | | Paid-In | |
| Fund | | Income (Loss) | | | Gain (Loss) | | | Capital | |
| Event Arbitrage | | $ | 42,385 | | | $ | 166 | | | $ | (42,551 | ) |
| Global Tactical Allocation | | | 107,748 | | | | (8 | ) | | | (107,740 | ) |
| Mid-Cap Value | | | 30,739 | | | | — | | | | (30,739 | ) |
| Small-Cap Value | | | 21,854 | | | | (5,496 | ) | | | (16,358 | ) |
| Strategic Growth | | | 1,868,843 | | | | (510 | ) | | | (1,868,333 | ) |
Note 8 — Distributions to Shareholders
Income and long-term capital gain distributions are determined in accordance with federal income tax regulations, which may differ from GAAP. The information set forth below is for each Fund as required by federal securities laws.
The tax character of dividends and distributions paid during the fiscal years of 2016 and 2015 were as follows:
| | | Ordinary Income | | | Long-Term Capital Gain | |
| Fund | | 2016 | | | 2015 | | | 2016 | | | 2015 | |
| Event Arbitrage | | $ | 5,355,904 | | | $ | 4,575,077 | | | $ | — | | | $ | 2,745,313 | |
| Global Tactical Allocation | | | — | | | | — | | | | — | | | | — | |
| Mid-Cap Value | | | — | | | | — | | | | — | | | | — | |
| Small-Cap Value | | | — | | | | 485,728 | | | | 2,564,967 | | | | 1,439,322 | |
| Strategic Growth | | | — | | | | — | | | | — | | | | — | |
Note 9 — Fund Share Transactions
At June 30, 2016, there were an unlimited number of shares of beneficial interest with a $0.01 par value authorized. The following table summarizes the activity in shares of each Fund:
| | | Event Arbitrage | |
| | | Year Ended 6/30/16 | | | Year Ended 6/30/15 | |
| | | Shares | | | Value | | | Shares | | | Value | |
| Shares sold: | | | | | | | | | | | | |
| Class A | | | 164,719 | | | $ | 2,016,773 | | | | 905,363 | | | $ | 12,254,338 | |
| Class C | | | 65,857 | | | | 752,078 | | | | 115,337 | | | | 1,524,645 | |
| Institutional Class | | | 1,417,648 | | | | 17,829,495 | | | | 4,039,138 | | | | 55,213,233 | |
| Shares issued to shareholders due | | | | | | | | | | | | | | | | |
| to reinvestment of distributions: | | | | | | | | | | | | | | | | |
| Class A | | | 131,922 | | | | 1,436,632 | | | | 153,700 | | | | 1,999,629 | |
| Class C | | | 40,419 | | | | 424,799 | | | | 26,248 | | | | 333,092 | |
| Institutional Class | | | 188,327 | | | | 2,064,058 | | | | 259,644 | | | | 3,390,950 | |
| | | | 2,008,892 | | | $ | 24,523,835 | | | | 5,499,430 | | | $ | 74,715,887 | |
| Shares Redeemed: | | | | | | | | | | | | | | | | |
| Class A | | | (1,446,579 | ) | | | (16,822,707 | ) | | | (2,451,002 | ) | | | (33,109,361 | ) |
| Class C | | | (206,687 | ) | | | (2,299,048 | ) | | | (112,778 | ) | | | (1,488,382 | ) |
| Institutional Class | | | (5,943,485 | ) | | | (68,456,381 | ) | | | (2,897,825 | ) | | | (39,026,774 | ) |
| | | | (7,596,751 | ) | | $ | (87,578,136 | ) | | | (5,461,605 | ) | | $ | (73,624,517 | ) |
| Net increase (decrease) | | | (5,587,859 | ) | | $ | (63,054,301 | ) | | | 37,825 | | | $ | 1,091,370 | |
2016 ANNUAL REPORT
Notes to the Financial Statements (continued)
Note 9 — Fund Share Transactions (Continued)
| | | Global Tactical Allocation | |
| | | Year Ended 6/30/16 | | | Year Ended 6/30/15 | |
| | | Shares | | | Value | | | Shares | | | Value | |
| Shares sold: | | | | | | | | | | | | |
| Class A | | | 89,237 | | | $ | 959,273 | | | | 171,068 | | | $ | 1,873,645 | |
| Class C | | | 72,024 | | | | 754,719 | | | | 5,188 | | | | 54,684 | |
| Institutional Class | | | 243,325 | | | | 3,016,440 | | | | 23,969 | | | | 292,810 | |
| Shares issued to shareholders due | | | | | | | | | | | | | | | | |
| to reinvestment of distributions: | | | | | | | | | | | | | | | | |
| Class A | | | — | | | | — | | | | — | | | | — | |
| Class C | | | — | | | | — | | | | — | | | | — | |
| Institutional Class | | | — | | | | — | | | | — | | | | — | |
| | | | 404,586 | | | $ | 4,730,432 | | | | 200,225 | | | $ | 2,221,139 | |
| Shares Redeemed: | | | | | | | | | | | | | | | | |
| Class A | | | (265,117 | ) | | | (2,753,883 | ) | | | (56,889 | ) | | | (613,616 | ) |
| Class C | | | (81,694 | ) | | | (787,122 | ) | | | (45,102 | ) | | | (461,761 | ) |
| Institutional Class | | | (175,288 | ) | | | (2,054,323 | ) | | | (16,035 | ) | | | (200,394 | ) |
| | | | (522,099 | ) | | $ | (5,595,328 | ) | | | (118,026 | ) | | $ | (1,275,771 | ) |
| Net increase (decrease) | | | (117,513 | ) | | $ | (864,896 | ) | | | 82,199 | | | $ | 945,368 | |
| | | | | | | | | | | | | | | | | |
| | | Mid-Cap Value | |
| | | Year Ended 6/30/16 | | | Year Ended 6/30/15 | |
| | | Shares | | | Value | | | Shares | | | Value | |
| Shares sold: | | | | | | | | | | | | | | | | |
| Class A | | | 1,881 | | | $ | 43,012 | | | | 20,905 | | | $ | 518,227 | |
| Class C | | | 694 | | | | 13,877 | | | | 8,693 | | | | 188,645 | |
| Institutional Class | | | 5,020 | | | | 114,887 | | | | 13,687 | | | | 358,766 | |
| Shares issued to shareholders due | | | | | | | | | | | | | | | | |
| to reinvestment of distributions: | | | | | | | | | | | | | | | | |
| Class A | | | — | | | | — | | | | — | | | | — | |
| Class C | | | — | | | | — | | | | — | | | | — | |
| Institutional Class | | | — | | | | — | | | | — | | | | — | |
| | | | 7,595 | | | $ | 171,776 | | | | 43,285 | | | $ | 1,065,638 | |
| Shares Redeemed: | | | | | | | | | | | | | | | | |
| �� Class A | | | (52,638 | ) | | | (1,183,778 | ) | | | (30,631 | ) | | | (760,869 | ) |
| Class C | | | (13,894 | ) | | | (273,981 | ) | | | (15,163 | ) | | | (331,838 | ) |
| Institutional Class | | | (11,130 | ) | | | (267,895 | ) | | | (41,840 | ) | | | (1,069,844 | ) |
| | | | (77,662 | ) | | $ | (1,725,654 | ) | | | (87,634 | ) | | $ | (2,162,551 | ) |
| Net increase (decrease) | | | (70,067 | ) | | $ | (1,553,878 | ) | | | (44,349 | ) | | $ | (1,096,913 | ) |
2016 ANNUAL REPORT
Notes to the Financial Statements (continued)
Note 9 — Fund Share Transactions (Continued)
| | | Small-Cap Value | |
| | | Year Ended 6/30/16 | | | Year Ended 6/30/15 | |
| | | Shares | | | Value | | | Shares | | | Value | |
| Shares sold: | | | | | | | | | | | | |
| Class A | | | 11,691 | | | $ | 250,197 | | | | 24,232 | | | $ | 575,979 | |
| Class C | | | 10,602 | | | | 193,798 | | | | 7,070 | | | | 140,710 | |
| Institutional Class | | | 52,805 | | | | 1,135,000 | | | | 67,527 | | | | 1,675,441 | |
| Shares issued to shareholders due | | | | | | | | | | | | | | | | |
| to reinvestment of distributions: | | | | | | | | | | | | | | | | |
| Class A | | | 24,361 | | | | 506,715 | | | | 16,692 | | | | 389,261 | |
| Class C | | | 7,880 | | | | 132,549 | | | | 4,997 | | | | 96,689 | |
| Institutional Class | | | 67,292 | | | | 1,473,012 | | | | 43,621 | | | | 1,063,930 | |
| | | | 174,631 | | | $ | 3,691,271 | | | | 164,139 | | | $ | 3,942,010 | |
| Shares Redeemed: | | | | | | | | | | | | | | | | |
| Class A | | | (38,582 | ) | | | (804,852 | ) | | | (68,939 | ) | | | (1,613,897 | ) |
| Class C | | | (11,575 | ) | | | (186,481 | ) | | | (16,097 | ) | | | (319,242 | ) |
| Institutional Class | | | (84,509 | ) | | | (1,918,930 | ) | | | (84,281 | ) | | | (2,101,729 | ) |
| | | | (134,666 | ) | | $ | (2,910,263 | ) | | | (169,317 | ) | | $ | (4,034,868 | ) |
| Net increase (decrease) | | | 39,965 | | | $ | 781,008 | | | | (5,178 | ) | | $ | (92,858 | ) |
| | | | | | | | | | | | | | | | | |
| | | Strategic Growth | |
| | | Year Ended 6/30/16 | | | Year Ended 6/30/15 | |
| | | Shares | | | Value | | | Shares | | | Value | |
| Shares sold: | | | | | | | | | | | | | | | | |
| Class A | | | 57,050 | | | $ | 1,408,584 | | | | 105,203 | | | $ | 2,646,589 | |
| Class C | | | 17,680 | | | | 375,441 | | | | 8,587 | | | | 194,244 | |
| Institutional Class | | | 179,430 | | | | 4,801,987 | | | | 522,464 | | | | 13,725,217 | |
| Shares issued to shareholders due | | | | | | | | | | | | | | | | |
| to reinvestment of distributions: | | | | | | | | | | | | | | | | |
| Class A | | | — | | | | — | | | | — | | | | — | |
| Class C | | | — | | | | — | | | | — | | | | — | |
| Institutional Class | | | — | | | | — | | | | — | | | | — | |
| | | | 254,160 | | | $ | 6,586,012 | | | | 636,254 | | | $ | 16,566,050 | |
| Shares Redeemed: | | | | | | | | | | | | | | | | |
| Class A | | | (563,222 | ) | | | (13,957,325 | ) | | | (797,163 | ) | | | (20,101,248 | ) |
| Class C | | | (140,669 | ) | | | (3,022,567 | ) | | | (216,593 | ) | | | (4,826,492 | ) |
| Institutional Class | | | (2,046,038 | ) | | | (54,865,899 | ) | | | (464,759 | ) | | | (12,110,894 | ) |
| | | | (2,749,929 | ) | | $ | (71,845,791 | ) | | | (1,478,515 | ) | | $ | (37,038,634 | ) |
| Net increase (decrease) | | | (2,495,769 | ) | | $ | (65,259,779 | ) | | | (842,261 | ) | | $ | (20,472,584 | ) |
Note 10 — Offsetting Assets and Liabilities
The Funds are subject to various Master Netting Arrangements (“MNA”), which govern the terms of certain transactions with select counterparties. The MNA allow the Funds to close out and net their total exposure to a counterparty in the event of a default with respect to all the transactions governed under a single agreement with a counterparty. The MNA also specify collateral posting arrangements at pre-arranged exposure levels. Under the MNA, collateral is routinely transferred if the total net exposure to certain transactions (net of existing collateral already in place) governed under the revelant MNA with a counterparty in a given account exceeds a specified threshold depending on the counterparty and the type of MNA.
2016 ANNUAL REPORT
Notes to the Financial Statements (continued)
Note 10 — Offsetting Assets and Liabilities (Continued)
The following is a summary of the Assets and Liabilities for each Fund subject to offsets as of June 30, 2016:
| Liabilities: | | | | | | | | | | | | | | | | | | |
| | | | | | Gross | | | Net | | | Gross Amounts Not | | | | |
| | | | | | Amounts | | | Amounts | | | Offset in the Statements | | | | |
| | | | | | Offset | | | Presented | | | of Assets and Liabilities | | | | |
| | | | | | in the | | | in the | | | | | | | | | | |
| | | Gross Amounts | | | Statements | | | Statements | | | | | | Collateral | | | | |
| | | of Recognized | | | of Assets | | | of Assets | | | Financial | | | Pledged | | | Net | |
| Description | | Liabilities | | | and Liabilities | | | and Liabilities | | | Instruments | | | (Received) | | | Amount | |
Event Arbitrage | | | | | | | | | | | | | | | | | | |
| Written Options | | $ | 211,547 | | | $ | — | | | $ | 211,547 | | | $ | — | | | $ | 211,547 | | | $ | — | |
| Securities Lending | | | 4,709,849 | | | | — | | | | 4,709,849 | | | | 4,709,849 | | | | — | | | | — | |
| | | | 4,921,396 | | | | — | | | | 4,921,396 | | | | 4,709,849 | | | | 211,547 | | | | — | |
Global Tactical Allocation | | | | | | | | | | | | | | | | | | | | | | | | |
| Securities Lending | | | — | | | | — | | | | — | | | | — | | | | — | | | | — | |
| | | | | | | | | | | | | | | | | | | | | | | | | |
Mid-Cap Value | | | | | | | | | | | | | | | | | | | | | | | | |
| Securities Lending | | | 1,930,487 | | | | — | | | | 1,930,487 | | | | 1,930,487 | | | | — | | | | — | |
| | | | | | | | | | | | | | | | | | | | | | | | | |
Small-Cap Value | | | | | | | | | | | | | | | | | | | | | | | | |
| Securities Lending | | | 8,824,306 | | | | — | | | | 8,824,306 | | | | 8,824,306 | | | | — | | | | — | |
| | | | | | | | | | | | | | | | | | | | | | | | | |
Strategic Growth | | | | | | | | | | | | | | | | | | | | | | | | |
| Securities Lending | | | 23,725,114 | | | | — | | | | 23,725,114 | | | | 23,725,114 | | | | — | | | | — | |
Note 11 — Indemnifications
Under the Trust’s organizational documents, its officers and Trustees are indemnified against certain liabilities arising out of the performance of their duties to the Funds. In addition, in the normal course of business, the Trust enters into contracts with its vendors and others that provide for general indemnifications.
The Trust’s maximum exposure under these arrangements is dependent on future claims that may be made against the Trust, and, therefore, cannot be estimated; however, based on experience, risk of loss from such claims is considered remote.
Note 12 — Securities Lending
The Funds hold shares of the Mount Vernon Securities Lending Trust Prime Portfolio as cash collateral, which is a registered money market fund whose main objective is to maximize current income to the extent consistent with the preservation of capital and liquidity. It primarily invests in Certificates of Deposits, Asset Backed and Financial Company Commercial Paper, and Repurchase Agreements.
At June 30, 2016, the aggregate market value of loaned securities and the value of the cash collateral the Funds received is as follows:
| | | Loaned Securities | | | Value of | | | % of | |
| | | Market Value | | | Cash Collateral | | | Net Assets | |
| Event Arbitrage | | $ | 4,682,746 | | | $ | 4,709,849 | | | | 13.9 | % |
| Global Tactical Allocation | | | — | | | | — | | | | — | % |
| Mid-Cap Value | | | 1,930,029 | | | | 1,930,487 | | | | 28.0 | % |
| Small-Cap Value | | | 8,760,189 | | | | 8,824,306 | | | | 27.1 | % |
| Strategic Growth | | | 23,423,295 | | | | 23,725,114 | | | | 27.6 | % |
Investments purchased with proceeds from securities lending collateral is included in the Schedules of Investments and the Statements of Assets and Liabilities.
2016 ANNUAL REPORT
Notes to the Financial Statements (continued)
Note 13 — New Accounting Pronouncement
In May 2015, the FASB issued Accounting Standards Update (“ASU”) No. 2015-07 “Disclosure for Investments in Certain Entities that Calculate Net Asset Value per Share (or Its Equivalent)”. The amendments in ASU No. 2015-07 remove the requirement to categorize within the fair value hierarchy investments measured using the NAV practical expedient. The ASU also removes certain disclosure requirements for investments that qualify, but do not utilize, the NAV practical expedient. The amendments in the ASU are effective for fiscal years beginning after December 15, 2015, and interim periods within those fiscal years. Management is currently evaluating the impact these changes will have on the Funds’ financial statements and related disclosures.
Note 14 — Events Subsequent to Year-End
Management has evaluated portfolio related events and transactions that occurred subsequent to June 30, 2016 through the date of issuance of the financial statements. There were no events or transactions that occurred during this period that materially impacted the amounts or disclosures in the financial statements.
2016 ANNUAL REPORT
Report of Independent Registered Public Accounting Firm
To the Shareholders and Board of Trustees of Quaker Investment Trust
We have audited the accompanying statements of assets and liabilities of Quaker Event Arbitrage Fund, Quaker Global Tactical Allocation Fund, Quaker Mid-Cap Value Fund, Quaker Small-Cap Value Fund, and Quaker Strategic Growth Fund (the “Funds”), each a series of Quaker Investment Trust (the “Trust”), including the schedules of investments, as of June 30, 2016, the related statements of operations for the year then ended, the statements of changes in net assets for each of the two years in the period then ended, and the financial highlights for each of the five years in the period then ended. These financial statements and financial highlights are the responsibility of the Funds’ management. Our responsibility is to express an opinion on these financial statements and financial highlights based on our audits.
We conducted our audits in accordance with the standards of the Public Company Accounting Oversight Board (United States). Those standards require that we plan and perform the audits to obtain reasonable assurance about whether the financial statements and financial highlights are free of material misstatement. The Funds are not required to have, nor were we engaged to perform, an audit of their internal control over financial reporting. Our audits included consideration of internal control over financial reporting as a basis for designing audit procedures that are appropriate in the circumstances, but not for the purpose of expressing an opinion on the effectiveness of the Funds’ internal control over financial reporting. Accordingly, we express no such opinion. An audit includes examining, on a test basis, evidence supporting the amounts and disclosures in the financial statements. Our procedures included confirmation of securities owned as of June 30, 2016, by correspondence with the custodian and brokers or through other appropriate procedures where replies from brokers were unable to be obtained. An audit also includes assessing the accounting principles used and significant estimates made by management, as well as evaluating the overall financial statement presentation. We believe that our audits provide a reasonable basis for our opinion.
In our opinion, the financial statements and financial highlights referred to above present fairly, in all material respects, the financial position of Quaker Event Arbitrage Fund, Quaker Global Tactical Allocation Fund, Quaker Mid-Cap Value Fund, Quaker Small-Cap Value Fund, and Quaker Strategic Growth Fund, as of June 30, 2016, the results of their operations for the year then ended, the changes in their net assets for each of the two years in the period then ended, and the financial highlights for each of the five years in the period then ended, in conformity with accounting principles generally accepted in the United States of America.
 |
| TAIT, WELLER & BAKER LLP |
Philadelphia, Pennsylvania
August 29, 2016
2016 ANNUAL REPORT
Trustees and Officers (unaudited)
June 30, 2016
The Board has overall responsibility for conduct of the Trust’s affairs. The day-to-day operations of the Trust are managed by QFI subject to the Bylaws of the Trust and review by the Board. The Trustees, including those Trustees who are also officers, are listed below:
| | | Serving as | | | |
| | | an Officer | | Portfolios | Directorships |
| Name, Address | Position(s) Held | or Trustee of | Principal Occupation(s) | Overseen by | Held by |
| and Age | with the Trust | the Trust | During Past 5 Years | Trustee | Trustee(1) |
Jeffry H. King, Sr.(2)(3) | Chairman of the | Since | Chairman of Board of Directors | 5 | None |
| 1180 W. Swedesford Road, | Board and Chief | Nov. 1996 | and Chief Executive Officer, | | |
| Suite 150 | Executive Officer | | Quaker Funds, Inc. (1996–present). | | |
| Berwyn, PA 19312 | | | | | |
| Age 73 | | | | | |
Laurie Keyes(3)(4) | Treasurer and | Since | Chief Financial Officer, | 5 | None |
| 1180 W. Swedesford Road, | Trustee | Nov. 1996 | Quaker Funds, Inc. (1996–present). | | |
| Suite 150 | | | | | |
| Berwyn, PA 19312 | | | | | |
| Age 66 | | | | | |
Justin Brundage(5) | Secretary | Since | President, Quaker Funds, Inc. | N/A | N/A |
| 1180 W. Swedesford Road, | | Nov. 2006 | (2007–present); Chief Operating | | |
| Suite 150 | | | Officer, Quaker Funds, Inc. | | |
| Berwyn, PA 19312 | | | (2005–present). | | |
| Age 46 | | | | | |
| Timothy E. Richards | Chief Compliance | Since | General Counsel to Quaker Funds, | N/A | N/A |
| 1180 W. Swedesford Road, | Officer | March 2004 | Inc. (2003–present); Chief | | |
| Suite 150 | | | Compliance Officer for the Quaker | | |
| Berwyn, PA 19312 | | | Investment Trust (2004–present). | | |
| Age 51 | | | | | |
| James R. Brinton | Trustee | Since | Vice President, Powers Craft | 5 | None |
| 1180 W. Swedesford Road, | | Feb. 2002 | Parker & Beard (2015–present); | | |
| Suite 150 | Lead | Since | President, Robert J. McAllister | | |
| Berwyn, PA 19312 | Independent | Aug. 2007 | Agency, Inc. (1979–2015). | | |
| Age 62 | Trustee | | | | |
| Gary Edward Shugrue | Trustee | Since | Managing Director, Veritable, LP | 5 | Director, BHR |
| 1180 W. Swedesford Road, | | July 2008 | (Jan. 2016–present); | | Institutional |
| Suite 150 | | | President and Chief Investment | | Funds; Director, |
| Berwyn, PA 19312 | | | Officer, Ascendant Capital | | ACP Funds |
| Age 62 | | | Partners (2001–Jan. 2016). | | Trust |
| Warren West | Trustee | Since | President and owner, Greentree | 5 | None |
| 1180 W. Swedesford Road, | | Nov. 2003 | Brokerage Services, Inc. | | |
| Suite 150 | | | (1998–present). | | |
| Berwyn, PA 19312 | | | | | |
| Age 59 | | | | | |
2016 ANNUAL REPORT
Trustees and Officers (unaudited) (continued)
| | | Serving as | | | |
| | | an Officer | | Portfolios | Directorships |
| Name, Address | Position(s) Held | or Trustee of | Principal Occupation(s) | Overseen by | Held by |
| and Age | with the Trust | the Trust | During Past 5 Years | Trustee | Trustee(1) |
| Everett T. Keech | Trustee | Since | Chairman-Executive Committee, | 5 | Director, |
| 1180 W. Swedesford Road, | | Nov. 2005 | Technology Development | | Technology |
| Suite 150 | | | Corp., (1997–present) technology | | Development |
| Berwyn, PA 19312 | | | development and manufacturing | | Corp. |
| Age 76 | | | firm (1997–present); Affiliated | | |
| | | | Faculty, University of | | |
| | | | Pennsylvania (1998–present). | | |
| (1) | Directorship of companies required to report to the SEC under the Securities and Exchange Act of 1934, as amended (the “Exchange Act”) (i.e., “public companies”) and investment companies registered under the 1940 Act. |
| (2) | Mr. King is considered to be “interested person” of the Trust for purposes of the 1940 Act because he is the Chief Executive Officer and a controlling shareholder of Quaker Funds, Inc., the investment adviser to the Funds. |
| (3) | Mr. King and Ms. Keyes are husband and wife. |
| (4) | Ms. Keyes is considered to be an “interested person” of the Trust for purposes of the 1940 Act because she is the Trust’s Treasurer and a controlling shareholder of Quaker Funds, Inc. |
| (5) | Mr. Brundage is Ms. Keyes’ son. |
The Statement of Additional Information for the Trust includes additional information about the Trustees and Officers and is available, without charge, upon request by calling (800) 220-8888.
Form N-Q Filing and Proxy Voting Policies and Procedures
Each Fund files its complete schedule of portfolio holdings with the Securities and Exchange Commission (“SEC”) for the first and third quarters of each fiscal year on Form N-Q. Each Fund’s Forms N-Q, as well as a description of the policies and procedures that each Fund uses to determine how to vote proxies (if any) relating to portfolio securities is available without charge: (i) upon request, by calling (800) 220-8888; and (ii) on the SEC’s web-site at http://www.sec.gov. Each Fund’s Forms N-Q may be reviewed and copied at the SEC’s Public Reference Room in Washington, DC; information on the operation of the Public Reference Room may be obtained by calling 1-800-SEC-0330.
Information (if any) regarding how the Funds voted proxies relating to portfolio securities during the most recently disclosed 12-month period ended June 30 is available: (i) without charge, upon request, by calling (800) 220-8888; and (ii) on the SEC’s web-site at http://www.sec.gov.
2016 ANNUAL REPORT
Approval of Advisory and Sub-Advisory Agreements (unaudited)
At a meeting held on June 24, 2016, the Independent Trustees of the Board of the Trust (“Trustees” or “Board”) considered the continuation of the Investment Advisory Agreement between the Trust and Quaker Funds, Inc. (“Adviser”) and each of the respective Sub-Advisory Agreements between the Adviser and Aronson Johnson Ortiz, LP, DG Capital Management, Inc. and Kennedy Capital Management, Inc. (collectively, “Agreements”) with regard to each Fund. At the meeting, the Independent Trustees reported to the full Board their considerations with respect to the Agreements, and the Board, including a majority of Independent Trustees, considered and approved the renewal of the Agreements. The renewals were each effective through May 2017.
In considering the continuation of the advisory and sub-advisory agreements, the Trustees considered the nature and quality of the services provided by the Adviser and each of the sub-advisers, the proposed fee structures, the level of fee waivers, each Fund’s past expense ratios, possible economies of scale resulting from increases in the size of the Funds and other possible benefits the Adviser and each of the sub-advisers derive from their relationships with the Funds. The Trustees reviewed the information provided to them by the Adviser and each of the sub-advisers for the Board’s March 10, 2016 annual contract renewal meeting (the “March Meeting’), including certain updated information as well as representations made by management about the continued accuracy of information previously provided to the Board. The Trustees also considered other information that had been received from the Adviser and each of the sub-advisers at other meetings throughout the year.
The Trustees first evaluated the nature, extent and quality of services provided by the Adviser and the sub-advisers to the Funds and their shareholders. The Board’s reviewed factors such as the background and experience of the management personnel involved in the Funds’ operations, the quality of the monitoring of each Fund’s investment performance, the monitoring of various service providers to the Funds, the Adviser’s success in obtaining meaningful information on a timely basis from each of the Fund’s sub-advisers, and continued efforts to further the Funds’ distribution channels. The nature of the sub-advisers’ services to each Fund was considered primarily in respect to the investment performance of the Funds. The Board was, however, satisfied with the adherence by each sub-adviser to the investment policies and restrictions of the Funds advised, as well as their adherence to various compliance and other procedures and the materials furnished at quarterly Board meetings.
With respect to the Funds’ investment performance, the Trustees reviewed each Fund’s performance compared to both its Morningstar peer group and relative benchmark indices over one-year, three-year, five-year, ten-year and since inception periods, as applicable. In the course of their deliberations, the Trustees took into account information previously provided by the Adviser in connection with the March Meeting, as well as for the most recently completed quarter and during the Funds’ regular quarterly meetings. The Board noted and considered the reasons for a Fund’s over or underperformance against its particular benchmark and each Fund’s Morningstar category ranking. With respect to the underperforming Funds, in some cases, the Adviser considered a Fund’s underperformance to be the result of the sub-adviser’s investment style being out of favor or a temporary unfavorable over- or underweight to out-of-favor or underperforming sectors. The Board emphasized its desire to see performance improvements and considered the Adviser’s plans to address longer-term underperformance issues.
The Trustees also considered the costs of the services provided to the Trust and the profits realized by the Adviser from its relationship with the Trust, including the Adviser’s and sub-advisers’ willingness to waive fees. The Trustees considered whether the Adviser and sub-advisers might be able to recover some of their waived fees in the future. The Trustees noted that the sub-advisory fees are paid by the Adviser to each sub-adviser and are not additional fees borne by the Funds. The Board again discussed, in detail, with the Adviser its financial condition and its strategic partnership plans. It considered the meeting with, and presentation by, the Adviser’s
2016 ANNUAL REPORT
Approval of Advisory and Sub-Advisory Agreements (unaudited) (continued)
intended strategic partner in evaluating the costs of services provided, and to be provided. The Trustees determined that the Funds’ contractual rates were reasonable in light of, among other things, the types of capacity constrained and alternative strategy offered by the Funds, the Adviser’s continued financial commitment to the complex during the periods when assets under management have continued to fall, and the Adviser’s strategic partnership plans. As the Trust is the Adviser’s only client, there was no available comparative fee information for other accounts.
Additionally, the Board concluded that based on the small asset size of the complex, neither the Adviser nor the applicable Funds’ sub-advisers received any ancillary benefits from their relationships with the Trust.
Based on the totality of the information considered, the Trustees concluded that the Funds’ advisory contracts should be continued through May 2017.
2016 ANNUAL REPORT
General Information (unaudited)
Tax Information
We are required to advise you within 60 days of the Funds’ fiscal year-end regarding the federal tax status of certain distributions received by shareholders during such fiscal year. The information below is provided for the fiscal year ending June 30, 2016. During the fiscal year ended June 30, 2016, the following Fund paid a long-term capital distribution.
| | Long-Term |
| Fund | Capital Gains |
| Small-Cap Value | $2,564,967 |
Individual shareholders are eligible for reduced tax rates on the following percentages of qualified dividend income. For the purposes of computing the dividends eligible for reduced taxes, the following amounts of the dividends paid by the Fund from ordinary income earned during the fiscal year are considered qualified dividend income.
| Fund | Amount | Percentage |
| Event Arbitrage | $1,172,407 | 21.89% |
Corporate shareholders may exclude up to the following percentages of qualifying dividends. For the purposes of computing this exclusion, the following amounts of the dividends paid by the Funds from ordinary income earned during the fiscal year represents qualifying dividends.
| Fund | Amount | Percentage |
| Event Arbitrage | $776,606 | 14.50% |
During the fiscal year ending June 30, 2016, the percentage of taxable ordinary income distributions that are designated as short-term capital gain distributions under Internal Revenue Section 871(k)(2)(C) for the Fund was as follows.
| Fund | Percentage |
| Event Arbitrage | 100% |
Dividends and distributions received by retirement plans such as IRAs, Keogh type plans and 403(b) plans need not be reported as taxable income. However, many retirement plan trusts may need this information for their annual information reporting. Since the information above is reported for the Funds’ fiscal year and not the calendar year, shareholders should refer to their Form 1099-DIV or other tax information which will be mailed in January 2017 to determine the calendar year amounts to be included on their 2016 tax returns. Shareholders should consult their tax advisers.
Privacy Policy
Your personal privacy is important. At Quaker Investment Trust, including its subsidiaries and affiliated entities, we recognize that whether you are an existing customer or are considering a relationship with us, you have an interest in how we collect, retain and use information about you and your relationship with us.
We are committed to protecting your confidential information. We do this by maintaining standards and procedures designed to prevent the accidental disclosure of such information and/or its misuse. Our Customer Privacy Policy, which outlines how we accomplish the protection of your information, is set forth below.
2016 ANNUAL REPORT
General Information (unaudited) (continued)
| I. | INFORMATION COLLECTION |
| | We may collect “non-public personal information” about you from the following sources: |
| | • | Information we receive from you on account applications and other account forms you provide to us; |
| | • | Information about your transactions with us, our affiliates, and other entities; |
| | • | Information we receive from third parties, such as credit bureaus, the IRS, and others. “Non-public personal information” is non-public information about you that we obtain in connection with providing a financial product or service to you. For example, non-public personal information includes information regarding your account balance, shares held, which funds you own, your investment history, etc. |
| II. | INFORMATION USE & SHARING WITH THIRD PARTIES |
We are permitted under law to share information about our experiences or transactions with you or your account (such as your account balance, shares owned, and investment history) with affiliates. We may also share additional information about you or your account (such as information we receive from account applications and other correspondence) with our affiliates. We do not disclose information to our affiliates that does not directly relate to our or our affiliates’, experiences or transactions with your account.
We are also permitted under law to disclose non-public information about you to “non-affiliated third parties” in certain circumstances. We may share certain kinds of customer information with these third parties solely to facilitate the offering, administration, collection and delivery of our services to you, and only under strictly controlled circumstances designed to protect the privacy of your information. We require any non-affiliated third party with whom we share such information to execute our Confidentiality and Consumer Privacy Protection Agreement. Under that agreement, those parties are not allowed to release, use for their own purposes, or sell, transfer or provide any customer information we share with them to any other party.
You should be aware that there may be occasions where we are legally required to disclose information about you, such as in response to a governmental or court order.
If you decide to close your account with us, we will continue to adhere to these privacy policies. Lastly, we do not sell customer lists or individual customer information.
At Quaker Investment Trust and our affiliates, employee access to customer information is authorized for business purposes only and only for employees who need to know such information.
We regularly train our employees on privacy and privacy security, and we have established and continuously maintain standards and procedures to protect the privacy of your information.
When you use our on-line (Internet) products and services, we may collect information about you to personalize our services to you, but we do not share any such information or your email information to anyone other than our affiliates, unless compelled to do so under law.
We continually strive to maintain complete and accurate information about you and your accounts. Should you ever believe that our records are inaccurate or incomplete, please call us immediately at 1-800-220-8888. We will investigate your concerns and correct any inaccuracies. We will also confirm to you the actions we have taken concerning your account. You may also write to us at the Quaker Investment Trust, c/o U.S. Bancorp Fund Services, LLC, P.O. Box 701, Milwaukee, Wisconsin 53201-0701.
2016 ANNUAL REPORT
General Information (unaudited) (continued)
Notice Regarding Delivery of Shareholder Documents
In an effort to decrease costs, each Fund intends to reduce the number of duplicate Prospectuses and Annual and Semi-Annual Reports you receive by sending only one copy of each to those addresses shared by two or more accounts and to shareholders we reasonably believe are from the same family or household. Once implemented, if you would like to discontinue householding for your accounts, please call toll-free at 1-800-220-8888 to request individual copies of these documents. Once a Fund receives notice to stop householding, we will begin sending individual copies thirty days after receiving your request. This policy does not apply to account statements.
2016 ANNUAL REPORT
The Quaker Funds are distributed by
Foreside Fund Services, LLC.
Contact us:
Quaker Funds, Inc.
c/o U.S. Bancorp Fund Services, LLC.
PO Box 701
Milwaukee, WI 53201-0701
800.220.8888
www.quakerfunds.com
©2016 Quaker® Investment Trust
QKAR 062016
Item 2. Code of Ethics.
As of the period ended June 30, 2016 (the “Reporting Period”), the Registrant has adopted a code of ethics that applies to the Registrant’s Principal Executive Officer and Principal Financial Officer. During the Reporting Period, there have been no changes to, amendments to, or waivers from, any provision of the code of ethics. A copy of this code of ethics, dated June 30, 2007, is filed as an Exhibit to this Form N-CSR pursuant to Item 12(a)(1).
Item 3. Audit Committee Financial Expert.
The Registrant’s Board of Trustees (the “Board”) has determined that the Registrant has one audit committee financial expert serving on its audit committee. The Board has designated Everett T. Keech audit committee financial expert serving on the registrant’s audit committee, and determined that Everett T. Keech is independent within the meaning of paragraph (a)(2) of Item 3 of Form N-CSR.
Item 4. Principal Accountant Fees and Services.
| (a) | Audit Fees: The aggregate fees billed for each of the last two fiscal years for professional services rendered to the Registrant by the principal accountant for the audit of the Registrant’s annual financial statements or services that are normally provided by the accountant in connection with statutory and regulatory filings or engagements for those fiscal years are $62,500 for 2016 and $62,500 for 2015. |
| (b) | Audit-Related Fees: The aggregate fees billed in each of the last two fiscal years for assurance and related services rendered to the Registrant by the principal accountant that are reasonably related to the performance of the audit of the Registrant’s financial statements and are not reported under paragraph (a) of this Item are $0 for 2016 and $0 for 2015. |
| (c) | Tax Fees: The aggregate fees billed in each of the last two fiscal years for professional services rendered to the Registrant by the principal accountant for tax compliance, tax advice, and tax planning are $12,500 for 2016 and $12,500 for 2015. The services for each of the fiscal years ended June 30, 2016 and June 30, 2015 consisted of: (i) review or preparation of U.S. federal, state, local and excise tax returns; (ii) U.S. federal, state and local tax planning, advice and assistance regarding statutory, regulatory or administrative developments; and (iii) tax advice regarding tax qualification. |
| (d) | All Other Fees: The aggregate fees billed in each of the last two fiscal years for products and services provided by the principal accountant, other than the services reported in paragraphs (a) through (c) of this Item are $0 for 2016 and $0 for 2015. |
| (e) | The Audit Committee of the Board of Trustees (the “Audit Committee”) has not adopted pre-approval policies and procedures. Instead, pursuant to the registrant’s Audit Committee Charter that has been adopted by the Audit Committee, the Audit Committee shall approve, prior to appointment, the engagement of the auditor to provide audit services to the registrant and non-audit services to the registrant, its investment adviser or any entity controlling, controlled by or under common control with the investment adviser that provides on-going services to the registrant if the engagement relates directly to the operations and financial reporting of the Registrant. |
| (f) | All of the principal accountant’s hours spent on auditing the Registrant’s financial statements were attributed to work performed by full time permanent employees of the principal accountant. |
| (g) | The aggregate non-audit fees billed by the Registrant’s accountant for services rendered to the Registrant and to the Registrant’s investment adviser (not including any sub-adviser whose role is primarily portfolio management and whose activities are overseen by the Registrant’s investment adviser) and any entity controlling, controlled by, or under common control with the investment adviser that provides ongoing services to the Registrant, for each of the Registrant’s last two fiscal years are $0 for 2016 and $0 for 2015. |
| (h) | The Audit Committee has considered whether the provision of non-audit services that were rendered to the Registrant’s investment adviser is compatible with maintaining the principal accountant’s independence. The Audit Committee has concluded that the provision of such non-audit services by the accountant has not compromised the accountant’s independence. |
Item 5. Audit Committee of Listed Registrants.
Not Applicable.
Item 6. Schedule of Investments.
| (a) | A Schedule of Investments in securities of unaffiliated issuers as of the close of the reporting period is included as part of the report to shareholders filed under Item 1, Report to Shareholders, of this Form N-CSR. |
Item 7. Disclosure of Proxy Voting Policies and Procedures for Closed-End Management Investment Companies.
Not Applicable.
Item 8. Portfolio Managers of Closed-End Management Investment Companies.
Not Applicable.
Item 9. Purchases of Equity Securities by Closed‑End Management Investment Company and Affiliated Purchasers.
Not Applicable.
Item 10. Submission of Matters to a Vote of Security Holders.
There have been no material changes to the procedures by which shareholders may recommend nominees to the registrant’s Board of Trustees, where those changes were implemented after the Registrant last provided disclosure in response to the requirements of Item 407(c)(2)(iv) of Regulation S-K (as required by Item 22(b)(15) of Schedule 14A (17 CFR 240.14a-101)), or this Item.
Item 11. Controls and Procedures.
| (a) | The Registrant’s Principal Executive Officer and Principal Financial Officer, or persons performing similar functions, have reviewed the Registrant's disclosure controls and procedures (as defined in Rule 30a-3(c) under the Investment Company Act of 1940, as amended (the “Act”)) as of a date within 90 days of the filing of this report, as required by Rule 30a-3(b) under the Act and Rules 13a-15(b) or 15d‑15(b) under the Securities Exchange Act of 1934. Based on their review, such officers have concluded that the disclosure controls and procedures are effective in ensuring that information required to be disclosed in this report is appropriately recorded, processed, summarized and reported and made known to them by others within the Registrant and by the Registrant’s service provider. |
| (b) | There were no changes in the Registrant's internal control over financial reporting (as defined in Rule 30a-3(d) under the Act) that occurred during the second fiscal quarter of the period covered by this report that has materially affected, or is reasonably likely to materially affect, the Registrant's internal control over financial reporting. |
Item 12. Exhibits.
(a)(1) Any code of ethics or amendment thereto, that is subject of the disclosure required by Item 2, to the extent that the registrant intends to satisfy Item 2 requirements through filing an exhibit. Filed herewith.
(a)(2) Certifications pursuant to Section 302 of the Sarbanes-Oxley Act of 2002. Filed herewith.
(a)(3) Any written solicitation to purchase securities under Rule 23c‑1 under the Act sent or given during the period covered by the report by or on behalf of the registrant to 10 or more persons. Not applicable to open-end investment companies.
(b)Certification pursuant to Section 906 of the Sarbanes‑Oxley Act of 2002. Filed herewith.
SIGNATURES
Pursuant to the requirements of the Securities Exchange Act of 1934 and the Investment Company Act of 1940, the registrant has duly caused this report to be signed on its behalf by the undersigned, thereunto duly authorized.
(Registrant) Quaker Investment Trust
By (Signature and Title) /s/Jeffry H. King, Sr.
Jeffry H. King, Sr.,
Chief Executive Officer
Date August 30, 2016
Pursuant to the requirements of the Securities Exchange Act of 1934 and the Investment Company Act of 1940, this report has been signed below by the following persons on behalf of the registrant and in the capacities and on the dates indicated.
By (Signature and Title) /s/Jeffry H. King, Sr.
Jeffry H. King, Sr.,
Chief Executive Officer
Date August 30, 2016
By (Signature and Title) /s/Laurie Keyes
Laurie Keyes,
Treasurer
Date August 30, 2016