Performance Update (unaudited) (continued)
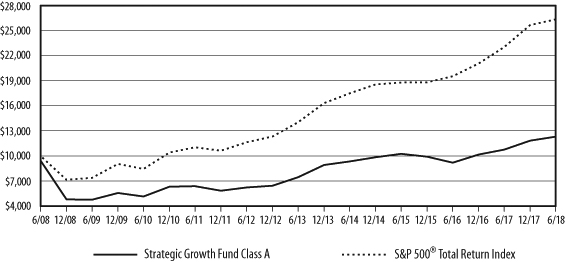
Quaker Strategic Growth Fund (QUAGX, QAGCX, QAGIX)
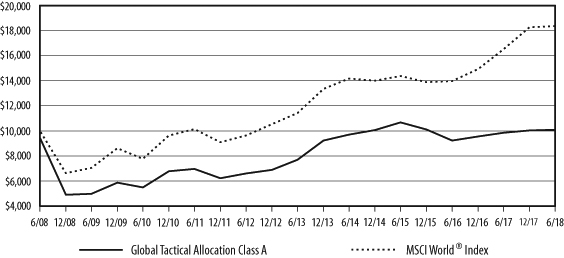
Growth of a Hypothetical $10,000 Investment
June 30, 2018
| Average Annualized Total Return |
| | | | | | | | | | | Commencement |
| | Gross | Net | | | | | | | | of operations |
| | Expense | Expense | Inception | | | | | | | through |
| | Ratio* | Ratio* | Date | One Year | Five Year | Ten Year | 6/30/2018 |
| | | | | with | without | with | without | with | without | with | without |
| | | | | sales | sales | sales | sales | sales | sales | sales | sales |
| | | | | charge | charge | charge | charge | charge | charge | charge | charge |
| Class A | 2.34% | 2.22% | 11/25/96 | 8.11% | 14.39% | 9.30% | 10.54% | 2.10% | 2.68% | 10.70% | 10.99% |
| Class C | 3.09% | 2.97% | 7/11/00 | 13.54% | 13.54% | 9.72% | 9.72% | 1.91% | 1.91% | 4.55% | 4.55% |
| Institutional Class | 2.09% | 1.97% | 7/20/00 | 14.70% | 14.70% | 10.81% | 10.81% | 2.92% | 2.92% | 5.52% | 5.52% |
| S&P 500® Total Return Index** | | | 14.37% | 14.37% | 13.42% | 13.42% | 10.17% | 10.17% | 8.11% | 8.11% |
| * | As stated in the Prospectus dated October 30, 2017, supplemented December 28, 2017 and January 12, 2018. |
| ** | The benchmark since inception returns are calculated since commencement of November 25, 1996 through June 30, 2018. |
Performance data quoted represents past performance and is no guarantee of future results. Investment return and principal value will fluctuate so that shares, when redeemed, may be worth more or less than their original cost. Current performance may be lower or higher than performance data quoted. Performance data current to the most recent month end is available at www.quakerfunds.com or by calling us toll free at 800-220-8888. Total return includes reinvestment of dividends and capital gains.
Class A shares of the Fund have a maximum sales charge of 5.50%.
The performance table does not reflect the deduction of taxes that a shareholder might pay on fund distributions or the redemption of fund shares. Total return calculations reflect expense reimbursements and fee waivers in the applicable periods. See financial highlights for periods where fees were waived or reimbursed.
The Fund’s portfolio holdings may differ significantly from the securities held in the index and, unlike a mutual fund, an unmanaged index assumes no transaction costs, taxes, management fees or other expenses. You cannot invest directly in an index.
The S&P 500® Total Return Index (“S&P 500® Index”) is a widely recognized, unmanaged index consisting of the approximately 500 largest companies in the United States as measured by market capitalization. The S&P 500® Index assumes reinvestment of all dividends and distributions.
Expense Information (unaudited)
As a shareholder of the Funds, you incur two types of costs: (1) transaction costs, including applicable sales charges and redemption fees; and (2) ongoing costs, including management fees, distribution (12b-1) fees and other Fund expenses. This example is intended to help you understand your ongoing costs (in dollars) of investing in the Funds and to compare these costs with the ongoing costs of investing in other funds. The example is based on an investment of $1,000 invested at the beginning of the (six-month) period and held for the entire period January 1, 2018 through June 30, 2018.
ACTUAL EXPENSES
The first section of each table below provides information about actual account values and actual expenses for each of the Funds. You may use this information, together with the amount you invested, to estimate the expenses that you paid over the period. Simply divide your account value by $1,000 (for example, an $8,600 account value divided by $1,000 = 8.6), then multiply the result by the number in the applicable line under the heading entitled “Expenses Paid During the Period” to estimate the expenses you paid on your account during this period.
HYPOTHETICAL EXAMPLE FOR COMPARISON PURPOSES
The second section of each table below provides information about hypothetical account values and hypothetical expenses based on the Fund’s actual expense ratio and an assumed rate of return of 5% per year before expenses, which is not the Fund’s actual return. The hypothetical account values and expenses may not be used to estimate the actual ending account balance or expenses you paid for the period. You may use this information to compare the ongoing costs of investing in the Fund to other funds. To do so, compare this 5% hypothetical example with the 5% hypothetical examples that appear in the shareholder reports of the other funds. Please note that the expenses shown in the table are meant to highlight your ongoing costs only and do not reflect any transactional costs, such as sales charges (loads), redemption fees or exchange fees. Therefore, the second section of the table is useful in comparing ongoing costs only, and will not help you determine the relative total costs of owning different funds. In addition, if these transactional costs were included, your costs would have been higher.
| | | Beginning | Annualized | Ending | |
| | | Account Value | Expense Ratio | Account Value | Expenses Paid |
| | | (1/1/2018) | for the Period | (06/30/2018) | During Period* |
| Global Tactical Allocation | | | | | |
| Example based on actual return of: | | | | | |
| Class A | 0.55% | $1,000.00 | 3.01% | $1,005.50 | $14.97 |
| Class C | 0.20% | 1,000.00 | 3.74% | 1,002.00 | 18.56 |
| Institutional Class | 0.80% | 1,000.00 | 2.23% | 1,008.00 | 11.10 |
| Hypothetical example based on assumed 5% return: | | | | | |
| Class A | | 1,000.00 | 3.01% | 1,009.87 | 15.00 |
| Class C | | 1,000.00 | 3.74% | 1,006.25 | 18.60 |
| Institutional Class | | 1,000.00 | 2.23% | 1,013.74 | 11.13 |
Expense Information (unaudited) (continued)
| | | Beginning | Annualized | Ending | |
| | | Account Value | Expense Ratio | Account Value | Expenses Paid |
| | | (1/1/2018) | for the Period | (06/30/2018) | During Period* |
| Mid-Cap Value | | | | | |
| Example based on actual return of: | | | | | |
| Class A | -0.64% | $1,000.00 | 2.49% | $ 993.60 | $12.31 |
| Class C | -1.00% | 1,000.00 | 3.25% | 990.00 | 16.04 |
| Institutional Class | -0.51% | 1,000.00 | 2.23% | 994.90 | 11.03 |
| Hypothetical example based on assumed 5% return: | | | | | |
| Class A | | 1,000.00 | 2.49% | 1,012.45 | 12.42 |
| Class C | | 1,000.00 | 3.25% | 1,008.68 | 16.19 |
| Institutional Class | | 1,000.00 | 2.23% | 1,013.74 | 11.13 |
| Small-Cap Value | | | | | |
| Example based on actual return of: | | | | | |
| Class A | 3.52% | 1,000.00 | 2.73% | 1,035.20 | 13.78 |
| Class C | 3.15% | 1,000.00 | 3.50% | 1,031.50 | 17.63 |
| Institutional Class | 3.67% | 1,000.00 | 2.37% | 1,036.70 | 11.97 |
| Hypothetical example based on assumed 5% return: | | | | | |
| Class A | | 1,000.00 | 2.73% | 1,011.26 | 13.61 |
| Class C | | 1,000.00 | 3.50% | 1,007.44 | 17.42 |
| Institutional Class | | 1,000.00 | 2.37% | 1,013.04 | 11.83 |
| Strategic Growth | | | | | |
| Example based on actual return of: | | | | | |
| Class A | 4.01% | 1,000.00 | 2.32% | 1,040.10 | 11.74 |
| Class C | 3.64% | 1,000.00 | 3.07% | 1,036.40 | 15.50 |
| Institutional Class | 4.15% | 1,000.00 | 2.07% | 1,041.50 | 10.48 |
| Hypothetical example based on assumed 5% return: | | | | | |
| Class A | | 1,000.00 | 2.32% | 1,013.29 | 11.58 |
| Class C | | 1,000.00 | 3.07% | 1,009.57 | 15.30 |
| Institutional Class | | 1,000.00 | 2.07% | 1,014.53 | 10.34 |
| * | Expenses are equal to the Funds’ annualized six-month expense ratios multiplied by the average account value over the period multiplied by the number of days in the most recent fiscal half year (181) divided by 365 to reflect the one-half year period. |
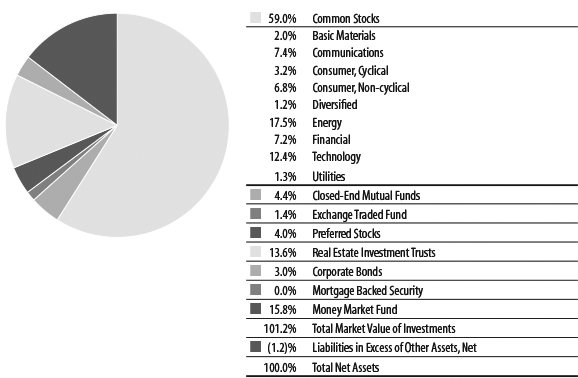
Schedule of Investments
Quaker Global Tactical Allocation Fund
June 30, 2018
| | | Number | | | Fair | |
| | | of Shares | | | Value | |
| Long-Term Investments — 85.4% | | | | | | |
| Common Stocks — 59.0% | | | | | | |
| Basic Materials — 2.0% | | | | | | |
| Chemicals — 2.0% | | | | | | |
| The Mosaic Co. | | | 1,800 | | | $ | 50,490 | |
| Total Basic Materials (Cost $48,858) | | | | | | | 50,490 | |
| Communications — 7.4% | | | | | | | | |
| Media — 4.3% | | | | | | | | |
| Twenty-First Century Fox Inc. Cl B | | | 2,220 | | | | 109,379 | |
| Telecommunications — 3.1% | | | | | | | | |
| AT&T Inc. | | | 2,520 | | | | 80,917 | |
| Total Communications | | | | | | | | |
| (Cost $168,973) | | | | | | | 190,296 | |
| Consumer, Cyclical — 3.2% | | | | | | | | |
| Airlines — 0.5% | | | | | | | | |
| AMR Corp. Escrow (a)*^ | | | 7,600 | | | | 12,692 | |
| Auto Manufacturers — 2.7% | | | | | | | | |
| General Motors Co. | | | 1,800 | | | | 70,920 | |
| Total Consumer, Cyclical | | | | | | | | |
| (Cost $64,885) | | | | | | | 83,612 | |
| Consumer, Non-cyclical — 6.8% | | | | | | | | |
| Beverages — 2.7% | | | | | | | | |
| Molson Coors Brewing Co. | | | 1,020 | | | | 69,401 | |
| Food — 4.1% | | | | | | | | |
| B&G Foods Inc. | | | 2,000 | | | | 59,800 | |
Nestlé S.A. — SP-ADR f | | | 600 | | | | 46,458 | |
| | | | | | | | 106,258 | |
| Total Consumer, Non-cyclical | | | | | | | | |
| (Cost $202,240) | | | | | | | 175,659 | |
| Diversified — 1.2% | | | | | | | | |
| Holding Companies — 1.2% | | | | | | | | |
CK Hutchison Holdings Ltd. — ADR f | | | 3,000 | | | | 31,680 | |
| Total Diversified (Cost $36,027) | | | | | | | 31,680 | |
| Energy — 17.5% | | | | | | | | |
| Energy-Alternate Sources — 3.5% | | | | | | | | |
| Enviva Partners LP | | | 1,111 | | | | 32,330 | |
| Pattern Energy Group Inc. | | | 3,132 | | | | 58,725 | |
| | | | | | | | 91,055 | |
| Pipelines — 14.0% | | | | | | | | |
| Andeavor Logistics LP | | | 381 | | | | 16,204 | |
| Cheniere Energy Partners LP | | | 737 | | | | 26,495 | |
| Crestwood Equity Partners LP | | | 3,600 | | | | 114,300 | |
Enbridge Inc. f | | | 499 | | | | 17,809 | |
| Enterprise Products Partners LP | | | 2,835 | | | | 78,445 | |
| Magellan Midstream Partners LP | | | 313 | | | | 21,622 | |
| MPLX LP | | | 588 | | | | 20,074 | |
| ONEOK Inc. | | | 450 | | | | 31,424 | |
| Plains All American Pipeline LP | | | 663 | | | | 15,673 | |
| Western Gas Partners LP | | | 369 | | | | 17,856 | |
| | | | | | | | 359,902 | |
| Total Energy (Cost $424,460) | | | | | | | 450,957 | |
| Financial — 7.2% | | | | | | | | |
| Diversified Financial Services — 2.0% | | | | | | | | |
Aircastle Ltd. f | | | 2,500 | | | | 51,250 | |
| Insurance — 5.2% | | | | | | | | |
| Aflac Inc. | | | 1,380 | | | | 59,368 | |
| Tiptree Inc. | | | 11,000 | | | | 74,800 | |
| | | | | | | | 134,168 | |
| Total Financial (Cost $182,394) | | | | | | | 185,418 | |
| Technology — 12.4% | | | | | | | | |
| Computers — 7.4% | | | | | | | | |
| Dell Technologies Inc. Cl V (a) | | | 2,250 | | | | 190,305 | |
| Software — 5.0% | | | | | | | | |
| Microsoft Corp. | | | 1,320 | | | | 130,165 | |
| Total Technology (Cost $279,054) | | | | | | | 320,470 | |
| Utilities — 1.3% | | | | | | | | |
| Electric — 1.3% | | | | | | | | |
| NRG Yield Inc. Cl C | | | 2,025 | | | | 34,830 | |
| Total Utilities (Cost $38,738) | | | | | | | 34,830 | |
| Total Common Stocks | | | | | | | | |
| Cost ($1,445,629) | | | | | | | 1,523,412 | |
| | | | | | | | | |
| Closed-End Mutual Funds — 4.4% | | | | | | | | |
| FS Investment Corp. | | | 6,000 | | | | 44,100 | |
| PGIM Global Short Duration | | | | | | | | |
| High Yield Fund Inc. | | | 5,000 | | | | 68,300 | |
| | | | | | | | 112,400 | |
| Total Closed-End Mutual Funds | | | | | | | | |
| Cost ($115,004) | | | | | | | 112,400 | |
| | | | | | | | | |
| Exchange Traded Fund — 1.4% | | | | | | | | |
| iShares Silver Trust (a) | | | 2,400 | | | | 36,360 | |
| Total Exchange Traded Fund | | | | | | | | |
| Cost ($38,616) | | | | | | | 36,360 | |
The accompanying notes are an integral part of the financial statements.
Schedule of Investments (continued)
Quaker Global Tactical Allocation Fund
June 30, 2018
| | | Number | | | Fair | |
| | | of Shares | | | Value | |
| Preferred Stocks — 4.0% | | | | | | |
| Industrial — 4.0% | | | | | | |
| Transportation — 4.0% | | | | | | |
Scorpio Tankers Inc., 8.25% f | | | 429 | | | $ | 10,961 | |
Seaspan Corp., 6.375% f | | | 3,600 | | | | 91,872 | |
| | | | | | | | 102,833 | |
| Total Industrial (Cost $102,458) | | | | | | | 102,833 | |
| Total Preferred Stocks | | | | | | | | |
| Cost ($102,458) | | | | | | | 102,833 | |
| | | | | | | | | |
| Real Estate Investment Trusts — 13.6% | | | | | | | | |
| Blackstone Mortgage Trust Inc. | | | 2,000 | | | | 62,860 | |
| Digital Realty Trust Inc. | | | 446 | | | | 49,765 | |
| Independence Realty Trust Inc. | | | 6,300 | | | | 64,953 | |
| Lamar Advertising Co. | | | 553 | | | | 37,775 | |
| MGM Growth Properties LLC | | | 1,500 | | | | 45,690 | |
| Starwood Property Trust Inc. | | | 4,129 | | | | 89,641 | |
| | | | | | | | 350,684 | |
| Total Real Estate Investment Trusts | | | | | | | | |
| Cost ($323,288) | | | | | | | 350,684 | |
| | | Par | | | | | |
| | | Value | | | | | |
| Corporate Bonds — 3.0% | | | | | | | | |
| Consumer, Cyclical — 0.3% | | | | | | | | |
| Retail — 0.3% | | | | | | | | |
| Toys R Us Inc., | | | | | | | | |
7.375%, 10/15/2018 *+• | | $ | 66,000 | | | | 6,600 | |
| Total Consumer, Cyclical | | | | | | | | |
| (Cost $65,792) | | | | | | | 6,600 | |
| Financial — 2.7% | | | | | | | | |
| Banks — 2.7% | | | | | | | | |
| Bank of Montreal, 2.968% | | | | | | | | |
| (3 Month LIBOR USD + 0.610%), | | | | | | | | |
07/31/2018 f• | | | 70,000 | | | | 70,048 | |
| Total Financial (Cost $70,015) | | | | | | | 70,048 | |
| Total Corporate Bonds | | | | | | | | |
| Cost ($135,807) | | | | | | | 76,648 | |
| | | | | | | | | |
| Mortgage Backed Security — 0.0% | | | | | | | | |
| Federal Home Loan Mortgage Corp., Class | | | | | | | | |
IG, Series 3756, 4.000%, 11/15/2037• | | | 12,457 | | | | 3 | |
| Total Mortgage Backed Security | | | | | | | | |
| Cost ($12,388) | | | | | | | 3 | |
| Total Long-Term Investments | | | | | | | | |
| Cost ($2,173,190) | | | | | | | 2,202,340 | |
| | | Number | | | | | |
| | | of Shares | | | | | |
| Short-Term Investments — 15.8% | | | | | | | | |
| Money Market Fund — 15.8% | | | | | | | | |
| First American Government | | | | | | | | |
| Obligations Fund, Cl X, 1.81% † | | | 408,997 | | | | 408,997 | |
| Total Short-Term Investments | | | | | | | | |
| Cost ($408,997) | | | | | | | 408,997 | |
| Total Investments | | | | | | | | |
| (Cost $2,582,187) — 101.2% | | | | | | | 2,611,337 | |
| Liabilities in Excess of | | | | | | | | |
| Other Assets, Net (1.2)% | | | | | | | (31,184 | ) |
| Total Net Assets — 100.0% | | | | | | $ | 2,580,153 | |
ADR - American Depositary Receipt
SP-ADR - Sponsored American Depositary Receipt
| (a) | Non-income producing security. |
| f | Foreign issued security. |
| † | The rate quoted is the annualized 7 day yield as of June 30, 2018. |
| * | Indicates an illiquid security. Total market value for illiquid securities is $19,292, representing 0.7% of net assets. |
| + | Defaulted bond. |
| | The coupon rate shown on floating or adjustable rate securities represents the rate at period end. |
| • | Level 2 securities. |
| ^ | Indicates a fair valued security. Total market value for fair valued securities is $12,692, representing 0.5% of net assets and Level 3 securities. |
The accompanying notes are an integral part of the financial statements.
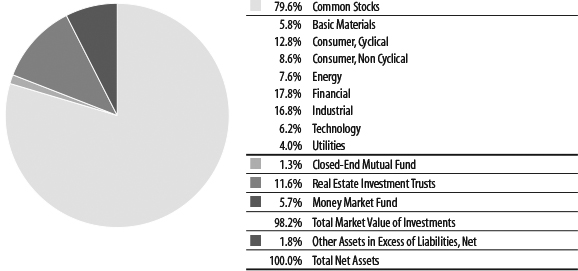
Schedule of Investments
Quaker Mid-Cap Value Fund
June 30, 2018
| | | Number | | | Fair | |
| | | of Shares | | | Value | |
| Long-Term Investments — 92.5% | | | | | | |
| Common Stocks — 79.6% | | | | | | |
| Basic Materials — 5.8% | | | | | | |
| Chemicals — 1.9% | | | | | | |
| Westlake Chemical Corp. | | | 1,000 | | | $ | 107,630 | |
| Iron & Steel — 3.9% | | | | | | | | |
| Reliance Steel & Aluminum Co. | | | 1,400 | | | | 122,556 | |
| Steel Dynamics Inc. | | | 2,000 | | | | 91,900 | |
| | | | | | | | 214,456 | |
| Total Basic Materials (Cost $211,704) | | | | | | | 322,086 | |
| Consumer, Cyclical — 12.8% | | | | | | | | |
| Auto Manufacturers — 2.1% | | | | | | | | |
| PACCAR Inc. | | | 1,866 | | | | 115,617 | |
| Auto Parts & Equipment — 1.4% | | | | | | | | |
| The Goodyear Tire & Rubber Co. | | | 3,427 | | | | 79,815 | |
| Entertainment — 2.3% | | | | | | | | |
| Cedar Fair LP | | | 2,000 | | | | 126,020 | |
| Leisure Time — 4.1% | | | | | | | | |
| Brunswick Corp. | | | 2,205 | | | | 142,179 | |
| Norwegian Cruise Line | | | | | | | | |
Holdings Ltd. (a) f | | | 1,828 | | | | 86,373 | |
| | | | | | | | 228,552 | |
| Textiles — 1.0% | | | | | | | | |
| Mohawk Industries Inc. (a) | | | 271 | | | | 58,067 | |
| Toys/Games & Hobbies — 1.9% | | | | | | | | |
| Hasbro Inc. | | | 1,165 | | | | 107,541 | |
| Total Consumer, Cyclical | | | | | | | | |
| (Cost $654,444) | | | | | | | 715,612 | |
| Consumer, Non Cyclical — 8.6% | | | | | | | | |
| Biotechnology — 1.3% | | | | | | | | |
| United Therapeutics Corp. (a) | | | 619 | | | | 70,040 | |
| Commercial Services — 1.0% | | | | | | | | |
| The Brink’s Co. | | | 695 | | | | 55,426 | |
| Food — 1.6% | | | | | | | | |
| Ingredion Inc. | | | 822 | | | | 90,995 | |
| Healthcare-Products — 2.2% | | | | | | | | |
STERIS PLC f | | | 1,158 | | | | 121,602 | |
| Healthcare-Services — 2.5% | | | | | | | | |
| Centene Corp. (a) | | | 1,142 | | | | 140,706 | |
| Total Consumer, Non-cyclical | | | | | | | | |
| (Cost $367,953) | | | | | | | 478,769 | |
| Energy — 7.6% | | | | | | | | |
| Energy-Alternate Sources — 0.8% | | | | | | | | |
| Enviva Partners LP | | | 1,529 | | | | 44,494 | |
| Oil & Gas — 2.5% | | | | | | | | |
| Andeavor | | | 1,051 | | | | 137,870 | |
| Oil & Gas Services — 0.9% | | | | | | | | |
| RPC Inc. | | | 3,356 | | | | 48,897 | |
| Pipelines — 3.4% | | | | | | | | |
| Crestwood Equity Partners LP | | | 6,000 | | | | 190,500 | |
| Total Energy (Cost $324,421) | | | | | | | 421,761 | |
| Financial — 17.8% | | | | | | | | |
| Banks — 8.2% | | | | | | | | |
| Bank of the Ozarks Inc. | | | 2,349 | | | | 105,799 | |
| East West Bancorp Inc. | | | 1,000 | | | | 65,200 | |
| Huntington Bancshares Inc. | | | 10,650 | | | | 157,194 | |
| PacWest Bancorp | | | 2,579 | | | | 127,454 | |
| | | | | | | | 455,647 | |
| Diversified Financial Services — 2.5% | | | | | | | | |
| T. Rowe Price Group Inc. | | | 1,184 | | | | 137,451 | |
| Insurance — 7.1% | | | | | | | | |
| Lincoln National Corp. | | | 1,585 | | | | 98,666 | |
| Reinsurance Group of America Inc. Cl A | | | 1,139 | | | | 152,034 | |
| Torchmark Corp. | | | 1,803 | | | | 146,782 | |
| | | | | | | | 397,482 | |
| Total Financial (Cost $669,804) | | | | | | | 990,580 | |
| Industrial — 16.8% | | | | | | | | |
| Aerospace & Defense — 2.8% | | | | | | | | |
| Teledyne Technologies Inc. (a) | | | 800 | | | | 159,248 | |
| Electronics — 3.5% | | | | | | | | |
| Avnet Inc. | | | 2,214 | | | | 94,958 | |
| Trimble Inc. (a) | | | 3,007 | | | | 98,750 | |
| | | | | | | | 193,708 | |
| Hand & Machine Tools — 2.4% | | | | | | | | |
| Snap-on Inc. | | | 833 | | | | 133,880 | |
| Machinery-Diversified — 2.6% | | | | | | | | |
| Roper Technologies Inc. | | | 522 | | | | 144,025 | |
| Miscellaneous Manufacturing — 1.5% | | | | | | | | |
| Carlisle Cos. Inc. | | | 769 | | | | 83,290 | |
The accompanying notes are an integral part of the financial statements.
Schedule of Investments (continued)
Quaker Mid-Cap Value Fund
June 30, 2018
| | | Number | | | Fair | |
| | | of Shares | | | Value | |
| Common Stocks — 79.6% (Continued) | | | | | | |
| Transportation — 4.0% | | | | | | |
| Kirby Corp. (a) | | | 1,600 | | | $ | 133,760 | |
| Old Dominion Freight Line Inc. | | | 600 | | | | 89,376 | |
| | | | | | | | 223,136 | |
| Total Industrial (Cost $672,697) | | | | | | | 937,287 | |
| Technology — 6.2% | | | | | | | | |
| Semiconductors — 4.8% | | | | | | | | |
Marvell Technology Group Ltd. f | | | 5,583 | | | | 119,700 | |
| ON Semiconductor Corp. (a) | | | 3,750 | | | | 83,381 | |
| Skyworks Solutions Inc. | | | 650 | | | | 62,822 | |
| | | | | | | | 265,903 | |
| Software — 1.4% | | | | | | | | |
| Akamai Technologies Inc. (a) | | | 1,059 | | | | 77,551 | |
| Total Technology (Cost $285,401) | | | | | | | 343,454 | |
| Utilities — 4.0% | | | | | | | | |
| Electric — 1.6% | | | | | | | | |
| CenterPoint Energy Inc. | | | 10 | | | | 277 | |
| NRG Yield Inc. Cl C | | | 5,062 | | | | 87,066 | |
| | | | | | | | 87,343 | |
| Water — 2.4% | | | | | | | | |
| Aqua America Inc. | | | 3,848 | | | | 135,373 | |
| Total Utilities (Cost $220,482) | | | | | | | 222,716 | |
| Total Common Stocks | | | | | | | | |
| (Cost $3,406,906) | | | | | | | 4,432,265 | |
| | | | | | | | | |
| Closed-End Mutual Fund — 1.3% | | | | | | | | |
| FS Investment Corp. | | | 10,000 | | | | 73,500 | |
| Total Closed-End Mutual Fund | | | | | | | | |
| (Cost $74,582) | | | | | | | 73,500 | |
| | | | | | | | | |
| Real Estate Investment Trusts — 11.6% | | | | | | | | |
| CyrusOne Inc. | | | 2,147 | | | | 125,299 | |
| Independence Realty Trust Inc. | | | 15,000 | | | | 154,650 | |
| Starwood Property Trust Inc. | | | 4,588 | | | | 99,605 | |
| Sun Communities Inc. | | | 1,361 | | | | 133,215 | |
| WP Carey Inc. | | | 2,000 | | | | 132,700 | |
| | | | | | | | 645,469 | |
| Total Real Estate Investment Trusts | | | | | | | | |
| (Cost $546,127) | | | | | | | 645,469 | |
| Total Long-Term Investments | | | | | | | | |
| (Cost $4,027,615) | | | | | | | 5,151,234 | |
| | | | | | | | | |
| Short-Term Investments — 5.7% | | | | | | | | |
| Money Market Fund — 5.7% | | | | | | | | |
| First American Government | | | | | | | | |
| Obligations Fund, Cl X, 1.81% † | | | 319,134 | | | | 319,134 | |
| Total Short-Term Investments | | | | | | | | |
| (Cost $319,134) | | | | | | | 319,134 | |
| Total Investments | | | | | | | | |
| (Cost $4,346,749) — 98.2% | | | | | | | 5,470,368 | |
| Other Assets in Excess | | | | | | | | |
| of Liabilities, Net 1.8% | | | | | | | 98,404 | |
| Total Net Assets — 100.0% | | | | | | $ | 5,568,772 | |
| (a) | Non-income producing security. |
| f | Foreign issued security. |
| † | The rate quoted is the annualized 7 day yield as of June 30, 2018. |
The accompanying notes are an integral part of the financial statements.
Schedule of Investments
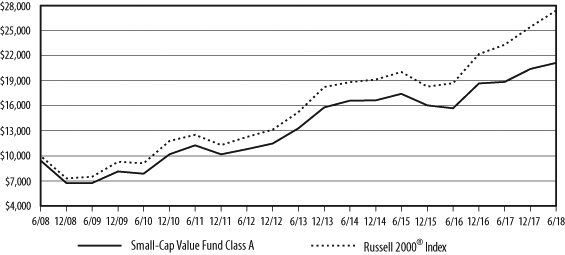
Quaker Small-Cap Value Fund
June 30, 2018
| | | Number | | | Fair | |
| | | of Shares | | | Value | |
| Long-Term Investments — 95.2% | | | | | | |
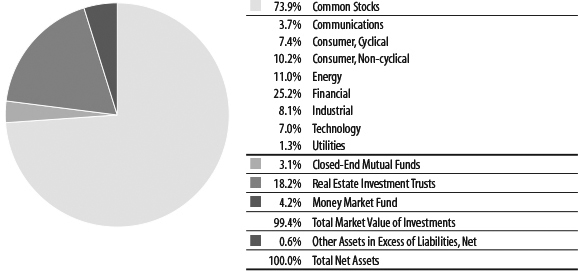
| Common Stocks — 73.9% | | | | | | |
| Communications — 3.7% | | | | | | |
| Media — 1.9% | | | | | | |
| The New York Times Co. | | | 11,500 | | | $ | 297,850 | |
| Telecommunications — 1.8% | | | | | | | | |
| Gogo Inc. (a) | | | 7,500 | | | | 36,450 | |
| Verizon Communications Inc. | | | 5,000 | | | | 251,550 | |
| | | | | | | | 288,000 | |
| Total Communications | | | | | | | | |
| (Cost $598,732) | | | | | | | 585,850 | |
| Consumer, Cyclical — 7.4% | | | | | | | | |
| Auto Parts & Equipment — 1.5% | | | | | | | | |
| Commercial Vehicle Group Inc. (a) | | | 10,039 | | | | 73,686 | |
| Tenneco Inc. | | | 3,600 | | | | 158,256 | |
| | | | | | | | 231,942 | |
| Entertainment — 5.0% | | | | | | | | |
| Cedar Fair LP | | | 6,000 | | | | 378,060 | |
| Six Flags Entertainment Corp. | | | 6,000 | | | | 420,300 | |
| | | | | | | | 798,360 | |
| Retail — 0.9% | | | | | | | | |
| Rush Enterprises Inc. (a) | | | 3,239 | | | | 140,508 | |
| Total Consumer, Cyclical | | | | | | | | |
| (Cost $1,181,944) | | | | | | | 1,170,810 | |
| Consumer, Non-cyclical — 10.2% | | | | | | | | |
| Agriculture — 1.2% | | | | | | | | |
| Phibro Animal Health Corp. | | | 4,169 | | | | 191,982 | |
| Commercial Services — 2.2% | | | | | | | | |
| The Brink’s Co. | | | 3,021 | | | | 240,925 | |
| Heidrick & Struggles | | | | | | | | |
| International Inc. | | | 2,997 | | | | 104,895 | |
| | | | | | | | 345,820 | |
| Food — 2.8% | | | | | | | | |
| B&G Foods Inc. | | | 15,000 | | | | 448,500 | |
| Healthcare-Products — 1.8% | | | | | | | | |
| Haemonetics Corp. (a) | | | 3,071 | | | | 275,407 | |
| Healthcare-Services — 0.7% | | | | | | | | |
Nobilis Health Corp. (a)f | | | 38,393 | | | | 46,072 | |
| Psychemedics Corp. | | | 3,275 | | | | 63,011 | |
| | | | | | | | 109,083 | |
| Pharmaceuticals — 1.5% | | | | | | | | |
| BioSpecifics Technologies Corp. (a) | | | 2,139 | | | | 95,956 | |
| Taro Pharmaceutical | | | | | | | | |
Industries Ltd. (a)f | | | 1,174 | | | | 135,820 | |
| | | | | | | | 231,776 | |
| Total Consumer, Non-cyclical | | | | | | | | |
| (Cost $1,289,142) | | | | | | | 1,602,568 | |
| Energy — 11.0% | | | | | | | | |
| Energy-Alternate Sources — 2.8% | | | | | | | | |
| Enviva Partners LP | | | 6,919 | | | | 201,343 | |
| Pattern Energy Group Inc. | | | 9,785 | | | | 183,469 | |
| REX American Resources Corp. (a) | | | 666 | | | | 53,926 | |
| | | | | | | | 438,738 | |
| Pipelines — 8.2% | | | | | | | | |
| Crestwood Equity Partners LP | | | 22,000 | | | | 698,500 | |
| Enterprise Products Partners LP | | | 10,000 | | | | 276,700 | |
| Targa Resources Corp. | | | 6,500 | | | | 321,685 | |
| | | | | | | | 1,296,885 | |
| Total Energy (Cost $1,578,874) | | | | | | | 1,735,623 | |
| Financial — 25.2% | | | | | | | | |
| Banks — 6.9% | | | | | | | | |
| Century Bancorp Inc. | | | 1,241 | | | | 94,812 | |
| Financial Institutions Inc. | | | 5,055 | | | | 166,310 | |
| M&T Bank Corp. | | | 1,000 | | | | 170,150 | |
| QCR Holdings Inc. | | | 1,053 | | | | 49,965 | |
| Republic Bancorp Inc. | | | 2,377 | | | | 107,678 | |
| Sierra Bancorp | | | 2,470 | | | | 69,753 | |
| TriCo Bancshares | | | 4,461 | | | | 167,065 | |
| TrustCo Bank Corp. | | | 10,086 | | | | 89,765 | |
| U.S. Bancorp | | | 3,500 | | | | 175,070 | |
| | | | | | | | 1,090,568 | |
| Diversified Financial Services — 7.8% | | | | | | | | |
Aircastle Ltd. f | | | 28,947 | | | | 593,413 | |
| Federated Investors Inc. | | | 15,000 | | | | 349,800 | |
Lazard Ltd. f | | | 5,792 | | | | 283,287 | |
| | | | | | | | 1,226,500 | |
The accompanying notes are an integral part of the financial statements.
Schedule of Investments (continued)
Quaker Small-Cap Value Fund
June 30, 2018
| | | Number | | | Fair | |
| | | of Shares | | | Value | |
| Common Stocks — 73.9% (Continued) | | | | | | |
| Insurance — 9.1% | | | | | | |
| American Equity Investment | | | | | | |
| Life Holding Co. | | | 7,000 | | | $ | 252,000 | |
| Reinsurance Group of | | | | | | | | |
| America Inc. Cl A | | | 2,202 | | | | 293,923 | |
| Tiptree Inc. | | | 50,000 | | | | 340,000 | |
| Torchmark Corp. | | | 3,123 | | | | 254,243 | |
| Voya Financial Inc. | | | 6,118 | | | | 287,546 | |
| | | | | | | | 1,427,712 | |
| Savings & Loans — 1.4% | | | | | | | | |
| TFS Financial Corp. | | | 14,000 | | | | 220,780 | |
| Total Financial (Cost $3,597,650) | | | | | | | 3,965,560 | |
| Industrial — 8.1% | | | | | | | | |
| Building Materials — 2.3% | | | | | | | | |
| Boise Cascade Co. | | | 3,738 | | | | 167,089 | |
| Owens Corning | | | 3,036 | | | | 192,391 | |
| | | | | | | | 359,480 | |
| Electronics — 2.4% | | | | | | | | |
Orbotech Ltd. (a)f | | | 2,870 | | | | 177,366 | |
| Tech Data Corp. (a) | | | 2,500 | | | | 205,300 | |
| | | | | | | | 382,666 | |
| Engineering & Construction — 0.6% | | | | | | | | |
| Argan Inc. | | | 2,438 | | | | 99,836 | |
| Packaging & Containers — 1.4% | | | | | | | | |
| Crown Holdings Inc. (a) | | | 5,000 | | | | 223,800 | |
| Trucking & Leasing — 1.4% | | | | | | | | |
AerCap Holdings N.V. (a)f | | | 4,000 | | | | 216,600 | |
| Total Industrial (Cost $1,214,773) | | | | | | | 1,282,382 | |
| Technology — 7.0% | | | | | | | | |
| Computers — 4.0% | | | | | | | | |
| Dell Technologies Inc. Cl V (a) | | | 7,500 | | | | 634,350 | |
| Semiconductors — 3.0% | | | | | | | | |
| Cohu Inc. | | | 1,023 | | | | 25,074 | |
| Diodes Inc. (a) | | | 5,982 | | | | 206,199 | |
| Kulicke & Soffa Industries Inc. (a) | | | 5,260 | | | | 125,293 | |
| Micron Technology Inc. (a) | | | 1,000 | | | | 52,440 | |
Nova Measuring Instruments Ltd. (a)f | | | 2,335 | | | | 63,629 | |
| | | | | | | | 472,635 | |
| Total Technology (Cost $893,809) | | | | | | | 1,106,985 | |
| Utilities — 1.3% | | | | | | | | |
| Electric — 1.3% | | | | | | | | |
| NRG Yield Inc. Cl C | | | 11,475 | | | | 197,370 | |
| Total Utilities (Cost $222,468) | | | | | | | 197,370 | |
| Total Common Stocks | | | | | | | | |
| (Cost $10,577,392) | | | | | | | 11,647,148 | |
| | | | | | | | | |
| Closed-End Mutual Funds — 3.1% | | | | | | | | |
| FS Investment Corp. | | | 55,000 | | | | 404,250 | |
| PGIM Global Short Duration | | | | | | | | |
| High Yield Fund Inc. | | | 6,000 | | | | 81,960 | |
| | | | | | | | 486,210 | |
| Total Closed-End Mutual Funds | | | | | | | | |
| (Cost $499,918) | | | | | | | 486,210 | |
| | | | | | | | | |
| Real Estate Investment Trusts — 18.2% | | | | | | | | |
| Apple Hospitality REIT Inc. | | | 10,000 | | | | 178,800 | |
| Blackstone Mortgage Trust Inc. | | | 7,000 | | | | 220,010 | |
| DiamondRock Hospitality Co. | | | 23,568 | | | | 289,415 | |
| Independence Realty Trust Inc. | | | 75,000 | | | | 773,250 | |
| Ryman Hospitality Properties Inc. | | | 1,222 | | | | 101,609 | |
| Starwood Property Trust Inc. | | | 37,000 | | | | 803,270 | |
| WP Carey Inc. | | | 5,000 | | | | 331,750 | |
| Xenia Hotels & Resorts Inc. | | | 7,000 | | | | 170,520 | |
| | | | | | | | 2,868,624 | |
| Total Real Estate Investment Trusts | | | | | | | | |
| (Cost $2,654,905) | | | | | | | 2,868,624 | |
| Total Long-Term Investments | | | | | | | | |
| (Cost $13,732,215) | | | | | | | 15,001,982 | |
| | | | | | | | | |
| Short-Term Investments — 4.2% | | | | | | | | |
| Money Market Fund — 4.2% | | | | | | | | |
| First American Government | | | | | | | | |
| Obligations Fund, Cl X, 1.81% † | | | 661,382 | | | | 661,382 | |
| Total Short-Term Investments | | | | | | | | |
| (Cost $661,382) | | | | | | | 661,382 | |
| Total Investments | | | | | | | | |
| (Cost $14,393,597) — 99.4% | | | | | | | 15,663,364 | |
| Other Assets in Excess | | | | | | | | |
| of Liabilities, Net 0.6% | | | | | | | 89,687 | |
| Total Net Assets — 100.0% | | | | | | $ | 15,753,051 | |
| (a) | Non-income producing security. |
| f | Foreign issued security. |
| † | The rate quoted is the annualized 7 day yield as of June 30, 2018. |
The accompanying notes are an integral part of the financial statements.
Schedule of Investments
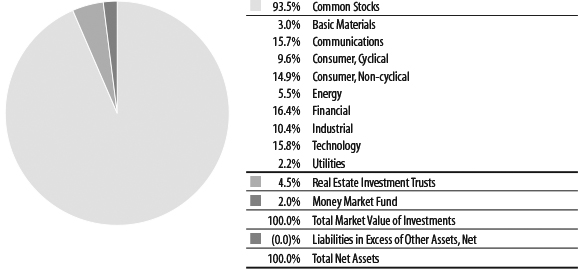
Quaker Strategic Growth Fund
June 30, 2018
| | | Number | | | Fair | |
| | | of Shares | | | Value | |
| Long-Term Investments — 98.0% | | | | | | |
| Common Stocks — 93.5% | | | | | | |
| Basic Materials — 3.0% | | | | | | |
| Chemicals — 2.0% | | | | | | |
| Albemarle Corp. | | | 2,069 | | | $ | 195,169 | |
| Balchem Corp. | | | 2,274 | | | | 223,170 | |
| FMC Corp. | | | 2,710 | | | | 241,759 | |
| Hawkins Inc. | | | 6,579 | | | | 232,568 | |
| Innospec Inc. | | | 3,472 | | | | 265,782 | |
| The Sherwin-Williams Co. | | | 409 | | | | 166,696 | |
| | | | | | | | 1,325,144 | |
| Forest Products & Paper — 1.0% | | | | | | | | |
| International Paper Co. | | | 12,000 | | | | 624,960 | |
| Total Basic Materials | | | | | | | | |
| (Cost $1,976,847) | | | | | | | 1,950,104 | |
| Communications — 15.7% | | | | | | | | |
| Internet — 11.2% | | | | | | | | |
| Alibaba Group Holding | | | | | | | | |
Ltd. — SP-ADR (a) f | | | 1,115 | | | | 206,866 | |
| Alphabet Inc. Cl A (a) | | | 1,060 | | | | 1,196,941 | |
| Alphabet Inc. Cl C (a) | | | 1,128 | | | | 1,258,453 | |
| Amazon.com Inc. (a) | | | 1,200 | | | | 2,039,760 | |
| Booking Holdings Inc. (a) | | | 166 | | | | 336,497 | |
| Facebook Inc. Cl A (a) | | | 8,250 | | | | 1,603,140 | |
| Netflix Inc. (a) | | | 1,000 | | | | 391,430 | |
| The Trade Desk Inc. (a) | | | 2,500 | | | | 234,500 | |
| | | | | | | | 7,267,587 | |
| Media — 1.8% | | | | | | | | |
| Charter Communications Inc. (a) | | | 514 | | | | 150,710 | |
| Comcast Corp. | | | 20,000 | | | | 656,200 | |
| The New York Times Co. | | | 15,000 | | | | 388,500 | |
| | | | | | | | 1,195,410 | |
| Telecommunications — 2.7% | | | | | | | | |
| AT&T Inc. | | | 13,605 | | | | 436,856 | |
| Cisco Systems Inc. | | | 8,125 | | | | 349,619 | |
| Gogo Inc. (a) | | | 15,000 | | | | 72,900 | |
| LogMeIn Inc. | | | 2,115 | | | | 218,374 | |
| Verizon Communications Inc. | | | 13,586 | | | | 683,512 | |
| | | | | | | | 1,761,261 | |
| Total Communications | | | | | | | | |
| (Cost $8,722,407) | | | | | | | 10,224,258 | |
| Consumer, Cyclical — 9.6% | | | | | | | | |
| Airlines — 0.5% | | | | | | | | |
| AMR Corp. Escrow (a)*^ | | | 211,235 | | | | 352,762 | |
| Apparel — 0.3% | | | | | | | | |
adidas AG — SP-ADR f | | | 2,000 | | | | 218,000 | |
| Auto Manufacturers — 1.0% | | | | | | | | |
| Blue Bird Corp. (a) | | | 11,278 | | | | 252,064 | |
| General Motors Co. | | | 5,498 | | | | 216,621 | |
| REV Group Inc. | | | 8,610 | | | | 146,456 | |
| | | | | | | | 615,141 | |
| Auto Parts & Equipment — 1.3% | | | | | | | | |
Aptiv PLC f | | | 2,886 | | | | 264,444 | |
| Gentherm Inc. (a) | | | 5,000 | | | | 196,500 | |
| Motorcar Parts of America Inc. (a) | | | 12,303 | | | | 230,189 | |
| Tenneco Inc. | | | 4,052 | | | | 178,126 | |
| | | | | | | | 869,259 | |
| Distribution & Wholesale — 0.4% | | | | | | | | |
| LKQ Corp. (a) | | | 7,393 | | | | 235,837 | |
| Entertainment — 1.5% | | | | | | | | |
| Six Flags Entertainment Corp. | | | 8,000 | | | | 560,400 | |
| Vail Resorts Inc. | | | 1,565 | | | | 429,107 | |
| | | | | | | | 989,507 | |
| Home Builders — 0.7% | | | | | | | | |
| Lennar Corp. | | | 3,891 | | | | 204,278 | |
| NVR Inc. (a) | | | 80 | | | | 237,628 | |
| | | | | | | | 441,906 | |
| Lodging — 0.4% | | | | | | | | |
| Marriott International Inc. | | | 2,134 | | | | 270,164 | |
| Retail — 3.5% | | | | | | | | |
| Dollar General Corp. | | | 1,200 | | | | 118,320 | |
| Dollar Tree Inc. (a) | | | 1,000 | | | | 85,000 | |
| The Home Depot Inc. | | | 3,584 | | | | 699,238 | |
| Lowe’s Cos. Inc. | | | 2,699 | | | | 257,943 | |
| Ross Stores Inc. | | | 3,412 | | | | 289,167 | |
| Starbucks Corp. | | | 5,957 | | | | 291,000 | |
| The TJX Cos. Inc. | | | 3,050 | | | | 290,299 | |
| Walgreens Boots Alliance Inc. | | | 3,855 | | | | 231,358 | |
| | | | | | | | 2,262,325 | |
| Total Consumer, Cyclical | | | | | | | | |
| (Cost $6,059,809) | | | | | | | 6,254,901 | |
The accompanying notes are an integral part of the financial statements.
Schedule of Investments (continued)
Quaker Strategic Growth Fund
June 30, 2018
| | | Number | | | Fair | |
| | | of Shares | | | Value | |
| Common Stocks — 93.5% (Continued) | | | | | | |
| Consumer, Non-cyclical — 14.9% | | | | | | |
| Beverages — 0.3% | | | | | | |
| Farmer Brothers Co. (a) | | | 6,598 | | | $ | 201,569 | |
| Biotechnology — 3.4% | | | | | | | | |
| Alexion Pharmaceuticals Inc. (a) | | | 1,886 | | | | 234,147 | |
| Amgen Inc. | | | 2,641 | | | | 487,502 | |
| Biogen Inc. (a) | | | 688 | | | | 199,685 | |
| Celgene Corp. (a) | | | 2,884 | | | | 229,047 | |
| Gilead Sciences Inc. | | | 5,000 | | | | 354,200 | |
| Illumina Inc. (a) | | | 985 | | | | 275,100 | |
| Regeneron Pharmaceuticals Inc. (a) | | | 635 | | | | 219,069 | |
| Vertex Pharmaceuticals Inc. (a) | | | 1,432 | | | | 243,383 | |
| | | | | | | | 2,242,133 | |
| Commercial Services — 1.7% | | | | | | | | |
| The Brink’s Co. | | | 5,695 | | | | 454,176 | |
| Cintas Corp. | | | 1,068 | | | | 197,655 | |
IHS Markit Ltd. (a) f | | | 3,648 | | | | 188,200 | |
| PayPal Holdings Inc. (a) | | | 3,243 | | | | 270,045 | |
| | | | | | | | 1,110,076 | |
| Food — 0.7% | | | | | | | | |
| Lamb Weston Holdings Inc. | | | 2,995 | | | | 205,188 | |
| Sprouts Farmers Market Inc. (a) | | | 10,073 | | | | 222,311 | |
| | | | | | | | 427,499 | |
| Healthcare-Products — 5.7% | | | | | | | | |
| Align Technology Inc. (a) | | | 934 | | | | 319,559 | |
| Becton Dickinson and Co. | | | 995 | | | | 238,362 | |
| Boston Scientific Corp. (a) | | | 8,316 | | | | 271,933 | |
| The Cooper Cos. Inc. | | | 960 | | | | 226,032 | |
| DENTSPLY SIRONA Inc. | | | 3,794 | | | | 166,064 | |
| Edwards Lifesciences Corp. (a) | | | 1,716 | | | | 249,798 | |
| Henry Schein Inc. (a) | | | 3,016 | | | | 219,082 | |
| Hologic Inc. (a) | | | 5,723 | | | | 227,489 | |
| IDEXX Laboratories Inc. (a) | | | 1,244 | | | | 271,117 | |
| Intuitive Surgical Inc. (a) | | | 546 | | | | 261,250 | |
Medtronic PLC f | | | 4,522 | | | | 387,129 | |
| Patterson Cos. Inc. | | | 6,614 | | | | 149,940 | |
| Stryker Corp. | | | 1,417 | | | | 239,275 | |
| Thermo Fisher Scientific Inc. | | | 1,452 | | | | 300,767 | |
| Zimmer Biomet Holdings Inc. | | | 1,869 | | | | 208,281 | |
| | | | | | | | 3,736,078 | |
| Healthcare-Services — 1.1% | | | | | | | | |
| HCA Healthcare Inc. | | | 2,215 | | | | 227,259 | |
| IQVIA Holdings Inc. (a) | | | 2,207 | | | | 220,302 | |
| Laboratory Corp. of | | | | | | | | |
| America Holdings (a) | | | 1,292 | | | | 231,953 | |
| | | | | | | | 679,514 | |
| Pharmaceuticals — 2.0% | | | | | | | | |
| AbbVie Inc. | | | 4,421 | | | | 409,606 | |
Allergan PLC f | | | 1,015 | | | | 169,221 | |
| Bristol-Myers Squibb Co. | | | 4,596 | | | | 254,343 | |
Perrigo Co. PLC f | | | 2,552 | | | | 186,066 | |
| Pfizer Inc. | | | 8,566 | | | | 310,774 | |
| | | | | | | | 1,330,010 | |
| Total Consumer, Non-cyclical | | | | | | | | |
| (Cost $9,200,614) | | | | | | | 9,726,879 | |
| Energy — 5.5% | | | | | | | | |
| Energy-Alternate Sources — 4.1% | | | | | | | | |
Canadian Solar Inc. (a) f | | | 12,761 | | | | 156,195 | |
| Enviva Partners LP | | | 3,424 | | | | 99,638 | |
| NextEra Energy Partners LP | | | 8,372 | | | | 390,721 | |
| Pattern Energy Group Inc. | | | 21,256 | | | | 398,550 | |
| Plug Power Inc. (a) | | | 113,424 | | | | 229,117 | |
| SolarEdge Technologies Inc. (a) | | | 6,693 | | | | 320,260 | |
| TerraForm Power Inc. | | | 29,559 | | | | 345,840 | |
| TPI Composites Inc. (a) | | | 12,495 | | | | 365,354 | |
Vestas Wind Systems A/S — ADR f | | | 2,782 | | | | 57,142 | |
| Vivint Solar Inc. (a) | | | 54,979 | | | | 272,146 | |
| | | | | | | | 2,634,963 | |
| Pipelines — 1.4% | | | | | | | | |
| Enterprise Products Partners LP | | | 10,000 | | | | 276,700 | |
| ONEOK Inc. | | | 1,833 | | | | 127,999 | |
| Targa Resources Corp. | | | 10,800 | | | | 534,492 | |
| | | | | | | | 939,191 | |
| Total Energy (Cost $3,199,617) | | | | | | | 3,574,154 | |
| Financial — 16.4% | | | | | | | | |
| Banks — 10.8% | | | | | | | | |
| Bank of America Corp. | | | 28,000 | | | | 789,320 | |
| Bank of Hawaii Corp. | | | 1,688 | | | | 140,813 | |
| BB&T Corp. | | | 2,614 | | | | 131,850 | |
| BOK Financial Corp. | | | 1,477 | | | | 138,853 | |
| Camden National Corp. | | | 3,271 | | | | 149,517 | |
| Chemical Financial Corp. | | | 2,513 | | | | 139,899 | |
The accompanying notes are an integral part of the financial statements.
Schedule of Investments (continued)
Quaker Strategic Growth Fund
June 30, 2018
| | | Number | | | Fair | |
| | | of Shares | | | Value | |
| Common Stocks — 93.5% (Continued) | | | | | | |
| Banks (Continued) | | | | | | |
| Citigroup Inc. | | | 7,501 | | | $ | 501,967 | |
| Citizens Financial Group Inc. | | | 3,152 | | | | 122,613 | |
| Comerica Inc. | | | 1,485 | | | | 135,016 | |
| Commerce Bancshares Inc. | | | 2,423 | | | | 156,792 | |
| Fifth Third Bancorp | | | 4,296 | | | | 123,295 | |
| First Hawaiian Inc. | | | 250 | | | | 7,255 | |
| First Interstate BancSystem Inc. | | | 3,472 | | | | 146,518 | |
| First Midwest Bancorp Inc. | | | 5,676 | | | | 144,568 | |
| JPMorgan Chase & Co. | | | 9,742 | | | | 1,015,116 | |
| KeyCorp | | | 6,729 | | | | 131,485 | |
| Lakeland Bancorp Inc. | | | 7,105 | | | | 141,034 | |
| M&T Bank Corp. | | | 750 | | | | 127,613 | |
| MB Financial Inc. | | | 3,427 | | | | 160,041 | |
| Mercantile Bank Corp. | | | 4,108 | | | | 151,832 | |
| Morgan Stanley | | | 6,174 | | | | 292,648 | |
| Nicolet Bankshares Inc. (a) | | | 2,584 | | | | 142,404 | |
| Old National Bancorp | | | 8,055 | | | | 149,823 | |
| The PNC Financial Services Group Inc. | | | 910 | | | | 122,941 | |
| Seacoast Banking Corp. of Florida (a) | | | 5,646 | | | | 178,301 | |
| Southside Bancshares Inc. | | | 4,071 | | | | 137,111 | |
| State Street Corp. | | | 1,361 | | | | 126,696 | |
| TCF Financial Corp. | | | 6,492 | | | | 159,833 | |
| Tompkins Financial Corp. | | | 1,749 | | | | 150,204 | |
| TowneBank | | | 4,811 | | | | 154,433 | |
| TriState Capital Holdings Inc. (a) | | | 6,090 | | | | 158,949 | |
| Triumph Bancorp Inc. (a) | | | 3,603 | | | | 146,822 | |
| Trustmark Corp. | | | 4,478 | | | | 146,117 | |
| UMB Financial Corp. | | | 1,873 | | | | 142,779 | |
| U.S. Bancorp | | | 2,567 | | | | 128,401 | |
| WesBanco Inc. | | | 3,335 | | | | 150,208 | |
| | | | | | | | 7,043,067 | |
| Diversified Financial Services — 2.9% | | | | | | | | |
| BlackRock Inc. | | | 264 | | | | 131,746 | |
| The Charles Schwab Corp. | | | 2,720 | | | | 138,992 | |
| CME Group Inc. | | | 865 | | | | 141,791 | |
| Intercontinental Exchange Inc. | | | 2,020 | | | | 148,571 | |
| Mastercard Inc. Cl A | | | 3,138 | | | | 616,680 | |
| Raymond James Financial Inc. | | | 371 | | | | 33,149 | |
| Visa Inc. Cl A | | | 4,956 | | | | 656,422 | |
| | | | | | | | 1,867,351 | |
| Insurance — 2.0% | | | | | | | | |
| Berkshire Hathaway Inc. Cl B (a) | | | 5,639 | | | | 1,052,520 | |
Chubb Ltd. f | | | 958 | | | | 121,685 | |
| Prudential Financial Inc. | | | 1,285 | | | | 120,160 | |
| | | | | | | | 1,294,365 | |
| Savings & Loans — 0.7% | | | | | | | | |
| Beneficial Bancorp Inc. | | | 9,026 | | | | 146,221 | |
| OceanFirst Financial Corp. | | | 5,310 | | | | 159,088 | |
| Provident Financial Services Inc. | | | 5,476 | | | | 150,754 | |
| | | | | | | | 456,063 | |
| Total Financial (Cost $9,199,780) | | | | | | | 10,660,846 | |
| Industrial — 10.4% | | | | | | | | |
| Building Materials — 2.6% | | | | | | | | |
| Apogee Enterprises Inc. | | | 5,433 | | | | 261,708 | |
| Forterra Inc. (a) | | | 15,881 | | | | 154,522 | |
Johnson Controls International PLC f | | | 6,172 | | | | 206,453 | |
| Lennox International Inc. | | | 981 | | | | 196,347 | |
| Owens Corning | | | 2,710 | | | | 171,733 | |
| PGT Innovations Inc. (a) | | | 13,108 | | | | 273,302 | |
| Quanex Building Products Corp. | | | 10,699 | | | | 192,047 | |
| Trex Co. Inc. (a) | | | 4,194 | | | | 262,502 | |
| | | | | | | | 1,718,614 | |
| Electrical Components & Equipment — 0.3% | | | | | | | | |
| Advanced Energy Industries Inc. (a) | | | 3,544 | | | | 205,871 | |
| Electronics — 2.8% | | | | | | | | |
| Agilent Technologies Inc. | | | 2,410 | | | | 149,034 | |
| Badger Meter Inc. | | | 3,548 | | | | 158,596 | |
| Control4 Corp. (a) | | | 9,371 | | | | 227,809 | |
| ESCO Technologies Inc. | | | 2,665 | | | | 153,771 | |
| II-VI Inc. (a) | | | 5,278 | | | | 229,329 | |
| PerkinElmer Inc. | | | 2,922 | | | | 213,978 | |
| Tech Data Corp. (a) | | | 6,000 | | | | 492,720 | |
| Woodward Inc. | | | 2,312 | | | | 177,700 | |
| | | | | | | | 1,802,937 | |
| Engineering & Construction — 0.7% | | | | | | | | |
| Argan Inc. | | | 4,208 | | | | 172,317 | |
| Comfort Systems U.S.A. Inc. | | | 5,702 | | | | 261,152 | |
| | | | | | | | 433,469 | |
The accompanying notes are an integral part of the financial statements.
Schedule of Investments (continued)
Quaker Strategic Growth Fund
June 30, 2018
| | | Number | | | Fair | |
| | | of Shares | | | Value | |
| Common Stocks — 93.5% (Continued) | | | | | | |
| Environmental Control — 0.9% | | | | | | |
| Energy Recovery Inc. (a) | | | 23,036 | | | $ | 186,131 | |
| Hudson Technologies Inc. (a) | | | 40,089 | | | | 80,579 | |
| US Ecology Inc. | | | 4,727 | | | | 301,110 | |
| | | | | | | | 567,820 | |
| Hand & Machine Tools — 0.3% | | | | | | | | |
| Franklin Electric Co. Inc. | | | 3,867 | | | | 174,402 | |
| Machinery-Construction & Mining — 0.2% | | | | | | | | |
| Hyster Yale Materials Handling Inc. | | | 2,519 | | | | 161,846 | |
| Machinery-Diversified — 1.5% | | | | | | | | |
| Columbus McKinnon Corp. | | | 4,703 | | | | 203,922 | |
| Cummins Inc. | | | 1,393 | | | | 185,269 | |
| IDEX Corp. | | | 1,492 | | | | 203,628 | |
| Wabtec Corp. | | | 2,291 | | | | 225,847 | |
| Xylem Inc. | | | 2,293 | | | | 154,502 | |
| | | | | | | | 973,168 | |
| Miscellaneous Manufacturing — 0.8% | | | | | | | | |
| A.O. Smith Corp. | | | 2,661 | | | | 157,398 | |
| Donaldson Co. Inc. | | | 3,517 | | | | 158,687 | |
| Federal Signal Corp. | | | 8,699 | | | | 202,600 | |
| | | | | | | | 518,685 | |
| Packaging & Containers — 0.3% | | | | | | | | |
| Crown Holdings Inc. (a) | | | 5,000 | | | | 223,800 | |
| Total Industrial (Cost $6,669,453) | | | | | | | 6,780,612 | |
| Technology — 15.8% | | | | | | | | |
| Computers — 5.6% | | | | | | | | |
| Apple Inc. | | | 14,250 | | | | 2,637,818 | |
| Dell Technologies Inc. Cl V (a) | | | 10,500 | | | | 888,090 | |
| Western Digital Corp. | | | 2,000 | | | | 154,820 | |
| | | | | | | | 3,680,728 | |
| Semiconductors — 3.9% | | | | | | | | |
| Analog Devices Inc. | | | 2,327 | | | | 223,206 | |
| Applied Materials Inc. | | | 3,332 | | | | 153,905 | |
| Broadcom Inc. | | | 1,350 | | | | 327,564 | |
| Intel Corp. | | | 13,000 | | | | 646,230 | |
| KLA-Tencor Corp. | | | 1,651 | | | | 169,277 | |
| Lam Research Corp. | | | 1,144 | | | | 197,740 | |
| Micron Technology Inc. (a) | | | 2,700 | | | | 141,588 | |
| NVIDIA Corp. | | | 1,700 | | | | 402,730 | |
| Skyworks Solutions Inc. | | | 951 | | | | 91,914 | |
| Veeco Instruments Inc. (a) | | | 11,360 | | | | 161,880 | |
| | | | | | | | 2,516,034 | |
| Software — 6.3% | | | | | | | | |
| Adobe Systems Inc. (a) | | | 1,717 | | | | 418,622 | |
| Cerner Corp. (a) | | | 3,484 | | | | 208,308 | |
| Electronic Arts Inc. (a) | | | 2,619 | | | | 369,331 | |
| ImageWare Systems Inc. (a) | | | 75,000 | | | | 81,750 | |
| Microsoft Corp. | | | 21,910 | | | | 2,160,545 | |
| MINDBODY Inc. (a) | | | 7,354 | | | | 283,864 | |
| Paychex Inc. | | | 5,099 | | | | 348,517 | |
| salesforce.com Inc. (a) | | | 1,884 | | | | 256,978 | |
| | | | | | | | 4,127,915 | |
| Total Technology | | | | | | | | |
| (Cost $8,022,208) | | | | | | | 10,324,677 | |
| Utilities — 2.2% | | | | | | | | |
| Electric — 2.2% | | | | | | | | |
Atlantica Yield PLC f | | | 6,503 | | | | 131,231 | |
Brookfield Renewable Partners LP f | | | 10,276 | | | | 308,794 | |
| NextEra Energy Inc. | | | 2,199 | | | | 367,299 | |
| NRG Yield Inc. Cl A | | | 2,609 | | | | 44,483 | |
| NRG Yield Inc. Cl C | | | 18,189 | | | | 312,851 | |
| Ormat Technologies Inc. | | | 5,116 | | | | 272,120 | |
| | | | | | | | 1,436,778 | |
| Total Utilities (Cost $1,503,108) | | | | | | | 1,436,778 | |
| Total Common Stocks | | | | | | | | |
| (Cost $54,553,843) | | | | | | | 60,933,209 | |
| | | | | | | | | |
| Real Estate Investment Trusts — 4.5% | | | | | | | | |
| American Tower Corp. | | | 1,211 | | | | 174,590 | |
| Community Healthcare Trust Inc. | | | 15,144 | | | | 452,351 | |
| Education Realty Trust Inc. | | | 6,348 | | | | 263,442 | |
| Equinix Inc. | | | 765 | | | | 328,866 | |
| Healthcare Realty Trust Inc. | | | 5,826 | | | | 169,420 | |
| Independence Realty Trust Inc. | | | 65,000 | | | | 670,150 | |
| Physicians Realty Trust | | | 12,996 | | | | 207,156 | |
| Starwood Property Trust Inc. | | | 10,000 | | | | 217,100 | |
| Ventas Inc. | | | 3,922 | | | | 223,358 | |
| Weyerhaeuser Co. | | | 5,760 | | | | 210,010 | |
| | | | | | | | 2,916,443 | |
| Total Real Estate Investment Trusts | | | | | | | | |
| (Cost $2,661,519) | | | | | | | 2,916,443 | |
| Total Long-Term Investments | | | | | | | | |
| (Cost $57,215,362) | | | | | | | 63,849,652 | |
The accompanying notes are an integral part of the financial statements.
Schedule of Investments (continued)
Quaker Strategic Growth Fund
June 30, 2018
| | | Number | | | Fair | |
| | | of Shares | | | Value | |
| Short-Term Investments — 2.0% | | | | | | |
| Money Market Fund — 2.0% | | | | | | |
| First American Government | | | | | | |
| Obligations Fund, Cl X, 1.81% † | | | 1,285,235 | | | $ | 1,285,235 | |
| Total Short-Term Investments | | | | | | | | |
| (Cost $1,285,235) | | | | | | | 1,285,235 | |
| Total Investments | | | | | | | | |
| (Cost $58,500,597) — 100.0% | | | | | | | 65,134,887 | |
| Liabilities in Excess of | | | | | | | | |
| Other Assets, Net (0.0%) | | | | | | | (11,575 | ) |
| Total Net Assets — 100.0% | | | | | | $ | 65,123,312 | |
ADR - American Depositary Receipt
SP-ADR - Sponsored American Depositary Receipt
| (a) | Non-income producing security. |
| f | Foreign issued security. |
| † | The rate quoted is the annualized 7 day yield as of June 30, 2018. |
| * | Indicates an illiquid security. Total market value for illiquid securities is $352,762, representing 0.5% of net assets. |
| ^ | Indicates a fair valued security. Total market value for fair valued securities is $352,762, representing 0.5% of net assets and Level 3 securities. |
The accompanying notes are an integral part of the financial statements.
Statements of Assets and Liabilities
June 30, 2018
| | | Quaker | | | Quaker | | | Quaker | | | Quaker | |
| | | Global Tactical | | | Mid-Cap | | | Small-Cap | | | Strategic | |
| | | Allocation Fund | | | Value Fund | | | Value Fund | | | Growth Fund | |
| ASSETS: | | | | | | | | | | | | |
| Investments, at value | | $ | 2,611,337 | | | $ | 5,470,368 | | | $ | 15,663,364 | | | $ | 65,134,887 | |
| Due from advisor | | | 364 | | | | 464 | | | | — | | | | 63 | |
| Receivables: | | | | | | | | | | | | | | | | |
| Dividends and interest | | | 8,351 | | | | 10,605 | | | | 61,251 | | | | 40,098 | |
| Capital shares sold | | | — | | | | 21 | | | | 134 | | | | 602 | |
| Investment securities sold | | | — | | | | 87,634 | | | | 256,070 | | | | 163,544 | |
| Prepaid expenses and other assets | | | 7,766 | | | | 15,485 | | | | 50,422 | | | | 171,140 | |
| Total assets | | | 2,627,818 | | | | 5,584,577 | | | | 16,031,241 | | | | 65,510,334 | |
| | | | | | | | | | | | | | | | | |
| LIABILITIES: | | | | | | | | | | | | | | | | |
| Payables: | | | | | | | | | | | | | | | | |
| Due to advisor (Note 3) | | $ | 212 | | | $ | 581 | | | $ | 11,969 | | | $ | 6,703 | |
| Capital shares redeemed | | | 3,984 | | | | — | | | | 50 | | | | 9,584 | |
| Investment securities purchased | | | 34,313 | | | | — | | | | 219,906 | | | | 219,906 | |
| Distribution fees | | | 956 | | | | 2,500 | | | | 2,064 | | | | 20,294 | |
| Chief compliance officer fees | | | 217 | | | | 489 | | | | 1,337 | | | | 5,457 | |
| Audit fees | | | 2,931 | | | | 3,807 | | | | 15,038 | | | | 39,271 | |
| Funds administration and accounting fees | | | 1,631 | | | | 3,053 | | | | 10,402 | | | | 30,098 | |
| Legal fees | | | 1,418 | | | | 1,377 | | | | 5,064 | | | | 11,149 | |
| Transfer agent fees | | | 1,709 | | | | 3,462 | | | | 9,279 | | | | 38,285 | |
| Accrued expenses | | | 294 | | | | 536 | | | | 3,081 | | | | 6,275 | |
| Total liabilities | | | 47,665 | | | | 15,805 | | | | 278,190 | | | | 387,022 | |
| Net assets | | $ | 2,580,153 | | | $ | 5,568,772 | | | $ | 15,753,051 | | | $ | 65,123,312 | |
| | | | | | | | | | | | | | | | | |
| NET ASSETS CONSIST OF: | | | | | | | | | | | | | | | | |
| Paid-in capital | | $ | 2,538,954 | | | $ | 4,480,898 | | | $ | 11,129,152 | | | $ | 58,927,972 | |
| Accumulated net investment income (loss) | | | (2,780 | ) | | | (31,549 | ) | | | (17,820 | ) | | | (386,290 | ) |
| Accumulated net realized gain (loss) on investments | | | 14,829 | | | | (4,196 | ) | | | 3,371,952 | | | | (52,660 | ) |
| Net unrealized appreciation (depreciation) on investments: | | | | | | | | | | | | | | | | |
| Securities | | | 29,150 | | | | 1,123,619 | | | | 1,269,767 | | | | 6,634,290 | |
| Total net assets | | $ | 2,580,153 | | | $ | 5,568,772 | | | $ | 15,753,051 | | | $ | 65,123,312 | |
| Total investments, at cost | | $ | 2,582,187 | | | $ | 4,346,749 | | | $ | 14,393,597 | | | $ | 58,500,597 | |
| Class A shares: | | | | | | | | | | | | | | | | |
| Net assets | | $ | 1,290,318 | | | $ | 3,196,306 | | | $ | 4,737,302 | | | $ | 44,964,198 | |
Shares of beneficial interest outstanding(1) | | | 118,620 | | | | 102,682 | | | | 203,931 | | | | 1,410,943 | |
| Net asset value per share and redemption price per share | | $ | 10.88 | | | $ | 31.13 | | | $ | 23.23 | | | $ | 31.87 | |
| Offering price per share | | | | | | | | | | | | | | | | |
| (100/94.50 x net asset value per share) | | $ | 11.51 | | | $ | 32.94 | | | $ | 24.58 | | | $ | 33.72 | |
| Class C shares: | | | | | | | | | | | | | | | | |
| Net assets | | $ | 817,470 | | | $ | 1,340,830 | | | $ | 1,268,734 | | | $ | 11,119,772 | |
Shares of beneficial interest outstanding(1) | | | 81,127 | | | | 50,243 | | | | 71,822 | | | | 406,930 | |
| Net asset value per share and redemption price per share | | $ | 10.08 | | | $ | 26.69 | | | $ | 17.66 | | | $ | 27.33 | |
| Institutional Class Shares: | | | | | | | | | | | | | | | | |
| Net assets | | $ | 472,365 | | | $ | 1,031,636 | | | $ | 9,747,015 | | | $ | 9,039,342 | |
Shares of beneficial interest outstanding(1) | | | 37,436 | | | | 31,340 | | | | 392,608 | | | | 270,657 | |
| Net asset value per share and redemption price per share | | $ | 12.62 | | | $ | 32.92 | | | $ | 24.83 | | | $ | 33.40 | |
(1) | Unlimited number of shares of beneficial interest with a 0.01 par value authorized. |
The accompanying notes are an integral part of the financial statements.
Statements of Operations
For the Fiscal Year Ended June 30, 2018
| | | Quaker | | | Quaker | | | Quaker | | | Quaker | |
| | | Global Tactical | | | Mid-Cap | | | Small-Cap | | | Strategic | |
| | | Allocation Fund | | | Value Fund | | | Value Fund | | | Growth Fund | |
| INVESTMENT INCOME (LOSS) | | | | | | | | | | | | |
| Income: | | | | | | | | | | | | |
| Dividends (net of foreign withholding taxes) | | $ | 76,287 | | | $ | 103,412 | | | $ | 360,568 | | | $ | 1,025,090 | |
| Interest | | | 74,430 | | | | 1,212 | | | | 6,980 | | | | 11,312 | |
| Securities lending income, net | | | — | | | | 2,909 | | | | 9,408 | | | | 6,862 | |
| Total Income | | | 150,717 | | | | 107,533 | | | | 376,956 | | | | 1,043,264 | |
| Expenses: | | | | | | | | | | | | | | | | |
| Investment advisory fees (Note 3) | | | 36,968 | | | | 57,232 | | | | 240,727 | | | | 526,899 | |
| Funds administration and accounting fees | | | 17,772 | | | | 18,647 | | | | 72,055 | | | | 170,710 | |
| Transfer agent fees | | | 15,126 | | | | 20,591 | | | | 57,773 | | | | 213,496 | |
| Custody fees | | | 1,167 | | | | 1,521 | | | | 10,702 | | | | 14,027 | |
| Trustee fees | | | 3,775 | | | | 5,166 | | | | 19,752 | | | | 52,716 | |
| Legal fees | | | 6,240 | | | | 7,740 | | | | 31,660 | | | | 76,433 | |
| Audit fees | | | 2,966 | | | | 3,845 | | | | 15,180 | | | | 39,636 | |
| Distribution fee — Class A | | | 3,707 | | | | 9,477 | | | | 13,924 | | | | 118,782 | |
| Distribution fee — Class C | | | 8,943 | | | | 15,030 | | | | 12,515 | | | | 120,257 | |
| Insurance | | | 6,866 | | | | 7,271 | | | | 29,278 | | | | 74,278 | |
| Officers’ compensation fees | | | 6,838 | | | | 9,292 | | | | 35,951 | | | | 96,633 | |
| Registration and filing expenses | | | 10,049 | | | | 10,719 | | | | 43,767 | | | | 109,956 | |
| Printing expenses | | | 4,888 | | | | 4,485 | | | | 8,346 | | | | 30,293 | |
| Interest Expense | | | 920 | | | | — | | | | 309 | | | | — | |
| Other operating expenses | | | 2,133 | | | | 2,057 | | | | 2,111 | | | | 2,301 | |
| Total expenses | | | 128,358 | | | | 173,073 | | | | 594,050 | | | | 1,646,417 | |
| Investment advisory fees reimbursed (Note 3) | | | (15,115 | ) | | | — | | | | — | | | | — | |
| Net expenses | | | 113,243 | | | | 173,073 | | | | 594,050 | | | | 1,646,417 | |
| Net investment income (loss) | | | 37,474 | | | | (65,540 | ) | | | (217,094 | ) | | | (603,153 | ) |
| | | | | | | | | | | | | | | | | |
| REALIZED AND UNREALIZED GAIN (LOSS) ON INVESTMENTS | | | | | | | | | | | | | | | | |
| Net realized gain (loss) on investments: | | | | | | | | | | | | | | | | |
| Securities | | | 110,086 | | | | 1,030,662 | | | | 4,365,650 | | | | 10,964,744 | |
| Foreign currency transactions | | | 6 | | | | — | | | | 5 | | | | — | |
| Net realized gain (loss) on investments | | | 110,092 | | | | 1,030,662 | | | | 4,365,655 | | | | 10,964,744 | |
| Net change in unrealized appreciation | | | | | | | | | | | | | | | | |
| (depreciation) of investments: | | | | | | | | | | | | | | | | |
| Securities | | | 9,353 | | | | (225,625 | ) | | | (1,278,703 | ) | | | (1,070,288 | ) |
| Foreign currency transactions | | | (2 | ) | | | — | | | | (12 | ) | | | — | |
| Net change in unrealized appreciation | | | | | | | | | | | | | | | | |
| (depreciation) of investments | | | 9,351 | | | | (225,625 | ) | | | (1,278,715 | ) | | | (1,070,288 | ) |
| Net realized and unrealized gain (loss) on investments | | | 119,443 | | | | 805,037 | | | | 3,086,940 | | | | 9,894,456 | |
| Net increase (decrease) in net | | | | | | | | | | | | | | | | |
| assets resulting from operations | | $ | 156,917 | | | $ | 739,497 | | | $ | 2,869,846 | | | $ | 9,291,303 | |
| (Foreign withholding taxes on | | | | | | | | | | | | | | | | |
| dividends/tax reclaims/interest) | | $ | (619 | ) | | $ | — | | | $ | (1,066 | ) | | $ | (1,469 | ) |
The accompanying notes are an integral part of the financial statements.
(This Page Intentionally Left Blank.)
Statements of Changes in Net Assets
For the Fiscal Year Ended June 30, 2018
| | | Quaker | | | Quaker | | | Quaker | | | Quaker | |
| | | Global Tactical | | | Mid-Cap | | | Small-Cap | | | Strategic | |
| | | Allocation Fund | | | Value Fund | | | Value Fund | | | Growth Fund | |
| INCREASE (DECREASE) IN NET ASSETS | | | | | | | | | | | | |
| Operations: | | | | | | | | | | | | |
| Net investment income (loss) | | $ | 37,474 | | | $ | (65,540 | ) | | $ | (217,094 | ) | | $ | (603,153 | ) |
| Net realized gain (loss) on investment transactions: | | | | | | | | | | | | | | | | |
| Securities | | | 110,086 | | | | 1,030,662 | | | | 4,365,650 | | | | 10,964,744 | |
| Foreign currency transactions | | | 6 | | | | — | | | | 5 | | | | — | |
| Net change in unrealized appreciation | | | | | | | | | | | | | | | | |
| (depreciation) of investment transactions: | | | | | | | | | | | | | | | | |
| Securities | | | 9,353 | | | | (225,625 | ) | | | (1,278,703 | ) | | | (1,070,288 | ) |
| Foreign currency transactions | | | (2 | ) | | | — | | | | (12 | ) | | | — | |
| Net increase (decrease) in net | | | | | | | | | | | | | | | | |
| assets resulting from operations | | | 156,917 | | | | 739,497 | | | | 2,869,846 | | | | 9,291,303 | |
| Distributions to shareholders from: | | | | | | | | | | | | | | | | |
| Net realized capital gain — Class A | | | — | | | | — | | | | (816,102 | ) | | | — | |
| Net realized capital gain — Class C | | | — | | | | — | | | | (221,639 | ) | | | — | |
| Net realized capital gain — Institutional Class | | | — | | | | — | | | | (3,013,329 | ) | | | — | |
| Total distributions | | | — | | | | — | | | | (4,051,070 | ) | | | — | |
| Capital share transactions: | | | | | | | | | | | | | | | | |
| Increase (decrease) in net assets | | | | | | | | | | | | | | | | |
| from fund share transactions (Note 8) | | | (4,370,384 | ) | | | (2,259,532 | ) | | | (11,754,070 | ) | | | (15,718,541 | ) |
| Total increase (decrease) in net assets | | | (4,213,467 | ) | | | (1,520,035 | ) | | | (12,935,294 | ) | | | (6,427,238 | ) |
| | | | | | | | | | | | | | | | | |
| NET ASSETS | | | | | | | | | | | | | | | | |
| Beginning of year | | | 6,793,620 | | | | 7,088,807 | | | | 28,688,345 | | | | 71,550,550 | |
| End of year | | $ | 2,580,153 | | | $ | 5,568,772 | | | $ | 15,753,051 | | | $ | 65,123,312 | |
| Undistributed (Accumulated) net investment | | | | | | | | | | | | | | | | |
| income (loss), at end of year | | $ | (2,780 | ) | | $ | (31,549 | ) | | $ | (17,820 | ) | | $ | (386,290 | ) |
The accompanying notes are an integral part of the financial statements.
Statements of Changes in Net Assets (continued)
For the Fiscal Year Ended June 30, 2017
| | | Quaker | | | Quaker | | | Quaker | | | Quaker | |
| | | Global Tactical | | | Mid-Cap | | | Small-Cap | | | Strategic | |
| | | Allocation Fund | | | Value Fund | | | Value Fund | | | Growth Fund | |
| INCREASE (DECREASE) IN NET ASSETS | | | | | | | | | | | | |
| Operations: | | | | | | | | | | | | |
| Net investment income (loss) | | $ | 2,518 | | | $ | (55,798 | ) | | $ | (234,855 | ) | | $ | (302,466 | ) |
| Net realized gain (loss) on investment transactions: | | | | | | | | | | | | | | | | |
| Securities | | | 619,944 | | | | 489,697 | | | | 4,469,004 | | | | 8,397,117 | |
| Securities sold short | | | (1,932 | ) | | | — | | | | — | | | | — | |
| Foreign currency transactions | | | — | | | | — | | | | 13 | | | | — | |
| Net change in unrealized appreciation | | | | | | | | | | | | | | | | |
| (depreciation) of investment transactions: | | | | | | | | | | | | | | | | |
| Securities | | | (161,513 | ) | | | 806,946 | | | | 1,680,019 | | | | 4,165,653 | |
| Foreign currency transactions | | | 2 | | | | — | | | | 10 | | | | — | |
| Net increase (decrease) in net | | | | | | | | | | | | | | | | |
| assets resulting from operations | | | 459,019 | | | | 1,240,845 | | | | 5,914,191 | | | | 12,260,304 | |
| Capital share transactions: | | | | | | | | | | | | | | | | |
| Increase (decrease) in net assets | | | | | | | | | | | | | | | | |
| from fund share transactions (Note 8) | | | (404,319 | ) | | | (1,056,973 | ) | | | (9,776,060 | ) | | | (26,700,407 | ) |
| Total increase (decrease) in net assets | | | 54,700 | | | | 183,872 | | | | (3,861,869 | ) | | | (14,440,103 | ) |
| | | | | | | | | | | | | | | | | |
| NET ASSETS | | | | | | | | | | | | | | | | |
| Beginning of year | | | 6,738,920 | | | | 6,904,935 | | | | 32,550,214 | | | | 85,990,653 | |
| End of year | | $ | 6,793,620 | | | $ | 7,088,807 | | | $ | 28,688,345 | | | $ | 71,550,550 | |
| Undistributed (Accumulated) net investment | | | | | | | | | | | | | | | | |
| income (loss), at end of year | | $ | (4,759 | ) | | $ | (29,423 | ) | | $ | — | | | $ | (5,631 | ) |
The accompanying notes are an integral part of the financial statements.
Financial Highlights
Quaker Global Tactical Allocation Fund
(For a Share Outstanding Throughout each Year)
| | | Class A | |
| | | Years Ended June 30, | |
| | | 2018 | | | 2017 | | | 2016 | | | 2015 | | | 2014 | |
| Net asset value, beginning of year | | $ | 10.62 | | | $ | 9.95 | | | $ | 11.51 | | | $ | 10.46 | | | $ | 8.30 | |
| Income from investment operations: | | | | | | | | | | | | | | | | | | | | |
Net investment income (loss)(1) | | | 0.08 | | | 0.00 | ^ | | | (0.14 | ) | | | (0.11 | ) | | | (0.08 | ) |
| Net realized and unrealized | | | | | | | | | | | | | | | | | | | | |
| gain (loss) on investments | | | 0.18 | | | | 0.67 | | | | (1.42 | ) | | | 1.16 | | | | 2.24 | |
| Total from investment operations | | | 0.26 | | | | 0.67 | | | | (1.56 | ) | | | 1.05 | | | | 2.16 | |
| Distributions to shareholders from: | | | | | | | | | | | | | | | | | | | | |
| Net investment income | | | — | | | | — | | | | — | | | | — | | | | — | |
| Net realized capital gain | | | — | | | | — | | | | — | | | | — | | | | — | |
| Total distributions | | | — | | | | — | | | | — | | | | — | | | | — | |
| Net asset value, end of year | | $ | 10.88 | | | $ | 10.62 | | | $ | 9.95 | | | $ | 11.51 | | | $ | 10.46 | |
Total Return(2) | | | 2.45 | % | | | 6.73 | % | | | (13.55 | )% | | | 10.04 | % | | | 26.02 | % |
| Ratios/supplemental data: | | | | | | | | | | | | | | | | | | | | |
| Net assets, end of year (000’ omitted) | | $ | 1,290 | | | $ | 1,706 | | | $ | 3,184 | | | $ | 5,707 | | | $ | 3,992 | |
| Ratio of expenses to average net assets: | | | | | | | | | | | | | | | | | | | | |
Expense before reductions(3)(4) | | | 2.55 | % | | | 2.35 | % | | | 2.42 | % | | | 2.27 | % | | | 2.19 | % |
Expense net of fee waivers, if any(3) | | | 2.25 | % | | | 2.16 | % | | | 2.42 | % | | | 2.27 | % | | | 2.19 | % |
| Ratio of net investment income (loss) | | | | | | | | | | | | | | | | | | | | |
| to average net assets: | | | | | | | | | | | | | | | | | | | | |
Before waiver and expense reimbursement(3) | | | 0.44 | % | | | (0.15 | )% | | | (1.30 | )%* | | | (1.03 | )%* | | | (0.80 | )%* |
After waiver and expense reimbursement(3) | | | 0.74 | % | | | 0.04 | % | | | (1.30 | )%* | | | (1.03 | )%* | | | (0.80 | )%* |
| Portfolio turnover rate | | | 56 | % | | | 184 | % | | | 211 | % | | | 125 | % | | | 130 | % |
| (1) | The average shares outstanding method has been applied for per share information. |
| (2) | Total investment return is based on the change in net asset value of a share during the year, assumes reinvestment of dividends and distributions at net asset value and does not reflect the impact of a sales charge. |
| (3) | Expenses waived or reimbursed reflect reductions to total expenses, as discussed in the notes to the financial statements. These amounts would increase the net investment loss ratio or decrease the net investment income ratio, as applicable, had such reductions not occurred. |
| (4) | Ratio of expenses (excluding dividend and interest expense for securities sold short) were 2.41%, 2.25% and 2.15% for the years ended June 30, 2016, 2015 and 2014, respectively. |
| ^ | Amount is less than 0.005 per share. |
| * | The net investment income (loss) ratios include dividends on short positions. |
The accompanying notes are an integral part of the financial statements.
Financial Highlights
Quaker Global Tactical Allocation Fund
(For a Share Outstanding Throughout each Year)
| | | Class C | |
| | | Years Ended June 30, | |
| | | 2018 | | | 2017 | | | 2016 | | | 2015 | | | 2014 | |
| Net asset value, beginning of year | | $ | 9.91 | | | $ | 9.36 | | | $ | 10.91 | | | $ | 9.99 | | | $ | 7.98 | |
| Income from investment operations: | | | | | | | | | | | | | | | | | | | | |
Net investment income (loss)(1) | | (0.00 | )^ | | | (0.07 | ) | | | (0.20 | ) | | | (0.19 | ) | | | (0.14 | ) |
| Net realized and unrealized | | | | | | | | | | | | | | | | | | | | |
| gain (loss) on investments | | | 0.17 | | | | 0.62 | | | | (1.35 | ) | | | 1.11 | | | | 2.15 | |
| Total from investment operations | | | 0.17 | | | | 0.55 | | | | (1.55 | ) | | | 0.92 | | | | 2.01 | |
| Distributions to shareholders from: | | | | | | | | | | | | | | | | | | | | |
| Net investment income | | | — | | | | — | | | | — | | | | — | | | | — | |
| Net realized capital gain | | | — | | | | — | | | | — | | | | — | | | | — | |
| Total distributions | | | — | | | | — | | | | — | | | | — | | | | — | |
| Net asset value, end of year | | $ | 10.08 | | | $ | 9.91 | | | $ | 9.36 | | | $ | 10.91 | | | $ | 9.99 | |
Total Return(2) | | | 1.72 | % | | | 5.88 | % | | | (14.21 | )% | | | 9.21 | % | | | 25.19 | % |
| Ratios/supplemental data: | | | | | | | | | | | | | | | | | | | | |
| Net assets, end of year (000’ omitted) | | $ | 818 | | | $ | 1,041 | | | $ | 1,497 | | | $ | 1,851 | | | $ | 2,093 | |
| Ratio of expenses to average net assets: | | | | | | | | | | | | | | | | | | | | |
Expense before reductions(3)(4) | | | 3.30 | % | | | 3.10 | % | | | 3.17 | % | | | 3.02 | % | | | 2.94 | % |
Expense net of fee waivers, if any(3) | | | 3.00 | % | | | 2.91 | % | | | 3.17 | % | | | 3.02 | % | | | 2.94 | % |
| Ratio of net investment income (loss) | | | | | | | | | | | | | | | | | | | | |
| to average net assets: | | | | | | | | | | | | | | | | | | | | |
Before waiver and expense reimbursement(3) | | | (0.31 | )% | | | (0.90 | )% | | | (2.05 | )%* | | | (1.78 | )%* | | | (1.55 | )%* |
After waiver and expense reimbursement(3) | | | (0.01 | )% | | | (0.71 | )% | | | (2.05 | )%* | | | (1.78 | )%* | | | (1.55 | )%* |
| Portfolio turnover rate | | | 56 | % | | | 184 | % | | | 211 | % | | | 125 | % | | | 130 | % |
| (1) | The average shares outstanding method has been applied for per share information. |
| (2) | Total investment return is based on the change in net asset value of a share during the year, assumes reinvestment of dividends and distributions at net asset value and does not reflect the impact of a sales charge. |
| (3) | Expenses waived or reimbursed reflect reductions to total expenses, as discussed in the notes to the financial statements. These amounts would increase the net investment loss ratio or decrease the net investment income ratio, as applicable, had such reductions not occurred. |
| (4) | Ratio of expenses (excluding dividend and interest expense for securities sold short) were 3.16%, 3.00% and 2.90%% for the years ended June 30, 2016, 2015 and 2014, respectively. |
| ^ | Amount is less than 0.005 per share. |
| * | The net investment income (loss) ratios include dividends on short positions. |
The accompanying notes are an integral part of the financial statements.
Financial Highlights
Quaker Global Tactical Allocation Fund
(For a Share Outstanding Throughout each Year)
| | | Institutional Class | |
| | | Years Ended June 30, | |
| | | 2018 | | | 2017 | | | 2016 | | | 2015 | | | 2014 | |
| Net asset value, beginning of year | | $ | 12.27 | | | $ | 11.47 | | | $ | 13.23 | | | $ | 12.00 | | | $ | 9.49 | |
| Income from investment operations: | | | | | | | | | | | | | | | | | | | | |
Net investment income (loss)(1) | | | 0.12 | | | | 0.03 | | | | (0.13 | ) | | | (0.10 | ) | | | (0.06 | ) |
| Net realized and unrealized | | | | | | | | | | | | | | | | | | | | |
| gain (loss) on investments | | | 0.23 | | | | 0.77 | | | | (1.63 | ) | | | 1.33 | | | | 2.57 | |
| Total from investment operations | | | 0.35 | | | | 0.80 | | | | (1.76 | ) | | | 1.23 | | | | 2.51 | |
| Distributions to shareholders from: | | | | | | | | | | | | | | | | | | | | |
| Net investment income | | | — | | | | — | | | | — | | | | — | | | | — | |
| Net realized capital gain | | | — | | | | — | | | | — | | | | — | | | | — | |
| Total distributions | | | — | | | | — | | | | — | | | | — | | | | — | |
| Net asset value, end of year | | $ | 12.62 | | | $ | 12.27 | | | $ | 11.47 | | | $ | 13.23 | | | $ | 12.00 | |
Total Return(2) | | | 2.85 | % | | | 6.97 | % | | | (13.30 | )% | | | 10.25 | % | | | 26.45 | % |
| Ratios/supplemental data: | | | | | | | | | | | | | | | | | | | | |
| Net assets, end of year (000’ omitted) | | $ | 472 | | | $ | 4,047 | | | $ | 2,058 | | | $ | 1,474 | | | $ | 1,240 | |
| Ratio of expenses to average net assets: | | | | | | | | | | | | | | | | | | | | |
Expense before reductions(3)(4) | | | 2.30 | % | | | 2.10 | % | | | 2.17 | % | | | 2.02 | % | | | 1.94 | % |
Expense net of fee waivers, if any(3) | | | 2.00 | % | | | 1.91 | % | | | 2.17 | % | | | 2.02 | % | | | 1.94 | % |
| Ratio of net investment income (loss) | | | | | | | | | | | | | | | | | | | | |
| to average net assets: | | | | | | | | | | | | | | | | | | | | |
Before waiver and expense reimbursement(3) | | | 0.69 | % | | | 0.10 | % | | | (1.05 | )%* | | | (0.78 | )%* | | | (0.55 | )%* |
After waiver and expense reimbursement(3) | | | 0.99 | % | | | 0.29 | % | | | (1.05 | )%* | | | (0.78 | )%* | | | (0.55 | )%* |
| Portfolio turnover rate | | | 56 | % | | | 184 | % | | | 211 | % | | | 125 | % | | | 130 | % |
| (1) | The average shares outstanding method has been applied for per share information. |
| (2) | Total investment return is based on the change in net asset value of a share during the year, assumes reinvestment of dividends and distributions at net asset value and does not reflect the impact of a sales charge. |
| (3) | Expenses waived or reimbursed reflect reductions to total expenses, as discussed in the notes to the financial statements. These amounts would increase the net investment loss ratio or decrease the net investment income ratio, as applicable, had such reductions not occurred. |
| (4) | Ratio of expenses (excluding dividend and interest expense for securities sold short) were 2.16%, 2.00% and 1.90% for the years ended June 30, 2016, 2015 and 2014, respectively. |
| * | The net investment income (loss) ratios include dividends on short positions. |
The accompanying notes are an integral part of the financial statements.
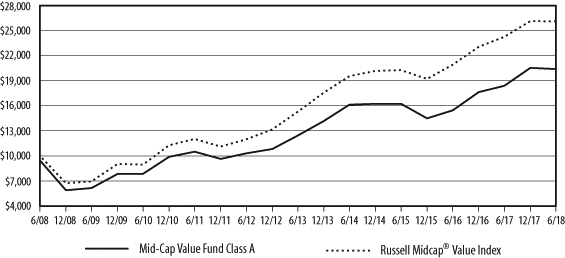
Financial Highlights
Quaker Mid-Cap Value Fund
(For a Share Outstanding Throughout each Year)
| | | Class A | |
| | | Years Ended June 30, | |
| | | 2018 | | | 2017 | | | 2016 | | | 2015 | | | 2014 | |
| Net asset value, beginning of year | | $ | 28.06 | | | $ | 23.58 | | | $ | 24.78 | | | $ | 24.62 | | | $ | 18.99 | |
| Income from investment operations: | | | | | | | | | | | | | | | | | | | | |
Net investment income (loss)(1) | | | (0.26 | ) | | | (0.17 | ) | | | (0.06 | ) | | | (0.10 | ) | | | (0.09 | ) |
| Net realized and unrealized | | | | | | | | | | | | | | | | | | | | |
| gain (loss) on investments | | | 3.33 | | | | 4.65 | | | | (1.14 | ) | | | 0.26 | | | | 5.72 | |
| Total from investment operations | | | 3.07 | | | | 4.48 | | | | (1.20 | ) | | | 0.16 | | | | 5.63 | |
| Distributions to shareholders from: | | | | | | | | | | | | | | | | | | | | |
| Net investment income | | | — | | | | — | | | | — | | | | — | | | | — | |
| Net realized capital gain | | | — | | | | — | | | | — | | | | — | | | | — | |
| Total distributions | | | — | | | | — | | | | — | | | | — | | | | — | |
| Net asset value, end of year | | $ | 31.13 | | | $ | 28.06 | | | $ | 23.58 | | | $ | 24.78 | | | $ | 24.62 | |
Total Return(2) | | | 10.94 | % | | | 19.00 | % | | | (4.84 | )% | | | 0.65 | % | | | 29.65 | % |
| Ratios/supplemental data: | | | | | | | | | | | | | | | | | | | | |
| Net assets, end of year (000’ omitted) | | $ | 3,196 | | | $ | 4,081 | | | $ | 4,057 | | | $ | 5,520 | | | $ | 5,724 | |
| Ratio of expenses to average net assets | | | 2.49 | % | | | 2.39 | % | | | 2.17 | % | | | 1.98 | % | | | 2.03 | % |
| Ratio of net investment income (loss) | | | | | | | | | | | | | | | | | | | | |
| to average net assets | | | (0.87 | )% | | | (0.66 | )% | | | (0.26 | )% | | | (0.39 | )% | | | (0.42 | )% |
| Portfolio turnover rate | | | 34 | % | | | 28 | % | | | 71 | % | | | 49 | % | | | 62 | % |
| (1) | The average shares outstanding method has been applied for per share information. |
| (2) | Total investment return is based on the change in net asset value of a share during the year, assumes reinvestment of dividends and distributions at net asset value and does not reflect the impact of a sales charge. |
The accompanying notes are an integral part of the financial statements.
Financial Highlights
Quaker Mid-Cap Value Fund
(For a Share Outstanding Throughout each Year)
| | | Class C | |
| | | Years Ended June 30, | |
| | | 2018 | | | 2017 | | | 2016 | | | 2015 | | | 2014 | |
| Net asset value, beginning of year | | $ | 24.24 | | | $ | 20.52 | | | $ | 21.73 | | | $ | 21.75 | | | $ | 16.91 | |
| Income from investment operations: | | | | | | | | | | | | | | | | | | | | |
Net investment income (loss)(1) | | | (0.42 | ) | | | (0.32 | ) | | | (0.20 | ) | | | (0.25 | ) | | | (0.22 | ) |
| Net realized and unrealized | | | | | | | | | | | | | | | | | | | | |
| gain (loss) on investments | | | 2.87 | | | | 4.04 | | | | (1.01 | ) | | | 0.23 | | | | 5.06 | |
| Total from investment operations | | | 2.45 | | | | 3.72 | | | | (1.21 | ) | | | (0.02 | ) | | | 4.84 | |
| Distributions to shareholders from: | | | | | | | | | | | | | | | | | | | | |
| Net investment income | | | — | | | | — | | | | — | | | | — | | | | — | |
| Net realized capital gain | | | — | | | | — | | | | — | | | | — | | | | — | |
| Total distributions | | | — | | | | — | | | | — | | | | — | | | | — | |
| Net asset value, end of year | | $ | 26.69 | | | $ | 24.24 | | | $ | 20.52 | | | $ | 21.73 | | | $ | 21.75 | |
Total Return(2) | | | 10.11 | % | | | 18.13 | % | | | (5.57 | )% | | | (0.09 | )% | | | 28.62 | % |
| Ratios/supplemental data: | | | | | | | | | | | | | | | | | | | | |
| Net assets, end of year (000’ omitted) | | $ | 1,341 | | | $ | 1,526 | | | $ | 1,565 | | | $ | 1,944 | | | $ | 2,086 | |
| Ratio of expenses to average net assets | | | 3.24 | % | | | 3.14 | % | | | 2.92 | % | | | 2.73 | % | | | 2.78 | % |
| Ratio of net investment income (loss) | | | | | | | | | | | | | | | | | | | | |
| to average net assets | | | (1.62 | )% | | | (1.41 | )% | | | (1.01 | )% | | | (1.14 | )% | | | (1.17 | )% |
| Portfolio turnover rate | | | 34 | % | | | 28 | % | | | 71 | % | | | 49 | % | | | 62 | % |
| (1) | The average shares outstanding method has been applied for per share information. |
| (2) | Total investment return is based on the change in net asset value of a share during the year, assumes reinvestment of dividends and distributions at net asset value and does not reflect the impact of a sales charge. |
The accompanying notes are an integral part of the financial statements.
Financial Highlights
Quaker Mid-Cap Value Fund
(For a Share Outstanding Throughout each Year)
| | | Institutional Class | |
| | | Years Ended June 30, | |
| | | 2018 | | | 2017 | | | 2016 | | | 2015 | | | 2014 | |
| Net asset value, beginning of year | | $ | 29.60 | | | $ | 24.81 | | | $ | 26.01 | | | $ | 25.77 | | | $ | 19.83 | |
| Income from investment operations: | | | | | | | | | | | | | | | | | | | | |
Net investment income (loss)(1) | | | (0.20 | ) | | | (0.11 | ) | | (0.00 | )^ | | | (0.04 | ) | | | (0.04 | ) |
| Net realized and unrealized | | | | | | | | | | | | | | | | | | | | |
| gain (loss) on investments | | | 3.52 | | | | 4.90 | | | | (1.20 | ) | | | 0.28 | | | | 5.98 | |
| Total from investment operations | | | 3.32 | | | | 4.79 | | | | (1.20 | ) | | | 0.24 | | | | 5.94 | |
| Distributions to shareholders from: | | | | | | | | | | | | | | | | | | | | |
| Net investment income | | | — | | | | — | | | | — | | | | — | | | | — | |
| Net realized capital gain | | | — | | | | — | | | | — | | | | — | | | | — | |
| Total distributions | | | — | | | | — | | | | — | | | | — | | | | — | |
| Net asset value, end of year | | $ | 32.92 | | | $ | 29.60 | | | $ | 24.81 | | | $ | 26.01 | | | $ | 25.77 | |
Total Return(2) | | | 11.22 | % | | | 19.31 | % | | | (4.61 | )% | | | 0.93 | % | | | 29.95 | % |
| Ratios/supplemental data: | | | | | | | | | | | | | | | | | | | | |
| Net assets, end of year (000’ omitted) | | $ | 1,032 | | | $ | 1,482 | | | $ | 1,283 | | | $ | 1,504 | | | $ | 2,216 | |
| Ratio of expenses to average net assets | | | 2.24 | % | | | 2.14 | % | | | 1.92 | % | | | 1.73 | % | | | 1.78 | % |
| Ratio of net investment income (loss) | | | | | | | | | | | | | | | | | | | | |
| to average net assets | | | (0.62 | )% | | | (0.41 | )% | | | (0.01 | )% | | | (0.14 | )% | | | (0.17 | )% |
| Portfolio turnover rate | | | 34 | % | | | 28 | % | | | 71 | % | | | 49 | % | | | 62 | % |
| (1) | The average shares outstanding method has been applied for per share information. |
| (2) | Total investment return is based on the change in net asset value of a share during the year, assumes reinvestment of dividends and distributions at net asset value and does not reflect the impact of a sales charge. |
| ^ | Amount is less than 0.005 per share. |
The accompanying notes are an integral part of the financial statements.
Financial Highlights
Quaker Small-Cap Value Fund
(For a Share Outstanding Throughout each Year)
| | | Class A | |
| | | Years Ended June 30, | |
| | | 2018 | | | 2017 | | | 2016 | | | 2015 | | | 2014 | |
| Net asset value, beginning of year | | $ | 24.13 | | | $ | 20.09 | | | $ | 24.15 | | | $ | 24.28 | | | $ | 19.50 | |
| Income from investment operations: | | | | | | | | | | | | | | | | | | | | |
Net investment income (loss)(1) | | | (0.23 | ) | | | (0.20 | ) | | | (0.08 | ) | | | (0.06 | ) | | | (0.11 | ) |
| Net realized and unrealized | | | | | | | | | | | | | | | | | | | | |
| gain (loss) on investments | | | 3.03 | | | | 4.24 | | | | (2.26 | ) | | | 1.22 | | | | 4.95 | |
| Total from investment operations | | | 2.80 | | | | 4.04 | | | | (2.34 | ) | | | 1.16 | | | | 4.84 | |
| Distributions to shareholders from: | | | | | | | | | | | | | | | | | | | | |
| Net investment income | | | — | | | | — | | | | — | | | | — | | | | (0.06 | ) |
| Net realized capital gain | | | (3.70 | ) | | | — | | | | (1.72 | ) | | | (1.29 | ) | | | — | |
| Total distributions | | | (3.70 | ) | | | — | | | | (1.72 | ) | | | (1.29 | ) | | | (0.06 | ) |
| Net asset value, end of year | | $ | 23.23 | | | $ | 24.13 | | | $ | 20.09 | | | $ | 24.15 | | | $ | 24.28 | |
Total Return(2) | | | 12.07 | % | | | 20.11 | % | | | (9.93 | )% | | | 4.96 | % | | | 24.83 | % |
| Ratios/supplemental data: | | | | | | | | | | | | | | | | | | | | |
Net assets, end of year (000’ omitted) | | $ | 4,737 | | | $ | 6,434 | | | $ | 6,431 | | | $ | 7,790 | | | $ | 8,512 | |
| Ratio of expenses to average net assets | | | 2.44 | % | | | 2.21 | % | | | 1.93 | % | | | 1.78 | % | | | 1.83 | % |
| Ratio of net investment income (loss) | | | | | | | | | | | | | | | | | | | | |
| to average net assets | | | (0.99 | )% | | | (0.89 | )% | | | (0.37 | )% | | | (0.26 | )% | | | (0.47 | )% |
| Portfolio turnover rate | | | 122 | % | | | 146 | % | | | 119 | % | | | 128 | % | | | 176 | % |
| (1) | The average shares outstanding method has been applied for per share information. |
| (2) | Total investment return is based on the change in net asset value of a share during the year, assumes reinvestment of dividends and distributions at net asset value and does not reflect the impact of a sales charge. |
The accompanying notes are an integral part of the financial statements.
Financial Highlights
Quaker Small-Cap Value Fund
(For a Share Outstanding Throughout each Year)
| | | Class C | |
| | | Years Ended June 30, | |
| | | 2018 | | | 2017 | | | 2016 | | | 2015 | | | 2014 | |
| Net asset value, beginning of year | | $ | 19.30 | | | $ | 16.19 | | | $ | 19.96 | | | $ | 20.43 | | | $ | 16.49 | |
| Income from investment operations: | | | | | | | | | | | | | | | | | | | | |
Net investment income (loss)(1) | | | (0.32 | ) | | | (0.30 | ) | | | (0.19 | ) | | | (0.20 | ) | | | (0.23 | ) |
| Net realized and unrealized | | | | | | | | | | | | | | | | | | | | |
| gain (loss) on investments | | | 2.38 | | | | 3.41 | | | | (1.86 | ) | | | 1.02 | | | | 4.17 | |
| Total from investment operations | | | 2.06 | | | | 3.11 | | | | (2.05 | ) | | | 0.82 | | | | 3.94 | |
| Distributions to shareholders from: | | | | | | | | | | | | | | | | | | | | |
| Net investment income | | | — | | | | — | | | | — | | | | — | | | | — | |
| Net realized capital gain | | | (3.70 | ) | | | — | | | | (1.72 | ) | | | (1.29 | ) | | | — | |
| Total distributions | | | (3.70 | ) | | | — | | | | (1.72 | ) | | | (1.29 | ) | | | — | |
| Net asset value, end of year | | $ | 17.66 | | | $ | 19.30 | | | $ | 16.19 | | | $ | 19.96 | | | $ | 20.43 | |
Total Return(2) | | | 11.23 | % | | | 19.21 | % | | | (10.59 | )% | | | 4.20 | % | | | 23.89 | % |
| Ratios/supplemental data: | | | | | | | | | | | | | | | | | | | | |
| Net assets, end of year (000’ omitted) | | $ | 1,269 | | | $ | 1,302 | | | $ | 1,477 | | | $ | 1,684 | | | $ | 1,806 | |
| Ratio of expenses to average net assets | | | 3.19 | % | | | 2.96 | % | | | 2.68 | % | | | 2.53 | % | | | 2.58 | % |
| Ratio of net investment income (loss) | | | | | | | | | | | | | | | | | | | | |
| to average net assets | | | (1.74 | )% | | | (1.64 | )% | | | (1.12 | )% | | | (1.01 | )% | | | (1.22 | )% |
| Portfolio turnover rate | | | 122 | % | | | 146 | % | | | 119 | % | | | 128 | % | | | 176 | % |
| (1) | The average shares outstanding method has been applied for per share information. |
| (2) | Total investment return is based on the change in net asset value of a share during the year, assumes reinvestment of dividends and distributions at net asset value and does not reflect the impact of a sales charge. |
The accompanying notes are an integral part of the financial statements.
Financial Highlights
Quaker Small-Cap Value Fund
(For a Share Outstanding Throughout each Year)
| | | Institutional Class | |
| | | Years Ended June 30, | |
| | | 2018 | | | 2017 | | | 2016 | | | 2015 | | | 2014 | |
| Net asset value, beginning of year | | $ | 25.49 | | | $ | 21.17 | | | $ | 25.29 | | | $ | 25.30 | | | $ | 20.29 | |
| Income from investment operations: | | | | | | | | | | | | | | | | | | | | |
Net investment income (loss)(1) | | | (0.19 | ) | | | (0.15 | ) | | | (0.03 | ) | | (0.00 | )^ | | | (0.05 | ) |
| Net realized and unrealized | | | | | | | | | | | | | | | | | | | | |
| gain (loss) on investments | | | 3.23 | | | | 4.47 | | | | (2.37 | ) | | | 1.28 | | | | 5.14 | |
| Total from investment operations | | | 3.04 | | | | 4.32 | | | | (2.40 | ) | | | 1.28 | | | | 5.09 | |
| Distributions to shareholders from: | | | | | | | | | | | | | | | | | | | | |
| Net investment income | | | — | | | | — | | | | — | | | | — | | | | (0.08 | ) |
| Net realized capital gain | | | (3.70 | ) | | | — | | | | (1.72 | ) | | | (1.29 | ) | | | — | |
| Total distributions | | | (3.70 | ) | | | — | | | | (1.72 | ) | | | (1.29 | ) | | | (0.08 | ) |
| Net asset value, end of year | | $ | 24.83 | | | $ | 25.49 | | | $ | 21.17 | | | $ | 25.29 | | | $ | 25.30 | |
Total Return(2) | | | 12.39 | % | | | 20.41 | % | | | (9.71 | )% | | | 5.24 | % | | | 25.13 | % |
| Ratios/supplemental data: | | | | | | | | | | | | | | | | | | | | |
| Net assets, end of year (000’ omitted) | | $ | 9,747 | | | $ | 20,952 | | | $ | 24,642 | | | $ | 28,528 | | | $ | 27,868 | |
| Ratio of expenses to average net assets | | | 2.19 | % | | | 1.96 | % | | | 1.68 | % | | | 1.53 | % | | | 1.58 | % |
| Ratio of net investment income (loss) | | | | | | | | | | | | | | | | | | | | |
| to average net assets | | | (0.74 | )% | | | (0.64 | )% | | | (0.12 | )% | | | (0.01 | )% | | | (0.22 | )% |
| Portfolio turnover rate | | | 122 | % | | | 146 | % | | | 119 | % | | | 128 | % | | | 176 | % |
| (1) | The average shares outstanding method has been applied for per share information. |
| (2) | Total investment return is based on the change in net asset value of a share during the year, assumes reinvestment of dividends and distributions at net asset value and does not reflect the impact of a sales charge. |
| ^ | Amount is less than 0.005 per share. |
The accompanying notes are an integral part of the financial statements.
Financial Highlights
Quaker Strategic Growth Fund
(For a Share Outstanding Throughout each Year)
| | | Class A | |
| | | Years Ended June 30, | |
| | | 2018 | | | 2017 | | | 2016 | | | 2015 | | | 2014 | |
| Net asset value, beginning of year | | $ | 27.86 | | | $ | 23.80 | | | $ | 26.55 | | | $ | 24.19 | | | $ | 19.31 | |
| Income from investment operations: | | | | | | | | | | | | | | | | | | | | |
Net investment income (loss)(1) | | | (0.24 | ) | | | (0.07 | ) | | | (0.32 | ) | | | (0.30 | ) | | | (0.26 | ) |
| Net realized and unrealized | | | | | | | | | | | | | | | | | | | | |
| gain (loss) on investments | | | 4.25 | | | | 4.13 | | | | (2.43 | ) | | | 2.66 | | | | 5.14 | |
| Total from investment operations | | | 4.01 | | | | 4.06 | | | | (2.75 | ) | | | 2.36 | | | | 4.88 | |
| Distributions to shareholders from: | | | | | | | | | | | | | | | | | | | | |
| Net investment income | | | — | | | | — | | | | — | | | | — | | | | — | |
| Net realized capital gain | | | — | | | | — | | | | — | | | | — | | | | — | |
| Total distributions | | | — | | | | — | | | | — | | | | — | | | | — | |
| Net asset value, end of year | | $ | 31.87 | | | $ | 27.86 | | | $ | 23.80 | | | $ | 26.55 | | | $ | 24.19 | |
Total Return(2) | | | 14.39 | % | | | 17.01 | % | | | (10.36 | )% | | | 9.76 | % | | | 25.27 | % |
| Ratios/supplemental data: | | | | | | | | | | | | | | | | | | | | |
| Net assets, end of year (000’ omitted) | | $ | 44,964 | | | $ | 49,859 | | | $ | 57,159 | | | $ | 77,188 | | | $ | 87,053 | |
| Ratio of expenses to average net assets: | | | | | | | | | | | | | | | | | | | | |
Before expense reimbursements or recoveries(3)(4) | | | 2.30 | % | | | 2.34 | % | | | 2.30 | % | | | 2.12 | % | | | 2.15 | % |
After expense reimbursements or recoveries(3)(5) | | | 2.30 | % | | | 2.22 | % | | | 2.24 | % | | | 2.24 | % | | | 2.24 | % |
| Ratio of net investment income (loss) | | | | | | | | | | | | | | | | | | | | |
| to average net assets: | | | | | | | | | | | | | | | | | | | | |
Before expense reimbursements or recoveries(3) | | | (0.78 | )% | | | (0.40 | )% | | | (1.34 | )%* | | | (1.06 | )% | | | (1.06 | )% |
After expense reimbursements or recoveries(3) | | | (0.78 | )% | | | (0.28 | )% | | | (1.28 | )%* | | | (1.18 | )% | | | (1.15 | )% |
| Portfolio turnover rate | | | 119 | % | | | 185 | % | | | 211 | % | | | 149 | % | | | 170 | % |
| (1) | The average shares outstanding method has been applied for per share information. |
| (2) | Total investment return is based on the change in net asset value of a share during the year, assumes reinvestment of dividends and distributions at net asset value and does not reflect the impact of a sales charge. |
| (3) | Expense waived or reimbursed reflect reductions to total expenses, as discussed in the notes to the financial statements. These reimbursed amounts would increase the net investment loss ratio or decrease the net investment income ratio and recovered amounts would decrease the net investment loss ratio or increase the net investment income ratio, as applicable, had such reductions or increases not occurred. |
| (4) | Expenses before reductions (excluding dividend and interest expense for securities sold short) were 2.29% for the year ended June 30, 2016. |
| (5) | Expenses net of all reductions (excluding dividend and interest expense for securities sold short) were 2.23% for the year ended June 30, 2016. |
| * | The net investment income (loss) ratios include dividends on short positions. |
The accompanying notes are an integral part of the financial statements.
Financial Highlights
Quaker Strategic Growth Fund
(For a Share Outstanding Throughout each Year)
| | | Class C | |
| | | Years Ended June 30, | |
| | | 2018 | | | 2017 | | | 2016 | | | 2015 | | | 2014 | |
| Net asset value, beginning of year | | $ | 24.07 | | | $ | 20.72 | | | $ | 23.28 | | | $ | 21.37 | | | $ | 17.19 | |
| Income from investment operations: | | | | | | | | | | | | | | | | | | | | |
Net investment income (loss)(1) | | | (0.40 | ) | | | (0.23 | ) | | | (0.44 | ) | | | (0.43 | ) | | | (0.37 | ) |
| Net realized and unrealized | | | | | | | | | | | | | | | | | | | | |
| gain (loss) on investments | | | 3.66 | | | | 3.58 | | | | (2.12 | ) | | | 2.34 | | | | 4.55 | |
| Total from investment operations | | | 3.26 | | | | 3.35 | | | | (2.56 | ) | | | 1.91 | | | | 4.18 | |
| Distributions to shareholders from: | | | | | | | | | | | | | | | | | | | | |
| Net investment income | | | — | | | | — | | | | — | | | | — | | | | — | |
| Net realized capital gain | | | — | | | | — | | | | — | | | | — | | | | — | |
| Total distributions | | | — | | | | — | | | | — | | | | — | | | | — | |
| Net asset value, end of year | | $ | 27.33 | | | $ | 24.07 | | | $ | 20.72 | | | $ | 23.28 | | | $ | 21.37 | |
Total Return(2) | | | 13.54 | % | | | 16.17 | % | | | (11.00 | )% | | | 8.94 | % | | | 24.32 | % |
| Ratios/supplemental data: | | | | | | | | | | | | | | | | | | | | |
| Net assets, end of year (000’ omitted) | | $ | 11,120 | | | $ | 12,687 | | | $ | 15,375 | | | $ | 20,140 | | | $ | 22,931 | |
| Ratio of expenses to average net assets: | | | | | | | | | | | | | | | | | | | | |
Before expense reimbursements or recoveries(3)(4) | | | 3.05 | % | | | 3.09 | % | | | 3.05 | % | | | 2.87 | % | | | 2.90 | % |
After expense reimbursements or recoveries(3)(5) | | | 3.05 | % | | | 2.97 | % | | | 2.99 | % | | | 2.99 | % | | | 2.99 | % |
| Ratio of net investment income (loss) | | | | | | | | | | | | | | | | | | | | |
| to average net assets: | | | | | | | | | | | | | | | | | | | | |
Before expense reimbursements or recoveries(3) | | | (1.53 | )% | | | (1.15 | )% | | | (2.09 | )%* | | | (1.81 | )% | | | (1.81 | )% |
After expense reimbursements or recoveries(3) | | | (1.53 | )% | | | (1.03 | )% | | | (2.03 | )%* | | | (1.93 | )% | | | (1.90 | )% |
| Portfolio turnover rate | | | 119 | % | | | 185 | % | | | 211 | % | | | 149 | % | | | 170 | % |
| (1) | The average shares outstanding method has been applied for per share information. |
| (2) | Total investment return is based on the change in net asset value of a share during the year, assumes reinvestment of dividends and distributions at net asset value and does not reflect the impact of a sales charge. |
| (3) | Expense waived or reimbursed reflect reductions to total expenses, as discussed in the notes to the financial statements. These reimbursed amounts would increase the net investment loss ratio or decrease the net investment income ratio and recovered amounts would decrease the net investment loss ratio or increase the net investment income ratio, as applicable, had such reductions or increases not occurred. |
| (4) | Expenses before reductions (excluding dividend and interest expense for securities sold short) were 3.04% for the year ended June 30, 2016. |
| (5) | Expenses net of all reductions (excluding dividend and interest expense for securities sold short) were 2.98% for the year ended June 30, 2016. |
| * | The net investment income (loss) ratios include dividends on short positions. |
The accompanying notes are an integral part of the financial statements.
Financial Highlights
Quaker Strategic Growth Fund
(For a Share Outstanding Throughout each Year)
| | | Institutional Class | |
| | | Years Ended June 30, | |
| | | 2018 | | | 2017 | | | 2016 | | | 2015 | | | 2014 | |
| Net asset value, beginning of year | | $ | 29.12 | | | $ | 24.82 | | | $ | 27.62 | | | $ | 25.10 | | | $ | 19.99 | |
| Income from investment operations: | | | | | | | | | | | | | | | | | | | | |
Net investment income (loss)(1) | | | (0.17 | ) | | | (0.01 | ) | | | (0.27 | ) | | | (0.25 | ) | | | (0.21 | ) |
| Net realized and unrealized | | | | | | | | | | | | | | | | | | | | |
| gain (loss) on investments | | | 4.45 | | | | 4.31 | | | | (2.53 | ) | | | 2.77 | | | | 5.32 | |
| Total from investment operations | | | 4.28 | | | | 4.30 | | | | (2.80 | ) | | | 2.52 | | | | 5.11 | |
| Distributions to shareholders from: | | | | | | | | | | | | | | | | | | | | |
| Net investment income | | | — | | | | — | | | | — | | | | — | | | | — | |
| Net realized capital gain | | | — | | | | — | | | | — | | | | — | | | | — | |
| Total distributions | | | — | | | | — | | | | — | | | | — | | | | — | |
| Net asset value, end of year | | $ | 33.40 | | | $ | 29.12 | | | $ | 24.82 | | | $ | 27.62 | | | $ | 25.10 | |
Total Return(2) | | | 14.70 | % | | | 17.32 | % | | | (10.14 | )% | | | 10.04 | % | | | 25.56 | % |
| Ratios/supplemental data: | | | | | | | | | | | | | | | | | | | | |
| Net assets, end of year (000’ omitted) | | $ | 9,039 | | | $ | 9,005 | | | $ | 13,457 | | | $ | 66,521 | | | $ | 58,999 | |
| Ratio of expenses to average net assets: | | | | | | | | | | | | | | | | | | | | |
Before expense reimbursements or recoveries(3)(4) | | | 2.05 | % | | | 2.09 | % | | | 2.05 | % | | | 1.87 | % | | | 1.90 | % |
After expense reimbursements or recoveries(3)(5) | | | 2.05 | % | | | 1.97 | % | | | 1.99 | % | | | 1.99 | % | | | 1.99 | % |
| Ratio of net investment income (loss) | | | | | | | | | | | | | | | | | | | | |
| to average net assets: | | | | | | | | | | | | | | | | | | | | |
Before expense reimbursements or recoveries(3) | | | (0.53 | )% | | | (0.15 | )% | | | (1.09 | )%* | | | (0.81 | )% | | | (0.81 | )% |
After expense reimbursements or recoveries(3) | | | (0.53 | )% | | | (0.03 | )% | | | (1.03 | )%* | | | (0.93 | )% | | | (0.90 | )% |
| Portfolio turnover rate | | | 119 | % | | | 185 | % | | | 211 | % | | | 149 | % | | | 170 | % |
| (1) | The average shares outstanding method has been applied for per share information. |
| (2) | Total investment return is based on the change in net asset value of a share during the year, assumes reinvestment of dividends and distributions at net asset value and does not reflect the impact of a sales charge. |
| (3) | Expense waived or reimbursed reflect reductions to total expenses, as discussed in the notes to the financial statements. These reimbursed amounts would increase the net investment loss ratio or decrease the net investment income ratio and recovered amounts would decrease the net investment loss ratio or increase the net investment income ratio, as applicable, had such reductions or increases not occurred. |
| (4) | Expenses before reductions (excluding dividend and interest expense for securities sold short) were 2.04% for the year ended June 30, 2016. |
| (5) | Expenses net of all reductions (excluding dividend and interest expense for securities sold short) were 1.98% for the year ended June 30, 2016. |
| * | The net investment income (loss) ratios include dividends on short positions. |
The accompanying notes are an integral part of the financial statements.
Notes to the Financial Statements
Note 1 — Organization
The Quaker Investment Trust (“Trust”), a diversified, open-end management investment company, was organized as a Massachusetts business trust on October 24, 1990, and is registered under the Investment Company Act of 1940, as amended (“1940 Act”). The Trust’s Amended and Restated Declaration of Trust permits the Trustees to issue an unlimited number of shares of beneficial interest. The Trust currently has four series: Quaker Global Tactical Allocation Fund (“Global Tactical Allocation”), Quaker Mid-Cap Value Fund (“Mid-Cap Value”), Quaker Small-Cap Value Fund (“Small-Cap Value”) and Quaker Strategic Growth Fund (“Strategic Growth”) (each a “Fund” and collectively, “Funds”). All Funds are diversified. The investment objectives of each Fund are set forth below. On January 1, 2018, Community Capital Management, Inc. (“CCM”) became the new investment adviser to the Funds. On June 22, 2018, the Quaker Event Arbitrage Fund moved to the Frank Funds Trust.
Strategic Growth and Small-Cap Value commenced operations on November 25, 1996. Mid-Cap Value commenced operations on December 31, 1997. Global Tactical Allocation commenced operations on May 1, 2008. The investment objective of these Funds is to seek long-term growth of capital. The investment objective of these funds is non-fundamental in that this objective may be changed by the Board of Trustees (“Board” or “Trustees”) without shareholder approval. Each Fund is an investment company and accordingly follows the investment company accounting and reporting guidance of the Financial Accounting Standards Board (“FASB”) Accounting Standards Codification Topic 946 “Financial Services – Investment Companies.”
The Funds currently offer three classes of shares (Class A, Class C and Institutional Class shares). Class A shares are charged a front-end sales charge and a distribution and servicing fee; Class C shares are charged a distribution fee, but bear no front-end sales charge or contingent deferred sales charge (“CDSC”); and Institutional Class shares bear no front-end sales charge or CDSC, but have higher minimum investment thresholds. CCM, the investment adviser to each of the Funds, has the ability to waive the minimum investment for Institutional Class shares at its discretion.
Note 2 — Summary of Significant Accounting Policies and Other Information
The following is a summary of significant accounting policies consistently followed by the Funds in the preparation of their financial statements. The policies are in conformity with accounting principles generally accepted in the United States of America (“GAAP”).
A. Security Valuation. The Funds’ investments in securities are carried at market value. Securities listed on an exchange or quoted on a national market system are generally valued at the last quoted sales price at the time of valuation. Other securities traded in the over-the-counter market and listed securities for which no sale was reported on that date are valued at the most recent bid price. Each security reported on the NASDAQ National Market System is valued at the NASDAQ Official Closing Price.
Debt and other fixed-income securities are valued at the last quoted bid price and/or by using a combination of daily quotes and matrix evaluations provided by an independent pricing service (which reflect such factors as security prices, yields, maturities, ratings, and dealer and exchange quotations), the use of which has been approved by the Board.
The Funds may enter into forward foreign currency contracts to lock in the U.S. dollar cost of purchase and sale transactions or to defend the portfolio against currency fluctuations. A forward foreign currency contract is a commitment to purchase or sell a foreign currency at a future date at a negotiated rate. These contracts are valued daily, and the Fund’s net equity therein, representing unrealized gain or loss on the contracts as measured by the difference between the forward foreign exchange rates at the dates of entry into the contracts and the forward rates at the end of the reporting period, if any, is included in the Statements of Assets and Liabilities.
Notes to the Financial Statements (continued)
Note 2 — Summary of Significant Accounting Policies and Other Information (Continued)
Realized and unrealized gains and losses, if any, are included in the Statements of Operations. Risks may arise upon entering into these contracts from the potential inability of counterparties to meet the terms of the contract and from unanticipated movements in the value of foreign currencies relative to the U.S. dollar.
For financial reporting purposes, investment transactions are recorded on the trade date; however, for purposes of executing shareholder transactions, the Funds record changes in holdings of portfolio securities no later than the first business day after the trade date in accordance with Rule 2a-4 of the 1940 Act. Accordingly, certain differences between net asset value for financial reporting and for executing shareholder transactions may arise.
The Funds have adopted fair valuation procedures to value securities at fair market value in certain circumstances, and the Trust has established a Valuation Committee responsible for determining when fair valuing a security is necessary and appropriate. The Funds will value securities at fair market value when market quotations are not readily available or when securities cannot be accurately valued within established pricing procedures. The Valuation Committee may also fair value foreign securities whose prices may have been affected by events occurring after the close of trading in their respective markets but prior to the time the Fund holding the foreign securities calculates its net asset value. The Funds’ fair valuation procedures are designed to help ensure that prices at which Fund shares are purchased and redeemed are fair and do not result in dilution of shareholder interest or other harm to shareholders.
The Fund is required to disclose information regarding the fair value measurements of the Fund’s assets and liabilities. Fair value is defined as the price that the Fund may receive upon selling an investment in an orderly transaction to an independent buyer in the principal or most advantageous market for the investment. The disclosure requirements utilize a three-tier hierarchy to maximize the use of observable market data, minimize the use of unobservable inputs and establish classification of fair value measurements for disclosure purposes. A financial instrument’s level within the fair value hierarchy is based on the lowest level that is significant to the fair value measurement. Inputs refer broadly to the assumptions that market participants would use in pricing the asset or liability, including assumptions about risk, for example, the risk inherent in a particular valuation technique used to measure fair value including the pricing model used and/or the risk inherent in the inputs to the valuation technique. Inputs may be observable or unobservable.
Observable inputs are inputs that reflect the assumptions market participants would use in pricing the asset or liability, which are based on market data obtained from sources independent of the reporting entity. Unobservable inputs are inputs that reflect the reporting entity’s own assumptions about the assumptions market participants would use in pricing the asset or liability developed based on the best information available in the circumstances.
The significant unobservable inputs used in the fair value measurement of the reporting entity’s private equity holdings are, the projected final distribution applied for lack of marketability. Significant increases (decreases) in any of those inputs in isolation could result in a significantly lower (higher) fair value measurement.
Various inputs may be used to determine the value of each Fund’s investments. These inputs are summarized in three broad levels for financial statement purposes. The inputs or methodologies used to value securities are not necessarily an indication of the risk associated with investing in those securities.
Level 1 — Quoted prices in active markets for identical securities.
Notes to the Financial Statements (continued)
Note 2 — Summary of Significant Accounting Policies and Other Information (Continued)
Level 2 — Prices determined using significant other observable inputs (including quoted prices for similar securities, interest rates, prepayment speeds, credit risk, etc.) municipal securities, long-term U.S. Government obligations and corporate debt securities are valued in accordance with the evaluated price supplied by the pricing service and generally categorized as Level 2 in the hierarchy. Other securities that are categorized as Level 2 in the hierarchy include, but are not limited to, warrants and structured notes that do not trade on an exchange, OTC options and international equity securities valued by an independent third party in order to adjust for stale pricing and foreign market holidays.
Level 3 — Prices determined using significant unobservable inputs (including the Fund’s own assumptions). For restricted equity securities where observable inputs are limited, assumptions about market activity and risk are used in determining fair value. These are categorized as Level 3 in the hierarchy.
For international equity securities traded on a foreign exchange or market which closes prior to a Fund’s Valuation Time, in order to adjust for events which occur between the close of the foreign exchange they are traded on and the close of the New York Stock Exchange, a fair valuation model is used, and these securities are categorized as Level 2.
A Fund may hold securities, some of which are classified as Level 3 investments (as defined below). Level 3 investments have significant unobservable inputs, as they trade infrequently. In determining the fair value of these investments, management uses the market approach which includes as the primary input the capital balance reported; however, adjustments to the reported capital balance may be made based on various factors, including, but not limited to, the attributes of the interest held, including the rights and obligations, and any restrictions or illiquidity of such interests, and the fair value of these securities.
The value of a foreign security is generally determined as of the close of trading on the foreign stock exchange on which the security is primarily traded, or as of the close of trading on the New York Stock Exchange (“NYSE”), if earlier. The value is then converted into its U.S. dollar equivalent at the foreign exchange rate in effect at the close of the NYSE (generally 4:00 p.m. Eastern time) on the day that the value of the foreign security is determined. If no sale is reported at that time, the foreign security will be valued within the range of the most recent quoted bid and ask prices. If market quotations are not readily available for a foreign security or an event has occurred that caused a quotation to be unavailable or unreliable, the Valuation Committee will fair value foreign securities using the procedures described below.
The Trust has adopted fair valuation procedures to value securities at fair market value when independent prices are unavailable or unreliable, and the Trust has established a Valuation Committee that is responsible for determining when fair valuing a security is necessary and appropriate. Securities and assets for which market quotations are not readily available may be valued based upon valuation methods that include: (i) multiple of earnings; (ii) yield to maturity with respect to debt issues; (iii) discounts from market prices of similar freely traded securities; or (iv) a combination of these or other methods. Securities may also be priced using fair value pricing methods when their closing prices do not reflect their market values at the time the Fund calculates its net asset value (“NAV”) because an event had occurred since the closing prices were established on the domestic or foreign exchange or market but before the Fund’s NAV calculation.
Notes to the Financial Statements (continued)
Note 2 — Summary of Significant Accounting Policies and Other Information (Continued)
The following is a summary of the fair valuations according to the inputs used as of June 30, 2018 in valuing the Fund’s assets and liabilities:
| Description | GLOBAL TACTICAL ALLOCATION FUND | | Level 1 | | | Level 2 | | | Level 3 | | | Total | |
Common Stocks(1) | | | $ | 1,510,720 | | | $ | — | | | $ | 12,692 | | | $ | 1,523,412 | |
| Closed End Mutual Funds | | | | 112,400 | | | | — | | | | — | | | | 112,400 | |
| Exchange Traded Fund | | | | 36,360 | | | | — | | | | — | | | | 36,360 | |
| Preferred Stocks | | | | 102,833 | | | | — | | | | — | | | | 102,833 | |
| Real Estate Investment Trusts | | | | 350,684 | | | | — | | | | — | | | | 350,684 | |
| Corporate Bonds | | | | — | | | | 76,648 | | | | — | | | | 76,648 | |
| Mortgage Backed Security | | | | — | | | | 3 | | | | — | | | | 3 | |
| Money Market Fund | | | | 408,997 | | | | — | | | | — | | | | 408,997 | |
| Total Investments in Securities | | | $ | 2,521,994 | | | $ | 76,651 | | | $ | 12,692 | | | $ | 2,611,337 | |
| | | | | | | | | | | | | | | | | | |
| Description | MID-CAP VALUE FUND | | Level 1 | | | Level 2 | | | Level 3 | | | Total | |
| Common Stocks | | | $ | 4,432,265 | | | $ | — | | | $ | — | | | $ | 4,432,265 | |
| Closed End Mutual Fund | | | | 73,500 | | | | — | | | | — | | | | 73,500 | |
| Real Estate Investment Trusts | | | | 645,469 | | | | — | | | | — | | | | 645,469 | |
| Money Market Fund | | | | 319,134 | | | | — | | | | — | | | | 319,134 | |
| Total Investments in Securities | | | $ | 5,470,368 | | | $ | — | | | $ | — | | | $ | 5,470,368 | |
| | | | | | | | | | | | | | | | | | |
| Description | SMALL-CAP VALUE FUND | | Level 1 | | | Level 2 | | | Level 3 | | | Total | |
| Common Stocks | | | $ | 11,647,148 | | | $ | — | | | $ | — | | | $ | 11,647,148 | |
| Closed End Mutual Funds | | | | 486,210 | | | | — | | | | — | | | | 486,210 | |
| Real Estate Investment Trusts | | | | 2,868,624 | | | | — | | | | — | | | | 2,868,624 | |
| Money Market Fund | | | | 661,382 | | | | — | | | | — | | | | 661,382 | |
| Total Investments in Securities | | | $ | 15,663,364 | | | $ | — | | | $ | — | | | $ | 15,663,364 | |
| | | | | | | | | | | | | | | | | | |
| Description | STRATEGIC GROWTH FUND | | Level 1 | | | Level 2 | | | Level 3 | | | Total | |
Common Stocks(1) | | | $ | 60,580,447 | | | $ | — | | | $ | 352,762 | | | $ | 60,933,209 | |
| Real Estate Investment Trusts | | | | 2,916,443 | | | | — | | | | — | | | | 2,916,443 | |
| Money Market Fund | | | | 1,285,235 | | | | — | | | | — | | | | 1,285,235 | |
| Total Investments in Securities | | | $ | 64,782,125 | | | $ | — | | | $ | 352,762 | | | $ | 65,134,887 | |
(1) | See the Fund’s Schedules of Investments for the industry classification of the one security in each Fund footnoted as Level 3. |
Level 3 Reconciliation
The following is a reconciliation of Global Tactical Allocation’s and Strategic Growth’s Level 3 investments for which significant unobservable inputs were used in determining value. See Schedules of Investments for industry breakouts:
GLOBAL TACTICAL ALLOCATION FUND
| | | Balance | | | | | | | | | | | | Net | | | | | | | | | | | | Balance | |
| | | as of | | | | | | | | | | | | Unrealized | | | Amortized | | | Transfers | | | Transfers | | | as of | |
| | | June 30, | | | | | | | | | Realized | | | appreciation | | | discounts/ | | | in to | | | out of | | | June 30, | |
| | | 2017 | | | Purchases | | | Sales | | | gain (loss) | | | (depreciation) | | | premiums | | | Level 3 | | | Level 3 | | | 2018 | |
| Common Stocks | | $ | 14,364 | | | $ | — | | | $ | — | | | $ | — | | | $ | (1,672 | ) | | $ | — | | | $ | — | | | $ | — | | | $ | 12,692 | |
| | | $ | 14,364 | | | $ | — | | | $ | — | | | $ | — | | | $ | (1,672 | ) | | $ | — | | | $ | — | | | $ | — | | | $ | 12,692 | |
| Net change in unrealized appreciation (depreciation) for Level 3 investments still held as of June 30, 2018 | | | | | | | $ | (1,672 | ) |
Notes to the Financial Statements (continued)
Note 2 — Summary of Significant Accounting Policies and Other Information (Continued)
STRATEGIC GROWTH FUND
| | | Balance | | | | | | | | | | | | Net | | | | | | | | | | | | Balance | |
| | | as of | | | | | | | | | | | | Unrealized | | | Amortized | | | Transfers | | | Transfers | | | as of | |
| | | June 30, | | | | | | | | | Realized | | | appreciation | | | discounts/ | | | in to | | | out of | | | June 30, | |
| | | 2017 | | | Purchases | | | Sales | | | gain (loss) | | | (depreciation) | | | premiums | | | Level 3 | | | Level 3 | | | 2018 | |
| Common Stocks | | $ | 399,234 | | | $ | — | | | $ | — | | | $ | — | | | $ | (46,472 | ) | | $ | — | | | $ | — | | | $ | — | | | $ | 352,762 | |
| | | $ | 399,234 | | | $ | — | | | $ | — | | | $ | — | | | $ | (46,472 | ) | | $ | — | | | $ | — | | | $ | — | | | $ | 352,762 | |
| Net change in unrealized appreciation (depreciation) for Level 3 investments still held as of June 30, 2018 | | | | | | | $ | (46,472 | ) |
Transfers are recognized at the end of the reporting period.
There have been no transfers in and out of Level 1 and Level 2 fair value measurements as of June 30, 2018.
The following presents information about significant unobservable inputs related to Level 3 investments at June 30, 2018:
GLOBAL TACTICAL ALLOCATION FUND
| Asset | Fair Value at | Valuation | Unobservable | Input | |
| Categories | June 30, 2018 | Technique | Input | Values* | |
| Common Stocks | | | | | |
| Airlines | $ 12,692 | Market approach | Estimated bankruptcy expense | $7.64 | |
| STRATEGIC GROWTH FUND | | | | | |
| Common Stocks | | | | | |
| Airlines | $352,762 | Market approach | Estimated bankruptcy expense | $7.64 | |
| * | An increase in the unobservable input would decrease the valuation and a decrease in the unobservable input would increase the valuation. |
B. Federal Income Taxes. It is the Funds’ policy to comply with the requirements of Subchapter M of the Internal Revenue Code and to distribute substantially all of their taxable income to shareholders. Therefore, no federal income tax provision is required.
In accordance with Financial Accounting Standards Board (“FASB”) Interpretation ASC 740, (“ASC 740”), each Fund recognizes a tax benefit from an uncertain position only if it is more likely than not that the position is sustainable, based solely on its technical merits and consideration of the relevant taxing authority’s widely understood administrative practices and precedents. If this threshold is met, a Fund measures the tax benefit as the largest amount of benefit that is greater than fifty percent likely of being realized upon ultimate settlement. The Funds identify their major tax jurisdictions as U.S. Federal and the Commonwealth of Massachusetts. Management has reviewed the tax positions for each of the three open tax years as of June 30, 2018 and has determined that the implementation of ASC 740 does not have a material impact on the Funds’ financial statements. Each Fund’s federal tax returns for the prior three fiscal years remains subject to examination by the Internal Revenue Service.
Net investment income or loss and net realized gains or losses may differ for financial statement and income tax purposes primarily due to investments that have a different basis for financial statement and income tax purposes. The character of distributions made during the year from net investment income or net realized gains may differ from their ultimate characterization for federal income tax purposes. Also, due to the timing of dividend distributions, the fiscal year in which amounts are distributed may differ from the year that the income or realized gains were recorded by each Fund. Permanent differences in the recognition of earnings are reclassified to additional paid-in capital. Distributions in excess of tax-basis earnings are recorded as a return of capital.
Notes to the Financial Statements (continued)
Note 2 — Summary of Significant Accounting Policies and Other Information (Continued)
C. Security Transactions and Investment Income. Security transactions are recorded on the trade date. Realized gains and losses are determined using the specific identification cost method. Interest income on debt securities is recorded daily on the accrual basis. Discounts and premiums on debt securities are amortized over their respective lives. Dividend income is recorded on the ex-dividend date, or as soon as information is available to the Fund.
D. Short Sales of Investments. Certain Funds may make short sales of investments, which are transactions in which a Fund sells a security it does not own in anticipation of a decline in the fair value of that security. To complete such a transaction, the Fund must borrow the security to make delivery to the buyer. The Fund is then obligated to replace the security borrowed by purchasing it at the market price at the time of replacement. The broker retains the proceeds of short sales to the extent necessary to meet margin requirements until the short position is closed out.
If a security pays a dividend while the Fund holds it short, the Fund will need to pay the dividend to the original owner of the security. Since the Fund borrowed the shares and sold them to a third party, the third party will receive the dividend from the security and the Fund will pay the original owner the dividend directly. The Fund is not entitled to the dividend because it does not own the shares. A gain, limited to the price at which the Fund sold the security short, or a loss, unlimited in size, will be recognized upon the termination of a short sale. The Funds did not have any short sales during the fiscal year ended June 30, 2018.
E. Written Options Contracts. Certain Funds may write options to manage exposure to certain changes in the market. When a Fund writes an option, an amount equal to the premium received by the Fund is recorded as a liability, which is marked-to-market daily to reflect the current market value of the option written. If the option expires, the Fund realizes a gain from investments equal to the amount of the premium received. When a written call option is exercised, the difference between the premium and the amount for effecting a closing purchase transaction, including brokerage commission, is also treated as a realized gain or loss. When a written put option is exercised, the amount of the premium received reduces the cost of the security purchased by the Fund.
A risk in writing a covered call option is that the Fund may forego the opportunity of profit if the market price of the underlying security increases and the option is exercised. The risk in writing a put option is that the Fund may incur a loss if the market price of the underlying security decreases and the option is exercised.
In addition, there is the risk that the Fund may not be able to enter into a closing transaction because of an illiquid secondary market. The Funds did not have any written option contracts for the fiscal year ended June 30, 2018.
F. Purchased Options. Certain Funds may purchase call options in anticipation of an increase in the market value of securities of the type in which they may invest. The purchase of a call option will entitle a Fund, in return for the premium paid, to purchase specified securities at a specified price during the option period. A Fund will ordinarily realize a gain if, during the option period, the value of such securities exceeded the sum of the exercise price, the premium paid and transaction costs; otherwise, the Fund will realize either no gain or a loss on the purchase of the call option. A Fund will normally purchase put options in anticipation of a decline in the market value of securities in its portfolio (“protective puts”) or in securities in which it may invest. The purchase of a put option will entitle the Fund, in exchange for the premium paid, to sell specified securities at a specified price during the option period. The purchase of protective puts is designed to offset or hedge against a decline in the market value of the Fund’s securities. Put options may also be purchased by a Fund for the purpose of affirmatively benefiting from a decline in the price of securities which it does not own. The Fund will ordinarily realize a gain if, during the option period, the value of the underlying securities decreased below the exercise price sufficiently to more than cover the premium and transaction costs; otherwise the Fund will realize
Notes to the Financial Statements (continued)
Note 2 — Summary of Significant Accounting Policies and Other Information (Continued)
either no gain or a loss on the purchase of the put option. Gains and losses on the purchase of protective put options would tend to be offset by countervailing changes in the value of the underlying portfolio securities. The Funds did not have any purchased options for the fiscal year ended June 30, 2018.
G. Futures Contracts. Certain Funds may enter into financial futures contracts, to the extent permitted by their investment policies and objectives, for bona fide hedging and other permissible risk management purposes including protecting against anticipated changes in the value of securities a Fund intends to purchase. Upon entering into a financial futures contract, a Fund is required to deposit cash or securities as initial margin.
Additional securities are also segregated as collateral up to the current market value of the financial futures contracts. Subsequent payments, known as variation margin, are made or received by the Fund, depending on the fluctuation in the value of the underlying financial instruments. The Fund recognizes an unrealized gain or loss equal to the variation margin. When the financial futures contracts are closed, a realized gain or loss is recognized equal to the difference between the proceeds from (or cost of) the closing transactions and the Fund’s basis in the contracts. The risks associated with entering into financial futures contracts include the possibility that a change in the value of the contract may not correlate with the changes in the value of the underlying instruments. In addition, investing in financial futures contracts involves the risk that the Fund could lose more than the original margin deposit and subsequent payments required for a futures transaction. Risks may also arise upon entering into these contracts from the potential inability of the counterparties to meet the terms of their contracts. The Funds did not enter into any futures contracts during the fiscal year ended June 30, 2018.
H. Foreign Currency Transactions. Securities and other assets and liabilities denominated in foreign currencies are converted each business day into U.S. dollars based on the prevailing rates of exchange. Purchases and sales of portfolio securities and income and expenses are converted into U.S. dollars on the respective dates of such transactions.
Gains and losses resulting from changes in exchange rates applicable to foreign securities are not reported separately from gains and losses arising from movements in securities prices.
Net realized foreign exchange gains and losses include gains and losses from sales and maturities of foreign currency exchange contracts, gains and losses realized between the trade and settlement dates of foreign securities transactions, and the difference between the amount of dividends, interest and foreign withholding taxes on the Funds’ books and the U.S. dollar equivalent of the amounts actually received. Net unrealized foreign exchange gains and losses include gains and losses from changes in the fair value of assets and liabilities denominated in foreign currencies other than portfolio securities, resulting from changes in exchange rates.
I. Forward Foreign Currency Contracts. Certain Funds may enter into forward foreign currency contracts to hedge against foreign currency exchange rate risk on their non-U.S. dollar denominated securities or to facilitate settlement of foreign currency denominated portfolio transactions. A forward foreign currency contract is an agreement between two parties to buy and sell a currency at a set price on a future date. The contract is marked-to-market daily and the change in value is recorded by a Fund as an unrealized gain or loss. When a forward foreign currency contract is extinguished, through either delivery or offset by entering into another forward foreign currency contract, the Fund records a realized gain or loss equal to the difference between the value of the contract at the time it was opened and the value of the contract at the time it was extinguished.
Forward foreign currency contracts involve elements of market risk in excess of the amounts reflected in the Statements of Assets and Liabilities. The Fund bears the risk of an unfavorable change in the foreign exchange rate underlying the forward foreign currency contract. Risks may also arise upon entering into these contracts
Notes to the Financial Statements (continued)
Note 2 — Summary of Significant Accounting Policies and Other Information (Continued)
from the potential inability of the counterparties to meet the terms of their contracts. The Funds did not enter into any forward foreign currency contracts during the fiscal year ended June 30, 2018.
J. Portfolio Investment Risks. Investments in securities of foreign issuers carry certain risks not ordinarily associated with investments in securities of U.S. issuers. These risks include future disruptive political and economic developments and the possible imposition of exchange controls or other unfavorable foreign government laws and restrictions. In addition, investments in certain countries may carry risks of expropriation of assets, confiscatory taxation, political or social instability, or diplomatic developments that adversely affect investments in those countries. Certain countries may also impose substantial restrictions on investments in their capital markets by foreign entities, including restrictions on investments in issuers in industries deemed sensitive to relevant national interests. These factors may limit the investment opportunities available and result in a lack of liquidity and high price volatility with respect to securities of issuers from developing countries.
K. Multiple Class Allocations. Each class of shares has equal rights as to earnings and assets except that each class bears different distribution and shareholder servicing expenses. Each class of shares has exclusive voting rights with respect to matters that affect just that class. Income, expenses (other than expenses attributable to a specific class) and realized and unrealized gains or losses on investments are allocated to each class of shares based on its relative net assets.
L. Expense Allocations. Expenses are allocated to each series based upon its relative proportion of net assets to the Trust’s total net assets.
M. Distributions to Shareholders. Each Fund generally declares dividends at least annually, payable in December, on a date selected by the Board. In addition, distributions may be made annually in December out of net realized gains through October 31 of that calendar year. Distributions to shareholders are recorded on the ex-dividend date. Each Fund may make a supplemental distribution subsequent to the end of its fiscal year ending June 30.
N. Use of Estimates. The preparation of financial statements in conformity with GAAP requires management to make estimates and assumptions that affect the reported amounts of assets and liabilities and the disclosure of contingent assets and liabilities at the date of the financial statements, and the reported amounts of revenue and expenses during the reporting period. Actual results could differ from those estimates, and those differences could be significant.
O. Security Loans. The Funds receive compensation in the form of fees, or retain a portion of interest on the investment of any cash received as collateral. The Funds also continue to receive interest or dividends on the securities loaned, if any. The loans are secured by collateral at least equal to 102% of the prior days market value of the loaned securities. Gain or loss in the fair value of the securities loaned that may occur during the term of the loan will be for the account of the Funds. The Funds have the right under the lending agreement to recover the securities from the borrower on demand. The Funds did not have any securities out on loan at June 30, 2018.
P. Derivative Instruments. The Funds have adopted amendments to authoritative guidance on disclosures about derivative instruments and hedging activities which require that the Funds disclose: a) how and why an entity uses derivative instruments; and b) how derivative instruments and related hedged items affect an entity’s financial position, financial performance and cash flows.
The Funds may trade financial instruments where they are considered to be a seller of credit derivatives in accordance with authoritative guidance under GAAP on derivatives and hedging.
The Funds did not have any derivative instruments at June 30, 2018.
Notes to the Financial Statements (continued)
Note 3 — Investment Advisory Fee and Other Related Party Transactions
Community Capital Management, Inc. (“CCM” or “Adviser”) serves as investment adviser to each Fund.
Advisory Fees — The interim investment advisory agreement (“Interim Advisory Agreement”) expired on May 30, 2018, for the Global Tactical Allocation Fund, Mid-Cap Value Fund and Strategic Growth Fund at which time the Funds applied for an extension from the Securities and Exchange Commission (“SEC”) under a No Action Letter. The Funds received a 60 day extension to solicit shareholders. During this time period until the date of each Fund’s shareholder meeting listed below, these Funds did not accrue or receive an advisory fee. At special shareholder meetings on May 23, 2018, June 14, 2018 and June 27, 2018, the shareholders approved Advisory Agreements between each of the Funds and CCM with the following effective dates:
| Fund | Advisory Fee | Effective Dates |
| Global Tactical Allocation | 0.75% | June 15, 2018 |
| Mid-Cap Value | 0.90% | June 26, 2018 |
| Small-Cap Value | 0.90% | May 24, 2018 |
| Strategic Growth | 0.75% | June 26, 2018 |
The Board approved an Interim Advisory Agreement which became effective January 1, 2018 between Quaker Investment Trust (the “Trust” or “QIT”) and CCM. Under the Interim Advisory Agreement, CCM provided or arranged to provide the same advisory services to the Global Tactical Allocation Fund, Mid-Cap Value Fund, Small-Cap Value Fund and Strategic Growth Fund at the same fees or at lower Advisory fees as those provided under the previous investment advisory agreement (the “Prior Investment Advisory Agreement”) between the Trust and Quaker Investment Fund (“QFI”). Pursuant to the Prior and Interim Advisory Agreements with the Trust, the investment adviser (either CCM or QFI, as applicable) directed the daily operations of the Fund and supervised the performance of the Sub-Advisers (under the Prior Agreement) and the performance of administrative and professional services provided by others. As compensation for its services and the related expenses borne by CCM, the Funds paid an investment advisory fee, computed and accrued daily and paid monthly, at an annual rate of 0.75% for the Global Tactical Allocation Fund, Mid-Cap Value Fund and Strategic Growth Fund and 0.90% for the Small-Cap Value Fund’s average daily net assets.
For the period July 1, 2017 to December 31, 2017, QFI charged the following advisory fees, computed and accrued daily and paid monthly, at an annual rate of 0.75% for the Global Tactical Allocation Fund, 1.05% for the Mid-Cap Value Fund, 0.95% for the Small-Cap Value Fund and 0.95% on the first $25 million; 0.85% on the next $175 million: and 0.75%, thereafter for the Strategic Growth Fund. Also during this period, Kennedy Capital Management, Inc. served as Sub-adviser to Mid-Cap Value Fund, AJO, LP served as Sub-adviser to the Small-Cap Value Fund and Los Angeles Capital Management and Equity Research, Inc. served as Sub-adviser to Strategic Growth Fund. The Sub-advisers provided certain services pursuant to a sub-advisory agreement between QFI, the Sub-adviser and the Trust on behalf of each Fund. Sub -adviser fees were paid by QFI.
Each Fund paid CCM and QFI aggregate fees shown in the table below for the fiscal year ending June 30, 2018. Amounts are expressed as an annualized percentage of average net assets.
| | | | | | Advisory & |
| | | | | Subadvisory fee | subadvisory |
| | Aggregate | Advisory fee | Advisory fee | paid by QFI to | (reimbursed)/ |
| | advisory fee | paid to CCM | paid to QFI | the sub-adviser | recovered |
| Global Tactical Allocation | 0.73% | 0.70% | 0.75% | N/A | (0.30)% |
| Mid-Cap Value | 0.86% | 0.65% | 1.05% | 0.75% | N/A |
| Small-Cap Value | 0.93% | 0.90% | 0.95% | 0.60% | N/A |
| Strategic Growth | 0.77% | 0.64% | 0.89% | 0.34% | N/A |
Notes to the Financial Statements (continued)
Note 3 — Investment Advisory Fee and Other Related Party Transactions (Continued)
For the fiscal year ending June 30, 2018, CCM and QFI earned and reimbursed fees as follows:
| | | | | | Advisory & |
| | | | Aggregate | Subadvisory fee | subadvisory |
| | Aggregate | Advisory fee | advisory fee | paid by QFI to | (reimbursed)/ |
| | advisory fee | paid to CCM | paid to QFI | the sub-adviser | recovered |
| Global Tactical Allocation | $ 36,968 | $ 11,572 | $ 25,396 | N/A | $(15,115) |
| Mid-Cap Value | 57,232 | 19,818 | 37,414 | 26,724 | N/A |
| Small-Cap Value | 240,727 | 102,379 | 138,348 | 87,378 | N/A |
| Strategic Growth | 526,899 | 213,421 | 313,478 | 118,794 | N/A |
CCM and QFI contractually agreed to waive the lesser of 0.30% of its management fee or assume expenses to the extent necessary to reduce the total operating expenses of the Global Tactical Allocation (excluding 12b-1 fees, interest, taxes, brokerage commissions and other costs incurred in connection with the purchase or sale of portfolio securities, and extraordinary items) when they exceed 1.50% of the average daily net assets of the Global Tactical Allocation Fund. CCM currently has no intention to terminate this arrangement; however, it may do so at any time in its sole discretion.
If, at any time, the annualized expenses of Global Tactical Allocation were less than the 1.50% limitation above, the Trust, on behalf of Global Tactical Allocation, would reimburse CCM or QFI for any fees previously waived and/or expenses previously assumed, provided, however, that the repayment shall be payable only to the extent that it: (a) can be made during the three (3) years following the time at which the adviser waived fees or assumed expenses for Global Tactical Allocation, and (b) can be repaid without causing the expenses of Global Tactical Allocation to exceed the annualized expense ratio at the time of reimbursement. Since the advisory agreement between QFI and the Trust has been terminated, the unreimbursed amount waived by QFI which may not be recovered is $23,951.
At June 30, 2018, the cumulative unreimbursed amount paid and/or waived by CCM on behalf of Global Tactical Allocation that may be recovered is $4,956. The Adviser may recapture portions of the above amount no later than the date stated below.
| | June 30, | |
| | 2021 | |
| Global Tactical Allocation | $4,956 | |
Foreside Fund Services, LLC (“Distributor”) serves as principal underwriter for the Trust. The Trust has adopted distribution and shareholder servicing plans pursuant to Rule 12b-1 of the 1940 Act for Class A and Class C shares described below. There is no Rule 12b-1 distribution plan for Institutional Class shares of the Funds. The Class A Plan provides that each Fund may pay a servicing or Rule 12b-1 fee at an annual rate of 0.25% of the Class A average net assets on a monthly basis to persons or institutions for performing certain servicing functions for the Class A shareholders. The Class A Plan also allows the Fund to pay or reimburse expenditures in connection with sales and promotional services related to distribution of the Fund’s shares, including personal services provided to prospective and existing shareholders. The Class C Plan provides that each Fund may compensate QFI and others for services provided and expenses incurred in the distribution of shares at an annual rate of 1.00% of the average net assets of each class on a monthly basis.
Notes to the Financial Statements (continued)
Note 3 — Investment Advisory Fee and Other Related Party Transactions (Continued)
For the fiscal year ending June 30, 2018, the Distributor received underwriter concessions from the sale of Funds shares as follows:
| Fund | | Amount | |
| Global Tactical Allocation | | $ | 343 | |
| Mid-Cap Value | | | 6 | |
| Small-Cap Value | | | 651 | |
| Strategic Growth | | | 556 | |
Except for the Trust’s Chief Compliance Officer (“CCO”), employees and Officers of QFI do not receive any compensation from the Trust. For the period July 1, 2017 to December 31, 2017 the CCO of the Trust also served as general counsel to QFI. For this period, the Funds compensated the CCO as follows:
| Fund | | Amount paid | |
| Global Tactical Allocation | | $ | 4,379 | |
| Mid-Cap Value | | | 4,606 | |
| Small-Cap Value | | | 18,824 | |
| Strategic Growth | | | 45,787 | |
For the period January 1, 2018 to June 15, 2018, the Trust continued to pay the Chief Compliance Officer directly the following fees:
| Fund | | Amount paid | |
| Global Tactical Allocation | | $ | 2,242 | |
| Mid-Cap Value | | | 4,197 | |
| Small-Cap Value | | | 15,790 | |
| Strategic Growth | | | 45,389 | |
For the period June 16, 2018 to June 30, 2018 the Trust paid Little Consulting Group, LLC the following fees:
| Fund | | Amount paid | |
| Global Tactical Allocation | | $ | 217 | |
| Mid-Cap Value | | | 489 | |
| Small-Cap Value | | | 1,337 | |
| Strategic Growth | | | 5,457 | |
Note 4 — Purchases and Sales of Investments
For the fiscal year ending June 30, 2018 aggregate purchases and sales of investment securities (excluding short-term investments) for each Fund were as follows:
| | | Purchases | | | Sales | |
| Global Tactical Allocation | | $ | 2,463,244 | | | $ | 6,330,158 | |
| Mid-Cap Value | | | 2,155,195 | | | | 4,585,801 | |
| Small-Cap Value | | | 30,315,498 | | | | 46,581,727 | |
| Strategic Growth | | | 79,688,444 | | | | 97,250,876 | |
Notes to the Financial Statements (continued)
Note 5 — Tax Matters
For U.S. federal income tax purposes, the cost of securities owned, gross appreciation, gross depreciation, and net unrealized appreciation (depreciation) of investments at June 30, 2018 for each Fund were as follows:
| | | | | | Gross | | | Gross | | | Net Appreciation | |
| Fund | | Cost | | | Appreciation | | | Depreciation | | | (Depreciation) | |
| Global Tactical | | $ | 2,592,293 | | | $ | 212,406 | | | $ | (193,362 | ) | | $ | 19,044 | |
| Mid-Cap Value | | | 4,350,945 | | | | 1,209,070 | | | | (89,647 | ) | | | 1,119,423 | |
| Small-Cap Value | | | 14,411,630 | | | | 1,617,434 | | | | (365,700 | ) | | | 1,251,734 | |
| Strategic Growth | | | 58,553,257 | | | | 8,929,945 | | | | (2,348,315 | ) | | | 6,581,630 | |
As of June 30, 2018, the components of distributable earnings on a tax basis were as follows:
| | | | | | | | | | | | | | | | | | | | | | | | Total | |
| | | | | | Undis- | | | Undis- | | | Other | | | Capital | | | | | | Post- | | | Distribu- | |
| | | Unrealized | | | tributed | | | tributed | | | Accum- | | | Loss | | | Late | | | October | | | table | |
| | | Appreciation | | | Ordinary | | | Capital | | | ulated | | | Carry- | | | Year | | | Capital | | | Earnings/ | |
| Fund | | (Depreciation) | | | Income | | | Gain | | | Gain/(Loss) | | | forward | | | Loss | | | Loss | | | (Loss) | |
| Global Tactical | | $ | 19,044 | | | $ | 22,155 | | | $ | — | | | $ | — | | | $ | — | | | $ | — | | | $ | — | | | $ | 41,199 | |
| Mid-Cap Value | | | 1,119,423 | | | | — | | | | — | | | | — | | | | — | | | | (31,549 | ) | | | — | | | | 1,087,874 | |
| Small-Cap Value | | | 1,251,734 | | | | 1,445,433 | | | | 1,926,732 | | | | — | | | | — | | | | — | | | | — | | | | 4,623,899 | |
| Strategic Growth | | | 6,581,630 | | | | — | | | | — | | | | — | | | | — | | | | (386,290 | ) | | | — | | | | 6,195,340 | |
The difference between book basis and tax basis unrealized appreciation (depreciation) is attributable primarily to the tax deferral of losses on wash sales, and the differing book/tax treatment of unrealized appreciation/depreciation on partnership adjustments.
The undistributed ordinary income, capital gains and carryforward losses shown above differ from the corresponding accumulated net investment income and accumulated net realized gain (loss) figures reported in the statements of assets and liabilities due to differing book/tax treatment of short-term capital gains, and certain temporary book/tax differences such as the deferral of realized losses on wash sales, partnership adjustments and net losses realized after October 31 and from ordinary losses incurred after December 31.
Under current tax law, foreign currency and net capital losses realized after October 31 may be deferred and treated as occurring on the first day of the following fiscal year. The Funds elected to defer net capital and currency losses as indicated in the chart below.
At June 30, 2018, the capital loss carryovers, late year losses, post-October capital loss and the capital loss utilized for the Funds were as follows:
| | | | | | | | | | | | Capital Loss | | | | |
| | | Capital Loss | | | | | | | | | Carryovers | | | | |
| | | Carryovers | | | Late Year | | | Post-October | | | Expired | | | Capital Loss | |
| Fund | | Indefinite | | | Loss | | | Capital Loss | | | 2018 | | | Utilized | |
| Global Tactical | | $ | — | | | $ | — | | | $ | — | | | $ | 2,701,227 | | | $ | 17,456 | |
| Mid-Cap Value | | | — | | | | 31,549 | | | | — | | | | 188,692 | | | | 981,880 | |
| Small-Cap Value | | | — | | | | — | | | | — | | | | — | | | | — | |
| Strategic Growth | | | — | | | | 386,290 | | | | — | | | | 153,800,600 | | | | 10,913,697 | |
Notes to the Financial Statements (continued)
Note 6 — Reclassification of Capital Accounts
In accordance with the accounting pronouncements, each Fund has recorded reclassifications in the capital accounts. These reclassifications have no impact on the net asset value of the Funds and are designed generally to present undistributed income and realized gains on a tax basis which is considered to be more informative to shareholders. As of June 30, 2018, the Funds recorded the following reclassification to increase (decrease) the accounts listed below:
| | | Accumulated | | | Accumulated | | | | |
| | | Net Investment | | | Net Realized | | | Paid in | |
| Fund | | Income (Loss) | | | Gain (Loss) | | | Capital | |
| Global Tactical | | $ | (35,495 | ) | | $ | 2,736,745 | | | $ | (2,701,250 | ) |
| Mid-Cap Value | | | 63,414 | | | | 144,023 | | | | (207,437 | ) |
| Small-Cap Value | | | 199,274 | | | | (199,274 | ) | | | — | |
| Strategic Growth | | | 222,494 | | | | 153,804,584 | | | | (154,027,078 | ) |
Note 7 — Distributions to Shareholders
Income and long-term capital gain distributions are determined in accordance with federal income tax regulations, which may differ from GAAP. The information set forth below is for each Fund as required by federal securities laws. The Small-Cap Value Fund is the only Fund that required a distribution during the 2017 and 2018 fiscal years.
The tax character of dividends and distributions paid during the fiscal years of 2018 and 2017 were as follows:
| | Ordinary Income | | Long-Term Capital Gain |
| Fund | 2018 | 2017 | | 2018 | 2017 |
| Small-Cap Value | $1,382,278 | $ — | | $2,668,792 | $ — |
Note 8 — Fund Share Transactions
At June 30, 2018, there were an unlimited number of shares of beneficial interest with a $0.01 par value authorized. The following table summarizes the activity in shares of each Fund:
| | | Global Tactical Allocation | |
| | | Year Ended 6/30/18 | | | Year Ended 6/30/17 | |
| | | Shares | | | Value | | | Shares | | | Value | |
| Shares sold: | | | | | | | | | | | | |
| Class A | | | 7,299 | | | $ | 79,382 | | | | 7,980 | | | $ | 83,591 | |
| Class C | | | 1 | | | | 10 | | | | 2,103 | | | | 20,892 | |
| Institutional Class | | | 127,027 | | | | 1,582,451 | | | | 307,084 | | | | 3,677,885 | |
| Shares issued to shareholders due | | | | | | | | | | | | | | | | |
| to reinvestment of distributions: | | | | | | | | | | | | | | | | |
| Class A | | | — | | | | — | | | | — | | | | — | |
| Class C | | | — | | | | — | | | | — | | | | — | |
| Institutional Class | | | — | | | | — | | | | — | | | | — | |
| | | | 134,327 | | | $ | 1,661,843 | | | | 317,167 | | | $ | 3,782,368 | |
| Shares Redeemed: | | | | | | | | | | | | | | | | |
| Class A | | | (49,337 | ) | | | (524,151 | ) | | | (167,117 | ) | | | (1,748,988 | ) |
| Class C | | | (23,939 | ) | | | (236,564 | ) | | | (56,996 | ) | | | (557,112 | ) |
| Institutional Class | | | (419,415 | ) | | | (5,271,512 | ) | | | (156,645 | ) | | | (1,880,587 | ) |
| | | | (492,691 | ) | | $ | (6,032,227 | ) | | | (380,758 | ) | | $ | (4,186,687 | ) |
| Net increase (decrease) | | | (358,364 | ) | | $ | (4,370,384 | ) | | | (63,591 | ) | | $ | (404,319 | ) |
Notes to the Financial Statements (continued)
Note 8 — Fund Share Transactions (Continued)
| | | Mid-Cap Value | |
| | | Year Ended 6/30/18 | | | Year Ended 6/30/17 | |
| | | Shares | | | Value | | | Shares | | | Value | |
| Shares sold: | | | | | | | | | | | | |
| Class A | | | 3,322 | | | $ | 101,337 | | | | 4,309 | | | $ | 113,588 | |
| Class C | | | 119 | | | | 3,117 | | | | 247 | | | | 5,732 | |
| Institutional Class | | | 1,710 | | | | 52,430 | | | | 6,465 | | | | 187,330 | |
| Shares issued to shareholders due | | | | | | | | | | | | | | | | |
| to reinvestment of distributions: | | | | | | | | | | | | | | | | |
| Class A | | | — | | | | — | | | | — | | | | — | |
| Class C | | | — | | | | — | | | | — | | | | — | |
| Institutional Class | | | — | | | | — | | | | — | | | | — | |
| | | | 5,151 | | | $ | 156,884 | | | | 11,021 | | | $ | 306,650 | |
| Shares Redeemed: | | | | | | | | | | | | | | | | |
| Class A | | | (46,047 | ) | | | (1,404,702 | ) | | | (30,932 | ) | | | (823,921 | ) |
| Class C | | | (12,849 | ) | | | (335,680 | ) | | | (13,530 | ) | | | (309,983 | ) |
| Institutional Class | | | (20,434 | ) | | | (676,034 | ) | | | (8,120 | ) | | | (229,719 | ) |
| | | | (79,330 | ) | | $ | (2,416,416 | ) | | | (52,582 | ) | | $ | (1,363,623 | ) |
| Net increase (decrease) | | | (74,179 | ) | | $ | (2,259,532 | ) | | | (41,561 | ) | | $ | (1,056,973 | ) |
| | | | |
| | | Small-Cap Value | |
| | | Year Ended 6/30/18 | | | Year Ended 6/30/17 | |
| | | Shares | | | Value | | | Shares | | | Value | |
| Shares sold: | | | | | | | | | | | | | | | | |
| Class A | | | 8,231 | | | $ | 183,931 | | | | 8,736 | | | $ | 199,054 | |
| Class C | | | 787 | | | | 13,745 | | | | 411 | | | | 7,675 | |
| Institutional Class | | | 12,241 | | | | 301,296 | | | | 15,401 | | | | 366,482 | |
| Shares issued to shareholders due | | | | | | | | | | | | | | | | |
| to reinvestment of distributions: | | | | | | | | | | | | | | | | |
| Class A | | | 35,546 | | | | 800,131 | | | | — | | | | — | |
| Class C | | | 12,052 | | | | 207,168 | | | | — | | | | — | |
| Institutional Class | | | 117,150 | | | | 2,815,103 | | | | — | | | | — | |
| | | | 186,007 | | | $ | 4,321,374 | | | | 24,548 | | | $ | 573,211 | |
| Shares Redeemed: | | | | | | | | | | | | | | | | |
| Class A | | | (106,446 | ) | | | (2,503,450 | ) | | | (62,175 | ) | | | (1,437,981 | ) |
| Class C | | | (8,491 | ) | | | (160,941 | ) | | | (24,210 | ) | | | (451,121 | ) |
| Institutional Class | | | (558,629 | ) | | | (13,411,053 | ) | | | (357,329 | ) | | | (8,460,169 | ) |
| | | | (673,566 | ) | | $ | (16,075,444 | ) | | | (443,714 | ) | | $ | (10,349,271 | ) |
| Net increase (decrease) | | | (487,559 | ) | | $ | (11,754,070 | ) | | | (419,166 | ) | | $ | (9,776,060 | ) |
Notes to the Financial Statements (continued)
Note 8 — Fund Share Transactions (Continued)
| | | Strategic Growth | |
| | | Year Ended 6/30/18 | | | Year Ended 6/30/17 | |
| | | Shares | | | Value | | | Shares | | | Value | |
| Shares sold: | | | | | | | | | | | | |
| Class A | | | 17,276 | | | $ | 523,299 | | | | 26,993 | | | $ | 704,491 | |
| Class C | | | 3,636 | | | | 95,497 | | | | 15,462 | | | | 363,910 | |
| Institutional Class | | | 15,767 | | | | 503,204 | | | | 44,663 | | | | 1,197,952 | |
| Shares issued to shareholders due | | | | | | | | | | | | | | | | |
| to reinvestment of distributions: | | | | | | | | | | | | | | | | |
| Class A | | | — | | | | — | | | | — | | | | — | |
| Class C | | | — | | | | — | | | | — | | | | — | |
| Institutional Class | | | — | | | | — | | | | — | | | | — | |
| | | | 36,679 | | | $ | 1,122,000 | | | | 87,118 | | | $ | 2,266,353 | |
| Shares Redeemed: | | | | | | | | | | | | | | | | |
| Class A | | | (396,109 | ) | | | (11,898,484 | ) | | | (638,440 | ) | | | (16,536,992 | ) |
| Class C | | | (123,869 | ) | | | (3,210,249 | ) | | | (230,332 | ) | | | (5,180,033 | ) |
| Institutional Class | | | (54,329 | ) | | | (1,731,808 | ) | | | (277,544 | ) | | | (7,249,735 | ) |
| | | | (574,307 | ) | | $ | (16,840,541 | ) | | | (1,146,316 | ) | | $ | (28,966,760 | ) |
| Net increase (decrease) | | | (537,628 | ) | | $ | (15,718,541 | ) | | | (1,059,198 | ) | | $ | (26,700,407 | ) |
Note 9 — Indemnifications
Under the Trust’s organizational documents, its officers and Trustees are indemnified against certain liabilities arising out of the performance of their duties to the Funds. In addition, in the normal course of business, the Trust enters into contracts with its vendors and others that provide for general indemnifications.
The Trust’s maximum exposure under these arrangements is dependent on future claims that may be made against the Trust, and, therefore, cannot be estimated; however, based on experience, risk of loss from such claims is considered remote.
Note 10 — Events Subsequent to Year-End
Following the completion of the Funds’ 2018 fiscal year, the Board has undertaken to complete the re-domestication of the Trust from Massachusetts to Delaware, consistent with the approval of an agreement and plan of reorganization that was approved by Fund shareholders. The Board also has approved the merger of the Quaker Global Tactical Allocation Fund into the Quaker Impact Growth Fund (formerly, Quaker Strategic Growth Fund) and the merger of the Quaker Mid-Cap Value Fund into the Quaker Small/Mid-Cap Impact Value Fund (formerly, Quaker Small-Cap Value Fund), which mergers do not require shareholder approval and which are expected to occur during the fall of 2018. Shareholders will receive an information statement/prospectus describing such changes. In addition, the Board has approved the elimination of the front-end sales charge for Class A shares and the re-designation of Class A shares as “Adviser Class shares.” This change should be effective on or about September 30, 2018. Finally, the Board also approved the conversion of Class C shares to Class A shares, which is expected to occur during the fall of 2018.
Note 11 — Matters Submitted for Shareholder Vote (unaudited)
A special meeting of the shareholders of the Quaker Investment Trust - Quaker Small-Cap Value Fund was held on May 23, 2018. At the meeting, the Approval of the New Investment Management Agreement between the Trust on behalf of the Quaker Small-Cap Value Fund and Community Capital Management, Inc. and an Agreement of the Plan of Reorganization that provides for the Reorganization of the Trust from its Current Form of
Notes to the Financial Statements (continued)
Note 11 — Matters Submitted for Shareholder Vote (unaudited) (Continued)
Organization as a Massachusetts Business Trust into a Newly Formed Delaware Statutory Trust was approved by a majority of the outstanding voting securities of the Quaker Small-Cap Value Fund. The results of the shareholder votes are as follows:
| Proposals | For | Against | Abstain |
| The New Investment Management Agreement | 583,825 | 735 | 20,300 |
| The Plan of Reorganization | 583,237 | 880 | 20,743 |
A special meeting of the shareholders of the Quaker Investment Trust - Quaker Global Tactical Allocation Fund was held on June 14, 2018. At the meeting, the Approval of the New Investment Management Agreement between the Trust on behalf of the Quaker Global Tactical Allocation Fund and Community Capital Management, Inc. and an Agreement of the Plan of Reorganization that provides for the Reorganization of the Trust from its Current Form of Organization as a Massachusetts Business Trust into a Newly Formed Delaware Statutory Trust was approved by a majority of the outstanding voting securities of the Quaker Global Tactical Allocation Fund. The results of the shareholder votes are as follows:
| Proposals | For | Against | Abstain |
| The New Investment Management Agreement | 99,733 | 1,954 | 29,273 |
| The Plan of Reorganization | 99,733 | 1,954 | 29,273 |
A special meeting of the shareholders of the Quaker Investment Trust - Quaker Mid-Cap Value Fund was held on June 27, 2018. At the meeting, the Approval of the New Investment Management Agreement between the Trust on behalf of the Quaker Mid-Cap Value Fund and Community Capital Management, Inc. and an Agreement of the Plan of Reorganization that provides for the Reorganization of the Trust from its Current Form of Organization as a Massachusetts Business Trust into a Newly Formed Delaware Statutory Trust was approved by a majority of the outstanding voting securities of the Quaker Mid-Cap Value Fund. The results of the shareholder votes are as follows:
| Proposals | For | Against | Abstain |
| The New Investment Management Agreement | 90,235 | 1,480 | 19,479 |
| The Plan of Reorganization | 89,593 | 1,142 | 20,457 |
A special meeting of the shareholders of the Quaker Investment Trust - Quaker Strategic Growth Fund was held on June 27, 2018. At the meeting, the Approval of the New Investment Management Agreement between the Trust on behalf of the Quaker Strategic Growth Fund and Community Capital Management, Inc. and an Agreement of the Plan of Reorganization that provides for the Reorganization of the Trust from its Current Form of Organization as a Massachusetts Business Trust into a Newly Formed Delaware Statutory Trust was approved by a majority of the outstanding voting securities of the Quaker Strategic Growth Fund. The results of the shareholder votes are as follows:
| Proposals | For | Against | Abstain |
| The New Investment Management Agreement | 861,771 | 31,836 | 247,480 |
| The Plan of Reorganization | 852,751 | 43,628 | 244,710 |
A special meeting of the shareholders of the Quaker Investment Trust - Quaker Global Tactical Allocation Fund, Quaker Mid-Cap Value Fund, Quaker Small-Cap Value Fund and Quaker Strategic Growth Fund (the (“Trust”) was held on June 27, 2018. At the meeting, the Election of a New Board of Trustees for the Trust was approved in plurality by a majority of the outstanding voting securities of the Quaker Investment Trust. The result of the shareholder vote is as follows:
| Proposal | For | Against | Abstain |
| Elect a Board of Trustees for the Trust | 2,913,324 | — | 78,335 |
Report of Independent Registered Public Accounting Firm
To the Shareholders and Board of Trustees of Quaker Investment Trust
Opinion on the Financial Statements
We have audited the accompanying statements of assets and liabilities of Quaker Global Tactical Allocation Fund, Quaker Mid-Cap Value Fund, Quaker Small-Cap Value Fund, and Quaker Strategic Growth Fund (the “Funds”), each a series of Quaker Investment Trust (the “Trust”), including the schedules of investments, as of June 30, 2018, the related statements of operations for the year then ended, the statements of changes in net assets for each of the two years in the period then ended, and the financial highlights for each of the five years in the period then ended, and the related notes (collectively referred to as the “financial statements”). In our opinion, the financial statements present fairly, in all material respects, the financial position of the Funds as of June 30, 2018, the results of their operations for the year then ended, the changes in their net assets for each of the two years in the period then ended, and their financial highlights for each of the five years in the period then ended, in conformity with accounting principles generally accepted in the United States of America.
Basis for Opinion
These financial statements are the responsibility of the Funds’ management. Our responsibility is to express an opinion on the Funds’ financial statements based on our audits. We are a public accounting firm registered with the Public Company Accounting Oversight Board (United States) (“PCAOB”) and are required to be independent with respect to the Funds in accordance with the U.S. federal securities laws and the applicable rules and regulations of the Securities and Exchange Commission and the PCAOB. We have served as the auditor of one or more of the funds in the Trust since 2012.
We conducted our audits in accordance with the standards of the PCAOB. Those standards require that we plan and perform the audits to obtain reasonable assurance about whether the financial statements are free of material misstatement, whether due to error or fraud. The Funds are not required to have, nor were we engaged to perform, an audit of the Funds’ internal control over financial reporting. As part of our audits we are required to obtain an understanding of internal control over financial reporting, but not for the purpose of expressing an opinion on the effectiveness of the Funds’ internal control over financial reporting. Accordingly, we express no such opinion.
Our audits included performing procedures to assess the risks of material misstatement of the financial statements, whether due to error or fraud, and performing procedures that respond to those risks. Such procedures included examining, on a test basis, evidence regarding the amounts and disclosures in the financial statements. Our audits also included evaluating the accounting principles used and significant estimates made by management, as well as evaluating the overall presentation of the financial statements. Our procedures included confirmation of securities owned as of June 30, 2018 by correspondence with the custodian and brokers; when replies were not received from brokers, we performed other auditing procedures. We believe that our audits provide a reasonable basis for our opinion.
TAIT, WELLER & BAKER LLP
Philadelphia, Pennsylvania
August 13, 2018
Trustees and Officers (unaudited)
June 30, 2018
The Board has overall responsibility for conduct of the Trust’s affairs. The day-to-day operations of the Trust are managed by CCM subject to the Bylaws of the Trust and review by the Board. The Trustees, including those Trustees who are also officers, are listed below:
| | | Serving as | | | Other |
| | | an Officer | | Portfolios | Directorships |
| Name, Age & | Position(s) Held | or Trustee of | Principal Occupation(s) | Overseen by | Held by |
| Address* | with the Trust | the Trust | During Past 5 Years | Trustee | Trustee(1) |
| Independent Trustees | | | | | |
| James R. Brinton | Trustee | Since 2002 | Vice President, BMT Insurance | 4 | None |
| Age 64 | Chairman | Since 2018 | Advisors (a commercial insurance | | |
| | Lead | 2007–2018 | brokerage firm) since 2015; | | |
| | Independent | | President, Robert J. McAllister | | |
| | Trustee | | Agency, Inc. (a commercial | | |
| | | | insurance brokerage firm). | | |
| Everett T. Keech | Trustee | 2005–Present | Chairman, Technology | 4 | Director, |
| Age 78 | | | Development Corp., since 1997; | | Technology |
| | | | Affiliated Faculty, University | | Development |
| | | | of Pennsylvania since 1998. | | Corp. |
| Gary Edward Shugrue | Trustee | 2008–Present | Veritable, LP (investment advisory | 4 | Director, |
| Age 64 | | | firm) since 2015; President and | | Vivaldi |
| | | | Chief Investment Officer, | | Opportunities |
| | | | Ascendant Capital Partners | | Fund |
| | | | from 2001–2015. | | |
| Warren West | Trustee | 2003–Present | Retired since 2017. Greentree | 4 | None |
| Age 61 | | | Brokerage Services, Inc. | | |
| | | | from 1998–2017. | | |
| Interested Trustee | | | | | |
Alyssa Greenspan(2) | President | Since | President, Community Capital | 4 | Director, |
| Age 46 | | January, 2018 | Management, Inc. since | | Impact Shares |
| | Trustee | Since | January 2015; Chief Operating | | |
| | | June, 2018 | Officer, Community Capital | | |
| | | | Management, Inc. since June | | |
| | | | 2009; Senior Vice President and | | |
| | | | Portfolio Manager, Community | | |
| | | | Capital Management, Inc. | | |
| | | | since May 2003. | | |
| Officers | | | | | |
| Todd Cohen | Secretary | Since | Chief Executive Officer and Chief | N/A | N/A |
| Age 52 | | June, 2018 | Investment Officer, Community | | |
| | | | Capital Management, Inc. since | | |
| | | | January 2015; President and Chief | | |
| | | | Investment Officer, Community | | |
| | | | Capital Management, Inc. | | |
| | | | January 2007–January 2015. | | |
Trustees and Officers (unaudited) (continued)
| | | Serving as | | | Other |
| | | an Officer | | Portfolios | Directorships |
| Name, Age & | Position(s) Held | or Trustee of | Principal Occupation(s) | Overseen by | Held by |
| Address* | with the Trust | the Trust | During Past 5 Years | Trustee | Trustee(1) |
| David K. Downes | Treasurer | Since | Chair of the Board, Community | N/A | N/A |
| Age 78 | | June, 2018 | Capital Management, Inc. since | | |
| | | | February 2015; Chief Executive | | |
| | | | Officer, Community Capital | | |
| | | | Management, Inc. from | | |
| | | | January 2004–February 2015. | | |
| Stefanie Little | Chief Compliance | Since | Chief Compliance Officer, | N/A | N/A |
| Age 50 | Officer | June, 2018 | Community Capital Management, | | |
| | | | Inc. (2010–present). Chief | | |
| | | | Compliance Officer for Quaker | | |
| | | | Investment Trust since June, 2018. | | |
| | | | Founder of Chenery Compliance | | |
| | | | Group, LLC (2015–present); | | |
| | | | Managing Member SEC Compliance | | |
| | | | Alliance, LLC (2012–present), | | |
| | | | President of Little Consulting Group, | | |
| | | | Inc. (2011–present). | | |
| * | The address for each Trustee and Officer is Community Capital Management, Inc., 2500 Weston Road, Suite 101, Weston, Florida 33331. |
| (1) | Directorship of companies required to report to the SEC under the Securities and Exchange Act of 1934, as amended (the “Exchange Act”) (i.e., “public companies”) and investment companies registered under the 1940 Act. |
| (2) | Ms. Greenspan is an “interested person of the Trust (as defined in the 1940 act) due to the position she holds with Community Capital Management, Inc. |
The Statement of Additional Information for the Trust includes additional information about the Trustees and Officers and is available, without charge, upon request by calling (800) 220-8888.
Form N-Q Filing and Proxy Voting Policies and Procedures
Each Fund files its complete schedule of portfolio holdings with the Securities and Exchange Commission (“SEC”) for the first and third quarters of each fiscal year on Form N-Q. Each Fund’s Forms N-Q, as well as a description of the policies and procedures that each Fund uses to determine how to vote proxies (if any) relating to portfolio securities is available without charge: (i) upon request, by calling (800) 220-8888; and (ii) on the SEC’s web-site at http://www.sec.gov. Each Fund’s Forms N-Q may be reviewed and copied at the SEC’s Public Reference Room in Washington, DC; information on the operation of the Public Reference Room may be obtained by calling 1-800-SEC-0330.
Information (if any) regarding how the Funds voted proxies relating to portfolio securities during the most recently disclosed 12-month period ended June 30 is available: (i) without charge, upon request, by calling (800) 220-8888; and (ii) on the SEC’s web-site at http://www.sec.gov.
General Information (unaudited)
Tax Information
We are required to advise you within 60 days of the Funds’ fiscal year-end regarding the federal tax status of certain distributions received by shareholders during such fiscal year. The information below is provided for the fiscal year ending June 30, 2018. During the fiscal year ended June 30, 2018, the following Fund paid a long-term capital distribution.
| Fund | |
| Small-Cap Value | $2,668,792 |
Individual shareholders are eligible for reduced tax rates on the following percentages of qualified dividend income. For the purposes of computing the dividends eligible for reduced taxes, the following percentage of the dividends paid by the Fund from ordinary income earned during the fiscal year are considered qualified dividend income.
| Fund | Percentage |
| Small-Cap Value | 22.26% |
Corporate shareholders may exclude up to the following percentages of qualifying dividends. For the purposes of computing this exclusion, the following percentage of the dividends paid by the Funds from ordinary income earned during the fiscal year represents qualifying dividends.
| Fund | Percentage |
| Small-Cap Value | 18.82% |
During the fiscal year ending June 30, 2018, the percentage of taxable ordinary income distributions that are designated as short-term capital gain distributions under Internal Revenue Section 871(k)(2)(C) for the Fund was as follows.
| Fund | Percentage |
| Small-Cap Value | 100.00% |
Dividends and distributions received by retirement plans such as IRAs, Keogh type plans and 403(b) plans need not be reported as taxable income. However, many retirement plan trusts may need this information for their annual information reporting. Since the information above is reported for the Funds’ fiscal year and not the calendar year, shareholders should refer to their Form 1099-DIV or other tax information which will be mailed in January 2019 to determine the calendar year amounts to be included on their 2018 tax returns. Shareholders should consult their tax advisers.
Privacy Policy
Your personal privacy is important. At Quaker Investment Trust, including its subsidiaries and affiliated entities, we recognize that whether you are an existing customer or are considering a relationship with us, you have an interest in how we collect, retain and use information about you and your relationship with us.
We are committed to protecting your confidential information. We do this by maintaining standards and procedures designed to prevent the accidental disclosure of such information and/or its misuse. Our Customer Privacy Policy, which outlines how we accomplish the protection of your information, is set forth below.
General Information (unaudited) (continued)
| I. | INFORMATION COLLECTION |
| | |
| | We may collect “non-public personal information” about you from the following sources: |
| | • | Information we receive from you on account applications and other account forms you provide to us; |
| | | |
| | • | Information about your transactions with us, our affiliates, and other entities; |
| | | |
| | • | Information we receive from third parties, such as credit bureaus, the IRS, and others. “Non-public personal information” is non-public information about you that we obtain in connection with providing a financial product or service to you. For example, non-public personal information includes information regarding your account balance, shares held, which funds you own, your investment history, etc. |
| II. | INFORMATION USE & SHARING WITH THIRD PARTIES |
We are permitted under law to share information about our experiences or transactions with you or your account (such as your account balance, shares owned, and investment history) with affiliates. We may also share additional information about you or your account (such as information we receive from account applications and other correspondence) with our affiliates. We do not disclose information to our affiliates that does not directly relate to our or our affiliates’, experiences or transactions with your account. We are also permitted under law to disclose non-public information about you to “non-affiliated third parties” in certain circumstances. We may share certain kinds of customer information with these third parties solely to facilitate the offering, administration, collection and delivery of our services to you, and only under strictly controlled circumstances designed to protect the privacy of your information. We require any non-affiliated third party with whom we share such information to execute our Confidentiality and Consumer Privacy Protection Agreement. Under that agreement, those parties are not allowed to release, use for their own purposes, or sell, transfer or provide any customer information we share with them to any other party. You should be aware that there may be occasions where we are legally required to disclose information about you, such as in response to a governmental or court order. If you decide to close your account with us, we will continue to adhere to these privacy policies. Lastly, we do not sell customer lists or individual customer information. |
At Quaker Investment Trust and our affiliates, employee access to customer information is authorized for business purposes only and only for employees who need to know such information. We regularly train our employees on privacy and privacy security, and we have established and continuously maintain standards and procedures to protect the privacy of your information. When you use our on-line (Internet) products and services, we may collect information about you to personalize our services to you, but we do not share any such information or your email information to anyone other than our affiliates, unless compelled to do so under law. |
|
|
|
|
| We continually strive to maintain complete and accurate information about you and your accounts. Should you ever believe that our records are inaccurate or incomplete, please call us immediately at 1-800-220-8888. We will investigate your concerns and correct any inaccuracies. We will also confirm to you the actions we have taken concerning your account. You may also write to us at the Quaker Investment Trust, c/o U.S. Bancorp Fund Services, LLC, P.O. Box 701, Milwaukee, Wisconsin 53201-0701. |
General Information (unaudited) (continued)
Notice Regarding Delivery of Shareholder Documents
In an effort to decrease costs, each Fund intends to reduce the number of duplicate Prospectuses and Annual and Semi-Annual Reports you receive by sending only one copy of each to those addresses shared by two or more accounts and to shareholders we reasonably believe are from the same family or household. Once implemented, if you would like to discontinue householding for your accounts, please call toll-free at 1-800-220-8888 to request individual copies of these documents. Once a Fund receives notice to stop householding, we will begin sending individual copies thirty days after receiving your request. This policy does not apply to account statements.
The Quaker Funds are distributed by
Foreside Fund Services, LLC.
Contact us:
Quaker Investment Trust
c/o U.S. Bancorp Fund Services, LLC.
PO Box 701
Milwaukee, WI 53201-0701
800.220.8888
www.quakerfunds.com
©2018 Quaker® Investment Trust
 | QKAR 062018 |