CCM Core Impact Equity Fund
(Formerly Quaker Impact Growth Fund)
CCM Small/Mid-Cap Impact Value Fund
(Formerly Quaker Small/Mid-Cap Impact Value Fund)

Mutual fund investing involves risk. Principal loss is possible. Equity securities are subject to price fluctuation. Small- and mid-cap stocks involve greater risks and volatility than large-cap stocks. The Funds invest in companies that appear to be “undervalued” in the marketplace. The Funds’ exposure to (MLPs) may subject the Funds to greater volatility than investments in traditional securities. This report must be preceded or accompanied by a current prospectus. The opinions expressed are those of the adviser through the end of the period for this report, are subject to change, are not a guarantee, and should not be considered investment advice. Fund holdings are subject to change and should not be considered a recommendation to buy or sell any security. Current and future holdings are subject to risk. |
| Chair’s Letter to the Shareholders (unaudited) |
June 30, 2021
Dear Shareholders:
On behalf of the Board of Trustees of the Quaker Investment Trust, I am pleased to present the Annual Report to Shareholders for the year ended June 30, 2021.
We applaud the disciplined and productive efforts of Community Capital Management, Inc., registered investment advisor to the Trust, and we thank you, our shareholders, for your investments. We appreciate your continued confidence.
Sincerely,
James R. Brinton
Chair and Lead Independent Trustee
Quaker Investment Trust
2021 ANNUAL REPORT | 2
| Performance Update (unaudited) |
CCM Core Impact Equity Fund
(QUAGX, QAGIX)
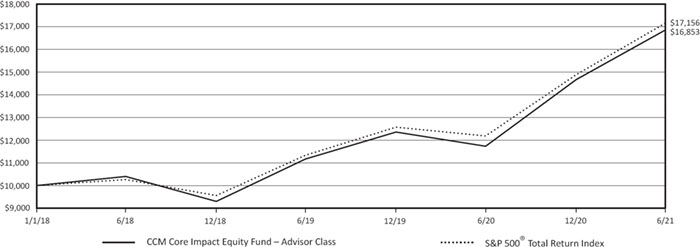
The institutional share class of the CCM Core Impact Equity Fund (the Fund) returned 44.00% for the fiscal year ended June 30, 2021, outperforming the S&P 500 Total Return Index’s return of 40.79%. The Fund’s outperformance versus its benchmark was partially driven by an overweight allocation to companies in the Financials sector, which were the best performing sector in the S&P 500, returning 61.60% as a group. The Fund was also underweight the Consumer Staples sector, which was the second worst performing sector up 23.29%. The Fund generated positive returns versus the benchmark with regards to selecting securities within specific sectors, including holdings in the Industrial, Financial, and Utilities sectors.
The portfolio management team seeks to invest in high-quality companies that have demonstrated a history of above average earnings growth and we anticipate that they will potentially grow their earnings for several years at above the average of companies of the S&P 500. Typically, these companies are also trading at lower price-to-earnings (PE)1 ratios than the market or to their historical averages.
The Fund’s fiscal year saw a continuation of the recovery in equity markets that started in April of 2020. Unprecedented fiscal and monetary stimulus in combination with the swift development of vaccines resulted in significant gains for equity markets. Additionally, 2020 was an election year where Democrats gained control of both houses of Congress and the White House, resulting in an expectation for more fiscal stimulus to aid the economy. These heightened expectations resulted in strong gains for the S&P 500. The Fund’s holdings benefited from these events, particularly its Financials holdings, which rose on the expectation that higher interest rates would benefit earnings.
We continue to manage the Fund with consideration for companies’ environmental, social, and governance (ESG) practices. More than 50% of the portfolio is comprised of companies that we believe provide a net benefit to society through their focus on social wellbeing and/or preserving and protecting the environment. We define these companies as moderate positive impact or strong positive impact. Investments that fall within these ratings range from pharmaceutical and healthcare services companies to renewable energy producers. The Fund is also now fossil fuel free. Moving forward, investors will likely focus on the shape of the U.S. recovery, the impacts of COVID-19 variants as well as fiscal and monetary policy. So far, the shape and speed of the economic recovery appear to be strong. However, many of the policies instituted during the last eighteen months are expected to roll off over the next year, which could result in volatile equity markets.
While uncertainty still exists about the path of the U.S. economic recovery, overall, we believe that high quality companies that continue to create shareholder value year after year will outperform over the long term. We believe that the performance of the underlying businesses within the Fund’s portfolio are likely to experience little interruption from some of the risks that we are seeing in the economy and markets today.
Sincerely,
The Portfolio Management Team
| 1 | Price-earnings (P/E): ratio between a company’s share price to its earnings per share. |
2021 ANNUAL REPORT | 3
| Performance Update (unaudited) (continued) |
CCM Core Impact Equity Fund
(QUAGX, QAGIX)
(Formerly Quaker Impact Growth Fund)
OBJECTIVES AND PRINCIPAL STRATEGIES
The Fund, seeks to provide long-term growth of capital. The Fund’s principal holdings are large companies that demonstrate long term ability to compound earnings at higher rates than the broader market, regardless of industry. The Fund is managed independent of any index sector weightings. The Fund investments will be centered on US-domestic based companies although the Fund has the ability to invest internationally as well. The Fund will under normal market conditions, employ a tactical allocation philosophy.
| | Average Annualized Total Return | | | |
| | | | | | Inception |
| | | | | | through |
| | Expense Ratio* | Inception Date | One Year | Three Years | 6/30/21+ |
| Advisor Class | 2.09% | 1/1/18 | 43.65% | 17.45% | 16.10% |
| Institutional Class | 1.84% | 1/1/18 | 44.00% | 17.75% | 16.40% |
| S&P 500® Total Return Index** | | | 40.79% | 18.67% | 16.69% |
| * | As stated in the Prospectus dated October 28, 2020, as amended November 16, 2020 and May 13, 2021. |
| ** | The benchmark since inception returns are calculated since commencement of January 1, 2018 through June 30, 2021. |
| + | The Fund amended and restated its Registration Statement to change the performance reporting history. The inception date for the Fund’s performance history is now January 1, 2018, the date Community Capital Management, Inc. became the new investment adviser to the Fund. |
Performance data quoted represents past performance and is no guarantee of future results. Investment return and principal value will fluctuate so that shares, when redeemed, may be worth more or less than their original cost. Current performance may be lower or higher than performance data quoted. Performance data current to the most recent month end is available at www.ccminvests.com or by calling us toll free at 888-272-0007. Total return includes reinvestment of dividends and capital gains.
The performance table does not reflect the deduction of taxes that a shareholder might pay on fund distributions or the redemption of fund shares. Total return calculations reflect expense reimbursements and fee waivers in the applicable periods. See financial highlights for periods where fees were waived or reimbursed.
The Fund’s portfolio holdings may differ significantly from the securities held in the index and, unlike a mutual fund, an unmanaged index assumes no transaction costs, taxes, management fees or other expenses. You cannot invest directly in an index.
The S&P 500® Total Return Index (“S&P 500® Index”) is a widely recognized, unmanaged index consisting of the approximately 500 largest companies in the United States as measured by market capitalization. The S&P 500® Index assumes reinvestment of all dividends and distributions.
2021 ANNUAL REPORT | 4
| Performance Update (unaudited) (continued) |
CCM Core Impact Equity Fund
(QUAGX, QAGIX)
(Formerly Quaker Impact Growth Fund)
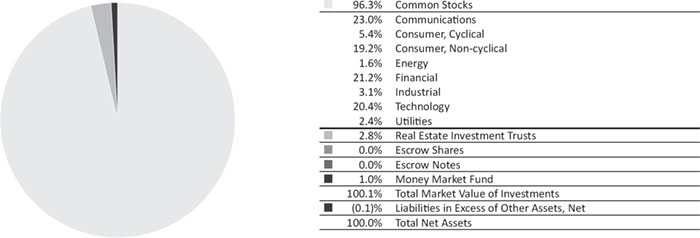
TOTAL NET ASSETS:
AS OF JUNE 30, 2021
$71,353,313
| Top 10 Holdings* (% of net assets) | |
| Amazon.com Inc. | 5.8% |
| Microsoft Corp. | 5.7% |
| Facebook Inc. Cl A | 5.4% |
| Apple Inc. | 4.4% |
| Alphabet Inc. Cl C | 3.8% |
| Alphabet Inc. Cl A | 3.8% |
| Discover Financial Services | 3.1% |
| BlackRock Inc. | 3.1% |
| Fiserv Inc. | 3.0% |
| Cigna Corp. | 2.7% |
| % Fund Total | 40.8% |
* Includes Long-Term Investments only.
| Sectors (% of net assets) |
2021 ANNUAL REPORT | 5
| Performance Update (unaudited) |
CCM Small/Mid-Cap Impact Value Fund
(QUSVX, QSVIX)
The CCM Small/Mid-Cap Impact Value Fund institutional share class (the Fund) returned 49.10% for the fiscal year ended June 30, 2021, underperforming the Russell 2500 Value Index’s return of 63.23% and the Russell 2500 Index’s return of 57.79%. While the Fund underperformed, it generated positive alpha1 versus its benchmark of 1.70%.
The Fund outperformed its benchmark in the calendar third quarter of 2020 but underperformed during the other three quarters. The largest underperformance occurred during the calendar fourth quarter as markets and in particular small-cap value stocks experienced significant gains after the election. The two major causes of underperformance were slight underperformance of the Fund’s equity securities and the Fund’s allocation to preferred stock, which are considered to be lower risk investments than equities. As a result, the Fund underperformed during this “risk-on” environment.
We continue to structure the portfolio to have a major percentage of the holdings in investments we have characterized as moderate positive impact and strong positive impact. The Fund is now fossil fuel free and, as part of our research process, we extensively review, discuss, and revisit each holding in the portfolio to determine our impact rating.
As the U.S. economic recovery continues to take shape, there’s potential for the Fed to begin tapering its balance sheet and potentially cause a rise in long term rates, which could be a positive for value versus growth stocks. However, the decline in long-term U.S. Bond yields during the back half of the second calendar quarter of 2021 may be signaling a weakening U.S. economy and a continuation of a challenging environment for value versus growth stocks. If either of these scenarios play out, we believe we are well positioned to take advantage of either of these environments.
While there is uncertainty around employment, interest rates, fiscal policy, and monetary policy, the Fund owns companies that the portfolio management team views as high quality and expects will create significant shareholder value over the next several years. We believe these companies will be resilient in several economic environments and give the Fund the opportunity to capture upside in markets and the potential to limit downside capture in volatile environments.
Sincerely,
The Portfolio Management Team
| 1 | Alpha: risk-adjusted measure of the amount an investment has returned in comparison to a broad benchmark that the investment is compared against. |
2021 ANNUAL REPORT | 6
| Performance Update (unaudited) (continued) |
CCM Small/Mid-Cap Impact Value Fund
(QUSVX, QSVIX)
(Formerly Quaker Small/Mid-Cap Impact Value Fund)
OBJECTIVES AND PRINCIPAL STRATEGIES
The Fund, seeks to provide long-term growth of capital. Under normal circumstances, the Fund will invest at least 80% of its assets, plus the amount of any borrowings for investment purposes, in the securities of small- and mid-cap U.S. companies. The Fund generally considers small- and mid-cap companies to be those companies represented by the Russell 2500® Index.

| | Average Annualized Total Return | | | |
| | Gross
Expense Ratio* | Net
Expense Ratio* | Inception Date | One Year | Three Years | Inception
through
6/30/21+ |
| Advisor Class | 2.66% | 1.83% | 1/1/18 | 48.79% | 2.41% | 3.08% |
| Institutional Class | 2.41% | 1.58% | 1/1/18 | 49.10% | 2.65% | 3.33% |
| Russell 2500® Value Index** | | | | 63.23% | 10.60% | 9.95% |
| Russell 2500® Index** | | | | 57.79% | 15.24% | 14.67% |
| * | As stated in the Prospectus dated October 28, 2020, as amended November 16, 2020 and May 13, 2021. The Adviser has contractually agreed to waive all or a portion of its investment advisory fees and/or pay/reimburse expenses (excluding any Rule 12b-1 fees, taxes, interest, acquired fund fees and expenses, short sale dividend and interest expenses, brokerage fees, certain insurance costs, and nonroutine expenses or costs, including, but not limited to, those relating to reorganizations, litigation, conducting shareholder meetings, liquidations and other extraordinary expenses) in order to prevent total annual fund operating expenses from exceeding 1.30% of the Fund’s average daily net assets through October 28, 2021. Pursuant to its expense limitation agreement with the Fund, the Adviser is entitled to recoup any fees that it waived and/or Fund expenses that it paid for a period of three years following such fee waivers and expense payments, to the extent that such recoupment by the Adviser will not cause the Fund to exceed any applicable expense limitation that was in place for the Fund when the fees were waived or expenses were paid. These waivers and reimbursements may be terminated at any time with respect to the Fund by it Board of Trustees upon sixty (60) days’ written notice to the Adviser without payment of any penalty and shall automatically terminate upon the termination of the Fund’s advisory contract with the Adviser. |
| ** | The benchmarks since inception returns are calculated since commencement of January 1, 2018 through June 30, 2021. |
| + | The Fund amended and restated its Registration Statement to change the performance reporting history. The inception date for the Fund’s performance history is now January 1, 2018, the date Community Capital Management, Inc. became the new investment adviser to the Fund. |
Performance data quoted represents past performance and is no guarantee of future results. Investment return and principal value will fluctuate so that shares, when redeemed, may be worth more or less than their original cost. Current performance may be lower or higher than performance data quoted. Performance data current to the most recent month end is available at www.ccminvests.com or by calling us toll free at 888-272-0007. Total return includes reinvestment of dividends and capital gains.
The performance table does not reflect the deduction of taxes that a shareholder might pay on fund distributions or the redemption of fund shares. Total return calculations reflect expense reimbursements and fee waivers in the applicable periods.
The Fund’s portfolio holdings may differ significantly from the securities held in the index and, unlike a mutual fund, an unmanaged index assumes no transaction costs, taxes, management fees or other expenses. You cannot invest directly in an index.
The Russell 2500® Index is a widely recognized, unmanaged index comprised of the smallest 2500 companies represented in the Russell 3000® Index.
2021 ANNUAL REPORT | 7
Performance Update (unaudited) (continued)
CCM Small/Mid-Cap Impact Value Fund
(QUSVX, QSVIX)
(Formerly Quaker Small/Mid-Cap Impact Value Fund)
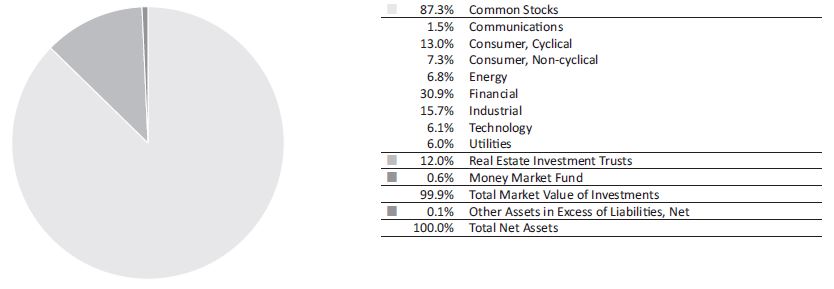
TOTAL NET ASSETS:
AS OF JUNE 30, 2021
$19,190,537
| Top 10 Holdings* (% of net assets) | | |
| Enviva Partners LP | | 6.8 | % |
| Fidelity National Financial Inc. | | 4.4 | % |
| WP Carey Inc. | | 4.3 | % |
| Berry Global Group Inc. | | 3.9 | % |
| The Timken Co. | | 3.7 | % |
| Financial Institutions Inc. | | 3.6 | % |
| Raymond James Financial Inc. | | 3.6 | % |
| Clearway Energy Inc. Cl C | | 3.5 | % |
| Mid-America Apartment Communities Inc. | | 3.5 | % |
| Ameriprise Financial Inc. | | 3.4 | % |
| % Fund Total | | 40.7 | % |
* Includes Long-Term Investments only.
| | Sectors (% of net assets) |
2021 ANNUAL REPORT | 8
Expense Information (unaudited)
As a shareholder of the Funds, you incur two types of costs: (1) transaction costs, including applicable sales charges and redemption fees; and (2) ongoing costs, including management fees, distribution (12b-1) fees and other Fund expenses. This example is intended to help you understand your ongoing costs (in dollars) of investing in the Funds and to compare these costs with the ongoing costs of investing in other funds. The example is based on an investment of $1,000 invested at the beginning of the (six-month) period and held for the entire period January 1, 2021 through June 30, 2021.
ACTUAL EXPENSES
The first section of each table below provides information about actual account values and actual expenses for each of the Funds. You may use this information, together with the amount you invested, to estimate the expenses that you paid over the period. Simply divide your account value by $1,000 (for example, an $8,600 account value divided by $1,000 = 8.6), then multiply the result by the number in the applicable line under the heading entitled “Expenses Paid During the Period” to estimate the expenses you paid on your account during this period.
HYPOTHETICAL EXAMPLE FOR COMPARISON PURPOSES
The second section of each table below provides information about hypothetical account values and hypothetical expenses based on the Fund’s actual expense ratio and an assumed rate of return of 5% per year before expenses, which is not the Fund’s actual return. The hypothetical account values and expenses may not be used to estimate the actual ending account balance or expenses you paid for the period. You may use this information to compare the ongoing costs of investing in the Fund to other funds. To do so, compare this 5% hypothetical example with the 5% hypothetical examples that appear in the shareholder reports of the other funds. Please note that the expenses shown in the table are meant to highlight your ongoing costs only and do not reflect any transactional costs, such as sales charges (loads), redemption fees or exchange fees. Therefore, the second section of the table is useful in comparing ongoing costs only, and will not help you determine the relative total costs of owning different funds. In addition, if these transactional costs were included, your costs would have been higher.
| | | | | | Beginning
Account Value
(01/01/2021) | | Annualized
Expense Ratio
for the Period | | Ending
Account Value
(06/30/2021) | | Expenses Paid
During Period* |
| CCM Core Impact Equity Fund (Formerly Quaker Impact Growth Fund) | | | | | | | | | |
| Example based on actual return of: | | | | | | | | | | | | | | | | | | | | |
| Advisor Class | | | 14.89 | % | | $ | 1,000.00 | | | | 2.01 | % | | $ | 1,148.90 | | | $ | 10.71 | |
| Institutional Class | | | 15.05 | % | | | 1,000.00 | | | | 1.76 | % | | | 1,150.50 | | | | 9.38 | |
| Hypothetical example based on assumed 5% return: | | | | | | | | | | | | | | | | | |
| Advisor Class | | | | | | | 1,000.00 | | | | 2.01 | % | | | 1,014.83 | | | | 10.04 | |
| Institutional Class | | | | | | | 1,000.00 | | | | 1.76 | % | | | 1,016.07 | | | | 8.80 | |
| CCM Small/Mid-Cap Impact Value Fund (Formerly Quaker Small/Mid-Cap Impact Value Fund) | |
| Example based on actual return of: | | | | | | | | | | | | | | | | | | | | |
| Advisor Class | | | 19.46 | % | | | 1,000.00 | | | | 1.55 | % | | | 1,194.60 | | | | 8.43 | |
| Institutional Class | | | 19.58 | % | | | 1,000.00 | | | | 1.30 | % | | | 1,195.80 | | | | 7.08 | |
| Hypothetical example based on assumed 5% return: | | | | | | | | | | | | | | | | | |
| Advisor Class | | | | | | | 1,000.00 | | | | 1.55 | % | | | 1,017.11 | | | | 7.75 | |
| Institutional Class | | | | | | | 1,000.00 | | | | 1.30 | % | | | 1,018.35 | | | | 6.51 | |
| * | Expenses are equal to the Funds’ annualized six-month expense ratios multiplied by the average account value over the period multiplied by the number of days in the most recent fiscal half year (181) divided by 365 to reflect the one-half year period. |
2021 ANNUAL REPORT | 9
Schedule of Investments
CCM Core Impact Equity Fund
(Formerly Quaker Impact Growth Fund)
June 30, 2021
| | | Number
of Shares | | | Fair
Value | |
| Long-Term Investments — 99.1% | | | | | | | | |
| Common Stocks — 96.3% | | | | | | | | |
| Communications — 23.0% | | | | | | | | |
| Broadcast Service/Program — 0.9% | | | | | | | | |
| Discovery Inc. (a) | | | 22,000 | | | $ | 637,560 | |
| E-Commerce/Products — 7.2% | | | | | | | | |
| Alibaba Group Holding Ltd. - ADR (a) f | | | 4,600 | | | | 1,043,188 | |
| Amazon.com Inc. (a) | | | 1,200 | | | | 4,128,192 | |
| | | | | | | | 5,171,380 | |
| Internet Content-Entertainment — 5.4% | | | | | | | | |
| Facebook Inc. Cl A (a) | | | 11,000 | | | | 3,824,810 | |
| Internet Content-Info/News — 1.9% | | | | | | | | |
| Tencent Holdings Ltd. - ADR f | | | 18,000 | | | | 1,355,400 | |
| Web Portals/Internet Service Providers — 7.6% | | | | | | | | |
| Alphabet Inc. Cl A (a) | | | 1,102 | | | | 2,690,853 | |
| Alphabet Inc. Cl C (a) | | | 1,100 | | | | 2,756,952 | |
| | | | | | | | 5,447,805 | |
| Total Communications | | | | | | | | |
| (Cost $9,236,036) | | | | | | | 16,436,955 | |
| Consumer, Cyclical — 5.4% | | | | | | | | |
| Distribution/Wholesale — 1.7% | | | | | | | | |
| IAA Inc. (a) | | | 9,000 | | | | 490,860 | |
| LKQ Corp. (a) | | | 15,000 | | | | 738,300 | |
| | | | | | | | 1,229,160 | |
| Retail-Automobile — 2.3% | | | | | | | | |
| Asbury Automotive Group Inc. (a) | | | 5,400 | | | | 925,398 | |
| Lithia Motors Inc. | | | 2,000 | | | | 687,280 | |
| | | | | | | | 1,612,678 | |
| Retail-Restaurants — 1.4% | | | | | | | | |
| Starbucks Corp. | | | 8,844 | | | | 988,848 | |
| Total Consumer, Cyclical | | | | | | | | |
| (Cost $2,591,989) | | | | | | | 3,830,686 | |
| Consumer, Non-cyclical — 19.2% | | | | | | | | |
| Brewery — 1.0% | | | | | | | | |
| Constellation Brands Inc. | | | 3,000 | | | | 701,670 | |
| Commercial Services — 1.6% | | | | | | | | |
| Quanta Services Inc. | | | 12,500 | | | | 1,132,125 | |
| Commercial Services-Finance — 1.2% | | | | | | | | |
| FleetCor Technologies Inc. (a) | | | 3,200 | | | | 819,392 | |
| Diagnostic Equipment — 1.5% | | | | | | | | |
| Thermo Fisher Scientific Inc. | | | 2,181 | | | | 1,100,249 | |
| Food-Confectionery — 0.5% | | | | | | | | |
| Mondelez International Inc. | | | 6,000 | | | | 374,640 | |
| Medical Instruments — 2.5% | | | | | | | | |
| Boston Scientific Corp. (a) | | | 14,000 | | | | 598,640 | |
| Edwards Lifesciences Corp. (a) | | | 3,810 | | | | 394,602 | |
| Intuitive Surgical Inc. (a) | | | 854 | | | | 785,372 | |
| | | | | | | | 1,778,614 | |
| Medical Products — 1.5% | | | | | | | | |
| The Cooper Cos. Inc. | | | 1,479 | | | | 586,083 | |
| Stryker Corp. | | | 1,956 | | | | 508,032 | |
| | | | | | | | 1,094,115 | |
| Medical-Drugs — 2.3% | | | | | | | | |
| Bristol-Myers Squibb Co. | | | 10,000 | | | | 668,200 | |
| Merck & Co Inc. | | | 12,000 | | | | 933,240 | |
| Organon & Co. (a) | | | 1,200 | | | | 36,312 | |
| | | | | | | | 1,637,752 | |
| Medical-Health Maintenance Organization — 2.2% | | | | | | | | |
| Anthem Inc. | | | 4,100 | | | | 1,565,380 | |
| Medical-Wholesale Drug Distributors — 2.2% | | | | | | | | |
| AmerisourceBergen Corp. | | | 11,000 | | | | 1,259,390 | |
| McKesson Corp. | | | 1,800 | | | | 344,232 | |
| | | | | | | | 1,603,622 | |
| Pharmacy Services — 2.7% | | | | | | | | |
| Cigna Corp. | | | 8,000 | | | | 1,896,560 | |
| Total Consumer, Non-cyclical | | | | | | | | |
| (Cost $10,267,145) | | | | | | | 13,704,119 | |
| Energy — 1.6% | | | | | | | | |
| Energy-Alternate Sources — 1.6% | | | | | | | | |
| Enviva Partners LP | | | 21,500 | | | | 1,126,815 | |
| Total Energy | | | | | | | | |
| (Cost $598,943) | | | | | | | 1,126,815 | |
| Financial — 21.2% | | | | | | | | |
| Commercial Banks — 2.0% | | | | | | | | |
| Financial Institutions Inc. | | | 24,823 | | | | 744,690 | |
| Signature Bank | | | 2,900 | | | | 712,385 | |
| | | | | | | | 1,457,075 | |
| Diversified Banking Institutions — 2.0% | | | | | | | | |
| JPMorgan Chase & Co. | | | 9,000 | | | | 1,399,860 | |
| Finance-Credit Card — 5.6% | | | | | | | | |
| Discover Financial Services | | | 18,900 | | | | 2,235,681 | |
| Visa Inc. Cl A | | | 7,600 | | | | 1,777,032 | |
| | | | | | | | 4,012,713 | |
| Insurance Brokers — 1.6% | | | | | | | | |
| Willis Towers Watson PLC f | | | 5,000 | | | | 1,150,100 | |
| Investment Management/Advisory Services — 4.5% | | | | | | | | |
| Ameriprise Financial Inc. | | | 4,000 | | | | 995,520 | |
| BlackRock Inc. | | | 2,500 | | | | 2,187,425 | |
| | | | | | | | 3,182,945 | |
| Life/Health Insurance — 0.9% | | | | | | | | |
| Principal Financial Group Inc. | | | 10,000 | | | | 631,900 | |
| Property/Casualty Insurance — 4.6% | | | | | | | | |
| Arch Capital Group Ltd. (a) f | | | 18,000 | | | | 700,920 | |
| Berkshire Hathaway Inc. Cl B (a) | | | 5,300 | | | | 1,472,976 | |
| Fidelity National Financial Inc. | | | 25,000 | | | | 1,086,500 | |
| | | | | | | | 3,260,396 | |
| Total Financial | | | | | | | | |
| (Cost $10,153,695) | | | | | | | 15,094,989 | |
The accompanying notes are an integral part of the financial statements.
2021 ANNUAL REPORT | 10
Schedule of Investments (continued)
CCM Core Impact Equity Fund
(Formerly Quaker Impact Growth Fund)
June 30, 2021
| | | Number
of Shares | | | Fair
Value | |
| Common Stocks — 96.3% (Continued) | | | | | | | | |
| Industrial — 3.1% | | | | | | | | |
| Electronic Parts Distributors — 1.0% | | | | | | | | |
| SYNNEX Corp. | | | 6,000 | | | $ | 730,560 | |
| Metal Processors & Fabricators — 2.1% | | | | | | | | |
| Rexnord Corp. | | | 22,000 | | | | 1,100,880 | |
| The Timken Co. | | | 4,500 | | | | 362,655 | |
| | | | | | | | 1,463,535 | |
| Total Industrial | | | | | | | | |
| (Cost $2,135,964) | | | | | | | 2,194,095 | |
| Technology — 20.4% | | | | | | | | |
| Applications Software — 5.7% | | | | | | | | |
| Microsoft Corp. | | | 14,900 | | | | 4,036,410 | |
| Computer Data Security — 0.7% | | | | | | | | |
| Check Point Software Technologies Ltd. (a) f | | | 4,500 | | | | 522,585 | |
| Computers — 4.4% | | | | | | | | |
| Apple Inc. | | | 23,000 | | | | 3,150,080 | |
| Data Processing/Management — 3.0% | | | | | | | | |
| Fiserv Inc. (a) | | | 19,800 | | | | 2,116,422 | |
| ImageWare Systems Inc. (a) | | | 125,000 | | | | 6,412 | |
| | | | | | | | 2,122,834 | |
| Electronic Components-Semiconducters — 2.9% | | | | | | | | |
| Broadcom Inc. | | | 2,250 | | | | 1,072,890 | |
| NVIDIA Corp. | | | 1,250 | | | | 1,000,125 | |
| | | | | | | | 2,073,015 | |
| Electronic Forms — 1.7% | | | | | | | | |
| Adobe Inc. (a) | | | 2,087 | | | | 1,222,231 | |
| Software Tools — 2.0% | | | | | | | | |
| VMware Inc. Cl A (a) | | | 9,000 | | | | 1,439,730 | |
| Total Technology | | | | | | | | |
| (Cost $9,043,804) | | | | | | | 14,566,885 | |
| Utilities — 2.4% | | | | | | | | |
| Electric-Generation — 1.0% | | | | | | | | |
| Brookfield Renewable Corp. f | | | 3,853 | | | | 161,595 | |
| Brookfield Renewable Partners LP f | | | 15,414 | | | | 594,518 | |
| | | | | | | | 756,113 | |
| Electric-Integrated — 1.4% | | | | | | | | |
| CMS Energy Corp. | | | 6,000 | | | | 354,480 | |
| NextEra Energy Inc. | | | 8,500 | | | | 622,880 | |
| | | | | | | | 977,360 | |
| Total Utilities | | | | | | | | |
| (Cost $1,213,074) | | | | | | | 1,733,473 | |
| Total Common Stocks | | | | | | | | |
| (Cost $45,240,650) | | | | | | | 68,688,017 | |
| | | | | | | | | |
| Real Estate Investment Trusts — 2.8% | | | | | | | | |
| Diversified — 2.8% | | | | | | | | |
| American Tower Corp. | | | 3,000 | | | | 810,420 | |
| Equinix Inc. | | | 990 | | | | 794,574 | |
| WP Carey Inc. | | | 5,000 | | | | 373,100 | |
| | | | | | | | 1,978,094 | |
| Total Real Estate Investment Trusts | | | | | | | | |
| (Cost $1,387,825) | | | | | | | 1,978,094 | |
| Escrow Shares — 0.0% | | | | | | | | |
| Consumer, Cyclical — 0.0% | | | | | | | | |
| Airlines — 0.0% | | | | | | | | |
| AMR Corp. Escrow (a)*^ | | | 218,835 | | | | 37,202 | |
| Total Escrow Shares | | | | | | | | |
| (Cost $24,536) | | | | | | | 37,202 | |
| | | Par | | | | |
| | | Value | | | | |
| Escrow Notes — 0.0% | | | | | | | | |
| Consumer, Cyclical — 0.0% | | | | | | | | |
| Retail — 0.0% | | | | | | | | |
| CB Trailer Bridge Inc. Escrow | | | | | | | | |
| (Toys R Us) (a)+*^ | | $ | 66,000 | | | | 0 | |
| Total Escrow Notes | | | | | | | | |
| (Cost $65,792) | | | | | | | 0 | |
| Total Long-Term Investments | | | | | | | | |
| (Cost $46,718,803) | | | | | | | 70,703,313 | |
| | | Number | | | | |
| | | of Shares | | | | |
| Short-Term Investments — 1.0% | | | | | | | | |
| Money Market Fund — 1.0% | | | | | | | | |
| First American Government | | | | | | | | |
| Obligations Fund, Cl X 0.026% (b) | | | 735,484 | | | | 735,484 | |
| Total Short-Term Investments | | | | | | | | |
| (Cost $735,484) | | | | | | | 735,484 | |
| Total Investments | | | | | | | | |
| (Cost $47,454,287) — 100.1% | | | | | | | 71,438,797 | |
| Liabilities in Excess of Other Assets, Net (0.1)% | | | | | | | (85,484 | ) |
| Total Net Assets — 100.0% | | | | | | $ | 71,353,313 | |
ADR - Unsponsored American Depositary Receipt
| (a) | Non-income producing security. |
| (b) | The rate quoted is the annualized 7 day yield as of June 30, 2021. |
| f | Foreign issued security. |
| * | Indicates an illiquid security. Total market value for illiquid securities is $37,202 representing 0.0% of net assets. |
| ^ | Indicates a fair valued security. Total market value for fair valued securities is $37,202, representing 0.0% of net assets and level 3 securities. |
The accompanying notes are an integral part of the financial statements.
2021 ANNUAL REPORT | 11
Schedule of Investments
CCM Small/Mid-Cap Impact Value Fund
(Formerly Quaker Small/Mid-Cap Impact Value Fund)
June 30, 2021
| | | Number
of Shares | | | Fair
Value | |
| Long-Term Investments — 99.3% | | | | | | | | |
| Common Stocks — 87.3% | | | | | | | | |
| Communications — 1.5% | | | | | | | | |
| Advertising Agencies — 1.5% | | | | | | | | |
| Omnicom Group Inc. | | | 3,500 | | | $ | 279,965 | |
| Total Communications | | | | | | | | |
| (Cost $292,655) | | | | | | | 279,965 | |
| Consumer, Cyclical — 13.0% | | | | | | | | |
| Building-Residential/Commercial — 3.1% | | | | | | | | |
| NVR Inc. (a) | | | 120 | | | | 596,796 | |
| Distribution/Wholesale — 4.7% | | | | | | | | |
| IAA Inc. (a) | | | 9,700 | | | | 529,038 | |
| LKQ Corp. (a) | | | 7,500 | | | | 369,150 | |
| | | | | | | | 898,188 | |
| Recreational Vehicles — 0.5% | | | | | | | | |
| Brunswick Corp. | | | 1,000 | | | | 99,620 | |
| Retail-Automobile — 4.7% | | | | | | | | |
| Asbury Automotive Group Inc. (a) | | | 3,700 | | | | 634,069 | |
| Lithia Motors Inc. | | | 800 | | | | 274,912 | |
| | | | | | | | 908,981 | |
| Total Consumer, Cyclical | | | | | | | | |
| (Cost $2,259,836) | | | | | | | 2,503,585 | |
| Consumer, Non-cyclical — 7.3% | | | | | | | | |
| Commercial Services — 1.7% | | | | | | | | |
| Quanta Services Inc. | | | 3,500 | | | | 316,995 | |
| Medical-Drugs — 2.0% | | | | | | | | |
| Organon & Co. (a) | | | 13,000 | | | | 393,380 | |
| Medical-Hospitals — 0.0% | | | | | | | | |
| Nobilis Health Corp. (a) f | | | 38,393 | | | | 69 | |
| Medical-Wholesale Drug Distributors — 2.1% | | | | | | | | |
| Cardinal Health Inc. | | | 7,000 | | | | 399,630 | |
| Rental Auto/Equipment — 1.5% | | | | | | | | |
| PROG Holdings Inc. | | | 6,000 | | | | 288,780 | |
| Total Consumer, Non-cyclical | | | | | | | | |
| (Cost $1,369,437) | | | | | | | 1,398,854 | |
| Energy — 6.8% | | | | | | | | |
| Energy-Alternate Sources — 6.8% | | | | | | | | |
| Enviva Partners LP | | | 25,000 | | | | 1,310,250 | |
| Total Energy | | | | | | | | |
| (Cost $569,609) | | | | | | | 1,310,250 | |
| Financial — 30.9% | | | | | | | | |
| Commercial Banks — 7.5% | | | | | | | | |
| Financial Institutions Inc. | | | 23,300 | | | | 699,000 | |
| First Citizens BancShares Inc. Cl A | | | 250 | | | | 208,185 | |
| Signature Bank | | | 2,150 | | | | 528,148 | |
| | | | | | | | 1,435,333 | |
| Finance-Credit Card — 3.3% | | | | | | | | |
| Discover Financial Services | | | 5,400 | | | | 638,766 | |
| Investment Management/Advisory Services — 8.9% | | | | | | | | |
| AllianceBernstein Holding LP | | | 8,000 | | | | 372,480 | |
| Ameriprise Financial Inc. | | | 2,600 | | | | 647,088 | |
| Raymond James Financial Inc. | | | 5,250 | | | | 681,975 | |
| | | | | | | | 1,701,543 | |
| Life/Health Insurance — 1.1% | | | | | | | | |
| Principal Financial Group Inc. | | | 3,200 | | | | 202,208 | |
| Property/Casualty Insurance — 6.8% | | | | | | | | |
| Arch Capital Group Ltd. (a) f | | | 12,000 | | | | 467,280 | |
| Fidelity National Financial Inc. | | | 19,300 | | | | 838,778 | |
| | | | | | | | 1,306,058 | |
| Savings & Loans/Thrifts — 3.3% | | | | | | | | |
| The Hingham Institution For Savings | | | 2,200 | | | | 639,100 | |
| Total Financial | | | | | | | | |
| (Cost $4,808,225) | | | | | | | 5,923,008 | |
| Industrial — 15.7% | | | | | | | | |
| Containers-Paper/Plastic — 3.9% | | | | | | | | |
| Berry Global Group Inc. (a) | | | 11,500 | | | | 750,030 | |
| Electronic Parts Distributors — 1.0% | | | | | | | | |
| SYNNEX Corp. | | | 1,600 | | | | 194,816 | |
| Machinery-General Industrial — 1.1% | | | | | | | | |
| Wabtec Corp. | | | 2,600 | | | | 213,980 | |
| Machinery-Thermal Process — 2.8% | | | | | | | | |
| GrafTech International Ltd. | | | 45,500 | | | | 528,710 | |
| Metal Processors & Fabricators — 6.9% | | | | | | | | |
| Rexnord Corp. | | | 12,300 | | | | 615,492 | |
| The Timken Co. | | | 8,800 | | | | 709,192 | |
| | | | | | | | 1,324,684 | |
| Total Industrial | | | | | | | | |
| (Cost $2,975,056) | | | | | | | 3,012,220 | |
| Technology — 6.1% | | | | | | | | |
| Computer Data Security — 2.6% | | | | | | | | |
| Check Point Software Technologies Ltd. (a) f | | | 4,200 | | | | 487,746 | |
| Data Processing/Management — 0.0% | | | | | | | | |
| ImageWare Systems Inc. (a) | | | 30,000 | | | | 1,539 | |
| Enterprise Software/Services — 3.5% | | | | | | | | |
| ACI Worldwide Inc. (a) | | | 13,000 | | | | 482,820 | |
| SS&C Technologies Holdings Inc. | | | 2,700 | | | | 194,562 | |
| | | | | | | | 677,382 | |
| Total Technology | | | | | | | | |
| (Cost $1,227,775) | | | | | | | 1,166,667 | |
The accompanying notes are an integral part of the financial statements.
2021 ANNUAL REPORT | 12
Schedule of Investments (continued)
CCM Small/Mid-Cap Impact Value Fund
(Formerly Quaker Small/Mid-Cap Impact Value Fund)
June 30, 2021
| | | Number
of Shares | | | Fair
Value | |
| Common Stocks — 87.3% (Continued) | | | | | | | | |
| Utilities — 6.0% | | | | | | | | |
| Electric-Integrated — 2.0% | | | | | | | | |
| CMS Energy Corp. | | | 6,500 | | | $ | 384,020 | |
| Independent Power Producers — 4.0% | | | | | | | | |
| Clearway Energy Inc. Cl A | | | 4,000 | | | | 100,880 | |
| Clearway Energy Inc. Cl C | | | 25,500 | | | | 675,240 | |
| | | | | | | | 776,120 | |
| Total Utilities | | | | | | | | |
| (Cost $1,207,946) | | | | | | | 1,160,140 | |
| Total Common Stocks | | | | | | | | |
| (Cost $14,710,539) | | | | | | | 16,754,689 | |
| Real Estate Investment Trusts — 12.0% | | | | | | | | |
| Apartments — 3.5% | | | | | | | | |
| Mid-America Apartment Communities Inc. | | | 4,000 | | | | 673,680 | |
| Diversified — 4.3% | | | | | | | | |
| WP Carey Inc. | | | 11,000 | | | | 820,820 | |
| Office Property — 2.1% | | | | | | | | |
| Alexandria Real Estate Equities Inc. | | | 2,250 | | | | 409,365 | |
| Single Tenant — 2.1% | | | | | | | | |
| National Retail Properties Inc. | | | 8,600 | | | | 403,168 | |
| Total Real Estate Investment Trusts | | | | | | | | |
| (Cost $2,066,612) | | | | | | | 2,307,033 | |
| Total Long-Term Investments | | | | | | | | |
| (Cost $16,777,151) | | | | | | | 19,061,722 | |
| Short-Term Investments — 0.6% | | | | | | | | |
| Money Market Fund — 0.6% | | | | | | | | |
| First American Government | | | | | | | | |
| Obligations Fund, Cl X 0.026% (b) | | | 111,603 | | | | 111,603 | |
| Total Short-Term Investments | | | | | | | | |
| (Cost $111,603) | | | | | | | 111,603 | |
| Total Investments | | | | | | | | |
| (Cost $16,888,754) — 99.9% | | | | | | | 19,173,325 | |
| Other Assets in Excess of Liabilities, Net 0.1% | | | | | | | 17,212 | |
| Total Net Assets — 100.0% | | | | | | $ | 19,190,537 | |
| (a) | Non-income producing security. |
| (b) | The rate quoted is the annualized 7 day yield as of June 30, 2021. |
| f | Foreign issued security. |
The accompanying notes are an integral part of the financial statements.
2021 ANNUAL REPORT | 13
Statements of Assets and Liabilities
June 30, 2021
| | | | | CCM Small/Mid-Cap |
| | | CCM Core Impact | | Impact Value Fund |
| | | Equity Fund | | (Formerly Quaker |
| | | (Formerly Quaker | | Small/Mid-Cap |
| | | Impact Growth Fund) | | Impact Value Fund) |
| ASSETS: | | | | |
| Investments, at value | | $ | 71,438,797 | | | $ | 19,173,325 | |
| Cash | | | 5,170 | | | | — | |
| Due from advisor (Note 3) | | | — | | | | 3,410 | |
| Receivables: | | | | | | | | |
| Dividends and interest | | | 30,860 | | | | 29,375 | |
| Capital shares sold | | | 4,612 | | | | 125 | |
| Prepaid expenses and other assets | | | 23,212 | | | | 19,475 | |
| Total assets | | | 71,502,651 | | | | 19,225,710 | |
| | | | | | | | | |
| LIABILITIES: | | | | | | | | |
| Payables: | | | | | | | | |
| Due to advisor (Note 3) | | | 43,867 | | | | — | |
| Capital shares redeemed | | | 8,493 | | | | 3,958 | |
| Distribution fees | | | 12,261 | | | | 1,386 | |
| Audit fees | | | 23,092 | | | | 6,908 | |
| Transfer agent fees | | | 21,881 | | | | 7,025 | |
| Fund administration and accounting fees | | | 16,080 | | | | 4,982 | |
| Shareholder servicing fees | | | 11,692 | | | | 2,351 | |
| Printing and mailing expense | | | 7,408 | | | | 4,744 | |
| Accrued expenses | | | 4,564 | | | | 3,819 | |
| Total liabilities | | | 149,338 | | | | 35,173 | |
| Net assets | | $ | 71,353,313 | | | $ | 19,190,537 | |
| | | | | | | | | |
| NET ASSETS CONSIST OF: | | | | | | | | |
| Paid-in capital | | $ | 37,119,792 | | | $ | 20,241,629 | |
| Total distributable earnings (losses) | | | 34,233,521 | | | | (1,051,092 | ) |
| Total net assets | | $ | 71,353,313 | | | $ | 19,190,537 | |
| Total investments, at cost | | $ | 47,454,287 | | | $ | 16,888,754 | |
| Advisor Class shares: | | | | | | | | |
| Net assets | | $ | 59,786,272 | | | $ | 6,638,495 | |
| Shares of beneficial interest outstanding(1) | | | 1,186,604 | | | | 393,345 | |
| Net asset value per share and redemption price per share | | $ | 50.38 | | | $ | 16.88 | |
| Institutional Class Shares: | | | | | | | | |
| Net assets | | $ | 11,567,041 | | | $ | 12,552,042 | |
| Shares of beneficial interest outstanding(1) | | | 217,153 | | | | 673,669 | |
| Net asset value per share and redemption price per share | | $ | 53.27 | | | $ | 18.63 | |
| (1) | Unlimited number of shares of beneficial interest with no par value authorized. |
The accompanying notes are an integral part of the financial statements.
2021 ANNUAL REPORT | 14
Statements of Operations
For the Fiscal Year Ended June 30, 2021
| | | | | CCM Small/Mid-Cap |
| | | CCM Core Impact | | Impact Value Fund |
| | | Equity Fund | | (Formerly Quaker |
| | | (Formerly Quaker | | Small/Mid-Cap |
| | | Impact Growth Fund) | | Impact Value Fund) |
| INVESTMENT INCOME (LOSS) | | | | | | | | |
| Income: | | | | | | | | |
| Dividends (net of foreign withholding taxes) | | $ | 574,309 | | | $ | 324,502 | |
| Interest | | | 996 | | | | 312 | |
| Total income | | | 575,305 | | | | 324,814 | |
| Expenses: | | | | | | | | |
| Investment advisory fees (Note 3) | | | 487,722 | | | | 174,393 | |
| Distribution fee - Advisor Class | | | 136,843 | | | | 15,682 | |
| Transfer agent fees | | | 129,657 | | | | 41,547 | |
| Funds administration and accounting fees | | | 96,084 | | | | 30,293 | |
| Insurance | | | 84,998 | | | | 32,636 | |
| Trustee fees | | | 73,104 | | | | 20,639 | |
| Legal fees | | | 70,901 | | | | 21,056 | |
| Shareholder servicing fees | | | 64,790 | | | | 14,278 | |
| Chief Compliance Officer fees | | | 48,823 | | | | 23,177 | |
| Registration and filing expenses | | | 40,529 | | | | 39,911 | |
| Printing and mailing expenses | | | 29,533 | | | | 22,673 | |
| Audit fees | | | 23,120 | | | | 6,880 | |
| Custody fees | | | 4,628 | | | | 4,328 | |
| Other operating expenses | | | 1,934 | | | | 13,699 | |
| Total expenses | | | 1,292,666 | | | | 461,192 | |
| Investment advisory fees reimbursed (Note 3) | | | — | | | | (193,610 | ) |
| Net expenses | | | 1,292,666 | | | | 267,582 | |
| Net investment income (loss) | | | (717,361 | ) | | | 57,232 | |
| | | | | | | | | |
| REALIZED AND UNREALIZED GAIN (LOSS) ON INVESTMENTS | | | | | | | | |
| Net realized gain (loss) on investments: | | | | | | | | |
| Securities | | | 11,962,086 | | | | 3,351,123 | |
| Net realized gain (loss) on investments | | | 11,962,086 | | | | 3,351,123 | |
| Net change in unrealized appreciation (depreciation) of investments: | | | | | | | | |
| Securities | | | 11,822,011 | | | | 4,322,212 | |
| Net realized and unrealized gain (loss) on investments | | | 23,784,097 | | | | 7,673,335 | |
| Net increase (decrease) in net assets resulting from operations | | $ | 23,066,736 | | | $ | 7,730,567 | |
| (Foreign withholding taxes on dividends/tax reclaims/interest) | | $ | (2,813 | ) | | $ | — | |
The accompanying notes are an integral part of the financial statements.
2021 ANNUAL REPORT | 15
Statements of Changes in Net Assets
CCM Core Impact Equity Fund
(Formerly Quaker Impact Growth Fund)
| | | For the Years Ended June 30, | |
| | | 2021 | | | 2020 | |
| INCREASE (DECREASE) IN NET ASSETS | | | | | | | | |
| Operations: | | | | | | | | |
| Net investment income (loss) | | $ | (717,361 | ) | | $ | (551,275 | ) |
| Net realized gain (loss) on investment transactions: | | | | | | | | |
| Securities | | | 11,962,086 | | | | 1,013,407 | |
| Foreign currency transactions | | | — | | | | 139 | |
| Net change in unrealized appreciation | | | | | | | | |
| (depreciation) of investment transactions: | | | | | | | | |
| Securities | | | 11,822,011 | | | | 2,442,904 | |
| Net increase (decrease) in net assets resulting from operations | | | 23,066,736 | | | | 2,905,175 | |
| Distributions to shareholders from: | | | | | | | | |
| Advisor Class | | | (366,465 | ) | | | (959,644 | ) |
| Institutional Class | | | (65,100 | ) | | | (159,052 | ) |
| Total distributions | | | (431,565 | ) | | | (1,118,696 | ) |
| Capital share transactions: | | | | | | | | |
| Increase (decrease) in net assets from fund share transactions (Note 9) | | | (7,618,842 | ) | | | (7,487,483 | ) |
| Total increase (decrease) in net assets | | | 15,016,329 | | | | (5,701,004 | ) |
| | | | | | | | | |
| NET ASSETS | | | | | | | | |
| Beginning of year | | | 56,336,984 | | | | 62,037,988 | |
| End of year | | $ | 71,353,313 | | | $ | 56,336,984 | |
The accompanying notes are an integral part of the financial statements.
2021 ANNUAL REPORT | 16
Statements of Changes in Net Assets
CCM Small/Mid-Cap Impact Value Fund
(Formerly Quaker Small/Mid-Cap Impact Value Fund)
| | | For the Years Ended June 30, | |
| | | 2021 | | | 2020 | |
| INCREASE (DECREASE) IN NET ASSETS | | | | | | | | |
| Operations: | | | | | | | | |
| Net investment income (loss) | | $ | 57,232 | | | $ | 160,234 | |
| Net realized gain (loss) on investment transactions: | | | | | | | | |
| Securities | | | 3,351,123 | | | | (6,032,512 | ) |
| Net change in unrealized appreciation | | | | | | | | |
| (depreciation) of investment transactions: | | | | | | | | |
| Securities | | | 4,322,212 | | | | (2,793,218 | ) |
| Net increase (decrease) in net assets resulting from operations | | | 7,730,567 | | | | (8,665,496 | ) |
| Distributions to shareholders from: | | | | | | | | |
| Advisor Class | | | (79,469 | ) | | | (675,516 | ) |
| Institutional Class | | | (184,600 | ) | | | (1,222,174 | ) |
| Total distributions | | | (264,069 | ) | | | (1,897,690 | ) |
| Capital share transactions: | | | | | | | | |
| Increase (decrease) in net assets from fund share transactions (Note 9) | | | (6,864,590 | ) | | | 9,165,439 | |
| Total increase (decrease) in net assets | | | 601,908 | | | | (1,397,747 | ) |
| | | | | | | | | |
| NET ASSETS | | | | | | | | |
| Beginning of year | | | 18,588,629 | | | | 19,986,376 | |
| End of year | | $ | 19,190,537 | | | $ | 18,588,629 | |
The accompanying notes are an integral part of the financial statements.
2021 ANNUAL REPORT | 17
Financial Highlights
CCM Core Impact Equity Fund
(Formerly Quaker Impact Growth Fund)
(For a Share Outstanding Throughout each Year)
| | | Advisor Class | |
| | | Years Ended June 30, | |
| | | 2021 | | | 2020 | | | 2019 | | | 2018 | | | 2017 | |
| Net asset value, beginning of year | | $ | 35.31 | | | $ | 34.22 | | | $ | 31.87 | | | $ | 27.86 | | | $ | 23.80 | |
| Income from investment operations: | | | | | | | | | | | | | | | | | | | | |
| Net investment income (loss)(1) | | | (0.50 | ) | | | (0.34 | ) | | | (0.30 | ) | | | (0.24 | ) | | | (0.07 | ) |
| Net realized and unrealized gain (loss) on investments | | | 15.86 | | | | 2.10 | | | | 2.65 | | | | 4.25 | | | | 4.13 | |
| Total from investment operations | | | 15.36 | | | | 1.76 | | | | 2.35 | | | | 4.01 | | | | 4.06 | |
| Distributions to shareholders from: | | | | | | | | | | | | | | | | | | | | |
| Net investment income | | | — | | | | — | | | | — | | | | — | | | | — | |
| Net realized capital gain | | | (0.29 | ) | | | (0.67 | ) | | | — | | | | — | | | | — | |
| Total distributions | | | (0.29 | ) | | | (0.67 | ) | | | — | | | | — | | | | — | |
| Net asset value, end of year | | $ | 50.38 | | | $ | 35.31 | | | $ | 34.22 | | | $ | 31.87 | | | $ | 27.86 | |
| Total Return(2) | | | 43.65 | % | | | 5.05 | % | | | 7.37 | % | | | 14.39 | % | | | 17.01 | % |
| Ratios/supplemental data: | | | | | | | | | | | | | | | | | | | | |
| Net assets, end of year (000’ omitted) | | $ | 59,786 | | | $ | 47,731 | | | $ | 53,292 | | | $ | 44,964 | | | $ | 49,859 | |
| Ratio of expenses to average net assets: | | | | | | | | | | | | | | | | | | | | |
| Before expense reimbursements or recoveries | | | 2.03 | % | | | 2.09 | % | | | 2.48 | % | | | 2.30 | % | | | 2.34 | %(3) |
| After expense reimbursements or recoveries | | | 2.03 | % | | | 2.09 | % | | | 2.48 | % | | | 2.30 | % | | | 2.22 | %(3) |
| Ratio of net investment income (loss) to average net assets: | | | | | | | | | | | | | | | | | | | | |
| Before expense reimbursements or recoveries | | | (1.14 | )% | | | (0.97 | )% | | | (0.99 | )% | | | (0.78 | )% | | | (0.40 | )%(3) |
| After expense reimbursements or recoveries | | | (1.14 | )% | | | (0.97 | )% | | | (0.99 | )% | | | (0.78 | )% | | | (0.28 | )%(3) |
| Portfolio turnover rate | | | 56 | % | | | 69 | % | | | 24 | % | | | 119 | % | | | 185 | % |
| (1) | The average shares outstanding method has been applied for per share information. |
| (2) | Total investment return is based on the change in net asset value of a share during the year, assumes reinvestment of dividends and distributions at net asset value and does not reflect the impact of a sales charge. As of September 30, 2018 the Fund no longer charges a sales charge. |
| (3) | Expense waived or reimbursed reflect reductions to total expenses, as discussed in the notes to the financial statements. These reimbursed amounts would increase the net investment loss ratio or decrease the net investment income ratio and recovered amounts would decrease the net investment loss ratio or increase the net investment income ratio, as applicable, had such reductions or increases not occurred. |
The accompanying notes are an integral part of the financial statements.
2021 ANNUAL REPORT | 18
Financial Highlights
CCM Core Impact Equity Fund
(Formerly Quaker Impact Growth Fund)
(For a Share Outstanding Throughout each Year)
| | | Institutional Class | |
| | | Years Ended June 30, | |
| | | 2021 | | | 2020 | | | 2019 | | | 2018 | | | 2017 | |
| Net asset value, beginning of year | | $ | 37.23 | | | $ | 35.96 | | | $ | 33.40 | | | $ | 29.12 | | | $ | 24.82 | |
| Income from investment operations: | | | | | | | | | | | | | | | | | | | | |
| Net investment income (loss)(1) | | | (0.41 | ) | | | (0.26 | ) | | | (0.25 | ) | | | (0.17 | ) | | | (0.01 | ) |
| Net realized and unrealized gain (loss) on investments | | | 16.74 | | | | 2.20 | | | | 2.81 | | | | 4.45 | | | | 4.31 | |
| Total from investment operations | | | 16.33 | | | | 1.94 | | | | 2.56 | | | | 4.28 | | | | 4.30 | |
| Distributions to shareholders from: | | | | | | | | | | | | | | | | | | | | |
| Net investment income | | | — | | | | — | | | | — | | | | — | | | | — | |
| Net realized capital gain | | | (0.29 | ) | | | (0.67 | ) | | | — | | | | — | | | | — | |
| Total distributions | | | (0.29 | ) | | | (0.67 | ) | | | — | | | | — | | | | — | |
| Net asset value, end of year | | $ | 53.27 | | | $ | 37.23 | | | $ | 35.96 | | | $ | 33.40 | | | $ | 29.12 | |
| Total Return(2) | | | 44.00 | % | | | 5.31 | % | | | 7.66 | % | | | 14.70 | % | | | 17.32 | % |
| Ratios/supplemental data: | | | | | | | | | | | | | | | | | | | | |
| Net assets, end of year (000’ omitted) | | $ | 11,567 | | | $ | 8,606 | | | $ | 8,746 | | | $ | 9,039 | | | $ | 9,005 | |
| Ratio of expenses to average net assets: | | | | | | | | | | | | | | | | | | | | |
| Before expense reimbursements or recoveries | | | 1.78 | % | | | 1.84 | % | | | 2.23 | % | | | 2.05 | % | | | 2.09 | %(3) |
| After expense reimbursements or recoveries | | | 1.78 | % | | | 1.84 | % | | | 2.23 | % | | | 2.05 | % | | | 1.97 | %(3) |
| Ratio of net investment income (loss) to average net assets: | | | | | | | | | | | | | | | | | | | | |
| Before expense reimbursements or recoveries | | | (0.89 | )% | | | (0.72 | )% | | | (0.74 | )% | | | (0.53 | )% | | | (0.15 | )%(3) |
| After expense reimbursements or recoveries | | | (0.89 | )% | | | (0.72 | )% | | | (0.74 | )% | | | (0.53 | )% | | | (0.03 | )%(3) |
| Portfolio turnover rate | | | 56 | % | | | 69 | % | | | 24 | % | | | 119 | % | | | 185 | % |
| (1) | The average shares outstanding method has been applied for per share information. |
| (2) | Total investment return is based on the change in net asset value of a share during the year, assumes reinvestment of dividends and distributions at net asset value. |
| (3) | Expense waived or reimbursed reflect reductions to total expenses, as discussed in the notes to the financial statements. These reimbursed amounts would increase the net investment loss ratio or decrease the net investment income ratio and recovered amounts would decrease the net investment loss ratio or increase the net investment income ratio, as applicable, had such reductions or increases not occurred. |
The accompanying notes are an integral part of the financial statements.
2021 ANNUAL REPORT | 19
Financial Highlights
CCM Small/Mid-Cap Impact Value Fund
(Formerly Quaker Small/Mid-Cap Impact Value Fund)
(For a Share Outstanding Throughout the Year)
| | | Advisor Class | |
| | | Years Ended June 30, | |
| | | 2021 | | | 2020 | | | 2019 | | | 2018 | | | 2017 | |
| Net asset value, beginning of year | | $ | 11.49 | | | $ | 17.65 | | | $ | 23.23 | | | $ | 24.13 | | | $ | 20.09 | |
| Income from investment operations: | | | | | | | | | | | | | | | | | | | | |
| Net investment income (loss)(1) | | | 0.02 | | | | 0.09 | | | | 0.08 | | | | (0.23 | ) | | | (0.20 | ) |
| Net realized and unrealized gain (loss) on investments | | | 5.55 | | | | (4.91 | ) | | | 0.12 | | | | 3.03 | | | | 4.24 | |
| Total from investment operations | | | 5.57 | | | | (4.82 | ) | | | 0.20 | | | | 2.80 | | | | 4.04 | |
| Distributions to shareholders from: | | | | | | | | | | | | | | | | | | | | |
| Net investment income | | | (0.18 | ) | | | (0.34 | ) | | | — | | | | — | | | | — | |
| Net realized capital gain | | | — | | | | (1.00 | ) | | | (5.78 | ) | | | (3.70 | ) | | | — | |
| Total distributions | | | (0.18 | ) | | | (1.34 | ) | | | (5.78 | ) | | | (3.70 | ) | | | — | |
| Net asset value, end of year | | $ | 16.88 | | | $ | 11.49 | | | $ | 17.65 | | | $ | 23.23 | | | $ | 24.13 | |
| Total Return(2) | | | 48.79 | % | | | (30.04 | )% | | | 3.17 | % | | | 12.07 | % | | | 20.11 | % |
| Ratios/supplemental data: | | | | | | | | | | | | | | | | | | | | |
| Net assets, end of year (000’ omitted) | | $ | 6,639 | | | $ | 5,890 | | | $ | 9,176 | | | $ | 4,737 | | | $ | 6,434 | |
| Ratio of expenses to average net assets: | | | | | | | | | | | | | | | | | | | | |
| Before expense reimbursements | | | 2.55 | %(3) | | | 2.38 | %(3) | | | 2.84 | %(3) | | | 2.44 | % | | | 2.21 | % |
| After expense reimbursements | | | 1.55 | %(3) | | | 1.55 | %(3) | | | 2.65 | %(3) | | | 2.44 | % | | | 2.21 | % |
| Ratio of net investment income (loss) to average net assets: | | | | | | | | | | | | | | | | | | | | |
| Before expense reimbursements | | | (0.87 | )%(3) | | | (0.28 | )%(3) | | | 0.28 | %(3) | | | (0.99 | )% | | | (0.89 | )% |
| After expense reimbursements | | | 0.13 | %(3) | | | 0.55 | %(3) | | | 0.47 | %(3) | | | (0.99 | )% | | | (0.89 | )% |
| Portfolio turnover rate | | | 96 | % | | | 117 | % | | | 111 | % | | | 122 | % | | | 146 | % |
| (1) | The average shares outstanding method has been applied for per share information. |
| (2) | Total investment return is based on the change in net asset value of a share during the year, assumes reinvestment of dividends and distributions at net asset value and does not reflect the impact of a sales charge. As of September 30, 2018 the Fund no longer charges a sales charge. |
| (3) | Expense waived or reimbursed reflect reductions to total expenses, as discussed in the notes to the financial statements. These reimbursed amounts would increase the net investment loss ratio or decrease the net investment income ratio, as applicable, had such reductions not occurred. |
The accompanying notes are an integral part of the financial statements.
2021 ANNUAL REPORT | 20
Financial Highlights
CCM Small/Mid-Cap Impact Value Fund
(Formerly Quaker Small/Mid-Cap Impact Value Fund)
(For a Share Outstanding Throughout the Year)
| | | Institutional Class | |
| | | Years Ended June 30, | |
| | | 2021 | | | 2020 | | | 2019 | | | 2018 | | | 2017 | |
| Net asset value, beginning of year | | $ | 12.67 | | | $ | 19.36 | | | $ | 24.83 | | | $ | 25.49 | | | $ | 21.17 | |
| Income from investment operations: | | | | | | | | | | | | | | | | | | | | |
| Net investment income (loss)(1) | | | 0.06 | | | | 0.13 | | | | 0.15 | | | | (0.19 | ) | | | (0.15 | ) |
| Net realized and unrealized gain (loss) on investments | | | 6.12 | | | | (5.41 | ) | | | 0.16 | | | | 3.23 | | | | 4.47 | |
| Total from investment operations | | | 6.18 | | | | (5.28 | ) | | | 0.31 | | | | 3.04 | | | | 4.32 | |
| Distributions to shareholders from: | | | | | | | | | | | | | | | | | | | | |
| Net investment income | | | (0.22 | ) | | | (0.41 | ) | | | — | | | | — | | | | — | |
| Net realized capital gain | | | — | | | | (1.00 | ) | | | (5.78 | ) | | | (3.70 | ) | | | — | |
| Total distributions | | | (0.22 | ) | | | (1.41 | ) | | | (5.78 | ) | | | (3.70 | ) | | | — | |
| Net asset value, end of year | | $ | 18.63 | | | $ | 12.67 | | | $ | 19.36 | | | $ | 24.83 | | | $ | 25.49 | |
| Total Return(2) | | | 49.10 | % | | | (29.89 | )% | | | 3.47 | % | | | 12.39 | % | | | 20.41 | % |
| Ratios/supplemental data: | | | | | | | | | | | | | | | | | | | | |
| Net assets, end of year (000’ omitted) | | $ | 12,552 | | | $ | 12,699 | | | $ | 10,811 | | | $ | 9,747 | | | $ | 20,952 | |
| Ratio of expenses to average net assets: | | | | | | | | | | | | | | | | | | | | |
| Before expense reimbursements | | | 2.30 | %(3) | | | 2.13 | %(3) | | | 2.58 | %(3) | | | 2.19 | % | | | 1.96 | % |
| After expense reimbursements | | | 1.30 | %(3) | | | 1.30 | %(3) | | | 2.39 | %(3) | | | 2.19 | % | | | 1.96 | % |
| Ratio of net investment income (loss) to average net assets: | | | | | | | | | | | | | | | | | | | | |
| Before expense reimbursements | | | (0.62 | )%(3) | | | (0.03 | )%(3) | | | 0.53 | %(3) | | | (0.74 | )% | | | (0.64 | )% |
| After expense reimbursements | | | 0.38 | %(3) | | | 0.80 | %(3) | | | 0.72 | %(3) | | | (0.74 | )% | | | (0.64 | )% |
| Portfolio turnover rate | | | 96 | % | | | 117 | % | | | 111 | % | | | 122 | % | | | 146 | % |
| (1) | The average shares outstanding method has been applied for per share information. |
| (2) | Total investment return is based on the change in net asset value of a share during the year, assumes reinvestment of dividends and distributions at net asset value. |
| (3) | Expense waived or reimbursed reflect reductions to total expenses, as discussed in the notes to the financial statements. These reimbursed amounts would increase the net investment loss ratio or decrease the net investment income ratio, as applicable, had such reductions not occurred. |
The accompanying notes are an integral part of the financial statements.
2021 ANNUAL REPORT | 21
Notes to the Financial Statements
Note 1 — Organization
The Quaker Investment Trust (“Trust”), a diversified, open-end management investment company, was originally organized as a Massachusetts business trust on October 24, 1990, and was reorganized as a Delaware statutory trust on September 30, 2018. The Trust is registered under the Investment Company Act of 1940, as amended (“1940 Act”). The Trust’s Declaration of Trust permits the Trustees to issue an unlimited number of shares of beneficial interest for each of its series. Currently, the Trust offers two series: CCM Core Impact Equity Fund (“Core Impact Equity”) (Formerly Quaker Impact Growth Fund) and CCM Small/Mid-Cap Impact Value Fund (“Small/Mid-Cap Impact Value”)(Formerly Quaker Small/Mid-Cap Impact Value Fund) (each a “Fund” and collectively, “Funds”). Both Funds are diversified. The investment objectives of each Fund are set forth below. Community Capital Management, Inc. (“CCM”) has managed the Funds since January 1, 2018.
Core Impact Equity and Small/Mid-Cap Impact Value commenced operations on November 25, 1996. The investment objective of these Funds is to seek long-term growth of capital. The investment objective of these Funds is non-fundamental in that this objective may be changed by the Board of Trustees (“Board” or “Trustees”) without shareholder approval. Each Fund is an investment company and accordingly follows the investment company accounting and reporting guidance of the Financial Accounting Standards Board (“FASB”) Accounting Standards Codification Topic 946 “Financial Services – Investment Companies.”
The Funds offer two classes of shares: Advisor Class and Institutional Class. The Advisor Class shares are charged a distribution and service fee; and Institutional Class shares bear no distribution fee but have higher minimum investment thresholds. CCM has the ability to waive the minimum investment for Institutional Class shares at its discretion.
On February 1, 2019 the Trust amended and restated its Registration Statement to change each of the Funds’ performance reporting history. The inception date for each of the Fund’s performance reporting history is now January 1, 2018, the date CCM became the Adviser to the Funds.
Note 2 — Summary of Significant Accounting Policies and Other Information
The following is a summary of significant accounting policies consistently followed by the Funds in the preparation of their financial statements. The policies are in conformity with accounting principles generally accepted in the United States of America (“GAAP”).
A. Security Valuation. The Funds’ investments in securities are carried at market value. Securities listed on an exchange or quoted on a national market system are generally valued at the last quoted sales price at the time of valuation. Other securities traded in the over-the-counter market and listed securities for which no sale was reported on that date are valued at the most recent bid price. Each security reported on the NASDAQ National Market System is valued at the NASDAQ Official Closing Price.
Debt and other fixed-income securities are valued at the last quoted bid price and/or by using a combination of daily quotes and matrix evaluations provided by an independent pricing service (which reflect such factors as security prices, yields, maturities, ratings, and dealer and exchange quotations), the use of which has been approved by the Board.
The Funds may enter into forward foreign currency contracts to lock in the U.S. dollar cost of purchase and sale transactions or to defend the portfolio against currency fluctuations. A forward foreign currency contract is a commitment to purchase or sell a foreign currency at a future date at a negotiated rate. These contracts are valued daily, and the Fund’s net equity therein, representing unrealized gain or loss on the contracts as measured by the difference between the forward foreign exchange rates at the dates of entry into the contracts and the forward rates at the end of the reporting period, if any, is included in the Statements of Assets and Liabilities.
Realized and unrealized gains and losses, if any, are included in the Statements of Operations. Risks may arise upon entering into these contracts from the potential inability of counterparties to meet the terms of the contract and from unanticipated movements in the value of foreign currencies relative to the U.S. dollar.
For financial reporting purposes, investment transactions are recorded on the trade date; however, for purposes of executing shareholder transactions, the Funds record changes in holdings of portfolio securities no later than the first business day after the trade date in accordance with Rule 2a-4 of the 1940 Act. Accordingly, certain differences between net asset value for financial reporting and for executing shareholder transactions may arise.
The Funds have adopted fair valuation procedures to value securities at fair market value in certain circumstances, and the Trust has established an Investment Trading and Valuation Committee responsible for determining when fair valuing a security is necessary and appropriate. The Funds will value securities at fair market value when market quotations are not readily available or when securities cannot be accurately valued within established pricing procedures. The Investment Trading and Valuation Committee may also fair value foreign securities whose prices may have been affected by events occurring after the close of trading in their respective markets but prior to the time the Fund holding the foreign securities calculates its net asset value. The Funds’ fair valuation procedures are designed to help ensure that prices at which Fund shares are purchased and redeemed are fair and do not result in dilution of shareholder interest or other harm to shareholders.
The Fund is required to disclose information regarding the fair value measurements of the Fund’s assets and liabilities. Fair value is defined as the price that the Fund may receive upon selling an investment in an orderly transaction to an independent buyer in the principal or most advantageous market for the investment. The disclosure requirements utilize a three-tier hierarchy to maximize the use of observable market data, minimize the use of unobservable inputs and establish classification of fair value measurements for disclosure purposes. A financial instrument’s level within the fair value hierarchy is based on the lowest level that is significant to the fair value measurement. Inputs refer broadly to the assumptions that market participants would use in pricing the asset or liability, including assumptions about risk, for example, the risk inherent in a particular valuation technique used to measure fair value including the pricing model used and/or the risk inherent in the inputs to the valuation technique. Inputs may be observable or unobservable.
Observable inputs are inputs that reflect the assumptions market participants would use in pricing the asset or liability, which are based on market data obtained from sources independent of the reporting entity. Unobservable inputs are inputs that reflect the reporting entity’s own assumptions about the assumptions market participants would use in pricing the asset or liability developed based on the best information available in the circumstances.
The significant unobservable inputs used in the fair value measurement of the reporting entity’s equity holdings are, the projected final distribution applied for lack of marketability. Significant increases (decreases) in any of those inputs in isolation could result in a significantly lower (higher) fair value measurement.
Various inputs may be used to determine the value of each Fund’s investments. These inputs are summarized in three broad levels for financial statement purposes. The inputs or methodologies used to value securities are not necessarily an indication of the risk associated with investing in those securities.
| Level 1 — | Quoted prices in active markets for identical securities. |
2021 ANNUAL REPORT | 22
Notes to the Financial Statements (continued)
| Level 2 — | Prices determined using significant other observable inputs (including quoted prices for similar securities, interest rates, prepayment speeds, credit risk, etc.) municipal securities, long-term U.S. Government obligations and corporate debt securities are valued in accordance with the evaluated price supplied by the pricing service and generally categorized as Level 2 in the hierarchy. Other securities that are categorized as Level 2 in the hierarchy may include, but are not limited to, OTC options and international equity securities valued by an independent third party in order to adjust for stale pricing and foreign market holidays. |
| Level 3 — | Prices determined using significant unobservable inputs (including the Fund’s own assumptions). For restricted equity securities where observable inputs are limited, assumptions about market activity and risk are used in determining fair value. These are categorized as Level 3 in the hierarchy. |
For international equity securities traded on a foreign exchange or market which closes prior to a Fund’s Valuation Time, in order to adjust for events which occur between the close of the foreign exchange they are traded on and the close of the New York Stock Exchange, a fair valuation model is used, and these securities are categorized as Level 2.
A Fund may hold securities, some of which are classified as Level 3 investments (as defined below). Level 3 investments have significant unobservable inputs, as they trade infrequently. In determining the fair value of these investments, management uses the market approach which includes as the primary input the capital balance reported; however, adjustments to the reported capital balance may be made based on various factors, including, but not limited to, the attributes of the interest held, including the rights and obligations, and any restrictions or illiquidity of such interests, and the fair value of these securities.
The value of a foreign security is generally determined as of the close of trading on the foreign stock exchange on which the security is primarily traded, or as of the close of trading on the New York Stock Exchange (“NYSE”), if earlier. The value is then converted into its U.S. dollar equivalent at the foreign exchange rate in effect at the close of the NYSE (generally 4:00 p.m. Eastern time) on the day that the value of the foreign security is determined. If no sale is reported at that time, the foreign security will be valued within the range of the most recent quoted bid and ask prices. If market quotations are not readily available for a foreign security or an event has occurred that caused a quotation to be unavailable or unreliable, the Investment Trading and Valuation Committee will fair value foreign securities using the procedures described below.
The Trust has adopted fair valuation procedures to value securities at fair market value when independent prices are unavailable or unreliable, and the Trust has established an Investment Trading and Valuation Committee that is responsible for determining when fair valuing a security is necessary and appropriate. Securities and assets for which market quotations are not readily available may be valued based upon valuation methods that include: (i) multiple of earnings; (ii) yield to maturity with respect to debt issues; (iii) discounts from market prices of similar freely traded securities; or (iv) a combination of these or other methods. Securities may also be priced using fair value pricing methods when their closing prices do not reflect their market values at the time the Fund calculates its net asset value (“NAV”) because an event had occurred since the closing prices were established on the domestic or foreign exchange or market but before the Fund’s NAV calculation.
The following is a summary of the fair valuations according to the inputs used as of June 30, 2021 in valuing the Fund’s assets and liabilities:
CORE IMPACT EQUITY FUND
| Description | | Level 1 | | | Level 2 | | | Level 3 | | | Total | |
| Common Stocks | | $ | 68,688,017 | | | $ | — | | | $ | — | | | $ | 68,688,017 | |
| Real Estate Investment Trusts | | | 1,978,094 | | | | — | | | | — | | | | 1,978,094 | |
| Escrow Shares(1) | | | — | | | | — | | | | 37,202 | | | | 37,202 | |
| Escrow Notes(1) | | | — | | | | — | | | | 0 | | | | 0 | |
| Money Market Fund | | | 735,484 | | | | — | | | | — | | | | 735,484 | |
| Total Investments in Securities | | $ | 71,401,595 | | | $ | — | | | $ | 37,202 | | | $ | 71,438,797 | |
| SMALL/MID-CAP IMPACT VALUE FUND | | | | | | | | | |
| | | | | | | | | | |
| Description | | Level 1 | | | Level 2 | | | Level 3 | | | Total | |
| Common Stocks | | $ | 16,754,689 | | | $ | — | | | $ | — | | | $ | 16,754,689 | |
| Real Estate Investment Trusts | | | 2,307,033 | | | | — | | | | — | | | | 2,307,033 | |
| Money Market Fund | | | 111,603 | | | | — | | | | — | | | | 111,603 | |
| Total Investments in Securities | | $ | 19,173,325 | | | $ | — | | | $ | — | | | $ | 19,173,325 | |
| (1) | See the Core Impact Equity Fund’s Schedule of Investments for industry classifications of the two securities noted as Level 3. |
Level 3 Reconciliation
The following is a reconciliation of each Fund’s Level 3 investments for which significant unobservable inputs were used in determining value:
CORE IMPACT EQUITY FUND
| | | | | | | | | | | | | | | Net unrealized | | | Amortized | | | | | | | |
| | | Balance as of | | | | | | | | | Realized | | | appreciation | | | discounts/ | | | Transfers in | | | Balance as of | |
| | | June 30, 2020 | | | Purchases | | | Sales | | | gain (loss) | | | (depreciation) | | | premiums | | | to Level 3 | | | June 30, 2021 | |
| Escrow Shares | | $ | 28,449 | | | $ | — | | | $ | — | | | $ | — | | | $ | 8,753 | | | $ | — | | | $ | — | | | $ | 37,202 | |
| Escrow Notes | | $ | 0 | | | $ | — | | | $ | — | | | $ | — | | | $ | — | | | $ | — | | | $ | — | | | $ | 0 | |
| Total | | $ | 28,449 | | | $ | — | | | $ | — | | | $ | — | | | $ | 8,753 | | | $ | — | | | $ | — | | | $ | 37,202 | |
| Net change in unrealized appreciation (depreciation) for Level 3 investments still held as of June 30, 2021 | | | $ | 8,753 | |
The following presents information about significant unobservable inputs related to Level 3 investments at June 30, 2021:
CORE IMPACT EQUITY FUND
| | | Fair Value at | | | Valuation | | | Unobservable | | | Input | |
| | | June 30, 2021 | | | Technique | | | Input | | | Values | |
| Escrow Shares | | | | | | | | | | | | |
| Airlines | | $ | 37,202 | | | Market approach | | | Estimated obligations to other parties | | | | 60mm | * |
| Escrow Notes | | | | | | | | | | | | | | |
| Retail | | $
| 0 | | | Profitability expected return method | | | Uncertainty of any additional future payout | | | $ | 0.00 | ** |
| * | An increase in the unobservable input would decrease the valuation and a decrease in the unobservable input would increase the valuation. |
| ** | An increase in the unobservable input would increase the valuation and a decrease in the unobservable input would decrease the valuation. |
2021 ANNUAL REPORT | 23
| Notes to the Financial Statements (continued) |
B. Federal Income Taxes. It is the Funds’ policy to comply with the requirements of Subchapter M of the Internal Revenue Code and to distribute substantially all of their taxable income to shareholders. Therefore, no federal income tax provision is required.
In accordance with FASB Interpretation ASC 740, (“ASC 740”), each Fund recognizes a tax benefit from an uncertain position only if it is more likely than not that the position is sustainable, based solely on its technical merits and consideration of the relevant taxing authority’s widely understood administrative practices and precedents. If this threshold is met, a Fund measures the tax benefit as the largest amount of benefit that is greater than fifty percent likely of being realized upon ultimate settlement. The Funds identify their major tax jurisdictions as U.S. Federal, the Commonwealth of Massachusetts and the State of Delaware. Management has reviewed the tax positions for each of the three open tax years as of June 30, 2021 and has determined that the implementation of ASC 740 does not have a material impact on the Funds’ financial statements. Each Fund’s federal tax returns for the prior three fiscal years remains subject to examination by the Internal Revenue Service.
Net investment income or loss and net realized gains or losses may differ for financial statement and income tax purposes primarily due to investments that have a different basis for financial statement and income tax purposes. The character of distributions made during the year from net investment income or net realized gains may differ from their ultimate characterization for federal income tax purposes. Also, due to the timing of dividend distributions, the fiscal year in which amounts are distributed may differ from the year that the income or realized gains were recorded by each Fund. Permanent differences in the recognition of earnings are reclassified to additional paid-in capital. Distributions in excess of tax-basis earnings are recorded as a return of capital.
C. Security Transactions and Investment Income. Security transactions are recorded on the trade date. Realized gains and losses are determined using the specific identification cost method. Interest income on debt securities is recorded daily on the accrual basis. Discounts and premiums on debt securities are amortized over their respective lives. Dividend income is recorded on the ex-dividend date, or as soon as information is available to the Fund.
D. Short Sales of Investments. The Funds may make short sales of investments, which are transactions in which a Fund sells a security it does not own in anticipation of a decline in the fair value of that security. To complete such a transaction, the Fund must borrow the security to make delivery to the buyer. The Fund is then obligated to replace the security borrowed by purchasing it at the market price at the time of replacement. The broker retains the proceeds of short sales to the extent necessary to meet margin requirements until the short position is closed out.
If a security pays a dividend while the Fund holds it short, the Fund will need to pay the dividend to the original owner of the security. Since the Fund borrowed the shares and sold them to a third party, the third party will receive the dividend from the security and the Fund will pay the original owner the dividend directly. The Fund is not entitled to the dividend because it does not own the shares. A gain, limited to the price at which the Fund sold the security short, or a loss, unlimited in size, will be recognized upon the termination of a short sale. The Funds did not have any short sales during the fiscal year ended June 30, 2021.
E. Written Options Contracts. The Funds may write options to manage exposure to certain changes in the market. When a Fund writes an option, an amount equal to the premium received by the Fund is recorded as a liability, which is marked-to-market daily to reflect the current market value of the option written. If the option expires, the Fund realizes a gain from investments equal to the amount of the premium received. When a written call option is exercised, the difference between the premium and the amount for effecting a purchase transaction, including brokerage commission, is also treated as a realized gain or loss. When a written put option is exercised, the amount of the premium received reduces the cost of the security purchased by the Fund.
A risk in writing a covered call option is that the Fund may forego the opportunity of profit if the market price of the underlying security increases and the option is exercised. The risk in writing a put option is that the Fund may incur a loss if the market price of the underlying security decreases and the option is exercised.
In addition, there is the risk that the Fund may not be able to enter into a closing transaction because of an illiquid secondary market. The Funds did not have any written option contracts for the fiscal year ended June 30, 2021.
F. Purchased Options. The Funds may purchase call options in anticipation of an increase in the market value of securities of the type in which they may invest. The purchase of a call option will entitle a Fund, in return for the premium paid, to purchase specified securities at a specified price during the option period. A Fund will ordinarily realize a gain if, during the option period, the value of such securities exceeded the sum of the exercise price, the premium paid and transaction costs; otherwise, the Fund will realize either no gain or a loss on the purchase of the call option. A Fund will normally purchase put options in anticipation of a decline in the market value of securities in its portfolio (“protective puts”) or in securities in which it may invest. The purchase of a put option will entitle the Fund, in exchange for the premium paid, to sell specified securities at a specified price during the option period. The purchase of protective puts is designed to offset or hedge against a decline in the market value of the Fund’s securities. Put options may also be purchased by a Fund for the purpose of affirmatively benefiting from a decline in the price of securities which it does not own. The Fund will ordinarily realize a gain if, during the option period, the value of the underlying securities decreased below the exercise price sufficiently to more than cover the premium and transaction costs; otherwise the Fund will realize either no gain or a loss on the purchase of the put option. Gains and losses on the purchase of protective put options would tend to be offset by countervailing changes in the value of the underlying portfolio securities. The Funds did not have any purchased options for the fiscal year ended June 30, 2021.
G. Futures Contracts. The Funds may enter into financial futures contracts, to the extent permitted by their investment policies and objectives, for bona fide hedging and other permissible risk management purposes including protecting against anticipated changes in the value of securities a Fund intends to purchase. Upon entering into a financial futures contract, a Fund is required to deposit cash or securities as initial margin.
Additional securities are also segregated as collateral up to the current market value of the financial futures contracts. Subsequent payments, known as variation margin, are made or received by the Fund, depending on the fluctuation in the value of the underlying financial instruments. The Fund recognizes an unrealized gain or loss equal to the variation margin. When the financial futures contracts are closed, a realized gain or loss is recognized equal to the difference between the proceeds from (or cost of) the closing transactions and the Fund’s basis in the contracts. The risks associated with entering into financial futures contracts include the possibility that a change in the value of the contract may not correlate with the changes in the value of the underlying instruments. In addition, investing in financial futures contracts involves the risk that the Fund could lose more than the original margin deposit and subsequent payments required for a futures transaction. Risks may also arise upon entering into these contracts from the potential inability of the counterparties to meet the terms of their contracts. The Funds did not enter into any futures contracts during the fiscal year ended June 30, 2021.
2021 ANNUAL REPORT | 24
| Notes to the Financial Statements (continued) |
H. Foreign Currency Transactions. Securities and other assets and liabilities denominated in foreign currencies are converted each business day into U.S. dollars based on the prevailing rates of exchange. Purchases and sales of portfolio securities and income and expenses are converted into U.S. dollars on the respective dates of such transactions.
Gains and losses resulting from changes in exchange rates applicable to foreign securities are not reported separately from gains and losses arising from movements in securities prices.
Net realized foreign exchange gains and losses include gains and losses from sales and maturities of foreign currency exchange contracts, gains and losses realized between the trade and settlement dates of foreign securities transactions, and the difference between the amount of dividends, interest and foreign withholding taxes on the Funds’ books and the U.S. dollar equivalent of the amounts actually received. Net unrealized foreign exchange gains and losses include gains and losses from changes in the fair value of assets and liabilities denominated in foreign currencies other than portfolio securities, resulting from changes in exchange rates.
I. Forward Foreign Currency Contracts. The Funds may enter into forward foreign currency contracts to hedge against foreign currency exchange rate risk on their non-U.S. dollar denominated securities or to facilitate settlement of foreign currency denominated portfolio transactions. A forward foreign currency contract is an agreement between two parties to buy and sell a currency at a set price on a future date. The contract is marked-to-market daily and the change in value is recorded by a Fund as an unrealized gain or loss. When a forward foreign currency contract is extinguished, through either delivery or offset by entering into another forward foreign currency contract, the Fund records a realized gain or loss equal to the difference between the value of the contract at the time it was opened and the value of the contract at the time it was extinguished.
Forward foreign currency contracts involve elements of market risk in excess of the amounts reflected in the Statements of Assets and Liabilities. The Fund bears the risk of an unfavorable change in the foreign exchange rate underlying the forward foreign currency contract. Risks may also arise upon entering into these contracts from the potential inability of the counterparties to meet the terms of their contracts. The Funds did not enter into any forward foreign currency contracts during the fiscal year ended June 30, 2021.
J. Portfolio Investment Risks. Investments in securities of foreign issuers carry certain risks not ordinarily associated with investments in securities of U.S. issuers. These risks include future disruptive political and economic developments and the possible imposition of exchange controls or other unfavorable foreign government laws and restrictions. In addition, investments in certain countries may carry risks of expropriation of assets, confiscatory taxation, political or social instability, or diplomatic developments that adversely affect investments in those countries. Certain countries may also impose substantial restrictions on investments in their capital markets by foreign entities, including restrictions on investments in issuers in industries deemed sensitive to relevant national interests. These factors may limit the investment opportunities available and result in a lack of liquidity and high price volatility with respect to securities of issuers from developing countries.
K. Multiple Class Allocations. Each class of shares has equal rights as to earnings and assets except that each class bears different distribution and shareholder servicing expenses. Each class of shares has exclusive voting rights with respect to matters that affect just that class. Income, expenses (other than expenses attributable to a specific class) and realized and unrealized gains or losses on investments are allocated to each class of shares based on its relative net assets.
L. Expense Allocations. Expenses are allocated to each series based upon its relative proportion of net assets to the Trust’s total net assets or by other equitable means.
M. Distributions to Shareholders. Each Fund generally declares dividends at least annually, payable in December, on a date selected by the Board. In addition, distributions may be made annually in December out of net realized gains through October 31 of that calendar year. Distributions to shareholders are recorded on the ex-dividend date. Each Fund may make a supplemental distribution subsequent to the end of its fiscal year ending June 30.
N. Use of Estimates. The preparation of financial statements in conformity with GAAP requires management to make estimates and assumptions that affect the reported amounts of assets and liabilities and the disclosure of contingent assets and liabilities at the date of the financial statements, and the reported amounts of revenue and expenses during the reporting period. Actual results could differ from those estimates, and those differences could be significant.
O. Derivative Instruments. The Funds follow certain regulatory guidance on disclosures about derivative instruments and hedging activities which require that the Funds disclose: a) how and why an entity uses derivative instruments; and b) how derivative instruments and related hedged items affect an entity’s financial position, financial performance and cash flows.
The Funds may trade financial instruments where they are considered to be a seller of credit derivatives in accordance with authoritative guidance under GAAP on derivatives and hedging.
The Funds did not have any derivative instruments at June 30, 2021.
Note 3 — Investment Advisory Fee and Other Related Party Transactions
Community Capital Management, Inc. (“CCM” or “Adviser”) serves as investment adviser to each Fund.
Each Fund paid advisory fees shown in the table below for the fiscal year ended June 30, 2021. Amounts paid and reimbursed are expressed as dollar amounts and annualized percentages of average net assets.
| |
| Percentage | Advisory | Percentage of |
| | Advisory | of Advisory | Fees | Advisory Fees |
| | Fees Paid | Fees Paid | Reimbursed | Reimbursed |
| Core Impact Equity | $487,722 | 0.75% | N/A | N/A |
| Small/Mid-Cap Impact Value | 174,393 | 0.90% | $193,610 | 1.00% |
On May 1, 2019, CCM contractually agreed to waive a portion of its management fee and/or assume expenses to the extent necessary to reduce the total operating expenses of Small/Mid-Cap Impact Value (excluding 12b-1 fees, taxes, interest, acquired fund fees and expenses, short sale dividend and interest expense, brokerage fees, certain insurance costs, and non-routine expenses or costs, including, but not limited to, those relating to reorganizations litigation, conducting shareholder meetings, liquidations and other extraordinary expenses) in order to prevent total annual fund operating expenses from exceeding 1.30% of the Small/Mid-Cap Impact Value Fund’s average daily net assets through October 28, 2021. Pursuant to this agreement, CCM is entitled to recoup any fees that it waived and/or the Fund expenses that it paid for a period of three years following such fee waivers and expense payments, to the extent that such recoupment by CCM will not cause the Fund to exceed any applicable expense limitation that was in place when the fees were waived or expenses were paid. These waivers and reimbursements may be terminated at any time with respect to the Fund by the Board upon (60) days written notice to CCM without payment of any penalty and shall automatically terminate upon the termination of the Fund’s advisory contract with CCM.
2021 ANNUAL REPORT | 25
| Notes to the Financial Statements (continued) |
At June 30, 2021, the unreimbursed amount paid and/or waived by the Adviser on behalf of Small/Mid-Cap Impact Value that may be recovered is $417,622. The Adviser may recapture portions of the above amounts no later than the dates stated below:
| | June 30, | June 30, | June 30, |
| | 2022 | 2023 | 2024 |
| Small/Mid-Cap Impact Value | $35,019 | $188,993 | $193,610 |
At June 30, 2021, a shareholder owned 56.44% of the outstanding shares of the Institutional Class of the Small/Mid-Cap Impact Value, which is deemed to be “control” as defined in the 1940 Act.
Foreside Fund Services, LLC (“Distributor”) serves as principal underwriter for the Trust. The Trust has adopted distribution and shareholder servicing plans pursuant to Rule 12b-1 of the 1940 Act for Advisor Class shares described below. There is no Rule 12b-1 distribution plan for Institutional Class shares of the Funds. The Advisor Class Plan provides that each Fund may pay a servicing or Rule 12b-1 fee at an annual rate of 0.25% of the Advisor Class average net assets on a monthly basis to persons or institutions for performing certain servicing functions for the Advisor Class shareholders. The Advisor Class Plan also allows the Fund to pay or reimburse expenditures in connection with sales and promotional services related to distribution of the Fund’s shares, including personal services provided to prospective and existing shareholders. Effective September 30, 2018, the Class C shares were merged into the Advisor Class shares. For the fiscal year ended June 30, 2021, Rule 12b-1 fees incurred are disclosed on the statement of operations for each Fund.
For the fiscal year ended June 30, 2021, the Trust paid Little Consulting Group, LLC the following fees for Chief Compliance Officer (“CCO”) services:
| Fund | Amount |
| Core Impact Equity | $48,823 |
| Small/Mid-Cap Impact Value | 23,177 |
Note 4 — Shareholder Servicing Plan
The Funds have adopted a Shareholder Servicing Plan on behalf of each of the Funds pursuant to which each Fund’s Class of shares may pay financial institutions; securities dealers and other industry professionals (“Shareholder Servicing Agents”) at an annual rate not to exceed 0.20% of the average daily net assets value.
For the fiscal year ended June 30, 2021, shareholder servicing fees incurred are:
| Fund | Amount |
| Core Impact Equity | $64,790 |
| Small/Mid-Cap Impact Value | 14,278 |
Note 5 — Purchases and Sales of Investments
For the fiscal year ended June 30, 2021 aggregate purchases and sales of investment securities (excluding short-term investments) for each Fund were as follows:
| Fund | | Purchases | | | Sales | |
| Core Impact Equity | | $ | 35,350,720 | | | $ | 41,185,467 | |
| Small/Mid-Cap Impact Value | | | 17,749,667 | | | | 23,683,423 | |
Note 6 — Tax Matters
For U.S. federal income tax purposes, the cost of securities owned, gross appreciation, gross depreciation, and net unrealized appreciation (depreciation) of investments at June 30, 2021 for each Fund were as follows:
| | |
| | | Gross | | | Gross | | | Net Appreciation | |
| Fund | | Cost | | | Appreciation | | | Depreciation | | | (Depreciation) | |
| Core Impact Equity | | $ | 47,483,436 | | | $ | 24,573,613 | | | $ | (618,252 | ) | | $ | 23,955,361 | |
| Small/Mid-Cap Impact Value | | | 16,868,919 | | | | 2,926,361 | | | | (621,955 | ) | | | 2,304,406 | |
As of June 30, 2021, the components of distributable earnings on a tax basis were as follows:
| | | Unrealized | | | Undistributed | | | Undistributed | | | Other | | | Total | |
| | | Appreciation | | | Ordinary | | | Capital | | | Accumulated | | | Distributable | |
| Fund | | (Depreciation) | | | Income | | | Gain | | | Gain/(Loss) | | | Earnings/(Loss) | |
| Core Impact Equity | | $ | 23,955,361 | | | $ | 393,787 | | | $ | 9,884,373 | | | $ | — | | | $ | 34,233,521 | |
| Small/Mid-Cap Impact Value | | | 2,304,406 | | | | — | | | | — | | | | (3,355,498 | ) | | | (1,051,092 | ) |
The difference between book basis and tax basis unrealized appreciation (depreciation) is attributable primarily to the tax deferral of losses on wash sales and the differing book/tax treatment of unrealized appreciation (depreciation) on partnership adjustments.
Under current tax law, foreign currency and net capital losses realized after October 31 may be deferred and treated as occurring on the first day of the following fiscal year. The Funds elected to defer net capital and currency losses as indicated in the chart below.
At June 30, 2021, the capital loss carryovers, late year losses, post-October capital loss and the capital loss outstanding for the Funds were as follows:
| | | Short-Term | | | | | | | | | | |
| | | Capital Loss | | | | | | | | | | |
| | | Carryovers | | | Late Year | | | Post-October | | | Capital Loss | |
| Fund | | Indefinite | | | Loss | | | Capital Loss | | | Utilized | |
| Core Impact Equity | | $ | — | | | $ | — | | | $ | — | | | $ | — | |
| Small/Mid-Cap Impact Value | | | (3,073,914 | ) | | | 281,584 | | | | — | | | | — | |
Note 7 — Reclassification of Capital Accounts
In accordance with the accounting pronouncements, each Fund has recorded reclassifications in the capital accounts. These reclassifications have no impact on the net asset value of the Funds and are designed generally to present distributable earnings on a tax basis which is considered to be more informative to shareholders. As of June 30, 2021, the Funds recorded the following reclassification to increase (decrease) the accounts listed below:
| | Total Distributable | |
| Fund | Earnings/(Loss) | Paid in Capital |
| Core Impact Equity | $(618,990) | $ 618,990 |
| Small/Mid-Cap Impact Value | 169,458 | (169,458) |
2021 ANNUAL REPORT | 26
| Notes to the Financial Statements (continued) |
Note 8 — Distributions to Shareholders
Income and long-term capital gain distributions are determined in accordance with federal income tax regulations, which may differ from GAAP. The information set forth below is for each Fund as required by federal securities laws.
The tax character of dividends and distributions paid during the fiscal years of 2021 and 2020 were as follows:
| | | Ordinary Income | | | Long-Term Capital Gain | |
| | | Fiscal Year Ended | | | Fiscal Year Ended | | | Fiscal Year Ended | | | Fiscal Year Ended | |
| Fund | | June 30, 2021 | | | June 30, 2020 | | | June 30, 2021 | | | June 30, 2020 | |
| Core Impact Equity | | $ | — | | | $ | — | | | $ | 431,565 | | | $ | 1,118,696 | |
| Small/Mid-Cap Impact Value | | $ | 264,069 | | | $ | 1,027,832 | | | $ | — | | | $ | 869,858 | |
Note 9 — Fund Share Transactions
At June 30, 2021, there were an unlimited number of shares of beneficial interest with no par value authorized. The following table summarizes the activity in shares of each Fund:
| | | Core Impact Equity |
| | | Year Ended 6/30/21 | | | Year Ended 6/30/20 | |
| | | Shares | | | Value | | | Shares | | | Value | |
| Shares sold: | | | | | | | | | | | | |
| Advisor Class | | | 16,518 | | | $ | 739,927 | | | | 21,178 | | | $ | 740,431 | |
| Institutional Class | | | 9,919 | | | | 454,277 | | | | 18,683 | | | | 690,288 | |
| Shares issued to shareholders due to reinvestment of distributions: | | | | | | | | | | | | | | | | |
| Advisor Class | | | 7,843 | | | | 337,710 | | | | 24,107 | | | | 888,323 | |
| Institutional Class | | | 1,380 | | | | 62,750 | | | | 3,976 | | | | 154,272 | |
| | | | 35,660 | | | $ | 1,594,664 | | | | 67,944 | | | $ | 2,473,314 | |
| Shares redeemed: | | | | | | | | | | | | | | | | |
| Advisor Class | | | (189,365 | ) | | | (8,069,228 | ) | | | (250,804 | ) | | | (8,715,963 | ) |
| Institutional Class | | | (25,301 | ) | | | (1,144,278 | ) | | | (34,737 | ) | | | (1,244,834 | ) |
| | | | (214,666 | ) | | $ | (9,213,506 | ) | | | (285,541 | ) | | $ | (9,960,797 | ) |
| Net increase (decrease) | | | (179,006 | ) | | $ | (7,618,842 | ) | | | (217,597 | ) | | $ | (7,487,483 | ) |
| | | Small/Mid-Cap Impact Value | |
| | | Year Ended 6/30/21 | | | Year Ended 6/30/20 | |
| | | Shares | | | Value | | | Shares | | | Value | |
| Shares sold: | | | | | | | | | | | | |
| Advisor Class | | | 7,895 | | | $ | 112,073 | | | | 85,693 | | | $ | 1,368,826 | |
| Institutional Class | | | 52,694 | | | | 792,166 | | | | 724,315 | | | | 13,021,106 | |
| Shares issued to shareholders due to reinvestment of distributions: | | | | | | | | | | | | | | | | |
| Advisor Class | | | 5,243 | | | | 73,825 | | | | 34,789 | | | | 623,772 | |
| Institutional Class | | | 11,418 | | | | 177,212 | | | | 59,123 | | | | 1,167,079 | |
| | | | 77,250 | | | $ | 1,155,276 | | | | 903,920 | | | $ | 16,180,783 | |
| Shares redeemed: | | | | | | | | | | | | | | | | |
| Advisor Class | | | (132,237 | ) | | | (1,817,358 | ) | | | (127,790 | ) | | | (1,859,725 | ) |
| Institutional Class | | | (392,506 | ) | | | (6,202,508 | ) | | | (339,929 | ) | | | (5,155,619 | ) |
| | | | (524,743 | ) | | $ | (8,019,866 | ) | | | (467,719 | ) | | $ | (7,015,344 | ) |
| Net increase (decrease) | | | (447,493 | ) | | $ | (6,864,590 | ) | | | 436,201 | | | $ | 9,165,439 | |
Note 10 — Indemnifications
Under the Trust’s organizational documents, its officers and Trustees are indemnified against certain liabilities arising out of the performance of their duties to the Funds. In addition, in the normal course of business, the Trust enters into contracts with its vendors and others that provide for general indemnifications.
The Trust’s maximum exposure under these arrangements is dependent on future claims that may be made against the Trust, and, therefore, cannot be estimated; however, based on experience, risk of loss from such claims is considered remote.
Note 11 — Events Subsequent to Year-End
Management has evaluated portfolio related events and transactions that occurred subsequent to June 30, 2021 through the date of issuance of the financial statements. There were no events or transactions that occurred during the period that materially impacted the amounts or disclosures in the financial statements.
2021 ANNUAL REPORT | 27
| Report of Independent Registered Public Accounting Firm |
To the Shareholders and Board of Trustees of Quaker Investment Trust Opinion on the Financial Statements
We have audited the accompanying statements of assets and liabilities of CCM Core Impact Equity Fund and CCM Small / Mid-Cap Impact Value Fund (the “Funds”), each a series of Quaker Investment Trust (the “Trust”), including the schedules of investments, as of June 30, 2021, the related statements of operations for the year then ended, the statements of changes in net assets for each of the two years in the period then ended, and the financial highlights for each of the five years in the period then ended, and the related notes (collectively referred to as the “financial statements”). In our opinion, the financial statements present fairly, in all material respects, the financial position of the Funds as of June 30, 2021, the results of their operations for the year then ended, the changes in their net assets for each of the two years in the period then ended, and their financial highlights for each of the five years in the period then ended, in conformity with accounting principles generally accepted in the United States of America.
Basis for Opinion
These financial statements are the responsibility of the Funds’ management. Our responsibility is to express an opinion on the Funds’ financial statements based on our audits. We are a public accounting firm registered with the Public Company Accounting Oversight Board (United States) (“PCAOB”) and are required to be independent with respect to the Funds in accordance with the U.S. federal securities laws and the applicable rules and regulations of the Securities and Exchange Commission and the PCAOB. We have served as the auditor of one or more of the funds in the Trust since 2012.
We conducted our audits in accordance with the standards of the PCAOB. Those standards require that we plan and perform the audits to obtain reasonable assurance about whether the financial statements are free of material misstatement, whether due to error or fraud. The Funds are not required to have, nor were we engaged to perform, an audit of the Funds’ internal control over financial reporting. As part of our audits we are required to obtain an understanding of internal control over financial reporting, but not for the purpose of expressing an opinion on the effectiveness of the Funds’ internal control over financial reporting. Accordingly, we express no such opinion.
Our audits included performing procedures to assess the risks of material misstatement of the financial statements, whether due to error or fraud, and performing procedures that respond to those risks. Such procedures included examining, on a test basis, evidence regarding the amounts and disclosures in the financial statements. Our audits also included evaluating the accounting principles used and significant estimates made by management, as well as evaluating the overall presentation of the financial statements. Our procedures included confirmation of securities owned as of June 30, 2021 by correspondence with the custodian. We believe that our audits provide a reasonable basis for our opinion.
| |  |
| | TAIT, WELLER & BAKER LLP |
| Philadelphia, Pennsylvania | |
| August 16, 2021 | |
2021 ANNUAL REPORT | 28
Trustees and Officers (unaudited)
June 30, 2021
The Board has overall responsibility for conduct of the Trust’s affairs. The day-to-day operations of the Trust are managed by CCM subject to the Bylaws of the Trust and review by the Board. The Trustees, including those Trustees who are also officers, are listed below:
Name, Age &
Address* | Position(s) Held
with the Trust | Serving as
an Officer
or Trustee of
the Trust | Principal Occupation(s)
During Past 5 Years | Portfolios
Overseen by
Trustee | Other
Directorships
Held by
Trustee(1) |
| Independent Trustees | | | | | |
James R. Brinton
Age 67 | Chair
Trustee
Lead
Independent
Trustee | Since 2018
Since 2002
2007–2018 | Vice President, Retired since 2019. BMT Insurance Advisors (a commercial insurance brokerage firm) from 2015 to 2019. | 2 | None |
Gary Edward Shugrue
Age 67 | Trustee | 2008–Present | Veritable, LP (investment advisory firm) since 2015; President and Chief Investment Officer, Ascendant Capital Partners from 2001–2015. | 2 | Director,
RFS Family of
Funds/UMB
Fund Services |
Warren West
Age 64 | Trustee | 2003–Present | Retired since 2017. Greentree Brokerage Services, Inc. from 1998–2017. | 2 | None |
| Interested Trustee | | | | | |
Alyssa Greenspan(2)
Age 49 | President
Trustee | Since
January, 2018
Since
June, 2018 | President, Community Capital Management, Inc. since January 2015; Chief Operating Officer, Community Capital Management, Inc. since June 2009; Senior Vice President and Portfolio Manager, Community Capital Management, Inc. since May 2003. | 2 | None |
| Officers | | | | | |
Todd Cohen
Age 55 | Secretary | Since
June, 2018 | Chief Executive Officer, Community Capital Management, Inc. since January 2015; President and Chief Investment Officer, Community Capital Management, Inc. January 2007–January 2015. | N/A | N/A |
James Malone
Age 50 | Treasurer | Since
January, 2021 | Chief Financial Officer of Community Capital Management, Inc. since July 2013; Director of Investment Platforms, since September 2011. | N/A | N/A |
Stefanie Little
Age 53 | Chief
Compliance
Officer | Since
June, 2018 | Chief Compliance Officer, Community Capital Management, Inc. (2010–present). Chief Compliance Officer for Quaker Investment Trust since June, 2018. Founder of Chenery Compliance Group, LLC (2015–present); Managing Member SEC Compliance Alliance, LLC (2012–2019), President of Little Consulting Group, Inc. (2011–present). | N/A | N/A |
| * | The address for each Trustee and Officer is Community Capital Management, Inc., 2500 Weston Road, Suite 101, Weston, Florida 33331. |
| (1) | Directorship of companies required to report to the SEC under the Securities and Exchange Act of 1934, as amended (the “Exchange Act”) (i.e., “public companies”) and investment companies registered under the 1940 Act. |
| (2) | Ms. Greenspan is an “interested person” of the Trust (as defined in the 1940 act) due to the position she holds with Community Capital Management, Inc. |
The Statement of Additional Information for the Trust includes additional information about the Trustees and Officers is available, without charge, upon request by calling 888-272-0007.
2021 ANNUAL REPORT | 29
General Information (unaudited)
Form N-Port Filing and Proxy Voting Policies and Procedures
Each Fund files its complete schedule of portfolio holdings with the Securities and Exchange Commission (“SEC”) for the first and third quarters of each fiscal year on Part F of Form N-Port . Each Fund’s Part F of Form N-Port, as well as a description of the policies and procedures that each Fund uses to determine how to vote proxies (if any) relating to portfolio securities is available without charge: (i) upon request, by calling 888-272-0007; and (ii) on the SEC’s web-site at http://www.sec.gov. Each Fund’s Forms N-Port EX may be reviewed and copied at the SEC’s Public Reference Room in Washington, DC; information on the operation of the Public Reference Room may be obtained by calling 1-800-SEC-0330.
Information (if any) regarding how the Funds voted proxies relating to portfolio securities during the most recently disclosed 12-month period ended June 30 is available: (i) without charge, upon request, by calling 888-272-0007; and (ii) on the SEC’s web-site at http://www.sec.gov.
Tax Information
We are required to advise you within 60 days of the Funds’ fiscal year-end regarding the federal tax status of certain distributions received by shareholders during such fiscal year. The information below is provided for the fiscal year ending June 30, 2021. During the fiscal year ended June 30, 2021, the following Fund paid a long-term capital distribution.
Fund
| Core Impact Equity | $ 431,565 |
Individual shareholders are eligible for reduced tax rates on the following percentages of qualified dividend income. For the purposes of computing the dividends eligible for reduced taxes, the following percentage of the dividends paid by the Fund from ordinary income earned during the fiscal year are considered qualified dividend income.
| Small/Mid-Cap Impact Value | 53.46% |
Corporate shareholders may exclude up to the following percentages of qualifying dividends. For the purposes of computing this exclusion, the following percentage of the dividends paid by the Fund from ordinary income earned during the fiscal year represents qualifying dividends.
| Small/Mid-Cap Impact Value | 51.17% |
During the fiscal year ending June 30, 2021, the Funds did not pay any taxable ordinary income distributions that would be designated as short- term capital gain distributions under Internal Revenue Section 871(k)(2)(C).
Dividends and distributions received by retirement plans such as IRAs, Keogh type plans and 403(b) plans need not be reported as taxable income. However, many retirement plan trusts may need this information for their annual information reporting. Since the information above is reported for the Funds’ fiscal year and not the calendar year, shareholders should refer to their Form 1099-DIV or other tax information which will be mailed in January 2022 to determine the calendar year amounts to be included on their 2021 tax returns. Shareholders should consult their tax advisers.
Privacy Policy
Your personal privacy is important. At Quaker Investment Trust, including its subsidiaries and affiliated entities, we recognize that whether you are an existing customer or are considering a relationship with us, you have an interest in how we collect, retain and use information about you and your relationship with us.
We are committed to protecting your confidential information. We do this by maintaining standards and procedures designed to prevent the accidental disclosure of such information and/or its misuse. Our Customer Privacy Policy, which outlines how we accomplish the protection of your information, is set forth below.
We may collect “non-public personal information” about you from the following sources:
| • | Information we receive from you on account applications and other account forms you provide to us; |
| • | Information about your transactions with us, our affiliates, and other entities; |
| • | Information we receive from third parties, such as credit bureaus, the IRS, and others. “Non-public personal information” is non-public information about you that we obtain in connection with providing a financial product or service to you. For example, non-public personal information includes information regarding your account balance, shares held, which funds you own, your investment history, etc. |
| II. | INFORMATION USE & SHARING WITH THIRD PARTIES |
We are permitted under law to share information about our experiences or transactions with you or your account (such as your account balance, shares owned, and investment history) with affiliates. We may also share additional information about you or your account (such as information we receive from account applications and other correspondence) with our affiliates. We do not disclose information to our affiliates that does not directly relate to our or our affiliates’, experiences or transactions with your account.
We are also permitted under law to disclose non-public information about you to “non-affiliated third parties” in certain circumstances. We may share certain kinds of customer information with these third parties solely to facilitate the offering, administration, collection and delivery of our services to you, and only under strictly controlled circumstances designed to protect the privacy of your information. We require any non-affiliated third party with whom we share such information to execute our Confidentiality and Consumer Privacy Protection Agreement. Under that agreement, those parties are not allowed to release, use for their own purposes, or sell, transfer or provide any customer information we share with them to any other party.
You should be aware that there may be occasions where we are legally required to disclose information about you, such as in response to a governmental or court order.
If you decide to close your account with us, we will continue to adhere to these privacy policies. Lastly, we do not sell customer lists or individual customer information.
At Quaker Investment Trust and our affiliates, employee access to customer information is authorized for business purposes only and only for employees who need to know such information.
We regularly train our employees on privacy and privacy security, and we have established and continuously maintain standards and procedures to protect the privacy of your information.
When you use our on-line (Internet) products and services, we may collect information about you to personalize our services to you, but we do not share any such information or your email information to anyone other than our affiliates, unless compelled to do so under law.
2021 ANNUAL REPORT | 30
General Information (unaudited) (continued)
We continually strive to maintain complete and accurate information about you and your accounts. Should you ever believe that our records are inaccurate or incomplete, please call us immediately at 1-888-272-0007. We will investigate your concerns and correct any inaccuracies. We will also confirm to you the actions we have taken concerning your account. You may also write to us at the Quaker Investment Trust, c/o U.S. Bancorp Fund Services, LLC, P.O. Box 701, Milwaukee, Wisconsin 53201-0701.
Notice Regarding Delivery of Shareholder Documents
In an effort to decrease costs, each Fund intends to reduce the number of duplicate Prospectuses and Annual and Semi-Annual Reports you receive by sending only one copy of each to those addresses shared by two or more accounts and to shareholders we reasonably believe are from the same family or household. Once implemented, if you would like to discontinue householding for your accounts, please call toll-free at 1-888-272-0007 to request individual copies of these documents. Once a Fund receives notice to stop householding, we will begin sending individual copies thirty days after receiving your request. This policy does not apply to account statements.
2021 ANNUAL REPORT | 31
(This Page Intentionally Left Blank.)

2500 Weston Road Suite 101 Weston, FL 33331
954-217-7999 Fax: 954-385-9299 Toll Free: 877-272-1977
www.ccminvests.com
QKAR062021
The registrant has adopted a code of ethics that applies to the registrant’s principal executive officer and principal financial officer. The registrant has not made any substantive amendments to its code of ethics during the period covered by this report. The registrant has not granted any waivers from any provisions of the code of ethics during the period covered by this report.
A copy of the registrant’s Code of Ethics is filed herewith.
The Registrant’s Board of Trustees (the “Board”) has determined that there is at least one audit committee financial expert serving on its audit committee. Gary E. Shugrue is the audit committee financial expert and is considered to be “independent” as each term is defined in Item 3 of Form N CSR.
The registrant has engaged its principal accountant to perform audit services, audit-related services, tax services and other services during the past two fiscal years. “Audit services” refer to performing an audit of the registrant's annual financial statements or services that are normally provided by the accountant in connection with statutory and regulatory filings or engagements for those fiscal years. “Audit-related services” refer to the assurance and related services by the principal accountant that are reasonably related to the performance of the audit. “Tax services” refer to professional services rendered by the principal accountant for tax compliance, tax advice, and tax planning. There were no “Other services” provided by the principal accountant. The following table details the aggregate fees billed or expected to be billed for each of the last two fiscal years for audit fees, audit-related fees, tax fees and other fees by the principal accountant.
(e) The Audit Committee of the Board of Trustees (the “Audit Committee”) has not adopted pre-approval policies and procedures. Instead, pursuant to the registrant’s Audit Committee Charter that has been adopted by the Audit Committee, the Audit Committee shall approve, prior to appointment, the engagement of the auditor to provide audit services to the registrant and non-audit services to the registrant, its investment adviser or any entity controlling, controlled by or under common control with the investment adviser that provides on-going services to the registrant if the engagement relates directly to the operations and financial reporting of the Registrant.
(f) All of the principal accountant’s hours spent on auditing the Registrant’s financial statements were attributed to work performed by full time permanent employees of the principal accountant.
(h) The Audit Committee has considered whether the provision of non-audit services that were rendered to the Registrant’s investment adviser is compatible with maintaining the principal accountant’s independence. The Audit Committee has concluded that the provision of such non-audit services by the accountant has not compromised the accountant’s independence.
Not applicable to registrants who are not listed issuers (as defined in Rule 10A-3 under the Securities Exchange Act of 1934).
Not applicable to open-end investment companies.
Not applicable to open-end investment companies.
Not applicable to open-end investment companies.
There have been no material changes to the procedures by which shareholders may recommend nominees to the registrant’s Board of Trustees.
Not applicable to open-end investment companies.
Pursuant to the requirements of the Securities Exchange Act of 1934 and the Investment Company Act of 1940, the registrant has duly caused this report to be signed on its behalf by the undersigned, thereunto duly authorized.
Pursuant to the requirements of the Securities Exchange Act of 1934 and the Investment Company Act of 1940, this report has been signed below by the following persons on behalf of the registrant and in the capacities and on the dates indicated.