UNITED STATES
SECURITIES AND EXCHANGE COMMISSION
Washington, D.C. 20549
FORM N-CSR
CERTIFIED SHAREHOLDER REPORT OF REGISTERED MANAGEMENT
INVESTMENT COMPANIES
Investment Company Act File Number 811-06260
Quaker Investment Trust
(Exact name of Registrant as specified in charter)
2500 Weston Road
Suite 101
Weston, FL 33331
(Address of principal executive offices) (Zip code)
Alyssa D. Greenspan
Quaker Investment Trust
2500 Weston Road, Suite 101
Weston, FL 33331
(Name and address of agent for service)
Registrant’s telephone number, including area code: 1-888-272-0007
Date of fiscal year end: June 30, 2022
Date of reporting period: June 30, 2022
Form N-CSR is to be used by management investment companies to file reports with the Commission not later than 10 days after the transmission to stockholders of any report that is required to be transmitted to stockholders under Rule 30e-1 under the Investment Company Act of 1940 (17 CFR 270.30e-1). The Commission may use the information provided on Form N-CSR in its regulatory, disclosure review, inspection, and policymaking roles.
A Registrant is required to disclose the information specified by Form N-CSR, and the Commission will make this information public. A registrant is not required to respond to the collection of information contained in Form N-CSR unless the Form displays a currently valid Office of Management and Budget ("OMB") control number. Please direct comments concerning the accuracy of the information collection burden estimate and any suggestions for reducing the burden to Secretary, Securities and Exchange Commission, 450 Fifth Street, NW, Washington, DC 20549-0609. The OMB has reviewed this collection of information under the clearance requirements of 44 U.S.C. ss. 3507.
Item 1. Report to Stockholders.
A copy of the report transmitted to Stockholders pursuant to Rule 30e-1 under the Investment Company Act of 1940, as amended (the “Act”) (17 CFR 270.30e-1) is attached hereto.

Annual Report 2022

QUAKER INVESTMENT TRUST
June 30, 2022
CCM Core Impact Equity Fund
CCM Small/Mid-Cap Impact Value Fund

June 30, 2022
Dear Shareholders:
On behalf of the Board of Trustees of the Quaker Investment Trust, I am pleased to present the Annual Report to Shareholders for the year ended June 30, 2022.
We applaud the disciplined and productive efforts of Community Capital Management, LLC, registered investment advisor to the Trust, and we thank you, our shareholders, for your investments. We appreciate your continued confidence.
Sincerely,
James R. Brinton
Chair and Lead Independent Trustee
Quaker Investment Trust
2022
TABLE OF CONTENTS
Letter to Shareholders | 1 |
Manager’s Discussion & Analysis | 3 |
Disclosures of Fund Expenses | 12 |
Fund Profile | 14 |
Schedules of Investments | 16 |
Statements of Assets and Liabilities | 23 |
Statements of Operations | 25 |
Statements of Changes in Net Assets | 27 |
Financial Highlights | 29 |
Notes to Financial Statements | 33 |
Report of Independent Registered Public Accounting Firm | 43 |
Notice to Shareholders | 45 |
Trustees and Officers | 46 |
Additional Information | 48 |

Manager’s Discussion & Analysis (Unaudited)June 30, 2022
CCM Core Impact Equity Fund
(QUAGX, QAGIX)
Equity markets had a volatile 12-month period ending June 30, 2022. The S&P 500 had its best quarter of 2021 in Q4, rising 11.0%. We believe the rise was the result of improving corporate earnings in combination with the Federal Reserve’s bond buying program and low interest rate policies driving up equity market valuations. This rise was soon followed by one of the worst starts to the year in history, as it became clear that the theory of transitory inflation was proving to be elusive. The Ukraine-Russia conflict exacerbated these pressures as the war resulted in the rapid rise of commodity prices throughout the world. Rapidly rising commodity prices led to increased expectations from equity markets that the Fed was going to tighten monetary policy to try to temper inflation.
In the bond markets, the prospect for monetary policy tightening led to significant selloffs in the fourth quarter of 2021 and the first and second quarters of 2022. The yield on the 10-Year U.S. Treasury rose from 1.49% on September 30, 2021, to 3.02% on June 30, 2022. The dramatic increase in interest rates caused significant valuation compression within the equity markets. The S&P 500 fell 4.6% and 16.1% during the first and second quarters of 2022, respectively.
The CCM Core Impact Equity Fund underperformed during the 12-month period ended June 30, 2022. The institutional share class of the CCM Core Impact Equity Fund (the Fund) returned -12.69% underperforming the S&P 500 Fossil Fuel Free Index’s (the “Benchmark Index”) return of -11.84% by 0.85%.
The Fund’s underperformance versus its benchmark was partially driven by an overweight allocation to companies in the Communication Services sector, which was the worst performing sector in the S&P 500, returning -29%. Additionally, the Fund was underweight the Consumer Staples sector, which was the third best performing sector, returning 6.7%. The Fund benefited from strong security selection in its Industrial, Information Technology, and Health Care sector holdings.
The portfolio management team seeks to invest in high-quality companies that have demonstrated a history of above average earnings growth and that they anticipate will potentially grow their earnings for several years at above the average of companies in the S&P 500. Typically, these companies are also trading at lower price-to-earnings (PE)1 ratios than the market or to their historical averages. In general, we believe that companies with these attributes have the potential to produce market beating returns when held over a longer-term time horizon.
Moving forward, we believe inflation will continue to be at the forefront of the direction of equity markets as investors attempt to anticipate how aggressive the Fed will be for inflation to return to their longer-term target.
The aggressive rate of interest rate increases so far has clouded the outlook for the U.S. economy. While the labor market remains robust, leading economic indicators point to slowing or potentially even negative economic growth in the future. The spread between the 2-year and 10-year treasury is inverted and the 3-month to 10-year spread has flattened to the lowest level in more than two years. Several other leading economic indicators also point to a slowing economy.
While significant uncertainty exists, equity markets tend to be forward looking and the rout during the first half of 2022 may have already captured the recent deterioration in economic data. Our bias towards owning what we deem to be high quality companies with strong balance sheets gives us confidence that even though the portfolios holdings may experience volatility, we are confident that these companies have the potential to come out of a weak macroeconomic environment stronger than they were going into one.
Sincerely,
The Portfolio Management Team
Past performance is no guarantee of future results.
Mutual fund investing involves risk. Principal loss is possible. The Adviser may select or exclude securities of certain companies for reasons other than performance and, as a result, the Fund may underperform other funds that do not use an impact/ESG screening process. Small- and mid-cap stocks involve greater risks and volatility than large-cap stocks. The Funds’ exposure to (MLPs) may subject the Funds to greater volatility than investments in traditional securities.
This report must be preceded or accompanied by a current prospectus.
The opinions expressed are those of the adviser through the end of the period for this report, are subject to change, are not a guarantee, and should not be considered investment advice.
Fund holdings and sector allocations are subject to change and should not be considered a recommendation to buy or sell any security. Current and future holdings are subject to risk.
The CCM Funds are distributed by Foreside Fund Services, LLC.
1 The price to earnings ratio simply the stock price divided by the company's earnings per share for a designated period like the past 12 months. The price/earnings ratio conveys how much investors will pay per share for $1 of earnings.
Annual Total Returns | | | One Year | | | | Three Years | | | Inception
to Date+ | |
The CCM Core Impact Equity Fund —Advisor Class Shares‡ | | | -12.90% | | | | 9.54% | | | | 8.91% | |
The CCM Core Impact Equity Fund — Institutional Class Shares‡ | | | -12.69% | | | | 9.81% | | | | 9.18% | |
S&P 500 Fossil Fuel Free Index*(1) | | | -11.84% | | | | 10.66% | | | | 10.13% | |
S&P 500 Index* | | | -10.62% | | | | 10.60% | | | | 9.97% | |
| | | | | | | | | | | | | |
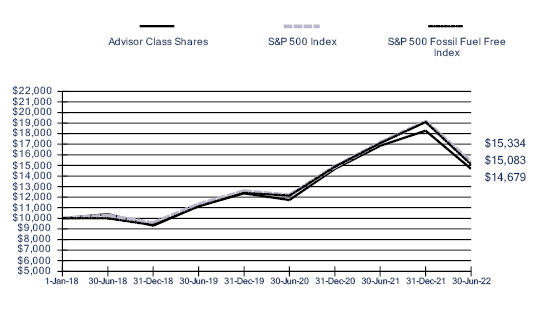
The above chart compares a hypothetical $10,000 investment made in the Fund's Advisor Share Class, the S&P 500 Index, and the S&P 500 Fossil Fuel Free Index on January 1, 2018. This chart does not imply any future performance.
| * | The benchmark since inception returns are calculated since commencement of January 1, 2018 through June 30, 2022. |
| + | The Fund amended and restated its Registration Statement to change the performance reporting history. The inception date for the Fund’s performance history is now January 1, 2018, the date Community Capital Management, LLC became the new investment adviser to the Fund. |
| ‡ | As stated in the October 28, 2021 and February 3, 2022 prospectus, the Fund’s annualized ratios of expenses in relation to average net assets were 1.97% and 1.72% for the Advisor Class Shares and Institutional Class Shares, respectively. |
| (1) | Prior to January 1, 2022, the Fund’s performance was compared to the S&P 500 Index as its benchmark. The Trust has elected to compare the Fund’s performance to the S&P 500 Fossil Fuel Free Index, as the Adviser believes this index is more aligned with the Fund’s investment strategy. |
Performance data quoted represents past performance and is no guarantee of future results. Investment return and principal value will fluctuate so that shares, when redeemed, may be
worth more or less than their original cost. Current performance may be lower or higher than performance data quoted. Performance data current to the most recent month end is available at www.ccminvests.com or by calling us toll free at 888-272-0007. Total return includes reinvestment of dividends and capital gains.
The performance table and chart do not reflect the deduction of taxes that a shareholder might pay on fund distributions or the redemption of fund shares. Total return calculations reflect expense reimbursements and fee waivers in the applicable periods. See financial highlights for periods where fees were waived or reimbursed.
The Fund’s portfolio holdings may differ significantly from the securities held in the index and, unlike a mutual fund, an unmanaged index assumes no transaction costs, taxes, management fees or other expenses. You cannot invest directly in an index.
The S&P 500 Fossil Fuel Free Index is designed to measure the performance of companies in the S&P 500 that do not own fossil fuel reserves. The S&P 500 Total Return Index (“S&P 500® Index”) is a widely recognized, unmanaged index consisting of the approximately 500 largest companies in the United States as measured by market capitalization. The S&P 500 Index assumes reinvestment of all dividends and distributions.
Manager’s Discussion & Analysis (Unaudited) June 30, 2022
CCM Small/Mid-Cap Impact Value Fund
(QUSVX, QSVIX)
The CCM Small/Mid-Cap Impact Value Fund institutional share class (the Fund) returned -8.53% for the fiscal year ended June 30, 2022, outperforming the Russell 2500 Value Index return of -13.19% by 4.66% and the Russell 2500 Index’s return of -21.00% by 12.47%.
The Fund outperformed the Russell 2500 Value Index in the third and fourth calendar quarters of 2021. Companies with strong financial profiles became more desirable as economic data began to be less robust. Unfortunately, the Fund gave back a portion of its outperformance during the first and second calendar quarters of 2022. The war in Ukraine caused commodity prices to spike higher leading to strong gains in fossil fuel and mining stock, which the Fund does not invest in.
During the next 12 months, we believe inflation will be the main factor behind the direction of equity markets as investors attempt to anticipate how aggressive the Fed will need to be for inflation to return to their longer-term target.
The aggressive rate of interest rate increases so far has clouded the outlook for the U.S. economy. While the labor market remains robust, leading economic indicators point to slowing or potentially even negative economic growth in the future. The spread between the 2-year and 10-year treasury is inverted and the 3-month to 10-year spread has flattened to the lowest level in more than two years. Several other leading economic indicators also point to a slowing economy.
While significant uncertainty exists, equity markets tend to be forward looking and the rout during the first half of 2022 may have already captured the recent deterioration in economic data. Our bias towards owning what we deem to be high quality companies with strong balance sheets gives us confidence that even though the portfolios holdings may experience volatility, we are confident that these companies have the potential to come out of a weak macroeconomic environment stronger than they were going into one.
Sincerely,
The Portfolio Management Team
Past performance is no guarantee of future results.
Mutual fund investing involves risk. Principal loss is possible. The Adviser may select or exclude securities of certain companies for reasons other than performance and, as a result, the Fund may underperform other funds that do not use an impact/ESG screening process. Small- and mid-cap stocks involve greater risks and volatility than large-cap stocks. The Funds’ exposure to (MLPs) may subject the Funds to greater volatility than investments in traditional securities.
This report must be preceded or accompanied by a current prospectus.
The opinions expressed are those of the adviser through the end of the period for this report, are subject to change, are not a guarantee, and should not be considered investment advice.
Fund holdings and sector allocations are subject to change and should not be considered a recommendation to buy or sell any security. Current and future holdings are subject to risk.
The CCM Funds are distributed by Foreside Fund Services, LLC.
Annual Total Returns | | | One Year | | | | Three Years | | | Inception
to Date+ | |
The CCM Small/Mid-Cap Impact Value Fund —Advisor Class Shares‡ | | | -8.83% | | | | -1.73% | | | | 0.30% | |
The CCM Small/Mid-Cap Impact Value Fund — Institutional Class Shares‡ | | | -8.53% | | | | -1.49% | | | | 0.56% | |
Russell 2500 Value Index* | | | -13.19% | | | | 6.19% | | | | 4.32% | |
Russell 2500 Index* | | | -21.00% | | | | 5.91% | | | | 5.55% | |
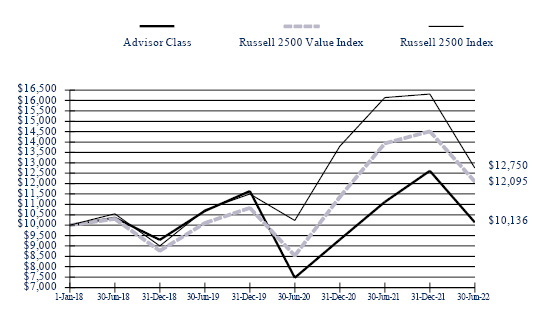
The above chart compares a hypothetical $10,000 investment made in the Fund's Advisor Shares Class, the Russell 2500 Index, and the Russell 2500 Value Index on January 1, 2018. This chart does not imply any future performance.
| * | The benchmark since inception returns are calculated since commencement of January 1, 2018 through June 30, 2022. |
| + | The Fund amended and restated its Registration Statement to change the performance reporting history. The inception date for the Fund’s performance history is now January 1, 2018, the date Community Capital Management, LLC became the new investment adviser to the Fund. |
| ‡ | As stated in the October 28, 2021 and February 3, 2022 prospectus, the Adviser has contractually agreed to waive all or a portion of its investment advisory fees and/or pay/reimburse expenses (excluding any Rule 12b-1 fees, taxes, interest, acquired fund fees and expenses, short sale dividend and interest expenses, brokerage fees, certain insurance costs, and non-routine expenses or costs, including, but not limited to, those relating to reorganizations, litigation, conducting shareholder meetings, liquidations and other extraordinary expenses). The contractual expense limits are in effect until October 28, 2022. Pursuant to the current February 3, 2022 prospectus, the Fund’s annualized gross ratios of expenses in relation to average net assets were 2.34% and 2.09% for the Advisory Class Shares and the Institutional Class Shares, respectively, and the Fund’s annualized ratios of expenses in relation to net assets after fee waivers and reimbursements were 1.60% and 1.35% for the Advisory Class Shares and the Institutional Class Shares, respectively. Pursuant to its expense limitation agreement with |
10 | Quaker Investment Trust |
the Fund, the Adviser is entitled to recoup any fees that it waived and/or Fund expenses that it paid for a period of three years following such fee waivers and expense payments, to the extent that such recoupment by the Adviser will not cause the Fund to exceed any applicable expense limitation that was in place for the Fund when the fees were waived or expenses were paid. These waivers and reimbursements may be terminated at any time with respect to the Fund by its Board of Trustees upon sixty (60) days’ written notice to the Adviser without payment of any penalty and shall automatically terminate upon the termination of the Fund’s advisory contract with the Adviser.
Performance data quoted represents past performance and is no guarantee of future results. Investment return and principal value will fluctuate so that shares, when redeemed, may be worth more or less than their original cost. Current performance may be lower or higher than performance data quoted. Performance data current to the most recent month end is available at www.ccminvests.com or by calling us toll free at 888-272-0007. Total return includes reinvestment of dividends and capital gains.
The performance table and chart do not reflect the deduction of taxes that a shareholder might pay on fund distributions or the redemption of fund shares. Total return calculations reflect expense reimbursements and fee waivers in the applicable periods.
The Fund’s portfolio holdings may differ significantly from the securities held in the index and, unlike a mutual fund, an unmanaged index assumes no transaction costs, taxes, management fees or other expenses. You cannot invest directly in an index.
The Russell 2500 Value Index measures the performance of the small to mid-cap value segment of the US equity universe. The Russell 2500 Index measures the performance of the 2,500 smallest companies in the Russell 3000 Index.
this page intentionally left blank.
12 | Quaker Investment Trust |
Disclosure of Fund Expenses June 30, 2022
As a shareholder of the Fund, you incur two types of costs: transaction costs, such as wire fees; and ongoing costs, including management fees and other Fund operating expenses. This example is intended to help you understand your ongoing costs (in dollars) of investing in the Fund and to compare these costs with the ongoing costs of investing in other mutual funds.
This example is based on an investment of $1,000 invested on January 1, 2022 and held for the six-month period ended June 30, 2022.
Actual expenses (Unaudited)
The first line of the table below provides information about actual account values and actual expenses. You may use the information in this line, together with the amount you invested at the beginning of the period, to estimate the expenses that you paid over the period. Simply divide your account value by $1,000 (for example, an $8,600 account value divided by $1,000 = 8.6), then multiply the result by the number in the first line under the heading “Expenses Paid During Period” to estimate the expenses you paid on your account during this period.
Hypothetical example for comparison purposes (Unaudited)
The second line of the table provides information about hypothetical account values and hypothetical expenses based on the Fund’s actual expense ratio and an assumed rate of return of 5% per year before expenses, which is not the Fund’s actual return. The hypothetical account values and expenses may not be used to estimate the actual ending account balance or expenses you paid for the period. You may use this information to compare ongoing costs of investing in the Fund and other funds. To do so, compare this 5% hypothetical example with the 5% hypothetical examples that appear in the shareholder reports of other funds.
Please note that the expenses shown in the table are meant to highlight your ongoing costs only and do not reflect any transactional costs, such as wire fees or low balance fees. Therefore, the second line of the table is useful in comparing ongoing costs only and will not help you determine the relative total costs of owning different funds. In addition, if these transactional costs were included, your costs would be higher.
| | | Beginning Account Value 1/01/22 | | | Ending Account Value 6/30/22 | | | Expenses Paid During Period* | |
CCM Core Impact Equity Fund |
Actual Fund Return |
Advisor Class Shares | | $ | 1,000.00 | | | $ | 803.00 | | | $ | 9.03 | |
Institutional Class Shares | | | 1,000.00 | | | | 804.00 | | | | 7.92 | |
Hypothetical 5% Return |
Advisor Class Shares | | $ | 1,000.00 | | | $ | 1,014.78 | | | $ | 10.09 | |
Institutional Class Shares | | | 1,000.00 | | | | 1,016.02 | | | | 8.85 | |
CCM Small/Mid-Cap Impact Value Fund |
Actual Fund Return |
Advisor Class Shares | | $ | 1,000.00 | | | $ | 803.70 | | | $ | 6.26 | |
Institutional Class Shares | | | 1,000.00 | | | | 804.90 | | | | 5.15 | |
Hypothetical 5% Return |
Advisor Class Shares | | $ | 1,000.00 | | | $ | 1,017.85 | | | $ | 7.00 | |
Institutional Class Shares | | | 1,000.00 | | | | 1,019.09 | | | | 5.76 | |
| * | Expenses are equal to the annualized six month expense ratio multiplied by the average account value over the period, multiplied by 181 days/365 days (to reflect the one-half year period). |
14 | Quaker Investment Trust |
Fund Profile June 30, 2022
CCM Core Impact Equity Fund
Top Ten Holdings* |
(% of Net Assets) |
Microsoft | | | 5.13% | |
Alphabet, Cl C | | | 4.23% | |
Alphabet, Cl A | | | 3.72% | |
NextEra Energy Partners | | | 3.65% | |
Fiserv | | | 3.38% | |
Global Payments | | | 3.23% | |
Cigna | | | 3.13% | |
Anthem | | | 2.93% | |
Electronic Arts | | | 2.83% | |
Quanta Services | | | 2.76% | |
| | | | 34.99% | |
* | Excludes Short-Term Investments |
Asset Allocation | | | |
(% of Net Assets) | | | | |
Communication Services | | | 10.78% | |
Consumer Discretionary | | | 11.32% | |
Consumer Staples | | | 5.08% | |
Energy | | | 2.38% | |
Financials | | | 13.79% | |
Health Care | | | 15.34% | |
Industrials | | | 5.64% | |
Information Technology | | | 21.50% | |
Materials | | | 1.59% | |
Money Market Fund | | | 5.03% | |
Real Estate | | | 2.85% | |
Utilities | | | 4.88% | |
Liabilities in Excess of Other Assets | | | (0.18)% | |
| | | | 100.00% | |
Fund Profile June 30, 2022
CCM Small/Mid-Cap Impact Value Fund
Top Ten Holdings* |
(% of Net Assets) |
Enviva | | | 5.60% | |
NextEra Energy Partners | | | 5.31% | |
Berry Global Group | | | 3.75% | |
Clearway Energy, Cl C | | | 3.70% | |
WP Carey | | | 3.56% | |
Fidelity National Financial | | | 3.42% | |
Universal Health Services, Cl B | | | 3.37% | |
Financial Institutions | | | 3.26% | |
Hingham Institution For Savings | | | 3.03% | |
TD SYNNEX | | | 2.99% | |
| | | | 37.99% | |
* | Excludes Short-Term Investments |
Asset Allocation | | | |
(% of Net Assets) | | | | |
Communication Services | | | 2.15% | |
Consumer Discretionary | | | 12.34% | |
Consumer Staples | | | 2.05% | |
Energy | | | 5.60% | |
Financials | | | 24.13% | |
Health Care | | | 4.37% | |
Industrials | | | 7.37% | |
Information Technology | | | 7.85% | |
Materials | | | 3.75% | |
Money Market Fund | | | 8.46% | |
Real Estate | | | 10.62% | |
Utilities | | | 11.43% | |
Liabilities in Excess of Other Assets | | | (0.12)% | |
| | | | 100.00% | |
16 | CCM Core Impact Equity Fund |
Schedule of Investments June 30, 2022
| | | Shares | | | Value | |
COMMON STOCK - 95.14% |
Communication Services - 10.78% | | | | | | | | |
Entertainment Software - 2.83% | | | | | | | | |
Electronic Arts | | | 13,200 | | | $ | 1,605,780 | |
Web Portals/Internet Service Providers - 7.95% | | | | | | | | |
Alphabet, Cl A (a) | | | 970 | | | | 2,113,882 | |
Alphabet, Cl C (a) | | | 1,100 | | | | 2,406,195 | |
| | | | | | | | 6,125,857 | |
| |
Consumer Discretionary - 11.32% | | | | | | | | |
Building-Residential/Commercial - 1.56% | | | | | | | | |
Lennar, Cl B | | | 10,000 | | | | 587,100 | |
NVR (a) | | | 75 | | | | 300,310 | |
Distribution/Wholesale - 1.12% | | | | | | | | |
LKQ | | | 13,000 | | | | 638,170 | |
E-Commerce/Services - 0.98% | | | | | | | | |
Booking Holdings (a) | | | 320 | | | | 559,677 | |
Retail-Apparel/Shoe - 0.87% | | | | | | | | |
Ross Stores | | | 7,000 | | | | 491,610 | |
Retail-Automobile - 4.12% | | | | | | | | |
Asbury Automotive Group (a) | | | 5,400 | | | | 914,436 | |
Lithia Motors, Cl A | | | 5,200 | | | | 1,429,012 | |
Retail-Restaurants - 2.67% | | | | | | | | |
Jack in the Box | | | 16,600 | | | | 930,596 | |
Restaurant Brands International | | | 11,700 | | | | 586,755 | |
| | | | | | | | 6,437,666 | |
| |
Consumer Staples - 5.08% | | | | | | | | |
Brewery - 1.35% | | | | | | | | |
Constellation Brands, Cl A | | | 3,300 | | | | 769,098 | |
Cosmetics &Toiletries - 2.42% | | | | | | | | |
Unilever PLC ADR | | | 30,000 | | | | 1,374,900 | |
Food-Confectionery - 1.31% | | | | | | | | |
Mondelez International, Cl A | | | 12,000 | | | | 745,080 | |
| | | | | | | | 2,889,078 | |
| |
Energy - 2.38% | | | | | | | | |
Energy-Alternate Sources - 2.38% | | | | | | | | |
Enviva | | | 23,680 | | | | 1,354,970 | |
| | | | | | | | | |
| |
Financials - 13.79% | | | | | | | | |
Commer Banks-Western US - 0.94% | | | | | | | | |
SVB Financial Group (a) | | | 1,350 | | | | 533,237 | |
Commercial Banks - 3.41% | | | | | | | | |
Financial Institutions | | | 24,823 | | | | 645,894 | |
Signature Bank NY | | | 7,200 | | | | 1,290,312 | |
Finance-Credit Card - 1.83% | | | | | | | | |
Discover Financial Services | | | 11,000 | | | | 1,040,380 | |
Investment Management/Advisory Services - 3.49% | | | | | | | | |
Ameriprise Financial | | | 4,000 | | | | 950,720 | |
BlackRock, Cl A | | | 1,700 | | | | 1,035,368 | |
Life/Health Insurance - 0.43% | | | | | | | | |
Lincoln National | | | 5,200 | | | | 243,204 | |
The accompanying notes are an integral part of the financial statements.
| | Shares | | | Value | |
COMMON STOCK — continued |
Property/Casualty Insurance - 3.69% | | | | | | | | |
Berkshire Hathaway, Cl B (a) | | | 3,700 | | | $ | 1,010,174 | |
Fidelity National Financial | | | 29,400 | | | | 1,086,624 | |
| | | | | | | | 7,835,913 | |
| |
Health Care - 15.34% | | | | | | | | |
Diagnostic Equipment - 1.43% | | | | | | | | |
Thermo Fisher Scientific | | | 1,500 | | | | 814,920 | |
Medical Instruments - 2.03% | | | | | | | | |
Boston Scientific (a) | | | 31,000 | | | | 1,155,370 | |
Medical Products - 0.82% | | | | | | | | |
Cooper | | | 1,479 | | | | 463,104 | |
Medical-Drugs - 1.44% | | | | | | | | |
Merck | | | 9,000 | | | | 820,530 | |
Medical-Health Maintenance Organization - 2.93% | | | | | | | | |
Anthem | | | 3,450 | | | | 1,664,901 | |
Medical-Hospitals - 1.37% | | | | | | | | |
Universal Health Services, Cl B | | | 7,700 | | | | 775,467 | |
Medical-Wholesale Drug Distributors - 2.19% | | | | | | | | |
AmerisourceBergen, Cl A | | | 8,800 | | | | 1,245,024 | |
Pharmacy Services - 3.13% | | | | | | | | |
Cigna | | | 6,750 | | | | 1,778,760 | |
| | | | | | | | 8,718,076 | |
| |
Industrials - 5.63% | | | | | | | | |
Building & Construction Products-Miscellaneous - 0.99% | | | | | | | | |
Owens Corning | | | 7,600 | | | | 564,756 | |
Commercial Services - 2.76% | | | | | | | | |
Quanta Services | | | 12,500 | | | | 1,566,750 | |
Diversified Manufact Op - 1.21% | | | | | | | | |
Parker-Hannifin | | | 2,800 | | | | 688,940 | |
Machinery-General Indust - 0.67% | | | | | | | | |
Zurn Water Solutions | | | 14,000 | | | | 381,360 | |
| | | | | | | | 3,201,806 | |
| |
Information Technology - 21.50% | | | | | | | | |
Applications Software - 5.37% | | | | | | | | |
Intuit | | | 350 | | | | 134,904 | |
Microsoft | | | 11,350 | | | | 2,915,021 | |
Commercial Service-Finance - 5.45% | | | | | | | | |
FleetCor Technologies (a) | | | 6,000 | | | | 1,260,660 | |
Global Payments | | | 16,600 | | | | 1,836,624 | |
Computers - 1.03% | | | | | | | | |
Apple | | | 4,300 | | | | 587,896 | |
Data Processing/Management - 3.38% | | | | | | | | |
Fiserv (a) | | | 21,600 | | | | 1,921,752 | |
Electronic Components-Semiconducters - 2.22% | | | | | | | | |
Broadcom | | | 2,600 | | | | 1,263,106 | |
Electronic Forms - 0.48% | | | | | | | | |
Adobe (a) | | | 750 | | | | 274,545 | |
Electronic Parts Distributors - 1.93% | | | | | | | | |
TD SYNNEX | | | 12,000 | | | | 1,093,200 | |
The accompanying notes are an integral part of the financial statements.
18 | CCM Core Impact Equity Fund |
| | Shares | | | Value | |
COMMON STOCK — continued |
Enterprise Software/Services - 1.09% | | | | | | | | |
SS&C Technologies Holdings | | | 10,700 | | | $ | 621,349 | |
Software Tools - 0.55% | | | | | | | | |
VMware, Cl A (a) | | | 2,750 | | | | 313,445 | |
| | | | | | | | 12,222,502 | |
| |
Materials - 1.59% | | | | | | | | |
Containers-Paper/Plastic - 1.59% | | | | | | | | |
Berry Global Group (a) | | | 16,500 | | | | 901,560 | |
| | | | | | | | | |
| |
Real Estate - 2.85% | | | | | | | | |
REITS-Diversified - 2.85% | | | | | | | | |
American Tower | | | 2,700 | | | | 690,093 | |
WP Carey | | | 11,200 | | | | 928,032 | |
| | | | | | | | 1,618,125 | |
| |
Utilities - 4.88% | | | | | | | | |
Electric-Generation - 1.23% | | | | | | | | |
Brookfield Renewable Partners (b) | | | 20,000 | | | | 696,000 | |
Energy-Alternate Sources - 3.65% | | | | | | | | |
NextEra Energy Partners | | | 28,000 | | | | 2,076,480 | |
| | | | | | | | 2,772,480 | |
| |
TOTAL COMMON STOCK | | | | |
(Cost $48,356,979) | | | | | | | 54,078,033 | |
| |
| | | | | | | | | |
ESCROW SHARES - 0.01% |
Industrials - 0.01% | | | | | | | | |
Airlines - 0.01% | | | | | | | | |
American Airlines Escrow (a) (c) | | | 218,835 | | | | 6,565 | |
| | | | | | | | | |
TOTAL ESCROW SHARES | | | | |
(Cost $24,536) | | | | | | | 6,565 | |
| |
| | | | | | | | | |
SHORT-TERM INVESTMENT - 5.03% | | | | | | | | |
Money Market Fund - 5.03% |
First American Government Obligations Fund, Cl X, 1.29%, (d) | | | 2,858,607 | | | | 2,858,607 | |
TOTAL SHORT-TERM INVESTMENT | | | | |
(Cost $2,858,607) | | | | | | | 2,858,607 | |
| |
Total Investments (Cost $51,240,122) - 100.18% | | $ | 56,943,205 | |
Liabilities in Excess of Other Assets, Net - (0.18)% | | | (104,185 | ) |
NET ASSETS - 100.00% | | $ | 56,839,020 | |
(a) | Non-income producing security. |
(b) | Security is considered to be a Master Limited Partnership. At June 30, 2022 these securities amounted to $696,000 or 1.22% of total net assets. |
(c) | Level 3 security in accordance with fair value hierarchy. |
(d) | The rate shown is the 7-day effective yield as of June 30, 2022. |
ADR — American Depositary Receipt |
Cl — Class |
PLC — Public Limited Company |
REIT — Real Estate investment Trust |
The accompanying notes are an integral part of the financial statements.
The following table sets forth information about the level within the fair value hierarchy at which the Fund’s investments are measured at June 30, 2022:
Assets | | Level 1 | | | Level 2 | | | Level 3* | | | Total | |
Common Stock | | $ | 54,078,033 | | | $ | — | | | $ | — | | | $ | 54,078,033 | |
Escrow Shares | | | — | | | | — | | | | 6,565 | | | | 6,565 | |
Short-Term Investment | | | 2,858,607 | | | | — | | | | — | | | | 2,858,607 | |
Total Investments in Securities | | $ | 56,936,640 | | | $ | — | | | $ | 6,565 | | | $ | 56,943,205 | |
* | A reconciliation of Level 3 investments is presented when the Fund has a significant amount of Level 3 investments at the beginning and/or end of the period in relation to net assets. Management has concluded that Level 3 investments are not material in relation to net assets. |
The accompanying notes are an integral part of the financial statements.
20 | CCM Small/Mid-Cap Impact Value Fund |
Schedule of Investments June 30, 2022
| | | Shares | | | Value | |
COMMON STOCK - 91.66% |
Communication Services - 2.15% | | | | | | | | |
Advertising Agencies - 1.71% | | | | | | | | |
Omnicom Group | | | 4,500 | | | $ | 286,245 | |
Entertainment Software - 0.44% | | | | | | | | |
Take-Two Interactive Software (a) | | | 600 | | | | 73,518 | |
| | | | | | | | 359,763 | |
| |
Consumer Discretionary - 12.34% | | | | | | | | |
Building-Residential/Commercial - 1.67% | | | | | | | | |
NVR (a) | | | 70 | | | | 280,290 | |
Distribution/Wholesale - 1.67% | | | | | | | | |
LKQ | | | 5,700 | | | | 279,813 | |
E-Commerce/Services - 0.28% | | | | | | | | |
Expedia Group (a) | | | 500 | | | | 47,415 | |
Recreational Vehicles - 1.41% | | | | | | | | |
Brunswick | | | 3,600 | | | | 235,368 | |
Retail-Automobile - 5.15% | | | | | | | | |
Asbury Automotive Group (a) | | | 2,700 | | | | 457,218 | |
Lithia Motors, Cl A | | | 1,475 | | | | 405,345 | |
Retail-Restaurants - 2.16% | | | | | | | | |
Jack in the Box | | | 6,450 | | | | 361,587 | |
| | | | | | | | 2,067,036 | |
| |
Consumer Staples - 2.05% | | | | | | | | |
Beverages-Non-alcoholic - 1.16% | | | | | | | | |
Coca-Cola Femsa ADR | | | 3,500 | | | | 193,480 | |
Pastoral&Agricultural - 0.89% | | | | | | | | |
Darling Ingredients (a) | | | 2,500 | | | | 149,500 | |
| | | | | | | | 342,980 | |
| |
Energy - 5.60% | | | | | | | | |
Energy-Alternate Sources - 5.60% | | | | | | | | |
Enviva | | | 16,400 | | | | 938,408 | |
| | | | | | | | | |
| |
Financials - 24.13% | | | | | | | | |
Commer Banks-Western US - 0.94% | | | | | | | | |
SVB Financial Group (a) | | | 400 | | | | 157,996 | |
Commercial Banks - 7.48% | | | | | | | | |
Financial Institutions | | | 21,000 | | | | 546,420 | |
First Citizens BancShares, Cl A | | | 520 | | | | 339,966 | |
Signature Bank NY | | | 2,050 | | | | 367,380 | |
Finance-Credit Card - 2.15% | | | | | | | | |
Discover Financial Services | | | 3,800 | | | | 359,404 | |
Investment Management/Advisory Services - 5.49% | | | | | | | | |
Ameriprise Financial | | | 1,800 | | | | 427,824 | |
Raymond James Financial | | | 5,500 | | | | 491,755 | |
Life/Health Insurance - 1.62% | | | | | | | | |
Lincoln National | | | 5,800 | | | | 271,266 | |
Property/Casualty Insurance - 3.42% | | | | | | | | |
Fidelity National Financial | | | 15,500 | | | | 572,880 | |
The accompanying notes are an integral part of the financial statements.
| | Shares | | | Value | |
COMMON STOCK — continued |
Savings & Loans/Thrifts - 3.03% | | | | | | | | |
Hingham Institution For Savings | | | 1,790 | | | $ | 507,948 | |
| | | | | | | | 4,042,839 | |
| |
Health Care - 4.37% | | | | | | | | |
Medical-Health Maintenance Organization - 1.00% | | | | | | | | |
Molina Healthcare (a) | | | 600 | | | | 167,766 | |
Medical-Hospitals - 3.37% | | | | | | | | |
Nobilis Health (a) (b) | | | 38,393 | | | | — | |
Universal Health Services, Cl B | | | 5,600 | | | | 563,976 | |
| | | | | | | | 731,742 | |
| |
Industrials - 7.37% | | | | | | | | |
Building & Construction Products-Miscellaneous - 2.33% | | | | | | | | |
Owens Corning | | | 5,250 | | | | 390,128 | |
Commercial Services - 2.62% | | | | | | | | |
Quanta Services | | | 3,500 | | | | 438,690 | |
Diversified Manufact Op - 1.32% | | | | | | | | |
Parker-Hannifin | | | 900 | | | | 221,445 | |
Machinery-General Indust - 1.10% | | | | | | | | |
Zurn Water Solutions | | | 6,800 | | | | 185,232 | |
| | | | | | | | 1,235,495 | |
| |
Information Technology - 7.85% | | | | | | | | |
Commercial Service-Finance - 2.51% | | | | | | | | |
FleetCor Technologies (a) | | | 2,000 | | | | 420,220 | |
Electronic Parts Distributors - 2.99% | | | | | | | | |
TD SYNNEX | | | 5,500 | | | | 501,050 | |
Enterprise Software/Services - 2.35% | | | | | | | | |
SS&C Technologies Holdings | | | 6,800 | | | | 394,876 | |
| | | | | | | | 1,316,146 | |
| |
Materials - 3.75% | | | | | | | | |
Containers-Paper/Plastic - 3.75% | | | | | | | | |
Berry Global Group (a) | | | 11,500 | | | | 628,360 | |
| | | | | | | | | |
| |
Real Estate - 10.62% | | | | | | | | |
REITS-Diversified - 3.56% | | | | | | | | |
WP Carey | | | 7,200 | | | | 596,592 | |
REITS-Office Property - 4.29% | | | | | | | | |
Alexandria Real Estate Equities | | | 2,250 | | | | 326,317 | |
Highwoods Properties | | | 11,500 | | | | 393,185 | |
REITS-Single Tenant - 2.77% | | | | | | | | |
National Retail Properties | | | 10,800 | | | | 464,400 | |
| | | | | | | | 1,780,494 | |
| |
Utilities - 11.43% | | | | | | | | |
Electric-Integrated - 1.65% | | | | | | | | |
CMS Energy | | | 4,100 | | | | 276,750 | |
Energy-Alternate Sources - 5.31% | | | | | | | | |
NextEra Energy Partners | | | 12,000 | | | | 889,920 | |
Independent Power Producer - 4.47% | | | | | | | | |
Clearway Energy, Cl A | | | 4,000 | | | | 127,880 | |
The accompanying notes are an integral part of the financial statements.
22 | CCM Small/Mid-Cap Impact Value Fund |
| | Shares | | | Value | |
COMMON STOCK — continued |
Clearway Energy, Cl C | | | 17,800 | | | $ | 620,152 | |
| | | | | | | | 1,914,702 | |
| |
TOTAL COMMON STOCK | | | | |
(Cost $15,560,718) | | | | | | | 15,357,965 | |
| |
| | | | | | | | | |
SHORT-TERM INVESTMENT - 8.46% | | | | | | | | |
Money Market Fund - 8.46% |
First American Government Obligations Fund, Cl X, 1.29%, (c) | | | 1,418,079 | | | | 1,418,079 | |
TOTAL SHORT-TERM INVESTMENT | | | | |
(Cost $1,418,079) | | | | | | | 1,418,079 | |
| |
Total Investments (Cost $16,978,797) - 100.12% | | $ | 16,776,044 | |
Liabilities in Excess of Other Assets, Net - (0.12)% | | | (19,482 | ) |
NET ASSETS - 100.00% | | $ | 16,756,562 | |
(a) | Non-income producing security. |
(b) | Level 3 security in accordance with fair value hierarchy. |
(c) | The rate shown is the 7-day effective yield as of June 30, 2022. |
ADR — American Depositary Receipt |
Cl — Class |
REIT — Real Estate investment Trust |
The following table sets forth information about the level within the fair value hierarchy at which the Fund’s investments are measured at June 30, 2022:
Assets | | Level 1 | | | Level 2 | | | Level 3 | | | Total | |
Common Stock | | $ | 15,357,965 | | | $ | — | | | $ | — | | | $ | 15,357,965 | |
Short-Term Investment | | | 1,418,079 | | | | — | | | | — | | | | 1,418,079 | |
Total Investments in Securities | | $ | 16,776,044 | | | $ | — | | | $ | — | | | $ | 16,776,044 | |
The accompanying notes are an integral part of the financial statements.
Statements of Assets and Liabilities as of June 30, 2022
| | | CCM Core Impact Equity Fund | |
Assets: | | | | |
Investments, at fair value (identified cost — $51,240,122) | | $ | 56,943,205 | |
Cash | | | 6,445 | |
Receivables: | | | | |
Dividends and interest | | | 42,750 | |
Capital shares sold | | | 1,403 | |
Reclaims | | | 1,204 | |
Prepaid expenses | | | 29,539 | |
Total Assets | | | 57,024,546 | |
Liabilities: | | | | |
Payables: | | | | |
Investment advisory fees | | | 36,576 | |
Capital shares redeemed | | | 31,612 | |
Audit fees | | | 23,101 | |
Printing fees | | | 21,238 | |
Legal fees | | | 14,897 | |
Trustees' fees | | | 14,438 | |
Shareholder servicing fees | | | 11,552 | |
Distribution fees | | | 10,235 | |
Transfer agent fees | | | 8,871 | |
Administration fees | | | 2,438 | |
Other accrued expenses | | | 10,568 | |
Total Liabilities | | $ | 185,526 | |
Net Assets: | | $ | 56,839,020 | |
Net Assets consist of: | | | | |
Paid-in capital | | $ | 40,979,800 | |
Total distributable earnings | | | 15,859,220 | |
Net Assets | | $ | 56,839,020 | |
Net Assets — Advisor Class Shares (Unlimited shares of beneficial interest with no par value authorized; 1,261,557 shares outstanding) | | $ | 47,716,288 | |
Net Assets — Institutional Class Shares (Unlimited shares of beneficial interest with no par value authorized; 225,610 shares outstanding) | | $ | 9,122,732 | |
Net Asset Value, offering and redemption price per share —
Advisor Class Shares | | $ | 37.82 | |
Net Asset Value, offering and redemption price per share —
Institutional Class Shares | | $ | 40.44 | |
The accompanying notes are an integral part of the financial statements.
24 | Quaker Investment Trust |
Statements of Assets and Liabilities as of June 30, 2022
| | | CCM Small/Mid-Cap Impact Value Fund | |
Assets: | | | | |
Investments, at fair value (identified cost — $16,978,797) | | $ | 16,776,044 | |
Receivables: | | | | |
Dividends and interest | | | 22,520 | |
Capital shares sold | | | 34 | |
Prepaid expenses | | | 8,922 | |
Total Assets | | | 16,807,520 | |
Liabilities: | | | | |
Payables: | | | | |
Printing fees | | | 11,537 | |
Transfer agent fees | | | 7,941 | |
Audit fees | | | 6,899 | |
Investment advisory fees | | | 5,753 | |
Legal fees | | | 4,449 | |
Trustees' fees | | | 4,312 | |
Shareholder servicing fees | | | 3,469 | |
Administration fees | | | 2,055 | |
Distribution fees | | | 1,193 | |
Other accrued expenses | | | 3,350 | |
Total Liabilities | | $ | 50,958 | |
Net Assets: | | $ | 16,756,562 | |
Net Assets consist of: | | | | |
Paid-in capital | | $ | 19,003,460 | |
Total distributable loss | | | (2,246,898 | ) |
Net Assets | | $ | 16,756,562 | |
Net Assets — Advisor Class Shares (Unlimited shares of beneficial interest with no par value authorized; 359,004 shares outstanding) | | $ | 5,526,630 | |
Net Assets — Institutional Class Shares (Unlimited shares of beneficial interest with no par value authorized; 659,071 shares outstanding) | | $ | 11,229,932 | |
Net Asset Value, offering and redemption price per share —
Advisor Class Shares | | $ | 15.39 | |
Net Asset Value, offering and redemption price per share —
Institutional Class Shares | | $ | 17.04 | |
The accompanying notes are an integral part of the financial statements.
Statements of Operations June 30, 2022
| | | CCM Core Impact Equity Fund | |
Investment Income: | | | | |
Dividends | | $ | 836,019 | |
Interest | | | 4,433 | |
Less: Foreign Taxes Withheld | | | (3,705 | ) |
Total investment income | | | 836,747 | |
Expenses: | | | | |
Investment advisory fees | | | 521,348 | |
Distribution fees — Advisor Class Shares | | | 145,613 | |
Shareholder Servicing Fees | | | 63,546 | |
Insurance expense | | | 94,658 | |
Legal fees | | | 79,174 | |
Transfer agent fees | | | 75,659 | |
Trustees' fees | | | 58,198 | |
Accounting and administration fees | | | 55,079 | |
Chief Compliance Officer fees | | | 51,063 | |
Registration and filing expenses | | | 47,080 | |
Printing fees | | | 32,836 | |
Audit fees | | | 23,122 | |
Custodian fees | | | 5,655 | |
Other | | | 71,934 | |
Total expenses | | | 1,324,965 | |
Less: | | | | |
Net expenses | | | 1,324,965 | |
Net investment income (Loss) | | | (488,218 | ) |
Realized and unrealized gain (loss) on: | | | | |
Net realized gain on investments | | | 10,564,974 | |
Net change in unrealized appreciation/(depreciation) on investments | | | (18,281,427 | ) |
Net realized and unrealized loss | | | (7,716,453 | ) |
Net decrease in net assets resulting from operations: | | $ | (8,204,671 | ) |
The accompanying notes are an integral part of the financial statements.
26 | Quaker Investment Trust |
Statements of Operations June 30, 2022
| | | CCM Small/Mid-Cap Impact Value Fund | |
Investment Income: | | | | |
Dividends | | $ | 319,534 | |
Interest | | | 1,610 | |
Total investment income | | | 321,144 | |
Expenses: | | | | |
Investment advisory fees | | | 179,510 | |
Distribution fees — Advisor Class Shares | | | 17,000 | |
Shareholder Servicing Fees | | | 15,492 | |
Transfer agent fees | | | 41,562 | |
Registration and filing expenses | | | 35,118 | |
Insurance expense | | | 28,206 | |
Accounting and administration fees | | | 26,615 | |
Legal fees | | | 23,064 | |
Chief Compliance Officer fees | | | 20,937 | |
Trustees' fees | | | 16,809 | |
Printing fees | | | 15,195 | |
Audit fees | | | 6,878 | |
Custodian fees | | | 3,874 | |
Other | | | 21,506 | |
Total expenses | | | 451,766 | |
Less: | | | | |
Investment advisory fees waived | | | (174,987 | ) |
Net expenses | | | 276,779 | |
Net investment income | | | 44,365 | |
Realized and unrealized gain (loss) on: | | | | |
Net realized gain on investments | | | 937,968 | |
Net change in unrealized appreciation/(depreciation) on investments | | | (2,487,324 | ) |
Net realized and unrealized loss | | | (1,549,356 | ) |
Net decrease in net assets resulting from operations: | | $ | (1,504,991 | ) |
The accompanying notes are an integral part of the financial statements.
Statements of Changes in Net Assets June 30, 2022
| | | CCM Core Impact Equity Fund | |
| | | For the
Fiscal Year Ended
June 30, 2022 | | | For the
Fiscal Year Ended
June 30, 2021 | |
Operations: | | | | | | | | |
Net investment loss | | $ | (488,218 | ) | | $ | (717,361 | ) |
Net realized gain on investments | | | 10,564,974 | | | | 11,962,086 | |
Net change in unrealized appreciation (depreciation) on investments | | | (18,281,427 | ) | | | 11,822,011 | |
Net increase (decrease) in net assets resulting from operations | | | (8,204,671 | ) | | | 23,066,736 | |
Distributions | | | | | | | | |
Advisor Class Shares | | | (8,671,674 | ) | | | (366,465 | ) |
Institutional Class Shares | | | (1,606,507 | ) | | | (65,100 | ) |
Total distributions | | | (10,278,181 | ) | | | (431,565 | ) |
Capital share transactions: | | | | | | | | |
Advisor Class Shares | | | | | | | | |
Shares issued | | | 904,148 | | | | 739,927 | |
Shares reinvested | | | 7,910,266 | | | | 337,710 | |
Shares redeemed | | | (5,299,133 | ) | | | (8,069,228 | ) |
| | | | 3,515,281 | | | | (6,991,591 | ) |
Institutional Class Shares | | | | | | | | |
Shares issued | | | 314,889 | | | | 454,277 | |
Shares reinvested | | | 1,542,918 | | | | 62,750 | |
Shares redeemed | | | (1,404,529 | ) | | | (1,144,278 | ) |
| | | | 453,278 | | | | (627,251 | ) |
Increase (decrease) in net assets from capital share transactions | | | 3,968,559 | | | | (7,618,842 | ) |
Increase (decrease) in net assets | | | (14,514,293 | ) | | | 15,016,329 | |
Net Assets: | | | | | | | | |
Beginning of year | | | 71,353,313 | | | | 56,336,984 | |
End of year | | $ | 56,839,020 | | | $ | 71,353,313 | |
Share Transactions: | | | | | | | | |
Advisor Class Shares | | | | | | | | |
Shares Issued | | | 18,499 | | | | 16,518 | |
Shares reinvested | | | 167,271 | | | | 7,843 | |
Shares redeemed | | | (110,817 | ) | | | (189,365 | ) |
| | | | 74,953 | | | | (165,004 | ) |
Institutional Class Shares | | | | | | | | |
Shares Issued | | | 6,078 | | | | 9,919 | |
Shares reinvested | | | 30,553 | | | | 1,380 | |
Shares redeemed | | | (28,174 | ) | | | (25,301 | ) |
| | | | 8,457 | | | | (14,002 | ) |
Increase (decrease) in shares | | | 83,410 | | | | (179,006 | ) |
The accompanying notes are an integral part of the financial statements.
28 | Quaker Investment Trust |
Statements of Changes in Net Assets June 30, 2022
| | | CCM Small/Mid-Cap Impact Value Fund | |
| | | For the
Fiscal Year Ended
June 30, 2022 | | | For the
Fiscal Year Ended
June 30, 2021 | |
Operations: | | | | | | | | |
Net investment income | | $ | 44,365 | | | $ | 57,232 | |
Net realized gain on investments | | | 937,968 | | | | 3,351,123 | |
Net change in unrealized appreciation (depreciation) on investments | | | (2,487,324 | ) | | | 4,322,212 | |
Net increase (decrease) in net assets resulting from operations | | | (1,504,991 | ) | | | 7,730,567 | |
Distributions | | | | | | | | |
Advisor Class Shares | | | — | | | | (79,469 | ) |
Institutional Class Shares | | | — | | | | (184,600 | ) |
Total distributions | | | — | | | | (264,069 | ) |
Capital share transactions: | | | | | | | | |
Advisor Class Shares | | | | | | | | |
Shares issued | | | 912,653 | | | | 112,073 | |
Shares reinvested | | | — | | | | 73,825 | |
Shares redeemed | | | (1,540,365 | ) | | | (1,817,358 | ) |
| | | | (627,712 | ) | | | (1,631,460 | ) |
Institutional Class Shares | | | | | | | | |
Shares issued | | | 633,560 | | | | 792,166 | |
Shares reinvested | | | — | | | | 177,212 | |
Shares redeemed | | | (934,832 | ) | | | (6,202,508 | ) |
| | | | (301,272 | ) | | | (5,233,130 | ) |
Decrease in net assets from capital share transactions | | | (928,984 | ) | | | (6,864,590 | ) |
Increase (decrease) in net assets | | | (2,433,975 | ) | | | 601,908 | |
Net Assets: | | | | | | | | |
Beginning of year | | | 19,190,537 | | | | 18,588,629 | |
End of year | | $ | 16,756,562 | | | $ | 19,190,537 | |
Share Transactions: | | | | | | | | |
Advisor Class Shares | | | | | | | | |
Shares Issued | | | 50,746 | | | | 7,895 | |
Shares reinvested | | | — | | | | 5,243 | |
Shares redeemed | | | (85,087 | ) | | | (132,237 | ) |
| | | | (34,341 | ) | | | (119,099 | ) |
Institutional Class Shares | | | | | | | | |
Shares Issued | | | 32,275 | | | | 52,694 | |
Shares reinvested | | | — | | | | 11,418 | |
Shares redeemed | | | (46,873 | ) | | | (392,506 | ) |
| | | | (14,598 | ) | | | (328,394 | ) |
Decrease in shares | | | (48,939 | ) | | | (447,493 | ) |
The accompanying notes are an integral part of the financial statements.
Financial Highlights - Per share data (for a share outstanding throughout the period) June 30, 2022
| | | Advisor Class Shares | |
CCM Core Impact Equity Fund | | For the
Fiscal Year
Ended
June 30, 2022 | | | For the
Fiscal Year
Ended
June 30, 2021 | | | For the
Fiscal Year
Ended
June 30, 2020 | | | For the
Fiscal Year
Ended
June 30, 2019 | | | For the
Fiscal Year
Ended
June 30, 2018 | |
Net Asset Value, Beginning of Year | | $ | 50.38 | | | $ | 35.31 | | | $ | 34.22 | | | $ | 31.87 | | | $ | 27.86 | |
Investment Operations:
Net investment Income (loss)(a) | | | (0.35 | ) | | | (0.50 | ) | | | (0.34 | ) | | | (0.30 | ) | | | (0.24 | ) |
Net realized and unrealized gain (loss) on investments | | | (4.63 | ) | | | 15.86 | | | | 2.10 | | | | 2.65 | | | | 4.25 | |
Total from investment operations | | | (4.98 | ) | | | 15.36 | | | | 1.76 | | | | 2.35 | | | | 4.01 | |
Distributions from: | | | | | | | | | | | | | | | | | | | | |
Net investment income | | | — | | | | — | | | | — | | | | — | | | | — | |
Net capital gains | | | (7.58 | ) | | | (0.29 | ) | | | (0.67 | ) | | | — | | | | — | |
Total distributions | | | (7.58 | ) | | | (0.29 | ) | | | (0.67 | ) | | | — | | | | — | |
Net Asset Value, End of Year | | $ | 37.82 | | | $ | 50.38 | | | $ | 35.31 | | | $ | 34.22 | | | $ | 31.87 | |
Total return | | | (12.90 | )% | | | 43.65 | %(1) | | | 5.05 | %(1) | | | 7.37 | %(1) | | | 14.39 | %(1) |
Ratios/Supplemental Data | | | | | | | | | | | | | | | | | | | | |
Net assets, end of year (in 000s) | | $ | 47,716 | | | $ | 59,786 | | | $ | 47,731 | | | $ | 53,292 | | | $ | 44,964 | |
Ratio of expenses to average net assets
Before fee waiver | | | 1.95 | % | | | 2.03 | % | | | 2.09 | % | | | 2.48 | % | | | 2.30 | % |
After fee waiver | | | 1.95 | % | | | 2.03 | % | | | 2.09 | % | | | 2.48 | % | | | 2.30 | % |
Ratio of net investment income (loss) to average net assets
Before fee waiver | | | (0.74 | )% | | | (1.14 | )% | | | (0.97 | )% | | | (0.99 | )% | | | (0.78 | )% |
After fee waiver | | | (0.74 | )% | | | (1.14 | )% | | | (0.97 | )% | | | (0.99 | )% | | | (0.78 | )% |
Portfolio turnover rate | | | 47 | % | | | 56 | % | | | 69 | % | | | 24 | % | | | 119 | % |
(a) | Based on the average daily number of shares outstanding during the year. |
(1) | Total investment return is based on the change in net asset value of a share during the year, assumes reinvestment of dividends and distributions at net asset value and does not reflect the impact of a sales charge. As of September 30, 2018 the Fund no longer charges a sales charge. |
The accompanying notes are an integral part of the financial statements.
30 | Quaker Investment Trust |
Financial Highlights - Per share data (for a share outstanding throughout the period) June 30, 2022
| | | Institutional Class Shares | |
CCM Core Impact Equity Fund | | For the
Fiscal Year
Ended
June 30, 2022 | | | For the
Fiscal Year
Ended
June 30, 2021 | | | For the
Fiscal Year
Ended
June 30, 2020 | | | For the
Fiscal Year
Ended
June 30, 2019 | | | For the
Fiscal Year
Ended
June 30, 2018 | |
Net Asset Value, Beginning of Year | | $ | 53.27 | | | $ | 37.23 | | | $ | 35.96 | | | $ | 33.40 | | | $ | 29.12 | |
Investment Operations:
Net investment Income (loss)(a) | | | (0.25 | ) | | | (0.41 | ) | | | (0.26 | ) | | | (0.25 | ) | | | (0.17 | ) |
Net realized and unrealized gain (loss) on investments | | | (5.00 | ) | | | 16.74 | | | | 2.20 | | | | 2.81 | | | | 4.45 | |
Total from investment operations | | | (5.25 | ) | | | 16.33 | | | | 1.94 | | | | 2.56 | | | | 4.28 | |
Distributions from: | | | | | | | | | | | | | | | | | | | | |
Net investment income | | | — | | | | — | | | | — | | | | — | | | | — | |
Net capital gains | | | (7.58 | ) | | | (0.29 | ) | | | (0.67 | ) | | | — | | | | — | |
Total distributions | | | (7.58 | ) | | | (0.29 | ) | | | (0.67 | ) | | | — | | | | — | |
Net Asset Value, End of Year | | $ | 40.44 | | | $ | 53.27 | | | $ | 37.23 | | | $ | 35.96 | | | $ | 33.40 | |
Total return | | | (12.69 | )% | | | 44.00 | %(1) | | | 5.31 | %(1) | | | 7.66 | %(1) | | | 14.70 | %(1) |
Ratios/Supplemental Data | | | | | | | | | | | | | | | | | | | | |
Net assets, end of year (in 000s) | | $ | 9,123 | | | $ | 11,567 | | | $ | 8,606 | | | $ | 8,746 | | | $ | 9,039 | |
Ratio of expenses to average net assets
Before fee waiver | | | 1.70 | % | | | 1.78 | % | | | 1.84 | % | | | 2.23 | % | | | 2.05 | % |
After fee waiver | | | 1.70 | % | | | 1.78 | % | | | 1.84 | % | | | 2.23 | % | | | 2.05 | % |
Ratio of net investment income (loss) to average net assets
Before fee waiver | | | (0.49 | )% | | | (0.89 | )% | | | (0.72 | )% | | | (0.74 | )% | | | (0.53 | )% |
After fee waiver | | | (0.49 | )% | | | (0.89 | )% | | | (0.72 | )% | | | (0.74 | )% | | | (0.53 | )% |
Portfolio turnover rate | | | 47 | % | | | 56 | % | | | 69 | % | | | 24 | % | | | 119 | % |
(a) | Based on the average daily number of shares outstanding during the year. |
(1) | Total investment return is based on the change in net asset value of a share during the year, assumes reinvestment of dividends and distributions at net asset value. |
The accompanying notes are an integral part of the financial statements.
Financial Highlights - Per share data (for a share outstanding throughout the period) June 30, 2022
| | | Advisor Class Shares | |
CCM Small/Mid-Cap Impact Value Fund | | For the
Fiscal Year
Ended
June 30, 2022 | | | For the
Fiscal Year
Ended
June 30, 2021 | | | For the
Fiscal Year
Ended
June 30, 2020 | | | For the
Fiscal Year
Ended
June 30, 2019 | | | For the
Fiscal Year
Ended
June 30, 2018 | |
Net Asset Value, Beginning of Year | | $ | 16.88 | | | $ | 11.49 | | | $ | 17.65 | | | $ | 23.23 | | | $ | 24.13 | |
Investment Operations:
Net investment Income (loss)(a) | | | 0.01 | | | | 0.02 | | | | 0.09 | | | | 0.08 | | | | (0.23 | ) |
Net realized and unrealized gain (loss) on investments | | | (1.50 | ) | | | 5.55 | | | | (4.91 | ) | | | 0.12 | | | | 3.03 | |
Total from investment operations | | | (1.49 | ) | | | 5.57 | | | | (4.82 | ) | | | 0.20 | | | | 2.80 | |
Distributions from: | | | | | | | | | | | | | | | | | | | | |
Net investment income | | | — | | | | (0.18 | ) | | | (0.34 | ) | | | — | | | | — | |
Net capital gains | | | — | | | | — | | | | (1.00 | ) | | | (5.78 | ) | | | (3.70 | ) |
Total distributions | | | — | | | | (0.18 | ) | | | (1.34 | ) | | | (5.78 | ) | | | (3.70 | ) |
Net Asset Value, End of Year | | $ | 15.39 | | | $ | 16.88 | | | $ | 11.49 | | | $ | 17.65 | | | $ | 23.23 | |
Total return | | | (8.83 | )% | | | 48.79 | %(1) | | | (30.04 | )%(1) | | | 3.17 | %(1) | | | 12.07 | %(1) |
Ratios/Supplemental Data | | | | | | | | | | | | | | | | | | | | |
Net assets, end of year (in 000s) | | $ | 5,527 | | | $ | 6,639 | | | $ | 5,890 | | | $ | 9,176 | | | $ | 4,737 | |
Ratio of expenses to average net assets
Before fee waiver | | | 2.43 | %(b) | | | 2.55 | %(b) | | | 2.38 | %(b) | | | 2.84 | %(b) | | | 2.44 | % |
After fee waiver | | | 1.55 | %(b) | | | 1.55 | %(b) | | | 1.55 | %(b) | | | 2.65 | %(b) | | | 2.44 | % |
Ratio of net investment income (loss) to average net assets
Before fee waiver | | | (0.82 | )%(b) | | | (0.87 | )%(b) | | | (0.28 | )%(b) | | | 0.28 | %(b) | | | (0.99 | )% |
After fee waiver | | | 0.06 | %(b) | | | 0.13 | %(b) | | | 0.55 | %(b) | | | 0.47 | %(b) | | | (0.99 | )% |
Portfolio turnover rate | | | 49 | % | | | 96 | % | | | 117 | % | | | 111 | % | | | 122 | % |
(a) | Based on the average daily number of shares outstanding during the year. |
(b) | Expense waived or reimbursed reflect reductions to total expenses, as discussed in the notes to the financial statements. These reimbursed amounts would increase the net investment loss ratio or decrease the net investment income ratio and recovered amounts would decrease the net investment loss ratio or increase the net investment income ratio, as applicable, had such reductions or increases not occurred. |
(1) | Total investment return is based on the change in net asset value of a share during the year, assumes reinvestment of dividends and distributions at net asset value and does not reflect the impact of a sales charge. As of September 30, 2018 the Fund no longer charges a sales charge. |
The accompanying notes are an integral part of the financial statements.
32 | Quaker Investment Trust |
Financial Highlights - Per share data (for a share outstanding throughout the period) June 30, 2022
| | | Institutional Class Shares | |
CCM Small/Mid-Cap Impact Value Fund | | For the
Fiscal Year
Ended
June 30, 2022 | | | For the
Fiscal Year
Ended
June 30, 2021 | | | For the
Fiscal Year
Ended
June 30, 2020 | | | For the
Fiscal Year
Ended
June 30, 2019 | | | For the
Fiscal Year
Ended
June 30, 2018 | |
Net Asset Value, Beginning of Year | | $ | 18.63 | | | $ | 12.67 | | | $ | 19.36 | | | $ | 24.83 | | | $ | 25.49 | |
Investment Operations:
Net investment Income (loss)(a) | | | 0.06 | | | | 0.06 | | | | 0.13 | | | | 0.15 | | | | (0.19 | ) |
Net realized and unrealized gain (loss) on investments | | | (1.65 | ) | | | 6.12 | | | | (5.41 | ) | | | 0.16 | | | | 3.23 | |
Total from investment operations | | | (1.59 | ) | | | 6.18 | | | | (5.28 | ) | | | 0.31 | | | | 3.04 | |
Distributions from: | | | | | | | | | | | | | | | | | | | | |
Net investment income | | | — | | | | (0.22 | ) | | | (0.41 | ) | | | — | | | | — | |
Net capital gains | | | — | | | | — | | | | (1.00 | ) | | | (5.78 | ) | | | (3.70 | ) |
Total distributions | | | — | | | | (0.22 | ) | | | (1.41 | ) | | | (5.78 | ) | | | (3.70 | ) |
Net Asset Value, End of Year | | $ | 17.04 | | | $ | 18.63 | | | $ | 12.67 | | | $ | 19.36 | | | $ | 24.83 | |
Total return | | | (8.53 | )% | | | 49.10 | %(1) | | | (29.89 | )%(1) | | | 3.47 | %(1) | | | 12.39 | %(1) |
Ratios/Supplemental Data | | | | | | | | | | | | | | | | | | | | |
Net assets, end of year (in 000s) | | $ | 11,230 | | | $ | 12,552 | | | $ | 12,699 | | | $ | 10,811 | | | $ | 9,747 | |
Ratio of expenses to average net assets
Before fee waiver | | | 2.18 | %(b) | | | 2.30 | %(b) | | | 2.13 | %(b) | | | 2.58 | %(b) | | | 2.19 | % |
After fee waiver | | | 1.30 | %(b) | | | 1.30 | %(b) | | | 1.30 | %(b) | | | 2.39 | %(b) | | | 2.19 | % |
Ratio of net investment income (loss) to average net assets
Before fee waiver | | | (0.57 | )% (b) | | | (0.62 | )%(b) | | | (0.03 | )%(b) | | | 0.53 | %(b) | | | (0.74 | )% |
After fee waiver | | | 0.31 | %(b) | | | 0.38 | %(b) | | | 0.80 | %(b) | | | 0.72 | %(b) | | | (0.74 | )% |
Portfolio turnover rate | | | 49 | % | | | 96 | % | | | 117 | % | | | 111 | % | | | 122 | % |
(a) | Based on the average daily number of shares outstanding during the year. |
(b) | Expense waived or reimbursed reflect reductions to total expenses, as discussed in the notes to the financial statements. These reimbursed amounts would increase the net investment loss ratio or decrease the net investment income ratio and recovered amounts would decrease the net investment loss ratio or increase the net investment income ratio, as applicable, had such reductions or increases not occurred. |
(1) | Total investment return is based on the change in net asset value of a share during the year, assumes reinvestment of dividends and distributions at net asset value. |
The accompanying notes are an integral part of the financial statements.
Notes to Financial Statements June 30, 2022
Note 1 – ORGANIZATION AND SIGNIFICANT ACCOUNTING POLICIES
The Quaker Investment Trust (the “Trust”), a diversified, open-end management investment company, was originally organized as a Massachusetts business trust on October 24, 1990, and was reorganized as a Delaware statutory trust on September 30, 2018. The Trust is registered under the Investment Company Act of 1940, as amended (the “Act”). The Trust’s Declaration of Trust permits the Trustees to issue an unlimited number of shares of beneficial interest for each of its series. Currently, the Trust offers two series: CCM Core Impact Equity Fund (“Core Impact Equity Fund”) and CCM Small/Mid-Cap Impact Value Fund (“Small/Mid-Cap Impact Value Fund”) (each a “Fund” and collectively, “Funds”). Both Funds are diversified. The investment objectives of each Fund are set forth below. Community Capital Management, LLC (“CCM” or “Adviser”) has managed the Funds since January 1, 2018.
Core Impact Equity Fund and Small/Mid-Cap Impact Value Fund commenced operations on November 25, 1996. The investment objective of these Funds is to seek long-term growth of capital. The investment objective of these Funds is non-fundamental in that this objective may be changed by the Board of Trustees (“Board” or “Trustees”) without shareholder approval.
The Funds offer two classes of shares: Advisor Class and Institutional Class. The Advisor Class shares are charged a distribution and service fee; and Institutional Class shares bear no distribution fee but have higher minimum investment thresholds. CCM has the ability to waive the minimum investment for Institutional Class shares at its discretion.
On February 1, 2019 the Trust amended and restated its Registration Statement to change each of the Funds’ performance reporting history. The inception date for each of the Fund’s performance reporting history is now January 1, 2018, the date CCM became the Adviser to the Funds.
Each Fund is an investment company and accordingly follows the investment company accounting and reporting guidance of the Financial Accounting Standards Board (“FASB”) Accounting Standards Codification Topic 946 “Financial Services – Investment Companies.” The following is a summary of significant accounting policies consistently followed by the Funds in the preparation of their financial statements. The policies are in conformity with accounting principles generally accepted in the United States of America (“U.S. GAAP”).
Security Valuation. The Funds’ investments in securities are carried at market value. Securities listed on an exchange or quoted on a national market system are generally valued at the last quoted sales price at the time of valuation. Other securities traded in the over-the-counter market and listed securities for which no sale was reported on that date are valued at the most
34 | Quaker Investment Trust |
recent bid price. Each security reported on the NASDAQ National Market System is valued at the NASDAQ Official Closing Price.
Debt securities are valued by market bid quotation or independent pricing services which use bid prices provided by market makers or estimates of market values obtained from yield data relating to instruments or securities with similar characteristics. Discounts or premiums on debt securities are amortized to income over their prospective lives, using the effective interest method.
The Funds may hold foreign securities that trade on weekends or other days when the Fund does not price its shares. Therefore, the value of such securities may change on days when shareholders will not be able to purchase or redeem shares.
In accordance with the authoritative guidance on fair value measurements and disclosure under U.S. GAAP, the Fund discloses the fair value of its investments in a hierarchy that prioritizes the inputs to evaluation techniques used to measure the fair value. The objective of a fair value measurement is to determine the price that would be received to sell an asset or paid to transfer a liability in an orderly transaction between willing market participants at the measurement date (an exit price). Accordingly, the fair value hierarchy gives the highest priority to quoted prices (unadjusted) in active markets for identical assets or liabilities (Level 1) and the lowest priority to unobservable inputs (Level 3). The three levels of the fair value hierarchy are described below:
| | ● | Level 1 — Unadjusted quoted prices in active markets for identical, unrestricted assets or liabilities that the Fund has the ability to access at the measurement date; |
| | ● | Level 2 — Quoted prices which are not active, or inputs that are observable (either directly or indirectly) for substantially the full term of the asset or liability; and |
| | ● | Level 3 — Prices, inputs or exotic modeling techniques which are both significant to the fair value measurement and unobservable (supported by little or no market activity). |
Investments are classified within the level of the lowest significant input considered in determining fair value. Investments classified within Level 3 whose fair value measurement considers several inputs may include Level 1 or Level 2 inputs as components of the overall fair value measurement.
For the year ended June 30, 2022, there have been no significant changes to the Funds’ fair value methodologies.
Investment Income and Securities Transactions. Security transactions are accounted for on the date the securities are purchased or sold. Realized gains and losses on sales of investments are determined on the basis of the identified cost for both financial statement and federal income tax purposes. Dividend income is recognized on the ex-dividend date or as soon
as information is available to the Fund. Interest income is recognized on an accrual basis.
Determination of Net Asset Value and Calculation of Expenses. In calculating the net asset value (“NAV”) per share of the Fund, investment income, realized and unrealized gains and losses, and expenses are allocated daily to each share based upon the proportion of net assets of each share.
Federal Income Taxes. It is the policy of the Funds to comply with all requirements of the Internal Revenue Code of 1986, as amended (the “IRC”) applicable to regulated investment companies and to distribute substantially all of its taxable income to its shareholders. Therefore, no Federal income tax provision is required.
Each Fund evaluates tax positions taken or expected to be taken in the course of preparing a Fund’s tax returns to determine whether it is “more-likely-than-not” (i.e., greater than 50-percent) that each tax position will be sustained upon examination by a taxing authority based on the technical merits of the position. Tax positions deemed to meet the more-likely-than-not threshold are recorded as a tax benefit in the current year. However, management’s conclusions regarding tax positions taken may be subject to review and adjustment at a later date based on factors including, but not limited to, examination by tax authorities (i.e., all open tax year ends, as applicable), ongoing analysis of and changes to tax laws, regulations and interpretations thereof.
Distributions to Shareholders. Each Fund generally declares dividends at least annually, payable in December, on a date selected by the Board. In addition, distributions may be made annually in December out of net realized gains through October 31 of that calendar year. Distributions to shareholders are recorded on the ex-dividend date. Each Fund may make a supplemental distribution subsequent to the end of its fiscal year ending June 30. Income and capital gain distributions are determined in accordance with income tax regulations, which may differ from U.S. GAAP.
Use of Estimates. In preparing financial statements in conformity with U.S. GAAP, management makes estimates and assumptions that affect the reported amounts of assets and liabilities at the date of the financial statements, as well as the reported amount of revenues and expenses during the reporting period. Actual results could differ from those estimates.
Indemnifications. Under each Fund’s organizational documents, its officers and Trustees are indemnified against certain liabilities arising out of the performance of their duties to the Fund. In the normal course of business, each Fund enters into contracts that contain a variety of representations that provide general indemnifications. Each Fund’s maximum liability exposure under these arrangements is unknown, as future claims that have not yet occurred may be made against the Fund. However, based on experience, the Fund expects the risk of loss to be remote.
36 | Quaker Investment Trust |
Note 2 – INVESTMENT TRANSACTIONS
The aggregate purchases and sales and maturities of investments, excluding short-term investments, short sales, purchases to cover, options premiums paid and received, and futures, by each of the Funds for the year ended June 30, 2022, were as follows:
Core Impact Equity Fund
Purchases: | | | |
U.S. Government | | $ | – | |
Other | | | 31,690,866 | |
Sales and Maturities: | | | | |
U.S. Government | | $ | – | |
Other | | | 40,409,828 | |
Small/Mid-Cap Impact Value Fund
Purchases: | | | |
U.S. Government | | $ | – | |
Other | | | 9,389,380 | |
Sales and Maturities: | | | | |
U.S. Government | | $ | – | |
Other | | | 11,476,335 | |
At June 30, 2022, the cost of securities for income purposes and the gross unrealized appreciation (depreciation) of investments for tax purposes was a follows:
| | | CCM Core Impact Equity Fund | | | CCM Small/Mid-Cap Impact Value Fund | |
Cost of investments | | $ | 51,268,687 | | | $ | 16,889,030 | |
Gross unrealized appreciation | | | 10,220,316 | | | | 1,934,049 | |
Gross unrealized depreciation | | | (4,545,798 | ) | | | (2,047,035 | ) |
Net appreciation (depreciation) on investments | | $ | 5,674,518 | | | $ | (112,986 | ) |
The material book/tax difference are deferred losses from wash sales and partnership investments.
Note 3 – ADVISORY, SPECIAL ADMINISTRATIVE SERVICES, DISTRIBUTION AND SERVICE FEES
Each Fund paid advisory fees shown in the table below for the year ended June 30, 2022. Amounts paid and reimbursed are expressed as dollar amounts and annualized percentages of average net assets.
| | | Advisory Fees Paid | | | Percentage of Advisory Fees Paid | | | Advisory Fees Reimbursed | | | Percentage of Advisory Fees Reimbursed | |
Core Impact Equity Fund | | | $521,348 | | | | 0.75% | | | | N/A | | | | N/A | |
Small/Mid-Cap Impact Value Fund | | | 179,510 | | | | 0.90 | | | | $174,987 | | | | 0.88% | |
CCM contractually agreed to waive a portion of its management fee and/or assume expenses to the extent necessary to reduce the total operating expenses of Small/Mid-Cap Impact Value Fund (excluding 12b-1 fees, taxes, interest, acquired fund fees and expenses, short sale dividend and interest expense, brokerage fees, certain insurance costs, and non-routine expenses or costs, including, but not limited to, those relating to reorganizations litigation, conducting shareholder meetings, liquidations and other extraordinary expenses) in order to prevent total annual fund operating expenses from exceeding 1.30% of the Small/Mid-Cap Impact Value Fund’s average daily net assets through October 28, 2022. Pursuant to this agreement, CCM is entitled to recoup any fees that it waived and/or the Fund expenses that it paid for a period of three years following such fee waivers and expense payments, to the extent that such recoupment by CCM will not cause the Fund to exceed any applicable expense limitation that was in place when the fees were waived or expenses were paid. These waivers and reimbursements may be terminated at any time with respect to the Fund by the Board upon (60) days written notice to CCM without payment of any penalty and shall automatically terminate upon the termination of the Fund’s advisory contract with CCM.
At June 30, 2022, the unreimbursed amount paid and/or waived by the Adviser on behalf of Small/Mid-Cap Impact Value Fund that may be recovered is $557,590. The Adviser may recapture portions of the above amounts no later than the dates stated below:
| | | | June 30, 2023 | | | | June 30, 2024 | | | | June 30, 2025 | |
Small/Mid-Cap Impact Value Fund | | $ | 188,993 | | | $ | 193,610 | | | $ | 174,987 | |
38 | Quaker Investment Trust |
Foreside Fund Services, LLC (“Distributor”) serves as principal underwriter for the Trust. The Trust has adopted distribution and shareholder servicing plans pursuant to Rule 12b-1 of the 1940 Act for Advisor Class shares described below. There is no Rule 12b-1 distribution plan for Institutional Class shares of the Funds. The Advisor Class Plan provides that each Fund may pay a servicing or Rule 12b-1 fee at an annual rate of 0.25% of the Advisor Class average net assets on a monthly basis to persons or institutions for performing certain servicing functions for the Advisor Class shareholders. The Advisor Class Plan also allows the Fund to pay or reimburse expenditures in connection with sales and promotional services related to distribution of the Fund’s shares, including personal services provided to prospective and existing shareholders. Effective September 30, 2018, the Class C shares were merged into the Advisor Class shares. For the year ended June 30, 2022, Rule 12b-1 fees incurred are disclosed on the statements of operations for each Fund.
For the year ended June 30, 2022, the Trust paid Little Consulting Group, LLC the following fees for Chief Compliance Officer (“CCO”) services:
Fund | | Amount | |
Core Impact Equity Fund | | $ | 51,063 | |
Small/Mid-Cap Impact Value Fund | | | 20,937 | |
The Funds have adopted a Shareholder Servicing Plan on behalf of each of the Funds pursuant to which each Fund’s Class of shares may pay financial institutions; securities dealers and other industry professionals (“Shareholder Servicing Agents”) at an annual rate not to exceed 0.20% of the average daily net assets value.
For the year ended June 30, 2022, shareholder servicing fees incurred are:
Fund | | Amount | |
Core Impact Equity Fund | | $ | 63,546 | |
Small/Mid-Cap Impact Value Fund | | | 15,492 | |
Note 4 – DISTRIBUTIONS TO SHAREHOLDERS
Each Fund has qualified and intends to continue to qualify as a regulated investment company under Subchapter M of the IRC for federal income tax purposes and to distribute all of its taxable income and net capital gains. Accordingly, no provision has been made for federal income taxes.
Dividends from net investment income and distributions from net realized capital gains are determined in accordance with U.S. federal income tax regulations, which may differ from those amounts determined under U.S. GAAP. These book/tax differences are either temporary or permanent in nature. To the extent these differences are permanent, they are charged or credited to paid-in capital, and undistributed earnings, in the period that the differences arise.
As of June 30, 2022, the Funds recorded the following reclassification to increase (decrease) the accounts listed below:
Core Impact Equity Fund
Distributable Earnings | Paid-in Capital |
$108,551 | $(108,551) |
Small/Mid-Cap Impact Value Fund
Distributable Earnings | Paid-in Capital |
$309,185 | $(309,185) |
The permanent book/tax differences primarily consist of partnership investment related and net operating losses. The permanent differences that are credited or charged to paid in Capital and Distributable earnings as of June 30, 2022 is related to net operating losses and partnership non-deductible expenses.
The tax character of dividends declared for each fiscal year indicated was as follows:
Core Impact Equity Fund
| | | Fiscal Year
Ended
June 30, 2022 | | | Fiscal Year
Ended
June 30, 2021 | |
Distributions declared from: | | | | | | | | |
Ordinary income | | $ | 388,242 | | | $ | — | |
Long-term capital gain | | | 9,889,939 | | | | 431,565 | |
Total Distributions | | $ | 10,278,181 | | | $ | 431,565 | |
Small/Mid-Cap Impact Value Fund
| | | Fiscal Year
Ended
June 30, 2022 | | | Fiscal Year
Ended
June 30, 2021 | |
Distributions declared from: | | | | | | | | |
Ordinary income | | $ | – | | | $ | 264,069 | |
Long-term capital gain | | | — | | | | — | |
Total Distributions | | $ | – | | | $ | 264,069 | |
As of June 30, 2022, the components of distributable earnings (accumulated losses) on a tax basis were as follows:
| | | CCM Core Impact Equity Fund | | | CCM Small/Mid-Cap Impact Value Fund | |
Undistributed long-term capital gain | | $ | 10,184,745 | | | $ | – | |
Capital loss carryforwards | | | – | | | | (2,133,912 | ) |
Other temporary differences | | | (43 | ) | | | – | |
Unrealized appreciation (depreciation), net | | | 5,674,518 | | | | (112,986 | ) |
40 | Quaker Investment Trust |
| | | CCM Core Impact Equity Fund | | | CCM Small/Mid-Cap Impact Value Fund | |
Distributable earnings (Accumulated losses), net | | $ | 15,859,220 | | | $ | (2,246,898 | ) |
At June 30, 2022, the capital loss carryovers and late year losses outstanding for Small/Mid-Cap Value Fund was as follows:
| | | Short-Term | | | | Long-Term | | | Total Capital
Loss Carryforwards | |
| | $ | 2,133,912 | | | $ | – | | | $ | 2,133,912 | |
During the year ended June 30, 2022, the Small/Mid-Cap Value Fund utilized $915,105 of capital loss carryforwards to offset capital gains.
Note 5 – CONCENTRATION/RISK
Each Fund, in pursuing its investment objective, is subject to risks. The following is a summary of certain of the risks, and a more complete list can be found in the Fund’s most recent prospectus:
Impact/ESG Risk: The Adviser may select or exclude securities of certain companies for reasons other than performance and, as a result, the Fund may underperform other funds that do not use an impact/ESG screening process. Impact/ESG investing is qualitative and subjective by nature. There is no guarantee that impact/ESG criteria used by the Adviser will reflect beliefs or values of any particular investor.
Common Stock Risk: Common stock risks include the financial risk of selecting individual companies that do not perform as anticipated, the risk that the stock markets in which the Fund invests may experience periods of turbulence and instability, and the general risk that domestic and global economies may go through periods of decline and cyclical change.
Growth Risk: There is a risk that the Fund’s growth style may perform poorly or fall out of favor with investors. For example, at times the market may favor large capitalization stocks over small capitalization stocks, value stocks over growth stocks, or vice versa.
Small-Cap and Mid-Cap Securities Risk: The Fund invests in companies with small market capitalizations. Because these companies are relatively small compared to large-capitalization companies, they may be engaged in business mostly within their own geographic region, may be less well known to the investment community, and may have more volatile share prices. Also, small companies often have less liquidity, less management depth, narrower market penetrations, less diverse product lines and fewer resources than larger companies. As a result, small-capitalization stock prices have greater volatility than large company securities.
Value Securities Risk: The Fund invests in companies that appear to be "undervalued" in the marketplace (i.e., trading at prices below the company's
true worth). If the Adviser's perceptions of value are wrong, the securities purchased may not perform as expected, reducing the Fund's return.
Foreign Securities Risk: Investments in foreign securities involve greater risks compared to domestic investments for the following reasons: foreign companies may not be subject to the regulatory requirements of U.S. companies, so there may be less publicly available information about foreign issuers than U.S. companies; foreign companies generally are not subject to uniform accounting, auditing and financial reporting standards; dividends and interest on foreign securities may be subject to foreign withholding taxes; such taxes may reduce the net return to Fund shareholders; foreign securities are often denominated in a currency other than the U.S. dollar, which will subject the Fund to the risks associated with fluctuations in currency values.
Management Risk: The Fund is subject to management risk because it is an actively managed investment portfolio. The Adviser will apply its investment techniques and risk analyses, including tactical allocation strategies, in making investment decisions for the Fund, but there is no guarantee that its decisions will produce the intended result.
Liquidity Risk: This is the risk that the market for a security or other investment cannot accommodate an order to buy or sell the security or other investment in the desired time frame and/or at the desired price. The values of illiquid investments are often more volatile than the values of more liquid investments. It may be more difficult for the Fund to determine a fair value of an illiquid investment than that of a more liquid comparable investment.
Master Limited Partnership Risk: The Fund’s exposure to master limited partnerships (MLP) may subject the Fund to greater volatility than investments in traditional securities. The value of MLP and MLP based exchange traded funds and notes may be affected by changes in overall market movements, commodity index volatility, changes in interest rates, or sectors affecting a particular industry or commodity, such as drought, floods, weather, livestock disease, embargoes, tariffs, and international economic, political and regulatory developments.
Real Estate Investment Trust Risk: The Fund may have investments in securities issued by, and/or have exposure to, commercial and residential real estate companies. Real estate securities are subject to risks similar to those associated with direct ownership of real estate, including changes in local and general economic conditions, vacancy rates, interest rates, zoning laws, rental income, property taxes, operating expenses and losses from casualty or condemnation. An investment in a REIT is subject to additional risks, including poor performance by the manager of the REIT, adverse tax consequences, and limited diversification resulting from being invested in a limited number or type of properties or a narrow geographic area.
Recent Market Events Risk: U.S. and international markets have experienced significant periods of volatility in recent years and months
42 | Quaker Investment Trust |
due to a number of economic, political and global macro factors including the impact of the coronavirus (COVID-19) as a global pandemic, which has resulted in public health issues, growth concerns in the U.S. and overseas, layoffs, rising unemployment and reduced consumer spending. The effects of COVID-19 may lead to a substantial economic downturn or recession in the U.S. and global economies, the recovery from which is uncertain and may last for an extended period of time. As a result of this significant volatility, many of the risks discussed herein associated with an investment in the Fund may be increased.
Note 6 – INDEMNIFICATIONS
Under the Trust’s organizational documents, its officers and Trustees are indemnified against certain liabilities arising out of the performance of their duties to the Funds. In addition, in the normal course of business, the Trust enters into contracts with its vendors and others that provide for general indemnifications.
The Trust’s maximum exposure under these arrangements is dependent on future claims that may be made against the Trust, and, therefore, cannot be estimated; however, based on experience, risk of loss from such claims is considered remote.
Note 7 – SUBSEQUENT EVENTS
The Funds have evaluated the need for additional disclosures and/or adjustments resulting from subsequent events. Based on this evaluation, no additional disclosures or adjustments were required to the financial statements.
REPORT OF INDEPENDENT REGISTERED PUBLIC ACCOUNTING FIRM
To the Shareholders and Board of Trustees
of Quaker Investment Trust
Opinion on the Financial Statements
We have audited the accompanying statements of assets and liabilities of CCM Core Impact Equity Fund and CCM Small / Mid-Cap Impact Value Fund (the “Funds”), each a series of Quaker Investment Trust (the “Trust”), including the schedules of investments, as of June 30, 2022, the related statements of operations for the year then ended, the statements of changes in net assets for each of the two years in the period then ended, and the financial highlights for each of the five years in the period then ended, and the related notes (collectively referred to as the “financial statements”). In our opinion, the financial statements present fairly, in all material respects, the financial position of the Funds as of June 30, 2022, the results of their operations for the year then ended, the changes in their net assets for each of the two years in the period then ended, and their financial highlights for each of the five years in the period then ended, in conformity with accounting principles generally accepted in the United States of America.
Basis for Opinion
These financial statements are the responsibility of the Funds’ management. Our responsibility is to express an opinion on the Funds’ financial statements based on our audits. We are a public accounting firm registered with the Public Company Accounting Oversight Board (United States) (“PCAOB”) and are required to be independent with respect to the Funds in accordance with the U.S. federal securities laws and the applicable rules and regulations of the Securities and Exchange Commission and the PCAOB. We have served as the auditor of one or more of the funds in the Trust since 2012.
We conducted our audits in accordance with the standards of the PCAOB. Those standards require that we plan and perform the audits to obtain reasonable assurance about whether the financial statements are free of material misstatement, whether due to error or fraud. The Funds are not required to have, nor were we engaged to perform, an audit of the Funds’ internal control over financial reporting. As part of our audits we are required to obtain an understanding of internal control over financial reporting, but not for the purpose of expressing an opinion on the effectiveness of the Funds’ internal control over financial reporting. Accordingly, we express no such opinion.
Our audits included performing procedures to assess the risks of material misstatement of the financial statements, whether due to error or fraud, and performing procedures that respond to those risks. Such procedures included examining, on a test basis, evidence regarding the amounts and disclosures in the financial statements. Our audits also included evaluating the accounting principles used and significant estimates made by management, as well as evaluating the overall presentation of the financial statements. Our procedures included confirmation of securities owned as of June 30, 2022
44 | Quaker Investment Trust |
by correspondence with the custodian. We believe that our audits provide a reasonable basis for our opinion.

TAIT, WELLER & BAKER LLP
Philadelphia, Pennsylvania
August 29, 2022
Notice to Shareholders June 30, 2022
CCM Core Impact Equity Fund
Return of Capital | Long-Term Capital Gain Distributions | Ordinary Income Distributions | Total Distributions | Qualifying for Corporate Dividends Received Deduction(1) |
0.00% | 96.22% | 3.78% | 100.00% | 100.00% |
Qualifying Dividend Income(2) | Qualifying Business Income(6) | U.S. Government Interest(3) | Interest Related Dividends(4) | Short Term Capital Gain Dividends(5) |
100.00% | 0.00% | 0.00% | 0.00% | 100.00% |
CCM Small/Mid-Cap Impact Value Fund
Return of Capital | Long-Term Capital Gain Distributions | Ordinary Income Distributions | Total Distributions | Qualifying for Corporate Dividends Received Deduction(1) |
0.00% | 0.00% | 0.00% | 0.00% | 0.00% |
Qualifying Dividend Income(2) | Qualifying Business Income(6) | U.S. Government Interest(3) | Interest Related Dividends(4) | Short Term Capital Gain Dividends(5) |
0.00% | 0.00% | 0.00% | 0.00% | 0.00% |
1 Qualifying dividends represent dividends which qualify for the corporate dividends received deduction and is reflected as a percentage of ordinary income distributions (the total of short-term capital gain and net investment income distributions).
2 The percentage in this column represents the amount of “Qualifying Dividend Income” as created by the Jobs and Growth Tax Relief Reconciliation Act of 2003 and is reflected as a percentage of ordinary income distributions (the total of short-term capital gain and net investment income distributions). It is the intention of the Fund to designate the maximum amount permitted by law.
3 “U.S. Government Interest” represents the amount of interest that was derived from direct U.S. Government obligations and distributed during the fiscal year. This amount is reflected as a percentage of ordinary income. Generally, interest from direct U.S. Government obligations is exempt from state income tax. However, for shareholders of the Fund who are residents of California, Connecticut and New York, the statutory threshold requirements were not satisfied to permit exemption of these amounts from state income tax.
4 The percentage in this column represents the amount of “Interest Related Dividends” and is reflected as a percentage of ordinary income distributions. Interest related dividends are exempted from U.S. withholding tax when paid to foreign investors.
5 The percentage of this column represents the amount of “Short-Term Capital Gain Dividends” and is reflected as a percentage of short-term capital gain distributions that are exempted from U.S. withholding tax when paid to foreign investors.
6 The percentage of this column represents that amount of ordinary dividend income that qualified for 20% Business Income Deduction.
46 | Quaker Investment Trust |
Trustees and Officers June 30, 2022
The business and affairs of the Trust are managed under the direction of the Trust’s Board of Trustees in accordance with the laws of the State of Delaware and the Trust’s Declaration of Trust. Information pertaining to the trustees and officers of the Trust is set forth below. Trustees who are not deemed to be “interested persons” of the Trust as defined in the 1940 Act are referred to as “Independent Trustees.” Trustees who are deemed to be “interested persons” of the Trust are referred to as “Interested Trustees.” The Fund’s Statement of Additional Information includes additional information about the Trustees and is available, without charge, upon request, by calling 888-272-0007.
Name, address and Age1 | Position(s) Held with the Trust | Served in Position Since2 | Principal Occupation(s) During Past 5 Years | Number of Portfolios Overseen by Trustee3 | Other Directorships Held by Trustee During Past 5 Years4 |
INDEPENDENT TRUSTEES |
James R. Brinton Age 68 | Chair Trustee Lead Independent Trustee | Since 2018 Since 2002 2007-2018 | Vice President, Retired since 2019. BMT Insurance Advisors (a commercial insurance brokerage firm) from 2015 to 2019. | 2 | None |
Gary Edward Shugrue Age 68 | Trustee | Since 2008 | Veritable, LP (investment advisory firm) since 2015; President and Chief Investment Officer, Ascendant Capital Partners from 2001–2015. | 2 | Director, RFS Family of Funds/UMB Fund Services |
Warren West Age 65 | Trustee | Since 2003 | Retired since 2017. Greentree Brokerage Services, Inc. from 1998–2017. | 2 | None |
INTERESTED TRUSTEE |
Alyssa Greenspan5 Age 50 | President
Trustee
| Since January, 2018
Since June, 2018
| President, Community Capital Management, LLC since January 2015; Chief Operating Officer, Community Capital Management, LLC since June 2009; Senior Vice President and Portfolio Manager, Community Capital Management, LLC since May 2003. | 2 | None |
Name Address and Age1 | Position(s) Held with the Trust | Served in Position Since2 | Principal Occupation(s) During Past 5 Years | Number of Portfolios Overseen by Trustee3 | Other Directorships Held by Trustee During Past 5 Years4 |
OFFICERS |
Todd Cohen Age 56 | Secretary | Since June, 2018 | Chief Executive Officer, Community Capital Management, LLC since January 2015; President and Chief Investment Officer, Community Capital Management, LLC January 2007–January 2015. | N/A | N/A |
James Malone Age 51 | Treasurer | Since January, 2021 | Chief Financial Officer of Community Capital Management, LLC since July 2013; Director of Investment Platforms, since September 2011. | N/A | N/A |
Stefanie Little Age 54 | Chief Compliance Officer | Since June, 2018 | Chief Compliance Officer, Community Capital Management, LLC 2010–present). Chief Compliance Officer for Quaker Investment Trust since June, 2018. Founder of Chenery Compliance Group, LLC (2015–present); Managing Member SEC Compliance Alliance, LLC (2012–2019), President of Little Consulting Group, Inc. 2011–present). | N/A | N/A |
1 | Each Trustee may be contacted by writing to the Trustee, c/o Community Capital Management, Inc. 2500 Weston Road, Suite 101, Weston, Florida 33331. |
2 | Each Trustee holds office until he or she resigns, is removed or dies. The president, treasurer and secretary shall hold office for a one-year term and until their respective successors are chosen and qualified, or until such officer dies or resigns. |
3 | The Trust has two series, CCM Core Impact Equity Fund and CCM Small/Mid-Cap Impact Value Fund. |
4 | Directorships of companies required to report to the SEC under the Securities Exchange Act of 1934 (i.e., “public companies”) or other investment companies registered under the 1940 Act. |
5 | Ms. Greenspan is an “interested person” of the Trust (as defined in the 1940 act) due to the position she holds with Community Capital Management, LLC. |
48 | Quaker Investment Trust |
Additional Information June 30, 2022
Proxy Policies (Unaudited)
A description of the policies and procedures that the Fund uses to determine how to vote proxies relating to portfolio securities and information regarding how the Fund voted proxies relating to portfolio securities during the most recent 12-month period ended June 30 is available (i) without charge, upon request by calling 1-888-272-0007 and (ii) on the Securities and Exchange Commission (the “SEC”) website at http://www.sec.gov.
Quarterly Filings (Unaudited)
The Fund files its complete schedule of portfolio holdings with the SEC for its first and third fiscal quarters or as an exhibit to its reports on Form N-PORT within 60 days after the end of the period. The Fund’s N-PORT (and its predecessor form, Form N-Q) reports are available on the SEC’s website at http://www.sec.gov.
This report is intended for the Fund’s shareholders. It may not be distributed to prospective investors unless it is preceded by or accompanied by the Fund’s prospectus. An investor should read the prospectus carefully before investing or sending money. A prospectus may be obtained by calling the Fund at 1-888-272-0007.

2500 Weston Road ■ Suite 101 ■ Weston, FL 33331
954-217-7999 ■ Fax: 954-385-9299 ■ Toll Free: 888-272-0007 ■ www.ccminvests.com
Item 2. Code of Ethics.
| (a) | The Registrant has, as of the end of the period covered by this report, adopted a code of ethics that applies to the Registrant's principal executive officer, principal financial officer, principal accounting officer or controller, or persons performing similar functions, regardless of whether these individuals are employed by the Registrant or a third party. |
| (b) | During the period covered by this report, there were no amendments to any provision of the code of ethics. |
| (c) | During the period covered by this report, there were no waivers or implicit waivers of a provision of the code of ethics. |
Item 3. Audit Committee Financial Expert.
The Registrant's Board of Trustees has determined that Gary E. Shugrue, a member of the Registrant's Board of Trustees and Audit Committee, qualifies as an audit committee financial expert. Gary E. Shugrue is "independent" as that term is defined in paragraph (a)(2) of this Item's instructions.
Item 4. Principal Accountant Fees and Services.
| (a) | Audit Fees. The aggregate fees billed for each of the last two fiscal years for professional services rendered by the Registrant's principal accountant for the audit of the Registrant's annual financial statements or services that are normally provided by the accountant in connection with statutory and regulatory filings or engagements for those fiscal years were $25,000 and $25,000 for fiscal years ended June 30, 2022 and June 30, 2021, respectively. |
| (b) | Audit-Related Fees. The aggregate fees billed for each of the last two fiscal years for assurance and related services by the Registrant's principal accountant that are reasonably related to the performance of the audit of the Registrant's financial statements and not reported under paragraph (a) of this Item were $0 and $0 for the fiscal years ended June 30, 2022 and June 30, 2021, respectively. |
| (c) | Tax Fees. The aggregate fees billed for the last two fiscal years for professional services rendered by the principal accountant for tax compliance were $5,000 and $5,000 for the fiscal years ended June 30, 2022 and June 30, 2021, respectively. The tax fees include a review of the Funds’ federal and state income tax returns for the year ended June 30, 2022 and the excise returns for December 31, 2022. |
| (d) | All Other Fees. The aggregate fees billed in each of the last two fiscal years for products and services provided by the Registrant's principal accountant, other than the services reported in paragraphs (a) through (c) of this Item were $0 and $0 for the fiscal years ended June 30, 2022 and June 30, 2021, respectively. |
| (e)(1) | Pursuant to the requirements of the Sarbanes-Oxley Act of 2002, the SEC adopted Rule 2-01 under Regulation S-X, which, among other things, requires a fund’s audit committee to pre-approve certain audit and non-audit services that are provided by its independent auditors in order to ensure the auditors’ independence. The Trust’s Board has established an Audit Committee that has been charged with, among other things, assisting the Board in its oversight of: the Trust’s independent auditors; pre-approving all audit and non-audit services provided by the Trust’s independent auditors; the integrity of the Trust’s financial statements; the independent auditors’ qualifications and independence; and the adequacy of the Trust’s financial reporting, tax compliance, internal financial and disclosure controls and use of appropriate accounting principles. |
| (e)(2) | There were no services described in each of paragraphs (b) through (d) of this Item that were approved by the audit committee pursuant to paragraph (c)(7)(i)(C) of Rule 2-01 of Regulation S-X. |
| (f) | Not applicable. The percentage of hours expended on the principal accountant's engagement to audit the Registrant's financial statements for the most recent fiscal year that were attributed to work performed by persons other than the principal accountant's full-time, permanent employees was zero percent (0%). |
| (g) | All non-audit fees billed by the Registrant's principal accountant for services rendered to the Registrant, and rendered to the Registrant’s investment adviser, and any entity controlling, controlled by, or under common control with the adviser that provides ongoing services to the Registrant for the fiscal years ended June 30, 2022 and June 30, 2021 are disclosed in (b)-(d) above. There were no audit or non-audit services performed by the Registrant's principal accountant for the Registrant's adviser. |
Item 5. Audit Committee of Listed Registrants.
Not applicable.
Item 6. Investments.
Included in Annual Report to Stockholders filed under Item 1 of this form.
Item 7. Disclosure of Proxy Voting Policies and Procedures for Closed-End Management Investment Companies.
Not applicable.
Item 8. Portfolio Managers of Closed-End Management Investment Companies.
Not applicable.
Item 9. Purchases of Equity Securities by Closed-End Management Investment Company and Affiliated Purchasers.
Not applicable.
Item 10. Submission of Matters to a Vote of Security Holders.
There have been no material changes to the procedures by which shareholders may recommend nominees to the Registrant's board of trustees.
Item 11. Controls and Procedures.
| (a) | The Registrant's principal executive and principal financial officers, or persons performing similar functions, have concluded that the Registrant's disclosure controls and procedures (as defined in Rule 30a-3(c) under the 1940 Act are effective, as of a date within 90 days of the filing date of the report that includes the disclosure required by this paragraph, based on the evaluation of these controls and procedures required by Rule 30a-3(b) under the 1940 Act and Rule 15d-15(b) under the Securities Exchange Act of 1934, as amended. |
| (b) | There were no changes in the Registrant's internal control over financial reporting (as defined in Rule 30a-3(d) under the 1940 Act) that occurred during the period covered by this report that have materially affected, or are reasonably likely to materially affect, the Registrant's internal control over financial reporting. |
Item 12. Disclosure of Securities Lending Activities for Closed-End Management Investment Companies.
Not applicable.
Item 13. Exhibits.
SIGNATURES
Pursuant to the requirements of the Securities Exchange Act of 1934 and the Investment Company Act of 1940, the Registrant has duly caused this report to be signed on its behalf by the undersigned, thereunto duly authorized.
| (Registrant) | Quaker Investment Trust | |
| | | |
| By (Signature and Title) | /s/ Alyssa D. Greenspan | |
| | Alyssa D. Greenspan, | |
| Date: September 8, 2022 | President and Principal Executive Officer | |
Pursuant to the requirements of the Securities Exchange Act of 1934 and the Investment Company Act of 1940, this report has been signed below by the following persons on behalf of the Registrant and in the capacities and on the dates indicated.
| By (Signature and Title) | /s/ Alyssa D. Greenspan | |
| | Alyssa D. Greenspan, | |
| Date: September 8, 2022 | President and Principal Executive Officer | |
| | | |
| By (Signature and Title) | /s/ James H. Malone | |
| | James H. Malone, | |
| Date: September 8, 2022 | Treasurer and Principal Financial Officer | |