Annual Report
June 30, 2017
| | Quaker Event Arbitrage Fund |
| | Quaker Global Tactical Allocation Fund |
| | Quaker Mid-Cap Value Fund |
| | Quaker Small-Cap Value Fund |
| | Quaker Strategic Growth Fund |
| | Mutual fund investing involves risk. Principal loss is possible. | |
| | Investing in the Quaker Funds may involve special risk including, but not limited to, investments in smaller companies, short sales, foreign securities, special situations, debt securities and value growth investing. Please refer to the prospectus for more complete information. | |
| | This report must be preceded or accompanied by a current prospectus. | |
| | The opinions expressed are those of the adviser or sub-advisers through the end of the period for this report, are subject to change, are not a guarantee, and should not be considered investment advice. | |
| | Fund holdings are subject to change and should not be considered a recommendation to buy or sell any security. Current and future holdings are subject to risk. | |
Chairman’s Letter to the Shareholders (unaudited)
June 30, 2017
Dear Fellow Shareholder:
The premise upon which Quaker Funds, Inc. was founded was the desire to afford everyday investors access to the same tactical and allocation strategies used by professional money managers to augment traditional investing strategies within a holistic asset allocation mix. Our commitment to this principle is still as strong today as it was the day we opened our doors.
Our management team continually strives to provide our shareholders with innovative investment alternatives and advisers that constantly seek superior returns. Thank you for your trust and investment in the Quaker Funds.
Sincerely,
Jeffry H. King, Sr.
Chairman & CEO
Quaker Investment Trust
| | | | | |
| | | Table of Contents | | |
| | | | Page | |
| | | Chairman’s Letter to the Shareholders | 1 | |
| | | Performance Update: | | |
| | | Quaker Event Arbitrage Fund | 2 | |
| | | Quaker Global Tactical Allocation Fund | 5 | |
| | | Quaker Mid-Cap Value Fund | 8 | |
| | | Quaker Small-Cap Value Fund | 12 | |
| | | Quaker Strategic Growth Fund | 15 | |
| | | Expense Information | 18 | |
| | | Schedule of Investments | 20 | |
| | | Statements of Assets and Liabilities | 42 | |
| | | Statements of Operations | 44 | |
| | | Statements of Changes in Net Assets | 46 | |
| | | Financial Highlights | 48 | |
| | | Notes to the Financial Statements | 63 | |
| | | Report of Independent Registered Public | | |
| | | Accounting Firm | 82 | |
| | | Trustees and Officers | 83 | |
| | | Approval of Advisory and | | |
| | | Sub-Advisory Agreements | 85 | |
| | | General Information | 87 | |
| | | | | |
Performance Update (unaudited)
Quaker Event Arbitrage Fund (QEAAX, QEACX, QEAIX)
OBJECTIVES AND PRINCIPAL STRATEGIES
The Quaker Event Arbitrage Fund (“Fund”) seeks to provide long-term growth of capital. The Fund generally invests in the securities of publicly traded companies involved in mergers, takeovers, tender offers, leveraged buyouts, spin-offs, liquidations or similar events.
PERFORMANCE REVIEW AND MARKET OUTLOOK
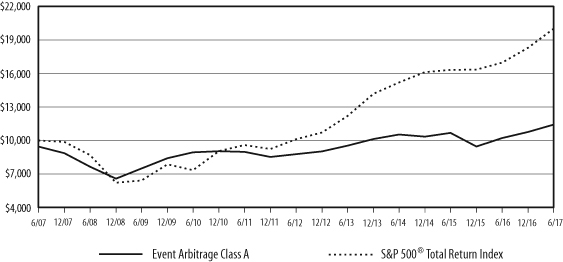
Over the last year the Fund returned 11.70% (before sales charges), whereas the total return of the S&P 500 was 17.90%. While the equity market gyrated over the last year, the Fund’s daily volatility was roughly one quarter lower than that of the S&P 500. The performance differential to the S&P 500 can be explained by the lower risk of the Fund, that translates into a lower volatility, as well as the different return characteristics of event-driven securities that the Fund invests in. Moreover, the Fund has a part of its portfolio invested in bonds that have a lower return than equities, whereas the S&P 500 index consists only of equities.
The past 12 months saw the event-driven asset class continue to recover from the turmoil it experienced in late 2015 and into early 2016. Many investments in distressed energy exploration & production companies not only recovered over the last year but reached their target levels and were sold. Nevertheless, while exploration and production companies may not be attractive at this point, distressed energy services companies such as deep sea equipment owners continue to provide attractive risk/reward profiles. Activity of activist investors has not yet reached the levels seen at its peak in 2014 and 2015 but nevertheless many investments in this area provide very attractive risk/return profiles. Merger arbitrage continued to have unattractive risk/return profiles throughout the period because its return potential depends on the level of interest rates, which generally remain near the recent historic lows. As a result, few positions in this sub-strategy were entered into throughout the year.
Looking forward, the portfolio management team believes the best risk/reward opportunities are likely to remain in activist investments, distressed investments and special situations such as spin-offs because the overall market environment is expected to persist for the foreseeable future. We believe that the prospect of a comprehensive corporate tax reform should support event-driven securities, because lower corporate taxes or repatriation of offshore profits would boost the cash reserves of corporations, some of which is likely to be used for corporate events such as mergers. In addition, we believe that the risk taking environment remains favorable, as evidenced by low credit spreads, which are important for corporate events because the availability of credit is an important factor for the completion of corporate events, that often require issuance of new debt or refinancing of existing debt.
I wish all investors a prosperous year and thank you for your continued support.
Sincerely,
Thomas Kirchner, Portfolio Manager
Quaker Funds, Inc.
Performance Update (unaudited) (continued)
Quaker Event Arbitrage Fund (QEAAX, QEACX, QEAIX)
ADVISER:
Quaker Funds, Inc.
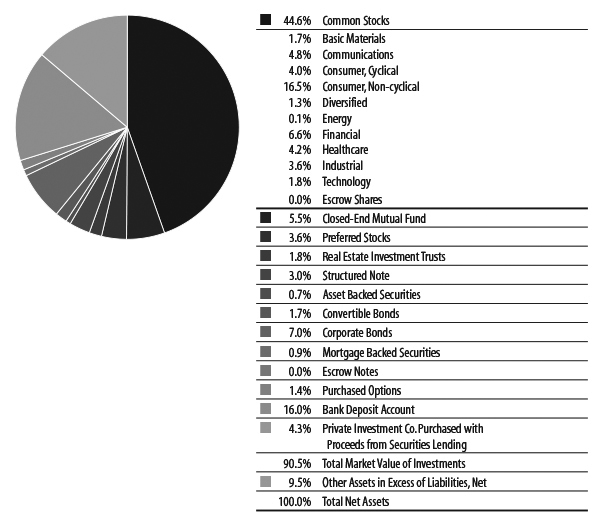
TOTAL NET ASSETS:
AS OF JUNE 30, 2017
$29,701,092
| Top 10 Holdings* (% of net assets) | | |
| Altaba Inc. | 5.5% | |
| Diagnostic Services Holdings Inc. | 4.2% | |
| IEC Electronics Corp. | 3.6% | |
| Mondelez International Inc. | 3.3% | |
| CA Immobilien Anlagen AG | 3.2% | |
| Heineken Holding NV Structured Note, | | |
| Expiration: 2/27/2018 | 3.0% | |
| Conwert Immobilien Invest SE | 3.0% | |
| Pfizer Inc. | 2.8% | |
| Anheuser-Busch InBev NV - ADR | 2.2% | |
| Imperva Inc. | 2.1% | |
| % Fund Total | 32.9% | |
| * Includes Long-Term Investments only. | | |
| Sectors (% of net assets) |
Performance Update (unaudited) (continued)
Quaker Event Arbitrage Fund (QEAAX, QEACX, QEAIX)
Growth of a Hypothetical $10,000 Investment
June 30, 2017
| Average Annualized Total Return |
| | | | | | | | | | Commencement |
| | | | | | | | | | of operations |
| | Expense | Inception | | | | | | | through |
| | Ratio* | Date | One Year | Five Year | Ten Year | 6/30/2017 |
| | | | with | without | with | without | with | without | with | without |
| | | | sales | sales | sales | sales | sales | sales | sales | sales |
| | | | charge | charge | charge | charge | charge | charge | charge | charge |
| Class A | 1.99% | 11/21/03 | 5.57% | 11.70% | 4.22% | 5.40% | 1.33% | 1.90% | 5.24% | 5.68% |
| Class C | 2.74% | 6/7/10 | 10.91% | 10.91% | 4.62% | 4.62% | N/A | N/A | 2.99% | 2.99% |
| Institutional Class | 1.74% | 6/7/10 | 12.10% | 12.10% | 5.69% | 5.69% | N/A | N/A | 4.01% | 4.01% |
| S&P 500® Total Return Index** | | | 17.90% | 17.90% | 14.63% | 14.63% | 7.18% | 7.18% | 8.67% | 8.67% |
| * | As stated in the Prospectus dated November 1, 2016. Net Expense Ratio shown. Gross Expense Ratio: A:2.41%, C:3.16%, I:2.16%. The net expense ratio reflects a contractual commitment by the Fund’s investment adviser to waive fees and reimburse expenses through November 1, 2017. Absent the waiver and reimbursement, performance would have been less favorable. |
| ** | The benchmark since inception returns are calculated since commencement of November 21, 2003 through June 30, 2017. |
Performance data quoted represents past performance and is no guarantee of future results. Investment return and principal value will fluctuate so that shares, when redeemed, may be worth more or less than their original cost. Current performance may be lower or higher than performance data quoted. Performance data current to the most recent month end is available at www.quakerfunds.com or by calling us toll free at 800-220-8888. Total return includes reinvestment of dividends and capital gains.
Class A shares of the Fund have a maximum sales charge of 5.50%.
The performance table does not reflect the deduction of taxes that a shareholder might pay on fund distributions or the redemption of fund shares. Total return calculations reflect expense reimbursements and fee waivers in the applicable periods. See financial highlights for periods where fees were waived or reimbursed.
The Fund’s portfolio holdings may differ significantly from the securities held in the index and, unlike a mutual fund, an unmanaged index assumes no transaction costs, taxes, management fees or other expenses. You cannot invest directly in an index.
The S&P 500® Total Return Index (“S&P 500® Index”) is a widely recognized, unmanaged index consisting of the approximately 500 largest companies in the United States as measured by market capitalization. The S&P 500® Index assumes reinvestment of all dividends and distributions.
Performance Update (unaudited)
Quaker Global Tactical Allocation Fund (QTRAX, QTRCX, QTRIX)
OBJECTIVES AND PRINCIPAL STRATEGIES
The Fund seeks to provide long-term growth of capital. The Fund invests in ETFs and common stocks of U.S. companies, ETF’s and ADRs of foreign companies, and individual bonds and ETFs of fixed income securities, without regard to market capitalization.
PERFORMANCE REVIEW AND MARKET OUTLOOK
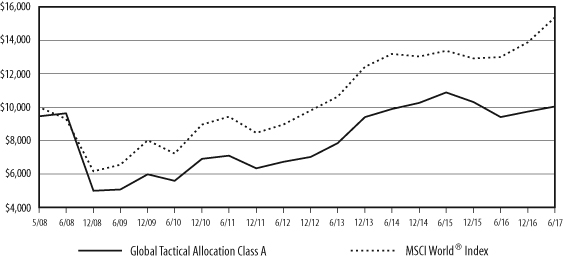
For the fiscal year ended June 30, 2017, the Fund returned 6.73% (before sales charges), whereas the total return of the MSCI World Index (“MSCI World”) was18.20%.
��
Since taking over management of the Fund in early 2017 the objective of the new management team has been to maintain the existing exposure of the Fund’s portfolio, which has the benefit of minimizing portfolio turnover. The result has been a relatively large exposure to bonds, which is atypical for funds in this category. However, the advantage of this exposure is a significantly reduced volatility compared to what a large exposure to equities would have produced. While we believe this portfolio allocation is likely to generate good income for investors in the future, it limits the prospects for capital gains, as evidenced by the underperformance compared to the benchmark, which has no bond allocation. The Fund’s dividend yield of 4% currently compares favorably with the benchmark’s 2.6%. Moreover, the Fund differs from the benchmark in its allocation to mid- and small cap stocks, which generally have seen less appreciation in recent quarters than large and mega-caps, to which the benchmark is overexposed.
Looking forward, the investment team expects to continue to seek to increase the international exposure of the Fund by acquiring the equity of a number of international portfolio companies. For the remainder of the year global equity markets are likely to be driven by interest rate policy as well as the potential for corporate tax reform in the U.S., which is likely to provide support to the equity markets.
Overall, the Fund is well positioned to produce income while providing price stability through its bond exposure.
I wish all investors a prosperous year and thank you for your continued support.
Sincerely,
Thomas Kirchner, Portfolio Manager
Quaker Funds, Inc.
Performance Update (unaudited) (continued)
Quaker Global Tactical Allocation Fund (QTRAX, QTRCX, QTRIX)
ADVISER:
Quaker Funds, Inc.
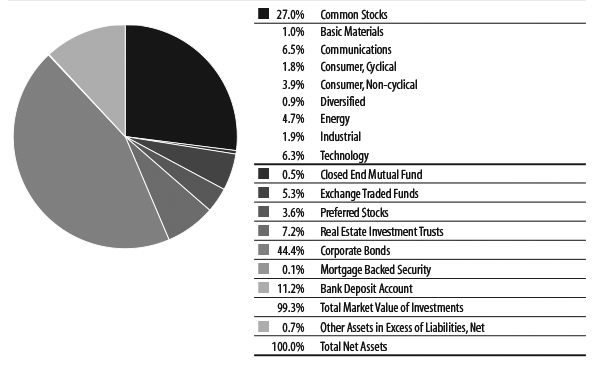
TOTAL NET ASSETS:
AS OF JUNE 30, 2017
$6,793,620
| Top 10 Holdings* (% of net assets) | | |
| iShares MSCI United Kingdom ETF | 3.0% | |
| Verizon Communications Inc. | 2.6% | |
| QUALCOMM Inc. | 2.6% | |
| AT&T Inc. | 2.4% | |
| PowerShares DB Commodity Index Tracking Fund | 2.3% | |
| Microsoft Corp. | 2.2% | |
| Molson Coors Brewing Co. | 2.2% | |
| General Electric Co. | 1.9% | |
| General Motors Co. | 1.6% | |
| Twenty-First Century Fox Inc. Cl B | 1.5% | |
| % Fund Total | 22.3% | |
| * Includes Long-Term Investments only. | | |
| Sectors (% of net assets) |
Performance Update (unaudited) (continued)
Quaker Global Tactical Allocation Fund (QTRAX, QTRCX, QTRIX)
Growth of a Hypothetical $10,000 Investment
June 30, 2017
| Average Annualized Total Return |
| | | | | | | | | | Commencement |
| | | | | | | | | | of operations |
| | Expense | Inception | | | | | | | through |
| | Ratio* | Date | One Year | Five Year | Ten Year | 6/30/2017 |
| | | | with | without | with | without | with | without | with | without |
| | | | sales | sales | sales | sales | sales | sales | sales | sales |
| | | | charge | charge | charge | charge | charge | charge | charge | charge |
| Class A | 1.80% | 5/1/08 | 0.85% | 6.73% | 7.12% | 8.33% | N/A | N/A | 0.04% | 0.66% |
| Class C | 2.55% | 5/1/08 | 5.88% | 5.88% | 7.51% | 7.51% | N/A | N/A | -0.10% | -0.10% |
| Institutional Class | 1.55% | 7/23/08 | 6.97% | 6.97% | 8.61% | 8.61% | N/A | N/A | 2.32% | 2.32% |
| MSCI World® Index** | | | 18.20% | 18.20% | 11.38% | 11.38% | N/A | N/A | 4.80% | 4.80% |
| * | As stated in the Prospectus dated November 1, 2016. Net Expense Ratio shown. Gross Expense Ratio: A:2.10%, C:2.85%, I:1.85%. The net expense ratio reflects a contractual commitment by the Fund’s investment adviser to waive fees and reimburse expenses through November 1, 2017. Absent the waiver and reimbursement, performance would have been less favorable. |
| ** | The benchmark since inception returns are calculated since commencement of May 1, 2008 through June 30, 2017. |
Performance data quoted represents past performance and is no guarantee of future results. Investment return and principal value will fluctuate so that shares, when redeemed, may be worth more or less than their original cost. Current performance may be lower or higher than performance data quoted. Performance data current to the most recent month end is available at www.quakerfunds.com or by calling us toll free at 800-220-8888. Total return includes reinvestment of dividends and capital gains.
Class A shares of the Fund have a maximum sales charge of 5.50%.
The performance table does not reflect the deduction of taxes that a shareholder might pay on fund distributions or the redemption of fund shares. Total return calculations reflect expense reimbursements and fee waivers in the applicable periods. See financial highlights for periods where fees were waived or reimbursed.
The Fund’s portfolio holdings may differ significantly from the securities held in the index and, unlike a mutual fund, an unmanaged index assumes no transaction costs, taxes, management fees or other expenses. You cannot invest directly in an index.
The Morgan Stanley Capital International World Index (“MSCI World® Index”) measures developed-market equity performance throughout the world. The MSCI World® Index assumes reinvestment of all dividends and distributions.
Performance Update (unaudited)
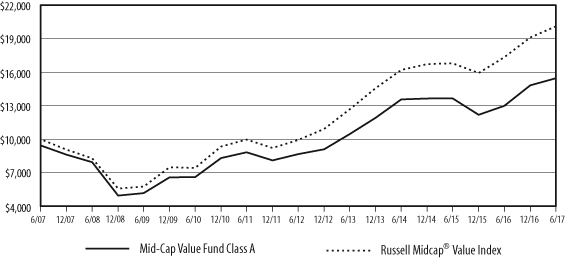
Quaker Mid-Cap Value Fund (QMCVX, QMCCX, QMVIX)
OBJECTIVES AND PRINCIPAL STRATEGIES
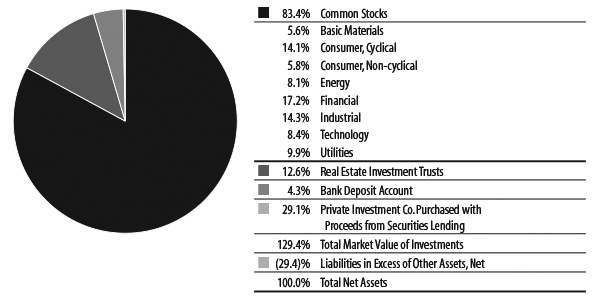
The Quaker Mid-Cap Value Fund (the “Fund”) seeks to provide long-term growth of capital. Current income is not a significant investment consideration and any such income realized will be considered incidental to the Fund’s investment objective. The Fund invests primarily in common stocks comparable to the companies included in the Russell Midcap® Value Index.
PERFORMANCE REVIEW AND MARKET OUTLOOK
For the fiscal year ended June 30, 2017, the Fund increased 19.00% (before sales charges), versus a gain of 15.93% for the Russell Midcap® Value Index. The past year saw dramatic changes to the drivers of performance for the Fund. In the previous fiscal year, utilities and real estate were two of the best performing sectors, while information technology and consumer discretionary were two of the worst. But this past year, that completely reversed. In the Fund, the information technology and consumer discretionary sectors were the leading contributors to performance with gains of 50% and 42%, versus gains in the benchmark of 41% and 22%, respectively. The largest detractors from performance were the energy and health care sectors, with returns of -9% and +5% versus the benchmark returns of -5% and +10%, respectively.
We believe the most notable changes in the environment over the past year were the change in interest rates, and the improved economic outlook following the surprise victory of President Trump in November. Last year at this time we wrote about the extraordinarily low interest rate environment and the headwinds that it created for the Fund over the prior year. We thought rates would go up and return to somewhat normalized levels, leading to a market that rewarded stock pickers like ourselves, but did not profess to know when that would happen. Not long after our writing, higher interest rates appeared, along with recognition of improved growth in the economy. The result was a robust stock market, with significant gains in several positions in the Fund.
Looking forward, we continue to expect modest growth for the U.S. economy for the balance of the year. Unemployment remains at post-recession lows, and most economic indicators appear supportive of a continued modest growth thesis. This modest growth outlook is without any help from proposed policy changes from the Trump administration. Anticipation of changes that would be stimulative to business while simultaneously reducing regulatory burdens helped the markets in the weeks immediately following the election, but we believe that optimism has diminished in the past few months on the failure of the administration to push through any changes thus far. So that remains a potential stimulus to the economy and to equity markets.
Offsetting that optimism somewhat is our recognition of the market’s valuation. We have talked frequently about equity values having been driven higher in part by a lowering of the discount rate being assigned to future cash flows. The current implied discount rate, as measured by Credit Suisse HOLT, has now reached its lowest level since the Tech bubble of 2000. However, that doesn’t have to suggest that a major decline in equity values is imminent. A low discount rate is explainable in the low interest rate environment where potential returns for other investment options appear quite low. In addition, should the economy accelerate, thus generating better than expected corporate performance, we would expect equities to follow suit. The point is simply to illustrate that in our opinion the tailwind for equities from a lower discount rate is increasingly unlikely. There may no longer be a “rising tide to lift all (most) boats”, making stock selection increasingly important. Our investment process continues to focus on identifying companies with improving corporate performance which
Performance Update (unaudited) (continued)
we believe will be increasingly important to generate performance should the discount rate begin to normalize back toward historical levels.
Sincerely,
Frank Latuda, Jr. CFA
Chief Investment Officer & Portfolio Manager
Kennedy Capital Management, Inc.
Performance Update (unaudited) (continued)
Quaker Mid-Cap Value Fund (QMCVX, QMCCX, QMVIX)
SUB-ADVISER:
Kennedy Capital Management, Inc.
TOTAL NET ASSETS:
AS OF JUNE 30, 2017
$7,088,807
| Top 10 Holdings* (% of net assets) | | |
| Reinsurance Group of America Inc. Cl A | 2.9% | |
| East West Bancorp Inc. | 2.7% | |
| Centene Corp. | 2.5% | |
| Old Dominion Freight Line Inc. | 2.4% | |
| Huntington Bancshares Inc. | 2.3% | |
| Torchmark Corp. | 2.2% | |
| Brunswick Corp. | 2.2% | |
| Lincoln National Corp. | 2.2% | |
| Western Digital Corp. | 2.2% | |
| DTE Energy Co. | 2.1% | |
| % Fund Total | 23.7% | |
| * Includes Long-Term Investments only. | | |
| Sectors (% of net assets) |
Performance Update (unaudited) (continued)
Quaker Mid-Cap Value Fund (QMCVX, QMCCX, QMVIX)
Growth of a Hypothetical $10,000 Investment
June 30, 2017
| Average Annualized Total Return |
| | | | | | | | | | Commencement |
| | | | | | | | | | of operations |
| | Expense | Inception | | | | | | | through |
| | Ratio* | Date | One Year | Five Year | Ten Year | 6/30/2017 |
| | | | with | without | with | without | with | without | with | without |
| | | | sales | sales | sales | sales | sales | sales | sales | sales |
| | | | charge | charge | charge | charge | charge | charge | charge | charge |
| Class A | 2.17% | 12/31/97 | 12.47% | 19.00% | 11.00% | 12.27% | 4.45% | 5.05% | 7.27% | 7.58% |
| Class C | 2.92% | 7/31/00 | 18.13% | 18.13% | 11.43% | 11.43% | 4.27% | 4.27% | 7.77% | 7.77% |
| Institutional Class | 1.92% | 11/21/00 | 19.31% | 19.31% | 12.55% | 12.55% | 5.31% | 5.31% | 9.03% | 9.03% |
| Russell Midcap® Value Index** | | | 15.93% | 15.93% | 15.14% | 15.14% | 7.23% | 7.23% | 9.48% | 9.48% |
| * | As stated in the Prospectus dated November 1, 2016. |
| ** | The benchmark since inception returns are calculated since commencement of December 31,1997 through June 30, 2017. |
Performance data quoted represents past performance and is no guarantee of future results. Investment return and principal value will fluctuate so that shares, when redeemed, may be worth more or less than their original cost. Current performance may be lower or higher than performance data quoted. Performance data current to the most recent month end is available at www.quakerfunds.com or by calling us toll free at 800-220-8888. Total return includes reinvestment of dividends and capital gains.
Class A shares of the Fund have a maximum sales charge of 5.50%.
The performance table does not reflect the deduction of taxes that a shareholder might pay on fund distributions or the redemption of fund shares. Total return calculations reflect expense reimbursements and fee waivers in the applicable periods. See financial highlights for periods where fees were waived or reimbursed.
The Fund’s portfolio holdings may differ significantly from the securities held in the index and, unlike a mutual fund, an unmanaged index assumes no transaction costs, taxes, management fees or other expenses. You cannot invest directly in an index.
The Russell Midcap® Value Index is a widely recognized, unmanaged index of companies included in the Russell 1000 Index with current market capitalizations between $1.2 billion to $28.2 billion. The Russell Midcap® Value index assumes reinvestment of all dividends.
Performance Update (unaudited)
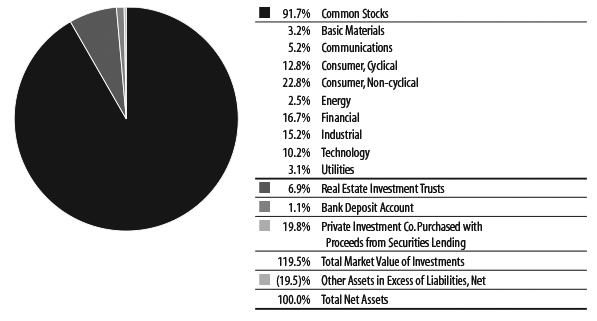
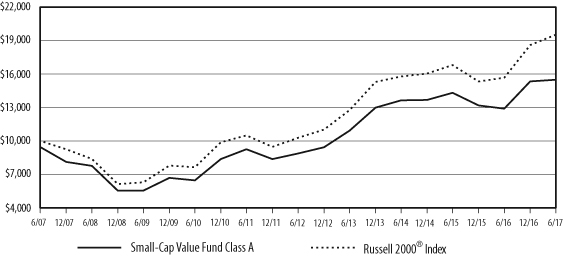
Quaker Small-Cap Value Fund (QUSVX, QSVCX, QSVIX)
OBJECTIVES AND PRINCIPAL STRATEGIES
The Fund seeks to provide long-term growth of capital. Current income is not a significant investment consideration, and any such income realized will be considered incidental to the Fund’s investment objective. The Fund invests primarily in common stocks of U.S. companies with market capitalizations similar to the market capitalizations of companies included in the Russell 2000® Index and Russell 2500® Index. The Fund invests in companies considered by the Fund’s sub-adviser to have consistent earnings and above-average core assets, selling at relatively low market valuations, with attractive growth and momentum characteristics.
PERFORMANCE REVIEW AND MARKET OUTLOOK
For the fiscal year ended June 30, 2017, the Fund’s performance was 20.11% (before sales charges), while the Fund’s benchmark, the Russell 2000® Index (a broad-based cross-section of the entire U.S. small-cap market), returned 24.60%. Working from the bottom up, we evaluate companies relative to their industry peers using four broad categories of attractiveness: value, management, momentum, and sentiment. Value to us means fairly traditional ratios of price to fundamental value; management measures seek evidence that company management has produced and will continue to produce earnings power; momentum helps us determine when stocks might be expected to begin their ascent toward full valuation; and sentiment provides another level of understanding of the buying and selling behavior of key investor segments.
Our work produced mixed results over this period, during which our returns followed the value trend: when value recovered at the end of 2016, we outperformed; and when it faltered in the second quarter of 2017, our work was challenged. The bulk of our underperformance arose from poor stock selection in the health care sector where despite enthusiasm for the biotech industry, our more value oriented holdings lagged. The same theme carried through to the energy sector where attractively priced drillers suffered in the face of volatile oil supply dynamics. And to top it off, our REIT picks (mostly our bets in brick and mortar retail REITs) underperformed.
On a positive note, in the financials sector, our deeper-than-benchmark value orientation provided much needed relief, particularly in the insurance industry.
We remain firm in our conviction that superior results can be achieved through a consistent, systematic approach that focuses on low-priced companies with proven management, earnings power, and favorable investor sentiment.
The Portfolio Management Team
AJO, LP
Performance Update (unaudited) (continued)
Quaker Small-Cap Value Fund (QUSVX, QSVCX, QSVIX)
SUB-ADVISER:
AJO, LP
TOTAL NET ASSETS:
AS OF JUNE 30, 2017
$28,688,345
| Top 10 Holdings* (% of net assets) | | |
| Owens Corning | 1.2% | |
| Reinsurance Group of America Inc. Cl A | 1.2% | |
| Vishay Intertechnology Inc. | 1.2% | |
| Synovus Financial Corp. | 1.1% | |
| Aspen Technology Inc. | 1.1% | |
| United Community Banks Inc. | 1.1% | |
| Assured Guaranty Ltd. | 1.1% | |
| Lear Corp. | 1.1% | |
| MicroStrategy Inc. | 1.1% | |
| Mack-Cali Realty Corp. | 1.1% | |
| % Fund Total | 11.3% | |
| * Includes Long-Term Investments only. | | |
| Sectors (% of net assets) |
Performance Update (unaudited) (continued)
Quaker Small-Cap Value Fund (QUSVX, QSVCX, QSVIX)
Growth of a Hypothetical $10,000 Investment
June 30, 2017
| Average Annualized Total Return |
| | | | | | | | | | Commencement |
| | | | | | | | | | of operations |
| | Expense | Inception | | | | | | | through |
| | Ratio* | Date | One Year | Five Year | Ten Year | 6/30/2017 |
| | | | with | without | with | without | with | without | with | without |
| | | | sales | sales | sales | sales | sales | sales | sales | sales |
| | | | charge | charge | charge | charge | charge | charge | charge | charge |
| Class A | 1.98% | 11/25/96 | 13.50% | 20.11% | 10.53% | 11.79% | 4.47% | 5.06% | 9.47% | 9.77% |
| Class C | 2.73% | 7/28/00 | 19.21% | 19.21% | 10.96% | 10.96% | 4.27% | 4.27% | 8.48% | 8.48% |
| Institutional Class | 1.73% | 9/12/00 | 20.41% | 20.41% | 12.06% | 12.06% | 5.33% | 5.33% | 8.91% | 8.91% |
| Russell 2000® Index** | | | 24.60% | 24.60% | 13.70% | 13.70% | 6.92% | 6.92% | 8.42% | 8.42% |
| * | As stated in the Prospectus dated November 1, 2016. |
| ** | The benchmark since inception returns are calculated since commencement of November 25, 1996 through June 30, 2017. |
Performance data quoted represents past performance and is no guarantee of future results. Investment return and principal value will fluctuate so that shares, when redeemed, may be worth more or less than their original cost. Current performance may be lower or higher than performance data quoted. Performance data current to the most recent month end is available at www.quakerfunds.com or by calling us toll free at 800-220-8888. Total return includes reinvestment of dividends and capital gains.
Class A shares of the Fund have a maximum sales charge of 5.50%.
The performance table does not reflect the deduction of taxes that a shareholder might pay on fund distributions or the redemption of fund shares. Total return calculations reflect expense reimbursements and fee waivers in the applicable periods. See financial highlights for periods where fees were waived or reimbursed.
The Fund’s portfolio holdings may differ significantly from the securities held in the index and, unlike a mutual fund, an unmanaged index assumes no transaction costs, taxes, management fees or other expenses. You cannot invest directly in an index.
The Russell 2000® Index is a widely recognized, unmanaged index comprised of the smallest 2000 companies represented in the Russell 3000® Index. The Russell 2000® Index currently represents approximately 8% of the market capitalization of the Russell 3000® Index.
Performance Update (unaudited)
Quaker Strategic Growth Fund (QUAGX, QAGCX, QAGIX)
OBJECTIVES AND PRINCIPAL STRATEGIES
The Fund seeks to provide long-term growth of capital. The Fund invests primarily in the common stock of companies, which the Fund’s sub-adviser believes will provide a higher total return than that of the index.
PERFORMANCE REVIEW AND MARKET OUTLOOK
June marks the 10 year anniversary since the start of the financial crisis. Leveraged value stocks peaked in July 2007 before mortgage and high yield bonds began their 18 month slide, leading to the August quant crisis as the deleveraging process began and value stock prices contracted. The bull market in equities continued as the S&P 500® Index generated a 17.90% return for the fiscal year ended June 30, 2017. The Fund finished the fiscal year with a return of 17.01% (before sales charges).
In late 2016 we witnessed a round of investor optimism, and thus small capitalization value stocks outperformed large capitalization growth stocks. However, like similar rallies since the financial crisis, this confidence has unraveled. The first half of 2017 has again disappointed investors with lower than expected growth and inflation. In turn, interest rates remain very low and value stocks have continued to underperform. The value stocks that continue to disappoint are concentrated in sectors that are most sensitive to the lasting impacts of the financial crisis. Among the cheapest sectors on a Book-to-Price valuation basis are financials, energy, and materials.
The best performing stocks over the trailing one year were those with higher volatility and strong long term price momentum. Stocks with strong analyst expectations underperformed while stocks with financial risk outperformed as investors embraced risk. In a reversal from recent periods, higher yielding stocks underperformed as the market adjusted to rising rate expectations. In terms of sectors, financials offered the highest returns as investors initially anticipated a lower regulatory burden under the new administration, a sentiment which began to dissipate during the first quarter. Telecom, utilities, real estate and energy stocks lagged on expectations for rising rates and energy prices which began to stall following their rapid rise earlier in 2016.
While greater exposure to book-to-price added value, a general overweight to value characteristics detracted from return and the Fund reduced its exposure to value characteristics over the period. Additionally, overweights to stocks with greater financial risk and volatility added value as the market embraced risk. Over the period the Fund increased its exposure to stocks with strong long term momentum, however the shift did not capture the strong returns exhibited throughout the period and an average underweight detracted from performance. An underweight to the energy sector yielded positive returns relative to the benchmark while stock selection in technology detracted largely due to lower exposure to large cap technology names with strong returns.
Looking forward, larger cap stocks with higher levels of foreign revenue are increasingly attractive as foreign currency prices have stabilized and the dollar has weakened. We believe stocks with strong price momentum also continue to be favored. Return expectations for value oriented securities have come down as the market renews its focus on earnings growth and VIX remains at historically low levels. The Fund is tilted towards technology and health care and away from energy and capital goods.
The Portfolio Management Team
Los Angeles Capital Management and Equity Research, Inc.
Performance Update (unaudited) (continued)
Quaker Strategic Growth Fund (QUAGX, QAGCX, QAGIX)
SUB-ADVISER:
Los Angeles Capital Management and Equity Research, Inc.
TOTAL NET ASSETS:
AS OF JUNE 30, 2017
$71,550,550
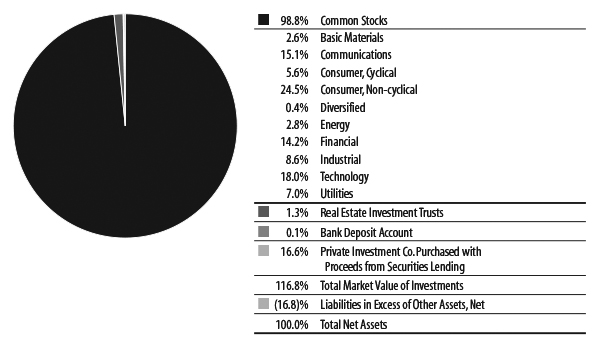
| Top 10 Holdings* (% of net assets) | | |
| Apple Inc. | 5.5% | |
| Amazon.com Inc. | 3.6% | |
| Facebook Inc. Cl A | 2.7% | |
| JPMorgan Chase & Co. | 2.1% | |
| Microsoft Corp. | 2.0% | |
| Deere & Co. | 2.0% | |
| Altria Group Inc. | 2.0% | |
| Alphabet Inc. Cl A&C | 1.8% | |
| The Dun & Bradstreet Corp. | 1.8% | |
| Broadcom Ltd. | 1.7% | |
| % Fund Total | 25.2% | |
| * Includes Long-Term Investments only. | | |
| Sectors (% of net assets) |
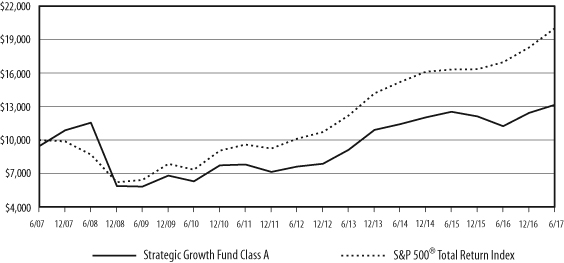
Performance Update (unaudited) (continued)
Quaker Strategic Growth Fund (QUAGX, QAGCX, QAGIX)
Growth of a Hypothetical $10,000 Investment
June 30, 2017
| Average Annualized Total Return |
| | | | | | | | | | Commencement |
| | | | | | | | | | of operations |
| | Expense | Inception | | | | | | | through |
| | Ratio* | Date | One Year | Five Year | Ten Year | 6/30/2017 |
| | | | with | without | with | without | with | without | with | without |
| | | | sales | sales | sales | sales | sales | sales | sales | sales |
| | | | charge | charge | charge | charge | charge | charge | charge | charge |
| Class A | 1.87% | 11/25/96 | 10.56% | 17.01% | 10.29% | 11.55% | 2.77% | 3.36% | 10.53% | 10.83% |
| Class C | 2.62% | 7/11/00 | 16.17% | 16.17% | 10.71% | 10.71% | 2.59% | 2.59% | 4.05% | 4.05% |
| Institutional Class | 1.62% | 7/20/00 | 17.32% | 17.32% | 11.82% | 11.82% | 3.63% | 3.63% | 5.00% | 5.00% |
| S&P 500® Total Return Index** | | | 17.90% | 17.90% | 14.63% | 14.63% | 7.18% | 7.18% | 7.82% | 7.82% |
| * | As stated in the Prospectus dated November 1, 2016. |
| ** | The benchmark since inception returns are calculated since commencement of November 25, 1996 through June 30, 2017. |
Performance data quoted represents past performance and is no guarantee of future results. Investment return and principal value will fluctuate so that shares, when redeemed, may be worth more or less than their original cost. Current performance may be lower or higher than performance data quoted. Performance data current to the most recent month end is available at www.quakerfunds.com or by calling us toll free at 800-220-8888. Total return includes reinvestment of dividends and capital gains.
Class A shares of the Fund have a maximum sales charge of 5.50%.
The performance table does not reflect the deduction of taxes that a shareholder might pay on fund distributions or the redemption of fund shares. Total return calculations reflect expense reimbursements and fee waivers in the applicable periods. See financial highlights for periods where fees were waived or reimbursed.
The Fund’s portfolio holdings may differ significantly from the securities held in the index and, unlike a mutual fund, an unmanaged index assumes no transaction costs, taxes, management fees or other expenses. You cannot invest directly in an index.
The S&P 500® Total Return Index (“S&P 500® Index”) is a widely recognized, unmanaged index consisting of the approximately 500 largest companies in the United States as measured by market capitalization. The S&P 500® Index assumes reinvestment of all dividends and distributions.
Expense Information (unaudited)
As a shareholder of the Fund, you incur two types of costs: (1) transaction costs, including applicable sales charges and redemption fees; and (2) ongoing costs, including management fees, distribution (12b-1) fees and other Fund expenses. This example is intended to help you understand your ongoing costs (in dollars) of investing in the Fund and to compare these costs with the ongoing costs of investing in other funds. The example is based on an investment of $1,000 invested at the beginning of the (six-month) period and held for the entire period January 1, 2017 through June 30, 2017.
ACTUAL EXPENSES
The first section of each table below provides information about actual account values and actual expenses for each of the Funds. You may use this information, together with the amount you invested, to estimate the expenses that you paid over the period. Simply divide your account value by $1,000 (for example, an $8,600 account value divided by $1,000 = 8.6), then multiply the result by the number in the applicable line under the heading entitled “Expenses Paid During the Period” to estimate the expenses you paid on your account during this period.
HYPOTHETICAL EXAMPLE FOR COMPARISON PURPOSES
The second section of each table below provides information about hypothetical account values and hypothetical expenses based on the Fund’s actual expense ratio and an assumed rate of return of 5% per year before expenses, which is not the Fund’s actual return. The hypothetical account values and expenses may not be used to estimate the actual ending account balance or expenses you paid for the period. You may use this information to compare the ongoing costs of investing in the Fund to other funds. To do so, compare this 5% hypothetical example with the 5% hypothetical examples that appear in the shareholder reports of the other funds. Please note that the expenses shown in the table are meant to highlight your ongoing costs only and do not reflect any transactional costs, such as sales charges (loads), redemption fees or exchange fees. Therefore, the second section of the table is useful in comparing ongoing costs only, and will not help you determine the relative total costs of owning different funds. In addition, if these transactional costs were included, your costs would have been higher.
| | | Beginning | Annualized | Ending | |
| | | Account Value | Expense Ratio | Account Value | Expenses Paid |
| | | (1/1/2017) | for the Period | (6/30/2017) | During Period* |
| Event Arbitrage | | | | | |
| Example based on actual return of: | | | | | |
| Class A | 6.03% | $1,000.00 | 1.99% | $1,060.30 | $10.17 |
| Class C | 5.59% | 1,000.00 | 2.74% | 1,055.90 | 13.97 |
| Institutional Class | 6.22% | 1,000.00 | 1.74% | 1,062.20 | 8.90 |
| Hypothetical example based on assumed 5% return: | | | | | |
| Class A | | 1,000.00 | 1.99% | 1,014.93 | 9.94 |
| Class C | | 1,000.00 | 2.74% | 1,011.21 | 13.66 |
| Institutional Class | | 1,000.00 | 1.74% | 1,016.17 | 8.70 |
Expense Information (unaudited) (continued)
| | | | Beginning | Annualized | Ending | |
| | | | Account Value | Expense Ratio | Account Value | Expenses Paid |
| | | | (1/1/2017) | for the Period | (6/30/2017) | During Period* |
| | Global Tactical Allocation | | | | | |
| | Example based on actual return of: | | | | | |
| | Class A | 3.11% | $1,000.00 | 1.90% | $1,031.10 | $ 9.57 |
| | Class C | 2.69% | 1,000.00 | 2.63% | 1,026.90 | 13.22 |
| | Institutional Class | 3.20% | 1,000.00 | 1.60% | 1,032.00 | 8.06 |
| | Hypothetical example based on assumed 5% return: | | | | | |
| | Class A | | 1,000.00 | 1.90% | 1,015.37 | 9.49 |
| | Class C | | 1,000.00 | 2.63% | 1,011.75 | 13.12 |
| | Institutional Class | | 1,000.00 | 1.60% | 1,016.86 | 8.00 |
| | Mid-Cap Value | | | | | |
| | Example based on actual return of: | | | | | |
| | Class A | 4.27% | 1,000.00 | 2.39% | 1,042.70 | 12.10 |
| | Class C | 3.90% | 1,000.00 | 3.14% | 1,039.00 | 15.87 |
| | Institutional Class | 4.41% | 1,000.00 | 2.15% | 1,044.10 | 10.90 |
| | Hypothetical example based on assumed 5% return: | | | | | |
| | Class A | | 1,000.00 | 2.39% | 1,012.94 | 11.93 |
| | Class C | | 1,000.00 | 3.14% | 1,009.22 | 15.64 |
| | Institutional Class | | 1,000.00 | 2.15% | 1,014.13 | 10.74 |
| | Small-Cap Value | | | | | |
| | Example based on actual return of: | | | | | |
| | Class A | 0.96% | 1,000.00 | 2.28% | 1,009.60 | 11.36 |
| | Class C | 0.63% | 1,000.00 | 3.03% | 1,006.30 | 15.07 |
| | Institutional Class | 1.07% | 1,000.00 | 2.03% | 1,010.70 | 10.12 |
| | Hypothetical example based on assumed 5% return: | | | | | |
| | Class A | | 1,000.00 | 2.28% | 1,013.49 | 11.38 |
| | Class C | | 1,000.00 | 3.03% | 1,009.77 | 15.10 |
| | Institutional Class | | 1,000.00 | 2.03% | 1,014.73 | 10.14 |
| | Strategic Growth | | | | | |
| | Example based on actual return of: | | | | | |
| | Class A | 5.77% | 1,000.00 | 2.19% | 1,057.70 | 11.17 |
| | Class C | 5.34% | 1,000.00 | 2.94% | 1,053.40 | 14.97 |
| | Institutional Class | 5.85% | 1,000.00 | 1.94% | 1,058.50 | 9.90 |
| | Hypothetical example based on assumed 5% return: | | | | | |
| | Class A | | 1,000.00 | 2.19% | 1,013.93 | 10.94 |
| | Class C | | 1,000.00 | 2.94% | 1,010.22 | 14.65 |
| | Institutional Class | | 1,000.00 | 1.94% | 1,015.17 | 9.69 |
| * | Expenses are equal to the Funds’ annualized six-month expense ratios multiplied by the average account value over the period multiplied by the number of days in the most recent fiscal half year (181) divided by 365 to reflect the one-half year period. |
Schedule of Investments
Quaker Event Arbitrage Fund
June 30, 2017
| | | Number | | | Fair | |
| | | of Shares | | | Value | |
| Long-Term Investments — 68.8% | | | | | | |
| Common Stocks — 44.6% | | | | | | |
| Basic Materials — 1.7% | | | | | | |
| Chemicals — 1.7% | | | | | | |
| MPM Holdings Inc. (a)(b) | | | 34,576 | | | $ | 515,182 | |
| Mining — 0.0% | | | | | | | | |
Sacre-Coeur Minerals Ltd. (a) f *^ | | | 109,444 | | | | 0 | |
Talvivaara Mining Co. PLC (a) f *^ | | | 123,845,509 | | | | 0 | |
| | | | | | | | 0 | |
| Total Basic Materials | | | | | | | | |
| (Cost $2,393,882) | | | | | | | 515,182 | |
| Communications — 4.8% | | | | | | | | |
| Internet — 4.6% | | | | | | | | |
30DC Inc. (a)• | | | 50,000 | | | | 353 | |
| comScore Inc. (a)(b) | | | 8,500 | | | | 223,125 | |
| Imperva Inc. (a) | | | 13,000 | | | | 622,050 | |
| Liberty Ventures (a) | | | 9,000 | | | | 470,610 | |
| WebMD Health Corp. (a)(b) | | | 1,071 | | | | 62,814 | |
| | | | | | | | 1,378,952 | |
| Telecommunications — 0.2% | | | | | | | | |
| NII Holdings Inc. (a) | | | 64,529 | | | | 51,881 | |
| Total Communications | | | | | | | | |
| (Cost $1,982,572) | | | | | | | 1,430,833 | |
| Consumer, Cyclical — 4.0% | | | | | | | | |
| Auto Parts & Equipment — 0.1% | | | | | | | | |
| Exide Technologies (a)^ | | | 5,926 | | | | 15,000 | |
| Distribution & Wholesale — 0.5% | | | | | | | | |
Medion AG f | | | 8,011 | | | | 160,030 | |
| Retail — 3.4% | | | | | | | | |
| Advance Auto Parts Inc. | | | 2,000 | | | | 233,180 | |
Punch Taverns PLC (a) f | | | 60,336 | | | | 140,667 | |
Signet Jewelers Ltd. (b) f | | | 2,500 | | | | 158,100 | |
| Walgreens Boots Alliance Inc. | | | 6,000 | | | | 469,860 | |
| | | | | | | | 1,001,807 | |
| Total Consumer, Cyclical | | | | | | | | |
| (Cost $1,848,825) | | | | | | | 1,176,837 | |
| Consumer, Non-cyclical — 16.5% | | | | | | | | |
| Agriculture — 0.6% | | | | | | | | |
Black Earth Farming Ltd. (a) f | | | 240,000 | | | | 197,989 | |
| Beverages — 2.2% | | | | | | | | |
Anheuser-Busch InBev NV - ADR f ** | | | 6,000 | | | | 662,160 | |
| Commercial Services — 1.1% | | | | | | | | |
GFK SE (a) f | | | 6,000 | | | | 320,065 | |
| Food — 3.3% | | | | | | | | |
| Mondelez International Inc. | | | 22,540 | | | | 973,503 | |
| Healthcare-Products — 0.1% | | | | | | | | |
| Strategic Environment Inc. (a)^ | | | 43,000 | | | | 19,002 | |
| Healthcare-Services — 2.5% | | | | | | | | |
| Brookdale Senior Living Inc. (a) | | | 29,650 | | | | 436,152 | |
| Envision Healthcare Corp. (a)(b) | | | 5,000 | | | | 313,350 | |
| | | | | | | | 749,502 | |
| Pharmaceuticals — 6.7% | | | | | | | | |
| AbbVie Inc. (b) | | | 3,030 | | | | 219,705 | |
| Bristol-Myers Squibb Co. | | | 4,000 | | | | 222,880 | |
Celesio AG f | | | 11,796 | | | | 360,398 | |
INYX Inc. (a)• | | | 167,850 | | | | 395 | |
Perrigo Co. PLC (b) f | | | 4,500 | | | | 339,840 | |
| Pfizer Inc. | | | 25,060 | | | | 841,765 | |
| | | | | | | | 1,984,983 | |
| Total Consumer, Non-cyclical | | | | | | | | |
| (Cost $4,827,354) | | | | | | | 4,907,204 | |
| Diversified — 1.3% | | | | | | | | |
| Holding Companies — 1.3% | | | | | | | | |
CF Corp. (a) f • | | | 11,400 | | | | 141,075 | |
Silver Run Acquisition Corp. II (a)• | | | 22,800 | | | | 243,846 | |
| Stoneleigh Partners | | | | | | | | |
| Acquisition Corp. (a)*^ | | | 400 | | | | 0 | |
| | | | | | | | 384,921 | |
| Total Diversified | | | | | | | | |
| (Cost $342,000) | | | | | | | 384,921 | |
| Energy — 0.1% | | | | | | | | |
| Oil & Gas — 0.1% | | | | | | | | |
| OGX Austria Petroleo e | | | | | | | | |
Gas SA-SP-ADR (a) f • | | | 55,075 | | | | 40,061 | |
| Total Energy | | | | | | | | |
| (Cost $667,925) | | | | | | | 40,061 | |
| Financial — 6.6% | | | | | | | | |
| Diversified Financial Services — 0.4% | | | | | | | | |
Guoco Group Ltd. f | | | 10,000 | | | | 114,634 | |
| Real Estate — 6.2% | | | | | | | | |
CA Immobilien Anlagen AG f | | | 38,800 | | | | 946,579 | |
Conwert Immobilien Invest SE f | | | 45,000 | | | | 877,345 | |
The accompanying notes are an integral part of the financial statements.
Schedule of Investments (continued)
Quaker Event Arbitrage Fund
June 30, 2017
| | | Number | | | Fair | |
| | | of Shares | | | Value | |
| Common Stocks — 44.6% (Continued) | | | | | | |
| Real Estate (Continued) | | | | | | |
| Safeway Casa Ley CVR (a)*^ | | | 47,000 | | | $ | 10,575 | |
| Safeway Property Development | | | | | | | | |
| Center LLC CVR (a)*^ | | | 47,000 | | | | 10,575 | |
| | | | | | | | 1,845,074 | |
| Total Financial | | | | | | | | |
| (Cost $1,357,972) | | | | | | | 1,959,708 | |
| Healthcare — 4.2% | | | | | | | | |
| Healthcare-Services — 4.2% | | | | | | | | |
| Diagnostic Services | | | | | | | | |
| Holdings Inc. (a)^ | | | 10,221 | | | | 1,240,529 | |
| Total Healthcare | | | | | | | | |
| (Cost $735,000) | | | | | | | 1,240,529 | |
| Industrial — 3.6% | | | | | | | | |
| Electronics — 3.6% | | | | | | | | |
| IEC Electronics Corp. (a) | | | 293,656 | | | | 1,057,162 | |
| Total Industrial | | | | | | | | |
| (Cost $1,263,275) | | | | | | | 1,057,162 | |
| Technology — 1.8% | | | | | | | | |
| Computers — 1.8% | | | | | | | | |
| Computer Horizons Corp. (a)*^ | | | 65,000 | | | | 0 | |
| Hewlett Packard Enterprise Co. | | | 32,500 | | | | 539,175 | |
| | | | | | | | 539,175 | |
| Total Technology | | | | | | | | |
| (Cost $545,525) | | | | | | | 539,175 | |
| Escrow Shares — 0.0% | | | | | | | | |
| Exide Technologies (a)*^ | | | 1,777 | | | | 0 | |
| Petrocorp Inc. (a)*^ | | | 200 | | | | 0 | |
| Total Escrow Shares | | | | | | | | |
| (Cost $1,687) | | | | | | | 0 | |
| Total Common Stocks | | | | | | | | |
| (Cost $15,966,017) | | | | | | | 13,251,612 | |
| Closed-End Mutual Fund — 5.5% | | | | | | | | |
| Altaba Inc. (a)** | | | 30,000 | | | | 1,634,400 | |
| Total Closed-End Mutual Fund | | | | | | | | |
| (Cost $1,601,700) | | | | | | | 1,634,400 | |
| Preferred Stocks — 3.6% | | | | | | | | |
| Energy — 0.0% | | | | | | | | |
| Oil & Gas — 0.0% | | | | | | | | |
| GeoMet Inc., Convertible Series A, | | | | | | | | |
12.500%, Perpetual*• | | | 3 | | | | 1 | |
| Total Energy | | | | | | | | |
| (Cost $17) | | | | | | | 1 | |
| Financial — 1.5% | | | | | | | | |
| Insurance — 0.1% | | | | | | | | |
| MBIA Insurance Corp., | | | | | | | | |
| 4.707%, Perpetual (a)*#^ | | | 10 | | | | 40,000 | |
| Mortgage Agencies — 1.4% | | | | | | | | |
| Federal Home Loan Mortgage Corp., | | | | | | | | |
| Series F, 5.000%, Perpetual (a) | | | 4,500 | | | | 37,125 | |
| Federal Home Loan Mortgage Corp., | | | | | | | | |
Series M, 0.000%, Perpetual (a)• | | | 9,500 | | | | 74,432 | |
| Federal Home Loan Mortgage Corp., | | | | | | | | |
Series Q, 0.000%, Perpetual (a)• | | | 1,000 | | | | 7,955 | |
| Federal Home Loan Mortgage Corp., | | | | | | | | |
Series S, 0.000%, Perpetual (a)• | | | 25,000 | | | | 203,500 | |
| Federal Home Loan Mortgage Corp., | | | | | | | | |
| Series V, 5.570%, Perpetual (a) | | | 8,300 | | | | 35,690 | |
| Federal Home Loan Mortgage Corp., | | | | | | | | |
| Series W, 5.660%, Perpetual (a) | | | 2,674 | | | | 11,124 | |
| Federal Home Loan Mortgage Corp., | | | | | | | | |
| Series X, 6.020%, Perpetual (a) | | | 10,000 | | | | 40,000 | |
| | | | | | | | 409,826 | |
| Total Financial | | | | | | | | |
| (Cost $1,099,271) | | | | | | | 449,826 | |
| Healthcare — 2.1% | | | | | | | | |
| Healthcare-Services — 2.1% | | | | | | | | |
| Diagnostic Services Holdings Inc., | | | | | | | | |
| 0.000% (a)*^ | | | 613 | | | | 613,000 | |
| Total Healthcare | | | | | | | | |
| (Cost $613,000) | | | | | | | 613,000 | |
| Total Preferred Stocks | | | | | | | | |
| (Cost $1,712,288) | | | | | | | 1,062,827 | |
| Real Estate Investment Trusts — 1.8% | | | | | | | | |
| New York REIT Inc. (b) | | | 33,000 | | | | 285,120 | |
| Taubman Centers Inc. | | | 4,000 | | | | 238,200 | |
| | | | | | | | 523,320 | |
| Total Real Estate Investment Trusts | | | | | | | | |
| (Cost $565,022) | | | | | | | 523,320 | |
| Structured Note — 3.0% | | | | | | | | |
| Heineken Holding NV Structured Note, | | | | | | | | |
Expiration: 2/27/2018 (a)• | | | 212 | | | | 895,216 | |
| Total Structured Note | | | | | | | | |
| (Cost $940,223) | | | | | | | 895,216 | |
The accompanying notes are an integral part of the financial statements.
Schedule of Investments (continued)
Quaker Event Arbitrage Fund
June 30, 2017
| | | Par | | | Fair | |
| | | Value | | | Value | |
| Asset Backed Securities — 0.7% | | | | | | |
| AFC Home Equity Loan Trust | | | | | | |
| Class 1A, Series 2000-2, | | | | | | |
1.810%, 06/25/2030• | | $ | 7,309 | | | $ | 6,688 | |
| Citigroup Mortgage Loan Trust Inc. | | | | | | | | |
| Class M3, Series 2005-OPT1, | | | | | | | | |
1.730%, 02/25/2035• | | | 186,182 | | | | 170,259 | |
| Countrywide Asset-Backed Certificates | | | | | | | | |
| Class 2M2, Series 2007-11, | | | | | | | | |
1.340%, 06/25/2047+• | | | 954,363 | | | | 14,338 | |
| Countrywide Home Equity Loan Trust | | | | | | | | |
| Class 2A, Series 2005-A, | | | | | | | | |
1.400%, 04/15/2035• | | | 15,358 | | | | 13,562 | |
| | | | | | | | 204,847 | |
| Total Asset Backed Securities | | | | | | | | |
| (Cost $202,688) | | | | | | | 204,847 | |
| Convertible Bonds — 1.7% | | | | | | | | |
| Consumer, Cyclical — 0.3% | | | | | | | | |
| Auto Parts & Equipment — 0.3% | | | | | | | | |
| Exide Technologies, | | | | | | | | |
7.000%, 04/30/2025• | | | 170,991 | | | | 94,045 | |
| Total Consumer, Cyclical | | | | | | | | |
| (Cost $164,698) | | | | | | | 94,045 | |
| Financial — 1.4% | | | | | | | | |
| Banks — 1.4% | | | | | | | | |
| BNP Paribas Fortis SA, 1.671%, | | | | | | | | |
Perpetual f • | | € | 500,000 | | | | 428,181 | |
| Total Financial | | | | | | | | |
| (Cost $557,174) | | | | | | | 428,181 | |
| Total Convertible Bonds | | | | | | | | |
| (Cost $721,872) | | | | | | | 522,226 | |
| Corporate Bonds — 7.0% | | | | | | | | |
| Consumer, Cyclical — 2.4% | | | | | | | | |
| Auto Parts & Equipment — 1.3% | | | | | | | | |
| Exide Technologies, | | | | | | | | |
| 8.625%, 02/12/2018*+^ | | $ | 1,000,000 | | | | 0 | |
| Exide Technologies, | | | | | | | | |
11.000%, 04/30/2022#• | | | 459,797 | | | | 383,930 | |
| | | | | | | | 383,930 | |
| Retail — 1.1% | | | | | | | | |
| The Neiman Marcus Group LLC, | | | | | | | | |
7.125%, 06/01/2028• | | | 500,000 | | | | 342,500 | |
| Total Consumer, Cyclical | | | | | | | | |
| (Cost $829,634) | | | | | | | 726,430 | |
| Consumer, Non-cyclical — 1.4% | | | | | | | | |
| Pharmaceuticals — 1.4% | | | | | | | | |
| Valeant Pharmaceuticals | | | | | | | | |
| International Inc., | | | | | | | | |
5.500%, 03/01/2023 f #• | | | 500,000 | | | | 424,370 | |
| Total Consumer, Non-cyclical | | | | | | | | |
| (Cost $382,782) | | | | | | | 424,370 | |
| Energy — 1.5% | | | | | | | | |
| Oil & Gas — 1.5% | | | | | | | | |
| Drill Rigs Holdings Inc., | | | | | | | | |
6.500%, 10/01/2017 f +#• | | | 1,000,000 | | | | 281,250 | |
| OGX Austria GMBH, | | | | | | | | |
8.500%, 06/01/2018 f *+• | | | 3,500,000 | | | | 35 | |
| Seadrill Ltd., | | | | | | | | |
5.625%, 09/15/2017 f #• | | | 550,000 | | | | 170,500 | |
| | | | | | | | 451,785 | |
| Total Energy | | | | | | | | |
| (Cost $700,105) | | | | | | | 451,785 | |
| Financial — 1.7% | | | | | | | | |
| Diversified Financial Services — 1.7% | | | | | | | | |
| Hellas Telecommunications | | | | | | | | |
| Luxembourg II SCA, | | | | | | | | |
0.000%, 01/15/2015 f *+#^ | | | 5,000,000 | | | | 25,000 | |
| Lehman Brothers Holdings Inc., | | | | | | | | |
7.000%, 01/28/2020*+• | | | 100,000 | | | | 6,125 | |
| Lehman Brothers Holdings Inc., | | | | | | | | |
5.500%, 02/27/2020*+• | | | 100,000 | | | | 6,125 | |
| Lehman Brothers Holdings Inc., | | | | | | | | |
8.250%, 09/23/2020*+• | | | 100,000 | | | | 6,125 | |
| Lehman Brothers Holdings Inc., | | | | | | | | |
8.750%, 02/14/2023*+• | | | 200,000 | | | | 12,250 | |
| Lehman Brothers Holdings Inc., | | | | | | | | |
4.550%, 12/29/2099*+• | | | 110,000 | | | | 6,875 | |
| Lehman Brothers Holdings Inc., | | | | | | | | |
5.320%, 12/29/2099*+• | | | 130,000 | | | | 7,963 | |
| Twin Reefs Pass-Through Trust, | | | | | | | | |
| 0.000%, Perpetual*+#^ | | | 1,000,000 | | | | 420,000 | |
| | | | | | | | 490,463 | |
The accompanying notes are an integral part of the financial statements.
Schedule of Investments (continued)
Quaker Event Arbitrage Fund
June 30, 2017
| | | Par | | | Fair | |
| | | Value | | | Value | |
| Corporate Bonds — 7.0% (Continued) | | | | | | |
| Venture Capital — 0.0% | | | | | | |
| Infinity Capital Group, | | | | | | |
| 7.000%, 12/31/2049*+^ | | $ | 25,000 | | | $ | 0 | |
| Total Financial | | | | | | | | |
| (Cost $610,000) | | | | | | | 490,463 | |
| Total Corporate Bonds | | | | | | | | |
| (Cost $2,522,521) | | | | | | | 2,093,048 | |
| Mortgage Backed Securities — 0.9% | | | | | | | | |
| Federal Home Loan Mortgage | | | | | | | | |
| Corp. Class IG, Series 3756, | | | | | | | | |
4.000%, 11/15/2037• | | | 650,339 | | | | 11,837 | |
| GSR Mortgage Loan Trust | | | | | | | | |
| Class B2, Series 2005-5F, | | | | | | | | |
5.740%, 06/25/2035• | | | 616,266 | | | | 246,495 | |
| | | | | | | | 258,332 | |
| Total Mortgage Backed Securities | | | | | | | | |
| (Cost $577,150) | | | | | | | 258,332 | |
| Escrow Notes — 0.0% | | | | | | | | |
| Mirant Corp.*+^ | | | 20,000 | | | | 0 | |
| NewPage Corp.*+^ | | | 300,000 | | | | 0 | |
| | | | | | | | 0 | |
| Total Escrow Notes | | | | | | | | |
| (Cost $198,770) | | | | | | | 0 | |
| Total Long-Term Investments | | | | | | | | |
| (Cost $25,008,251) | | | | | | | 20,445,828 | |
| | | | | | | | | |
| | | Number | | | | | |
| | | of Contracts | | | | | |
| | | (100 Shares | | | | | |
| | | Per Contract) | | | | | |
| Purchased Options — 1.4% | | | | | | | | |
| Call Options — 1.1% | | | | | | | | |
| Advance Auto Parts Inc., | | | | | | | | |
| Expiration: September, 2017 | | | | | | | | |
| Exercise Price: $135.00 | | | 45 | | | | 7,200 | |
| Buffalo Wild Wings Inc., | | | | | | | | |
| Expiration: September, 2017 | | | | | | | | |
| Exercise Price: $145.00 | | | 45 | | | | 11,250 | |
| Chipotle Mexican Grill Inc., | | | | | | | | |
| Expiration: September, 2017 | | | | | | | | |
| Exercise Price: $450.00 | | | 20 | | | | 17,120 | |
| Depomed Inc., | | | | | | | | |
| Expiration: September, 2017 | | | | | | | | |
Exercise Price: $11.00• | | | 280 | | | | 34,300 | |
| The Hain Celestial Group Inc., | | | | | | | | |
| Expiration: November, 2017 | | | | | | | | |
| Exercise Price: $38.00 | | | 400 | | | | 155,200 | |
| Hess Corp., | | | | | | | | |
| Expiration: July, 2017 | | | | | | | | |
| Exercise Price: $43.50 | | | 173 | | | | 29,410 | |
| The Kraft Heinz Co., | | | | | | | | |
| Expiration: October, 2017 | | | | | | | | |
| Exercise Price: $90.00 | | | 400 | | | | 64,800 | |
| SPDR S&P500 ETF Trust, | | | | | | | | |
| Expiration: September, 2017 | | | | | | | | |
| Exercise Price: $260.00 | | | 200 | | | | 2,200 | |
| Valeant Pharmaceuticals International Inc., | | | | | | | | |
| Expiration: January, 2018 | | | | | | | | |
| Exercise Price: $30.00 | | | 100 | | | | 6,100 | |
| Total Call Options | | | | | | | | |
| (Cost $330,438) | | | | | | | 327,580 | |
| Put Options — 0.3% | | | | | | | | |
| Cisco Systems Inc., | | | | | | | | |
| Expiration: September, 2017 | | | | | | | | |
| Exercise Price: $32.00 | | | 24 | | | | 3,648 | |
| CurrencyShares Euro Trust, | | | | | | | | |
| Expiration: September, 2017 | | | | | | | | |
| Exercise Price: $109.00 | | | 370 | | | | 25,530 | |
| International Business Machines Corp., | | | | | | | | |
| Expiration: September, 2017 | | | | | | | | |
| Exercise Price: $155.00 | | | 4 | | | | 2,256 | |
| Juniper Networks Inc., | | | | | | | | |
| Expiration: October, 2017 | | | | | | | | |
| Exercise Price: $28.00 | | | 29 | | | | 4,582 | |
| NetApp Inc., | | | | | | | | |
| Expiration: September, 2017 | | | | | | | | |
| Exercise Price: $40.00 | | | 19 | | | | 3,610 | |
| Oracle Corp., | | | | | | | | |
| Expiration: September, 2017 | | | | | | | | |
| Exercise Price: $50.00 | | | 17 | | | | 2,635 | |
| SPDR S&P500 ETF Trust, | | | | | | | | |
| Expiration: September, 2017 | | | | | | | | |
| Exercise Price: $230.00 | | | 200 | | | | 47,200 | |
| Total Put Options | | | | | | | | |
| (Cost $127,078) | | | | | | | 89,461 | |
| Total Purchased Options | | | | | | | | |
| (Cost $457,516) | | | | | | | 417,041 | |
The accompanying notes are an integral part of the financial statements.
Schedule of Investments (continued)
Quaker Event Arbitrage Fund
June 30, 2017
| | | Par | | | Fair | |
| | | Value | | | Value | |
| Bank Deposit Account — 16.0% | | | | | | |
| U.S. Bank, N.A., 0.30% | | $ | 4,741,307 | | | $ | 4,741,307 | |
| Total Bank Deposit Account | | | | | | | | |
| (Cost $4,741,307) | | | | | | | 4,741,307 | |
| | | Units | | | | | |
| Private Investment Co. Purchased with | | | | | | | | |
| Proceeds from Securities Lending — 4.3% | | | | | | | | |
| Mount Vernon Liquid Assets | | | | | | | | |
| Portfolio LLC, 1.33% (c)(d) | | | 1,268,709 | | | | 1,268,709 | |
| Total Private Investment Co. Purchased | | | | | | | | |
| with Proceeds from Securities Lending | | | | | | | | |
| (Cost $1,268,709) | | | | | | | 1,268,709 | |
| Total Investments | | | | | | | | |
| (Cost $31,475,783) — 90.5% | | | | | | | 26,872,885 | |
| Other Assets in Excess | | | | | | | | |
| of Liabilities, Net 9.5% | | | | | | | 2,828,207 | |
| Total Net Assets — 100.0% | | | | | | $ | 29,701,092 | |
| | | Number | | | | | |
| | | of Shares | | | | | |
| Schedule of Securities Sold Short (a) | | | | | | | | |
| Common Stocks — 6.8% | | | | | | | | |
| Communications — 6.8% | | | | | | | | |
| Internet —5.5 % | | | | | | | | |
Alibaba Group Holding Ltd. - ADR f | | | 11,540 | | | | 1,625,986 | |
| Media —1.3 % | | | | | | | | |
| Liberty Broadband Corp. Series C | | | 4,452 | | | | 386,211 | |
| Total Common Stocks | | | | | | | 2,012,197 | |
| Total Securities Sold Short | | | | | | | | |
| (Proceeds $1,771,098) | | | | | | $ | 2,012,197 | |
| | | | | | | | | |
| | | Number | | | | | |
| | | of Contracts | | | | | |
| | | (100 Shares | | | | | |
| | | Per Contract) | | | | | |
| Written Options | | | | | | | | |
| Call Options | | | | | | | | |
| AbbVie Inc., Expiration: July, 2017 | | | | | | | | |
Exercise Price: $71.00• | | | 30 | | | | 5,340 | |
| Advance Auto Parts Inc., | | | | | | | | |
| Expiration: September, 2017 | | | | | | | | |
| Exercise Price: $140.00 | | | 45 | | | | 3,825 | |
| Buffalo Wild Wings Inc., | | | | | | | | |
| Expiration: September, 2017 | | | | | | | | |
Exercise Price: $150.00• | | | 45 | | | | 7,200 | |
| Chipotle Mexican Grill Inc., | | | | | | | | |
| Expiration: September, 2017 | | | | | | | | |
| Exercise Price: $470.00 | | | 20 | | | | 9,000 | |
| Cisco Systems Inc., | | | | | | | | |
| Expiration: September, 2017 | | | | | | | | |
| Exercise Price: $32.00 | | | 24 | | | | 1,776 | |
| CurrencyShares Euro Trust, | | | | | | | | |
| Expiration: September, 2017 | | | | | | | | |
| Exercise Price: $109.00 | | | 370 | | | | 87,320 | |
| Envision Healthcare Corp., | | | | | | | | |
| Expiration: July, 2017 | | | | | | | | |
| Exercise Price: $65.00 | | | 50 | | | | 2,600 | |
| The Hain Celestial Group Inc., | | | | | | | | |
| Expiration: November, 2017 | | | | | | | | |
| Exercise Price: $41.00 | | | 400 | | | | 101,600 | |
| International Business Machines Corp., | | | | | | | | |
| Expiration: September, 2017 | | | | | | | | |
| Exercise Price: $155.00 | | | 4 | | | | 1,508 | |
| Juniper Networks Inc., | | | | | | | | |
| Expiration: October, 2017 | | | | | | | | |
| Exercise Price: $28.00 | | | 29 | | | | 4,176 | |
| The Kraft Heinz Co., | | | | | | | | |
| Expiration: October, 2017 | | | | | | | | |
| Exercise Price: $92.50 | | | 400 | | | | 40,400 | |
| Mondelez International Inc., | | | | | | | | |
| Expiration: July, 2017 | | | | | | | | |
| Exercise Price: $45.00 | | | 225 | | | | 5,850 | |
| NetApp Inc., | | | | | | | | |
| Expiration: September, 2017 | | | | | | | | |
Exercise Price: $40.00• | | | 19 | | | | 3,715 | |
| Oracle Corp., | | | | | | | | |
| Expiration: September, 2017 | | | | | | | | |
| Exercise Price: $50.00 | | | 17 | | | | 3,111 | |
| Perrigo Co. PLC, | | | | | | | | |
| Expiration: July, 2017 | | | | | | | | |
Exercise Price: $73.50• | | | 45 | | | | 13,500 | |
| Pfizer Inc., | | | | | | | | |
| Expiration: July, 2017 | | | | | | | | |
| Exercise Price: $33.50 | | | 100 | | | | 4,500 | |
| Pfizer Inc., | | | | | | | | |
| Expiration: July, 2017 | | | | | | | | |
| Exercise Price: $34.50 | | | 100 | | | | 900 | |
| Total Call Options | | | | | | | | |
| (Premiums Received $215,918) | | | | | | | 296,321 | |
The accompanying notes are an integral part of the financial statements.
Schedule of Investments (continued)
Quaker Event Arbitrage Fund
June 30, 2017
| | | Number | | | | |
| | | of Contracts | | | | |
| | | (100 Shares | | | Fair | |
| | | Per Contract) | | | Value | |
| Written Options (Continued) | | | | | | |
| Put Options | | | | | | |
| Advance Auto Parts Inc., | | | | | | |
| Expiration: July, 2017 | | | | | | |
| Exercise Price: $120.00 | | | 20 | | | $ | 9,700 | |
| Buffalo Wild Wings Inc., | | | | | | | | |
| Expiration: July, 2017 | | | | | | | | |
| Exercise Price: $130.00 | | | 30 | | | | 14,100 | |
| Chipotle Mexican Grill Inc., | | | | | | | | |
| Expiration: July, 2017 | | | | | | | | |
| Exercise Price: $420.00 | | | 10 | | | | 10,020 | |
| Depomed Inc., | | | | | | | | |
| Expiration: September, 2017 | | | | | | | | |
Exercise Price: $11.00• | | | 280 | | | | 39,900 | |
| Encana Corp., | | | | | | | | |
| Expiration: July, 2017 | | | | | | | | |
| Exercise Price: $8.00 | | | 250 | | | | 2,500 | |
| Gigamon Inc., | | | | | | | | |
| Expiration: July, 2017 | | | | | | | | |
| Exercise Price: $40.00 | | | 100 | | | | 16,700 | |
| The Procter & Gamble Co., | | | | | | | | |
| Expiration: July, 2017 | | | | | | | | |
Exercise Price: $89.50• | | | 60 | | | | 17,910 | |
| Total Put Options | | | | | | | | |
| (Premiums Received $85,583) | | | | | | | 110,830 | |
| Total Written Options | | | | | | | | |
| (Premiums Received $301,501) | | | | | | $ | 407,151 | |
ADR - American Depositary Receipt
CVR - Contingent Value Rights
€ - Euro
| (a) | Non-income producing security. |
| (b) | All or a portion of the security is out on loan. The total market value of securities on loan was $1,243,416. The remaining contractual maturity of all of the securities lending transactions is overnight and continuous. |
| (c) | Rate shown is the annualized seven-day yield at period end. |
| (d) | Represents investments of collateral received from securities lending transactions. Refer to Note 12 of Notes to the Financial Statements for additional information. |
| f | Foreign issued security. |
| * | Indicates an illiquid security. Total market value for illiquid securities is $1,164,649, representing 3.9% of net assets. |
| ** | All or a portion of the shares have been committed as collateral for open securities sold short or written options. |
| + | Defaulted bonds. |
| # | Restricted security that may be sold to “qualified institutional buyers” pursuant to the conditions of Rule 144A under the Securities Act of 1933, as amended. |
| | The coupon rate shown on floating or adjustable rate securities represents the rate at period end. |
| • | Level 2 securities. |
| ^ | Indicates a fair valued security. Total market value for fair valued securities is $2,393,681 representing 8.1% of net assets and Level 3 securities. |
The accompanying notes are an integral part of the financial statements.
Schedule of Investments
Quaker Global Tactical Allocation Fund
June 30, 2017
| | | Number | | | Fair | |
| | | of Shares | | | Value | |
| Long-Term Investments — 88.1% | | | | | | |
| Common Stocks — 27.0% | | | | | | |
| Basic Materials — 1.0% | | | | | | |
| Chemicals — 1.0% | | | | | | |
| The Mosaic Co. | | | 3,000 | | | $ | 68,490 | |
| Total Basic Materials (Cost $81,430) | | | | | | | 68,490 | |
| Communications — 6.5% | | | | | | | | |
| Media — 1.5% | | | | | | | | |
| Twenty-First Century Fox Inc. Cl B | | | 3,700 | | | | 103,119 | |
| Telecommunications — 5.0% | | | | | | | | |
| AT&T Inc. | | | 4,200 | | | | 158,466 | |
| Verizon Communications Inc. | | | 4,000 | | | | 178,640 | |
| | | | | | | | 337,106 | |
| Total Communications | | | | | | | | |
| (Cost $474,579) | | | | | | | 440,225 | |
| Consumer, Cyclical — 1.8% | | | | | | | | |
| Airlines — 0.2% | | | | | | | | |
| AMR Corp. Escrow (a)*^ | | | 7,600 | | | | 14,364 | |
| Auto Manufacturers — 1.6% | | | | | | | | |
| General Motors Co. | | | 3,000 | | | | 104,790 | |
| Total Consumer, Cyclical | | | | | | | | |
| (Cost $106,023) | | | | | | | 119,154 | |
| Consumer, Non-cyclical — 3.9% | | | | | | | | |
| Beverages — 2.2% | | | | | | | | |
| Molson Coors Brewing Co. | | | 1,700 | | | | 146,778 | |
| Food — 1.3% | | | | | | | | |
Nestle SA f | | | 1,000 | | | | 87,200 | |
| Pharmaceuticals — 0.4% | | | | | | | | |
Mallinckrodt PLC (a) f | | | 600 | | | | 26,886 | |
| Total Consumer, Non-cyclical | | | | | | | | |
| (Cost $274,028) | | | | | | | 260,864 | |
| Diversified — 0.9% | | | | | | | | |
| Holding Companies — 0.9% | | | | | | | | |
CK Hutchison Holdings Ltd. f | | | 5,000 | | | | 62,625 | |
| Total Diversified (Cost $60,044) | | | | | | | 62,625 | |
| Energy — 4.7% | | | | | | | | |
| Pipelines — 4.7% | | | | | | | | |
| Cheniere Energy Partners LP | | | 1,229 | | | | 39,820 | |
Enbridge Inc. f | | | 831 | | | | 33,082 | |
| Enterprise Products Partners LP | | | 1,392 | | | | 37,696 | |
| Magellan Midstream Partners LP | | | 522 | | | | 37,203 | |
| MPLX LP | | | 980 | | | | 32,732 | |
| ONEOK Partners LP | | | 845 | | | | 43,154 | |
| Plains All American Pipeline LP | | | 1,105 | | | | 29,028 | |
| Tesoro Logistics LP | | | 635 | | | | 32,823 | |
| Western Gas Partners LP | | | 615 | | | | 34,403 | |
| | | | | | | | 319,941 | |
| Total Energy (Cost $313,151) | | | | | | | 319,941 | |
| Industrial — 1.9% | | | | | | | | |
| Miscellaneous Manufacturing — 1.9% | | | | | | | | |
| General Electric Co. | | | 4,800 | | | | 129,648 | |
| Total Industrial (Cost $144,658) | | | | | | | 129,648 | |
| Technology — 6.3% | | | | | | | | |
| Semiconductors — 4.1% | | | | | | | | |
| Microsemi Corp. (a) | | | 2,200 | | | | 102,960 | |
| QUALCOMM Inc. | | | 3,200 | | | | 176,704 | |
| | | | | | | | 279,664 | |
| Software — 2.2% | | | | | | | | |
| Microsoft Corp. | | | 2,200 | | | | 151,646 | |
| Total Technology (Cost $436,386) | | | | | | | 431,310 | |
| Total Common Stocks | | | | | | | | |
| Cost ($1,890,299) | | | | | | | 1,832,257 | |
| Closed-End Mutual Fund — 0.5% | | | | | | | | |
| Ares Capital Corp. | | | 2,242 | | | | 36,724 | |
| Total Closed-End Mutual Fund | | | | | | | | |
| Cost ($35,547) | | | | | | | 36,724 | |
| Exchange Traded Funds — 5.3% | | | | | | | | |
| iShares MSCI United Kingdom ETF | | | 6,250 | | | | 208,312 | |
| PowerShares DB Commodity | | | | | | | | |
| Index Tracking Fund (a) | | | 10,760 | | | | 155,482 | |
| Total Exchange Traded Funds | | | | | | | | |
| Cost ($369,732) | | | | | | | 363,794 | |
| Preferred Stocks — 3.6% | | | | | | | | |
| Consumer, Cyclical — 0.8% | | | | | | | | |
| Auto Manufacturers — 0.8% | | | | | | | | |
| Porsche Automobil | | | | | | | | |
Holding SE - ADR f | | | 10,000 | | | | 55,800 | |
| Total Consumer, Cyclical | | | | | | | | |
| (Cost $52,502) | | | | | | | 55,800 | |
| Energy — 0.5% | | | | | | | | |
| Pipelines — 0.5% | | | | | | | | |
| Kinder Morgan Inc., | | | | | | | | |
| Convertible, Series A, 9.750% | | | 729 | | | | 31,989 | |
| Total Energy (Cost $35,518) | | | | | | | 31,989 | |
The accompanying notes are an integral part of the financial statements.
Schedule of Investments (continued)
Quaker Global Tactical Allocation Fund
June 30, 2017
| | | Number | | | Fair | |
| | | of Shares | | | Value | |
| Preferred Stocks — 3.6% (Continued) | | | | | | |
| Financial — 1.1% | | | | | | |
| Banks — 0.5% | | | | | | |
| Barclays Bank PLC, | | | | | | |
Series 5, 8.125%, Perpetual f | | | 1,365 | | | $ | 36,295 | |
| Insurance — 0.6% | | | | | | | | |
| PartnerRe Ltd., | | | | | | | | |
Series I, 5.875%, Perpetual f | | | 1,485 | | | | 38,966 | |
| Total Financial (Cost $72,065) | | | | | | | 75,261 | |
| Real Estate Investment Trusts — 1.2% | | | | | | | | |
| Public Storage, | | | | | | | | |
| Series V, 5.375%, Perpetual | | | 1,620 | | | | 40,905 | |
| Taubman Centers Inc., | | | | | | | | |
| Series K, 6.250%, Perpetual | | | 1,490 | | | | 37,757 | |
| | | | | | | | 78,662 | |
| Total Real Estate Investment Trusts | | | | | | | | |
| (Cost $75,073) | | | | | | | 78,662 | |
| Total Preferred Stocks | | | | | | | | |
| (Cost $235,158) | | | | | | | 241,712 | |
| Real Estate Investment Trusts — 7.2% | | | | | | | | |
| Apartment Investment & | | | | | | | | |
| Management Co. | | | 1,514 | | | | 65,057 | |
| Colony NorthStar Inc., Cl A | | | 4,344 | | | | 61,207 | |
| Dupont Fabros Technology Inc. | | | 1,365 | | | | 83,483 | |
| Lamar Advertising Co. | | | 921 | | | | 67,758 | |
| MGM Growth Properties LLC | | | 2,500 | | | | 72,975 | |
| Prologis Inc. | | | 1,244 | | | | 72,948 | |
| Weyerhaeuser Co. | | | 1,960 | | | | 65,660 | |
| | | | | | | | 489,088 | |
| Total Real Estate Investment Trusts | | | | | | | | |
| (Cost $426,643) | | | | | | | 489,088 | |
| | | Par | | | | | |
| | | Value | | | | | |
| Corporate Bonds — 44.4% | | | | | | | | |
| Basic Materials — 2.0% | | | | | | | | |
| Chemicals — 2.0% | | | | | | | | |
| CF Industries Inc., | | | | | | | | |
3.450%, 06/01/2023• | | $ | 70,000 | | | | 66,150 | |
| Monsanto Co., | | | | | | | | |
2.750%, 07/15/2021• | | | 70,000 | | | | 70,660 | |
| | | | | | | | 136,810 | |
| Total Basic Materials (Cost $133,565) | | | | | | | 136,810 | |
| Communications — 5.2% | | | | | | | | |
| Internet — 1.0% | | | | | | | | |
eBay Inc., 2.200%, 08/01/2019• | | | 70,000 | | | | 70,280 | |
| Media — 1.1% | | | | | | | | |
| Discovery Communications LLC, | | | | | | | | |
4.375%, 06/15/2021• | | | 70,000 | | | | 73,885 | |
| Telecommunications — 3.1% | | | | | | | | |
AT&T Inc., 2.800%, 02/17/2021• | | | 70,000 | | | | 70,743 | |
| CenturyLink Inc., | | | | | | | | |
7.500%, 04/01/2024• | | | 70,000 | | | | 76,650 | |
| Frontier Communications Corp., | | | | | | | | |
11.000%, 09/15/2025• | | | 70,000 | | | | 64,925 | |
| | | | | | | | 212,318 | |
| Total Communications | | | | | | | | |
| (Cost $359,218) | | | | | | | 356,483 | |
| Consumer, Cyclical — 3.1% | | | | | | | | |
| Home Builders — 1.2% | | | | | | | | |
KB Home, 7.500%, 09/15/2022• | | | 70,000 | | | | 79,013 | |
| Retail — 1.9% | | | | | | | | |
| JC Penney Corp. Inc., | | | | | | | | |
5.650%, 06/01/2020• | | | 70,000 | | | | 68,863 | |
| Toys R Us Inc., | | | | | | | | |
7.375%, 10/15/2018• | | | 66,000 | | | | 59,400 | |
| | | | | | | | 128,263 | |
| Total Consumer, Cyclical | | | | | | | | |
| (Cost $210,051) | | | | | | | 207,276 | |
| Consumer, Non-cyclical — 9.5% | | | | | | | | |
| Agriculture — 1.1% | | | | | | | | |
| Altria Group Inc., | | | | | | | | |
4.750%, 05/05/2021• | | | 70,000 | | | | 76,350 | |
| Beverages — 1.0% | | | | | | | | |
| Molson Coors Brewing Co., | | | | | | | | |
2.100%, 07/15/2021• | | | 70,000 | | | | 68,836 | |
| Biotechnology — 1.1% | | | | | | | | |
| Gilead Sciences Inc., | | | | | | | | |
4.400%, 12/01/2021• | | | 70,000 | | | | 75,516 | |
| Commercial Services — 2.1% | | | | | | | | |
| Quad/Graphics Inc., | | | | | | | | |
7.000%, 05/01/2022• | | | 70,000 | | | | 71,283 | |
| RR Donnelley & Sons Co., | | | | | | | | |
7.000%, 02/15/2022• | | | 70,000 | | | | 73,237 | |
| | | | | | | | 144,520 | |
The accompanying notes are an integral part of the financial statements.
Schedule of Investments (continued)
Quaker Global Tactical Allocation Fund
June 30, 2017
| | | Par | | | Fair | |
| | | Value | | | Value | |
| Corporate Bonds — 44.4% (Continued) | | | | | | |
| Food — 2.1% | | | | | | |
| Campbell Soup Co., | | | | | | |
4.250%, 04/15/2021• | | $ | 70,000 | | | $ | 74,486 | |
| SUPERVALU Inc., | | | | | | | | |
6.750%, 06/01/2021• | | | 70,000 | | | | 68,600 | |
| | | | | | | | 143,086 | |
| Healthcare-Services — 1.1% | | | | | | | | |
Cigna Corp., 4.500%, 03/15/2021• | | | 70,000 | | | | 74,690 | |
| Pharmaceuticals — 1.0% | | | | | | | | |
| Teva Pharmaceutical Finance | | | | | | | | |
| Netherlands III BV, | | | | | | | | |
2.200%, 07/21/2021 f • | | | 70,000 | | | | 68,716 | |
| Total Consumer, Non-cyclical | | | | | | | | |
| (Cost $645,217) | | | | | | | 651,714 | |
| Energy — 4.9% | | | | | | | | |
| Oil & Gas — 3.9% | | | | | | | | |
Apache Corp., 3.625%, 02/01/2021• | | | 70,000 | | | | 72,208 | |
Chevron Corp., 2.100%, 05/16/2021• | | | 70,000 | | | | 69,788 | |
Ensco PLC, 4.500%, 10/01/2024 f • | | | 70,000 | | | | 53,900 | |
| Shell International Finance BV, | | | | | | | | |
1.875%, 05/10/2021 f • | | | 70,000 | | | | 69,142 | |
| | | | | | | | 265,038 | |
| Oil & Gas Services — 1.0% | | | | | | | | |
SESI LLC, 6.375%, 05/01/2019• | | | 70,000 | | | | 69,125 | |
| Total Energy (Cost $341,156) | | | | | | | 334,163 | |
| Financial — 9.6% | | | | | | | | |
| Banks — 6.5% | | | | | | | | |
| Bank of America Corp., | | | | | | | | |
2.625%, 10/19/2020• | | | 80,000 | | | | 80,807 | |
| Bank of Montreal, | | | | | | | | |
1.780%, 07/31/2018 f• | | | 70,000 | | | | 70,331 | |
| Citigroup Inc., | | | | | | | | |
2.350%, 08/02/2021• | | | 70,000 | | | | 69,364 | |
| The Goldman Sachs Group Inc., | | | | | | | | |
2.313%, 04/23/2020• | | | 70,000 | | | | 71,169 | |
| JPMorgan Chase & Co., | | | | | | | | |
4.350%, 08/15/2021• | | | 70,000 | | | | 74,925 | |
| Wells Fargo & Co., | | | | | | | | |
2.230%, 12/07/2020• | | | 70,000 | | | | 71,017 | |
| | | | | | | | 437,613 | |
| Insurance — 1.0% | | | | | | | | |
| Genworth Holdings Inc., | | | | | | | | |
6.515%, 05/22/2018• | | | 70,000 | | | | 69,912 | |
| Private Equity — 1.1% | | | | | | | | |
| Icahn Enterprises LP, | | | | | | | | |
6.000%, 08/01/2020• | | | 70,000 | | | | 72,056 | |
| Real Estate Investment Trusts — 1.0% | | | | | | | | |
| Simon Property Group LP, | | | | | | | | |
2.500%, 07/15/2021• | | | 70,000 | | | | 70,012 | |
| Total Financial (Cost $645,935) | | | | | | | 649,593 | |
| Industrial — 3.2% | | | | | | | | |
| Aerospace & Defense — 1.1% | | | | | | | | |
| Kratos Defense & Security Solutions Inc., | | | | | | | | |
7.000%, 05/15/2019• | | | 70,000 | | | | 71,225 | |
| Engineering & Construction — 1.0% | | | | | | | | |
MasTec Inc., 4.875%, 03/15/2023• | | | 70,000 | | | | 69,825 | |
| Machinery-Diversified — 1.1% | | | | | | | | |
| Xerium Technologies Inc., | | | | | | | | |
9.500%, 08/15/2021• | | | 70,000 | | | | 74,375 | |
| Total Industrial (Cost $208,938) | | | | | | | 215,425 | |
| Technology — 5.8% | | | | | | | | |
| Computers — 1.0% | | | | | | | | |
| Seagate HDD Cayman, | | | | | | | | |
4.875%, 06/01/2027 f • | | | 65,000 | | | | 64,913 | |
| Office & Business Equipment — 1.1% | | | | | | | | |
Xerox Corp., 4.500%, 05/15/2021• | | | 70,000 | | | | 73,322 | |
| Semiconductors — 2.1% | | | | | | | | |
| Analog Devices Inc., | | | | | | | | |
2.500%, 12/05/2021• | | | 70,000 | | | | 70,063 | |
| Micron Technology Inc., | | | | | | | | |
5.875%, 02/15/2022• | | | 70,000 | | | | 73,238 | |
| | | | | | | | 143,301 | |
| Software — 1.6% | | | | | | | | |
| BMC Software Inc., | | | | | | | | |
7.250%, 06/01/2018• | | | 37,000 | | | | 38,295 | |
Oracle Corp., 1.900%, 09/15/2021• | | | 70,000 | | | | 69,384 | |
| | | | | | | | 107,679 | |
| Total Technology (Cost $379,912) | | | | | | | 389,215 | |
| Utilities — 1.1% | | | | | | | | |
| Electric — 1.1% | | | | | | | | |
DPL Inc., 7.250%, 10/15/2021• | | | 70,000 | | | | 74,900 | |
| Total Utilities (Cost $72,183) | | | | | | | 74,900 | |
| Total Corporate Bonds | | | | | | | | |
| Cost ($2,996,175) | | | | | | | 3,015,579 | |
The accompanying notes are an integral part of the financial statements.
Schedule of Investments (continued)
Quaker Global Tactical Allocation Fund
June 30, 2017
| | | Par | | | Fair | |
| | | Value | | | Value | |
| Mortgage Backed Security — 0.1% | | | | | | |
| Federal Home Loan | | | | | | |
| Mortgage Corp., Class IG, | | | | | | |
Series 3756, 4.000%, 11/15/2037• | | $ | 570,473 | | | $ | 10,383 | |
| Total Mortgage Backed Security | | | | | | | | |
| Cost ($16,186) | | | | | | | 10,383 | |
| Total Long-Term Investments | | | | | | | | |
| Cost ($5,969,740) | | | | | | | 5,989,537 | |
| Bank Deposit Account— 11.2% | | | | | | | | |
| U.S. Bank, N.A., 0.30% | | | 759,323 | | | | 759,323 | |
| Total Bank Deposit Account | | | | | | | | |
| Cost ($759,323) | | | | | | | 759,323 | |
| Total Investments | | | | | | | | |
| (Cost $6,729,063) — 99.3% | | | | | | | 6,748,860 | |
| Other Assets in Excess | | | | | | | | |
| of Liabilities, Net 0.7% | | | | | | | 44,760 | |
| Total Net Assets — 100.0% | | | | | | $ | 6,793,620 | |
ADR - American Depositary Receipt
| (a) | Non-income producing security. |
| f | Foreign issued security. |
| * | Indicates an illiquid security. Total market value for illiquid securities is $14,364, representing 0.2% of net assets. |
| | The coupon rate shown on floating or adjustable rate securities represents the rate at period end. |
| • | Level 2 securities. |
| ^ | Indicates a fair valued security. Total market value for fair valued securities is $14,364, representing 0.2% of net assets and Level 3 securities. |
The accompanying notes are an integral part of the financial statements.
Schedule of Investments
Quaker Mid-Cap Value Fund
June 30, 2017
| | | Number | | | Fair | |
| | | of Shares | | | Value | |
| Long-Term Investments — 96.0% | | | | | | |
| Common Stocks — 83.4% | | | | | | |
| Basic Materials — 5.6% | | | | | | |
| Chemicals — 2.2% | | | | | | |
| Westlake Chemical Corp. | | | 2,298 | | | $ | 152,151 | |
| Iron & Steel — 3.4% | | | | | | | | |
| Reliance Steel & Aluminum Co. | | | 1,909 | | | | 138,994 | |
| Steel Dynamics Inc. (b) | | | 2,918 | | | | 104,494 | |
| | | | | | | | 243,488 | |
| Total Basic Materials (Cost $342,873) | | | | | | | 395,639 | |
| Consumer, Cyclical — 14.1% | | | | | | | | |
| Auto Manufacturers — 1.9% | | | | | | | | |
| PACCAR Inc. | | | 2,056 | | | | 135,778 | |
| Auto Parts & Equipment — 3.4% | | | | | | | | |
| The Goodyear Tire & Rubber Co. | | | 3,801 | | | | 132,883 | |
| Lear Corp. | | | 752 | | | | 106,844 | |
| | | | | | | | 239,727 | |
| Home Furnishings — 1.1% | | | | | | | | |
| Whirlpool Corp. (b) | | | 419 | | | | 80,289 | |
| Leisure Time — 3.8% | | | | | | | | |
| Brunswick Corp. | | | 2,485 | | | | 155,884 | |
| Norwegian Cruise Line | | | | | | | | |
Holdings Ltd. (a) f | | | 2,025 | | | | 109,937 | |
| | | | | | | | 265,821 | |
| Retail — 0.8% | | | | | | | | |
| Casey’s General Stores Inc. | | | 528 | | | | 56,554 | |
| Textiles — 1.0% | | | | | | | | |
| Mohawk Industries Inc. (a) | | | 299 | | | | 72,265 | |
| Toys/Games & Hobbies — 2.1% | | | | | | | | |
| Hasbro Inc. (b) | | | 1,318 | | | | 146,970 | |
| Total Consumer, Cyclical | | | | | | | | |
| (Cost $815,386) | | | | | | | 997,404 | |
| Consumer, Non-cyclical — 5.8% | | | | | | | | |
| Food — 1.6% | | | | | | | | |
| Ingredion Inc. | | | 938 | | | | 111,819 | |
| Healthcare-Services — 2.5% | | | | | | | | |
| Centene Corp. (a) | | | 2,217 | | | | 177,094 | |
| Pharmaceuticals — 1.7% | | | | | | | | |
Mylan NV (a) f | | | 3,128 | | | | 121,429 | |
| Total Consumer, Non-cyclical | | | | | | | | |
| (Cost $349,043) | | | | | | | 410,342 | |
| Energy — 8.1% | | | | | | | | |
| Oil & Gas — 7.0% | | | | | | | | |
| Concho Resources Inc. (a) | | | 965 | | | | 117,276 | |
| Diamond Offshore Drilling Inc. (a)(b) | | | 2,066 | | | | 22,375 | |
| Helmerich & Payne Inc. (b) | | | 2,039 | | | | 110,799 | |
| Marathon Oil Corp. | | | 6,041 | | | | 71,586 | |
| Newfield Exploration Co. (a)(b) | | | 2,229 | | | | 63,437 | |
| Tesoro Corp. | | | 1,183 | | | | 110,729 | |
| | | | | | | | 496,202 | |
| Oil & Gas Services — 1.1% | | | | | | | | |
| RPC Inc. (b) | | | 3,731 | | | | 75,404 | |
| Total Energy (Cost $612,567) | | | | | | | 571,606 | |
| Financial — 17.2% | | | | | | | | |
| Banks — 8.6% | | | | | | | | |
| Bank of the Ozarks Inc. | | | 2,574 | | | | 120,643 | |
| East West Bancorp Inc. (b) | | | 3,217 | | | | 188,452 | |
| Huntington Bancshares Inc. | | | 12,082 | | | | 163,349 | |
| PacWest Bancorp (b) | | | 2,901 | | | | 135,477 | |
| | | | | | | | 607,921 | |
| Diversified Financial Services — 1.3% | | | | | | | | |
| T. Rowe Price Group Inc. | | | 1,301 | | | | 96,547 | |
| Insurance — 7.3% | | | | | | | | |
| Lincoln National Corp. | | | 2,280 | | | | 154,082 | |
| Reinsurance Group of America Inc. Cl A | | | 1,622 | | | | 208,249 | |
| Torchmark Corp. | | | 2,050 | | | | 156,825 | |
| | | | | | | | 519,156 | |
| Total Financial (Cost $854,136) | | | | | | | 1,223,624 | |
| Industrial — 14.3% | | | | | | | | |
| Aerospace & Defense — 2.0% | | | | | | | | |
| Teledyne Technologies Inc. (a) | | | 1,124 | | | | 143,479 | |
| Electronics — 5.4% | | | | | | | | |
| Avnet Inc. | | | 1,419 | | | | 55,171 | |
| Garmin Ltd. (b)f | | | 1,931 | | | | 98,539 | |
| Trimble Inc. (a)(b) | | | 3,367 | | | | 120,101 | |
| Woodward Inc. | | | 1,565 | | | | 105,762 | |
| | | | | | | | 379,573 | |
| Machinery-Diversified — 1.9% | | | | | | | | |
| Roper Technologies Inc. (b) | | | 584 | | | | 135,213 | |
| Miscellaneous Manufacturing — 1.1% | | | | | | | | |
| Carlisle Cos. Inc. | | | 847 | | | | 80,804 | |
The accompanying notes are an integral part of the financial statements.
Schedule of Investments (continued)
Quaker Mid-Cap Value Fund
June 30, 2017
| | | Number | | | Fair | |
| | | of Shares | | | Value | |
| Common Stocks — 83.4% (Continued) | | | | | | |
| Transportation — 3.9% | | | | | | |
| Kirby Corp. (a) | | | 1,525 | | | $ | 101,946 | |
| Old Dominion Freight Line Inc. | | | 1,818 | | | | 173,146 | |
| | | | | | | | 275,092 | |
| Total Industrial (Cost $800,914) | | | | | | | 1,014,161 | |
| Technology — 8.4% | | | | | | | | |
| Computers — 3.6% | | | | | | | | |
| CSRA Inc. (b) | | | 3,212 | | | | 101,981 | |
| Western Digital Corp. | | | 1,724 | | | | 152,746 | |
| | | | | | | | 254,727 | |
| Semiconductors — 3.0% | | | | | | | | |
| ON Semiconductor Corp. (a)(b) | | | 9,153 | | | | 128,508 | |
| Skyworks Solutions Inc. (b) | | | 928 | | | | 89,042 | |
| | | | | | | | 217,550 | |
| Software — 1.8% | | | | | | | | |
| Synopsys Inc. (a) | | | 1,738 | | | | 126,752 | |
| Total Technology (Cost $399,683) | | | | | | | 599,029 | |
| Utilities — 9.9% | | | | | | | | |
| Electric — 5.9% | | | | | | | | |
| CenterPoint Energy Inc. | | | 4,386 | | | | 120,089 | |
| DTE Energy Co. | | | 1,439 | | | | 152,232 | |
| Xcel Energy Inc. | | | 3,244 | | | | 148,835 | |
| | | | | | | | 421,156 | |
| Gas — 2.0% | | | | | | | | |
| UGI Corp. | | | 2,898 | | | | 140,292 | |
| Water — 2.0% | | | | | | | | |
| Aqua America Inc. | | | 4,202 | | | | 139,927 | |
| Total Utilities (Cost $514,416) | | | | | | | 701,375 | |
| Total Common Stocks | | | | | | | | |
| (Cost $4,689,018) | | | | | | | 5,913,180 | |
| Real Estate Investment Trusts — 12.6% | | | | | | | | |
| Alexandria Real Estate Equities Inc. (b) | | | 1,230 | | | | 148,178 | |
| AvalonBay Communities Inc. (b) | | | 572 | | | | 109,921 | |
| Brixmor Property Group Inc. | | | 5,505 | | | | 98,429 | |
| CyrusOne Inc. (b) | | | 2,364 | | | | 131,793 | |
| Duke Realty Corp. | | | 4,991 | | | | 139,499 | |
| Gaming and Leisure Properties Inc. (b) | | | 3,475 | | | | 130,903 | |
| Sun Communities Inc. (b) | | | 1,513 | | | | 132,675 | |
| | | | | | | | 891,398 | |
| Total Real Estate Investment Trusts | | | | | | | | |
| (Cost $766,316) | | | | | | | 891,398 | |
| Total Long-Term Investments | | | | | | | | |
| (Cost $5,455,334) | | | | | | | 6,804,578 | |
| | | Par | | | | | |
| | | Value | | | | | |
| Bank Deposit Account — 4.3% | | | | | | | | |
| U.S. Bank, N.A., 0.30% | | $ | 307,524 | | | | 307,524 | |
| Total Bank Deposit Account | | | | | | | | |
| (Cost $307,524) | | | | | | | 307,524 | |
| | | Units | | | | | |
| Private Investment Co. Purchased with | | | | | | | | |
| Proceeds from Securities Lending — 29.1% | | | | | | | | |
| Mount Vernon Liquid Assets | | | | | | | | |
| Portfolio LLC, 1.33% (c)(d) | | | 2,060,060 | | | | 2,060,060 | |
| Total Private Investment Co. Purchased | | | | | | | | |
| with Proceeds from Securities Lending | | | | | | | | |
| (Cost $2,060,060) | | | | | | | 2,060,060 | |
| Total Investments | | | | | | | | |
| (Cost $7,822,918) — 129.4% | | | | | | | 9,172,162 | |
| Liabilities in Excess | | | | | | | | |
| of Other Assets, Net (29.4)% | | | | | | | (2,083,355 | ) |
| Total Net Assets — 100.0% | | | | | | $ | 7,088,807 | |
| (a) | Non-income producing security. |
| (b) | All or a portion of the security is out on loan. The total market value of securities on loan was $2,022,215. The remaining contractual maturity of all of the securities lending transactions is overnight and continuous. |
| (c) | The rate shown is the annualized seven-day yield at period end. |
| (d) | Represents investments of collateral received from securities lending transactions. Refer to Note 12 of Notes to the Financial Statements for additional information. |
| f | Foreign issued security. |
The accompanying notes are an integral part of the financial statements.
Schedule of Investments
Quaker Small-Cap Value Fund
June 30, 2017
| | | Number | | | Fair | |
| | | of Shares | | | Value | |
| Long-Term Investments — 98.6% | | | | | | |
| Common Stocks — 91.7% | | | | | | |
| Basic Materials — 3.2% | | | | | | |
| Chemicals — 1.4% | | | | | | |
| Cabot Corp. | | | 1,358 | | | $ | 72,558 | |
| Chemours Co. | | | 3,015 | | | | 114,329 | |
| KMG Chemicals Inc. | | | 1,899 | | | | 92,424 | |
Orion Engineered Carbons SA f | | | 6,680 | | | | 133,266 | |
| | | | | | | | 412,577 | |
| Forest Products & Paper — 0.4% | | | | | | | | |
| Mercer International Inc. | | | 9,415 | | | | 108,273 | |
| Mining — 1.4% | | | | | | | | |
Constellium NV (a) f | | | 9,495 | | | | 65,516 | |
Dominion Diamond Corp. f | | | 13,122 | | | | 164,812 | |
Silvercorp Metals Inc. f | | | 29,012 | | | | 92,258 | |
Taseko Mines Ltd. (a) f | | | 55,790 | | | | 70,853 | |
| | | | | | | | 393,439 | |
| Total Basic Materials | | | | | | | | |
| (Cost $858,738) | | | | | | | 914,289 | |
| Communications — 5.2% | | | | | | | | |
| Internet — 3.2% | | | | | | | | |
| 1-800-Flowers.com Inc. (a) | | | 12,623 | | | | 123,074 | |
| Autobytel Inc. (a) | | | 6,502 | | | | 81,990 | |
| DHI Group Inc. (a) | | | 36,355 | | | | 103,612 | |
Points International Ltd. (a) f | | | 3,860 | | | | 34,894 | |
Quarterhill Inc. f | | | 42,870 | | | | 61,733 | |
| Travelzoo Inc. (a) | | | 8,046 | | | | 88,103 | |
| Web.com Group Inc. (a)(b) | | | 6,650 | | | | 168,245 | |
| XO Group Inc. (a) | | | 6,332 | | | | 111,570 | |
| Zix Corp. (a)(b) | | | 25,797 | | | | 146,785 | |
| | | | | | | | 920,006 | |
| Media — 1.6% | | | | | | | | |
| Gannett Co. Inc. | | | 10,142 | | | | 88,438 | |
| John Wiley & Sons Inc. | | | 377 | | | | 19,887 | |
| MSG Networks Inc. (a) | | | 9,502 | | | | 213,320 | |
| Time Inc. | | | 8,739 | | | | 125,405 | |
| | | | | | | | 447,050 | |
| Telecommunications — 0.4% | | | | | | | | |
| Black Box Corp. (b) | | | 8,981 | | | | 76,788 | |
| Telephone & Data Systems Inc. (b) | | | 1,375 | | | | 38,156 | |
| | | | | | | | 114,944 | |
| Total Communications | | | | | | | | |
| (Cost $1,658,394) | | | | | | | 1,482,000 | |
| Consumer, Cyclical — 12.8% | | | | | | | | |
| Airlines — 1.7% | | | | | | | | |
| Hawaiian Holdings Inc. (a)(b) | | | 3,652 | | | | 171,462 | |
| JetBlue Airways Corp. (a) | | | 4,357 | | | | 99,470 | |
| Spirit Airlines Inc. (a)(b) | | | 4,371 | | | | 225,762 | |
| | | | | | | | 496,694 | |
| Auto Manufacturers — 0.6% | | | | | | | | |
| Wabash National Corp. (b) | | | 8,404 | | | | 184,720 | |
| Auto Parts & Equipment — 4.0% | | | | | | | | |
| Commercial Vehicle Group Inc. (a) | | | 9,305 | | | | 78,627 | |
| Lear Corp. | | | 2,264 | | | | 321,669 | |
| SORL Auto Parts Inc. (a)(b) | | | 14,556 | | | | 97,234 | |
| Tenneco Inc. | | | 4,886 | | | | 282,557 | |
| Tower International Inc. | | | 6,692 | | | | 150,236 | |
| Visteon Corp. (a) | | | 2,166 | | | | 221,062 | |
| | | | | | | | 1,151,385 | |
| Entertainment — 1.0% | | | | | | | | |
| Pinnacle Entertainment Inc. (a)(b) | | | 11,516 | | | | 227,556 | |
| RCI Hospitality Holdings Inc. | | | 2,929 | | | | 69,828 | |
| | | | | | | | 297,384 | |
| Home Builders — 0.8% | | | | | | | | |
| M/I Homes Inc. (a)(b) | | | 7,541 | | | | 215,296 | |
| Leisure Time — 1.7% | | | | | | | | |
| Brunswick Corp. | | | 1,265 | | | | 79,353 | |
| Liberty TripAdvisor Holdings Inc. (a) | | | 8,156 | | | | 94,610 | |
| Malibu Boats Inc. (a) | | | 4,989 | | | | 129,065 | |
| MCBC Holdings Inc. (a) | | | 9,627 | | | | 188,208 | |
| | | | | | | | 491,236 | |
| Lodging — 0.3% | | | | | | | | |
| Monarch Casino & Resort Inc. (a) | | | 2,453 | | | | 74,203 | |
| Office Furnishings — 0.6% | | | | | | | | |
| Kimball International Inc. | | | 9,412 | | | | 157,086 | |
| Retail — 2.1% | | | | | | | | |
| Barnes & Noble Inc. | | | 11,863 | | | | 90,159 | |
| Bed Bath & Beyond Inc. | | | 445 | | | | 13,528 | |
| Del Frisco’s Restaurant Group Inc. (a)(b) | | | 4,035 | | | | 64,963 | |
| Haverty Furniture Cos. Inc. | | | 5,252 | | | | 131,825 | |
| Office Depot Inc. | | | 22,565 | | | | 127,267 | |
| World Fuel Services Corp. | | | 4,843 | | | | 186,213 | |
| | | | | | | | 613,955 | |
| Total Consumer, Cyclical | | | | | | | | |
| (Cost $3,286,417) | | | | | | | 3,681,959 | |
The accompanying notes are an integral part of the financial statements.
Schedule of Investments (continued)
Quaker Small-Cap Value Fund
June 30, 2017
| | | Number | | | Fair | |
| | | of Shares | | | Value | |
| Common Stocks — 91.7% (Continued) | | | | | | |
| Consumer, Non-cyclical — 22.8% | | | | | | |
| Agriculture — 0.6% | | | | | | |
Adecoagro SA (a) f | | | 10,366 | | | $ | 103,556 | |
| Turning Point Brands Inc. (a) | | | 3,714 | | | | 56,973 | |
| | | | | | | | 160,529 | |
| Beverages — 0.2% | | | | | | | | |
| Coca-Cola Bottling Co. Consolidated | | | 208 | | | | 47,605 | |
| Biotechnology — 1.8% | | | | | | | | |
| Applied Genetic | | | | | | | | |
| Technologies Corp. (a) | | | 24,743 | | | | 126,189 | |
| CytomX Therapeutics Inc. (a) | | | 6,177 | | | | 95,744 | |
| Pfenex Inc. (a) | | | 8,201 | | | | 32,886 | |
| Retrophin Inc. (a)(b) | | | 7,939 | | | | 153,937 | |
| RTI Surgical Inc. (a) | | | 19,969 | | | | 116,819 | |
| | | | | | | | 525,575 | |
| Commercial Services — 7.6% | | | | | | | | |
| Aaron’s Inc. | | | 4,947 | | | | 192,438 | |
| American Public Education Inc. (a)(b) | | | 2,307 | | | | 54,561 | |
| Bridgepoint Education Inc. (a)(b) | | | 7,733 | | | | 114,139 | |
| CAI International Inc. (a) | | | 3,964 | | | | 93,550 | |
| Capella Education Co. (b) | | | 581 | | | | 49,734 | |
| CorVel Corp. (a) | | | 3,155 | | | | 149,705 | |
| CRA International Inc. | | | 3,963 | | | | 143,936 | |
| Ennis Inc. | | | 8,120 | | | | 155,092 | |
| Everi Holdings Inc. (a) | | | 12,651 | | | | 92,099 | |
| ManpowerGroup Inc. | | | 1,954 | | | | 218,164 | |
| Medifast Inc. | | | 4,183 | | | | 173,469 | |
| Neff Corp. (a) | | | 6,183 | | | | 117,477 | |
| Net 1 UEPS Technologies Inc. (a) | | | 9,559 | | | | 94,252 | |
| Nutrisystem Inc. (b) | | | 1,989 | | | | 103,528 | |
| Quanta Services Inc. (a) | | | 7,410 | | | | 243,937 | |
| RPX Corp. (a) | | | 12,771 | | | | 178,155 | |
| | | | | | | | 2,174,236 | |
| Food — 1.3% | | | | | | | | |
| Dean Foods Co. | | | 8,387 | | | | 142,579 | |
| Sanderson Farms Inc. (b) | | | 1,971 | | | | 227,946 | |
| | | | | | | | 370,525 | |
| Healthcare-Products — 3.2% | | | | | | | | |
| Exactech Inc. (a)(b) | | | 3,714 | | | | 110,677 | |
| Haemonetics Corp. (a) | | | 3,500 | | | | 138,215 | |
| Halyard Health Inc. (a) | | | 7,049 | | | | 276,885 | |
| Lantheus Holdings Inc. (a) | | | 5,527 | | | | 97,552 | |
| Meridian Bioscience Inc. | | | 4,575 | | | | 72,056 | |
Orthofix International NV (a) f | | | 4,698 | | | | 218,363 | |
| | | | | | | | 913,748 | |
| Healthcare-Services — 2.9% | | | | | | | | |
| Addus HomeCare Corp. (a) | | | 2,949 | | | | 109,703 | |
| Chemed Corp. (b) | | | 425 | | | | 86,925 | |
| LHC Group Inc. (a) | | | 2,100 | | | | 142,569 | |
Nobilis Health Corp. (a) f | | | 47,393 | | | | 90,047 | |
| Providence Services Corp. (a) | | | 3,641 | | | | 184,271 | |
| Psychemedics Corp. | | | 4,075 | | | | 101,671 | |
| RadNet Inc. (a) | | | 15,989 | | | | 123,915 | |
| | | | | | | | 839,101 | |
| Pharmaceuticals — 5.2% | | | | | | | | |
| BioSpecifics Technologies Corp. (a) | | | 1,762 | | | | 87,237 | |
| Catalent Inc. (a) | | | 4,967 | | | | 174,342 | |
| Catalyst Pharmaceuticals Inc. (a) | | | 36,774 | | | | 101,496 | |
| Corcept Therapeutics Inc. (a) | | | 8,219 | | | | 96,984 | |
| Eagle Pharmaceuticals Inc. (a)(b) | | | 1,108 | | | | 87,410 | |
Endo International PLC (a) f | | | 7,249 | | | | 80,971 | |
| Heska Corp. (a)(b) | | | 963 | | | | 98,293 | |
| Kindred Biosciences Inc. (a) | | | 10,201 | | | | 87,729 | |
Mallinckrodt PLC (a)(b) f | | | 1,952 | | | | 87,469 | |
| Omega Protein Corp. (b) | | | 5,524 | | | | 98,880 | |
| Phibro Animal Health Corp. | | | 5,151 | | | | 190,845 | |
| Vanda Pharmaceuticals Inc. (a) | | | 12,575 | | | | 204,972 | |
| VIVUS Inc. (a)(b) | | | 86,205 | | | | 105,170 | |
| | | | | | | | 1,501,798 | |
| Total Consumer, Non-cyclical | | | | | | | | |
| (Cost $5,969,011) | | | | | | | 6,533,117 | |
| Energy — 2.5% | | | | | | | | |
| Coal — 0.3% | | | | | | | | |
| Hallador Energy Co. | | | 10,062 | | | | 78,182 | |
| Energy-Alternate Sources — 1.1% | | | | | | | | |
| Renewable Energy Group Inc. (a) | | | 13,813 | | | | 178,878 | |
| REX American Resources Corp. (a)(b) | | | 1,315 | | | | 126,977 | |
| | | | | | | | 305,855 | |
| Oil & Gas — 0.2% | | | | | | | | |
| Geopark Ltd. (a)f | | | 8,282 | | | | 62,529 | |
| Oil & Gas Services — 0.9% | | | | | | | | |
| Exterran Corp. (a) | | | 3,403 | | | | 90,860 | |
McDermott International Inc. (a) f | | | 22,396 | | | | 160,579 | |
The accompanying notes are an integral part of the financial statements.
Schedule of Investments (continued)
Quaker Small-Cap Value Fund
June 30, 2017
| | | Number | | | Fair | |
| | | of Shares | | | Value | |
| Common Stocks — 91.7% (Continued) | | | | | | |
| Oil & Gas Services (Continued) | | | | | | |
North American Energy Partners Inc. f | | | 2,064 | | | $ | 9,082 | |
| | | | | | | | 260,521 | |
| Total Energy (Cost $626,185) | | | | | | | 707,087 | |
| Financial — 16.7% | | | | | | | | |
| Banks — 6.8% | | | | | | | | |
| Central Pacific Financial Corp. | | | 9,242 | | | | 290,846 | |
| Financial Institutions Inc. | | | 4,983 | | | | 148,493 | |
| First Connecticut Bancorp Inc. | | | 949 | | | | 24,342 | |
| Independent Bank Corp. | | | 7,761 | | | | 168,802 | |
| Northeast Bancorp | | | 2,044 | | | | 41,595 | |
| Old Second Bancorp Inc. | | | 9,162 | | | | 105,821 | |
| Peoples Bancorp Inc. | | | 3,163 | | | | 101,627 | |
Popular Inc. f | | | 4,798 | | | | 200,125 | |
| QCR Holdings Inc. | | | 3,246 | | | | 153,860 | |
| State Bank Financial Corp. | | | 2,674 | | | | 72,519 | |
| Synovus Financial Corp. | | | 7,401 | | | | 327,420 | |
| United Community Banks Inc. | | | 11,721 | | | | 325,844 | |
| | | | | | | | 1,961,294 | |
| Diversified Financial Services — 2.9% | | | | | | | | |
| Enova International Inc. (a) | | | 3,391 | | | | 50,356 | |
| Evercore Partners Inc. (b) | | | 2,008 | | | | 141,564 | |
| GAMCO Investors Inc. | | | 2,147 | | | | 63,551 | |
| INTL FCStone Inc. (a) | | | 4,152 | | | | 156,780 | |
Lazard Ltd. f | | | 5,087 | | | | 235,681 | |
| LPL Financial Holdings Inc. | | | 1,613 | | | | 68,488 | |
| R1 RCM Inc. (a) | | | 6,332 | | | | 23,745 | |
| Regional Management Corp. (a) | | | 3,723 | | | | 87,974 | |
| | | | | | | | 828,139 | |
| Insurance — 6.5% | | | | | | | | |
| Argo Group | | | | | | | | |
International Holdings Ltd. f | | | 4,288 | | | | 259,853 | |
Aspen Insurance Holdings Ltd. f | | | 1,098 | | | | 54,735 | |
Assured Guaranty Ltd. (b) f | | | 7,745 | | | | 323,276 | |
| CNO Financial Group Inc. | | | 7,121 | | | | 148,687 | |
Everest Re Group Ltd. f | | | 66 | | | | 16,803 | |
| MGIC Investment Corp. (a) | | | 9,736 | | | | 109,043 | |
| Reinsurance Group of America Inc. Cl A | | | 2,634 | | | | 338,179 | |
| Stewart Information Services Corp. (b) | | | 4,600 | | | | 208,748 | |
| Universal Insurance Holdings Inc. (b) | | | 4,249 | | | | 107,075 | |
| Voya Financial Inc. | | | 8,310 | | | | 306,556 | |
| | | | | | | | 1,872,955 | |
| Real Estate — 0.5% | | | | | | | | |
| RMR Group Inc. | | | 2,993 | | | | 145,610 | |
| Total Financial (Cost $4,267,558) | | | | | | | 4,807,998 | |
| Industrial — 15.2% | | | | | | | | |
| Aerospace & Defense — 1.9% | | | | | | | | |
| Moog Inc. (a) | | | 3,655 | | | | 262,137 | |
| Spirit AeroSystems Holdings Inc. (b) | | | 4,712 | | | | 273,013 | |
| | | | | | | | 535,150 | |
| Building Materials — 2.5% | | | | | | | | |
| Boise Cascade Co. (a) | | | 4,917 | | | | 149,477 | |
| Continental Building Products Inc. (a) | | | 9,612 | | | | 223,960 | |
| Owens Corning | | | 5,068 | | | | 339,150 | |
| | | | | | | | 712,587 | |
| Electrical Components & Equipment — 0.7% | | | | | | | | |
| Advanced Energy Industries Inc. (a) | | | 3,251 | | | | 210,307 | |
| Electronics — 3.7% | | | | | | | | |
Celestica Inc. (a) f | | | 13,271 | | | | 180,220 | |
| Jabil Inc. (b) | | | 8,165 | | | | 238,336 | |
| KEMET Corp. (a) | | | 6,759 | | | | 86,515 | |
| Kimball Electronics Inc. (a) | | | 6,902 | | | | 124,581 | |
| Vishay Intertechnology Inc. (b) | | | 19,876 | | | | 329,942 | |
| Zagg Inc. (a) | | | 12,458 | | | | 107,762 | |
| | | | | | | | 1,067,356 | |
| Engineering & Construction — 1.6% | | | | | | | | |
| Argan Inc. | | | 1,855 | | | | 111,300 | |
| MYR Group Inc. (a) | | | 5,057 | | | | 156,868 | |
| Orion Group Holdings Inc. (a) | | | 12,175 | | | | 90,947 | |
| Sterling Construction Co. Inc. (a) | | | 8,256 | | | | 107,906 | |
| | | | | | | | 467,021 | |
| Machinery-Diversified — 1.0% | | | | | | | | |
| Applied Industrial Technologies Inc. | | | 5,008 | | | | 295,723 | |
| Metal Fabricate & Hardware — 1.0% | | | | | | | | |
| Atkore International Group Inc. (a) | | | 5,565 | | | | 125,491 | |
| Global Brass & Copper Holdings Inc. | | | 4,942 | | | | 150,978 | |
| | | | | | | | 276,469 | |
| Miscellaneous Manufacturing — 2.1% | | | | | | | | |
| Core Molding Technologies Inc. (a) | | | 4,047 | | | | 87,456 | |
| FreightCar America Inc. (b) | | | 5,065 | | | | 88,080 | |
| Myers Industries Inc. | | | 7,683 | | | | 137,910 | |
Trinseo SA f | | | 4,057 | | | | 278,716 | |
| | | | | | | | 592,162 | |
The accompanying notes are an integral part of the financial statements.
Schedule of Investments (continued)
Quaker Small-Cap Value Fund
June 30, 2017
| | | Number | | | Fair | |
| | | of Shares | | | Value | |
| Common Stocks — 91.7% (Continued) | | | | | | |
| Packaging & Containers — 0.3% | | | | | | |
| UFP Technologies Inc. (a) | | | 3,264 | | | $ | 92,371 | |
| Transportation — 0.4% | | | | | | | | |
Euronav NV f | | | 2,573 | | | | 20,327 | |
| Radiant Logistics Inc. (a) | | | 17,235 | | | | 92,724 | |
| | | | | | | | 113,051 | |
| Total Industrial | | | | | | | | |
| (Cost $3,832,514) | | | | | | | 4,362,197 | |
| Technology — 10.2% | | | | | | | | |
| Computers — 0.3% | | | | | | | | |
| Insight Enterprises Inc. (a) | | | 2,331 | | | | 93,217 | |
| Semiconductors — 4.9% | | | | | | | | |
| Alpha & Omega | | | | | | | | |
Semiconductor Ltd. (a)f | | | 4,459 | | | | 74,332 | |
| Amkor Technology Inc. (a)(b) | | | 16,056 | | | | 156,867 | |
| Cabot Microelectronics Corp. | | | 324 | | | | 23,921 | |
| Cohu Inc. | | | 6,652 | | | | 104,702 | |
| Diodes Inc. (a) | | | 5,357 | | | | 128,729 | |
| IXYS Corp. (a) | | | 9,287 | | | | 152,771 | |
| Kulicke & Soffa Industries Inc. (a) | | | 11,005 | | | | 209,315 | |
Nova Measuring Instruments Ltd. (a) f | | | 2,935 | | | | 64,834 | |
| Photronics Inc. (a)(b) | | | 14,972 | | | | 140,737 | |
| Rudolph Technologies Inc. (a)(b) | | | 2,922 | | | | 66,768 | |
| Teradyne Inc. | | | 9,240 | | | | 277,477 | |
| | | | | | | | 1,400,453 | |
| Software — 5.0% | | | | | | | | |
| American Software Inc. (b) | | | 6,080 | | | | 62,563 | |
| Aspen Technology Inc. (a) | | | 5,899 | | | | 325,979 | |
| Bazaarvoice Inc. (a) | | | 13,189 | | | | 65,286 | |
| Cadence Design Systems Inc. (a) | | | 4,371 | | | | 146,385 | |
| MicroStrategy Inc. (a) | | | 1,638 | | | | 313,955 | |
| Progress Software Corp. | | | 8,479 | | | | 261,916 | |
| Quality Systems Inc. (a)(b) | | | 15,235 | | | | 262,194 | |
| | | | | | | | 1,438,278 | |
| Total Technology | | | | | | | | |
| (Cost $2,572,709) | | | | | | | 2,931,948 | |
| Utilities — 3.1% | | | | | | | | |
| Electric — 2.1% | | | | | | | | |
| AES Corp. (b) | | | 23,673 | | | | 263,007 | |
| El Paso Electric Co. | | | 1,268 | | | | 65,556 | |
| Portland General Electric Co. | | | 5,837 | | | | 266,692 | |
| | | | | | | | 595,255 | |
| Gas — 1.0% | | | | | | | | |
| UGI Corp. | | | 5,993 | | | | 290,121 | |
| Total Utilities (Cost $769,891) | | | | | | | 885,376 | |
| Total Common Stocks | | | | | | | | |
| (Cost $23,841,417) | | | | | | | 26,305,971 | |
| Real Estate Investment Trusts — 6.9% | | | | | | | | |
| Ashford Hospitality Trust Inc. | | | 26,790 | | | | 162,883 | |
| DiamondRock Hospitality Co. (b) | | | 17,535 | | | | 192,008 | |
| Gaming and Leisure Properties Inc. (b) | | | 5,438 | | | | 204,849 | |
| LaSalle Hotel Properties (b) | | | 7,052 | | | | 210,150 | |
| Mack-Cali Realty Corp. | | | 11,478 | | | | 311,513 | |
| Ryman Hospitality Properties Inc. (b) | | | 1,318 | | | | 84,365 | |
| Sabra Health Care REIT Inc. (b) | | | 8,215 | | | | 197,982 | |
| Terreno Realty Corp. | | | 7,972 | | | | 268,338 | |
| Tier REIT Inc. | | | 10,848 | | | | 200,471 | |
| UMH Properties Inc. (b) | | | 9,249 | | | | 157,695 | |
| | | | | | | | 1,990,254 | |
| Total Real Estate Investment Trusts | | | | | | | | |
| (Cost $1,906,338) | | | | | | | 1,990,254 | |
| Total Long-Term Investments | | | | | | | | |
| (Cost $25,747,755) | | | | | | | 28,296,225 | |
| | | | | | | | | |
| | | Par | | | | | |
| | | Value | | | | | |
| Bank Deposit Account — 1.1% | | | | | | | | |
| U.S. Bank, N.A., 0.30% | | $ | 297,001 | | | | 297,001 | |
| Total Bank Deposit Account | | | | | | | | |
| (Cost $297,001) | | | | | | | 297,001 | |
The accompanying notes are an integral part of the financial statements.
Schedule of Investments (continued)
Quaker Small-Cap Value Fund
June 30, 2017
| | | | | | Fair | |
| | | Units | | | Value | |
| Private Investment Co. Purchased with | | | | | | |
| Proceeds from Securities Lending — 19.8% | | | | | | |
| Mount Vernon Liquid Assets | | | | | | |
| Portfolio LLC, 1.33% (c)(d) | | | 5,691,418 | | | $ | 5,691,418 | |
| Total Private Investment Co. Purchased | | | | | | | | |
| with Proceeds from Securities Lending | | | | | | | | |
| (Cost $5,691,418) | | | | | | | 5,691,418 | |
| Total Investments | | | | | | | | |
| (Cost $31,736,174) — 119.5% | | | | | | | 34,284,644 | |
| Liabilities in Excess of | | | | | | | | |
| Other Assets, Net (19.5)% | | | | | | | (5,596,299 | ) |
| Total Net Assets — 100.0% | | | | | | $ | 28,688,345 | |
| (a) | Non-income producing security. |
| (b) | All or a portion of the security is out on loan. The total market value of securities on loan was $5,549,586. The remaining contractual maturity of all of the securities lending transactions is overnight and continuous. |
| (c) | The rate shown is the annualized seven-day yield at period end. |
| (d) | Represents investments of collateral received from securities lending transactions. Refer to Note 12 of Notes to the Financial Statements for additional information. |
| f | Foreign issued security. |
The accompanying notes are an integral part of the financial statements.
Schedule of Investments
Quaker Strategic Growth Fund
June 30, 2017
| | | Number | | | Fair | |
| | | of Shares | | | Value | |
| Long-Term Investments — 100.1% | | | | | | |
| Common Stocks — 98.8% | | | | | | |
| Basic Materials — 2.6% | | | | | | |
| Chemicals — 2.2% | | | | | | |
| AdvanSix Inc. (a) | | | 128 | | | $ | 3,999 | |
| The Dow Chemical Co. | | | 5,850 | | | | 368,960 | |
| Eastman Chemical Co. | | | 2,600 | | | | 218,374 | |
| FMC Corp. (b) | | | 620 | | | | 45,291 | |
| International Flavors | | | | | | | | |
| & Fragrances Inc. (b) | | | 300 | | | | 40,500 | |
LyondellBasell Industries NV (b) f | | | 3,165 | | | | 267,094 | |
| PPG Industries Inc. (b) | | | 2,000 | | | | 219,920 | |
| Praxair Inc. | | | 2,760 | | | | 365,838 | |
| | | | | | | | 1,529,976 | |
| Forest Products & Paper — 0.3% | | | | | | | | |
| International Paper Co. | | | 4,000 | | | | 226,440 | |
| Mining — 0.1% | | | | | | | | |
| Newmont Mining Corp. | | | 2,700 | | | | 87,453 | |
| Total Basic Materials | | | | | | | | |
| (Cost $1,590,159) | | | | | | | 1,843,869 | |
| Communications — 15.1% | | | | | | | | |
| Internet — 11.9% | | | | | | | | |
| Alphabet Inc. Cl A (a) | | | 705 | | | | 655,424 | |
| Alphabet Inc. Cl C (a) | | | 693 | | | | 629,750 | |
| Amazon.com Inc. (a) | | | 2,658 | | | | 2,572,944 | |
| eBay Inc. (a) | | | 16,400 | | | | 572,688 | |
| F5 Networks Inc. (a) | | | 300 | | | | 38,118 | |
| Facebook Inc. Cl A (a) | | | 13,024 | | | | 1,966,364 | |
| Netflix Inc. (a) | | | 5,882 | | | | 878,830 | |
| Symantec Corp. | | | 42,490 | | | | 1,200,342 | |
| VeriSign Inc. (a)(b) | | | 120 | | | | 11,155 | |
| | | | | | | | 8,525,615 | |
| Media — 0.5% | | | | | | | | |
| Charter Communications Inc. (a) | | | 20 | | | | 6,737 | |
| News Corp. Cl B (b) | | | 10,596 | | | | 149,933 | |
| The Walt Disney Co. | | | 1,954 | | | | 207,613 | |
| | | | | | | | 364,283 | |
| Telecommunications — 2.7% | | | | | | | | |
| AT&T Inc. | | | 14,210 | | | | 536,143 | |
| Cisco Systems Inc. | | | 22,500 | | | | 704,250 | |
| Juniper Networks Inc. (b) | | | 11,100 | | | | 309,468 | |
| LogMeIn Inc. | | | 422 | | | | 44,099 | |
| Motorola Solutions Inc. (b) | | | 2,860 | | | | 248,076 | |
| Verizon Communications Inc. | | | 792 | | | | 35,371 | |
| | | | | | | | 1,877,407 | |
| Total Communications | | | | | | | | |
| (Cost $9,986,691) | | | | | | | 10,767,305 | |
| Consumer, Cyclical — 5.6% | | | | | | | | |
| Airlines — 1.6% | | | | | | | | |
| Alaska Air Group Inc. | | | 551 | | | | 49,458 | |
| AMR Corp. Escrow (a)*^ | | | 211,235 | | | | 399,234 | |
| Southwest Airlines Co. | | | 11,463 | | | | 712,311 | |
| | | | | | | | 1,161,003 | |
| Leisure Time — 0.1% | | | | | | | | |
Royal Caribbean Cruises Ltd. f | | | 770 | | | | 84,107 | |
| Lodging — 1.1% | | | | | | | | |
| Hilton Worldwide Holdings Inc. | | | 600 | | | | 37,110 | |
| Marriott International Inc. (b) | | | 5,790 | | | | 580,795 | |
| Wyndham Worldwide Corp. | | | 1,400 | | | | 140,574 | |
| | | | | | | | 758,479 | |
| Retail — 2.7% | | | | | | | | |
| Coach Inc. | | | 5,000 | | | | 236,700 | |
| The Home Depot Inc. | | | 980 | | | | 150,332 | |
| McDonald’s Corp. | | | 6,672 | | | | 1,021,884 | |
| Ulta Beauty Inc. (a) | | | 100 | | | | 28,734 | |
| Urban Outfitters Inc. (a)(b) | | | 560 | | | | 10,382 | |
| Yum! Brands Inc. | | | 6,546 | | | | 482,833 | |
| | | | | | | | 1,930,865 | |
| Toys/Games & Hobbies — 0.1% | | | | | | | | |
| Hasbro Inc. (b) | | | 700 | | | | 78,057 | |
| Total Consumer, Cyclical | | | | | | | | |
| (Cost $3,161,028) | | | | | | | 4,012,511 | |
| Consumer, Non-cyclical — 24.5% | | | | | | | | |
| Agriculture — 3.6% | | | | | | | | |
| Altria Group Inc. | | | 19,063 | | | | 1,419,622 | |
| Archer-Daniels-Midland Co. | | | 2,750 | | | | 113,795 | |
| Philip Morris International Inc. | | | 8,550 | | | | 1,004,197 | |
| | | | | | | | 2,537,614 | |
| Beverages — 1.5% | | | | | | | | |
| The Coca-Cola Co. | | | 11,570 | | | | 518,914 | |
| Molson Coors Brewing Co. | | | 4,273 | | | | 368,931 | |
| PepsiCo Inc. | | | 1,610 | | | | 185,939 | |
| | | | | | | | 1,073,784 | |
The accompanying notes are an integral part of the financial statements.
Schedule of Investments (continued)
Quaker Strategic Growth Fund
June 30, 2017
| | | Number | | | Fair | |
| | | of Shares | | | Value | |
| Common Stocks — 98.8% (Continued) | | | | | | |
| Biotechnology — 1.1% | | | | | | |
| Amgen Inc. | | | 4,185 | | | $ | 720,783 | |
| Bioverativ Inc. (a)(b) | | | 1,125 | | | | 67,691 | |
| | | | | | | | 788,474 | |
| Commercial Services — 1.3% | | | | | | | | |
| Cintas Corp. | | | 2,270 | | | | 286,111 | |
IHS Markit Ltd. (a) f | | | 10,070 | | | | 443,483 | |
| PayPal Holdings Inc. (a) | | | 385 | | | | 20,663 | |
| Quanta Services Inc. (a) | | | 540 | | | | 17,777 | |
| Verisk Analytics Inc. Cl A (a) | | | 100 | | | | 8,437 | |
| The Western Union Co. (b) | | | 9,150 | | | | 174,307 | |
| | | | | | | | 950,778 | |
| Cosmetics & Personal Care — 1.0% | | | | | | | | |
| The Procter & Gamble Co. (b) | | | 8,430 | | | | 734,674 | |
| Food — 1.1% | | | | | | �� | | |
| Campbell Soup Co. | | | 1,950 | | | | 101,693 | |
| General Mills Inc. | | | 2,370 | | | | 131,298 | |
| The Hershey Co. | | | 1,800 | | | | 193,266 | |
| Lamb Weston Holdings Inc. | | | 261 | | | | 11,494 | |
| Mondelez International Inc. | | | 770 | | | | 33,256 | |
| Tyson Foods Inc. (b) | | | 5,315 | | | | 332,878 | |
| | | | | | | | 803,885 | |
| Healthcare-Products — 5.7% | | | | | | | | |
| Abbott Laboratories | | | 6,080 | | | | 295,549 | |
| Baxter International Inc. | | | 5,000 | | | | 302,700 | |
| Becton Dickinson and Co. (b) | | | 5,398 | | | | 1,053,204 | |
| Boston Scientific Corp. (a) | | | 17,450 | | | | 483,714 | |
| The Cooper Cos. Inc. | | | 2,197 | | | | 526,006 | |
| CR Bard Inc. | | | 70 | | | | 22,128 | |
| Danaher Corp. | | | 3,820 | | | | 322,370 | |
| Edwards Lifesciences Corp. (a) | | | 3,380 | | | | 399,651 | |
| IDEXX Laboratories Inc. (a) | | | 860 | | | | 138,821 | |
Medtronic PLC f | | | 4,300 | | | | 381,625 | |
| Patterson Cos. Inc. (b) | | | 3,690 | | | | 173,245 | |
| | | | | | | | 4,099,013 | |
| Healthcare-Services — 2.2% | | | | | | | | |
| Aetna Inc. | | | 910 | | | | 138,165 | |
| Anthem Inc. | | | 250 | | | | 47,033 | |
| Centene Corp. (a) | | | 7,270 | | | | 580,728 | |
| Cigna Corp. (b) | | | 1,390 | | | | 232,672 | |
| HCA Healthcare Inc. (a) | | | 1,015 | | | | 88,508 | |
| UnitedHealth Group Inc. | | | 2,760 | | | | 511,759 | |
| | | | | | | | 1,598,865 | |
| Household Products & Wares — 0.8% | | | | | | | | |
| Avery Dennison Corp. | | | 3,950 | | | | 349,061 | |
| Kimberly-Clark Corp. (b) | | | 1,660 | | | | 214,323 | |
| | | | | | | | 563,384 | |
| Pharmaceuticals — 6.2% | | | | | | | | |
| AbbVie Inc. (b) | | | 5,263 | | | | 381,620 | |
Allergan PLC (b) f | | | 2,740 | | | | 666,067 | |
| AmerisourceBergen Corp. (b) | | | 2,450 | | | | 231,599 | |
| Bristol-Myers Squibb Co. | | | 14,950 | | | | 833,014 | |
| Cardinal Health Inc. (b) | | | 670 | | | | 52,207 | |
| Eli Lilly & Co. | | | 5,601 | | | | 460,962 | |
| Johnson & Johnson | | | 7,370 | | | | 974,977 | |
| Merck & Co. Inc. | | | 4,690 | | | | 300,582 | |
| Pfizer Inc. | | | 10,800 | | | | 362,772 | |
| Zoetis Inc. | | | 2,380 | | | | 148,464 | |
| | | | | | | | 4,412,264 | |
| Total Consumer, Non-cyclical | | | | | | | | |
| (Cost $16,352,850) | | | | | | | 17,562,735 | |
| Diversified — 0.4% | | | | | | | | |
| Holding Companies — 0.4% | | | | | | | | |
| Leucadia National Corp. | | | 9,670 | | | | 252,967 | |
| Total Diversified (Cost $179,287) | | | | | | | 252,967 | |
| Energy — 2.8% | | | | | | | | |
| Oil & Gas — 2.7% | | | | | | | | |
| Chevron Corp. | | | 5,772 | | | | 602,193 | |
| EOG Resources Inc. | | | 650 | | | | 58,838 | |
| Exxon Mobil Corp. | | | 14,900 | | | | 1,202,877 | |
| Phillips 66 (b) | | | 1,050 | | | | 86,824 | |
| | | | | | | | 1,950,732 | |
| Pipelines — 0.1% | | | | | | | | |
| Kinder Morgan Inc. | | | 3,675 | | | | 70,413 | |
| Total Energy (Cost $2,095,906) | | | | | | | 2,021,145 | |
| Financial — 14.2% | | | | | | | | |
| Banks — 8.1% | | | | | | | | |
| Bank of America Corp. | | | 49,525 | | | | 1,201,477 | |
| Citigroup Inc. | | | 13,510 | | | | 903,549 | |
| Citizens Financial Group Inc. | | | 300 | | | | 10,704 | |
| Fifth Third Bancorp | | | 2,300 | | | | 59,708 | |
| The Goldman Sachs Group Inc. | | | 1,420 | | | | 315,098 | |
The accompanying notes are an integral part of the financial statements.
Schedule of Investments (continued)
Quaker Strategic Growth Fund
June 30, 2017
| | | Number | | | Fair | |
| | | of Shares | | | Value | |
| Common Stocks — 98.8% (Continued) | | | | | | |
| Banks (Continued) | | | | | | |
| JPMorgan Chase & Co. | | | 16,381 | | | $ | 1,497,223 | |
| Morgan Stanley (b) | | | 17,950 | | | | 799,852 | |
| Northern Trust Corp. | | | 600 | | | | 58,326 | |
| The PNC Financial Services Group Inc. | | | 1,100 | | | | 137,357 | |
| State Street Corp. (b) | | | 700 | | | | 62,811 | |
| SunTrust Banks Inc. | | | 4,200 | | | | 238,224 | |
| Wells Fargo & Co. | | | 9,540 | | | | 528,611 | |
| Zions Bancorporation | | | 140 | | | | 6,147 | |
| | | | | | | | 5,819,087 | |
| Diversified Financial Services — 1.0% | | | | | | | | |
| American Express Co. (b) | | | 3,350 | | | | 282,204 | |
| Mastercard Inc. Cl A | | | 3,455 | | | | 419,610 | |
| | | | | | | | 701,814 | |
| Insurance — 4.7% | | | | | | | | |
| Aflac Inc. | | | 4,830 | | | | 375,194 | |
Aon PLC f | | | 4,230 | | | | 562,379 | |
| Arthur J Gallagher & Co. | | | 100 | | | | 5,725 | |
| Berkshire Hathaway Inc. Cl B (a) | | | 2,050 | | | | 347,208 | |
Chubb Ltd. f | | | 1,105 | | | | 160,645 | |
| Cincinnati Financial Corp. (b) | | | 1,480 | | | | 107,226 | |
| The Hartford Financial | | | | | | | | |
| Services Group Inc. | | | 6,570 | | | | 345,385 | |
| MetLife Inc. (b) | | | 12,470 | | | | 685,102 | |
| Principal Financial Group Inc. | | | 2,200 | | | | 140,954 | |
| The Progressive Corp. | | | 6,380 | | | | 281,294 | |
| The Travelers Cos. Inc. | | | 2,230 | | | | 282,162 | |
XL Group Ltd. (b) f | | | 570 | | | | 24,966 | |
| | | | | | | | 3,318,240 | |
| Savings & Loans — 0.4% | | | | | | | | |
| People’s United Financial Inc. (b) | | | 16,910 | | | | 298,631 | |
| Total Financial (Cost $7,909,710) | | | | | | | 10,137,772 | |
| Industrial — 8.6% | | | | | | | | |
| Aerospace & Defense — 0.5% | | | | | | | | |
| L3 Technologies Inc. | | | 730 | | | | 121,969 | |
| Northrop Grumman Corp. | | | 430 | | | | 110,385 | |
| United Technologies Corp. | | | 830 | | | | 101,351 | |
| | | | | | | | 333,705 | |
| Electronics — 2.9% | | | | | | | | |
| Agilent Technologies Inc. | | | 4,477 | | | | 265,531 | |
Allegion PLC f | | | 1,500 | | | | 121,680 | |
| Corning Inc. | | | 9,900 | | | | 297,495 | |
| FLIR Systems Inc. | | | 11,300 | | | | 391,658 | |
Garmin Ltd. (b) f | | | 3,020 | | | | 154,111 | |
| Honeywell International Inc. | | | 2,300 | | | | 306,567 | |
| Mettler-Toledo International Inc. (a) | | | 717 | | | | 421,983 | |
| Waters Corp. (a) | | | 460 | | | | 84,566 | |
| | | | | | | | 2,043,591 | |
| Engineering & Construction — 0.0% | | | | | | | | |
| Jacobs Engineering Group Inc. (b) | | | 500 | | | | 27,195 | |
| Environmental Control — 0.3% | | | | | | | | |
| Waste Management Inc. | | | 2,642 | | | | 193,791 | |
| Hand & Machine Tools — 0.0% | | | | | | | | |
| Snap-on Inc. (b) | | | 100 | | | | 15,800 | |
| Machinery-Diversified — 2.1% | | | | | | | | |
| Cummins Inc. | | | 300 | | | | 48,666 | |
| Deere & Co. (b) | | | 11,600 | | | | 1,433,644 | |
| | | | | | | | 1,482,310 | |
| Miscellaneous Manufacturing — 1.4% | | | | | | | | |
| 3M Co. (b) | | | 1,450 | | | | 301,876 | |
Eaton Corp. PLC f | | | 2,000 | | | | 155,660 | |
| General Electric Co. | | | 10,790 | | | | 291,438 | |
| Illinois Tool Works Inc. (b) | | | 200 | | | | 28,650 | |
Ingersoll-Rand PLC f | | | 1,600 | | | | 146,224 | |
| Parker Hannifin Corp. | | | 500 | | | | 79,910 | |
| | | | | | | | 1,003,758 | |
| Packaging & Containers — 0.0% | | | | | | | | |
| WestRock Co. | | | 500 | | | | 28,330 | |
| Transportation — 1.4% | | | | | | | | |
| Kansas City Southern | | | 2,780 | | | | 290,927 | |
| Norfolk Southern Corp. | | | 780 | | | | 94,926 | |
| Union Pacific Corp. | | | 2,610 | | | | 284,255 | |
| United Parcel Service Inc. | | | 3,070 | | | | 339,511 | |
| | | | | | | | 1,009,619 | |
| Total Industrial (Cost $5,285,093) | | | | | | | 6,138,099 | |
| Technology — 18.0% | | | | | | | | |
| Computers — 7.0% | | | | | | | | |
Accenture PLC Cl A f | | | 1,100 | | | | 136,048 | |
| Apple Inc. | | | 27,340 | | | | 3,937,507 | |
| Cognizant Technology Solutions Corp. | | | 120 | | | | 7,968 | |
| DXC Technology Co. | | | 1,503 | | | | 115,310 | |
| Hewlett Packard Enterprise Co. | | | 11,850 | | | | 196,591 | |
The accompanying notes are an integral part of the financial statements.
Schedule of Investments (continued)
Quaker Strategic Growth Fund
June 30, 2017
| | | Number | | | Fair | |
| | | of Shares | | | Value | |
| Common Stocks — 98.8% (Continued) | | | | | | |
| Computers (Continued) | | | | | | |
| HP Inc. | | | 140 | | | $ | 2,447 | |
| International Business | | | | | | | | |
| Machines Corp. (b) | | | 890 | | | | 136,909 | |
| NetApp Inc. (b) | | | 11,300 | | | | 452,565 | |
| | | | | | | | 4,985,345 | |
| Semiconductors — 5.2% | | | | | | | | |
| Advanced Micro Devices Inc. (a)(b) | | | 18,600 | | | | 232,128 | |
| Analog Devices Inc. | | | 400 | | | | 31,120 | |
| Applied Materials Inc. | | | 1,240 | | | | 51,224 | |
Broadcom Ltd. f | | | 5,330 | | | | 1,242,157 | |
| Intel Corp. (b) | | | 30,400 | | | | 1,025,696 | |
| NVIDIA Corp. (b) | | | 3,557 | | | | 514,200 | |
| Skyworks Solutions Inc. (b) | | | 2,340 | | | | 224,523 | |
| Texas Instruments Inc. | | | 2,600 | | | | 200,018 | |
| Xilinx Inc. | | | 3,600 | | | | 231,552 | |
| | | | | | | | 3,752,618 | |
| Software — 5.8% | | | | | | | | |
| Adobe Systems Inc. (a) | | | 701 | | | | 99,149 | |
| Autodesk Inc. (a) | | | 1,360 | | | | 137,115 | |
| CA Inc. (b) | | | 4,200 | | | | 144,774 | |
| Citrix Systems Inc. (a)(b) | | | 1,870 | | | | 148,815 | |
| The Dun & Bradstreet Corp. | | | 11,880 | | | | 1,284,822 | |
| Electronic Arts Inc. (a)(b) | | | 3,190 | | | | 337,247 | |
| Microsoft Corp. | | | 21,010 | | | | 1,448,219 | |
| Oracle Corp. | | | 4,700 | | | | 235,658 | |
| Paychex Inc. | | | 5,700 | | | | 324,558 | |
| | | | | | | | 4,160,357 | |
| Total Technology | | | | | | | | |
| (Cost $11,545,847) | | | | | | | 12,898,320 | |
| Utilities — 7.0% | | | | | | | | |
| Electric — 7.0% | | | | | | | | |
| AES Corp. | | | 11,360 | | | | 126,210 | |
| Ameren Corp. | | | 4,000 | | | | 218,680 | |
| American Electric Power Co. Inc. | | | 2,500 | | | | 173,675 | |
| CenterPoint Energy Inc. (b) | | | 10,960 | | | | 300,085 | |
| Consolidated Edison Inc. | | | 1,250 | | | | 101,025 | |
| Dominion Energy Inc. (b) | | | 2,500 | | | | 191,575 | |
| DTE Energy Co. | | | 700 | | | | 74,053 | |
| Duke Energy Corp. | | | 4,700 | | | | 392,873 | |
| Entergy Corp. | | | 4,790 | | | | 367,728 | |
| Eversource Energy | | | 500 | | | | 30,355 | |
| Exelon Corp. | | | 23,100 | | | | 833,217 | |
| FirstEnergy Corp. | | | 29,200 | | | | 851,472 | |
| NextEra Energy Inc. | | | 1,000 | | | | 140,130 | |
| PG&E Corp. (b) | | | 700 | | | | 46,459 | |
| Pinnacle West Capital Corp. | | | 1,400 | | | | 119,224 | |
| PPL Corp. | | | 6,700 | | | | 259,022 | |
| Public Service Enterprise Group Inc. | | | 7,790 | | | | 335,048 | |
| SCANA Corp. | | | 530 | | | | 35,515 | |
| The Southern Co. (b) | | | 8,400 | | | | 402,192 | |
| | | | | | | | 4,998,538 | |
| Gas — 0.0% | | | | | | | | |
| Sempra Energy | | | 200 | | | | 22,550 | |
| Total Utilities | | | | | | | | |
| (Cost $4,880,840) | | | | | | | 5,021,088 | |
| Total Common Stocks | | | | | | | | |
| (Cost $62,987,411) | | | | | | | 70,655,811 | |
| Real Estate Investment Trusts — 1.3% | | | | | | | | |
| Equinix Inc. | | | 1,647 | | | | 706,827 | |
| GGP Inc. (b) | | | 1,300 | | | | 30,628 | |
| Public Storage | | | 270 | | | | 56,303 | |
| UDR Inc. (b) | | | 160 | | | | 6,235 | |
| Weyerhaeuser Co. (b) | | | 4,340 | | | | 145,390 | |
| | | | | | | | 945,383 | |
| Total Real Estate Investment Trusts | | | | | | | | |
| (Cost $909,205) | | | | | | | 945,383 | |
| Total Long-Term Investments | | | | | | | | |
| (Cost $63,896,616) | | | | | | | 71,601,194 | |
| | | Par | | | | | |
| | | Value | | | | | |
| Bank Deposit Account — 0.1% | | | | | | | | |
| U.S. Bank, N.A., 0.30% | | $ | 66,112 | | | | 66,112 | |
| Total Bank Deposit Account | | | | | | | | |
| (Cost $66,112) | | | | | | | 66,112 | |
The accompanying notes are an integral part of the financial statements.
Schedule of Investments (continued)
Quaker Strategic Growth Fund
June 30, 2017
| | | | | | Fair | |
| | | Units | | | Value | |
| Private Investment Co. Purchased with | | | | | | |
| Proceeds from Securities Lending — 16.6% | | | | | | |
| Mount Vernon Liquid Assets | | | | | | |
| Portfolio LLC, 1.33% (c)(d) | | | 11,925,730 | | | $ | 11,925,730 | |
| Total Private Investment Co. Purchased | | | | | | | | |
| with Proceeds from Securities Lending | | | | | | | | |
| (Cost $11,925,730) | | | | | | | 11,925,730 | |
| Total Investments | | | | | | | | |
| (Cost $75,888,458) — 116.8% | | | | | | | 83,593,036 | |
| Liabilities in Excess of | | | | | | | | |
| Other Assets, Net (16.8)% | | | | | | | (12,042,486 | ) |
| Total Net Assets — 100.0% | | | | | | $ | 71,550,550 | |
| (a) | Non-income producing security. |
| (b) | All or a portion of the security is out on loan. The total market value of securities on loan was $11,664,807. The remaining contractual maturity of all of the securities lending transactions is overnight and continuous. |
| (c) | The rate shown is the annualized seven-day yield at period end. |
| (d) | Represents investments of collateral received from securities lending transactions. Refer to Note 12 of Notes to the Financial Statements for additional information. |
| f | Foreign issued security. |
| * | Indicates an illiquid security. Total market value for illiquid securities is $399,234, representing 0.6% of net assets. |
| ^ | Indicates a fair valued security. Total market value for fair valued securities is $399,234, representing 0.6% of net assets and Level 3 securities. |
The accompanying notes are an integral part of the financial statements.
Statements of Assets and Liabilities
June 30, 2017
| | | | | | Quaker Global | | | Quaker | | | Quaker | | | Quaker | |
| | | Quaker Event | | | Tactical | | | Mid-Cap | | | Small-Cap | | | Strategic | |
| | | Arbitrage Fund | | | Allocation Fund | | | Value Fund | | | Value Fund | | | Growth Fund | |
| ASSETS: | | | | | | | | | | | | | | | |
| Investments, at value (Note 12) | | $ | 26,872,885 | | | $ | 6,748,860 | | | $ | 9,172,162 | | | $ | 34,284,644 | | | $ | 83,593,036 | |
| Cash | | | 27,327 | | | | — | | | | — | | | | 1,259 | | | | 1,267 | |
| Foreign currency, at value | | | 278,167 | | | | — | | | | — | | | | — | | | | — | |
| Cash held at brokers for short sales | | | 3,123,574 | | | | — | | | | — | | | | — | | | | — | |
| Receivables: | | | | | | | | | | | | | | | | | | | | |
| Dividends and interest | | | 55,194 | | | | 39,979 | | | | 10,415 | | | | 32,568 | | | | 70,024 | |
| Capital shares sold | | | 41,081 | | | | 10,490 | | | | 98 | | | | 102 | | | | 3,231 | |
| Investment securities sold | | | 5,345,463 | | | | — | | | | — | | | | 1,334,653 | | | | — | |
| Securities lending income, net | | | 340 | | | | — | | | | 288 | | | | 1,180 | | | | 1,870 | |
| Prepaid expenses and other assets | | | 54,893 | | | | 12,754 | | | | 13,380 | | | | 54,482 | | | | 137,119 | |
| Total assets | | | 35,798,924 | | | | 6,812,083 | | | | 9,196,343 | | | | 35,708,888 | | | | 83,806,547 | |
| | | | | | | | | | | | | | | | | | | | | |
| LIABILITIES: | | | | | | | | | | | | | | | | | | | | |
| Written options, at value | | $ | 407,151 | | | $ | — | | | $ | — | | | $ | — | | | $ | — | |
| Securities sold short, at value | | | 2,012,197 | | | | — | | | | — | | | | — | | | | — | |
| Payables: | | | | | | | | | | | | | | | | | | | | |
| Due to advisor (Note 3) | | | 11,536 | | | | 2,527 | | | | 6,152 | | | | 22,486 | | | | 52,816 | |
| Capital shares redeemed | | | 90,536 | | | | 100 | | | | 200 | | | | — | | | | 125,769 | |
| Upon return of securities loaned | | | 1,268,709 | | | | — | | | | 2,060,060 | | | | 5,691,418 | | | | 11,925,730 | |
| Investment securities purchased | | | 2,239,531 | | | | — | | | | 25,917 | | | | 1,253,727 | | | | — | |
| Distribution fees | | | 7,296 | | | | 2,551 | | | | 2,155 | | | | 533 | | | | 19,417 | |
| Trustee expenses | | | 5,141 | | | | 1,169 | | | | 1,151 | | | | 5,028 | | | | 12,511 | |
| Chief compliance officer fees | | | 3,067 | | | | 711 | | | | 745 | | | | 3,016 | | | | 7,555 | |
| Accrued expenses | | | 52,668 | | | | 11,405 | | | | 11,156 | | | | 44,335 | | | | 112,199 | |
| Total liabilities | | | 6,097,832 | | | | 18,463 | | | | 2,107,536 | | | | 7,020,543 | | | | 12,255,997 | |
| Net assets | | $ | 29,701,092 | | | $ | 6,793,620 | | | $ | 7,088,807 | | | $ | 28,688,345 | | | $ | 71,550,550 | |
The accompanying notes are an integral part of the financial statements.
Statements of Assets and Liabilities (continued)
June 30, 2017
| | | | | | Quaker Global | | | Quaker | | | Quaker | | | Quaker | |
| | | Quaker Event | | | Tactical | | | Mid-Cap | | | Small-Cap | | | Strategic | |
| | | Arbitrage Fund | | | Allocation Fund | | | Value Fund | | | Value Fund | | | Growth Fund | |
| NET ASSETS CONSIST OF: | | | | | | | | | | | | | | | |
| Paid-in capital | | $ | 40,785,751 | | | $ | 9,610,588 | | | $ | 6,947,867 | | | $ | 22,883,222 | | | $ | 228,673,591 | |
| Accumulated net investment income (loss) | | | 452,422 | | | | (4,759 | ) | | | (29,423 | ) | | | — | | | | (5,631 | ) |
| Accumulated net realized | | | | | | | | | | | | | | | | | | | | |
| gain (loss) on investments | | | (6,591,305 | ) | | | (2,832,008 | ) | | | (1,178,881 | ) | | | 3,256,641 | | | | (164,821,988 | ) |
| Net unrealized appreciation (depreciation) | | | | | | | | | | | | | | | | | | | | |
| on investments: | | | | | | | | | | | | | | | | | | | | |
| Securities | | | (4,602,898 | ) | | | 19,797 | | | | 1,349,244 | | | | 2,548,470 | | | | 7,704,578 | |
| Securities sold short | | | (241,099 | ) | | | — | | | | — | | | | — | | | | — | |
| Written option contracts | | | (105,650 | ) | | | — | | | | — | | | | — | | | | — | |
| Foreign currency transactions | | | 3,871 | | | | 2 | | | | — | | | | 12 | | | | — | |
| Total net assets | | $ | 29,701,092 | | | $ | 6,793,620 | | | $ | 7,088,807 | | | $ | 28,688,345 | | | $ | 71,550,550 | |
| Total investments, at cost | | $ | 31,475,783 | | | $ | 6,729,063 | | | $ | 7,822,918 | | | $ | 31,736,174 | | | $ | 75,888,458 | |
| Includes loaned securities | | | | | | | | | | | | | | | | | | | | |
| with a market value of | | $ | 1,243,416 | | | $ | — | | | $ | 2,022,215 | | | $ | 5,549,586 | | | $ | 11,664,807 | |
| Total foreign currency, at cost | | $ | 271,654 | | | $ | — | | | $ | — | | | $ | — | | | $ | — | |
| Proceeds from securities sold short | | | 1,771,098 | | | | — | | | | — | | | | — | | | | — | |
| Premiums on written options | | | 301,501 | | | | — | | | | — | | | | — | | | | — | |
| Class A shares: | | | | | | | | | | | | | | | | | | | | |
| Net assets | | $ | 12,548,432 | | | $ | 1,705,608 | | | $ | 4,080,534 | | | $ | 6,433,989 | | | $ | 49,858,410 | |
Shares of beneficial interest outstanding(1) | | | 964,211 | | | | 160,658 | | | | 145,407 | | | | 266,600 | | | | 1,789,776 | |
| Net asset value per share and | | | | | | | | | | | | | | | | | | | | |
| redemption price per share | | $ | 13.01 | | | $ | 10.62 | | | $ | 28.06 | | | $ | 24.13 | | | $ | 27.86 | |
| Offering price per share | | | | | | | | | | | | | | | | | | | | |
| (100/94.50 x net asset value per share) | | $ | 13.77 | | | $ | 11.24 | | | $ | 29.69 | | | $ | 25.53 | | | $ | 29.48 | |
| Class C shares: | | | | | | | | | | | | | | | | | | | | |
| Net assets | | $ | 3,262,794 | | | $ | 1,040,977 | | | $ | 1,526,431 | | | $ | 1,302,057 | | | $ | 12,687,194 | |
Shares of beneficial interest outstanding(1) | | | 261,553 | | | | 105,065 | | | | 62,973 | | | | 67,474 | | | | 527,163 | |
| Net asset value per share and | | | | | | | | | | | | | | | | | | | | |
| redemption price per share | | $ | 12.47 | | | $ | 9.91 | | | $ | 24.24 | | | $ | 19.30 | | | $ | 24.07 | |
| Institutional Class Shares: | | | | | | | | | | | | | | | | | | | | |
| Net assets | | $ | 13,889,866 | | | $ | 4,047,035 | | | $ | 1,481,842 | | | $ | 20,952,299 | | | $ | 9,004,946 | |
Shares of beneficial interest outstanding(1) | | | 1,057,307 | | | | 329,824 | | | | 50,064 | | | | 821,846 | | | | 309,219 | |
| Net asset value per share and | | | | | | | | | | | | | | | | | | | | |
| redemption price per share | | $ | 13.14 | | | $ | 12.27 | | | $ | 29.60 | | | $ | 25.49 | | | $ | 29.12 | |
(1) Unlimited number of shares of beneficial interest with a 0.01 par value authorized.
The accompanying notes are an integral part of the financial statements.
Statements of Operations
For the Fiscal Year Ended June 30, 2017
| | | | | | Quaker Global | | | Quaker | | | Quaker | | | Quaker | |
| | | Quaker Event | | | Tactical | | | Mid-Cap | | | Small-Cap | | | Strategic | |
| | | Arbitrage Fund | | | Allocation Fund | | | Value Fund | | | Value Fund | | | Growth Fund | |
| INVESTMENT INCOME (LOSS) | | | | | | | | | | | | | | | |
| Income: | | | | | | | | | | | | | | | |
| Dividends (net of foreign withholding taxes) | | $ | 343,495 | | | $ | 72,543 | | | $ | 120,740 | | | $ | 393,237 | | | $ | 1,475,981 | |
| Interest | | | 657,513 | | | | 88,686 | | | | 323 | | | | 395 | | | | 1,713 | |
| Securities lending income, net | | | 11,280 | | | | — | | | | 4,705 | | | | 23,532 | | | | 44,652 | |
| Total Income | | | 1,012,288 | | | | 161,229 | | | | 125,768 | | | | 417,164 | | | | 1,522,346 | |
| Expenses: | | | | | | | | | | | | | | | | | | | | |
| Investment advisory fees (Note 3) | | | 400,645 | | | | 68,922 | | | | 76,133 | | | | 304,604 | | | | 815,697 | |
| Funds administration and accounting fees | | | 68,977 | | | | 22,422 | | | | 17,665 | | | | 74,174 | | | | 162,367 | |
| Transfer agent fees | | | 114,618 | | | | 20,388 | | | | 21,819 | | | | 62,513 | | | | 232,379 | |
| Custody fees | | | 18,141 | | | | 3,151 | | | | 2,437 | | | | 20,916 | | | | 17,862 | |
| Trustee fees | | | 19,821 | | | | 4,714 | | | | 4,595 | | | | 20,363 | | | | 50,508 | |
| Legal fees | | | 18,785 | | | | 2,979 | | | | 2,897 | | | | 12,919 | | | | 32,192 | |
| Audit fees | | | 15,303 | | | | 3,514 | | | | 3,468 | | | | 15,151 | | | | 37,565 | |
| Distribution fee — Class A | | | 34,518 | | | | 5,902 | | | | 10,594 | | | | 16,942 | | | | 134,927 | |
| Distribution fee — Class C | | | 38,974 | | | | 12,601 | | | | 15,758 | | | | 14,664 | | | | 140,193 | |
| Insurance | | | 30,881 | | | | 6,209 | | | | 5,965 | | | | 27,930 | | | | 75,574 | |
| Officers’ compensation fees | | | 35,800 | | | | 8,537 | | | | 8,491 | | | | 36,827 | | | | 91,472 | |
| Registration and filing expenses | | | 46,256 | | | | 8,830 | | | | 7,560 | | | | 35,204 | | | | 100,769 | |
| Printing expenses | | | 8,981 | | | | 2,414 | | | | 2,351 | | | | 7,692 | | | | 23,744 | |
| Dividends and interest on securities sold short | | | 4,553 | | | | — | | | | — | | | | — | | | | — | |
| Other operating expenses | | | 2,049 | | | | 1,920 | | | | 1,833 | | | | 2,120 | | | | 2,257 | |
| Total expenses | | | 858,302 | | | | 172,503 | | | | 181,566 | | | | 652,019 | | | | 1,917,506 | |
| Investment advisory fees | | | | | | | | | | | | | | | | | | | | |
| reimbursed (Note 3) | | | (248,548 | ) | | | (13,792 | ) | | | — | | | | — | | | | (92,694 | ) |
| Net expenses | | | 609,754 | | | | 158,711 | | | | 181,566 | | | | 652,019 | | | | 1,824,812 | |
| Net investment income (loss) | | | 402,534 | | | | 2,518 | | | | (55,798 | ) | | | (234,855 | ) | | | (302,466 | ) |
The accompanying notes are an integral part of the financial statements.
Statements of Operations (continued)
For the Fiscal Year Ended June 30, 2017
| | | | | | Quaker Global | | | Quaker | | | Quaker | | | Quaker | |
| | | Quaker Event | | | Tactical | | | Mid-Cap | | | Small-Cap | | | Strategic | |
| | | Arbitrage Fund | | | Allocation Fund | | | Value Fund | | | Value Fund | | | Growth Fund | |
| REALIZED AND UNREALIZED GAIN (LOSS) ON INVESTMENTS | | | | | | | | | | | | | |
| Net realized gain (loss) on investments: | | | | | | | | | | | | | | | |
| Securities | | $ | 626,325 | | | $ | 619,944 | | | $ | 489,697 | | | $ | 4,469,004 | | | $ | 8,397,117 | |
| Securities sold short | | | (48,427 | ) | | | (1,932 | ) | | | — | | | | — | | | | — | |
| Written options | | | 884,772 | | | | — | | | | — | | | | — | | | | — | |
| Foreign currency transactions | | | (10,745 | ) | | | — | | | | — | | | | 13 | | | | — | |
| Net realized gain (loss) on investments | | | 1,451,925 | | | | 618,012 | | | | 489,697 | | | | 4,469,017 | | | | 8,397,117 | |
| Net change in unrealized appreciation | | | | | | | | | | | | | | | | | | | | |
| (depreciation) of investments: | | | | | | | | | | | | | | | | | | | | |
| Securities | | | 2,033,033 | | | | (161,513 | ) | | | 806,946 | | | | 1,680,019 | | | | 4,165,653 | |
| Securities sold short | | | (241,099 | ) | | | — | | | | — | | | | — | | | | — | |
| Written options | | | (236,444 | ) | | | — | | | | — | | | | — | | | | — | |
| Foreign currency transactions | | | 4,260 | | | | 2 | | | | — | | | | 10 | | | | — | |
| Net change in unrealized appreciation | | | | | | | | | | | | | | | | | | | | |
| (depreciation) of investments | | | 1,559,750 | | | | (161,511 | ) | | | 806,946 | | | | 1,680,029 | | | | 4,165,653 | |
| Net realized and unrealized | | | | | | | | | | | | | | | | | | | | |
| gain (loss) on investments | | | 3,011,675 | | | | 456,501 | | | | 1,296,643 | | | | 6,149,046 | | | | 12,562,770 | |
| Net increase (decrease) in net | | | | | | | | | | | | | | | | | | | | |
| assets resulting from operations | | $ | 3,414,209 | | | $ | 459,019 | | | $ | 1,240,845 | | | $ | 5,914,191 | | | $ | 12,260,304 | |
| (Foreign withholding taxes on | | | | | | | | | | | | | | | | | | | | |
| dividends/tax reclaims/interest) | | $ | (8,023 | ) | | $ | (1,135 | ) | | $ | — | | | $ | (5,550 | ) | | $ | (2,497 | ) |
The accompanying notes are an integral part of the financial statements.
Statements of Changes in Net Assets
For the Fiscal Year Ended June 30, 2017
| | | | | | Quaker Global | | | Quaker | | | Quaker | | | Quaker | |
| | | Quaker Event | | | Tactical | | | Mid-Cap | | | Small-Cap | | | Strategic | |
| | | Arbitrage Fund | | | Allocation Fund | | | Value Fund | | | Value Fund | | | Growth Fund | |
| INCREASE (DECREASE) IN NET ASSETS | | | | | | | | | | | | | | | |
| Operations: | | | | | | | | | | | | | | | |
| Net investment income (loss) | | $ | 402,534 | | | $ | 2,518 | | | $ | (55,798 | ) | | $ | (234,855 | ) | | $ | (302,466 | ) |
| Net realized gain (loss) | | | | | | | | | | | | | | | | | | | | |
| on investment transactions: | | | | | | | | | | | | | | | | | | | | |
| Securities | | | 626,325 | | | | 619,944 | | | | 489,697 | | | | 4,469,004 | | | | 8,397,117 | |
| Securities sold short | | | (48,427 | ) | | | (1,932 | ) | | | — | | | | — | | | | — | |
| Written options | | | 884,772 | | | | — | | | | — | | | | — | | | | — | |
| Foreign currency transactions | | | (10,745 | ) | | | — | | | | — | | | | 13 | | | | — | |
| Net change in unrealized appreciation | | | | | | | | | | | | | | | | | | | | |
| (depreciation) of investment transactions: | | | | | | | | | | | | | | | | | | | | |
| Securities | | | 2,033,033 | | | | (161,513 | ) | | | 806,946 | | | | 1,680,019 | | | | 4,165,653 | |
| Securities sold short | | | (241,099 | ) | | | — | | | | — | | | | — | | | | — | |
| Written options | | | (236,444 | ) | | | — | | | | — | | | | — | | | | — | |
| Foreign currency transactions | | | 4,260 | | | | 2 | | | | — | | | | 10 | | | | — | |
| Net increase (decrease) in net | | | | | | | | | | | | | | | | | | | | |
| assets resulting from operations | | | 3,414,209 | | | | 459,019 | | | | 1,240,845 | | | | 5,914,191 | | | | 12,260,304 | |
| Distributions to shareholders from: | | | | | | | | | | | | | | | | | | | | |
| Net investment income — Class A | | | (70,505 | ) | | | — | | | | — | | | | — | | | | — | |
| Net investment income — Class C | | | (5,529 | ) | | | — | | | | — | | | | — | | | | — | |
| Net investment income — Institutional Class | | | (83,962 | ) | | | — | | | | — | | | | — | | | | — | |
| Total distributions | | | (159,996 | ) | | | — | | | | — | | | | — | | | | — | |
| Capital share transactions: | | | | | | | | | | | | | | | | | | | | |
| Increase (decrease) in net assets | | | | | | | | | | | | | | | | | | | | |
| from fund share transactions (Note 9) | | | (7,444,709 | ) | | | (404,319 | ) | | | (1,056,973 | ) | | | (9,776,060 | ) | | | (26,700,407 | ) |
| Total increase (decrease) in net assets | | | (4,190,496 | ) | | | 54,700 | | | | 183,872 | | | | (3,861,869 | ) | | | (14,440,103 | ) |
| | | | | | | | | | | | | | | | | | | | | |
| NET ASSETS | | | | | | | | | | | | | | | | | | | | |
| Beginning of year | | | 33,891,588 | | | | 6,738,920 | | | | 6,904,935 | | | | 32,550,214 | | | | 85,990,653 | |
| End of year | | $ | 29,701,092 | | | $ | 6,793,620 | | | $ | 7,088,807 | | | $ | 28,688,345 | | | $ | 71,550,550 | |
| Undistributed (Accumulated) net investment | | | | | | | | | | | | | | | | | | | | |
| income (loss), at end of year | | $ | 452,422 | | | $ | (4,759 | ) | | $ | (29,423 | ) | | $ | — | | | $ | (5,631 | ) |
The accompanying notes are an integral part of the financial statements.
Statements of Changes in Net Assets (continued)
For the Fiscal Year Ended June 30, 2016
| | | | | | Quaker Global | | | Quaker | | | Quaker | | | Quaker | |
| | | Quaker Event | | | Tactical | | | Mid-Cap | | | Small-Cap | | | Strategic | |
| | | Arbitrage Fund | | | Allocation Fund | | | Value Fund | | | Value Fund | | | Growth Fund | |
| INCREASE (DECREASE) IN NET ASSETS | | | | | | | | | | | | | | | |
| Operations: | | | | | | | | | | | | | | | |
| Net investment income (loss) | | $ | 15,072 | | | $ | (120,903 | ) | | $ | (28,091 | ) | | $ | (72,892 | ) | | $ | (1,558,243 | ) |
| Net realized gain (loss) on | | | | | | | | | | | | | | | | | | | | |
| investment transactions: | | | | | | | | | | | | | | | | | | | | |
| Securities | | | (7,728,438 | ) | | | (551,302 | ) | | | (39,028 | ) | | | (902,423 | ) | | | (562,424 | ) |
| Securities sold short | | | (117,016 | ) | | | (14,810 | ) | | | — | | | | — | | | | (173,758 | ) |
| Written options | | | 316,179 | | | | — | | | | — | | | | — | | | | — | |
| Foreign currency transactions | | | (20,296 | ) | | | 15 | | | | — | | | | (6 | ) | | | — | |
| Capital gain distributions from | | | | | | | | | | | | | | | | | | | | |
| regulated investment companies | | | — | | | | 9,574 | | | | — | | | | — | | | | — | |
| Net change in unrealized appreciation | | | | | | | | | | | | | | | | | | | | |
| (depreciation) of investment transactions: | | | | | | | | | | | | | | | | | | | | |
| Securities | | | (4,096,077 | ) | | | (749,693 | ) | | | (441,921 | ) | | | (2,691,298 | ) | | | (10,304,539 | ) |
| Securities sold short | | | 11,942 | | | | — | | | | — | | | | — | | �� | | — | |
| Written options | | | 92,613 | | | | — | | | | — | | | | — | | | | — | |
| Foreign currency transactions | | | (3,994 | ) | | | — | | | | — | | | | 2 | | | | — | |
| Net increase (decrease) in net | | | | | | | | | | | | | | | | | | | | |
| assets resulting from operations | | | (11,530,015 | ) | | | (1,427,119 | ) | | | (509,040 | ) | | | (3,666,617 | ) | | | (12,598,964 | ) |
| Distributions to shareholders from: | | | | | | | | | | | | | | | | | | | | |
| Net realized capital gain — Class A | | | (1,695,347 | ) | | | — | | | | — | | | | (539,696 | ) | | | — | |
| Net realized capital gain — Class C | | | (467,044 | ) | | | — | | | | — | | | | (156,220 | ) | | | — | |
| Net realized capital gain — Institutional Class | | | (3,193,513 | ) | | | — | | | | — | | | | (1,869,051 | ) | | | — | |
| Total distributions | | | (5,355,904 | ) | | | — | | | | — | | | | (2,564,967 | ) | | | — | |
| Capital share transactions: | | | | | | | | | | | | | | | | | | | | |
| Increase (decrease) in net assets | | | | | | | | | | | | | | | | | | | | |
| from fund share transactions (Note 9) | | | (63,054,301 | ) | | | (864,896 | ) | | | (1,553,878 | ) | | | 781,008 | | | | (65,259,779 | ) |
| Total increase (decrease) in net assets | | | (79,940,220 | ) | | | (2,292,015 | ) | | | (2,062,918 | ) | | | (5,450,576 | ) | | | (77,858,743 | ) |
| | | | | | | | | | | | | | | | | | | | | |
| NET ASSETS | | | | | | | | | | | | | | | | | | | | |
| Beginning of year | | | 113,831,808 | | | | 9,030,935 | | | | 8,967,853 | | | | 38,000,790 | | | | 163,849,396 | |
| End of year | | $ | 33,891,588 | | | $ | 6,738,920 | | | $ | 6,904,935 | | | $ | 32,550,214 | | | $ | 85,990,653 | |
| Undistributed (Accumulated) net investment | | | | | | | | | | | | | | | | | | | | |
| income (loss), at end of year | | $ | (2,437 | ) | | $ | (57,345 | ) | | $ | (15,879 | ) | | $ | (51,144 | ) | | $ | (513,707 | ) |
The accompanying notes are an integral part of the financial statements.
Financial Highlights
Quaker Event Arbitrage Fund
(For a Share Outstanding Throughout each Year)
| | | Class A | |
| | | | |
| | | Years Ended June 30, | |
| | | 2017 | | | 2016 | | | 2015 | | | 2014 | | | 2013 | |
| Net asset value, beginning of year | | $ | 11.71 | | | $ | 13.39 | | | $ | 14.07 | | | $ | 12.81 | | | $ | 11.93 | |
| Income from investment operations: | | | | | | | | | | | | | | | | | | | | |
Net investment income (loss)(1) | | | 0.16 | | | | (0.01 | ) | | | (0.04 | ) | | | 0.41 | | | | 0.37 | |
| Net realized and unrealized | | | | | | | | | | | | | | | | | | | | |
| gain (loss) on investments | | | 1.21 | | | | (0.65 | ) | | | 0.21 | | | | 0.93 | | | | 0.65 | |
| Total from investment operations | | | 1.37 | | | | (0.66 | ) | | | 0.17 | | | | 1.34 | | | | 1.02 | |
| Distributions to shareholders from: | | | | | | | | | | | | | | | | | | | | |
| Net investment income | | | (0.07 | ) | | | — | | | | (0.11 | ) | | | (0.01 | ) | | | (0.01 | ) |
| Net realized capital gain | | | — | | | | (1.02 | ) | | | (0.74 | ) | | | (0.07 | ) | | | (0.13 | ) |
| Total distributions | | | (0.07 | ) | | | (1.02 | ) | | | (0.85 | ) | | | (0.08 | ) | | | (0.14 | ) |
| Net asset value, end of year | | $ | 13.01 | | | $ | 11.71 | | | $ | 13.39 | | | $ | 14.07 | | | $ | 12.81 | |
Total Return(2) | | | 11.70 | % | | | (4.33 | )% | | | 1.38 | % | | | 10.47 | % | | | 8.70 | % |
| Ratios/supplemental data: | | | | | | | | | | | | | | | | | | | | |
| Net assets, end of year (000’ omitted) | | $ | 12,548 | | | $ | 14,363 | | | $ | 31,817 | | | $ | 53,035 | | | $ | 35,232 | |
| Ratio of expenses to average net assets: | | | | | | | | | | | | | | | | | | | | |
Expense before reductions(3)(4) | | | 2.80 | % | | | 2.41 | % | | | 2.17 | % | | | 2.15 | % | | | 2.37 | % |
Expense net of fee waivers, if any(3)(5) | | | 1.99 | % | | | 1.99 | % | | | 1.99 | % | | | 1.99 | % | | | 1.99 | % |
| Ratio of net investment income (loss) | | | | | | | | | | | | | | | | | | | | |
| to average net assets*: | | | | | | | | | | | | | | | | | | | | |
Before waiver and expense reimbursement(3) | | | 0.49 | % | | | (0.50 | )% | | | (0.47 | )% | | | 2.85 | % | | | 2.64 | % |
After waiver and expense reimbursement(3) | | | 1.30 | % | | | (0.08 | )% | | | (0.29 | )% | | | 3.01 | % | | | 3.02 | % |
| Portfolio turnover rate | | | 326 | % | | | 160 | % | | | 237 | % | | | 280 | % | | | 186 | % |
| (1) | The average shares outstanding method has been applied for per share information. |
| (2) | Total investment return is based on the change in net asset value of a share during the year, assumes reinvestment of dividends and distributions at net asset value and does not reflect the impact of a sales charge. |
| (3) | Expense waived or reimbursed reflect reductions to total expenses, as discussed in the notes to the financial statements. These amounts would increase the net investment loss ratio or decrease the net investment income ratio, as applicable, had such reductions not occurred. |
| (4) | Expenses before reductions (excluding dividend and interest expense for securities sold short) were 2.78%, 2.40%, 2.16%, 2.14% and 2.34% for the years ended June 30, 2017, 2016, 2015, 2014 and 2013, respectively. |
| (5) | Expenses net of all reductions (excluding dividend and interest expense for securities sold short) were 1.98%,1.98%, 1.98%, 1.98% and 1.96% for the years ended June 30, 2017, 2016, 2015, 2014 and 2013, respectively. |
| * | The net investment income (loss) ratios include dividends on short positions. |
The accompanying notes are an integral part of the financial statements.
Financial Highlights
Quaker Event Arbitrage Fund
(For a Share Outstanding Throughout each Year)
| | | Class C | |
| | | | |
| | | Years Ended June 30, | |
| | | 2017 | | | 2016 | | | 2015 | | | 2014 | | | 2013 | |
| Net asset value, beginning of year | | $ | 11.26 | | | $ | 13.01 | | | $ | 13.72 | | | $ | 12.57 | | | $ | 11.78 | |
| Income from investment operations: | | | | | | | | | | | | | | | | | | | | |
Net investment income (loss)(1) | | | 0.06 | | | | (0.09 | ) | | | (0.14 | ) | | | 0.30 | | | | 0.28 | |
| Net realized and unrealized | | | | | | | | | | | | | | | | | | | | |
| gain (loss) on investments | | | 1.17 | | | | (0.64 | ) | | | 0.20 | | | | 0.92 | | | | 0.64 | |
| Total from investment operations | | | 1.23 | | | | (0.73 | ) | | | 0.06 | | | | 1.22 | | | | 0.92 | |
| Distributions to shareholders from: | | | | | | | | | | | | | | | | | | | | |
| Net investment income | | | (0.02 | ) | | | — | | | | (0.03 | ) | | | — | | | | — | |
| Net realized capital gain | | | — | | | | (1.02 | ) | | | (0.74 | ) | | | (0.07 | ) | | | (0.13 | ) |
| Total distributions | | | (0.02 | ) | | | (1.02 | ) | | | (0.77 | ) | | | (0.07 | ) | | | (0.13 | ) |
| Net asset value, end of year | | $ | 12.47 | | | $ | 11.26 | | | $ | 13.01 | | | $ | 13.72 | | | $ | 12.57 | |
Total Return(2) | | | 10.91 | % | | | (5.03 | )% | | | 0.52 | % | | | 9.72 | % | | | 7.91 | % |
| Ratios/supplemental data: | | | | | | | | | | | | | | | | | | | | |
| Net assets, end of year (000’ omitted) | | $ | 3,263 | | | $ | 4,576 | | | $ | 6,595 | | | $ | 6,555 | | | $ | 5,954 | |
| Ratio of expenses to average net assets: | | | | | | | | | | | | | | | | | | | | |
Expense before reductions(3)(4) | | | 3.55 | % | | | 3.16 | % | | | 2.92 | % | | | 2.90 | % | | | 3.12 | % |
Expense net of fee waivers, if any(3)(5) | | | 2.74 | % | | | 2.74 | % | | | 2.74 | % | | | 2.74 | % | | | 2.74 | % |
| Ratio of net investment income (loss) | | | | | | | | | | | | | | | | | | | | |
| to average net assets*: | | | | | | | | | | | | | | | | | | | | |
Before waiver and expense reimbursement(3) | | | (0.26 | )% | | | (1.25 | )% | | | (1.22 | )% | | | 2.10 | % | | | 1.89 | % |
After waiver and expense reimbursement(3) | | | 0.55 | % | | | (0.83 | )% | | | (1.04 | )% | | | 2.26 | % | | | 2.27 | % |
| Portfolio turnover rate | | | 326 | % | | | 160 | % | | | 237 | % | | | 280 | % | | | 186 | % |
| (1) | The average shares outstanding method has been applied for per share information. |
| (2) | Total investment return is based on the change in net asset value of a share during the year, assumes reinvestment of dividends and distributions at net asset value and does not reflect the impact of a sales charge. |
| (3) | Expense waived or reimbursed reflect reductions to total expenses, as discussed in the notes to the financial statements. These amounts would increase the net investment loss ratio or decrease the net investment income ratio, as applicable, had such reductions not occurred. |
| (4) | Expenses before reductions (excluding dividend and interest expense for securities sold short) were 3.53%, 3.15%, 2.91%, 2.89% and 3.09% for the years ended June 30, 2017, 2016, 2015, 2014 and 2013, respectively. |
| (5) | Expenses net of all reductions (excluding dividend and interest expense for securities sold short) were 2.73%, 2.73%, 2.73%, 2.73% and 2.71% for the years ended June 30, 2017, 2016, 2015, 2014 and 2013, respectively. |
| * | The net investment income (loss) ratios include dividends on short positions. |
The accompanying notes are an integral part of the financial statements.
Financial Highlights
Quaker Event Arbitrage Fund
(For a Share Outstanding Throughout each Year)
| | | Institutional Class | |
| | | | |
| | | Years Ended June 30, | |
| | | 2017 | | | 2016 | | | 2015 | | | 2014 | | | 2013 | |
| Net asset value, beginning of year | | $ | 11.80 | | | $ | 13.46 | | | $ | 14.15 | | | $ | 12.86 | | | $ | 11.97 | |
| Income from investment operations: | | | | | | | | | | | | | | | | | | | | |
Net investment income (loss)(1) | | | 0.19 | | | | 0.02 | | | | (0.01 | ) | | | 0.44 | | | | 0.40 | |
| Net realized and unrealized | | | | | | | | | | | | | | | | | | | | |
| gain (loss) on investments | | | 1.23 | | | | (0.66 | ) | | | 0.21 | | | | 0.94 | | | | 0.67 | |
| Total from investment operations | | | 1.42 | | | | (0.64 | ) | | | 0.20 | | | | 1.38 | | | | 1.07 | |
| Distributions to shareholders from: | | | | | | | | | | | | | | | | | | | | |
| Net investment income | | | (0.08 | ) | | | — | | | | (0.15 | ) | | | (0.02 | ) | | | (0.05 | ) |
| Net realized capital gain | | | — | | | | (1.02 | ) | | | (0.74 | ) | | | (0.07 | ) | | | (0.13 | ) |
| Total distributions | | | (0.08 | ) | | | (1.02 | ) | | | (0.89 | ) | | | (0.09 | ) | | | (0.18 | ) |
| Net asset value, end of year | | $ | 13.14 | | | $ | 11.80 | | | $ | 13.46 | | | $ | 14.15 | | | $ | 12.86 | |
Total Return(2) | | | 12.10 | % | | | (4.15 | )% | | | 1.61 | % | | | 10.77 | % | | | 9.04 | % |
| Ratios/supplemental data: | | | | | | | | | | | | | | | | | | | | |
| Net assets, end of year (000’ omitted) | | $ | 13,890 | | | $ | 14,953 | | | $ | 75,420 | | | $ | 59,474 | | | $ | 24,929 | |
| Ratio of expenses to average net assets: | | | | | | | | | | | | | | | | | | | | |
Expense before reductions(3)(4) | | | 2.55 | % | | | 2.16 | % | | | 1.92 | % | | | 1.90 | % | | | 2.12 | % |
Expense net of fee waivers, if any(3)(5) | | | 1.74 | % | | | 1.74 | % | | | 1.74 | % | | | 1.74 | % | | | 1.74 | % |
| Ratio of net investment income (loss) | | | | | | | | | | | | | | | | | | | | |
| to average net assets*: | | | | | | | | | | | | | | | | | | | | |
Before waiver and expense reimbursement(3) | | | 0.74 | % | | | (0.25 | )% | | | (0.22 | )% | | | 3.10 | % | | | 2.89 | % |
After waiver and expense reimbursement(3) | | | 1.55 | % | | | 0.17 | % | | | (0.04 | )% | | | 3.26 | % | | | 3.27 | % |
| Portfolio turnover rate | | | 326 | % | | | 160 | % | | | 237 | % | | | 280 | % | | | 186 | % |
| (1) | The average shares outstanding method has been applied for per share information. |
| (2) | Total investment return is based on the change in net asset value of a share during the year, assumes reinvestment of dividends and distributions at net asset value and does not reflect the impact of a sales charge. |
| (3) | Expense waived or reimbursed reflect reductions to total expenses, as discussed in the notes to the financial statements. These amounts would increase the net investment loss ratio or decrease the net investment income ratio, as applicable, had such reductions not occurred. |
| (4) | Expenses before reductions (excluding dividend and interest expense for securities sold short) were 2.53%, 2.15%, 1.91%, 1.89% and 2.09% for the years ended June 30, 2017, 2016, 2015, 2014 and 2013, respectively. |
| (5) | Expenses net of all reductions (excluding dividend and interest expense for securities sold short) were 1.73%, 1.73%, 1.73%, 1.73% and 1.71% for the years ended June 30, 2017, 2016, 2015, 2014 and 2013, respectively. |
| * | The net investment income (loss) ratios include dividends on short positions. |
The accompanying notes are an integral part of the financial statements.
Financial Highlights
Quaker Global Tactical Allocation Fund
(For a Share Outstanding Throughout each Year)
| | | Class A | |
| | | | |
| | | Years Ended June 30, | |
| | | 2017 | | | 2016 | | | 2015 | | | 2014 | | | 2013 | |
| Net asset value, beginning of year | | $ | 9.95 | | | $ | 11.51 | | | $ | 10.46 | | | $ | 8.30 | | | $ | 7.12 | |
| Income from investment operations: | | | | | | | | | | | | | | | | | | | | |
Net investment income (loss)(1) | | | — | | | | (0.14 | ) | | | (0.11 | ) | | | (0.08 | ) | | | (0.09 | ) |
| Net realized and unrealized | | | | | | | | | | | | | | | | | | | | |
| gain (loss) on investments | | | 0.67 | | | | (1.42 | ) | | | 1.16 | | | | 2.24 | | | | 1.27 | |
| Total from investment operations | | | 0.67 | | | | (1.56 | ) | | | 1.05 | | | | 2.16 | | | | 1.18 | |
| Distributions to shareholders from: | | | | | | | | | | | | | | | | | | | | |
| Net investment income | | | — | | | | — | | | | — | | | | — | | | | — | |
| Net realized capital gain | | | — | | | | — | | | | — | | | | — | | | | — | |
| Total distributions | | | — | | | | — | | | | — | | | | — | | | | — | |
| Net asset value, end of year | | $ | 10.62 | | | $ | 9.95 | | | $ | 11.51 | | | $ | 10.46 | | | $ | 8.30 | |
Total Return(2) | | | 6.73 | % | | | (13.55 | )% | | | 10.04 | % | | | 26.02 | % | | | 16.57 | % |
| Ratios/supplemental data: | | | | | | | | | | | | | | | | | | | | |
| Net assets, end of year (000’ omitted) | | $ | 1,706 | | | $ | 3,184 | | | $ | 5,707 | | | $ | 3,992 | | | $ | 3,856 | |
| Ratio of expenses to average net assets: | | | | | | | | | | | | | | | | | | | | |
Expense before reductions(3)(4) | | | 2.35 | % | | | 2.42 | % | | | 2.27 | % | | | 2.19 | % | | | 2.83 | % |
Expense net of fee waivers, if any(3) | | | 2.16 | % | | | 2.42 | % | | | 2.27 | % | | | 2.19 | % | | | 2.83 | % |
| Ratio of net investment income (loss) | | | | | | | | | | | | | | | | | | | | |
| to average net assets: | | | | | | | | | | | | | | | | | | | | |
Before waiver and expense reimbursement(3) | | | (0.15 | )% | | | (1.30 | )%* | | | (1.03 | )%* | | | (0.80 | )%* | | | (1.22 | )%* |
After waiver and expense reimbursement(3) | | | 0.04 | % | | | (1.30 | )%* | | | (1.03 | )%* | | | (0.80 | )%* | | | (1.22 | )%* |
| Portfolio turnover rate | | | 184 | % | | | 211 | % | | | 125 | % | | | 130 | % | | | 484 | % |
| (1) | The average shares outstanding method has been applied for per share information. |
| (2) | Total investment return is based on the change in net asset value of a share during the year, assumes reinvestment of dividends and distributions at net asset value and does not reflect the impact of a sales charge. |
| (3) | Expense waived or reimbursed reflect reductions to total expenses, as discussed in the notes to the financial statements. These amounts would increase the net investment loss ratio or decrease the net investment income ratio, as applicable, had such reductions not occurred. |
| (4) | Ratio of expenses (excluding dividend and interest expense for securities sold short) were 2.41%, 2.25%, 2.15% and 2.83% for the years ended June 30, 2016, 2015, 2014 and 2013, respectively. |
| * | The net investment income (loss) ratios include dividends on short positions. |
The accompanying notes are an integral part of the financial statements.
Financial Highlights
Quaker Global Tactical Allocation Fund
(For a Share Outstanding Throughout each Year)
| | | Class C | |
| | | | |
| | | Years Ended June 30, | |
| | | 2017 | | | 2016 | | | 2015 | | | 2014 | | | 2013 | |
| Net asset value, beginning of year | | $ | 9.36 | | | $ | 10.91 | | | $ | 9.99 | | | $ | 7.98 | | | $ | 6.90 | |
| Income from investment operations: | | | | | | | | | | | | | | | | | | | | |
Net investment income (loss)(1) | | | (0.07 | ) | | | (0.20 | ) | | | (0.19 | ) | | | (0.14 | ) | | | (0.14 | ) |
| Net realized and unrealized | | | | | | | | | | | | | | | | | | | | |
| gain (loss) on investments | | | 0.62 | | | | (1.35 | ) | | | 1.11 | | | | 2.15 | | | | 1.22 | |
| Total from investment operations | | | 0.55 | | | | (1.55 | ) | | | 0.92 | | | | 2.01 | | | | 1.08 | |
| Distributions to shareholders from: | | | | | | | | | | | | | | | | | | | | |
| Net investment income | | | — | | | | — | | | | — | | | | — | | | | — | |
| Net realized capital gain | | | — | | | | — | | | | — | | | | — | | | | — | |
| Total distributions | | | — | | | | — | | | | — | | | | — | | | | — | |
| Net asset value, end of year | | $ | 9.91 | | | $ | 9.36 | | | $ | 10.91 | | | $ | 9.99 | | | $ | 7.98 | |
Total Return(2) | | | 5.88 | % | | | (14.21 | )% | | | 9.21 | % | | | 25.19 | % | | | 15.65 | % |
| Ratios/supplemental data: | | | | | | | | | | | | | | | | | | | | |
| Net assets, end of year (000’ omitted) | | $ | 1,041 | | | $ | 1,497 | | | $ | 1,851 | | | $ | 2,093 | | | $ | 2,124 | |
| Ratio of expenses to average net assets: | | | | | | | | | | | | | | | | | | | | |
Expense before reductions(3)(4) | | | 3.10 | % | | | 3.17 | % | | | 3.02 | % | | | 2.94 | % | | | 3.58 | % |
Expense net of fee waivers, if any(3) | | | 2.91 | % | | | 3.17 | % | | | 3.02 | % | | | 2.94 | % | | | 3.58 | % |
| Ratio of net investment income (loss) | | | | | | | | | | | | | | | | | | | | |
| to average net assets: | | | | | | | | | | | | | | | | | | | | |
Before waiver and expense reimbursement(3) | | | (0.90 | )% | | | (2.05 | )%* | | | (1.78 | )%* | | | (1.55 | )%* | | | (1.97 | )%* |
After waiver and expense reimbursement(3) | | | (0.71 | )% | | | (2.05 | )%* | | | (1.78 | )%* | | | (1.55 | )%* | | | (1.97 | )%* |
| Portfolio turnover rate | | | 184 | % | | | 211 | % | | | 125 | % | | | 130 | % | | | 484 | % |
| (1) | The average shares outstanding method has been applied for per share information. |
| (2) | Total investment return is based on the change in net asset value of a share during the year, assumes reinvestment of dividends and distributions at net asset value and does not reflect the impact of a sales charge. |
| (3) | Expense waived or reimbursed reflect reductions to total expenses, as discussed in the notes to the financial statements. These amounts would increase the net investment loss ratio or decrease the net investment income ratio, as applicable, had such reductions not occurred. |
| (4) | Ratio of expenses (excluding dividend and interest expense for securities sold short) were 3.16%, 3.00%, 2.90% and 3.58% for the years ended June 30, 2016, 2015, 2014 and 2013, respectively. |
| * | The net investment income (loss) ratios include dividends on short positions. |
The accompanying notes are an integral part of the financial statements.
Financial Highlights
Quaker Global Tactical Allocation Fund
(For a Share Outstanding Throughout each Year)
| | | Institutional Class | |
| | | | |
| | | Years Ended June 30, | |
| | | 2017 | | | 2016 | | | 2015 | | | 2014 | | | 2013 | |
| Net asset value, beginning of year | | $ | 11.47 | | | $ | 13.23 | | | $ | 12.00 | | | $ | 9.49 | | | $ | 8.12 | |
| Income from investment operations: | | | | | | | | | | | | | | | | | | | | |
Net investment income (loss)(1) | | | 0.03 | | | | (0.13 | ) | | | (0.10 | ) | | | (0.06 | ) | | | (0.08 | ) |
| Net realized and unrealized | | | | | | | | | | | | | | | | | | | | |
| gain (loss) on investments | | | 0.77 | | | | (1.63 | ) | | | 1.33 | | | | 2.57 | | | | 1.45 | |
| Total from investment operations | | | 0.80 | | | | (1.76 | ) | | | 1.23 | | | | 2.51 | | | | 1.37 | |
| Distributions to shareholders from: | | | | | | | | | | | | | | | | | | | | |
| Net investment income | | | — | | | | — | | | | — | | | | — | | | | — | |
| Net realized capital gain | | | — | | | | — | | | | — | | | | — | | | | — | |
| Total distributions | | | — | | | | — | | | | — | | | | — | | | | — | |
| Net asset value, end of year | | $ | 12.27 | | | $ | 11.47 | | | $ | 13.23 | | | $ | 12.00 | | | $ | 9.49 | |
Total Return(2) | | | 6.97 | % | | | (13.30 | )% | | | 10.25 | % | | | 26.45 | % | | | 16.87 | % |
| Ratios/supplemental data: | | | | | | | | | | | | | | | | | | | | |
| Net assets, end of year (000’ omitted) | | $ | 4,047 | | | $ | 2,058 | | | $ | 1,474 | | | $ | 1,240 | | | $ | 625 | |
| Ratio of expenses to average net assets: | | | | | | | | | | | | | | | | | | | | |
Expense before reductions(3)(4) | | | 2.10 | % | | | 2.17 | % | | | 2.02 | % | | | 1.94 | % | | | 2.58 | % |
Expense net of fee waivers, if any(3) | | | 1.91 | % | | | 2.17 | % | | | 2.02 | % | | | 1.94 | % | | | 2.58 | % |
| Ratio of net investment income (loss) | | | | | | | | | | | | | | | | | | | | |
| to average net assets: | | | | | | | | | | | | | | | | | | | | |
Before waiver and expense reimbursement(3) | | | 0.10 | % | | | (1.05 | )%* | | | (0.78 | )%* | | | (0.55 | )%* | | | (0.97 | )%* |
After waiver and expense reimbursement(3) | | | 0.29 | % | | | (1.05 | )%* | | | (0.78 | )%* | | | (0.55 | )%* | | | (0.97 | )%* |
| Portfolio turnover rate | | | 184 | % | | | 211 | % | | | 125 | % | | | 130 | % | | | 484 | % |
| (1) | The average shares outstanding method has been applied for per share information. |
| (2) | Total investment return is based on the change in net asset value of a share during the year, assumes reinvestment of dividends and distributions at net asset value and does not reflect the impact of a sales charge. |
| (3) | Expense waived or reimbursed reflect reductions to total expenses, as discussed in the notes to the financial statements. These amounts would increase the net investment loss ratio or decrease the net investment income ratio, as applicable, had such reductions not occurred. |
| (4) | Ratio of expenses (excluding dividend and interest expense for securities sold short) were 2.16%, 2.00%, 1.90% and 2.58% for the years ended June 30, 2016, 2015, 2014 and 2013, respectively. |
| * | The net investment income (loss) ratios include dividends on short positions. |
The accompanying notes are an integral part of the financial statements.
Financial Highlights
Quaker Mid-Cap Value Fund
(For a Share Outstanding Throughout each Year)
| | | Class A | |
| | | | |
| | | Years Ended June 30, | |
| | | 2017 | | | 2016 | | | 2015 | | | 2014 | | | 2013 | |
| Net asset value, beginning of year | | $ | 23.58 | | | $ | 24.78 | | | $ | 24.62 | | | $ | 18.99 | | | $ | 15.73 | |
| Income from investment operations: | | | | | | | | | | | | | | | | | | | | |
Net investment income (loss)(1) | | | (0.17 | ) | | | (0.06 | ) | | | (0.10 | ) | | | (0.09 | ) | | | (0.14 | ) |
| Net realized and unrealized | | | | | | | | | | | | | | | | | | | | |
| gain (loss) on investments | | | 4.65 | | | | (1.14 | ) | | | 0.26 | | | | 5.72 | | | | 3.40 | |
| Total from investment operations | | | 4.48 | | | | (1.20 | ) | | | 0.16 | | | | 5.63 | | | | 3.26 | |
| Distributions to shareholders from: | | | | | | | | | | | | | | | | | | | | |
| Net investment income | | | — | | | | — | | | | — | | | | — | | | | — | |
| Net realized capital gain | | | — | | | | — | | | | — | | | | — | | | | — | |
| Total distributions | | | — | | | | — | | | | — | | | | — | | | | — | |
| Net asset value, end of year | | $ | 28.06 | | | $ | 23.58 | | | $ | 24.78 | | | $ | 24.62 | | | $ | 18.99 | |
Total Return(2) | | | 19.00 | % | | | (4.84 | )% | | | 0.65 | % | | | 29.65 | % | | | 20.72 | % |
| Ratios/supplemental data: | | | | | | | | | | | | | | | | | | | | |
| Net assets, end of year (000’ omitted) | | $ | 4,081 | | | $ | 4,057 | | | $ | 5,520 | | | $ | 5,724 | | | $ | 6,029 | |
| Ratio of expenses to average net assets | | | 2.39 | % | | | 2.17 | % | | | 1.98 | % | | | 2.03 | % | | | 2.19 | % |
| Ratio of net investment income (loss) | | | | | | | | | | | | | | | | | | | | |
| to average net assets | | | (0.66 | )% | | | (0.26 | )% | | | (0.39 | )% | | | (0.42 | )% | | | (0.80 | )% |
| Portfolio turnover rate | | | 28 | % | | | 71 | % | | | 49 | % | | | 62 | % | | | 47 | % |
| (1) | The average shares outstanding method has been applied for per share information. |
| (2) | Total investment return is based on the change in net asset value of a share during the year, assumes reinvestment of dividends and distributions at net asset value and does not reflect the impact of a sales charge. |
The accompanying notes are an integral part of the financial statements.
Financial Highlights
Quaker Mid-Cap Value Fund
(For a Share Outstanding Throughout each Year)
| | | Class C | |
| | | | |
| | | Years Ended June 30, | |
| | | 2017 | | | 2016 | | | 2015 | | | 2014 | | | 2013 | |
| Net asset value, beginning of year | | $ | 20.52 | | | $ | 21.73 | | | $ | 21.75 | | | $ | 16.91 | | | $ | 14.11 | |
| Income from investment operations: | | | | | | | | | | | | | | | | | | | | |
Net investment income (loss)(1) | | | (0.32 | ) | | | (0.20 | ) | | | (0.25 | ) | | | (0.22 | ) | | | (0.24 | ) |
| Net realized and unrealized | | | | | | | | | | | | | | | | | | | | |
| gain (loss) on investments | | | 4.04 | | | | (1.01 | ) | | | 0.23 | | | | 5.06 | | | | 3.04 | |
| Total from investment operations | | | 3.72 | | | | (1.21 | ) | | | (0.02 | ) | | | 4.84 | | | | 2.80 | |
| Distributions to shareholders from: | | | | | | | | | | | | | | | | | | | | |
| Net investment income | | | — | | | | — | | | | — | | | | — | | | | — | |
| Net realized capital gain | | | — | | | | — | | | | — | | | | — | | | | — | |
| Total distributions | | | — | | | | — | | | | — | | | | — | | | | — | |
| Net asset value, end of year | | $ | 24.24 | | | $ | 20.52 | | | $ | 21.73 | | | $ | 21.75 | | | $ | 16.91 | |
Total Return(2) | | | 18.13 | % | | | (5.57 | )% | | | (0.09 | )% | | | 28.62 | % | | | 19.84 | % |
| Ratios/supplemental data: | | | | | | | | | | | | | | | | | | | | |
| Net assets, end of year (000’ omitted) | | $ | 1,526 | | | $ | 1,565 | | | $ | 1,944 | | | $ | 2,086 | | | $ | 1,815 | |
| Ratio of expenses to average net assets | | | 3.14 | % | | | 2.92 | % | | | 2.73 | % | | | 2.78 | % | | | 2.94 | % |
| Ratio of net investment income (loss) | | | | | | | | | | | | | | | | | | | | |
| to average net assets | | | (1.41 | )% | | | (1.01 | )% | | | (1.14 | )% | | | (1.17 | )% | | | (1.55 | )% |
| Portfolio turnover rate | | | 28 | % | | | 71 | % | | | 49 | % | | | 62 | % | | | 47 | % |
| (1) | The average shares outstanding method has been applied for per share information. |
| (2) | Total investment return is based on the change in net asset value of a share during the year, assumes reinvestment of dividends and distributions at net asset value and does not reflect the impact of a sales charge. |
The accompanying notes are an integral part of the financial statements.
Financial Highlights
Quaker Mid-Cap Value Fund
(For a Share Outstanding Throughout each Year)
| | | Institutional Class | |
| | | | |
| | | Years Ended June 30, | |
| | | 2017 | | | 2016 | | | 2015 | | | 2014 | | | 2013 | |
| Net asset value, beginning of year | | $ | 24.81 | | | $ | 26.01 | | | $ | 25.77 | | | $ | 19.83 | | | $ | 16.39 | |
| Income from investment operations: | | | | | | | | | | | | | | | | | | | | |
Net investment income (loss)(1) | | | (0.11 | ) | | (0.00 | )^ | | | (0.04 | ) | | | (0.04 | ) | | | (0.10 | ) |
| Net realized and unrealized | | | | | | | | | | | | | | | | | | | | |
| gain (loss) on investments | | | 4.90 | | | | (1.20 | ) | | | 0.28 | | | | 5.98 | | | | 3.54 | |
| Total from investment operations | | | 4.79 | | | | (1.20 | ) | | | 0.24 | | | | 5.94 | | | | 3.44 | |
| Distributions to shareholders from: | | | | | | | | | | | | | | | | | | | | |
| Net investment income | | | — | | | | — | | | | — | | | | — | | | | — | |
| Net realized capital gain | | | — | | | | — | | | | — | | | | — | | | | — | |
| Total distributions | | | — | | | | — | | | | — | | | | — | | | | — | |
| Net asset value, end of year | | $ | 29.60 | | | $ | 24.81 | | | $ | 26.01 | | | $ | 25.77 | | | $ | 19.83 | |
Total Return(2) | | | 19.31 | % | | | (4.61 | )% | | | 0.93 | % | | | 29.95 | % | | | 20.99 | % |
| Ratios/supplemental data: | | | | | | | | | | | | | | | | | | | | |
| Net assets, end of year (000’ omitted) | | $ | 1,482 | | | $ | 1,283 | | | $ | 1,504 | | | $ | 2,216 | | | $ | 1,060 | |
| Ratio of expenses to average net assets | | | 2.14 | % | | | 1.92 | % | | | 1.73 | % | | | 1.78 | % | | | 1.94 | % |
| Ratio of net investment income (loss) | | | | | | | | | | | | | | | | | | | | |
| to average net assets | | | (0.41 | )% | | | (0.01 | )% | | | (0.14 | )% | | | (0.17 | )% | | | (0.55 | )% |
| Portfolio turnover rate | | | 28 | % | | | 71 | % | | | 49 | % | | | 62 | % | | | 47 | % |
| (1) | The average shares outstanding method has been applied for per share information. |
| (2) | Total investment return is based on the change in net asset value of a share during the year, assumes reinvestment of dividends and distributions at net asset value and does not reflect the impact of a sales charge. |
| ^ | Amount is less than 0.005 per share. |
The accompanying notes are an integral part of the financial statements.
Financial Highlights
Quaker Small-Cap Value Fund
(For a Share Outstanding Throughout each Year)
| | | Class A | |
| | | | |
| | | Years Ended June 30, | |
| | | 2017 | | | 2016 | | | 2015 | | | 2014 | | | 2013 | |
| Net asset value, beginning of year | | $ | 20.09 | | | $ | 24.15 | | | $ | 24.28 | | | $ | 19.50 | | | $ | 15.85 | |
| Income from investment operations: | | | | | | | | | | | | | | | | | | | | |
Net investment income (loss)(1) | | | (0.20 | ) | | | (0.08 | ) | | | (0.06 | ) | | | (0.11 | ) | | | 0.09 | |
| Net realized and unrealized | | | | | | | | | | | | | | | | | | | | |
| gain (loss) on investments | | | 4.24 | | | | (2.26 | ) | | | 1.22 | | | | 4.95 | | | | 3.58 | |
| Total from investment operations | | | 4.04 | | | | (2.34 | ) | | | 1.16 | | | | 4.84 | | | | 3.67 | |
| Distributions to shareholders from: | | | | | | | | | | | | | | | | | | | | |
| Net investment income | | | — | | | | — | | | | — | | | | (0.06 | ) | | | (0.02 | ) |
| Net realized capital gain | | | — | | | | (1.72 | ) | | | (1.29 | ) | | | — | | | | — | |
| Total distributions | | | — | | | | (1.72 | ) | | | (1.29 | ) | | | (0.06 | ) | | | (0.02 | ) |
| Net asset value, end of year | | $ | 24.13 | | | $ | 20.09 | | | $ | 24.15 | | | $ | 24.28 | | | $ | 19.50 | |
Total Return(2) | | | 20.11 | % | | | (9.93 | )% | | | 4.96 | % | | | 24.83 | % | | | 23.17 | % |
| Ratios/supplemental data: | | | | | | | | | | | | | | | | | | | | |
| Net assets, end of year (000’ omitted) | | $ | 6,434 | | | $ | 6,431 | | | $ | 7,790 | | | $ | 8,512 | | | $ | 7,727 | |
| Ratio of expenses to average net assets | | | 2.21 | % | | | 1.93 | % | | | 1.78 | % | | | 1.83 | % | | | 1.93 | % |
| Ratio of net investment income (loss) | | | | | | | | | | | | | | | | | | | | |
| to average net assets | | | (0.89 | )% | | | (0.37 | )% | | | (0.26 | )% | | | (0.47 | )% | | | 0.49 | % |
| Portfolio turnover rate | | | 146 | % | | | 119 | % | | | 128 | % | | | 176 | % | | | 142 | % |
| (1) | The average shares outstanding method has been applied for per share information. |
| (2) | Total investment return is based on the change in net asset value of a share during the year, assumes reinvestment of dividends and distributions at net asset value and does not reflect the impact of a sales charge. |
The accompanying notes are an integral part of the financial statements.
Financial Highlights
Quaker Small-Cap Value Fund
(For a Share Outstanding Throughout each Year)
| | | Class C | |
| | | | |
| | | Years Ended June 30, | |
| | | 2017 | | | 2016 | | | 2015 | | | 2014 | | | 2013 | |
| Net asset value, beginning of year | | $ | 16.19 | | | $ | 19.96 | | | $ | 20.43 | | | $ | 16.49 | | | $ | 13.49 | |
| Income from investment operations: | | | | | | | | | | | | | | | | | | | | |
Net investment income (loss)(1) | | | (0.30 | ) | | | (0.19 | ) | | | (0.20 | ) | | | (0.23 | ) | | | (0.04 | ) |
| Net realized and unrealized | | | | | | | | | | | | | | | | | | | | |
| gain (loss) on investments | | | 3.41 | | | | (1.86 | ) | | | 1.02 | | | | 4.17 | | | | 3.04 | |
| Total from investment operations | | | 3.11 | | | | (2.05 | ) | | | 0.82 | | | | 3.94 | | | | 3.00 | |
| Distributions to shareholders from: | | | | | | | | | | | | | | | | | | | | |
| Net investment income | | | — | | | | — | | | | — | | | | — | | | | — | |
| Net realized capital gain | | | — | | | | (1.72 | ) | | | (1.29 | ) | | | — | | | | — | |
| Total distributions | | | — | | | | (1.72 | ) | | | (1.29 | ) | | | — | | | | — | |
| Net asset value, end of year | | $ | 19.30 | | | $ | 16.19 | | | $ | 19.96 | | | $ | 20.43 | | | $ | 16.49 | |
Total Return(2) | | | 19.21 | % | | | (10.59 | )% | | | 4.20 | % | | | 23.89 | % | | | 22.24 | % |
| Ratios/supplemental data: | | | | | | | | | | | | | | | | | | | | |
| Net assets, end of year (000’ omitted) | | $ | 1,302 | | | $ | 1,477 | | | $ | 1,684 | | | $ | 1,806 | | | $ | 1,625 | |
| Ratio of expenses to average net assets | | | 2.96 | % | | | 2.68 | % | | | 2.53 | % | | | 2.58 | % | | | 2.68 | % |
| Ratio of net investment income (loss) | | | | | | | | | | | | | | | | | | | | |
| to average net assets | | | (1.64 | )% | | | (1.12 | )% | | | (1.01 | )% | | | (1.22 | )% | | | (0.26 | )% |
| Portfolio turnover rate | | | 146 | % | | | 119 | % | | | 128 | % | | | 176 | % | | | 142 | % |
| (1) | The average shares outstanding method has been applied for per share information. |
| (2) | Total investment return is based on the change in net asset value of a share during the year, assumes reinvestment of dividends and distributions at net asset value and does not reflect the impact of a sales charge. |
The accompanying notes are an integral part of the financial statements.
Financial Highlights
Quaker Small-Cap Value Fund
(For a Share Outstanding Throughout each Year)
| | | Institutional Class | |
| | | | |
| | | Years Ended June 30, | |
| | | 2017 | | | 2016 | | | 2015 | | | 2014 | | | 2013 | |
| Net asset value, beginning of year | | $ | 21.17 | | | $ | 25.29 | | | $ | 25.30 | | | $ | 20.29 | | | $ | 16.50 | |
| Income from investment operations: | | | | | | | | | | | | | | | | | | | | |
Net investment income (loss)(1) | | | (0.15 | ) | | | (0.03 | ) | | (0.00 | )^ | | | (0.05 | ) | | | 0.13 | |
| Net realized and unrealized | | | | | | | | | | | | | | | | | | | | |
| gain (loss) on investments | | | 4.47 | | | | (2.37 | ) | | | 1.28 | | | | 5.14 | | | | 3.73 | |
| Total from investment operations | | | 4.32 | | | | (2.40 | ) | | | 1.28 | | | | 5.09 | | | | 3.86 | |
| Distributions to shareholders from: | | | | | | | | | | | | | | | | | | | | |
| Net investment income | | | — | | | | — | | | | — | | | | (0.08 | ) | | | (0.07 | ) |
| Net realized capital gain | | | — | | | | (1.72 | ) | | | (1.29 | ) | | | — | | | | — | |
| Total distributions | | | — | | | | (1.72 | ) | | | (1.29 | ) | | | (0.08 | ) | | | (0.07 | ) |
| Net asset value, end of year | | $ | 25.49 | | | $ | 21.17 | | | $ | 25.29 | | | $ | 25.30 | | | $ | 20.29 | |
Total Return(2) | | | 20.41 | % | | | (9.71 | )% | | | 5.24 | % | | | 25.13 | % | | | 23.44 | % |
| Ratios/supplemental data: | | | | | | | | | | | | | | | | | | | | |
| Net assets, end of year (000’ omitted) | | $ | 20,952 | | | $ | 24,642 | | | $ | 28,528 | | | $ | 27,868 | | | $ | 23,393 | |
| Ratio of expenses to average net assets | | | 1.96 | % | | | 1.68 | % | | | 1.53 | % | | | 1.58 | % | | | 1.68 | % |
| Ratio of net investment income (loss) | | | | | | | | | | | | | | | | | | | | |
| to average net assets | | | (0.64 | )% | | | (0.12 | )% | | | (0.01 | )% | | | (0.22 | )% | | | 0.74 | % |
| Portfolio turnover rate | | | 146 | % | | | 119 | % | | | 128 | % | | | 176 | % | | | 142 | % |
| (1) | The average shares outstanding method has been applied for per share information. |
| (2) | Total investment return is based on the change in net asset value of a share during the year, assumes reinvestment of dividends and distributions at net asset value and does not reflect the impact of a sales charge. |
| ^ | Amount is less than 0.005 per share. |
The accompanying notes are an integral part of the financial statements.
Financial Highlights
Quaker Strategic Growth Fund
(For a Share Outstanding Throughout each Year)
| | | Class A | |
| | | | |
| | | Years Ended June 30, | |
| | | 2017 | | | 2016 | | | 2015 | | | 2014 | | | 2013 | |
| Net asset value, beginning of year | | $ | 23.80 | | | $ | 26.55 | | | $ | 24.19 | | | $ | 19.31 | | | $ | 16.13 | |
| Income from investment operations: | | | | | | | | | | | | | | | | | | | | |
Net investment income (loss)(1) | | | (0.07 | ) | | | (0.32 | ) | | | (0.30 | ) | | | (0.26 | ) | | | (0.15 | ) |
| Net realized and unrealized | | | | | | | | | | | | | | | | | | | | |
| gain (loss) on investments | | | 4.13 | | | | (2.43 | ) | | | 2.66 | | | | 5.14 | | | | 3.33 | |
| Total from investment operations | | | 4.06 | | | | (2.75 | ) | | | 2.36 | | | | 4.88 | | | | 3.18 | |
| Distributions to shareholders from: | | | | | | | | | | | | | | | | | | | | |
| Net investment income | | | — | | | | — | | | | — | | | | — | | | | — | |
| Net realized capital gain | | | — | | | | — | | | | — | | | | — | | | | — | |
| Total distributions | | | — | | | | — | | | | — | | | | — | | | | — | |
| Net asset value, end of year | | $ | 27.86 | | | $ | 23.80 | | | $ | 26.55 | | | $ | 24.19 | | | $ | 19.31 | |
Total Return(2) | | | 17.01 | % | | | (10.36 | )% | | | 9.76 | % | | | 25.27 | % | | | 19.71 | % |
| Ratios/supplemental data: | | | | | | | | | | | | | | | | | | | | |
| Net assets, end of year (000’ omitted) | | $ | 49,859 | | | $ | 57,159 | | | $ | 77,188 | | | $ | 87,053 | | | $ | 88,970 | |
| Ratio of expenses to average net assets: | | | | | | | | | | | | | | | | | | | | |
Before expense reimbursements or recoveries(3)(4) | | | 2.34 | % | | | 2.30 | % | | | 2.12 | % | | | 2.15 | % | | | 2.36 | % |
After expense reimbursements or recoveries(3)(5) | | | 2.22 | % | | | 2.24 | % | | | 2.24 | % | | | 2.24 | % | | | 2.24 | % |
| Ratio of net investment income (loss) | | | | | | | | | | | | | | | | | | | | |
| to average net assets: | | | | | | | | | | | | | | | | | | | | |
Before expense reimbursements or recoveries(3) | | | (0.40 | )% | | | (1.34 | )%* | | | (1.06 | )% | | | (1.06 | )% | | | (0.98 | )% |
After expense reimbursements or recoveries(3) | | | (0.28 | )% | | | (1.28 | )%* | | | (1.18 | )% | | | (1.15 | )% | | | (0.86 | )% |
| Portfolio turnover rate | | | 185 | % | | | 211 | % | | | 149 | % | | | 170 | % | | | 294 | % |
| (1) | The average shares outstanding method has been applied for per share information. |
| (2) | Total investment return is based on the change in net asset value of a share during the year, assumes reinvestment of dividends and distributions at net asset value and does not reflect the impact of a sales charge. |
| (3) | Expense waived or reimbursed reflect reductions to total expenses, as discussed in the notes to the financial statements. These reimbursed amounts would increase the net investment loss ratio or decrease the net investment income ratio and recovered amounts would decrease the net investment loss ratio or increase the net investment income ratio, as applicable, had such reductions or increases not occurred. |
| (4) | Expenses before reductions (excluding dividend and interest expense for securities sold short) were 2.29% for the year ended June 30, 2016. |
| (5) | Expenses net of all reductions (excluding dividend and interest expense for securities sold short) were 2.23% for the year endedJune 30, 2016. |
| * | The net investment income (loss) ratios include dividends on short positions. |
The accompanying notes are an integral part of the financial statements.
Financial Highlights
Quaker Strategic Growth Fund
(For a Share Outstanding Throughout each Year)
| | | Class C | |
| | | | |
| | | Years Ended June 30, | |
| | | 2017 | | | 2016 | | | 2015 | | | 2014 | | | 2013 | |
| Net asset value, beginning of year | | $ | 20.72 | | | $ | 23.28 | | | $ | 21.37 | | | $ | 17.19 | | | $ | 14.47 | |
| Income from investment operations: | | | | | | | | | | | | | | | | | | | | |
Net investment income (loss)(1) | | | (0.23 | ) | | | (0.44 | ) | | | (0.43 | ) | | | (0.37 | ) | | | (0.25 | ) |
| Net realized and unrealized | | | | | | | | | | | | | | | | | | | | |
| gain (loss) on investments | | | 3.58 | | | | (2.12 | ) | | | 2.34 | | | | 4.55 | | | | 2.97 | |
| Total from investment operations | | | 3.35 | | | | (2.56 | ) | | | 1.91 | | | | 4.18 | | | | 2.72 | |
| Distributions to shareholders from: | | | | | | | | | | | | | | | | | | | | |
| Net investment income | | | — | | | | — | | | | — | | | | — | | | | — | |
| Net realized capital gain | | | — | | | | — | | | | — | | | | — | | | | — | |
| Total distributions | | | — | | | | — | | | | — | | | | — | | | | — | |
| Net asset value, end of year | | $ | 24.07 | | | $ | 20.72 | | | $ | 23.28 | | | $ | 21.37 | | | $ | 17.19 | |
Total Return(2) | | | 16.17 | % | | | (11.00 | )% | | | 8.94 | % | | | 24.32 | % | | | 18.80 | % |
| Ratios/supplemental data: | | | | | | | | | | | | | | | | | | | | |
| Net assets, end of year (000’ omitted) | | $ | 12,687 | | | $ | 15,375 | | | $ | 20,140 | | | $ | 22,931 | | | $ | 22,968 | |
| Ratio of expenses to average net assets: | | | | | | | | | | | | | | | | | | | | |
Before expense reimbursements or recoveries(3)(4) | | | 3.09 | % | | | 3.05 | % | | | 2.87 | % | | | 2.90 | % | | | 3.11 | % |
After expense reimbursements or recoveries(3)(5) | | | 2.97 | % | | | 2.99 | % | | | 2.99 | % | | | 2.99 | % | | | 2.99 | % |
| Ratio of net investment income (loss) | | | | | | | | | | | | | | | | | | | | |
| to average net assets: | | | | | | | | | | | | | | | | | | | | |
Before expense reimbursements or recoveries(3) | | | (1.15 | )% | | | (2.09 | )%* | | | (1.81 | )% | | | (1.81 | )% | | | (1.74 | )% |
After expense reimbursements or recoveries(3) | | | (1.03 | )% | | | (2.03 | )%* | | | (1.93 | )% | | | (1.90 | )% | | | (1.62 | )% |
| Portfolio turnover rate | | | 185 | % | | | 211 | % | | | 149 | % | | | 170 | % | | | 294 | % |
| (1) | The average shares outstanding method has been applied for per share information. |
| (2) | Total investment return is based on the change in net asset value of a share during the year, assumes reinvestment of dividends and distributions at net asset value and does not reflect the impact of a sales charge. |
| (3) | Expense waived or reimbursed reflect reductions to total expenses, as discussed in the notes to the financial statements. These reimbursed amounts would increase the net investment loss ratio or decrease the net investment income ratio and recovered amounts would decrease the net investment loss ratio or increase the net investment income ratio, as applicable, had such reductions or increases not occurred. |
| (4) | Expenses before reductions (excluding dividend and interest expense for securities sold short) were 3.04% for the year ended June 30, 2016. |
| (5) | Expenses net of all reductions (excluding dividend and interest expense for securities sold short) were 2.98% for the year ended June 30, 2016. |
| * | The net investment income (loss) ratios include dividends on short positions. |
The accompanying notes are an integral part of the financial statements.
Financial Highlights
Quaker Strategic Growth Fund
(For a Share Outstanding Throughout each Year)
| | | Institutional Class | |
| | | | |
| | | Years Ended June 30, | |
| | | 2017 | | | 2016 | | | 2015 | | | 2014 | | | 2013 | |
| Net asset value, beginning of year | | $ | 24.82 | | | $ | 27.62 | | | $ | 25.10 | | | $ | 19.99 | | | $ | 16.66 | |
| Income from investment operations: | | | | | | | | | | | | | | | | | | | | |
Net investment income (loss)(1) | | | (0.01 | ) | | | (0.27 | ) | | | (0.25 | ) | | | (0.21 | ) | | | (0.11 | ) |
| Net realized and unrealized | | | | | | | | | | | | | | | | | | | | |
| gain (loss) on investments | | | 4.31 | | | | (2.53 | ) | | | 2.77 | | | | 5.32 | | | | 3.44 | |
| Total from investment operations | | | 4.30 | | | | (2.80 | ) | | | 2.52 | | | | 5.11 | | | | 3.33 | |
| Distributions to shareholders from: | | | | | | | | | | | | | | | | | | | | |
| Net investment income | | | — | | | | — | | | | — | | | | — | | | | — | |
| Net realized capital gain | | | — | | | | — | | | | — | | | | — | | | | — | |
| Total distributions | | | — | | | | — | | | | — | | | | — | | | | — | |
| Net asset value, end of year | | $ | 29.12 | | | $ | 24.82 | | | $ | 27.62 | | | $ | 25.10 | | | $ | 19.99 | |
Total Return(2) | | | 17.32 | % | | | (10.14 | )% | | | 10.04 | % | | | 25.56 | % | | | 19.99 | % |
| Ratios/supplemental data: | | | | | | | | | | | | | | | | | | | | |
| Net assets, end of year (000’ omitted) | | $ | 9,005 | | | $ | 13,457 | | | $ | 66,521 | | | $ | 58,999 | | | $ | 45,851 | |
| Ratio of expenses to average net assets: | | | | | | | | | | | | | | | | | | | | |
Before expense reimbursements or recoveries(3)(4) | | | 2.09 | % | | | 2.05 | % | | | 1.87 | % | | | 1.90 | % | | | 2.11 | % |
After expense reimbursements or recoveries(3)(5) | | | 1.97 | % | | | 1.99 | % | | | 1.99 | % | | | 1.99 | % | | | 1.99 | % |
| Ratio of net investment income (loss) | | | | | | | | | | | | | | | | | | | | |
| to average net assets: | | | | | | | | | | | | | | | | | | | | |
Before expense reimbursements or recoveries(3) | | | (0.15 | )% | | | (1.09 | )%* | | | (0.81 | )% | | | (0.81 | )% | | | (0.74 | )% |
After expense reimbursements or recoveries(3) | | | (0.03 | )% | | | (1.03 | )%* | | | (0.93 | )% | | | (0.90 | )% | | | (0.62 | )% |
| Portfolio turnover rate | | | 185 | % | | | 211 | % | | | 149 | % | | | 170 | % | | | 294 | % |
| (1) | The average shares outstanding method has been applied for per share information. |
| (2) | Total investment return is based on the change in net asset value of a share during the year, assumes reinvestment of dividends and distributions at net asset value and does not reflect the impact of a sales charge. |
| (3) | Expense waived or reimbursed reflect reductions to total expenses, as discussed in the notes to the financial statements. These reimbursed amounts would increase the net investment loss ratio or decrease the net investment income ratio and recovered amounts would decrease the net investment loss ratio or increase the net investment income ratio, as applicable, had such reductions or increases not occurred. |
| (4) | Expenses before reductions (excluding dividend and interest expense for securities sold short) were 2.04% for the year ended June 30, 2016. |
| (5) | Expenses net of all reductions (excluding dividend and interest expense for securities sold short) were 1.98% for the year ended June 30, 2016. |
| * | The net investment income (loss) ratios include dividends on short positions. |
The accompanying notes are an integral part of the financial statements.
Notes to the Financial Statements
Note 1 — Organization
The Quaker Investment Trust (“Trust”), a diversified, open-end management investment company, was organized as a Massachusetts business trust on October 24, 1990, and is registered under the Investment Company Act of 1940, as amended (“1940 Act”). The Trust’s Amended and Restated Declaration of Trust permits the Trustees to issue an unlimited number of shares of beneficial interest. The Trust currently has five series: Quaker Event Arbitrage Fund (“Event Arbitrage”), Quaker Global Tactical Allocation Fund (“Global Tactical Allocation”), Quaker Mid-Cap Value Fund (“Mid-Cap Value”), Quaker Small-Cap Value Fund (“Small-Cap Value”) and Quaker Strategic Growth Fund (“Strategic Growth”) (each a “Fund” and collectively, “Funds”). All Funds are diversified. The investment objectives of each Fund are set forth below.
Strategic Growth and Small-Cap Value commenced operations on November 25, 1996. Mid-Cap Value commenced operations on December 31, 1997. Global Tactical Allocation commenced operations on May 1, 2008. Event Arbitrage commenced operations on June 7, 2010 in conjunction with the reorganization of the Pennsylvania Avenue Event Driven Fund (“Event Driven Fund”). The predecessor to the Event Driven Fund, the Pennsylvania Avenue Fund, commenced operations on September 19, 2002. The investment objective of these Funds is to seek long-term growth of capital. The investment objective of these funds is non-fundamental in that this objective may be changed by the Board of Trustees (“Board” or “Trustees”) without shareholder approval. Each Fund is an investment company and accordingly follows the investment company accounting and reporting guidance of the Financial Accounting Standards Board (“FASB”) Accounting Standards Codification Topic 946 “Financial Services – Investment Companies.”
The Funds currently offer three classes of shares (Class A, Class C and Institutional Class shares). Class A shares are charged a front-end sales charge and a distribution and servicing fee; Class C shares are charged a distribution fee, but bear no front-end sales charge or contingent deferred sales charge (“CDSC”); and Institutional Class shares bear no front-end sales charge or CDSC, but have higher minimum investment thresholds. Quaker Funds, Inc. (“QFI”), the investment adviser to each of the Funds, has the ability to waive the minimum investment for Institutional Class shares at its discretion.
Note 2 — Summary of Significant Accounting Policies and Other Information
The following is a summary of significant accounting policies consistently followed by the Funds in the preparation of their financial statements. The policies are in conformity with accounting principles generally accepted in the United States of America (“GAAP”).
A. Security Valuation. The Funds’ investments in securities are carried at market value. Securities listed on an exchange or quoted on a national market system are generally valued at the last quoted sales price at the time of valuation. Other securities traded in the over-the-counter market and listed securities for which no sale was reported on that date are valued at the most recent bid price. Each security reported on the NASDAQ National Market System is valued at the NASDAQ Official Closing Price.
Debt and other fixed-income securities are valued at the last quoted bid price and/or by using a combination of daily quotes and matrix evaluations provided by an independent pricing service (which reflect such factors as security prices, yields, maturities, ratings, and dealer and exchange quotations), the use of which has been approved by the Board.
The Funds may enter into forward foreign currency contracts to lock in the U.S. dollar cost of purchase and sale transactions or to defend the portfolio against currency fluctuations. A forward foreign currency contract is a commitment to purchase or sell a foreign currency at a future date at a negotiated rate. These contracts are
Notes to the Financial Statements (continued)
Note 2 — Summary of Significant Accounting Policies and Other Information (Continued)
valued daily, and the Fund’s net equity therein, representing unrealized gain or loss on the contracts as measured by the difference between the forward foreign exchange rates at the dates of entry into the contracts and the forward rates at the end of the reporting period, if any, is included in the Statements of Assets and Liabilities. Realized and unrealized gains and losses, if any, are included in the Statements of Operations. Risks may arise upon entering into these contracts from the potential inability of counterparties to meet the terms of the contract and from unanticipated movements in the value of foreign currencies relative to the U.S. dollar.
For financial reporting purposes, investment transactions are recorded on the trade date; however, for purposes of executing shareholder transactions, the Funds record changes in holdings of portfolio securities no later than the first business day after the trade date in accordance with Rule 2a-4 of the 1940 Act. Accordingly, certain differences between net asset value for financial reporting and for executing shareholder transactions may arise.
The Funds have adopted fair valuation procedures to value securities at fair market value in certain circumstances, and the Trust has established a Valuation Committee responsible for determining when fair valuing a security is necessary and appropriate. The Funds will value securities at fair market value when market quotations are not readily available or when securities cannot be accurately valued within established pricing procedures. The Valuation Committee may also fair value foreign securities whose prices may have been affected by events occurring after the close of trading in their respective markets but prior to the time the Fund holding the foreign securities calculates its net asset value. The Funds’ fair valuation procedures are designed to help ensure that prices at which Fund shares are purchased and redeemed are fair and do not result in dilution of shareholder interest or other harm to shareholders.
The Fund is required to disclose information regarding the fair value measurements of the Fund’s assets and liabilities. Fair value is defined as the price that the Fund may receive upon selling an investment in an orderly transaction to an independent buyer in the principal or most advantageous market for the investment. The disclosure requirements utilize a three-tier hierarchy to maximize the use of observable market data, minimize the use of unobservable inputs and establish classification of fair value measurements for disclosure purposes. A financial instrument’s level within the fair value hierarchy is based on the lowest level that is significant to the fair value measurement. Inputs refer broadly to the assumptions that market participants would use in pricing the asset or liability, including assumptions about risk, for example, the risk inherent in a particular valuation technique used to measure fair value including the pricing model used and/or the risk inherent in the inputs to the valuation technique. Inputs may be observable or unobservable.
Observable inputs are inputs that reflect the assumptions market participants would use in pricing the asset or liability, which are based on market data obtained from sources independent of the reporting entity. Unobservable inputs are inputs that reflect the reporting entity’s own assumptions about the assumptions market participants would use in pricing the asset or liability developed based on the best information available in the circumstances.
The significant unobservable inputs used in the fair value measurement of the reporting entity’s private equity holdings are, the last traded price, the cost of prior transactions, single broker quotes, uncertainty of future payout, pricing service price adjusted for recent payout distribution, last trade price on pre-conversion bond and discounts applied for lack of marketability. Significant increases (decreases) in any of those inputs in isolation could result in a significantly lower (higher) fair value measurement.
Various inputs may be used to determine the value of each Fund’s investments. These inputs are summarized in three broad levels for financial statement purposes. The inputs or methodologies used to value securities are not necessarily an indication of the risk associated with investing in those securities.
Notes to the Financial Statements (continued)
Note 2 — Summary of Significant Accounting Policies and Other Information (Continued)
Level 1 — Quoted prices in active markets for identical securities.
Level 2 — Prices determined using significant other observable inputs (including quoted prices for similar securities, interest rates, prepayment speeds, credit risk, etc.) municipal securities, long-term U.S. Government obligations and corporate debt securities are valued in accordance with the evaluated price supplied by the pricing service and generally categorized as Level 2 in the hierarchy. Other securities that are categorized as Level 2 in the hierarchy include, but are not limited to, warrants and structured notes that do not trade on an exchange, OTC options and international equity securities valued by an independent third party in order to adjust for stale pricing and foreign market holidays.
Level 3 — Prices determined using significant unobservable inputs (including the Fund’s own assumptions). For restricted equity securities where observable inputs are limited, assumptions about market activity and risk are used in determining fair value. These are categorized as Level 3 in the hierarchy.
For international equity securities traded on a foreign exchange or market which closes prior to a Fund’s Valuation Time, in order to adjust for events which occur between the close of the foreign exchange they are traded on and the close of the New York Stock Exchange, a fair valuation model is used, and these securities are categorized as Level 2.
A Fund may hold securities, some of which are classified as Level 3 investments (as defined below). Level 3 investments have significant unobservable inputs, as they trade infrequently. In determining the fair value of these investments, management uses the market approach which includes as the primary input the capital balance reported; however, adjustments to the reported capital balance may be made based on various factors, including, but not limited to, the attributes of the interest held, including the rights and obligations, and any restrictions or illiquidity of such interests, and the fair value of these securities.
The value of a foreign security is generally determined as of the close of trading on the foreign stock exchange on which the security is primarily traded, or as of the close of trading on the New York Stock Exchange (“NYSE”), if earlier. The value is then converted into its U.S. dollar equivalent at the foreign exchange rate in effect at the close of the NYSE (generally 4:00 p.m. Eastern time) on the day that the value of the foreign security is determined. If no sale is reported at that time, the foreign security will be valued within the range of the most recent quoted bid and ask prices. If market quotations are not readily available for a foreign security or an event has occurred that caused a quotation to be unavailable or unreliable, the Valuation Committee will fair value foreign securities using the procedures described below.
The Trust has adopted fair valuation procedures to value securities at fair market value when independent prices are unavailable or unreliable, and the Trust has established a Valuation Committee that is responsible for determining when fair valuing a security is necessary and appropriate. Securities and assets for which market quotations are not readily available may be valued based upon valuation methods that include: (i) multiple of earnings; (ii) yield to maturity with respect to debt issues; (iii) discounts from market prices of similar freely traded securities; or (iv) a combination of these or other methods. Securities may also be priced using fair value pricing methods when their closing prices do not reflect their market values at the time the Fund calculates its net asset value (“NAV”) because an event had occurred since the closing prices were established on the domestic or foreign exchange or market but before the Fund’s NAV calculation.
Notes to the Financial Statements (continued)
Note 2 — Summary of Significant Accounting Policies and Other Information (Continued)
The following is a summary of the fair valuations according to the inputs used as of June 30, 2017 in valuing the Fund’s assets and liabilities:
| | | | | | | | | | | | Investments | | | | |
| | | | | | | | | Measured at | | | | |
| Description EVENT ARBITRAGE FUND | | Level 1 | | | Level 2 | | | Level 3 | | | Net Asset Value | | | Total | |
| Common Stocks | | $ | 11,530,201 | | | $ | 425,730 | | | $ | 1,295,681 | | | $ | — | | | $ | 13,251,612 | |
| Closed End Mutual Fund | | | 1,634,400 | | | | — | | | | — | | | | — | | | | 1,634,400 | |
| Preferred Stocks | | | 123,939 | | | | 285,888 | | | | 653,000 | | | | — | | | | 1,062,827 | |
| Real Estate Investment Trusts | | | 523,320 | | | | — | | | | — | | | | — | | | | 523,320 | |
| Structured Note | | | — | | | | 895,216 | | | | — | | | | — | | | | 895,216 | |
| Asset Backed Securities | | | — | | | | 204,847 | | | | — | | | | — | | | | 204,847 | |
| Convertible Bonds | | | — | | | | 522,226 | | | | — | | | | — | | | | 522,226 | |
| Corporate Bonds | | | — | | | | 1,648,048 | | | | 445,000 | | | | — | | | | 2,093,048 | |
| Mortgage Backed Securities | | | — | | | | 258,332 | | | | — | | | | — | | | | 258,332 | |
| Escrow Notes | | | — | | | | — | | | | 0 | | | | — | | | | 0 | |
| Purchased Options | | | 382,741 | | | | 34,300 | | | | — | | | | — | | | | 417,041 | |
| Bank Deposit Account | | | 4,741,307 | | | | — | | | | — | | | | — | | | | 4,741,307 | |
| Private Investment Co. Purchased | | | | | | | | | | | | | | | | | | | | |
| with Proceeds from Securities Lending | | | — | | | | — | | | | — | | | | 1,268,709 | | | | 1,268,709 | |
| Total Investments in Securities | | $ | 18,935,908 | | | $ | 4,274,587 | | | $ | 2,393,681 | | | $ | 1,268,709 | | | $ | 26,872,885 | |
| Common Stocks sold short | | $ | (2,012,197 | ) | | $ | — | | | $ | — | | | $ | — | | | $ | (2,012,197 | ) |
| Written Options | | | (319,586 | ) | | | (87,565 | ) | | | — | | | | — | | | | (407,151 | ) |
| Total Investments in Securities sold short | | $ | (2,331,783 | ) | | $ | (87,565 | ) | | $ | — | | | $ | — | | | $ | (2,419,348 | ) |
| | | | | | | | | | | | | | | | | | | | | |
| | | | | | | | | | | | | | | Investments | | | | | |
| | | | | | | | | | | Measured at | | | | | |
| Description GLOBAL TACTICAL ALLOCATION FUND | | Level 1 | | | Level 2 | | | Level 3 | | | Net Asset Value | | | Total | |
| Common Stocks | | $ | 1,817,893 | | | $ | — | | | $ | 14,364 | | | $ | — | | | $ | 1,832,257 | |
| Closed End Mutual Fund | | | 36,724 | | | | — | | | | — | | | | — | | | | 36,724 | |
| Exchange Traded Funds | | | 363,794 | | | | — | | | | — | | | | — | | | | 363,794 | |
| Preferred Stocks | | | 241,712 | | | | — | | | | — | | | | — | | | | 241,712 | |
| Real Estate Investment Trusts | | | 489,088 | | | | — | | | | — | | | | — | | | | 489,088 | |
| Corporate Bonds | | | — | | | | 3,015,579 | | | | — | | | | — | | | | 3,015,579 | |
| Mortgage Backed Security | | | — | | | | 10,383 | | | | — | | | | — | | | | 10,383 | |
| Bank Deposit Account | | | 759,323 | | | | — | | | | — | | | | — | | | | 759,323 | |
| Total Investments in Securities | | $ | 3,708,534 | | | $ | 3,025,962 | | | $ | 14,364 | | | $ | — | | | $ | 6,748,860 | |
| | | | | | | | | | | | | | | | | | | | | |
| | | | | | | | | | | | | | | Investments | | | | | |
| | | | | | | | | | | Measured at | | | | | |
| Description MID-CAP VALUE FUND | | Level 1 | | | Level 2 | | | Level 3 | | | Net Asset Value | | | Total | |
| Common Stocks | | $ | 5,913,180 | | | $ | — | | | $ | — | | | $ | — | | | $ | 5,913,180 | |
| Real Estate Investment Trusts | | | 891,398 | | | | — | | | | — | | | | — | | | | 891,398 | |
| Bank Deposit Account | | | 307,524 | | | | — | | | | — | | | | — | | | | 307,524 | |
| Private Investment Co. Purchased | | | | | | | | | | | | | | | | | | | | |
| with Proceeds from Securities Lending | | | — | | | | — | | | | — | | | | 2,060,060 | | | | 2,060,060 | |
| Total Investments in Securities | | $ | 7,112,102 | | | $ | — | | | $ | — | | | $ | 2,060,060 | | | $ | 9,172,162 | |
Notes to the Financial Statements (continued)
Note 2 — Summary of Significant Accounting Policies and Other Information (Continued)
| | | | | | | | | | | | Investments | | | | |
| | | | | | | | | | | | Measured at | | | | |
| Description SMALL-CAP VALUE FUND | | Level 1 | | | Level 2 | | | Level 3 | | | Net Asset Value | | | Total | |
| Common Stocks | | $ | 26,305,971 | | | $ | — | | | $ | — | | | $ | — | | | $ | 26,305,971 | |
| Real Estate Investment Trusts | | | 1,990,254 | | | | — | | | | — | | | | — | | | | 1,990,254 | |
| Bank Deposit Account | | | 297,001 | | | | — | | | | — | | | | — | | | | 297,001 | |
| Private Investment Co. Purchased | | | | | | | | | | | | | | | | | | | | |
| with Proceeds from Securities Lending | | | — | | | | — | | | | — | | | | 5,691,418 | | | | 5,691,418 | |
| Total Investments in Securities | | $ | 28,593,226 | | | $ | — | | | $ | — | | | $ | 5,691,418 | | | $ | 34,284,644 | |
| | | | | | | | | | | | | | | | | | | | | |
| | | | | | | | | | | | | | | Investments | | | | | |
| | | | | | | | | | | | | | | Measured at | | | | | |
| Description STRATEGIC GROWTH FUND | | Level 1 | | | Level 2 | | | Level 3 | | | Net Asset Value | | | Total | |
| Common Stocks | | $ | 70,256,577 | | | $ | — | | | $ | 399,234 | | | $ | — | | | $ | 70,655,811 | |
| Real Estate Investment Trusts | | | 945,383 | | | | — | | | | — | | | | — | | | | 945,383 | |
| Bank Deposit Account | | | 66,112 | | | | — | | | | — | | | | — | | | | 66,112 | |
| Private Investment Co. Purchased | | | | | | | | | | | | | | | | | | | | |
| with Proceeds from Securities Lending | | | — | | | | — | | | | — | | | | 11,925,730 | | | | 11,925,730 | |
| Total Investments in Securities | | $ | 71,268,072 | | | $ | — | | | $ | 399,234 | | | $ | 11,925,730 | | | $ | 83,593,036 | |
Refer to the Fund’s Schedules of Investments for industry classifications.
Level 3 Reconciliation
The following is a reconciliation of Event Arbitrage’s, Global Tactical Allocation’s and Strategic Growth’s Level 3 investments for which significant unobservable inputs were used in determining value. See Schedules of Investments for industry breakouts:
EVENT ARBITRAGE FUND
| | | Balance | | | | | | | | | | | | Net | | | | | | | | | | | | Balance | |
| | | as of | | | | | | | | | | | | Unrealized | | | Amortized | | | Transfers | | | Transfers | | | as of | |
| | | June 30, | | | | | | | | | Realized | | | appreciation | | | discounts/ | | | in to | | | out of | | | June 30, | |
| | | 2016 | | | Purchases | | | Sales | | | gain (loss) | | | (depreciation) | | | premiums | | | Level 3 | | | Level 3 | | | 2017 | |
| Common Stocks | | $ | 1,175,330 | | | $ | 0 | | | $ | — | | | $ | (26,771 | ) | | $ | 147,122 | | | $ | — | | | $ | — | | | $ | — | | | $ | 1,295,681 | |
| Preferred Stocks | | | 695,826 | | | | — | | | | (2,690 | ) | | | (412 | ) | | | (39,724 | ) | | | — | | | | — | | | | — | | | | 653,000 | |
Convertible Bonds(1) | | | 0 | | | | — | | | | (0 | ) | | | — | | | | 0 | | | | — | | | | — | | | | — | | | | — | |
| Corporate Bonds | | | 581,627 | | | | — | | | | (250,102 | ) | | | 37,772 | | | | 75,523 | | | | 180 | | | | — | | | | — | | | | 445,000 | |
| Escrow Notes | | | 0 | | | | — | | | | — | | | | — | | | | — | | | | — | | | | — | | | | — | | | | 0 | |
| | | $ | 2,452,783 | | | $ | 0 | | | $ | (252,792 | ) | | $ | 10,589 | | | $ | 182,921 | | | $ | 180 | | | $ | — | | | $ | — | | | $ | 2,393,681 | |
| Net change in unrealized appreciation (depreciation) for Level 3 investments still held as of June 30, 2017 | | | | | | | $ | 135,351 | |
(1) Converted to Common Stock
GLOBAL TACTICAL ALLOCATION FUND
| | | Balance | | | | | | | | | | | | Net | | | | | | | | | | | | Balance | |
| | | as of | | | | | | | | | | | | Unrealized | | | Amortized | | | Transfers | | | Transfers | | | as of | |
| | | June 30, | | | | | | | | | Realized | | | appreciation | | | discounts/ | | | in to | | | out of | | | June 30, | |
| | | 2016 | | | Purchases | | | Sales | | | gain (loss) | | | (depreciation) | | | premiums | | | Level 3 | | | Level 3 | | | 2017 | |
| Common Stocks | | $ | 11,020 | | | $ | — | | | $ | — | | | $ | — | | | $ | 3,344 | | | $ | — | | | $ | — | | | $ | — | | | $ | 14,364 | |
| | | $ | 11,020 | | | $ | — | | | $ | — | | | $ | — | | | $ | 3,344 | | | $ | — | | | $ | — | | | $ | — | | | $ | 14,364 | |
| Net change in unrealized appreciation (depreciation) for Level 3 investments still held as of June 30, 2017 | | | | | | | $ | 3,344 | |
Notes to the Financial Statements (continued)
Note 2 — Summary of Significant Accounting Policies and Other Information (Continued)
STRATEGIC GROWTH FUND
| | | Balance | | | | | | | | | | | | Net | | | | | | | | | | | | Balance | |
| | | as of | | | | | | | | | | | | Unrealized | | | Amortized | | | Transfers | | | Transfers | | | as of | |
| | | June 30, | | | | | | | | | Realized | | | appreciation | | | discounts/ | | | in to | | | out of | | | June 30, | |
| | | 2016 | | | Purchases | | | Sales | | | gain (loss) | | | (depreciation) | | | premiums | | | Level 3 | | | Level 3 | | | 2017 | |
| Common Stocks | | $ | 306,291 | | | $ | — | | | $ | — | | | $ | — | | | $ | 92,943 | | | $ | — | | | $ | — | | | $ | — | | | $ | 399,234 | |
| | | $ | 306,291 | | | $ | — | | | $ | — | | | $ | — | | | $ | 92,943 | | | $ | — | | | $ | — | | | $ | — | | | $ | 399,234 | |
| Net change in unrealized appreciation (depreciation) for Level 3 investments still held as of June 30, 2017 | | | | | | | $ | 92,943 | |
Transfers are recognized at the end of the reporting period.
There have been no transfers in and out of Level 1 and Level 2 fair value measurements as of June 30, 2017, except for the Quaker Event Arbitrage Fund listed below:
| Transfers out of Level 1 into Level 2 | $426,962 | Due to a decrease in market activity. |
| Transfers out of Level 2 into Level 1 | $515,182 | Due to an increase of market activity. |
The following presents information about significant unobservable inputs related to Level 3 investments at June 30, 2017:
EVENT ARBITRAGE FUND
| Asset | | Fair Value at | | Valuation | Unobservable | | Input | | Increase in Inputs |
| Categories | | June 30, 2017 | | Technique | Input | | Values | | Impact on Valuation* |
| Common Stocks | | | | | | | | | |
| Auto Parts & | | $ | 15,000 | | Market approach | Last traded price of | | $ | 2.53 | | Increase |
| Equipment | | | | | | pre-conversion bonds | | | | | |
| Computers | | | 0 | | Profitability expected | Uncertainty of any | | $ | 0.00 | | Increase |
| | | | | | return method | additional future payout | | | | | |
| Escrow Shares | | | 0 | | Profitability expected | Uncertainty of any | | $ | 0.00 | | Increase |
| | | | | | return method | additional future payout | | | | | |
| Healthcare-Products | | | 19,002 | | Market approach | Last traded price of non- | | | -32.00 | % | Decrease |
| | | | | | | restricted shares less a discount | | | | | |
| Healthcare-Services | | | 1,240,529 | | Market approach | Last traded price adjusted | | | 0.09 | % | Increase |
| | | | | | | by movement in index | | | | | |
| Holding Companies- | | | 0 | | Profitability expected | Uncertainty of any | | $ | 0.00 | | Increase |
| Diversified | | | | | return method | additional future payout | | | | | |
| Mining | | | 0 | | Profitability expected | Uncertainty of any | | $ | 0.00 | | Increase |
| | | | | | return method | additional future payout | | | | | |
| Real Estate | | | 21,150 | | Vendor pricing | Single broker quote since | | $ | 0.23 | | Increase |
| | | | | | | shares are not listed yet | | | | | |
| Corporate Bonds | | | | | | | | | | | |
| Auto Parts & | | | 0 | | Profitability expected | Uncertainty of any | | $ | 0.00 | | Increase |
| Equipment | | | | | return method | additional future payout | | | | | |
| Diversified Financial | | | 25,000 | | Vendor pricing | Single broker quote | | $ | 0.50 | | Increase |
| Services | | | | | | | | | | | |
| Diversified Financial | | | 420,000 | | Vendor pricing | Single broker quote | | $ | 42.00 | | Increase |
| Services | | | | | | | | | | | |
| Venture Capital | | | 0 | | Profitability expected | Uncertainty of any | | $ | 0.00 | | Increase |
| | | | | | return method | additional future payout | | | | | |
| Escrow Notes | | | 0 | | Profitability expected | Uncertainty of any | | $ | 0.00 | | Increase |
| | | | | | return method | additional future payout | | | | | |
| Preferred stock | | | | | | | | | | | |
| Healthcare-Services | | | 613,000 | | Market approach | Prior transaction cost | | $ | 1,000.00 | | Increase |
| Insurance | | | 40,000 | | Vendor pricing | Single broker quote | | $ | 4,000.00 | | Increase |
Notes to the Financial Statements (continued)
Note 2 — Summary of Significant Accounting Policies and Other Information (Continued)
GLOBAL TACTICAL ALLOCATION FUND
| Asset | | Fair Value at | | Valuation | Unobservable | | Input | | Increase in Inputs |
| Categories | | June 30, 2017 | | Technique | Input | | Values | | Impact on Valuation* |
| Common Stocks | | | | | | | | | |
| Airlines | | $ | 14,364 | | Market approach | Projected final distribution | | $ | 1.89 | | Decrease |
| STRATEGIC GROWTH FUND | | | | | | | | |
| Common Stocks | | | | | | | | | | | |
| Airlines | | $ | 399,234 | | Market approach | Projected final distribution | | $ | 1.89 | | Decrease |
* An impact to Valuation from a decrease in input would produce the opposite effect of an increase.
B. Federal Income Taxes. It is the Funds’ policy to comply with the requirements of Subchapter M of the Internal Revenue Code and to distribute substantially all of their taxable income to shareholders. Therefore, no federal income tax provision is required.
In accordance with Financial Accounting Standards Board (“FASB”) Interpretation ASC 740, (“ASC 740”), each Fund recognizes a tax benefit from an uncertain position only if it is more likely than not that the position is sustainable, based solely on its technical merits and consideration of the relevant taxing authority’s widely understood administrative practices and precedents. If this threshold is met, a Fund measures the tax benefit as the largest amount of benefit that is greater than fifty percent likely of being realized upon ultimate settlement. The Funds identify their major tax jurisdictions as U.S. Federal and the Commonwealth of Massachusetts. Management has reviewed the tax positions for each of the three open tax years as of June 30, 2017 and has determined that the implementation of ASC 740 does not have a material impact on the Funds’ financial statements. Each Fund’s federal tax returns for the prior three fiscal years remains subject to examination by the Internal Revenue Service.
Net investment income or loss and net realized gains or losses may differ for financial statement and income tax purposes primarily due to investments that have a different basis for financial statement and income tax purposes. The character of distributions made during the year from net investment income or net realized gains may differ from their ultimate characterization for federal income tax purposes. Also, due to the timing of dividend distributions, the fiscal year in which amounts are distributed may differ from the year that the income or realized gains were recorded by each Fund. Permanent differences in the recognition of earnings are reclassified to additional paid-in capital. Distributions in excess of tax-basis earnings are recorded as a return of capital.
C. Security Transactions and Investment Income. Security transactions are recorded on the trade date. Realized gains and losses are determined using the specific identification cost method. Interest income on debt securities is recorded daily on the accrual basis. Discounts and premiums on debt securities are amortized over their respective lives. Dividend income is recorded on the ex-dividend date, or as soon as information is available to the Fund.
D. Short Sales of Investments. Certain Funds may make short sales of investments, which are transactions in which a Fund sells a security it does not own in anticipation of a decline in the fair value of that security. To complete such a transaction, the Fund must borrow the security to make delivery to the buyer. The Fund is then obligated to replace the security borrowed by purchasing it at the market price at the time of replacement. The broker retains the proceeds of short sales to the extent necessary to meet margin requirements until the short position is closed out.
If a security pays a dividend while the Fund holds it short, the Fund will need to pay the dividend to the original owner of the security. Since the Fund borrowed the shares and sold them to a third party, the third party will receive the dividend from the security and the Fund will pay the original owner the dividend directly. The
Notes to the Financial Statements (continued)
Note 2 — Summary of Significant Accounting Policies and Other Information (Continued)
Fund is not entitled to the dividend because it does not own the shares. A gain, limited to the price at which the Fund sold the security short, or a loss, unlimited in size, will be recognized upon the termination of a short sale.
E. Written Options Contracts. Certain Funds may write options to manage exposure to certain changes in the market. When a Fund writes an option, an amount equal to the premium received by the Fund is recorded as a liability, which is marked-to-market daily to reflect the current market value of the option written. If the option expires, the Fund realizes a gain from investments equal to the amount of the premium received. When a written call option is exercised, the difference between the premium and the amount for effecting a closing purchase transaction, including brokerage commission, is also treated as a realized gain or loss. When a written put option is exercised, the amount of the premium received reduces the cost of the security purchased by the Fund.
A risk in writing a covered call option is that the Fund may forego the opportunity of profit if the market price of the underlying security increases and the option is exercised. The risk in writing a put option is that the Fund may incur a loss if the market price of the underlying security decreases and the option is exercised.
In addition, there is the risk that the Fund may not be able to enter into a closing transaction because of an illiquid secondary market.
F. Purchased Options. Certain Funds may purchase call options in anticipation of an increase in the market value of securities of the type in which they may invest. The purchase of a call option will entitle a Fund, in return for the premium paid, to purchase specified securities at a specified price during the option period. A Fund will ordinarily realize a gain if, during the option period, the value of such securities exceeded the sum of the exercise price, the premium paid and transaction costs; otherwise, the Fund will realize either no gain or a loss on the purchase of the call option. A Fund will normally purchase put options in anticipation of a decline in the market value of securities in its portfolio (“protective puts”) or in securities in which it may invest. The purchase of a put option will entitle the Fund, in exchange for the premium paid, to sell specified securities at a specified price during the option period. The purchase of protective puts is designed to offset or hedge against a decline in the market value of the Fund’s securities. Put options may also be purchased by a Fund for the purpose of affirmatively benefiting from a decline in the price of securities which it does not own. The Fund will ordinarily realize a gain if, during the option period, the value of the underlying securities decreased below the exercise price sufficiently to more than cover the premium and transaction costs; otherwise the Fund will realize either no gain or a loss on the purchase of the put option. Gains and losses on the purchase of protective put options would tend to be offset by countervailing changes in the value of the underlying portfolio securities.
G. Futures Contracts. Certain Funds may enter into financial futures contracts, to the extent permitted by their investment policies and objectives, for bona fide hedging and other permissible risk management purposes including protecting against anticipated changes in the value of securities a Fund intends to purchase. Upon entering into a financial futures contract, a Fund is required to deposit cash or securities as initial margin.
Additional securities are also segregated as collateral up to the current market value of the financial futures contracts. Subsequent payments, known as variation margin, are made or received by the Fund, depending on the fluctuation in the value of the underlying financial instruments. The Fund recognizes an unrealized gain or loss equal to the variation margin. When the financial futures contracts are closed, a realized gain or loss is recognized equal to the difference between the proceeds from (or cost of) the closing transactions and the Fund’s basis in the contracts. The risks associated with entering into financial futures contracts include the possibility that a change in the value of the contract may not correlate with the changes in the value of the
Notes to the Financial Statements (continued)
Note 2 — Summary of Significant Accounting Policies and Other Information (Continued)
underlying instruments. In addition, investing in financial futures contracts involves the risk that the Fund could lose more than the original margin deposit and subsequent payments required for a futures transaction. Risks may also arise upon entering into these contracts from the potential inability of the counterparties to meet the terms of their contracts.
H. Foreign Currency Transactions. Securities and other assets and liabilities denominated in foreign currencies are converted each business day into U.S. dollars based on the prevailing rates of exchange. Purchases and sales of portfolio securities and income and expenses are converted into U.S. dollars on the respective dates of such transactions.
Gains and losses resulting from changes in exchange rates applicable to foreign securities are not reported separately from gains and losses arising from movements in securities prices.
Net realized foreign exchange gains and losses include gains and losses from sales and maturities of foreign currency exchange contracts, gains and losses realized between the trade and settlement dates of foreign securities transactions, and the difference between the amount of dividends, interest and foreign withholding taxes on the Funds’ books and the U.S. dollar equivalent of the amounts actually received. Net unrealized foreign exchange gains and losses include gains and losses from changes in the fair value of assets and liabilities denominated in foreign currencies other than portfolio securities, resulting from changes in exchange rates.
I. Forward Foreign Currency Contracts. Certain Funds may enter into forward foreign currency contracts to hedge against foreign currency exchange rate risk on their non-U.S. dollar denominated securities or to facilitate settlement of foreign currency denominated portfolio transactions. A forward foreign currency contract is an agreement between two parties to buy and sell a currency at a set price on a future date. The contract is marked-to-market daily and the change in value is recorded by a Fund as an unrealized gain or loss. When a forward foreign currency contract is extinguished, through either delivery or offset by entering into another forward foreign currency contract, the Fund records a realized gain or loss equal to the difference between the value of the contract at the time it was opened and the value of the contract at the time it was extinguished.
Forward foreign currency contracts involve elements of market risk in excess of the amounts reflected in the Statements of Assets and Liabilities. The Fund bears the risk of an unfavorable change in the foreign exchange rate underlying the forward foreign currency contract. Risks may also arise upon entering into these contracts from the potential inability of the counterparties to meet the terms of their contracts.
J. Portfolio Investment Risks. Investments in securities of foreign issuers carry certain risks not ordinarily associated with investments in securities of U.S. issuers. These risks include future disruptive political and economic developments and the possible imposition of exchange controls or other unfavorable foreign government laws and restrictions. In addition, investments in certain countries may carry risks of expropriation of assets, confiscatory taxation, political or social instability, or diplomatic developments that adversely affect investments in those countries. Certain countries may also impose substantial restrictions on investments in their capital markets by foreign entities, including restrictions on investments in issuers in industries deemed sensitive to relevant national interests. These factors may limit the investment opportunities available and result in a lack of liquidity and high price volatility with respect to securities of issuers from developing countries.
K. Multiple Class Allocations. Each class of shares has equal rights as to earnings and assets except that each class bears different distribution and shareholder servicing expenses. Each class of shares has exclusive
Notes to the Financial Statements (continued)
Note 2 — Summary of Significant Accounting Policies and Other Information (Continued)
voting rights with respect to matters that affect just that class. Income, expenses (other than expenses attributable to a specific class) and realized and unrealized gains or losses on investments are allocated to each class of shares based on its relative net assets.
L. Expense Allocations. Expenses are allocated to each series based upon its relative proportion of net assets to the Trust’s total net assets.
M. Distributions to Shareholders. Each Fund generally declares dividends at least annually, payable in December, on a date selected by the Board. In addition, distributions may be made annually in December out of net realized gains through October 31 of that calendar year. Distributions to shareholders are recorded on the ex-dividend date. Each Fund may make a supplemental distribution subsequent to the end of its fiscal year ending June 30.
N. Use of Estimates. The preparation of financial statements in conformity with GAAP requires management to make estimates and assumptions that affect the reported amounts of assets and liabilities and the disclosure of contingent assets and liabilities at the date of the financial statements, and the reported amounts of revenue and expenses during the reporting period. Actual results could differ from those estimates, and those differences could be significant.
O. Security Loans. The Funds receive compensation in the form of fees, or retain a portion of interest on the investment of any cash received as collateral. The Funds also continue to receive interest or dividends on the securities loaned. The loans are secured by collateral at least equal to 102% of the prior days market value of the loaned securities. Gain or loss in the fair value of the securities loaned that may occur during the term of the loan will be for the account of the Funds. The Funds have the right under the lending agreement to recover the securities from the borrower on demand.
P. Derivative Instruments. The Funds have adopted amendments to authoritative guidance on disclosures about derivative instruments and hedging activities which require that the Funds disclose: a) how and why an entity uses derivative instruments; and b) how derivative instruments and related hedged items affect an entity’s financial position, financial performance and cash flows.
The Funds may trade financial instruments where they are considered to be a seller of credit derivatives in accordance with authoritative guidance under GAAP on derivatives and hedging.
The fair value of derivative instruments whose primary underlying risk exposure is equity price risk at June 30, 2017 were as follows:
EVENT ARBITRAGE
| | Fair Value |
| Derivative | Asset Derivatives(1) | | Liability Derivatives(2) |
| Written Options | | $ | — | | | | $ | 407,151 | |
| Purchased Options | | | 417,041 | | | | | — | |
| (1) | Statement of Assets and Liabilities location: Investments, at value. |
| (2) | Statement of Assets and Liabilities location: Written options, at value. |
Notes to the Financial Statements (continued)
Note 2 — Summary of Significant Accounting Policies and Other Information (Continued)
The effect of derivative instruments on the Statement of Operations whose underlying risk exposure is equity price risk for the period ended June 30, 2017 were as follows:
| EVENT ARBITRAGE | | | | | Change in Unrealized Appreciation |
| | Realized Gain (Loss) on Derivatives | | (Depreciation) on Derivatives |
| Derivative | Recognized in Income(1) | | Recognized in Income(2) |
| Written Options | | $ | 884,772 | | | | $ | (236,444 | ) |
| Purchased Options | | | (338,293 | ) | | | | 52,252 | |
| (1) | Statement of Operations location: Net realized gain (loss) from written options and net realized gain (loss) from securities. |
| (2) | Statement of Operations location: Net unrealized appreciation (depreciation) on written options and net unrealized appreciation (depreciation) on securities. |
For the period ending June 30, 2017, the Event Arbitrage Fund had: long option contracts (5,563 contracts) were purchased and $1,898,284 in premiums were paid, written option contracts (23,220 contracts) were opened and $2,548,566 in premiums were received.
Note 3 — Investment Advisory Fee and Other Related Party Transactions
QFI serves as investment adviser to each Fund. Pursuant to separate investment sub-advisory agreements, QFI has selected the following investment advisory firms to serve as sub-advisers:
| Fund | Sub-adviser |
| Event Arbitrage | N/A |
| Global Tactical Allocation | N/A |
| Mid-Cap Value | Kennedy Capital Management, Inc. |
| Small-Cap Value | AJO, LP |
| Strategic Growth | Los Angeles Capital Management and Equity Research, Inc. |
As of the close of business on October 31, 2016, DG Capital Management, Inc. resigned as the sub-adviser to the Global Tactical Allocation Fund and the Strategic Growth Fund. The Global Tactical Allocation Fund has not entered into a new sub-advisory agreement. On November 1, 2016 the Strategic Growth Fund entered into a new sub-advisory agreement with Los Angeles Capital Management and Equity Research, Inc.
QFI or the sub-advisers provide each Fund with a continuous program of supervision of the Fund’s assets, including the composition of its portfolio, and furnish advice and recommendations with respect to investments, investment policies and the purchase and sale of securities.
Each Fund paid QFI aggregate fees shown in the table below for the fiscal year ending June 30, 2017. Amounts are expressed as an annualized percentage of average net assets.
| | Aggregate | Subadvisory | Advisory & |
| | advisory fee | fee paid by QFI | subadvisory |
| | paid to QFI* | to the sub-adviser | (reimbursed) fee |
| Event Arbitrage | 1.30% | N/A | (0.81)% |
| Global Tactical Allocation | 0.94% | 0.28% | (0.19)% |
| Mid-Cap Value | 1.05% | 0.75% | N/A |
| Small-Cap Value | 0.96% | 0.61% | N/A |
| Strategic Growth | 1.04% | 0.49% | (0.12)% |
| * | The Global Tactical Allocation Fund paid an aggregate advisory fee of 1.25% for the period July 1, 2016 to October 31, 2016 and 0.75% for the period November 1, 2016 to June 30, 2017 . The Small-Cap Value Fund paid an aggregate advisory fee of 1.00% for the period July 1, 2016 to September 30, 2016 and 0.95% for the period October 1, 2016 to June 30, 2017. The Strategic Growth Fund paid an aggregate advisory fee of 1.30% for the period July 1, 2016 to October 31, 2016 and a fee of 0.95% on the first $25 million; 0.85% on the next $175 million; and 0.75% thereafter for the period November 1, 2016 to June 30, 2017. |
Notes to the Financial Statements (continued)
Note 3 — Investment Advisory Fee and Other Related Party Transactions (Continued)
For the fiscal year ending June 30, 2017, QFI and the sub-advisers earned and reimbursed fees as follows:
| | | Aggregate | | | Subadvisory | | | Advisory & | |
| | | advisory fee | | | fee paid by QFI | | | subadvisory | |
| | | paid to QFI | | | to the sub-adviser | | | (reimbursed) fee | |
| Event Arbitrage | | $ | 400,645 | | | | N/A | | | $ | (248,548 | ) |
| Global Tactical Allocation | | | 68,922 | | | | 20,666 | | | | (13,792 | ) |
| Mid-Cap Value | | | 76,133 | | | | 54,381 | | | | N/A | |
| Small-Cap Value | | | 304,604 | | | | 193,964 | | | | N/A | |
| Strategic Growth | | | 815,697 | | | | 382,911 | | | | (92,694 | ) |
QFI contractually agreed to waive its management fee to the extent that the total operating expenses of Event Arbitrage (exclusive of interest, taxes, brokerage commissions and other costs incurred in connection with the purchase or sale of portfolio securities, and extraordinary items) exceed the annual rate of 1.99% for Class A shares, 2.74% for Class C shares, and 1.74% for Institutional Class shares of the average net assets of each class, respectively. QFI currently has no intention to terminate this arrangement; however, it may do so at any time in its sole discretion.
If, at any time, the annualized expenses of Event Arbitrage were less than the annualized expense ratio, the Trust, on behalf of Event Arbitrage, would reimburse QFI for any fees previously waived and/or expenses previously assumed; provided, however, that repayment would be payable only to the extent that it (a) can be made during the three (3) years following the time at which the adviser waived fees or assumed expenses for Event Arbitrage, and (b) can be repaid without causing the expenses of Event Arbitrage to exceed the annualized expense ratio. This fee waiver agreement shall continue in effect from October 28, 2016 until November 1, 2017. This agreement shall automatically terminate upon termination of the advisory agreement between QFI and the Trust or, with respect to Event Arbitrage, in the event of its merger or liquidation.
On November 1, 2016, QFI contractually agreed to waive the lesser of 0.30% of its management fee or assume expenses to the extent necessary to reduce the total operating expenses of Global Tactical Allocation (excluding 12b-1 fees, interest, taxes, brokerage commissions and other costs incurred in connection with the purchase or sale of portfolio securities, and extraordinary items) when they exceed 1.50% of the average daily net assets of the Global Tactical Allocation Fund. QFI currently has no intention to terminate this arrangement; however, it may do so at any time in its sole discretion.
If, at any time, the annualized expenses of Global Tactical Allocation were less than the annualized expense ratio or fee waiver, the Trust, on behalf of Global Tactical Allocation, would reimburse QFI for any fees previously waived and/or expenses previously assumed, provided, however, that the repayment shall be payable only to the extent that it: (a) can be made during the three (3) years following the time at which the adviser waived fees or assumed expenses for Global Tactical Allocation, and (b) can be repaid without causing the expenses of Global Tactical Allocation to exceed the annualized expense ratio. This fee waiver agreement shall continue in effect from November 1, 2016 until November 1, 2017. This agreement shall automatically terminate upon termination of the advisory agreement between QFI and the Trust or, with respect to Global Tactical Allocation, in the event of its merger or liquidation.
Additionally, QFI contractually agreed to waive its management fee to the extent that the total operating expenses of Strategic Growth (exclusive of interest, taxes, brokerage commissions and other costs incurred in connection with the purchase or sale of portfolio securities, and extraordinary items) exceed the annual rate of 2.24% for Class A shares, 2.99% for Class C shares, and 1.99% for Institutional Class shares of the average net assets of each class, respectively. QFI has agreed to pass these waivers onto the shareholders. QFI terminated this arrangement as of the close of business on October 31, 2016.
Notes to the Financial Statements (continued)
Note 3 — Investment Advisory Fee and Other Related Party Transactions (Continued)
If, prior to November 1, 2016 the annualized expenses of Strategic Growth were less than the annualized expense ratio, the Trust, on behalf of Strategic Growth, would reimburse the sub-adviser for any fees previously waived and/or expenses previously assumed, provided, however, that the repayment shall be payable only to the extent that it: (a) can be made during the three (3) years following the time at which the sub-adviser waived fees or assumed expenses for Strategic Growth, and (b) can be repaid without causing the expenses of Strategic Growth to exceed the annualized expense ratio. This agreement automatically terminated upon the termination of the sub-advisory agreement with DG Capital Management, Inc., with respect to Strategic Growth.
At June 30, 2017, the cumulative unreimbursed amount paid and/or waived by the Adviser on behalf of Event Arbitrage and Global Tactical Allocation that may be recovered are $753,774 and $13,792, respectively. For Strategic Growth Fund the unreimbursed amount waived by the Adviser which may not be recovered is $92,694. The Adviser may recapture portions of the above amounts no later than the dates stated below.
| | | June 30, | | | June 30, | | | June 30, | |
| | | 2018 | | | 2019 | | | 2020 | |
| Event Arbitrage | | $ | 206,244 | | | $ | 298,982 | | | $ | 248,548 | |
| Global Tactical Allocation | | | — | | | | — | | | | 13,792 | |
Foreside Fund Services, LLC (“Distributor”) serves as principal underwriter for the Trust. The Trust has adopted distribution and shareholder servicing plans pursuant to Rule 12b-1 of the 1940 Act for Class A and Class C shares described below. There is no Rule 12b-1 distribution plan for Institutional Class shares of the Funds. The Class A Plan provides that each Fund may pay a servicing or Rule 12b-1 fee at an annual rate of 0.25% of the Class A average net assets on a monthly basis to persons or institutions for performing certain servicing functions for the Class A shareholders. The Class A Plan also allows the Fund to pay or reimburse expenditures in connection with sales and promotional services related to distribution of the Fund’s shares, including personal services provided to prospective and existing shareholders. The Class C Plan provides that each Fund may compensate QFI and others for services provided and expenses incurred in the distribution of shares at an annual rate of 1.00% of the average net assets of each class on a monthly basis.
For the fiscal year ending June 30, 2017, the Distributor received underwriter concessions from the sale of Funds shares as follows:
| Fund | | Amount | |
| Event Arbitrage | | $ | 3,506 | |
| Global Tactical Allocation | | | 36 | |
| Mid-Cap Value | | | 67 | |
| Small-Cap Value | | | 15 | |
| Strategic Growth | | | 718 | |
Except for the Trust’s Chief Compliance Officer (“CCO”), employees and Officers of QFI do not receive any compensation from the Trust. The CCO of the Trust also serves as general counsel to QFI. For fiscal year ending June 30, 2017, the Funds compensated the CCO as follows:
| Fund | | Amount | |
| Event Arbitrage | | $ | 35,800 | |
| Global Tactical Allocation | | | 8,537 | |
| Mid-Cap Value | | | 8,491 | |
| Small-Cap Value | | | 36,827 | |
| Strategic Growth | | | 91,472 | |
Notes to the Financial Statements (continued)
Note 4 — Purchases and Sales of Investments
For the fiscal year ending June 30, 2017 aggregate purchases and sales of investment securities (excluding short-term investments) for each Fund were as follows:
| | | Purchases | | | Sales | |
| Event Arbitrage | | $ | 80,295,064 | | | $ | 94,361,499 | |
| Global Tactical Allocation | | | 12,226,943 | | | | 13,206,168 | |
| Mid-Cap Value | | | 2,000,180 | | | | 3,195,425 | |
| Small-Cap Value | | | 45,648,513 | | | | 55,450,546 | |
| Strategic Growth | | | 140,530,014 | | | | 160,123,947 | |
Note 5 — Options Written
A summary of option contracts written by the Trust during the fiscal year ending June 30, 2017 are as follows:
| | | Event Arbitrage | |
| | | Number of | | | Option | |
| | | Contracts | | | Premiums | |
| Options outstanding at beginning of year | | | 1,510 | | | $ | 342,341 | |
| Options written | | | 23,220 | | | | 2,548,566 | |
| Options closed | | | (6,716 | ) | | | (1,013,977 | ) |
| Options exercised | | | (3,815 | ) | | | (561,142 | ) |
| Options expired | | | (11,526 | ) | | | (1,014,287 | ) |
| Options outstanding at end of year | | | 2,673 | | | $ | 301,501 | |
Note 6 — Tax Matters
For U.S. federal income tax purposes, the cost of securities owned, gross appreciation, gross depreciation, and net unrealized appreciation (depreciation) of investments at June 30, 2017 for each Fund were as follows:
| | | | | | Gross | | | Gross | | | Net Appreciation | |
| Fund | | Cost | | | Appreciation | | | Depreciation | | | (Depreciation) | |
| Event Arbitrage | | $ | 31,805,889 | | | $ | 2,085,635 | | | $ | (7,018,639 | ) | | $ | (4,933,004 | ) |
| Global Tactical Allocation | | | 6,729,063 | | | | 180,781 | | | | (160,984 | ) | | | 19,797 | |
| Mid-Cap Value | | | 7,831,227 | | | | 1,533,380 | | | | (192,445 | ) | | | 1,340,935 | |
| Small-Cap Value | | | 31,765,750 | | | | 3,401,035 | | | | (882,141 | ) | | | 2,518,894 | |
| Strategic Growth | | | 75,995,782 | | | | 8,503,411 | | | | (906,157 | ) | | | 7,597,254 | |
As of June 30, 2017, the components of distributable earnings on a tax basis were as follows:
| | | | | | | | | | | | Other | | | | | | | | | | | | Total | |
| | | | | | Undis- | | | Undis- | | | Accum- | | | Capital | | | | | | Post- | | | Distribu- | |
| | | Unrealized | | | tributed | | | tributed | | | ulated | | | Loss | | | Late | | | October | | | table | |
| | | Appreciation | | | Ordinary | | | Capital | | | Gain/ | | | Carry- | | | Year | | | Capital | | | Earnings/ | |
| Fund | | (Depreciation) | | | Income | | | Gain | | | (Loss) | | | forward | | | Loss | | | Loss | | | (Loss) | |
| Event Arbitrage | | $ | (4,933,004 | ) | | $ | 745,188 | | | $ | — | | | $ | (342,878 | ) | | $ | (5,514,315 | ) | | $ | — | | | $ | (1,039,650 | ) | | $ | (11,084,659 | ) |
| Global Tactical Allocation | | | 19,797 | | | | — | | | | — | | | | 2 | | | | (2,836,767 | ) | | | — | | | | — | | | | (2,816,968 | ) |
| Mid-Cap Value | | | 1,340,935 | | | | — | | | | — | | | | — | | | | (1,170,572 | ) | | | (29,423 | ) | | | — | | | | 140,940 | |
| Small-Cap Value | | | 2,518,894 | | | | 1,025,614 | | | | 2,260,603 | | | | 12 | | | | — | | | | — | | | | — | | | | 5,805,123 | |
| Strategic Growth | | | 7,597,254 | | | | — | | | | — | | | | (367 | ) | | | (164,714,297 | ) | | | (5,631 | ) | | | — | | | | (157,123,041 | ) |
The difference between book basis and tax basis unrealized appreciation (depreciation) is attributable primarily to the tax deferral of losses on wash sales and straddles from options, and the differing book/tax treatment of unrealized appreciation/depreciation on partnership adjustments.
Notes to the Financial Statements (continued)
Note 6 — Tax Matters (Continued)
The undistributed ordinary income, capital gains and carryforward losses shown above differ from the corresponding accumulated net investment income and accumulated net realized gain (loss) figures reported in the statements of assets and liabilities due to differing book/tax treatment of short-term capital gains, and certain temporary book/tax differences such as the deferral of realized losses on wash sales, PFIC mark to market, partnership adjustments, straddles from options and net losses realized after October 31 and from ordinary losses incurred after December 31.
Under current tax law, foreign currency and net capital losses realized after October 31 may be deferred and treated as occurring on the first day of the following fiscal year. The Funds elected to defer net capital and currency losses as indicated in the chart below.
At June 30, 2017, the capital loss carryovers, late year losses, post-October capital loss and the capital loss utilized for the Funds were as follows:
| | | Capital Loss Carryovers Expiring | | | Late Year | | | Post-October | | | Capital Loss | |
| Fund | | Indefinite | | | 2018 | | | Loss | | | Capital Loss | | | Utilized | |
| Event Arbitrage | | $ | 5,514,315 | | | $ | — | | | $ | — | | | $ | 1,039,650 | | | $ | — | |
| Global Tactical Allocation | | | 118,084 | | | | 2,718,683 | | | | — | | | | — | | | | — | |
| Mid-Cap Value | | | — | | | | 1,170,572 | | | | 29,423 | | | | — | | | | 347,332 | |
| Small-Cap Value | | | — | | | | — | | | | — | | | | — | | | | — | |
| Strategic Growth | | | — | | | | 164,714,297 | | | | 5,631 | | | | — | | | | 3,739,578 | |
Note 7 — Reclassification of Capital Accounts
In accordance with the accounting pronouncements, each Fund has recorded reclassifications in the capital accounts. These reclassifications have no impact on the net asset value of the Funds and are designed generally to present undistributed income and realized gains on a tax basis which is considered to be more informative to shareholders. As of June 30, 2017, the Funds recorded the following reclassification to increase (decrease) the accounts listed below:
| | | Accumulated | | | Accumulated | | | | |
| | | Net Investment | | | Net Realized | | | Paid in | |
| Fund | | Income (Loss) | | | Gain (Loss) | | | Capital | |
| Event Arbitrage | | $ | 212,321 | | | $ | (212,321 | ) | | $ | — | |
| Global Tactical Allocation | | | 50,068 | | | | 7,414,401 | | | | (7,464,469 | ) |
| Mid-Cap Value | | | 42,254 | | | | 3,241,867 | | | | (3,284,121 | ) |
| Small-Cap Value | | | 285,999 | | | | (285,999 | ) | | | — | |
| Strategic Growth | | | 810,542 | | | | 189,465,000 | | | | (190,275,542 | ) |
Note 8 — Distributions to Shareholders
Income and long-term capital gain distributions are determined in accordance with federal income tax regulations, which may differ from GAAP. The information set forth below is for each Fund as required by federal securities laws.
The tax character of dividends and distributions paid during the fiscal years of 2017 and 2016 were as follows:
| | | Ordinary Income | | | Long-Term Capital Gain | |
| Fund | | 2017 | | | 2016 | | | 2017 | | | 2016 | |
| Event Arbitrage | | $ | 159,996 | | | $ | 5,355,904 | | | $ | — | | | $ | — | |
| Small-Cap Value | | | — | | | | — | | | | — | | | | 2,564,967 | |
Notes to the Financial Statements (continued)
Note 9 — Fund Share Transactions
At June 30, 2017, there were an unlimited number of shares of beneficial interest with a $0.01 par value authorized. The following table summarizes the activity in shares of each Fund:
| | | Event Arbitrage | |
| | | Year Ended 6/30/17 | | | Year Ended 6/30/16 | |
| | | Shares | | | Value | | | Shares | | | Value | |
| Shares sold: | | | | | | | | | | | | |
| Class A | | | 207,521 | | | $ | 2,565,664 | | | | 164,719 | | | $ | 2,016,773 | |
| Class C | | | 14,517 | | | | 173,664 | | | | 65,857 | | | | 752,078 | |
| Institutional Class | | | 352,078 | | | | 4,453,078 | | | | 1,417,648 | | | | 17,829,495 | |
| Shares issued to shareholders due | | | | | | | | | | | | | | | | |
| to reinvestment of distributions: | | | | | | | | | | | | | | | | |
| Class A | | | 4,798 | | | | 58,779 | | | | 131,922 | | | | 1,436,632 | |
| Class C | | | 435 | | | | 5,123 | | | | 40,419 | | | | 424,799 | |
| Institutional Class | | | 5,782 | | | | 71,407 | | | | 188,327 | | | | 2,064,058 | |
| | | | 585,131 | | | $ | 7,327,715 | | | | 2,008,892 | | | $ | 24,523,835 | |
| Shares Redeemed: | | | | | | | | | | | | | | | | |
| Class A | | | (475,134 | ) | | | (5,908,748 | ) | | | (1,446,579 | ) | | | (16,822,707 | ) |
| Class C | | | (159,711 | ) | | | (1,888,778 | ) | | | (206,687 | ) | | | (2,299,048 | ) |
| Institutional Class | | | (567,510 | ) | | | (6,974,898 | ) | | | (5,943,485 | ) | | | (68,456,381 | ) |
| | | | (1,202,355 | ) | | $ | (14,772,424 | ) | | | (7,596,751 | ) | | $ | (87,578,136 | ) |
| Net increase (decrease) | | | (617,224 | ) | | $ | (7,444,709 | ) | | | (5,587,859 | ) | | $ | (63,054,301 | ) |
| | | | |
| | | Global Tactical Allocation | |
| | | Year Ended 6/30/17 | | | Year Ended 6/30/16 | |
| | | Shares | | | Value | | | Shares | | | Value | |
| Shares sold: | | | | | | | | | | | | | | | | |
| Class A | | | 7,980 | | | $ | 83,591 | | | | 89,237 | | | $ | 959,273 | |
| Class C | | | 2,103 | | | | 20,892 | | | | 72,024 | | | | 754,719 | |
| Institutional Class | | | 307,084 | | | | 3,677,885 | | | | 243,325 | | | | 3,016,440 | |
| Shares issued to shareholders due | | | | | | | | | | | | | | | | |
| to reinvestment of distributions: | | | | | | | | | | | | | | | | |
| Class A | | | — | | | | — | | | | — | | | | — | |
| Class C | | | — | | | | — | | | | — | | | | — | |
| Institutional Class | | | — | | | | — | | | | — | | | | — | |
| | | | 317,167 | | | $ | 3,782,368 | | | | 404,586 | | | $ | 4,730,432 | |
| Shares Redeemed: | | | | | | | | | | | | | | | | |
| Class A | | | (167,117 | ) | | | (1,748,988 | ) | | | (265,117 | ) | | | (2,753,883 | ) |
| Class C | | | (56,996 | ) | | | (557,112 | ) | | | (81,694 | ) | | | (787,122 | ) |
| Institutional Class | | | (156,645 | ) | | | (1,880,587 | ) | | | (175,288 | ) | | | (2,054,323 | ) |
| | | | (380,758 | ) | | $ | (4,186,687 | ) | | | (522,099 | ) | | $ | (5,595,328 | ) |
| Net increase (decrease) | | | (63,591 | ) | | $ | (404,319 | ) | | | (117,513 | ) | | $ | (864,896 | ) |
Notes to the Financial Statements (continued)
Note 9 — Fund Share Transactions (Continued)
| | | Mid-Cap Value | |
| | | Year Ended 6/30/17 | | | Year Ended 6/30/16 | |
| | | Shares | | | Value | | | Shares | | | Value | |
| Shares sold: | | | | | | | | | | | | |
| Class A | | | 4,309 | | | $ | 113,588 | | | | 1,881 | | | $ | 43,012 | |
| Class C | | | 247 | | | | 5,732 | | | | 694 | | | | 13,877 | |
| Institutional Class | | | 6,465 | | | | 187,330 | | | | 5,020 | | | | 114,887 | |
| Shares issued to shareholders due | | | | | | | | | | | | | | | | |
| to reinvestment of distributions: | | | | | | | | | | | | | | | | |
| Class A | | | — | | | | — | | | | — | | | | — | |
| Class C | | | — | | | | — | | | | — | | | | — | |
| Institutional Class | | | — | | | | — | | | | — | | | | — | |
| | | | 11,021 | | | $ | 306,650 | | | | 7,595 | | | $ | 171,776 | |
| Shares Redeemed: | | | | | | | | | | | | | | | | |
| Class A | | | (30,932 | ) | | | (823,921 | ) | | | (52,638 | ) | | | (1,183,778 | ) |
| Class C | | | (13,530 | ) | | | (309,983 | ) | | | (13,894 | ) | | | (273,981 | ) |
| Institutional Class | | | (8,120 | ) | | | (229,719 | ) | | | (11,130 | ) | | | (267,895 | ) |
| | | | (52,582 | ) | | $ | (1,363,623 | ) | | | (77,662 | ) | | $ | (1,725,654 | ) |
| Net increase (decrease) | | | (41,561 | ) | | $ | (1,056,973 | ) | | | (70,067 | ) | | $ | (1,553,878 | ) |
| | | | |
| | | Small-Cap Value | |
| | | Year Ended 6/30/17 | | | Year Ended 6/30/16 | |
| | | Shares | | | Value | | | Shares | | | Value | |
| Shares sold: | | | | | | | | | | | | | | | | |
| Class A | | | 8,736 | | | $ | 199,054 | | | | 11,691 | | | $ | 250,197 | |
| Class C | | | 411 | | | | 7,675 | | | | 10,602 | | | | 193,798 | |
| Institutional Class | | | 15,401 | | | | 366,482 | | | | 52,805 | | | | 1,135,000 | |
| Shares issued to shareholders due | | | | | | | | | | | | | | | | |
| to reinvestment of distributions: | | | | | | | | | | | | | | | | |
| Class A | | | — | | | | — | | | | 24,361 | | | | 506,715 | |
| �� Class C | | | — | | | | — | | | | 7,880 | | | | 132,549 | |
| Institutional Class | | | — | | | | — | | | | 67,292 | | | | 1,473,012 | |
| | | | 24,548 | | | $ | 573,211 | | | | 174,631 | | | $ | 3,691,271 | |
| Shares Redeemed: | | | | | | | | | | | | | | | | |
| Class A | | | (62,175 | ) | | | (1,437,981 | ) | | | (38,582 | ) | | | (804,852 | ) |
| Class C | | | (24,210 | ) | | | (451,121 | ) | | | (11,575 | ) | | | (186,481 | ) |
| Institutional Class | | | (357,329 | ) | | | (8,460,169 | ) | | | (84,509 | ) | | | (1,918,930 | ) |
| | | | (443,714 | ) | | $ | (10,349,271 | ) | | | (134,666 | ) | | $ | (2,910,263 | ) |
| Net increase (decrease) | | | (419,166 | ) | | $ | (9,776,060 | ) | | | 39,965 | | | $ | 781,008 | |
Notes to the Financial Statements (continued)
Note 9 — Fund Share Transactions (Continued)
| | | Strategic Growth | |
| | | Year Ended 6/30/17 | | | Year Ended 6/30/16 | |
| | | Shares | | | Value | | | Shares | | | Value | |
| Shares sold: | | | | | | | | | | | | |
| Class A | | | 26,993 | | | $ | 704,491 | | | | 57,050 | | | $ | 1,408,584 | |
| Class C | | | 15,462 | | | | 363,910 | | | | 17,680 | | | | 375,441 | |
| Institutional Class | | | 44,663 | | | | 1,197,952 | | | | 179,430 | | | | 4,801,987 | |
| Shares issued to shareholders due | | | | | | | | | | | | | | | | |
| to reinvestment of distributions: | | | | | | | | | | | | | | | | |
| Class A | | | — | | | | — | | | | — | | | | — | |
| Class C | | | — | | | | — | | | | — | | | | — | |
| Institutional Class | | | — | | | | — | | | | — | | | | — | |
| | | | 87,118 | | | $ | 2,266,353 | | | | 254,160 | | | $ | 6,586,012 | |
| Shares Redeemed: | | | | | | | | | | | | | | | | |
| Class A | | | (638,440 | ) | | | (16,536,992 | ) | | | (563,222 | ) | | | (13,957,325 | ) |
| Class C | | | (230,332 | ) | | | (5,180,033 | ) | | | (140,669 | ) | | | (3,022,567 | ) |
| Institutional Class | | | (277,544 | ) | | | (7,249,735 | ) | | | (2,046,038 | ) | | | (54,865,899 | ) |
| | | | (1,146,316 | ) | | $ | (28,966,760 | ) | | | (2,749,929 | ) | | $ | (71,845,791 | ) |
| Net increase (decrease) | | | (1,059,198 | ) | | $ | (26,700,407 | ) | | | (2,495,769 | ) | | $ | (65,259,779 | ) |
Note 10 — Offsetting Assets and Liabilities
The Funds are subject to various Master Netting Arrangements (“MNA”), which govern the terms of certain transactions with select counterparties. The MNA allow the Funds to close out and net their total exposure to a counterparty in the event of a default with respect to all the transactions governed under a single agreement with a counterparty. The MNA also specify collateral posting arrangements at pre-arranged exposure levels. Under the MNA, collateral is routinely transferred if the total net exposure to certain transactions (net of existing collateral already in place) governed under the relevant MNA with a counterparty in a given account exceeds a specified threshold depending on the counterparty and the type of MNA.
The following is a summary of the Assets and Liabilities for each Fund subject to offsets as of June 30, 2017:
Liabilities:
| | | | | | Gross | | | Net | | | | | | | | | | |
| | | | | | Amounts | | | Amounts | | | Gross Amounts Not | | | | |
| | | | | | Offset | | | Presented | | | Offset in the Statements | | | | |
| | | | | | in the | | | in the | | | of Assets and Liabilities | | | | |
| | | Gross Amounts | | | Statements | | | Statements | | | | | | Collateral | | | | |
| | | of Recognized | | | of Assets | | | of Assets | | | Financial | | | Pledged | | | Net | |
| Description | | Liabilities | | | and Liabilities | | | and Liabilities | | | Instruments | | | (Received) | | | Amount | |
Event Arbitrage | | | | | | | | | | | | | | | | | | |
| Written Options | | $ | 407,151 | | | $ | — | | | $ | 407,151 | | | $ | — | | | $ | 407,151 | | | $ | — | |
| Securities Lending | | | 1,268,709 | | | | — | | | | 1,268,709 | | | | 1,268,709 | | | | — | | | | — | |
| | | | 1,675,860 | | | | — | | | | 1,675,860 | | | | 1,268,709 | | | | 407,151 | | | | — | |
| | | | | | | | | | | | | | | | | | | | | | | | | |
Mid-Cap Value | | | | | | | | | | | | | | | | | | | | | | | | |
| Securities Lending | | | 2,060,060 | | | | — | | | | 2,060,060 | | | | 2,060,060 | | | | — | | | | — | |
| | | | | | | | | | | | | | | | | | | | | | | | | |
Small-Cap Value | | | | | | | | | | | | | | | | | | | | | | | | |
| Securities Lending | | | 5,691,418 | | | | — | | | | 5,691,418 | | | | 5,691,418 | | | | — | | | | — | |
| | | | | | | | | | | | | | | | | | | | | | | | | |
Strategic Growth | | | | | | | | | | | | | | | | | | | | | | | | |
| Securities Lending | | | 11,925,730 | | | | — | | | | 11,925,730 | | | | 11,925,730 | | | | — | | | | — | |
Notes to the Financial Statements (continued)
Note 11 — Indemnifications
Under the Trust’s organizational documents, its officers and Trustees are indemnified against certain liabilities arising out of the performance of their duties to the Funds. In addition, in the normal course of business, the Trust enters into contracts with its vendors and others that provide for general indemnifications.
The Trust’s maximum exposure under these arrangements is dependent on future claims that may be made against the Trust, and, therefore, cannot be estimated; however, based on experience, risk of loss from such claims is considered remote.
Note 12 — Securities Lending
The Funds hold units of the Mount Vernon Liquid Assets Portfolio, LLC as cash collateral whose main objective is to maximize current income to the extent consistent with the preservation of capital and liquidity. It primarily invests in Certificates of Deposits, Asset Backed and Financial Company Commercial Paper, and Repurchase Agreements. The Mid-Cap Value, Small-Cap Value and Strategic Growth Funds’ all hold a significant concentration in the Mount Vernon Liquid Assets Portfolio, LLC.
At June 30, 2017, the aggregate market value of loaned securities and the value of the cash collateral the Funds received is as follows:
| | | Loaned Securities | | | Value of | | | % of | |
| | | Market Value | | | Cash Collateral | | | Net Assets | |
| Event Arbitrage | | $ | 1,243,416 | | | $ | 1,268,709 | | | | 4.3 | % |
| Mid-Cap Value | | | 2,022,215 | | | | 2,060,060 | | | | 29.1 | % |
| Small-Cap Value | | | 5,549,586 | | | | 5,691,418 | | | | 19.8 | % |
| Strategic Growth | | $ | 11,664,807 | | | $ | 11,925,730 | | | | 16.6 | % |
Private Investment Co. purchased with proceeds from securities lending collateral is included in the Schedules of Investments and the Statements of Assets and Liabilities. The interest income, net of fees, earned by the Funds on the cash collateral received from borrowers for the securities loaned to them is reflected in the Statements of Operations.
Note 13 — New Accounting Pronouncement
In October 2016, the U.S. Securities and Exchange Commission adopted new rules and amended existing rules (together, “final rules”) intended to modernize the reporting and disclosure of information by registered investment companies. In part, the final rules amend Regulation S-X and require standardized, enhanced disclosure about derivatives in investment company financial statements, as well as other amendments. The compliance date for the amendments to Regulation S-X is August 1, 2017. Management is currently evaluating the impact that the adoption of the amendments to Regulation S-X will have on the financial statements and related disclosures.
Note 14 — Events Subsequent to Year-End
Management has evaluated portfolio related events and transactions that occurred subsequent to June 30, 2017 through the date of issuance of the financial statements. There were no events or transactions that occurred during the period that materially impacted the amounts or disclosures in the financial statements.
Report of Independent Registered Public Accounting Firm
To the Shareholders and Board of Trustees of Quaker Investment Trust
We have audited the accompanying statements of assets and liabilities of Quaker Event Arbitrage Fund, Quaker Global Tactical Allocation Fund, Quaker Mid-Cap Value Fund, Quaker Small-Cap Value Fund, and Quaker Strategic Growth Fund (the “Funds”), each a series of Quaker Investment Trust (the “Trust”), including the schedules of investments, as of June 30, 2017, the related statements of operations for the year then ended, the statements of changes in net assets for each of the two years in the period then ended, and the financial highlights for each of the five years in the period then ended. These financial statements and financial highlights are the responsibility of the Funds’ management. Our responsibility is to express an opinion on these financial statements and financial highlights based on our audits.
We conducted our audits in accordance with the standards of the Public Company Accounting Oversight Board (United States). Those standards require that we plan and perform the audits to obtain reasonable assurance about whether the financial statements and financial highlights are free of material misstatement. The Funds are not required to have, nor were we engaged to perform, an audit of their internal control over financial reporting. Our audits included consideration of internal control over financial reporting as a basis for designing audit procedures that are appropriate in the circumstances, but not for the purpose of expressing an opinion on the effectiveness of the Funds’ internal control over financial reporting. Accordingly, we express no such opinion. An audit includes examining, on a test basis, evidence supporting the amounts and disclosures in the financial statements. Our procedures included confirmation of securities owned as of June 30, 2017, by correspondence with the custodian and brokers or through other appropriate procedures where replies from brokers were unable to be obtained. An audit also includes assessing the accounting principles used and significant estimates made by management, as well as evaluating the overall financial statement presentation. We believe that our audits provide a reasonable basis for our opinion.
In our opinion, the financial statements and financial highlights referred to above present fairly, in all material respects, the financial position of Quaker Event Arbitrage Fund, Quaker Global Tactical Allocation Fund, Quaker Mid-Cap Value Fund, Quaker Small-Cap Value Fund, and Quaker Strategic Growth Fund, as of June 30, 2017, the results of their operations for the year then ended, the changes in their net assets for each of the two years in the period then ended, and the financial highlights for each of the five years in the period then ended, in conformity with accounting principles generally accepted in the United States of America.
TAIT, WELLER & BAKER LLP
Philadelphia, Pennsylvania
August 28, 2017
Trustees and Officers (unaudited)
June 30, 2017
The Board has overall responsibility for conduct of the Trust’s affairs. The day-to-day operations of the Trust are managed by QFI subject to the Bylaws of the Trust and review by the Board. The Trustees, including those Trustees who are also officers, are listed below:
| | | Serving as | | | |
| | | an Officer | | Portfolios | Directorships |
| Name, Address | Position(s) Held | or Trustee of | Principal Occupation(s) | Overseen by | Held by |
| and Age | with the Trust | the Trust | During Past 5 Years | Trustee | Trustee(1) |
Jeffry H. King, Sr.(2)(3) | Chairman of the | Since | Chairman of Board of Directors | 5 | None |
| 1180 W. Swedesford Road, | Board and Chief | Nov. 1996 | and Chief Executive Officer, | | |
| Suite 150 | Executive Officer | | Quaker Funds, Inc. (1996–present). | | |
| Berwyn, PA 19312 | | | | | |
| Age 74 | | | | | |
Laurie Keyes(3)(4) | Treasurer and | Since | Chief Financial Officer, | 5 | None |
| 1180 W. Swedesford Road, | Trustee | Nov. 1996 | Quaker Funds, Inc. (1996–present). | | |
| Suite 150 | | | | | |
| Berwyn, PA 19312 | | | | | |
| Age 67 | | | | | |
Justin Brundage(5) | Secretary | Since | President, Quaker Funds, Inc. | N/A | N/A |
| 1180 W. Swedesford Road, | | Nov. 2006 | (2007–present); Chief Operating | | |
| Suite 150 | | | Officer, Quaker Funds, Inc. | | |
| Berwyn, PA 19312 | | | (2005–present). | | |
| Age 47 | | | | | |
| Timothy E. Richards | Chief Compliance | Since | General Counsel to Quaker Funds, | N/A | N/A |
| 1180 W. Swedesford Road, | Officer | March 2004 | Inc. (2003–present); Chief | | |
| Suite 150 | | | Compliance Officer for the Quaker | | |
| Berwyn, PA 19312 | | | Investment Trust (2004–present). | | |
| Age 52 | | | | | |
| James R. Brinton | Trustee | Since | Vice President, Powers Craft | 5 | None |
| 1180 W. Swedesford Road, | | Feb. 2002 | Parker & Beard (2015–present); | | |
| Suite 150 | Lead | Since | President, Robert J. McAllister | | |
| Berwyn, PA 19312 | Independent | Aug. 2007 | Agency, Inc. (1979–2015). | | |
| Age 63 | Trustee | | | | |
| Gary Edward Shugrue | Trustee | Since | Managing Director, Veritable, LP | 5 | Director, BHR |
| 1180 W. Swedesford Road, | | July 2008 | (2016–present); President | | Institutional |
| Suite 150 | | | and Chief Investment | | Funds; Director, |
| Berwyn, PA 19312 | | | Officer, Ascendant Capital | | ACP Funds |
| Age 63 | | | Partners (2001–2016). | | Trust |
| Warren West | Trustee | Since | President and owner, Greentree | 5 | None |
| 1180 W. Swedesford Road, | | Nov. 2003 | Brokerage Services, Inc. | | |
| Suite 150 | | | (1998–present). | | |
| Berwyn, PA 19312 | | | | | |
| Age 60 | | | | | |
Trustees and Officers (unaudited) (continued)
| | | Serving as | | | |
| | | an Officer | | Portfolios | Directorships |
| Name, Address | Position(s) Held | or Trustee of | Principal Occupation(s) | Overseen by | Held by |
| and Age | with the Trust | the Trust | During Past 5 Years | Trustee | Trustee(1) |
| Everett T. Keech | Trustee | Since | Chairman-Executive Committee, | 5 | Director, |
| 1180 W. Swedesford Road, | | Nov. 2005 | Technology Development | | Technology |
| Suite 150 | | | Corp., (1997–present) technology | | Development |
| Berwyn, PA 19312 | | | development and manufacturing | | Corp. |
| Age 77 | | | firm (1997–present); Affiliated | | |
| | | | Faculty, University of | | |
| | | | Pennsylvania (1998–present). | | |
| (1) | Directorship of companies required to report to the SEC under the Securities and Exchange Act of 1934, as amended (the “Exchange Act”) (i.e., “public companies”) and investment companies registered under the 1940 Act. |
| (2) | Mr. King is considered to be “interested person” of the Trust for purposes of the 1940 Act because he is the Chief Executive Officer and a controlling shareholder of Quaker Funds, Inc., the investment adviser to the Funds. |
| (3) | Mr. King and Ms. Keyes are husband and wife. |
| (4) | Ms. Keyes is considered to be an “interested person” of the Trust for purposes of the 1940 Act because she is the Trust’s Treasurer and a controlling shareholder of Quaker Funds, Inc. |
| (5) | Mr. Brundage is Ms. Keyes’ son. |
The Statement of Additional Information for the Trust includes additional information about the Trustees and Officers and is available, without charge, upon request by calling (800) 220-8888.
Form N-Q Filing and Proxy Voting Policies and Procedures
Each Fund files its complete schedule of portfolio holdings with the Securities and Exchange Commission (“SEC”) for the first and third quarters of each fiscal year on Form N-Q. Each Fund’s Forms N-Q, as well as a description of the policies and procedures that each Fund uses to determine how to vote proxies (if any) relating to portfolio securities is available without charge: (i) upon request, by calling (800) 220-8888; and (ii) on the SEC’s web-site at http://www.sec.gov. Each Fund’s Forms N-Q may be reviewed and copied at the SEC’s Public Reference Room in Washington, DC; information on the operation of the Public Reference Room may be obtained by calling 1-800-SEC-0330.
Information (if any) regarding how the Funds voted proxies relating to portfolio securities during the most recently disclosed 12-month period ended June 30 is available: (i) without charge, upon request, by calling (800) 220-8888; and (ii) on the SEC’s web-site at http://www.sec.gov.
Approval of Advisory and Sub-Advisory Agreements (unaudited)
At a meeting held on May 3, 2017, the Board of the Trust (“Trustees” or “Board”) considered the continuation of the Investment Advisory Agreement between the Trust and Quaker Funds, Inc. (“Adviser”) and each of the respective Sub-Advisory Agreements between the Adviser and AJO, LP and Kennedy Capital Management, Inc. (collectively, the “Agreements”) with regard to the Quaker Event Arbitrage Fund, Quaker Global Tactical Allocation Fund, Quaker Small-Cap Value Fund, and Quaker Mid-Cap Value Fund (each a “Fund” and collectively, the “Funds”). At the meeting, the Trustees who are not “interested persons” (as defined in the 1940 Act) reported to the full Board their considerations with respect to the Agreements, and the Board, including a majority of Independent Trustees, considered and approved the renewal of the Agreements. The renewals were each effective through May 2018. The sub-advisory agreement for the Trust’s remaining sub-advisor, Los Angeles Capital Management and Equity Research, Inc., was not up for re-approval because that agreement is still in its initial two-year term.
In considering the continuation of the Agreements, the Trustees considered the nature and quality of the services provided by the Adviser and each of the sub-advisers, the proposed fee structures, the level of fee waivers (as applicable), each Fund’s past expense ratios, possible economies of scale, and other possible benefits the Adviser and each of the sub-advisers derive from their relationships with the Funds. The Trustees also considered other information that had been received from the Adviser and each of the sub-advisers at other meetings throughout the year.
The Trustees first evaluated the nature, extent and quality of services provided by the Adviser and the sub-advisers to the Funds and their shareholders. The Board reviewed factors such as the background and experience of the management personnel involved in the Funds’ operations, the quality of the monitoring of each Fund’s operations and investment performance, and the monitoring of various service providers to the Funds, the Adviser’s success in obtaining meaningful information on a timely basis from each of the Fund’s sub-advisers. The Board also considered the Adviser’s discussion of its business operations and costs in managing the Funds. The nature of the sub-advisers’ services to each Fund was considered primarily in respect to the Advisers’ assessment of investment performance of the Funds. The Board was, however, satisfied with the adherence by each sub-adviser to the investment policies and restrictions of the Funds advised, as well as their adherence to various compliance and other procedures, the materials furnished at quarterly Board meetings, and their communications with the Adviser.
With respect to the Funds’ investment performance, the Trustees reviewed each Fund’s performance compared to relative benchmark indices over one-year, three-year, five-year, ten-year and since inception periods, as applicable, as of the end of the most recent calendar year. The Board considered the reasons for a Fund’s over or underperformance against its particular benchmark. It noted that several of the Funds had experienced some positive short-term outperformance on a gross of fees basis. The Board took into account the Adviser’s discussion concerning the longer-term underperformance in the Funds, including underperformance due to a sub-adviser’s investment style being out of favor or a temporary unfavorable over- or underweight to out-of-favor or underperforming sectors, or stock selection. The Board expressed its desire to see performance improvements.
In considering the appropriateness of the advisory fees charged to the Funds, the Board also reviewed and considered the advisory fees in light of the nature, extent and quality of the investment management services provided, and to be provided, by the Adviser and each sub-adviser, as more fully discussed above. The Trustees considered the costs of the services provided to the Trust and the profits (or the lack thereof) realized by the Adviser from its relationship with the Trust based on the profitability information provided to the Board. It also considered the Adviser’s and sub-advisers’ willingness to waive or reduce fees, as applicable, noting that in the
Approval of Advisory and Sub-Advisory Agreements (unaudited) (continued)
case of sub-adviser fee waivers or reductions, those waivers or reductions were passed on to shareholders. The Trustees noted that under certain conditions, the Adviser and sub-advisers might be able to recover some of their waived fees in the future. The Trustees also noted that the sub-advisory fees are paid by the Adviser to each sub-adviser and are not additional fees borne by the Funds.
The Board discussed with the Adviser its financial condition and its continuing efforts to develop strategic partnership plans or seek out transactions that would, among other things, help to increase Fund assets and reduce expenses. The Board considered those evolving plans in evaluating the costs of services provided, and to be provided. The Board noted the Adviser’s view of the challenge of finding adequate comparative expense peer groups due to the tactical investment process of several of the Funds, the Trust’s manager-of-managers structure, and the fact that some fund complexes use a unitary fee while others break out their expenses in a more transparent manner. As the Trust is the Adviser’s only client, there was no available comparative fee information for other accounts managed by the Adviser. The Trustees determined that the Funds’ contractual rates were reasonable in light of, among other things, the types of capacity constrained, tactical allocation, and alternative strategies that they offer.
Additionally, the Board concluded that based on the small asset size of the complex, neither the Adviser nor the applicable Funds’ sub-advisers received any ancillary benefits from their relationships with the Trust.
Based on the totality of the information considered, the Trustees, including a majority of the Funds’ independent Trustees, concluded that the Funds’ advisory contracts should be continued through May 2018.
General Information (unaudited)
Tax Information
We are required to advise you within 60 days of the Funds’ fiscal year-end regarding the federal tax status of certain distributions received by shareholders during such fiscal year. The information below is provided for the fiscal year ending June 30, 2017. During the fiscal year ended June 30, 2017, there were no Funds that paid a long-term capital distribution.
Individual shareholders are eligible for reduced tax rates on the following percentages of qualified dividend income. For the purposes of computing the dividends eligible for reduced taxes, the following percentage of the dividends paid by the Fund from ordinary income earned during the fiscal year are considered qualified dividend income.
| Fund | Percentage |
| Event Arbitrage | 37.49% |
Corporate shareholders may exclude up to the following percentages of qualifying dividends. For the purposes of computing this exclusion, the following percentage of the dividends paid by the Funds from ordinary income earned during the fiscal year represents qualifying dividends.
| Fund | Percentage |
| Event Arbitrage | 30.44% |
During the fiscal year ending June 30, 2017, the percentage of taxable ordinary income distributions that are designated as short-term capital gain distributions under Internal Revenue Section 871(k)(2)(C) for the Fund was as follows.
| Fund | Percentage |
| Event Arbitrage | 0.00% |
Dividends and distributions received by retirement plans such as IRAs, Keogh type plans and 403(b) plans need not be reported as taxable income. However, many retirement plan trusts may need this information for their annual information reporting. Since the information above is reported for the Funds’ fiscal year and not the calendar year, shareholders should refer to their Form 1099-DIV or other tax information which will be mailed in January 2018 to determine the calendar year amounts to be included on their 2017 tax returns. Shareholders should consult their tax advisers.
Privacy Policy
Your personal privacy is important. At Quaker Investment Trust, including its subsidiaries and affiliated entities, we recognize that whether you are an existing customer or are considering a relationship with us, you have an interest in how we collect, retain and use information about you and your relationship with us.
We are committed to protecting your confidential information. We do this by maintaining standards and procedures designed to prevent the accidental disclosure of such information and/or its misuse. Our Customer Privacy Policy, which outlines how we accomplish the protection of your information, is set forth below.
General Information (unaudited) (continued)
I. INFORMATION COLLECTION
We may collect “non-public personal information” about you from the following sources:
| | • | Information we receive from you on account applications and other account forms you provide to us; |
| | • | Information about your transactions with us, our affiliates, and other entities; |
| | • | Information we receive from third parties, such as credit bureaus, the IRS, and others. “Non-public personal information” is non-public information about you that we obtain in connection with providing a financial product or service to you. For example, non-public personal information includes information regarding your account balance, shares held, which funds you own, your investment history, etc. |
II. INFORMATION USE & SHARING WITH THIRD PARTIES
We are permitted under law to share information about our experiences or transactions with you or your account (such as your account balance, shares owned, and investment history) with affiliates. We may also share additional information about you or your account (such as information we receive from account applications and other correspondence) with our affiliates. We do not disclose information to our affiliates that does not directly relate to our or our affiliates’, experiences or transactions with your account.
We are also permitted under law to disclose non-public information about you to “non-affiliated third parties” in certain circumstances. We may share certain kinds of customer information with these third parties solely to facilitate the offering, administration, collection and delivery of our services to you, and only under strictly controlled circumstances designed to protect the privacy of your information. We require any non-affiliated third party with whom we share such information to execute our Confidentiality and Consumer Privacy Protection Agreement. Under that agreement, those parties are not allowed to release, use for their own purposes, or sell, transfer or provide any customer information we share with them to any other party.
You should be aware that there may be occasions where we are legally required to disclose information about you, such as in response to a governmental or court order.
If you decide to close your account with us, we will continue to adhere to these privacy policies. Lastly, we do not sell customer lists or individual customer information.
III. SECURITY STANDARDS
At Quaker Investment Trust and our affiliates, employee access to customer information is authorized for business purposes only and only for employees who need to know such information.
We regularly train our employees on privacy and privacy security, and we have established and continuously maintain standards and procedures to protect the privacy of your information.
When you use our on-line (Internet) products and services, we may collect information about you to personalize our services to you, but we do not share any such information or your email information to anyone other than our affiliates, unless compelled to do so under law.
IV. ACCURACY
We continually strive to maintain complete and accurate information about you and your accounts. Should you ever believe that our records are inaccurate or incomplete, please call us immediately at 1-800-220-8888. We will investigate your concerns and correct any inaccuracies. We will also confirm to you the actions we have taken concerning your account. You may also write to us at the Quaker Investment Trust, c/o U.S. Bancorp Fund Services, LLC, P.O. Box 701, Milwaukee, Wisconsin 53201-0701.
General Information (unaudited) (continued)
Notice Regarding Delivery of Shareholder Documents
In an effort to decrease costs, each Fund intends to reduce the number of duplicate Prospectuses and Annual and Semi-Annual Reports you receive by sending only one copy of each to those addresses shared by two or more accounts and to shareholders we reasonably believe are from the same family or household. Once implemented, if you would like to discontinue householding for your accounts, please call toll-free at 1-800-220-8888 to request individual copies of these documents. Once a Fund receives notice to stop householding, we will begin sending individual copies thirty days after receiving your request. This policy does not apply to account statements.
(This Page Intentionally Left Blank.)
The Quaker Funds are distributed by
Foreside Fund Services, LLC.
Contact us:
Quaker Funds, Inc.
c/o U.S. Bancorp Fund Services, LLC.
PO Box 701
Milwaukee, WI 53201-0701
800.220.8888
www.quakerfunds.com
©2017 Quaker® Investment Trust
QKAR 062017