UNITED STATES
SECURITIES AND EXCHANGE COMMISSION
Washington, D.C. 20549
FORM N-CSR
CERTIFIED SHAREHOLDER REPORT OF REGISTERED
MANAGEMENT INVESTMENT COMPANIES
Investment Company Act file number (811-06260)
Quaker Investment Trust
(Exact name of registrant as specified in charter)
309 Technology Drive
Malvern, PA 19355
(Address of principal executive offices) (Zip code)
Jeffry H. King, Sr.
Quaker Investment Trust
309 Technology Drive
Malvern, PA 19355
(Name and address of agent for service)
(800) 220-8888
Registrant’s telephone number, including area code
Date of fiscal year end: June 30, 2014
Date of reporting period: June 30, 2014
Item 1. Report to Stockholders.
Annual Report
2 0 1 4
Quaker Event Arbitrage Fund
Quaker Global Tactical Allocation Fund
Quaker Mid-Cap Value Fund
Quaker Small-Cap Value Fund
Quaker Strategic Growth Fund

Mutual fund investing involves risk. Principal loss is possible.
Investing in the Quaker Funds may involve special risk including, but not limited to, investments in smaller companies, short sales, foreign securities, special situations, debt securities and value growth investing. Please refer to the prospectus for more complete information.
This report must be preceded or accompanied by a current prospectus.
The opinions expressed are those of the adviser or sub-adviser through the end of the period for this report, are subject to change, are not a guarantee, and should not be considered investment advice.
Fund holdings are subject to change and should not be considered a recommendation to buy or sell any security. Current and future holdings are subject to risk.
Chairman’s Letter to the Shareholders (Unaudited)
June 30, 2014
Dear Fellow Shareholder,
The premise on which Quaker Funds, Inc. was founded was the desire to afford everyday investors access to the same tactical allocation used by professional money managers to augment traditional investing strategies within a holistic asset allocation mix. Our commitment to this principle is still as strong today as it was the day we opened our doors.
Our management team continually strives to provide our shareholders with innovative investment alternatives and advisers that constantly seek superior returns. Thank you for your trust and investment in the Quaker Funds.
Sincerely,
Jeffry King
Chairman & CEO
Quaker Investment Trust
Performance Update (Unaudited)
Quaker Event Arbitrage Fund (QEAAX, QEACX, QEAIX)
OBJECTIVES AND PRINCIPAL STRATEGIES
The Quaker Event Arbitrage Fund (“Fund”) seeks to provide long-term growth of capital. The Fund generally invests in the securities of publicly traded companies involved in mergers, takeovers, tender offers, leveraged buyouts, spin-offs, liquidations or similar events.
PERFORMANCE REVIEW AND MARKET OUTLOOK
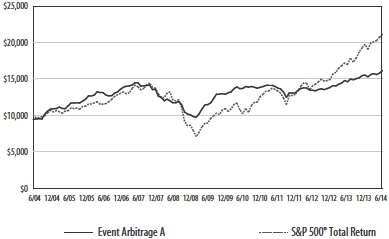
For the fiscal year ended June 30, 2014, the Fund returned 10.47%, and the total return of the S&P 500® was 24.61%. While the equity market gyrated over the last year, the Fund’s daily volatility was roughly 48% lower than that of the S&P 500.
The past 12 months proved again favorable for event driven investing. This is evident in looking at the HFRI Event Driven (Total) Index which returned 11.24%. The HFRI Event Driven (Total) Index is a good barometer for the asset class as it aggregates many hedge funds into one index that represents event driven investing. With the monetary environment likely to become less accommodative over the next several years the Investment Team anticipates that the favorable backdrop for the event-driven investment style will persist.
Looking forward, the portfolio management team sees opportunities in proxy fights, distressed investments and special situations such as spin-offs, REIT conversions or tax inversions. Activist investors continue to exert pressure on underperforming companies to sell themselves or optimize their structure through spin-offs and other divestitures. But even in the absence of pressure from activist investors many company managers see changes in company structure as the only remaining area in which efficiency gains can be achieved when all conceivable other productivity improvements have been implemented over the last few years. As a result, we expect that special situations will continue to provide attractive opportunities.
Over the last year, the Fund has found many new opportunities in distressed securities of corporate issues. These investments are spread over a wide range of sectors, ranging from industries as diverse as shipping or banking to natural resources.
Finally, we expect merger arbitrage to remain a small portion of the portfolio. Despite the recent surge in activity including many mergers of large size, this strategy in general generates unattractive returns while interest rates remain near historic lows, in particular in light of the risks incurred. Nevertheless, opportunities appear from time to time and the Investment Team may invest in merger arbitrage opportunities on such occasions.
I wish all investors a prosperous year and thank you for your continued support.
Sincerely,
Thomas Kirchner, Portfolio Manager
Quaker Funds, Inc.
| ADVISER:
Quaker Funds, Inc.
TOTAL NET ASSETS:
AS OF JUNE 30, 2014
$119,064,457 |
| Top 10 Holdings ** (% of net assets) |
| | | | | |
| Sprint Corp., Expiration: June, 2015 Warrant | | | 2.5 | % |
| Twenty-First Century Fox, Inc. | | | 2.2 | % |
| API Technologies Corp. | | | 2.1 | % |
| CST Brands, Inc. | | | 1.8 | % |
| Hologic, Inc. | | | 1.7 | % |
| Liberty Media Corp. | | | 1.7 | % |
| Pfizer Inc. | | | 1.7 | % |
| News Corp. Class A | | | 1.7 | % |
| CommonWealth REIT | | | 1.6 | % |
| Ambac Financial Group, Inc. | | | 1.6 | % |
| % Fund Total | | | 18.6 | % |
| ** | | Includes Long Holdings Only and Excludes Short-Term Investments |
| Sectors (% of net assets) |
| | | | |
 | 46.6% | | Domestic Common Stocks |
| | 0.5% | | Basic Materials |
| | 11.0% | | Communications |
| | 6.4% | | Consumer, Cyclical |
| | 10.5% | | Consumer, Non-cyclical |
| | 1.1% | | Diversified |
| | 2.8% | | Energy |
| | 3.5% | | Financial |
| | 0.8% | | Healthcare |
| | 8.9% | | Industrial |
| | 1.1% | | Technology |
 | 5.6% | | Foreign Common Stocks |
 | 2.6% | | Preferred Stocks |
 | 4.4% | | Real Estate Investment Trusts |
 | 0.3% | | Rights |
 | 3.4% | | Warrants |
 | 0.7% | | Asset Backed Securities |
 | 1.2% | | Convertible Bonds |
 | 4.8% | | Corporate Bonds |
 | 0.8% | | Mortgage Backed Securities |
 | 1.0% | | Municipal Bonds |
 | 0.4% | | Term Loan |
 | 3.3% | | Purchased Options |
 | 6.5% | | Investments Purchased with Proceeds from Securities Lending |
| | 81.6% | | Total Market Value of Investments |
 | 18.4% | | Other Assets in Excess of Liabilities, Net |
| | 100.0% | | Total Net Assets |
2 | 2 0 1 4 A N N U A L R E P O R T
| * | The benchmark since inception returns are calculated for the period November 21, 2003 through June 30, 2014. |
Quaker Event Arbitrage Fund
Growth of a Hypothetical $10,000 Investment
June 30, 2014
| Average Annualized Total Return |
| | | Expense
Ratio | | Inception
Date | | One Year | | Five Year | | Ten Year | | Commencement
of operations
through 6/30/2014 | |
| | | | | | | with
sales charge | | without
sales
charge | | with
sales
charge | | without
sales
charge | | with
sales
charge | | without
sales
charge | | with
sales
charge | | without
sales
charge | |
| | | | | | | | | | | | | | | | | | | | | | | | | | | | | | | | | | | | | | | | |
| Class A | | | 1.99% | | | 11/21/2003 | | | 4.36 | % | | | 10.47 | % | | | 5.85 | % | | | 7.06 | % | | | 4.91 | % | | | 5.50 | % | | | 5.97 | % | | | 6.54 | % | |
| | | | | | | | | | | | | | | | | | | | | | | | | | | | | | | | | | | | | | | | |
| Class C | | | 2.74% | | | 6/7/2010 | | | 9.72 | % | | | 9.72 | % | | | N/A | | | | N/A | | | | N/A | | | | N/A | | | | 3.78 | % | | | 3.78 | % | |
| | | | | | | | | | | | | | | | | | | | | | | | | | | | | | | | | | | | | | | | |
| Institutional Class | | | 1.74% | | | 6/7/2010 | | | 10.77 | % | | | 10.77 | % | | | N/A | | | | N/A | | | | N/A | | | | N/A | | | | 4.78 | % | | | 4.78 | % | |
| | | | | | | | | | | | | | | | | | | | | | | | | | | | | | | | | | | | | | | | |
| S&P 500® Total Return Index* | | | 24.61 | % | | | 24.61 | % | | | 18.83 | % | | | 18.83 | % | | | 7.78 | % | | | 7.78 | % | | | 8.41 | % | | | 8.41 | % | |
Performance data quoted represents past performance and is no guarantee of future results. Investment return and principal value will fluctuate so that shares, when redeemed, may be worth more or less than their original cost. Current performance may be lower or higher than performance data quoted. Performance data current to the most recent month end is available at www.quakerfunds.com or by calling us toll free at 800-220-8888. Total return includes reinvestment of dividends and capital gains.
Class A shares of the Fund have a maximum sales charge of 5.50%.
The line graph and performance table do not reflect the deduction of taxes that a shareholder might pay on fund distributions or the redemption of fund shares. Total return calculations reflect expense reimbursements and fee waivers in the applicable periods. See financial highlights for periods where fees were waived or reimbursed.
The Fund’s portfolio holdings may differ significantly from the securities held in the index and, unlike a mutual fund, an unmanaged index assumes no transaction costs, taxes, management fees or other expenses. You cannot invest directly in an index.
The S&P 500® Total Return Index (“Index”) is a widely recognized, unmanaged index consisting of the approximately 500 largest companies in the United States as measured by market capitalization. The Index assumes reinvestment of all dividends and distributions.
2 0 1 4 A N N U A L R E P O R T | 3
Performance Update (Unaudited)
Quaker Global Tactical Allocation Fund (QTRAX, QTRCX, QTRIX)
OBJECTIVES AND PRINCIPAL STRATEGIES
The Quaker Global Tactical Allocation Fund (“Fund”) seeks to provide long-term growth of capital. The Fund invests in common stocks of U.S. companies and American Depositary Receipts (“ADRs”) of foreign companies without regard to market capitalization. Under normal circumstances, the Fund will invest at least 40% of its total assets in common stocks and ADRs of foreign companies.
PERFORMANCE REVIEW AND MARKET OUTLOOK
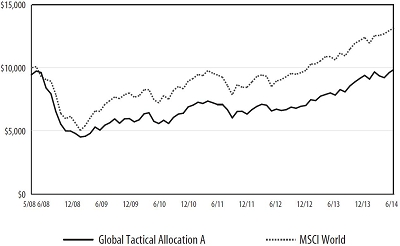
For the fiscal year ended June 30, 2014, the MSCI World Index (“MSCI World”, a global market proxy) gained 24.05% while the Quaker Global Tactical Allocation Fund finished the fiscal year with a gain of 26.02%. For the first half of the 2014 calendar year, the MSCI World rose 6.18% while the Quaker Global Tactical Allocation Fund gained 5.13%.
The first half of the fiscal year was characterized by a period of optimism in global markets as Europe emerged from a shallow recession and the US moved forward with modest but stable growth. Even developed Asian markets were upbeat with Japan’s Nikkei Index hitting a multiyear high (boosted by the “Abenomics” weak-yen strategy). This period of relative calm boosted investor confidence and encouraged a rotation of investment assets out of fixed-income securities and into equities.
The latter half of the fiscal year, however, saw a sharp uptick in US market volatility as a harsh winter hurt domestic consumption, investor concern over diminishing returns from “Abenomics” coupled with a sales tax hike in Japan spooked Asian markets and imperialist ambitions by Russia on the Crimean peninsula rattled Europe. However, the continued “dovishness” on the part of the US Federal Reserve coupled with the ECB’s negative interest rate policy stabilized developed global equity markets as the fiscal year ended. In the emerging markets, continued Chinese central government expansionist economic policies and a change in the political leadership in India led to stability in the emerging equity markets as well.
All sectors posted strong gains for the fiscal year with the technology, energy and healthcare (an overweight) sectors advancing the most and financials, consumer staples (both underweights) and consumer discretionaries trailing other sectors. During the fiscal year, the portfolio was helped by stock picks in the consumer discretionary, healthcare and industrial sectors and hurt by stock picks in the materials and technology sectors and an underweight to the energy sector.
Going forward, we expect to continue to have an overweight in the healthcare sector, concentrating on global biotech and pharmaceutical companies with large and expanding drug pipelines, the potential (via FDA approval) to expand sales of existing products via new applications and by tapping new global markets. In technology, we are also currently overweight, focusing on companies with particular strength in creating innovative productivity enhancing solutions for both businesses and consumers, especially in the mobility and cloud computing areas. We currently have significant investments in the consumer discretionary sector (mainly in the media space) and in the industrial sector (concentrated in US legacy airlines which we believe are benefitting from industry consolidation and relatively low valuations).
We continue to strive to provide a good risk adjusted return for our clients through the intensive evaluation of opportunities domestically and worldwide. At the same time the Fund will continue to seek to fulfill its mandate to protect capital by tactically raising cash and by utilizing short-selling strategies.
Respectfully,
Manu P. Daftary, Portfolio Manager
DG Capital Management, Inc.
SUB-ADVISER: DG Capital Management, Inc. TOTAL NET ASSETS: AS OF JUNE 30, 2014 $7,325,138 |
| Top 10 Holdings ** (% of net assets) |
| | | | | |
| Biogen Idec, Inc. | | | 4.6 | % |
| Roche Holdings, Ltd.- ADR | | | 3.6 | % |
| American Airlines Group, Inc. | | | 3.4 | % |
| Amgen, Inc. | | | 3.1 | % |
| Abengoa SA - ADR | | | 2.8 | % |
| Bayerische Motoren Werke AG - ADR | | | 2.7 | % |
| Sanofi - ADR | | | 2.5 | % |
| Adobe Systems Inc. | | | 2.3 | % |
| FedEx Corp. | | | 2.3 | % |
| Micron Technology, Inc. | | | 2.3 | % |
| % Fund Total | | | 29.6 | % |
| ** Excludes Short-Term Investments |
| Country Allocation (% of net assets) |
| | | | |
 | 97.7% | | Common Stocks |
| | 1.6% | | Belgium |
| | 0.6% | | Bermuda |
| | 2.0% | | Cayman Islands |
| | 1.5% | | Curacao |
| | 1.7% | | Finland |
| | 2.5% | | France |
| | 2.9% | | Germany |
| | 1.5% | | India |
| | 2.1% | | Ireland |
| | 2.2% | | Netherlands |
| | 2.8% | | Spain |
| | 9.0% | | Switzerland |
| | 6.8% | | United Kingdom |
| | 60.5% | | United States |
 | 7.0% | | Investments Purchased with Proceeds from Securities Lending |
| | 104.7% | | Total Market Value of Investments |
 | (4.7)% | | Liabilities in Excess of Other Assets, Net |
| | 100.0% | | Total Net Assets |
4 | 2 0 1 4 A N N U A L R E P O R T
| | |
| * | The benchmark since inception returns are calculated since commencement of May 1, 2008 through June 30, 2014. |
| | |
Quaker Global Tactical Allocation Fund
Growth of a Hypothetical $10,000 Investment June 30, 2014
| Average Annualized Total Return |
| | | Expense
Ratio | | Inception
Date | | One Year | | Five Year | | Ten Year | | Commencement
of operations
through 6/30/2014 |
| | | | | | | | | | with
sales
charge | | | without
sales
charge | | | with
sales
charge | | | without
sales
charge | | with
sales
charge | | without
sales
charge | | | with
sales
charge | | | without
sales
charge |
| | | | | | | | | | | | | | | | | | | | | | | | | | | | | |
| Class A | | | 2.83% | | | 5/1/2008 | | | 19.13 | % | | | 26.02 | % | | | 12.99 | % | | | 14.26 | % | | N/A | | N/A | | | -0.18 | % | | | 0.73 | % |
| | | | | | | | | | | | | | | | | | | | | | | | | | | | | | | | | | | |
| Class C | | | 3.58% | | | 5/1/2008 | | | 25.19 | % | | | 25.19 | % | | | 13.43 | % | | | 13.43 | % | | N/A | | N/A | | | -0.02 | % | | | -0.02 | % |
| | | | | | | | | | | | | | | | | | | | | | | | | | | | | | | | | | | |
| Institutional Class | | | 2.58% | | | 7/23/2008 | | | 26.45 | % | | | 26.45 | % | | | 14.57 | % | | | 14.57 | % | | N/A | | N/A | | | 3.12 | % | | | 3.12 | % |
| | | | | | | | | | | | | | | | | | | | | | | | | | | | | | | | | | | |
| MSCI World Index* | | | | | | 24.05 | % | | | 24.05 | % | | | 14.99 | % | | | 14.99 | % | | N/A | | N/A | | | 4.58 | % | | | 4.58 | % |
Performance data quoted represents past performance and is no guarantee of future results. Investment return and principal value will fluctuate so that shares, when redeemed, may be worth more or less than their original cost. Current performance may be lower or higher than performance data quoted. Performance data current to the most recent month end is available at www.quakerfunds.com or by calling us toll free at 800-220-8888. Total return includes reinvestment of dividends and capital gains.
Class A shares of the Fund have a maximum sales charge of 5.50%.
The line graph and performance table do not reflect the deduction of taxes that a shareholder might pay on fund distributions or the redemption of fund shares. Total return calculations reflect expense reimbursements and fee waivers in the applicable periods. See financial highlights for periods where fees were waived or reimbursed.
The Fund’s portfolio holdings may differ significantly from the securities held in the index and, unlike a mutual fund, an unmanaged index assumes no transaction costs, taxes, management fees or other expenses. You cannot invest directly in an index.
The Morgan Stanley Capital International World Index (“MSCI World Index”) measures developed-market equity performance throughout the world. The MSCI Index assumes reinvestment of all dividends and distributions.
2 0 1 4 A N N U A L R E P O R T | 5
Performance Update (Unaudited)
Quaker Mid-Cap Value Fund (QMCVX, QMCCX, QMVIX)
OBJECTIVES AND PRINCIPAL STRATEGIES
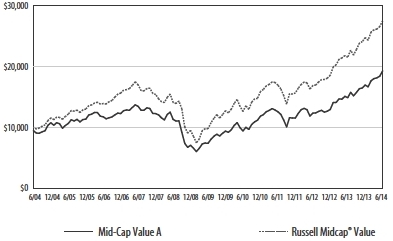
The Quaker Mid-Cap Value Fund (“Fund”) seeks to provide long-term growth of capital. Current income is not a significant investment consideration and any such income realized will be considered incidental to the Fund’s investment objective. The Fund invests primarily in common stocks comparable to the companies included in the Russell Midcap® Value Index.
PERFORMANCE REVIEW AND MARKET OUTLOOK
For the period from July 1, 2013 through June 30, 2014, the Fund generated a gain of 29.65% versus a gain of 27.76% for the Russell Midcap® Value Index. Like the previous year, every sector in the benchmark was up double-digits; all but one was up more than 20%. The same was true for the Fund. Stock selection provided the majority of the Fund’s outperformance with particular strength in Consumer Discretionary, which was up 40% in the Fund versus a gain of 26% in the benchmark, led by Harman International Industries, Inc., which more than doubled. The Technology sector was one of the strongest sectors in the benchmark with a gain of 40%, but was the largest detractor from the Fund’s relative performance with a gain of 27%.
As we stated in last year’s letter, we believe a large part of the rally in equities over the past year has been the result of the massive amount of liquidity the Fed has injected through its $85 billion per month bond buying program. At times, it seems like the equity markets have been behaving like revelers at a party, with the Federal Reserve supplying the music and the punch bowl. No one knows what time the party will end, no one wants to be the last to leave, but no one wants to leave too early. At times, when comments from the Fed have been interpreted to indicate a change in tone, they have often been met with quick sell-offs in both equity and fixed income markets. The Fed has in fact been turning the music down ever so slowly as it continues its measured reductions or “tapering” of its massive bond buying program, but the cumulative effect of its purchases continues to expand the Fed’s balance sheet. The Fed’s most-recent minutes have indicated it plans to “stop the music” in October as it stops its bond purchases completely, but with the growth in the Federal Reserve’s balance sheet to unprecedented levels, there still looks like a lot of punch in the punch bowl.
We believe the economy is likely to continue to show modest growth for the balance of the year. Despite the weather-related softness to start the year, unemployment has continued to trend lower, now standing at 6.1%,down from 6.7% at the beginning of the year. Auto sales have remained strong, and housing starts have maintained their upward trajectory. As such, we continue to target our investments in companies likely to achieve improving returns on invested capital in this low-growth environment. We would expect the Fed’s reduced intervention in debt markets to allow interest rates to gradually move higher, but we are cautious that this process could result in increased market volatility.
Sincerely,
Frank Latuda, Jr. CFA
Chief Investment Officer & Portfolio Manager
Kennedy Capital Management, Inc.
| SUB-ADVISER:
Kennedy Capital Management, Inc.
TOTAL NET ASSETS:
AS OF JUNE 30, 2014
$10,025,865 |
| Top 10 Holdings ** (% of net assets) |
| |
| Foot Locker, Inc. | | | 2.5 | % |
| Hospira, Inc. | | | 2.4 | % |
| Helmerich & Payne, Inc. | | | 2.4 | % |
| Ultra Petroleum Corp. | | | 2.3 | % |
| Cadence Design Systems, Inc. | | | 2.3 | % |
| Reinsurance Group of America, Inc., Class A | | | 2.2 | % |
| Dana Holding Corp. | | | 2.1 | % |
| Parker Hannifin Corp. | | | 2.1 | % |
| Steel Dynamics, Inc. | | | 2.1 | % |
| Trinity Industries, Inc. | | | 2.1 | % |
| % Fund Total | | | 22.5 | % |
| ** | | Excludes Short-Term Investments |

| Sectors (% of net assets) |
| |
 | 80.7% | | Domestic Common Stocks |
| | 5.2% | | Basic Materials |
| | 1.9% | | Communications |
| | 13.9% | | Consumer, Cyclical |
| | 7.4% | | Consumer, Non-cyclical |
| | 7.6% | | Energy |
| | 11.3% | | Financial |
| | 15.6% | | Industrial |
| | 8.8% | | Technology |
| | 9.0% | | Utilities |
 | 5.5% | | Foreign Common Stocks |
 | 9.3% | | Real Estate Investment Trusts |
 | 15.6% | | Investments Purchased with Proceeds from Securities Lending |
| | 111.1% | | Total Market Value of Investments |
 | (11.1)% | | Liabilities in Excess of Other Assets, Net |
| | 100.0% | | Total Net Assets |
6 | 2 0 1 4 A N N U A L R E P O R T
| * | The benchmark since inception returns are calculated since commencement of December 31, 1997 through June 30, 2014. |
Quaker Mid-Cap Value Fund
Growth of a Hypothetical $10,000 Investment
June 30, 2014
| Average Annualized Total Return |
| | | | | | | | | | | | | | | | | | | |
| | | | | | | | | | | | | | | | | | | |
| | | Expense
Ratio | | Inception
Date | | One Year | | Five Year | | Ten Year | | Commencement
of operations
through 6/30/2014 |
| | | | | | | with | | without | | with | | without | | with | | without | | with | | without |
| | | | | | | sales | | sales | | sales | | sales | | sales | | sales | | sales | | sales |
| | | | | | | charge | | charge | | charge | | charge | | charge | | charge | | charge | | charge |
| | | | | | | | | | | | | | | | | | | | | |
| Class A | | 2.19% | | 12/31/1997 | | 22.49% | | 29.65% | | 19.89% | | 21.26% | | 6.79% | | 7.40% | | 7.79% | | 8.16% |
| | | | | | | | | | | | | | | | | | | | | |
| Class C | | 2.94% | | 7/31/2000 | | 28.62% | | 28.62% | | 20.36% | | 20.36% | | 6.60% | | 6.60% | | 8.67% | | 8.67% |
| | | | | | | | | | | | | | | | | | | | | |
| Institutional Class | | 1.94% | | 11/21/2000 | | 29.95% | | 29.95% | | 21.58% | | 21.58% | | 7.67% | | 7.67% | | 10.00% | | 10.00% |
| | | | | | | | | | | | | | | | | |
| Russell Midcap® Value Index* | | 27.76% | | 27.76% | | 22.97% | | 22.97% | | 10.66% | | 10.66% | | 9.85% | | 9.85% |
Performance data quoted represents past performance and is no guarantee of future results. Investment return and principal value will fluctuate so that shares, when redeemed, may be worth more or less than their original cost. Current performance may be lower or higher than performance data quoted. Performance data current to the most recent month end is available at www.quakerfunds.com or by calling us toll free at 800-220-8888. Total return includes reinvestment of dividends and capital gains.
Class A shares of the Fund have a maximum sales charge of 5.50%.
The line graph and performance table do not reflect the deduction of taxes that a shareholder might pay on fund distributions or the redemption of fund shares. Total return calculations reflect expense reimbursements and fee waivers in the applicable periods. See financial highlights for periods where fees were waived or reimbursed.
The Fund’s portfolio holdings may differ significantly from the securities held in the index and, unlike a mutual fund, an unmanaged index assumes no transaction costs, taxes, management fees or other expenses. You cannot invest directly in an index.
The Russell Midcap® Value Index is a widely recognized, unmanaged index of companies included in the Russell 1000 Index with current market capitalizations between $888.21 million to $26.16 billion. The Russell Midcap® Value Index assumes reinvestment of all dividends.
2 0 1 4 A N N U A L R E P O R T | 7
Performance Update (Unaudited)
Quaker Small-Cap Value Fund (QUSVX, QSVCX, QSVIX)
OBJECTIVES AND PRINCIPAL STRATEGIES
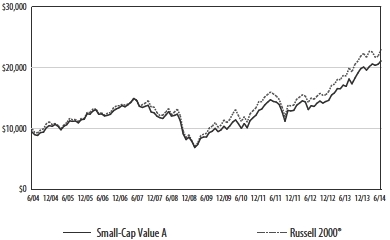
The Quaker Small-Cap Value Fund (“Fund”) seeks to provide long-term growth of capital. Current income is not a significant investment consideration, and any such income realized will be considered incidental to the Fund’s investment objective. The Fund invests primarily in common stocks of U.S. companies with market capitalizations similar to the market capitalizations of companies included in the Russell 2000® Index and Russell 2500® Index. The Fund invests in companies considered by the Fund’s sub-adviser to have consistent earnings and above-average core assets, selling at relatively low market valuations, with attractive growth and momentum characteristics.
PERFORMANCE REVIEW AND MARKET OUTLOOK
For the fiscal year ended June 30, 2014, the Fund’s performance was 24.89%, while the Fund’s benchmark, the Russell 2000® Index (a broad-based cross-section of the entire U.S. small-cap market), returned 23.64%. Working from the bottom up, we evaluate companies relative to their industry peers using four broad categories of attractiveness: value, management, momentum, and sentiment. Value to us means fairly traditional ratios of price to fundamental value; management measures seek evidence that company management has produced and will continue to produce earnings power; momentum helps us determine when stocks might be expected to begin their ascent toward full valuation; and sentiment provides another level of understanding of the buying and selling behavior of key investor segments.
All four broad categories of attractiveness contributed to our positive relative return. While industrials, materials and consumer discretionary sectors added the most to our outperformance, eight out of the 10 sectors added value. Value measures were consistent contributors, particularly in the industrials sector. Our evaluation of management was aided by the strong performance of companies with evidence of efficient growth and positive share repurchase. Companies with rising earnings estimates, one of our momentum signals, added to the bottom line in nearly all economic sectors. Performance was also supported by factors measuring the sentiment of market participants, especially within the information technology sector.
We remain firm in our conviction that superior results can be achieved through a consistent, systematic approach that focuses on low-priced companies with proven management and earnings power.
The Portfolio Management Team
Aronson Johnson Ortiz, LP
| | SUB-ADVISER:
Aronson Johnson Ortiz, LP TOTAL NET ASSETS:
AS OF JUNE 30, 2014
$38,187,153 |
| | |
| Top 10 Holdings ** (% of net assets) |
| | | | |
| Lexmark International, Inc. | | | 1.4 | % |
| RLJ Lodging Trust REIT | | | 1.4 | % |
| Tower International, Inc. | | | 1.4 | % |
| SM Energy Co. | | | 1.4 | % |
| PDL BioPharma, Inc. | | | 1.4 | % |
| SPX Corp. | | | 1.4 | % |
| Dupont Fabros Technology, Inc. REIT | | | 1.3 | % |
| Foot Locker, Inc. | | | 1.3 | % |
| Global Cash Access Holdings, Inc. | | | 1.3 | % |
| Aspen Insurance Holdings Ltd. | | | 1.3 | % |
| % Fund Total | | | 13.6 | % |
| ** Excludes Short-Term Investments | | | | |

| Sectors (% of net assets) |
| | | | |
 | 79.1% | | Domestic Common Stocks |
| | 5.0% | | Basic Materials |
| | 3.7% | | Communications |
| | 14.8% | | Consumer, Cyclical |
| | 15.4% | | Consumer, Non-cyclical |
| | 6.3% | | Energy |
| | 9.8% | | Financial |
| | 13.5% | | Industrial |
| | 7.5% | | Technology |
| | 3.1% | | Utilities |
 | 15.5% | | Foreign Common Stocks |
 | 4.0% | | Real Estate Investment Trusts |
 | 13.9% | | Investments Purchased with Proceeds from Securities Lending |
| | 112.5% | | Total Market Value of Investments |
 | (12.5)% | | Liabilities in Excess of Other Assets, Net |
| | 100.0% | | Total Net Assets |
8 | 2 0 1 4 A N N U A L R E P O R T
| | * | The benchmark since inception returns are calculated since commencement of November 25, 1996 through June 30, 2014. |
Quaker Small-Cap Value Fund
Growth of a Hypothetical $10,000 Investment
June 30, 2014
| Average Annualized Total Return |
| | | Expense
Ratio | | Inception
Date | | One Year | | Five Year | | Ten Year | | Commencement
of operations
through 6/30/2014 |
| | | | | | | | with
sales
charge | | without
sales
charge | | with
sales
charge | | without
sales
charge | | with
sales
charge | | without
sales
charge | | with
sales
charge | | without
sales
charge |
| | | | | | | | | | | | | | | | | | | | | | |
| Class A | | | 1.93% | | | 11/25/1996 | | | 18.05 | % | | | 24.89 | % | | | 18.38 | % | | | 19.74 | % | | | 7.76 | % | | | 8.37 | % | | | 10.37 | % | | | 10.72 | % |
| | | | | | | | | | | | | | | | | | | | | | | | | | | | | | | | | | | | | | | |
| Class C | | | 2.68% | | | 7/28/2000 | | | 23.89 | % | | | 23.89 | % | | | 18.84 | % | | | 18.84 | % | | | 7.57 | % | | | 7.57 | % | | | 9.58 | % | | | 9.58 | % |
| | | | | | | | | | | | | | | | | | | | | | | | | | | | | | | | | | | | | | | |
| Institutional Class | | | 1.68% | | | 9/12/2000 | | | 25.13 | % | | | 25.13 | % | | | 20.03 | % | | | 20.03 | % | | | 8.64 | % | | | 8.64 | % | | | 9.87 | % | | | 9.87 | % |
| | | | | | | | | | | | | | | | | | | | | | | | | | | | | | | | | | | | | | | |
| Russell 2000® Index* | | | | | 23.64 | % | | | 23.64 | % | | | 20.21 | % | | | 20.21 | % | | | 8.70 | % | | | 8.70 | % | | | 8.60 | % | | | 8.60 | % |
Performance data quoted represents past performance and is no guarantee of future results. Investment return and principal value will fluctuate so that shares, when redeemed, may be worth more or less than their original cost. Current performance may be lower or higher than performance data quoted. Performance data current to the most recent month end is available at www.quakerfunds.com or by calling us toll free at 800-220-8888. Total return includes reinvestment of dividends and capital gains.
Class A shares of the Fund have a maximum sales charge of 5.50%.
The line graph and performance table do not reflect the deduction of taxes that a shareholder might pay on fund distributions or the redemption of fund shares. Total return calculations reflect expense reimbursements and fee waivers in the applicable periods. See financial highlights for periods where fees were waived or reimbursed.
The Fund’s portfolio holdings may differ significantly from the securities held in the index and, unlike a mutual fund, an unmanaged index assumes no transaction costs, taxes, management fees or other expenses. You cannot invest directly in an index.
The Russell 2000® Index is a widely recognized, unmanaged index comprised of the smallest 2000 companies represented in the Russell 3000® Index. The Russell 2000® Index currently represents approximately 8% of the market capitalization of the Russell 3000® Index
2 0 1 4 A N N U A L R E P O R T | 9
Performance Update (Unaudited)
Quaker Strategic Growth Fund (QUAGX, QAGCX, QAGIX)
OBJECTIVES AND PRINCIPAL STRATEGIES
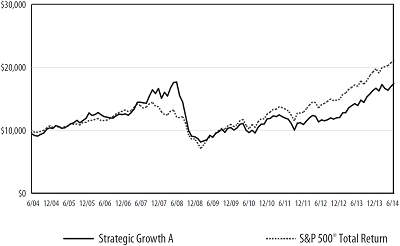
The Quaker Strategic Growth Fund (“Fund”) seeks to provide long-term growth of capital. Current income is not a significant investment consideration. The Fund invests primarily in equity securities of domestic U.S. companies which the Fund’s sub-adviser believes show a high probability for superior growth.
PERFORMANCE REVIEW AND MARKET OUTLOOK
For the fiscal year ended June 30, 2014, the S&P 500®Total Return Index (the “S&P 500”),a broad based market proxy, gained 24.61% while the Quaker Strategic Growth Fund finished the fiscal year with a total return of 25.27%. For the first half of calendar year 2014, the S&P 500 gained 7.14% while the Fund rose 4.72%.
The first half of the fiscal year was characterized by a market price/earning multiple expansion and was also accompanied by low market volatility. At the beginning of the fiscal year, the trailing S&P 500 Index multiple stood at 15.7X and by the mid-point of the fiscal year it had expanded to 17.5X (at the end of the fiscal year the multiple stood at 18.2X). We believe that this multiple expansion was the result of increasing investor confidence in the economic recovery and the rotation of investment assets out of fixed-income securities into equities.
Unlike the first half of the fiscal year, the second half saw increased volatility in the market due to macro events (Russia/Ukraine) and also concern about the Federal Reserve draining liquidity from the economic system as the economy slowly recovered. Offsetting these negative issues was the fact that US corporate earnings and revenue continued to grow modestly and the largest surge in corporate M&A activity occurred since 2007.
Market sectors that posted strong gains during the fiscal year were the materials, technology and healthcare (a fund overweight) sectors while the financial, consumer staples and telecom sectors (which were fund underweights) underperformed the general market. During the fiscal year, the portfolio was helped by stock picks in the healthcare and industrial sectors and hurt by stock picks in consumer discretionaries and an underweight to the sector.
Going forward, we expect to continue to have an overweight in the healthcare sector, concentrating on biotech and pharmaceutical companies with large and expanding drug pipelines, the potential (via FDA approval) to expand sales of existing products via new applications and by tapping new markets overseas. In technology, we are also currently overweight, focusing on companies with particular strength in creating innovative productivity enhancing solutions for both businesses and consumers, especially in the mobility and cloud computing areas. We currently have significant investments in the consumer discretionary sector (mainly in the media space) and in the industrials sector (concentrated in US legacy airlines which we believe are benefitting from industry consolidation and relatively low valuations).
We continue to strive to provide a good risk adjusted return for our clients going forward through intensive stock selection and at the same time the Fund will seek to continue to fulfill its mandate to protect capital by tactically raising cash and by utilizing short-selling strategies.
Thank you for your continued support.
Respectfully,
Manu P. Daftary, Portfolio Manager
DG Capital Management, Inc.
| SUB-ADVISER: |
| DG Capital Management, Inc. |
| |
| TOTAL NET ASSETS: |
| AS OF JUNE 30, 2014 |
| $168,983,016 |
| |
| Top 10 Holdings ** (% of net assets) |
| | | | | |
| Biogen Idec, Inc. | | | 4.6 | % |
| Roche Holdings, Ltd. | | | 3.5 | % |
| American Airlines Group, Inc. | | | 3.4 | % |
| Amgen, Inc. | | | 3.0 | % |
| Micron Technology, Inc. | | | 2.3 | % |
| Adobe Systems Inc. | | | 2.3 | % |
| FedEx Corp. | | | 2.3 | % |
| Eli Lilly & Company | | | 2.0 | % |
| Novartis AG - ADR | | | 2.0 | % |
| Gilead Sciences, Inc. | | | 2.0 | % |
| % Fund Total | | | 27.4 | % |
** Excludes Short-Term Investments
| Sectors (% of net assets) |
| | | |
 | 78.9% | | Domestic Common Stocks |
| | 2.0% | | Basic Materials |
| | 13.4% | | Communications |
| | 9.9% | | Consumer, Cyclical |
| | 23.5% | | Consumer, Non-cyclical |
| | 3.0% | | Energy |
| | 7.5% | | Financial |
| | 3.8% | | Industrial |
| | 15.8% | | Technology |
 | 16.9% | | Foreign Common Stocks |
 | 12.4% | | Investments Purchased with Proceeds
from Securities Lending |
| | 108.2% | | Total Market Value of Investments |
 | (8.2)% | | Liabilities in Excess of Other Assets, Net |
| | 100.0% | | Total Net Assets |
10 | 2 0 1 4 A N N U A L R E P O R T
| | |
| * | The benchmark since inception returns are calculated since commencement of November 25, 1996 through June 30, 2014. |
| | |
Quaker Strategic Growth Fund
Growth of a Hypothetical $10,000 Investment
June 30, 2014
| | | Average Annualized Total Return | |
| | | Expense
Ratio | | Inception
Date | | One Year | | Five Year | | Ten Year | | Commencement
of operations
through 6/30/2014 | |
| | | | | | | with
sales
charge | | without
sales
charge | | with
sales charge | | without
sales
charge | | with
sales
charge | | without
sales
charge | | with
sales
charge | | without
sales
charge | |
| | | | | | | | | | | | | | | | | | | | | | |
| Class A | | | 2.24% | | | | 11/25/1996 | | | | 18.40 | % | | | 25.27 | % | | | 13.14 | % | | | 14.43 | % | | | 5.73 | % | | | 6.33 | % | | | 11.53 | % | | | 11.89 | % | |
| | | | | | | | | | | | | | | | | | | | | | | | | | | | | | | | | | | | | | | | | | |
| Class C | | | 2.99% | | | | 7/11/2000 | | | | 24.32 | % | | | 24.32 | % | | | 13.57 | % | | | 13.57 | % | | | 5.53 | % | | | 5.53 | % | | | 4.05 | % | | | 4.05 | % | |
| | | | | | | | | | | | | | | | | | | | | | | | | | | | | | | | | | | | | | | | | | |
| Institutional Class | | | 1.99% | | | | 7/20/2000 | | | | 25.56 | % | | | 25.56 | % | | | 14.69 | % | | | 14.69 | % | | | 6.58 | % | | | 6.58 | % | | | 4.98 | % | | | 4.98 | % | |
| | | | | | | | | | | | | | | | | | | | | | | | | | | | | | | | | | | | | | | | | | |
| S&P 500® Total Return Index* | | | | 24.61 | % | | | 24.61 | % | | | 18.83 | % | | | 18.83 | % | | | 7.78 | % | | | 7.78 | % | | | 7.51 | % | | | 7.51 | % | |
Performance data quoted represents past performance and is no guarantee of future results. Investment return and principal value will fluctuate so that shares, when redeemed, may be worth more or less than their original cost. Current performance may be lower or higher than performance data quoted. Performance data current to the most recent month end is available at www.quakerfunds.com or by calling us toll free at 800-220-8888. Total return includes reinvestment of dividends and capital gains.
Class A shares of the Fund have a maximum sales charge of 5.50%.
The line graph and performance table do not reflect the deduction of taxes that a shareholder might pay on fund distributions or the redemption of fund shares. Total return calculations reflect expense reimbursements or recoveries in the applicable periods. See financial highlights for periods where fees were reimbursed or recovered.
The Fund’s portfolio holdings may differ significantly from the securities held in the index and, unlike a mutual fund, an unmanaged index assumes no transaction costs, taxes, management fees or other expenses. You cannot invest directly in an index.
The S&P 500® Total Return Index (“Index”) is a widely recognized, unmanaged index consisting of the approximately 500 largest companies in the United States as measured by market capitalization. The Index assumes reinvestment of all dividends and distributions.
2 0 1 4 A N N U A L R E P O R T | 11
Expense Information (Unaudited)
As a shareholder of the Fund, you incur two types of costs: (1) transaction costs, including applicable sales charges and redemption fees; and (2) ongoing costs, including management fees, distribution (12b-1) fees and other Fund expenses. This example is intended to help you understand your ongoing costs (in dollars) of investing in the Fund and to compare these costs with the ongoing costs of investing in other funds. The example is based on an investment of $1,000 invested at the beginning of the (six-month) period and held for the entire period January 1, 2014 through June 30, 2014.
ACTUAL EXPENSES
The first section of each table below provides information about actual account values and actual expenses for each of the Funds. You may use this information, together with the amount you invested, to estimate the expenses that you paid over the period. Simply divide your account value by $1,000 (for example, an $8,600 account value divided by $1,000 = 8.6), then multiply the result by the number in the applicable line under the heading entitled “Expenses Paid During the Period” to estimate the expenses you paid on your account during this period.
HYPOTHETICAL EXAMPLE FOR COMPARISON PURPOSES
The second section of each table below provides information about hypothetical account values and hypothetical expenses based on the Fund’s actual expense ratio and an assumed rate of return of 5% per year before expenses, which is not the Fund’s actual return. The hypothetical account values and expenses may not be used to estimate the actual ending account balance or expenses you paid for the period. You may use this information to compare the ongoing costs of investing in the Fund to other funds. To do so, compare this 5% hypothetical example with the 5% hypothetical examples that appear in the shareholder reports of the other funds. Please note that the expenses shown in the table are meant to highlight your ongoing costs only and do not reflect any transactional costs, such as sales charges (loads), redemption fees or exchange fees. Therefore, the second section of the table is useful in comparing ongoing costs only, and will not help you determine the relative total costs of owning different funds. In addition, if these transactional costs were included, your costs would have been higher.
12 | 2 0 1 4 A N N U A L R E P O R T
| | | | | | | | | | | |
| | | | | | | | | | | |
| | | | | Beginning Account
Value (01/01/2014) | | Annualized Expense
Ratio for the Period | | Ending Account
Value (06/30/2014) | | Expenses Paid
During Period* |
| Event Arbitrage | | | | | | | | | | | | | | |
| Actual return based on actual return of: | | | | | | | | | | |
| Class A | | 3.99% | | $1,000.00 | | | 1.99% | | | $1,039.90 | | | $10.07 | |
| Class C | | 3.55% | | 1,000.00 | | | 2.74% | | | 1,035.50 | | | 13.83 | |
| Institutional Class | | 4.12% | | 1,000.00 | | | 1.74% | | | 1,041.20 | | | 8.81 | |
| Hypothetical return based on assumed 5% return: | | | | | | | | | | |
| Class A | | | | 1,000.00 | | | 1.99% | | | 1,014.93 | | | 9.94 | |
| Class C | | | | 1,000.00 | | | 2.74% | | | 1,011.21 | | | 13.66 | |
| Institutional Class | | | | 1,000.00 | | | 1.74% | | | 1,016.17 | | | 8.70 | |
| Global Tactical Allocation | | | | | | | | | | | |
| Actual return based on actual return of: | | | | | | | | | | |
| Class A | | 5.13% | | 1,000.00 | | | 2.00% | | | 1,051.30 | | | 10.17 | |
| Class C | | 4.83% | | 1,000.00 | | | 2.75% | | | 1,048.30 | | | 13.97 | |
| Institutional Class | | 5.36% | | 1,000.00 | | | 1.75% | | | 1,053.60 | | | 8.91 | |
| Hypothetical return based on assumed 5% return: | | | | | | | | | | |
| Class A | | | | 1,000.00 | | | 2.00% | | | 1,014.88 | | | 9.99 | |
| Class C | | | | 1,000.00 | | | 2.75% | | | 1,011.16 | | | 13.71 | |
| Institutional Class | | | | 1,000.00 | | | 1.75% | | | 1,016.12 | | | 8.75 | |
| Mid-Cap Value | | | | | | | | | | | | | | |
| Actual return based on actual return of: | | | | | | | | | | |
| Class A | | 13.77% | | 1,000.00 | | | 2.07% | | | 1,137.70 | | | 10.97 | |
| Class C | | 13.34% | | 1,000.00 | | | 2.82% | | | 1,133.40 | | | 14.92 | |
| Institutional Class | | 13.88% | | 1,000.00 | | | 1.82% | | | 1,138.80 | | | 9.65 | |
| Hypothetical return based on assumed 5% return: | | | | | | | | | | |
| Class A | | | | 1,000.00 | | | 2.07% | | | 1,014.53 | | | 10.34 | |
| Class C | | | | 1,000.00 | | | 2.82% | | | 1,010.81 | | | 14.06 | |
| Institutional Class | | | | 1,000.00 | | | 1.82% | | | 1,015.77 | | | 9.10 | |
| Small-Cap Value | | | | | | | | | | | | | | |
| Actual return based on actual return of: | | | | | | | | | | |
| Class A | | 5.06% | | 1,000.00 | | | 1.86% | | | 1,050.60 | | | 9.46 | |
| Class C | | 4.66% | | 1,000.00 | | | 2.61% | | | 1,046.60 | | | 13.24 | |
| Institutional Class | | 5.20% | | 1,000.00 | | | 1.61% | | | 1,052.00 | | | 8.19 | |
| Hypothetical return based on assumed 5% return: | | | | | | | | | | |
| Class A | | | | 1,000.00 | | | 1.86% | | | 1,015.57 | | | 9.30 | |
| Class C | | | | 1,000.00 | | | 2.61% | | | 1,011.85 | | | 13.02 | |
| Institutional Class | | | | 1,000.00 | | | 1.61% | | | 1,016.81 | | | 8.05 | |
| Strategic Growth | | | | | | | | | | | | | | |
| Actual return based on actual return of: | | | | | | | | | | |
| Class A | | 4.72% | | 1,000.00 | | | 2.30% | | | 1,047.20 | | | 11.67 | |
| Class C | | 4.29% | | 1,000.00 | | | 3.05% | | | 1,042.90 | | | 15.45 | |
| Institutional Class | | 4.85% | | 1,000.00 | | | 2.05% | | | 1,048.50 | | | 10.41 | |
| Hypothetical return based on assumed 5% return: | | | | | | | | | | |
| Class A | | | | 1,000.00 | | | 2.30% | | | 1,013.39 | | | 11.48 | |
| Class C | | | | 1,000.00 | | | 3.05% | | | 1,009.67 | | | 15.20 | |
| Institutional Class | | | | 1,000.00 | | | 2.05% | | | 1,014.63 | | | 10.24 | |
| * | Expenses are equal to the Funds’ annualized six-month expense ratios multiplied by the average account value over the period multiplied by the number of days in the most recent fiscal half year (181) divided by 365 to reflect the one-half year period. |
2 0 1 4 A N N U A L R E P O R T | 13
Schedule of Investments
Quaker Event Arbitrage Fund
June 30, 2014
| | | Number
of Shares | | | Fair
Value | |
| Domestic Common Stocks — 46.6% | | | | | |
| | | | | | | | | |
| Basic Materials — 0.5% | | | | | | | | |
| Forest Products & Paper — 0.5% | | | | | | | | |
| International Paper Co. | | | 6,100 | | | $ | 307,867 | |
| KapStone Paper and Packaging Corp. (a) | | | 9,800 | | | | 324,674 | |
| | | | | | | | 632,541 | |
| Total Basic Materials (Cost $503,431) | | | | | | | 632,541 | |
| | | | | | | | | |
| Communications — 11.0% | | | | | | | | |
| Internet — 1.6% | | | | | | | | |
| 30DC, Inc. (a) • | | | 50,000 | | | | 5,275 | |
| eBay, Inc. (a) | | | 26,800 | | | | 1,341,608 | |
| Unwired Planet, Inc. (a)(b) | | | 271,372 | | | | 605,160 | |
| | | | | | | | 1,952,043 | |
| | | | | | | | | |
| Media — 7.8% | | | | | | | | |
| Comcast Corp. (b) | | | 19,480 | | | | 1,045,686 | |
| The Dolan Co. (a)^ | | | 500,000 | | | | 19,000 | |
| Liberty Media Corp. (a) | | | 15,000 | | | | 2,050,200 | |
| News Corp. Class A (a) | | | 112,200 | | | | 2,012,868 | |
| Tribune Co. Class A (a) | | | 17,800 | | | | 1,513,890 | |
| Twenty-First Century Fox, Inc. | | | 78,217 | | | | 2,677,368 | |
| | | | | | | | 9,319,012 | |
| | | | | | | | | |
| Telecommunications — 1.6% | | | | | | | | |
| Telephone & Data Systems, Inc. | | | 71,100 | | | | 1,856,421 | |
| Total Communications (Cost $12,379,117) | | | | | | | 13,127,476 | |
| | | | | | | | | |
| Consumer, Cyclical — 6.4% | | | | | | | | |
| Auto Parts & Equipment — 0.8% | | | | | | | | |
| Allison Transmission Holdings, Inc. | | | 30,000 | | | | 933,000 | |
| | | | | | | | | |
| Lodging — 0.0% | | | | | | | | |
| Trump Entertainment Resorts, Inc. (a)^* | | | 8,949 | | | | 0 | |
| Trump Entertainment Resorts, Inc. (a)^* | | | 135 | | | | 409 | |
| | | | | | | | 409 | |
| | | | | | | | | |
| Retail — 5.6% | | | | | | | | |
| Bob Evans Farms, Inc. (b) | | | 37,500 | | | | 1,876,875 | |
| CST Brands, Inc. | | | 60,600 | | | | 2,090,700 | |
| GNC Holdings, Inc. (b) | | | 37,000 | | | | 1,261,700 | |
| Walgreen Co. | | | 20,000 | | | | 1,482,600 | |
| | | | | | | | 6,711,875 | |
| Total Consumer, Cyclical (Cost $7,420,624) | | | | | | | 7,645,284 | |
| | | | | | | | | |
| Consumer, Non-cyclical — 10.5% | | | | | | | | |
| Beverages — 0.2% | | | | | | | | |
| PepsiCo, Inc. | | | 2,300 | | | | 205,482 | |
| | | | | | | | | |
| Commercial Services — 3.9% | | | | | | | | |
| Hertz Global Holdings, Inc. (a) | | | 61,500 | | | | 1,723,845 | |
| Iron Mountain Inc. | | | 43,000 | | | | 1,524,350 | |
| The Western Union Co. (b) | | | 83,200 | | | | 1,442,688 | |
| | | | | | | | 4,690,883 | |
| | | | | | | | | |
| Food — 1.8% | | | | | | | | |
| Mondelez International, Inc. | | | 42,800 | | | | 1,609,708 | |
| Pinnacle Foods, Inc. | | | 16,700 | | | | 549,430 | |
| | | | | | | | 2,159,138 | |
| | | | | | | | | |
| Healthcare-Products — 2.0% | | | | | | | | |
| Hologic, Inc. (a) | | | 81,300 | | | | 2,060,955 | |
| Synovis Life Technologies, Inc. (a)^ | | | 43,000 | | | | 39,474 | |
| Volcano Corp. (a)(b) | | | 11,500 | | | | 202,515 | |
| | | | | | | | 2,302,944 | |
| | | Number
of Shares | | | Fair
Value | |
| Domestic Common Stocks (Continued) | | | | | | |
| | | | | | | | | |
| Pharmaceuticals — 2.6% | | | | | | | | |
| Forest Laboratories, Inc. (a) | | | 10,850 | | | $ | 1,074,150 | |
| INYX, Inc. (a) | | | 167,850 | | | | 252 | |
| Pfizer Inc. | | | 68,000 | | | | 2,018,240 | |
| Savient Pharmaceuticals, Inc.^*# | | | 1,000 | | | | 2,025 | |
| | | | | | | | 3,094,667 | |
| Total Consumer, Non-cyclical (Cost $11,748,610) | | | | | | | 12,453,114 | |
| | | | | | | | | |
| Diversified — 1.1% | | | | | | | | |
| Holding Companies-Diversified — 1.1% | | | | | | | | |
| Boulevard Acquisition Corp. (a) | | | 75,000 | | | | 757,500 | |
| Levy Acquisition Corp. (a)(b) • | | | 52,800 | | | | 532,488 | |
| Stoneleigh Partners Acquisition Corp. (a)^* | | | 400 | | | | 0 | |
| | | | | | | | 1,289,988 | |
| Total Diversified (Cost $1,277,088) | | | | | | | 1,289,988 | |
| | | | | | | | | |
| Energy — 2.8% | | | | | | | | |
| Oil & Gas — 2.8% | | | | | | | | |
| Dresser-Rand Group, Inc. (a)(b) | | | 24,400 | | | | 1,555,012 | |
| QEP Resources, Inc. | | | 50,750 | | | | 1,750,875 | |
| | | | | | | | 3,305,887 | |
| Total Energy (Cost $3,014,507) | | | | | | | 3,305,887 | |
| | | | | | | | | |
| Financial — 3.5% | | | | | | | | |
| Diversified Financial Services — 0.8% | | | | | | | | |
| Ally Financial Inc. (a) | | | 40,000 | | | | 956,400 | |
| | | | | | | | | |
| Insurance — 1.6% | | | | | | | | |
| Ambac Financial Group, Inc. (a) | | | 69,200 | | | | 1,889,852 | |
| | | | | | | | | |
| Savings & Loans — 1.1% | | | | | | | | |
| Fox Chase Bancorp, Inc. | | | 77,800 | | | | 1,311,708 | |
| Total Financial (Cost $3,928,839) | | | | | | | 4,157,960 | |
| | | | | | | | | |
| Healthcare — 0.8% | | | | | | | | |
| Healthcare-Services — 0.8% | | | | | | | | |
| Diagnostic Services Holdings, Inc. (a)^ | | | 10,221 | | | | 934,138 | |
| Total Healthcare (Cost $735,000) | | | | | | | 934,138 | |
| | | | | | | | | |
| Industrial — 8.9% | | | | | | | | |
| Aerospace & Defense — 2.1% | | | | | | | | |
| API Technologies Corp. (a)(b) | | | 917,970 | | | | 2,515,238 | |
| | | | | | | | | |
| Electronics — 2.7% | | | | | | | | |
| Agilent Technologies, Inc. | | | 26,500 | | | | 1,522,160 | |
| IEC Electronics Corp. (a) | | | 400,000 | | | | 1,740,000 | |
| | | | | | | | 3,262,160 | |
| | | | | | | | | |
| Engineering & Construction — 1.3% | | | | | | | | |
| URS Corp. | | | 32,600 | | | | 1,494,710 | |
| | | | | | | | | |
| Machinery-Diversified — 1.3% | | | | | | | | |
| The Babcock & Wilcox Co. | | | 46,000 | | | | 1,493,160 | |
| | | | | | | | | |
| Miscellaneous Manufacturing — 1.2% | | | | | | | | |
| LSB Industries, Inc. (a) | | | 35,000 | | | | 1,458,450 | |
| | | | | | | | | |
| Packaging & Containers — 0.3% | | | | | | | | |
| Rock Tenn Co. | | | 3,800 | | | | 401,242 | |
| Total Industrial (Cost $10,810,049) | | | | | | | 10,624,960 | |
| | | | | | | | | |
| Technology — 1.1% | | | | | | | | |
| Computers — 1.1% | | | | | | | | |
| Computer Horizons Corp. (a)^* | | | 65,000 | | | | 0 | |
| EMC Corp. | | | 48,000 | | | | 1,264,320 | |
| | | | | | | | 1,264,320 | |
The accompanying notes are an integral part of the financial statements.
14 | 2 0 1 4 A N N U A L R E P O R T
Schedule of Investments
Quaker Event Arbitrage Fund
June 30, 2014
| | | Number
of Shares | | | Fair
Value | |
| Domestic Common Stocks (Continued) | | | | | | | | |
| | | | | | | | | |
| Software — 0.0% | | | | | | | | |
| Contra Softbrands, Inc. (a)^* | | | 5,000 | | | $ | 0 | |
| Total Technology (Cost $1,138,893) | | | | | | | 1,264,320 | |
Total Domestic Common Stocks
(Cost $52,956,158) | | | | | | | 55,435,668 | |
| | | | | | | | | |
| Foreign Common Stocks — 5.6% | | | | | | | | |
| | | | | | | | | |
| Canada — 1.8% | | | | | | | | |
| Healthcare-Products — 1.0% | | | | | | | | |
| Nordion, Inc. (a) | | | 90,000 | | | | 1,130,400 | |
| | | | | | | | | |
| Mining — 0.0% | | | | | | | | |
| Sacre-Coeur Minerals Ltd. (a) | | | 109,444 | | | | 2,564 | |
| | | | | | | | | |
| Real Estate — 0.8% | | | | | | | | |
| Brookfield Property Partners LP | | | 47,000 | | | | 980,890 | |
| Total Canada (Cost $2,063,839) | | | | | | | 2,113,854 | |
| | | | | | | | | |
| Germany — 0.3% | | | | | | | | |
| Pharmaceuticals — 0.3% | | | | | | | | |
| Celesio AG | | | 9,996 | | | | 355,875 | |
| Total Germany (Cost $314,427) | | | | | | | 355,875 | |
| | | | | | | | | |
| Italy — 0.1% | | | | | | | | |
| Banks — 0.1% | | | | | | | | |
| Banca Monte dei Paschi di Siena SpA (a) | | | 63,130 | | | | 122,318 | |
| Total Italy (Cost $86,163) | | | | | | | 122,318 | |
| | | | | | | | | |
| Jersey — 1.2% | | | | | | | | |
| Media — 1.2% | | | | | | | | |
| UBM PLC | | | 120,000 | | | | 1,366,717 | |
| Total Jersey (Cost $1,344,129) | | | | | | | 1,366,717 | |
| | | | | | | | | |
| Marshall Islands — 2.2% | | | | | | | | |
| Transportation — 2.2% | | | | | | | | |
| Scorpio Tankers Inc. | | | 130,000 | | | | 1,322,100 | |
| Teekay LNG Partners LP (b) | | | 18,415 | | | | 849,668 | |
| Teekay Offshore Partners LP | | | 12,616 | | | | 455,438 | |
| Teekay Tankers Ltd. (b) | | | 9,107 | | | | 39,069 | |
| | | | | | | | 2,666,275 | |
| Total Marshall Islands (Cost $2,357,403) | | | | | | | 2,666,275 | |
Total Foreign Common Stocks
(Cost $6,165,961) | | | | | | | 6,625,039 | |
| | | | | | | | | |
| Preferred Stocks — 2.6% | | | | | | | | |
| | | | | | | | | |
| Diagnostic Services Holdings, Inc. (a)^* | | | 613 | | | | 613,000 | |
Federal Home Loan Mortgage Corp., 0.00%,
Series G (a)p | | | 3,000 | | | | 50,700 | |
Federal Home Loan Mortgage Corp., 5.00%,
Series F (a) | | | 4,500 | | | | 78,750 | |
Federal Home Loan Mortgage Corp., 0.00%,
Series S (a)p | | | 25,000 | | | | 440,000 | |
Federal Home Loan Mortgage Corp., 0.00%,
Series Q (a)p | | | 1,000 | | | | 16,430 | |
Federal Home Loan Mortgage Corp., 0.00%,
Series M (a) | | | 9,500 | | | | 159,125 | |
| GeoMet, Inc., 9.60% (a) | | | 3 | | | | 9 | |
| JPMorgan Chase & Co., 6.30% (a)(b) | | | 50,000 | | | | 1,250,000 | |
| MBIA Insurance Corp. (a)^*# | | | 10 | | | | 440,000 | |
| | | | | | | | 3,048,014 | |
Total Preferred Stocks
(Cost $2,914,316) | | | | | | | 3,048,014 | |
| | | Number
of Shares | | | Fair
Value | |
| Real Estate Investment Trusts — 4.4% | | | | | | | | |
| | | | | | | | | |
| American Realty Capital HealthcareTrust, Inc. | | | 100,000 | | | $ | 1,089,000 | |
| Brookfield DTLA Fund Office Trust Investor, Inc. - Preferred (a) | | | 30,000 | | | | 852,000 | |
| CommonWealth | | | 74,600 | | | | 1,963,472 | |
| Weyerhaeuser Co. | | | 40,000 | | | | 1,323,600 | |
| | | | | | | | 5,228,072 | |
Total Real Estate Investment Trusts
(Cost $4,952,702) | | | | | | | 5,228,072 | |
| | | | | | | | | |
| Rights — 0.3% | | | | | | | | |
| | | | | | | | | |
| Petrocorp, Inc. Escrow (a)^* | | | 200 | | | | 0 | |
| Sanofi (a) | | | 650,000 | | | | 325,000 | |
| | | | | | | | 325,000 | |
Total Rights
(Cost $215,670) | | | | | | | 325,000 | |
| | | | | | | | | |
| Warrants — 3.4% | | | | | | | | |
| | | | | | | | | |
| Heineken Holding NV, Expiration: January, 2015 (a)^ | | | 1,000 | | | | 1,141,370 | |
| Sprint Corp., Expiration: June, 2015 (a)^ | | | 111,000 | | | | 2,919,633 | |
| | | | | | | | 4,061,003 | |
Total Warrants
(Cost $4,214,051) | | | | | | | 4,061,003 | |
| | | | Par
Value | | | | Fair
Value | |
| Asset Backed Securities — 0.7% | | | | | | | | |
| | | | | | | | | |
| United States — 0.7% | | | | | | | | |
AFC Home Equity Loan Trust
Class 1A, Series 2000-2, 0.94%, 06/25/2030 p• | | $ | 12,951 | | | | 11,871 | |
Citigroup Mortgage Loan Trust, Inc.
Class M3, Series 2005-OPT1, 0.86%, 02/25/2035 p• | | | 264,508 | | | | 215,671 | |
Countrywide Asset-Backed Certificates
Class 2M2, Series 2007-11, 0.47%, 06/25/2047 p• | | | 403,042 | | | | 190 | |
Countrywide Asset-Backed Certificates
Class A1, Series 2006-SD4, 0.49%, 12/25/2036 #p• | | | 106,166 | | | | 62,110 | |
Countrywide Asset-Backed Certificates
Class A6, Series 2006-S6, 5.66%, 03/25/2034 p• | | | 60,167 | | | | 88,130 | |
Countrywide Asset-Backed Certificates
Class M2, Series 2006-BC4, 0.47%, 11/25/2036 p• | | | 727,095 | | | | 27,814 | |
Countrywide Home Equity Loan Trust
Class 2A, Series 2005-A, 0.39%, 04/15/2035 p• | | | 35,988 | | | | 30,410 | |
Structured Asset Investment Loan Trust
Class M1, Series 2003-BC9, 1.20%, 08/25/2033 p• | | | 483,405 | | | | 455,235 | |
| | | | | | | | 891,431 | |
| Total United States (Cost $932,098) | | | | | | | 891,431 | |
Total Asset Backed Securities
(Cost $932,098) | | | | | | | 891,431 | |
| | | | | | | | | |
| Convertible Bonds — 1.2% | | | | | | | | |
| | | | | | | | | |
| Belgium — 0.4% | | | | | | | | |
| BNP Paribas Fortis SA, 2.22%, 12/29/2049 p• | | | 500,000 | | | | 556,121 | |
| Total Belgium (Cost $551,759) | | | | | | | 556,121 | |
| | | | | | | | | |
| Finland — 0.4% | | | | | | | | |
| Talvivaara Mining Co. PLC, 4.00%, 12/16/2015 *+• | | | 3,200,000 | | | | 438,176 | |
| Total Finland (Cost $705,626) | | | | | | | 438,176 | |
The accompanying notes are an integral part of the financial statements.
2 0 1 4 A N N U A L R E P O R T | 15
Schedule of Investments
Quaker Event Arbitrage Fund
June 30, 2014
| | | Par
Value | | | Fair
Value | |
| Convertible Bonds (Continued) | | | | | | | | |
| | | | | | | | | |
| Luxembourg — 0.3% | | | | | | | | |
The Bank of New York Mellon Luxembourg SA,
4.58%, 12/30/2099 +p• | | $ | 500,000 | | | $ | 345,748 | |
| Total Luxembourg (Cost $301,609) | | | | | | | 345,748 | |
| United States — 0.1% | | | | | | | | |
| | | | | | | | | |
| U.S. Concrete, Inc., 9.50%, 08/31/2015 ^*+# | | | 100,000 | | | | 100,000 | |
| Total United States (Cost $100,000) | | | | | | | 100,000 | |
Total Convertible Bonds
(Cost $1,658,994) | | | | | | | 1,440,045 | |
| | | | | | | | | |
| Corporate Bonds — 4.8% | | | | | | | | |
| | | | | | | | | |
| Basic Materials — 0.7% | | | | | | | | |
| | | | | | | | | |
| Chemicals — 0.7% | | | | | | | | |
| Momentive Performance Materials, Inc., 9.00%, 01/15/2021 (b)+• | | | 1,000,000 | | | | 830,000 | |
| | | | | | | | | |
| Forest Products & Paper — 0.0% | | | | | | | | |
| | | | | | | | | |
| NewPage Corp., 0.00%, 05/01/2012 ^*+ | | | 300,000 | | | | 0 | |
| Total Basic Materials (Cost $943,322) | | | | | | | 830,000 | |
| | | | | | | | | |
| Consumer, Cyclical — 0.5% | | | | | | | | |
| | | | | | | | | |
| Auto Parts & Equipment — 0.5% | | | | | | | | |
| | | | | | | | | |
| Exide Technologies, 8.625%, 02/01/2018 +• | | | 1,000,000 | | | | 600,000 | |
| Total Consumer, Cyclical (Cost $583,750) | | | | | | | 600,000 | |
| | | | | | | | | |
| Energy — 1.0% | | | | | | | | |
| | | | | | | | | |
| Oil & Gas — 0.8% | | | | | | | | |
| | | | | | | | | |
| National JSC Naftogaz of Ukraine, 9.50%, 09/30/2014 • | | | 1,000,000 | | | | 980,000 | |
| | | | | | | | | |
| Oil, Gas & Coal — 0.2% | | | | | | | | |
| | | | | | | | | |
| OGX Petroleo e Gas Participacoes SA, 8.50%, 06/01/2018 +• | | | 3,500,000 | | | | 210,000 | |
| Total Energy (Cost $1,615,786) | | | | | | | 1,190,000 | |
| | | | | | | | | |
| Financial — 2.1% | | | | | | | | |
| | | | | | | | | |
| Diversified Financial Services — 1.8% | | | | | | | | |
| | | | | | | | | |
| DEPFA Funding II LP, 6.50%, 10/29/2049 +• | | | 1,000,000 | | | | 739,422 | |
| DEPFA Funding III LP, 1.72%, 06/29/2049 +• | | | 1,000,000 | | | | 698,343 | |
Hellas Telecommunications Luxembourg II SCA,
0.00%, 01/15/2015 ^*+#p | | | 5,000,000 | | | | 100,000 | |
| Lehman Brothers Holdings, Inc., 4.55%, 07/08/2014 +• | | | 110,000 | | | | 21,588 | |
| Lehman Brothers Holdings, Inc., 5.32%, 02/17/2015 +• | | | 130,000 | | | | 25,350 | |
| Lehman Brothers Holdings, Inc., 5.50%, 02/27/2020 +• | | | 100,000 | | | | 19,500 | |
| Lehman Brothers Holdings, Inc., 7.00%, 01/28/2020 +• | | | 100,000 | | | | 19,500 | |
| Lehman Brothers Holdings, Inc., 8.25%, 09/23/2020 +• | | | 100,000 | | | | 19,500 | |
| Lehman Brothers Holdings, Inc., 8.75%, 02/14/2023 +• | | | 200,000 | | | | 39,000 | |
| Twin Reefs Pass-Through Trust, 0.00%, 12/29/2049 ^+#p | | | 1,000,000 | | | | 530,000 | |
| | | | | | | | 2,212,203 | |
| Insurance — 0.3% | | | | | | | | |
| | | | | | | | | |
| Ambac Assurance Corp., 5.10%, 06/07/2020 +#• | | | 300,000 | | | | 341,250 | |
| | | | | | | | | |
| Venture Capital — 0.0% | | | | | | | | |
| | | | | | | | | |
| Infinity Capital Group, 7.00%, 12/31/2049 ^*+ | | | 25,000 | | | | 0 | |
| Total Financial (Cost $2,661,937) | | | | | | | 2,553,453 | |
| | | | | | | | | |
| Industrial — 0.5% | | | | | | | | |
| | | | | | | | | |
| Transportation — 0.5% | | | | | | | | |
| | | | | | | | | |
Overseas Shipholding Group Inc., 8.125%,
03/30/2018 +• | | | 500,000 | | | | 605,000 | |
| Total Industrial (Cost $593,979) | | | | | | | 605,000 | |
| | | Par
Value | | | Fair
Value | |
| Corporate Bonds (Continued) | | | | | | | | |
| | | | | | | | | |
| Utilities — 0.0% | | | | | | | | |
| | | | | | | | | |
| Electric — 0.0% | | | | | | | | |
| | | | | | | | | |
| Mirant Corp., 2.50%, 06/15/2021 ^*+ | | $ | 20,000 | | | $ | 0 | |
| Total Utilities (Cost $0) | | | | | | | 0 | |
Total Corporate Bonds
(Cost $6,398,774) | | | | | | | 5,778,453 | |
| | | | | | | | | |
| Mortgage Backed Securities — 0.8% | | | | | | | | |
| | | | | | | | | |
| United States — 0.8% | | | | | | | | |
| | | | | | | | | |
Countrywide Alternative Loan Trust
Class 2A2A, Series 2006-OC5, 0.32%, 06/25/2046 p• | | | 79,539 | | | | 66,940 | |
GSR Mortgage Loan Trust
Class B2, Series 2005-5F, 5.75%, 06/25/2035 p• | | | 628,584 | | | | 384,994 | |
Wachovia Commercial Mortgage Securities Inc. Pass-Thru Certificates
Class E, Series 2003-C9, 5.29%, 12/15/2035 p• | | | 500,000 | | | | 499,826 | |
| | | | | | | | 951,760 | |
| Total United States (Cost $1,009,617) | | | | | | | 951,760 | |
Total Mortgage Backed Securities
(Cost $1,009,617) | | | | | | | 951,760 | |
| | | | | | | | | |
| Municipal Bonds — 1.0% | | | | | | | | |
| | | | | | | | | |
| United States — 1.0% | | | | | | | | |
| | | | | | | | | |
City of Detroit MI Sewage Disposal System Revenue, Second Lien,
Series A, 4.50%, 07/01/2035 • | | | 355,000 | | | | 317,625 | |
City of Detroit MI Water Supply System Revenue, Senior Lien,
Series A, 5.00%, 07/01/2034 • | | | 500,000 | | | | 495,630 | |
City of Detroit MI Water Supply System Revenue, Senior Lien,
Series A, 4.50%, 07/01/2035 • | | | 75,000 | | | | 67,807 | |
City of Detroit MI Water Supply System Revenue, Senior Lien,
Series A, 5.00%, 07/01/2036 • | | | 200,000 | | | | 194,538 | |
City of Detroit MI Water Supply System Revenue, Senior Lien,
Series C, 5.00%, 07/01/2041 • | | | 95,000 | | | | 92,799 | |
| | | | | | | | 1,168,399 | |
| Total United States (Cost $1,186,393) | | | | | | | 1,168,399 | |
Total Municipal Bonds
(Cost $1,186,393) | | | | | | | 1,168,399 | |
| | | | | | | | | |
| Term Loan — 0.4% | | | | | | | | |
| | | | | | | | | |
| United States — 0.4% | | | | | | | | |
| | | | | | | | | |
Diagnostic Services Holdings, Inc. 14.50%,
05/05/2016 ^* | | | 511,054 | | | | 511,054 | |
| Total United States (Cost $511,054) | | | | | | | 511,054 | |
Total Term Loan
(Cost $511,054) | | | | | | | 511,054 | |
| | | | | | | | |
| | | Number
of Contracts | | | | Fair
Value | |
| Purchased Options — 3.3% | | | | | | | | |
| | | | | | | | | |
| Call Options — 2.7% | | | | | | | | |
| | | | | | | | | |
CommonWealth REIT, Expiration: July, 2014
Exercise Price:$27.50 | | | 180 | | | | 1,800 | |
Comverse, Inc., Expiration: August, 2014
Exercise Price:$25.00 • | | | 439 | | | | 96,580 | |
Darden Restaurants, Inc., Expiration: August, 2014
Exercise Price:$46.00 | | | 325 | | | | 35,750 | |
The accompanying notes are an integral part of the financial statements.
16 | 2 0 1 4 A N N U A L R E P O R T
Schedule of Investments
Quaker Event Arbitrage Fund
June 30, 2014
| | | Number
of Contracts | | | Fair
Value | |
| Purchased Options (Continued) | | | | | | | | |
| | | | | | | | | |
| Call Options (Continued) | | | | | | | | |
Dean Foods Co., Expiration: September, 2014
Exercise Price: $15.00 • | | | 1,500 | | | $ | 427,500 | |
eBay, Inc., Expiration: January, 2015
Exercise Price: $50.00 | | | 1,200 | | | | 444,000 | |
FTD Cos. Inc., Expiration: August, 2014
Exercise Price: $30.00 • | | | 475 | | | | 122,312 | |
General Motors Co., Expiration: January, 2015
Exercise Price: $35.00 | | | 600 | | | | 180,000 | |
Lorillard, Inc., Expiration: December, 2014
Exercise Price: $70.00 | | | 550 | | | | 77,000 | |
Noble Corp. PLC, Expiration: August, 2014
Exercise Price: $40.00 • | | | 380 | | | | 2,470 | |
PepsiCo., Inc., Expiration: January, 2015
Exercise Price: $80.00 | | | 1,150 | | | | 1,121,250 | |
Regis Corp., Expiration: August, 2014
Exercise Price: $12.50 • | | | 1,190 | | | | 181,475 | |
Safeway, Inc., Expiration: August, 2014
Exercise Price: $36.00 • | | | 470 | | | | 2,350 | |
Sotheby’s, Inc., Expiration: August, 2014
Exercise Price: $40.00 | | | 423 | | | | 115,902 | |
Talisman Energy, Inc., Expiration: August, 2014
Exercise Price: $11.00 | | | 845 | | | | 29,575 | |
Time Warner Cable, Inc., Expiration: October, 2014
Exercise Price: $135.00 • | | | 125 | | | | 171,250 | |
Volcano Corp., Expiration: August, 2014
Exercise Price: $17.50 • | | | 796 | | | | 101,490 | |
Yahoo! Inc., Expiration: October, 2014
Exercise Price: $37.00 | | | 500 | | | | 110,500 | |
| Total Call Options (Cost $2,190,300) | | | | | | | 3,221,204 | |
| | | | | | | | | |
| Put Options — 0.6% | | | | | | | | |
Comcast Corp., Expiration: January, 2015
Exercise Price: $55.00 • | | | 200 | | | | 77,000 | |
CurrencyShares Euro Trust, Expiration: September, 2014
Exercise Price: $137.00 | | | 150 | | | | 39,750 | |
eBay, Inc., Expiration: January, 2015
Exercise Price: $40.00 | | | 1,200 | | | | 67,200 | |
Packaging Corp. of America, Expiration: July, 2014
Exercise Price: $67.50 • | | | 150 | | | | 4,875 | |
Teekay Corp., Expiration: October, 2014
Exercise Price: $62.50 | | | 400 | | | | 144,000 | |
Time Warner Cable, Inc., Expiration: October, 2014
Exercise Price: $100.00 • | | | 125 | | | | 2,188 | |
TRI Pointe Homes, Inc., Expiration: July, 2014
Exercise Price: $20.00 • | | | 317 | | | | 145,820 | |
Twenty-First Century Fox, Inc., Expiration: October, 2014
Exercise Price: $34.00 | | | 758 | | | | 94,750 | |
Weyerhaeuser Co., Expiration: July, 2014
Exercise Price: $38.00 | | | 256 | | | | 130,560 | |
Yahoo! Inc., Expiration: October, 2014
Exercise Price: $30.00 | | | 500 | | | | 39,500 | |
| Total Put Options (Cost $1,123,193) | | | | | | | 745,643 | |
Total Purchased Options
(Cost $3,313,493) | | | | | | | 3,966,847 | |
| | | Number
of Shares | | | Fair
Value | |
Investments Purchased with Proceeds from Securities
Lending — 6.5% | | | | | |
| | | | | | | | | |
| Money Market Funds — 6.5% | | | | | | | | |
Mount Vernon Securities Lending Trust Prime Portfolio,
0.18% (c)(d) | | | 7,688,944 | | | $ | 7,688,944 | |
Total Investments Purchased with Proceeds from
Securities Lending (Cost $7,688,944) | | | | | | | 7,688,944 | |
Total Investments
(Cost $94,118,225) — 81.6% | | | | | | | 97,119,729 | |
| Other Assets in Excess of Liabilities, Net 18.4% | | | | | | | 21,944,728 | |
| Total Net Assets — 100.0% | | | | | | $ | 119,064,457 | |
| | | | | | | | | |
| Schedule of Securities Sold Short (e) | | | | | | | | |
| Common Stocks | | | | | | | | |
| | | | | | | | | |
| Actavis PLC | | | 3,600 | | | | 802,980 | |
| Charter Communications, Inc. | | | 3,634 | | | | 575,553 | |
| Live Nation Entertainment, Inc. | | | 6,771 | | | | 167,176 | |
| Sirius XM Holdings, Inc. | | | 409,770 | | | | 1,417,804 | |
| VMware, Inc. | | | 7,680 | | | | 743,501 | |
Total Common Stocks
(Proceeds $3,512,220) | | | | | | | 3,707,014 | |
| | | | | | | | | |
| Real Estate Investment Trusts | | | | | | | | |
| | | | | | | | | |
| General Growth Properties, Inc. | | | 17,400 | | | | 409,944 | |
Total Real Estate Investment Trusts
(Proceeds $370,797) | | | | | | | 409,944 | |
| Total Securities Sold Short (Proceeds $3,883,017) | | | | | | $ | 4,116,958 | |
| | | | | | | |
| | | Number
of Contracts | | | Fair
Value | |
| Written Options | | | | | | | | |
| | | | | | | | | |
| Call Options | | | | | | | | |
Agilent Technologies, Inc., Expiration: July, 2014
Exercise Price: $55.00 • | | | 265 | | | | 70,622 | |
Allison Transmission Holdings, Inc., Expiration: July, 2014
Exercise Price: $30.00 • | | | 300 | | | | 42,000 | |
Ambac Financial Group, Inc., Expiration: July, 2014
Exercise Price: $25.00 • | | | 225 | | | | 55,687 | |
Ambac Financial Group, Inc., Expiration: August, 2014
Exercise Price: $22.50 • | | | 220 | | | | 112,200 | |
Bob Evans Farms, Inc., Expiration: July, 2014
Exercise Price: $42.00 ^ | | | 375 | | | | 310,500 | |
Comcast Corp., Expiration: January, 2015
Exercise Price: $55.00 • | | | 200 | | | | 37,000 | |
CommonWealth REIT, Expiration: July, 2014
Exercise Price: $29.00 ^ | | | 360 | | | | 1,080 | |
CST Brands, Inc., Expiration: July, 2014
Exercise Price: $32.00 • | | | 173 | | | | 41,953 | |
CST Brands, Inc., Expiration: July, 2014
Exercise Price: $34.00 | | | 433 | | | | 31,609 | |
CurrencyShares Euro Trust, Expiration: September, 2014
Exercise Price: $137.00 | | | 150 | | | | 6,600 | |
Dean Foods Co., Expiration: September, 2014
Exercise Price: $19.00 • | | | 1,500 | | | | 75,000 | |
The accompanying notes are an integral part of the financial statements.
2 0 1 4 A N N U A L R E P O R T | 17
Schedule of Investments
Quaker Event Arbitrage Fund
June 30, 2014
| | | Number
of Contracts | | | Fair
Value | |
| Written Options (Continued) | | | | | | | | |
| | | | | | | | | |
| Call Options (Continued) | | | | | | | | |
Dresser-Rand Group, Inc., Expiration: July, 2014
Exercise Price: $57.50 ^ | | | 244 | | | $ | 153,964 | |
eBay, Inc., Expiration: January, 2015
Exercise Price: $55.00 | | | 1,200 | | | | 212,400 | |
eBay, Inc., Expiration: July, 2014
Exercise Price: $48.00 | | | 53 | | | | 13,939 | |
General Motors Co., Expiration: January, 2015
Exercise Price: $40.00 | | | 600 | | | | 60,000 | |
GNC Holdings, Inc., Expiration: July, 2014
Exercise Price: $35.00 | | | 170 | | | | 8,500 | |
Hertz Global Holdings, Inc., Expiration: July, 2014
Exercise Price: $27.00 | | | 185 | | | | 30,340 | |
Hologic, Inc., Expiration: July, 2014
Exercise Price: $24.00 • | | | 547 | | | | 76,580 | |
Iron Mountain, Inc., Expiration: August, 2014
Exercise Price: $35.00 | | | 215 | | | | 32,250 | |
Lorillard, Inc., Expiration: December, 2014
Exercise Price: $80.00 • | | | 550 | | | | 8,800 | |
Mondelez International, Inc., Expiration: July, 2014
Exercise Price: $37.00 | | | 170 | | | | 13,940 | |
News Corp., Expiration: July, 2014
Exercise Price: $17.00 • | | | 250 | | | | 25,625 | |
Packaging Corp. of America, Expiration: July, 2014
Exercise Price: $67.50 | | | 150 | | | | 63,000 | |
PepsiCo, Inc., Expiration: January, 2015
Exercise Price: $87.50 • | | | 1,150 | | | | 491,625 | |
PepsiCo, Inc., Expiration: July, 2014
Exercise Price: $87.50 | | | 23 | | | | 5,060 | |
Pfizer, Inc., Expiration: July, 2014
Exercise Price: $29.60 ^ | | | 170 | | | | 5,610 | |
Pinnacle Foods, Inc., Expiration: August, 2014
Exercise Price: $30.00 • | | | 167 | | | | 52,605 | |
Scorpio Tankers, Inc., Expiration: August, 2014
Exercise Price: $10.00 | | | 300 | | | | 18,000 | |
Teekay Corp., Expiration: October, 2014
Exercise Price: $62.50 | | | 400 | | | | 120,000 | |
Telephone & Data Systems, Inc., Expiration: July, 2014
Exercise Price: $25.00 • | | | 200 | | | | 24,500 | |
Time Warner Cable, Inc., Expiration: October, 2014
Exercise Price: $150.00 | | | 125 | | | | 50,000 | |
TRI Pointe Homes, Inc., Expiration: July, 2014
Exercise Price: $20.00 • | | | 317 | | | | 1,585 | |
Twenty-First Century Fox, Inc., Expiration: October, 2014
Exercise Price: $34.00 | | | 758 | | | | 187,226 | |
Volcano Corp., Expiration: July, 2014
Exercise Price: $17.50 • | | | 115 | | | | 10,063 | |
Walgreen Co., Expiration: July, 2014
Exercise Price: $72.50 | | | 100 | | | | 25,400 | |
Weyerhaeuser Co., Expiration: July, 2014
Exercise Price: $38.00 | | | 256 | | | | 1,280 | |
Yahoo! Inc., Expiration: October, 2014
Exercise Price: $39.00 | | | 500 | | | | 80,000 | |
| Total Call Options (Premiums Received $2,368,393) | | | | | | | 2,556,543 | |
| | | Number
of Contracts | | | Fair
Value | |
| Written Options (Continued) | | | | | | | | |
| | | | | | | | | |
| Put Options | | | | | | | | |
Allison Transmission Holdings, Inc., Expiration: July, 2014
Exercise Price: $29.00 ^ | | | 200 | | | $ | 3,000 | |
CommonWealth REIT, Expiration: August, 2014
Exercise Price: $25.00 • | | | 200 | | | | 8,000 | |
Comverse, Inc., Expiration: August, 2014
Exercise Price: $25.00 • | | | 439 | | | | 24,145 | |
Darden Restaurants, Inc., Expiration: August, 2014
Exercise Price: $46.00 | | | 325 | | | | 47,125 | |
Dean Foods Co., Expiration: August, 2014
Exercise Price: $16.00 • | | | 625 | | | | 21,875 | |
eBay, Inc., Expiration: January, 2015
Exercise Price: $43.00 • | | | 1,200 | | | | 127,800 | |
FTD Cos. Inc., Expiration: August, 2014
Exercise Price: $30.00 • | | | 475 | | | | 35,625 | |
Hertz Global Holdings, Inc., Expiration: August, 2014
Exercise Price: $24.00 • | | | 125 | | | | 4,687 | |
Life Time Fitness, Inc., Expiration: July, 2014
Exercise Price: $45.00 • | | | 266 | | | | 7,315 | |
LSB Industries, Inc., Expiration: July, 2014
Exercise Price: $41.00 ^ | | | 120 | | | | 14,880 | |
Noble Corp. PLC, Expiration: August, 2014
Exercise Price: $40.00 • | | | 380 | | | | 260,300 | |
Pfizer, Inc., Expiration: July, 2014
Exercise Price: $29.00 | | | 345 | | | | 2,760 | |
Pinnacle Foods, Inc., Expiration: July, 2014
Exercise Price: $30.00 • | | | 435 | | | | 5,438 | |
Regis Corp., Expiration: August, 2014
Exercise Price: $12.50 • | | | 1,190 | | | | 11,900 | |
Safeway, Inc., Expiration: August, 2014
Exercise Price: $36.00 • | | | 470 | | | | 83,425 | |
Sotheby’s, Expiration: August, 2014
Exercise Price: $40.00 | | | 423 | | | | 41,031 | |
Talisman Energy, Inc., Expiration: August, 2014
Exercise Price: $11.00 | | | 845 | | | | 67,600 | |
Time Warner Cable, Inc., Expiration: October, 2014
Exercise Price: $120.00 | | | 125 | | | | 6,875 | |
Volcano Corp., Expiration: August, 2014
Exercise Price: $17.50 • | | | 796 | | | | 89,550 | |
Walgreen Co., Expiration: July, 2014
Exercise Price: $73.50 ^ | | | 68 | | | | 7,820 | |
Yahoo! Inc., Expiration: October, 2014
Exercise Price: $32.00 | | | 500 | | | | 72,000 | |
| Total Put Options (Premiums Received $1,095,234) | | | | | | | 943,151 | |
| Total Written Options (Premiums Received $3,463,627) | | | | | | $ | 3,499,694 | |
The accompanying notes are an integral part of the financial statements.
18 | 2 0 1 4 A N N U A L R E P O R T
Schedule of Investments
Quaker Event Arbitrage Fund
June 30, 2014
ADR - American Depositary Receipt
| (a) | Non-income producing security. |
| (b) | All or a portion of the security is out on loan. |
| (c) | Rate shown is the annualized seven-day effective yield at period end. |
| (d) | Represents investments of collateral received from securities lending transactions. |
| (e) | Securities sold short are non-income producing. |
| ^ | Indicates a fair valued security. Total market value for fair valued securities is $6,853,249 representing 5.8% of net assets and Level 3 securities. |
| * | Indicates an illiquid security. Total market value for illiquid securities is $2,204,664, representing 1.9% of net assets. |
| + | Defaulted bonds. |
| # | Restricted security that may be sold to “qualified institutional buyers” pursuant to the conditions of Rule 144A under the Securities Act of 1933, as amended. |
| ▲ | The coupon rate shown on floating or adjustable rate securities represents the rate at period end. |
| • | Level 2 securities. |
The accompanying notes are an integral part of the financial statements.
2 0 1 4 A N N U A L R E P O R T | 19
Schedule of Investments
Quaker Global Tactical Allocation Fund
June 30, 2014
| | | Number | | | Fair | |
| | | of Shares | | | Value | |
| Common Stocks — 97.7% | | | | | | |
| | | | | | | |
| Belgium — 1.6% | | | | | | |
| Anheuser-Busch InBev NV - ADR | | | 1,010 | | | $ | 116,089 | |
| Total Belgium (Cost $86,364) | | | | | | | 116,089 | |
| | | | | | | | | |
| Bermuda — 0.6% | | | | | | | | |
| Arch Capital Group Ltd. (a) | | | 700 | | | | 40,208 | |
| Total Bermuda (Cost $30,872) | | | | | | | 40,208 | |
| | | | | | | | | |
| Cayman Islands — 2.0% | | | | | | | | |
| Qihoo 360 Technology Co Ltd. - ADR (a) | | | 805 | | | | 74,092 | |
| Vipshop Holdings Ltd. - ADR (a) | | | 395 | | | | 74,157 | |
| Total Cayman Islands (Cost $145,989) | | | | | | | 148,249 | |
| | | | | | | | | |
| Curacao — 1.5% | | | | | | | | |
| Schlumberger Ltd. | | | 955 | | | | 112,642 | |
| Total Curacao (Cost $86,282) | | | | | | | 112,642 | |
| | | | | | | | | |
| Finland — 1.7% | | | | | | | | |
| Nokia OYJ - ADR | | | 15,960 | | | | 120,658 | |
| Total Finland (Cost $120,849) | | | | | | | 120,658 | |
| | | | | | | | | |
| France — 2.5% | | | | | | | | |
| Sanofi - ADR | | | 3,410 | | | | 181,310 | |
| Total France (Cost $161,455) | | | | | | | 181,310 | |
| | | | | | | | | |
| Germany — 2.9% | | | | | | | | |
| Adidas AG - ADR | | | 340 | | | | 17,226 | |
| Bayerische Motoren Werke AG - ADR | | | 4,590 | | | | 194,157 | |
| Total Germany (Cost $162,021) | | | | | | | 211,383 | |
| | | | | | | | | |
| India — 1.5% | | | | | | | | |
| HDFC Bank Ltd. - ADR | | | 2,385 | | | | 111,666 | |
| Total India (Cost $86,704) | | | | | | | 111,666 | |
| | | | | | | | | |
| Ireland — 2.1% | | | | | | | | |
| Alkermes PLC (a) | | | 3,085 | | | | 155,268 | |
| Total Ireland (Cost $104,728) | | | | | | | 155,268 | |
| | | | | | | | | |
| Netherlands — 2.2% | | | | | | | | |
| NXP Semiconductor NV (a) | | | 2,410 | | | | 159,494 | |
| Total Netherlands (Cost $119,136) | | | | | | | 159,494 | |
| | | | | | | | | |
| Spain — 2.8% | | | | | | | | |
| Abengoa SA - ADR (b) | | | 7,696 | | | | 204,867 | |
| Total Spain (Cost $145,616) | | | | | | | 204,867 | |
| | | | | | | | | |
| Switzerland — 9.0% | | | | | | | | |
| ACE Ltd. | | | 1,455 | | | | 150,883 | |
| Logitech International SA (b) | | | 7,650 | | | | 99,680 | |
| Novartis AG - ADR | | | 1,615 | | | | 146,206 | |
| Roche Holdings, Ltd. - ADR | | | 7,040 | | | | 262,592 | |
| Total Switzerland (Cost $565,622) | | | | | | | 659,361 | |
| | | | | | | | | |
| United Kingdom — 6.8% | | | | | | | | |
| BP PLC - ADR | | | 1,440 | | | | 75,960 | |
| InterContinental Hotels Group PLC - ADR | | | 2,822 | | | | 117,141 | |
| Liberty Global PLC (a) | | | 3,735 | | | | 158,028 | |
| Prudential PLC - ADR | | | 3,245 | | | | 148,881 | |
| Total United Kingdom (Cost $410,001) | | | | | | | 500,010 | |
| | | | | | | | | |
| United States — 60.5% | | | | | | | | |
| Abbott Laboratories | | | 2,309 | | | | 94,438 | |
| AbbVie, Inc. | | | 1,705 | | | | 96,230 | |
| Adobe Systems Inc. (a) | | | 2,330 | | | | 168,599 | |
| Aetna, Inc. | | | 1,515 | | | | 122,836 | |
| American Airlines Group, Inc. (a) | | | 5,876 | | | | 252,416 | |
| | | Number | | | Fair | |
| | | of Shares | | | Value | |
| Common Stocks (Continued) | | | | | | | | |
| | | | | | | | | |
| United States (Continued) | | | | | | | | |
| Amgen, Inc. | | | 1,900 | | | $ | 224,903 | |
| AMR Corp. Escrow (a)^ | | | 7,600 | | | | 13,148 | |
| Anadarko Petroleum Corp. | | | 1,000 | | | | 109,470 | |
| Apple, Inc. | | | 1,200 | | | | 111,516 | |
| Biogen Idec, Inc. (a) | | | 1,075 | | | | 338,958 | |
| CBS Corp. | | | 1,860 | | | | 115,580 | |
| Celgene Corp. (a)(b) | | | 870 | | | | 74,716 | |
| Delta Air Lines, Inc. | | | 3,580 | | | | 138,618 | |
| Eli Lilly & Company | | | 2,480 | | | | 154,182 | |
| Facebook, Inc. Class A (a) | | | 1,629 | | | | 109,615 | |
| FedEx Corp. | | | 1,100 | | | | 166,518 | |
| Gilead Sciences, Inc. (a)(b) | | | 1,765 | | | | 146,336 | |
| Google, Inc. Class A (a) | | | 68 | | | | 39,758 | |
| Google, Inc. Class C (a) | | | 73 | | | | 41,995 | |
| Hartford Financial Services Group, Inc. | | | 1,055 | | | | 37,780 | |
| Hewlett-Packard Co. | | | 1,125 | | | | 37,890 | |
| Honeywell International, Inc. | | | 1,170 | | | | 108,752 | |
| Intuit Inc. | | | 1,320 | | | | 106,300 | |
| Lam Research Corp. | | | 845 | | | | 57,105 | |
| Las Vegas Sands Corp. | | | 1,910 | | | | 145,580 | |
| Mastercard, Inc. Class A | | | 1,535 | | | | 112,776 | |
| Mead Johnson Nutrition Co. | | | 1,255 | | | | 116,928 | |
| Micron Technology, Inc. (a)(b) | | | 5,050 | | | | 166,398 | |
| Mondelez International, Inc. | | | 2,920 | | | | 109,821 | |
| Monsanto Co. | | | 1,190 | | | | 148,441 | |
| Morgan Stanley | | | 3,455 | | | | 111,700 | |
| Noble Energy, Inc. | | | 1,015 | | | | 78,622 | |
| Regeneron Pharmaceuticals, Inc. (a)(b) | | | 261 | | | | 73,725 | |
| Time Warner, Inc. | | | 1,545 | | | | 108,536 | |
| Twenty-First Century Fox, Inc. Class A | | | 3,135 | | | | 110,195 | |
| Vertex Pharmaceuticals, Inc. (a) | | | 195 | | | | 18,463 | |
| Viacom, Inc. | | | 1,280 | | | | 111,014 | |
| Visa, Inc. Class A (b) | | | 520 | | | | 109,569 | |
| Yelp, Inc. (a) | | | 565 | | | | 43,324 | |
| Total United States (Cost $3,662,343) | | | | | | | 4,432,751 | |
Total Common Stocks
Cost ($5,887,982) | | | | | | | 7,153,956 | |
| | | | | | | | | |
| Investments Purchased with Proceeds from Securities Lending — 7.0% |
| | | | | | | | | |
| Money Market Funds — 7.0% | | | | | | | | |
| Mount Vernon Securities Lending Trust Prime Portfolio, 0.18% (c)(d) | | | 515,535 | | | | 515,535 | |
Total Investments Purchased with Proceeds from Securities Lending
(Cost $515,535) | | | | | | | 515,535 | |
Total Investments
(Cost $6,403,517) — 104.7% | | | | | | | 7,669,491 | |
| Liabilities in Excess of Other Assets , Net (4.7)% | | | | | | | (344,353 | ) |
| Total Net Assets — 100.0% | | | | | | $ | 7,325,138 | |
The accompanying notes are an integral part of the financial statements.
20 | 2 0 1 4 A N N U A L R E P O R T
Schedule of Investments
Quaker Global Tactical Allocation Fund
June 30, 2014
| | | Number | | | Fair | |
| Schedule of Securities Sold Short (e) | | of Shares | | | Value | |
| | | | | | | |
| Exchange-Traded Funds | | | | | | | | |
| | | | | | | | | |
| CurrencyShares Australian Dollar Trust | | | 1,530 | | | $ | 144,524 | |
| Total Exchange-Traded Funds | | | | | | | 144,524 | |
| Total Securities Sold Short (Proceeds: $154,611) | | | | | | | 144,524 | |
ADR - American Depositary Receipt
| (a) | Non-income producing security. |
| (b) | All or a portion of the security is out on loan. |
| (c) | The rate shown is the annualized seven-day effective yield at period end. |
| (d) | Represents investments of collateral received from securities lending transactions. |
| (e) | Securities sold short are non-income producing. |
| ^ | Indicates a fair valued security. Total market value for fair valued securities is $13,148, representing 0.2% of net assets and Level 3 securities. |
The accompanying notes are an integral part of the financial statements.
2 0 1 4 A N N U A L R E P O R T | 21
Schedule of Investments
Quaker Mid-Cap Value Fund
June 30, 2014
| | | Number
of Shares | | | Fair
Value | |
| Domestic Common Stocks — 80.7% | | | | | | | | |
| | | | | | | | | |
| Basic Materials — 5.2% | | | | | | | | |
| Chemicals — 3.1% | | | | | | | | |
| Axiall Corp. | | | 4,272 | | | $ | 201,938 | |
| FMC Corp. | | | 1,464 | | | | 104,222 | |
| | | | | | | | 306,160 | |
| Iron & Steel Production — 2.1% | | | | | | | | |
| Steel Dynamics, Inc. | | | 11,657 | | | | 209,243 | |
| Total Basic Materials (Cost $371,721) | | | | | | | 515,403 | |
| Communications — 1.9% | | | | | | | | |
| Telecommunications — 1.9% | | | | | | | | |
| JDS Uniphase Corp. (a) | | | 15,299 | | | | 190,778 | |
| Total Communications (Cost $178,610) | | | | | | | 190,778 | |
| Consumer, Cyclical — 13.9% | | | | | | | | |
| Airlines — 2.0% | | | | | | | | |
| Southwest Airlines Co. | | | 7,304 | | | | 196,185 | |
| Auto Parts & Equipment — 2.1% | | | | | | | | |
| Dana Holding Corp. (b) | | | 8,734 | | | | 213,284 | |
| Home Furnishings — 3.6% | | | | | | | | |
| Harman International Industries, Inc. | | | 1,690 | | | | 181,557 | |
| Whirlpool Corp. | | | 1,267 | | | | 176,392 | |
| | | | | | | | 357,949 | |
| Retail — 6.2% | | | | | | | | |
| American Eagle Outfitters, Inc. (b) | | | 9,228 | | | | 103,538 | |
| Foot Locker, Inc. | | | 4,884 | | | | 247,716 | |
| JC Penney Co., Inc. (a) | | | 8,533 | | | | 77,224 | |
| Nordstrom, Inc. | | | 2,893 | | | | 196,522 | |
| | | | | | | | 625,000 | |
| Total Consumer, Cyclical (Cost $1,063,975) | | | | | | | 1,392,418 | |
| Consumer, Non-cyclical — 7.4% | | | | | | | | |
| Food — 1.8% | | | | | | | | |
| Ingredion Inc. | | | 1,337 | | | | 100,329 | |
| Safeway, Inc. | | | 2,413 | | | | 82,862 | |
| | | | | | | | 183,191 | |
| Healthcare-Products — 3.8% | | | | | | | | |
| Hospira, Inc. (a) | | | 4,778 | | | | 245,446 | |
| Zimmer Holdings, Inc. | | | 1,327 | | | | 137,822 | |
| | | | | | | | 383,268 | |
| Healthcare-Services — 1.8% | | | | | | | | |
| Community Health Systems, Inc. (a)(b) | | | 3,985 | | | | 180,799 | |
| Total Consumer, Non-cyclical (Cost $601,215) | | | | | | | 747,258 | |
| Energy — 7.6% | | | | | | | | |
| Oil & Gas — 7.6% | | | | | | | | |
| Atwood Oceanics, Inc. (a) | | | 2,792 | | | | 146,524 | |
| Denbury Resources, Inc. (b) | | | 10,836 | | | | 200,033 | |
| Helmerich & Payne, Inc. (b) | | | 2,105 | | | | 244,411 | |
| Whiting Petroleum Corp. (a) | | | 2,081 | | | | 167,000 | |
| | | | | | | | 757,968 | |
| Total Energy (Cost $501,530) | | | | | | | 757,968 | |
| | | Number
of Shares | | | Fair
Value | |
| Domestic Common Stocks (Continued) | | | | | | | | |
| | | | | | | | | |
| Financial — 11.3% | | | | | | | | |
| Banks — 5.3% | | | | | | | | |
| Huntington Bancshares, Inc. | | | 18,533 | | | $ | 176,805 | |
| Keycorp | | | 13,166 | | | | 188,669 | |
| Regions Financial Corp. | | | 15,463 | | | | 164,217 | |
| | | | | | | | 529,691 | |
| Insurance — 6.0% | | | | | | | | |
| Lincoln National Corp. | | | 3,858 | | | | 198,456 | |
| Reinsurance Group of America, Inc., Class A | | | 2,745 | | | | 216,580 | |
| Torchmark Corp. | | | 2,313 | | | | 189,481 | |
| | | | | | | | 604,517 | |
| Total Financial (Cost $767,544) | | | | | | | 1,134,208 | |
| Industrial — 15.6% | | | | | | | | |
| Electrical Components & Equipment — 1.0% | | | | | | | | |
| Energizer Holdings, Inc. | | | 810 | | | | 98,845 | |
| Electronics — 2.1% | | | | | | | | |
| Woodward, Inc. | | | 4,132 | | | | 207,344 | |
| Hand & Machine Tools — 3.0% | | | | | | | | |
| Regal-Beloit Corp. | | | 1,859 | | | | 146,043 | |
| Stanley Black & Decker, Inc. | | | 1,793 | | | | 157,461 | |
| | | | | | | | 303,504 | |
| Machinery-Diversified — 3.6% | | | | | | | | |
| AGCO Corp. (b) | | | 3,236 | | | | 181,928 | |
| Roper Industries, Inc. | | | 1,225 | | | | 178,862 | |
| | | | | | | | 360,790 | |
| Miscellaneous Manufacturing — 5.9% | | | | | | | | |
| Dover Corp. | | | 1,898 | | | | 172,623 | |
| Parker Hannifin Corp. | | | 1,667 | | | | 209,592 | |
| Trinity Industries, Inc. | | | 4,764 | | | | 208,282 | |
| | | | | | | | 590,497 | |
| Total Industrial (Cost $1,195,589) | | | | | | | 1,560,980 | |
| Technology — 8.8% | | | | | | | | |
| Computers — 3.9% | | | | | | | | |
| Cadence Design Systems, Inc. (a)(b) | | | 12,996 | | | | 227,300 | |
| NCR Corp. (a) | | | 4,621 | | | | 162,151 | |
| | | | | | | | 389,451 | |
| Semiconductors — 4.9% | | | | | | | | |
| KLA-Tencor Corp. | | | 1,386 | | | | 100,679 | |
| Skyworks Solutions, Inc. | | | 4,090 | | | | 192,067 | |
| Teradyne, Inc. (b) | | | 10,007 | | | | 196,137 | |
| | | | | | | | 488,883 | |
| Total Technology (Cost $676,526) | | | | | | | 878,334 | |
| Utilities — 9.0% | | | | | | | | |
| Electric — 3.3% | | | | | | | | |
| Westar Energy, Inc. (b) | | | 5,173 | | | | 197,557 | |
| Xcel Energy, Inc. | | | 4,177 | | | | 134,625 | |
| | | | | | | | 332,182 | |
The accompanying notes are an integral part of the financial statements.
22 | 2 0 1 4 A N N U A L R E P O R T
Schedule of Investments
Quaker Mid-Cap Value Fund
June 30, 2014
| | | Number
of Shares | | | Fair
Value | |
| Domestic Common Stocks (Continued) | | | | | | | | |
| | | | | | | | | |
| Gas — 5.7% | | | | | | | | |
| Centerpoint Energy, Inc. | | | 7,427 | | | $ | 189,686 | |
| Questar Corp. | | | 7,278 | | | | 180,494 | |
| UGI Corp. | | | 4,071 | | | | 205,585 | |
| | | | | | | | 575,765 | |
| Total Utilities (Cost $684,433) | | | | | | | 907,947 | |
Total Domestic Common Stocks
(Cost $6,041,143) | | | | | | | 8,085,294 | |
| | | | | | | | | |
| Foreign Common Stocks — 5.5% | | | | | | | | |
| | | | | | | | | |
| Bermuda — 1.6% | | | | | | | | |
| Diversified Financial Services — 1.6% | | | | | | | | |
| Invesco Ltd. | | | 4,324 | | | | 163,231 | |
| Total Bermuda (Cost $95,693) | | | | | | | 163,231 | |
| Canada — 3.9% | | | | | | | | |
| Apparel — 1.6% | | | | | | | | |
| Gildan Activewear, Inc., Class A | | | 2,607 | | | | 153,500 | |
| Oil & Gas — 2.3% | | | | | | | | |
| Ultra Petroleum Corp. (a) | | | 7,799 | | | | 231,552 | |
| Total Canada (Cost $254,717) | | | | | | | 385,052 | |
Total Foreign Common Stocks
(Cost $350,410) | | | | | | | 548,283 | |
| | | | | | | | | |
| Real Estate Investment Trusts — 9.3% | | | | | | | | |
| | | | | | | | | |
| Brixmor Property Group, Inc. | | | 8,794 | | | | 201,822 | |
| Camden Property Trust | | | 2,484 | | | | 176,737 | |
| DDR Corp. (b) | | | 9,189 | | | | 162,002 | |
| Host Hotels & Resorts, Inc. (b) | | | 8,557 | | | | 188,340 | |
| Mid-America Apartment Communities, Inc. | | | 2,824 | | | | 206,293 | |
| | | | | | | | 935,194 | |
Total Real Estate Investment Trusts
(Cost $783,300) | | | | | | | 935,194 | |
| | | | | | | | | |
| Investments Purchased with Proceeds from Securities Lending — 15.6% | |
| | | | | | | | | |
| Money Market Funds — 15.6% | | | | | | | | |
| Mount Vernon Securities Lending Trust Prime Portfolio, 0.18% (c)(d) | | | 1,565,695 | | | | 1,565,695 | |
| Total Investments Purchased with Proceeds from Securities Lending (Cost $1,565,695) | | | | | | | 1,565,695 | |
Total Investments
(Cost $8,740,548) — 111.1% | | | | | | | 11,134,466 | |
| Liabilities in Excess of Other Assets , Net (11.1)% | | | | | | | (1,108,601 | ) |
| Total Net Assets — 100.0% | | | | | | $ | 10,025,865 | |
| (a) | Non-income producing security. |
| (b) | All or a portion of the security is out on loan. |
| (c) | The rate shown is the annualized seven-day effective yield at period end. |
| (d) | Represents investments of collateral received from securities lending transactions. |
The accompanying notes are an integral part of the financial statements.
2 0 1 4 A N N U A L R E P O R T | 23
Schedule of Investments
Quaker Small-Cap Value Fund
June 30, 2014
| | | Number | | | Fair | |
| | | of Shares | | | Value | |
| Domestic Common Stocks — 79.1% | | | | | | | | |
| |
| Basic Materials — 5.0% | | | | | | | | |
| Chemicals — 1.3% | | | | | | | | |
| Ferro Corp. (a) | | | 19,600 | | | $ | 246,176 | |
| Huntsman Corp. | | | 9,200 | | | | 258,520 | |
| | | | | | | | 504,696 | |
| Forest Products & Paper — 2.6% | | | | | | | | |
| Domtar Corp. | | | 7,560 | | | | 323,946 | |
| KapStone Paper and Packaging Corp. (a) | | | 7,180 | | | | 237,873 | |
| Resolute Forest Products, Inc. (a)(b) | | | 25,200 | | | | 422,856 | |
| | | | | | | | 984,675 | |
| Iron & Steel — 1.1% | | | | | | | | |
| United States Steel Corp. (b) | | | 16,500 | | | | 429,660 | |
| Total Basic Materials (Cost $1,783,756) | | | | | | | 1,919,031 | |
| Communications — 3.7% | | | | | | | | |
| Internet — 0.9% | | | | | | | | |
| United Online, Inc. | | | 33,800 | | | | 351,520 | |
| Telecommunications — 2.8% | | | | | | | | |
| Fairpoint Communications, Inc. (a) | | | 7,000 | | | | 97,790 | |
| Inteliquent, Inc. | | | 27,100 | | | | 375,877 | |
| LogMeIn, Inc. (a)(b) | | | 6,900 | | | | 321,678 | |
| Polycom, Inc. (a) | | | 20,700 | | | | 259,371 | |
| | | | | | | | 1,054,716 | |
| Total Communications (Cost $1,102,691) | | | | | | | 1,406,236 | |
| Consumer, Cyclical — 14.8% | | | | | | | | |
| Airlines — 2.4% | | | | | | | | |
| Alaska Air Group, Inc. | | | 3,560 | | | | 338,378 | |
| Hawaiian Holdings, Inc. (a)(b) | | | 31,900 | | | | 437,349 | |
| JetBlue Airways Corp. (a)(b) | | | 12,700 | | | | 137,795 | |
| | | | | | | | 913,522 | |
| Apparel — 0.2% | | | | | | | | |
| Skechers U.S.A., Inc. (a) | | | 1,600 | | | | 73,120 | |
| Auto Parts & Equipment — 4.4% | | | | | | | | |
| American Axle & Manufacturing Holdings Inc. (a) | | | 6,700 | | | | 126,563 | |
| Lear Corp. | | | 5,410 | | | | 483,221 | |
| Meritor, Inc. (a) | | | 21,900 | | | | 285,576 | |
| The Goodyear Tire & Rubber Co. | | | 9,400 | | | | 261,132 | |
| Tower International, Inc. (a) | | | 14,390 | | | | 530,128 | |
| | | | | | | | 1,686,620 | |
| Distribution & Wholesale — 2.1% | | | | | | | | |
| Arrow Electronics, Inc. (a) | | | 5,100 | | | | 308,091 | |
| Core-Mark Holding Co., Inc. | | | 2,400 | | | | 109,512 | |
| Ingram Micro, Inc. (a) | | | 12,690 | | | | 370,675 | |
| | | | | | | | 788,278 | |
| Home Builders — 0.2% | | | | | | | | |
| NVR, Inc. (a) | | | 60 | | | | 69,036 | |
| Leisure Time — 0.4% | | | | | | | | |
| Polaris Industries, Inc. | | | 1,220 | | | | 158,893 | |
| Lodging — 0.5% | | | | | | | | |
| The Marcus Corp. | | | 10,100 | | | | 184,325 | |
| | | Number | | | Fair | |
| | | of Shares | | | Value | |
| Domestic Common Stocks (Continued) | | | | | | | | |
| | | | | | | | | |
| Retail — 4.6% | | | | | | | | |
| ANN, Inc. (a) | | | 2,900 | | | $ | 119,306 | |
| Asbury Automotive Group, Inc. (a) | | | 2,100 | | | | 144,354 | |
| Brinker International, Inc. | | | 2,900 | | | | 141,085 | |
| Foot Locker, Inc. | | | 10,000 | | | | 507,200 | |
| Jack in the Box, Inc. | | | 2,600 | | | | 155,584 | |
| Rite Aid Corp. (a) | | | 36,200 | | | | 259,554 | |
| The Finish Line, Inc. | | | 14,800 | | | | 440,152 | |
| | | | | | | | 1,767,235 | |
| Total Consumer, Cyclical (Cost $4,779,390) | | | | | | | 5,641,029 | |
| Consumer, Non-cyclical — 15.4% | | | | | | | | |
| Biotechnology — 4.3% | | | | | | | | |
| Acorda Therapeutics, Inc. (a) | | | 6,300 | | | | 212,373 | |
| Ligand Pharmaceuticals, Inc. (a) | | | 1,200 | | | | 74,748 | |
| Myriad Genetics, Inc. (a)(b) | | | 10,610 | | | | 412,941 | |
| PDL BioPharma, Inc. (b) | | | 53,800 | | | | 520,784 | |
| United Therapeutics Corp. (a) | | | 4,900 | | | | 433,601 | |
| | | | | | | | 1,654,447 | |
| Commercial Services — 4.7% | | | | | | | | |
| Avis Budget Group, Inc. (a) | | | 7,500 | | | | 447,675 | |
| Global Cash Access Holdings, Inc. (a) | | | 56,900 | | | | 506,410 | |
| ITT Educational Services, Inc. (a)(b) | | | 7,900 | | | | 131,851 | |
| Net 1 UEPS Technologies, Inc. (a) | | | 36,100 | | | | 410,818 | |
| Strayer Education, Inc. (a) | | | 1,900 | | | | 99,769 | |
| The Providence Services Corp. (a) | | | 5,600 | | | | 204,904 | |
| | | | | | | | 1,801,427 | |
| Food — 1.4% | | | | | | | | |
| Cal-Maine Foods, Inc. | | | 2,700 | | | | 200,664 | |
| Sanderson Farms, Inc. | | | 3,300 | | | | 320,760 | |
| | | | | | | | 521,424 | |
| Healthcare-Products — 0.6% | | | | | | | | |
| Symmetry Medical, Inc. (a) | | | 27,000 | | | | 239,220 | |
| Healthcare-Services — 1.8% | | | | | | | | |
| Health Net, Inc. (a) | | | 8,900 | | | | 369,706 | |
| Magellan Health Services, Inc. (a) | | | 5,100 | | | | 317,424 | |
| | | | | | | | 687,130 | |
| Household Products & Wares — 0.3% | | | | | | | | |
| Spectrum Brands Holdings, Inc. | | | 1,200 | | | | 103,236 | |
| Pharmaceuticals — 2.3% | | | | | | | | |
| Lannett Co., Inc. (a) | | | 1,600 | | | | 79,392 | |
| Omnicare, Inc. (b) | | | 7,500 | | | | 499,275 | |
| PharMerica Corp. (a) | | | 10,800 | | | | 308,772 | |
| | | | | | | | 887,439 | |
| Total Consumer, Non-cyclical (Cost $5,078,978) | | | | | | | 5,894,323 | |
| Energy — 6.3% | | | | | | | | |
| Energy-Alternate Sources — 1.0% | | | | | | | | |
| Green Plains, Inc. (b) | | | 11,200 | | | | 368,144 | |
| Oil & Gas — 4.6% | | | | | | | | |
| Gran Tierra Energy, Inc. (a) | | | 14,700 | | | | 119,364 | |
| Parker Drilling Co. (a) | | | 37,800 | | | | 246,456 | |
| PBF Energy, Inc. | | | 14,500 | | | | 386,425 | |
| SM Energy Co. | | | 6,300 | | | | 529,830 | |
| Targa Resources Corp. | | | 3,300 | | | | 460,581 | |
| | | | | | | | 1,742,656 | |
The accompanying notes are an integral part of the financial statements.
24 | 2 0 1 4 A N N U A L R E P O R T
Schedule of Investments
Quaker Small-Cap Value Fund
June 30, 2014
| | | Number | | | Fair | |
| | | of Shares | | | Value | |
| Domestic Common Stocks (Continued) | | | | | | |
| |
| Oil & Gas Services — 0.7% | | | | | | | | |
| Pioneer Energy Services Corp. (a) | | | 16,200 | | | $ | 284,148 | |
| Total Energy (Cost $2,134,659) | | | | | | | 2,394,948 | |
| Financial — 9.8% | | | | | | | | |
| Banks — 0.6% | | | | | | | | |
| Lakeland Financial Corp. (b) | | | 5,690 | | | | 217,130 | |
| Diversified Financial Services — 2.7% | | | | | | | | |
| Manning & Napier, Inc. | | | 8,870 | | | | 153,096 | |
| Outerwall, Inc. (a)(b) | | | 7,900 | | | | 468,865 | |
| Waddell & Reed Financial, Inc. | | | 6,320 | | | | 395,569 | |
| | | | | | | | 1,017,530 | |
| Insurance — 6.2% | | | | | | | | |
| American Financial Group, Inc. | | | 6,330 | | | | 377,015 | |
| Assurant, Inc. (b) | | | 6,820 | | | | 447,051 | |
| Genworth Financial, Inc. (a) | | | 26,300 | | | | 457,620 | |
| Radian Group, Inc. (b) | | | 33,700 | | | | 499,097 | |
| Reinsurance Group of America, Inc., Class A | | | 5,840 | | | | 460,776 | |
| United Insurance Holdings Corp. | | | 7,300 | | | | 125,998 | |
| | | | | | | | 2,367,557 | |
| Real Estate — 0.3% | | | | | | | | |
| Jones Lang LaSalle, Inc. | | | 1,000 | | | | 126,390 | |
| Total Financial (Cost $3,444,978) | | | | | | | 3,728,607 | |
| Industrial — 13.5% | | | | | | | | |
| Aerospace & Defense — 1.8% | | | | | | | | |
| Alliant Techsystems, Inc. | | | 2,470 | | | | 330,782 | |
| Exelis, Inc. | | | 21,910 | | | | 372,032 | |
| | | | | | | | 702,814 | |
| Building Materials — 3.7% | | | | | | | | |
| Broadwind Energy, Inc. (a) | | | 8,400 | | | | 73,668 | |
| Comfort Systems U.S.A., Inc. | | | 18,700 | | | | 295,460 | |
| Drew Industries, Inc. | | | 9,080 | | | | 454,091 | |
| Nortek, Inc. (a) | | | 2,100 | | | | 188,496 | |
| Patrick Industries, Inc. (a) | | | 5,100 | | | | 237,609 | |
| Universal Forest Products, Inc. | | | 3,500 | | | | 168,945 | |
| | | | | | | | 1,418,269 | |
| Electronics — 2.0% | | | | | | | | |
| Avnet, Inc. | | | 6,600 | | | | 292,446 | |
| Benchmark Electronics, Inc. (a) | | | 19,100 | | | | 486,668 | |
| | | | | | | | 779,114 | |
| Engineering & Construction — 1.4% | | | | | | | | |
| Argan, Inc. | | | 8,400 | | | | 313,236 | |
| URS Corp. | | | 5,100 | | | | 233,835 | |
| | | | | | | | 547,071 | |
| Miscellaneous Manufacturing — 2.9% | | | | | | | | |
| Smith & Wesson Holding Corp. (a)(b) | | | 31,900 | | | | 463,826 | |
| SPX Corp. | | | 4,800 | | | | 519,408 | |
| Trinity Industries, Inc. | | | 3,000 | | | | 131,160 | |
| | | | | | | | 1,114,394 | |
| Packaging & Containers — 0.5% | | | | | | | | |
| Packaging Corp. of America | | | 2,700 | | | | 193,023 | |
| Shipbuilding — 1.2% | | | | | | | | |
| Huntington Ingalls Industries, Inc. | | | 4,750 | | | | 449,303 | |
| Total Industrial (Cost $4,216,865) | | | | | | | 5,203,988 | |
| | | Number | | | Fair | |
| | | of Shares | | | Value | |
| Domestic Common Stocks (Continued) | | | | | | | | |
| |
| Technology — 7.5% | | | | | | | | |
| Computers — 3.6% | | | | | | | | |
| Engility Holdings, Inc. (a)(b) | | | 8,000 | | | $ | 306,080 | |
| Insight Enterprises, Inc. (a) | | | 6,900 | | | | 212,106 | |
| Lexmark International, Inc. (b) | | | 11,100 | | | | 534,576 | |
| Manhattan Associates, Inc. (a) | | | 8,900 | | | | 306,427 | |
| | | | | | | | 1,359,189 | |
| Semiconductors — 2.4% | | | | | | | | |
| Cirrus Logic, Inc. (a) | | | 7,200 | | | | 163,728 | |
| Lattice Semiconductor Corp. (a) | | | 12,600 | | | | 103,950 | |
| ON Semiconductor Corp. (a) | | | 21,500 | | | | 196,510 | |
| QLogic Corp. (a) | | | 45,700 | | | | 461,113 | |
| | | | | | | | 925,301 | |
| Software — 1.5% | | | | | | | | |
| Aspen Technology, Inc. (a) | | | 2,600 | | | | 120,640 | |
| Ebix, Inc. (b) | | | 14,600 | | | | 208,926 | |
| Progress Software Corp. (a) | | | 9,300 | | | | 223,572 | |
| | | | | | | | 553,138 | |
| Total Technology (Cost $2,611,929) | | | | | | | 2,837,628 | |
| Utilities — 3.1% | | | | | | | | |
| Electric — 1.0% | | | | | | | | |
| El Paso Electric Co. | | | 5,200 | | | | 209,092 | |
| Portland General Electric Co. | | | 5,400 | | | | 187,218 | |
| | | | | | | | 396,310 | |
| Gas — 2.1% | | | | | | | | |
| UGI Corp. | | | 9,700 | | | | 489,850 | |
| Vectren Corp. | | | 7,300 | | | | 310,250 | |
| | | | | | | | 800,100 | |
| Total Utilities (Cost $1,065,242) | | | | | | | 1,196,410 | |
Total Domestic Common Stocks
(Cost $26,218,488) | | | | | | | 30,222,200 | |
|
| | | | | | | | | |
| Foreign Common Stocks — 15.5% | | | | | | | | |
| |
| Bermuda — 6.8% | | | | | | | | |
| Insurance — 6.8% | | | | | | | | |
| Aspen Insurance Holdings Ltd. | | | 11,100 | | | | 504,162 | |
| Axis Capital Holdings Ltd. | | | 4,820 | | | | 213,430 | |
| Everest Re Group Ltd. | | | 3,120 | | | | 500,729 | |
| PartnerRe Ltd. | | | 4,050 | | | | 442,300 | |
| Platinum Underwriters Holdings Ltd. | | | 7,400 | | | | 479,890 | |
| Validus Holdings Ltd. | | | 12,000 | | | | 458,880 | |
| | | | | | | | 2,599,391 | |
| Total Bermuda (Cost $2,231,393) | | | | | | | 2,599,391 | |
| Canada — 2.2% | | | | | | | | |
| Commercial Services — 1.2% | | | | | | | | |
| FirstService Corp. | | | 8,790 | | | | 444,686 | |
| Electrical Components & Equipment — 0.5% | | | | | | | | |
| Canadian Solar, Inc. (a) | | | 6,500 | | | | 203,190 | |
| Healthcare-Products — 0.5% | | | | | | | | |
| Nordion, Inc. (a) | | | 16,000 | | | | 200,960 | |
| Total Canada (Cost $758,276) | | | | | | | 848,836 | |
The accompanying notes are an integral part of the financial statements.
2 0 1 4 A N N U A L R E P O R T | 25
Schedule of Investments
Quaker Small-Cap Value Fund
June 30, 2014
| | | Number | | | Fair | |
| | | of Shares | | | Value | |
| Foreign Common Stocks (continued) | | | | | | |
| | | | | | | |
| Cayman Islands — 2.0% | | | | | | |
| Insurance — 1.3% | | | | | | |
| Greenlight Capital Re Ltd. (a) | | | 14,600 | | | $ | 480,924 | |
| Pharmaceuticals — 0.7% | | | | | | | | |
| Herbalife Ltd. (b) | | | 4,100 | | | | 264,614 | |
| Total Cayman Islands (Cost $682,140) | | | | | | | 745,538 | |
| Curacao — 1.2% | | | | | | | | |
| Healthcare-Products — 1.2% | | | | | | | | |
| Orthofix International NV (a) | | | 12,500 | | | | 453,125 | |
| Total Curacao (Cost $417,504) | | | | | | | 453,125 | |
| Ireland — 1.1% | | | | | | | | |
| Healthcare-Services — 1.1% | | | | | | | | |
| ICON PLC (a) | | | 8,700 | | | | 409,857 | |
| Total Ireland (Cost $339,987) | | | | | | | 409,857 | |
| Netherlands — 1.1% | | | | | | | | |
| Engineering & Construction — 1.1% | | | | | | | | |
| Chicago Bridge & Iron Co. NV | | | 6,000 | | | | 409,200 | |
| Total Netherlands (Cost $477,050) | | | | | | | 409,200 | |
| Singapore — 0.9% | | | | | | | | |
| Electronics — 0.9% | | | | | | | | |
| Flextronics International Ltd. (a) | | | 30,700 | | | | 339,849 | |
| Total Singapore (Cost $256,806) | | | | | | | 339,849 | |
| Switzerland — 0.2% | | | | | | | | |
| Insurance — 0.2% | | | | | | | | |
| Allied World Assurance Co. Holdings AG | | | 2,550 | | | | 96,951 | |
| Total Switzerland (Cost $71,668) | | | | | | | 96,951 | |
Total Foreign Common Stocks
(Cost $5,234,824) | | | | | | | 5,902,747 | |
| | | | | | | | | |
| Real Estate Investment Trusts — 4.0% | | | | | | | | |
| | | | | | | | | |
| Dupont Fabros Technology, Inc. (b) | | | 18,900 | | | | 509,544 | |
| RLJ Lodging Trust | | | 18,400 | | | | 531,576 | |
| Ryman Hospitality Properties | | | 10,300 | | | | 495,945 | |
| | | | | | | | 1,537,065 | |
Total Real Estate Investment Trusts
(Cost $1,366,170) | | | | | | | 1,537,065 | |
| | | | | | | | | |
| Investments Purchased with Proceeds from Securities Lending — 13.9% | |
| | | | | | | | | |
| Money Market Funds — 13.9% | | | | | | | | |
| Mount Vernon Securities Lending Trust Prime Portfolio, 0.18% (c)(d) | | | 5,298,458 | | | | 5,298,458 | |
| Total Investments Purchased with Proceeds from Securities Lending (Cost $5,298,458) | | | 5,298,458 | |
Total Investments
(Cost $38,117,940) — 112.5% | | | | | | | 42,960,470 | |
| Liabilities in Excess of Other Assets , Net (12.5)% | | | | | | | (4,773,317 | ) |
| Total Net Assets — 100.0% | | | | | | $ | 38,187,153 | |
| (a) | Non-income producing security. |
| (b) | All or a portion of the security is out on loan. |
| (c) | The rate shown is the annualized seven-day effective yield at period end. |
| (d) | Represents investments of collateral received from securities lending transactions. |
The accompanying notes are an integral part of the financial statements.
26 | 2 0 1 4 A N N U A L R E P O R T
Schedule of Investments
Quaker Strategic Growth Fund
June 30, 2014
| | | Number | | | Fair | |
| | | of Shares | | | Value | |
| Domestic Common Stocks — 78.9% | | | | | | |
| |
| Basic Materials — 2.0% | | | | | | | | |
| Chemicals — 2.0% | | | | | | | | |
| Monsanto Co. | | | 26,470 | | | $ | 3,301,868 | |
| Total Basic Materials (Cost $2,846,277) | | | | | | | 3,301,868 | |
| Communications — 13.4% | | | | | | | | |
| Internet — 6.7% | | | | | | | | |
| Amazon.com, Inc. (a) | | | 6,415 | | | | 2,083,464 | |
| Facebook, Inc. Class A (a) | | | 37,645 | | | | 2,533,132 | |
| Google, Inc. Class A (a) | | | 2,990 | | | | 1,748,163 | |
| Google, Inc. Class C (a) | | | 3,045 | | | | 1,751,728 | |
| The Priceline Group, Inc. (a) | | | 1,755 | | | | 2,111,265 | |
| Yelp, Inc. (a) | | | 14,756 | | | | 1,131,490 | |
| | | | | | | | 11,359,242 | |
| Media — 6.7% | | | | | | | | |
| AMC Networks, Inc. (a) | | | 6,980 | | | | 429,200 | |
| CBS Corp. | | | 48,490 | | | | 3,013,169 | |
| Time Warner, Inc. | | | 35,065 | | | | 2,463,316 | |
| Twenty-First Century Fox, Inc. Class A (b) | | | 71,205 | | | | 2,502,856 | |
| Viacom, Inc. | | | 33,885 | | | | 2,938,846 | |
| | | | | | | | 11,347,387 | |
| Total Communications (Cost $20,228,413) | | | | | | | 22,706,629 | |
| Consumer, Cyclical — 9.9% | | | | | | | | |
| Airlines — 6.1% | | | | | | | | |
| American Airlines Group, Inc. (a) | | | 135,324 | | | | 5,813,519 | |
| AMR Corp. Escrow (a)^ | | | 211,235 | | | | 365,437 | |
| Delta Air Lines, Inc. | | | 86,815 | | | | 3,361,477 | |
| United Continental Holdings, Inc. (a) | | | 19,775 | | | | 812,159 | |
| | | | | | | | 10,352,592 | |
| Auto Parts & Equipment — 0.8% | | | | | | | | |
| TRW Automotive Holdings Corp. (a)(b) | | | 15,030 | | | | 1,345,486 | |
| Lodging — 2.0% | | | | | | | | |
| Las Vegas Sands Corp. | | | 44,024 | | | | 3,355,509 | |
| Retail — 1.0% | | | | | | | | |
| L Brands, Inc. | | | 29,155 | | | | 1,710,232 | |
| Total Consumer, Cyclical (Cost $10,437,850) | | | | | | | 16,763,819 | |
| Consumer, Non-cyclical — 23.5% | | | | | | | | |
| Biotechnology — 11.8% | | | | | | | | |
| Amgen, Inc. (b) | | | 43,245 | | | | 5,118,911 | |
| Biogen Idec, Inc. (a) | | | 24,430 | | | | 7,703,023 | |
| Celgene Corp. (a)(b) | | | 19,930 | | | | 1,711,588 | |
| Gilead Sciences, Inc. (a)(b) | | | 40,735 | | | | 3,377,339 | |
| Regeneron Pharmaceuticals, Inc. (a)(b) | | | 5,969 | | | | 1,686,063 | |
| Vertex Pharmaceuticals, Inc. (a) | | | 4,525 | | | | 428,427 | |
| | | | | | | | 20,025,351 | |
| Commercial Services — 1.4% | | | | | | | | |
| Mastercard, Inc. Class A | | | 33,310 | | | | 2,447,286 | |
| Food — 1.6% | | | | | | | | |
| Mondelez International, Inc. | | | 72,395 | | | | 2,722,776 | |
| Healthcare-Services — 2.0% | | | | | | | | |
| Aetna, Inc. | | | 41,150 | | | | 3,336,442 | |
| | | Number | | | Fair | |
| | | of Shares | | | Value | |
| Domestic Common Stocks (Continued) | | | | | | | | |
| |
| Pharmaceuticals — 6.7% | | | | | | | | |
| Abbott Laboratories | | | 52,445 | | | $ | 2,145,001 | |
| AbbVie, Inc. | | | 46,735 | | | | 2,637,723 | |
| Eli Lilly & Company | | | 55,185 | | | | 3,430,851 | |
| Mead Johnson Nutrition Co. | | | 33,215 | | | | 3,094,642 | |
| | | | | | | | 11,308,217 | |
| Total Consumer, Non-cyclical (Cost $34,395,454) | | | | | | | 39,840,072 | |
| Energy — 3.0% | | | | | | | | |
| Oil & Gas — 3.0% | | | | | | | | |
| Anadarko Petroleum Corp. | | | 22,895 | | | | 2,506,316 | |
| Noble Energy, Inc. | | | 32,185 | | | | 2,493,050 | |
| | | | | | | | 4,999,366 | |
| Total Energy (Cost $4,550,819) | | | | | | | 4,999,366 | |
| Financial — 7.5% | | | | | | | | |
| Banks — 1.5% | | | | | | | | |
| Morgan Stanley | | | 79,720 | | | | 2,577,348 | |
| Diversified Financial Services — 2.9% | | | | | | | | |
| The Charles Schwab Corp. (b) | | | 92,765 | | | | 2,498,161 | |
| Visa, Inc. Class A (b) | | | 11,770 | | | | 2,480,057 | |
| | | | | | | | 4,978,218 | |
| Insurance — 3.1% | | | | | | | | |
| Hartford Financial Services Group, Inc. | | | 71,600 | | | | 2,563,996 | |
| Marsh & McLennan Cos., Inc. | | | 50,438 | | | | 2,613,697 | |
| | | | | | | | 5,177,693 | |
| Total Financial (Cost $11,642,556) | | | | | | | 12,733,259 | |
| Industrial — 3.8% | | | | | | | | |
| Electronics — 1.5% | | | | | | | | |
| Honeywell International, Inc. | | | 26,795 | | | | 2,490,595 | |
| Transportation — 2.3% | | | | | | | | |
| FedEx Corp. (b) | | | 25,310 | | | | 3,831,428 | |
| Total Industrial (Cost $5,996,521) | | | | | | | 6,322,023 | |
| Technology — 15.8% | | | | | | | | |
| Computers — 2.5% | | | | | | | | |
| Apple Inc. | | | 27,255 | | | | 2,532,807 | |
| Hewlett-Packard Co. | | | 48,340 | | | | 1,628,091 | |
| | | | | | | | 4,160,898 | |
| Semiconductors — 5.0% | | | | | | | | |
| Lam Research Corp. | | | 19,195 | | | | 1,297,198 | |
| Micron Technology, Inc. (a)(b) | | | 116,595 | | | | 3,841,805 | |
| Texas Instruments Inc. | | | 69,140 | | | | 3,304,201 | |
| | | | | | | | 8,443,204 | |
| Software — 8.3% | | | | | | | | |
| Activision Blizzard Inc. | | | 96,020 | | | | 2,141,246 | |
| Adobe Systems Inc. (a)(b) | | | 53,030 | | | | 3,837,251 | |
| Autodesk, Inc. (a) | | | 45,095 | | | | 2,542,456 | |
| Intuit Inc. (b) | | | 31,555 | | | | 2,541,124 | |
| Microsoft Corp. | | | 70,980 | | | | 2,959,866 | |
| | | | | | | | 14,021,943 | |
| Total Technology (Cost $24,096,899) | | | | | | | 26,626,045 | |
Total Domestic Common Stocks
(Cost $114,194,789) | | | | | | | 133,293,081 | |
The accompanying notes are an integral part of the financial statements.
2 0 1 4 A N N U A L R E P O R T | 27
Schedule of Investments
Quaker Strategic Growth Fund
June 30, 2014
| | | Number | | | Fair | |
| | | of Shares | | | Value | |
| Foreign Common Stocks — 16.9% | | | | | | | | |
| |
| Belgium — 1.5% | | | | | | | | |
| Beverages — 1.5% | | | | | | | | |
| Anheuser-Busch InBev NV - ADR | | | 22,425 | | | $ | 2,577,530 | |
| Total Belgium (Cost $2,193,565) | | | | | | | 2,577,530 | |
| Curacao — 1.5% | | | | | | | | |
| Oil & Gas Services — 1.5% | | | | | | | | |
| Schlumberger Ltd. | | | 22,040 | | | | 2,599,618 | |
| Total Curacao (Cost $2,034,039) | | | | | | | 2,599,618 | |
| Finland — 1.2% | | | | | | | | |
| Telecommunications — 1.2% | | | | | | | | |
| Nokia OYJ - ADR | | | 259,240 | | | | 1,959,854 | |
| Total Finland (Cost $2,025,549) | | | | | | | 1,959,854 | |
| France — 2.0% | | | | | | | | |
| Pharmaceuticals — 2.0% | | | | | | | | |
| Sanofi - ADR | | | 62,385 | | | | 3,317,010 | |
| Total France (Cost $3,112,682) | | | | | | | 3,317,010 | |
| Ireland — 1.7% | | | | | | | | |
| Pharmaceuticals — 1.7% | | | | | | | | |
| Actavis PLC (a)(b) | | | 13,321 | | | | 2,971,249 | |
| Total Ireland (Cost $2,775,086) | | | | | | | 2,971,249 | |
| Netherlands — 2.0% | | | | | | | | |
| Semiconductors — 2.0% | | | | | | | | |
| NXP Semiconductor NV (a) | | | 50,835 | | | | 3,364,260 | |
| Total Netherlands (Cost $2,590,166) | | | | | | | 3,364,260 | |
| Switzerland — 7.0% | | | | | | | | |
| Insurance — 1.5% | | | | | | | | |
| ACE Ltd. (b) | | | 24,515 | | | | 2,542,206 | |
| Pharmaceuticals — 5.5% | | | | | | | | |
| Novartis AG - ADR (b) | | | 37,555 | | | | 3,399,854 | |
| Roche Holdings, Ltd. - ADR | | | 156,420 | | | | 5,834,466 | |
| | | | | | | | 9,234,320 | |
| Total Switzerland (Cost $10,426,205) | | | | | | | 11,776,526 | |
Total Foreign Common Stocks
(Cost $25,157,292) | | | | | | | 28,566,047 | |
| |
| Investments Purchased with Proceeds from Securities Lending — 12.4% | |
| | | | | | | | | |
| Money Market Funds — 12.4% | | | | | | | | |
| Mount Vernon Securities Lending Trust Prime Portfolio, 0.18% (c)(d) | | | 21,035,500 | | | | 21,035,500 | |
Total Investments Purchased with Proceeds from Securities Lending
(Cost $21,035,500) | | | | | | | 21,035,500 | |
Total Investments
(Cost $160,387,581) — 108.2% | | | | | | | 182,894,628 | |
| Liabilities in Excess of Other Assets , Net (8.2)% | | | | | | | (13,911,612 | ) |
| Total Net Assets — 100.0% | | | | | | $ | 168,983,016 | |
| ADR - American Depositary Receipt |
| (a) | Non-income producing security. |
| (b) | All or a portion of the security is out on loan. |
| (c) | The rate shown is the annualized seven-day effective yield at period end. |
| (d) | Represents investments of collateral received from securities lending transactions. |
| ^ | Indicates a fair valued security. Total market value for fair valued securities is $365,437, representing 0.2% of net assets and Level 3 securities. |
The accompanying notes are an integral part of the financial statements.
28 | 2 0 1 4 A N N U A L R E P O R T
Statements of Assets and Liabilities
| June 30, 2014 | | | | | | | | | | | | | | | |
| | | Quaker Event
Arbitrage Fund | | | Quaker Global
Tactical
Allocation Fund | | | Quaker Mid-
Cap Value
Fund | | | Quaker Small-
Cap Value
Fund | | | Quaker
Strategic
Growth Fund | |
| ASSETS: | | | | | | | | | | | | | | | | | | | | |
| Investments, at value (Note 12) | | $ | 97,119,729 | | | $ | 7,669,491 | | | $ | 11,134,466 | | | $ | 42,960,470 | | | $ | 182,894,628 | |
| Cash | | | 25,447,154 | | | | 104,052 | | | | 693,563 | | | | 197,247 | | | | 6,717,242 | |
| Foreign currency, at value | | | 556,322 | | | | — | | | | — | | | | — | | | | — | |
| Cash held at brokers | | | 8,620,355 | | | | 243,701 | | | | — | | | | — | | | | — | |
| Receivables: | | | | | | | | | | | | | | | | | | | | |
| Dividends and interest | | | 131,261 | | | | 14,070 | | | | 15,585 | | | | 26,782 | | | | 269,092 | |
| Capital shares sold | | | 1,227,553 | | | | — | | | | 18,006 | | | | 5,197 | | | | 344,523 | |
| Investment securities sold | | | 8,910,376 | | | | 9,005 | | | | — | | | | 960,988 | | | | 1,023,356 | |
| Securities lending income | | | 2,803 | | | | 506 | | | | 113 | | | | 1,873 | | | | 6,190 | |
| Prepaid expenses and other assets | | | 93,313 | | | | 6,221 | | | | 7,416 | | | | 31,064 | | | | 139,892 | |
| Total Assets | | | 142,108,866 | | | | 8,047,046 | | | | 11,869,149 | | | | 44,183,621 | | | | 191,394,923 | |
| | | | | | | | | | | | | | | | | | | | | |
| LIABILITIES: | | | | | | | | | | | | | | | | | | | | |
| Written options, at value | | $ | 3,499,694 | | | $ | — | | | $ | — | | | $ | — | | | $ | — | |
| Securities sold short, at value | | | 4,116,958 | | | | 144,524 | | | | — | | | | — | | | | — | |
| Payables: | | | | | | | | | | | | | | | | | | | | |
| Due to advisor (Note 3) | | | 85,028 | | | | 7,545 | | | | 8,373 | | | | 31,155 | | | | 169,650 | |
| Capital shares redeemed | | | 240,935 | | | | 10,089 | | | | 40,972 | | | | 6,597 | | | | 436,721 | |
| Upon return of securities loaned | | | 7,688,944 | | | | 515,535 | | | | 1,565,695 | | | | 5,298,458 | | | | 21,035,500 | |
| Investment securities purchased | | | 7,312,845 | | | | 31,600 | | | | 215,288 | | | | 625,252 | | | | 549,424 | |
| Distribution fees | | | 15,548 | | | | 2,561 | | | | 2,834 | | | | 3,218 | | | | 36,676 | |
| Trustee expenses | | | 7,098 | | | | 603 | | | | 732 | | | | 2,951 | | | | 13,536 | |
| Chief compliance officer fees | | | 4,879 | | | | 337 | | | | 407 | | | | 1,723 | | | | 7,677 | |
| Accrued expenses | | | 72,480 | | | | 9,114 | | | | 8,983 | | | | 27,114 | | | | 162,723 | |
| Total liabilities | | | 23,044,409 | | | | 721,908 | | | | 1,843,284 | | | | 5,996,468 | | | | 22,411,907 | |
| Net Assets | | $ | 119,064,457 | | | $ | 7,325,138 | | | $ | 10,025,865 | | | $ | 38,187,153 | | | $ | 168,983,016 | |
| | | | | | | | | | | | | | | | | | | | | |
| NET ASSETS CONSIST OF: | | | | | | | | | | | | | | | | | | | | |
| Paid-in capital | | $ | 110,235,942 | | | $ | 17,573,517 | | | $ | 14,019,450 | | | $ | 32,069,867 | | | $ | 535,237,202 | |
| Accumulated net investment income (loss) | | | 3,306,993 | | | | (16,907 | ) | | | (19,443 | ) | | | — | | | | (852,247 | ) |
| Accumulated net realized gain (loss) on investments | | | 2,772,552 | | | | (11,507,533 | ) | | | (6,368,060 | ) | | | 1,274,756 | | | | (387,908,986 | ) |
| Net unrealized appreciation (depreciation) on investments: | | | | | | | | | | | | | | | | | | | | |
| Securities | | | 3,001,504 | | | | 1,265,974 | | | | 2,393,918 | | | | 4,842,530 | | | | 22,507,047 | |
| Securities sold short | | | (233,941 | ) | | | 10,087 | | | | — | | | | — | | | | — | |
| Written option contracts | | | (36,067 | ) | | | — | | | | — | | | | — | | | | — | |
| Foreign currency transactions | | | 17,474 | | | | — | | | | — | | | | — | | | | — | |
| Total net assets | | $ | 119,064,457 | | | $ | 7,325,138 | | | $ | 10,025,865 | | | $ | 38,187,153 | | | $ | 168,983,016 | |
| Total investments, at cost | | $ | 94,118,225 | | | $ | 6,403,517 | | | $ | 8,740,548 | | | $ | 38,117,940 | | | $ | 160,387,581 | |
| Includes loaned securities with a market value of | | $ | 7,302,819 | | | $ | 473,610 | | | $ | 1,515,280 | | | $ | 5,092,529 | | | $ | 19,942,937 | |
| Total foreign currency, at cost | | $ | 538,880 | | | $ | — | | | $ | — | | | $ | — | | | $ | — | |
| Proceeds from securities sold short | | | 3,883,017 | | | | 154,611 | | | | — | | | | — | | | | — | |
| Premiums on options | | | 3,463,627 | | | | ��� | | | | — | | | | — | | | | — | |
| Class A shares: | | | | | | | | | | | | | | | | | | | | |
| Net Assets | | $ | 53,035,051 | | | $ | 3,991,647 | | | $ | 5,723,795 | | | $ | 8,512,390 | | | $ | 87,052,644 | |
| Shares of beneficial interest outstanding(1) | | | 3,768,903 | | | | 381,496 | | | | 232,513 | | | | 350,584 | | | | 3,599,355 | |
| Net asset value per share and redemption price per share | | $ | 14.07 | | | $ | 10.46 | | | $ | 24.62 | | | $ | 24.28 | | | $ | 24.19 | |
| Offering price per share (100/94.50 x net asset value per share) | | $ | 14.89 | | | $ | 11.07 | | | $ | 26.05 | | | $ | 25.69 | | | $ | 25.60 | |
| Class C shares: | | | | | | | | | | | | | | | | | | | | |
| Net Assets | | $ | 6,554,906 | | | $ | 2,092,946 | | | $ | 2,086,214 | | | $ | 1,806,301 | | | $ | 22,930,803 | |
| Shares of beneficial interest outstanding(1) | | | 477,916 | | | | 209,542 | | | | 95,926 | | | | 88,396 | | | | 1,073,028 | |
| Net asset value per share and redemption price per share | | $ | 13.72 | | | $ | 9.99 | | | $ | 21.75 | | | $ | 20.43 | | | $ | 21.37 | |
| Institutional Class Shares: | | | | | | | | | | | | | | | | | | | | |
| Net Assets | | $ | 59,474,500 | | | $ | 1,240,545 | | | $ | 2,215,856 | | | $ | 27,868,462 | | | $ | 58,999,569 | |
| Shares of beneficial interest outstanding(1) | | | 4,203,510 | | | | 103,414 | | | | 85,982 | | | | 1,101,319 | | | | 2,351,003 | |
| Net asset value per share and redemption price per share | | $ | 14.15 | | | $ | 12.00 | | | $ | 25.77 | | | $ | 25.30 | | | $ | 25.10 | |
| (1) | Unlimited number of shares of beneficial interest with a 0.01 par value authorized. |
The accompanying notes are an integral part of the financial statements.
2 0 1 4 A N N U A L R E P O R T | 29
Statements of Operations
For the Fiscal Year Ended June 30, 2014
| | | Quaker Event
Arbitrage Fund | | | Quaker Global
Tactical
Allocation Fund | | | Quaker Mid-
Cap Value
Fund | | | Quaker Small-
Cap Value
Fund | | | Quaker
Strategic
Growth Fund | |
| INVESTMENT INCOME: | | | | | | | | | | | | | | | | | | | | |
| Dividends (net of foreign withholding taxes) | | $ | 1,474,206 | | | $ | 98,554 | | | $ | 142,561 | | | $ | 417,292 | | | $ | 1,780,587 | |
| Interest | | | 2,899,708 | | | | 6 | | | | 77 | | | | 93 | | | | 1,500 | |
| Securities lending income | | | 61,566 | | | | 4,346 | | | | 4,323 | | | | 77,793 | | | | 30,107 | |
| Total Income | | | 4,435,480 | | | | 102,906 | | | | 146,961 | | | | 495,178 | | | | 1,812,194 | |
| Expenses: | | | | | | | | | | | | | | | | | | | | |
| Investment advisory fees (Note 3) | | | 1,153,048 | | | | 92,621 | | | | 95,663 | | | | 363,534 | | | | 2,172,641 | |
| Funds administration and accounting fees | | | 109,549 | | | | 10,403 | | | | 12,659 | | | | 47,554 | | | | 186,692 | |
| Transfer agent fees | | | 171,130 | | | | 14,728 | | | | 22,172 | | | | 44,560 | | | | 371,203 | |
| Custody fees | | | 12,736 | | | | — | | | | 526 | | | | 14,564 | | | | 11,067 | |
| Trustee fees and meeting expenses | | | 27,924 | | | | 2,337 | | | | 2,869 | | | | 11,577 | | | | 54,095 | |
| Legal fees | | | 14,561 | | | | 929 | | | | 1,117 | | | | 4,438 | | | | 20,858 | |
| Audit fees | | | 19,682 | | | | 1,165 | | | | 1,978 | | | | 7,957 | | | | 35,601 | |
| Distribution fee — Class A | | | 106,777 | | | | 10,438 | | | | 14,897 | | | | 20,952 | | | | 224,025 | |
| Distribution fee — Class C | | | 61,251 | | | | 21,809 | | | | 18,910 | | | | 17,210 | | | | 235,541 | |
| Insurance | | | 38,629 | | | | 3,650 | | | | 5,034 | | | | 18,479 | | | | 83,469 | |
| Officers’ compensation fees | | | 51,350 | | | | 4,185 | | | | 5,276 | | | | 21,038 | | | | 96,983 | |
| Registration and filing expenses | | | 48,538 | | | | 6,401 | | | | 7,728 | | | | 28,295 | | | | 74,796 | |
| Printing expenses | | | 28,298 | | | | 4,273 | | | | 5,422 | | | | 11,025 | | | | 55,521 | |
| Dividends and interest on securities sold short | | | 6,127 | | | | 2,832 | | | | — | | | | — | | | | — | |
| Other operating expenses | | | 5,293 | | | | — | | | | 1,916 | | | | 3,178 | | | | 7,448 | |
| Total expenses | | | 1,854,893 | | | | 175,771 | | | | 196,167 | | | | 614,361 | | | | 3,629,940 | |
| Investment advisory fees (reimbursed) or recovered (Note 3) | | | (143,771 | ) | | | — | | | | — | | | | — | | | | 155,549 | |
| Net expenses | | | 1,711,122 | | | | 175,771 | | | | 196,167 | | | | 614,361 | | | | 3,785,489 | |
| Net investment income (loss) | | | 2,724,358 | | | | (72,865 | ) | | | (49,206 | ) | | | (119,183 | ) | | | (1,973,295 | ) |
| | | | | | | | | | | | | | | | | | | | | |
| REALIZED AND UNREALIZED GAIN (LOSS) ON INVESTMENTS | | | | | | | | | | | | | | | |
| Net realized gain (loss) on investments: | | | | | | | | | | | | | | | | | | | | |
| Securities | | | 4,286,494 | | | | 1,133,949 | | | | 1,749,962 | | | | 6,633,684 | | | | 35,701,470 | |
| Securities sold short | | | (407,873 | ) | | | 6,386 | | | | — | | | | — | | | | — | |
| Written options | | | (777,755 | ) | | | — | | | | — | | | | — | | | | — | |
| Foreign currency transactions | | | 26,590 | | | | — | | | | — | | | | — | | | | — | |
| Forwards | | | (14,974 | ) | | | — | | | | — | | | | — | | | | — | |
| Net change in unrealized appreciation (depreciation) of investments: | | | | | | | | | | | | | | | | | | | | |
| Securities | | | 3,217,315 | | | | 603,050 | | | | 658,016 | | | | 1,488,495 | | | | 3,559,837 | |
| Securities sold short | | | (228,457 | ) | | | (11,938 | ) | | | — | | | | — | | | | — | |
| Written options | | | 78,628 | | | | — | | | | — | | | | — | | | | — | |
| Foreign currency transactions | | | 21,680 | | | | — | | | | — | | | | — | | | | — | |
| Forwards | | | 420 | | | | — | | | | — | | | | — | | | | — | |
| Net realized and unrealized gain on investments | | | 6,202,068 | | | | 1,731,447 | | | | 2,407,978 | | | | 8,122,179 | | | | 39,261,307 | |
| Net increase in net assets resulting from operations | | $ | 8,926,426 | | | $ | 1,658,582 | | | $ | 2,358,772 | | | $ | 8,002,996 | | | $ | 37,288,012 | |
| (Foreign withholding taxes on dividends/tax reclaims/interest) | | $ | (8,010 | ) | | $ | (6,760 | ) | | $ | (187 | ) | | $ | (321 | ) | | $ | (114,235 | ) |
The accompanying notes are an integral part of the financial statements.
30 | 2 0 1 4 A N N U A L R E P O R T
Statements of Changes in Net Assets
For the Fiscal Year Ended June 30, 2014
| | | Quaker Event
Arbitrage Fund | | | Quaker
Global Tactical
Allocation Fund | | | Quaker Mid-
Cap Value
Fund | | | Quaker Small-
Cap Value
Fund | | | Quaker
Strategic
Growth Fund | |
| INCREASE (DECREASE) IN NET ASSETS | | | | | | | | | | | | | | | | | | | | |
| Operations: | | | | | | | | | | | | | | | | | | | | |
| Net investment income (loss) | | $ | 2,724,358 | | | $ | (72,865 | ) | | $ | (49,206 | ) | | $ | (119,183 | ) | | $ | (1,973,295 | ) |
| Net realized gain (loss) on investment transactions: | | | | | | | | | | | | | | | | | |
| Securities | | | 4,286,494 | | | | 1,133,949 | | | | 1,749,962 | | | | 6,633,684 | | | | 35,701,470 | |
| Securities sold short | | | (407,873 | ) | | | 6,386 | | | | — | | | | — | | | | — | |
| Written options | | | (777,755 | ) | | | — | | | | — | | | | — | | | | — | |
| Foreign currency transactions | | | 26,590 | | | | — | | | | — | | | | — | | | | — | |
| Forwards | | | (14,974 | ) | | | — | | | | — | | | | — | | | | — | |
| Net change in unrealized appreciation (depreciation) of investment transactions: | | | | | | | | |
| Securities | | | 3,217,315 | | | | 603,050 | | | | 658,016 | | | | 1,488,495 | | | | 3,559,837 | |
| Securities sold short | | | (228,457 | ) | | | (11,938 | ) | | | — | | | | — | | | | — | |
| Written options | | | 78,628 | | | | — | | | | — | | | | — | | | | — | |
| Foreign currency transactions | | | 21,680 | | | | — | | | | — | | | | — | | | | — | |
| Forwards | | | 420 | | | | — | | | | — | | | | — | | | | — | |
| Net increase (decrease) in net assets resulting from operations | | | 8,926,426 | | | | 1,658,582 | | | | 2,358,772 | | | | 8,002,996 | | | | 37,288,012 | |
| Distributions to shareholders from: | | | | | | | | | | | | | | | | | | | | |
| Net investment income — Class A | | | (27,671 | ) | | | — | | | | — | | | | (21,954 | ) | | | — | |
| Net investment income — Institutional Class | | | (65,885 | ) | | | — | | | | — | | | | (95,111 | ) | | | — | |
| Net realized capital gain — Class A | | | (216,462 | ) | | | — | | | | — | | | | — | | | | — | |
| Net realized capital gain — Class C | | | (33,170 | ) | | | — | | | | — | | | | — | | | | — | |
| Net realized capital gain — Institutional Class | | | (207,847 | ) | | | — | | | | — | | | | — | | | | — | |
| Total distributions | | | (551,035 | ) | | | — | | | | — | | | | (117,065 | ) | | | — | |
| Capital share transactions: | | | | | | | | | | | | | | | | | | | | |
| Increase (decrease) in net assets from fund share transactions (Note 9) | | | 44,574,266 | | | | (939,131 | ) | | | (1,237,219 | ) | | | (2,444,037 | ) | | | (26,094,689 | ) |
| Total increase (decrease) in net assets | | | 52,949,657 | | | | 719,451 | | | | 1,121,553 | | | | 5,441,894 | | | | 11,193,323 | |
| | | | | | | | | | | | | | | | | | | | | |
| NET ASSETS | | | | | | | | | | | | | | | | | | | | |
| Beginning of period | | | 66,114,800 | | | | 6,605,687 | | | | 8,904,312 | | | | 32,745,259 | | | | 157,789,693 | |
| End of period | | $ | 119,064,457 | | | $ | 7,325,138 | | | $ | 10,025,865 | | | $ | 38,187,153 | | | $ | 168,983,016 | |
| Undistributed (Accumulated) net investment income (loss), at end of period | | $ | 3,306,993 | | | $ | (16,907 | ) | | $ | (19,443 | ) | | $ | — | | | $ | (852,247 | ) |
For the Fiscal Year Ended June 30, 2013
| | | Quaker Event
Arbitrage Fund | | | Quaker
Global Tactical
Allocation Fund | | | Quaker Mid-
Cap Value
Fund | | | Quaker Small-
Cap Value
Fund | | | Quaker
Strategic
Growth Fund | |
| INCREASE (DECREASE) IN NET ASSETS | | | | | | | | | | | | | | | | | | | | |
| Operations: | | | | | | | | | | | | | | | | | | | | |
| Net investment income (loss) | | $ | 1,719,627 | | | $ | (119,641 | ) | | $ | (76,923 | ) | | $ | 194,525 | | | $ | (1,511,147 | ) |
| Net realized gain (loss) on investment transactions: | | | | | | | | | | | | | | | | | | | | |
| Securities | | | (4,811,477 | ) | | | 1,133,487 | | | | 1,127,978 | | | | 4,025,085 | | | | 22,222,065 | |
| Securities sold short | | | (915,912 | ) | | | (79,072 | ) | | | — | | | | — | | | | — | |
| Written options | | | 6,102,873 | | | | 1,230 | | | | — | | | | — | | | | 21,331 | |
| Foreign currency transactions | | | 64,001 | | | | — | | | | — | | | | — | | | | — | |
| Forwards | | | 91,691 | | | | — | | | | — | | | | — | | | | — | |
| Net change in unrealized appreciation (depreciation) of investment transactions: | | | | | | | | | | | | | | | | | | | | |
| Securities | | | 2,252,194 | | | | 284,065 | | | | 439,560 | | | | 2,301,123 | | | | 8,287,981 | |
| Securities sold short | | | (54,987 | ) | | | 36,139 | | | | — | | | | — | | | | — | |
| Written options | | | 326,361 | | | | 107 | | | | — | | | | — | | | | 1,704 | |
| Foreign currency transactions | | | (7,798 | ) | | | — | | | | — | | | | — | | | | — | |
| Forwards | | | (23,831 | ) | | | — | | | | — | | | | — | | | | — | |
| Net increase (decrease) in net assets resulting from operations | | | 4,742,742 | | | | 1,256,315 | | | | 1,490,615 | | | | 6,520,733 | | | | 29,021,934 | |
| Distributions to shareholders from: | | | | | | | | | | | | | | | | | | | | |
| Net investment income — Class A | | | (39,234 | ) | | | — | | | | — | | | | (8,724 | ) | | | — | |
| Net investment income — Institutional Class | | | (61,271 | ) | | | — | | | | — | | | | (77,784 | ) | | | — | |
| Net realized capital gain — Class A | | | (351,265 | ) | | | — | | | | — | | | | — | | | | — | |
| Net realized capital gain — Class C | | | (74,102 | ) | | | — | | | | — | | | | — | | | | — | |
| Net realized capital gain — Institutional Class | | | (174,648 | ) | | | — | | | | — | | | | — | | | | — | |
| Total distributions | | | (700,520 | ) | | | — | | | | — | | | | (86,508 | ) | | | — | |
| Capital share transactions: | | | | | | | | | | | | | | | | | | | | |
| Increase (decrease) in net assets from fund share transactions (Note 9) | | | 6,860,869 | | | | (4,414,061 | ) | | | (1,001,539 | ) | | | (3,927,430 | ) | | | (50,399,652 | ) |
| Total increase (decrease) in net assets | | | 10,903,091 | | | | (3,157,746 | ) | | | 489,076 | | | | 2,506,795 | | | | (21,377,718 | ) |
| | | | | | | | | | | | | | | | | | | | | |
| NET ASSETS | | | | | | | | | | | | | | | | | | | | |
| Beginning of period | | | 55,211,709 | | | | 9,763,433 | | | | 8,415,236 | | | | 30,238,464 | | | | 179,167,411 | |
| End of period | | $ | 66,114,800 | | | $ | 6,605,687 | | | $ | 8,904,312 | | | $ | 32,745,259 | | | $ | 157,789,693 | |
| Undistributed (Accumulated) net investment income (loss), at end of period | | $ | 1,855,341 | | | $ | (46,337 | ) | | $ | (34,658 | ) | | $ | 75,167 | | | $ | (574,287 | ) |
|
The accompanying notes are an integral part of the financial statements.
2 0 1 4 A N N U A L R E P O R T | 31
Financial Highlights
Quaker Event Arbitrage Fund
(For a Share Outstanding Throughout the Period)
| | | Class A |
| | | Years Ended June 30, | | | For the Period
January 1, 2010 | | Year Ended
December 31, |
| | | 2014 | | | 2013 | | | 2012 | | | 2011 | | | to June 30, 2010 | | 2009 |
| Net asset value, beginning of period | | | $12.81 | | | | $11.93 | | | | $12.50 | | | | $12.54 | | | $ | 11.80 | | | $ | 9.23 | |
| Income from investment operations: | | | | | | | | | | | | | | | | | | | | | | | | |
| Net investment income (loss)(1) | | | 0.41 | | | | 0.37 | | | | 0.11 | | | | — | | | | 0.34 | | | | (0.05 | ) |
| Net realized and unrealized gain (loss) on investments | | | 0.93 | | | | 0.65 | | | | (0.41 | ) | | | 0.06 | | | | 0.40 | | | | 2.62 | |
| Total from investment operations | | | 1.34 | | | | 1.02 | | | | (0.30 | ) | | | 0.06 | | | | 0.74 | | | | 2.57 | |
| Distributions to shareholders from: | | | | | | | | | | | | | | | | | | | | | | | | |
| Net investment income | | | (0.01 | ) | | | (0.01 | ) | | | — | | | | (0.06 | ) | | | — | | | | — | |
| Net realized capital gain | | | (0.07 | ) | | | (0.13 | ) | | | (0.27 | ) | | | (0.04 | ) | | | — | | | | — | |
| Total distributions | | | (0.08 | ) | | | (0.14 | ) | | | (0.27 | ) | | | (0.10 | ) | | | — | | | | — | |
| Net asset value, end of period | | | $14.07 | | | | $12.81 | | | | $11.93 | | | | $12.50 | | | $ | 12.54 | | | $ | 11.80 | |
| Total Return(2) | | | 10.47 | % | | | 8.70 | % | | | (2.31 | )% | | | 0.47 | % | | | 6.27 | %* | | | 27.84 | % |
| Ratios/supplemental data: | | | | | | | | | | | | | | | | | | | | | | | | |
| Net assets, end of period (000’ omitted) | | | $53,035 | | | | $35,232 | | | | $34,725 | | | | $25,413 | | | $ | 4,283 | | | $ | 2,918 | |
| Ratio of expenses to average net assets: | | | | | | | | | | | | | | | | | | | | | | | | |
| Expense before reductions(3)(4) | | | 2.15 | % | | | 2.37 | % | | | 2.37 | % | | | 2.30 | % | | | 3.25 | %** | | | 3.86 | % |
| Expense net of fee waivers, if any(3)(5) | | | 1.99 | % | | | 1.99 | % | | | 1.99 | % | | | 1.99 | % | | | 2.44 | %** | | | 1.91 | % |
| Ratio of net investment income (loss) to average net assets ***: | | | | | | | | | | | | | | | | | | | | | | | | |
| Before waiver and expense reimbursement(3) | | | 2.85 | % | | | 2.64 | % | | | 0.55 | % | | | (0.28 | )% | | | 5.59 | %** | | | (0.47 | )% |
| After waiver and expense reimbursement(3) | | | 3.01 | % | | | 3.02 | % | | | 0.92 | % | | | 0.04 | % | | | 5.59 | %** | | | (0.47 | )% |
| Portfolio turnover rate | | | 280 | % | | | 186 | % | | | 157 | % | | | 99 | % | | | 139 | %* | | | 226 | % |
| | |
| (1) | The average shares outstanding method has been applied for per share information. |
| | |
| (2) | Total investment return is based on the change in net asset value of a share during the period, assumes reinvestment of dividends and distributions at net asset value and does not reflect the impact of a sales charge. |
| | |
| (3) | Expense waived or reimbursed reflect reductions to total expenses, as discussed in the notes to the financial statements. These amounts would increase the net investment loss ratio or decrease the net investment income ratio, as applicable, had such reductions not occurred. |
| | |
| (4) | Expenses before reductions (excluding dividend and interest expense for securities sold short) were 2.14%, 2.34%, 2.35%, 2.24%, 2.56% and 3.46% for the years ended June 30, 2014, 2013, 2012, 2011, for the period January 1, 2010 to June 30, 2010 and for the year ended December 31, 2009, respectively. |
| | |
| (5) | Expenses net of all reductions (excluding dividend and interest expense for securities sold short) were 1.98%, 1.96%, 1.98%, 1.93%, 1.76% and 1.50% for the years ended June 30, 2014, 2013, 2012, 2011, for the period January 1, 2010 to June 30, 2010 and for the year ended December 31, 2009, respectively. |
| | |
| * | Not annualized. |
| | |
| ** | Annualized. |
| | |
| *** | The net investment income (loss) ratios include dividends on short positions. |
The accompanying notes are an integral part of the financial statements.
32 | 2 0 1 4 A N N U A L R E P O R T
Financial Highlights
Quaker Event Arbitrage Fund
(For a Share Outstanding Throughout the Period)
| | | Class C |
| | | Years Ended June 30, | | | For the Period
June 7, 2010
(commencement
of operations) |
| | | 2014 | | | 2013 | | | 2012 | | | 2011 | | | to June 30, 2010 |
| Net asset value, beginning of period | | | $12.57 | | | | $11.78 | | | | $12.45 | | | | $12.55 | | | $ | 12.35 | |
| Income from investment operations: | | | | | | | | | | | | | | | | | | | | |
| Net investment income (loss)(1) | | | 0.30 | | | | 0.28 | | | | 0.02 | | | | (0.07 | ) | | | (0.21 | ) |
| Net realized and unrealized gain (loss) on investments | | | 0.92 | | | | 0.64 | | | | (0.42 | ) | | | 0.04 | | | | 0.41 | |
| Total from investment operations | | | 1.22 | | | | 0.92 | | | | (0.40 | ) | | | (0.03 | ) | | | 0.20 | |
| Distributions to shareholders from: | | | | | | | | | | | | | | | | | | | | |
| Net investment income | | | — | | | | — | | | | — | | | | (0.03 | ) | | | — | |
| Net realized capital gain | | | (0.07 | ) | | | (0.13 | ) | | | (0.27 | ) | | | (0.04 | ) | | | — | |
| Total distributions | | | (0.07 | ) | | | (0.13 | ) | | | (0.27 | ) | | | (0.07 | ) | | | — | |
| Net asset value, end of period | | | $13.72 | | | | $12.57 | | | | $11.78 | | | | $12.45 | | | $ | 12.55 | |
| Total Return(2) | | | 9.72 | % | | | 7.91 | % | | | (3.13 | )% | | | (0.24 | )% | | | 1.62 | %* |
| Ratios/supplemental data: | | | | | | | | | | | | | | | | | | | | |
| Net assets, end of period (000’ omitted) | | | $6,555 | | | | $5,954 | | | | $7,195 | | | | $4,369 | | | $ | 231 | |
| Ratio of expenses to average net assets: | | | | | | | | | | | | | | | | | | | | |
| Expense before reductions(3)(4) | | | 2.90 | % | | | 3.12 | % | | | 3.12 | % | | | 3.08 | % | | | 2.74 | %** |
| Expense net of fee waivers, if any(3)(5) | | | 2.74 | % | | | 2.74 | % | | | 2.74 | % | | | 2.74 | % | | | 2.74 | %** |
| Ratio of net investment income (loss) to average net assets ***: | | | | | | | | | | | | | | | | | | | | |
| Before waiver and expense reimbursement(4) | | | 2.10 | % | | | 1.89 | % | | | (0.17 | )% | | | (0.91 | )% | | | (29.65 | )%** |
| After waiver and expense reimbursement(4) | | | 2.26 | % | | | 2.27 | % | | | 0.21 | % | | | (0.57 | )% | | | (29.65 | )%** |
| Portfolio turnover rate | | | 280 | % | | | 186 | % | | | 157 | % | | | 99 | % | | | 139 | %* |
| | |
| (1) | The average shares outstanding method has been applied for per share information. |
| | |
| (2) | Total investment return is based on the change in net asset value of a share during the period, assumes reinvestment of dividends and distributions at net asset value and does not reflect the impact of a sales charge. |
| | |
| (3) | Expense waived or reimbursed reflect reductions to total expenses, as discussed in the notes to the financial statements. These amounts would increase the net investment loss ratio or decrease the net investment income ratio, as applicable, had such reductions not occurred. |
| | |
| (4) | Expenses before reductions (excluding dividend and interest expense for securities sold short) were 2.89%, 3.09%, 3.10%, 3.02% and 2.52% for the years ended June 30, 2014, 2013, 2012, 2011 and for the period June 7, 2010 to June 30, 2010, respectively. |
| | |
| (5) | Expenses net of all reductions (excluding dividend and interest expense for securities sold short) were 2.73%, 2.71%, 2.73%, 2.68% and 2.52% for the years ended June 30, 2014, 2013, 2012, 2011 and for the period June 7, 2010 to June 30, 2010, respectively. |
| | |
| * | Not annualized. |
| | |
| ** | Annualized. |
| | |
| *** | The net investment income (loss) ratios include dividends on short positions. |
The accompanying notes are an integral part of the financial statements.
2 0 1 4 A N N U A L R E P O R T | 33
Financial Highlights
Quaker Event Arbitrage Fund
(For a Share Outstanding Throughout the Period)
| | | Institutional Class |
| | | Years Ended June 30, | | | For the Period
June 7, 2010
(commencement
of operations) |
| | | 2014 | | | 2013 | | | 2012 | | | 2011 | | | to June 30, 2010 |
| Net asset value, beginning of period | | | $12.86 | | | | $11.97 | | | | $12.52 | | | | $12.54 | | | $ | 12.35 | |
| Income from investment operations: | | | | | | | | | | | | | | | | | | | | |
| Net investment income (loss)(1) | | | 0.44 | | | | 0.40 | | | | 0.13 | | | | 0.08 | | | | (0.03 | ) |
| Net realized and unrealized gain (loss) on investments | | | 0.94 | | | | 0.67 | | | | (0.41 | ) | | | 0.02 | | | | 0.22 | |
| Total from investment operations | | | 1.38 | | | | 1.07 | | | | (0.28 | ) | | | 0.10 | | | | 0.19 | |
| Distributions to shareholders from: | | | | | | | | | | | | | | | | | | | | |
| Net investment income | | | (0.02 | ) | | | (0.05 | ) | | | — | | | | (0.08 | ) | | | — | |
| Net realized capital gain | | | (0.07 | ) | | | (0.13 | ) | | | (0.27 | ) | | | (0.04 | ) | | | — | |
| Total distributions | | | (0.09 | ) | | | (0.18 | ) | | | (0.27 | ) | | | (0.12 | ) | | | — | |
| Net asset value, end of period | | | $14.15 | | | | $12.86 | | | | $11.97 | | | | $12.52 | | | $ | 12.54 | |
| Total Return(2) | | | 10.77 | % | | | 9.04 | % | | | (2.14 | )% | | | 0.72 | % | | | 1.54 | %* |
| Ratios/supplemental data: | | | | | | | | | | | | | | | | | | | | |
| Net assets, end of period (000’ omitted) | | | $59,474 | | | | $24,929 | | | | $13,292 | | | | $19,941 | | | $ | 743 | |
| Ratio of expenses to average net assets: | | | | | | | | | | | | | | | | | | | | |
| Expense before reductions(3)(4) | | | 1.90 | % | | | 2.12 | % | | | 2.09 | % | | | 2.11 | % | | | 3.00 | %** |
| Expense net of fee waivers, if any(3)(5) | | | 1.74 | % | | | 1.74 | % | | | 1.74 | % | | | 1.74 | % | | | 3.00 | %** |
| Ratio of net investment income (loss) to average net assets ***: | | | | | | | | | | | | | | | | | | | | |
| Before waiver and expense reimbursement(4) | | | 3.10 | % | | | 2.89 | % | | | 0.75 | % | | | 0.26 | % | | | (3.81 | )%** |
| After waiver and expense reimbursement(4) | | | 3.26 | % | | | 3.27 | % | | | 1.11 | % | | | 0.62 | % | | | (3.81 | )%** |
| Portfolio turnover rate | | | 280 | % | | | 186 | % | | | 157 | % | | | 99 | % | | | 139 | %* |
| | |
| (1) | The average shares outstanding method has been applied for per share information. |
| | |
| (2) | Total investment return is based on the change in net asset value of a share during the period, assumes reinvestment of dividends and distributions at net asset value and does not reflect the impact of a sales charge. |
| | |
| (3) | Expense waived or reimbursed reflect reductions to total expenses, as discussed in the notes to the financial statements. These amounts would increase the net investment loss ratio or decrease the net investment income ratio, as applicable, had such reductions not occurred. |
| | |
| (4) | Expenses before reductions (excluding dividend and interest expense for securities sold short) were 1.89%, 2.09%, 2.08%, 2.06% and 2.88% for the years ended June 30, 2014, 2013, 2012, 2011 and for the period June 7, 2010 to June 30, 2010, respectively. |
| | |
| (5) | Expenses net of all reductions (excluding dividend and interest expense for securities sold short) were 1.73%, 1.71%, 1.73%, 1.70% and 2.88% for the years ended June 30, 2014, 2013, 2012, 2011 and for the period June 7, 2010 to June 30, 2010, respectively. |
| | |
| * | Not annualized. |
| | |
| ** | Annualized. |
| | |
| *** | The net investment income (loss) ratios include dividends on short positions. |
The accompanying notes are an integral part of the financial statements.
34 | 2 0 1 4 A N N U A L R E P O R T
Financial Highlights
Quaker Global Tactical Allocation Fund
(For a Share Outstanding Throughout the Period)
| | | Class A |
| | | Years Ended June 30, |
| | | 2014 | | | 2013 | | | 2012 | | | 2011 | | | 2010 | |
| Net asset value, beginning of period | | | $8.30 | | | | $7.12 | | | | $7.51 | | | | $5.92 | | | | $5.37 | |
| Income from investment operations: | | | | | | | | | | | | | | | | | | | | |
| Net investment loss(1) | | | (0.08 | ) | | | (0.09 | ) | | | (0.10 | ) | | | (0.09 | ) | | | (0.07 | ) |
| Net realized and unrealized gain (loss) on investments | | | 2.24 | | | | 1.27 | | | | (0.29 | ) | | | 1.68 | | | | 0.62 | |
| Total from investment operations | | | 2.16 | | | | 1.18 | | | | (0.39 | ) | | | 1.59 | | | | 0.55 | |
| Distributions to shareholders from: | | | | | | | | | | | | | | | | | | | | |
| Net investment income | | | — | | | | — | | | | — | | | | — | | | | — | |
| Net realized capital gain | | | — | | | | — | | | | — | | | | — | | | | — | |
| Total distributions | | | — | | | | — | | | | — | | | | — | | | | — | |
| Net asset value, end of period | | | $10.46 | | | | $8.30 | | | | $7.12 | | | | $7.51 | | | | $5.92 | |
| Total Return(2) | | | 26.02 | % | | | 16.57 | % | | | (5.19 | )% | | | 26.86 | % | | | 10.24 | % |
| Ratios/supplemental data: | | | | | | | | | | | | | | | | | | | | |
| Net assets, end of period (000’ omitted) | | | $3,992 | | | | $3,856 | | | | $5,707 | | | | $11,708 | | | | $12,889 | |
| Ratio of expenses to average net assets(3) | | | 2.19 | % | | | 2.83 | % | | | 2.68 | % | | | 2.41 | % | | | 2.32 | % |
| Ratio of net investment income (loss) to average net assets* | | | (0.80 | )% | | | (1.22 | )% | | | (1.41 | )% | | | (1.30 | )% | | | (1.12 | )% |
| Portfolio turnover rate | | | 130 | % | | | 484 | % | | | 880 | % | | | 732 | % | | | 1213 | % |
| | |
| (1) | The average shares outstanding method has been applied for per share information. |
| | |
| (2) | Total investment return is based on the change in net asset value of a share during the period, assumes reinvestment of dividends and distributions at net asset value and does not reflect the impact of a sales charge. |
| | |
| (3) | Ratio of expenses (excluding dividend and interest expense for securities sold short) were 2.15% and 2.83% for the years ended June 30, 2014 and 2013, respectively. |
| | |
| * | The net investment income (loss) ratios include dividends on short positions. |
| | |
| | | Class C |
| | | Years Ended June 30, |
| | | 2014 | | | 2013 | | | 2012 | | | 2011 | | | 2010 | |
| Net asset value, beginning of period | | | $7.98 | | | | $6.90 | | | | $7.34 | | | | $5.82 | | | | $5.32 | |
| Income from investment operations: | | | | | | | | | | | | | | | | | | | | |
| Net investment loss(1) | | | (0.14 | ) | | | (0.14 | ) | | | (0.15 | ) | | | (0.14 | ) | | | (0.11 | ) |
| Net realized and unrealized gain (loss) on investments | | | 2.15 | | | | 1.22 | | | | (0.29 | ) | | | 1.66 | | | | 0.61 | |
| Total from investment operations | | | 2.01 | | | | 1.08 | | | | (0.44 | ) | | | 1.52 | | | | 0.50 | |
| Distributions to shareholders from: | | | | | | | | | | | | | | | | | | | | |
| Net investment income | | | — | | | | — | | | | — | | | | — | | | | — | |
| Net realized capital gain | | | — | | | | — | | | | — | | | | — | | | | — | |
| Total distributions | | | — | | | | — | | | | — | | | | — | | | | — | |
| Net asset value, end of period | | | $9.99 | | | | $7.98 | | | | $6.90 | | | | $7.34 | | | | $5.82 | |
| Total Return(2) | | | 25.19 | % | | | 15.65 | % | | | (5.99 | )% | | | 26.12 | % | | | 9.40 | % |
| Ratios/supplemental data: | | | | | | | | | | | | | | | | | | | | |
| Net assets, end of period (000’ omitted) | | | $2,093 | | | | $2,124 | | | | $3,158 | | | | $6,880 | | | | $9,512 | |
| Ratio of expenses to average net assets(3) | | | 2.94 | % | | | 3.58 | % | | | 3.43 | % | | | 3.16 | % | | | 3.07 | % |
| Ratio of net investment income (loss) to average net assets* | | | (1.55 | )% | | | (1.97 | )% | | | (2.15 | )% | | | (2.07 | )% | | | (1.87 | )% |
| Portfolio turnover rate | | | 130 | % | | | 484 | % | | | 880 | % | | | 732 | % | | | 1213 | % |
| | |
| (1) | The average shares outstanding method has been applied for per share information. |
| | |
| (2) | Total investment return is based on the change in net asset value of a share during the period, assumes reinvestment of dividends and distributions at net asset value and does not reflect the impact of a sales charge. |
| | |
| (3) | Ratio of expenses (excluding dividend and interest expense for securities sold short) were 2.90% and 3.58% for the years ended June 30, 2014 and 2013, respectively. |
| | |
| * | The net investment income (loss) ratios include dividends on short positions. |
The accompanying notes are an integral part of the financial statements.
2 0 1 4 A N N U A L R E P O R T | 35
Financial Highlights
Quaker Global Tactical Allocation Fund
(For a Share Outstanding Throughout the Period)
| | | Institutional Class |
| | | Years Ended June 30, |
| | | 2014 | | | 2013 | | | 2012 | | | 2011 | | | 2010 | |
| Net asset value, beginning of period | | | $9.49 | | | | $8.12 | | | | $8.55 | | | | $6.71 | | | | $6.08 | |
| Income from investment operations: | | | | | | | | | | | | | | | | | | | | |
| Net investment loss(1) | | | (0.06 | ) | | | (0.08 | ) | | | (0.09 | ) | | | (0.08 | ) | | | (0.05 | ) |
| Net realized and unrealized gain (loss) on investments | | | 2.57 | | | | 1.45 | | | | (0.34 | ) | | | 1.92 | | | | 0.68 | |
| Total from investment operations | | | 2.51 | | | | 1.37 | | | | (0.43 | ) | | | 1.84 | | | | 0.63 | |
| Distributions to shareholders from: | | | | | | | | | | | | | | | | | | | | |
| Net investment income | | | — | | | | — | | | | — | | | | — | | | | — | |
| Net realized capital gain | | | — | | | | — | | | | — | | | | — | | | | — | |
| Total distributions | | | — | | | | — | | | | — | | | | — | | | | — | |
| Net asset value, end of period | | | $12.00 | | | | $9.49 | | | | $8.12 | | | | $8.55 | | | | $6.71 | |
| Total Return(2) | | | 26.45 | % | | | 16.87 | % | | | (5.03 | )% | | | 27.42 | % | | | 10.36 | % |
| Ratios/supplemental data: | | | | | | | | | | | | | | | | | | | | |
| Net assets, end of period (000’ omitted) | | | $1,240 | | | | $625 | | | | $899 | | | | $987 | | | | $877 | |
| Ratio of expenses to average net assets(3) | | | 1.94 | % | | | 2.58 | % | | | 2.47 | % | | | 2.16 | % | | | 1.86 | % |
| Ratio of net investment income (loss) to average net assets* | | | (0.55 | )% | | | (0.97 | )% | | | (1.12 | )% | | | (1.05 | )% | | | (0.70 | )% |
| Portfolio turnover rate | | | 130 | % | | | 484 | % | | | 880 | % | | | 732 | % | | | 1213 | % |
| | |
| (1) | The average shares outstanding method has been applied for per share information. |
| | |
| (2) | Total investment return is based on the change in net asset value of a share during the period, assumes reinvestment of dividends and distributions at net asset value and does not reflect the impact of a sales charge. |
| | |
| (3) | Ratio of expenses (excluding dividend and interest expense for securities sold short) were 1.90% and 2.58% for the years ended June 30, 2014 and 2013, respectively. |
| | |
| * | The net investment income (loss) ratios include dividends on short positions. |
The accompanying notes are an integral part of the financial statements.
36 | 2 0 1 4 A N N U A L R E P O R T
Financial Highlights
Quaker Mid Cap Value Fund
(For a Share Outstanding Throughout the Period)
| | | Class A |
| | | Years Ended June 30, |
| | | 2014 | | | 2013 | | | 2012 | | | 2011 | | | 2010 | |
| Net asset value, beginning of period | | | $18.99 | | | | $15.73 | | | | $16.03 | | | | $11.99 | | | | $9.39 | |
| Income from investment operations: | | | | | | | | | | | | | | | | | | | | |
| Net investment income (loss)(1) | | | (0.09 | ) | | | (0.14 | ) | | | (0.11 | ) | | | (0.13 | ) | | | (0.05 | ) |
| Net realized and unrealized gain (loss) on investments | | | 5.72 | | | | 3.40 | | | | (0.19 | ) | | | 4.17 | | | | 2.65 | |
| Total from investment operations | | | 5.63 | | | | 3.26 | | | | (0.30 | ) | | | 4.04 | | | | 2.60 | |
| Distributions to shareholders from: | | | | | | | | | | | | | | | | | | | | |
| Net investment income | | | — | | | | — | | | | — | | | | — | | | | — | |
| Net realized capital gain | | | — | | | | — | | | | — | | | | — | | | | — | |
| Total distributions | | | — | | | | — | | | | — | | | | — | | | | — | |
| Net asset value, end of period | | | $24.62 | | | | $18.99 | | | | $15.73 | | | | $16.03 | | | | $11.99 | |
| Total Return(2) | | | 29.65 | % | | | 20.72 | % | | | (1.87 | )% | | | 33.69 | % | | | 27.69 | % |
| Ratios/supplemental data: | | | | | | | | | | | | | | | | | | | | |
| Net assets, end of period (000’ omitted) | | | $5,724 | | | | $6,029 | | | | $6,114 | | | | $7,229 | | | | $6,796 | |
| Ratio of expenses to average net assets | | | 2.03 | % | | | 2.19 | % | | | 2.21 | % | | | 2.13 | % | | | 2.09 | % |
| Ratio of net investment income (loss) to average net assets | | | (0.42 | )% | | | (0.80 | )% | | | (0.70 | )% | | | (0.88 | )% | | | (0.41 | )% |
| Portfolio turnover rate | | | 62 | % | | | 47 | % | | | 42 | % | | | 27 | % | | | 51 | % |
| | | Class C |
| | | Years Ended June 30, |
| | | 2014 | | | 2013 | | | 2012 | | | 2011 | | | 2010 | |
| Net asset value, beginning of period | | | $16.91 | | | | $14.11 | | | | $14.48 | | | | $10.92 | | | | $8.61 | |
| Income from investment operations: | | | | | | | | | | | | | | | | | | | | |
| Net investment loss(1) | | | (0.22 | ) | | | (0.24 | ) | | | (0.20 | ) | | | (0.22 | ) | | | (0.12 | ) |
| Net realized and unrealized gain (loss) on investments | | | 5.06 | | | | 3.04 | | | | (0.17 | ) | | | 3.78 | | | | 2.43 | |
| Total from investment operations | | | 4.84 | | | | 2.80 | | | | (0.37 | ) | | | 3.56 | | | | 2.31 | |
| Distributions to shareholders from: | | | | | | | | | | | | | | | | | | | | |
| Net investment income | | | — | | | | — | | | | — | | | | — | | | | — | |
| Net realized capital gain | | | — | | | | — | | | | �� | | | | — | | | | — | |
| Total distributions | | | — | | | | — | | | | — | | | | — | | | | — | |
| Net asset value, end of period | | | $21.75 | | | | $16.91 | | | | $14.11 | | | | $14.48 | | | | $10.92 | |
| Total Return(2) | | | 28.62 | % | | | 19.84 | % | | | (2.56 | )% | | | 32.60 | % | | | 26.83 | % |
| Ratios/supplemental data: | | | | | | | | | | | | | | | | | | | | |
| Net assets, end of period (000’ omitted) | | | $2,086 | | | | $1,815 | | | | $1,950 | | | | $2,577 | | | | $2,427 | |
| Ratio of expenses to average net assets | | | 2.78 | % | | | 2.94 | % | | | 2.96 | % | | | 2.88 | % | | | 2.83 | % |
| Ratio of net investment income (loss) to average net assets | | | (1.17 | )% | | | (1.55 | )% | | | (1.45 | )% | | | (1.63 | )% | | | (1.16 | )% |
| Portfolio turnover rate | | | 62 | % | | | 47 | % | | | 42 | % | | | 27 | % | | | 51 | % |
| | |
| (1) | The average shares outstanding method has been applied for per share information. |
| | |
| (2) | Total investment return is based on the change in net asset value of a share during the period, assumes reinvestment of dividends and distributions at net asset value and does not reflect the impact of a sales charge. |
The accompanying notes are an integral part of the financial statements.
2 0 1 4 A N N U A L R E P O R T | 37
Financial Highlights
Quaker Mid Cap Value Fund
(For a Share Outstanding Throughout the Period)
| | | Institutional Class |
| | | Years Ended June 30, |
| | | 2014 | | | 2013 | | | 2012 | | | 2011 | | | 2010 | |
| Net asset value, beginning of period | | | $19.83 | | | | $16.39 | | | | $16.66 | | | | $12.43 | | | | $9.70 | |
| Income from investment operations: | | | | | | | | | | | | | | | | | | | | |
| Net investment income (loss)(1) | | | (0.04 | ) | | | (0.10 | ) | | | (0.07 | ) | | | (0.10 | ) | | | (0.02 | ) |
| Net realized and unrealized gain (loss) on investments | | | 5.98 | | | | 3.54 | | | | (0.20 | ) | | | 4.33 | | | | 2.75 | |
| Total from investment operations | | | 5.94 | | | | 3.44 | | | | (0.27 | ) | | | 4.23 | | | | 2.73 | |
| Distributions to shareholders from: | | | | | | | | | | | | | | | | | | | | |
| Net investment income | | | — | | | | — | | | | — | | | | — | | | | — | |
| Net realized capital gain | | | — | | | | — | | | | — | | | | — | | | | — | |
| Total distributions | | | — | | | | — | | | | — | | | | — | | | | — | |
| Net asset value, end of period | | | $25.77 | | | | $19.83 | | | | $16.39 | | | | $16.66 | | | | $12.43 | |
| Total Return(2) | | | 29.95 | % | | | 20.99 | % | | | (1.62 | )% | | | 34.03 | % | | | 28.14 | % |
| Ratios/supplemental data: | | | | | | | | | | | | | | | | | | | | |
| Net assets, end of period (000’ omitted) | | | $2,216 | | | | $1,060 | | | | $351 | | | | $433 | | | | $245 | |
| Ratio of expenses to average net assets | | | 1.78 | % | | | 1.94 | % | | | 1.96 | % | | | 1.87 | % | | | 1.84 | % |
| Ratio of net investment income (loss) to average net assets | | | (0.17 | )% | | | (0.55 | )% | | | (0.45 | )% | | | (0.62 | )% | | | (0.19 | )% |
| Portfolio turnover rate | | | 62 | % | | | 47 | % | | | 42 | % | | | 27 | % | | | 51 | % |
| (1) | The average shares outstanding method has been applied for per share information. |
| | |
| (2) | Total investment return is based on the change in net asset value of a share during the period, assumes reinvestment of dividends and distributions at net asset value and does not reflect the impact of a sales charge. |
The accompanying notes are an integral part of the financial statements.
38 | 2 0 1 4 A N N U A L R E P O R T
Financial Highlights
Quaker Small-Cap Value Fund
(For a Share Outstanding Throughout the Period)
| | | Class A |
| | | Years Ended June 30, |
| | | 2014 | | | 2013 | | | 2012 | | | 2011 | | | 2010 | |
| Net asset value, beginning of period | | | $19.50 | | | | $15.85 | | | | $16.53 | | | | $11.54 | | | | $9.90 | |
| Income from investment operations: | | | | | | | | | | | | | | | | | | | | |
| Net investment income (loss)(1) | | | (0.11 | ) | | | 0.09 | | | | (0.08 | ) | | | (0.05 | ) | | | (0.07 | ) |
| Net realized and unrealized gain (loss) on investments | | | 4.95 | | | | 3.58 | | | | (0.60 | ) | | | 5.04 | | | | 1.71 | |
| Total from investment operations | | | 4.84 | | | | 3.67 | | | | (0.68 | ) | | | 4.99 | | | | 1.64 | |
| Distributions to shareholders from: | | | | | | | | | | | | | | | | | | | | |
| Net investment income | | | (0.06 | ) | | | (0.02 | ) | | | — | | | | — | | | | — | |
| Net realized capital gain | | | — | | | | — | | | | — | | | | — | | | | — | |
| Total distributions | | | (0.06 | ) | | | (0.02 | ) | | | — | | | | — | | | | — | |
| Net asset value, end of period | | | $24.28 | | | | $19.50 | | | | $15.85 | | | | $16.53 | | | | $11.54 | |
| Total Return(2) | | | 24.83 | % | | | 23.17 | % | | | (4.11 | )% | | | 43.24 | % | | | 16.57 | % |
| Ratios/supplemental data: | | | | | | | | | | | | | | | | | | | | |
| Net assets, end of period (000’ omitted) | | | $8,512 | | | | $7,727 | | | | $8,347 | | | | $14,168 | | | | $19,398 | |
| Ratio of expenses to average net assets: | | | | | | | | | | | | | | | | | | | | |
| Before expense reimbursements and waived fees | | | 1.83 | % | | | 1.93 | % | | | 1.96 | % | | | 1.98 | % | | | 1.89 | % |
| After expense reimbursements and waived fees | | | 1.83 | % | | | 1.93 | % | | | 1.96 | % | | | 1.98 | % | | | 1.83 | % |
| Ratio of net investment income (loss) to average net assets | | | (0.47 | )% | | | 0.49 | % | | | (0.52 | )% | | | (0.35 | )% | | | (0.60 | )% |
| Portfolio turnover rate | | | 176 | % | | | 142 | % | | | 158 | % | | | 131 | % | | | 113 | % |
| | | Class C | |
| | | Years Ended June 30, | |
| | | 2014 | | | 2013 | | | 2012 | | | 2011 | | | 2010 | |
| Net asset value, beginning of period | | | $16.49 | | | | $13.49 | | | | $14.17 | | | | $9.98 | | | | $8.62 | |
| Income from investment operations: | | | | | | | | | | | | | | | | | | | | |
| Net investment loss(1) | | | (0.23 | ) | | | (0.04 | ) | | | (0.16 | ) | | | (0.14 | ) | | | (0.14 | ) |
| Net realized and unrealized gain (loss) on investments | | | 4.17 | | | | 3.04 | | | | (0.52 | ) | | | 4.33 | | | | 1.50 | |
| Total from investment operations | | | 3.94 | | | | 3.00 | | | | (0.68 | ) | | | 4.19 | | | | 1.36 | |
| Distributions to shareholders from: | | | | | | | | | | | | | | | | | | | | |
| Net investment income | | | — | | | | — | | | | — | | | | — | | | | — | |
| Net realized capital gain | | | — | | | | — | | | | — | | | | — | | | | — | |
| Total distributions | | | — | | | | — | | | | — | | | | — | | | | — | |
| Net asset value, end of period | | | $20.43 | | | | $16.49 | | | | $13.49 | | | | $14.17 | | | | $9.98 | |
| Total Return(2) | | | 23.89 | % | | | 22.24 | % | | | (4.80 | )% | | | 41.98 | % | | | 15.78 | % |
| Ratios/supplemental data: | | | | | | | | | | | | | | | | | | | | |
| Net assets, end of period (000’ omitted) | | | $1,806 | | | | $1,625 | | | | $1,863 | | | | $2,524 | | | | $2,085 | |
| Ratio of expenses to average net assets: | | | | | | | | | | | | | | | | | | | | |
| Before expense reimbursements and waived fees | | | 2.58 | % | | | 2.68 | % | | | 2.70 | % | | | 2.73 | % | | | 2.63 | % |
| After expense reimbursements and waived fees | | | 2.58 | % | | | 2.68 | % | | | 2.70 | % | | | 2.73 | % | | | 2.57 | % |
| Ratio of net investment income (loss) to average net assets | | | (1.22 | )% | | | (0.26 | )% | | | (1.25 | )% | | | (1.15 | )% | | | (1.36 | )% |
| Portfolio turnover rate | | | 176 | % | | | 142 | % | | | 158 | % | | | 131 | % | | | 113 | % |
| (1) | The average shares outstanding method has been applied for per share information. |
| | |
| (2) | Total investment return is based on the change in net asset value of a share during the period, assumes reinvestment of dividends and distributions at net asset value and does not reflect the impact of a sales charge. |
The accompanying notes are an integral part of the financial statements.
2 0 1 4 A N N U A L R E P O R T | 39
Financial Highlights
Quaker Small-Cap Value Fund
(For a Share Outstanding Throughout the Period)
| | | Institutional Class |
| | | Years Ended June 30, |
| | | 2014 | | | 2013 | | | 2012 | | | 2011 | | | 2010 | |
| Net asset value, beginning of period | | | $20.29 | | | | $16.50 | | | | $17.15 | | | | $11.96 | | | | $10.24 | |
| Income from investment operations: | | | | | | | | | | | | | | | | | | | | |
| Net investment income (loss)(1) | | | (0.05 | ) | | | 0.13 | | | | (0.04 | ) | | | (0.01 | ) | | | (0.04 | ) |
| Net realized and unrealized gain (loss) on investments | | | 5.14 | | | | 3.73 | | | | (0.61 | ) | | | 5.20 | | | | 1.77 | |
| Total from investment operations | | | 5.09 | | | | 3.86 | | | | (0.65 | ) | | | 5.19 | | | | 1.73 | |
| Distributions to shareholders from: | | | | | | | | | | | | | | | | | | | | |
| Net investment income | | | (0.08 | ) | | | (0.07 | ) | | | — | | | | — | | | | (0.01 | ) |
| Net realized capital gain | | | — | | | | — | | | | — | | | | — | | | | — | |
| Total distributions | | | (0.08 | ) | | | (0.07 | ) | | | — | | | | — | | | | (0.01 | ) |
| Net asset value, end of period | | | $25.30 | | | | $20.29 | | | | $16.50 | | | | $17.15 | | | | $11.96 | |
| Total Return(2) | | | 25.13 | % | | | 23.44 | % | | | (3.79 | )% | | | 43.39 | % | | | 16.90 | % |
| Ratios/supplemental data: | | | | | | | | | | | | | | | | | | | | |
| Net assets, end of period (000’ omitted) | | | $27,868 | | | | $23,393 | | | | $20,028 | | | | $23,073 | | | | $61,004 | |
| Ratio of expenses to average net assets: | | | | | | | | | | | | | | | | | | | | |
| Before expense reimbursements and waived fees | | | 1.58 | % | | | 1.68 | % | | | 1.71 | % | | | 1.73 | % | | | 1.64 | % |
| After expense reimbursements and waived fees | | | 1.58 | % | | | 1.68 | % | | | 1.71 | % | | | 1.73 | % | | | 1.58 | % |
| Ratio of net investment income (loss) to average net assets | | | (0.22 | )% | | | 0.74 | % | | | (0.25 | )% | | | (0.07 | )% | | | (0.35 | )% |
| Portfolio turnover rate | | | 176 | % | | | 142 | % | | | 158 | % | | | 131 | % | | | 113 | % |
| (1) | The average shares outstanding method has been applied for per share information. |
| | |
| (2) | Total investment return is based on the change in net asset value of a share during the period, assumes reinvestment of dividends and distributions at net asset value and does not reflect the impact of a sales charge. |
The accompanying notes are an integral part of the financial statements.
40 | 2 0 1 4 A N N U A L R E P O R T
Financial Highlights
Quaker Strategic Growth Fund
(For a Share Outstanding Throughout the Period)
| | | Class A |
| | | Years Ended June 30, |
| | | 2014 | | | 2013 | | | 2012 | | | 2011 | | | 2010 | |
| Net asset value, beginning of period | | | $19.31 | | | | $16.13 | | | | $16.53 | | | | $13.33 | | | | $12.33 | |
| Income from investment operations: | | | | | | | | | | | | | | | | | | | | |
| Net investment loss(1) | | | (0.26 | ) | | | (0.15 | ) | | | (0.15 | ) | | | (0.14 | ) | | | (0.10 | ) |
| Net realized and unrealized gain (loss) on investments | | | 5.14 | | | | 3.33 | | | | (0.25 | ) | | | 3.34 | | | | 1.10 | |
| Total from investment operations | | | 4.88 | | | | 3.18 | | | | (0.40 | ) | | | 3.20 | | | | 1.00 | |
| Distributions to shareholders from: | | | | | | | | | | | | | | | | | | | | |
| Net investment income | | | — | | | | — | | | | — | | | | — | | | | — | |
| Net realized capital gain | | | — | | | | — | | | | — | | | | — | | | | — | |
| Total distributions | | | — | | | | — | | | | — | | | | — | | | | — | |
| Net asset value, end of period | | | $24.19 | | | | $19.31 | | | | $16.13 | | | | $16.53 | | | | $13.33 | |
| Total Return(2) | | | 25.27 | % | | | 19.71 | % | | | (2.42 | )% | | | 24.01 | % | | | 8.11 | % |
| Ratios/supplemental data: | | | | | | | | | | | | | | | | | | | | |
| Net assets, end of period (000’ omitted) | | | $87,053 | | | | $88,970 | | | | $111,778 | | | | $186,877 | | | | $306,523 | |
| Ratio of expenses to average net assets: | | | | | | | | | | | | | | | | | | | | |
| Before expense reimbursements or recoveries | | | 2.15 | % | | | 2.36 | % | | | 2.30 | % | | | 2.21 | % | | | 1.99 | % |
| After expense reimbursements or recoveries | | | 2.24 | % | | | 2.24 | % | | | 2.24 | % | | | 1.99 | % | | | 1.99 | % |
| Ratio of net investment income (loss) to average net assets: | | | | | | | | | | | | | | | | | | | | |
| Before expense reimbursements or recoveries(3) | | | (1.06 | )% | | | (0.98 | )% | | | (1.03 | )% | | | (1.14 | )% | | | (0.69 | )% |
| After expense reimbursements or recoveries(3) | | | (1.15 | )% | | | (0.86 | )% | | | (0.98 | )% | | | (0.92 | )% | | | (0.69 | )% |
| Portfolio turnover rate | | | 170 | % | | | 294 | % | | | 178 | % | | | 136 | % | | | 276 | % |
| | | Class C | |
| | | Years Ended June 30, | |
| | | 2014 | | | 2013 | | | 2012 | | | 2011 | | | 2010 | |
| Net asset value, beginning of period | | | $17.19 | | | | $14.47 | | | | $14.94 | | | | $12.14 | | | | $11.31 | |
| Income from investment operations: | | | | | | | | | | | | | | | | | | | | |
| Net investment loss(1) | | | (0.37 | ) | | | (0.25 | ) | | | (0.24 | ) | | | (0.23 | ) | | | (0.19 | ) |
| Net realized and unrealized gain (loss) on investments | | | 4.55 | | | | 2.97 | | | | (0.23 | ) | | | 3.03 | | | | 1.02 | |
| Total from investment operations | | | 4.18 | | | | 2.72 | | | | (0.47 | ) | | | 2.80 | | | | 0.83 | |
| Distributions to shareholders from: | | | | | | | | | | | | | | | | | | | | |
| Net investment income | | | — | | | | — | | | | — | | | | — | | | | — | |
| Net realized capital gain | | | — | | | | — | | | | — | | | | — | | | | — | |
| Total distributions | | | — | | | | — | | | | — | | | | — | | | | — | |
| Net asset value, end of period | | | $21.37 | | | | $17.19 | | | | $14.47 | | | | $14.94 | | | | $12.14 | |
| Total Return(2) | | | 24.32 | % | | | 18.80 | % | | | (3.15 | )% | | | 23.06 | % | | | 7.34 | % |
| Ratios/supplemental data: | | | | | | | | | | | | | | | | | | | | |
| Net assets, end of period (000’ omitted) | | | $22,931 | | | | $22,968 | | | | $27,102 | | | | $42,729 | | | | $63,002 | |
| Ratio of expenses to average net assets: | | | | | | | | | | | | | | | | | | | | |
| Before expense reimbursements or recoveries | | | 2.90 | % | | | 3.11 | % | | | 3.04 | % | | | 2.96 | % | | | 2.74 | % |
| After expense reimbursements or recoveries | | | 2.99 | % | | | 2.99 | % | | | 2.99 | % | | | 2.74 | % | | | 2.74 | % |
| Ratio of net investment income (loss) to average net assets: | | | | | | | | | | | | | | | | | | | | |
| Before expense reimbursements or recoveries(3) | | | (1.81 | )% | | | (1.74 | )% | | | (1.77 | )% | | | (1.90 | )% | | | (1.44 | )% |
| After expense reimbursements or recoveries(3) | | | (1.90 | )% | | | (1.62 | )% | | | (1.72 | )% | | | (1.68 | )% | | | (1.44 | )% |
| Portfolio turnover rate | | | 170 | % | | | 294 | % | | | 178 | % | | | 136 | % | | | 276 | % |
| (1) | The average shares outstanding method has been applied for per share information. |
| | |
| (2) | Total investment return is based on the change in net asset value of a share during the period, assumes reinvestment of dividends and distributions at net asset value and does not reflect the impact of a sales charge. |
| | |
| (3) | Expenses reimbursed reflect reductions and expenses recovered reflect increases to total expenses, as discussed in the notes to the financial statements. These reimbursed amounts would increase the net investment loss ratio or decrease the net investment income ratio and recovered amounts would decrease the net investment loss ratio or increase the net investment income ratio, as applicable, had such reductions or increases not occurred. |
The accompanying notes are an integral part of the financial statements.
2 0 1 4 A N N U A L R E P O R T | 41
Financial Highlights
Quaker Strategic Growth Fund
(For a Share Outstanding Throughout the Period)
| | | Institutional Class |
| | | Years Ended June 30, |
| | | 2014 | | | 2013 | | | 2012 | | | 2011 | | | 2010 | |
| Net asset value, beginning of period | | | $19.99 | | | | $16.66 | | | | $17.03 | | | | $13.71 | | | | $12.65 | |
| Income from investment operations: | | | | | | | | | | | | | | | | | | | | |
| Net investment loss(1) | | | (0.21 | ) | | | (0.11 | ) | | | (0.11 | ) | | | (0.11 | ) | | | (0.07 | ) |
| Net realized and unrealized gain (loss) on investments | | | 5.32 | | | | 3.44 | | | | (0.26 | ) | | | 3.43 | | | | 1.13 | |
| Total from investment operations | | | 5.11 | | | | 3.33 | | | | (0.37 | ) | | | 3.32 | | | | 1.06 | |
| Distributions to shareholders from: | | | | | | | | | | | | | | | | | | | | |
| Net investment income | | | — | | | | — | | | | — | | | | — | | | | — | |
| Net realized capital gain | | | — | | | | — | | | | — | | | | — | | | | — | |
| Total distributions | | | — | | | | — | | | | — | | | | — | | | | — | |
| Net asset value, end of period | | | $25.10 | | | | $19.99 | | | | $16.66 | | | | $17.03 | | | | $13.71 | |
| Total Return(2) | | | 25.56 | % | | | 19.99 | % | | | (2.17 | )% | | | 24.22 | % | | | 8.38 | % |
| Ratios/supplemental data: | | | | | | | | | | | | | | | | | | | | |
| Net assets, end of period (000’ omitted) | | | $58,999 | | | | $45,851 | | | | $40,288 | | | | $41,519 | | | | $20,355 | |
| Ratio of expenses to average net assets: | | | | | | | | | | | | | | | | | | | | |
| Before expense reimbursements or recoveries | | | 1.90 | % | | | 2.11 | % | | | 2.03 | % | | | 1.97 | % | | | 1.75 | % |
| After expense reimbursements or recoveries | | | 1.99 | % | | | 1.99 | % | | | 1.99 | % | | | 1.74 | % | | | 1.75 | % |
| Ratio of net investment income (loss) to average net assets: | | | | | | | | | | | | | | | | | | | | |
| Before expense reimbursements or recoveries(3) | | | (0.81 | )% | | | (0.74 | )% | | | (0.72 | )% | | | (0.89 | )% | | | (0.46 | )% |
| After expense reimbursements or recoveries(3) | | | (0.90 | )% | | | (0.62 | )% | | | (0.68 | )% | | | (0.66 | )% | | | (0.46 | )% |
| Portfolio turnover rate | | | 170 | % | | | 294 | % | | | 178 | % | | | 136 | % | | | 276 | % |
| (1) | The average shares outstanding method has been applied for per share information. |
| | |
| (2) | Total investment return is based on the change in net asset value of a share during the period, assumes reinvestment of dividends and distributions at net asset value and does not reflect the impact of a sales charge. |
| | |
| (3) | Expenses reimbursed reflect reductions and expenses recovered reflect increases to total expenses, as discussed in the notes to the financial statements. These reimbursed amounts would increase the net investment loss ratio or decrease the net investment income ratio and recovered amounts would decrease the net investment loss ratio or increase the net investment income ratio, as applicable, had such reductions or increases not occurred. |
The accompanying notes are an integral part of the financial statements.
42 | 2 0 1 4 A N N U A L R E P O R T
Notes to the Financial Statements
Note 1 — Organization
The Quaker Investment Trust (“Trust”), a diversified, open-end management investment company, was organized as a Massachusetts business trust on October 24, 1990, and is registered under the Investment Company Act of 1940, as amended (“1940 Act”). The Trust’s Amended and Restated Declaration of Trust permits the Trustees to issue an unlimited number of shares of beneficial interest. The Trust currently has five series: Quaker Event Arbitrage Fund (“Event Arbitrage”), Quaker Global Tactical Allocation Fund (“Global Tactical Allocation”), Quaker Mid-Cap Value Fund (“Mid-Cap Value”), Quaker Small-Cap Value Fund (“Small-Cap Value”) and Quaker Strategic Growth Fund (“Strategic Growth”) (each a “Fund” and collectively, “Funds”). All Funds are diversified. The investment objectives of each Fund are set forth below.
Strategic Growth and Small-Cap Value commenced operations on November 25, 1996. Mid-Cap Value commenced operations on December 31, 1997. Global Tactical Allocation commenced operations on May 1, 2008. Event Arbitrage commenced operations on June 7, 2010 in conjunction with the reorganization of the Pennsylvania Avenue Event Driven Fund (“Event Driven Fund”). The predecessor Event Driven Fund commenced operations on September 19, 2002. The investment objective of these Funds is to seek long-term growth of capital. The investment objective of these funds is non-fundamental in that this objective may be changed by the Board of Trustees (“Board” or “Trustees”) without shareholder approval.
The Funds currently offer three classes of shares (Class A, Class C and Institutional Class Shares). Class A Shares are charged a front-end sales charge and a distribution and servicing fee; Class C shares are charged a distribution fee, but bear no front-end sales charge or contingent deferred sales charge (“CDSC”); and Institutional Class Shares bear no front-end sales charge or CDSC, but have higher minimum investment thresholds. Quaker Funds, Inc. (“QFI”), the investment adviser to each of the Funds, has the ability to waive the minimum investment for Institutional Class shares at its discretion.
Note 2 — Summary of Significant Accounting Policies and Other Information
The following is a summary of significant accounting policies consistently followed by the Funds in the preparation of their financial statements. The policies are in conformity with accounting principles generally accepted in the United States of America (“GAAP”).
A. Security Valuation. The Funds’ investments in securities are carried at market value. Securities listed on an exchange or quoted on a national market system are generally valued at the last quoted sales price at the time of valuation. Other securities traded in the over-the-counter market and listed securities for which no sale was reported on that date are valued at the most recent bid price. Each security reported on the NASDAQ National Market System is valued at the NASDAQ Official Closing Price.
Debt and other fixed-income securities (other than short-term obligations) are valued at the last quoted bid price and/or by using a combination of daily quotes and matrix evaluations provided by an independent pricing service (which reflect such factors as security prices, yields, maturities, ratings, and dealer and exchange quotations), the use of which has been approved by the Board.
Short-term investments are valued at amortized cost, which approximates fair market value.
The Funds enter into forward foreign currency contracts to lock in the U.S. dollar cost of purchase and sale transactions or to defend the portfolio against currency fluctuations. A forward foreign currency contract is a commitment to purchase or sell a foreign currency at a future date at a negotiated rate. These contracts are valued daily, and the Fund’s net equity therein, representing unrealized gain or loss on the contracts as measured by the
difference between the forward foreign exchange rates at the dates of entry into the contracts and the forward rates at the reporting, is included in the Statements of Assets and Liabilities. Realized and unrealized gains and losses are included in the Statements of Operations. Risks may arise upon entering into these contracts from the potential inability of counterparties to meet the terms of the contract and from unanticipated movements in the value of foreign currencies relative to the U.S. dollar.
The Funds have adopted fair valuation procedures to value securities at fair market value in certain circumstances, and the Trust has established a Valuation Committee responsible for determining when fair valuing a security is necessary and appropriate. The Funds will value securities at fair market value when market quotations are not readily available or when securities cannot be accurately valued within established pricing procedures. The Valuation Committee may also fair value foreign securities whose prices may have been affected by events occurring after the close of trading in their respective markets but prior to the time the Fund holding the foreign securities calculates its net asset value. The Funds’ fair valuation procedures are designed to help ensure that prices at which Fund shares are purchased and redeemed are fair and do not result in dilution of shareholder interest or other harm to shareholders.
The Fund is required to disclose information regarding the fair value measurements of the Fund’s assets and liabilities. Fair value is defined as the price that the Fund would receive upon selling an investment in an orderly transaction to an independent buyer in the principal or most advantageous market for the investment. The disclosure requirements utilize a three-tier hierarchy to maximize the use of observable market data, minimize the use of unobservable inputs and establish classification of fair value measurements for disclosure purposes. A financial instrument’s level within the fair value hierarchy is based on the lowest level that is significant to the fair value measurement. Inputs refer broadly to the assumptions that market participants would use in pricing the asset or liability, including assumptions about risk, for example, the risk inherent in a particular valuation technique used to measure fair value including the pricing model used and/or the risk inherent in the inputs to the valuation technique. Inputs may be observable or unobservable.
Observable inputs are inputs that reflect the assumptions market participants would use in pricing the asset or liability, which are based on market data obtained from sources independent of the reporting entity. Unobservable inputs are inputs that reflect the reporting entity’s own assumptions about the assumptions market participants would use in pricing the asset or liability developed based on the best information available in the circumstances.
The significant unobservable inputs used in the fair value measurement of the reporting entity’s private equity holdings are the cost of prior transactions in the secondary market, prior stock repurchase offers from the company, single broker quotes and discounts applied for a lack of marketability. Significant increases (decreases) in any of those inputs in isolation could result in a significantly lower (higher) fair value measurement.
Various inputs may be used to determine the value of each Fund’s investments. These inputs are summarized in three broad levels for financial statement purposes. The inputs or methodologies used to value securities are not necessarily an indication of the risk associated with investing in those securities.
Level I — Quoted prices in active markets for identical securities.
Level II — Prices determined using significant other observable inputs (including quoted prices for similar securities, interest rates, prepayment speeds, credit risk, etc.) Municipal securities, long-term U.S. Government obligations and corporate debt securities are valued in accordance with the evaluated price supplied by the pricing service and generally categorized as Level 2 in the hierarchy. Other securities that are categorized as Level 2 in the hierarchy include, but are not limited to, warrants that do not trade on an exchange, OTC options and international equity securities valued by an independent third party in order to adjust for stale pricing and foreign market holidays.
2 0 1 4 A N N U A L R E P O R T | 43
Notes to the Financial Statements
Note 2 — Summary of Significant Accounting Policies and Other Information (Continued)
Level III — Prices determined using significant unobservable inputs (including the Fund’s own assumptions). For restricted equity securities where observable inputs are limited, assumptions about market activity and risk are used in determining fair value. These are categorized as Level 3 in the hierarchy.
For international equity securities traded on a foreign exchange or market which closes prior to a Fund’s Valuation Time, in order to adjust for events which occur between the close of the foreign exchange they are traded on and the close of the New York Stock Exchange, a fair valuation model is used, and these securities are categorized as Level 2.
A Fund may hold securities, some of which are classified as Level 3 investments (as defined below). Level 3 investments have significant unobservable inputs, as they trade infrequently. In determining the fair value of these investments, management uses the market approach which includes as the primary input the capital balance reported; however, adjustments to the reported capital balance may be made based on various factors, including, but not limited to, the attributes of the interest held, including the rights and obligations, and any restrictions or illiquidity of such interests, and the fair value of these securities.
The value of a foreign security is generally determined as of the close of trading on the foreign stock exchange on which the security is primarily traded, or as of the close of trading on the New York Stock Exchange (“NYSE”), if earlier. The value is then converted into its U.S. dollar equivalent at the foreign exchange rate in effect at the close of the NYSE (generally 4:00 p.m. Eastern time) on the day that the value of the foreign security is determined. If no sale is reported at that time, the foreign security will be valued within the range of the most recent quoted bid and ask prices. If market quotations are not readily available for a foreign security or an event has occurred that caused a quotation to be unavailable or unreliable, the Valuation Committee will fair value foreign securities using the procedures described below.
The Trust has adopted fair valuation procedures to value securities at fair market value when independent prices are unavailable or unreliable, and the Trust has established a Valuation Committee that is responsible for determining when fair valuing a security is necessary and appropriate. Securities and assets for which market quotations are not readily available may be valued based upon valuation methods that include: (i) multiple of earnings; (ii) yield to maturity with respect to debt issues; (iii) discounts from market prices of similar freely traded securities; or (iv) a combination of these methods. Securities may also be priced using fair value pricing methods when their closing prices do not reflect their market values at the time the Fund calculates its net asset value (“NAV”) because an event had occurred since the closing prices were established on the domestic or foreign exchange or market but before the Fund’s NAV calculation.
The following is a summary of the fair valuations according to the inputs used as of June 30, 2014 in valuing the Fund’s assets and liabilities:
| Description | | EVENT ARBITRAGE FUND | | Level 1 | | | Level 2 | | | Level 3 | | | Total | |
| Domestic Common Stocks | | $ | 53,902,859 | | | $ | 537,763 | | | $ | 995,046 | | | $ | 55,435,668 | |
| Foreign Common Stocks | | | 6,625,039 | | | | — | | | | — | | | | 6,625,039 | |
| Preferred Stocks | | | 1,995,014 | | | | — | | | | 1,053,000 | | | | 3,048,014 | |
| Real Estate Investment Trusts | | | 5,228,072 | | | | — | | | | — | | | | 5,228,072 | |
| Rights | | | 325,000 | | | | — | | | | — | | | | 325,000 | |
| Warrants | | | — | | | | — | | | | 4,061,003 | | | | 4,061,003 | |
| Asset Backed Securities | | | — | | | | 891,431 | | | | — | | | | 891,431 | |
| Convertible Bonds | | | — | | | | 1,340,045 | | | | 100,000 | | | | 1,440,045 | |
| Corporate Bonds | | | — | | | | 5,148,453 | | | | 630,000 | | | | 5,778,453 | |
| Mortgage Backed Securities | | | — | | | | 951,760 | | | | — | | | | 951,760 | |
| Municipal Bonds | | | — | | | | 1,168,399 | | | | — | | | | 1,168,399 | |
| Term Loan | | | — | | | | — | | | | 511,054 | | | | 511,054 | |
| Purchased Options | | | 2,631,537 | | | | 1,335,310 | | | | — | | | | 3,966,847 | |
| Investments Purchased with Proceeds from Securities Lending | | | 7,688,944 | | | | — | | | | — | | | | 7,688,944 | |
| Total Investments in Securities | | $ | 78,396,465 | | | $ | 11,373,161 | | | $ | 7,350,103 | | | $ | 97,119,729 | |
| Common Stocks sold short | | | (3,707,014 | ) | | | — | | | | — | | | | (3,707,014 | ) |
| Real Estate Investment Trusts sold short | | | (409,944 | ) | | | — | | | | — | | | | (409,944 | ) |
| Written Options | | | (1,196,935 | ) | | | (1,805,905 | ) | | | (496,854 | ) | | | (3,499,694 | ) |
| Total Investments in Securities sold short | | $ | (5,313,893 | ) | | $ | (1,805,905 | ) | | $ | (496,854 | ) | | $ | (7,616,652 | ) |
| | | | | | | | | | | | | | | | | | | |
| Description | | GLOBAL TACTICAL ALLOCATION FUND | | | Level 1 | | | | Level 2 | | | | Level 3 | | | | Total | |
| Common Stocks | | | | $ | 7,140,808 | | | $ | — | | | $ | 13,148 | | | $ | 7,153,956 | |
| Investments Purchased with Proceeds from Securities Lending | | | 515,535 | | | | — | | | | — | | | | 515,535 | |
| Total Investments in Securities | | $ | 7,656,343 | | | $ | — | | | $ | 13,148 | | | $ | 7,669,491 | |
| Exchange-Traded Funds sold short | | | (144,524 | ) | | | — | | | | — | | | | (144,524 | ) |
| Total Investments in Securities sold short | | $ | (144,524 | ) | | $ | — | | | $ | — | | | $ | (144,524 | ) |
| | | | | | | | | | | | | | | | | | | |
| Description | | MID-CAP VALUE FUND | | | Level 1 | | | | Level 2 | | | | Level 3 | | | | Total | |
| Domestic Common Stocks | | $ | 8,085,294 | | | $ | — | | | $ | — | | | $ | 8,085,294 | |
| Foreign Common Stocks | | | 548,283 | | | | — | | | | — | | | | 548,283 | |
| Real Estate Investment Trusts | | | 935,194 | | | | — | | | | — | | | | 935,194 | |
| Investments Purchased with Proceeds from Securities Lending | | | 1,565,695 | | | | — | | | | — | | | | 1,565,695 | |
| Total Investments in Securities | | $ | 11,134,466 | | | $ | — | | | $ | — | | | $ | 11,134,466 | |
44 | 2 0 1 4 A N N U A L R E P O R T
Note 2 — Summary of Significant Accounting Policies and Other Information (Continued)
| Description | | SMALL-CAP VALUE FUND | | Level 1 | | Level 2 | | Level 3 | | Total |
| Domestic Common Stocks | | | | $ | 30,222,200 | | | $ | — | | | $ | — | | | $ | 30,222,200 | |
| Foreign Common Stocks | | | | | 5,902,747 | | | | — | | | | — | | | | 5,902,747 | |
| Real Estate Investment Trusts | | | | | 1,537,065 | | | | — | | | | — | | | | 1,537,065 | |
| Investments Purchased with Proceeds from Securities Lending | | | 5,298,458 | | | | — | | | | — | | | | 5,298,458 | |
| Total Investments in Securities | | $ | 42,960,470 | | | $ | — | | | $ | — | | | $ | 42,960,470 | |
| | | | | | | | | | | | | | | | | | | |
| Description | | STRATEGIC GROWTH FUND | | Level 1 | | Level 2 | | Level 3 | | Total |
| Domestic Common Stocks | | | | $ | 132,927,644 | | | $ | — | | | $ | 365,437 | | | $ | 133,293,081 | |
| Foreign Common Stocks | | | | | 28,566,047 | | | | — | | | | — | | | | 28,566,047 | |
| Investments Purchased with Proceeds from Securities Lending | | | 21,035,500 | | | | — | | | | — | | | | 21,035,500 | |
| Total Investments in Securities | | $ | 182,529,191 | | | $ | — | | | $ | 365,437 | | | $ | 182,894,628 | |
Refer to the Fund’s Schedules of Investments for industry classifications.
Level 3 Reconciliation
The following is a reconciliation of Event Arbitrage’s, Global Tactical Allocation’s, and Strategic Growth’s Level 3 investments for which significant unobservable inputs were used in determining value. See Schedules of Investments for industry classifications:
| EVENT ARBITRAGE FUND | | Balance as of
June 30, 2013 | | Purchases | | Sales | | Realized
gain (loss) | | Net Unrealized
appreciation
(depreciation) | | Amortized
discounts/
premiums | | Transfers in
to Level 3 | | Transfers out
of Level 3 | | Balance as of
6/30/2014 |
| Common Stocks | | $ | 1,248,016 | | | $ | 42,175 | | | $ | (468,440 | ) | | $ | (43,090 | ) | | $ | 216,385 | | | | $— | | | | $— | | | | $— | | | $ | 995,046 | |
| Preferred Stocks | | | 613,000 | | | | 550,000 | | | | — | | | | — | | | | (110,000 | ) | | | — | | | | — | | | | — | | | | 1,053,000 | |
| Warrants | | | — | | | | 4,214,051 | | | | — | | | | — | | | | (153,048 | ) | | | — | | | | — | | | | — | | | | 4,061,003 | |
| Asset Backed Securities | | | 240,000 | | | | 50,000 | | | | (420,000 | ) | | | 83,274 | | | | 288,881 | | | | (242,155 | ) | | | — | | | | — | | | | — | |
| Convertible Bonds | | | 503,750 | | | | 65,000 | | | | (1,012,000 | ) | | | 206,265 | | | | 43,674 | | | | 193,311 | | | | 100,000 | | | | — | | | | 100,000 | |
| Corporate Bonds | | | — | | | | 585,000 | | | | — | | | | — | | | | 45,000 | | | | — | | | | — | | | | — | | | | 630,000 | |
| Term Loan | | | 511,054 | | | | — | | | | — | | | | — | | | | — | | | | — | | | | — | | | | — | | | | 511,054 | |
| Purchased Options | | | 626,467 | | | | — | | | | (514,847 | ) | | | (23,450 | ) | | | (88,170 | ) | | | — | | | | — | | | | — | | | | — | |
| | | $ | 3,742,287 | | | $ | 5,506,226 | | | $ | (2,415,287 | ) | | $ | 222,999 | | | $ | 242,722 | | | $ | (48,844 | ) | | $ | 100,000 | | | | $— | | | $ | 7,350,103 | |
| Written Options | | $ | (916,623 | ) | | $ | (638,866 | ) | | $ | 955,797 | | | $ | (214,413 | ) | | $ | 317,251 | | | | $— | | | | $— | | | | $— | | | $ | (496,854 | ) |
| Net change in unrealized appreciation (depreciation) for Level 3 investments still held as of June 30, 2014 | | | | | | | | | | | | | | | $ | (38,207 | ) |
| | | | | | | | | | | | | | | | | | | | | | | | | | | | | | | | | | | | | |
| GLOBAL TACTICAL ALLOCATION FUND | | Balance as of
June 30, 2013 | | Purchases | | Sales | | Realized
gain (loss) | | Net Unrealized
appreciation
(depreciation) | | Amortized
discounts/
premiums | | Transfers in
to Level 3 | | Transfers out
of Level 3 | | Balance as of
6/30/2014 |
| Common Stocks | | | $— | | | $ | 3,178 | | | | $— | | | | $— | | | $ | 9,970 | | | | $— | | | | $— | | | | $— | | | $ | 13,148 | |
| | | | $— | | | $ | 3,178 | | | | $— | | | | $— | | | $ | 9,970 | | | | $— | | | | $— | | | | $— | | | $ | 13,148 | |
| Net change in unrealized appreciation (depreciation) for Level 3 investments still held as of June 30, 2014 | | | | | | | | | | | | | | | $ | 9,970 | |
| | | | | | | | | | | | | | | | | | | | | | | | | | | | | | | | | | | | | |
| STRATEGIC GROWTH FUND | | Balance as of
June 30, 2013 | | Purchases | | Sales | | Realized
gain (loss) | | Net Unrealized
appreciation
(depreciation) | | Amortized
discounts/
premiums | | Transfers in
to Level 3 | | Transfers out
of Level 3 | | Balance as of
6/30/2014 |
| Common Stocks | | | $— | | | $ | 77,899 | | | | $— | | | | $— | | | $ | 287,538 | | | | $— | | | | $— | | | | $— | | | $ | 365,437 | |
| | | | $— | | | $ | 77,899 | | | | $— | | | | $— | | | $ | 287,538 | | | | $— | | | | $— | | | | $— | | | $ | 365,437 | |
| Net change in unrealized appreciation (depreciation) for Level 3 investments still held as of June 30, 2014 | | | | | | | | | | | | | | | $ | 287,538 | |
Transfers are recognized at the end of the reporting period.
2 0 1 4 A N N U A L R E P O R T | 45
Notes to the Financial Statements
Note 2 — Summary of Significant Accounting Policies and Other Information (Continued)
There have been no transfers in and out of Level 1 and Level 2 fair value measurements as of June 30, 2014, except for the Quaker Event Arbitrage Fund listed below:
| Transfers out of Level 2 into Level 1 | | $ | 2,573 | | Due to an increase of market activity. |
| Transfers out of Level 2 into Level 3 | | $ | 100,000 | | Due to a decrease of market activity. |
The following presents information about significant unobservable inputs related to Level 3 investments at June 30, 2014:
| EVENT ARBITRAGE FUND | Fair Value at
June 30, 2014 | Valuation
Technique | | Unobservable
Input |
| Common Stocks | | $ | 0 | | | Qualitative assessment | | Uncertainty of any additional future payout |
| Common Stocks | | | 2,025 | | | Qualitative assessment | | Future payout implied on last traded price and payments to date |
| Common Stocks | | | 953,138 | | | Qualitative assessment | | Adjustment to last traded price |
| Common Stocks | | | 39,474 | | | Qualitative assessment | | Last traded price, discount for restriction on resale |
| Common Stocks | | | 409 | | | Qualitative assessment | | Last traded price of pre-conversion bond adjusted to post-reorg.equity |
| Preferred Stocks | | | 440,000 | | | Qualitative assessment | | Single broker quote |
| Preferred Stocks | | | 613,000 | | | Qualitative assessment | | Last traded price |
| Rights | | | 0 | | | Qualitative assessment | | Uncertainty of any additional future payout |
| Warrants | | | 4,061,003 | | | Qualitative assessment | | Single broker quote |
| Convertible Bonds | | | 100,000 | | | Qualitative assessment | | Principal after changes in indenture |
| Corporate Bonds | | | 0 | | | Qualitative assessment | | Uncertainty of any additional future payout |
| Corporate Bonds | | | 630,000 | | | Qualitative assessment | | Single broker quote |
| Term Loan | | | 511,054 | | | Qualitative assessment | | Prior transaction cost |
| Written Options | | | (496,854 | ) | | Options pricing model | | Implied Volatility |
| | | | | | | | | |
GLOBAL TACTICAL
ALLOCATION FUND | Fair Value at
June 30, 2014 | Valuation
Technique | | Unobservable
Input |
| Common Stocks | | $ | 13,148 | | | Qualitative assessment | | Projected final distribution, discounted for lack of marketability |
| | | | | | | | | |
| STRATEGIC GROWTH FUND | Fair Value at
June 30, 2014 | Valuation
Technique | | Unobservable
Input |
| Common Stocks | | $ | 365,437 | | | Qualitative assessment | | Projected final distribution, discounted for lack of marketability |
B. Federal Income Taxes. It is the Funds’ policy to comply with the requirements of Subchapter M of the Internal Revenue Code and to distribute substantially all of their taxable income to shareholders. Therefore, no federal income tax provision is required.
In accordance with Financial Accounting Standards Board (“FASB”) Interpretation ASC 740, (“ASC 740”), each Fund recognizes a tax benefit from an uncertain position only if it is more likely than not that the position is sustainable, based solely on its technical merits and consideration of the relevant taxing authority’s widely understood administrative practices and precedents. If this threshold is met, a Fund measures the tax benefit as the largest amount of benefit that is greater than fifty percent likely of
being realized upon ultimate settlement. Management has reviewed the tax positions for each of the four open tax years as of June 30, 2014 and has determined that the implementation of ASC 740 does not have a material impact on the Funds’ financial statements. Each Fund’s federal tax returns for the prior three fiscal years remains subject to examination by the Internal Revenue Service.
Net investment income or loss and net realized gains or losses may differ for financial statement and income tax purposes primarily due to investments that have a different basis for financial statement and income tax purposes. The character of distributions made during the year from net investment income or net realized gains may differ from their ultimate characterization for federal income tax purposes. Also, due to the timing of dividend distributions, the fiscal year in which amounts are distributed may differ from the year that the income or realized gains were recorded by each Fund. Permanent differences in the recognition of earnings are reclassified to additional paid-in capital. Distributions in excess of tax-basis earnings are recorded as a return of capital.
C. Security Transactions and Investment Income. Security transactions are recorded on the trade date. Realized gains and losses are determined using the specific identification cost method. Interest income on debt securities is recorded daily on the accrual basis. Discounts and premiums on debt securities are amortized over their respective lives. Dividend income is recorded on the ex-dividend date, or as soon as information is available to the Fund.
D. Short Sales of Investments. Certain Funds may make short sales of investments, which are transactions in which a Fund sells a security it does not own in anticipation of a decline in the fair value of that security. To complete such a transaction, the Fund must borrow the security to make delivery to the buyer. The Fund is then obligated to replace the security borrowed by purchasing it at the market price at the time of replacement. The broker retains the proceeds of short sales to the extent necessary to meet margin requirements until the short position is closed out.
If a security pays a dividend while the Fund holds it short, the Fund will need to pay the dividend to the original owner of the security. Since the Fund borrowed the shares and sold them to a third party, the third party will receive the dividend from the security and the Fund will pay the original owner the dividend directly. The Fund is not entitled to the dividend because it does not own the shares. A gain, limited to the price at which the Fund sold the security short, or a loss, unlimited in size, will be recognized upon the termination of a short sale.
E. Written Options Contracts. Certain Funds may write options to manage exposure to certain changes in the market. When a Fund writes an option, an amount equal to the premium received by the Fund is recorded as a liability, which is marked-to-market daily to reflect the current market value of the option written. If the option expires, the Fund realizes a gain from investments equal to the amount of the premium received. When a written call option is exercised, the difference between the premium and the amount for effecting a closing purchase transaction, including brokerage commission, is also treated as a realized gain or loss. When a written put option is exercised, the amount of the premium received reduces the cost of the security purchased by the Fund.
A risk in writing a covered call option is that the Fund may forego the opportunity of profit if the market price of the underlying security increases and the option is exercised. The risk in writing a put option is that the Fund may incur a loss if the market price of the underlying security decreases and the option is exercised.
In addition, there is the risk that the Fund may not be able to enter into a closing transaction because of an illiquid secondary market.
46 | 2 0 1 4 A N N U A L R E P O R T
Note 2 — Summary of Significant Accounting Policies and Other Information (Continued)
F. Purchased Options. Certain Funds may purchase call options in anticipation of an increase in the market value of securities of the type in which they may invest. The purchase of a call option will entitle a Fund, in return for the premium paid, to purchase specified securities at a specified price during the option period. A Fund will ordinarily realize a gain if, during the option period, the value of such securities exceeded the sum of the exercise price, the premium paid and transaction costs; otherwise, the Fund will realize either no gain or a loss on the purchase of the call option. A Fund will normally purchase put options in anticipation of a decline in the market value of securities in its portfolio (“protective puts”) or in securities in which it may invest. The purchase of a put option will entitle the Fund, in exchange for the premium paid, to sell specified securities at a specified price during the option period. The purchase of protective puts is designed to offset or hedge against a decline in the market value of the Fund’s securities. Put options may also be purchased by a Fund for the purpose of affirmatively benefiting from a decline in the price of securities which it does not own. The Fund will ordinarily realize a gain if, during the option period, the value of the underlying securities decreased below the exercise price sufficiently to more than cover the premium and transaction costs; otherwise the Fund will realize either no gain or a loss on the purchase of the put option. Gains and losses on the purchase of protective put options would tend to be offset by countervailing changes in the value of the underlying portfolio securities.
G. Futures Contracts. Certain Funds may enter into financial futures contracts, to the extent permitted by their investment policies and objectives, for bona fide hedging and other permissible risk management purposes including protecting against anticipated changes in the value of securities a Fund intends to purchase. Upon entering into a financial futures contract, a Fund is required to deposit cash or securities as initial margin.
Additional securities are also segregated as collateral up to the current market value of the financial futures contracts. Subsequent payments, known as variation margin, are made or received by the Fund, depending on the fluctuation in the value of the underlying financial instruments. The Fund recognizes an unrealized gain or loss equal to the variation margin. When the financial futures contracts are closed, a realized gain or loss is recognized equal to the difference between the proceeds from (or cost of) the closing transactions and the Fund’s basis in the contracts. The risks associated with entering into financial futures contracts include the possibility that a change in the value of the contract may not correlate with the changes in the value of the underlying instruments. In addition, investing in financial futures contracts involves the risk that the Fund could lose more than the original margin deposit and subsequent payments required for a futures transaction. Risks may also arise upon entering into these contracts from the potential inability of the counterparties to meet the terms of their contracts.
H. Foreign Currency Transactions. Securities and other assets and liabilities denominated in foreign currencies are converted each business day into U.S. dollars based on the prevailing rates of exchange. Purchases and sales of portfolio securities and income and expenses are converted into U.S. dollars on the respective dates of such transactions.
Gains and losses resulting from changes in exchange rates applicable to foreign securities are not reported separately from gains and losses arising from movements in securities prices.
Net realized foreign exchange gains and losses include gains and losses from sales and maturities of foreign currency exchange contracts, gains and losses realized between the trade and settlement dates of foreign securities transactions, and the difference between the amount of dividends, interest and foreign withholding taxes on the Funds’ books and the U.S. dollar equivalent of the amounts actually received. Net unrealized
foreign exchange gains and losses include gains and losses from changes in the fair value of assets and liabilities denominated in foreign currencies other than portfolio securities, resulting from changes in exchange rates.
I. Forward Foreign Currency Contracts. Certain Funds may enter into forward foreign currency contracts to hedge against foreign currency exchange rate risk on their non-U.S. dollar denominated securities or to facilitate settlement of foreign currency denominated portfolio transactions. A forward foreign currency contract is an agreement between two parties to buy and sell a currency at a set price on a future date. The contract is marked-to-market daily and the change in value is recorded by a Fund as an unrealized gain or loss. When a forward foreign currency contract is extinguished, through either delivery or offset by entering into another forward foreign currency contract, the Fund records a realized gain or loss equal to the difference between the value of the contract at the time it was opened and the value of the contract at the time it was extinguished.
Forward foreign currency contracts involve elements of market risk in excess of the amounts reflected in the Statements of Assets and Liabilities. The Fund bears the risk of an unfavorable change in the foreign exchange rate underlying the forward foreign currency contract. Risks may also arise upon entering into these contracts from the potential inability of the counterparties to meet the terms of their contracts.
J. Portfolio Investment Risks. Investments in securities of foreign issuers carry certain risks not ordinarily associated with investments in securities of U.S. issuers. These risks include future disruptive political and economic developments and the possible imposition of exchange controls or other unfavorable foreign government laws and restrictions. In addition, investments in certain countries may carry risks of expropriation of assets, confiscatory taxation, political or social instability, or diplomatic developments that adversely affect investments in those countries. Certain countries may also impose substantial restrictions on investments in their capital markets by foreign entities, including restrictions on investments in issuers in industries deemed sensitive to relevant national interests. These factors may limit the investment opportunities available and result in a lack of liquidity and high price volatility with respect to securities of issuers from developing countries.
K. Multiple Class Allocations. Each class of shares has equal rights as to earnings and assets except that each class bears different distribution and shareholder servicing expenses. Each class of shares has exclusive voting rights with respect to matters that affect just that class. Income, expenses (other than expenses attributable to a specific class) and realized and unrealized gains or losses on investments are allocated to each class of shares based on its relative net assets.
L. Expense Allocations. Expenses are allocated to each series based upon its relative proportion of net assets to the Trust’s total net assets.
M. Distributions to Shareholders. Each Fund generally declares dividends at least annually, payable in December, on a date selected by the Board. In addition, distributions may be made annually in December out of net realized gains through October 31 of that calendar year. Distributions to shareholders are recorded on the ex-dividend date. Each Fund may make a supplemental distribution subsequent to the end of its fiscal year ending June 30.
N. Use of Estimates. The preparation of financial statements in conformity with GAAP requires management to make estimates and assumptions that affect the reported amounts of assets and liabilities and the disclosure of contingent assets and liabilities at the date of the financial statements, and the reported amounts of revenue and expenses during the reporting period. Actual results could differ from those estimates, and those differences could be significant.
2 0 1 4 A N N U A L R E P O R T | 47
Notes to the Financial Statements
Note 2 — Summary of Significant Accounting Policies and Other Information (Continued)
O. Security Loans. The Funds receive compensation in the form of fees, or retain a portion of interest on the investment of any cash received as collateral. The Funds also continue to receive interest or dividends on the securities loaned. The loans are secured by collateral at least equal, at all times, to 102% of the market value of the loaned securities. Gain or loss in the fair value of the securities loaned that may occur during the term of the loan will be for the account of the Funds. The Funds have the right under the lending agreement to recover the securities from the borrower on demand.
P. Derivative Instruments. The Funds have adopted amendments to authoritative guidance on disclosures about derivative instruments and hedging activities which require that the Funds disclose: a) how and why an entity uses derivative instruments; and b) how derivative instruments and related hedged items affect an entity’s financial position, financial performance and cash flows.
The Funds traded financial instruments where they are considered to be a seller of credit derivatives in accordance with authoritative guidance under GAAP on derivatives and hedging.
The fair value of derivative instruments and whose primary underlying risk exposure is equity price risk at June 30, 2014 was as follows:
Event Arbitrage
| | | Fair Value |
| Derivative | | Asset Derivatives(1) | | Liability Derivatives(2) |
| Written Options | | $ | — | | | $ | 3,499,694 | |
| Purchased Options | | | 3,966,847 | | | | — | |
| Warrants | | | 4,061,003 | | | | — | |
| (1) | Statement of Assets and Liabilities location: Investments, at value. |
| (2) | Statement of Assets and Liabilities location: Call Options Written, at value. |
The effect of derivative instruments on the Statement of Operations and whose underlying risk exposure is equity price risk for the period ended June 30, 2014 was as follows:
Event Arbitrage
| Derivative | | Realized Gain(Loss)
on Derivatives
Recognized in
Income(1) | | Change in Unrealized
Appreciation
(Depreciation) on
Derivatives Recognized
in Income(2) |
| Written Options | | $ | (777,755 | ) | | $ | 78,628 | |
| Purchased Options | | | 1,395,159 | | | | 686,386 | |
| Forward Currency Contracts | | | (14,974 | ) | | | 420 | |
| Warrants | | | 101,825 | | | | (215,884 | ) |
| (1) | Statement of Operations location: Net realized gain (loss) from written options, net realized gain (loss) from investments and net realized gain (loss) from futures and forward currency contracts. |
| (2) | Statement of Operations location: Net unrealized appreciation (depreciation) on written options, net unrealized appreciation (depreciation) on investments and net unrealized appreciation (depreciation) on futures and forward currency contracts. |
For the period ended June 30, 2014 the Event Arbitrage Fund had: long option contracts (41,744 contracts) were purchased and $9,983,148 in premiums were paid, written option contracts (125,882 contracts) were opened and $17,147,777 in premiums were received and one forward currency exchange contract position was closed during the year.
Note 3 — Investment Advisory Fee and Other Related Party Transactions
QFI serves as investment adviser to each Fund. Pursuant to separate investment sub-advisory agreements, QFI has selected the following investment advisory firms to serve as sub-advisers:
| Fund | Sub-adviser |
| Event Arbitrage | N/A |
| Global Tactical Allocation | DG Capital Management, Inc. |
| Mid-Cap Value | Kennedy Capital Management, Inc. |
| Small-Cap Value | Aronson Johnson Ortiz, LP |
| Strategic Growth | DG Capital Management, Inc. |
QFI or the sub-advisers provide each Fund with a continuous program of supervision of the Fund’s assets, including the composition of its portfolio, and furnish advice and recommendations with respect to investments, investment policies and the purchase and sale of securities.
Each Fund paid QFI aggregate fees shown in the table below for the fiscal year ending June 30, 2014. Amounts are expressed as an annualized percentage of average net assets.
| Fund | | Aggregate
advisory fee
paid to QFI | | Subadvisory
fee paid by QFI
to the sub-adviser | | Advisory &
subadvisory fees
(reimbursed)/
recovered |
| Event Arbitrage | | | 1.30 | % | | | N/A | | | | (0.16)% | |
| Global Tactical Allocation | | | 1.25 | % | | | 0.75% | | | | N/A | |
| Mid-Cap Value | | | 1.05 | % | | | 0.75% | | | | N/A | |
| Small-Cap Value | | | 1.00 | % | | | 0.65% | | | | N/A | |
| Strategic Growth | | | 1.30 | % | | | 0.75% | | | | 0.09% | |
For the fiscal year ending June 30, 2014, QFI and the sub-advisers earned and (reimbursed) or recovered fees as follows:
| Fund | | Aggregate
advisory fee
paid to QFI | | Subadvisory
fee paid by QFI
to the sub-adviser | | Advisory &
subadvisory
(reimbursed)/
recovered |
| Event Arbitrage | | $ | 1,153,048 | | | | N/A | | | $ | (143,771 | ) |
| Global Tactical Allocation | | | 92,621 | | | | 55,573 | | | | N/A | |
| Mid-Cap Value | | | 95,663 | | | | 68,331 | | | | N/A | |
| Small-Cap Value | | | 363,534 | | | | 236,298 | | | | N/A | |
| Strategic Growth | | | 2,172,641 | | | | 1,253,446 | | | | 155,549 | |
QFI contractually agreed to waive its management fee to the extent that the total operating expenses of Event Arbitrage (exclusive of interest, taxes, brokerage commissions and other costs incurred in connection with the purchase or sale of portfolio securities, and extraordinary items) exceed the annual rate of 1.99% for Class A shares, 2.74% for Class C shares, and 1.74% for Institutional Class shares of the average net assets of each class, respectively. QFI currently has no intention to terminate this arrangement; however, it may do so at any time in its sole discretion. If, at any time, the annualized expenses of Event Arbitrage were less than the annualized expense ratio, the Trust, on behalf of Event Arbitrage, would reimburse QFI for any fees previously waived and/or expenses previously assumed; provided, however, that repayment would be payable only to the extent that it (a) can be made during the three (3) years following the time at which the adviser waived fees or assumed expenses for Event Arbitrage, and (b) can be repaid without causing the expenses of Event Arbitrage to exceed the annualized expense ratio. This fee waiver agreement shall continue in effect from October 28, 2013 until October 28, 2014. This agreement shall automatically terminate upon termination of the advisory agreement between QFI and the Trust or, with respect to Event Arbitrage, in the event of its merger or liquidation.
48 | 2 0 1 4 A N N U A L R E P O R T
Note 3 — Investment Advisory Fee and Other Related Party Transactions (Continued)
Additionally, QFI voluntarily agreed to waive its management fee to the extent that the total operating expenses of Small-Cap Value (exclusive of interest, taxes, brokerage commissions and other costs incurred in connection with the purchase or sale of portfolio securities, and extraordinary items) exceed the annual rate of 2.60% for Class A shares, 3.35% for Class C shares, and 2.35% for Institutional Class shares of the average net assets of each class, respectively. QFI currently has no intention to terminate this arrangement; however, it may do so at any time in its sole discretion.
Additionally, QFI contractually agreed to waive its management fee to the extent that the total operating expenses of Strategic Growth (exclusive of interest, taxes, brokerage commissions and other costs incurred in connection with the purchase or sale of portfolio securities, and extraordinary items) exceed the annual rate of 2.24% for Class A shares, 2.99% for Class C shares, and 1.99% for Institutional Class shares of the average net assets of each class, respectively. QFI has agreed to pass these waivers onto the shareholders. QFI currently has no intention to terminate this arrangement; however, it may do so at any time in its sole discretion.
If, at any time, the annualized expenses of Strategic Growth were less than the annualized expense ratio, the Trust, on behalf of Strategic Growth, would reimburse the sub-adviser for any fees previously waived and/or expenses previously assumed, provided, however, that the repayment shall be payable only to the extent that it: (a) can be made during the five years following 2011 and the three years following 2013 at which the sub-adviser waived fees or assumed expenses for Strategic Growth, and (b) can be repaid without causing the expenses of Strategic Growth to exceed the annualized expense ratio. This fee waiver agreement shall continue in effect from October 28, 2013 until October 28, 2014. This agreement shall automatically terminate upon termination of the advisory agreement, sub-advisory agreement or, with respect to Strategic Growth, in the event of its merger or liquidation.
At June 30, 2014, the cumulative unreimbursed amount paid and/or waived by the Advisor on behalf of Event Arbitrage and Strategic Growth that may be recovered are $549,397 and $595,576, respectively. The Advisor may recover portions of the above amounts no later than the dates stated below.
| | | June 30,
2015 | | June 30,
2016 | | June 30,
2017 |
| Event Arbitrage | | $ | 187,347 | | | $ | 218,279 | | | $ | 143,771 | |
| Strategic Growth | | | — | | | | 595,576 | | | | — | |
Foreside Fund Services, LLC (“Distributor”) serves as principal underwriter for the Trust. The Trust has adopted distribution and shareholder servicing plans pursuant to Rule 12b-1 of the 1940 Act for Class A and Class C shares described below. There is no Rule 12b-1 distribution plan for Institutional Class shares of the Funds. The Class A Plan provides that each Fund may pay a servicing or Rule 12b-1 fee at an annual rate of 0.25% of the Class A average net assets on a monthly basis to persons or institutions for performing certain servicing functions for the Class A shareholders. The Class A Plan also allows the Fund to pay or reimburse expenditures in connection with sales and promotional services related to distribution of the Fund’s shares, including personal services provided to prospective and existing shareholders. The Class C Plan provides that each Fund may compensate QFI and others for services provided and expenses incurred in the distribution of shares at an annual rate of 1.00% of the average net assets of each class on a monthly basis.
For the fiscal year ending June 30, 2014, the Distributor received underwriter concessions from the sale of Funds shares as follows:
| Fund | | Amount |
| Event Arbitrage | | $ | 4,482 | |
| Global Tactical Allocation | | | 318 | |
| Mid-Cap Value | | | 378 | |
| Small-Cap Value | | | 201 | |
| Strategic Growth | | | 6,106 | |
Except for the Trust’s Chief Compliance Officer (“CCO”), employees and Officers of QFI do not receive any compensation from the Trust. The CCO of the Trust also serves as general counsel to QFI. For the fiscal year ending June 30, 2014, the Funds compensated the CCO as follows:
| Fund | | Amount |
| Event Arbitrage | | $ | 51,350 | |
| Global Tactical Allocation | | | 4,185 | |
| Mid-Cap Value | | | 5,276 | |
| Small-Cap Value | | | 21,038 | |
| Strategic Growth | | | 96,983 | |
Note 4 — Purchases and Sales of Investments
For the fiscal year ending June 30, 2014 aggregate purchases and sales of investment securities (excluding short-term investments) for each Fund were as follows:
| | | Purchases | | Sales |
| Event Arbitrage | | $ | 218,949,348 | | | $ | 192,440,684 | |
| Global Tactical Allocation | | | 9,179,818 | | | | 10,303,087 | |
| Mid-Cap Value | | | 5,450,096 | | | | 6,630,873 | |
| Small-Cap Value | | | 63,344,661 | | | | 66,120,717 | |
| Strategic Growth | | | 266,855,603 | | | | 295,151,096 | |
Note 5 — Written Options
A summary of option contracts written by the Trust during the fiscal year ended June 30, 2014 are as follows:
| | | Event Arbitrage |
| | | Number of
Contracts | | Option
Premiums |
| Options outstanding at beginning of period | | | 18,941 | | | $ | 1,667,720 | |
| Options written | | | 125,882 | | | | 17,147,777 | |
| Options closed | | | (49,910 | ) | | | (7,606,037 | ) |
| Options exercised | | | (30,076 | ) | | | (5,357,891 | ) |
| Options expired | | | (42,169 | ) | | | (2,387,942 | ) |
| Options outstanding at end of period | | | 22,668 | | | $ | 3,463,627 | |
2 0 1 4 A N N U A L R E P O R T | 49
Notes to the Financial Statements
Note 6 — Tax Matters
For U.S. federal income tax purposes, the cost of securities owned, gross appreciation, gross depreciation, and net unrealized appreciation (depreciation) of investments at June 30, 2014 for each Fund were as follows:
| Fund | | Cost | | Gross
Appreciation | | Gross
Depreciation | | Net Appreciation
(Depreciation) |
| Event Arbitrage | | $ | 94,924,035 | | | $ | 5,451,466 | | | $ | (3,255,772 | ) | | $ | 2,195,694 | |
| Global Tactical Allocation | | | 6,436,771 | | | | 1,265,781 | | | | (33,061 | ) | | | 1,232,720 | |
| Mid-Cap Value | | | 8,787,039 | | | | 2,387,846 | | | | (40,419 | ) | | | 2,347,427 | |
| Small-Cap Value | | | 38,119,087 | | | | 5,416,753 | | | | (575,370 | ) | | | 4,841,383 | |
| Strategic Growth | | | 160,959,535 | | | | 22,155,541 | | | | (220,448 | ) | | | 21,935,093 | |
As of June 30, 2014, the components of distributable earnings on a tax basis were as follows:
| Fund | | Unrealized
Appreciation
(Depreciation) | | Undistributed
Ordinary Income | | Undistributed
Capital Gain | | Capital Loss
Carryforward | | Late Year
Loss | | Total
Distributable
Earnings/(Loss) |
| Event Arbitrage | | $ | 1,942,740 | | | $ | 4,154,612 | | | $ | 2,731,163 | | | $ | — | | | $ | — | | | $ | 8,828,515 | |
| Global Tactical Allocation | | | 1,242,807 | | | | — | | | | — | | | | (11,474,279 | ) | | | (16,907 | ) | | | (10,248,379 | ) |
| Mid-Cap Value | | | 2,347,427 | | | | — | | | | — | | | | (6,321,569 | ) | | | (19,443 | ) | | | (3,993,585 | ) |
| Small-Cap Value | | | 4,841,383 | | | | 1,275,903 | | | | — | | | | — | | | | — | | | | 6,117,286 | |
| Strategic Growth | | | 21,935,093 | | | | — | | | | — | | | | (387,337,032 | ) | | | (852,247 | ) | | | (366,254,186 | ) |
The difference between book basis and tax basis unrealized appreciation (depreciation) is attributable primarily to the tax deferral of losses on wash sales and straddles from options, the differing book/tax treatment of unrealized appreciation/depreciation on forward foreign currency contracts, and outstanding PFIC adjustments.
The undistributed ordinary income, capital gains and carryforward losses shown above differ from the corresponding accumulated net investment income and accumulated net realized gain (loss) figures reported in the statements of assets and liabilities due to differing book/tax treatment of short-term capital gains, and certain temporary book/tax differences such as the deferral of realized losses on wash sales, straddles from options and net losses realized after October 31 and from ordinary losses incurred after December 31.
Under current tax law, foreign currency and net capital losses realized after October 31 may be deferred and treated as occurring on the first day of the following fiscal year. The Funds elected to defer net capital and currency losses as indicated in the chart below.
At June 30, 2014, the capital loss carryovers for the Funds were as follows:
| | | Capital Loss Carryovers Expiring | | Late Year | | Capital Loss |
| Fund | | 2018 | | 2017 | | Loss | | Utilized |
| Event Arbitrage | | $ | — | | | $ | — | | | $ | — | | | $ | — | |
| Global Tactical Allocation | | | 2,718,683 | | | | 8,755,596 | | | | 16,907 | | | | 1,110,183 | |
| Mid-Cap Value | | | 1,170,572 | | | | 5,150,997 | | | | 19,443 | | | | 1,739,840 | |
| Small-Cap Value | | | — | | | | — | | | | — | | | | 5,165,206 | |
| Strategic Growth | | | 164,714,297 | | | | 222,622,735 | | | | 852,247 | | | | 35,164,482 | |
Note 7 — Reclassification of Capital Accounts
In accordance with the accounting pronouncements, each Fund has recorded reclassifications in the capital accounts. These reclassifications have no impact on the net asset value of the Funds and are designed generally to present undistributed income and realized gains on a tax basis which is considered to be more informative to shareholders. As of June 30, 2014, the Funds recorded the following reclassification to increase (decrease) the accounts listed below:
| Fund | | Accumulated
Net Investment
Income (Loss) | | Accumulated
Net Realized
Gain (Loss) | | Paid-in
Capital |
| Event Arbitrage | | $ | (1,179,150 | ) | | $ | 1,179,150 | | | $ | — | |
| Global Tactical Allocation | | | 102,295 | | | | — | | | | (102,295 | ) |
| Mid-Cap Value | | | 64,421 | | | | — | | | | (64,421 | ) |
| Small-Cap Value | | | 161,081 | | | | (174,849 | ) | | | 13,768 | |
| Strategic Growth | | | 1,695,335 | | | | — | | | | (1,695,335 | ) |
50 | 2 0 1 4 A N N U A L R E P O R T
Note 8 — Distributions to Shareholders
Income and long-term capital gain distributions are determined in accordance with federal income tax regulations, which may differ from GAAP. The information set forth below is for each Fund’s fiscal year as required by federal securities laws.
The tax character of dividends and distributions paid during the fiscal years of 2014 and 2013 were as follows:
| | | Ordinary Income | | | Long-Term Capital Gain | |
| Fund | | 2014 | | | 2013 | | | 2014 | | | 2013 | |
| Event Arbitrage | | | $551,035 | | | | $700,520 | | | | $— | | | | $— | |
| Global Tactical Allocation | | | — | | | | — | | | | — | | | | — | |
| Mid-Cap Value | | | — | | | | — | | | | — | | | | — | |
| Small-Cap Value | | | 117,065 | | | | 86,508 | | | | — | | | | — | |
| Strategic Growth | | | — | | | | — | | | | — | | | | — | |
Note 9 — Fund Share Transactions
At June 30, 2014, there were an unlimited number of shares of beneficial interest with a $0.01 par value authorized. The following table summarizes the activity in shares of each Fund:
| Event Arbitrage | |
| | | For the Fiscal Year Ended June 30, 2014 | | | For the Fiscal Year Ended June 30, 2013 |
| | | Sold | | | Redeemed | | | Reinvested | | | End Shares | | | Sold | | | Redeemed | | | Reinvested | | | End Shares | |
| Class A | | | | | | | | | | | | | | | | | | | | | | | | | | | | | | | | |
| Shares | | | 2,023,265 | | | | (1,022,262 | ) | | | 16,919 | | | | 3,768,903 | | | | 1,020,896 | | | | (1,212,671 | ) | | | 30,835 | | | | 2,750,981 | |
| Value | | $ | 27,263,608 | | | $ | (13,672,859 | ) | | $ | 228,577 | | | | | | | $ | 12,620,599 | | | $ | (14,814,872 | ) | | $ | 371,562 | | | | | |
| Class C | | | | | | | | | | | | | | | | | | | | | | | | | | | | | | | | |
| Shares | | | 127,679 | | | | (125,728 | ) | | | 2,324 | | | | 477,916 | | | | 113,780 | | | | (256,519 | ) | | | 5,746 | | | | 473,641 | |
| Value | | $ | 1,686,768 | | | $ | (1,645,105 | ) | | $ | 30,719 | | | | | | | $ | 1,388,619 | | | $ | (3,121,760 | ) | | $ | 68,205 | | | | | |
| Institutional Class | | | | | | | | | | | | | | | | | | | | | | | | | | | | | | | | |
| Shares | | | 2,977,895 | | | | (729,663 | ) | | | 16,276 | | | | 4,203,510 | | | | 1,161,683 | | | | (349,132 | ) | | | 16,200 | | | | 1,939,002 | |
| Value | | $ | 40,315,673 | | | $ | (9,853,990 | ) | | $ | 220,875 | | | | | | | $ | 14,462,851 | | | $ | (4,310,034 | ) | | $ | 195,699 | | | | | |
| Global Tactical Allocation | |
| | | For the Fiscal Year Ended June 30, 2014 | | | For the Fiscal Year Ended June 30, 2013 |
| | | Sold | | | Redeemed | | | Reinvested | | | End Shares | | | Sold | | | Redeemed | | | Reinvested | | | End Shares | |
| Class A | | | | | | | | | | | | | | | | | | | | | | | | | | | | | | | | |
| Shares | | | 51,669 | | | | (134,765 | ) | | | — | | | | 381,496 | | | | 41,787 | | | | (379,191 | ) | | | — | | | | 464,592 | |
| Value | | $ | 479,932 | | | $ | (1,288,291 | ) | | $ | — | | | | | | | $ | 309,689 | | | $ | (2,905,906 | ) | | $ | — | | | | | |
| Class C | | | | | | | | | | | | | | | | | | | | | | | | | | | | | | | | |
| Shares | | | 9,849 | | | | (66,493 | ) | | | — | | | | 209,542 | | | | 2,199 | | | | (193,971 | ) | | | — | | | | 266,186 | |
| Value | | $ | 90,711 | | | $ | (614,304 | ) | | $ | — | | | | | | | $ | 15,378 | | | $ | (1,436,277 | ) | | $ | — | | | | | |
| Institutional Class | | | | | | | | | | | | | | | | | | | | | | | | | | | | | | | | |
| Shares | | | 46,116 | | | | (8,570 | ) | | | — | | | | 103,414 | | | | 1,318 | | | | (46,164 | ) | | | — | | | | 65,868 | |
| Value | | $ | 492,035 | | | $ | (99,214 | ) | | $ | — | | | | | | | $ | 12,075 | | | $ | (409,020 | ) | | $ | — | | | | | |
| Mid-Cap Value | |
| | | For the Fiscal Year Ended June 30, 2014 | | | For the Fiscal Year Ended June 30, 2013 |
| | | Sold | | | Redeemed | | | Reinvested | | | End Shares | | | Sold | | | Redeemed | | | Reinvested | | | End Shares | |
| Class A | | | | | | | | | | | | | | | | | | | | | | | | | | | | | | | | |
| Shares | | | 27,174 | | | | (112,092 | ) | | | — | | | | 232,513 | | | | 74,459 | | | | (145,642 | ) | | | — | | | | 317,431 | |
| Value | | $ | 583,357 | | | $ | (2,415,606 | ) | | $ | — | | | | | | | $ | 1,379,496 | | | $ | (2,506,200 | ) | | $ | — | | | | | |
| Class C | | | | | | | | | | | | | | | | | | | | | | | | | | | | | | | | |
| Shares | | | 3,424 | | | | (14,867 | ) | | | — | | | | 95,926 | | | | 3,057 | | | | (33,899 | ) | | | — | | | | 107,369 | |
| Value | | $ | 71,274 | | | $ | (278,978 | ) | | $ | — | | | | | | | $ | 46,032 | | | $ | (520,042 | ) | | $ | — | | | | | |
| Institutional Class | | | | | | | | | | | | | | | | | | | | | | | | | | | | | | | | |
| Shares | | | 39,622 | | | | (7,083 | ) | | | — | | | | 85,982 | | | | 48,215 | | | | (16,203 | ) | | | — | | | | 53,443 | |
| Value | | $ | 965,121 | | | $ | (162,387 | ) | | $ | — | | | | | | | $ | 907,883 | | | $ | (308,708 | ) | | $ | — | | | | | |
2 0 1 4 A N N U A L R E P O R T | 51
Notes to the Financial Statements
Note 9 — Fund Share Transactions (Continued)
| Small-Cap Value | |
| | | For the Fiscal Year Ended June 30, 2014 | | | For the Fiscal Year Ended June 30, 2013 |
| | | Sold | | | Redeemed | | | Reinvested | | | End Shares | | | Sold | | | Redeemed | | | Reinvested | | | End Shares | |
| Class A | | | | | | | | | | | | | | | | | | | | | | | | | | | | | | | | |
| Shares | | | 10,449 | | | | (57,104 | ) | | | 872 | | | | 350,584 | | | | 17,706 | | | | (148,506 | ) | | | 489 | | | | 396,367 | |
| Value | | $ | 237,119 | | | $ | (1,292,311 | ) | | $ | 20,125 | | | | | | | $ | 302,337 | | | $ | (2,558,282 | ) | | $ | 8,059 | | | | | |
| Class C | | | | | | | | | | | | | | | | | | | | | | | | | | | | | | | | |
| Shares | | | 4,192 | | | | (14,364 | ) | | | — | | | | 88,396 | | | | 2,096 | | | | (41,640 | ) | | | — | | | | 98,568 | |
| Value | | $ | 80,147 | | | $ | (266,783 | ) | | $ | — | | | | | | | $ | 31,188 | | | $ | (617,552 | ) | | $ | — | | | | | |
| Institutional Class | | | | | | | | | | | | | | | | | | | | | | | | | | | | | | | | |
| Shares | | | 27,778 | | | | (82,487 | ) | | | 2,892 | | | | 1,101,319 | | | | 64,487 | | | | (128,787 | ) | | | 3,255 | | | | 1,153,136 | |
| Value | | $ | 652,335 | | | $ | (1,944,101 | ) | | $ | 69,432 | | | | | | | $ | 1,183,195 | | | $ | (2,332,157 | ) | | $ | 55,782 | | | | | |
| Strategic Growth | |
| | | For the Fiscal Year Ended June 30, 2014 | | | For the Fiscal Year Ended June 30, 2013 |
| | | Sold | | | Redeemed | | | Reinvested | | | End Shares | | | Sold | | | Redeemed | | | Reinvested | | | End Shares | |
| Class A | | | | | | | | | | | | | | | | | | | | | | | | | | | | | | | | |
| Shares | | | 172,716 | | | | (1,180,586 | ) | | | — | | | | 3,599,355 | | | | 530,779 | | | | (2,851,509 | ) | | | — | | | | 4,607,225 | |
| Value | | $ | 3,777,874 | | | $ | (25,888,622 | ) | | | $— | | | | | | | $ | 9,819,661 | | | $ | (50,010,445 | ) | | | $— | | | | | |
| Class C | | | | | | | | | | | | | | | | | | | | | | | | | | | | | | | | |
| Shares | | | 16,505 | | | | (279,526 | ) | | | — | | | | 1,073,028 | | | | 23,191 | | | | (559,927 | ) | | | — | | | | 1,336,049 | |
| Value | | $ | 321,354 | | | $ | (5,496,331 | ) | | | $— | | | | | | | $ | 364,184 | | | $ | (8,702,474 | ) | | | $— | | | | | |
| Institutional Class | | | | | | | | | | | | | | | | | | | | | | | | | | | | | | | | |
| Shares | | | 598,508 | | | | (541,639 | ) | | | — | | | | 2,351,003 | | | | 931,177 | | | | (1,055,174 | ) | | | — | | | | 2,294,134 | |
| Value | | $ | 13,593,469 | | | $ | (12,402,433 | ) | | | $— | | | | | | | $ | 16,754,902 | | | $ | (18,625,480 | ) | | | $— | | | | | |
Note 10 — Offsetting Assets and Liabilities
The Funds are subject to various Master Netting Arrangements (“MNA”), which govern the terms of certain transactions with select counterparties. The MNA allow the Funds to close out and net their total exposure to a counterparty in the event of a default with respect to all the transactions governed under a single agreement with a counterparty. The MNA also specify collateral posting arrangements at pre-arranged exposure levels. Under the MNA, collateral is routinely transferred if the total net exposure to certain transactions (net of existing collateral already in place) governed under the revelant MNA with a counterparty in a given account exceeds a specified threshold depending on the counterparty and the type of MNA.
The following is a summary of the Assets and Liabilities for each Fund subject to offsets as of June 30, 2014:
Liabilities:
| | | | | | | Gross | | Net | | | | | | | | | | |
| | | | | | | Amounts | | Amounts | | Gross Amounts Not | | | | |
| | | | | | | Offset | | Presented | | Offset in the Statements | | | | |
| | | | | | | in the | | in the | | of Assets and Liabilities | | | | |
| | | Gross Amounts | | Statements | | Statements | | | | | Collateral | | | | |
| | | of Recognized | | of Assets | | of Assets | | Financial | | Pledged | | Net |
| Description | | Liabilities | | and Liabilities | | and Liabilities | | Instruments | | (Received) | | Amount |
| Event Arbitrage | | | | | | | | | | | | | | | | | | | | | | | | | | | |
| Written Options | | | $ | 3,499,694 | | | | $ | — | | | $ | 3,499,694 | | | $ | — | | | $ | 3,499,694 | | | | $ | — | |
| Securities Lending | | | | 7,688,944 | | | | | — | | | | 7,688,944 | | | | 7,688,944 | | | | — | | | | | — | |
| | | | | 11,188,638 | | | | | — | | | | 11,188,638 | | | | 7,688,944 | | | | 3,499,694 | | | | | — | |
| Global Tactical Allocation | | | | | | | | | | | | | | | | | | | | | | | | | | | |
| Securities Lending | | | | 515,535 | | | | | — | | | | 515,535 | | | | 515,535 | | | | — | | | | | — | |
| Mid-Cap Value | | | | | | | | | | | | | | | | | | | | | | | | | | | |
| Securities Lending | | | | 1,565,695 | | | | | — | | | | 1,565,695 | | | | 1,565,695 | | | | — | | | | | — | |
| Small-Cap Value | | | | | | | | | | | | | | | | | | | | | | | | | | | |
| Securities Lending | | | | 5,298,458 | | | | | — | | | | 5,298,458 | | | | 5,298,458 | | | | — | | | | | — | |
| Strategic Growth | | | | | | | | | | | | | | | | | | | | | | | | | | | |
| Securities Lending | | | | 21,035,500 | | | | | — | | | | 21,035,500 | | | | 21,035,500 | | | | — | | | | | — | |
52 | 2 0 1 4 A N N U A L R E P O R T
Note 11 — Indemnifications
Under the Trust’s organizational documents, its officers and Trustees are indemnified against certain liabilities arising out of the performance of their duties to the Funds. In addition, in the normal course of business, the Trust enters into contracts with its vendors and others that provide for general indemnifications.
The Trust’s maximum exposure under these arrangements is dependant on future claims that may be made against the Trust, and, therefore, cannot be estimated; however, based on experience, risk of loss from such claims is considered remote.
Note 12 — Securities Lending
The Funds hold shares of the Mount Vernon Securities Lending Trust Prime Portfolio as cash collateral, which is a registered money market fund whose main objective is to maximize current income to the extent consistent with the preservation of capital and liquidity. It primarily invests in Certificates of Deposits, Asset Backed and Financial Company Commercial Paper, and Repurchase Agreements.
At June 30, 2014, the aggregate market value of loaned securities and the value of the cash collateral the Funds received is as follows:
| | | Loaned Securities | | Value of | | % of |
| | | Market Value | | Cash Collateral | | Net Assets |
| Event Arbitrage | | | 7,302,819 | | | | 7,688,944 | | | | 6.5 | % |
| Global Tactical Allocation | | | 473,610 | | | | 515,535 | | | | 7.0 | % |
| Mid-Cap Value | | | 1,515,280 | | | | 1,565,695 | | | | 15.6 | % |
| Small-Cap Value | | | 5,092,529 | | | | 5,298,458 | | | | 13.9 | % |
| Strategic Growth | | | 19,942,937 | | | | 21,035,500 | | | | 12.4 | % |
Note 13 — Recent Accounting Pronouncements
In June 2014, the Financial Accounting Standard Board issued ASU No. 2014-11 “Repurchase-to-Maturity Transactions, Repurchase Financings, and Disclosures.” ASU No. 2014-11 makes limited changes to the accounting for repurchase agreements, clarifies when repurchase agreements and securities lending transactions should be accounted for as secured borrowings, and requires additional disclosures regarding these types of transactions. The guidance is effective for fiscal years beginning after December 15, 2014, and for interim periods within those fiscal years. Management is currently evaluating the impact these disclosures will have on the Funds’ financial statement disclosures.
REPORT OF INDEPENDENT REGISTERED PUBLIC ACCOUNTING FIRM
To the Shareholders and Board of Trustees of Quaker Investment Trust
We have audited the accompanying statements of assets and liabilities of Quaker Event Arbitrage Fund, Quaker Global Tactical Allocation Fund, Quaker Mid-Cap Value Fund, Quaker Small-Cap Value Fund, and Quaker Strategic Growth Fund (the “Funds”), each a series of Quaker Investment Trust (the “Trust”), including the schedules of investments, as of June 30, 2014, the related statements of operations for the year then ended, the statements of changes in net assets for each of the two years in the period then ended, and the financial highlights for each of the three years in the period then ended. These financial statements and financial highlights are the responsibility of the Funds’ management. Our responsibility is to express an opinion on these financial statements and financial highlights based on our audits. The financial highlights for each of the two years in the period ended June 30, 2011 were audited by other auditors, whose report dated August 29, 2011 expressed an unqualified opinion on such financial highlights.
We conducted our audits in accordance with the standards of the Public Company Accounting Oversight Board (United States). Those standards require that we plan and perform the audits to obtain reasonable assurance about whether the financial statements and financial highlights are free of material misstatement. The Funds are not required to have, nor were we engaged to perform, an audit of their internal control over financial reporting. Our audits included consideration of internal control over financial reporting as a basis for designing audit procedures that are appropriate in the circumstances, but not for the purpose of expressing an opinion on the effectiveness of the Funds’ internal control over financial reporting. Accordingly, we express no such opinion. An audit includes examining, on a test basis, evidence supporting the amounts and disclosures in the financial statements. Our procedures included confirmation of securities owned as of June 30, 2014, by correspondence with the custodian and brokers or through other appropriate procedures where replies from brokers were unable to be obtained. An audit also includes assessing the accounting principles used and significant estimates made by management, as well as evaluating the overall financial statement presentation. We believe that our audits provide a reasonable basis for our opinion.
In our opinion, the financial statements and financial highlights referred to above present fairly, in all material respects, the financial position of Quaker Event Arbitrage Fund, Quaker Global Tactical Allocation Fund, Quaker Mid-Cap Value Fund, Quaker Small-Cap Value Fund, and Quaker Strategic Growth Fund, as of June 30, 2014, the results of their operations for the year then ended, the changes in their net assets for each of the two years in the period then ended, and the financial highlights for each of the three years in the period then ended, in conformity with accounting principles generally accepted in the United States of America.
Tait, Weller & Baker LLP
Philadelphia, Pennsylvania
August 28, 2014
2 0 1 4 A N N U A L R E P O R T | 53
Trustees and Officers (Unaudited)
June 30, 2014
The Board has overall responsibility for conduct of the Trust’s affairs. The day-to-day operations of the Trust are managed by QFI subject to the Bylaws of
the Trust and review by the Board. The Trustees, including those Trustees who are also officers, are listed below:
| Name, Address and Age | | Position(s) Held
with the Trust | | Serving as
an Officer
or Trustee of
the Trust | | Principal Occupation(s) During Past 5 Years | | Portfolios
Overseen by
Trustee | | Directorships
Held by
Trustee(1) |
Jeffry H. King, Sr.(2)(3)
309 Technology Drive
Malvern, PA 19355
Age 71 | | Chairman of the Board and Chief Executive Officer | | Since
Nov. 1996 | | Chairman of Board of Directors and Chief Executive Officer, Quaker Funds, Inc. (1996–present). | | 5 | | None |
Laurie Keyes(3)(4)
309 Technology Drive
Malvern, PA 19355
Age 64 | | Treasurer and Trustee | | Since
Nov. 1996 | | Chief Financial Officer, Quaker Funds, Inc. (1996–present). | | 5 | | None |
Justin Brundage(5)
309 Technology Drive
Malvern, PA 19355
Age 44 | | Secretary | | Since
Nov. 2006 | | President, Quaker Funds, Inc. (2007–present); Chief Operating Officer, Quaker Funds, Inc. (2005–present). | | N/A | | N/A |
Timothy E. Richards
309 Technology Drive
Malvern, PA 19355
Age 49 | | Chief Compliance Officer | | Since
March 2004 | | General Counsel to Quaker Funds, Inc. (2003–present); Chief Compliance Officer for the Quaker Investment Trust (2004–present). | | N/A | | N/A |
James R. Brinton
309 Technology Drive
Malvern, PA 19355
Age 60 | | Trustee
Lead Independent Trustee | | Since
Feb. 2002
Since
Aug. 2007 | | President, Robert J. McAllister Agency, Inc. (commercial insurance brokerage firm) (1979–present). | | 5 | | Director, ACP Funds Trust |
Gary Edward Shugrue
309 Technology Drive
Malvern, PA 19355
Age 60 | | Trustee | | Since
July 2008 | | President and Chief Investment Officer, Ascendant Capital Partners. | | 5 | | Director, BHR Institutional Funds; Director, ACP Funds Trust |
Warren West
309 Technology Drive
Malvern, PA 19355
Age 57 | | Trustee | | Since
Nov. 2003 | | President and owner, Greentree Brokerage Services, Inc. (1998–present). | | 5 | | None |
Everett T. Keech
309 Technology Drive
Malvern, PA 19355
Age 74 | | Trustee
Interested Trustee, Vice Chairman of the Board, President, Treasurer Trustee | | Since
Nov. 2005
Nov.,1996 –
Jan., 2005
Nov.,1996 –
Feb.,2002 | | Chairman-Executive Committee, Technology Development Corp., (1997–Present) technology development and manufacturing firm (1997–present); Affiliated Faculty, University of Pennsylvania (1998–present). | | 5 | | Director, Technology Development Corp.; Director, Advanced Training Systems International, Inc.; Director, Phoenix Data Systems, Inc. |
| (1) | Directorship of companies required to report to the SEC under the Securities and Exchange Act of 1934, as amended (the “Exchange Act”) (i.e., “public companies”) and investment companies registered under the 1940 Act. |
| (2) | Mr. King is considered to be “interested person” of the Trust for purposes of the 1940 Act because he is the Chief Executive Officer and a controlling shareholder of Quaker Funds, Inc., the investment adviser to the Funds. |
| (3) | Mr. King and Ms. Keyes are husband and wife. |
| (4) | Ms. Keyes is considered to be an “interested person” of the Trust for purposes of the 1940 Act because she is the Trust’s Treasurer and a controlling shareholder of Quaker Funds, Inc. |
| (5) | Mr. Brundage is Ms. Keyes’ son. |
The Statement of Additional Information for the Trust includes additional information about the Trustees and Officers and is available, without charge, upon request by calling (800) 220-8888.
Form N-Q Filing and Proxy Voting Policies and Procedures
Each Fund files its complete schedule of portfolio holdings with the Securities and Exchange Commission (“SEC”) for the first and third quarters of each fiscal year on Form N-Q. Each Fund’s Forms N-Q, as well as a description of the policies and procedures that each Fund uses to determine how to vote proxies (if any) relating to portfolio securities is available without charge: (i) upon request, by calling (800) 220-8888; and (ii) on the SEC’s web-site at http://www.sec.gov. Each Fund’s Forms N-Q may be reviewed and
copied at the SEC’s Public Reference Room in Washington, DC; information on the operation of the Public Reference Room may be obtained by calling 1-800-SEC-0330.
Information (if any) regarding how the Funds voted proxies relating to portfolio securities during the most recently disclosed 12-month period ended June 30 is available: (i) without charge, upon request, by calling (800) 220-8888; and (ii) on the SEC’s web-site at http://www.sec.gov.
54 | 2 0 1 4 A N N U A L R E P O R T
Board Consideration of the Investment Advisory and Sub-Advisory Agreements (Unaudited)
At a meeting held on March 20, 2014, the Independent Trustees of the Board of the Trust (“Trustees” or “Board”) considered the continuation of the Investment Advisory Agreement between the Trust and Quaker Funds, Inc. (“Adviser”) and each of the respective Sub-Advisory Agreements between the Adviser and Arson Johnson Ortiz, LP, DG Capital Management, Inc. and Kennedy Capital Management, Inc. (collectively, “Agreements”) with regard to each Fund. At the meeting, the Independent Trustees reported to the full Board their considerations with respect to the Agreements, and the Board, including a majority of Independent Trustees, considered and approved the renewal of the Agreements. Each of the Agreements was approved for a one year period.
In considering the continuation of the advisory and sub-advisory agreements, the Trustees considered the nature and quality of the services provided by the Adviser and each of the sub-advisers, the proposed fee structures, the level of fee waivers, each Fund’s past and anticipated expense ratios, possible economies of scale resulting from increases in the size of the Funds and other possible benefits the Adviser and each of the sub-advisers derived from their relationships with the Funds. The Trustees carefully analyzed the information provided to them by the Adviser and each of the sub-advisers, focusing particularly on the level of advisory fees and expenses of each Fund and the performance of each Fund compared to funds with similar investment objectives. The Trustees also considered other information that had been received from the Adviser and each of the sub-advisers at other meetings throughout the year.
The Trustees first evaluated the nature, extent and quality of services provided by the Adviser and the sub-advisers to the Funds and their shareholders. The Board considered reports furnished to it throughout the year, which covered matters such as the relative performance of each Fund, compliance of portfolio managers with the investment policies, strategies and restrictions for each Fund, compliance by the personnel at the Adviser and sub-advisers with the Trust’s Code of Ethics, as well as the Codes of Ethics applicable to their firms, and adherence to fair value pricing procedures as established by the Board. The Board gave favorable consideration to the Adviser’s continued efforts to control expenses as the Trust’s assets decreased while maintaining service levels committed to Fund matters. The Board considered the quality of the portfolio management services that each sub-adviser provided to the Funds; the depth, experience and demonstrated consistency in investment approach of each of the Adviser’s and the sub-advisers’ portfolio management teams. The Board also acknowledged the Adviser’s commitment to servicing the Funds as its only client and the nature of the non-investment advisory services provided to the Funds, such as the supervision of the Funds’ other third-party service providers, including the sub-advisers, by the Adviser. The Board was satisfied with the nature, extent and quality of the overall services provided by the Adviser and the sub-advisers.
With respect to the Funds’ investment performance, the Trustees reviewed each Fund’s performance compared to both its peer group and relative benchmark indices over one-year, three-year, five-year, ten-year and since inception periods, as applicable. The Trustees considered factors, including but not limited to the sub-advisers’ management style, peer group performance and overall market conditions that had affected the performance of each Fund relative to its peer group benchmark. Taking into consideration the portfolio managers’ investment strategies, the Funds’ investment objectives and the recent economic environment, the Trustees were satisfied with the Funds’ overall performance.
The Trustees considered the costs of the services provided to the Trust and the profits realized by the Adviser from its relationship with the Trust, including the Adviser’s and sub-advisers’ willingness to waive fees. The Trustees also considered that the Adviser and sub-advisers might be able to recover some of its waived fees in the future. The Trustees were satisfied with the Funds’ contractual rates, and in particular, the Adviser’s continued financial commitment to the Funds’ during the periods when assets under management had fallen significantly. Because the Adviser has no other advisory accounts, the Trustees did not consider the relationship between the Adviser’s advisory fees compared to other accounts that the Adviser advises.
The Trustees considered whether there are any “fall out” or ancillary benefits that may accrue to the Adviser or a sub-adviser as a result of their relationship with the Funds. Based on the information provided and the relative size of the complex, the Trustees noted that there did not appear to be any significant benefits in this regard.
Based on the totality of the information considered, the Trustees concluded that Funds were likely to benefit from the nature, extent and quality of the services provided by the Adviser and each of the sub-advisers’ services, as applicable, and that the Adviser and each of the sub-advisers have the ability to continue to provide these services based on their respective experience, operations and resources.
After evaluation of the fee and expense information, comparative performance, and the Adviser’s profitability, ancillary benefits and other considerations as described above, and in light of the nature, extent and quality of services to be provided by the Adviser and each of the sub-advisers, the Trustees determined the level of fees to be paid to the Adviser and each of the sub-advisers to be reasonable.
The Board discussed in detail the content of the information provided by the Adviser and each of the sub-advisers and raised specific questions they had from their individual reviews. In voting unanimously to approve the Advisory Agreement and Sub-advisory Agreements, based on the various considerations discussed above, the Trustees, including all of the Independent Trustees, determined that the approval of each of the Advisory Agreement and Sub-Advisory Agreements was in the best interests of the Funds.
2 0 1 4 A N N U A L R E P O R T | 55
General Information (Unaudited)
Tax Information
We are required to advise you within 60 days of the Funds’ fiscal year-end regarding the federal tax status of certain distributions received by shareholders during such fiscal year. The information below is provided for the fiscal year ending June 30, 2014. During the fiscal year ended June 30, 2014, the Funds did not pay any long-term capital distributions.
Individual shareholders are eligible for reduced tax rates on the following percentages of qualified dividend income. For the purposes of computing the dividends eligible for reduced taxes, the following amounts of the dividends paid by the Fund from ordinary income earned during the fiscal year are considered qualified dividend income.
| Fund | | Amount | | | Percentage |
| Event Arbitrage | | $ | 62,377 | | | | 11.32 | % |
| Global Tactical Allocation | | | — | | | | — | |
| Mid-Cap Value | | | — | | | | — | |
| Small-Cap Value | | | 117,065 | | | | 100.00 | % |
| Strategic Growth | | | — | | | | — | |
Corporate shareholders may exclude up to the following percentages of qualifying dividends. For the purposes of computing this exclusion, the following amounts of the dividends paid by the Funds from ordinary income earned during the fiscal year represents qualifying dividends.
| Fund | | Amount | | | Percentage |
| Event Arbitrage | | $ | 54,057 | | | | 9.81 | % |
| Global Tactical Allocation | | | — | | | | — | |
| Mid-Cap Value | | | — | | | | — | |
| Small-Cap Value | | $ | 117,065 | | | | 100.00 | % |
| Strategic Growth | | | — | | | | — | |
Dividends and distributions received by retirement plans such as IRAs, Keogh type plans and 403(b) plans need not be reported as taxable income. However, many retirement plan trusts may need this information for their annual information reporting. Since the information above is reported for the Funds’ fiscal year and not the calendar year, shareholders should refer to their Form 1099-DIV or other tax information which will be mailed in January 2015 to determine the calendar year amounts to be included on their 2014 tax returns. Shareholders should consult their tax advisers.
Privacy Policy
Your personal privacy is important. At Quaker Investment Trust, including its subsidiaries and affiliated entities, we recognize that whether you are an existing customer or are considering a relationship with us, you have an interest in how we collect, retain and use information about you and your relationship with us.
We are committed to protecting your confidential information. We do this by maintaining standards and procedures designed to prevent the accidental disclosure of such information and/or its misuse. Our Customer Privacy Policy, which outlines how we accomplish the protection of your information, is set forth below.
I. INFORMATION COLLECTION
We may collect “non-public personal information” about you from the following sources:
| | • | Information we receive from you on account applications and other account forms you provide to us; |
| | | |
| | • | Information about your transactions with us, our affiliates, and other entities; |
| | | |
| | • | Information we receive from third parties, such as credit bureaus, the IRS, and others. “Non-public personal information” is non-public information about you that we obtain in connection with providing a financial product or service to you. For example, non-public personal information includes information regarding your account balance, shares held, which funds you own, your investment history, etc. |
II. INFORMATION USE & SHARING WITH THIRD PARTIES
We are permitted under law to share information about our experiences or transactions with you or your account (such as your account balance, shares owned, and investment history) with affiliates. We may also share additional information about you or your account (such as information we receive from account applications and other correspondence) with our affiliates. We do not disclose information to our affiliates that does not directly relate to our or our affiliates’, experiences or transactions with your account.
We are also permitted under law to disclose non-public information about you to “non-affiliated third parties” in certain circumstances. We may share certain kinds of customer information with these third parties solely to facilitate the offering, administration, collection and delivery of our services to you, and only under strictly controlled circumstances designed to protect the privacy of your information. We require any non-affiliated third party with whom we share such information to execute our Confidentiality and Consumer Privacy Protection Agreement. Under that agreement, those parties are not allowed to release, use for their own purposes, or sell, transfer or provide any customer information we share with them to any other party.
You should be aware that there may be occasions where we are legally required to disclose information about you, such as in response to a governmental or court order.
If you decide to close your account with us, we will continue to adhere to these privacy policies. Lastly, we do not sell customer lists or individual customer information.
III. SECURITY STANDARDS
At Quaker Investment Trust and our affiliates, employee access to customer information is authorized for business purposes only and only for employees who need to know such information.
We regularly train our employees on privacy and privacy security, and we have established and continuously maintain standards and procedures to protect the privacy of your information.
When you use our on-line (Internet) products and services, we may collect information about you to personalize our services to you, but we do not share any such information or your email information to anyone other than our affiliates, unless compelled to do so under law.
IV. ACCURACY
We continually strive to maintain complete and accurate information about you and your accounts. Should you ever believe that our records are inaccurate or incomplete, please call us immediately at 800-220-8888. We will investigate your concerns and correct any inaccuracies. We will also confirm to you the actions we have taken concerning your account. You may also write to us at the Quaker Investment Trust, c/o U.S. Bancorp Fund Services, LLC 615 E. Michigan St., 3rd Floor, Milwaukee, Wisconsin 53202-52007.
Notice Regarding Delivery of Shareholder Documents
In an effort to decrease costs, each Fund intends to reduce the number of duplicate Prospectuses and Annual and Semi-Annual Reports you receive by sending only one copy of each to those addresses shared by two or more accounts and to shareholders we reasonably believe are from the same family or household. Once implemented, if you would like to discontinue householding for your accounts, please call toll-free at 1-800-220-8888 to request individual copies of these documents. Once a Fund receives notice to stop householding, we will begin sending individual copies thirty days after receiving your request. This policy does not apply to account statements.
56 | 2 0 1 4 A N N U A L R E P O R T
The Quaker Funds are distributed by
Foreside Fund Services, LLC.
Contact us:
Quaker Funds, Inc.
c/o U.S. Bancorp Fund Services, LLC.
PO Box 701
Milwaukee, WI 53201-0701
800-220-8888
www.quakerfunds.com
©2014 Quaker® Investment Trust
 | QKAR 062014 |
Item 2. Code of Ethics.
As of the period ended June 30, 2014 (the “Reporting Period”), the Registrant has adopted a code of ethics that applies to the Registrant’s Principal Executive Officer and Principal Financial Officer. During the Reporting Period, there have been no changes to, amendments to, or waivers from, any provision of the code of ethics. A copy of this code of ethics, dated June 30, 2007, is filed as an Exhibit to this Form N-CSR pursuant to Item 12(a)(1).
Item 3. Audit Committee Financial Expert.
The Registrant’s Board of Trustees (the “Board”) has determined that the Registrant has one audit committee financial expert serving on its audit committee. The Board has designated Everett T. Keech audit committee financial expert serving on the registrant’s audit committee, and determined that Everett T. Keech is independent within the meaning of paragraph (a)(2) of Item 3 of Form N-CSR.
Item 4. Principal Accountant Fees and Services.
| (a) | Audit Fees: The aggregate fees billed for each of the last two fiscal years for professional services rendered to the Registrant by the principal accountant for the audit of the Registrant’s annual financial statements or services that are normally provided by the accountant in connection with statutory and regulatory filings or engagements for those fiscal years are $62,500 for 2014 and $87,500 for 2013. |
| (b) | Audit-Related Fees: The aggregate fees billed in each of the last two fiscal years for assurance and related services rendered to the Registrant by the principal accountant that are reasonably related to the performance of the audit of the Registrant’s financial statements and are not reported under paragraph (a) of this Item are $0 for 2014 and $0 for 2013. |
| (c) | Tax Fees: The aggregate fees billed in each of the last two fiscal years for professional services rendered to the Registrant by the principal accountant for tax compliance, tax advice, and tax planning are $15,500 for 2014 and $17,500 for 2013. The services for each of the fiscal years ended June 30, 2014 and June 30, 2013 consisted of: (i) review or preparation of U.S. federal, state, local and excise tax returns; (ii) U.S. federal, state and local tax planning, advice and assistance regarding statutory, regulatory or administrative developments; and (iii) tax advice regarding tax qualification. |
| (d) | All Other Fees: The aggregate fees billed in each of the last two fiscal years for products and services provided by the principal accountant, other than the services reported in paragraphs (a) through (c) of this Item are $0 for 2014 and $0 for 2013. |
| (e) | The Audit Committee of the Board of Trustees (the “Audit Committee”) has not adopted pre-approval policies and procedures. Instead, pursuant to the registrant’s Audit Committee Charter that has been adopted by the Audit Committee, the Audit Committee shall approve, prior to appointment, the engagement of the auditor to provide audit services to the registrant and non-audit services to the registrant, its investment adviser or any entity controlling, controlled by or under common control with the investment adviser that provides on-going services to the registrant if the engagement relates directly to the operations and financial reporting of the Registrant. |
| (f) | All of the principal accountant’s hours spent on auditing the Registrant’s financial statements were attributed to work performed by full time permanent employees of the principal accountant. |
| (g) | The aggregate non-audit fees billed by the Registrant’s accountant for services rendered to the Registrant and to the Registrant’s investment adviser (not including any sub- |
| | adviser whose role is primarily portfolio management and whose activities are overseen by the Registrant’s investment adviser) and any entity controlling, controlled by, or under common control with the investment adviser that provides ongoing services to the Registrant, for each of the Registrant’s last two fiscal years are $0 for 2014 and $0 for 2013. |
| (h) | The Audit Committee has considered whether the provision of non-audit services that were rendered to the Registrant’s investment adviser is compatible with maintaining the principal accountant’s independence. The Audit Committee has concluded that the provision of such non-audit services by the accountant has not compromised the accountant’s independence. |
Item 5. Audit Committee of Listed Registrants.
Not Applicable.
Item 6. Schedule of Investments.
| (a) | A Schedule of Investments in securities of unaffiliated issuers as of the close of the reporting period is included as part of the report to shareholders filed under Item 1, Report to Shareholders, of this Form N-CSR. |
Item 7. Disclosure of Proxy Voting Policies and Procedures for Closed-End Management Investment Companies.
Not Applicable.
Item 8. Portfolio Managers of Closed-End Management Investment Companies.
Not Applicable.
Item 9. Purchases of Equity Securities by Closed-End Management Investment Company and Affiliated Purchasers.
Not Applicable.
Item 10. Submission of Matters to a Vote of Security Holders.
There have been no material changes to the procedures by which shareholders may recommend nominees to the registrant’s Board of Trustees, where those changes were implemented after the Registrant last provided disclosure in response to the requirements of Item 407(c)(2)(iv) of Regulation S-K (as required by Item 22(b)(15) of Schedule 14A (17 CFR 240.14a-101)), or this Item.
Item 11. Controls and Procedures.
| (a) | The Registrant’s Principal Executive Officer and Principal Financial Officer, or persons performing similar functions, have reviewed the Registrant’s disclosure controls and |
| | procedures (as defined in Rule 30a-3(c) under the Investment Company Act of 1940, as amended (the “Act”)) as of a date within 90 days of the filing of this report, as required by Rule 30a-3(b) under the Act and Rules 13a-15(b) or 15d-15(b) under the Securities Exchange Act of 1934. Based on their review, such officers have concluded that the disclosure controls and procedures are effective in ensuring that information required to be disclosed in this report is appropriately recorded, processed, summarized and reported and made known to them by others within the Registrant and by the Registrant’s service provider. |
| (b) | There were no changes in the Registrant’s internal control over financial reporting (as defined in Rule 30a-3(d) under the Act) that occurred during the second fiscal quarter of the period covered by this report that has materially affected, or is reasonably likely to materially affect, the Registrant’s internal control over financial reporting. |
Item 12. Exhibits.
(a)(1) Any code of ethics or amendment thereto, that is subject of the disclosure required by Item 2, to the extent that the registrant intends to satisfy Item 2 requirements through filing an exhibit. Filed herewith.
(a)(2) Certifications pursuant to Section 302 of the Sarbanes-Oxley Act of 2002. Filed herewith.
(a)(3) Any written solicitation to purchase securities under Rule 23c-1 under the Act sent or given during the period covered by the report by or on behalf of the registrant to 10 or more persons. Not applicable to open-end investment companies.
(b) Certification pursuant to Section 906 of the Sarbanes-Oxley Act of 2002. Filed herewith.
SIGNATURES
Pursuant to the requirements of the Securities Exchange Act of 1934 and the Investment Company Act of 1940, the registrant has duly caused this report to be signed on its behalf by the undersigned, thereunto duly authorized.
(Registrant) Quaker Investment Trust
| | By (Signature and Title) | /s/ Jeffry H. King | |
| | | Jeffry H. King, Sr., |
| | | Chief Executive Officer |
Pursuant to the requirements of the Securities Exchange Act of 1934 and the Investment Company Act of 1940, this report has been signed below by the following persons on behalf of the registrant and in the capacities and on the dates indicated.
| | By (Signature and Title) | /s/ Jeffry H. King | |
| | | Jeffry H. King, Sr., | |
| | | Chief Executive Officer | |
| | By (Signature and Title) | /s/ Laurie Keyes | |
| | | Laurie Keyes, | |
| | | Treasurer | |