UNITED STATES
SECURITIES AND EXCHANGE COMMISSION
Washington, D.C. 20549
FORM N-CSR
CERTIFIED SHAREHOLDER REPORT OF REGISTERED
MANAGEMENT INVESTMENT COMPANIES
Investment Company Act file number | 811-06279 |
|
Harris Associates Investment Trust |
(Exact name of registrant as specified in charter) |
|
Two North La Salle Street, Suite 500 Chicago, Illinois | | 60602-3790 |
(Address of principal executive offices) | | (Zip code) |
|
Kristi L. Rowsell Harris Associates L.P. Two North La Salle Street, #500 Chicago, Illinois 60602 | Paulita A. Pike K&L Gates LLP Three First National Plaza, #3100 Chicago, Illinois 60602 |
(Name and address of agent for service) |
|
Registrant’s telephone number, including area code: | (312) 621-0600 | |
|
Date of fiscal year end: | 09/30/13 | |
|
Date of reporting period: | 09/30/13 | |
| | | | | | | | | |
Item 1. Reports to Shareholders.

THE OAKMARK FUNDS
ANNUAL REPORT | SEPTEMBER 30, 2013
OAKMARK FUND
OAKMARK SELECT FUND
OAKMARK EQUITY AND INCOME FUND
OAKMARK GLOBAL FUND
OAKMARK GLOBAL SELECT FUND
OAKMARK INTERNATIONAL FUND
OAKMARK INTERNATIONAL SMALL CAP FUND
The Oakmark Funds
2013 Annual Report
TABLE OF CONTENTS
President's Letter | | | 1 | | |
Fund Expenses | | | 2 | | |
Oakmark Fund | |
Summary Information | | | 4 | | |
Portfolio Manager Commentary | | | 5 | | |
Schedule of Investments | | | 6 | | |
Oakmark Select Fund | |
Summary Information | | | 8 | | |
Portfolio Manager Commentary | | | 9 | | |
Schedule of Investments | | | 10 | | |
Oakmark Equity and Income Fund | |
Summary Information | | | 12 | | |
Portfolio Manager Commentary | | | 13 | | |
Schedule of Investments | | | 15 | | |
Oakmark Global Fund | |
Summary Information | | | 20 | | |
Portfolio Manager Commentary | | | 21 | | |
Schedule of Investments | | | 23 | | |
Oakmark Global Select Fund | |
Summary Information | | | 26 | | |
Portfolio Manager Commentary | | | 27 | | |
Schedule of Investments | | | 28 | | |
Oakmark International Fund | |
Summary Information | | | 30 | | |
Portfolio Manager Commentary | | | 31 | | |
Schedule of Investments | | | 32 | | |
Oakmark International Small Cap Fund | |
Summary Information | | | 36 | | |
Portfolio Manager Commentary | | | 37 | | |
Schedule of Investments | | | 38 | | |
Financial Statements | |
Statements of Assets and Liabilities | | | 40 | | |
Statements of Operations | | | 42 | | |
Statements of Changes in Net Assets | | | 44 | | |
Notes to Financial Statements | | | 51 | | |
Financial Highlights | | | 62 | | |
Report of Independent Registered Public Accounting Firm | | | 69 | | |
Federal Tax Information | | | 70 | | |
Disclosures and Endnotes | | | 70 | | |
Trustees and Officers | | | 72 | | |
FORWARD-LOOKING STATEMENT DISCLOSURE
One of our most important responsibilities as mutual fund managers is to communicate with shareholders in an open and direct manner. Some of our comments in our letters to shareholders are based on current management expectations and are considered "forward-looking statements". Actual future results, however, may prove to be different from our expectations. You can identify forward-looking statements by words such as "estimate", "may", "will", "expect", "believe",
"plan" and other similar terms. We cannot promise future returns. Our opinions are a reflection of our best judgment at the time this report is compiled, and we disclaim any obligation to update or alter forward-looking statements as a result of new information, future events, or otherwise.
THE OAKMARK FUNDS
The Oakmark Funds September 30, 2013
President's Letter

Dear Fellow Shareholders,
The Oakmark Funds posted strong absolute and relative returns during the fiscal year that ended September 30, 2013, with each Fund significantly outperforming its benchmark for the period. While we are gratified by such rewarding results, we always look to our long-term performance to determine whether we are meeting our shareholders' expectations. This quarter, our portfolio managers' letters reflect upon the fiscal year and explain why we still find equity valuations attractive, even after the recent market gains.
Slowing Cash Inflows
Cash flows into the Oakmark International Fund were substantial in 2013. We have chosen to slow inflows beginning in October by closing the Fund to most new investors. Existing shareholders, including retirement plans and advisory platforms, can continue to add to their accounts or platforms. Our prospectus supplement at www.oakmark.com provides more specific details. An essential part of acting as good stewards of shareholder assets is monitoring the size of a fund versus our capacity to invest. Our experience with partial closes is that fund flows tend to level, rather than turn into net redemptions, as often occurs with full closes. This matches our desire for continued orderly investment into new, undervalued companies, while retiring those that have appreciated closer to our estimate of full business value.
Capacity determinations reflect several of our core tenets. We construct our portfolios so that successful ideas can meaningfully contribute to portfolio returns. We do this by limiting the number of stocks we own in a portfolio and by assigning the largest weights to companies that we believe trade at the greatest discount to business value. We determine holding limits for the level of outstanding shares of a company we are willing to own. These holding limits consider factors such as the average daily trading volume of the security, and they reflect our conviction in the company's business model, management team, and level of potential upside relative to business value. To test capacity, we
determine the desired position size in the Fund, and evaluate how the consequent dollar amount fits these criteria and the universe of opportunities reflected on our approved lists. We are committed to closing a fund ahead of any indications of strain, especially while there is plenty of capacity ahead for existing shareholders.
Outlook for Year-End Distributions
Mutual funds are required to distribute their income and realized capital gains annually. Throughout the year Oakmark managers strive to be tax efficient, paying close attention to maximizing after-tax returns without reducing pre-tax returns. Securities are typically held for several years, thus our distributions tend to be long-term and subject to a more favorable tax rate. That said, the Funds have experienced large absolute returns over the past year, and several positions were sold as they approached full valuation. The time period to accrue capital gains for distribution stays open through October, and income distributions continue to accrue through December 31. However, many shareholders appreciate when we share our outlook. At this time, each of the Oakmark Funds expects to pay a distribution, ranging from nominal amounts to a few dollars per share. In all cases they are expected to represent low- or mid-single-digit percentages of the respective Fund's net asset value—which we believe are very reasonable levels given performance over the year. We will release more definitive estimates on our website in mid-November, once the applicable recording periods have closed.
Thank you for your continued investment and confidence in The Oakmark Funds. We welcome your comments and suggestions. You may reach us via email at ContactOakmark@oakmark.com.
Kristi L. Rowsell
President of The Oakmark Funds
President of Harris Associates L.P.
oakmark.com 1
Fund Expenses (Unaudited)
A shareholder of each Fund incurs ongoing costs, including investment advisory fees, transfer agent fees and other fund expenses. The examples below are intended to help shareholders understand the ongoing costs (in dollars) of investing in each Fund and to compare these costs with the ongoing costs of investing in other funds.
The following table provides information about actual account values and actual fund expenses as well as hypothetical account values and hypothetical fund expenses for shares of each Fund.
ACTUAL EXPENSES
The following table shows the expenses a shareholder would have paid on a $1,000 investment in each Fund from April 1, 2013 to September 30, 2013, as well as how much a $1,000 investment would be worth at the close of the period, assuming actual fund returns and expenses. A shareholder can estimate expenses incurred for the period by dividing the account value at September 30, 2013, by $1,000 and multiplying the result by the number in the Actual Expenses Paid During Period column shown below.
Shares of Oakmark International Small Cap Fund, held for 90 days or less, may be charged a 2% redemption fee upon redemption. Please consult the Funds' prospectus at oakmark.com for more information.
HYPOTHETICAL EXAMPLE FOR COMPARISON PURPOSES
The following table provides information about hypothetical account values and hypothetical expenses for shares of each Fund based on actual expense ratios and an assumed rate of return of 5% per year before expenses, which are not the Funds' actual returns. The hypothetical account values and expenses may not be used to estimate the actual ending account balances or actual expenses shareholders paid for the period. Shareholders may use this information to compare the ongoing costs of investing in a Fund and other funds. To do so, compare this 5% hypothetical example with the 5% hypothetical examples that appear in the shareholder reports of the other funds.
Please note that the expenses shown in the table are meant to highlight your ongoing costs only and do not reflect any transaction costs. Therefore, the Hypothetical Expenses Paid During Period column of the table is useful in comparing ongoing costs only and will not help you determine the relative total costs of owning different funds. If transaction costs were included, the total costs would have been higher.
| | | | ACTUAL | | HYPOTHETICAL
(5% annual return before expenses) | | | |
| | Beginning
Account Value
(4/1/13) | | Ending
Account Value
(9/30/13) | | Expenses
Paid During
Period* | | Ending
Account Value
(9/30/13) | | Expenses
Paid During
Period* | | Annualized
Expense
Ratio | |
Oakmark Fund | |
Class I | | $ | 1,000.00 | | | $ | 1,123.20 | | | $ | 5.00 | | | $ | 1,020.36 | | | $ | 4.76 | | | | 0.94 | % | |
Class II | | $ | 1,000.00 | | | $ | 1,121.40 | | | $ | 6.75 | | | $ | 1,018.70 | | | $ | 6.43 | | | | 1.27 | % | |
Oakmark Select Fund | |
Class I | | $ | 1,000.00 | | | $ | 1,133.30 | | | $ | 5.40 | | | $ | 1,020.00 | | | $ | 5.11 | | | | 1.01 | % | |
Class II | | $ | 1,000.00 | | | $ | 1,131.60 | | | $ | 7.21 | | | $ | 1,018.30 | | | $ | 6.83 | | | | 1.35 | % | |
Oakmark Equity and Income Fund | |
Class I | | $ | 1,000.00 | | | $ | 1,092.50 | | | $ | 3.99 | | | $ | 1,021.26 | | | $ | 3.85 | | | | 0.76 | % | |
Class II | | $ | 1,000.00 | | | $ | 1,090.70 | | | $ | 5.77 | | | $ | 1,019.55 | | | $ | 5.57 | | | | 1.10 | % | |
Oakmark Global Fund | |
Class I | | $ | 1,000.00 | | | $ | 1,166.50 | | | $ | 6.03 | | | $ | 1,019.50 | | | $ | 5.62 | | | | 1.11 | % | |
Class II | | $ | 1,000.00 | | | $ | 1,164.80 | | | $ | 7.87 | | | $ | 1,017.80 | | | $ | 7.33 | | | | 1.45 | % | |
Oakmark Global Select Fund | |
Class I | | $ | 1,000.00 | | | $ | 1,154.30 | | | $ | 6.16 | | | $ | 1,019.35 | | | $ | 5.77 | | | | 1.14 | % | |
Oakmark International Fund | |
Class I | | $ | 1,000.00 | | | $ | 1,174.10 | | | $ | 5.34 | | | $ | 1,020.16 | | | $ | 4.96 | | | | 0.98 | % | |
Class II | | $ | 1,000.00 | | | $ | 1,171.90 | | | $ | 7.46 | | | $ | 1,018.20 | | | $ | 6.93 | | | | 1.37 | % | |
Oakmark International Small Cap Fund | |
Class I | | $ | 1,000.00 | | | $ | 1,168.20 | | | $ | 7.28 | | | $ | 1,018.35 | | | $ | 6.78 | | | | 1.34 | % | |
Class II | | $ | 1,000.00 | | | $ | 1,165.60 | | | $ | 9.07 | | | $ | 1,016.70 | | | $ | 8.44 | | | | 1.67 | % | |
* Expenses for each share class is equal to the annualized expense ratio, multiplied by the average account value over the period, multiplied by the number of days in the most recent half-year divided by 365 (to reflect one-half year period)
2 THE OAKMARK FUNDS

This page intentionally left blank.
oakmark.com 3
Oakmark Fund September 30, 2013
Summary Information
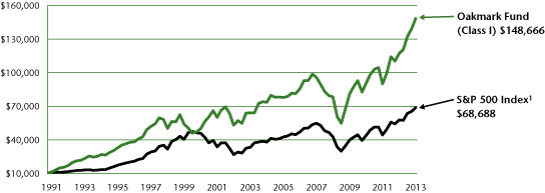
VALUE OF A $10,000 INVESTMENT
Since Inception - 08/05/91 (Unaudited)
PERFORMANCE
| | | | | Average Annual Total Returns (as of 09/30/13)2 | |
(Unaudited) | | Total Return
Last 3 Months | | 1-year | | 3-year | | 5-year | | 10-year | | Since
Inception
(08/05/91) | |
Oakmark Fund (Class I) | | | 6.60 | % | | | 26.75 | % | | | 17.98 | % | | | 13.66 | % | | | 8.79 | % | | | 12.96 | % | |
S&P 500 Index | | | 5.25 | % | | | 19.34 | % | | | 16.27 | % | | | 10.02 | % | | | 7.57 | % | | | 9.09 | % | |
Dow Jones Industrial Average3 | | | 2.12 | % | | | 15.59 | % | | | 14.94 | % | | | 9.93 | % | | | 7.74 | % | | | 10.17 | % | |
Lipper Large Cap Value Funds Index4 | | | 4.99 | % | | | 23.25 | % | | | 14.97 | % | | | 8.95 | % | | | 7.20 | % | | | 8.62 | % | |
The graph and table above do not reflect the deduction of taxes that a shareholder would pay on Fund distributions or the redemption of Fund shares.
Past Performance is no guarantee of future results. Performance data quoted represents past performance. Current performance may be lower or higher than the performance data quoted. The investment return and principal value vary so that an investor's shares when redeemed may be worth more or less than the original cost. To obtain the most recent month-end performance, please visit oakmark.com.
TOP TEN EQUITY HOLDINGS5 | | % of Net Assets | |
Bank of America Corp. | | | 3.0 | | |
Capital One Financial Corp. | | | 2.5 | | |
American International Group, Inc. | | | 2.5 | | |
UnitedHealth Group, Inc. | | | 2.4 | | |
TE Connectivity, Ltd. | | | 2.3 | | |
FedEx Corp. | | | 2.3 | | |
Franklin Resources, Inc. | | | 2.3 | | |
Oracle Corp. | | | 2.2 | | |
Medtronic, Inc. | | | 2.2 | | |
Illinois Tool Works, Inc. | | | 2.2 | | |
FUND STATISTICS | |
Ticker | | OAKMX | |
Inception | | 08/05/91 | |
Number of Equity Holdings | | 53 | |
Net Assets | | $10.5 billion | |
Benchmark | | S&P 500 Index | |
Weighted Average Market Cap | | $84.2 billion | |
Median Market Cap | | $40.2 billion | |
Portfolio Turnover (for the 12-months ended 09/30/13) | | 19% | |
Expense Ratio - Class I (as of 09/30/12) | | 1.03% | |
Expense Ratio - Class I (as of 09/30/13) | | 0.95% | |
SECTOR ALLOCATION | | % of Net Assets | |
Financials | | | 24.6 | | |
Information Technology | | | 19.2 | | |
Consumer Discretionary | | | 16.5 | | |
Energy | | | 10.2 | | |
Industrials | | | 10.1 | | |
Health Care | | | 9.8 | | |
Consumer Staples | | | 3.5 | | |
Short-Term Investments and Other | | | 6.1 | | |
4 THE OAKMARK FUNDS
Oakmark Fund September 30, 2013
Portfolio Manager Commentary


William C. Nygren, CFA
Portfolio Manager
oakmx@oakmark.com
Kevin Grant, CFA
Portfolio Manager
oakmx@oakmark.com
The Oakmark Fund increased 7% during the past quarter, which brings the gain to 27% for the fiscal year ended September 30. The S&P 5001 gained 5% in the quarter and gained 19% for the fiscal year. While we are thrilled with these strong results, we remind shareholders that our style doesn't typically lead to such dramatic outperformance in periods of broad market gains.
Looking back at the fiscal year, we outperformed a very strong 19% return for the S&P 500 with leading performance from the financials and information technology sectors. We still find these two sectors to be attractively valued, and they currently represent a combined 47% of our portfolio. For the fiscal year, 26 of the Oakmark Fund's holdings gained over 30%, and only Apple declined by more than 20%. Despite Apple's poor full fiscal year performance, it was one of the Fund's top two performers for the third quarter, gaining 21%. After a period of skepticism surrounding the company's ability to create compelling new products, Apple is once again experiencing strong demand for its recently introduced iPhones. We remain pleased that the company is allocating more of their $145B cash balance to share repurchases and dividends. Throughout the market, even as equity valuations have increased, we are still finding attractive opportunities in businesses with strong balance sheets, high free cash flow, and a management committed to return a substantial portion of excess capital to shareholders through dividends and share repurchases.
During the quarter, we eliminated positions in Boeing and Northrop Grumman as both approached our sell targets. We started new positions in Nestle and Qualcomm, which are described briefly below:
Nestle S.A. (NSRGY-$70)
Nestle is a global leader in packaged foods with $100 billion of revenue and operations in over 70 countries. The company has more than 25 brands with sales over $1 billion, with leading market share in most of their product categories. With broad exposure to high-growth emerging markets, Nestle has enjoyed strong and consistent revenue growth. Like many of our holdings, Nestle generates more cash than they need to run the business, so the company has used a significant portion of its excess cash to repurchase shares and pay dividends. Over the past four years, Nestle has reduced their share count by over 10%. We think this is a high quality, stable business that deserves to sell at a premium, so we initiated a position when Nestle was priced at a discount to other global consumer products companies due to concerns about Europe.
Qualcomm Inc. (QCOM-$67)
Qualcomm is the global leader in wireless technology licensing and mobile device chipsets. Qualcomm has dominant market share in both businesses, and it uses the strong recurring cash flow from its licensing business to reinvest in its chipset business. The company owns intellectual property that defines many of
the standards used for 3G and 4G wireless communication, which allows it to collect royalties from handset providers that license these ubiquitous standards. Qualcomm's licensing business accounts for only a third of the company's revenue, and it is often underappreciated. However, its licensing business has unusually high profitability and represents close to two-thirds of Qualcomm's profits. The majority of the world's mobile handset users are still using older 2G technology, which is not a focus area for Qualcomm, so when these customers upgrade to 3G and 4G, Qualcomm should be well positioned to enjoy robust incremental revenue. The company is also the leading provider of chipsets, which function as the brains for wireless devices. Qualcomm's industry-leading product breadth and peer-leading R&D investment should drive the company's chipset growth. We expect Qualcomm to earn over $4.50 per share in a couple of years, and after adjusting for $20/share of cash, this high-quality business is priced at a forward P/E6 of just 11x.
oakmark.com 5
Oakmark Fund September 30, 2013
Schedule of Investments (in thousands)
| | | Shares | | Value | |
COMMON STOCKS - 93.9% | |
FINANCIALS - 24.6% | |
DIVERSIFIED FINANCIALS - 15.0% | |
Bank of America Corp.
Other Diversified Financial Services | | | 22,950 | | | $ | 316,710 | | |
Capital One Financial Corp.
Consumer Finance | | | 3,753 | | | | 257,967 | | |
Franklin Resources, Inc.
Asset Management & Custody Banks | | | 4,740 | | | | 239,607 | | |
JPMorgan Chase & Co.
Other Diversified Financial Services | | | 4,495 | | | | 232,347 | | |
The Goldman Sachs Group, Inc.
Investment Banking & Brokerage | | | 1,213 | | | | 191,909 | | |
State Street Corp.
Asset Management & Custody Banks | | | 2,800 | | | | 184,100 | | |
Bank of New York Mellon Corp.
Asset Management & Custody Banks | | | 5,260 | | | | 158,788 | | |
| | | | | | 1,581,428 | | |
INSURANCE - 7.7% | |
American International Group, Inc.
Multi-line Insurance | | | 5,295 | | | | 257,496 | | |
Aflac, Inc.
Life & Health Insurance | | | 3,210 | | | | 198,988 | | |
Principal Financial Group, Inc.
Life & Health Insurance | | | 4,500 | | | | 192,690 | | |
Aon PLC (b)
Insurance Brokers | | | 2,100 | | | | 156,324 | | |
| | | | | | 805,498 | | |
BANKS - 1.9% | |
Wells Fargo & Co.
Diversified Banks | | | 4,820 | | | | 199,162 | | |
| | | | | | 2,586,088 | | |
INFORMATION TECHNOLOGY - 19.2% | |
SOFTWARE & SERVICES - 8.6% | |
Oracle Corp.
Systems Software | | | 7,080 | | | | 234,844 | | |
MasterCard, Inc., Class A
Data Processing & Outsourced Services | | | 313 | | | | 210,580 | | |
Microsoft Corp.
Systems Software | | | 5,920 | | | | 197,195 | | |
Google, Inc., Class A (a)
Internet Software & Services | | | 179 | | | | 156,788 | | |
Automatic Data Processing, Inc.
Data Processing & Outsourced Services | | | 1,430 | | | | 103,503 | | |
| | | | | | 902,910 | | |
| | | Shares | | Value | |
TECHNOLOGY HARDWARE & EQUIPMENT - 5.4% | |
TE Connectivity, Ltd. (b)
Electronic Manufacturing Services | | | 4,686 | | | $ | 242,623 | | |
Apple, Inc.
Computer Hardware | | | 381 | | | | 181,642 | | |
QUALCOMM, Inc.
Communications Equipment | | | 2,100 | | | | 141,456 | | |
| | | | | | 565,721 | | |
SEMICONDUCTORS & SEMICONDUCTOR EQUIPMENT - 5.2% | |
Texas Instruments, Inc.
Semiconductors | | | 5,465 | | | | 220,076 | | |
Intel Corp.
Semiconductors | | | 8,800 | | | | 201,696 | | |
Applied Materials, Inc.
Semiconductor Equipment | | | 7,160 | | | | 125,586 | | |
| | | | | | 547,358 | | |
| | | | | | 2,015,989 | | |
CONSUMER DISCRETIONARY - 16.5% | |
MEDIA - 5.6% | |
DIRECTV (a)
Cable & Satellite | | | 3,639 | | | | 217,440 | | |
Omnicom Group, Inc.
Advertising | | | 3,171 | | | | 201,184 | | |
Comcast Corp., Class A
Cable & Satellite | | | 3,940 | | | | 170,878 | | |
| | | | | | 589,502 | | |
AUTOMOBILES & COMPONENTS - 4.7% | |
Delphi Automotive PLC (b)
Auto Parts & Equipment | | | 3,984 | | | | 232,745 | | |
General Motors Co. (a)
Automobile Manufacturers | | | 5,300 | | | | 190,641 | | |
Harley-Davidson, Inc.
Motorcycle Manufacturers | | | 1,102 | | | | 70,793 | | |
| | | | | | 494,179 | | |
RETAILING - 4.3% | |
Liberty Interactive Corp., Class A (a)
Catalog Retail | | | 8,370 | | | | 196,436 | | |
The Home Depot, Inc.
Home Improvement Retail | | | 1,957 | | | | 148,401 | | |
Kohl's Corp.
Department Stores | | | 2,042 | | | | 105,668 | | |
| | | | | | 450,505 | | |
CONSUMER SERVICES - 1.9% | |
McDonald's Corp.
Restaurants | | | 2,059 | | | | 198,096 | | |
| | | | | | 1,732,282 | | |
See accompanying Notes to Financial Statements.
6 THE OAKMARK FUNDS
Oakmark Fund September 30, 2013
Schedule of Investments (in thousands) (continued)
| | | Shares | | Value | |
COMMON STOCKS - 93.9% (continued) | |
ENERGY - 10.2% | |
Apache Corp.
Oil & Gas Exploration & Production | | | 2,600 | | | $ | 221,364 | | |
Halliburton Co.
Oil & Gas Equipment & Services | | | 3,950 | | | | 190,192 | | |
Devon Energy Corp.
Oil & Gas Exploration & Production | | | 3,202 | | | | 184,948 | | |
Exxon Mobil Corp.
Integrated Oil & Gas | | | 2,117 | | | | 182,147 | | |
National Oilwell Varco, Inc.
Oil & Gas Equipment & Services | | | 2,300 | | | | 179,653 | | |
Cenovus Energy, Inc. (b)
Integrated Oil & Gas | | | 3,930 | | | | 117,310 | | |
| | | | | | 1,075,614 | | |
INDUSTRIALS - 10.1% | |
CAPITAL GOODS - 7.8% | |
Illinois Tool Works, Inc.
Industrial Machinery | | | 3,060 | | | | 233,386 | | |
Parker Hannifin Corp.
Industrial Machinery | | | 1,875 | | | | 203,850 | | |
3M Co.
Industrial Conglomerates | | | 1,643 | | | | 196,191 | | |
Cummins, Inc.
Construction & Farm Machinery & Heavy Trucks | | | 1,380 | | | | 183,360 | | |
| | | | | | 816,787 | | |
TRANSPORTATION - 2.3% | |
FedEx Corp.
Air Freight & Logistics | | | 2,100 | | | | 239,631 | | |
| | | | | | 1,056,418 | | |
HEALTH CARE - 9.8% | |
HEALTH CARE EQUIPMENT & SERVICES - 7.1% | |
UnitedHealth Group, Inc.
Managed Health Care | | | 3,460 | | | | 247,771 | | |
Medtronic, Inc.
Health Care Equipment | | | 4,385 | | | | 233,501 | | |
Covidien PLC (b)
Health Care Equipment | | | 2,708 | | | | 165,025 | | |
Baxter International, Inc.
Health Care Equipment | | | 1,523 | | | | 100,046 | | |
| | | | | | 746,343 | | |
PHARMACEUTICALS, BIOTECHNOLOGY & LIFE SCIENCES - 2.7% | |
Forest Laboratories, Inc. (a)
Pharmaceuticals | | | 4,950 | | | | 211,811 | | |
Merck & Co., Inc.
Pharmaceuticals | | | 1,587 | | | | 75,535 | | |
| | | | | | 287,346 | | |
| | | | | | 1,033,689 | | |
| | | Shares | | Value | |
CONSUMER STAPLES - 3.5% | |
FOOD, BEVERAGE & TOBACCO - 2.6% | |
Unilever PLC (c)
Packaged Foods & Meats | | | 3,983 | | | $ | 153,664 | | |
Nestle SA (c)
Packaged Foods & Meats | | | 1,700 | | | | 118,320 | | |
| | | | | | 271,984 | | |
FOOD & STAPLES RETAILING - 0.9% | |
Wal-Mart Stores, Inc.
Hypermarkets & Super Centers | | | 1,265 | | | | 93,560 | | |
| | | | | | 365,544 | | |
TOTAL COMMON STOCKS - 93.9%
(COST $6,645,820) | | | | | 9,865,624 | | |
| | | Par Value | | Value | |
SHORT TERM INVESTMENT - 6.1% | |
REPURCHASE AGREEMENT - 6.1% | |
Fixed Income Clearing Corp. Repurchase
Agreement, 0.00% dated 09/30/13 due
10/01/13, repurchase price $641,852,
collateralized by a Federal Home Loan
Bank Bond, 1.750%, due 06/10/20,
value plus accrued interest of $22,200,
by Federal Home Loan Mortgage
Corp. Bonds, 1.600% - 1.650%, due
11/15/19 - 01/09/20, aggregate value
plus accrued interest of $632,492
(Cost: $641,852) | | | 641,852 | | | | 641,852 | | |
TOTAL SHORT TERM INVESTMENTS - 6.1%
(COST $641,852) | | | | | 641,852 | | |
TOTAL INVESTMENTS - 100.0%
(COST $7,287,672) | | | | | 10,507,476 | | |
Liabilities In Excess of Other Assets - 0.0% (d) | | | | | (4,651 | ) | |
TOTAL NET ASSETS - 100.0% | | | | $ | 10,502,825 | | |
(a) Non-income producing security
(b) Foreign domiciled corporation
(c) Sponsored American Depositary Receipt
(d) Amount rounds to less than 0.1%.
See accompanying Notes to Financial Statements.
oakmark.com 7
Oakmark Select Fund September 30, 2013
Summary Information
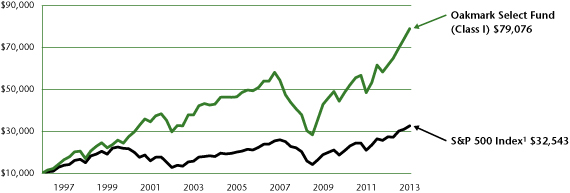
VALUE OF A $10,000 INVESTMENT
Since Inception - 11/01/96 (Unaudited)
PERFORMANCE
| | | | | Average Annual Total Returns (as of 09/30/13)2 | |
(Unaudited) | | Total Return
Last 3 Months | | 1-year | | 3-year | | 5-year | | 10-year | | Since
Inception
(11/01/96) | |
Oakmark Select Fund (Class I) | | | 6.46 | % | | | 28.40 | % | | | 17.59 | % | | | 15.87 | % | | | 7.65 | % | | | 13.01 | % | |
S&P 500 Index | | | 5.25 | % | | | 19.34 | % | | | 16.27 | % | | | 10.02 | % | | | 7.57 | % | | | 7.23 | % | |
Lipper Multi-Cap Value Funds Index7 | | | 5.84 | % | | | 25.58 | % | | | 15.22 | % | | | 9.50 | % | | | 7.16 | % | | | 7.25 | % | |
The graph and table do not reflect the deduction of taxes that a shareholder would pay on Fund distributions or the redemption of Fund shares.
Past performance is no guarantee of future results. Performance data quoted represents past performance. Current performance may be lower or higher than the performance data quoted. The investment return and principal value vary so that an investor's shares when redeemed may be worth more or less than the original cost. To obtain the most recent month-end performance data, visit oakmark.com.
TOP TEN EQUITY HOLDINGS5 | | % of Net Assets | |
TRW Automotive Holdings Corp. | | | 8.1 | | |
TE Connectivity, Ltd. | | | 6.8 | | |
Capital One Financial Corp. | | | 6.0 | | |
Bank of America Corp. | | | 6.0 | | |
American International Group, Inc. | | | 5.7 | | |
Medtronic, Inc. | | | 5.5 | | |
MasterCard, Inc., Class A | | | 5.4 | | |
JPMorgan Chase & Co. | | | 5.0 | | |
DIRECTV | | | 4.8 | | |
Liberty Interactive Corp., Class A | | | 4.6 | | |
FUND STATISTICS | |
Ticker | | OAKLX | |
Inception | | 11/01/96 | |
Number of Equity Holdings | | 20 | |
Net Assets | | $4.0 billion | |
Benchmark | | S&P 500 Index | |
Weighted Average Market Cap | | $59.1 billion | |
Median Market Cap | | $38.2 billion | |
Portfolio Turnover (for the 12-months ended 09/30/13) | | 24% | |
Expense Ratio - Class I (as of 09/30/12) | | 1.05% | |
Expense Ratio - Class I (as of 09/30/13) | | 1.01% | |
SECTOR ALLOCATION | | % of Net Assets | |
Information Technology | | | 24.3 | | |
Financials | | | 22.6 | | |
Consumer Discretionary | | | 21.0 | | |
Health Care | | | 10.1 | | |
Industrials | | | 7.5 | | |
Energy | | | 6.0 | | |
Utilities | | | 3.7 | | |
Short-Term Investments and Other | | | 4.8 | | |
8 THE OAKMARK FUNDS
Oakmark Select Fund September 30, 2013
Portfolio Manager Commentary


William C. Nygren, CFA
Portfolio Manager
oaklx@oakmark.com
Anthony P. Coniaris, CFA
Portfolio Manager
oaklx@oakmark.com
Win Murray
Portfolio Manager
oaklx@oakmark.com
For the quarter, the Oakmark Select Fund gained 6%, compared to 5% for the S&P 5001. This brings the Fund's fiscal year (September 30) return to a strong absolute and relative return of 28%, compared to 19% for the S&P 500. As we've stated in the past, our investors should not expect this magnitude of absolute and relative performance every quarter or year, but we hope you enjoy them, as we do as fellow investors in the Fund.
These strong fiscal-year results were primarily due to stock selection and our relatively large weighting in more economically sensitive sectors such as consumer discretionary and financials. Our five largest contributors were TRW Automotive Holdings (up 63%), TE Connectivity (56%), Bank of America (57%), AIG (49%) and MasterCard (50%). You may have noticed that many of our top 5 contributors to performance remain among our largest holdings. This is not by accident. We are constantly evaluating the upside of our holdings relative to our estimate of intrinsic value on a risk-adjusted basis. Despite the strong price performance, we believe these investments remain attractive enough to warrant above average weights in the portfolio. Our largest two detractors were both energy related. Newfield Exploration (down 13%) and Cenovus Energy (down 12%) were the only two current holdings that generated negative returns over the past 12 months.
During the past fiscal year, we eliminated three positions in the Fund (Discovery Holdings, Dell, BMC Software) and added three new positions (Forest Laboratories, Kennametal, Oracle). Although this is less change than the Fund normally experiences, we neither wear this with a badge of honor nor manage the portfolio to a non-economic metric such as a turnover ratio. Position changes are simply the result of applying our investment process, which is to buy businesses at substantial discounts to our estimate of intrinsic value, where we see a clear path to that value growing on a per share basis, and management is focused on maximizing per share value. We sell a stock when we believe one or more of these criteria are no longer met.
We have discussed our thoughts on the Discovery and Dell sales in past letters, but we did receive a worthy update on BMC since we sold it in the fourth quarter of 2012. Recall that BMC management conducted a strategic review during the second quarter that we owned the stock and decided to remain an independent company. Given the lack of a compelling purchase offer for BMC during the review, we exited our position because we no longer believed it was selling at a significant discount to private market value. Our opinion has since been validated. On September 10, 2013, BMC management sold the company for $46.25 per share—roughly 12% above our average sale price. During that same time, the Oakmark Select Fund and the S&P 500 returned 25% and 20%, respectively—both well in excess of BMC's modest price increase.
In the past fiscal year, we purchased Forest Laboratories, Kennametal, and Oracle, which were all discussed in prior letters. Forest's many new drug launches remain on track with our original estimates and we look forward to this value being demonstrated in the income statement as sales ramp relative to expenses over the next several years. Kennametal is still operating well below our estimate of mid-cycle earnings though managing expenses consistent with our expectations such that incremental profits from an eventual recovery in demand ought to result in substantial profit improvement. In the quarter we have owned Oracle, it has had more difficulty keeping up with Wall Street's expectations than with ours. We continue to view the shares—selling at approximately 10x free cash flow—as significantly undervalued. Meanwhile, management is doing the right thing by aggressively repurchasing shares at what we believe to be a terrific price.
One year ago in this letter we discussed our view that equities remained the most attractively priced asset class despite having returned 30% in the prior year. One year later, the S&P gained another 19%, and Oakmark Select returned 28%, while the Barclays U.S. Aggregate Bond Index8 experienced a decline of 2%. While it's personally rewarding to see our analysis confirmed, you are likely (and rightly) more concerned about whether our opinion has changed. In short, it has not. While equities may be less undervalued than they were one year ago, we believe they are still reasonably priced, particularly when compared to bonds, which continue to offer historically low yields.
Thank you for your continued investment in the Fund.
oakmark.com 9
Oakmark Select Fund September 30, 2013
Schedule of Investments (in thousands)
| | | Shares | | Value | |
COMMON STOCKS - 95.2% | |
INFORMATION TECHNOLOGY - 24.3% | |
SOFTWARE & SERVICES - 9.5% | |
MasterCard, Inc., Class A
Data Processing & Outsourced Services | | | 315 | | | $ | 211,925 | | |
Oracle Corp.
Systems Software | | | 5,000 | | | | 165,850 | | |
| | | | | | 377,775 | | |
SEMICONDUCTORS & SEMICONDUCTOR EQUIPMENT - 8.0% | |
Texas Instruments, Inc.
Semiconductors | | | 4,150 | | | | 167,121 | | |
Intel Corp.
Semiconductors | | | 6,447 | | | | 147,765 | | |
| | | | | | 314,886 | | |
TECHNOLOGY HARDWARE & EQUIPMENT - 6.8% | |
TE Connectivity, Ltd. (b)
Electronic Manufacturing Services | | | 5,194 | | | | 268,942 | | |
| | | | | | 961,603 | | |
FINANCIALS - 22.6% | |
DIVERSIFIED FINANCIALS - 16.9% | |
Capital One Financial Corp.
Consumer Finance | | | 3,450 | | | | 237,153 | | |
Bank of America Corp.
Other Diversified Financial Services | | | 17,100 | | | | 235,980 | | |
JPMorgan Chase & Co.
Other Diversified Financial Services | | | 3,800 | | | | 196,422 | | |
| | | | | | 669,555 | | |
INSURANCE - 5.7% | |
American International Group, Inc.
Multi-line Insurance | | | 4,605 | | | | 223,951 | | |
| | | | | | 893,506 | | |
CONSUMER DISCRETIONARY - 21.0% | |
MEDIA - 8.3% | |
DIRECTV (a)
Cable & Satellite | | | 3,148 | | | | 188,090 | | |
Comcast Corp., Class A
Cable & Satellite | | | 3,250 | | | | 140,952 | | |
| | | | | | 329,042 | | |
AUTOMOBILES & COMPONENTS - 8.1% | |
TRW Automotive Holdings Corp. (a)
Auto Parts & Equipment | | | 4,500 | | | | 320,895 | | |
RETAILING - 4.6% | |
Liberty Interactive Corp., Class A (a)
Catalog Retail | | | 7,800 | | | | 183,066 | | |
| | | | | | 833,003 | | |
| | | Shares | | Value | |
HEALTH CARE - 10.1% | |
HEALTH CARE EQUIPMENT & SERVICES - 5.5% | |
Medtronic, Inc.
Health Care Equipment | | | 4,100 | | | $ | 218,325 | | |
PHARMACEUTICALS, BIOTECHNOLOGY & LIFE SCIENCES - 4.6% | |
Forest Laboratories, Inc. (a)
Pharmaceuticals | | | 4,200 | | | | 179,718 | | |
| | | | | | 398,043 | | |
INDUSTRIALS - 7.5% | |
TRANSPORTATION - 4.2% | |
FedEx Corp.
Air Freight & Logistics | | | 1,450 | | | | 165,460 | | |
CAPITAL GOODS - 3.3% | |
Kennametal, Inc.
Industrial Machinery | | | 2,902 | | | | 132,328 | | |
| | | | | | 297,788 | | |
ENERGY - 6.0% | |
Cenovus Energy, Inc. (b)
Integrated Oil & Gas | | | 4,097 | | | | 122,307 | | |
Newfield Exploration Co. (a)
Oil & Gas Exploration & Production | | | 4,250 | | | | 116,312 | | |
| | | | | | 238,619 | | |
UTILITIES - 3.7% | |
Calpine Corp. (a)
Independent Power Producers & Energy Traders | | | 7,604 | | | | 147,754 | | |
TOTAL COMMON STOCKS - 95.2%
(COST $2,325,602) | | | | | 3,770,316 | | |
| | | Par Value | | Value | |
SHORT TERM INVESTMENTS - 4.2% | |
REPURCHASE AGREEMENT - 4.2% | |
Fixed Income Clearing Corp. Repurchase
Agreement, 0.00% dated 09/30/13 due
10/01/13, repurchase price $165,580,
collateralized by a Federal Home Loan
Bank Bond, 2.470%, due 08/27/24,
value plus accrued interest of $15,246,
by Federal National Mortgage
Association Bonds, 2.210% - 7.125%,
due 12/27/22 - 01/15/30, aggregate
value plus accrued interest of $153,648
(Cost: $165,580) | | | 165,580 | | | | 165,580 | | |
TOTAL SHORT TERM INVESTMENTS - 4.2%
(COST $165,580) | | | | | 165,580 | | |
TOTAL INVESTMENTS - 99.4%
(COST $2,491,182) | | | | | 3,935,896 | | |
Other Assets In Excess of Liabilities - 0.6% | | | | | 23,726 | | |
TOTAL NET ASSETS - 100.0% | | | | $ | 3,959,622 | | |
(a) Non-income producing security
(b) Foreign domiciled corporation
See accompanying Notes to Financial Statements.
10 THE OAKMARK FUNDS

This page intentionally left blank.
oakmark.com 11
Oakmark Equity and Income Fund September 30, 2013
Summary Information
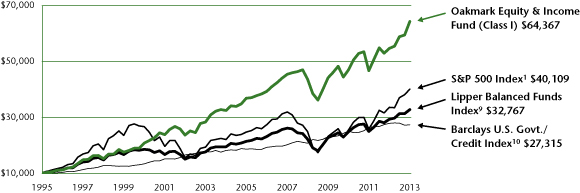
VALUE OF A $10,000 INVESTMENT
Since Inception - 11/01/95 (Unaudited)
PERFORMANCE
| | | | | Average Annual Total Returns (as of 09/30/13)2 | |
(Unaudited) | | Total Return
Last 3 Months | | 1-year | | 3-year | | 5-year | | 10-year | | Since
Inception
(11/01/95) | |
Oakmark Equity & Income Fund (Class I) | | | 8.18 | % | | | 17.63 | % | | | 11.01 | % | | | 8.04 | % | | | 8.56 | % | | | 10.95 | % | |
Lipper Balanced Funds Index | | | 4.58 | % | | | 11.70 | % | | | 9.68 | % | | | 8.11 | % | | | 6.44 | % | | | 6.85 | % | |
S&P 500 Index | | | 5.25 | % | | | 19.34 | % | | | 16.27 | % | | | 10.02 | % | | | 7.57 | % | | | 8.06 | % | |
Barclays U.S. Govt./Credit Index | | | 0.36 | % | | | -1.96 | % | | | 2.89 | % | | | 5.71 | % | | | 4.52 | % | | | 5.77 | % | |
The graph and table above do not reflect the deduction of taxes that a shareholder would pay on Fund distributions or the redemption of Fund shares.
Past Performance is no guarantee of future results. Performance data quoted represents past performance. Current performance may be lower or higher than the performance data quoted. The investment return and principal value vary so that an investor's shares when redeemed may be worth more or less than the original cost. To obtain the most recent month-end performance, please visit oakmark.com.
TOP TEN EQUITY HOLDINGS5 | | % of Net Assets | |
Dover Corp. | | | 3.5 | | |
UnitedHealth Group, Inc. | | | 3.2 | | |
General Dynamics Corp. | | | 3.0 | | |
Oracle Corp. | | | 3.0 | | |
General Motors Co. | | | 2.9 | | |
Rockwell Automation, Inc. | | | 2.9 | | |
FedEx Corp. | | | 2.7 | | |
National Oilwell Varco | | | 2.7 | | |
Philip Morris International, Inc. | | | 2.6 | | |
Bank of America Corp. | | | 2.6 | | |
FUND STATISTICS | |
Ticker | | OAKBX | |
Inception | | 11/01/95 | |
Number of Equity Holdings | | 49 | |
Net Assets | | $19.4 billion | |
Benchmark | | Lipper Balanced Funds Index | |
Weighted Average Market Cap | | $47.5 billion | |
Median Market Cap | | $12.6 billion | |
Portfolio Turnover (for the 12-months ended 09/30/13) | | 25% | |
Expense Ratio - Class I (as of 09/30/12) | | 0.78% | |
Expense Ratio - Class I (as of 09/30/13) | | 0.77% | |
SECTOR ALLOCATION | | % of Net Assets | |
Equity Investments | |
Industrials | | | 16.0 | | |
Consumer Discretionary | | | 11.8 | | |
Energy | | | 11.7 | | |
Health Care | | | 10.2 | | |
Consumer Staples | | | 8.7 | | |
Information Technology | | | 8.0 | | |
Financials | | | 6.8 | | |
Total Equity Investments | | | 73.2 | | |
Government and Agency Securities | | | 9.7 | | |
Corporate Bonds | | | 2.0 | | |
Asset Backed Securities | | | 0.1 | | |
Short-Term Investments and Other | | | 15.0 | | |
12 THE OAKMARK FUNDS
Oakmark Equity and Income Fund September 30, 2013
Portfolio Manager Commentary


Clyde S. McGregor, CFA
Portfolio Manager
oakbx@oakmark.com
M. Colin Hudson, CFA
Portfolio Manager
oakbx@oakmark.com
Matthew A. Logan, CFA
Portfolio Manager
oakbx@oakmark.com
Edward J. Wojciechowski, CFA
Portfolio Manager
oakbx@oakmark.com
A Good September Quarter Surprise
"Sell in May and go away" is a well-known phrase in the investing community. It derives from empirical observations that the summer months are often difficult for the stock market. September has a particularly high propensity to produce losses. Academics spend considerable effort attempting to explain these market tendencies, yet the past two years will only make their job more difficult: in both years the September quarters have been quite rewarding to investors.
The Equity and Income Fund participated in the September quarter's strength, earning 8% in the period, which contrasts to a 5% gain for the Lipper Balanced Fund Index9, the Fund's performance benchmark. For the nine months of the calendar year the returns are 16% for the Fund, and 10% for the Lipper Index. Finally, for the Funds' fiscal year ending September 30, the return to the Fund was 18%, while the Lipper Index returned 12%. The annualized compound rate of return since the Fund's inception in 1995 is 11% while the corresponding return to the Lipper Index is 7%.
Rockwell Automation, Cimarex Energy, Dover, FedEx and General Dynamics contributed most significantly to the past quarter's returns. The largest detractors were Foot Locker, Ultra Petroleum (purchased during the quarter—see below), Laboratory Corporation of America, Range Resources (sold early in the quarter) and Staples. The price declines for the detractors were all quite small. Over the past nine months, detractors included Walter Energy (sold), Cenovus Energy, EnCana, Blount International and Apache (sold). The largest contributors to portfolio return were Dover, United Health, General Dynamics, MasterCard and Cimarex Energy. Finally, for the Fund's fiscal year, the largest contributors were Dover, Rockwell Automation, General Dynamics, MasterCard and Flowserve (sold in the quarter). The largest 12-month detractors were Walter Energy, Cenovus Energy, EnCana, Apache and Devon Energy. The detractors were all energy resource companies, although Walter primarily produces coal used in the production of steel.
We write this letter at a time of unusual macroeconomic uncertainty given the twin possibilities for governmental shutdown and federal debt default. We see little value in ruminating about the various possibilities, especially since this may all be resolved in the time between letter completion and its distribution. We leave it to our friends in the trading community to attempt to profit from the volatility surrounding the political controversy. We will continue to focus on understanding the long-term fundamental values of the Fund's holdings, both current and prospective. We believe that, regardless of the maneuvering in
Washington, the employees of the companies in which we invest will go home at the end of each day knowing that they have helped to increase their employer's value.
Transaction Activity
Our activity in the September quarter favored the sell side as we eliminated five holdings while initiating only one. As noted above, absolute returns have been strong over the past 12 months. To produce this level of return, many stocks within the portfolio have excelled—and several more reached—our sell targets. To review our process, as value managers we establish buy and sell targets for the stock of any company that is voted onto our firm's approved list. Buy targets are normally set at 60% of our estimate of the company's intrinsic value and sell targets at 90%. Of course, our targets are not static. With new information and the passage of time, our targets evolve to reflect a business' current fundamentals better. Generally, when a stock approaches the sell target we begin to reduce the size of the holding because its relative attraction has diminished. Its higher price makes it less able to compete for portfolio space. Sometimes, however, the stock price jumps to the area of its sell target because of a merger offer, which is what happened this past quarter to one of the Fund's smallest companies, Kaydon. Kaydon is a quality manufacturer with strong market shares in specialty industrial products such as bearings and seals. SKF, a Swedish industrial company, recognized Kaydon's attractiveness and agreed to purchase the company during the quarter.
The other four portfolio eliminations also had an industrial orientation. Northrop Grumman is a major defense and aerospace contractor. The company is well-managed and shareholder-friendly with a solid history of dividends and share repurchase. Teledyne Technologies also has products in aerospace and defense electronics as well as digital imaging, although instrumentation is its largest segment. Range Resources is an exploration and production company with major leaseholds in the Marcellus Shale. Natural gas prices have been low for many months, and the outlook is for prices to stay low well into the future. This means that controlling production costs is essential for profitability, and Range's costs are among the industry's lowest. Last, but hardly least, is Flowserve, a leading manufacturer of pumps, valves and seals. Flowserve served the Equity and Income Fund well during its nearly three years in the portfolio, and we wish to thank our recently retired long-time partner John Raitt for this successful idea (as well as many others). We did not enjoy eliminating any of these five holdings from the portfolio as each company had been performing well and meeting or exceeding expectations. Nevertheless, our discipline
oakmark.com 13
Oakmark Equity and Income Fund September 30, 2013
Portfolio Manager Commentary (continued)
demands that we move on whenever price and our estimate of intrinsic value per share come together.
The Fund's one new purchase is actually a return to a previous holding, Ultra Petroleum. During the past year, companies in the energy sector have experienced a wide variety of investment outcomes. A few, such as Cimarex and Range, have enjoyed strong share price increases, but others, such as Ultra, have trailed market returns. We sold the Fund's Ultra holding 17 months ago to realize a tax loss but have watched the company carefully over the intervening period. In our opinion the discount to value in Ultra is simply too great to prevail indefinitely, particularly with its solid management team that is heavily invested in the company.
Fixed Income Management under Rate Suppression
Times remain unusual in the world of fixed income investing. The Federal Reserve continues to suppress interest rates through the purchase of Treasury and Agency securities. Although this policy does not appear to have had the desired effect of increasing business investment, it did produce negative real interest rates on 10-year Treasuries for all of 2012 and much of 2013. Negative real rates make the search for attractive fixed income instruments extremely difficult. Early in the summer interest rates increased fairly dramatically when the Fed suggested that monetary policy would soon become less accommodating (what became known as "the taper"), and we became hopeful that attractive opportunities would develop. In September, however, the Fed elected to maintain its previous policy, and rates have retraced some of their move upward. It is difficult to invest prudently in fixed income investments when rates are being managed to such low levels.
Our basic answer has been to accept credit, but not duration, risk. What this means in practice is that we have kept maturities of our investments very short, particularly for low-risk issuers such as governments and agencies, while we seek out opportunities to increase portfolio yield with what we think is well-priced corporate debt. During much of the past three years this has been difficult to execute when investors were pouring money into fixed income funds. Generally, managers of fixed income funds invest money as it comes in without regard for value considerations. In the most recent quarter, however, the competition was less fierce because investors were pulling money from bond funds.
We have made progress in building the Fund's corporate debt allocation, but this process will take time because of our price and quality requirements, combined with these unusual market conditions. Even with some success to this effort, any increase in portfolio income yield will hardly be stunning. When we opened the Fund to investment in 1995, we naively assumed as our base case that the Fund would average 6% yields on its fixed income allocation. Those days passed very quickly. Although the search for fixed income return is less rewarding than in the past, we continue the search, always guided by our disciplined value philosophy.
Once again we thank our fellow shareholders for investing in the Equity and Income Fund and welcome your comments and questions.
14 THE OAKMARK FUNDS
Oakmark Equity and Income Fund September 30, 2013
Schedule of Investments (in thousands)
| | | Shares | | Value | |
COMMON STOCKS - 73.2% | |
INDUSTRIALS - 16.0% | |
CAPITAL GOODS - 12.9% | |
Dover Corp.
Industrial Machinery | | | 7,563 | | | $ | 679,411 | | |
General Dynamics Corp.
Aerospace & Defense | | | 6,765 | | | | 592,103 | | |
Rockwell Automation Inc.
Electrical Components & Equipment | | | 5,347 | | | | 571,755 | | |
Illinois Tool Works, Inc.
Industrial Machinery | | | 4,239 | | | | 323,339 | | |
Parker Hannifin Corp.
Industrial Machinery | | | 2,718 | | | | 295,496 | | |
Blount International, Inc. (a)
Industrial Machinery | | | 2,263 | | | | 27,410 | | |
Crane Co.
Industrial Machinery | | | 271 | | | | 16,694 | | |
| | | | | | 2,506,208 | | |
TRANSPORTATION - 2.9% | |
FedEx Corp.
Air Freight & Logistics | | | 4,672 | | | | 533,083 | | |
Atlas Air Worldwide Holdings, Inc. (a)
Air Freight & Logistics | | | 800 | | | | 36,888 | | |
| | | | | | 569,971 | | |
COMMERCIAL & PROFESSIONAL SERVICES - 0.2% | |
Herman Miller, Inc.
Office Services & Supplies | | | 1,402 | | | | 40,898 | | |
| | | | | | 3,117,077 | | |
CONSUMER DISCRETIONARY - 11.8% | |
AUTOMOBILES & COMPONENTS - 6.3% | |
General Motors Co. (a)
Automobile Manufacturers | | | 15,938 | | | | 573,272 | | |
BorgWarner, Inc.
Auto Parts & Equipment | | | 3,229 | | | | 327,358 | | |
Lear Corp.
Auto Parts & Equipment | | | 4,424 | | | | 316,601 | | |
| | | | | | 1,217,231 | | |
MEDIA - 2.4% | |
Scripps Networks Interactive, Inc., Class A
Broadcasting | | | 5,895 | | | | 460,474 | | |
RETAILING - 2.2% | |
Foot Locker, Inc. (b)
Apparel Retail | | | 7,711 | | | | 261,705 | | |
Staples, Inc.
Specialty Stores | | | 5,934 | | | | 86,934 | | |
HSN, Inc.
Catalog Retail | | | 1,534 | | | | 82,231 | | |
| | | | | | 430,870 | | |
| | | Shares | | Value | |
CONSUMER DURABLES & APPAREL - 0.9% | |
Carter's, Inc.
Apparel, Accessories & Luxury Goods | | | 1,691 | | | $ | 128,300 | | |
Leggett & Platt, Inc.
Home Furnishings | | | 1,603 | | | | 48,320 | | |
| | | | | | 176,620 | | |
| | | | | | 2,285,195 | | |
ENERGY - 11.7% | |
National Oilwell Varco, Inc.
Oil & Gas Equipment & Services | | | 6,662 | | | | 520,388 | | |
Baker Hughes, Inc.
Oil & Gas Equipment & Services | | | 10,059 | | | | 493,907 | | |
Devon Energy Corp.
Oil & Gas Exploration & Production | | | 5,481 | | | | 316,584 | | |
Encana Corp. (c)
Oil & Gas Exploration & Production | | | 14,713 | | | | 254,983 | | |
Cimarex Energy Co.
Oil & Gas Exploration & Production | | | 2,461 | | | | 237,231 | | |
Cenovus Energy, Inc. (c)
Integrated Oil & Gas | | | 6,675 | | | | 199,246 | | |
Concho Resources, Inc. (a)
Oil & Gas Exploration & Production | | | 1,302 | | | | 141,627 | | |
Ultra Petroleum Corp. (a) (c)
Oil & Gas Exploration & Production | | | 3,575 | | | | 73,527 | | |
Patterson-UTI Energy, Inc.
Oil & Gas Drilling | | | 1,730 | | | | 36,987 | | |
| | | | | | 2,274,480 | | |
HEALTH CARE - 10.2% | |
HEALTH CARE EQUIPMENT & SERVICES - 8.5% | |
UnitedHealth Group, Inc.
Managed Health Care | | | 8,799 | | | | 630,068 | | |
Omnicare, Inc.
Health Care Services | | | 5,138 | | | | 285,181 | | |
Quest Diagnostics, Inc.
Health Care Services | | | 4,115 | | | | 254,241 | | |
Laboratory Corp. of America Holdings (a)
Health Care Services | | | 2,524 | | | | 250,259 | | |
Varian Medical Systems, Inc. (a) (b)
Health Care Equipment | | | 3,148 | | | | 235,280 | | |
| | | | | | 1,655,029 | | |
PHARMACEUTICALS, BIOTECHNOLOGY & LIFE SCIENCES - 1.7% | |
Hospira, Inc. (a)
Pharmaceuticals | | | 6,217 | | | | 243,850 | | |
Bruker Corp. (a)
Life Sciences Tools & Services | | | 3,834 | | | | 79,162 | | |
| | | | | | 323,012 | | |
| | | | | | 1,978,041 | | |
See accompanying Notes to Financial Statements.
oakmark.com 15
Oakmark Equity and Income Fund September 30, 2013
Schedule of Investments (in thousands) (continued)
| | | Shares | | Value | |
COMMON STOCKS - 73.2% (continued) | |
CONSUMER STAPLES - 8.7% | |
FOOD, BEVERAGE & TOBACCO - 7.2% | |
Philip Morris International, Inc.
Tobacco | | | 5,915 | | | $ | 512,171 | | |
Nestle SA (d)
Packaged Foods & Meats | | | 6,956 | | | | 484,145 | | |
Diageo PLC (d)
Distillers & Vintners | | | 3,124 | | | | 397,049 | | |
| | | | | | 1,393,365 | | |
FOOD & STAPLES RETAILING - 1.5% | |
CVS Caremark Corp.
Drug Retail | | | 5,285 | | | | 299,932 | | |
| | | | | | 1,693,297 | | |
INFORMATION TECHNOLOGY - 8.0% | |
SOFTWARE & SERVICES - 5.9% | |
Oracle Corp.
Systems Software | | | 17,795 | | | | 590,260 | | |
MasterCard, Inc., Class A
Data Processing & Outsourced Services | | | 535 | | | | 359,909 | | |
Broadridge Financial Solutions, Inc. (b)
Data Processing & Outsourced Services | | | 5,904 | | | | 187,436 | | |
| | | | | | 1,137,605 | | |
TECHNOLOGY HARDWARE & EQUIPMENT - 2.1% | |
TE Connectivity, Ltd. (c)
Electronic Manufacturing Services | | | 6,797 | | | | 351,928 | | |
ARRIS Group, Inc. (a)
Communications Equipment | | | 3,461 | | | | 59,046 | | |
| | | | | | 410,974 | | |
| | | | | | 1,548,579 | | |
FINANCIALS - 6.8% | |
DIVERSIFIED FINANCIALS - 4.3% | |
Bank of America Corp.
Other Diversified Financial Services | | | 37,109 | | | | 512,103 | | |
TD Ameritrade Holding Corp.
Investment Banking & Brokerage | | | 12,006 | | | | 314,327 | | |
| | | | | | 826,430 | | |
INSURANCE - 1.7% | |
Principal Financial Group, Inc.
Life & Health Insurance | | | 4,727 | | | | 202,393 | | |
Aflac, Inc.
Life & Health Insurance | | | 2,077 | | | | 128,741 | | |
| | | | | | 331,134 | | |
BANKS - 0.8% | |
U.S. Bancorp
Diversified Banks | | | 4,461 | | | | 163,177 | | |
| | | | | | 1,320,741 | | |
TOTAL COMMON STOCKS - 73.2%
(COST $9,452,429) | | | | | 14,217,410 | | |
| | | Par Value | | Value | |
FIXED INCOME - 11.8% | |
GOVERNMENT AND AGENCY SECURITIES - 9.7% | |
U.S. GOVERNMENT NOTES - 8.9% | |
1.375%, due 07/15/18, Inflation Indexed | | $ | 539,946 | | | $ | 592,675 | | |
1.25%, due 07/15/20, Inflation Indexed | | | 533,895 | | | | 584,114 | | |
2.125%, due 01/15/19, Inflation Indexed | | | 216,925 | | | | 246,210 | | |
1.00%, due 09/30/16 | | | 199,380 | | | | 201,436 | | |
1.00%, due 01/15/14 | | | 99,690 | | | | 99,967 | | |
| | | | | | 1,724,402 | | |
U.S. GOVERNMENT AGENCIES - 0.6% | |
Federal Home Loan Bank,
1.65%, due 07/18/19 | | | 29,550 | | | | 28,712 | | |
Federal Home Loan Mortgage Corp.,
2.25%, due 03/13/20 | | | 25,000 | | | | 24,817 | | |
Federal National Mortgage Association,
1.25%, due 09/27/18 | | | 24,680 | | | | 24,213 | | |
Federal Home Loan Bank,
1.00%, due 07/10/18 | | | 10,845 | | | | 10,847 | | |
Federal National Mortgage Association,
1.125%, due 07/18/18 | | | 9,825 | | | | 9,864 | | |
Federal National Mortgage Association,
1.00%, due 01/30/20 | | | 9,525 | | | | 9,182 | | |
| | | | | | 107,635 | | |
CANADIAN GOVERNMENT BONDS - 0.2% | |
4.25%, due 12/01/21, Inflation Indexed | | CAD | 36,939 | | | | 46,343 | | |
Total Government and Agency Securities
(Cost $1,755,525) | | | | | 1,878,380 | | |
CORPORATE BONDS - 2.0% | |
Kinetic Concepts, Inc.,
10.50%, due 11/01/18 | | | 47,940 | | | | 52,914 | | |
General Motors Co., 144A,
4.875%, due 10/02/23 (e) | | | 41,400 | | | | 40,468 | | |
Fifth & Pacific Cos., Inc.,
10.50%, due 04/15/19 | | | 31,603 | | | | 34,447 | | |
Omnicare, Inc.,
7.75%, due 06/01/20 | | | 27,669 | | | | 30,315 | | |
General Motors Co., 144A,
3.50%, due 10/02/18 (e) | | | 29,525 | | | | 29,451 | | |
The William Carter Co., 144A,
5.25%, due 08/15/21 (e) | | | 28,002 | | | | 28,002 | | |
Denbury Resources, Inc.,
8.25%, due 02/15/20 | | | 21,771 | | | | 23,894 | | |
Delphi Corp.,
5.875%, due 05/15/19 | | | 20,943 | | | | 22,226 | | |
Triumph Group, Inc.,
8.625%, due 07/15/18 | | | 20,000 | | | | 21,700 | | |
Kinetic Concepts, Inc.,
12.50%, due 11/01/19 | | | 14,360 | | | | 15,006 | | |
The Manitowoc Co., Inc.,
8.50%, due 11/01/20 | | | 12,825 | | | | 14,268 | | |
Penn National Gaming, Inc.,
8.75%, due 08/15/19 | | | 9,970 | | | | 10,917 | | |
Live Nation Entertainment, Inc., 144A,
7.00%, due 09/01/20 (e) | | | 9,605 | | | | 10,025 | | |
Howard Hughes Corp., 144A,
6.875%, due 10/01/21 (e) | | | 10,000 | | | | 10,025 | | |
See accompanying Notes to Financial Statements.
16 THE OAKMARK FUNDS
Oakmark Equity and Income Fund September 30, 2013
Schedule of Investments (in thousands) (continued)
| | | Par Value | | Value | |
FIXED INCOME - 11.8% (continued) | |
CORPORATE BONDS - 2.0% (continued) | |
Six Flags Entertainment Corp., 144A,
5.25%, due 01/15/21 (e) | | $ | 9,970 | | | $ | 9,496 | | |
Health Net, Inc.,
6.375%, due 06/01/17 | | | 8,680 | | | | 9,223 | | |
Concho Resources, Inc.,
5.50%, due 10/01/22 | | | 6,980 | | | | 6,963 | | |
Serta Simmons Holdings LLC, 144A,
8.125%, due 10/01/20 (e) | | | 4,990 | | | | 5,252 | | |
Scotiabank Peru SA, 144A,
4.50%, due 12/13/27 (e) (f) | | | 6,000 | | | | 5,220 | | |
Walter Energy, Inc., 144A,
9.875%, due 12/15/20 (b) (e) | | | 5,390 | | | | 4,689 | | |
Walter Energy, Inc., 144A,
8.50%, due 04/15/21 (b) (e) | | | 5,000 | | | | 4,175 | | |
Activision Blizzard, Inc., 144A,
6.125%, due 09/15/23 (e) | | | 3,000 | | | | 3,015 | | |
Quiksilver, Inc. / QS Wholesale, Inc., 144A,
7.875%, due 08/01/18 (e) | | | 2,000 | | | | 2,085 | | |
Quiksilver, Inc. / QS Wholesale, Inc., 144A,
10.00%, due 08/01/20 (e) | | | 1,000 | | | | 1,053 | | |
Post Holdings, Inc.,
7.375%, due 02/15/22 | | | 1,000 | | | | 1,051 | | |
Activision Blizzard, Inc., 144A,
5.625%, due 09/15/21 (e) | | | 1,000 | | | | 1,001 | | |
CNO Financial Group, Inc., 144A,
6.375%, due 10/01/20 (e) | | | 250 | | | | 261 | | |
Hologic, Inc.,
6.25%, due 08/01/20 | | | 250 | | | | 260 | | |
Tempur Sealy International, Inc.,
6.875%, due 12/15/20 | | | 100 | | | | 105 | | |
Total Corporate Bonds
(Cost $395,567) | | | | | 397,507 | | |
ASSET BACKED SECURITIES - 0.1% | |
Cabela's Master Credit Card Trust, 144A,
0.732%, due 10/15/19 (e) (f)
(Cost $11,450) | | | 11,450 | | | | 11,501 | | |
CONVERTIBLE BOND - 0.0%(g) | |
Live Nation Entertainment, Inc.,
2.875%, due 07/15/27
(Cost $834) | | | 828 | | | | 845 | | |
TOTAL FIXED INCOME - 11.8%
(COST $2,163,376) | | | | | 2,288,233 | | |
| | | Par Value | | Value | |
SHORT TERM INVESTMENTS - 14.9% | |
COMMERCIAL PAPER - 4.9% | |
Toyota Motor Credit Corp.,
0.05% - 0.10%, due
10/03/13 - 11/26/13 (h) | | $ | 350,000 | | | $ | 349,974 | | |
General Mills Inc., 144A,
0.12% - 0.17%, due
10/02/13 - 11/08/13 (e) (h) | | | 221,500 | | | | 221,482 | | |
BP Capital Markets PLC, 144A,
0.07%, due 10/09/13 - 10/10/13 (e) (h) | | | 100,000 | | | | 99,998 | | |
Kellogg Co., 144A,
0.14% - 0.19%, due
10/01/13 - 12/09/13 (e) (h) | | | 99,475 | | | | 99,458 | | |
American Honda Finance Corp.,
0.09%, due 10/22/13 - 10/23/13 (h) | | | 83,750 | | | | 83,745 | | |
Wellpoint, Inc., 144A,
0.23% - 0.30%, due
10/10/13 - 12/03/13 (e) (h) | | | 52,200 | | | | 52,191 | | |
John Deere Capital Co., 144A,
0.05% - 0.06%, due
10/08/13 - 10/15/13 (e) (h) | | | 50,000 | | | | 49,999 | | |
Total Commercial Paper
(Cost $956,851) | | | | | 956,847 | | |
GOVERNMENT AND AGENCY SECURITIES - 4.4% | |
United States Treasury Bill,
0.05%, due 10/24/13 (h) | | | 350,000 | | | | 349,988 | | |
United States Treasury Note,
0.06%, due 12/31/13 (h) | | | 250,000 | | | | 250,899 | | |
United States Treasury Note,
0.06%, due 12/15/13 (h) | | | 250,000 | | | | 250,361 | | |
Total Government and Agency Securities
(Cost $851,231) | | | | | 851,248 | | |
REPURCHASE AGREEMENT - 3.4% | |
Fixed Income Clearing Corp. Repurchase
Agreement, 0.00% dated 09/30/13 due
10/01/13, repurchase price $659,912,
collateralized by Federal Home Loan
Bank Bonds, 1.750% - 1.770%, due
06/10/20 - 03/18/21, aggregate value
plus accrued interest of $96,644, by
Federal National Mortgage Association
Bonds, 2.220% - 2.230%, due
12/06/22 - 12/27/22, aggregate value
plus accrued interest of $576,466
(Cost: $659,912) | | | 659,912 | | | | 659,912 | | |
See accompanying Notes to Financial Statements.
oakmark.com 17
Oakmark Equity and Income Fund September 30, 2013
Schedule of Investments (in thousands) (continued)
| | Par Value | | Value | |
SHORT TERM INVESTMENTS - 14.9% (continued) | |
CORPORATE BONDS - 1.2% | |
Merrill Lynch & Co., Inc.,
5.45%, due 07/15/14 | | $ | 43,637 | | | $ | 45,237 | | |
Citigroup, Inc.,
5.00%, due 09/15/14 | | | 38,240 | | | | 39,681 | | |
Capital One Financial Corp.,
7.38%, due 05/23/14 | | | 36,712 | | | | 38,275 | | |
MetLife, Inc.,
2.38%, due 02/06/14 | | | 37,151 | | | | 37,417 | | |
Citigroup, Inc.,
6.00%, due 12/13/13 | | | 34,839 | | | | 35,217 | | |
Anheuser-Busch InBev Worldwide, Inc.,
1.50%, due 07/14/14 | | | 18,200 | | | | 18,359 | | |
BP Capital Markets PLC,
3.63%, due 05/08/14 | | | 14,500 | | | | 14,787 | | |
United Parcel Service, Inc.,
3.88%, due 04/01/14 | | | 13,075 | | | | 13,294 | | |
Total Corporate Bonds
(Cost $242,359) | | | | | 242,267 | | |
CANADIAN TREASURY BILLS - 1.0% | |
1.04% - 1.05%, due 10/24/13 - 11/21/13 (h)
(Cost $199,466) | | CAD | 200,000 | | | | 193,961 | | |
TOTAL SHORT TERM INVESTMENTS - 14.9%
(COST $2,909,819) | | | | | 2,904,235 | | |
TOTAL INVESTMENTS - 99.9%
(COST $14,525,624) | | | | | 19,409,878 | | |
Foreign Currencies (Cost $0) - 0.0% (g) | | | | | 0 | (i) | |
Other Assets In Excess of Liabilities - 0.1% | | | | | 24,059 | | |
NET ASSETS - 100.0% | | | | $ | 19,433,937 | | |
(a) Non-income producing security
(b) See Note 5 in the Notes to the Financial Statements regarding investments in affiliated issuers.
(c) Foreign domiciled corporation
(d) Sponsored American Depositary Receipt
(e) See Note 1 in the Notes to Financial Statements regarding restricted securities. These securities may be resold subject to restrictions on resale under federal securities law.
(f) Floating Rate Note. Rate shown is as of September 30, 2013.
(g) Amount rounds to less than 0.1%.
(h) The rate shown represents the annualized yield at the time of purchase; not a coupon rate.
(i) Amount rounds to less than $1,000.
Key to Abbreviations:
CAD Canadian Dollar
See accompanying Notes to Financial Statements.
18 THE OAKMARK FUNDS

This page intentionally left blank.
oakmark.com 19
Oakmark Global Fund September 30, 2013
Summary Information
VALUE OF A $10,000 INVESTMENT
Since Inception - 08/04/99 (Unaudited)

PERFORMANCE
| | | | | Average Annual Total Returns (as of 09/30/13)2 | |
(Unaudited) | | Total Return
Last 3 Months | | 1-year | | 3-year | | 5-year | | 10-year | | Since
Inception
(08/04/99) | |
Oakmark Global Fund (Class I) | | | 11.36 | % | | | 39.55 | % | | | 14.12 | % | | | 10.59 | % | | | 10.24 | % | | | 11.57 | % | |
MSCI World Index | | | 8.18 | % | | | 20.21 | % | | | 11.82 | % | | | 7.84 | % | | | 7.58 | % | | | 3.53 | % | |
Lipper Global Funds Index12 | | | 8.01 | % | | | 22.17 | % | | | 10.07 | % | | | 7.70 | % | | | 7.79 | % | | | 4.60 | % | |
The graph and table do not reflect the deduction of taxes that a shareholder would pay on Fund distributions or the redemption of Fund shares.
Past performance is no guarantee of future results. Performance data quoted represents past performance. Current performance may be lower or higher than the performance data quoted. The investment return and principal value vary so that an investor's shares when redeemed may be worth more or less than the original cost. To obtain the most recent month-end performance data, visit oakmark.com.
TOP TEN EQUITY HOLDINGS5 | | % of Net Assets | |
Julius Baer Group, Ltd. | | | 4.8 | | |
Oracle Corp. | | | 4.5 | | |
Daimler AG | | | 4.0 | | |
MasterCard, Inc., Class A | | | 3.9 | | |
Credit Suisse Group | | | 3.4 | | |
TE Connectivity, Ltd. | | | 3.4 | | |
General Motors Co. | | | 3.2 | | |
FedEx Corp. | | | 3.2 | | |
Incitec Pivot, Ltd. | | | 3.2 | | |
Holcim, Ltd. | | | 3.0 | | |
FUND STATISTICS | |
Ticker | | OAKGX | |
Inception | | 08/04/99 | |
Number of Equity Holdings | | 44 | |
Net Assets | | $2.9 billion | |
Benchmark | | MSCI World Index | |
Weighted Average Market Cap | | $42.9 billion | |
Median Market Cap | | $16.5 billion | |
Portfolio Turnover (for the 12-months ended 09/30/13) | | 45% | |
Expense Ratio - Class I (as of 09/30/12) | | 1.16% | |
Expense Ratio - Class I (as of 09/30/13) | | 1.13% | |
SECTOR ALLOCATION | | % of Net Assets | |
Information Technology | | | 23.1 | | |
Industrials | | | 19.7 | | |
Financials | | | 14.1 | | |
Consumer Discretionary | | | 12.6 | | |
Materials | | | 9.7 | | |
Energy | | | 8.6 | | |
Health Care | | | 7.2 | | |
Consumer Staples | | | 3.5 | | |
Short-Term Investments and Other | | | 1.5 | | |
GEOGRAPHIC ALLOCATION | |
| | | % of Equity | |
North America | | | 44.4 | | |
United States | | | 44.4 | | |
Europe | | | 39.1 | | |
Switzerland | | | 20.9 | | |
Netherlands* | | | 8.4 | | |
Germany* | | | 6.4 | | |
UK | | | 3.4 | | |
| | | % of Equity | |
Asia | | | 13.3 | | |
Japan | | | 13.3 | | |
Australasia | | | 3.2 | | |
Australia | | | 3.2 | | |
* Euro currency countries comprise 14.8% of equity investments
20 THE OAKMARK FUNDS
Oakmark Global Fund September 30, 2013
Portfolio Manager Commentary


Clyde S. McGregor, CFA
Portfolio Manager
oakgx@oakmark.com
Robert A. Taylor, CFA
Portfolio Manager
oakgx@oakmark.com
The September quarter produced strong equity outcomes across most world markets. The Oakmark Global Fund participated in this rally, gaining 11%. The MSCI World Index11 returned 8%, and the Lipper Global Fund Index12 returned 8%. The Fund's return for the calendar nine months is 26%, compared to the 17% return for the MSCI World Index and the Lipper Global Fund Index. For the Global Fund's fiscal year ended September 30 the returns are 40% for the Fund, 20% for the MSCI World Index, and 22% for the Lipper Global Fund Index. As always, we are most pleased to report the Fund's 12% compound annualized rate of return since inception, which compares to 4% for the MSCI World Index and 5% for the Lipper Global Fund Index for the same period.
The countries that contributed most to the Fund's quarter return were the U.S., Switzerland, and Japan. Australia was the only country to have equities that detracted from the Fund's return in the quarter. The five largest contributors to the Fund's return in the quarter were Daimler (Germany), Julius Baer (Switzerland), Cimarex Energy (U.S.), Credit Suisse (Switzerland) and MasterCard (U.S.). The Fund holdings that detracted most were Tenet Healthcare (U.S.), Incitec Pivot (Australia), Intel (U.S.), Bank of America (U.S. new purchase) and Canon (Japan).
For the calendar nine months the highest contributing countries were the U.S., Japan and Switzerland. Holdings in both Spain and Australia detracted from nine-month return. Daiwa Securities Group (Japan), Daimler, Live Nation (U.S.), MasterCard and Julius Baer were the leading contributors. Incitec Pivot, Canon, Banco Santander (Spain), Bank of America and Apache (U.S.) detracted most from the nine-month return. For the Fund's fiscal year the U.S., Japan and Switzerland were again the leading contributors to return while Australia was the only detractor. The five companies that led the contributors list were Daiwa Securities Group, Daimler, Tenet Healthcare, Credit Suisse and MasterCard. Detractors were Incitec Pivot, Square Enix (Japan), Apache, Bank of America and Franklin Resources (U.S. new purchase).
Portfolio Activity
Although equity markets moved higher in the quarter, we found opportunities to make new additions to the Fund, adding three U.S. and two European holdings. The first name alphabetically is Bank of America. For years, Bank of America was the poster child for all that was troubling about banks. But like the industry as a whole, we believe Bank of America has made tremendous progress simplifying and "de-risking" its business. For instance, in just the past few quarters it has gone from being one of the worst capitalized big banks to one of the best. (For perspective, the company's tangible common equity ratio is 64% higher than it was in 2006, which was before the crisis). Management also took advantage of lowered investor expectations as an opportunity to invest heavily in systems technology and rationalization. Investors have rewarded the company for
its progress and brought the stock up from its lows. However, it is still being valued at a sizeable discount to its peers. In our view, the discount derives both from stale perceptions of the relative risk profile, but also because Bank of America's near-term earnings are more depressed than its peers. We expect this discount to close with time, as investors reevaluate the "new" Bank of America and its profitability catches up.
Our second new purchase is Franklin Resources, an investment firm that manages a family of more than 300 mutual funds under the names Franklin, Templeton and Fiduciary Trust, among others. The funds invest internationally and domestically in equities, fixed income and money market instruments. Franklin Resources also offers separately managed accounts and insurance product funds. Franklin Resources has an excellent brand name and a well-established global network, with a presence in over 17 international markets. The company has deliberately built this international presence over decades, and we believe this provides, and will continue to provide, a distinct competitive advantage. In addition, management has historically returned capital to shareholders through stock buybacks and dividends, and we expect Franklin Resources to continue to be good stewards of shareholders' capital.
Next is Fugro, a Netherlands-domiciled geological engineering company that primarily serves the off-shore oil market. Much of Fugro's value—about 85%—comes from businesses that are tied to construction or production related to the off-shore oil market. Investors are attracted to this market because it is growing at nearly a double-digit rate, and Fugro controls very high market shares in many of its businesses. That said, the other 15% of Fugro's value comes from Geoscience, which is not nearly as attractive. Fugro essentially operates ships that take seismic pictures of the ocean floor. This business is capital intensive (ships and cameras), and its returns are erratic, like a commodity's (because it depends on exploration demand). While this "lumpiness" can cause short-term earnings to fluctuate greatly, in our view, it does not affect long-term business value. We have taken advantage of this volatility—and other investors' shortsightedness—and initiated a position during the quarter when Fugro's share price fell after missing Street guidance.
Long-term holders of the Global Fund may remember us buying Holcim (Switzerland) in late 2010. We sold it only one year later, an unusually short holding period relative to our normal three- to five-year holding period. We did not sell because of a change in our investment thesis about Holcim. Instead, our other holdings were not doing as well. Many Japanese names were hurt by the earthquake and tsunami in March 2011 and the Thai floods in the Fall of 2011. In addition, many of our European names also fared poorly in the third and fourth quarters of 2011 as markets feared the break-up of the Euro. We sold Holcim so that we could purchase other positions that offered greater share appreciation potential.
oakmark.com 21
Oakmark Global Fund September 30, 2013
Portfolio Manager Commentary (continued)
Looking back, these trades worked in our favor. Since the sale of Holcim, the Global Fund appreciated almost 50%, while Holcim appreciated less than 30%. During the past quarter we started buying Holcim at a price that was only 7% higher than our previous average cost, while our estimate of intrinsic value increased more than 10%. This makes Holcim absolutely and relatively more attractive now than when we purchased it in 2010.
As a refresher, Switzerland-based Holcim is one of the world's largest cement makers. The company has a broad geographic spread, with more than 70% of its pre-tax profits originating in emerging markets such as India, Indonesia and Africa. We think the company will thrive in these emerging economies and will gain from development in these areas. In addition, recent consolidations in the cement sector have strengthened the company's market position. Holcim's cost-reduction plan, which includes a restructuring plan in India to improve the cost base, is on track for 2014, and we believe its expected benefits have not yet been reflected in the stock price and that demand for cement will increase over the medium term.
Returning to the U.S., our last new purchase was shares of Itron, a global supplier of metering products and services for electric, natural gas and water utilities. Its product portfolio includes traditional, standard (manual-read) meters as well as radio- and telephone-based automatic meter-reading systems, handheld meter-reading computers, smart meters and meter data acquisition and analysis software. Approximately 8,000 customers in more than 100 countries use its products and services. We believe that Itron is poised to benefit from a wave of spending in the coming years, as utilities around the globe continue to upgrade approximately 2.5 billion outdated meters to more advanced meters, which are capable of automated readings and two-way communication. The company generates strong free cash flow given the minimal capital needed to run the business, and we think its leading market position is protected by large R&D investments, customer switching costs and solid brand value.
There were two full eliminations from the portfolio. The first was Rohm, a Japanese semiconductor company, which was sold to help fund more attractive holdings. The second was International Flavors & Fragrances, which, despite its name, is a U.S.-domiciled concern. As IFF's shares approached our sell target, we sold it in order to help fund new purchases. We salute IFF management for their excellent stewardship of the company during the Fund's three-and-a-half years of ownership.
Applied Materials/Tokyo Electron
Late in the quarter Applied Materials, one of our holdings, announced that it would merge with Tokyo Electron in an all-stock transaction. Mergers of American and Japanese firms are quite unusual, but this one developed in part because of the two CEO's long-term friendship. Applied's CEO will become the combined company's leader and will move to Japan to help the deal progress. Both companies make semiconductor manufacturing equipment, but their products primarily overlap rather than directly compete. The deal also offers cost synergies and tax management possibilities.
If the merger takes place and semiconductor demand begins to pick up, the combined company should be very well positioned to benefit. Alternatively, should sales remain sluggish, we believe that Applied's management team can introduce produc-
tive cost-reduction measures at Tokyo Electron to boost profits. But perhaps most importantly, we think this transaction suggests ever greater possibilities for worldwide economic consolidation and integration, which can enhance productive economic growth and expansion.
Currency Hedges
Global currencies were relatively stable during the quarter, but we continue to believe some currencies are overvalued. As a result, we defensively hedge a portion of the Fund's currency exposure. Approximately 38% of the Australian dollar, 25% of the Swiss franc and 15% of the Japanese yen were hedged at quarter-end.
As always, we thank you for being our shareholders and partners in the Oakmark Global Fund. We look forward to your questions and comments.
22 THE OAKMARK FUNDS
Oakmark Global Fund September 30, 2013
Schedule of Investments (in thousands)
| | | Shares | | Value | |
COMMON STOCKS - 98.5% | |
INFORMATION TECHNOLOGY - 23.1% | |
TECHNOLOGY HARDWARE & EQUIPMENT - 9.2% | |
TE Connectivity, Ltd. (Switzerland)
Electronic Manufacturing Services | | | 1,899 | | | $ | 98,351 | | |
Canon, Inc. (Japan)
Office Electronics | | | 2,656 | | | | 84,575 | | |
Hirose Electric Co., Ltd. (Japan)
Electronic Components | | | 343 | | | | 52,506 | | |
OMRON Corp. (Japan)
Electronic Components | | | 612 | | | | 22,079 | | |
Itron, Inc. (United States) (a)
Electronic Equipment & Instruments | | | 242 | | | | 10,347 | | |
| | | | | | 267,858 | | |
SOFTWARE & SERVICES - 8.6% | |
Oracle Corp. (United States)
Systems Software | | | 3,984 | | | | 132,146 | | |
MasterCard, Inc., Class A (United States)
Data Processing & Outsourced Services | | | 169 | | | | 113,633 | | |
Square Enix Holdings Co., Ltd. (Japan)
Home Entertainment Software | | | 395 | | | | 6,255 | | |
| | | | | | 252,034 | | |
SEMICONDUCTORS & SEMICONDUCTOR EQUIPMENT - 5.3% | |
Applied Materials, Inc. (United States)
Semiconductor Equipment | | | 3,548 | | | | 62,227 | | |
Intel Corp. (United States)
Semiconductors | | | 2,483 | | | | 56,915 | | |
Texas Instruments, Inc. (United States)
Semiconductors | | | 881 | | | | 35,481 | | |
| | | | | | 154,623 | | |
| | | | | | 674,515 | | |
INDUSTRIALS - 19.7% | |
CAPITAL GOODS - 10.2% | |
CNH Industrial N.V. (Netherlands) (a)
Construction & Farm Machinery & Heavy Trucks | | | 6,566 | | | | 84,209 | | |
Rheinmetall AG (Germany)
Industrial Conglomerates | | | 1,199 | | | | 68,878 | | |
Snap-on, Inc. (United States)
Industrial Machinery | | | 534 | | | | 53,084 | | |
Koninklijke Philips NV (Netherlands)
Industrial Conglomerates | | | 1,211 | | | | 39,047 | | |
Travis Perkins PLC (UK)
Trading Companies & Distributors | | | 1,191 | | | | 31,812 | | |
Smiths Group PLC (UK)
Industrial Conglomerates | | | 958 | | | | 21,692 | | |
| | | | | | 298,722 | | |
| | | Shares | | Value | |
TRANSPORTATION - 7.7% | |
FedEx Corp. (United States)
Air Freight & Logistics | | | 824 | | | $ | 94,038 | | |
Union Pacific Corp. (United States)
Railroads | | | 427 | | | | 66,253 | | |
Kuehne + Nagel International AG (Switzerland)
Marine | | | 477 | | | | 62,555 | | |
| | | | | | 222,846 | | |
COMMERCIAL & PROFESSIONAL SERVICES - 1.8% | |
Adecco SA (Switzerland)
Human Resource & Employment Services | | | 731 | | | | 52,056 | | |
| | | | | | 573,624 | | |
FINANCIALS - 14.1% | |
DIVERSIFIED FINANCIALS - 14.1% | |
Julius Baer Group, Ltd. (Switzerland)
Asset Management & Custody Banks | | | 3,028 | | | | 141,311 | | |
Credit Suisse Group (Switzerland)
Diversified Capital Markets | | | 3,279 | | | | 100,157 | | |
Daiwa Securities Group, Inc. (Japan)
Investment Banking & Brokerage | | | 7,832 | | | | 70,117 | | |
Franklin Resources, Inc. (United States)
Asset Management & Custody Banks | | | 1,153 | | | | 58,299 | | |
Bank of America Corp. (United States)
Other Diversified Financial Services | | | 3,069 | | | | 42,351 | | |
| | | | | | 412,235 | | |
CONSUMER DISCRETIONARY - 12.6% | |
AUTOMOBILES & COMPONENTS - 10.8% | |
Daimler AG (Germany)
Automobile Manufacturers | | | 1,492 | | | | 116,311 | | |
General Motors Co. (United States) (a)
Automobile Manufacturers | | | 2,638 | | | | 94,871 | | |
Yamaha Motor Co., Ltd. (Japan)
Motorcycle Manufacturers | | | 4,378 | | | | 63,872 | | |
Toyota Motor Corp. (Japan)
Automobile Manufacturers | | | 609 | | | | 38,834 | | |
| | | | | | 313,888 | | |
MEDIA - 1.8% | |
Live Nation Entertainment, Inc.
(United States) (a)
Movies & Entertainment | | | 2,914 | | | | 54,059 | | |
| | | | | | 367,947 | | |
MATERIALS - 9.7% | |
Incitec Pivot, Ltd. (Australia)
Diversified Chemicals | | | 36,810 | | | | 92,375 | | |
Holcim, Ltd. (Switzerland)
Construction Materials | | | 1,189 | | | | 88,453 | | |
Akzo Nobel NV (Netherlands)
Diversified Chemicals | | | 887 | | | | 58,270 | | |
Kansai Paint Co., Ltd. (Japan)
Specialty Chemicals | | | 3,372 | | | | 44,670 | | |
| | | | | | 283,768 | | |
See accompanying Notes to Financial Statements.
oakmark.com 23
Oakmark Global Fund September 30, 2013
Schedule of Investments (in thousands) (continued)
| | | Shares | | Value | |
COMMON STOCKS - 98.5% (continued) | |
ENERGY - 8.6% | |
National Oilwell Varco, Inc. (United States)
Oil & Gas Equipment & Services | | | 979 | | | $ | 76,477 | | |
Devon Energy Corp. (United States)
Oil & Gas Exploration & Production | | | 1,219 | | | | 70,398 | | |
Fugro NV (Netherlands)
Oil & Gas Equipment & Services | | | 968 | | | | 59,042 | | |
Cimarex Energy Co. (United States)
Oil & Gas Exploration & Production | | | 475 | | | | 45,768 | | |
| | | | | | 251,685 | | |
HEALTH CARE - 7.2% | |
HEALTH CARE EQUIPMENT & SERVICES - 7.2% | |
Tenet Healthcare Corp. (United States) (a)
Health Care Facilities | | | 1,894 | | | | 78,021 | | |
Laboratory Corp. of America Holdings
(United States) (a)
Health Care Services | | | 762 | | | | 75,535 | | |
Health Net, Inc. (United States) (a)
Managed Health Care | | | 1,788 | | | | 56,689 | | |
| | | | | | 210,245 | | |
CONSUMER STAPLES - 3.5% | |
FOOD, BEVERAGE & TOBACCO - 3.5% | |
Nestle SA (Switzerland)
Packaged Foods & Meats | | | 808 | | | | 56,490 | | |
Diageo PLC (UK)
Distillers & Vintners | | | 1,410 | | | | 44,848 | | |
| | | | | | 101,338 | | |
TOTAL COMMON STOCKS - 98.5%
(COST $2,205,850) | | | | | 2,875,357 | | |
| | | Par Value | | Value | |
SHORT TERM INVESTMENT - 2.5% | |
REPURCHASE AGREEMENT - 2.5% | |
Fixed Income Clearing Corp. Repurchase
Agreement, 0.00% dated 09/30/13 due
10/01/13, repurchase price $73,324,
collateralized by a Federal National
Mortgage Association Bond, 2.220%,
due 12/27/22, value plus accrued
interest of $74,794 (Cost: $73,324) | | | 73,324 | | | | 73,324 | | |
TOTAL SHORT TERM INVESTMENTS - 2.5%
(COST $73,324) | | | | | 73,324 | | |
TOTAL INVESTMENTS - 101.0%
(COST $2,279,174) | | | | | 2,948,681 | | |
Foreign Currencies (Cost $0) - 0.0% (b) | | | | | 0 | (c) | |
Liabilities In Excess of Other Assets - (1.0)% | | | | | (29,368 | ) | |
TOTAL NET ASSETS - 100.0% | | | | $ | 2,919,313 | | |
(a) Non-income producing security
(b) Amount rounds to less than 0.1%.
(c) Amount rounds to less than $1,000.
See accompanying Notes to Financial Statements.
24 THE OAKMARK FUNDS

This page intentionally left blank.
oakmark.com 25
Oakmark Global Select Fund September 30, 2013
Summary Information
VALUE OF A $10,000 INVESTMENT
Since Inception - 10/02/06 (Unaudited)

PERFORMANCE
| | | | | Average Annual Total Returns (as of 09/30/13)2 | |
(Unaudited) | | Total Return
Last 3 Months | | 1-year | | 3-year | | 5-year | | Since
Inception
(10/02/06) | |
Oakmark Global Select Fund (Class I) | | | 9.02 | % | | | 37.69 | % | | | 16.57 | % | | | 15.64 | % | | | 8.59 | % | |
MSCI World Index | | | 8.18 | % | | | 20.21 | % | | | 11.82 | % | | | 7.84 | % | | | 3.87 | % | |
Lipper Global Funds Index12 | | | 8.01 | % | | | 22.17 | % | | | 10.07 | % | | | 7.70 | % | | | 4.03 | % | |
The graph and table do not reflect the deduction of taxes that a shareholder would pay on Fund distributions or the redemption of Fund shares.
Past performance is no guarantee of future results. Performance data quoted represents past performance. Current performance may be lower or higher than the performance data quoted. The investment return and principal value vary so that an investor's shares when redeemed may be worth more or less than the original cost. To obtain the most recent month-end performance data, visit oakmark.com.
TOP TEN EQUITY HOLDINGS5 | | % of Net Assets | |
Daimler AG | | | 6.3 | | |
Canon, Inc. | | | 6.1 | | |
CNH Industrial N.V. | | | 5.5 | | |
Credit Suisse Group | | | 5.1 | | |
Kuehne + Nagel International AG | | | 5.0 | | |
Daiwa Securities Group, Inc. | | | 5.0 | | |
Adecco SA | | | 4.9 | | |
Kering | | | 4.8 | | |
Bank of America Corp. | | | 4.5 | | |
FedEx Corp. | | | 4.5 | | |
FUND STATISTICS | |
Ticker | | OAKWX | |
Inception | | 10/02/06 | |
Number of Equity Holdings | | 20 | |
Net Assets | | $1.2 billion | |
Benchmark | | MSCI World Index | |
Weighted Average Market Cap | | $59.5 billion | |
Median Market Cap | | $41.4 billion | |
Portfolio Turnover (for the 12-months ended 09/30/13) | | 36% | |
Expense Ratio - Class I (as of 09/30/12) | | 1.23% | |
Expense Ratio - Class I (as of 09/30/13) | | 1.15% | |
SECTOR ALLOCATION | | % of Net Assets | |
Financials | | | 27.7 | | |
Industrials | | | 20.0 | | |
Consumer Discretionary | | | 19.9 | | |
Information Technology | | | 19.1 | | |
Health Care | | | 4.5 | | |
Consumer Staples | | | 3.8 | | |
Short-Term Investments and Other | | | 5.0 | | |
GEOGRAPHIC ALLOCATION | |
| | | % of Equity | |
North America | | | 46.3 | | |
United States | | | 46.3 | | |
Europe | | | 42.0 | | |
Switzerland | | | 20.4 | | |
Germany* | | | 6.7 | | |
Netherlands* | | | 5.8 | | |
France* | | | 5.1 | | |
UK | | | 4.0 | | |
| | | % of Equity | |
Asia | | | 11.7 | | |
Japan | | | 11.7 | | |
* Euro currency countries comprise 17.6% of equity investments
26 THE OAKMARK FUNDS
Oakmark Global Select Fund September 30, 2013
Portfolio Manager Commentary


William C. Nygren, CFA
Portfolio Manager
oakwx@oakmark.com
David G. Herro, CFA
Portfolio Manager
oakwx@oakmark.com
The Oakmark Global Select Fund returned 9% for the quarter ended September 30, 2013, outperforming the 8% return from the MSCI World Index11. For the fiscal year ended September 30, 2013, the Fund returned 38%, significantly outperforming the MSCI World Index, which returned 20%.
Daiwa Securities Group, Japan's second-largest broker, was the top contributor to performance over the past 12 months, returning 139%. As discussed in previous letters, Daiwa has benefitted from the Japanese stock market rally and the weakened yen that followed talks of economic reform. Daiwa's fiscal 2012 results were very strong: net operating revenues increased by 24% while operating costs decreased by 7%. The most recent quarterly numbers also exceeded our expectations. The retail business achieved operating margins around 50%, and the quarter's EBIT was more than half of what we estimated for Daiwa's entire fiscal year. Although Daiwa's stock price has almost tripled over the past year, we continue to believe the company's stock has significant upside and will remain a good investment for our shareholders.
Another top contributor for the year was Daimler, the global auto manufacturer of the Mercedes brand, which returned 67%. Shares reacted positively to the company's 2012 results, which included higher profits than we expected for the company's Mercedes-Benz Car and Truck divisions. More recently Daimler announced significantly improved earnings and net profits for the second quarter of 2013. In addition, sales of Mercedes-Benz cars increased in all markets, driving unit sales to a new record. Although Mercedes continues to underperform Audi and BMW in China, we expect an increase in growth from its new model launches, new organizational structure, and 75 new dealerships by year end. The Trucks division has also performed well, led by a significant rebound in Latin American unit sales, which increased by 57%. Daimler management remains upbeat about global operations and reiterated the full-year guidance for all divisions.
The biggest detractor from performance for the year was Cenovus, a Canadian-based oil company, which declined 17% before we sold our position in August of this year. Our business value estimate for Cenovus fell more than the stock price after we incorporated a lower futures oil price into our model. At the same time, the share price of DirecTV, a U.S. digital television entertainment provider, fell in response to weak quarterly results, which did not affect our estimate of intrinsic value. The divergence between the two stocks was enough to tip the balance in favor of owning DirecTV, and we harvested a small tax loss by selling Cenovus. In our view, DirecTV's shift in focus to higher-end customers has led to slower but more profitable growth. Management is focused on building shareholder value by returning cash to shareholders. Over the past five years DirecTV has aggressively repurchased shares and has reduced its outstanding shares by almost 50%. We are happy to see growth
in value per share whether it comes from a growing numerator or a shrinking denominator.
In addition to the sale mentioned above we sold our shares of Toyota Motor during the quarter. You will see a new security held in the Fund, CNH Industrial. This is a result of a merger between Fiat Industrial, which was owned by the Fund, and CNH Global. Fiat owned 88% of publicly listed CNH, and to simplify the shareholder structure, it decided to fully consolidate and merge the two companies. The merger is expected to result in financial, cost and tax savings. CNH Industrial is now domiciled in the Netherlands rather than Italy.
Geographically, we ended the quarter with our European and Japanese holdings comprising 42% and 12% of the Fund, respectively. North America accounts for the remainder of the Fund's holdings.
We continue to believe some global currencies are overvalued, and we are defensively hedging the Fund's currency exposure. As of quarter end, approximately 25% of the Swiss franc and 7% of the Japanese yen exposures were hedged.
We thank you, our shareholders, for your continued support and confidence.
oakmark.com 27
Oakmark Global Select Fund September 30, 2013
Schedule of Investments (in thousands)
| | | Shares | | Value | |
COMMON STOCKS - 95.0% | |
FINANCIALS - 27.7% | |
DIVERSIFIED FINANCIALS - 23.4% | |
Credit Suisse Group (Switzerland)
Diversified Capital Markets | | | 1,922 | | | $ | 58,697 | | |
Daiwa Securities Group, Inc. (Japan)
Investment Banking & Brokerage | | | 6,500 | | | | 58,192 | | |
Bank of America Corp. (United States)
Other Diversified Financial Services | | | 3,810 | | | | 52,578 | | |
Capital One Financial Corp. (United States)
Consumer Finance | | | 745 | | | | 51,211 | | |
JPMorgan Chase & Co. (United States)
Other Diversified Financial Services | | | 980 | | | | 50,656 | | |
| | | | | | 271,334 | | |
INSURANCE - 4.3% | |
American International Group, Inc.
(United States)
Multi-line Insurance | | | 1,030 | | | | 50,089 | | |
| | | | | | 321,423 | | |
INDUSTRIALS - 20.0% | |
TRANSPORTATION - 9.6% | |
Kuehne + Nagel International AG (Switzerland)
Marine | | | 447 | | | | 58,559 | | |
FedEx Corp. (United States)
Air Freight & Logistics | | | 459 | | | | 52,376 | | |
| | | | | | 110,935 | | |
CAPITAL GOODS - 5.5% | |
CNH Industrial N.V. (Netherlands) (a)
Construction & Farm Machinery &
Heavy Trucks | | | 5,014 | | | | 64,307 | | |
COMMERCIAL & PROFESSIONAL SERVICES - 4.9% | |
Adecco SA (Switzerland)
Human Resource & Employment Services | | | 792 | | | | 56,414 | | |
| | | | | | 231,656 | | |
CONSUMER DISCRETIONARY - 19.9% | |
AUTOMOBILES & COMPONENTS - 6.4% | |
Daimler AG (Germany)
Automobile Manufacturers | | | 944 | | | | 73,609 | | |
CONSUMER DURABLES & APPAREL - 4.8% | |
Kering (France)
Apparel, Accessories & Luxury Goods | | | 250 | | | | 56,115 | | |
MEDIA - 4.4% | |
DIRECTV (United States) (a)
Cable & Satellite | | | 850 | | | | 50,787 | | |
RETAILING - 4.3% | |
Liberty Interactive Corp., Class A
(United States) (a)
Catalog Retail | | | 2,140 | | | | 50,226 | | |
| | | | | | 230,737 | | |
| | | Shares | | Value | |
INFORMATION TECHNOLOGY - 19.1% | |
TECHNOLOGY HARDWARE & EQUIPMENT - 10.4% | |
Canon, Inc. (Japan)
Office Electronics | | | 2,209 | | | $ | 70,325 | | |
TE Connectivity, Ltd. (Switzerland)
Electronic Manufacturing Services | | | 984 | | | | 50,946 | | |
| | | | | | 121,271 | | |
SOFTWARE & SERVICES - 4.4% | |
Oracle Corp. (United States)
Systems Software | | | 1,535 | | | | 50,916 | | |
SEMICONDUCTORS & SEMICONDUCTOR EQUIPMENT - 4.3% | |
Intel Corp. (United States)
Semiconductors | | | 2,177 | | | | 49,897 | | |
| | | | | | 222,084 | | |
HEALTH CARE - 4.5% | |
HEALTH CARE EQUIPMENT & SERVICES - 4.5% | |
Medtronic, Inc. (United States)
Health Care Equipment | | | 982 | | | | 52,292 | | |
CONSUMER STAPLES - 3.8% | |
FOOD, BEVERAGE & TOBACCO - 3.8% | |
Diageo PLC (UK)
Distillers & Vintners | | | 1,391 | | | | 44,262 | | |
TOTAL COMMON STOCKS - 95.0%
(COST $895,517) | | | | | 1,102,454 | | |
| | | Par Value | | Value | |
SHORT TERM INVESTMENTS - 5.3% | |
REPURCHASE AGREEMENT - 5.3% | |
Fixed Income Clearing Corp. Repurchase
Agreement, 0.00% dated 09/30/13 due
10/01/13, repurchase price $61,040,
collateralized by a Federal National
Mortgage Association Bond, 2.220%,
due 12/27/22, value plus accrued interest
of $62,263 (Cost: $61,040) | | | 61,040 | | | | 61,040 | | |
TOTAL SHORT TERM INVESTMENTS - 5.3%
(COST $61,040) | | | | | 61,040 | | |
TOTAL INVESTMENTS - 100.3%
(COST $956,557) | | | | | 1,163,494 | | |
Foreign Currencies (Cost $0) - 0.0% (b) | | | | | 0 | (c) | |
Liabilities In Excess of Other Assets - (0.3)% | | | | | (3,731 | ) | |
TOTAL NET ASSETS - 100.0% | | | | $ | 1,159,763 | | |
(a) Non-income producing security
(b) Amount rounds to less than 0.1%.
(c) Amount rounds to less than $1,000.
See accompanying Notes to Financial Statements.
28 THE OAKMARK FUNDS

This page intentionally left blank.
oakmark.com 29
Oakmark International Fund September 30, 2013
Summary Information
VALUE OF A $10,000 INVESTMENT
Since Inception - 09/30/92 (Unaudited)

PERFORMANCE
| | | | | Average Annual Total Returns (as of 09/30/13)2 | |
(Unaudited) | | Total Return
Last 3 Months | | 1-year | | 3-year | | 5-year | | 10-year | | Since
Inception
(09/30/92) | |
Oakmark International Fund (Class I) | | | 13.16 | % | | | 40.79 | % | | | 13.93 | % | | | 14.42 | % | | | 11.63 | % | | | 11.10 | % | |
MSCI World ex U.S. Index | | | 11.31 | % | | | 21.45 | % | | | 7.89 | % | | | 6.12 | % | | | 8.18 | % | | | 6.55 | % | |
MSCI EAFE Index14 | | | 11.56 | % | | | 23.77 | % | | | 8.47 | % | | | 6.35 | % | | | 8.01 | % | | | 6.35 | % | |
Lipper International Funds Index15 | | | 10.70 | % | | | 21.91 | % | | | 7.93 | % | | | 6.76 | % | | | 8.48 | % | | | 7.43 | % | |
The graph and table above do not reflect the deduction of taxes that a shareholder would pay on Fund distributions or the redemption of Fund shares.
Past Performance is no guarantee of future results. Performance data quoted represents past performance. Current performance may be lower or higher than the performance data quoted. The investment return and principal value vary so that an investor's shares when redeemed may be worth more or less than the original cost. To obtain the most recent month-end performance, please visit oakmark.com.
TOP TEN EQUITY HOLDINGS5 | | % of Net Assets | |
Credit Suisse Group | | | 5.0 | | |
Intesa Sanpaolo SPA | | | 3.6 | | |
BNP Paribas SA | | | 3.3 | | |
Allianz SE | | | 3.3 | | |
Daimler AG | | | 3.2 | | |
Canon, Inc. | | | 2.9 | | |
Bayerische Motoren Werke (BMW) AG | | | 2.7 | | |
Holcim, Ltd. | | | 2.7 | | |
CNH Industrial N.V. | | | 2.5 | | |
Lloyds Banking Group PLC | | | 2.4 | | |
FUND STATISTICS | |
Ticker | | OAKIX | |
Inception | | 09/30/92 | |
Number of Equity Holdings | | 58 | |
Net Assets | | $24.3 billion | |
Benchmark | | MSCI World ex U.S. Index | |
Weighted Average Market Cap | | $49.9 billion | |
Median Market Cap | | $27.9 billion | |
Portfolio Turnover (for the 12-months ended 09/30/13) | | 37% | |
Expense Ratio - Class I (as of 09/30/12) | | 1.06% | |
Expense Ratio - Class I (as of 09/30/13) | | 0.98% | |
SECTOR ALLOCATION | | % of Net Assets | |
Financials | | | 26.4 | | |
Consumer Discretionary | | | 22.5 | | |
Industrials | | | 15.6 | | |
Consumer Staples | | | 11.6 | | |
Materials | | | 7.5 | | |
Information Technology | | | 7.4 | | |
Health Care | | | 4.4 | | |
Short-Term Investments and Other | | | 4.6 | | |
GEOGRAPHIC ALLOCATION | |
| | | % of Equity | |
Europe | | | 77.7 | | |
Switzerland | | | 17.7 | | |
UK | | | 15.0 | | |
France* | | | 13.6 | | |
Germany* | | | 12.5 | | |
Netherlands* | | | 8.4 | | |
Sweden | | | 4.9 | | |
Italy* | | | 3.8 | | |
Ireland* | | | 1.8 | | |
| | | % of Equity | |
Asia | | | 14.0 | | |
Japan | | | 13.7 | | |
South Korea | | | 0.3 | | |
Australasia | | | 5.0 | | |
Australia | | | 5.0 | | |
North America | | | 2.0 | | |
Canada | | | 2.0 | | |
Middle East | | | 1.3 | | |
Isreal | | | 1.3 | | |
* Euro currency countries comprise 40.1% of equity investments
30 THE OAKMARK FUNDS
Oakmark International Fund September 30, 2013
Portfolio Manager Commentary


David G. Herro, CFA
Portfolio Manager
oakix@oakmark.com
Robert A. Taylor, CFA
Portfolio Manager
oakix@oakmark.com
The Oakmark International Fund returned 41% for the fiscal year ended September 30, 2013, comparing favorably to the MSCI World ex U.S. Index13, which returned 21%. For the most recent quarter the Fund outperformed the MSCI World ex U.S. Index, returning 13% versus 11%. The Fund has returned an average of 11% per year since its inception in September 1992, outperforming the MSCI World ex U.S. Index, which has averaged 7% per year over the same period.
Daiwa Securities Group, Japan's second-largest broker, was the top contributor to performance over the past 12 months, returning 139%. As discussed in previous letters, Daiwa has benefitted from the Japanese stock market rally and the weakened yen that followed talks of economic reform. Daiwa's fiscal 2012 results were very strong: net operating revenues increased by 24% while operating costs decreased by 7%. The most recent quarterly numbers also exceeded our expectations. The retail business achieved operating margins around 50%, and the quarter's EBIT was more than half of what we estimated for Daiwa's entire fiscal year. Although Daiwa's stock price has almost tripled over the past year, we continue to believe the company's stock has significant upside and will remain a good investment for our shareholders.
Another top contributor was Lloyd's Banking Group, the dominant retail bank in the U.K., which returned 90% over the past twelve months. Over the past year Lloyd's has removed substantial amounts of risk from its balance sheet, and it is disposing of its non-core assets ahead of expectations. Lloyd's is projected to have less than 70 billion pounds in non-core assets and a Core Tier 1 of greater than 10% by the end of 2013, a year ahead of previous guidance. During the first half of 2013, Lloyd's core expenses were down 3%, compared to the first half of 2012, and management anticipates further cost savings. Lloyd's loan book quality has also improved due to a decline in non-performing loans. We are encouraged by Lloyd's strengthening balance sheet and believe it is well positioned for the future.
The largest detractor from performance over the past twelve months was Orica, an Australian mining-services company, which declined 24%. Shares reacted negatively to the news that the company's net profit in fiscal year 2013 would not meet expectations. Much of this was due to macro weakness and a weaker commodity environment, but numerous isolated incidents also contributed. Minova, the company's ground support business, which generated A$109m in EBIT last year, is only expected to breakeven on an EBIT basis due to restructuring, two isolated customer issues and a dispute with a supplier. Indonesia operations will suffer due to two large customers temporarily suspending operations, as well as a more difficult competitive environment. Finally, slower than expected growth will impact the Australian business. We believe many of these issues are one-off in nature and are likely to reverse next year. Synergy gains from integrating Minova with the rest of the business,
continued growth in Australia, and weakening of the Australian dollar should significantly boost Orica's earnings growth in fiscal year 2014.
There was a lot of portfolio activity during the past quarter—we sold our positions in ASSA ABLOY, Amcor, Bank of Ireland, Grupo Televisa and Roche. We added four new names to the Fund: Pernod Ricard, the second largest worldwide producer of spirits; Samsung Electronics, a consumer and industrial electronics manufacturer; Sanofi, a pharmaceutical company; and WPP, a leading advertising and communications services company.
Geographically we ended the quarter with 78% of our holdings in Europe, 14% in Japan and 5% in Australia. The remaining positions are in North America (Canada), South Korea and the Middle East (Israel).
We continue to believe some global currencies are overvalued. As a result, we defensively hedge a portion of the Fund's currency exposure. Approximately 35% of the Australian dollar, 29% of the Swedish krona, 24% of the Swiss franc and 7% of the Japanese yen were hedged at quarter-end
We continue to adhere to a long-term value philosophy that has enabled us to build a portfolio of high quality names trading at discounts to our estimate of intrinsic value. We thank you, our shareholders, for your continued support.
oakmark.com 31
Oakmark International Fund September 30, 2013
Schedule of Investments (in thousands)
| | | Shares | | Value | |
COMMON STOCKS - 95.4% | |
FINANCIALS - 26.4% | |
BANKS - 9.4% | |
Intesa Sanpaolo SPA (Italy)
Diversified Banks | | | 421,326 | | | $ | 869,237 | | |
BNP Paribas SA (France)
Diversified Banks | | | 11,958 | | | | 808,896 | | |
Lloyds Banking Group PLC (UK) (a)
Diversified Banks | | | 495,597 | | | | 590,349 | | |
| | | | | | 2,268,482 | | |
DIVERSIFIED FINANCIALS - 9.1% | |
Credit Suisse Group (Switzerland)
Diversified Capital Markets | | | 40,046 | | | | 1,223,065 | | |
Daiwa Securities Group, Inc. (Japan)
Investment Banking & Brokerage | | | 62,492 | | | | 559,469 | | |
Schroders PLC (UK)
Asset Management & Custody Banks | | | 10,099 | | | | 421,148 | | |
Schroders PLC, Non-Voting (UK)
Asset Management & Custody Banks | | | 31 | | | | 1,095 | | |
| | | | | | 2,204,777 | | |
INSURANCE - 7.9% | |
Allianz SE (Germany)
Multi-line Insurance | | | 5,105 | | | | 802,528 | | |
AMP, Ltd. (Australia)
Life & Health Insurance | | | 135,258 | | | | 581,698 | | |
Willis Group Holdings PLC (UK) (b)
Insurance Brokers | | | 12,505 | | | | 541,829 | | |
| | | | | | 1,926,055 | | |
| | | | | | 6,399,314 | | |
CONSUMER DISCRETIONARY - 22.5% | |
AUTOMOBILES & COMPONENTS - 10.6% | |
Daimler AG (Germany)
Automobile Manufacturers | | | 9,930 | | | | 774,040 | | |
Bayerische Motoren Werke (BMW)
AG (Germany)
Automobile Manufacturers | | | 6,179 | | | | 664,289 | | |
Honda Motor Co., Ltd. (Japan)
Automobile Manufacturers | | | 14,279 | | | | 542,553 | | |
Toyota Motor Corp. (Japan)
Automobile Manufacturers | | | 6,818 | | | | 434,891 | | |
Continental AG (Germany)
Auto Parts & Equipment | | | 965 | | | | 163,647 | | |
| | | | | | 2,579,420 | | |
| | | Shares | | Value | |
CONSUMER DURABLES & APPAREL - 6.0% | |
Kering (France)
Apparel, Accessories & Luxury Goods | | | 2,273 | | | $ | 509,482 | | |
Cie Financiere Richemont SA (Switzerland)
Apparel, Accessories & Luxury Goods | | | 3,978 | | | | 398,526 | | |
LVMH Moet Hennessy Louis Vuitton SA (France)
Apparel, Accessories & Luxury Goods | | | 1,687 | | | | 332,198 | | |
Christian Dior SA (France)
Apparel, Accessories & Luxury Goods | | | 1,098 | | | | 215,359 | | |
| | | | | | 1,455,565 | | |
MEDIA - 3.6% | |
Thomson Reuters Corp. (Canada)
Publishing | | | 12,916 | | | | 451,666 | | |
Publicis Groupe SA (France)
Advertising | | | 4,026 | | | | 320,372 | | |
WPP PLC (UK)
Advertising | | | 4,164 | | | | 85,610 | | |
| | | | | | 857,648 | | |
RETAILING - 2.3% | |
Hennes & Mauritz AB (H&M) - Class B
(Sweden)
Apparel Retail | | | 10,626 | | | | 461,481 | | |
Signet Jewelers, Ltd. (UK)
Specialty Stores | | | 1,358 | | | | 97,322 | | |
| | | | | | 558,803 | | |
| | | | | | 5,451,436 | | |
INDUSTRIALS - 15.6% | |
CAPITAL GOODS - 9.0% | |
CNH Industrial N.V. (Netherlands) (a)
Construction & Farm Machinery &
Heavy Trucks | | | 46,633 | | | | 598,065 | | |
Koninklijke Philips NV (Netherlands)
Industrial Conglomerates | | | 12,134 | | | | 391,193 | | |
Smiths Group PLC (UK)
Industrial Conglomerates | | | 17,025 | | | | 385,583 | | |
Atlas Copco AB, Series B (Sweden)
Industrial Machinery | | | 13,913 | | | | 367,586 | | |
SKF AB (Sweden)
Industrial Machinery | | | 10,644 | | | | 296,302 | | |
FANUC Corp. (Japan)
Industrial Machinery | | | 364 | | | | 60,011 | | |
Wolseley PLC (UK)
Trading Companies & Distributors | | | 1,049 | | | | 54,298 | | |
Geberit AG (Switzerland)
Building Products | | | 94 | | | | 25,437 | | |
| | | | | | 2,178,475 | | |
See accompanying Notes to Financial Statements.
32 THE OAKMARK FUNDS
Oakmark International Fund September 30, 2013
Schedule of Investments (in thousands) (continued)
| | | Shares | | Value | |
COMMON STOCKS - 95.4% (continued) | |
COMMERCIAL & PROFESSIONAL SERVICES - 4.4% | |
Adecco SA (Switzerland)
Human Resource & Employment Services | | | 6,634 | | | $ | 472,388 | | |
Experian Group, Ltd. (Ireland)
Research & Consulting Services | | | 22,119 | | | | 421,460 | | |
Secom Co., Ltd. (Japan)
Security & Alarm Services | | | 1,495 | | | | 93,398 | | |
Meitec Corp. (Japan) (b)
Research & Consulting Services | | | 2,805 | | | | 80,693 | | |
| | | | | | 1,067,939 | | |
TRANSPORTATION - 2.2% | |
Kuehne + Nagel International AG (Switzerland)
Marine | | | 4,154 | | | | 544,365 | | |
| | | | | | 3,790,779 | | |
CONSUMER STAPLES - 11.6% | |
FOOD, BEVERAGE & TOBACCO - 8.5% | |
Nestle SA (Switzerland)
Packaged Foods & Meats | | | 7,209 | | | | 504,223 | | |
Diageo PLC (UK)
Distillers & Vintners | | | 14,344 | | | | 456,303 | | |
Pernod Ricard SA (France)
Distillers & Vintners | | | 3,554 | | | | 441,317 | | |
Danone SA (France)
Packaged Foods & Meats | | | 5,801 | | | | 436,656 | | |
Heineken Holdings NV (Netherlands)
Brewers | | | 3,538 | | | | 223,768 | | |
| | | | | | 2,062,267 | | |
FOOD & STAPLES RETAILING - 3.1% | |
Tesco PLC (UK)
Food Retail | | | 83,284 | | | | 484,033 | | |
Koninklijke Ahold NV (Netherlands)
Food Retail | | | 15,297 | | | | 264,989 | | |
| | | | | | 749,022 | | |
| | | | | | 2,811,289 | | |
MATERIALS - 7.5% | |
Holcim, Ltd. (Switzerland)
Construction Materials | | | 8,749 | | | | 651,114 | | |
Orica, Ltd. (Australia) (b)
Commodity Chemicals | | | 30,592 | | | | 572,490 | | |
Akzo Nobel NV (Netherlands)
Diversified Chemicals | | | 7,245 | | | | 476,114 | | |
Givaudan SA (Switzerland)
Specialty Chemicals | | | 77 | | | | 113,059 | | |
| | | | | | 1,812,777 | | |
| | | Shares | | Value | |
INFORMATION TECHNOLOGY - 7.4% | |
TECHNOLOGY HARDWARE & EQUIPMENT - 3.5% | |
Canon, Inc. (Japan)
Office Electronics | | | 22,414 | | | $ | 713,714 | | |
OMRON Corp. (Japan) (b)
Electronic Components | | | 3,755 | | | | 135,431 | | |
| | | | | | 849,145 | | |
SOFTWARE & SERVICES - 3.2% | |
SAP AG (Germany)
Application Software | | | 6,572 | | | | 486,038 | | |
Check Point Software Technologies, Ltd.
(Israel) (a)
Systems Software | | | 5,445 | | | | 307,952 | | |
| | | | | | 793,990 | | |
SEMICONDUCTORS & SEMICONDUCTOR EQUIPMENT - 0.7% | |
ROHM Co., Ltd. (Japan) (b)
Semiconductors | | | 2,546 | | | | 104,396 | | |
Samsung Electronics Co., Ltd. (South Korea)
Semiconductors | | | 48 | | | | 60,675 | | |
| | | | | | 165,071 | | |
| | | | | | 1,808,206 | | |
HEALTH CARE - 4.4% | |
PHARMACEUTICALS, BIOTECHNOLOGY & LIFE SCIENCES - 2.5% | |
GlaxoSmithKline PLC (UK)
Pharmaceuticals | | | 14,244 | | | | 359,151 | | |
Novartis AG (Switzerland)
Pharmaceuticals | | | 2,251 | | | | 173,014 | | |
Sanofi (France)
Pharmaceuticals | | | 846 | | | | 85,774 | | |
| | | | | | 617,939 | | |
HEALTH CARE EQUIPMENT & SERVICES - 1.9% | |
Olympus Corp. (Japan) (a)
Health Care Equipment | | | 14,986 | | | | 454,783 | | |
| | | | | | 1,072,722 | | |
TOTAL COMMON STOCKS - 95.4%
(COST $19,061,734) | | | | | 23,146,523 | | |
See accompanying Notes to Financial Statements.
oakmark.com 33
Oakmark International Fund September 30, 2013
Schedule of Investments (in thousands) (continued)
| | | Par Value | | Value | |
SHORT TERM INVESTMENTS - 3.8% | |
REPURCHASE AGREEMENT - 3.0% | |
Fixed Income Clearing Corp. Repurchase
Agreement, 0.00% dated 09/30/13 due
10/01/13, repurchase price $733,729,
collateralized by Federal Home Loan
Mortgage Corp. Bonds, 1.250% - 2.500%,
due 07/30/19 - 11/15/19, aggregate
value plus accrued interest of $611,283,
by a Federal National Mortgage
Association Bond, 0.875%, due 05/21/18,
value plus accrued interest of $3,475,
by a United States Treasury Bond, 3.125%,
due 05/15/19, value plus accrued interest
of $133,647 (Cost: $733,729) | | | 733,729 | | | $ | 733,729 | | |
U.S. GOVERNMENT BILLS - 0.8% | |
United States Treasury Bill (Cost: $199,990) | | | 200,000 | | | | 199,995 | | |
TOTAL SHORT TERM INVESTMENTS - 3.8%
(COST $933,719) | | | | | 933,724 | | |
TOTAL INVESTMENTS - 99.2%
(COST $19,995,453) | | | | | 24,080,247 | | |
Foreign Currencies (Cost $831) - 0.0% (c) | | | | | 832 | | |
Other Assets In Excess of Liabilities - 0.8% | | | | | 191,753 | | |
TOTAL NET ASSETS - 100.0% | | | | $ | 24,272,832 | | |
(a) Non-income producing security
(b) See Note 5 in the Notes to the Financial Statements regarding investments in affiliated issuers.
(c) Amount rounds to less than 0.1%.
See accompanying Notes to Financial Statements.
34 THE OAKMARK FUNDS

This page intentionally left blank.
oakmark.com 35
Oakmark International Small Cap Fund September 30, 2013
Summary Information
VALUE OF A $10,000 INVESTMENT
Since 09/30/03 (Unaudited)
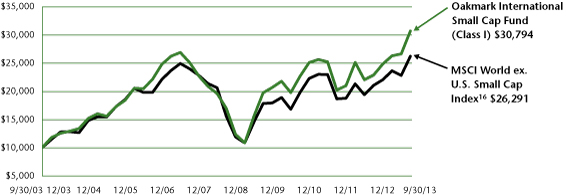
PERFORMANCE
| | | | | Average Annual Total Returns (as of 09/30/13)2 | |
(Unaudited) | | Total Return
Last 3 Months | | 1-year | | 3-year | | 5-year | | 10-year | | Since
Inception
(11/01/95) | |
Oakmark International Small Cap Fund (Class I) | | | 15.34 | % | | | 34.42 | % | | | 10.74 | % | | | 12.61 | % | | | 11.90 | % | | | 10.82 | % | |
MSCI World ex U.S. Small Cap Index | | | 14.97 | % | | | 24.75 | % | | | 9.92 | % | | | 11.06 | % | | | 10.15 | % | | | N/A | | |
MSCI World ex U.S. Index13 | | | 11.31 | % | | | 21.45 | % | | | 7.89 | % | | | 6.12 | % | | | 8.18 | % | | | 5.65 | % | |
Lipper International Small Cap Funds Index17 | | | 12.54 | % | | | 27.26 | % | | | 11.20 | % | | | 11.47 | % | | | 11.64 | % | | | N/A | | |
The graph and table do not reflect the deduction of taxes that a shareholder would pay on Fund distributions or the redemption of Fund shares.
Past performance is no guarantee of future results. Performance data quoted represents past performance. Current performance may be lower or higher than the performance data quoted. The investment return and principal value vary so that an investor's shares when redeemed may be worth more or less than the original cost. The performance of the Fund does not reflect the 2% redemption fee imposed on shares redeemed within 90 days of purchase. To obtain the most recent month-end performance data, visit oakmark.com.
TOP TEN EQUITY HOLDINGS5 | | % of Net Assets | |
Julius Baer Group, Ltd. | | | 4.1 | | |
Atea ASA | | | 2.8 | | |
Altran Technologies SA | | | 2.7 | | |
Goodman Fielder, Ltd. | | | 2.7 | | |
Alten, Ltd. | | | 2.6 | | |
Kaba Holding AG | | | 2.5 | | |
Premier Farnell PLC | | | 2.5 | | |
Rheinmetall AG | | | 2.5 | | |
Incitec Pivot, Ltd. | | | 2.4 | | |
BS Financial Group, Inc. | | | 2.3 | | |
FUND STATISTICS | |
Ticker | | OAKEX | |
Inception | | 11/01/95 | |
Number of Equity Holdings | | 60 | |
Net Assets | | $2.3 billion | |
Benchmark | | MSCI World ex U.S. Small Cap Index | |
Weighted Average Market Cap | | $2.9 billion | |
Median Market Cap | | $1.9 billion | |
Portfolio Turnover (for the 12-months ended 09/30/13) | | 50% | |
Expense Ratio - Class I (as of 09/30/12) | | 1.41% | |
Expense Ratio - Class I (as of 09/30/13) | | 1.35% | |
SECTOR ALLOCATION | | % of Net Assets | |
Industrials | | | 28.9 | | |
Information Technology | | | 18.4 | | |
Consumer Discretionary | | | 14.3 | | |
Financials | | | 12.3 | | |
Materials | | | 7.2 | | |
Consumer Staples | | | 6.9 | | |
Energy | | | 3.3 | | |
Health Care | | | 2.6 | | |
Short-Term Investments and Other | | | 6.1 | | |
GEOGRAPHIC ALLOCATION | |
| | | % of Equity | |
Europe | | | 60.9 | | |
UK | | | 15.1 | | |
Switzerland | | | 14.5 | | |
France* | | | 8.9 | | |
Italy* | | | 5.8 | | |
Germany* | | | 4.4 | | |
Netherlands* | | | 3.6 | | |
Norway | | | 3.0 | | |
Finland* | | | 2.0 | | |
Greece* | | | 1.7 | | |
Denmark | | | 1.7 | | |
Sweden | | | 0.2 | | |
| | | % of Equity | |
Asia | | | 23.2 | | |
Japan | | | 16.3 | | |
South Korea | | | 4.9 | | |
Hong Kong | | | 2.0 | | |
Australasia | | | 11.2 | | |
Australia | | | 10.0 | | |
New Zealand | | | 1.2 | | |
Middle East | | | 2.0 | | |
Isreal | | | 2.0 | | |
North America | | | 1.8 | | |
US | | | 1.5 | | |
Canada | | | 0.3 | | |
Latin America | | | 0.9 | | |
Brazil | | | 0.9 | | |
* Euro currency countries comprise 26.4% of equity investments
36 THE OAKMARK FUNDS
Oakmark International Small Cap Fund September 30, 2013
Portfolio Manager Commentary


David G. Herro, CFA
Portfolio Manager
oakex@oakmark.com
Michael L. Manelli, CFA
Portfolio Manager
oakex@oakmark.com
The Oakmark International Small Cap Fund returned 15.3% for the quarter ended September 30, 2013, in line with a 15.0% return from the MSCI World ex U.S. Small Cap Index16. For the fiscal year ended September 30, the Fund returned 34%, significantly outperforming the MSCI World ex U.S. Small Cap Index, which returned 25%.
The top-performing stock for the one-year period and a strong contributor for the recent quarter was LSL Property Services, one of the U.K.'s largest residential estate agency and property appraisal companies. There is increasing optimism in the U.K. over a potential recovery in the residential housing market, where transactions are off nearly 60% since the '06 peak. In early 2014, the U.K. government is expected to implement its "help to buy" program. Although other government programs have been implemented in the past to support the residential housing market, "help to buy" appears to be different because of its large scale and because it will benefit purchasers of existing homes, as opposed to previous programs that targeted new homes. Even though the program is not yet in effect, banks seem increasingly willing to make mortgage loans, as reflected in the double-digit year-over-year increase in mortgage approvals in May and June. We believe the U.K. residential market is in the early stages of recovery and that LSL will be one of the biggest beneficiaries of this trend.
The weakening yen and market rally in Japan benefitted Yamaha Motor, another top performer in the Fund for fiscal year 2013. Yamaha is a world leader in producing motorcycles and recreational vehicles, and it also produces motor vehicle engines for Toyota Motor Corp. and Ford Motor Co. The company's specialty products include motor boats, snowmobiles, golf carts and electric power generators. Yamaha sells its products globally, including in Japan, North America, Europe, Asia and South America. Yamaha's first-quarter financial statements showed that its best results came from its marine segment, driven by all product areas: outboard motors, personal watercraft, boats and parts. The company's core motorcycles unit produced the weakest performance. However, we believe positive trends are emerging, including a stabilizing Indonesian market, as evidenced by a growth in Yamaha's Asian motorcycle sales and improved sales volumes month over month.
Incitec Pivot was the largest detractor from performance for the fiscal year and also a detractor for the quarter. Incitec supplies mining explosives products and services in Australasia and North America, and it is also Australia's largest fertilizer distributor and only phosphate fertilizer manufacturer. Fertilizer prices fell significantly over the period, which caused investors to lower earnings estimates for the company. However, we believe this simply reflects a move towards a more normal pricing environment. Also, in July, Incitec experienced a production outage at its Phosphate Hill ammonia plant. Management indicated that the outage would reduce production of ammonium
phosphates during the second half of the year, estimating an earnings impact around $23.5 million (USD) after tax. This setback, combined with a production disruption at the new Moranbah explosives plant, caused investors to worry about near-term consequences for the company. Although these issues occurred in close succession, we believe that both were one-off events and that the company resolved them relatively quickly. Based on our research and discussions with management, we believe that outside of the difficulties at these two plants, the rest of Incitec's plants are operating well. The company is enacting a number of improvements that should help prevent such problems in the future, including changes of operations management and in the way that the engineering and operations groups interact. We remain confident in Incitec Pivot's management team, and we continue to believe that this investment will reward shareholders in the long term.
Four new securities were added to the Fund this quarter. From Brazil, Totvs, a developer and marketer of software solutions; Wajax, a Canadian multiline distributor active in the sale and service of mobile equipment, power systems and industrial components; Italy-based Davide Campari, the sixth largest spirits company in the world; and Sulzer, a Swiss company specializing in industrial machinery and equipment, surface technology and rotating equipment maintenance. We sold Britvic, Konica Minolta and Ichiyoshi Securities during the quarter.
Geographically we ended the quarter with 23% of our holdings in Asia, 61% in Europe and 11% in Australasia. The remaining positions are in North America, Latin America and the Middle East.
Because we continue to believe that some global currencies are over-valued, we maintained hedge positions on five currency exposures. At the recent quarter end, we had hedged 35% of the Fund's Australian dollar, 51% of the Norwegian krone, 25% of the Swiss franc, 7% of the Japanese yen and 30% of the Swedish krona exposures.
We believe the Fund is positioned to perform well in a variety of market climates. Thank you for investing alongside us.
oakmark.com 37
Oakmark International Small Cap Fund September 30, 2013
Schedule of Investments (in thousands)
| | | Shares | | Value | |
COMMON STOCKS - 93.9% | |
INDUSTRIALS - 28.9% | |
CAPITAL GOODS - 14.8% | |
Rheinmetall AG (Germany)
Industrial Conglomerates | | | 981 | | | $ | 56,369 | | |
Konecranes OYJ (Finland)
Industrial Machinery | | | 1,244 | | | | 41,875 | | |
Morgan Advanced Materials PLC (UK)
Industrial Machinery | | | 8,181 | | | | 41,215 | | |
Prysmian SpA (Italy)
Electrical Components & Equipment | | | 1,625 | | | | 39,791 | | |
Saft Groupe SA (France) (b)
Electrical Components & Equipment | | | 1,340 | | | | 36,977 | | |
Interpump Group SpA (Italy)
Industrial Machinery | | | 3,220 | | | | 35,005 | | |
Travis Perkins PLC (UK)
Trading Companies & Distributors | | | 1,203 | | | | 32,145 | | |
Bucher Industries AG (Switzerland)
Construction & Farm Machinery &
Heavy Trucks | | | 109 | | | | 27,906 | | |
NORMA Group SE (Germany)
Industrial Machinery | | | 181 | | | | 8,721 | | |
Sulzer AG (Switzerland)
Industrial Machinery | | | 54 | | | | 8,287 | | |
Wajax Corp. (Canada)
Trading Companies & Distributors | | | 151 | | | | 5,485 | | |
| | | | | | 333,776 | | |
COMMERCIAL & PROFESSIONAL SERVICES - 8.7% | |
Kaba Holding AG (Switzerland)
Security & Alarm Services | | | 130 | | | | 57,500 | | |
Michael Page International PLC (UK)
Human Resource & Employment Services | | | 5,722 | | | | 45,603 | | |
gategroup Holding AG (Switzerland) (a) (b)
Diversified Support Services | | | 1,640 | | | | 41,984 | | |
Randstad Holding N.V. (Netherlands)
Human Resource & Employment Services | | | 566 | | | | 31,883 | | |
SThree PLC (UK)
Human Resource & Employment Services | | | 2,841 | | | | 16,351 | | |
Cision AB (Sweden)
Research & Consulting Services | | | 628 | | | | 3,663 | | |
| | | | | | 196,984 | | |
TRANSPORTATION - 5.4% | |
DSV AS (Denmark)
Trucking | | | 1,294 | | | | 36,706 | | |
Panalpina Welttransport Holding AG
(Switzerland)
Air Freight & Logistics | | | 225 | | | | 33,177 | | |
BBA Aviation PLC (UK)
Airport Services | | | 5,374 | | | | 26,533 | | |
Freightways, Ltd. (New Zealand)
Air Freight & Logistics | | | 7,133 | | | | 25,001 | | |
| | | | | | 121,417 | | |
| | | | | | 652,177 | | |
| | | Shares | | Value | |
INFORMATION TECHNOLOGY - 18.4% | |
SOFTWARE & SERVICES - 12.2% | |
Atea ASA (Norway) (b)
IT Consulting & Other Services | | | 6,039 | | | $ | 63,525 | | |
Altran Technologies SA (France) (a)
IT Consulting & Other Services | | | 7,533 | | | | 61,964 | | |
Alten, Ltd. (France)
IT Consulting & Other Services | | | 1,384 | | | | 59,252 | | |
Capcom Co., Ltd. (Japan)
Home Entertainment Software | | | 2,543 | | | | 48,839 | | |
Square Enix Holdings Co., Ltd. (Japan)
Home Entertainment Software | | | 1,492 | | | | 23,603 | | |
Totvs SA (Brazil)
Systems Software | | | 1,105 | | | | 18,688 | | |
| | | | | | 275,871 | | |
TECHNOLOGY HARDWARE & EQUIPMENT - 6.2% | |
Premier Farnell PLC (UK)
Technology Distributors | | | 16,156 | | | | 56,810 | | |
Orbotech, Ltd. (Israel) (a) (b)
Electronic Equipment & Instruments | | | 3,501 | | | | 41,972 | | |
Hirose Electric Co., Ltd. (Japan)
Electronic Components | | | 269 | | | | 41,184 | | |
| | | | | | 139,966 | | |
| | | | | | 415,837 | | |
CONSUMER DISCRETIONARY - 14.3% | |
AUTOMOBILES & COMPONENTS - 6.0% | |
Nifco, Inc. (Japan)
Auto Parts & Equipment | | | 1,899 | | | | 50,705 | | |
Yamaha Motor Co., Ltd. (Japan)
Motorcycle Manufacturers | | | 2,868 | | | | 41,837 | | |
Autoliv, Inc. (United States)
Auto Parts & Equipment | | | 364 | | | | 31,801 | | |
Takata Corp. (Japan)
Auto Parts & Equipment | | | 447 | | | | 11,220 | | |
| | | | | | 135,563 | | |
RETAILING - 5.5% | |
Myer Holdings, Ltd. (Australia)
Department Stores | | | 20,527 | | | | 49,980 | | |
Hengdeli Holdings, Ltd. (Hong Kong)
Specialty Stores | | | 174,132 | | | | 41,760 | | |
Carpetright PLC (UK) (a)
Home Improvement Retail | | | 3,168 | | | | 33,262 | | |
| | | | | | 125,002 | | |
MEDIA - 1.7% | |
Asatsu-DK, Inc. (Japan)
Advertising | | | 1,405 | | | | 38,022 | | |
CONSUMER DURABLES & APPAREL—1.1% | |
Vitec Group PLC (UK) (b)
Photographic Products | | | 2,213 | | | | 24,417 | | |
| | | | | | 323,004 | | |
See accompanying Notes to Financial Statements.
38 THE OAKMARK FUNDS
Oakmark International Small Cap Fund September 30, 2013
Schedule of Investments (in thousands) (continued)
| | | Shares | | Value | |
COMMON STOCKS - 93.9% (continued) | |
FINANCIALS - 12.3% | |
DIVERSIFIED FINANCIALS - 5.7% | |
Julius Baer Group, Ltd. (Switzerland)
Asset Management & Custody Banks | | | 2,004 | | | $ | 93,508 | | |
MLP AG (Germany)
Asset Management & Custody Banks | | | 4,568 | | | | 29,235 | | |
Azimut Holding SPA (Italy)
Asset Management & Custody Banks | | | 262 | | | | 5,989 | | |
| | | | | | 128,732 | | |
BANKS - 4.6% | |
BS Financial Group, Inc. (South Korea)
Regional Banks | | | 3,532 | | | | 52,748 | | |
DGB Financial Group, Inc. (South Korea)
Regional Banks | | | 3,392 | | | | 51,135 | | |
| | | | | | 103,883 | | |
REAL ESTATE - 2.0% | |
LSL Property Services PLC (UK) (b)
Real Estate Services | | | 5,974 | | | | 44,805 | | |
| | | | | | 277,420 | | |
MATERIALS - 7.2% | |
Incitec Pivot, Ltd. (Australia)
Diversified Chemicals | | | 22,019 | | | | 55,257 | | |
Kansai Paint Co., Ltd. (Japan)
Specialty Chemicals | | | 2,780 | | | | 36,829 | | |
Titan Cement Co. SA (Greece) (a)
Construction Materials | | | 1,460 | | | | 36,353 | | |
Sika AG (Switzerland)
Specialty Chemicals | | | 9 | | | | 26,962 | | |
Taiyo Holdings Co., Ltd. (Japan)
Specialty Chemicals | | | 129 | | | | 4,009 | | |
Nihon Parkerizing Co., Ltd. (Japan)
Specialty Chemicals | | | 179 | | | | 3,646 | | |
| | | | | | 163,056 | | |
CONSUMER STAPLES - 6.9% | |
FOOD, BEVERAGE & TOBACCO - 4.9% | |
Goodman Fielder, Ltd. (Australia)
Packaged Foods & Meats | | | 91,323 | | | | 60,489 | | |
Treasury Wine Estates, Ltd. (Australia)
Distillers & Vintners | | | 9,637 | | | | 39,737 | | |
Davide Campari-Milano SPA (Italy)
Distillers & Vintners | | | 1,098 | | | | 9,521 | | |
| | | | | | 109,747 | | |
FOOD & STAPLES RETAILING - 2.0% | |
Sugi Holdings Co., Ltd. (Japan)
Drug Retail | | | 1,069 | | | | 45,777 | | |
| | | | | | 155,524 | | |
| | | Shares | | Value | |
ENERGY - 3.3% | |
Fugro NV (Netherlands)
Oil & Gas Equipment & Services | | | 732 | | | $ | 44,657 | | |
CGG (France) (a)
Oil & Gas Equipment & Services | | | 1,307 | | | | 30,126 | | |
| | | | | | 74,783 | | |
HEALTH CARE - 2.6% | |
HEALTH CARE EQUIPMENT & SERVICES - 1.8% | |
Amplifon S.p.A. (Italy)
Health Care Distributors | | | 5,790 | | | | 31,632 | | |
Primary Health Care, Ltd. (Australia)
Health Care Services | | | 1,763 | | | | 7,925 | | |
| | | | | | 39,557 | | |
PHARMACEUTICALS, BIOTECHNOLOGY & LIFE SCIENCES - 0.8% | |
Tecan Group AG (Switzerland)
Life Sciences Tools & Services | | | 173 | | | | 18,279 | | |
| | | | | | 57,836 | | |
TOTAL COMMON STOCKS - 93.9%
(COST $1,748,485) | | | | | 2,119,637 | | |
| | | Par Value | | Value | |
SHORT TERM INVESTMENTS - 5.4% | |
REPURCHASE AGREEMENT - 5.4% | |
Fixed Income Clearing Corp. Repurchase
Agreement, 0.00% dated 09/30/13 due
10/01/13, repurchase price $121,791,
collateralized by a Federal National
Mortgage Association Bond, 2.220%,
due 12/27/22, value plus accrued
interest of $124,229 (Cost: $121,791) | | | 121,791 | | | | 121,791 | | |
TOTAL SHORT TERM INVESTMENTS - 5.4%
(COST $121,791) | | | | | 121,791 | | |
TOTAL INVESTMENTS - 99.3%
(COST $1,870,276) | | | | | 2,241,428 | | |
Foreign Currencies (Cost $0) - 0.0% (c) | | | | | 0 | (d) | |
Other Assets In Excess of Liabilities - 0.7% | | | | | 16,154 | | |
TOTAL NET ASSETS - 100.0% | | | | $ | 2,257,582 | | |
(a) Non-income producing security
(b) See Note 5 in the Notes to the Financial Statements regarding investments in affiliated issuers.
(c) Amount rounds to less than 0.1%.
(d) Amount rounds to less than $1,000.
See accompanying Notes to Financial Statements.
oakmark.com 39
The Oakmark Funds
Statements of Assets and Liabilities—September 30, 2013
(in thousands except per share amounts)
| | | Oakmark
Fund | | Oakmark
Select
Fund | | Oakmark
Equity and
Income Fund | | Oakmark
Global
Fund | |
Assets | |
Investments in unaffiliated securities, at value (a) | | $ | 10,507,476 | | | $ | 3,935,896 | | | $ | 19,148,173 | | | $ | 2,948,681 | | |
Investments in affiliated securities, at value (b) | | | 0 | | | | 0 | | | | 261,705 | | | | 0 | | |
Foreign currency, at value (c) | | | 0 | | | | 0 | | | | 0 | (d) | | | 0 | (d) | |
Receivable for: | |
Securities sold | | | 29,601 | | | | 17,786 | | | | 11,428 | | | | 16,290 | | |
Fund shares sold | | | 36,401 | | | | 8,251 | | | | 23,802 | | | | 5,122 | | |
Dividends and interest from unaffiliated securities (Net of foreign tax withheld) | | | 7,527 | | | | 1,815 | | | | 40,283 | | | | 2,892 | | |
Dividends and interest from affiliated securities (Net of foreign tax withheld) | | | 0 | | | | 0 | | | | 0 | | | | 0 | | |
Forward foreign currency contracts | | | 0 | | | | 0 | | | | 0 | | | | 279 | | |
Tax reclaim from unaffiliated securities | | | 0 | | | | 0 | | | | 3,207 | | | | 783 | | |
Total receivables | | | 73,529 | | | | 27,852 | | | | 78,720 | | | | 25,366 | | |
Other assets | | | 1 | | | | 1 | | | | 2 | | | | 1 | | |
Total assets | | | 10,581,006 | | | | 3,963,749 | | | | 19,488,600 | | | | 2,974,048 | | |
Liabilities and Net Assets | |
Payable for: | |
Securities purchased | | | 66,778 | | | | 0 | | | | 11,951 | | | | 48,304 | | |
Fund shares redeemed | | | 7,251 | | | | 1,980 | | | | 36,021 | | | | 4,974 | | |
Forward foreign currency contracts | | | 0 | | | | 0 | | | | 0 | | | | 0 | | |
Investment advisory fee | | | 667 | | | | 287 | | | | 1,075 | | | | 220 | | |
Other shareholder servicing fees | | | 1,066 | | | | 314 | | | | 2,863 | | | | 276 | | |
Transfer and dividend disbursing agent fees | | | 373 | | | | 170 | | | | 312 | | | | 169 | | |
Trustee fees | | | 2 | | | | 2 | | | | 3 | | | | 2 | | |
Deferred trustee compensation | | | 1,192 | | | | 1,050 | | | | 1,026 | | | | 497 | | |
Other | | | 852 | | | | 324 | | | | 1,412 | | | | 293 | | |
Total liabilities | | | 78,181 | | | | 4,127 | | | | 54,663 | | | | 54,735 | | |
Net assets applicable to Fund shares outstanding | | $ | 10,502,825 | | | $ | 3,959,622 | | | $ | 19,433,937 | | | $ | 2,919,313 | | |
Analysis of Net Assets | |
Paid in capital | | $ | 6,712,629 | | | $ | 2,268,609 | | | $ | 12,883,006 | | | $ | 2,193,313 | | |
Accumulated undistributed net realized gain (loss) on investments, forward
contracts, short sales and foreign currency transactions | | | 525,845 | | | | 245,352 | | | | 1,580,225 | | | | 6,064 | | |
Net unrealized appreciation on investments, forward contracts,
and foreign currency translation | | | 3,219,806 | | | | 1,444,716 | | | | 4,884,262 | | | | 669,859 | | |
Accumulated undistributed net investment income
(Distributions in excess of net investment income) | | | 44,545 | | | | 945 | | | | 86,444 | | | | 50,077 | | |
Net assets applicable to Fund shares outstanding | | $ | 10,502,825 | | | $ | 3,959,622 | | | $ | 19,433,937 | | | $ | 2,919,313 | | |
Price of Shares | |
Net asset value, offering and redemption price per share: Class I | | $ | 59.73 | | | $ | 37.74 | | | $ | 33.06 | | | $ | 29.70 | | |
Class I—Net assets | | $ | 10,409,043 | | | $ | 3,944,616 | | | $ | 18,222,514 | | | $ | 2,880,414 | | |
Class I—Shares outstanding (Unlimited shares authorized) | | | 174,280 | | | | 104,522 | | | | 551,172 | | | | 96,978 | | |
Net asset value, offering and redemption price per share: Class II | | $ | 59.58 | | | $ | 37.50 | (e) | | $ | 32.83 | | | $ | 28.98 | (e) | |
Class II—Net assets | | $ | 93,782 | | | $ | 15,006 | | | $ | 1,211,423 | | | $ | 38,899 | | |
Class II—Shares outstanding (Unlimited shares authorized) | | | 1,574 | | | | 400 | | | | 36,902 | | | | 1,342 | | |
| (a) Identified cost of investments in unaffiliated securities | | $ | 7,287,672 | | | $ | 2,491,182 | | | $ | 14,320,852 | | | $ | 2,279,174 | | |
| (b) Identified cost of investments in affiliated securities | | | 0 | | | | 0 | | | | 204,772 | | | | 0 | | |
| (c) Identified cost of foreign currency | | | 0 | | | | 0 | | | | 0 | (d) | | | 0 | (d) | |
| (d) Amount rounds to less than $1,000. | | | | | | | | | | | | | | | | | |
| (e) Net assets have been rounded for presentation purposes. The net asset value per share is as reported on September 30, 2013. | | | | | | | | | | | | | | | | | |
See accompanying Notes to Financial Statements.
40 THE OAKMARK FUNDS
| | | Oakmark
Global Select
Fund | | Oakmark
International
Fund | | Oakmark
International
Small Cap Fund | |
Assets | |
Investments in unaffiliated securities, at value (a) | | $ | 1,163,494 | | | $ | 22,885,236 | | | $ | 1,987,748 | | |
Investments in affiliated securities, at value (b) | | | 0 | | | | 1,195,011 | | | | 253,680 | | |
Foreign currency, at value (c) | | | 0 | (d) | | | 832 | | | | 0 | (d) | |
Receivable for: | |
Securities sold | | | 3 | | | | 101,386 | | | | 3,475 | | |
Fund shares sold | | | 4,640 | | | | 210,529 | | | | 4,159 | | |
Dividends and interest from unaffiliated securities (Net of foreign tax withheld) | | | 1,340 | | | | 36,763 | | | | 8,414 | | |
Dividends and interest from affiliated securities (Net of foreign tax withheld) | | | 0 | | | | 4,336 | | | | 319 | | |
Forward foreign currency contracts | | | 0 | | | | 11,194 | | | | 7,389 | | |
Tax reclaim from unaffiliated securities | | | 501 | | | | 10,477 | | | | 785 | | |
Total receivables | | | 6,484 | | | | 374,685 | | | | 24,541 | | |
Other assets | | | 1 | | | | 1 | | | | 1 | | |
Total assets | | | 1,169,979 | | | | 24,455,765 | | | | 2,265,970 | | |
Liabilities and Net Assets | |
Payable for: | |
Securities purchased | | | 8,044 | | | | 159,377 | | | | 5,661 | | |
Fund shares redeemed | | | 583 | | | | 14,973 | | | | 1,339 | | |
Forward foreign currency contracts | | | 1,149 | | | | 0 | | | | 0 | | |
Investment advisory fee | | | 86 | | | | 1,467 | | | | 193 | | |
Other shareholder servicing fees | | | 85 | | | | 2,596 | | | | 281 | | |
Transfer and dividend disbursing agent fees | | | 81 | | | | 477 | | | | 113 | | |
Trustee fees | | | 1 | | | | 3 | | | | 1 | | |
Deferred trustee compensation | | | 16 | | | | 828 | | | | 476 | | |
Other | | | 171 | | | | 3,212 | | | | 324 | | |
Total liabilities | | | 10,216 | | | | 182,933 | | | | 8,388 | | |
Net assets applicable to Fund shares outstanding | | $ | 1,159,763 | | | $ | 24,272,832 | | | $ | 2,257,582 | | |
Analysis of Net Assets | |
Paid in capital | | $ | 923,013 | | | $ | 19,819,353 | | | $ | 1,859,494 | | |
Accumulated undistributed net realized gain (loss) on investments, forward
contracts, short sales and foreign currency transactions | | | 20,419 | | | | 3,466 | | | | (33,682 | ) | |
Net unrealized appreciation on investments, forward contracts,
and foreign currency translation | | | 205,841 | | | | 4,097,297 | | | | 378,584 | | |
Accumulated undistributed net investment income
(Distributions in excess of net investment income) | | | 10,490 | | | | 352,716 | | | | 53,186 | | |
Net assets applicable to Fund shares outstanding | | $ | 1,159,763 | | | $ | 24,272,832 | | | $ | 2,257,582 | | |
Price of Shares | |
Net asset value, offering and redemption price per share: Class I | | $ | 15.71 | | | $ | 25.89 | | | $ | 17.29 | | |
Class I—Net assets | | $ | 1,159,763 | | | $ | 23,885,956 | | | $ | 2,254,113 | | |
Class I—Shares outstanding (Unlimited shares authorized) | | | 73,807 | | | | 922,633 | | | | 130,355 | | |
Net asset value, offering and redemption price per share: Class II | | $ | 0 | | | $ | 25.98 | | | $ | 17.17 | | |
Class II—Net assets | | $ | 0 | | | $ | 386,876 | | | $ | 3,469 | | |
Class II—Shares outstanding (Unlimited shares authorized) | | | 0 | | | | 14,894 | | | | 202 | | |
| (a) Identified cost of investments in unaffiliated securities | | $ | 956,557 | | | $ | 18,737,110 | | | $ | 1,653,797 | | |
| (b) Identified cost of investments in affiliated securities | | | 0 | | | | 1,258,343 | | | | 216,479 | | |
| (c) Identified cost of foreign currency | | | 0 | (d) | | | 831 | | | | 0 | (d) | |
| (d) Amount rounds to less than $1,000. | | | | | | | | | | | | | |
| (e) Net assets have been rounded for presentation purposes. The net asset value per share is as reported on September 30, 2013. | | | | | | | | | | | | | |
oakmark.com 41
The Oakmark Funds
Statements of Operations—For the Year Ended September 30, 2013
(in thousands)
| | | Oakmark
Fund | | Oakmark
Select
Fund | | Oakmark
Equity and
Income Fund | | Oakmark
Global
Fund | |
Investment Income: | |
Dividends from unaffiliated securities | | $ | 150,671 | | | $ | 40,362 | | | $ | 225,350 | | | $ | 46,663 | | |
Dividends from affiliated securities | | | 0 | | | | 0 | | | | 13,366 | | | | 0 | | |
Interest income from unaffiliated securities | | | 227 | | | | 94 | | | | 80,016 | | | | 318 | | |
Interest income from affiliated securities | | | 0 | | | | 0 | | | | 676 | | | | 0 | | |
Security lending income | | | 0 | | | | 229 | | | | 1,756 | | | | 638 | | |
Foreign taxes withheld | | | (565 | ) | | | (591 | ) | | | (6,184 | ) | | | (2,315 | ) | |
Total investment income | | | 150,333 | | | | 40,094 | | | | 314,980 | | | | 45,304 | | |
Expenses: | |
Investment advisory fee | | | 70,263 | | | | 31,651 | | | | 126,059 | | | | 23,346 | | |
Transfer and dividend disbursing agent fees | | | 1,316 | | | | 602 | | | | 1,160 | | | | 608 | | |
Other shareholder servicing fees | | | 8,297 | | | | 2,563 | | | | 16,377 | | | | 1,953 | | |
Service fee—Class II | | | 145 | | | | 34 | | | | 3,243 | | | | 87 | | |
Reports to shareholders | | | 653 | | | | 293 | | | | 886 | | | | 172 | | |
Custody and accounting fees | | | 505 | | | | 228 | | | | 1,259 | | | | 502 | | |
Trustees fees | | | 566 | | | | 431 | | | | 676 | | | | 273 | | |
Legal fees | | | 89 | | | | 61 | | | | 163 | | | | 54 | | |
Audit fees | | | 50 | | | | 26 | | | | 66 | | | | 50 | | |
Other | | | 860 | | | | 362 | | | | 466 | | | | 301 | | |
Total expenses | | | 82,744 | | | | 36,251 | | | | 150,355 | | | | 27,346 | | |
Net Investment Income | | $ | 67,589 | | | $ | 3,843 | | | $ | 164,625 | | | $ | 17,958 | | |
Net realized and unrealized gain (loss): | |
Net realized gain (loss) on: | |
Unaffiliated investments | | $ | 551,385 | | | $ | 275,793 | | | $ | 1,381,246 | | | $ | 141,867 | | |
Affiliated investments | | | 0 | | | | 0 | | | | 291,375 | | | | 0 | | |
Unaffiliated in-kind transactions | | | 0 | | | | 0 | | | | 14,517 | | | | 38,483 | | |
Affiliated in-kind transactions | | | 0 | | | | 0 | | | | 1,941 | | | | 0 | | |
Securities sold short | | | 219 | | | | 0 | | | | 0 | | | | 0 | | |
Forward foreign currency contracts | | | 0 | | | | 0 | | | | 0 | | | | 53,014 | | |
Foreign currency transactions | | | 10 | | | | 10 | | | | (375 | ) | | | (997 | ) | |
Net realized gain | | | 551,614 | | | | 275,803 | | | | 1,688,704 | | | | 232,367 | | |
Net change in unrealized appreciation (depreciation) on: | |
Unaffiliated investments | | | 1,432,253 | | | | 601,830 | | | | 1,218,320 | | | | 538,495 | | |
Affiliated investments | | | 0 | | | | 0 | | | | (1,900 | ) | | | 0 | | |
Forward foreign currency contracts | | | 0 | | | | 0 | | | | 0 | | | | (2,837 | ) | |
Foreign currency translation | | | 8 | | | | 8 | | | | (16 | ) | | | 85 | | |
Net change in unrealized appreciation (depreciation) | | | 1,432,261 | | | | 601,838 | | | | 1,216,404 | | | | 535,743 | | |
Net realized and unrealized gain | | | 1,983,875 | | | | 877,641 | | | | 2,905,108 | | | | 768,110 | | |
Net increase in net assets resulting from operations | | $ | 2,051,464 | | | $ | 881,484 | | | $ | 3,069,733 | | | $ | 786,068 | | |
See accompanying Notes to Financial Statements.
42 THE OAKMARK FUNDS
| | | Oakmark
Global Select
Fund | | Oakmark
International
Fund | | Oakmark
International
Small Cap Fund | |
Investment Income: | |
Dividends from unaffiliated securities | | $ | 18,397 | | | $ | 376,608 | | | $ | 41,177 | | |
Dividends from affiliated securities | | | 0 | | | | 30,727 | | | | 8,180 | | |
Interest income from unaffiliated securities | | | 15 | | | | 1,749 | | | | 25 | | |
Interest income from affiliated securities | | | 0 | | | | 0 | | | | 0 | | |
Security lending income | | | 394 | | | | 10,607 | | | | 1,085 | | |
Foreign taxes withheld | | | (1,354 | ) | | | (33,540 | ) | | | (3,884 | ) | |
Total investment income | | | 17,452 | | | | 386,151 | | | | 46,583 | | |
Expenses: | |
Investment advisory fee | | | 7,754 | | | | 122,041 | | | | 19,978 | | |
Transfer and dividend disbursing agent fees | | | 240 | | | | 1,606 | | | | 374 | | |
Other shareholder servicing fees | | | 553 | | | | 15,944 | | | | 2,411 | | |
Service fee—Class II | | | 0 | | | | 771 | | | | 7 | | |
Reports to shareholders | | | 62 | | | | 1,220 | | | | 217 | | |
Custody and accounting fees | | | 172 | | | | 4,656 | | | | 707 | | |
Trustees fees | | | 126 | | | | 527 | | | | 258 | | |
Legal fees | | | 45 | | | | 117 | | | | 51 | | |
Audit fees | | | 27 | | | | 118 | | | | 59 | | |
Other | | | 292 | | | | 2,207 | | | | 312 | | |
Total expenses | | | 9,271 | | | | 149,207 | | | | 24,374 | | |
Net Investment Income | | $ | 8,181 | | | $ | 236,944 | | | $ | 22,209 | | |
Net realized and unrealized gain (loss): | |
Net realized gain (loss) on: | |
Unaffiliated investments | | $ | 41,629 | | | $ | 765,259 | | | $ | 100,351 | | |
Affiliated investments | | | 0 | | | | (26,074 | ) | | | (18,120 | ) | |
Unaffiliated in-kind transactions | | | 0 | | | | 11,023 | | | | 0 | | |
Affiliated in-kind transactions | | | 0 | | | | 453 | | | | 0 | | |
Securities sold short | | | 0 | | | | 0 | | | | 0 | | |
Forward foreign currency contracts | | | 7,365 | | | | 158,774 | | | | 22,826 | | |
Foreign currency transactions | | | (271 | ) | | | (4,367 | ) | | | (888 | ) | |
Net realized gain | | | 48,723 | | | | 905,068 | | | | 104,169 | | |
Net change in unrealized appreciation (depreciation) on: | |
Unaffiliated investments | | | 185,726 | | | | 3,713,844 | | | | 359,233 | | |
Affiliated investments | | | 0 | | | | (42,672 | ) | | | 46,422 | | |
Forward foreign currency contracts | | | (2,240 | ) | | | (4,590 | ) | | | 8,397 | | |
Foreign currency translation | | | 46 | | | | 1,549 | | | | 90 | | |
Net change in unrealized appreciation (depreciation) | | | 183,532 | | | | 3,668,131 | | | | 414,142 | | |
Net realized and unrealized gain | | | 232,255 | | | | 4,573,199 | | | | 518,311 | | |
Net increase in net assets resulting from operations | | $ | 240,436 | | | $ | 4,810,143 | | | $ | 540,520 | | |
oakmark.com 43
The Oakmark Funds
Statements of Changes in Net Assets
(in thousands)
| | | Oakmark Fund | |
| | | Year Ended
September 30, 2013 | | Year Ended
September 30, 2012 | |
From Operations: | |
Net investment income | | $ | 67,589 | | | $ | 46,110 | | |
Net realized gain (loss) | | | 551,614 | | | | 258,699 | | |
Net change in unrealized appreciation (depreciation) | | | 1,432,261 | | | | 1,129,564 | | |
Net increase in net assets from operations | | | 2,051,464 | | | | 1,434,373 | | |
Distributions to shareholders from: | |
Net investment income—Class I | | | (54,716 | ) | | | (41,986 | ) | |
Net investment income—Class II | | | (236 | ) | | | (145 | ) | |
Net realized gain—Class I | | | (218,081 | ) | | | 0 | | |
Net realized gain—Class II | | | (1,251 | ) | | | 0 | | |
Total distributions to shareholders | | | (274,284 | ) | | | (42,131 | ) | |
From Fund share transactions: | |
Proceeds from shares sold—Class I | | | 3,641,054 | | | | 1,845,468 | | |
Proceeds from shares sold—Class II | | | 59,463 | | | | 15,122 | | |
Reinvestment of distributions—Class I | | | 253,015 | | | | 39,449 | | |
Reinvestment of distributions—Class II | | | 1,033 | | | | 104 | | |
Payment for shares redeemed—Class I | | | (1,988,190 | ) | | | (1,043,430 | ) | |
Payment for shares redeemed—Class II | | | (15,531 | ) | | | (11,377 | ) | |
Redemption fees—Class I | | | 0 | | | | 0 | (a) | |
Redemption fees—Class II | | | 0 | | | | 0 | (a) | |
Net increase in net assets from Fund share transactions | | | 1,950,844 | | | | 845,336 | | |
Total increase in net assets | | | 3,728,024 | | | | 2,237,578 | | |
Net assets: | |
Beginning of year | | | 6,774,801 | | | | 4,537,223 | | |
End of year | | $ | 10,502,825 | | | $ | 6,774,801 | | |
Accumulated undistributed net investment income | | $ | 44,545 | | | $ | 31,898 | | |
Fund Share Transactions—Class I: | |
Shares sold | | | 67,775 | | | | 40,652 | | |
Shares issued in reinvestment of dividends | | | 5,282 | | | | 976 | | |
Less shares redeemed | | | (36,378 | ) | | | (23,197 | ) | |
Net increase in shares outstanding | | | 36,679 | | | | 18,431 | | |
Fund Share Transactions—Class II: | |
Shares sold | | | 1,104 | | | | 331 | | |
Shares issued in reinvestment of dividends | | | 21 | | | | 2 | | |
Less shares redeemed | | | (290 | ) | | | (247 | ) | |
Net increase in shares outstanding | | | 835 | | | | 86 | | |
(a) Amount rounds to less than $1,000.
See accompanying Notes to Financial Statements.
44 THE OAKMARK FUNDS
The Oakmark Funds
Statements of Changes in Net Assets (continued)
(in thousands)
| | | Oakmark Select Fund | |
| | | Year Ended
September 30, 2013 | | Year Ended
September 30, 2012 | |
From Operations: | |
Net investment income | | $ | 3,843 | | | $ | 3,148 | | |
Net realized gain (loss) | | | 275,803 | | | | 297,254 | | |
Net change in unrealized appreciation (depreciation) | | | 601,838 | | | | 311,721 | | |
Net increase in net assets from operations | | | 881,484 | | | | 612,123 | | |
Distributions to shareholders from: | |
Net investment income—Class I | | | (2,753 | ) | | | (5,125 | ) | |
Net realized gain—Class I | | | (288,202 | ) | | | 0 | | |
Net realized gain—Class II | | | (1,091 | ) | | | 0 | | |
Total distributions to shareholders | | | (292,046 | ) | | | (5,125 | ) | |
From Fund share transactions: | |
Proceeds from shares sold—Class I | | | 877,926 | | | | 628,631 | | |
Proceeds from shares sold—Class II | | | 9,007 | | | | 5,140 | | |
Reinvestment of distributions—Class I | | | 254,534 | | | | 4,978 | | |
Reinvestment of distributions—Class II | | | 622 | | | | 0 | | |
Payment for shares redeemed—Class I | | | (804,315 | ) | | | (475,544 | ) | |
Payment for shares redeemed—Class II | | | (8,914 | ) | | | (3,607 | ) | |
Redemption fees—Class I | | | 0 | | | | 0 | (a) | |
Net increase in net assets from Fund share transactions | | | 328,860 | | | | 159,598 | | |
Total increase in net assets | | | 918,298 | | | | 766,596 | | |
Net assets: | |
Beginning of year | | | 3,041,324 | | | | 2,274,728 | | |
End of year | | $ | 3,959,622 | | | $ | 3,041,324 | | |
Accumulated undistributed net investment income (loss) | | $ | 945 | | | $ | (155 | ) | |
Fund Share Transactions—Class I: | |
Shares sold | | | 26,233 | | | | 20,400 | | |
Shares issued in reinvestment of dividends | | | 8,384 | | | | 184 | | |
Less shares redeemed | | | (23,787 | ) | | | (15,787 | ) | |
Net increase in shares outstanding | | | 10,830 | | | | 4,797 | | |
Fund Share Transactions—Class II: | |
Shares sold | | | 271 | | | | 171 | | |
Shares issued in reinvestment of dividends | | | 21 | | | | 0 | | |
Less shares redeemed | | | (260 | ) | | | (117 | ) | |
Net increase in shares outstanding | | | 32 | | | | 54 | | |
(a) Amount rounds to less than $1,000.
See accompanying Notes to Financial Statements.
oakmark.com 45
The Oakmark Funds
Statements of Changes in Net Assets (continued)
(in thousands)
| | | Oakmark Equity and Income Fund | |
| | | Year Ended
September 30, 2013 | | Year Ended
September 30, 2012 | |
From Operations: | |
Net investment income | | $ | 164,625 | | | $ | 156,763 | | |
Net realized gain (loss) | | | 1,688,704 | | | | 619,845 | | |
Net change in unrealized appreciation (depreciation) | | | 1,216,404 | | | | 2,197,131 | | |
Net increase in net assets from operations | | | 3,069,733 | | | | 2,973,739 | | |
Distributions to shareholders from: | |
Net investment income—Class I | | | (164,075 | ) | | | (237,261 | ) | |
Net investment income—Class II | | | (7,829 | ) | | | (13,396 | ) | |
Net realized gain—Class I | | | (430,958 | ) | | | (297,451 | ) | |
Net realized gain—Class II | | | (31,084 | ) | | | (22,216 | ) | |
Total distributions to shareholders | | | (633,946 | ) | | | (570,324 | ) | |
From Fund share transactions: | |
Proceeds from shares sold—Class I | | | 2,256,227 | | | | 2,382,888 | | |
Proceeds from shares sold—Class II | | | 210,649 | | | | 283,394 | | |
Reinvestment of distributions—Class I | | | 562,268 | | | | 505,765 | | |
Reinvestment of distributions—Class II | | | 34,450 | | | | 31,536 | | |
Payment for shares redeemed—Class I | | | (4,763,063 | ) | | | (3,680,330 | ) | |
Payment for shares redeemed—Class II | | | (479,308 | ) | | | (402,966 | ) | |
Net decrease in net assets from Fund share transactions | | | (2,178,777 | ) | | | (879,713 | ) | |
Total increase in net assets | | | 257,010 | | | | 1,523,702 | | |
Net assets: | |
Beginning of year | | | 19,176,927 | | | | 17,653,225 | | |
End of year | | $ | 19,433,937 | | | $ | 19,176,927 | | |
Accumulated undistributed net investment income | | $ | 86,444 | | | $ | 108,614 | | |
Fund Share Transactions—Class I: | |
Shares sold | | | 74,037 | | | | 85,194 | | |
Shares issued in reinvestment of dividends | | | 19,805 | | | | 19,187 | | |
Less shares redeemed | | | (157,552 | ) | | | (131,117 | ) | |
Net decrease in shares outstanding | | | (63,710 | ) | | | (26,736 | ) | |
Fund Share Transactions—Class II: | |
Shares sold | | | 7,025 | | | | 10,173 | | |
Shares issued in reinvestment of dividends | | | 1,219 | | | | 1,201 | | |
Less shares redeemed | | | (15,913 | ) | | | (14,439 | ) | |
Net decrease in shares outstanding | | | (7,669 | ) | | | (3,065 | ) | |
See accompanying Notes to Financial Statements.
46 THE OAKMARK FUNDS
The Oakmark Funds
Statements of Changes in Net Assets (continued)
(in thousands)
| | | Oakmark Global Fund | |
| | | Year Ended
September 30, 2013 | | Year Ended
September 30, 2012 | |
From Operations: | |
Net investment income | | $ | 17,958 | | | $ | 19,290 | | |
Net realized gain (loss) | | | 232,367 | | | | 103,793 | | |
Net change in unrealized appreciation (depreciation) | | | 535,743 | | | | 154,219 | | |
Net increase in net assets from operations | | | 786,068 | | | | 277,302 | | |
Distributions to shareholders from: | |
Net investment income—Class I | | | (33,109 | ) | | | 0 | | |
Net investment income—Class II | | | (430 | ) | | | 0 | | |
Total distributions to shareholders | | | (33,539 | ) | | | 0 | | |
From Fund share transactions: | |
Proceeds from shares sold—Class I | | | 638,657 | | | | 436,946 | | |
Proceeds from shares sold—Class II | | | 5,701 | | | | 4,039 | | |
Reinvestment of distributions—Class I | | | 30,952 | | | | 0 | | |
Reinvestment of distributions—Class II | | | 402 | | | | 0 | | |
Payment for shares redeemed—Class I | | | (593,418 | ) | | | (463,538 | ) | |
Payment for shares redeemed—Class II | | | (11,347 | ) | | | (12,683 | ) | |
Redemption fees—Class I | | | 0 | (a) | | | 293 | | |
Redemption fees—Class II | | | 0 | (a) | | | 5 | | |
Net increase (decrease) in net assets from Fund share transactions | | | 70,947 | | | | (34,938 | ) | |
Total increase in net assets | | | 823,476 | | | | 242,364 | | |
Net assets: | |
Beginning of year | | | 2,095,837 | | | | 1,853,473 | | |
End of year | | $ | 2,919,313 | | | $ | 2,095,837 | | |
Accumulated undistributed net investment income | | $ | 50,077 | | | $ | 8,673 | | |
Fund Share Transactions—Class I: | |
Shares sold | | | 24,401 | | | | 20,811 | | |
Shares issued in reinvestment of dividends | | | 1,363 | | | | 0 | | |
Less shares redeemed | | | (24,162 | ) | | | (22,011 | ) | |
Net increase (decrease) in shares outstanding | | | 1,602 | | | | (1,200 | ) | |
Fund Share Transactions—Class II: | |
Shares sold | | | 221 | | | | 195 | | |
Shares issued in reinvestment of dividends | | | 18 | | | | 0 | | |
Less shares redeemed | | | (463 | ) | | | (616 | ) | |
Net decrease in shares outstanding | | | (224 | ) | | | (421 | ) | |
(a) Amount rounds to less than $1,000.
See accompanying Notes to Financial Statements.
oakmark.com 47
The Oakmark Funds
Statements of Changes in Net Assets (continued)
(in thousands)
| | | Oakmark Global Select Fund | |
| | | Year Ended
September 30, 2013 | | Year Ended
September 30, 2012 | |
From Operations: | |
Net investment income | | $ | 8,181 | | | $ | 3,674 | | |
Net realized gain (loss) | | | 48,723 | | | | 11,770 | | |
Net change in unrealized appreciation (depreciation) | | | 183,532 | | | | 55,794 | | |
Net increase in net assets from operations | | | 240,436 | | | | 71,238 | | |
Distributions to shareholders from: | |
Net investment income—Class I | | | (7,715 | ) | | | 0 | | |
Net realized gain—Class I | | | (4,628 | ) | | | 0 | | |
Total distributions to shareholders | | | (12,343 | ) | | | 0 | | |
From Fund share transactions: | |
Proceeds from shares sold—Class I | | | 531,364 | | | | 215,857 | | |
Reinvestment of distributions—Class I | | | 10,639 | | | | 0 | | |
Payment for shares redeemed—Class I | | | (166,160 | ) | | | (153,526 | ) | |
Redemption fees—Class I | | | 0 | | | | 211 | | |
Net increase in net assets from Fund share transactions | | | 375,843 | | | | 62,542 | | |
Total increase in net assets | | | 603,936 | | | | 133,780 | | |
Net assets: | |
Beginning of year | | | 555,827 | | | | 422,047 | | |
End of year | | $ | 1,159,763 | | | $ | 555,827 | | |
Accumulated undistributed net investment income | | $ | 10,490 | | | $ | 2,931 | | |
Fund Share Transactions—Class I: | |
Shares sold | | | 37,392 | | | | 19,158 | | |
Shares issued in reinvestment of dividends | | | 865 | | | | 0 | | |
Less shares redeemed | | | (12,176 | ) | | | (13,805 | ) | |
Net increase in shares outstanding | | | 26,081 | | | | 5,353 | | |
See accompanying Notes to Financial Statements.
48 THE OAKMARK FUNDS
The Oakmark Funds
Statements of Changes in Net Assets (continued)
(in thousands)
| | | Oakmark International Fund | |
| | | Year Ended
September 30, 2013 | | Year Ended
September 30, 2012 | |
From Operations: | |
Net investment income | | $ | 236,944 | | | $ | 152,075 | | |
Net realized gain (loss) | | | 905,068 | | | | (95,930 | ) | |
Net change in unrealized appreciation (depreciation) | | | 3,668,131 | | | | 1,202,068 | | |
Net increase in net assets from operations | | | 4,810,143 | | | | 1,258,213 | | |
Distributions to shareholders from: | |
Net investment income—Class I | | | (218,798 | ) | | | (52,874 | ) | |
Net investment income—Class II | | | (4,980 | ) | | | (723 | ) | |
Total distributions to shareholders | | | (223,778 | ) | | | (53,597 | ) | |
From Fund share transactions: | |
Proceeds from shares sold—Class I | | | 12,816,063 | | | | 2,844,623 | | |
Proceeds from shares sold—Class II | | | 188,732 | | | | 111,338 | | |
Reinvestment of distributions—Class I | | | 199,670 | | | | 47,135 | | |
Reinvestment of distributions—Class II | | | 3,133 | | | | 432 | | |
Payment for shares redeemed—Class I | | | (2,612,687 | ) | | | (1,989,516 | ) | |
Payment for shares redeemed—Class II | | | (143,384 | ) | | | (109,827 | ) | |
Redemption fees—Class I | | | 0 | | | | 1,346 | | |
Redemption fees—Class II | | | 0 | | | | 39 | | |
Net increase in net assets from Fund share transactions | | | 10,451,527 | | | | 905,570 | | |
Total increase in net assets | | | 15,037,892 | | | | 2,110,186 | | |
Net assets: | |
Beginning of year | | | 9,234,940 | | | | 7,124,754 | | |
End of year | | $ | 24,272,832 | | | $ | 9,234,940 | | |
Accumulated undistributed net investment income | | $ | 352,716 | | | $ | 182,080 | | |
Fund Share Transactions—Class I: | |
Shares sold | | | 549,644 | | | | 160,870 | | |
Shares issued in reinvestment of dividends | | | 9,899 | | | | 2,933 | | |
Less shares redeemed | | | (115,610 | ) | | | (114,105 | ) | |
Net increase in shares outstanding | | | 443,933 | | | | 49,698 | | |
Fund Share Transactions—Class II: | |
Shares sold | | | 8,312 | | | | 6,304 | | |
Shares issued in reinvestment of dividends | | | 154 | | | | 27 | | |
Less shares redeemed | | | (6,372 | ) | | | (6,138 | ) | |
Net increase in shares outstanding | | | 2,094 | | | | 193 | | |
See accompanying Notes to Financial Statements.
oakmark.com 49
The Oakmark Funds
Statements of Changes in Net Assets (continued)
(in thousands)
| | | Oakmark International Small Cap Fund | |
| | | Year Ended
September 30, 2013 | | Year Ended
September 30, 2012 | |
From Operations: | |
Net investment income | | $ | 22,209 | | | $ | 22,193 | | |
Net realized gain (loss) | | | 104,169 | | | | (65,509 | ) | |
Net change in unrealized appreciation (depreciation) | | | 414,142 | | | | 214,244 | | |
Net increase in net assets from operations | | | 540,520 | | | | 170,928 | | |
Distributions to shareholders from: | |
Net investment income—Class I | | | (24,448 | ) | | | (1,698 | ) | |
Net investment income—Class II | | | (36 | ) | | | 0 | | |
Net realized gain—Class I | | | 0 | | | | (302 | ) | |
Net realized gain—Class II | | | 0 | | | | 0 | (a) | |
Total distributions to shareholders | | | (24,484 | ) | | | (2,000 | ) | |
From Fund share transactions: | |
Proceeds from shares sold—Class I | | | 544,646 | | | | 407,759 | | |
Proceeds from shares sold—Class II | | | 1,226 | | | | 1,345 | | |
Reinvestment of distributions—Class I | | | 21,893 | | | | 1,827 | | |
Reinvestment of distributions—Class II | | | 14 | | | | 0 | (a) | |
Payment for shares redeemed—Class I | | | (353,631 | ) | | | (381,126 | ) | |
Payment for shares redeemed—Class II | | | (1,233 | ) | | | (829 | ) | |
Redemption fees—Class I | | | 212 | | | | 205 | | |
Redemption fees—Class II | | | 0 | (a) | | | 0 | (a) | |
Net increase in net assets from Fund share transactions | | | 213,127 | | | | 29,181 | | |
Total increase in net assets | | | 729,163 | | | | 198,109 | | |
Net assets: | |
Beginning of year | | | 1,528,419 | | | | 1,330,310 | | |
End of year | | $ | 2,257,582 | | | $ | 1,528,419 | | |
Accumulated undistributed net investment income | | $ | 53,186 | | | $ | 18,092 | | |
Fund Share Transactions—Class I: | |
Shares sold | | | 36,156 | | | | 31,918 | | |
Shares issued in reinvestment of dividends | | | 1,601 | | | | 154 | | |
Less shares redeemed | | | (24,243 | ) | | | (30,195 | ) | |
Net increase in shares outstanding | | | 13,514 | | | | 1,877 | | |
Fund Share Transactions—Class II: | |
Shares sold | | | 82 | | | | 104 | | |
Shares issued in reinvestment of dividends | | | 1 | | | | 0 | (a) | |
Less shares redeemed | | | (84 | ) | | | (66 | ) | |
Net increase (decrease) in shares outstanding | | | (1 | ) | | | 38 | | |
(a) Amount rounds to less than $1,000.
See accompanying Notes to Financial Statements.
50 THE OAKMARK FUNDS
The Oakmark Funds
Notes to Financial Statements
1. SIGNIFICANT ACCOUNTING POLICIES
The following are the significant accounting policies of Oakmark Fund ("Oakmark"), Oakmark Select Fund ("Select"), Oakmark Equity and Income Fund ("Equity and Income"), Oakmark Global Fund ("Global"), Oakmark Global Select Fund ("Global Select"), Oakmark International Fund ("International"), and Oakmark International Small Cap Fund ("Int'l Small Cap"), collectively referred to as the "Funds," each a series of Harris Associates Investment Trust (the "Trust"), a Massachusetts business trust, organized on February 1, 1991, which is registered as an open-end management investment company under the Investment Company Act of 1940, as amended (the "1940 Act"). Each Fund, other than Select and Global Select, is diversified in accordance with the 1940 Act. The following policies are in conformity with accounting principles generally accepted in the United States of America ("GAAP"). The presentation of financial statements in conformity with GAAP requires management to make estimates and assumptions that affect the reported amounts of assets and liabilities at the date of the financial statements and the reported amounts of revenues and expenses during the reporting period. Actual results could differ from those estimates and assumptions.
Class disclosure—
Each Fund offers two classes of shares: Class I Shares and Class II Shares. Class I Shares are offered to the general public. Class II Shares are offered to certain retirement plans such as 401(k) and profit sharing plans. Class II Shares pay a service fee at the annual rate of up to 0.25% of average net assets of Class II Shares of the Funds. This service fee is paid to a third-party administrator for performing the services associated with the administration of such retirement plans. Class I Shares do not have such an associated service fee. Global Select had no outstanding Class II shares during the year ended September 30, 2013.
Income, realized and unrealized capital gains and losses, and expenses of the Funds not directly attributable to a specific class of shares are allocated to each class pro rata based on the relative net assets of each class. Transfer and dividend disbursing agent fees and other shareholder servicing fees are specific to each class.
Redemption fees—
Int'l Small Cap imposes a short-term trading fee on redemptions of shares held for 90 days or less to help offset two types of costs to the Fund caused by abusive trading: portfolio transaction and market impact costs associated with erratic redemption activity and administrative costs associated with processing redemptions. The fee is paid to the Fund and is 2% of the redemption value and is deducted from either the redemption proceeds or from the balance in the account. The "first-in, first-out" ("FIFO") method is used to determine the holding period. The Funds may approve the waiver of redemption fees on certain types of accounts held through intermediaries, pursuant to the Funds' policies and procedures.
Security valuation—
The Funds' share prices or net asset values ("NAVs") are calculated as of the close of regular session trading (usually 4:00 pm Eastern time) on the New York Stock Exchange ("NYSE") on any day on which the NYSE is open for trading. Equity securities principally traded on securities exchanges in the United States and over-the-counter securities are valued at the last sales price or the official closing price on the day of valuation, or lacking any reported sales that day, at the most recent bid quotation. Securities traded on the NASDAQ National Market are valued at the NASDAQ Official Closing Price ("NOCP"), or lacking an NOCP, at the most recent bid quotation on the NASDAQ National Market. Equity securities principally traded on securities exchanges outside the United States are valued, depending on local convention or regulation, at the last sales price, the last bid or asked price, the mean between the last bid and asked prices, or the official closing price, or are based on a pricing composite as of the close of the regular trading hours on the appropriate exchange or other designated time. Each long-term debt instrument is valued at the latest bid quotation or an evaluated price provided by an independent pricing service. The pricing service may use standard inputs such as benchmark yields, reported trades, broker/dealer quotes, issuer spreads, two-sided markets, benchmark securities, bids, offers, and reference data including market research publications. For certain security types additional inputs may be used or some of the standard inputs may not be applicable. Additionally, the pricing service monitors market indicators and industry and economic events, which may serve as a trigger to gather and possibly use additional market data. Each short-term debt instrument (i.e., debt instruments whose maturities or expiration dates at the time of acquisition are one year or less) or money market instrument maturing in 61 days or more from the date of valuation is valued at the latest bid quotation or an evaluated price provided by an independent pricing service. Each short-term instrument maturing in 60 days or less from the date of valuation is valued at amortized cost, which approximates market value. Options are valued at the last reported sales price on the day of valuation or, lacking any reported sale price on the valuation date, at the mean of the most recent bid and asked quotations or, if the mean is not available, at the most recent bid quotation.
Securities for which quotations are not readily available or securities that may have been affected by a significant event occurring between the close of a foreign market and the close of the NYSE are valued at fair value, determined by or under the direction of the pricing committee authorized by the Board of Trustees. A significant event may include the performance of U.S. markets since the close of foreign markets. The Funds may use a systematic fair valuation model provided by an independent pricing service to value foreign securities in order to adjust local closing prices for information or events that may occur between the close of certain foreign exchanges and the close of the NYSE.
Fair value measurement—
Various inputs are used in determining the value of each Fund's investments. These inputs are prioritized into three broad levels as follows:
Level 1—quoted prices in active markets for identical securities
Level 2—other significant observable inputs (including quoted prices for similar investments, interest rates, prepayment speeds, credit risk, and others)
oakmark.com 51
The Oakmark Funds
Notes to Financial Statements (continued)
Level 3—significant unobservable inputs (including the Funds' own assumptions in determining the fair value of investments)
Observable inputs are those based on market data obtained from independent sources, and unobservable inputs reflect the Funds' own assumptions based on the best information available. The input levels are not necessarily an indication of risk or liquidity associated with investing in those securities.
The Funds recognize transfers between level 1 and 2 at the end of the reporting cycle. At September 30, 2013 Equity and Income had a transfer from level 2 to level 1 in the amount of $484,144,560. The transfer was due to a security no longer being valued based on observable market prices of similar assets, but instead by a market quotation.
The following is a summary of the inputs used as of September 30, 2013 in valuing each Fund's assets and liabilities. Except for the industries or investment types separately stated below, the total amounts for common stocks, fixed-income and short-term investments in the table below are presented by industry or investment type in each Fund's Schedule of Investments. Information on forward foreign currency contracts is presented by contract in the notes following the below summary:
(in thousands) | | Quoted Prices
in Active
Markets for
Identical
Assets
(Level 1) | | Other
Significant
Observable
Inputs
(Level 2) | | Significant
Unobservable
Inputs
(Level 3) | |
Oakmark | | | | | | | | | | | | | |
Common Stocks | | $ | 9,865,624 | | | $ | 0 | | | $ | 0 | | |
Short Term Investments | | | 0 | | | | 641,852 | | | | 0 | | |
Total | | $ | 9,865,624 | | | $ | 641,852 | | | $ | 0 | | |
Select | | | | | | | | | | | | | |
Common Stocks | | $ | 3,770,316 | | | $ | 0 | | | $ | 0 | | |
Short Term Investments | | | 0 | | | | 165,580 | | | | 0 | | |
Total | | $ | 3,770,316 | | | $ | 165,580 | | | $ | 0 | | |
Equity and Income | | | | | | | | | | | | | |
Common Stocks | | $ | 14,217,410 | | | $ | 0 | | | $ | 0 | | |
Government and Agency Securities | | | 0 | | | | 1,878,380 | | | | 0 | | |
Corporate Bonds | | | 0 | | | | 397,507 | | | | 0 | | |
Asset Backed Securities | | | 0 | | | | 11,501 | | | | 0 | | |
Convertible Bonds | | | 0 | | | | 845 | | | | 0 | | |
Short Term Investments | | | 0 | | | | 2,904,235 | | | | 0 | | |
Total | | $ | 14,217,410 | | | $ | 5,192,468 | | | $ | 0 | | |
Global | | | | | | | | | | | | | |
Common Stocks | | $ | 2,875,357 | | | $ | 0 | | | $ | 0 | | |
Short Term Investments | | | 0 | | | | 73,324 | | | | 0 | | |
Forward Foreign Currency Contracts—Assets | | | 0 | | | | 3,669 | | | | 0 | | |
Forward Foreign Currency Contracts—Liabilities | | | 0 | | | | (3,390 | ) | | | 0 | | |
Total | | $ | 2,875,357 | | | $ | 73,603 | | | $ | 0 | | |
Global Select | | | | | | | | | | | | | |
Common Stocks | | $ | 1,102,454 | | | $ | 0 | | | $ | 0 | | |
Short Term Investments | | | 0 | | | | 61,040 | | | | 0 | | |
Forward Foreign Currency Contracts—Assets | | | 0 | | | | 40 | | | | 0 | | |
Forward Foreign Currency Contracts—Liabilities | | | 0 | | | | (1,189 | ) | | | 0 | | |
Total | | $ | 1,102,454 | | | $ | 59,891 | | | $ | 0 | | |
International | | | | | | | | | | | | | |
Common Stocks | | $ | 23,146,523 | | | $ | 0 | | | $ | 0 | | |
Short Term Investments | | | 0 | | | | 933,724 | | | | 0 | | |
Forward Foreign Currency Contracts—Assets | | | 0 | | | | 42,643 | | | | 0 | | |
Forward Foreign Currency Contracts—Liabilities | | | 0 | | | | (31,449 | ) | | | 0 | | |
Total | | $ | 23,146,523 | | | $ | 944,918 | | | $ | 0 | | |
52 THE OAKMARK FUNDS
The Oakmark Funds
Notes to Financial Statements (continued)
(in thousands) | | Quoted Prices
in Active
Markets for
Identical
Assets
(Level 1) | | Other
Significant
Observable
Inputs
(Level 2) | | Significant
Unobservable
Inputs
(Level 3) | |
Int'l Small Cap | | | | | | | | | | | | | |
Common Stocks | | $ | 2,119,637 | | | $ | 0 | | | $ | 0 | | |
Short Term Investments | | | 0 | | | | 121,791 | | | | 0 | | |
Forward Foreign Currency Contracts—Assets | | | 0 | | | | 9,447 | | | | 0 | | |
Forward Foreign Currency Contracts—Liabilities | | | 0 | | | | (2,058 | ) | | | 0 | | |
Total | | $ | 2,119,637 | | | $ | 129,180 | | | $ | 0 | | |
Foreign currency translations—
Certain Funds invest in foreign securities, which may involve a number of risk factors and special considerations not present with investments in securities of U.S. corporations. Values of investments and other assets and liabilities denominated in foreign currencies are translated into U.S. dollars at current exchange rates obtained by a recognized bank, dealer, or independent pricing service on the day of valuation. Purchases and sales of investments and dividend and interest income are converted at the prevailing rate of exchange on the respective dates of such transactions.
The Funds do not isolate that portion of the results of operations resulting from changes in foreign exchange rates on investments from the fluctuations arising from changes in market prices of securities held. Such fluctuations are included in net realized gain (loss) on investments and net change in unrealized appreciation (depreciation) on investments in the Statements of Operations. Net realized gains and losses on foreign currency transactions arising from the sale of foreign currencies, currency gains or losses realized between the trade and settlement dates on securities transactions and the difference between the amounts of dividends, interest and tax reclaims recorded and the U.S. dollar equivalent of the amounts actually received or paid are included in net realized gain (loss) on foreign currency transactions in the Statements of Operations. Unrealized gains and losses arising from changes in the fair value of assets and liabilities, other than investments in securities, resulting from changes in exchange rates are included in net change in unrealized appreciation (depreciation) on foreign currency translation in the Statements of Operations.
Forward foreign currency contracts—
Forward foreign currency contracts are agreements to exchange one currency for another at a future date and at a specified price. The Funds' transactions in forward foreign currency contracts are limited to transaction and portfolio hedging. The contractual amounts of forward foreign currency contracts do not necessarily represent the amounts potentially subject to risk. The measurement of the risks associated with these instruments is meaningful only when all related and offsetting transactions are considered and could exceed the net unrealized value shown in the tables below. Risks arise from the possible inability of counterparties to meet the terms of their contracts and from movements in currency values. Forward foreign currency contracts are valued at the current day's interpolated foreign exchange rates. Unrealized gain or loss on the contracts as measured by the difference between the forward foreign exchange rates at the dates of entry into the contracts and the forward rates at the end of the period is included in the Statements of Assets and Liabilities. Realized gains and losses and the net change in unrealized appreciation (depreciation) on forward foreign currency contracts for the period are included in the Statements of Operations.
At September 30, 2013 Global, Global Select, International, and Int'l Small Cap held forward foreign currency contracts, which are considered derivative instruments, each of whose counterparty is State Street Bank and Trust Company ("State Street"), as follows (in thousands):
Global
| | | Local
Contract
Amount | | Settlement
Date | | Valuation at
9/30/13 | | Unrealized
Appreciation/
(Depreciation) | |
Foreign Currency Sold: | | | | | | | | | | | | | | | |
Australian Dollar | | | 37,900 | | | 12/18/13 | | $ | 35,175 | | | $ | 3,381 | | |
Japanese Yen | | | 6,000,000 | | | 12/18/13 | | | 61,074 | | | | 288 | | |
Swiss Franc | | | 114,000 | | | 03/19/14 | | | 126,260 | | | | (3,390 | ) | |
| | | | | | | $ | 222,509 | | | $ | 279 | | |
During the year ended September 30, 2013 the proceeds from forward foreign currency contracts opened for Global were $382,098 and the cost to close or settle contracts was $499,468 (in thousands).
oakmark.com 53
The Oakmark Funds
Notes to Financial Statements (continued)
Global Select
| | | Local
Contract
Amount | | Settlement
Date | | Valuation at
9/30/13 | | Unrealized
Appreciation/
(Depreciation) | |
Foreign Currency Sold: | | | | | | | | | | | | | |
Japanese Yen | | | 840,000 | | | 12/18/13 | | $ | 8,550 | | | $ | 40 | | |
Swiss Franc | | | 40,000 | | | 03/19/14 | | | 44,302 | | | | (1,189 | ) | |
| | | | | | | $ | 52,852 | | | $ | (1,149 | ) | |
During the year ended September 30, 2013 the proceeds from forward foreign currency contracts opened for Global Select were $86,092 and the cost to close or settle contracts was $91,878 (in thousands).
International
| | | Local
Contract
Amount | | Settlement
Date | | Valuation at
9/30/13 | | Unrealized
Appreciation/
(Depreciation) | |
Foreign Currency Bought: | | | | | | | | | | | | | | | |
Australian Dollar | | | 29,000 | | | 12/18/13 | | $ | 26,915 | | | $ | 666 | | |
| | | | | | | $ | 26,915 | | | $ | 666 | | |
Foreign Currency Sold: | | | | | | | | | | | | | | | |
Australian Dollar | | | 460,000 | | | 12/18/13 | | $ | 426,922 | | | $ | 40,969 | | |
Japanese Yen | | | 21,030,000 | | | 12/18/13 | | | 214,066 | | | | 1,008 | | |
Swedish Krona | | | 2,100,000 | | | 06/18/14 | | | 324,803 | | | | (4,447 | ) | |
Swiss Franc | | | 908,000 | | | 03/19/14 | | | 1,005,651 | | | | (27,002 | ) | |
| | | | | | | $ | 1,971,442 | | | $ | 10,528 | | |
During the year ended September 30, 2013 the proceeds from forward foreign currency contracts opened for International were $3,419,543 and the cost to close or settle contracts was $3,023,052 (in thousands).
Int'l Small Cap
| | | Local
Contract
Amount | | Settlement
Date | | Valuation at
9/30/13 | | Unrealized
Appreciation/
(Depreciation) | |
Foreign Currency Bought: | | | | | | | | | | | | | | | |
Australian Dollar | | | 14,150 | | | 12/18/13 | | $ | 13,132 | | | $ | 325 | | |
| | | | | | | $ | 13,132 | | | $ | 325 | | |
Foreign Currency Sold: | | | | | | | | | | | | | | | |
Australian Dollar | | | 94,000 | | | 12/18/13 | | $ | 87,241 | | | $ | 8,386 | | |
Japanese Yen | | | 2,349,000 | | | 12/18/13 | | | 23,911 | | | | 113 | | |
Norwegian Krona | | | 194,200 | | | 06/18/14 | | | 31,986 | | | | 623 | | |
Swedish Krona | | | 7,000 | | | 06/18/14 | | | 1,083 | | | | (15 | ) | |
Swiss Franc | | | 68,700 | | | 03/19/14 | | | 76,088 | | | | (2,043 | ) | |
| | | | | | | $ | 220,309 | | | $ | 7,064 | | |
During the year ended September 30, 2013 the proceeds from forward foreign currency contracts opened for Int'l Small Cap were $331,814 and the cost to close or settle contracts was $450,248 (in thousands).
Security transactions and investment income—
Security transactions are accounted for on the trade date (date the order to buy or sell is executed), and dividend income is recorded on the ex-dividend date, except that certain dividends from foreign securities are recorded as soon as the information becomes available after the ex-dividend date. Interest income and expenses are recorded on an accrual basis. Discount is accreted and premium is amortized on long-term fixed income securities using the yield-to-maturity method. Withholding taxes and tax reclaims on foreign dividends have been provided for in accordance with the Funds' understanding of the applicable country's tax rules and rates. Net realized gains and losses on investments are determined by the specific identification method.
Short sales—
Each Fund may sell a security it does not own in anticipation of a decline in the fair value of that security. When a Fund sells a security short, it must borrow the security sold short and deliver it to the broker-dealer through which it made the short sale. A
54 THE OAKMARK FUNDS
The Oakmark Funds
Notes to Financial Statements (continued)
gain, limited to the price at which the Fund sold the security short, or loss, unlimited in size, will be recognized upon the termination of the short sale. At September 30, 2013 none of the Funds had short sales.
When-issued or delayed-delivery securities—
Each Fund may purchase securities on a when-issued or delayed-delivery basis. Although the payment and interest terms of these securities are established at the time a Fund enters into the commitment, the securities may be delivered and paid for a month or more after the date of purchase, when their value may have changed. A Fund makes such commitments only with the intention of actually acquiring the securities, but may sell the securities before the settlement date if the Adviser deems it advisable for investment reasons.
Accounting for options—
When a Fund writes an option, the premium received by the Fund is recorded as a liability and is subsequently adjusted to the current fair value of the option written. Premiums received from writing options that expire are recorded by the Fund on the expiration date as realized gains from option transactions. The difference between the premium and the amount paid on effecting a closing purchase transaction, including brokerage commissions, is also treated as a realized gain, or if the premium is less than the amount paid for the closing purchase transaction, as a realized loss. If a call option is exercised, the premium is added to the proceeds from the sale of the underlying security or currency in determining whether the Fund has realized a gain or a loss. If a put option is exercised, the premium reduces the cost basis of the security or currency purchased by the Fund. In writing an option, the Fund bears the market risk of an unfavorable change in the price of the security or currency underlying the written option. Exercise of an option written by the Fund could result in the Fund selling or buying a security or currency at a price different from the current fair value. Options written by the Fund do not give rise to counterparty credit risk, as they obligate the Fund, not its counterparties, to perform.
When a Fund purchases an option, the premium paid by the Fund is recorded as an asset and is subsequently adjusted to the current fair value of the option purchased. Purchasing call options tends to increase the Fund's exposure to the underlying instrument. Purchasing put options tends to decrease the Fund's exposure to the underlying instrument. Premiums paid for purchasing options that expire are treated as realized losses. Premiums paid for purchasing options that are exercised or closed are added to the amounts paid or offset against the proceeds on the underlying security to determine the realized gain or loss. The risks associated with purchasing put and call options are potential loss of the premium paid and, in the instances of OTC derivatives, the failure of the counterparty to honor its obligation under the contract.
The Funds did not write or purchase options during the year ended September 30, 2013.
Committed line of credit—
The Trust has an unsecured committed line of credit (the "Facility") with State Street in the amount of $500 million. Borrowings under that arrangement bear interest at 1.25% above the greater of the Federal Funds Effective Rate or LIBOR, as defined in the credit agreement. To maintain the Facility, an annualized commitment fee of 0.09% on the unused portion is charged to the Trust. Fees and interest expense, if any, related to the Facility are included in other expenses in the Statements of Operations. There were no borrowings under the Facility during the year ended September 30, 2013.
Expense offset arrangement—
State Street serves as custodian of the Funds. State Street's fee may be reduced by credits that are an earnings allowance calculated on the average daily cash balances each Fund maintains with State Street. Credit balances used to reduce the Funds' custodian fees, if any, are reported as a reduction of total expenses in the Statements of Operations. During the year ended September 30, 2013 none of the Funds received an expense offset credit.
Repurchase agreements—
Each Fund may invest in repurchase agreements, which are short-term investments whereby the Fund acquires ownership of a debt security and the seller agrees to repurchase the security at a future date at a specified price.
The Funds' custodian receives delivery of the underlying securities collateralizing repurchase agreements. It is the Funds' policy that the value of the collateral be at least equal to 102% of the repurchase price, including interest. Harris Associates L.P. (the "Adviser") is responsible for determining that the value of the collateral is at all times at least equal to 102% of the repurchase price, including interest. Repurchase agreements could involve certain risks in the event of default or insolvency of the counterparty, including possible delays or restrictions upon a Fund's ability to dispose of the underlying securities.
Security lending—
Each Fund, except Oakmark, may lend its portfolio securities to broker-dealers and banks. Any such loan must be continuously secured by collateral in cash, cash equivalents or U.S. Treasurys maintained on a current basis in an amount at least equal to the fair value of the securities loaned by the Fund. Collateral is marked to market and monitored daily. The Fund continues to receive the equivalent of the interest or dividends paid by the issuer on the securities loaned and also receives an additional return that may be in the form of a fixed fee or a percentage of the earnings on the collateral. The Fund has the right to call the loan and attempt to obtain the securities loaned at any time on notice of not more than five business days. In the event of bankruptcy or other default of the borrower, the Fund could experience delays in liquidating the loan collateral or recovering the loaned securities and incur expenses related to enforcing its rights. In addition, there could be a decline in the value of the collateral or in the fair value of the securities loaned while the Fund seeks to enforce its rights thereto, and the Fund could experience subnormal levels of income or lack of access to income during that period.
At September 30, 2013 none of the Funds had securities on loan.
oakmark.com 55
The Oakmark Funds
Notes to Financial Statements (continued)
Restricted securities—
The following investments, the sales of which are subject to restrictions on resale under federal securities laws, have been valued in good faith according to the securities valuation procedures established by the Board of Trustees (as stated in the Security valuation section) since their acquisition dates.
At September 30, 2013 Equity and Income held the following restricted securities:
Equity and Income
| | Par Value
(000) | | Security
Name | | Acquisition
Date | | Carrying
Value | | Original
Cost | | Value
(000) | | Percentage of
Net Assets | |
| | | $ | 2,000 | | | Activision Blizzard, Inc., 144A,
6.125%, due 09/15/23 | | 09/17/13 | | $ | 100.5000 | | | $ | 101.6250 | | | $ | 2,010 | | | | 0.01 | % | |
| | | | 1,000 | | | Activision Blizzard, Inc., 144A,
6.125%, due 09/15/23 | | 09/12/13 | | | 100.5000 | | | | 100.0000 | | | | 1,005 | | | | 0.01 | % | |
| | | | 1,000 | | | Activision Blizzard, Inc., 144A,
5.625%, due 09/15/21 | | 09/12/13 | | | 100.1250 | | | | 100.0000 | | | | 1,001 | | | | 0.01 | % | |
| | | | 50,000 | | | BP Capital Markets PLC, 144A,
0.07%, due 10/09/13 | | 09/09/13 | | | 99.9983 | | | | 99.9942 | | | | 49,999 | | | | 0.26 | % | |
| | | | 50,000 | | | BP Capital Markets PLC, 144A,
0.07%, due 10/10/13 | | 09/09/13 | | | 99.9983 | | | | 99.9940 | | | | 49,999 | | | | 0.26 | % | |
| | | | 11,450 | | | Cabela's Master Credit Card Trust, 144A,
0.732%, due 10/15/19 | | 10/20/11 | | | 100.4442 | | | | 100.0000 | | | | 11,501 | | | | 0.06 | % | |
| | | | 250 | | | CNO Financial Group, Inc., 144A,
6.375%, due 10/01/20 | | 09/20/12 | | | 104.5000 | | | | 100.0000 | | | | 261 | | | | 0.00 | %* | |
| | | | 30,000 | | | General Mills Inc., 144A,
0.12%, due 10/21/13 | | 09/11/13 | | | 99.9933 | | | | 99.9867 | | | | 29,998 | | | | 0.15 | % | |
| | | | 25,000 | | | General Mills Inc., 144A,
0.17%, due 10/25/13 | | 09/26/13 | | | 99.9887 | | | | 99.9863 | | | | 24,997 | | | | 0.13 | % | |
| | | | 23,000 | | | General Mills Inc., 144A,
0.16%, due 10/22/13 | | 09/20/13 | | | 99.9907 | | | | 99.9858 | | | | 22,998 | | | | 0.12 | % | |
| | | | 20,000 | | | General Mills Inc., 144A,
0.12%, due 10/02/13 | | 09/03/13 | | | 99.9997 | | | | 99.9903 | | | | 20,000 | | | | 0.10 | % | |
| | | | 20,000 | | | General Mills Inc., 144A,
0.16%, due 10/25/13 | | 09/20/13 | | | 99.9893 | | | | 99.9844 | | | | 19,998 | | | | 0.10 | % | |
| | | | 20,000 | | | General Mills Inc., 144A,
0.14%, due 10/28/13 | | 09/30/13 | | | 99.9895 | | | | 99.9891 | | | | 19,998 | | | | 0.10 | % | |
| | | | 17,000 | | | General Mills Inc., 144A,
0.15%, due 10/17/13 | | 09/17/13 | | | 99.9933 | | | | 99.9875 | | | | 16,999 | | | | 0.09 | % | |
| | | | 17,000 | | | General Mills Inc., 144A,
0.16%, due 11/04/13 | | 09/25/13 | | | 99.9849 | | | | 99.9822 | | | | 16,997 | | | | 0.09 | % | |
| | | | 15,000 | | | General Mills Inc., 144A,
0.16%, due 11/08/13 | | 09/26/13 | | | 99.9831 | | | | 99.9809 | | | | 14,998 | | | | 0.08 | % | |
| | | | 13,000 | | | General Mills Inc., 144A,
0.17%, due 10/21/13 | | 09/18/13 | | | 99.9906 | | | | 99.9844 | | | | 12,999 | | | | 0.07 | % | |
| | | | 12,000 | | | General Mills Inc., 144A,
0.13%, due 10/11/13 | | 08/28/13 | | | 99.9964 | | | | 99.9841 | | | | 12,000 | | | | 0.06 | % | |
| | | | 5,000 | | | General Mills Inc., 144A,
0.15%, due 10/15/13 | | 09/12/13 | | | 99.9942 | | | | 99.9863 | | | | 5,000 | | | | 0.02 | % | |
| | | | 4,500 | | | General Mills Inc., 144A,
0.16%, due 10/18/13 | | 09/20/13 | | | 99.9924 | | | | 99.9876 | | | | 4,500 | | | | 0.02 | % | |
| | | | 34,400 | | | General Motors Co., 144A,
4.875%, due 10/02/23 | | 09/24/13 | | | 97.7500 | | | | 100.0000 | | | | 33,626 | | | | 0.17 | % | |
| | | | 5,000 | | | General Motors Co., 144A,
4.875%, due 10/02/23 | | 09/25/13 | | | 97.7500 | | | | 99.0000 | | | | 4,887 | | | | 0.02 | % | |
| | | | 2,000 | | | General Motors Co., 144A,
4.875%, due 10/02/23 | | 09/30/13 | | | 97.7500 | | | | 97.5000 | | | | 1,955 | | | | 0.01 | % | |
| | | | 29,525 | | | General Motors Co., 144A,
3.50%, due 10/02/18 | | 09/24/13 | | | 99.7500 | | | | 100.0000 | | | | 29,451 | | | | 0.15 | % | |
| | | | 10,000 | | | Howard Hughes Corp., 144A,
6.875%, due 10/01/21 | | 09/27/13 | | | 100.2500 | | | | 100.0000 | | | | 10,025 | | | | 0.05 | % | |
| | | | 25,000 | | | John Deere Capital Co., 144A,
0.06%, due 10/15/13 | | 09/24/13 | | | 99.9977 | | | | 99.9965 | | | | 24,999 | | | | 0.13 | % | |
56 THE OAKMARK FUNDS
The Oakmark Funds
Notes to Financial Statements (continued)
| | Par Value
(000) | | Security
Name | | Acquisition
Date | | Carrying
Value | | Original
Cost | | Value
(000) | | Percentage of
Net Assets | |
| | | $ | 25,000 | | | John Deere Capital Co., 144A,
0.05%, due 10/08/13 | | 09/13/13 | | $ | 99.9990 | | | $ | 99.9965 | | | $ | 25,000 | | | | 0.13 | % | |
| | | | 35,000 | | | Kellogg Co., 144A,
0.16%, due 10/22/13 | | 09/26/13 | | | 99.9907 | | | | 99.9884 | | | | 34,997 | | | | 0.18 | % | |
| | | | 25,000 | | | Kellogg Co., 144A,
0.15%, due 10/04/13 | | 09/16/13 | | | 99.9988 | | | | 99.9925 | | | | 25,000 | | | | 0.13 | % | |
| | | | 25,000 | | | Kellogg Co., 144A,
0.19%, due 12/09/13 | | 09/16/13 | | | 99.9423 | | | | 99.9557 | | | | 24,986 | | | | 0.13 | % | |
| | | | 5,975 | | | Kellogg Co., 144A,
0.16%, due 10/01/13 | | 09/11/13 | | | 100.0000 | | | | 99.9911 | | | | 5,975 | | | | 0.03 | % | |
| | | | 5,000 | | | Kellogg Co., 144A,
0.15%, due 10/07/13 | | 09/16/13 | | | 99.9975 | | | | 99.9913 | | | | 5,000 | | | | 0.02 | % | |
| | | | 3,500 | | | Kellogg Co., 144A,
0.14%, due 10/01/13 | | 09/19/13 | | | 100.0000 | | | | 99.9953 | | | | 3,500 | | | | 0.02 | % | |
| | | | 9,605 | | | Live Nation Entertainment, Inc., 144A,
7.00%, due 09/01/20 | | 08/15/12 | | | 104.3750 | | | | 100.0000 | | | | 10,025 | | | | 0.05 | % | |
| | | | 2,000 | | | Quiksilver, Inc. / QS Wholesale, Inc., 144A,
7.875%, due 08/01/18 | | 07/11/13 | | | 104.2500 | | | | 99.4830 | | | | 2,085 | | | | 0.01 | % | |
| | | | 1,000 | | | Quiksilver, Inc. / QS Wholesale, Inc., 144A,
10.00%, due 08/01/20 | | 07/11/13 | | | 105.2500 | | | | 98.7570 | | | | 1,053 | | | | 0.01 | % | |
| | | | 6,000 | | | Scotiabank Peru SA, 144A,
4.50%, due 12/13/27 | | 12/06/12 | | | 87.0000 | | | | 100.0000 | | | | 5,220 | | | | 0.03 | % | |
| | | | 2,725 | | | Serta Simmons Holdings LLC, 144A,
8.125%, due 10/01/20 | | 09/27/12 | | | 105.2500 | | | | 99.8750 | | | | 2,868 | | | | 0.01 | % | |
| | | | 2,265 | | | Serta Simmons Holdings LLC, 144A,
8.125%, due 10/01/20 | | 09/26/12 | | | 105.2500 | | | | 99.0000 | | | | 2,384 | | | | 0.01 | % | |
| | | | 6,820 | | | Six Flags Entertainment Corp., 144A,
5.25%, due 01/15/21 | | 12/11/12 | | | 95.2500 | | | | 100.0000 | | | | 6,496 | | | | 0.03 | % | |
| | | | 3,150 | | | Six Flags Entertainment Corp., 144A,
5.25%, due 01/15/21 | | 12/11/12 | | | 95.2500 | | | | 101.0000 | | | | 3,000 | | | | 0.02 | % | |
| | | | 5,390 | | | Walter Energy, Inc., 144A,
9.875%, due 12/15/20 | | 11/16/12 | | | 87.0000 | | | | 99.3020 | | | | 4,689 | | | | 0.02 | % | |
| | | | 5,000 | | | Walter Energy, Inc., 144A,
8.50%, due 04/15/21 | | 03/22/13 | | | 83.5000 | | | | 100.0000 | | | | 4,175 | | | | 0.02 | % | |
| | | | 25,000 | | | Wellpoint, Inc., 144A,
0.30%, due 10/15/13 | | 07/16/13 | | | 99.9883 | | | | 99.9242 | | | | 24,997 | | | | 0.13 | % | |
| | | | 15,000 | | | Wellpoint, Inc., 144A,
0.30%, due 10/10/13 | | 07/12/13 | | | 99.9925 | | | | 99.9250 | | | | 14,999 | | | | 0.08 | % | |
| | | | 10,000 | | | Wellpoint, Inc., 144A,
0.25%, due 12/03/13 | | 09/10/13 | | | 99.9644 | | | | 99.9417 | | | | 9,996 | | | | 0.05 | % | |
| | | | 2,200 | | | Wellpoint, Inc., 144A,
0.23%, due 11/13/13 | | 09/19/13 | | | 99.9725 | | | | 99.9649 | | | | 2,199 | | | | 0.01 | % | |
| | | | 7,000 | | | The William Carter Co., 144A,
5.25%, due 08/15/21 | | 08/15/13 | | | 100.0000 | | | | 101.0000 | | | | 7,000 | | | | 0.04 | % | |
| | | | 7,000 | | | The William Carter Co., 144A,
5.25%, due 08/15/21 | | 09/10/13 | | | 100.0000 | | | | 100.2500 | | | | 7,000 | | | | 0.04 | % | |
| | | | 5,502 | | | The William Carter Co., 144A,
5.25%, due 08/15/21 | | 08/14/13 | | | 100.0000 | | | | 101.2500 | | | | 5,502 | | | | 0.03 | % | |
| | | | 5,000 | | | The William Carter Co., 144A,
5.25%, due 08/15/21 | | 08/13/13 | | | 100.0000 | | | | 101.2500 | | | | 5,000 | | | | 0.02 | % | |
| | | | 2,000 | | | The William Carter Co., 144A,
5.25%, due 08/15/21 | | 08/12/13 | | | 100.0000 | | | | 101.3750 | | | | 2,000 | | | | 0.01 | % | |
| | | | 1,400 | | | The William Carter Co., 144A,
5.25%, due 08/15/21 | | 08/26/13 | | | 100.0000 | | | | 100.5000 | | | | 1,400 | | | | 0.01 | % | |
| | | | 100 | | | The William Carter Co., 144A,
5.25%, due 08/15/21 | | 09/10/13 | | | 100.0000 | | | | 100.0000 | | | | 100 | | | | 0.00 | %* | |
| | | | | | | | | | | | | | | $ | 688,847 | | | | 3.54 | % | |
* Amount rounds to less than 0.01%
oakmark.com 57
The Oakmark Funds
Notes to Financial Statements (continued)
Federal income taxes—
It is each Fund's policy to comply with the requirements of the Internal Revenue Code applicable to regulated investment companies and to distribute substantially all of its net taxable income, including any net realized gains on investments, to its shareholders. Therefore, no federal income tax provision is required. There is no material liability for unrecognized tax benefits in the accompanying financial statements. Generally, each of the tax years in the four-year period ended September 30, 2013 remains subject to examination by taxing authorities.
2. TRANSACTIONS WITH AFFILIATES
Each Fund has an investment advisory agreement with the Adviser. For management services and facilities furnished, the Adviser receives from each Fund a monthly fee based on that Fund's net assets at the end of the preceding month. Annual fee rates are as follows:
Fund | | Advisory Fees | |
Oakmark | | 1.00% up to $2 billion;
0.90% on the next $1 billion;
0.80% on the next $2 billion;
0.75% on the next $2.5 billion;
0.675% on the next $2.5 billion; and
0.625% over $10 billion | |
Select | | 1.00% up to $1 billion;
0.95% on the next $500 million;
0.90% on the next $500 million;
0.85% on the next $500 million;
0.80% on the next $2.5 billion;
0.75% on the next $5 billion; and
0.725% over $10 billion | |
Equity and Income | | 0.75% up to $5 billion;
0.70% on the next $2.5 billion;
0.675% on the next $2.5 billion;
0.65% on the next $2.5 billion;
0.60% on the next $3.5 billion;
0.585% on the next $5 billion;
0.5775% on the next $7 billion; and
0.5725% over $28 billion | |
Fund | | Advisory Fees | |
Global | | 1.00% up to $2 billion;
0.95% on the next $2 billion;
0.90% on the next $4 billion; and
0.875% over $8 billion | |
Global Select | | 1.00% up to $2 billion;
0.95% on the next $1 billion;
0.875% on the next $4 billion; and
0.85% over $7 billion | |
International | | 1.00% up to $2 billion;
0.95% on the next $1 billion;
0.85% on the next $2 billion;
0.825% on the next $2.5 billion;
0.815% on the next $3.5 billion;
0.805% on the next $5.5 billion; and
0.80% over $16.5 billion | |
Int'l Small Cap | | 1.25% up to $500 million;
1.10% on the next $1 billion;
1.05% on the next $2 billion;
1.025% on the next $1.5 billion; and
1.00% over $5 billion | |
The Adviser is contractually obligated through January 31, 2014 to reimburse each Fund Class to the extent, but only to the extent, that its annualized expenses (excluding taxes, interest, all commissions and other normal charges incident to the purchase and sale of portfolio securities, and extraordinary charges such as litigation costs, but including fees paid to the Adviser) exceed the percent set forth below of average daily net assets of each Fund Class.
Fund | | Class I | | Class II | |
Oakmark | | | 1.50 | % | | | 1.75 | % | |
Select | | | 1.50 | | | | 1.75 | | |
Equity and Income | | | 1.00 | | | | 1.25 | | |
Global | | | 1.75 | | | | 2.00 | | |
Global Select | | | 1.75 | | | | 2.00 | | |
International | | | 2.00 | | | | 2.25 | | |
Int'l Small Cap | | | 2.00 | | | | 2.25 | | |
The Adviser is entitled to recoup from any Fund Class, in any fiscal year through September 30, 2017, amounts reimbursed to that Fund Class, except to the extent that the Fund Class already has paid such recoupment to the Adviser or such recoupment would cause the annual ordinary operating expenses of a Fund Class for that fiscal year to exceed the applicable limit stated above. As of September 30, 2013 there were no amounts subject to recoupment.
The Adviser and the Funds have entered into agreements with financial intermediaries to provide recordkeeping, processing, shareholder communications and other services to customers of the intermediaries and have agreed to compensate the intermediaries for providing those services. Certain of those services would be provided by the Funds if the shares of those customers were registered directly with the Funds' transfer agent. Accordingly, the Funds pay a portion of the intermediary fees pursuant to an agreement with the Adviser that calls for each Fund to pay a portion of the intermediary fees attributable to shares of the Fund held by the intermediary (which generally are a percentage of value of the shares held) not exceeding the lesser of 75% of the fees charged by the intermediary or what the Fund would have paid its transfer agent had each customer's shares been registered
58 THE OAKMARK FUNDS
The Oakmark Funds
Notes to Financial Statements (continued)
directly with the transfer agent instead of held through the intermediary. The Adviser pays the remainder of the fees. The fees incurred by the Funds are reflected as other shareholder servicing fees in the Statements of Operations.
The Independent Trustees of the Trust may participate in the Trust's Deferred Compensation Plan for Independent Trustees. Participants in the plan may elect to defer all or a portion of their compensation. Amounts deferred are retained by the Trust and represent an unfunded obligation of the Trust. The value of a participant's deferral account is determined by reference to the change in value of Class I shares of one or more of the Funds or a money market fund as specified by the participant. Benefits would be payable after a stated number of years or retirement from the Board of Trustees. The accrued obligations of the Funds under the plan are reflected as deferred Trustee compensation in the Statements of Assets and Liabilities. The change in the accrued obligations for the period is included in Trustees fees in the Statements of Operations. The Trust pays the compensation of the Trustees other than those affiliated with the Adviser and all expenses incurred in connection with their services to the Trust. The Trust does not provide any pension or retirement benefits to its Trustees.
The Funds reimburse the Adviser for a portion of the compensation paid to the Funds' Chief Compliance Officer ("CCO"). The CCO expenses incurred by the Funds are included in other expenses in the Statements of Operations.
3. FEDERAL INCOME TAXES
At September 30, 2013 the cost of investments for federal income tax purposes and related composition of unrealized gains and losses for each Fund were as follows (in thousands):
Fund | | Cost of Investments
for Federal Income
Tax Purposes | | Gross Unrealized
Appreciation | | Gross Unrealized
(Depreciation) | | Net Unrealized
Appreciation
(Depreciation) | |
Oakmark | | $ | 7,296,280 | | | $ | 3,211,196 | | | $ | 0 | | | $ | 3,211,196 | | |
Select | | | 2,491,182 | | | | 1,444,714 | | | | 0 | | | | 1,444,714 | | |
Equity and Income | | | 14,525,624 | | | | 4,912,799 | | | | (28,545 | ) | | | 4,884,254 | | |
Global | | | 2,299,006 | | | | 675,788 | | | | (26,113 | ) | | | 649,675 | | |
Global Select | | | 960,174 | | | | 206,989 | | | | (3,669 | ) | | | 203,320 | | |
International | | | 20,204,544 | | | | 4,125,657 | | | | (249,954 | ) | | | 3,875,703 | | |
Int'l Small Cap | | | 1,907,556 | | | | 400,277 | | | | (66,405 | ) | | | 333,872 | | |
Under the Regulated Investment Company Modernization Act of 2010 (the "Act"), net capital losses arising in taxable years after December 22, 2010 may be carried forward indefinitely, and their character is retained as short-term and/or long-term losses. Previously, net capital losses were carried forward for eight years and treated as short-term losses. As a transition rule, the Act requires that post-enactment net capital losses be used before pre-enactment net capital losses. At September 30, 2013 the Funds had pre-enactment and post-enactment net capital losses for federal income tax purposes as shown in the following table (in thousands):
Fund | | Expires
September 30, 2017 | | Expires
September 30, 2018 | | Unlimited
(Short Term) | | Unlimited
(Long Term) | | Utilized During
the Year ended
September 30, 2013 | |
Oakmark | | $ | 0 | | | $ | 0 | | | $ | 0 | | | $ | 0 | | | $ | 0 | | |
Select | | | 0 | | | | 0 | | | | 0 | | | | 0 | | | | 0 | | |
Equity and Income | | | 0 | | | | 0 | | | | 0 | | | | 0 | | | | 0 | | |
Global | | | 0 | | | | 0 | | | | 0 | | | | 0 | | | | 123,386 | | |
Global Select | | | 0 | | | | 0 | | | | 0 | | | | 0 | | | | 10,038 | | |
International | | | 0 | | | | 0 | | | | 0 | | | | 0 | | | | 429,022 | | |
Int'l Small Cap | | | 0 | | | | 0 | | | | 13,905 | | | | 5,837 | | | | 0 | | |
At September 30, 2013 the components of distributable earnings on a tax basis (excluding unrealized appreciation (depreciation)) were as follows (in thousands):
| | | Undistributed
Ordinary Income | | Undistributed Long-
Term Gain | | Total Distributable
Earnings | |
Oakmark | | $ | 62,604 | | | $ | 517,566 | | | $ | 580,170 | | |
Select | | | 1,957 | | | | 245,352 | | | | 247,309 | | |
Equity and Income | | | 87,417 | | | | 1,580,226 | | | | 1,667,643 | | |
Global | | | 68,840 | | | | 7,899 | | | | 76,739 | | |
Global Select | | | 9,378 | | | | 24,037 | | | | 33,415 | | |
International | | | 381,449 | | | | 196,112 | | | | 577,561 | | |
Int'l Small Cap | | | 84,372 | | | | 0 | | | | 84,372 | | |
oakmark.com 59
The Oakmark Funds
Notes to Financial Statements (continued)
During the years ended September 30, 2013 and 2012 the tax character of distributions paid was as follows (in thousands):
| | | Year Ended
September 30, 2013 | | Year Ended
September 30, 2012 | |
Fund | | Distributions Paid
from Ordinary
Income | | Distributions Paid
from Long-Term
Capital Gain | | Distributions Paid
from Ordinary
Income | | Distributions Paid
from Long-Term
Capital Gain | |
Oakmark | | $ | 54,952 | | | $ | 219,332 | | | $ | 42,131 | | | $ | 0 | | |
Select | | | 2,753 | | | | 289,293 | | | | 5,125 | | | | 0 | | |
Equity and Income | | | 171,904 | | | | 462,042 | | | | 250,657 | | | | 319,667 | | |
Global | | | 33,539 | | | | 0 | | | | 0 | | | | 0 | | |
Global Select | | | 7,715 | | | | 4,628 | | | | 0 | | | | 0 | | |
International | | | 223,778 | | | | 0 | | | | 53,597 | | | | 0 | | |
Int'l Small Cap | | | 24,484 | | | | 0 | | | | 1,698 | | | | 302 | | |
On September 30, 2013 the Funds had temporary book/tax differences in undistributed earnings that were primarily attributable to trustee deferred compensation expenses, passive foreign investment companies, foreign currency contracts, post October currency loss deferrals and deferrals of capital losses on wash sales. Temporary differences will reverse over time. The Funds have permanent differences in book/tax undistributed earnings primarily attributable to currency gains and losses, equalization debits and in-kind transactions gains and losses. Permanent differences have been recorded in their respective component of the Analysis of Net Assets.
4. INVESTMENT TRANSACTIONS
For the year ended September 30, 2013 transactions in investment securities (excluding short-term and U.S. Government securities) were as follows (in thousands):
| | | Oakmark | | Select | | Equity and
Income | | Global | | Global
Select | | International | | Int'l
Small Cap | |
Purchases | | $ | 3,044,573 | | | $ | 815,049 | | | $ | 4,101,291 | | | $ | 1,248,991 | | | $ | 609,129 | | | $ | 15,174,766 | | | $ | 1,026,330 | | |
Proceeds from sales | | | 1,518,871 | | | | 795,801 | | | | 6,294,056 | | | | 1,047,290 | | | | 270,023 | | | | 5,340,963 | | | | 851,938 | | |
Purchases at cost and proceeds from sales (in thousands) of long-term U.S. Government securities for the year ended September 30, 2013 were $190,236 and $1,918,425, respectively, for Equity and Income.
For the year ended September 30, 2013 the proceeds from in-kind sales including short-term securities (in thousands) were $56,798, $125,281 and $28,680 for Equity and Income, Global and International, respectively. The table above excludes such in-kind transactions. Gains and losses on in-kind transactions are not taxable for federal income tax purposes.
During the year ended September 30, 2013 Int'l Small Cap engaged in purchase transactions (in thousands) totaling $2,880 with funds that have a common investment adviser. These purchase transactions complied with Rule 17a-7 under the 1940 Act.
5. INVESTMENT IN AFFILIATED ISSUERS
Each of the companies listed below was considered to be an affiliate of a Fund because that Fund owned 5% or more of the company's voting securities during all or part of the year ended September 30, 2013. Purchase and sale transactions and dividend and interest income earned during the period on these securities are set forth below (in thousands):
Schedule of Transactions with Affiliated Issuers
Equity and Income
Affiliates | | Shares
Held | | Purchases
(Cost) | | Sales
(Proceeds) | | Dividend
Income | | Interest
Income | | Value
September 30,
2012 | | Value
September 30,
2013 | |
Broadridge Financial Solutions, Inc. (b) | | | 5,904 | | | $ | 0 | | | $ | 22,155 | | | $ | 4,607 | | | $ | 0 | | | $ | 160,977 | | | $ | 187,436 | | |
Flowserve Corp. (c) | | | 0 | | | | 0 | | | | 614,027 | | | | 3,660 | | | | 0 | | | | 464,869 | | | | 0 | | |
Foot Locker, Inc. | | | 7,711 | | | | 157,229 | | | | 294 | | | | 3,782 | | | | 0 | | | | 106,500 | | | | 261,705 | | |
PharMerica Corp. (a) (c) | | | 0 | | | | 0 | | | | 25,011 | | | | 0 | | | | 0 | | | | 21,649 | | | | 0 | | |
Varian Medical Systems, Inc. (a) (b) | | | 3,148 | | | | 0 | | | | 183,224 | | | | 0 | | | | 0 | | | | 343,824 | | | | 235,280 | | |
Walter Energy, Inc. (c) | | | 0 | | | | 41,988 | | | | 50,732 | | | | 1,317 | | | | 0 | | | | 97,380 | | | | 0 | | |
Walter Energy, Inc., 144A (b) | | | 5,390 | | | | 5,362 | | | | 11 | | | | 0 | | | | 458 | | | | 0 | | | | 4,689 | | |
Walter Energy, Inc., 144A (b) | | | 5,000 | | | | 5,000 | | | | 0 | | | | 0 | | | | 218 | | | | 0 | | | | 4,175 | | |
TOTALS | | | | $ | 209,579 | | | $ | 895,454 | | | $ | 13,366 | | | $ | 676 | | | $ | 1,195,199 | | | $ | 693,285 | | |
60 THE OAKMARK FUNDS
The Oakmark Funds
Notes to Financial Statements (continued)
Schedule of Transactions with Affiliated Issuers
International
Affiliates | | Shares Held | | Purchases
(Cost) | | Sales
(Proceeds) | | Dividend
Income | | Value
September 30,
2012 | | Value
September 30,
2013 | |
Meitec Corp. | | | 2,805 | | | $ | 12,644 | | | $ | 16,424 | | | $ | 3,302 | | | $ | 64,836 | | | $ | 80,693 | | |
OMRON Corp. (b) | | | 3,755 | | | | 77,322 | | | | 375,809 | | | | 4,330 | | | | 241,978 | | | | 135,431 | | |
Orica, Ltd. | | | 30,592 | | | | 584,615 | | | | 865 | | | | 11,502 | | | | 131,315 | | | | 572,490 | | |
ROHM Co., Ltd. (b) | | | 2,546 | | | | 56,705 | | | | 219,463 | | | | 616 | | | | 219,315 | | | | 104,396 | | |
Willis Group Holdings PLC | | | 12,505 | | | | 318,091 | | | | 17,230 | | | | 10,977 | | | | 165,516 | | | | 541,829 | | |
TOTALS | | | | $ | 1,049,377 | | | $ | 629,791 | | | $ | 30,727 | | | $ | 822,960 | | | $ | 1,434,839 | | |
Schedule of Transactions with Affiliated Issuers
Int'l Small Cap
Affiliates | | Shares Held | | Purchases
(Cost) | | Sales
(Proceeds) | | Dividend
Income | | Value
September 30,
2012 | | Value
September 30,
2013 | |
Atea ASA | | | 6,039 | | | $ | 8,799 | | | $ | 3,123 | | | $ | 4,930 | | | $ | 53,914 | | | $ | 63,525 | | |
gategroup Holding AG (a) | | | 1,640 | | | | 7,850 | | | | 0 | | | | 0 | | | | 31,635 | | | | 41,984 | | |
LSL Property Services PLC | | | 5,974 | | | | 0 | | | | 27,713 | | | | 1,384 | | | | 35,183 | | | | 44,805 | | |
Orbotech, Ltd. (a) | | | 3,501 | | | | 1,969 | | | | 0 | | | | 0 | | | | 28,603 | | | | 41,972 | | |
Pasona Group, Inc. (c) | | | 0 | | | | 0 | | | | 16,741 | | | | 0 | | | | 20,938 | | | | 0 | | |
Saft Groupe SA | | | 1,340 | | | | 35,574 | | | | 0 | | | | 1,117 | | | | 0 | | | | 36,977 | | |
Vitec Group PLC | | | 2,213 | | | | 1,100 | | | | 458 | | | | 749 | | | | 24,790 | | | | 24,417 | | |
TOTALS | | | | $ | 55,292 | | | $ | 48,035 | | | $ | 8,180 | | | $ | 195,063 | | | $ | 253,680 | | |
(a) Non-income producing security.
(b) Due to transactions during the year ended September 30, 2013, the company is no longer an affiliate.
(c) Position in issuer liquidated during the year ended September 30, 2013.
6. SUBSEQUENT EVENTS
Management has evaluated the possibility of subsequent events existing in the Funds' financial statements. International Fund was closed to most new investors as of the close of business on October 4, 2013. Please see the Prospectus Supplement dated October 4, 2013 available on oakmark.com, for additional information. Management has determined that there are no other material events that would require adjustment or disclosure in the Funds' financial statements through the date of the publication of this report.
oakmark.com 61
Financial Highlights–Class I
For a share outstanding throughout each period
| | | Year Ended September 30, | |
| | | 2013 | | 2012 | | 2011 | | 2010 | | 2009 | |
Net Asset Value, Beginning of Year | | $ | 48.97 | | | $ | 37.87 | | | $ | 38.36 | | | $ | 34.55 | | | $ | 35.31 | | |
Income From Investment Operations: | |
Net Investment Income | | | 0.42 | (a) | | | 0.36 | (a) | | | 0.34 | (a) | | | 0.24 | | | | 0.29 | (a) | |
Net Gain (Loss) on Investments (both realized and unrealized) | | | 12.22 | | | | 11.09 | | | | (0.58 | ) | | | 3.80 | | | | 0.39 | | |
Total From Investment Operations | | | 12.64 | | | | 11.45 | | | | (0.24 | ) | | | 4.04 | | | | 0.68 | | |
Less Distributions: | |
From Net Investment Income | | | (0.38 | ) | | | (0.35 | ) | | | (0.25 | ) | | | (0.23 | ) | | | (0.45 | ) | |
From Capital Gains | | | (1.50 | ) | | | 0.00 | | | | 0.00 | | | | 0.00 | | | | (0.99 | ) | |
Total Distributions | | | (1.88 | ) | | | (0.35 | ) | | | (0.25 | ) | | | (0.23 | ) | | | (1.44 | ) | |
Redemption Fees | | | 0.00 | | | | 0.00 | (b) | | | 0.00 | (b) | | | 0.00 | (b) | | | 0.00 | (b) | |
Net Asset Value, End of Year | | $ | 59.73 | | | $ | 48.97 | | | $ | 37.87 | | | $ | 38.36 | | | $ | 34.55 | | |
Total Return | | | 26.75 | % | | | 30.43 | % | | | -0.67 | % | | | 11.74 | % | | | 3.38 | % | |
Ratios/Supplemental Data: | |
Net Assets, End of Year ($million) | | $ | 10,409.0 | | | $ | 6,738.7 | | | $ | 4,512.5 | | | $ | 3,419.3 | | | $ | 3,144.2 | | |
Ratio of Expenses to Average Net Assets | | | 0.95 | % | | | 1.03 | % | | | 1.04 | % | | | 1.11 | % | | | 1.23 | % | |
Ratio of Net Investment Income to Average Net Assets | | | 0.78 | % | | | 0.81 | % | | | 0.82 | % | | | 0.65 | % | | | 1.06 | % | |
Portfolio Turnover Rate | | | 19 | % | | | 27 | % | | | 18 | % | | | 24 | % | | | 62 | % | |
Financial Highlights–Class II
For a share outstanding throughout each period
| | | Year Ended September 30, | |
| | | 2013 | | 2012 | | 2011 | | 2010 | | 2009 | |
Net Asset Value, Beginning of Year | | $ | 48.89 | | | $ | 37.78 | | | $ | 38.32 | | | $ | 34.56 | | | $ | 35.12 | | |
Income From Investment Operations: | |
Net Investment Income | | | 0.27 | (a) | | | 0.24 | (a) | | | 0.19 | (a) | | | 0.13 | | | | 0.24 | (a) | |
Net Gain (Loss) on Investments (both realized and unrealized) | | | 12.20 | | | | 11.09 | | | | (0.59 | ) | | | 3.79 | | | | 0.45 | | |
Total From Investment Operations | | | 12.47 | | | | 11.33 | | | | (0.40 | ) | | | 3.92 | | | | 0.69 | | |
Less Distributions: | |
From Net Investment Income | | | (0.28 | ) | | | (0.22 | ) | | | (0.14 | ) | | | (0.16 | ) | | | (0.26 | ) | |
From Capital Gains | | | (1.50 | ) | | | 0.00 | | | | 0.00 | | | | 0.00 | | | | (0.99 | ) | |
Total Distributions | | | (1.78 | ) | | | (0.22 | ) | | | (0.14 | ) | | | (0.16 | ) | | | (1.25 | ) | |
Redemption Fees | | | 0.00 | | | | 0.00 | (b) | | | 0.00 | (b) | | | 0.00 | (b) | | | 0.00 | (b) | |
Net Asset Value, End of Year | | $ | 59.58 | | | $ | 48.89 | | | $ | 37.78 | | | $ | 38.32 | | | $ | 34.56 | | |
Total Return | | | 26.41 | % | | | 30.11 | % | | | -1.07 | % | | | 11.37 | % | | | 3.22 | % | |
Ratios/Supplemental Data: | |
Net Assets, End of Year ($million) | | $ | 93.8 | | | $ | 36.1 | | | $ | 24.7 | | | $ | 9.0 | | | $ | 8.2 | | |
Ratio of Expenses to Average Net Assets | | | 1.23 | % | | | 1.30 | % | | | 1.45 | % | | | 1.42 | % | | | 1.44 | % | |
Ratio of Net Investment Income to Average Net Assets | | | 0.49 | % | | | 0.54 | % | | | 0.44 | % | | | 0.34 | % | | | 0.88 | % | |
Portfolio Turnover Rate | | | 19 | % | | | 27 | % | | | 18 | % | | | 24 | % | | | 62 | % | |
(a) Computed using average shares outstanding throughout the period.
(b) Amount rounds to less than $0.01 per share.
62 THE OAKMARK FUNDS
Financial Highlights–Class I
For a share outstanding throughout each period
| | | Year Ended September 30, | |
| | | 2013 | | 2012 | | 2011 | | 2010 | | 2009 | |
Net Asset Value, Beginning of Year | | $ | 32.33 | | | $ | 25.50 | | | $ | 25.64 | | | $ | 22.68 | | | $ | 20.34 | | |
Income From Investment Operations: | |
Net Investment Income | | | 0.04 | | | | 0.04 | | | | 0.04 | (a) | | | 0.06 | (a) | | | 0.11 | (a) | |
Net Gain (Loss) on Investments (both realized and unrealized) | | | 8.40 | | | | 6.85 | | | | (0.12 | ) | | | 2.97 | | | | 2.48 | | |
Total From Investment Operations | | | 8.44 | | | | 6.89 | | | | (0.08 | ) | | | 3.03 | | | | 2.59 | | |
Less Distributions: | |
From Net Investment Income | | | (0.03 | ) | | | (0.06 | ) | | | (0.06 | ) | | | (0.07 | ) | | | (0.25 | ) | |
From Capital Gains | | | (3.00 | ) | | | 0.00 | | | | 0.00 | | | | 0.00 | | | | 0.00 | | |
Total Distributions | | | (3.03 | ) | | | (0.06 | ) | | | (0.06 | ) | | | (0.07 | ) | | | (0.25 | ) | |
Redemption Fees | | | 0.00 | | | | 0.00 | (b) | | | 0.00 | (b) | | | 0.00 | (b) | | | 0.00 | (b) | |
Net Asset Value, End of Year | | $ | 37.74 | | | $ | 32.33 | | | $ | 25.50 | | | $ | 25.64 | | | $ | 22.68 | | |
Total Return | | | 28.40 | % | | | 27.05 | % | | | -0.34 | % | | | 13.39 | % | | | 13.30 | % | |
Ratios/Supplemental Data: | |
Net Assets, End of Year ($million) | | $ | 3,944.6 | | | $ | 3,029.5 | | | $ | 2,266.7 | | | $ | 2,407.8 | | | $ | 2,265.3 | | |
Ratio of Expenses to Average Net Assets | | | 1.01 | % | | | 1.05 | % | | | 1.07 | % | | | 1.08 | % | | | 1.19 | % | |
Ratio of Net Investment Income to Average Net Assets | | | 0.11 | % | | | 0.11 | % | | | 0.15 | % | | | 0.22 | % | | | 0.66 | % | |
Portfolio Turnover Rate | | | 24 | % | | | 32 | % | | | 16 | % | | | 25 | % | | | 34 | % | |
Financial Highlights–Class II
For a share outstanding throughout each period
| | | Year Ended September 30, | |
| | | 2013 | | 2012 | | 2011 | | 2010 | | 2009 | |
Net Asset Value, Beginning of Year | | $ | 32.21 | | | $ | 25.43 | | | $ | 25.59 | | | $ | 22.70 | | | $ | 20.29 | | |
Income From Investment Operations: | |
Net Investment Income (Loss) | | | (0.11 | ) | | | (0.06 | )(a) | | | (0.05 | )(a) | | | (0.02 | )(a) | | | 0.12 | (a) | |
Net Gain (Loss) on Investments (both realized and unrealized) | | | 8.40 | | | | 6.84 | | | | (0.11 | ) | | | 2.97 | | | | 2.49 | | |
Total From Investment Operations | | | 8.29 | | | | 6.78 | | | | (0.16 | ) | | | 2.95 | | | | 2.61 | | |
Less Distributions: | |
From Net Investment Income | | | 0.00 | | | | 0.00 | | | | 0.00 | | | | (0.06 | ) | | | (0.20 | ) | |
From Capital Gains | | | (3.00 | ) | | | 0.00 | | | | 0.00 | | | | 0.00 | | | | 0.00 | | |
Total Distributions | | | (3.00 | ) | | | 0.00 | | | | 0.00 | | | | (0.06 | ) | | | (0.20 | ) | |
Redemption Fees | | | 0.00 | | | | 0.00 | (b) | | | 0.00 | (b) | | | 0.00 | (b) | | | 0.00 | (b) | |
Net Asset Value, End of Year | | $ | 37.50 | | | $ | 32.21 | | | $ | 25.43 | | | $ | 25.59 | | | $ | 22.70 | | |
Total Return | | | 27.99 | % | | | 26.66 | % | | | -0.63 | % | | | 12.99 | % | | | 13.34 | % | |
Ratios/Supplemental Data: | |
Net Assets, End of Year ($million) | | $ | 15.0 | | | $ | 11.8 | | | $ | 8.0 | | | $ | 8.3 | | | $ | 8.1 | | |
Ratio of Expenses to Average Net Assets | | | 1.33 | % | | | 1.36 | % | | | 1.38 | % | | | 1.39 | % | | | 1.28 | % | |
Ratio of Net Investment Income (loss) to Average Net Assets | | | (0.21 | )% | | | (0.21 | )% | | | (0.16 | )% | | | (0.08 | )% | | | 0.72 | % | |
Portfolio Turnover Rate | | | 24 | % | | | 32 | % | | | 16 | % | | | 25 | % | | | 34 | % | |
(a) Computed using average shares outstanding throughout the period.
(b) Amount rounds to less than $0.01 per share.
oakmark.com 63
Oakmark Equity and Income Fund
Financial Highlights–Class I
For a share outstanding throughout each period
| | | Year Ended September 30, | |
| | | 2013 | | 2012 | | 2011 | | 2010 | | 2009 | |
Net Asset Value, Beginning of Year | | $ | 29.09 | | | $ | 25.62 | | | $ | 26.03 | | | $ | 24.72 | | | $ | 25.57 | | |
Income From Investment Operations: | |
Net Investment Income | | | 0.28 | | | | 0.25 | | | | 0.26 | | | | 0.27 | (a) | | | 0.35 | (a) | |
Net Gain (Loss) on Investments (both realized and unrealized) | | | 4.68 | | | | 4.07 | | | | (0.45 | ) | | | 1.33 | | | | (0.24 | ) | |
Total From Investment Operations | | | 4.96 | | | | 4.32 | | | | (0.19 | ) | | | 1.60 | | | | 0.11 | | |
Less Distributions: | |
From Net Investment Income | | | (0.27 | ) | | | (0.38 | ) | | | (0.22 | ) | | | (0.29 | ) | | | (0.39 | ) | |
From Capital Gains | | | (0.72 | ) | | | (0.47 | ) | | | 0.00 | | | | 0.00 | | | | (0.57 | ) | |
Total Distributions | | | (0.99 | ) | | | (0.85 | ) | | | (0.22 | ) | | | (0.29 | ) | | | (0.96 | ) | |
Net Asset Value, End of Year | | $ | 33.06 | | | $ | 29.09 | | | $ | 25.62 | | | $ | 26.03 | | | $ | 24.72 | | |
Total Return | | | 17.63 | % | | | 17.19 | % | | | -0.77 | % | | | 6.52 | % | | | 1.02 | % | |
Ratios/Supplemental Data: | |
Net Assets, End of Year ($million) | | $ | 18,222.5 | | | $ | 17,889.0 | | | $ | 16,441.0 | | | $ | 16,993.7 | | | $ | 14,418.4 | | |
Ratio of Expenses to Average Net Assets | | | 0.77 | % | | | 0.78 | % | | | 0.77 | % | | | 0.79 | % | | | 0.85 | % | |
Ratio of Net Investment Income to Average Net Assets | | | 0.89 | % | | | 0.84 | % | | | 0.93 | % | | | 1.04 | % | | | 1.59 | % | |
Portfolio Turnover Rate | | | 25 | %(b) | | | 29 | % | | | 47 | % | | | 91 | % | | | 78 | %(b) | |
Financial Highlights–Class II
For a share outstanding throughout each period
| | | Year Ended September 30, | |
| | | 2013 | | 2012 | | 2011 | | 2010 | | 2009 | |
Net Asset Value, Beginning of Year | | $ | 28.90 | | | $ | 25.45 | | | $ | 25.85 | | | $ | 24.57 | | | $ | 25.40 | | |
Income From Investment Operations: | |
Net Investment Income | | | 0.17 | | | | 0.15 | | | | 0.17 | | | | 0.18 | | | | 0.28 | (a) | |
Net Gain (Loss) on Investments (both realized and unrealized) | | | 4.66 | | | | 4.05 | | | | (0.43 | ) | | | 1.33 | | | | (0.24 | ) | |
Total From Investment Operations | | | 4.83 | | | | 4.20 | | | | (0.26 | ) | | | 1.51 | | | | 0.04 | | |
Less Distributions: | |
From Net Investment Income | | | (0.18 | ) | | | (0.28 | ) | | | (0.14 | ) | | | (0.23 | ) | | | (0.30 | ) | |
From Capital Gains | | | (0.72 | ) | | | (0.47 | ) | | | 0.00 | | | | 0.00 | | | | (0.57 | ) | |
Total Distributions | | | (0.90 | ) | | | (0.75 | ) | | | (0.14 | ) | | | (0.23 | ) | | | (0.87 | ) | |
Net Asset Value, End of Year | | $ | 32.83 | | | $ | 28.90 | | | $ | 25.45 | | | $ | 25.85 | | | $ | 24.57 | | |
Total Return | | | 17.23 | % | | | 16.82 | % | | | -1.04 | % | | | 6.17 | % | | | 0.70 | % | |
Ratios/Supplemental Data: | |
Net Assets, End of Year ($million) | | $ | 1,211.4 | | | $ | 1,288.0 | | | $ | 1,212.2 | | | $ | 1,270.1 | | | $ | 1,110.4 | | |
Ratio of Expenses to Average Net Assets | | | 1.10 | % | | | 1.09 | % | | | 1.09 | % | | | 1.12 | % | | | 1.18 | % | |
Ratio of Net Investment Income to Average Net Assets | | | 0.56 | % | | | 0.53 | % | | | 0.61 | % | | | 0.71 | % | | | 1.26 | % | |
Portfolio Turnover Rate | | | 25 | %(b) | | | 29 | % | | | 47 | % | | | 91 | % | | | 78 | %(b) | |
(a) Computed using average shares outstanding throughout the period.
(b) The ratio excludes in-kind transactions.
64 THE OAKMARK FUNDS
Financial Highlights–Class I
For a share outstanding throughout each period
| | | Year Ended September 30, | |
| | | 2013 | | 2012 | | 2011 | | 2010 | | 2009 | |
Net Asset Value, Beginning of Year | | $ | 21.63 | | | $ | 18.81 | | | $ | 20.39 | | | $ | 18.94 | | | $ | 19.43 | | |
Income From Investment Operations: | |
Net Investment Income | | | 0.21 | | | | 0.20 | | | | 0.16 | (a) | | | 0.10 | | | | 0.11 | | |
Net Gain (Loss) on Investments (both realized and unrealized) | | | 8.23 | | | | 2.62 | | | | (1.65 | ) | | | 1.49 | | | | 0.13 | | |
Total From Investment Operations | | | 8.44 | | | | 2.82 | | | | (1.49 | ) | | | 1.59 | | | | 0.24 | | |
Less Distributions: | |
From Net Investment Income | | | (0.37 | ) | | | 0.00 | | | | (0.09 | ) | | | (0.14 | ) | | | (0.70 | ) | |
From Capital Gains | | | 0.00 | | | | 0.00 | | | | 0.00 | | | | 0.00 | | | | (0.03 | ) | |
Total Distributions | | | (0.37 | ) | | | 0.00 | | | | (0.09 | ) | | | (0.14 | ) | | | (0.73 | ) | |
Redemption Fees | | | 0.00 | (b) | | | 0.00 | (b) | | | 0.00 | (b) | | | 0.00 | (b) | | | 0.00 | (b) | |
Net Asset Value, End of Year | | $ | 29.70 | | | $ | 21.63 | | | $ | 18.81 | | | $ | 20.39 | | | $ | 18.94 | | |
Total Return | | | 39.55 | % | | | 14.99 | % | | | -7.38 | % | | | 8.43 | % | | | 2.65 | % | |
Ratios/Supplemental Data: | |
Net Assets, End of Year ($million) | | $ | 2,880.4 | | | $ | 2,062.8 | | | $ | 1,816.9 | | | $ | 2,031.8 | | | $ | 1,675.9 | | |
Ratio of Expenses to Average Net Assets | | | 1.13 | % | | | 1.16 | % | | | 1.16 | % | | | 1.15 | % | | | 1.23 | % | |
Ratio of Net Investment Income to Average Net Assets | | | 0.75 | % | | | 0.91 | % | | | 0.70 | % | | | 0.53 | % | | | 0.76 | % | |
Portfolio Turnover Rate | | | 45 | %(c) | | | 26 | % | | | 29 | %(c) | | | 37 | % | | | 32 | % | |
Financial Highlights–Class II
For a share outstanding throughout each period
| | | Year Ended September 30, | |
| | | 2013 | | 2012 | | 2011 | | 2010 | | 2009 | |
Net Asset Value, Beginning of Year | | $ | 21.11 | | | $ | 18.42 | | | $ | 19.97 | | | $ | 18.58 | | | $ | 19.01 | | |
Income From Investment Operations: | |
Net Investment Income | | | 0.03 | | | | 0.11 | (a) | | | 0.06 | (a) | | | 0.00 | (b) | | | 0.07 | (a) | |
Net Gain (Loss) on Investments (both realized and unrealized) | | | 8.14 | | | | 2.58 | | | | (1.61 | ) | | | 1.48 | | | | 0.14 | | |
Total From Investment Operations | | | 8.17 | | | | 2.69 | | | | (1.55 | ) | | | 1.48 | | | | 0.21 | | |
Less Distributions: | |
From Net Investment Income | | | (0.30 | ) | | | 0.00 | | | | 0.00 | (b) | | | (0.09 | ) | | | (0.61 | ) | |
From Capital Gains | | | 0.00 | | | | 0.00 | | | | 0.00 | | | | 0.00 | | | | (0.03 | ) | |
Total Distributions | | | (0.30 | ) | | | 0.00 | | | | 0.00 | (b) | | | (0.09 | ) | | | (0.64 | ) | |
Redemption Fees | | | 0.00 | (b) | | | 0.00 | (b) | | | 0.00 | (b) | | | 0.00 | (b) | | | 0.00 | (b) | |
Net Asset Value, End of Year | | $ | 28.98 | | | $ | 21.11 | | | $ | 18.42 | | | $ | 19.97 | | | $ | 18.58 | | |
Total Return | | | 39.11 | % | | | 14.60 | % | | | -7.75 | % | | | 8.02 | % | | | 2.43 | % | |
Ratios/Supplemental Data: | |
Net Assets, End of Year ($million) | | $ | 38.9 | | | $ | 33.1 | | | $ | 36.6 | | | $ | 50.5 | | | $ | 54.4 | | |
Ratio of Expenses to Average Net Assets | | | 1.48 | % | | | 1.50 | % | | | 1.55 | % | | | 1.54 | % | | | 1.54 | % | |
Ratio of Net Investment Income to Average Net Assets | | | 0.40 | % | | | 0.55 | % | | | 0.27 | % | | | 0.09 | % | | | 0.46 | % | |
Portfolio Turnover Rate | | | 45 | %(c) | | | 26 | % | | | 29 | %(c) | | | 37 | % | | | 32 | % | |
(a) Computed using average shares outstanding throughout the period.
(b) Amount rounds to less than $0.01 per share.
(c) The ratio excludes in-kind transactions.
oakmark.com 65
Oakmark Global Select Fund
Financial Highlights–Class I
For a share outstanding throughout each period
| | | Year Ended September 30, | |
| | | 2013 | | 2012 | | 2011 | | 2010 | | 2009 | |
Net Asset Value, Beginning of Year | | $ | 11.65 | | | $ | 9.96 | | | $ | 10.15 | | | $ | 9.54 | | | $ | 8.23 | | |
Income From Investment Operations: | |
Net Investment Income | | | 0.14 | | | | 0.09 | | | | 0.02 | | | | 0.04 | | | | 0.06 | | |
Net Gain (Loss) on Investments (both realized and unrealized) | | | 4.18 | | | | 1.60 | | | | (0.19 | ) | | | 0.61 | | | | 1.60 | | |
Total From Investment Operations | | | 4.32 | | | | 1.69 | | | | (0.17 | ) | | | 0.65 | | | | 1.66 | | |
Less Distributions: | |
From Net Investment Income | | | (0.16 | ) | | | 0.00 | | | | (0.02 | ) | | | (0.04 | ) | | | (0.35 | ) | |
From Capital Gains | | | (0.10 | ) | | | 0.00 | | | | 0.00 | | | | 0.00 | | | | 0.00 | | |
Total Distributions | | | (0.26 | ) | | | 0.00 | | | | (0.02 | ) | | | (0.04 | ) | | | (0.35 | ) | |
Redemption Fees | | | 0.00 | | | | 0.00 | (a) | | | 0.00 | (a) | | | 0.00 | (a) | | | 0.00 | (a) | |
Net Asset Value, End of Year | | $ | 15.71 | | | $ | 11.65 | | | $ | 9.96 | | | $ | 10.15 | | | $ | 9.54 | | |
Total Return | | | 37.69 | % | | | 16.97 | % | | | -1.65 | % | | | 6.81 | % | | | 22.24 | % | |
Ratios/Supplemental Data: | |
Net Assets, End of Year ($million) | | $ | 1,159.8 | | | $ | 555.8 | | | $ | 422.0 | | | $ | 329.9 | | | $ | 266.2 | | |
Ratio of Expenses to Average Net Assets | | | 1.15 | % | | | 1.23 | % | | | 1.24 | % | | | 1.29 | % | | | 1.43 | % | |
Ratio of Net Investment Income to Average Net Assets | | | 1.01 | % | | | 0.72 | % | | | 0.33 | % | | | 0.40 | % | | | 0.88 | % | |
Portfolio Turnover Rate | | | 36 | % | | | 36 | % | | | 49 | % | | | 50 | % | | | 41 | % | |
(a) Amount rounds to less than $0.01 per share.
66 THE OAKMARK FUNDS
Oakmark International Fund
Financial Highlights–Class I
For a share outstanding throughout each period
| | | Year Ended September 30, | |
| | | 2013 | | 2012 | | 2011 | | 2010 | | 2009 | |
Net Asset Value, Beginning of Year | | $ | 18.79 | | | $ | 16.13 | | | $ | 18.18 | | | $ | 16.25 | | | $ | 15.71 | | |
Income From Investment Operations: | |
Net Investment Income | | | 0.28 | | | | 0.34 | (a) | | | 0.31 | (a) | | | 0.20 | (a) | | | 0.16 | (a) | |
Net Gain (Loss) on Investments (both realized and unrealized) | | | 7.26 | | | | 2.45 | | | | (2.20 | ) | | | 1.85 | | | | 1.87 | | |
Total From Investment Operations | | | 7.54 | | | | 2.79 | | | | (1.89 | ) | | | 2.05 | | | | 2.03 | | |
Less Distributions: | |
From Net Investment Income | | | (0.44 | ) | | | (0.13 | ) | | | (0.16 | ) | | | (0.12 | ) | | | (1.39 | ) | |
From Capital Gains | | | 0.00 | | | | 0.00 | | | | 0.00 | | | | 0.00 | | | | (0.10 | ) | |
Total Distributions | | | (0.44 | ) | | | (0.13 | ) | | | (0.16 | ) | | | (0.12 | ) | | | (1.49 | ) | |
Redemption Fees | | | 0.00 | | | | 0.00 | (b) | | | 0.00 | (b) | | | 0.00 | (b) | | | 0.00 | (b) | |
Net Asset Value, End of Year | | $ | 25.89 | | | $ | 18.79 | | | $ | 16.13 | | | $ | 18.18 | | | $ | 16.25 | | |
Total Return | | | 40.79 | % | | | 17.40 | % | | | -10.54 | % | | | 12.67 | % | | | 17.71 | % | |
Ratios/Supplemental Data: | |
Net Assets, End of Year ($million) | | $ | 23,886.0 | | | $ | 8,993.6 | | | $ | 6,920.8 | | | $ | 5,707.4 | | | $ | 4,045.4 | | |
Ratio of Expenses to Average Net Assets | | | 0.98 | % | | | 1.06 | % | | | 1.06 | % | | | 1.08 | % | | | 1.17 | % | |
Ratio of Net Investment Income to Average Net Assets | | | 1.58 | % | | | 1.90 | % | | | 1.63 | % | | | 1.21 | % | | | 1.32 | % | |
Portfolio Turnover Rate | | | 37 | %(c) | | | 38 | % | | | 45 | % | | | 51 | % | | | 53 | % | |
Financial Highlights–Class II
For a share outstanding throughout each period
| | | Year Ended September 30, | |
| | | 2013 | | 2012 | | 2011 | | 2010 | | 2009 | |
Net Asset Value, Beginning of Year | | $ | 18.86 | | | $ | 16.18 | | | $ | 18.25 | | | $ | 16.38 | | | $ | 15.55 | | |
Income From Investment Operations: | |
Net Investment Income | | | 0.27 | (a) | | | 0.27 | | | | 0.24 | (a) | | | 0.14 | (a) | | | 0.14 | (a) | |
Net Gain (Loss) on Investments (both realized and unrealized) | | | 7.23 | | | | 2.47 | | | | (2.20 | ) | | | 1.86 | | | | 1.96 | | |
Total From Investment Operations | | | 7.50 | | | | 2.74 | | | | (1.96 | ) | | | 2.00 | | | | 2.10 | | |
Less Distributions: | |
From Net Investment Income | | | (0.38 | ) | | | (0.06 | ) | | | (0.11 | ) | | | (0.13 | ) | | | (1.17 | ) | |
From Capital Gains | | | 0.00 | | | | 0.00 | | | | 0.00 | | | | 0.00 | | | | (0.10 | ) | |
Total Distributions | | | (0.38 | ) | | | (0.06 | ) | | | (0.11 | ) | | | (0.13 | ) | | | (1.27 | ) | |
Redemption Fees | | | 0.00 | | | | 0.00 | (b) | | | 0.00 | (b) | | | 0.00 | (b) | | | 0.00 | (b) | |
Net Asset Value, End of Year | | $ | 25.98 | | | $ | 18.86 | | | $ | 16.18 | | | $ | 18.25 | | | $ | 16.38 | | |
Total Return | | | 40.31 | % | | | 16.99 | % | | | -10.85 | % | | | 12.26 | % | | | 17.70 | % | |
Ratios/Supplemental Data: | |
Net Assets, End of Year ($million) | | $ | 386.9 | | | $ | 241.4 | | | $ | 204.0 | | | $ | 146.0 | | | $ | 107.8 | | |
Ratio of Expenses to Average Net Assets | | | 1.34 | % | | | 1.39 | % | | | 1.45 | % | | | 1.45 | % | | | 1.32 | % | |
Ratio of Net Investment Income to Average Net Assets | | | 1.20 | % | | | 1.55 | % | | | 1.26 | % | | | 0.83 | % | | | 1.15 | % | |
Portfolio Turnover Rate | | | 37 | %(c) | | | 38 | % | | | 45 | % | | | 51 | % | | | 53 | % | |
(a) Computed using average shares outstanding throughout the period.
(b) Amount rounds to less than $0.01 per share.
(c) The ratio excludes in-kind transactions.
oakmark.com 67
Oakmark International Small Cap Fund
Financial Highlights–Class I
For a share outstanding throughout each period
| | | Year Ended September 30, | |
| | | 2013 | | 2012 | | 2011 | | 2010 | | 2009 | |
Net Asset Value, Beginning of Year | | $ | 13.06 | | | $ | 11.56 | | | $ | 13.02 | | | $ | 11.51 | | | $ | 11.36 | | |
Income From Investment Operations: | |
Net Investment Income | | | 0.18 | | | | 0.20 | | | | 0.15 | (a) | | | 0.12 | (a) | | | 0.15 | (a) | |
Net Gain (Loss) on Investments (both realized and unrealized) | | | 4.26 | | | | 1.32 | | | | (1.53 | ) | | | 1.55 | | | | 1.06 | | |
Total From Investment Operations | | | 4.44 | | | | 1.52 | | | | (1.38 | ) | | | 1.67 | | | | 1.21 | | |
Less Distributions: | |
From Net Investment Income | | | (0.21 | ) | | | (0.02 | ) | | | (0.08 | ) | | | (0.16 | ) | | | (0.93 | ) | |
From Capital Gains | | | 0.00 | | | | 0.00 | (b) | | | 0.00 | | | | 0.00 | | | | (0.13 | ) | |
Total Distributions | | | (0.21 | ) | | | (0.02 | ) | | | (0.08 | ) | | | (0.16 | ) | | | (1.06 | ) | |
Redemption Fees | | | 0.00 | (b) | | | 0.00 | (b) | | | 0.00 | (b) | | | 0.00 | (b) | | | 0.00 | (b) | |
Net Asset Value, End of Year | | $ | 17.29 | | | $ | 13.06 | | | $ | 11.56 | | | $ | 13.02 | | | $ | 11.51 | | |
Total Return | | | 34.42 | % | | | 13.15 | % | | | -10.72 | % | | | 14.70 | % | | | 16.28 | % | |
Ratios/Supplemental Data: | |
Net Assets, End of Year ($million) | | $ | 2,254.1 | | | $ | 1,525.8 | | | $ | 1,328.4 | | | $ | 1,217.2 | | | $ | 768.0 | | |
Ratio of Expenses to Average Net Assets | | | 1.35 | % | | | 1.41 | % | | | 1.38 | % | | | 1.38 | % | | | 1.54 | % | |
Ratio of Net Investment Income to Average Net Assets | | | 1.23 | % | | | 1.54 | % | | | 1.10 | % | | | 1.02 | % | | | 1.77 | % | |
Portfolio Turnover Rate | | | 50 | % | | | 33 | % | | | 46 | % | | | 54 | % | | | 46 | % | |
Financial Highlights–Class II
For a share outstanding throughout each period
| | | Year Ended September 30, | |
| | | 2013 | | 2012 | | 2011 | | 2010 | | 2009 | |
Net Asset Value, Beginning of Year | | $ | 12.98 | | | $ | 11.50 | | | $ | 12.97 | | | $ | 11.50 | | | $ | 11.33 | | |
Income From Investment Operations: | |
Net Investment Income | | | 0.13 | (a) | | | 0.17 | (a) | | | 0.12 | (a) | | | 0.09 | (a) | | | 0.14 | (a) | |
Net Gain (Loss) on Investments (both realized and unrealized) | | | 4.24 | | | | 1.31 | | | | (1.55 | ) | | | 1.54 | | | | 1.06 | | |
Total From Investment Operations | | | 4.37 | | | | 1.48 | | | | (1.43 | ) | | | 1.63 | | | | 1.20 | | |
Less Distributions: | |
From Net Investment Income | | | (0.18 | ) | | | 0.00 | | | | (0.04 | ) | | | (0.16 | ) | | | (0.90 | ) | |
From Capital Gains | | | 0.00 | | | | 0.00 | (b) | | | 0.00 | | | | 0.00 | | | | (0.13 | ) | |
Total Distributions | | | (0.18 | ) | | | 0.00 | (b) | | | (0.04 | ) | | | (0.16 | ) | | | (1.03 | ) | |
Redemption Fees | | | 0.00 | (b) | | | 0.00 | (b) | | | 0.00 | (b) | | | 0.00 | (b) | | | 0.00 | (b) | |
Net Asset Value, End of Year | | $ | 17.17 | | | $ | 12.98 | | | $ | 11.50 | | | $ | 12.97 | | | $ | 11.50 | | |
Total Return | | | 34.04 | % | | | 12.90 | % | | | -11.09 | % | | | 14.30 | % | | | 16.08 | % | |
Ratios/Supplemental Data: | |
Net Assets, End of Year ($million) | | $ | 3.5 | | | $ | 2.6 | | | $ | 1.9 | | | $ | 1.4 | | | $ | 0.8 | | |
Ratio of Expenses to Average Net Assets | | | 1.64 | % | | | 1.69 | % | | | 1.72 | % | | | 1.72 | % | | | 1.71 | % | |
Ratio of Net Investment Income to Average Net Assets | | | 0.90 | % | | | 1.34 | % | | | 0.85 | % | | | 0.74 | % | | | 1.66 | % | |
Portfolio Turnover Rate | | | 50 | % | | | 33 | % | | | 46 | % | | | 54 | % | | | 46 | % | |
(a) Computed using average shares outstanding throughout the period.
(b) Amount rounds to less than $0.01 per share.
68 THE OAKMARK FUNDS
Report of Independent Registered Public Accounting Firm
To the Board of Trustees and
Shareholders of Harris
Associates Investment Trust
We have audited the accompanying statements of assets and liabilities, including the schedules of investments, of Harris Associates Investment Trust, comprised of Oakmark Fund, Oakmark Select Fund, Oakmark Equity and Income Fund, Oakmark Global Fund, Oakmark Global Select Fund, Oakmark International Fund, and Oakmark International Small Cap Fund (collectively the "Funds"), as of September 30, 2013, the related statements of operations for the year then ended, the statements of changes in net assets for each of the two years in the period then ended, and the financial highlights for each of the five years in the period then ended. These financial statements and financial highlights are the responsibility of the Funds' management. Our responsibility is to express an opinion on these financial statements and financial highlights based on our audits.
We conducted our audits in accordance with the standards of the Public Company Accounting Oversight Board (United States). Those standards require that we plan and perform the audits to obtain reasonable assurance about whether the financial statements and financial highlights are free of material misstatement. The Funds are not required to have, nor were we engaged to perform, an audit of their internal control over financial reporting. Our audits included consideration of internal control over financial reporting as a basis for designing audit procedures that are appropriate in the circumstances, but not for the purpose of expressing an opinion on the effectiveness of the Funds' internal control over financial reporting. Accordingly, we express no such opinion. An audit also includes examining, on a test basis, evidence supporting the amounts and disclosures in the financial statements, assessing the accounting principles used and significant estimates made by management, as well as evaluating the overall financial statement presentation. Our procedures included confirmation of securities owned as of September 30, 2013, by correspondence with the Funds' custodian and brokers; where replies were not received from brokers, we performed other auditing procedures. We believe that our audits provide a reasonable basis for our opinion.
In our opinion, the financial statements and financial highlights referred to above present fairly, in all material respects, the financial position of each of the Funds as of September 30, 2013, the results of their operations for the year then ended, the changes in their net assets for each of the two years in the period then ended, and the financial highlights for each of the five years in the period then ended, in conformity with accounting principles generally accepted in the United States of America.

Chicago, Illinois
November 18, 2013
oakmark.com 69
Federal Tax Information
(Unaudited)
Global, Global Select, International and Int'l Small Cap paid qualifying foreign taxes of $1,192,430, $728,435, $18,652,864 and $2,207,721 and earned $26,796,887, $9,716,088, $313,376,740 and $40,554,694 of foreign source income during the year ended September 30, 2013, respectively. Pursuant to Section 853 of the Internal Revenue Code, Global, Global Select, International and Int'l Small Cap designated $0.01, $0.01, $0.02 and $0.02 per share as foreign taxes paid and $0.27, $0.13, $0.33 and $0.31 per share as income earned from foreign sources for the year ended September 30, 2013, respectively.
Qualified dividend income ("QDI") received by the Funds through September 30, 2013 that qualified for a reduced tax rate pursuant to the Jobs and Growth Tax Relief Reconciliation Act of 2003 are as follows (in thousands):
Fund | |
Oakmark | | $ | 150,666 | | |
Select | | | 36,464 | | |
Equity and Income | | | 215,024 | | |
Global | | | 37,197 | | |
Global Select | | | 14,707 | | |
International | | | 302,673 | | |
Int'l Small Cap | | | 38,689 | | |
For corporate shareholders, a portion of the ordinary dividends paid during the Funds' year ended September 30, 2013 qualified for the dividends received deduction, as follows:
Fund | |
Oakmark | | | 100.00 | % | |
Select | | | 100.00 | % | |
Equity and Income | | | 100.00 | % | |
Global | | | 42.43 | % | |
Global Select | | | 55.77 | % | |
International | | | 0.00 | % | |
Int'l Small Cap | | | 0.00 | % | |
Disclosures and Endnotes
Reporting to Shareholders. The Funds reduce the number of duplicate prospectuses, annual and semi-annual reports your household receives by sending only one copy of each to those addresses shared by two or more accounts. Call the Funds at 1-800-OAKMARK to request individual copies of these documents. The Funds will begin sending individual copies thirty days after receiving your request.
Before investing in any Oakmark Fund, you should carefully consider the Fund's investment objectives, risks, management fees and other expenses. This and other important information is contained in a Fund's prospectus and summary prospectus. Please read the prospectus and summary prospectus carefully before investing. For more information, please visit oakmark.com or call 1-800-OAKMARK (625-6275).
The discussion of the Funds' investments and investment strategy (including current investment themes, the portfolio managers' research and investment process, and portfolio characteristics) represents the Funds' investments and the views of the portfolio managers and Harris Associates L.P., the Funds' investment adviser, at the time of this report, and are subject to change without notice.
Endnotes:
1. The S&P 500 Total Return Index is a market capitalization-weighted index of 500 large-capitalization stocks commonly used to represent the U.S. equity market. All returns reflect reinvested dividends and capital gains distributions. This index is unmanaged and investors cannot invest directly in this index.
2. Total return includes change in share prices and in each case includes reinvestment of any dividends and capital gain distributions.
3. The Dow Jones Industrial Average is an index that includes 30 U.S. blue-chip stocks that are generally the leaders in their industry. This index is unmanaged and investors cannot invest directly in this index.
4. The Lipper Large Cap Value Funds Index is an equally-weighted index of the largest 30 funds within the large cap value funds investment objective as defined by Lipper Inc. The index is adjusted for the reinvestment of capital gains and income dividends. This index is unmanaged and investors cannot invest directly in this index.
5. Portfolio holdings are subject to change without notice and are not intended as recommendations of individual stocks.
6. The Price-Earnings Ratio ("P/E") is the most common measure of the expensiveness of a stock.
7. The Lipper Multi-Cap Value Funds Index tracks the results of the 30 largest mutual funds in the Lipper Multi-Cap Value Funds category. This index is unmanaged and investors cannot invest directly in this index.
8. The Barclays U.S. Aggregate Bond Index is a benchmark index made up of the Barclays U.S. Government/Credit Bond Index, Mortgage-Backed Securities Index, and Asset-Backed Securities Index, including securities that are investment-grade quality or higher, have at least one year to maturity, and have an outstanding par value of at least $100 million. This index is unmanaged and investors cannot invest directly in this index.
9. The Lipper Balanced Funds Index measures the performance of the 30 largest U.S. balanced funds tracked
70 THE OAKMARK FUNDS
Disclosures and Endnotes (continued)
by Lipper. This index is unmanaged and investors cannot invest directly in this index.
10. The Barclays U.S. Government/Credit Index is a benchmark index made up of the Barclays U.S. Government and U.S. Corporate Bond indices, including U.S. government Treasury and agency securities as well as corporate and Yankee bonds. This index is unmanaged and investors cannot invest directly in this index.
11. The MSCI World Index (Net) is a free float-adjusted market capitalization weighted index that is designed to measure the global equity market performance of developed markets. This benchmark calculates reinvested dividends net of withholding taxes using Luxembourg tax rates. This index is unmanaged and investors cannot invest directly in this index.
12. The Lipper Global Funds Index measures the performance of the 30 largest mutual funds that invest in securities throughout the world. This index is unmanaged and investors cannot invest directly in this index.
13. The MSCI World ex U.S. Index (Net) is a free float-adjusted market capitalization index that is designed to measure international developed market equity performance, excluding the U.S. This benchmark calculates reinvested dividends net of withholding taxes using Luxembourg tax rates. This index is unmanaged and investors cannot invest directly in this index.
14. The MSCI EAFE (Europe, Australasia, Far East) Index (Net) is a free float-adjusted market capitalization index that is designed to measure the international equity market performance of developed markets, excluding the U.S. & Canada. This benchmark calculates reinvested dividends net of withholding taxes using Luxembourg tax rates. This index is unmanaged and investors cannot invest directly in this index.
15. The Lipper International Funds Index reflects the net asset value weighted total return of the 30 largest international equity funds. This index is unmanaged and investors cannot invest directly in this index.
16. The MSCI World ex U.S. Small Cap Index (Net) is a free float-adjusted market capitalization index that is designed to measure global developed market equity performance, excluding the U.S. The MSCI Small Cap Indices target 40% of the eligible Small Cap universe within each industry group, within each country. MSCI defines the Small Cap universe as all listed securities that have a market capitalization in the range of USD200-1,500 million. This benchmark calculates reinvested dividends net of withholding taxes using Luxembourg tax rates. This index is unmanaged and investors cannot invest directly in this index.
17. The Lipper International Small Cap Funds Index measures the performance of the 10 largest international small-cap funds tracked by Lipper. This index is unmanaged and investors cannot invest directly in this index.
OAKMARK, OAKMARK FUNDS, OAKMARK INTERNATIONAL, and OAKMARK and tree design are trademarks owned or registered by Harris Associates L.P. in the U.S. and/or other countries.
oakmark.com 71
The board of trustees has overall responsibility for the conduct of the affairs of Harris Associates Investment Trust ("Trust"), and its seven series, The Oakmark Funds. Each trustee serves until the next annual meeting of shareholders and until the election and qualification of his or her successor, or until he or she dies, resigns or is removed. Each trustee must retire at the end of the calendar year in which the trustee attains the age of 72. The board of trustees may fill any vacancy on the board provided that after such appointment, at least two-thirds of the trustees have been elected by the shareholders. No person shall be appointed or elected to serve as a trustee after attaining the age of 65. The shareholders may remove a trustee by a vote of two-thirds of the outstanding shares of the Trust at any meeting of shareholders called for the purpose of removing such trustee.
The board of trustees elects or appoints the officers of the Trust. The president, any vice president, treasurer and secretary serves until the election and qualification of his or her successor, or until he or she dies, resigns, or is removed or disqualified. Each other officer shall serve at the pleasure of the board of trustees. The board of trustees may remove any officer at any time, with or without cause, by the vote of a majority of the trustees then in office.
The names and ages of the trustees and officers, the position each holds with the Trust, the date each was first elected to office, their principal business occupations during the last five years and other directorships held are shown below.
Trustees Who Are Interested Persons of the Trust
Name and age† | | First Year
of Current
Position | | Principal
Occupation(s) Held
During Past Five Years# | | Other Directorships
Held by Trustee | |
Kristi L. Rowsell*
47
President | | | 2010 | | | President and Director, HAI, Harris Associates L.P. ("HALP") and Harris Associates Securities L.P. ("HASLP"), since 2010; Director, Chief Financial Officer and Treasurer, HAI, HALP and HASLP 2005-2010. | | None | |
Trustees Who Are Not Interested Persons of the Trust
Name and age† | | First Year
of Current
Position | | Principal
Occupation(s) Held
During Past Five Years# | | Other Directorships
Held by Trustee | |
Allan J. Reich**
65
Chairman | | | 1993 | | | Senior Partner, Seyfarth Shaw LLP (law firm). | | None | |
Michael J. Friduss
71 | | | 1995 | | | Principal, MJ Friduss & Associates (telecommunications consultants). | | None | |
Thomas H. Hayden
62 | | | 1995 | | | Lecturer, Department of Integrated Marketing Communications, the Medill School, Northwestern University, since July 2006. | | None | |
Christine M. Maki
52 | | | 1995 | | | Senior Vice President—Tax, RR Donnelley & Sons Company (global provider of integrated communications), since August 2008; Senior Vice President—Tax, Global Hyatt Corporation (hotel management) from 1995 to 2008. | | None | |
Laurence C. Morse, Ph.D.***
62 | | | 2013 | | | Managing Partner, Fairview Capital Partners, Inc. (private equity investment management firm). | | Director, Webster Bank (bank and financial institution); Director, Webster Financial Corporation (bank holding company) | |
Steven S. Rogers
56 | | | 2006 | | | Senior Lecturer of Business Administration, Harvard Business School since 2012; Clinical Professor of Finance & Management, Kellogg Graduate School of Management, Northwestern University since 1995-2012; Entrepreneur-in-Residence, Ewing Marion Kauffman Foundation since 1994. | | Director, SC Johnson Wax (manufacturer of household cleaning, personal care and insecticide products), AMCORE Financial, Inc. (bank holding company), and W.S. Darley & Co. (fire fighting and emergency equipment manufacturers) | |
Burton W. Ruder
69 | | | 1995 | | | President, BWR Enterprises (venture capital investment and transactional financing firm); Manager, Cedar Green Associates (real estate management firm). | | None | |
Peter S. Voss
66 | | | 1995 | | | Retired, since 2007. | | None | |
Gary N. Wilner, M.D.****
72 | | | 1993 | | | Retired, since 2004. | | None | |
72 THE OAKMARK FUNDS
Trustees and Officers (continued)
Other Officers of the Trust
Name and age† | | Position(s) with Trust | | First Year
of Current
Position | | Principal Occupation(s)
Held During Past Five Years# | |
Robert M. Levy
63 | | Executive Vice President | | | 2003 | | | Director, HAI; Chairman and Chief Investment Officer, Domestic Equity of HAI, HALP and HASLP; Portfolio Manager, HALP | |
Judson H. Brooks####
42 | | Vice President | | | 2013 | | | Analyst, HALP | |
Anthony P. Coniaris##
36 | | Vice President and Portfolio Manager (Oakmark Select Fund) | | | 2013 | | | Portfolio Manager and Analyst, HALP | |
Richard J. Gorman
47 | | Vice President, Chief Compliance Officer, Anti-Money Laundering Officer, and Assistant Secretary | | | 2006 | | | Chief Compliance Officer of the Trust | |
Kevin G. Grant
49 | | Vice President and Portfolio Manager (Oakmark Fund) | | | 2000 | | | Portfolio Manager and Analyst, HALP | |
Thomas E. Herman
51 | | Principal Financial Officer | | | 2011 | | | Chief Financial Officer and Treasurer, HAI, HALP and HASLP since 2010; Senior V.P., Chief Financial Officer and Treasurer, Ariel Investments, prior thereto. | |
David G. Herro
52 | | Vice President and Portfolio Manager (Oakmark Global Select Fund, Oakmark International Fund and Oakmark International Small Cap Fund) | | | 1992 | | | Director, HAI; Vice President and Chief Investment Officer, International Equity, HAI and HALP; Portfolio Manager and Analyst, HALP | |
M. Colin Hudson###
43 | | Vice President and Portfolio Manager (Oakmark Equity and Income Fund) | | | 2013 | | | Portfolio Manager and Analyst, HALP | |
John J. Kane
42 | | Treasurer | | | 2005 | | | Director, Global Investment Services, HALP since 2008 | |
Matthew A. Logan###
29 | | Vice President and Portfolio Manager (Oakmark Equity and Income Fund) | | | 2013 | | | Portfolio Manager and Analyst, HALP | |
Michael L. Manelli
33 | | Vice President and Portfolio Manager (Oakmark International Small Cap Fund) | | | 2011 | | | Portfolio Manager and Analyst, HALP | |
Clyde S. McGregor
60 | | Vice President and Portfolio Manager (Oakmark Equity and Income Fund and Oakmark Global Fund) | | | 1995 | | | Vice President, HAI and HALP; Portfolio Manager, HALP | |
Thomas W. Murray##
43 | | Vice President and Portfolio Manager (Oakmark Select Fund) | | | 2013 | | | Vice President and Director of Domestic Research, HAI and HALP since 2012; Portfolio Manager and Analyst, HALP | |
Michael J. Neary
45 | | Vice President | | | 2009 | | | Managing Director, Marketing and Client Relations, HALP | |
William C. Nygren
55 | | Vice President and Portfolio Manager (Oakmark Fund, Oakmark Select Fund and Oakmark Global Select Fund) | | | 1996 | | | Vice President, HAI and HALP; Portfolio Manager and Analyst, HALP | |
Vineeta D. Raketich
42 | | Vice President | | | 2003 | | | Managing Director, Global Operations and Client Relations, HALP | |
Janet L. Reali
62 | | Vice President, Secretary and Chief Legal Officer | | | 2001 | | | Director, HAI; Vice President, General Counsel and Secretary, HAI and HALP; General Counsel and Chief Compliance Officer, HASLP | |
Robert A. Taylor
40 | | Vice President and Portfolio Manager (Oakmark Global Fund and Oakmark International Fund) | | | 2005 | | | Vice President and Director of International Research HAI and HALP; Portfolio Manager and Analyst, HALP | |
oakmark.com 73
Trustees and Officers (continued)
Name and age† | | Position(s) with Trust | | First Year
of Current
Position | | Principal Occupation(s)
Held During Past Five Years# | |
Andrew J. Tedeschi
48 | | Assistant Treasurer | | | 2008 | | | Employee of HALP | |
Edward J. Wojciechowski###
40 | | Vice President and Portfolio Manager (Oakmark Equity and Income Fund) | | | 2013 | | | Portfolio Manager, Analyst and Director of Fixed Income, HALP | |
Randall T. Zipfel#####
55 | | Vice President | | | 2013 | | | Chief Operating Officer, HALP since 2013; formerly, Senior Vice President, Chief Administrative Officer and Chief Operating Officer, Calamos Investments (2006-2013) | |
† Age for Trustees and Officers is as of September 30, 2013.
* Ms. Rowsell is a trustee who is an "interested person" of the Trust as defined in the 1940 Act because she is an officer of the Adviser and a director of HAI.
** On January 1, 2013, Allan J. Reich was appointed Chairman of the board of trustees.
*** Dr. Morse was appointed a Trustee effective October 15, 2013.
**** Dr. Wilner retired from the board of trustees on December 31, 2012.
# As used in this table, "HALP," "HAI" and "HASLP" refer to the Adviser, the general partner of the Adviser, and the Funds' distributor, respectively.
## Prior to January 2013, Messrs. Coniaris and Murray were not officers or portfolio managers of the Select Fund.
### Prior to April 17, 2013, Messrs. Hudson, Logan and Wojciechowski were not officers or portfolio managers of the Equity and Income Fund.
#### Prior to July 17, 2013, Mr. Brooks was not an officer of the Trust.
##### Prior to October 16, 2013, Mr. Zipfel was not an officer of the Trust.
Unless otherwise noted, the business address of each officer and trustee listed in the tables is Two North LaSalle Street, Suite 500, Chicago, Illinois 60602-3790.
The Statement of Additional Information (SAI) contains further information about the trustees and is available without charge upon your request by calling 1-800-625-6275.
74 THE OAKMARK FUNDS
The Oakmark Funds
Other Information
Investment Adviser
Harris Associates L.P.
Two North LaSalle Street
Chicago, Illinois 60602-3790
Transfer Agent
Boston Financial Data Services, Inc.
Quincy, Massachusetts
Legal Counsel
K&L Gates LLP
Chicago, Illinois
Independent Registered Public Accounting Firm
Deloitte & Touche LLP
Chicago, Illinois
Contact Us
Please call 1-800-OAKMARK
(1-800-625-6275)
or 617-483-8327
Website
oakmark.com
To obtain a prospectus, an application or periodic reports, access our web site at oakmark.com, or call 1-800-OAKMARK (1-800-625-6275) or (617) 483-8327.
Each Fund will file its complete schedule of portfolio holdings with the Securities and Exchange Commission ("SEC") for the first and third quarters of each fiscal year on Form N-Q. The Funds' Form N-Q is available on the SEC's website at sec.gov. The Funds' Form N-Q may be reviewed and copied at the SEC's Public Reference Room in Washington, DC, and information on the operation of the Public Reference Room may be obtained by calling 1-800-SEC-0330.
A description of the policies and procedures the Funds use to determine how to vote proxies relating to portfolio securities is available without charge, upon request, by calling toll-free 1-800-625-6275; on the Funds' website at oakmark.com; and on the Securities and Exchange Commission's website at sec.gov.
No later than August 31 of each year, information regarding how the Adviser, on behalf of the Funds, voted proxies relating to the Funds' portfolio securities for the twelve months ended the preceding June 30 will be available through a link on the Funds' website at oakmark.com and on the SEC's website at sec.gov.
This report is submitted for the general information of the shareholders of the Funds.The report is not authorized for distribution to prospective investors in the Funds unless it is accompanied or preceded by a currently effective prospectus or summary prospectus of the Funds.
No sales charge to the shareholder or to the new investor is made in offering the shares of the Funds, however, a shareholder of the Oakmark International Small Cap Fund may incur a 2% redemption fee on an exchange or redemption of Class I Shares and Class II Shares held for 90 days or less.


THE VALUE OF A $10,000 INVESTMENT IN OAKMARK FUND FROM ITS
INCEPTION (04/05/01) TO PRESENT (09/30/13) AS COMPARED TO THE
STANDARD & POOR'S 500 INDEX (UNAUDITED)

Average Annual Total Returns
(as of 09/30/13)
(Unaudited) | | 1-year | | 5-year | | 10-year | | Since
Inception
(04/05/01) | |
Oakmark Fund (Class II) | | | 26.41 | % | | | 13.34 | % | | | 8.45 | % | | | 7.20 | % | |
S&P 500 Index | | | 19.34 | % | | | 10.02 | % | | | 7.57 | % | | | 5.12 | % | |
The graph and table do not reflect the deduction of taxes that a shareholder would pay on fund distributions or the redemption of fund shares.
The expense ratio for Class II shares as of 09/30/12 was 1.30% and 1.23% as of 09/30/13.
The performance data quoted represents past performance. Past performance does not guarantee future results. The investment return and principal value will fluctuate so that an investor's shares, when redeemed, may be worth more or less than their original cost. Current performance may be lower or higher than the performance data quoted. Average annual total return measures annualized change, while total return measures aggregate change. To obtain the most recent month-end performance data, visit oakmark.com.
The S&P 500 Total Return Index is a broad market-weighted average of U.S. blue-chip companies. This index is unmanaged and investors cannot invest directly in this index.
Harris Associates Securities L.P., member FINRA, November 2013
OAKMARK SELECT FUND CLASS II
THE VALUE OF A $10,000 INVESTMENT IN OAKMARK SELECT FUND FROM ITS
INCEPTION (12/31/99) TO PRESENT (09/30/13) AS COMPARED TO THE
STANDARD & POOR'S 500 INDEX (UNAUDITED)
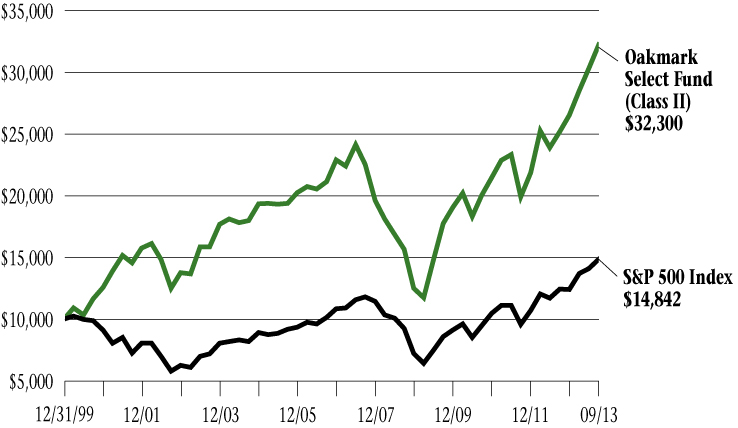
Average Annual Total Returns
(as of 09/30/13)
(Unaudited) | | 1-year | | 5-year | | 10-year | | Since
Inception
(12/31/99) | |
Oakmark Select Fund (Class II) | | | 27.99 | % | | | 15.59 | % | | | 7.36 | % | | | 8.90 | % | |
S&P 500 Index | | | 19.34 | % | | | 10.02 | % | | | 7.57 | % | | | 2.91 | % | |
The graph and table do not reflect the deduction of taxes that a shareholder would pay on fund distributions or the redemption of fund shares.
The expense ratio for Class II shares as of 09/30/12 was 1.36% and 1.33% as of 09/30/13.
The performance data quoted represents past performance. Past performance does not guarantee future results. The investment return and principal value will fluctuate so that an investor's shares, when redeemed, may be worth more or less than their original cost. Current performance may be lower or higher than the performance data quoted. Average annual total return measures annualized change, while total return measures aggregate change. To obtain the most recent month-end performance data, visit oakmark.com.
The S&P 500 Total Return Index is a broad market-weighted average of U.S. blue-chip companies. This index is unmanaged and investors cannot invest directly in this index.
Harris Associates Securities L.P., member FINRA, November 2013
OAKMARK EQUITY AND INCOME FUND CLASS II
THE VALUE OF A $10,000 INVESTMENT IN OAKMARK EQUITY AND INCOME
FUND FROM ITS INCEPTION (07/12/00) TO PRESENT (09/30/13) AS COMPARED TO
THE LIPPER BALANCED FUND INDEX (UNAUDITED)
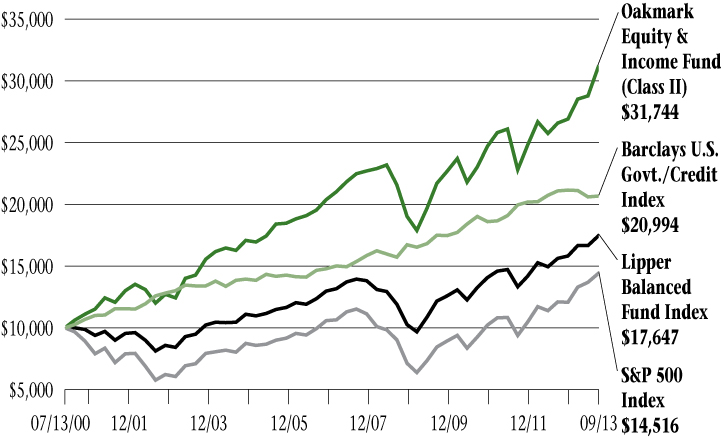
Average Annual Total Returns
(as of 09/30/13)
| (Unaudited) | | 1-year | | 5-year | | 10-year | | Since
Inception
(7/13/00) | |
Oakmark Equity & Income Fund
(Class II) | | | 17.23 | % | | | 7.70 | % | | | 8.22 | % | | | 9.13 | % | |
Lipper Balanced Fund Index | | | 11.70 | % | | | 8.11 | % | | | 6.44 | % | | | 4.39 | % | |
S&P 500 Index | | | 19.34 | % | | | 10.02 | % | | | 7.57 | % | | | 2.86 | % | |
Barclays U.S. Govt./Credit Index | | | -1.96 | % | | | 5.71 | % | | | 4.52 | % | | | 5.77 | % | |
The graph and table do not reflect the deduction of taxes that a shareholder would pay on fund distributions or the redemption of fund shares.
The expense ratio for Class II shares as of 09/30/12 was 1.09% and 1.10% as of 09/30/13.
The performance data quoted represents past performance. Past performance does not guarantee future results. The investment return and principal value will fluctuate so that an investor's shares, when redeemed, may be worth more or less than their original cost. Current performance may be lower or higher than the performance data quoted. Average annual total return measures annualized change, while total return measures aggregate change. To obtain the most recent month-end performance data, visit oakmark.com.
The Lipper Balanced Fund Index measures the performance of the 30 largest U.S. balanced funds tracked by Lipper. This index is unmanaged and investors cannot invest directly in this index.
Harris Associates Securities L.P., member FINRA, November 2013
OAKMARK GLOBAL FUND CLASS II
THE VALUE OF A $10,000 INVESTMENT IN OAKMARK GLOBAL FUND
FROM ITS INCEPTION (10/10/01) TO PRESENT (09/30/13) AS COMPARED TO THE
MSCI WORLD INDEX (UNAUDITED)
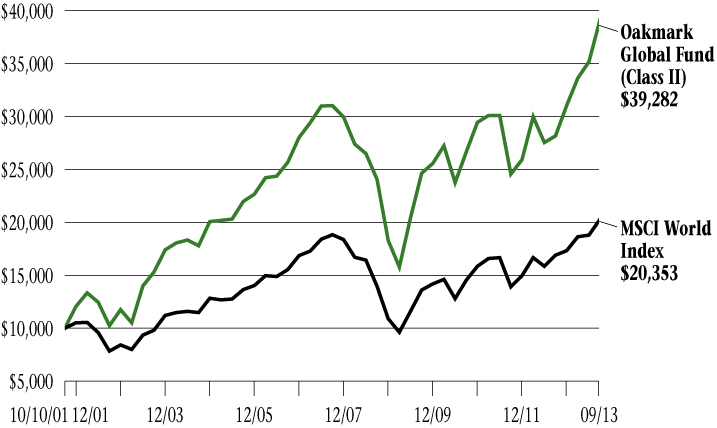
Average Annual Total Returns
(as of 09/30/13)
| (Unaudited) | | 1-year | | 5-year | | 10-year | | Since
Inception
(10/10/01) | |
Oakmark Global Fund (Class II) | | | 39.11 | % | | | 10.23 | % | | | 9.87 | % | | | 12.11 | % | |
MSCI World Index | | | 20.21 | % | | | 7.84 | % | | | 7.58 | % | | | 6.12 | % | |
The graph and table do not reflect the deduction of taxes that a shareholder would pay on fund distributions or the redemption of fund shares.
The expense ratio for Class II shares as of 09/30/12 was 1.50% and 1.48% as of 09/30/13.
The performance data quoted represents past performance. Past performance does not guarantee future results. The investment return and principal value will fluctuate so that an investor's shares, when redeemed, may be worth more or less than their original cost. Current performance may be lower or higher than the performance data quoted. Average annual total return measures annualized change, while total return measures aggregate change. To obtain the most recent month-end performance data, visit oakmark.com.
The MSCI World Index (Net) is a free float-adjusted market capitalization weighted index that is designed to measure the global equity market performance of developed markets. This benchmark calculates reinvested dividends net of withholding taxes using Luxembourg tax rates. This index is unmanaged and investors cannot invest directly in this index.
Harris Associates Securities L.P., member FINRA, November 2013
OAKMARK INTERNATIONAL FUND CLASS II
THE VALUE OF A $10,000 INVESTMENT IN OAKMARK INTERNATIONAL FUND
FROM ITS INCEPTION (11/04/99) TO PRESENT (09/30/13) AS COMPARED TO THE
MSCI WORLD EX U.S. INDEX (UNAUDITED)
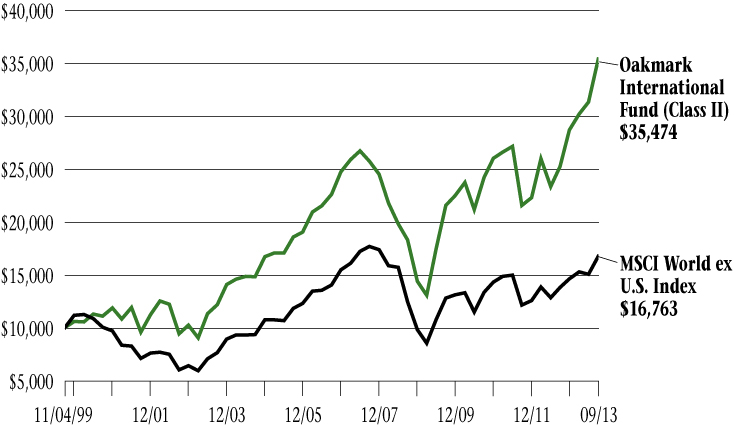
Average Annual Total Returns
(as of 09/30/13)
| (Unaudited) | | 1-year | | 5-year | | 10-year | | Since
Inception
(11/04/99) | |
Oakmark International Fund (Class II) | | | 40.31 | % | | | 14.10 | % | | | 11.27 | % | | | 9.53 | % | |
MSCI World ex U.S. Index | | | 21.45 | % | | | 6.12 | % | | | 8.18 | % | | | 3.79 | % | |
The graph and table do not reflect the deduction of taxes that a shareholder would pay on fund distributions or the redemption of fund shares.
The expense ratio for Class II shares as of 09/30/12 was 1.39% and 1.34% as of 09/30/13.
The performance data quoted represents past performance. Past performance does not guarantee future results. The investment return and principal value will fluctuate so that an investor's shares, when redeemed, may be worth more or less than their original cost. Current performance may be lower or higher than the performance data quoted. Average annual total return measures annualized change, while total return measures aggregate change. To obtain the most recent month-end performance data, visit oakmark.com.
The MSCI World ex U.S. Index (Net) is a free float-adjusted market capitalization index that is designed to measure international developed market equity performance, excluding the U.S. This benchmark calculates reinvested dividends net of withholding taxes using Luxembourg tax rates. This index is unmanaged and investors cannot invest directly in this index.
Harris Associates Securities L.P., member FINRA, November 2013
OAKMARK INTERNATIONAL
SMALL CAP FUND CLASS II
THE VALUE OF A $10,000 INVESTMENT IN OAKMARK INTERNATIONAL SMALL CAP FUND FROM ITS INCEPTION (01/08/01) TO PRESENT (09/30/13) AS COMPARED TO THE MSCI WORLD EX U.S. SMALL CAP INDEX (UNAUDITED)

Average Annual Total Returns
(as of 09/30/13)
| (Unaudited) | | 1-year | | 5-year | | 10-year | | Since
Inception
(1/8/01) | |
Oakmark International Small Cap Fund
(Class II) | | | 34.04 | % | | | 12.29 | % | | | 11.70 | % | | | 11.69 | % | |
MSCI World ex U.S. Small Cap Index | | | 24.75 | % | | | 11.06 | % | | | 10.15 | % | | | 9.22 | % | |
The graph and table do not reflect the deduction of taxes that a shareholder would pay on fund distributions or the redemption of fund shares.
The expense ratio for Class II shares as of 09/30/12 was 1.69% and 1.64% as of 09/30/13.
The performance data quoted represents past performance. The above performance information does not reflect the imposition of a 2% redemption fee on shares held for 90 days or less. If reflected, the fee would reduce the performance quoted. Past performance does not guarantee future results. The investment return and principal value will fluctuate so that an investor's shares, when redeemed, may be worth more or less than their original cost. Current performance may be lower or higher than the performance data quoted. Average annual total return measures annualized change, while total return measures aggregate change. To obtain the most recent month-end performance data, visit oakmark.com.
The MSCI World ex U.S. Small Cap Index (Net) is a free float-adjusted market capitalization index that is designed to measure global developed market equity performance, excluding the U.S. The MSCI Small Cap Indices target 40% of the eligible Small Cap universe within each industry group, within each country. MSCI defines the Small Cap universe as all listed securities that have a market capitalization in the range of USD200-1,500 million. This benchmark calculates reinvested dividends net of withholding taxes using Luxembourg tax rates. This index is unmanaged and investors cannot invest directly in this index.
Harris Associates Securities L.P., member FINRA, November 2013
Item 2. Code of Ethics.
(a) Registrant has adopted a code of ethics (the “Code”) that applies to its Principal Executive Officer, Principal Financial Officer and Principal Accounting Officer.
(b) No disclosures are required by this Item 2(b).
(c) During the period covered by the report, no amendments were made to the provisions of the Code.
(d) During the period covered by the report, Registrant did not grant any waivers, including implicit waivers, from the provisions of the Code.
(e) Not applicable.
(f) A copy of the Code is filed as Exhibit (a)(1) to this Form N-CSR. Copies of the Code will also be made available free of charge upon request, by writing or calling The Oakmark Funds, P.O. Box 8510, Boston, MA 02266-8510, 1-800-OAKMARK, (1-800-625-6275).
Item 3. Audit Committee Financial Expert.
Registrant’s board of trustees has determined that each of the following members of the Registrant’s audit committee qualifies as an “audit committee financial expert,” as such term is defined in Instruction 2(b) to Item 3 of Form N-CSR: Christine M. Maki, Stephen S. Rogers, Burton W. Ruder and Peter S. Voss. Each of those members of Registrant’s audit committee is “independent” as such term is defined in paragraph (a)(2) of Item 3 of Form N-CSR.
Under applicable securities laws, a person who is determined to be an audit committee financial expert will not be deemed an “expert” for any purpose, including without limitation for the purposes of Section 11 of the Securities Act of 1933, as a result of being designated or identified as an audit committee financial expert. The designation or identification of a person as an audit committee financial expert does not impose on such person any duties, obligations, or liability that are greater than the duties, obligations, and liability imposed on such person as a member of the audit committee and board of trustees in the absence of such designation or identification. The designation or identification of a person as an audit committee financial expert does not affect the duties, obligations, or liability of any other member of the audit committee or board of trustees.
Item 4. Principal Accountant Fees and Services.
Aggregate fees billed to the Registrant for professional services rendered by the Registrant’s principal accountant were as follows:
| | Fiscal Year
Ended
September 30,
2013 | | Fiscal Year
Ended
September 30,
2012 | |
Audit Fees(1) | | $ | 243,000 | | $ | 243,000 | |
Audit-Related Fees(2) | | $ | 0 | | $ | 0 | |
Tax Fees(3) | | $ | 39,700 | | $ | 39,700 | |
All Other Fees(4) | | $ | 124,421 | | $ | 0 | |
During its regularly scheduled periodic meetings, the Registrant’s audit committee will pre-approve all audit, audit-related, tax and other services to be provided by the principal accountants of the Registrant. The audit committee has authorized its chair to exercise that authority in the intervals between meetings; and the chair presents any such pre-approvals to the audit committee at its next regularly scheduled meeting. Under paragraph (c)(7)(i)(C) of Rule 2-01 of Regulation S-X, pre-approval of non-audit services may be waived provided that: 1) the aggregate amount for all such services provided constitutes no more than five percent of the total amount of revenues paid by the Registrant to its principal accountant during the fiscal year in which such services are provided; 2) such services were not recognized by management at the time of engagement as non-audit services; and 3) such services are promptly brought to the attention of the Registrant’s audit committee by management and approved prior to the completion of the audit by the audit committee or by one or more members of the audit committee who are members of the board of trustees to whom authority to grant such approvals has been delegated by the audit committee.
No audit-related, tax or non-audit services were approved by waiver pursuant to paragraph (c)(7)(i)(C) of Rule 2-01 of Regulation S-X.
(1) “Audit Fees” include amounts for professional services rendered by the principal accountant for the audit of the Registrant’s annual financial statements and services that are normally provided by the accountant in connection with statutory and regulatory filings or engagements.
(2) “Audit-Related Fees” include amounts for assurance and related services by the principal accountant that are reasonably related to the performance of the audit of the Registrant’s financial statements.
(3) “Tax Fees” include amounts for professional services rendered by the principal accountant for tax compliance, tax advice and tax planning, specifically distribution consultation.
(4) “All Other Fees” include amounts for products and services provided by the principal accountant.
Less than 50 percent of the hours expended on the principal accountant’s engagement to audit the Registrant’s financial statements for the most recent fiscal year were attributed to work performed by persons other than the principal accountant’s full-time, permanent employees.
The aggregate non-audit fees billed for the fiscal years ended September 30, 2013 and September 30, 2012 by the Registrant’s principal accountant for services rendered to the Registrant, its investment adviser and any entity controlling, controlled by or under common control with the investment adviser that provides ongoing services to the Registrant were $124,421 and $0, respectively. These non-audit services provided to the Registrant by the principal accountant related to clerical and ministerial tasks for the filing of tax reclaims in certain European Union countries.
The audit committee of Registrant’s board of trustees has considered whether the provision of non-audit services that were rendered by Registrant’s principal accountant to Registrant’s investment adviser, and any entity controlling, controlled by or under common control with the investment adviser that provides ongoing services to the Registrant that were not pre-approved pursuant to paragraph (c)(7)(ii) of Rule 2-01 of Regulation S-X is compatible with maintaining the principal accountant’s independence.
Item 5. Audit Committee of Listed Registrants.
Not applicable.
Item 6. Investments.
(a) The Schedule of Investments in securities of unaffiliated issuers as of the close of the reporting period is included as part of the annual report to shareholders filed under Item 1 of this Form.
(b) No disclosures are required by this Item 6(b).
Item 7. Disclosure of Proxy Voting Policies and Procedures for Closed-End Management Investment Companies.
Not applicable.
Item 8. Portfolio Managers of Closed-End Management Investment Companies.
Not applicable.
Item 9. Purchases of Equity Securities by Closed-End Management Investment Company and Affiliated Purchasers.
Not applicable.
Item 10. Submission of Matters to a Vote of Security Holders.
During the period covered by this report, no material changes were made to the procedures by which shareholders may recommend nominees to the Registrant’s board of trustees that were adopted in fiscal year 2004.
Item 11. Controls and Procedures.
(a) Based on an evaluation of the Registrant’s disclosure controls and procedures (as defined in Rule 30a-3(c) under the Investment Company Act of 1940, the “Disclosure Controls”), the Disclosure Controls are effectively designed to ensure that information required to be disclosed by the Registrant in this report is recorded, processed, summarized, and reported within 90 days prior to the filing of this report, including ensuring that information required to be disclosed in this report is accumulated and communicated to the Registrant’s management, including the Registrant’s principal executive officer and principal financial officer, as appropriate to allow timely decisions regarding required disclosure.
(b) There were no changes in the Registrant’s internal controls over financial reporting (as defined in Rule 30a-3(d) under the Investment Company Act of 1940) that occurred during the Registrant’s second fiscal quarter of the time period covered by this report that has materially affected, or is reasonably likely to materially affect, the Registrant’s internal control over financial reporting.
Item 12. Exhibits.
(a)(1) Code of Ethics for Principal Executive Officer and Senior Financial Officers (as referenced in Item 2 above), attached hereto as Exhibit (a)(1).
(2) Certifications of Kristi L. Rowsell, Principal Executive Officer, and Thomas E. Herman, Principal Financial Officer, pursuant to Rule 30a-2 under the Investment Company Act of 1940 (17 CFR 270.30a-2), attached hereto as Exhibits (a)(2)(i) and (a)(2)(ii).
(3) Not applicable.
(b) Certification of Kristi L. Rowsell, Principal Executive Officer, and Thomas E. Herman, Principal Financial Officer, pursuant to Section 906 of the Sarbanes-Oxley Act of 2002, attached hereto as Exhibit (b).
SIGNATURES
Pursuant to the requirements of the Securities Exchange Act of 1934 and the Investment Company Act of 1940, the Registrant has duly caused this report to be signed on its behalf by the undersigned, thereunto duly authorized.
Harris Associates Investment Trust
By: | /s/ Kristi L. Rowsell | |
| Kristi L. Rowsell | |
| Principal Executive Officer | |
Date: | November 22, 2013 | |
Pursuant to the requirements of the Securities Exchange Act of 1934 and the Investment Company Act of 1940, this report has been signed below by the following persons on behalf of the Registrant and in the capacities and on the dates indicated.
By: | /s/ Kristi L. Rowsell | |
| Kristi L. Rowsell | |
| Principal Executive Officer | |
Date: | November 22, 2013 | |
| | |
| | |
By: | /s/ Thomas E. Herman | |
| Thomas E. Herman | |
| Principal Financial Officer | |
Date: | November 22, 2013 | |