UNITED STATES
SECURITIES AND EXCHANGE COMMISSION
Washington, DC 20549
FORMN-CSR
CERTIFIED SHAREHOLDER REPORT OF REGISTERED
MANAGEMENT INVESTMENT COMPANIES
Investment Company Act file number811-06243
Franklin Strategic Series
(Exact name of registrant as specified in charter)
One Franklin Parkway, San Mateo, Ca 94403-1906
(Address of principal executive offices) (Zip code)
Craig S. Tyle, One Franklin Parkway, San Mateo, CA 94403-1906
(Name and address of agent for service)
Registrant’s telephone number, including area code: 650312-2000
Date of fiscal year end: 8/31
Date of reporting period: 8/31/19
| Item 1. | Reports to Stockholders. |
[INSERT ANNUAL REPORTS]
| Franklin Templeton SMACS: Series CH | Franklin Templeton SMACS: Series H | |||
|
| |||
| Franklin Templeton SMACS: Series E | Franklin Templeton SMACS: Series I | |||
|
| |||
Sign up for electronic delivery at franklintempleton.com/edelivery
Internet Delivery of Fund Reports Unless You Request Paper Copies:Effective January 1, 2021, as permitted by the SEC, paper copies of the Fund’s shareholder reports will no longer be sent by mail, unless you specifically request them from the Fund or your financial intermediary. Instead, the reports will be made available on a website, and you will be notified by mail each time a report is posted and provided with a website link to access the report.
If you already elected to receive shareholder reports electronically, you will not be affected by this change and you need not take any action. If you have not signed up for electronic delivery, we would encourage you to join fellow shareholders who have. You may elect to receive shareholder reports and other communications electronically from the Fund by calling (800)632-2301 or by contacting your financial intermediary.
You may elect to continue to receive paper copies of all your future shareholder reports free of charge by contacting your financial intermediary or, if you invest directly with a Fund, calling (800)632-2301 to let the Fund know of your request. Your election to receive reports in paper will apply to all funds held in your account.
FRANKLIN TEMPLETON
Successful investing begins with ambition. And achievement only comes when you reach for it. That’s why we continually strive to deliver better outcomes for investors. No matter what your goals are, our deep, global investment expertise allows us to offer solutions that can help.
During our more than 70 years of experience, we’ve managed through all kinds of markets—up, down and those in between. We’re always preparing for what may come next. It’s because of this, combined with our strength as one of the world’s largest asset managers that we’ve earned the trust of millions of investors around the world.
| Visitfranklintempleton.comfor fund updates, to access your account, or to find helpful financial planning tools. |
Not FDIC Insured| May Lose Value| No Bank Guarantee |
| franklintempleton.com | Not part of the annual report | 1 | ||
Franklin Templeton SMACS: Series CH
This inaugural annual report for Franklin Templeton SMACS: Series CH (Fund) covers the period since the Fund’s inception on June 3, 2019, through August 31, 2019.
Your Fund’s Goal and Main Investments
The Fund seeks to provide investors with a high level of income exempt from federal and California personal income taxes, with capital appreciation as a secondary goal.1 Under normal market conditions, the Fund invests substantially all of its net assets in municipal securities in any rating category, including below-investment grade securities and defaulted securities, whose interest is free from regular federal income taxes and from California personal income taxes.1
Credit Quality Composition*
8/31/19
| Ratings | % of Total Investments | |
A | 11.39% | |
BBB | 12.12% | |
Below Investment Grade | 13.33% | |
Not Rated | 63.16% | |
*Securities, except for those labeled Not Rated, are assigned ratings by one or more Nationally Recognized Statistical Credit Rating Organizations (NRSROs), such as Standard & Poor’s, Moody’s and Fitch, that can be considered by the investment manager as part of its independent securities analysis. When ratings from multiple agencies are available, the highest is used, consistent with the portfolio investment process. Ratings reflect an NRSRO’s opinion of an issuer’s creditworthiness and typically range from AAA (highest) to D (lowest). The Below Investment Grade category consists of bonds rated belowBBB-. The Refunded category generally consists of refunded bonds secured by U.S. government or other high-quality securities and not rerated by an NRSRO. The Not Rated category consists of ratable securities that have not been rated by an NRSRO. Cash and equivalents are excluded from this composition.
Performance Overview
The Fund’s share price, as measured by net asset value (NAV), increased from $10.00 on June 3, 2019, to $10.26 on August 31, 2019. The Fund paid dividends totaling 4.5860 cents per share for the reporting period.2 The Performance
Dividend Distributions*
6/3/19–8/31/19
| Month | Dividend per Share (cents) | |||
June | 0.4376 | |||
July | 1.7774 | |||
August | 2.3710 | |||
Total | 4.5860 | |||
*The distribution amount is the sum of all net investment income distributions for the period shown. Assumes shares were purchased and held for the entire accrual period. Since dividends accrue daily, your actual distributions will vary depending on the date you purchased your shares and any account activity. All Fund distributions will vary depending upon current market conditions, and past distributions are not indicative of future trends.
Summary beginning on page 5 shows that at the end of this reporting period the Fund’s distribution rate was 2.77% based on an annualization of August’s 2.3710 cents per share dividend and the NAV of $10.26 on August 31, 2019. An investor in the 2019 maximum combined effective federal and California personal income tax bracket of 53.10% (including 3.80% Medicare tax) would need to earn a distribution rate of 5.91% from a taxable investment to match the Fund’stax-free distribution rate.
Performance data represent past performance, which does not guarantee future results. Investment return and principal value will fluctuate, and you may have a gain or loss when you sell your shares. Current performance may differ from figures shown. For most recentmonth-end performance, go tofranklintempleton.comor call(800)342-5236.
Municipal Bond Market Overview
The financial markets experienced volatility during the three months ended August 31, 2019. Continuing trade concerns, uncertainties about the prospects for global economic growth and speculations on major central banks’ future policy decisions led to volatility in domestic fixed income and equity securities. U.S. equities rose during the period, while
1. For investors subject to alternative minimum tax, a small portion of Fund dividends may be taxable. Distributions of capital gains are generally taxable. To avoid imposition of 28% backup withholding on all Fund distributions and redemption proceeds, U.S. investors must be properly certified on FormW-9 andnon-U.S. investors on FormW-8BEN.
2. The distribution amount is the sum of all net investment income distributions for the period shown. Assumes shares were purchased and held for the entire accrual period. Since dividends accrue daily, your actual distributions will vary depending on the date you purchased your shares and any account activity. All Fund distributions will vary depending upon current market conditions, and past distributions are not indicative of future trends.
The dollar value, number of shares or principal amount, and names of all portfolio holdings are listed in the Fund’s Statement of Investments (SOI).
The SOI begins on page 27.
2 | Annual Report | franklintempleton.com | ||
FRANKLIN TEMPLETON SMACS: SERIES CH
fixed income assets such as municipal bonds and U.S. Treasuries rallied as interest rates moved in a downward trajectory.
Investment-grade municipal bonds, as measured by the Bloomberg Barclays Municipal Bond Index, performed well, aided by interest-rate declines and favorable supply and demand dynamics. However, they underperformed U.S. Treasuries, as measured by the Bloomberg Barclays U.S. Treasury Index, and investment-grade corporate bonds, as measured by the Bloomberg Barclays U.S. Corporate Bond Index. U.S. stocks, as represented by the Standard & Poor’s® (S&P) 500 Index, outperformed the fixed income markets.
Municipal bonds with longer maturities generally outperformed bonds with shorter maturities during the three-month period. High-yield municipal bonds, as measured by the Bloomberg Barclays High Yield Municipal Bond Index, generally outperformed investment-grade municipal bonds, as measured by the Bloomberg Barclays Municipal Bond Index.
Municipal bond issuance during the three-month reporting period totaled approximately $104 billion, which represented a 9% increase from the prior-year’s three-month period.3 Calendar-year 2019 municipal bond issuance through August was approximately $240 billion, which represented a 5% increase from the prior-year period.3
The U.S. Federal Reserve (Fed) lowered its target range for the federal funds rate by 0.25% at its July meeting, to 2.00%–2.25%, after leaving it unchanged during the first half of 2019. Although Fed Chair Jerome Powell said the first interest rate cut since December 2008 was intended to “insure against downside risks,” he did not indicate the beginning of a prolonged easing cycle. The Fed cited lingering uncertainties surrounding the economic and inflation outlook, and left the door open for modest additional easing.
Atperiod-end, we maintained our positive view of the municipal bond market. We believe municipal bonds continue to be an attractive asset class among fixed income securities, and we intend to follow our solid discipline of investing to maximize income, while seeking value in the municipal bond market.
Portfolio Composition
8/31/19
% of Total Investments | ||||
Tax-Supported | 52.12% | |||
Housing | 17.65% | |||
Hospital & Health Care | 13.47% | |||
Other Revenue | 11.48% | |||
Transportation | 5.28% | |||
State Update
California’s large and diverse economy continued to expand during the three months under review. High profile educational institutions and an innovative business environment supported the state’s expansion. The unemployment rate decreased slightly from 4.2% in May 2019 to 4.1% atperiod-end, which was higher than the 3.7% national rate.4
The state closed fiscal year 2019 (ended June 30) with a better-than-projected positive general fund balance in its special fund for economic uncertainties and budget stabilization account, resulting from greater-than-projected tax revenues. The enacted fiscal year 2020 budget modestly increased ongoing spending such as education, Medicaid and housing. The fiscal year 2020 general fund tax revenue is projected to increase moderately; personal income tax and sales and use tax revenues are estimated to increase, while corporation tax revenue is estimated to decline (resulting from a surge in fiscal year 2019 corporation tax collections). The state continued to budget solid reserve levels.
California’s nettax-supported debt was $2,194 per capita and 3.7% of personal income, compared with the $1,068 and 2.2% national medians, respectively.5 Independent credit rating agency S&P affirmed California’s general obligation bonds rating ofAA- with a stable outlook.6 The rating reflected S&P’s view on the state’s diverse and expanding economy, demonstrated commitment to balance recurring revenues and expenses while paying down budgetary debts, solid budgetary reserve levels, a strong fiscal year 2020 liquidity projection, and declining, though moderately high, debt ratios. In contrast, S&P cited several challenges to the state, including the persistently high cost of housing,difficult-to-forecast revenues, minimal prefunding of retiree
3. Source: The Bond Buyer, Thomson Reuters.
4. Source: Bureau of Labor Statistics.
5. Source: Moody’s Investors Service,“State government – U.S.: Medians – Flat debt total signals cautious borrowing, despite infrastructure needs,”6/3/19.
6. This does not indicate S&P’s rating of the Fund.
See www.franklintempletondatasources.com for additional data provider information
| franklintempleton.com | Annual Report | 3 | ||
FRANKLIN TEMPLETON SMACS: SERIES CH
health care benefits, and a large backlog of deferred maintenance and infrastructure needs. The stable outlook reflected S&P’s view of California’s structurally balanced budget.
Investment Strategy
We select securities we believe will provide the best balance between risk and return within the Fund’s range of allowable investments and typically use abuy-and-hold strategy. This means we generally hold securities in the Fund’s portfolio for income purposes, rather than trading securities for capital gains, although we may sell a security at any time if we believe doing so could help the Fund meet its goal. We may consider existing market conditions, the availability of lower-rated securities, and whether the difference in yields between higher- and lower-rated securities justifies the higher risk of lower-rated securities. Thus, there may be times when the Fund has a majority of its investments in securities that are considered investment grade.
Manager’s Discussion
Consistent with our high-yield investment strategy, we sought to invest in bonds that have an average weighted maturity of 15 to 30 years with good call features. Based on the combination of our value-oriented philosophy of investing primarily for income and a positively sloping municipal yield curve, in which interest rates for longer-term bonds are higher than those for shorter-term bonds, we favored the use of longer-term bonds. The Fund does not use leverage or credit derivatives to boost short-term returns. We believe our conservative,buy-and-hold investment strategy can help us achieve high, current,tax-free income for shareholders.
Thank you for your participation in Franklin Templeton SMACS: Series CH. We look forward to serving your future investment needs.
The foregoing information reflects our analysis, opinions and portfolio holdings as of August 31, 2019, the end of the reporting period. The way we implement our main investment strategies and the resulting portfolio holdings may change depending on factors such as market and economic conditions. These opinions may not be relied upon as investment advice or an offer for a particular security. The information is not a complete analysis of every aspect of any market, state, industry, security or the Fund. Statements of fact are from sources considered reliable, but the investment manager makes no representation or warranty as to their completeness or accuracy. Although historical performance is no guarantee of future results, these insights may help you understand our investment management philosophy.
4 | Annual Report | franklintempleton.com | ||
FRANKLIN TEMPLETON SMACS: SERIES CH
Performance Summary as of August 31, 2019
The performance tables do not reflect any taxes that a shareholder would pay on Fund dividends, capital gain distributions, if any, or any realized gains on the sale of Fund shares. Total return reflects reinvestment of the Fund’s dividends and capital gain distributions, if any, and any unrealized gains or losses. Your dividend income will vary depending on dividends or interest paid by securities in the Fund’s portfolio, adjusted for operating expenses. Capital gain distributions are net profits realized from the sale of portfolio securities.
Performance as of 8/31/191
| | Cumulative Total Return | 2 | | Average Annual Total Return | 3 | |||
| ||||||||
Since Inception (6/3/19) | +3.06% | +3.06% | ||||||
| ||||||||
| Taxable Equivalent Distribution Rate5 | 30-Day Standardized Yield6 | Taxable Equivalent 30-Day Standardized Yield5 | ||||||||||||||||||||||
| Distribution Rate4 | (with fee waiver) | (without fee waiver) | (with fee waiver) | (without fee waiver) | ||||||||||||||||||||
2.77% | 5.91% | 2.77% | -1.20% | 5.91% | -2.57% | |||||||||||||||||||
Performance data represent past performance, which does not guarantee future results. Investment return and principal value will fluctuate, and you may have a gain or loss when you sell your shares. Current performance may differ from figures shown. For most recentmonth-end performance, go tofranklintempleton.comor call(800)342-5236.
See page 6 for Performance Summary footnotes.
| franklintempleton.com | Annual Report | 5 | ||
FRANKLIN TEMPLETON SMACS: SERIES CH
PERFORMANCE SUMMARY
Share Price
| Symbol: FQCHX | 8/31/19 | 6/3/19 | Change | |||||||||
Net Asset Value (NAV) | $10.26 | $10.00 | +$0.26 | |||||||||
Distributions(6/3/19–8/31/19)
Net Investment Income |
$ 0.045860 |
Total Annual Operating Expenses7
| With Fee Waiver | Without Fee Waiver | |||
| 0.00% | 0.76% | |||
All investments involve risks, including possible loss of principal. Because municipal bonds are sensitive to interest-rate movements, the Fund’s yield and share price will fluctuate with market conditions. Bond prices generally move in the opposite direction of interest rates. Thus, as prices of bonds in the Fund adjust to a rise in interest rates, the Fund’s share price may decline. Because the Fund invests principally in a single state, it is subject to greater risk of adverse economic and regulatory changes in that state than a geographically diversified fund. Investments in lower-rated bonds include higher risk of default and loss of principal. Changes in the credit rating of a bond, or in the credit rating or financial strength of a bond’s issuer, insurer or guarantor, may affect the bond’s value. The Fund may invest a significant part of its assets in municipal securities that finance similar types of projects, such as utilities, hospitals, higher education and transportation. A change that affects one project would likely affect all similar projects, thereby increasing market risk. The Fund is actively managed but there is no guarantee that the manager’s investment decisions will produce the desired results. The Fund’s prospectus also includes a description of the main investment risks.
1. The Fund has an expense reduction (including acquired fund fees and expenses) contractually guaranteed through 6/2/20. Fund investment results reflect the expense reduction; without this reduction, the results would have been lower.
2. Cumulative total return represents the change in value of an investment over the period indicated.
3. Average annual total return represents the average annual change in value of an investment over the period indicated. Return for less than one year, if any, has not been annualized.
4. Distribution rate is based on an annualization of the Fund’s August dividend and the NAV per share on 8/31/19.
5. Taxable equivalent distribution rate and yield assume the published rates as of 7/16/19 for the maximum combined effective federal and California state personal income tax rate of 53.10%, based on the federal income tax rate of 37.00% plus 3.80% Medicare tax.
6. The Fund’s30-day standardized yield is calculated over a trailing30-day period using the yield to maturity on bonds and/or the dividends accrued on stocks. It may not equal the Fund’s actual income distribution rate, which reflects the Fund’s past dividends paid to shareholders.
7. Figures are as stated in the Fund’s current prospectus, including the effect of acquired fund fees and expenses, and may differ from the expense ratios disclosed in the Your Fund’s Expenses and Financial Highlights sections in this report. In periods of market volatility, assets may decline significantly, causing total annual Fund operating expenses to become higher than the figures shown.
6 | Annual Report | franklintempleton.com | ||
FRANKLIN TEMPLETON SMACS: SERIES CH
Your Fund’s Expenses
Shareholders of mutual funds incur ongoing costs, such as management fees (if any), custodian fees and other Fund expenses, which are sometimes referred to as operating expenses. The table below shows the ongoing costs of investing in the Fund and can help you understand these costs and compare them with those of other mutual funds. The table assumes a $1,000 investment held for the six months indicated.
Please note that the expenses shown in the table are meant to highlight your ongoing Fund costs only and do not reflect any program fees that you may pay. Therefore, the second line in the table is useful in comparing ongoing costs of investing in the Fund only, and will not help you determine the relative total costs of participating in any one investment program.
Actual Fund Expenses
The table below provides information about actual account values and actual expenses in the columns under the heading “Actual.” In these columns the Fund’s actual return, which includes the effect of Fund expenses, is used to calculate the “Ending Account Value.” You can estimate the expenses you paid during the period by following these steps (of course, your account value and expenses will differ from those in this illustration): Divide your account value by $1,000 (if your account had an $8,600 value, then $8,600÷ $1,000 = 8.6). Then multiply the result by the number in the row for your class of shares under the headings “Actual” and “Expenses Paid During Period” (if Actual Expenses Paid During Period were $7.50, then 8.6 x $7.50= $64.50). In this illustration, the actual expenses paid this period are $64.50.
Hypothetical Example for Comparison with Other Funds
Under the heading “Hypothetical” in the table, information is provided about hypothetical account values and hypothetical expenses based on the Fund’s actual expense ratio and an assumed rate of return of 5% per year before expenses, which is not the Fund’s actual return. This information may not be used to estimate the actual ending account balance or expenses you paid for the period, but it can help you compare ongoing costs of investing in the Fund with those of other funds. To do so, compare this 5% hypothetical example for the class of shares you hold with the 5% hypothetical examples that appear in the shareholder reports of other funds.
Please note that expenses shown in the table are meant to highlight ongoing costs and do not reflect any transactional costs. Therefore, information under the heading “Hypothetical” is useful in comparing ongoing costs only, and will not help you compare total costs of owning different funds. In addition, if transactional costs were included, your total costs would have been higher.
| Actual (actual return after expenses) | Hypothetical (5% annual return before expenses) | |||||||||
Beginning Account Value1 | Ending Account Value 8/31/19 | Expenses Paid During Period 6/3/19–8/31/192, 3 | Ending Account Value 8/31/19 | Expenses Paid During Period 3/1/19–8/31/192,3 | Net Annualized Expense Ratio3 | |||||
|
|
|
| |||||||
| $1,000 | $1,030.60 | $0.00 | $1,025.21 | $0.00 | 0.00% | |||||
1. June 3, 2019 for Actual; March 1, 2019 for Hypothetical.
2. Expenses are equal to the annualized expense ratio for thesix-month period as indicated above—in the far right column—multiplied by the simple average account value over the period indicated, and then multiplied by 184/365 to reflect theone-half year period for Hypothetical expenses.Non-recurring expenses are not annualized. For Actual expenses, the multiplier is 89/365 to reflect the number of days since commencement of operations.
3. Reflects expenses after fee waivers and expense reimbursements.
| franklintempleton.com | Annual Report | 7 | ||
Franklin Templeton SMACS: Series E
This inaugural annual report for Franklin Templeton SMACS: Series E (Fund) covers the period since the Fund’s inception on June 3, 2019, through August 31, 2019.
Your Fund’s Goal and Main Investments
The Fund seeks to maximize income, while maintaining prospects for capital appreciation by investing, under normal market conditions, predominantly in equity securities from any capitalization range, primarilylarge-cap securities.
Performance Overview
The Fund posted a +7.31% cumulative total return for the period since the Fund’s inception on June 3, 2019, through August 31, 2019. In comparison, the Fund’s benchmark, the MSCI USA High Dividend Yield Index, which measures performance of U.S. stocks (excluding real estate investment trusts) with higher dividend income and quality characteristics than average dividend yields, posted a +5.41% total return for the same period.1 You can find more performance data in the Performance Summary beginning on page 11.
Performance data represent past performance, which does not guarantee future results. Investment return and principal value will fluctuate, and you may have a gain or loss when you sell your shares. Current performance may differ from figures shown. For most recentmonth-end performance, go tofranklintempleton.comor call(800)342-5236.
Economic and Market Overview
The U.S. economy grew during the three months ended August 31, 2019. However, the economy moderated in the second quarter, due to weakness in inventory investment, exports, housing investment and business investment. The manufacturing sector expanded during the period’s first two months, but contracted in August, while the services sector expanded throughout the period. The unemployment rate increased slightly from 3.6% in May 2019 to 3.7% atperiod-end.2 The annual inflation rate, as measured by the Consumer Price Index, decreased slightly from 1.8% in May 2019 to 1.7% atperiod-end.2
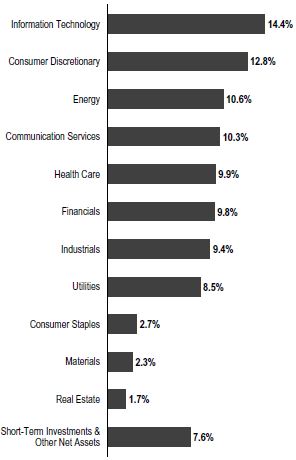
Portfolio Composition
Based on Total Net Assets as of 8/31/19
The U.S. Federal Reserve (Fed) lowered its target range for the federal funds rate for the first time since December 2008, to 2.00%–2.25%, citing muted inflation pressures and the potential effects of global trade tensions on economic growth. Furthermore, the Fed ended its balance sheet normalization program earlier than previously indicated.
U.S. equity markets overall rose during the period, benefiting from upbeat economic data and U.S. corporate earnings, the Fed’s rate cut and investor optimism about further monetary easing. However, markets reflected concerns about tighter
1. Source: FactSet.
The index is unmanaged and includes reinvestment of any income or distributions. It does not reflect any fees, expenses or sales charges. One cannot invest directly in an index, and an index is not representative of the Fund’s portfolio.
2. Source: Bureau of Labor Statistics.
See www.franklintempletondatasources.com for additional data provider information.
The dollar value, number of shares or principal amount, and names of all portfolio holdings are listed in the Fund’s Statement of Investments (SOI).
The SOI begins on page 29.
8 | Annual Report | franklintempleton.com | ||
FRANKLIN TEMPLETON SMACS: SERIES E
regulation of technology companies, political uncertainties in the U.S. and abroad, and the impact of U.S. trade disputes with China and other trading partners on global growth and corporate earnings. These concerns were partly alleviated at certain points during the period by easing trade tensions and optimism about a potential U.S.-China trade deal. The broad U.S. stock market, as measured by the Standard & Poor’s 500 Index (S&P 500®), reached a newall-time high in July. However, stocks retreated in August, due to escalating trade tensions and heightened concerns about U.S. and global economic growth. Overall, the S&P 500 posted solid gains for the three-month period.
Top Five Equity Holdings
8/31/19
Company Sector/Industry | % of Total Net Assets | |
Target Corp. Consumer Discretionary | 7.0% | |
AT&T Inc. Communication Services | 4.2% | |
The Home Depot Inc. Consumer Discretionary | 4.0% | |
Texas Instruments Inc. Information Technology | 3.8% | |
Broadcom Inc. Information Technology | 3.7% | |
Investment Strategy
We employ abottom-up, value-oriented, long-term approach, focusing on the market price of a company’s securities relative to our evaluation of the company’s long-term earnings, asset value and cash flow potential. We also consider a company’s price/earnings ratio, profit margins and liquidation value. We may, from time to time, use a variety of equity-related derivatives and complex equity securities, which may include purchasing or selling call and put options on equity securities and equity security indexes, futures on equity securities and equity indexes, options on equity index futures and equity-linked notes, for various purposes including enhancing Fund returns, increasing liquidity, gaining exposure to particular instruments in more efficient or less expensive ways and/or hedging risks relating to changes in certain equity markets. We also may, from time to time, use currency derivatives to hedge (protect) against currency risks.
What is an option? |
An option is a contract to buy or sell a specific financial product known as the option’s underlying instrument at a specific price. The buyer of an option has the right, but not the obligation, to buy or sell the underlying instrument at or until a specified expiration date. Conversely, the seller (“writer”) of an option who opens a transaction is obligated to buy or sell the underlying instrument should the option holder exercise that right.
|
What is a futures contract? |
A futures contract is an agreement between the Fund and a counterparty made through a U.S. or foreign futures exchange to buy or sell an underlying instrument or asset at a specific price on a future date.
|
Manager’s Discussion
During the period under review, key contributors to the Fund’s absolute performance included holdings in the consumer discretionary and information technology (IT) sectors.
Within consumer discretionary, general merchandise store owner and operator Target and home improvement retailer Home Depot boosted results. In the IT sector, semiconductor solutions designer and manufacturer Texas Instruments aided performance.
Other notable contributors included health care services provider CVS Health and telecommunications media and technology services provider AT&T.
In contrast, key detractors from the Fund’s absolute performance included holdings in the energy and real estate sectors.
Within the energy sector, energy infrastructure company The Williams Cos. and U.K.-listed oil and natural gas producer Royal Dutch Shell hindered results. In the real estate sector, luxury and upper-scale hotel manager Host Hotels & Resorts hampered performance.
Other key detractors include Rio Tinto, a U.K.-based company engaged in the exploration, mining and processing of mineral resources.
The Fund’s use of derivatives during the period was limited to covered-call writing, which did not have a meaningful impact on performance.
| franklintempleton.com | Annual Report | 9 | ||
FRANKLIN TEMPLETON SMACS: SERIES E
Thank you for your participation in Franklin Templeton SMACS: Series E. We look forward to serving your future investment needs.
 |
Edward Perks, CFA | |
 |
Brendan Circle, CFA | |
| Todd Brighton, CFA | ||
| Portfolio Management Team | ||


The foregoing information reflects our analysis, opinions and portfolio holdings as of August 31, 2019, the end of the reporting period. The way we implement our main investment strategies and the resulting portfolio holdings may change depending on factors such as market and economic conditions. These opinions may not be relied upon as investment advice or an offer for a particular security. The information is not a complete analysis of every aspect of any market, country, industry, security or the Fund. Statements of fact are from sources considered reliable, but the investment manager makes no representation or warranty as to their completeness or accuracy. Although historical performance is no guarantee of future results, these insights may help you understand our investment management philosophy.
10 | Annual Report | franklintempleton.com | ||
FRANKLIN TEMPLETON SMACS: SERIES E
Performance Summary as of August 31, 2019
The performance tables do not reflect any taxes that a shareholder would pay on Fund dividends, capital gain distributions, if any, or any realized gains on the sale of Fund shares. Total return reflects reinvestment of the Fund’s dividends and capital gain distributions, if any, and any unrealized gains or losses. Your dividend income will vary depending on dividends or interest paid by securities in the Fund’s portfolio, adjusted for operating expenses. Capital gain distributions are net profits realized from the sale of portfolio securities.
Performance as of 8/31/191
| | Cumulative Total Return | 2 |
| | Average Annual Total Return | 3 | ||||
| ||||||||||
Since Inception (6/3/19) | +7.31% | +7.31% | ||||||||
| ||||||||||
| 30-Day Standardized Yield5 | ||||
| Distribution Rate4 | (with fee waiver) | (without fee waiver) | ||
2.53% | 3.56% | -0.84% | ||
Performance data represent past performance, which does not guarantee future results. Investment return and principal value will fluctuate, and you may have a gain or loss when you sell your shares. Current performance may differ from figures shown. For most recentmonth-end performance, go tofranklintempleton.comor call(800)342-5236.
See page 12 for Performance Summary footnotes.
| franklintempleton.com | Annual Report | 11 | ||
FRANKLIN TEMPLETON SMACS: SERIES E
PERFORMANCE SUMMARY
Share Price
| Symbol: FQTEX | 8/31/19 | 6/3/19 | Change | |||||||
Net Asset Value (NAV) | $10.69 | $10.00 | +$0.69 | |||||||
Distributions(6/3/19–8/31/19)
Net Investment Income | ||
$0.0404 | ||
Total Annual Operating Expenses6
With Fee Waiver |
| Without Fee Waiver |
| |||||
| 0.00% | 0.53% | |||||||
All investments involve risks, including possible loss of principal. Stock prices fluctuate, sometimes rapidly and dramatically, due to factors affecting individual companies, particular industries or sectors, or general market conditions. The Fund’s distributions to shareholders may decline when prevailing interest rates fall or when dividend income from investments in stocks decline. Foreign investing involves additional risks such as currency and market volatility, as well as political and social instability. Derivatives, including currency management strategies, involve costs and can create economic leverage in the portfolio which may result in significant volatility and cause the Fund to participate in losses (as well as enable gains) on an amount that exceeds the Fund’s initial investment. The Fund may not achieve the anticipated benefits, and may realize losses when a counterparty fails to perform as promised. The Fund is actively managed but there is no guarantee that the manager’s investment decisions will produce the desired results. The Fund’s prospectus also includes a description of the main investment risks.
1. The Fund has an expense reduction (including acquired fund fees and expenses) contractually guaranteed through 6/2/20. Fund investment results reflect the expense reduction; without this reduction, the results would have been lower.
2. Cumulative total return represents the change in value of an investment over the period indicated.
3. Average annual total return represents the average annual change in value of an investment over the period indicated. Return for less than one year, if any, has not been annualized.
4. Distribution rate is based on an annualization of the Fund’s August dividend and the NAV per share on 8/31/19.
5. The Fund’s30-day standardized yield is calculated over a trailing30-day period using the yield to maturity on bonds and/or the dividends accrued on stocks. It may not equal the Fund’s actual income distribution rate, which reflects the Fund’s past dividends paid to shareholders.
6. Figures are as stated in the Fund’s current prospectus, including the effect of acquired fund fees and expenses, and may differ from the expense ratios disclosed in the Your Fund’s Expenses and Financial Highlights sections in this report. In periods of market volatility, assets may decline significantly, causing total annual Fund operating expenses to become higher than the figures shown.
12 | Annual Report | franklintempleton.com | ||
FRANKLIN TEMPLETON SMACS: SERIES E
Your Fund’s Expenses
Shareholders of mutual funds incur ongoing costs, such as management fees (if any), custodian fees and other Fund expenses, which are sometimes referred to as operating expenses. The table below shows the ongoing costs of investing in the Fund and can help you understand these costs and compare them with those of other mutual funds. The table assumes a $1,000 investment held for the six months indicated.
Please note that the expenses shown in the table are meant to highlight your ongoing Fund costs only and do not reflect any program fees that you may pay. Therefore, the second line in the table is useful in comparing ongoing costs of investing in the Fund only, and will not help you determine the relative total costs of participating in any one investment program.
Actual Fund Expenses
The table below provides information about actual account values and actual expenses in the columns under the heading “Actual.” In these columns the Fund’s actual return, which includes the effect of Fund expenses, is used to calculate the “Ending Account Value.” You can estimate the expenses you paid during the period by following these steps (of course, your account value and expenses will differ from those in this illustration): Divide your account value by $1,000 (if your account had an $8,600 value, then $8,600÷ $1,000 = 8.6). Then multiply the result by the number in the row for your class of shares under the headings “Actual” and “Expenses Paid During Period” (if Actual Expenses Paid During Period were $7.50, then 8.6 x $7.50= $64.50). In this illustration, the actual expenses paid this period are $64.50.
Hypothetical Example for Comparison with Other Funds
Under the heading “Hypothetical” in the table, information is provided about hypothetical account values and hypothetical expenses based on the Fund’s actual expense ratio and an assumed rate of return of 5% per year before expenses, which is not the Fund’s actual return. This information may not be used to estimate the actual ending account balance or expenses you paid for the period, but it can help you compare ongoing costs of investing in the Fund with those of other funds. To do so, compare this 5% hypothetical example for the class of shares you hold with the 5% hypothetical examples that appear in the shareholder reports of other funds.
Please note that expenses shown in the table are meant to highlight ongoing costs and do not reflect any transactional costs. Therefore, information under the heading “Hypothetical” is useful in comparing ongoing costs only, and will not help you compare total costs of owning different funds. In addition, if transactional costs were included, your total costs would have been higher.
Actual (actual return after expenses) | Hypothetical (5% annual return before expenses) | |||||||||
|
| |||||||||
Beginning Account Value1 | Ending Account Value 8/31/19 | Expenses Paid During Period 6/3/19–8/31/192, 3 | Ending Account Value 8/31/19 | Expenses Paid During Period 3/1/19–8/31/192, 3 | Net Annualized Expense Ratio3 | |||||
|
|
|
| |||||||
$1,000 | $1,073.10 | $0.00 | $1,025.21 | $0.00 | 0.00% | |||||
1. June 3, 2019 for Actual; March 1, 2019 for Hypothetical.
2. Expenses are equal to the annualized expense ratio for thesix-month period as indicated above—in the far right column—multiplied by the simple average account value over the period indicated, and then multiplied by 184/365 to reflect theone-half year period for Hypothetical expenses.Non-recurring expenses are not annualized. For Actual expenses, the multiplier is 89/365 to reflect the number of days since commencement of operations.
3. Reflects expenses after fee waivers and expense reimbursements. Does not include acquired fund fees and expenses.
| franklintempleton.com | Annual Report | 13 | ||
Franklin Templeton SMACS: Series H
This inaugural annual report for Franklin Templeton SMACS: Series H (Fund) covers the period since the Fund’s inception on June 3, 2019, through August 31, 2019.
Your Fund’s Goal and Main Investments
The Fund seeks to provide investors with a high level of income exempt from federal income taxes.1 Its secondary goal is capital appreciation to the extent possible and consistent with the Fund’s principal investment goal. Under normal market conditions, the Fund invests substantially all of its net assets in securities in any rating category, including below-investment grade securities and defaulted securities, whose interest is free from federal income taxes, including the federal alternative minimum tax.1 Although the Fund attempts to invest all of its assets in tax-free securities, it is possible that a portion of the Fund’s net assets may be invested in securities that pay interest that may be subject to the federal alternative minimum tax and, although not anticipated, in securities that pay interest subject to other federal or state income taxes.1
Credit Quality Composition*
8/31/19
| Ratings | % of Total Investments | |
AAA | 8.77% | |
AA | 27.19% | |
BBB | 8.43% | |
Below Investment Grade | 10.60% | |
Not Rated** | 45.01% | |
*Securities, except for those labeled Not Rated, are assigned ratings by one or more Nationally Recognized Statistical Credit Rating Organizations (NRSROs), such as Standard & Poor’s, Moody’s and Fitch, that can be considered by the investment manager as part of its independent securities analysis. When ratings from multiple agencies are available, the highest is used, consistent with the portfolio investment process. Ratings reflect an NRSRO’s opinion of an issuer’s creditworthiness and typically range from AAA (highest) to D (lowest). The Below Investment Grade category consists of bonds rated below BBB-. The Refunded category generally consists of refunded bonds secured by U.S. government or other high-quality securities and not rerated by an NRSRO. The Not Rated category consists of ratable securities that have not been rated by an NRSRO. Cash is excluded from this composition.
**Includes exchange-traded funds.
Dividend Distributions*
6/3/19–8/31/19
| Month | Dividend per Share (cents) | |
June | 0.8739 | |
July | 1.6745 | |
August | 1.5105 | |
Total | 4.0589 | |
*The distribution amount is the sum of all net investment income distributions for the period shown. Assumes shares were purchased and held for the entire accrual period. Since dividends accrue daily, your actual distributions will vary depending on the date you purchased your shares and any account activity. All Fund distributions will vary depending upon current market conditions, and past distributions are not indicative of future trends.
Performance Overview
The Fund’s share price, as measured by net asset value (NAV), increased from $10.00 on June 3, 2019, to $10.09 on August 31, 2019. The Fund paid dividends totaling 4.0589 cents per share for the reporting period.2 The Performance Summary beginning on page 17 shows that at the end of this reporting period the Fund’s distribution rate was 1.80% based on an annualization of August’s 1.5105 cents per share dividend and the NAV of $10.09 on August 31, 2019. An investor in the 2019 maximum federal income tax bracket of 40.80% (including 3.80% Medicare tax) would need to earn a distribution rate of 3.04% from a taxable investment to match the Fund’s tax-free distribution rate.
Performance data represent past performance, which does not guarantee future results. Investment return and principal value will fluctuate, and you may have a gain or loss when you sell your shares. Current performance may differ from figures shown. For most recent month-end performance, go tofranklintempleton.comor call(800) 342-5236.
Municipal Bond Market Overview
The financial markets experienced volatility during the three months ended August 31, 2019. Continuing trade concerns, uncertainties about the prospects for global economic growth and speculations on major central banks’ future policy decisions led to volatility in domestic fixed income and
1. For investors subject to alternative minimum tax, a small portion of Fund dividends may be taxable. Distributions of capital gains are generally taxable. To avoid imposition of 28% backup withholding on all Fund distributions and redemption proceeds, U.S. investors must be properly certified on Form W-9 and non-U.S. investors on Form W-8BEN.
2. The distribution amount is the sum of all net investment income distributions for the period shown. Assumes shares were purchased and held for the entire accrual period. Since dividends accrue daily, your actual distributions will vary depending on the date you purchased your shares and any account activity. All Fund distributions will vary depending upon current market conditions, and past distributions are not indicative of future trends.
The dollar value, number of shares or principal amount, and names of all portfolio holdings are listed in the Fund’s Statement of Investments (SOI).
The SOI begins on page 33.
14 | Annual Report | franklintempleton.com | ||
FRANKLIN TEMPLETON SMACS: SERIES H
equity securities. U.S. equities rose during the period, while fixed income assets such as municipal bonds and U.S. Treasuries rallied as interest rates moved in a downward trajectory.
Investment-grade municipal bonds, as measured by the Bloomberg Barclays Municipal Bond Index, performed well, aided by interest-rate declines and favorable supply and demand dynamics. However, they underperformed U.S. Treasuries, as measured by the Bloomberg Barclays U.S. Treasury Index, and investment-grade corporate bonds, as measured by the Bloomberg Barclays U.S. Corporate Bond Index. U.S. stocks, as represented by the Standard & Poor’s 500 Index, outperformed the fixed income markets.
Municipal bonds with longer maturities generally outperformed bonds with shorter maturities during the three-month period. High-yield municipal bonds, as measured by the Bloomberg Barclays High Yield Municipal Bond Index, generally outperformed investment-grade municipal bonds, as measured by the Bloomberg Barclays Municipal Bond Index.
Municipal bond issuance during the three-month reporting period totaled approximately $104 billion, which represented a 9% increase from the prior-year’s three-month period.3 Calendar-year 2019 municipal bond issuance through August was approximately $240 billion, which represented a 5% increase from the prior-year period.3
The U.S. Federal Reserve (Fed) lowered its target range for the federal funds rate by 0.25% at its July meeting, to 2.00%–2.25%, after leaving it unchanged during the first half of 2019. Although Fed Chair Jerome Powell said the first interest rate cut since December 2008 was intended to “insure against downside risks,” he did not indicate the beginning of a prolonged easing cycle. The Fed cited lingering uncertainties surrounding the economic and inflation outlook, and left the door open for modest additional easing.
At period-end, we maintained our positive view of the municipal bond market. We believe municipal bonds continue to be an attractive asset class among fixed income securities, and we intend to follow our solid discipline of investing to maximize income, while seeking value in the municipal bond market.
Investment Strategy
We select securities we believe will provide the best balance between risk and return within the Fund’s range of allowable investments and typically use a buy-and-hold strategy. This means we generally hold securities in the Fund’s portfolio for income purposes, rather than trading securities for capital gains, although we may sell a security at any time if we believe it could help the Fund meet its goal. We also consider existing market conditions, the availability of lower-rated securities, and whether the difference in yields between higher- and lower-rated securities justifies the higher risk of lower-rated securities. Thus, there may be times when the Fund has a majority of its investments in securities that are considered investment grade.
Portfolio Composition
8/31/19
| % of Total Investments* | ||
Other Revenue | 37.19% | |
Tax-Supported | 31.75% | |
Hospital & Health Care | 20.62% | |
Higher Education | 10.44% | |
*Does not include cash and cash equivalents.
Manager’s Discussion
We constructed the Fund around our core principles of credit selection, value identification and risk management, consistent with the primary goal of providing shareholders with a high level of tax-exempt income by taking advantage of credit-driven opportunities in all rating categories. We rely on a deep and experienced investment team, featuring a group of 15 research analysts that covers every sector of the municipal bond market. The breadth and depth of our research team allow us to evaluate any investment opportunity. Since the Fund’s inception on June 3, 2019, we have added eight long-term positions to the portfolio with an average credit rating of BBB. The Fund does not use leverage or credit derivatives to boost short-term returns, and we were careful to not overexpose the portfolio to any one credit or sector. We believe our conservative, buy-and-hold investment strategy can help us achieve high, current, tax-free income for shareholders.
Thank you for participation in Franklin Templeton SMACS: Series H. We look forward to serving your future investment needs.
3. Source: The Bond Buyer, Thomson Reuters.
See www.franklintempletondatasources.com for additional data provider information.
| franklintempleton.com | Annual Report | 15 | ||
FRANKLIN TEMPLETON SMACS: SERIES H
The foregoing information reflects our analysis, opinions and portfolio holdings as of August 31, 2019, the end of the reporting period. The way we implement our main investment strategies and the resulting portfolio holdings may change depending on factors such as market and economic conditions. These opinions may not be relied upon as investment advice or an offer for a particular security. The information is not a complete analysis of every aspect of any market, state, industry, security or the Fund. Statements of fact are from sources considered reliable, but the investment manager makes no representation or warranty as to their completeness or accuracy. Although historical performance is no guarantee of future results, these insights may help you understand our investment management philosophy.
16 | Annual Report | franklintempleton.com | ||
FRANKLIN TEMPLETON SMACS: SERIES H
Performance Summary as of August 31, 2019
The performance tables do not reflect any taxes that a shareholder would pay on Fund dividends, capital gain distributions, if any, or any realized gains on the sale of Fund shares. Total return reflects reinvestment of the Fund’s dividends and capital gain distributions, if any, and any unrealized gains or losses. Your dividend income will vary depending on dividends or interest paid by securities in the Fund’s portfolio, adjusted for operating expenses. Capital gain distributions are net profits realized from the sale of portfolio securities.
Performance as of 8/31/191
Cumulative Total Return2 | Average Annual Total Return3 | |||
Since Inception (6/3/19) | +1.31% | +1.31% | ||
| Taxable Equivalent | 30-Day Standardized Yield6 | Taxable Equivalent 30-Day Standardized Yield5 | ||||||||
|
| |||||||||
| Distribution Rate4 | Distribution Rate5 | (with fee waiver) | (without fee waiver) | (with fee waiver) | (without fee waiver) | |||||
1.80% | 3.04% | 1.91% | -2.30% | 3.23% | -3.88% | |||||
Performance data represent past performance, which does not guarantee future results. Investment return and principal value will fluctuate, and you may have a gain or loss when you sell your shares. Current performance may differ from figures shown. For most recent month-end performance, go tofranklintempleton.comor call(800) 342-5236.
See page 18 for Performance Summary footnotes.
| franklintempleton.com | Annual Report | 17 | ||
FRANKLIN TEMPLETON SMACS: SERIES H
PERFORMANCE SUMMARY
Share Price
| Symbol: FQTHX | 8/31/19 | 6/3/19 | Change | |||||||||
Net Asset Value (NAV) | $10.09 | $10.00 | +$0.09 | |||||||||
Distributions(6/3/19–8/31/19)
Net Investment Income |
$ 0.040589 |
Total Annual Operating Expenses7
| With Fee Waiver | Without Fee Waiver | |||
| 0.00% | 0.93% | |||
All investments involve risks, including possible loss of principal. Because municipal bonds are sensitive to interest-rate movements, the Fund’s yield and share price will fluctuate with market conditions. Bond prices generally move in the opposite direction of interest rates. Thus, as prices of bonds in the Fund adjust to a rise in interest rates, the Fund’s share price may decline. Investments in lower-rated bonds include higher risk of default and loss of principal. Changes in the credit rating of a bond, or in the credit rating or financial strength of a bond’s issuer, insurer or guarantor, may affect the bond’s value. The Fund may invest a significant part of its assets in municipal securities that finance similar types of projects, such as utilities, hospitals, higher education and transportation. A change that affects one project would likely affect all similar projects, thereby increasing market risk. The Fund is actively managed but there is no guarantee that the manager’s investment decisions will produce the desired results. The Fund’s prospectus also includes a description of the main investment risks.
1. The Fund has an expense reduction (including acquired fund fees and expenses) contractually guaranteed through 6/2/20. Fund investment results reflect the expense reduction; without this reduction, the results would have been lower.
2. Cumulative total return represents the change in value of an investment over the period indicated.
3. Average annual total return represents the average annual change in value of an investment over the period indicated. Return for less than one year, if any, has not been annualized.
4. Distribution rate is based on an annualization of the Fund’s August dividend and the NAV per share on 8/31/19.
5. Taxable equivalent distribution rate and yield assume the 2019 maximum federal income tax rate of 37.00% plus 3.80% Medicare tax.
6. The Fund’s30-day standardized yield is calculated over a trailing30-day period using the yield to maturity on bonds and/or the dividends accrued on stocks. It may not equal the Fund’s actual income distribution rate, which reflects the Fund’s past dividends paid to shareholders.
7. Figures are as stated in the Fund’s current prospectus, including the effect of acquired fund fees and expenses, and may differ from the expense ratios disclosed in the Your Fund’s Expenses and Financial Highlights sections in this report. In periods of market volatility, assets may decline significantly, causing total annual Fund operating expenses to become higher than the figures shown.
18 | Annual Report | franklintempleton.com | ||
FRANKLIN TEMPLETON SMACS: SERIES H
Your Fund’s Expenses
Shareholders of mutual funds incur ongoing costs, such as management fees (if any), custodian fees and other Fund expenses, which are sometimes referred to as operating expenses. The table below shows the ongoing costs of investing in the Fund and can help you understand these costs and compare them with those of other mutual funds. The table assumes a $1,000 investment held for the six months indicated.
Please note that the expenses shown in the table are meant to highlight your ongoing Fund costs only and do not reflect any program fees that you may pay. Therefore, the second line in the table is useful in comparing ongoing costs of investing in the Fund only, and will not help you determine the relative total costs of participating in any one investment program.
Actual Fund Expenses
The table below provides information about actual account values and actual expenses in the columns under the heading “Actual.” In these columns the Fund’s actual return, which includes the effect of Fund expenses, is used to calculate the “Ending Account Value.” You can estimate the expenses you paid during the period by following these steps (of course, your account value and expenses will differ from those in this illustration): Divide your account value by $1,000 (if your account had an $8,600 value, then $8,600÷ $1,000 = 8.6). Then multiply the result by the number in the row for your class of shares under the headings “Actual” and “Expenses Paid During Period” (if Actual Expenses Paid During Period were $7.50, then 8.6 x $7.50= $64.50). In this illustration, the actual expenses paid this period are $64.50.
Hypothetical Example for Comparison with Other Funds
Under the heading “Hypothetical” in the table, information is provided about hypothetical account values and hypothetical expenses based on the Fund’s actual expense ratio and an assumed rate of return of 5% per year before expenses, which is not the Fund’s actual return. This information may not be used to estimate the actual ending account balance or expenses you paid for the period, but it can help you compare ongoing costs of investing in the Fund with those of other funds. To do so, compare this 5% hypothetical example for the class of shares you hold with the 5% hypothetical examples that appear in the shareholder reports of other funds.
Please note that expenses shown in the table are meant to highlight ongoing costs and do not reflect any transactional costs. Therefore, information under the heading “Hypothetical” is useful in comparing ongoing costs only, and will not help you compare total costs of owning different funds. In addition, if transactional costs were included, your total costs would have been higher.
Actual (actual return after expenses) | Hypothetical (5% annual return before expenses) | |||||||||
|
| |||||||||
Beginning Account Value1 | Ending Account Value 8/31/19 | Expenses Paid During Period 6/3/19–8/31/192, 3 | Ending Account Value 8/31/19 | Expenses Paid During Period 3/1/19–8/31/192, 3 | Net Annualized Expense Ratio3 | |||||
|
|
|
| |||||||
$1,000 | $1,013.10 | $0.00 | $1,025.21 | $0.00 | 0.00% | |||||
1. June 3, 2019 for Actual; March 1, 2019 for Hypothetical.
2. Expenses are equal to the annualized expense ratio for thesix-month period as indicated above—in the far right column—multiplied by the simple average account value over the period indicated, and then multiplied by 184/365 to reflect theone-half year period for Hypothetical expenses.Non-recurring expenses are not annualized. For Actual expenses, the multiplier is 89/365 to reflect the number of days since commencement of operations.
3. Reflects expenses after fee waivers and expense reimbursements. Does not include acquired fund fees and expenses.
| franklintempleton.com | Annual Report | 19 | ||
Franklin Templeton SMACS: Series I
This inaugural annual report for Franklin Templeton SMACS: Series I (Fund) covers the period since the Fund’s inception on June 3, 2019, through August 31, 2019.
Your Fund’s Goal and Main Investments
The Fund seeks to maximize income, while maintaining prospects for capital appreciation by investing, under normal market conditions, predominantly in debt securities.
Performance Overview
The Fund posted a +2.25% cumulative total return for the period since the Fund’s inception on June 3, 2019, through August 31, 2019. In comparison, the Fund’s primary benchmark, the Bloomberg Barclays U.S. High Yield Very Liquid Index, which is designed to track a more liquid component of the U.S. dollar-denominated, high yield, fixed-rate corporate bond market, posted a +3.73% total return, while its secondary benchmark, the Blended 50% Bloomberg Barclays U.S. High Yield Very Liquid Index and 50% Bloomberg Barclays U.S. Corporate Index, posted a +4.83% total return for the same period.1 You can find more performance data in the Performance Summary beginning on page 23.
Performance data represent past performance, which does not guarantee future results. Investment return and principal value will fluctuate, and you may have a gain or loss when you sell your shares. Current performance may differ from figures shown. For most recentmonth-end performance, go tofranklintempleton.comor call(800)342-5236.
Economic and Market Overview
The U.S. economy grew during the three months ended August 31, 2019. However, the economy moderated in the second quarter, due to weakness in inventory investment, exports, housing investment and business investment. The manufacturing sector expanded during the period’s first two months, but contracted in August, while the services sector expanded throughout the period. The unemployment rate increased slightly from 3.6% in May 2019 to 3.7% atperiod-end.2 The annual inflation rate, as measured by the
Dividend Distributions*
6/3/19–8/31/19
| Month | Dividend per Share (cents) | |||
June | — | |||
July | 3.91 | |||
August | 6.62 | |||
Total | 10.53 | |||
*The distribution amount is the sum of all net investment income distributions for the period shown. All Fund distributions will vary depending upon current market conditions, and past distributions are not indicative of future trends.
Consumer Price Index, decreased slightly from 1.8% in May 2019 to 1.7% atperiod-end.2
The U.S. Federal Reserve (Fed) lowered its target range for the federal funds rate for the first time since December 2008, to 2.00%–2.25%, citing muted inflation pressures and the potential effects of global trade tensions on economic growth. Furthermore, the Fed ended its balance sheet normalization program earlier than previously indicated.
The10-year Treasury yield, which moves inversely to its price, decreased during the period, falling to multi-year lows nearperiod-end. Concerns about political uncertainties in the U.S. and abroad, slower domestic and global economic growth, optimism the Fed would take a more accommodative approach to its monetary policy decisions and expectations of more stimulus from global central banks weighed on the Treasury yield. However, several better-than-expected U.S. economic reports and periods of optimism about a potential U.S.-China trade deal supported the yield at certain points during the period. The10-year yield started the period lower than certain short-term yields and fell below thetwo-year yield in August, due to weaker economic data, escalating U.S. trade tensions with China and other trading partners, and the Fed’s recent monetary policy easing. However, the10-year yield ended the period at the same level as the2-year yield. Overall, the10-year Treasury yield declined from 2.07% on June 3, 2019, to 1.50% atperiod-end.
1. Source: FactSet.
The indexes are unmanaged and include reinvestment of any income or distributions. They do not reflect any fees, expenses or sales charges. One cannot invest directly in an index, and an index is not representative of the Fund’s portfolio.
2. Source: Bureau of Labor Statistics.
See www.franklintempletondatasources.com for additional data provider information.
The dollar value, number of shares or principal amount, and names of all portfolio holdings are listed in the Fund’s Statement of Investments (SOI).
The SOI begins on page 36.
20 | Annual Report | franklintempleton.com | ||
FRANKLIN TEMPLETON SMACS: SERIES I
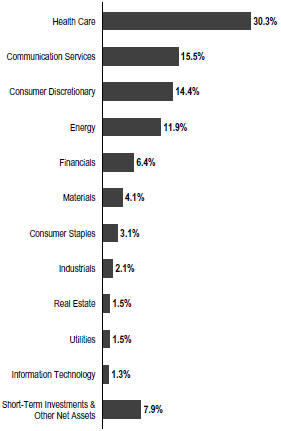
Portfolio Composition
Based on Total Net Assets as of 8/31/19
Investment Strategy
We employ abottom-up, value-oriented, long-term approach, focusing on the market price of a company’s securities relative to our evaluation of the company’s long-term earnings, asset value and cash flow potential. We generally perform independent analysis of the securities being considered for the Fund’s portfolio, rather than relying principally on the ratings assigned by the ratings organizations. We also consider a company’s price/earnings ratio, profit margins and liquidation value. With respect to securities in the utilities sector, we also consider the effects of the regulatory environment on utilities companies.
The Fund may, from time to time, use interest-rate derivatives for various purposes including enhancing Fund returns, increasing liquidity, gaining exposure to particular instruments in more efficient or less expensive ways and/or hedging risks relating to changes in interest rates. The Fund also may, from time to time, use currency derivatives to
hedge (protect) against currency risks, and credit-related derivatives to hedge (protect) against credit risks.
Manager’s Discussion
During the period under review, nearly all sectors represented in the Fund’s portfolio contributed to absolute performance, led by communication services, consumer discretionary and health care.
The top four individual contributors came from the health care sector: hospital manager and operator Community Health Systems, health care services provider Tenet Healthcare, pharmaceutical products manufacturer Mylan and pharmaceutical and medical device products manufacturer Bausch Health.
In contrast, the energy sector detracted from the Fund’s absolute performance, primarily due to the share price decline of independent oil and gas exploration and production company Chesapeake Energy.
Other key individual detractors included global specialty pharmaceuticals company Mallinckrodt and pharmaceuticals firm Par Pharmaceutical.
The Fund did not use derivatives during the period.
Top Five Fixed Income Holdings
8/31/19
Company Sector/Industry | % of Total Net Assets | |
CHS/Community Health Systems Inc. | 8.3% | |
Health Care | ||
Tenet Healthcare Corp. | 8.1% | |
Health Care | ||
Chesapeake Energy Corp. | 6.4% | |
Energy | ||
Bausch Health Cos. Inc. | 4.9% | |
Health Care | ||
Citigroup Inc. | 4.9% | |
Financials | ||
| franklintempleton.com | Annual Report | 21 | ||
FRANKLIN TEMPLETON SMACS: SERIES I
Thank you for your participation in Franklin Templeton SMACS: Series I. We look forward to serving your future investment needs.
|
Edward Perks, CFA | |
|
Brendan Circle, CFA | |
| Todd Brighton, CFA | ||
| Portfolio Management Team | ||
The foregoing information reflects our analysis, opinions and portfolio holdings as of August 31, 2019, the end of the reporting period. The way we implement our main investment strategies and the resulting portfolio holdings may change depending on factors such as market and economic conditions. These opinions may not be relied upon as investment advice or an offer for a particular security. The information is not a complete analysis of every aspect of any market, country, industry, security or the Fund. Statements of fact are from sources considered reliable, but the investment manager makes no representation or warranty as to their completeness or accuracy. Although historical performance is no guarantee of future results, these insights may help you understand our investment management philosophy.
22 | Annual Report | franklintempleton.com | ||
FRANKLIN TEMPLETON SMACS: SERIES I
Performance Summary as of August 31, 2019
The performance tables do not reflect any taxes that a shareholder would pay on Fund dividends, capital gain distributions, if any, or any realized gains on the sale of Fund shares. Total return reflects reinvestment of the Fund’s dividends and capital gain distributions, if any, and any unrealized gains or losses. Your dividend income will vary depending on dividends or interest paid by securities in the Fund’s portfolio, adjusted for operating expenses. Capital gain distributions are net profits realized from the sale of portfolio securities.
Performance as of 8/31/191
| | Cumulative Total Return2 |
| | Average Annual Total Return | 3 | |||
| ||||||||
Since Inception (6/3/19) | +2.25% | +2.25% | ||||||
| ||||||||
| ||||||||
| 30-Day Standardized Yield5 | ||||||||
|
| |||||||
| Distribution Rate4 | (with fee waiver) | (without fee waiver) | ||||||
| ||||||||
7.85% | 8.08% | 2.27% | ||||||
| ||||||||
Performance data represent past performance, which does not guarantee future results. Investment return and principal value will fluctuate, and you may have a gain or loss when you sell your shares. Current performance may differ from figures shown. For most recentmonth-end performance, go tofranklintempleton.comor call(800)342-5236.
See page 24 for Performance Summary footnotes.
| franklintempleton.com | Annual Report | 23 | ||
FRANKLIN TEMPLETON SMACS: SERIES I
PERFORMANCE SUMMARY
Share Price
| Symbol: FQTIX | 8/31/19 | 6/3/19 | Change | |||
| ||||||
Net Asset Value (NAV) | $10.12 | $10.00 | +$0.12 | |||
| ||||||
Distributions(6/3/19–8/31/19)
| Net Investment Income |
| $0.1053 |
Total Annual Operating Expenses6
With Fee Waiver | Without fee Waiver | |||
| 0.00% | 0.53% |
All investments involve risks, including possible loss of principal. The Fund’s share price and yield will be affected by interest-rate movements. Bond prices generally move in the opposite direction of interest rates. Thus, as prices of bonds in the Fund adjust to a rise in interest rates, the Fund’s share price may decline. Changes in the financial strength of a bond issuer or in a bond’s credit rating may affect its value. The Fund’s portfolio includes a substantial portion of higher-yielding, lower-rated corporate bonds because of the relatively higher yields they offer. Floating rate loans are lower-rated, higher-yielding instruments, which are subject to increased risk of default and can potentially result in loss of principal. These securities carry a greater degree of credit risk relative to investment-grade securities. Because the Fund can only distribute what it earns, the Fund’s distributions to shareholders may decline when prevailing interest rates fall or when the Fund experiences defaults on debt securities it holds. Derivatives, including currency management strategies, involve costs and can create economic leverage in the portfolio which may result in significant volatility and cause the Fund to participate in losses (as well as enable gains) on an amount that exceeds the Fund’s initial investment. The Fund may not achieve the anticipated benefits, and may realize losses when a counterparty fails to perform as promised. The Fund is actively managed but there is no guarantee that the manager’s investment decisions will produce the desired results. The Fund’s prospectus also includes a description of the main investment risks.
1. The Fund has an expense reduction (including acquired fund fees and expenses) contractually guaranteed through 6/2/20. Fund investment results reflect the expense reduction; without this reduction, the results would have been lower.
2. Cumulative total return represents the change in value of an investment over the period indicated.
3. Average annual total return represents the average annual change in value of an investment over the period indicated. Return for less than one year, if any, has not been annualized.
4. Distribution rate is based on an annualization of the Fund’s August dividend and the NAV per share on 8/31/19.
5. The Fund’s30-day standardized yield is calculated over a trailing30-day period using the yield to maturity on bonds and/or the dividends accrued on stocks. It may not equal the Fund’s actual income distribution rate, which reflects the Fund’s past dividends paid to shareholders.
6. Figures are as stated in the Fund’s current prospectus, including the effect of acquired fund fees and expenses, and may differ from the expense ratios disclosed in the Your Fund’s Expenses and Financial Highlights sections in this report. In periods of market volatility, assets may decline significantly, causing total annual Fund operating expenses to become higher than the figures shown.
24 | Annual Report | franklintempleton.com | ||
FRANKLIN TEMPLETON SMACS: SERIES I
Your Fund’s Expenses
Shareholders of mutual funds incur ongoing costs, such as management fees (if any), custodian fees and other Fund expenses, which are sometimes referred to as operating expenses. The table below shows the ongoing costs of investing in the Fund and can help you understand these costs and compare them with those of other mutual funds. The table assumes a $1,000 investment held for the six months indicated.
Please note that the expenses shown in the table are meant to highlight your ongoing Fund costs only and do not reflect any program fees that you may pay. Therefore, the second line in the table is useful in comparing ongoing costs of investing in the Fund only, and will not help you determine the relative total costs of participating in any one investment program.
Actual Fund Expenses
The table below provides information about actual account values and actual expenses in the columns under the heading “Actual.” In these columns the Fund’s actual return, which includes the effect of Fund expenses, is used to calculate the “Ending Account Value.” You can estimate the expenses you paid during the period by following these steps (of course, your account value and expenses will differ from those in this illustration): Divide your account value by $1,000 (if your account had an $8,600 value, then $8,600÷ $1,000 = 8.6). Then multiply the result by the number in the row for your class of shares under the headings “Actual” and “Expenses Paid During Period” (if Actual Expenses Paid During Period were $7.50, then 8.6 x $7.50= $64.50). In this illustration, the actual expenses paid this period are $64.50.
Hypothetical Example for Comparison with Other Funds
Under the heading “Hypothetical” in the table, information is provided about hypothetical account values and hypothetical expenses based on the Fund’s actual expense ratio and an assumed rate of return of 5% per year before expenses, which is not the Fund’s actual return. This information may not be used to estimate the actual ending account balance or expenses you paid for the period, but it can help you compare ongoing costs of investing in the Fund with those of other funds. To do so, compare this 5% hypothetical example for the class of shares you hold with the 5% hypothetical examples that appear in the shareholder reports of other funds.
Please note that expenses shown in the table are meant to highlight ongoing costs and do not reflect any transactional costs. Therefore, information under the heading “Hypothetical” is useful in comparing ongoing costs only, and will not help you compare total costs of owning different funds. In addition, if transactional costs were included, your total costs would have been higher.
| Actual | Hypothetical | |||||||||||||||||||
| (actual return after expenses) | (5% annual return before expenses) | |||||||||||||||||||
Beginning Account Value1 | Ending Account Value 8/31/19 | Expenses Paid During 6/3/19–8/31/192, 3 |
| Ending Account Value 8/31/19 | Expenses Paid During Period 3/1/19–8/31/192, 3 |
| Net Annualized Expense Ratio3 | |||||||||||||
|
|
|
| |||||||||||||||||
| $1,000 | $1,022.50 | $0.00 | $1,025.21 | $0.00 | 0.00% | |||||||||||||||
1. June 3, 2019 for Actual; March 1, 2019 for Hypothetical.
2. Expenses are equal to the annualized expense ratio for thesix-month period as indicated above—in the far right column—multiplied by the simple average account value over the period indicated, and then multiplied by 184/365 to reflect theone-half year period for Hypothetical expenses.Non-recurring expenses are not annualized. For Actual expenses, the multiplier is 89/365 to reflect the number of days since commencement of operations.
3. Reflects expenses after fee waivers and expense reimbursements. Does not include acquired fund fees and expenses.
| franklintempleton.com | Annual Report | 25 | ||
FRANKLIN STRATEGIC SERIES
Franklin Templeton SMACS: Series CH
Year Ended August 31, 2019a | ||||
Per share operating performance | ||||
(for a share outstanding throughout the year) | ||||
Net asset value, beginning of year | $10.00 | |||
Income from investment operationsb: | ||||
Net investment incomec | 0.05 | |||
Net realized and unrealized gains (losses) | 0.26 | |||
Total from investment operations | 0.31 | |||
Less distributions from: | ||||
Net investment income | (0.05 | ) | ||
Net asset value, end of year | $10.26 | |||
Total returnd | 3.06% | |||
Ratios to average net assetse | ||||
Expenses before waiver and payments by affiliates | 3.74% | |||
Expenses net of waiver and payments by affiliates | —% | |||
Net investment income | 1.87% | |||
Supplemental data | ||||
Net assets, end of year (000’s) | $4,028 | |||
Portfolio turnover rate | 18.11% | |||
aFor the period June 3, 2019 (commencement of operations) to August 31, 2019.
bThe amount shown for a share outstanding throughout the period may not correlate with the Statement of Operations for the period due to the timing of sales and repurchases of the Fund shares in relation to income earned and/or fluctuating fair value of the investments of the Fund.
cBased on average daily shares outstanding.
dTotal return is not annualized for periods less than one year.
eRatios are annualized for periods less than one year, except fornon-recurring expenses, if any.
26 | Annual Report | The accompanying notes are an integral part of these financial statements. | franklintempleton.com | ||
FRANKLIN STRATEGIC SERIES
Statement of Investments, August 31, 2019
Franklin Templeton SMACS: Series CH
| Principal Amount | Value | |||||||
| Municipal Bonds 98.6% | ||||||||
California 98.6% | ||||||||
California Community Housing Agency Workforce Housing Revenue, Annadel Apartments, Series A, 5.00%, 4/01/49 | $ | 200,000 | $ | 224,914 | ||||
California Municipal Finance Authority Revenue, Kern Regional Center Project, Refunding, Series A, 5.00%, 5/01/49 | 200,000 | 242,636 | ||||||
California PFA Educational Facilities Revenue, Trinity Classical Academy Project, Series A, 5.00%, 7/01/44 | 200,000 | 213,424 | ||||||
California State Municipal Finance Authority Senior Living Revenue, MT San Antonio Gardens Project, Refunding, 5.00%, 11/15/49 | 200,000 | 236,744 | ||||||
California State Municipal Finance Authority Student Housing Revenue,CHF-Riverside IILLC-UCR North District Phase 1 Student Housing Project, 5.00%, 5/15/49 | 200,000 | 244,914 | ||||||
California Statewide CDA College Housing Revenue, NCCD-Hooper StreetLLC-California College of the Arts Project, 5.25%, 7/01/52 | 200,000 | 231,218 | ||||||
California Statewide CDA Revenue, Loma Linda University Medical Center, Series A, 5.50%, 12/01/58 | 250,000 | 298,163 | ||||||
Corona CFDNo. 2018-1 Special Tax, Improvement Area No. 1, Bedford, Series A, 5.00%, 9/01/43 | 200,000 | 227,710 | ||||||
Dublin CFDNo. 2015-1 Special Tax, Improvement Area No. 2, Dublin Crossing, 5.00%, 9/01/49 | 200,000 | 232,424 | ||||||
Folsom Ranch Financing Authority Special Tax Revenue, | ||||||||
CFD No. 19, Mangini Ranch, 5.00%, 9/01/47 | 200,000 | 234,120 | ||||||
CFD No. 19, Mangini Ranch, 5.00%, 9/01/49 | 200,000 | 234,210 | ||||||
Fontana Special Tax, CFD No. 74B, Citrus/Summit, 5.00%, 9/01/49 | 200,000 | 231,020 | ||||||
Foothill/Eastern Transportation Corridor Agency Toll Road Revenue, SubseriesB-2, Refunding, Series B, 3.50%, 1/15/53 | 200,000 | 209,858 | ||||||
Roseville Special Tax, Villages at Sierra Vista CFD No. 1, Public Facilities, 5.00%, 9/01/49 | 200,000 | 232,842 | ||||||
Tracy CFDNo. 2016-1 Special Tax, | ||||||||
Improvement Area No. 1, Tracy Hills, 5.00%, 9/01/48 | 200,000 | 230,905 | ||||||
Improvement Area No. 1, Tracy Hills, 5.00%, 9/01/49 | 200,000 | 230,712 | ||||||
Upland CFDNo. 2015-1 Special Tax, Sycamore Hills, Series A, 4.00%, 9/01/49 | 200,000 | 216,616 | ||||||
|
| |||||||
| Total Municipal Bonds (Cost $3,853,642) 98.6% | 3,972,430 | |||||||
| Other Assets, less Liabilities 1.4%. | 55,078 | |||||||
|
| |||||||
| Net Assets 100.0% | $ | 4,027,508 | ||||||
|
| |||||||
See Abbreviations on page 51.
| franklintempleton.com | The accompanying notes are an integral part of these financial statements. | Annual Report | 27 | ||
FRANKLIN STRATEGIC SERIES
Financial Highlights
Franklin Templeton SMACS: Series E
Year Ended August 31, 2019a | ||||
Per share operating performance | ||||
(for a share outstanding throughout the year) | ||||
Net asset value, beginning of year | $10.00 | |||
Income from investment operationsb: | ||||
Net investment incomec | 0.10 | |||
Net realized and unrealized gains (losses) | 0.63 | |||
Total from investment operations | 0.73 | |||
Less distributions from: | ||||
Net investment income | (0.04 | ) | ||
Net asset value, end of year | $10.69 | |||
Total returnd,e | 7.31% | |||
Ratios to average net assetsf | ||||
Expenses before waiver and payments by affiliates | 4.76% | |||
Expenses net of waiver and payments by affiliates | —% | |||
Net investment income | 4.11% | |||
Supplemental data | ||||
Net assets, end of year (000’s) | $3,959 | |||
Portfolio turnover rate | 16.33% | |||
aFor the period June 3, 2019 (commencement of operations) to August 31, 2019.
bThe amount shown for a share outstanding throughout the period may not correlate with the Statement of Operations for the period due to the timing of sales and repurchases of the Fund’s shares in relation to income earned and/or fluctuating fair value of the investments of the Fund.
cBased on average daily shares outstanding.
dTotal return excluding payments by Advisers for acquired fund fees and expenses is 7.31% for the year ended August 31, 2019. See Note 3(e).
eTotal return is not annualized for periods less than one year.
fRatios are annualized for periods less than one year, except fornon-recurring expenses, if any.
28 | Annual Report | The accompanying notes are an integral part of these financial statements. | franklintempleton.com | ||
FRANKLIN STRATEGIC SERIES
Statement of Investments, August 31, 2019
Franklin Templeton SMACS: Series E
| Country | Shares | Value | ||||||||||
Common Stocks 78.6% | ||||||||||||
Communication Services 10.3% | ||||||||||||
aAlphabet Inc., A | United States | 70 | $ | 83,337 | ||||||||
AT&T Inc. | United States | 4,700 | 165,722 | |||||||||
bComcast Corp., A | United States | 900 | 39,834 | |||||||||
Verizon Communications Inc. | United States | 2,020 | 117,483 | |||||||||
| 406,376 | ||||||||||||
Consumer Discretionary 12.8% | ||||||||||||
aAmazon.com Inc. | United States | 39 | 69,275 | |||||||||
The Home Depot Inc. | United States | 700 | 159,537 | |||||||||
Target Corp. | United States | 2,600 | 278,304 | |||||||||
| 507,116 | ||||||||||||
Consumer Staples 2.7% | ||||||||||||
PepsiCo Inc. | United States | 800 | 109,384 | |||||||||
Energy 10.6% | ||||||||||||
Chevron Corp. | United States | 1,200 | 141,264 | |||||||||
Royal Dutch Shell PLC, A, ADR | United Kingdom | 2,200 | 122,320 | |||||||||
Schlumberger Ltd. | United States | 1,900 | 61,617 | |||||||||
The Williams Cos. Inc. | United States | 4,000 | 94,400 | |||||||||
| 419,601 | ||||||||||||
Financials 1.9% | ||||||||||||
Wells Fargo & Co. | United States | 1,600 | 74,512 | |||||||||
Health Care 7.7% | ||||||||||||
Bristol-Myers Squibb Co. | United States | 1,675 | 80,517 | |||||||||
CVS Health Corp. | United States | 1,865 | 113,616 | |||||||||
Merck & Co. Inc. | United States | 1,300 | 112,411 | |||||||||
| 306,544 | ||||||||||||
Industrials 9.4% | ||||||||||||
3M Co. | United States | 850 | 137,462 | |||||||||
The Boeing Co. | United States | 226 | 82,284 | |||||||||
General Dynamics Corp. | United States | 600 | 114,762 | |||||||||
United Technologies Corp. | United States | 285 | 37,119 | |||||||||
| 371,627 | ||||||||||||
Information Technology 10.7% | ||||||||||||
Analog Devices Inc. | United States | 150 | 16,475 | |||||||||
Broadcom Inc. | United States | 525 | 148,386 | |||||||||
International Business Machines Corp. | United States | 810 | 109,779 | |||||||||
Texas Instruments Inc. | United States | 1,200 | 148,500 | |||||||||
| 423,140 | ||||||||||||
Materials 2.3% | ||||||||||||
Rio Tinto PLC, ADR | Australia | 1,800 | 91,044 | |||||||||
Real Estate 1.7% | ||||||||||||
Host Hotels & Resorts Inc. | United States | 4,140 | 66,406 | |||||||||
| franklintempleton.com | Annual Report | 29 | ||
FRANKLIN STRATEGIC SERIES
STATEMENT OF INVESTMENTS
Franklin Templeton SMACS: Series E(continued)
| Country | Shares | Value | ||||||||||
Common Stocks (continued) | ||||||||||||
Utilities 8.5% | ||||||||||||
Dominion Energy Inc. | United States | 1,400 | $ | 108,682 | ||||||||
Duke Energy Corp. | United States | 1,200 | 111,288 | |||||||||
The Southern Co. | United States | 2,000 | 116,520 | |||||||||
| 336,490 | ||||||||||||
Total Common Stocks (Cost $2,959,630) | 3,112,240 | |||||||||||
cEquity-Linked Securities 5.9% | ||||||||||||
Health Care 2.2% | ||||||||||||
dUBS AG London into CVS Health Corp., 8.50%, 144A | United States | 1,400 | 85,884 | |||||||||
Information Technology 3.7% | ||||||||||||
dRoyal Bank of Canada into Intel Corp., 8.00%, 144A | United States | 3,100 | 147,153 | |||||||||
Total Equity-Linked Securities (Cost $233,396) | 233,037 | |||||||||||
Preferred Stocks 7.0% | ||||||||||||
Financials 7.0% | ||||||||||||
BB&T Corp., 5.625%, pfd., E | United States | 5,500 | 137,555 | |||||||||
Citigroup Inc., 6.875%, pfd., K | United States | 5,000 | 139,750 | |||||||||
Total Preferred Stocks (Cost $276,019) | 277,305 | |||||||||||
Units | ||||||||||||
eIndex-Linked Notes (Cost $39,189) 0.9% | ||||||||||||
Financials 0.9% | ||||||||||||
d,fCredit Suisse AG, senior note, 144A, 8.16%, 2/08/21 | United States | 13 | 37,606 | |||||||||
Total Investments before Short Term Investments (Cost $3,508,234) | 3,660,188 | |||||||||||
Shares | ||||||||||||
Short Term Investments (Cost $324,104) 8.2% | ||||||||||||
Money Market Funds 8.2% | ||||||||||||
g,hInstitutional Fiduciary Trust Money Market Portfolio, 1.85% | United States | 324,104 | 324,104 | |||||||||
Total Investments (Cost $3,832,338) 100.6% | 3,984,292 | |||||||||||
Options Written (0.0)%† | (342 | ) | ||||||||||
Other Assets, less Liabilities (0.6)% | (24,780 | ) | ||||||||||
Net Assets 100.0% | $ | 3,959,170 | ||||||||||
| Number of Contracts | Notional Amount | |||||||||||
iOptions Written (Premiums received $408) (0.0)%† | ||||||||||||
Calls - Exchange-Traded | ||||||||||||
Comcast Corp., A, September Strike Price $45, Expires 9/20/19 | 6 | 600 | (342 | ) | ||||||||
30 | Annual Report | franklintempleton.com | ||
FRANKLIN STRATEGIC SERIES
STATEMENT OF INVESTMENTS
Franklin Templeton SMACS: Series E(continued)
See Abbreviations on page 51.
†Rounds to less than 0.1% of net assets.
aNon-income producing.
bA portion or all of the security is held in connection with written option contracts open at year end.
cSee Note 1(e) regarding equity-linked securities.
dSecurity was purchased pursuant to Rule 144A under the Securities Act of 1933 and may be sold in transactions exempt from registration only to qualified institutional buyers or in a public offering registered under the Securities Act of 1933. These securities have been deemed liquid under guidelines approved by the Trust’s Board of Trustees. At August 31, 2019, the aggregate value of these securities was $270,643, representing 6.8% of net assets.
eSee Note 1(d) regarding index-linked notes.
fSecurity pays variable interest based on the distribution of the SPXDIV Index and proceeds earned from related equity derivatives. The interest rate shown represents the rate at period end. Cash payment at maturity or upon early redemption is based on the performance of the S&P 500 Index.
gSee Note 3(d) regarding investments in affiliated management investment companies.
hThe rate shown is the annualizedseven-day effective yield at period end.
iSee Note 1(c) regarding written options.
| franklintempleton.com | The accompanying notes are an integral part of these financial statements. | Annual Report | 31 | ||
FRANKLIN STRATEGIC SERIES
Financial Highlights
Franklin Templeton SMACS: Series H
Year Ended August 31,
2019a | ||||
Per share operating performance | ||||
(for a share outstanding throughout the year) | ||||
Net asset value, beginning of year | $10.00 | |||
Income from investment operationsb: | ||||
Net investment incomec | 0.04 | |||
Net realized and unrealized gains (losses) | 0.09 | |||
Total from investment operations | 0.13 | |||
Less distributions from: | ||||
Net investment income | (0.04 | ) | ||
Net asset value, end of year | $10.09 | |||
Total returnd,e | 1.31% | |||
Ratios to average net assetsf | ||||
Expenses before waiver and payments by affiliates | 3.85% | |||
Expenses net of waiver and payments by affiliates | —% | |||
Net investment income | 1.69% | |||
Supplemental data | ||||
Net assets, end of year (000’s) | $3,042 | |||
Portfolio turnover rate | —% | |||
aFor the period June 3, 2019 (commencement of operations) to August 31, 2019.
bThe amount shown for a share outstanding throughout the period may not correlate with the Statement of Operations for the period due to the timing of sales and repurchases of the Fund’s shares in relation to income earned and/or fluctuating fair value of the investments of the Fund.
cBased on average daily shares outstanding.
dTotal return excluding payments by Advisers for acquired fund fees and expenses is 1.31% for the year ended August 31, 2019. See Note 3(e).
eTotal return is not annualized for periods less than one year.
fRatios are annualized for periods less than one year, except fornon-recurring expenses, if any.
32 | Annual Report | The accompanying notes are an integral part of these financial statements. | franklintempleton.com | ||
FRANKLIN STRATEGIC SERIES
Statement of Investments, August 31, 2019
Franklin Templeton SMACS: Series H
| Shares | Value | |||||||
| ||||||||
Management Investment Companies (Cost $1,017,100) 34.0% | ||||||||
Financials 34.0% | ||||||||
aFranklin Liberty Intermediate Municipal Opportunities ETF | 40,000 | $1,033,400 | ||||||
|
| |||||||
| Principal Amount | ||||||||
Municipal Bonds 38.0% | ||||||||
Colorado 12.1% | ||||||||
Hunters Overlook Metropolitan District No. 5 GO, In the Town of Severance, Weld County, Limited Tax, Series A, 5.00%, 12/01/39 | $150,000 | 161,987 | ||||||
Village at Dry Creek Metropolitan District No. 2 GO, In the City of Thorton, Adams County, Limited Tax, 4.375%, 12/01/44 | 200,000 | 205,374 | ||||||
|
| |||||||
| 367,361 | ||||||||
|
| |||||||
District of Columbia 5.5% | ||||||||
District of Columbia Revenue, District of Columbia International School Issue, 5.00%, 7/01/54 | 140,000 | 167,546 | ||||||
|
| |||||||
Indiana 3.9% | ||||||||
bIndiana State Finance Authority Educational Facilities Revenue, Marian University Project, Series A, 5.00%, 9/15/39 | 100,000 | 120,808 | ||||||
|
| |||||||
Louisiana 12.4% | ||||||||
bCalcasieu Parish Memorial Hospital Service District Hospital Revenue, Lake Charles Memorial Hospital Project, Refunding, 5.00%, 12/01/39 | 200,000 | 238,604 | ||||||
Louisiana Local Government Environmental Facilities and CDA Revenue, St. Martin Parish Gomesa Project, 4.40%, 11/01/44 | 135,000 | 138,816 | ||||||
|
| |||||||
| 377,420 | ||||||||
|
| |||||||
Texas 4.1% | ||||||||
New Hope Cultural Education Facilities Finance Corp. Education Revenue, Cityscape Schools Inc., Series A, 5.00%, 8/15/39 | 110,000 | 124,043 | ||||||
|
| |||||||
Total Municipal Bonds (Cost $1,132,391) | 1,157,178 | |||||||
|
| |||||||
Total Investments before Short Term Investments (Cost $2,149,491) | 2,190,578 | |||||||
|
| |||||||
Short Term Investments 40.4% | ||||||||
Municipal Bonds 40.4% | ||||||||
Florida 3.3% | ||||||||
cSt. Lucie County PCR, Florida Power and Light Co. Project, Refunding, Daily VRDN and Put, 1.38%, 9/01/28 | 100,000 | 100,000 | ||||||
|
| |||||||
Maryland 6.6% | ||||||||
cMaryland State Health and Higher Educational Facilities Authority Revenue, University of Maryland Medical System Issue, Refunding, Series D, LOC Toronto Dominion Bank, Daily VRDN and Put, 1.39%, 7/01/41 | 100,000 | 100,000 | ||||||
cMontgomery County GO, Consolidated Public Improvement, Series E, SPA US Bank National Association, Daily VRDN and Put, 1.36%, 11/01/37 | 100,000 | 100,000 | ||||||
|
| |||||||
| 200,000 | ||||||||
|
| |||||||
| franklintempleton.com | Annual Report | 33 | ||
FRANKLIN STRATEGIC SERIES
STATEMENT OF INVESTMENTS
Franklin Templeton SMACS: Series H(continued)
| Principal Amount | Value | |||||||
| ||||||||
Short Term Investments(continued) | ||||||||
Municipal Bonds(continued) | ||||||||
Michigan 6.6% | ||||||||
cUniversity of Michigan Revenue, | ||||||||
Regents, General, Series A, SPA Wells Fargo Bank, Daily VRDN and Put, 1.36%, 4/01/38 | $100,000 | $ | 100,000 | |||||
Regents, General, SeriesD-1, Daily VRDN and Put, 1.37%, 12/01/24 | 100,000 | 100,000 | ||||||
|
| |||||||
| 200,000 | ||||||||
|
| |||||||
Mississippi 6.6% | ||||||||
cMississippi Business Finance Corp. Gulf Opportunity Zone IDR, | ||||||||
Chevron USA Inc. Project, Series B, Daily VRDN and Put, 1.35%, 11/01/35 | 100,000 | 100,000 | ||||||
Chevron USA Inc. Project, Series L, Daily VRDN and Put, 1.35%, 11/01/35 | 100,000 | 100,000 | ||||||
|
| |||||||
| 200,000 | ||||||||
|
| |||||||
New York 6.5% | ||||||||
cNew York City GO, Fiscal 2015, Series F, SubseriesF-6, SPA JPMorgan Chase Bank, Daily VRDN and Put, 1.39%, 6/01/44 | 100,000 | 100,000 | ||||||
cSyracuse IDA Civic Facility Revenue, Syracuse University Project, SeriesA-2, LOC JPMorgan Chase Bank, Daily VRDN and Put, 1.35%, 12/01/37 | 100,000 | 100,000 | ||||||
|
| |||||||
| 200,000 | ||||||||
|
| |||||||
Utah 7.5% | ||||||||
cUtah County Hospital Revenue, IHC Health Services Inc., Series C, SPA TD Bank National Association, Daily VRDN and Put, 1.35%, 5/15/58 | 100,000 | 100,000 | ||||||
cWeber County Hospital Revenue, IHC Health Services Inc., Series C, SPA Bank of New York Mellon, Daily VRDN and Put, 1.39%, 2/15/35 | 130,000 | 130,000 | ||||||
|
| |||||||
| 230,000 | ||||||||
|
| |||||||
Virginia 3.3% | ||||||||
cVirginia College Building Authority Educational Facilities Revenue, University of Richmond Project, SPA Wells Fargo Bank, Daily VRDN and Put, 1.38%, 11/01/36 | 100,000 | 100,000 | ||||||
|
| |||||||
Total Short Term Investments (Cost $1,230,000) | 1,230,000 | |||||||
|
| |||||||
Total Investments (Cost $3,379,491) 112.4% | 3,420,578 | |||||||
Other Assets, less Liabilities (12.4)% | (378,305 | ) | ||||||
|
| |||||||
Net Assets 100.0% | $ | 3,042,273 | ||||||
|
| |||||||
See Abbreviations on page 51.
aSee Note 3(d) regarding investments in affiliated management investment companies.
bSecurity purchased on a when-issued basis. See Note 1(b).
cVariable rate demand notes (VRDNs) are obligations which contain a floating or variable interest rate adjustment formula and an unconditional right of demand to receive payment of the principal balance plus accrued interest at specified dates. Unless otherwise noted, the coupon rate is determined based on factors including supply and demand, underlying credit, tax treatment, and current short term rates. The coupon rate shown represents the rate at period end.
34 | Annual Report | | The accompanying notes are an integral part of these financial statements. | franklintempleton.com | |||
FRANKLIN STRATEGIC SERIES
Financial Highlights
Franklin Templeton SMACS: Series I
Year Ended August 31, 2019a | ||||
Per share operating performance | ||||
(for a share outstanding throughout the year) | ||||
Net asset value, beginning of year | $10.00 | |||
Income from investment operationsb: | ||||
Net investment incomec | 0.19 | |||
Net realized and unrealized gains (losses) | 0.04 | |||
Total from investment operations | 0.23 | |||
Less distributions from: | ||||
Net investment income | (0.11 | ) | ||
Net asset value, end of year | $10.12 | |||
Total returnd,e | 2.25% | |||
Ratios to average net assetsf | ||||
Expenses before waiver and payments by affiliates | 5.96% | |||
Expenses net of waiver and payments by affiliates | —% | |||
Net investment income | 7.61% | |||
Supplemental data | ||||
Net assets, end of year (000’s) | $3,774 | |||
Portfolio turnover rate | —% | |||
aFor the period June 3, 2019 (commencement of operations) to August 31, 2019.
bThe amount shown for a share outstanding throughout the period may not correlate with the Statement of Operations for the period due to the timing of sales and repurchases of the Fund’s shares in relation to income earned and/or fluctuating fair value of the investments of the Fund.
cBased on average daily shares outstanding.
dTotal return excluding payments by Advisers for acquired fund fees and expenses is 2.25% for the year ended August 31, 2019. See Note 3(e).
eTotal return is not annualized for periods less than one year.
fRatios are annualized for periods less than one year, except fornon-recurring expenses, if any.
| franklintempleton.com | The accompanying notes are an integral part of these financial statements. | Annual Report | 35 | ||
FRANKLIN STRATEGIC SERIES
Statement of Investments, August 31, 2019
Franklin Templeton SMACS: Series I
| Principal Amount | Value | |||||||
| ||||||||
Corporate Bonds 92.1% | ||||||||
Communication Services 15.5% | ||||||||
AMC Entertainment Holdings Inc., senior sub. bond, 5.75%, 6/15/25 | $110,000 | $ | 104,913 | |||||
aCCO Holdings LLC/CCO Holdings Capital Corp., senior bond, 144A, 5.00%, 2/01/28 | 50,000 | 52,625 | ||||||
DISH DBS Corp., senior bond, 5.875%, 7/15/22 | 110,000 | 114,262 | ||||||
Netflix Inc., senior bond, 4.875%, 4/15/28 | 75,000 | 78,656 | ||||||
Sprint Communications Inc., senior note, 6.00%, 11/15/22 | 120,000 | 128,024 | ||||||
aUnivision Communications Inc., senior secured note, first lien, 144A, 5.125%, 2/15/25 | 110,000 | 106,288 | ||||||
|
| |||||||
| 584,768 | ||||||||
|
| |||||||
Consumer Discretionary 14.4% | ||||||||
a24 Hour Holdings III LLC, senior note, 144A, 8.00%, 6/01/22 | 110,000 | 99,550 | ||||||
Ford Motor Co., senior note, 4.346%, 12/08/26 | 110,000 | 113,055 | ||||||
aGolden Nugget Inc., senior note, 144A, 6.75%, 10/15/24 | 55,000 | 56,375 | ||||||
aHanesbrands Inc., senior bond, 144A, 4.875%, 5/15/26 | 75,000 | 79,438 | ||||||
aShea Homes LP/Shea Homes Funding Corp., senior bond, 144A, 6.125%, 4/01/25 | 110,000 | 114,400 | ||||||
aWynn Las Vegas LLC/Wynn Las Vegas Capital Corp., senior bond, 144A, 5.50%, 3/01/25 | 75,000 | 79,313 | ||||||
|
| |||||||
| 542,131 | ||||||||
|
| |||||||
Consumer Staples 3.1% | ||||||||
aPost Holdings Inc., senior bond, 144A, 5.625%, 1/15/28 | 110,000 | 117,563 | ||||||
|
| |||||||
Energy 11.9% | ||||||||
Calumet Specialty Products Partners LP/Calumet Finance Corp., senior note, 7.75%, 4/15/23 | 110,000 | 102,575 | ||||||
Chesapeake Energy Corp., senior note, 7.50%, 10/01/26 | 350,000 | 241,500 | ||||||
Matador Resources Co., senior note, 5.875%, 9/15/26 | 55,000 | 53,556 | ||||||
aTransocean Inc., senior note, 144A, 7.25%, 11/01/25 | 55,000 | 50,256 | ||||||
|
| |||||||
| 447,887 | ||||||||
|
| |||||||
Financials 6.4% | ||||||||
bCitigroup Inc., junior sub. bond, 5.35% to 5/15/23, FRN thereafter, Perpetual | 180,000 | 184,773 | ||||||
Navient Corp., senior note, 5.50%, 1/25/23 | 55,000 | 57,973 | ||||||
|
| |||||||
| 242,746 | ||||||||
|
| |||||||
Health Care 30.3% | ||||||||
aBausch Health Cos. Inc., senior bond, 144A, 6.125%, 4/15/25 | 180,000 | 185,850 | ||||||
CHS/Community Health Systems Inc., senior note, 6.875%, 2/01/22 | 450,000 | 313,744 | ||||||
DaVita Inc., senior bond, 5.00%, 5/01/25 | 55,000 | 55,275 | ||||||
aMallinckrodt International Finance SA/Mallinckrodt CB LLC, senior note, 144A, 5.75%, 8/01/22 | 110,000 | 63,800 | ||||||
Mylan Inc., senior bond, 4.55%, 4/15/28 | 110,000 | 118,442 | ||||||
aPar Pharmaceutical Inc., senior secured note, 144A, 7.50%, 4/01/27 | 110,000 | 102,850 | ||||||
Tenet Healthcare Corp., senior note, 7.00%, 8/01/25 | 300,000 | 304,290 | ||||||
|
| |||||||
| 1,144,251 | ||||||||
|
| |||||||
Industrials 2.1% | ||||||||
United Rentals North America Inc., senior bond, 4.875%, 1/15/28 | 75,000 | 78,938 | ||||||
|
| |||||||
Information Technology 1.3% | ||||||||
aCommScope Technologies LLC, senior bond, 144A, 6.00%, 6/15/25 | 55,000 | 49,500 | ||||||
|
| |||||||
36 | Annual Report | franklintempleton.com | ||
FRANKLIN STRATEGIC SERIES
STATEMENT OF INVESTMENTS
Franklin Templeton SMACS: Series I(continued)
| Principal Amount | Value | |||||||
Corporate Bonds(continued) | ||||||||
Materials 4.1% | ||||||||
Freeport-McMoRan Inc., senior bond, 3.875%, 3/15/23 | $ | 50,000 | $ | 50,645 | ||||
aMauser Packaging Solutions Holding Co., senior note, 144A, 7.25%, 4/15/25 | 110,000 | 105,463 | ||||||
|
| |||||||
| 156,108 | ||||||||
|
| |||||||
Real Estate 1.5% | ||||||||
aIron Mountain Inc., senior note, 144A, 4.875%, 9/15/27 | 55,000 | 56,753 | ||||||
|
| |||||||
Utilities 1.5% | ||||||||
Calpine Corp., senior note, 5.50%, 2/01/24 | 55,000 | 55,618 | ||||||
|
| |||||||
Total Corporate Bonds | 3,476,263 | |||||||
|
| |||||||
| Shares | ||||||||
Short Term Investments (Cost $281,746) 7.5% | ||||||||
Money Market Funds 7.5% | ||||||||
c,dInstitutional Fiduciary Trust Money Market Portfolio, 1.85% | 281,746 | 281,746 | ||||||
|
| |||||||
Total Investments (Cost $3,774,715) 99.6%. | 3,758,009 | |||||||
Other Assets, less Liabilities 0.4% | 15,822 | |||||||
|
| |||||||
Net Assets 100.0% | $ | 3,773,831 | ||||||
|
| |||||||
See Abbreviations on page 51.
aSecurity was purchased pursuant to Rule 144A under the Securities Act of 1933 and may be sold in transactions exempt from registration only to qualified institutional buyers or in a public offering registered under the Securities Act of 1933. These securities have been deemed liquid under guidelines approved by the Trust’s Board of Trustees. At August 31, 2019, the aggregate value of these securities was $1,320,024, representing 35.0% of net assets.
bPerpetual security with no stated maturity date.
cSee Note 3(d) regarding investments in affiliated management investment companies.
dThe rate shown is the annualizedseven-day effective yield at period end.
| franklintempleton.com | The accompanying notes are an integral part of these financial statements. | Annual Report | 37 | ||
FINANCIAL STATEMENTS
Statements of Assets and Liabilities
August 31, 2019
Franklin Templeton SMACS: Series CH | Franklin Templeton SMACS: Series E | Franklin Templeton SMACS: Series H | Franklin Templeton SMACS: Series I | |||||||||||||
Assets: | ||||||||||||||||
Investments in securities: | ||||||||||||||||
Cost - Unaffiliated issuers | $3,853,642 | $3,508,234 | $2,362,391 | $3,492,969 | ||||||||||||
Cost -Non-controlled affiliates (Note 3d) | — | 324,104 | 1,017,100 | 281,746 | ||||||||||||
|
| |||||||||||||||
Value - Unaffiliated issuers | $3,972,430 | $3,660,188 | $2,387,178 | $3,476,263 | ||||||||||||
Value -Non-controlled affiliates (Note 3d) | — | 324,104 | 1,033,400 | 281,746 | ||||||||||||
Cash | 63,494 | — | 16,879 | — | ||||||||||||
Receivables: | ||||||||||||||||
Dividends and interest | 35,878 | 17,695 | 5,788 | 58,925 | ||||||||||||
Affiliates | 27,337 | 14,932 | 18,406 | 24,139 | ||||||||||||
Offering costs | 19,729 | 17,652 | 19,805 | 20,651 | ||||||||||||
|
| |||||||||||||||
Total assets | 4,118,868 | 4,034,571 | 3,481,456 | 3,861,724 | ||||||||||||
|
| |||||||||||||||
Liabilities: | ||||||||||||||||
Payables: | ||||||||||||||||
Investment securities purchased | — | — | 351,934 | — | ||||||||||||
Transfer agent fees | 83 | 65 | 80 | 64 | ||||||||||||
Professional fees | 35,504 | 30,963 | 35,845 | 39,840 | ||||||||||||
Distributions to shareholders | 11,155 | — | 6,153 | — | ||||||||||||
Organization costs | 16,303 | 18,471 | 16,754 | 18,466 | ||||||||||||
Offering costs | 26,067 | 23,323 | 26,169 | 27,286 | ||||||||||||
Options written, at value (premiums received $—, $408, $— and $—, respectively) | — | 342 | — | — | ||||||||||||
Accrued expenses and other liabilities | 2,248 | 2,237 | 2,248 | 2,237 | ||||||||||||
|
| |||||||||||||||
Total liabilities | 91,360 | 75,401 | 439,183 | 87,893 | ||||||||||||
|
| |||||||||||||||
Net assets, at value | $4,027,508 | $3,959,170 | $3,042,273 | $3,773,831 | ||||||||||||
|
| |||||||||||||||
Net assets consist of: | ||||||||||||||||
Paid-in capital | $3,900,000 | $3,758,853 | $3,000,000 | $3,765,490 | ||||||||||||
Total distributable earnings (loss) | 127,508 | 200,317 | 42,273 | 8,341 | ||||||||||||
|
| |||||||||||||||
Net assets, at value | $4,027,508 | $3,959,170 | $3,042,273 | $3,773,831 | ||||||||||||
|
| |||||||||||||||
Shares outstanding | 392,473 | 370,463 | 301,587 | 372,756 | ||||||||||||
|
| |||||||||||||||
Net asset value per share | $10.26 | $10.69 | $10.09 | $10.12 | ||||||||||||
|
| |||||||||||||||
38 | Annual Report | The accompanying notes are an integral part of these financial statements. | franklintempleton.com | ||
FRANKLIN STRATEGIC SERIES
FINANCIAL STATEMENTS
Statements of Operations
for the year ended August 31, 2019a
Franklin Templeton SMACS: Series CH | Franklin Templeton SMACS: Series E | Franklin Templeton SMACS: Series H | Franklin Templeton SMACS: Series I | |||||||||||||
Investment income: | ||||||||||||||||
Dividends: | ||||||||||||||||
Unaffiliated issuers | $ — | $ 33,391 | $ — | $ — | ||||||||||||
Non-controlled affiliates (Note 3d) | — | 1,527 | 6,234 | 1,216 | ||||||||||||
Interest: | ||||||||||||||||
Unaffiliated issuers | 22,576 | 393 | 13,806 | 62,779 | ||||||||||||
Other incomeb | — | 257 | 42 | 202 | ||||||||||||
|
| |||||||||||||||
Total investment income | 22,576 | 35,568 | 20,082 | 64,197 | ||||||||||||
|
| |||||||||||||||
Expenses: | ||||||||||||||||
Transfer agent fees (Note 3c) | 273 | 210 | 269 | 206 | ||||||||||||
Custodian fees (Note 4) | 24 | 12 | 24 | 12 | ||||||||||||
Reports to shareholders | 3,231 | 3,231 | 3,231 | 3,231 | ||||||||||||
Professional fees | 35,540 | 30,999 | 35,881 | 39,876 | ||||||||||||
Organization costs | 16,303 | 18,471 | 16,754 | 18,466 | ||||||||||||
Amortization of offering costs | 6,338 | 5,671 | 6,363 | 6,635 | ||||||||||||
Other | 702 | 887 | 702 | 886 | ||||||||||||
|
| |||||||||||||||
Total expenses | 62,411 | 59,481 | 63,224 | 69,312 | ||||||||||||
Expenses waived/paid by affiliates (Note 3d and 3e) | (62,411 | ) | (59,481 | ) | (63,224 | ) | (69,312 | ) | ||||||||
|
| |||||||||||||||
Net expenses | — | — | — | — | ||||||||||||
|
| |||||||||||||||
Net investment income | 22,576 | 35,568 | 20,082 | 64,197 | ||||||||||||
|
| |||||||||||||||
Realized and unrealized gains (losses): | ||||||||||||||||
Net realized gain (loss) from: | ||||||||||||||||
Investments: | ||||||||||||||||
Unaffiliated issuers | 8,374 | 24,483 | — | — | ||||||||||||
Written options | — | 3,199 | — | — | ||||||||||||
|
| |||||||||||||||
Net realized gain (loss) | 8,374 | 27,682 | — | — | ||||||||||||
|
| |||||||||||||||
Net change in unrealized appreciation (depreciation) on: | ||||||||||||||||
Investments: | ||||||||||||||||
Unaffiliated issuers | 118,788 | 151,954 | 24,787 | (16,706 | ) | |||||||||||
Non-controlled affiliates (Note 3d) | — | — | 16,300 | — | ||||||||||||
Written options | — | 66 | — | — | ||||||||||||
|
| |||||||||||||||
Net change in unrealized appreciation (depreciation) | 118,788 | 152,020 | 41,087 | (16,706 | ) | |||||||||||
|
| |||||||||||||||
Net realized and unrealized gain (loss) | 127,162 | 179,702 | 41,087 | (16,706 | ) | |||||||||||
|
| |||||||||||||||
Net increase (decrease) in net assets resulting from operations | $149,738 | $215,270 | $61,169 | $47,491 | ||||||||||||
|
| |||||||||||||||
aFor the period June 3, 2019 (commencement of operations) to August 31, 2019.
bOther income includes payments by Advisers for acquired fund fees and expenses (See Note 3e).
| franklintempleton.com | The accompanying notes are an integral part of these financial statements. | Annual Report | 39 | ||
FRANKLIN STRATEGIC SERIES
FINANCIAL STATEMENTS
Statements of Changes in Net Assets
Franklin Templeton SMACS: Series CH | Franklin Templeton SMACS: Series E | |||||||
|
| |||||||
| Year Ended August 31, 2019a | Year Ended August 31, 2019a | |||||||
| ||||||||
Increase (decrease) in net assets: | ||||||||
Operations: | ||||||||
Net investment income | $ 22,576 | $ 35,568 | ||||||
Net realized gain (loss) | 8,374 | 27,682 | ||||||
Net change in unrealized appreciation (depreciation) | 118,788 | 152,020 | ||||||
|
| |||||||
Net increase (decrease) in net assets resulting from operations | 149,738 | 215,270 | ||||||
|
| |||||||
Distributions to shareholders | (22,230 | ) | (14,953 | ) | ||||
|
| |||||||
Capital share transactions (Note 2) | 3,900,000 | 3,758,853 | ||||||
|
| |||||||
Net increase (decrease) in net assets. | 4,027,508 | 3,959,170 | ||||||
Net assets: | ||||||||
End of year | $4,027,508 | $3,959,170 | ||||||
|
| |||||||
aFor the period June 3, 2019 (commencement of operations) to August 31, 2019.
40 | Annual Report | The accompanying notes are an integral part of these financial statements. | franklintempleton.com | ||
FRANKLIN STRATEGIC SERIES
FINANCIAL STATEMENTS
Statements of Changes in Net Assets(continued)
Franklin Templeton SMACS: Series H | Franklin Templeton SMACS: Series I | |||||||
|
| |||||||
Year Ended August 31, 2019a | Year Ended August 31, 2019a | |||||||
| ||||||||
Increase (decrease) in net assets: | ||||||||
Operations: | ||||||||
Net investment income | $ 20,082 | $ 64,197 | ||||||
Net change in unrealized appreciation (depreciation) | 41,087 | (16,706 | ) | |||||
|
| |||||||
Net increase (decrease) in net assets resulting from operations | 61,169 | 47,491 | ||||||
|
| |||||||
Distributions to shareholders | (18,896 | ) | (39,150 | ) | ||||
|
| |||||||
Capital share transactions (Note 2) | 3,000,000 | 3,765,490 | ||||||
|
| |||||||
Net increase (decrease) in net assets | 3,042,273 | 3,773,831 | ||||||
Net assets: | ||||||||
End of year | $3,042,273 | $3,773,831 | ||||||
|
| |||||||
aFor the period June 3, 2019 (commencement of operations) to August 31, 2019.
| franklintempleton.com | The accompanying notes are an integral part of these financial statements. | Annual Report | 41 | ||
FRANKLIN STRATEGIC SERIES
1. Organization and Significant Accounting Policies
Franklin Strategic Series (Trust) is registered under the Investment Company Act of 1940 (1940 Act) as anopen-end management investment company, consisting of twelve separate funds, four of which are included in this report (Funds) and applies the specialized accounting and reporting guidance in U.S. Generally Accepted Accounting Principles (U.S. GAAP).
The Funds commenced operations effective June 3, 2019.
The following summarizes the Funds’ significant accounting policies.
a. Financial Instrument Valuation
The Funds’ investments in financial instruments are carried at fair value daily. Fair value is the price that would be received to sell an asset or paid to transfer a liability in an orderly transaction between market participants on the measurement date. The Funds calculate the net asset value (NAV) per share each business day as of 4 p.m. Eastern time or the regularly scheduled close of the New York Stock Exchange (NYSE), whichever is earlier. Under compliance policies and procedures approved by the Trust’s Board of Trustees (the Board), the Funds’ administrator has responsibility for oversight of valuation, including leading the cross-functional Valuation Committee (VC). The Funds may utilize independent pricing services, quotations from securities and financial instrument dealers, and other market sources to determine fair value.
Equity securities, exchange traded funds and derivative financial instruments listed on an exchange or on the NASDAQ National Market System are valued at the last quoted sale price or the official closing price of the day, respectively. Foreign equity securities are valued as of the close of trading on the foreign stock exchange on which the security is primarily traded, or as of 4 p.m. Eastern time. The value is then converted into its U.S. dollar equivalent at the foreign exchange rate in effect at 4 p.m. Eastern time on the day that the value of the security is determined.Over-the-counter (OTC) securities are valued within the range of the most recent quoted bid and ask prices. Securities that trade in multiple markets or on multiple exchanges are valued according to the broadest and most representative market. Certain equity securities are valued based upon fundamental characteristics or relationships to similar securities.
Debt securities generally trade in the OTC market rather than on a securities exchange. The Funds’ pricing services use multiple valuation techniques to determine fair value. In instances where sufficient market activity exists, the pricing services may utilize a market-based approach through which quotes from market makers are used to determine fair value. In instances where sufficient market activity may not exist or is limited, the pricing services also utilize proprietary valuation models which may consider market characteristics such as benchmark yield curves, credit spreads, estimated default rates, anticipated market interest rate volatility, coupon rates, anticipated timing of principal repayments, underlying collateral, and other unique security features in order to estimate the relevant cash flows, which are then discounted to calculate the fair value.
Investments inopen-end mutual funds are valued at the closing NAV.
The Funds have procedures to determine the fair value of financial instruments for which market prices are not reliable or readily available. Under these procedures, the Funds primarily employ a market-based approach which may use related or comparable assets or liabilities, recent transactions, market multiples, book values, and other relevant information for the investment to determine the fair value of the investment. An income-based valuation approach may also be used in which the anticipated future cash flows of the investment are discounted to calculate fair value. Discounts may also be applied due to the nature or duration of any restrictions on the disposition of the investments. Due to the inherent uncertainty of valuations of such investments, the fair values may differ significantly from the values that would have been used had an active market existed.
Trading in securities on foreign securities stock exchanges and OTC markets may be completed before 4 p.m. Eastern time. In addition, trading in certain foreign markets may not take place on every Funds’ business day. Occasionally, events occur between the time at which trading in a foreign security is completed and 4 p.m. Eastern time that might call into question the reliability of the value of a portfolio security held by the Fund. As a result, differences may arise between the value of the Funds’ portfolio securities as determined at the foreign market close and the latest indications of value at 4 p.m. Eastern time. In order to minimize the potential for these differences, the VC monitors price movements following the close of trading in foreign stock markets through a series of country specific market proxies (such as baskets of
42 | Annual Report | franklintempleton.com | ||
FRANKLIN STRATEGIC SERIES
NOTES TO FINANCIAL STATEMENTS
American Depositary Receipts, futures contracts and exchange traded funds). These price movements are measured against established trigger thresholds for each specific market proxy to assist in determining if an event has occurred that may call into question the reliability of the values of the foreign securities held by the Funds. If such an event occurs, the securities may be valued using fair value procedures, which may include the use of independent pricing services.
When the last day of the reporting period is anon-business day, certain foreign markets may be open on those days that the Funds’ NAV is not calculated, which could result in differences between the value of the Funds’ portfolio securities on the last business day and the last calendar day of the reporting period. Any significant security valuation changes due to an open foreign market are adjusted and reflected by the Funds for financial reporting purposes.
b. Securities Purchased on a When-Issued Basis
Certain or all Funds purchase securities on a when-issued basis, with payment and delivery scheduled for a future date. These transactions are subject to market fluctuations and are subject to the risk that the value at delivery may be more or less than the trade date purchase price. Although the Funds will generally purchase these securities with the intention of holding the securities, they may sell the securities before the settlement date. Sufficient assets have been segregated for these securities.
c. Derivative Financial Instruments
Certain or all Funds invested in derivative financial instruments in order to manage risk or gain exposure to various other investments or markets. Derivatives are financial contracts based on an underlying or notional amount, require no initial investment or an initial net investment that is smaller than would normally be required to have a similar response to changes in market factors, and require or permit net settlement. Derivatives contain various risks including the potential inability of the counterparty to fulfill their obligations under the terms of the contract, the potential for an illiquid secondary market, and/or the potential for market movements which expose the Fund to gains or losses in excess of the amounts shown in the Statements of Assets and Liabilities. Realized gain and loss and unrealized appreciation and depreciation on these contracts for the period are included in the Statements of Operations.
Collateral requirements differ by type of derivative. Collateral or initial margin requirements are set by the broker or exchange clearing house for exchange traded and centrally cleared derivatives. Initial margin deposited is held at the exchange and can be in the form of cash and/or securities.
Certain or all Funds purchased or wrote exchange traded option contracts primarily to manage and/or gain exposure to equity price risk. An option is a contract entitling the holder to purchase or sell a specific amount of shares or units of an asset or notional amount of a swap (swaption), at a specified price. When an option is purchased or written, an amount equal to the premium paid or received is recorded as an asset or liability, respectively. Upon exercise of an option, the acquisition cost or sales proceeds of the underlying investment is adjusted by any premium received or paid. Upon expiration of an option, any premium received or paid is recorded as a realized gain or loss. Upon closing an option other than through expiration or exercise, the difference between the premium received or paid and the cost to close the position is recorded as a realized gain or loss.
See Note 9 regarding other derivative information.
d. Index-Linked Notes
Certain or all Funds invest in index-linked notes. Index-linked notes are senior, unsecured, subordinated debt securities issued by a financial institution, and the value is based on the price movements of the underlying index. Index-linked notes are designed to provide investors access to the returns of various market benchmarks and intended to replicate the economic effects that would apply had the Fund directly purchased the underlying referenced asset or basket of assets. The risks of investing in index-linked notes include unfavorable price movements in the underlying index and the credit risk of the issuing financial institution. There may be no guarantee of a return of principal with index-linked notes and the appreciation potential may be limited. Index-linked notes may be more volatile and less liquid than other investments held by the Funds.
e. Equity-Linked Securities
Certain or all Funds invest in equity-linked securities. Equity-linked securities are hybrid financial instruments that generally combine both debt and equity characteristics into a single note form. Income received from equity-linked securities is recorded as realized gains in the Statements of Operations and may be based on the performance of an
| franklintempleton.com | Annual Report | 43 | ||
FRANKLIN STRATEGIC SERIES
NOTES TO FINANCIAL STATEMENTS
1. Organization and Significant Accounting
Policies(continued)
e. Equity-Linked Securities(continued)
underlying equity security, an equity index, or an option position. The risks of investing in equity-linked securities include unfavorable price movements in the underlying security and the credit risk of the issuing financial institution. There may be no guarantee of a return of principal with equity-linked securities and the appreciation potential may be limited. Equity-linked securities may be more volatile and less liquid than other investments held by the Funds.
f. Income Taxes
It is each Fund’s policy to qualify as a regulated investment company under the Internal Revenue Code. Each Fund intends to distribute to shareholders substantially all of its income and net realized gains to relieve it from federal income and excise taxes. As a result, no provision for U.S. federal income taxes is required.
Each Fund may recognize an income tax liability related to its uncertain tax positions under U.S. GAAP when the uncertain tax position has a less than 50% probability that it will be sustained upon examination by the tax authorities based on its technical merits. As of August 31, 2019, each Fund has determined that no tax liability is required in its financial statements related to uncertain tax positions for any open tax years (or expected to be taken in future tax years). Open tax years are those that remain subject to examination and are based on the statute of limitations in each jurisdiction in which the Fund invests.
g. Security Transactions, Investment Income, Expenses and Distributions
Security transactions are accounted for on trade date. Realized gains and losses on security transactions are determined on a specific identification basis. Interest income and estimated expenses are accrued daily. Amortization of premium and accretion of discount on debt securities are included in interest income. Dividend income is recorded on theex-dividend date except for certain dividends from securities where the dividend rate is not available. In such cases, the dividend is recorded as soon as the information is received by the Funds. Dividends from net investment income are normally declared daily and may be reinvested or paid
monthly to shareholders for Franklin Templeton SMACS: Series CH and Franklin Templeton SMACS: Series H, and recorded onex-dividend date for Franklin Templeton SMACS: Series E and Franklin Templeton SMACS: Series I. Distributions from realized capital gains and other distributions, if any, are recorded on theex-dividend date. Distributable earnings are determined according to income tax regulations (tax basis) and may differ from earnings recorded in accordance with U.S. GAAP. These differences may be permanent or temporary. Permanent differences are reclassified among capital accounts to reflect their tax character. These reclassifications have no impact on net assets or the results of operations. Temporary differences are not reclassified, as they may reverse in subsequent periods.
Common expenses incurred by the Trust are allocated among the Funds based on the ratio of net assets of each Fund to the combined net assets of the Trust or based on the ratio of number of shareholders of each Fund to the combined number of shareholders of the Trust. Fund specific expenses are charged directly to the Fund that incurred the expense.
h. Organization and Offering Costs
Organization costs were expensed as incurred. Offering costs are amortized on a straight line basis over twelve months.
i. Accounting Estimates
The preparation of financial statements in accordance with U.S. GAAP requires management to make estimates and assumptions that affect the reported amounts of assets and liabilities at the date of the financial statements and the amounts of income and expenses during the reporting period. Actual results could differ from those estimates.
j. Guarantees and Indemnifications
Under the Trust’s organizational documents, its officers and trustees are indemnified by the Trust against certain liabilities arising out of the performance of their duties to the Trust. Additionally, in the normal course of business, the Trust, on behalf of the Funds, enters into contracts with service providers that contain general indemnification clauses. The Trust’s maximum exposure under these arrangements is unknown as this would involve future claims that may be made against the Trust that have not yet occurred. Currently, the Trust expects the risk of loss to be remote.
44 | Annual Report | franklintempleton.com | ||
FRANKLIN STRATEGIC SERIES
NOTES TO FINANCIAL STATEMENTS
2. Shares of Beneficial Interest
At August 31, 2019, there were an unlimited number of shares authorized (without par value). Transactions in the Funds’ shares were as follows:
Franklin Templeton SMACS: Series CH | Franklin Templeton SMACS: Series E | Franklin Templeton SMACS: Series H | Franklin Templeton SMACS: Series I | |||||||||||||||||||||||||||||||||||||||||
| Shares | Amount | Shares | Amount | Shares | Amount | Shares | Amount | |||||||||||||||||||||||||||||||||||||
Year ended August 31, 2019a Shares sold | 500,000 | $ | 5,000,000 | 370,000 | $ | 3,754,000 | 500,000 | $ | 5,000,000 | 371,500 | $ | 3,752,665 | ||||||||||||||||||||||||||||||||
Shares issued in reinvestment of distributions | — | — | 463 | 4,853 | — | — | 1,256 | 12,825 | ||||||||||||||||||||||||||||||||||||
Shares redeemed | (107,527 | ) | (1,100,000 | ) | — | — | (198,413 | ) | (2,000,000 | ) | — | — | ||||||||||||||||||||||||||||||||
Net increase (decrease) | 392,473 | $ | 3,900,000 | 370,463 | $ | 3,758,853 | 301,587 | $ | 3,000,000 | 372,756 | $ | 3,765,490 | ||||||||||||||||||||||||||||||||
aFor the period June 3, 2019 (commencement of operations) to August 31, 2019.
3. Transactions with Affiliates
Franklin Resources, Inc. is the holding company for various subsidiaries that together are referred to as Franklin Templeton. Certain officers and trustees of the Trust are also officers and/or directors of the following subsidiaries:
| Subsidiary | Affiliation | |
| Franklin Advisers, Inc. (Advisers) | Investment manager | |
| Franklin Templeton Services, LLC (FT Services) | Administrative manager | |
| Franklin Templeton Distributors, Inc. (Distributors) | Principal underwriter | |
| Franklin Templeton Investor Services, LLC (Investor Services) | Transfer agent | |
a. Management Fees
Advisers provides investment management services to the Funds. The Funds do not pay a fee for these services.
b. Administrative Fees
Under an agreement with Advisers, FT Services provides administrative services to the Funds. The Funds do not pay a fee for these services.
c. Transfer Agent Fees
The Funds pay transfer agent fees to Investor Services for its performance of shareholder servicing obligations. The fees are based on an annualized asset based fee of 0.02% plus a transaction based fee. In addition, the Funds reimburse Investor Services for out of pocket expenses incurred and reimburses shareholder servicing fees paid to third parties.
| franklintempleton.com | Annual Report | 45 | ||
FRANKLIN STRATEGIC SERIES
NOTES TO FINANCIAL STATEMENTS
3. Transactions with Affiliates(continued)
c. Transfer Agent Fees(continued)
For the year ended August 31, 2019, the Funds paid transfer agent fees as noted in the Statements of Operations of which the following amounts were retained by Investor Services:
| Franklin Templeton SMACS: Series CH | Franklin Templeton SMACS: Series E | Franklin Templeton SMACS: Series H | Franklin Templeton SMACS: Series I | |||||||||||||
Transfer agent fees | $273 | $210 | $269 | $206 | ||||||||||||
d. Investments in Affiliated Management Investment Companies
Certain or all Funds invest in one or more affiliated management investment companies for purposes other than exercising a controlling influence over the management or policies. Advisers has contractually agreed to reimburse expenses of the Funds in an amount equal to fees indirectly borne by the Funds on assets invested in the affiliated management investment companies, as noted in the Statements of Operations. During the year ended August 31, 2019, investments in affiliated management investment companies were as follows:
| Value at Beginning of Year | Purchases | Sales | Realized Gain (Loss) | Net Change in Unrealized Appreciation (Depreciation) | Value at End of Year | Number of Shares Held at End of Year | Dividend Income | |||||||||||||||||||||||||
Franklin Templeton SMACS: Series E | ||||||||||||||||||||||||||||||||
Non-Controlled Affiliates | ||||||||||||||||||||||||||||||||
Institutional Fiduciary Trust Money Market Portfolio, 1.85% | $ — | $4,261,055 | $(3,936,951) | $ — | $ — | $ 324,104 | 324,104 | $1,527 | ||||||||||||||||||||||||
Franklin Templeton SMACS: Series H | ||||||||||||||||||||||||||||||||
Non-Controlled Affiliates | ||||||||||||||||||||||||||||||||
Franklin Liberty Intermediate Municipal Opportunities ETF. | $ — | $1,017,100 | $ — | $ — | $16,300 | $1,033,400 | 40,000 | $6,234 | ||||||||||||||||||||||||
Franklin Templeton SMACS: Series I | ||||||||||||||||||||||||||||||||
Non-Controlled Affiliates | ||||||||||||||||||||||||||||||||
Institutional Fiduciary Trust Money Market Portfolio, 1.85% | $ — | $3,849,088 | $(3,567,342) | $ — | $ — | $ 281,746 | 281,746 | $1,216 | ||||||||||||||||||||||||
e. Waiver and Expense Reimbursements
Advisers has contractually agreed in advance to waive or assume as its own expense certain expenses otherwise payable by the Funds so that the expenses (including acquired fund fees and expenses, but excluding certainnon-routine expenses or costs, including those relating to litigation, indemnification, reorganizations, and liquidations) of the Funds do not exceed 0.00%, based on the average net assets until June 2, 2020. Total expenses waived or paid are not subject to recapture subsequent to the Funds’ fiscal year end.
Acquired fund fees and expenses are indirect expenses, and therefore Advisers may make payments, if necessary, to the Funds to offset these estimated indirect expenses. Payments by Advisers for the year ended August 31, 2019, are reflected as other income in the Statements of Operations.
46 | Annual Report | franklintempleton.com | ||
FRANKLIN STRATEGIC SERIES
NOTES TO FINANCIAL STATEMENTS
f. Other Affiliated Transactions
At August 31, 2019, Franklin Advisers, Inc. and Franklin Resources, Inc. owned a percentage of the Funds’ outstanding shares as follows:
| Shares | Percentage of Outstanding Shares | |||||
Franklin Templeton SMACS: Series CH | ||||||
Franklin Resources, Inc. | 392,473 | 100.0%a | ||||
Franklin Templeton SMACS: Series E | ||||||
Franklin Advisers, Inc. | 120,463 | 32.5% | ||||
Franklin Resources, Inc. | 250,000 | 67.5%a | ||||
Franklin Templeton SMACS: Series H | ||||||
Franklin Resources, Inc. | 301,587 | 100.0%a | ||||
Franklin Templeton SMACS: Series I | ||||||
Franklin Advisers, Inc. | 122,756 | 32.9% | ||||
Franklin Resources, Inc. | 250,000 | 67.1%a | ||||
aInvestment activities of this shareholder could have a material impact on the Fund.
g. Interfund Transactions
Certain or all Funds engaged in purchases and sales of investments with funds or other accounts that have common investment managers (or affiliated investment managers), directors, trustees or officers. These purchases and sales for the year ended August 31, 2019, were as follows:
Franklin Templeton SMACS: Series CH | Franklin Templeton SMACS: Series H | |||||||
Purchases | $ 700,000 | $1,700,000 | ||||||
Sales | $1,300,000 | $2,125,000 | ||||||
4. Expense Offset Arrangement
The Funds have entered into an arrangement with their custodian whereby credits realized as a result of uninvested cash balances are used to reduce a portion of the Funds’ custodian expenses. During the year ended August 31, 2019, there were no credits earned.
5. Income Taxes
The tax character of distributions paid during the year ended August 31, 2019, was as follows:
Franklin Templeton SMACS: Series CH | Franklin Templeton SMACS: Series E | Franklin Templeton SMACS: Series H | Franklin Templeton SMACS: Series I | |||||
Distributions paid from: | ||||||||
Tax exempt income | $22,230 | $ — | $18,896 | $ — | ||||
Ordinary income | — | 14,953 | — | 39,150 | ||||
$22,230 | $14,953 | $18,896 | $39,150 |
| franklintempleton.com | Annual Report | 47 | ||
FRANKLIN STRATEGIC SERIES
NOTES TO FINANCIAL STATEMENTS
5. Income Taxes(continued)
At August 31, 2019, the cost of investments, net unrealized appreciation (depreciation), undistributed tax exempt and ordinary income for income tax purposes were as follows:
Franklin Templeton SMACS: Series CH | Franklin Templeton | Franklin Templeton | Franklin Templeton | |||||||||||||||||||||||||||
Cost of investments | $ | 3,853,642 | $ | 3,831,934 | $ | 3,379,491 | $ | 3,775,773 | ||||||||||||||||||||||
Unrealized appreciation | $ | 118,788 | $ | 220,489 | $ | 41,087 | $ | 99,868 | ||||||||||||||||||||||
Unrealized depreciation | — | (68,473 | ) | — | (117,632 | ) | ||||||||||||||||||||||||
Net unrealized appreciation (depreciation) | $ | 118,788 | $ | 152,016 | $ | 41,087 | $ | (17,764 | ) | |||||||||||||||||||||
Distributable earnings: | ||||||||||||||||||||||||||||||
Undistributed ordinary income | $ | 8,373 | $ | 48,303 | $ | — | $ | 23,296 | ||||||||||||||||||||||
Undistributed tax exempt income | 11,502 | — | 7,339 | — | ||||||||||||||||||||||||||
Total distributable earnings | $ | 19,875 | $ | 48,303 | $ | 7,339 | $ | 23,296 | ||||||||||||||||||||||
Differences between income and/or capital gains as determined on a book basis and a tax basis are primarily due to differing treatment of bond discounts and premiums.
6. Investment Transactions
Purchases and sales of investments and ETFs (excluding short term securities) for the year ended August 31, 2019, were as follows:
| Franklin Templeton SMACS: Series CH | Franklin Templeton SMACS: Series E | Franklin Templeton SMACS: Series H | Franklin Templeton SMACS: Series I | |||||||||||||||||||||||||||||
Purchases | $ | 4,332,290 | $ | 3,921,309 | $ | 2,149,722 | $ | 3,480,088 | ||||||||||||||||||||||||
Sales | $ | 481,030 | $ | 437,553 | $ | — | $ | — | ||||||||||||||||||||||||
7. Credit Risk
At August 31, 2019, Franklin Templeton SMACS: Series CH, Franklin Templeton SMACS: Series H and Franklin Templeton SMACS: Series I had 76.5%, 25.4% and 86.3%, respectively, of their portfolio invested in high yield, senior secured floating rate loans, or other securities rated below investment grade and unrated securities, if any. These securities may be more sensitive to economic conditions causing greater price volatility and are potentially subject to a greater risk of loss due to default than higher rated securities.
8. Concentration of Risk
Franklin Templeton SMACS: Series CH invests a large percentage of its total assets in obligations of issuers within California. Such concentration may subject the Fund to risks associated with industrial or regional matters, and economic, political or legal developments occurring within California. In addition, investments in these securities are sensitive to interest rate changes and credit risk of the issuer and may subject the Fund to increased market volatility. The market for these investments may be limited, which may make them difficult to buy or sell.
48 | Annual Report | franklintempleton.com | ||
FRANKLIN STRATEGIC SERIES
NOTES TO FINANCIAL STATEMENTS
9. Other Derivative Information
At August 31, 2019, investments in derivative contracts are reflected in the Statements of Assets and Liabilities as follows:
Asset Derivatives | Liability Derivatives | |||||||||||||||
Derivative Contracts Not Accounted for as Hedging Instruments | Statements of Assets and Liabilities Location | Fair Value | Statements of Assets and Liabilities Location | Fair Value | ||||||||||||
Franklin Templeton SMACS: Series E | ||||||||||||||||
Equity contracts | Investments in securities, at value | $ — | Options written, at value | $342 | ||||||||||||
|
|
|
| |||||||||||||
For the year ended August 31, 2019, the effect of derivative contracts in the Statements of Operations was as follows:
Derivative Contracts Not Accounted for as Hedging Instruments | Statements of Operations Location | Net Realized Gain (Loss) for the Year | Statements of Operations Location | Net Change in Unrealized Appreciation (Depreciation) for the Year | ||||||||
| Net realized gain (loss) from: | Net change in unrealized appreciation (depreciation) on: | |||||||||||
Franklin Templeton SMACS: Series E | ||||||||||||
Equity contracts | Written options | $3,199 | Written options | $66 | ||||||||
|
|
|
| |||||||||
For the year ended August 31, 2019, the average month end notional amount of options contract represented 3,633 shares.
See Note 1(c) regarding derivative financial instruments.
10. Fair Value Measurements
The Funds follow a fair value hierarchy that distinguishes between market data obtained from independent sources (observable inputs) and the Funds’ own market assumptions (unobservable inputs). These inputs are used in determining the value of the Funds’ financial instruments and are summarized in the following fair value hierarchy:
| • | Level 1 – quoted prices in active markets for identical financial instruments |
| • | Level 2 – other significant observable inputs (including quoted prices for similar financial instruments, interest rates, prepayment speed, credit risk, etc.) |
| • | Level 3 – significant unobservable inputs (including the Funds’ own assumptions in determining the fair value of financial instruments) |
The input levels are not necessarily an indication of the risk or liquidity associated with financial instruments at that level.
| franklintempleton.com | Annual Report | 49 | ||
FRANKLIN STRATEGIC SERIES
NOTES TO FINANCIAL STATEMENTS
10. Fair Value Measurements(continued)
A summary of inputs used as of August 31, 2019, in valuing the Funds’ assets and liabilities carried at fair value, is as follows:
| Level 1 | Level 2 | Level 3 | Total | |||||||||||||
| ||||||||||||||||
Franklin Templeton SMACS: Series CH | ||||||||||||||||
Assets: | ||||||||||||||||
Investments in Securities:a | ||||||||||||||||
Municipal Bonds | $ | — | $ | 3,972,430 | $ | — | $ | 3,972,430 | ||||||||
|
| |||||||||||||||
Total Investments in Securities | $ | — | $ | 3,972,430 | $ | — | $ | 3,972,430 | ||||||||
|
| |||||||||||||||
Franklin Templeton SMACS: Series E | ||||||||||||||||
Assets: | ||||||||||||||||
Investments in Securities:a | ||||||||||||||||
Equity Investmentsb | $ | 3,389,545 | $ | — | $ | — | $ | 3,389,545 | ||||||||
Equity-Linked Securities | — | 233,037 | — | 233,037 | ||||||||||||
Index-Linked Notes | — | 37,606 | — | 37,606 | ||||||||||||
Short Term Investments | 324,104 | — | �� | 324,104 | ||||||||||||
|
| |||||||||||||||
Total Investments in Securities | $ | 3,713,649 | $ | 270,643 | $ | — | $ | 3,984,292 | ||||||||
|
| |||||||||||||||
Liabilities: | ||||||||||||||||
Other Financial Instruments: | ||||||||||||||||
Options Written | $ | 342 | $ | — | $ | — | $ | 342 | ||||||||
|
| |||||||||||||||
Franklin Templeton SMACS: Series H | ||||||||||||||||
Assets: | ||||||||||||||||
Investments in Securities:a | ||||||||||||||||
Equity Investmentsb | $ | 1,033,400 | $ | — | $ | — | $ | 1,033,400 | ||||||||
Municipal Bonds | — | 1,157,178 | — | 1,157,178 | ||||||||||||
Short Term Investments | — | 1,230,000 | — | 1,230,000 | ||||||||||||
|
| |||||||||||||||
Total Investments in Securities | $ | 1,033,400 | $ | 2,387,178 | $ | — | $ | 3,420,578 | ||||||||
|
| |||||||||||||||
Franklin Templeton SMACS: Series I | ||||||||||||||||
Assets: | ||||||||||||||||
Investments in Securities:a | ||||||||||||||||
Corporate Bonds | $ | — | $ | 3,476,263 | $ | — | $ | 3,476,263 | ||||||||
Short Term Investments | 281,746 | — | — | 281,746 | ||||||||||||
|
| |||||||||||||||
Total Investments in Securities | $ | 281,746 | $ | 3,476,263 | $ | — | $ | 3,758,009 | ||||||||
|
| |||||||||||||||
aFor detailed categories, see the accompanying Statement of Investments.
bIncludes common and preferred stocks and management investment companies.
11. Subsequent Events
The Funds have evaluated subsequent events through the issuance of the financial statements and determined that no events have occurred that require disclosure.
50 | Annual Report | franklintempleton.com | ||
FRANKLIN STRATEGIC SERIES
NOTES TO FINANCIAL STATEMENTS
| Abbreviations | ||
| Selected Portfolio | ||
ADR | American Depository Receipt | |
CDA | Community Development Authority/Agency | |
CFD | Community Facilities District | |
ETF | Exchange-Traded Fund | |
FRN | Floating Rate Note | |
GO | General Obligation | |
IDA | Industrial Development Authority/Agency | |
IDR | Industrial Development Revenue | |
LOC | Letter of Credit | |
PCR | Pollution Control Revenue | |
PFA | Public Financing Authority | |
SPA | Standby Purchase Agreement | |
SPXDIV | S&P 500 Dividend Points | |
| franklintempleton.com | Annual Report | 51 | ||
FRANKLIN STRATEGIC SERIES
Report of Independent Registered Public Accounting Firm
To the Board of Trustees of Franklin Strategic Series and Shareholders of Franklin Templeton SMACS: Series CH, Franklin Templeton SMACS: Series E, Franklin Templeton SMACS: Series H and Franklin Templeton SMACS: Series I
Opinions on the Financial Statements
We have audited the accompanying statements of assets and liabilities, including the statements of investments, of Franklin Templeton SMACS: Series CH, Franklin Templeton SMACS: Series E, Franklin Templeton SMACS: Series H and Franklin Templeton SMACS: Series I (the “Funds”) as of August 31, 2019, and the related statements of operations and changes in net assets, including the related notes, and the financial highlights for the period June 3, 2019 (commencement of operations) through August 31, 2019 (collectively referred to as the “financial statements”). In our opinion, the financial statements present fairly, in all material respects, the financial position of each of the Funds as of August 31, 2019, and the results of each of their operations, changes in each of their net assets, and each of the financial highlights for the period June 3, 2019 (commencement of operations) through August 31, 2019 in conformity with accounting principles generally accepted in the United States of America.
Basis for Opinions
These financial statements are the responsibility of the Funds’ management. Our responsibility is to express an opinion on the Funds’ financial statements based on our audits. We are a public accounting firm registered with the Public Company Accounting Oversight Board (United States) (PCAOB) and are required to be independent with respect to the Funds in accordance with the U.S. federal securities laws and the applicable rules and regulations of the Securities and Exchange Commission and the PCAOB.
We conducted our audits of these financial statements in accordance with the standards of the PCAOB. Those standards require that we plan and perform the audit to obtain reasonable assurance about whether the financial statements are free of material misstatement, whether due to error or fraud.
Our audits included performing procedures to assess the risks of material misstatement of the financial statements, whether due to error or fraud, and performing procedures that respond to those risks. Such procedures included examining, on a test basis, evidence regarding the amounts and disclosures in the financial statements. Our audits also included evaluating the accounting principles used and significant estimates made by management, as well as evaluating the overall presentation of the financial statements. Our procedures included confirmation of securities owned as of August 31, 2019 by correspondence with the custodian, transfer agent and brokers; when replies were not received from brokers, we performed other auditing procedures. We believe that our audits provide a reasonable basis for our opinions.
PricewaterhouseCoopers LLP
San Francisco, California
October 21, 2019
We have served as the auditor of one or more investment companies in the Franklin Templeton Group of Funds since 1948.
52 | Annual Report | franklintempleton.com | ||
FRANKLIN STRATEGIC SERIES
Under Section 852(b)(5)(A) of the Internal Revenue Code, the Funds hereby report 100% of the distributions paid from net investment income as exempt-interest dividends for Franklin Templeton SMACS: Series CH and Franklin Templeton SMACS: Series H for the fiscal year ended August 31, 2019. A portion of the Funds’ exempt-interest dividends may be subject to the federal alternative minimum tax. Bymid-February 2020, shareholders will be notified of amounts for use in preparing their 2019 income tax returns.
Under Section 854(b)(1)(A) of the Internal Revenue Code, the Funds hereby report the following percentage amounts of the ordinary income dividends as income qualifying for the dividends received deduction for the fiscal year ended August 31, 2019:
Franklin Templeton SMACS: Series E |
100.00% |
Under Section 854(b)(1)(B) of the Internal Revenue Code, the Funds hereby report the maximum amount allowable but no less than the following amounts as qualified dividends for purposes of the maximum rate under Section 1(h)(11) of the Internal Revenue Code for the fiscal year ended August 31, 2019:
Franklin Templeton SMACS: Series E |
$28,036 |
Distributions, including qualified dividend income, paid during calendar year 2019 will be reported to shareholders on Form1099-DIV bymid-February 2020. Shareholders are advised to check with their tax advisors for information on the treatment of these amounts on their individual income tax returns.
| franklintempleton.com | Annual Report | 53 | ||
FRANKLIN STRATEGIC SERIES
The name, year of birth and address of the officers and board members, as well as their affiliations, positions held with the Trust, principal occupations during at least the past five years and number of U.S. registered portfolios overseen in the Franklin Templeton fund complex, are shown below. Generally, each board member serves until that person’s successor is elected and qualified.
| Independent Board Members | ||||||||
Name, Year of Birth and Address
| Position
| Length of
| Number of Portfolios in by Board Member*
| Other Directorships Held During at Least the Past 5 Years
| ||||
Harris J. Ashton (1932) One Franklin Parkway San Mateo, CA94403-1906 | Trustee | Since 1991 | 138 | Bar-S Foods (meat packing company) (1981-2010). | ||||
| Principal Occupation During at Least the Past 5 Years: | ||||||||
Director of various companies; andformerly,Director, RBC Holdings, Inc. (bank holding company) (until 2002); and President, Chief Executive Officer and Chairman of the Board, General Host Corporation (nursery and craft centers) (until 1998).
| ||||||||
Terrence J. Checki (1945) One Franklin Parkway San Mateo, CA 94403-1906 | Trustee | Since 2017 | 115 | Hess Corporation (exploration of oil and gas) (2014-present). | ||||
| Principal Occupation During at Least the Past 5 Years: | ||||||||
Member of the Council on Foreign Relations (1996-present); Member of the National Committee on U.S.-China Relations (1999-present); member of the Board of Trustees of the Economic Club of New York (2013-present); member of the Board of Trustees of the Foreign Policy Association (2005-present) and member of various other boards of trustees and advisory boards; andformerly,Executive Vice President of the Federal Reserve Bank of New York and Head of its Emerging Markets and Internal Affairs Group and Member of Management Committee (1995-2014); and Visiting Fellow at the Council on Foreign Relations (2014).
| ||||||||
Mary C. Choksi (1950) One Franklin Parkway San Mateo, CA 94403-1906 | Trustee | Since 2014 | 138 | Avis Budget Group Inc. (car rental) (2007-present), Omnicom Group Inc. (advertising and marketing communications services) (2011-present) and White Mountains Insurance Group, Ltd. (holding company) (2017-present). | ||||
| Principal Occupation During at Least the Past 5 Years: | ||||||||
Director of various companies; andformerly,Founder and Senior Advisor, Strategic Investment Group (investment management group) (2015-2017); Founding Partner and Senior Managing Director, Strategic Investment Group (1987-2015); Founding Partner and Managing Director, Emerging Markets Management LLC (investment management firm) (1987-2011); and Loan Officer/Senior Loan Officer/Senior Pension Investment Officer, World Bank Group (international financial institution) (1977-1987).
| ||||||||
Edith E. Holiday (1952) One Franklin Parkway San Mateo, CA 94403-1906 | Lead Independent Trustee | Trustee since 1998 and Lead Independent Trustee since March 2019 | 138 | Hess Corporation (exploration of oil and gas) (1993-present), Canadian National Railway (railroad) (2001-present), White Mountains Insurance Group, Ltd. (holding company) (2004-present), Santander Consumer USA Holdings, Inc. (consumer finance) (2016-present), RTI International Metals, Inc. (manufacture and distribution of titanium) (1999-2015) and H.J. Heinz Company (processed foods and allied products) (1994-2013). | ||||
| Principal Occupation During at Least the Past 5 Years: | ||||||||
Director or Trustee of various companies and trusts; andformerly,Assistant to the President of the United States and Secretary of the Cabinet (1990-1993); General Counsel to the United States Treasury Department (1989-1990); and Counselor to the Secretary and Assistant Secretary for Public Affairs and Public Liaison–United States Treasury Department (1988-1989).
| ||||||||
54 | Annual Report | franklintempleton.com | ||
FRANKLIN STRATEGIC SERIES
Independent Board Members(continued)
Name, Year of Birth and Address
| Position
| Length of
| Number of Portfolios in Fund Complex Overseen by Board Member*
| Other Directorships Held During at Least the Past 5 Years
| ||||
J. Michael Luttig (1954) One Franklin Parkway San Mateo, CA 94403-1906 | Trustee | Since 2009 | 138 | Boeing Capital Corporation (aircraft financing) (2006-2013). | ||||
| Principal Occupation During at Least the Past 5 Years: | ||||||||
Executive Vice President, Counselor and Senior Advisor to Boeing Chairman and Board of Directors, The Boeing Company (aerospace company) (May 2019); andformerly, General Counsel and member of the Executive Council, The Boeing Company (2006-2019) and Federal Appeals Court Judge, U.S. Court of Appeals for the Fourth Circuit (1991-2006).
| ||||||||
Larry D. Thompson (1945) One Franklin Parkway San Mateo, CA 94403-1906 | Trustee | Since 2007 | 138 | The Southern Company (energy company) (2014-present; previously 2010-2012), Graham Holdings Company (education and media organization) (2011-present) and Cbeyond, Inc. (business communications provider) (2010-2012). | ||||
| Principal Occupation During at Least the Past 5 Years: | ||||||||
Director of various companies; Counsel, Finch McCranie, LLP (law firm) (2015-present); Independent Compliance Monitor and Auditor, Volkswagen AG (manufacturer of automobiles and commercial vehicles) (2017-present); John A. Sibley Professor of Corporate and Business Law, University of Georgia School of Law (2015-present; previously 2011-2012); andformerly,Executive Vice President – Government Affairs, General Counsel and Corporate Secretary, PepsiCo, Inc. (consumer products) (2012-2014); Senior Vice President – Government Affairs, General Counsel and Secretary, PepsiCo, Inc. (2004-2011); Senior Fellow of The Brookings Institution (2003-2004); Visiting Professor, University of Georgia School of Law (2004); and Deputy Attorney General, U.S. Department of Justice (2001-2003).
| ||||||||
| Interested Board Members and Officers | ||||||||
Name, Year of Birth and Address
| Position
| Length of
| Number of Portfolios in Fund Complex Overseen by Board Member*
| Other Directorships Held During at Least the Past 5 Years
| ||||
**Gregory E. Johnson (1961) One Franklin Parkway San Mateo, CA 94403-1906 | Trustee | Since 2013 | 150 | None | ||||
| Principal Occupation During at Least the Past 5 Years: | ||||||||
Chairman of the Board, Member – Office of the Chairman, Director and Chief Executive Officer, Franklin Resources, Inc.; officer and/or director or
| ||||||||
**Rupert H. Johnson, Jr. (1940) One Franklin Parkway San Mateo, CA 94403-1906 | Chairman of the Board and Trustee | Chairman of the Board since 2013 and Trustee since 1991 | 138 | None | ||||
| Principal Occupation During at Least the Past 5 Years: | ||||||||
Vice Chairman, Member – Office of the Chairman and Director, Franklin Resources, Inc.; Director, Franklin Advisers, Inc.; and officer and/or director or
| ||||||||
Alison E. Baur (1964) One Franklin Parkway San Mateo, CA 94403-1906 | Vice President | Since 2012 | Not Applicable | Not Applicable | ||||
| Principal Occupation During at Least the Past 5 Years: | ||||||||
Deputy General Counsel, Franklin Templeton; and officer of some of the other subsidiaries of Franklin Resources, Inc. and of 44 of the investment
| ||||||||
| franklintempleton.com | Annual Report | 55 | ||
FRANKLIN STRATEGIC SERIES
Interested Board Members and Officers(continued)
Name, Year of Birth and Address
| Position
| Length of
| Number of Portfolios in
| Other Directorships Held During at Least the Past 5 Years
| ||||
Sonal Desai, Ph.D. (1963) One Franklin Parkway San Mateo, CA 94403-1906 | Vice President | Since December 2018 | Not Applicable | Not Applicable | ||||
| Principal Occupation During at Least the Past 5 Years: | ||||||||
Director and Executive Vice President, Franklin Advisers, Inc.; Executive Vice President, Franklin Templeton Institutional, LLC; and officer of 18 of the investment companies in Franklin Templeton.
| ||||||||
Gaston Gardey (1967) One Franklin Parkway San Mateo, CA 94403-1906 | Treasurer, Chief Financial Officer and, Chief Accounting Officer | Since 2009 | Not Applicable | Not Applicable | ||||
| Principal Occupation During at Least the Past 5 Years: | ||||||||
Treasurer, U.S. Fund Administration & Reporting and officer of 26 of the investment companies in Franklin Templeton.
| ||||||||
Aliya S. Gordon (1973) One Franklin Parkway San Mateo, CA 94403-1906 | Vice President | Since 2009 | Not Applicable | Not Applicable | ||||
| Principal Occupation During at Least the Past 5 Years: | ||||||||
Senior Associate General Counsel, Franklin Templeton; Vice President and Secretary, Franklin Resources, Inc.; and officer of 44 of the investment companies in Franklin Templeton.
| ||||||||
Steven J. Gray (1955) One Franklin Parkway San Mateo, CA 94403-1906 | Vice President and Co- Secretary | Vice President since 2009 andCo-Secretary since January 2019 | Not Applicable | Not Applicable | ||||
| Principal Occupation During at Least the Past 5 Years: | ||||||||
Senior Associate General Counsel, Franklin Templeton; Vice President, Franklin Templeton Distributors, Inc. and FASA, LLC; and officer of 44 of the investment companies in Franklin Templeton.
| ||||||||
Matthew T. Hinkle (1971) One Franklin Parkway San Mateo, CA 94403-1906 | Chief Executive Officer – Finance and Administration | Since 2017 | Not Applicable | Not Applicable | ||||
| Principal Occupation During at Least the Past 5 Years: | ||||||||
Senior Vice President, Franklin Templeton Services, LLC; officer of 44 of the investment companies in Franklin Templeton; andformerly, Vice President, Global Tax (2012-April 2017) and Treasurer/Assistant Treasurer, Franklin Templeton (2009-2017).
| ||||||||
Robert Lim (1948) One Franklin Parkway San Mateo, CA 94403-1906 | Vice President –AML Compliance | Since 2016 | Not Applicable | Not Applicable | ||||
| Principal Occupation During at Least the Past 5 Years: | ||||||||
Vice President, Franklin Templeton Companies, LLC; Chief Compliance Officer, Franklin Templeton Distributors, Inc. and Franklin Templeton Investor Services, LLC; and officer of 44 of the investment companies in Franklin Templeton.
| ||||||||
Kimberly H. Novotny (1972) 300 S.E. 2nd Street Fort Lauderdale, FL 33301-1923 | Vice President | Since 2013 | Not Applicable | Not Applicable | ||||
| Principal Occupation During at Least the Past 5 Years: | ||||||||
Senior Associate General Counsel, Franklin Templeton; Vice President and Corporate Secretary, Fiduciary Trust International of the South; Vice President, Templeton Investment Counsel, LLC; Assistant Secretary, Franklin Resources, Inc.; and officer of 44 of the investment companies in Franklin Templeton.
| ||||||||
56 | Annual Report | franklintempleton.com | ||
FRANKLIN STRATEGIC SERIES
Interested Board Members and Officers(continued)
Name, Year of Birth and Address
| Position
| Length of
| Number of Portfolios in Fund Complex Overseen by Board Member*
| Other Directorships Held During at Least the Past 5 Years
| ||||
Edward D. Perks (1970) One Franklin Parkway San Mateo, CA 94403-1906 | President and Chief Executive Officer – Investment Management | Since December 2018 | Not Applicable | Not Applicable | ||||
| Principal Occupation During at Least the Past 5 Years: | ||||||||
President and Director, Franklin Advisers, Inc.; and officer of nine of the investment companies in Franklin Templeton (since December 2018).
| ||||||||
Robert C. Rosselot (1960) 300 S.E. 2nd Street Fort Lauderdale, FL 33301-1923 | Chief Compliance Officer | Since 2013 | Not Applicable | Not Applicable | ||||
| Principal Occupation During at Least the Past 5 Years: | ||||||||
Director, Global Compliance, Franklin Templeton; Vice President, Franklin Templeton Companies, LLC; officer of 44 of the investment companies in Franklin Templeton; andformerly, Senior Associate General Counsel, Franklin Templeton (2007-2013); and Secretary and Vice President, Templeton Group of Funds (2004-2013).
| ||||||||
Navid J. Tofigh (1972) One Franklin Parkway San Mateo, CA 94403-1906 | Vice President | Since 2015 | Not Applicable | Not Applicable | ||||
| Principal Occupation During at Least the Past 5 Years: | ||||||||
Associate General Counsel and officer of 44 of the investment companies in Franklin Templeton.
| ||||||||
Craig S. Tyle (1960) One Franklin Parkway San Mateo, CA 94403-1906 | Vice President | Since 2005 | Not Applicable | Not Applicable | ||||
| Principal Occupation During at Least the Past 5 Years: | ||||||||
General Counsel and Executive Vice President, Franklin Resources, Inc.; and officer of some of the other subsidiaries of Franklin Resources, Inc. and of 44 of the investment companies in Franklin Templeton.
| ||||||||
Lori A. Weber (1964) 300 S.E. 2nd Street Fort Lauderdale, FL 33301-1923 | Vice President andCo-Secretary | Vice President since 2011 andCo-Secretary since January 2019 | Not Applicable | Not Applicable | ||||
| Principal Occupation During at Least the Past 5 Years: | ||||||||
Senior Associate General Counsel, Franklin Templeton; Assistant Secretary, Franklin Resources, Inc.; Vice President and Secretary, Templeton Investment Counsel, LLC; and officer of 44 of the investment companies in Franklin Templeton.
| ||||||||
| franklintempleton.com | Annual Report | 57 | ||
FRANKLIN STRATEGIC SERIES
*We base the number of portfolios on each separate series of the U.S. registered investment companies within the Franklin Templeton fund complex. These portfolios have a common investment manager or affiliated investment managers.
**Gregory E. Johnson is considered to be an interested person of the Fund under the federal securities laws due to his position as an officer and director of Franklin Resources, Inc. (Resources), which is the parent company of the Fund’s investment manager and distributor. Rupert H. Johnson, Jr. is considered to be an interested person of the Fund under the federal securities laws due to his position as an officer and director and major shareholder of Resources.
Note 1: Rupert H. Johnson, Jr. is the uncle of Gregory E. Johnson.
Note 2: Officer information is current as of the date of this report. It is possible that after this date, information about officers may change.
The Sarbanes-Oxley Act of 2002 and Rules adopted by the Securities and Exchange Commission require the Fund to disclose whether the Fund’s Audit Committee includes at least one member who is an audit committee financial expert within the meaning of such Act and Rules. The Fund’s Board has determined that there is at least one such financial expert on the Audit Committee and has designated Mary C. Choksi as its audit committee financial expert. The Board believes that Ms. Choksi qualifies as such an expert in view of her extensive business background and experience. She currently serves as a director of Avis Budget Group, Inc. (2007-present) and formerly, Founder and Senior Advisor, Strategic Investment Group (1987 to 2017). Ms. Choksi has been a Member of the Fund’s Audit Committee since 2014. As a result of such background and experience, the Board believes that Ms. Choksi has acquired an understanding of generally accepted accounting principles and financial statements, the general application of such principles in connection with the accounting estimates, accruals and reserves, and analyzing and evaluating financial statements that present a breadth and level of complexity of accounting issues generally comparable to those of the Fund, as well as an understanding of internal controls and procedures for financial reporting and an understanding of audit committee functions. Ms. Choksi is an independent Board member as that term is defined under the relevant Securities and Exchange Commission Rules and Releases.
The Statement of Additional Information (SAI) includes additional information about the board members and is available, without charge, upon request. Shareholders may call (800) DIALBEN/342-5236 to request the SAI.
58 | Annual Report | franklintempleton.com | ||
FRANKLIN STRATEGIC SERIES
Board Approval of Investment
Management Agreements
FRANKLIN STRATEGIC SERIES
Franklin Templeton SMACS: Series I
Franklin Templeton SMACS: Series CH
Franklin Templeton SMACS: Series H
Franklin Templeton SMACS: Series E
(each a Fund)
At anin-person meeting held on April 16, 2019 (Meeting), the Board of Trustees (Board) of Franklin Strategic Series (Trust), including a majority of the trustees who are not “interested persons” as defined in the Investment Company Act of 1940 (Independent Trustees), reviewed and approved an investment management agreement between Franklin Advisers, Inc. (Manager) and the Trust, on behalf of each Fund (Management Agreement) for an initialtwo-year period. The Independent Trustees received advice from and met separately with Independent Trustee counsel in considering whether to approve the Management Agreement.
In considering the approval of the Management Agreement, the Board reviewed and considered information provided by the Manager in connection with the Meeting and throughout the year at meetings of the Board and its committees. The Board reviewed and considered all of the factors it deemed relevant in approving the Management Agreement, including, but not limited to: (1) the nature, extent and quality of the services to be provided by the Manager; (ii) the costs of the services to be provided by the Manager; and (iii) the extent to which economies of scale may be realized as each Fund grows. The Board also reviewed and considered the form of Management Agreement and the terms of the Management Agreement which were discussed at the Meeting.
In approving the Management Agreement, the Board, including a majority of the Independent Trustees, determined that the terms of the proposed Management Agreement are fair and reasonable and that the approval of such Management Agreement is in the interests of each Fund and its shareholders. While attention was given to all information furnished, the following discusses some primary factors relevant to the Board’s determination.
Nature, Extent and Quality of Services
The Board reviewed and considered information regarding the nature, extent and quality of investment management services to be provided by the Manager and its affiliates to each Fund and its shareholders. This information included,
among other things, management’s explanation that it intends to use the Funds to complete separately managed account portfolios managed by the Manager and its affiliates, each Fund’s proposed investment strategies and the ability of the Manager to implement such investment strategies; the qualifications, background and experience of the investment personnel that will be responsible for theday-to-day portfolio management of the Funds; the Manager’s experience as the manager of other funds and accounts, including other series of the Trust and other funds in the Franklin Templeton family of funds; the Manager’s strength and reputation within the industry; the personnel, operations, financial condition, and investment management capabilities, methodologies and resources of the Manager; and the Manager’s compliance capabilities, as demonstrated by, among other things, its policies and procedures reasonably designed to prevent violations of the Federal Securities Laws (as defined in Rule38a-1 of the Investment Company Act of 1940). Following consideration of such information, the Board was satisfied with the nature, extent and quality of services to be provided by the Manager and its affiliates to each Fund and its shareholders.
Fund Performance
The Board noted that, as the Funds have not yet commenced investment operations, there was no investment performance for the Funds. The Board considered the proposed performance benchmark for each Fund and how such benchmark would be utilized to measure performance of the Manager.
Comparative Fees and Expenses
The Board reviewed and considered information regarding whether an investment management fee would be charged to each Fund by the Manager. In particular, the Board noted that, pursuant to the Management Agreement, the Manager will provide general investment management and administrative services to each Fund for a zero management fee. The Board also noted that the Manager will assume all expenses incurred by each Fund (including acquired fund fees and expenses), excluding certainnon-routine expenses, such as those relating to litigation, indemnification, reorganizations and liquidations, incurred by each Fund. The Board further noted that comparative fee data for the Funds customarily prepared by Broadridge Financial Services, Inc. was not provided because the Funds will have a zero management fee. The Board concluded that the proposed management fee for each Fund is reasonable.
| franklintempleton.com | Annual Report | 59 | ||
FRANKLIN STRATEGIC SERIES
SHAREHOLDER INFORMATION
Profitability
The Board then noted that the Manager (and its affiliates) could not report any financial results from their relationships with the Funds because the Funds had not yet commenced investment operations, and thus, the Board could not evaluate the Manager’s (or its affiliates’) profitability with respect to the Funds.
Economies of Scale
The Board reviewed and considered the extent to which the Manager may realize economies of scale, if any, as each Fund grows larger and whether each Fund’s management fee structure reflects any economies of scale for the benefit of shareholders. In connection with this review, the Trustees noted that because each Fund will pay a zero management fee, the consideration of possible economies of scale in the future was not relevant.
Conclusion
Based on its review, consideration and evaluation of all factors it believed relevant, including the above-described factors and conclusions, the Board, including a majority of the Independent Trustees, approved the Management Agreement for each Fund for an initialtwo-year period.
Proxy Voting Policies and Procedures
The Trust’s investment manager has established Proxy Voting Policies and Procedures (Policies) that the Trust uses to determine how to vote proxies relating to portfolio securities. Shareholders may view the Trust’s complete Policies online at franklintempleton.com. Alternatively, shareholders may request copies of the Policies free of charge by calling the Proxy Group collect at (954)527-7678 or by sending a written request to: Franklin Templeton Companies, LLC, 300 S.E. 2nd Street, Fort Lauderdale, FL 33301, Attention: Proxy Group. Copies of the Trust’s proxy voting records are also made available online at franklintempleton.com and posted on the U.S. Securities and Exchange Commission’s website at sec.gov and reflect the most recent12-month period ended June 30.
Quarterly Statement of Investments
The Trust files a complete statement of investments with the U.S. Securities and Exchange Commission for the first and third quarters for each fiscal year as an exhibit to its report on FormN-PORT. Shareholders may view the filed FormN-PORT by visiting the Commission’s website at sec.gov. The filed form may also be viewed and copied at the
Commission’s Public Reference Room in Washington, DC. Information regarding the operations of the Public Reference Room may be obtained by calling(800) SEC-0330.
Householding of Reports and Prospectuses
You will receive each Fund’s financial reports every six months as well as an annual updated summary prospectus (prospectus available upon request). To reduce Fund expenses, we try to identify related shareholders in a household and send only one copy of the financial reports and summary prospectus. This process, called “householding,” will continue indefinitely unless you instruct us otherwise. If you prefer not to have these documents householded, please call us at (800)632-2301. At any time you may view current prospectuses/summary prospectuses and financial reports on our website. If you choose, you may receive these documents through electronic delivery.
60 | Annual Report | franklintempleton.com | ||
Authorized for distribution only when accompanied or preceded by a summary prospectus and/or prospectus. Investors should carefully consider a fund’s investment goals, risks, charges and expenses before investing. A prospectus contains this and other information; please read it carefully before investing.
To help ensure we provide you with quality service, all calls to and from our service areas are monitored and/or recorded.
 | Annual Report Franklin Strategic Series | |||||
| Investment Manager | Distributor | Shareholder Services | ||||
| Franklin Advisers, Inc. | Franklin Templeton Distributors, Inc. | (800)632-2301 | ||||
| (800) DIAL BEN®/342-5236 | ||||||
| franklintempleton.com | ||||||
| © 2019 Franklin Templeton Investments. All rights reserved. | FSS3 A 10/19 |
| Item 2. | Code of Ethics. |
(a) The Registrant has adopted a code of ethics that applies to its principal executive officers and principal financial and accounting officer.
(c) N/A
(d) N/A
(f) Pursuant to Item 13(a)(1), the Registrant is attaching as an exhibit a copy of its code of ethics that applies to its principal executive officers and principal financial and accounting officer.
| Item 3. | Audit Committee Financial Expert. |
(a)(1) The Registrant has an audit committee financial expert serving on its audit committee.
(2) The audit committee financial expert is Mary C. Choksi and she is “independent” as defined under the relevant Securities and Exchange Commission Rules and Releases.
| Item 4. | Principal Accountant Fees and Services. |
(a) Audit Fees
The aggregate fees paid to the principal accountant for professional services rendered by the principal accountant for the audit of the registrant’s annual financial statements or for services that are normally provided by the principal accountant in connection with statutory and regulatory filings or engagements were $139,718 for the fiscal year ended August 31, 2019 and $0 for the fiscal year ended August 31, 2018.
(b) Audit-Related Fees
There were no fees paid to the principal accountant for assurance and related services rendered by the principal accountant to the registrant that are reasonably related to the performance of the audit of the registrant’s financial statements and are not reported under paragraph (a) of Item 4.
There were no fees paid to the principal accountant for assurance and related services rendered by the principal accountant to the registrant’s investment adviser and any entity controlling, controlled by or under common control with the investment adviser that provides ongoing services to the registrant that are reasonably related to the performance of the audit of their financial statements.
(c) Tax Fees
There were no fees paid to the principal accountant for professional services rendered by the principal accountant to the registrant for tax compliance, tax advice and tax planning.
The aggregate fees paid to the principal accountant for professional services rendered by the principal accountant to the registrant’s investment adviser and any entity controlling, controlled by or under common control with the investment adviser that provides ongoing services to the registrant for tax compliance, tax advice and tax planning were $20,000 for the fiscal year ended August 31, 2019 and $0 for the fiscal year ended August 31, 2018. The services for which these fees were paid included professional fees in connection with tax treatment of equipment lease transactions and professional fees in connection with an Indonesia withholding tax refund claim.
(d) All Other Fees
There were no fees paid to the principal accountant for products and services rendered by the principal accountant to the registrant, other than the services reported in paragraphs (a)-(c) of Item 4.
The aggregate fees paid to the principal accountant for products and services rendered by the principal accountant to the registrant’s investment adviser and any entity controlling, controlled by or under common control with the investment adviser that provides ongoing services to the registrant not reported in paragraphs (a)-(c) of Item 4 were $22,200 for the fiscal year ended August 31, 2019 and $0 for the fiscal year ended August 31, 2018. The services for which these fees were paid included the issuance of an Auditors’ Certificate for South Korean regulatory shareholders disclosures and benchmarking services in connection with the ICI TA survey.
(e) (1) The registrant’s audit committee is directly responsible for approving the services to be provided by the auditors, including:
(i) pre-approval of all audit and audit related services;
(ii) pre-approval of allnon-audit related services to be provided to the Fund by the auditors;
(iii) pre-approval of allnon-audit related services to be provided to the registrant by the auditors to the registrant’s investment adviser or to any entity that controls, is controlled by or is under common control with the registrant’s investment adviser and that provides ongoing services to the registrant where thenon-audit services relate directly to the operations or financial reporting of the registrant; and
(iv) establishment by the audit committee, if deemed necessary or appropriate, as an alternative to committeepre-approval of services to be provided by the auditors, as required by paragraphs (ii) and (iii) above, of policies and procedures to permit such services to bepre-approved by other means, such as through establishment of guidelines or by action of a designated member or members of the committee; provided the policies and procedures are detailed as to the particular service and the committee is informed of each service and such policies and procedures do not include delegation of audit committee responsibilities, as contemplated under the Securities Exchange Act of 1934, to management; subject, in the case of (ii) through (iv), to any waivers, exceptions or exemptions that may be available under applicable law or rules.
(e) (2) None of the services provided to the registrant described in paragraphs (b)-(d) of Item 4 were approved by the audit committee pursuant to paragraph (c)(7)(i)(C) of Rule2-01 of regulationS-X.
(f) No disclosures are required by this Item 4(f).
(g) The aggregatenon-audit fees paid to the principal accountant for services rendered by the principal accountant to the registrant and the registrant’s investment adviser and any entity controlling, controlled by or under common control with the investment adviser that provides ongoing services to the registrant were $42,200 for the fiscal year ended August 31, 2019 and $0 for the fiscal year ended August 31, 2018.
(h) The registrant’s audit committee of the board has considered whether the provision ofnon-audit services that were rendered to the registrant’s investment adviser (not including anysub-adviser whose role is primarily portfolio management and is subcontracted with or overseen by another investment adviser), and any entity controlling, controlled by, or under common control with the investment adviser that provides ongoing services to the registrant that were notpre-approved pursuant to paragraph (c)(7)(ii) of Rule2-01 of RegulationS-X is compatible with maintaining the principal accountant’s independence.
| Item 5. | Audit Committee of Listed Registrants. N/A |
| Item 6. | Schedule of Investments. N/A |
| Item 7. | Disclosure of Proxy Voting Policies and Procedures forClosed-End Management Investment Companies. N/A |
| Item 8. | Portfolio Managers ofClosed-End Management Investment Companies. N/A |
| Item 9. | Purchases of Equity Securities byClosed-End Management Investment Company and Affiliated Purchasers. N/A |
| Item 10. | Submission of Matters to a Vote of Security Holders. |
There have been no changes to the procedures by which shareholders may recommend nominees to the Registrant’s Board of Trustees that would require disclosure herein.
| Item 11. | Controls and Procedures. |
(a) Evaluation of Disclosure Controls and Procedures. The Registrant maintains disclosure controls and procedures that are designed to provide reasonable assurance that information required to be disclosed in the Registrant’s filings under the Securities Exchange Act of 1934, as amended, and the Investment Company Act of 1940 is recorded, processed, summarized and reported within the periods specified in the rules and forms of the Securities and Exchange Commission. Such information is accumulated and communicated to the Registrant’s management, including its principal executive officer and principal financial officer, as appropriate, to allow timely decisions regarding required disclosure. The Registrant’s management, including the principal executive officer and the principal financial officer, recognizes that any set of controls and procedures, no matter how well designed and operated, can provide only reasonable assurance of achieving the desired control objectives.
Within 90 days prior to the filing date of this Shareholder Report onForm N-CSR, the Registrant had carried out an evaluation, under the supervision and with the participation of the Registrant’s management, including the Registrant’s principal executive officer and the Registrant’s principal financial officer, of the effectiveness of the design and operation of the Registrant’s disclosure controls and procedures. Based on such evaluation, the Registrant’s principal executive officer and principal financial officer concluded that the Registrant’s disclosure controls and procedures are effective.
(b) Changes in Internal Controls. There have been no changes in the Registrant’s internal control over financial reporting that occurred during the period covered by this report that has materially affected, or is reasonably likely to materially affect the internal control over financial reporting.
| Item 12. | Disclosure of Securities Lending Activities forClosed-End Management Investment Company. N/A |
| Item 13. | Exhibits. |
(a) (1) Code of Ethics
(a) (2) Certifications pursuant to Section 302 of the Sarbanes-Oxley Act of 2002 of Matthew T. Hinkle, Chief Executive Officer - Finance and Administration, and Gaston Gardey, Chief Financial Officer and Chief Accounting Officer
(b) Certifications pursuant to Section 906 of the Sarbanes-Oxley Act of 2002 of Matthew T. Hinkle, Chief Executive Officer - Finance and Administration, and Gaston Gardey, Chief Financial Officer and Chief Accounting Officer
SIGNATURES
Pursuant to the requirements of the Securities Exchange Act of 1934 and the Investment Company Act of 1940, the registrant has duly caused this report to be signed on its behalf by the undersigned, thereunto duly authorized.
| FRANKLIN STRATEGIC SERIES | ||
| By | /S/ MATTHEW T. HINKLE | |
| Matthew T. Hinkle | ||
| Chief Executive Officer – Finance and Administration | ||
| Date | October 31, 2019 | |
Pursuant to the requirements of the Securities Exchange Act of 1934 and the Investment Company Act of 1940, this report has been signed below by the following persons on behalf of the registrant and in the capacities and on the dates indicated.
| By | /S/ MATTHEW T. HINKLE | |
| Matthew T. Hinkle | ||
| Chief Executive Officer – Finance and Administration | ||
| Date | October 31, 2019 | |
| By | /S/ GASTON GARDEY | |
| Gaston Gardey | ||
| Chief Financial Officer and Chief Accounting Officer | ||
Date | October 31, 2019 | |